implementasi digital inter-clustering linkage agroindustry ...
Upload
khangminh22Category
view
19download
0
YIELD LINKAGE DRAG IN QUALITY PROTEIN MAIZE INBRED LINES AND
HYBRIDS
By
ISAAC KODZO AMEGBOR
Submitted in fulfilment of the requirements of the degree
DOCTOR OF PHILOSOPHY
(PLANT BREEDING)
in the
Department of Plant Sciences (Plant Breeding), Faculty of Natural and Agricultural
Sciences, University of the Free State, Bloemfontein, South Africa
Promoter: Prof. Maryke T. Labuschagne
Co-promoters: Dr. Angeline van Biljon
Dr. Nemera Shargie
Dr. Amsal T. Tarekegne
October 2020
i
SUMMARY
The development of high yielding and stable quality protein maize (QPM) hybrids is
important for increasing grain yield output per unit area, to support the fight against hunger
and malnutrition in sub-Saharan Africa (SSA), as well as for feed supplement formulation
for the animal and poultry industries. Despite the development of QPM genotypes with
increased lysine and tryptophan content, important information is lacking on the yield
potential of QPM genotypes compared to non-QPM (normal) genotypes. The main
objective of this study was to quantify grain yield reduction (if any) due to the QPM trait.
The specific objectives were to: (i) compare QPM and non-QPM inbred lines for yield and
yield related traits, as well as quality traits, and determine stability for grain yield, (ii)
compare QPM and non-QPM hybrids for yield and yield stability, (iii) estimate the
combining ability for grain yield and quality traits of QPM and non-QPM inbred lines (iv)
estimate the heritability, variance components, principal components, correlation
coefficients, and do path analysis of grain yield, and agronomic and quality traits. In this
study, 130 single cross hybrids were developed from 33 QPM and non-QPM inbred lines
and four testers (two QPM and two non-QPM). Five hybrid checks (two QPM and three
non-QPM, all single cross hybrids) were included, obtained from the International Maize
and Wheat Improvement Center, Zimbabwe. The 135 hybrids together with the 40 inbred
lines were evaluated in South Africa and Zimbabwe during the 2017/2018 and 2018/2019
cropping seasons. The inbred lines were evaluated at seven locations using a 5 x 16 alpha
lattice design, while the hybrids were evaluated at 13 locations using a 5 x 27 alpha lattice
design with two replications. In the field experiments, two plants per plot were self-
pollinated for the determination of zein, tryptophan, amylose and starch, protein, oil,
moisture and fibre contents. In the inbred line trials, the top six performing lines out-
yielded the best yielding check by 15%. Although the top two inbred lines were non-QPM,
three of the six top yielding inbred lines were QPM. The QPM inbred line average yield
was 0.29 ton ha-1 higher than for non-QPM inbreds. Inbred lines 39, 27 and 10 had protein
content above 9%, while lines 2, 5 and 16 had tryptophan concentrations above 0.09%.
The best performing hybrids were a QPM cross of line 11 x CZL15049 (entry 41) followed
by a non-QPM hybrid involving line 28 x CZL15049 (entry 108). The best QPM hybrid
outperformed the best non-QPM hybrid by 8.81%. In addition, the best QPM hybrid,
genotype 41, outperformed the best non-QPM check (Pioneer) and best QPM check (CBI)
by 50.45 and 52.24%, respectively. Despite this, QPM hybrids yielded 13.90% lower than

ii
non-QPM genotypes on average. The additive main effects and multiplicative interaction
(AMMI) and genotype main effect plus genotype by environment interaction (GGE)
biplots identified genotypes 108 and 12 as the most stable and high yielding hybrids. QPM
hybrid 41 and non-QPM hybrids 108 and 12 were the highest yielding genotypes. Both
additive and non-additive genetic effects were important in the expression of measured
traits, with non-additive gene action controlling the inheritance of grain yield. Inbred lines
11, 14 and 28 and non-QPM tester CML444 showed desirable general combining ability
effects for grain yield. Based on the specific combining ability values, crosses 41, 85, 99,
105, 105 and 121 were identified as the best hybrids across the 13 locations for grain yield.
Hybrids 45, 69 and 6 had a high quality index, while hybrids 45 and 57 had high tryptophan
content. Hybrids 51 and 37 had high values for starch and oil contents, respectively.
Additive genetic effects were predominant in the control of the quality traits. Broad sense
heritability estimates were higher than 80% for the traits measured. Most of the hybrids
displayed heterosis for grain yield, with some having very high values. In conclusion, QPM
inbred lines yielded higher than non-QPM lines, but QPM hybrids yielded 13.9% less than
non-QPM hybrids. So it would seem that there is yield drag associated with increased
protein quality in hybrids in this specific set of material. There were, however, specific
QPM hybrids that had excellent and stable yield, which can be considered for commercial
release.
Keywords: combining ability, grain yield, heterosis, maize, tryptophan, protein

iii
DECLARATION
I, Isaac Kodzo Amegbor declare that the thesis hereby submitted for Doctoral Degree in
Plant Breeding in the Department of Plant Sciences (Plant Breeding), Faculty of Natural
and Agricultural Sciences, University of the Free State, Bloemfontein, South Africa is my
personal, original and independent work which has not previously been submitted by me
at any other University, Faculty or Institution of higher education. I declare that, the source
of genetic materials, reference materials and financial sources leading to the acquisition of
this qualification have been duly acknowledged. I furthermore cede copyright of this
dissertation in favour of the University of the Free State and all content of this write-up
can only be published after the approval of my Promoter in any journal of media.

iv
DEDICATION
This piece of work is dedicated to my lovely wife Philipine Aseye Amegbor and all well
wishers

v
ACKNOWLEDGMENTS
After years of intensive research and reading, I am glad that this thesis is finally completed
through hard work, dedication and the contribution of many people. I see this aspect as one
of the most difficult and challenging aspect of thesis writing due to the possibility of
unintended omissions that might made by not capturing all the people who have in one
way or the other assisted in the successful completion of this work.
My heartfelt appreciation goes to the Almighty God for His abundant grace, sustenance,
leadership, protection, love and favour, “Being confident of this very thing, that He which
hath begun a good work in me will perform it until the day of Jesus Christ. Philippians
1:6”. Indeed His promises are yea and Amen.
My profound gratitude goes to my competent and generous promoter, Professor Maryke
Labuschagne who has helped me in securing a fellowship to pursue this study and also
assisted in numerous ways for the field trials conducted. Prof. Maryke, thank you so very
much for your immense contributions and constructive criticisms leading to the success of
this thesis. You were not just a promoter and mentor to me but also a mother who has
created enabling environment for me to write this thesis with a peaceful mind. I will rate
you as the best supervisor in the world! You are a God given promoter, inspiring many
lives.
Special appreciation to my co-promoters: Dr Angeline van Biljon for her technical
assistance in carrying out the laboratory experiments, critical comments and observation
leading to the completion of the thesis. Dr Nemera Shargie, I say thank you greatly for
taking your time to go through the thesis promptly as well as for providing inputs and
staffers to assist in conducting the field trials at Potchefstroom. To my amiable Dr Amsal,
I am deeply grateful for providing me the genetic materials used in this study and for
coordinating the trials conducted at eight different locations in Zimbabwe. Your technical
contributions to the thesis are greatly acknowledged.
I am indebted to the University of the Free State and the Department of Plant Sciences for
the financial assistance to undergo this study and research. I greatly thank all the lecturers
and staff members in the Department of Plant Sciences, particularly, Ms Sadie Geldenhuys

vi
(retired) for her active help in relation to all the administrative matters as well as her
motherly pieces of advice and hospitality shown since I have arrived in South Africa for
the study. I equally appreciate the technical support from the International Maize and
Wheat Improvement Center, Zimbabwe; the Agricultural Research Council-Grain Crops
Institute, Potchefstroom staffers most especially Patrick, Madam Thembi and Petros for
their immense help during the field trials at Potchefstroom and Cedara.
An African adage says, “a river that forgets its source will soon dry” therefore, I cannot
but appreciate my amazing, wonderful and supportive family members starting from my
parents, I appreciate and love you all. I wish my father Mr Gershon Alormenu who has
died during the course of writing this thesis a very peaceful rest. It is sad that I could not
have the chance to spend time with you on your sick bed due to travel restrictions because
of the COVID-19 pandemic. You will forever be remembered. I equally extend my special
and magnanimous appreciation to my Mother (Veronica Tawiah) and grandparents most
especially my grandfather, John Kudese of blessed memory, who invested in my education
from high school through to my first degree. I wish death had delayed its sting for you to
witness this day but nevertheless I will always be grateful to you grandpa! I cannot forget
the support from my uncles and all my beautiful siblings. Your affectionate love, assistance
in sundry ways, advice and support have always mesmerized me. A big thank you to you
all. To my virtuous wife, Philipine Aseye Amegbor, a special thanks to you my love for
your prayers, motivation and hours of lengthy calls to give company while writing this
thesis. Words cannot quantify my gratitude. Thanks love.
Finally, I thank the Management of the Council for Scientific and Industrial Research-
Savanna Agricultural Research Institute for giving me the opportunity to undertake this
study; the One Big Family and Pastor Joseph Kyeremateng for their constant prayers. I will
definitely miss the interactive sessions with the students in the Department of Plant Science
division Plant Breeding and all lab mates, especially Stefan, Dr Sajjad, Martin, Julius, Dr
Neila, Keneuoe, Nginamau and Schae-Lee for their cheerful comments and suggestions.
Thanks for being a jolly good fellow. I really appreciate you all!

vii
LIST OF ABBREVIATIONS
AMMI Additive Main Effects and Multiplicative Interaction
ANOVA Analysis of variance
ASI Anthesis-silking interval
BPH Better-parent heterosis
BLUPs Best linear unbiased predictors
CIMMYT International Maize and Wheat Improvement Center
CV Coefficient of variation
DA Days to 50% anthesis
DF Degree of freedom
DS Days to silking
EA Ear aspect
EH Ear height
EPP Ears per plant
ER Ear rot
GCA General combining ability
GDP Gross domestic product
GEI Genotype x environment interaction
GGE Genotype main effect plus genotype by environment interaction
GY Grain yield
G x E Genotype by environment
H2 Broad sense heritablity
h2 Narrow sense heritability
HC Husk cover
HSGCA Specific and general combining ability of heterotic groups
IITA International Institute of Tropical Agriculture
MET Multi-environment trials
Moist Moisture
MPH Mid-parent heterosis
NARES National Agricultural Research and Extension Systems
NaOH Sodium hydroxide
NIR Near-infrared transmission spectroscopy
PCA Principal component analysis

viii
PH Plant height
Prot Protein
QI Quality index
QPM Quality protein maize
rG Genetic correlation coefficient
RL Root lodging
rP Phenotypic correlation coefficient
RP-HPLC Reverse phase high-performance liquid chromatography
Rpm Revolution per minute
RV Relative value
SAS Statistical analysis software
SCA Specific combining ability
SE Standard error
SL Stalk lodging
SSA Sub-Saharan Africa
TFA Trifluoroacetic acid
Trypt Tryptophan
UNICEF United Nations Children’s Fund
USDA United States Department of Agriculture
ix
TABLE OF CONTENTS Page
SUMMARY ......................................................................................................................... i
DECLARATION ............................................................................................................... iii
DEDICATION ................................................................................................................... iv
ACKNOWLEDGMENTS ................................................................................................... v
LIST OF ABBREVIATIONS ........................................................................................... vii
TABLE OF CONTENTS ................................................................................................... ix
LIST OF TABLES ........................................................................................................... xiv
LIST OF FIGURES ......................................................................................................... xvii
LISTOF APPENDICES ................................................................................................. xviii
CHAPTER ONE ................................................................................................................. 1
INTRODUCTION ........................................................................................................... 1
References ....................................................................................................................... 5
CHAPTER TWO ............................................................................................................... 10
LITERATURE REVIEW .............................................................................................. 10
2.1 Maize: economic importance and production ...................................................... 10
2.2 Importance and nutritional quality of QPM and non-QPM in SSA ..................... 11
2.3 Development of QPM genotypes ......................................................................... 13
2.4 Importance of heterosis, heterotic groups and patterns in breeding .................... 14
2.5 Significance of combining ability studies in breeding ......................................... 17
2.6 Line x tester mating design .................................................................................. 19
2.7 Genotype by environment interactions and stability studies ............................... 19
2.8 The importance of heritability in plant breeding ................................................. 22
2.9 Correlation among traits in plant breeding .......................................................... 23
2.10 Evaluation and chemical analysis of inbred lines .............................................. 24
2.11 Success in breeding for quality and yield drag .................................................. 25
References ..................................................................................................................... 26
CHAPTER THREE ........................................................................................................... 42
QUALITY AND NON-QUALITY PROTEIN MAIZE INBRED LINES: STABILITY
AND PERFORMANCE IN SOUTHERN AFRICA ........................................................ 42
3.1 Abstract .................................................................................................................... 42
3.2 Introduction ............................................................................................................. 43
3.3 Materials and methods ............................................................................................. 44
3.3.1 Genetic material and field evaluation ............................................................... 44
x
3.3.2 Data collection .................................................................................................. 45
3.3.3 Obtaining seed samples for quality traits analyses ........................................... 46
3.3.4 Zein extraction and determination of zein fractions using reverse phase high-
performance liquid chromatography .......................................................................... 46
3.3.5 Determination of amylose using iodine ............................................................ 48
3.3.6 Preparation of amylose standard curve ............................................................. 48
3.3.7 Determination of tryptophan ............................................................................. 50
3.3.7.1 Seed sample selection, milling and defatting ................................................. 50
3.3.7.2 Determination of tryptophan content ............................................................. 51
3.3.8 Starch determination ......................................................................................... 53
3.3.9 Determination of protein, oil, moisture and fibre ............................................. 53
3.3.10 Data analysis ................................................................................................... 54
3.4 Results ..................................................................................................................... 54
3.4.1 Analysis of variance for individual and combined locations ............................ 54
3.4.2 Performance of inbred lines across locations .................................................... 55
3.4.3 Analysis for variance for quality traits and zein proteins in 40 inbred lines .... 55
3.4.4 Performance of the lines for quality traits across four locations....................... 55
3.4.5 Correlation among grain yield and agronomic traits ........................................ 60
3.4.6 Principal component analysis for agronomic traits of 35 QPM inbred lines and
five checks evaluated in seven environments ............................................................ 60
3.4.7 Yield performance and stability of 35 QPM inbred lines and five checks under
seven growing conditions .......................................................................................... 61
3.5 Discussion ................................................................................................................ 64
3.6 Conclusions ............................................................................................................. 66
References ..................................................................................................................... 66
CHAPTER FOUR ............................................................................................................. 71
COMPARISON OF GRAIN YIELD AND YIELD STABILITY OF QUALITY
PROTEIN AND NON-QUALITY PROTEIN MAIZE HYBRIDS .............................. 71
4.1 Abstract .................................................................................................................... 71
4.2 Introduction ............................................................................................................. 72
4.3 Materials and methods ............................................................................................. 73
4.3.1 Genetic material ................................................................................................ 73
4.3.2 Experimental sites, design and agronomic practices ........................................ 76
4.3.3 Data collection .................................................................................................. 77
4.3.4 Statistical analyses ............................................................................................ 77
4.3.5 GGE biplot analysis .......................................................................................... 77

xi
4.3.6 AMMI analysis ................................................................................................. 77
4.3.7 Estimation of yield reduction of QPM vs non-QPM hybrids ........................... 78
4.4 Results ..................................................................................................................... 78
4.4.1 Analysis of variance for grain yield measured at Potchefstroom, Cedara and
Zimbabwe during the 2018 and 2019 cropping seasons ............................................ 78
4.4.2 Combined analysis of variance for measured traits across 13 locations for the
trials conducted in South Africa and Zimbabwe during the 2017/2018 and 2018/2019
cropping seasons ........................................................................................................ 81
4.4.4 Yield performance and stability of 135 QPM and non-QPM hybrids across 13
locations ..................................................................................................................... 81
4.4.4.1 “Which-won-where” biplots .......................................................................... 81
4.4.4.2 Stability analysis of the 135 hybrids .............................................................. 85
4.4.4.3 AMMI analysis for grain yield ...................................................................... 86
4.4.5 Quantifying grain yield reduction or yield increase due to the QPM trait ........ 86
4.5 Discussion ................................................................................................................ 91
4.6 Conclusions ............................................................................................................. 93
CHAPTER FIVE ............................................................................................................... 98
COMBINING ABILITY ANALYSIS AND ASSOCIATION AMONG AGRONOMIC
TRAITS OF QUALITY AND NON-QUALITY PROTEIN MAIZE INBRED LINES
....................................................................................................................................... 98
5.1 Abstract .................................................................................................................... 98
5.2 Introduction ............................................................................................................. 99
5.3 Materials and methods ........................................................................................... 100
5.3.1 Germplasm, field evaluation and data collection ............................................ 100
5.3.3 Estimation of grain yield reduction ................................................................. 102
5.4 Results ................................................................................................................... 103
5.4.1 Analysis of variance for general and specific combining ability of 130 hybrids
evaluated at Potchefstroom, Cedara and Zimbabwe during the 2017/2018 and
2018/2019 cropping seasons .................................................................................... 103
5.4.2 Analysis of variance for general and specific combining ability of 130 hybrids
evaluated across 13 locations ................................................................................... 105
5.4.3 Performance of lines in hybrid generation ...................................................... 105
5.4.4 Performance of testers in hybrid generation ................................................... 105
5.4.5 General combining ability effects of lines for grain yield and other agronomic
traits across 13 locations .......................................................................................... 109
5.4.6 General combining ability effects of testers for grain yield and other agronomic
traits across 13 locations .......................................................................................... 109

xii
5.4.7 Specific combining ability effects among the crosses for grain yield and other
measured traits across the 13 locations .................................................................... 112
5.4.8 Heterotic groupings of the 33 inbred lines based on grain yield across the 13
locations from the combined analysis using specific combining ability ................. 112
5.4.9 Estimation of yield differences of QPM and non-QPM hybrids and the
performance of the parents for grain yield, days to anthesis, plant height and
tryptophan ................................................................................................................ 116
5.5 Discussion .............................................................................................................. 120
5.6 Conclusions ........................................................................................................... 122
References ................................................................................................................... 122
CHAPTER SIX ............................................................................................................... 126
COMBINING ABILITY ANALYSIS OF QUALITY TRAITS FOR QUALITY AND
NON-QUALITY PROTEIN MAIZE INBRED LINES .............................................. 126
6.1 Abstract .................................................................................................................. 126
6.2 Introduction ........................................................................................................... 127
6.3 Materials and methods ........................................................................................... 129
6.3.1 Genetic material .............................................................................................. 129
6.3.2 Quality characteristics ..................................................................................... 129
6.3.3 Quality index ................................................................................................... 129
6.4 Results ................................................................................................................... 130
6.4.1 Analysis of variance for quality traits at Potchefstroom, Cedara and Zimbabwe
during the 2017/2018 and 2018/2019 cropping seasons and combined analysis across
six locations/years. ................................................................................................... 130
6.4.2 Mean values of measured quality traits of QPM and non-QPM hybrids and five
commercial checks ................................................................................................... 130
6.4.3 Estimates of combining ability for quality traits ............................................. 131
6.4.3.1 Analysis of variance for general and specific combining ability of lines and
testers evaluated at Potchefstroom, Cedara and Zimbabwe during the 2017/2018 and
2018/2019 cropping seasons .................................................................................... 131
6.4.3.2 Analysis of variance of general and specific combining ability of 33 lines and
four testers analysed for six quality traits across six environments ......................... 137
6.4.3.3 General combining ability effects of 33 lines for six quality traits across six
.................................................................................................................................. 137
6.4.3.4 General combining ability effects of testers for quality traits across six
locations ................................................................................................................... 140
6.4.3.5 Specific combining ability effects among the crosses for quality traits across
six locations ............................................................................................................. 140
6.5 Discussion .............................................................................................................. 145
xiii
6.6 Conclusions ........................................................................................................... 148
References ................................................................................................................... 149
CHAPTER SEVEN ......................................................................................................... 156
HERITABILITY AND TRAIT ASSOCIATIONS IN QUALITY AND NON-
QUALITY PROTEIN MAIZE GENOTYPES ............................................................ 156
7.1 Abstract .................................................................................................................. 156
7.2 Introduction ........................................................................................................... 157
7.3 Materials and methods ........................................................................................... 159
7.3.1 Genetic materials ............................................................................................ 159
7.3.2 Heritability estimates ...................................................................................... 159
7.3.3 Heterosis ......................................................................................................... 160
7.3.3.1 Mid-parent heterosis .................................................................................... 160
7.3.3.2 Better-parent heterosis ................................................................................. 160
7.3.4 Principal component analysis ......................................................................... 160
7.3.5 Genetic and phenotypic correlation estimations ............................................. 160
7.3.6 Path coefficient analysis.................................................................................. 161
7.4 Results ................................................................................................................... 161
7.4.1 Variance components and heritability for grain yield, agronomic characters and
quality traits ............................................................................................................. 161
7.4.2 Heterosis for grain yield and its secondary traits and quality traits ................ 162
7.4.3 Principal component analysis ......................................................................... 166
7.4.4 Genotypic and phenotypic correlation between grain yield and other agronomic
traits of 135 QPM and non-QPM hybrids evaluated across 13 locations during the
2017/2018 and 2018/2019 cropping seasons ........................................................... 171
7.4.5 Path coefficient analysis for grain yield and agronomic traits ........................ 175
7.5 Discussion .............................................................................................................. 178
7.5.1 Heritability and variance components for agronomic and quality traits ......... 178
7.5.2 Heterosis of grain yield, agronomic characters and quality traits ................... 179
7.5.3 Principal component analysis for agronomic and quality traits ...................... 179
7.5.4 Correlation coefficients and path analysis of grain yield, agronomic and quality
traits .......................................................................................................................... 180
7.6 Conclusions ........................................................................................................... 181
Reference ..................................................................................................................... 182
CHAPTER EIGHT .......................................................................................................... 188
CONCLUSIONS AND RECOMMENDATIONS ...................................................... 188

xiv
LIST OF TABLES Page
Table 3.1 Description of the QPM and non-QPM inbred lines and checks used in the
study .................................................................................................................................. 47
Table 3.2 Description of samples used for the amylose standard curve ........................... 49
Table 3.3 Analysis of variance for grain yield and other agronomic traits of 40 inbred
lines evaluated in seven environments in Zimbabwe and South Africa during the
2017/2018 cropping season ............................................................................................... 56
Table 3.4 Mean grain yield and other agronomic traits of 40 inbred lines evaluated at
seven locations in Southern Africa during the 2017/2018 cropping season ..................... 57
Table 3.5 Analysis of variance of quality traits analysed for 40 inbred lines at four
environments in Zimbabwe and South Africa during the 2017/2018 cropping season .... 58
Table 3.6 Means of quality traits for 40 inbred lines analysed across four environments
in Zimbabwe and South Africa during the 2017/2018 cropping season ........................... 59
Table 3.7 Genotypic correlation coefficients (rG) between grain yield and agronomic
traits of 40 QPM inbred lines evaluated at seven locations during the 2017/2018 growing
season ................................................................................................................................ 60
Table 3.8 Eigen values, proportion of the total variance represented by first four
principal components, cumulative percent variance and component loading of different
traits in 35 QPM inbred lines and five checks .................................................................. 61
Table 4.1 Description of the inbred lines and testers used to create hybrids.................... 74
Table 4.2 Description of the 130 QPM and non-QPM hybrids and the five commercial
checks used in the study .................................................................................................... 75
Table 4.3 Site description for the test locations in South Africa and Zimbabwe ............. 76
Table 4.4 Mean squares from analysis of variance for grain yield and other agronomic
traits of 135 hybrids evaluated under optimal growing conditions at Cedara (2017/2018
and 2018/2019), Potchefstroom (2017/2018 and 2018/2019) and Zimbabwe (2017/2018)
........................................................................................................................................... 79
Table 4.5 Mean squares from combined analysis of variance for grain yield and other
agronomic traits of 135 hybrids evaluated at 13 locations in South Africa and Zimbabwe
during the 2017/2018 and 2018/2019 cropping seasons ................................................... 80
Table 4.6 Mean grain yield of 30 selected hybrids from the individual locations used for
the GGE and AMMI biplot analyses ................................................................................. 82
Table 4.7 Mean averages of grain yield and agronomic traits measured for 40 (top 20,
middle 10, poorest 5) selected hybrids including the five checks, evaluated across 13
locations during the 2018 and 2019 cropping seasons in South Africa and Zimbabwe ... 83
Table 4.8 Comparison of grain yield and quantification of yield changes of QPM vs. non-
QPM hybrids and checks ................................................................................................... 88
Table 5.1 General form of analysis of variance for line x tester design repeated over
locations .......................................................................................................................... 102
Table 5.2 Mean squares from analysis of variance for general and specific combining
ability for grain yield and other agronomic traits of 130 QPM hybrids at Potchefstroom,
Cedara and Zimbabwe during the 2018 and 2019 cropping seasons .............................. 104

xv
Table 5.3 Mean squares from analysis of variance for general and specific combining
ability for grain yield and other agronomic traits of 130 QPM hybrids across 13 locations
in South Africa and Zimbabwe during 2018 and 2019 cropping seasons ....................... 106
Table 5.4 Mean values of lines generated from 130 crosses across 13 locations ........... 107
Table 5.5 Average performance of each tester for grain yield and other agronomic
character across 13 locations during the 2018 and 2019 cropping seasons .................... 108
Table 5.6 General combining ability effects of 33 lines for grain yield and other traits
evaluated at 13 locations during the 2018 and 2019 seasons in South Africa and Zimbabwe
......................................................................................................................................... 110
Table 5.7 General combining ability effects of four testers for grain yield and other traits
evaluated at 13 locations during the 2018 and 2019 seasons .......................................... 111
Table 5.8 Specific combining ability effects of 33 QPM inbred lines crossed with four
testers evaluated for grain yield and other traits across 13 locations in South Africa and
Zimbabwe during the 2017/2018 and 2018/2019 cropping seasons ............................... 113
Table 5.9 Classification of 33 maize inbred lines into heterotic groups based on the specific
combining ability across 13 locations in Zimbabwe and South Africa ........................... 116
Table 5.10 Grain yield differences between QPM and non-QPM hybrids and the
performance of the parents for grain yield, days to anthesis, plant height and tryptophan
......................................................................................................................................... 117
Table 6.1 Analysis of variance of 135 hybrids, including the checks, for quality traits from
seeds samples obtained from Cedara, Potchefstroom, Zimbabwe and across six sites during
2017/2018 and 2018/2019 cropping seasons .................................................................. 132
Table 6.2 Statistics and ranges for tryptophan and five other quality traits analysed for 135
QPM and non-QPM seed samples from Cedara, Potchefstroom, Zimbabwe and across six
sites during the 2017/2018 and 2018/2019 cropping seasons ......................................... 133
Table 6.3 Mean values from analysis of variance for tryptophan, moisture, protein, oil,
starch and fibre contents of 135 hybrids seed across six sites during the 2017/2018 and
2018/2019 cropping seasons ........................................................................................... 134
Table 6.4 Mean squares from analysis of variance for general and specific combining
ability for six quality traits of 33 inbred lines and four testers at Potchefstroom, Cedara and
Zimbabwe during the 2017/2018 and 2018/2019 cropping seasons ............................... 136
Table 6.5 Mean squares from combined analysis of variance for general and specific
combining ability for six quality traits of 33 inbred lines and four testers across six sites
during the 2017/2018 and 2018/2019 cropping seasons ................................................. 138
Table 6.6 General combining ability effects of 33 lines for quality traits across six sites
during the 2017/2018 and 2018/2019 cropping seasons in South Africa and Zimbabwe
......................................................................................................................................... 139
Table 6.7 General combining ability effects of four testers for six quality traits across six
sites during the 2017/2018 and 2018/2019 cropping seasons ......................................... 140
Table 6.8 Specific combining ability effects of 33 lines with four testers for quality traits
across six locations in South Africa and Zimbabwe during the 2017/2018 and 2018/2019
cropping seasons ............................................................................................................. 142

xvi
Table 7.1 Estimates of variance components and heritability for grain yield, agronomic
and quality traits of 130 crosses evaluated across 13 during 2017/2018 and 2018/2019
cropping seasons ............................................................................................................. 163
Table 7.2 Mid-parent (MPH%) and better parent (BPH%) heterosis for grain yield and
selected secondary traits of the 15 top performing, 10 middle and 10 poorest performing
genotypes selected from the 130 crosses evaluated across 13 location during 2017/2018
and 2018/2019 cropping seasons ..................................................................................... 164
Table 7.3 Mid-parent (MPH%) and better parent (BPH%) heterosis for quality traits of the
15 top performing, 10 middle and 10 poorest performing genotypes selected from the 130
crosses evaluated across six location during 2017/2018 and 2018/2019 cropping seasons
......................................................................................................................................... 165
Table 7.4 Estimates of principal component analysis for 135 QPM and non-PQM hybrids
for grain yield and other agronomic traits ....................................................................... 166
Table 7.5 Principal component analysis of 135 QPM and non-PQM hybrids for quality
traits ................................................................................................................................. 168
Table 7.6 Principal component analysis of 135 QPM and non-QPM hybrids for grain yield,
agronomic and quality traits ............................................................................................ 170
Table 7.7 Phenotypic correlation (rP) above diagonal and genotypic correlation (rG)
coefficients below diagonal between grain yield and agronomic traits of 135 QPM and non-
QPM hybrids evaluated at 13 environments during the 2017/2018 and 2018/2019 growing
seasons ............................................................................................................................. 173
Table 7.8 Phenotypic correlation (rP) above diagonal and genotypic correlation (rG)
coefficients below diagonal between quality traits of 135 QPM and non-QPM hybrids
evaluated at 13 environments during 2017/2018 and 2018/2019 growing seasons ........ 173
Table 7.9 Phenotypic correlation (rP) above diagonal and genotypic correlation (rG)
coefficients below diagonal between grain yield, agronomic and quality traits of 135 QPM
and non-QPM hybrids evaluated during the 2017/2018 and 2018/2019 growing seasons
......................................................................................................................................... 174
xvii
LIST OF FIGURES Page
Figure 3.1 Standard curve developed for amylose determination .................................... 50
Figure 3.2 Standard curve developed and used in the calculation of tryptophan contents of
the samples analysed ......................................................................................................... 51
Figure 3.3 “Which won where” genotype plus genotype x environment interaction biplot
of grain yield of 35 QPM inbred lines and five checks evaluated under seven environments
........................................................................................................................................... 62
Figure 3.4 The entry/tester genotype plus genotype x environment biplot based on grain
yield of 35 QPM inbred lines and five checks evaluated in seven environments ............. 63
Figure 4.1 ‘‘Which-won-where” genotype plus genotype x environment interaction biplot
of grain yield of 30 QPM and non-QPM maize hybrids evaluated at 13 locations during
2017/2018 and 2018/2019 cropping seasons .................................................................... 84
Figure 4.2 Entry/tester genotype plus genotype x environment biplot based on grain yield
of 30 QPM and non-QPM maize hybrids evaluated at 13 locations during 2017/2018 and
2018/2019 cropping seasons. ............................................................................................ 85
Figure 4.3 AMMI biplot of grain yield data and the first interaction principal component
axis (IPCA 1) of 30 QPM, non-QPM and check hybrids evaluated at 13 locations in South
Africa and Zimbabwe during the 2017/2018 and 2018/2019 cropping seasons ............... 87
Figure 7.1 Principal component analysis biplot of genotype by grain yield and other
agronomic traits of 135 QPM and non-QPM hybrids evaluated across 13 locations. .... 167
Figure 7.2 Principal component analysis biplot of genotype by quality traits of 135 QPM
and non-QPM hybrids evaluated across six locations. .................................................... 169
Figure 7.3 Combined principal component analysis biplot of 135 genotypes by grain yield,
agronomic and quality traits. ........................................................................................... 171
Figure 7.4 Path analysis showing the relationship of grain yield and agronomic traits of
135 QPM and non-QPM maize hybrids .......................................................................... 176
Figure 7.5 Path analysis showing the relationship of grain yield, agronomic and quality
traits of 135 QPM and non-QPM maize hybrids ............................................................. 177

xviii
LISTOF APPENDICES Page
Appendix 1. Grain yield and agronomic performance of 130 hybrids and five checks at
Cedara during 2017/2018 and 2018/2019 cropping seasons …….……………………. 191
Appendix 2. Grain yield and agronomic performance of 130 hybrids and five checks at
Potchefstroom during 2017/2018 and 2018/2019 cropping seasons ……….………… 194
Appendix 3. Grain yield and agronomic performance of 130 hybrids and five checks at
eight locations in Zimbabwe during 2017/2018 cropping season …………….……… 197
Appendix 4. Grain yield and agronomic performance of 130 hybrids and five checks at 13
locations in South Africa and Zimbabwe during 2017/2018 and 2018/2019 cropping
seasons ………………………………………………………………………………… 200
Appendix 5. Grain yield of 130 hybrids and five checks at 13 locations in South Africa and
Zimbabwe during 2017/2018 and 2018/2019 cropping seasons
……………………………………………………………………………………….…203
Appendix 6. Biochemical analysis of 130 hybrids and five checks obtained from self-
pollinated seed samples at Cedara during 2017/2018 and 2018/2019 cropping seasons
…………………………………………………………………………………………. 206
Appendix 7. Biochemical analysis of 130 hybrids and five checks obtained from self-
pollinated seed samples at Potchefstroom during 2017/2018 and 2018/2019 cropping
seasons ………………………………………………………………………………... 209
Appendix 8. Biochemical analysis of 130 hybrids and five checks obtained from self-
pollinated seed samples at Harare during 2017/2018 cropping season
………………………………………………………………………………………… 212
Appendix 9. Biochemical analysis and grain yield of 130 hybrids and five checks obtained
from self-pollinated seed samples at across during 2017/2018 and 2018/20121 cropping
season …………………………………………………………………………………. 215
Appendix 10. GCA of 33 lines and four testers for grain yield and agronomic traits for
trials evaluated at Cedara during 2017/2018 and 2018/2019 cropping seasons
…………………………………………………………………………………………. 218
Appendix 11. SCA of 130 hybrids for grain yield and agronomic traits for trials evaluated
at Cedara during 2017/2018 and 2018/2019 cropping seasons
…………………………………………………………………………………………. 219
Appendix 12. GCA of 33 lines and four testers for grain yield and agronomic traits for
trials evaluated at Potchefstroom during 2017/2018 and 2018/2019 cropping seasons
…………………………………………………………………………………………. 222
Appendix 13. SCA of 130 hybrids for grain yield and agronomic traits for trials evaluated
at Potchefstroom during 2017/2018 and 2018/2019 cropping seasons
…………………………………………………………………………………………. 223
Appendix 14. GCA of 33 lines and four testers for grain yield and agronomic traits for
trials evaluated at eight locations in Zimbabwe during 2017/2018 cropping season
…………………………………………………………………………………………. 226

xix
Appendixn15. SCA of 130 hybrids for grain yield and agronomic traits for trials evaluated
at eight locations in Zimbabwe during 2017/2018 cropping season
…………………………………………………………………………………………. 227
Appendix 16. GCA of 33 lines and four testers for biochemical traits for self-pollinated
seed samples obtained from Cedara during 2017/2018 and 2018/2019 cropping seasons
………………………………………………………………………………………… 230
Appendix 17. SCA of 130 hybrids for biochemical traits for self-pollinated seed samples
obtained from Cedara during 2017/2018 and 2018/2019 cropping seasons
………….………………………………………………………………..…………….. 231
Appendix 18. GCA of 33 lines and four testers for biochemical traits for self-pollinated
seed samples obtained from Potchefstroom during 2017/2018 and 2018/2019 cropping
seasons ……………………………………………………………………………...… 234
Appendix 19. SCA of 130 hybrids for biochemical traits for self-pollinated seed samples
obtained from Potchefstroom during 2017/2018 and 2018/2019 cropping seasons
……………..…………………………………………………………………………... 235
Appendix 20. GCA of 33 lines and four testers for biochemical traits for self-pollinated
seed samples obtained from two locations in Zimbabwe during cropping season
…………………………………………………………………………………………. 238
Appendix 21. SCA of 130 hybrids for biochemical traits for self-pollinated seed samples
obtained from two locations in Zimbabwe during 2017/2018 and 2018/2019 cropping
seasons ………………………………………………………………………………... 239
Appendix 22. Heterosis of grain yield and agronomic traits of 130 hybrids across 13
environments during 2017/2018 and 2018/2019 cropping seasons
……………………………………………………………………….………………... 242
Appendix 23. Heterosis of biochemical traits for 130 hybrids across six environments
during 2017/2018 and 2018/2019 cropping seasons
…………….……...……………………………………………………………………. 246
1
CHAPTER ONE
INTRODUCTION
Maize (Zea mays L.) is ranked among the top three cultivated crops in the world. It is the
most widely cultivated cereal crop in the world and serves as a primary food source for
nearly a billion people, predominantly in the developing world (Babu and Prasanna 2014;
Bekele and Rao 2014). Based on the demand for the crop and stress factors affecting its
production, it has been estimated that maize yields need to increase by 60% by 2050 to
address increasing population demand (Ray et al. 2013; Epule et al. 2017). In 2019, global
maize production was 1 123.65 million ton, however, the United States Department of
Agriculture (USDA) projected that there would be a decrease in the 2020 global maize
production by 0.95%, which will amount to about 10.63 million ton (USDA 2020). The
top world maize producer is the United States with 361 million metric ton in 2017 and
347.80 million metric ton in 2019, while South Africa is the leading producer in Africa
with 14.90 million ton in 2015 and 16 million ton in 2019 (Outreach 2017; USDA 2020).
Even though normal maize contains about 10% protein, it has major nutritional constraints
as human food. This is because the endosperm is deficient in two essential amino acids,
namely lysine and tryptophan (Babu and Prasanna 2014; Njeri et al. 2017; Liu et al. 2019).
Malnutrition as a result of nutrient deficiency affects nearly half of the world’s population,
particularly in the developing countries, due to over-reliance on major staple crops such as
maize, rice and cassava with little or no available micronutrients (UNICEF 2003; De
Groote et al. 2014). Nutrient deficiency results from prolonged lack of nutrients in the diet
and malnutrition occurs when the body does not obtain the necessary nutrients to perform
its functions (UNICEF 2003). Consequently, infants constantly fed on normal maize with
little or without any balanced protein supplements from animal sources, suffer from
malnutrition and develop diseases such as kwashiorkor (Badu-Apraku and Lum 2010;
Manjeru et al. 2019). Residual effects of malnutrition could also result in night blindness
in adults, a higher risk of child and maternal mortality as well as susceptibility to several
infectious diseases (Badejo 2018; Manjeru et al. 2019; Prasanna et al. 2020).
Plant based products are a vital source of nutrients and minerals for millions of people in
tropical Africa and other developing areas of the world (Tawanda et al. 2011). To address

2
problems posed by malnutrition, efforts were made to develop maize cultivars with
enhanced levels of these essential amino acids, which was started in 1963 by Mertz et al.
(1964). These scientists identified a mutant gene opaque-2 (o2) in maize that lead to the
same amount of protein as normal maize but with elevated levels of the essential amino
acids lysine and tryptophan, which improves the protein quality. Over the past three
decades, researchers from the International Maize and Wheat Improvement Center
(CIMMYT) and other international and national agricultural institutes/stations continued
the work of Mertz and others, which focused on enhancing the nutritional composition of
normal maize (Manjeru et al. 2019; Setimela et al. 2017; Kaur et al. 2019). Their efforts
led to the development of improved products from the soft o2 maize with good agronomic
traits as well as high lysine and tryptophan contents, and this was termed quality protein
maize (QPM) (Vasal et al. 1993; CIMMYT 2000; Vivek et al. 2008; Eshetie 2017;
O’Kennedy and Fox 2017; Mansilla et al. 2019). QPM may supply about 70 to 73% of
human protein requirements compared to 46% from normal maize and constitute biological
value of 80% protein compared to 40 to 57% for normal maize and 86% for eggs. In
addition, QPM has been reported to have 90% relative value (RV) of milk compared to
40% RV for normal maize (Bressani 1992; Masindeni 2013; Eshetie 2017; Mebratu et al.
2019).
Consumption of higher carbohydrate food products among poorer sections of the
population in the under-developed and developing countries leads to other health related
diseases such diabetes, obesity, heart diseases as well as other metabolic syndromes. This
has intensified research to breed new crop varieties with enhanced amino acid content,
which can be consumed through maize-based food ingredients (Ai and Jane 2016). Because
of the multi-purpose use of maize for humans and animals, it serves as an important source
of micronutrients (Sinha et al. 2011). Maize kernels consist of 61 to 78% starch, 6 to12%
protein, and 3 to 6% fat (Sinha et al. 2011; Ai and Jane 2016; Singh et al. 2019). Protein
exists largely in the form of zein proteins (β, γ and α), and kernels also contain fibre and
unsaturated oil (Sabagh et al. 2017; Salleh et al. 2019; Singh et al. 2019).
Because of the high yield potential of hybrids, they are used in the developed countries for
increased maize production even though open pollinated varieties are still being cultivated
in the developing countries. For hybrids to be developed, it is crucial to know the
combining ability of inbred lines that are used as parents for hybrid production in breeding

3
programmes. Maize production can be enhanced by gathering useful information on the
heterotic pattern and genetic variability of the inbred lines, which is important in breeding
programmes. Combining ability studies provide information on the genetic mechanisms
controlling the inheritance of quantitative traits and enable breeders to select suitable
parents for further improvement or use in hybrid breeding for commercial purposes (Ali et
al. 2012; Njeri et al. 2017; Kanwar and Nag 2019; Mansilla et al. 2019). Combining ability
enhances crossbreeding by facilitating the preliminary selection of inbred lines, which
perform well in crosses. Eventually, an entire population of high performing hybrids can
be generated (Nduwumuremyi et al. 2013). The general combining ability (GCA) and
specific combining ability (SCA) of inbred lines are important aspects to consider when
selecting materials for hybrid development and population improvement in maize
breeding. While GCA measure average contribution a parental line to hybrid performance
in a series of hybrid combinations in comparison to other parental lines in the same series
of hybrid combinations and this is due to additive gene action. On the other hand, SCA is
the contribution of an inbred to hybrid performance in a cross with a specific other inbred
in relation to its contributions in crosses with an array of other parental lines (Haydar and
Paul 2014). Therefore, combining ability is used extensively in the breeding of several
economic crop species (Mengesha 2013; Mebratu et al. 2019).
In spite of the nutritional benefits of QPM genotypes, one of the drawbacks reported for
QPM is reduced grain yield compared to non-QPM (normal) genotypes (Derera et al. 2014;
Tandzi et al. 2017; Oloyede-Kamiyo and Adetumbi 2017). Contrary to this, Mebratu et al.
(2019) reported relatively increased yield in QPM genotypes. To the farmer, the most
important aspect of cultivated crops, most especially maize hybrids, is grain yield. Several
researchers reported on the superiority of non-QPM to QPM varieties in terms of grain
yield (Pixley 2003; Bhatnagar et al. 2004; Krivanek et al. 2007). Another major drawback
is that the gene(s) responsible for QPM are recessive. Nuss et al. (2011) noted that, the o2
gene responsible for suppressing the synthesis of maize amino acids such as zein,
tryptophan and lysine thereby simultaneously increases the synthesis non-zein proteins that
are richer sources of tryptophan and lysine. Since endosperm modification is a
quantitatively inherited trait and has complex genetic control and lacks reliable molecular
markers linked to the endosperm modifier loci, a light table is presently used to physically
select for endosperm hardness (Hossain et al. 2008). This means that QPM maize must be
4
segregated from normal maize in the farmers’ field or the normal pollen will pollinate some
of the QPM plants and hide the expression of the trait.
There are several studies on biochemical analyses on QPM to determine the lysine and
tryptophan content of the grains (Mbuya et al. 2011; Wegary et al. 2011). Wessel-Beaver
et al. (1985) and Tandzi et al. (2017) observed that it is difficult to combine high grain
yield with high-quality protein content in elite maize varieties because these two
characteristics are often negatively correlated, hence, improving yield may adversely affect
protein quality and vice versa. Because either the grain yield is directly involved in the
process of seed modification or the modifier gene(s) could be tightly linked to those
responsible for protein synthesis (Prasanna et al. 2001). Therefore, if maize genotypes are
nutritionally enhanced but are low yielding, it would not be economically viable to the
farmer, and this may lead to rejection even after release.
The present study was done to assess possible yield reduction or “linkage drag” due to
increased protein quality in selected QPM inbred lines and hybrids, with the aim of
generating information on possible yield linkage drag, and to determine combining ability
effects, heritability and yield stability of crosses between QPM lines and QPM and non-
QPM lines. The nature of trait associations between grain yield, quality traits as well as its
associated characters, was determined in order to select superior genotypes from the
genetic material studied. Therefore, this study explored QPM and non-QPM lines recently
developed by CYMMIT to substantiate if indeed there is a yield reduction of QPM
compared to non-QPM genotypes.
The specific aims of this study were to:
- To compare QPM and non-QPM inbred lines for yield and quality traits
- To compare hybrids from these QPM and non-QPM inbred lines for yield and
quality traits
- To estimate the combining ability for yield and yield related traits as well as quality
traits of QPM and non-QPM inbred lines
- Estimate the heritability, variance components, principal components, path analysis
and correlation coefficients of grain yield and quality traits of the hybrids

5
References
Ai Y and Jane JL (2016) Macronutrients in corn and human nutrition. Comprehensive
Reviews in Food Science and Food Safety 15: 581-598.
Ali F, Irfan AS, Rahman H, Mohammad N, Durrishahwar, Muhammad YK, Ihteram U and
Jianbing Y (2012) Heterosis for yield and agronomic attributes in diverse maize
germplasm. Australian Journal of Crop Science 6: 455-462.
Babu R and Prasanna BM (2014) Molecular breeding for quality protein maize (QPM). In:
Tuberosa R, Graner A and Frison E (eds), Genomics of Plant Genetic Resources.
Springer, pp. 490-505.
Badejo AA (2018) Elevated carotenoids in staple crops: The biosynthesis, challenges and
measures for target delivery. Journal of Genetic Engineering and Biotechnology 16:
553-562.
Badu-Apraku B and Lum AF (2010) The pattern of grain yield response of normal and
quality protein maize cultivars in stressed and non-stressed environments. Agronomy
Journal 102: 381-394.
Bekele A and Rao TN (2014) Estimates of heritability, genetic advance and correlation
study for yield and it’s attributes in maize (Zea mays L.). Journal of Plant Sciences 2:
1-4.
Bhatnagar S, Betran FJ and Rooney LW (2004) Combining abilities of quality protein
maize inbreds. Crop Science 44: 1997-2005.
Bressani R (1992) Nutritional value of high-lysine maize in humans. In ET Mertz (ed.),
Quality Protein Maize. American Association of Cereal Chemists. St. Paul, MN, pp.
205-225.
CIMMYT (2000) CIMMYT in 1999-2000. Science and Sustenance. Mexico, D.F.:
CIMMYT.
De Groote H, Chege CK, Tomlins K and Gunaratna NS (2014) Combining experimental
auctions with a modified home-use test to assess rural consumers’ acceptance of
quality protein maize, a biofortified crop. Food Quality and Preference Journal 38: 1-
13.
Derera J, Pixley KV, Giga DP and Makanda I (2014) Resistance of maize to the maize
weevil:III. Grain weight loss assessment and implications for breeding. Journal of
Stored Products Research 59: 25-35.
Epule TE, Ford JD and Lwasa S (2017) Projections of maize yield vulnerability to droughts
and adaptation options in Uganda. Land Use Policy 65: 154-163.

6
Eshetie T (2017) Review of quality protein maize as food and feed: In alleviating protein
deficiency in developing countries. American Journal of Food and Nutrition 5: 99-
105.
Haydar FMA and Paul NK (2014) Combininbg ability analysis for different yield trails in
maize. Bangladesh Journal of Plant Breeding and Genetics 27: 1-5.
Hossain F, Prassana BM, Kumar R and Singh BB (2008) Genetic analysis of kernel
modification in Quality Protein Maize genotypes. Indian Journal of Genetics 68: 1-9.
Kanwar SS and Nag YK (2019) To study correlation and path analysis in rice breeding
lines. International Journal of Current Microbiology and Applied Sciences 8: 2481-
2487.
Kaur N, Singh B and Sharma S (2019) Comparison of quality protein maize (QPM) and
normal maize with respect to properties of instant porridge. LWT - Food Science and
Technology 99: 291-298.
Krivanek AF, De Groote H, Gunaratna NS, Diallo A and Friesen D (2007) Breeding and
disseminating quality protein maize (QPM) for Africa. African Journal of
Biotechnology 6: 312-324.
Liu Z, Cao X, Ren S, Wang J and Zhang H (2019) Physicochemical characterization of a
zein prepared using a novel aqueous extraction technology and tensile properties of
the zein film. Industrial Crops and Products 130: 57-62.
Manjeru P, van Biljon A and Labuschagne M (2019) The development and release of maize
fortified with provitamin A carotenoids in developing countries. Critical Reviews in
Food Science and Nutrition 59: 1284-1293.
Mansilla PS, Nazar MC and Pérez GT (2019) Evaluation and comparison of protein
composition and quality in half-sib families of opaque-2 maize (Zea mays L.) from
Argentina. Agriscientia 36: 39-53.
Masindeni DR (2013) Evaluation of South African high quality protein maize (Zea mays
L.) inbred lines under optimum and low nitrogen conditions and the identification of
suitable donor parents. PhD thesis in Plant Breeding, University of the Free State, Soth
Africa.
Mbuya K, Nkongolo KK and Kalonji-Mbuyi A (2011) Nutritional analysis of quality
protein maize varieties selected for agronomic characteristics in a breeding program.
International Jounal of Plant Breeding and Genetics 5: 317-327.

7
Mebratu A, Wegary D, Mohammed W, Teklewold A and Tarekegne A (2019) Genotype
× environment interaction of quality protein maize hybrids under contrasting
management conditions in Eastern and Southern Africa. Crop Science 59: 1576-1589.
Mengesha WA (2013) Genetic diversity, stability, and combining ability of maize
genotypes for grain yield and resistance to NCLB in the mid-altitude sub-humid agro-
ecologies of Ethiopia. MSc thesis in Plant Breeding, University of the Free State,
South Africa.
Mertz ET, Bates ET and Nelson OE (1964) Mutant genes that change protein composition
and increase lysine content of maize endosperm. Science 145: 279-280.
Nduwumuremyi A, Pangirayi T and Slyvestre H (2013) Mating designs: Helpful tool for
quantitative plant breeding analysis. Journal of Plant Breeding and Genetics 1: 117-
129.Njeri SG, Makumbi D, Warburton ML, Diallo A, Jumbo MB and Chemining’wa
G (2017) Genetic analysis of tropical quality protein maize (Zea mays L.) germplasm.
Euphytica 213: 1-19.
Nuss ET and Tanumihardjo S (2011) Quality Protein Maize for Africa: Closing the protein
inadequacy gap in vulnerable populations. American Society for Nutrition. Advances
in Nutrition 2: 217-214.
O’Kennedy KO and Fox G (2017) Zein characterisation of South African maize hybrids
and their respective parental lines using MALDI-TOF MS. Food Anlytical Methods
10: 1661-1668.
Oloyede-Kamiyo QO and Adetumbi JA (2017) Relationship between seed physical traits
and maize weevil (Sitophilus zeamais) damage parameters in selected quality protein
maize (QPM) varieties. Journal of Stored Products Research 73: 42-46.
Outreach IPB (2017) Maize in Africa. International Plant Biotechnology Outreach.
http://ipbo.vib-ugent.be/wp-content/uploads/2015/02/vib_fact_MaizeForAfrica_EN_
2017_LR.pdf
Pixley KV (2003) The development and promotion of quality protein maize in Sub-
Saharan Africa; Progress Report; CIMMYT: Harare, Zimbabwe.
Prasanna BM, Vasal SK, Kassahun B and Singh NN (2001) Quality Protein Maize. Current
Science 81: 1308-1319.
Prasanna BM, Palacios-Rojas N, Hossain F, Muthusamy V, Menkir A, Dhliwayo T,
Ndhlela T, Vicente FS, Nair SK, Vivek BS, Zhang X, Olsen M and Fan X (2020)
Molecular breeding for nutritionally enriched maize : Status and prospects. Frontiers
in Genetics 10: 1-16.

8
Ray DK, Mueller ND, West PC and Foley JA (2013) Yield trends are insufficient to double
global crop production by 2050. PLoS ONE 8: 1-8. e66428.
doi:10.1371/journal.pone.0066428
Sabagh AEl, Hossain A, Barutçular C, Anjorin FB, Islam MS, Ratnasekera D, Kizilgeçi F,
Yadav GS, Yıldırım M and Saneoka H (2017) A review on various factors which
affecting sustainable maize (Zea mays l.) production under drought stress. Journal of
Experimental Biology and Agricultural Sciences 5: 1-9.
Salleh SN, Fairus AAH, Mohd Nizam Zahary MN, Raj NB and Jalil AMM (2019)
Unravelling the effects of soluble dietary fibre supplementation on energy intake and
perceived satiety in healthy adults: evidence from systematic review and meta-analysis
of randomised-controlled trials. Foods 8: 1-22. doi:10.3390/foods8010015
Setimela PS, Gasura E and Tarekegne AT (2017) Evaluation of grain yield and related
agronomic traits of quality protein maize hybrids in Southern Africa. Euphytica 213:1-
14.
Singh N, Singh S and Shevkani K (2019) Maize: Composition, bioactive constituents, and
unleavened bread. In: Preedy VR and Watson RR (eds), Flour and Breads and Their
Fortification in Health and Disease Prevention. Second edition. Academic Press, pp.
111-121. doi:10.1016/b978-0-12-814639-2.00009-5
Sinha AK, Kumar V, Makkar HPS, De Boeck G and Becker K (2011) Non-starch
polysaccharides and their role in fish nutrition - A review. Food Chemistry 127: 1409-
1426.
Tandzi LN, Mutengwa CS, Ngonkew ELM, Woïn N and Gracen V (2017) Breeding for
quality protein maize (QPM) varieties: A review. Agronomy 80: 1-16.
Tawanda M, Tendekayi HG, Andrew HS, Michael AG, Robert MR and Guangwen T
(2011) Yellow maize with high β-carotene is an effective source of vitamin A in
healthy Zimbabwean men. American Journal of Clinical Nutrition 94: 510-519.
UNICEF (2003). http://www.unicef.org/nutrition/index_iodine.html UNICEF
USDA (2020) United States Department of Agriculture. http://www. Worldagricultural
production.com/crops/corn.aspx.
Vasal SK, Srinivasan G, Pandey S, Gonzalez FC, Crossa J and Beck DL (1993) Heterosis
and combining ability of CIMMYT’s quality protein maize germplasm: I. Lowland
tropical. Crop Science 33: 46-51.

9
Vivek BS, Krivanek AF, Palacios-Rojas N, Twumasi-Afriyie S and Diallo AO (2008)
Breeding quality protein maize (QPM): Protocols for developing QPM cultivars.
CIMMYT, Mexico, D.F.
Wegary D, Labuschagne MT and Vivek BS (2011) Protein quality and endosperm
modification of quality protein maize (Zea mays L.) under two contrasting soil
nitrogen environments. Field Crops Research 121: 408-415.
Wessel-Beaver L, Lambert RJ and Dudley JW (1985) Genetic variability and correlations
in a modified endosperm texture opaque-2 maize population. Crop Science 25: 129-
132.

10
CHAPTER TWO
LITERATURE REVIEW
2.1 Maize: economic importance and production
Maize (Zea mays L. 2x = 20) is ranked as the third most important cereal crop after wheat
and rice, in the world. Maize is the most globally cultivated cereal across diverse agro-
ecologies and geographical locations ranging from low to high altitudes. Over the past few
decades, the crop has gained wider acceptability among rural farmers in Africa and has
replaced other traditionally cultivated cereals such as pearl millet (Pennisetum glaucum)
and sorghum (Sorghum bicolor) in many of the African countries.
The importance of maize for uses such as food for humans, feed for animals and as an
industrial crop, is incomparable to any other food crop cultivated in sub-Saharan Africa
(SSA). Civilization revolves more around maize than any other crop (Amudalat 2015). In
Africa, maize is grown primarily for its carbohydrate-rich kernel, serving as staple food
for more than 300 million people, both in the rural and urban areas (Bänziger and Diallo
2001). Maize is cultivated as food and feed crop in SSA, where it provides energy and
protein for both humans and livestock (Ngaboyisonga 2008) and accounts for about 70%
of the total caloric intake for people living in SSA and other developing countries (Martin
et al. 2000; Edmonds et al. 2009).
Furthermore, maize serves as source of revenue through export within the African
continent (Asea 2005). In South Africa and most of the countries in SSA, maize is grown
mainly as food and feed crop. In 2014 for example, maize was the most-produced cereal
crop worldwide with more than 1 022 million ton from 170 countries with a cultivated area
of approximately 181 million hectare (Outreach 2017). In 2019, global maize production
was 1 123.65 million ton however, the USDA projected that there would be a decrease in
2020 global maize production by 0.95% which will amount to about 10.63 million ton
(USDA 2020). The top world maize producer is the United States of America with 361
metric ton in 2017 and 406.3 metric ton in 2019 while South Africa is the leading producer
in Africa with 14.9 million ton in 2015 and 16 million ton in 2019 (Outreach 2017; USDA
2020). The maize crop is widely adapted to diverse agro-ecologies and has an estimated
average grain yield of 4.8 t ha-1 in South Africa and 1.8 t ha-1 in Nigeria (Amudalat 2015;

11
Outreach 2017). Because of increasing population and higher demand for the crop by
millions of households in West Africa, Eastern and Southern Africa, it is expected that the
production area will double by 2050 to meet the increasing demand (Ray et al. 2013).
Hence, increased maize production and productivity will play a crucial role in ensuring
food security in SSA, where maize is grown largely by smallholder, resource-poor farmers,
who rely mainly on rainfall (SARI 1996).
2.2 Importance and nutritional quality of QPM and non-QPM in SSA
Undernourishment is a chronic problem worldwide, especially in rural communities of
SSA, where people rely chiefly on staple foods which are carbohydrate sources and have
restricted access to a varied diet. Breeding for biofortified crops with enriched nutritional
quality can help improve nutritional deficiencies in SSA and other developing regions.
This could be achieved if nutritionally enhanced crops are accepted, produced and are made
available in large quantities for consumption by both humans and animals (De Groote et
al. 2014).
Non-QPM, which is generally cultivated, provides little or no nutritional benefits as food
and feed for humans and other monogastric animals. Maize provides micronutrients like
vitamin B complex, ß-carotene and essential minerals, i.e. magnesium, zinc, phosphorus,
copper, etc. However the endosperm of non-QPM is deficient in two essential proteins,
lysine and tryptophan, even though the endosperm contains about 10% protein and about
73% starch and 4% oil (Annor and Badu-Apraku 2016). The deficiency of these essential
amino acids can negatively affect human and animal growth (Prasanna et al. 2001). As a
result, infants who are constantly fed with normal endosperm maize with little or no protein
supplements from animal products suffer from malnutrition, and this often leads to the
development of pellagra and other health related diseases (Babu and Prasanna 2014). The
development, adoption and cultivation of QPM with higher concentrations of tryptophan
and lysine contents can significantly reduce malnutrition and its related diseases, as well
as death, in low-income countries in the developing world (Mbuya et al. 2011).
Lysine and tryptophan have to be supplied through the diet for adequate availability for
synthesis of proteins. Therefore, lysine and tryptophan are often considered as the most
essential amino acids for the body, while the remaining amino acids are considered non-

12
essential, since they can be synthesized through metabolism (Giwa and Ikujenlola 2009).
QPM can supply about 70 to 80% of human protein requirements, depending on the variety,
while non-QPM genotypes can only supply a maximum of 46%. The biological value of
protein, which measures how effectively the body absorbs and utilises amino acids, is 80%
for QPM, which is comparable to 86% found in egg, while for normal endosperm maize it
is 40 to 57% (Babu and Prasanna 2014; Teklewold et al. 2015). The available protein
content of QPM is 90% of the RV of milk, while RV of normal endosperm maize is 40%
(Bressani 1992; Badu-Apraku and Lum 2010; Dang 2010; Badu-Apraku and Fakorede
2017; Eshetie 2017). QPM genotypes can therefore be an effective approach for health
restoration in malnourished populations.
QPM genotypes were reported to exhibit consistently increased levels of tryptophan
concentration, about twice the biological value of normal endosperm maize protein
(Bressani 1992; Tandzi et al. 2017). For maize grain to be classified as QPM, it must have
a quality index (QI) equal or above 0.8, where QI is the proportion of tryptophan to protein
present in a particular sample or genotype (Wegary et al. 2011; 2014: Masindeni 2013;
Twumasi-Afriye et al. 2016; Tandzi et al. 2017). Ignjatovic-Micic et al. (2013) and Tandzi
et al. (2017) observed that the QI of hybrid maize resulting from hybridizing QPM and
ordinary maize lines was in the range of 0.71 to 0.74, which was superior to the standard
hybrids with 0.57 to 0.62, however it was less than the QPM threshold which is 0.80.
Consumption of maize products with enhanced lysine and tryptophan could help alleviate
the growing challenge posed by malnutrition in several parts of the world (Menkir et al.
2008; Mpofu et al. 2012). Several authors have reported on the nutritional values of QPM
over non-QPM through feeding experiments involving livestock, especially monogastric
animals, as well as children (Akuamoa-Boateng 2002; Mpofu et al. 2012). Children who
were fed with meals made from QPM were observed to have less sick days compared to
those fed with food products from normal maize. Consequently, consumption of food
products from QPM genotypes rather than normal maize resulted in 12% increase in the
body mass and 9% increase in the rate of growth (height) among infants and children of
school going age suffering from slight to moderate under nutrition (Gunaratna et al. 2010;
Tandzi et al. 2017).

13
Studies have shown that within some African countries in Southern Africa, for example
Lesotho, Malawi and Zambia, consumption of about 100 g of a QPM food product is
essential for children of school going age to sustain the adequacy of lysine, and this
accounts for about a 40% reduction in maize intake requirements relative to normal maize
(Nuss and Tanumihardjo 2011; Tandzi et al. 2017). As with normal maize, QPM
germplasm also has varying maturity groups, as well as varied grains both in colour and
texture (Vasal 1999).
2.3 Development of QPM genotypes
Genetic enhancement for nutritional value in maize commenced in 1963 by Mertz et al.
(1964) who identified mutant opaque-2 (o2) maize that contains an amount of protein equal
to that in normal endosperm maize (Premlatha and Kalamani 2010). However, o2 maize
contains about twice the normal levels of lysine and tryptophan, which increases the
protein quality in normal maize (Badu-Apraku and Lum 2010).
In spite of this advancement, the o2 maize produced undesirable traits such as soft, opaque
kernels instead of having hard and translucent endosperm. Other undesirable traits included
the chalky nature of the o2 kernels, the plants also produced smaller ears and grain yields
were 8 to 15% lower than those of normal endosperm maize genotypes (Badu-Apraku and
Lum 2010; Wegary et al. 2011). Similarly, o2 maize was found to be more vulnerable to
several factors such fungi and insects attacks and often produced lower grain weight than
ordinary maize, because air spaces surround its loosely packed starch granules with a
corresponding decrease in grain yield (Singh and Venkatesh 2006; Ram 2014). These
conditions resulted in farmer’s refusal to adopt o2 maize.
The effort of researchers at CIMMYT made it possible to integrate the gene of o2 maize
with genetic modifiers from ordinary maize to harden the o2 maize kernels and made the
endosperm translucent with increased grain yields. The modification in the endosperm has
resulted in the new type of maize designated as QPM that contains the high nutritional
value of o2 maize as well as modified kernel structure of traditional maize cultivars (Werle
et al. 2014). CIMMYT has made substantial advancement in developing QPM germplasm
with the o2 gene integrated with other gene modifiers. Also, over the past two decades, the
International Institute of Tropical Agriculture (IITA) together with the National
Agricultural Research and Extension Systems (NARES) have intensified work on

14
developing and promoting the adoption of QPM genotypes with varying maturity periods
with tolerance to biotic and abiotic stresses. QPM materials have been usually used to
develop QPM cultivars that are now widely exploited in several countries in West, East,
Southern and Central Africa (Krivanek et al. 2007).
In addition to the o2 identified by breeders, other lysine mutant genes discovered were o1,
o5, o9-11, o13, o17, fl2, fl3, Mucronate and Defective endosperm B30 however, these
mutant genes could not be used successfully in other breeding programmes due to the
significant loss in grain yield by genotypes resulting from these mutant genes (Gibbon and
Larkins 2005; Sarika et al. 2018). Yang et al. (2005) indicated that, a search for improved
mutant gene with increased lysine and tryptophan led to the discovery of another recessive
mutant gene from Robertson’s Mutator stocks, and this was named opaque16 (o16)
Tripathy et al. (2017). Sarika et al. (2017) reported that, o16 gene located on chromosome
8 has more lysine and tryptophan concentrations than o2 mutant genes and the o16 genes
does not create higher degree of opaqueness as noted for o2. One of the disadvantages of
o2 is the low lysine content which does not meet standards for food and fodder production
(Zhang et al. 2013). To ameliorate this defects, molecular breeding approach was used to
pyramid o2 and o16 mutant genes into a single genetic material using single-sequence
repeats (SSRs) markers which led to the development of o2o2 and o16o16 genotypes with
lysine content increased by 30 to 60% (Yang et al. 2005; Pukalenthy et al. 2020). Even
though o16 mutants were found to have high lysine, the effect of o16 on increased
accumulation of lysine was also reported by Yang et al. (2005) and Zhang et al. (2013).
2.4 Importance of heterosis, heterotic groups and patterns in breeding
The term heterosis or hybrid vigour was first used by Shull in 1908 to express the
unexpected performance of the F1 individuals obtained from crossing two genetically
diverse breeding lines (Duvick and Brown 1981). Similarly, Mather and Jinks (1971) and
de Franca (1983) coined heterosis as the extent to which the average of any F1 generation
performs better than its better parent, or an average of its parents.
The two main theories used to elucidate the manifestation of heterosis are: (i) the
dominance theory proposed by Bruce (1910) and Keeble and Pellow (1910) who stated
that, the recessive and deleterious alleles present in the parental lines are transferred to the
F1 progeny and subsequent generations. In this model, additive genetic effects of

15
favourable genes increase the superior phenotype of the F1 over each parent and (ii) the
overdominance theory by Shull (1911) and East and Hayes (1912) proposed the
overdominance hypothesis, which states that heterosis is a result of heterozygosity or the
fitness of heterozygotes over their homozygous parents. According to this model, novel
alleles are interchanged between contrasting parents with differing alleles and this results
in expression of superiority of the F1’s to the homozygous parents. Shull (1948), Sprague
et al. (1962), de Franca (1983), Premlatha and Kalamani (2010) and Fu et al. (2014)
subsequently affirmed that dominance is the main cause of heterosis in crop breeding. Even
though the importance of heterosis in maize production has been reported, the inherent
mechanisms and most importantly, the physiological and biochemical mechanisms of these
phenomena are yet to be fully elucidated (Blum 2013). In addition, epistasis which is the
essential component of the genetic architecture of polygenic traits that occurs when the
genes controlling a trait interact such that the phenotypic effect of a gene is nonlinearly
dependent on the allelic state of at least one other gene in the genome plays an important
role in heterosis among F1 hybrids (Kaeppler 2012; Kerwin et al. 2017). Even though
epistasis influences hetorosis, this is often not estimated statistically due to the interactive
nature of genes at different loci (Kaeppler 2012).
The expression of superiority of hybrids over their parents is based on how diverse the two
parents are. Hence, two parental lines which manifest relatively large magnitudes of
heterosis from their crosses can be said to be genetically unrelated compared to two
parental lines that exhibit little or no heterosis in their F1 hybrids. In maize breeding or
production, it is estimated that heterosis could range from 15 to 50% to increase yield
potential and improves adaptation to various stresses (Saleh et al. 2002; Lippman and
Zamir 2006; Chairi et al. 2016). In a study by Saleh et al. (2002), high levels of heterosis
for grain yield, grain weight per ear, cob weight were seen, while adequate values were
obtained in normal endosperm maize for plant and ear heights, number of kernel rows per
ear and number of kernels per ear row. Nigussie and Zelleke (2001) noted that hybridizing
of maize genotypes obtained from dissimilar genetic backgrounds often resulted in better
utilization of hybrid vigour.
Grouping of inbred lines into defined heterotic groups could significantly enhance breeding
efficiency (Hallauer and Miranda 1988; Fan et al. 2014, 2016). There are several heterotic
grouping methods and patterns available, which are being exploited by researchers to

16
classify maize parental lines into heterotic groups depending on the breeding objectives.
In order to maximize the utilization of heterosis, parental lines are assigned into distinct
groups before crosses are made in breeding programmes. Crossing of inbred lines from
two different heterotic groups result in hybrids with superior genetic manifestations of the
traits of interest (Tollenaar et al. 2004; Aguiar et al. 2008; Fu et al. 2014).
A heterotic group, according to Fischer et al. (2010) and Melchinger and Gumber (1998),
is considered as a set of similar or dissimilar parents having the same or different genetic
backgrounds which exhibit similar combining ability effects and heterotic response when
hybridised with parental lines from genetically distinct germplasm groups. On the other
hand, heterotic pattern could be referred to as two heterotically distinct groups, which
express high heterosis and hybrid performance. Grouping of parents into well-defined
heterotic groups helps to prevent the development and evaluation of hybrids or genotypes
that should have been eliminated, in order to allow maximum heterosis to be fully exploited
by crossing parents resulting from a different genetic base (Terron et al. 1997). A number
of methods of classifying inbred lines into heterotic group are used widely across the world
in several breeding programmes. The traditional method of estimating combining ability
exploits the SCA approach with given information on line-pedigree of the parental lines
and/or information gathered on hybrid yield through field evaluations to apportion the lines
into a heterotic group (Fan et al. 2004; Musila et al. 2010; Wegary et al. 2014; Adebayo
and Menkir 2015; Bari et al. 2016). The SCA method of grouping inbred parents based on
grain yield into heterotic groups have been utilised by several researchers (Melani and
Carena 2005; Legesse et al. 2009; Kanyamasoro et al. 2012; Woyengo et al. 2015). In spite
of the importance of the SCA method of grouping, the effects of grain yield of parental
lines have often been reported to be under the influence of the interaction between the
parents as well as their interaction with the environment (Munaro et al. 2011). Due to
environmental effects, this often results in assigning the same parental lines into different
heterotic groups when used in different studies (Legesse et al. 2009; Dragicevic et al.
2016). Also, in some studies, molecular markers were used to estimate genetic resemblance
or distance to assign maize parental lines into dissimilar heterotic groups (Barata and
Carena 2006; Munaro et al. 2011; Reid et al. 2011). Because of the limitations and
unreliability of the SCA method of grouping inbred lines, Fan et al. (2008) suggested the
use of SCA and GCA of heterotic groups (HSGCA). This method combines both SCA and
GCA effects as a more suitable approach for classifying parental lines into heterotic groups.

17
This methodology has been found to be superior to the use of the SCA method (Fan et al.
2009; Badu-Apraku et al. 2013) as well as using only genetic markers for assigning inbred
lines into heterotic groups (Badu-Apraku et al. 2013). Mostly, assigning inbred lines into
a heterotic group either by SCA, molecular markers or HSGCA is generally dependent on
only one trait, mostly grain yield. This has several limitations, since grain yield is a
polygenic character controlled by several genes influenced by other traits, which is
characterised by low heritability, especially when the study is carried out under stress
conditions. In spite of the above grouping methods, the best way to assign inbreds to
heterotic groups is to cross the inbreds onto specific tester inbreds. Any inbred that
produces superior hybrids when crossed onto a tester inbred is in the opposite heterotic
group from the tester (Gracen, unpublished data). Hence, inbreds are said to belong to
different groups if for example those in group A combine well with those in group B.
Similarly, if inbreds in group A does not combine well with inbreds from group B, then A
and B are in the same (or closely related) heterotic group(s) (Gracen, unpublished dada).
Also, newly developed inbreds that exhibit greater heterosis with a specific tester are said
to be complementary in heterotic pattern to the tester and can be classed as being anti to
that tester (Gracen, unpublished dada).
2.5 Significance of combining ability studies in breeding
As a result of increased yield potential of hybrid varieties, they are used worldwide to attain
increased maize yield. In plant breeding programmes, it is essential to understand how
inbred lines or parents combine for the development of hybrids. Therefore, grain yield can
be improved by gathering useful and essential facts about the heterotic pattern and genetic
variability of the parents, which is important in breeding for field crops (Amegbor et al.,
2017; Bhandari et al. 2017).
The term “combining ability” was first used by Sprague and Tatum (1942). Vacaro et al.
(2002) noted that the performance of any genetic material is dependent on its potential per
se performance as well as the combining ability of the line in crosses. Combining ability
studies generate useful information on the genetic mechanisms governing how quantitative
traits are inherited and this assists plant breeders to select superior parental lines for further
crop improvement or use in hybrid production for commercial purposes (Abuali et al. 2012;
Ali et al. 2012).

18
There are two types of combining ability commonly used in biometrical genetics and these
are GCA and SCA (Abuali et al. 2012; Haydar and Paul 2014). The GCA is average
contribution an inbred makes to hybrid performance in a series of hybrid combinations in
comparison to other inbreds in the same series of hybrid combinations and this is due to
additive gene action, while the SCA, on the other hand, the contribution of an inbred to
hybrid performance in a cross with a specific other inbred in relation to its contributions in
crosses with an array of other inbreds (Abuali et al. 2012; Sharief et al. 2009; Haydar and
Paul 2014).
Sprague and Tatum (1942), Griffing (1956) and Muraya et al. (2006) indicated that, with
respect to genetic variance, GCA signifies additive gene action while SCA on the other
hand represents non-additive gene action involving dominance and epistasis. Researchers
can make good use of information generated from combining ability studies for developing
high yielding inbred lines primarily breeders develop high yield in hybrids, inbred line
performance per se is of lesser importance as well as hybrids. Hence, relevant information
of combining ability is vital in the choice of appropriate parents for hybridization and
identification of promising hybrids in breeding programmes (Machikowa and Laosuwan
2011). Selection and progress in breeding is easier for characters with high additive genetic
variance rather than those with higher dominance genetic variance. This is because
dominance is mainly composed of intra-locus gene interactions among the individuals
(Muraya et al. 2006; Gissa 2008). This suggests that, in subsequent generations
characterised by random mating, the association between the individuals will be
interrupted and consequently results in restructuring as well as recombination of genes in
the next generation from parents to offspring (Muraya et al. 2006).
Genes that are additive in nature have a good chance of improving that trait by increasing
the desirable genes for efficient selection. GCA and SCA effects can be assessed by using
biometrical approaches. The diallel cross technique is one of the most commonly used
methods because of its combinations with all other lines in a particular study. Detailed
methodology for the estimation of gene effects and variances in diallel cross analysis has
been provided by Griffing (1956). Also, several studies reported that non-additive genetic
variances are of great importance in the inheritance of grain yield and other quantitative
traits that are of economic importance (Darrah and Hallauer 1972; Gangashetty et al. 2016;
Bhusal and Lal 2017). However, for unselected materials, the additive genetic variance

19
assumes a greater role than non-additive variance (Badu-Apraku et al. 2013; Menkir et al.
2017; Mastrodomenico et al. 2018; Manjeru et al. 2019). It is important to note that, for
hybrid developemt, non-additive variance in far more important in providing heterosis and
superior performance.
2.6 Line x tester mating design
Even though there are several mating designs used in plant breeding, they all come with
advantages and disadvantages. Several researchers reported on the use of diallel and North
Carolina mating designs. However, it becomes more expensive to handle when there are
many lines that are used in generating the hybrids. Therefore, in a study with a relatively
high number of inbred lines, it is essential to use line x tester analysis to obtain genetic
information on all the inbred lines.
The line x tester mating design is an extension of the topcross design, where more than one
tester is used instead of one tester as used in a topcross (Nduwumuremyi et al. 2013). Line
x tester mating design for estimating GCA and SCA for hybrid development was first
proposed by Kempthorne (1957) and was extensively used by several researchers such as
Sharma (2006) and Nduwumuremyi et al. (2013). In this design, the hybridization is
conducted between lines, which are used as females and broad based testers as males,
where each tester is crossed to a line in a one to one fashion, to generate a number of female
x male crosses (Muruya et al. 2006; Sharma 2006).
Line x tester is one of the simplest mating designs that estimates genetic information for
both full-sibs and half-sibs concurrently, unlike in the case of the topcross that provides
information only on half-sibs. This design estimates SCA of every cross and it does not
only provide GCA of parents but of the testers as well, as lines and testers are different sets
of genotypes (Sharma 2006). Furthermore, it is also used in estimating various types of
gene actions that are important in the expression of quantitative traits (Rashid et al. 2007).
2.7 Genotype by environment interactions and stability studies
Multi-environment trials (MET) are conducted by plant breeders to evaluate new or
improved genotypes developed across several environments or locations replicated in years
before they are recommended and released for production on commercial basis. From

20
MET, the average performance(s) or ranking of the genotypes are generally inconsistent
from one environment to another as a result of influence of environment on the genotypes
(Martin 2000; Sorensen 2010; Mebratu et al. 2019).
The interference that exist between the genotype and environment is known as genotype x
environment interaction (GEI). This interaction may confound the selection process and
thereby recommendation of a superior genotype for a target environment will be affected
(Ebdon and Gauch 2002; Gauch 2006; Xu et al. 2014). Analysis of variance (ANOVA) is
performed on the genetic materials studied across environments to identify superior
genotypes in the presence of GEI in MET. After the analysis, when significant GEI
variance was identified, one of the various methods for determining the stability of genetic
materials can be deployed to select the most stable and consistent genotype(s). GEI has
been reported in many breeding programmes in several cultivated crops, especially maize
(Alwala et al. 2010; Zali et al. 2011; Xu et al. 2014; Zhang et al. 2016).
GEI in major maize production environments is a result of climatic and environmental
factors such as drought, low soil nitrogen, temperature, rainfall, duration of the cropping
period, soil chemical properties (such as soil pH) and socio-economic issues that compel
farmers to engage in sub-optimal application of agro inputs such as fertilizer (Bänziger et
al. 2006). GEI decreases the relationship between the phenotypic and genotypic values and
as a result, it leads to improper assessment of gene and combining ability effects among
the traits that are highly influenced by environmental factors, making selection difficult
(Farshadfar et al. 2000, 2011).
Analysis of GEI is important to gather relevant data on the performance of the genetic
materials in terms of adaptability and stability. Maize hybrids, which are high yielding with
enhanced nutritional composition and comparatively stable when grown in different
environments, is of prime significance to commercial maize production in SSA (Edmeades
et al. 1997; Beck et al. 2003). Živanović et al. (2004) and Mastrodomenico et al. (2018)
stated that grain yield stability in maize is partly under genetic control and thus appropriate
for selection.
Two of the most powerful statistical tools used for the analysis of METs data on maize
trials are the Additive Main Effects and Multiplicative Interaction (AMMI) model reported
21
by Zobel et al. (1988), Gauch and Zobel (1997) and de Abreu et al. (2019). The other tool
is the genotype main effect plus genotype by environment interaction (GGE) biplot method
recommended by Yan et al. (2000). One of the advantages of the AMMI model is that it is
able to integrate the ANOVA for not only the cultivar but also effects from the environment
as well as the principal components analysis (PCA) of the interaction between genotype
and environment. In addition, it provides better estimates and serves as a useful method for
understanding GEI and attaining better yield estimates provided by the AMMI analysis.
The interaction between genotype and environment is displayed in a biplot where PCA
scores are provided with double-centred PCA (Mitrović et al. 2012; Abakemal et al. 2016).
The PCA values are plotted against each other and the interpretation of GEI components
is primarily based on the graph provided. The GGE allows grouping of genotypes based
on similarity in their performances across varied environments or locations because the
biplot enables and integrates genotypic stability statistics of the genotypes. Furthermore,
the GGE biplot methodology provides visual (graphical) performance of interaction
estimates. GGE biplots integrate ANOVA and PCA by apportioning sums of squares of
genotypes and GEI. This is significant in genotype assessment by deploying a PCA based
method. The biplot method is used for the determination and assessment of genotypes
evaluated under diverse environments based on environment-centred PCA (Mitrović et al.
2012; Erdemc 2018). The GGE biplot provides the first principal component (PC1) and
second principal component (PC2) which are attained by decomposition of singular values
of multi-location trials yield data (Yan et al. 2007; Mitrović et al. 2012). In addition, the
GGE analysis allows the highest yielding genotypes across different environments to be
identified, to compare their consistency in performance from varied environmental
conditions, and identification of superior and ideal genotypes as well as mega-
environments (model of regional distribution or target environment) (Yan et al. 2007;
Alwala et al. 2010; Badu-Apraku et al. 2011).
As a result of the broad information provided by AMMI and GGE biplots, several
researchers have assessed the usefulness and efficiency of AMMI and GGE biplot analyses
for analysing data obtained from GEI. Alwala et al. (2010) reported that, one of the major
disadvantages of the AMMI model in examining stability is that it is not sensitive to
crossover effects, which is the main part of GEI. Additionally, the AMMI methodology
does not provide any significance to the plant scientist for genotypic and site evaluation
22
when analysing MET data, because there is no obvious biological differentiation between
the two terms, that is genotype and GEI. The GGE biplot has been identified as a powerful
statistical model that overcomes the limitations associated with AMMI. The GGE biplot is
an efficient statistical tool used for identifying not only the best performing cultivar or
genotype in a specific environment, but it is also capable of identifying an ideal
environment for a particular genotype (Yan et al. 2007; Masindeni 2013; Zhang et al.
2016). Furthermore, this method is capable of comparing a given set of genotypes in
separate environments. Also it can identify the best genotype for each environment and
can differentiate mega-environments, determine average yield and stability of the
genotypes, and has the ability to discriminate between environments (Zerihun 2011; Yan
et al. 2007; Farshadfar 2012; Krisnawati and Adie 2018).
Contrary to the reports from other researchers about the usefulness of GGE biplots, several
researchers found the AMMI to be highly effective for the analysis of MET and also the
best to describe the GEI in maize research trial across several locations and environments
(Gruneberg et al. 2005; Kandus et al. 2010). On the other hand, Stojaković et al. (2010)
and Mitrović et al. (2012) documented that both AMMI and GGE biplot models provided
similar results when used in their study. On the other hand, Yan et al. (2007), Farshadfar
(2012) and Koundinya et al. (2019) in independent studies, concluded that the GGE biplot
model was superior to the AMMI biplot in mega-environment analysis and genotype
evaluations.
2.8 The importance of heritability in plant breeding
Information on the mode of inheritance of grain yield, essential secondary traits and quality
traits in maize production will be beneficial for development of appropriate breeding
approaches for improving these traits. This is because varying environmental conditions
adversely affect heritability of grain yield and quality traits, thereby implicate selection of
superior individuals (Songsri et al. 2008; Visscher et al. 2008; Hemmatabadi et al. 2016).
The genetic improvement of grain yield and its related traits as well as quality traits relies
on the nature and the degree of variability in available germplasm. Most of the traits that
are of interest to the breeder, in this case yield and quality, are complex traits and hence
are polygenically controlled. In order to carry out successful selection in a breeding
programme, it is important not to consider only heritability of desired traits but also the
evidence of association among various yield related and quality traits and their relationship

23
with grain yield (Bekele and Rao 2014). Heritability is considered essential in breeding
programmes because parents used in developing hybrids transfer only one copy of their
genes each to the formed individual through descent (Visscher et al. 2008; Ogunniyan and
Olakojo 2014). Visscher et al. (2008) suggested that in addtion to combining ability,
selection shoud be based on heritability of traits, both broad sense (H2) and narrow sense
(h2), and correlation between yield and secondary traits even though this might not be
efficient as combining ability estimates.
2.9 Correlation among traits in plant breeding
In most breeding programmes, increase of yield is the primary objective. However, as a
result of interactions between genotype and the environment, the full expression of grain
yield and other traits that are quantitatively inherited are variable under varying
environmental conditions (Qi et al. 2010; Gangashetty et al. 2016). As a result, for selection
of grain yield and quality traits to be efficient, it is important to consider traits that
contribute to yield. The polygenic nature of grain yield often leads to variability across
varied environmental conditions (Machikowa and Laosuwan 2011). Subsequently, grain
yield and quality traits enhancement in maize can be realised through exploitation of the
association between grain yield, quality traits and their related characters. Correlations
have been exploited in several studies for indirect selection of yield and quality traits.
(Machikowa and Laosuwan 2011; Amini et al. 2013; Adesoji et al. 2015).
Correlation measures the association that exist between traits in a given gene pool.
Genotypic and phenotypic correlations are found where characters have a cause and effect
association, whereby one trait is dependent on the other trait such that variation in the
independent variable causes a change in the dependent variable (du Toit et al. 1997;
Adesoji et al. 2015). Phenotypic correlation (rP) is controlled by genetic make-up of the
genotypes and environmental effects while genetic correlation (rG) is only due to the
additive genetic variance. The association between two traits may be attributed to
pleiotropism and/or linkage disequilibrium (Hallauer and Miranda 1988; Falconer 1989).
Information on correlations is crucial in maize breeding to aid in the identification of
superior genotypes with higher grain yield through indirect selection achieved via selection
of secondary traits (Bello and Olaoye 2009). However, it is important to note that
correlations among traits are not adequate to describe the significance of each trait in
contributing to final grain yield (Sreckov et al. 2011). Bizeti et al. (2004) further noted that,
24
these inadequacies often lead to observed dissimilarities that are due to more than one
indirect cause. As a result, it is important to conduct in-depth studies on trait associations
to fully understand the contribution of each character and then rank their importance for
targeting in selection. One of the ways of achieving this is to use the path coefficient
analysis to assess the relationship among these traits (Udensi and Ikpeme 2012; Adesoji et
al. 2015).
In relation to breeding for QPM hybrids with enhanced quality traits, it is important that
protein quality has a positive relationship with other kernel quality characteristics, which
is essential to success of breeding for quality traits. The study of the correlations between
quality traits of maize, such as endosperm hardness, protein quality, starch and other traits
related to endosperm hardness, is important for kernel modification in breeding
programmes by crossing genotypes with hard kernels with the genotypes with higher
amounts of amino acids but having soft kernels (Wessel-Beaver et al. 1985; Gissa 2008).
Several reports indicated that, as the amount of protein and tryptophan increased, there is
also a decrease in the endosperm modification (Vasal et al. 1980; Wegary et al. 2011; Tulu
2014; Aman et al., 2016). In addition, Sharma et al. (2017) noted that traits such as number
of kernels per cob, tryptophan and lysine contents and grain yield per plant showed high
values for heritability, genetic advance and genetic correlations. Gissa (2008) reported a
negative relationship between grain yield and protein quality, and grain yield and kernel
modification, hence there is a need to conduct chemical analysis on the maize endosperm
for tryptophan and lysine before classifying a genotypes as QPM (Idikut et al. 2009; Aliu
et al. 2012). Pixley and Bjarnason (2002), Aliu et al. (2012) and Mural et al. (2012)
reported insignificant genotypic correlation between endosperm texture, protein content
and grain yield.
2.10 Evaluation and chemical analysis of inbred lines
Several studies have reported on the evaluation of QPM inbred lines for combining ability
under varying environmental conditions to identify QPM donors and testers using several
mating designs (Živanović et al. 2006; Mbuya et al. 2012; Amin et al. 2014; Sarika et al.
2018). Amin et al. (2014) and Sarika et al. (2018) reported differing data on the yield
performance of inbred lines and their progenies. As a result of inconsistencies in
performance of inbred lines under different field conditions, there is a need to evaluate the

25
newly developed QPM lines for agronomic characters and also conduct chemical analysis
on the selected lines.
2.11 Success in breeding for quality and yield drag
In the developed countries, maize is primarily used as feed for animals because of its rich
energy value, which is due to the high starch content present in the endosperm. However,
in SSA and other developing countries across the globe, maize forms a major part of the
human diet, where it supplies daily calories and to some extent protein and other essential
amino acids (de Oliveira et al. 2004). Kernel protein content is polygenically controlled
(Mittelman et al. 2003; Aliu et al. 2012; Tripathy et al. 2017).
QPM has much higher levels of lysine and tryptophan than normal maize. It has been
reported that the yield gap between QPM and non-QPM materials ranges between 10 to
15% for grain yield, which is predominantly characterised by a slower drying rate, greater
part of the cob which is affected by kernel rots and consequently, lower kernel weight in
the QPM material (Vasal 2002; Li and Vasal 2016; Tandzi et al. 2017).
To overcome the problems associated with the o2 mutation, breeders over the past four
decades have introgressed gene modifiers from normal maize to harden the endosperm of
QPM genotypes without reduction in lysine and tryptophan contents (Mertz et al. 1964;
Kumar et al. 2011; Gupta et al. 2013; Pandey et al. 2016; Krishna et al. 2017). This was
done not only by conventional breeding but also through molecular approaches to broaden
the genetic variability of QPM varieties with increased yield comparable to normal maize
(Tandzi et al. 2017). In spite of the unprecedented progress made to harden the endosperm
of QPM varieties with enhanced yield, there has been several contradictory reports about
the yield of QPM against that of non-QPM genotypes. There are available reports of normal
maize being superior in terms of grain yield compared to QPM varieties (Bhatnagar et al.
2004; Krivanek et al. 2007) while Pixley and Bjarnason (1993) reported that QPM hybrids
yielded better than non-QPM hybrids. Interaction between genes, which control major
traits can cause yield reduction (‘yield drag’ and ‘event lag’ effects) (Shi et al. 2013). The
yield gap between non-QPM and QPM genotypes is termed as yield drag. Until now, there
is no available information on yield drag (reduction in grain yield as a result of the QPM
trait) to truly quantify if indeed QPM yields are lower than non-QPM or if their yields are

26
comparable. Therefore, this study seeks to examine the yield gap between QPM and their
non-QPM counterparts. The other drawback of QPM hybrids is that they must be grown in
isolation from normal hybrids or cross pollinations across fields will cover the recessive
QPM character.
References
Abakemal D, Shimelis H and Derera J (2016) Genotype-by-environment interaction and
yield stability of quality protein maize hybrids developed from tropical-highland
adapted inbred lines. Euphytica 209: 757-769.
Abuali AI, Abdelmulla AA, Khalafalla MM, Atif Elsadig Idris AE and Osman AM (2012)
Combining ability and heterosis for yield and yield components in maize. Australian
Jourmal of Basic and Applied Sciences 6: 36-41.
Adebayo MA and Menkir A (2015) Combining ability of adapted and exotic drought-
tolerant maize inbred lines under full irrigation and rainfed conditions in Nigeria.
Journal of Crop Improvement 29: 117-130.
Adesoji AG, Abubakar IU and Labe DA (2015) Character association and path coefficient
analysis of maize (Zea mays L.) grown under incorporated legumes and nitrogen.
Journal of Agronomy 14: 158-163.
Aguiar CG, Schuster I, Amaral AT, Scapim CA and Vieira ESN (2008) Heterotic groups
in tropical maize germplasm by test crosses and simple sequence repeat markers.
Genetics and Molecular Research 7: 1233-1244.
Akuamoa-Boateng A (2002) Quality protein maize: infant feeding trials in Ghana. Ghana
Health Service, Ashanti, Ghana. Cochran WG and Cox GM. 1957. Experimental
Design. 2nd ed. John Wiley & Sons, Inc. New York, NY.
Ali F, Irfan AS, Rahman H, Mohammad N, Durrishahwar, Muhammad YK, Ihteram U and
Jianbing Y (2012) Heterosis for yield and agronomic attributes in diverse maize
germplasm. Australian Journal of Crop Science 6: 455-462.
Aliu S, Rusinovci I, Fetahu S and Simeonovska E (2012) Genetic diversity and correlation
estimates for grain yield and quality traits in Kosovo local maize (Zea mays L.)
populations. Notulae Scientia Biologicae 4: 121-128.

27
Alwala S, Kwolek T, McPherson M, Pellowc MJ and Meyer D (2010) A comprehensive
comparison between Eberhart and Russell joint regression and GGE biplot analyses
to identify stable and high yielding maize hybrids. Field Crops Research 119: 225–
230.
Aman J, Bantte K, Alamerew S and Tolera B (2016) Evaluation of quality protein maize
(Zea mays L ) hybrids at Jimma, Western Ethiopia. Journal Forensic Anthropology 1:
1-6.
Amegbor IK, Badu-Apraku B and Annor B (2017) Combining ability and heterotic patterns
of extra-early maturing white maize inbreds with genes from Zea diploperennis
under multiple environments. Euphytica 213: 1-16.
Amin MN, Amiruzzaman M, Ahmed A and Ali MR (2014) Evaluation of inbred lines of
maize (Zea mays L.) through line × tester method. Bangladesh Journal Agricultural
Research 39: 675-683.
Amini Z, Khodambashi M and Houshmand S (2013) Correlation and path coefficient
analysis of seed yield related traits in maize. International Journal of Agriculture and
Crop Sciences 5: 2217-2220.
Amudalat BO (2015) Maize: Panacea for hunger in Nigeria. African Journal of Plant
Science 9: 155-174.
Annor B and Badu-Apraku B (2016) Gene action controlling grain yield and other
agronomic traits of extra-early quality protein maize under stress and non-stress
conditions. Euphytica 212: 213-228.
Asea A (2005) Stress proteins and initiation of immune response: Chaperokine activity of
hsp72. Exercise Immunology Review 11: 34-45.
Babu R and Prasanna B.M (2014). Molecular breeding for quality protein maize (QPM).
In: Tuberosa R, Graner A and Frison E (eds), Genomics of Plant Genetic Resources.
Springer, pp. 490-505.
Badu-Apraku B and Fakorede MAB (2017) Breeding of quality protein and provitamin A
maize: In: Advances in genetic enhancement of early and extra-early maize for sub-
Saharan Africa. Springer Int Publ., pp. 217-244. doi:10.1007/978-3-319-64852-1.
Badu-Apraku B and Lum AF (2010) The pattern of grain yield response of normal and
quality protein maize cultivars in stressed and non-stressed environments. Agronomy
Journal 102: 381-394.

28
Badu-Apraku B, Akinwale RO, Menkir A, Obeng-Antwi K, Osuman AS, Coulibaly N,
Onyibe JE, Yallou GC, Abdullai MS and Didjera A (2011) Use of GGE biplot for
targeting early maturing maize cultivars to mega-environments in west Africa.
African Crop Science Journal 19: 79-96.
Badu-Apraku B, Oyekunle M, Fakorede MAB, Vroh I, Akinwale RI and Aderounmu M
(2013) Combining ability, heterotic patterns and genetic diversity of extra-early
yellow inbreds under contrasting environments. Euphytica 192: 413-433.
Bänziger M and Diallo A (2001) Progress in developing drought and N stress tolerant
maize cultivars for Eastern and Southern Africa. Seventh Eastern and Southern Africa
Maize Conference, 11-15 February, pp. 189-194.
Bänziger M, Setimela PS, Hodson D and Vivek V (2006). Breeding for improved abiotic
stress tolerance in maize adapted to southern Africa. Agricultural Water Management
80: 212-224.
Barata C and Carena MJ (2006) Classification of North Dakota maize inbred lines into
heterotic groups based on molecular and testcross data. Euphytica 151: 339-349.
Bari MAA, Carena MJ and Pereira MG (2016) Identification of heterotic patterns between
expired proprietary, NDSU, and industry short-season maize inbred lines. Crop
Breeding and Applied Biotechnology 16: 274-281.
Beck D, Ba M and Edmeades GO (2003) Genetic analysis of inbred and hybrid grain yield
under stress and nonstress environments in tropical maize. Crop Science 43: 807-817.
Bekele A and Rao TN (2014) Estimates of heritability, genetic advance and correlation
study for yield and it’s attributes in maize (Zea mays L.). Journal of Plant Science 2:
1-4.
Bello OB and Olaoye G (2009) Combining ability for maize grain yield and other
agronomic characters in a typical southern Guinea Savannah ecology of Nigeria.
African Journal of Biotechnology 8: 2518-2522.
Bhandari HR, Bhanu AN, Srivastava K, Singh MN, Shreya and Hemantaranjan A (2017)
Assessment of genetic diversity in crop plants - An overview. Advances in Plants and
Agriculture Research 7: 1-8.
Bhatnagar S, Betran FJ and Rooney LW (2004) Combining abilities of quality protein
maize inbreds. Crop Science 44: 1997-2005.
Bhusal TN and Lal GM (2017) Relationship among heterosis, combining ability and SSR
based genetic distance in single cross hybrids of maize (Zea Mays L). Vegetos 30: 1-
10.

29
Bizeti HS, Carvalho CGP, Souza JRP and Destro D (2004) Path analysis under
multicollinearity in soybean. Brazilian Archives of Biology and Technology 47: 669-
676.
Blum A (2013) Heterosis, stress, and the environment: a possible road map towards the
general improvement of crop yield. Journal Experimental Botany 64: 4829-4837.
Bressani R (1992) Nutritional value of high-lysine maize in humans. In: Mertz ET (ed),
Quality Protein Maize. American Association of Cereal Chemists. St. Paul, MN, pp.
205-225.
Bruce AB (1910) The Mendelian theory of heredity and the augmentation of vigor. Science
32: 627-628.
Chairi F, Elazab A, Sanchez-Bragado R, Aras JL and Serret MD (2016) Heterosis for water
status in maize seedlings. Agricultural Water Management 164:100-109.
Dang NC (2010) Improvement of protein quality in waxy maize (Zea mays L.) by doubled
haploid and marker assisted selection techniques. PhD thesis: University of Thai
Nguyen.
Darrah LL and Hallauer AR (1972) Genetic effects estimated from generation means in
four diallel sets of maize inbred. Crop Science 12: 615-621.
De Abreu VM, Von Pinho EVR, Mendes-Resende MP, Balestre M, Lima AC, Santos HO
and Von Pinho RG (2019) Combining ability and heterosis of maize genotypes under
water stress during seed germination and seedling emergence. Crop Science 58: 1-11
De Franca JGE (1983) Genetic and combining ability analysis of some agronomic and
grain quality characters in sorghum (Sorghum bicolor (L.) Moench). MSc Thesis,
Andhra Pradesh Agricultural University.
De Groote H, Gunaratna N, Okuro J, Wondimu A, Chege C and Tomlins K (2014)
Consumer acceptance of quality protein maize (QPM) in East Africa. Journal of the
Science of Food and Agriculture 94: 3201-3212.
De Oliveira JP, Chaves LJ, Duarte JB, Brasil EM, Ferreira Júnior LT and Ribeiro KO
(2004) Teor de proteína no grão em populações de milho de alta qualidade protéica e
seus cruzamentos. Pesquisa Agropecuária Tropical 34: 45-51.
Dragicevic V, Mladenovic-Drinic S, Stojiljkovic M, Filipovic M, Nikolic B, Babic V, and
Kravic N (2016) Maize inbreds from different heterotic groups as favorable sources
for increased potential bioavailability of magnesium, iron, manganese and zinc.
Chilean Journal of Agricultural Research 76: 213-219.
30
du Toit AS, Booysen J and Human JJ (1997) Use of linear regression and correlation matrix
in the evaluation of CERES3 (Maize) 14: 177-181. South African Journal of Plant and
Soil 14: 177-182.
Duvick DN and Brown WL (1981) Current breeding methods in maize. In: Sneep J and
Hendricksen T (eds), Plant Breeding Perspectives. Wageningen, Holand: Pudoc, pp.
190-203.
East EM and Hayes HK (1912) Heterozygosis in evolution and in plant breeding. U.S.
Department of Agriculture Bulletin.
Ebdon JS and Gauch HG (2002) Additive main effect and multiplicative interaction
analysis of national Turfgrass performance trials: I. Interpretation of genotype
environment × interaction. Crop Science 42: 489-496.
Edmeades GO, Bänziger M, Mickelson HR and Peña-Valdivia CB (1997) Developing
drought- and low N-tolerant maize. Proceedings of Symposium, March 25-29, 1996,
CIMMYT, El Batán, Mexico D.F., pp. 1-543.
Edmonds DE, Abreu SL, West A, Caasi DR, Conley TO, Daft MC, Desta B, England BB,
Farris CD, Nobles TJ, Patel NK, Rounds EW, Sanders BH, Shawaqfeh SS, Lakmini,
Lokuralalage, Manandhar R and Raun WR (2009) Cereal nitrogen use efficiency in
Sub Saharan Africa. Journal of Plant Nutrition 32: 2107-2122.
Erdemc I (2018) Investigation of genotype × environment interaction in chickpea
genotypes using AMMI and GGE biplot analysis. Turkish Journal of Field Crops 23:
20-26.
Eshetie T (2017) Review of quality protein maize as food and feed: In alleviating protein
deficiency in developing countries. American Journal of Food Nutrition 5: 99-105.
Falconer DS (1989) Introduction to quantitative genetics. Longman Scientific and
Technical Group Ltd, 3rd ed. John Wiley and Sons, New York
Fan XM, Chen HM, Tan J, Xu CX, Zhang YD, Luo LM, Huang YX and Kang MS (2008)
Combining abilities for yield and yield components in maize. Maydica 53: 39-46.
Fan XM, Tan J, Yang JY and Chen HM (2004) Combining ability and heterotic grouping
of ten temperate, subtropical and tropical quality protein maize inbreds. Maydica 49:
267-272.
Fan XM, Yin XF, Zhang YD, Bi YQ, Liu L, Chen HM and Kang MS (2016) Combining
ability estimation for grain yield of maize exotic germplasm using testers from three
heterotic groups. Crop Science 56: 2527-2535.

31
Fan XM, Zhang YD, Yao WH, Bi YQ, Liu L, Chen HM and Kang MS (2014) Reciprocal
diallel crosses impact combining ability, variance estimation, and heterotic group
classification. Crop Science 54: 89-97.
Fan XM, Zhang YM, Yao WH, Chen HM, Tan J, Xu CX, Han XL, Luo LM and Kang MS
(2009) Classifying maize inbred lines into heterotic groups using a factorial mating
design. Agronomy Journal 101: 106-112.
Farshadfar E (2012) GGE Biplot analysis of genotype × environment interaction in
chickpea genotypes. Australian Journal of Crop Sciene 6:1074-1079.
Farshadfar E, Farshadfar M and Kiani M (2011) Involvement of chromosome 5R carrying
the genes controlling yield and yield stability in rye (Secale cereale cv. Imperial).
European Journal of Scientific Research 59: 352-360.
Farshadfar E, Farshadfar M and Sutka J (2000) Combining ability analysis of drought
tolerance in wheat over different water regimes. Acta Agronomica Hungarica 48: 353-
361.
Fischer S, Maurer HP, Würschum T, Möhring J, Piepho HP, Schön CC, Thiemt EM,
Dhillon BS, Weissmann EA, Melchinger AE and Reif JC (2010) Development of
heterotic groups in triticale. Crop Science 50: 584.
Fu D, Xiao M, Hayward A, Fu Y, Jiang G and Zhang H (2014) Utilization of crop heterosis:
A review. Euphytica 197: 161-173.
Gangashetty PI, Motagi BN, Pavan R and Roodagi MB (2016) Breeding crop plants for
improved human nutrition through biofortification: Progress and Prospects. In: Al-
Khayri J, Jain S and Johnson D (eds), Advances in Plant Breeding Strategies:
Agronomic, Abiotic and Biotic Stress Traits, 2nd ed. Springer Netherlands, pp 35-68.
doi 10.1007/978-3-319-22518-0_2
Gauch HG (2006) Statistical analysis of yield trials by AMMI and GGE. Crop Science 46:
1488-1500.
Gauch HG and Zobel RW (1997) Identifying mega-environments and targeting genotypes.
Crop Science 37: 311-326.
Gracen VE (2020) Grouping of inbred lines into heterotic groups. Chapter 6. Breeding F1
Hybrid Crops (unpublished).
Gibbon BC and Larkins BA (2005) Molecular genetic approaches to developing quality
protein maize. Trends in Genetics 21: 227-233.

32
Gissa DW (2008) Genotypic variability and combining ability of quality protein maize
inbred lines under stress and optimal conditions. PhD Thesis in Plant Breeding,
University of the Free State, South Africa.
Giwa EO and Ikujenlola AV (2009) Application of quality protein maize in the formulation
of broiler’s finisher feed. Journal of Science, Food and Hospitality 1: 47-50.
Griffing BA (1956) Concept of general and specific combining ability in relation to diallel
crossing systems. Australian Journal Biology Science 9: 463-493.
Gruneberg WJ, Manrique K, Zhang D and Hermann M (2005) Genotype x environment
interactions for a diverse set of sweetpotato clones evaluated across varying
ecographic conditions in Peru. Crop Science 45: 2160-2171.
Gunaratna NS, De Groote H, Nestel P, Pixley KV and McCabe G (2010) Evaluating the
impact of biofortification: A meta-analysis of community-based studies on quality
protein maize (QPM). Food Policy 35: 202-210.
Gupta HS, Babu R, Agarwal PK, Mahajan V, Hossain F and Nepolean T (2013)
Accelerated development of quality protein maize hybrid through marker-assisted
introgression of opaque-2 allele. Plant Breeding 132: 77-82.
Hallauer AR and Miranda JB (1988) Quantitative genetics in maize breeding. 2nd ed. Iowa
State University Press, Ames.
Haydar FMA and Paul NK (2014) Combininbg ability analysis for different yield trails in
maize. Bangladesh Journal of Plant Breeding and Genetics 27: 1-5.
Hemmatabadi RN, Seidavi A and Gharahveysi S (2016) A review on correlation,
heritability and selection in silkworm breeding. Journal of Applied Animal Research
44: 9-23.
Idikut L, Atalay AI, Kara SN and Kamalak A (2009) Effect of hybrid on starch, protein
and yields of maize grain. Journal of Animal and Veterinary Advances 8: 1945-1947.
Ignjatovic-Micic D, Kostadinovic M, Stankovic G, Markovic K, Vancetovic J, Bozinovic
S and Andjelkovic V (2013) Biochemical and agronomic performance of quality
protein maize hybrids adapted to temperate regions. Maydica 58: 311-317.
Kaeppler S (2012) Heterosis: Many genes, many mechanisms-end the search for an
undiscovered unifying theory. ISRN Botany 2012: 1–12.
Kandus M, Almorza D, Boggio R and Salerno JC (2010) Statistical models for evaluating
the genotype-environment interaction in maize (Zea mays L.). International Journal
of Experimental Botany 79: 39-46.

33
Kanyamasoro MG, Karungi J, Asea G and Gibson P (2012) Determination of the heterotic
groups of maize inbred lines and the inheritance of their resistance to the maize
weevil. African Crop Science Journal 20: 99-104.
Keeble F and Pellow E (1910) The mode of inheritance of stature and time of flowering in
peas. Genetics 1: 47-56.
Kempthorne O (1957) An introduction to genetic statistics. Jonh Wiley and Sons, New
York.
Kerwin RE, Feusier J, Muok A, Lin C, Larson B, Copeland D, Corwin JA, Rubin MJ,
Francisco M, Li B, Joseph B, Weinig C and Kliebenstein DJ (2017) Epistasis ×
environment interactions among Arabidopsis thaliana glucosinolate genes impact
complex traits and fitness in the field. New Phytologist 215:1249-1263.
Koundinya AVV, Pandit MK, Ramesh D and Mishra P (2019) Phenotypic stability of
eggplant for yield and quality through AMMI, GGE and cluster analyses. Scientia
Horticulturae 247: 216-223.
Krishna MSR, Surender M and Sokka Reddy S (2017) Marker assisted breeding for
introgression of opaque-2 allele into elite maize inbred line BML-6. Acta Ecologica
Sinica 37: 340-345.
Krisnawati A and Adie MM (2018) Genotype by environment interaction and yield
stability of soybean genotypes. Indonesian Journal of Agricultural Science 19: 25-32.
Krivanek AF, De Groote H, Gunaratna N, Diallo A and Friesen D (2007) Breeding and
disseminating quality protein maize (QPM) for Africa. African Journal of
Biotechnology 6: 312-324.
Kumar J, Jaiswal V, Kumar A, Kumar N, Mir RR, Kumar S, Dhariwal R, Tyagi S,
Khandelwal M, Prabhu KV, Prasad R, Balyan HS and Gupta PK (2011) Introgression
of a major gene for high grain protein content in some Indian bread wheat cultivars.
Field Crops Research 123: 226-233.
Legesse BW, Pixley KV and Botha AM (2009) Combining ability and heterotic grouping
of highland transition maize inbred lines. Maydica 54:1-9.
Li JS and Vasal SK (2016) Maize: quality protein maize. In: Wrligley C, Corke H,
Seetharaman K and Faubion J (eds), Encyclopedia of Food Grains. 2nd. Ed. Elsevier,
pp. 212-216.
Lippman ZB and Zamir D (2006) Heterosis: Revisiting the magic. Trends in Genetics 23:
60-65.

34
Machikowa T and Laosuwan P (2011) Path coefficient analysis for yield of early maturing
soybean. Sonklanakarin Journal of Science and Technology 33: 365-368.
Manjeru P, van Biljon A and Labuschagne M (2019) The development and release of maize
fortified with provitamin A carotenoids in developing countries. Critical Reviews in
Food Science and Nutrition 59: 1284-1293.
Martin N (2000) Gene-environment interaction and twin studies. In: Spector T, Snieder H,
and MacGregor A (eds), Advances in twin and sib-pair analysis. Greenwich Medical
Media, London, pp. 143-150.
Martin RV, Washington R and Downing TE (2000) Seasonal maize forecasting for South
Africa and Zimbabwe derived from an agroclimatological model. Journal of Applied
Meteorology 39: 473-1479.
Masindeni DR (2013) Evaluation of South African high quality protein maize (Zea mays
L.) inbred lines under optimum and low nitrogen conditions and the identification of
suitable donor parents. PhD Thesis in Plant Breeding, University of the Free State,
South Africa.
Mastrodomenico AT, Haegele JW, Seebauer JR and Below FE (2018) Yield stability
differs in commercial maize hybrids in response to changes in plant density, nitrogen
fertility, and environment. Crop Science 58: 230-241.
Mather K and Jinks JL (1971) Biometrical genetics. The study of continous variation.
Cornell University Press, New York.
Mbuya K, Nkongolo KK and Narendrula R (2012) Development of quality protein maize
(QPM) inbred lines and genetic diversity assessed with ISSR markers in a maize
breeding program. American Journal of Experimental Agriculture 2: 626-640.
Mbuya K, Nkongolo KK and Kalonji-Mbuyi A (2011) Nutritional analysis of quality
protein maize varieties selected for agronomic characteristics in a breeding
programme. International Journal of Plant Breeding and Genetics 5: 317-327.
Mebratu A, Wegary D, Mohammed W, Teklewold A and Tarekegne A (2019) Genotype ´
environment interaction of quality protein maize hybrids under contrasting
management conditions in Eastern and Southern Africa. Crop Science 59: 1576-1589.
Melani MD, Carena MJ (2005) Alternative maize heterotic patterns for the Northern Corn
Belt. Crop Science 45: 2186.
Melchinger AE and Gumber RK (1998) Overview of heterosis and heterotic groups in
agronomic crops. In: Lamkey KR and Staub JE (ed), Concepts and breeding of
heterosis in crop plants. CSSA, Madison, WI, pp. 29-44.

35
Menkir A, Maziya-Dixon B, Mengesha W, Rocheford T and Alamu EO (2017) Accruing
genetic gain in pro-vitamin A enrichment from harnessing diverse maize germplasm.
Euphytica 213: 1-12.
Menkir A, White WS, Maziya-Dixon B, Rocheford T and Weiping L (2008) Carotenoid
diversity in tropical adapted yellow maize inbred lines. Food Chemistry 109: 521-
529.
Mertz ET, Bates ET and Nelson OE (1964) Mutant genes that change protein composition
and increase lysine content of maize endosperm. Science 145: 279-280.
Mitrović B, Stanisavljevi D, Treski S, Stojaković M, Ivanović M, Bekavac G and Rajković
M (2012) Evaluation of experimental maize hybrids tested in multi-location trials
using ammi and GGE biplot analyses. Turkish Journal of Field Crops 17: 35-40.
Mittelman A, Filho J, Lima G, Klain C and Tanaka R (2003) Potential of the ESA23B
maize population for protein and oil content improvement. Scientia Agricola 60: 319-
327.
Mpofu IDT, Sibanda S, Shonihwa A and Pixley K (2012) The nutritional value of quality
protein maize for weaner pigs. Journal of Petroleum and Evironmental Biotechnology
3: 129.
Munaro EM, Eyhérabide GH, D’Andrea KE, Cirilobmm AG and Otegui, ME (2011)
Heterosis x environment interaction in maize: What drives heterosis for grain yield?
Field Crops Research 124: 441-449.
Mural RV Chikkalingaiah and Hittalmani S (2012) Correlation study for protein content,
grain yield and yield contributing traits in quality protein maize (QPM) (Zea mays L.)
Electronic Journal of Plant Breeding 3: 747-752.
Muraya MM, Ndirangu CM and Omolo EO (2006) Heterosis and combining ability in
diallel crosses involving maize (Zea mays L.) S1 lines. Australian Journal of
Experimental Agriculture 46: 387-393.
Musila RN, Diallo OA, Makumbi D and Njoroge K (2010) Combining ability of early-
maturing quality protein maize inbred lines adapted to Eastern Africa. Field Crops
Research 119: 231-237.
Nduwumuremyi A, Tongoona P, Habimana S and Husbandry A (2013) Mating designs:
helpful tool for quantitative plant breeding analysis. Journal of Plant Breeding and
Genetics 1: 117-129.
Ngaboyisonga C (2008) Quality protein maize under stress environments: gene action and
genotype × environment effects. PhD Thesis, University of Nairobi, Kenya.

36
Nigussie M and Zelleke H (2001) Heterosis and combining ability in a diallel among eight
elite maize populations. African Crop Science Journal 9: 471- 479.
Nuss ET and Tanumihardjo SA (2011) Quality protein maize for Africa: Closing the
protein inadequacy gap in vulnerable populations. Advances in Nutrition 2: 217-224.
Ogunniyan DJ and Olakojo SA (2014) Genetic variation, heritability, genetic advance and
agronomic character association of yellow elite inbred lines of maize (Zea mays L.).
Nigerian Journal of Genetics 28 24-28.
Outreach IPB (2017) Maize in Africa. International Plant Biotechnology Outreach 1–55.
http://ipbo.vib-ugent.be/wp-content/uploads/2015/02/vib_fact_MaizeForAfrica_
EN_2017_LR.pdf
Pandey N, Hossain F, Kumar K, Vishwakarma AK, Muthusamy V, Saha S, Agrawal PK,
Guleria SK, Reddy SS, Thirunavukkarasu N and Gupta HS (2016) Molecular
characterization of endosperm and amino acids modifications among quality protein
maize inbreds. Plant Breeding 135: 47-54.
Pixley KV and Bjarnason MS (1993) Combining ability for yield and protein quality
among modified-endosperm opaque-2 tropical maize inbreds. Crop Science 33: 1229-
1234.
Pixley KV and Bjarnason MS (2002) Stability of grain yield, endosperm modification, and
protein quality of hybrid and open-pollinated quality protein maize cultivars. Crop
Science 42: 1882-1890.
Prasanna BM, Vasal SK, Kassahun B and Singh NN (2001) Quality protein maize. Current
Science 81: 1308-1319.
Premlatha M and Kalamani A (2010) Heterosis and combining ability studies for grain
yield and growth characters in maize (Zea Mays L.). Indian Journal of Agricultural
Reseach 44: 62-65.
Pukalenthy, B., Manickam, D., Adhimoolam, K., Mahesh, S. G., Ramanathan, N.,
Chandran, S. Sampathrajan V, Rajasekaran R, ArunachalamK, Senthil K,
Muthusamy V, Hossain F and Natesan, S. (2020) Marker aided introgression of
opaque-2 (o2) allele improving lysine and tryptophan in maize (Zea mays L.).
Physiology and Molecular Biology of Plants 26:1925-1930.
Qi X, Li ZH, Jiang LL, Yu XM, Ngezahayo F and Liu B (2010) Grain yield heterosis in
Zea mays L. shows positive correlation with parental difference in CHG methylation.
Crop Science 50: 2338-2346.

37
Ram L (2014) Improvement of non-QPM lines through introgression of QPM genes. PhD
Thesis, Banaras Hindu University.
Rashid M, Cheema AA and Ashraf M (2007). Line x tester analysis in Basmati rice.
Pakistan Journal of Botany 39: 2035-2042.
Ray DK, Mueller ND, West PC and Foley JA (2013) Yield Trends Are Insufficient to
Double Global Crop Production by 2050. PLoS ONE 8: e66428.
Reid LM, Xiang K, Zhu X, Baum BR and Molnar SJ (2011) Genetic diversity analysis of
119 Canadian maize inbred lines based on pedigree and simple sequence repeat
markers. Canadian Journal Plant Sciences 91: 651-661.
Saleh G, Abdullah D and Anuar AR (2002) Performance, heterosis and heritability in
selected tropical maize single, double and three-way cross hybrids. Journal of
Agricultural Sciences 138: 21-28.
Sarika K, Hossain F, Muthusamy V, Baveja A, Zunjare R, Goswami R, Thirunavukkarasu
N, Saha S and Gupta HS (2017) Exploration of novel opaque16 mutation as a source
for high lysine and tryptophan in maize endosperm. Indian Journal of Genetic and
Plant Breeding 77: 59-64.
Sarika K, Hossain F, Muthusamy V, Zunjare RU, Baveja A, Goswami R, Bhat JS, Saha S
and Gupta HS (2018) Marker-assisted pyramiding of opaque2 and novel opaque16
genes for further enrichment of lysine and tryptophan in sub-tropical maize. Plant
Science 272: 142-152.
SARI (Savanna Agricultural Research Institute) (1996) Annual Report. SARI, Ghana.
Sharief AE, El-Kalla SE, Gado HE and Abo-Yousef HAE (2009) Heterosis in yellow
maize. Australian Journal of Crop Science 3: 146-154.
Sharma JR (2006) Statistical and biometrical techniques in plant breeding. First ed. New
Age International, Mohan lal Printers, Delhi.
Sharma P, Punia MS, Kamboj MC, Singh N and Chand M (2017) Evaluation of quality
protein maize crosses through line x tester analysis for grain yield and quality traits.
Agricultural Science Digest 37: 42-45.
Shi G, Chavas JP and Lauer J (2013) Commercialized transgenic traits, maize productivity
and yield risk. Nature Biotechnology 31: 111-114.
Shull GH (1911) The genotypes of maize. American Naturalist 45: 234-252.
Shull GH (1948) What is heterosis? Genetics 33: 439-446.

38
Singh NN and Venkatesh S (2006) Development of quality protein maize inbred lines. In:
Kaloo G, Rai M, Singh M and Kumar S (eds), Heterosis in Crop Plants. Res. Book
Center, New Delhi, pp. 102-113.
Songsri P, Jogloy S, Kesmala T, Vorasoot N, Akkasaeng C, Patanothai and Holbrooket CC
(2008) Heritability of drought resistance traits and correlation of drought resistance
and agronomic traits in peanut. Crop Science 48: 2245-2253.
Sorensen D (2010) The genetics of environmental variation. In: Proceedings of the 9th
World Congress on Genetics Applied to Livestock. Leipzig, Germany.
Sprague GF and Tatum LA (1942) General versus specific combining ability in single
crosses of corn. Journal of the American Society of Agronomy 34: 923-928.
Sprague GF, Russell WA, Pennyr H, Horneran W and Hanson DWD (1962) Effect of
epistasis on grain yield in maize. Crop Science 2: 205-208.
Sreckov Z, Nastasic A, Bocanski J, Djalovic I, Vukosavljev M and Jockovic B (2011)
Correlation and path analysis of grain yield and morphological traits in test–cross
populations of maize. Pakistan Journal of Botany 43: 1729-1731.
Stojaković M, Ivanović M, Jocković D, Bekavac G, Purar B, Nastasić A, Stanisavljević D,
Mitrović B, Treskić S and Laišić R (2010) NS maize hybrids in production regions of
Serbia. Field and Vegetable Crops Research 47: 93-102.
Tandzi LN, Mutengwa CS, Ngonkew ELM, Woïn N and Gracen V (2017) Breeding for
quality protein maize (QPM) varieties: A review. Agronomy 80: 1-16.
Teklewold A, Wegary D, Tadesse A, Tadesse B, Bantte K, Friesen D and Prasanna BM
(2015) Quality protein (QPM) maize. A guide to the technology and its promotion in
Ethiopia. CIMMYT.
Terron A, Preciado E, Cordova H, Mickelson H and Lopez R (1997) Determinacion del
patron heterotico de 30 lineas de maiz derivadas del la poblacion 43 SR del CIMMYT.
Agronomy Mesoam 8: 26-34.
Tollenaar M, Ahmadzadeh A and Lee EA (2004) Physiological basis of heterosis for grain
yield in maize. Crop Science 44: 2086-2094.
Tripathy SK, Ithape DM, Maharana M and Prusty AM (2017) Quality Protein Maize
(QPM): Genetic basis and breeding perspective. Tropical Plant Research 4: 145-152.
Tulu BN (2014) Correlation and path coefficients analysis studies among yield and yield
related traits of quality protein maize (QPM) inbred lines. International Journal of
Plant Breeding and Crop Science 1: 6-17.

39
Twumasi-Afriye S, Rojas PN, Friesen D, Teklewold A, Gissa DW, De Groote H and
Prasanna BM (2016) Guidelines for the quality control of Quality Protein Maize
(QPM) seed and grain: Technical bulletin. Addis Ababa, Ethiopia. CGIAR.
CIMMYT.
Udensi O and Ikpeme EV (2012) Correlation and path coefficient analyses of seed yield
and its contributing traits in Cajanus cajan (L.) Millsp. American Journal of
Experimental Agriculture 2: 351-358.
USDA (2020) United States Department of Agriculture
http://www.worldagriculturalproduction.com/crops/corn.aspx.
Vacaro E, Fernandes J, Neto B, Pegoraro DG, Nuss CN and Conccicao LH (2002)
Combining ability of twellaw maize population. Pesquisa Agropecuária Brasileira
37: 67-72.
Vasal SK (1999) Quality Protein Maize Story. In: Improving Human Nutrition Through
Agriculture: The Role of International Agricultural Research: International Food
Policy Research Institute Workshop held at the International Rice Research Institute,
October 5-7, Los Banos, Philippines. http://www.ifpri.cgiar.org/sites/default/files/
publications/vasal.pdf.
Vasal SK (2002) Quality protein maize: Overcoming the hurdles. Journal of Crop
Production 6: 193-227.
Vasal SK Villegas E, Bjarnason M, Gelaw B and Goertz P (1980) Genetic modifiers and
breeding strategies in developing hard endosperm opaque-2 materials. In: Pollmer
WG and Phipps RH (eds), Improvement of quality traits of maize for grain and silage
use. Nijhoff, The Hague, Netherlands, pp. 37-71.
Visscher PM, Hill WG and Wray NR (2008) Heritability in the genomics era - Concepts
and misconceptions. Nature Reviews Genetics 9: 255-266.
Wegary D, Labuschagne MT and Vivek BS (2011) Protein quality and endosperm
modification of quality protein maize (Zea mays L.) under two contrasting soil
nitrogen environments. Field Crop Research 121: 408-415.
Wegary D, Vivek BS and Labuschagne MT (2014) Combining ability of certain agronomic
traits in quality protein maize under stress and nonstress environments in Eastern and
Southern Africa. Crop Science 54: 1004-1014.
Werle AJK, Ferreira FRA, Pinto RJB, Mangolin CA, Scapim CA and Gonçalves LSA
(2014) Diallel analysis of maize inbred lines for grain yield, oil and protein. Crop
Breeding and Applied Biotechnology 14: 23-28.

40
Wessel-Beaver L, Lambert RJ and Dudley JW (1985) Genetic variability and correlations
in a modified endosperm texture opaque-2 maize population. Crop Science 25: 129-
132.
Xu N, Fok M, Zhang G, Li J and Zhou Z (2014) The application of GGE biplot analysis
for evaluating test locations and mega-environment investigation of cotton regional
trials. Journal of Integrative Agriculture 13: 1921-1933.
Yan W K, Kang M S, Ma B, Woods S and Cornelius PL (2007). GGE biplot vs. AMMI
analysis of genotype-by-environment data. Crop Science 47: 643-655.
Yan W, Hunt LA, Sheng Q and Szlavnics Z (2000) Cultivar evaluation and mega-
environment investigation based on the GGE biplot. Crop Science 40: 597-605.
Yang W, Zheng Y, Zheng W and Feng R (2005) Molecular genetic mapping of a high-
lysine mutant gene (opaque-16) and the double recessive effect with opaque-2 in
maize. Molecular Breeding 15: 257–269.
Zali H, Farshadfar E and Sabaghpour SH (2011) Non-parametric analysis of phenotypic
stability in chickpea (Cicer arietinum L.) genotypes in Iran. Crop Breeding Journal 1:
89-100.
Zerihun J (2011) GGE – biplot analysis of multi–environment yield trials of barley
(Hordeum vulgare L.) genotypes in southeastern Ethiopian highlands. International
Journal of Plant Breeding and Genetics 5: 59-75.
Zhang W, Yang W, Wang M, Wang W, Zeng G, Chen Z and Cai Y (2013) Increasing
lysine content of waxy maize through introgression of opaque-2 and opaque-16 genes
using molecular assisted and biochemical development. PLoS ONE 8(2): e56227.
doi:10.1371/journal.pone.0056227
Zhang PP, Song H, Ke XW, Jin XJ , Yin LH , Liu Y, Qu Y , Su W, Feng NJ, Zheng DF
and Feng BL (2016) GGE biplot analysis of yield stability and test location
representativeness in proso millet (Panicum miliaceum L.) genotypes. Journal of
Integrative Agriculture 15: 1218-1227.
Živanović T, Maja Vračarević M, Krstanović S and Šurlan-Momirović G (2004) Selection
on uniformity and yield stability in maize. Journal of Agricultural Science 49: 117-
130.
Živanović T, Vuckovic S, Prodanovic S and Todorovic G (2006) Evaluation of inbred lines
as sources of new alleles for improving elite maize hybrid. Cereal Research
Communications 34: 941-948.

41
Zobel RW, Wright MJ and Gauch HG (1988) Statistical analysis of a yield trial. Agronomy
Journal 80: 388-393.
42
CHAPTER THREE
QUALITY AND NON-QUALITY PROTEIN MAIZE INBRED LINES:
STABILITY AND PERFORMANCE IN SOUTHERN AFRICA
3.1 Abstract
Malnutrition as a result of deficiency of essential nutrients in cereal food products and
consumption of a poorly balanced diet is a major challenge facing millions of people in
developing countries. However, developing maize inbred lines which are high yielding
with enhanced nutritional traits for hybrid development, still remains a challenge. This
study evaluated 40 inbred lines: 26 quality protein maize (QPM) based lines, nine non-
QPM lines and five checks (three QPM and two non-QPM) at seven optimum
environments in Zimbabwe and South Africa during the 2017/2018 cropping season. The
objective of the study was to identify high yielding and stable QPM inbred lines and to
determine the level of association between measured traits, and assess the performance of
the lines for quality traits and zein proteins. The experimental design used at all locations
was a 5 x 8 alpha lattice design with two replications. Observations were made on grain
yield and yield components, agronomic characteristics as well as quality traits. The results
showed that genotypes varied significantly for all the measured traits. The top six
performing lines out-yielded the best yielding check by more than 15%. The top two
performers (also the most stable performers) were non-QPM, but three of the six top
performers were non-QPM. The average yield of QPM lines was higher than that of non-
QPM lines, and several high yielding and stable QPM lines were identified. Inbred lines
39, 27 and 10 had protein content above 9.0% while lines 16, 5 and 2 had tryptophan
concentrations above 0.09%. The predominant zein proteins were 21.87% β-zein, 64.87%
γ-zein and 65.17% α-zein. The first four principal components (PC’s) from PCA accounted
for 98% of the total variation among the traits with PC1 explaining 82% of the variation.
The GGE biplot captured 71.18% of the total variation due to the interaction between
genotype and environment. The high yielding and stable lines identified in this study could
be exploited by breeding programmes for the development of high yielding QPM hybrid(s)
in sub-Saharan Africa.

43
Keywords: Inbred line development, grain yield, stability, quality protein maize, trait
association, principal component analysis, “Which won where”.
3.2 Introduction
Malnutrition, due to a lack of a balanced diet, has become a chronic disease in under-
developed and developing countries, affecting about two billion people (Sarika et al. 2018),
leading to about 45% child mortality among infants under five years (Black et al. 2013).
Consequently, malnutrition has become an international problem and has caused an 11%
loss of annual gross domestic product (GDP) in Africa and other developing countries
(Sarika et al. 2018). Maize is the third most important staple cereal food crop in the world
after wheat and rice, and contributes about 30% of food-calorie intake and is a source of
protein for more than 4 billion people in 94 developing countries (Shiferaw et al. 2011).
In addition to being a source of carbohydrate and proteins for humans, maize serves as
source of feed to animals and industrial purposes in developed countries. Even though
maize plays a crucial food role for billions of people, its endosperm contains inadequate
lysine and tryptophan, which are essential amino acids for human and other monogastric
animals. These essential, but limited, amino acids have, in some cases, been supplemented
in food products at the point of milling through food biofortification to raise nutrient levels
to those of meat, egg, fish and milk, which are the best sources of protein. Hence, to make
quality protein available to the poorer section of people in society, there is a need to
develop plant-based food products with enhanced nutritional content (Eshetie 2017). This
has led to the development of QPM in the 1960’s through conventional breeding, to
ameliorate nutritional content of the traditionally cultivated varieties to combat
malnutrition. Scientists from both national and international maize research programmes
work on enhancing the levels of essential amino acids. Development of biofortified crop
varieties with improved nutritional value through conventional breeding approaches
provides a sustainable and cost-effective solution to combat malnutrition (Gupta et al.
2015). Maize parental lines are the fundamental genetic materials essential for
understanding the mechanism and principles of breeding. Inbred lines have been utilized
effectively in several studies in the areas of applied plant genetics and molecular breeding
(Liu et al. 2003; Semagn et al. 2012; Wegary et al. 2018).

44
Over the past years, a large number of QPM inbred lines have been developed and
successfully used as parents in generating hybrids and synthetic varieties (Njeri et al. 2017;
Sood et al. 2017; Wegary et al. 2018). Inbred lines also serve as source of favourable genes
for crop improvement (Menkir et al. 2003). Inbred lines or hybrids are better sources of
genetic materials for maize production than open pollinated varieties. Parental materials
form the basis on which the development of stable and high yielding maize hybrids revolve
(Chandel et al. 2014). As such, inbred lines should be extensively evaluated at different
locations for consistency in performance of grain yield and other traits of interest.
Examining GEI is very important in crop development because several factors contribute
to the performance of a genotype as the production environment is variable. GEI studies
enable superior cultivars and environments to be identified (de Oliveira et al. 2019). Even
though there are several methods available for identifying the stability of maize genotypes,
the GGE biplot analysis has been reported to be more efficient than other methods, because
it makes use of first and second component axes and predicts mean performance of each
genotype in each environment (Yan and Holland 2010; Santos et al. 2017; de Oliveira et
al. 2019). There is currently limited information on yield performance and stability of new
QPM inbred lines developed by CIMMYT, even though studies have been conducted to
group QPM inbred lines into heterotic groups. Therefore, the objective of this study was
to identify high yielding and stable QPM inbred lines and to determine associations among
yield and yield components as well as agronomic characteristics.
3.3 Materials and methods
3.3.1 Genetic material and field evaluation
The genetic material used consisted of 26 QPM based inbred lines and nine non-QPM lines
as well as five commercial checks (three QPM and two non-QPM) (Table 3.1) developed
by CIMMYT, Zimbabwe. The experiment was carried out under optimum conditions at
Cedara (latitude -29.54°, longitude 30.26°, with elevation of 1066 m above sea level, with
reddish brown clay soils) and Potchefstroom (latitude -26.73°, longitude 27.08°, with
elevation of 1349 m above sea level, with brown sandy loam soils) in South Africa. Trials
were grown under normal and misting conditions (which is used to induce diseases) in
Harare (latitude 17°46', longitude 31°02', with elevation of 1406 m above sea level),
Glendale (latitude 17°31', longitude 31°3', with elevation 1147 above sea level) and
Glendale (late planting thus two months after main planting season) and Gwebi (latitude

45
17°13', longitude 31°E, altitude of 1406 above sea level) in Zimbabwe during the
2017/2018 cropping season.
The experimental design used was a 5 x 8 alpha lattice design with two replications at all
locations. The experimental unit was one-row plots, each 4 m long with inter-row spacing
of 0.75 m and spacing within rows of 0.25 m. Two seeds were planted per hill and seedlings
later thinned to one plant per hill at four weeks after emergence to give a final plant
population density of about 53 333 plants ha-1. At Potchefstroom, the fertilizer regime
consisted of compound fertilizer 3:2:1 (25) + Zn, applied as a basal application at planting,
at a rate of 200 kg NPK ha-1. LAN with 28% N was used for top-dressing in two equal
splits at 28 and 56 days after emergence at a rate of 100 kg ha-1 each. At Cedara, MAP at
250 kg ha-1 was applied at planting, and LAN given at 150 kg ha-1 in two equal splits of 75
kg ha-1 at 28 and 56 days after emergence. For the Zimbabwe trials, fertilizers were applied
at the recommended rate of 250 kg ha-1 N, 83 kg ha-1 P and 111 kg ha-1 K. Basal fertilizer
application was done in the form of NPK, and additional N application was done four
weeks after seed emergence. Pre-emergence herbicides; Gramoxone, Basagram and 2, 4-
D were applied to control weeds and after that hand weeding was done to make sure that
the fields were relatively free of weeds. Insecticides; Carbaryl and Karate were applied to
control stalk borer and cutworms, respectively. Carbaryl was applied at planting stage
while Karate was applied at planting and seedling emergence stages.
3.3.2 Data collection
Data was recorded on days to 50% anthesis (DA) and silking (DS). Anthesis-silking
interval (ASI) was calculated as the difference between DS and DA. Plant height (PH; cm)
was measured as the length from the base of the plant to the last leaf (flag leaf) while ear
height (EH; cm) was measured from the base to the node bearing the top ear. Root lodging
(RL; %) was measured as the percentage of plants leaning more than 30° from the vertical,
while stalk lodging (SL; %) was also recorded on plants with broken stalks below the ear.
Number of ears per plant (EPP) was calculated by dividing the total number of ears per
plot by the number of plants at harvest. Ear aspect (EA) was rated on a scale of 1 to 5 where
1 = clean, uniform, large, and well-filled ears; while 5 = ears with undesirable features such
as diseased and rotten ears, small ears and ears that are not well filled with grains. Number
of rotten ears was counted and converted to percentage. At harvest, field weight

46
(kg plot-1) of the harvested ears was measured, followed by determination of moisture
content. Grain yield (t ha-1) was computed based on 80% shelling percentage.
3.3.3 Obtaining seed samples for quality traits analyses
The seed samples used were obtained by selfing two cobs from each entry in the two
replications from four sites out of the seven used for the inbred trials. The self-pollinated
seeds were harvested and the two cobs per entry were shelled and bulked for determination
of tryptophan, starch, fibre, moisture, protein and oil. Amylose/amylopectin and zein
proteins were also analysed.
3.3.4 Zein extraction and determination of zein fractions using reverse phase high-
performance liquid chromatography
For the extraction of zein proteins, an aqueous solution containing 70% ethanol (Sigma;
96% v/v); 24.5% filtered double distilled water, 5% beta-mercaptoethanol (Sigma; ≥ 99%
v/v) and 0.5% sodium acetate (Saarchem AR; w/v) was prepared as a stock solution (Gupta
et al. 2016; O’Kennedy and Fox 2017). One ml of the prepared solution was added to 200
mg maize in a 2 ml reaction tube to digest the protein. The samples were vortexed for 30
min and later centrifuged for 30 min at 6 000 revolution per min (rpm). After which the
supernatant was transferred to a new 2 ml reaction tube and again centrifuged for another
30 min at 6 000 rpm. After centrifugation, the remaining supernatant was transferred into
a glass vial for reverse phase high-performance liquid chromatography (RP-HPLC)
analysis. In the case where the supernatant could not be injected into the HPLC system,
they were stored in a refrigerator at 4°C.
The RP-HPLC was done on a Shimadzu Prominence LC System using a Jupiter C18
column of 250 x 4.6 mm, with a 5 µm particle size and 300 Å pore size. Samples of 50 µl
were injected and eluted with the solvent at 1 ml per minute flow rate with a column
temperature of 55°C. The two solvents used were labelled A and B. Solvent A was made
up of LiChrosolv Acetonitrile (Merck) containing 0.1% HiPersolv trifluoroacetic acid
(TFA) (VWR chemicals) and Solvent B was filtered deionised water comprising of 0.1%
(v/v) TFA and was set to run for 75 min per sample. Zein fractions were determined in a
chromatograph using a Shimadzu Class-VP 6.14 SP1. Based on the distinct peak retention
time, β-, γ- and α-zeins were determined.

47
Table 3.1 Description of the QPM and non-QPM inbred lines and checks used in the
study
Code Name Donor Description
L1 CZL1330 QPM progeny Conversion of early maturing elite drought and low N stress tolerant inbred line
L2 CZL15041 QPM progeny Conversion of Medium maturing elite MSV tolerant inbred line
L3 CZL15055 QPM progeny Conversion of early maturing elite drought and low N stress tolerant inbred line
L4 CZL15073 QPM progeny Conversion of early maturing elite drought and low N stress tolerant inbred line
L5 CZL1471 QPM progeny Conversion of medium maturing elite Southern Africa adapted mid-altitude inbred line with
high GCA
L6 TL135470 QPM progeny Conversion of medium maturing elite Southern Africa adapted mid-altitude inbred line with
high GCA
L7 VL06378 QPM progeny Conversion of late maturing elite mid-altitude adapted inbred line with high GCA
L8 TL155805 QPM progeny Conversion of late maturing elite mid-altitude adapted inbred line with high GCA
L9 TL147078 QPM progeny Conversion of late maturing elite mid-altitude adapted inbred line with high GCA
L10 TL147070 QPM progeny Conversion of late maturing elite mid-altitude adapted inbred line with high GCA
L11 TL13609 QPM progeny Conversion of medium maturing elite drought tolerant mid-altitude adapted inbred line
L12 TL145743 QPM progeny Introgressed with temperate germplasm
L13 TL156614 QPM progeny Conversion of early maturing elite drought and low N stress tolerant inbred line
L14 CZL1477 QPM progeny Conversion of medium maturing elite mid-altitude adapted inbred line with high GCA
L15 CZL15074 QPM donor Conversion of elite inbred lines with mid-altitude to highland adaptation
L16 CZL0616 QPM progeny Conversion of elite inbred lines with mid-altitude to highland adaptation
L17 CZL083 QPM progeny Conversion of elite MSV tolerant inbred line
L18 CML572 Non-QPM parent Elite early maturing drought and low N stress tolerant inbred line with high GCA
L19 EBL167787 Non-QPM check Elite medium maturing MSV tolerant inbred line
L 20 CZL0520 Non-QPM parent Elite medium maturing MSV tolerant inbred line
L 21 CZL99005 Non-QPM parent Elite medium maturing Southern Africa adapted inbred line
L 22 CML502 QPM donor Sub-tropical adapted
L 23 CZL0920 QPM donor Sub-tropical adapted
L 24 CML144 QPM donor Sub-tropical adapted
L 25 CML159 QPM donor Mid-altitude adapted
L 26 CML181 QPM donor Sub-tropical adapted
L 27 CML197 Non-QPM parent Mid-altitude adapted
L 28 CML312SR Non-QPM parent Mid-altitude adapted, MSV tolerant
L 29 CML488 Non-QPM parent Mid-altitude adapted, drought tolerant
L 30 CML491 QPM donor Sub-tropical adapted
L 31 LH51 Non-QPM parent Temperate adapted inbred line
L 32 CZL00025 Non-QPM parent Mid-attitude to highland adapted
L33 CZL15049 QPM tester Mid-altitude adapted
L34 CZL059 QPM tester Mid-altitude adapted
L35 CML444 Non-QPM tester Mid-altitude adapted
L36 CML395 Non-QPM tester Mid-altitude adapted
L37 CZL01005 QPM check Southern Africa adapted
L38 CML511 QPM check Mid-altitude adapted
L39 CML 312 Non-QPM check Mid-altitude adapted
L40 CZL1470 QPM check Mid-altitude adapted

48
3.3.5 Determination of amylose using iodine
Amylose content was determined following the protocol developed by Deja Cruz and
Khush (2000). Absolute ethanol was diluted with distilled water to 95% concentration.
Forty g sodium hydroxide (NaOH) was dissolved in double distilled water and made to 1
L. Acetic acid was prepared from 57.2 ml of glacial acetic acid (Mr = 60.05; density = 1.05
g per ml) added to 1 L distilled water and the iodine solution was prepared by dissolving
0.2 g iodine and 2.0 g potassium iodide in 100 ml distilled water. Maize kernels were milled
using a Fritsch (Fritsch Industries, Idar-Oberstein, Germany) analysis grinder fitted with a
0.5 mm sieve. A 0.1g ±0.0001 g sample was weighed into 15 ml tubes for analysis. A tube
containing no flour was included as a reagent blank. In addition, a positive sample of
known amylose percentage (64% maize amylose) was included. One ml of 95% ethanol
(v/v) was added to each tube. A 9 ml NaOH solution was added followed by mixing
thoroughly through vortexing with the tubes tightly closed. The samples were placed in
boiling water to gelatinise the starch for 30 min. After removing the samples from the
boiling water, they were allowed to cool for 1 hour at room temperature and then centrifuge
for 5 min at 3 000 rpm. Of this starch solution, 100 l was transferred into a clean 15 ml
test tube and 20 l 1M acetic acid was added, followed by adding 200 l iodine solution.
The final volume was made up to 10 ml using double distilled water. It was thoroughly
mixed and left to stand for 20 min for colour development to take place, before reading the
absorbance at 620 nm on a UV vis spectrophotometer (JENWAY Spectrophotometer
Model 7315, Designed and Manufactured by Bibby Scientific LTD Stone, Staffs, UK,
ST15 OSA).
3.3.6 Preparation of amylose standard curve
One hundred mg potato amylose (Sigma A0512) was weighed into a 15 ml test tube. A
tube containing no amylose was used as reagent blank. One ml of 95% ethanol was added
to each tube. Tubes were vortexed thoroughly, after which 9 ml of 1M NaOH solution was
added to each tube. Tubes were heated in a boiling water bath for 10 min to gelatinise the
starch. Tubes were then cooled to room temperature (1 hour) and made up to 10 ml with
distilled water, followed by thorough vortexing. This stock solution was used to prepare a
dilution series in 15 ml test tubes as indicated in Table 3.2 below.

49
Table 3.2 Description of samples used for the amylose standard curve
Tube No.
Volume of
amylose stock
solution taken
Volume of 1M
acetic acid added
Volume of
iodine solution
(μL)
Volume of
distilled water
added to
Amylose
Blank 0.00 mL = 0 μL 0.02 mL = 20 μL 200 9.78 mL 0.0
1 0.02 mL = 20 μL 0.02mL = 20μL 200 9.76 mL 0.2
2 0.04 mL = 40 μL 0.04 mL = 40μL 200 9.72 mL 0.4
3 0.06 mL = 60 μL 0.06mL = 60μL 200 9.68 mL 0.6
4 0.08 mL = 80 μL 0.08mL = 80μL 200 9.64 mL 0.8
5 0.10 mL = 100 μL 0.10mL = 100μL 200 9.60 mL 1.0
6 0.15 mL = 150 μL 0.15mL = 150μL 200 9.50 mL 1.5
7 0.20 mL = 200 μL 0.20mL = 200μL 200 9.40 mL 2.0
8 0.25 mL = 250 μL 0.25mL = 250μL 200 9.30 mL 2.5
9 0.30 mL = 300 μL 0.30mL = 300μL 200 9.20 mL 3.0
10 0.35 mL= 350 μL 0.35mL= 350μL 200 9.10 mL 3.5
11 0.40 mL = 400 μL 0.40mL = 400 μL 200 9.00 mL 4.0
1M acetic acid was added as described in the table above followed by 200 l iodine
solution to each tube. Double distilled water was added to bring the total volume to 10 ml.
It was mixed well and was allowed to stand for 20 min at room temperature. Samples were
read at 620 nm absorbance using the blank to zero the spectrophotometer.
Figure 3.1 shows the standard curve developed and was used in the calculation of the
amylose content in each sample. The amylose percentage was calculated as follows:
Amylose % = Total amylose in sample (mg) x 100
Sample mass (mg)

50
Figure 3.1 Standard curve developed for amylose determination
3.3.7 Determination of tryptophan
3.3.7.1 Seed sample selection, milling and defatting
Fifty kernels of uniform size were selected from the bulked seed samples. The selected
kernels were clean and had no rotten kernels. The kernels were milled into a fine flour
using a Fritsch analysis grinder. The ground samples were passed through a built-in 0.5
mm sieve. Two g of the sieved samples were placed into 50 ml Falcon tubes for defatting.
A mixture of 10 ml chloroform and methanol in a 2:1 ratio (v/v) was added to each sample
and was kept at 4°C for 12 hours. After standing to reach room temperature, the samples
were washed three times using the same amount of above mixture using commercial filter
paper (Grade: 3 hw Art.no.: 3.303.185). The samples, which were trapped in the filter
paper, were left in open air to dry. The dried samples were stored at 4°C for tryptophan
determination.
y = 10.73x + 0.1609R² = 0.9984
0
0,5
1
1,5
2
2,5
3
3,5
4
4,5
5
0,00 0,05 0,10 0,15 0,20 0,25 0,30 0,35 0,40 0,45
Am
ylo
se (
mg)
Absorbance

51
3.3.7.2 Determination of tryptophan content
A standard curve was first developed (Figure 3.2) using glyoxylic acid reaction, DL-
tryptophan, ferric chloride and sulphuric acid (H2SO4) according to the protocol of Nurit
et al. (2009). Concentrations of 0, 10, 15, 20, 25 and 30 μg ml-1 were prepared from the
DL-tryptophan stock solution in 0.1 M sodium acetate (pH 7). A 1 ml aliquot was
transferred from each sample into a 15 ml glass tube and 3 ml of colorimetric reagent was
added into each test tube. The samples were vortexed for 8-10 sec and then incubated in a
water bath at 64°C for 30 min to enable colour development. After 30 min, the samples
were taken from the water bath and then cooled at room temperature for optical density
readings using a spectrophotometer (Jenway Spectrophotometer Model 7315, Designed
and Manufactured by Bibby Scientific LTD Stone, Staffs, UK, ST15 OSA). The readings
obtained were used in drawing a calibration curve with the slope having a unit of OD560nm
x ml μg-1.
Figure 3.2 Standard curve developed and used in the calculation of tryptophan contents of
the samples analysed
Tryptophan percentage was then calculated following Nurit et al. (2009) as:
Tryptophan (%) = OD560mm × hydrolysis volume × 100
slope sample weight
y = 0.0144x - 0.0076
R² = 0.9919
0,000
0,050
0,100
0,150
0,200
0,250
0,300
0,350
0,400
0,450
0 5 10 15 20 25 30 35
Op
tica
l de
nsi
ty (
56
0 n
m)
Tryptophan concentration (ug ml-1)
52
Papain and sodium acetate solutions were prepared on a daily basis as required. Chemicals
and reagents were prepared as follows:
One mg ml-1 papain was dissolved in 0.165 M sodium acetate solution. Sodium acetate
solution was prepared by dissolving 13.6 g of sodium acetate in 1 000 ml of double distilled
water and stored in the refrigerator at 4°C. A 30 N of H2SO4 stock solution was prepared
by adding 833.30 ml of H2SO4 (96%) concentration slowly into a glass beaker with 166.70
ml of double distilled water making a volume of 1000 ml while placed on ice, it was
allowed to cool down to room temperature. A 7 N of H2SO4 stock solution was prepared
by mixing 35 ml 30 N of H2SO4 and 115 ml of double distilled water to prepare 150 ml
7 N of H2SO4. Required reagents were prepared daily. Reagent A was made up of 0.1 M
glyoxilic acid by weighing 0.736 g of glyoxilic acid into a 100 ml glass beaker. Thereafter,
80 ml of 7 N H2SO4 was added, which was shaken gently until all the granules of the
glyoxilic acid was dissolved completely. Reagent B, consisted of 1.8 mM ferric chloride,
where 0.0389 g was added to reagent A. This mixture was called reagent C. Reagent D,
which could also be referred to as the colorimetric reagent, was formed by adding 80 ml
of 30 N H2SO4 to reagent C. Aluminium foil was used to wrap the glass beaker containing
the colorimetric reagent to prevent light and oxygen interactions.
For tryptophan analysis, 0.08 g of each defatted sample was placed in a 15 ml Falcon tube
and 3 ml of the papain and sodium acetate solution was added to digest the samples. For
daily analysis, two blank controls with papain and sodium acetate solution were added to
calibrate the spectrophotometer to zero before reading the actual samples. The tubes
containing the samples were vortexed for 10 sec. The vortexed samples were incubated in
the water bath at a temperature of 64°C for 16 hours. During incubation, the samples were
vortexed twice, an hour after putting the samples into the water bath and one hour before
the end of the incubation period. The samples were taken out of the water bath after the
incubation period and allowed to cool down to an ambient temperature, then vortexed and
centrifuged at 3 600 rpm for 5 min. One ml of the hydrolysate from each sample was
transferred into glass tubes and 3 ml of the colorimetric reagent was added. The samples
were vortexed for 10 sec then placed into the water bath at 64°C for 30 min. The samples
were taken out of the water bath and were cooled down to room temperature after which
optical density or absorbance was read at 560 nm with a spectrophotometer (Jenway
Spectrophotometer Model 7315).

53
3.3.8 Starch determination
A polarimetric method was used to determine total starch following Caprita et al. (2011).
Ground maize samples (2.5 g) were weighed into 100 ml Erlenmeyer flasks. Fifty ml of a
32% GR HCL (Merck) solution was added and the flasks placed in the water bath at 95°C
for 15 min. After this, the samples were removed and allowed to cool down to 20°C after
which the samples were transferred into 100 ml volumetric flasks. A 10 ml 4% GR
tungstonphosphoric acid (Sigma) solution was added followed by adding double distilled
water to make up the volume to 100 ml. The mixture was gently shaken and inverted for
several times to allow the water to mix thoroughly with the tungstonphosphoric acid. The
mixture was then double filtered using Whatman no. 4 filter paper until a volume of about
70 ml was achieved. The filtrate was then read on an automatic polarimeter (ATAGO® AP-
300) at 589 nm.
The percentage of starch in the sample was computed as follows:
Starch (%) = 100000 x P
L x [𝑎]𝐷20° x S
Where P = the measured angle of the optical rotation in degree;
L = Length (dm) of the sample tube
[𝑎]𝐷20° = specific rotation of the pure starch
S = Exact mass of the sample weight out
3.3.9 Determination of protein, oil, moisture and fibre
A total of 500 g of the self-pollinated seeds for each sample was used for protein, oil,
moisture and fibre content determination using near-infrared transmission spectroscopy
(NIR) using a Perten Grain Analyzer (Model DA 7250, Perten, Instruments AB, Sweden),
with three subsamples for each sample. Agri-Envrion Solutions (www.aelab.co.za)
calibrated the NIR instrument before use. Results from the wet chemistry for 50 samples
was used in the calibration for all parameters determined using the NIR. The correlation
between the wet chemistry and the NIR values was more than 90%, making the NIR values
reliable (data not shown). The percentage of oil, protein, moisture and fibre contents were
expressed on a dry matter percentage weight basis (%wt).

54
3.3.10 Data analysis
ANOVA was done on plot means for grain yield and all measured traits from the field and
laboratory experiments with PROC GLM in SAS (SAS Institute, 2011 version 9.4). Prior
to the ANOVA, best linear unbiased predictors (BLUPs) of plot means for all traits across
the seven environments were calculated. In the combined ANOVA, location, replications
and blocks of each experiment were regarded as random factors while entries were
considered as fixed effects. The PCA was performed on the phenotypic variables and
correlation matrix was obtained from the BLUPs for all the measured traits using the
PRINCOMP in SAS. The PCA was used to identify quantitative phenotypic characters that
represent independent systems of trait variation.
The grain yield data was subjected to GGE biplot analysis to determine inbred line stability
according to Yan (2001) and Yan et al (2001) using GenStat edition 16 (GenStat 2012).
Genetic correlation coefficient (rG) estimates were determined to show the level of
association between grain yield and its components and among other yield components and
agronomic traits using SAS.
3.4 Results
3.4.1 Analysis of variance for individual and combined locations
At Harare and Gwebi, the inbred lines varied significantly for grain yield and most of the
other characteristics examined, except anthesis-silking interval, root and stalk lodgings,
husk cover and ear rot (Table 3.3). Harare, under misting conditions, showed significant
variation between the inbreds for grain yield, days to anthesis, anthesis-silking interval,
plant and ear heights, root lodging, ears per plant and ear rot, while the rest of the traits
were not statistically different (P >0.05). Apart from root lodging, ears per plant, husk
cover and ear aspect did not differ significantly at Glendale. The rest of the traits differed
significantly. At the Glendale late planting there were significant differences for most of
the traits measured, except root lodging, ears per plant and husk cover. The trials
established at Cedara and Potchefstroom showed significant variations for the inbred lines
for almost all the traits except anthesis-silking interval, root and stalk lodging at both
locations, and ear rot at Cedara. Across the seven locations, genotypes varied significantly
for all the traits examined, except stalk lodging. GEI was significant for all traits except
for anthesis-silking interval, stalk lodging and husk cover (Table 3.3).

55
3.4.2 Performance of inbred lines across locations
The grain yield ranged from 0.75 t ha-1 for QPM inbred line 27 to 3.73 t ha-1 for non-QPM
inbred line 29 with an average of 2.45 t ha-1 (Table 3.4). Days to anthesis and ASI varied
among the lines, ranging from 71.28 to 85.02 days and -1.49 to 3.75, respectively. Inbred
line 2 was the most prolific genotype producing nearly two cobs per plant (Table 3.4). Ear
rot ranged from 1.05 for line 27 to 7.71 for line 26. Ear aspect varied among the lines.
3.4.3 Analysis for variance for quality traits and zein proteins in 40 inbred lines
The biochemical analysis for the seed samples grown at Cedara showed significant
variations among the inbred lines for the traits analysed except for protein and β-zein, while
the seed samples from Potchefstroom produced significant differences for all quality traits
analysed. Harare seed samples also showed significant variation among the inbred lines
for all the traits except amylose and γ-zein; while moisture, oil, fibre and tryptophan
contents were the only traits showing significant variation for seed samples obtained from
Gwebi (Table 3.5). The combined ANOVA for the seed samples across the four locations
for all traits revealed significant variations, while GEI also influenced the majority of the
traits analysed except protein, starch, γ-zein and α-zein.
3.4.4 Performance of the lines for quality traits across four locations
Moisture content varied from 11.87% for line 38 to 14.02% for line 19. Protein ranged
from 5.80 to 10.19% for inbred lines 40 (QPM) and 39 (non-QPM check), respectively.
Oil content ranged from 3.05 to 6.22% for lines 30 (QPM) and 20 (non-QPM), respectively.
Starch content ranged from 57.49 to 67.49% for inbred lines 14 (QPM) and 28 (non-QPM),
respectively. Amylose ranged from 31.32% for line 32 (non-QPM) to 83.57% for line 6
(QPM). Fibre content varied from 2.46 to 2.98% for genotypes 9 and 6, respectively (both
QPM). Tryptophan contents ranged from 0.034% for line 36 (non-QPM) to 0.094% for
line 16 (QPM). Beta-zein ranged from 2.26 to 21.87% for lines 21 and 6, respectively; γ-
zein ranged from 18.49% for 39 to 64.69% for 24 and values of 19.93 to 65.17% for α-zein
was recorded for lines 25 and 35, respectively (Table 3.6). Quality index (QI) of the inbred
lines ranged from 0.37 to 1.38 for line 39 and line 25, respectively. All the QPM lines have
higher QI than non-QPM lines.

56
Table 3.3 Analysis of variance for grain yield and other agronomic traits of 40 inbred lines
evaluated in seven environments in Zimbabwe and South Africa during the 2017/2018
cropping season
Source DFF GY DA ASI PH EH RL SL EPP HC ER EA
Harare
Rep 1 0.04 59.51** 42.05* 720.00** 551.25* 2.74 0.01 0.01 0.38 1.74 0.11
Block(rep) 14 0.43* 4.05 5.45 219.48** 101.29 0.78 0.07 0.03 17.15 0.73 0.10
Entry 39 1.74** 30.20** 6.78 315.33** 268.57** 0.47 0.09 0.08** 15.13 5.40** 0.39**
Error 25 0.19 8.25 9.42 83.29 90.23 0.77 0.13 0.02 13.68 1.65 0.13
Gwebi
Rep 1 0.11 39.20* 1.80 475.31* 52.81 1.27 0.01 0.01 8.68 2.39 0.45
Block(rep) 14 0.15 4.43 1.42 75.65 81.51 4.06 0.59 0.05 5.56 1.15 0.11
Entry 39 1.17** 24.15** 1.55 369.02** 207.60** 7.49 0.46 0.25** 3.74 6.18** 0.43**
Error 25 0.24 6.27 1.61 75.12 67.74 4.05 0.49 0.05 3.47 1.85 0.17
Harare-misting
Rep 1 2.01* 22.05* 5.51 61.25 86.11 0.19 0.01 0.07 0.99 0.99 0.16
Block(rep) 14 0.23 3.07 3.24 93.59 65.28* 0.58 0.35 0.04 3.26 3.26 0.09
Entry 39 0.47* 19.43** 7.16** 352.60** 240.99** 0.43ns 0.28 0.07** 6.77 6.77 0.26*
Error 25 0.23 3.44 2.47 83.14 29.78 0.34 0.29 0.02 4.58 4.58 0.12
Glendale
Rep 1 2.08 0.31 4.05 11.25 1.25 24.52* 1.88 0.01 4.22 1.06 0.01
Block(rep) 14 1.91 1.87 0.90 453.39* 258.13* 12.14** 0.97 0.24 1.89 4.70 0.15
Entry 39 6.11** 8.89** 2.28* 457.40** 244.62** 7.31* 1.24 0.33 2.25 8.61** 0.62
Error 25 1.76 2.76 1.05 165.65 92.40 3.21 0.89 0.18 2.59 3.37 0.22
Glendale –late
Rep 1 2.08 0.31 4.05 11.25 1.25 24.52* 1.88 0.01 4.22 1.06 0.01
Block(rep) 14 1.91 1.87 0.90 453.39* 258.13* 12.14** 0.98 0.24 1.89 4.70 0.15
Entry 39 6.11* 8.89** 2.28* 457.40** 244.62** 7.31* 1.23 0.33 2.25 8.61** 0.61**
Error 25 1.76 2.76 1.05 165.65 92.40 3.20 0.89 0.18 2.59 3.37 0.22
Cedara
Rep 1 0.01 9.80 1.01 361.25 106.95 0.04 0.12 0.08 0.20 2.43 0.80*
Block(rep) 14 0.11 5.33 2.32 244.25 185.41* 3.70 1.54 0.04 0.16 2.028 0.16
Entry 39 1.87** 18.21** 2.93 419.76** 317.74** 2.39 1.54 0.16** 0.33** 3.77 0.63**
Error 25 0.16 2.54 3.08 164.27 81.52 1.88 1.11 0.06 0.10 2.13 0.19
Potchefstroom
Rep 1 0.05 5.00 0.11 74.11 11.25 0.11 0.20 0.24* 0.013 0.31 0.15
Block(rep) 14 0.21 2.95 1.74 274.53** 70.57 0.39 0.17 0.05 0.20 4.70 0.45
Entry 39 5.39** 40.25** 4.89 535.59** 368.68** 0.31 0.44 0.08* 1.02** 8.66** 1.47**
Error 25 0.33 6.38 3.84 68.68 36.87 0.19 0.30 0.04 0.21 2.91 0.31
Across locations
Environment(E) 6 83.25** 5073.51** 64.60** 19851.21** 11885.76** 239.94** 7.23** 3.09** 96.94** 196.56** 9.16**
Rep (E) 7 0.65 21.02** 8.42* 312.84** 162.55* 4.13* 0.45 0.08 2.43 3.33 0.26
Block(E*Rep) 98 0.50 3.80 3.03 211.86** 115.99** 3.21** 0.56 0.07 4.36 2.50 0.20
Genotype (G) 39 5.56** 93.42** 8.40** 1863.13** 1131.66** 4.97** 0.66 0.42** 3.76 15.71** 1.10**
G x E 232 1.12** 6.67** 3.54 154.00* 95.30* 2.64** 0.58 0.11** 3.87 5.70** 0.51**
Error 172 0.49 4.93 3.86 116.11 74.01 1.70 0.51 0.06 3.55 2.83 0.19
R-Square 0.94 0.98 0.76 0.94 0.93 0.90 0.78 0.87 0.764226 0.88 0.89
DF = degree of freedom; GY = grain yield; DA = Days to anthesis; ASI = anthesis silking interval; PH = plant height; EH = ear
height; RL = root lodging; SL = stalk lodging; EPP = ear per plant; HC = husk cover. ER = ear rot; EA = ear aspect *P<0.05,
**P<0.01
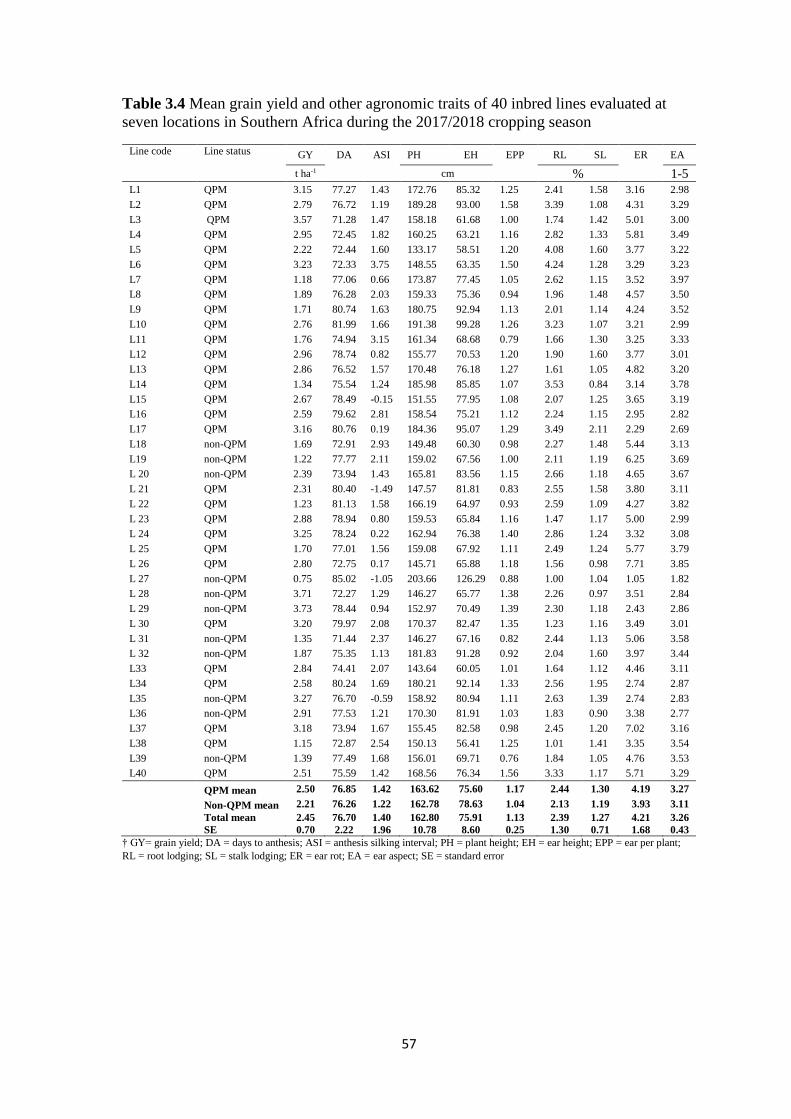
57
Table 3.4 Mean grain yield and other agronomic traits of 40 inbred lines evaluated at
seven locations in Southern Africa during the 2017/2018 cropping season
Line code Line status GY DA ASI PH EH EPP RL SL ER EA
t ha-1 cm % 1-5
L1 QPM 3.15 77.27 1.43 172.76 85.32 1.25 2.41 1.58 3.16 2.98
L2 QPM 2.79 76.72 1.19 189.28 93.00 1.58 3.39 1.08 4.31 3.29
L3 QPM 3.57 71.28 1.47 158.18 61.68 1.00 1.74 1.42 5.01 3.00
L4 QPM 2.95 72.45 1.82 160.25 63.21 1.16 2.82 1.33 5.81 3.49
L5 QPM 2.22 72.44 1.60 133.17 58.51 1.20 4.08 1.60 3.77 3.22
L6 QPM 3.23 72.33 3.75 148.55 63.35 1.50 4.24 1.28 3.29 3.23
L7 QPM 1.18 77.06 0.66 173.87 77.45 1.05 2.62 1.15 3.52 3.97
L8 QPM 1.89 76.28 2.03 159.33 75.36 0.94 1.96 1.48 4.57 3.50
L9 QPM 1.71 80.74 1.63 180.75 92.94 1.13 2.01 1.14 4.24 3.52
L10 QPM 2.76 81.99 1.66 191.38 99.28 1.26 3.23 1.07 3.21 2.99
L11 QPM 1.76 74.94 3.15 161.34 68.68 0.79 1.66 1.30 3.25 3.33
L12 QPM 2.96 78.74 0.82 155.77 70.53 1.20 1.90 1.60 3.77 3.01
L13 QPM 2.86 76.52 1.57 170.48 76.18 1.27 1.61 1.05 4.82 3.20
L14 QPM 1.34 75.54 1.24 185.98 85.85 1.07 3.53 0.84 3.14 3.78
L15 QPM 2.67 78.49 -0.15 151.55 77.95 1.08 2.07 1.25 3.65 3.19
L16 QPM 2.59 79.62 2.81 158.54 75.21 1.12 2.24 1.15 2.95 2.82
L17 QPM 3.16 80.76 0.19 184.36 95.07 1.29 3.49 2.11 2.29 2.69
L18 non-QPM 1.69 72.91 2.93 149.48 60.30 0.98 2.27 1.48 5.44 3.13
L19 non-QPM 1.22 77.77 2.11 159.02 67.56 1.00 2.11 1.19 6.25 3.69
L 20 non-QPM 2.39 73.94 1.43 165.81 83.56 1.15 2.66 1.18 4.65 3.67
L 21 QPM 2.31 80.40 -1.49 147.57 81.81 0.83 2.55 1.58 3.80 3.11
L 22 QPM 1.23 81.13 1.58 166.19 64.97 0.93 2.59 1.09 4.27 3.82
L 23 QPM 2.88 78.94 0.80 159.53 65.84 1.16 1.47 1.17 5.00 2.99
L 24 QPM 3.25 78.24 0.22 162.94 76.38 1.40 2.86 1.24 3.32 3.08
L 25 QPM 1.70 77.01 1.56 159.08 67.92 1.11 2.49 1.24 5.77 3.79
L 26 QPM 2.80 72.75 0.17 145.71 65.88 1.18 1.56 0.98 7.71 3.85
L 27 non-QPM 0.75 85.02 -1.05 203.66 126.29 0.88 1.00 1.04 1.05 1.82
L 28 non-QPM 3.71 72.27 1.29 146.27 65.77 1.38 2.26 0.97 3.51 2.84
L 29 non-QPM 3.73 78.44 0.94 152.97 70.49 1.39 2.30 1.18 2.43 2.86
L 30 QPM 3.20 79.97 2.08 170.37 82.47 1.35 1.23 1.16 3.49 3.01
L 31 non-QPM 1.35 71.44 2.37 146.27 67.16 0.82 2.44 1.13 5.06 3.58
L 32 non-QPM 1.87 75.35 1.13 181.83 91.28 0.92 2.04 1.60 3.97 3.44
L33 QPM 2.84 74.41 2.07 143.64 60.05 1.01 1.64 1.12 4.46 3.11
L34 QPM 2.58 80.24 1.69 180.21 92.14 1.33 2.56 1.95 2.74 2.87
L35 non-QPM 3.27 76.70 -0.59 158.92 80.94 1.11 2.63 1.39 2.74 2.83
L36 non-QPM 2.91 77.53 1.21 170.30 81.91 1.03 1.83 0.90 3.38 2.77
L37 QPM 3.18 73.94 1.67 155.45 82.58 0.98 2.45 1.20 7.02 3.16
L38 QPM 1.15 72.87 2.54 150.13 56.41 1.25 1.01 1.41 3.35 3.54
L39 non-QPM 1.39 77.49 1.68 156.01 69.71 0.76 1.84 1.05 4.76 3.53
L40 QPM 2.51 75.59 1.42 168.56 76.34 1.56 3.33 1.17 5.71 3.29
QPM mean 2.50 76.85 1.42 163.62 75.60 1.17 2.44 1.30 4.19 3.27
Non-QPM mean 2.21 76.26 1.22 162.78 78.63 1.04 2.13 1.19 3.93 3.11
Total mean
SE
2.45
0.70
76.70
2.22
1.40
1.96
162.80
10.78
75.91
8.60
1.13
0.25
2.39
1.30
1.27
0.71
4.21
1.68
3.26
0.43
† GY= grain yield; DA = days to anthesis; ASI = anthesis silking interval; PH = plant height; EH = ear height; EPP = ear per plant;
RL = root lodging; SL = stalk lodging; ER = ear rot; EA = ear aspect; SE = standard error

58
Table 3.5 Analysis of variance of quality traits analysed for 40 inbred lines at four environments in Zimbabwe and South Africa during the
2017/2018 cropping season
Source DF Moisture % Protein % Oil % Fibre % Starch % Tryptophan % Amylose % β-Zein γ-Zein α-Zein QI
Cedara
Rep 1 0.16 0.61 0.03 0.01 23.62* 0.000003 15.77 54.90 14.30 110.80 0.03
Block(rep) 14 0.18 0.34 0.37 0.01 2.36 0.000026 13.24* 31.38 284.91 357.91 0.01
Entry 39 0.61* 0.86 1.44* 0.04* 9.59* 0.000700** 224.68** 29.47 814.77** 596.97* 0.11**
Error 20 0.30 0.59 0.47 0.02 4.81 0.000026 3.99 43.81 185.02 277.94 0.01
Potchefstroom
Rep 1 0.56 0.01 0.82 0.03 5.61 0.00012* 3.43 2.89 506.42 184.40 0.01
Block(rep) 14 0.14 0.26 0.61 0.02 1.93 0.00001 13.95* 1.05 113.45 123.29 0.01
Entry 39 0.42* 1.77** 1.77** 0.08** 11.59** 0.00007** 127.90** 2.56* 626.25** 749.91** 0.11**
Error 20 0.17 0.41 0.44 0.01 3.38 0.00001 5.62 1.09 173.98 102.07 0.01
Harare
Rep 1 0.15 0.01 0.01 0.02 0.44 0.00005 25.97 51.47 265.39 1124.40* 0.05
Block(rep) 14 0.30 0.11 0.07 0.03 0.40 0.00003 2355.03 39.93 316.37 98.22 0.03
Entry 39 0.42 2.12* 1.05* 0.04* 3.16** 0.00048** 2459.23ns 159.55** 455.05 491.71** 0.16**
Error 20 0.28 0.45 0.08 0.01 0.13 0.00004 1861.53 31.43 279.22 132.02 0.01
Gwebi
Rep 1 0.06 0.23 0.30 0.00 0.04 0.00005 23.99 34.95 8228.20* 52.26 0.01
Block(rep) 14 0.04 0.51 0.11 0.00 0.89 0.00003 4.93 13.56 491.27 758.97 0.01
Entry 39 0.22* 2.33 0.97* 0.010* 4.70 0.00050** 166.79 11.12 390.22 591.20 0.11**
Error 20 0.07 1.00 0.13 0.00 1.41 0.00002 7.54 23.68 454.75 806.43 0.01
Across locations
Environment (E) 3 29.43** 199.54* 7.50* 1.50** 719.28** 0.00654** 2294.19* 55.91 4084.39** 381.51 251.05
Rep(E) 4 0.23 0.21 0.29 0.03* 7.43 0.00005 17.29 35.85 2253.57** 367.96 12673.33
Block(E*rep) 55 0.16 0.31 0.30 0.02 1.42 0.00004 596.79* 21.48 301.50 334.60 16640.09**
Entry 39 0.45* 3.51** 2.24** 0.10** 11.95** 0.00182** 944.42* 67.04** 1194.45** 1131.98** 10912.92**
E*Entry 107 0.37* 0.70 0.68* 0.03** 3.21 0.00026** 769.36* 39.66* 361.73 409.82 5065.21
Error 56 0.21 0.56 0.37 0.01 3.27 0.00003 43.57 24.76 273.24 329.62 251.05
*P<0.05, **P<0.01; QI = quality index

59
Table 3.6 Means of quality traits for 40 inbred lines analysed across four environments in
Zimbabwe and South Africa during the 2017/2018 cropping season
Line
code
Line status Moisture
%
Protei
n %
Fat
%
Starch
%
Fibre
%
Tryptopha
n %
QI Amylose
%
β -Zein
%
γ -Zein
%
α- Zein
%
L1 QPM 12.10 7.21 4.27 65.69 2.88 0.081 1.12 41.23 17.47 49.47 33.06
L2 QPM 12.56 8.43 4.00 65.30 2.48 0.090 1.07 44.24 4.22 43.24 40.56
L3 QPM 12.43 7.36 5.17 63.72 2.72 0.080 1.09 42.04 4.95 43.22 28.08
L4 QPM 12.67 8.09 3.81 66.53 2.62 0.066 0.82 45.92 5.99 29.77 52.49
L5 QPM 12.37 8.35 5.57 62.55 2.61 0.091 1.09 38.94 4.78 61.46 21.86
L6 QPM 12.31 6.38 3.83 66.72 2.98 0.076 1.19 83.57 21.87 39.94 38.19
L7 QPM 12.32 8.87 3.44 59.18 2.93 0.089 1.00 77.12 5.11 57.99 25.03
L8 QPM 12.36 8.94 5.14 62.66 2.66 0.079 0.88 46.10 5.65 35.73 46.96
L9 QPM 12.87 9.01 4.92 62.74 2.46 0.089 0.99 49.46 5.18 54.66 28.31
L10 QPM 12.56 9.15 6.22 60.45 2.71 0.075 0.82 37.30 5.81 37.52 56.67
L11 QPM 12.22 6.89 5.34 63.24 2.66 0.076 1.10 35.38 4.35 41.21 42.48
L12 QPM 12.81 7.26 3.64 66.05 2.54 0.077 1.06 36.07 6.16 55.58 26.54
L13 QPM 12.39 6.75 4.26 66.56 2.84 0.082 1.21 34.67 5.36 56.16 38.51
L14 QPM 12.34 8.18 4.02 57.49 2.83 0.083 1.01 33.75 5.02 56.04 27.07
L15 QPM 13.05 6.96 4.33 66.32 2.60 0.079 1.14 44.08 6.60 56.04 25.69
L16 QPM 12.42 8.98 5.06 63.61 2.53 0.094 1.05 44.12 4.71 49.60 45.69
L17 QPM 12.27 6.69 5.30 65.11 2.68 0.086 1.29 48.00 4.81 60.26 34.93
L18 non-QPM 12.29 8.43 3.54 65.94 2.73 0.035 0.42 39.82 6.04 36.07 46.14
L19 non-QPM 14.02 8.83 3.63 63.46 2.59 0.036 0.41 48.10 6.05 24.97 57.01
L 20 non-QPM 12.42 8.17 4.50 65.06 2.81 0.040 0.49 49.42 4.52 21.67 61.87
L 21 QPM 12.54 9.13 3.80 64.74 2.69 0.042 0.46 44.46 2.26 32.64 52.88
L 22 QPM 12.77 7.62 4.46 62.51 2.78 0.081 1.06 37.23 5.38 51.73 42.90
L 23 QPM 12.01 8.60 3.74 63.97 2.71 0.074 0.86 39.01 4.83 36.06 47.22
L 24 QPM 12.43 7.87 4.05 64.71 2.50 0.085 1.08 43.61 5.71 64.69 29.60
L 25 QPM 12.20 6.10 4.95 64.48 2.78 0.084 1.38 53.18 6.81 61.62 19.93
L 26 QPM 12.39 8.53 3.86 65.64 2.72 0.078 0.91 39.37 3.06 43.13 53.81
L 27 non-QPM 12.59 9.52 5.92 63.84 2.83 0.038 0.40 33.60 3.92 23.83 36.22
L 28 non-QPM 12.34 7.09 4.07 67.49 2.57 0.035 0.49 36.04 5.64 32.26 62.10
L 29 non-QPM 12.73 7.79 5.34 66.32 2.63 0.042 0.54 39.48 3.55 30.58 53.81
L 30 QPM 12.37 6.98 3.05 64.52 2.64 0.042 0.60 44.73 6.63 50.15 31.55
L 31 non-QPM 12.26 8.34 3.88 64.94 2.65 0.050 0.60 39.40 2.35 26.42 59.02
L 32 non-QPM 11.92 8.57 4.12 63.63 2.82 0.042 0.49 31.32 3.76 26.95 57.26
L33 QPM 12.15 6.63 5.65 65.38 2.88 0.085 1.28 50.20 4.27 57.41 38.32
L34 QPM 12.29 6.54 5.44 65.39 2.71 0.076 1.16 46.65 4.63 55.58 27.87
L35 non-QPM 12.18 8.17 4.70 64.68 2.70 0.041 0.50 46.37 3.43 31.41 65.17
L36 non-QPM 12.24 7.16 4.77 66.42 2.76 0.034 0.47 31.88 6.85 29.98 63.16
L37 QPM 12.31 6.67 4.13 66.14 2.84 0.066 0.99 37.68 4.19 59.29 24.53
L38 QPM 11.87 7.50 5.14 66.40 2.72 0.080 1.07 39.50 5.27 31.79 27.41
L39 non-QPM 12.70 10.19 5.20 62.63 2.62 0.038 0.37 45.71 5.30 18.49 40.70
L40 QPM 12.00 5.80 4.72 64.48 2.97 0.074 1.28 44.49 4.93 55.98 39.08
QPM mean 12.39 7.64 4.53 64.22 2.71 0.078 44.90 6.07 49.24 36.11
Non-QPM
mean
12.51 8.39 4.52 64.95 2.70 0.039 40.10 4.67 27.51 54.77
Total mean 12.42 7.79 4.53 3.27 2.71 0.068 43.57 5.77 43.26 41.24
SE 0.46 0.75 0.61 1.81 0.11 0.005 22.34 4.98 16.53 18.16
SE = Standard error; QPM = quality protein maize; non-QPM = non quality protein maize; QI = quality index

60
3.4.5 Correlation among grain yield and agronomic traits
Grain yield was significantly and positively correlated with plant height, ear height and
ears per plant while it was negatively correlated with anthesis-silking interval, ear rot and
ear aspect (Table 3.7). However, no significant correlation was observed between days to
anthesis and grain yield; grain yield and husk cover; grain yield and stalk lodging; and days
to anthesis and plant height. Ears per plant had significant negative correlation with husk
cover, ear rot and ear aspect. Also, weak significant genotypic correlation (rG = 0.23) was
obtained between husk cover and ear rot.
Table 3.7 Genotypic correlation coefficients (rG) between grain yield and agronomic traits
of 40 QPM inbred lines evaluated at seven locations during the 2017/2018 growing season
DA ASI PH EH RL SL EPP HC ER EA
GY -0.07 -0.14** 0.16** 0.25** -0.03 -0.04 0.38** 0.11 -0.15** -0.48**
DA -0.18** -0.10 0.11* -0.20** 0.21** -0.26** 0.33** 0.33** -0.20**
ASI 0.09* 0.02 0.03 -0.05 -0.11** -0.14** 0.01 0.11**
PH 0.83** -0.08 -0.17** 0.07 -0.16** -0.20** -0.11**
EH -0.16** -0.10* 0.01 -0.07 -0.09 -0.18**
RL -0.02 0.31** -0.20** -0.23** -0.01
SL -0.05 0.10* 0.04 -0.05
EPP -0.17** -0.23** -0.15**
HC 0.23** -0.06
ER 0.18**
† GY= grain yield; DA = days to anthesis; ASI = anthesis-silking interval; PH= plant height; EH= ear
height; RL = root lodging; SL = stalk lodging; EPP = ear per plant; HC = husk cover; ER = ear rot; EA =
ear aspect; *P<0.05, **P<0.01
3.4.6 Principal component analysis for agronomic traits of 35 QPM inbred lines and
five checks evaluated in seven environments
The first four principal components (PCs) explained 98% of the variation (Table 3.8). The
first three PCs were significant, however, PC1 alone accounted for 82% of the variation.
The most important traits in this PC were plant and ear height. The second and third PC’s
explained 10.5 and 4.8% of the variation, respectively. The most important trait in these
PC’s were days to anthesis and stalk lodging for PC2 while the most important trait in PC3
were days to anthesis and plant height. Ear rot was the most important trait in PC4 and this
PC contributed only 0.72% to the total variation
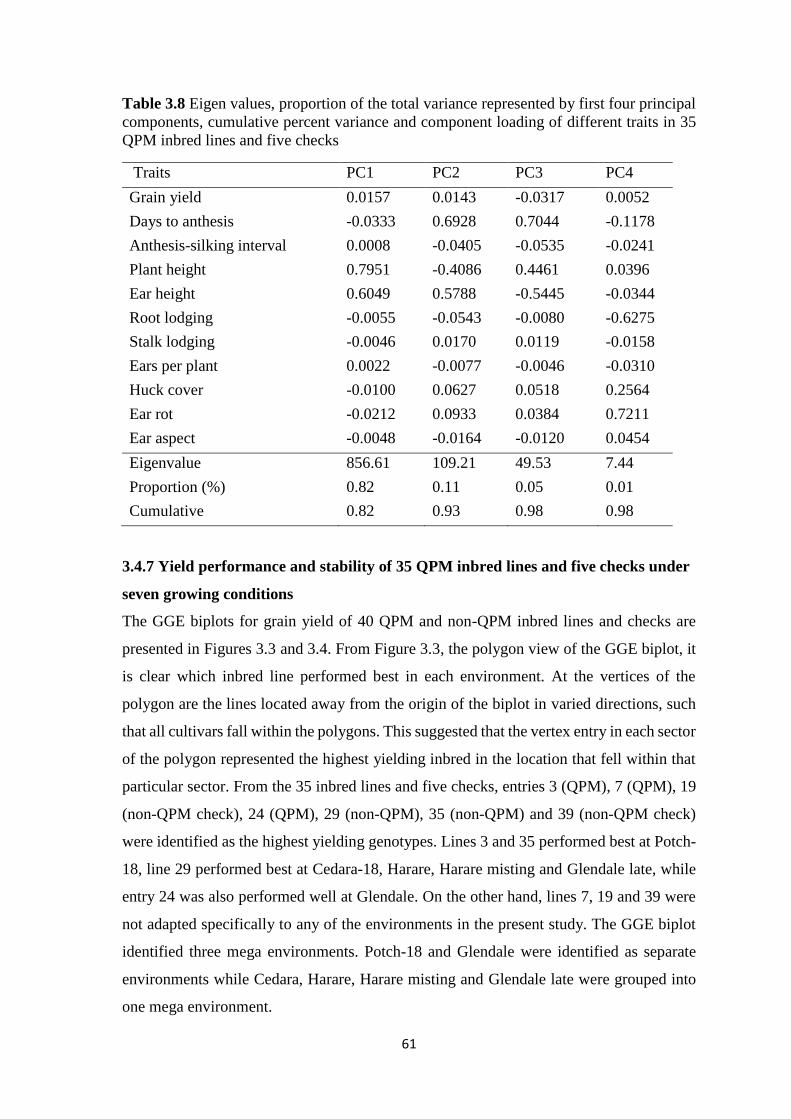
61
Table 3.8 Eigen values, proportion of the total variance represented by first four principal
components, cumulative percent variance and component loading of different traits in 35
QPM inbred lines and five checks
Traits PC1 PC2 PC3 PC4
Grain yield 0.0157 0.0143 -0.0317 0.0052
Days to anthesis -0.0333 0.6928 0.7044 -0.1178
Anthesis-silking interval 0.0008 -0.0405 -0.0535 -0.0241
Plant height 0.7951 -0.4086 0.4461 0.0396
Ear height 0.6049 0.5788 -0.5445 -0.0344
Root lodging -0.0055 -0.0543 -0.0080 -0.6275
Stalk lodging -0.0046 0.0170 0.0119 -0.0158
Ears per plant 0.0022 -0.0077 -0.0046 -0.0310
Huck cover -0.0100 0.0627 0.0518 0.2564
Ear rot -0.0212 0.0933 0.0384 0.7211
Ear aspect -0.0048 -0.0164 -0.0120 0.0454
Eigenvalue 856.61 109.21 49.53 7.44
Proportion (%) 0.82 0.11 0.05 0.01
Cumulative 0.82 0.93 0.98 0.98
3.4.7 Yield performance and stability of 35 QPM inbred lines and five checks under
seven growing conditions
The GGE biplots for grain yield of 40 QPM and non-QPM inbred lines and checks are
presented in Figures 3.3 and 3.4. From Figure 3.3, the polygon view of the GGE biplot, it
is clear which inbred line performed best in each environment. At the vertices of the
polygon are the lines located away from the origin of the biplot in varied directions, such
that all cultivars fall within the polygons. This suggested that the vertex entry in each sector
of the polygon represented the highest yielding inbred in the location that fell within that
particular sector. From the 35 inbred lines and five checks, entries 3 (QPM), 7 (QPM), 19
(non-QPM check), 24 (QPM), 29 (non-QPM), 35 (non-QPM) and 39 (non-QPM check)
were identified as the highest yielding genotypes. Lines 3 and 35 performed best at Potch-
18, line 29 performed best at Cedara-18, Harare, Harare misting and Glendale late, while
entry 24 was also performed well at Glendale. On the other hand, lines 7, 19 and 39 were
not adapted specifically to any of the environments in the present study. The GGE biplot
identified three mega environments. Potch-18 and Glendale were identified as separate
environments while Cedara, Harare, Harare misting and Glendale late were grouped into
one mega environment.

62
PC1 and PC2 respectively explained 57.28% and 20.70% of the variance, which, together
is 77.98% of the total variance (Figure 3.4). The figure represents the means vs. the stability
of the 40 lines evaluated. A set of lines parallel to the double-arrow line passes the whole
range of the entries, dividing them based on their mean performances. The inbred lines
were ranked along the average-tester axis, with the arrow pointing to a higher value based
on their mean performances across the seven environments. The vertical green line
separates the entries into below and above average means (Figure 3.4). The single-arrow
line that passes through the biplot origin and the average environment is referred to as the
average-tester axis; this line points to the average environment from the biplot origin.
Figure 3.3 “Which won where” genotype plus genotype x environment interaction biplot
of grain yield of 35 QPM inbred lines and five checks evaluated under seven environments
(Cedara, Glendale, Glendale late plating, Harare, Harare misting, Gwebi and
Potchefstroom)

63
Principal component (PC1 and PC2) accounted for 71.18% of yield variation. The average
yield of the inbred line was estimated based on the distance from the markers on the
average-tester axis. The stability of the inbred lines was also estimated by their projection
onto the average-tester coordinate y-axis single-arrow line. The further a genotype is from
the average tester axis, the less stable it is, and those closer to the average tester axis are
stable. Hence, the most stable and high yielding lines identified were inbred lines 23
(QPM), 28 (non-QPM) and 29 (non-QPM) while inbred line 24 (QPM) was a very unstable,
but high yielding line. From Figure 3.4, a long environmental vector axis discriminated the
inbred lines. With the longest vectors from the origin, Potch was the most discriminating
of the genotypes, followed by Glendale, while the rest of the environments were
moderately discriminating.
Figure 3.4 The entry/tester genotype plus genotype x environment biplot based on grain
yield of 35 QPM inbred lines and five checks evaluated in seven environments (Cedara,
Glendale, Glendale late plating, Harare, Harare misting, Gwebi and Potchefstroom)
1
40
20
28
21
5
22
7
23
8
24
10
25
1226
14
27
162
2918
30
4
31
Ranking biplot (Total - 77.97%)
3211
33
15
34
17
35
6
36
13
19
9
3
37
38
39
Glandel-late
Cedara_18
Glandel
Gwebi
Harare
Harare-misting
Potch_18
PC1 - 57.28%
PC2
- 20.
70%
AEC
Environment scores
Genotype scores

64
3.5 Discussion
The differences recorded among the inbred lines evaluated for grain yield and other
agronomic characters across the test environments showed that there is a prospect of
choosing ideal inbred lines, which could be used in hybrid development if they have
superior SCA with other lines. The QPM lines had a higher average yield than the non-
QPM lines, indicating no yield penalty due to improved protein quality. Although the two
top performers were non-QPM, three of the six top performers were QPM lines. Substantial
differences were evident between the seven test environments. The significant inbred x
environment interactions in combination with stability estimates from GGE biplot results
indicate the presence of a crossover association (Mebratu et al. 2019), which may
complicate selecting high yielding and superior lines across a wide range of environments.
Several QPM lines were identified which were high yielding and stable.
Significant site mean squares for grain yield and most traits across environments showed
that the test environments were distinctive in discriminating among the inbred lines. The
highly significant site variance indicated that the environments used for the study were
variable and this will aid in the selection of inbred lines for the development of superior
QPM hybrids across a wide range of environments in Southern Africa.
The significant negative correlation between grain yield and anthesis-silking interval, grain
yield and ear rot as well as grain yield and ear aspect indicated that these traits are inversely
related, hence could be considered as essential traits in breeding for QPM genotypes. These
results confirm the earlier work conducted by Betrán et al. (2003) and Akhtar et al. (2011)
who detected negative phenotypic correlation between grain yield and days to anthesis.
The presence of positive and significant correlation of grain yield with number of ears per
plant, with plant height, and with ear height indicates that these traits can be used for
selecting high yielding QPM genotypes corroborating the findings of Pixley and Bjarnason
(2002), and Babu and Prasanna (2014) as well as Tulu (2014). However, the husk cover
has significant implications for ear rot, suggesting that it could be considered as a
secondary trait since ear rot affects grain yield and quality, as exposed tips could serve as
entry point for water and pathogens, thereby reducing grain yield.
PCA simplifies the complexity in high-dimensional data while retaining trends and
patterns. This converts the data into fewer dimensions, which summarize the traits of

65
interest (Lever et al. 2017). From this study, the most discriminatory traits were days to
anthesis, plant and ear heights, root lodging and ear rot. PCA has been used by several
researchers in combination with correlation for identifying and classifying genetic
materials. The PCA method becomes useful when screening germplasm with several
descriptor variables (Kamara et al. 2003; Salihu et al. 2006). The results corroborate the
studies conducted by Upadyayula et al. (2006) and Suryanarayana et al. (2017) who
reported that when traits are correlated, PCA derived from the components of the
eigenvectors of the phenotypic covariance or correlation matrix could be used to identify
linear combinations of traits.
Substantial differences were recorded for the quality traits analysed among the 40 inbred
lines, indicating significant genetic variation, therefore superior inbred lines could be
selected to serve as parents for development of QPM hybrids with improved quality traits.
The significant GEI observed for all the quality traits analysed, except for protein and α-
zein, indicated that the environment played an important role in the performance of these
lines. Therefore, even though lines with good quality traits were developed, these traits are
influenced by environmental factors. Zimmer et al. (2016) and Siracusa et al. (2017) found
differences in amino acids contents as a result of variation in soil nitrogen contents on
cowpea and different planting dates of buckwheat. This is also consistent with the results
of Singh et al. (2019) who reported on the influence of the environment on oil content
suggesting both genetic and environmental factors contribute to the performance of quality
traits as evident in the present study.
Generally, the range of the starch content values in the present study for the inbred lines is
comparable to the values by Sharma and Carena (2016) and Lu et al. (2019). Similarly,
amylose, which is a major constituent of starch, varied for the lines evaluated. The amylose
contents for inbred lines studied is consistent with the values obtained by Weiwei et al.
(2016) and Li et al. (2018, 2020). The existence of variation for protein content at each and
combined locations indicated the presence of genetic variability for protein synthesis
among the lines developed. Even though protein content of 10.19% has been recorded in
this study, it is lower than the 11.60% reported by Mansilla et al. (2019). There was a large
difference between QPM and non-QPM for zein composition, with QPM inbreds having
significantly more β- and γ-zein than non-QPM, while non-QPM inbreds had far more α-
zein than QPM inbreds. Mansilla et al. (2019) observed that maize kernels with hard

66
endosperm produced more α-zein (22 and 19 kDa). O’Kennedy and Fox (2017) and
Mansilla et al. (2019) reported on a decline of 22 and 19 kDa zein band intensity of QPM
genotypes, corroborating the results of the present study. Also, the QPM lines were found
to be superior to the non-QPM lines for QI. This is usually expected since the tryptophan
content of QPM genotypes are higher than the non-QPM genotypes. The values recoded
for the QI by the QPM lines studied far exceeded the values reported by Musila et al.
(2010). The lines with high QI values can be selected and hybridised for the development
of QPM hybrids and populations.
3.6 Conclusions
The present study identified promising QPM inbred lines based on the wide genetic
variation among the 40 inbred lines evaluated for grain yield and agronomic characters.
The best inbred lines for grain yield and agronomic characters included inbred lines 29
(non-QPM), 28 (non-QPM), 3 (QPM), 35 (non-QPM), 24 (QPM), 6 (QPM) and 30 (QPM).
Based on GGE biplot, the most promising and desirable inbreds in this study were lines 28
(non-QPM), 9 (QPM) and 30 (QPM) across all seven environments. Inbred lines 39, 27
and 10 had protein content above 9.0%, while lines 2, 5 and 16 contained tryptophan
concentrations of 0.09% or above. The study further showed that the correlation between
grain yield and some secondary traits such as ear aspect and ear rot should be considered
when breeding for QPM genotypes. The potential QPM inbred lines identified in this study
could be exploited by the breeding programmes in sub-Saharan Africa for development of
suitable QPM hybrids to reduce malnutrition.
References
Akhtar N, Mehmood T, Ahsan M, Aziz A, Ashraf M, Ahmad S, Asif M and Safdar E
(2011) Estimation of correlation coefficients among seed yield and some quantitative
traits in wheat (Triticum aestivum L.). African Journal of Agricultural Research 6:
152-157.
Babu R, and Prasanna BM (2014) Molecular Breeding for Quality Protein Maize (QPM).
In: Tuberosa R, Graner A and Frison E (eds), Genomics of Plant Genetic Resources.
Springer, pp. 490-505. doi: 10.1007/978-94-007-7575-6

67
Betrán FJ, Beck D, Bänziger M and Edmeades GO (2003) Genetic analysis of inbred and
hybrid grain yield under stress and non-stress environments in tropical maize. Crop
Science 43: 807-817.
Black RE, Victora CG, Walker SP, Bhutta ZA, Christian P, De Onis M, Ezzati M,
Grantham-Mcgregor S, Katz J, Martorell R and Uauy R (2013) Maternal and child
undernutrition and overweight in low-income and middle-income countries. Lancet
382: 427-451.
Caprita R, Caprita A and Cretescu I (2011) Effective extraction of soluble non-starch
polysaccharides and viscosity determination of aqueous extracts from wheat and
barley. Proceedings of the World Congress on Engineering and Computer Science 2:
1-3.
Chandel U, Mankotia SB and Thakur K (2014) Evaluation of CIMMYT maize (Zea Mays
L.) germplasm by tropical inbred testers. Bangladesh Journal of Botany 43: 131-139.
de Oliveira TRA, de Carvalho HWL, de Oliveira GHF, Costa EFN, Gravina GA, dos
Santos RD and Filho JLSC (2019). Hybrid maize selection through GGE biplot
analysis. Bragantia 78: 166-174.
Deja Cruz N and Khush GS (2000). Rice grain quality evaluation procedures. In: Aromatic
rice. Singh RK, Singh US and Khush GS (eds), Oxford and IBA publishing Co pvt
Ltd, New Dheli, Calcuta.
Eshetie T (2017). Review of quality protein maize as food and feed: In alleviating protein
deficiency in developing countries. American Journal of Food and Nutrition 5: 99-
105.
GenStat (2012). Introduction to GenStat for Windows. 16th ed. VSN International, Hemel
Hemstead, Hertfordshire HPI. IES, UK
Gupta HS, Hossain F and Muthusamy V (2015) Biofortification of maize: an Indian
perspective. Indian Journal of Genetics 75: 1-22.
Gupta J, Wilson BW and Vadlan PV (2016) Evaluation of green solvents for a sustainable
zein extraction from ethanol industry DDGS. Biomass and Bioenergy 85: 313-319.
Kamara AY, Menkir A, Badu-Apraku B and Ibikunle O (2003) The influence of drought
stress on growth, yield and yield components of selected maize genotypes. Journal of
Agricultural Science 141: 43-50.
Lever J, Krzywinski M and Altman N (2017) Principal component analysis. Nature
Publishing Group 14: 641-642.

68
Li C, Huang Y, Huang R, Wu Y and Wang W (2018) The genetic architecture of amylose
biosynthesis in maize kernel. Plant Biotechnology Journal 16: 688-695.
Li H, Dhital S, Flanagan BM, Mata J, Gilbert EP and Gidley (2020) Food hydrocolloids
High-amylose wheat and maize starches have distinctly different granule organization
and annealing behaviour : A key role for chain mobility. Food Hydrocoll 105: 105820.
Liu K, Goodman M, Buckler E, Muse S, Smith JS and Doebley J (2003) Genetic structure
and diversity among maize inbred lines as inferred from DNA microsatellites.
Genetics 165: 2117-2128.
Lu X, Chen J, Zheng M, Guo J, Qi J, Chen Y, Miao S and Zheng B (2019) Effect of high-
intensity ultrasound irradiation on the stability and structural features of coconut-grain
milk composite systems utilizing maize kernels and starch with different amylose
contents. Ultrason-Sonochemistry 55: 135-148.
Mansilla PS, Nazar MC and Pérez GT (2019) Evaluation and comparison of protein
composition and quality in half-sib families of opaque-2 maize (Zea mays L.) from.
Agriscientia 36: 39-53.
Mebratu A, Wegary D, Mohammed W, Teklewold A and Tarekegne A (2019) Genotype
× environment interaction of quality protein maize hybrids under contrasting
managementcConditions in Eastern and Southern Africa. Crop Science 59: 1576-
1589.
Menkir A, Badu-Apraku B and Adepoju A (2003) Evaluation of heterotic patterns of IITA
lowland white maize inbred lines. Maydica 48: 161-170.
Musila RN, Diallo AO, Makumbi D and Njoroge K (2010) Combining ability of early-
maturing quality protein maize inbred lines adapted to Eastern Africa. Field Crops
Research 119: 231-237.
Njeri SG, Makumbi D, Warburton ML, Diallo A, Jumbo MB and Chemining’wa G (2017)
Genetic analysis of tropical quality protein maize (Zea mays L.) germplasm.
Euphytica 213: 1-19.
Nurit E, Tiessen A, Pixley K and Palacios-Rojas N (2009) Reliable and inexpensive
colorimetric method for deter- mining protein-bound tryptophan in maize kernels.
Journal of Agricultural and Food Chemistry 57: 7233-7238.
O’Kennedy K and Fox G (2017) Zein characterisation of South African maize hybrids and
their respective parental lines using MALDI-TOF MS. Food Analytical Methods 10:
1661-1668.

69
Pixley KV and Bjarnason MS (2002) Stability of grain yield, endosperm modification and
protein quality of hybrid and open-pollinated quality protein maize cultivars. Crop
Science 42: 1882-1890.
Salihu S, Grausgruber H and Ruckenbauer P (2006) Agronomic and quality performance
of international winter wheat genotypes grown in Kosovo. Cereal Research
Communications 34: 957-964.
Santos A, do Amaral Júnior AT, Kurosawa RNF, Gerhardt IFS and Neto RF (2017) GGE
biplot projection in discriminating the efficiency of popcorn lines to use nitrogen.
Ciência e Agrotecnologia 41: 22-31.
Sarika K, Hossain F, Muthusamy F, Zunjare RU, Baveja A, Goswami R, Bhat JS, Saha S
and Gupta HS (2018) Marker-assisted pyramiding of opaque2 and novel opaque16
genes for further enrichment of lysine and tryptophan in sub-tropical maize. Plant
Science 272: 142-152.
SAS Institute (2011) Statistical Analysis Software (SAS) user’s guide.
Semagn K, Magorokosho C, Vivek BS, Makumbi D, Beyene Y, Mugo S, Prasanna BM
and Warburton ML (2012) Molecular characterization of diverse CIMMYT maize
inbred lines from eastern and southern Africa using single nucleotide polymorphic
markers. BMC Genomics 13: 113.
Sharma S and Carena MJ (2016) Grain quality in maize (Zea mays L.): breeding
implications for short-season drought environments. Euphytica 212: 247-260.
Shiferaw B, Prasanna BM, Hellin J and Bänziger M (2011) Crops that feed the world 6.
Past successes and future challenges to the role played by maize in global food
security. Food Security 3: 307-327.
Singh AA, Agrawal SB, Shahi JP and Agrawal M (2019) Yield and kernel nutritional
quality in normal maize and quality protein maize cultivars exposed to ozone. Journal
of the Science of Food and Agriculture 99: 2205-2214.
Siracusa L, Gresta F, Sperlinga E and Ruberto G (2017) Effect of sowing time and soil
water content on grain yield and phenolic profile of four buckwheat (Fagopyrum
esculentum Moench.) varieties in a Mediterranean environment Journal of Food
Composition and Analysis 62: 1-7.
Sood A, Thakur K, Sharma PN, Gupta D, Singode A, Rana R and Lata S (2017) A
comprehensive study of variation in selected QPM and Non-QPM maize inbred lines.
Agricultural Research 6: 103-113.
70
Suryanarayana L, Sekhar MR, Babu DR, Ramana AV and Rao VS (2017) Cluster and
principal component analysis in maize. International Journal of Current Microbiology
and Applied Sciences 6: 360-365.
Tulu BN (2014) Correlation and path coefficients analysis studies among yield and yield
related traits of quality protein maize (QPM) inbred lines. International
Journal of Plant Breeding and Crop Science 1: 6-17.
Upadyayula N, Wassom J, Bohn MO and Rocheford TR (2006) Quantitative trait loci
analysis of phenotypic traits and principal components of maize tassel inflorescence
architecture. Theoretical and Applied Genetics 113: 1395-1407.
Wegary D, Vivek BS and Labuschagne MT (2018) Genetic relationships and heterotic
structure of quality protein maize (Zea mays L.) inbred lines adapted to eastern and
southern Africa. Euphytica 214: 1-11.
Weiwei L, Juan X, Beijiu C, Suwen Z, Qing M and Huan M (2016) Anaerobic
biodegradation , physical and structural properties of normal and high-amylose maize
starch films. International Journal of Agricultural and Biological Engineering 9: 184-
193.
Yan W (2001) GGE biplot - a Windows application for graphical analysis of multi
environment trial data and other types of two-way data. Agronomy Journal 93: 1111-
1118.
Yan W and Holland JB (2010) A heritability-adjusted GGE biplot for test environment
evaluation. Euphytica 171: 355-369.
Yan W, Cornelius PL, Crossa J and Hunt LA (2001) Two types of GGE biplots for
analyzing multi-environment trial data. Crop Science 41: 656-663.
Zimmer S, Messmer M, Haase T, Piephoe HP, Mindermann A, Schulz H, Habekuß A,
Ordon F, Wilboisg KP and Heß J (2016) Effects of soybean variety and
Bradyrhizobium strains on yield , protein content and biological nitrogen fixation
under cool growing conditions in Germany. European Journal of Agronomy 72: 38-
46.

71
CHAPTER FOUR
COMPARISON OF GRAIN YIELD AND YIELD STABILITY OF QUALITY
PROTEIN AND NON-QUALITY PROTEIN MAIZE HYBRIDS
4.1 Abstract
Development of high yielding and stable QPM hybrids is important for increasing grain
yield output per unit area as well supporting the fight against malnutrition in SSA. Maize,
in general, serves as an income generator and staple food crop for millions of people in
SSA. Despite the development of QPM genotypes with increased lysine and tryptophan,
information is lacking on yield potential of QPM genotypes compared to non-QPM
genotypes. Therefore, the objectives of this study were to compare the yield of QPM and
their non-QPM counterparts as well as examine the yield stability of these genotypes using
GGE and AMMI biplot models. A total of 130 hybrids were developed by crossing 33
QPM and non-QPM inbred lines to four elite testers (two QPM and two non-QPM) using
a line x tester mating design. Hybrids were evaluated together with five commercial hybrid
checks (three QPM and two non-QPM) for two years at 13 locations in Zimbabwe and
South Africa. The trial was arranged in a 5 x 27 alpha lattice with two replications. The
results showed significant genotype, environment and GEI effects. The best performing
hybrids identified in this study were a QPM hybrid of line 11 x CZL15049 (entry 41),
followed by a non-QPM hybrid of line 28 x CZL15049 (entry 108). The best QPM hybrid
outperformed the best non-QPM hybrid by 8.81%. In addition, the best QPM hybrid
(genotype 41) outperformed the best non-QPM check (Pioneer) and best QPM check (CBI)
by 50.45 and 52.24%, respectively. In spite of this, the QPM hybrids yielded 13.9% less
on average than non-QPM hybrids. The AMMI analyses indicated that the grain yield
performance of QPM and non-QPM hybrids were highly affected by environment coupled
with large GEI. The AMMI and GGE biplot analysis permitted estimation of interaction
effect of a genotype in each environment and helped to identify genotypes best suited for
specific environments. The discriminating power vs. representativeness view of the GGE
biplot was an effective tool for test environments evaluation. The AMMI and GGE biplots
identified genotypes 108 and 12 as the most stable and high yielding hybrids. QPM hybrids
41 and 120 and non-QPM hybrids 108 and 12 were the highest yielding genotypes in this
study. Hence, the promotion of these superior hybrids for adoption and release will not

72
only enhance grain yield output but also help improve nutritional status of people who
depend on maize products as their staple meal.
Keywords: Yield reduction, quality protein maize, non-quality protein maize, yield
stability, mega environments.
4.2 Introduction
In SSA and other developing regions across the globe, maize forms a major part of the
human diet as it supplies daily calories and, to some extent, protein and other essential
amino acids (Nuss and Tanumihardjo 2011; Chaudhary et al. 2014; De Groote et al. 2014).
Grain yield and kernel protein content are polygenically controlled which makes it difficult
for the two traits to be improved simultaneously (Mittelman et al. 2003; Aliu et al. 2012;
Tripathy et al. 2017). QPM has much higher levels of the essential amino acids lysine and
tryptophan than normal maize. It has been reported that the gap between QPM and non-
QPM grain yield ranges between 10 to 15%, which is predominantly characterized by
slower drying rate, higher susceptibility to kernel rot and lower kernel weight (Mukanga
et al. 2011; Tandzi et al. 2017; Darrah et al. 2019). To overcome the problems associated
with the o2 mutation, breeders, over the past five decades, have introgressed gene modifiers
from normal maize to harden the endosperm of QPM genotypes without reduction in lysine
and tryptophan content (Mertz et al. 1964; Kumar et al. 2011; Gupta et al. 2013; Pandey et
al. 2016; Krishna et al. 2017). This was done not only through conventional breeding but
also through molecular approaches to enhance the genetic variability of QPM genotypes
with increased yield comparable to normal maize (Tandzi et al. 2017). In spite of the
unprecedented progress made to harden the endosperm of QPM varieties with enhanced
yield, there have been several contradictory reports about the yield of QPM compared to
non-QPM genotypes. There are reports of normal maize being superior for grain yields
compared to QPM varieties (Bhatnagar et al. 2004; Krivanek et al. 2007) while Pixley and
Bjarnason (1993) reported that QPM hybrids yielded better than non-QPM hybrids.
Interaction between genes which control major traits can cause yield reduction or “yield
drag” and “event lag effects” (Shi et al. 2013). Yield drag usually refers to reduction in
yield after major genes are added to a genotype compared to the genotype without the
added gene. There is almost no information on yield drag (reduction in grain yield as a
result of adding the QPM trait to a non-QPM inbred or hybrid) to truly quantify if addition

73
of the QPM trait results in lower yield than non-QPM genotypes. Analysis of GEI is
important to determine performance of genetic materials in terms of adaptability and
stability. Maize hybrids which are high yielding with enhanced nutritional composition and
comparatively stable for grain yield when grown in different environments are important
to commercial maize production in SSA (Edmeades et al. 1997; Beck et al. 2003).
Živanović et al. (2004) and Mastrodomenico et al. (2018) stated that grain yield stability
in maize is partly under genetic control and thus appropriate for selection of superior and
high yielding genotypes. Therefore, this study was conducted to examine the yield gap, if
present, between hybrid QPM and their non-QPM counterparts as well as to examine the
stability of these genotypes.
4.3 Materials and methods
4.3.1 Genetic material
This study was carried out during the 2017/2018 and 2018/2019 cropping seasons at 13
locations in South Africa and Zimbabwe. The genetic materials used in the study were
developed from germplasm from various genetic backgrounds. Some were obtained from
conversion of normal endosperm maize to QPM lines with genes from early maturing elite
drought and low N stress tolerant inbred lines, conversion of medium maturing elite MSV
tolerant inbred lines, Southern Africa adapted mid-altitude inbred lines with high GCA,
conversion of medium maturing elite Southern Africa adapted mid-altitude inbred lines
with high GCA and introgressing of temperate germplasm (See Table 3.1 in Chapter 3).
Consequently, the lines were selected based on their yield potential and quality traits. A
total of 33 QPM and non-QPM inbred lines obtained from CIMMYT Zimbabwe were
crossed with four elite testers, two QPM and two non-QPM (Table 4.1) to generate 132
single cross hybrids (Table 4.2). However, because of unavailability of seed, two crosses
were discarded, bringing the total number of hybrids to 130. Five commercial hybrids (two
QPM and three non-QPM) were used as checks. Hence, 135 hybrids were included in this
study (Table 4.2).

74
Table 4.1 Description of the inbred lines and testers used to create hybrids
Line Name Donor
L1 CZL0920 QPM
L2 CZL1330 QPM progeny
L3 CZL15041 QPM progeny
L4 CZL15055 QPM progeny
L5 CZL15073 QPM progeny
L6 CZL1471 QPM progeny
L7 TL135470 QPM progeny
L8 VL06378 QPM progeny
L9 TL155805 QPM progeny
L10 TL147078 QPM progeny
L11 TL147070 QPM progeny
L12 TL13609 QPM progeny
L13 TL145743 QPM progeny
L14 TL156614 QPM progeny
L15 CZL1477 QPM progeny
L16 CZL15074 QPM progeny
L17 CZL0616 QPM progeny
L18 CZL083 QPM progeny
L19 CML572 Non-QPM parent
L20 EBL167787 Non-QPM parent
L21 CZL0520 Non-QPM parent
L22 CZL99005 Non-QPM parent
L23 CML502 QPM donor
L24 CML144 QPM donor
L25 CML159 QPM donor
L26 CML181 QPM donor
L27 CML197 QPM donor
L28 CML312SR Non-QPM parent
L29 CML488 Non-QPM parent
L30 CML491 Non-QPM parent
L31 LH51 QPM donor
L32 CZL00025 Non-QPM parent
L35 CML444 Non-QPM parent
Tester
T1 CZL15049 QPM tester
T2 CZL059 QPM tester
T3 CML444 Non-QPM tester
T4 CML395 Non-QPM tester

75
Table 4.2 Description of the 130 QPM and non-QPM hybrids and the five commercial checks used in the study
Entry Cross Entry Cross Entry Cross Entry Cross Entry Cross
1 L1 x CZL15049 (QPM) 28 L7 x CML395 (non-QPM) 55 L14 x CML444 (non-QPM) 82 L21 x CML444 (non-QPM) 109 L28 x CZL059 (non-QPM)
2 L1 x CZL059 (QPM) 29 L8 x CZL15049 (QPM) 56 L14 x CML395 (non-QPM) 83 L21 x CML395 (non-QPM) 110 L28 x CML444 (non-QPM)
3 L1 x CML444 (non-QPM) 30 L8 x CZL059 (QPM) 57 L15 x CZL15049 (QPM) 84 L22 x CZL15049 (non-QPM) 111 L28 x CML395 (non-QPM)
4 L1 x CML395 (non-QPM) 31 L8 x CML444 (non-QPM) 58 L15 x CZL059 (QPM) 85 L22 x CZL059 (non-QPM) 112 L29 x CZL15049 (non-QPM)
5 L2 x CZL15049 (QPM) 32 L8 x CML395 (non-QPM) 59 L15 x CML444 (non-QPM) 86 L22 x CML444 (non-QPM) 113 L29 x CZL059 (non-QPM)
6 L2 x CZL059 (QPM) 33 L9 x CZL15049 (QPM) 60 L15 x CML395 (non-QPM) 87 L22 x CML395 (non-QPM) 114 L29 x CML444 (non-QPM)
7 L2 x CML444 (non-QPM) 34 L9 x CZL059 (QPM) 61 L16 x CZL15049 (QPM) 88 L23 x CZL15049 (QPM) 115 L29 x CML395 (non-QPM)
8 L2 x CML395 (non-QPM) 35 L9 x CML444 (non-QPM) 62 L16 x CZL059 (QPM) 89 L23 x CZL059 (QPM) 116 L30 x CZL15049 (non-QPM)
9 L3 x CZL15049 (QPM) 36 L9 x CML395 (non-QPM) 63 L16 x CML444 (non-QPM) 90 L23 x CML444 (non-QPM) 117 L30 x CZL059 (non-QPM)
10 L3 x CZL059 (QPM) 37 L10 x CZL15049 (QPM) 64 L16 x CML395 (non-QPM) 91 L23 x CML395 (non-QPM) 118 L30 x CML444 (non-QPM)
11 L3 x CML444 (non-QPM) 38 L10 x CZL059 (QPM) 65 L17 x CZL15049 (QPM) 92 L24 x CZL15049 (QPM) 119 L30 x CML395 (non-QPM)
12 L3 x CML395 (non-QPM) 39 L10 x CML444 (non-QPM) 66 L17 x CZL059 (QPM) 93 L24 x CZL059 (QPM) 120 L31 x CZL15049 (QPM)
13 L4 x CZL15049 (QPM) 40 L10 x CML395 (non-QPM) 67 L17 x CML444 (non-QPM) 94 L24 x CML444 (non-QPM) 121 L31 x CZL059 (QPM)
14 L4 x CZL059 (QPM) 41 L11 x CZL15049 (QPM) 68 L17 x CML395 (non-QPM) 95 L24 x CML395 (non-QPM) 122 L31 x CML444 (non-QPM)
15 L4 x CML444 (non-QPM) 42 L11 x CZL059 (QPM) 69 L18 x CZL15049 (QPM) 96 L25 x CZL15049 (QPM) 123 L31 x CML395 (non-QPM)
16 L4 x CML395 (non-QPM) 43 L11 x CML444 (non-QPM) 70 L18 x CZL059 (QPM) 97 L25 x CZL059 (QPM) 124 L32 x CZL15049 (non-QPM)
17 L5 x CZL15049 (QPM) 44 L11 x CML395 (non-QPM) 71 L18 x CML444 (non-QPM) 98 L25 x CML444 (non-QPM) 125 L32 x CML444 (non-QPM)
18 L5 x CZL059 (QPM) 45 L12 x CZL15049 (QPM) 72 L18 x CML395 (non-QPM) 99 L25 x CML395 (non-QPM) 126 L32 x CML395 (non-QPM)
19 L5 x CML444 (non-QPM) 46 L12 x CZL059 (QPM) 73 L19 x CZL15049 (non-QPM) 100 L26 x CZL15049 (QPM) 127 L35 x CZL15049 (non-QPM)
20 L5 x CML395 (non-QPM) 47 L12 x CML444 (non-QPM) 74 L19 x CZL059 (non-QPM) 101 L26 x CZL059 (QPM) 128 L35 x CZL059 (non-QPM)
21 L6 x CZL15049 (QPM) 48 L12 x CML395 (non-QPM) 75 L19 x CML444 (non-QPM) 102 L26 x CML444 (non-QPM) 129 L35 x CML444 (non-QPM)
22 L6 x CZL059 (QPM) 49 L13 x CZL15049 (QPM) 76 L19 x CML395 (non-QPM) 103 L26 x CML395 (non-QPM) 130 L35 x CML395 (non-QPM)
23 L6 x CML444 (non-QPM) 50 L13 x CZL059 (QPM) 77 L20 x CZL15049 (non-QPM) 104 L27 x CZL15049 (QPM) 131 ZS261 (Check QPM1)
24 L6 x CML395 (non-QPM) 51 L13 x CML444 (non-QPM) 78 L20 x CML444 (non-QPM) 105 L27 x CZL059 (QPM) 132 Mama MQ623 (Check QPM2)
25 L7 x CZL15049 (QPM) 52 L13 x CML395 (non-QPM) 79 L20 x CML395 (non-QPM) 106 L27 x CML444 (non-QPM) 133 PHB30G19 (Check Non-QPM1)
26 L7 x CZL059 (QPM) 53 L14 x CZL15049 (QPM) 80 L21 x CZL15049 (non-QPM) 107 L27 x CML395 (non-QPM) 134 SC627 (Check Non-QPM2)
27 L7 x CML444 (non-QPM) 54 L14 x CZL059 (QPM) 81 L21 x CZL059 (non-QPM) 108 L28 x CZL15049 (non-QPM) 135 SC513 (Check Non-QPM3)

76
4.3.2 Experimental sites, design and agronomic practices
The study was conducted at 13 locations in South Africa and Zimbabwe during the
2017/2018 and 2018/2019 cropping seasons (Table 4.3).
Table 4.3 Site description for the test locations in South Africa and Zimbabwe
Site Location name Country Latitude Longitude
Elevation above
sea level (m)
S1 Harare Zimbabwe 17°46'S 31°02'E 1406
S2 Gwebi Zimbabwe 17°13'S 31°E' 1406
S3 Bindura Zimbabwe 17 °18’S 31° 02'E 1480
S4 Harare-misting Zimbabwe 17°46'S 31°02'E 1406
S5 Rattrey-Arnold Zimbabwe 17o 67’S 31o 17’E 1462
S6 Glendale Zimbabwe 17°31'S 31°3'E 1147
S7 Lionsdel Zimbabwe 17o25’S 30o 02’E 1232
S8 Cedara 2018 South Africa -29°54'S 30°26'E 1066
S9 PotchTB8-18 South Africa -26°73'S 27°08'E 1349
S10 PotchR8-18 South Africa -26°73'S 27°06'E 1349
S11 Potch 2019 South Africa -26°74'S 27°08'E 1349
S12 Cedara 2019 South Africa -29°71'S 30°26'E 1066
S13 Glendale Zimbabwe 17°31'S 31°3'E 1147
PotchTB8-18=Potchefstroom TB8 2018; PotchR8-18= Potchefstroom R8 2018
The experiments were established using a 5 x 27 alpha lattice experimental design
(Patterson and Williams 1976) with two replications at 13 locations. At each location, the
experimental unit used was single row plots of 5.2 m long with inter-row spacing of 0.75
m and within rows spacing of 0.25 m. Two seeds were planted per hill and seedlings later
thinned to one plant per hill, four weeks after emergence, to give a final plant population
density of about 53 333 plants ha-1. In Potchefstroom the fertilizer regime consisted of
compound fertilizer 3:2:1 (25) + Zn, applied as a basal application at planting, at a rate of
200 kg NPK ha-1. LAN with 28% N was used for top-dressing in two equal splits at 28 and
56 days after emergence at a rate of 100 kg ha-1 each. At Cedara, MAP at 250 kg ha-1 was
applied at planting, and LAN given at 150 kg ha-1 in two equal splits of 75 kg ha-1 at 28
and 56 days after emergence. For the Zimbabwe trials, fertilizers were applied at the
recommended rate of 250 kg ha-1 N, 83 kg ha-1 P, and 111 kg ha-1 K. Basal fertilizer
application was done in the form of NPK, and additional N application was done four
weeks after seedling emergence. Pre-emergence herbicides Gramoxone, Basagram and 2,
4-D were applied to control weeds and after that hand weeding was done to make sure that
the fields were relatively free of weeds. Insecticides Carbaryl and Karate were applied to
control stalk borer and cutworms, respectively. Carbaryl was applied at planting stage

77
while Karate was applied at planting and seedling emergence stages.
4.3.3 Data collection
This was done as described in Chapter 3.
4.3.4 Statistical analyses
Grain yield data and other measured parameters were subjected to ANOVA for each
location and combined locations using PROC GLM procedure in SAS (SAS Institute, 2011
version 9.4) to test the significance of genotype, environment/location and GEI. In the
model, the hybrids or genotypes were regarded as fixed while environments, replications
nested in environment and blocks within replications across environments were treated as
random factors. Before the ANOVA, BLUPs of plot means for all traits across the seven
environments were calculated.
4.3.5 GGE biplot analysis
The GGE biplot graphical method was deployed to study the relationship and the
interaction between genotype and the environment and also to examine stability of grain
yield (Yan et al. 2000). The grain yield obtained from the multi-location trials was
expressed by the formula:
Yij- Ȳj=λ1ξi1ηj1+ λ2ξi2ηj2+εij,
where, Yij is the average yield of genotype i in environment j; Ȳj is the average grain yield
for all the genotypes in environment j; λ1 and λ2 are the singular values decompositions for
the first and second principal components, PC1 and PC2, respectively; ξi1 and ξi2 are vector
scores of genotype i on PC1 and PC2, respectively; ηj1 and ηj2 are vector scores of
environment j on PC1 and PC2, respectively; and εij is the residual of the model associated
with the genotype i in environment j.
4.3.6 AMMI analysis
In addition to the GGE biblot analysis, the grain yield data of 30 selected genotypes (top
15, middle 5, bottom 5 and the 5 checks) from the 135 genotypes were subjected to AMMI
analysis to determine the relationships among genotypes, environments and GEI. The

78
AMMI model was used in several studies (Zobel et al. 1988; Gauch and Zobel 1988; Crossa
1990). The AMMI model uses PCA to determine the multiplicative effects. The AMMI
analysis was conducted using the GGE biplot software Windows application that fully
automates biplot analysis (Yan 2001) following the GGE model:
𝑌ijr = µ + e𝑗 + ∑ λ𝑘 α𝑖𝑘 γ𝑗𝑘 εijr
𝑥
𝑘−1
Yijr = observation of the rth replicate of the ith genotype in the jth environment, µ = the
overall means, ej = main effect of the jth environment, χ = matrix rank {gge}ij when {gge}ij
= gi + geij, λk = the singular value for principal component k, αik = the eigenvector score
for genotype i and component k, γjk = the eigenvector score for environment j and
component k, and εijr = the error for genotype i and environment j and replicate r.
4.3.7 Estimation of yield reduction of QPM vs non-QPM hybrids
From the ANOVA, means for each hybrid were obtained. They were then separated
according to the crosses made, thus lines that were crossed with QPM testers and lines
crossed with non-QPM testers. It is important to note that each line was crossed with two
QPM and two non-QPM testers, except for two lines, 20 and 32, which were crossed with
only one QPM tester. The averages for means for each line as obtained in crosses for both
QPM and non-QPM were obtained and consequently, yield reduction was calculated using
the formula below:
Yield drag = (Yield of QPM hybrid – Yield of non-QPM hybrid) x 100
Yield of non-QPM hybrid
4.4 Results
4.4.1 Analysis of variance for grain yield measured at Potchefstroom, Cedara and
Zimbabwe during the 2018 and 2019 cropping seasons
The ANOVA at separate locations and across locations for grain yield and other measured
traits of the 135 hybrids evaluated in 13 locations is presented in Table 4.4. At Cedara,
there were variations among the tested hybrids for grain yield and all the other traits except
for anthesis-silking interval, ears per plant, husk cover and ear rot.

79
Table 4.4 Mean squares from analysis of variance for grain yield and other agronomic traits of 135 hybrids evaluated under optimal growing
conditions at Cedara (2017/2018 and 2018/2019), Potchefstroom (2017/2018 and 2018/2019) and Zimbabwe (2017/2018)
Source DF GY DA ASI PH EH RL SL EPP HC ER EA
Cedara
Year 1 114.57** 2352.09** 0.31 191064.46** 104931.96** 21630.66** 13639.12** 0.01 19.08** 30964.80** 0.73*
Rep(Year) 2 7.09* 85.56** 1.63 3153.57** 2300.26** 471.98* 272.57 0.09* 4.91** 1363.54* 0.65*
Block(Year*Rep) 104 1.89* 10.10** 1.44 574.53** 343.90** 186.29* 297.78** 0.02 0.52** 515.17 0.23*
Entry 134 5.69** 28.52** 1.11 508.85** 577.21** 234.68** 325.55** 0.01 0.23 458.55 0.31*
Year*Entry 134 5.30** 7.07* 0.89 281.00* 223.97* 213.40* 252.72** 0.02 0.26 436.55 0.40*
Error 164 1.21 4.94 1.34 212.94 150.91 118.14 146.91 0.02 0.20 21.45 0.19
Potchefstroom
Site 2 1996.14** 710.72** 0.87 29307.18** 14019.62** 1630.01** 12549.02** 5.15** 19.56** 11772.21** 0.30
Rep(Site) 3 5.75* 19.93** 0.42 2220.08** 5259.83** 93.03 1383.80** 0.46** 0.39 187.19 0.25
Block(Site*Rep) 156 1.86 5.09** 0.85* 244.98** 166.54** 81.77 218.29** 0.04 0.30** 124.85 0.17
Entry 134 9.34** 41.38** 1.42** 618.22** 805.50** 116.05** 243.18** 0.06** 0.27** 241.83** 0.28**
Site*Entry 268 4.15** 3.77** 0.79 113.62 97.97* 117.65** 226.99** 0.04 0.31** 158.58* 0.30**
Error 246 1.60 2.66 0.65 106.19 68.32 69.31 124.32 0.03 0.17 107.52 0.17
Zimbabwe
Site 7 1184.02** 8224.87** 118.33** 210736.67** 96209.59** 68121.40** 933.93** 1.78** 57.65** 7643.70** 11.07**
Rep(Site) 8 4.75** 21.78** 7.02** 3737.23** 3874.83** 925.38** 46.54 0.07* 3.97 295.57** 0.79**
Block(Site*Rep) 416 1.24* 4.65 1.27 367.43** 215.95** 252.48** 25.93 0.03 11.39 86.62* 0.13**
Entry 134 8.87** 67.90** 1.98** 2116.63** 1565.90** 236.97** 40.75** 0.12** 13.90* 228.58** 0.76**
Site*Entry 936 1.71** 5.10** 1.33* 240.90 159.88* 185.16** 34.10** 0.04* 11.49 105.27** 0.16**
Error 654 0.99 4.06 1.15 226.52 134.08 134.07 26.15 0.02 11.26 69.59 0.09
†DF= degree of freedom; GY (t ha-1) = Grain yield; DA = Days to anthesis; ASI = anthesis silking interval; PH = plant height; EH = ear height; RL = root lodging; SL = stalk lodging; EPP=
ear per plant; HC = husk cover; ER = ear rot; EA = ear aspect. *P<0.05, **P<0.01

80
Table 4.5 Mean squares from combined analysis of variance for grain yield and other agronomic traits of 135 hybrids evaluated at 13 locations
in South Africa and Zimbabwe during the 2017/2018 and 2018/2019 cropping seasons
Source DF GY DA ASI PH EH RL SL EPP HC ER EA
Rep(site) 13 1413.63** 13808.47** 134.41** 209318.02** 73936.40** 43115.36** 14959.39** 3.16** 191.33** 37224.83** 8.33**
Block(rep*site) 624 5.34** 31.17** 4.67** 3297.32** 3952.20** 663.55** 389.91** 0.16** 3.29 434.86** 0.64**
Site 12 14.30** 115.08** 2.10** 2671.50** 2410.75** 224.03** 171.01** 0.12** 8.29 357.78** 0.75**
Entry 134 1.48** 5.59** 1.20* 371.04** 224.23** 202.91** 112.14** 0.03* 7.16 161.37* 0.16**
Entry*site 1474 3.03** 5.57** 1.19* 224.22** 164.88** 175.37** 112.85** 0.04** 7.35 169.98** 0.23**
Error 1242 1.17 3.88 1.07 196.66 121.49 116.66 67.42 0.03 6.99 132.59 0.12
†DF= degree of freedom; GY (t ha-1) = Grain yield; DA = Days to anthesis; ASI = anthesis silking interval; PH = plant height; EH = ear height; RL = root lodging; SL = stalk lodging; EPP =
ear per plant; HC = husk cover; ER = ear rot; EA = ear aspect. *P<0.05, **P<0.01

81
There was significant year x genotype interaction for grain yield. For the trials conducted
at Potchefstroom, significant differences were observed for all the traits and also significant
year x genotype interaction for grain and all measured traits, except for anthesis-silking
interval, plant height and ears per plant. At Zimbabwe, there were significant genotypes as
well as genotype x location interaction effects for all characteristics except for plant height
and husk cover
4.4.2 Combined analysis of variance for measured traits across 13 locations for the
trials conducted in South Africa and Zimbabwe during the 2017/2018 and 2018/2019
cropping seasons
There were significant variations (P< 0.05) for grain yield and most of the traits measured
across the 13 locations (Table 4.6). Furthermore, the effect of environment as well as GEI
was significant (P< 0.01) for grain yield.
4.4.3 Mean of grain yield and agronomic traits of QPM and non-QPM hybrids as well
the five commercial checks
The mean grain yield of the hybrids ranged from 2.31 to 8.61 t ha-1 across the 13
environments for genotypes 70 and 41, respectively (Table 4.5). The least days to 50%
pollen shed were 67 for genotype 124, while genotype 70 shed pollen at 80 days after
planting. Also, anthesis-silking interval ranged between 0.42 and 2.29. Ears per plant
ranged from 0.71 to 1.33. On the other hand, husk cover ranged from 0.18 to 4.69 while
ear rot ranged from 2.26 to 30% (Table 4.7).
4.4.4 Yield performance and stability of 135 QPM and non-QPM hybrids across 13
locations
4.4.4.1 “Which-won-where” biplots
The GGE biplots for grain yield of 135 QPM and non-QPM hybrids including the five
hybrid checks are shown in Figure 4.1. From the polygon view of the GGE biplots, it is
clear which hybrid performed best in each environment. At the vertices of the polygon are
the hybrids located away from the origin of the biplot in varied directions, such that all
hybrids fall within the polygons. This suggested that the vertex entry in each sector of the
polygon represented the highest yielding hybrid at the location that fell within that

82
particular sector. Of the 135 hybrids evaluated, entries 23, 41, 56, 70, 87 and 108 were
identified as the highest yielding genotypes.
Table 4.6 Mean grain yield of 30 selected hybrids from the individual locations used for
the GGE and AMMI biplot analyses
Hybrid
Research sites
S1 S2 S3 S4 S5 S6 S7 S8 S9 S10 S11 S12 S13
8 9.49 6.73 1.40 3.49 7.63 9.16 4.52 8.27 11.69 11.70 4.16 8.60 7.26
12 9.36 6.90 1.78 4.42 8.63 11.06 5.51 8.10 11.64 10.19 3.07 5.73 7.00
13 7.24 4.64 2.50 2.56 5.55 7.42 3.72 4.47 7.12 8.48 4.22 6.24 6.00
16 7.76 7.10 3.42 3.51 6.94 9.10 5.13 10.16 11.21 10.74 4.46 7.70 7.95
23 8.53 4.02 1.80 2.82 5.11 9.91 6.00 7.09 18.08 11.00 4.91 7.18 7.28
26 7.07 5.55 1.05 2.26 4.11 5.01 5.00 7.36 11.17 5.95 3.85 7.06 5.29
28 8.78 5.20 2.35 3.54 8.27 9.43 5.05 6.85 16.43 12.05 5.20 10.62 5.47
34 8.83 5.73 1.46 2.77 5.38 6.58 4.56 6.15 5.94 7.81 2.64 6.58 5.87
41 11.08 5.99 2.05 4.16 6.40 11.19 5.29 7.91 15.55 13.96 3.89 8.31 8.31
46 7.17 5.63 2.44 3.57 5.72 5.90 3.76 6.49 6.79 6.75 2.20 6.41 6.19
52 10.42 6.46 2.81 4.28 6.83 9.29 5.79 6.43 10.90 12.26 5.72 11.16 6.13
56 8.06 5.64 1.33 3.24 7.92 11.23 5.02 5.32 16.56 10.69 3.91 10.75 7.80
62 6.11 3.84 1.37 2.38 3.26 7.03 3.64 6.58 3.82 9.32 0.98 4.43 4.87
63 5.68 4.18 1.41 2.63 5.12 9.89 4.02 3.47 7.34 5.73 3.03 3.57 5.27
66 4.91 3.50 1.55 2.01 3.30 4.26 3.55 8.84 7.74 7.13 0.88 4.56 3.99
70 11.18 1.36 1.12 0.48 1.50 2.83 1.06 1.59 2.24 5.99 0.49 0.43 1.75
78 4.99 5.04 1.75 3.30 4.35 4.22 3.78 3.82 5.86 6.86 4.13 9.05 4.14
79 10.17 7.03 2.20 3.74 7.33 8.64 5.03 6.98 11.19 9.40 4.77 9.49 7.54
87 3.50 2.77 1.14 1.23 3.05 3.45 3.22 2.08 7.92 5.09 2.43 4.01 3.73
97 5.86 3.68 0.72 2.24 3.44 2.48 4.30 7.59 5.18 6.10 0.88 3.15 4.28
99 8.65 6.45 1.48 3.65 8.55 11.86 5.64 9.15 12.75 8.88 4.28 6.51 7.17
101 8.57 5.66 1.25 3.69 4.35 8.26 4.78 5.76 6.26 7.02 3.30 7.26 4.21
108 11.79 5.79 2.47 4.83 8.10 11.47 6.12 7.44 9.86 14.77 4.49 6.91 7.03
120 10.27 5.58 1.56 3.94 6.63 11.40 4.69 6.49 11.78 12.94 4.57 7.79 7.80
121 5.66 4.26 1.70 2.60 3.63 7.79 3.50 3.22 4.53 7.69 1.85 4.33 5.78
131 5.68 4.92 2.08 2.70 3.19 6.97 4.71 8.28 10.81 11.42 4.09 3.54 5.62
132 5.74 4.10 2.89 2.85 6.35 8.78 3.96 3.78 5.94 9.34 4.33 7.68 5.38
133 8.03 5.25 1.05 4.23 5.83 6.21 4.78 7.13 7.57 11.35 5.31 6.92 4.11
134 5.86 4.66 1.27 3.27 4.04 6.65 4.42 5.01 11.97 8.90 2.25 7.73 5.13
135 5.08 4.31 2.67 2.17 3.84 4.90 3.56 5.63 9.80 9.74 2.53 4.94 4.71
NB: Description of the sites are presented in Table 4.3

83
Table 4.7 Means of grain yield and agronomic traits measured for 40 (top 20, middle 10,
poorest 5) selected hybrids including the five checks, evaluated across 13 locations during
the 2018 and 2019 cropping seasons in South Africa and Zimbabwe
Entry GY ASI DA PH EH ER RL SL EPP HC EA
t ha-1 cm % 1-5
41 8.61 1.27 73.02 239.55 124.66 14.08 8.98 7.06 1.09 1.03 2.63
108 7.95 0.99 73.99 233.50 132.83 18.13 7.69 1.72 1.06 0.71 2.68
12 7.51 1.00 73.82 247.59 141.11 5.26 4.64 3.56 1.12 0.55 2.65
52 7.49 1.49 73.87 222.65 124.43 10.86 4.81 7.37 1.20 0.52 2.84
28 7.45 1.25 69.97 217.71 122.60 14.23 5.75 0.89 1.11 2.52 2.85
56 7.45 1.11 72.47 230.56 124.20 27.19 5.13 3.11 0.99 3.19 2.83
99 7.42 1.68 72.90 222.14 120.96 10.99 5.96 7.15 1.14 0.65 2.93
120 7.37 1.71 74.36 225.18 114.38 9.87 9.25 4.89 1.01 0.01 2.88
16 7.36 1.15 70.07 226.45 120.73 12.92 5.56 5.12 1.01 0.83 2.66
23 7.27 1.62 71.39 221.18 119.56 16.34 7.72 11.86 1.07 1.55 2.81
8 7.24 0.88 70.80 220.55 116.11 13.54 6.66 9.49 1.25 2.04 2.90
79 7.18 1.21 70.72 231.13 125.67 18.62 8.83 2.13 1.12 0.33 2.72
130 7.05 0.42 70.26 226.83 122.46 18.46 4.96 5.14 1.07 1.56 2.65
95 6.70 1.06 76.85 228.58 122.29 18.58 3.22 3.31 1.15 0.85 2.96
91 6.69 1.26 75.47 231.57 119.42 16.23 8.70 -0.11 1.04 0.58 2.98
96 6.64 1.46 73.80 222.64 117.85 10.05 8.11 8.06 1.05 1.02 2.89
109 6.17 1.86 77.62 255.13 151.23 8.39 11.89 10.99 1.21 0.42 2.49
98 6.15 1.24 74.52 231.98 129.12 4.28 5.27 6.04 1.06 1.04 2.67
90 6.09 1.75 76.78 237.41 128.66 9.41 4.79 8.24 1.02 1.71 2.85
100 6.07 1.96 70.82 208.56 99.94 13.48 9.04 9.21 0.93 0.00 2.70
131 5.65 1.09 69.47 226.53 112.45 29.79 9.05 6.63 1.07 0.93 3.17
132 5.56 1.57 69.81 208.40 105.10 14.19 6.71 1.26 1.09 2.77 3.02
133 5.83 2.29 71.73 243.16 121.16 10.26 5.60 2.67 1.06 0.99 2.42
134 5.29 1.08 70.22 222.51 114.79 18.81 10.90 0.25 0.97 0.98 2.97
135 4.71 1.63 68.65 226.09 112.78 22.07 12.38 0.63 0.95 1.40 3.35
2 5.93 1.11 73.77 241.15 129.07 11.78 5.45 4.42 1.13 1.18 2.87
107 5.93 1.15 68.81 211.90 111.93 19.98 10.34 1.07 1.09 1.66 2.91
1 5.64 0.83 69.42 221.96 105.60 10.99 7.70 5.87 1.10 1.20 2.88
34 5.40 1.60 75.52 234.22 130.99 8.73 9.69 4.12 1.14 0.90 2.86
26 5.27 2.01 71.40 221.68 118.44 15.32 8.74 9.89 1.06 2.29 2.87
46 5.23 1.32 76.22 243.59 130.30 8.42 6.87 7.85 1.06 0.82 2.87
13 5.08 1.58 68.82 208.48 100.89 14.78 7.55 11.69 1.01 2.30 2.92
63 4.63 1.80 74.84 218.13 117.29 17.62 9.47 6.91 0.99 1.03 3.16
78 4.48 0.97 72.61 240.40 134.82 15.85 6.94 3.62 1.00 0.76 2.67
121 4.45 1.01 76.85 219.72 121.13 9.94 7.85 9.17 1.16 1.30 3.03
62 4.28 1.29 76.73 215.17 118.95 12.06 9.14 6.77 1.03 1.02 3.39
66 4.21 1.96 77.20 217.14 121.10 7.46 6.16 8.86 0.94 1.14 3.39
97 3.90 1.11 77.98 210.58 121.78 8.08 7.01 14.18 1.01 0.45 3.21
87 2.94 0.91 77.51 186.37 107.17 15.73 3.50 3.06 0.94 1.59 3.45
70 2.31 2.25 79.68 201.79 111.21 5.00 12.00 9.24 0.71 3.01 3.78
R-
Square 0.95 0.81 0.98 0.95 0.94 0.87 0.89 0.87 0.83 0.73 0.85
SE 1.08 1.03 1.97 14.02 11.02 11.51 10.80 8.21 0.17 2.65 0.35
Mean 6.08 1.34 72.86 227.26 121.24 12.90 7.75 6.08 1.06 1.20 2.83
GY (t ha-1) = Grain yield; PH = plant height; EH = ear height; ASI = anthesis silking interval; DA = Days to anthesis;
RL = root lodging; SL = stalk lodging; HC = huck cover; EPP = ear per plant; ER = ear rot; EA = ear aspect

84
Figure 4.1 ‘‘Which-won-where” genotype plus genotype x environment interaction biplot
of grain yield of 30 QPM and non-QPM maize hybrids evaluated at 13 locations during
2017/2018 and 2018/2019 cropping seasons
Only genotypes 23, 131 and 134 were adapted to S9 while genotype 108 was adapted to
S2, S3, S4, S5, S6 and S10. Hybrids 12, 16, 41, 56, 98 and 99 were adapted to sites S1, S7,
S8, S12 and S13. The remaining genotypes, for example 70, 78, 87 and 97, were not
adapted to any of the 13 environments used in this study. The GGE biplot identified three
mega environments. Sites S7, S8, S11, S12 and S13 grouped into one environment while
S9 stood alone. The third group involves S1, S2, S3, S4, S5, S6 and S10. PC1 explained
63.4% for the total variation while PC2 on the other hand accounted for 10.9% of the
variation. Together, PC1 and PC2 accounted for 74.3% of the variation in grain yield
(Figure 4.1).

85
4.4.4.2 Stability analysis of the 135 hybrids
Presented in Figure 4.2 is the “means vs. the stability” of the 30 hybrids selected from 135
hybrids evaluated. The set of lines parallel to the double-arrow line passes the whole range
of the entries, dividing them based on their mean performances. Thereby, the hybrids were
ranked along the average-tester axis, with the arrow pointing to a higher value based on
their mean performances across the 13 environments. The vertical blue line separates the
entries into below and above average means. Principal component (PC 1 and PC 2)
contribute 74.3% to yield variation. The information on genotypes and sites for the GGE
biplot are presented in Tables 4.2 and 4.3, respectively.
Figure 4.2 Entry/tester genotype plus genotype x environment biplot based on grain yield
of 30 QPM and non-QPM maize hybrids evaluated at 13 locations during 2017/2018 and
2018/2019 cropping seasons.
The red and single-arrowed line, which passes through the biplot origin and the average
environment, is referred to as the average-tester axis. This line points to the average
environment from the biplot origin (Figure 4.2). The average yield of the hybrid is
estimated by the distance from the markers on the average-tester axis. The stability of the

86
hybrids is therefore estimated by their projection onto the average-tester coordinate y-axis
single-arrow line. The further a genotype is from the average tester axis, the less stable it
is, and those closer to the average tester axis are stable. Hence, the most stable and high
yielding hybrids identified were 12, 16, 19 and 20. Even though hybrids 41 and 108 are
identified as the highest yielding genotypes, they were fairly unstable. The most unstable
hybrids were 23 and 56.
4.4.4.3 AMMI analysis for grain yield
Grain yield performance of 30 selected hybrids is shown in Figure 4.3. From the graph, the
vertical dotted line represents the average performance for grain yield and divides the graph
into below and above yielding environments. The horizontal dotted line on the other hand
(y-ordinate) is the interaction principal component 1 (IPC1) value of zero. Thus, genotypes
that are positioned at the right side of the vertical dotted line performed better than the
grand mean and vice versa for the cultivars at the left side of vertical line. Genotypes close
to the horizontal dotted line have little interaction with the environment, and are considered
to be more stable than those far away from the horizontal line. The site (E), genotype (G)
and the IPC1 accounted for 86.1% of the entire variation for grain yield across the 13
locations. Genotypes 108, 16, 52 and 79 were identified as the stable and high yielding
genotypes by the AMMI model. The information on genotypes and sites for the AMMI
biplot are presented in Tables 4.2 and 4.3, respectively.
4.4.5 Quantifying grain yield reduction or yield increase due to the QPM trait
Cumulatively, QPM genotypes yielded 13.90% lower than non-QPM genotypes. Lines that
were crossed with two QPM testers yielded less than those that were crossed with two non-
QPM testers) (Table 4.8). However, the best performing genotype among the 135
genotypes evaluated was a QPM genotype. The best performing QPM hybrid genotype,
41, out-yielded the best performing non-QPM hybrid genotype 108 by 8.51%. Also, the
best QPM hybrid had 52.40 and 33.60% higher grain yield than the best QPM and non-
QPM hybrid checks, respectively. For the checks used in the present study, two of the four
were non-QPM, which performed relatively better than the QPM checks.

87
Figure 4.3 AMMI biplot of grain yield data and the first interaction principal component
axis (IPCA 1) of 30 QPM, non-QPM and check hybrids evaluated at 13 locations in South
Africa and Zimbabwe during the 2017/2018 and 2018/2019 cropping seasons

88
Table 4.8 Comparison of grain yield and quantification of yield differences of QPM vs. non-QPM hybrids and checks
QPM hybrids Non-QPM hybrids Yield reduction (YR) %
Entry Line Tester GY (t ha-1) Av. GY (t ha-1) Entry Line Tester GY (t ha-1)
Av. GY
(t ha-1)
QPM vs.
non-QPM
QPM vs. best non-
QPM
hybrid
QPM vs.
best QPM check
QPM vs. best
non-QPM check
1 1 1 5.79 6.01
3 1 3 5.63 6.09 -1.37
-29.3 -1.95 -0.78
2 1 2 6.23 4 1 4 6.56 -24.1 5.36 6.62
5 2 1 6.08 6.03
7 2 3 5.91 6.71 -10.1
-25.8 2.89 4.13
6 2 2 5.98 8 2 4 7.51 -27.1 1.19 2.41
9 3 1 5.97 5.72
11 3 3 6.18 6.97 -17.9
-27.2 1.06 2.27
10 3 2 5.46 12 3 4 7.76 -33.4 -7.55 -6.44
13 4 1 5.1 5.73
15 4 3 6.77 7.2 -20.5
-37.8 -13.7 -12.6
14 4 2 6.35 16 4 4 7.63 -22.5 7.49 8.78
17 5 1 5.65 6.08
19 5 3 6.26 6.74 -9.71
-31.1 -4.39 -3.24
18 5 2 6.51 20 5 4 7.21 -20.6 10.22 11.54
21 6 1 6.22 6
23 6 3 7.46 7.19 -16.6
-24.1 5.33 6.59
22 6 2 5.77 24 6 4 6.92 -29.6 -2.38 -1.21
25 7 1 5.45 5.46
27 7 3 6.44 7.01 -22.2
-33.5 -7.75 -6.64
26 7 2 5.46 28 7 4 7.58 -33.4 -7.57 -6.46
29 8 1 6.48 6.18
31 8 3 7.17 7.02 -11.9
-21 9.58 10.89
30 8 2 5.89 32 8 4 6.87 -28.2 -0.32 0.88
33 9 1 6.74 6.16
35 9 3 6.89 7.03 -12.3
-17.8 14.1 15.47
34 9 2 5.59 36 9 4 7.18 -31.9 -5.48 -4.34
37 10 1 7.53 6.86
39 10 3 6.91 7.09 -3.32
-8.23 27.33 28.85
38 10 2 6.19 40 10 4 7.27 -24.5 4.76 6.02
41 11 1 8.9 7.56
43 11 3 7.56 7.21 4.89
8.48 50.51 52.32
42 11 2 6.23 44 11 4 6.86 -24 5.44 6.71
45 12 1 5.25 5.36
47 12 3 5.83 6.27 -14.6
-36 -11.2 -10.2
46 12 2 5.47 48 12 4 6.72 -33.3 -7.49 -6.38
49 13 1 7.21 6.22
51 13 3 7.45 7.56 -17.7
-12.1 22.03 23.49
50 13 2 5.23 52 13 4 7.67 -36.2 -11.5 -10.5
† GY= grain yield of individual QPM hybrids; Av. GY QPM = average grain yield of lines crossed with the two QPM testers; Non-QPM GY = grain yield of individual non-QPM hybrids; Av. GY for non-QPM =
average grain yield of lines crossed with the two non-QPM testers; YR = yield reduction

89
Table 4.8 Comparison of grain yield and quantification of yield differences of QPM vs. non-QPM hybrids and checks (continued)
QPM hybrids Non-QPM hybrids Yield reduction (YR) %
Entry Line Tester GY (t ha-1) Av. GY (t ha-1) Entry Line Tester GY (t ha-1)
Av. GY
(t ha-1)
QPM vs.
non-QPM
QPM vs.
best non-QPM
hybrid
QPM vs.
best QPM
check
QPM vs.
best non-QPM
check
53 14 1 6.73 6.8
55 14 3 6.27 7.01 -3.1
-17.9 13.95 15.32
54 14 2 6.86 56 14 4 7.75 -16.4 16 17.39
57 15 1 5.82 5.98
59 15 3 7.25 6.88 -13.1
-29.1 -1.6 -0.42
58 15 2 6.14 60 15 4 6.51 -25.1 3.97 5.21
61 16 1 5.93 5.21
63 16 3 4.78 5.49 -5.15
-27.7 0.3 1.51
62 16 2 4.49 64 16 4 6.2 -45.2 -24 -23.1
65 17 1 6.89 5.7
67 17 3 6.56 6.81 -16.3
-16 16.61 18.01
66 17 2 4.51 68 17 4 7.05 -45.1 -23.8 -22.9
69 18 1 6.34 4.36
71 18 3 6.34 6.65 -34.4
-22.6 7.36 8.65
70 18 2 2.38 72 18 4 6.96 -71 -59.8 -59.3
- - - - - 73 19 1 5.83 - - - - -
- - - - - 74 19 2 6.11 - - - - -
- - - - - 75 19 3 6.21 - - - - -
- - - - - 76 19 4 5.9 - - - - -
- - - - - 77 20 1 5.71 - - - - -
- - - - - 78 20 3 4.52 - - - - -
- - - - - 79 20 4 7.35 - - - - -
- - - - - 80 21 1 6.02 - - - - -
- - - - - 81 21 2 6.04 - - - - -
- - - - - 82 21 3 5.73 - - - - -
- - - - - 83 21 4 6.51 - - - - -
- - - - - 84 22 1 7.29 - - - - -
- - - - - 85 22 2 6.82 - - - - -
- - - - - 86 22 3 6.62 - - - - -
- - - - - 87 22 4 3.08 - - - - -
88 23 1 5.47 5.62
90 23 3 6.41 6.65 -15.5
-33.2 -7.37 -6.26
89 23 2 5.77 91 23 4 6.89 -29.7 -2.42 -1.25
† GY= grain yield of individual QPM hybrids; Av. GY QPM = average grain yield of lines crossed with the two QPM testers; Non-QPM GY = grain yield of individual non-QPM hybrids; Av. GY for non-QPM =
average grain yield of lines crossed with the two non-QPM testers; YR = yield reduction

90
Table 4.8 Comparison of grain yield and quantification of yield differences of QPM vs. non-QPM hybrids and checks (continued)
QPM hybrids Non-QPM hybrids Yield reduction (YR) %
Entry Line Tester GY (t ha-1) Av. GY (t ha-1) Entry Line Tester GY (t ha-1)
Av. GY
(t ha-1)
QPM vs.
non-QPM
QPM vs.
best non-QPM
hybrid
QPM vs.
best QPM
check
QPM vs.
best non-
QPM check
92 24 1 5.58 5.8
94 24 3 6.91 6.96 -16.6
-31.9 -5.53 -4.4
93 24 2 6.02 95 24 4 7.01 -26.5 1.92 3.15
96 25 1 6.96 5.56
98 25 3 6.36 7.02 -20.7
-15.1 17.81 19.22
97 25 2 4.16 99 25 4 7.68 -49.2 -29.5 -28.7
100 26 1 6.36 5.88
102 26 3 6.9 6.83 -13.9
-22.4 7.63 8.92 101 26 2 5.39 103 26 4 6.75 -34.2 -8.75 -7.65
104 27 1 5.49 5.6
106 27 3 5.89 6.01 -6.82
-33 -7.04 -5.93
105 27 2 5.7 107 27 4 6.12 -30.5 -3.59 -2.43 - - - - - 108 28 1 8.2 - - - -
- - - - - 109 28 2 6.35 - - - -
- - - - - 110 28 3 6.85 - - - - - - - - - 111 28 4 6.75 - - - -
- - - - - 112 29 1 5.73 - - - -
- - - - - 113 29 2 6.63 - - - -
- - - - - 114 29 3 5.93 - - - -
- - - - - 115 29 4 6.54 - - - -
- - - - - 116 30 1 6.63 - - - - - - - - - 117 30 2 5.89 - - - -
- - - - - 118 30 3 5.91 - - - - - - - - - 119 30 4 6.52 - - - -
120 31 1 7.56 6.11
122 31 3 6.81 7.03 -13.2
-7.82 27.9 29.44
121 31 2 4.65 123 31 4 7.25 -43.2 -21.2 -20.3 - - - - - 124 32 1 4.71 - - - - -
- - - - - 125 32 3 5.18 - - - - -
- - - - - 126 32 4 5.27 - - - - - - - - - - 127 35 1 5.83 - - - - -
- - - - - 128 35 2 6.18 - - - - -
- - - - - 129 35 3 6.32 - - - - - - - - - - 130 35 4 7.13 - - - - -
- - - - - 133 - - 5.91 - - - - -
131 - - 5.84 - 134 - - 5.61 - - -28.7 -1.13 0 132 - - 5.66 - 135 - - 4.77 - - -31 -4.31 -3.17
† GY= grain yield of individual QPM hybrids; Av. GY QPM = average grain yield of lines crossed with the two QPM testers; Non-QPM GY = grain yield of individual non-QPM hybrids; Av. GY for non-QPM =
average grain yield of lines crossed with the two non-QPM testers; YR = yield reduction

91
4.5 Discussion
The results suggest that there is a prospect of identifying improved QPM hybrids, which
could be used for commercialisation in SSA. Substantial differences were evident between
the 13 test environments indicating that hybrids could be identified to suit target locations.
The environment had a very large influence on grain yield as has been reported in other
studies (Maazou et al. 2016; Priyadarshan 2019). The significant GEI together with
stability estimates from the GGE biplot analyses indicated the presence of crossover
association (Mebratu et al. 2019), which may complicate selecting high yielding and
superior hybrids across a wide range of environments. Significant site mean squares for
grain yield and most measured traits across environments showed that the test
environments were distinctive in discriminating among the 135 hybrids. The highly
significant site variance indicated that the environments used for the study were variable
and this will aid in the selection of superior QPM hybrids across a wide range of
environments in Southern Africa for commercialization.
When average yields of QPM and non-QPM hybrids were compared across all
environments, the non-QPM genotypes were found to have superior yield compared to the
QPM genotypes. This is consistent with the results of studies conducted previously
(Wegary et al. 2013; Ababulgu et al. 2018; Tilahun et al. 2018) even though those studies
might not have considered the volume of the genetic materials used in this study. In
addition, the conditions and the environments under which the studies were performed
could have played a role in the outcome of the studies. This study showed that QPM lines
crossed with QPM testers produced some excellent hybrids compared to some non-QPM
hybrids. The average yield for line 11 crossed with QPM testers 1 and 2, genotypes 41 and
42, produced grain yield of 4.85% higher than when line 11 was crossed with non-QPM
testers 3 and 4 (genotypes 43 and 44). Hybrids 84 and 85 obtained from non-QPM line 28
crossed with QPM testers 1 and 2 recorded 0.07% increased grain yield over line 28 crossed
with non-QPM testers 3 and 4 thus genotypes 86 and 87. Therefore, in the current study,
the best performing hybrid was a QPM hybrid, although QPM hybrids in general produced
13.9% less yield than non-QPM hybrids. Previous reports stated that QPM genotypes are
inferior in terms of grain against non-QPM hybrids (Singh et al. 2014). This suggested that
some QPM hybrids have the potential to produce comparable grain yield to non-QPM
hybrids. The increased grain yield of the best QPM over the best non-QPM hybrids

92
confirmed results from an earlier study (Setimela et al. 2017) that also found QPM
genotypes yielding 12 to 25% above the non-QPM genotypes used as checks.
From this study across the 13 locations under optimum conditions, it is possible that
outstanding QPM genotypes could be selected for commercial production in SSA. The
AMMI biplot is very useful because of its discriminatory ability in the identification and
selection of superior genotypes (Wang et al. 2016). Hybrids 108, 16, 52 and 79, which
were identified by the AMMI biplot analysis as high-yielding and stable across the test
locations, indicated that these genotypes can be grown under optimal conditions in SSA
without a grain yield penalty.
QPM hybrids 41 and non-QPM hybrids 108, 12 and 20 had the highest yield and stability
across locations. Hybrids 108 and 41 were identified as the best performing hybrids.
Among these four superior genotypes, hybrids 20 and 12 were the most consistent across
all the locations, however, their yield potential was not comparable to that of hybrids 108
and 41. Superior and outstanding QPM hybrid 41 was adapted to five locations while the
best non-QPM hybrid 108 on the other hand, was well adapted to seven of the 13 locations
used, indicating that these hybrids have the potential to be produce high and stable yield in
wider maize growing environments in Southern Africa under rainfed conditions.
The AMMI analysis was effective in discriminating among the various environments. The
GGE biplot identified all 13 locations used as superior environments for maize production.
However, with the use of the AMMI biplot, only six locations were considered ideal
environments. While the AMMI biplot accounted for 86.1% of the total yield variation, the
GGE biplot accounted for 74.3% of variation. There was also variation for stability of the
genotypes between the two models. The GGE biplot identified genotype 108 as high
yielding but relatively unstable. The AMMI model on the other hand identified the same
genotype as high yielding and highly stable. The two models are superior tools in
identifying superior genotypes but they could classify genotypes and environments
differently, confirming the earlier studies of Yan et al. (2007), Hadasch et al. (2017) and
Erdemci (2018).
This study is of great interest for maize breeding programmes and seed companies to tackle
the issues surrounding the cultivation of QPM genotypes in terms of the low yield reported
93
in several studies (Ababulgu et al. 2018; Kaur et al. 2019). The excellent yield performance
of some of the QPM hybrids across the test locations will be of importance to countries
that rely heavily on maize as their major staple food. The outcome of this study suggests
that further evaluation should be carried out to identify superior and stable QPM genotypes.
These results suggest that the outstanding hybrids should be extensively tested in on-farm
trials in SSA and vigorously promoted for adoption and commercialization to contribute
to food and nutritional security in the sub-region.
4.6 Conclusions
The best performing hybrid identified in this study was a QPM hybrid involving the cross
between line 11 x tester 1 (CZL15049), followed by a non-QPM hybrid involving line 28
x tester 1 (CZL15049), hybrids 41 and 108, respectively. The best QPM hybrid
outperformed the best non-QPM hybrid by 8.81% but overall, non-QPM hybrids yielded
better that QPM hybrids. In addition, the best QPM hybrid genotype 41 outperformed best
non-QPM check (Pioneer PHB30G19) and best QPM check (CBI) by 50.45 and 52.24%,
respectively. The AMMI analyses indicated that the grain yield performance of QPM and
non-QPM hybrids were highly affected by environmental effects. The AMMI and GGE
biplot analysis permitted estimation of interaction effect of a genotype in each environment
and it helped to identify genotypes best suited for specific environments. The GGE biplot
identified three mega environments. In addition, the discriminating power vs.
representativeness view of the GGE biplot was an effective tool for test environments
evaluation. The AMMI and GGE biplots identified genotypes 108 and 12 as the most stable
and high yielding hybrids. QPM hybrids 41 and 120 (L30 x CZL15049) and non-QPM
hybrid 12 and 108 were found to be the high yielding genotypes. Hence, the promotion of
these superior hybrids for adoption and release will not only enhance grain yield output
but also help improve nutritional status of people who depend on maize products for their
livelihood.
References
Ababulgu D, Shimelis H, Laing M and Beyene A (2018) Phenotypic characterization of
elite quality protein maize (QPM) inbred lines adapted to tropical-highlands and the
association studies using SSR markers. Australia Journal of Crop Science 12: 22-31.

94
Aliu S, Rusinovci I, Fetahu S and Simeonovska E (2012) Genetic diversity and correlation
estimates for grain yield and quality traits in Kosovo local maize (Zea mays L.)
populations. Notulae Scientia Biologicae 4: 121-128.
Beck D, Ba M and Edmeades GO (2003) Genetic analysis of inbred and hybrid grain yield
under stress and nonstress environments in tropical maize. Crop Science 43: 807-817.
Bhatnagar S, Betran FJ and Rooney LW (2004) Combining abilities of quality protein
maize inbreds. Crop Science 44: 1997-2005.
Chaudhary DP, Kumar D, Verma R, Langyan S and Sangwan S (2014) Nutritional Quality
of Maize. In: Chaudhary DP, Kumar, S and Singh S (eds), Maize: Nutrition Dynamics
and Novel Uses. Springer, pp. 135-140.
Crossa J (1990) Statistical analyses of multilocation trials. Advances in Agronomy 44: 55-
85.
Darrah LL, McMullen MD and Zuber MS (2019) Breeding, Genetics and Seed Corn
Production. In: Serna-Saldivar SO (ed), Corn Chemistry and Technology. Elsevier,
pp. 19-41. doi:10.1016/b978-0-12-811971-6.00002-4
De Groote H, Chege CK, Tomlins K and Gunaratna NS (2014) Combining experimental
auctions with a modified home-use test to assess rural consumers’ acceptance of
quality protein maize, a biofortified crop. Food Quality and Preference 38: 1-13.
Edmeades GO, Bänziger M, Mickelson HR and Peña-Valdivia CB (eds) (1997)
Developing drought- and low N-tolerant maize. Proceedings of a Symposium, March
25-29, 1996. CIMMYT, El Batán, Mexico, D.F., pp. 1-543.
Erdemci I (2018) Investigation of genotype × environment interaction in chickpea
genotypes using AMMI and GGE biplot analysis. Turkish Journal of Field Crops 23:
20-26.
Gauch HG and Zobel RW (1988) Predictive and postdictive success of statistical analyses
of yield trials. Theoretical and Applied Genetics 76: 1-10.
Gupta HS, Babu R,Agarwal PK, MahajanV, Hossain F and Thirunavukkarasu N (2013)
Accelerated development of quality protein maize hybrid through marker-assisted
introgression of opaque-2 allele. Plant Breeding 132: 77-82.
Hadasch S, Forkman J and Piepho HP (2017) Cross-validation in AMMI and GGE models:
A comparison of methods. Crop Science 57: 264-274.
Kaur N, Singh B and Sharma S (2019) Comparison of quality protein maize (QPM) and
normal maize with respect to properties of instant porridge. LWT-Food Science and
Technology 99: 291-298.

95
Krishna MSR, Surender M and Reddy S (2017) Marker assisted breeding for introgression
of opaque-2 allele into elite maize inbred line BML-6. Acta Ecologica Sinica 37: 340-
345.
Krivanek AF, De Groote H, Gunaratna N, Diallo A and Friesen D (2007) Breeding and
disseminating quality protein maize (QPM) for Africa. African Journal of
Biotechnology 6: 312-324.
Kumar J, Jaiswal V, Kumar A, Kumar N, Mir RR, Kumar S, Dhariwal R, Tyagi S,
Khandelwal M, Prabhu KV, Prasad R, Balyan HS and Gupta PK (2011) Introgression
of a major gene for high grain protein content in some Indian bread wheat cultivars
Field Crops Research 123: 226-233.
Maazou A-RS, Tu J, Qiu J and Liu Z (2016) Breeding for drought tolerance in Maize (Zea
mays L.). American Journal of Plant Sciences 7: 1858-1870.
Mastrodomenico AT, Haegele JW, Seebauer JR and Below FE (2018) Yield stability
differs in commercial maize hybrids in response to changes in plant density, nitrogen
fertility, and environment. Crop Science 58: 230-241.
Mebratu A, Wegary D, Mohammed W, Teklewold A and Tarekegne A (2019) Genotype
× environment interaction of quality protein maize hybrids under contrasting
management conditions in eastern and southern Africa. Crop Science 59: 1576-1589.
Mertz ET, Bates ET and Nelson OE (1964) Mutant genes that change protein composition
and increase lysine content of maize endosperm. Science 145: 279-280.
Mittelman A, Filho J, Lima G, Klain C and Tanaka R (2003) Potential of the ESA23B
maize population for protein and oil content improvement. Scientia Agricola 60: 319-
327.
Mukanga M, Derera J, Tongoona P and Laing MD (2011) Farmers perceptions and
management of maize ear rots and their implications for breeding for resistance.
African Journal for Agricultural Research 6: 45544-4554.
Nuss ET and Tanumihardjo SA (2011) Quality Protein maize for Africa: Closing the
protein inadequacy gap in vulnerable populations. Advances in Nutrition 2: 217-224.
Pandey N, Hossain F, Kumar K, Vishwakarma AK, Muthusamy V, Saha S, Agrawal PK,
Guleria SK, Reddy SS, Thirunavukkarasu N and Gupta HS (2016) Molecular
characterization of endosperm and amino acids modifications among quality protein
maize inbreds. Plant Breeding 135: 47-54.
Patterson H and Williams E (1976) A new class of resolvable incomplete block designs.
Biometrika 63: 83-92.

96
Pixley KV and Bjarnason MS (1993) Combining ability for yield and protein quality
among modified-endosperm opaque-2 tropical maize inbreds. Crop Science 33: 1229-
1234.
Priyadarshan PM (2019) Genotype-by-Environment Interactions. In: Priyadarshan PM
(ed), Plant Breeding: Classical to Modern. Springer, Singapore, pp. 457-472.
SAS Institute. 2011. Statistical Analysis Software (SAS) user’s guide.
Setimela PS, Gasura E and Tarekegne AT (2017) Evaluation of grain yield and related
agronomic traits of quality protein maize hybrids in Southern Africa. Euphytica 213:
289.
Shi G, Chavas JP and Lauer J (2013) Commercialized transgenic traits, maize productivity
and yield risk. Nature Biotechnology 31: 111-114.
Singh AA, Agrawal SB, Shahi JP and Agrawal M (2014) Assessment of growth and yield
losses in two Zea mays L. cultivars (quality protein maize and nonquality protein
maize) under projected levels of ozone. Environmental Science and Pollution
Research 21: 2628-2641.
Tandzi LN, Mutengwa CS, Ngonkew ELM, Woïn N and Gracen V (2017) Breeding for
quality protein maize (QPM) varieties: A Review. Agronomy 7: 1-16.
Tilahun B, Azimach G, Keno T, Chibsa T, Garoma B, Abebe B, Tulu D, Tafa Z and
Chalchisa D (2018) Test cross performance and combining ability of newly
introduced quality protein maize (Zea mays) inbred lines for grain yield and
agronomic traits evaluated in mid-altitude agro-ecological zones of Ethiopia. South
African Journal of Plant and Soil 36: 173-180.
Tripathy SK, Ithape DM, Maharana M and Prusty AM (2017) Quality protein maize
(QPM): Genetic basis and breeding perspective. Tropical Plant Research 4: 145-152.
Wang R, HuD, Huiquan Zheng H, Yan S and Wei R (2016) Genotype x environmental
interaction by AMMI and GGE biplot analysis for the provenances of Michelia
chapensis in South China. Journal of Forestry Research 27: 659-664.
Wegary D, Vivek B and Labuschagne M (2013) Association of parental genetic distance
with heterosis and specific combining ability in quality protein maize. Euphytica 191:
205-216.
Yan W, Hunt LA, Sheng Q and Szlavnics Z (2000) Cultivar evaluation and mega
environment investigation based on the GGE biplot. Crop Science 40: 597-605.
Yan W, Kang MS, Ma B, Woods S and Cornelius PL (2007) GGE biplot vs. AMMI
analysis of genotype-by-environment data. Crop Science 47: 643-655.

97
Yan W (2001) GGE biplot- a windows application for graphical analysis of multi-
environment trial data and other types of two-way data. Agronomy Journal 93: 1111-
1118.
Živanović T, Vračarević M, Krstanović S and Šurlan-Momirović G (2004) Selection on
uniformity and yield stability in maize. Journal of Agricultural Sciences 49: 117-130.
Zobel RW, Wright MJ and Gauch HG (1988) Statistical analysis of a yield trial. Agronomy
Journal 80: 388-393.

98
CHAPTER FIVE
COMBINING ABILITY ANALYSIS AND ASSOCIATION AMONG
AGRONOMIC TRAITS OF QUALITY AND NON-QUALITY PROTEIN MAIZE
INBRED LINES
5.1 Abstract
Development of high yielding QPM hybrids would fight hunger and malnutrition of the
increasing human population and help meet the high demand of maize for human
consumption, industrial use and feed for animal and poultry. However, most maize
genotypes being cultivated and consumed, particularly in SSA, are normal endosperm
maize. It is therefore important to explore and understand the genetic mechanisms
conditioning the inheritance of grain yield and other essential traits used in the
development of superior maize genotypes. Exploitation of GCA and SCA for maize
improvement has been documented in several studies on temperate and tropical genotypes
of various maturity groups. In spite of this, only limited information is available on genetic
studies involving QPM genotypes for hybrid development. The main objective of this study
was to determine the combining ability for grain yield and other agronomic traits of QPM
and non-QPM inbred lines with two QPM and two non-QPM testers. Nine non-QPM and
24 QPM lines were crossed with four elite testers having QPM and non-QPM backgrounds
to generate 130 hybrids. The 130 single cross hybrids were evaluated at 13 locations in
South Africa and Zimbabwe during the 2018 and 2019 cropping seasons. The results
showed significant GCA for lines and testers as well significant SCA for hybrids between
lines and testers for most of the measured traits. Both additive and non-additive genetic
effects were important in the expression of traits, with non-additive gene action controlling
the inheritance of grain yield. Inbred lines 11 (QPM), 14 (QPM) and 28 (non-QPM) and
non-QPM tester CML444 showed desirable GCA effects for grain yield, indicating that
these lines in combination with tester CML444 should be considered when targeting
development of superior maize genotypes with QPM traits. Lines 1 (QPM), 2 (QPM), 8
(QPM), 13 (QPM) and 30 (non-QPM) were prolific, while QPM tester CZL059 was the
only tester to display positive significant GCA for ears per plant, which is a major
contributor to grain yield. The SCA grouping method showed that QPM testers were
superior to non-QPM testers in discriminating the lines for grain yield. Based on the SCA
values, crosses 120, 108, 105, 99, 85 and 41 were identified as the best hybrids across the
99
locations. It is recommended that maize breeding programmes targeting the development
of high yielding QPM hybrids should exploit lines with high GCA values if they produce
hybrids with high SCA. In addition, the identified superior hybrids may be further
evaluated and consequently promoted for release which could increase incomes of farmers
and help to alleviate poverty, hunger and malnutrition in southern Africa and SSA at large.
Keywords: Combining ability, quality traits, grain yield, yield reduction
5.2 Introduction
Maize (Zea mays L) ranks among the top three most important cereal crops worldwide
based on its yield potential and adaptability to several agro-ecological environments. In
maize breeding programmes, inbred lines are used to generate hybrids for commercial
production. Because of their increased yield potential, hybrid maize varieties are used
worldwide to attain higher grain yield. In breeding, it is essential to understand how inbred
lines or parents combine for the development of superior hybrids (Amegbor et al. 2017; de
Abreu et al. 2019). The term “combining ability” was first used by Sprague and Tatum
(1942). Vacaro et al. (2002) and Wegary et al. (2013) noted that the performance of any
genetic material is dependent on its potential per se performance as well as the combining
ability of the lines in crosses, however since heterosis for superior performance is
controlled primarily by SCA, lines should be selected based on their SCA with testers.
Combining ability studies generate useful information on the genetic mechanisms
governing how quantitative traits are inherited and this assists plant breeders in selecting
superior parental lines for further crop improvement or use in hybrid production for
commercial purposes (Abuali et al. 2012; Ali et al. 2012; Saif-ul-Malook et al. 2016).
Two types of combining ability are commonly used in breeding and biometrical genetics,
and these are general combining ability (GCA) and specific combining ability (SCA)
(Abuali et al. 2012; Haydar and Paul 2014). The GCA is the average contribution an inbred
makes to hybrid performance in a series of hybrid combinations in comparison to other
inbreds in the same series of hybrid combinations and this is due to additive gene action
while SCA the contribution of an inbred to hybrid performance in a cross with a specific
other inbred in relation to its contributions in crosses with an array of other inbreds
(Sprague and Tatum 1942; Haydar and Paul 2014). In developing hybrids, one must choose
100
an appropriate mating design to generate the hybrids. Even though there are several mating
designs used in plant breeding, they all come with advantages and disadvantages. Several
researchers use the diallel and North Carolina mating designs. However, it is very
expensive to use a diallel when there is a high number of lines used in generating the
hybrids. Therefore, in a study with a relatively high number of inbred lines, it is better to
use the line x tester mating design. This mating design for estimating GCA and SCA for
hybrid development was first proposed by Kempthorne (1957) and has been extensively
used by several researchers such as Sharma (2006), Nduwumuremyi et al. (2013), Wegary
et al. (2014) and Tilahun et al. (2019). In this design, hybrids are made between lines which
are used as females and testers as males. Each tester is crossed to each line to generate
hybrids (Maruya et al. 2006; Sharma 2006; Sharief et al. 2009; Abuali et al. 2012; Haydar
and Paul 2014).
The genetic improvement of grain yield and its related traits relies on the nature and the
degree of genetic variation in available germplasm. Grain yield is the most important trait
of interest to the breeder and farmer and grain yield is a complex trait controlled by several
genes. However, it is important to consider associations of yield related traits with grain
yield (Bekele and Rao 2014). It is useful to understand the relationship between grain yield
and its related traits (Qi et al. 2010; Gangashetty et al. 2016). The objective of this study
was to determine the combining ability for grain yield and related traits for QPM and non-
QPM inbred lines crossed with two QPM and two non-QPM testers, and the relationship
between the measured traits.
5.3 Materials and methods
5.3.1 Germplasm, field evaluation and data collection
The materials and methodology for the field evaluations used in this study are the same as
described in Chapters 3 and 4. Observations were made on traits reported in Chapter 3.
Tables 4.1 and 4.2 in Chapter 4 contain the names of the inbred lines and testers (Table
4.1) used in generating the hybrids (Table 4.2).

101
5.3.2 Data analysis
The data obtained from 13 locations (Table 4.3) were combined to estimate GCA, SCA,
heritability and correlation. Line x tester analysis was done according to Singh and
Chaudhary (1985). The GCA and SCA and their standard errors were computed for grain
yield and other measured traits using the PROC Mixed Procedure in SAS version 9.4 (SAS
2011). The variation among hybrids was partitioned into sources due to lines, testers and
line x testers. GCA of testers (male) was obtained based on their performance in the F1
hybrid combinations with all possible lines (females). Similarly, GCA of each line was
also determined based on the performance of F1 hybrids with all possible testers. GCA and
SCA effects were determined for each agronomic trait for each location and across
locations following the procedure described by He et al. (2018).
The general linear model for line x tester mating design is:
𝑌𝑖𝑗𝑘𝑙 = µ + 𝑎1 + 𝑏𝑘𝑙 + 𝑣𝑖𝑗 + (𝑎𝑣)𝑖𝑗𝑙 + Ԑ𝑖𝑗𝑘𝑙
where Yijkl = observed value from each experimental unit;
μ = population mean; al = location effect;
bkl = block or replication effect within each location;
vij = F1 hybrid effect = gi + gj+ sij. i.e. 𝑣𝑖𝑗 = 𝑔𝑖 + 𝑔𝑗 + 𝑠𝑖𝑗,
where gi = GCA for the ith parental line;
gj = GCA effects of jth tester;
sij = SCA for the ijth F1 hybrid
(av)ijl = interaction effect between ith F1 hybrid and lth location
Ɛijkl = residual effect (Table 5.1).
Heterotic groupings were made based on SCA of grain yield as described by Agbaje et al.
(2008). Classification of an inbred line into a heterotic group was based on the significant
(P<0.05) positive SCA effects with one of the testers or significant (P<0.05) negative SCA
effects with the other with a mean yield of the tester hybrid being equal to or greater than
one standard error (SE) above the grand mean of all testcrosses (Agbaje et al. 2008).

102
Table 5.1 General form of analysis of variance for line x tester design repeated over
locations
Source Df MS
Expected mean square
Model I Model II
Replication
(r) r-1
Lines (f) f-1 M1
𝜎2 + 𝑟𝑓1
𝑚 − 1+ ∑ 𝑔𝑡
2
𝑡
𝜎2 + 𝑣𝑠𝑐𝑎+ 𝑟𝑓𝑔𝑐𝑎(𝑚)
Tester (m) m-1 M2 𝜎2 + 𝑟𝑚(
1
𝑓 − 1) + ∑ 𝑔𝑗
2
𝑗
𝜎2 + 𝑟𝑣𝑠𝑐𝑎+ 𝑟𝑚𝑔𝑐𝑎(𝑓)
Line x Tester (f-1)(m-1) M3
𝜎2 + 𝑟[1
𝑚 − 1)(𝑓 − 1)]
+ ∑ ∑ 𝑠𝑖𝑗
𝑗𝑖
𝜎2 + 𝑟𝑣𝑠𝑐𝑎
Error (r-1)(fm-1) M4 𝜎2 𝜎2
Nduwumuremyi et al. (2013)
5.3.3 Estimation of grain yield reduction
The grain yield of the hybrids, days to anthesis, plant height and tryptophan content of the
inbred lines were used to estimate yield reduction. The hybrids and lines were grouped into
QPM, non-QPM and resulting QPM, thus each group consisted of three genotypes (QPM,
non-QPM and resulting QPM). The resulting lines were developed from a cross between
QPM genotypes and non-QPM genotypes. For each group, resulting QPM genotypes were
used as the standard and consequently, increase in grain yield for QPM or non-QPM was
calculated based on the grain yield of the resulting QPM genotypes using the formula:
Yield reduction of QPM = (yield of resulting QPM – yield of QPM) x 100
yield of QPM
Yield reduction of non-QPM = (yield of resulting QPM – yield of non-QPM) x 100
yield of non-QPM

103
5.4 Results
5.4.1 Analysis of variance for general and specific combining ability of 130 hybrids
evaluated at Potchefstroom, Cedara and Zimbabwe during the 2017/2018 and
2018/2019 cropping seasons
The ANOVA for combining ability for trials conducted at Potchefstroom during 2018 and
2019 cropping seasons showed significant effects of line and tester and for line x tester for
all the traits measured excepted for stalk lodging and husk cover (Table 5.2). At Cedara,
line x tester SCA effect was also significant for most of the traits except stalk lodging and
husk cover. Apart from grain yield, ear aspects and root lodging, other traits measured were
not significant for site x line x tester.
At Cedara, ANOVA for the two seasons revealed significant (P<0.01) line GCA for grain
yield, days to pollen shed, plant and ear heights, ear aspect, root and stalk lodging. GCA
for tester was not significant for anthesis-silking interval, ear aspect, ears per plant, husk
cover and number ear rots (Table 5.2). Site had significant interaction with line for grain
yield, days to pollen shed, ear aspect, root lodging and ear rot, while site x tester was
significant for grain yield, days to pollen shed, plant height, ear aspect and root lodging.
The ANOVA of the trials conducted at eight sites in Zimbabwe showed significant line
GCA for all the traits measured (Table 5.2). Similarly, tester GCA was also significant for
all the measured traits, except for husk cover. Site x line was also significant for the traits
measured, except husk cover, while, apart from plant height and husk cover, site x tester
effect was significant for all measured traits. The SCA for line x tester was not significant
for root lodging, stalk lodging and husk cover. Site x line x tester effect in Zimbabwe trials
was significant for grain yield, ear aspect, ears per plant, stalk lodging and ear rot.

104
Table 5.2 Mean squares from analysis of variance for general and specific combining ability for grain yield and other agronomic traits of 130
QPM hybrids at Potchefstroom, Cedara and Zimbabwe during the 2018 and 2019 cropping seasons
Source DF GY DA ASI PH EH EA EPP RL SL HC ER
Potchefstroom 2018 and 2019
Rep 1 1.84 0.16 0.93 3969.03** 88.68 0.25 0.11 78.85 987.71 0.02 215.12
Year 2 2845.99** 979.25** 1.84 42125.48** 19741.85** 0.64* 7.57** 2226.26** 18372.80** 29.23** 17594.95**
Line 32 9.23** 128.13** 1.87** 1662.64** 2019.68** 0.41** 0.09** 185.09** 547.55** 0.49** 750.64**
Tester 3 172.26** 729.93** 9.04** 9143.28** 16352.36** 0.97** 0.28** 539.30** 2178.98** 0.94** 674.00**
Year*Line 64 5.65** 5.99** 1.15** 260.16** 123.79 0.55** 0.05* 143.32** 468.26** 0.48** 258.04**
Year*Tester 6 18.03** 17.85** 0.49 800.75** 231.26 2.49** 0.21** 1114.46** 1699.07** 0.08 184.42
Line*Tester 94 8.17** 7.42** 1.13** 614.15** 327.58** 0.25* 0.06** 100.84* 152.33 0.26 149.15*
Year*Line*Tester 188 4.38** 3.32 0.59 183.07 141.04 0.24 0.04 96.61* 210.01* 0.30* 191.11**
Error 389 1.69 3.68 0.73 163.35 145.07 0.17 0.04 75.92 171.04 0.23 113.65
Cedara 2018 and 2019
Rep 1 3.73 14.89 2.22 1246.21 1467.31* 0.042 0.005 1005.94** 40.35 5.10** 3.82
Year 1 114.08** 2324.27** 0.18 186831.04** 104032.73** 0.56 0.001 19476.29** 13144.50** 18.19** 29362.80**
Line 32 7.92** 95.59** 1.71 726.71** 1068.07** 0.43** 0.015 602.08** 482.44** 0.28 466.88
Tester 3 27.80** 298.12** 0.97 3687.03** 6524.59** 0.19 0.033 1576.93** 1604.46** 0.37 484.80
Year*Line 32 9.03** 17.11** 1.59 428.84 289.52 0.45** 0.024 395.22** 262.33 0.37 723.27*
Year*Tester 3 22.10** 28.79* 0.87 1523.67** 609.41 0.82** 0.003 1205.82** 77.81 0.45 290.05
Line*Tester 94 7.18** 10.14* 1.36 584.49** 387.92** 0.35** 0.014 223.30** 214.73 0.34 514.33
Year*Line*Tester 94 5.3** 6.76 0.99 401.73 260.52 0.45** 0.021 240.27** 229.98 0.29 429.80
Error 259 1.51 7.59 1.4 369.45 235.93 0.22 0.018 142.08 212.43 0.34 461.41
Zimbabwe 2018
Rep 1 4.62* 32.25** 3.98 11150.89** 6595.97** 1.48** 0.30** 600.22 5.12 7.41 40.44
Site 7 1149.62** 8012.63** 108.62** 203931.89** 93895.25** 11.17** 1.66** 66361.61** 883.61** 49.69** 6909.50**
Line 32 16.15** 219.53** 2.38** 5695.34** 4238.37** 1.62** 0.17** 451.76** 74.02** 33.19** 563.92**
Tester 3 63.21** 1348.61** 15.92** 41038.23** 40356.22** 8.79** 1.85** 1464.44** 379.67** 4.39 2010.81**
Site*Line 224 2.39** 8.12** 1.58** 360.24* 259.59** 0.25** 0.04* 273.05** 47.18** 11.76 149.03**
Site*Tester 21 5.07** 30.54** 3.51** 361.79 713.88** 0.42** 0.17** 1035.82** 76.56** 13.92 399.01**
Line*Tester 94 7.58** 19.55** 1.65* 1124.33** 531.50** 0.50** 0.12** 170.30 32.76 12.10 105.59*
Site*Line*Tester 658 1.50** 4.49 1.23 278.91 150.94 0.13* 0.04* 171.16 33.11** 10.48 87.62*
Error 1039 1.11 4.39 1.24 296.92 187.29 0.11 0.03 184.17 26.83 10.95 78.14
† DF= degrees of freedom; GY = Grain yield; DA = Days to anthesis; ASI = anthesis silking interval; PH = plant height; EH = ear height; EA = ear aspect; EPP= ear per plant; RL = root
lodging; SL = stalk lodging; HC = hick cover; ER = ear rot; *P<0.05, **P<0.01

105
5.4.2 Analysis of variance for general and specific combining ability of 130 hybrids
evaluated across 13 locations
The combined ANOVA for grain yield and other agronomic traits of the inbred lines (Table
5.3) showed significant (P<0.05) site mean squares for all the traits. The GCA of line was
significant (P<0.05) for all the measured traits while the GCA of the testers was also
significant (P<0.01) for all the measured traits, except husk cover. Site x line effect was
only significant (P<.05) for anthesis-silking interval, ear aspects, husk cover and root
lodging, while site x tester effect was significant for the majority of the traits measured,
except days to pollen shed, plant height, husk cover and ear rot. The line x tester SCA was
significant for grain yield, anthesis-silking interval, plant and ear heights, ear aspect, husk
cover, root lodging and ear per plant. However, site x line x tester was only significant for
root lodging. Across the 13 locations, percentage sum of squares due to SCA was found to
be higher than that due to GCA for grain yield, anthesis-silking interval, ears per plant and
husk cover. On the other hand, GCA sum of squares primarily explained variation for days
to pollen shed, plant and ear height, ear aspect, root and stacking lodging and ear rot.
5.4.3 Performance of lines in hybrid generation
Across the 13 locations, the grain yield ranged from 5.14 t ha-1 for line 32 to 6.87 t ha-1 for
line 11 (Table 5.4). For ears per plant, line 4 recorded the least number of ears and lines 2
and 30 the most ears (1.15). Ear rots ranged from 8.86% for line 30 to 22.66% for line 14.
Generally, all the lines displayed good performance for ear aspect with the exception of
lines 32 and 16. Root lodging ranged from 3.82 to 14.13% for lines 8 and 11, respectively,
while stalk lodging ranged from 2.78 to 10.34% for line 8 and line 18, respectively. With
the exception of lines 5, 7, 14 and 19, all the lines recorded a husk cover score below 2.
5.4.4 Performance of testers in hybrid generation
Among the four testers, non-QPM tester 4 (CML444) produced the highest grain yield
(6.57 t ha-1) and QPM tester 2 (CZL059) had lowest grain yield of 5.49 t ha-1 (Table 5.5).
For ear aspect, all the non-QPM testers performed better than the QPM testers and a similar
trend was observed for root and stalk logging. QPM tester 2 recorded the highest number
of ears per plant, followed by non-QPM tester 4.

106
Table 5.3 Mean squares from analysis of variance for general and specific combining ability for grain yield and other agronomic traits of 130
QPM hybrids across 13 locations in South Africa and Zimbabwe during 2018 and 2019 cropping seasons
Source DF GY DA ASI PH EH ER EA HC EPP RL SL
t ha-1 cm Scale (1-5) %
Rep 1 0.08 33.42 0.27 9851.68** 2831.28** 7.97 0.40 1.72 0.09 6.32 117.30
Site 12 1386.42** 9176.85** 168.02** 157807.42** 65344.70** 25867.33** 10.04** 178.37** 2.57** 619** 13639.82**
Line 32 14.78** 302.86** 2.05** 5841.34** 4947.64** 562.90** 1.01** 19.08** 0.14** 777.32** 228.37**
Tester 3 121.49** 1697.53** 16.22** 43271.07** 49665.48** 2167.99** 5.77** 2.84 1.62** 650.20** 1213.84**
Site*Line 256 4.56 9.08 1.66** 403.94 286.42 168.89 0.33** 9.13** 0.04 345.96** 135.02
Site*Tester 24 18.21** 43.61 3.48** 605.12 786.79** 316.33 0.73** 7.99 0.20** 1337.72** 241.62*
Line*Tester 94 10.05* 20.46 1.68** 1419.75** 652.69* 136.78 0.41** 8.90* 0.11** 201.52* 108.35
Site*Line*Tester 752 2.66 4.69 1.19 311.63 180.62 128.98 0.17 7.43 0.04 210.01** 84.85
Error 2209 4.16 44.84 1.19 800.28 338.93 281.57 0.19 6.80 1.06 142.43 143.89
%GCA SS 47.00 88.49 42.07 70.36 83.36 65.60 56.51 42.52 47.53 58.61 51.81
%SCA SS 53.00 11.51 57.93 29.64 16.64 34.40 43.49 57.48 52.47 41.39 48.19
†DF= degree of freedom; GY= Grain yield; DA = Days to anthesis; ASI = anthesis silking interval; PH = plant height; EH = ear height; EA = ear aspect; RL=
root lodging; SL = stalk lodging; ER = ear rot; EPP = ear per plant; GCA = general combining ability; SCA = specific combing ability; SS = sum of squares;
*P<0.05, **P<0.01

107
Table 5.4 Mean values of lines generated from 130 crosses across 13 locations
Cross
Line
GY DA ASI PH EH RL SL EA HC ER EPP t ha-1
cm % Scale (1-5)
1 5.90 72.24 1.06 229.50 117.63 7.03 4.58 2.90 1.46 10.52 1.11 2 6.14 71.99 1.47 224.91 117.92 7.71 7.98 2.96 1.05 14.20 1.15 3 6.09 73.62 1.46 234.18 128.75 7.00 7.16 2.77 0.79 10.35 1.07 4 6.30 70.71 1.35 220.48 111.50 6.64 6.98 2.75 1.20 11.37 0.99 5 6.11 71.27 1.31 226.53 117.54 10.94 9.14 2.78 2.47 14.14 1.08 6 6.43 70.81 1.34 216.13 113.19 8.32 9.60 2.85 1.09 14.11 1.10 7 6.33 70.83 1.61 219.04 116.96 6.15 4.87 2.82 2.37 12.94 1.05 8 6.24 73.88 1.16 241.96 131.25 3.82 2.78 2.87 0.82 13.84 1.13 9 6.47 73.67 1.54 232.65 127.89 10.73 4.83 2.76 1.16 11.39 1.05 10 6.56 74.21 1.38 237.73 133.42 13.03 6.26 2.72 0.79 11.12 1.02 11 6.87 75.09 1.42 246.70 138.53 14.13 7.34 2.70 0.90 10.95 1.08 12 5.61 73.79 1.33 234.01 122.35 5.59 4.63 2.83 0.86 13.26 1.05 13 6.62 75.27 1.38 226.88 123.25 5.31 4.79 2.78 0.76 12.33 1.11 14 6.64 72.69 1.48 224.21 119.52 5.70 5.56 2.90 2.07 22.66 1.09 15 6.31 72.16 1.29 238.64 126.01 6.94 5.95 2.78 1.07 10.15 1.02 16 5.21 73.96 1.37 221.88 119.95 8.11 6.97 3.04 0.82 14.07 1.04 17 6.04 75.13 1.56 219.59 119.52 4.57 5.24 2.97 1.08 10.16 1.00 18 5.35 74.75 1.25 222.21 122.50 9.04 10.34 2.98 1.68 9.14 1.01 19 5.78 70.43 1.40 220.05 110.13 6.65 5.18 2.76 2.00 12.10 1.01 20 5.85 71.18 1.01 231.94 125.56 8.96 4.95 2.77 1.16 20.83 1.02 21 5.91 70.64 1.30 225.39 126.19 11.92 5.24 2.85 0.86 14.87 1.02 22 5.88 75.48 1.31 221.78 127.38 5.84 7.23 2.75 1.24 9.80 1.07 23 5.93 74.80 1.43 232.45 119.43 6.38 5.43 2.88 1.28 14.56 1.05 24 6.19 75.99 1.27 235.73 122.61 6.13 3.82 2.99 1.12 12.05 1.07 25 6.01 75.08 1.38 220.55 121.76 7.60 8.23 2.92 0.80 9.40 1.07 26 6.11 72.81 1.47 224.59 113.42 8.67 6.75 2.70 1.01 11.02 1.01 27 5.62 69.88 1.06 218.62 111.92 7.98 4.11 2.99 1.05 15.56 1.08 28 6.77 75.82 1.54 243.36 144.41 11.21 6.77 2.63 0.85 12.83 1.06 29 6.09 70.82 1.17 219.00 112.19 8.14 6.79 2.66 1.24 10.62 1.08 30 6.04 72.20 1.21 214.68 113.53 5.03 4.80 2.84 0.78 8.86 1.15 31 6.26 75.73 1.20 223.87 121.63 5.55 7.75 2.77 1.06 13.36 1.08 32 5.14 67.91 0.96 219.83 108.08 7.53 2.93 3.01 1.22 14.29 1.02 35 6.20 71.66 1.21 231.00 122.92 7.25 7.71 2.71 1.25 12.93 1.02
R-Square 0.65 0.51 0.54 0.55 0.62 0.72 0.43 0.50 0.42 0.40 0.51 SE 2.04 6.70 1.09 28.29 18.41 11.93 12.00 0.44 2.61 16.78 0.20 Mean 6.10 72.98 1.33 227.30 121.55 7.74 6.18 2.83 1.19 12.65 1.06
† GY= Grain yield; DA = Days to anthesis; ASI = anthesis silking interval; PH = plant height; EH = ear height; RL = root lodging; SL = stalk lodging; HC = husk cover; EA
= ear aspect; ER = ear rot; EPP = ear per plant.

108
Table 5.5 Average performance of testers for grain yield and other agronomic traits across 13 locations during the 2018 and 2019 cropping
seasons
Tester Tester
GY DA ASI PH EH RL SL HC EA ER EPP
t ha-1
Cm % Scale (1-5)
1 CZL15049 6.15 70.94 1.31 218.37 109.57 8.92 6.48 1.16 2.88 14.84 1.03
2 CZL059 5.49 74.84 1.42 232.01 126.78 7.83 7.64 1.22 2.90 10.77 1.10
3 CML395 6.15 73.81 1.47 235.10 127.94 7.70 6.64 1.15 2.71 11.66 1.02
4 CML444 6.57 72.43 1.12 223.99 122.24 6.52 4.03 1.24 2.83 13.20 1.09
R-Square 0.65 0.51 0.54 0.55 0.62 0.72 0.43 0.42 0.50 0.40 0.51
SE 2.04 6.70 1.09 28.29 18.41 11.93 12.00 2.61 0.44 16.78 0.20
Mean 6.10 72.98 1.33 227.30 121.55 7.74 6.1 1.19 2.83 12.65 1.06
†GY = Grain yield; DA = Days to anthesis; ASI = anthesis silking interval; PH = plant height; EH = ear height; RL = root lodging; SL = stalk lodging; HC = husk cover; EA
= ear aspect; ER = ear rot; EPP = ear per plant; SE = Standard error.

109
Non-QPM tester 3 (CML395) displayed the poorest husk cover. Ear rot was most common
in QPM tester 1 followed by non-QPM tester 4, while QPM tester 2 recorded the lowest
amount of ear rots.
5.4.5 General combining ability effects of lines for grain yield and other agronomic
traits across 13 locations
For grain yield, lines 11, 13, 14 and 28 had positive and significant GCA while lines 16,
18 and 32 had significant (P<0.05) negative GCA for grain yield (Table 5.6). A total of 15
lines, representing 45.45% of the total lines, had significant and negative GCA for days to
pollen shed. For anthesis-silking interval, only lines 20 and 32 were negative and
significant (P<0.05). Lines 11, 26, 28 and 29 showed significant and negative GCA effects
for ear aspect. Five lines representing 15.15% of the total, recorded positive and significant
GCA for ears per plant. None of the lines had negative and significant GCA effects for root
lodging while lines 10, 11 and 21 showed positive and significant GCA for root lodging.
Lines 8 and 32 had negative and significant (P<0.05) GCA for stalk lodging while lines 5,
6 and 18 recorded positive and significant GCA. For ear rot, lines 14 and 20 had positive
and significant GCA while line VL0510130 exhibited negative and significant GCA
effects.
5.4.6 General combining ability effects of testers for grain yield and other agronomic
traits across 13 locations
QPM tester 2 had negative and significant GCA for grain yield while non-QPM tester 4
had positive and significant (P<0.01) GCA for grain yield (Table 5.7). For days to pollen
shed, testers 1 and 4 recorded negative effects while testers 2 and 3 had significant positive
GCA effects. Tester 3 had significant positive effects for anthesis-silking interval, while
tester 4 had a significant negative effect. QPM tester 2 recorded positive and significant
GCA effects for ear aspect and ears per plant. Non-QPM tester 3 had negative and
significant GCA effects for ear aspect and ear per plant. None of the testers displayed
neither positive and significant nor significant negative GCA effects for root lodging. QPM
testers 1 and 2 had positive and significant GCA values for husk cover, while the non-QPM
tester had negative and significant GCA effects for husk cover. Tester 1 recorded positive
and significant GCA effects for ear rot, while tester 2 had negative and significant effects
for ear rot.
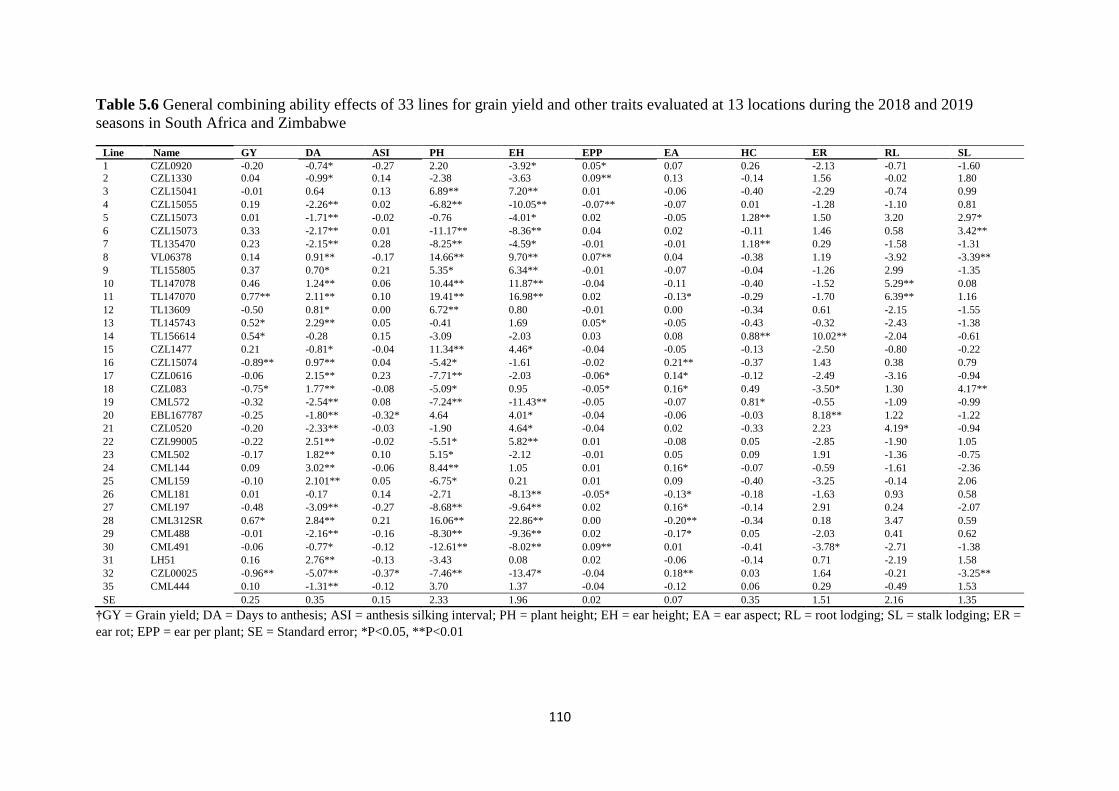
110
Table 5.6 General combining ability effects of 33 lines for grain yield and other traits evaluated at 13 locations during the 2018 and 2019
seasons in South Africa and Zimbabwe
Line
Name
GY DA ASI PH EH EPP EA HC ER RL SL
1 CZL0920 -0.20 -0.74* -0.27 2.20 -3.92* 0.05* 0.07 0.26 -2.13 -0.71 -1.60
2 CZL1330 0.04 -0.99* 0.14 -2.38 -3.63 0.09** 0.13 -0.14 1.56 -0.02 1.80
3 CZL15041 -0.01 0.64 0.13 6.89** 7.20** 0.01 -0.06 -0.40 -2.29 -0.74 0.99
4 CZL15055 0.19 -2.26** 0.02 -6.82** -10.05** -0.07** -0.07 0.01 -1.28 -1.10 0.81
5 CZL15073 0.01 -1.71** -0.02 -0.76 -4.01* 0.02 -0.05 1.28** 1.50 3.20 2.97*
6 CZL15073 0.33 -2.17** 0.01 -11.17** -8.36** 0.04 0.02 -0.11 1.46 0.58 3.42**
7 TL135470 0.23 -2.15** 0.28 -8.25** -4.59* -0.01 -0.01 1.18** 0.29 -1.58 -1.31
8 VL06378 0.14 0.91** -0.17 14.66** 9.70** 0.07** 0.04 -0.38 1.19 -3.92 -3.39**
9 TL155805 0.37 0.70* 0.21 5.35* 6.34** -0.01 -0.07 -0.04 -1.26 2.99 -1.35
10 TL147078 0.46 1.24** 0.06 10.44** 11.87** -0.04 -0.11 -0.40 -1.52 5.29** 0.08
11 TL147070 0.77** 2.11** 0.10 19.41** 16.98** 0.02 -0.13* -0.29 -1.70 6.39** 1.16
12 TL13609 -0.50 0.81* 0.00 6.72** 0.80 -0.01 0.00 -0.34 0.61 -2.15 -1.55
13 TL145743 0.52* 2.29** 0.05 -0.41 1.69 0.05* -0.05 -0.43 -0.32 -2.43 -1.38
14 TL156614 0.54* -0.28 0.15 -3.09 -2.03 0.03 0.08 0.88** 10.02** -2.04 -0.61
15 CZL1477 0.21 -0.81* -0.04 11.34** 4.46* -0.04 -0.05 -0.13 -2.50 -0.80 -0.22
16 CZL15074 -0.89** 0.97** 0.04 -5.42* -1.61 -0.02 0.21** -0.37 1.43 0.38 0.79
17 CZL0616 -0.06 2.15** 0.23 -7.71** -2.03 -0.06* 0.14* -0.12 -2.49 -3.16 -0.94
18 CZL083 -0.75* 1.77** -0.08 -5.09* 0.95 -0.05* 0.16* 0.49 -3.50* 1.30 4.17**
19 CML572 -0.32 -2.54** 0.08 -7.24** -11.43** -0.05 -0.07 0.81* -0.55 -1.09 -0.99
20 EBL167787 -0.25 -1.80** -0.32* 4.64 4.01* -0.04 -0.06 -0.03 8.18** 1.22 -1.22
21 CZL0520 -0.20 -2.33** -0.03 -1.90 4.64* -0.04 0.02 -0.33 2.23 4.19* -0.94
22 CZL99005 -0.22 2.51** -0.02 -5.51* 5.82** 0.01 -0.08 0.05 -2.85 -1.90 1.05
23 CML502 -0.17 1.82** 0.10 5.15* -2.12 -0.01 0.05 0.09 1.91 -1.36 -0.75
24 CML144 0.09 3.02** -0.06 8.44** 1.05 0.01 0.16* -0.07 -0.59 -1.61 -2.36
25 CML159 -0.10 2.101** 0.05 -6.75* 0.21 0.01 0.09 -0.40 -3.25 -0.14 2.06
26 CML181 0.01 -0.17 0.14 -2.71 -8.13** -0.05* -0.13* -0.18 -1.63 0.93 0.58
27 CML197 -0.48 -3.09** -0.27 -8.68** -9.64** 0.02 0.16* -0.14 2.91 0.24 -2.07
28 CML312SR 0.67* 2.84** 0.21 16.06** 22.86** 0.00 -0.20** -0.34 0.18 3.47 0.59
29 CML488 -0.01 -2.16** -0.16 -8.30** -9.36** 0.02 -0.17* 0.05 -2.03 0.41 0.62
30 CML491 -0.06 -0.77* -0.12 -12.61** -8.02** 0.09** 0.01 -0.41 -3.78* -2.71 -1.38
31 LH51 0.16 2.76** -0.13 -3.43 0.08 0.02 -0.06 -0.14 0.71 -2.19 1.58
32 CZL00025 -0.96** -5.07** -0.37* -7.46** -13.47* -0.04 0.18** 0.03 1.64 -0.21 -3.25**
35 CML444 0.10 -1.31** -0.12 3.70 1.37 -0.04 -0.12 0.06 0.29 -0.49 1.53
SE 0.25 0.35 0.15 2.33 1.96 0.02 0.07 0.35 1.51 2.16 1.35
†GY = Grain yield; DA = Days to anthesis; ASI = anthesis silking interval; PH = plant height; EH = ear height; EA = ear aspect; RL = root lodging; SL = stalk lodging; ER =
ear rot; EPP = ear per plant; SE = Standard error; *P<0.05, **P<0.01

111
Table 5.7 General combining ability effects of four testers for grain yield and other traits evaluated at 13 locations during the 2018 and 2019
seasons
Tester
Status
GY DA ASI PH EH RL SL HC EA ER EPP
t ha-1 cm % Scale (1-5)
1 QPM 0.05 -2.04** -0.02 -8.93** -11.98** 1.18 0.31 0.007** 0.055 2.19** -0.03
2 QPM -0.61** 1.87** 0.09 4.72** 5.23** 0.09 1.47** 0.006** 0.068* -1.88** 0.04**
3 Non-
QPM 0.05 0.83** 0.14* 7.81** 6.38** -0.04 0.46 -0.004** -0.118** -0.98 -0.04**
4 Non-
QPM 0.47** -0.54* -0.21** -3.30** 0.69 -1.22 -2.15** -0.008** -0.001 0.56 0.03
R-Square 0.15 0.24 0.07 0.87 1 1.3 0.55 0.001 0.030 0.63 0.01
†GY= Grain yield; DA = Days to anthesis; ASI = anthesis silking interval; PH = plant height; EH = ear height; RL = root lodging; SL = stalk lodging; HC = husk cover, EA =
ear aspect; ER = ear rot; EPP = ear per plant; *P<0.05, **P<0.01

112
5.4.7 Specific combining ability effects among the crosses for grain yield and other
measured traits across the 13 locations
The SCA values for the crosses ranged from -3.00 to 1.17 for yield. Thirty crosses,
representing 23.08% of the total, showed both positive and negative SCA effects (Table
5.8). Of these, 17 crosses had positive and significant effects while 13 crosses showed
negative and significant SCA effects. Hybrid 22 x 2 (entry 85) showed the highest SCA
effects for grain yield. Twelve hybrids showed significant and negative SCA effects for
days to pollen shed. For anthesis-silking interval, only four crosses showed significant
negative SCA effects while for ear aspect, only nine crosses of the 130, had negative and
significant SCA effects (Table 5.8). Only eight hybrids had positive and significant SCA
effects for ears per plant with hybrid 18 x 1 having the highest value. Across the 13
locations, only hybrid 10 x 1 out of the 130 crosses recorded significant and negative SCA
effects for root lodging, while for stalk lodging, three crosses had positive and significant
SCA effects and 6 x 4 had negative and significant SCA effects for stalk lodging. The SCA
of ear rot, ranged from -5.33 for 21 x 1 to 6.82 for 8 x 4. Of all the hybrids, only three had
significant and negative SCA effects and three also recorded positive and significant SCA
values for ear rot.
5.4.8 Heterotic groupings of the 33 inbred lines based on grain yield across the 13
locations from the combined analysis using specific combining ability
For an inbred line to be grouped in a heterotic group, the line must have significant
(P<0.05) positive SCA effects with one of the testers or also significant (P<0.05) negative
SCA effects with at least one of the other testers (Table 5.9). In addition, the line must
display a mean yield equal to or greater than one standard error above the grand mean of
all testcrosses involving the positive SCA tester. This will enable planned crosses to be
made. Based on this rule, 16 of the 33 inbred lines could be classified into a heterotic group.
The testers met the criteria for grouping the inbred lines into a heterotic group. Each testers
had at least negative and a positive SCA with lines. Having satisfied the criteria for
grouping, four lines were grouped with QPM tester CZL15049, six with QPM tester
CZL059 while non-QPM testers CML395 and CML444 could discriminate only three lines
each (Table 5.9).

113
Table 5.8 Specific combining ability effects of 33 QPM inbred lines crossed with four
testers evaluated for grain yield and other traits across 13 locations in South Africa and
Zimbabwe during the 2017/2018 and 2018/2019 cropping seasons
ENTRY GY DA ASI PH EH ER EA HC EPP RL SL
1 -0.17 -0.74 -0.23 -1.97 -2.21 0.09 -0.09 -0.37 0.04 0.72 0.30
2 0.70* -0.49 0.04 3.52 3.67 1.95 -0.11 -0.45 0.01 -3.43 1.46
3 -0.27 0.31 0.03 -1.67 -2.33 -2.75 0.16 1.58** -0.07 -0.39 0.46
4 -0.23 0.80 0.15 -0.17 0.54 0.83 0.04 -0.76 0.02 3.09 -2.15
5 -0.39 0.20 0.17 -4.37 -5.25* -1.65 -0.11 -0.06 -0.06 -2.77 0.30**
6 0.13 0.26 0.09 0.18 1.06 -0.69 0.13 -0.34 0.00 -0.86 1.46
7 -0.33 -0.01 0.04 0.94 0.96 1.44 0.01 -0.22 0.00 2.52 0.46
8 0.62 -0.56 -0.30 2.97 2.91 1.01 -0.03 0.62 0.04 1.10 -2.15
9 -0.15 -0.65 -0.13 -3.31 -4.59 -1.01 -0.10 0.00 -0.01 0.56 0.30
10 -0.23 -1.25** 0.17 -12.63** -7.19** 1.12 0.12 -0.07 -0.02 0.63 1.46
11 -0.20 0.98* 0.20 -1.30 -1.63 3.97 0.06 -0.02 0.01 -2.29 0.46
12 0.62 0.81 -0.25 16.95 13.10** -3.96 -0.08 0.08 0.02 1.09 -2.15
13 -0.95** -0.10 0.29 -7.83* -2.21 0.51 0.11 1.27* 0.05 1.25 0.30
14 0.42 -0.23 0.02 3.91 0.30 0.44 -0.09 -0.53 -0.03 -1.73 1.46
15 0.02 0.03 -0.33 -6.55 -6.66** -2.00 0.06 -0.27 -0.01 0.57 0.46
16 0.55 0.18 0.02 10.19** 8.25** 1.16 -0.08 -0.48 -0.01 -0.09 -2.15
17 -0.61 -0.23 0.14 -2.43 -1.09 -0.84 -0.05 0.50 0.02 4.65 0.30
18 0.37 -1.17** 0.17 2.58 -1.44 4.02 0.01 -0.12 -0.01 1.54 1.46
19 -0.16 1.24** -0.03 -1.63 0.77 0.66 0.05 -0.65 -0.04 -2.13 0.46
20 0.44 0.04 -0.29 1.19 1.45 -3.72 -0.01 0.27 0.03 -4.06 -2.15
21 -0.47 1.08** 0.26 -8.01* -5.59* -0.25 0.07 -0.33 0.03 0.53 0.30
22 -0.02 -0.10 -0.24 3.75 5.46* -1.51 -0.17* 0.05 -0.03 -2.65 1.46
23 0.72* -0.87* 0.10 -2.82 -1.27 1.88 0.06 0.25 0.05 0.60 0.46
24 -0.19 -0.22 -0.13 6.79 1.08 0.00 0.03 0.02 -0.05 1.52 -2.15*
25 -0.68* 1.13** 0.30 0.25 2.14 -0.43 0.07 -0.27 -0.04 2.18 0.30
26 -0.28 -0.96* 0.26 -1.43 -5.38* 1.14 -0.08 0.28 0.00 0.40 1.46
27 0.17 0.23 -0.52** -3.43 -3.23 0.45 0.03 -0.07 0.00 -2.96 0.46
28 0.83* -0.51 -0.05 4.32 6.16* -1.05 -0.01 0.06 0.04 0.38 -2.15
29 0.00 -0.62 -0.06 -2.08 0.44 -3.40 0.04 0.04 -0.09* -0.84 0.30
30 -0.16 0.06 -0.07 0.41 -0.46 -1.33 0.03 -0.07 0.04 0.17 1.46
31 0.37 0.28 0.08 0.74 2.69 -1.98 -0.02 0.05 -0.04 2.36 0.46
32 -0.17 0.16 0.05 0.65 -2.99 6.82** -0.06 -0.02 0.09* -1.69 -2.15
33 0.33 0.33 -0.09 7.30* 3.76 1.58 -0.06 -0.13 -0.06 -1.28 0.30
34 -0.45 0.12 -0.10 -2.19 0.05 -0.33 -0.06 -0.31 0.09* -1.71 1.46
35 0.10 -0.04 0.17 -3.36 -6.16* 1.39 0.13 -0.27 -0.04 4.12 0.46
36 0.06 -0.51 0.02 -2.04 2.04 -2.53 -0.01 0.71 0.00 -1.14 -2.15
37 0.41 0.52 -0.02 6.03 1.83 0.87 0.03 -0.01 0.02 -6.49* 0.30
38 -0.34 -0.50 0.06 -2.60 -2.53 0.89 -0.08 -0.01 -0.03 1.54 1.46
39 0.00 0.61 0.01 -0.42 -0.01 -0.39 0.10 0.04 0.00 4.32 0.46
40 -0.03 -0.74 -0.06 -3.29 0.40 -1.26 0.05 -0.02 0.01 0.62 -2.15
41 1.08** -0.24 0.02 -1.98 -2.24 0.92 -0.10 0.01 -0.04 -2.57 0.30
†GY= grain yield; DA = days to anthesis; ASI - anthesis silking interval; PH = plant height; EH = ear height; EA = ear
aspect; RL = root lodging; SL = stalk lodging; ER = ear rot; EPP = ear per plant; SE = Standard error; *P<0.05,
**P<0.01

114
Table 5.8 Specific combining ability effects of 33 QPM inbred lines crossed with four
testers evaluated for grain yield and other traits across 13 locations in South Africa and
Zimbabwe during the 2017/2018 and 2018/2019 cropping seasons (continued)
ENTRY GY DA ASI PH EH ER
EA HC
EPP RL SL
42 -0.12 0.09 -0.10 -2.21 0.59 -0.80 -0.03 -0.12 0.03 3.15 1.46
43 0.00 0.27 0.17 5.80 4.66 1.04 0.06 -0.07 -0.01 0.60 0.46
44 -0.92** -0.23 -0.10 -1.90 -3.33 -1.05 0.07 0.17 0.01 -1.19 -2.15
45 -0.42 -2.14** -0.15 -10.01** -6.43** 0.55 -0.02 0.04 0.03 0.32 0.30
46 0.32 0.77 -0.04 5.62 3.42 1.91 -0.05 -0.13 -0.06 -1.21 1.46
47 -0.11 0.03 0.11 -4.76 -3.14 1.05 0.04 0.05 0.00 1.96 0.46
48 0.25 1.22** 0.07 8.87** 5.83* -3.39 0.02 0.04 0.03 -1.07 -2.15
49 0.21 1.77** 0.07 5.56 4.97 3.95 -0.08 0.08 -0.03 -3.40 0.30
50 -0.84** -1.02** -0.24 -7.06* -7.69** 2.78 0.19 -0.03 0.00 2.14 1.46
51 0.18 0.17 -0.17 0.41 -0.05 -1.35 -0.01 0.02 -0.01 0.07 0.46
52 0.48 -1.03** 0.33 0.80 2.45 -5.28* -0.11 -0.06 0.04 1.18 -2.15
53 -0.34 0.69 -0.11 -11.85** -0.50 0.18 0.08 -0.50 -0.01 2.08 0.30
54 0.46 -0.87* 0.54** 4.89 0.05 1.71 0.05 0.31 0.11** -3.01 1.46
55 -0.47 0.09 -0.20 1.20 -0.97 -4.55 -0.13 -0.68 -0.02 -0.59 0.46
56 0.39 -0.03 -0.23 5.48 1.10 2.77 0.00 0.87 -0.08* 1.52 -2.15
57 -0.33 0.10 0.16 -6.40 -4.05 4.16 0.15 0.45 0.02 0.00 0.30
58 0.24 0.13 -0.65** 3.24 0.70 -2.44 0.00 -0.28 -0.01 -0.16 1.46
59 0.70** -1.07** 0.11 5.36 4.53 -0.79 -0.01 -0.23 -0.02 -0.15 0.46
60 -0.58 0.73 0.38 -2.49 -1.49 -0.82 -0.14 0.06 0.00 0.30 -2.15
61 0.51 0.08 0.12 11.99** 7.50** -2.71 -0.12 -0.10 0.06 -0.32 0.30
62 -0.16 0.90* -0.35 -6.33 -1.89 -0.01 0.18 -0.05 -0.06 -1.55 1.46
63 -0.54 0.13 0.03 -9.49** -6.02* 4.95* 0.07 -0.06 -0.01 1.07 0.46
64 0.23 -1.22** 0.19 3.54 0.10 -2.11 -0.14 0.21 0.01 0.79 -2.15
65 0.50 -0.05 0.16 5.13 1.54 2.20 -0.10 -0.03 0.03 -0.50 0.30
66 -1.11** 0.28 0.04 -6.47 -4.18 -2.25 0.25 0.01 -0.08* -0.84 1.46
67 0.08 -0.26 -0.20 -1.39 2.48 0.23 -0.04 0.09 0.03 0.67 0.46
68 0.56 -0.08 0.00 2.45 -0.15 -0.07 -0.12 -0.06 0.02 0.67 -2.15
69 0.94** -0.40 -0.42* 14.66** 11.68 -0.82 -0.21** -0.79 0.20** 1.19 0.30
70 -2.27** 3.03** 0.85** -30.00** -18.60** 2.40 0.72** 1.72** -0.31** 1.75 1.46
71 0.67* -0.39 -0.28 12.29 9.35** -2.43 -0.29** -0.63 0.11** -2.34 0.46
72 0.69* -2.16 -0.16 2.77 -2.74 0.96 -0.21** -0.31 -0.02 -0.60 -2.15
73 -0.23 -0.24 0.00 -6.45 -1.64 1.65 0.13 -0.85 0.05 2.41 0.30
74 0.69* -1.53** 0.19 6.67 -0.34 3.53 -0.10 2.50** -0.03 0.95 1.46
75 0.28 0.85** 0.11 0.91 -2.62 -0.25 0.07 -0.41 0.03 -4.19 0.46
76 -0.70* 0.80 -0.31 -1.42 4.29 -4.82* -0.11 -1.24* -0.05 0.83 -2.15
77 -0.26 0.40 -0.07 -5.43 -3.04 2.06 0.06 0.56 -0.02 2.94 0.30
78 -1.19** 0.83* -0.23 7.20* 5.99* -3.07 -0.02 -0.43 0.04 -2.30 0.46
79 0.87* 0.52 0.39 2.66 1.96 -0.76 0.02 -0.11 0.02 -0.56 -2.15
80 -0.32 0.39 -0.16 2.56 -2.90 -5.33** 0.16 0.03 0.00 2.49 0.30
81 0.63* 0.38 -0.16 4.68 6.10* 1.31 -0.30** -0.21 0.08 1.34 1.46
82 -0.23 -0.40 0.33 -4.18 -3.10 0.70 0.18* -0.01 -0.02 -2.22 0.46
83 -0.04 -0.48 -0.01 -3.34 -0.42 3.44 -0.04 0.19 -0.05 -1.62 -2.15
†GY= grain yield; DA = days to anthesis; ASI - anthesis silking interval; PH = plant height; EH = ear height; EA = ear aspect; RL =
root lodging; SL = stalk lodging; ER = ear rot; EPP = ear per plant; SE = Standard error; *P<0.05, **P<0.01
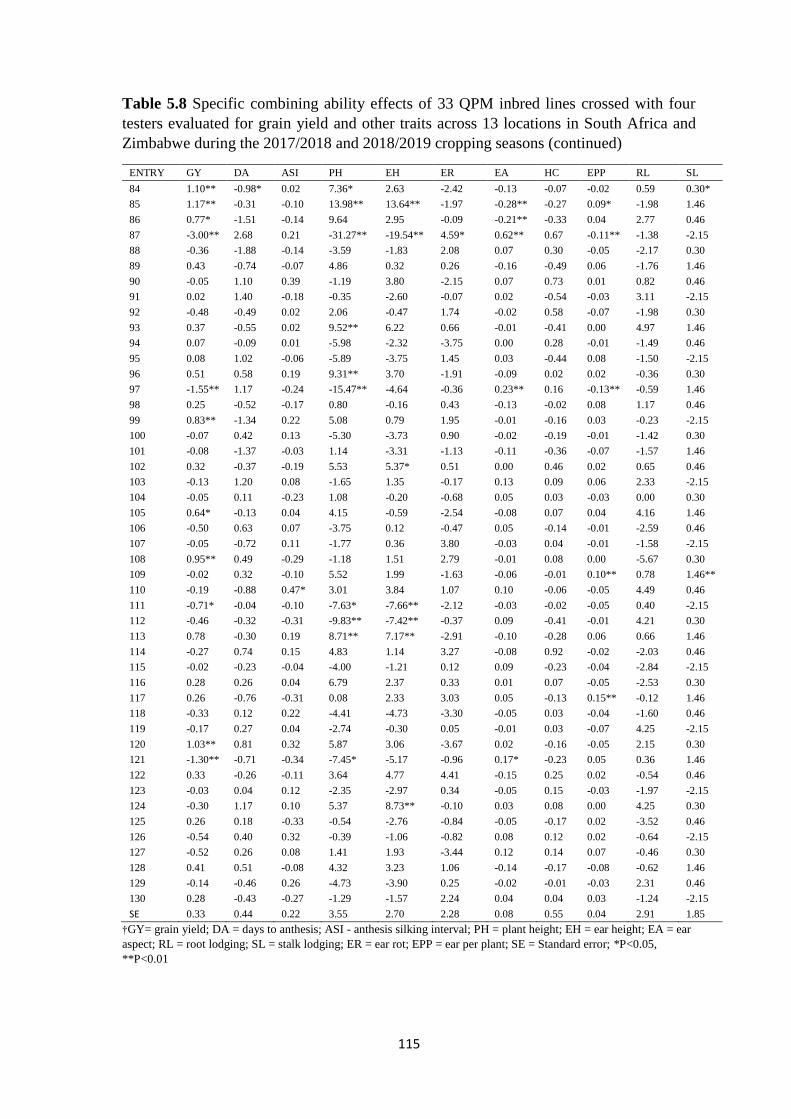
115
Table 5.8 Specific combining ability effects of 33 QPM inbred lines crossed with four
testers evaluated for grain yield and other traits across 13 locations in South Africa and
Zimbabwe during the 2017/2018 and 2018/2019 cropping seasons (continued)
ENTRY GY DA ASI PH EH ER EA HC EPP RL SL
84 1.10** -0.98* 0.02 7.36* 2.63 -2.42 -0.13 -0.07 -0.02 0.59 0.30*
85 1.17** -0.31 -0.10 13.98** 13.64** -1.97 -0.28** -0.27 0.09* -1.98 1.46
86 0.77* -1.51 -0.14 9.64 2.95 -0.09 -0.21** -0.33 0.04 2.77 0.46
87 -3.00** 2.68 0.21 -31.27** -19.54** 4.59* 0.62** 0.67 -0.11** -1.38 -2.15
88 -0.36 -1.88 -0.14 -3.59 -1.83 2.08 0.07 0.30 -0.05 -2.17 0.30
89 0.43 -0.74 -0.07 4.86 0.32 0.26 -0.16 -0.49 0.06 -1.76 1.46
90 -0.05 1.10 0.39 -1.19 3.80 -2.15 0.07 0.73 0.01 0.82 0.46
91 0.02 1.40 -0.18 -0.35 -2.60 -0.07 0.02 -0.54 -0.03 3.11 -2.15
92 -0.48 -0.49 0.02 2.06 -0.47 1.74 -0.02 0.58 -0.07 -1.98 0.30
93 0.37 -0.55 0.02 9.52** 6.22 0.66 -0.01 -0.41 0.00 4.97 1.46
94 0.07 -0.09 0.01 -5.98 -2.32 -3.75 0.00 0.28 -0.01 -1.49 0.46
95 0.08 1.02 -0.06 -5.89 -3.75 1.45 0.03 -0.44 0.08 -1.50 -2.15
96 0.51 0.58 0.19 9.31** 3.70 -1.91 -0.09 0.02 0.02 -0.36 0.30
97 -1.55** 1.17 -0.24 -15.47** -4.64 -0.36 0.23** 0.16 -0.13** -0.59 1.46
98 0.25 -0.52 -0.17 0.80 -0.16 0.43 -0.13 -0.02 0.08 1.17 0.46
99 0.83** -1.34 0.22 5.08 0.79 1.95 -0.01 -0.16 0.03 -0.23 -2.15
100 -0.07 0.42 0.13 -5.30 -3.73 0.90 -0.02 -0.19 -0.01 -1.42 0.30
101 -0.08 -1.37 -0.03 1.14 -3.31 -1.13 -0.11 -0.36 -0.07 -1.57 1.46
102 0.32 -0.37 -0.19 5.53 5.37* 0.51 0.00 0.46 0.02 0.65 0.46
103 -0.13 1.20 0.08 -1.65 1.35 -0.17 0.13 0.09 0.06 2.33 -2.15
104 -0.05 0.11 -0.23 1.08 -0.20 -0.68 0.05 0.03 -0.03 0.00 0.30
105 0.64* -0.13 0.04 4.15 -0.59 -2.54 -0.08 0.07 0.04 4.16 1.46
106 -0.50 0.63 0.07 -3.75 0.12 -0.47 0.05 -0.14 -0.01 -2.59 0.46
107 -0.05 -0.72 0.11 -1.77 0.36 3.80 -0.03 0.04 -0.01 -1.58 -2.15
108 0.95** 0.49 -0.29 -1.18 1.51 2.79 -0.01 0.08 0.00 -5.67 0.30
109 -0.02 0.32 -0.10 5.52 1.99 -1.63 -0.06 -0.01 0.10** 0.78 1.46**
110 -0.19 -0.88 0.47* 3.01 3.84 1.07 0.10 -0.06 -0.05 4.49 0.46
111 -0.71* -0.04 -0.10 -7.63* -7.66** -2.12 -0.03 -0.02 -0.05 0.40 -2.15
112 -0.46 -0.32 -0.31 -9.83** -7.42** -0.37 0.09 -0.41 -0.01 4.21 0.30
113 0.78 -0.30 0.19 8.71** 7.17** -2.91 -0.10 -0.28 0.06 0.66 1.46
114 -0.27 0.74 0.15 4.83 1.14 3.27 -0.08 0.92 -0.02 -2.03 0.46
115 -0.02 -0.23 -0.04 -4.00 -1.21 0.12 0.09 -0.23 -0.04 -2.84 -2.15
116 0.28 0.26 0.04 6.79 2.37 0.33 0.01 0.07 -0.05 -2.53 0.30
117 0.26 -0.76 -0.31 0.08 2.33 3.03 0.05 -0.13 0.15** -0.12 1.46
118 -0.33 0.12 0.22 -4.41 -4.73 -3.30 -0.05 0.03 -0.04 -1.60 0.46
119 -0.17 0.27 0.04 -2.74 -0.30 0.05 -0.01 0.03 -0.07 4.25 -2.15
120 1.03** 0.81 0.32 5.87 3.06 -3.67 0.02 -0.16 -0.05 2.15 0.30
121 -1.30** -0.71 -0.34 -7.45* -5.17 -0.96 0.17* -0.23 0.05 0.36 1.46
122 0.33 -0.26 -0.11 3.64 4.77 4.41 -0.15 0.25 0.02 -0.54 0.46
123 -0.03 0.04 0.12 -2.35 -2.97 0.34 -0.05 0.15 -0.03 -1.97 -2.15
124 -0.30 1.17 0.10 5.37 8.73** -0.10 0.03 0.08 0.00 4.25 0.30
125 0.26 0.18 -0.33 -0.54 -2.76 -0.84 -0.05 -0.17 0.02 -3.52 0.46
126 -0.54 0.40 0.32 -0.39 -1.06 -0.82 0.08 0.12 0.02 -0.64 -2.15
127 -0.52 0.26 0.08 1.41 1.93 -3.44 0.12 0.14 0.07 -0.46 0.30
128 0.41 0.51 -0.08 4.32 3.23 1.06 -0.14 -0.17 -0.08 -0.62 1.46
129 -0.14 -0.46 0.26 -4.73 -3.90 0.25 -0.02 -0.01 -0.03 2.31 0.46
130 0.28 -0.43 -0.27 -1.29 -1.57 2.24 0.04 0.04 0.03 -1.24 -2.15
SE 0.33 0.44 0.22 3.55 2.70 2.28 0.08 0.55 0.04 2.91 1.85
†GY= grain yield; DA = days to anthesis; ASI - anthesis silking interval; PH = plant height; EH = ear height; EA = ear
aspect; RL = root lodging; SL = stalk lodging; ER = ear rot; EPP = ear per plant; SE = Standard error; *P<0.05,
**P<0.01

116
Table 5.9 Classification of 33 maize inbred lines into heterotic groups based on the
specific combining ability across 13 locations in Zimbabwe and South Africa
CZL15049 CZL059 CML395 CML444
4 (QPM) 19 (non-QPM) 20 (non-QPM) 7 (QPM)
11 (QPM) 31 (QPM) 6 (QPM) 22 (non-QPM)
18 (QPM) 13 (QPM) 15 (QPM) 25 (QPM)
28 (non-QPM) 17 (QPM)
21 (non-QPM)
27 (QPM)
5.4.9 Estimation of yield differences of QPM and non-QPM hybrids and the
performance of the parents for grain yield, days to anthesis, plant height and
tryptophan
From the group which was made up of lines 16 (QPM), 19 (non-QPM) and 2 (QPM) (Table
5.10), the non-QPM genotype (line 2 x CML395) produced the highest grain yield of 7.51
t ha-1 however, a QPM genotype involving the cross between line 16 x CZL059 produced
33.18% more grain yield than non-QPM hybrids in that group. Line 2 produced the highest
grain yield in that category and was found to have positive GCA as well as positive SCA
with the non-QPM testers (Table 5.10). In the group containing lines 1 (QPM), 27 (QPM)
and 11 (QPM), the QPM line 11 hybrids were the best in this study. Line 11 x CZL15049
gave a grain yield of 8.90 t ha-1. This hybrid yielded 62.11% more than non-QPM hybrids
in this group. Line 11 took 81 days to flower. It was noticed that non-QPM testers
combined better with the lines than QPM testers. In the group consisting of lines 30, 31
and 13, the QPM hybrids were inferior in terms grain yield to the non-QPM hybrids where
the QPM hybrid from line 13 x CZL15049 yielded 30.56% less than the non-QPM hybrid
in this group. QPM line 31 combined well with QPM CZL15049 (Table 5.10).

117
Table 5.10 Grain yield differences between QPM and non-QPM hybrids and the performance of the parents for grain yield, days to anthesis,
plant height and tryptophan
Grain yield (t ha-1)
GCA
Line
Lines SCA
Line QPM tester Non-QPM tester GY DA PH TRP QPM tester Non-QPM tester
CZL15049 CZL059 CML444 CML395 t ha-1 cm % CZL15049 CZL059 CML444 CML395
L16 QPM(P1) 5.93 4.49 4.78 6.20 -0.89 2.67 78.49 151.55 0.079 0.51 -0.16 -0.54 0.23
L19 non-QPM(P2) 5.83 6.11 6.21 5.90 -0.32 1.69 72.91 149.48 0.035 -0.23 0.69 0.28 -0.70
L2 QPM(Res L1) 6.08 5.98 5.91 7.51 0.04 3.15 77.27 172.76 0.081 -0.39 0.13 -0.33 0.62 % over L16 2.53 33.18 23.64 21.13 -104.49 17.98 -1.55 14.00 2.530 -176.47 -181.25 -38.89 169.57
% over L19 4.29 -2.13 -4.83 27.29 -112.50 86.39 5.98 15.57 131.430 69.57 -81.16 -217.86 -188.57
L26 QPM(P1) 6.36 5.39 6.90 6.75 0.01 2.80 72.75 145.71 0.078 -0.07 -0.08 0.32 -0.13
L20 non-QPM(P2) 5.71 4.52 7.35 -0.25 1.22 77.77 159.02 0.036 -0.26 -1.19 0.87
L3 QPM(Res L1) 5.97 5.46 6.18 7.76 -0.01 2.79 76.72 189.28 0.090 -0.15 -0.23 -0.20 0.62 % over L26 -6.13 1.30 -10.43 14.96 -200.00 -0.36 5.46 29.90 15.380 114.29 187.50 -162.50 -576.92
% over L20 4.55 36.73 5.58 -96.00 128.69 -1.35 19.03 150.000 -42.31 -83.19 -28.74
L16 QPM(P1) 5.93 4.49 4.78 6.20 0.01 2.67 78.49 151.55 0.079 0.51 -0.16 -0.54 0.23
L19 non-QPM(P2) 5.83 6.11 6.21 5.90 -0.32 1.69 72.91 149.48 0.035 -0.23 0.69 0.28 -0.70
L4 QPM(Res L1) 5.10 6.35 6.77 7.63 0.19 3.57 71.28 158.18 0.080 -0.95 0.42 0.02 0.55 % over L16 -14.00 41.43 41.63 23.06 1800.00 33.71 -9.19 4.37 1.270 -286.27 -362.50 -103.70 139.13
% over L19 -12.52 3.93 9.02 29.32 -159.38 111.24 -2.24 5.82 128.570 313.04 -39.13 -92.86 -178.57
L1 QPM(P1) 5.79 6.23 5.63 6.56 -0.20 2.88 78.94 159.53 0.074 -0.17 0.70 -0.27 -0.23
L19 non-QPM(P2) 5.83 6.11 6.21 5.90 -0.32 1.69 72.91 149.48 0.035 -0.23 0.69 0.28 -0.70 L5 QPM(Res L1) 5.65 6.51 6.26 7.21 0.01 2.95 72.45 160.25 0.066 -0.61 0.37 -0.16 0.44
% over L1 -2.42 4.49 11.19 9.91 -105.00 2.43 -8.22 0.45 -10.810 258.82 -47.14 -40.74 -291.30
% over L19 -3.09 6.55 0.81 22.20 -103.13 74.56 -0.63 7.20 88.570 165.22 -46.38 -157.14 -162.86
L1 QPM(P1) 5.79 6.23 5.63 6.56 -0.20 2.88 78.94 159.53 0.074 -0.17 0.70 -0.27 -0.23
L22 non-QPM(P2) 7.29 6.82 6.62 3.08 -0.22 2.31 80.40 147.57 0.042 1.10 1.17 0.77 -3.00
L6 QPM(Res L1) 6.22 5.77 7.46 6.92 0.33 2.22 72.44 133.17 0.091 -0.47 -0.02 0.72 -0.19
% over L1 7.43 -7.38 32.50 5.49 -265.00 -22.92 -8.23 -16.52 22.970 176.47 -102.86 -366.67 -17.39
% over L22 -14.68 -15.40 12.69 124.68 -250.00 -3.90 -9.90 -9.76 116.670 -142.73 -101.71 -6.49 -93.67
† GY = grain yield; DA = days to anthesis; PH = plant height, TRP = tryptophan; GCA = general combining ability; SCA = specific combining ability; QPM = quality protein maize; non-QPM
= non quality protein maize
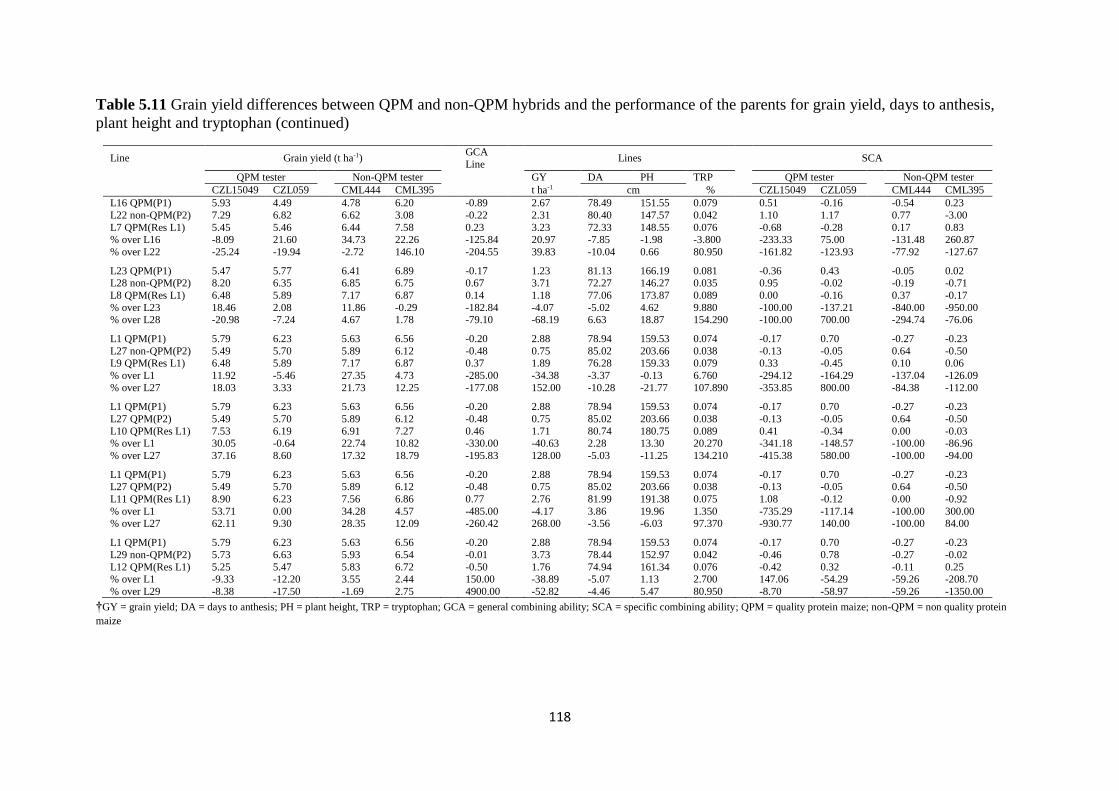
118
Table 5.11 Grain yield differences between QPM and non-QPM hybrids and the performance of the parents for grain yield, days to anthesis,
plant height and tryptophan (continued)
Line Grain yield (t ha-1) GCA
Line Lines SCA
QPM tester Non-QPM tester GY DA PH TRP QPM tester Non-QPM tester
CZL15049 CZL059 CML444 CML395 t ha-1 cm % CZL15049 CZL059 CML444 CML395
L16 QPM(P1) 5.93 4.49 4.78 6.20 -0.89 2.67 78.49 151.55 0.079 0.51 -0.16 -0.54 0.23
L22 non-QPM(P2) 7.29 6.82 6.62 3.08 -0.22 2.31 80.40 147.57 0.042 1.10 1.17 0.77 -3.00
L7 QPM(Res L1) 5.45 5.46 6.44 7.58 0.23 3.23 72.33 148.55 0.076 -0.68 -0.28 0.17 0.83 % over L16 -8.09 21.60 34.73 22.26 -125.84 20.97 -7.85 -1.98 -3.800 -233.33 75.00 -131.48 260.87
% over L22 -25.24 -19.94 -2.72 146.10 -204.55 39.83 -10.04 0.66 80.950 -161.82 -123.93 -77.92 -127.67
L23 QPM(P1) 5.47 5.77 6.41 6.89 -0.17 1.23 81.13 166.19 0.081 -0.36 0.43 -0.05 0.02 L28 non-QPM(P2) 8.20 6.35 6.85 6.75 0.67 3.71 72.27 146.27 0.035 0.95 -0.02 -0.19 -0.71
L8 QPM(Res L1) 6.48 5.89 7.17 6.87 0.14 1.18 77.06 173.87 0.089 0.00 -0.16 0.37 -0.17
% over L23 18.46 2.08 11.86 -0.29 -182.84 -4.07 -5.02 4.62 9.880 -100.00 -137.21 -840.00 -950.00 % over L28 -20.98 -7.24 4.67 1.78 -79.10 -68.19 6.63 18.87 154.290 -100.00 700.00 -294.74 -76.06
L1 QPM(P1) 5.79 6.23 5.63 6.56 -0.20 2.88 78.94 159.53 0.074 -0.17 0.70 -0.27 -0.23
L27 non-QPM(P2) 5.49 5.70 5.89 6.12 -0.48 0.75 85.02 203.66 0.038 -0.13 -0.05 0.64 -0.50
L9 QPM(Res L1) 6.48 5.89 7.17 6.87 0.37 1.89 76.28 159.33 0.079 0.33 -0.45 0.10 0.06
% over L1 11.92 -5.46 27.35 4.73 -285.00 -34.38 -3.37 -0.13 6.760 -294.12 -164.29 -137.04 -126.09
% over L27 18.03 3.33 21.73 12.25 -177.08 152.00 -10.28 -21.77 107.890 -353.85 800.00 -84.38 -112.00
L1 QPM(P1) 5.79 6.23 5.63 6.56 -0.20 2.88 78.94 159.53 0.074 -0.17 0.70 -0.27 -0.23
L27 QPM(P2) 5.49 5.70 5.89 6.12 -0.48 0.75 85.02 203.66 0.038 -0.13 -0.05 0.64 -0.50
L10 QPM(Res L1) 7.53 6.19 6.91 7.27 0.46 1.71 80.74 180.75 0.089 0.41 -0.34 0.00 -0.03 % over L1 30.05 -0.64 22.74 10.82 -330.00 -40.63 2.28 13.30 20.270 -341.18 -148.57 -100.00 -86.96
% over L27 37.16 8.60 17.32 18.79 -195.83 128.00 -5.03 -11.25 134.210 -415.38 580.00 -100.00 -94.00
L1 QPM(P1) 5.79 6.23 5.63 6.56 -0.20 2.88 78.94 159.53 0.074 -0.17 0.70 -0.27 -0.23 L27 QPM(P2) 5.49 5.70 5.89 6.12 -0.48 0.75 85.02 203.66 0.038 -0.13 -0.05 0.64 -0.50
L11 QPM(Res L1) 8.90 6.23 7.56 6.86 0.77 2.76 81.99 191.38 0.075 1.08 -0.12 0.00 -0.92
% over L1 53.71 0.00 34.28 4.57 -485.00 -4.17 3.86 19.96 1.350 -735.29 -117.14 -100.00 300.00 % over L27 62.11 9.30 28.35 12.09 -260.42 268.00 -3.56 -6.03 97.370 -930.77 140.00 -100.00 84.00
L1 QPM(P1) 5.79 6.23 5.63 6.56 -0.20 2.88 78.94 159.53 0.074 -0.17 0.70 -0.27 -0.23
L29 non-QPM(P2) 5.73 6.63 5.93 6.54 -0.01 3.73 78.44 152.97 0.042 -0.46 0.78 -0.27 -0.02
L12 QPM(Res L1) 5.25 5.47 5.83 6.72 -0.50 1.76 74.94 161.34 0.076 -0.42 0.32 -0.11 0.25 % over L1 -9.33 -12.20 3.55 2.44 150.00 -38.89 -5.07 1.13 2.700 147.06 -54.29 -59.26 -208.70
% over L29 -8.38 -17.50 -1.69 2.75 4900.00 -52.82 -4.46 5.47 80.950 -8.70 -58.97 -59.26 -1350.00
†GY = grain yield; DA = days to anthesis; PH = plant height, TRP = tryptophan; GCA = general combining ability; SCA = specific combining ability; QPM = quality protein maize; non-QPM = non quality protein
maize

119
Table 5.12 Grain yield differences between QPM and non-QPM hybrids and the performance of the parents for grain yield, days to anthesis,
plant height and tryptophan (continued)
Line Grain yield (t ha-1) GCA
Lines Lines SCA
QPM tester Non-QPM tester GY DA PH TRP QPM tester Non-QPM tester
CZL15049 CZL059 CML444 CML395 t ha-1 cm % CZL15049 CZL059 CML444 CML395
L30 non-QPM(P1) 6.63 5.89 5.91 6.52 -0.06 2.88 78.94 159.53 0.074 0.28 0.26 -0.33 -0.17
L31 QPM(P2) 7.56 4.65 6.81 7.25 0.16 3.73 78.44 152.97 0.042 1.03 -1.30 0.33 -0.03
L13 QPM(Res L1) 5.25 5.47 5.83 6.72 0.52 2.96 78.74 155.77 0.077 0.21 -0.84 0.18 0.48
% over L30 -20.81 -7.13 -1.35 3.07 -966.67 2.78 -0.25 -2.36 4.050 -25.00 -423.08 -154.55 -382.35
% over L31 -30.56 17.63 -14.39 -7.31 225.00 -20.64 0.38 1.83 83.330 -79.61 -35.38 -45.45 -1700.00
L30 non-QPM(P1) 6.63 5.89 5.91 6.52 -0.06 3.20 79.97 170.37 0.042 0.28 0.26 -0.33 -0.17
L19 non-QPM(P2) 5.83 6.11 6.21 5.90 -0.32 1.69 72.91 149.48 0.035 -0.23 0.69 0.28 -0.70
L14 QPM(Res L1) 6.73 6.86 6.27 7.75 0.54 2.86 76.52 170.48 0.082 -0.34 0.46 -0.47 0.39
% over L30 1.51 16.47 6.09 18.87 1000.00 -10.63 -4.31 0.06 95.240 -221.43 76.92 42.42 -329.41
% over L19 15.44 12.27 0.97 31.36 -268.75 69.23 4.95 14.05 134.290 47.83 -33.33 -267.86 -155.71
L23 QPM(P1) 5.47 5.77 6.41 6.89 -0.17 1.23 81.13 166.19 0.081 -0.36 0.43 -0.05 0.02
L28 non-QPM(P2) 8.20 6.35 6.85 6.75 0.67 3.71 72.27 146.27 0.035 0.95 -0.02 -0.19 -0.71
L15 QPM(Res L1) 5.82 6.14 7.25 6.51 0.21 1.34 75.54 185.98 0.083 -0.33 0.24 0.70 -0.58
% over L23 6.40 6.41 13.10 -5.52 -223.53 8.94 -6.89 11.91 2.470 -8.33 -44.19 -1500.00 -3000.00
% over L28 -29.02 -3.31 5.84 -3.56 -68.66 -63.88 4.52 27.15 137.140 -134.74 -1300.00 -468.42 -18.31
L24 QPM(P1) 5.58 6.02 6.91 7.01 0.09 3.25 78.24 162.94 0.085 -0.48 0.37 0.07 0.08
L32 non-QPM(P2) 4.71 5.18 5.27 -0.96 1.87 75.35 181.83 0.042 -0.30 0.26 -0.54
L17 QPM(Res L1) 6.89 4.51 6.56 7.05 -0.06 2.59 79.62 158.54 0.094 0.50 -1.11 0.08 0.56
% over L24 23.48 -25.08 -5.07 0.57 -166.67 -20.31 1.76 -2.70 10.590 -204.17 -400.00 14.29 600.00
% over L32 46.28 26.64 33.78 -93.75 38.50 5.67 -12.81 123.810 -266.67 -69.23 -203.70
L25 QPM(P1) 6.96 4.16 6.36 7.68 -0.10 1.70 77.01 159.08 0.084 0.51 -1.55 0.25 0.83
L21non-QPM(P2) 6.02 6.04 5.73 6.51 -0.20 2.39 73.94 165.81 0.040 -0.32 0.63 -0.23 -0.04
L18 QPM(Res L1) 6.34 2.38 6.34 6.96 -0.75 3.16 80.76 184.36 0.086 0.94 -2.27 0.67 0.69
% over L25 -8.91 -42.79 -0.31 -9.38 650.00 85.88 4.87 15.89 2.380 84.31 46.45 168.00 -16.87
% over L21 5.32 -60.60 10.65 6.91 275.00 32.22 9.22 11.19 115.000 -393.75 -460.32 -391.30 -1825.00
† GY = grain yield; DA = days to anthesis; PH = plant height, TRP = tryptophan; GCA = general combining ability; SCA = specific combining ability; QPM = quality protein maize; non-QPM = non quality protein
maize

120
5.5 Discussion
Successful crop enhancement through genetic manipulation in breeding programmes
depends on the ability of the parental material to transfer traits of interest to their offspring
for inbred or heterozygous crops. It depends on combining ability, especially SCA for
hybrids. Also, it is essential that germplasm used in breeding programmes are carefully
selected in order to determine their integral potential. GCA and SCA identifies breeding
values of genotypes (Alamerew and Warsi 2015). The SCA is mainly due to non-additive
or over dominant and epistatic gene action effects, while GCA is due to additive gene
action. Variances due to SCA and GCA were accessed in order to ascertain the type of
gene action primarily controlling the inheritance of grain yield and yield related
characteristics. The results from this study, involving QPM and non-QPM lines crossed
with QPM and non-QPM testers, showed variation and significant differences for GCA for
lines and testers and SCA effects for single cross hybrids. This indicates the presence of
both additive and non-additive gene actions conditioning the inheritance of grain yield and
most of the measured characters. The variance due to GCA sum of squares and SCA sum
of squares as percentage of total sum of squares was estimated to quantify gene effects that
determined the inheritance of the traits measured. Non-additive gene effects primarily
controlled grain yield. These findings differ from earlier reports by Abbas et al. (2016) and
Chiuta and Mutengwa (2020), who found GCA effects to be predominant in the inheritance
of grain yield under optimal conditions. However, these results are consistent with those
of Asefa et al. (2008) who found SCA to be a more important contributor to grain yield
than GCA. These differences might be due to the genetic background of the materials used,
as well as the conditions under which the studies were carried out, since environment plays
an important role in the performance genotypes.
Positive and significant GCA is important for grain yield improvement of inbreds but SCA
is most important for superior hybrid performance. Lines or testers with positive GCA
values suggests that they will contribute positively to grain yield, while lines and testers
with negative GCA are undesirable as they may not contribute positively to the traits of
interest.
The significant effect of site, site × GCALine and site × GCATester for grain yield and most
of the characters measured in this study means that the site had a large effect on GCA and
that there was a site with GCA interaction for both lines and testers and GCA effects

121
changed ranking between sites. However, the absence of significant site x line x tester
effect for grain yield and most other measured traits suggested that the performance of the
hybrids was consistent across the 13 locations. The substantial GCALine, GCATester and
SCALine × Tester mean squares for ears per plant and ear aspect emphasized the importance
of both additive and non-additive gene action in the expression of these secondary traits.
The positive and significant GCA effects recorded for lines 11, 13, 14 and 28 suggests that
these lines have the prospects to be utilized in breeding superior QPM hybrids if they also
have superior SCA. Using these parents should lead to progenies with high grain yield
(Fasahat et al. 2016). Since ear rot is an important trait in breeding for QPM genotypes,
lines with negative and significant GCA effect need to be selected and used in making
crosses to overcome the issues surrounding soft kernels of QPM genotypes. Lines 18 and
30 have the potential to pass kernel hardness to their progeny, thereby preventing kernel
rots (Vancetovic et al. 2015).
Several studies have used the SCA and other grouping methods to classify lines into well-
defined groups to allow successful crosses to be carried out (Badu-Apraku et al. 2013;
Annor and Badu-Apraku 2016; Fan et al. 2016). The SCA method of grouping lines under
testers could classify 48.48% of the lines. However, in this study, since it does not involve
molecular studies, only the SCA method was used, hence, the efficiency of the grouping
could not be estimated.
The high grain yield displayed by the superior QPM hybrid (line 11 x CZL15049) might
have been due to the increased days the parental line took to flower (above 80 days). The
longer maturity allows the hybrid more time for photosynthate accumulation which is
partitioned into grain yield, thereby translating into higher grain yield. This observation
differed from the study of Akinwale et al. (2011) who reported positive and non-significant
association between days to maturity and grain yield in rice and Pratap et al. (2018) who
also found significant negative association between days to 50% flowering and grain yield
in rice. However, this finding is in accordance with Egli (1993) who reported on the effects
of photosynthesis and flowering on yield components and seeds of cowpea. From the yield
comparison analysis for the hybrids studied, it was established that tryptophan content
negatively affects the yield potential of the QPM hybrids.
122
5.6 Conclusions
Significant variations for grain yield and agronomic traits were found for lines, testers, and
line x tester at Potchefstroom, Cedara, and Zimbabwe trials and across the 13 testing
locations for the 2018 and 2019 cropping seasons. Inbred lines and testers having positive
and significant GCA effects for grain yield have the potential to transfer high yielding traits
to their first filial generation. Non-additive genetic effects controlled more than 50% of
inheritance of grain yield and also controlled the inheritance of anthesis-silking interval,
husk cover and ears per plant. On the other hand, additive genetic effects controlled the
inheritance of ear rot, plant and ear heights, days to pollen shed, ear aspect as well as root
and stalk lodging. This suggested that both additive and dominance gene actions played an
important role in the inheritance of traits measured in this study. Inbred lines 11 and 14
and non-QPM tester CML444 showed desirable GCA effects for grain yield, indicating
that these lines in combination with the tester should be considered when targeting the
development of superior maize genotypes with QPM traits. Inbred lines 1, 2, 8, 13 and 30
were prolific while QPM tester CZL059 was the only tester to display positive significant
GCA for ears per plant, which is a major contributor to grain yield. The SCA grouping
method showed that QPM testers were superior to non-QPM testers because they have
more lines grouped under them for grain yield. Based on the SCA values, crosses 31 x 1
(both QPM), 28 x 1 (non-QPM x QPM), 27 x2 (both QPM), 25 x 4 (both QPM), 22 x 2
(non-QPM x QPM) and 11 x 1 (both QPM) were identified as the best hybrids across
locations. These crosses might be considered for further evaluation and commercialization
in Southern Africa under rainfed conditions.
References
Ababulgu D, Shimelis H, Laing M and Beyene A (2018) Phenotypic characterization of
elite quality protein maize (QPM) inbred lines adapted to tropical-highlands and the
association studies using SSR markers. Australia Journal of Crop Science 12: 22-31.
Abbas G, Ahsan M, Saleem M and Ahmad R (2016) Inheritance study of different
agronomic traits in mung × mash interspecific recombinant inbred lines.
Journal of Animal and Plant Sciences 26: 149-155.
Abuali AI, Abdelmulla AA, Khalafalla MM, Atif Elsadig Idris AE and Osman AM (2012)
Combining ability and heterosis for yield and yield components in maize. Australian
Journal of Basic and Applied Sciences 6: 36-41.

123
Agbaje SA, Badu-Apraku B and Fakorede MAB (2008) Heterotic patterns of early
maturing maize inbred lines in Striga-free and Striga-infested environments. Maydica
53: 87-96.
Akinwale MG, Gregorio G, Nwilene F, Akinyele BO, Ogunbayo SA and Odiyi AC (2011)
Heritability and correlation coefficient analysis for yield and its components in rice
(Oryza sativa L.). African Journal of Plant Science 5: 207-212.
Alamerew S and Warsi MZK (2015) Heterosis and combining ability of subtropical maize
inbred lines. Africa Crop Science Journal 23: 123-133.
Ali F, Irfan AS, Rahman H, Mohammad N, Durrishahwar, Muhammad YK, Ihteram U and
Jianbing Y (2012) Heterosis for yield and agronomic attributes in diverse maize
germplasm. Australian Journal of Crop Science 6: 455-462.
Amegbor IK, Badu-Apraku B and Annor B (2017) Combining ability and heterotic patterns
of extra-early maturing white maize inbreds with genes from Zea diploperennis
under multiple environments. Euphytica 213: 1-16.
Annor B and Badu-Apraku B (2016) Gene action controlling grain yield and other
agronomic traits of extra-early quality protein maize under stress and non-stress
conditions. Euphytica 212: 213-228.
Asefa B, Mohammed H and Zelleke H (2008) Combining ability of transitional highland
maize inbred lines. East African Journal of Sciences 2: 19-24.
Badu-Apraku B, Oyekunle M, Fakorede MAB, Vroh I, Akinwale RO and Aderounmu M
(2013) Combining ability, heterotic patterns and genetic diversity of extra-early
yellow inbreds under contrasting environments. Euphytica 192: 413-433.
Bekele A and Rao TN (2014) Estimates of heritability, genetic advance and correlation
study for yield and it’s attributes in maize (Zea mays L.). Journal of Plant Science 2:
1-4.
Chiuta NE and Mutengwa CS (2020) Combining ability of quality protein maize inbred
lines for yield and morpho-agronomic traits under optimum as well as combined
drought and heat-stressed conditions. Agronomy 10: 1-14.
de Abreu VM, Von Pinho ÉV de R, Mendes-Resende MP, Balestre M, Lima AC, Heloisa
Oliveira Santos HO and Von Pinho RG (2019) Combining ability and heterosis of
maize genotypes under water stress during seed germination and seedling emergence.
Crop Science 59: 33-43.
Egli DB (1993) Cultivar maturity and potential yield of soybean. Field Crops Research 32:
147-158.

124
Fan XM, Yin XF, Zhang YD, Bi YQ, Liu L, Chen HM and Kang MS (2016) Combining
ability estimation for grain yield of maize exotic germplasm using testers from three
heterotic groups. Crop Science 56: 2527-2535.
Fasahat P, Rajabi A, Rad JM and Derera J (2016) Principles and utilization of combining
ability in plant breeding. Biometrics and Biostatistics International Journal 4: 1-24.
Gangashetty PI, Motagi BN, Pavan R and Roodagi MB (2016) Breeding crop plants for
improved human nutrition through biofortification: Progress and prospects. In: Jaiwal
PK, Chhillar AK, Chaudhary D, Jaiwal R (eds), Advances in Plant Breeding
Strategies: Agronomic, Abiotic and Biotic Stress Traits. Springer International
Publishing, Switzerland Vol.2, pp. 35-68.
Haydar FMA and Paul NK (2014) Combining ability analysis for different yield trails in
maize. Bangladesh Journal of Plant Breeding and Genetics 27: 1-5.
He K, Chang L, Dong Y, Cui T, Qu J, Liu X, Xu S, Xue J and Liu J (2018) Identification
of quantitative trait loci for agronomic and physiological traits in maize (Zea mays L.)
under high-nitrogen and low-nitrogen conditions. Euphytica 214: 1-17.
Kaur N, Singh B and Sharma S (2019) Comparison of quality protein maize (QPM) and
normal maize with respect to properties of instant porridge. LWT-Food Science and
Technology 99: 291-298.
Kempthorne O (1957) An introduction to genetic statistics. Jonh Wiley and Sons, New
York.
Muraya MM, Ndirangu CM and Omolo EO (2006) Heterosis and combining ability in
diallel crosses involving maize (Zea mays L.) S1 lines. Australian Journal of
Experimental Agriculture 46: 387-393.
Nduwumuremyi A, Tongoona P, Habimana S and Husbandry A (2013) Journal of Plant
Breeding and Genetics 1: 117-129.
Pratap A, Bisen P, Loitongbam B, Sandhya and Singh PK (2018) Assessment of genetic
variability for yield and yield components in rice (Oryza sativa L.) germplasms.
International Journal of Bio-resource and Stress Management 9: 087-092.
Qi X, Li ZH, Jiang LL, Yu XM, Ngezahayo F and Liu B (2010) Grain-yield heterosis in
Zea mays L. shows positive correlation with parental difference in CHG methylation.
Crop Science 50: 2338-2346.
Saif-ul-Malook, Ali Q, Ahsan M, Muhammad Khalid Shabaz MK, Waseem M and Aamir
A (2016) Combining ability analysis for evaluation of maize hybrids under drought
stress. Journal of the National Science Foundation of Sri Lanka 44: 223-230.

125
SAS Institute (2011) Statistical Analysis Software (SAS) user’s guide
Sharief AE, El-Kalla SE, Gado HE and Abo-Yousef HAE (2009) Heterosis in yellow
maize. Australia Journal of Crop Science 3: 146-154.
Sharma JR (2006) Statistical and biometrical techniques in plant breeding. 1st edition. New
Age International, Mohan lal Printers, Delhi, pp. 265-285.
Singh RK and Chaudhary BD (1985) Biometrical methods in quantitative genetic analysis.
Kalyani Publishers, New Delhi, pp. 103-157.
Sprague GF and Tatum LA (1942) General versus specific combining ability in single
crosses of corn. Journal of the American Society of Agronomy 34: 923-928.
Tilahun B, Azimach G, Keno T, Chibsa T, Garoma B, Abebe B, Tulu D, Tafa Z and
Chalchisa D (2019) Test cross performance and combining ability of newly
introduced quality protein maize (Zea mays) inbred lines for grain yield and
agronomic traits evaluated in mid-altitude agro-ecological zones of Ethiopia. South
African Journal of Plant and Soil 36: 173-180.
Vacaro E, Fernandes J, Neto B, Pegoraro DG, Nuss CN and Conccicao LH (2002)
Combining ability of twelve maize populations. Pesquisa Agropecuária Brasileira
37: 67-72.
Vancetovic J, Bozinovic S, Ignjatovic-Micic D, Delic N, Kravic N and Nikolic N (2015)
A diallel cross among drought tolerant maize populations. Euphytica 205: 1-16.
Wegary D, Vivek B and Labuschagne M (2013) Association of parental genetic distance
with heterosis and specific combining ability in quality protein maize. Euphytica 191:
205-216.
Wegary D, Vivek BS and Labuschagne MT (2014) Combining ability of certain agronomic
traits in quality protein maize under stress and nonstress environments in Eastern and
Southern Africa. Crop Science 54: 1004-1014.

126
CHAPTER SIX
COMBINING ABILITY ANALYSIS OF QUALITY TRAITS FOR QUALITY
AND NON-QUALITY PROTEIN MAIZE INBRED LINES
6.1 Abstract
Breeding and identification of maize hybrids with enhanced quality traits is important for
addressing malnutrition among the increasing human population, as well as for feed
supplement formulation for the animal and poultry industries. The objectives of this study
were to estimate the combining ability of QPM lines with QPM and non-QPM testers for
quality traits and to quantify trait performance of the hybrids produced. A total of 135
hybrids were analysed for quality traits, including tryptophan, protein, starch, oil, fibre and
moisture content across six environments in South Africa and Zimbabwe during the
2017/2018 and 2018/2019 cropping seasons. The results showed significant variations for
quality traits among the hybrids. Hybrids L12 x CZL15049 (61%), L18 x CZL15049 (61%)
and L2 x CZL059 (60%) had high quality index while hybrids 45 and 57 had high
tryptophan content. Hybrids L13 x CML444 (51) and L10 x CZL15049 (37) had high
values for starch and oil contents, respectively. Combining ability estimates were
significant for both lines and testers used in this study. Both additive and non-additive gene
action played an important role in the inheritance of the quality traits analysed, but additive
genetic effects were predominant. Inbred lines 15, 1, 8 and 12; and QPM testers CZL15049
and CZL059 showed desirable GCA effects for tryptophan. The SCA for hybrids 127 and
87 were high for protein content. The superior hybrids identified for various quality traits
will be important for the food and animal feed industries to enhance human and animal
nutrition. Inbred lines and testers identified for good GCA effects for quality traits should
be utilised by other maize improvement programmes for development of superior QPM
hybrids in SSA. Promotion and adoption of these superior QPM hybrids for good quality
traits would contribute significantly to the fight against malnutrition in SSA.
Keywords: Combining ability, quality traits, quality index, non-quality protein maize

127
6.2 Introduction
The crucial role maize (Zea mays L.) plays as the main staple food for millions of people
in the world cannot be underestimated, with global production of 1060 million metric ton
from about 187 million hectare in 2016 (FAOSTAT 2016; Hossain et al. 2019).
Undernourishment is a chronic problem worldwide, particularly in rural communities of
SSA where people rely chiefly on maize, which is a high carbohydrate source, as staple
food. Most people have little access to varied diets containing protein. Breeding for
biofortified crops with enriched nutritional quality can help improve nutritional
deficiencies in SSA and other developing worlds. This could be achieved if nutritionally
enhanced crops are accepted, produced and are made available in large quantities for
consumption by both humans and animals (De Groote et al. 2010; 2014). Globally, an
estimated population of about two billion are suffering from deficiency of essential
micronutrients and its related issues and over 800 million people are reported to be
malnourished (Global Nutrition Report 2017; Hossain et al. 2019). Some of the visible
symptoms of malnutrition are stunted growth and underweight. Black et al. (2013) and
Zimmerman et al. (2018) reported that more than 85% of the countries in the world are
plagued by malnutrition in one form or another. This causes about 45% of deaths among
children below the age of five.
Even though normal endosperm maize, which is generally cultivated, is rich in many
nutrients, carbohydrates and oil, it provides little or no essential amino acids for humans
and other monogastric animals. The endosperm of normal maize is deficient in two
essential amino acids, lysine and tryptophan, even though the endosperm contains about
10% protein with about 73% starch and 4% oil (Annor and Badu-Apraku 2016). The
deficiency of essential amino acids can negatively affect human and animal growth
(Prasanna et al. 2001). As a result, infants who are constantly fed normal endosperm maize
with little or no protein supplements from animal or legume products, suffer from
malnutrition, and this often leads to the development of pellagra and other health related
diseases (Babu and Prasanna 2014). The development, adoption and cultivation of quality
protein maize (QPM) with higher concentrations of tryptophan and lysine could
significantly reduce malnutrition and its related diseases, as well as death, in low income
countries in the developing world (Mbuya et al. 2011). QPM can supply about 70 to 80%
of human protein requirements, depending on the variety, while non-QPM genotypes can
only supply a maximum of 46% (Babu and Prasanna 2014). The biological value of protein,

128
which measures how effectively the body absorbs and utilises amino acids, is 80% for
QPM, which is comparable to 86% for egg, while for normal endosperm maize it is 40 to
57% (Babu and Prasanna 2014; Teklewold et al. 2015).
For a maize genotype or the grain to be classified as QPM, it must have a QI equal or above
0.80, where QI is referred to as the proportion of tryptophan to protein present in the grain
(Wegary et al. 2011; Masindeni 2013; Wegary et al. 2014; Twumasi-Afriye et al. 2016;
Tandzi et al. 2017). Ignjatovic-Micic et al. (2013) and Tandzi et al. (2017) observed that
the QI of hybrid maize resulting from hybridizing QPM and non-QPM lines was in the
range of 0.71 to 0.74, which was superior to the normal hybrids with 0.57 to 0.62, however
it was less than the QPM threshold which is 0.80. The hybrids between QPM and non-
QPM lines express the QI regardless of isolation from non-QPM maize while the QPM
lines may show reduced QI in non-isolated fields. Consumption of maize products with
enhanced lysine and tryptophan content could help alleviate the growing challenge posed
by malnutrition in several parts of the world (Menkir et al. 2008; Mpofu et al. 2012).
Several authors have reported on the nutritional advantages of QPM in feeding experiments
involving livestock, especially monogastric animals, and children (Akuamoa-Boateng
2002; Mpofu et al. 2012; Kostadinovic et al. 2016). Children who were fed with meals
made from QPM were healthier than those fed with food products from normal maize
(Gunaratna et al. 2010; Tandzi et al. 2017). Studies have shown that within some Southern
African countries, for example Lesotho, Malawi and Zambia, consumption of about 100 g
of a QPM food product per day is essential for children of school going age to obtain
adequate amounts of lysine (Nuss and Tanumihardjo 2011; Tandzi et al. 2017).
Even though the University of Illinois started selections for high protein and high oil
contents much earlier than breeding for o2, genetic enhancement of nutritional value in
maize commenced in 1963 with Mertz et al. (1964) who identified mutant o2 maize that
contains an amount of protein equal to that in normal endosperm maize (Premlatha and
Kalamani 2010), but about twice the normal levels of lysine and tryptophan, which
increases the protein quality in normal maize (Badu-Apraku and Lum 2010). Several
studies of QPM inbred lines for combining ability under varying environmental conditions
to identify QPM donors and testers using several mating designs have been reported
(Živanović et al. 2006; Mbuya et al. 2011; Amin et al. 2014; Sarika et al. 2018). QPM
genotypes with higher amino acid contents had lower grain yield. Therefore, the major aim

129
of some breeding programmes presently is to improve both grain yield and nutritional value
of QPM genotypes instead of focusing only on quality traits (Li and Vasal 2016). Even
though there are variations between QPM and non-QPM genotypes for insect attacks,
kernel rots and moisture content, there are no differences in some of the physico-chemical
properties such as starch and oil contents (Zhang et al. 2008; Li and Vasal 2016; Synrem
et al. 2017).
With increasing technological advancement, some quality traits of maize can be screened
non-destructively by using NIR techniques which require less time, are cost effective and
accurate (Paulsen and Singh 2004; Bastianelli et al. 2007; Alander et al. 2013; Sharma and
Carena 2016). A “r=0.90” correlation was reported between laboratory analysis and NIR
results (Sharma and Carena 2016) for protein, starch and gluten content in maize. Even
though several studies have been conducted on QPM for grain yield and nutritional
characteristics to address hidden hunger in resource limited populations, important
information on the combining ability of genotypes for these quality traits is lacking for the
recently released QPM inbred lines developed by the CIMMYT Zimbabwe maize breeding
programme. Information on combining ability of lines used in crop development will
identify superior lines to be crossed to develop hybrids with improved yield and quality
traits. The objectives of this study were to identify the combining ability of QPM and non-
QPM lines with QPM and non-QPM testers for quality trait performance of the hybrids.
6.3 Materials and methods
6.3.1 Genetic material
The genetic material and experimental design used for this study were the same as
described in Chapters four and five.
6.3.2 Quality characteristics
Tryptophan, moisture, protein, oil, fibre and starch were analysed as described in Chapter
3 in the materials and methods section.
6.3.3 Quality index
Protein QI was calculated as the concentration of tryptophan over protein content
expressed as:

130
Quality index (QI) = % tryptophan concentration x 100
% protein in endosperm
6.4 Results
6.4.1 Analysis of variance for quality traits at Potchefstroom, Cedara and Zimbabwe
during the 2017/2018 and 2018/2019 cropping seasons and combined analysis across
six locations/years.
The ANOVA of separate and combined locations for the measured quality traits for the
135 hybrids evaluated at six locations is presented in Table 6.1. For the Cedara trials, the
effect of hybrids (entry) on tryptophan, protein, starch, oil, fibre and moisture was
significant (P<0.01). There was significant interaction between year x genotype for all the
traits measured at Cedara except for oil. The Potchefstroom trials also had significant
differences among the hybrids for all the traits, except for moisture. There was significant
year x genotype interaction for the traits analysed, except for oil and fibre. In the Zimbabwe
trials, the effect of genotype was significant for all the traits analysed except for starch,
while site x entry interaction was significant for only tryptophan (Table 6.1).
The combined ANOVA of the 135 hybrids showed significant (P<0.05) variations for all
the quality traits analysed across the six locations (Table 6.1). The effect of sites, genotypes
(entry) as well as site x entry interaction was significant (P<0.01) for all the quality traits
measured, except for oil and fibre.
6.4.2 Mean values of measured quality traits of QPM and non-QPM hybrids and five
commercial checks
Tryptophan values of the hybrids ranged from 0.03% for genotype 110 to 0.09% for
genotype 45 across the six environments with a mean of 0.06% (Table 6.2). Protein content
had an average value of 8.48% and ranged from 6.82% for genotype 69 to 10.04% for
genotype 127. Oil content ranged from 3.77 to 6.78% for genotypes 135 and 37,
respectively, with a mean value of 5.27% while starch ranged from 63.78 to 68.24% for
genotypes 37 and 51, respectively, with an average value of 66.15% (Table 6.2). Fibre
content ranged from 2.17% for genotype 34 to 2.96% for genotype 37 with a mean value
2.50% while moisture content ranged from 13.63% for genotype 87 to 17.99% for
genotype 37 with a mean value 15.61%. QI was used to rank the hybrids, which ranged

131
from 0.37 for genotype 110 to 1.17 for genotypes 45 and 69 (Table 6.3). Genotype 109
with the highest tryptophan value outperformed the best QPM check genotypes 131 and
132 by 15%.
6.4.3 Estimates of combining ability for quality traits
6.4.3.1 Analysis of variance for general and specific combining ability of lines and
testers evaluated at Potchefstroom, Cedara and Zimbabwe during the 2017/2018 and
2018/2019 cropping seasons
The ANOVA for combining ability for the seed samples from Cedara during the 2017/2018
and 2018/2019 cropping seasons showed significant line GCA and tester GCA for all the
traits measured, except tester GCA for moisture content (Table 6.4). Line x tester (SCA
effect) was significant for all the quality traits, except oil. Apart from protein and starch,
other quality traits showed significant site x line x tester effects (Table 6.4).
Analysis of the Potchefstroom trials showed significant (P<0.01) GCA for lines and testers
for all the quality traits (Table 6.4). The SCA for line x tester was significant only for
tryptophan, protein, oil and fibre. Site x line x tester effect was only significant for
tryptophan, protein and starch (Table 6.4).
The ANOVA for combining ability from two sites in Zimbabwe showed significant
(P<0.01) line GCA and significant tester GCA for all the traits that were analysed. The site
x line x tester effect was significant only for tryptophan, while site effect was significant
for all the quality traits (Table 6.4). The SCA for line x tester was also significant for all
quality traits (Table 6.4).

132
Table 6.1 Analysis of variance of 135 hybrids, including the checks, for quality traits from
seeds samples obtained from Cedara, Potchefstroom, Zimbabwe and across six sites during
2017/2018 and 2018/2019 cropping seasons
Source DF Tryptophan % Moisture % Protein % Oil % Fibre % Starch %
Cedara
Year 1 0.00280* 1871.07** 12.65** 29.79** 1.81** 111.66**
Rep (Year) 2 0.00005 0.16 0.56 0.02 0.029 1.98
Block (Year*Rep) 104 0.00003* 0.69 0.59* 0.54 0.01 1.62
Entry 134 0.00075** 1.01** 1.12** 1.26** 0.06** 4.00**
Year*Entry 134 0.00011** 0.89* 0.53* 0.68 0.02* 1.86*
Error 164 0.00002 0.60 0.37 0.75 0.01 1.32
Potchefstroom
Year 1 0.00003 4496.04** 78.44** 36.99** 4.02** 74.97**
Rep (Year) 2 0.00009* 2.00 2.41** 0.95 0.01 8.46*
Block (Year*Rep) 104 0.00003* 1.46 0.58* 0.63 0.02 1.79
Entry 134 0.00102** 1.66 1.63** 1.31** 0.08** 4.71**
Year*Entry 134 0.00013** 1.76** 0.77** 0.58 0.03 2.29**
Error 164 0.00002 1.39 0.42 0.58 0.03 1.43
Zimbabwe
Site 1 0.00901** 67.63** 11.01 8.59** 4.02** 25.92**
Rep (Site) 2 0.00002 60.63** 1.40* 0.079 0.01 1.41*
Block (Site*Rep) 104 0.00005 3.66 0.35 0.09 0.02 0.42
Entry 134 0.00096** 9.88** 3.21** 1.08** 0.08** 2.2388
Site*Entry 134 0.00014** 2.82 0.29 0.08 0.03 0.36
Error 164 0.00004 3.81 0.32 0.10 0.0272 0.40
Across six locations
Year 5 0.00748** 3600.05** 403.99** 34.78** 2.02** 1617.87**
Rep (Site) 6 0.00005 20.93** 1.46* 0.35 0.02 3.95*
Block (Site*Year) 312 0.00004** 1.94 0.51* 0.42 0.02 1.28**
Entry 134 0.00208** 5.18** 3.66** 2.31** 0.17** 6.19**
Year*Entry 670 0.00016** 2.53** 0.68** 0.51 0.02 1.73**
Error 492 0.00003 1.93 0.37 0.48 0.02 1.05
*P<0.05; **P<0.01

133
Table 6.2 Statistics and ranges for tryptophan and five other quality traits analysed for 135 QPM and non-QPM seed samples from Cedara,
Potchefstroom, Zimbabwe and across six sites during the 2017/2018 and 2018/2019 cropping seasons
Traits R2 CV SE Mean Range R2 CV SE Mean Range
Cedara 2017/2018 and 2018/2019 Potchefstroom 2017/2018 and 2018/2019
Tryptophan (%) 0.98 8.28 0.01 0.056 0.025-0.092 0.98 8.70 0.01 0.056 0.024-0.097
Moisture (%) 0.96 5.79 0.77 13.35 11.90-14.81 0.96 8.35 1.18 14.11 11.89-16.21
Protein (%) 0.85 8.30 0.60 7.28 5.99-9.21 0.88 7.89 0.65 8.24 6.73-10.30
Oil (%) 0.76 16.85 0.87 5.15 3.78-6.74 0.80 15.09 0.76 5.05 2.89-6.72
Fibre (%) 0.88 4.85 0.12 2.48 2.22-2.29 0.85 6.51 0.16 2.51 2.10-3.08
Starch (%) 0.85 1.76 1.15 65.41 62.77-68.14 0.85 1.87 1.20 63.90 59.875-67.846
Zimbabwe 2017/2018 Across six locations 2017/2018 and 2018/2019
Tryptophan (%) 0.97 9.84 0.01 0.064 0.034-0.112 0.98 9.07 0.01 0.059 0.033-0.090
Moisture (%) 0.81 10.09 1.95 19.36 15.47-24.56 0.96 8.91 1.39 15.61 13.63-17.99
Protein (%) 0.92 5.75 0.57 9.91 7.40-12.62 0.95 7.18 0.61 8.48 6.82-10.04
Oil (%) 0.93 5.64 0.32 5.61 3.39-7.69 0.82 13.11 0.69 5.27 3.77-6.78
Fibre (%) 0.84 6.56 0.16 2.51 2.18-3.01 0.85 6.04 0.15 2.50 2.17-2.96
Starch (%) 0.88 0.91 0.63 69.14 66.19-71.95 0.95 1.55 1.03 66.15 63.78-68.24
†R2 = coefficient of determination, CV = coefficient of variation, SE = standard error

134
Table 6.3 Mean values from analysis of variance for tryptophan, moisture, protein, oil, starch and fibre contents of 135 hybrids seed across six
sites during the 2017/2018 and 2018/2019 cropping seasons
Entry Trpt % Mois % Prot % Oil % Starch % Fibre % QI Rank Entry Trpt % Mois % Prot % Oil % Starch % Fibre % QI Rank
69 0.080 16.19 6.82 5.80 66.64 2.60 1.17 1 88 0.078 15.90 8.27 6.06 64.49 2.66 0.94 35
45 0.090 15.84 7.67 6.07 65.52 2.81 1.17 2 131 0.077 14.86 8.21 4.60 67.13 2.38 0.94 36
6 0.088 16.09 7.67 4.93 67.55 2.44 1.14 3 46 0.076 14.65 8.16 6.14 65.37 2.47 0.94 37
26 0.083 15.79 7.34 4.84 66.84 2.63 1.12 4 97 0.076 15.13 8.17 5.03 66.51 2.37 0.93 38
37 0.086 17.99 7.84 6.78 63.78 2.96 1.09 5 92 0.078 16.22 8.34 5.43 65.12 2.60 0.93 39
101 0.079 14.98 7.26 5.31 67.37 2.49 1.09 6 13 0.073 17.73 7.77 5.62 65.43 2.78 0.93 40
70 0.082 15.66 7.54 5.70 66.08 2.47 1.09 7 104 0.075 16.39 8.11 5.32 65.94 2.74 0.93 41
121 0.081 15.45 7.70 4.56 67.36 2.32 1.05 8 5 0.079 15.83 8.54 5.28 65.86 2.67 0.92 42
120 0.083 16.06 7.86 4.84 67.07 2.50 1.05 9 38 0.074 15.76 7.96 5.79 66.06 2.50 0.92 43
62 0.079 15.50 7.54 4.93 67.54 2.47 1.05 10 29 0.082 15.17 8.99 6.09 63.90 2.75 0.92 44
100 0.074 16.11 7.06 5.27 66.79 2.74 1.04 11 33 0.076 16.68 8.50 5.98 65.70 2.47 0.90 45
57 0.088 15.21 8.40 5.63 63.92 2.72 1.04 12 93 0.071 15.38 8.00 5.91 65.45 2.55 0.89 46
105 0.077 15.11 7.42 5.16 67.25 2.42 1.04 13 53 0.069 17.16 7.82 4.87 66.16 2.80 0.88 47
49 0.078 17.52 7.54 5.22 65.60 2.88 1.04 14 41 0.077 15.06 8.71 6.32 65.23 2.53 0.88 48
2 0.080 15.14 7.85 5.67 66.15 2.54 1.02 15 17 0.073 15.04 8.51 5.09 66.54 2.58 0.86 49
50 0.077 16.14 7.57 4.71 66.79 2.57 1.02 16 34 0.072 14.36 8.94 6.03 65.84 2.16 0.81 50
30 0.080 15.51 7.85 5.88 65.65 2.62 1.01 17 117 0.054 16.05 7.48 5.95 66.88 2.49 0.72 51
61 0.079 16.33 7.84 5.35 65.93 2.80 1.01 18 55 0.061 15.61 8.56 5.07 66.21 2.62 0.71 52
21 0.078 15.71 7.71 5.64 65.59 2.60 1.01 19 3 0.056 15.89 8.22 5.52 66.74 2.41 0.69 53
22 0.077 15.60 7.62 5.03 66.69 2.32 1.01 20 73 0.058 15.77 8.51 4.96 66.04 2.53 0.68 54
89 0.081 16.40 8.08 5.83 64.77 2.57 1.00 21 67 0.056 16.62 8.26 5.03 66.65 2.48 0.68 55
132 0.078 15.76 7.82 5.26 67.08 2.52 1.00 22 116 0.055 15.17 8.42 6.54 65.44 2.49 0.66 56
65 0.083 16.39 8.32 6.01 64.28 2.64 1.00 23 81 0.051 15.44 7.88 6.05 66.35 2.52 0.65 57
1 0.074 15.39 7.44 5.83 65.69 2.72 0.99 24 112 0.055 14.72 8.52 4.64 67.26 2.45 0.65 58
14 0.074 14.37 7.46 5.20 66.23 2.63 0.99 25 71 0.050 16.48 7.85 5.06 67.39 2.49 0.64 59
10 0.070 15.15 7.07 5.05 67.27 2.44 0.99 26 12 0.053 15.99 8.30 5.31 65.99 2.50 0.64 60
96 0.077 15.39 7.78 5.74 66.08 2.56 0.99 27 82 0.056 14.83 8.73 4.95 66.93 2.60 0.64 61
9 0.077 16.43 7.91 5.93 64.97 2.75 0.97 28 74 0.054 15.31 8.45 4.94 66.21 2.44 0.63 62
58 0.079 14.89 8.11 5.45 65.49 2.58 0.97 29 78 0.058 14.84 9.14 4.01 67.07 2.29 0.63 63
54 0.073 16.09 7.51 5.21 66.64 2.55 0.97 30 52 0.051 15.50 8.02 4.77 66.96 2.40 0.63 64
18 0.074 14.34 7.71 4.82 67.84 2.49 0.96 31 51 0.049 15.19 7.87 4.87 68.24 2.55 0.62 65
25 0.072 17.87 7.56 5.37 65.99 2.88 0.96 32 109 0.057 15.48 9.20 6.21 63.96 2.45 0.61 66
66 0.075 15.22 7.94 6.13 65.45 2.34 0.95 33 63 0.052 15.28 8.57 4.90 66.99 2.47 0.61 67
42 0.085 14.91 9.03 6.19 65.23 2.31 0.94 34 94 0.054 15.36 8.85 5.28 66.01 2.55 0.61 68
SE 0.005 1.39 0.61 0.69 0.15 1.03 -
SE 0.005 1.39 0.61 0.69 0.15 1.03 -
† QI = Quality index used to rank the hybrids; SE = Standard error; trypt = tryptophan; moist = moisture; prot = protein
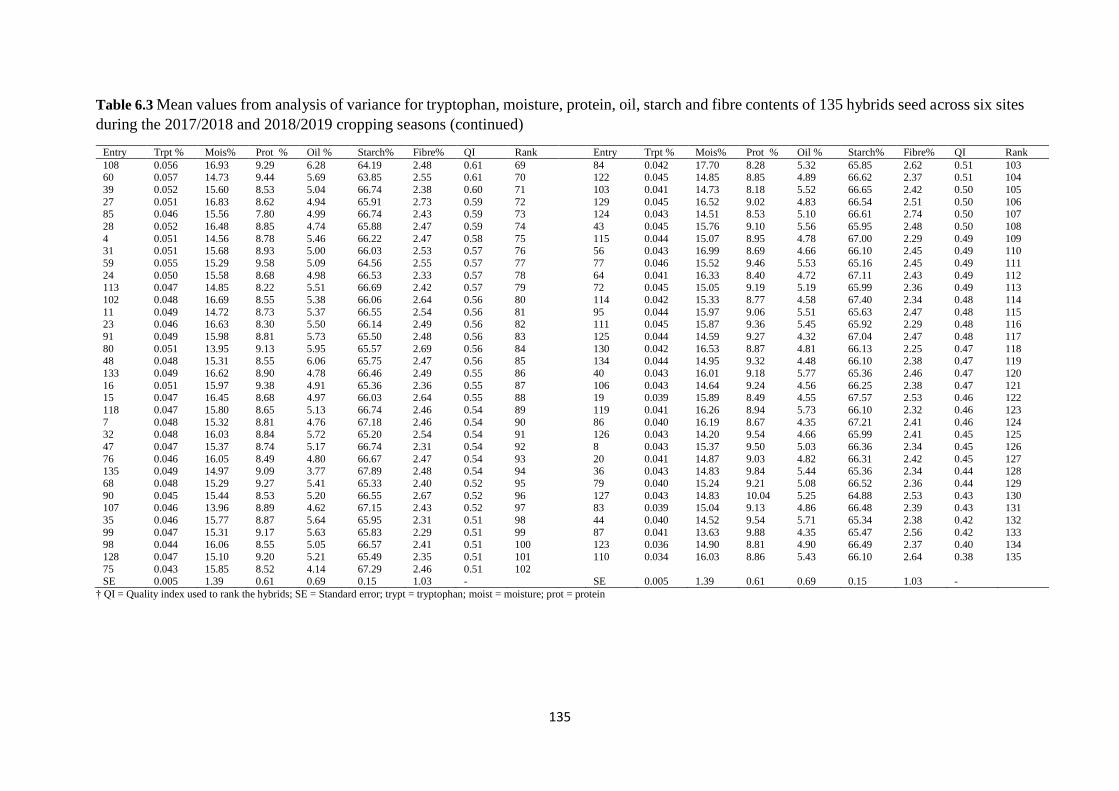
135
Table 6.3 Mean values from analysis of variance for tryptophan, moisture, protein, oil, starch and fibre contents of 135 hybrids seed across six sites
during the 2017/2018 and 2018/2019 cropping seasons (continued)
Entry Trpt % Mois% Prot % Oil % Starch% Fibre% QI Rank Entry Trpt % Mois% Prot % Oil % Starch% Fibre% QI Rank
108 0.056 16.93 9.29 6.28 64.19 2.48 0.61 69 84 0.042 17.70 8.28 5.32 65.85 2.62 0.51 103 60 0.057 14.73 9.44 5.69 63.85 2.55 0.61 70 122 0.045 14.85 8.85 4.89 66.62 2.37 0.51 104
39 0.052 15.60 8.53 5.04 66.74 2.38 0.60 71 103 0.041 14.73 8.18 5.52 66.65 2.42 0.50 105
27 0.051 16.83 8.62 4.94 65.91 2.73 0.59 72 129 0.045 16.52 9.02 4.83 66.54 2.51 0.50 106 85 0.046 15.56 7.80 4.99 66.74 2.43 0.59 73 124 0.043 14.51 8.53 5.10 66.61 2.74 0.50 107
28 0.052 16.48 8.85 4.74 65.88 2.47 0.59 74 43 0.045 15.76 9.10 5.56 65.95 2.48 0.50 108
4 0.051 14.56 8.78 5.46 66.22 2.47 0.58 75 115 0.044 15.07 8.95 4.78 67.00 2.29 0.49 109 31 0.051 15.68 8.93 5.00 66.03 2.53 0.57 76 56 0.043 16.99 8.69 4.66 66.10 2.45 0.49 110
59 0.055 15.29 9.58 5.09 64.56 2.55 0.57 77 77 0.046 15.52 9.46 5.53 65.16 2.45 0.49 111
24 0.050 15.58 8.68 4.98 66.53 2.33 0.57 78 64 0.041 16.33 8.40 4.72 67.11 2.43 0.49 112 113 0.047 14.85 8.22 5.51 66.69 2.42 0.57 79 72 0.045 15.05 9.19 5.19 65.99 2.36 0.49 113
102 0.048 16.69 8.55 5.38 66.06 2.64 0.56 80 114 0.042 15.33 8.77 4.58 67.40 2.34 0.48 114
11 0.049 14.72 8.73 5.37 66.55 2.54 0.56 81 95 0.044 15.97 9.06 5.51 65.63 2.47 0.48 115 23 0.046 16.63 8.30 5.50 66.14 2.49 0.56 82 111 0.045 15.87 9.36 5.45 65.92 2.29 0.48 116
91 0.049 15.98 8.81 5.73 65.50 2.48 0.56 83 125 0.044 14.59 9.27 4.32 67.04 2.47 0.48 117
80 0.051 13.95 9.13 5.95 65.57 2.69 0.56 84 130 0.042 16.53 8.87 4.81 66.13 2.25 0.47 118 48 0.048 15.31 8.55 6.06 65.75 2.47 0.56 85 134 0.044 14.95 9.32 4.48 66.10 2.38 0.47 119
133 0.049 16.62 8.90 4.78 66.46 2.49 0.55 86 40 0.043 16.01 9.18 5.77 65.36 2.46 0.47 120
16 0.051 15.97 9.38 4.91 65.36 2.36 0.55 87 106 0.043 14.64 9.24 4.56 66.25 2.38 0.47 121 15 0.047 16.45 8.68 4.97 66.03 2.64 0.55 88 19 0.039 15.89 8.49 4.55 67.57 2.53 0.46 122
118 0.047 15.80 8.65 5.13 66.74 2.46 0.54 89 119 0.041 16.26 8.94 5.73 66.10 2.32 0.46 123
7 0.048 15.32 8.81 4.76 67.18 2.46 0.54 90 86 0.040 16.19 8.67 4.35 67.21 2.41 0.46 124 32 0.048 16.03 8.84 5.72 65.20 2.54 0.54 91 126 0.043 14.20 9.54 4.66 65.99 2.41 0.45 125
47 0.047 15.37 8.74 5.17 66.74 2.31 0.54 92 8 0.043 15.37 9.50 5.03 66.36 2.34 0.45 126
76 0.046 16.05 8.49 4.80 66.67 2.47 0.54 93 20 0.041 14.87 9.03 4.82 66.31 2.42 0.45 127 135 0.049 14.97 9.09 3.77 67.89 2.48 0.54 94 36 0.043 14.83 9.84 5.44 65.36 2.34 0.44 128
68 0.048 15.29 9.27 5.41 65.33 2.40 0.52 95 79 0.040 15.24 9.21 5.08 66.52 2.36 0.44 129
90 0.045 15.44 8.53 5.20 66.55 2.67 0.52 96 127 0.043 14.83 10.04 5.25 64.88 2.53 0.43 130 107 0.046 13.96 8.89 4.62 67.15 2.43 0.52 97 83 0.039 15.04 9.13 4.86 66.48 2.39 0.43 131
35 0.046 15.77 8.87 5.64 65.95 2.31 0.51 98 44 0.040 14.52 9.54 5.71 65.34 2.38 0.42 132
99 0.047 15.31 9.17 5.63 65.83 2.29 0.51 99 87 0.041 13.63 9.88 4.35 65.47 2.56 0.42 133 98 0.044 16.06 8.55 5.05 66.57 2.41 0.51 100 123 0.036 14.90 8.81 4.90 66.49 2.37 0.40 134
128 0.047 15.10 9.20 5.21 65.49 2.35 0.51 101 110 0.034 16.03 8.86 5.43 66.10 2.64 0.38 135
75 0.043 15.85 8.52 4.14 67.29 2.46 0.51 102
SE 0.005 1.39 0.61 0.69 0.15 1.03 - SE 0.005 1.39 0.61 0.69 0.15 1.03 -
† QI = Quality index used to rank the hybrids; SE = Standard error; trypt = tryptophan; moist = moisture; prot = protein

136
Table 6.4 Mean squares from analysis of variance for general and specific combining ability for six quality traits of 33 inbred lines and four testers
at Potchefstroom, Cedara and Zimbabwe during the 2017/2018 and 2018/2019 cropping seasons
Source DF Tryptophan (%) Moist (%) Protein (%) Oil (%) Fibre (%) Starch (%) Quality Index Cedara Rep 1 0.000007 0.07 0.07 0.005 0.03 0.39 0.00 Year 1 0.002731** 1799.64** 12.94** 29.611** 1.84** 105.62** 1.38** GCALine 32 0.000808** 1.82** 1.96** 2.496** 0.11** 8.57** 0.22** GCATester 3 0.020580** 1.39 10.11** 15.019** 1.55** 38.30** 5.60** Year*Line 32 0.000148** 1.30* 0.62 0.529 0.02* 1.94 0.04** Year*Tester 3 0.000390** 1.69* 2.17* 1.368 0.19** 5.26* 0.02 SCALine*Tester 94 0.000380** 0.96* 0.80* 0.755 0.03** 2.83** 0.09** Year*Line*Tester 94 0.000162** 0.87* 0.49 0.702 0.02* 1.80 0.04** Error 259 0.000025 0.59 0.45 0.680 0.01 1.45 0.01 Potchefstroom Rep 1 0.00001 0.16 0.69 1.69 0.005 0.09 0.01 Year 1 0.00004 4291.63** 70.92** 35.92** 3.938** 70.82** 0.38** GCALine 32 0.00101** 2.64* 3.70** 2.68** 0.124** 11.76** 0.24** GCATester 3 0.03915** 6.24** 13.30** 10.60** 1.566** 41.75** 7.65** Year*Line 32 0.00017** 2.76* 0.96* 0.81 0.037* 3.17* 0.04** Year*Tester 3 0.00048** 1.77 7.99** 0.49 0.275** 8.98** 0.12** SCALine*Tester 94 0.00037** 1.53 0.90** 0.71 0.045** 2.06 0.07** Year*Line*Tester 94 0.00017** 1.53 0.64* 0.64 0.025 2.27* 0.03** Error 259 0.00003 1.42 0.49 0.57 0.025 1.66 0.01 Zimbabwe Rep 1 0.000008 124.75** 2.33* 0.0003 0.005 1.80* 0.01 Site 1 0.008371** 67.04** 9.81** 7.8667** 3.938** 23.11** 1.25** GCALine 32 0.001469** 17.01** 4.28** 3.1268** 0.124** 5.16** 0.22** GCATester 3 0.019617** 110.72** 77.99** 13.6516** 1.566** 16.72** 4.35** Site*Line 32 0.000151** 3.89 0.46 0.0701 0.037* 0.41 0.02** Site*Tester 3 0.000225** 8.15 0.38 0.1511 0.275** 0.81 0.01 SCALine*Tester 94 0.000453** 7.66** 1.18** 0.2618** 0.045** 1.03** 0.07** Site*Line*Tester 94 0.000195** 3.18 0.27 0.0902 0.025 0.32 0.02** Error 259 0.000043 3.81 0.34 0.0973 0.027 0.41 0.01
†GCA = general combining ability; SCA = specific combining ability; *P<0.05, **P<0.01

137
6.4.3.2 Analysis of variance of general and specific combining ability of 33 lines and
four testers analysed for six quality traits across six environments
The combined ANOVA showed significant genotype effects for all the quality traits and
QI (P<0.05). GCA of lines as well as testers were significant for all the traits (P<0.01). The
SCA of line x tester was also significant for all the quality traits and QI (Table 6.5). Similar
observations were recorded for site, site x line and site x tester for all the traits analysed.
Apart for oil and fibre contents, all quality traits showed significant site x line x tester
effects across the six environments. The percentage sum of squares for GCA was higher
than for SCA for all the quality traits analysed and calculated QI, indicating dominance of
additive effects over non-additive gene effects for the traits (Table 6.5).
6.4.3.3 General combining ability effects of 33 lines for six quality traits across six
The GCA effects for the lines varied for the quality traits analysed (Table 6.6). For
tryptophan, only lines 1, 2, 6, 7, 8, 12, 13, 15, 17 and 18 recorded positive and significant
GCA, while lines 19, 20, 21, 22, 28, 29, 30 32 and 35 had significant and negative GCA.
Lines 4, 7, 10 and 14 had significant and positive GCA for moisture content (Table 6.6).
For protein content, 14 lines (42.42% of entries) had positive and significant GCA effects
while 13 lines (33.39% of entries) had negative but significant GCA effects (Table 6.6).
Eight lines (24.24% of entries) recorded positive and significant GCA effects and nine
lines (33.39% of entries) had negative and significant GCA for oil content. For fibre
content, nine lines had positive and significant GCA effects while 10 lines recorded
significant but negative GCA effects. Lines 5, 13, 16, 19, 26, 27, 29 and 31 showed positive
and significant GCA effects for starch while nine lines also recorded negative and
significant GCA effects for starch (Table 6.6). Inbred lines 1, 3, 6, 7, 12, 13, 15, 16, 17, 18
and 31 showed positive and significant GCA effects for QI.

138
Table 6.5 Mean squares from combined analysis of variance for general and specific combining ability for six quality traits of 33 inbred lines and
four testers across six sites during the 2017/2018 and 2018/2019 cropping seasons
Source DF Tryptophan % Moisture % Protein % Oil % Fibre % Starch % Quality Index
Rep 1 0.000007 36.83** 2.28* 0.61 0.0004 0.06 0.02
Site 5 0.007482** 3452.19** 385.05** 33.72** 2.0014** 1560.82** 1.28**
GCALine 32 0.002509** 11.28** 7.92** 6.95** 0.3305** 18.38** 0.58**
GCATester 3 0.076647** 43.48** 77.95** 35.99** 4.6677** 83.86** 17.09**
Site*Line 160 0.000249** 3.63** 0.81** 0.55* 0.0256* 2.53** 0.04**
Site*Tester 15 0.000758** 17.30** 6.80** 1.06* 0.1514** 5.59** 0.13**
SCALine*Tester 94 0.000754** 3.99** 1.39** 0.67* 0.0781** 2.71** 0.15**
Site*Line*Tester 470 0.000198** 2.35* 0.58** 0.50 0.0211 1.52* 0.04**
Error 779 0.000032 2.05 0.42 0.45 0.02098 1.17 0.01
%GCA SS 81.41 56.72 78.86 84.01 77.00 76.73 83.06
%SCA SS 18.59 43.28 21.14 15.99 23.00 23.27 16.94
†GCA = general combining ability; SCA = specific combining ability; *P<0.05, **P<0.01

139
Table 6.6 General combining ability effects of 33 lines for quality traits across six sites
during the 2017/2018 and 2018/2019 cropping seasons in South Africa and Zimbabwe
Line Name Tryptophan % Moisture% Protein % Oil % Fibre % Starch % Quality Index
1 CZL0920 0.007* -0.47 0.29** -0.34* 0.03 0.07 0.12**
2 CZL1330 0.006* 0.32 -0.25* 0.24 -0.03 0.40 0.05
3 CZL15041 0.004 -0.02 -0.03 -0.50** 0.07** 0.31 0.09**
4 CZL15055 0.002 0.54* -0.20 -0.18 0.10** -0.14 0.03
5 CZL15073 -0.002 -0.51 -0.50** 0.05 -0.01 0.84** -0.03
6 CZL15073 0.005* 0.27 0.01 -0.33* -0.07* 0.08 0.09**
7 TL135470 0.006* 0.88** -0.27* -0.47** 0.19** 0.11 0.12**
8 VL06378 0.007* -0.03 0.37** 0.21 0.11** -0.98** 0.05
9 TL155805 0.001 -0.20 0.51** 0.64** -0.16** -0.54* -0.05
10 TL147078 0.004 0.78* 0.48** -0.09 0.07** -0.51* 0.05
11 TL147070 0.003 -0.40 0.65** 0.63** -0.08** -0.83** -0.03
12 TL13609 0.006* -0.41 0.54** -0.14 0.01 -0.28 0.09**
13 TL145743 0.006* 0.27 -0.38* -0.72** 0.09** 0.78** 0.14**
14 TL156614 0.003 0.59* -0.26* -0.39* 0.07** 0.32 0.05
15 CZL1477 0.011** -0.54 0.09 0.30* 0.08** -1.41** 0.10**
16 CZL15074 0.003 0.18 -0.16 -0.48** 0.02 0.75** 0.07**
17 CZL0616 0.006* 0.48 0.35* -0.06 -0.04 -0.60** 0.07**
18 CZL083 0.006* 0.39 0.24* -0.57** 0.01 0.31 0.15**
19 CML572 -0.010** -0.14 -0.67** 0.14 -0.07** 0.58* -0.14**
20 EBL167787 -0.010** -0.09 -0.36** 0.57** -0.13** 0.42 -0.17**
21 CZL0520 -0.009** -0.93** 0.15 0.26* 0.03 0.19 -0.14**
22 CZL99005 -0.016** 0.32 -0.53** 0.23 0.01 0.02 -0.21**
23 CML502 0.004 0.42 0.44** -0.02 0.09** -0.93** 0.05
24 CML144 0.004 0.08 0.32* 0.01 0.04 -0.59* 0.04
25 CML159 0.002 -0.3 -0.07 -0.17 -0.10** 0.32 0.03
26 CML181 0.001 0.09 0.14 -0.71** 0.06 0.52* 0.08**
27 CML197 0.002 -0.49 -0.44** -0.03 -0.03 0.55* 0.04
28 CML312SR -0.011** 0.42 0.50** 0.76** -0.02 -1.13** -0.17**
29 CML488 -0.011** -0.59* -0.34* 0.15 -0.12** 0.95** -0.15**
30 CML491 -0.009** 0.20 0.43** 0.08 -0.07** 0.12 -0.12**
31 LH51 0.004 -0.46 -0.40** -0.24 -0.13** 0.66* 0.07**
32 CZL00025 -0.016** -1.25** -0.58** 0.71** 0.06* 0.22 -0.24**
35 CML444 -0.015** 0.29 -0.29* 0.80** -0.09** -0.43 -0.23**
SE 0.002 0.27 0.11 0.13 0.02 0.23 0.03
*P<0.05, **P<0.01; SE = standard error

140
6.4.3.4 General combining ability effects of testers for quality traits across six
locations
QPM testers CZL15049 and CZL059 had positive and significant GCA effects for
tryptophan while the two non-QPM testers CML395 and CML444 had negative and
significant GCA effects for tryptophan (Table 6.7). Only QPM tester CZL15049 recorded
positive and significant GCA effects for moisture content.
Similar to the tryptophan content, the two QPM testers exhibited positive and significant
GCA effects for protein while the two non-QPM testers also exhibited negative and
significant GCA effects for protein content (Table 6.7). For oil content, non-QPM tester
CML444 had positive and significant GCA effects while the two QPM testers CZL15049
and CZL059 recorded negative and significant GCA effects for oil content. QPM tester
CZL15049 had positive and significant GCA values for fibre content while QPM tester
CZL059 and non-QPM tester CML444 recorded negative and significant SCA effects.
QPM tester CZL15049 recorded significant and positive GCA effects for starch content
while non-QPM tester CML395 had negative and significant GCA effects (Table 6.7). The
QPM testers used in the study showed positive and significant GCA effect for QI while the
non-QPM testers showed negative and significant GCA for QI.
Table 6.7 General combining ability effects of four testers for six quality traits across six
sites during the 2017/2018 and 2018/2019 cropping seasons
Tester Name Tryptophan Moisture Protein Oil Fibre Starch QI
1 CZL15049 0.012** 0.42* 0.35** -0.25* 0.15** -0.58** 0.17**
2 CZL059 0.013** -0.23 0.14** -0.52** -0.05** 0.17 0.20**
3 CML395 -0.010** 0.08 -0.34** 0.22 -0.01 0.51** -0.15**
4 CML444 -0.014** -0.28 -0.15** 0.52* -0.10** -0.08 -0.21**
SE 0.001 0.18 0.045 0.11 0.02 0.10 0.02
*P<0.05, **P<0.01; SE = standard error; QI = quality index
6.4.3.5 Specific combining ability effects among the crosses for quality traits across
six locations
The SCA values of tryptophan for the crosses ranged from -0.013 to 0.018 for entries 113
and 78, respectively (Table 6.8). A total of 21 hybrids (6 QPM hybrids and 15 non-QPM
hybrids) representing 16.15% of the total crosses had significant and positive SCA effects
for tryptophan. For moisture content, 11 crosses had significant and positive GCA effects

141
and 11 crosses again showed negative and significant SCA effects. Ten crosses had
positive and significant SCA effects for oil content, while four crosses showed negative
and significant SCA effects. Hybrid (L7 x CML444 (non-QPM) (27) showed the highest
SCA effects for oil content. Seventeen hybrids (13.08% of hybrids) showed significant and
positive SCA effects for protein content with hybrid L35 x CZL15049 (non-QPM) (127)
being the highest. For fibre content, a total of 20 crosses showed significant negative SCA
effects while 22 crosses also had positive and significant SCA effects. Hybrids L10 x
CML444 (non-QPM) (39) and (L10 x CZL15049 (QPM) (37) recorded the least and the
highest SCA values for fibre content, respectively. Only eight hybrids had positive and
significant SCA effects for starch content with L15 x CZL059 (QPM) (58) being the
highest, while 13 crosses recorded significant and negative SCA effects with L10 x
CZL15049 (QPM) (37) recording the lowest value (Table 6.8). The genetic analysis for QI
indicated that, 25 hybrids recorded positive and significant SCA. Hybrid 78 (L20 x
CML444 non-QPM) recorded the highest SCA value of 0.24 for QI (Table 6.8).

142
Table 6.8 Specific combining ability effects of 33 lines with four testers for quality traits
across six locations in South Africa and Zimbabwe during the 2017/2018 and 2018/2019
cropping seasons
Entries Pedigree Tryp % Moist % Oil % Prot % Fibre % Starch % QI
1 L1 x CZL15049 (QPM) -0.001 0.27 -0.07 -0.33 0.03 -0.21 0.02
2 L1 x CZL059 (QPM) 0.002 0.04 -0.02 0.25 0.06 -0.28 0.01
3 L1 x CML444 (non-QPM) 0.003 0.15 0.14 0.05 -0.09* 0.00 0.03
4 L1 x CML395 (non-QPM) -0.004 -0.45 -0.06 0.07 0.00 0.48 -0.07
5 L2 x CZL15049 (QPM) 0.002 0.08 -0.06 -0.01 0.04 0.05 0.00
6 L2 x CZL059 (QPM) 0.012** 0.71 -0.14 -0.17 0.03 0.21 0.17**
7 L2 x CML444 (non-QPM) -0.007* -0.65 0.13 -0.17 -0.02 0.07 -0.07
8 L2 x CML395 (non-QPM) -0.007* -0.12 0.05 0.37* -0.05 -0.34 -0.11**
9 L3 x CZL15049 (QPM) 0.004 0.35 0.36* 0.01 -0.01 -0.71* 0.04
10 L3 x CZL059 (QPM) -0.005 -0.15 -0.49** -0.31 -0.02 0.83* -0.01
11 L3 x CML444 (non-QPM) -0.004 -0.72 0.05 0.43* -0.04 0.16 -0.09*
12 L3 x CML395 (non-QPM) 0.005 0.54 0.08 -0.10 0.07 -0.30 0.05
13 L4 x CZL15049 (QPM) -0.003 0.87 0.18 -0.30 0.05 0.15 -0.02
14 L4 x CZL059 (QPM) 0.000 -0.90 -0.15 -0.16 0.07* 0.05 0.03
15 L4 x CML444 (non-QPM) -0.005 0.08 0.10 0.12 0.03 -0.14 -0.07
16 L4 x CML395 (non-QPM) 0.007* -0.04 -0.13 0.38* -0.16** -0.07 0.06
17 L5 x CZL15049 (QPM) 0.005 -0.93* 0.04 0.20 -0.03 0.20 0.03
18 L5 x CZL059 (QPM) 0.005 0.21 -0.25 -0.03 0.02 0.49 0.08
19 L5 x CML444 (non-QPM) -0.006 0.79* 0.02 -0.21 0.01 -0.11 -0.05
20 L5 x CML395 (non-QPM) -0.005 -0.06 0.18 0.07 -0.01 -0.59 -0.07
21 L6 x CZL15049 (QPM) 0.004 -0.27 0.05 0.02 0.01 -0.18 0.05
22 L6 x CZL059 (QPM) -0.001 -0.23 -0.31 -0.25 -0.08* 0.70* 0.03
23 L6 x CML444 (non-QPM) -0.004 0.59 0.39* 0.13 0.08* -0.66* -0.06
24 L6 x CML395 (non-QPM) -0.001 -0.08 -0.14 0.13 -0.01 0.13 -0.04
25 L7 x CZL15049 (QPM) -0.003 0.59 -0.10 -0.14 0.08* 0.36 -0.01
26 L7 x CZL059 (QPM) 0.006 -0.56 -0.29 -0.32 -0.03 0.56 0.13**
27 L7 x CML444 (non-QPM) -0.005 0.08 0.50** 0.28 0.08* -0.701* -0.10*
28 L7 x CML395 (non-QPM) 0.001 -0.10 -0.11 0.20 -0.11** -0.22 -0.02
29 L8 x CZL15049 (QPM) 0.006 -0.60 0.06 0.38* 0.00 -0.60* 0.03
30 L8 x CZL059 (QPM) 0.001 -0.20 -0.04 -0.14 -0.01 0.32 0.03
31 L8 x CML444 (non-QPM) -0.004 -0.06 -0.16 0.05 0.00 0.16 -0.05
32 L8 x CML395 (non-QPM) -0.004 0.87* 0.13 -0.26 0.02 0.11 -0.03
33 L9 x CZL15049 (QPM) 0.007* 0.14 -0.14 0.08 -0.03 0.23 0.07
34 L9 x CZL059 (QPM) -0.002 -0.47 -0.11 0.51* -0.08* -0.20 -0.10
35 L9 x CML444 (non-QPM) -0.003 0.10 0.31 -0.43* 0.02 -0.13 0.01
36 L9 x CML395 (non-QPM) -0.003 0.25 -0.07 -0.13 0.10** 0.08 0.01
37 L10 x CZL15049 (QPM) 0.012** 1.28** 0.43** -0.14 0.24** -1.15** 0.16**
38 L10 x CZL059 (QPM) -0.004 -0.94* -0.13 0.02 -0.01 0.65* -0.06
39 L10 x CML444 (non-QPM) -0.003 -0.67 -0.32 -0.07 -0.22** 0.58 -0.02
40 L10 x CML395 (non-QPM) -0.006 0.35 0.02 0.21 -0.01 -0.09 -0.09
41 L11 x CZL15049 (QPM) 0.002 -0.39 -0.11 -0.08 -0.06 0.46 0.03
42 L11 x CZL059 (QPM) 0.011** 0.14 0.15 0.48* -0.08* -0.42 0.06
SE 0.003 0.38 0.17 0.19 0.04 0.30 0.05
†SE = standard error; Tryp = tryptophan; Moist = moisture; Prot = protein; QI = quality index; *P<0.05, **P<0.01

143
Table 6.9 Specific combining ability effects of 33 lines with four testers for quality traits
across six locations in South Africa and Zimbabwe during the 2017/2018 and 2018/2019
cropping seasons (continued)
Entries Pedigree Tryp % Moist % Oil % Prot % Fibre % Starch % QI
43 L11 x CML444 (non-QPM) -0.006 0.80* 0.06 -0.30 0.07* 0.05 -0.03
44 L11 x CML395 (non-QPM) -0.008** -0.53 -0.11 -0.07 0.07* -0.10 -0.07
45 L12 x CZL15049 (QPM) 0.012** -0.14 -0.01 -0.31 0.11** 0.17 0.19**
46 L12 x CZL059 (QPM) -0.003 -0.07 0.11 0.05 -0.01 -0.06 -0.05
47 L12 x CML444 (non-QPM) -0.007* -0.13 -0.25 0.32 -0.15** -0.04 -0.12**
48 L12 x CML395 (non-QPM) -0.003 0.35 0.14 -0.02 0.06 -0.07 -0.04
49 L13 x CZL15049 (QPM) 0.002 0.86* -0.11 -0.15 0.14 -0.32 0.08
50 L13 x CZL059 (QPM) 0.001 0.40 -0.25 0.21 0.02 -0.22 0.01
51 L13 x CML444 (non-QPM) -0.003 -1.06* 0.37* 0.22 -0.04 0.38 -0.06
52 L13 x CML395 (non-QPM) -0.001 -0.19 -0.02 -0.25 -0.12** 0.16 -0.03
53 L14 x CZL15049 (QPM) -0.004 0.29 -0.21 0.01 0.04 0.20 -0.06
54 L14 x CZL059 (QPM) -0.001 -0.06 0.01 0.00 -0.03 0.20 0.00
55 L14 x CML444 (non-QPM) 0.010** -0.30 0.34* -0.01 0.05 -0.42 0.13**
56 L14 x CML395 (non-QPM) -0.006 0.10 -0.15 0.03 -0.05 0.01 -0.08
57 L15 x CZL15049 (QPM) 0.006 -0.05 0.05 -0.23 0.00 -0.40 0.07
58 L15 x CZL059 (QPM) -0.003 0.08 -0.20 -0.26 0.00 0.84** -0.02
59 L15 x CML444 (non-QPM) -0.004 -0.14 -0.11 0.48* -0.01 -0.11 -0.07
60 L15 x CML395 (non-QPM) -0.001 0.13 0.25 0.04 0.02 -0.35 0.00
61 L16 x CZL15049 (QPM) 0.003 0.20 0.02 -0.06 0.10** -0.40 0.04
62 L16 x CZL059 (QPM) 0.003 0.10 -0.03 0.09 -0.08* 0.26 0.05
63 L16 x CML444 (non-QPM) 0.001 -0.40 0.18 0.22 -0.05 -0.22 -0.01
64 L16 x CML395 (non-QPM) -0.007* 0.11 -0.18 -0.21 0.04 0.35 -0.09
65 L17 x CZL15049 (QPM) 0.003 0.32 0.35* -0.12 0.08* -0.62* 0.04
66 L17 x CZL059 (QPM) -0.001 -0.47 0.12 0.14 -0.13** -0.22 -0.02
67 L17 x CML444 (non-QPM) 0.001 0.89* -0.33 -0.37* 0.02 0.81** 0.05
68 L17 x CML395 (non-QPM) -0.004 -0.73 -0.15 0.38* 0.03 0.02 -0.08
69 L18 x CZL15049 (QPM) 0.005 -0.08 0.09 -0.70* -0.02 0.49 0.15**
70 L18 x CZL059 (QPM) 0.005 0.10 0.05 0.35 0.04 -0.64* 0.04
71 L18 x CML444 (non-QPM) -0.004 0.35 -0.14 -0.40* 0.02 0.36 -0.06
72 L18 x CML395 (non-QPM) -0.006 -0.36 -0.01 0.77** -0.04 -0.22 -0.15**
73 L19 x CZL15049 (non-QPM) -0.004 -0.47 -0.09 0.25 -0.07 0.25 -0.08
74 L19 x CZL059 (non-QPM) -0.009** 0.11 0.10 0.39* -0.02 -0.62* -0.15**
75 L19 x CML444 (non-QPM) 0.004 0.24 -0.18 -0.23 0.00 0.35 0.07
76 L19 x CML395 (non-QPM) 0.008** 0.13 0.16 -0.38* 0.10* 0.01 0.14**
77 L20 x CZL15049 (non-QPM) -0.010** -0.13 0.25 0.38* -0.05 -0.36 -0.15**
78 L20 x CML444 (non-QPM) 0.018** -0.34 -0.46** -0.26 -0.10** 0.16 0.24**
79 L20 x CML395 (non-QPM) 0.005 0.25 0.34* -0.61** 0.11 0.35 0.10*
80 L21 x CZL15049 (non-QPM) -0.010** -1.24** 0.07 0.58** -0.06 0.06 -0.17**
81 L21 x CZL059 (non-QPM) -0.011** 0.83* 0.33 -0.21 0.03 -0.08 -0.12**
82 L21 x CML444 (non-QPM) 0.017** 0.40 -0.11 -0.23 0.08* -0.14 0.22**
83 L21 x CML395 (non-QPM) 0.003 0.03 -0.30 -0.12 -0.06 0.15 0.05
84 L22 x CZL15049 (non-QPM) -0.013** 1.06* 0.05 -0.03 -0.08* 0.15 -0.16**
85 L22 x CZL059 (non-QPM) -0.010** -0.21 0.12 -0.26 -0.03 0.35 -0.12**
86 L22 x CML444 (non-QPM) 0.008** 0.22 0.06 -0.32 -0.04 0.36 0.13**
SE 0.003 0.38 0.17 0.19 0.04 0.30 0.05
†SE = standard error; Tryp = tryptophan; Moist = moisture; Prot = protein; QI = quality index; *P<0.05, **P<0.01
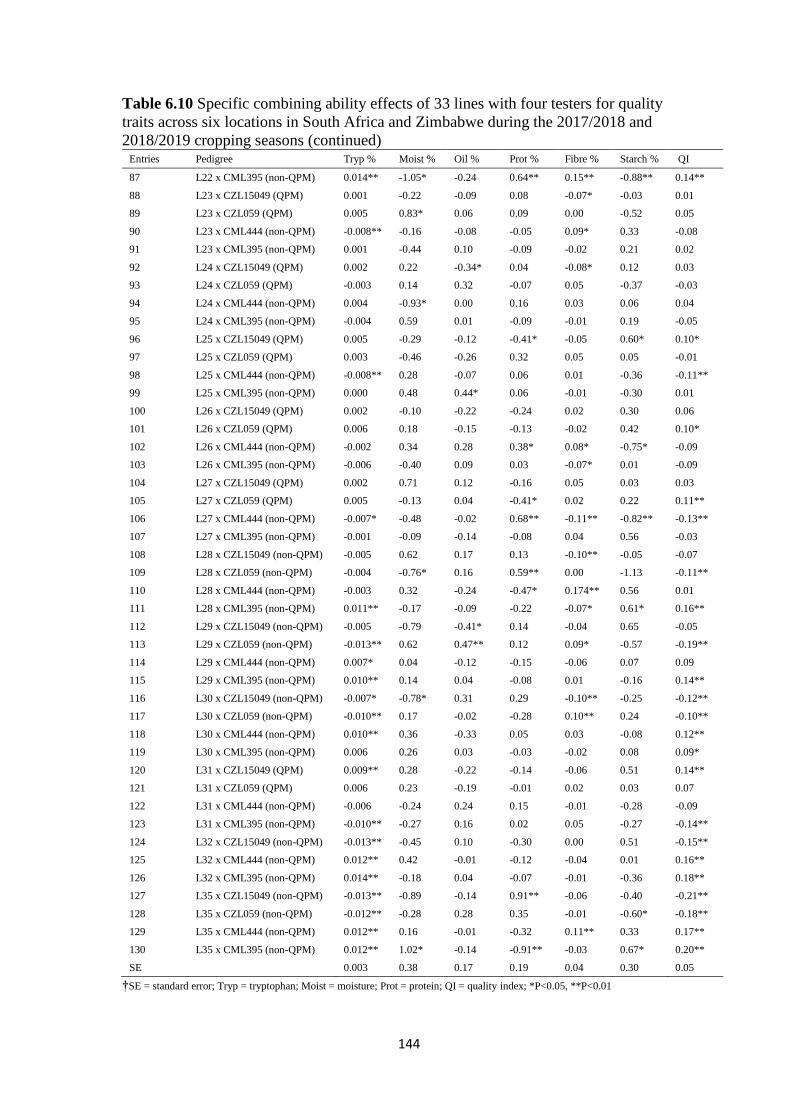
144
Table 6.10 Specific combining ability effects of 33 lines with four testers for quality
traits across six locations in South Africa and Zimbabwe during the 2017/2018 and
2018/2019 cropping seasons (continued) Entries Pedigree Tryp % Moist % Oil % Prot % Fibre % Starch % QI
87 L22 x CML395 (non-QPM) 0.014** -1.05* -0.24 0.64** 0.15** -0.88** 0.14**
88 L23 x CZL15049 (QPM) 0.001 -0.22 -0.09 0.08 -0.07* -0.03 0.01
89 L23 x CZL059 (QPM) 0.005 0.83* 0.06 0.09 0.00 -0.52 0.05
90 L23 x CML444 (non-QPM) -0.008** -0.16 -0.08 -0.05 0.09* 0.33 -0.08
91 L23 x CML395 (non-QPM) 0.001 -0.44 0.10 -0.09 -0.02 0.21 0.02
92 L24 x CZL15049 (QPM) 0.002 0.22 -0.34* 0.04 -0.08* 0.12 0.03
93 L24 x CZL059 (QPM) -0.003 0.14 0.32 -0.07 0.05 -0.37 -0.03
94 L24 x CML444 (non-QPM) 0.004 -0.93* 0.00 0.16 0.03 0.06 0.04
95 L24 x CML395 (non-QPM) -0.004 0.59 0.01 -0.09 -0.01 0.19 -0.05
96 L25 x CZL15049 (QPM) 0.005 -0.29 -0.12 -0.41* -0.05 0.60* 0.10*
97 L25 x CZL059 (QPM) 0.003 -0.46 -0.26 0.32 0.05 0.05 -0.01
98 L25 x CML444 (non-QPM) -0.008** 0.28 -0.07 0.06 0.01 -0.36 -0.11**
99 L25 x CML395 (non-QPM) 0.000 0.48 0.44* 0.06 -0.01 -0.30 0.01
100 L26 x CZL15049 (QPM) 0.002 -0.10 -0.22 -0.24 0.02 0.30 0.06
101 L26 x CZL059 (QPM) 0.006 0.18 -0.15 -0.13 -0.02 0.42 0.10*
102 L26 x CML444 (non-QPM) -0.002 0.34 0.28 0.38* 0.08* -0.75* -0.09
103 L26 x CML395 (non-QPM) -0.006 -0.40 0.09 0.03 -0.07* 0.01 -0.09
104 L27 x CZL15049 (QPM) 0.002 0.71 0.12 -0.16 0.05 0.03 0.03
105 L27 x CZL059 (QPM) 0.005 -0.13 0.04 -0.41* 0.02 0.22 0.11**
106 L27 x CML444 (non-QPM) -0.007* -0.48 -0.02 0.68** -0.11** -0.82** -0.13**
107 L27 x CML395 (non-QPM) -0.001 -0.09 -0.14 -0.08 0.04 0.56 -0.03
108 L28 x CZL15049 (non-QPM) -0.005 0.62 0.17 0.13 -0.10** -0.05 -0.07
109 L28 x CZL059 (non-QPM) -0.004 -0.76* 0.16 0.59** 0.00 -1.13 -0.11**
110 L28 x CML444 (non-QPM) -0.003 0.32 -0.24 -0.47* 0.174** 0.56 0.01
111 L28 x CML395 (non-QPM) 0.011** -0.17 -0.09 -0.22 -0.07* 0.61* 0.16**
112 L29 x CZL15049 (non-QPM) -0.005 -0.79 -0.41* 0.14 -0.04 0.65 -0.05
113 L29 x CZL059 (non-QPM) -0.013** 0.62 0.47** 0.12 0.09* -0.57 -0.19**
114 L29 x CML444 (non-QPM) 0.007* 0.04 -0.12 -0.15 -0.06 0.07 0.09
115 L29 x CML395 (non-QPM) 0.010** 0.14 0.04 -0.08 0.01 -0.16 0.14**
116 L30 x CZL15049 (non-QPM) -0.007* -0.78* 0.31 0.29 -0.10** -0.25 -0.12**
117 L30 x CZL059 (non-QPM) -0.010** 0.17 -0.02 -0.28 0.10** 0.24 -0.10**
118 L30 x CML444 (non-QPM) 0.010** 0.36 -0.33 0.05 0.03 -0.08 0.12**
119 L30 x CML395 (non-QPM) 0.006 0.26 0.03 -0.03 -0.02 0.08 0.09*
120 L31 x CZL15049 (QPM) 0.009** 0.28 -0.22 -0.14 -0.06 0.51 0.14**
121 L31 x CZL059 (QPM) 0.006 0.23 -0.19 -0.01 0.02 0.03 0.07
122 L31 x CML444 (non-QPM) -0.006 -0.24 0.24 0.15 -0.01 -0.28 -0.09
123 L31 x CML395 (non-QPM) -0.010** -0.27 0.16 0.02 0.05 -0.27 -0.14**
124 L32 x CZL15049 (non-QPM) -0.013** -0.45 0.10 -0.30 0.00 0.51 -0.15**
125 L32 x CML444 (non-QPM) 0.012** 0.42 -0.01 -0.12 -0.04 0.01 0.16**
126 L32 x CML395 (non-QPM) 0.014** -0.18 0.04 -0.07 -0.01 -0.36 0.18**
127 L35 x CZL15049 (non-QPM) -0.013** -0.89 -0.14 0.91** -0.06 -0.40 -0.21**
128 L35 x CZL059 (non-QPM) -0.012** -0.28 0.28 0.35 -0.01 -0.60* -0.18**
129 L35 x CML444 (non-QPM) 0.012** 0.16 -0.01 -0.32 0.11** 0.33 0.17**
130 L35 x CML395 (non-QPM) 0.012** 1.02* -0.14 -0.91** -0.03 0.67* 0.20**
SE 0.003 0.38 0.17 0.19 0.04 0.30 0.05
†SE = standard error; Tryp = tryptophan; Moist = moisture; Prot = protein; QI = quality index; *P<0.05, **P<0.01

145
6.5 Discussion
Development of QPM genotypes with increased lysine and tryptophan and good quality
traits is important to alleviate poor nutritional status in the increasing population that
depends on maize products. Understanding of gene action and mode of quality trait
inheritance of QPM genotypes is essential in any breeding programme because of its
implications in speeding up the breeding progress by selecting superior lines for hybrid
formation. In the present study, there was large variability among the QPM and non-QPM
hybrids for six quality traits. The high values for QI and other quality characteristics,
combined with acceptable yield, in a number of hybrids, showed that QPM hybrids with
superior quality traits with increased grain yield can be identified for commercialisation
across southern Africa and to a larger extent, SSA. Fifty of the 130 single cross hybrids
developed had QI above 0.80. The QI values recorded in this study were more than the
values reported by other studies (Masindeni 2013; Twumasi-Afriye et al. 2016; Tandzi et
al. 2017). This suggested that good improvement has been attained in developing QPM
materials in SSA.
The significant genotype x site interactions observed for all the quality traits analysed
indicate that the environment plays an important role in the inheritance of the quality traits,
and that genotypes do not react the same in all environments. This indicates that genotypes
must be selected that are stable for the required traits across different environments. Kaya
and Akcura (2014), Nehe et al. (2019), and Anandan et al. (2020) also found interaction
between environment and quality traits in rice and wheat cultivars. Singh et al. (2019)
reported on the influence of the environment on oil content, suggesting both genetic and
environmental factors contribute to inheritance of quality traits.
The tryptophan values obtained from the present study for both QPM and non-QPM
genotypes fall within the range reported by several authors (Zilic et al. 2011; Li and Vasal
2016; Sarika et al. 2018; Singh et al. 2019) suggesting the tryptophan contents from the
QPM lines and testers were indeed transferred to the progenies.
The protein content recorded for the materials analysed indicated the presence of genetic
variability for protein synthesis. It is interesting to note that the best genotype with the
highest protein content of 10.04% is a non-QPM hybrid 127, which is a product of non-
QPM inbred line 35 by a QPM tester. This is consistent with Marta et al. (2017) who
146
recorded similar protein content in Indonesian maize hybrids. Superior genotypes with
enhanced nutritional traits could be beneficial to the food industries where they use maize
for meal and feed for both humans and animals, as well as by companies that use maize for
manufacturing of bread and biscuits.
Generally, the starch content of the maize genotypes fell within the starch content of maize
as previously reported (Li and Vasal 2016; Sharma and Carena 2016; Lu et al. 2019). Non-
QPM based hybrids had higher starch content than their QPM counterparts, suggesting that
QPM genotypes have the potential to contribute to health benefits because of their
increased protein content with decreased starch. Although non-QPM hybrid L13 x
CML444 (51) was observed to have the highest starch content of 68.24%, the figure is far
below the reported values for non-QPM or normal maize genotypes having 70 to 75% of
starch (Boyer and Hannah 2001; Laude and Carena 2014). The reason for such low values
could be that genetic materials used were largely QPM. This observation is in line with
previous findings (Hossain et al. 2019; Kaur et al. 2019) that reported low starch contents
for QPM genotypes.
Oil from maize is very important for human and animal consumption. The oil content
values in this study were higher than those previously reported (Boyer and Hannah 2001;
Blumenthal et al. 2008). Interestingly, a QPM hybrid had higher oil contents than the non-
QPM hybrids. QPM hybrid L10 x CZL15049 (37) recorded an oil content of 6.78%, far
above the range of 3.10 to 5.70% reported by Clark et al. (2006) and Synrem et al. (2017).
Such hybrids could be exploited by oil producing companies for manufacturing edible oil
to serve as source of fat and poly-unsaturated fatty acids to form part of human and animal
nutrition (Cuevas-Rodríguez et al. 2006; Blumenthal et al. 2008).
Fibre from maize consists of non-digestible sugars and lignin that are fundamental and
integral in plants (Zilic et al. 2011). The fibre contents of the maize hybrids were
significantly lower than the values report by Marta et al. (2017). While the range of fibre
recorded in this study across six locations was 2.17 to 2.96%, Marta et al. (2017) reported
a range of 3.11 to 4.15%. This difference is probably due to the genetic materials used in
the current study. The QPM genotypes generally produced less fibre than non-QPM
hybrids. This study could be important to the livestock farmers to include maize genotypes
with low fibre in their feed formulation corroborating the study by Dei (2017).

147
QPM genotypes in the present study retained more moisture than the non-QPM genotypes.
In fact, this is a known characteristic of QPM genotypes, suggesting there is a need to
ensure that grains from QPM genotypes are dried to the required moisture before storage
to avoid post-harvest losses and also to keep the seeds viable for longer durations (Bhandari
et al. 2018; Kaur et al. 2019).
In the current study, there was larger contribution of GCA sum of squares for all the quality
traits analysed than the SCA sum of squares. This indicated that the quality traits measured
were determined predominantly by additive genetic effects. This is in line with results
reported in several studies involving QPM and non-QPM genetic materials for quality
traits, particularly tryptophan, protein, starch and oil contents (Mathur and Mathuw 1986;
Pixley and Bjarnason 1993; Njeri et al. 2017; Darshan and Marker 2019). With the
predominance of additive genetic effects and the large genetic variability for the quality
traits, selection methods such as recurrent selection using half-sibs can be used to improve
this germplasm.
Inbred line CZL1477 (15), with significant positive GCA effects for tryptophan across the
six sites, is the only inbred line having the favourable alleles to be used by breeding
programmes with the aim of developing hybrids with high tryptophan. On the other hand,
the two QPM testers (CZL15049 and CZL059) were superior contributors of tryptophan
content due to displaying significant positive GCA effects. The 14 inbred lines that showed
significant GCA effects for protein content across the six sites denotes their ability to
transfer this trait to their progeny. Therefore, lines with high and stable protein content
with significant positive GCA effects are good genetic materials to be used in QPM inbred
line recycling programmes (Njeri et al. 2017). Similarly, lines and testers having positive
and significant GCA effects for oil content are desirable as contributors in breeding for
high oil contents. This agrees with the studies by Laude and Carena (2014), Kostadinovic
et al. (2016) and Synrem et al. (2017). For nutritional benefits, it is desirable to select lines
with negative and significant GCA effects for starch and fibre. However, industries with
the aim of producing genotypes with high starch content could select lines with significant
positive GCA effects for starch and lines with low GCA for fibre contents (Cuevas-
Rodríguez et al. 2006; Mamun et al. 2015; Ai and Jane 2016).

148
The crosses showing positive and significant specific combinations for tryptophan, protein,
and oil contents are desirable for commercial hybrid production and vice versa for the
hybrids with negative and significant SCA effects for starch and fibre contents. Even
though only 10 inbred lines recorded significant GCA for tryptophan, several hybrids were
found to have positive and significant SCA, with hybrids L20 x CML444 (78) and L21 x
CML444 (82) being the superior genotypes. Similarly, non-QPM hybrid L35 x CZL15049
(127) was the best genotype for protein content. These findings were similar with the
results reported by Wegary et al. (2013), Williams and Kucheryavskiy (2016), Synrem et
al. (2017) and Tilahun et al. (2018) on significant SCA effects for quality traits.
The genetic analysis for QI indicated that the majority of the QPM lines recorded positive
and significant GCA, while the non-QPM lines recorded negative and significant GCA.
Some of the QPM lines such as 5, 9 and 11 recorded non-significant negative GCA. Lines
with significant GCA values could be selected for hybrid development with enhanced
quality traits. These lines could also be useful in the development of populations.
Interestingly, some of the hybrids that are classified as non-QPM for example 78 (L20 x
CML444; non-QPM) and 82 (L21 x ML444; non-QPM) showed significant and positive
SCA effects for QI, more than the QPM hybrids. This may be linked to one of the parents
being QPM for those hybrids, implying that heterosis for QI could be achieved when QPM
lines are crossed with non-QPM lines because of the genetic distance the lines and testers.
Inheritance of QI traits for the genetic materials studies was controlled additive genetic
effects. The observed result is consistent with the study reported by Machida et al. (2010)
and Ignjatovic-Micic et al. (2013) who also detected the predominance of GCA over SCA.
6.6 Conclusions
A total of 135 hybrids were analysed for quality traits, including tryptophan, protein,
starch, oil, fibre and moisture contents across six environments in South Africa and
Zimbabwe. Combining ability of the inbred lines and testers for quality traits were
determined. Several hybrids had a QI above 1.00, and the best three hybrids for QI were
QPM hybrids L12 x CZL15049 (45), L18 x CZL15049 (69) and L2 x CZL059 (6). For
tryptophan, hybrids L12 x CZL15049 (45) and L15 x CZL15049 (57) outperformed the
best check, QPM (entry 132) by 15.38 and 12.82%, respectively. Hybrids 45 and 57 were
identified as the crosses with the highest tryptophan content, while hybrids L13 x CML444

149
(51) and L10 x CZL15049 (37) recorded the highest values for starch and oil contents,
respectively. Additive gene action was predominant in controlling the inheritance of
tryptophan, protein, starch, oil and fibre contents. Inbred lines 1, 2, 6, 7, 8, 12, 13, 15, 17
and 18 and QPM testers CZL15049 and CZL059 showed desirable GCA effects for
tryptophan, suggesting this line and testers should be considered for QPM inbred
development for high tryptophan content. Several lines had good GCA effects for protein
and oil. Based on the SCA values, crosses 78, 82, 87 and 126 were identified as the best
hybrids across the six locations for tryptophan content. Hybrids 127 and 87 were identified
for superior protein content. The superior hybrids identified for various quality traits will
be important for the food and animal feed industries to enhance human and animal
nutrition. It is also recommended that these hybrids should be further evaluated across
several other locations since the environment was found to interact with these quality traits.
Inbred lines and testers with good GCA effects for quality traits could be utilised by other
maize improvement programmes for development of superior QPM hybrids. Promotion
and adoption of these superior QPM hybrids for quality traits from the present study would
contribute significantly to fight against malnutrition in SSA.
References
Ai Y and Jane JL (2016) Macronutrients in Corn and Human Nutrition. Comprehensive
Reviews in Food Science and Food Safety 15: 581-598.
Akuamoa-Boateng A (2002) Quality Protein Maize: Infant Feeding Trials in Ghana. Ghana
Health Service, Ashanti, Ghana.
Alander JT, Bochko V, Martinkauppi B, Saranwong S and Mantere T (2013) A review of
optical nondestructive visual and near-infrared methods for food quality and safety.
International Journal of Spectroscopy 2013: 1-36.
Amin MN, Amiruzzaman M, Ahmed A and Ali MR (2014) Evaluation of inbred lines of
maize (Zea mays L.) through line × tester method. Bangladesh Journal Agricultural
Research 39: 675-683.
Anandan A, Sabesan T, Eswaran R, Rajiv G and Muthalagan N (2020) Appraisal of
environmental interaction on quality traits of rice by additive main effects and
multiplicative interaction analysis. Cereal Research Communications 37: 131-140.

150
Annor B and Badu-Apraku B (2016) Gene action controlling grain yield and other
agronomic traits of extra-early quality protein maize under stress and non-stress
conditions. Euphytica 212: 213-228.
Babu R and Prasanna B (2014) Molecular Breeding for Quality Protein Maize (QPM). In:
Tuberosa R, Graner A and Frison E (eds), Genomics of Plant Genetic Resources.
Springer, Dordrecht, pp. 490-505. doi: 10.1007/978-94-007-7575-6
Badu-Apraku B and Lum AF (2010) The pattern of grain yield response of normal and
quality protein maize cultivars in stressed and non-stressed environments. Agronomy
Journal 102: 381-394.
Bastianelli D, Fermet-Quinet E, Davrieux F, Hervouet C and Bonnal L (2007) Calibration
strategies for prediction of amino acid content of poultry feeds. Proceedings of the
12th International Conference on Near Infrared Spectroscopy, 9-15th April 2005,
Auckland, pp. 314-318.
Black RE, Victoria CG, Walker SP, Bhutta ZA, Christian P, De-Onis M, Ezzati M,
Grantham-McGregor S, Katz J, Martorell R and Uauy R (2013) Maternal and child
undernutrition and overweight in low-income and middle-income countries. The
Lancet 382: 427-445.
Bhandari G, Ghimire TB, Kaduwal S, Shrestha J and Acharya R (2018) Effects of storage
structures and moisture contents on seed quality attributes of quality protein maize.
Journal of Maize Research and Development 3: 77-85.
Blumenthal J, Baltensperger D, Cassman KG, Mason S and Palvilista A (2008) Importance
and effects of nitrogen on crop quality and health. Agronomy and Horticulture Faculty
Publications. University of Nebraska - Lincoln.
Boyer CD and Hannah LC (2001) Kernel mutants of corn. In: Hallauer AR (ed), Specialty
corns. CRC Press LLC, Boca Raton, pp. 1-32.
Caprita R, Caprita A and Cretescu I (2011) Effective extraction of soluble non-starch
polysaccharides and viscosity determination of aqueous extracts from wheat and
barley. Proceedings of the World Congress on Engineering and Computer Science 2:
1-3.
Clark D, Dudley JW, Rocheford TR and Ledeaux JR (2006) Genetic analysis of corn kernel
chemical composition in the random mated 10 generation of the cross of generations
70 IHO x ILO. Crop Science 46: 807-819.

151
Cuevas-Rodríguez EO, Verdugo-Montoya NM, Angulo-Bejarano PI, Milán-Carrillo J,
Mora-Escobedo R, Bello-Pérez LA, Garzón-Tiznado JA and Reyes-Moreno C (2006)
Nutritional properties of tempeh flour from quality protein maize (Zea mays L.). LWT
- Food Science and Technology 39: 1072-1079.
Darshan SS and Marker S (2019) Heterosis and combining ability for grain yield and its
component characters in quality protein maize (Zea mays L.) hybrids. Electronic
Jounal of Plant Breeding 10: 111-118.
De Groote H, Gunaratna N, Ergano K and Friesen D (2010) Extension and adoption of
biofortified crops: Quality protein maize in East Africa. Paper presented at the Joint
3rd African Association of Agricultural Economists (AAAE) and 48th Agricultural
Economists Association of South Africa (AEASA) Conference, Cape Town, South
Africa.
De Groote H, Gunaratna N, Okuro J, Wondimu A, Chege C and Tomlins K (2014)
Consumer acceptance of quality protein maize (QPM) in East Africa. Journal of the
Science of Food and Agriculture 94: 3201-3212.
Dei HK (2017) Assessment of Maize (Zea mays L.) as Feed Resource for Poultry In:
Manafi M (ed), Poultry Science, pp. 1-32. http://dx.doi.org/10.5772/65363
FAOSTAT (2016) http://www.fao.org/faostat/en/#data/QC/visualize
Global Nutrition Report (2017) http://www.globalnutritionreport.org
Gunaratna NS, De Groote H, Nestel P, Pixley KV and McCabe G (2010) Evaluating the
impact of biofortification: A meta-analysis of community-based studies on quality
protein maize (QPM). Food Policy 35: 202-210.
Hossain F, Sarika K, Muthusamy V, Zunjare RU and Gupta HS (2019) Quality protein
maize for nutritional security. In: Qureshi AMI, Dar ZA and Wani SH (eds), Quality
Breeding in Field Crops. Springer, Switzerland, pp. 217-237. doi: 10.1007/978-3-
030-04609-5_11
Ignjatovic-Micic D, Kostadinovic M, Stankovic G, Markovic K, Vancetovic J, Bozinovic
S and Andjelkovic V (2013) Biochemical and agronomic performance of quality
protein maize hybrids adapted to temperate regions. Maydica 58: 311-317.
Kaur N, Singh B and Sharma S (2019) Comparison of quality protein maize (QPM) and
normal maize with respect to properties of instant porridge. LWT - Food Science and
Technology 99: 291-298. https://doi.org/10.1016/j.lwt.2018.09.070

152
Kaya Y and Akcura M (2014) Effects of genotype and environment on grain yield and
quality traits in bread wheat (T. aestivum L.). Food Science and Technology 34: 386-
393.
Kostadinović M, Ignjatović-Micić D, Vancetović J, Ristić D, Bozinović S, Stanković G
and Mladenović-Drinić S (2016) Development of high tryptophan maize near
isogenic lines adapted to temperate regions through marker assisted selection -
impediments and benefits. PLoS One 11:1-17.
Laude TP and Carena MJ (2014) Diallel analysis among 16 maize populations adapted to
the northern U.S. Corn Belt for grain yield and grain quality traits. Euphytica 200: 29-
44.
Li JS and Vasal SK (2016) Maize: Quality Protein Maize. In: Wrigley C, Corke H,
Seetharaman K and Faubion J (eds), Encyclopedia of Food Grains: Second Edition.
Elsevier, pp. 420-424. doi: 10.1016/B978-0-12-394437-5.00223-0
Lu X, Chen J, Zheng M, Guo J, Qi J, Chen Y, Miao S and Zheng B (2019) Effect of high-
intensity ultrasound irradiation on the stability and structural features of coconut-grain
milk composite systems utilizing maize kernels and starch with different amylose
contents. Ultrason-Sonochemistry 55: 135-148.
Machida L, Derera J, Tongoona P and MacRobert J (2010) Combining Ability and
Reciprocal Cross Effects of Elite Quality Protein Maize Inbred Lines in Subtropical
Environments. Crop Science 50: 1708-1717.
Mamun AA, Heim HP and Bledzki AK (2015) The use of maize, oat, barley and rye fibres
as reinforcements in composites. In: Faruk O and Sain M (eds), Biofiber
Reinforcements in Composite Materials. Woodhead Publishing, pp. 454-487. doi:
10.1533/9781782421276.4.454
Marta H, Suryadi E and Ruswandi D (2017) Chemical composition and genetics of
Indonesian maize hybrids. American Journal of Food Technology 12: 116-123.
Masindeni DR (2013) Evaluation of South African high quality protein maize (Zea mays
L.) inbred lines under optimum and low nitrogen conditions and the identification of
suitable donor parents. PhD Thesis in Plant Breeding, University of the Free State,
South Africa.
Mathur PN and Mathuw JR (1986) Combining ability for yield, protein, lysine and
tryptophan in pearl millet (Pennisetum americanum L.). Field Crops Research 15:
181-189.

153
Mbuya K, Nkongolo KK and Kalonji-Mbuyi A (2011) Nutritional analysis of quality
protein maize varieties selected for agronomic characteristics in a breeding program.
International Journal of Plant Breeding and Genetics 5: 317-327.
Menkir A, White WS, Maziya-Dixon B, Rocheford T and Weiping L (2008) Carotenoid
diversity in tropical adapted yellow maize inbred lines. Food Chemistry 109: 521-
529.
Mertz ET, Bates ET and Nelson OE (1964) Mutant genes that change protein composition
and increase lysine content of maize endosperm. Science 145: 279-280.
Mpofu IDT, Sibanda S, Shonihwa A and Pixley K (2012) The nutritional value of quality
protein maize for weaner pigs. Journal of Petroleum and Evironmental Biotechnology
3: 1-4. doi: 10.4172/2157-7463.1000129
Nehe A, Akin B, Sanal T, Evlice AK, Unsal R, Dincer N, Demir L, Geren H, Sevim I,
Orhan S, Yaktubay S, Ezici A, Guzman C and Morgounov A (2019) Genotype x
environment interaction and genetic gain for grain yield and grain quality traits in
Turkish spring wheat released between 1964 and 2010. PLoS ONE 14: 1-18.
e0219432. https://doi.org/10.1371/journal. pone.0219432
Njeri SG, Makumbi D, Warburton ML, Diallo A, Jumbo MDB and Chemining’wa G
(2017) Genetic analysis of tropical quality protein maize (Zea mays L.) germplasm.
Euphytica 213: 1-19. doi 10.1007/s10681-017-2048-4
Nurit E, Tiessen A, Pixley K and Palacios-Rojas N (2009) Reliable and inexpensive
colorimetric method for deter- mining protein-bound tryptophan in maize kernels.
Journal of Agricultural and Food Chemistry 57: 7233-7238.
Nuss ET and Tanumihardjo SA (2011) Quality protein maize for Africa: Closing the
protein inadequacy gap in vulnerable populations. Advances in Nutrition 2: 217-224.
Paulsen MR and Singh M (2004) Calibration of a near-infrared transmission grain analyzer
for extractable starch in maize. Biosystems Engineering 89: 79-83.
Pixley K V and Bjarnason MS (1993) Combining ability for yield and protein quality
among modified-endosperm opaque-2 tropical maize inbreds. Crop Science 33: 1229-
1234.
Prasanna BM, Vasal SK, Kassahun B and Singh NN (2001) Quality Protein Maize. Current
Science 81: 1308-1319.
Premlatha M and Kalamani A (2010) Heterosis and combining ability studies for grain
yield and growth characters in maize (Zea Mays L.). Indian Journal of Agricultural
Reseach 44: 62-65.
154
Sarika K, Hossain F, Muthusamy V, Zunjare RU, Baveja A, Goswami R, Bhat JS, Saha S
and Gupta HS (2018) Marker-assisted pyramiding of opaque2 and novel opaque16
genes for further enrichment of lysine and tryptophan in sub-tropical maize. Plant
Science 272: 142-152.
Sarika K, Hossain F, Muthusamy V, Zunjare RU, Baveja A, Goswami R, Bhat JS, Saha S
and Gupta HS (2018) Marker-assisted pyramiding of opaque2 and novel opaque16
genes for further enrichment of lysine and tryptophan in sub-tropical maize. Plant
Science 272:142-152.
Sharma S and Carena MJ (2016) Grain quality in maize (Zea mays L.): breeding
implications for short-season drought environments. Euphytica 212: 247-260.
Singh AA, Agrawal SB, Shahi JP and Agrawal M (2019) Yield and kernel nutritional
quality in normal maize and quality protein maize cultivars exposed to ozone. Journal
of the Science of Food and Agriculture 99: 2205-2214.
Synrem GJ, Marker S and Ramteke PW (2017) Gene action and combining ability analysis
for grain yield and quality parameters in sub-tropical maize (Zea mays L.). Vegetos
30: 139-147.
Tandzi LN, Mutengwa CS, Ngonkew ELM, Woïn N and Gracen V (2017) Breeding for
quality protein maize (QPM) varieties: a review. Agronomy 7: 1-16.
Teklewold A, Wegary D, Tadesse A, Tadesse B, Bantte K, Friesen D and Prasanna BM
(2015) Quality protein (QPM) maize: a guide to the technology and its promotion in
Ethiopia. CIMMYT, Addis Ababa, Ethiopia.
Tilahun B, Azimach G, Keno T, Chibsa T, Garoma B, Abebe B, Tulu D, Tafa Z and
Chalchisa D (2018) Test cross performance and combining ability of newly
introduced quality protein maize (Zea mays L.) inbred lines for grain yield and
agronomic traits evaluated in mid-altitude agro-ecological zones of Ethiopia. South
African Journal of Plant and Soil 36: 173-180.
Twumasi-Afriye S, Rojas PN, Friesen D, Teklewold A, Gissa DW, De Groote H and
Prasanna BM (2016) Guidelines for the quality control of Quality Protein Maize
(QPM) seed and grain. CIMMYT, Addis Ababa, Ethiopia.
Vanous A, Gardner C, Blanco M, Martin‐Schwarze A, Wang J, Li X, Lipka AE, Flint‐
Garcia, S, Bohn M, Edwards J and Lübberstedt T (2019) Stability analysis of kernel
quality traits in exotic‐derived doubled haploid maize lines. Plant Genome 12: 1-14.

155
Wegary D, Labuschagne MT and Vivek BS (2011) Protein quality and endosperm
modification of quality protein maize (Zea mays L.) under two contrasting soil
nitrogen environments. Field Crops Research 121: 408-415.
Wegary D, Vivek B and Labuschagne M (2013) Association of parental genetic distance
with heterosis and specific combining ability in quality protein maize. Euphytica 191:
205-216.
Wegary D, Vivek BS and Labuschagne MT (2014) Combining ability of certain agronomic
traits in quality protein maize under stress and nonstress environments in Eastern and
and Southern Africa. Crop Science 54: 1004-1014.
Williams PJ and Kucheryavskiy S (2016) Classification of maize kernels using NIR
hyperspectral imaging. Food Chemistry 209:131-138.
Zhang J, Lu XQ, Song XF, Yan JB, Song TM, Dai JR, Rocheford, T and Li JS (2008)
Mapping quantitative trait loci for oil, starch, and protein concentrations in grain with
high-oil maize by SSR markers. Euphytica 162: 335-344.
Zilic S, Milasinovic M, Terzic D, Barac M and Ignjatovic-Micic D (2011) Características
y composición del grano de híbridos de maíz de especialidad. Spanish Journal of
Agricultural Research 9: 230-241.
Zimmerman AO, Millear AI, Stubbs RW, Shields C, Pickering BV, Earl L, Graetz N ,
Kinyoki DK, Ray SE, Bhatt S, Browne AJ, Burstein R, Cameron E, Casey DC,
Deshpande A, Fullman N, Gething PW, Gibson RS, Henry NJ, Herrero M, Krause
LK, Letourneau ID, Levine AJ, Liu PY, Longbottom J, Mayala BK, Mosser JF, Noor
AM, Pigott AM, Piwoz EG, Rao P, Rawat R, Reiner Jr RC, Smith DL, Weiss DJ,
Wiens KE, Mokdad AH, Lim SS, Murray CJL, Kassebaum NJ and Hay SI (2018)
Mapping child growth failure in Africa between 2000 and 2015. Nature 555: 41-47.
Živanović T, Vuckovic S, Prodanovic S and Todorovic G (2006) Evaluation of inbred lines
as sources of new alleles for improving elite maize hybrid. Cereal Research
Communications 34: 941-948.

156
CHAPTER SEVEN
HERITABILITY AND TRAIT ASSOCIATIONS IN QUALITY AND NON-
QUALITY PROTEIN MAIZE GENOTYPES
7.1 Abstract
Exploitation of variance components, correlations and path analysis can be useful to the
plant breeder in making informed decision on traits to be considered in breeding for high
grain yield and enhanced quality traits in maize breeding programmes. This study was
conducted to i) estimate the heritability of grain yield and its related characters as well as
quality traits ii) estimate the heterosis of the hybrids for the measured traits and iii)
determine the association among grain yield, agronomic and quality traits and. Data was
obtained from field and laboratory experiments for grain yield and agronomic characters
across 13 locations and for quality traits across six locations. Genotypic variance was larger
than the environmental variance for grain yield and a majority of the agronomic traits and
all the quality traits analysed in the study. Broad sense heritability estimates were more
than 80% for the traits measured. Apart from mid parent (MPH) and better parent (BPH)
heterosis for tryptophan, of which a majority of the hybrids were inferior to their parents,
most hybrids displayed vigour over their parents for grain yield, as high as 268.75% and
799.76% for MPH and BHP, respectively. The first four principal components accounted
for more than 90% of the variations for grain yield and agronomic and quality traits, and
combinations of traits. The study revealed significant genotypic and phenotypic
correlations for grain yield vs. plant height (rG = 0.41; rP = 0.34), grain yield vs. ears per
plant (rG = 0.24; rP = 0.24), grain yield vs. protein (rG = 0.38; rP = 0.25) and tryptophan vs.
oil content (rG = 0.58; rP = 0.25). Negative rG and rP correlations were recorded for grain
yield vs. ear aspect, protein vs. tryptophan and grain yield vs. tryptophan. Path analysis
identified ear aspect, ears per plant and starch as the major traits contributing to grain yield.
It is recommended that ear aspect should be considered a key secondary trait in breeding
for QPM hybrids. Furthermore, with the negative association between grain yield and
tryptophan; as well as protein and tryptophan, it might be possible that gene stacking for
grain yield and tryptophan might lead to development of hybrids with high grain yield at
the same time with increased tryptophan content.

157
Keywords: Path coefficient analysis, variance components, heterosis, principal
components
7.2 Introduction
Heritability and heterosis of traits are some of the important components considered in
breeding superior hybrids. Combinability is far more important than heritability in
breeding superior hybrids. Heterosis, or hybrid vigour, is the increased performance of the
F1 individuals obtained from crossing two genetically diverse breeding lines (Duvick and
Brown 1981). Mather and Jinks (1971) and de Franca (1983) defined heterosis as the extent
to which the average of any F1 generation performs better than its better parent, or an
average of its parents. However commercially, performance of a hybrid compared to a
commercial check hybrid is important since farmers do not grow inbreds and require new
hybrids better than their current ones. The two main theories used to elucidate the
manifestation of heterosis are: (i) the dominance theory proposed by Lee and Tracy (2009)
and Ram (2014) who stated that the recessive and deleterious alleles present in the parental
lines are transferred to the F1 progeny and subsequent generations. In this model, additive
genetic effects of favourable genes increase the superior phenotype of the F1 over each
parent and (ii) the overdominance theory of Shull (1911), East and Hays (1912) and Ram
(2014), which states that heterosis is a result of heterozygosity or the fitness of
heterozygotes over their homozygous parents. According to this model, novel alleles are
interchanged between contrasting parents with differing alleles and this results in
expression of superiority of the F1’s to the homozygous parents. It is important to note that,
epistasis influences heterosis of hybrids, however, this is often neglected in genetic
analysis and also not estimated statistically probably due to the interactive nature of genes
at different loci (Kaeppler 2012; Kerwin et al. 2017). Hence, it is important to consider
epistasis when selecting superior hybrids.
Even though the importance of heterosis in maize production has been reported, the
inherent mechanisms and most importantly, the physiological and biochemical
mechanisms of these phenomena are yet to be fully elucidated (Blum 2013). Even though
the expression of superiority of hybrids over their parents is based on how diverse the two
parents are, this is often not replicated. For example inbreds B73 and Mo17 which
produced one of the most successful hybrids in the USA are fairly closely related (Personal
communication: Vernon Gracen). Hence, two parental lines which manifest relatively large

158
magnitudes of heterosis in their crosses can be said to combine well specifically. In maize,
it is estimated that heterosis above 10% of the best hybrid over the best commercial check
is usually accepted (Lippman and Zamir, 2006; Chairi et al. 2016). In studies by Saleh et
al. (2002) and Ram (2014) high levels of hybrid vigour for grain yield, grain weight per
ear and cob weight were observed, while heterosis above 10% was obtained in normal
endosperm maize for plant and ear heights, number of kernel rows per ear as well as
number of kernels per ear row. Nigussie and Zelleke (2001) noted that hybridizing maize
genotypes obtained from dissimilar genetic backgrounds often resulted in better expression
of hybrid vigour.
In most breeding programmes, increased yield is the primary objective. As a result of
interactions between genotype and the environment, the full expression of grain yield and
other traits, which are quantitatively inherited, are variable under varying environmental
conditions (Qi et al. 2010; Gangashetty et al. 2016). For selection of grain yield and quality
traits to be efficient, it is important to consider traits that contribute to yield and quality.
The polygenic nature of grain yield often leads to variability across varied environmental
conditions (Machikowa and Laosuwan 2011; Wegary et al. 2013). Subsequently, grain
yield and quality traits enhancement in maize can be realised via utilisation of the
association between grain yield, quality traits and their associated characters (Amini et al.
2013; Adesoji et al. 2015). Correlations have been exploited in several studies for indirect
selection of yield and quality traits (Amini et al. 2013; Adesoji et al. 2015; Muturi et al.
2019).
Information on correlations between traits is crucial in maize breeding to aid in the
identification of superior genotypes with higher grain yield through indirect selection
achieved via selection of secondary traits (Meseka et al. 2013; Matthew 2015). However,
it is important to note that correlations among traits are not adequate to describe the
significance of each character contributing to grain yield (Sreckov et al. 2011; Matthew
2015). Bizeti et al. (2004) further noted that these inadequacies often lead to observed
dissimilarities that are due to more than one indirect cause. As a result, it is important to
conduct in-depth studies on trait associations to fully understand the contribution of each
character and then rank their importance for targeting selection. One of the ways of
achieving this is to use the path coefficient analysis to assess direct and indirect relationship
among traits (Udensi and Ikpeme 2012; Adesoji et al. 2015). There is not enough

159
information reported on the association between grain yield, agronomic characters and
quality traits. Therefore, the objectives of this study were to: (i) estimate the heritability of
grain yield, its related characters and quality traits, (ii) estimate the heterosis of the hybrids
for the traits measured and, (iii) determine the association among grain yield, agronomic
and quality traits.
7.3 Materials and methods
7.3.1 Genetic materials
The hybrids evaluated as reported in Chapter 4 (4.3.1) for agronomic traits and Chapter 5
(5.3.1) for quality traits performance and genetic analysis were used in this chapter.
7.3.2 Heritability estimates
Broad sense heritability estimates (H2) of each trait across environments was computed as
follows:
H2= σ2
g / σ2p
Where here σ2g = genotypic variance; and σ2
p = phenotypic variance. The σ2p was computed
as follows:
σ2p = σ2
g+σ2g/l+σ2
gt/t+σ2glt/lt+σ2
e/rlt;
Where σ2gl = genotype × location interaction variance, σ2
gt =genotype × treatment
interaction variance, σ2 glt = genotype × location × treatment interaction variance, σ2e =
environmental variance, r = no. of replications; l = no. of locations and t = no. of treatments.
Narrow sense heritability (h2) was computed as follows:
h2= σ2a / σ
2p
Where σ2a = additive genetic variance.

160
7.3.3 Heterosis
7.3.3.1 Mid-parent heterosis
The mid-parent values for grain yield, agronomic characters and quality traits analysed was
calculated as the average of the two parents for the agronomic and quality traits across all
locations. Mid-parent heterosis (MPH) was calculated as:
MPH =(F1−MP)
MP x 100
Where F1 is the mean of the F1 hybrid performance and MP = (P1 + P2)/2 in which P1 and
P2 are the respective means of the inbred parents.
7.3.3.2 Better-parent heterosis
Better-parent heterosis (BPH) was computed as the percentage increase or decrease
demonstrated by the Fl hybrids over better parents as:
BPH =(F1−better parent)
Better parent x 100
7.3.4 Principal component analysis
GenStart 20th edition statistical software (GenStat 2019) was used for the PCA to obtain
the Eigenvalues and PC biplot of the traits measured.
7.3.5 Genetic and phenotypic correlation estimations
The raw data obtained for both agronomic and quality traits used to estimate genetic (rG)
and phenotypic (rP) correlations using META-R (Multi Environment Trial Analysis with
R for Windows) Version 6.04 (Alvarado et al. 2015) used the procedure:
Genotypic correlation (rG) = CAXY/(VAXVAY)1/2
Where CAXY = additive covariance between characteristic X and Y; VAX = additive
variance of characteristic X, and VAY = additive variance of characteristic Y
Phenotypic correlation (rP) = CovXY/(σ2Xσ2
Y)
Where CovXY = phenotypic covariance between characteristic X and Y; σ2X = phenotypic
variance of characteristic X, and σ2Y = phenotypic variance of characteristic Y.

161
7.3.6 Path coefficient analysis
The coefficient values estimated were used to do the path analysis to determine direct and
indirect relationships among the variables measured and analysed for agronomic and
quality traits, respectively. Independent variables were regressed on the dependent
variables. Grain yield was used as the independent variable for agronomic and quality traits
combined. The path coefficient analysis was conducted following (Yu et al. 2019):
𝑌 = 𝛽0 + 𝛽1𝑋𝑚 + 𝛽2𝑋 + ε1
𝑋𝑚 = γ0 + γ1𝑋 + ε2
where, Y denotes the dependent variable; Xm is the mediator in dependent variable; X is
the exogenous independent variable matrix; ε1 and ε2 are the errors; β0 and γ0 are the
intercepts; β1, β2, and γ1 are the regression coefficients to be estimated.
The predictable coefficient values β1, β2 and γ1 were used to calculate the impacts of
independent variables on dependent variables, where β2 represents the direct effect of X on
Y and the magnitude of the indirect effect of X on Y estimated by 𝛾1β1.
7.4 Results
7.4.1 Variance components and heritability for grain yield, agronomic characters and
quality traits
The estimates of genotypic variance and its related mechanisms, heritability of grain yield,
agronomic characters and quality traits are shown in Table 7.1. Estimates of tester variance
was higher than line variance for anthesis-silking interval, plant and ear heights, grain yield
and stalk lodging, while line variance was higher for ear rot, husk cover, days to anthesis
and root lodging, but values were generally low. Genetic variance was larger for estimates
of grain yield, plant and ear heights, ear per plant, ear aspect, ear rot and days to pollen
shed than environmental variance. The environmental variance on the other hand was
higher for anthesis-silking interval, husk cover and root and stalk lodgings. Broad sense
heritability (H2) estimates for the traits measured were generally higher than 80% (Table
7.1).

162
For the quality traits studied, the estimates of tester variance was high for tryptophan,
protein and fibre while line variance was also high for moisture, oil content and starch.
Genetic variances were relatively low for tryptophan, moisture and oil content but
relatively high for protein and starch contents. The genotypic variances were higher than
the environmental variance for all the traits analysed. Furthermore, additive variances were
larger than dominance variances for tryptophan, oil content, moisture, fibre, starch and
protein. Broad sense heritability (H2) estimates were high (above 90%) for all the quality
traits analysed in this study (Table 7.1).
7.4.2 Heterosis for grain yield and its secondary traits and quality traits
From the present study, estimates for heterosis were positive for MPH and BPH for grain
yield for all the hybrids evaluated except for hybrid 70. Heterosis over the better parent
was higher than the MPH for grain yield, and most of the agronomic characters measured.
For the agronomic traits, all the hybrids exhibited superiority over their parents, suggesting
presence of substantial heterosis of the crosses and the potential of these parents for hybrid
development (Table 7.2). For ears per plant, some of the hybrids recorded negative values.
All the hybrids showed superiority of BPH for anthesis-silking interval and ear aspect over
the parents except hybrid 70.
Estimates of heterosis for quality traits revealed that most of the hybrids performed poorly
against their parents, especially for tryptophan, except for a few hybrids such 120, 104,
105 and 121. Apart from hybrids 109 and 37 with negative values of MPH for starch, the
rest of the 35 hybrids shown were superior to their mid- and better parents for protein, oil
content and starch (Table 7.3). MPH and BPH values for fibre indicated that the hybrids
have lower fibre content than their parents by recording negative values, except for hybrids
37 and 61.

163
Table 7.1 Estimates of variance components and heritability for grain yield, agronomic and quality traits of 130 crosses evaluated across 13
during 2017/2018 and 2018/2019 cropping seasons
Variance components
Agronomic traits
ASI EH EPP ER EA GY HC PH DA RL SL
Line Variance 0.002 56.023 0.001 5.324 0.004 0.025 0.117 54.170 3.720 3.057 1.208
Tester Variance 0.020 67.955 0.001 2.651 0.006 0.176 0.000 54.733 2.535 0.000 1.645
Line x Tester Variance 0.024 24.043 0.003 0.741 0.017 0.430 0.029 52.729 0.682 0.000 0.457
Genotype Variance 0.042 130.616 0.005 7.872 0.025 0.580 0.147 147.695 6.290 2.896 2.867
Additive Variance 0.167 522.463 0.019 31.488 0.101 2.319 0.590 590.780 25.159 11.584 11.467
Dominance Variance 0.097 96.171 0.012 2.964 0.068 1.720 0.116 210.918 2.728 0.000 1.827
Environmental Variance 0.045 6.608 0.001 7.042 0.010 0.131 0.265 9.282 0.235 7.024 4.656
Broad sense heritability (%) 0.854 0.989 0.955 0.830 0.946 0.969 0.727 0.989 0.992 0.623 0.741
Narrow sense heritability (%) 0.541 0.836 0.578 0.759 0.563 0.556 0.608 0.728 0.895 0.623 0.639 Quality traits
Fibre Moisture Oil Protein Starch Tryptophan
Line Variance 0.005 0.132 0.133 0.133 0.305 0.00000
Tester Variance 0.011 0.059 0.089 0.188 0.195 0.00033
Line x Tester Variance 0.005 0.128 0.014 0.069 0.099 0.00001
Genotype Variance 0.018 0.298 0.212 0.344 0.547 0.00026
Additive Variance 0.074 1.191 0.849 1.375 2.187 0.00102
Dominance Variance 0.019 0.513 0.056 0.274 0.394 0.00003
Environmental Variance 0.002 0.236 0.044 0.063 0.152 0.00002
Broad sense heritability (%) 0.978 0.878 0.954 0.963 0.944 0.98280
Narrow sense heritability (%) 0.777 0.614 0.895 0.803 0.800 0.95646
† GY=grain yield; DA = days to anthesis; ASI = anthesis-silking interval; PH = plant height; EH = ear height; EA = ear aspect; RL = root lodging; SL = stock
lodging; HC = husk cover; EPP = ear per plant.

164
Table 7.2 Mid-parent (MPH%) and better parent (BPH%) heterosis for grain yield and selected secondary traits of the 15 top performing, 10
middle and 10 poorest performing genotypes selected from the 130 crosses evaluated across 13 location during 2017/2018 and 2018/2019 cropping
seasons
Entry
Grain yield ASI Ears per plant Ear rot Ear aspect
MPH (%) BPH (%) MPH (%) BPH (%) MPH (%) BPH (%) MPH (%) BPH (%) MPH (%) BPH (%)
111 268.75 131.90 821.43 -170.20 7.22 16.36 246.28 126.92 11.67 -7.48
109 281.62 146.28 412.07 -256.06 12.18 40.87 376.44 229.51 5.64 -13.68
48 187.65 130.81 -30.03 -51.57 16.77 34.51 70.11 66.84 -5.24 -13.21
36 199.08 146.66 -55.17 -39.98 14.67 20.16 95.71 70.23 -10.33 -19.68
60 206.21 123.61 -44.16 -44.84 0.88 2.84 150.66 141.76 -19.06 -29.88
110 240.91 109.55 -229.66 -280.20 -0.26 12.77 457.79 285.77 7.84 -11.40
39 177.65 111.42 171.70 -339.47 -10.65 -11.44 112.73 75.10 -20.56 -28.34
59 214.54 121.72 375.39 -361.87 -8.67 -6.96 194.81 176.03 -20.72 -30.69
79 256.15 152.74 -40.05 -52.83 13.14 14.83 308.89 215.01 -13.73 -24.49
103 192.99 132.08 -2.61 -13.54 3.37 7.38 144.30 93.70 -12.54 -24.31
75 150.40 89.91 42.34 -382.26 -4.26 2.09 99.35 49.88 -12.36 -16.56
37 230.77 164.97 -29.08 -36.62 -7.66 -2.17 155.97 162.61 -16.90 -21.74
30 213.37 128.34 -85.70 -90.06 5.71 19.80 218.97 183.63 -16.89 -28.40
127 147.64 105.35 -35.04 -49.79 9.85 15.22 73.04 63.54 -12.79 -16.98
31 222.04 119.13 1080.7 -170.04 -4.27 -1.54 270.67 229.60 -19.77 -31.29
69 111.50 123.42 -63.88 114.82 5.66 20.30 221.28 143.12 -4.59 -11.03
52 161.21 163.46 4.62 29.50 8.61 17.58 233.21 215.98 -0.91 -4.86
3 94.88 72.24 135.70 -265.79 -23.41 -7.89 183.66 109.89 -0.67 -7.61
77 181.41 101.15 -68.56 -68.86 -8.64 -8.18 371.12 303.66 -16.57 -23.13
57 178.26 104.78 -21.88 -37.54 -3.25 -0.38 357.01 289.38 -11.94 -19.75
62 71.11 74.09 29.54 -764.98 -10.38 -0.01 130.53 101.79 9.43 3.94
80 130.31 112.48 -34.74 -44.83 -7.53 -1.12 211.00 204.64 -9.28 -16.20
18 135.59 152.48 -20.44 -23.28 16.66 25.21 292.27 188.63 -11.32 -19.19
8 163.47 158.04 -85.92 -86.04 -1.57 24.71 267.07 227.47 -4.48 -12.03
124 124.64 65.71 -56.33 -59.10 14.28 27.52 289.60 266.50 -4.48 -10.75
7 95.16 80.84 80.04 -191.55 -14.93 3.08 399.99 308.93 -3.81 -10.53
83 145.60 123.66 -26.87 -32.49 -6.61 -1.17 496.58 415.11 -11.76 -22.58
117 86.66 128.26 -28.18 -44.12 -0.60 1.64 405.94 377.32 9.01 8.82
56 168.73 166.42 -46.42 -52.56 -14.25 -4.26 541.52 445.69 -4.81 -11.21
53 136.30 137.13 -26.46 -35.34 -3.04 9.44 504.16 481.59 -4.00 -5.35
26 88.05 111.74 -28.64 -48.24 -27.45 -22.81 457.51 410.91 -5.57 -10.83
87 18.10 5.92 314.24 -147.93 4.95 17.59 407.53 379.48 16.14 9.80
27 98.14 96.63 -46.03 -244.52 -22.54 -8.94 491.98 442.50 -7.19 -12.93
63 61.11 46.33 -490.48 -1063.2 -8.52 -7.24 495.96 421.67 3.83 -2.03
70 -17.13 -24.73 153.03 1151.90 -39.60 -38.66 338.10 302.12 34.69 30.47

165
Table 7.3 Mid-parent (MPH%) and better parent (BPH%) heterosis for quality traits of the 15 top performing, 10 middle and 10 poorest
performing genotypes selected from the 130 crosses evaluated across six location during 2017/2018 and 2018/2019 cropping seasons
Entry Tryptophan Protein Oil Starch Fibre
Sum MPH % BPH % MPH % BPH % MPH % BPH % MPH % BPH % MPH % BPH %
120 23.35 66.00 15.53 18.50 11.36 58.73 3.26 3.95 -9.66 -13.38 200.68
104 22.38 97.37 7.02 22.31 11.92 37.72 0.66 0.46 -2.39 -5.05 199.83
105 35.14 102.63 -1.56 13.37 10.98 33.62 2.65 2.85 -10.88 -11.19 199.68
121 28.61 62.00 13.86 17.61 7.40 49.48 3.70 4.40 -13.11 -14.09 187.06
29 -5.52 -3.04 15.98 35.52 34.03 76.93 2.61 7.98 -5.29 -6.12 164.49
73 -2.99 65.71 12.94 28.23 7.96 40.10 0.58 1.02 -9.70 -12.11 153.56
74 -2.67 54.29 12.90 29.16 10.05 39.62 0.82 1.25 -10.26 -10.63 145.42
77 -23.70 27.78 22.36 42.57 19.14 52.14 1.15 2.68 -10.57 -15.05 144.12
30 -3.01 5.32 1.81 19.91 32.48 70.95 5.41 10.95 -7.22 -10.82 143.83
109 2.74 62.86 14.61 40.65 9.29 14.15 -1.02 0.18 -11.55 -13.51 143.46
108 -6.33 60.00 15.00 40.01 8.56 11.24 -0.65 0.55 -13.13 -13.90 128.38
57 5.03 6.02 13.50 26.69 16.48 40.10 4.05 11.19 -4.64 -3.84 123.06
80 -18.12 27.50 23.41 37.67 17.36 32.37 0.54 0.79 -5.59 -6.76 121.52
78 17.85 61.11 7.59 11.91 -3.77 10.30 4.68 5.69 -13.46 -15.13 115.36
2 6.70 8.11 27.19 35.40 11.68 20.18 1.88 2.60 -10.43 -14.41 113.74
101 2.63 4.01 14.85 19.01 2.13 7.16 3.74 4.48 -9.21 -10.43 58.00
27 -26.32 -18.31 18.55 35.19 15.95 29.02 0.32 1.90 -3.72 -8.34 56.30
124 -32.06 2.38 13.97 28.63 7.06 31.45 2.22 2.56 -1.00 -4.98 56.22
28 -26.15 -19.78 30.79 38.76 10.29 23.75 -1.03 -0.80 -13.75 -17.02 55.83
70 1.26 7.96 13.91 15.17 6.21 7.64 1.27 1.50 -8.12 -8.60 54.92
65 -7.04 -1.86 6.58 25.41 12.19 18.66 -0.33 1.06 -2.50 -8.42 54.67
99 -36.84 -27.49 22.07 28.13 27.68 38.89 0.41 1.73 -12.86 -16.97 54.58
62 1.96 4.01 11.64 15.16 0.91 13.78 2.55 3.28 -7.02 -8.87 53.29
66 -11.74 -1.26 2.31 21.33 16.71 21.08 1.47 2.90 -10.57 -13.44 52.80
119 -23.24 -2.38 19.63 24.96 13.38 20.20 -0.40 -0.33 -13.71 -15.67 51.82
47 -32.10 -24.72 16.11 7.04 3.04 10.09 4.34 5.52 -13.94 -14.48 -10.68
43 -34.51 -27.92 5.11 11.46 1.92 18.43 5.42 9.11 -8.16 -8.41 -10.99
71 -32.63 -19.91 5.69 17.39 1.31 7.82 3.84 4.19 -7.42 -7.76 -12.30
24 -35.82 -22.87 11.91 21.23 -3.68 4.48 3.17 6.36 -13.34 -15.63 -15.22
15 -34.00 -24.72 11.86 18.03 0.71 5.81 2.84 3.62 -2.63 -3.06 -15.85
39 -31.32 -16.71 -0.65 4.46 4.92 7.43 4.75 6.37 -7.43 -11.57 -20.75
67 -28.40 -10.30 -3.69 1.08 3.17 7.19 3.90 4.78 -5.16 -8.07 -22.28
64 -42.99 -36.75 19.10 20.80 3.75 8.92 1.11 1.18 -9.38 -11.99 -24.88
23 -40.04 -26.32 0.48 1.58 7.06 17.09 3.97 5.74 -6.07 -7.57 -30.44
19 -39.27 -37.53 4.39 4.91 6.99 19.41 2.99 4.47 -5.00 -6.32 -33.64

166
7.4.3 Principal component analysis
The agronomic traits for the hybrids showed that the first four principal components (PCs)
explained 96.4% of the variation of the traits measured (Table 7.4). The first four PC were
significant with PC1 accounting for 80.10% of the variation. The most important traits in
PC1 were plant and ear height. The second, third and fourth PCs explained 6.90, 5.30 and
4.10% of the variations, respectively. The most important traits in these PCs were plant
height for PC2 and ear rot and ear height for PC3. Root and stalk lodgings were the
important traits located on the PC4.
Table 7.4 Estimates of principal component analysis for 135 QPM and non-PQM hybrids
for grain yield and other agronomic traits
Traits Eigenvectors
PC1 PC2 PC3 PC4
Grain yield 0.018 0.012 0.019 -0.021
Plant height 0.718 0.657 -0.211 -0.011
Ear height 0.682 -0.610 0.364 0.003
ASI 0.003 0.005 -0.014 0.019
Day to shed 0.095 -0.202 -0.058 -0.067
Root lodging -0.001 0.111 0.199 0.893
Stalk lodging 0.002 -0.146 -0.191 0.427
Husk cover -0.006 0.009 0.023 -0.007
Ears per plant 0.001 -0.002 0.000 -0.003
Ear rot -0.105 0.347 0.861 -0.119
Ear aspect -0.006 -0.001 0.008 -0.001
Eigenvalue 273.987 23.479 18.174 14.102
Proportion (%) 80.10 6.90 5.30 4.10
Cumulative (%) 80.10 87.00 92.30 96.40 PC = principal component

167
Figure 7.1 Principal component analysis biplot of genotype by grain yield and other
agronomic traits of 135 QPM and non-QPM hybrids evaluated across 13 locations.
GY = Grain yield; EPP = ears per plant; PHT = plant height; EHT = ear height; EASP =
ear aspect; HC = husk cover; SL = stalk lodging; RL = root lodging; ASI = anthesis-silking
interval
The graphical view of the principal component analysis (PCA) biplot showed that the
hybrids varied with regards to the agronomic traits measured. Genotypes 43 and 109
recorded high values for ear and plant height, respectively. Genotypes 123 and 69 were
identified as the most prolific hybrids, while genotype 79 had higher grain yield. The angle
forming between ears per plant and grain yield is less than 60° suggesting the strong
correlation between the two traits. Similarly, ear and plant heights are strongly correlated

168
based on the angle between the traits. Grain yield and ear aspect are in directly opposite of
one another, suggesting the negative correlation between the two traits (Figure 7.1).
The PCA conducted for quality traits showed that the first three PCs accounted for 99.70%
of the total variation (Table 7.5). However, only the first three PCs were significant for the
traits of which PC1 accounted for 63.70% of the variation and most important traits located
on this axis were grain moisture and starch contents. The second PC explained 20.50% of
the variation, with protein, oil content and starch as the most important traits on this axis,
while the third PC explained 15.0% of the variation. The traits important on this PC were
protein, oil and starch contents.
The PCA biplot for quality traits indicated significant variations among the hybrids for the
quality traits analysed. Strong positive correlation was detected between fibre and
tryptophan with hybrid 53 being the most superior genotype for these traits. Hybrid 42 was
the best genotype for oil content. Protein and tryptophan were not positively correlated and
similar observations were made between protein and oil content (Figure 7.2).
Table 7.5 Principal component analysis of 135 QPM and non-PQM hybrids for quality
traits
Traits Eigenvectors
PC1 PC2 PC3 PC4
Tryptophan 0.002 -0.003 -0.011 -0.002
Moisture 0.982 -0.065 0.157 0.077
Protein -0.048 0.811 0.534 0.205
Oil 0.048 0.185 -0.602 0.756
Starch -0.172 -0.551 0.568 0.557
Fibre 0.030 -0.026 -0.063 -0.266
Eigenvalue 3.562 1.149 0.837 0.029
Proportion (%) 63.663 20.540 14.961 0.521
Cumulative (%) 63.66 84.20 99.16 99.68
Principal component

169
Figure 7.2 Principal component analysis biplot of genotype by quality traits of 135 QPM
and non-QPM hybrids evaluated across six locations.
Trypt_pert = tryptophan; prot = protein
When the agronomic traits were combined with the quality traits, six significant PCs were
identified and these explained 98.40% of the variation for the measured traits (Table 7.6).
The first PC explained 78.80% of the variation and the traits located on this PC were ear
height and ear rot. PC2 accounted for 6.80% of the variation and the traits contributing
through PC2 were plant and ear height, and ear rot. The third and fourth PCs accounted for
5.3 and 4.10% of variation, respectively. The essential traits found on these PCs were ear
height and ear rot for PC3, and ear rot, root and stalk lodgings for PC4 (Table 7.6).
The agronomic data set and the data obtained from quality traits were combined to observe
the associations between these traits. Most of the traits taken from the agronomic data set
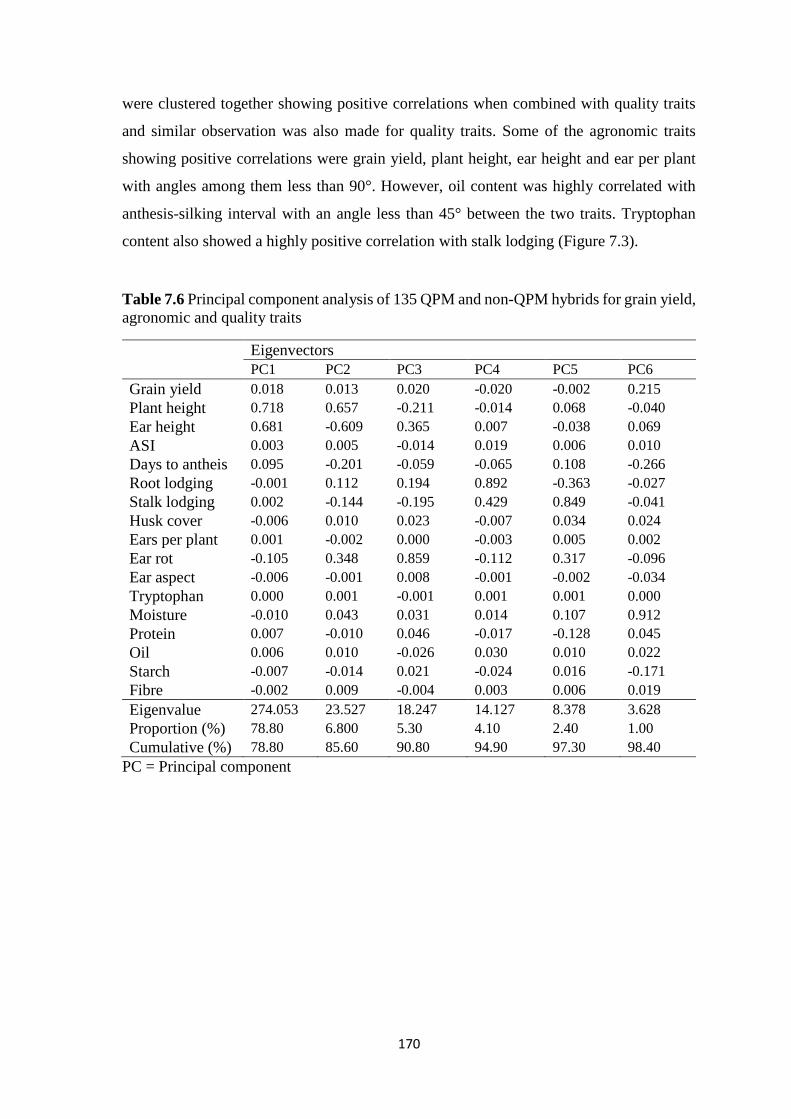
170
were clustered together showing positive correlations when combined with quality traits
and similar observation was also made for quality traits. Some of the agronomic traits
showing positive correlations were grain yield, plant height, ear height and ear per plant
with angles among them less than 90°. However, oil content was highly correlated with
anthesis-silking interval with an angle less than 45° between the two traits. Tryptophan
content also showed a highly positive correlation with stalk lodging (Figure 7.3).
Table 7.6 Principal component analysis of 135 QPM and non-QPM hybrids for grain yield,
agronomic and quality traits
Eigenvectors
PC1 PC2 PC3 PC4 PC5 PC6
Grain yield 0.018 0.013 0.020 -0.020 -0.002 0.215
Plant height 0.718 0.657 -0.211 -0.014 0.068 -0.040
Ear height 0.681 -0.609 0.365 0.007 -0.038 0.069
ASI 0.003 0.005 -0.014 0.019 0.006 0.010
Days to antheis 0.095 -0.201 -0.059 -0.065 0.108 -0.266
Root lodging -0.001 0.112 0.194 0.892 -0.363 -0.027
Stalk lodging 0.002 -0.144 -0.195 0.429 0.849 -0.041
Husk cover -0.006 0.010 0.023 -0.007 0.034 0.024
Ears per plant 0.001 -0.002 0.000 -0.003 0.005 0.002
Ear rot -0.105 0.348 0.859 -0.112 0.317 -0.096
Ear aspect -0.006 -0.001 0.008 -0.001 -0.002 -0.034
Tryptophan 0.000 0.001 -0.001 0.001 0.001 0.000
Moisture -0.010 0.043 0.031 0.014 0.107 0.912
Protein 0.007 -0.010 0.046 -0.017 -0.128 0.045
Oil 0.006 0.010 -0.026 0.030 0.010 0.022
Starch -0.007 -0.014 0.021 -0.024 0.016 -0.171
Fibre -0.002 0.009 -0.004 0.003 0.006 0.019
Eigenvalue 274.053 23.527 18.247 14.127 8.378 3.628
Proportion (%) 78.80 6.800 5.30 4.10 2.40 1.00
Cumulative (%) 78.80 85.60 90.80 94.90 97.30 98.40
PC = Principal component

171
Figure 7. 3 Combined principal component analysis biplot of 135 genotypes by grain yield,
agronomic and quality traits.
GY = grain yield; EPP = ears per plant; PHT = plant height; EHT = ear height; EASP =
ear aspect; HC = husk cover; SL = stalk lodging; RL = root lodging; ASI = anthesis-silking
interval; Trypt_pert = tryptophan; prot = protein.
7.4.4 Genotypic and phenotypic correlation between grain yield and other agronomic
traits of 135 QPM and non-QPM hybrids evaluated across 13 locations during the
2017/2018 and 2018/2019 cropping seasons
The estimates for genotypic and phenotypic correlations are presented in Table 7.7. For
genotypic correlation, grain yield was significantly and positively correlated with plant
height, ear height, ear rot and ears per plant while it was negatively correlated with husk
cover, stalk lodging and ear aspect. Ears per plant were also found to be positively and
significantly correlated with plant and ear height but negatively with anthesis-silking

172
interval, root lodging and husk cover. Ear aspect was significantly and positively correlated
with husk cover and negatively correlated with plant and ear height, stalk lodging and husk
cover. However, no significant correlation was observed between grain yield and days to
pollen shed and grain yield vs. anthesis-silking interval. Similar to the genotypic
correlation for the agronomic traits, grain yield was significantly and positively correlated
with plant height, ear height and ears per plant phenotypically. Grain yield showed negative
and significant phenotypic correlation with ear aspect (rP =-0.61) and also showed negative
correlation with stalk lodging and husk cover (Table 7.7).
For the genotypic correlation, tryptophan content showed significant positive association
with moisture, oil and fibre contents but strong negative correlation with protein and starch
contents. Protein had a significant and negative relationship with fibre and starch but
correlated poorly with oil. Oil content showed a strong positive correlation with fibre and
also a highly negative relation with starch (rG = -0.78) (Table 7.8). For the phenotypic
relationships among the quality traits analysed, tryptophan exhibited positive correlation
with oil content and fibre but did not correlate with moisture, while a significant negative
correlation was recorded between tryptophan and protein (rP = -0.559) and tryptophan and
starch (rP = -0.299). Protein showed a negative and significant relationships with all the
quality traits analysed at phenotypic level, except for oil content (Table 7.8). Oil content
showed a negative correlation with starch but positively correlated with starch, while fibre
exhibited a negative relationship with starch.
The genotypic relationship between agronomic and quality traits examined showed that
grain yield had positive association with moisture and protein content but negatively with
protein and starch contents (Table 7.9).
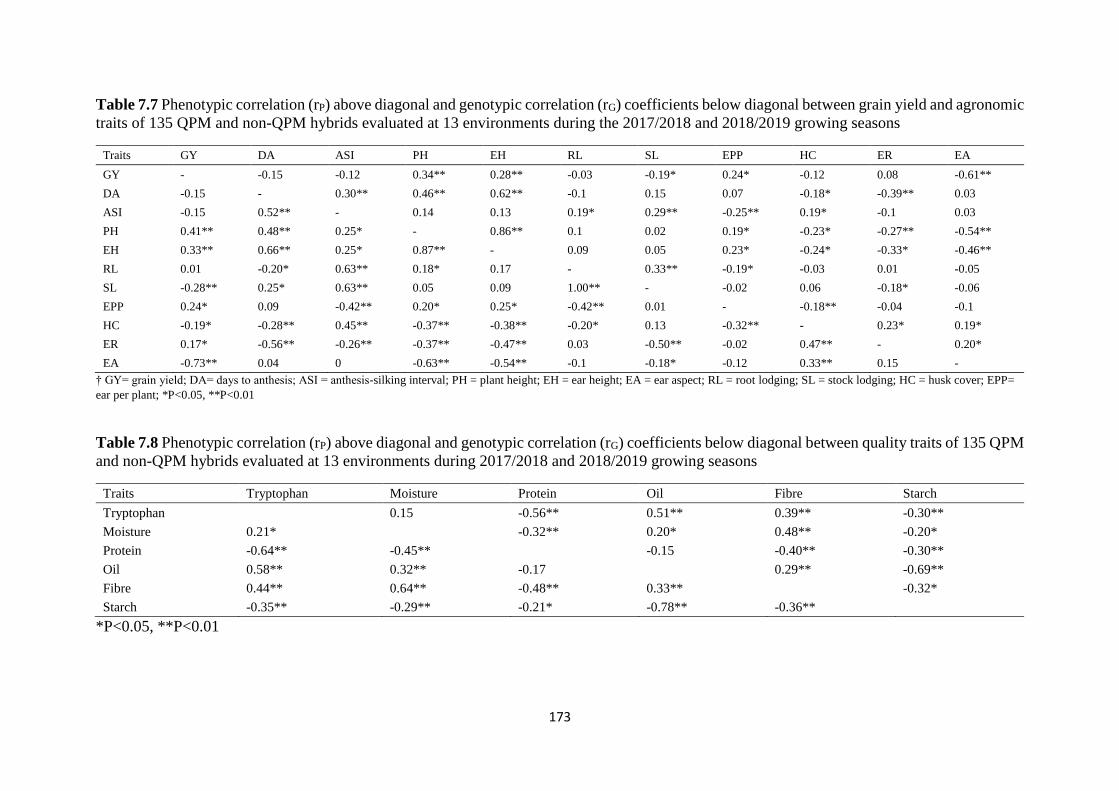
173
Table 7.7 Phenotypic correlation (rP) above diagonal and genotypic correlation (rG) coefficients below diagonal between grain yield and agronomic
traits of 135 QPM and non-QPM hybrids evaluated at 13 environments during the 2017/2018 and 2018/2019 growing seasons
Traits GY DA ASI PH EH RL SL EPP HC ER EA
GY - -0.15 -0.12 0.34** 0.28** -0.03 -0.19* 0.24* -0.12 0.08 -0.61**
DA -0.15 - 0.30** 0.46** 0.62** -0.1 0.15 0.07 -0.18* -0.39** 0.03
ASI -0.15 0.52** - 0.14 0.13 0.19* 0.29** -0.25** 0.19* -0.1 0.03
PH 0.41** 0.48** 0.25* - 0.86** 0.1 0.02 0.19* -0.23* -0.27** -0.54**
EH 0.33** 0.66** 0.25* 0.87** - 0.09 0.05 0.23* -0.24* -0.33* -0.46**
RL 0.01 -0.20* 0.63** 0.18* 0.17 - 0.33** -0.19* -0.03 0.01 -0.05
SL -0.28** 0.25* 0.63** 0.05 0.09 1.00** - -0.02 0.06 -0.18* -0.06
EPP 0.24* 0.09 -0.42** 0.20* 0.25* -0.42** 0.01 - -0.18** -0.04 -0.1
HC -0.19* -0.28** 0.45** -0.37** -0.38** -0.20* 0.13 -0.32** - 0.23* 0.19*
ER 0.17* -0.56** -0.26** -0.37** -0.47** 0.03 -0.50** -0.02 0.47** - 0.20*
EA -0.73** 0.04 0 -0.63** -0.54** -0.1 -0.18* -0.12 0.33** 0.15 -
† GY= grain yield; DA= days to anthesis; ASI = anthesis-silking interval; PH = plant height; EH = ear height; EA = ear aspect; RL = root lodging; SL = stock lodging; HC = husk cover; EPP=
ear per plant; *P<0.05, **P<0.01
Table 7.8 Phenotypic correlation (rP) above diagonal and genotypic correlation (rG) coefficients below diagonal between quality traits of 135 QPM
and non-QPM hybrids evaluated at 13 environments during 2017/2018 and 2018/2019 growing seasons
Traits Tryptophan Moisture Protein Oil Fibre Starch
Tryptophan 0.15 -0.56** 0.51** 0.39** -0.30**
Moisture 0.21* -0.32** 0.20* 0.48** -0.20*
Protein -0.64** -0.45** -0.15 -0.40** -0.30**
Oil 0.58** 0.32** -0.17 0.29** -0.69**
Fibre 0.44** 0.64** -0.48** 0.33** -0.32*
Starch -0.35** -0.29** -0.21* -0.78** -0.36**
*P<0.05, **P<0.01

174
Table 7.9 Phenotypic correlation (rP) above diagonal and genotypic correlation (rG) coefficients below diagonal between grain yield, agronomic
and quality traits of 135 QPM and non-QPM hybrids evaluated during the 2017/2018 and 2018/2019 growing seasons
Traits GY DA ASI PH EH RL SL EPP HC ER ESP Trpt Mois Prot Oil Fibre Starch
GY - -0.16 -0.14 0.29** 0.19* 0.18* -0.19* 0.42** -0.1 0.06 -0.54** -0.27** 0.26** 0.25* 0.07 -0.06 -0.17
DA -0.19** - 0.35** 0.39** 0.60** 0.02 0.22* -0.04 -0.33** -0.29** 0.01 -0.10 0.03 -0.07 0.13 -0.27** 0.02
ASI -0.23** 0.78** - 0.09 0.14 0.15 0.32** -0.29** 0.08 -0.09 0.14 0.10 0.19* -0.24* 0.14 0.18* -0.01
PH 0.40** 0.43** 0.30** - 0.82** 0.20* 0.14 0.15 -0.15 -0.17 -0.53** -0.09 0.01 0.08 0.14 -0.07 -0.09
EH 0.27** 0.65** 0.37** 0.86** - 0.20* 0.19* 0.14 -0.23* -0.24* -0.44** -0.23* -0.07 0.18* 0.04 -0.26** -0.01
RL NA NA NA NA NA - 0.13 -0.03 0.23* -0.03 -0.18* -0.18* 0.01 0.14 0.14 -0.07 0.04
SL -0.28** 0.47** 1.00** 0.37** 0.43** NA - -0.08 0.03 -0.20** -0.13 0.19* 0.04 -0.26** -0.02 -0.09 0.21*
EPP 0.64** -0.08 -0.76** 0.19* 0.20* NA -0.16 - -0.20* 0.05 -0.34** -0.10 0.01 0.05 -0.04 -0.17 0.07
HC -0.16 -0.68** 0.21* -0.24* -0.41** NA 0.06 -0.63** - 0.18* 0.06 0.11 -0.05 -0.01 -0.10 0.16 0.06
ER 0.29** -0.47** -0.35** -0.20* -0.39** NA -0.88** 0.31** 0.36** - 0.28** -0.03 0.12 0.06 -0.03 0.16 -0.09
ESP -0.83** 0.01 0.27** -0.83** -0.74** NA -0.68** -0.58* -0.02 0.11 - 0.19* -0.02 -0.14 0.05 0.14 -0.08
Trpt -0.39** -0.12 0.16 -0.12 -0.26** NA 0.42** -0.18* 0.24* -0.04 0.35** - 0.15 -0.56** 0.51** 0.39** -0.30**
Mois 0.50** 0.05 0.38** 0.02 -0.10 NA 0.05 0.06 -0.06 0.15 -0.07 0.21* - -0.32** 0.20* 0.48** -0.20*
Prot 0.38** -0.04 -0.45** 0.11 0.23* NA -0.54** 0.15 -0.01 0.07 -0.31** -0.64** -0.45** - -0.15 -0.40** -0.30**
Oil 0.04 0.14 0.21* 0.14 0.03 NA -0.16 -0.09 -0.23* -0.05 0.13 0.58** 0.32** -0.17* - 0.29** -0.69**
Fibre -0.10 -0.31** 0.28** -0.09 -0.31** NA -0.19* -0.26** 0.31** 0.24** 0.20* 0.44** 0.64** -0.48** 0.33** - -0.32**
Starch -0.25* 0.01 0.01 -0.12 -0.02 NA 0.44** 0.04 0.16 -0.13 -0.08 -0.35** -0.29** -0.21* -0.78** -0.36** -
† GY= grain yield; DA = days to anthesis; ASI = anthesis-silking interval; PH = plant height; EH = ear height; EA = ear aspect; RL = root lodging; SL = stock lodging; HC =
husk cover; EPP = ear per plant; Trpt = tryptophan; Mois- = moisture and Prot = protein; *P<0.05, **P<0.01; NA – not applicable
175
Ear aspect recorded significant positive association with tryptophan and fibre contents but
was negatively correlated with protein content. There was no association between plant
height and all the quality traits analysed in this study. However, ear height was significantly
and negatively correlated with tryptophan and fibre content (Table 7.9). For phenotypic
relationship, grain yield showed negative and significant associations with tryptophan,
moisture and protein content. Ears per plant, ear rot and husk cover had no relationships
with the quality traits at phenotypic level. Ear aspect showed a weak positive (rP=0.19)
correlation with tryptophan (Table 7.9).
7.4.5 Path coefficient analysis for grain yield and agronomic traits
The path coefficient analysis using the stepwise regression model for grain yield and
agronomic traits measured identified ear aspect, ears per plant, stalk lodging and ear rot as
the traits which contributed to grain yield most directly and accounted for 68% of the
variation in grain yield (Figure 7.4). Ear aspect recorded the highest direct effect (-0.64)
on grain yield while ear rot had the least direct effect on grain yield. Plant and ear height,
anthesis-silking interval, husk cover, days to anthesis and stalk lodging are ranked as the
second order of traits. With the exception of husk cover and anthesis-silking interval, the
rest of the second order traits contributed to gran yield indirectly via ear aspect. Anthesis-
silking interval and root lodging contributed to grain yield through ears per plant, while
husk cover contributed to grain yield through ear rot. However, none of the second order
traits contributed through stalk lodging to grain yield.

176
Figure 7.4 Path analysis showing the relationship of grain yield and agronomic traits of
135 QPM and non-QPM maize hybrids
Yield = grain yield; ER = ear rot; EPP = ear per plant, EA = ear aspect, HC = husk cover,
ASI = anthesis-silking interval; EH, ear height; PH = plant height; DA = days to anthesis;
RL = root lodging and SL = stalk lodging of 135 QPM and non-QPM maize hybrids.
Values in parenthesis are correlation coefficients and other values are direct path
coefficients. R1 represent the residual effects.
The path analysis represented in Figure 7.5 shows the stepwise regression model for grain
yield, secondary traits related to grain yield and quality traits examined in this study. The
first order traits identified contributing directly to grain yield were ear aspect, ear per plant,
starch and tryptophan, these contributed 71% of the variation of grain yield (Figure 7.5).
Ear aspect contributed the highest direct effect (-0.49) for grain yield while tryptophan
recorded the least effect with the contribution of -0.23. Plant and ear heights, protein, fibre
and oil content were the other traits contributing to grain yield indirectly. Oil content, fibre
and protein contributed to grain yield through starch while ear height, protein and fibre
also contributed to grain yield indirectly through ears per plant. Only plant height

177
contributed to grain yield through ear aspect while oil content also contributed to grain
yield via tryptophan for the secondary order traits. Husk cover was identified as the only
third order trait contributing to grain yield through plant height and ear aspect and also
through oil content and tryptophan.
Figure 7.5 Path analysis showing the relationship of grain yield, agronomic and quality
traits of 135 QPM and non-QPM maize hybrids
Yield = grain yield; ER = ear rot; EPP = ear per plant, EA = ear aspect, HC = husk cover,
ASI = anthesis-silking interval; EH, ear height; PH = plant height; DA = days to anthesis;
Trypt = tryptophan; prot = protein. Values in parenthesis are correlation coefficients and
other values are direct path coefficients. R1 represent the residual effects.

178
7.5 Discussion
7.5.1 Heritability and variance components for agronomic and quality traits
The present study showed substantial phenotypic and genotypic variations among the QPM
and non-QPM hybrids evaluated. High values for broad sense heritability suggested
selection will be possible for superior inbred genotypes, confirming earlier findings (Halilu
et al. 2016; Saif-ul-Malook et al. 2016; Ababulgu et al. 2018). However, the heritability
estimates in this study were higher than the previous estimates. Dutta et al. (2017) and
Mastrodomenico et al. (2018) indicated that phenotypic variance and heritability are
indicators for direct selection. For the genotypes studied, the magnitude of genotypic
variances (σ2g) were greater than environmental variances (σ2e) for most of the traits
measured except for husk cover, root and stalk lodgings. This finding is consistent with the
work by Halilu et al. (2016) and Ababulgu et al. (2018), suggesting the recently developed
QPM inbred lines by CIMMYT are suitable germplasm for developing superior hybrids
for grain yield and other phenotypic traits measured.
The high broad sense heritability (H2) values recorded for the various quality traits in the
present study indicates that the identification and selection of inbreds with increased
tryptophan, protein, starch, oil content and low fibre is possible to reduce malnutrition. The
higher values further indicates the genetic variability among the genetic material studied,
hence some of the genotypes can be selected for synthetic cultivar or population
development from which other superior quality traits such as tryptophan, protein and oil
content could be developed.
Assefa et al. (1999) and Aman et al. (2016) suggested that selection based only on traits
with high H2 is easy because of the limited influence of the environment on these genotype.
However, H2 solely is not adequate to select for promising individuals and it is important
to include other genetic components (Johnson et al. 1995; Muturi et al. 2019). This study
showed that σ2g was greater than σ2e for protein, tryptophan, oil content, starch and fibre.
This corroborates the findings of Bekele and Rao (2014), Setimela et al. (2017), and
Sharma et al. (2017). This implied that quality traits are controlled by additive gene effects
as the result of inheritance from their parents.

179
7.5.2 Heterosis of grain yield, agronomic characters and quality traits
Hybrid vigour for grain yield is of utmost importance to the breeder because of the
economic usefulness of the trait. Flint-Garcia et al. (2009) and Ige et al. (2018) noted that
better progress was attained when the parental lines were developed from populations or
parents with maximum variability in their progenies. The majority of the crosses in the
current study had high positive values for MPH and BPH for grain yield, plant and ear
height, and ears per plant as a manifestation of diversity among the parents. MPH and BPH
recorded in this study is consistent with studies by Ige et al. (2018) and Chakrabarty et al.
(2019) under optimal conditions but the values recorded in this study were far higher than
their values. The negative heterosis value obtained for anthesis-silking interval in the
current study implies that the crosses flowered earlier than their analogous parents.
Moreover, it is expected that superior hybrids should display negative values for ear aspect
and ear rot. This was observed for ear aspect whereby most hybrids performed better than
their corresponding parents, however, all the hybrids performed poorly in terms of ear rot
compared to their parents.
Heterosis for the quality traits analysed indicated that only a few crosses were better than
their parents for both MPH and BPH probably because of the additive nature of such traits.
A deeper insight into this further revealed that hybrids with high grain yield tend to have
low tryptophan suggesting the two traits might not be inherited together since they are both
controlled by poly genes. However, this development of inbreds with high tryptophan and
good SCA could result in hybrids with high tryptophan and yield. From the study, most of
the hybrids displayed superiority over their parents for protein, starch, fibre and oil content,
corroborating the findings of Werle et al. (2014) and Darshan and Marker (2019). The
presence of MPH for crosses showing positive values for tryptophan, protein and oil
content and negative values for fibre implied that promising genes of interest exist for
quality traits improvement.
7.5.3 Principal component analysis for agronomic and quality traits
For the PC biplot of the agronomic traits, PC1 and PC2 accounted for 51.25% of the
variations for the traits measured with a strong association between grain yield and ear per
plant; and plant and ear height, suggesting that for high grain yield to be attained,
prolificacy of a genotype is a major contributor coupled with plant and ear heights.

180
For quality traits, a large contribution from maturity and protein content were observed to
PC1 and PC2. This result is partly consistent with Liu et al. (2019) in which major amino
acids such as leucine and lysine were located on the first PC. The strong association
between tryptophan and fibre as evident in the PC biplot suggested that the two traits can
be selected for without affecting each other. Similarly, the angle between tryptophan and
oil content is less than 90° suggesting the existence of a strong relationship between the
traits. However, with the position of tryptophan and protein, the two traits cannot be
selected together within the same breeding objective to improve protein and tryptophan at
the same time (Sarika et al. 2018).
For the combined agronomic and quality traits, the characters used different pathways.
While the agronomic traits were located on the first four PCs, the quality traits used were
mainly located on the fifth and sixth PCs. This shows how divergent the traits are and
further evident in the PCA biplot especially for grain yield and tryptophan.
7.5.4 Correlation coefficients and path analysis of grain yield, agronomic and quality
traits
Genetic and phenotypic correlations showed similar trends for the traits analysed, hence
the discussion applies to both phenotypic and genotypic correlations. The substantial
negative relationship between grain yield and anthesis-silking interval; and grain yield and
ear aspect indicated that these traits are inversely interrelated therefore could be considered
as essential traits in breeding for QPM genotypes aiming at high grain yield with reduced
days to maturity. This confirms previous reports by Izzam et al. (2017) and Singh and
Kumar (2017). The manifestation of positive and significant correlation between grain
yield and number of ears per plant, grain yield and plant height, and grain yield with ear
height, indicated that these traits can be used for selecting high yielding QPM genotypes,
corroborating the findings of various studies (Babu and Prasanna 2014; Tulu 2014; Izzam
et al. 2017; Bhusal and Lal 2017). Husk cover has significant implications for ear rot at
genotypic and phenotypic levels signifying closed tip of cobs should be considered as an
important secondary trait to prevent exposure of kernel from adverse environmental
conditions and also from insect attack which consequently affects grain yield and its
quality. Grain yield was negatively associated with tryptophan and starch content. The
inverse association between grain and tryptophan indicated that the traits cannot be

181
selected together, implying pleiotropy, thereby as one increases, the other decreases. The
strong positive relationship between grain yield and protein implied the traits can be
selected together. The strong negative correlation between protein and tryptophan content,
and starch and oil content implied that simultaneous improvement of these traits will be
difficult. The correlation between grain yield and protein content varied from the study
conducted by Gupta et al. (1974) who recorded strong negative association between grain
yield and protein but agrees with the study by Mutiga et al. (2017) who also reported
positive and significant association between grain yield and protein.
Because of the polygenic nature of grain yield, selection based only on correlation may not
be efficient in selecting superior genotypes, therefore, it is crucial to access other pathways
through which grain yield is inherited. Bocianowski et al. (2016) and Raza et al. (2018)
indicated that path coefficient analysis assists plant breeders in detecting favourable traits
which aid in selection to enhance grain yield. The path coefficient analysis was conducted
for grain yield against other agronomic traits and how the combination between agronomic
and quality traits are related to grain yield. The study identified ear aspect as a major
contributor to grain yield and it also serves as a channel through which several secondary
traits contribute to grain yield indirectly. Identification of ear aspect in this study is
consistent with the results of Badu-Apraku et al. (2017) who reported on ear aspect as a
major trait which contributes to grain yield. Ears per plant was also identified as a direct
and indirect means though which ear height, protein and fibre content contributed to grain
yield. It was interesting that tryptophan content contributed directly to grain yield even
though the correlation analysis showed that the traits are inversely related. Also, starch and
husk cover contributed indirectly to grain yield through tryptophan. This, indeed suggests
for the use of path analysis to identify other essential traits rather than relying on
correlations only for the selection of secondary traits as utilized by several authors on other
crops apart from maize [Barrera et al. 2019 (tomato); John et al. 2019 (groundnut); Kanwar
and Nag 2019 (rice)]
7.6 Conclusions
This study was conducted to determine various associations among grain yield and
agronomic traits; associations among quality traits and among the two trait sets by
exploiting variance components and multivariate analysis such as correlations, principal
182
component and path analyses. Mid- and better parent heterosis were high for grain yield,
plant and ear height and ear aspect over the parental lines. Only few hybrids were found to
be superior to their two parents for tryptophan. However, the crosses showed vigour over
the parents for protein, starch, oil and fibre contents. All the traits studied were highly
heritable with genetic variance dominating environmental variance. The present study
showed that the relationship between grain yield and secondary traits ear aspect, ears per
plant, ear rot and earliness are important contributors to grain yield. Path analysis identified
ears per plant as a medium through which several secondary traits contributed to grain
yield indirectly. For efficient selection to be realised, breeders should explore several
genetic analyses before choosing a particular genotype. It is strongly recommended that
ear aspect should be considered a key secondary trait in breeding for QPM hybrids. Also
with the negative association between grain yield and tryptophan; and protein and
tryptophan, it is recommended that gene pyramiding should be considered for these traits.
There might be a possibility that, the full potentials of QPM hybrids would be realised if
all these traits are incorporated into a specific genetic material.
Reference
Ababulgu D, Shimelis H, Laing M and Beyene A (2018) Phenotypic characterization of
elite quality protein maize (QPM) inbred lines adapted to tropical-highlands and the
association studies using SSR markers. Australia Journal of Crop Science 12: 22-31.
Adesoji AG, Abubakar IU and Labe DA (2015) Character association and path coefficient
analysis of maize (Zea mays L.) grown under incorporated legumes and nitrogen.
Journal of Agronomy 14: 158-163.
Alvarado G, López M, Vargas M, Pacheco Á, Rodríguez F, Burgueño J and Crossa J (2015)
META-R (Multi Environment Trail Analysis with R for Windows) Version
6.04", hdl:11529/10201, CIMMYT Research Data and Software Repository Network,
V23
Aman J, Bantte K, Alamerew S and Tolera B (2016) Evaluation of quality protein maize
(Zea mays L.) hybrids at Jimma. Journal of Forensic Anthropology 1: 1-6.
Amini Z, Khodambashi M and Houshmand S (2013) Correlation and path coefficient
analysis of seed yield related traits in maize. International Journal of Agriculture and
Crop Sciences 5: 2217-2220.

183
Assefa K, Ketema S, Tefera H, Nguyen HT, Blum A, Ayele M, Bai G, Simane B and
Kefyalew T (1999) Diversity among germplasm lines of the Ethiopian cereal tef
(Eragrostis tef (Zucc.) Trotter). Euphytica 106: 87-97.
Babu R and Prasanna B.M (2014). Molecular breeding for quality protein maize (QPM).
In: Tuberosa R, Graner A and Frison E (eds), Genomics of Plant Genetic Resources.
Springer. pp. 490-505. doi: 10.1007/978-94-007-7575-6
Badu-Apraku B, Fakorede MAB, Annor B and Talabi AO (2017) Improvement in grain
yield and low-nitrogen tolerance in maize cultivars of three eras. Experimental
Agriculture 54: 1-19.
Barrera SF, Ribeiro LP, Rodrigues EV, Lopes BL and Eduardo TP (2019) Correlations and
path analysis in cherry tomato genotypes. Functional Plant Breeding Journal 1: 37-
44.
Bekele A and Rao TN (2014) Estimates of heritability, genetic advance and correlation
study for yield and it’s attributes in maize (Zea mays L.). Journal of Plant Sciences 2:
1-4.
Bhargava A, Shukla S, Rajan S and Ohri D (2007) Genetic diversity for morphological and
quality traits in quinoa (Chenopodium quinoa Willd) germplasm. Genetic Resources
and Crop Evolution 54: 167-173.
Bhusal TN and Lal GM (2017) Relationship among heterosis, combining ability and SSR
based genetic distance in single cross hybrids of maize (Zea Mays L). Vegetos- An
International Journal of Plant Research 30: 1-10.
Bizeti HS, Carvalho CGP, Souza JRP and Destro D (2004) Path analysis under
multicollinearity in soybean. Brazilian Archives of Biology and Technology 47: 669-
676.
Blum A (2013) Heterosis, stress, and the environment: a possible road map towards the
general improvement of crop yield. Journal Experimental Botany 64: 4829-4837.
Bocianowski J, Górczak K, Nowosad K, Wojciech Rybiński W and Piesik D (2016) Path
analysis and estimation of additive and epistatic gene effects of barley SSD lines.
Journal of Integrative Agriculture 15: 1983-1990.
Chairi F, Elazab A, Sanchez-Bragado R, Aras JL and Serret MD (2016) Heterosis for water
status in maize seedlings. Agricultural Water Management 164:100-109.
Chakrabarty S, Islam AKMA, Mian MAK and Ahamed T (2019) Combining ability and
heterosis for yield and related traits in chili (Capsicum annuum L.). Open Agriculture
Journal 13: 34-43.
184
Darshan SS and Marker S (2019) Heterosis and combining ability for grain yield and its
component characters in quality protein maize (Zea mays L.) hybrids. Electron
Journal of Plant Breeding 10: 111-118.
De Franca JGE (1983) Genetic and combining ability analysis of some agronomic and
grain quality characters in sorghum (Sorghum bicolor (L.) Moench). MSc Thesis,
Department of Genetics and Plant Breeding, Andhra Pradesh Agricultural University.
Dutta R, Kumar A, Chandra S and Ngachan SV (2017) Genetic divergence, path
coefficient, principal component and cluster analyses of maize genotypes in the mid-
altitudes of Meghalaya. Maydica 62: 1-5.
Duvick DN and Brown WL (1981) Current breeding methods in maize: Sneep J and
Hendricksen T (eds), Wageningen, Holand: Pudoc. Plant Breeding Perspectives, pp.
190-203.
East EM and Hayes HK (1912) Heterozygosis in evolution and in plant breeding. U. S.
Department Agriculture Bulletin.
Flint-Garcia SA, Buckler ES, Tiffin P, Ersoz E and Springer NM (2009) Heterosis is
prevalent for multiple traits in diverse maize germplasm. PLoS One 4: 1-11.
Gangashetty PI, Motagi BN, Pavan R and Roodagi MB (2016) Breeding crop plants for
improved human nutrition through biofortification: Progress and prospects. In: Jaiwal
PK, Chhillar AK, Chaudhary AK and Jaiwal R (eds), Advances in Plant Breeding
Strategies: Agronomic, Abiotic and Biotic Stress Traits, 2nd edn. Springer
Netherlands, vol.2, pp. 35-68. doi 10.1007/978-3-319-22518-0_2
GenStat (2019) VSN International. GenStat for Windows 20th edition. VSN International
Gupta D, Kovács I and Gáspár L (1974) Protein quality traits and their relationships with
yield and yield components of opaque-2 and analogous normal maize hybrids and
inbred lines. Theoretical and Applied Genetics 45: 341-348.
Halilu AD, Ado SG, Aba DA and Usman IS (2016) Genetics of carotenoids for provitamin
A biofortification in tropical-adapted maize. The Crop Journal 4: 313-322.
Ige SA, Bello OB and Alake O (2018) Combining ability and heterosis of tolerance to low
soil nitrogen in tropical maize cultivars derived from two breeding eras. Open
Agriculture 3: 339-346.
Izzam A, Rehman H, Sohail A, Ali S, Manzoor and Hussain Q (2017) Genetic variability
and correlation studies for morphological and yield traits in maize (Zea mays L.). Pure
and Applied Biology 6: 1243-1243.

185
John K and Santhoshi MVM and Rajasekhar P (2019) Correlation and path analysis for
yield and yield attributes in groundnut (Arachis hypogaea L.). Legume Research 42:
518-522.
Johnson HW, Robinson HF and Comstock RE (1955) Estimates of genetic and
environmental variability in soybeans. Agronomy Journal 47: 314-318.
Kanwar SS and Nag YK (2019) To study correlation and path analysis in rice breeding
lines. International Journal of Current Microbiology and Applied Sciences 8: 2481-
2487.
Lee EA and Tracy WF (2009) Modern Maize Breeding. In: Bennetzen JL and Hake S (eds),
Handbook of Maize: Genetics and Genomics. Springer Science + Business Media,
LLC, pp. 141-160. doi: 10.1007/978-0-387-77863-1
Lippman ZB and Zamir D (2006) Heterosis: Revisiting the magic. Trends in Genetics 23:
60-65.
Liu H, Pandey MK, Xu Z, Rao D, Huang Z, Chen M, Feng D, Varshney RK and Hong Y
(2019) Analysis and evaluation of quality traits of peanut varieties with near infra-red
spectroscopy technology. International Journal of Agriculture and Biology 21:491-
498.
Machikowa T and Laosuwan P (2011) Path coefficient analysis for yield of early maturing
soybean. Sonklanakarin Journal of Science and Technology 33: 365-368.
Mastrodomenico A, Hendrix C and Below F (2018) Nitrogen use efficiency and the genetic
variation of maize expired plant variety protection germplasm. Agriculture 8: 1-17.
Mather K and Jinks JL (1971) Biometrical genetics. The study of continous variation.
Cornell University Press, New York.
Matthew I (2015) Combining ability, Genetic gains and path coefficient analyses of maize
hybrids developed from maize streak virus and downey mildew resistant recombinant
inbred lines. Student thesis, University of KwaZulu-Natal Pietermaritzburg, South
Africa.
Meseka S, Fakorede MA, Ajala S, Badu-Apraku B and Menkir A (2013) Introgression of
alleles from maize landraces to improve drought tolerance in an adapted germplasm.
Journal of Crop Improvement 27: 96-112.
Mutiga SK, Morales L, Angwenyi S, Wainaina J, Harveyb J, Das B and Nelson BJ (2017)
Field crops research association between agronomic traits and aflatoxin accumulation
in diverse maize lines grown under two soil nitrogen levels in Eastern Kenya. Field
Crops Research 205: 124-134.
186
Muturi PW, Mgonja M and Rubaihayo P (2019) Gene action conditioning resistance traits
to spotted stem borer, Chilo partellus, in grain sorghum. International Journal of
Tropical Insect Science 39: 147-155.
Nigussie M and Zelleke H (2001) Heterosis and combining ability in a diallel among eight
elite maize populations. African Crop Science Journal 9: 471-479.
Qi X, Li ZH, Jiang LL, Yu XM, Ngezahayo F and Liu B (2010) Grain-yield heterosis in
Zea mays L. shows positive correlation with parental difference in CHG Methylation.
Crop Science 50: 2338-2346.
Ram L. (2014) Improvement of non-QPM lines through introgression of QPM genes.
Student thesis, Department of Genetics and Plant Breeding, Banaras Hindu University
Varanasi, India.
Raza I, Khan A, Masood A and Abid S (2018) Path analysis for potato crisps. International
Journal of Scientific and Engineering Research 9: 1565-1570.
Saif-ul-Malook, Ali Q, Ahsan M, Muhammad Khalid Shabaz MK, Waseem M and
MumtazA (2016) Combining ability analysis for evaluation of maize hybrids under
drought stress. Journal of the National Science Foundation of Sri Lanka 44: 223-230.
Saleh G, Abdullah D and Anuar AR (2002) Performance, heterosis and heritability in
selected tropical maize single, double and three-way cross hybrids. Journal of
Agricultural Sciences 138: 21-28.
Sarika K, Hossain F, Muthusamy V, Zunjare RU, Baveja A, Goswami R, Bhat JS, Saha S
and Gupta HS (2018) Marker-assisted pyramiding of opaque2 and novel opaque16
genes for further enrichment of lysine and tryptophan in sub-tropical maize. Plant
Science 272: 142-152.
Setimela PS, Gasura E and Tarekegne AT (2017) Evaluation of grain yield and related
agronomic traits of quality protein maize hybrids in Southern Africa. Euphytica 213:
1-14.
Sharma P, Punia MS, Kamboj MC, Singh N and Chand M (2017) Evaluation of quality
protein maize crosses through line x tester analysis for grain yield and quality traits.
Agricultural Science Digest 37: 42-45.
Shull GH (1911) The genotypes of maize. American Naturalist 45: 234-252.
Singh G and Kumar R (2017) Genetic parameters and character association study for yield
traits in maize (Zea mays L.). Journal of Pharmacognosy and Phytochemistry 6: 808-
813.
187
Sreckov Z, Nastasic A, Bocanski J, Djalovic I, Vukosavljev M and Jockovic B (2011)
Correlation and path analysis of grain yield and morphological traits in test–cross
populations of maize. Pakistan Journal of Botany 43: 1729-1731.
Tulu BN (2014) Correlation and path coefficients analysis studies among yield and yield
related traits of quality protein maize (QPM) inbred lines. International
Journal of Plant Breeding and Crop Science 1: 6-17.
Udensi O and Ikpeme EV (2012) Correlation and path coefficient analyses of seed yield
and its contributing traits in Cajanus cajan (L.) Millsp. American Journal of
Experimental Agriculture 2: 351-358.
Wegary D, Vivek B and Labuschagne M (2013) Association of parental genetic distance
with heterosis and specific combining ability in quality protein maize. Euphytica 191:
205-216.
Werle AJK, Ferreira FRA, Pinto RJB, Mangolin CA, Scapim CA and Gonçalves LSA
(2014) Diallel analysis of maize inbred lines for grain yield, oil and protein. Crop
Breeding and Applied Biotechnology 14: 23-28.
Yu R, Zheng Y, Abdel-Aty M and Gao Z (2019) Exploring crash mechanisms with
microscopic traffic flow variables: A hybrid approach with latent class logit and path
analysis models. Accident Analysis and Prevention 125: 70-78.

188
CHAPTER EIGHT
CONCLUSIONS AND RECOMMENDATIONS
As the world population keeps increasing, millions of people have critical health issues as
a result of a poor diet weakening their immune systems and making them susceptible to
several chronic diseases. Maize is the most widely grown and cultivated cereal crop in
SSA, therefore developing maize genotypes with increased amounts of essential amino
acids will contribute significantly to supporting the fight against hunger and malnutrition.
In this study, 130 single cross hybrids developed from 33 QPM and non-QPM inbred lines
and four testers (two QPM and two non-QPM) as well as five hybrid checks (two QPM
and three non-QPM, all single cross hybrids) obtained from the International Maize and
Wheat Improvement Center (CIMMYT), Zimbabwe were used. The 135 hybrids together
with 40 inbred lines were evaluated in South Africa and Zimbabwe during the 2017/2018
and 2018/2019 cropping seasons. Self-pollinated seeds were used for determination of
quality traits, tryptophan, protein, moisture, starch, oil, fibre, amylose and zein proteins.
Promising QPM inbred lines were identified for grain yield, and agronomic and quality
traits. The average yield of QPM inbred lines was higher than that of non-QPM lines. The
best six performing inbred lines identified included three QPM and three non-QPM lines,
although the two top performers were non-QPM lines. Based on the GGE biplot, the most
promising and desirable inbred lines in this study were two non-QPM lines and one QPM
line across all the environments.
Among the 135 hybrids evaluated, the best performing hybrid was a QPM hybrid involving
a cross between line 11 x CZL15049 (entry 41), followed by a non-QPM hybrid, entry 108
(line 28 x CZL15049). The best QPM hybrid outperformed the best non-QPM hybrid by
8.81%. In addition, the best QPM hybrid genotype 41 outperformed best non-QPM check
(Pioneer) and best QPM check (CBI) by 50.45 and 52.24%, respectively. In spite of this,
there was a substantial yield reduction (13.9%) for QPM versus non-QPM hybrids. The
AMMI analyses indicated that the grain yield performance of QPM and non-QPM hybrids
was highly affected by environmental effects. The AMMI and GGE biplots identified QPM
hybrids 108 and 41 and non-QPM hybrid 12 as the highest yielding and most stable
genotypes in this study.

189
Non-additive genetic effects controlled more than 50% of inheritance of grain yield and
also controlled the inheritance of anthesis-silking interval, husk cover and ears per plant.
On the other hand, additive genetic effects controlled the inheritance of ear rot, plant and
ear heights, days to pollen shed, ear aspect as well as root and stalk lodging. This suggested
that both additive and dominance gene effects played an important role in the inheritance
measured traits. Inbred lines 11, 14 and 28 and non-QPM tester CML444 showed desirable
GCA effects for grain yield, indicating that these lines in combination with the tester could
be considered when targeting the development of superior maize genotypes with QPM
traits. Lines 1, 2, 8, 13 and 30 were found to be prolific while QPM tester CZL059 was the
only tester to display positive significant GCA for ears per plant, which is a major
contributor to grain yield. The SCA grouping method showed that QPM testers were
superior to non-QPM testers in discriminating between the lines for grain yield. Based on
the SCA values, crosses with the entries 41, 85, 99, 105, 105 and 121 were identified as
the best hybrids across the 13 locations for grain yield.
The quality traits analysed for the QPM and non-QPM maize genotypes varied
significantly, and were also influenced by the environment. Several hybrids had QI above
1, but the best three hybrids for QI were QPM L12 x CZL15049 (45), L18 x CZL15049
(69) and L2 x CZL059 (6). Hybrids L12 x CZL15049 (45) and L15 x CZL15049 (57)
outperformed the best check, QPM (entry 132) by 15.38 and 12.82%, respectively for
tryptophan. Hybrids 45 and 57 were identified as the crosses with the highest tryptophan
content. Additive gene action was predominant in the inheritance tryptophan, protein,
starch, oil and fibre contents. Inbred lines 1, 2, 6, 7, 8, 12, 13, 15, 17 and 18 and QPM
testers CZL15049 and CZL059 showed desirable GCA effects for tryptophan, suggesting
this line and testers should be considered for QPM hybrid development for high tryptophan
content. Several lines were found to have good GCA effects for protein and oil. Based on
the SCA values, crosses with the entries 78, 82, 87 and 126 were identified as the best
hybrids across the six locations for tryptophan. Hybrids 127 and 87 were also identified
for superior protein content.
Mid- and better parent heterosis was high for grain yield, plant and ear height and ear
aspect. Only a few hybrids were superior to their parents for tryptophan. However, the
crosses showed vigour over the parents for grain protein, starch, oil and fibre contents. All
the traits studied were highly heritable with additive genetic variance dominating. There

190
was a strong relationship between grain yield and secondary traits such as ear aspect, ears
per plant, ear rot and earliness, which are clearly important contributors to grain yield. Path
analysis identified ears per plant as a medium through which several secondary traits
contributed to grain yield indirectly.
This study has, therefore, shown that although QPM inbred lines performed somewhat
better than non-QPM lines, there was a yield penalty associated with QPM, compared to
non-QPM hybrids. There were, however, some excellent QPM hybrids. Superior QPM
inbred lines identified in this study could be exploited by breeding programmes in SSA.
The high yielding QPM hybrids identified could be further tested for commercial release.
Good QPM hybrids can contribute to alleviate poverty, hunger and malnutrition in southern
Africa and SSA at large. It is suggested that tropical maize breeding should in the future
be more focused on pyramiding of high protein and tryptophan content genes together with
high grain yield.
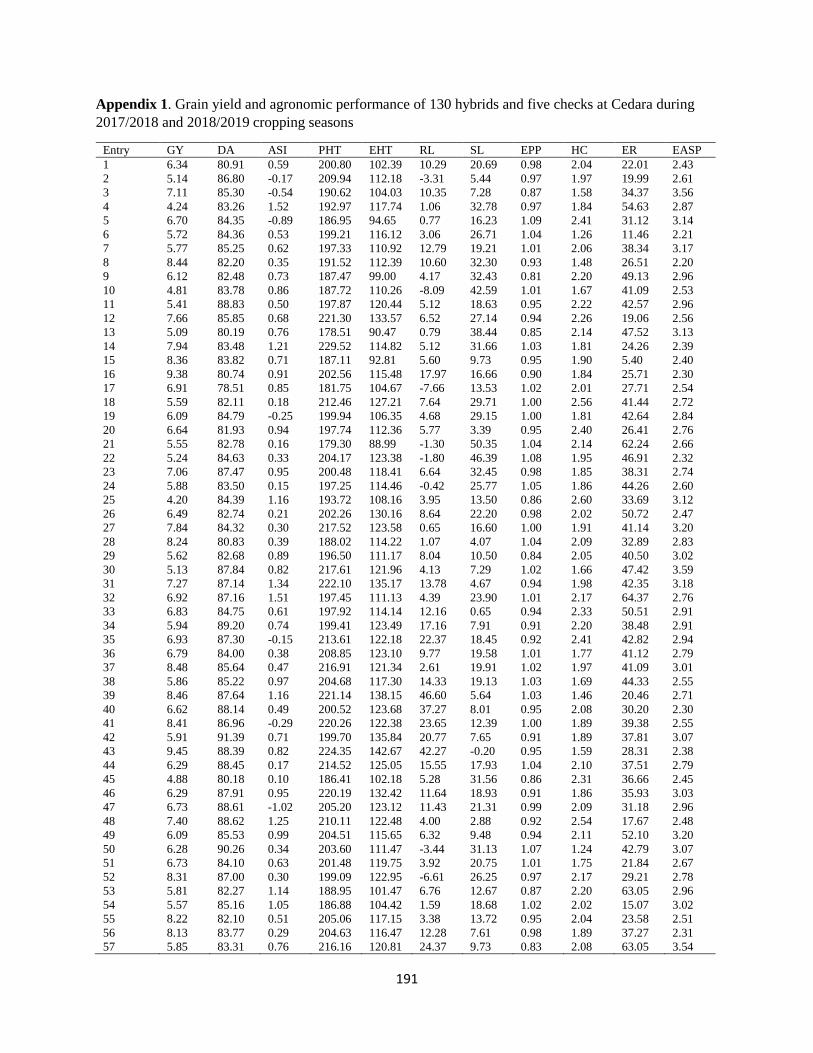
191
Appendix 1. Grain yield and agronomic performance of 130 hybrids and five checks at Cedara during
2017/2018 and 2018/2019 cropping seasons
Entry GY DA ASI PHT EHT RL SL EPP HC ER EASP
1 6.34 80.91 0.59 200.80 102.39 10.29 20.69 0.98 2.04 22.01 2.43
2 5.14 86.80 -0.17 209.94 112.18 -3.31 5.44 0.97 1.97 19.99 2.61
3 7.11 85.30 -0.54 190.62 104.03 10.35 7.28 0.87 1.58 34.37 3.56
4 4.24 83.26 1.52 192.97 117.74 1.06 32.78 0.97 1.84 54.63 2.87
5 6.70 84.35 -0.89 186.95 94.65 0.77 16.23 1.09 2.41 31.12 3.14
6 5.72 84.36 0.53 199.21 116.12 3.06 26.71 1.04 1.26 11.46 2.21
7 5.77 85.25 0.62 197.33 110.92 12.79 19.21 1.01 2.06 38.34 3.17
8 8.44 82.20 0.35 191.52 112.39 10.60 32.30 0.93 1.48 26.51 2.20
9 6.12 82.48 0.73 187.47 99.00 4.17 32.43 0.81 2.20 49.13 2.96
10 4.81 83.78 0.86 187.72 110.26 -8.09 42.59 1.01 1.67 41.09 2.53
11 5.41 88.83 0.50 197.87 120.44 5.12 18.63 0.95 2.22 42.57 2.96
12 7.66 85.85 0.68 221.30 133.57 6.52 27.14 0.94 2.26 19.06 2.56
13 5.09 80.19 0.76 178.51 90.47 0.79 38.44 0.85 2.14 47.52 3.13
14 7.94 83.48 1.21 229.52 114.82 5.12 31.66 1.03 1.81 24.26 2.39
15 8.36 83.82 0.71 187.11 92.81 5.60 9.73 0.95 1.90 5.40 2.40
16 9.38 80.74 0.91 202.56 115.48 17.97 16.66 0.90 1.84 25.71 2.30
17 6.91 78.51 0.85 181.75 104.67 -7.66 13.53 1.02 2.01 27.71 2.54
18 5.59 82.11 0.18 212.46 127.21 7.64 29.71 1.00 2.56 41.44 2.72
19 6.09 84.79 -0.25 199.94 106.35 4.68 29.15 1.00 1.81 42.64 2.84
20 6.64 81.93 0.94 197.74 112.36 5.77 3.39 0.95 2.40 26.41 2.76
21 5.55 82.78 0.16 179.30 88.99 -1.30 50.35 1.04 2.14 62.24 2.66
22 5.24 84.63 0.33 204.17 123.38 -1.80 46.39 1.08 1.95 46.91 2.32
23 7.06 87.47 0.95 200.48 118.41 6.64 32.45 0.98 1.85 38.31 2.74
24 5.88 83.50 0.15 197.25 114.46 -0.42 25.77 1.05 1.86 44.26 2.60
25 4.20 84.39 1.16 193.72 108.16 3.95 13.50 0.86 2.60 33.69 3.12
26 6.49 82.74 0.21 202.26 130.16 8.64 22.20 0.98 2.02 50.72 2.47
27 7.84 84.32 0.30 217.52 123.58 0.65 16.60 1.00 1.91 41.14 3.20
28 8.24 80.83 0.39 188.02 114.22 1.07 4.07 1.04 2.09 32.89 2.83
29 5.62 82.68 0.89 196.50 111.17 8.04 10.50 0.84 2.05 40.50 3.02
30 5.13 87.84 0.82 217.61 121.96 4.13 7.29 1.02 1.66 47.42 3.59
31 7.27 87.14 1.34 222.10 135.17 13.78 4.67 0.94 1.98 42.35 3.18
32 6.92 87.16 1.51 197.45 111.13 4.39 23.90 1.01 2.17 64.37 2.76
33 6.83 84.75 0.61 197.92 114.14 12.16 0.65 0.94 2.33 50.51 2.91
34 5.94 89.20 0.74 199.41 123.49 17.16 7.91 0.91 2.20 38.48 2.91
35 6.93 87.30 -0.15 213.61 122.18 22.37 18.45 0.92 2.41 42.82 2.94
36 6.79 84.00 0.38 208.85 123.10 9.77 19.58 1.01 1.77 41.12 2.79
37 8.48 85.64 0.47 216.91 121.34 2.61 19.91 1.02 1.97 41.09 3.01
38 5.86 85.22 0.97 204.68 117.30 14.33 19.13 1.03 1.69 44.33 2.55
39 8.46 87.64 1.16 221.14 138.15 46.60 5.64 1.03 1.46 20.46 2.71
40 6.62 88.14 0.49 200.52 123.68 37.27 8.01 0.95 2.08 30.20 2.30
41 8.41 86.96 -0.29 220.26 122.38 23.65 12.39 1.00 1.89 39.38 2.55
42 5.91 91.39 0.71 199.70 135.84 20.77 7.65 0.91 1.89 37.81 3.07
43 9.45 88.39 0.82 224.35 142.67 42.27 -0.20 0.95 1.59 28.31 2.38
44 6.29 88.45 0.17 214.52 125.05 15.55 17.93 1.04 2.10 37.51 2.79
45 4.88 80.18 0.10 186.41 102.18 5.28 31.56 0.86 2.31 36.66 2.45
46 6.29 87.91 0.95 220.19 132.42 11.64 18.93 0.91 1.86 35.93 3.03
47 6.73 88.61 -1.02 205.20 123.12 11.43 21.31 0.99 2.09 31.18 2.96
48 7.40 88.62 1.25 210.11 122.48 4.00 2.88 0.92 2.54 17.67 2.48
49 6.09 85.53 0.99 204.51 115.65 6.32 9.48 0.94 2.11 52.10 3.20
50 6.28 90.26 0.34 203.60 111.47 -3.44 31.13 1.07 1.24 42.79 3.07
51 6.73 84.10 0.63 201.48 119.75 3.92 20.75 1.01 1.75 21.84 2.67
52 8.31 87.00 0.30 199.09 122.95 -6.61 26.25 0.97 2.17 29.21 2.78
53 5.81 82.27 1.14 188.95 101.47 6.76 12.67 0.87 2.20 63.05 2.96
54 5.57 85.16 1.05 186.88 104.42 1.59 18.68 1.02 2.02 15.07 3.02
55 8.22 82.10 0.51 205.06 117.15 3.38 13.72 0.95 2.04 23.58 2.51
56 8.13 83.77 0.29 204.63 116.47 12.28 7.61 0.98 1.89 37.27 2.31
57 5.85 83.31 0.76 216.16 120.81 24.37 9.73 0.83 2.08 63.05 3.54

192
58 5.74 86.73 0.43 217.53 122.47 13.06 12.95 0.96 2.19 24.30 3.32
59 9.07 87.65 0.09 229.69 145.17 3.56 19.90 0.99 1.76 30.87 2.36
60 6.31 87.66 1.07 200.84 111.37 -0.11 21.98 1.02 1.44 24.32 2.53
61 5.19 83.81 0.80 198.76 101.58 -2.55 34.92 0.94 1.94 49.79 3.13
62 5.71 89.16 0.51 172.22 92.26 19.02 16.84 1.06 2.18 26.15 3.12
63 3.45 86.18 1.12 191.54 109.24 7.98 17.04 0.81 2.13 86.65 3.55
64 5.05 86.06 0.84 202.63 117.40 -5.27 31.99 0.94 2.06 28.92 2.59
65 5.84 85.19 1.34 189.19 101.00 -8.63 12.58 0.92 2.48 44.55 2.95
66 6.10 86.60 -0.22 193.33 112.25 1.73 24.60 0.91 1.53 33.94 2.71
67 4.91 86.22 1.34 187.50 113.52 3.08 27.23 0.83 2.02 42.37 3.28
68 6.28 85.71 0.63 192.72 115.56 2.86 10.67 0.98 1.99 26.79 2.67
69 5.99 84.00 -0.48 205.97 118.10 12.06 26.91 0.98 2.29 48.85 2.50
70 0.95 92.49 1.58 172.27 103.11 -1.81 17.90 0.71 2.30 33.67 4.03
71 8.85 84.35 0.80 203.37 129.99 21.28 20.04 0.88 2.06 20.78 2.24
72 9.11 85.94 0.21 192.67 107.07 11.98 9.51 1.00 1.69 30.51 2.25
73 5.55 80.32 2.14 167.03 75.83 6.65 6.53 0.79 2.11 32.81 2.61
74 6.60 83.33 0.87 203.37 107.39 0.70 25.57 0.97 1.94 27.44 2.54
75 6.90 86.62 1.90 194.75 103.02 15.22 15.71 1.00 2.07 16.93 2.62
76 6.70 82.30 0.39 192.41 105.65 2.18 20.78 0.93 1.80 29.65 2.28
77 7.08 79.51 0.64 186.75 98.29 7.49 20.85 1.00 2.13 45.65 2.69
78 6.43 85.01 -0.08 220.21 132.78 7.00 4.33 1.03 1.59 37.20 2.38
79 8.93 82.48 0.50 194.81 110.75 28.99 -1.96 0.99 1.61 49.51 2.45
80 6.35 82.26 0.63 204.02 115.12 6.99 17.87 0.99 2.39 34.03 2.30
81 5.90 84.79 0.37 196.89 134.63 13.53 39.88 0.99 1.91 23.42 2.25
82 4.53 83.72 0.93 195.87 119.33 16.08 12.38 0.90 1.90 45.74 2.69
83 7.20 82.12 0.22 206.97 137.07 23.09 3.57 0.70 2.27 75.92 2.69
84 7.78 88.82 2.07 200.13 113.71 1.56 21.21 0.96 1.93 8.18 2.32
85 7.55 88.17 2.15 200.01 132.98 3.34 22.85 0.98 1.46 35.28 2.35
86 7.37 90.08 0.23 209.08 124.99 7.12 25.40 1.02 2.54 32.35 2.27
87 2.88 89.83 2.24 161.94 100.79 6.61 2.88 0.99 2.14 48.77 3.08
88 6.24 82.62 0.39 191.69 90.97 0.16 9.13 1.08 1.93 34.00 2.68
89 5.05 87.42 1.20 190.35 101.40 5.97 22.59 1.04 2.64 28.85 2.39
90 5.74 88.79 0.91 211.66 114.21 24.74 17.24 1.02 1.97 19.94 2.47
91 6.80 88.60 0.79 191.49 98.07 23.63 -0.73 0.93 1.87 59.33 3.10
92 4.93 85.05 0.01 203.89 105.93 7.80 12.77 0.94 1.87 45.71 2.97
93 5.81 91.37 0.32 209.60 124.01 22.79 11.91 1.06 1.77 34.35 2.63
94 6.16 91.12 -0.12 212.88 121.34 -0.04 5.16 1.05 1.56 16.37 2.14
95 5.27 90.99 0.59 189.27 111.98 16.35 10.60 0.93 1.91 56.24 3.09
96 6.83 86.32 1.40 209.78 128.01 4.02 17.48 0.99 1.82 37.63 2.58
97 5.51 90.92 0.22 180.42 102.58 2.46 45.95 1.02 1.92 26.05 2.82
98 8.01 85.52 1.05 198.80 116.02 8.69 15.67 0.98 1.87 18.16 2.44
99 8.13 84.05 2.53 182.10 106.53 9.33 17.55 0.92 1.99 30.10 2.90
100 8.19 81.09 1.07 186.58 89.11 6.95 28.43 0.97 1.94 36.90 2.09
101 5.94 86.92 0.49 206.13 113.67 5.62 32.32 0.94 1.92 29.59 2.83
102 6.85 85.84 -0.06 203.69 110.19 15.83 15.90 1.03 1.14 19.53 2.39
103 6.59 88.89 2.19 193.96 104.15 18.49 1.61 0.92 1.62 41.89 2.92
104 5.47 80.16 0.23 190.54 92.27 -0.71 9.42 0.95 2.01 25.87 2.74
105 6.30 83.44 0.36 204.29 102.33 6.05 20.44 0.98 2.62 31.22 2.67
106 6.84 80.99 0.39 199.31 110.11 -2.16 22.56 1.08 1.72 36.29 3.05
107 6.57 79.59 1.16 188.16 114.90 23.55 14.77 1.04 2.15 31.44 2.61
108 7.85 85.42 -0.30 195.46 119.37 13.82 3.86 1.07 2.39 45.39 3.11
109 6.27 87.03 1.75 220.81 140.00 3.27 35.94 0.91 1.86 33.01 2.42
110 6.97 89.91 1.13 214.63 132.39 10.73 24.33 0.94 1.50 42.90 3.03
111 7.15 87.79 0.05 205.97 131.85 0.45 10.40 0.96 2.06 19.45 2.84
112 6.70 78.38 0.18 171.31 80.10 -4.29 38.10 1.00 2.27 40.45 2.60
113 6.62 82.42 0.79 209.05 115.77 4.04 22.26 0.95 1.59 23.52 2.46
114 7.33 83.67 0.89 205.67 101.11 5.37 11.73 0.91 1.95 46.28 2.74
115 8.35 83.33 0.36 198.73 111.77 2.82 24.81 1.00 1.45 22.41 2.13
116 9.25 85.07 0.23 180.47 90.27 17.16 19.19 0.80 1.90 39.63 2.60
117 5.26 84.87 0.76 182.64 100.41 3.80 19.65 1.02 2.01 33.53 2.85
118 8.16 87.19 0.49 201.41 113.40 9.11 7.03 0.96 2.30 8.56 2.62
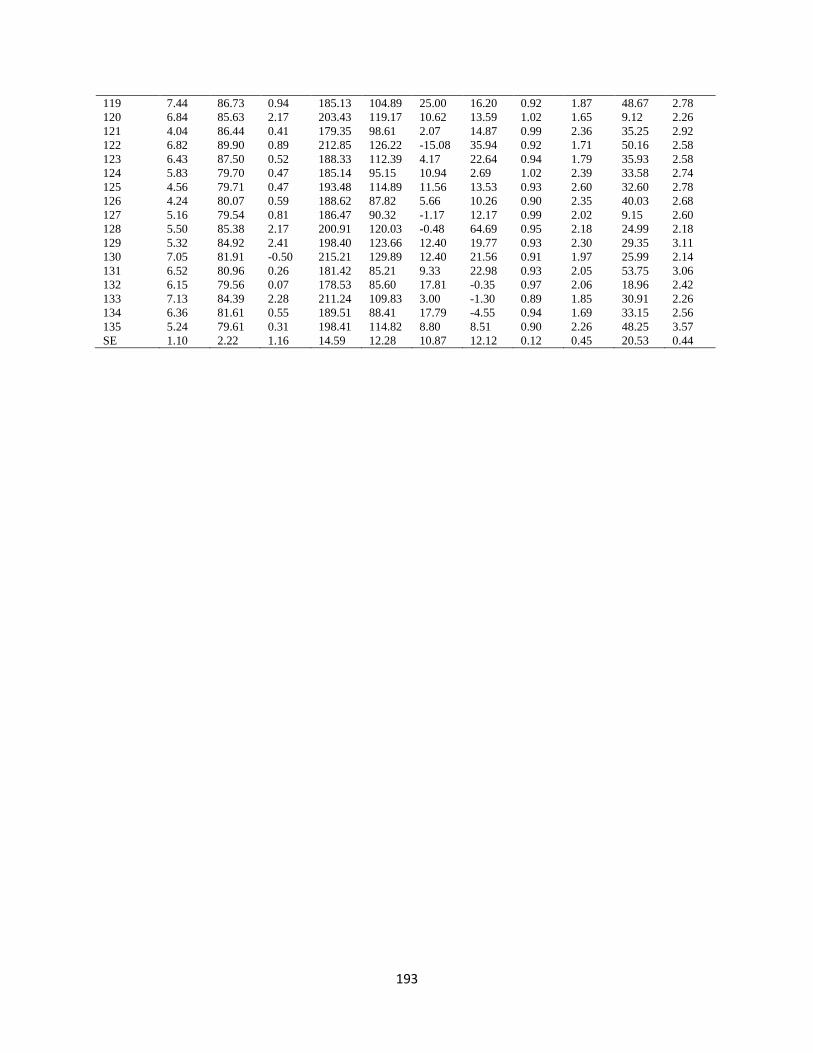
193
119 7.44 86.73 0.94 185.13 104.89 25.00 16.20 0.92 1.87 48.67 2.78
120 6.84 85.63 2.17 203.43 119.17 10.62 13.59 1.02 1.65 9.12 2.26
121 4.04 86.44 0.41 179.35 98.61 2.07 14.87 0.99 2.36 35.25 2.92
122 6.82 89.90 0.89 212.85 126.22 -15.08 35.94 0.92 1.71 50.16 2.58
123 6.43 87.50 0.52 188.33 112.39 4.17 22.64 0.94 1.79 35.93 2.58
124 5.83 79.70 0.47 185.14 95.15 10.94 2.69 1.02 2.39 33.58 2.74
125 4.56 79.71 0.47 193.48 114.89 11.56 13.53 0.93 2.60 32.60 2.78
126 4.24 80.07 0.59 188.62 87.82 5.66 10.26 0.90 2.35 40.03 2.68
127 5.16 79.54 0.81 186.47 90.32 -1.17 12.17 0.99 2.02 9.15 2.60
128 5.50 85.38 2.17 200.91 120.03 -0.48 64.69 0.95 2.18 24.99 2.18
129 5.32 84.92 2.41 198.40 123.66 12.40 19.77 0.93 2.30 29.35 3.11
130 7.05 81.91 -0.50 215.21 129.89 12.40 21.56 0.91 1.97 25.99 2.14
131 6.52 80.96 0.26 181.42 85.21 9.33 22.98 0.93 2.05 53.75 3.06
132 6.15 79.56 0.07 178.53 85.60 17.81 -0.35 0.97 2.06 18.96 2.42
133 7.13 84.39 2.28 211.24 109.83 3.00 -1.30 0.89 1.85 30.91 2.26
134 6.36 81.61 0.55 189.51 88.41 17.79 -4.55 0.94 1.69 33.15 2.56
135 5.24 79.61 0.31 198.41 114.82 8.80 8.51 0.90 2.26 48.25 3.57
SE 1.10 2.22 1.16 14.59 12.28 10.87 12.12 0.12 0.45 20.53 0.44

194
Appendix 2. Grain yield and agronomic performance of 130 hybrids and five checks at
Potchefstroom during 2017/2018 and 2018/2019 cropping seasons
Entry GY DA ASI PHT EHT RL SL EPP HC ER EASP
1 7.69 69.00 0.17 206.00 97.00 1.19 7.33 1.10 2.08 3.68 2.42
2 7.70 73.50 0.17 221.83 129.17 4.55 11.27 1.12 2.42 17.40 2.88
3 6.59 73.67 0.67 226.50 117.33 7.02 17.60 0.95 2.08 3.33 2.75
4 8.11 72.83 0.00 219.00 110.50 0.00 2.50 1.07 2.00 4.26 2.42
5 6.99 69.33 0.50 213.67 93.00 2.58 0.00 1.07 2.42 7.07 2.75
6 6.16 74.33 1.00 210.83 107.83 0.00 24.78 0.98 2.00 5.00 3.08
7 7.41 72.50 1.17 217.50 117.00 5.68 18.33 1.00 2.17 4.42 2.58
8 9.18 71.50 0.17 210.67 108.67 0.98 8.68 1.30 1.83 10.52 2.67
9 7.79 72.33 0.33 211.33 104.83 8.33 4.75 1.07 2.17 6.20 2.75
10 5.34 76.67 1.50 218.83 120.67 3.33 5.65 0.87 2.25 0.00 2.92
11 7.67 76.83 2.17 234.67 135.17 2.63 19.68 1.05 1.75 14.93 2.75
12 8.30 75.17 0.67 235.17 139.33 3.87 3.74 1.22 2.33 4.23 2.75
13 6.61 68.50 0.33 193.17 98.83 8.71 13.25 0.97 2.42 7.12 2.67
14 7.35 73.50 0.50 218.17 112.67 3.61 14.48 0.98 1.75 7.50 2.75
15 7.80 73.17 0.50 217.50 117.83 5.13 20.47 0.82 2.67 9.64 2.50
16 8.80 71.33 0.67 220.67 115.67 2.23 10.46 0.97 2.08 8.89 2.58
17 6.39 68.33 0.67 212.83 106.83 32.53 22.54 0.88 2.17 26.27 2.50
18 7.05 72.83 0.83 223.67 117.83 11.24 28.86 1.05 2.33 20.60 2.67
19 6.84 73.00 1.17 219.67 125.33 2.96 26.23 0.85 2.00 22.59 2.50
20 9.30 71.33 0.17 197.50 105.67 3.03 1.04 1.17 1.92 11.98 2.58
21 9.08 70.33 1.17 196.50 95.17 9.16 15.88 1.05 1.92 12.84 2.75
22 8.13 76.50 1.17 211.17 118.17 1.96 14.34 1.17 2.25 8.03 2.83
23 11.33 72.33 0.33 219.00 117.67 1.00 15.55 1.12 2.08 23.43 2.83
24 8.85 72.00 0.50 217.50 114.83 12.77 2.15 1.02 2.33 11.94 3.08
25 8.19 68.50 1.33 200.00 98.33 11.18 6.07 0.95 2.08 15.28 2.67
26 6.99 72.50 1.83 207.67 107.83 2.56 11.97 1.10 1.92 11.37 2.50
27 7.15 73.83 0.17 219.83 124.67 2.23 1.04 0.97 1.92 18.63 2.67
28 11.23 71.33 0.50 210.67 122.33 1.04 1.04 1.20 1.92 17.66 2.50
29 7.81 70.00 0.50 229.50 115.83 1.39 2.26 0.98 2.42 13.37 2.83
30 5.11 76.33 0.83 229.00 126.50 1.33 2.58 0.93 2.17 13.99 2.83
31 7.50 75.17 1.33 231.00 131.00 1.39 7.78 0.97 2.25 17.10 2.83
32 6.25 75.67 0.50 223.67 122.50 0.00 0.00 1.03 2.25 18.86 2.58
33 8.56 73.00 0.17 224.50 118.17 4.44 3.10 1.03 2.83 7.52 2.58
34 5.46 76.17 1.83 224.17 120.83 4.38 10.14 0.95 2.17 3.06 2.92
35 8.02 76.33 1.67 222.83 138.50 2.71 16.96 1.02 2.17 10.83 2.92
36 7.44 75.50 1.17 209.17 131.00 2.86 9.26 0.97 2.00 3.42 2.75
37 8.11 74.00 0.33 223.83 120.83 2.30 0.00 0.98 2.25 12.71 3.00
38 6.39 75.17 1.67 225.17 128.17 9.72 16.49 0.93 2.08 8.12 2.83
39 6.01 79.17 1.33 222.17 141.17 0.00 23.10 0.80 2.17 10.57 2.75
40 8.13 74.83 0.67 213.67 129.50 0.00 11.67 1.00 2.25 9.76 2.83
41 11.13 75.00 0.50 228.33 125.33 0.00 15.63 1.18 2.50 12.22 2.83
42 6.67 78.33 0.83 240.33 138.83 11.66 18.81 1.08 2.25 6.55 2.75
43 5.74 79.50 1.50 245.50 155.67 0.00 26.92 0.92 2.33 12.14 3.08
44 8.03 76.00 0.67 226.50 128.00 1.67 16.93 1.03 2.08 1.39 2.33
45 7.76 69.33 0.50 211.17 102.50 4.76 0.00 1.03 2.17 15.99 2.42
46 5.24 75.83 1.00 240.50 133.50 1.75 11.70 0.83 2.08 11.25 3.00
47 6.46 74.83 0.83 226.83 120.50 0.00 0.00 0.97 2.50 18.16 2.92
48 7.37 74.17 0.67 241.50 131.33 0.00 1.85 1.03 2.25 13.06 2.92
49 9.58 75.67 1.00 226.50 116.17 0.00 1.33 1.17 2.33 19.50 2.75
50 5.98 76.17 0.33 223.00 123.00 0.00 1.50 1.10 2.17 12.62 3.08
51 6.41 79.17 0.50 223.75 127.33 0.00 11.98 1.03 2.08 9.23 2.75
52 9.63 76.83 0.83 215.67 118.50 3.70 1.85 1.22 2.00 9.62 2.50
53 7.83 70.83 0.50 205.67 106.33 14.72 9.71 0.93 2.42 29.93 2.92
54 8.60 74.17 0.67 225.67 118.33 6.07 7.21 1.22 2.75 31.95 2.92
55 6.48 76.83 0.83 216.17 122.67 3.57 6.54 1.12 2.17 25.43 2.75
56 10.39 72.83 0.50 205.17 106.50 2.78 2.50 1.18 2.58 39.10 2.92
57 9.46 70.83 1.00 215.17 105.33 1.83 8.89 1.08 2.25 10.61 2.92

195
58 7.04 73.50 0.83 234.83 121.33 0.00 17.54 0.97 2.25 6.27 2.75
59 8.37 73.50 0.50 248.67 148.33 8.51 16.11 0.85 2.25 4.81 2.75
60 7.64 73.17 0.50 232.33 129.67 3.13 6.11 1.03 2.08 11.05 2.50
61 7.29 73.50 0.67 225.17 122.00 5.45 4.55 1.20 1.92 11.30 2.83
62 4.71 77.33 1.00 207.83 119.67 1.28 10.09 0.85 2.00 25.83 3.33
63 5.36 78.17 0.67 220.00 128.83 3.38 8.45 0.93 1.67 7.84 2.67
64 7.92 73.50 1.00 216.67 119.83 0.00 10.96 1.07 2.00 8.45 2.75
65 9.70 72.67 0.83 209.67 111.83 3.57 17.69 1.12 2.00 15.19 2.83
66 5.25 78.33 1.67 197.67 112.17 5.00 5.77 0.87 2.50 9.52 3.42
67 7.66 76.33 0.67 219.33 133.83 2.39 17.51 0.97 2.08 9.21 2.92
68 9.25 75.17 0.83 207.83 106.50 3.03 2.56 1.00 2.00 4.55 2.92
69 9.01 71.67 0.33 220.67 117.00 7.44 23.45 1.27 2.42 2.32 2.58
70 2.90 79.40 2.17 176.67 94.17 12.88 21.73 0.60 2.67 0.00 3.42
71 6.45 77.17 0.83 232.50 138.17 8.17 18.18 1.08 1.92 5.09 2.48
72 6.98 72.33 0.33 210.17 122.33 9.17 18.48 1.05 2.33 18.65 3.00
73 7.77 67.83 0.33 203.17 99.17 10.08 1.96 1.08 2.50 14.58 2.83
74 7.09 71.83 0.83 227.50 109.67 3.19 14.86 0.97 2.25 6.80 2.83
75 7.75 72.33 1.00 217.17 116.33 1.17 6.33 1.00 2.33 13.21 2.83
76 6.70 70.83 0.33 203.50 111.67 0.00 6.79 1.07 2.08 7.61 2.75
77 8.22 68.17 0.17 211.17 108.17 13.28 8.83 1.08 2.33 12.10 2.50
78 5.62 73.50 0.33 237.17 142.33 1.85 8.16 1.07 1.92 12.61 2.58
79 8.45 72.50 0.83 226.83 132.67 8.54 11.28 1.07 2.33 15.86 2.67
80 8.17 68.83 0.50 210.33 115.33 14.68 6.35 0.90 2.33 8.57 2.83
81 6.61 74.00 0.50 226.17 132.83 4.71 6.86 1.23 1.83 6.16 2.67
82 7.99 73.00 0.50 230.33 135.33 4.39 6.07 0.93 2.17 11.30 2.83
83 8.01 71.33 0.50 212.50 123.00 6.67 2.08 0.97 2.42 8.07 2.67
84 9.49 72.83 0.50 216.33 115.17 2.56 11.31 1.03 2.42 10.33 2.50
85 6.77 77.17 0.33 224.17 126.67 5.58 3.77 1.00 2.17 0.00 2.42
86 8.68 75.33 0.83 227.50 130.33 2.83 8.81 1.10 2.08 10.94 2.58
87 5.14 77.83 0.33 167.17 99.50 0.93 6.17 0.90 2.00 3.61 3.25
88 6.49 71.00 0.17 213.83 99.33 2.96 17.23 0.92 2.25 24.19 2.50
89 6.39 76.17 1.33 231.00 115.33 0.00 11.59 1.18 2.00 1.52 2.33
90 6.11 78.00 1.50 228.83 128.33 1.52 14.76 0.97 2.17 10.29 2.92
91 7.73 76.17 1.00 221.83 110.50 0.88 0.88 1.00 2.17 4.26 2.17
92 7.39 74.50 1.17 222.17 109.83 1.28 1.00 0.92 2.00 11.89 2.67
93 6.78 76.83 1.00 240.67 130.50 1.04 1.11 0.98 2.08 4.64 2.83
94 7.37 77.67 1.00 237.33 132.67 0.00 1.67 0.90 2.08 2.02 2.83
95 9.88 76.33 0.50 219.67 117.17 0.88 1.75 1.22 1.92 8.15 2.83
96 8.26 72.50 0.83 214.83 111.33 12.52 5.36 1.12 2.17 5.27 2.83
97 4.05 79.50 1.17 202.00 119.33 5.40 21.22 0.87 2.33 7.56 3.17
98 7.41 76.00 1.00 222.50 127.50 5.23 7.24 1.08 1.67 2.58 2.42
99 8.64 73.50 1.17 218.00 124.83 1.11 5.09 1.08 1.75 5.35 2.75
100 7.65 71.83 0.67 207.00 97.17 3.03 11.28 0.87 2.00 7.41 2.25
101 5.53 75.17 0.67 220.67 120.67 3.00 6.90 0.85 1.75 4.70 2.75
102 7.54 74.83 1.00 230.17 127.83 2.56 14.24 0.87 2.25 6.94 2.50
103 9.03 74.67 0.83 197.17 112.50 9.21 5.51 1.03 2.17 3.07 2.83
104 7.67 67.33 0.33 198.33 88.83 0.00 1.96 0.95 2.50 22.45 3.00
105 6.48 72.83 0.83 204.50 105.50 5.27 3.36 0.98 2.25 8.94 2.92
106 6.18 70.83 0.50 216.17 113.17 0.00 2.04 0.95 2.33 16.70 3.00
107 7.94 67.17 0.33 200.33 100.33 1.52 1.67 1.03 2.42 20.97 2.83
108 9.70 75.67 0.83 234.50 138.33 3.03 9.04 1.03 2.33 20.61 3.00
109 5.46 78.83 1.33 231.83 147.50 2.78 22.89 0.90 2.17 1.67 3.08
110 6.83 78.67 3.67 251.83 169.67 8.09 9.64 0.80 2.33 14.07 3.08
111 6.66 78.33 1.00 209.67 129.33 2.78 9.31 0.88 2.67 17.97 2.75
112 8.12 69.00 0.00 191.83 85.83 17.22 0.00 0.98 2.25 9.22 2.58
113 6.91 72.67 1.17 218.50 118.67 18.06 6.13 1.00 2.00 0.00 2.50
114 8.43 72.17 0.83 233.33 124.17 2.86 12.67 1.02 2.33 16.27 2.42
115 8.72 71.33 0.33 195.67 104.33 1.52 3.33 1.07 2.08 5.99 2.58
116 7.59 71.00 0.67 205.17 99.50 4.57 2.08 1.17 2.25 6.15 2.83
117 6.53 73.33 0.50 203.17 112.67 0.00 6.41 1.23 1.75 1.45 2.50
118 7.64 74.00 0.33 220.83 116.67 2.08 18.54 1.13 2.00 4.46 2.67
119 7.88 73.00 0.83 206.17 117.83 7.50 1.11 1.22 2.33 6.11 2.67

196
120 9.76 74.00 0.33 213.50 114.33 5.18 9.89 0.93 2.50 11.36 2.92
121 4.69 77.33 0.50 202.83 114.83 2.38 16.35 1.08 2.08 10.81 3.00
122 6.35 77.00 0.67 226.33 132.50 6.84 10.26 1.12 1.92 19.34 2.33
123 8.64 76.33 0.33 208.50 117.17 1.17 4.55 1.07 2.33 2.22 2.58
124 6.89 66.33 0.50 201.33 98.00 0.00 1.52 0.90 2.58 22.27 2.67
125 9.28 68.33 0.50 217.83 110.33 0.00 4.22 1.00 2.67 18.90 2.75
126 6.43 67.83 1.00 202.83 103.00 1.11 3.33 1.00 2.67 24.36 2.92
127 7.61 69.83 0.33 215.50 107.83 2.67 6.48 1.00 2.58 17.23 2.92
128 7.27 73.33 0.33 231.00 126.00 1.00 14.24 1.02 2.33 5.09 2.75
129 8.42 72.00 0.50 225.17 124.67 4.72 13.13 0.98 2.00 6.77 2.42
130 8.79 71.00 0.67 214.00 112.17 0.00 6.46 0.98 2.25 10.30 2.42
131 8.77 68.33 0.67 213.50 103.17 6.24 9.06 1.02 2.00 27.16 2.58
132 6.53 71.00 1.00 198.50 98.83 0.00 1.00 1.02 2.08 10.68 2.67
133 8.07 73.83 1.67 234.17 122.67 4.22 11.03 1.07 2.08 3.94 2.08
134 7.70 70.83 0.33 218.17 111.67 0.00 0.98 0.90 2.25 28.10 3.00
135 7.23 70.00 0.71 215.50 116.86 3.06 4.76 0.91 2.50 25.39 2.86
SE 1.27 1.63 0.81 10.30 8.27 8.33 11.15 0.17 0.42 10.37 0.41

197
Appendix 3. Grain yield and agronomic performance of 130 hybrids and five checks at eight
locations in Zimbabwe during 2017/2018 cropping season
Entry GY PHT EHT DA ASI RL SL HC EPP ER EASP
1 4.78 231.77 107.12 66.70 1.21 9.44 2.21 0.56 1.14 11.63 3.13
2 5.58 255.09 132.12 70.21 1.88 8.05 1.77 0.50 1.21 6.98 2.86
3 4.78 248.72 126.44 70.84 1.53 7.45 0.92 3.63 1.03 8.40 2.98
4 6.28 235.31 121.97 68.98 1.26 10.78 0.07 -0.13 1.29 7.61 3.11
5 5.31 222.07 108.36 66.13 2.25 12.94 1.09 -0.47 1.06 10.76 2.91
6 5.55 248.01 131.79 71.52 2.28 8.75 2.94 0.27 1.34 13.21 3.36
7 5.16 249.40 131.10 70.44 1.99 9.22 4.97 -0.95 1.22 13.79 2.99
8 6.13 231.36 121.31 67.93 1.19 7.68 2.79 2.20 1.29 11.22 3.13
9 5.11 229.91 113.61 67.80 1.77 10.71 1.67 -0.80 1.03 6.67 2.77
10 5.54 242.85 139.13 70.78 1.95 5.96 -0.15 0.10 1.19 3.42 2.92
11 5.65 254.74 136.74 71.41 2.09 3.87 0.27 0.77 1.14 2.80 2.61
12 7.10 260.22 145.51 69.74 1.21 4.30 0.47 -0.61 1.14 1.01 2.64
13 4.59 218.32 102.04 66.28 2.36 9.44 5.25 2.30 1.06 11.48 3.04
14 5.18 235.52 117.24 69.32 1.69 12.57 0.52 -0.20 0.98 5.92 2.89
15 5.52 229.00 109.95 67.75 1.66 11.32 0.70 0.02 0.93 8.16 2.87
16 6.38 235.44 124.95 66.76 1.33 5.28 -0.25 0.04 1.05 10.14 2.73
17 4.97 223.51 107.19 66.69 1.86 16.73 3.31 2.51 1.13 11.07 3.05
18 5.96 239.84 118.68 68.22 2.27 7.69 0.72 2.37 1.19 8.14 2.94
19 5.62 242.57 127.65 70.94 2.04 11.29 1.76 2.18 1.00 3.10 2.73
20 6.08 242.03 126.54 67.43 1.53 6.02 1.31 2.85 1.20 4.55 2.85
21 5.15 205.82 97.75 66.08 1.82 12.07 4.79 -0.12 1.13 10.31 3.17
22 4.80 231.09 123.19 68.38 1.34 12.06 6.07 1.35 1.16 6.73 2.84
23 5.77 228.22 119.74 66.81 2.29 10.93 3.79 1.35 1.09 7.54 2.78
24 6.11 226.18 116.53 65.55 1.15 8.39 -0.11 0.17 1.15 8.08 2.71
25 4.88 221.24 109.38 66.30 2.33 7.86 2.12 1.74 1.03 7.18 3.04
26 4.50 230.50 117.28 68.51 2.34 11.90 3.37 2.53 1.06 8.20 3.09
27 5.67 224.00 118.23 68.17 1.72 3.81 0.26 2.81 1.07 6.20 2.81
28 6.05 228.27 126.40 66.83 1.79 8.04 0.59 2.90 1.07 7.29 3.03
29 6.02 238.32 121.93 69.06 0.85 5.96 1.76 -0.40 1.07 8.50 2.91
30 5.80 270.85 149.26 72.90 1.19 3.81 3.23 0.31 1.35 1.01 2.85
31 6.33 260.63 142.54 71.95 1.44 5.32 0.66 0.43 1.08 4.10 2.61
32 6.58 259.38 136.63 69.36 0.95 2.16 0.51 1.09 1.33 9.22 2.81
33 5.73 241.71 121.58 68.98 1.80 14.65 0.88 -0.08 0.97 8.98 2.71
34 5.31 245.73 137.35 72.15 1.56 10.53 0.77 0.05 1.25 3.94 2.83
35 6.01 249.57 125.96 70.28 2.47 20.99 -0.62 0.75 0.94 7.60 2.64
36 6.69 235.47 128.86 69.19 1.57 9.03 -1.20 1.87 1.20 0.55 2.82
37 6.41 237.50 120.96 69.28 1.93 6.02 0.35 -0.29 1.07 6.18 2.59
38 5.76 252.52 144.88 72.96 1.69 17.32 -0.59 0.60 1.06 7.03 2.60
39 6.42 257.81 139.59 71.11 1.91 20.82 2.59 0.46 1.03 3.81 2.47
40 6.73 246.88 140.95 68.28 1.35 9.94 -0.69 0.37 1.11 8.54 2.78
41 7.15 247.64 126.21 68.79 2.10 9.36 1.70 0.20 1.05 9.56 2.66
42 5.68 264.96 147.50 74.21 1.86 17.43 -0.02 0.32 1.20 4.06 2.76
43 6.89 278.74 149.82 71.43 1.95 11.24 1.93 -0.20 1.09 5.51 2.47
44 5.94 251.23 140.19 69.49 1.84 8.33 0.31 0.74 1.18 6.89 2.82
45 4.25 229.52 109.51 66.62 1.66 13.74 1.26 -0.55 1.13 10.03 2.99
46 5.06 251.64 131.10 73.23 1.57 8.45 1.72 0.14 1.17 0.88 2.73
47 4.85 245.05 121.89 70.84 2.21 4.09 0.93 -0.11 1.01 3.42 2.75
48 5.74 247.27 130.80 71.38 1.60 7.34 2.30 0.42 1.12 0.92 3.00

198
49 6.20 230.72 119.30 72.16 1.91 5.18 1.58 -0.37 0.99 13.38 2.79
50 4.43 235.02 123.55 72.16 1.50 7.05 0.47 0.23 1.17 4.44 3.04
51 7.07 247.27 131.61 72.73 2.12 3.27 3.71 0.72 1.08 3.09 2.48
52 6.50 232.30 127.70 69.49 2.09 7.76 1.89 -0.48 1.26 6.03 2.94
53 6.28 206.47 109.12 68.88 1.57 9.87 7.34 1.83 1.13 14.72 3.12
54 5.77 248.75 133.86 70.49 2.98 -0.17 3.48 1.03 1.32 17.63 3.11
55 5.46 248.12 126.35 69.89 2.00 3.18 0.41 0.96 0.99 9.07 2.57
56 6.38 241.93 128.37 69.39 1.58 3.55 1.56 3.80 0.94 19.98 3.03
57 4.62 228.40 108.82 66.85 1.76 15.15 0.36 0.96 1.04 9.00 2.95
58 5.55 253.88 136.21 70.59 1.10 8.23 0.20 0.59 1.05 7.92 2.96
59 6.17 258.94 136.86 66.93 2.12 7.85 2.15 0.54 1.01 3.76 2.64
60 5.94 248.88 132.83 67.71 1.71 4.89 1.76 0.17 1.06 1.78 2.63
61 5.04 224.16 111.80 69.53 2.07 18.92 1.69 0.67 1.08 4.02 3.07
62 3.96 230.65 125.73 73.28 1.67 9.04 1.61 0.25 1.07 2.99 3.42
63 4.77 223.65 116.02 70.91 2.19 11.61 3.69 0.51 1.05 4.06 3.06
64 5.13 230.74 120.38 68.33 1.77 12.98 1.44 1.02 1.16 7.73 3.05
65 5.80 228.70 114.43 70.32 1.98 6.58 0.35 0.54 0.95 8.44 2.86
66 3.24 228.56 124.64 74.38 2.64 8.86 2.21 0.53 1.00 0.88 3.46
67 6.19 244.65 133.78 72.40 1.99 9.90 2.33 0.63 1.07 -0.73 2.55
68 6.09 232.80 130.64 71.80 1.50 5.30 -1.35 0.52 1.09 10.54 2.93
69 5.47 240.38 126.47 69.68 0.89 13.40 5.11 -0.04 1.20 3.17 2.89
70 2.49 216.41 118.49 77.02 2.40 14.89 4.84 3.44 0.76 3.80 3.87
71 5.57 253.27 140.24 71.87 1.87 9.34 -0.11 0.40 1.12 3.23 2.64
72 5.90 233.46 122.17 68.20 1.29 7.46 7.21 1.30 0.99 2.78 2.78
73 4.89 213.84 101.09 65.08 1.66 13.70 3.74 -0.19 1.13 9.07 3.03
74 5.20 231.37 118.33 67.85 2.23 10.93 1.24 6.24 1.09 8.91 2.73
75 5.29 240.22 112.43 68.91 2.00 4.90 1.28 0.77 1.01 3.98 2.52
76 4.85 230.99 121.51 67.45 1.38 9.55 3.33 -0.39 1.04 3.38 2.69
77 4.45 229.47 114.20 67.79 1.74 12.42 2.33 1.19 0.94 4.50 2.97
78 3.57 249.33 131.60 69.04 1.47 8.03 2.07 0.09 0.99 13.86 2.77
79 6.13 245.27 128.36 67.05 1.70 3.39 1.10 -0.70 1.13 15.23 2.85
80 4.87 226.68 106.63 66.36 1.35 19.72 5.22 0.13 0.98 10.77 3.26
81 5.71 242.24 138.16 69.40 1.48 15.50 2.19 0.20 1.17 16.04 2.69
82 4.88 236.41 130.65 68.13 2.31 8.41 2.83 0.73 1.02 6.21 2.88
83 5.36 224.03 130.05 65.97 1.55 5.78 0.30 0.39 1.03 13.91 2.92
84 5.94 226.05 117.37 68.77 1.87 12.15 8.05 1.53 1.04 8.36 2.87
85 6.31 251.91 154.50 74.65 1.00 1.33 3.51 0.59 1.35 2.90 2.67
86 5.61 255.67 147.66 71.05 1.48 4.97 5.41 -1.02 1.11 3.98 2.35
87 2.29 199.64 111.01 74.78 0.76 3.15 2.59 1.25 0.96 13.53 3.61
88 4.79 226.09 106.98 67.68 2.05 7.36 0.51 1.06 1.04 14.75 3.31
89 5.56 262.62 135.21 73.15 2.05 4.06 -0.47 0.89 1.12 8.05 2.91
90 5.92 247.04 131.47 73.33 1.83 0.32 3.23 1.44 1.03 7.60 2.87
91 6.22 245.30 127.72 72.01 1.48 9.85 -0.02 -0.34 1.08 10.13 3.24
92 5.38 239.84 114.82 69.62 1.76 6.12 6.56 2.08 1.02 12.95 3.22
93 5.70 257.92 133.34 73.86 1.59 10.60 2.39 0.57 1.22 8.76 3.17
94 6.23 247.17 127.23 72.83 1.91 11.92 -0.22 0.95 1.12 7.27 2.96
95 5.98 240.38 126.36 73.17 1.24 0.17 -0.18 0.20 1.22 12.64 2.95
96 6.06 229.70 116.09 70.54 1.71 7.85 6.73 0.37 1.06 5.25 2.98
97 3.29 218.63 126.77 74.08 1.38 10.29 4.91 -0.61 1.07 2.26 3.26
98 5.48 241.69 131.94 71.37 1.52 4.99 3.35 0.55 1.10 1.15 2.84
99 6.87 234.95 124.89 70.28 1.46 5.10 4.42 -0.21 1.21 9.31 2.99
100 5.05 216.75 104.45 67.94 2.43 11.71 3.82 -1.19 0.92 11.05 3.03
101 5.00 241.69 115.35 69.25 2.16 5.32 1.73 0.74 1.06 3.95 2.59

199
102 6.08 249.72 128.09 69.35 2.00 6.72 3.10 1.18 1.04 10.67 2.69
103 5.55 228.47 114.72 69.22 1.32 5.72 -0.11 0.41 1.15 5.39 2.88
104 4.35 218.82 101.81 65.35 1.32 17.45 0.86 0.79 1.07 14.91 3.21
105 4.91 242.06 124.57 68.94 1.29 8.86 3.99 -0.04 1.24 5.66 3.04
106 4.92 234.32 125.59 69.08 1.78 6.32 3.16 0.57 1.08 4.84 2.79
107 5.27 220.73 115.92 66.44 1.43 10.58 -0.13 1.33 1.16 17.69 3.05
108 7.38 243.81 135.88 70.21 1.46 8.15 0.25 -0.30 1.08 10.93 2.54
109 6.43 270.56 154.91 74.64 2.12 16.46 2.22 -0.55 1.41 3.54 2.32
110 6.35 265.26 153.79 71.21 1.90 19.57 -0.67 -0.55 1.02 4.82 2.32
111 6.30 245.94 143.74 70.97 1.17 16.08 0.82 0.41 1.12 3.21 2.48
112 4.59 209.16 97.07 65.87 1.10 13.19 2.44 0.46 1.04 11.72 2.83
113 5.91 239.85 126.73 69.84 1.49 -0.79 3.04 -0.36 1.28 2.65 2.77
114 4.79 240.64 121.47 69.52 2.07 8.69 3.52 2.61 1.05 3.75 2.50
115 5.13 227.09 117.63 66.10 1.70 9.67 2.93 0.57 1.11 10.81 2.97
116 5.25 225.04 114.21 67.41 1.42 5.17 1.99 -1.61 1.03 9.61 3.02
117 5.49 235.08 125.67 70.08 1.09 8.06 3.34 0.47 1.44 9.00 3.25
118 4.51 223.72 118.42 69.22 2.25 -1.49 2.80 -0.30 1.06 -0.40 2.70
119 5.42 214.49 115.85 68.49 1.04 10.76 0.28 -0.43 1.08 4.32 2.97
120 6.43 233.15 113.90 71.66 2.01 10.77 2.80 -1.44 1.03 10.02 2.97
121 4.41 233.40 128.20 74.53 1.31 11.66 3.25 0.79 1.24 4.67 3.09
122 6.60 243.50 132.55 72.86 1.11 3.69 0.91 0.90 1.16 7.06 2.50
123 6.35 229.25 125.61 71.12 1.49 -1.14 -0.45 1.40 1.18 13.76 2.68
124 3.78 227.02 107.80 64.74 1.63 18.64 2.40 0.89 1.06 11.52 3.49
125 3.97 235.71 111.22 66.88 0.88 3.06 0.35 -1.57 0.95 3.81 2.86
126 4.91 231.93 122.57 65.94 1.48 4.79 0.36 -0.14 1.11 5.59 3.19
127 4.97 229.68 112.74 67.72 1.95 13.74 5.66 0.66 1.09 4.25 2.96
128 5.50 252.15 135.26 71.30 1.34 14.34 0.32 0.92 0.93 12.21 2.74
129 5.40 245.82 125.56 67.94 2.13 12.94 0.10 -0.16 1.02 2.20 2.53
130 6.39 234.50 125.35 67.26 0.61 6.50 0.80 1.25 1.15 17.65 2.89
131 4.42 243.92 122.60 66.74 1.46 10.24 1.35 0.24 1.07 23.79 3.41
132 4.92 219.43 112.23 67.05 2.25 7.14 -0.62 3.21 1.10 15.61 3.33
133 4.89 254.80 121.75 67.95 2.38 6.05 2.40 0.34 1.10 8.16 2.58
134 4.29 231.29 120.40 67.16 1.46 15.68 -0.45 0.22 1.00 12.67 2.99
135 3.54 238.01 112.44 66.18 2.47 16.09 1.11 0.74 0.97 14.90 3.45
SE 1.00 15.05 11.58 2.02 1.07 11.58 5.11 3.36 0.17 8.34 0.30

200
Appendix 4. Grain yield and agronomic performance of 130 hybrids and five checks at 13
locations in South Africa and Zimbabwe during 2017/2018 and 2018/2019 cropping seasons
Entry GY DA ASI PHT EHT RL SL HC EPP ER EASP
1 5.64 69.42 0.83 221.96 105.60 7.70 5.87 1.20 1.10 10.99 2.88
2 5.93 73.77 1.11 241.15 129.07 5.45 4.42 1.18 1.13 11.78 2.87
3 5.51 73.63 1.11 234.08 120.80 7.10 4.34 2.91 1.01 11.54 3.03
4 6.35 72.16 0.95 223.96 117.80 7.03 5.23 0.68 1.18 16.05 2.95
5 5.99 69.63 1.33 214.11 103.11 8.21 3.75 0.60 1.07 12.50 2.88
6 5.70 74.10 1.75 232.40 124.11 5.50 11.54 0.77 1.21 10.75 3.13
7 5.79 73.27 1.52 233.58 123.63 9.04 9.65 0.27 1.14 16.89 2.91
8 7.24 70.80 0.88 220.55 116.11 6.66 9.49 2.04 1.25 13.54 2.90
9 5.77 71.09 1.29 219.20 109.31 7.48 6.41 0.28 0.99 13.26 2.79
10 5.23 73.98 1.73 228.51 131.76 2.67 7.48 0.84 1.09 9.03 2.82
11 6.00 75.04 1.80 241.26 134.09 4.77 6.46 1.25 1.08 9.67 2.68
12 7.51 73.82 1.00 247.59 141.11 4.64 3.56 0.55 1.12 5.26 2.65
13 5.08 68.82 1.58 208.48 100.89 7.55 11.69 2.30 1.01 14.78 2.92
14 6.14 72.37 1.25 230.36 114.40 8.45 7.29 0.57 0.99 9.44 2.76
15 6.64 71.65 1.20 219.28 107.59 8.36 7.49 0.92 0.90 9.07 2.70
16 7.36 70.07 1.15 226.45 120.73 5.56 5.12 0.83 1.01 12.92 2.66
17 5.49 69.01 1.42 214.14 105.49 16.36 8.67 2.38 1.06 17.57 2.82
18 6.26 71.44 1.58 233.43 122.20 8.11 12.28 2.38 1.11 15.27 2.84
19 6.12 73.50 1.38 231.65 123.76 8.93 11.30 2.15 0.95 14.66 2.74
20 6.91 70.50 1.09 226.52 121.83 5.00 2.68 2.55 1.16 10.98 2.78
21 6.12 69.38 1.36 199.59 94.47 9.55 13.80 0.73 1.09 19.24 3.02
22 5.69 72.48 1.15 223.06 123.10 8.09 14.49 1.57 1.15 13.34 2.78
23 7.27 71.39 1.62 221.18 119.56 7.72 11.86 1.55 1.07 16.34 2.81
24 6.76 69.73 0.77 220.21 117.36 9.06 3.23 0.96 1.09 15.49 2.81
25 5.45 69.49 1.98 211.91 107.12 9.00 5.02 1.94 0.98 12.80 2.94
26 5.27 71.40 2.01 221.68 118.44 8.74 9.89 2.29 1.06 15.32 2.87
27 6.19 72.23 1.17 221.59 120.67 3.67 4.55 2.45 1.01 16.27 2.79
28 7.45 69.97 1.25 217.71 122.60 5.75 0.89 2.52 1.11 14.23 2.85
29 6.36 71.37 0.69 228.41 117.44 5.03 3.63 0.65 1.03 13.52 2.88
30 5.59 76.06 1.06 252.84 139.50 3.25 3.51 0.96 1.21 10.36 2.90
31 6.89 74.96 1.50 246.87 137.75 5.73 2.83 1.06 1.03 12.78 2.76
32 6.66 73.59 0.94 241.22 129.49 2.69 4.13 1.54 1.23 20.30 2.75
33 6.59 72.39 1.26 231.99 119.96 11.20 2.22 0.93 0.99 15.18 2.71
34 5.40 75.52 1.60 234.22 130.99 9.69 4.12 0.90 1.14 8.73 2.86
35 6.57 74.33 2.06 239.53 128.90 17.25 5.83 1.34 0.94 13.17 2.77
36 6.92 72.65 1.23 225.61 127.75 8.30 4.08 1.90 1.11 7.93 2.81
37 7.22 73.08 1.24 231.37 120.93 5.73 4.87 0.62 1.05 12.17 2.76
38 5.88 75.55 1.53 239.41 137.69 15.04 7.21 1.14 1.06 12.66 2.66
39 6.62 75.40 1.69 244.44 139.30 20.79 8.39 1.03 0.97 7.79 2.60
40 7.00 72.66 1.11 232.85 134.49 10.96 3.73 1.07 1.08 12.46 2.75
41 8.61 73.02 1.27 239.55 124.66 8.98 7.06 1.03 1.09 14.08 2.63
42 6.01 77.86 1.46 249.59 144.40 16.84 6.11 0.90 1.13 10.17 2.76
43 7.10 75.88 1.70 262.83 150.24 15.38 8.39 0.62 1.05 10.48 2.63
44 6.58 73.90 1.33 240.68 136.04 7.76 5.17 1.21 1.13 9.04 2.64
45 5.20 69.46 1.04 218.23 106.20 10.22 6.33 0.54 1.07 16.69 2.81
46 5.23 76.22 1.32 243.59 130.30 6.87 7.85 0.82 1.06 8.42 2.87
47 5.63 74.50 1.47 233.85 122.28 4.05 1.84 0.77 1.00 9.68 2.80
48 6.47 74.75 1.37 237.91 129.28 4.82 3.78 1.16 1.07 5.85 2.90
49 7.02 74.76 1.60 225.34 117.83 3.18 3.40 0.68 1.05 20.21 2.86
50 5.07 75.86 0.98 227.12 121.17 3.19 3.90 0.82 1.14 11.54 3.05
51 6.88 75.96 1.51 235.07 130.47 1.97 9.69 1.18 1.07 6.88 2.58

201
52 7.49 73.87 1.49 222.65 124.43 4.81 7.37 0.52 1.20 10.86 2.84
53 6.50 71.21 1.22 203.24 106.17 10.99 8.92 2.04 1.05 26.26 3.09
54 6.61 73.42 2.17 232.67 124.66 1.34 5.81 1.58 1.27 19.36 3.04
55 6.20 73.39 1.46 235.45 126.14 2.75 2.27 1.40 1.00 14.55 2.56
56 7.45 72.47 1.11 230.56 124.20 5.13 3.11 3.19 0.99 27.19 2.83
57 5.68 70.11 1.48 223.58 109.45 13.65 3.42 1.43 1.02 16.03 3.05
58 5.91 73.86 0.96 243.80 130.93 7.04 6.03 1.21 1.01 10.41 2.98
59 7.11 71.68 1.29 251.35 139.51 6.36 7.17 1.10 0.98 6.68 2.60
60 6.28 72.00 1.39 237.40 128.30 4.22 5.21 0.79 1.03 7.90 2.61
61 5.83 72.72 1.58 218.66 111.97 12.89 6.86 1.26 1.08 12.94 3.04
62 4.28 76.73 1.29 215.17 118.95 9.14 6.77 1.02 1.03 12.06 3.39
63 4.63 74.84 1.80 218.13 117.29 9.47 6.91 1.03 0.99 17.62 3.16
64 5.97 72.42 1.37 222.19 119.87 8.81 8.37 1.36 1.11 11.78 2.88
65 6.75 73.31 1.58 218.71 112.47 3.36 4.09 1.18 0.97 15.74 2.82
66 4.21 77.20 1.96 217.14 121.10 6.16 8.86 1.14 0.94 7.46 3.39
67 6.31 75.37 1.46 231.13 131.69 7.13 8.46 1.17 1.01 6.68 2.73
68 6.74 74.72 1.21 221.61 123.96 5.42 1.32 1.06 1.02 11.82 2.83
69 6.31 72.19 0.61 230.98 123.48 12.32 11.85 0.87 1.17 9.64 2.70
70 2.31 79.68 2.25 201.79 111.21 12.00 9.24 3.01 0.71 3.80 3.78
71 6.28 74.66 1.52 240.60 137.77 10.97 7.94 1.01 1.09 6.33 2.54
72 6.78 71.81 0.85 222.74 119.62 7.70 10.75 1.57 1.02 10.94 2.74
73 5.70 67.94 1.48 203.36 96.67 11.95 4.66 0.77 1.09 13.80 2.87
74 5.95 71.27 1.70 225.37 113.58 7.30 9.21 4.69 1.05 11.63 2.71
75 6.16 72.71 1.76 227.40 111.72 5.30 6.35 1.35 1.01 9.39 2.64
76 5.75 70.74 0.94 220.60 117.98 5.96 7.63 0.53 1.03 8.34 2.68
77 5.65 69.91 1.22 218.97 110.31 11.10 8.00 1.58 0.95 6.30 2.80
78 4.48 72.61 0.97 240.40 134.82 6.94 3.62 0.76 1.00 15.85 2.67
79 7.18 70.72 1.21 231.13 125.67 8.83 2.13 0.33 1.12 18.62 2.72
80 5.88 69.42 1.21 218.85 110.08 16.65 8.24 1.01 0.98 13.40 3.00
81 5.91 72.90 1.15 231.67 138.10 12.37 10.18 0.84 1.15 16.68 2.63
82 5.53 71.89 1.67 228.28 129.43 9.60 5.17 1.20 0.97 13.51 2.84
83 6.45 69.56 1.09 219.56 129.23 8.16 0.77 1.18 0.96 22.96 2.79
84 7.07 72.81 1.63 220.62 117.49 9.38 10.08 1.74 1.03 8.11 2.71
85 6.49 77.23 0.97 238.89 146.96 3.12 6.88 1.11 1.19 7.35 2.58
86 6.54 74.98 1.13 242.97 140.28 4.42 9.69 0.18 1.10 10.75 2.41
87 2.94 77.51 0.91 186.37 107.17 3.50 3.06 1.59 0.94 15.73 3.45
88 5.38 70.86 1.29 218.06 102.43 5.08 5.93 1.45 1.04 19.29 3.03
89 5.56 75.98 1.73 242.17 125.02 3.31 6.11 1.42 1.11 9.86 2.70
90 6.09 76.78 1.75 237.41 128.66 4.79 8.24 1.71 1.02 9.41 2.85
91 6.69 75.47 1.26 231.57 119.42 8.70 -0.11 0.58 1.04 16.23 2.98
92 5.63 73.02 1.36 229.39 111.84 6.67 6.07 2.06 0.98 17.44 3.07
93 5.85 77.52 1.23 244.99 129.97 10.48 4.23 1.09 1.14 12.24 2.95
94 6.59 76.90 1.42 238.43 126.94 6.62 0.62 1.29 1.08 8.60 2.85
95 6.70 76.85 1.06 228.58 122.29 3.22 3.31 0.85 1.15 18.58 2.96
96 6.64 73.80 1.46 222.64 117.85 8.11 8.06 1.02 1.05 10.05 2.89
97 3.90 77.98 1.11 210.58 121.78 7.01 14.18 0.45 1.01 8.08 3.21
98 6.15 74.52 1.24 231.98 129.12 5.27 6.04 1.04 1.06 4.28 2.67
99 7.42 72.90 1.68 222.14 120.96 5.96 7.15 0.65 1.14 10.99 2.93
100 6.07 70.82 1.96 208.56 99.94 9.04 9.21 0.00 0.93 13.48 2.70
101 5.33 73.62 1.67 231.33 115.43 4.53 7.10 1.21 0.99 9.20 2.63
102 6.63 73.04 1.41 237.64 124.98 7.33 8.30 1.44 1.01 10.88 2.55
103 6.49 73.18 1.39 216.41 113.06 9.55 0.91 1.01 1.10 9.34 2.85
104 5.19 68.31 0.91 207.40 96.92 10.71 4.50 1.36 1.04 18.54 3.09
105 5.42 72.11 1.02 229.08 117.42 6.73 6.98 0.84 1.12 11.82 3.01
106 5.70 71.23 1.26 225.34 119.47 2.78 6.17 1.12 1.05 12.04 2.88
107 5.93 68.81 1.15 211.90 111.93 10.34 1.07 1.66 1.09 19.98 2.91

202
108 7.95 73.99 0.99 233.50 132.83 7.69 1.72 0.71 1.06 18.13 2.68
109 6.17 77.62 1.86 255.13 151.23 11.89 10.99 0.42 1.21 8.39 2.49
110 6.47 75.74 2.23 252.93 152.96 15.41 6.31 0.43 0.95 11.93 2.59
111 6.55 75.03 0.96 233.21 139.88 10.49 4.05 1.18 1.05 8.51 2.58
112 5.70 68.25 0.66 200.59 91.93 11.38 8.33 1.20 1.02 15.23 2.76
113 6.31 72.19 1.35 230.83 122.57 4.94 6.24 0.43 1.15 6.05 2.69
114 5.69 72.59 1.51 231.89 117.53 7.74 6.45 2.47 1.01 14.10 2.54
115 6.41 70.07 1.13 216.11 114.35 7.65 6.88 1.11 1.07 11.21 2.75
116 6.39 70.95 1.09 213.03 104.91 6.48 6.24 -0.18 1.02 14.63 2.93
117 5.75 73.28 1.00 221.14 118.69 5.60 6.34 0.96 1.33 11.43 3.05
118 5.64 73.17 1.68 219.75 116.73 1.58 7.07 0.62 1.03 2.26 2.67
119 6.26 72.35 1.02 207.52 113.68 11.76 3.95 0.55 1.11 12.95 2.90
120 7.37 74.36 1.71 225.18 114.38 9.25 4.89 0.01 1.01 9.87 2.88
121 4.45 76.85 1.01 219.72 121.13 7.85 9.17 1.30 1.16 9.94 3.03
122 6.62 76.53 0.84 233.63 131.82 1.63 7.22 1.30 1.11 15.92 2.46
123 7.03 74.70 1.04 217.64 122.00 -0.28 3.76 1.63 1.12 14.31 2.62
124 4.77 67.26 1.19 214.42 103.99 13.10 1.68 1.54 1.01 17.41 3.17
125 5.05 69.14 0.67 225.14 111.72 3.38 3.48 0.01 0.95 12.04 2.83
126 5.12 68.72 1.20 217.46 112.33 4.31 0.41 0.92 1.03 14.57 3.00
127 5.65 70.14 1.45 219.13 107.65 9.69 6.15 1.30 1.06 8.86 2.89
128 6.03 73.86 1.33 237.59 129.83 9.39 12.16 1.55 0.95 12.74 2.62
129 6.17 71.55 1.73 233.79 124.78 10.78 4.01 0.78 1.00 7.95 2.61
130 7.05 70.26 0.42 226.83 122.46 4.96 5.14 1.56 1.07 18.46 2.65
131 5.65 69.47 1.09 226.53 112.45 9.05 6.63 0.93 1.07 29.79 3.17
132 5.56 69.81 1.57 208.40 105.10 6.71 1.26 2.77 1.09 14.19 3.02
133 5.83 71.73 2.29 243.16 121.16 5.60 2.67 0.99 1.06 10.26 2.42
134 5.29 70.22 1.08 222.51 114.79 10.90 0.25 0.98 0.97 18.81 2.97
135 4.71 68.65 1.63 226.09 112.78 12.38 0.63 1.40 0.95 22.07 3.35
SE 1.03 1.85 1.14 13.06 10.11 9.68 6.89 2.44 0.22 12.32 0.32

203
Appendix 5. Grain yield of 130 hybrids and five checks at 13 locations in South Africa and
Zimbabwe during 2017/2018 and 2018/2019 cropping seasons
Entry Site1 Site2 Site3 Site4 Site5 Site6 Site7 Site8 Site9 Site10 Site11 Site12 Site13
1 6.80 4.34 1.64 3.10 4.84 8.39 4.37 5.82 10.40 8.73 3.96 6.79 6.01
2 7.61 5.53 1.94 3.40 6.29 7.68 4.80 4.38 8.22 12.77 2.11 6.13 7.01
3 7.85 4.62 2.36 3.22 4.46 6.76 3.84 7.21 7.71 8.38 3.69 8.05 5.77
4 7.79 5.66 1.12 3.19 6.92 10.77 5.27 4.75 10.40 10.23 3.70 2.92 7.17
5 7.31 5.39 1.45 3.60 5.90 7.37 4.09 6.53 7.07 9.57 4.34 6.61 6.27
6 8.41 5.47 1.98 3.74 5.15 9.72 3.48 4.17 7.49 9.25 1.75 6.95 5.99
7 7.88 5.91 1.39 3.11 5.04 7.09 3.99 4.35 8.87 9.66 3.70 8.29 6.92
8 9.49 6.73 1.40 3.49 7.63 9.16 4.52 8.27 11.69 11.70 4.16 8.60 7.26
9 7.77 4.09 2.39 2.80 5.42 8.50 4.70 6.30 10.66 8.68 4.02 7.46 5.18
10 6.79 4.66 1.56 2.59 6.21 8.65 4.89 4.29 5.76 7.98 2.28 5.64 6.92
11 7.84 5.52 1.78 3.13 6.98 7.87 4.78 6.79 9.33 10.07 3.62 3.16 6.47
12 9.36 6.90 1.78 4.42 8.63 11.06 5.51 8.10 11.64 10.19 3.07 5.73 7.00
13 7.24 4.64 2.50 2.56 5.55 7.42 3.72 4.47 7.12 8.48 4.22 6.24 6.00
14 6.97 5.44 2.43 2.28 7.16 8.09 4.28 7.13 8.23 10.49 3.34 7.65 5.81
15 7.17 5.35 1.48 2.61 7.27 9.40 5.49 9.72 8.48 10.45 4.46 6.11 4.79
16 7.76 7.10 3.42 3.51 6.94 9.10 5.13 10.16 11.21 10.74 4.46 7.70 7.95
17 6.36 5.79 2.20 2.67 5.61 7.07 4.15 3.89 7.55 8.72 2.90 9.87 5.42
18 8.43 6.59 2.55 2.86 5.61 6.37 4.41 4.44 8.50 9.42 3.23 6.52 7.31
19 8.79 4.30 3.87 3.66 7.38 6.38 4.49 4.21 4.85 12.48 3.18 6.75 7.62
20 8.85 6.15 3.06 3.66 7.44 8.27 5.29 6.34 14.70 9.64 3.55 7.10 7.15
21 7.24 4.91 2.01 2.50 5.92 7.56 4.33 3.57 12.79 9.31 5.14 7.27 5.67
22 7.72 5.47 1.51 2.57 5.25 7.93 4.84 4.36 9.92 9.37 5.12 5.99 5.27
23 8.53 4.02 1.80 2.82 5.11 9.91 6.00 7.09 18.08 11.00 4.91 7.18 7.28
24 8.96 6.27 3.37 3.63 6.45 8.22 5.43 5.40 11.29 10.36 4.89 6.81 6.18
25 7.26 4.71 3.39 2.76 5.74 7.56 4.04 3.59 11.03 9.69 3.86 4.83 5.70
26 7.07 5.55 1.05 2.26 4.11 5.01 5.00 7.36 11.17 5.95 3.85 7.06 5.29
27 8.20 6.03 2.85 2.44 7.44 8.20 5.56 8.83 9.31 9.18 2.96 7.35 6.82
28 8.78 5.20 2.35 3.54 8.27 9.43 5.05 6.85 16.43 12.05 5.20 10.62 5.47
29 9.04 6.47 1.46 3.46 6.40 8.40 4.58 7.17 10.00 8.97 4.46 5.40 5.99
30 8.40 7.08 1.08 4.26 6.55 8.15 4.92 4.90 4.78 8.35 2.19 5.67 4.83
31 7.76 7.44 3.24 5.72 5.16 9.25 4.56 7.17 6.95 12.53 3.03 7.03 6.86
32 11.28 6.90 2.01 5.00 7.65 10.70 4.64 3.64 7.50 7.22 4.05 9.64 4.88
33 9.72 5.10 2.11 4.50 7.58 9.25 5.73 6.95 11.53 9.96 4.21 6.88 5.57
34 8.83 5.73 1.46 2.77 5.38 6.58 4.56 6.15 5.94 7.81 2.64 6.58 5.87
35 8.80 4.02 2.02 5.41 7.77 9.27 5.33 6.56 9.80 11.11 3.16 6.74 6.21
36 10.39 6.08 1.61 4.36 7.62 11.93 5.34 5.42 10.42 7.93 3.97 8.90 7.15
37 10.72 5.75 1.92 4.26 8.10 7.67 4.01 8.25 7.36 12.66 4.31 8.88 7.45
38 8.34 4.70 1.65 3.44 6.94 8.25 4.79 5.47 6.85 10.35 1.98 4.08 6.12
39 9.31 4.80 2.16 5.56 8.19 9.28 5.43 7.04 6.27 7.97 3.80 8.75 7.40
40 9.53 6.51 1.90 4.34 8.09 10.06 5.11 6.57 8.32 12.55 3.54 6.79 7.79
41 11.08 5.99 2.05 4.16 6.40 11.19 5.29 7.91 15.55 13.96 3.89 8.31 8.31
42 9.80 7.05 1.39 4.27 5.94 8.68 5.22 7.29 7.07 9.83 3.11 4.75 5.36
43 10.33 6.93 1.72 5.16 5.78 10.84 5.44 7.69 7.73 7.81 1.70 10.91 8.04
44 6.51 6.95 1.92 3.96 7.60 9.50 5.31 4.23 8.47 12.39 3.23 6.71 6.72
45 6.46 4.40 2.04 2.40 4.80 4.98 4.81 4.10 9.57 9.05 4.67 5.05 5.81
46 7.17 5.63 2.44 3.57 5.72 5.90 3.76 6.49 6.79 6.75 2.20 6.41 6.19
47 6.04 4.74 2.38 2.98 6.44 5.96 4.24 5.70 7.04 9.58 2.77 8.46 5.75
48 7.15 6.06 1.44 3.49 6.23 9.03 5.15 8.31 10.09 8.84 3.17 7.01 6.33
49 9.78 5.98 1.48 3.69 6.17 8.56 5.16 4.79 12.05 11.94 4.77 7.63 7.50

204
50 6.52 5.01 1.30 2.09 4.29 8.91 3.87 6.53 6.64 8.57 2.73 5.74 4.88
51 11.11 6.19 2.38 4.53 7.92 10.47 4.51 5.39 8.47 7.95 2.81 8.05 9.33
52 10.42 6.46 2.81 4.28 6.83 9.29 5.79 6.43 10.90 12.26 5.72 11.16 6.13
53 7.76 6.09 1.95 3.25 7.20 9.94 4.06 4.35 8.92 10.52 4.04 8.55 5.90
54 7.51 6.02 2.49 3.30 5.97 9.28 4.28 6.73 11.47 10.72 3.61 6.13 6.78
55 6.79 5.32 1.93 4.54 5.84 9.34 4.55 7.13 5.61 9.14 4.68 10.09 5.90
56 8.06 5.64 1.33 3.24 7.92 11.23 5.02 5.32 16.56 10.69 3.91 10.75 7.80
57 7.11 4.66 1.25 3.64 6.30 5.25 4.16 6.42 13.37 10.37 4.66 5.20 6.16
58 7.79 6.29 2.49 4.15 4.89 8.58 4.56 7.74 8.79 8.95 3.38 3.58 6.05
59 9.78 5.33 1.66 5.16 6.59 8.88 5.23 6.21 8.13 11.54 5.43 12.05 5.85
60 8.74 7.21 2.15 4.27 4.88 7.36 4.46 2.95 9.03 8.94 4.95 8.97 6.87
61 7.07 4.87 1.84 3.33 5.90 8.28 3.65 6.49 9.43 7.92 4.52 5.66 6.06
62 6.11 3.84 1.37 2.38 3.26 7.03 3.64 6.58 3.82 9.32 0.98 4.43 4.87
63 5.68 4.18 1.41 2.63 5.12 9.89 4.02 3.47 7.34 5.73 3.03 3.57 5.27
64 7.21 5.87 2.05 3.68 5.96 9.03 4.08 4.39 9.46 10.85 3.44 5.34 5.44
65 8.80 4.82 1.36 2.96 5.75 9.40 4.62 6.22 10.10 14.72 4.27 6.04 6.72
66 4.91 3.50 1.55 2.01 3.30 4.26 3.55 8.84 7.74 7.13 0.88 4.56 3.99
67 10.19 5.18 1.86 4.17 6.37 8.80 4.59 3.94 10.80 9.53 2.66 4.35 7.88
68 10.88 6.23 1.33 4.72 7.97 9.17 4.58 6.30 14.25 10.59 2.92 6.73 6.34
69 6.48 5.39 1.21 3.24 6.20 10.46 4.80 4.27 10.15 11.28 5.61 7.46 5.90
70 11.18 1.36 1.12 0.48 1.50 2.83 1.06 1.59 2.24 5.99 0.49 0.43 1.75
71 7.19 5.87 1.47 3.64 5.07 7.50 4.83 7.36 5.93 8.22 5.21 11.02 5.67
72 6.76 5.76 2.57 3.37 7.29 8.59 5.11 5.83 7.54 8.98 4.43 11.43 7.05
73 5.78 3.88 0.96 2.38 5.79 8.38 4.58 5.31 10.84 8.39 4.09 5.98 6.54
74 7.82 5.17 1.99 2.75 5.86 7.11 4.17 6.92 10.36 7.62 3.29 7.56 5.55
75 8.85 3.93 1.73 2.95 7.06 6.96 4.28 8.44 7.05 10.71 5.50 5.17 6.84
76 8.06 4.90 1.83 2.97 6.13 4.97 4.53 5.76 5.66 10.54 3.92 7.34 5.65
77 5.73 4.54 1.35 3.11 4.90 5.17 4.68 4.97 8.89 10.40 5.38 9.72 4.41
78 4.99 5.04 1.75 3.30 4.35 4.22 3.78 3.82 5.86 6.86 4.13 9.05 4.14
79 10.17 7.03 2.20 3.74 7.33 8.64 5.03 6.98 11.19 9.40 4.77 9.49 7.54
80 6.78 4.20 1.21 2.79 4.96 7.92 3.85 4.23 10.37 10.28 3.87 6.97 5.86
81 8.89 5.77 1.00 3.65 7.19 7.79 4.55 5.53 5.83 9.70 4.29 7.39 5.46
82 7.71 5.33 2.30 3.47 5.24 6.53 5.13 2.95 10.20 10.28 3.50 4.89 6.89
83 7.12 5.48 1.28 3.03 5.96 6.39 5.13 6.34 9.90 9.07 5.06 9.41 8.22
84 9.51 5.18 2.70 3.34 7.70 7.65 5.62 4.42 10.98 13.02 4.48 11.24 5.64
85 8.02 6.71 2.82 3.42 6.54 7.99 5.52 5.42 8.55 9.01 2.74 9.50 7.49
86 8.05 6.47 2.43 3.63 7.30 5.97 5.20 3.57 9.24 11.58 5.24 11.34 7.16
87 3.50 2.77 1.14 1.23 3.05 3.45 3.22 2.08 7.92 5.09 2.43 4.01 3.73
88 7.09 4.82 1.85 3.57 5.85 8.37 4.00 6.46 7.62 8.07 3.77 6.37 5.27
89 8.01 6.37 2.40 3.11 6.56 8.26 5.57 6.91 6.55 9.85 2.77 3.69 4.74
90 9.31 4.84 2.57 4.05 6.91 9.00 5.33 5.42 6.57 9.19 2.58 5.21 6.15
91 9.03 6.11 1.34 3.55 7.15 10.37 5.50 5.65 9.70 8.67 4.82 6.49 5.13
92 7.31 4.78 4.92 3.41 5.30 8.26 4.17 5.07 9.81 8.64 3.73 4.30 5.25
93 8.29 5.44 1.93 3.93 5.72 9.21 4.90 7.47 9.14 8.22 2.98 3.82 6.31
94 7.65 6.35 2.40 3.83 6.44 10.73 4.46 5.56 10.13 9.31 2.67 6.36 6.25
95 7.92 5.96 1.33 3.29 6.75 9.45 5.26 4.77 15.21 11.05 3.40 7.47 5.82
96 7.84 5.22 1.06 3.50 7.10 9.81 4.95 4.73 12.32 10.09 2.36 9.08 7.31
97 5.86 3.68 0.72 2.24 3.44 2.48 4.30 7.59 5.18 6.10 0.88 3.15 4.28
98 7.96 4.93 2.06 4.40 6.74 7.00 5.14 7.49 8.04 10.34 3.84 6.94 7.16
99 8.65 6.45 1.48 3.65 8.55 11.86 5.64 9.15 12.75 8.88 4.28 6.51 7.17
100 7.23 4.22 1.69 2.91 5.77 6.67 4.13 9.30 10.28 9.19 3.49 7.83 6.49
101 8.57 5.66 1.25 3.69 4.35 8.26 4.78 5.76 6.26 7.02 3.30 7.26 4.21
102 8.52 5.12 1.93 4.33 6.57 10.18 5.42 3.74 8.75 10.79 3.08 8.92 6.95

205
103 6.30 5.98 2.37 3.01 6.92 8.28 4.15 5.48 9.97 12.70 4.42 7.33 7.07
104 7.32 4.11 1.19 3.05 4.95 8.45 4.53 4.90 9.68 9.74 3.59 6.70 4.88
105 7.24 4.64 2.27 2.84 4.66 9.29 4.38 6.16 7.96 8.47 3.03 6.77 5.68
106 7.01 5.54 1.56 3.21 3.62 5.57 4.42 6.26 5.99 9.23 3.33 5.73 5.72
107 6.69 5.87 1.77 2.76 5.28 8.71 4.94 5.19 9.66 10.93 3.22 8.01 5.56
108 11.79 5.79 2.47 4.83 8.10 11.47 6.12 7.44 9.86 14.77 4.49 6.91 7.03
109 9.16 7.06 4.01 4.08 4.44 9.67 4.97 6.07 7.58 7.30 1.50 5.67 8.38
110 10.12 6.78 2.83 4.18 7.99 7.58 4.13 9.06 8.61 10.46 1.44 5.44 7.70
111 8.85 7.24 1.48 4.47 7.74 7.08 4.39 8.29 8.40 8.44 3.14 7.79 7.74
112 6.22 5.26 2.46 2.37 4.82 5.87 3.94 5.21 8.56 9.52 6.28 8.63 4.83
113 8.75 6.97 1.34 4.44 4.67 10.14 5.13 5.12 8.36 9.34 3.02 8.05 6.05
114 7.52 4.88 1.60 3.36 4.73 4.95 4.38 8.52 11.29 9.58 4.43 5.98 5.14
115 8.03 4.38 2.18 3.15 6.05 6.25 4.18 8.63 11.17 10.05 4.95 8.89 7.20
116 8.67 5.02 2.32 3.36 4.99 8.49 3.87 7.64 8.02 10.43 4.33 10.28 5.42
117 7.49 5.19 2.74 2.32 5.71 7.83 3.93 6.73 7.11 8.74 3.76 6.05 6.39
118 6.13 5.17 0.94 3.94 4.11 4.24 4.63 9.63 8.93 11.23 2.78 7.16 6.10
119 7.76 5.92 1.14 3.57 5.26 8.85 3.68 7.26 9.35 9.44 4.86 8.49 6.95
120 10.27 5.58 1.56 3.94 6.63 11.40 4.69 6.49 11.78 12.94 4.57 7.79 7.80
121 5.66 4.26 1.70 2.60 3.63 7.79 3.50 3.22 4.53 7.69 1.85 4.33 5.78
122 9.46 6.76 2.65 4.41 8.32 9.84 4.46 9.09 5.22 9.55 4.29 4.70 7.68
123 9.27 5.54 1.75 3.45 7.64 9.37 5.20 4.64 11.53 10.13 4.26 7.87 6.57
124 4.21 3.69 3.20 2.14 3.80 4.01 3.81 7.56 7.57 9.43 3.67 5.73 4.83
125 5.53 3.45 3.53 1.92 4.60 6.07 4.15 5.43 13.63 10.35 3.88 3.52 4.91
126 6.85 5.01 1.48 2.26 5.20 7.78 4.74 3.01 8.09 7.97 3.22 4.52 5.79
127 7.25 5.03 2.31 2.71 7.62 6.61 4.76 3.78 10.16 8.61 4.07 6.29 5.39
128 8.61 4.56 2.60 4.71 5.35 6.92 4.26 5.19 8.22 10.14 3.46 6.81 7.21
129 9.43 5.98 1.82 4.68 8.03 4.73 4.92 5.80 9.72 11.29 4.25 3.51 5.32
130 8.99 6.41 2.51 3.96 6.87 9.88 4.62 5.34 9.70 10.99 5.69 7.99 7.49
131 5.68 4.92 2.08 2.70 3.19 6.97 4.71 8.28 10.81 11.42 4.09 3.54 5.62
132 5.74 4.10 2.89 2.85 6.35 8.78 3.96 3.78 5.94 9.34 4.33 7.68 5.38
133 8.03 5.25 1.05 4.23 5.83 6.21 4.78 7.13 7.57 11.35 5.31 6.92 4.11
134 5.86 4.66 1.27 3.27 4.04 6.65 4.42 5.01 11.97 8.90 2.25 7.73 5.13
135 5.08 4.31 2.67 2.17 3.84 4.90 3.56 5.63 9.80 9.74 2.53 4.94 4.71
SE 2.58 0.81 0.88 0.50 0.93 1.62 0.65 0.89 1.71 1.26 0.56 1.28 1.11

206
Appendix 6. Biochemical analysis of 130 hybrids and five checks obtained from self-pollinated
seed samples at Cedara during 2017/2018 and 2018/2019 cropping seasons
ENTRY Tryptophan Moisture Protein Oil Fibre Starch
1 0.069 13.79 6.55 6.16 2.94 63.51
2 0.080 13.32 6.94 5.01 2.55 65.82
3 0.055 13.23 6.87 5.22 2.43 65.88
4 0.045 13.45 6.97 4.57 2.43 66.62
5 0.072 13.38 7.64 4.83 2.59 65.40
6 0.083 13.49 6.74 4.58 2.42 66.68
7 0.047 12.90 7.04 4.33 2.47 67.65
8 0.035 12.40 7.92 4.84 2.37 65.98
9 0.071 13.83 6.94 5.98 2.76 63.74
10 0.064 14.58 6.27 4.48 2.48 66.47
11 0.045 13.30 7.31 5.63 2.58 65.22
12 0.055 14.27 6.91 6.03 2.56 64.70
13 0.048 14.02 7.03 5.40 2.77 63.92
14 0.068 13.53 6.75 5.66 2.55 64.72
15 0.050 14.21 7.54 4.93 2.55 65.47
16 0.054 13.20 8.16 4.57 2.37 64.65
17 0.063 12.80 6.17 5.41 2.59 66.67
18 0.072 13.34 6.47 4.38 2.42 67.53
19 0.040 14.22 6.83 4.07 2.51 67.42
20 0.031 12.53 7.74 4.18 2.35 65.94
21 0.074 12.52 6.24 5.07 2.56 65.99
22 0.075 12.70 6.89 5.69 2.37 65.05
23 0.057 13.28 7.19 4.95 2.45 65.54
24 0.051 12.74 7.65 4.97 2.37 65.45
25 0.065 14.72 6.15 5.04 2.82 66.03
26 0.072 14.49 7.32 4.72 2.63 64.62
27 0.049 12.73 8.20 5.28 2.57 63.98
28 0.060 14.32 7.94 4.97 2.52 64.45
29 0.081 11.97 8.16 5.54 2.69 62.94
30 0.076 13.25 7.70 6.02 2.65 64.21
31 0.058 13.07 7.87 5.27 2.59 64.26
32 0.042 13.87 7.92 5.99 2.58 63.40
33 0.077 13.60 7.20 6.15 2.46 64.39
34 0.039 12.39 7.92 5.81 2.22 64.81
35 0.040 13.31 7.38 5.87 2.28 65.37
36 0.050 11.90 8.83 5.35 2.37 64.27
37 0.088 14.35 7.02 6.19 2.79 62.90
38 0.066 13.42 6.98 6.02 2.40 65.48
39 0.042 14.06 6.94 4.45 2.33 67.07
40 0.035 13.10 7.57 5.72 2.41 64.71
41 0.071 12.82 7.44 5.76 2.63 64.94
42 0.072 14.30 7.64 5.66 2.32 65.70
43 0.049 13.85 7.61 4.93 2.40 65.90
44 0.032 12.55 7.90 5.43 2.40 64.52
45 0.085 13.39 6.79 5.55 2.77 65.51
46 0.060 13.62 6.71 6.70 2.47 64.77
47 0.039 12.35 7.52 5.12 2.43 65.70
48 0.043 13.80 7.58 6.15 2.45 64.69
49 0.087 13.84 6.94 4.51 2.66 64.95

207
50 0.075 13.59 6.64 4.74 2.55 66.35
51 0.050 12.85 6.27 4.92 2.62 67.40
52 0.040 13.28 6.56 4.60 2.44 66.74
53 0.044 13.35 6.65 4.65 2.85 64.97
54 0.056 13.96 6.34 5.93 2.42 65.96
55 0.055 12.77 7.36 5.55 2.58 64.94
56 0.038 13.66 7.81 3.87 2.42 64.98
57 0.075 12.72 7.74 4.58 2.70 62.77
58 0.076 12.06 7.69 5.49 2.45 64.26
59 0.051 13.92 8.26 4.72 2.59 63.74
60 0.066 14.17 7.61 5.69 2.55 63.44
61 0.077 14.12 7.67 4.92 2.81 63.75
62 0.072 13.25 5.99 5.28 2.42 67.86
63 0.055 14.25 7.66 4.56 2.36 66.10
64 0.035 13.39 6.88 4.75 2.49 66.58
65 0.077 13.34 7.30 6.44 2.55 63.12
66 0.071 14.24 6.15 5.94 2.32 65.53
67 0.051 13.61 6.92 5.19 2.52 66.00
68 0.031 13.23 7.85 5.63 2.32 64.11
69 0.079 13.45 6.33 5.69 2.49 65.10
70 0.092 14.30 6.42 5.77 2.50 64.91
71 0.049 13.11 6.56 4.87 2.37 67.30
72 0.061 13.40 7.95 4.64 2.33 65.45
73 0.061 13.44 7.38 5.05 2.45 65.22
74 0.077 12.18 7.62 4.58 2.37 65.10
75 0.037 13.65 7.33 3.86 2.42 67.54
76 0.041 13.81 6.99 5.02 2.37 66.43
77 0.074 12.75 8.14 5.57 2.40 64.71
78 0.062 13.20 8.05 4.16 2.24 65.70
79 0.028 12.94 7.75 4.70 2.35 65.96
80 0.075 12.54 8.02 5.93 2.69 64.23
81 0.062 13.43 6.65 5.90 2.51 66.31
82 0.060 12.63 7.58 4.92 2.61 66.31
83 0.034 12.62 8.48 4.92 2.46 65.04
84 0.077 13.74 6.63 5.81 2.64 65.22
85 0.079 13.89 6.09 4.65 2.49 66.66
86 0.036 13.62 7.19 3.83 2.31 67.50
87 0.036 12.70 8.81 4.10 2.53 63.57
88 0.072 13.01 7.13 6.10 2.66 63.55
89 0.075 13.89 7.24 5.48 2.49 63.63
90 0.049 12.92 7.32 5.01 2.53 66.10
91 0.051 13.82 7.65 5.43 2.36 64.84
92 0.077 13.62 6.74 5.30 2.75 64.34
93 0.062 12.80 7.29 6.10 2.47 64.67
94 0.047 13.58 7.41 5.38 2.54 65.01
95 0.035 13.94 7.28 5.33 2.39 65.54
96 0.068 13.16 6.90 5.76 2.58 64.77
97 0.070 13.41 7.39 4.49 2.27 66.05
98 0.042 13.98 6.84 5.09 2.42 65.76
99 0.049 13.63 8.27 5.73 2.26 64.18
100 0.075 13.82 6.41 5.76 2.85 65.02
101 0.060 13.21 7.14 5.78 2.42 64.81
102 0.036 12.97 7.38 4.95 2.49 64.82

208
103 0.045 13.34 6.77 4.10 2.32 67.05
104 0.072 13.06 6.83 5.06 2.48 65.27
105 0.075 13.31 6.43 4.92 2.48 66.53
106 0.044 13.27 7.96 4.82 2.49 65.02
107 0.039 13.55 6.79 4.78 2.45 66.76
108 0.067 14.81 7.92 5.97 2.54 63.02
109 0.068 13.79 7.46 6.66 2.35 63.42
110 0.044 14.44 7.47 4.97 2.25 66.63
111 0.045 13.19 7.41 5.56 2.42 65.90
112 0.077 13.86 6.17 3.95 2.45 68.14
113 0.074 12.91 7.25 4.56 2.25 66.48
114 0.032 12.89 7.61 4.41 2.45 66.82
115 0.046 13.60 7.20 4.80 2.31 66.49
116 0.074 13.29 7.06 6.74 2.46 65.02
117 0.074 13.33 6.66 6.32 2.55 65.37
118 0.043 13.50 7.85 4.12 2.43 66.32
119 0.048 13.11 7.45 5.76 2.23 65.84
120 0.082 13.11 6.50 4.08 2.66 67.07
121 0.074 13.37 7.03 4.26 2.34 66.54
122 0.044 12.57 8.01 4.59 2.31 66.36
123 0.027 13.50 7.06 4.38 2.34 66.99
124 0.079 12.53 6.88 5.40 2.68 65.86
125 0.040 13.08 7.79 4.37 2.49 66.46
126 0.036 12.82 7.11 5.29 2.53 65.49
127 0.075 11.98 9.21 4.90 2.41 63.36
128 0.079 12.97 7.94 5.72 2.27 64.13
129 0.045 13.00 7.58 4.94 2.57 65.87
130 0.047 13.32 7.22 5.28 2.35 65.25
131 0.077 13.14 7.31 3.80 2.45 65.92
132 0.079 13.17 6.68 5.20 2.56 66.53
133 0.051 12.77 7.59 5.03 2.43 66.20
134 0.043 13.10 8.64 3.78 2.33 65.16
135 0.047 13.08 7.88 4.22 2.48 67.13
SE 0.004 0.77 0.60 0.87 0.12 1.15

209
Appendix 7. Biochemical analysis of 130 hybrids and five checks obtained from self-pollinated
seed samples at Potchefstroom during 2017/2018 and 2018/2019 cropping seasons
ENTRY Tryptophan Moisture Protein Oil Fibre Starch
1 0.072 13.23 6.94 5.06 2.57 64.77
2 0.087 13.73 8.22 5.89 2.50 63.35
3 0.057 14.77 7.50 5.93 2.39 65.17
4 0.052 13.84 8.18 5.75 2.55 63.66
5 0.077 14.00 8.28 5.44 2.70 63.27
6 0.071 14.66 7.13 4.54 2.40 66.61
7 0.030 12.90 9.01 4.85 2.51 64.67
8 0.032 13.07 8.80 5.06 2.20 64.34
9 0.074 13.64 7.64 5.63 2.72 63.08
10 0.073 12.40 7.26 4.89 2.39 65.76
11 0.044 14.22 8.24 5.67 2.54 64.00
12 0.048 14.15 8.40 4.98 2.52 62.63
13 0.079 15.95 7.18 5.38 2.75 63.89
14 0.076 13.70 8.00 4.32 2.66 63.77
15 0.037 15.17 8.29 5.03 2.70 63.32
16 0.036 14.24 9.08 4.79 2.33 62.66
17 0.078 13.61 9.30 4.49 2.59 63.36
18 0.080 14.21 7.97 5.12 2.58 64.71
19 0.031 14.71 7.86 4.79 2.55 65.36
20 0.037 13.12 8.72 5.23 2.54 63.49
21 0.086 14.02 7.96 5.71 2.73 62.27
22 0.074 14.55 7.39 3.89 2.28 64.99
23 0.035 14.02 7.70 6.14 2.52 63.93
24 0.040 13.81 8.31 4.72 2.35 64.43
25 0.076 14.83 7.37 5.21 2.95 63.66
26 0.082 14.58 6.98 4.50 2.62 65.36
27 0.037 16.19 8.07 4.49 2.89 64.30
28 0.042 13.93 8.07 4.44 2.50 63.98
29 0.083 13.34 8.74 6.35 2.87 60.70
30 0.077 15.57 6.84 5.42 2.65 64.22
31 0.030 13.66 8.08 4.24 2.47 65.23
32 0.036 14.50 8.05 5.37 2.59 63.57
33 0.072 14.95 7.92 5.61 2.44 64.23
34 0.079 13.49 8.26 5.52 2.10 65.13
35 0.039 14.12 8.57 5.14 2.30 64.13
36 0.037 12.77 8.94 5.04 2.29 63.58
37 0.075 16.21 6.77 6.47 3.08 62.25
38 0.062 14.72 7.87 5.13 2.57 64.13
39 0.052 14.38 8.65 4.74 2.38 64.25
40 0.036 13.80 8.65 5.71 2.45 63.00
41 0.078 13.19 7.92 6.28 2.50 63.32
42 0.072 13.54 9.11 6.19 2.22 62.25
43 0.027 13.79 8.85 5.65 2.48 63.79
44 0.028 13.79 8.11 5.41 2.25 64.21
45 0.097 14.40 7.47 6.29 2.83 62.38
46 0.082 13.43 8.62 5.01 2.46 62.80
47 0.044 13.45 8.28 4.66 2.16 65.61
48 0.048 14.96 7.56 5.70 2.50 64.06
49 0.074 15.66 7.24 5.58 2.98 62.78
50 0.073 14.90 8.01 4.06 2.59 64.01
51 0.049 14.22 7.37 4.03 2.58 67.85
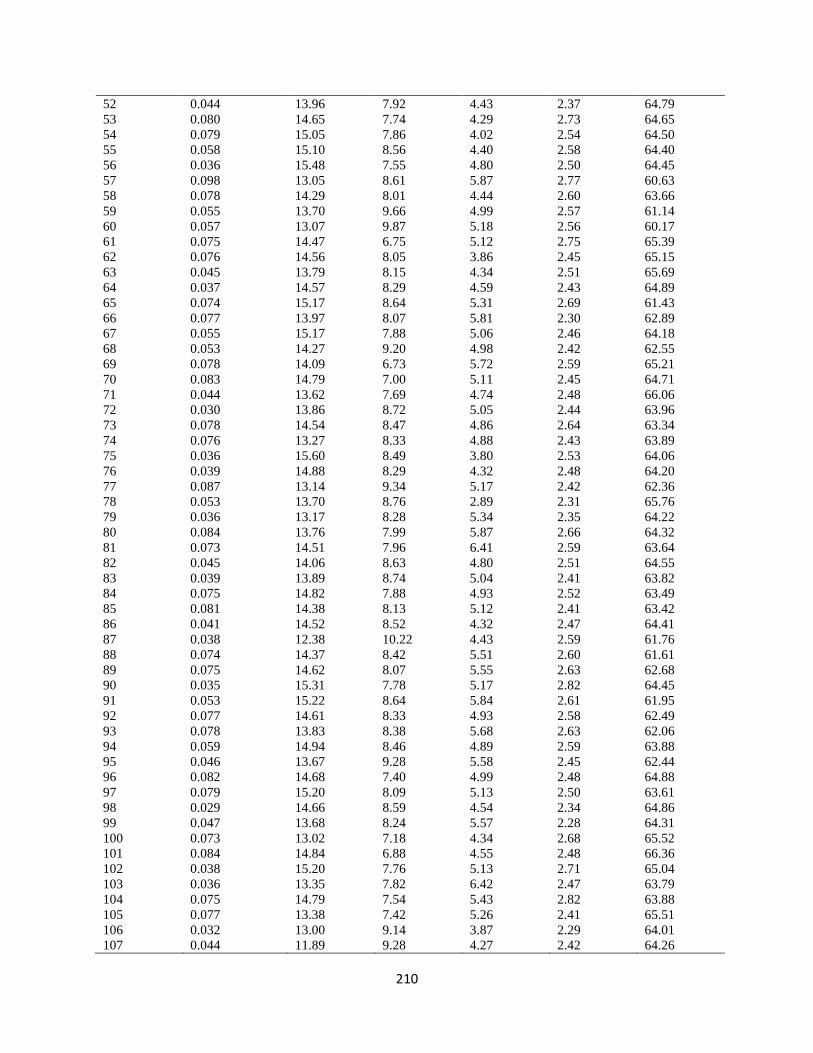
210
52 0.044 13.96 7.92 4.43 2.37 64.79
53 0.080 14.65 7.74 4.29 2.73 64.65
54 0.079 15.05 7.86 4.02 2.54 64.50
55 0.058 15.10 8.56 4.40 2.58 64.40
56 0.036 15.48 7.55 4.80 2.50 64.45
57 0.098 13.05 8.61 5.87 2.77 60.63
58 0.078 14.29 8.01 4.44 2.60 63.66
59 0.055 13.70 9.66 4.99 2.57 61.14
60 0.057 13.07 9.87 5.18 2.56 60.17
61 0.075 14.47 6.75 5.12 2.75 65.39
62 0.076 14.56 8.05 3.86 2.45 65.15
63 0.045 13.79 8.15 4.34 2.51 65.69
64 0.037 14.57 8.29 4.59 2.43 64.89
65 0.074 15.17 8.64 5.31 2.69 61.43
66 0.077 13.97 8.07 5.81 2.30 62.89
67 0.055 15.17 7.88 5.06 2.46 64.18
68 0.053 14.27 9.20 4.98 2.42 62.55
69 0.078 14.09 6.73 5.72 2.59 65.21
70 0.083 14.79 7.00 5.11 2.45 64.71
71 0.044 13.62 7.69 4.74 2.48 66.06
72 0.030 13.86 8.72 5.05 2.44 63.96
73 0.078 14.54 8.47 4.86 2.64 63.34
74 0.076 13.27 8.33 4.88 2.43 63.89
75 0.036 15.60 8.49 3.80 2.53 64.06
76 0.039 14.88 8.29 4.32 2.48 64.20
77 0.087 13.14 9.34 5.17 2.42 62.36
78 0.053 13.70 8.76 2.89 2.31 65.76
79 0.036 13.17 8.28 5.34 2.35 64.22
80 0.084 13.76 7.99 5.87 2.66 64.32
81 0.073 14.51 7.96 6.41 2.59 63.64
82 0.045 14.06 8.63 4.80 2.51 64.55
83 0.039 13.89 8.74 5.04 2.41 63.82
84 0.075 14.82 7.88 4.93 2.52 63.49
85 0.081 14.38 8.13 5.12 2.41 63.42
86 0.041 14.52 8.52 4.32 2.47 64.41
87 0.038 12.38 10.22 4.43 2.59 61.76
88 0.074 14.37 8.42 5.51 2.60 61.61
89 0.075 14.62 8.07 5.55 2.63 62.68
90 0.035 15.31 7.78 5.17 2.82 64.45
91 0.053 15.22 8.64 5.84 2.61 61.95
92 0.077 14.61 8.33 4.93 2.58 62.49
93 0.078 13.83 8.38 5.68 2.63 62.06
94 0.059 14.94 8.46 4.89 2.59 63.88
95 0.046 13.67 9.28 5.58 2.45 62.44
96 0.082 14.68 7.40 4.99 2.48 64.88
97 0.079 15.20 8.09 5.13 2.50 63.61
98 0.029 14.66 8.59 4.54 2.34 64.86
99 0.047 13.68 8.24 5.57 2.28 64.31
100 0.073 13.02 7.18 4.34 2.68 65.52
101 0.084 14.84 6.88 4.55 2.48 66.36
102 0.038 15.20 7.76 5.13 2.71 65.04
103 0.036 13.35 7.82 6.42 2.47 63.79
104 0.075 14.79 7.54 5.43 2.82 63.88
105 0.077 13.38 7.42 5.26 2.41 65.51
106 0.032 13.00 9.14 3.87 2.29 64.01
107 0.044 11.89 9.28 4.27 2.42 64.26

211
108 0.080 13.65 8.68 6.72 2.45 61.78
109 0.085 12.47 10.21 5.59 2.46 59.87
110 0.023 14.80 9.38 5.24 2.89 62.48
111 0.038 14.58 9.34 4.93 2.24 63.00
112 0.070 13.45 8.87 4.32 2.42 64.28
113 0.080 14.02 7.81 6.39 2.54 64.47
114 0.047 13.89 8.55 4.22 2.35 65.43
115 0.032 13.14 8.91 4.20 2.27 65.15
116 0.071 14.38 7.79 6.69 2.49 62.64
117 0.077 14.56 7.07 5.96 2.54 64.98
118 0.052 13.92 8.91 5.92 2.50 64.13
119 0.037 13.90 7.98 5.88 2.47 63.93
120 0.087 13.42 8.18 4.93 2.31 64.95
121 0.082 14.08 7.49 3.71 2.34 65.73
122 0.055 13.58 7.98 4.95 2.40 64.44
123 0.031 13.89 8.53 4.64 2.28 63.98
124 0.073 13.67 8.13 5.08 2.78 63.70
125 0.039 12.55 9.41 4.01 2.43 64.82
126 0.038 13.84 10.30 4.06 2.37 62.00
127 0.076 13.91 9.25 5.18 2.61 62.49
128 0.078 13.35 8.97 4.47 2.35 63.43
129 0.037 14.43 8.56 4.90 2.51 64.29
130 0.034 14.52 8.74 4.12 2.18 63.95
131 0.073 13.01 7.82 4.92 2.36 64.91
132 0.071 14.38 6.89 4.41 2.55 66.86
133 0.053 14.49 8.95 4.40 2.50 63.80
134 0.044 14.26 9.20 5.20 2.46 62.53
135 0.056 13.41 9.09 3.72 2.51 64.59
SE 0.005 1.18 0.65 0.76 0.16 1.20

212
Appendix 8. Biochemical analysis of 130 hybrids and five checks obtained from self-pollinated
seed samples at Harare during 2017/2018 cropping season
ENTRY Tryptophan Moisture Protein Oil Fibre Starch
1 0.084 19.14 8.82 6.27 2.65 68.79
2 0.072 18.38 8.39 6.12 2.57 69.30
3 0.060 19.68 10.28 5.41 2.42 69.18
4 0.049 16.39 11.20 6.06 2.43 68.37
5 0.086 20.13 9.71 5.55 2.71 68.93
6 0.110 20.12 9.13 5.67 2.50 69.35
7 0.066 20.16 10.39 5.09 2.41 69.24
8 0.065 20.66 11.78 5.17 2.46 68.76
9 0.086 21.81 9.15 6.19 2.77 68.09
10 0.073 18.47 7.69 5.77 2.45 69.58
11 0.055 16.62 10.63 4.81 2.50 70.43
12 0.055 19.54 9.58 4.92 2.43 70.65
13 0.090 23.22 9.10 6.07 2.82 68.47
14 0.079 15.87 7.63 5.61 2.67 70.21
15 0.052 19.97 10.22 4.95 2.67 69.30
16 0.068 20.46 10.89 5.36 2.37 68.78
17 0.080 18.70 10.07 5.37 2.56 69.60
18 0.070 15.47 8.69 4.96 2.47 71.27
19 0.047 18.74 10.77 4.80 2.51 69.92
20 0.051 18.97 10.64 5.05 2.37 69.50
21 0.073 20.59 8.91 6.12 2.51 68.51
22 0.082 19.54 8.59 5.50 2.30 70.02
23 0.049 22.60 10.00 5.40 2.50 68.95
24 0.057 20.18 10.07 5.26 2.26 69.71
25 0.074 24.07 9.16 5.87 2.87 68.29
26 0.092 18.28 7.73 5.30 2.65 70.55
27 0.063 21.57 9.60 5.06 2.75 69.45
28 0.061 21.18 10.54 4.82 2.40 69.22
29 0.086 20.21 10.07 6.37 2.70 68.07
30 0.083 17.72 9.00 6.21 2.54 68.53
31 0.064 20.32 10.82 5.47 2.54 68.60
32 0.064 19.72 10.55 5.81 2.45 68.63
33 0.082 21.49 10.37 6.17 2.51 68.48
34 0.098 17.19 10.63 6.74 2.18 67.59
35 0.055 19.89 10.66 5.92 2.34 68.35
36 0.045 19.82 11.77 5.92 2.36 68.22
37 0.097 23.41 9.75 7.69 3.01 66.19
38 0.092 19.13 9.03 6.24 2.52 68.58
39 0.056 18.34 10.00 5.94 2.45 68.89
40 0.057 21.15 11.32 5.86 2.53 68.39
41 0.077 19.17 10.76 6.93 2.45 67.43
42 0.109 16.88 10.35 6.74 2.39 67.75
43 0.061 19.64 10.86 6.10 2.57 68.17
44 0.062 17.23 12.62 6.30 2.51 67.30
45 0.088 19.74 8.74 6.37 2.81 68.66
46 0.086 16.89 9.17 6.72 2.47 68.55
47 0.058 20.31 10.44 5.72 2.33 68.90
48 0.050 17.17 10.52 6.33 2.47 68.51

213
49 0.074 23.06 8.43 5.57 2.98 69.08
50 0.089 19.92 8.07 5.33 2.58 70.02
51 0.048 18.52 9.98 5.67 2.44 69.48
52 0.068 19.27 9.58 5.29 2.38 69.36
53 0.084 23.47 9.07 5.67 2.82 68.86
54 0.083 19.25 8.34 5.68 2.69 69.47
55 0.072 18.95 9.77 5.27 2.69 69.28
56 0.053 21.84 10.72 5.32 2.42 68.88
57 0.088 19.85 8.86 6.43 2.70 68.38
58 0.085 18.31 8.64 6.43 2.69 68.57
59 0.058 18.26 10.83 5.58 2.49 68.80
60 0.047 16.96 10.83 6.19 2.54 67.95
61 0.086 20.40 9.10 6.02 2.85 68.64
62 0.087 18.69 8.57 5.66 2.52 69.60
63 0.057 17.82 9.89 5.79 2.53 69.17
64 0.050 21.02 10.05 4.82 2.36 69.84
65 0.096 20.66 9.02 6.27 2.67 68.30
66 0.078 17.45 9.60 6.64 2.40 67.94
67 0.065 21.07 9.97 4.85 2.46 69.76
68 0.060 18.36 10.77 5.63 2.47 69.34
69 0.083 21.03 7.40 5.98 2.71 69.60
70 0.071 17.88 9.20 6.22 2.46 68.63
71 0.058 22.72 9.31 5.58 2.61 68.81
72 0.044 17.88 10.89 5.87 2.32 68.55
73 0.081 19.32 9.67 4.96 2.51 69.58
74 0.083 20.48 9.41 5.36 2.51 69.64
75 0.055 18.29 9.74 4.75 2.42 70.28
76 0.054 19.47 10.18 5.06 2.55 69.37
77 0.075 20.66 10.89 5.84 2.53 68.41
78 0.055 17.63 10.61 4.96 2.32 69.75
79 0.058 19.61 11.61 5.21 2.38 69.39
80 0.081 15.54 11.38 6.05 2.71 68.17
81 0.077 18.37 9.04 5.86 2.46 69.10
82 0.060 17.80 9.97 5.14 2.67 69.92
83 0.046 18.61 10.18 4.63 2.30 70.58
84 0.087 24.56 10.31 5.22 2.69 68.85
85 0.073 18.40 9.17 5.19 2.38 70.14
86 0.042 20.43 10.30 4.90 2.45 69.73
87 0.050 15.81 10.62 4.50 2.57 71.07
88 0.073 20.31 9.26 6.57 2.72 68.29
89 0.092 20.70 8.94 6.45 2.58 67.99
90 0.050 18.09 10.50 5.41 2.67 69.10
91 0.042 18.90 10.15 5.91 2.46 69.70
92 0.079 20.43 9.94 6.05 2.46 68.52
93 0.076 19.53 8.32 5.96 2.54 69.63
94 0.054 17.58 10.69 5.57 2.50 69.13
95 0.052 20.29 10.62 5.62 2.56 68.92
96 0.075 18.33 9.03 6.48 2.62 68.60
97 0.084 16.78 9.02 5.47 2.33 69.88
98 0.060 19.56 10.22 5.51 2.46 69.09
99 0.044 18.62 11.00 5.59 2.32 69.00
100 0.074 21.49 7.59 5.70 2.69 69.84
101 0.096 16.88 7.78 5.59 2.57 70.93
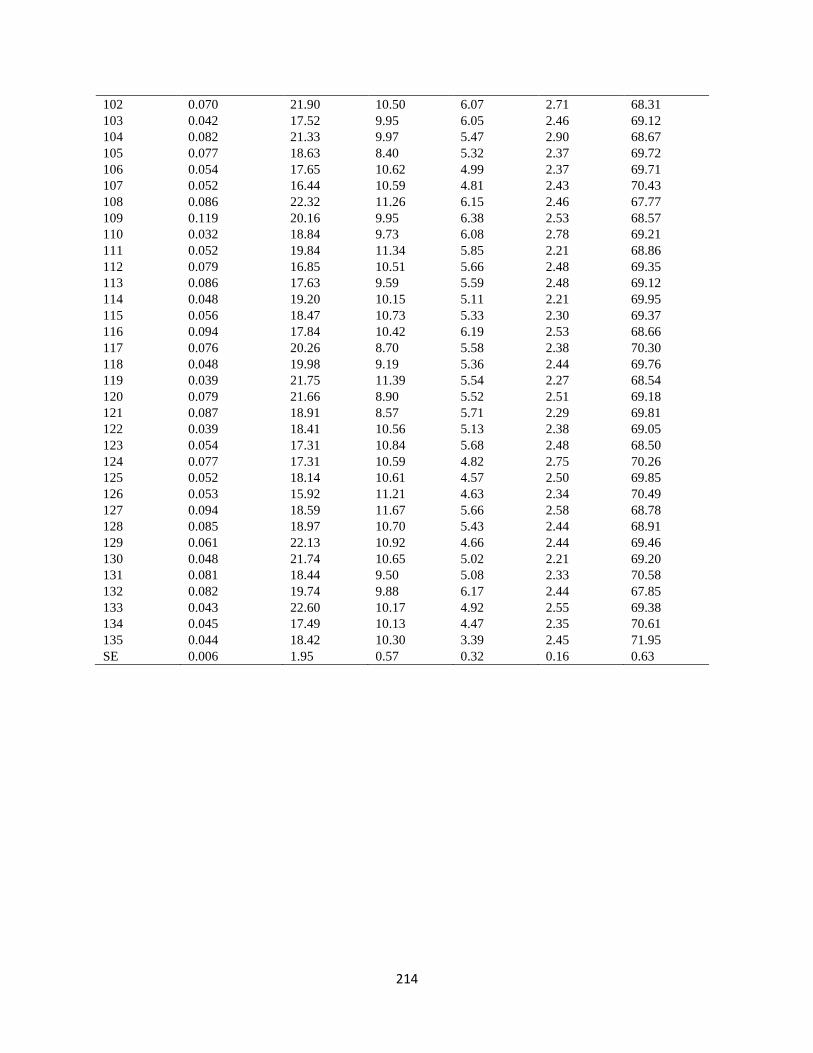
214
102 0.070 21.90 10.50 6.07 2.71 68.31
103 0.042 17.52 9.95 6.05 2.46 69.12
104 0.082 21.33 9.97 5.47 2.90 68.67
105 0.077 18.63 8.40 5.32 2.37 69.72
106 0.054 17.65 10.62 4.99 2.37 69.71
107 0.052 16.44 10.59 4.81 2.43 70.43
108 0.086 22.32 11.26 6.15 2.46 67.77
109 0.119 20.16 9.95 6.38 2.53 68.57
110 0.032 18.84 9.73 6.08 2.78 69.21
111 0.052 19.84 11.34 5.85 2.21 68.86
112 0.079 16.85 10.51 5.66 2.48 69.35
113 0.086 17.63 9.59 5.59 2.48 69.12
114 0.048 19.20 10.15 5.11 2.21 69.95
115 0.056 18.47 10.73 5.33 2.30 69.37
116 0.094 17.84 10.42 6.19 2.53 68.66
117 0.076 20.26 8.70 5.58 2.38 70.30
118 0.048 19.98 9.19 5.36 2.44 69.76
119 0.039 21.75 11.39 5.54 2.27 68.54
120 0.079 21.66 8.90 5.52 2.51 69.18
121 0.087 18.91 8.57 5.71 2.29 69.81
122 0.039 18.41 10.56 5.13 2.38 69.05
123 0.054 17.31 10.84 5.68 2.48 68.50
124 0.077 17.31 10.59 4.82 2.75 70.26
125 0.052 18.14 10.61 4.57 2.50 69.85
126 0.053 15.92 11.21 4.63 2.34 70.49
127 0.094 18.59 11.67 5.66 2.58 68.78
128 0.085 18.97 10.70 5.43 2.44 68.91
129 0.061 22.13 10.92 4.66 2.44 69.46
130 0.048 21.74 10.65 5.02 2.21 69.20
131 0.081 18.44 9.50 5.08 2.33 70.58
132 0.082 19.74 9.88 6.17 2.44 67.85
133 0.043 22.60 10.17 4.92 2.55 69.38
134 0.045 17.49 10.13 4.47 2.35 70.61
135 0.044 18.42 10.30 3.39 2.45 71.95
SE 0.006 1.95 0.57 0.32 0.16 0.63

215
Appendix 9. Biochemical analysis and grain yield of 130 hybrids and five checks obtained from
self-pollinated seed samples at across during 2017/2018 and 2018/20121 cropping season
ENTRY Tryptophan Grain yield Moisture Protein Oil Fibre Starch
1 0.075 5.64 15.39 7.44 5.83 2.72 65.69
2 0.080 5.93 15.14 7.85 5.67 2.54 66.15
3 0.057 5.51 15.89 8.22 5.52 2.41 66.74
4 0.049 6.35 14.56 8.78 5.46 2.47 66.22
5 0.078 5.99 15.83 8.54 5.28 2.67 65.86
6 0.088 5.70 16.09 7.67 4.93 2.44 67.55
7 0.048 5.79 15.32 8.81 4.76 2.46 67.18
8 0.044 7.24 15.37 9.50 5.03 2.34 66.36
9 0.077 5.77 16.43 7.91 5.93 2.75 64.97
10 0.070 5.23 15.15 7.07 5.05 2.44 67.27
11 0.048 6.00 14.72 8.73 5.37 2.54 66.55
12 0.053 7.51 15.99 8.30 5.31 2.50 65.99
13 0.072 5.08 17.73 7.77 5.62 2.78 65.43
14 0.075 6.14 14.37 7.46 5.20 2.63 66.23
15 0.046 6.64 16.45 8.68 4.97 2.64 66.03
16 0.053 7.36 15.97 9.38 4.91 2.36 65.36
17 0.074 5.49 15.04 8.51 5.09 2.58 66.54
18 0.074 6.26 14.34 7.71 4.82 2.49 67.84
19 0.039 6.12 15.89 8.49 4.55 2.53 67.57
20 0.040 6.91 14.87 9.03 4.82 2.42 66.31
21 0.078 6.12 15.71 7.71 5.64 2.60 65.59
22 0.077 5.69 15.60 7.62 5.03 2.32 66.69
23 0.047 7.27 16.63 8.30 5.50 2.49 66.14
24 0.049 6.76 15.58 8.68 4.98 2.33 66.53
25 0.072 5.45 17.87 7.56 5.37 2.88 65.99
26 0.082 5.27 15.79 7.34 4.84 2.63 66.84
27 0.050 6.19 16.83 8.62 4.94 2.73 65.91
28 0.054 7.45 16.48 8.85 4.74 2.47 65.88
29 0.083 6.36 15.17 8.99 6.09 2.75 63.90
30 0.079 5.59 15.51 7.85 5.88 2.62 65.65
31 0.050 6.89 15.68 8.93 5.00 2.53 66.03
32 0.048 6.66 16.03 8.84 5.72 2.54 65.20
33 0.077 6.59 16.68 8.50 5.98 2.47 65.70
34 0.072 5.40 14.36 8.94 6.03 2.16 65.84
35 0.045 6.57 15.77 8.87 5.64 2.31 65.95
36 0.044 6.92 14.83 9.84 5.44 2.34 65.36
37 0.087 7.22 17.99 7.84 6.78 2.96 63.78
38 0.073 5.88 15.76 7.96 5.79 2.50 66.06
39 0.050 6.62 15.60 8.53 5.04 2.38 66.74
40 0.043 7.00 16.01 9.18 5.77 2.46 65.36
41 0.075 8.61 15.06 8.71 6.32 2.53 65.23
42 0.084 6.01 14.91 9.03 6.19 2.31 65.23
43 0.045 7.10 15.76 9.10 5.56 2.48 65.95
44 0.041 6.58 14.52 9.54 5.71 2.38 65.34
45 0.090 5.20 15.84 7.67 6.07 2.81 65.52
46 0.076 5.23 14.65 8.16 6.14 2.47 65.37
47 0.047 5.63 15.37 8.74 5.17 2.31 66.74
48 0.047 6.47 15.31 8.55 6.06 2.47 65.75
49 0.078 7.02 17.52 7.54 5.22 2.88 65.60
50 0.079 5.07 16.14 7.57 4.71 2.57 66.79
51 0.049 6.88 15.19 7.87 4.87 2.55 68.24

216
52 0.051 7.49 15.50 8.02 4.77 2.40 66.96
53 0.069 6.50 17.16 7.82 4.87 2.80 66.16
54 0.073 6.61 16.09 7.51 5.21 2.55 66.64
55 0.062 6.20 15.61 8.56 5.07 2.62 66.21
56 0.042 7.45 16.99 8.69 4.66 2.45 66.10
57 0.087 5.68 15.21 8.40 5.63 2.72 63.92
58 0.080 5.91 14.89 8.11 5.45 2.58 65.49
59 0.055 7.11 15.29 9.58 5.09 2.55 64.56
60 0.057 6.28 14.73 9.44 5.69 2.55 63.85
61 0.079 5.83 16.33 7.84 5.35 2.80 65.93
62 0.078 4.28 15.50 7.54 4.93 2.47 67.54
63 0.052 4.63 15.28 8.57 4.90 2.47 66.99
64 0.041 5.97 16.33 8.40 4.72 2.43 67.11
65 0.082 6.75 16.39 8.32 6.01 2.64 64.28
66 0.075 4.21 15.22 7.94 6.13 2.34 65.45
67 0.057 6.31 16.62 8.26 5.03 2.48 66.65
68 0.048 6.74 15.29 9.27 5.41 2.40 65.33
69 0.080 6.31 16.19 6.82 5.80 2.60 66.64
70 0.082 2.31 15.66 7.54 5.70 2.47 66.08
71 0.050 6.28 16.48 7.85 5.06 2.49 67.39
72 0.045 6.78 15.05 9.19 5.19 2.36 65.99
73 0.073 5.70 15.77 8.51 4.96 2.53 66.04
74 0.079 5.95 15.31 8.45 4.94 2.44 66.21
75 0.043 6.16 15.85 8.52 4.14 2.46 67.29
76 0.045 5.75 16.05 8.49 4.80 2.47 66.67
77 0.079 5.65 15.52 9.46 5.53 2.45 65.16
78 0.056 4.48 14.84 9.14 4.01 2.29 67.07
79 0.041 7.18 15.24 9.21 5.08 2.36 66.52
80 0.080 5.88 13.95 9.13 5.95 2.69 65.57
81 0.071 5.91 15.44 7.88 6.05 2.52 66.35
82 0.055 5.53 14.83 8.73 4.95 2.60 66.93
83 0.040 6.45 15.04 9.13 4.86 2.39 66.48
84 0.080 7.07 17.70 8.28 5.32 2.62 65.85
85 0.078 6.49 15.56 7.80 4.99 2.43 66.74
86 0.040 6.54 16.19 8.67 4.35 2.41 67.21
87 0.041 2.94 13.63 9.88 4.35 2.56 65.47
88 0.073 5.38 15.90 8.27 6.06 2.66 64.49
89 0.081 5.56 16.40 8.08 5.83 2.57 64.77
90 0.044 6.09 15.44 8.53 5.20 2.67 66.55
91 0.049 6.69 15.98 8.81 5.73 2.48 65.50
92 0.078 5.63 16.22 8.34 5.43 2.60 65.12
93 0.072 5.85 15.38 8.00 5.91 2.55 65.45
94 0.053 6.59 15.36 8.85 5.28 2.55 66.01
95 0.044 6.70 15.97 9.06 5.51 2.47 65.63
96 0.075 6.64 15.39 7.78 5.74 2.56 66.08
97 0.078 3.90 15.13 8.17 5.03 2.37 66.51
98 0.044 6.15 16.06 8.55 5.05 2.41 66.57
99 0.047 7.42 15.31 9.17 5.63 2.29 65.83
100 0.074 6.07 16.11 7.06 5.27 2.74 66.79
101 0.080 5.33 14.98 7.26 5.31 2.49 67.37
102 0.048 6.63 16.69 8.55 5.38 2.64 66.06
103 0.041 6.49 14.73 8.18 5.52 2.42 66.65
104 0.076 5.19 16.39 8.11 5.32 2.74 65.94
105 0.077 5.42 15.11 7.42 5.16 2.42 67.25
106 0.043 5.70 14.64 9.24 4.56 2.38 66.25
107 0.045 5.93 13.96 8.89 4.62 2.43 67.15

217
108 0.078 7.95 16.93 9.29 6.28 2.48 64.19
109 0.091 6.17 15.48 9.20 6.21 2.45 63.96
110 0.033 6.47 16.03 8.86 5.43 2.64 66.10
111 0.045 6.55 15.87 9.36 5.45 2.29 65.92
112 0.075 5.70 14.72 8.52 4.64 2.45 67.26
113 0.080 6.31 14.85 8.22 5.51 2.42 66.69
114 0.043 5.69 15.33 8.77 4.58 2.34 67.40
115 0.045 6.41 15.07 8.95 4.78 2.29 67.00
116 0.080 6.39 15.17 8.42 6.54 2.49 65.44
117 0.076 5.75 16.05 7.48 5.95 2.49 66.88
118 0.048 5.64 15.80 8.65 5.13 2.46 66.74
119 0.041 6.26 16.26 8.94 5.73 2.32 66.10
120 0.083 7.37 16.06 7.86 4.84 2.50 67.07
121 0.081 4.45 15.45 7.70 4.56 2.32 67.36
122 0.046 6.62 14.85 8.85 4.89 2.37 66.62
123 0.037 7.03 14.90 8.81 4.90 2.37 66.49
124 0.076 4.77 14.51 8.53 5.10 2.74 66.61
125 0.044 5.05 14.59 9.27 4.32 2.47 67.04
126 0.042 5.12 14.20 9.54 4.66 2.41 65.99
127 0.082 5.65 14.83 10.04 5.25 2.53 64.88
128 0.081 6.03 15.10 9.20 5.21 2.35 65.49
129 0.048 6.17 16.52 9.02 4.83 2.51 66.54
130 0.043 7.05 16.53 8.87 4.81 2.25 66.13
131 0.077 5.65 14.86 8.21 4.60 2.38 67.13
132 0.077 5.56 15.76 7.82 5.26 2.52 67.08
133 0.049 5.83 16.62 8.90 4.78 2.49 66.46
134 0.044 5.29 14.95 9.32 4.48 2.38 66.10
135 0.049 4.71 14.97 9.09 3.77 2.48 67.89
SE 0.005 1.03 1.39 0.61 0.69 0.15 1.03

218
Appendix 10. GCA of 33 lines and four testers for grain yield and agronomic traits for trials
evaluated at Cedara during 2017/2018 and 2018/2019 cropping seasons
Line GY DA ASI PH EH RL SL EPP HC Ear rot EA
1 -0.715 -1.28 -0.31 -4.21 -6.19 -4.05 -7.50 0.00 -0.08 -4.44 0.13
2 0.252 -1.16 -0.44 -2.80 -4.32 0.32 5.08 0.02 -0.05 -4.93 -0.13
3 -0.537 0.47 -0.25 -1.55 1.93 -3.04 9.55 -0.02 -0.01 6.75 0.19
4 0.926 -3.03 0.19 1.73 -6.35 -2.03 0.91 -0.05 -0.05 -6.58 0.00
5 -0.330 -2.97 -0.13 -1.71 -3.07 0.30 4.92 0.02 0.17 0.11 -0.06
6 -0.512 -1.22 -0.31 -1.71 -3.25 -5.59 12.07 0.04 0.02 5.21 -0.03
7 0.593 -2.10 0.06 0.92 4.43 -6.56 0.23 0.04 -0.08 -5.80 -0.09
8 -0.143 0.90 0.44 7.67 3.81 -2.16 -11.03 0.00 -0.08 2.65 0.35
9 0.303 0.47 0.00 10.79 10.37 7.25 -4.26 0.02 0.17 8.29 0.06
10 0.508 1.40 -0.19 11.89 13.65 17.90 -1.38 -0.01 -0.11 1.40 0.07
11 0.756 3.53 -0.06 12.26 17.25 21.27 -4.88 0.01 -0.08 2.47 0.03
12 -0.030 1.72 0.06 3.92 3.03 -1.19 0.44 -0.06 0.20 7.43 0.03
13 0.495 1.65 0.00 -0.77 2.40 -6.40 2.52 0.02 -0.26 -0.38 0.03
14 0.911 -1.78 0.12 4.01 -0.41 -3.16 -4.59 0.00 -0.11 1.80 -0.09
15 0.170 1.65 -0.19 11.73 6.15 -0.29 0.27 0.01 -0.08 -1.20 0.16
16 -1.479 1.53 -0.25 -7.02 -6.35 -4.25 5.86 -0.01 0.05 16.01 0.38
17 -0.598 1.09 0.25 -10.93 -5.72 -6.39 -5.53 -0.07 0.08 -3.32 0.25
18 -0.299 1.47 0.12 -6.55 0.06 -0.31 -0.23 -0.05 -0.05 -6.65 0.06
19 0.090 -2.97 0.25 -5.77 -12.00 -3.14 -1.72 -0.03 0.24 -2.64 -0.09
20 0.867 -2.07 -0.61 -0.30 -0.05 2.47 -6.70 0.03 -0.07 8.70 -0.09
21 -0.507 -2.47 0.00 5.01 13.25 5.21 1.46 -0.03 -0.08 1.66 -0.25
22 -0.021 3.40 1.25 -3.89 6.62 -1.27 -2.29 0.03 -0.01 -4.90 -0.25
23 -0.695 2.09 -0.06 -3.33 -10.57 4.43 -5.16 0.02 0.11 5.60 0.00
24 -0.867 4.34 -0.31 8.45 0.37 -0.31 -6.61 0.04 -0.17 -3.71 -0.06
25 0.358 2.22 0.37 -9.33 -1.50 -4.22 4.51 0.02 0.02 -1.49 0.03
26 0.482 0.53 0.06 -2.02 -9.00 2.74 2.58 0.02 -0.14 -4.32 -0.28
27 -0.256 -3.78 -0.19 -7.18 -11.66 1.40 -2.76 0.02 0.08 -0.65 0.13
28 0.613 3.28 0.06 10.17 18.18 0.52 1.14 0.01 -0.01 3.23 0.13
29 0.909 -3.78 -0.13 0.29 -7.44 -4.56 5.50 0.01 -0.14 -3.90 -0.31
30 1.434 -0.16 -0.06 -11.86 -11.35 3.94 -5.29 0.01 -0.01 -9.70 -0.12
31 -0.454 2.34 0.25 -4.36 0.37 -4.54 8.83 0.02 -0.01 0.43 -0.14
32 -1.508 -6.41 -0.52 -1.97 -8.59 -3.42 -7.44 -0.05 0.43 -3.33 0.03
35 -0.879 -1.03 0.25 -2.18 3.81 -1.12 7.98 -0.02 0.20 -2.45 -0.09
SE 0.740 1.02 0.31 5.10 4.19 4.89 3.99 0.04 0.15 6.62 0.17
Tester GCA
1 -0.007 -2.20 -0.03 -4.48 -9.71 -3.96 0.37 -0.01 0.08 1.71 0.02
2 -0.650 0.99 0.09 3.29 4.43 -1.53 4.75 0.02 -0.05 -2.97 0.01
3 0.234 1.20 0.06 5.83 6.09 3.97 -0.56 -0.01 -0.01 0.43 0.03
4 0.383 0.08 -0.12 -4.45 -0.54 1.44 -4.28 0.00 -0.02 0.64 -0.06
SE 0.354 0.40 0.07 2.94 1.86 2.62 0.66 0.00 0.05 1.28 0.07

219
Appendix 11. SCA of 130 hybrids for grain yield and agronomic traits for trials evaluated at
Cedara during 2017/2018 and 2018/2019 cropping seasons
Entry GY DA ASI PH EH RL SL EPP HC Ear rot EA
1 0.556 -1.42 -0.10 6.51 3.15 7.53 7.55 0.03 0.26 3.44 -0.36
2 0.148 0.89 -0.47 6.86 0.89 -2.57 -6.86 0.01 0.02 -7.25 -0.10
3 1.639 -0.32 -0.44 -5.05 -4.53 -1.41 -2.74 -0.03 -0.27 -9.06 0.25
4 -2.304 0.80 1.00 -8.52 0.23 -3.46 1.76 -0.01 -0.01 13.04 0.21
5 -0.145 2.95 0.03 -10.52 -8.10 -1.62 -13.05 0.01 0.61 6.49 0.39
6 -0.511 -0.49 -0.09 4.21 7.14 -6.04 -2.73 0.07 -0.14 -5.26 -0.35
7 -0.637 -0.95 0.19 -3.33 -8.91 9.33 8.99 -0.02 -0.05 -1.85 -0.02
8 1.332 -1.58 -0.13 9.45 9.60 -1.57 6.51 -0.06 -0.42 0.80 -0.03
9 0.956 -0.42 0.59 1.35 -6.22 -1.14 -0.66 0.00 -0.30 -4.31 -0.30
10 -0.319 -2.86 -0.03 -15.79 -10.36 -1.65 7.64 0.03 -0.42 8.69 -0.04
11 -1.192 1.93 -0.25 -0.83 3.59 5.26 -7.27 -0.01 0.17 6.38 0.19
12 0.595 1.30 -0.32 15.07 12.73 -2.38 0.01 -0.02 0.55 -10.58 0.15
13 -2.031 -0.92 0.15 -14.43 -6.07 0.34 9.33 -0.10 0.23 11.47 0.26
14 0.641 0.64 0.53 22.80 4.79 -4.59 2.47 0.06 -0.01 4.49 -0.23
15 0.282 0.43 -0.69 -10.36 -5.62 -7.27 -15.12 0.02 -0.17 -19.48 0.00
16 1.147 -0.20 0.00 1.79 6.63 11.61 3.03 0.01 -0.04 3.70 -0.04
17 0.746 -0.73 0.47 -14.74 -4.35 -4.49 -10.50 0.03 -0.11 -10.70 -0.30
18 -0.012 -0.67 -0.41 14.99 14.64 14.40 1.99 -0.01 0.27 16.87 0.08
19 -0.894 1.36 0.13 1.20 -7.66 -5.38 5.08 0.00 -0.14 2.53 0.19
20 0.199 -0.01 -0.19 -1.65 -2.90 -4.44 3.15 -0.01 -0.01 -8.51 0.02
21 -0.531 0.77 0.15 -16.62 -20.41 3.07 5.28 0.04 -0.21 5.90 -0.08
22 -0.134 -1.92 -0.22 6.24 8.45 -1.02 1.91 -0.05 -0.08 -6.74 -0.32
23 0.943 1.36 0.31 4.32 6.28 -1.23 1.78 -0.04 0.14 1.94 0.16
24 -0.239 -0.26 -0.25 5.85 5.41 -0.73 -9.25 0.05 0.15 -0.92 0.24
25 -2.845 4.14 0.78 -8.62 -5.60 2.38 10.70 -0.07 0.39 6.08 0.36
26 0.799 -0.05 -0.34 6.61 6.51 2.89 -4.08 0.05 -0.11 5.56 -0.38
27 0.795 -0.51 -0.06 1.70 -6.41 -5.55 -4.28 0.00 -0.14 1.08 0.22
28 1.290 -3.64 -0.38 0.10 5.23 0.38 -2.64 0.02 -0.13 -12.54 -0.19
29 -0.036 -1.11 -0.10 -6.62 -1.85 2.97 -2.70 -0.12 -0.24 -9.07 -0.08
30 -0.391 -0.80 -0.22 1.24 -2.24 1.79 -3.53 -0.01 -0.11 -3.36 0.18
31 0.536 0.24 0.31 13.70 13.59 -0.57 -4.60 0.02 0.11 -8.20 0.03
32 -0.069 1.61 0.00 -8.52 -9.77 -4.10 10.54 0.11 0.24 20.81 -0.13
33 0.152 0.08 0.59 2.76 5.34 5.23 -10.12 -0.05 0.01 6.70 0.08
34 0.241 1.39 -0.03 -12.51 -2.55 -8.66 -1.31 0.06 0.27 0.03 -0.04
35 -0.361 0.43 0.00 -0.05 -7.34 14.29 4.73 -0.03 0.11 -11.02 0.06
36 0.007 -1.95 -0.57 9.60 4.29 -10.76 6.42 0.01 -0.38 4.46 -0.10
37 1.594 0.14 -0.47 16.67 12.68 -17.92 1.93 0.04 -0.46 8.80 0.07
38 -1.554 -1.05 0.41 -17.98 -15.21 -9.11 -0.30 -0.05 0.30 -1.20 0.08
39 0.683 0.49 0.44 9.48 7.50 15.43 2.44 0.06 0.01 -5.94 -0.04
40 -0.683 0.36 -0.38 -8.36 -5.24 11.68 -4.36 -0.05 0.15 -1.48 -0.11
41 0.893 0.02 -0.60 4.04 1.59 1.68 -2.31 -0.04 0.01 -1.98 -0.27
42 -0.554 -0.42 0.28 -13.98 -0.05 -7.85 -7.35 -0.05 0.02 -2.74 0.24
43 1.841 -0.39 0.31 14.10 9.53 13.46 4.64 0.03 -0.27 -3.79 -0.28
44 -2.141 0.74 0.00 -4.36 -11.34 -7.20 4.74 0.05 0.24 8.69 0.31
45 -1.860 -2.42 -0.47 -14.74 -8.57 -2.99 7.83 -0.04 0.11 -0.68 -0.14
46 0.658 0.64 0.41 8.74 4.17 4.84 0.81 -0.02 -0.39 12.65 0.24
47 0.406 1.43 -0.56 -11.93 -8.12 3.96 1.88 0.03 -0.30 1.86 -0.03
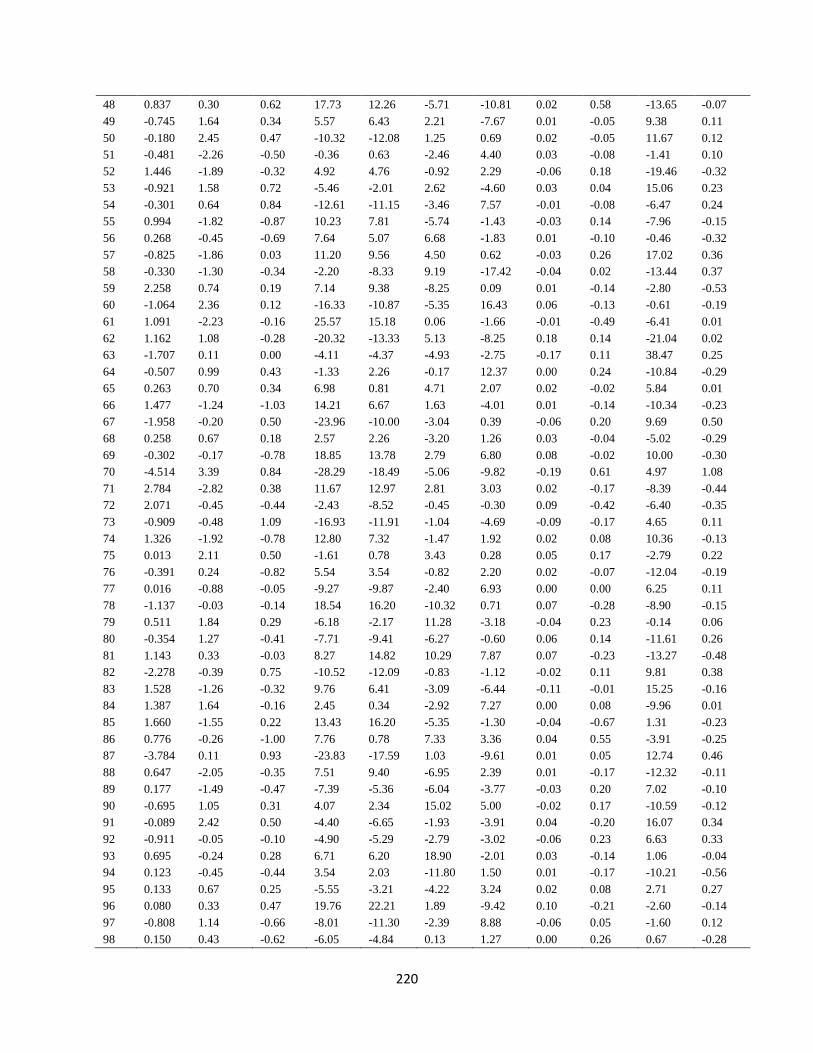
220
48 0.837 0.30 0.62 17.73 12.26 -5.71 -10.81 0.02 0.58 -13.65 -0.07
49 -0.745 1.64 0.34 5.57 6.43 2.21 -7.67 0.01 -0.05 9.38 0.11
50 -0.180 2.45 0.47 -10.32 -12.08 1.25 0.69 0.02 -0.05 11.67 0.12
51 -0.481 -2.26 -0.50 -0.36 0.63 -2.46 4.40 0.03 -0.08 -1.41 0.10
52 1.446 -1.89 -0.32 4.92 4.76 -0.92 2.29 -0.06 0.18 -19.46 -0.32
53 -0.921 1.58 0.72 -5.46 -2.01 2.62 -4.60 0.03 0.04 15.06 0.23
54 -0.301 0.64 0.84 -12.61 -11.15 -3.46 7.57 -0.01 -0.08 -6.47 0.24
55 0.994 -1.82 -0.87 10.23 7.81 -5.74 -1.43 -0.03 0.14 -7.96 -0.15
56 0.268 -0.45 -0.69 7.64 5.07 6.68 -1.83 0.01 -0.10 -0.46 -0.32
57 -0.825 -1.86 0.03 11.20 9.56 4.50 0.62 -0.03 0.26 17.02 0.36
58 -0.330 -1.30 -0.34 -2.20 -8.33 9.19 -17.42 -0.04 0.02 -13.44 0.37
59 2.258 0.74 0.19 7.14 9.38 -8.25 0.09 0.01 -0.14 -2.80 -0.53
60 -1.064 2.36 0.12 -16.33 -10.87 -5.35 16.43 0.06 -0.13 -0.61 -0.19
61 1.091 -2.23 -0.16 25.57 15.18 0.06 -1.66 -0.01 -0.49 -6.41 0.01
62 1.162 1.08 -0.28 -20.32 -13.33 5.13 -8.25 0.18 0.14 -21.04 0.02
63 -1.707 0.11 0.00 -4.11 -4.37 -4.93 -2.75 -0.17 0.11 38.47 0.25
64 -0.507 0.99 0.43 -1.33 2.26 -0.17 12.37 0.00 0.24 -10.84 -0.29
65 0.263 0.70 0.34 6.98 0.81 4.71 2.07 0.02 -0.02 5.84 0.01
66 1.477 -1.24 -1.03 14.21 6.67 1.63 -4.01 0.01 -0.14 -10.34 -0.23
67 -1.958 -0.20 0.50 -23.96 -10.00 -3.04 0.39 -0.06 0.20 9.69 0.50
68 0.258 0.67 0.18 2.57 2.26 -3.20 1.26 0.03 -0.04 -5.02 -0.29
69 -0.302 -0.17 -0.78 18.85 13.78 2.79 6.80 0.08 -0.02 10.00 -0.30
70 -4.514 3.39 0.84 -28.29 -18.49 -5.06 -9.82 -0.19 0.61 4.97 1.08
71 2.784 -2.82 0.38 11.67 12.97 2.81 3.03 0.02 -0.17 -8.39 -0.44
72 2.071 -0.45 -0.44 -2.43 -8.52 -0.45 -0.30 0.09 -0.42 -6.40 -0.35
73 -0.909 -0.48 1.09 -16.93 -11.91 -1.04 -4.69 -0.09 -0.17 4.65 0.11
74 1.326 -1.92 -0.78 12.80 7.32 -1.47 1.92 0.02 0.08 10.36 -0.13
75 0.013 2.11 0.50 -1.61 0.78 3.43 0.28 0.05 0.17 -2.79 0.22
76 -0.391 0.24 -0.82 5.54 3.54 -0.82 2.20 0.02 -0.07 -12.04 -0.19
77 0.016 -0.88 -0.05 -9.27 -9.87 -2.40 6.93 0.00 0.00 6.25 0.11
78 -1.137 -0.03 -0.14 18.54 16.20 -10.32 0.71 0.07 -0.28 -8.90 -0.15
79 0.511 1.84 0.29 -6.18 -2.17 11.28 -3.18 -0.04 0.23 -0.14 0.06
80 -0.354 1.27 -0.41 -7.71 -9.41 -6.27 -0.60 0.06 0.14 -11.61 0.26
81 1.143 0.33 -0.03 8.27 14.82 10.29 7.87 0.07 -0.23 -13.27 -0.48
82 -2.278 -0.39 0.75 -10.52 -12.09 -0.83 -1.12 -0.02 0.11 9.81 0.38
83 1.528 -1.26 -0.32 9.76 6.41 -3.09 -6.44 -0.11 -0.01 15.25 -0.16
84 1.387 1.64 -0.16 2.45 0.34 -2.92 7.27 0.00 0.08 -9.96 0.01
85 1.660 -1.55 0.22 13.43 16.20 -5.35 -1.30 -0.04 -0.67 1.31 -0.23
86 0.776 -0.26 -1.00 7.76 0.78 7.33 3.36 0.04 0.55 -3.91 -0.25
87 -3.784 0.11 0.93 -23.83 -17.59 1.03 -9.61 0.01 0.05 12.74 0.46
88 0.647 -2.05 -0.35 7.51 9.40 -6.95 2.39 0.01 -0.17 -12.32 -0.11
89 0.177 -1.49 -0.47 -7.39 -5.36 -6.04 -3.77 -0.03 0.20 7.02 -0.10
90 -0.695 1.05 0.31 4.07 2.34 15.02 5.00 -0.02 0.17 -10.59 -0.12
91 -0.089 2.42 0.50 -4.40 -6.65 -1.93 -3.91 0.04 -0.20 16.07 0.34
92 -0.911 -0.05 -0.10 -4.90 -5.29 -2.79 -3.02 -0.06 0.23 6.63 0.33
93 0.695 -0.24 0.28 6.71 6.20 18.90 -2.01 0.03 -0.14 1.06 -0.04
94 0.123 -0.45 -0.44 3.54 2.03 -11.80 1.50 0.01 -0.17 -10.21 -0.56
95 0.133 0.67 0.25 -5.55 -3.21 -4.22 3.24 0.02 0.08 2.71 0.27
96 0.080 0.33 0.47 19.76 22.21 1.89 -9.42 0.10 -0.21 -2.60 -0.14
97 -0.808 1.14 -0.66 -8.01 -11.30 -2.39 8.88 -0.06 0.05 -1.60 0.12
98 0.150 0.43 -0.62 -6.05 -4.84 0.13 1.27 0.00 0.26 0.67 -0.28

221
99 0.617 -1.95 0.81 -5.90 -6.34 0.47 -1.02 -0.04 -0.10 3.70 0.31
100 1.623 -1.73 -0.22 -3.18 -5.29 -4.54 7.95 0.00 0.20 -3.92 -0.46
101 0.207 -0.42 -0.59 7.80 4.95 -4.35 5.25 -0.04 -0.05 1.69 0.05
102 -0.857 -1.39 -0.81 3.39 3.91 5.18 -6.11 0.05 -0.33 -8.58 -0.09
103 -0.934 3.49 1.62 -8.21 -3.84 3.81 -7.38 -0.01 0.18 10.99 0.49
104 -0.409 0.83 0.03 -3.65 -3.26 -5.58 -4.19 0.00 -0.27 -12.68 -0.11
105 0.902 0.39 -0.09 6.71 -4.27 9.49 -4.51 -0.04 0.36 6.08 -0.10
106 -0.453 0.43 0.19 -4.58 -4.06 -13.51 5.25 0.00 0.08 11.34 0.25
107 -0.002 -1.70 -0.13 1.32 11.32 9.70 3.16 0.04 -0.17 -4.56 -0.04
108 0.096 0.77 -0.22 -9.12 -4.97 5.35 -6.56 0.09 0.33 5.87 0.26
109 -0.563 0.33 0.16 8.11 9.64 1.20 11.84 -0.07 0.45 4.20 -0.10
110 -0.067 -0.64 0.19 -3.18 -5.78 -2.70 0.61 0.01 -0.58 0.06 0.00
111 0.573 -0.51 -0.13 3.98 0.85 -3.76 -6.18 -0.03 -0.20 -9.94 -0.16
112 -0.454 -1.17 -0.28 -8.62 -6.85 0.37 16.37 0.05 -0.05 -1.59 0.08
113 -0.144 0.14 0.59 12.86 9.01 1.27 -6.13 0.01 -0.05 -3.65 -0.04
114 -0.361 0.18 0.13 -3.30 -5.16 -4.56 -8.12 -0.04 0.05 11.96 0.06
115 0.999 0.80 -0.44 -1.15 2.73 3.00 -2.40 -0.02 0.05 -6.54 -0.10
116 1.063 1.20 -0.60 3.54 2.68 0.50 2.43 -0.09 -0.05 -8.69 -0.11
117 -0.864 -2.49 0.03 1.39 1.67 -10.55 4.18 0.05 -0.17 9.94 0.15
118 0.256 1.05 0.06 -1.77 -3.12 -1.70 -7.71 0.06 0.05 -9.67 -0.12
119 -0.416 0.17 0.50 -3.36 -1.49 11.85 0.81 -0.03 0.18 8.61 0.09
120 1.129 0.70 0.59 12.29 11.59 10.70 -6.05 0.03 -0.17 -22.49 -0.22
121 -1.595 -1.74 -0.53 -13.61 -13.18 0.30 -4.37 0.02 0.45 -0.48 0.29
122 0.647 0.55 0.50 -0.52 3.28 -7.58 4.83 -0.02 -0.20 16.15 -0.23
123 -0.141 0.42 -0.57 1.64 -1.96 -3.33 5.30 -0.03 -0.07 7.01 0.16
124 1.692 1.70 -0.14 6.14 10.55 3.40 -0.45 0.05 0.00 -0.89 -0.14
125 -0.720 -0.45 0.27 -3.54 3.49 -1.31 5.75 0.02 0.10 -0.16 -0.03
126 -1.582 -0.33 -0.05 0.49 -9.88 -3.53 -0.83 -0.04 -0.15 -1.73 0.18
127 -0.547 -0.67 -0.91 4.48 -3.10 -1.40 -3.68 0.05 -0.02 -11.02 0.11
128 1.060 0.89 0.72 -2.67 -1.61 -3.12 14.15 -0.02 -0.14 -5.75 -0.38
129 -1.167 0.68 1.00 -15.21 -3.91 4.75 -1.21 -0.01 0.70 21.47 0.47
130 0.693 -0.95 -0.82 13.20 8.35 -0.14 -9.55 -0.02 -0.54 -4.52 -0.19
SE 0.990 1.11 0.43 8.55 6.88 6.61 6.47 0.06 0.23 8.84 0.29

222
Appendix 12. GCA of 33 lines and four testers for grain yield and agronomic traits for trials
evaluated at Potchefstroom during 2017/2018 and 2018/2019 cropping seasons
Line GY DA ASI PH EH RL SL EPP HC Ear Rot EA
1 0.025 -1.45 -0.52 0.51 -5.16 -0.97 0.35 0.04 -0.05 -3.88 -0.13
2 -0.062 -1.78 -0.06 -4.66 -12.04 -1.85 3.62 0.07 -0.09 -4.30 0.02
3 -0.223 1.55 0.40 7.18 6.34 0.38 -0.87 0.03 -0.07 -4.71 0.04
4 0.141 -2.07 -0.27 -5.45 -7.41 0.76 5.34 -0.08 0.04 -2.76 -0.12
5 -0.105 -2.32 -0.06 -4.41 -4.74 8.27 10.34 -0.03 -0.09 9.31 -0.19
6 1.849 -0.91 0.02 -6.78 -7.20 2.06 2.65 0.07 -0.05 3.01 0.13
7 0.891 -2.16 0.19 -8.28 -5.37 0.09 -4.30 0.04 -0.23 4.69 -0.17
8 -0.830 0.59 0.02 10.47 5.30 -3.14 -6.17 -0.04 0.08 4.78 0.02
9 -0.126 1.55 0.44 2.34 8.46 -0.57 0.54 -0.03 0.10 -4.84 0.04
10 -0.336 2.09 0.23 3.39 11.26 -1.16 3.48 -0.09 -0.01 -0.76 0.11
11 0.396 3.51 0.11 17.34 18.30 -0.83 10.25 0.04 0.10 -2.97 0.00
12 -0.789 -0.16 -0.02 12.18 3.30 -2.54 -5.94 -0.05 0.06 3.57 0.06
13 0.401 3.26 -0.10 4.41 2.59 -3.24 -5.16 0.11 -0.05 1.69 0.02
14 0.825 -0.03 -0.14 -4.66 -5.20 2.62 -2.84 0.09 0.29 20.56 0.13
15 0.628 -0.95 -0.06 14.93 7.51 -0.80 2.84 -0.03 0.02 -2.86 -0.02
16 -1.178 1.93 0.07 -0.41 3.92 -1.64 -0.82 -0.01 -0.30 2.31 0.15
17 0.468 1.93 0.23 -9.20 -2.58 -0.67 1.56 -0.03 -0.05 -1.43 0.27
18 -1.161 1.26 0.15 -7.82 -0.74 5.25 11.13 -0.02 0.14 -4.53 0.12
19 -0.169 -2.99 -0.14 -4.99 -9.45 -0.55 -1.84 0.01 0.10 -0.50 0.06
20 -0.067 -2.31 -0.32 7.23 9.06 3.73 0.10 0.05 0.00 2.48 -0.17
21 0.198 -1.91 -0.27 2.01 7.96 3.45 -3.99 -0.01 -0.01 -2.52 0.00
22 0.024 2.09 -0.27 -9.03 -0.74 -1.19 -1.81 -0.01 -0.03 -4.83 -0.06
23 -0.819 1.63 0.23 6.05 -5.29 -2.83 1.79 0.00 -0.05 -0.98 -0.27
24 0.359 2.63 0.15 12.14 3.88 -3.36 -7.94 -0.01 -0.17 -4.37 0.04
25 -0.409 1.68 0.27 -3.49 2.09 1.90 0.40 0.02 -0.21 -5.86 0.04
26 -0.061 0.43 0.02 -4.07 -4.12 0.29 0.16 -0.11 -0.15 -5.52 -0.17
27 -0.430 -4.16 -0.27 -12.99 -16.70 -2.47 -7.07 -0.04 0.18 6.22 0.19
28 -0.334 4.18 0.94 14.14 27.55 0.00 3.39 -0.11 0.18 2.53 0.23
29 0.547 -2.41 -0.18 -7.99 -10.41 5.75 -3.79 0.00 -0.03 -3.18 -0.23
30 -0.085 -0.87 -0.18 -8.99 -6.99 -0.63 -2.29 0.17 -0.11 -6.50 -0.08
31 -0.137 2.47 -0.31 -5.03 1.05 -0.27 0.93 0.03 0.02 -0.12 -0.04
32 0.036 -6.20 -0.10 -10.49 -14.88 -3.79 -6.30 -0.05 0.45 10.80 0.03
35 0.525 -2.16 -0.31 3.59 -0.99 -2.07 0.75 -0.02 0.10 -1.20 -0.12
SE 0.478 0.49 0.22 3.24 2.24 2.41 4.35 0.05 0.14 3.23 0.15
Tester
1 0.677 -2.68 -0.22 -5.32 -11.28 2.28 -1.73 0.01 0.10 2.07 -0.03
2 -1.284 1.75 0.21 1.56 1.69 0.15 2.63 -0.02 -0.03 -2.71 0.11
3 -0.199 1.31 0.17 9.02 10.82 -1.11 3.10 -0.04 -0.06 0.89 -0.03
4 0.727 -0.26 -0.15 -5.18 -1.12 -1.31 -3.84 0.05 -0.02 -0.40 -0.04
SE 0.261 0.26 0.04 0.94 2.05 2.54 0.03 0.02 0.84 0.10

223
Appendix 13. SCA of 130 hybrids for grain yield and agronomic traits for trials evaluated at
Potchefstroom during 2017/2018 and 2018/2019 cropping seasons
Entry GY DA ASI PH EH RL SL EPP HC Ear rot EH
1 -0.507 0.63 0.13 -7.02 -5.22 -4.28 -0.61 0.03 -0.17 -5.56 -0.17
2 1.458 0.63 -0.29 1.94 13.98 1.21 -1.03 0.08 0.30 12.95 0.16
3 -0.734 0.63 0.25 -0.86 -6.99 4.94 4.82 -0.07 -0.01 -4.72 0.17
4 -0.139 0.63 -0.10 5.84 -1.88 -1.88 -3.34 -0.04 -0.13 -2.50 -0.16
5 -1.120 0.63 0.01 5.82 -2.34 -2.01 -11.22 -0.03 0.21 -1.75 0.01
6 0.009 0.63 0.08 -3.90 -0.48 -2.46 9.20 -0.08 -0.07 0.96 0.20
7 0.171 0.63 0.29 -4.69 -0.44 4.48 2.28 -0.05 0.12 -3.22 -0.15
8 1.018 0.63 -0.39 2.68 3.17 -0.02 -0.42 0.17 -0.25 4.17 -0.06
9 -0.167 0.63 -0.62 -8.35 -8.89 1.51 -1.98 0.01 -0.06 -2.21 -0.02
10 -0.649 0.63 0.12 -7.73 -6.02 -1.36 -5.43 -0.16 0.16 -3.63 0.01
11 0.599 0.63 0.83 0.64 -0.65 -0.81 8.12 0.04 -0.32 7.70 -0.01
12 0.295 0.63 -0.35 15.34 15.46 0.65 -0.88 0.12 0.22 -1.71 0.00
13 -1.710 0.63 0.05 -13.89 -1.14 1.51 0.32 0.02 0.08 -3.23 0.07
14 0.997 0.63 -0.21 4.23 -0.27 -1.46 -2.81 0.07 -0.45 1.93 0.01
15 0.357 0.63 -0.17 -3.90 -4.24 1.31 2.70 -0.08 0.49 0.47 -0.09
16 0.434 0.63 0.32 13.47 5.54 -1.37 -0.37 -0.01 -0.13 1.00 0.00
17 -1.682 0.63 0.18 4.73 4.20 17.81 4.60 -0.12 -0.04 3.85 -0.04
18 0.942 0.63 -0.09 8.69 2.23 -1.35 6.57 0.08 0.26 2.95 -0.01
19 -0.358 0.63 0.29 -2.77 0.60 -8.37 3.46 -0.10 -0.05 1.34 -0.03
20 1.176 0.63 -0.39 -10.74 -7.13 -8.09 -14.79 0.13 -0.17 -7.98 0.06
21 -0.945 0.63 0.59 -9.22 -5.01 0.66 5.63 -0.05 -0.33 -3.29 -0.10
22 0.071 0.63 0.16 -1.44 5.02 -4.41 -0.27 0.10 0.14 -3.32 -0.15
23 2.180 0.63 -0.63 -1.07 -4.61 -4.12 0.47 0.07 -0.01 8.49 -0.01
24 -1.229 0.63 -0.14 11.63 4.50 7.87 -5.99 -0.12 0.20 -1.72 0.25
25 -0.873 0.63 0.59 -4.22 -3.68 4.64 2.77 -0.12 0.02 -2.52 0.11
26 -0.118 0.63 0.66 -3.44 -7.15 -1.84 4.31 0.07 -0.01 -1.65 -0.19
27 -1.040 0.63 -0.96 1.27 0.56 -0.91 -7.09 -0.05 0.01 2.01 0.12
28 2.110 0.63 -0.31 6.30 10.17 -1.90 -0.15 0.10 -0.03 2.33 -0.04
29 0.464 0.63 -0.07 6.53 3.16 -1.92 0.84 -0.01 0.04 -4.53 0.09
30 -0.277 0.63 -0.17 -0.86 0.85 0.16 -3.20 -0.02 -0.07 0.88 -0.05
31 1.032 0.63 0.37 -6.32 -3.78 1.47 1.52 0.03 0.04 0.38 0.10
32 -1.141 0.63 -0.14 0.55 -0.33 0.29 0.69 0.01 0.00 3.43 -0.14
33 0.515 0.63 -0.82 9.65 2.32 -1.43 -5.04 0.03 0.44 -0.76 -0.18
34 -0.625 0.63 0.41 2.44 -7.98 0.63 -2.35 -0.02 -0.09 -0.43 0.01
35 0.849 0.63 0.29 -6.36 0.56 0.22 4.00 0.06 -0.07 3.74 0.16
36 -0.661 0.63 0.11 -5.82 5.00 0.58 3.23 -0.07 -0.28 -2.38 0.00
37 0.270 0.63 -0.45 7.94 2.20 -2.98 -11.08 0.04 -0.04 0.35 0.17
38 0.515 0.63 0.46 2.39 -3.44 6.57 1.05 0.03 -0.07 0.54 -0.13
39 -0.952 0.63 0.16 -8.07 0.43 -1.90 7.18 -0.09 0.04 -0.61 -0.07
40 0.245 0.63 -0.18 -2.37 0.71 -1.69 2.69 0.02 0.08 -0.13 0.02
41 2.560 0.63 -0.16 -1.52 -0.34 -5.61 -2.22 0.12 0.11 2.08 0.11
42 0.059 0.63 -0.25 3.60 0.19 8.18 -3.39 0.05 -0.01 1.18 -0.11
43 -1.950 0.63 0.45 1.31 7.89 -2.23 4.25 -0.10 0.10 3.18 0.37
44 -0.591 0.63 -0.06 -3.49 -7.83 -0.35 1.20 -0.07 -0.19 -6.28 -0.37
45 0.376 0.63 -0.03 -13.52 -8.18 0.85 -1.66 0.06 -0.19 -0.69 -0.37
46 -0.181 0.63 0.04 8.94 9.85 -0.02 5.68 -0.11 -0.14 -0.65 0.08
47 -0.046 0.63 -0.09 -12.19 -12.28 -0.52 -6.49 0.04 0.31 2.66 0.14
48 -0.071 0.63 0.07 16.68 10.50 -0.31 2.30 0.02 0.02 -1.16 0.15
49 1.007 0.63 0.55 9.59 6.20 -3.21 -1.10 0.03 0.08 4.69 0.01

224
50 -0.635 0.63 -0.54 -0.79 0.06 -1.08 -5.29 -0.01 0.05 2.59 0.20
51 -1.294 0.63 -0.34 -7.50 -4.74 0.18 4.71 -0.06 -0.01 -4.40 0.01
52 1.000 0.63 0.32 -1.39 -1.63 4.09 1.53 0.04 -0.13 -2.72 -0.23
53 -1.173 0.63 0.09 -2.18 4.16 5.66 4.95 -0.19 -0.17 -3.74 0.07
54 1.563 0.63 -0.17 10.94 3.19 -0.87 -1.91 0.13 0.30 3.06 -0.07
55 -1.648 0.63 0.04 -6.02 -1.61 -2.11 -3.05 0.04 -0.26 -7.06 -0.09
56 1.336 0.63 0.03 -2.82 -5.83 -2.69 -0.15 0.02 0.12 7.90 0.09
57 0.660 0.63 0.51 -12.27 -9.55 -3.81 -1.54 0.09 -0.06 0.36 0.21
58 0.193 0.63 -0.09 0.52 -6.52 -3.52 2.75 0.00 0.07 0.80 -0.09
59 0.439 0.63 -0.38 6.89 11.35 6.25 0.85 -0.09 0.10 -4.26 0.06
60 -1.214 0.63 -0.06 4.76 4.62 1.07 -2.21 0.00 -0.11 3.27 -0.19
61 0.292 0.63 0.05 13.07 10.70 0.64 -2.23 0.18 -0.08 -4.12 -0.04
62 -0.328 0.63 -0.04 -11.15 -4.61 -1.40 -1.05 -0.14 0.14 15.19 0.33
63 -0.757 0.63 -0.34 -6.44 -4.57 1.96 -3.16 -0.04 -0.17 -6.40 -0.19
64 0.871 0.63 0.32 4.43 -1.63 -1.21 6.29 0.01 0.12 -4.50 -0.10
65 1.053 0.63 0.05 6.36 7.03 -2.21 8.53 0.12 -0.25 3.51 -0.16
66 -1.431 0.63 0.46 -12.52 -5.61 1.35 -7.74 -0.10 0.39 2.62 0.29
67 -0.104 0.63 -0.50 1.68 6.93 0.00 3.53 0.02 -0.01 -1.29 -0.07
68 0.560 0.63 -0.01 4.38 -8.46 0.85 -4.48 -0.03 -0.13 -4.67 -0.06
69 1.999 0.63 -0.37 15.98 10.36 -4.25 4.72 0.26 -0.02 -6.26 -0.26
70 -2.151 0.63 1.04 -34.90 -25.44 3.32 -1.36 -0.38 0.36 -3.80 0.44
71 0.313 0.63 -0.25 13.48 9.43 -0.14 -5.38 0.12 -0.36 -2.31 -0.35
72 -0.084 0.63 -0.43 5.34 5.54 1.07 1.86 0.00 0.02 12.54 0.17
73 -0.236 0.63 -0.07 -4.35 1.24 4.19 -3.79 0.04 0.11 1.96 0.05
74 1.042 0.63 0.00 13.10 -1.23 -0.57 4.75 -0.04 -0.01 -1.04 -0.09
75 0.623 0.63 0.20 -4.69 -3.69 -1.34 -4.26 0.01 0.10 1.77 0.06
76 -1.351 0.63 -0.14 -4.16 3.58 -2.30 3.15 -0.01 -0.19 -2.54 -0.02
77 0.114 0.63 -0.06 -8.57 -8.27 3.11 1.14 0.00 0.04 -3.49 -0.06
78 -1.617 0.63 -0.28 3.09 3.79 -4.93 -4.37 0.03 -0.22 -1.80 0.03
79 0.297 0.63 0.54 6.95 6.07 1.97 5.70 -0.05 0.16 2.74 0.13
80 -0.202 0.63 0.22 -4.18 -0.01 4.79 2.74 -0.12 0.04 -2.02 0.11
81 0.195 0.63 -0.21 4.77 4.52 -3.05 -1.11 0.25 -0.32 0.35 -0.19
82 0.497 0.63 -0.17 1.48 -2.11 -2.12 -2.38 -0.04 0.04 1.89 0.12
83 -0.412 0.63 0.15 -2.16 -2.50 0.37 0.58 -0.09 0.25 -0.05 -0.04
84 1.294 0.63 0.22 12.86 8.53 -2.69 5.53 0.01 0.15 2.04 -0.16
85 0.530 0.63 -0.38 13.81 7.06 2.45 -6.37 0.01 0.03 -3.50 -0.38
86 1.361 0.63 0.16 9.68 1.60 0.97 -1.81 0.13 -0.03 3.83 -0.07
87 -3.107 0.63 -0.01 -36.45 -17.29 -0.73 2.49 -0.16 -0.15 -2.21 0.61
88 -0.870 0.63 -0.62 -4.72 -2.76 -0.66 7.85 -0.11 0.00 12.06 0.05
89 0.993 0.63 0.12 5.56 0.27 -1.49 -2.15 0.19 -0.11 -5.84 -0.26
90 -0.367 0.63 0.33 -4.07 4.14 1.28 0.54 -0.01 0.08 -0.66 0.47
91 0.321 0.63 0.15 3.13 -1.75 0.85 -6.40 -0.06 0.04 -5.40 -0.27
92 -1.140 0.63 0.47 -2.47 -1.43 -1.80 1.35 -0.10 -0.12 3.15 -0.10
93 0.207 0.63 -0.13 9.14 6.27 0.09 -2.90 0.00 0.09 0.68 -0.07
94 -0.289 0.63 -0.09 -1.65 -0.69 0.31 -2.82 -0.07 0.12 -5.54 0.08
95 1.301 0.63 -0.26 -5.12 -4.25 1.39 4.21 0.17 -0.09 1.87 0.09
96 0.490 0.63 0.01 5.82 1.86 4.17 -2.64 0.07 0.08 -1.99 0.07
97 -1.751 0.63 -0.09 -13.90 -3.11 -0.81 8.87 -0.15 0.39 5.09 0.26
98 0.518 0.63 -0.21 -0.86 -4.07 0.27 -5.59 0.08 -0.26 -3.50 -0.34
99 0.821 0.63 0.28 8.84 5.21 -3.64 -0.80 0.00 -0.21 0.56 0.00
100 -0.461 0.63 0.09 -1.43 -6.09 -3.70 3.53 -0.05 -0.14 -0.18 -0.31
101 -0.627 0.63 -0.34 5.35 4.44 -1.60 -5.21 -0.03 -0.26 1.88 0.06
102 0.300 0.63 0.04 7.39 2.47 -0.78 1.66 0.00 0.26 0.53 -0.05
103 0.866 0.63 0.19 -11.41 -0.92 6.07 -0.14 0.08 0.14 -2.06 0.29

225
104 -0.077 0.63 0.05 -1.18 -1.84 -3.98 1.43 -0.04 0.02 3.12 0.09
105 0.700 0.63 0.12 -1.90 1.85 3.43 -1.52 0.03 -0.09 -5.61 -0.13
106 -0.686 0.63 -0.17 2.31 0.39 -0.59 -3.32 0.01 0.01 -1.45 0.10
107 0.140 0.63 -0.01 0.68 -0.50 1.13 3.25 0.01 0.06 4.11 -0.06
108 1.861 0.63 -0.66 7.86 3.41 -3.42 -1.95 0.12 -0.14 4.96 0.05
109 -0.420 0.63 -0.59 -1.69 -0.40 -1.54 7.54 0.02 -0.18 -9.20 -0.01
110 -0.132 0.63 1.79 10.85 12.64 5.03 -6.18 -0.07 0.01 -0.39 0.14
111 -1.231 0.63 -0.56 -17.12 -15.75 -0.08 0.43 -0.07 0.31 4.80 -0.19
112 -0.605 0.63 -0.37 -12.68 -11.14 5.03 -3.80 -0.04 -0.02 -0.72 0.09
113 0.146 0.63 0.37 7.10 8.73 7.99 -2.03 0.00 -0.14 -5.16 -0.13
114 0.587 0.63 0.08 14.48 5.10 -5.95 4.04 0.04 0.22 7.52 -0.07
115 -0.050 0.63 -0.10 -8.99 -2.79 -7.08 1.64 0.00 -0.07 -1.48 0.11
116 -0.497 0.63 0.30 1.65 -0.89 -1.25 -3.22 -0.03 0.06 -0.46 0.19
117 0.406 0.63 -0.29 -7.23 -0.69 -3.69 -3.25 0.07 -0.30 -0.38 -0.28
118 0.428 0.63 -0.42 2.98 -5.82 -0.35 8.40 -0.02 -0.03 -0.97 0.03
119 -0.259 0.63 0.40 2.51 7.29 5.28 -2.08 -0.02 0.27 1.97 0.04
120 1.725 0.63 0.09 6.03 5.91 -0.99 1.36 -0.13 0.19 -1.64 0.23
121 -1.387 0.63 -0.17 -11.52 -6.56 -1.66 3.46 0.05 -0.09 2.59 0.18
122 -0.812 0.63 0.04 4.52 1.97 4.05 -3.10 0.11 -0.24 7.52 -0.34
123 0.551 0.63 0.03 0.88 -1.42 -1.41 -1.87 -0.03 0.14 -8.31 -0.08
124 -1.321 0.63 0.05 -0.68 5.50 -2.65 0.22 -0.08 -0.16 -1.64 -0.09
125 1.949 0.63 -0.34 1.48 -4.26 0.74 -1.90 0.07 0.08 -3.83 0.01
126 -1.834 0.63 0.49 0.68 0.35 2.05 4.15 -0.01 0.04 2.92 0.18
127 -1.088 0.63 0.09 -0.60 1.45 -1.71 -1.86 -0.01 0.19 5.31 0.32
128 0.532 0.63 -0.34 8.02 6.64 -1.25 1.53 0.04 0.07 -2.04 0.01
129 0.593 0.63 -0.13 -5.27 -3.82 3.73 -0.05 0.03 -0.24 -3.96 -0.17
130 0.041 0.63 0.36 -2.24 -4.38 -0.78 0.22 -0.06 -0.03 0.86 -0.16
SE 0.729 0.63 0.27 4.71 4.13 3.42 5.05 0.07 0.19 4.81 0.17

226
Appendix 14. GCA of 33 lines and four testers for grain yield and agronomic traits for trials
evaluated at eight locations in Zimbabwe during 2017/2018 cropping season
Line GY DA ASI PH EH RL SL EPP HC ER EA
1 -0.158 -0.33 -0.17 4.43 -2.88 0.23 -0.85 0.06 0.46 -0.89 0.14
2 0.025 -0.64 0.36 -1.43 -0.31 0.58 0.30 0.11 -0.19 5.38 0.23
3 0.207 0.34 0.13 8.89 8.83 -0.58 -0.46 0.01 -0.62 -3.65 -0.15
4 0.031 -2.14 0.08 -9.47 -11.96 -1.56 -0.92 -0.07 0.01 0.61 -0.07
5 0.132 -1.16 0.02 0.84 -3.98 2.03 -0.29 0.04 2.07 -1.09 0.00
6 -0.028 -2.88 0.08 -15.18 -10.07 1.57 1.55 0.03 -0.16 -0.06 0.00
7 -0.107 -2.16 0.36 -10.54 -6.56 -0.97 -0.57 -0.05 2.02 0.16 0.07
8 0.580 1.03 -0.39 17.98 12.82 -4.65 -0.44 0.12 -0.62 -0.51 -0.04
9 0.578 0.43 0.18 5.12 4.54 3.26 -1.33 -0.01 -0.14 -2.30 -0.15
10 0.751 0.87 0.05 12.71 11.65 4.56 -0.83 -0.03 -0.62 -2.54 -0.23
11 0.917 1.23 0.13 21.96 16.41 5.38 -0.73 0.01 -0.49 -2.26 -0.22
12 -0.502 0.95 -0.01 5.37 -0.70 -2.25 -0.40 0.01 -0.62 -2.20 -0.04
13 0.566 2.09 0.11 -2.13 1.18 -1.13 -0.94 0.03 -0.62 -1.06 -0.10
14 0.334 0.00 0.27 -4.28 -1.24 -3.51 1.22 0.01 1.34 8.12 0.10
15 0.069 -1.38 0.00 9.90 2.90 -0.92 -1.49 -0.05 -0.19 -2.68 -0.11
16 -0.642 0.50 0.10 -6.90 -2.49 2.29 0.13 -0.02 -0.51 -2.55 0.20
17 -0.119 2.50 0.22 -6.35 -0.90 -3.29 -0.72 -0.07 -0.19 -2.67 0.06
18 -0.714 2.04 -0.21 -3.69 1.80 0.23 2.66 -0.07 0.75 -2.33 0.19
19 -0.475 -2.27 0.11 -8.46 -12.02 -0.77 -0.49 -0.07 1.21 -0.04 -0.11
20 -0.605 -1.53 -0.24 4.90 3.13 -0.04 -0.35 -0.09 -0.03 10.19 -0.01
21 -0.264 -2.46 0.05 -5.10 1.24 4.21 -0.40 -0.05 -0.52 4.15 0.09
22 -0.356 2.43 -0.25 -4.60 8.08 -2.32 2.96 0.02 0.09 -1.60 -0.04
23 0.207 1.83 0.10 6.93 1.18 -2.26 -0.59 -0.01 0.13 2.08 0.18
24 0.234 2.83 -0.07 7.04 0.16 -1.28 0.80 0.02 -0.01 1.61 0.25
25 -0.092 2.23 -0.12 -7.32 -0.07 0.12 2.06 0.00 -0.57 -2.71 0.12
26 -0.080 -0.57 0.21 -2.36 -9.42 0.72 0.23 -0.05 -0.20 0.51 -0.08
27 -0.557 -2.52 -0.29 -7.44 -6.48 0.97 -0.02 0.04 -0.32 2.56 0.16
28 1.067 2.23 -0.03 18.26 22.27 5.50 -0.60 0.04 -0.62 -1.46 -0.44
29 -0.447 -1.66 -0.15 -10.57 -9.45 -0.36 1.05 0.03 0.13 -1.13 -0.11
30 -0.419 -0.89 -0.10 -14.16 -7.57 -5.15 -0.05 0.08 -0.62 -1.28 0.08
31 0.426 2.97 -0.15 -2.60 -0.35 -2.32 0.00 0.02 -0.22 1.09 -0.05
32 -1.196 -4.30 -0.43 -7.70 -14.16 1.94 -1.05 -0.03 -0.23 -0.55 0.28
35 0.187 -1.07 -0.14 5.21 1.65 0.26 0.22 -0.05 0.01 1.53 -0.12
SE 0.190 0.35 0.15 2.34 1.98 2.03 0.85 0.02 0.42 1.50 0.06
Tester
1 -0.168 -1.75 0.05 -11.40 -12.81 2.05 1.05 -0.05 -0.11 2.36 0.09
2 -0.354 2.13 0.05 6.25 6.76 0.47 0.21 0.07 0.06 -1.29 0.07
3 0.101 0.56 0.15 7.84 4.79 -0.64 -0.27 -0.05 -0.05 -2.04 -0.19
4 0.399 -0.81 -0.25 -2.32 1.67 -1.85 -0.98 0.03 0.10 0.89 0.03
SE 0.085 0.21 0.07 0.72 1.01 1.21 0.33 0.02 0.14 0.75 0.02

227
Appendixn15. SCA of 130 hybrids for grain yield and agronomic traits for trials evaluated at eight
locations in Zimbabwe during 2017/2018 cropping season
Entry GY DA ASI PH EH RL SL EPP HC ER EA
1 -0.224 -0.64 -0.40 -2.20 -2.42 0.90 -0.26 0.05 -0.61 1.37 0.01
2 0.558 -0.83 0.29 3.28 0.51 -5.39 -0.74 -0.02 -0.85 0.13 -0.21
3 -0.570 0.55 0.07 -1.12 -0.03 -2.13 -0.31 -0.08 2.63 -0.44 0.13
4 0.258 0.79 0.03 -0.34 1.53 6.59 1.29 0.05 -1.18 -0.98 0.07
5 -0.170 -0.45 0.26 -6.65 -5.62 -3.35 -0.02 -0.08 -0.33 -3.65 -0.27
6 0.336 0.29 0.13 0.70 0.12 1.04 -1.55 0.02 -0.49 -0.16 0.22
7 -0.445 0.48 -0.09 4.11 3.96 0.09 2.38 0.03 -0.39 4.01 0.07
8 0.301 -0.46 -0.31 1.46 1.14 2.19 -0.83 0.03 1.20 -0.12 -0.02
9 -0.418 -0.87 -0.13 -2.59 -2.58 0.63 -0.79 -0.02 0.11 0.26 -0.08
10 -0.054 -1.19 0.24 -13.67 -6.84 1.95 0.61 0.02 -0.06 1.00 0.20
11 -0.247 1.00 0.08 -2.14 -3.31 -4.73 -0.81 0.00 0.05 1.96 0.05
12 0.741 0.93 -0.20 18.02 12.31 2.12 0.97 0.00 -0.10 -3.15 -0.17
13 -0.396 0.24 0.42 -3.91 -1.66 1.37 1.05 0.09 1.98 -0.83 0.09
14 0.144 -0.58 -0.02 -0.94 -0.60 -1.12 -0.24 -0.09 -0.69 -1.12 -0.10
15 -0.175 -0.14 -0.31 -6.59 -7.82 2.25 -0.76 0.00 -0.58 1.44 0.12
16 0.448 0.36 -0.09 11.07 9.67 -2.54 -0.06 -0.01 -0.72 0.59 -0.12
17 -0.540 -0.06 0.04 -2.04 -2.26 2.00 0.48 0.07 0.86 -0.14 0.01
18 0.253 -1.63 0.42 -2.81 -6.84 -0.60 -0.91 -0.04 -0.36 1.20 -0.02
19 0.091 1.56 -0.18 -1.90 2.94 1.03 -0.79 -0.03 -1.00 -0.07 0.05
20 0.217 0.00 -0.28 6.38 5.75 -2.46 1.21 0.00 0.50 -0.92 -0.05
21 -0.274 1.47 0.17 -5.40 -2.11 -0.16 -0.14 0.06 -0.36 -0.65 0.18
22 -0.033 -0.41 -0.40 5.08 4.88 -2.40 2.47 -0.08 0.05 0.47 -0.14
23 0.123 -1.09 0.32 -5.26 -1.90 2.83 -0.01 0.06 0.38 -0.61 0.05
24 0.206 -0.10 -0.09 5.21 -1.28 -0.30 -2.34 -0.05 -0.07 0.87 -0.10
25 -0.066 0.94 0.07 4.15 6.25 1.20 -0.46 0.00 -0.55 -1.27 -0.02
26 -0.608 -1.25 0.26 -2.69 -7.70 0.61 1.52 -0.04 0.49 1.09 0.04
27 0.462 0.13 -0.46 -6.47 -3.86 -3.08 -0.67 0.02 -0.09 -0.29 -0.06
28 0.234 0.06 0.13 4.63 4.89 1.24 -0.41 0.02 0.15 0.55 0.04
29 -0.173 -0.12 -0.05 -4.18 0.00 -1.39 1.14 -0.12 0.11 -1.55 0.05
30 -0.053 0.18 0.01 0.67 -0.51 -0.23 0.38 0.08 -0.06 -1.65 0.02
31 0.080 0.56 -0.09 0.14 2.39 3.43 -1.00 -0.08 0.05 -1.31 -0.07
32 0.167 -0.75 0.13 2.99 -2.30 -1.83 -0.53 0.12 -0.10 4.60 -0.01
33 0.299 0.35 0.01 7.55 3.91 -2.85 -0.60 -0.09 -0.38 1.17 -0.06
34 -0.561 0.15 -0.30 -1.35 3.71 -0.85 0.14 0.14 -0.54 -0.38 -0.09
35 -0.063 -0.09 0.16 -3.06 -8.39 3.05 0.10 -0.08 -0.44 3.61 0.13
36 0.346 -0.53 0.13 -3.53 0.36 0.63 0.36 0.03 1.35 -4.33 0.01
37 0.166 0.47 0.26 2.65 -1.01 -4.95 -1.17 0.01 0.11 -0.92 -0.03
38 -0.354 0.34 -0.18 -0.63 0.98 2.33 -0.91 -0.05 -0.06 1.54 -0.10
39 0.180 0.09 -0.15 -0.03 -2.06 3.87 2.21 0.01 0.05 1.09 0.03
40 0.030 -1.03 0.07 -2.37 1.69 -1.28 -0.14 0.02 -0.10 -1.63 0.10
41 0.574 -0.57 0.24 -3.66 -3.91 -2.48 -1.88 -0.09 -0.03 1.21 -0.13
42 -0.086 0.48 -0.13 -1.44 0.90 4.02 0.39 0.04 -0.19 -1.06 -0.07
43 0.276 0.17 0.02 5.41 2.24 -1.55 0.25 0.01 -0.08 1.45 0.02
44 -0.744 -0.21 -0.14 -0.68 0.36 -0.01 1.22 0.03 0.30 -1.52 0.18
45 -0.355 -2.29 -0.12 -7.51 -5.23 0.94 -1.47 0.03 0.11 1.32 0.15
46 0.417 0.89 -0.18 3.59 0.82 -3.17 1.16 -0.04 -0.06 0.18 -0.17
47 -0.268 -0.30 0.35 -0.19 1.54 2.39 -0.80 -0.02 0.05 0.25 0.02

228
48 0.227 1.57 -0.06 3.72 2.47 -0.19 1.09 0.03 -0.10 -1.67 -0.01
49 0.156 1.94 -0.18 4.05 4.14 -4.87 -1.67 -0.07 0.11 2.31 -0.17
50 -1.089 -1.32 -0.30 -8.60 -9.49 3.57 -0.74 -0.01 -0.06 0.64 0.21
51 0.903 0.50 -0.02 3.56 1.54 0.67 1.74 0.00 0.05 -0.18 -0.04
52 0.051 -1.25 0.50 0.60 3.41 0.61 0.66 0.07 -0.10 -2.69 -0.01
53 0.117 0.79 -0.40 -17.08 -1.87 0.60 3.23 0.05 -0.77 -2.07 0.05
54 0.239 -1.10 0.73 6.99 1.68 -3.71 -1.14 0.13 0.41 3.25 0.04
55 -0.394 -0.09 -0.12 1.65 -2.92 1.26 -1.07 -0.04 -1.04 -2.76 -0.14
56 0.060 0.28 -0.22 8.06 2.70 1.81 -1.02 -0.14 1.40 1.65 0.05
57 -0.571 0.35 0.06 -8.60 -5.39 0.31 -0.72 0.01 0.69 2.38 0.07
58 0.401 0.90 -0.94 5.62 5.66 -1.23 -0.67 -0.01 -0.49 -0.90 -0.06
59 0.404 -1.72 0.27 4.35 0.75 -0.52 0.85 0.00 -0.38 1.01 0.10
60 -0.213 0.34 0.61 -1.75 -1.44 1.42 0.52 -0.01 0.17 -2.41 -0.12
61 0.449 0.47 0.21 8.20 4.38 -0.78 -2.00 0.03 -0.01 -1.26 -0.18
62 -0.427 1.21 -0.48 -1.02 1.99 -3.27 -0.25 -0.10 -0.17 -0.46 0.16
63 -0.171 -0.28 0.18 -11.98 -6.98 2.24 2.14 0.04 -0.06 0.83 0.13
64 0.171 -1.53 0.08 4.43 0.20 1.78 0.10 0.02 0.24 0.97 -0.12
65 0.355 -0.15 0.15 4.21 -0.34 -1.17 -0.57 0.00 0.04 0.79 -0.10
66 -1.629 0.40 0.15 -9.38 -6.35 -2.28 0.39 -0.10 -0.10 -2.05 0.36
67 0.661 -0.16 -0.26 3.10 3.93 1.85 0.06 0.06 0.10 -1.56 -0.17
68 0.636 -0.22 -0.04 1.69 2.36 1.56 0.12 0.04 -0.04 2.89 -0.10
69 0.856 -0.39 -0.35 13.12 11.64 2.83 0.28 0.22 -1.27 -1.48 -0.17
70 -1.758 3.04 0.77 -28.60 -16.06 2.86 -0.19 -0.31 2.51 4.09 0.73
71 0.281 -0.27 -0.45 12.00 8.41 -4.46 -2.53 0.14 -0.84 -0.98 -0.24
72 0.642 -2.52 0.02 3.10 -4.41 -1.27 2.43 -0.05 -0.40 -1.55 -0.33
73 -0.056 -0.20 -0.24 -4.62 -0.16 2.61 0.15 0.09 -1.38 0.78 0.16
74 0.396 -1.77 0.51 2.73 -1.92 2.12 -1.15 -0.04 4.05 3.54 -0.09
75 0.212 0.73 -0.02 3.64 -3.07 -7.17 -1.19 0.03 -0.74 -0.37 0.04
76 -0.530 1.11 -0.25 -2.14 4.73 2.41 2.17 -0.09 -1.93 -3.86 -0.12
77 -0.477 1.07 -0.07 -3.29 0.63 4.22 -0.09 -0.03 0.89 3.09 0.09
78 -1.036 1.06 -0.23 5.91 4.27 0.69 -0.11 0.03 -0.54 -2.08 0.00
79 1.180 -0.13 0.36 3.25 1.45 -4.46 0.40 0.07 -0.29 -2.22 -0.03
80 -0.357 0.43 -0.24 7.65 -2.36 3.82 0.92 0.02 0.00 -5.00 0.15
81 0.670 0.36 -0.18 3.75 4.51 0.75 -0.67 0.01 -0.16 5.32 -0.29
82 0.002 -0.52 0.41 -4.72 -1.21 -2.60 0.31 -0.01 -0.06 -2.03 0.15
83 -0.294 -0.39 0.00 -7.06 -1.34 -2.00 -0.58 -0.03 0.22 1.79 -0.01
84 0.956 -1.90 -0.01 6.52 0.99 2.69 2.59 -0.03 -0.19 -2.20 -0.16
85 1.287 0.03 -0.07 14.19 15.48 -2.79 -1.50 0.14 -0.29 -2.21 -0.25
86 0.546 -1.72 -0.04 10.10 4.00 2.30 1.13 0.00 -0.66 -0.61 -0.25
87 -2.768 3.47 0.11 -31.18 -20.87 -2.23 -2.23 -0.12 1.14 5.10 0.66
88 -0.423 -1.92 0.09 -5.95 -4.30 -1.55 -1.16 -0.03 0.54 1.93 0.12
89 0.290 -0.49 -0.04 7.65 1.76 -0.79 -1.35 0.03 -0.81 0.85 -0.14
90 0.224 1.02 0.43 -1.44 4.04 -2.91 2.04 0.03 1.11 -0.61 -0.04
91 -0.070 1.26 -0.48 -0.65 -1.91 5.21 0.46 -0.03 -0.84 -2.10 0.06
92 -0.126 -1.11 -0.12 5.51 1.09 -1.85 3.50 -0.07 0.93 0.00 -0.08
93 0.351 -0.36 0.01 10.36 6.21 3.31 0.05 0.00 -0.67 0.56 0.01
94 0.193 -0.05 0.16 -9.98 -4.01 0.41 -1.79 0.01 0.45 -1.46 0.11
95 -0.397 1.39 -0.06 -6.26 -3.70 -1.91 -1.78 0.06 -0.71 0.98 -0.05
96 0.623 0.93 0.18 8.00 -0.23 -2.61 1.93 -0.02 0.05 -1.70 -0.13
97 -1.666 0.73 -0.19 -17.93 -3.56 -0.06 -0.05 -0.13 0.10 -2.09 0.24
98 0.176 -0.70 -0.04 3.14 2.47 1.76 -1.93 0.09 -0.01 1.84 -0.01
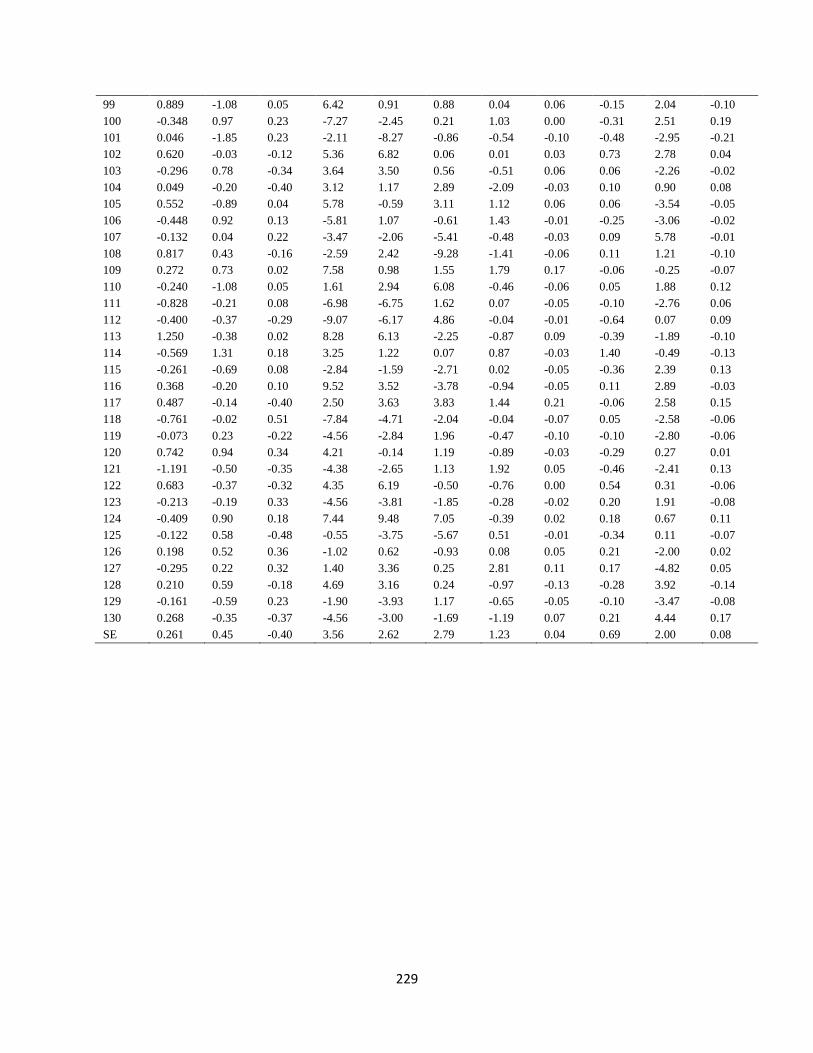
229
99 0.889 -1.08 0.05 6.42 0.91 0.88 0.04 0.06 -0.15 2.04 -0.10
100 -0.348 0.97 0.23 -7.27 -2.45 0.21 1.03 0.00 -0.31 2.51 0.19
101 0.046 -1.85 0.23 -2.11 -8.27 -0.86 -0.54 -0.10 -0.48 -2.95 -0.21
102 0.620 -0.03 -0.12 5.36 6.82 0.06 0.01 0.03 0.73 2.78 0.04
103 -0.296 0.78 -0.34 3.64 3.50 0.56 -0.51 0.06 0.06 -2.26 -0.02
104 0.049 -0.20 -0.40 3.12 1.17 2.89 -2.09 -0.03 0.10 0.90 0.08
105 0.552 -0.89 0.04 5.78 -0.59 3.11 1.12 0.06 0.06 -3.54 -0.05
106 -0.448 0.92 0.13 -5.81 1.07 -0.61 1.43 -0.01 -0.25 -3.06 -0.02
107 -0.132 0.04 0.22 -3.47 -2.06 -5.41 -0.48 -0.03 0.09 5.78 -0.01
108 0.817 0.43 -0.16 -2.59 2.42 -9.28 -1.41 -0.06 0.11 1.21 -0.10
109 0.272 0.73 0.02 7.58 0.98 1.55 1.79 0.17 -0.06 -0.25 -0.07
110 -0.240 -1.08 0.05 1.61 2.94 6.08 -0.46 -0.06 0.05 1.88 0.12
111 -0.828 -0.21 0.08 -6.98 -6.75 1.62 0.07 -0.05 -0.10 -2.76 0.06
112 -0.400 -0.37 -0.29 -9.07 -6.17 4.86 -0.04 -0.01 -0.64 0.07 0.09
113 1.250 -0.38 0.02 8.28 6.13 -2.25 -0.87 0.09 -0.39 -1.89 -0.10
114 -0.569 1.31 0.18 3.25 1.22 0.07 0.87 -0.03 1.40 -0.49 -0.13
115 -0.261 -0.69 0.08 -2.84 -1.59 -2.71 0.02 -0.05 -0.36 2.39 0.13
116 0.368 -0.20 0.10 9.52 3.52 -3.78 -0.94 -0.05 0.11 2.89 -0.03
117 0.487 -0.14 -0.40 2.50 3.63 3.83 1.44 0.21 -0.06 2.58 0.15
118 -0.761 -0.02 0.51 -7.84 -4.71 -2.04 -0.04 -0.07 0.05 -2.58 -0.06
119 -0.073 0.23 -0.22 -4.56 -2.84 1.96 -0.47 -0.10 -0.10 -2.80 -0.06
120 0.742 0.94 0.34 4.21 -0.14 1.19 -0.89 -0.03 -0.29 0.27 0.01
121 -1.191 -0.50 -0.35 -4.38 -2.65 1.13 1.92 0.05 -0.46 -2.41 0.13
122 0.683 -0.37 -0.32 4.35 6.19 -0.50 -0.76 0.00 0.54 0.31 -0.06
123 -0.213 -0.19 0.33 -4.56 -3.81 -1.85 -0.28 -0.02 0.20 1.91 -0.08
124 -0.409 0.90 0.18 7.44 9.48 7.05 -0.39 0.02 0.18 0.67 0.11
125 -0.122 0.58 -0.48 -0.55 -3.75 -5.67 0.51 -0.01 -0.34 0.11 -0.07
126 0.198 0.52 0.36 -1.02 0.62 -0.93 0.08 0.05 0.21 -2.00 0.02
127 -0.295 0.22 0.32 1.40 3.36 0.25 2.81 0.11 0.17 -4.82 0.05
128 0.210 0.59 -0.18 4.69 3.16 0.24 -0.97 -0.13 -0.28 3.92 -0.14
129 -0.161 -0.59 0.23 -1.90 -3.93 1.17 -0.65 -0.05 -0.10 -3.47 -0.08
130 0.268 -0.35 -0.37 -4.56 -3.00 -1.69 -1.19 0.07 0.21 4.44 0.17
SE 0.261 0.45 -0.40 3.56 2.62 2.79 1.23 0.04 0.69 2.00 0.08

230
Appendix 16. GCA of 33 lines and four testers for biochemical traits for self-pollinated seed
samples obtained from Cedara during 2017/2018 and 2018/2019 cropping seasons
Line Tryptophan Moisture Protein Oil Fibre Starch
1 0.008 0.11 -0.39 0.06 0.10 0.14
2 0.004 -0.08 0.17 -0.36 -0.03 0.58
3 0.003 0.50 -0.36 0.14 0.10 -0.06
4 -0.003 0.50 -0.24 -0.10 0.06 -0.03
5 -0.002 -0.24 -0.34 -0.57 -0.02 1.29
6 0.008 -0.58 -0.03 -0.15 -0.07 0.05
7 0.006 0.73 0.00 -0.05 0.16 -0.61
8 0.009 -0.18 0.46 0.42 0.17 -1.46
9 -0.005 -0.48 0.57 0.64 -0.14 -0.57
10 0.002 0.42 -0.06 0.15 -0.02 -0.06
11 0.003 -0.04 0.45 0.41 -0.07 -0.35
12 0.001 -0.10 0.03 0.54 0.01 -0.34
13 0.007 0.10 -0.66 -0.54 0.08 0.95
14 -0.007 0.19 -0.35 -0.12 0.05 -0.09
15 0.011 -0.14 0.60 -0.18 0.08 -1.82
16 0.003 0.26 -0.38 0.01 0.04 0.69
17 0.002 0.19 -0.20 0.51 -0.06 -0.57
18 0.015 0.29 -0.59 0.31 0.00 0.43
19 -0.008 -0.12 0.28 -0.65 -0.10 0.63
20 -0.010 -0.16 0.47 -0.37 -0.14 0.52
21 -0.003 -0.41 0.33 0.36 0.08 0.04
22 -0.015 0.16 0.06 -0.54 0.02 0.07
23 0.006 0.05 0.09 0.35 0.04 -1.06
24 0.001 0.11 -0.08 0.29 0.05 -0.56
25 0.002 0.07 -0.08 0.04 -0.10 0.07
26 -0.003 -0.02 -0.47 0.15 0.03 0.09
27 0.004 0.04 -0.33 -0.40 -0.01 0.68
28 -0.003 0.51 0.40 0.51 -0.07 -0.70
29 -0.011 -0.10 -0.12 -0.72 -0.13 1.56
30 -0.007 -0.13 0.18 0.48 -0.08 0.07
31 0.002 -0.47 -0.07 -0.63 -0.06 1.00
32 -0.017 -0.97 0.19 -0.05 0.07 0.20
35 -0.009 -0.32 0.63 -0.06 -0.06 -0.61
SE 0.003 0.28 0.19 0.18 -1.65 0.34
Tester
1 0.012 0.03 -0.22 0.34 0.16 -0.71
2 0.010 0.15 -0.25 0.26 -0.06 0.08
3 -0.009 -0.04 0.13 -0.34 -0.02 0.60
4 -0.013 -0.13 0.33 -0.23 -0.09 0.04
SE 0.001 0.10 0.11 0.09 0.03 0.17

231
Appendix 17. SCA of 130 hybrids for biochemical traits for self-pollinated seed samples obtained
from Cedara during 2017/2018 and 2018/2019 cropping seasons
Entry Pedigree Tryptophan Moisture Protein Oil Fibre Starch
1 L1 x CZL15049 (QPM) -0.003 0.39 0.10 0.37 0.15 -1.40
2 L1 x CZL059 (QPM) 0.009 -0.29 0.14 -0.26 0.05 0.23
3 L1 x CML444 (non-QPM) 0.001 -0.03 0.03 0.24 -0.12 -0.17
4 L1 x CML395 (non-QPM) -0.007 -0.08 -0.25 -0.37 -0.08 1.33
5 L2 x CZL15049 (QPM) 0.000 0.21 0.16 -0.05 -0.02 0.15
6 L2 x CZL059 (QPM) 0.013 0.22 -0.19 -0.21 0.01 0.10
7 L2 x CML444 (non-QPM) -0.003 0.09 -0.34 0.03 0.00 0.30
8 L2 x CML395 (non-QPM) -0.011 -0.52 0.39 0.20 0.01 -0.54
9 L3 x CZL15049 (QPM) 0.001 -0.06 0.17 0.39 0.01 -0.97
10 L3 x CZL059 (QPM) -0.005 0.21 -0.23 -1.13 -0.03 1.35
11 L3 x CML444 (non-QPM) -0.005 -0.46 0.42 0.30 0.00 -0.43
12 L3 x CML395 (non-QPM) 0.007 0.30 -0.35 0.43 0.02 0.05
13 L4 x CZL15049 (QPM) -0.019 0.36 -0.01 -0.23 0.04 0.01
14 L4 x CZL059 (QPM) 0.002 -0.59 -0.36 0.15 0.04 -0.03
15 L4 x CML444 (non-QPM) 0.002 0.28 0.21 -0.11 0.01 0.07
16 L4 x CML395 (non-QPM) 0.015 -0.06 0.17 0.17 -0.09 -0.06
17 L5 x CZL15049 (QPM) 0.003 -0.10 -0.37 0.61 -0.02 0.31
18 L5 x CZL059 (QPM) 0.010 0.12 -0.07 -0.28 -0.02 0.57
19 L5 x CML444 (non-QPM) -0.002 0.39 0.00 -0.21 0.08 -0.15
20 L5 x CML395 (non-QPM) -0.011 -0.41 0.46 -0.14 -0.05 -0.74
21 L6 x CZL15049 (QPM) -0.002 -0.25 -0.27 -0.05 -0.01 0.54
22 L6 x CZL059 (QPM) -0.002 0.12 -0.29 0.09 -0.03 0.17
23 L6 x CML444 (non-QPM) 0.003 0.32 0.03 0.07 0.08 -0.46
24 L6 x CML395 (non-QPM) 0.000 -0.20 0.54 -0.13 -0.04 -0.26
25 L7 x CZL15049 (QPM) -0.007 0.37 -0.91 -0.52 0.01 2.08
26 L7 x CZL059 (QPM) -0.002 0.35 -0.04 -0.61 0.04 0.00
27 L7 x CML444 (non-QPM) -0.002 -1.05 0.50 1.00 0.00 -1.46
28 L7 x CML395 (non-QPM) 0.010 0.32 0.47 0.12 -0.05 -0.63
29 L8 x CZL15049 (QPM) 0.006 -0.61 0.35 -0.27 -0.08 -0.31
30 L8 x CZL059 (QPM) 0.003 0.10 0.29 -0.13 0.01 0.27
31 L8 x CML444 (non-QPM) 0.001 -0.29 -0.24 0.02 0.00 0.19
32 L8 x CML395 (non-QPM) -0.010 0.79 -0.38 0.37 0.08 -0.15
33 L9 x CZL15049 (QPM) 0.017 0.44 0.16 -0.15 -0.06 0.01
34 L9 x CZL059 (QPM) -0.023 -0.38 0.38 -0.30 -0.06 -0.10
35 L9 x CML444 (non-QPM) -0.003 0.27 -0.70 0.42 0.05 0.30
36 L9 x CML395 (non-QPM) 0.009 -0.34 0.17 0.02 0.07 -0.22
37 L10 x CZL15049 (QPM) 0.018 0.75 0.02 0.34 0.17 -1.53
38 L10 x CZL059 (QPM) -0.003 -0.58 -0.03 0.12 0.00 1.07
39 L10 x CML444 (non-QPM) -0.007 0.22 -0.19 -0.38 -0.15 0.76
40 L10 x CML395 (non-QPM) -0.009 -0.40 0.21 -0.10 -0.01 -0.30
41 L11 x CZL15049 (QPM) 0.003 -0.35 -0.26 -0.21 0.01 0.77
42 L11 x CZL059 (QPM) 0.007 0.81 0.41 0.24 -0.09 -0.19

232
43 L11 x CML444 (non-QPM) 0.001 0.68 -0.35 -0.01 0.00 0.20
44 L11 x CML395 (non-QPM) -0.012 -1.14 0.21 -0.03 0.09 -0.80
45 L12 x CZL15049 (QPM) 0.014 0.26 -0.27 -0.52 0.05 1.00
46 L12 x CZL059 (QPM) -0.008 0.21 -0.39 0.38 0.01 0.07
47 L12 x CML444 (non-QPM) -0.009 -0.88 0.33 -0.23 -0.07 -0.34
48 L12 x CML395 (non-QPM) 0.002 0.40 0.34 0.36 0.01 -0.74
49 L13 x CZL15049 (QPM) 0.011 0.23 0.11 -0.38 0.00 -0.12
50 L13 x CZL059 (QPM) 0.004 0.01 0.30 -0.14 0.01 -0.07
51 L13 x CML444 (non-QPM) -0.006 -0.82 -0.18 0.45 0.03 0.18
52 L13 x CML395 (non-QPM) -0.009 0.57 -0.21 0.06 -0.04 0.00
53 L14 x CZL15049 (QPM) -0.015 -0.23 -0.24 -0.38 0.10 0.35
54 L14 x CZL059 (QPM) -0.001 -0.05 0.32 0.08 -0.10 0.19
55 L14 x CML444 (non-QPM) 0.014 -0.05 -0.13 1.00 0.03 -0.86
56 L14 x CML395 (non-QPM) 0.002 0.32 0.07 -0.71 -0.03 0.32
57 L15 x CZL15049 (QPM) -0.003 -0.28 0.20 -0.33 0.00 -0.98
58 L15 x CZL059 (QPM) -0.001 -1.03 0.02 -0.03 -0.03 0.94
59 L15 x CML444 (non-QPM) -0.006 0.62 0.11 -0.05 0.03 0.04
60 L15 x CML395 (non-QPM) 0.009 0.68 -0.32 0.39 0.01 0.00
61 L16 x CZL15049 (QPM) 0.001 0.74 0.45 -0.17 0.12 -1.35
62 L16 x CZL059 (QPM) 0.004 -0.57 -0.31 0.11 -0.07 1.26
63 L16 x CML444 (non-QPM) 0.004 0.20 0.50 0.06 -0.12 -0.71
64 L16 x CML395 (non-QPM) -0.010 -0.38 -0.62 -0.02 0.07 0.79
65 L17 x CZL15049 (QPM) 0.007 0.06 0.49 0.94 0.01 -1.44
66 L17 x CZL059 (QPM) 0.005 0.04 -0.30 0.05 -0.05 0.23
67 L17 x CML444 (non-QPM) 0.000 0.13 -0.57 -0.41 0.07 1.05
68 L17 x CML395 (non-QPM) -0.013 -0.24 0.40 -0.59 -0.04 0.16
69 L18 x CZL15049 (QPM) -0.002 -0.12 -0.40 0.12 -0.08 0.06
70 L18 x CZL059 (QPM) 0.009 0.44 0.38 -0.12 0.07 -0.91
71 L18 x CML444 (non-QPM) -0.012 -0.15 -0.36 0.10 0.01 0.57
72 L18 x CML395 (non-QPM) 0.005 -0.17 0.40 -0.12 0.01 0.28
73 L19 x CZL15049 (non-QPM) -0.001 0.25 0.01 0.03 -0.07 0.41
74 L19 x CZL059 (non-QPM) -0.006 -0.82 0.60 -0.05 0.01 -1.38
75 L19 x CML444 (non-QPM) -0.003 0.12 -0.01 -0.30 0.00 0.47
76 L19 x CML395 (non-QPM) 0.008 0.43 -0.59 0.31 0.06 0.50
77 L20 x CZL15049 (non-QPM) -0.010 0.09 0.10 0.50 -0.11 0.18
78 L20 x CML444 (non-QPM) 0.025 0.32 0.17 -0.38 -0.07 -0.58
79 L20 x CML395 (non-QPM) -0.005 -0.26 -0.50 0.12 0.12 0.47
80 L21 x CZL15049 (non-QPM) -0.009 -0.18 0.17 0.07 -0.03 0.31
81 L21 x CZL059 (non-QPM) -0.002 0.42 -0.64 0.36 0.01 0.42
82 L21 x CML444 (non-QPM) 0.019 0.05 -0.05 -0.09 0.05 -0.09
83 L21 x CML395 (non-QPM) -0.009 -0.31 0.54 -0.35 -0.03 -0.64
84 L22 x CZL15049 (non-QPM) -0.010 0.18 -0.34 0.37 -0.08 0.72
85 L22 x CZL059 (non-QPM) -0.007 0.44 -0.55 -0.07 0.02 0.85
86 L22 x CML444 (non-QPM) 0.006 -0.01 -0.25 -0.11 -0.04 0.88
87 L22 x CML395 (non-QPM) 0.010 -0.61 1.14 -0.20 0.11 -2.45
88 L23 x CZL15049 (QPM) 0.000 -0.35 0.01 0.18 -0.01 0.11
89 L23 x CZL059 (QPM) 0.002 0.67 0.35 -0.22 0.02 -1.16

233
90 L23 x CML444 (non-QPM) -0.004 0.02 -0.36 -0.25 -0.02 0.95
91 L23 x CML395 (non-QPM) 0.001 -0.34 0.01 0.28 0.01 0.10
92 L24 x CZL15049 (QPM) 0.009 -0.16 -0.20 -0.44 0.06 0.18
93 L24 x CZL059 (QPM) -0.001 -0.20 0.44 0.50 0.00 -0.74
94 L24 x CML444 (non-QPM) -0.001 -0.22 0.07 -0.05 0.04 0.01
95 L24 x CML395 (non-QPM) -0.008 0.57 -0.29 -0.02 -0.10 0.55
96 L25 x CZL15049 (QPM) 0.002 -0.54 -0.14 -0.01 0.01 0.43
97 L25 x CZL059 (QPM) 0.002 0.08 0.17 -0.55 -0.06 0.49
98 L25 x CML444 (non-QPM) -0.009 0.26 -0.40 0.01 0.02 -0.03
99 L25 x CML395 (non-QPM) 0.005 0.18 0.39 0.54 0.02 -0.89
100 L26 x CZL15049 (QPM) 0.008 -0.07 0.03 0.33 0.15 -0.44
101 L26 x CZL059 (QPM) -0.006 0.38 -0.13 0.38 -0.07 0.02
102 L26 x CML444 (non-QPM) -0.007 -0.09 0.25 0.04 0.03 -0.73
103 L26 x CML395 (non-QPM) 0.004 -0.24 -0.14 -0.77 -0.11 1.15
104 L27 x CZL15049 (QPM) 0.002 -0.05 -0.04 -0.23 -0.12 0.27
105 L27 x CZL059 (QPM) 0.010 -0.05 -0.32 -0.11 0.07 0.24
106 L27 x CML444 (non-QPM) -0.008 -0.37 0.82 0.30 0.02 -1.36
107 L27 x CML395 (non-QPM) -0.005 0.46 -0.45 0.03 0.03 0.84
108 L28 x CZL15049 (non-QPM) -0.002 0.33 0.03 0.07 0.11 -0.46
109 L28 x CZL059 (non-QPM) -0.004 -0.70 0.29 0.66 -0.03 -1.22
110 L28 x CML444 (non-QPM) 0.000 0.94 -0.23 -0.62 -0.10 1.11
111 L28 x CML395 (non-QPM) 0.005 -0.58 -0.08 -0.13 0.02 0.57
112 L29 x CZL15049 (non-QPM) 0.000 0.37 -0.56 -0.41 -0.01 1.37
113 L29 x CZL059 (non-QPM) -0.014 -0.41 0.20 0.02 -0.01 -0.39
114 L29 x CML444 (non-QPM) -0.002 -0.08 0.21 -0.05 0.07 -0.28
115 L29 x CML395 (non-QPM) 0.015 0.11 0.16 0.42 -0.05 -0.70
116 L30 x CZL15049 (non-QPM) -0.008 -0.28 -0.03 0.81 -0.08 0.07
117 L30 x CZL059 (non-QPM) -0.011 0.15 -0.37 0.50 0.20 -0.63
118 L30 x CML444 (non-QPM) 0.004 0.21 0.41 -1.28 0.03 0.33
119 L30 x CML395 (non-QPM) 0.014 -0.10 0.00 -0.04 -0.15 0.23
120 L31 x CZL15049 (QPM) 0.013 -0.14 -0.33 -0.41 0.02 0.63
121 L31 x CZL059 (QPM) 0.006 -0.22 0.20 -0.13 0.06 -0.26
122 L31 x CML444 (non-QPM) -0.004 -0.28 0.47 0.50 -0.10 -0.57
123 L31 x CML395 (non-QPM) -0.016 0.63 -0.33 0.03 0.02 0.20
124 L32 x CZL15049 (non-QPM) -0.010 -0.11 0.23 0.18 -0.11 -0.18
125 L32 x CML444 (non-QPM) 0.011 -0.02 0.06 0.19 0.01 -0.04
126 L32 x CML395 (non-QPM) 0.009 0.28 -0.53 -0.14 0.05 0.29
127 L35 x CZL15049 (non-QPM) -0.008 -0.85 1.41 -0.44 -0.15 -0.94
128 L35 x CZL059 (non-QPM) -0.010 0.25 0.22 0.42 -0.06 -0.84
129 L35 x CML444 (non-QPM) 0.006 -0.03 -0.40 -0.10 0.13 0.67
130 L35 x CML395 (non-QPM) 0.010 0.62 -1.21 0.11 0.08 1.11
SE 0.005 0.40 0.30 0.36 0.06 0.57

234
Appendix 18. GCA of 33 lines and four testers for biochemical traits for self-pollinated seed
samples obtained from Potchefstroom during 2017/2018 and 2018/2019 cropping seasons
Line Tryptophan Moisture Protein Oil Fibre Starch
1 0.012 -0.38 -0.39 0.47 0.00 0.36
2 -0.002 -0.19 0.10 -0.05 -0.03 0.67
3 0.004 -0.11 -0.50 -0.02 0.06 0.44
4 0.002 0.24 0.11 -0.35 0.11 -0.45
5 -0.001 -0.28 0.46 -0.30 0.00 0.21
6 0.004 0.31 -0.53 0.10 -0.07 0.12
7 0.005 0.60 -0.69 -0.42 0.20 0.58
8 0.000 0.07 -0.08 0.27 0.07 -0.57
9 0.002 -0.21 0.37 0.31 -0.17 -0.13
10 -0.001 0.29 -0.12 0.53 0.11 -0.57
11 -0.005 0.03 0.35 0.68 -0.09 -0.81
12 0.013 -0.12 -0.32 0.47 0.00 -0.16
13 0.004 0.19 -0.68 -0.41 0.10 1.06
14 0.006 0.87 -0.61 -0.55 0.08 1.12
15 0.016 -0.30 0.54 -0.03 0.08 -1.91
16 0.002 0.30 -0.40 -0.28 0.02 1.06
17 0.008 0.83 0.06 0.26 -0.03 -0.90
18 0.002 0.30 -0.68 0.17 0.02 0.82
19 -0.012 0.00 0.16 -0.72 -0.06 0.38
20 -0.009 -0.69 0.33 -0.38 -0.12 0.64
21 -0.012 -0.18 0.19 0.37 0.00 0.02
22 -0.014 -0.21 0.43 -0.35 0.00 -0.75
23 0.005 0.56 0.00 0.50 0.11 -1.22
24 0.010 0.27 0.23 0.40 0.04 -1.16
25 0.003 0.43 -0.09 -0.22 -0.10 0.52
26 0.002 0.02 -0.84 0.06 0.08 1.22
27 0.001 -0.85 0.20 -0.41 -0.04 0.47
28 -0.011 -0.36 1.26 0.45 0.01 -2.02
29 -0.010 -0.65 0.23 -0.12 -0.12 1.03
30 -0.006 -0.21 -0.18 0.73 -0.07 0.34
31 0.007 -0.18 -0.23 -0.36 -0.16 0.74
32 -0.015 -0.65 1.00 -0.70 0.06 -0.56
35 -0.015 -0.07 0.66 -0.39 -0.10 -0.57
SE 0.003 0.41 0.24 0.22 0.05 0.44
Tester 1 0.015 0.08 -0.29 0.37 0.15 -0.54
2 0.016 0.15 -0.27 -0.03 -0.04 0.16
3 -0.014 0.11 0.17 -0.32 -0.01 0.72
4 -0.016 -0.33 0.38 -0.02 -0.10 -0.34
SE 0.002 0.10 0.21 0.05 0.04 0.23

235
Appendix 19. SCA of 130 hybrids for biochemical traits for self-pollinated seed samples obtained
from Potchefstroom during 2017/2018 and 2018/2019 cropping seasons
Entry Pedigree Tryptophan Moisture Protein Oil Fibre Starch
1 L1 x CZL15049 (QPM) -0.010 -0.47 -0.39 -0.49 -0.03 0.46
2 L1 x CZL059 (QPM) 0.005 0.28 0.59 0.17 0.07 -1.13
3 L1 x CML444 (non-QPM) 0.006 0.41 -0.14 0.31 -0.07 0.23
4 L1 x CML395 (non-QPM) -0.002 -0.23 -0.05 0.01 0.04 0.43
5 L2 x CZL15049 (QPM) 0.006 -0.13 0.13 -0.07 0.07 -0.10
6 L2 x CZL059 (QPM) 0.006 0.37 -0.12 -0.23 0.03 0.52
7 L2 x CML444 (non-QPM) -0.009 -0.68 0.08 0.40 -0.02 -0.33
8 L2 x CML395 (non-QPM) -0.004 0.43 -0.07 -0.10 -0.08 -0.10
9 L3 x CZL15049 (QPM) 0.001 -0.47 0.09 0.31 -0.01 -0.32
10 L3 x CZL059 (QPM) -0.002 -0.83 -0.36 -0.44 -0.02 1.33
11 L3 x CML444 (non-QPM) -0.002 0.49 0.06 0.16 -0.05 0.23
12 L3 x CML395 (non-QPM) 0.002 0.80 0.23 -0.02 0.09 -1.26
13 L4 x CZL15049 (QPM) 0.006 1.24 -0.83 0.48 0.06 0.71
14 L4 x CZL059 (QPM) 0.004 -0.88 0.43 -0.65 0.09 -0.18
15 L4 x CML444 (non-QPM) -0.009 0.21 -0.07 0.62 0.04 -0.68
16 L4 x CML395 (non-QPM) -0.003 -0.57 0.49 -0.44 -0.19 0.14
17 L5 x CZL15049 (QPM) 0.007 -0.22 0.73 -0.51 -0.04 0.04
18 L5 x CZL059 (QPM) 0.007 0.33 -0.08 -0.20 0.04 0.38
19 L5 x CML444 (non-QPM) -0.010 0.52 -0.68 0.29 -0.02 0.16
20 L5 x CML395 (non-QPM) -0.004 -0.64 0.05 0.43 0.02 -0.59
21 L6 x CZL15049 (QPM) 0.012 -0.61 0.40 0.08 0.02 -0.62
22 L6 x CZL059 (QPM) -0.002 0.64 -0.49 -0.59 -0.11 1.01
23 L6 x CML444 (non-QPM) -0.009 -0.18 -0.14 0.92 0.08 -0.83
24 L6 x CML395 (non-QPM) -0.002 0.14 0.26 -0.40 0.01 0.42
25 L7 x CZL15049 (QPM) 0.004 -0.06 0.17 0.11 0.11 -0.57
26 L7 x CZL059 (QPM) 0.009 -0.18 -0.30 0.02 -0.07 0.75
27 L7 x CML444 (non-QPM) -0.012 0.73 0.27 0.19 0.11 -0.28
28 L7 x CML395 (non-QPM) -0.001 -0.50 -0.12 -0.32 -0.15 0.10
29 L8 x CZL15049 (QPM) 0.009 -0.48 0.68 0.41 0.04 -1.55
30 L8 x CZL059 (QPM) 0.006 0.92 -0.41 0.00 -0.02 0.40
31 L8 x CML444 (non-QPM) -0.012 -0.61 -0.04 -0.44 0.00 0.66
32 L8 x CML395 (non-QPM) -0.004 0.17 -0.22 0.04 -0.02 0.48
33 L9 x CZL15049 (QPM) 0.003 0.40 0.07 -0.12 -0.01 0.26
34 L9 x CZL059 (QPM) 0.004 0.15 0.35 -0.13 -0.09 0.12
35 L9 x CML444 (non-QPM) -0.002 -0.45 -0.10 0.37 0.00 -0.64
36 L9 x CML395 (non-QPM) -0.005 -0.11 -0.31 -0.12 0.11 0.25
37 L10 x CZL15049 (QPM) 0.004 1.59 -0.60 -0.12 0.27 -0.46
38 L10 x CZL059 (QPM) -0.010 -0.43 0.19 -0.17 -0.02 0.31
39 L10 x CML444 (non-QPM) 0.008 -0.99 0.33 -0.28 -0.25 0.32
40 L10 x CML395 (non-QPM) -0.002 -0.18 0.09 0.57 0.00 -0.18
41 L11 x CZL15049 (QPM) 0.012 -0.49 0.03 -0.15 -0.10 0.49
42 L11 x CZL059 (QPM) 0.005 -0.44 0.75 0.05 -0.07 -0.81
43 L11 x CML444 (non-QPM) -0.010 0.06 0.05 0.24 0.11 -0.23
44 L11 x CML395 (non-QPM) -0.007 0.87 -0.82 -0.14 0.07 0.54

236
45 L12 x CZL15049 (QPM) 0.012 -0.34 -0.09 0.60 0.14 -0.85
46 L12 x CZL059 (QPM) -0.003 -0.21 0.35 -0.25 -0.02 0.07
47 L12 x CML444 (non-QPM) -0.008 -0.49 0.42 -0.36 -0.19 0.06
48 L12 x CML395 (non-QPM) -0.002 1.03 -0.66 0.02 0.08 0.71
49 L13 x CZL15049 (QPM) 0.000 0.68 -0.42 0.34 0.21 -0.74
50 L13 x CZL059 (QPM) -0.002 0.42 0.46 -0.35 0.02 -0.80
51 L13 x CML444 (non-QPM) 0.002 -0.65 0.05 0.13 -0.07 1.25
52 L13 x CML395 (non-QPM) -0.001 -0.47 -0.08 -0.12 -0.15 0.28
53 L14 x CZL15049 (QPM) 0.001 -0.18 0.18 -0.21 0.01 0.26
54 L14 x CZL059 (QPM) 0.000 0.23 -0.17 0.03 0.01 0.12
55 L14 x CML444 (non-QPM) 0.010 0.31 0.27 0.09 0.05 -0.51
56 L14 x CML395 (non-QPM) -0.012 -0.37 -0.26 0.09 -0.07 0.12
57 L15 x CZL15049 (QPM) 0.011 -0.27 -0.37 0.44 0.00 -0.26
58 L15 x CZL059 (QPM) -0.009 0.31 -0.58 -0.43 0.01 1.38
59 L15 x CML444 (non-QPM) -0.003 0.21 0.56 -0.20 -0.03 -0.39
60 L15 x CML395 (non-QPM) 0.000 -0.26 0.40 0.19 0.03 -0.73
61 L16 x CZL15049 (QPM) 0.001 0.29 -0.52 0.21 0.09 0.22
62 L16 x CZL059 (QPM) 0.001 -0.06 0.45 -0.06 -0.08 -0.50
63 L16 x CML444 (non-QPM) 0.003 -0.44 -0.05 0.03 -0.02 0.44
64 L16 x CML395 (non-QPM) -0.006 0.20 0.14 -0.18 0.02 -0.17
65 L17 x CZL15049 (QPM) -0.006 0.71 -0.03 -0.09 0.11 -0.49
66 L17 x CZL059 (QPM) -0.001 -0.78 0.25 0.17 -0.17 -0.32
67 L17 x CML444 (non-QPM) 0.004 0.81 -0.55 -0.15 0.00 0.88
68 L17 x CML395 (non-QPM) 0.003 -0.75 0.34 0.07 0.07 -0.09
69 L18 x CZL15049 (QPM) 0.005 -0.22 -0.51 0.23 0.01 0.64
70 L18 x CZL059 (QPM) 0.010 0.69 -0.19 0.12 0.02 -0.48
71 L18 x CML444 (non-QPM) -0.001 -0.08 -0.19 -0.35 0.03 0.35
72 L18 x CML395 (non-QPM) -0.015 -0.40 0.90 0.01 -0.06 -0.53
73 L19 x CZL15049 (non-QPM) -0.011 -0.05 0.44 -0.14 -0.07 0.23
74 L19 x CZL059 (non-QPM) -0.005 -0.31 0.05 0.34 -0.04 -0.34
75 L19 x CML444 (non-QPM) 0.007 0.17 -0.44 -0.18 -0.01 0.30
76 L19 x CML395 (non-QPM) 0.008 0.18 -0.04 -0.03 0.11 -0.20
77 L20 x CZL15049 (non-QPM) -0.005 -0.22 0.86 0.12 -0.03 -0.95
78 L20 x CML444 (non-QPM) 0.015 -0.08 -0.24 -0.92 -0.12 0.61
79 L20 x CML395 (non-QPM) 0.005 0.44 -0.88 0.78 0.11 0.49
80 L21 x CZL15049 (non-QPM) -0.015 -0.85 0.21 -0.08 -0.07 0.59
81 L21 x CZL059 (non-QPM) -0.009 0.41 -0.03 0.43 0.04 -0.06
82 L21 x CML444 (non-QPM) 0.011 0.52 -0.08 -0.33 0.10 -0.47
83 L21 x CML395 (non-QPM) 0.012 -0.08 -0.08 -0.01 -0.07 -0.07
84 L22 x CZL15049 (non-QPM) -0.016 0.64 -0.17 -0.13 -0.07 -0.01
85 L22 x CZL059 (non-QPM) -0.013 -0.31 -0.30 0.33 -0.06 0.43
86 L22 x CML444 (non-QPM) 0.014 0.43 -0.26 0.12 -0.04 0.40
87 L22 x CML395 (non-QPM) 0.014 -0.76 0.75 -0.33 0.17 -0.83
88 L23 x CZL15049 (QPM) 0.000 -0.58 0.36 -0.24 -0.10 -0.47
89 L23 x CZL059 (QPM) 0.001 -0.19 -0.41 0.16 -0.01 0.47
90 L23 x CML444 (non-QPM) -0.012 0.21 -0.11 0.11 0.14 0.10
91 L23 x CML395 (non-QPM) 0.010 0.55 0.17 -0.03 -0.03 -0.12
92 L24 x CZL15049 (QPM) -0.005 0.41 0.08 -0.52 -0.14 0.06

237
93 L24 x CZL059 (QPM) -0.005 -0.08 -0.30 0.49 0.08 -0.52
94 L24 x CML444 (non-QPM) 0.014 -0.11 -0.14 -0.07 0.03 0.38
95 L24 x CML395 (non-QPM) -0.005 -0.22 0.38 0.10 0.04 0.07
96 L25 x CZL15049 (QPM) 0.011 -0.05 -0.33 -0.54 -0.08 1.26
97 L25 x CZL059 (QPM) 0.004 0.16 0.53 0.07 0.10 -0.89
98 L25 x CML444 (non-QPM) -0.019 0.26 0.47 -0.16 0.01 -0.90
99 L25 x CML395 (non-QPM) 0.004 -0.38 -0.66 0.63 -0.03 0.52
100 L26 x CZL15049 (QPM) 0.002 -0.70 -0.17 -0.73 -0.05 0.96
101 L26 x CZL059 (QPM) 0.010 0.56 0.05 -0.40 0.00 0.40
102 L26 x CML444 (non-QPM) -0.006 0.30 0.00 0.40 0.10 -0.49
103 L26 x CML395 (non-QPM) -0.007 -0.17 0.14 0.74 -0.05 -0.87
104 L27 x CZL15049 (QPM) 0.002 1.13 -0.54 0.66 0.14 -0.07
105 L27 x CZL059 (QPM) 0.004 -0.37 -0.38 0.05 -0.01 0.63
106 L27 x CML444 (non-QPM) -0.010 -0.22 0.63 -0.49 -0.17 -0.88
107 L27 x CML395 (non-QPM) 0.003 -0.55 0.31 -0.21 0.04 0.31
108 L28 x CZL15049 (non-QPM) -0.003 -0.29 -0.51 0.82 -0.21 0.64
109 L28 x CZL059 (non-QPM) -0.001 -1.39 1.23 -0.23 0.02 -2.07
110 L28 x CML444 (non-QPM) -0.008 0.97 -0.25 -0.23 0.31 0.12
111 L28 x CML395 (non-QPM) 0.010 0.70 -0.47 -0.36 -0.12 1.30
112 L29 x CZL15049 (non-QPM) -0.003 -0.08 0.38 -0.65 -0.06 0.16
113 L29 x CZL059 (non-QPM) -0.014 0.54 -0.32 1.26 0.14 -0.38
114 L29 x CML444 (non-QPM) 0.014 -0.62 -0.20 -0.24 -0.12 0.21
115 L29 x CML395 (non-QPM) 0.003 0.15 0.16 -0.37 0.04 -0.01
116 L30 x CZL15049 (non-QPM) -0.011 0.33 0.19 0.01 -0.11 -0.55
117 L30 x CZL059 (non-QPM) -0.012 -0.43 -0.24 -0.17 0.05 0.48
118 L30 x CML444 (non-QPM) 0.016 0.36 0.39 0.27 0.02 -0.54
119 L30 x CML395 (non-QPM) 0.006 -0.27 -0.32 -0.10 0.04 0.59
120 L31 x CZL15049 (QPM) 0.009 -0.76 0.51 0.04 -0.11 0.22
121 L31 x CZL059 (QPM) 0.002 0.44 -0.14 -0.47 0.00 0.18
122 L31 x CML444 (non-QPM) 0.003 -0.21 -0.32 0.21 0.03 0.11
123 L31 x CML395 (non-QPM) -0.015 0.52 -0.03 0.22 0.07 -0.52
124 L32 x CZL15049 (non-QPM) -0.012 0.52 -1.00 0.26 0.06 1.01
125 L32 x CML444 (non-QPM) 0.012 -0.75 0.25 -0.35 -0.06 0.37
126 L32 x CML395 (non-QPM) 0.014 0.37 0.49 0.06 -0.03 -1.23
127 L35 x CZL15049 (non-QPM) -0.012 -0.09 0.61 -0.05 -0.02 -0.26
128 L35 x CZL059 (non-QPM) -0.009 -0.59 0.13 0.29 0.01 -0.46
129 L35 x CML444 (non-QPM) 0.010 -0.04 -0.17 0.17 0.09 -0.03
130 L35 x CML395 (non-QPM) 0.010 0.70 -0.56 -0.41 -0.08 0.73
SE 0.006 0.53 0.34 0.34 0.07 0.64

238
Appendix 20. GCA of 33 lines and four testers for biochemical traits for self-pollinated seed
samples obtained from two locations in Zimbabwe during cropping season
Line Tryptophan Moisture Protein Oil Fibre Starch
1 0.001 -1.14 -0.23 0.34 0.00 -0.30
2 0.017 1.23 0.45 -0.34 -0.03 -0.06
3 0.004 -0.45 -0.64 -0.23 0.06 0.56
4 0.006 0.88 -0.42 -0.14 0.11 0.07
5 -0.004 -1.00 0.03 -0.62 0.00 1.01
6 0.003 1.07 -0.43 0.04 -0.07 0.07
7 0.006 1.30 -0.73 -0.35 0.20 0.35
8 0.011 0.01 0.25 0.42 0.07 -0.90
9 0.006 0.10 0.98 0.56 -0.17 -0.91
10 0.009 1.63 -0.09 0.74 0.11 -0.91
11 0.013 -1.20 1.08 0.85 -0.09 -1.33
12 0.006 -1.00 -0.14 0.62 0.00 -0.34
13 0.007 0.51 -0.81 -0.17 0.10 0.31
14 0.009 0.70 -0.22 -0.12 0.08 -0.07
15 0.005 -1.19 -0.23 0.48 0.08 -0.50
16 0.004 -0.03 -0.65 -0.21 0.02 0.51
17 0.009 0.41 -0.05 0.27 -0.03 -0.33
18 0.002 0.58 -0.44 0.25 0.02 -0.33
19 -0.009 -0.30 -0.03 -0.66 -0.06 0.74
20 -0.012 0.56 0.91 -0.34 -0.12 0.10
21 -0.014 -2.19 0.25 -0.26 0.00 0.51
22 -0.017 1.00 0.19 -0.71 0.00 0.73
23 0.002 0.65 -0.14 0.47 0.11 -0.50
24 0.001 -0.15 -0.15 0.27 0.04 -0.04
25 0.000 -1.41 -0.34 -0.03 -0.10 0.36
26 0.005 0.26 -0.81 0.20 0.08 0.26
27 0.002 -0.66 0.03 -0.51 -0.04 0.49
28 -0.019 1.11 0.61 0.52 0.01 -0.66
29 -0.012 -1.02 0.34 -0.18 -0.12 0.26
30 -0.014 0.93 0.25 0.09 -0.07 -0.06
31 0.001 -0.72 -0.41 -0.21 -0.16 0.26
32 -0.015 -2.12 0.95 -0.99 0.06 1.03
35 -0.021 1.26 1.11 -0.42 -0.10 -0.11
SE 0.003 0.49 0.17 0.07 0.05 0.16
Tester
1 0.009 1.15 -0.23 0.36 0.15 -0.50
2 0.013 -0.99 -1.02 0.20 -0.04 0.26
3 -0.009 0.16 0.36 -0.35 -0.01 0.20
4 -0.012 -0.37 0.84 -0.20 -0.10 0.06
SE 0.001 0.22 0.05 0.03 0.04 0.07

239
Appendix 21. SCA of 130 hybrids for biochemical traits for self-pollinated seed samples obtained
from two locations in Zimbabwe during 2017/2018 and 2018/2019 cropping seasons
Entry Pedigree Tryptophan Moisture Protein Oil Fibre Starch
1 L1 x CZL15049 (QPM) 0.011 0.90 -0.69 -0.09 -0.03 0.31
2 L1 x CZL059 (QPM) -0.008 0.12 0.00 0.05 0.07 0.07
3 L1 x CML444 (non-QPM) 0.001 0.07 0.25 -0.14 -0.07 -0.07
4 L1 x CML395 (non-QPM) -0.004 -1.03 0.49 0.17 0.04 -0.33
5 L2 x CZL15049 (QPM) 0.000 0.16 -0.30 -0.06 0.07 0.12
6 L2 x CZL059 (QPM) 0.016 1.53 -0.18 0.03 0.03 0.00
7 L2 x CML444 (non-QPM) -0.010 -1.35 -0.24 -0.03 -0.02 0.24
8 L2 x CML395 (non-QPM) -0.007 -0.27 0.78 0.05 -0.08 -0.37
9 L3 x CZL15049 (QPM) 0.008 1.57 -0.23 0.38 -0.01 -0.83
10 L3 x CZL059 (QPM) -0.007 0.16 -0.34 0.09 -0.02 -0.19
11 L3 x CML444 (non-QPM) -0.006 -2.19 0.80 -0.32 -0.05 0.70
12 L3 x CML395 (non-QPM) 0.004 0.51 -0.17 -0.16 0.09 0.31
13 L4 x CZL15049 (QPM) 0.006 1.02 -0.07 0.27 0.06 -0.26
14 L4 x CZL059 (QPM) -0.005 -1.22 -0.56 0.06 0.09 0.35
15 L4 x CML444 (non-QPM) -0.010 -0.25 0.21 -0.22 0.04 0.19
16 L4 x CML395 (non-QPM) 0.009 0.51 0.48 -0.12 -0.19 -0.30
17 L5 x CZL15049 (QPM) 0.004 -2.48 0.23 0.02 -0.04 0.25
18 L5 x CZL059 (QPM) -0.001 0.18 0.07 -0.27 0.04 0.53
19 L5 x CML444 (non-QPM) -0.005 1.48 0.06 -0.02 -0.02 -0.35
20 L5 x CML395 (non-QPM) 0.001 0.88 -0.29 0.26 0.02 -0.44
21 L6 x CZL15049 (QPM) 0.003 0.05 -0.07 0.11 0.02 -0.46
22 L6 x CZL059 (QPM) 0.001 -1.46 0.05 -0.43 -0.11 0.90
23 L6 x CML444 (non-QPM) -0.005 1.64 0.49 0.19 0.08 -0.68
24 L6 x CML395 (non-QPM) -0.001 -0.16 -0.41 0.12 0.01 0.23
25 L7 x CZL15049 (QPM) -0.006 1.47 0.33 0.10 0.11 -0.44
26 L7 x CZL059 (QPM) 0.010 -1.84 -0.60 -0.29 -0.07 0.92
27 L7 x CML444 (non-QPM) 0.001 0.55 0.07 0.31 0.11 -0.37
28 L7 x CML395 (non-QPM) -0.005 -0.12 0.26 -0.14 -0.15 -0.13
29 L8 x CZL15049 (QPM) 0.002 -0.72 0.10 0.03 0.04 0.08
30 L8 x CZL059 (QPM) -0.004 -1.61 -0.31 0.01 -0.02 0.29
31 L8 x CML444 (non-QPM) -0.002 0.74 0.44 -0.04 0.00 -0.39
32 L8 x CML395 (non-QPM) 0.003 1.64 -0.17 -0.01 -0.02 0.00
33 L9 x CZL15049 (QPM) 0.002 -0.43 0.00 -0.16 -0.01 0.42
34 L9 x CZL059 (QPM) 0.015 -1.19 0.79 0.10 -0.09 -0.62
35 L9 x CML444 (non-QPM) -0.005 0.49 -0.49 0.15 0.00 -0.03
36 L9 x CML395 (non-QPM) -0.013 1.19 -0.24 -0.10 0.11 0.21
37 L10 x CZL15049 (QPM) 0.016 1.49 0.17 1.06 0.27 -1.46
38 L10 x CZL059 (QPM) 0.000 -1.82 -0.09 -0.33 -0.02 0.57
39 L10 x CML444 (non-QPM) -0.010 -1.25 -0.35 -0.31 -0.25 0.67
40 L10 x CML395 (non-QPM) -0.007 1.63 0.33 -0.43 0.00 0.20
41 L11 x CZL15049 (QPM) -0.008 -0.33 0.00 0.05 -0.10 0.11
42 L11 x CZL059 (QPM) 0.021 0.06 0.26 0.14 -0.07 -0.26
43 L11 x CML444 (non-QPM) -0.008 1.65 -0.60 -0.07 0.11 0.18
44 L11 x CML395 (non-QPM) -0.006 -1.32 0.40 -0.14 0.07 -0.05

240
45 L12 x CZL15049 (QPM) 0.009 -0.33 -0.58 -0.11 0.14 0.35
46 L12 x CZL059 (QPM) 0.002 -0.21 0.19 0.22 -0.02 -0.34
47 L12 x CML444 (non-QPM) -0.003 0.99 0.20 -0.16 -0.19 0.15
48 L12 x CML395 (non-QPM) -0.010 -0.39 0.25 0.04 0.08 -0.18
49 L13 x CZL15049 (QPM) -0.004 1.68 -0.14 -0.28 0.21 -0.10
50 L13 x CZL059 (QPM) 0.000 0.77 -0.15 -0.27 0.02 0.21
51 L13 x CML444 (non-QPM) -0.005 -1.71 0.80 0.53 -0.07 -0.30
52 L13 x CML395 (non-QPM) 0.007 -0.68 -0.46 0.01 -0.15 0.18
53 L14 x CZL15049 (QPM) 0.002 1.27 0.10 -0.03 0.01 0.00
54 L14 x CZL059 (QPM) -0.002 -0.37 -0.13 -0.09 0.01 0.29
55 L14 x CML444 (non-QPM) 0.007 -1.17 -0.19 -0.07 0.05 0.10
56 L14 x CML395 (non-QPM) -0.007 0.33 0.28 0.18 -0.07 -0.41
57 L15 x CZL15049 (QPM) 0.011 0.40 -0.54 0.02 0.00 0.06
58 L15 x CZL059 (QPM) 0.002 0.94 -0.22 -0.14 0.01 0.22
59 L15 x CML444 (non-QPM) -0.001 -1.26 0.77 -0.07 -0.03 0.03
60 L15 x CML395 (non-QPM) -0.012 -0.03 0.04 0.18 0.03 -0.33
61 L16 x CZL15049 (QPM) 0.006 -0.43 -0.12 0.04 0.09 -0.08
62 L16 x CZL059 (QPM) 0.004 0.91 0.12 -0.13 -0.08 0.01
63 L16 x CML444 (non-QPM) -0.005 -0.94 0.22 0.44 -0.02 -0.38
64 L16 x CML395 (non-QPM) -0.006 0.51 -0.16 -0.36 0.02 0.43
65 L17 x CZL15049 (QPM) 0.010 0.20 -0.82 0.21 0.11 0.06
66 L17 x CZL059 (QPM) -0.008 -0.66 0.47 0.15 -0.17 -0.56
67 L17 x CML444 (non-QPM) 0.000 1.72 0.01 -0.44 0.00 0.51
68 L17 x CML395 (non-QPM) -0.003 -1.21 0.41 0.07 0.07 -0.03
69 L18 x CZL15049 (QPM) 0.012 0.09 -1.18 -0.10 0.01 0.77
70 L18 x CZL059 (QPM) -0.004 -0.82 0.86 0.16 0.02 -0.55
71 L18 x CML444 (non-QPM) 0.000 1.28 -0.65 -0.17 0.03 0.17
72 L18 x CML395 (non-QPM) -0.009 -0.49 1.03 0.09 -0.06 -0.40
73 L19 x CZL15049 (non-QPM) -0.001 -1.60 0.31 -0.16 -0.07 0.12
74 L19 x CZL059 (non-QPM) -0.017 1.46 0.53 0.02 -0.04 -0.14
75 L19 x CML444 (non-QPM) 0.009 0.41 -0.25 -0.06 -0.01 0.27
76 L19 x CML395 (non-QPM) 0.009 -0.21 -0.53 0.19 0.11 -0.27
77 L20 x CZL15049 (non-QPM) -0.016 -0.25 0.17 0.14 -0.03 -0.31
78 L20 x CML444 (non-QPM) 0.013 -1.26 -0.69 -0.08 -0.12 0.46
79 L20 x CML395 (non-QPM) 0.016 0.57 -0.44 0.12 0.11 0.10
80 L21 x CZL15049 (non-QPM) -0.007 -2.69 1.38 0.22 -0.07 -0.73
81 L21 x CZL059 (non-QPM) -0.021 1.65 0.04 0.20 0.04 -0.59
82 L21 x CML444 (non-QPM) 0.020 0.62 -0.54 0.10 0.10 0.15
83 L21 x CML395 (non-QPM) 0.007 0.48 -0.82 -0.53 -0.07 1.16
84 L22 x CZL15049 (non-QPM) -0.012 2.37 0.41 -0.09 -0.07 -0.25
85 L22 x CZL059 (non-QPM) -0.010 -0.77 0.08 0.10 -0.06 -0.21
86 L22 x CML444 (non-QPM) 0.004 0.23 -0.45 0.16 -0.04 -0.20
87 L22 x CML395 (non-QPM) 0.017 -1.77 0.02 -0.18 0.17 0.64
88 L23 x CZL15049 (QPM) 0.004 0.27 -0.13 -0.19 -0.10 0.26
89 L23 x CZL059 (QPM) 0.013 2.01 0.34 0.25 -0.01 -0.86
90 L23 x CML444 (non-QPM) -0.008 -0.70 0.30 -0.11 0.14 -0.07
91 L23 x CML395 (non-QPM) -0.010 -1.52 -0.45 0.04 -0.03 0.65
92 L24 x CZL15049 (QPM) 0.003 0.42 0.23 -0.07 -0.14 0.12

241
93 L24 x CZL059 (QPM) -0.002 0.68 -0.35 -0.04 0.08 0.16
94 L24 x CML444 (non-QPM) -0.002 -2.45 0.54 0.13 0.03 -0.23
95 L24 x CML395 (non-QPM) 0.000 1.41 -0.36 -0.04 0.04 -0.07
96 L25 x CZL15049 (QPM) 0.002 -0.27 -0.75 0.18 -0.08 0.12
97 L25 x CZL059 (QPM) 0.002 -1.63 0.26 -0.31 0.10 0.56
98 L25 x CML444 (non-QPM) 0.004 0.32 0.10 -0.04 0.01 -0.15
99 L25 x CML395 (non-QPM) -0.008 1.64 0.45 0.16 -0.03 -0.54
100 L26 x CZL15049 (QPM) -0.003 0.46 -0.59 -0.27 -0.05 0.40
101 L26 x CZL059 (QPM) 0.012 -0.40 -0.32 -0.44 0.00 0.86
102 L26 x CML444 (non-QPM) 0.006 0.80 0.90 0.41 0.10 -1.03
103 L26 x CML395 (non-QPM) -0.016 -0.80 0.07 0.29 -0.05 -0.24
104 L27 x CZL15049 (QPM) 0.003 1.05 0.10 -0.08 0.14 -0.10
105 L27 x CZL059 (QPM) 0.001 0.02 -0.51 0.18 -0.01 -0.22
106 L27 x CML444 (non-QPM) -0.003 -0.83 0.58 0.12 -0.17 -0.23
107 L27 x CML395 (non-QPM) -0.002 -0.18 -0.10 -0.23 0.04 0.53
108 L28 x CZL15049 (non-QPM) -0.009 1.81 0.87 -0.40 -0.21 -0.33
109 L28 x CZL059 (non-QPM) -0.006 -0.17 0.24 0.04 0.02 -0.09
110 L28 x CML444 (non-QPM) -0.002 -0.95 -0.92 0.13 0.31 0.45
111 L28 x CML395 (non-QPM) 0.016 -0.62 -0.12 0.21 -0.12 -0.04
112 L29 x CZL15049 (non-QPM) -0.011 -2.66 0.59 -0.16 -0.06 0.42
113 L29 x CZL059 (non-QPM) -0.012 1.73 0.48 0.15 0.14 -0.94
114 L29 x CML444 (non-QPM) 0.010 0.83 -0.45 -0.06 -0.12 0.27
115 L29 x CML395 (non-QPM) 0.012 0.16 -0.56 0.07 0.04 0.23
116 L30 x CZL15049 (non-QPM) -0.002 -2.38 0.73 0.12 -0.11 -0.26
117 L30 x CZL059 (non-QPM) -0.006 0.78 -0.23 -0.37 0.05 0.85
118 L30 x CML444 (non-QPM) 0.010 0.50 -0.66 0.02 0.02 -0.03
119 L30 x CML395 (non-QPM) -0.003 1.16 0.23 0.22 0.04 -0.57
120 L31 x CZL15049 (QPM) 0.007 1.74 -0.59 -0.28 -0.11 0.68
121 L31 x CZL059 (QPM) 0.009 0.48 -0.07 0.03 0.00 0.16
122 L31 x CML444 (non-QPM) -0.018 -0.22 0.30 0.02 0.03 -0.37
123 L31 x CML395 (non-QPM) 0.001 -1.94 0.42 0.22 0.07 -0.48
124 L32 x CZL15049 (non-QPM) -0.017 -1.76 -0.12 -0.16 0.06 0.70
125 L32 x CML444 (non-QPM) 0.012 2.03 -0.66 0.15 -0.06 -0.30
126 L32 x CML395 (non-QPM) 0.017 -1.20 -0.19 0.20 -0.03 -0.16
127 L35 x CZL15049 (non-QPM) -0.018 -1.71 0.72 0.07 -0.02 -0.01
128 L35 x CZL059 (non-QPM) -0.016 -0.50 0.69 0.13 0.01 -0.50
129 L35 x CML444 (non-QPM) 0.018 0.55 -0.40 -0.10 0.09 0.34
130 L35 x CML395 (non-QPM) 0.015 1.73 -0.95 -0.12 -0.08 0.15
SE 0.006 0.76 0.22 0.13 0.07 0.24

242
Appendix 22. Heterosis of grain yield and agronomic traits of 130 hybrids across 13 environments during 2017/2018 and 2018/2019
cropping seasons
Entry Hybrids GY ASI PH EH EPP ER EA
Sum (GY
and EPP)
Rank
MID PH BP H MID PH BP H MID PH BP H MID PH BP H MID PH BP H MID PH BP H MID PH BP H
1 L1 x CZL15049 (QPM) 116.62 130.86 -52.77 -60.18 43.54 55.99 57.30 78.63 -13.92 9.52 127.71 102.78 -7.32 -9.86 243.08 29.77
2 L1 x CZL059 (QPM) 144.67 148.08 -10.40 -17.56 39.91 44.74 55.63 71.74 -14.24 -6.82 117.53 60.96 -7.66 -13.56 271.69 114.42
3 L1 x CML444 (non-QPM) 94.88 124.39 135.70 -265.79 44.11 48.48 55.47 60.16 -23.41 -7.89 183.66 109.89 -0.67 -7.61 187.97 -97.30
4 L1 x CML395 (non-QPM) 141.95 161.22 -34.61 -39.44 33.51 34.20 50.97 56.48 -10.16 12.96 269.47 194.09 -0.71 -8.56 305.97 -148.32
5 L2 x CZL15049 (QPM) 116.02 117.96 2.37 40.23 29.35 49.90 35.40 72.55 -15.98 7.73 206.00 211.32 -9.04 -11.53 225.73 -171.02
6 L2 x CZL059 (QPM) 122.74 131.81 -6.62 -20.43 27.66 30.88 36.23 36.87 -14.22 -6.15 248.80 185.27 0.90 -5.54 234.18 -195.25
7 L2 x CML444 (non-QPM) 95.16 111.95 80.04 -191.55 35.38 48.31 43.23 53.90 -14.93 3.08 399.99 308.93 -3.81 -10.53 195.27 -499.31
8 L2 x CML395 (non-QPM) 163.47 169.14 -85.92 -86.04 24.12 31.04 35.02 44.16 -1.57 24.71 267.07 227.47 -4.48 -12.03 355.75 -122.28
9 L3 x CZL15049 (QPM) 99.42 110.30 -31.23 -41.86 39.75 53.92 52.42 84.49 -10.66 -0.05 308.14 248.66 -9.27 -11.17 199.02 -337.34
10 L3 x CZL059 (QPM) 90.71 111.77 -29.15 -34.60 30.55 27.85 49.47 55.45 -14.56 -11.83 275.32 250.37 -3.72 -5.50 176.09 -340.38
11 L3 x CML444 (non-QPM) 92.37 96.03 324.50 -402.18 46.50 52.88 61.03 65.39 -6.60 -0.71 265.99 241.67 -8.44 -10.75 181.09 -307.38
12 L3 x CML395 (non-QPM) 156.08 166.64 -68.21 -70.66 45.73 46.78 70.44 73.99 -2.99 7.37 59.35 64.90 -6.42 -9.72 327.11 219.00
13 L4 x CZL15049 (QPM) 59.18 79.64 8.26 30.35 40.11 47.20 67.29 69.56 0.06 0.56 255.86 236.33 -3.38 -5.09 139.43 -344.29
14 L4 x CZL059 (QPM) 106.60 146.24 -26.25 -31.05 37.08 46.62 50.78 88.02 -14.05 0.13 108.93 61.60 -6.92 -8.94 238.92 84.25
15 L4 x CML444 (non-QPM) 98.02 107.10 131.25 -272.46 38.80 39.12 51.14 74.74 -24.20 -20.03 92.39 48.80 -7.80 -10.41 160.90 37.92
16 L4 x CML395 (non-QPM) 135.59 162.31 -27.61 -34.01 39.09 44.42 70.52 98.48 0.70 2.21 189.23 142.18 -8.96 -12.45 300.82 -9.18
17 L5 x CZL15049 (QPM) 95.19 98.97 -29.49 -33.74 41.52 49.70 71.71 76.23 -0.45 6.94 243.56 203.64 -13.38 -18.09 200.65 -215.08
18 L5 x CZL059 (QPM) 135.59 152.48 -20.44 -23.28 38.36 46.98 58.33 94.56 16.66 25.21 292.27 188.63 -11.32 -19.19 329.94 -120.45
19 L5 x CML444 (non-QPM) 101.40 112.32 120.98 -330.35 46.13 46.74 71.74 95.82 -12.35 -10.37 222.55 137.33 -15.20 -23.22 191.00 -130.46
20 L5 x CML395 (non-QPM) 146.07 147.76 -35.87 -46.61 38.51 42.86 71.39 96.75 8.53 15.38 108.29 64.73 -9.89 -19.18 317.74 173.79
21 L6 x CZL15049 (QPM) 146.04 180.39 -24.42 -33.00 45.04 50.74 60.55 62.67 -4.67 4.29 367.42 331.26 -5.79 -7.40 326.05 -359.44
22 L6 x CZL059 (QPM) 140.38 159.87 -52.31 -53.58 43.83 69.23 64.35 111.58 -6.08 -0.99 293.71 239.93 -10.87 -15.71 293.18 -213.88
23 L6 x CML444 (non-QPM) 171.71 235.97 178.80 -338.63 52.39 67.13 72.70 105.81 0.65 4.73 340.83 280.61 -6.74 -12.39 413.06 -189.25
24 L6 x CML395 (non-QPM) 169.61 211.51 -57.79 -62.94 45.67 65.98 67.63 101.15 0.97 9.31 290.61 270.40 -6.91 -13.42 391.40 -149.28
25 L7 x CZL15049 (QPM) 79.64 91.98 -49.41 -60.74 46.00 48.50 74.38 79.17 -24.64 -6.36 244.35 199.18 -4.76 -6.52 140.62 -291.63
26 L7 x CZL059 (QPM) 88.05 111.74 -28.64 -48.24 36.32 50.85 55.26 90.55 -27.45 -22.81 457.51 410.91 -5.57 -10.83 149.53 -702.49
27 L7 x CML444 (non-QPM) 98.14 99.36 -46.03 -244.52 45.22 50.29 68.70 92.12 -22.54 -8.94 491.98 442.50 -7.19 -12.93 166.02 -748.34
28 L7 x CML395 (non-QPM) 147.05 160.63 -64.41 -76.46 37.55 47.62 70.32 95.27 -14.22 5.35 359.33 353.21 -2.33 -9.29 298.81 -402.11
29 L8 x CZL15049 (QPM) 222.19 448.82 -77.40 -53.25 44.70 59.93 72.04 96.97 1.36 3.37 294.57 252.99 -16.95 -25.94 675.74 171.07
30 L8 x CZL059 (QPM) 213.37 399.26 -85.70 -90.06 44.96 47.61 65.68 81.39 5.71 19.80 218.97 183.63 -16.89 -28.40 638.14 280.83
31 L8 x CML444 (non-QPM) 222.04 507.24 1080.70 -170.04 49.94 57.00 76.42 80.39 -4.27 -1.54 270.67 229.60 -19.77 -31.29 723.48 274.27
32 L8 x CML395 (non-QPM) 236.11 482.49 -89.56 -91.93 42.19 43.68 63.65 68.36 19.68 20.84 423.76 413.35 -18.22 -30.58 759.11 -29.20
33 L9 x CZL15049 (QPM) 185.13 256.80 -38.11 -38.71 54.11 62.53 77.23 99.82 4.14 8.02 277.32 281.97 -16.77 -21.40 454.09 -67.03
34 L9 x CZL059 (QPM) 149.95 195.57 -24.38 -30.72 39.09 48.21 58.32 75.95 3.13 24.53 170.21 116.11 -9.08 -17.27 373.18 113.21
35 L9 x CML444 (non-QPM) 166.91 264.35 132.17 -383.33 52.49 52.68 65.94 72.09 -7.52 0.84 246.31 176.98 -14.27 -22.47 424.57 38.02

243
36 L9 x CML395 (non-QPM) 199.08 279.78 -55.17 -39.98 38.55 43.32 63.63 70.74 14.67 20.16 95.71 70.23 -10.33 -19.68 513.69 377.76
37 L10 x CZL15049 (QPM) 230.77 340.06 -29.08 -36.62 44.10 62.72 59.59 103.29 -7.66 -2.17 155.97 162.61 -16.90 -21.74 561.00 281.06
38 L10 x CZL059 (QPM) 188.65 262.08 -4.45 -6.15 33.89 34.09 50.58 51.23 -14.31 -6.73 284.80 216.73 -18.98 -26.46 429.70 -26.39
39 L10 x CML444 (non-QPM) 177.65 304.30 171.70 -339.47 45.75 55.76 60.51 72.40 -10.65 -11.44 112.73 75.10 -20.56 -28.34 459.85 320.92
40 L10 x CML395 (non-QPM) 214.92 325.41 -61.06 -66.08 34.56 38.69 56.53 67.07 0.67 5.56 227.89 194.64 -14.35 -23.48 546.56 161.86
41 L11 x CZL15049 (QPM) 217.69 222.30 -22.46 -30.14 43.47 67.31 56.62 107.77 -3.82 8.08 247.64 198.93 -13.32 -11.58 444.25 22.58
42 L11 x CZL059 (QPM) 133.40 141.54 -26.58 -27.23 35.49 39.69 51.19 57.04 -11.24 -8.77 274.14 246.75 -4.59 -6.50 254.93 -254.87
43 L11 x CML444 (non-QPM) 150.75 173.92 105.17 -286.04 52.41 67.98 68.24 87.30 -8.63 -2.46 210.80 188.05 -12.07 -14.43 313.58 -58.77
44 L11 x CML395 (non-QPM) 142.04 148.62 -31.18 -40.51 34.56 42.89 52.21 68.35 1.16 12.46 239.02 230.50 -5.23 -8.72 304.28 -151.29
45 L12 x CZL15049 (QPM) 128.12 198.11 -60.22 -67.04 44.04 52.92 66.19 78.13 16.09 32.26 330.04 271.71 -11.85 -14.77 374.58 -200.55
46 L12 x CZL059 (QPM) 151.96 210.65 -46.47 -58.87 43.94 52.36 62.88 90.70 1.94 36.78 198.86 175.41 -8.22 -14.56 401.32 49.83
47 L12 x CML444 (non-QPM) 131.84 231.29 9.06 -336.60 47.65 48.78 66.79 81.68 6.86 28.50 215.60 190.83 -10.67 -17.38 398.49 20.11
48 L12 x CML395 (non-QPM) 187.65 281.62 -30.03 -51.57 44.51 48.52 72.40 89.00 16.77 34.51 70.11 66.84 -5.24 -13.21 520.55 402.05
49 L13 x CZL15049 (QPM) 148.68 143.64 -34.21 -54.07 51.50 57.90 80.63 96.39 6.28 16.28 334.47 300.86 -7.79 -9.27 314.88 -303.39
50 L13 x CZL059 (QPM) 88.78 102.68 -5.61 44.46 36.25 46.93 50.07 73.06 -10.25 -5.39 230.75 185.57 1.79 -0.58 175.83 -241.70
51 L13 x CML444 (non-QPM) 139.06 151.58 516.63 -220.19 50.89 52.41 74.55 87.43 -5.19 -1.34 35.18 16.71 -14.09 -16.66 284.10 262.96
52 L13 x CML395 (non-QPM) 161.21 163.46 4.62 29.50 37.52 43.93 63.08 76.24 8.61 17.58 233.21 215.98 -0.91 -4.86 350.86 -92.56
53 L14 x CZL15049 (QPM) 136.30 137.13 -26.46 -35.34 29.87 42.00 59.01 80.37 -3.04 9.44 504.16 481.59 -4.00 -5.35 279.82 -696.58
54 L14 x CZL059 (QPM) 152.05 165.73 3.03 6.97 33.97 37.79 49.63 65.31 1.09 3.48 347.83 251.20 0.26 -4.91 322.35 -272.03
55 L14 x CML444 (non-QPM) 104.63 119.29 126.59 -288.19 43.86 49.10 62.07 67.14 -14.22 -8.04 241.19 167.57 -14.25 -19.21 201.66 -173.64
56 L14 x CML395 (non-QPM) 168.73 171.08 -46.42 -52.56 36.56 36.63 60.31 66.34 -14.25 -4.26 541.52 445.69 -4.81 -11.21 321.29 -649.90
57 L15 x CZL15049 (QPM) 178.26 334.01 -21.88 -37.54 36.46 56.57 51.53 84.08 -3.25 -0.38 357.01 289.38 -11.94 -19.75 508.64 -106.06
58 L15 x CZL059 (QPM) 213.49 358.53 -47.91 -54.84 34.93 37.09 48.93 54.39 -12.44 -1.81 204.43 185.04 -10.33 -21.12 557.77 199.75
59 L15 x CML444 (non-QPM) 214.54 441.05 375.39 -361.87 47.02 59.54 67.42 72.49 -8.67 -6.96 194.81 176.03 -20.72 -30.69 639.96 320.53
60 L15 x CML395 (non-QPM) 206.21 385.60 -44.16 -44.84 34.66 40.86 54.34 58.05 0.88 2.84 150.66 141.76 -19.06 -29.88 595.54 352.06
61 L16 x CZL15049 (QPM) 115.17 122.02 17.84 -854.20 48.89 52.99 62.43 86.64 18.66 22.78 239.15 208.35 -3.69 -4.90 278.63 -160.28
62 L16 x CZL059 (QPM) 71.11 74.09 29.54 -764.98 30.62 42.97 40.84 53.66 -10.38 -0.01 130.53 101.79 9.43 3.94 134.81 -110.88
63 L16 x CML444 (non-QPM) 61.11 79.21 -490.48 -1063.19 41.37 44.81 47.39 50.21 -8.52 -7.24 495.96 421.67 3.83 -2.03 124.56 -794.87
64 L16 x CML395 (non-QPM) 122.25 132.24 -46.52 -288.95 38.98 47.58 51.26 55.10 7.69 10.31 218.74 206.95 -2.79 -9.19 272.48 -141.23
65 L17 x CZL15049 (QPM) 153.84 166.09 -51.77 -58.12 45.04 52.56 65.49 86.38 -8.81 -3.85 312.84 242.95 -3.45 -7.95 307.28 -237.11
66 L17 x CZL059 (QPM) 74.29 74.63 -22.43 -37.89 30.13 39.02 46.39 62.87 -18.94 -11.34 122.46 130.99 15.06 14.06 118.64 -163.93
67 L17 x CML444 (non-QPM) 124.03 153.44 29.18 -343.03 47.09 47.27 69.23 75.68 -6.65 -6.23 166.68 176.90 -3.90 -4.07 264.58 -71.03
68 L17 x CML395 (non-QPM) 156.35 172.19 -49.32 -63.75 36.50 41.56 60.70 67.86 -3.05 1.19 298.57 273.22 1.97 1.06 326.68 -248.14
69 L18 x CZL15049 (QPM) 111.50 123.42 -63.88 114.82 41.75 61.84 59.12 105.52 5.66 20.30 221.28 143.12 -4.59 -11.03 260.87 -87.91
70 L18 x CZL059 (QPM) -17.13 -24.73 153.03 1151.85 11.37 12.65 18.15 16.33 -39.60 -38.66 338.10 302.12 34.69 30.47 -120.12 -825.50
71 L18 x CML444 (non-QPM) 97.11 100.54 -625.66 453.32 41.22 52.52 57.55 71.31 -7.08 0.45 183.16 159.91 -5.43 -7.77 191.02 -138.85
72 L18 x CML395 (non-QPM) 129.18 139.02 -69.74 -82.50 26.10 31.31 35.28 46.15 -13.50 -2.58 260.80 202.62 0.40 -1.05 252.13 -210.64
73 L19 x CZL15049 (non-QPM) 157.55 245.17 -55.24 -61.81 39.28 42.11 61.83 62.17 11.49 13.20 164.45 140.63 -7.11 -7.41 427.41 136.85
74 L19 x CZL059 (non-QPM) 186.01 261.31 -31.70 -46.15 38.11 52.30 50.67 90.44 -11.62 4.16 188.59 116.97 -9.07 -12.85 439.86 156.22
75 L19 x CML444 (non-QPM) 150.40 267.45 42.34 -382.26 48.41 53.09 59.56 86.86 -4.26 2.09 99.35 49.88 -12.36 -16.56 415.68 295.37
76 L19 x CML395 (non-QPM) 156.47 249.05 -79.29 -85.37 39.51 49.22 67.55 97.57 1.81 4.41 99.81 61.98 -8.07 -13.35 411.74 271.37
77 L20 x CZL15049 (non-QPM) 181.41 368.26 -68.56 -68.86 45.28 53.06 74.57 85.49 -8.64 -8.18 371.12 303.66 -16.57 -23.13 532.85 -102.23

244
78 L20 x CML444 (non-QPM) 101.13 270.10 24.98 -261.00 52.34 52.39 81.07 99.00 -4.58 0.66 255.26 155.50 -16.72 -26.42 367.31 -0.31
79 L20 x CML395 (non-QPM) 256.15 502.84 -40.05 -52.83 41.56 46.58 68.74 86.66 13.14 14.83 308.89 215.01 -13.73 -24.49 786.96 301.28
80 L21 x CZL15049 (non-QPM) 130.31 152.00 -34.74 -44.83 42.34 53.32 52.62 82.49 -7.53 -1.12 211.00 204.64 -9.28 -16.20 273.66 -116.50
81 L21 x CZL059 (non-QPM) 143.01 152.67 -52.11 -55.79 35.03 40.89 58.99 67.15 -6.12 -12.47 358.68 264.48 -18.45 -27.34 277.09 -300.28
82 L21 x CML444 (non-QPM) 102.41 139.67 282.12 -372.02 41.74 44.81 58.58 61.15 -11.29 -9.69 257.44 184.03 -12.29 -22.32 221.10 -185.76
83 L21 x CML395 (non-QPM) 145.60 172.32 -26.87 -32.49 31.31 33.09 58.01 59.60 -6.61 -1.17 496.58 415.11 -11.76 -22.58 310.15 -567.20
84 L22 x CZL15049 (non-QPM) 183.09 215.56 270.70 -172.15 52.20 54.28 67.45 97.79 14.74 27.18 102.31 87.34 -11.18 -11.18 440.57 273.28
85 L22 x CZL059 (non-QPM) 178.91 195.21 576.06 -145.37 47.11 63.38 70.45 81.21 7.54 39.93 148.92 114.20 -13.19 -16.54 421.58 188.19
86 L22 x CML444 (non-QPM) 137.45 186.79 -140.47 -171.33 59.85 66.00 74.18 75.11 11.82 30.68 217.45 173.17 -18.88 -22.53 366.74 17.53
87 L22 x CML395 (non-QPM) 18.10 33.44 314.24 -147.93 18.95 28.11 32.26 32.34 4.95 17.59 407.53 379.48 16.14 9.80 74.08 -738.87
88 L23 x CZL15049 (QPM) 169.01 345.07 -36.27 -43.81 40.85 51.91 64.15 70.88 8.61 13.28 369.94 359.93 -9.97 -18.34 535.97 -165.59
89 L23 x CZL059 (QPM) 202.74 368.88 -35.81 -37.90 41.68 47.66 62.04 95.92 -0.14 21.33 230.32 171.14 -18.54 -28.67 592.81 238.56
90 L23 x CML444 (non-QPM) 184.99 421.32 119.73 -284.35 47.75 51.13 76.56 98.26 2.02 11.89 223.68 165.69 -15.06 -26.06 620.23 271.98
91 L23 x CML395 (non-QPM) 232.99 460.39 -28.64 -36.99 38.78 40.50 64.53 85.98 9.69 15.59 370.83 321.76 -6.63 -19.46 718.66 52.16
92 L24 x CZL15049 (QPM) 95.21 96.59 -11.67 58.44 52.87 61.33 79.31 87.95 -8.31 -1.50 305.69 283.78 3.39 1.39 181.99 -412.26
93 L24 x CZL059 (QPM) 120.65 133.48 -6.43 45.62 45.60 55.04 65.72 98.82 -2.60 4.54 256.64 176.04 2.37 0.32 256.07 -179.30
94 L24 x CML444 (non-QPM) 124.81 140.03 1307.45 -350.48 51.50 51.79 74.55 94.56 -2.28 -0.08 134.44 81.45 -1.97 -4.60 262.48 53.16
95 L24 x CML395 (non-QPM) 142.06 143.33 -38.87 -49.23 39.80 44.52 67.26 87.67 18.14 25.59 377.66 300.28 2.31 -1.45 329.12 -349.68
96 L25 x CZL15049 (QPM) 128.66 145.17 -13.65 349.39 46.58 56.43 74.06 97.73 -10.62 6.64 187.73 150.96 -6.52 -6.97 269.85 -55.35
97 L25 x CZL059 (QPM) 42.85 61.40 -26.75 217.98 24.30 30.89 47.88 63.14 -24.98 -23.00 157.18 184.40 4.81 1.24 56.28 -291.35
98 L25 x CML444 (non-QPM) 95.10 95.70 -536.70 267.22 45.31 47.15 65.62 70.56 -12.98 -1.61 15.16 5.10 -8.55 -12.26 176.20 176.75
99 L25 x CML395 (non-QPM) 149.25 163.81 -48.21 -69.39 34.68 37.72 53.52 59.08 2.98 21.48 257.75 260.98 1.55 -3.56 337.52 -179.20
100 L26 x CZL15049 (QPM) 180.21 274.17 -27.48 -36.41 38.80 46.26 58.54 68.93 -12.78 -8.46 176.10 144.75 -20.55 -27.68 433.14 160.52
101 L26 x CZL059 (QPM) 152.02 217.24 -1.06 -4.86 37.44 46.57 45.17 71.06 -16.73 -8.47 143.81 79.79 -20.69 -30.32 344.06 171.47
102 L26 x CML444 (non-QPM) 177.81 306.09 208.69 -353.76 50.73 50.80 68.42 84.57 -10.34 -10.34 164.00 94.68 -22.74 -32.52 463.22 259.80
103 L26 x CML395 (non-QPM) 192.99 297.26 -2.61 -13.54 32.93 37.62 52.44 68.14 3.37 7.38 144.30 93.70 -12.54 -24.31 501.01 299.86
104 L27 x CZL15049 (QPM) 94.82 96.21 -22.43 411.03 44.76 45.81 56.96 64.57 -3.61 4.50 182.92 123.29 -11.84 -20.31 191.92 -82.14
105 L27 x CZL059 (QPM) 111.82 120.85 -62.69 104.12 42.71 59.61 51.86 82.12 -11.39 -5.76 116.18 46.51 -12.31 -23.47 215.52 88.61
106 L27 x CML444 (non-QPM) 93.96 110.24 -565.77 475.36 49.20 55.96 64.04 82.79 -16.01 -13.36 106.71 40.08 -15.75 -26.91 174.82 70.69
107 L27 x CML395 (non-QPM) 114.50 118.72 -17.09 236.52 35.17 46.57 54.33 73.11 -0.97 6.24 286.13 177.70 -11.23 -23.68 238.49 -190.43
108 L28 x CZL15049 (non-QPM) 356.70 993.03 120.42 -207.06 35.25 63.51 43.22 122.22 19.47 28.29 477.90 1416.29 8.39 -14.09 1397.49 -491.00
109 L28 x CZL059 (non-QPM) 281.62 747.20 412.07 -256.06 34.68 43.44 39.68 65.56 12.18 40.87 376.44 229.51 5.64 -13.68 1081.88 483.97
110 L28 x CML444 (non-QPM) 240.91 813.64 -229.66 -280.20 41.46 61.37 47.66 89.02 -0.26 12.77 457.79 285.77 7.84 -11.40 1067.06 327.06
111 L28 x CML395 (non-QPM) 268.75 799.76 821.43 -170.20 25.69 38.00 34.19 70.54 7.22 16.36 246.28 126.92 11.67 -7.48 1092.09 714.70
112 L29 x CZL15049 (non-QPM) 74.88 101.67 -62.25 -50.84 39.34 40.61 48.67 55.75 -2.74 15.07 336.42 289.94 -6.16 -10.24 188.88 -421.08
113 L29 x CZL059 (non-QPM) 110.72 156.86 -40.82 -47.83 42.62 59.17 57.78 89.41 -15.41 -13.82 149.05 121.73 -4.17 -4.67 238.35 -23.59
114 L29 x CML444 (non-QPM) 69.79 81.22 330.01 -355.09 53.23 59.86 61.43 80.04 -16.58 -6.43 313.42 268.07 -9.49 -9.65 128.00 -434.35
115 L29 x CML395 (non-QPM) 97.52 124.67 -15.43 -18.05 37.67 48.98 57.42 76.74 -6.38 9.53 266.59 259.80 0.42 -0.82 225.34 -300.65
116 L30 x CZL15049 (non-QPM) 101.81 133.43 -27.66 -47.41 44.23 48.91 63.65 77.88 -11.22 5.48 312.52 218.64 -0.76 -4.75 229.50 -296.15
117 L30 x CZL059 (non-QPM) 86.66 128.26 -28.18 -44.12 33.64 45.54 47.12 69.72 -0.60 1.64 405.94 377.32 9.01 8.82 215.96 -585.13
118 L30 x CML444 (non-QPM) 68.83 80.70 682.06 -331.97 41.84 44.60 53.17 64.53 -16.47 -5.94 -39.60 -43.01 -4.84 -5.34 127.12 219.91
119 L30 x CML395 (non-QPM) 96.44 124.12 -61.69 -65.96 29.36 36.69 51.15 63.39 -6.14 10.27 305.36 248.39 5.16 3.50 224.69 -337.72

245
120 L31 x CZL15049 (QPM) 150.30 166.17 -39.03 -39.17 44.59 58.04 61.81 92.01 -13.90 0.59 151.87 124.48 -5.71 -7.23 303.16 39.75
121 L31 x CZL059 (QPM) 61.07 80.42 -60.04 -63.78 27.71 31.40 40.25 48.47 -10.80 -10.13 201.16 168.80 2.85 0.46 120.56 -252.71
122 L31 x CML444 (non-QPM) 110.45 112.76 -28.32 -190.51 43.60 48.77 61.08 62.61 -8.50 1.39 340.48 293.15 -15.34 -17.87 216.10 -384.32
123 L31 x CML395 (non-QPM) 137.46 149.30 -42.15 -54.25 29.23 29.26 50.46 50.98 -7.18 7.24 383.00 375.39 -7.30 -10.99 286.82 -453.28
124 L32 x CZL15049 (non-QPM) 124.64 248.60 -56.33 -59.10 46.00 44.68 60.38 69.87 14.28 27.52 289.60 266.50 -4.48 -10.75 415.04 -125.83
125 L32 x CML444 (non-QPM) 124.18 283.59 -33.68 -200.05 48.58 55.01 51.85 67.43 -1.14 16.34 168.88 107.24 -10.99 -20.32 422.97 178.16
126 L32 x CML395 (non-QPM) 147.62 290.69 -81.57 -86.08 39.00 50.42 53.60 70.46 10.37 24.50 263.22 202.92 -5.13 -15.86 473.18 28.03
127 L35 x CZL15049 (non-QPM) 147.64 211.86 -35.04 -49.79 35.57 53.59 43.19 80.42 9.85 15.22 73.04 63.54 -12.79 -16.98 384.57 277.76
128 L35 x CZL059 (non-QPM) 177.64 230.35 -63.54 -69.58 32.01 32.61 42.64 43.31 -13.57 5.68 290.83 230.29 -16.70 -23.60 400.10 -80.72
129 L35 x CML444 (non-QPM) 146.07 238.18 500.86 -374.97 38.15 48.11 45.53 54.83 -1.03 9.19 145.30 107.30 -14.76 -22.31 392.41 176.88
130 L35 x CML395 (non-QPM) 198.24 281.18 -100.45 -100.47 29.52 33.90 43.51 51.72 10.24 16.83 447.01 406.37 -11.68 -20.28 506.49 -314.93
NB: Summation (Sum) was made for both mid- and better parent heterosis for grain yield (GY) and ears per plant (EPP) while “Rank” was
obtained by subtraction of mid- and better heterosis for ear rot (ER) and ear aspect (EA) from SUM

246
Appendix 23. Heterosis of biochemical traits for 130 hybrids across six environments during 2017/2018 and 2018/2019 cropping
seasons
Entry Pedigree Trip Protein Oil Starch Fibre
Sum
MID PH BP H MID PH BP H MID PH BP H1 MID PH BP H MID PH BP H
1 L1 x CZL15049 (QPM) -6.67 0.00 19.70 28.35 12.44 23.43 1.18 1.88 -7.00 -8.37 80.31
2 L1 x CZL059 (QPM) 6.70 8.11 27.19 35.40 11.68 20.18 1.88 2.60 -10.43 -14.41 113.74
3 L1 x CML444 (non-QPM) -17.91 -10.30 17.68 41.76 17.26 17.59 3.35 3.51 -14.83 -18.74 72.94
4 L1 x CML395 (non-QPM) -26.53 -21.32 35.60 51.50 15.05 15.60 1.18 2.70 -13.67 -16.76 73.78
5 L2 x CZL15049 (QPM) -4.57 -2.47 13.43 28.79 9.46 32.03 0.81 0.87 -0.42 7.66 78.35
6 L2 x CZL059 (QPM) 12.13 15.85 2.41 17.17 4.46 23.32 3.37 3.45 -5.83 -1.53 82.17
7 L2 x CML444 (non-QPM) -33.07 -23.12 6.19 7.89 9.48 19.05 3.38 3.87 -4.92 -8.75 -6.33
8 L2 x CML395 (non-QPM) -41.02 -33.67 21.93 32.78 14.70 25.74 0.76 1.63 -10.46 -14.97 22.85
9 L3 x CZL15049 (QPM) -11.79 -8.96 14.27 19.24 19.69 39.01 -0.86 -0.62 -4.53 -4.61 69.99
10 L3 x CZL059 (QPM) -15.64 -7.84 2.84 8.08 4.03 18.32 2.64 2.87 -12.58 -15.18 15.30
11 L3 x CML444 (non-QPM) -35.71 -21.52 13.50 21.04 19.85 25.85 2.10 2.89 -8.81 -11.66 28.00
12 L3 x CML395 (non-QPM) -31.53 -18.24 15.53 15.97 17.51 24.38 -0.09 0.47 -11.14 -13.00 24.00
13 L4 x CZL15049 (QPM) -11.29 -8.75 11.06 17.11 3.90 8.67 1.36 2.67 -0.77 -3.55 24.73
14 L4 x CZL059 (QPM) -5.10 -2.58 7.32 13.98 -2.06 0.50 2.59 3.94 -3.17 -3.44 18.59
15 L4 x CML444 (non-QPM) -34.00 -24.72 11.86 18.03 0.71 5.81 2.84 3.62 -2.63 -3.06 -15.85
16 L4 x CML395 (non-QPM) -29.57 -21.32 29.22 31.03 -1.26 2.93 0.45 2.57 -13.81 -14.38 14.05
17 L5 x CZL15049 (QPM) -3.04 10.61 15.65 28.33 7.63 33.55 0.89 1.79 -6.21 -10.44 95.41
18 L5 x CZL059 (QPM) 4.26 12.12 5.41 17.85 4.19 26.47 2.84 3.74 -6.58 -8.02 76.88
19 L5 x CML444 (non-QPM) -39.27 -37.53 4.39 4.91 6.99 19.41 2.99 4.47 -5.00 -6.32 -33.64
20 L5 x CML395 (non-QPM) -37.32 -36.75 18.52 26.24 12.34 26.44 -0.25 -0.16 -9.95 -12.16 9.06
21 L6 x CZL15049 (QPM) -11.15 -7.77 2.89 16.18 0.45 1.09 2.55 4.86 -5.39 -9.85 9.10
22 L6 x CZL059 (QPM) -7.76 1.37 2.35 16.45 -8.75 -7.62 4.25 6.62 -12.82 -14.35 6.91
23 L6 x CML444 (non-QPM) -40.04 -26.32 0.48 1.58 7.06 17.09 3.97 5.74 -6.07 -7.57 -30.44
24 L6 x CML395 (non-QPM) -35.82 -22.87 11.91 21.23 -3.68 4.48 3.17 6.36 -13.34 -15.63 -15.22
25 L7 x CZL15049 (QPM) -10.32 -5.26 16.19 18.52 13.36 40.19 -0.08 -1.08 -1.76 -3.43 71.52
26 L7 x CZL059 (QPM) 9.24 9.27 13.66 15.14 4.48 26.41 1.19 2.21 -7.39 -11.70 81.60
27 L7 x CML444 (non-QPM) -26.32 -18.31 18.55 35.19 15.95 29.02 0.32 1.90 -3.72 -8.34 56.30
28 L7 x CML395 (non-QPM) -26.15 -19.78 30.79 38.76 10.29 23.75 -1.03 -0.80 -13.75 -17.02 55.83
29 L8 x CZL15049 (QPM) -5.52 -3.04 15.98 35.52 34.03 76.93 2.61 7.98 -5.29 -6.12 164.49
30 L8 x CZL059 (QPM) -3.01 5.32 1.81 19.91 32.48 70.95 5.41 10.95 -7.22 -10.82 143.83
31 L8 x CML444 (non-QPM) -32.64 -18.31 4.76 9.26 22.80 45.16 6.62 11.58 -9.94 -13.57 49.22
32 L8 x CML395 (non-QPM) -37.59 -25.95 10.32 23.53 39.45 66.29 3.83 10.18 -10.71 -13.39 90.06

247
33 L9 x CZL15049 (QPM) -7.08 -3.80 9.13 28.11 10.87 16.38 2.63 4.85 -10.81 -14.19 61.10
34 L9 x CZL059 (QPM) -7.07 -5.21 15.46 36.61 13.95 17.34 2.84 5.08 -19.34 -19.97 79.00
35 L9 x CML444 (non-QPM) -34.95 -26.32 3.70 8.60 14.83 20.21 3.58 5.25 -13.95 -14.49 -5.10
36 L9 x CML395 (non-QPM) -40.20 -33.67 22.31 37.57 9.83 14.08 1.26 4.30 -13.60 -15.07 15.48
37 L10 x CZL15049 (QPM) -0.91 1.69 0.30 18.25 28.41 20.17 -0.43 1.66 10.96 20.59 69.14
38 L10 x CZL059 (QPM) -10.28 -2.58 2.34 21.61 11.87 17.78 3.11 5.29 -3.23 -7.70 49.14
39 L10 x CML444 (non-QPM) -31.32 -16.71 -0.65 4.46 4.92 7.43 4.75 6.37 -7.43 -11.57 -20.75
40 L10 x CML395 (non-QPM) -44.09 -33.67 13.59 28.29 19.05 20.97 1.21 4.18 -5.47 -10.63 9.53
41 L11 x CZL15049 (QPM) -3.49 2.67 10.34 31.30 6.64 12.03 3.69 7.91 -9.65 -12.32 71.08
42 L11 x CZL059 (QPM) 12.61 13.33 15.08 38.03 6.27 13.85 3.68 7.92 -14.58 -14.68 110.78
43 L11 x CML444 (non-QPM) -34.51 -27.92 5.11 11.46 1.92 18.43 5.42 9.11 -8.16 -8.41 -10.99
44 L11 x CML395 (non-QPM) -42.78 -38.29 17.02 33.35 4.03 19.85 3.01 8.10 -12.78 -13.50 4.28
45 L12 x CZL15049 (QPM) 12.10 18.42 13.38 15.59 10.48 13.66 1.88 3.60 1.26 5.42 89.11
46 L12 x CZL059 (QPM) 0.03 0.06 21.53 24.76 13.98 15.07 1.64 3.37 -8.10 -8.82 80.43
47 L12 x CML444 (non-QPM) -32.10 -24.72 16.11 7.04 3.04 10.09 4.34 5.52 -13.94 -14.48 -10.68
48 L12 x CML395 (non-QPM) -31.83 -25.95 21.79 24.13 19.97 27.16 1.42 3.97 -8.78 -10.33 40.66
49 L13 x CZL15049 (QPM) -3.45 1.30 8.50 13.60 12.51 43.57 -0.16 0.35 6.04 13.14 76.22
50 L13 x CZL059 (QPM) 0.68 1.37 9.75 15.74 3.80 29.54 1.63 2.14 -2.06 -5.02 64.65
51 L13 x CML444 (non-QPM) -29.72 -21.52 2.05 8.45 16.98 34.00 4.40 5.51 -2.79 0.17 20.16
52 L13 x CML395 (non-QPM) -28.08 -21.32 11.25 12.04 13.61 31.25 1.10 1.38 -9.49 -13.02 21.23
53 L14 x CZL15049 (QPM) -17.15 -15.85 16.89 17.88 -1.64 14.37 0.30 1.20 -2.20 -2.88 15.99
54 L14 x CZL059 (QPM) -7.57 -3.89 13.06 14.80 7.47 22.38 1.01 1.91 -8.00 -10.20 49.17
55 L14 x CML444 (non-QPM) -15.53 -2.30 14.84 26.95 13.33 19.13 0.89 2.36 -5.47 -7.88 59.67
56 L14 x CML395 (non-QPM) -41.43 -33.67 25.02 28.82 3.31 9.47 -0.58 -0.48 -12.59 -13.90 -9.53
57 L15 x CZL15049 (QPM) 5.03 6.02 13.50 26.69 16.48 40.10 4.05 11.19 -4.64 -3.84 123.06
58 L15 x CZL059 (QPM) -0.60 4.01 10.19 23.93 15.37 35.83 6.60 13.92 -6.76 -8.88 109.24
59 L15 x CML444 (non-QPM) -24.36 -11.91 17.26 17.31 16.98 26.87 5.69 12.30 -7.80 -10.04 60.14
60 L15 x CML395 (non-QPM) -22.88 -12.07 23.08 31.85 29.49 41.59 3.07 11.07 -8.70 -9.95 105.20
61 L16 x CZL15049 (QPM) -3.41 0.00 15.37 18.18 7.26 23.49 0.12 0.84 2.39 7.98 61.85
62 L16 x CZL059 (QPM) 1.96 4.01 11.64 15.16 0.91 13.78 2.55 3.28 -7.02 -8.87 53.29
63 L16 x CML444 (non-QPM) -26.47 -16.71 13.29 23.15 8.50 13.02 2.27 3.57 -6.72 -8.43 20.62
64 L16 x CML395 (non-QPM) -42.99 -36.75 19.10 20.80 3.75 8.92 1.11 1.18 -9.38 -11.99 -24.88
65 L17 x CZL15049 (QPM) -7.04 -1.86 6.58 25.41 12.19 18.66 -0.33 1.06 -2.50 -8.42 54.67
66 L17 x CZL059 (QPM) -11.74 -1.26 2.31 21.33 16.71 21.08 1.47 2.90 -10.57 -13.44 52.80
67 L17 x CML444 (non-QPM) -28.40 -10.30 -3.69 1.08 3.17 7.19 3.90 4.78 -5.16 -8.07 -22.28
68 L17 x CML395 (non-QPM) -39.56 -25.95 14.95 29.58 10.14 13.55 0.49 2.71 -9.15 -12.86 5.91
69 L18 x CZL15049 (QPM) -6.20 -5.41 2.33 2.76 5.94 9.42 2.14 2.35 -6.54 -9.86 13.33
70 L18 x CZL059 (QPM) 1.26 7.96 13.91 15.17 6.21 7.64 1.27 1.50 -8.12 -8.60 54.92

248
71 L18 x CML444 (non-QPM) -32.63 -19.91 5.69 17.39 1.31 7.82 3.84 4.19 -7.42 -7.76 -12.30
72 L18 x CML395 (non-QPM) -40.33 -30.58 32.69 37.33 3.10 8.85 0.34 1.35 -13.11 -14.37 12.75
73 L19 x CZL15049 (non-QPM) -2.99 65.71 12.94 28.23 7.96 40.10 0.58 1.02 -9.70 -12.11 153.56
74 L19 x CZL059 (non-QPM) -2.67 54.29 12.90 29.16 10.05 39.62 0.82 1.25 -10.26 -10.63 145.42
75 L19 x CML444 (non-QPM) -11.73 22.86 2.66 4.31 0.51 16.94 3.03 4.04 -9.41 -9.93 42.61
76 L19 x CML395 (non-QPM) -7.84 31.43 8.89 18.58 15.65 35.71 0.73 1.10 -10.01 -10.48 104.25
77 L20 x CZL15049 (non-QPM) -23.70 27.78 22.36 42.57 19.14 52.14 1.15 2.68 -10.57 -15.05 144.12
78 L20 x CML444 (non-QPM) 17.85 61.11 7.59 11.91 -3.77 10.30 4.68 5.69 -13.46 -15.13 115.36
79 L20 x CML395 (non-QPM) -20.65 11.11 15.30 28.74 21.05 39.95 2.44 4.83 -11.73 -14.35 102.77
80 L21 x CZL15049 (non-QPM) -18.12 27.50 23.41 37.67 17.36 32.37 0.54 0.79 -5.59 -6.76 121.52
81 L21 x CZL059 (non-QPM) -12.04 27.50 7.17 20.45 21.88 34.69 1.72 1.98 -8.66 -6.89 103.35
82 L21 x CML444 (non-QPM) 9.34 40.00 6.85 6.83 7.75 10.15 3.17 3.47 -5.69 -7.59 87.56
83 L21 x CML395 (non-QPM) -25.59 -2.50 19.18 27.59 4.95 8.11 1.13 2.19 -14.17 -14.99 35.06
84 L22 x CZL15049 (non-QPM) -33.64 0.00 5.02 24.75 12.66 40.08 1.22 1.71 -6.02 -9.22 51.80
85 L22 x CZL059 (non-QPM) -22.01 9.52 -0.52 19.11 8.01 31.38 2.57 3.09 -10.00 -10.33 51.16
86 L22 x CML444 (non-QPM) -23.40 -4.76 0.24 6.12 2.40 14.51 3.86 3.81 -10.41 -10.60 2.78
87 L22 x CML395 (non-QPM) -23.24 -2.38 21.40 38.12 1.50 14.45 -0.17 1.12 -5.83 -7.05 50.80
88 L23 x CZL15049 (QPM) -5.78 -3.70 16.00 24.63 19.90 35.78 0.85 3.16 -5.92 -7.61 90.83
89 L23 x CZL059 (QPM) 3.21 6.64 14.14 23.53 17.75 30.64 1.27 3.61 -6.36 -7.58 100.79
90 L23 x CML444 (non-QPM) -37.25 -27.92 8.09 11.97 13.49 16.44 4.64 6.46 -2.35 -3.78 -4.09
91 L23 x CML395 (non-QPM) -32.80 -24.41 19.29 23.17 24.08 28.30 1.60 4.77 -10.41 -10.75 44.01
92 L24 x CZL15049 (QPM) -8.00 -7.77 9.44 25.65 15.71 45.30 0.69 1.80 -7.07 -9.82 82.81
93 L24 x CZL059 (QPM) -11.78 -6.53 5.64 22.22 28.89 58.30 1.19 2.32 -5.94 -6.04 100.26
94 L24 x CML444 (non-QPM) -26.75 -13.51 5.58 8.36 25.26 41.36 2.62 3.19 -5.82 -6.08 46.12
95 L24 x CML395 (non-QPM) -41.26 -32.12 15.01 26.60 29.66 47.56 0.68 2.61 -9.81 -10.55 48.73
96 L25 x CZL15049 (QPM) -8.65 -8.33 7.29 17.26 18.42 41.65 1.60 2.12 -4.92 2.41 71.36
97 L25 x CZL059 (QPM) -4.97 0.06 13.34 24.79 5.96 24.07 2.25 2.79 -8.98 -12.49 68.28
98 L25 x CML444 (non-QPM) -39.90 -29.52 6.64 8.69 15.36 24.48 2.90 2.93 -7.35 -10.78 -8.43
99 L25 x CML395 (non-QPM) -36.84 -27.49 22.07 28.13 27.68 38.89 0.41 1.73 -12.86 -16.97 54.58
100 L26 x CZL15049 (QPM) -8.96 -5.13 10.86 15.69 -0.59 6.36 2.87 3.59 -3.19 -4.89 24.69
101 L26 x CZL059 (QPM) 2.63 4.01 14.85 19.01 2.13 7.16 3.74 4.48 -9.21 -10.43 58.00
102 L26 x CML444 (non-QPM) -31.64 -23.12 19.80 40.08 11.58 14.64 2.29 2.45 -3.66 -5.11 36.08
103 L26 x CML395 (non-QPM) -42.59 -36.75 23.40 34.05 13.69 15.92 1.84 3.37 -12.72 -13.09 12.93
104 L27 x CZL15049 (QPM) 22.38 97.37 7.02 22.31 11.92 37.72 0.66 0.46 -2.39 -5.05 199.83
105 L27 x CZL059 (QPM) 35.14 102.63 -1.56 13.37 10.98 33.62 2.65 2.85 -10.88 -11.19 199.68
106 L27 x CML444 (non-QPM) -14.37 13.16 10.67 13.11 6.53 17.99 1.67 0.92 -12.04 -12.49 49.68
107 L27 x CML395 (non-QPM) -10.53 21.05 13.30 24.16 7.05 19.56 1.70 2.30 -11.29 -11.81 78.60
108 L28 x CZL15049 (non-QPM) -6.33 60.00 15.00 40.01 8.56 11.24 -0.65 0.55 -13.13 -13.90 128.38

249
109 L28 x CZL059 (non-QPM) 2.74 62.86 14.61 40.65 9.29 14.15 -1.02 0.18 -11.55 -13.51 143.46
110 L28 x CML444 (non-QPM) -30.21 -2.86 0.20 8.47 2.30 15.69 2.87 3.54 -4.44 -6.70 0.00
111 L28 x CML395 (non-QPM) -9.84 28.57 12.31 30.85 1.88 14.26 1.21 3.25 -17.97 -19.04 82.49
112 L29 x CZL15049 (non-QPM) -13.09 30.95 24.11 28.37 -4.40 14.12 1.24 -0.35 -10.11 -14.93 80.95
113 L29 x CZL059 (non-QPM) -20.31 11.90 20.53 25.54 15.92 35.45 0.37 1.98 -8.19 -10.44 91.38
114 L29 x CML444 (non-QPM) -19.57 0.00 14.95 23.71 4.49 12.53 2.00 4.21 -11.30 -13.34 42.32
115 L29 x CML395 (non-QPM) -17.62 4.76 25.65 25.06 8.09 17.36 0.07 0.88 -13.89 -16.76 64.25
116 L30 x CZL15049 (non-QPM) -13.09 30.95 16.77 26.98 19.12 22.53 -0.62 0.10 -9.55 -13.48 102.74
117 L30 x CZL059 (non-QPM) -8.44 28.57 4.27 14.23 10.48 11.51 1.56 2.28 -6.64 -7.91 64.46
118 L30 x CML444 (non-QPM) -9.99 11.90 8.38 10.99 2.34 9.36 1.88 3.18 -7.75 -8.86 38.04
119 L30 x CML395 (non-QPM) -23.24 -2.38 19.63 24.96 13.38 20.20 -0.40 -0.33 -13.71 -15.67 51.82
120 L31 x CZL15049 (QPM) 23.35 66.00 15.53 18.50 11.36 58.73 3.26 3.95 -9.66 -13.38 200.68
121 L31 x CZL059 (QPM) 28.61 62.00 13.86 17.61 7.40 49.48 3.70 4.40 -13.11 -14.09 187.06
122 L31 x CML444 (non-QPM) -19.95 -10.00 16.88 26.88 26.23 60.26 3.12 3.25 -11.41 -12.27 106.67
123 L31 x CML395 (non-QPM) -37.29 -28.00 24.65 26.27 25.39 60.67 1.56 3.05 -12.35 -14.14 76.30
124 L32 x CZL15049 (non-QPM) -32.06 2.38 13.97 28.63 7.06 31.45 2.22 2.56 -1.00 -4.98 56.22
125 L32 x CML444 (non-QPM) -15.74 4.76 12.29 13.47 0.73 11.34 3.44 3.65 -7.47 -8.26 33.95
126 L32 x CML395 (non-QPM) -19.49 2.38 23.15 33.34 7.85 20.20 0.47 1.62 -10.71 -12.43 69.52
127 L35 x CZL15049 (non-QPM) -31.51 4.88 32.13 51.40 7.44 27.32 0.58 1.97 -11.19 -12.09 94.20
128 L35 x CZL059 (non-QPM) -19.63 14.63 21.82 40.65 8.92 26.37 1.52 2.93 -14.83 -16.61 97.22
129 L35 x CML444 (non-QPM) -12.99 9.76 7.78 10.42 9.67 17.33 3.72 4.57 -9.11 -11.15 50.26
130 L35 x CML395 (non-QPM) -20.62 2.44 12.80 23.93 8.21 16.70 1.71 3.94 -19.49 -20.44 49.11
NB: Summation (Sum) was made for both mid- and better parent heterosis for tryptophan, protein, oil and starch
Copyright © 2022 FDOKUMEN