study of drag reducing polymers and mechanisms of their - D ...
172
STUDY OF DRAG REDUCING POLYMERS AND MECHANISMS OF THEIR INTRAVASCULAR EFFECT by Joie Nicole Marhefka BChE, Villanova University, 2000 Submitted to the Graduate Faculty of The School of Engineering in partial fulfillment of the requirements for the degree of Doctor of Philosophy University of Pittsburgh 2007
-
Upload
khangminh22 -
Category
Documents
-
view
3 -
download
0
Transcript of study of drag reducing polymers and mechanisms of their - D ...

STUDY OF DRAG REDUCING POLYMERS AND MECHANISMS OF THEIR INTRAVASCULAR EFFECT
by
Joie Nicole Marhefka
BChE, Villanova University, 2000
Submitted to the Graduate Faculty of
The School of Engineering in partial fulfillment
of the requirements for the degree of
Doctor of Philosophy
University of Pittsburgh
2007

ii
UNIVERSITY OF PITTSBURGH
SCHOOL OF ENGINEERING
This dissertation was presented
by
Joie Nicole Marhefka
It was defended on
March 19, 2007
and approved by
James F. Antaki, Ph.D. Professor, Departments of Biomedical Engineering & Computer Science, Carnegie Mellon University; Professor, Departments of Bioengineering & Surgery, University of Pittsburgh
Harvey S. Borovetz, Ph.D.
Professor & Chair, Department of Bioengineering; Robert L. Hardesty Professor, Department of Surgery; Professor, Department of Chemical & Petroleum Engineering
Toby M. Chapman, Ph.D.
Associate Professor, Department of Chemistry
Richard R. Koepsel, Ph.D. Research Associate Professor, Department of Chemical & Petroleum Engineering
Marina V. Kameneva, Ph.D.
Dissertation Director Research Professor, Departments of Bioengineering & Surgery

iii
Copyright © by Joie Nicole Marhefka
2007

STUDY OF DRAG REDUCING POLYMERS AND MECHANISMS OF THEIR INTRAVASCULAR EFFECT
Joie Nicole Marhefka, PhD
University of Pittsburgh, 2007
Blood-soluble drag reducing polymers (DRPs) have been shown to produce considerable
beneficial effects on blood circulation, including an increase in tissue perfusion and tissue
oxygenation and a decrease in vascular resistance, when injected in blood at minute
concentrations in animal models of normal and especially pathological circulation. DRPs have
potential applications in treating tissue hypoperfusion caused by cardiovascular disease, stroke,
peripheral vascular disease, diabetes, and other illnesses. To help to translate this novel therapy
from the lab bench to the clinic, standard tests need to be developed for characterization and
efficacy testing of candidate polymers. Furthermore, elucidation of the mechanisms of the
observed DRP effects on blood circulation is extremely important for their future medical
applications. Finally, effective, biocompatible and stable polymers which can be easily produced
in large quantities must be identified.
In this work a sequence of tests was developed to characterize and assess efficacy of
DRPs for possible use in treating circulatory disorders. This research study also provided a better
understanding of mechanical degradation of DRPs, especially in the presence of blood cells or
particles. It was discovered that an increase in particle concentration led to an increase in
degradation rate, and that rigid particles caused an even higher degradation rate than deformable
red blood cells (RBCs).
iv

Microfluidic studies in models of microvessels showed that DRPs prevented RBC
movement from the walls of microchannels toward the center and lessened plasma skimming at
bifurcations, delivering more RBCs to smaller branches and thus to capillaries. In vivo, this may
lead to a reduction of the near-wall plasma layer, which would facilitate gas transport, increase
local wall shear stress and promote vasodilation decreasing vascular resistance in microvessels.
Three polymers, including an aloe vera derived polysaccharide (AVP), poly(N-vinyl
formamide), and hyaluronic acid (HA), were evaluated and characterized as new drag reducers
for potential clinical use and found to be very effective. HA and AVP were found to be the most
resistant to mechanical degradation of the tested polymers. Finally, relaxation time and gyration
radius were found to be the polymer’s physical properties which best predicted their drag
reducing effectiveness.
v

TABLE OF CONTENTS
NOMENCLATURE................................................................................................................. XVI
PREFACE................................................................................................................................. XIX
1.0 INTRODUCTION........................................................................................................ 1
2.0 BACKGROUND .......................................................................................................... 6
2.1 DRAG REDUCING POLYMERS ..................................................................... 6
2.2 INTRAVASCULAR EFFECTS OF DRPS ....................................................... 9
2.3 DRPS IN TREATMENT OF HEMORRHAGIC SHOCK............................ 10
2.4 DRP DEGRADATION...................................................................................... 12
2.5 MECHANISMS OF INTRAVASCULAR DRP EFFECTS .......................... 14 2.6 BLOOD-SOLUBLE DRAG REDUCING POLYMERS FOR POTENTIAL BIOMEDICAL APPLICATIONS .................................................................................... 17
2.6.1 Aloe vera derived DRP ............................................................................... 18
2.6.2 Poly(N-vinylformamide)............................................................................. 20
2.6.3 Hyaluronic Acid .......................................................................................... 21
3.0 HYDRODYNAMIC, RHEOLOGICAL, AND MOLECULAR TESTS TO CHARACTERIZE BLOOD SOLUBLE DRAG REDUCING POLYMERS ....................... 23
3.1 METHODS......................................................................................................... 24
3.1.1 Polymer drag reduction in turbulent flow................................................ 24
3.1.2 Polymer drag reduction in turbulent flow of blood................................. 27
vi

3.1.3 Gel Permeation Chromatography (GPC)................................................. 28
3.1.4 Rheological Characterization .................................................................... 29
3.1.5 DRP Degradation Studies........................................................................... 30
3.2 RESULTS ........................................................................................................... 33
3.2.1 Polymer drag reduction in turbulent flow................................................ 33
3.2.2 Polymer drag reduction in turbulent flow of blood................................. 35
3.2.3 GPC .............................................................................................................. 36
3.2.4 Rheological Characterization .................................................................... 37
3.2.5 DRP Degradation Studies........................................................................... 42
3.3 DISCUSSION..................................................................................................... 47
4.0 IN VITRO MICROSCALE STUDIES OF POTENTIAL MECHANISMS OF THE INTRAVASCULAR EFFECTS OF DRAG REDUCING POLYMERS ..................... 51
4.1 METHODS......................................................................................................... 51
4.1.1 Microchannel fabrication........................................................................... 51
4.1.2 Preparation of a red blood cell (RBC) suspension................................... 54
4.1.3 Effects of DRPs on blood flow in straight capillary tubes....................... 55
4.1.4 Effects of DRPs on blood flow in bifurcated microchannels................... 17
4.1.5 Model for DRP effects on microcirculation.............................................. 62
4.2 RESULTS ........................................................................................................... 65
4.2.1 Effects of DRPs on blood flow in straight capillary tubes....................... 65
4.2.2 Effects of DRPs on blood flow in straight glass microchannels.............. 71
4.2.3 Effects of DRPs on blood flow in bifurcated microchannels................... 76
4.2.4 Model for DRP effects on microcirculation.............................................. 86
4.2.5 Results Summary ........................................................................................ 87
vii

4.3 DISCUSSION..................................................................................................... 88
5.0 DEVELOPMENT AND TESTING OF NEW DRAG REDUCING POLYMERS FOR POTENTIAL BIOMEDICAL APPLICATIONS........................................................... 91
5.1 METHODS......................................................................................................... 92
5.1.1 Development and characterization of an aloe vera based DRP.............. 92
5.1.2 Synthesis and characterization of poly(N-vinylformamide) ................... 94
5.1.3 Characterization of hyaluronic acid (HA) as a DRP ............................... 95
5.1.4 Comparison and correlation of DRP physicochemical and rheological properties with their drag reducing activity and their effects on microchannel blood flow.................................................................................................................... 95
5.2 RESULTS ........................................................................................................... 96
5.2.1 Development and characterization of an aloe vera based DRP.............. 96
5.2.1.1 Chemical characterization of AVP.................................................... 97
5.2.1.2 GPC...................................................................................................... 98
5.2.1.3 In vitro test of drag reducing ability.................................................. 99
5.2.1.4 Viscoelasticity.................................................................................... 100
5.2.1.5 Mechanical degradation studies ...................................................... 104
5.2.2 Synthesis and characterization of poly(N-vinylformamide) ................. 106
5.2.2.1 1HNMR .............................................................................................. 106
5.2.2.2 GPC.................................................................................................... 106
5.2.2.3 In vitro test of drag reducing ability................................................ 107
5.2.2.4 Viscoelasticity.................................................................................... 109
5.2.2.5 Mechanical degradation studies ...................................................... 113
5.2.3 Characterization of high molecular weight hyaluronic acid for use as a DRP for potential use in vivo................................................................................... 116
viii

5.2.3.1 GPC.................................................................................................... 116
5.2.3.2 In vitro test of drag reducing ability................................................ 116
5.2.3.3 Viscoelasticity.................................................................................... 118
5.2.3.4 Mechanical degradation studies of HA........................................... 123
5.2.4 Comparison and correlation the DRP physicochemical and rheological properties with their drag reducing activity.......................................................... 124
5.2.4.1 Correlations between DRP physicochemical and rheological properties and their drag reducing effectiveness.......................................... 124
5.2.4.2 Correlations between DRP physicochemical and rheological properties and their effects in microflow of RBCs ....................................... 125
5.2.4.3 Comparison of mechanical degradation behavior among the class of DRPs ............................................................................................................ 125
5.3 DISCUSSION................................................................................................... 127
6.0 SUMMARY .............................................................................................................. 134
6.1 CONCLUSIONS.............................................................................................. 134
6.2 STUDY LIMITATIONS ................................................................................. 136
6.3 FUTURE STUDIES......................................................................................... 139
APPENDIX A............................................................................................................................ 141
APPENDIX B ............................................................................................................................ 144
BIBLIOGRAPHY..................................................................................................................... 124
ix

LIST OF TABLES
Table 3-1. Average drag reduction produced by various PEOs at a Reynolds number of 23,000 35 Table 3-2. Molecular characteristics of PEO and dextran obtained using GPC........................... 37
Table 3-3. Asymptotic viscosities of PEOs measured by a capillary viscometer at a concentration of 0.1 mg/ml at 22 °C ± 1 °C. ....................................................................................................... 41
Table 3-4. Molecular characteristics and drag reduction (DR) of PEO-4500 at 0.1 mg/ml during turbulent flow degradation in saline ............................................................................................. 46
Table 4-1. Reynolds number and calculated wall shear stress for blood flow in capillary tubes. 57
Table 4-2. Tube specifications and increase in wall shear stress caused by DRPs in blood flow in a straight channel .......................................................................................................................... 66
Table 5-1. Comparison of molecular parameters of several HA samples obtained from Lifecore Biomedical .................................................................................................................................. 116
Table 5-2. Comparison of maximum DR produced by various HAs at several concentrations in the turbulent flow system............................................................................................................ 117
Table 5-3. Viscosities of HAs measured using a capillary viscometer at a concentration of 0.1 mg/ml at 22 °C ± 1°C. ................................................................................................................ 122
x

LIST OF FIGURES
Figure 2-1. Effect of DRPs on turbulent flow in a pipe.................................................................. 7
Figure 2-2. Effect of a single injection of DRP (PNVF) injected in a normal animal at the concentration of 4 µg/ml in blood................................................................................................. 10
Figure 2-3. The size of the near wall plasma layer in a 100 micron channel decreases with an increase in DRP concentration (57). ............................................................................................. 17
Figure 2-4. Proposed structure of the major component of aloe vera gel [60] ............................. 20
Figure 2-5. Structure of PNVF...................................................................................................... 21
Figure 2-6. Structure of hyaluronic acid ....................................................................................... 22
Figure 3-1. Schematic for turbulent flow system used to test DRP efficacy................................ 27
Figure 3-2. Friction factor vs. Re for several PEOs tested in a turbulent flow circulating system at 100 µg/ml. The drag reducing ability of PEO increased with an increase in MW of the PEO .... 34
Figure 3-3. Maximum drag reduction in turbulent flow of blood produced by PEO-4500 and AVP at various concentrations...................................................................................................... 36
Figure 3-4. Viscosity data for PEOs at 2.5 mg/ml measured using a Brookfield cone and plate rheometer ...................................................................................................................................... 38
Figure 3-5. Viscosity data for PEOs at 2.5 mg/ml obtained using a viscoelastometer (Vilastic). 39
Figure 3-6. Elasticity data for PEOs at 2.5 mg/ml obtained using a viscoelastometer (Vilastic). 40
Figure 3-7. Relaxation times for PEOs at 2.5 mg/ml obtained using a viscoelastometer (Vilastic)....................................................................................................................................................... 41
Figure 3-8. Drag reduction vs. time for PEO-4500 at a concentration of 0.1 mg/ml in saline and in the presence of RBCs at several concentrations. The rate of DRP degradation increases with an increase in RBC concentration................................................................................................. 42
xi

Figure 3-9. Drag reduction vs. time for PEO-4500 at a concentration of 0.1 mg/ml in saline and in the presence of rigid glass particles at two concentrations. The rate of PEO degradation increases with an increase in concentration of particles. .............................................................. 43
Figure 3-10. Drag reduction vs. time for PEO-4500 at a concentration of 0.1 mg/ml in saline compared to that in 5% RBCs or 5% rigid glass particles. The rate of polymer degradation is higher in a RBC suspension than in saline, and further increases in a suspension of rigid particles. ........................................................................................................................................ 44
Figure 3-11. Drag reduction vs. time for PEO-4500 at a concentration of 0.1 mg/ml in saline compared to that in a 20% RBC suspension and an equiviscous glycerol solution. The rate of degradation of PEO-4500 at 0.1mg/ml in a 15% glycerol solution, having the same viscosity as a 20% RBC solution is slightly higher than in saline, but much lower than in the 20% RBC suspension..................................................................................................................................... 45
Figure 3-12. The rate of PEO degradation rate increases linearly with an increase in particle concentration. Rigid particles cause a larger increase in degradation rate than flexible RBCs for a given concentration increase......................................................................................................... 47
Figure 4-1. Sample microchannel design (left) and the chrome mask used for microchannel fabrication (right) .......................................................................................................................... 53
Figure 4-2. Micrographs of PDMS microchannels and the silicon wafer/photoresist master ..... 54
Figure 4-3. Schematic of capillary flow system. .......................................................................... 56
Figure 4-4. Schematic of microchannel flow system.................................................................... 60
Figure 4-5. System for microflow experiments consisting of: a) syringe pump, b) syringe, c) PVC tubing, d) microchannel, e) reservoir, and f) inverted microscope ...................................... 62
Figure 4-6. Schematic used for marginal zone model of capillary blood flow............................. 63
Figure 4-7. Friction factor vs. Re for RBCs flowing in a 220 µm capillary tube......................... 67
Figure 4-8. Friction factor vs. Re for RBCs (Ht = 20%) with 0 and 10 µg/ml PEO-4500 flowing in a 115 µm capillary tube ............................................................................................................ 68
Figure 4-9. Friction factor vs. Re for RBCs (Ht = 40%) with 0 and 10 µg/ml PEO-4500 flowing in a 115 µm capillary tube ............................................................................................................ 69
Figure 4-10. Friction factor vs. Re for RBCs (Ht = 20%) with 0 and 2 µg/ml PEO-4500 flowing in a 115 µm capillary tube ............................................................................................................ 70
Figure 4-11. Friction factor vs. Re for RBCs (Ht = 40%) with 0 and 2 µg/ml PEO-4500 flowing in a 115 µm capillary tube ............................................................................................................ 71
xii

Figure 4-12. RBCs in a 100 µm straight, glass channel with no polymer and no flow (top left) and flowing at 0.2 ml/min (top right) and with 10 µg/ml PEO-4500 and no flow (bottom left) and flowing at 0.2 ml/min (bottom right) ............................................................................................ 74
Figure 4-13. DRP (PEO-4500) caused a significant decrease in plasma layer size in a 100µm glass channel (p<0.001 at 0.05 ml/min and 0.1 ml/min) .............................................................. 75
Figure 4-14. Friction factor vs. Re for RBCs (Ht = 20%) with 0 and 10 µg/ml PEO-4500 flowing in a 100 µm rectangular microchannel ............................................................................ 76
Figure 4-15. RBCs in a 100 µm PDMS channel upstream of the bifurcations with no polymer and no flow (top left) and flowing at 0.1 ml/min (top middle) and 0.2 ml/min (top right) and with 0.01 mg/ml PEO-4500 and no flow (bottom left) and flowing at 0.1 ml/min (bottom middle) and 0.2 ml/min (bottom right) ............................................................................................................. 77
Figure 4-16. DRP (PEO-4500) caused a significant decrease in plasma layer size in a 100 µm section of a PDMS channel upstream of bifurcations (p=0.01 @ 0.05 ml/min and p<0.001 @ 0.1 ml/min).......................................................................................................................................... 78
Figure 4-17. Schematic of microchannel systems highlighting regions where images were taken in 100 µm to 100 µm bifurcation (left) and 100 µm to 50 µm bifurcation (right). Arrows indicate direction of flow............................................................................................................................ 79
Figure 4-18. RBC suspensions in a 100 µm to 100 µm right angle bifurcation with no polymer and no flow (top left) and flowing at 0.1 ml/min (top middle) and 0.2 ml/min (top right) and with 10 µg/ml PEO-4500 and AVP and no flow (middle and bottom left, respectively) and flowing at 0.1 ml/min (middle and bottom middle) and 0.2 ml/min (middle and bottom right) ................... 80
Figure 4-19. RBC suspensions in a 100 µm to 50 µm right angle bifurcation with no polymer and no flow (top left) and flowing at 0.1 ml/min (top middle) and 0.2 ml/min (top right) and with 10 µg/ml PEO-4500 and no flow (bottom left) and flowing at 0.1 ml/min (bottom middle) and 0.2 ml/min (bottom right) ................................................................................................................... 81
Figure 4-20. Comparison of hematocrits at the channel inlet and outlets of the parent and daughter branch. For RBC suspensions with no DRP flowing at 0.1 ml/min in a 50 µm to 25 µm bifurcation, parent branch hematocrit is significantly higher than that in the daughter branch indicating that plasma skimming is occurring .............................................................................. 82
Figure 4-21. Comparison of hematocrits at the channel inlet and outlets of the parent and daughter branch. For RBC suspensions with 10 µg/ml PEO-4500 flowing at 0.1 ml/min in a 50 µm to 25 µm bifurcation, the plasma skimming effect is attenuated and no significant difference is observed between parent and daughter hematocrit. .................................................................. 83
xiii

Figure 4-22. 20% hematocrit RBC suspension in a 50 µm to 200 µm expansion with no polymer and no flow (top left) and flowing at 0.1 ml/min (top middle) and 0.2 ml/min (top right) and with 10 µg/ml PEO-4500 and AVP and no flow (middle and bottom left, respectively) and flowing at 0.1 ml/min (middle and bottom middle) and 0.2 ml/min (middle and bottom right) ................... 84
Figure 4-23. 20% hematocrit RBC suspension in a 100 µm to 200 µm expansion with no polymer and no flow (top left) and flowing at 0.1 ml/min (top middle) and 0.2 ml/min (top right) and with 10 µg/ml PEO-4500 (bottom left) and flowing at 0.1 ml/min (bottom middle) and 0.2 ml/min (bottom right) ................................................................................................................... 85
Figure 4-24. 40% hematocrit RBC suspensions in a 100 µm to 200 µm expansion with no polymer and no flow (top left) and flowing at 0.1 ml/min (top middle) and 0.2 ml/min (top right) and with 10 µg/ml PEO-4500 (bottom left) and flowing at 0.1 ml/min (bottom middle) and 0.2 ml/min (bottom right) ................................................................................................................... 86
Figure 5-1. AFM of aloe-derived DRP molecule (image was obtained by Brian Cusick in Dr. Tomasz Kowalewski’s laboratory at Carnegie Mellon University) ............................................. 97
Figure 5-2. Drag reducing effect of AVP ..................................................................................... 99
Figure 5-3. Viscosity of AVP measured in the Brookfield cone and plate rheometer at a concentration of 2.5 mg/ml .......................................................................................................... 101
Figure 5-4. Viscosity of AVP measured in a viscoelastometer (Vilastic) at a concentration of 2.5 mg/ml ..................................................................................................................................... 102
Figure 5-5. Elasticity of AVP measured in a viscoelastometer (Vilastic) at a concentration of 2.5 mg/ml ..................................................................................................................................... 103
Figure 5-6. Relaxation time of AVP measured in a viscoelastometer (Vilastic) at a concentration of 2.5 mg/ml................................................................................................................................ 104
Figure 5-7. The rate of degradation of AVP at 0.1mg/ml is higher in a RBC suspension than in saline, but AVP maintains drag reducing ability in both saline and RBC suspensions following 15 min (top) and 5 hr (bottom) of exposure to turbulent flow.................................................... 105
Figure 5-8. Pressure vs. flow characteristics of PNVF solutions obtained in the turbulent flow system. ........................................................................................................................................ 108
Figure 5-9. Dimensionless friction factor vs. Reynolds number obtained for saline, PNVF (two concentrations) and two PEO solutions ...................................................................................... 109
Figure 5-10. Viscosity of PNVF solution at the concentration of 5 mg/ml compared to that of two PEOs ........................................................................................................................................... 110
xiv

Figure 5-11. Viscosity of PNVF solution measured in viscoelastometer at a concentration of 5 mg/ml compared to that of two PEOs......................................................................................... 111
Figure 5-12. Elasticity of PNVF solution measured in viscoelastometer at a concentration of 5 mg/ml compared to that of two PEOs......................................................................................... 112
Figure 5-13. Relaxation time of PNVF solution measured in viscoelastometer at a concentration of 5mg/ml compared to that of two PEOs .................................................................................. 113
Figure 5-14. Drag reducing ability of PNVF maintained after exposure to flow compared to that of several PEOs........................................................................................................................... 114
Figure 5-15. Weight average molecular weight decreases slightly as the PNVF drag reducing ability degrades during exposure to turbulent flow .................................................................... 115
Figure 5-16. Z average molecular weight decreases slightly as the PNVF drag reducing ability degrades during exposure to turbulent flow................................................................................ 115
Figure 5-17. Friction factor vs. Reynolds number obtained for several HAs at 0.1 mg/ml ....... 118
Figure 5-18. Viscosity of HA solutions at a concentration of 2.5 mg/ml................................... 119
Figure 5-19. Viscosity of HA solutions measured in viscoelastometer at a concentration of 2.5 mg/ml ..................................................................................................................................... 120
Figure 5-20. Elasticity of HA solutions measured in viscoelastometer at a concentration of 2.5 mg/ml .......................................................................................................................................... 121
Figure 5-21. Relaxation time of HA solutions measured in viscoelastometer at a concentration of 2.5 mg/ml .................................................................................................................................... 122
Figure 5-22. Percentage of original drag reducing ability maintained after exposure to flow ... 123
Figure 5-23. Percentage of original drag reducing effectiveness maintained after one hour of exposure to flow.......................................................................................................................... 127
xv

NOMENCLATURE
δ Plasma layer size
∆P Pressure drop
λ Friction factor
µ Dynamic viscosity
ν Kinematic viscosity
ρ Density
AVP Aloe vera-derived DRP
D Diameter
DR Drag reduction
DR(0) Initial drag reduction
DR(t) Drag reduction at a given time t
DRP Drag reducing polymer
FCD Functional capillary density
FDA Food and Drug Administration
F-L Fåhraeus-Lindquist
GPC Gel permeation chromatography
HA Hyaluronic acid
Ht Hematocrit
ID Tube inner diameter
IV Intrinsic viscosity
xvi

k Rate constant for DRP degradation
l, L Tube length
le Entrance length
Mn Number average molecular weight
MW Molecular weight
Mw Weight average molecular weight
Mz Z average molecular weight
NVF N-vinylformamide
PAM Polyacrylamide
PBS Phosphate buffered saline
PEO Poly(ethylene oxide)
PEO-200 Poly(ethylene oxide) molecular weight 200 kDa
PEO-600 Poly(ethylene oxide) molecular weight 600 kDa
PEO-1000 Poly(ethylene oxide) molecular weight 1000 kDa
PEO-2000 Poly(ethylene oxide) molecular weight 2000 kDa
PEO-3500 Poly(ethylene oxide) molecular weight 3500 kDa
PEO-4500 Poly(ethylene oxide) molecular weight 4500 kDa
PEO-5000 Poly(ethylene oxide) molecular weight 5000 kDa
PDI Polydispersity index
PDMS Poly(dimethyl siloxane)
PNVF Poly(N-vinylformamide)
Q Flow rate
r Tube radius
xvii

RBC Red blood cell
Re Reynolds number
Rg Radius of gyration
Rh Hydrodynamic radius
t Time
τw Wall shear stress
v Velocity
Wi Weissenberg number
xviii

PREFACE
I would like to thank my advisor, Dr. Marina Kameneva, for giving me the opportunity and
resources necessary to complete this research, and for all of time she has spent teaching me both
the theory and applications of rheology and how to become a better researcher. I truly appreciate
all of her guidance and patience throughout the years. I would also like to thank my co-advisor,
Dr. Toby Chapman, for all of his help with the chemistry aspects of my research. I am grateful
for all he has taught me, both about chemistry and about life. I would like to thank Drs. James
Antaki, Harvey Borovetz, and Richard Koepsel for agreeing to be members of my committee.
The time, expertise, and advice they provided were invaluable in completing this work.
I would like to acknowledge Rui Zhao for her help with all of the microfluidic and
imaging experiments, and for her patience throughout the process. I am also indebted to Dr.
Sachin Velankar for his help with microchannel experiments and for the valuable discussions on
rheology and microfluidics.
Thanks to all of the members, past and present, of the Hemodynamics, Hemorheology,
and Artificial Blood Research Laboratory for their assistance in completing the experiments
included in this dissertation, especially Dorian Arnold, Elaine Blyskun, Chenara Johnson, and
Jude Menie. My lab mates and officemates have definitely made the work days more fun, and for
this I am grateful. Special thanks are due to Stephanie Shaulis and Phil Marascalco for all of their
xix

help with research, data analysis, and proofreading, as well as for their moral support and
friendship.
I couldn’t have done this without the support of all of my wonderful friends, especially
those I have made during my grad school years. Thanks to Tiffany Sellaro and Susan Moore for
being great friends and for being there for me, rain or shine, over the last seven years. Thanks to
Jill Slaboda for helping to keep me sane while writing this dissertation, and of course for her
friendship.
To my family, for their constant love and support, I am forever grateful. I couldn’t have
done it without you. My sister Juli has always been a great friend, thanks for always being there
for me and putting up with me. Thanks to Uncle Michael for being supportive throughout my
grad school days and always. My parents have always encouraged me to work hard and to follow
my dreams. Without their endless support, I wouldn’t be where I am today. I appreciate all of the
advice and constant encouragement that my Mom has given me, throughout grad school and my
entire life. My Dad taught me to never give up. This is something I will always remember. Thank
you all for everything!
Finally, I would like to acknowledge the Pittsburgh Foundation, Lifecore Biomedical, the
Commonwealth of Pennsylvania and the PA Department of Health, the Pittsburgh Tissue
Engineering Initiative and the National Tissue Engineering Center, and the University of
Pittsburgh Provost’s Development Fund for providing the financial resources necessary to
complete this work.
xx

1.0 INTRODUCTION
Treatment of tissue hypoperfusion is extremely important for millions of patients suffering from
cardiovascular disease, stroke, peripheral vascular disease, diabetes, and other illnesses. Standard
therapies available today for treatment of tissue hypoperfusion include administration of
vasopressive agents to enhance pressure and administration of inotropic agents to enhance
myocardial contractility and cardiac output [1]. More advanced treatments of cardiovascular
diseases are being developed using tissue engineering and regenerative medicine methods. In
spite of significant progress in treatments of cardiovascular diseases and some decline in
mortality due to these diseases, they are still major causes of death in the United States and other
developed countries. The costs associated with treatment of these diseases and related disabilities
are enormous. Thus, development of novel methods of enhancement of impaired
microcirculation, which is the major cause of tissue hypoperfusion, is essential. The objective of
this study was to develop special blood-soluble drag reducing polymers (DRPs) as a novel
concept for improving inadequate microcirculation. Intravascular flow enhancement by DRP
additives to blood has been demonstrated in vivo in experimental animals [1-14]. The remarkable
ability of DRP additives to reduce/prevent the mortality of animals subjected to hemorrhagic
shock and acute hypoxia and to significantly improve microcirculation in animal models of
diabetes and myocardial infarction makes these polymers desirable candidates for new therapies
for treatment of insufficient blood circulation of any origin.
1

DRPs are soluble polymers which reduce resistance to turbulent flow in a pipe when
added to flowing fluid at nanomolar concentrations [15]. Polymer drag reduction is a physical
phenomenon that was discovered about 60 years ago and is still not completely understood.
Blood-soluble DRPs have been shown to produce significant beneficial effects on animal blood
circulation, including an increase in tissue perfusion and tissue oxygenation and a decrease in
vascular resistance, when intravenously injected at minute concentrations (1 – 10 µg/ml). These
polymers have been successfully applied in animal models of various pathologies including
hemorrhagic shock, atherosclerosis, and diabetes [1-4, 6, 8, 9, 12, 14, 16, 17]. It was shown that
the polymers did not affect blood viscosity and did not have a direct effect on the vessel tone.
Several hypotheses regarding the mechanisms underlying the observed beneficial hemodynamic
effects of DRPs were proposed in the past. It was first suggested that the DRPs may enhance
fluidity of the blood by reducing resistance to turbulent flow in the vascular system, which may
exist due to some pathological states. [18]. However, the DRP effect was seen in normal animals
in which turbulent blood flow is not present. In vitro studies regarding DRP effects on flow
separation in models of bifurcating vessels demonstrated that under flow conditions
corresponding to realistic vascular hemodynamics (1≤ Reynolds number (Re) ≤ 800), DRPs
reduced the size of the flow separation and delayed the development of vortices at bifurcations
[19, 20]. In vivo, this phenomenon would reduce pressure loss in arterial vessels and thus
increase precapillary pressure, thereby increasing the density of functional capillaries (tissue
perfusion). However, the exact mechanisms underlying the DRP intravascular phenomenon
remain incompletely understood. Several DRPs, including polyethylene oxides, polyacrylamides,
and certain polysaccharides have been identified and applied in various in vivo models of
circulation. These polymers are chemically dissimilar, but all possess drag reducing properties as
2

demonstrated in in vitro tests. Thus, the mechanisms underlying the demonstrated beneficial
hemodynamic effects of DRPs are most likely based on the fluid dynamic and/or viscoelastic
properties of the DRPs versus the actual chemistry of these polymers [1].
Several DRPs have been shown to be effective in vivo including high molecular weight
polyethylene oxide (PEO) [1, 3, 12, 14], polyacrylamide (PAM) [2, 4, 8, 9], and certain
polysaccharides [1, 6, 17]. However, none of the tested DRPs were found, in their present form,
to be ideal for biomedical applications. PEO was very effective in vivo, but rapidly mechanically
degraded when exposed to turbulent flow and other high stress conditions. PAM was also shown
to be effective in vivo and was relatively resistant to mechanical degradation. However, it was
not a good DRP candidate for biomedical applications because of its reported toxicity [9, 12].
High molecular weight polysaccharides were also shown to be very effective in vivo [1, 6, 17]
and resistant to mechanical degradation [21-23]. Additionally, polysaccharides as a class are
generally non-toxic [24, 25]. However, currently there is no method for their production in large
amounts. Therefore, it is essential to develop new DRPs for potential clinical use and to develop
a set of tests to characterize these new DRPs and assess their properties required for the
successful use in vivo.
This project aimed to develop a biocompatible DRP suitable for biomedical applications,
to make a significant step toward understanding the mechanisms of the intravascular DRP
phenomenon, and to find physicochemical characteristics of DRPs necessary for in vivo
efficiency. An ideal DRP preparation for biomedical applications, which is effective,
biocompatible, mechanically stable, well defined, and reproducible during preparation, must be
developed, and the mechanism responsible for the intravascular DRP effect must be identified in
3

order to translate this novel technology from the lab bench to the clinic. This development of
DRPs for bioengineering applications was accomplished through the following specific aims:
1) Develop a set of hydrodynamic, rheological, and molecular tests to characterize
blood soluble drag reducing polymers
To achieve this specific aim, a hydrodynamic system was developed for standardized
testing of polymer drag reducing efficiency in saline or in blood, molecular properties of the
DRPs were characterized using gel permeation chromatography (GPC), viscoelastic properties of
DRPs were characterized using rheological methods, and the mechanical degradation of DRPs
due to exposure to shear stress was characterized at a wide range of pipe flow conditions
(Reynolds numbers). The developed series of tests was applied to a well-known DRP, PEO, and
then to characterize and test new DRPs described in Specific Aim 3.
2) Determine potential mechanisms of the intravascular effects of drag reducing
polymers using in vitro microscale methods
In order for DRPs to be applied in the medical field, it is important to have an
understanding of the mechanism for their effects on hemodynamics. Therefore, an in vitro
microscale method of testing the rheological efficacy of DRPs and of studying their mechanism
was developed. Microchannel systems were fabricated, microfluidic studies of the DRP effects
on flow of blood or suspensions of red blood cells (RBCs) were performed, and the data were fit
to a model of RBC concentration distribution across the microchannel.
3) Develop and test new drag reducing polymers
Several DRPs, including high molecular weight PEOs, PAMs, and plant-derived
polysaccharides were applied and found to be effective in blood circulation in previous in vivo
studies. However, the search continues for new DRPs, which are biocompatible, mechanically
4

stable, well defined, and reproducible, for clinical use. Therefore, three novel blood soluble
DRPs were characterized and tested for potential biomedical applications including a DRP
derived from the aloe vera plant, poly(N-vinylformamide), and hyaluronic acid. Mechanical
degradation behavior of the polymers was compared. Correlations were determined between
physicochemical and rheological properties of these polymers and their drag reducing efficiency.
The physical and molecular properties which best predict a polymer’s effectiveness in microflow
systems and thus likely in vivo were also determined.
5

2.0 BACKGROUND
2.1 DRAG REDUCING POLYMERS
Various types of additives, including solid particles such as sands and fibers, colloidal systems
like surfactants and soaps, and many soluble polymers both synthetic and natural, have been
shown to reduce friction and, therefore, enhance fluid flow [26]. The class of soluble polymers,
so called drag reducing polymers (DRPs), has been proven to be the most effective of the drag
reducers. It was discovered several decades ago that the addition of minute concentrations of
some special soluble polymers could significantly decrease resistance to flow without affecting
viscosity or density of the fluid [15]. This phenomenon, known as the Toms effect, occurs in
developed turbulent flow with DRPs that exhibit certain physicochemical properties. Figure 2-1
shows the effect of DRPs, which cause a reduction in pressure gradient at a constant flow rate or
an increase in flow at a constant pressure, on turbulent pipe flow when added to flowing water at
the concentration of 10 µg/ml. Many organic and water-soluble long-chain polymers were found
to have drag reducing properties. Small concentrations of these DRPs can reduce friction by up
to 80% [26]. To possess drag reducing activity a polymer must have a high molecular weight
(MW>106 Da) and at least a fairly linear structure [26]. At the same molecular weight, a linear
polymer will be a more effective drag-reducer than a branched polymer [26]. Highly branched
polymers, such as high molecular weight dextran, have no drag reducing ability. It is important
6

for the polymer to be in a good solvent that will extend the polymer coil and increase flexibility
of the polymer chain. A poor solvent will cause a polymer to become rigid, inhibiting its drag
reducing activity [26]. The polymer’s drag reducing efficiency is best defined by degree of
polymerization, which describes the number of monomer units and therefore chain length. The
number of backbone chain links is important in determining a DRP’s efficacy [27]. Therefore, if
two polymers have the same molecular weight, the one with the lower molecular weight
monomer will be the better drag-reducer [27].
0
1
2
3
4
5
6
7
8
9
10
1.5 2 2.5 3 3.5 4 4.5 5 5.5Flow Rate (L/min)
Pres
sure
(N/c
m^2
)
6
Water DRP
Figure 2-1. Effect of DRPs on turbulent flow in a pipe.
Kulicke [26] reviewed the properties required for an effective DRP in detail by analyzing
primary, secondary, tertiary, and quaternary structure. He found, that average absolute molecular
weight, which is represented by the weight average (Mw) or number average (Mn) molecular
7
weight and describes the primary structure, must be greater than 106 Da. In general, the high
molecular weight tail of the distribution determines the polymer’s effectiveness as a drag-
reducer. Polymers that are more flexible, and therefore occupy a larger volume by forming a
solvent filled coil, are more effective DRPs [26]. Polyelectrolytes, which have a larger
hydrodynamic volume in distilled water than in salt solutions, exhibit better drag reducing
efficiency with decreasing concentrations of salt [26]. Ionic groups, arranged with a certain
structural orientation of charges, can also enhance a DRP’s activity [26]. It was found by Kinnier
[28] that, to obtain the same drag reduction with polymers of different molecular weights, equal
hydrodynamic volumes of the polymers are required.
The DRPs do not have any effect on pipe laminar flow characteristics and do not change
fluid viscosity at the effective concentrations. It was found, however, that DRP additives reduced
hydrodynamic resistance in systems with nonturbulent (disturbed laminar) flow, such as
pulsating flow in straight and spiral pipes or Couette flow with Taylor vortices at low Reynolds
numbers [29, 30]. The class of DRPs includes organic polymers such as polymethylmethacrylate,
polyisobutylene and polystyrene as well as several water soluble polymers. Well-known,
effective, water soluble DRPs include synthetic polymers such as PEO, PAM, poly(acrylic acid),
and natural polymers such as guar gum, xanthan, carboxymethylcellulose, DNA, hyaluronic acid,
a polysaccharide from the okra plant [17], several algae [31], fish slimes [32, 33], and several
bacterial polysaccharides [32]. More recently, a new DRP was discovered in the inner matter of
the aloe vera leaves [34], which was later successfully applied in an animal model of a lethal
hemorrhagic shock as an additive to a resuscitation fluid [1]. The Toms phenomenon has been
investigated and used for various industrial and engineering applications including crude oil
transport through pipelines, firefighting, and reducing drag on ships and submarines [35-37].
8

After several decades of intensive studies, several theories have been proposed, but the exact
mechanism of the Toms phenomenon is still unknown.
2.2 INTRAVASCULAR EFFECTS OF DRPS
While DRPs have been studied and applied in numerous industrial and engineering uses, their
application in the biomedical area is not well known. It has been shown, however, that the same
polymers that reduce resistance to turbulent flow also produce remarkable effects on blood
circulation in vivo. Blood soluble DRPs, when injected in the vascular system at nanomolar
concentrations, increase blood flow, tissue perfusion, and tissue oxygenation and reduce vascular
resistance with no direct effect on blood viscosity or blood vessel tone [12, 16, 38]. Figure 2-2
shows a typical record of the effect that a single intravenous injection of DRP, given to a normal
animal, has on tissue perfusion and mean arterial blood pressure [39]. DRPs caused both an
increase in tissue perfusion (top curve) and a slight decrease in the mean arterial pressure
(bottom curve), which indicated that the microvascular resistance was decreased. In animal
models of various pathological conditions, blood soluble DRPs have been applied and were
found to produce beneficial effects on the vascular system including a significant increase (up to
50%) in linear blood velocity in capillaries and in number of functioning capillaries in diabetic
rats [3] and a delay in the development of atherosclerosis in animals kept on atherogenic diet and
chronically injected with minute concentrations of DRPs [2, 4, 9, 13]. Most recently it was
shown that the DRPs, when used as a component of a resuscitation fluid, were able to
significantly improve tissue perfusion and oxygenation and to reduce/prevent lethality in animals
subjected to severe hemorrhagic shock [1, 6].
9

TP=4.6TP=5.3
MAP=80 mmHg MAP=75 mmHg
TP=4.6TP=5.3
MAP=80 mmHg MAP=75 mmHg
Figure 2-2. Effect of a single injection of DRP (PNVF) injected in a normal animal at the
concentration of 4 µg/ml in blood.
2.3 DRPS IN TREATMENT OF HEMORRHAGIC SHOCK
Traumatic injury is the leading cause of death among Americans under 44 years of age [40], and
hemorrhage and hemorrhagic shock are major causes of these deaths. Currently, treatment of
hemorrhagic shock is based on hemorrhage control and volume expansion, including intravenous
infusion of large volumes of crystalloid and/or colloid solutions as well as blood products. While
these therapies are effective in restoring fluid volume, they do not adequately address the
problem of impaired microvascular circulation caused by hemorrhagic shock [6]. Blood soluble
10

DRPs present a potential novel therapy for hemorrhagic shock which specifically addresses
microcirculatory complications.
In a recent study, the effects of DRPs on blood circulation were tested in anesthetized rats
exposed to acute hemorrhagic shock [1]. The animals were acutely resuscitated either with a
2.5% dextran solution (Control) or with the same solution containing a 5 µg/ml concentration of
one of two blood soluble DRPs: high molecular weight (MW=3,500 kDa) polyethylene oxide
(PEO-3500) or a DRP extracted from aloe vera (AVP). An additional group of animals was
resuscitated with a 75 µg/ml concentration of polyethylene oxide with a molecular weight of 200
kDa (PEO-200), which possesses no drag reducing ability. The animals were observed for two
hours following the initiation of fluid resuscitation or until they expired. It was found that
infusion of the DRP solutions significantly improved tissue perfusion, tissue oxygenation, and
two-hour survival rate. The survival rate increased from 19% in the Control group and 14% in
the PEO-200 group to 100% in the AVP and PEO-3500 groups. Furthermore, the Control and
PEO-200 animals that survived required a three times larger volume of infused fluid to maintain
their blood pressure than the AVP and PEO-3500 animals. This study demonstrated that blood
soluble DRPs, when injected at very low concentrations (as low as 5 µg/ml) in animals in
hemorrhagic shock, rapidly increased blood pressure and restored microcirculatory flow,
resulting in increased oxygen delivery to tissues and a significant decrease in lethality.
In another study, Macias et al. showed that resuscitation with a small volume of DRP
solution significantly prolonged survival and reduced mortality in a rat model of lethal, volume
controlled hemorrhagic shock [6]. It was found that infusion of 7 ml/kg of a 50 µg/ml solution
of AVP increased mean arterial blood pressure and whole body oxygen consumption (VCO2)
and delayed death compared to animals resuscitated with the same volume of normal saline.
11

Moreover, McClosky et al. showed that pretreatment of rats with DRPs (PEO-1000, 25 µg/ml in
blood) injected prior to exposing them to hemorrhagic shock preserved tissue perfusion and
oxygenation during hemorrhagic shock and prevented development of liver tissue hypoxia [7].
While these in vivo studies have shown that DRPs improve outcomes following severe
hemorrhage, the mechanism of their action in the vascular system is not yet known. One
hypothesis is based on the fact that, in small vessels (diameter less than 0.5 mm) at physiological
conditions, RBCs migrate toward the center of the vessel leaving a cell-free plasma layer near
the vessel wall [41]. It was hypothesized that the DRPs cause a redistribution of red blood cells
across the vessel, reducing the size of the cell free plasma layer and attenuating the plasma
skimming effect at vessel bifurcations [1]. The relocation of RBCs to the near wall space causes
an increase in apparent viscosity near the walls of the microvessels. Tsai and Intaglietta showed
that an increase in plasma viscosity during extreme hemodilution helped to maintain animal
functional capillary density (FCD), which was proven to be a major factor of survival in
hemorrhagic shock [42]. In this study, the high viscosity solution allowed for wall shear stress
dependent mechanisms to maintain optimal microvascular function even at extremely low
hematocrit. Kameneva et al. hypothesized that DRPs might maintain this microvascular function
in a similar manner by redistributing RBCs and thus increasing near wall viscosity [1].
2.4 DRP DEGRADATION
While DRPs have shown promise as a potential therapy for many pathological states including
acute enhancement of microcirculation in diabetic animals and treatment of hemorrhagic shock,
these polymers show a tendency to mechanically degrade over time when exposed to high stress
12

conditions. This could present a potential obstacle to clinical use of DRPs to treat chronic
conditions such as microcirculatory impairment caused by diabetes or atherosclerosis if the drag
reducing effect is diminished too quickly for practical use. Therefore, the degradation behavior
of these polymers must be investigated in detail. For clinical use, it is important to know how
quickly the polymer will degrade in order to determine how often the treatment would need to be
given. It is also necessary to select DRPs which would degrade sufficiently slowly for chronic
administration to be practical since DRP preparations have to be delivered via intravenous
injections.
DRP degradation has been intensively studied for decades [21, 22, 39, 43-51].
Degradation experiments have been performed in single pass turbulent flow systems [22, 45] and
in a rotating disk apparatus [47]. However, the effects of red blood cells (RBCs) or similar size
particles on dynamics of this process have not yet been identified. DRP mechanical degradation
can be defined as the chemical process by which the activation energy for the scission of a
polymer chain is provided by mechanical stresses on the polymer [46]. Mechanical degradation
of DRPs can also be defined as the loss of a polymer’s drag reduction effectiveness which is not
regained after mechanical stress is abolished [52]. High molecular weight PEOs were
demonstrated to be the most effective drag-reducers among commonly used DRPs [22]. At the
same time, it was shown that this class of DRPs quickly mechanically degrade in turbulent pipe
flow causing the drag reducing effect to diminish over a short exposure time [45].
Polyacrylamides were shown to degrade more slowly than PEOs [22, 45]. Certain high
molecular weight polysaccharides were found to be good drag reducers that are much more
resistant to mechanical degradation than PEOs [21-23]. The degradation of DRPs in solutions is
likely caused by chain scission. However, some studies have shown the drag reducing ability of
13

partially hydrolyzed PAM degrades in turbulent flow with little change in MW suggesting that
degradation occurs at least in part due to the breakup of molecular aggregates [49, 51].
It was shown that the effective biological half life of one DRP, polyacrylamide (Separan
AP-30), was about 35 hours in rats [53]. Mechanical degradation is likely responsible, at least in
part, for this loss of polymer effectiveness over time.
2.5 MECHANISMS OF INTRAVASCULAR DRP EFFECTS
Elucidation of the mechanism(s) underlying intravascular effects of DRPs would have both
academic and practical significance and is essential for the future applications of DRPs. Since
there is little turbulent flow in the vascular system (excluding the aorta) the mechanism
responsible for the intravascular DRP effect is likely different than that of the Toms effect.
Several hypotheses have been proposed for the intravascular DRP phenomenon.
The initial hypothesis was that DRPs acted in the vascular system by reducing resistance
in regions where turbulent flow may occur and enhancing fluidity of the blood [18]. However,
there is no turbulence in blood circulation in small animals, and DRPs reduce vascular resistance
in these animals, therefore the mechanism of the intravascular DRP effect is likely not based on
turbulent drag reduction.
Several in vitro studies have shown that DRPs reduce the size and delay development of
vortices and recirculation zones at vessel bifurcations under physiologically relevant flow
conditions [19, 20], therefore reducing resistance to flow. In in vitro studies of laminar flow in
either a bifurcated glass channel or an elastic tube containing a stenosis, DRPs were shown to
14
reduce the tendency of eddies to form. Tube diameters in these studies ranged from 3-12 mm,
and experiments were performed at Reynolds numbers ranging from 1 – 800.
Another hypothesis [1] behind the increase in tissue oxygenation caused by the DRPs
was that DRPs could increase plasma mixing efficiency in capillaries, thereby facilitating oxygen
transport. This hypothesis, which is yet to be proven, was based on the previously published
results of experiments which demonstrated that very viscous liquids containing a small amount
of DRP could be efficiently mixed in a curved channel (d = 3 mm) at very low Reynolds
numbers (Re<<1) which are similar to the conditions in the capillaries, and at relatively high
Weissenberg numbers (Wi>1) at which an elastic instability of flow occurred [54].
A new hypothesis proposed by Kameneva et al. [1], which was further tested in these
studies, deals with the Fåhraeus Effect and the Fåhraeus-Lindquist Effect [41, 55, 56]. The
Fåhraeus Effect states that, in small vessels (diameter less than 0.5 mm) at physiological
conditions, RBCs migrate toward the center of the vessel leaving a cell-free plasma layer near
the vessel wall [56]. The velocity of the RBCs in the core region is therefore higher than the
mean blood velocity, and the ratio of hematocrit in the tube to feed hematocrit decreases with a
decrease in tube size [56]. This leads to a reduction in apparent viscosity, and thus flow
resistance, in small tubes compared to that in larger tubes (Fåhraeus-Lindquist Effect) and a
decrease in apparent blood viscosity with decrease in tube diameter [56]. The observed decrease
in apparent viscosity is likely caused by the Fåhraeus effect, which states that hematocrit is lower
in smaller vessels, or by the rheological effects of uneven distribution of RBCs across the vessel
[56]. These phenomena produce a plasma skimming effect at bifurcations, where, due to the
migration of RBCs to the center of the vessel, a lower concentration of RBCs relative to that in
the parent branch enters the daughter branch at a bifurcation. This leads to a reduced hematocrit
15

in smaller vessel branches and, thus, in capillaries. While the original work of Fåhraeus and
Lindquist [41, 55, 56] states that this effect occurs in vessels with diameters < 0.3 mm, there is
discrepancy in the literature about the diameter where this effect becomes apparent. This exact
vessel diameter has yet to be quantitatively determined [57]. It has previously been shown that
the Fåhraeus Effect is more prominent at lower hematocrit for a given vessel diameter [56]. The
near wall plasma layer in arterioles presents a barrier to oxygen diffusion to tissues. While under
normal conditions this plasma skimming is not detrimental for circulation and oxygen transport,
in certain pathological states, such as hemorrhagic shock, it might hinder the ability of the RBCs
to transport oxygen to the tissues. It has been shown in vitro that the addition of a minute
concentration of DRPs to red blood cells (RBCs) flowing in a straight microchannel significantly
reduces the size of the near-wall cell free plasma layer [1, 58] as shown in Figure 2-3. In vivo
this may result in enhancement of oxygen transport to the tissue. In addition, this would attenuate
the plasma skimming effect and increase intracapillary hematocrit. This decrease in plasma layer
size would also lead to an increase in wall shear stress in the small vessels. The resulting increase
in wall shear stress would cause the endothelial cells to release endothelial-derived relaxing
factor comprised of nitric oxide leading to vasodilation and ultimately to a decrease in systemic
vascular resistance [59]. Average microvascular hematocrit has been shown to increase when
tissue perfusion is increased, and this change has been attributed to vasodilation of the arterioles
[57].
16

Figure 2-3. The size of the near wall plasma layer in a 100 micron channel decreases with an increase
in DRP concentration (57).
Neither the Fåhraeus Effect nor the drag reducing polymer effect is completely
understood. These two phenomena have nothing in common, but may come together in the
vascular system to produce interesting effects which have significant potential applications in
microfluidic technology and in medicine.
2.6 BLOOD-SOLUBLE DRAG REDUCING POLYMERS FOR POTENTIAL
BIOMEDICAL APPLICATIONS
Several DRPs, including PEO, PAM, and certain polysaccharides [1-14, 16, 17, 38] have been
applied and have shown beneficial effects in animal models. High molecular weight PEOs,
PAMs, and plant-derived polysaccharides are the most effective water soluble DRPs. The
polymers significantly reduce resistance to turbulent pipe flow and were found to produce
Figure 7 0 µg/ml 5 µg/ml 10 µg/ml
17

beneficial effects on blood circulation. PEO, however, mechanically degrades when exposed to
turbulent flow or other high shear stress conditions even for relatively short exposure times [45].
PAMs, on the other hand, are much more resistant to mechanical degradation, but their apparent
toxicity presents problems for potential biomedical use [9, 12]. Plant-derived DRPs are highly
resistant to mechanical degradation [22-24] and many polysaccharides are non-toxic [24, 25].
However, they are not well characterized and often difficult to manufacture in industrial
quantities. Therefore, the search continues for a DRP which produces beneficial effects on blood
flow, and is well characterized, biocompatible, resistant to mechanical degradation and easy to
manufacture.
Three candidates for DRP that could meet these requirements are a natural polymer
derived from the aloe vera plant (AVP), high molecular weight poly(N-vinylformamide)
(PNVF), which is synthesized from a non-toxic isomer of acrylamide, and hyaluronic acid, a
polysaccharide produced in the cellular plasma of vertebrates as well as by certain bacteria.
2.6.1 Aloe vera derived DRP
High molecular weight polysaccharides, such as a polymer extracted from okra and characterized
as a rhamnogalactogalacturonan, have been shown to be effective drag reducing polymers which
produced beneficial hemodynamic effects in a rodent model [17]. It was first discovered by
Gowda [60, 61] that high molecular weight polysaccharides could be isolated from aloe plants
via alcohol extraction. An aloe based polysaccharide would be an attractive DRP for biomedical
applications since toxicological studies have shown that Acemannan, a product extracted from
the aloe leaf gel, has minimal systemic toxicity when injected intraperitoneally or intravenously
[24]. Recently, it was discovered that a polymer extracted from the aloe vera plant mucilage was
18

also a very effective drag-reducer [1, 34, 62]. The aloe vera leaf consists of three major
components: clear sheets comprised of cell walls and membranes, microparticles comprised of
degenerated cellular organelles, and a viscous liquid gel comprised of the liquid components of
mesophyll cells. The DRP is extracted from the viscous gel portion of the aloe with ethanol. It is
known that the ethanol insoluble portion of the gel is > 50% carbohydrate [63]. A mannan
component has been identified in this portion of all aloe species studied, although differences in
molecular weight, degree of acetylation, and mannose-glucose ratio have been observed [60, 63].
In one study, the polysaccharides found in the aloe vera gel have been characterized as at least
four different partially acetylated linear glucomannans which contain 1-4 glycosidic linkages
[64]. In another study, the polysaccharides in aloe vera were shown to be composed of β-(1,4)-
linked acetylated polymannans containing O-acetyl groups with a mannose monomer to acetyl
ratio of approximately 1:1 [24]. A structure for the major component of aloe vera gel was
proposed by Chow et al. [60] based on data from chromatography, carbohydrate compositional
analysis, linkage analysis and NMR. This structure consists of a linear β-1,4-linked mannose
backbone with β-1,4-linked glucose substituting for mannose approximately every 30 residues.
Mannose residues are acetylated at O2, O3 or O6 and sidechains are single galactose residues α-
1,6-linked to the mannoses residues in the backbone. This proposed structure is shown in Figure
2-4. However, the structure of the active drag reducing component of the aloe vera DRP remains
unknown.
19

OO
H2C
OH
AcO
O O
HO
OAcH2C
O
O
OHOH
HO
CH2
HO
OO
OH
H2C
OH
OH
OO
CH2OH
OAc
O
ManOAcGlc
ManOAcnManOAc
Gal
OH
OH
Figure 2-4. Proposed structure of the major component of aloe vera gel [60]
2.6.2 Poly(N-vinylformamide)
Water-soluble PNVF has been known for the past 40 years but has become more common in the
last decade due to the development of improved processes for synthesis and purification of the
N-vinylformamide (NVF) monomer as well as the growing uses for PNVF and its derivatives in
industrial applications [65]. The polymer has been considered as a replacement for toxic
acrylamide polymers for industrial use [66]. Applications for PNVF and its hydrolysis products
include water treatment, papermaking, production of textiles, personal care items, adhesives and
coatings, and use in oil field industry and as a rheology modifier [67]. PNVF, shown in Figure 2-
5, is synthesized from the NVF monomer, which is a highly reactive isomer of acrylamide with
low toxicity [67]. It was shown that very high molecular weight PNVF (6.7x10⁶ Da) could be
synthesized using an inverse emulsion technique [68]. Due to its similarities with PAM, a well-
known very effective DRP, its ease of polymerization [68], and its high solubility in water [67],
20

high molecular weight PNVF could be a good candidate for a DRP. The low toxicity of the NVF
monomer [67] provides motivation for testing PNVF as a potential DRP for biomedical use.
Although hydrolysis products of PNVF, including poly(vinyl amine), have been tested and
shown to be effective DRPs [69], the drag reducing ability of PNVF was never tested before.
H2C
HC
NH
CH
O
n
Figure 2-5. Structure of PNVF
2.6.3 Hyaluronic Acid
Hyaluronic acid (HA), also referred to as hyaluronan since it primarily exists in its polyanion
form and not as the free acid form, is a linear, unbranched, negatively charged polysaccharide
with a molecular weight ranging from 105 to 107 Da. It is comprised of alternating units of D-
glucuronic acid and N-acetyl-D-glucosamine. The structure of HA is shown in Figure 2-6. It is
synthesized in the cellular plasma and found in all tissues and body fluids of vertebrates and also
in certain bacteria. HA was first discovered by Meyer and Palmer in 1934 [70]. Its medical
applications include wound care, medical device coating, orthopedic and ophthalmic
applications, and use as a drug-delivery vehicle [71]. One of the most successful applications of
HA in the medical field is in treating osteoarthritis [70]. HA was previously shown to have drag
reducing ability [72], and its current FDA approval for certain biomedical applications [73]
makes it an ideal candidate to be applied for enhancement of blood circulation.
21

O
O
O
C
O
O
HO
OH
HO
H2C
OH
O
NH
C
H3C
O
O
n
-
Figure 2-6. Structure of hyaluronic acid
22

3.0 HYDRODYNAMIC, RHEOLOGICAL, AND MOLECULAR TESTS TO
CHARACTERIZE BLOOD SOLUBLE DRAG REDUCING POLYMERS
In order to help to choose DRPs for potential clinical use, a standard set of tests was developed
for their characterization and evaluation of efficacy. It has previously been shown that polymers
which are effective at reducing resistance to turbulent flow in vitro are most effective in
improving hemodynamics in vivo. It is also known that high molecular weight, linear structure,
and non-Newtonian behavior of concentrated solution are characteristics of effective DRPs [26].
Therefore, methods were developed to evaluate these properties and predict a polymer’s
likelihood to be a good DRP for biomedical use. Microscale methods were also developed as a
next step in the prediction of whether a DRP would be effective in improving blood flow in vivo.
These methods involve the study of RBC flow in microchannels and will be discussed in detail in
Specific Aim 2. In addition, it is important to ensure that the DRPs maintain their activity in the
presence of flowing RBCs. Test methods were also developed to assess mechanical degradation
of these polymers in order to compare relative stability of DRPs and potentially gauge how long
the DRPs could be effective in the body. Since PEO is known to be one of the most effective of
the commonly used DRPs [22] and is commercially available at several molecular weights, and
dextran is known to be a high molecular weight polymer which has no drag reducing properties,
PEOs and dextran were used to assess the reliability of the tests developed in this specific aim.
Several PEOs, PEO-5000 (MW = 5000 kDa, Aldrich Chemical), PEO-4500 (MW = 4500 kDa,
23

Polyox WSR-301, Dow Chemical), PEO-2000 (MW = 2000 kDa, Aldrich Chemical), PEO-1000
(MW = 1000 kDa, Aldrich Chemical), PEO-600 (MW = 600 kDa, Aldrich Chemical), and PEO-
200 (MW = 200 kDa, Aldrich Chemical), were used for these studies.
3.1 METHODS
3.1.1 Polymer drag reduction in turbulent flow
The Toms effect is known to occur only in developed turbulent flow. Therefore the first test
system to identify candidate polymers was developed with the capacity to run at sufficiently high
Reynolds numbers. This recirculating flow system for testing the turbulent flow drag reducing
ability of polymers consists of a centrifugal pump (BioMedicus, Inc.), a flow meter and clamp-
on flow probe (Transonic Systems, Inc.), a pressure transducer (PCB Piezotronics, Inc.), a
smooth glass resistive tube with known dimensions (either 0.44 cm ID, 91.5 cm length or 0.56
cm ID, 120 cm length), and a one liter open fluid reservoir connected with 3/8 inch Tygon tubing
(Cole-Parmer). A schematic of the system is shown in Figure 3-1. Flow rates and system
geometry were chosen based on criteria necessary for the assessment of the drag reducing
phenomenon. Entrance length, le, calculated using
dl e ⋅⋅= 6
1
Re4.4 (1)
where d = tube diameter and Re = tube Reynolds number, is ~10% of the tube length [74]. DRP
was added to circulating saline to give concentrations ranging from 1 to 500 µg/ml in solution.
Saline was chosen as a testing vehicle (vs. water) since the ultimate goal of this study was to
24

bring DRPs to the animal test point and since some of DRPs have significantly different
physicochemical properties when dissolved in saline vs. water. Pressures and flow rates were
recorded before and after DRP addition. The in vitro flow experiments were performed at room
temperature. Drag reduction at a constant flow rate was calculated using
1000
0 ⋅∆
∆−∆=
PPP
DR p (2)
where DR = drag reduction (%), ∆PP = pressure drop for polymer solution, and ∆P0 = pressure
drop for saline alone. This formula, which represents a simple percent error, was chosen to
quantify drag reduction since it is the most commonly used metric in DRP literature. This
generally accepted definition of drag reduction was provided by Savins in the 1960s [26, 32].
Reynolds number (Re) was calculated using the formula [74]
νπ ⋅⋅⋅
=dQ4Re , (3)
where Q = volumetric flow rate, d = tube diameter and ν = kinematic viscosity. A dimensionless
friction factor, λ, was calculated for the DRP solutions and compared to that of saline alone using
[74]
2
25
8 QlPd
⋅⋅⋅∆⋅⋅
=ρ
πλ , (4)
which is derived from the Darcy-Weisbach equation, where λ = friction coefficient, ρ = density
of the fluid, and P = the pressure drop along the tube length, l. Blasius friction factor for
turbulent flow was also calculated using the Equation 5 [74],
25.0Re316.0
=λ (5)
and used for comparison to the experimental data.
25

Drag reducing effectiveness of several PEOs, PEO-5000, PEO-4500 PEO-2000, PEO-
1000, PEO-600, and PEO-200, was determined. Results for experimental data are presented as
mean friction factor ± standard deviation. Mean friction factors were compared using one-way
ANOVA followed by unpaired, two-sample Student’s t-tests assuming unequal variances.
Although blood flow in the body is not turbulent and the mechanism of the DRPs in the
circulatory system most likely differs from that in turbulent flow, previous studies have shown
that the DRPs that provide the highest drag reduction in turbulent flow also have the greatest
beneficial effects on blood circulation. On the other hand, polymers which do not produce drag
reduction are not effective in vivo. Therefore, the DRPs which give the best drag reducing ability
were determined using the turbulent flow test system, and these DRPs were used to perform
microchannel studies in order to evaluate their effectiveness in more physiologically relevant
conditions and elucidate the mechanism responsible for the intravascular DRP phenomenon as
well as to perform in vivo tests.
26

Open reservoir
Centrifugal pump
Glass tube
Flow probe
Pressure transducerFlow
Tygon tubing
Pressure transducer
Figure 3-1. Schematic for turbulent flow system used to test DRP efficacy
3.1.2 Polymer drag reduction in turbulent flow of blood
The efficacy DRPs in turbulent blood flow was tested using the circulating system described in
3.1.1 with blood replacing saline as the test fluid. This allowed for the assessment of the DRPs
performance in the presence of RBCs, which is important since DRPs injected intravenously
contact blood cells in vivo. It was therefore important to ensure that RBCs were not detrimental
to the DRPs’ activity.
Bovine blood obtained from a local slaughterhouse and diluted to the desired hematocrit
of 20% with saline was used for these tests. The drag reducing efficiency of two DRPs, PEO-
4500 and an aloe based DRP (AVP), was studied at concentrations ranging from 10 to 100 µg/ml
27

using the methods described in 3.1.1. Reynolds numbers for these studies of turbulent blood flow
ranged from 5,000 to 10,000. Results are presented as average drag reduction ± standard
deviation at each tested flow rate (Reynolds number).
3.1.3 Gel Permeation Chromatography (GPC)
Molecular characteristics, including high molecular weight and linear structure are important in
determining a DRP’s potential drag reducing efficiency. Number average and weight average
molecular weights (Mn and Mw), intrinsic viscosity (IV), radius of gyration (Rg), hydrodynamic
radius (Rh), and polydispersity index (PDI) were measured using a Viscotek Triple Detector
Array gel permeation chromatography (GPC) system (Viscotek, Houston, TX).
Mn is defined as the summation of the mole fraction of each species multiplied by its
molecular weight and is sensitive toward molecules of relatively low molecular weight (<104 to
5x10⁵). It can be determined through methods such as end group analysis, membrane osmometry,
and vapor pressure osmometry. Mw is defined as the summation of the weight fraction of each
species multiplied by its molecular weight. It is more sensitive to molecules of average
molecular weight (5x10⁵ to 107). It can be calculated by light scattering and ultracentrifugation.
PDI is defined as Mw/Mn and describes the MW distribution of a polymer [75]. Another average
molecular weight, z average (Mz), is a higher order molecular weight which is sensitive to
molecules of high molecular weight. IV, defined as specific viscosity divided by concentration
and extrapolated to zero concentration, is used to describe the hydrodynamic size of a particular
polymer. Its units are volume per mass (dl/g), and it is proportional to the hydrodynamic volume
of one gram of polymer. Rh can be calculated from the hydrodynamic volume of the polymer
molecule, determined from intrinsic viscosity. Rh calculation assumes the molecule to be
28

spherical in shape. Rg calculation, on the other hand, takes into account the fact that most
polymers are actually random coils, not hard spheres as assumed in Rh calculations. Rg is
determined through light scattering and viscometry.
Separation was performed on a methacrylate-based column with an exclusion limit of
5x10⁷ Da. The system combines a refractive index detector, a right angle laser light scattering
detector, and a differential viscometer in order to determine average MWs (Mn and Mw), IV, Rg,
Rh, and molecular weight distribution in a single experiment. Column and detector temperatures
were maintained at 30ºC and the mobile phase was 0.1 M NaNO3 with 0.01% NaN3. The system
was calibrated using a PEO standard with a molecular weight of 22 kDa and a narrow molecular
weight distribution (PDI ~ 1.0). Results are presented as mean ± standard deviation.
3.1.4 Rheological Characterization
Rheological parameters such as viscosity, elasticity, and relaxation time also can be analyzed in
order to fully characterize DRPs since these polymers are known to have high viscosity and
elasticity in relatively concentrated solutions. These DRP solutions are also known to exhibit
non-Newtonian flow behavior. A non-Newtonian fluid is defined as a fluid in which viscosity
depends on shear strain rate. Due to the non-Newtonian nature of concentrated DRP solutions, it
is advantageous to measure rheological properties over a wide range of shear rates. This was
accomplished using a Brookfield cone and plate rotational rheometer (Middleboro, MA) as well
as a Vilastic 3 viscoelasticity analyzer (Austin, TX). The Vilastic 3 employs controlled
oscillatory flow in a cylindrical tube to measure the major rheological parameters including
viscosity, elasticity, and relaxation time.
29
Viscosity is defined as a measure of resistance of a material to flow, and elasticity can be
defined as the ability of a material to return to its original state following deformation caused by
applied stress. Relaxation time is the time necessary for a system to forget the configuration it
had prior to a perturbation [76].
Mean values of each rheological parameter ± standard deviation were plotted as a
function of shear rate. Rheological parameters were measured in solutions with a concentration
of 2.5 mg/ml in saline. Asymptotic viscosity of DRP solutions at a concentration of 100 µg/ml
was measured using a capillary viscometer (Cannon Manning). At this concentration, the DRP
solutions behave as Newtonian fluids, and therefore measurement of asymptotic viscosity is
sufficient for rheological characterization.
3.1.5 DRP Degradation Studies
DRPs, especially PEO, were shown to produce strong beneficial effects on blood circulation with
a considerable potential for clinical applications, but quickly mechanically degrade when
exposed to turbulent flow or other relatively high shear stress conditions even for relatively short
exposure times [45]. For practical use, it is important to understand the degradation behavior of
the DRPs. Although there is almost no turbulent flow in the body, degradation studies were
performed in turbulent flow since it provides the shear stresses necessary to compare degradation
of different DRPs in a relatively short time period and allowed for measurement of polymer
degradation via decline of their drag reducing ability. The circulating flow system described in
3.1.1 was also used to study mechanical degradation of DRPs in turbulent flow. A decrease in a
polymer’s ability to reduce resistance to flow, signified by a decrease in flow rate at fixed wall
shear stress, indicated mechanical degradation of the polymer. Turbulent flow degradation
30

studies also allowed for comparison with literature since most previous studies were performed
in turbulent flow. Wall shear stress in the resistive tube was held constant at 45 N/m2 throughout
the degradation experiments. While shear stresses in the arteries of a healthy human range from 1
to 10 N/m2 [77], arteries with stenosis can have shear stresses greater than 10 N/m2 [78], and
shear stress in artificial heart valves and blood pumps can reach greater than 100 N/m2 [78].
Reynolds numbers (based on the diameter of the glass tube) ranged from 10,000 – 27,000.
Baseline pressure and flow rate were recorded before polymer addition, and DRP was added to
the system at a concentration of 0.1, 0.25, or 0.5 mg/ml. Pressure and flow were monitored
throughout a five-hour period or until the DRP ceased to produce any effect. Drag reduction at
constant wall shear stress (and therefore constant pressure drop) was calculated for each time
point using
1000
0 ×−
=Q
QQDR P (6)
where QP = flow rate of polymer solution and Q0 = flow rate of saline alone. Results are
presented as mean drag reduction ± standard deviation. The degradation behavior of several
PEOs including PEO-4500, PEO-2000, PEO-1000, PAM (Praestol 2510, Stockhausen, Inc.),
PNVF, and HA was studied.
GPC, as described in 3.1.3 was used to monitor MW (Mn, Mw, Mz), IV, Rg, and PDI
during exposure to flow. Mz is the z average molecular weight, which is sensitive to molecules in
the high end of the MW distribution. Polymer chain scission was signified by a decrease in
average MW and/or a shift in the MW distribution. The effects of exposure to flow, and therefore
mechanical degradation, on PDI were carefully examined. Chain scission and break up of
aggregates have both been shown to contribute to DRP degradation [49, 51]. A significant
31

change in MW and MW distribution with loss in drag reducing ability would show that the
primary cause is chain scission. No significant change in MW distribution would occur if the
major factor is break up of aggregates.
Additionally, the degradation of DRPs in the presence of RBCs or rigid particles was
investigated. This study was motivated by the fact that no previously published work was found
on the effect of the presence of particles in DRP solutions on degradation of DRPs. Moreover,
because DRPs only affect hemodynamics when they are injected intravenously, it is an important
consideration for potential clinical use. Bovine blood was obtained from a local slaughterhouse
and centrifuged for 15 minutes at 3600 rpm to remove plasma and buffy coat which consisted of
platelets and white blood cells. The RBCs were resuspended in saline at a concentration of 5, 10,
or 20%. A rigid particle suspension was prepared by adding glass particles (Potters Industries
Inc., one to one mixture of 110P8 and 60P18 with mean diameters of 11 and 18 µm and densities
of 1.1 g/cm3 and 0.6 g/cm3 respectively) to saline at a concentration of either 1 or 5% by volume.
The degradation behavior of two DRPs, PEO-4500 and AVP, was investigated in the presence of
RBCs, and that of PEO-4500 was also tested in the presence of rigid particles. Additionally,
PEO-4500 degradation was tested in a 15% glycerol solution, prepared as a viscosity analog for
the 20% RBC suspension. The viscosity of the 20% RBC suspension was measured to be ~ 1.8
cP using a capillary viscometer (Cannon Manning) at a shear rate of ~ 600 s-1. Therefore, a 15%
glycerol solution (~1.7 cP) was prepared as an equiviscous analog for the 20% RBC suspension
to determine whether the effects of particles on degradation were due to the particles themselves
or to the increase in viscosity.
In order to quantitatively compare the degradation behavior between two DRPs or
between DRPs in the presence or absence of particles, the mechanical degradation behavior of
32

DRPs in the turbulent flow system, both in saline solution and in the presence of RBCs or rigid
particles, was examined by fitting it to a previously developed single relaxation decay model [44,
46] as
)*exp()0()( tk
DRtDR
−= (7)
where t is exposure time of the polymer to flow, DR(0) and DR(t) are drag reduction at time 0
and t respectively, and k, while not a true rate constant, is a property that quantifies rate of loss of
drag reducing activity.
3.2 RESULTS
A comprehensive set of hydrodynamic, rheological, and molecular tests for the characterization
and evaluation of blood soluble drag reducing polymers, which have potential for clinical use,
was developed. The tests were performed on various PEOs, which ranged in molecular weight
from 2 x 10⁵ – 5 x 10⁶ Da in order to show that the these tests could be effectively used to
characterize new DRPs. The tests were also performed on high MW dextran (Aldrich, MW
claimed by manufacturer = 2,000 – 40,000 kDa), which is known to be highly branched and
therefore not a drag reducer, as a negative control.
3.2.1 Polymer drag reduction in turbulent flow
The drag reducing properties of PEOs and a high MW dextran were characterized using the
turbulent flow system described in section 3.1.1. It was found that drag reduction (DR) produced
33

by PEOs increased with an increase in MW, and that, as expected, dextran exhibited no DR.
Friction factor for saline agreed well with values calculated using the Blasius equation, whereas
the friction factors for PEOs with MW above 1000 kDa were much lower than the those
calculated using the Blasius equation. All of the tested PEOs, with the exception of PEO-200,
produced a statistically significant reduction in friction compared to saline (control) over the
entire range of studied Reynolds numbers (p < 0.01). Figure 3-2 shows dimensionless friction
factor vs. Re for PEO when added to the circulating system at 100 µg/ml, and Table 3-1 shows
the average DR produced by each polymer.
These tests were used in this project to characterize and evaluate the potential of new
DRPs to be effective in blood circulation. Results of these studies are discussed in Section 5.
0.01
0.10
15000 20000 25000 30000Reynolds Number
Fric
tion
Fact
or
Turbulent Theoretical SalinePEO-200 PEO-600PEO-1000 PEO-2000PEO-4500 PEO-5000
Blasius
0.01
0.10
15000 20000 25000 30000Reynolds Number
Fric
tion
Fact
or
Turbulent Theoretical SalinePEO-200 PEO-600PEO-1000 PEO-2000PEO-4500 PEO-5000
Blasius
Figure 3-2. Friction factor vs. Re for several PEOs tested in a turbulent flow circulating system at
100 µg/ml. The drag reducing ability of PEO increased with an increase in MW of the PEO
34

Table 3-1. Average drag reduction produced by various PEOs at a Reynolds number of 23,000
MW Drag Reduction (Da) at 100 µg/ml (%)
200K 0 600K 15 1000K 22 2000K 29 4500K 34 5000K 38 Dextran 2-40million 0
3.2.2 Polymer drag reduction in turbulent flow of blood
The efficacy of DRPs in turbulent blood flow was investigated using the flow system described
in 3.1.1. Bovine blood obtained from a slaughterhouse and diluted with saline to a hematocrit of
20% was used for this study. Two DRPs, PEO-4500 and aloe derived DRP (AVP), were tested,
and both were found to be able to significantly reduce flow resistance in blood. Figure 3-3 shows
the drag reduction produced by these polymers in turbulent blood flow [79]. As one can see,
aloe-based DRP has much higher drag-reducing efficiency than PEO-4500 when compared at the
same concentrations. Since the viscosity of blood was significantly higher than that of water, the
Reynolds numbers obtained in the blood loop were lower than those in the saline loop and,
therefore, the drag reducing effect in blood was not as strong as that in saline. It is known that
drag reducing ability increases with increased Reynolds number [27].
35

0
5
10
15
20
25
30
Max
imum
Dra
g R
educ
tion
(%)
0.01 mg/ml PEO-4500 0.02 mg/ml PEO-4500 0.1 mg/ml PEO-4500
0.01 mg/ml AVP 0.02 mg/ml AVP
Figure 3-3. Maximum drag reduction in turbulent flow of blood produced by PEO-4500 and AVP at
various concentrations.
3.2.3 GPC
Molecular characteristics, including Mn, Mw, IV, Rg, Rh, and PDI were determined for several
different PEOs and for high MW dextran. Results, obtained by GPC and presented as mean ±
standard deviation, are shown in Table 3-2.
36

Table 3-2. Molecular characteristics of PEO and dextran obtained using GPC.
Mn Mw IV Rg Rh PDI (Da) (Da) (dl/g) (nm) (nm)
PEO-200 4.0x10⁴ ± .3x104 2.0x10⁵ ± .02x105 1.6 ± .01 20.0 ± .1 15.4 ± .1 5.1 ± .3
PEO-600 2.1x10⁵ ± .2x105 9.5x10⁵ ± .3x105 5.0 ± .06 50.3 ± 1.2 38.7 ± .6 4.5 ± .3
PEO-1000 5.1x10⁵ ± 1.0x10⁵ 1.5x10⁶ ± .2x106 6.8 ± .4 65.3 ± 4.0 50.7 ± 2.9 3.0 ± .3
PEO-2000 5.3x10⁵ ± 1.5x10⁵ 1.9x10⁶ ± .8x106 8.6 ± .4 77.7 ± 1.5 60.0 ± 1.0 3.1 ± .2
PEO-4500 2.8 x10⁶± .6x106 4.4x10⁶± .2x106 13.0 ± .5 120.1 ± 3.6 92.1 ± 3.1 1.7 ± .4 PEO-5000 2.0x10⁶ ± .4x106 3.0x10⁶ ± .3x106 12.7 ± .7 107.3 ± 5.5 82.3 ± 4.5 1.6 ± .2 Dextran 6.8x10⁶ ± .3x106 1.4x10⁷ ± .09x107 0.9 ± .06 73.2 ± 1.5 56.3 ± .6 2.0 ± .1
3.2.4 Rheological Characterization
Concentrated PEO solutions with MW above 1 x 10⁶ Da exhibited non-Newtonian behavior, a
well-known property of DRPs. Viscosity vs. shear rate curves for these solutions at a
concentration of 2.5 mg/ml, determined using a cone and plate viscometer, are shown in Figure
3-4. Viscosity, elasticity, and relaxation time vs. shear rate curves for the PEO solutions with
MW 1 x 10⁶ Da and greater are shown in Figures 3-5, 3-6, and 3-7. Elasticity and relaxation time
are negligible for the lower MW PEOs and are therefore shown only for the two tested PEOs
with the highest MW (PEO-4500 and PEO-2000). PEOs with MW below 1 x 10⁶ Da, however,
behaved as Newtonian fluids. PEO-200 and PEO-600 had viscosities of 1.4 and 1.8 cP at 2.5
mg/ml, respectively. Asymptotic viscosities at a concentration of 0.1 mg/ml were measured
using a capillary viscometer at 22°C ± 1°C and are shown in Table 3-3. At low concentrations,
the DRPs behave as Newtonian fluids where viscosity is independent of shear rate. Therefore it
is valid to use asymptotic viscosity in characterizing these polymer solutions.
37

1
10
100
0 100 200 300 400 500 600 700 800
Shear Rate (1/s)
Vis
cosi
ty (c
P)PEO-1000 PEO-2000 PEO-4500
Figure 3-4. Viscosity data for PEOs at 2.5 mg/ml measured using a Brookfield cone and plate
rheometer
38
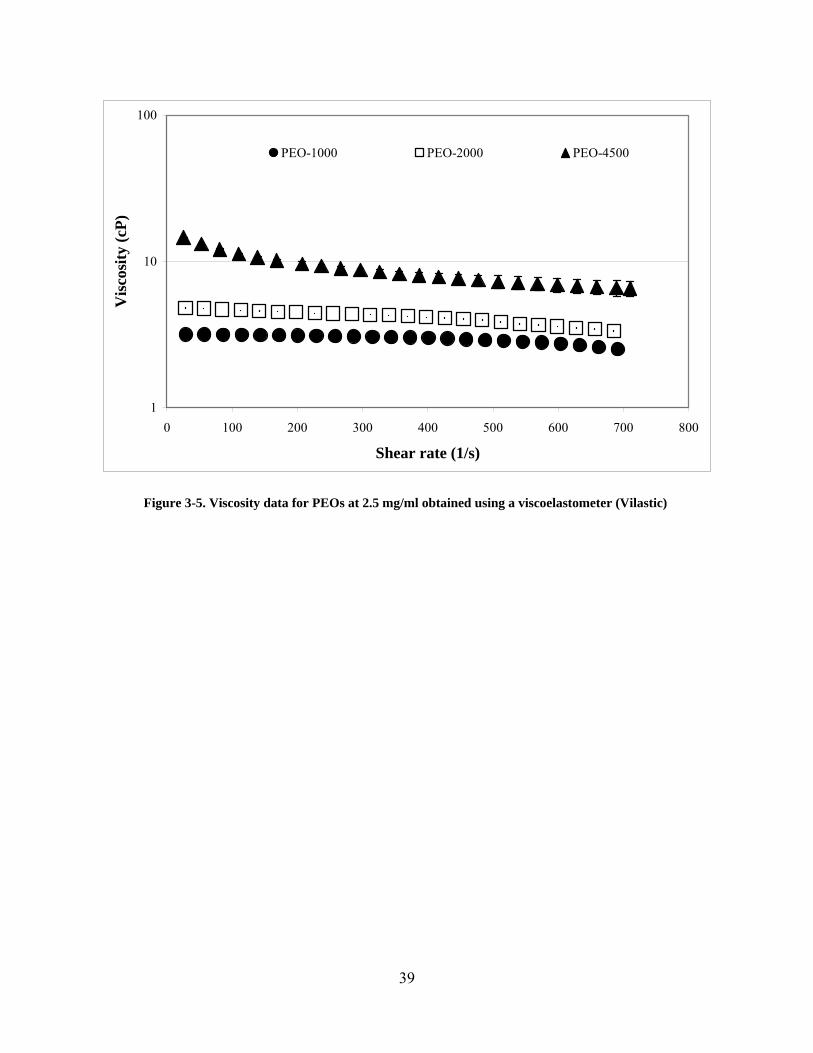
1
10
100
0 100 200 300 400 500 600 700 800
Shear rate (1/s)
Vis
cosi
ty (c
P)
PEO-1000 PEO-2000 PEO-4500
Figure 3-5. Viscosity data for PEOs at 2.5 mg/ml obtained using a viscoelastometer (Vilastic)
39

0.0
0.1
1.0
10.0
0 100 200 300 400 500 600 700 800
Shear rate (1/s)
Ela
stic
ity (c
P)
PEO-2000 PEO-4500
Figure 3-6. Elasticity data for PEOs at 2.5 mg/ml obtained using a viscoelastometer (Vilastic)
40

0.000
0.001
0.010
0.100
0 100 200 300 400 500 600 700 800
Shear rate (1/s)
Rel
axat
ion
time
(s)
PEO-2000 PEO-4500
Figure 3-7. Relaxation times for PEOs at 2.5 mg/ml obtained using a viscoelastometer (Vilastic)
Table 3-3. Asymptotic viscosities of PEOs measured by a capillary viscometer at a concentration of
0.1 mg/ml at 22 °C ± 1 °C.
Capillary Viscosity (cP) at 0.1 mg/ml
PEO-200 1.08 PEO-600 1.10 PEO-1000 1.10 PEO-2000 1.22 PEO-4500 1.25 Dextran 1.07
41

3.2.5 DRP Degradation Studies
PEO-4500 initially produced a significant reduction in resistance to flow of saline and of RBC
suspensions when it was added to flowing fluid. However, the drag reducing efficiency of this
polymer decreased rapidly with increased time of exposure to flow. In saline, the PEO-4500
completely lost its drag reducing ability after about an hour of flow. The presence of RBCs,
however, significantly accelerated the polymer degradation rate, as shown in Figure 3-8.
Additionally, an increase in RBC concentration led to an increase in degradation rate. In a 20%
suspension of RBCs, the PEO-4500 completely lost its drag reducing effectiveness in three
minutes (compared to ~60 minutes in saline alone).
0
10
20
30
40
50
60
0 2 4 6 8 10 12 14Time (min)
Dra
g R
educ
tion
(%)
Saline5% RBCs10% RBCs20% RBCs
Figure 3-8. Drag reduction vs. time for PEO-4500 at a concentration of 0.1 mg/ml in saline and in the
presence of RBCs at several concentrations. The rate of DRP degradation increases with an increase in RBC
concentration
42

A similar effect was observed for PEO-4500 degradation in suspensions of rigid glass
particles. Polymer degradation rate increased with an increase in particle concentration (Figure
3-9). While the polymer degraded much faster in either type of suspension than in saline, rigid
particles caused a greater increase in PEO-4500 degradation rate than deformable RBCs at the
same concentration (Figure 3-10). The matching viscosity control tests showed that while PEO-
4500 degraded slightly faster in a 15% glycerol solution than in saline, the degradation was
significantly slower in glycerol than in the 20% RBCs, which had the same viscosity (Figure 3-
11).
0
10
20
30
40
50
60
0 2 4 6 8 10 12 14Time (min)
Dra
g R
educ
tion
(%)
Saline1% Particles5% Particles
Figure 3-9. Drag reduction vs. time for PEO-4500 at a concentration of 0.1 mg/ml in saline and in the
presence of rigid glass particles at two concentrations. The rate of PEO degradation increases with an
increase in concentration of particles.
43
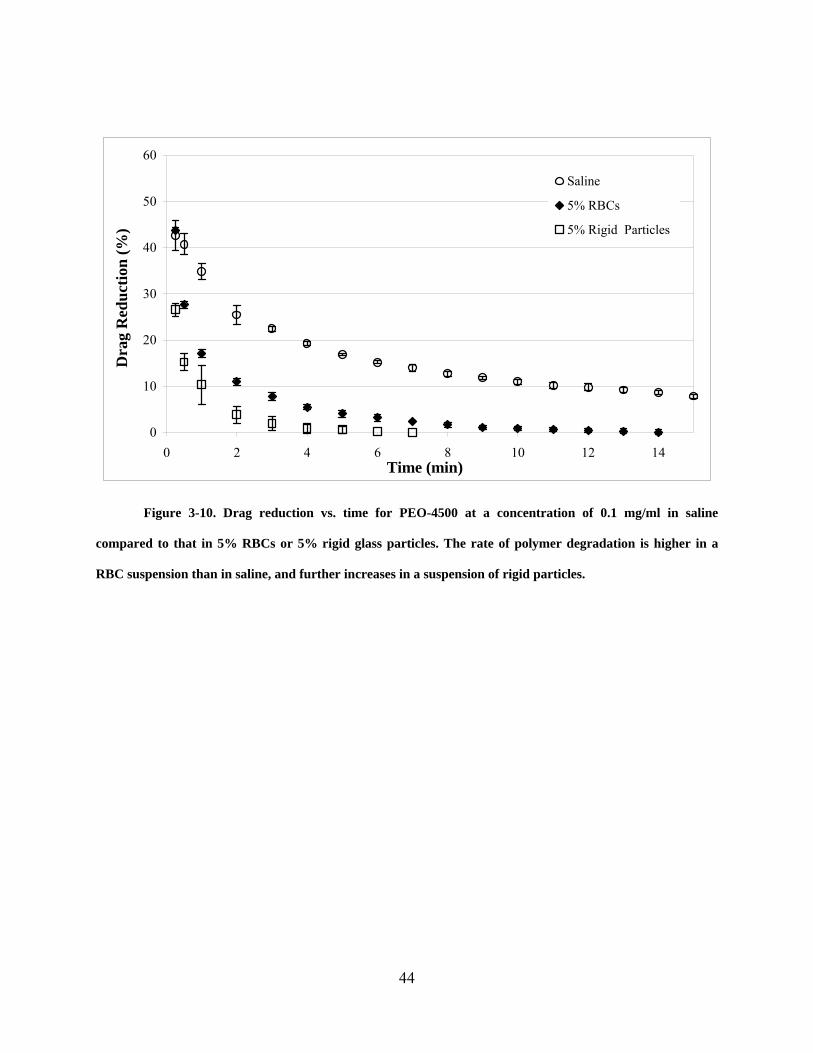
0
10
20
30
40
50
60
0 2 4 6 8 10 12 14Time (min)
Dra
g R
educ
tion
(%)
Saline
5% RBCs
5% Rigid Particles
Figure 3-10. Drag reduction vs. time for PEO-4500 at a concentration of 0.1 mg/ml in saline
compared to that in 5% RBCs or 5% rigid glass particles. The rate of polymer degradation is higher in a
RBC suspension than in saline, and further increases in a suspension of rigid particles.
44

0
10
20
30
40
50
60
0 2 4 6 8 10 12 14Time (min)
Dra
g R
educ
tion
(%)
Saline
20% RBCs
15% Glycerol
Figure 3-11. Drag reduction vs. time for PEO-4500 at a concentration of 0.1 mg/ml in saline
compared to that in a 20% RBC suspension and an equiviscous glycerol solution. The rate of degradation of
PEO-4500 at 0.1mg/ml in a 15% glycerol solution, having the same viscosity as a 20% RBC solution is slightly
higher than in saline, but much lower than in the 20% RBC suspension
The MW of PEO-4500, determined by GPC, decreased significantly with increased
exposure to flow. Mw of the PEO-4500 was initially 4.4 x 10⁶ Da, but decreased to 2.5 x 10⁶ Da
within one hour and 1.5 x 10⁶ Da following five hours of exposure to turbulent flow in saline. It
is known that, as DRPs decrease in molecular weight, the onset of drag reduction occurs at
higher Reynolds numbers [27]. Therefore, although polymers with molecular weights above 106
Da can still produce drag reduction, the Reynolds number in this case may not be high enough
for the PEO with a molecular weight of 2.5 x 10⁶ Da to produce significant drag reduction. IV
also decreased significantly throughout the five hour study. IV of PEO was initially 9.8 dl/g but
decreased to 7.7 dl/g within one hour and to 5.8 dl/g in five hours. The initial measurements for
45

this study were taken after one minute of exposure to turbulent flow. Although this initial Mw is
similar to that given for undegraded PEO-4500 in Table 3-2, the PDI is much higher in this case.
Therefore, there is a larger fraction of low MW polymer which would account for the lower IV
and Rg. The discrepancy between the initial values of the molecular parameters measured in this
study and the values in Table 3-2 may be due to the fact some degradation likely occurred during
the first minute of exposure to flow. The molecular characteristics of PEO-4500 following
exposure to turbulent flow in saline for a series of times are shown in Table 3-4.
Table 3-4. Molecular characteristics and drag reduction (DR) of PEO-4500 at 0.1 mg/ml during
turbulent flow degradation in saline
Time Mw IV Rg PDI DR (min) (Da) (dl/g) (nm) (%)
1 4.4 x 10⁶ 9.8 101 3.4 34 5 3.7 x 10⁶ 9.4 95 3.5 28 15 3.2 x 10⁶ 8.6 88 3.6 17 30 2.8 x 10⁶ 8.1 84 3.1 8 60 2.5 x 10⁶ 7.7 80 2.9 3 120 2.0 x 10⁶ 6.9 72 2.9 1 180 1.8 x 10⁶ 6.3 67 3 0 240 1.7 x 10⁶ 6.2 66 2.5 0 300 1.5 x 10⁶ 5.8 63 2.7 0
The single relaxation decay model, described in Section 3.1.5, fit the data well for PEO
degradation in any of the tested solutions or suspensions (saline, RBCs, rigid particles, glycerol)
for short term exposure to flow. DRP degradation rate (k) increased linearly with an increase in
particle concentration as seen in Figure 3-12.
46

0
0.1
0.2
0.3
0.4
0.5
0.6
0.7
0.8
0.9
1
0 5 10 15 20 25
Particle concentration (%)
Rat
e co
nsta
nt (1
/min
)RBC Rigid Particles Linear (RBC) Linear (Rigid Particles)
Figure 3-12. The rate of PEO degradation rate increases linearly with an increase in particle
concentration. Rigid particles cause a larger increase in degradation rate than flexible RBCs for a given
concentration increase.
3.3 DISCUSSION
As described in sections 3.1.1 – 3.1.4 and 3.2.1 – 3.2.4, a series of tests was created to
characterize and evaluate the effectiveness of a polymer as a DRP, and the test protocol was
validated using well characterized polymers, PEOs and high MW dextran. The results obtained
in this specific aim for a well known DRP, PEO, and a high molecular weight polymer which is
not a drag reducer, high MW dextran, agreed well with the literature. These tests verified that
high molecular weight in combination with linear structure and non-Newtonian behavior in
relatively concentrated solution are essential for drag reduction and that these properties could be
47

accurately evaluated using the protocol developed in this aim. Evaluation of DRP efficacy in
turbulent blood flow showed that the presence of RBCs, which would be encountered in vivo,
does not prevent the studied DRPs from reducing flow resistance. This test could be used to
ensure that the effectiveness of newly developed DRPs would not be destroyed by RBCs.
Overall, this series of experiments could be applied to new polymers to determine their potential
to be used as DRPs for biomedical applications. One limitation of this test protocol is that, since
the mechanism of the intravascular DRP effect is likely different from that in turbulent flow,
proving that a DRP is effective in turbulent flow may not be enough to ensure that it will be
effective in vivo. However, considering that the PEOs described above were tested in animal
models, and there was a certain correlation found between intravascular effectiveness of these
polymers and their physicochemical characteristics including drag reducing ability, it can be
concluded that the developed set of tests is predictive for the in vivo behavior of new DRP
candidates. This concern will be addressed more thoroughly in Specific Aims 2 and 3.
Mechanical degradation studies of DRPs, described in section 3.1.5 and 3.2.5, are also
essential in characterizing DRPs as well as predicting their potential for use in vivo, especially in
treating chronic circulatory disorders such as atherosclerosis or complications of diabetes.
Determination of degradation behavior in the presence of particles such as RBCs is especially
useful in predicting how DRPs will behave in the body, specifically how quickly their effects
will diminish and therefore how often they may have to be administered. The observed increase
in degradation rate of PEO in the presence of particles is a concern that must be considered in
choosing DRPs for use in vivo.
The results discussed in Section 3.2.5 suggested that the increased degradation in
suspensions is likely due to the combination of increased viscosity and the presence of particles,
48

with the particles playing the larger role. It has been shown that the intensity of turbulence of
blood at hematocrits lower than 30% is greater than that of plasma adjusted to the same viscosity
at a given Reynolds number [80]. Collisions between cells and their tumbling result in changes
of direction of motion and, thus, the development of additional vortices. These vortices might be
responsible, at least in part, for the increased PEO degradation rate observed in the presence of
particles. Rigid RBCs are known to increase turbulence intensity even more than normal, flexible
cells. The deformation of RBCs may absorb some of the kinetic energy from the turbulent flow
and therefore reduce the size of these vortices to some extent [80]. This may explain the increase
in PEO degradation rate in the presence of rigid particles compared to that in deformable RBCs.
The developed test provides a useful method for comparing the degradation behavior of
various DRPs or a DRP in different solvents. Contribution of the shear stresses in the pump head
to the mechanical degradation of PEO should be considered in the future in order to
quantitatively determine the stresses which cause DRP degradation, but does not play a major
role in this comparative study since the studies were performed at the same pump speed. It has
been suggested that mechanical degradation of DRPs could be used as a model to study shear
induced RBC damage [81]. It was also shown in an in vitro study that the Biomedicus pump did
not produce significant hemolysis [82], and therefore it can be hypothesized that the major DRP
degradation did not occur in the pump.
A single relaxation decay model was effective in predicting degradation behavior of PEO
in all tested suspensions. Rate constant increased linearly with an increase in particle
concentration, and was much higher for rigid particles than for deformable RBCs. This model
could be applied to predict the time course of degradation of PEO. This has little practical use for
PEO, however, since PEO degradation, especially in suspensions, occurs very quickly and can be
49
easily studied experimentally. A similar model was considered for predicting the mechanical
degradation of other DRPs which degrade much more slowly. This is discussed in section
5.2.1.5.
Overall, the methods devised in this aim provided a strong basis for characterization of
DRPs and determination of their efficacy. The combination of these tests can be used to evaluate
the potential of candidate polymers to be effective in improving blood flow in the vascular
system.
50

4.0 IN VITRO MICROSCALE STUDIES OF POTENTIAL MECHANISMS OF THE
INTRAVASCULAR EFFECTS OF DRAG REDUCING POLYMERS
Elucidation of the mechanisms of the DRP effects on hemodynamics is essential from a scientific
point of view as well as for their progress toward potential clinical use. The effects of DRPs on
blood flow over a range of macro and microflow conditions similar to those found in the vascular
system were studied using straight tubes of various lengths and diameters as well as fabricated
models of microvessel bifurcations. In this specific aim, microchannel flow systems simulating
the microflow environment of RBCs encountered in small arteries, arterioles and capillaries were
designed and fabricated. The effects of DRPs on blood microflow were quantified using pressure
and flow measurements as well as blood hematocrit measurements and microscopic flow
visualization methods.
4.1 METHODS
4.1.1 Microchannel fabrication
Standard photolithography techniques and replica molding were used to fabricate bifurcated
microchannels. Systems with channels ranging in diameter from 25 to 200 µm, one bifurcation
or multiple bifurcations, and channel expansions and contractions were fabricated for these
51
studies. Relative flow resistances were calculated using the Poiseuille equation (Equation 8) to
ensure that each branch will get sufficient flow.
LPrQ
⋅⋅∆⋅⋅
=µ
π8
4
(8)
The channel design was drawn using a computer-aided design program (Adobe Illustrator) and
was initially printed on a transparency using a high-resolution commercial printer to create a
photolithographic mask. Preliminary fabrication using a transparency mask produced channels
with rather rough edges. Therefore, in order to obtain channels with smooth, straight walls
necessary for clear visualization of a developed near wall plasma layer, a chrome mask
(fabricated at Penn State University), which significantly improved the resolution, was used. A
resolution of ~ 500 nm can be obtained using a chrome mask compared to > 20 µm with a
transparency mask [83]. Sample microchannel system designs are shown in Figure 4-1.
A negative photoresist, SU-8 2050 (Microchem), was spin-coated on either a three or
four inch silicon wafer at a spin speed of 3000 rpm in order to control the channel height close to
100 µm. The resist was then soft baked in order to evaporate solvent and increase film density.
The mask and wafer were exposed to near ultra-violet light, which produced the pattern of the
mask in the photoresist. After exposure, the wafer was baked and submerged in a developer in
order to remove unexposed photoresist. Since SU-8 is a negative resist, exposed areas were
cross-linked and remained on the wafer after development. Following development, the
patterned wafer was hard baked to remove remaining solvent from the photoresist.
A replica molding technique was then used to create a negative replica of the master in
polydimethyl siloxane (PDMS). PDMS was an excellent choice for this application since it is
strong, inexpensive, transparent, non-toxic, and can effectively reproduce features on the micron
scale using replica molding [83]. The PDMS was poured over the mold, placed under vacuum to
52

remove air bubbles, cured in an oven at 60ºC for four hours, and then peeled from the master.
This step provided three of the four walls of the channels. Access holes were then punched using
a blunt needle, and the PDMS replica was sealed to a flat glass surface (cover glass) using an
irreversible sealing technique where both surfaces were exposed to an air plasma, which
introduced silanol groups on the surfaces, which in turn formed covalent bonds creating an
irreversible seal [83]. Finally, the channels were placed in an oven at 60ºC overnight in order to
strengthen the bond between the glass and PDMS
.
Figure 4-1. Sample microchannel design (left) and the chrome mask used for microchannel
fabrication (right)
Cross sections of unsealed PDMS channels and of photoresist designs on the silicon
wafer were cut, and light microscopy (PDMS channels) and scanning electron microscopy
(silicon wafer) were used to verify the shape and dimensions of the channels. Figure 4-2 shows a
cross section of a 100 µm segment of a PDMS channel (top left), an intact channel contraction
53

from 200 µm to 100 µm (top right), and scanning electron micrographs of cross sections of 200
µm and 50 µm segments of the photoresist on the silicon wafer (bottom left and right,
respectively). All channel heights were verified to be ~ 100 µm.
Figure 4-2. Micrographs of PDMS microchannels and the silicon wafer/photoresist master
4.1.2 Preparation of a red blood cell (RBC) suspension
Bovine blood was obtained from a local slaughterhouse. Bovine blood was chosen since it is
easier to obtain and work with and less expensive than human blood and is often used in in vitro
modeling of physiological and pathophysiological effects in the cardiovascular system [54, 87-
89]. The RBCs were washed three times with phosphate buffered saline (PBS) and resuspended
at a hematocrit of either 20% or 40% in PBS with 1% bovine serum albumin added to preserve
54

the biconcave shape of the cells. A hematocrit of 20% was chosen for the majority of the studies
in capillary tubes and microchannels since in vivo microcirculatory hematocrit ranges between
20 and 50% of systemic hematocrit [56, 84] due to the Fåhraeus Effect which is more
pronounced at lower hematocrit for a given vessel diameter [56]. A hematocrit of 40% also was
used for several studies in order to mimic physiological hematocrit in the larger vessels since
studies were performed in capillary tubes with a wide range of diameters. DRP (saline in
controls) was added to the suspension at various concentrations and incubated at room
temperature for at least one hour. Light microscopy was used to verify normal biconcave shape
of the RBCs.
All in vitro blood flow experiments were performed at room temperature. Previous
experiments, where blood viscosity with and without polymer was measured in a rotational
viscometer at both room temperature and 37°C, showed that the addition of polymer did not
change the temperature dependence of blood viscosity. Therefore, it was appropriate to perform
the experiments at room temperature.
4.1.3 Effects of DRPs on blood flow in straight capillary tubes
The effects of DRPs on the flow of RBCs in a straight channel in laminar flow were studied
using a flow system (Figure 4-3) consisting of a syringe pump (Harvard Apparatus), a pressure
transducer (PCB Piezotronics), and a capillary tube with a known diameter ranging from 115-
1300 µm in order to test the hypothesis that DRPs attenuate the Fåhraeus-Lindquist Effect.
Experiments were performed using tubes with a wide range of diameters and lengths in order to
determine how the DRPs’ influence on blood flow is affected by capillary tube dimensions. In
order to prevent RBC sedimentation, the suspension in the syringe was kept well mixed by
55

placing a small magnetic stir bar inside the syringe, and manually agitating it using another
magnet on the outside. Length of collective tubing was minimized to avoid cell settling in the
tubing as much as possible.
Capillary tube
Pressure transducer
Flow
Syringe pump with flow control
Capillary tube
Pressure transducer
Flow
Syringe pump with flow control
Figure 4-3. Schematic of capillary flow system.
Flow rates varied from 0.05 to 20 ml/min in order to match physiological shear rates and
Reynolds numbers. Reynolds number was calculated using Equation 3, and wall shear stress (τw)
was calculated using
LdP
w *4*∆
=τ (9)
where ∆P is the pressure drop across the tube, d is tube diameter, and L is tube length. Reynolds
number and calculated wall shear stress values for the tubes used in this study are shown in
Table 4-1. In vivo, small arteries and arterioles have diameters ranging from 0.02 to 0.1 cm, flow
rates ranging from 0.004 to 5 ml/min, and Reynolds numbers ranging from 0.4 to100 [85].
56
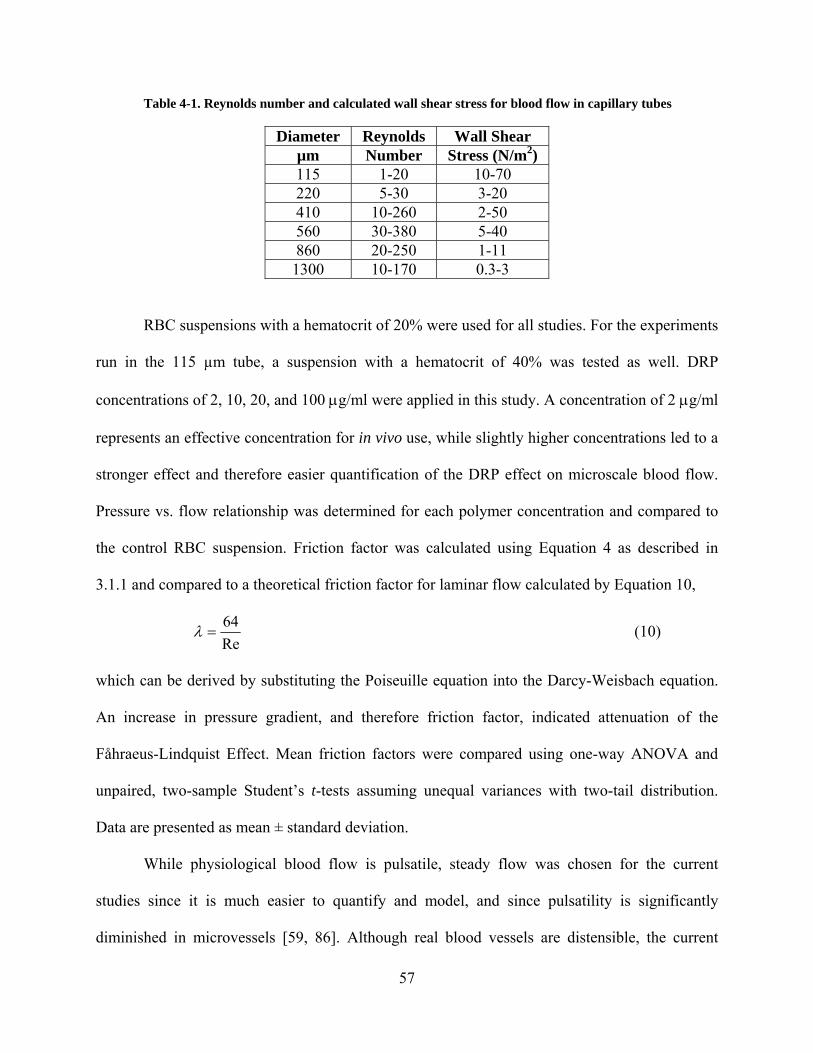
Table 4-1. Reynolds number and calculated wall shear stress for blood flow in capillary tubes
Diameter Reynolds Wall Shear µm Number Stress (N/m2) 115 1-20 10-70 220 5-30 3-20 410 10-260 2-50 560 30-380 5-40 860 20-250 1-11 1300 10-170 0.3-3
RBC suspensions with a hematocrit of 20% were used for all studies. For the experiments
run in the 115 µm tube, a suspension with a hematocrit of 40% was tested as well. DRP
concentrations of 2, 10, 20, and 100 µg/ml were applied in this study. A concentration of 2 µg/ml
represents an effective concentration for in vivo use, while slightly higher concentrations led to a
stronger effect and therefore easier quantification of the DRP effect on microscale blood flow.
Pressure vs. flow relationship was determined for each polymer concentration and compared to
the control RBC suspension. Friction factor was calculated using Equation 4 as described in
3.1.1 and compared to a theoretical friction factor for laminar flow calculated by Equation 10,
Re64
=λ (10)
which can be derived by substituting the Poiseuille equation into the Darcy-Weisbach equation.
An increase in pressure gradient, and therefore friction factor, indicated attenuation of the
Fåhraeus-Lindquist Effect. Mean friction factors were compared using one-way ANOVA and
unpaired, two-sample Student’s t-tests assuming unequal variances with two-tail distribution.
Data are presented as mean ± standard deviation.
While physiological blood flow is pulsatile, steady flow was chosen for the current
studies since it is much easier to quantify and model, and since pulsatility is significantly
diminished in microvessels [59, 86]. Although real blood vessels are distensible, the current
57

microflow studies were performed in tubes with rigid walls in order to be able to quantify DRP
effects on the wall shear stresses via measurements of pressure gradients across a microchannel.
If an increase in pressure gradient is seen after the addition of DRP to blood, it can be assumed
that in an in vivo situation this would cause vasodilation. However, to quantitatively characterize
the changes in the microchannel flow produced by DRP additives, application of channels with
rigid walls is valuable. Pressure versus flow relationships were determined for both control and
DRP suspensions in the same tubes at the same flow rates in order to ensure that there is no
difference in surface roughness between tests.
Entrance length (le), defined as the length needed for the velocity profile to become fully
developed, was calculated [74] using
, (11) dle ⋅⋅= Re06.0
where d is tube diameter. Tubes were selected to be sufficiently long, and therefore the
assumption of fully developed, steady, laminar flow is valid.
Entrance and exit effects were also considered. It was shown that drag reducing ability
correlates well with elongational viscosity [87], and, since the flow at the entrance to a tube is
highly elongational, the effects of this elongational viscosity on the pressure versus flow
relationship in the tube must be determined. These effects were examined through capillary
blood flow experiments in tubes of the same diameter with different lengths. Since the flow is
laminar, the pressure drop per unit length along the tube should be constant for a constant flow
rate. If this is not the case in the tubes of different length, the difference can be attributed to
entrance effects. Mean pressure drop per unit length was calculated for a 220 µm diameter tube
with a length of 50 mm and one with the same diameter but a length of 100 mm and compared
58

using an unpaired, two-sample Student’s t-test assuming unequal variances with two-tail
distribution. Exit effects can be assumed to be negligible since tubes exited to the atmosphere.
4.1.4 Effects of DRPs on blood flow in bifurcated microchannels
The effect of DRPs on the flow of RBCs in microchannels was studied using the PDMS channels
fabricated in 4.4.1. Bovine RBC suspensions were prepared using the method outlined in 4.1.2. It
was previously shown that feed hematocrit, diameter, and flow rate distribution between
branches are the most important factors in determining RBC distribution at a bifurcation [57],
and therefore these parameters were carefully considered in experimental design. Cell
distensibility, suspension medium, flow rate in the parent branch, and bifurcation geometry, on
the other hand, were shown to have little or no influence on RBC distribution at the bifurcation
[57]. In channels with parent branch diameters greater than 50 µm, it was also shown that ratio of
parent channel diameter to daughter channel did not affect RBC distribution between the
branches [88]. All experiments in this study were performed with parent channels having
diameters of 50 µm or greater. A syringe pump (Harvard Apparatus) in infuse mode was used to
generate flow of the RBC suspensions through the channels fabricated in 4.1.1. Flow rates
ranging in the parent channel from 0.01 to 0.2 ml/min, depending on channel dimensions, were
used for these experiments. Reynolds numbers ranged from 1 – 20. A schematic of the
microchannel flow system is shown in Figure 4-4.
59

Microchannel system
Pressure transducer
Flow
Syringe pump with flow control
Figure 4-4. Schematic of microchannel flow system
In a separate set of experiments blood samples were collected from each outlet, and
hematocrits were measured using a standard microcapillary technique. These experiments were
performed in bifurcated channels with a parent branch diameter of 50 µm and a daughter branch
diameter of 25 µm since the Fåhraeus, Fåhraeus-Lindquist, and plasma skimming effects become
more pronounced as tube diameter is decreased. Depth of both channels was 100 µm. A flow rate
of 0.1 ml/min was used for this experiment giving Re ~ 15 in the channel upstream of the
bifurcation. It was estimated that almost 90% of the flow went through the parent channel. Wall
shear stress was calculated to be ~ 250 N/m2. Blood samples were collected directly into
microcapillary tubes in order to minimize sedimentation in connective tubing. The outlet
60

hematocrit values from the parent and daughter branches were compared to each other using an
unpaired, two-sample Student’s t-test assuming unequal variances with two-tail distribution.
These values were compared in both the DRP and control samples in order to directly determine
whether the DRPs were attenuating the plasma skimming effect. Data are presented as mean
hematocrit ± standard deviation.
As the RBCs flowed through the microchannels under physiologically relevant pressures
and flow rates ranging from 0.01 to 0.2 ml/min, their flow behavior was recorded with a
microscopic flow imaging system (Figure 4-5), which consists of an inverted research
microscope (IX70, Olympus, NJ), a cooled CCD camera (MicroMax DIF, Roper Scientific, NJ),
and an associated image acquisition board hosted in a PC. The illuminated flow field was imaged
and recorded by the CCD camera. At least twenty images were recorded at each condition. The
control RBC suspension with no polymer added was run first in order to adjust the depth of focus
to visualize a clear near-wall plasma layer. The suspension was then replaced with RBC samples
containing DRP without moving the channel or changing the focus. Finally, the control
suspension was tested again to ensure that the plasma layer was still visible. Image J (a version
of NIH image software) was used to quantify the size of the cell free plasma layer in each image.
In each image, the cell free area along a given length of the channel was identified manually and
quantified using the Analyze Particle tool. Mean plasma layer size was compared between the
control and DRP case using an unpaired, two-sample Student’s t-test assuming unequal variances
with two-tail distribution. At least five images were analyzed in each case. Results are presented
as mean plasma layer size ± standard deviation. Areas in the main channel and the smaller
branch, as well as the bifurcation itself and channel expansions/contractions were imaged.
61

Images were also taken in a straight glass microchannel having a diameter of 100 µm
since its dimensions were well defined, and the plasma layer could be easily observed and
quantified. Reynolds numbers in this channel ranged from 1 – 20 and shear stress ranged from 5
– 70 N/m2. At least five images were analyzed in each case. Results are presented as mean
plasma layer size ± standard deviation.
Figure 4-5. System for microflow experiments consisting of: a) syringe pump, b) syringe, c) PVC
tubing, d) microchannel, e) reservoir, and f) inverted microscope
4.1.5 Model for DRP effects on microcirculation
Using the marginal zone model developed by Haynes [89], blood flow in small capillary
tubes (diameter < ~ 500 µm) can be described and size of the near wall plasma layer can be
62

predicted with and without DRP additives. Blood flow was modeled as steady flow of a two-
phase fluid through a cylindrical tube with a core region of RBCs and a cell free plasma region
near the wall. A schematic is shown in Figure 4-6
Figure 4-6. Schematic used for marginal zone model of capillary blood flow
Newtonian behavior was assumed in each region. Therefore, in the core RBC region
LrPP
drdv L
RBCz
RBCrz ⋅⋅−
=−=2
)( 0µτ (12)
where τrz is the shear stress, µRBC is the viscosity of the RBC region, vzRBC is the axial component
of the velocity, (P0-PL) is the pressure drop over the tube, r is the tube radius, and L is the tube
length. µRBC was assumed to be equal to bulk viscosity of the blood measured using a rotational
rheometer. Boundary conditions can be written such that
0=dr
dv RBCz at r = 0 since axial velocity is at a maximum at the centerline of the tube and
przRBCrz ττ = at r = R - δ, where δ is the size of the plasma layer, since the transport of
momentum must be constant across the interface between the RBC and plasma layer. For the
plasma region
63

LrPP
drdv L
pz
prz ⋅⋅−
=−=2
)( 0µτ (13)
where µp is the plasma viscosity and vzp is the axial component of the velocity. In this case,
experimental data were collected using RBCs suspended in PBS, and, therefore, µp is equal to
the viscosity of water. Boundary conditions can be written as
pz
RBCz vv = at r = R - δ since the velocity in each region must be the same at the interface
and
pzv = 0 at r = R because of the no slip boundary at the tube wall. Integration of Equations
11 and 12 gives the axial velocity profile in each region given in Equations 14 and 15.
⎥⎥⎦
⎤
⎢⎢⎣
⎡⎟⎠⎞
⎜⎝⎛−⋅
⋅⋅⋅−
=22
0 14
)()(
Rr
LRPP
rvp
Lpz µ
when RrR ≤≤− δ (14)
⎥⎥⎦
⎤
⎢⎢⎣
⎡⎟⎠⎞
⎜⎝⎛ −
+⎟⎠⎞
⎜⎝⎛−⎟
⎠⎞
⎜⎝⎛−⋅
⋅⋅⋅−
=2222
0 14
)()(
RR
Rr
Rr
LRPP
rvRBC
p
RBC
p
RBC
LRBCz
δµµ
µµ
µ
when δ−≤≤ Rr0 (15)
Flow rates (Q) for each region can then be obtained using Equations 16-19.
∫−
=R
R
pzp rdrrvQ
δ
π )(2 (16)
∫−
=δ
πR
RBCzRBC rdrrvQ
0
)(2 (17)
[ 2220 )(8
)(δ
µπ
−−⋅⋅⋅
−⋅= RR
LPP
Qp
Lp ] (18)
( ) ( )⎥⎥⎦
⎤
⎢⎢⎣
⎡ −⋅−
−⋅⎟⎟
⎠
⎞⎜⎜⎝
⎛−−−⋅
⋅⋅−⋅
= 2
4
2
420 1)(
4)(
RR
RRR
LPP
QRBC
p
RBC
p
p
LRBC
δµµδ
µµ
δµ
π (19)
64

The sum of the two fractions QRBC and Qp gives the total flow rate in the tube, Q.
⎥⎥⎦
⎤
⎢⎢⎣
⎡⎟⎟⎠
⎞⎜⎜⎝
⎛−⋅⎟
⎠⎞
⎜⎝⎛ −−⋅
⋅⋅−⋅⋅
=c
p
p
L
RLPPRQ
µµδ
µπ 111
8)( 4
04
(20)
Using the Poiseuille equation, Q = )( 0 LPP − π r 4 / 8 µ L, and Equation 20, the apparent viscosity
in the tube can be calculated as
⎟⎟⎠
⎞⎜⎜⎝
⎛−⋅⎟
⎠⎞
⎜⎝⎛ −−
=
RBC
p
papparent
R µµδ
µµ
1114 (21)
Using these equations and the experimental data obtained from capillary and
microchannel blood flow experiments, the effects of DRPs on the size of the near wall plasma
layer in tubes of different diameter can be calculated.
4.2 RESULTS
4.2.1 Effects of DRPs on blood flow in straight capillary tubes
Preliminary studies of the effects of DRPs on blood flow in straight capillary tubes were
conducted using tubes ranging in diameter from 0.41 to 1.3 mm. All data were normalized for
solution viscosity calculated using the Poiseuille equation and data obtained by running
suspension media with no RBCs through the flow system. Table 4-2 shows specifications for the
tubes tested and the increase in wall shear stress observed in each case. In the larger tubes, where
the Fåhraeus-Lindquist Effect did not occur (0.86 and 1.3 mm), the DRPs had no effect on the
65

wall shear stress. In the smaller tubes (0.41 and 0.56 mm), the DRPs produced a significant
increase in wall shear stress due to the attenuation of this effect.
Table 4-2. Tube specifications and increase in wall shear stress caused by DRPs in blood flow in a
straight channel
Diameter Length Flow Rates
Reynolds Numbers
Shear Rates Increase in wall shear stress (%)
(mm) (cm) (ml/min) (1/s) No
DRP
10 µg/ml PEO-4500
20 µg/ml PEO-4500
20 µg/ml AVP
100 µg/ml PEO-4500
0.41 3.5 0.5-10 10-260 1200-67000 0 42 40 18 N/A
0.41 12.7 0.5-2 10-60 1200-9000 0 N/A 23 15 22
0.56 7.5 2-20 30-380 1400-20000 0 15 N/A N/A N/A
0.86 13 2-20 20-250 400-5500 0 2 N/A N/A N/A
1.3 61.5 2-20 10-170 100-1600 0 0 0 0 N/A
Based on the results of these preliminary studies, which confirmed that the Fåhraeus-
Lindquist Effect was more pronounced in smaller tubes, additional studies were performed in
capillary tubes with diameters of 220 µm and 115 µm. In the 220 µm capillary with length of 50
mm, 10 µg/ml PEO-4500 caused an average increase in wall shear stress of 11%, and 20 µg/ml
PEO-4500 caused an increase of 14% (p < 0.01 at all but the lowest flow rate). In the 220 µm
capillary with length of 100 mm, PEO-4500 increased wall shear stress by 9% and 26% at
concentrations of 10 and 20 µg/ml respectively (p < 0.05 at all flow rates and p < 0.01 at all but
the lowest flow rate). Figure 4-7 shows friction factor vs. Reynolds number for blood flow in the
tube with length of 100 mm. In the control case, the experimental friction factor was
significantly lower than the theoretical due to lower near wall viscosity. When DRP was added,
66

however, the friction factor was significantly increased. Similar results were seen in the tube
with length of 50 mm.
1
10
100
1 10
Re
Fric
tion
Fact
or
100
Theoretical Control 0.01 mg/ml PEO 0.02 mg/ml PEO
Figure 4-7. Friction factor vs. Re for RBCs flowing in a 220 µm capillary tube
An even more significant effect was seen in the 115 µm capillary tube where the addition
of 10 µg/ml PEO-4500 caused an increase in wall shear stress of 24% at a hematocrit of 20% and
52% at a hematocrit of 40%. Figures 4-8 and 4-9 show friction factor vs. Reynolds number for
flow of RBCs in this tube at hematocrits of 20% and 40% respectively. In the control case, the
experimental friction factor is significantly lower than the theoretical. The experimental friction
factor increased with the addition of 10 µg/ml DRP, likely due to RBCs relocating to the near
67

wall space. Similar effects were observed with the addition of other DRPs including PAM, HA,
and AVP.
20% Ht
1
10
100
1 10Re
Fric
tion
Fact
or
100
Theoretical Control 0.01 mg/ml PEO
Figure 4-8. Friction factor vs. Re for RBCs (Ht = 20%) with 0 and 10 µg/ml PEO-4500 flowing in a
115 µm capillary tube
68

40% Ht
1
10
100
1 10 100Re
Fric
tion
Fact
orTheoretical Control 0.01 mg/ml PEO
Figure 4-9. Friction factor vs. Re for RBCs (Ht = 40%) with 0 and 10 µg/ml PEO-4500 flowing in a
115 µm capillary tube
The effects of PEO-4500 at a concentration of 2 µg/ml in 115 µm capillary tube were
also investigated since this concentration was found to be effective at improving hemodynamics
in vivo. The addition of PEO caused an increase in wall shear stress of 8% at a hematocrit of
20% and 26% at a hematocrit of 40%. Figures 4-10 and 4-11 show friction factor vs. Reynolds
number for flow of RBCs in this tube at hematocrits of 20% and 40% respectively. In the control
case, the experimental friction factor is significantly lower than the theoretical. Although the
effect was not as strong as in the 10 µg/ml case, the experimental friction factor significantly
increased with the addition of 2 µg/ml DRP compared to control. This increase in friction factor
was clearly due to reduction of near wall plasma layer size and increase in the near-wall
viscosity.
69

ANOVA showed that the addition of DRPs had a significant effect on wall shear stress
when RBCs flowed through the 115 µm tube at all flow rates (p < 0.05 in all cases and p <<
0.001 for all flow rates at 40% Ht and all flow rates except 0.05 ml/min at 20% Ht). A Student’s
t-test showed that the addition of 10 µg/ml PEO to flowing RBCs produced a statistically
significant increase in wall shear stress at all tested flow rates and hematocrits (p<0.01). The
addition of 2 µg/ml PEO produced a statistically significant increase in wall shear stress at all
tested flow rates at a hematocrit of 40% (p<0.01) and the all but the lowest flow rate at 20% Ht
(p<0.05).
20% Ht
1
10
100
1 10 100Re
Fric
tion
Fact
or
Theoretical Control 0.002 mg/ml PEO
Figure 4-10. Friction factor vs. Re for RBCs (Ht = 20%) with 0 and 2 µg/ml PEO-4500 flowing in a
115 µm capillary tube
70

40% Ht
1
10
100
1 10 100Re
Fric
tion
Fact
orTheoretical Control 0.002 mg/ml PEO
Figure 4-11. Friction factor vs. Re for RBCs (Ht = 40%) with 0 and 2 µg/ml PEO-4500 flowing in a
115 µm capillary tube
Additionally, in the 220 µm capillary tube, pressure drop per unit length was calculated
in the tubes of different lengths (50 and 100 mm). No significant difference was seen between
these values for the different length tubes (p > 0.01 in all cases). Therefore, it can be concluded
that entrance effects were negligible for these studies.
4.2.2 Effects of DRPs on blood flow in straight glass microchannels
The effect of DRPs on the near wall plasma layer was investigated in a straight glass
microchannel with a square cross section measuring 100 µm x 100 µm and a length of 2.5 cm
(Figure 4-12). A developed near wall cell free plasma layer can be seen in the control suspension
71

of 20% Ht RBCs flowing at 0.2 ml/min. When a DRP, PEO-4500 in this case, was added to the
suspension at a concentration of 10 µg/ml, the RBCs were shifted closer to the channel wall,
significantly reducing the size of the plasma layer and became elongated. The RBC elongation
likely occurred due to the increased stress on the RBCs caused by their proximity to the channel
walls. However, there is also a possibility that the RBC elongation might be caused in part by
some direct effect of the DRPs on the RBC membrane. When flow was stopped, there was a
slight but statistically significant difference between plasma layer size in the control suspension
(1.68 µm) and that with PEO (1.12 µm, p<0.001). The presence of a plasma layer, especially in
the control case, is likely due to the fact that, although the pump was stopped, some flow still
existed in the channel (a delay with imaging after stop of the pump would allow RBCs to settle).
During flow, the plasma layer increase was significantly larger in the control suspension than in
the PEO suspension (p<0.001 at 0.05 ml/min and at 0.1 ml/min). In the control suspension, the
plasma layer sized increased from 1.68 µm to 5.5 µm when flow was increased from 0 to 0.1
ml/min. When 10 µg/ml PEO was added to the suspension, however, an increase in flow rate
from 0 to 0.1 ml/min only caused the plasma layer to increase from 1.12 to 1.3 µm. Figure 4-13
shows the increase in plasma layer size with increase in flow rate for the control suspension, and
the significant decrease in near wall plasma layer size caused by DRP addition. Data are
presented as the average plasma layer size of five frames ± standard deviation. Similar results are
seen with other DRPs including PAM, AVP, and HA. However, polymers that have no drag
reducing ability, such as PEO-200 and high molecular weight dextran, produced no effect on the
cell-free layer.
Pressure gradient was also measured over the 100 µm x 100 µm x 2.5 cm straight glass
microchannel. In the control case, experimental pressure was found to be lower than theoretical.
72

The addition of a DRP, 10 µg/ml PEO-4500, led to an increase in pressure gradient, and thus in
wall shear stress, compared to control RBCs at all but the lowest tested flow rate. Pressure
increases were statistically significant (p < 0.01) at the higher flow rates. Figure 4-14 shows the
friction factor vs. Re in the rectangular glass microchannel for both control RBCs and RBCs with
10 µg/ml PEO. These results confirm that the DRPs cause a similar phenomenon in rectangular
channels to that observed in tubes with a circular cross section. This validates the use of
bifurcated microchannels with rectangular cross sections to investigate the effects of DRPs on
RBC behavior at bifurcations.
73
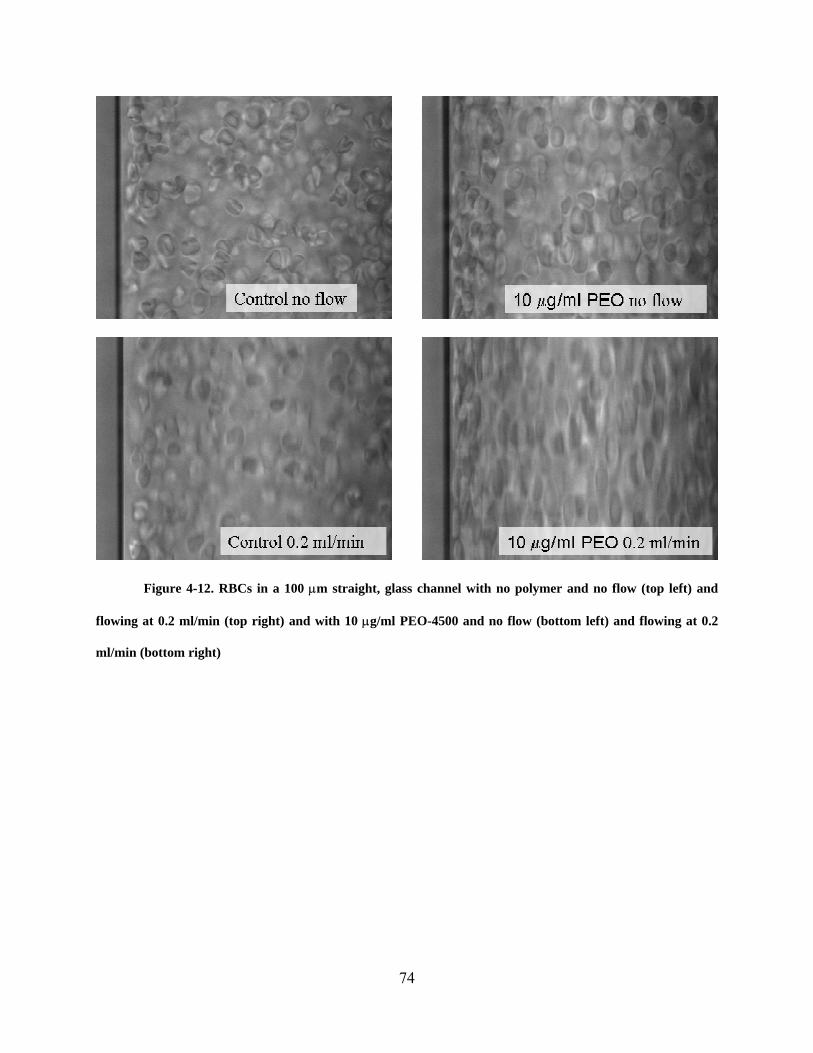
Figure 4-12. RBCs in a 100 µm straight, glass channel with no polymer and no flow (top left) and
flowing at 0.2 ml/min (top right) and with 10 µg/ml PEO-4500 and no flow (bottom left) and flowing at 0.2
ml/min (bottom right)
74

0
1
2
3
4
5
6
7
0 0.02 0.04 0.06 0.08 0.1 0.12
Flow rate (ml/min)
Plas
ma
laye
r si
ze (m
icro
ns)
control 0.01 mg/ml PEO-4500
Figure 4-13. DRP (PEO-4500) caused a significant decrease in plasma layer size in a 100µm glass
channel (p<0.001 at 0.05 ml/min and 0.1 ml/min)
75

1
10
100
1 10
Re
Fric
tion
Fact
or
100
Theoretical Control 0.01 mg/ml PEO
Figure 4-14. Friction factor vs. Re for RBCs (Ht = 20%) with 0 and 10 µg/ml PEO-4500 flowing in a
100 µm rectangular microchannel
4.2.3 Effects of DRPs on blood flow in bifurcated microchannels
The effect of DRPs on the flow of RBCs in PDMS microchannel systems was then studied in
order to determine the potential effects that DRPs have on blood flow at bifurcations in the
vascular system in vivo. Images were first taken upstream of the bifurcations, in the straight
section of the PDMS microchannel to confirm that RBCs behaved the same in PDMS as in glass,
and to ensure that a near wall plasma layer did form in the fabricated channels. Images such as
those in Figure 4-15 verified that the PDMS channels could be used to visualize the near wall
plasma layer. As in the glass channels, when PEO-4500 was added at a concentration of 10
µg/ml to the suspension of flowing RBCs (20% Ht) in the PDMS channel, the RBCs became
76

more elongated and moved closer to the channel wall, causing a reduction in size of the plasma
layer. When flow was stopped, no significant difference in plasma layer size between the control
and PEO (p=0.76) was seen. However, during flow, the plasma layer was significantly larger in
the control suspension than in the suspension containing PEO (p=0.01 at 0.05 ml/min and
p<0.001 at 0.1 ml/min). Figure 4-16 shows the increase in plasma layer size with increase in
flow rate for the control suspension, and the decrease in near wall plasma layer size when DRP
was added. Data are presented as the average plasma layer size calculated from frames ±
standard deviation. Similar results were seen with the addition of other DRPs such as PAM,
AVP, and HA.
Figure 4-15. RBCs in a 100 µm PDMS channel upstream of the bifurcations with no polymer and no
flow (top left) and flowing at 0.1 ml/min (top middle) and 0.2 ml/min (top right) and with 0.01 mg/ml PEO-
4500 and no flow (bottom left) and flowing at 0.1 ml/min (bottom middle) and 0.2 ml/min (bottom right)
77

0
1
2
3
4
0 0.02 0.04 0.06 0.08 0.1 0.12
Flow rate (ml/min)
Plas
ma
laye
r si
ze (m
icro
ns)
control 0.01 mg/ml PEO-4500
Figure 4-16. DRP (PEO-4500) caused a significant decrease in plasma layer size in a 100 µm section
of a PDMS channel upstream of bifurcations (p=0.01 @ 0.05 ml/min and p<0.001 @ 0.1 ml/min)
Next, the DRP effects on RBC distribution at microchannel bifurcations were directly
visualized using the methods described in 2.1.4. Figure 4-17 shows the locations in the channels
where images were taken. Images were taken in both 100 µm to 100 µm (Figure 4-18) and 100
µm to 50 µm (Figure 4-19) bifurcations with bifurcation angles of 90º. In both cases, a
developed near wall plasma layer can be seen as control RBCs flow through the bifurcations.
Flow direction in each image is indicated by the arrows. When DRPs, either PEO-4500 or AVP,
were added at a concentration of 10 µm/ml, the RBCs were relocated to this near wall region,
greatly reducing the plasma layer size. Due to the decrease in the size of the near wall plasma
78
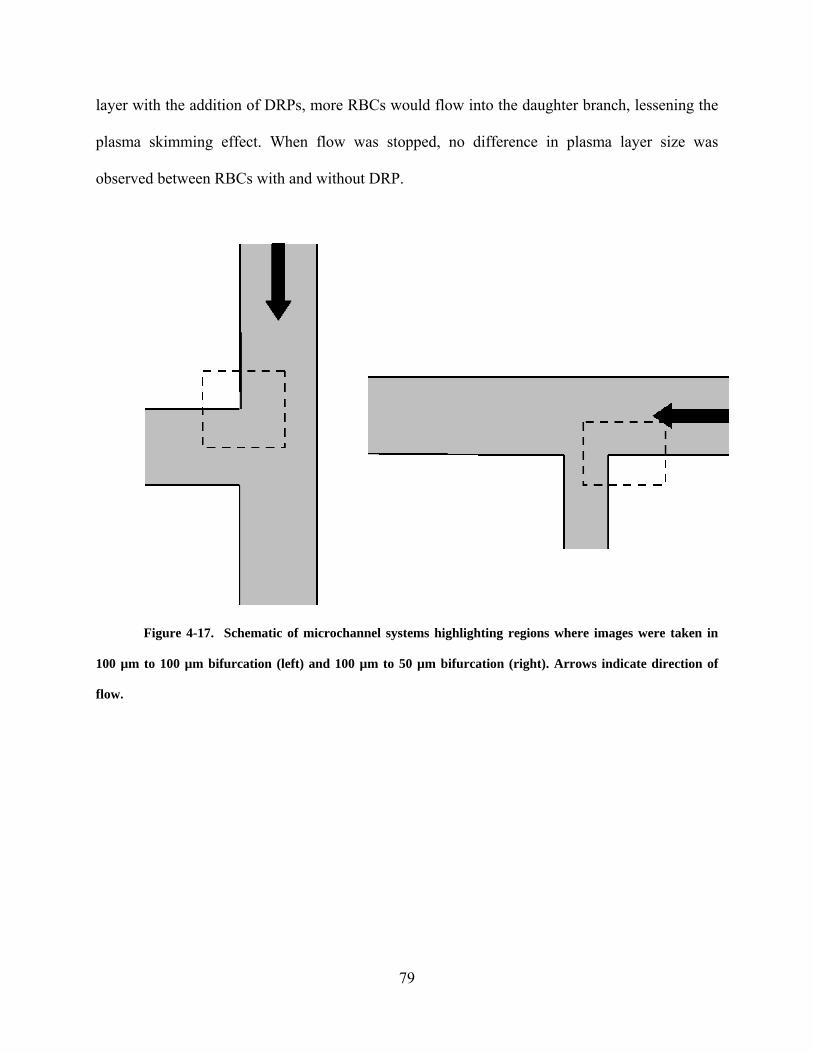
layer with the addition of DRPs, more RBCs would flow into the daughter branch, lessening the
plasma skimming effect. When flow was stopped, no difference in plasma layer size was
observed between RBCs with and without DRP.
Figure 4-17. Schematic of microchannel systems highlighting regions where images were taken in
100 µm to 100 µm bifurcation (left) and 100 µm to 50 µm bifurcation (right). Arrows indicate direction of
flow.
79

Figure 4-18. RBC suspensions in a 100 µm to 100 µm right angle bifurcation with no polymer and no
flow (top left) and flowing at 0.1 ml/min (top middle) and 0.2 ml/min (top right) and with 10 µg/ml PEO-4500
and AVP and no flow (middle and bottom left, respectively) and flowing at 0.1 ml/min (middle and bottom
middle) and 0.2 ml/min (middle and bottom right)
80

Figure 4-19. RBC suspensions in a 100 µm to 50 µm right angle bifurcation with no polymer and no
flow (top left) and flowing at 0.1 ml/min (top middle) and 0.2 ml/min (top right) and with 10 µg/ml PEO-4500
and no flow (bottom left) and flowing at 0.1 ml/min (bottom middle) and 0.2 ml/min (bottom right)
Finally, in a 50 µm to 25 µm bifurcation, blood samples were collected from the outlets
of both the parent and daughter branch as well as from the feed syringe. Hematocrit was
measured for each sample. In the control case, the parent hematocrit was found to be
significantly higher than that in the daughter branch (p < 0.001), showing that plasma skimming
was occurring in this system. Parent branch hematocrit was 19.0% ± 1.1%, while the daughter
branch hematocrit was 17.1% ± 1%. When 10 µg/ml PEO-4500 was added, however, the plasma
skimming effect was attenuated, and no significant difference was observed between parent and
daughter branch hematocrit (p = 0.6). Hematocrit in the parent channel and daughter channel
were 18.3% ± 1.3% and 18.6% ± 2.2% respectively. Feed hematocrit was 18.6% ± 1.3%, and no
81

significant difference between feed hematocrit in the control and polymer RBC suspensions was
observed (p > 0.1). Figures 4-20 and 4-21 compare hematocrits measured from blood samples
taken from the inlet and each outlet of the channel both in the control case and with the addition
of DRP.
Control
15
17
19
21
Hem
atoc
rit (
%)
Parent Branch Daughter Branch Feed
Figure 4-20. Comparison of hematocrits at the channel inlet and outlets of the parent and daughter
branch. For RBC suspensions with no DRP flowing at 0.1 ml/min in a 50 µm to 25 µm bifurcation, parent
branch hematocrit is significantly higher than that in the daughter branch indicating that plasma skimming
is occurring
82

0.01 mg/ml PEO
15
17
19
21
Hem
atoc
rit (
%)
Parent Branch Daughter Branch Feed
Figure 4-21. Comparison of hematocrits at the channel inlet and outlets of the parent and daughter
branch. For RBC suspensions with 10 µg/ml PEO-4500 flowing at 0.1 ml/min in a 50 µm to 25 µm bifurcation,
the plasma skimming effect is attenuated and no significant difference is observed between parent and
daughter hematocrit.
An interesting effect was observed when DRPs were added to RBCs (20% Ht) flowing
through a channel expansion. The addition of 10 µg/ml PEO-4500 to RBCs flowing through the
expansion caused a redistribution of RBCs at flow separations. As shown in Figure 4-22, at a
channel expansion from 50 µm to 200 µm with flow from top to bottom, significant flow
separation and formation of pockets of plasma can be seen in the control blood at the expansion.
When DRP was added, however, the RBCs were relocated to the near wall region eliminating the
plasma pockets at the expansion, and the flow separation was reduced. This effect became more
83

apparent as flow rate was increased, and no difference was seen between the control and DRP
case when flow was stopped. A similar effect was observed in a 100 µm to 200 µm expansion,
both with 20% hematocrit (Figure 4-23) and 40% hematocrit (Figure 4-24) RBCs, although the
recirculation zone was much smaller in the 40% Ht case.
Figure 4-22. 20% hematocrit RBC suspension in a 50 µm to 200 µm expansion with no polymer and
no flow (top left) and flowing at 0.1 ml/min (top middle) and 0.2 ml/min (top right) and with 10 µg/ml PEO-
4500 and AVP and no flow (middle and bottom left, respectively) and flowing at 0.1 ml/min (middle and
bottom middle) and 0.2 ml/min (middle and bottom right)
84

Figure 4-23. 20% hematocrit RBC suspension in a 100 µm to 200 µm expansion with no polymer and
no flow (top left) and flowing at 0.1 ml/min (top middle) and 0.2 ml/min (top right) and with 10 µg/ml PEO-
4500 (bottom left) and flowing at 0.1 ml/min (bottom middle) and 0.2 ml/min (bottom right)
85

Figure 4-24. 40% hematocrit RBC suspensions in a 100 µm to 200 µm expansion with no polymer
and no flow (top left) and flowing at 0.1 ml/min (top middle) and 0.2 ml/min (top right) and with 10 µg/ml
PEO-4500 (bottom left) and flowing at 0.1 ml/min (bottom middle) and 0.2 ml/min (bottom right)
4.2.4 Model for DRP effects on microcirculation
Based on in vitro and in vivo experiments, in vessels with diameters greater than 100 µm at a
hematocrit of ~ 40 % and flow rates high enough to prevent aggregation, the size of the near wall
plasma layer is likely to be no larger than 4 µm [56]. This agrees well with the plasma layer sizes
calculated using Equation 21, derived from the marginal zone theory, for the studies of flow of
86
RBCs through the 115 µm capillary tube which range from 1 to 4 µm depending on flow rate and
hematocrit. When DRP was added to the RBCs, plasma layer size calculated using this model
was reduced. When 10 µg/ml PEO-4500 was added to RBCs flowing in the 115 µm capillary
tube, plasma layer size was calculated to be between -2 and 1 µm depending on flow rate and
hematocrit. The negative plasma layer size, while physically impossible, may indicate that RBCs
are actually more concentrated in the near wall region than in bulk flow. This is qualitatively
supported by the imaging studies described in 4.2.1, where the RBCs appear to be more
concentrated in the near wall region than in the bulk flow when DRP is added to the RBC
suspension. Using the same method for RBCs flowing in the 100 µm microchannel, plasma layer
size was calculated to be 3.4 µm for control RBCs flowing at 0.05 ml/min and 4.4 µm at 0.1
ml/min. When 10 µg/ml PEO-4500, calculated plasma layer size was reduced to 2.0 µm and 0.6
µm at 0.05 and 0.1 ml/min respectively. These results agree relatively well with the measured
plasma layer size (4.3 µm for control RBCs flowing at 0.05 ml/min and 5.5 µm at 0.1 ml/min and
1.4 µm at 0.05 ml/min and 1.3 µm and 0.1 ml/min with 10 µg/ml PEO-4500).
4.2.5 Results Summary
Overall, the following major results were obtained through the studies performed in this
specific aim.
• The addition of DRPs to a RBC suspension flowing in a microchannel produced a
significant increase in wall shear stress.
• A significant decrease in near wall plasma layer size was observed when DRPs
were added to a RBC suspension flowing in a microchannel.
87

• When DRP was added to a RBC suspension flowing through a channel expansion,
RBCs were relocated to the near wall region, eliminating the plasma pockets at
the expansion and reducing flow separation in this area.
• DRPs significantly decreased the plasma skimming effect at a channel bifurcation
increasing the hematocrit of the blood flowing through the daughter branch.
4.3 DISCUSSION
At the present time, neither the Fåhraeus and Fåhraeus-Lindquist (F-L) Effects nor the drag
reducing polymer phenomenon is fully understood. Although the drag reducing phenomenon is
completely different from the Fåhraeus and F-L effects, the studies performed in this specific
aim indicate that these phenomena may unite in the vascular system to produce interesting
consequences which can potentially be beneficial in both microfluidic technology and medicine.
The observed redistribution of RBCs across the microchannels and reduction of plasma
layer size caused by DRPs are intriguing scientific phenomena. The prevention of RBC
movement toward the center of the vessel by DRPs may improve the transport function of blood
in the microcirculation and facilitate gas transport between RBCs and tissue in vivo by reducing
diffusion distance. This effect could also potentially be extremely beneficial in facilitating gas
exchange and reducing thrombosis (by reducing recirculation zones) in blood contacting
artificial organs and bioreactors. The observed increases in the near-wall hematocrit and in local
viscosity with the addition of DRPs produce an increase in wall shear stress in the
microchannels. In microvessels, this increase in wall shear stress would cause release of
endothelial-derived relaxing factor composed of nitric oxide [59], promoting vasodilatation and
88

thus decreasing overall vascular resistance. In vivo experiments have shown that DRPs cause a
decrease in vascular resistance [12, 16, 38, 39], and local vasodilation caused by RBC
redistribution could be one of the mechanisms responsible for this effect. The observed increase
in wall shear stress caused by DRPs could also lead to an increase in number of functioning
capillaries, which has been seen with the injection of DRPs in previous in vivo studies [3]. In the
case of hemorrhagic shock, the reduction in plasma skimming at vessel bifurcations might
improve microcirculation, delivering more RBCs to the capillaries, and acting as an
autotransfusion. This is extremely promising since it has been previously shown that adequate
functional capillary density is a major factor of survival in hemorrhagic shock [42].
The reduction of flow separations and elimination of the “plasma pocket” region
observed at channel expansions has potential clinical significance as well. It is known that
thrombi are likely to form in areas of flow separation [90-92]. Studies by Karino and Goldsmith,
performed with human platelets flowing in an expansion with a diameter ratio of 3.33 (151 µm to
504 µm), suggested that the combination of long residence times, flow patterns, and fluid
mechanical stresses present in vortices associated with flow separation lead to platelet
aggregation and thus thrombus formation [91]. Moving RBCs closer to the wall would wash
platelets out of this recirculating plasma zone and therefore could decrease thrombus formation.
This would be beneficial not only in the vessels, but also in medical devices where thrombosis is
one of the major concerns. Atherogenesis is known to occur in areas of flow separation where
low flow and low shear stress conditions are present. The reduction in flow separation caused by
DRPs and the movement of RBCs to the vessel wall and resulting increase in shear stress
supports the results of previous studies which showed that DRPs can prevent and delay the
development of atherosclerotic legions [2, 4, 9]. These findings suggest that DRPs produce a
89

novel phenomenon in blood flow in microvessels which could provide an exciting new avenue
for the treatment of cardiovascular disorders.
90

5.0 DEVELOPMENT AND TESTING OF NEW DRAG REDUCING POLYMERS FOR
POTENTIAL BIOMEDICAL APPLICATIONS
Several DRPs, including high molecular weight PEOs, PAMs, and plant-derived polysaccharides
were applied in previous in vivo studies and shown to have beneficial effects on blood
circulation, but currently none is being clinically used . PAM was applied in many animal studies
and shown to be very effective, but it is not ideal for use in vivo because of the known toxicity of
the acrylamide monomer as well as certain biocompatibility issues [9, 93]. PEO was also shown
to be effective in animal studies and is a good candidate for certain biomedical applications, but
its rapid mechanical degradation, especially in the presence of RBCs, may present a major
obstacle for use in treating chronic pathologies. Certain polysaccharides have also shown
promise, but lack of consistency between preparations and of a method for production of large
quantities are hurdles that must be overcome. Therefore, the search continues for new DRPs,
which are biocompatible, mechanically stable, well defined, and easily manufactured, to be
proposed for clinical uses. Three potential candidate DRPs have been identified that may meet
criteria necessary for use in vivo. These include a natural DRP extracted from the aloe vera plant;
poly(N-vinylformamide), a high molecular weight polymer synthesized from a non-toxic isomer
of acrylamide; and hyaluronic acid, a high molecular weight polysaccharide known to have drag
reducing properties and already approved by the FDA for some clinical uses (especially in the
91

veterinary practice) [73]. Each of these polymers was characterized and evaluated for its efficacy
as a drag reducer and ability to withstand stress induced degradation.
5.1 METHODS
5.1.1 Development and characterization of an aloe vera based DRP
Aloe vera DRP (AVP) was shown to be a very effective DRP, reducing resistance to
turbulent flow in vitro by up to 50% at a concentration of 10 µg/ml, but is not well characterized
or reproducible. It has long been known that plant components vary from plant to plant
depending on plant age, part used, or where it was grown [94, 95]. A standard protocol for AVP
preparation, which provides a relatively reproducible polymer, has been developed [34]. The
AVP was extracted from freshly cut leaves of aloe vera plants obtained from Silverthorn Ranch
Nursery (Fallbrook, CA). Leaves were removed from the aloe vera plant and sliced open
lengthwise, and the exposed gel scraped from the interior of the leaves. The gel was then mixed
with sterile saline. This mixture was filtered through several layers of cheesecloth and the
resulting filtrate collected and stirred. The aloe vera extract was then centrifuged at 14,000 rpm
for one hour at 4 °C. The resulting supernatant was collected and tested for drag reducing
effectiveness in vitro using a circulating flow loop as described in 3.1.1. The DRP was then
selectively precipitated from the supernatant using 100% ethanol. The precipitate was collected
and dried overnight in a vacuum. The dried precipitate was then dissolved at a concentration of
2.5 mg/ml in sterile saline with 0.1 mg/ml Gentamicin added as an antibacterial agent. Several
days of slow stirring at 4 °C were required to dissolve the precipitate. When completely
92

dissolved, the polymer solution was again centrifuged and the supernatant was dialyzed against
sterile saline using a Spectra/Por regenerated cellulose membrane (Spectrum Laboratories, Inc.)
with a molecular weight cutoff of 50,000 Da. Dialysis removed any low molecular weight
polymer or other low molecular weight impurities.
The effect of lyophilization (freeze-drying) of the AVP on its efficacy upon reconstitution
was investigated, since lyophilization of aloe might be beneficial for storage, transport, or
sterilization. AVP solution was lyophilized using a Labconco Freezone 4.5 freeze dryer.
Following lyophilization, the dry polymer was redissolved in normal saline.
AVP was characterized using hydrodynamic and rheological methods as well as GPC as
described in 3.1.1 – 3.1.5. Additional characterization was performed in an attempt to determine
the chemical structure of the active, drag reducing component of AVP. Proteinase K and trypsin
assays were used to rule out the presence of polypeptides in the active components of the
preparation. Since trypsin and proteinase K are both serine proteases which digest proteins by
hydrolyzing peptide bonds [96, 97], degradation of the polymer by these enzymes would indicate
peptide bonds were present in the active DRP component of aloe. Then, an approach similar to
that used in Chow et al [60], enzymatic digestion with endo-β-D-mannanse was used to make a
preliminary determination of the residues and linkages in the backbone of AVP. After treatment
with each enzyme, drag reduction tests of the AVP were used to determine enzymatic cleavage
in the polymer backbone. A decrease in drag reducing ability, likely caused by a decrease in
molecular weight, was used to indicate cleavage of the polymer.
93

5.1.2 Synthesis and characterization of poly(N-vinylformamide)
An inverse emulsion polymerization technique described by Badesso et al. [68] was used to
synthesize high molecular weight poly(N-vinylformamide) (PNVF). N-vinylformamide (NVF)
monomer (Sigma-Aldrich) was distilled at 80°C under vacuum. The distilled NVF monomer (25
ml), sorbitan monostearate (4.02 g), octane (145 ml), water (48 ml), and 2,2’-azobis(2,4-
dimethylpentanenitrile) (Vazo 52, 0.048 g, DuPont) reacted in a high-speed stirrer (500 rpm) at
50°C for three hours under nitrogen. The reaction produced an emulsion, which was broken with
excess acetone to yield high molecular weight PNVF. The PNVF was dried and then dissolved in
distilled water at a concentration of 5 mg/ml. The PNVF solution was then dialyzed against
distilled water using a Spectra/Por polyvinylidine difluoride membrane (Spectrum Laboratories,
Inc.) with a 1x10⁶ Da molecular weight cutoff to remove any unreacted monomer, low molecular
weight polymer, and other impurities. The dialyzed PNVF was lyophilized and redissolved at a
concentration of 5 mg/ml in distilled water or saline. Three lots of the polymer were synthesized.
Each preparation was characterized using the hydrodynamic, rheological, and chemical methods
described in 3.1.1 to 3.1.5. The preparation which was shown to have the best drag reducing
properties was selected for the further studies, and results of these studies are presented in 5.2.2.
1HNMR spectrum was recorded on a Bruker Avance 300 spectrometer, using deuterium oxide as
a solvent. 1HNMR was used to confirm that the tested polymer was indeed PNVF and not the
hydrolyzed form, poly(vinyl amine).
94

5.1.3 Characterization of hyaluronic acid (HA) as a DRP
Several HA samples with various MWs were obtained from Lifecore Biomedical. The polymers
were characterized, and their drag reducing efficacy and mechanical stability were investigated
using the methods described in 3.1.1 – 3.1.5 in order to assess the potential of HA as a DRP for
use in biomedical applications.
5.1.4 Comparison and correlation of DRP physicochemical and rheological properties
with their drag reducing activity and their effects on microchannel blood flow
Correlations between physicochemical and rheological properties of the polymers and their drag
reducing efficiency were evaluated. PEO-4500, AVP, PNVF, and HA, as well as PAM, were all
included in the correlations. High molecular weight dextran was included as a negative control.
Correlations with drag reducing ability were tested for molecular parameters including molecular
weight, intrinsic viscosity, radius of gyration, and hydrodynamic radius, as well as viscoelastic
properties of concentrated solutions including viscosity, elasticity, and relaxation time at low and
high shear rates in order to show which properties correlated best with a polymer’s drag reducing
efficiency. Correlations were also evaluated between these same molecular and rheological
parameters and the DRP effects in microchannel blood flow studies. These correlations provided
a better understanding of which properties best define and predict a polymer’s ability to improve
microcirculation.
Degradation behavior of the various DRPs in response to mechanical stresses was
compared. This allowed for the prediction of the ability of the DRPs to withstand the mechanical
95

stresses of the vascular system when injected intravenously and thus, at least in part, their ability
to be used to treat chronic circulatory disorders.
5.2 RESULTS
5.2.1 Development and characterization of an aloe vera based DRP
Since high MW polysaccharides are known to be effective drag reducers [1, 6, 17] that are
resistant to mechanical degradation [21-23], and a polysaccharide extracted from the aloe vera
plan was found to have low systemic toxicity when injected either intraperitoneally or
intravenously [24], it was hypothesized that AVP would be a good candidate DRP for use in the
medical field. Previous studies have shown that AVP was an effective DRP both in vitro and in
vivo [1, 34]. AVP, however, had not been fully characterized, and production methods were not
reproducible. Therefore, it was important to attempt to standardize AVP extraction methods in
order to eliminate variability between preparations, as well as to characterize this DRP. The
results presented in Sections 5.2.2.1 to 5.2.2.5 show certain progress made toward this
standardization and characterization of this novel DRP. Figure 5-1 shows an image of a molecule
of AVP obtained using an atomic force microscope (AFM).
96

Figure 5-1. AFM of aloe-derived DRP molecule (image was obtained by Brian Cusick in Dr. Tomasz
Kowalewski’s laboratory at Carnegie Mellon University)
5.2.1.1 Chemical characterization of AVP
Identification of the chemical structure of the active drag reducing component of AVP is
necessary before this DRP can be approved for use in the clinical setting. Using a trypsin based
assay as well as a proteinase K based assay, the possibility that the active drag reducing
component of aloe was a protein was ruled out. Trypsin and proteinase K are both serine
97

proteases which digest proteins by hydrolyzing peptide bonds [96, 97]. AVP maintained its drag
reducing activity when tested in the turbulent flow system at 10 µg/ml following treatment with
either trypsin or proteinase K. Since neither enzyme degraded the polymer, it was concluded that
the aloe-derived DRP did not contain peptide bonds. Based on these studies and the literature
[24, 60, 61, 63, 64, 95], it is reasonable to conclude that the drag reducing component of aloe is a
polysaccharide residue.
Treatment of AVP with endo-β-D-mannanse, however, did cause degradation of the
DRP. Following treatment with endo-β-D-mannanse, the drag reducing efficiency of AVP was
diminished. Before enzyme treatment, the AVP reduced resistance to flow by ~ 40% at a
concentration of 10 µg/ml; after treatment, the AVP produced no drag reducing effect. Since
endo-β-D-mannanse is known to hydrolyze mannans (galactomannans, glucomannans, and
galactoglucomannans) containing β-1,4 linkages, it can be inferred that the drag reducing
element of aloe likely contains a backbone comprised of β-1,4 linked mannose residues.
5.2.1.2 GPC
Mean weight average molecular weight of the AVP determined by GPC was 8.4 x 10⁶ Da ± 3.0 x
106 Da. Intrinsic viscosity was 29.3 dl/g ± 3.2 dl/g. Radius of gyration and hydrodynamic radius
were 199 nm ± 26 nm and 153 nm ± 20 nm respectively. Polydispersity index was calculated to
be 1.17 ± 0.17. These molecular characteristics are indicative of effective DRPs, but standard
deviations are high. This may be due to the fact that components vary among plants depending
on factors such as plant age [94, 95], or that slight variations may have still existed in the
extraction procedure leading to different actual concentrations of DRP in the final preparation.
98

5.2.1.3 In vitro test of drag reducing ability
Drag reducing ability of AVP was assessed at 10 µg/ml in turbulent flow. At a Re of
22,000, AVP reduced resistance to flow by 31% ± 6%. Figure 5-2 shows friction factor vs. Re
for 10 µg/ml AVP in the recirculating turbulent flow system compared to pure saline and the
friction factor obtained using the Blasius equation (Equation 5). At a higher concentration, 100
µg/ml, AVP was found to reduce friction by up to 50%. At a concentration of 10 µg/ml, AVP
produced a statistically significant reduction in friction factor compared to saline (control) at all
tested Reynolds numbers (p < 0.001)
0.01
0.10
10000 15000 20000 25000Reynolds Number
Fric
tion
Fact
or
Blasius Saline 0.01 mg/ml AVP
Figure 5-2. Drag reducing effect of AVP
As described in section 5.1.1.1, the effect of lyophilization of the drag reducing
effectiveness of AVP was also studied. It was found that the process of lyophilization produced
no change in the aloe polymer’s drag reducing activity. At a concentration of 10 µg/ml, the tested
99

AVP reduced resistance by 30.6% ± 2.1% prior to lyophilization compared to 29.3% ± 5.1%
following the lyophilization process. Therefore, lyophilization could be used to provide a safe
storage or transport method for AVP preparations.
5.2.1.4 Viscoelasticity
Concentrated AVP solutions demonstrated pronounced non-Newtonian behavior and high
viscosity, which are defining characteristics of all effective DRPs. Average viscosity, elasticity,
and relaxation time, determined at a concentration of 2.5 mg/ml in saline using the Brookfield
cone and plate rheometer and the Vilastic 3 viscoelastometer, are shown in Figures 5-3 through
5-6. At low concentrations AVP solutions had Newtonian flow behavior. Average asymptotic
viscosity at a concentration of 0.1 mg/ml was found to be ~ 1.2 cP.
100

10
100
1000
0 100 200 300 400 500 600 700 800
Shear rate (1/s)
Visc
osity
(cP)
Figure 5-3. Viscosity of AVP measured in the Brookfield cone and plate rheometer at a concentration
of 2.5 mg/ml
101
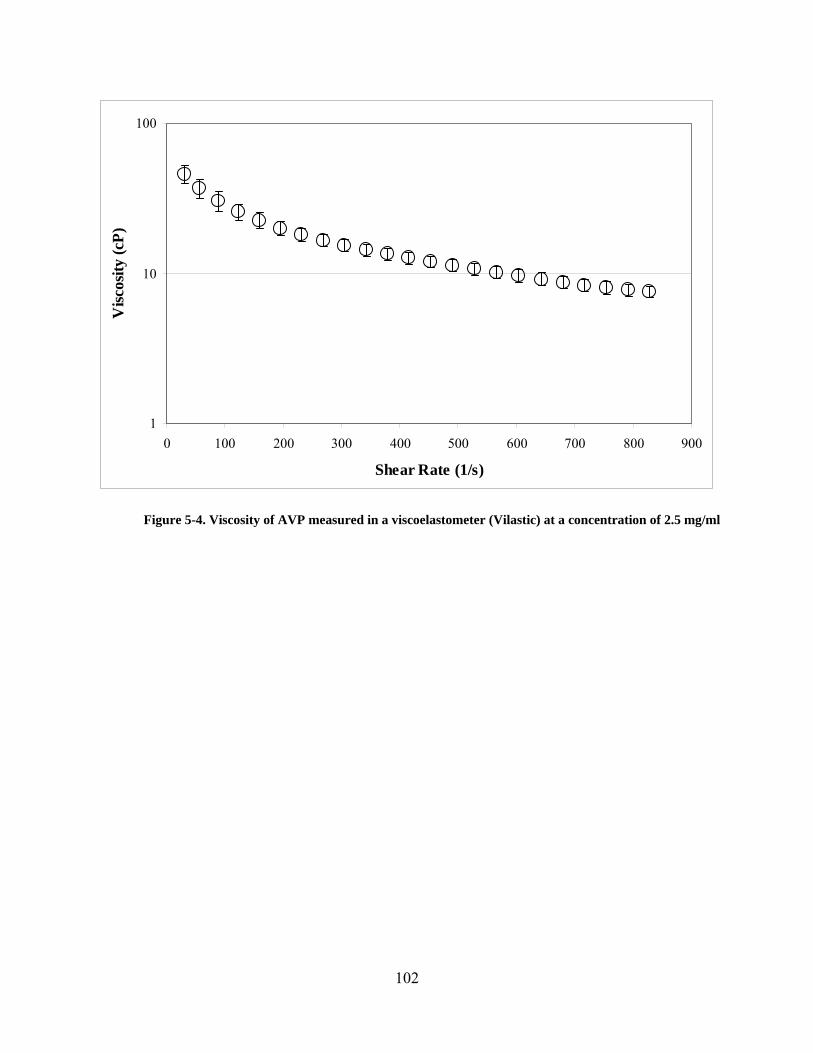
1
10
100
0 100 200 300 400 500 600 700 800 900
Shear Rate (1/s)
Visc
osity
(cP)
Figure 5-4. Viscosity of AVP measured in a viscoelastometer (Vilastic) at a concentration of 2.5 mg/ml
102

0
1
10
100
0 100 200 300 400 500 600 700 800 900
Shear Rate (1/s)
Ela
stic
ity (c
P)
Figure 5-5. Elasticity of AVP measured in a viscoelastometer (Vilastic) at a concentration of
2.5 mg/ml
103

0.00
0.01
0.10
0 100 200 300 400 500 600 700 800 900
Shear Rate (1/s)
Rel
axat
ion
Tim
e (s
)
Figure 5-6. Relaxation time of AVP measured in a viscoelastometer (Vilastic) at a concentration of
2.5 mg/ml
5.2.1.5 Mechanical degradation studies
AVP was found to be much less susceptible to mechanical degradation than PEO in both saline
and in the presence of RBCs. In saline, AVP retained over 50% of its original drag reducing
efficiency after five hours of exposure to turbulent flow. The degradation rate of AVP was
slightly faster in a 20% RBC suspension, but 40% of its original drag reduction was still
maintained in the suspension after five hours of exposure to turbulent flow (Figure 5-7).
Molecular characteristics of AVP, measured using GPC, did not change significantly following
exposure.
104

0
10
20
30
40
50
60
70
0 2 4 6 8 10 12 14 16
Time (min)
Dra
g R
educ
tion
(%)
Ht 0% Ht 20%
0
10
20
30
40
50
60
70
0 50 100 150 200 250 300Time (min)
Dra
g R
educ
tion(
%)
Ht 0% Ht 20%
Figure 5-7. The rate of degradation of AVP at 0.1mg/ml is higher in a RBC suspension than in saline,
but AVP maintains drag reducing ability in both saline and RBC suspensions following 15 min (top) and 5 hr
(bottom) of exposure to turbulent flow.
105

The single relaxation decay model, which was applied to PEO degradation and described
in Section 3.1.5, model was also tried for AVP degradation, where it could be used to predict
degradation over longer time periods than can be practically studied. However, this model did
not fit well. Therefore, it was determined that the single relaxation decay model could not be
used universally to predict degradation of any DRP at least in the studied recirculating flow
system.
5.2.2 Synthesis and characterization of poly(N-vinylformamide)
High MW PNVF was synthesized using an inverse emulsion technique, and tested as a potential
DRP. Since PNVF is synthesized from a non-toxic isomer of acrylamide [66, 67], and
polyacrylamide is known to be an effective DRP, high MW PNVF was considered to have
potential for DRP applications in vivo.
5.2.2.1 1HNMR
The synthesis of PNVF was confirmed by NMR, 1HNMR (D2O) δ 1.68 (br s, 2H, methylene),
3.89 (br s, 1H, methine), and 8.0 ppm (m, 1H, formyl H). The shift at 8.0 ppm, which represents
the formyl hydrogen, confirmed that the tested polymer was indeed PNVF and not the
hydrolyzed form, poly(vinyl amine).
5.2.2.2 GPC
The synthesized PNVF had a weight average molecular weight, measured by GPC, of 4.2x10⁶
Da ± 1.7x10⁵ Da with a polydispersity index of 4 prior to dialysis. Following dialysis against a
membrane with a 1x10⁶ Da molecular weight cutoff, the weight average molecular weight
106
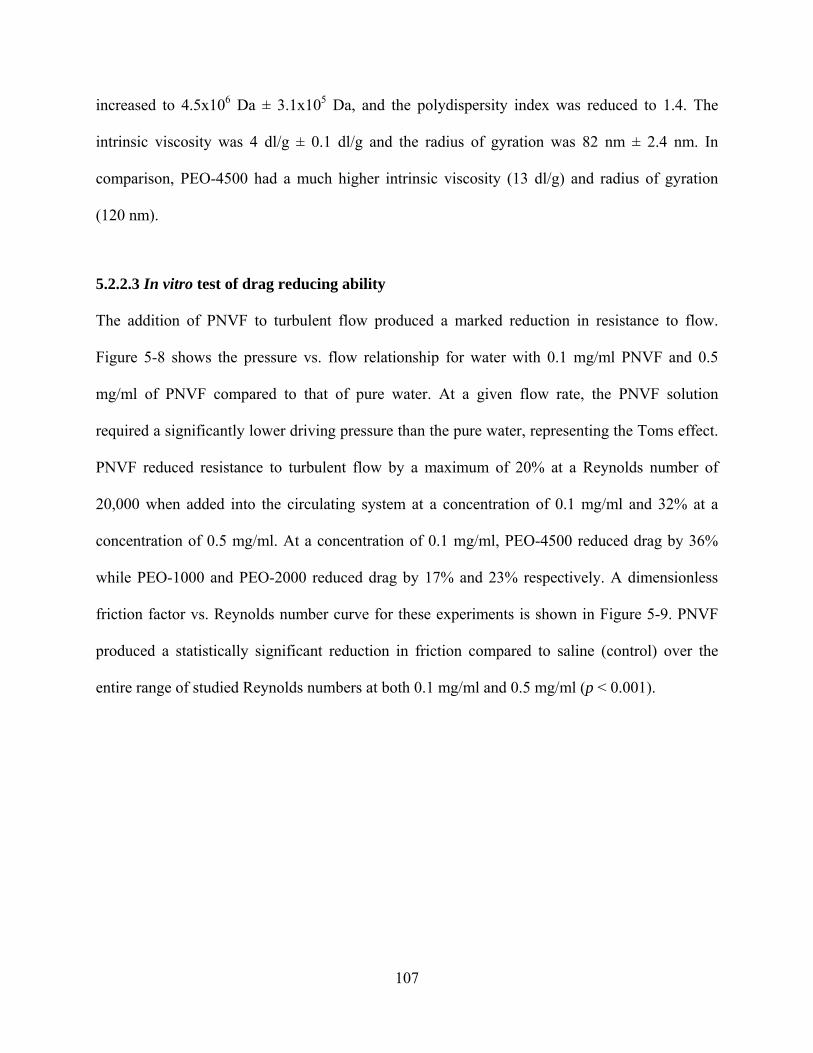
increased to 4.5x10⁶ Da ± 3.1x10⁵ Da, and the polydispersity index was reduced to 1.4. The
intrinsic viscosity was 4 dl/g ± 0.1 dl/g and the radius of gyration was 82 nm ± 2.4 nm. In
comparison, PEO-4500 had a much higher intrinsic viscosity (13 dl/g) and radius of gyration
(120 nm).
5.2.2.3 In vitro test of drag reducing ability
The addition of PNVF to turbulent flow produced a marked reduction in resistance to flow.
Figure 5-8 shows the pressure vs. flow relationship for water with 0.1 mg/ml PNVF and 0.5
mg/ml of PNVF compared to that of pure water. At a given flow rate, the PNVF solution
required a significantly lower driving pressure than the pure water, representing the Toms effect.
PNVF reduced resistance to turbulent flow by a maximum of 20% at a Reynolds number of
20,000 when added into the circulating system at a concentration of 0.1 mg/ml and 32% at a
concentration of 0.5 mg/ml. At a concentration of 0.1 mg/ml, PEO-4500 reduced drag by 36%
while PEO-1000 and PEO-2000 reduced drag by 17% and 23% respectively. A dimensionless
friction factor vs. Reynolds number curve for these experiments is shown in Figure 5-9. PNVF
produced a statistically significant reduction in friction compared to saline (control) over the
entire range of studied Reynolds numbers at both 0.1 mg/ml and 0.5 mg/ml (p < 0.001).
107

0.E+00
1.E+04
2.E+04
3.E+04
4.E+04
5.E+04
6.E+04
7.E+04
8.E+04
0 1 2 3 4 5 6 7
Flow rate (L/min)
Pres
sure
(N/m
2 )Saline 0.1 mg/ml PNVF 0.5 mg/ml PNVF
Figure 5-8. Pressure vs. flow characteristics of PNVF solutions obtained in the turbulent flow system.
108

0.01
0.10
10000 15000 20000 25000
Reynolds Number
Fric
tion
fact
orBlasius Saline 0.5 mg/ml PNVF
0.1 mg/ml PNVF 0.1 mg/ml PEO-1000 0.1 mg/ml PEO-2000
Figure 5-9. Dimensionless friction factor vs. Reynolds number obtained for saline, PNVF (two
concentrations) and two PEO solutions
5.2.2.4 Viscoelasticity
Concentrated PNVF solutions exhibited non-Newtonian behavior, a characteristic demonstrated
by DRPs. High shear viscosity of a 5 mg/ml PNVF solution dissolved in saline was ~6 cP at a
shear rate of 400 s-1. The viscosity vs. shear rate curves for this solution, determined using a
viscoelastometer and a cone and plate viscometer are shown in Figure 5-10. The viscosity,
elasticity, and relaxation time vs. shear rate curves for the PNVF, PEO-1000, and PEO-2000
solutions dissolved in saline are shown in Figures 5-11, 5-12, and 5-13. Asymptotic viscosity of
a 0.5 mg/ml PNVF solution was 1.3 cP and asymptotic viscosity of a 0.1 mg/ml solution was
1.05 cP.
109

5
10
0 50 100 150 200 250 300 350 400Shear rate (1/s)
Vis
cosi
ty (c
P)
Vilastic Viscoelastometer
Brookfield Cone and PlateViscometer
Figure 5-10. Viscosity of PNVF solution at the concentration of 5 mg/ml compared to that of two
PEOs
110

5
10
15
20
0 50 100 150 200 250 300 350 400Shear rate (1/s)
Vis
cosi
ty (c
P)PNVF PEO-1000 PEO-2000
Figure 5-11. Viscosity of PNVF solution measured in viscoelastometer at a concentration of 5 mg/ml
compared to that of two PEOs
111

0.0
0.1
1.0
10.0
0 50 100 150 200 250 300 350 400
Shear rate (1/s)
Ela
stic
ity (c
P)PNVF PEO-1000 PEO-2000
Figure 5-12. Elasticity of PNVF solution measured in viscoelastometer at a concentration of 5 mg/ml
compared to that of two PEOs
112

1.E-04
1.E-03
1.E-02
0 50 100 150 200 250 300 350 400Shear rate (1/s)
Rel
axat
ion
time
(s)
PNVF PEO-1000 PEO-2000
Figure 5-13. Relaxation time of PNVF solution measured in viscoelastometer at a concentration of
5mg/ml compared to that of two PEOs
5.2.2.5 Mechanical degradation studies
The PNVF initially reduced resistance to flow by 15% when added into the recirculating flow
system at a concentration of 0.1 mg/ml and a Reynolds number of 15,000. However, the drag
reducing efficiency of the PNVF decreased with continuing exposure to flow, vanishing within
90 minutes of exposure. The degradation of PNVF was compared to that of PEO-1000 and PEO-
2000, which exhibited similar initial drag reducing efficiency. Figure 5-14 shows the drag
reduction produced by these DRPs following exposure to flow induced shear stresses. PNVF
retained over 40% of its ability to reduce resistance to flow after 30 minutes of exposure to flow
induced shear stress and almost 25% after an hour of exposure, while the PEO-1000 lost its drag
113

reducing ability completely within 30 minutes and PEO-2000 within one hour. Average
molecular weight of the PNVF, however, decreased only slightly over time. The change in
molecular weight versus time of exposure to flow is shown in Figures 5-15 and 5-16. Both
weight average (Mw) and z average (Mz) molecular weight, which represents the higher end of
the molecular weight distribution, are shown.
0
5
10
15
20
25
30
35
40
0 10 20 30 40 50 6Time (min)
Dra
g R
educ
tion
(%)
0
PNVF
PEO-1000
PEO-2000
Figure 5-14. Drag reducing ability of PNVF maintained after exposure to flow compared to that of
several PEOs
114

0.0E+00
5.0E+05
1.0E+06
1.5E+06
2.0E+06
2.5E+06
3.0E+06
3.5E+06
4.0E+06
0 50 100 150 200 250 300 350
Time (min)
Ave
rage
Mol
ecul
ar W
eigh
t (M
w)
0
2
4
6
8
10
12
14
16
18
20
Dra
g re
duct
ion
(%)
Mw DR
Figure 5-15. Weight average molecular weight decreases slightly as the PNVF drag reducing ability
degrades during exposure to turbulent flow
0.E+00
1.E+06
2.E+06
3.E+06
4.E+06
5.E+06
6.E+06
7.E+06
8.E+06
9.E+06
0 50 100 150 200 250 300 350
Time (min)
Ave
rage
Mol
ecul
ar W
eigh
t (M
z)
0
2
4
6
8
10
12
14
16
18
20
Dra
g re
duct
ion
(%)
Mz DR
Figure 5-16. Z average molecular weight decreases slightly as the PNVF drag reducing ability
degrades during exposure to turbulent flow
115

5.2.3 Characterization of high molecular weight hyaluronic acid for use as a DRP for
potential use in vivo
HA has long been known to have drag reducing ability [72] and currently has FDA approval for
some biomedical applications (unrelated to its drag reducing properties) [73], making it an
desirable candidate to be applied for enhancement of blood circulation. Therefore, several HA
preparations, provided by Lifecore Biomedical, were characterized and evaluated for potential
use in such applications.
5.2.3.1 GPC
Mw, IV, Rg, and PDI were measured for a series of HA samples. Table 5-1 shows the measured
characteristics for each tested HA.
Table 5-1. Comparison of molecular parameters of several HA samples obtained from Lifecore
Biomedical
Sample Mw IV Rg PDI (Da) (dL/g) (nm)
002941 1.28 x 10⁵ 4.2 26 1.5 P9411-1 4.74 x 10⁵ 15 62 1.2 P0207-1 1.11 x 10⁶ 20.4 80 1.9 P9711-9 1.30 x 10⁶ 27.2 106 1.1
5.2.3.2 In vitro test of drag reducing ability
The addition of HA (with the exception of that with MW ~130 kDa) to turbulent flow produced a
significant reduction in resistance to flow. Drag reducing effectiveness of the tested HAs
increased with increase in concentration and with increase in Mw. Drag reduction produced by
116

the tested HA samples at various concentrations is shown in Table 5-2. The DR of the highest
MW HA could not be tested in the flow system at 500 µg/ml since, due to its high viscosity,
turbulent flow could not be achieved in the recirculating flow system. A dimensionless friction
factor vs. Reynolds number curve for these experiments performed at 0.1 mg/ml is shown in
Figure 5-17. The two HAs with MW above 106 Da produced a statistically significant reduction
in friction compared to saline (control) over the entire range of studied Reynolds numbers (p <
0.01), while the lower molecular weight polymers produced no significant change in friction
factor.
Table 5-2. Comparison of maximum DR produced by various HAs at several concentrations in the
turbulent flow system.
Sample Actual Mw Max. DR (%) Max. DR (%) Max. DR (%) Max. DR (%) (Da) 10 µg/ml 100 µg/ml 250 µg/ml 500 µg/ml
002941 1.28 x 10⁵ 0 0 0 0 P9411-1 4.74 x 10⁵ 3 8 16 20 P0207-1 1.11 x 10⁶ 6 17 26 37 P9711-9 1.30 x 10⁶ 10 35 43 N/A
117

0.01
0.10
5000 10000 15000 20000 25000
Reynolds Number
Fric
tion
Fact
or
BlasiusSaline0.1 mg/ml HA 2941 ~130k0.1 mg/ml HA P9411-1 ~470 kDa0.1 mg/ml HA P0207-1 ~1100 kDa0.1 mg/ml HA P9711-9 ~1300 kDa
Figure 5-17. Friction factor vs. Reynolds number obtained for several HAs at 0.1 mg/ml
5.2.3.3 Viscoelasticity
Concentrated HA solutions with MW ~ 500 kDa and above exhibited non-Newtonian behavior, a
well-known property of DRPs. The viscosity vs. shear rate curves for these solutions at a
concentration of 2.5 mg/ml, determined using a cone and plate viscometer, are shown in Figure
5-18. Due to the very high solution viscosity of HA with MW of 1100 kDa and 1300 kDa, it was
not possible to obtain viscosity at higher shear rates. The viscosity, elasticity, and relaxation time
vs. shear rate curves for the 2.5 mg/ml HA solutions, measured using the Vilastic 3
viscoelastometer, are shown in Figures 5-19, 5-20, and 5-21. Elasticity and relaxation time are
negligible for the lower MW polymers and are therefore shown only for the two highest MW
118

HAs. Viscosities at a concentration of 0.1 mg/ml were measured using capillary viscometers and
are shown in Table 5-3.
1
10
100
0 50 100 150 200 250 300 350 400
Shear Rate (1/s)
Vis
cosi
ty (c
P)
HA P9711-9 ~ 1300 kDA HA P0207-1 ~ 1100 kDaHA P9411-1 ~ 470 kDa HA 002941 ~ 130 kDa
Figure 5-18. Viscosity of HA solutions at a concentration of 2.5 mg/ml
119
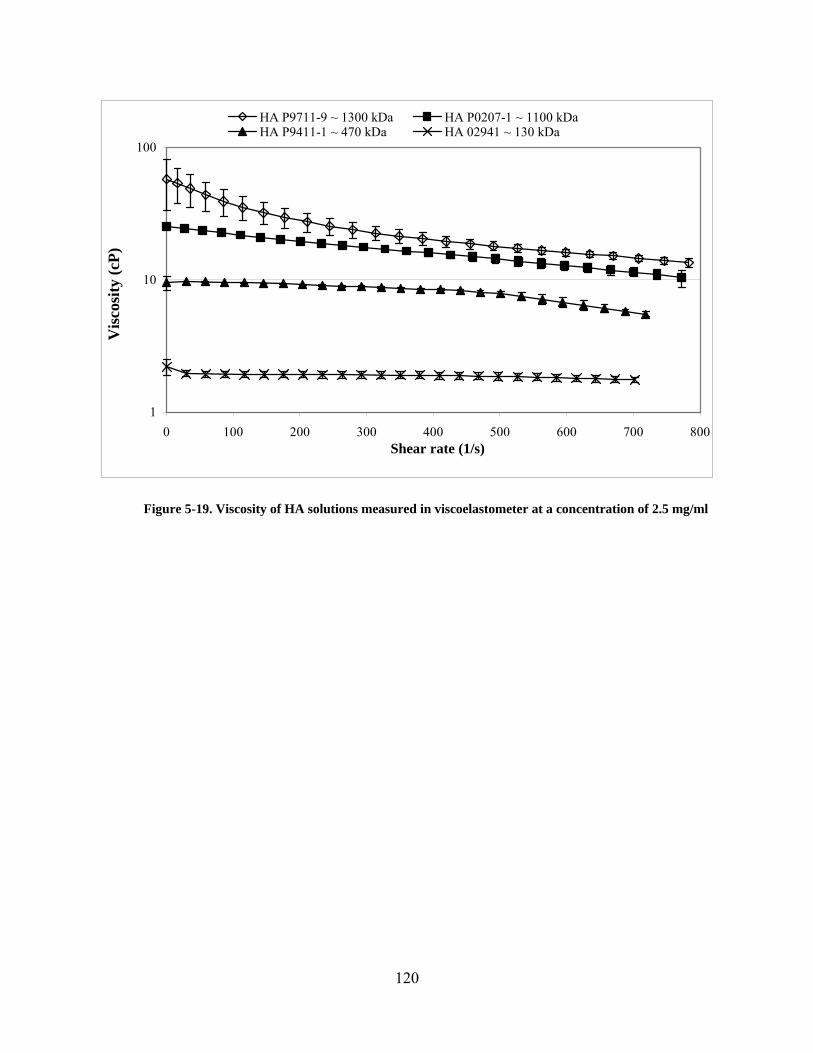
1
10
100
0 100 200 300 400 500 600 700 800Shear rate (1/s)
Vis
cosi
ty (c
P)HA P9711-9 ~ 1300 kDa HA P0207-1 ~ 1100 kDaHA P9411-1 ~ 470 kDa HA 02941 ~ 130 kDa
Figure 5-19. Viscosity of HA solutions measured in viscoelastometer at a concentration of 2.5 mg/ml
120

0.01
0.1
1
10
100
0 100 200 300 400 500 600 700 800Shear rate (1/s)
Ela
stic
ity (c
P)HA P9711-9 ~ 1300 kDa HA P0207-1 ~ 1100 kDa
Figure 5-20. Elasticity of HA solutions measured in viscoelastometer at a concentration of 2.5 mg/ml
121

0.001
0.01
0.1
0 100 200 300 400 500 600 700 800Shear rate (s^-1)
Rel
axat
ion
time
(s)
HA P9711-9 ~ 1300 kDa HA P0207-1 ~ 1100 kDa
Figure 5-21. Relaxation time of HA solutions measured in viscoelastometer at a concentration of 2.5
mg/ml
Table 5-3. Viscosities of HAs measured using a capillary viscometer at a concentration of 0.1 mg/ml
at 22 °C ± 1°C.
Sample Actual Mw Capillary viscosity (Da) at 0.1 mg/ml (cP)
002941 1.28 x 10⁵ 1.09 P9411-1 4.74 x 10⁵ 1.17 P0207-1 1.11 x 10⁶ 1.27 P9711-9 1.30 x 10⁶ 1.33
122

5.2.3.4 Mechanical degradation studies of HA
The HA with MW ~ 1300 kDa initially reduced resistance to flow by 20% when added into the
flow system at a concentration of 0.1 mg/ml and a Reynolds number of 15,000. The HA
maintained its drag reducing efficiency well with continuing exposure to flow. The degradation
of HA was compared to that of PEO-1000 and PEO-2000. Figure 5-22 shows the drag reducing
ability of these DRPs following exposure to flow induced shear stresses. HA maintained over
90% of its original drag reducing ability throughout the entire five hours of exposure to turbulent
flow. The PEO-1000 lost its drag reducing ability completely within 30 minutes and PEO-2000
within one hour.
0
5
10
15
20
25
30
35
40
0 50 100 150 200 250 300Time (min)
Dra
g R
educ
tion
(%)
HA ~ 1300kDaPEO-1000
PEO-2000
Figure 5-22. Percentage of original drag reducing ability maintained after exposure to flow
123

5.2.4 Comparison and correlation the DRP physicochemical and rheological properties
with their drag reducing activity
In order to help identify the best candidates for a DRP to be used for biomedical applications, as
well as the properties which would best define drag reducing effectiveness, the molecular and
rheological properties, drag reducing ability, and mechanical degradation of several DRPs,
including well-known DRPs such as PAM and PEO as well as novel DRPs such as AVP, HA,
and PNVF, were compared.
5.2.4.1 Correlations between DRP physicochemical and rheological properties and their
drag reducing effectiveness
Correlations were investigated between drag reducing efficiency and polymer properties
including MW, Rg, IV, concentrated solution viscosity, elasticity, and relaxation time for PEO-
4500, PAM (Praestol 2510, Stockhausen, Inc.), AVP, PNVF, HA (P9711-9, Mw ~ 1300 kDa),
and dextran. Drag reducing ability was found to best correlate with relaxation time measured in
concentrated solutions (r2 = 0.85 at a shear rate of 50 s-1 and r2 = 0.82 at 500 s-1) and radius of
gyration (r2 = 0.85). Elasticity in concentrated solutions (r2 = 0.64 at a shear rate of 50 s-1 and r2
= 0.60 at 500 s-1) and IV (r2 = 0.63) also correlated fairly well with drag reducing effectiveness.
Solution viscosity did not correlate with drag reducing ability as well as the other tested
parameters did (r2 = 0.50 at a shear rate of 50 s-1 and r2 = 0.34 at 500 s-1). Molecular weight was
found to be a good predictor of polymer drag reducing ability within the class of DRPs (r2 =
0.90). However, no correlation was found between drag reducing ability and Mw for polymers in
general. For example, the tested dextran had the highest Mw of all the tested polymers, but it had
no drag reducing ability.
124

5.2.4.2 Correlations between DRP physicochemical and rheological properties and their
effects in microflow of RBCs
Correlations were determined between the effects of DRPs on flow of RBCs in microchannels
and their physical properties including MW, Rg, IV, concentrated solution viscosity, elasticity,
and relaxation time for PEO-4500, PAM (Praestol 2510), AVP, and HA (Hyvisc, Boehringer
Ingelheim Vetmedica).
Observed near wall plasma layer size was determined to best correlate with relaxation
time measured at high shear rate in solutions with a concentration of 2.5 mg/ml (r2 = 0.92 at a
shear rate of 500 s-1) and with radius of gyration (r2 = 0.98). Since polymers with larger gyration
radii and relaxation times led to lower reduction in near wall plasma layers, it can be concluded
that DRPs which have lower Rg and relaxation time were more effective in altering flow of
RBCs in microchannels. It should be noted that this is true only within the class of DRPs.
Polymers such as PEO-200 and high molecular weight dextran, which had no drag reducing
properties, had no effect on flow of RBC suspension in microchannels even though their Rg and
relaxation time were the lowest of the studied polymers. Intrinsic viscosity (r2 = 0.64) and
elasticity measured at high shear rate in concentrated solutions (r2 = 0.64 at a shear rate of 500 s-
1) also predicted the effect of DRPs on plasma layer size fairly well.
5.2.4.3 Comparison of mechanical degradation behavior among the class of DRPs
Comparison of the mechanical degradation rates of different DRPs was important since it is
necessary for the DRPs to be able to withstand shear forces in the body for some length of time,
especially for use in treating chronic circulatory disorders. AVP was found to be the most
effective drag reducer of the tested polymers at the starting point of the hydrodynamic tests,
reducing resistance to flow by 50% at 0.1 mg/ml and a Reynolds number of ~ 20,000. PAM
125
(Praestol 2510) was also very effective, reducing resistance by 45% under the same conditions,
followed by PEO-4500 (40%), HA (P9711-9, Mw ~ 1500 kDa) (22%), and PNVF (13%) tested at
the same concentration. Following 15 minutes of exposure to stresses in the turbulent flow
recirculating system, AVP was still the most effective DRP (50 % DR or 100% of its original
DR) followed by PAM (30% or 67% of its original DR), HA (20% or 91% of its original DR
PEO (8% or 20% of its original DR), and PNVF (7% or 54% of its original DR). AVP remained
the most effective DRP after one hour (40% or 80% of its original DR) followed by HA (20% or
91% of its original DR), PAM (15% or 33% of its original DR), PNVF (3% or 23% of its
original DR), and PEO (2% or 5% of its original DR). After five hours of exposure to flow, AVP
continued to be the most effective DRP (30% DR, 60% of original DR) followed by HA (20%,
91% of the original DR), and PAM (5% or 11% of original DR). Both PEO and PNVF
completely degraded within five hours of exposure. Figure 5-23 shows the percentage of original
drag reducing effectiveness maintained after one hour of exposure to flow. The polysaccharides,
HA and AVP, were found to be the most resistant to mechanical degradation of the tested
polymers.
126

0
20
40
60
80
100
120
initial 60 min.
% o
f ori
gina
l DR
mai
ntai
ned
AV PAM PEO-4500 PNVF HA ~ 1300 kDa
Figure 5-23. Percentage of original drag reducing effectiveness maintained after one hour of
exposure to flow
5.3 DISCUSSION
DRPs have been shown to improve impaired blood circulation caused by numerous pathologies
in animal models [1-4, 6, 9, 12, 16]. Although commonly used DRPs such as PEOs, PAMs, and
plant derived polysaccharides are very effective in these models, they are not optimal for
potential clinical applications. PEO is degraded quickly by high stresses [45], PAM presents
toxicity issues [9, 12, 93], and natural polymers are often difficult to manufacture consistently in
the necessary quantities. Therefore, the search continues for better synthetic or easily produced
natural DRPs, which are resistant to mechanical degradation, biocompatible, well reproducible,
127

and easy to manufacture, for potential clinical use. The three polymers discussed in this section,
an aloe derived polysaccharide, poly(N-vinylformamide), and hyaluronic acid, all proved to be
effective DRPs, and have physicochemical characteristics attractive for use in clinical
applications.
AVP was found to be the most effective drag reducer of the tested polymers, reducing
resistance to turbulent pipe flow by up to 50% at the accessible range of Reynolds numbers in
the turbulent flow system used for these studies. The active drag reducing component was
determined to be a polysaccharide consisting of β-1,4 linked mannose residues, but additional
studies are needed to elucidate the exact chemical structure of this polymer. Molecular and
rheological properties of AVP are typical for an effective drag reducer. High standard deviations
in molecular and rheological properties are likely the result of variations between aloe
preparations caused by variations between plants, or slight variance in the extraction procedure.
The fact that standard deviations in viscoelastic parameters are highest at low shear rates may
also indicate the presence of some molecular aggregation which varied between samples. This
aggregation was also likely to be responsible for the higher viscosities measured using the cone
and plate rheometer compared to those measured using the Vilastic viscoelastometer. The
oscillatory flow in the viscoelastometer could break up these aggregates significantly reducing
the observed viscosity, especially at low shear rates.
AVP was much more resistant to mechanical degradation than PEO in both saline and in
the presence of RBCs making it a promising candidate for potential use in treatment of chronic
circulatory disorders. It has been previously hypothesized that certain polysaccharides may have
increased resistance to degradation due to their strong bonds between monomer units as well as
intra- and intermolecular interactions lessening the stresses on those bonds [22]. It has also been
128

suggested that branches on a polymer molecule increase its mechanical stability [23]. Although
the exact structure of the DRP component of aloe is not yet known, a structure proposed for the
main component of the aloe polysaccharide may contain some branches [60] while PEO does
not. Finally, since polysaccharides, such as the aloe-based polysaccharide, are comprised of
numerous six-carbon rings linked together, the molecules are more rigid, and therefore
degradation is not entropically favored [21]. The presence of rings could also allow for some
bonds to be broken without breaking up the polymer backbone. Therefore, unlike PEO, the aloe
polymer could likely withstand some bond breakage without compromising its drag reducing
activity. The degradation of AVP caused by biologic mechanisms in vivo, however, has not been
studied, but must be evaluated before AVP could be used clinically.
Unlike the natural AVP, the synthetic nature of PNVF makes production in large
quantities and consistent batches more feasible. Therefore, high molecular weight PNVF
(4.5x10⁶ Da) was synthesized and tested as a DRP for possible biomedical applications. The
synthesized PNVF had molecular properties characteristic of DRPs, including high molecular
weight and relatively large intrinsic viscosity and radius of gyration, and was effective in
reducing resistance to turbulent flow. While the PNVF was shown to be an effective drag-
reducer, reducing resistance to turbulent flow by over 30% at a concentration of 0.5 mg/ml at
turbulent flow conditions produced in the recirculating system, it was not as effective as PEO of
the same molecular weight (4.5x10⁶ Da). One possible explanation for this is that, since NVF
polymerization is known to exhibit some chain transfer [66], the PNVF is likely not entirely
linear. This hypothesis is supported by the fact that its intrinsic viscosity (4 dl/g) is significantly
lower than the 13 dl/g intrinsic viscosity of PEO-4500. Another factor that may contribute to this
difference in drag reducing efficiency is that the molecular weight of the NVF monomer is much
129
higher that the molecular weight of the ethylene oxide monomer. It is well known that, at the
same polymer molecular weight, the polymer with the lower monomer molecular weight and
therefore a higher degree of polymerization is a better drag-reducer [26]. The drag reducing
ability of the PNVF is close to that of PEO-1000 and PEO-2000 (at least in the applied range of
Reynolds numbers). In addition, viscoelastic properties of the PNVF correspond well to these
two PEOs, indicating that the viscosity, elasticity, and relaxation time are important parameters
in determining a polymer’s drag reducing activity.
Although PNVF was susceptible to mechanical degradation, losing all of its drag
reducing ability after 90 minutes of circulation in the turbulent flow system, its degradation rate
was significantly lower than that of PEO-1000 and PEO-2000, which lost their drag reducing
ability after circulation for 20 and 45 minutes respectively at the same concentration and
identical flow conditions. While there was a significant loss of drag reducing ability over time
for both PNVF and PEO, the molecular weight of PNVF decreased only slightly. These results
are consistent with previously published studies of mechanical degradation of drag reducing
polymers [49, 51]. Two theories have been proposed to explain this phenomenon, which is also
seen in polyacrylamide degradation. The first of these theories is the molecules at the high end of
the molecular weight distribution are most influential in a determining a DRP’s efficiency [98]
and scission of those molecules would account for loss in drag reducing ability. This is supported
by the decrease in Mz, which defines the high end of the molecular weight distribution. The
second hypothesis proposes that shear induced structure formation and molecular aggregation are
partially responsible for the DRP effects, and therefore, the irreversible breakup of these
structures is responsible for the declining drag reducing effect produced by polymers [49, 51].
The drag reducing ability of the PNVF was not restored after stopping the flow for one hour.
130

This is consistent with the experiments of Liberatore et al, suggesting that that polymer
aggregates contribute to the drag reducing ability and irreversibly break up as the solution
degrades [49]. The loss of the high molecular weight fraction of the PNVF during exposure to
high mechanical stresses might also be responsible for the loss of the polymer’s ability to form
molecular aggregates since flow-induced structure formation is highly dependent on molecular
weight [49, 99]. Sellin et al. suggested a similar theory for PEO degradation, proposing that both
chain scission and disentangling of molecular agglomerates could contribute to DRP degradation
[52]. Although there is evidence that either of these theories or a combination of them could
explain the loss of drag reducing ability, the mechanisms behind the degradation of DRPs and
the drag reducing phenomenon itself are still not completely understood, and therefore, it is
likely that a combination of these theories and other factors may contribute to the degradation of
PNVF. Due to its higher stability against mechanical stress than PEO, PNVF might be a more
favorable polymer for chronic medical uses.
In vitro and in vivo studies showed that the PNVF seemed to be biocompatible with blood
[39]. Preliminary in vivo studies showed that PNVF was efficient in reducing vascular resistance
without producing adverse effects, at least in acute experiments [39]. However, further in vivo
studies are necessary to prove beneficial effects of PNVF on normal and especially on
pathological blood circulation. Nevertheless, due to its obvious drag reducing effectiveness at
both in vitro and in vivo flow conditions, relatively slow mechanical degradation, and its very
low toxicity, PNVF can be considered as a DRP for potential biomedical applications.
HA, at MW above 106 Da, possessed molecular and rheological characteristics indicative
of DRPs. This natural polymer is available commercially and has been used in some medical
applications [70, 71, 100], making it more attractive for the potential translation to clinical use as
131

DRP than AVP. In this study, HA was proven to be an effective drag reducer which was more
resistant to mechanical degradation than any of the tested polymers. As with AVP, this increased
resistance to mechanical degradation is likely due to the strong bonds between monomer units,
characteristic of polysaccharides, and intra- and intermolecular interactions reducing stresses on
those bonds [22] as well as the ring-like structure of the monomer units providing stability. A
concern with HA, however, is degradation caused by biological mechanisms in vivo. HA was
found to degrade quickly in the blood stream, and the main method of HA removal from the
blood is by endothelial cells of liver sinusoids [100]. This is an issue that would need to be
addressed before HA can be used clinically for treating circulatory diseases as a DRP.
Various water-soluble DRPs have been shown to enhance blood flow in animal models of
several pathologies including diabetes hemorrhagic shock and myocardial ischemia [1-4, 6, 8-10,
12, 14, 16, 17, 53]. It was shown that the effective biological half life of one DRP, PAM
(Separan AP-30), was about 35 hours in rats [53]. Mechanical degradation could be at least
partially responsible for this observed loss of effectiveness. PEO was shown to be one of the
most effective drag reducers among well known DRPs and was used in many in vitro and in vivo
studies. Mechanical degradation, however, is a serious concern when considering using DRPs for
potential chronic treatment of patients. The stresses produced by cell motion in blood flow, as
evidenced in the current studies, cause even more rapid degradation of PEO. AVP, PNVF, and
HA, as well as PAM, were shown to degrade more slowly than PEO when exposed to
mechanical stresses.
The possibility that the decreased drag reducing ability may be a result of the polymer
adhering to the tube and pump walls and, thus, reduction of its concentration in the flowing
solution was considered in this study. The concentration of polymer in solution during five hours
132
of turbulent flow, determined using a refractive index detector, remained constant throughout the
experiment, and therefore the loss in drag reducing activity was not caused by polymer
adherence to the wall. More studies need to be done to further understand the DRP degradation
mechanisms. For potential biomedical use, it would be beneficial to have a DRP that degrades
relatively slowly since it can last for a significant amount of time after intravascular injection.
Considering that the blood flow in the cardiovascular system is not turbulent and that the shear
stresses in the in vitro turbulent flow systems are significantly higher than physiological shear
stresses, one can expect much a longer time of DRP circulation in vivo without degradation than
that in the in vitro turbulent flow system used in these studies.
A surprising result found in these studies was that, within the class of DRPs, polymers
which have lower Rg and IV and exhibit shorter relaxation times and lower elasticity in
concentrated solutions are more effective in redistributing RBCs in microchannels. The
mechanism by which the DRPs alter RBC distribution in microchannels remains unknown, and,
therefore, the properties necessary for this phenomenon have yet to be identified. One possible
explanation is that the effectiveness of DRPs on microflow is based on flexibility of the polymer
molecules. It was shown that, of the tested DRPs, those which have the lower monomer weight,
and are thus more flexible, are more effective in altering microchannel blood flow. This is
supported by the fact that DRPs which have lower elasticity, gyration radii, and intrinsic
viscosities, and therefore higher flexibility, performed best in RBC microflow experiments.
133

6.0 SUMMARY
6.1 CONCLUSIONS
A series of tests was developed to effectively evaluate and characterize water soluble DRPs for
possible clinical use in treating circulatory disorders and to further elucidate mechanisms of their
beneficial effects on blood circulation in vivo.
The mechanism responsible for the DRP beneficial effects in the microcirculation was
explained, at least in part, by the redistribution of RBCs flowing in the microcirculation, leading
to a reduction of near wall plasma layer size and thus attenuation of plasma skimming at
microvessel bifurcations. This, in turn, can improve gas transport between RBCs and the tissue
by significantly reducing the diffusion distance of gas molecules, as well as increase shear stress
on microvessel walls which would promote the release of shear stress dependent vasodilators,
leading to local vasodilation and a decrease in overall vascular resistance.
Additionally, this study provided a better understanding of mechanical degradation
behavior of DRPs exposed to flow induced shear stresses, especially in the presence of particles
such as RBCs in a flowing solution. It was found that an increase in particle concentration led to
an increase in degradation rate, and that presence of rigid particles led to an even larger
degradation rate increase than deformable RBCs.
134

Finally, three blood soluble DRPs with great potential for clinical use were characterized
and evaluated. These DRPs offer advantages of biocompatibility and resistance to stress induced
degradation over several of the commonly used DRPs. An aloe derived polysaccharide was
found to produce the largest drag reducing effect of any of the tested polymers. It proved to be
relatively resistant to mechanical degradation, and is likely non-toxic since some studies have
shown that the injection of aloe inner gel derived products produced little systemic toxicity [24].
Poly(N-vinyl formamide) was synthesized from a non-toxic isomer of acrylamide and found to
be an effective drag reducer which, given its synthetic nature, could be easily manufactured.
Finally, high molecular weight hyaluronic acid, a natural DRP which is currently used in certain
medical applications, was found to be a good drag reducer and was most mechanically stable of
any of the tested DRPs.
This study also lead to a better understanding of the characteristics that best predict a
DRP’s effectiveness, both in turbulent pipe flow and on blood flow in microchannels. Two
parameters, relaxation time in relatively concentrated solution (2.5 mg/ml) and gyration radius of
the polymer molecules, were found to be the physicochemical properties which are most
indicative of a polymer’s effectiveness in both cases. However, while larger radius of gyration
and intrinsic viscosity, longer relaxation time, and higher elasticity are characteristic of better
turbulent flow drag reducers, polymers within the class of DRPs which exhibit smaller gyration
radii, lower solution relaxation times and elasticity, and lower intrinsic viscosities, were actually
more effective in altering the microflow of blood, and would therefore be most likely to have the
largest effect in microcirculation in vivo.
135

The combination of these studies provided a significant step in the development of this
novel therapy, aimed at treating impaired circulation caused by a number of pathologies, toward
clinical use.
6.2 STUDY LIMITATIONS
While the performed DRP degradation study provided an effective, comparative assessment of
the relative ability of polymers to resist stress induced degradation, there were several limitations
in this study. The flow conditions necessary to quantify mechanical degradation using turbulent
flow drag reduction, as well as to compare degradation over relatively short exposure times,
produced shear stresses significantly higher than those found in the normal vascular system.
Therefore, only relative resistance to degradation, and not actual lifetime of DRPs in circulation,
could be determined from this study. Another limitation is that this study quantifies only
mechanical degradation and not degradation that would be produced by biological mechanisms
such as enzymatic degradation. It would be advantageous to investigate biological degradation in
the future since the polymers will be exposed to various enzymes in the vascular system. Finally,
the shear stresses encountered inside the pump head were not considered in this study. Since all
polymers were exposed to similar flow conditions in the pump, the comparative study is valid.
However, the magnitude of this stress and exposure time must be determined in order to
accurately quantify the magnitude of shear stress which caused the observed degradation.
Another major limitation of this study is that, although the work represents significant
progress toward the elucidation of the mechanisms of the intravascular DRP phenomenon, the
exact mechanism remains unknown. One of the potential mechanisms of the intravascular DRP
136

effect was found to involve redistribution of RBCs across vessels in the microcirculation,
reducing the size of the near wall plasma layer and delivering more RBCs to the smaller vessels
and thus capillaries. In vivo, this would likely lead to improved oxygen transport as well as local
vasodilatation which could account for the decrease in vascular resistance observed in animal
models. Although the current work has provided a much better understanding of the action of the
DRPs in the vascular system, the exact mechanisms of the intravascular DRP effect, including
the mechanism by which DRPs are preventing relocation of RBCs toward the center of the
microtube/microvessel, still remain unknown. One hypothesis for the DRP effect on distribution
of RBCs is that the polymers align along the flow paths and diminish RBC rotation, which is
important factor in the development of a near-wall plasma layer in microvessels [1].
Additionally, the increase in blood viscoelasticity caused by DRPs may strengthen non-
Newtonian patterns of the axial velocity profile, blunting the velocity profile and shifting mean
RBC velocity closer to that of the blood [1]. Examination of these hypotheses would help to
further elucidate mechanism by which DRPs act in vivo.
There were several other limitations in the in vitro microflow studies that should
be addressed in order to further understand the actions of DRPs in blood flow. One such
limitation was that the in vitro experiments to determine the effects of DRPs on blood flow in
microchannels were performed in steady flow in rigid tubes, while, in vivo, blood flow is
pulsatile and vessels are distensible. Steady flow was applied in these studies in order to allow
for quantification and simpler modeling, as well as due to the known fact that the pulsatility is
diminished in the microcirculation [59, 86]. However, physiological blood flow, even on the
microcirculatory level, does exhibit some pulsatility. It was discovered that the Fåhraeus effect
also occurred in pulsatile blood flow [101]. Therefore, studies of the DRP effects on pulsatile
137

blood flow in microchannels would help to determine whether DRPs had the same effect on
reduction of near wall plasma layer in unsteady flow as in steady flow. Additionally, although
blood vessels in vivo are distensible, the microflow studies in this project were performed in
tubes with rigid walls. This allowed for the quantification of DRP effects on wall shear stresses
via measurements of pressure gradients across a microchannel. If an increase in pressure gradient
was seen with the addition of DRP to blood, it could be assumed that in an in vivo situation this
would cause vasodilation. A study of DRP effects on blood flowing in distensible vessels would
provide further understanding of the effects of DRPs on the microcirculation.
Finally, some limitations are presented in the imaging and image analysis methods. It was
difficult to obtain images with no flow due to RBC sedimentation as well as due to the fact that
even with the pump stopped some residual flow still existed, and delay of imaging would change
the near wall RBC concentration due to their sedimentation. Therefore, due to this slow flow,
some slight RBC elongation was observed in some images taken when the pump was stopped.
Additionally, in order to quantify the plasma layer size, the near wall area which did not contain
cells had to be selected manually. Therefore, this determination of the exact edge of the cell free
layer is a possible source of error in measurement of plasma layer size.
In general, the limitations of the study relate to the fact that the experiments were
performed in vitro, and that the real vascular system is much more complex than the models that
were developed and applied in this work. Biological factors as well as the complex environments
that the polymers would encounter vivo have not yet been sufficiently addressed. While
additional in vitro experiments could help to provide more insight on the polymers action in the
vascular system, ultimately, the complete behavior of DRPs in the vascular system will be able
to be determined only through in vivo studies.
138
6.3 FUTURE STUDIES
The mechanism of the intravascular DRP effect was found to involve redistribution of
RBCs across vessels in the microcirculation, reducing the near wall cell-free plasma layer size
and leading to improved oxygen transport and, potentially, local vasodilatation. Although the
current work has provided a much better understanding of the action of the DRPs in the vascular
system, an important future study would involve elucidation of the mechanism by which DRPs
are causing relocation of RBCs. It was hypothesized that alignment and stretch of the polymers
along flow paths may diminish RBC rotation, which is an important factor in the formation of a
near-wall plasma layer in microvessels [1]. However, this hypothesis has not been confirmed
experimentally yet. An increase in blood viscoelasticity caused by DRPs may also strengthen
non-Newtonian patterns of the axial velocity profile, blunting the velocity profile and shifting
mean RBC velocity closer to the mean velocity of blood [1]. Evaluation of these hypotheses
would lead to a better understanding of the mechanism by which DRPs facilitate blood flow in
vivo.
While the DRPs developed and characterized for biomedical applications show promise,
much more work is still needed before these polymers can be used clinically. The candidate
polymers were all shown to be effective drag reducers that are at least somewhat resistant to
mechanical degradation. In the case of AVP [1] and PNVF [39], preliminary in vitro and in vivo
studies have shown biocompatibility and efficacy. However, in order for these polymers to be
used clinically, additional animal studies, including a formal toxicity investigation, must be
139

completed. Biological degradation must be considered along with mechanical degradation in
order to determine the length of time that DRPs, in particular the polysaccharides (AVP and HA)
will be effective in improving blood flow in the body. In the case of AVP, additional work to
standardize the extraction process and further characterization of the DRP composition are also
needed before clinical use can be considered. These additional studies would continue the
progress of this novel therapy for impaired microcirculation toward clinical use.
Finally, while this project provided a comparative study of DRP mechanical degradation
which could be used to determine which polymers were most mechanically stable, shear stresses
inside the pump incorporated in the turbulent flow system need to be determined in order to
quantify their effects on DRP degradation. Using computational fluid dynamics to evaluate
stresses experienced in the pump would allow for a better understanding of the mechanical
degradation of DRPs which could ultimately be used to predict degradation caused by shear
stress experienced in vivo. Investigation of the degradation of DRPs at different concentrations
would also be a useful study in evaluating the mechanical stability of DRPs.
140

APPENDIX A
PROPAGATION OF ERROR
Propagation of error is based on Equation 22 [102, 103].
22
,
22
,
22
,
2γ
βαβ
γαα
γβλ σ
γλσ
βλσ
αλσ ⎟⎟
⎠
⎞⎜⎜⎝
⎛+⎟⎟
⎠
⎞⎜⎜⎝
⎛+⎟
⎠⎞
⎜⎝⎛=
dd
dd
dd (22)
where λ is a computed quantity calculated from α, β, and γ, which are measured or previously
calculated quantities with known uncertainty, σ. The differentials in Equation 22 represent the
change in λ with change in any of the measured or previously calculated quantities.
In the case of addition, given by Equation 23
γβαλ ++= (23)
the differentials in Equation 22 are determined to be
1===γλ
βλ
αλ
dd
dd
dd (24)
Substitution of Equation 24 into Equation 22 gives the following equation for propagation of
error in the case of addition.
2222γβαλ σσσσ ++= (25)
In the case of multiplication,
141

αβγλ = , (26)
the differentials in Equation 22 are evaluated as follows.
βγαλ
=dd (27)
αγβλ
=dd (28)
αβγλ
=dd (29)
Substituting Equations 27, 28, and 29 into Equation 22, the following Equation for propagation
of error in the case of multiplication can be derived.
( ) ( ) ( ) 22222γβαλ σαβσαγσβγσ ++= (30)
Equation 30 can be simplified by dividing through by
2222 γβαλ = (31)
to give
2222 %%%% γβαλ σσσσ ++= (32)
where %σi is defined as
%100*%i
ii
σσ = (33)
In the case of multiplication of the quantities raised to some power,
cba γβαγ = (34)
the differentials in Equation 22 can be evaluated as follows.
cbaadd γβααλ 1−= (35)
cabbdd γαββλ 1−= (36)
142

abccdd αβγ
γλ 1−= (37)
Substituting Equations 35, 36, and 37 into Equation 22, the following equation for propagation
of error can be derived.
( ) ( ) ( ) 2212212212γβαλ σαβγσγαβσγβασ abccabcba cba −−− ++= (38)
The expression can be simplified by dividing through by Equation 39 to obtain Equation
40.
cba 2222 γβαλ = (39)
2222222 %%%% γβαλ σσσσ cba ++= (40)
143

APPENDIX B
FRICTION FACTOR ERROR ANALYSIS
Friction factor can be calculated using Equation 4.
2
25
8 QlPd
⋅⋅⋅⋅⋅
=ρπλ (4)
Since λ is calculated through multiplication of variables raised to some exponent, percent error
can be calculated using Equation 40.
2222222 %%%% γβαλ σσσσ cba ++= (40)
For a given flow system, the quantity ρ
π⋅⋅
⋅l
d8
25
is a constant based on geometry and fluid
properties. Therefore, the percent error for friction factor can be calculated by
2222 %)2(%% QP σσσ λ −+=
For the turbulent flow system, the flow probe accuracy is ± 2% [104]. Pressure transducer
accuracy is ± 0.25% [105]. Therefore, 4% for the turbulent flow studies. =2% λσ
Equation 40 can also be used to determine error for the friction factor in laminar flow
studies. Flow rate accuracy for the syringe pump (σQ) is ± 0.35% [106], and pressure transducer
accuracy (σP) is ± 0.25% [105]. Therefore σλ is calculated to be 0.74%.
144

BIBLIOGRAPHY
1. Kameneva, M.V., et al., Blood soluble drag-reducing polymers prevent lethality from hemorrhagic shock in acute animal experiments. Biorheology, 2004. 41: p. 53-64.
2. Faruqui, F.I., M.D. Otten, and P.I. Polimeni, Protection against atherogenesis with the polymer drag-reducing agent Separan AP-30. Circulation, 1987. 75(3): p. 627-35.
3. Golub, A.S., et al., Influence of polyethylene oxide on the capillary blood flow of diabetic rats. Soviet Physics -- Doklady, 1987. 32: p. 620-621.
4. Greene, H.L., R.A. Mostardi, and R.F. Nokes, Effect of drag reducing polymers on initiation of atherosclerosis. Polymer Engineering Science, 1980. 20: p. 499-504.
5. Grigorian, S.S., I.A. Sokolova, and A.A. Shakhnazarov, [The action of high-molecular linear polymers on the circulatory system]. Usp Fiziol Nauk, 1995. 26(2): p. 31-43.
6. Macias, C.A., et al., Survival in a rat model of lethal hemorrhagic shock is prolonged following resuscitation with a small volume of a solution containing a drag-reducing polymer derived from aloe vera. Shock, 2004. 22(2): p. 151-156.
7. McCloskey, C.A., et al., Tissue hypoxia activates JNK in the liver during hemorrhagic shock. Shock, 2004. 22(4): p. 380-6.
8. Mostardi, R.A., et al., The effect of drag reducing agents on stenotic flow disturbances in dogs. Biorheology, 1976. 13(2): p. 137-41.
9. Mostardi, R.A., et al., Suppression of atherosclerosis in rabbits using drag reducing polymers. Biorheology, 1978. 15(1): p. 1-14.
10. Pacella, J.J., et al., Effect of drag reducing polymers on myocardial perfusion during coronary stenosis. European Heart Journal, 2006. 19: p. 2362-2369.
11. Polimeni, P.I., B. Ottenbreit, and P. Coleman, Enhancement of aortic blood flow with a linear anionic macropolymer of extraordinary molecular length. J Mol Cell Cardiol, 1985. 17(7): p. 721-4.
145
12. Polimeni, P.I. and B.T. Ottenbreit, Hemodynamic effects of a poly(ethylene oxide) drag-reducing polymer, Polyox WSR N-60K, in the open-chest rat. J Cardiovasc Pharmacol, 1989. 14(3): p. 374-80.
13. Gannushkina, I.V., A.L. Antelava, and M.V. Baranchikova, Diminished experimental alimentary atherogenesis under the influence of polymers that decrease the hydrodynamic resistance of the blood. Bull. Exp. Biol. Med., 1993. 116: p. 367–370.
14. Gannushkina, I.V., et al., The possibility that after circulatory ischemia of the brain the blood circulation can be restored by introducing special polymers to the blood. Soviet Physics -- Doklady, 1981. 26(4): p. 376.
15. Toms, B.A. Some observations on the flow of linear polymer solution through straight tubes at large Reynolds numbers. in 1st Int. Congr. Rheology. 1948. Amsterdam.
16. Grigorian, S.S., M.V. Kameneva, and A.A. Shakhnazarov, Effect of high molecular weight compounds dissolved in blood on hemodynamics. Soviet Physics -- Doklady, 1976. 21(12): p. 702-703.
17. Polimeni, P.I., J. Al-Sadir, and A.F. Cutilletta, Polysaccharide for enhancement of cardiac output. 1979: United States.
18. Hoyt, J.W., Blood transfusion fluids having reduced turbulent friction properties. 1971: United States.
19. Kameneva, M.V., M.S. Polyakova, and E.V. Fedoseeva, Effect of drag-reducing polymers on the structure of the stagnant zones and eddies in models of constricted and branching blood vessels. Fluid Dyn., 1990. 25: p. 956-959.
20. Kameneva, M.V., M.S. Polyakova, and I.A. Gvozdkova, Nature of the influence of polymers that lower hydrodynamic resistance on blood circulation. Proc. Acad. Sci. USSR. Biophysics Section., 1988: p. 22-24.
21. D'Almeida, A.R. and M.L. Dias, Comparative study of shear degradation of carboxymethylcellulose and poly(ethylene oxide) in aqueous solution. Polymer Degradation and Stability, 1997. 56: p. 331-337.
22. Kenis, P.R., Turbulent Flow Friction Reduction Effectiveness and Hydrodynamic Degradation of Polysaccharides and Synthetic Polymers. Journal of Applied Polymer Science, 1971. 15: p. 607-618.
23. Kim, C.A., et al., Characterization of drag reducing guar gum in a rotating disk flow. Journal of Applied Polymer Science, 2002. 83(13): p. 2938-2944.
24. Talmadge, J., et al., Fractionation of Aloe vera L. inner gel, purification and molecular profiling of activity. International Immunopharmacology, 2004. 4: p. 1757-1773.
146

25. Williams, D.L., et al., Pre-clinical safety evaluation of soluble glucan. Int. J. Immunopharmacol, 1988. 10(4): p. 405-414.
26. Kulicke, W.M., M. Kotter, and H. Grager, Drag reduction phenomenon with special emphasis on homogeneous polymer solutions, in Advances in Polymer Science. 1989. p. 1-68.
27. Virk, P.S., Drag reducing fundamentals. AIChE Journal, 1975. 21(4): p. 625-654.
28. Kinnier, J.W., A correlation between friction reduction and molecular size for the flow of dilute aqueous polyethyleneoxide solutions in pipes. 1970, U.S. Naval Postgraduate School.
29. Keller, A., G. Kiss, and M.R. Mackley, Polymer drag reduction in Taylor vortices. Nature, 1975. 257: p. 304-305.
30. Driels, M.R. and S. Ayyash, Drag reduction in laminar flow. Nature, 1976. 259: p. 389-390.
31. Kenis, P.R., Drag Reduction by Bacterial Metabolites. Nature, 1968. 217: p. 940-942.
32. Shenoy, A.V., A reveiw on drag reduction with special reference to micellar systems. Colloid Polym. Sci., 1984. 262: p. 319-337.
33. Rosen, M. and N. Cornford, Fluid Friction of Fish Slimes. Nature, 1971. 234: p. 49-51.
34. Kameneva, M.V., et al., Artificial blood fluids and microflow drag reducing factors for enhanced blood circulation 2002: United States.
35. Fabula, A.G., J.L. Lumley, and W.D. Taylor, Some interpretations of the Toms effect, in Mechanics of Continua, S. Eskanaiz, Editor. 1966, Academic Press: New York. p. 100-120.
36. Hoyt, J.W., The effect of additives on fluid friction. Trans ASME, J Basic Eng, 1972. 94: p. 258-285.
37. Burger, E.D., L.G. Chorn, and T.K. Perkins, Studies of drag reduction conducted over a broad range of pipeline conditions when flowing Prudhoe Bay crude oil. J Rheol, 1980. 24: p. 603.
38. Grigorian, S.S. and M.V. Kameneva, Resistance-reducing polymers in the blood circulation, in Contemporary Problems of Biomechanics, G.G. Chernyi and S.A. Regirer, Editors. 1990, Mir Publ., CRC Press: Moscow, Boca Raton, FL. p. 99-110.
39. Marhefka, J.N., et al., Poly(N-vinylformamide)-A drag-reducing polymer for biomedical applications. Biomacromolecules, 2006. 7(5): p. 1597-603.
147

40. National Vital Statistics Reports, in National Vital Statistics Reports. 2002, Department of Health and Human Services: Hyattsville, MD.
41. Fahraeus, R. and T. Lindquist, The viscosity of blood in narrow capillary tubes. Am. J. Physiol, 1931. 96: p. 562-568.
42. Tsai, A.G. and M. Intaglietta, High viscosity plasma expanders: Volume resuscitation fluids for lowering the transfusion trigger. Biorheology, 2001. 2001(38): p. 229-237.
43. Brostow, W., Drag reduction and mechanical degradation in polymer solutions in flow. Polymer, 1983. 24: p. 631-638.
44. Choi, H.J., et al., An exponential decay function for polymer degradation in turbulent drag reduction. Polymer Degradation and Stability, 2000. 69: p. 341-346.
45. Fisher, D.H. and F. Rodriguez, Degradation of Drag Reducing Polymers. Journal of Applied Polymer Science, 1971. 15: p. 2975-2985.
46. Hunston, D.L. and J.L. Zakin, Flow-assisted degradation in dilute polystyrene solutions. Polymer Engineering and Science, 1980. 20(7): p. 517-523.
47. Kim, C.A., et al., Drag reduction and mechanical degradation of poly(ethylene oxide) in seawater. Journal of Chemical Engineering of Japan, 1999. 32(6): p. 803-811.
48. Lee, K., et al., Mechanical degradation of polyisobutylene under turbulent flow. Colloid Polym. Sci., 2002. 280: p. 779-782.
49. Liberatore, M.W., et al., Turbulent drag reduction of polyacrylamide solutions: Effect of degradation on molecular weight distribution. J Non-Newtonian Fluids, 2004. 123: p. 175-183.
50. Sung, J.H., et al., Turbulent drag reduction efficiency and mechanical degradation of poly(acrylamide). Journal of Macromolecular Science, 2004. B43(2): p. 507-518.
51. Vlachogiannis, M., et al., Effectiveness of a drag reducing polymer: Relation to molecular weight distribution. Physics of Fluids, 2003. 15(12): p. 3786-3794.
52. Sellin, R.H.J., J.W. Hoyt, and O. Scrivener, The effect of drag-reducing additives on fluid flows and their industrial applications part 1: Basic aspects. Journal of Hydraulic Research, 1982. 20(1): p. 29-68.
53. Nokes, R.F., et al. Biological fate of friction reducing agents. in ACEMB. 1972.
54. Groisman, A.S., V., Efficient mixing at low Reynolds numbers using polymer additives. Nature, 2001. 410(6831): p. 905-908.
55. Fahraeus, R., The suspension stability of the blood. Physiol. Rev., 1929. IX: p. 241-275.
148
56. Goldsmith, H.L., G.R. Cokelet, and P. Gaehtgens, Robin Fahraeus: Evolution of his concepts in cardiovascular physiology. Am. J. Physiol, 1989. 257: p. H1005-H1015.
57. Fenton, B.M., R.H. Carr, and G.R. Cokelet, Non-uniform red cell distribution in 20 - 100 µm bifurcations. Microvascular Research, 1985. 29: p. 103-126.
58. Wu, Z.J., et al., Modification of flow behavior of red blood cells by blood soluble drag-reducing polymers, in International Congress on Biological and Medical Engineering. 2002: Mandarin, Singapore.
59. Guyton, A.C. and J.E. Hall, Textbook of medical physiology. 9th ed. 1996, Philadelphia: W.B. Saunders. xliii, 1148.
60. Chow, J.T., et al., Chemical characterization of the immunomodulating polysaccharide of Aloe vera L., in The International Aloe Science Council, Inc., 23rd Annual Scientific Seminar 2004: Seoul, Korea.
61. Gowda, D.C., B. Neelisiddaiah, and Y.V. Anijaneyalu, Structural Studies of Polysaccharides from Aloe Vera. Carbohydrate Research, 1979. 72: p. 201-205.
62. Marhefka, J.N., et al., Further development of a drag-reducing component for artificial blood. ASAIO Journal, 2004. 50(2): p. 170.
63. Ni, Y., et al., Isolation and characterization of structural components of Aloe vera L. leaf pulp. International Immunopharmacology, 2004. 4: p. 1745-1755.
64. Eshun, K. and Q. He, Aloe vera: A valuable ingredient for the food, pharmaceutical, and cosmetic industries -- A review. Critical Reviews in Food Science and Nutrition, 2004. 44(2): p. 91-96.
65. Pinschmidt, R.K., et al., N-vinylformamide -- Building block for novel polymer structures. J.M.S. -- Pure Appl. Chem., 1997. A34(10): p. 1885-1905.
66. Gu, L., et al., Kinetics and modeling of free radical polymerization of N-vinylformamide. Polymer, 2001. 42: p. 3077-3086.
67. Badesso, R.J., R.K. Pinschmidt, and D.J. Sagi, Synthesis of amine functional homopolymers with n-ethenylformamide. Proc Am Chem Soc, Div Polymer Mat Sci Eng, 1993. 69: p. 251-252.
68. Badesso, R.J., et al., High and Medium Molecuar Weight Poly(Vinylamine). Polymer Preprints, 1991. 32: p. 110-111.
69. McAndrew, T.P., Drag reduction with amine functional polymers. 1993, Air Products and Chemicals, Inc.: United States.
149
70. Kakehi, K., M. Kinoshita, and S. Yasueda, Hyaluronic acid: separation and biological implications. Journal of Chromatography B: Analytical Technologies in the Biomedical & Life Sciences, 2003. 797(1-2): p. 347-55.
71. Hyaluronan...Utilizing nature to improve life. 2004 [cited 2005; Available from: http://www.lifecore.com/Products/Resource_Files/Pdf/Hyaluronan.pdf.
72. Hoyt, J.W., Symposium on Rheology, in ASME. 1965: New York.
73. Hamburger, M.I., et al., Intra-articular hyaluronans: A review of product-specific safety profiles. Seminars in Arthritis and Rheumatism, 2003. 32(5): p. 296-309.
74. White, F.M., Fluid mechanics. 4th ed. McGraw-Hill series in mechanical engineering. 1999, Boston, Mass.: WCB/McGraw-Hill. xiv, 826.
75. Stevens, M.P., Polymer chemistry : an introduction. 2nd ed. 1990, New York: Oxford University Press. xviii, 633.
76. Riande, E., et al., Polymer Viscoelasticity. 200, New York: Marcel Dekker, Inc.
77. Caro, C., et al., The mechanics of the circulation. 1978: Oxford University Press.
78. Klaus, S., et al., Investigation of flow and material induced hemolysis with a Couette type high shear system. Mat.-wiss. u. Werkstofftech, 2001. 32: p. 922-925.
79. Marhefka, J.N., P.J. Marascalco, and M.V. Kameneva, Studies on the mechanism of the intravascular effect of drag-reducing polymers, in BMES. 2004: Philadelphia, PA.
80. Stein, P.D. and H.N. Sabbah, Hemorheology of turbulence. Biorheology, 1980. 17(4): p. 301-319.
81. Pohl, M., et al., Mechanical degradation of polyacrylamide solutions as a model for flow induced blood damage in artificial organs. Biorheology, 2000. 37(4): p. 313-324.
82. Kameneva, M.V., et al., Effects of turbulent stresses upon mechanical hemolysis: experimental and computational analysis. ASAIO Journal, 2004. 50(5): p. 418-23.
83. McDonald, J.C., et al., Fabrication of microfluidic systems in poly(dimethylsiloxane). Elecrophoresis, 2000. 21: p. 27-40.
84. Boyle, J., Microcirculatory hematocrit and blood flow. J. Theor Biol. , 1988. 131(2): p. 223-229.
85. Whitmore, R.L., Rheology of the circulation. 1st ed. 1968, Oxford, New York,: Pergamon Press. xii, 196.
86. Popel, A.S. and P.C. Johnson, Microcirculation and Hemorheology. Annual Review of Fluid Mechanics, 2005. 37: p. 43-69.
150
87. Bonn, D., et al., Turbulent drag reduction by polymers. Journal of Physics: Condensed Matter, 2005. 17: p. S1195-S1202.
88. Carr, R.H. and L.L. Wickham, Influence of Vessel Diameter on Red Cell Distribution at Microvascular Bifurcations. Microvascular Research, 1991. 41(41): p. 184-196.
89. Haynes, R.H., Physical basis of the dependence of blood viscosity on tube radius. Am. J. Physiol, 1960. 198: p. 1193-1200.
90. Jordan, A., et al., The effects of margination and red cell augmented platelet diffusivity on platelet adhesion in complex flow. Biorheology, 2004. 41(5): p. 641-53.
91. Karino, T. and H.L. Goldsmith, Aggregation of Human Platelets in an Annular Vortex. Microvascular Research, 1979. 17: p. 217-237.
92. Karino, T. and H.L. Goldsmith, Adhesion of human platelets to collagen on the walls distal to a tubular expansion. Microvascular Research, 1979. 17(3 Pt 1): p. 238-62.
93. McCollister, D.D., F. Oyen, and V.K. Rowe, Toxicology of acrylamide. Toxicology and Applied Pharmacology 1963. 6(2): p. 172-181.
94. Dourembos, N.J., et al., Cultivation, extraction and analysis of Cannabis sativa L. Ann NY Acad of Sci, 1971: p. 3-14.
95. Turner, C.E., et al., Evaluation and comparison of commercially available Aloe vera L. products using size exclusion chromatograpy with refractive index and multi-angle laser light scattering detection. International Immunopharmacology, 2004. 4: p. 1727-1737.
96. Ebling, W., et al., Proteinase K from Tritirachium album Limber. Eur. J. Biochem, 1974. 47: p. 91-97.
97. Voet, D., J.G. Voet, and C.W. Pratt, Fundamentals of biochemistry. 1999, New York: Wiley. xxiii, 931.
98. Paterson, R.W. and F.H. Abernathy, Turbulent flow drag reduction and degradation with dilute polymer solutions. Journal of Fluid Mechanics, 1970. 43: p. 698-710.
99. Kishbaugh, A.J. and A.J. Mchugh, A Note on the Sensitivity of Birefringence to Polymer-Solution Degradation. Journal of Rheology, 1992. 36(6): p. 1213-1222.
100. Fraser, J.R.E., T.C. Laurent, and U.B.G. Laurent, Hyaluronan: its nature, distribution, functions, and turnover. Journal of Internal Medicine, 1997. 242(1): p. 27-33.
101. Cokelet, G.R., Rheology and hemodynamics. Annual Review of Physiology, 1980. 42: p. 311-24.
102. Taylor, J.R., An introduction to error analysis : the study of uncertainties in physical measurements. 1982, Mill Valley, Calif.: University Science Books. x, 270.
151

103. Brant, A.M., Hemodynamics and mass transfer aspects of arterial disease. 1986. p. xix, 247 leaves.
104. Transonic Systems, Inc. [cited 2007 2/5]; Available from: http://www.transonic.com/Research_Home/Products__Laboratory_Research/p._16-17_probe_specs.pdf.
105. Model 1502B01EZ5V20GPSI Thin Film Pressure Transducer / Transmitter Installation and Operating Manual. PCB Piezotronics [cited 2007 2/5]; Available from: http://www.pcb.com/contentstore/docs/PCB_Corporate/Pressure/products/Manuals/1502B01EZ5V20GPSI.pdf.
106. Harvard Apparatus. [cited 2007 2/5]; Available from: http://www.harvardapparatus.com/webapp/wcs/stores/servlet/product_11051_10001_44006_-1_HAI_ProductDetail_37314____.
152