Ultrafiltration of aqueous solutions containing organic polymers
Upload
khangminh22Category
view
1download
0

Adhesion ofPolymers
Roman A. VeselovskyVladimir N. Kestelman
McGraw-HillNew York Chicago San Francisco Lisbon London Madrid
Mexico City Milan New Delhi San Juan SeoulSingapore Sydney Toronto

Library of Congress Cataloging-in-Publication Data
Veselovsky, Roman A.Adhesion of polymers / Roman A. Veselovsky, Vladimir N. Kestelman
p. cm.Includes index.ISBN 0-07-137045-5
1. Adhesives. 2. Polymers. I. Kestelman, Vladimir N. II. Title.TP968.K42 2001 2001026703668 03—dc21
Copyright # 2002 by The McGraw-Hill Companies, Inc. All rights reserved.Printed in the United States of America. Except as permitted under the UnitedStates Copyright Act of 1976, no part of this publication may be reproduced ordistributed in any form or by any means, or stored in a data base or retrievalsystem, without the prior written permission of the publisher.
1 2 3 4 5 6 7 8 9 0 DOC/DOC 0 8 7 6 5 4 3 2 1
ISBN 0-07-137045-5
The sponsoring editor for this book was Kenneth P. McCombs, theediting superviser was David E. Fogarty, and the productionsupervisor was Pamela A. Pelton. It was set in Century Schoolbook byKeyword Publishing Services Ltd.
Printed and bound by R. R. Donnelly & Sons Company.
This book was printed on recycled, acid-free paper containinga minimum of 50% recycled, de-inked fiber.
McGraw-Hill books are available at special quantity discounts to use aspremiums and sales promotions, or for use in corporate training programs. Formore information, please write to the Director of Special Sales, ProfessionalPublishing, McGraw-Hill, Two Penn Plaza, New York, NY 10121-2298. Orcontact your local bookstore.
Information contained in this work has been obtained by The McGraw-Hill Companies, Inc.(‘‘McGraw-Hill’’) from sources believed to be reliable. However, neither McGraw-Hill nor itsauthors guarantee the accuracy or completeness of any information published herein, andneither McGraw-Hill nor its authors shall be responsible for any errors, omissions, or damagesarising out of use of this information. This work is published with the understanding thatMcGraw-Hill and its authors are supplying information but are not attempting to renderengineering or other professional services. If such services are required, the assistance of anappropriate professional should be sought.

About the Authors
ROMAN A. VESELOVSKY, D.SC., is a polymers expert at the Institute ofMacromolecular Chemistry of the National Academy of Sciences ofthe Ukraine, Academician of the Ukrainian Technological Academy,and a member of the International Scientific Board ‘‘Swissbonding,’’based in Switzerland. He has published 6 books and 220 journalarticles and holds 120 patents, all related to materials science.
VLADIMIR KESTELMAN, D.SC., is an internationally respected expert onthe mechanics and technology of composite materials and is presidentof KVN International, a worldwide consulting firm. An Academician ofthe Ukrainian Technological Academy, he is a former professor atMoscow Aviation Institute and the author of ElectrophysicalPhenomena in the Tribology of Polymers, Electrets in Engineering:Fundamentals and Applications, and other books. He has published26 books and 520 journal articles and holds 75 patents.
397

Contents
Preface ix
Chapter 1. The Process of Adhesive-Bonded Joint Formation 1
Chapter 2. Adhesive Properties Control by Surface-Active Substances 22
2.1 Alteration of Properties of Polymeric Composites under the Influence ofSurface-Active Substances 22
2.2 Colloid-Chemical Properties of Surfactants in Heterochain Oligomers 25
2.3 Surface Tension of Heterochain Oligomers with Surfactant Additives 33
2.4 Surface Tension of Curing Oligomers 38
2.5 Effect of Surface-Active Substances on the Thermodynamic and Physical-Chemical Properties of Solid Polymers 45
2.6 Oligomer–Metal Interphase Tension 60
2.7 Control of Polymer Adhesion Strength by Means of Surfactant 67
2.8 Influence of Surfactants on the Structure of Polymers 742.8.1 Influence of Surfactants on the Structure of Polyurethanes 742.8.2 Influence of Surfactants on the Structure of Polyepoxides 812.8.3 Influence of Surfactants on Curing Processes and Structure of
Unsaturated Polyesters 89
Chapter 3. Properties of Adhesives Based on Polymeric Mixtures 98
3.1 General 98
3.2 Adhesives Based on Interpenetrating Polymer Networks 1023.2.1 Properties of Sprut-5M Adhesive-Based Reinforced Coatings 109
3.3 Adhesives Based on Thermodynamically Incompatible PolymericMixtures 1123.3.1 Adhesives Based on Acrylic Polymer Mixtures 1123.3.2 Controlling the Properties of Adhesives Based on Epoxy Rubber
Polymeric Mixtures 1283.3.3 Modification of EP-20 Epoxy-Diane Resin by Epoxided
Polypropylene Glycol (Laproxides 503M and 703) 1603.3.4 Influence of Surfactants on Structure and Properties of
Polyurethanes Based on Oligomer Mixtures 1643.4 Organo-Mineral Composites 202
v

3.4.1 Consumption of Polyisocyanate Isocyanate Groups in OMCFormation Processes 203
3.4.2 Influence of ‘‘Silica Modulus’’ on OMC End Product Composition 2053.4.3 The Role of MGF-9 Oligoetheracrylate in the OMC Formation
Process 2093.4.4 Influence of Hydroxyl Anion on the Processes Occurring in the
inorganic Component During OMC Formation 2153.4.5 Strength Characteristics of Organo-Mineral Composites 217
Chapter 4. Internal Stresses in Adhesive-Bonded Joints and Ways ofDecreasing Them 227
4.1 Effects of Internal Stresses on Properties of Adhesive-Bonded Joints 227
4.2 Determination of Internal Stresses in Adhesive-Bonded Joints 2294.2.1 Thermal Stresses in Adhesive-Bonded Joints 2304.2.2 Shrinkage Internal Stresses in Adhesive-Bonded Joints 2374.2.3 Calculation of Internal Stresses by the Lattice Cell Method 2444.2.4 Edge Internal Stresses in Adhesive-Bonded Joints 251
4.3 Method of Decreasing Internal Stresses in Adhesive-BondedJoints 252
4.3.1 Effect of Surfactant on Internal Stresses in Adhesive-BondedJoints 254
4.3.2 Controlling Internal Stresses in Adhesive-Bonded Joints by TakingAccount of the Separation in Time of the Formation of Linear andCrosslinked Polymers 256
4.3.3 Decrease of Internal Stresses in Adhesive-Bonded Joints UsingAdhesives Based on Interpenetrating Networks 259
4.3.4 Methods of Decreasing Edge Internal Stresses in Adhesive-BondedJoints 260
Chapter 5. Cementing and Operation of Adhesive-Bonded Joints inLiquid Media 263
5.1 Cementing in Liquid Media 263
5.2 Effect of Liquids on the Properties of Adhesive-Bonded Joints 267
Chapter 6. Adhesion and Molecular Mobility of Filled Polymers 278
6.1 Control of Polymer-to-Solid Surface Adhesive Bond Strength byAddition of Fillers 278
6.2 Influence of the Molecular Size of the Filler Surface Modifier on theStrength of Adhesive Bonds with Solid Substrates and the MolecularMobility of the Filled Polyurethane 283
6.3 Molecular Mobility in Filled Polyurethanes and Their AdhesionProperties at Different Filler Concentrations 285
6.4 Influence of Aerosil Modification on the Aggregation of Particles inOligomer Medium 289
6.5 Structure of the Filled Polyurethane Interphase Layer at the MetalSubstrate Boundary 293
vi Contents

Chapter 7. Criteria of Adhesive Joint Strength 298
7.1 Adhesive Joint Strength under Combined Action of Various Stresses 298
7.2 Analysis of Strength Criteria as Applied to Adhesive Joints 308
7.3 Applicability of the Limited Stressed States Theories for MaterialsUnequally Resistant to Tension and Compression 315
7.4 Analysis of Design and Experimental Diagrams of the Limiting StressedState 319
Chapter 8. Control of Polymer Properties for Impregnation of PorousMaterials 331
8.1 Introduction 331
8.2 Physical-Chemical Aspects of the Impregnation of Porous Materials 333
8.2.1 Adhesion of the Composition to Impregnated Materials 3338.2.2 Selective Adsorption of Components of the Composition 3338.2.3 Impregnation of Wet Materials 336
8.3 One-Component Organic Compositions for Impregnation of PorousMaterials 337
8.4 Influence of Impregnation on Material Properties 338
Chapter 9. Practical Applications of Polymer Adhesion Studies 342
9.1 Adhesives for In-situ Maintenance and Repair Work 343
9.1.1 Ship Repairs 3439.1.2 Damage Control in the Oil and Gas Industry 3459.1.3 Reconstruction of Structural Units and Buildings 356
9.2 Manufacture of Pressware from Cellulose-Containing Materials 363
9.3 Adhesive for Fixing Organic Soft Tissues: KL-3 3649.3.1 Biodegradation of KL-3 Polyurethane Adhesive 3649.3.2 Use of KL-3 in Experimental and Clinical Surgery 366
9.4 Cyanoacrylate Adhesive 370
9.5 Use of Polymer Compositions for Nuclear Energy Applications 370
9.6 Quality Enhancement for Articles Made of Porous Materials 371
9.7 Brick and Concrete Paints 371
9.8 Manufacture of Floors 373
9.9 Manufacture of Heat Insulation Panels 373
9.10 Strengthening and Sealing of Rocks 374
References 377
Index 389
Contents vii

Preface
The development of contemporary technology and industry is closelyrelated to the creation of new polymeric materials, among which adhe-sives are playing an increasing role. Their production is beingincreased at higher rates than that of other polymeric materials.Adhesives find wide application in novel fields of technology. Suchenhanced interest in adhesives can be attributed to several factors:
1. Modern technology involves new types of materials that cannot bejoined by means of traditional mechanical methods such as welds,rivets, screws, and bolts. These materials include different types ofceramics, glass ceramics, alloys, composites, etc.
2. Newly developed adhesives characterized by strength, heat resis-tance, and noncombustibility better meet the requirements of thetechnology.
3. Adhesion is frequently the most effective way of joining very differ-ent materials in ways that can be achieved using relatively simpleequipment. The range of materials that can be cemented is practi-cally unlimited.
4. Application of adhesives results in valuable properties of the articleproduced, such as improved strength, waterproofness, resistance tovibration, and decreased weight.
The problem of improving adhesion strength is paramount not onlyfor adhesive-bonded joints. Filled and reinforced polymers are of pri-mary significance among new polymeric materials. These includeglass-reinforced plastics, laminated plastics, coatings, woodchipboards, and compounded and reinforced rubbers. The properties ofthese materials are determined mainly by interaction of the polymerwith the filling and reinforcing materials.
At present, there are many hypotheses in the theory of adhesivephenomena but they cannot be practically applied for developing
ix

x Preface
new adhesives insofar as these hypotheses mostly explain differentphenomena that occur in the course of cementing and fracture ofadhesive-bonded joints. This is essentially related to the fact thatthe process of formation of an adhesive-bonded joint is a complexset of closely interrelated phenomena. It is necessary to clearly differ-entiate two concepts—adhesion and adhesion strength. Generally,adhesion strength, defined as the adhesion work determined by theexperimental data on mechanical failure of the adhesive-bonded joint,differs considerably from the adhesion work determined by means ofthe thermodynamic equations or by the interaction energy betweensurface layers of atoms of the adhesive and the substrate. One of thereasons for such incongruence is the fact that the formation of theadhesive-bonded joint involves a great number of factors, which inthe course of loading of the joint facilitate its premature failure.Among these factors must be included the formation of weak layersof different types between the adhesive and the substrate, and of theinternal stresses in the adhesive layer.
All of this complicates the study of adhesion phenomena, hindersthe scientific approach to the problem of controlling the adhesiveproperties, and is one of the reasons why, despite the great scientificand practical importance of research on creation of new, efficient adhe-sive compounds, progress in this field has been achieved mainlyempirically.
This book generalizes the results of studies performed in theDepartment of Adhesion and Adhesives of the Institute ofMacromolecular Chemistry of the Ukrainian National Academy ofSciences. It considers some regularities of the formation of adhesive-bonded joints, presents thermodynamic and physical-chemical sub-stantiation of new principles of controlling the adhesion strengthand other important properties of polymeric adhesives, and describesapplication of these principles in the course of developing adhesives forvarious fields of engineering and medicine.
One of the basic principles of controlling the properties of adhesivesconsidered here is inclusion of surface-active substances (surfactants)capable of chemical interaction with the adhesive components andentering into the adhesives’ composition. Such reactive surface-active(RS) substances differ radically from chemically indifferent surface-active (IS) substances. In the course of polymerization of oligomerscontaining IS substances there is a decrease of the critical concentra-tion for micelle formation (CCMF) and formation of substantial quan-tities of large micelles of surfactant, which results in weak layers onthe boundary between the adhesive and substrate and in decrease ofthe adhesion strength.

RS substances react chemically with molecules of the polymerizingoligomers to form macromolecules that contain both oligomers and thesurface-active substance, which permits the decrease of CCMF andbreakdown of RS micelles without damage to the adsorption layer onthe substrate surface. Thus, application of RS substances provides forcontrolling the properties of the polymer boundary layers withoutinitiating deleterious side effects. Use of RS substances allows anincrease in the adhesion strength and water resistance of adhesive-bonded joints, making adhesives capable of cementing metals andother materials in water and petroleum products.
Of great interest is the application as adhesive compounds of poly-meric blends, such as thermodynamically incompatible polymers oneof which has a high modulus of elasticity and the other a low modulus.When the adhesive cures, the second polymer is liberated as a sepa-rate finely dispersed phase. Such separation of the blend into high-and low-modulus phases provides for controlling the relaxation prop-erties of the adhesive while maintaining its high strength.
A special type of polymeric blends is interpenetrating networks(IPN), which represent a system formed in the course of building upone crosslinked polymer inside the ready-made network-matrix ofanother under conditions of no chemical reaction between the net-works. Such IPN-based adhesive compounds are noted for consider-able long-term strength, which is explained by features of thedeformation processes that occur in the IPN layer when it is loaded.
The application of these principles of increasing the adhesionstrength and of controlling other properties of adhesives provides fordevelopment of polymeric compounds with a number of valuable fea-tures: for example, structural adhesives with high short-term andlong-term strength even when cementing untreated surfaces in var-ious liquids; sealing adhesives that combine high adhesion strengthand elasticity of the adhesive layer; foaming adhesives; medical-pur-pose adhesives capable of bonding biological tissues in an environmentof tissue fluids, of being infiltrated by living tissues, and of beingexcreted from the organism at prescribed times; photopolymeric com-pounds; binders for forming glass-reinforced plastics in liquids; andothers. Compounds can be cured both at high and at subzero tempera-tures; their adhesion strength is of low dependence on air humidity orpressure during cementing, on adhesive layer thickness, or on treat-ment of the surfaces to be bonded. These stipulations for high effi-ciency of adhesive compounds permit their application in fields ofengineering where adhesives have not so far been used, for example,when repairing underwater oil and gas pipelines, oil tanks, ships onthe high seas, and so on.
Preface xi
Chapter
1The Process of Adhesive-Bonded
Joint Formation
The strength and serviceability of adhesive-bonded joints are mainlythe result of the play of forces of intermolecular interaction betweenthe adhesive and the substrate. The forces of interaction between twocondensed bodies at distances on the atom size scale can produce highadhesion strength [1, 2]. For example, calculations performed byJoraelachvili and Tabor [3] showed that when cementing materialswith high surface energy the adhesion strength must be 170.0 MPa.With a gap between the contacting surfaces of 4 � 10�10 m [4] the forceof interaction between them is 115.3 MPa for a Teflon–polyamidecouple, 113.9 MPa for a polyamide–polyamide couple, 434.0 MPa fora Teflon–metal couple, and 569.0 MPa for a polyamide–metal couple.The values presented substantially exceed the usual adhesion andcohesion strengths determined for polymers, although only dispersionforces between contacting surfaces were taken into account in thecalculations. Taking high values of the interaction forces into account,some researchers consider that failure of adhesive-bonded joints mustalways be of the cohesion type [5].
The reason for the lack of concordance between the theoretically andexperimentally determined values of the adhesion strength lies in thefact that the process of achieving high adhesion strength is hinderedby a number of phenomena that accompany the formation of adhesive-bonded joints. These factors that decrease the strength of adhesive-bonded joints can be divided into two groups:
1. Weak layers on the boundary between the adhesive and the sub-strate.
1

2. Internal stresses of the adhesive-bonded joint.
Weak layers on the substrate surface are formed in the case ofincomplete wetting by the adhesive as well as when there are foreignimpurities on that surface. These impurities may come from the atmo-sphere, the substrate, and/or the adhesive. A solid surface is alwayscontaminated with ‘‘foreign’’ substances. There are no strict quantita-tive criteria of surface cleanness: the surface is considered to be cleanwithin a permissible amount of contamination [6]. Gases, vapors, andvarious greaselike substances are adsorbed onto the substrate surfacefrom the atmosphere [7]. The surface of a metal is almost alwayscoated with an oxide film. The first stage of interaction between themetal surface and the gas is the formation of a gas monolayer on thesurface; the sorption rate is so high that at room temperature it cannotbe measured [8]. At high cohesion strength and with good adhesion tothe metal, the oxide film does not produce any considerable effect uponthe adhesion strength, while in the case of poor adhesion to the metalit will influence the adhesion strength of an adhesive-bonded joint.
Adsorption or the presence of oxide layers on the substrate surfacecan be demonstrated by the fact that surfaces of metals are consider-ably reactive only at the moment of formation of the above layers andcan initiate polymerization reactions and start chemosorption interac-tion with polymers.
One of the sources of dirtiness of the substrate surface is low-mole-cular weight substances in the substrate itself that gradually diffuseto the surface and accumulate there. In the case of polymers, suchsubstances might be plasticizers, softeners, stabilizers, residual mono-mer, or various additives.
Low-molecular weight impurities in the adhesive can markedlydecrease its adhesiveness. Fractional precipitation of polyethyleneresults in removal of low-molecular weight impurities, which thereforesignificantly increases its adhesion to various materials [9, 10]. In apolymeric system that contains plasticizer, it is adsorbed mainly bythe surface of the solid body and, in the course of time, the concentra-tion of the plasticizer at the boundary increases up to an equilibrium.Low-molecular weight fractions in the epoxy resin are characterizedby high absorptivity. Their presence results in considerable decreaseof adhesion strength of the bonding. Removal of these fractions fromthe resin by means of multiple adsorption operations (from 76% solu-tion in toluene in SiO2) results in 20% increase of the adhesionstrength.
The adsorption of impurities in the composition of an adhesive ontothe substrate surface can be judged by the change of the system inter-phase tension. To study the interphase tension on the boundary
2 Chapter One

between oligomers and metal, a model system was used with purifiedand distilled mercury as the metal. The interphase tension was deter-mined using the sessile drop method [11] by measuring the para-meters of a mercury drop in a transparent adhesive with apolarographic system. Removal of low-molecular weight fractionsfrom ED-20 resin resulted in increase of the interphase tension (Fig.1.1). The epoxy resin was purified by vacuum distillation and the basicproduct was collected at boiling point of 2328C (1 Pa) and containedabout 25% epoxy groups. Figure 1.1 shows that the unpurified ED-20resin has minimum value of the equilibrium interphase tension, whilethe purified resin has the maximum value. Addition of alcohol to theunpurified resin results in some increase of the interphase tension.
With purified resin, alcohol decreases the interphase tension, withthe exception of OP-10 (allyl phenol oxyethylated ester) for which itproduces some increase (by 1 mN/m) [12]. These findings can beexplained by the fact that the alcohol facilitates desorption of thelow-molecular weight resin fractions with surface-active propertiesfrom the boundary between the resin and the mercury by increasingtheir compatibility with the bulk resin. The free energy advantage foralcohol adsorption on the mercury surface is less than that for low-molecular weight fractions, which is why it results in increase of theinterphase tension.
The Process of Adhesive-Bonded Joint Formation 3
Figure 1.1 Change over time of interphase tension at the interface ofmercury and ED-20 epoxy resin with different additives: (1) undistilledED-20 without additives; distilled ED-20 with (2) 1% ethanol, (3) 1%butanol, (4) 1% hexane, (5) 1% octane, (6) 1% decane; (7) distilled ED-20without additives.

Table 1.1 presents information on the effect of additives upon theadhesion strength of an adhesive based on ED-20 resin cured by poly-ethylene polyamine (PEPA). It is evident that the lowest adhesionstrength is exhibited by the adhesive based on the unpurified resin.The sorption of low-molecular weight fractions of an epoxy resin fromthe interphase boundary caused by addition of alcohols to this adhe-sive, i.e. resin purification, results in increase of the adhesionstrength. Adding further alcohol to a purified resin results in forma-tion of a weak layer on the interphase boundary, producing somedecrease of the adhesion strength.
In the course of formation of polymers, some monomer remains inthe cured adhesive. This monomer can diffuse to the boundary, plas-ticizing faulty surface layers of the polymer and adsorbing on thesubstrate surface [13]. Monomer at the boundary between the adhe-sive and the substrate inevitably decreases the adhesion strength. Forexample, by electron microscopy one can observe single crystals ofcaprolactam on the surface of PC-4 polycaprolactam [14]. Removal ofthe polymer surface layer usually results in noticeable increase of theadhesion strength in the course of bonding [15].
For many types of adhesives the adhesion strength depends on thetype and quantity of catalyst(s) used to cure the adhesive and of poly-merization initiators. This can be understood as being due to differentextents of cure of the adhesive on the interphase boundary. One studyinvestigated the effect of the residual methyl methacrylate (MMA)present in the adhesive layer upon the internal stresses and adhesionproperties of adhesives based on a 40% solution of polybutylmethacry-late (PBMA) in MMA or in butylmethacrylate (BMA). The adhesiveswere cured at room temperature with initiating systems such as ben-zoyl peroxide (BPO)–dimethylaniline (DMA), methyl ethyl ketone per-oxide (MEKP)–DMA, and n-toluenesulfonic acid–DMA. The quantityof BPO, MEKP and n-toluenesulfonic acid was varied from 0.5% to 2%;in all cases the quantity of DMA was equal to 1%. The quantity ofunreacted monomer in the adhesive interlayer was determined by apolarographic method using a P-60 polarograph with dropping mer-
4 Chapter One
TABLE 1.1 Effect of Addition of Alcohol on Adhesion Strength of Epoxy Adhesive
Adhesive Alcohol Adhesion strength (MPa)
Unpurified resin: ED-20þPEPA No alcohol 18Ethanol 23.6Decanol 20.6
Purified resin: ED-20þPEPA No alcohol 25.4Ethanol 23.6Decanol 21.0

cury cathode and bottom mercury as anode. The polarograms wererecorded against 0.2 mol/l of tetrabutylammonium iodide in dimethyl-formamide (DMFA).
The concentration X of the residual monomer was determined from
X ¼ hcw
h1 þ ðh1 � hÞV ð1:1Þ
where h1 is the total height of the polarographic wave after adding thestandard solution; h is the height of the wave that corresponds to theconcentration X; V and c are the volumes of the studied and standardsolutions; and w is the concentration of the standard solution. (Hereand hereafter, the weight fraction of substances is given in percent.)
A layer of the adhesive was dissolved in DMF immediately afterfailure of the adhesive-bonded joint.
Figure 1.2 shows the dependence of internal stresses and the adhe-sion strength of the specimens on content of the residual monomer.The quantity and type of the initiator affect the adhesion strength inthe same way as the polymerization reaction. No change of the cohe-sion strength of the polymers was observed with variation of the con-tent of monomer within the range examined.
With vacuum treatment of the specimens (at 2008C, 103 Pa) for 10days, the content of the monomer in the adhesive layer decreased andthe adhesion strength increased. The character of adhesion failure ofthe joint changed to cohesive type. The data allow a more completeexplanation of the so-called latent period—the period of achieving themaximum adhesion strength. It is evident that the strengthening ofsome adhesive-bonded joints in the course of time is caused by volati-
The Process of Adhesive-Bonded Joint Formation 5
Figure 1.2 Effect of residual MMA on the strength �str of adhe-sive-bonded joints (1) before and (2) after vacuum treatment and(3) on the internal stresses �is in the adhesive layer.

lization or by more complete bonding, the monomer being capable ofmigration to the substrate surface in the adhesive layer. Additionalheterogeneity at the boundary between the adhesive and the substratemay result from the influence of the substrate surface on the chemicalreactions in the adhesive. Selective adsorption of different componentsof the adhesive by the substrate surface results in a change in theconditions of the reaction insofar as it causes a different distributionof components of the cured system within the boundary layer. As aresult, not only the kinetic but also the chemical conditions of thereaction change with violation of the stoichiometry of the process. Letus consider the effect of substrates of various surface energy upon theprocess of formation of the boundary layer of an epoxy polymer [16].ED-20 epoxy resin cured by PEPA was used for the study. Reversed-phase gas chromatography was used to study the properties of thepolymer boundary layers, using an LKhM-72 chromatograph with airthermostat and flame ionization detection. Hydrophobicized glass,glass, and iron were used as support materials, which in this caseserved as substrate models. The hydrophobicized glass was obtainedby treating glass balls with a solution of dimethyldichlorosilane intoluene, with the formation of a polysilicon film on the glass surface.
Substrates of different types influence the glass vitrification tem-perature of the polymer. The glass-transition temperature Tg wasdetermined from the turning point of the dependence of the logarithmof the retention volume on the inverse temperature, log Vq vs. 1=T. AsFig. 1.3 shows, the effect of the substrates of low (hydrophobicized
6 Chapter One
Figure 1.3 Dependence of the glass-transition temperatureTg on film thickness d for ED-20-PEPA on hydrophobicizedglass (1), on iron (2, 2 0), and on glass (3, 3 0); (2) and (3),heating for 5 h; (2 0) and (3 0), heating for 10 h at 423 K.

glass) and high (iron, glass) energy on the polymer Tg on the boundarywith the substrate differs widely. For low-energy surfaces the polymervitrification temperature does not significantly depend on the polymerlayer thickness. The increase of Tg for a film 0:01 mm thick is related inthis case to limitation of the mobility of the polymeric chains close tothe solid surface. The dependence of Tg for high-energy surfaces illus-trates the complex structure of the boundary layer. For a film0:01�0:03 mm thick, there is no kink characterizing the glass vitrifica-tion temperature in the log Vq�1=T curve within the range of tempera-tures studied. This suggests that the boundary layer of the epoxycompound up to 0:03mm thickness does not undergo the transitionto the polymeric state under cold cure, although it may have sufficientmechanical strength due to the energy field of the surface. In fact, asshown in [17], a high-energy surface can selectively sorb the epoxyresin, as a result of which the adhesive layer is depleted by the curingagent and the stoichiometry of the compound is disturbed. In this case,the polymer layer enriched by epoxy resin has substantial extent. Inaddition, undercure of the adhesive boundary layer may be caused bydecrease of the polymer chain mobility due to the energy of interactionwith a solid surface, by limiting the conformation set, or by blocking ofthe active groups of components of the compound by the solid surface.
Heating the specimens for 5 h at 423 K results in a kink in thelog Vq�1=T curve that corresponds to the polymer glass vitrificationtemperature in a film of 0:01�0:03 mm thickness. In this case, theeffect of the iron surface on the glass vitrification temperature isgreater than that of the glass surface. Heating at the same tempera-ture for 10 h results in an increase of Tg; further heating of speci-mens for 15 h does not cause any futher increase of Tg. As Fig. 1.3shows, even heating does not increase the glass vitrification tempera-ture of specimens 0:01 mm thick to the Tg value of the block polymer.This suggests that the primary reason for adhesive undercure on theboundary with a high-energy substrate is depletion of the compoundboundary layer by the curing agent. The increase of the glass-transi-tion temperature of a 0:05 mm thick film of polymer can be explainedby this layer containing excess of the curing agent, which reacts withthe resin under prolonged heat treatment and results in increasedextent of crosslinking. The subsequent layer of 0:1�0:2 mm thicknesswith lower Tg seems to be explained by the structural looseness ofthe polymer within this zone [18]. Beginning at 0:3 mm thickness, theproperties of the polymer boundary layer approach those of the poly-mer in bulk.
These data allow determination of characteristic changes of valuesof the retention volume Vq depending on the film thickness.
The Process of Adhesive-Bonded Joint Formation 7

Insignificant change in Vq with varying film thickness is observed forpolymer on the hydrophobicized surface.
For the high-energy surfaces of the 0:03mm thick film there isabrupt increase of Vq that can be explained by decrease of the polymerstructure density [19]. Heat treatment of the film results in Vq
decreasing, i.e. in structure identification. Figure 1.4 shows the depen-dence of the parameter �1;2 of thermodynamic interaction between thepolymer and the solvent on the film thickness. It is evident that valuesare similar for the 0:03mm thick epoxy films made both with and with-out a curing agent, which indicates the latter case to be one of incom-plete gel-formation. Heating the 0:03mm thick film on iron or glasssubstrates causes an increase in the parameter �1;2 that is related tothe adhesive post-cure reaction that occurs in the course of heating. Asthe film thickness increases, the influence of the polar substrate on themagnitude of �1;2 has less effect, although it is observed for thick-nesses up to 0:6 mm.
The process of formation of the epoxy polymer in bulk was studiedusing IR spectroscopy, and on the boundary with the KRS-5 elementwas studied by the method of disturbed total internal reflection [20].In 24 h the degree of conversion of the epoxy groups was 28% in bulkand was zero at the boundary. In 8 h of heating the conversion levelwas 70% both for bulk and at the boundary. Formation of a surfactant
8 Chapter One
Figure 1.4 Dependence of the parameter �1;2 of interactionof polymer solvent on the film thickness for ED-20 (1) andED-20-PEPA (2, 2 0, 3, 3 0). Designations are the same as forFig. 1.3.

monolayer on the substrate surface results in an increase in the levelof conversion of the epoxy groups in the boundary layer to 20% for anunheated specimen. Undercure of the adhesive on the boundary withthe substrate resulting from the influence of the solid surface on poly-mer formation causes a decrease of adhesion strength of adhesive-bonded joints; heating the specimens increases the conversion of theepoxy groups and enhances the adhesion strength. Thus, whencementing steel specimens the adhesion strength of the thermallyuntreated adhesive is 10.3 MPa at normal break-off; for specimensheated at 423 K for 5 h it is 20.9 MPa; and for 10 and 15 h it is30 MPa. Useful increase of the adhesion strength can be achievedthrough formation of the surfactant monolayer on the substrate. Toclarify the mechanism, a monolayer of stearic acid from a solution inchloroform was applied to the surface of iron and glass support mate-rials. This decreased the effect of the surface energy field on the poly-mer formation process. Thus, for a 0:03 mm thick polymer film appliedto glass and iron surfaces with a surfactant monolayer, Tg was 369 Kand 364 K, respectively, and the heating produced essentially nochange.
These results indicate that a layer of undercured polymer can beformed when epoxy adhesives are used on high-energy substrates.When cementing surfaces with low surface energy, no such layerwas observed, but in this case the achievement of high adhesionstrength is hindered by poor substrate wetting by the adhesive.
Formation of weak boundary layers is confirmed by a study of themolecular mobility of filled epoxy polymers. The availability of thesolid surface results in a decrease of the molecular mobility in theboundary layer [21] as a result of limiting the conformation set andadsorption interactions of the polymer molecules with a solid body atthe boundary. The nature of the filler surface has little effect on themolecular mobility of the epoxy polymer and on the change of mobilityof its side-groups and segments. It has been concluded [21] that theprimary role in the change of mobility is played by geometric limita-tion of the number of possible conformations of macromolecules closeto the surface of the particles, i.e., by the entropy factor rather than byenergetic interactions of the surfaces.
Such information provides the basis for more detailed considerationof the physical-chemical processes that occur in the course of curing ofepoxy systems and that do not affect their relaxation behavior.
Dielectric relaxation of ED-20 epoxy resin (molecular weight¼ 450),both unfilled and filled with marshallite and cured by PEPA, wasstudied. The dielectric relaxation was measured using an E8 4-digitcapacity meter at an applied frequency of 1 kHz and the temperaturerange of measurements was 123–424 K.
The Process of Adhesive-Bonded Joint Formation 9

Epoxy polymers manufactured from commercial resins are known[12] to contain low-molecular weight impurities, which can adsorb onthe interface between the polymer and the solid substrate, and form aweak interlayer. In epoxy resin cured at room temperature and notthermally treated, there are two maxima in the dielectric lossesobserved in the low-temperature range (Fig. 1.5): at 153 K a dipole-grouped process of relaxation is manifested, while at a higher tem-perature of 231 K there is the onset of a relaxation process governedby the mobility of kinetic units larger than those responsible for thedipole-grouped motion but smaller than chain segments. The maxi-mum in tan � that corresponds to 153 K can apparently be explained
10 Chapter One
Figure 1.5 Dependence of tan � of the cured epoxy polymer on temperature: (1) unthermo-stated; (2) thermostated at 423 K for 2 h; (3) unfilled; (4) 10%, (5) 20%, (6) 50%, (7) 100%,(8) 150%, and (9) 200% marshallite.

by increase of the polymer molecular mobility caused by low-molecularweight impurities therein. After the heat treatment of the polymer,the relaxation process observed at 153 K disappears and the maximumof the molecular mobility at 231 K shifts into the region of highertemperatures. Such a temperature shift of the maximum in the dielec-tric loss is caused by complete cure of the polymer system and byvolatilization of the low-molecular weight impurities, which bringabout the decrease of molecular mobility. Increase of the polymermoisture content and holding it for 2 days at room temperature resultsin shift of the tan � maximum to lower temperatures and increase ofthe absolute value of tan �.
As Fig. 1.5 shows, the maximum for some systems does not show upat high temperatures. This can be explained by the increase of thetan � value caused by low-molecular weight impurities of the polymerserving as centers of conductivity. The change in the tan � values forthe epoxy system in the range of 333–383 K measured after 2 h ther-mal treatment is explained by the increase of the crosslink density ofthe space-network polymer and by the volatilization of the low-mole-cular weight impurities.
The amount of filler in the system needed to obtain the polymerinterlayer of a certain thickness was:
Content of marshallite in the polymer (%) 10 20 50 100 150 200
Distance between particles of the filler (mm) 6.354 4.155 2.035 0.928 0.325 0.154
At low temperatures, there are two regions of temperature transi-tions: 163–153 K and 238–231 K. The first characterizes the dipole-grouped relaxation process and the second characterizes the dipole-segmented process. With decrease of the polymer layer thickness inthe system, the relaxation processes shift toward higher tempera-tures. The decrease of the dipole-grouped and dipole-segmented mobi-lity at low filler content (up to 50%) is apparently explained bydepletion of the low-molecular weight impurities in the polymer dueto their adsorption on the filler surface. With increase of the fillercontent (over 50%), a considerable portion of the polymer makes atransition to the state of the boundary layer. Thus, if the thicknessof the faulty boundary layer characterized by polymer undercure inthe given system is about 0.1–0.2mm, addition of 50% filler to thesystem means that the thickness of the polymer layer on its surfaceis 1mm, i.e., 10% of the polymer is in the boundary layer state. Withincrease of the filler content, the maximum shifts to lower tempera-tures as a result of enhancement of molecular mobility of the polymerdue to decrease of the extent of conversion of the system. At a filler
The Process of Adhesive-Bonded Joint Formation 11

content over 100%, a considerable proportion of polymer enters theboundary layer state and further increase of the filler quantity hasno noticeable effect on the molecular mobility. The decrease of mobilitywithin the range of 100–200% of filler is apparently caused by entropyand energetic interactions of the polymer with the surface of fillerparticles [21].
These results show that the relaxation behavior of filled epoxy poly-mer is affected by two factors: the presence of the low-molecularweight impurities and the formation of the undercured boundarylayer.
Thus, for polymer formation in the course of reaction on the surface,the principal difference of interaction between the polymer and thehigh-energy substrate lies in the fact that an intermediate undercuredlayer is formed on the surface due to the absorption of reagents by thatsurface. The layer of completely cured polymer follows the intermedi-ate layer. Such a two-layer structure may be valuable from the point ofview of adhesion strength.
The presence of the solid surface affects the formation of crosslinkedand linear polymers in different ways [22]. In the case of crosslinkedpolymers, sufficiently large branched molecules are formed at com-paratively early stages of the process. In the formation of linear poly-mers, the critical molecular weight of macromolecules at which thesurface becomes capable of effecting its conformation set is higherthan for crosslinked polymers.
Study of the process of swelling of the polymeric coatings and filledpolymers found that the crosslinked concentration when the networkforms with surface present is significantly less than in bulk. In addi-tion, instances were observed of nonmonotonic dependence of themolecular weight of the polymer between crosslinks in the networkon the filler concentration, which indicates that the surface can orderthe arrangement and growth of chains [23]. The nature of the polymerand the type of surface determine the course of the process.
The solid surface has equivocal effects on different stages of thepolymerization process. Adding filling agents results in decrease ofinduction period of the polymerization of the methacrylic esters andin acceleration of polymerization in the reaction region before and atthe point of gel formation. After the gel formation point, the abruptdecrease of mobility of the elements of the polymerization systemcauses a drop in the polymerization rate, which practically ceasesdepending on the concentration and the character of the filler [24].The example of polycaprolactam [25] shows that that the number-average molecular weight at the polymer surface can be less than inbulk.
12 Chapter One

In a study of the influence of glass fiber on the formation of theglass-reinforced plastic, it was found [26] that the presence of theglass fiber determines both the rate and the depth of the bond cure,which in turn brings changes to the elastic properties and the bondstressed state around the fiber. Close to the fiber the organic siliconbond cures much more slowly than in bulk, i.e., it becomes weaker,which results in cohesion failure along the bond layer when glass-reinforced plastic is loaded.
The chemical bonding of the polymer with the surface of the fiberglass by means of finishing substances has been investigated [27]. Inthe majority of cases IR spectroscopy revealed the absence of chemicalinteraction of the organic silicon finishing agent containing vinylgroups with the polyester resin in the course of cure, although suchinteraction has been observed [28].
Thus, the solid surface can hinder the course of polymerization orpolycondensation. It is to be expected that formation of the low-mole-cular weight interlayer between the adhesive bond and the substratecannot but affect the adhesion strength.
The effect of the solid surface on polyurethane formation is specific.The surface does not hinder formation of the polyurethane itself,although polyaddition on the surface frequently proceeds at a differentrate from that in bulk. This is related to the effect of the adsorptionordering the boundary layer on the kinetics of the interaction [29]. Thedependence of polyurethane formation on the solid surface present isapparently explained by a number of factors. The isocyanate groupsare capable of strong interactions with various surfaces (metals,glass), and they can react both with one another and with a greatnumber of other compounds such as water, alcohols, amines, andunsaturated compounds. Many substances (salts of metals, amines,phosphines, and others) catalyze reactions of isocyanate.
Let us consider the formation of polyurethane in the presence ofmagnesium chloride. This salt was selected because metals of group2 form comparatively strong coordinate bonds with the oxygen-containing groups of the reactive system [30]. These groups providefor a certain interaction between the growing chains and the solidsurface and this must influence the kinetics of the polyurethaneformation. In addition, the metals of this group are frequently com-ponents of compounds used as the filling agents for plastics.
The system of polytetramethylene glycol (PTMG) of molecularweight 1000 and 4,4-diphenylmethane diisocyanate (DPMDI) wasinvestigated. The ratio of NCO and OH groups was 1:1.Chlorobenzene was the solvent. The total concentration of the reactingsubstances was 0.2 mol/l. Magnesium chloride was added to the solu-tion as a powder with the particle size � 5mm. The powder was dried
The Process of Adhesive-Bonded Joint Formation 13

at 1508C (10 Pa) for 3 h. Analysis showed that the reagent contained79% MgCl2, 4.7% MgO, and 16.3% H2O. Experiment determined thatadding MgO in the same quantity as that of the salt, and even some-what more, has no effect on the course of the process. We related theacquired result to the actual quantity of MgCl2. DPMDI was vacuumdistilled at 1568C (10 Pa). PTMG was dried at 808C (2 � 102 Pa) toresidual moisture content of 0.01%. The reaction was carried out ina dry argon environment. The reaction kinetics were studied by sam-pling with subsequent titration of the unreacted isocyanate groups.
The spontaneous reaction of polyurethane formation in solutionsfollows a second-order rate equation in the early stages. Toward theend of the reaction, the polymer formation rate constant increases.The rate constant of polyurethane formation from DPMDI andPTMG calculated by the second-order equation for 608C up to 76%conversion is 9:0 � 10�4 l/(mol.s), and from 76% conversion to theend of the reaction is 15:5 � 10�4 l/(mol.s). Some increase of the reac-tion rate constant at 76% conversion seems to be related to catalysis ofthe reaction by the urethane groups formed or by secondary reactionsin the system.
The addition of magnesium chloride causes a slight increase ofthe rate constant at the reaction first stage (up to 70% conversion).As soon as the magnesium chloride content in the system reaches9.43 g per mole of hydroxyl groups, the rate constant rises to13 � 10�4 l/(mol.s). Further increase of the salt content in the reactivesystem brings about no further elevation of the rate constant. At thefirst stage when the salt is added, the activation energy changes insig-nificantly, from 38.1 kJ/mol for spontaneous reaction to 57 2 kJ/molfor the system with 6.30 g of magnesium chloride added per mole ofhydroxyl groups (the constants were measured within the tempera-ture range 40�708C). At the second stage (after 70% conversion) therate constant rises abruptly in line with the increase of the quantity ofadded salt.
It should be noted that the increase in the reaction rate constant isnot related to MgCl2 solubility in the reactive system. Polarographicdetermination of MgCl2 solubility in chlorobenzene at 608C gives avalue of about 3 � 10�3 g/100 ml. Addition of such a quantity of saltinto the reactive system does not change the rate constant.
The polymer formed at the second stage of the reaction with mag-nesium chloride differs qualitatively from the polymers that areformed at the first stage and in the course of spontaneous reaction.Microscopic studies indicate that intensive formation of the polymerdirectly on the salt particles begins at the second stage. The content ofnitrogen in this polymer exceeds that estimated theoretically in poly-urethane. Thus a polymer is not soluble in the solvents that are
14 Chapter One

usually used for such polyurethanes. At 2708C the polymer does notmelt and begins to decompose. An intense absorption band at� 1660 cm�1 appears in the IR spectrum of the polymer in line withthe bands typical of the urethane groups. The intensity of this bandincreases with the increase of the quantity of the magnesium chlorideadded to the reactive system. This band is related to the urea bonds,which can be formed on account of water in the salt. Additionally, theextent of the carbonyl band splitting increases at � 1720 cm�1 in linewith the increase of the quantity of magnesium chloride. This splittingcan be related to formation of allophanic bonds that disintegrate underheating (after holding the specimen at 1208C for 6 h, the splitting ofthe carbonyl band disappears).
The appearance of the accelerating effect of the magnesium chlorideonly after 70% conversion (i.e. at sufficiently high concentration ofthe urethane groups in the growing polymeric chains) and formationof the polymer on the surface of the salt particles in the second stage ofthe reaction suggest that availability of the urethane groups facilitatesadsorption of the growing polymer chains from the solution onto thesurface of the salt solid particles. In line with this, it was shown thatthe polymer contains large amounts of allophanic bonds, which is whythe accelerating effect of the MgCl2 particles can be explained on theone hand by the accelerating effect of the surface due to its orderinginfluence, and on the other by the acceleration of formation of allopha-nic and urea groups. Apparently the reaction of the isocyanate groupswith water contained in MgCl2 becomes possible only when they are indirect contact with the surface (i.e., in case of adsorption), so that theband that characterizes the urea bonds does not appear at once butbecomes more intense at the second stage of the reaction. In the IRspectrum of the polymer obtained with anhydrous MgO, there was no1660 cm�1 band. The same can be assumed with respect to the allo-phanic bonds, which may appear with contact of the isocyanate andurethane groups in the sorbed layer.
Thus, the reactions of branching and formation of the network poly-mer take place on the surface of MgCl2. The orienting effect of theboundary surface with a solid body in the polyurethane formationreaction may not only accelerate the principal process but also facil-itate the course of side-reactions (in the case considered, these are thereactions of formation of branching through the allophanic groups).
The solid surface can cause breakdown of the adsorbed polymer. Forexample, immediately after adsorption of the polyesters on quartzglass, aluminum oxide, and other hydrated surfaces, hydrolysis isobserved [31]. Such behavior is understandable for these substancesgiven that upon adsorption the polar group of the ester must be indirect contact with the solid body if there is no steric hindance. It is
The Process of Adhesive-Bonded Joint Formation 15

also possible that solvating water molecules located on the surface aremore hydrolytically active due to the orientation than are those inbulk phase. Products of ester hydrolysis adsorb on the surface andblock it, breaking the hydrolysis reaction. In this connection, thebulk concentration of the hydrolyzed ester is very low and cannot beregistered by common methods of analysis.
Thus, the adhesive contacts the substrate via a layer of substancesthat frequently differ from the adhesive in composition. If the cohesionstrength of these substances is less than that of the adhesive, this willdetermine the failure stress of the adhesive-bonded joint. The adhe-sive, which has the same composition as that of the adhesive in bulk,can form a weak zone in the substrate surface. Adhesives are polymersand the particular nature of a polymer must have effects at all stagesof formation and operation of an adhesive-bonded joint.
The effect of the solid body surface propagates a considerable dis-tance from it; that is, the influence of the surface on the chains thatare in direct contact with it propagates via other chains into the bulkof the material. The range of action of the surface forces is a conse-quence of changes in the intermolecular interactions between chainsthat are directly adjacent to those in contact with the surface. Twofactors limit the molecular mobility of chains close to the boundary:adsorption reactions of macromolecules with the surface and decreaseof their entropy. Close to the boundary, the macromolecule cannotadopt the same number of conformations as in bulk, so that the surfacelimits the geometry of the molecule. As a result, the number of statesavailable to the molecule in the surface layer decreases. These limita-tions on conformation are the primary reason for the decrease of mole-cular mobility close to the boundary [32].
A result of the range of action of the solid body surface is that anarea of adhesive of considerable depth and close to the boundary isinvolved. It governs the details of the structure of the adhesive surfacelayer as well as the change in many physical-chemical properties ofthe adhesive and necessarily influences the adhesion strength.
The effect of the solid body surface on the structure of the polymerboundary layers has been considered in detail in a great number ofpublications and we will not consider this issue in detail. We point outonly that a number of publications have reported correlation betweenthe structure of the boundary layer and the adhesion strength forcouples such as metal–polycaproamide coating [33], fluoroplastic–steel [34], and epoxy rubber polymers–metals [35].
In the course of formation of the adhesive-bonded joint, internalstresses appear in the adhesive layer. These stresses can change theprocess of formation of the polymer boundary layer and cause theformation of faults. With increase of the internal stresses in polystyr-
16 Chapter One

ene, the softening temperature of the oriented films decreases. Thesame phenomenon has been observed with other polymers [36].
The faulty polymer layers on the boundary with the substrate canhave low adhesion strength and serve as a source of disintegration ofthe adhesive-bonded joint. It was shown [37, 38] that in this case thepolmer remains on the substrate as a very fine film or as separatespots, its quantity increasing with the time and temperature of thecontact of the adhesive and the substrate.
In many cases precision methods allowed detection of the thin layerof adhesive on the substrate surface [37–39]. For example, using dis-turbed total internal reflection it was shown [40] that when polyethy-lene was peeled off the quartz a thin layer of the polymer remained onthe latter. The remnants of the polyethylene are completely washed offthe quartz by xylene, which is proof of the absence of interactionbetween the quartz and the polyethylene. Such disintegration of adhe-sive-bonded joints is determined both by the adhesion interactionbetween the polymer and the substrate and by differences betweenthe behavior of the polymer when in thin layers on the substrateand when in the free state [85–89].
From the results described, one can conclude that a significantchange of the mechanical properties of a polymeric material on a sub-strate or with a solid filler surface present can be expected in ratherthin layers or in the thin interlayer of the polymeric matrix in filledpolymers when the thickness becomes comparable with the thicknessof the boundary layer.
Studies of the dynamic mechanical properties of polymeric objectscharacterized by the adhesion bond with a solid surface found that thegradient of the segmental mobility and of the indices of the mechanicalproperties was close to the interphase boundary during withdrawalfrom the solid surface.
Study of the mechanical properties of the boundary layers of reac-tive plastics, epoxy polymers in particular, is of special interest in thatundercure of the compound is observed on the surface of the solidbody; the primary reason for this is selective adsorption of componentsof the reactive system, which results in violation of stoichiometry ofthe initial products close to the solid body surface.
Let us consider the elastic properties of epoxy polymer thin films onsubstrates with various surface energies. The elasticity of the bound-ary layers and its contribution to the elasticity of the film on the sub-strate were assessed by the dependence of the modulus of elasticity onthe thickness of the polymeric coating formed on high-energy (alumi-num) and low-energy (polyethylene terephthalate) surfaces. ED-20epoxy resin (molecular weight 420, epoxy number 21.6) was selected
The Process of Adhesive-Bonded Joint Formation 17

for study; it was cured onto the substrate with PEPA (molecularweight 120); the weight ratio of components was 10:1.
Analysis of the known methods for determining the modulus ofelasticity of fine films on substrates, especially high-modulus films,showed that either they are of insufficient precision or they requirethe construction of special apparatus because of the complexity ofprocessing the results obtained [91–93]. In this case, the modulus ofelasticity was determined under conditions of tension at constant rateby the difference of results of tests on the epoxy coating with thesubstrate and on the substrate itself. The procedural problems arerelated to the fact that to obtain authentic results it is necessarythat the forces that appear in the high-modulus metallic substrateand in the low-modulus polymeric coating when being deformed arecomparable. This makes it necessary to use a very fine metallic foil assubstrate, the manufacture of which is very intricate. For this reasonthe modulus of elasticity of the epoxy coating was determined using acombined substrate that comprised a film made of polyethylene tere-phthalate coated with a super-thin aluminum layer 0:05mm thick byvacuum condensation. Both sides of such a substrate were used asmodels of the high-energy (aluminum) and low-energy (polyethyleneterephthalate) surfaces for the application and formation of the coat-ing under study.
To obtain thin coatings, the epoxy resin was diluted with acetone.The coatings, applied onto the substrate by special doctor blades, werecured for 20 h at 296 K and then for 15 h at 333 K. The thickness of thecured coatings was determined by gravimetry.
For mechanical tests, strip-shaped specimens of width 10 mm andtest length 100 mm were used. The experiment was carried out usingthe FU-1000e (produced in former East Germany) general-purposetensile testing machine, which performed automatic recording of theextension curves at a deformation rate of 5 mm/min. To enhance theaccuracy of determination of the modulus of elasticity, it was calcu-lated from extension diagrams as the ratio of the stress increment tothe relative deformation increment when the latter changed from 0.2%to 0.5%. A series of 30 similar specimens were tested on the high-energy surface, but for the thinner coatings the picture was reversed.With a 5mm thick coating on the polyethylene terephthalate, its mod-ulus of elasticity was 1.34 times higher than when the coating wasapplied to aluminum; at 1 mm thickness the film on aluminum becameof higher modulus, the difference between moduli reaching 38%.
It should be noted that for thin coatings the dependence under con-sideration is approximately linear. Extrapolation to thinner coatingsresults in a modulus of elasticity of ð60�70Þ � 103 MPa for the coatingon the aluminum substrate and of ð26�29Þ � 103 MPa for the coating
18 Chapter One

on the polyethylene terephthalate substrate at zero thickness; in otherwords, these values are close to the modulus of elasticity of the respec-tive substrates onto which they are applied.
If such an extrapolation is reasonable, it means that the modulus ofelasticity of thin films formed on various substrates depends on that ofthe substrate itself, i.e. the mechanical behavior of the low-moduluspolymeric film for slight deformations approaches the behavior of thehigher-modulus material of the substrate. The dependence obtainedfor the coating modulus of elasticity on the coating thickness in theregion of slight thickness concurs with the existence of the gradient ofthe structural and the segmental mobility in polymers close to theboundary with the solid surface. The increase of the modulus of elas-ticity of the epoxy coating when applied to a substrate in line with thedecrease of its thickness can be related not only to the energy andentropy effects of the substrate on the process of the structure forma-tion and on the final structure of the polymer boundary layers but alsoto the effect of the adhesion interaction on the process of their defor-mation together with the substrate [85–89], which results in effects ofcombined strengthening and increase of deformability of polymericfilms. In this case the lower values of the modulus of elasticity ofthe epoxy coatings on the high-energy substrate compared with themoduli for coatings on the low-energy substrate at coating thicknessesof 2–20 mm can be explained by a small contribution to the elasticity ofthe coating of the weak boundary layers [94, 95] formed, in line withformation of the polymer on the high-energy surface.
A screening effect is also possible, which decreases the range oftransmission of the externally fed deformation energy from the solidsurface of the higher-modulus substrate to the boundary layer andfarther to more remote layers of the polymeric coating via adhesionbonds. Statistical processing of the results of the mechanical testsshowed that the relative error in determining the modulus of elasticityof the coatings on the substrate does not exceed 10% for the confidencecoefficient of 0.95. The experiments obtained the dependence of themodulus of elasticity of the epoxy coating on its thickness within limitsof 1–100 mm as presented in Fig. 1.6. The tested coating was appliedto the aluminum and polyethylene terephthalate surfaces of the sub-strate.
It is evident that decreasing the coating thickness down to about10 mm has a slight effect on the value of the modulus of elasticity of theepoxy coating, independently of the nature and the energy field of thesubstrate surface. Apparently, the modulus of elasticity of the poly-meric coating in this range of thickness corresponds to that for thismaterial in bulk, where the contribution of the boundary layer is notpractically exhibited.
The Process of Adhesive-Bonded Joint Formation 19

Subsequent thinning of the coating on both substrates results inregular increase of the coating modulus of elasticity that is especiallyabrupt at thicknesses less than 3–4 mm in addition to that for the rangeof film thicknesses of 2–20 mm where the elasticity of the epoxy coatingson the low-energy surface appears to be higher. To determine the quan-titative contribution of the adhesion interaction of the epoxy coatingwith a substrate to the value of the modulus of elasticity, epoxy coat-ings in the shape of free films 100 mm thick, formed under similar con-ditions on both sides of the combined substrate as well as on aluminumfoil, were tested. The epoxy coating was separated by dilution of thePET film with phenol at 313 K and sulfuric acid was applied to thealuminum for a short period. An experimental check of the short-term effect of these reagents on the thick epoxy films did not detectany noticeable change in their elasticity (Table 1.2).
The results show that the modulus of elasticity of the thickest of thestudied films on the high-energy substrate appeared to be 20% and forthe low-energy substrate 13% higher than that of the films testedwithout substrates. This is evidence that, even for large thicknessesof coatings in which the boundary layers have no effect on the mechan-ical properties, the adhesion bond of the coating with the substrate hasa noticeable effect on the coating modulus of elasticity. However, forthe above experimental conditions the effect cannot be considered sig-nificant. Obtaining quantitative data on the role of such a factor with
20 Chapter One
Figure 1.6 Dependence of the elastic modulus of the epoxycoating on thickness on (1) aluminum and (2) polyethyleneterephthalate substrate.

deformation of the thinner films on the substrates is of significantinterest for understanding the mechanism of deformation and failureof the coatings and adhesive-bonded joints, but it presents seriousprocedural problems, which were not overcome in the present studies.There are grounds for assuming that, with further decrease of thick-ness of the coating film on a substrate, the contribution of this effectwill increase, and that for very fine films the elastic behavior of thepolymer–substrate system will be determined by the combined influ-ence of the adhesion interaction forces on the phase boundary and theparticular features of the cohesion behavior of the boundary layers.
Thus, despite unsoundness of the structure of the polymer boundarylayers, their mechanical properties can be high. The zone of failure ofthe adhesive-bonded joint in this case will depend on the correlationof the weakening and strengthening effects of the substrate on thepolymer layer in contact with it.
The Process of Adhesive-Bonded Joint Formation 21
TABLE 1.2 Dependence of the Elastic Modulus of Epoxy Films on Method ofProduction
Modulus ofCoating elasticity, 10�3E (MPa)
On the surface of the combined substrate made ofAluminum 3.02Polymer 2.49
Separated from the surface of the substrate made ofAluminum 2.51Polyethylene terephthalate 2.20
Separated from the aluminum foil 2.43

Chapter
2Adhesive Properties Control by
Surface-Active Substances
2.1 Alteration of Properties of PolymericComposites under the Influence ofSurface-Active Substances
Control of adhesion interaction by the addition to adhesives of surface-active substances (surfactants) is of great theoretical and practicalinterest. The particular effects of surfactants lie in their ability todecrease the surface tension of the solution due to positive adsorptionon the surface. Coating the surface of solid bodies and of liquids withthe finest layer of a surfactant added to the system in very smallquantities permits changes of the conditions of phase interactionand the progress of the physical-chemical processes.
Increase of adhesion strength is observed when there is adsorptionof a monolayer of surfactant, for example, of a fatty acid, between theadhesive and the substrate. The monolayer can be applied by theLangmuir method, by a mechanical-chemical procedure that consistsin polishing the metal surface using pastes based on the particularsurfactant, or by dipping the specimens into the surfactant solution.The results obtained are explained by the fact that in the case ofadsorption of diphilic molecules there appear areas of close-packedmolecules that prevent formation of the weak boundary layers.Using tagged stearic acid it was determined that the failure of poly-ethylene–metal adhesive-bonded joints with the metal coated with amonolayer of stearic acid is always accompanied by cohesion failure ofthe polyethylene. In the region close to the substrate modified by sur-factant a high degree of order of the polymer is observed.
22

Microscopic study of the cross-section of polyethylene from whichaluminum had been separated (by dissolving in alkali) showed thatcrystalline formations grouped perpendicularly to the surface werelocated in the area previously in contact with the metal surface.This layer is 50 mm thick; it was not observed on the reverse side ofthe film. Apparently, the hydrophobic parts of the molecules of theadsorbed surfactant oriented perpendicular to the metal surface sti-mulated a corresponding orientation of the macromolecules of thepolymer melt later applied. Treating the substrate surface with multi-layer adsorption films decreases the adhesion. This seems to occur notbecause of decrease of interaction of the diphilic molecules with thesubstrate surface but because of insufficient interaction between sepa-rate monolayers. Surfactant monolayers on solid surfaces have highphysical-mechanical properties. For example, a monolayer of stearicacid on a steel surface has a modulus of elasticity of 70.0 MPa underaxial compression. Liquidlike properties are inherent to the surfactantpolymolecular layer, but the layer can be of high viscosity.Measurement of the bonding forces between the solid particles coatedwith surfactant layers illustrated the multiple decrease of strength ofthe contacts with the surfactant present that is considered to be theresult of screening of the cohesion interaction of the particles by thesurfactant layers; this can be considered a direct display of themechanical properties (strength) of these layers, i.e., of their abilityto serve as structural-mechanical barriers.
Adsorption modification of the surface of fillers and pigments toimprove the quality of polymeric coatings has been widely used.With adsorption modification by surfactant, the nature of the solidphase surface and consequently the character of its interaction withthe polymer change. These adsorption layers lyophilizing the surfaceof particles of the pigment or the filler bring together the molecularproperties of the polymer and the filler. Regularities of the effects ofsurfactant used as adsorption modifiers of fillers upon the polymeradsorption and their control have been investigated by applying thecorresponding surfactant. The surface of filler ‘‘polymerophilized’’ bysurfactant initiates adsorption of the polymers from solution. Theadsorption (initiated by dichlorostearic acid) of perchlorovinyl resinfrom the dichloroethane is assumed to be caused by stretching out ofthe globules by the activated surface of the adsorbent; when the sur-face of the filler is partially filled with the surfactant molecules, thepolymer is able to chemosorb onto the unmodified portions of the sur-faces.
Surfactants are often added into paint materials to enable the paint-ing of wet surfaces. Optimal concentrations of surfactant are not thesame for different binders. One should always use the minimum pos-
Adhesive Properties Control by Surface-Active Substances 23

sible concentration at which good spreading of paint over the wet sur-face is provided because excess of surfactant decreases the strengthand water resistance of the coating.
The ability of surfactants to force spoiling off surfaces and of pene-trating into pores and capillaries is widely exploited in the applicationof coatings and in cementing bodies of porous and vesicular structure(wood, concrete, etc.).
The use of curing agents for polymeric adhesives and coatings withsurface-active properties is of considerable interest. These include cur-ing agents for epoxy resins like oligoamineamides (OAA) or versa-mides. Such substances change the surface tension of the epoxyresins and their wetting capacity is enhanced by the fatty alkylchain and by the polar amine groups; in structure they are similarto detergents. The curing of epoxy resins by liquid polyamide resinsgives products that have good wetting properties and better adhesionand elasticity compared with epoxy resins cured by polyamines. Theycan be applied on wet surfaces because, in the course of applying thecoating, water on the surface of the solid body emulsifies in the coatingand is removed during drying.
Nevertheless, it should be pointed out that there is comparativelylittle evidence of adhesion enhancement when surfactant is added toadhesives and paints. In the majority of cases, addition of surfactant topolymer results in decrease of adhesion—in practice this is frequentlyused to obtain coatings that hinder aircraft icing, compounds forremoving paints, and so on. Modification of the oxidized surface ofaluminum by the majority of tested surfactants (such as octadecyl-amine; stearic acid; ethyltriethoxysilane; g-aminopropyltriethoxy-silane, AMG-9) decreases the short-term strength of the adhesive-bonded joints, and the more modifier is adsorbed the greater is thedecrease. The drop in strength of the bond of the filler particles withthe binders is used to reduce the internal stresses in coatings when thefiller particles are modified by surfactant.
Frequently, surfactants increase the adhesion of polymers onlywithin a narrow range of concentrations, below which the surfactanthas practically no effect and above which the adhesion decreases. Theeffect of surfactant is well illustrated by the data presented in [62].The adhesion strength was determined by the method of peeling poly-ethylene containing different types of added surfactant off aluminum.Typical results were:
24 Chapter Two
Content of surfactant (%)
Surfactant 0 0.05 0.1 0.2 0.3 0.5
OS-20 50 – 80 200 100 0DS-10 50 80 200 340 200 20

It is seen that the effect of the surfactant on the adhesion strength ofpolymer is related not only to the surface but also to the bulk proper-ties of surfactant. Let us now pass to considering the details of surfac-tant behavior in oligomeric and polymeric solutions.
2.2 Colloid-Chemical Properties ofSurfactants in Heterochain Oligomers
Consider the properties of reactive surface-active (RS) substances(alkyl phenol oxyethylated ester (OP-10), dodecyl nitrile (DDN)) andof chemically indifferent surface-active substances (IS) like the oligo-amidoamines L-18, L-19, L-20 capable of reacting with such oligomericsolvents as the ED-20 and DEG-1 epoxy resins and polyoxypropylene-triol (POPT) of molecular weight 750. These oligomers are unasso-ciated low-polarity liquids, as confirmed by the data of Table 2.1.
The total surface energy En, the surface molar entropy Sm, and theparachor P were calculated by the equations
En ¼ � � Td�
dTð2:1Þ
P ¼ V�1=4 ð2:2Þ
Sm ¼ f V3=2N1=2A
d�
dTð2:3Þ
where V is the molar volume, NA is the Avogadro number, f is thepacking factor, � is the surface tension, and T is temperature. The
Adhesive Properties Control by Surface-Active Substances 25
TABLE 2.1 Thermodynamic Properties of Oligomeric Solvents
DEG-1 POPT ED-20
Temperature Temperature Temperature
(8C) (8C) (8C)
Property 20 60 20 60 20 60
Surface tension, � (mN/m) 44.7 40.66 36.13 30.50 48.9 46.2
Density, 10�3� (kg/m3) 1.157 1.1367 1.0111 0.972 1.145 1.133
Total surface energy, En
(mN/m) 74.0 74.0 76.48 76.30 91.3 91.2
Parachor Pa 560 557 1920 1915 1010 1010
(550) (550) (1923) (1923) (1006) (1006)
Molar surface entropy, Sm
(J/mol �K) 32.9 33.7 106.0 109.5 65.4 36.4
a Theoretical values of the parachor are given in parentheses.

theoretical values of the parachor are given in parentheses in Table2.1. The surface tension of the oligomers at different temperatures andits dependence on the surfactant concentration were determined bythe Wilhelmy method.
Absence of association in the oligomer is indicated by the fact thatthe values of the parachor (calculated from the experimental data andfrom the summation of atoms, bonds, and groups in a molecule accord-ing to the additive rule) coincide and hardly depend on the tempera-ture. A similar picture was observed for the surface molar entropy.This indicates that the extent of macromolecular association does notchange within the studied range of temperatures. The entropy of for-mation of the surface per cm2
�S ¼ �d�
dTð2:4Þ
also shows little dependence on temperature.The selected surfactants are surface-active with respect to the ED-
20 and DEG-1 solvents but not toward POPT. In this case L-19 can beconsidered indifferent in that at 208C its rate of interaction with DEG-1 is very low.
Figure 2.1 shows that on all the curves at a certain concentration ofsurfactant there is a distinct kink after which the surface tension ofthe solution becomes independent of the surfactant concentration.This is likely related to the formation of micelles of the surfactantmolecules that occurs at the surfactant concentration equal toCCMF (the critical concentration for micelle formation). Thus, thesurfactant solutions in the oligomers are subject to the same regula-rities as those in other solvents. For the OP-10 solutions in DEG-1 twokinks are observed on the isotherm; the kink at the lower surfactantconcentration is usually related to preassociation.
Table 2.2 presents CCMF ðCkÞ, areas occupied by the molecules inthe extremely saturated adsorption layer ðSmaxÞ, and surface activityðGÞ for OP-10 and L-19 in epoxy resins. CCMF was determined by thekink in the curves (Fig. 2.1). The areas occupied by molecules werecalculated by the formula
Smax ¼ 1
�maxNAð2:5Þ
where �max is the maximum adsorption determined by the equation
� ¼ ck
RT
��
�ckð2:6Þ
26 Chapter Two

Surface activities were determined by
G ¼ � � �k
ckð2:7Þ
where � is the surface tension of the oligomer, and �k is the same butat surfactant concentration equal to CCMF.
As Table 2.2 indicates, the areas occupied by the molecules of OP-10 and L-19 differ more than 1.5-fold, although these substancesare of similar structure. One can assume that the OP-10 moleculesform associations with the DEG-1 molecules that result inconsiderable increase of the area occupied by a molecule on thesurface.
Let us calculate the area that should be occupied by OP-10 mole-cules in an extremely saturated adsorption layer. The effective area ofthe normal cross-section of the hydrocarbon chains for benzene deri-vatives (according to structural analysis) is 23:8 � 10�10 m2, and thedistance between the axes of two oriented chains in the saturatedlayers is not less than ð4:5�6Þ � 10�10 m. Consequently the effectivecross-section for the OP-10 molecule with two hydrocarbon chains isabout ð52:1�53:6Þ � 10�10 m2. This value is less than that determinedexperimentally and practically coincides with the area occupied by theL-19 molecule in the adsorption layer. Thus, L-19 does not form asso-
Adhesive Properties Control by Surface-Active Substances 27
Figure 2.1 Isotherms of surfacetension of DDM (1) and L-19 (2)solutions in DEG-1 at 208C.

28
TABLE 2.2 Some Properties of Surfactant Adsorption Layers in Oligomers
DEG-1–L-19 DEG-1–OP-10 ED-20–OP-10
ck 10�10Smax G ck 10�10Smax G ck 10�10Smax GTemperature (8C) (kg/m3) (m2) (mN�m2/kg) (kg/m3) (m2) (mN �m2/kg) (kg/m3) (m2) (mN�m2/kg)
20 2.82 52.8 3.34 24 84.4 0.346 –a – –
40 –a – – 26.3 135 0.195 5.63 87.2 1.37
60 –a – – 41.6 177 0.076 14.1 23.0 0.44
a Not applicable—see text.

ciations with the oligomer, although it includes both proton-donor andproton-acceptor groups. It can be assumed that L-19 molecules underclose packing in the adsorption layers form hydrogen bonds with oneanother.
Let us now consider the dependence of the surfactant surface activ-ity on temperature. The DEG-1–L-19 system was studied only at 208Cbecause at higher temperature the reaction between its componentsbecomes noticeable. Taking account of high viscosity, ED-20 wasinvestigated at 408C and 608C only. As Table 2.2 shows, elevation ofthe temperature results in a decrease of the surface activity and anincrease of OP-10 CCMF in the oligomers that is related to theincrease of the surfactant solubility.
Alteration of the surface tension of the DEG-1–OP-10 system withtemperature is greatly influenced by the surfactant concentration(Fig. 2.2). At 11 kg/m3 of OP-10, the surface tension does not dependon temperature, and at high surfactant concentrations even increases.The OP-10 associations with DEG-1 must be of increased solubilityand must easily desorb from the boundary surface in the course ofraising the temperature. Thus, temperature increase may resultboth in decrease of the surface tension on account of increase of thethermal motion of the molecules and in its increase due to the de-sorption of surfactant molecules, and this increase has a direct depen-dence on the surfactant concentration. Superposition of these factorsfor certain surfactant concentrations can bring about independence ofthe system surface tension on temperature, confirmed by experiment.In the case of surfactant desorption, the system entropy increased due
Adhesive Properties Control by Surface-Active Substances 29
Figure 2.2 Dependence on tem-perature of the surface tensionof OP-10 solutions in DEG-1 ofvarious concentrations: (1) 0,(2) 0.4, (3) 2.0, (4) 4.0, (5) 20.0,(6) 40.0 g/l.

to more uniform distribution of surfactant molecules in the oligomer;when the adsorption increases, the system entropy decreases, as illu-strated by the decline of the straight lines in Fig. 2.2.
Let us consider the effect of the formation of surfactant micelles onthe thermodynamic compatibility of the system. The ED-20–OP-10system was used for study. Using reversed-phase gas chromato-graphy, thermodynamic parameters such as the excess free energy,enthalpy, and entropy of mixing were determined. In addition, theexperimental values of the parameters of the Flory–Huggins thermo-dynamic interaction �ij were found. The molecular weights of theoligomers were determined by means of the ED-68 ebulliograph.The studies were performed with the LKhM-72 chromatographwith a flame ionization detector and an air thermostat. Nitrogenserved as support gas. The AW 60/80 chromosorbent was used asa substrate. The films were applied from solution in methylenechloride.
The measurements were performed with extrapolation to zero dilu-tion of the sorbate (heptene, benzene), The following equation wasused to calculate the mixing thermodynamic parameters:
ln VM ¼X
xi ln VMi ��GM
RTð2:8Þ
where xi is the mole fraction of the ith component of the blend that isused as stationary phase; VM and VMi are retention volumes of thesorbate by a mixed phase and by an individual ith component; and�GM is the excess free energy of the mixed phase.
The blending excess enthalpy was calculated from
�HCM ¼X
�i�Hi ��HM ð2:9Þ
where �HCM and �Hi are the enthalpies of mixing the sorbate withthe blend and with the ith component of the blend; �HM is the excessenthalpy of the polymer–polymer blend.
The value of �HM was determined from
�HM ¼ R�
�ð1=TÞ � ln Vq p1 �p1
RTðB1;1 � V1Þ
h ið2:10Þ
where p1, B1;1, and V1 are the pressure of the saturated vapor, thesecond coefficient, and the sorbate molar volume at the column tem-perature, Vq is as defined previously.
30 Chapter Two

Adhesive Properties Control by Surface-Active Substances 31
The excess entropy of the blending was determined from
�S ¼ �HM ��GM
Tð2:11Þ
The parameter of the thermodynamic interaction between the sorbateand the blend was calculated in the following way:
�1;2;3 ¼�1;2
V1’2 þ
�1;3
V1’3 �
�2;3
V2’2’3
� �V1
¼ ln273Rðw2v2 þ w3v3Þ
p1V1Vq� 1 � V1
V2
� �’2
� 1 � V1
V3
� �’3 �
p1
RTðB1;1 � V1Þ ð2:12Þ
Here �1;2 and �1;3 are the parameters of the thermodynamic interac-tion between the sorbate and the individual components of the blend;�2;3 is that between the components of the blend; the ’i are the volumefraction of the components; the V1 are the molar volumes of the sor-bate and the blend components; w2, w3 and v2, v3 are the weight frac-tions and the specific volumes of the blend components. For theindividual components � was determined on separate columns.Numerical values were calculated from
� ¼ ln273RV2
Vq p1V1� 1 � V1
M2V2
� �� p1
RTðB1;1 � V1Þ ð2:13Þ
where M2 is the molecular weight of the stationary medium.When surfactant is added to the oligomer, the specific holding volume
of the oligomer begins to decrease; it subsequently increases, but up to30% of surfactant content it remains less than the volume calculatedunder conditions of additive dependence on the blend composition.
The data presented indicate the complex thermodynamic behavior ofthe system. Actually, as Fig 2.3 shows, the Flory–Huggins thermody-namic interaction parameter between the system components has avalue lower than the critical value in the region of surfactant concen-trations up to 30% that characterizes the thermodynamic stability ofthe system. The ��
2;3 critical parameter for the given oligomeric systemwas calculated using the equation
��2;3 ¼ 1
2
V1
V2
� �1=2
þ V1
V3
� �1=2" #2
ð2:14Þ
and was equal to 0.452.

The maximum thermodynamic stability is displayed by the systemwhen the surfactant concentration is equal to CCMF. With increase ofthe surfactant concentration, the interaction parameter increases andthe system becomes thermodynamically incompatible.
The enthalpy within the studied range of relationship of the blendcomponents has negative value; blending ED-20 and OP-10 results inrelease of heat, although from the enthalpy value one cannot unequi-vocally judge the state of the system. The system is characterized morecompletely by the change of the excess free energy ð�GM ¼ �HM�T�SMÞ in the course of blending the components because this accountsfor both the energy and entropy state of the system.
Increasing the surfactant concentration in the system results in adecrease of the components’’ compatibility that is characterized by theincrease of the excess energy of mixing, although the system becomesthermodynamically incompatible only when the surfactant content isabout 30%.
Thus, change of the oligomeric properties under the influence ofsurfactant does not in principle differ from that when aqueous orhydrocarbon solvents are used. Formation of associations of surfactantwith oligomer abruptly increases the area occupied by a surfactantmolecule in the extremely saturated adsorption layer and results indecrease of the surfactant surface activity and in the anomalousdependence of surface tension on temperature.
The study of thermodynamic parameters of mixing showed that theoligomer–surfactant system is thermodynamically stable even whenthe surfactant concentration is considerably above CCMF. This is asurprise and seems to be related to the fact that the surfactant mole-cules aggregate into the micelles in such a way that those parts of thesurfactant molecules are directed at the oligomeric solvent that havemaximum affinity to it.
32 Chapter Two
Figure 2.3 Dependence of ��2;3 on composition for ED-20–OP-10
system at 608C.

Now let us consider the colloid-chemical properties of the oligomer–surfactant system under conditions in which the system componentsare capable of chemical interaction.
2.3 Surface Tension of HeterochainOligomers with Surfactant Additives
The surface activity of a surfactant is determined first by the relation-ship between its hydrophilic and hydrophobic parts, or the hydrophi-lic–oleophilic balance. In the course of interaction of a surfactant withan oligomer, the surfactant’s hydrophilicity and hydrophobicity, itsstructure and hydrophilic–oleophilic balance will change dependingon its polarity and where in the surfactant molecule the active groupsare located. But independently of this, such an interaction alwaysresults in increase of the surfactant solubility in the oligomer and indecrease of its surface activity.
The interaction between epoxy resin and OAA (oligoamide amine)occurs as follows:
Figure 2.4 presents the isotherms of the surface tension of the DEG-1–surfactant system at various time intervals after mixing. The reac-tion between DEG and surfactant was carried out at 808C, with sub-sequent cooling of the system down to 208C for determination of thesurface tension. At 208C the rate of reaction between DEG-1 and OAAis low and the changes in surface tension in the course of measure-ment (for less than 0.5 h) are within the limits of the experimentalerror. Figure 2.4 shows that with the increase of the interval fromthe time of blending up to the measurement of the surface tensionthe kink on the isotherms shifts in the direction of higher surfactant
Adhesive Properties Control by Surface-Active Substances 33

concentrations, i.e., CCMF of the surfactant increases in line with theincrease of the system degree of conversion.
Let us consider the reasons for this. In addition to the increase ofsurfactant affinity to the solvent, CCMF may increase due to thegrowth of the micellar mass and to the decrease of the tendencyto aggregation because of increase of branching of the surfactant mole-cules. The contribution of the micellar mass change can be calculatedunder the condition of invariance of other factors of OAA and productsof reaction (PR) of OAA with resin by Equation (2.15) [67]:
CCMFPR ¼ CCMFOAAMPR
MOAAð2:15Þ
where MPR and MOAA are the molecular weights of the products ofreaction and of the oligoamide amines.
In calculating the molecular weight of the reaction products one canassume that with high probability there is no interaction between thereaction products and OAA, because of the great excess of the reactiveepoxy groups in the system. In our case the molar ratio of OAA toDEG-1 did not exceed 16:7 � 10�3. The contribution of the growth ofbranching of the surfactant molecules to the increase in CCMF canbe accounted for if one takes into consideration that CCMF increases1.5–2 times when there is surfactant branching.
34 Chapter Two
Figure 2.4 Isotherms of the surface tension of oligoamines (a) L-20, (b) L-19, and (c) L-18 at various time points: (1) after blending; with heating at 8008C for (2) 1 h, (3) 3 h, (4)5 h, and (5) after completion of the reaction.

Table 2.3 presents the colloid-chemical characteristics of OAA and ofPR; it is evident that, although PR themselves are surfactants, theirmicellar mass is substantially less than that of OAA. The aggregationnumber for PR is less than 2, i.e., the largest aggregates consist of twosurfactant molecules. Evidently the PR aggregates cannot be consid-ered as micelle formations, which is confirmed by the fact that thelower branches of the curves in Fig. 2.4 are not parallel to the concen-tration axis. Of particular interest is the fact that sphericity of mole-cular associations does not change in the course of the reaction. Thisseems to be related to the branching of the polar part of the surfactantmolecule and to its location in such a way that the nonpolar parts areinside the protomicelles. This conclusion follows from the invariance ofthe effective volumes of 1 g of OAA and PR calculated by the Gut andSimkh equation when varying the surfactant concentration.
The data in Table 2.3 suggest that the primary contribution toincrease of the system CCMF is made by the increase of the surfactantsolubility. In fact, CCMFPR estimated by the micellar mass for condi-tions where surfactant molecule branching is more extensive than thatof OAA, is 3-fold lower than CCMF determined experimentally. Thus,at least 2/3 of the CCMF growth is caused by increase of the surfactantaffinity for the solvent.
The decrease of the aggregation of surfactant particles in the courseof reaction is confirmed by light scattering studies. A study using theturbidity spectrum showed (Fig. 2.5) that the decrease of the colloidparticle concentration occurs in line with the decrease of the colloidparticle size. The decrease of the particle size is also confirmed by thedata from viscosity–diffusion (Table 2.3).
Let us review the information acquired. As shown above, the solu-bility of PR in the system is higher than that of OAA. At the beginningof the reaction when the PR concentration is low, the PR are in themolecular-dispersed state, which is why they do not affect the deter-mined size of the colloid particles in the system. As Fig. 2.5 shows, inthe early stages of the reaction there is an abrupt decrease of theparticle concentration while their size does not change significantly.Once the concentration of the PR molecules formed exceeds CCMF, adecrease of the particle size is observed such that the size of the PRaggregates is smaller than that of OAA.
The data permit an easy explanation of the regularities of thechange in surface tension during the course of DEC-1 reaction withvarious quantities of OAA (Fig. 2.6). The surface tension is seen toincrease with time at low content of OAA in the system; at higherOAA concentration the surface tension increases less strongly, andat OAA concentration of 5% change of the surface tension is notobserved. In the initial stage of the reaction there is a decrease of
Adhesive Properties Control by Surface-Active Substances 35

36
TABLE 2.3 Surfactant Colloid-Chemical Characteristics
EstimatedBefore reaction Products of reaction CCMFPR (mol/m3)
Molecular CCMF Micellar Aggregation Molecular CCMFPR Micellar Aggregation By micellar ByOAA weighta (mol/m3) weightb number weight (mol/m3) weight number weightbranching
L-18 770 1.16 – – 1070 6.61 – – – –L-19 860 1.63 2.73 31.7 1940 9.75 0.180 to 1.40 to 0.127 3.26
0.213 1.66L-20 940 1.2 – – 1690 7.81 – – – –
a Defined from IR-spectroscopy data.b Defined by a method of viscosity–diffusion.

the surface tension, this stage occurring for longer time at highersurfactant concentration.
As noted above, the colloid-chemical behavior of RS substancesdoes not differ from that of IS substances when there is no chemicalinteraction of RS substances with oligomer. Thus, the change in OAAproperties in the process of reaction is related only to the change intheir structure. The interaction of OAA with the oligomer results in
Adhesive Properties Control by Surface-Active Substances 37
Figure 2.5 Change with time of size rw (1) and number concen-tration N (2) of colloid particles in the course of reaction (at8008C) for a 7.5% solution of L-19 in DEG-1.
Figure 2.6 Change with time of the surface tension of surfactant solutions [(1) L-18; (2)L-19; (3) L-20] in DEG-1 in the course of reaction at various surfactant concentrations:(a) 0.1%, (b) 0.5%, (c) 1%, and (d) 5%.

increase of the surfactant solubility. In this case its surface activityestimated by Equation (2.7) decreases 150–170 times. This results ina decrease of the surfactant excess adsorption that causes increase ofthe solution surface tension. When the surfactant concentration inthe system is higher than CCMF, the disintegrating micelles of OAAserve as a source of surface-active molecules. Although the increaseof the PR solubility results in the decrease of their relative adsorp-tion (see Table 2.4), the absolute adsorption attainable also increasesbecause of the increase of CCMF; that is, by increasing the PRconcentration in the system one can achieve greater decrease ofthe surface tension than with OAA despite the much lower surfaceactivity of PR.
In OAA interactions with the oligomer there is formation of largebranched molecules whose cross-section S is much greater than that ofthe initial OAA (see Table 2.4)
The surface tension of OAA solutions in diethylene glycol, a non-reactive analogue of DEG-1, decreases linearly with increasing tem-perature for OAA content up to 5%. The increase of PR solubilitycompared with OAA means that as the system temperature is raisedPR desorb from the boundary surface. This initiates the surface ten-sion rise that is superimposed on the surface tension decrease due toincrease of molecular thermal motion. The dependence of the surfacetension on temperature for various PR concentrations is well describedby a straight-line equation.
2.4 Surface Tension of Curing Oligomers
The chemical composition as well as molecular weight and structurechanges when the oligomer is being cured. In the course of reactionof the epoxy resin with amines, the epoxy groups are replaced byhydroxyl groups; when polyesters react with isocyanate, the hydroxyland isocyanate groups are replaced by urethanes, and so on. Such achange in the solvent necessarily affects the surfactant’s affinity forit, which in turn results in change of the micellar mass and CCMF
38 Chapter Two
TABLE 2.4 Adsorption Properties of Surfactants
OAA PR
Initial surfactant 10�14� (mol/m2) 1010S (m2) 10�14� (mol/m2) 1010S (m2)
L-18 3.66 45.6 2.0 83.5L-19 3.04 52.8 1.6 104.0L-20 3.04 52.8 1.98 83.5

[70, 97, 98]. Consequently, the surface tension of the polymerizingsystem with added surfactant is affected both by changes of thestructure and the chemical composition of the polymerizing oligomerand by the change of surfactant colloid-chemical properties. To obvi-ate difficulties in separation of these two factors, DEG-1 epoxy resinwas selected as an oligomeric solvent. The surface tension of DEG-1when reacting with PEPA does not change up to a considerabledegree of conversion. This allows us to relate the observed changesto the surfactant colloid properties only. Figure 2.7 presents iso-therms of the surface tension of DEG-1 with DP-10 for variousdegrees of conversion of epoxy groups, which was controlled by thequantity of PEPA added.
Completion of the reaction and the degree of conversion of the epoxygroups were determined by IR spectroscopy. To determine the equili-brium value of the surface tension, a quantity of PEPA was added suchthat the extent of epoxy group conversion would not exceed 30–35%. Inthis case the resin remained in the liquid state.
At low degrees of epoxy conversion, CCMF of OP-10 does not change(see Fig. 2.7, curves 1–3). Only at 30% conversion does CCMF begin todecrease (curve 4). With increase of the degree of conversion, oneobserves the decrease of the system surface tension at the surfactantconcentration that corresponds to CCMF. The kink on the surfacetension isotherm at low surfactant concentrations can be related tothe formation of the surfactant ‘‘pre-associations’’ in the system.
Adhesive Properties Control by Surface-Active Substances 39
Figure 2.7 Isotherms of the sur-face tension of OP-10 solutions inDEG-1 at various conversionlevels of the epoxy groups: (1)5%, (2) 10%, (3) 20%, and (4)30%.

Figure 2.7 shows that with increase in the degree of epoxy conversion,‘‘pre-associations’’ occur at lower surfactant concentrations. The sur-factant concentration at which ‘‘pre-micelles’’ and micelles are formedis related to the decline of surfactant solubility in the oligomer duringits polymerization.
The size of micelles is determined by energetic factors andconcentration factors. The decrease of CCMF in a viscous systemmust result in decrease of the size of the micelles. For increase ofthe surfactant concentration, the micelle size increases, and sphericalmicelles transform into elliptic ones and then into plate-shaped onesas increase in the surfactant concentration in common solvents isaccompanied by a free energy advantage. It can be assumedthat such a process occurs with the increase of the degree ofconversion up to 30%. In this case CCMF shifts into the area oflower surfactant concentrations without any change in the surfacetension (see Fig. 2.7).
Consider the change in the system surface tension with the extent ofepoxy group conversion at different surfactant contents (Fig. 2.8). Thetransition of the surfactant molecules into the associated state withincrease of the degree of epoxy groups conversion (with increase ofthe oligomer molecular weight) results in depletion of the surfacelayer of surfactant molecules by diffusion to lower-concentrationregions, which causes the increase of the system surface tension(see Fig. 2.8, curves 2 and 3). Consequently, the formation of the
40 Chapter Two
Figure 2.8 Dependence of thesurface tension on the conver-sion level of epoxy groups forOP-10 solutions of variousconcentrations: (1) 0, (2) 1.2, (3)20.0, (4) 40.0, (5) 60.0, and (6)117 g/l.

‘‘pre-associations’’ produces only a small advantage of the free energythat does not compensate the increase of the system surface tensiondue to the desorption of surfactant molecules. The formation ofmicelles at epoxy groups conversion level above 20–30% or at surfac-tant concentration over 40 kg/m3 produces a large free energy advan-tage that causes the decrease of the surface tension along with theincrease of the conversion level (see Fig. 2.8).
Figure 2.9 presents the results of a study of the surface tension ofthe POPT-based system. The polymerization level of the oligomerwas controlled by the amount of toluene diisocyanate (TDI) addedto the system, the reaction of which with the polyester resulted inthe formation of the polyurethane. Completion of the reaction andthe system conversion level were monitored by IR spectroscopy usingthe change of the adsorption band in the region of 2280 cm�1 thatcorresponds to isocyanate groups. The surface tension was measuredat 908C.
The surface tension of the system increases with increase of theconcentration of urethane groups; DDN is not surface active withrespect to POPT. The surface activity develops with the increase ofthe concentration of urethane groups (see Fig. 2.9). It seems to becaused by the decline of the solubility of DDN in the oligomer.With the increase of urethane group content, CCMF decreases,and this decrease is most abrupt in the region of considerabledegrees of conversion of the system. A similar phenomenon wasobserved for the epoxy resin: the closer the system is to the gel-formation point, the worse is the surfactant solubility in it. It isprobable that at the observed high levels of system conversion
Adhesive Properties Control by Surface-Active Substances 41
Figure 2.9 Dependence of the surface tension ofDDN solutions on concentration of urethane groups:(1) 0, (2) 20, (3) 50, and (4) 100 g/l.

there appear the creation of the three-dimensional network, thecompatibility of which with the low-molecular weight substancesis sharply decreased.
The increase of aggregation of the surfactant molecules and thetransformation of micelles of one type into another one was confirmedby a study of the light scattering of the surfactant solutions of variousconcentrations with various levels of system conversion. Note that theoligomers investigated involve colored products that hinder the detec-tion of the small-sized colloid particles. The light scattering was deter-mined in the course of reaction at 208C. Since the system is in theliquid state and the polymerization rate is low, one can assume thatthe process of building up the micellar formations is close to the equi-librium.
Figure 2.10 shows the optical density of polymerizing systems con-taining various quantities of surfactant. There is a clear abruptincrease of the system optical density at certain degrees of conversion.With increased surfactant concentration the increase in optical den-sity is observed at lower degrees of conversion. These data indicatethat with increase of the surfactant concentration or of the systemconversion level there is an increase in the quantity and size of thecolloid particles formed in the system. At 15% surfactant in the systemand at 10% conversion, there is a decrease of the optical density (curve
42 Chapter Two
Figure 2.10 Change of the opti-cal density �0 in the course ofpolymerization of DEG-1 at var-ious surfactant concentrations:(1) 6.5%, (2) 7.0%, (3) 15.0%, (4)8.0%, and (5) 100% of DDN.

3). This is related to the formation of a great number of large colloidparticles at such a high surfactant concentration. Since at 10% con-version the system viscosity is still low, the colloid particles coalesceand the system separates into two phases (polymer and surfactant).The separation of surfactant from the oligomeric solvent results in thedecrease of the system’s optical density.
Thus, there is a critical surfactant concentration at which incompat-ibility with the polymer occurs. This concentration depends on thesystem’s degree of conversion. Similar processes can obviously beobserved at degrees of system conversion higher than the gel forma-tion point, with compatibility being evident at lower concentrations ofsurfactant than for systems in the liquid state. It is to be expected thatthe solid state of the system governs the specificity of the surfactantaggregation process.
At a certain degree of conversion of the system, the size and concen-trations of the OP-10 and DDN particles increase in a jump, occurringat a lower conversion level for DDN than for OP-10 (see Fig. 2.11).This seems to be caused not only by differences in the nature of thesetwo surfactants but also by the chemical alterations that arise underepoxy resin polymerization. Actually the formation of the hydroxylgroups in the resin increases its affinity with OP-10, which also con-tains hydroxyl groups. It shifts the onset of incompatibility in thedirection of higher conversions.
Adhesive Properties Control by Surface-Active Substances 43
Figure 2.11 Change of size rw (1, 2) and of number density Nof colloid particles (3, 4) in the course of reaction of a 10%solution of DDN (1, 3) and a 14% solution of OP-10 (2, 4) inDEG-1.

The system splits into phases at the maximum possible size of theDDN colloid particles (see Fig. 2.11, curve 1). After the particlesacquire this size, only growth is observed, with the particle concentra-tion (at which the system separates into phases) increasing with con-version level and consequently with increase of the system viscosity.In the case of OP-10, the system incompatibility occurs at higher con-version levels, which is why the system separation into phases is notobserved visually up to 40% of the epoxy group conversion.
The processes that occur in the polymerizing system have variouseffects on its ability to separate into macrophases. Increase of themolecular weight of the oligomer results in increase of the surfactantmolar fraction in the system, which facilitates formation of the surfac-tant aggregates. As seen in Section 2.2, surfactant aggregation mustprovide for the compatibility of the colloid particles with the oligomer.
Upon achieving the limiting size of the colloid particles and withincreasing polymerization of the oligomer, the concentration of parti-cles per unit volume of the solvent increases, causing loss of stabilityand producing aggregation with formation of a separate phase.Separation of surfactant from the polymer results in the abruptincrease of its concentration in the surface layer; when the systembecomes incompatible a decrease in its surface tension is observed.
The regularities of the surfactant behavior that have been describedin the curing of epoxy oligomers are also seen in the study of othersystems. Below a certain conversion level in the system of POPT curedby reaction with TDI and DDN, there is growth of the colloid particles,caused by the decline of the solubility of DDN in the oligomer. It isinteresting that the increase of particle size is accompanied by adecrease of their concentration. It seems that from the energeticpoint of view the existence of particle of a certain comparativelylarge size is most advantageous and the amount of surfactant sepa-rated from the system is insufficient to compensate the decrease of theparticle concentration due to the increase of their volume.
The information presented in this section demonstrates that theconditions of wetting of the substrate by the adhesive (which is thefirst and most important stage of formation of an adhesive-bondedjoint), determined by the adhesive’s surface tension, depend notonly on the type of surfactant and its concentration but also onthe change in the surfactant structure in the course of the adhesivepolymerization.
The findings presented in Sections 2.3 and 2.4 allow us to character-ize differences between IS and RS substances, the majority of whichshow a trend opposite to the change of solubility in the course ofoligomer polymerization: the solubility of IS substances decreasesand that of RS substances increases. The separation of surfactant
44 Chapter Two

from the polymerizing adhesive with added surfactant can causeabrupt decreases of the adhesion strength because the reactionbetween the adhesive and the substrate in this case will be carriedout via a layer of low-molecular weight substances that has low cohe-sion strength. For RS substances there is no threat of formation of theweak boundary layers because the polymerization of systems with RSsubstances does not result in separation into macrophases.
The information presented was obtained under equilibrium condi-tions, whereas an adhesive-bonded joint is formed under nonequili-brium conditions. Taking account of the fact that in the course ofadhesive polymerization there are a number of processes running atdifferent rates, the kinetics of the cementing process must exert afundamental effect on the properties of adhesive-bonded joints.
2.5 Effect of Surface-Active Substances onthe Thermodynamic and Physical-Chemical Properties of Solid Polymers
The surface tension of an oligomer depends on the lifetime of the sur-face relative to the fact that relaxation and diffusion processes in bulkand at the boundary run comparatively slowly. The viscosity of thesystem increases due to the oligomer polymerization, which increasesthe time of establishing equilibrium at the boundary surface. Thus,the surface tension of the polymer depends on the relationshipbetween the rate of polymerization and that of establishing the equili-brium density of molecules at the boundary between the oligomer andthe air. That is why studies of changes in the system surface tension information of a solid polymer from a liquid one permit one not only toestimate the surface tension of the former but also to determine themeans and nature of this change. Let us designate the unbalancedvalue of the system surface tension as S to differentiate it from theequilibrium value �. Consider the character of the change of the sur-face tension during polymerization of systems that do not containsurfactant (ED-20 and DEG-1 epoxy resins cured by PEPA; POPTwith molecular weight 750 cured by TDI) as well as during formationof the non-chemical network (gel formation) of concentrated gelatinsolutions. Investigations were carried out using the sessile dropmethod. The system density was measured in the course of polymer-ization by the dilatometric method.
Figure 2.12 presents the change of the surface tension of the DEG–PEPA system in the course of the reaction at various temperatures.At temperatures of 30, 40, and 608C for 24 h, the system comes tothestate in which the surface tension no longer changes with time,i.e., it is close to equilibrium. This system at 208C and the DEG-1
Adhesive Properties Control by Surface-Active Substances 45

system at 508C do not achieve equilibrium in the same period oftime. This is related to the low rate of the curing reaction in thesesystems.
The equilibrium value of the polymer surface tension decreases withincrease in temperature (see Fig. 2.12), which follows from basicthermodynamic relationships. Thus, the increase of the adhesionstrength for cementing at higher temperatures is caused, apart fromother factors, by the improvement of wetting of the substrate by adhe-sive due to the decrease of the adhesive surface tension.
The regularities observed in the course of gel-formation of concen-trated gelatin solutions are largely similar to those seen in studies ofoligomer polymerization. The surface tension of the reactive blendchanges while the reaction runs. Once the reaction is completed thesystem comes eventually to a state that corresponds to equilibrium. Itmust be borne in mind that actual (thermodynamic) equilibrium can-not be achieved in some simulated systems, which is why by ‘‘equili-brium systems’’ we mean systems (as in this particular case) in whichthe surface tension changes very slowly.
Let us consider the general regularities of the change in surfacetension as the system polymerizes. At low temperatures and in earlystages of curing one observes some drop of the system surface tension.This can be related to the formation of the macromolecular branching,to the increase of diphilicity when the oligomer macromolecule reactswith a molecule of the curing agent, and to the process of orientation ofthe macromolecules in the surface layer. With an increase of thedegree of oligomer polymerization, its surface tension is expected toincrease. Note that at 208C the surface tension of the DEG–PEPA
46 Chapter Two
Figure 2.12 Change of the sur-face tension of the DEG–PEPAsystem in the course of reactionat various temperatures: (1) 20,(2) 30, (3) 40, and (4) 608C.

system is practically unchanged for almost 3 h from the time the poly-merization begins.
The times of emergence of the surface tension isotherms and thekinetic curves onto the plateau practically coincide. Evidently the con-ditions are such that the process of building the equilibrium density onthe boundary surface, the kinetics of which is determined by the mobi-lity of molecules (segments), catches up with the process of surfacechange. This assumption was checked by investigating the rate ofincrease of the equilibrium surface tension of epoxy systems of variousviscosities at various temperatures. The system viscosity was variedfrom 5 to 500 Pa�s by adding different quantities of PEPA to the resin.For all system conversion levels studied, the change of the surfacetension was in step with temperature variation, which increased ordecreased at the rate of 0.18C/min. At high conversion levels the rate ofbuilding to equilibrium decreases, although the rate of polymerizationin the last stages of the reaction is rather low, so it can be assumedthat in this case the observed surface tension will not differ noticeablyfrom its equilibrium value. Thus, there is opportunity for processes ofcompletion of system polymerization and achieving the equilibriumsurface tension to coincide.
The change of the system surface tension when POPT reacts withTDI is characterized by a number of features. In the initial stages ofthe reaction the surface tension of the system increases (see Fig. 2.9),which is related to the formation of more polar urethane groups. Theincrease in the urethane content results in the increase of the surfacetension up to a certain value, only after which does it fall.
It is not permissible to adopt data acquired from changes of theliquid resin’s surface tension for solid state polymer. Zisman [72]does it supposing that the reversible adhesion work of the solid poly-mer must be close to that estimated for the liquid state. The conclusionfollows from the assumption that the forces that act on the phaseseparation boundary spread out to a depth that does not exceed thesize of some molecules. As a result, the interaction on the boundarycannot depend on the change of state of the substance. One mustaccept this because the determined values of the surface tension ofsolid polymers significantly exceed those for the liquid oligomers. Ifwe deal with undercured products the values usually exceed those forthe polymer surface tension acquired by wetting agent critical surfacetension methods.
Let us consider the surface tension of a polymerizing oligomericsystem containing surfactant. The surface tension kinetics of systemsbased on DEG-1 resin cured by PEPA and containing different quan-tities of OP-10 is presented in Fig. 2.13. It can be assumed that in thiscase the rate of building up the equilibrium surface tension will be
Adhesive Properties Control by Surface-Active Substances 47

decreased compared with systems that do not contain surfactant,because the rate of diffusion of the comparatively large surfactantmolecules to the boundary must be low.
At low degrees of conversion the trend of the isotherms coincideswith the change of the equilibrium surface tension when surfactant ispresent (see Figs. 2.6, 2.8). The equilibrium density of the surfactantmolecules appears to build up in the surface layer at low temperature(the reaction was performed at 208C, at which temperature the rate ofinteraction is low). With increase of the degree of conversion systemscontaining surfactant, the surface tension increases similarly to thatof systems without surfactant. The increase of the surface tension isespecially noticeable in the region of transition of the system from theliquid state to the solid.
The primary peculiarity of the system under consideration is thefact that increase of the quantity of surfactant does not always resultin decrease of surface tension. Thus, the surface tension of polymercontaining 1% of L-19 is higher than that of a polymer containing0.05% or 0.5% of L-19. Additionally, increase of the surfactant contentof the liquid oligomer always results in the decrease of the surfacetension (naturally when the surfactant concentration in the systemis lower than CCMF).
The increase of surface tension in the DEG–PEPA system isrelated to the change of surfactant solubility. The rate of aggregationof the surfactant molecules depends on the viscosity and the chemicalcomposition of the polymerizing oligomer. Increase in system viscos-
48 Chapter Two
Figure 2.13 Change of the sur-face tension in the course ofpolymerization of the DEG–PEPA system (208C) at variousconcentrations of OP-10: (1) 0%,(2) 2%, (3) 4%, and (4) 5%.

ity means that under the dynamic conditions one cannot alwaysrealize the most thermodynamically advantageous surfactant struc-ture, which depends on the relationship of the rates of system poly-merization, and on physical-chemical and chemical (in case of RSsubstances) surfactant conversions. Thus, under dynamic conditions,the change in surface tension of a system that contains surfactantcan be different.
The second reason for the anomalous change of surface tension ofa solid polymer containing surfactant lies in the structural andconformational conversions of the polymer itself under the influenceof the surfactant. Such factors as the increase of the polymer surfacetension when surfactant is added cannot be explained by thesurfactant adsorption on the polymer surface only (see Fig. 2.13).Later we will consider this in detail. As was noted above, if therate of aggregation of the surfactant molecules is higher than orequal to the rate of polymerization, the system surface tension altersduring polymerization in the same way as in the course of theequilibrium process. At a high rate of polymerization, the formationof micelles of the maximum possible size can be hindered by therapid increase of the system viscosity. In this case, when an ISsubstance is applied the split into two phases is not observed andthe system appears to be more oversaturated by surfactant than inthe first case.
The change in the surface tension of systems that contain RS sub-stances is determined to a great extent by the relationship of therates of the system polymerization reaction and of the reaction ofRS substance with the oligomer. It is clear that if the rate of thefirst reaction is much higher than that of the second, the influence ofRS substances upon the system properties does not differ from thatof IS substances.
The relationship between the rates of the polymerization reactionand of surfactant aggregation must affect the trajectory of the iso-therm of the system surface tension because these processes shiftthe value of the surface tension in opposite directions.
The above processes are also influenced by the change in the systemtemperature. Raising the temperature results in increase of the poly-merization reaction rate and at the same time in decrease of the ten-dency of surfactant molecules to aggregate because of the increase ofthermal motion that follows from the Debye equation:
W ¼ �3kT ln ck ð2:16Þ
where W is the adsorption work and k is the Boltzmann constant.Thus, by changing the system temperature one can alter the
Adhesive Properties Control by Surface-Active Substances 49

relationship between the rates of oligomer polymerization and ofsurfactant aggregation. Experimentally these processes were studiedon the DEG–PEPA system with added OP-10, DDN, and L-19. Thesystem was polymerized at 20, 40, and 608C. The temperaturechange noticeably affects the character of the surface tension iso-therms. The surface tension of systems polymerized at 208C changesgradually (see Fig. 2.13), while an increase in temperature results inthe appearance of maxima on the isotherms (see Fig. 2.14). Thisdifference in the path of the curves is explained by the fact that atlow temperature, when the rate of polymerization is low, the state ofaggregation of surfactant molecules falls into line with the state ofthe polymerizing solvent, which is demonstrated by the coincidenceof the values of the surface tension determined under the equili-brium and dynamic conditions in the course of system polymeriza-tion. Under the influence of these two factors, the surface tensionchanges smoothly. The ascending branch of the isotherm (see Fig.2.14) characterizes the increase in surface tension due to the oligo-mer polymerization at 608C. In this case the surfactant has no timeto fall into line with the oligomer state. At a certain conversion level,surfactant separates from the system. Such a process is character-ized by abrupt decrease of the surface tension.
The above considerations are confirmed by turbidity data from acured DEG–PEPA system containing different quantities of OP-10,DDN, and L-10.
50 Chapter Two
Figure 2.14 Change of the sur-face tension in the course ofpolymerization of the DEG–PEPA system (608C) at variousconcentrations of OP-10: (1) 0%,(2) 0.05%, (3) 0.50%, and (4) 1%.

Table 2.5 shows that increase of polymerization temperature at lowsurfactant concentrations results in the decrease of the optical densityof the solid polymer and illustrates that temperature increase causesan abrupt decrease of concentration and size of the colloid particles inthe polymer. Increase in the surfactant concentration results in theformation of colloid particles at conversion levels of the system forwhich its viscosity is still comparatively low. At the point of a sharpincrease in the viscosity of the reactive system, enough colloid parti-cles appear to be formed, which is why the rate of the viscosityincrease practically does not influence the number and the size ofthe particles. As the table shows, the optical density of polymersincluding 14% OP-10 or 8% DDN hardly changes as the polymeriza-tion temperature is increased from 20 to 608C.
Let us consider the features of the polymerization of systems thatincorporate surfactant. Depending on the reaction time, the characterof the alteration of the surface tension is similar for DEG–PEPA sys-tems that contain OP-10 or L-19. For the explanation of this, refer tothe information presented in Section 2.3. At the start of the reaction,when the concentration of L-19 that has reacted with DEG-1 is stilllow, L-19 behaves similarly to an IS substance, i.e., OP-10. In thecourse of system polymerization, the compatibility of RS substanceswith the oligomer increases (see Table 2.5), which is why the decreaseof the surface tension cannot be caused by the separation of surfactantfrom the system.
Adhesive Properties Control by Surface-Active Substances 51
TABLE 2.5 Dependence of Optical Density of a Cured DEG–PEPA Systemon Temperature of Curing and Concentration of Surfactant (given in par-entheses)
Optical density
Concentration (%) 208C 408C 608C
OP-105.0 0.64 (0) 0.1 (0) –8.2 2.0 (0) 1.0 (0) 0.3 (0)
14.0 2.7 (0) 2.6 (0) 2.65 (0)DDN
4.0 0.22 (0) – –6.0 3.0 (0) 1.9 (0) –8.0 3.0 (0) 2.7 (0) 2.7 (0)
L-193.0 0.04 (0.03) – –6.0 0.13 (1.03) 0.06 (1.03) –8.4 0.21 (1.2) 0.13 (1.2) 0.07 (1.2)
The products of the reaction between DEG-1 and L-19 havehigher solubility in the oligomer, and the extent of their aggregationin the course of micelle formation is much lower than that of theinitial surfactant. In this respect, when the surfactant concentrationis higher than CCMF the micelles are the source of surface-activemolecules—i.e., the probability of saturated sorption on a surfaceincreases. It is to be expected that such accumulation of surfactantin the system depends on the rate of the reaction between surfac-tant and the oligomer, which is much lower than the rate of thereaction between the oligomer and the curing agent. Temperatureelevation essentially does not change the relationship between therates, which is why the processes described will result in a notice-able decrease of the system surface tension only some time after thereaction begins.
The products of interaction of OAA with epoxy resins have anextent of aggregation no greater than 2, which is why they do notform large micelles. In addition, during accumulation of PR in thesystem there is an increase of solubility of OAA themselves in thesystem, so that the system is enriched in molecules that incorporateresidues of both oligoepoxide molecules and OAA. The increase inOAA solubility causes the CCMF to increase and the surfactantmicelles to disintegrate. In so doing, the rise in OAA concentrationin the system results in more intensive formation of reaction pro-ducts and an increase of the micelle failure rate. Actually, the mea-surements of the optical density of the DEG–PEPA system curedwith L-19 indicate that increase in the surfactant concentrationdoes not result in noticeable increase of the optical density of thecured system. Even at very high concentrations of surfactant, thesolid polymer turbidity is 5–15 times less than that of the initialblend and much less than the turbidity of systems that contain ISsubstances, i.e., OP-10 or DDN.
Thus, despite the similarity of the surface tension changes of sys-tems that incorporate RS and IS substances, the observed phenomenaare based on different mechanisms. The principal feature of the pre-sence of RS substances in polymerizing systems is the trend towardlower aggregation level in the course of system polymerizationwhereas IS substances exhibit the opposite behavior.
Increasing surfactant concentration does not always result indecrease of the solid polymer surface tension. As Fig. 2.15 shows,the surface tension of the DEG–PEPA and ED–PEPA systems passesthrough a maximum with surfactant growth.
The surfactant can block the polar groups of the polymer, disturb-ing the intra- and intermolecular bonds [73–75]. This results inalteration of the molecular chain conformation and of the intermole-
52 Chapter Two

cular interaction that depends on the linear, branched or globularshape of the molecule. In turn, the energy and the entropy changesinvolved in the transition of the macromolecules to the surface differdepending on the shape of the macromolecules. In this respect thestructure of the surface layer produced in the course of the dynamicprocess also changes [76, 77]. Surfactant blocking of the polymerpolar groups must result in decrease of the intermolecular interac-tion, although the alteration of the macromolecular conformation dueto such a blocking can cause increased interaction in connection withthe macromolecules stretching and the formation of new contacts.Similar processes seem to be observed in the systems we have stu-died. As Fig. 2.15 shows, the surface tension of polymers with highercontent of surfactant initially decreases then passes through a max-imum, and finally becomes independent of the surfactantconcentration. This behavior can be explained on the basis of theabove considerations.
For low surfactant concentrations the shape of the macromoleculesdoes not change noticeably. Adsorption of surfactant on the interfaceand the decrease of interaction between the macromolecules of thepolymer when its polar groups are blocked by surfactant cause adecrease of the polymer surface tension. At higher concentrationsof surfactant there is an abrupt increase of the polymer surface ten-sion. Subsequent increase of the surfactant concentration results inits filling the surface layer, which is indicated by a drop in the poly-mer surface tension and its independence of the surfactant concen-tration.
Adhesive Properties Control by Surface-Active Substances 53
Figure 2.15 Dependence of thesurface tension of cured systemson the surfactant concentration:(1) ED–PEPA (L-19); (2) ED–PEPA (OP-10); (3) DEG–PEPA(OP-10); (4) DEG-PEPA (L-19).

The passage of the surface tension through a maximum is notdetected for oligomers in the initial state because they have compara-tively low molecular weight for which the effect of the macromolecularshape alteration is not manifest or is only slight. The structurizingeffect of surfactant begins to be observed at the stage of the oligomerpolymerization at which macromolecules of sufficient flexibility areformed.
These considerations are confirmed by studies of viscosity of thesystems described. Measurements were made using the REOTESTviscometer. Figure 2.16 shows practically no change in the viscosityof the initial ED-20 oligomer with up to 14% OP-10 or L-19. Withincrease of the oligomer chain length by reaction with 1% PEPA (theoligomer viscosity increased in this case from 20 to 180 Pa�s), the sur-factant structurization begins to be seen. The dependence of resinviscosity on the PEPA content displays a maximum and a minimumthat correlate with the similar dependence of the polymer surfacetension (see Fig. 2.16). Stretching of the macromolecules and forma-tion of new contacts results in increase of both the system surfacetension and the viscosity, while decrease of the intermolecular inter-action results in their decrease.
54 Chapter Two
Figure 2.16 Dependence of viscosity of ED-20 resinon the surfactant concentration: (1, 3) OP-10; (2, 4)L-19; (3) PEPA fraction; (1, 2) initial resin; (3–5)product of reaction of the resin with 1% PEPA.

Let us consider to what extent the structure of the surfactantmanifests itself in the above effects. We studied the alteration ofthe system viscosity by an amine that is an initial component inthe production of L-19 and constitutes a hydrophilic part of the sur-factant molecule. This amine is a PEPA fraction obtained by distilla-tion at 100–1508C (103 Pa) [78]. Thus, the influence of two substanceson viscosity are compared. One of these substances has a hydro-carbon ‘‘tail,’’ i.e., the structure of a typical surfactant, and theother differs only by the absence of such a ‘‘tail.’’ Adding 4% PEPAfraction to the system gives a 15% increase of the viscosity, less thanthe 75% achieved when surfactant is applied (see Fig. 2.16). Thesystem viscosity was determined during the period when chemicalreaction between the resin and the PEPA fraction had not beencompleted. Consequently, it is the molecular diphilicity of theadded substance that in this case is the primary factor increasingthe system viscosity.
Polymers with the surfactant additives that provide for achievingthe maximum surface tension are characterized by a number of fea-tures, namely, the absence of the region of high elasticity and theconsiderable (20–508C) elevation of temperature of the maximumdeformation on the initiation of destructive flow of the polymer.These effects can be explained by the increase of the number ofcontacts of the macromolecules when the polymer is formed fromthe oligomer with the addition of surfactant. With a substantialaddition of surfactant a plasticizing effect is produced on the polymerthat results in decrease of the temperature of the maximumdeformation of the polymer and the appearance of the region ofhigh elasticity.
These findings are confirmed by study of the thermodynamic para-meters of mixing of the cured epoxy resin with OP-20. At 6–7% contentof surfactant, corresponding to the maximum surface tension of thepolymer, a kink and an area of decrease of the Flory–Huggins para-meter are observed in the dependence of �2;3 on the surfactantconcentration. This anomalous dependence can be explained interms of the rearrangement of the intermolecular bonds in the poly-mer–surfactant system. With ED-20 initial resin, there are no extremaon the curve. Alteration of the macromolecular conformation affectsthe supermolecular structure of the polymer. Adding surfactant to ED-20 resin changes the form and causes a noticeable decrease of the sizeof the polymeric supermolecular formations.
Consider the surface tension change in the course of polymerizationof the POPT–TDI polyurethane system with added surfactant. Asmentioned, compared with epoxy systems this one has a number ofpeculiarities evidently due to alteration of the structure of the poly-
Adhesive Properties Control by Surface-Active Substances 55

urethane formed. Increase in the concentration of an IS substancesuch as DDN results in the decrease of the polymer surface tensionthat (as above) is related to the separation of the low-molecular weightsurfactant into the surface layer. Comparing the equilibrium value ofthe surface tension with that obtained under the dynamic conditions ofthe polymerizing system, the surface tension of the POPT–TDI systemwith added DDN is higher for the polymerizing system at similarconversion levels. This is related to the lag of the rate of the surfactantphysical-chemical conversions behind the rate of system polymeriza-tion, since the equilibrium and dynamic values of the surface tensionof the POPT–TDI system coincide when there is no surfactant added.With increase of the surfactant concentration, the incompatibility isdisplayed at lower conversion levels and the maximum value of thesystem surface tension shifts into the region of lower conversion.
Consider the alteration of the surface tension of the polymerizingPOPT–TDI system with the addition of an RS substance such as L-19;the use of L-19 displays a number of features. Interaction of the TDIisocyanate groups with the L-19 amine groups occurs at a higher ratethan reaction with the POPT hydroxyl groups. The amine groups of L-19 and of the product of the reaction with TDI are capable of catalyz-ing the reaction between TDI and POPT.
Increase of the amount of surfactant in the system does not alwaysresult in decrease of the polymer surface tension. Thus, surface ten-sion decreases to the maximum extent at an L-19 content of 0.92%.Increasing the amount of surfactant to 1.9% results in a 2-fold increaseof the polymer surface tension. A similar phenomenon is observed instudies of epoxy systems (see Fig. 2.15). In this case the surface ten-sion increase also seems to be related to the surfactant structurizingeffect.
Let us compare the effects on the POPT–TDI system of L-19 and ofthe PEPA fraction that differs from L-19 by the absence of the hydro-carbon ‘‘tail.’’ Table 2.6 shows that L-19 causes a notably greater
56 Chapter Two
TABLE 2.6 Surface Tension (mN/m) of Polyurethane with AddedSurfactant
Concentration of L-19 orof PEPA fractioncalculated for L-19 (%) PEPA fraction L-19
0 35.0 35.00.49 27.2 20.41.37 40.5 53.62.70 31.6 36.03.50 22.0 36.0

increase of the polymer surface tension than does the PEPA fraction.This indicates that in this case the structurizing effect of the surfac-tant is caused by its diphilicity as well.
Consider now the effect of surfactant on the properties of the initialand the cured polyester resins. Such systems show a number of parti-cular features. The structure and properties of the cured polyesterresins are determined to a great extent by the compatibility of thecopolymerizing components of the system. There is almost no informa-tion on the possibility of controlling this compatibility by means ofsurfactant, which is why it is of great interest to study the influenceof surfactant upon the thermodynamics of compatibility of the compo-nents of the cured polyester resin, as well as the effect of this compat-ibility on the molecular mobility of the polymeric chains and on thephysical-mechanical properties of the polymer.
Studies were performed with PN 609-21M resin, which is a 60%solution of maleate phthalate polydiethylene glycol (MP PDEG) indimethylacrylate triethylene glycol (TGM-3) (curing was achievedwith the methyl ethyl ketone peroxide–cobalt naphthenate redox sys-tem). The surfactant effect was provided by OP-10 and by the productof interaction of 1 mol of adipate polydiethylene glycol with 2 mol oftoluene diisocyanate (MDI), which is surface-active [80]. MDI differsfrom OP-10 in the reactive isocyanate groups capable of reacting withthe carboxyl and hydroxyl groups of the polymer and of being includedinto the polymer. The interaction of MDI with the initial oligomers isnot observed in practice because its rate is much less than that ofpolymer formation. The polymer was investigated after the completeconsumption of the isocyanate groups.
The molecular mobility in the polymers was determined by dielectricstudies. Polymer films 300–500 mm thick cast between glass plates atroom temperature were used. Dielectric measurements were madeusing the E8-4 ac bridge within a broad temperature range. The super-imposed frequency of the external electric field was 1 kHz. The depen-dence of the coefficient of transmission of the cured polyester resin onthe OP-10 content was determined using the FEC-56M photoelectriccalorimeter.
Figure 2.17 presents the dependence of the tan � maximum for thecured PN 609-21M resin containing 2–10% of OP-10. It is evident thatthe tan � maximum for the resin without OP-10 appears in the regionof 215 K. For the polyester resin containing 5% of OP-10 the maximumshifts toward lower temperatures (218–227 K). For the resin containingover 5% of OP-10 the maximum of tan � appears at 227–216 K, i.e., themaxima are shifted toward higher temperatures. The appearance ofthe tan � maxima of all the studied systems in the low-temperaturerange indicates dipole-grouped processes of relaxation. Plasticization is
Adhesive Properties Control by Surface-Active Substances 57

known to shift the process toward lower temperatures. The shift of thetan � maxima toward higher temperatures when up to 5% of surfactantis added, as well as the extremal character of curve 1 (Fig. 2.17), revealsthe anomalous effect of plasticization of this system. The observedeffect is related to the change of the thermodynamic compatibility ofthe system components under the influence of surfactant.
Figure 2.18 (curve 1) presents the dependence of the �2;3
parameter of the thermodynamic interaction between the compo-nents on the composition of a mixture of MP PDGE–TGM-3 oligo-mers at 330 K. This mixture is thermodynamically compatiblethroughout almost the whole range of concentrations studiedbecause, according to theory, the components are thermodynamicallycompatible: ��
2;3 < ð�2;3Þ�crit In this case the latter is equal to 0.442. It
58 Chapter Two
Figure 2.17 Effect of OP-10 (1–3) and MDI (4, 5) content in cured PN609-21M resin on temperature of the maximum tan � for the dipole-grouped relaxation process at failure stress (1, 5), on the failurestress at static bending of the resin (2, 4), and on the optical density�0 of the resin (3).

is evident that the 40–60% range of the TGM-3 concentration thatprovides optimal physical-mechanical characteristics of the curedpolyester resins corresponds to the maximum thermodynamic stabi-lity of the system.
In the curve of compatibility of the cured resin with surfactant (Fig.2.18, curve 2), a kink is observed around 5% surfactant content and aregion of decrease of the Flory–Huggins parameter. Varying thethermodynamic compatibility of the components of the polymeric sys-tem must result in alteration of the shape of the macromolecules, andthe character and strength of their interaction. The improvement incompatibility will cancel the stretching of the growing macromoleculesthat increases the number of contacts between them. The anomalousconcentration dependence of ��
2;3 seems to be explained by the re-arrangement of the intermolecular links that exist in a polymericsystem due to the change in the polymer macromolecular conforma-tions, which must result in alteration of the relaxation processes of theelements of the polymeric network and in alteration of the polymerphysical-mechanical properties.
As Fig. 2.17 (curve 2) shows, the strength of the cured polyesterresin containing OP-10 has a maximum within the area of 5% of sur-factant that corresponds to the minimum value of ��
2;3 (Fig. 2.18, curve2) and to the highest temperature at which the maximum of tan �appears (Fig. 2.17, curve 1). This is confirmed by studies of the turbid-ity of the cured polyester resin containing OP-10. The transmission
Adhesive Properties Control by Surface-Active Substances 59
Figure 2.18 Concentrationdependence of the parameter��
2;3 for the MP PDEG–TGM-3system at 333 K (1) and for PN609-21M [cured by MEKP(O)]and NC–OP-10 systems at383 K (2). The dashed horizontalline represents the limit of ther-modynamic compatibility.

coefficient of the polymer has a maximum for 5% content of OP-10 (seeFig. 2.17, curve 3), indicating the minimal level of the phase lamina-tion of the components of the copolymerizing system. Consider thedipole-group relaxation process of the cured PN 609–21M polyesterresin with MDI. As MDI content increases up to 8% the relaxationprocess shifts toward higher temperatures compared with the tem-perature at which the tan � maximum of the initial system appears(see Fig. 2.17). The polymer has maximum strength at the surfactantcontent at which one observes the extremal value of the temperaturemaximum (see Fig. 2.17, curve 5).
The similar character of the dependence of polymer molecular mobi-lity on the concentration of both IS and RS substances confirms theassumption that the effect of surfactant on the system properties isalso related to the surfactant’s influence on the process of polymerformation, which occurs under better conditions of compatibility ofthe copolymerizing components.
2.6 Oligomer–Metal Interphase Tension
Earlier we considered the regularities of the effect of surfactants onthe oligomer surface tension. The properties of adhesive-bondedjoints are also determined by the character and the magnitude ofthe interaction at the adhesive–substrate interface, which to agreater extent is characterized by the magnitude of the interphasetension [82]. Study of the interphase tension is of great theoreticaland practical interest, but at present there are no direct methods forits determination.
The adsorption of surfactant can be successfully studied by electro-chemical methods. Thus, the polarographic method of the analyticaldetermination of surfactant is based on the surfactant’s capacity tosuppress the maximum. Methods involving measuring the capacityof the electric double layer are also widely used for studying theadsorption. Nevertheless, data from polarographic studies and of mea-surements of the capacity of the electric double layer alone cannotunequivocally characterize the adsorption level of an organic com-pound. Polarographic studies are usually carried out at a potentialat which some compounds adsorb to the maximum extent and othersto a lesser extent. Capacity measurements have no such shortcomingand permit determination of both the potential of the maximumadsorption and the range of potentials within which the adsorptionoccurs; though cases are known where adsorption of an aromatic com-pound does not practically affect the capacity of the double electriclayer [83]. Consequently, fuller information about the adsorption oforganic compounds is provided by a combination of these. Using
60 Chapter Two

these methods one can estimate the surface activity of both low-mole-cular weight organic compounds and oligomers and polymers relativeto one another and to the known surfactant [84].
Polarographic measurements were carried out using the LP-60instrument with the EZ-2 autographic recorder and with the droppingmercury electrode. For aqueous solutions a silver chloride electrodeserved as anode; in the case of nonaqueous solutions the bottom mer-cury was the anode. The anode potential did not change significantlyin the aqueous and nonaqueous solutions with surfactants; cathodepolarization was checked by means of the three-electrode circuit rela-tive to the normal calomel electrode.
The level of suppression of the persulfate ion polarographic maxi-mum was used to assess the surface activity of compounds under studyin aqueous solutions with an accurately determined amount of surfac-tant against background of 100 mol/m3 NaCl. Electrochemical reduc-tion of divalent copper was used in the study of the surface-activeproperties in nonaqueous media. It is known that spontaneous reduc-tion of Cu2þ ion against background of 100 mol/m3 of N(C4H9)4I gives aclear maximum at 70.2 V. Careful removal of oxygen is necessary toobtain regenerated waves because oxygen distorts the shape of thewave of copper reduction at 70.3 V. Within the concentration range0.26–0.43 kg/m3, the height of the Cu2þ maximum is proportional tothe concentration of the copper ions. Under these conditions, surfac-tant adsorption on the electrode has noticeable effects on the height ofthe maximum.
It is first necessary to select the range of copper ion concentrationsin which the maximum of the wave is most sensitive to the additions ofthe compounds under study. For this purpose an equal quantity ofsolution of the compounds under study is added to solutions of variouscopper concentration and the difference in the maximum heights isdetermined before and after surfactant is added. The difference inmagnitude increases initially with increase of the copper concentra-tion, then, having reached a certain limit, remains practicallyunchanged. With these considerations, the copper concentration forthe studies was taken as 0.26–0.43 kg/m3 because, in this case, lineardependence is observed between the maximum height and the copperconcentration.
The procedure is as follows. A solution containing 0.26 kg/m3
copper chloride in DMFA is polarographed against the backgroundof 100 mol/m3 of N(C4H9)4I; then a precisely defined quantity ofsurfactant is added and the solution is polarographed again. Therelative surface activity of the compounds under study is judged bythe maximum height difference of the copper before and aftersurfactant is added. The circuit comprising polarization with the
Adhesive Properties Control by Surface-Active Substances 61

amalgamated silver microcathode and the bottom mercury as anode,and with the prescribed current, was used for the oscillopolaro-graphic measurements. This method allows estimation of the adsorp-tion of organic compounds. The alteration of the electric double layercapacity and of the dE=dt polarization rate, well known in the courseof the surfactant adsorption, is observed by means of dE=dt oscillo-grams.
Since the alteration of the polarization capacity (c) and rate, and thecapacity itself, depend on the potential, a better picture of the adsorp-tion can be obtained by using the relative values of �c=c1 ¼ �V=V2,where V2 is the rate of the polarization with surfactant present. Fromthe �V=V2–E relationship one can estimate the adsorption ofsurfactant under study within a potential range limited only by thedepolarization process.
Table 2.7 presents the results of polarographic study of the adsorp-tion of some organic compounds in water and in DMFA. The relativeadsorption values as percentages were determined by the difference inheights (H) of the maxima with and without surfactant. The surfaceactivity was determined relative to that of Twin-60, assumed as 100units. As Table 2.7 shows, the surface activity of OP-10 is less thanthat of Twin-60 by 17 units in aqueous solution, while that of thesolvents under study is lower by 65–68 units. Judging from thesedata, the Twin-60 is much more surface active in aqueous solutionthan in DMFA.
62 Chapter Two
TABLE 2.7 Polarographic Study of Surfactant Adsorption in Water and in DMFA
Concentration Surface activityof surfactant H0 � H1
H0�100 ð%Þ
by correlation toSurfactant (kg/m3) Twin-60
In water
Twin-60 0.30 62.5 100OP-10 0.30 52.0 83.3Chloroform 0.31 22.0 35.0DMFA 0.30 20.0 32.0Methanol 0.30 20.0 32.0
In DMFA
Twin-60 0.30 20.0 100OP-10 0.30 4.9 24.6TMGF-11 0.32 17.0 85MGF-9 0.30 15.0 75MDF-2 0.31 11.4 57

The oligoester acrylate in DMFA adsorbs to great extent on thesurface of the mercury at 70.2 V (Fig. 2.19). The maximum surfaceactivity under the above conditions is that of TMGF-11 (85 units rela-tive to the Twin-60), while the relative surface activity of the higher-molecular weight oligoester MDF-2 is 57 units and that of OP-10 isonly 24.6 units relative to Twin-60 (Table 2.7). At the same time, eventhese low adsorptions cause considerable alteration of the double elec-tric layer capacity under the given conditions (Fig. 2.19a, b). Theadsorption maximum of all the compounds studied in aqueous solutionlies around the point of zero electrode charge.
The pictures of adsorption of each compound presented in the fig-ures have both common and differing features. Thus, Twin-60 beginsto be adsorbed at the potential E ¼ �0:2 V, and at �0:6 V its adsorp-tion is maximal. Twin-60 adsorbs completely at 1.8 V. With increase ofthe Twin-60 concentration the adsorption potential E and the poten-tial that characterizes complete desorption of this compound shifttoward more positive values; at the same time the range of the adsorp-tion potentials remains unchanged and is �1:6 V. The maximal valueof �V=V2 is 35 units. The area of the OP-10 adsorption potential issomewhat less (1.5 V). The maximum of this surfactant adsorptionshifts toward positive values of the potentials along with increase ofconcentration. The maximal value of �V=V2 is 32 units.
After the zero-charge point the adsorption of chloroform is maximal,and within the range of potentials from 70.6 to 71.6 V is constant,
Adhesive Properties Control by Surface-Active Substances 63
Figure 2.19 Dependence of �V=V2 vs. E with surfactant in DMFA againstN(C4H9)4I solution (1 mol/l) at surfactant concentration of 0.6 g/l (solid line)and 0.3 g/l (broken line): (a) Twin-60; (b) TMGF-11; (c) MGF-9; (d) OP-10.

judging from the capacity change. DMFA produces an adsorption peakat the zero-charge point which then drops to 0 at 71.2 V. With increas-ing DMFA concentration, the picture of the adsorption suddenlychanges. There are two adsorption peaks observed in the �V=V2�Erelationship: the first is at the zero-charge point, the second is atE ¼ �1:5 V, with the desorption within the potential range from70.9 to 71.1 V. Taking into account that in this case the maximalvalue of �V=V2 is less than at the initial concentration of DMFA, itcan be assumed that the DMFA forms associations capable ofadsorption. The appearance of the second adsorption maximum withthe considerable shift to negative values can be explained bydisintegration of the associations inside the thin layer at the electrodesurface.
In DMFA with 100 mol/m3 of N(C4H9)4I present, the picture ofsurfactant adsorption is somewhat different because both DMFAand N(C4H9)4I are surface-active. Thus, Twin-60 produces one sharppeak of adsorption at a potential of 70.4 V and a second one, which isless intense, at 70.6 V. The adsorption potential range is 1.3 V. OP-10adsorption begins at zero and the maximum is reached at 70.3 V.
Adsorption of the oligoester acrylate is characterized by a number ofpeaks. As Fig. 2.19 shows, TMGF-11 produces two peaks and MGF-9(at 0.3 g/l3 concentration) produces three peaks of adsorption. In addi-tion, the change of the electric double layer capacity with concentra-tion is less. This can be explained by the fact that at low concentrationthe molecules of the oligoester acrylate are stretched out in the elec-trode’s field and oriented parallel to its surface. With increase of con-centration they are arranged perpendicular to the electrode surface. Inline with the investigation of these compounds’ adsorption in waterand in DMFA, correlation of the polarographic and oscillo-polarographic data allows them to be arranged in series according todecreasing surface activity: in water, Twin-60>OP-10> chloro-form>mixture of DMFA with methanol; in DMFA, Twin-60>MGF-9>TMGF-11> OP-10. These findings show that the surface activityof OP-10 in DMFA differs greatly from that in aqueous medium.
On the whole the polarographic and oscillopolarographic data coin-cide, apart from TMGF-11, which suppresses the polarographic max-imum with the same intensity as Twin-60 and at the same time has novery noticeable effect upon the capacity of the electric double layer.Evidently we observe the case of an organic molecule with a system ofconjugated double bonds involved in the formation of the electric dou-ble layer as though increasing its thickness with small effect uponcapacity.
Thus, this method allows evaluation of the surface activity of anumber of compounds in terms of two characteristics quickly and
64 Chapter Two

fairly reliably. The short time needed for the experiment enables us todetermine the change of adsorption in time, which is especially impor-tant in the study of mixtures of substances that have different surfaceactivities and where surface activity changes with time, for example,in the course of chemical reaction in solution.
For the study of the interphase tension at the boundary between theoligomer and a metal, a model system was used in which liquid mer-cury was used for the metal. The mercury was thoroughly purified anddistilled prior to use. The interphase tension was determined by thesessile drop method [230]. The error was estimated as 3 mN/m. Theoligomers and adhesives based on them were ED-20 epoxy resin-basedadhesive with PEPA curing agent (12%) and PN 609-21M polyesterresin-based adhesive with MEKP(O).
Figure 2.20 presents isotherms of the interphase tension of surfac-tant in the PN-1, ED-20 and PN 609-21M oligomers. Comparing themwith the data described in Sections 2.1 and 2.2, one can conclude thatthere is no correlation between the surfactant activity on the boundaryof mercury and air for the cases under consideration. Thus, OP-10 andL-19 are active at the boundary between the oligomer and air and arenot active at the boundary with mercury. In contrast, the newly devel-oped product ATG is active on the boundary with mercury only. AsFig. 2.20 shows, the interphase tension of the ED-20 resin increaseswith added OP-10. The increase, earlier described, of the surface ten-sion at the boundary between the oligomer and the air with addition ofsurfactant to the oligomer was related to the availability of the sur-face-active impurities in the oligomer. In fact, commercial industrial
Adhesive Properties Control by Surface-Active Substances 65
Figure 2.20 Dependence of sur-factant content of surfacetension of oligomeric systemsat mercury interface: (1) ED-20–OP-10; (2) ED-20–decane;(3) ED-20–octane; (4) ED-20–L-19; (5) PN 609-21M–OP-10;(6) PN 609-21M–dibutyl phtha-late (DBP); (7) PN 609-21M–dimethyl phthalate; (8) ED-20–ethanol; (9) PN 609-21M–ATG.

oligomers always contain substances whose molecules differ from theoligomer molecules in chemical composition and structure. These sub-stances represent oxidized oligomer molecules with altered function-ality and branching, and the remains of catalysts, solvents, etc.Similar impurities can coincide poorly with the main bulk of the oli-gomer and can adsorb at the boundary between the oligomer andmercury. Adding surfactant to the oligomer was shown to result inincrease of the solubility of the impurities and in their desorptionfrom the boundary, which increases system surface tension. Theincrease of the interphase tension of ED-20 resin with added OP-10seems to occur for the same reasons.
The equilibrium interphase tension for the studied oligomers isachieved in 10–100 min. The low rate of reaching equilibrium evenfor the noncuring oligomers is evidently explained by both theincreased viscosity of the oligomer in the boundary layer and the dif-fusion processes on the boundary.
The principal peculiarity of the kinetics of the interphase changes atthe boundary between the adhesive and the mercury in comparisonwith those of the surface tension at the boundary with air is theapproach of the kinetic curves to the equilibrium value long beforegel-formation of the system, while the surface tension undergoesmaximum changes close to the gel formation point. The change inthe interphase tension at the point of transition of the system fromthe liquid state to solid is not observed for systems that do not containisocyanate groups. This seems to be related to the fact that polymer-ization at the interphase boundary in such systems occurs at a lowerrate than in the bulk, which can be caused by the selective sorption ofsome components of the system by the high-energy surface, disturbingits equimolarity, by the decrease of the macromolecular mobility in thesurface layer, and by blocking of the system functional groups by thesurface.
One reason for the stability of the interphase tension during transi-tion of the system into the gel state might also be adsorption of thelow-molecular weight impurities at the boundary with the mercury. Inthis case there is a layer of chemically unreactive liquid between thecured oligomer and the mercury surface, while the observed value ofthe interphase tension does not naturally reflect the state of the sys-tem. Figure 2.20 shows that some low-molecular weight compoundssuch as dibutyl phthalate (DBP) and dimethyl phthalate can diffusetoward the interphase boundary and adsorb onto it, decreasing theinterphase tension. For the systems containing isocyanate groups,the kinetic curve has a minimum. Such extrema seem to be due tothe fact that the surface can increase the probability of the reactionbetween isocyanate, urethane, and other polar groups adsorbed on the
66 Chapter Two

surface, resulting in the formation of branched macromolecules [29].The formation of branched macromolecules increases the interphasetension as a result of their less dense packing on the surface comparedwith the linear molecules.
2.7 Control of Polymer Adhesion Strengthby Means of Surfactant
The fracture stress of adhesive-bonded joints (adhesion strength) is aconsequence of processes that occur in the course of their formation,but all attempts to formulate a fundamental relationship betweenformation and failure of adhesive-bonded joints have so far beenunsuccessful. This is mainly due to the lack of methods for measuringadhesion that would permit determination of the failure equilibriumwork. Accordingly, the relationship between the experimentallydetermined value of the adhesion strength and the thermodynamiccharacteristics can be one of correlation only.
In our view, the failure to determine correlation between the thermo-dynamic characteristics of adhesion and the strength of adhesive-bonded joints lies in the fact that what was being studied was therelationship of the initial compound properties (in the liquid state)with the strength of joints in which the adhesive was in the curedstate. In addition to ignoring the essential differences of the curedadhesive from the initial liquid, there was no account for irregularityof the process of formation of adhesive-bonded joints itself, whichmeans that the most favorable adhesive structure (from the thermo-dynamic point of view) is not realized for kinetic reasons. The neces-sity for accounting for these factors has been established in previoussections.
Let us consider the effects upon the adhesion strength of substancesthat are active at the boundary between the adhesive and the air. Thecomparison of experimental data presented in Sections 2.2 and 2.5shows that the dependence of the surface tension of the initial liquidoligomers on the surfactant concentration differs noticeably from thatof the cured adhesive. For oligomers this dependence is characterizedby a monotonic decrease of its value with increasing surfactant con-centration up to a certain limit, while for polymers the dependencepasses through a maximum. Given that these characteristics reflectboth the dynamics of the adhesive-bonded joint formation process andthe essential difference between the cured polymer surface propertiesand those of the initial liquid mixture, it is of considerable interest tostudy the relationship of these characteristics with the adhesionstrength of the joint. In determining this relationship one shouldremember that the strength of the adhesive-bonded joint is affected
Adhesive Properties Control by Surface-Active Substances 67

by internal stresses, which decrease its value. Thus, the relationshipdetermined is a qualitative one, although it indicates possible ways tocontrol the adhesion strength.
Let us consider the dependence of the adhesion strength of adhesive-bonded joints on the content of surfactant (active at the boundarybetween the polymer and the metal) in the initial oligomer. As Fig.2.21 indicates, with the increase of the quantity of IS substance, theadhesion strength passes through a minimum, after which thestrength of the adhesive-bonded joint increases sharply, decreasingagain with further increase of surfactant content. Such a dependenceis observed for both epoxy and polyurethane systems. It should benoted that analogous dependences have been obtained for polyethy-lene and other polymers.
A somewhat different dependence is observed for RS substances (seeFig. 2.21, curve 1). For small quantities of surfactant this dependencefor RS substances coincides with the analogous dependence for ISsubstances; at greater quantities of surfactant this dependence doesnot indicate any drop in the adhesion strength in that it becomesindependent of the surfactant content and the change in the adhesionstrength shows the same dependence as the polymer surface tension.This correlation is not random: insofar as the adhesive spreads well onthe steel surface, the thermodynamic work of adhesion of the curedadhesive to a solid surface is essentially twice the value of the surfacetension, and consequently the dependence of the adhesion strength onthe surfactant content must coincide with the change in the surface
68 Chapter Two
Figure 2.21 Dependence on sur-factant content of the adhesionstrength of the ED–PEPA [(1)L-19, (2) OP-10)] and DEG–PEPA [(3) OP-10, (4) L-19)] sys-tems.

tension that is observed experimentally. Additionally, the increase ofthe polymer surface tension under the influence of surfactant iscaused, as shown earlier, by the change in the polymer structure,which affects the cohesion strength and naturally results in anincrease of the adhesion strength.
Comparison of Figs. 2.15 and 2.21 shows that the availability ofthis correlation permits easy interpretation of the dependence of theadhesion strength on the quantity of surfactant, taking account ofthe processes that occur in bulk and on the surface of the polymericphase.
Let us consider the mechanism of the effect of surfactant on theadhesion strength and the effects of RS and IS substances in account-ing for the observed correlation dependence. At a low surfactant con-tent the surface tension of a solid adhesive decreases, which decreasesthe adhesion tension. Further increase of surfactant content, and therelated growth of the thermodynamic work of adhesion, increases theadhesion strength as sharply as the growth of the surface tension. Butat these quantities of surfactant, as Figs. 2.15 and 2.21 show, theincrease of the adhesion strength occurs over a greater range of con-centrations than that of the surface tension. This seems to be relatedto the fact that internal stresses decrease with the increase of thesurface tension.
Increase of the surfactant content above a certain value results in adrop in the thermodynamic work of adhesion due to the decrease of thesurface tension. It can be assumed that the drop in adhesion strengthfor IS substances is related not only to the change of the thermody-namic work of adhesion but also to the formation of micelles that forma weak zone at the boundary between the adhesive and the substrate.The accumulation of such micelles occurs gradually with increasingsurfactant concentration, as a consequence of which a comparativelysmooth decrease of the adhesion strength is observed.
In the case of RS substances things are somewhat different. Thesurfactant solubility increase in the course of the reaction and chemi-cal interactions with the polymer mean that such surfactants do notform micelles. No decrease of the adhesion strength was observed evenwith large quantities of surfactant.
Thus, differences in the effects of surfactant of both types on theadhesion strength are exhibited only at high surfactant content andconsist of an opposite trend of the compatibility in the course of poly-merization to that found in studies of surface tension in the course ofoligomer polymerization. When cementing low-energy surfaces or inliquid media, the factors under consideration will be superimposed onthe change of wetting of the substrate by the adhesive due to the effectof surfactant.
Adhesive Properties Control by Surface-Active Substances 69

Now let us consider the effect on the adhesion strength of surface-active substances at the boundary between the adhesive and themetal. Figure 2.22 presents the dependence of the adhesive-to-steeladhesion strength on the difference between the interphase tensionof the solid adhesive–mercury system and the adhesive surface ten-sion. Because it is impossible to measure the adhesion strength atthe boundary with mercury, it was determined at the boundarybetween the adhesive and steel. The interphase tension will surelydiffer here from that at the boundary with mercury, although this isonly a quantitative difference and the qualitative relationship will bemaintained.
As Fig. 2.22 shows, the adhesion strength increases as �adh Hg��adh air decreases. RS substances were used to control the interphasetension. The thermodynamic work of adhesion is related to the surfacetension at the boundaries between adhesive and air, between adhesiveand solid, and between solid and air by the relationship
Wadh ¼ adh air þ adh air þ adh solid ð2:17Þ
Given that the metal surface tension was the same in all cases, thethermodynamic work of adhesion depends on the interphase tensionand on the adhesive surface tension. In this case (see Fig. 2.22) acorrelation is seen between the thermodynamic work of adhesionand the adhesion strength. This correlation was determined earlierby Lipatov and Myshko by applying the modified equation of Dupre–Young [102]. Epoxy, polyester, polyurethane, and polyacrylate adhe-sives were used: the type of the adhesive did not have a significanteffect on the correlation dependence.
Such a dependence is surprising at first sight. Actually, aswas shown in Chapter 1, the primary reason for disintegration ofadhesive-bonded joints is the formation of a weak zone at the bound-
70 Chapter Two
Figure 2.22 Dependence of theadhesion strength of adhesive-bonded joints on the differenceof the interphase and surfacetensions of adhesive.

ary between the adhesive and the substrate, which can be causedby layers of gases and vapors adsorbed from the air, by low-molecular weight impurities, or by certain ingredients of theadhesive on the surface of the substrate. In addition, the substratecan induce defects of the polymer boundary layers. In the course ofcementing surfaces with adsorption layers, the adhesive can forcethem apart or spread all over their surface. Most realistic areintermediate cases where the thickness of the adsorption layersdecreases with the application of the adhesive onto the substrate.Clearly, the lower the level of the interphase tension produced byRS substances, the higher the probability of desorption of substancespreviously adsorbed from the substrate surface and the lower theprobability of the selective sorption of some ingredients of theadhesive by the substrate.
Let us consider the effect of surfactant on the properties of thepolymer boundary layers. Octyltrimethylammonium bromide (OTMAB)integrated into the compound was used as surfactant. Figure 2.23shows that surfactant that has little effect on the cure rate of theepoxy compound in the bulk does increase the rate and the degree ofconversion in the boundary layer on the surface of KRS-5. The adsorp-tion of surfactant on the interface seems to remove the selective sorp-tion of the epoxy resin, which excludes the opportunity for formation ofthe undercured boundary layer and results in increase of the adhesionstrength (Table 2.8).
Addition of surfactant makes it possible to monitor the glass-transition temperature in polymer films only 0.01 mm thickobtained at room temperature (Fig. 2.24). Heating the polymerraises the glass-transition temperature in the boundary layers tohigher values than in the bulk, as was noted earlier for polymerscured on a low-energy solid surface (see Fig. 1.3). Beginning with asurfactant content of 10%, the adhesion strength decreases due to
Adhesive Properties Control by Surface-Active Substances 71
Figure 2.23 Time dependence ofthe conversion level of epoxygroups: (1) ED-20 (PEPA)–OTMAB (boundary layer); (2)ED-20 (PEPA); (3) ED-20(PEPA)–OTMAB.

formation of polymolecular boundary layers of surfactant. At thiscontent of surfactant, the thermodynamic compatibility of the sur-factant with the polymer increases, which confirms the formationof micelles in the system.
Thus, the inclusion of surfactant in the adhesive may result in thepresence of defects in the polymer boundary layers. Let us consider theeffect of OTMAB on the physical-mechanical properties of epoxy poly-mer boundary layers. A nonmonotonic dependence of the modulus ofelasticity of the coatings on both substrates on the surfactant concen-tration was observed for fine coatings in the systems investigated
72 Chapter Two
TABLE 2.8 Effect of OTMAB on Adhesion Strength and Glass-TransitionTemperature of Epoxy Adhesive
Tg from
OTMAB Adhesion Reversed-phase gasconcentration (%) strength (MPa) chromatography Calorimetry
0 11 370 3821 13 367 –5 24 365 –8 30 363 374
10 28 360 37120 20 355 366
Figure 2.24 Dependence of Tgon the layer thickness for epoxypolymers on iron: (1) ED-20–PEPA–OTMAB; (2) ED-20–PEPA–OTMAB with heatingfor 1h at 423 K; (3) ED-20–PEPA with heating for 3 h at423 K.

(Table 2.9). Addition of 5% of surfactant increases modulus, althoughincrease of the surfactant content up to 10% in the reactive mixtureresults in a noticeable decrease of the coating’s elasticity, which ismore important in the area of fine coatings on aluminum high-energysurfaces. When the coatings are 5 mm and more thick, this dependenceis weaker. The extreme character of the dependence of fine polymercoatings on the substrates can be explained by the fact that integra-tion of surfactant into a compound may cause formation of an adsorbedmonolayer on the surface of a solid even at low concentration. Thismonolayer has higher strength and forms a new interface with theepoxy coating with its own adhesion interaction. It is also bound tohinder the effect of the selective sorption of molecules of the epoxyoligomer, which is one reason for undercure of the epoxy compoundon a high-energy surface. This produces boundary layers with highercohesion properties, which seems to result in increase of the modulusof elasticity of fine coatings and the increase of the adhesion strengthof adhesive-bonded joints that is observed with addition of 5% surfac-tant. On further increase of the surfactant content in the reactivemixture up to 10%, the observed decrease of the elasticity of the coat-ings is related to plasticization by the low-molecular weight surfactantwhose contribution to the cohesion of the boundary layer becomesdominant.
Adhesive Properties Control by Surface-Active Substances 73
TABLE 2.9 Modulus of Elasticity En (103 MPa) of Epoxy Coatings onSubstrates at Various Surfactant Contents in the Reactive Blend
Surfactant content (%)
Coating thickness (mm) 0 5 10
Aluminum
1 27.0 34.0 16.02 10.0 14.5 6.85 5.0 5.5 3.4
10 4.3 4.7 2.420 3.2 2.9 2.2
Polyethylene terephthalate
1 19.5 25.0 15.72 11.2 17.2 12.05 6.7 6.8 5.2
10 4.6 4.8 4.020 3.4 3.4 3.0

The information presented convincingly illustrates the possibility ofanalyzing the processes that occur during formation of an adhesiveinterlayer by thermodynamic approaches and by colloid-chemical con-cepts. The regularities described make possible the prediction of adhe-sive properties and the creation of adhesives with predeterminedproperties.
2.8 Influence of Surfactants on theStructure of Polymers
2.8.1 Influence of surfactants on thestructure of polyurethanes
The properties of adhesives depend largely on the structure of thepolymers; accordingly, research on the ability to control this structurewith the help of surfactants is of considerable scientific and practicalinterest. For this reason, we have undertaken the investigation of thestructure-forming action of the surface-active substance KEP-2 in theformation of polyurethanes and polyepoxides, dimethylsiloxanes andalkylene glycol block copolymers. KEP-2 (a dimethylsiloxane–alkyleneglycol block copolymer) is an effective surfactant that exhibits surfaceactivity even at very low concentrations.
The reaction kinetics has been studied in the system of 2,4-toluenediisocyanate (TDI), polyoxypropylene glycol of �MMn ¼ 1000, and tri-methyl propane (TMP) with different contents of KEP-2 (0.02–0.2%)at 353 K [224]. The observed reaction rate constants of urethane for-mation on the first and the second sections of the kinetic curves (Table2.10) were calculated from the calorimetric data according to thesecond-order rate equation. As is evident, the presence of KEP-2 accel-erates the reaction. Two concentrations of surfactant (0.03% and0.15%) are exceptions. The observed acceleration becomes more notice-
74 Chapter Two
TABLE 2.10 Values of Reaction Rate Constants for Formation of Space-NetworkPolyurethanes of PPG-1000, TDI, TMP in the Presence of Different Amounts ofKEP-2 at 808C
Surfactant concentrationCKEP�2 (%)
102K11
mol � NCO � min
� �102K2
1
mol � NCO � min
� �
0 1.45 1.00.02 1.80 1.400.03 1.52 1.060.05 1.80 1.410.11 2.04 2.000.15 1.70 1.100.2 2.06 1.45

able at high degrees of the completion of reaction (above 60% trans-formation isocyanate groups). Since surfactants are active structure-forming agents, it is supposed that the observed acceleration by sur-factant is connected with this capacity. For this reason, further studydeals with the effect of KEP-2 on the structural parameters of thepolyurethane reaction mixture in the estimation of viscosity andlight diffusion during hardening. The process of gel formation beginslater for higher amounts of surfactant. This nature of the effect ofKEP-2 in hardening systems seems to be connected both with thedetails of surfactant behavior at the interfaces and with the mechan-ism of formation of network structures by the polycondensationmechanism. As is shown for the one-stage method of polyurethaneproduction [225], microparticles of the crosslinked polymer appear inthe reaction medium when the reaction is 55% complete. As soon asthe other phase appears, molecules of surfactant can sorb onto thealready formed surface of microheterogeneities just as on the inter-face. The adsorption layer of surfactant prevents hydrogen bondingand other forms of physical interaction of these particles with therest of the medium, and also promotes chemical interaction of themicrogels formed. These effects are manifest in the decrease of viscos-ity and in the delay of the sharp increase of viscosity, respectively.
A light diffusion method was used to determine the amount andcharacter of changes in the microheterogeneities during hardeningof the polyurethane reaction mixture. A general view of the depen-dence curves up to 85% transformation shows no differences fromother processes of formation of spatially crosslinked polymers studiedby this method [226, 227]. The observed behavior, due to the viscositychange in the course of the reaction, may be interpreted as follows.Before the considerable growth of viscosity in the presence of surfac-tant, larger scattering particles are formed than without surfactant.The particle size increases with the amount of KEP-2 in the system.Hence, it can be supposed that this method estimates the number of‘‘scattering nuclei,’’ which are polymer regions of different densityfrom the rest of the mass and which carry on their surface a thickerlayer of surfactant the higher the amount added to the reaction mix-ture. As a result, the reaction rate increases and more extendedregions of altered density are formed in the reaction mass. The begin-ning of the sharp growth in viscosity corresponds to the regionsapproaching the maximum and following the decrease of the size offormations. Thus, the redistribution of surfactant between the surfaceand the volume of the reaction mass takes place under the networkpolyurethane formation, which must result in the impoverishment ofthe surface layer of surfactant at the reaction mass–air interface.Estimation of the surface tension during the hardening of poly-
Adhesive Properties Control by Surface-Active Substances 75

urethane with 0.1% KEP-2 has shown a 35% growth of the surfacetension in the gel formation region.
Thus, the hardening of the toluene diisocyanate-based polyurethanesystem in the presence of microquantities of the surface-active agentKEP-2 occurs at all stages of the process in conditions different fromthe ordinary hardening mixture of TMP–TDI–oligoglycol. These differ-ences become apparent in kinetic and structural studies of the hard-ening process. The final product is a polymer with very weak adhesioncompared with the initial specimen (hardening temperature 353 K).
The increase of urethane formation reaction rate constants in thepresence of KEP-2 (Table 2.10) may be connected with the decrease ofthe reaction mass viscosity due to the weakening of intermolecularinteractions and the increase of the mobility of the reacting molecules.In general, the mechanism of the effect of surfactant is not clearlyunderstood. The surfactant is active at borders with low surfaceenergy and inactive at those with high surface energy. It may besupposed that essential structural rearrangements occur in the sys-tem under these concentrations of surfactant. It thus proves necessaryto define thermodynamic functions for the surface layer. A rigorousapproach to this definition is possible in the simple systems—binarysystems, for example.
Of all the reagents of the reaction mixture under study, polyoxypro-pylene glycol possesses the highest chemical affinity for KEP-2 anddefines the distribution of the latter in the reaction system. The modelsystem of oligoglycol–KEP-2 has been studied to elucidate the struc-ture-forming effect of surfactant. The concentration dependence of thesurface tension for the concentration range of surfactant from 0 to0.3% has been analyzed and isotherms typical of surfactant solutionswere obtained (Fig. 2.25). The equation for binary solutions of surfac-tant was used:
� ¼ ð�1 � �2Þe�bc þ �2 ð2:18Þ
where � ¼ surface tension of the solution containing surfactant;�1 ¼ surface tension of the solvent; �2 ¼ surface tension of surfactant;c ¼ surfactant concentration; and b ¼ a coefficient of proportionalitywith dimensions of inverse concentration (1=b ¼ the concentration ofsuch a solution for which the adsorption value for the Gibbs equationreaches a maximum).
Comparison of experimental and estimated curves (Fig. 2.25) showsthat Equation (2.18) satisfactorily describes the experimental dataonly when KEP-2 concentrations exceed 0.03%. A sharp change ofthe surfactant surface activity at this concentration is the cause ofdivergence between the estimated and experimental data. This can
76 Chapter Two

be supposed to occur as a result of reorientation in the surface layer ofsurfactant molecules rolled up in the form of plane disks into a helix-like shape [229]. This possibility was considered in the derivation ofthe equation and thus the estimated values of the surface tension arelower than the experimental ones (Fig. 2.25). Reorientation ofsurfactant molecules in the adsorption layer can draw oligoethermolecules into this process. This is indirectly confirmed by the sharpchange of morphology of the binary mixture surface layer and may beconfirmed by nuclear magnetic resonance (NMR) data (Fig. 2.26)[230]. The chemical shifts of proton signals do not change with
Adhesive Properties Control by Surface-Active Substances 77
Figure 2.25 Dependence of surface tension of the binarysystem PPC-1000–KEP-2 on concentration at differenttemperatures: (1) 608C, (2) 658C, (3) 708C, (4) 758C, and (5)808C. Curve (6) shows the dependence of d�=dc on the surfacetension in the system [estimated values of � (curves 1, 3, 5)].

amounts of KEP-2, while the integral intensity decreases regularlywith increase in measurement temperature. As is evident from Fig.2.26, the considerable decrease of integral intensity (20%) in thewhole temperature range under study is observed only for one surfac-tant concentration, namely 0.03%. Such a decrease of integral inten-sity may indicate the limitation of mobility [231] of the oligoethermolecules to such an extent that a proportion of the protons do notcontribute to the NMR signal. The experimental result indicates thechange of volume properties in the binary mixture under the effect ofsurfactant.
It is of interest to estimate the thermodynamic functions of surfacelayers of different composition. Since a binary system is considered, itis possible to make thermodynamic calculations for mixtures of differ-ent concentrations at different temperatures (Fig. 2.27). This was doneusing the equation that connects the surface pressure with the changein entropy and enthalpy of the surface layers [232]:
�HS ¼ þ Td
dTð2:19Þ
where �HS ¼ change of the surface layer enthalpy; ¼ surface pres-sure; and d=dT ¼ change of the surface layer entropy.
78 Chapter Two
Figure 2.26 Dependence of inte-gral intensity of proton signalson temperature in the systemPPC-1000–KEP-2 with variousKEP-2 contents: (1) 0%, (2)0.1%, (3) 0.15%, and (4) 0.03%.

As seen from Fig. 2.27, two concentrations of surfactant (0.3% and0.15%) have particular characteristics. The independence of �SS oftemperature is characteristic of the first concentration (Fig. 2.27),indicating the existence of structure that is not affected by the thermalfactor, according to the NMR data, within a rather wide temperaturerange. Thus, the behavior of a 0.03% solution of KEP-2 in oligoglycolmay (with a good degree of probability) be interpreted as reorientationof surfactant molecules in the surface layer, the glycol molecules beingdrawn in, resulting in the formation of a stable, ordered combinedstructure.
As can be seen from the isotherms of surface tension (Fig. 2.25),beginning from a KEP-2 concentration of 0.25%, increase ofsurfactant content does not lower the surface tension of the system,i.e., this concentration corresponds to the critical concentration. Theextremum in the change of thermodynamic functions of thesurfactant surface layer entropy (Fig. 2.27)—in particular—isobserved at 0.15% KEP-2, below the CMC. This testifies to structuralchanges in the adsorption layer [229] and may be explained in termsof current ideas of the process of micelle formation. Micelle forma-tion, like adsorption, is entropic as well as energetic in nature [233],as is shown well in thermodynamic studies of water solutions ofproteins [234]. Also, micelle formation is characterized by the con-centration region but is not a critical point [235]. From the calcula-tion of parameter b in Equation (2.18) one can conclude that the
Adhesive Properties Control by Surface-Active Substances 79
Figure 2.27 Change of surfaceentropy with concentration ofKEP-2 at different tempera-tures in the system PPC-1000–KEP-2: (1) 335 K, (2) 338 K, (3)343 K, (4) 348 K, and (5) 351 K.

positions of extrema in the concentration dependences of �SS and�HS (at 0.15%) correspond approximately to the concentration ofKEP-2 for which the Gibbs adsorption is maximum [228]. Thus, itmay be considered that the process resulting in micelle formationbegins even at a KEP-2 concentration of 0.15% in this system.Depending on the system temperature, it is characterized eitherby the maximum energy and the highest degree of randomness orby the highest packing density and minimum energy (Fig. 2.27).Under these conditions, change of sign of thermodynamicfunctions may be connected with change in the packing density[229] and conformation of molecules taking part in the formation ofa micelle [233].
Thus from analysis of the KEP-2–olyoxypropylene glycol mixtureit is established that there are two specific concentrations of surfac-tant. The state of the surface layer at 0.03% is characterized by thehighest stability and reflects the behavior of separate molecules.The extremal values of thermodynamic functions describing theonset of micelle formation in the adsorption layer—i.e., the coopera-tive behavior of KEP-2 molecules—are characteristic of the secondspecific concentration. These results lead to the conclusion that asthe role of the interface is increased in the polyurethane formationreaction, one should expect changes in the kinetic parameters.Because KEP-2 has high surface activity, the effect of the surface(adsorption) layer in the systems investigated extends a consider-able distance from the interface. Using data from [235]; interfacethickness in the range of the surfactant concentrations studied iscalculated as 1:3 � 10�6 m.
Comparing the results of kinetic studies with these conclusions,we see that the surfactant availability in the reaction system doesnot affect the formal kinetics of polyurethane formation precisely atthe transition state of the surfactant adsorption layer. The accelera-tion of the reaction is achieved when KEP-2 is introduced into thesystem at concentrations other than 0.03% and 0.15%. It is shownthat there is an important relation between the effect of surfactanton the formation kinetics of polyurethane networks and thestructure of surfactant layers in the oligoglycol in the formation ofthese polymers.
Hence, one can suppose that for nonionogenic surfactants theremust exist two concentration regions with the described effect onpolymer formation in systems with specific interaction of surfactantwith reagents. These concentration regions correspond to thearrangement of lyophobic groups in the interface plane and perpen-dicularly to it.
80 Chapter Two

2.8.2 Influence of surfactants on thestructure of polyepoxides
Proceeding to study of the role of KEP-2 adsorption layers in polyep-oxide formation, we apply the conclusions derived for the importantrole of thermodynamic functions in characterizing surface layers ofsurfactant and their relationship with the processes of formation ofthe chemical and physical structure of polyurethanes. This is why webegin from the thermodynamic study of the binary model system ofphenylglycidyl ether (PhGE)–KEP-2. We have studied the effect oftemperature (283–313 K) and concentration of surfactant (0.001–0.1%, within the limits up to CMC) on the surface tension of thesesurfactant solutions in PhGE, and thus, on the surface pressure ()calculated from [232]. The dependences of extrema in on csurfactant atthe temperatures show that the greatest changes in surface pressureare observed at lower temperatures and for surfactant concentrationsup to 0.01%. Further increase in concentration of added surface-activecompounds affects the surface pressure insignificantly. Information onthe value of surface pressure at each temperature studied for eachconcentration allowed to be calculated from the values of surfaceentropy (�S) and enthalpy (�H) characterizing the thermodynamicsof formation of surfactant adsorption layers under those conditions[228]. The concentration dependences of �HS and �SS exhibit theextremal character of changes in thermodynamic functions in the tem-perature range 288–313 K (Fig. 2.28, curves 5–12) and their approx-imation to the minimum constant value at 283–288 K (Fig. 2.28,curves 1–4). Lowering the temperature leads to broadening of theminimum and its shift towards higher concentration (from 0.01 to0.075%). The decrease of both thermodynamic functions to minimumvalues indicates formation of the most highly ordered structure of theadsorption layer. In accordance with the ideas for surfactant based onpolydimethylsiloxane, when the monolayer is compressed its structurerearranges, from molecules rolled up in the form of plane disks [229],through compaction of these two-dimensional formations, to the sub-sequent change of molecular conformation to a helix-like shape. Themovement of �SS into negative values proves this. Using the analogybetween compaction of the siloxane surfactant layer under compres-sion stress [229] and the change in its structure with increasing num-ber of surfactant molecules, let us consider the results. From thechange in thermodynamic functions (Fig. 2.28), one can concludethat �H and �S in the region of negative values describe the processof packing of coiled molecules to the maximally ordered state (theregion of the extremum). Gradual disordering of the adsorptionlayer occurs with further increase of surfactant concentration [229],
Adhesive Properties Control by Surface-Active Substances 81

and this is accompanied by the increase of �HS and �SS values (Fig.2.28, curves 5–12).
It thus follows that from the concentration dependences of thermo-dynamic functions we can determine the csurfactant values that promoteformation of the surface layer with the closest packing of molecules.These concentrations are in the region of values significantly belowthe critical values and depend on temperature. (The reported resultsare for the model system of phenylglycidyl ether–surfactant.)
The result based on the thermodynamic characteristics of the sur-factant surface layers in PhGE may be referred to the binary systemof ED-20 resin–surfactant. The dependence of viscosity on theamount of added surface-active compound is characterized by adecrease of viscosity to minimum value at 0.05% that is in goodagreement with the position of the extremum in the concentrationdependences of �SS and �HS (Fig. 2.28, curves 7 and 8). It follows
82 Chapter Two
Figure 2.28 Dependence on KEP-2 concentration of thermodynamicfunctions �SS (4, 5, 6, 8, 9, 11) and �HS (1–3, 7, 10, 12) of adsorption layersof surfactant solutions in PhGE at 283 K (1, 9), 288 K (2, 5), 293 K (3, 4, 6),298 K (7, 8), 308 K (9, 10), and 311 K (11, 12).

that when surfactant is introduced into ED-2, the resin viscositydecreases and is lower the closer the packing of surfactant moleculesin the adsorption layer. Volume viscosity is characterized here, so wewill deal with the effect of two interfaces: solution–air and solution–surface, determined by the microheterogeneous structure of the epox-ide oligomer itself [236].
The process of gel formation with formation of aminoepoxide beginsvery quickly and to investigate changes in the properties of polyepox-ide hardened in the presence of different amounts of surfactant onemust observe the extrema in the dependences of the thermodynamicfunctions of surface layers against concentration obtained from theanalysis. The position of maximum strength and closeness of poly-epoxide crosslinking corresponds to a surfactant concentration of0.05%. Therefore, the existence of closely packed surfactant layers inthe hardening system promotes the formation of a polyepoxide net-work with more closely crosslinked structure and higher adhesioncharacteristics. For concentrations in the region of 0.003% of surfac-tant, the presence of surface-active additives results in formation of apolymer with a defective structure and low strength.
No monotonic dependences of adhesion strength of polyepoxides onsurfactant concentration have previously been reported [223]. Thedecrease of adhesion strength at low concentrations of surfactantwas interpreted in terms of the decrease of the surface tension ofsolid glue and the thermodynamic work of adhesion. However, thereason for such a decrease of characteristics at low concentrations ofsurfactant remains obscure. In this connection we studied the morpho-logical structure of the surface of polyepoxide formed in presence ofsurfactants. Photomicrographs show that network polymers withoutadditives are characterized by a globular type of structure, with sizesranging from 50 to 900 nm. Separate supermolecular formations aregrouped into folded structures from 50 to 1000 nm in width. Thesestudies showed that the introduction of surfactant promotes adecrease of the average size of the globular formations in polyepoxides.At surfactant concentrations of 0.05%, the structure of a polymer ischaracterized by strictly bounded formations with diameter 50–80 nm, which are grouped into structures of irregular shape with max-imum extent of 250 nm. The introduction of 0.003% of surfactant intothe polymer promotes the formation of microstructure with character-istic globular formations of irregular shape and low packing densitythat correlates with the changes found in the polymer properties.Hence, it can be concluded that the structure of polyepoxide formedin presence of the surfactants studied depends both on the concentra-tion of surfactant molecules in the adsorption layers (this determinesconformation) and on their packing density.
Adhesive Properties Control by Surface-Active Substances 83

Thus, for block copolymers based on dimethylsiloxane with alkyleneglycols as surface-active additives there is a relation between thestructure of the epoxide system in the liquid state and that in thehardened state. This allows regulation of the properties of polyepox-ides using the thermodynamic characteristic of these surfactant solu-tions in monofunctional epoxide compounds. In addition, it is foundthat the introduction of surfactants of the epoxide series to polyepox-ides affects the parameters of the polymer structure rather differently,depending on the arrangement (parallel or perpendicular) of lyophobicgroups of KEP-2 in a monolayer with respect to the interface.
The use of quaternary ammonium salts [237] as surfactants forpolyepoxides is of interest. As shown in [223, p. 301], these additivesincrease the rate and extent of transformation of the epoxide groups inthe boundary layer. The typical (extremal) concentration dependenceof polyepoxide properties with unreactive surfactant is observed.Quaternary ammonium salts should be considered inactive surfac-tants in systems containing epoxide compounds. Salts of the type
where R is ethyl, octyl (in octylpyridinium bromide, OcPyBr), heptyl(in heptylpyridinium chloride, HepPyCl) or benzene, and Hal is Cl orBr, when dissolved in the epoxide compounds, show color with a char-acteristic band at 404 nm and consumption of epoxide groups isobserved. To more completely characterize the behavior of a numberof halogenides of pyridinium N-arylates and N-alkylates, we havestudied their interaction with PhGE as the model compound andmade comparisons with the binary system of pyridine–PhGE (Fig.2.29) [238]. As is evident from the electronic spectrum, the sameband appears in the pyridine–PhGE system as in the case of OcPyBrin epoxy compounds. From experimental results and given the ionicnature of the mechanism of polymerization of epoxide compoundsunder the influence of tertiary amines, the appearance of a complexband with maximum at 404 nm may be attributed to the formation ofintermediate complexes of epoxy compounds with introduced addi-tives, which then leads to the opening of the epoxide cycle or themost active center of ionic polymerization.
84 Chapter Two

The kinetics of accumulation of the compound characterized by theband at 404 nm (Fig. 2.29, curves 4 and 6) indicates a dependencebetween the amount of pyridine halogenide introduced into theepoxy compound and the concentration of the product formed: themaximum intensity of the absorption band in the visible regionincreases with the amount of additive. The character of the curvesfor accumulation and consumption of spectrally active particles differsfor bromides and chlorides (curves 3 and 6). It follows from the data inFig. 2.29 that the changes in the band with maximum at 404 nm(curves 4 and 6) are connected with consumption of epoxide groups(curves 8 and 10).
For example, the reaction rate constants for systems containing 10%and 1% of HepPyCl are 9:2 � 10�6 and 4:2 � 10�6 L mol�1 min�1,respectively. The interaction of growth of viscosity and intensity ofthe observed band is found in the reaction with participation of ED-20.
As was mentioned earlier, the introduction of proton-donor additivesin the case of tertiary amines considerably accelerates their inter-
Adhesive Properties Control by Surface-Active Substances 85
Figure 2.29 Kinetics of change of intensity for the optical band withmaximum at 404 nm (1–7, 11) and content of epoxide groups (8–10) ofsolutions in PhGE [1% pyridine (5, 10), with addition of absoluteethanol (10-fold surplus of pyridinium salt) (2) and (11), respec-tively]; 10% EthPyBr or OcPyBr (3); 10% HepPyCl or BenPyCl (6–9) [(7, 9) using 90% solution of salt in water]. Spectra are taken foralcoholic solutions of concentrations of 6 � 10�2 (1–5, 11) and6 � 10�3 mol/l (6, 7) PhGE.

action with epoxides [22–24], which is also demonstrated by the dataon Fig. 2.29 (curve 1). As is evident from Fig. 2.29, a nucleophilicreagent accelerates pyridine quaternary salts used for formation ofspectrally active particles. At the same time, the presence of a protondonor in solutions of pyridine halogenides can completely inhibit theappearance of the particles (Fig. 2.29, curve 11) or produce consider-able deceleration (curve 7). The latter is accompanied by a twofolddecrease of the rate constant of consumption of epoxy groups: forcurve 9, K2 ¼ 4:7 � 10�6 L mol�1 min�1.
Hence, it can be supposed that the opening of the epoxide cycle bypyridine and pyridine halogenides proceeds by different routes withthese substances. As a result, different end products—crosslinked orlinear or branched structures—are formed.
Ultraviolet microscopy using the band characterizing the aromaticring (250–260 nm) was also used to analyze the reaction betweenepoxy compounds and pyridine or its derivatives. Both aromatic andaliphatic monoepoxides were used. Changes in the intensity of theband during the reaction may be interpreted unambiguously whenbutylglycydyl ether is used. The number of aromatic moleculesdecreases in the course of interaction of pyridine or HepPyCl withthe epoxy compound. Because the other aromatic structure is excludedin these systems, the observed decrease of the band within the 250–260 nm region must be related to the consumption of pyridine hetero-cycles or the quaternary salt.
As the reaction proceeds a band appears in the 300–310 nm region.However, the use of a heterocyclic amine with epoxy compounds doesnot always result in such changes in the UV spectrum. For instance,with 2,6-dimethylpyridine the consumption of aromatic molecules oninteraction with PhGE is not observed. The reaction of 2,6-dimethyl-pyridine with PhGE is characterized by the appearance and accumu-lation of substances producing two bands in the visible spectrum (at408 and 505 nm), and by a decrease in the number of epoxide groups.
Thus, from comparison of the particular changes in the maximum at255 nm during reaction with unsubstituted pyridines and pyridinessubstituted in both -positions, it can be concluded that the reactionproceeds with participation of the ring CH-groups near the hetero-atom. IR and NMR spectroscopic studies have investigated themechanism of reactions proceeding through interaction of epoxy com-pounds with heterocyclic tertiary amines and their derivatives.
In 1H NMR study of the reaction between epoxy- and pyridine-containing compounds, the areas of signals in the ranges � ¼ 8:57 –6.88 ppm, 9.70–8.50 ppm, and 9.70–8.80 ppm, which characterize theprotons of the aromatic ring of pyridine and HepPyCl, decrease 1.5times more rapidly than the reduction mobility due to increase in
86 Chapter Two

viscosity. The measure of proton consumption from the reactive groupsis the ratio of integral intensity (II) of proton signals from both hetero-cycles to the II of protons of the aliphatic radical HepPyCl or OCH2 inthe glycidyl group, decrease in the signal being connected only withloss of mobility of the corresponding protons. Such processing of theNMR spectra permits one to observe the proportional consumption ofthe pyridine and epoxide rings in the reactions of pyridine and its saltwith epoxy compounds. There is a time limit for the method because ofrapid and significant rise of viscosity in the course of the reaction. Tobroaden the scope of the study, we used the ability of proton-donorreagents to inhibit reactions of quaternary chlorides with epoxy com-pounds. Use of a 90% solution of heptylpyridinium chloride in D2Opermitted us, first, to obtain the spectrum of the salt–phenylglycidylether system immediately after mixing, and, second, to inhibit theviscosity increase in the system during the reaction. Thus, it wasfound that dissolution of HepPyCl in the epoxy compound producesan instantaneous interaction. All the signals of protons of quaternaryaction shift toward strong field: the 0.27, 0.20, and 0.24 ppm shifts ofthe ring protons in the -, �-, and -positions, respectively, as well asthe 0.25, 0.2, 0.10, and 0.0 ppm shifts of protons of the heptyl radicalbound to the nitrogen atom as it moves away from the latter. Theseresults show that, like the case with pyridine [239], chemical interac-tion of reagents is preceded by complexation or association due toelectrostatic forces. Association is likely as the large dipole momentsof ionic pairs, as in quarternary salts, induce strong interaction withpolar molecules [240]. It should be noted here that complexation of atertiary amine with an epoxy compound is effective for the followingoligomerization only in the presence of a proton donor [239]. In ourexperiments the appearance of color in the pyridine–epoxide systemoccurs 3–5 hours later, depending on the ratio of reagents.
Different changes of II of signals for -, �- and -positions of aro-matic heterocycles are seen as a result of interaction inhibition; inNMR spectra of the heptylpyridinium cation there is a considerabledecrease of the signal at 9.43 ppm characterizing the protons of thearomatic heterocycle [241]. Hence, the total decrease in II of a signalfrom pyridine ring protons is mainly determined by the consumptionof -protons; and the observed decrease in the number of aromaticmolecules is connected not with the rupture of heterocycles but withthe change of their structure. Also, in a study of the interaction ofBytGE with pyridine by NMR it was found that in the region of� ¼ 6:2–5.7 ppm there appears a weak signal whose position is char-acteristic of �-protons and -pyridones [242]. This is confirmed by theobserved NMR spectrum of N-methyl--pyridone. The results of stu-dies of the reaction of epoxide compounds with pyridine or its quatern-
Adhesive Properties Control by Surface-Active Substances 87

ary salt by electron and NMR spectroscopy permit us to represent thescheme of their interaction as follows:
Such a reaction mechanism is in good agreement with IR spectro-scopic studies, which have shown that a simple ester bond of sym-metric structure is not detectably formed for 20 days in the PbGE–pyridine and PhGE–HepPyCl systems. One observes the exhaustion ofepoxide groups and aromatic heterocycles and the appearance andgrowth of bands at 1640, 1660, and 1700 cm�1 that characterize theabsence of conjugated double bonds and carbonyl groups, respectively[241]. The molecular mass of the reaction products grows in the early
88 Chapter Two

stages of the reaction as a result of the growth of oligomer molecules(product IV) due to the opening of the double bonds of 3,5-dienes (pro-duct II). Thus, the bands that appear in the IR spectrum may berelated to the valency changes of no conjugated double bond in theoligomer and of the carbonyl group of pyridone (product II). The bandcharacteristics of the carbonyl group [241] of pyridones also appears inthe electron spectrum at 300–310 nm. After 20 days of interaction asmall band appears at 1100 cm�1; the likelihood of reaction leading toformation of this band is probably determined by the decrease of mobi-lity of the alloxyanion formed because of the intensive increase of theviscosity of the reaction mixture. With 2,6-dimethylpyridine andPhGE as reagents, no new bands appear either in the 300 nm regionor in the IR spectrum in the 1600–1700 cm�1 region, although theappearance and accumulation of C — O — C bonds are observed; i.e.,only the epoxy compound oligomers are formed in this case. Suchbehavior is in good agreement with the results of the reaction of epox-ide compounds with 2-oxyethylpyridine [243].
This study thus indicates that at room temperature pyridine and itsquaternary haloid salt form oligomers when reacting with epoxides byseveral mechanisms. In the initial stages of the reaction (15–20 days)one mainly observes the formation of heterocyclic 3,5-dienes, theiroligomerization resulting in formation of a chain of heterocycles con-taining one nonconjugated double bond. As demonstrated, this reac-tion is a result of the attack by alkoxyanion on -hydrogens ofaromatic heterocycles; N-substituted pyridone is formed as a by-product. Parallel homooligomerization of the epoxide compounds bythe anion mechanism typical of epoxide–tertiary amine systems pro-ceeds in the following stages.
Under what conditions might such a scheme be realized of inter-action of quaternary ammonium salt with the epoxide compound inthe presence of primary or secondary amines? Reaction proceeding bythis mechanism is possible when the amine proton-donor reagents areexhausted and when there is essentially no water. Thus, depending onthe state in which the quaternary salt is introduced to the reactionsystem (as crystalline salt or as aqueous solution), it can act as areactive or an inert surface-active additive.
2.8.3 Influence of surfactants on curingprocesses and structure ofunsaturated polyesters
Polymer modifiers that influence the polymer structure in some wayare widely used for regulation of the properties of cured polymers andto produce composite materials with specified chracteristics. For mix-
Adhesive Properties Control by Surface-Active Substances 89

tures of unsaturated polyesters, the use of small quantities of surfac-tant additives is the universal method for influencing their structureand properties from the point of view of raw materials and operationalcapabilities. This section explores the possibility of regulating theproperties of cured systems based on polyester resins by the introduc-tion of nonreactive surfactants, since it is known that regulation of thelevel of intermolecular interaction can alter the molecular structureand physical-chemical properties of polymer networks [236]. It shouldbe noted that as long as the surfactants used in polyester compositionsare nonreactive, they exert their influence in a definite concentrationrange corresponding to the formation of the absorption layer. Withlarge surfactant contents at the substrate boundary, multilayers areformed, leading to reduction of adhesion strength.
2.8.3.1 The influence of surfactants on the formation of
microdiscontinuities. The structure and properties of the cured poly-ester resin are determined to a great extent by the compatibility of thesystem’s copolymerizing components. Let us therefore consider thepossibility of regulating their compatibility with the help of surfac-tants.
We have studied the influence of indifferent surfactants (alkylphenyl ester of an oligoethylene glycol (OP-10) and alkyl ester of anoligoethylene glycol (DC-10)) on the optical transmission coefficient ofthe cured styrene-free polyester resin PN-609-21M, a solution of poly-diethyleneglycol–maleate–phthalate in triethyleneglycol–dimethacry-late. The redox system of methyl ethyl ketone peroxide (PMEK) andcobalt naphthenate (NC-1) was used for curing. Results are shown inFig. 2.30, which shows that the optical transmission coefficient versustime for different surfactant contents has extrema in the area of 4–7%concentration, with maximum at 6% by weight. The data demonstratethe various influences of OP-10 and DC-10 surfactants on the curingprocess. Accumulation of microgel formations [244] in reaction mix-tures containing OP-10 occurs at earlier stages under the influence ofsurfactant in the system. DC-10 does not influence the rate of gelformation. Introducton of specific OP-10 concentrations promotes bet-ter compatibility of the cured system components and the system ischaracterized by a minimum degree of phase breaking of the copoly-merizing system components in the region of the maximum of thetransmission coefficient. This is obviously the result ofthe redistribution of surfactant in the system [236]. Introduction ofsmall quantities of DC-10 (2–6 wt%) has no influence on the com-patibility of the system components. With increasing DC-10 content,up to 10 wt%, the compatibility of the system components declines(Fig. 2.30, curve 2).
90 Chapter Two

Investigations of turbidity spectra of PN-609-21M polyester resin inthe presence of surfactant have permitted us to determine the concen-tration interval in which a surfactant significantly affects the system’scondition and to define the character of this influence on copolymeriz-ing systems. Investigation of the influence of these surfactants on therheological behavior of the system was done with the aim of confirm-ing the regularities and assumptions described above.
2.8.3.2 The rheological behavior of polyesters in the presence of
surfactants. Methods of measuring the rheological characteristicswere chosen to suit the features of the systems investigated.Unsaturated polyesters in the form of monomers in solution areNewtonian liquids since flow does not cause changes in their structureand their viscosity does not depend on voltage shift.
Results from investigations of the viscosity of polyester resins withaddition of OP-10 and DC-10 surfactants are presented in Fig. 2.31.The vicosity of the initial resin is virtually unchanged by introductionof surfactants, probably due to the comparatively small molecularweight of the initial resin, for which the effect of change of macro-molecular shape due to blocking of polar groups by surfactant is notyet evidenced [244]. A different pattern is observed with introductionof 4 wt% of the PMEK–NC-1 redox system (Fig. 2.31, curves 3 and 4).During curing in the presence of small quantities of OP-10 (1.2 wt%)the system viscosity increases only slightly, but on increase of surfac-tant content to 6 wt% a sharp increase of the viscosity of the cured
Adhesive Properties Control by Surface-Active Substances 91
Figure 2.30 Dependence of optical transmission coefficient ofPN-609-21M polyester resin on surfactant content in thecuring process. DC-10 wt%: (1) 0%, (2) 2%, (3) 4%, (4) 6%,(5) 8%, and (6) 10%. OP-10 wt%: (7) 6%.

system occurs. Increase of OP-10 up to 8 wt% leads to reduction of theviscosity of the polyester resin. The viscosity does not change withfurther increase of surfactant concentration. The introduction of var-ious quantities of DC-10 into the cured polyester resin produces only agradual viscosity increase throughout the range of surfactant concen-trations (Fig. 2.31, curve 4). Thus, it is concluded that during curing ofpolyester resins the structure-forming action of surfactants begins tobecome evident with the increase of the molecular mass of the resin[244].
2.8.3.3 Kinetics of the curing of unsaturated polyesters in the presence of
surfactants. Figure 2.32 depicts viscosity data for the cured PN-609-21M resin in the presence of OP-10. The viscosity of the polymerizedsystem increases sharply after a certain induction period. As seen,the introduction of surfactants to the cured system exerts a consider-able influence on the dependence. Thus, for systems cured in thepresence of OP-10 the curves of viscosity increase are located tothe left of those for the systems without surfactants, and the curvesfor OP-10 content of 4–6 wt% (curves 3 and 4) are distinguished bythe most rapid rise and greatest leftward shift of the verticalbranches. It follows that in reaction mixtures containing surfactantsthe gel formation process begins at earlier stages of interaction.Introducton of increasing concentrations of DC-10 somewhat acceler-ates the beginning of polyester resin gel formation over the entireconcentration interval.
92 Chapter Two
Figure 2.31 Dependence of PN-609-21M polyester resin viscos-ity on concentration of sur-factant: (1) OP-10; (2) DC-10;(3) OP-10 in the process ofcuring; (4) DC-10 in the processof curing.

The influence of OP-10 is of extreme character and the largest accel-eration of gel formation occurs with an OP-10 content of 4–6 wt%. Theacceleration of the initiation of gel formation in the system containingDC-10 depends directly on the concentration.
The data correlate well with turbidity data (Fig. 2.31, curves2–4) and show that acceleration of the start of gel formation with4–6 wt% OP-10 occurs because of accumulation of microgel forma-tions under the influence of the surfactant at an earlier stage.Acceleration of the start of gel formation wih DC-10 is insignificantand remains directly dependent on DC-10 concentration, correspond-ing to the turbidity data that indicate that this surfactant does notinfluence the compatibility of the system components and speed ofgel formation.
Adhesive Properties Control by Surface-Active Substances 93
Figure 2.32 Dependence of PN-609-21M polyester resinviscosity in the process of curing on concentration (wt%) ofsurfactant OP-10: (1) 0%, (2) 2%, (3) 4%, (4) 6%, (5) 8%, and(6) 10%.

2.8.3.4 The influence of surfactants on surface tension in reaction systems
based on unsaturated polyesters. Changes in the structure and chemi-cal composition of the polymerized oligomer and in the colloid-chemi-cal properties of the surfactant influence the surface tension ofpolymerized systems. The oligomer surface tension depends on thetime of existence of the surface because relaxation and diffusion pro-cesses in the bulk and at the boundary run comparatively slowly. Thesystem viscosity increases due to oligomer polymerization, thusextending the time of establishment of equilibrium at the boundary.Consequently, the polymer surface tension depends on the correlationof the rates of the polymerization reaction and the reaching of mole-cular equilibrium density at the oligomer–air boundary [236].
Let us consider the changes in surface tension during polymeriza-tion of polyester resin with surfactant additives. Experimental resultsare presented in Fig. 2.33, which shows that the dependence of thesolid polymers’ surface tension on the surfactant concentration has aminimum at low surfactant concentrations (1–2 wt% of OP-10 and1–5 wt% of DC-10). With increase in surfactant concentration, the sur-face tension also increases. In the case of OP-10, the maximum surfacetension is reached at a content of 4 wt%; for DC-10 the correspondingcontent is 7 wt%. Further increase in the concentration of both surfac-tants leads to a sharp reduction of the surface tension of the polyesterresin and ultimately to its independence of surfactant concentrations.As shown in [236], the surfactants can block polar groups of the poly-mers, breaking intra- and intermolecular bonds. This can result inchange of the conformation of molecular chains and of intermolecularinteractions that depend on whether the molecule is linear, unfolded,or globular in shape. Blocking of the polymer polar groups by the sur-factants should result in reduction of intermolecular interactions, butthe change in macromolecular conformation due to such blocking can
94 Chapter Two
Figure 2.33 Dependence of PN-609-21M polyester resin surfacetension on surfactant concentra-tion in the curing process: (1)OP-10; (2) DC-10.

increase interactions as a result of macromolecules unfolding and form-ing new contacts.
In the systems considered, similar processes evidently take place.Having adsorbed at the boundary, surfactants block the polar groups,leading to reduction of the interaction between polymer macromole-cules and worsening the surface tension. With increase of surfactantcontent in the system, polymer surface tension begins to increasesharply and reaches a maximum value that can be related to macro-molecular unfolding. At larger surfactant concentrations, the surfacetension decreases until it reaches a constant value that does notdepend on surfactant concentration and is apparently connectedwith filling of the surface layer with surfactant [236].
Thus, if the oligomer surface tension in the presence of surfactantdecreases monotonically to a certain limit, the solid polymers’ surfacetension is first reduced as the surfactant content increases, then itgoes through maximum, and finally becomes independent of the sur-factant concentration.
2.8.3.5 Cohesion and adhesion characteristics of polymers based on unsa-
turated polyesters with surfactant additives. As was shown earlier, thedependences of the surface tension of the initial liquid oligomers and ofthe cured polymers on surfactant concentration are notably different.For this reason it was of interest to study these relationships withchanges in the physical and mechanical properties of cured polyesters.Results from these investigations are given below. The breaking stres-ses �str:, �comp:, and �bend: increase with OP-10 concentration in thesystem, and only for OP-10 concentrations of 10 wt% does a certainreduction of breaking stress of stretching, compression, and bendingtake place. With introducton of DC-10 into the system, the breakingstresses of stretching, compression, and bending decrease monotoni-cally throughout the range of surfactant concentrations.
The dependence of the modulus of elasticity under compression onOP-10 and DC-10 concentration has extremal character, with a max-imum at 5–6 wt%; the DC-10 curve is located somewhat lower than thesimilar curve for OP-10. Ebend: does not depend on OP-10 concentra-tion, and only the introduction of 10 wt% of OP-10 leads to a decreaseof elasticity modulus under bending. Ebend: decreases monotonicallythroughout the range of DC-10 concentrations.
Introduction of OP-10 leads to an increase of cohesion strength at allconcentrations considered, and only a content of 10 wt% results indecrease. The influence of DC-10 on cohesion properties is the inverseof this: cohesion strength becomes worse at all concentrations in therange.
Adhesive Properties Control by Surface-Active Substances 95

Adhesion strength increases with time as a function of OP-10 con-centration over 10 days; it then reduces slightly, but further increas-ing the OP-10 concentration results in reduction of adhesion strength.Similar behavior is seen with DC-10, with the only difference beingthat introduction of 6 wt% of DC-10 leads to a noticeable increase inadhesion strength. Introducton of 8–10 wt% of DC-10 leads to a defi-nite reduction of adhesion characteristics during 10 days after adhe-sion, but adhesion strength then increases with time, and after 30days it exceeds the adhesion strength of polyester resin adhesive jointswithout surfactants.
Comparing the results obtained, the various influences of OP-10 andDC-10 on polyester resin adhesion can be assessed. Whereas introduc-tion of OP-10 leads to reduction of adhesion strength over the entireconcentration range, with DC-10 the introduction of small concentra-tions (2 wt%) causes a reduction of adhesion strength over time.Increasing DC-10 concentration in the system increases the adhesionstrength, and maximum adhesion strength increase is achieved withintroduction of 6 wt% of that surfactant.
The dependence of polyester resin adhesion strength on the surfac-tant concentration shows extrema. Adhesion strength with increasingsurfactant concentration first goes through a minimum; the adhesivejoint strength then increases, and with further increase of surfactantconcentration decreases again. To explain the increase in cohesion andadhesion strength, let us consider the data on change of turbiditycoefficient, viscosity, and surface tension of the system under theinfluence of surfactant. From the turbidity data, OP-10 surfactantpromotes better compatibility of copolymerized system components,while DC-10 has no influence and at higher DC-10 concentrationsthe compatibility of system components becomes worse. Hence, itcan be supposed that with OP-10 the change of parameters character-izing behavior of the cured system in bulk is greater; the second caserelates to the change of surface properties of the cured polyester resin.The turbidity data are well correlated with the results of the investi-gations of the cohesion and adhesion properties of polyesters.Naturally, the introduction of concentrations of OP-10 that do notactually worsen the adhesion characteristics leads to improvementof the cohesion properties of unsaturated polyesters, and with certainDC-10 concentrations the adhesion strength of the system increases.
As shown earlier, the dependence of the surface tension of solidpolymers on the surfactant concentration exhibits a minimum andmaximum, and the increase in surface tension under the influenceof surfactant is rather significant (Fig. 2.33). This is apparently dueto the demonstrated structure-forming action of surfactant, which ispossible only at stages of reaction when sufficiently flexible molecules
96 Chapter Two

are formed [236]. These results are supported by the fact that theviscosity of the initial systems is practically unchanged with introduc-tion of surfactant (Fig. 2.31, curves 1, 2). In the course of curing in thepresence of surfactant, the system viscosity increases sharply as themolecular mass grows, i.e., the surfactant structure-forming actionbegins. The dependence of the viscosity of unsaturated polyesterresin during the curing process on surfactant concentration is wellcorrelated with the same dependence for the surface tension (Figs.2.31 and 2.33).
Thus, dependence of adhesion strength on the surfactant concentra-tion correlates with the dependence of the system surface tension. Theincrease of surface tension under the influence of surfactant is causedby changes in the polymer structure that determine the cohesionstrength and should therefore lead to increase of the adhesionstrength.
From the investigations reported, it may be concluded that the con-centration dependences of the physical and mechanical properties ofunsaturated polyesters formed in the presence of surfactants are ofextremal character. This extremal character corresponds essentiallyto the same dependences of surface tension, turbidity, and viscosity ofsystem with surfactant present.
Thus, surfactant influences the processes of polyester formation,improving the physical and mechanical characteristics only whenthere is improvement of the compatibility of the components of thepolymerized system.
Adhesive Properties Control by Surface-Active Substances 97

Chapter
3Properties of Adhesives Based
on Polymeric Mixtures
3.1 General
In the course of blending polymers, the following systems can beformed: one-phase systems, two-phase (colloid) systems, or systemsin a metastable state of transition from a one-phase into a two-phase system. The properties of polymer mixtures are determined toa great extent by the phase equilibrium in the system formed and theirproperties can be changed by controlling the processes of phaseseparation, which occur by two mechanisms: by nucleation and growthor by the spinodal mechanism.
Two-phase mixtures of polymers differ from classical colloid systemsmainly by a transition layer that exists between the system compo-nents and is of special significance. The formation of such a layer inmixtures of linear polymers is governed by the kinetic factors of theretarded process of phase separation, by the collid-chemical mechan-ism of formation, or by the adsorption interaction as well as by thesegmental solubility [103, 104]. In mixtures of crosslinked polymers itsformation is governed also by the conditions of synthesis. Note alsothat in the thermodynamically nonequilibrium mixtures of polymersin the two-phase systems, the processes of segmental solubility usuallyhave time to reach completion while the macromolecules do not moveinside the high-viscosity medium, which ensures the stability of thestructure and its mechanical properties [103].
The most promising method of obtaining polymeric materials is bythe use of so-called hybrid binders. These constitute polymeric compo-site materials in which crosslinking indicates the heterogeneity of thedistribution of the system components determined by thermodynamic
98

incompatibility and thus hinders further phase separation. Areas ofmicroheterogeneity in colloid sizes are formed in the polymerizingsystem and are considered as virtual phase particles or phases. Thesystem reaches a metastable state (which is not thermodynamically atequilibrium). For such systems there is a great increase of themechanical properties in a narrow range of compositions [19].
Surface physical-chemical phenomena are involved in all heteroge-neous polymeric systems with a developed interphase surface. Theseinclude wetting and all kinds of adhesion (friction, fracture, disper-sion, homogenization, structuring). The development of the idea of theinterrelation of the dispersion state and surface phenomena, due toP.A. Rebinder, leads to the necessity for the addition of surfactant insmall amounts. The mechanism of the action of these additives ondifferent interphase boundaries is considered in detail in [105].
Integration of surfactant in small quantities facilitates the disper-sion of the structural elements of dispersions, solutions, and melts ofthe polymers. In the case of surfactant with groups that can beinvolved in the formation of hydrogen bonds between the structuralelements, the effect of particle dispersion increases with increase ofthe length of the surfactant hydrocarbon radical and with increase ofthe polymer polarity. To improve the properties of the polymer mix-ture, a third component is sometimes added. A rather promisingmethod of controlling the properties is to combine polymer mixtureswith their block polymers. The latter in small quantities tend to con-centrate on the interphase boundary, thus improving the interactionof the mixture components; they seem also to serve as emulsifiers.
The properties of polymer mixtures depend on the method by whichthey are obtained and are determined by many factors: by sizes ofparticles of the dispersed phase, by their shape and number in bulk,and by the thermodynamic affinity of the components for one another[19]. Linear polymers blend either in the course of their mutual dis-solution or, in two-phase systems, under conditions of thermodynamicincompatibility of the components, when the dispersion is forced. Themixtures formed can be compatible (forming true solutions of one poly-mer in another), incompatible (representing a typical colloid system),quasicompatible (characterized by microscopic homogeneity at a levelabove heterogeneity on the molecular level), or pseudocompatible(with a strong adhesion interaction on the boundary) [106].
In the majority of cases the compatibility of the polymers ischaracterized by the glass-transition temperature Tg, determined bymethods such as dilatometry, differential scanning calorimetry (DSC),reversed-phase gas chromatography (RGC), radiation thermal lumi-nescence (RTL), dynamic mechanical spectroscopy (DMS), nuclearmagnetic resonance (NMR), or dielectric loss. The existence of two
Properties of Adhesives Based on Polymeric Mixtures 99

values of Tg, corresponding to Tg of the individual components in atwo-component system, is a certain indication of the incompatibility ofthe components. When there is a single Tg that depends on the changeof composition, a mixture of two polymers can be considered compati-ble. The sensitivity of the method used must be taken into account. Forexample, DMS detects a much smaller quantity of the second phasethan does DSC, while NMR uniquely reveals small quantities of thesecond phase (‘‘clusters’’) that are not detected by other methods.
The compatibility of polymer–polymer mixtures can also be deter-mined by nonradiative energy transfer (NRET), by measuring theintensity of light scattering, and by electron and neutron diffractionstudies. Electron photomicrographs of two-phase systems suggest acolloid system of a solid in a solid; for compatible systems the secondphase does not show up. But electron microscopy does not unequivo-cally resolve the question of phase composition, in that 10–15 nmparticles can be either actual particles of the second phase or hetero-geneities that do not have the properties of the second phase. A macro-molecule coiled a certain number of times will have a size of this order,so that microscopic observation of heterogeneity does not necessarilyindicate that a second phase is present; additional information fromthe change of Tg is necessary.
It is more reliable to estimate the compatibility of polymers in termsof thermodynamics. The thermodynamic compatibility or mutual dis-tribution of molecules of one substance within another, which extendsup to the state of true solution and does not depend on the mixingprocedure, is always accompanied by Gibbs energy decrease [107]:
�Gmix ¼ �Hmix � T�Smix ð3:1Þ
where �Hmix and �Smix are the molar enthalpy and entropy of themixing, which determine the compatibility of the components. Thecompatibility of polymers is favored as a rule by negative values of�Hmix [39], but these do not mean thermodynamic compatibility in allcases: the role of �Smix is also important. To ensure a negative value of�Gmix (i.e., to produce a homogeneous solution) it is necessary to cre-ate favorable energetic and geometric conditions [40].
The concept of the solubility parameter �, which is frequently usedin studies of polymer compatibility, is not always applicable. The solu-bility parameter is equal to the square root of the substance’s cohesionenergy density ð� ¼
ffiffiffiffiffiffiffiffiffiffiffiDEC
pÞ and reflects only intermolecular interac-
tion without accounting for the entropy factor. This parameter is anintegral characteristic of only intermolecular interaction, and the com-ponents’ miscibility is determined by the presence of functional groupscapable of specific interactions in the polymer molecules. This is why
100 Chapter Three

one can predict that polymers with poorly matched solubility para-meters will not blend, although the opposite—good miscibility for poly-mers with close values of solubility parameters—does not always hold[108]. Thermodynamic compatibility is estimated using phase dia-grams of the three-component systems of solvent (1)–polymer (2)–poly-mer (3). In addition, in similar systems the region of the ply separationincreases with increase of the molecular weight of the componentsduring blending. The ply separation of the polymers in a solventdepends not only on the compatibility of the polymers but also ontheir change of compatibility in the solvent. Thus, mutual solubilityof the polymers is influenced both by their mutual interaction and bythe nature of the solvent.
It is accepted that the most reliable information on thermodynamiccompatibility of polymers is obtained from phase diagrams of binarysystems, which were introduced by G. Allen using the method of tur-bidity spots [109]. Such diagrams can also be plotted from results ofoptical interferometry, RGC, and other methods. To plot phase dia-grams it is necessary to determine the Gibbs free energy of mixing�Gmix and from its concentration and temperature dependences locatethe point that corresponds to @2G=@’1@’2 ¼ 0; this represents a spi-nodal on the Gibbs energy of mixing diagram and is determined by adouble graphical differentiation of the �Gmix ¼ f ð’Þ curves at varioustemperatures and by extrapolation of @2G=@2’ to zero at various con-centrations.
A.A. Tager [110] determined the change of �Gmix by producingthermodynamic cycles using static sorption of solvent vapors on thepolymeric specimens. However, in solution the polymer compatibilityis influenced by the difference of the thermodynamic interaction para-meters of the common solvent with each indvidual polymer.Additionally, compatibility in solution does not always correspondto that in the solid state (without a solvent). These shortcomingslimit the applicability of the �Gmix estimation method that Tagerdeveloped.
In the procedure proposed by Farooque and Deshpande [111], �Gmix
is found by the method of dynamic sorption of ROC, which removes theuncertainty in determining this parameter. These authors improvedthe procedure in such a way that the molecular weight and the poly-dispersity of the polymer stationary phase influence the experimen-tally determined value—the sorbate retention volume Vq.
Quantitative estimation of the compatibility of polymers and oligo-mers can be made from the concentration dependence of the Flory–Huggins thermodynamic interaction parameter �2;3. The shape of thephase diagram is judged to a certain extent by the type of this depen-dence in that there is a relation �Gmix ¼ RT�2;3’2’3 between the
Properties of Adhesives Based on Polymeric Mixtures 101
parameters �2;3 and �Gmix [111]. The critical miscibility temperatureis determined from the concentration dependence of �2;3 at varioustemperatures.
Of interest are the studies of polymer compatibility depending onthe excess volume of the blended components �V [112]. As theseauthors point out, �V < 0 for thermodynamically compatible systemsin the majority of cases. This was the basis for concluding that in thecourse of blending the mobility of the macromolecular chainsdecreases to values comparable with those of individual components.
Patterson [113] reports that compatibility of polymers can be con-sidered in terms of the dependence of the difference of their freevolumes �n on the interaction parameter �2;3 and on molecular weight.In particular, he showed that only polymers with small value of �n at�2;3 > 0 are compatible. However, if �2;3 < 0 (when there are specificinteractions between the components), compatibility is possible atgreater difference of their free volumes.
These considerations indicate that structural (X-ray analysis, andoptical and electron microscopy), relaxation (mechanical and dielectricrelaxation, NMR, and RTL), and thermodynamic (phase diagrams,thermodynamic cycles, RGC) methods of investigation are currentlyused to determine the limits of the mutual solubility of polymers. Atthe same time it must be noted that evaluation of polymer compat-ibility is complicated by kinetic factors and because thermodynami-cally unstable systems are formed in the course of mixing of polymer.The effects of the nature of the polymers and of foreign impurities oncompatibility do not yield to a complete explanation and this problemis far from being solved, despite its importance in the fact that theproblem of modifying the properties of polymeric material is related toevaluation of the compatibility of polymers.
3.2 Adhesives Based on InterpenetratingPolymer Networks
An interpenetrating network (IPN) can be defined as a mixture of twocrosslinked polymers when at least one of them is synthesized and (or)crosslinked with another [114]. The components that make up an IPNare thermodynamically incompatible and a transition region of twophases is formed in such a system. The whole complex of IPN proper-ties is determined by the availability and features of this region.
Let us consider the properties of an adhesive based on the followingmixture of oligomers: an unsaturated polyester resin and a pre-polymer with end isocyanate groups (or macrodiisocyanate) based onpolydiethylene glycol adipate of molecular weight 800 and on TDI(a mixture of the 2,4- and 2,6-isomers in ratio of 65:35), with the
102 Chapter Three

surfactant ATG added. The adhesive is cured by the effect of a redoxsystem, for which MEKP(O) and CN are commonly used.
The ‘‘Sprut-5M’’ adhesive consists of unsaturated polyester resin100 parts by weight, ATG-M 80 parts (a mixture of 50 parts of macro-diisocyanate and 30 parts of ATG), polymerization initiator(MEKP(O)) 2 parts. Usually 1 wt% of CN is integrated additionallyinto the adhesive base. Sprut-5M can be produced using various poly-ester resins, but the most applicable one is the adhesive based on PM-Iresin owing to its availability and low cost. For this reason we willconsider the properties of the adhesive based mainly on this resinalthough it has adhesion strength 20–40% lower than that of adhe-sives based on PN-11, NPS 609-21M, and other resins, especially whencementing in water.
MP PDEG in the composition of the polyester resin has end hydroxyland carboxyl groups capable of interacting with the isocyanate groups.To prevent the chemical interaction of the individual IPN networks,the MP PDEG end groups were pre-blocked with a monofunctionalisocyanate (phenyl isocyanate); later this reaction was excluded withalmost no effect upon the adhesive properties.
The adhesive cures for 20–40 min, during which time the isocyanategroups in fact have no time to interact noticeably with the hydroxylgroups and especially with less active carboxyl groups of MP PDEG.Immediately after the components were mixed and in the two weeksafter the cure (the adhesive was in the shape of a free film), the inten-sity of the 3500–3600 cm�1 absorption band, which is referred tovalence oscillations of polyester hydroxyl groups, did not change, indi-cating the low conversion of these groups in the course of adhesive
Properties of Adhesives Based on Polymeric Mixtures 103

cure. At 208C, after PN-1 and ATG-M are mixed, a clear change ofviscosity is observed at 3–4 h, which is evidence that there is no che-mical reaction between them up to that time.
It has been reported that under the influence of radical polymeriza-tion initiators styrene can copolymerize with TDI with the formationof the substitute polyamide, identified by the IR absorption band of thecarbonate group at �1730 cm�1. In the system under consideration noformation of the substituted polyamide is observed. Thus, the poly-ester and polyurethane components essentially do not react one withanother in the course of the adhesive cure.
With time, the free isocyanate groups of the solid adhesive reactwith the moisture that diffuses through the adhesive, as confirmedby the decrease of the IR absorption of the isocyanate groups at�2260 cm�1. This process results in polymerization of the macrodiiso-cyanate.
Interaction of the adhesive isocyanate groups with water alters anumber of adhesive properties such as the modulus of elasticity, theadhesion strength, electric properties, etc. Thus, the modulus of elas-ticity of adhesives determined at 3 days after curing for specimenscemented and kept in air, in water, and in oil was 40, 110, 160 MPa,respectively; at 100 days these values increased to 400, 120, 320 MPa.
Figure 3.1 presents the maximum stress surfaces when St3 steelis cemented with the Sprut-5M adhesive and the polyester and poly-
104 Chapter Three
Figure 3.1 Surfaces of maximum stress of steel spe-cimens cemented with Sprut-5M (I), polyester (II),and polyurethane (III) adhesives.

urethane individual components of this adhesive. It is clear that theadhesion strength of the Sprut-5M considerably exceeds not only thoseobserved using the indvidual components but also their sum. To clarifythis phenomenon, the interphase tension of the polyester, polyur-ethane and of their mixture was measured:
Polyurethane content in the mixture (%) 0 2 5 10 20 100Interphase tension (MPa) 331 311 300 290 296 370
As can be seen, the interphase tension of the polyester and the poly-urethane is much higher than that of their mixture. One can assumethat the formation of the loose transition region in the IPN type mix-tures facilitates the adsorption of the polymer’s polar groups on thesubstrate surface and their closer packing.
The decrease of the interphase tension governs the increase of adhe-sion strength of adhesive-bonded joints and their resistance to liquidmedia. Note that the adhesion strength of Sprut-5M adhesive is com-pletely determined by the polymer cohesion strength. When otherresins that produce stronger polymers replace the PN-1 resin, theadhesive strength of the adhesive also increases. The rupture of theadhesive-bonded joints is of cohesive character in all cases. Theiradhesion strength increases when they are held in oil and decreaseswhen they are held in water (by about 25%) then stabilizes at thislevel. The use of PN-11 and NPS 609-21M polyester resins (whichcontain triethylene glycol dimethyl acrylate instead of styrene) toreplace the PN-1 resin enhances the water resistance of adhesive-bonded joints. With integration of aerosil, which is hydrophobicizedby dimethyldichlorosilane, into the adhesive the adhesive strength didnot change when the joint was held in water.
Adhesives based on unsaturated polyester resins have not only com-paratively low adhesion but also low long-term strength. For example,the limit of PM-1 polyester resin long-term strength is less than 10% ofthe maximal short-term strength. The application of IPN-based adhe-sives considerably increases the long-term strength of adhesive-bonded joints. As Fig. 3.2 shows, the strength of Sprut-5M adhesiveloaded to 50% of the fracture loading does not decrease but increasesin time, with the loaded specimen’s strength growing more rapidlythan that of the unloaded specimens.
The long-term strength was studied by a method based on the prin-ciple of ‘‘damage accumulation,’’ i.e., plotting the kinetic curve of theshort-term strength dependence on the duration of constant loading.The growth of the long-term strength of adhesive-bonded joints ceasesas soon as the isocyanate groups in the adhesive are completely con-
Properties of Adhesives Based on Polymeric Mixtures 105

sumed. Thus, the increase of the long-term strength seems to berelated to the presence of the reactive oligomer in the adhesive.
Let us consider a possible mechanism for the increase in the long-term strength of adhesive-bonded joints. Under the effect of loading,the initially elastic adhesive interlayer is deformed. In this case theMDI molecules, which are in the interstructural regions of the poly-ester network, are oriented with the force field with changes in con-formation that can result in increase of the cohesion and adhesionstrengths. This assumption is confirmed by the following experiment.If adhesive-bonded joints are held at normal or shear load and thentested at various ratios of normal or tangential stresses, the strength-ening of the adhesive interlayer is observed mainly in the directionparallel to the applied load. Adhesive-bonded joints subjected for 100days to a shear or normal loading of 30% of the fracture load showedincreased strength, mainly for shear or normal pull (Fig. 3.3).
There is an increase in the polymer strength when the polymers areformed within a gradient of shear stresses, known to result in thealteration of the macromolecular conformation. For example, poly-ethylene produced by melt extrusion through capillaries under highpressure possesses unique physical-mechanical properties—its modu-lus of elasticity is of the same order as that of glass fiber ð7 � 1010 PaÞ[116].
We investigated the effect on the adhesion strength of shear stressesapplied to the adhesive interlayer MDI as a component of Sprut-5Madhesive. An equimolar quantity of butylene glycol was added to MDIto cure it. The shear stresses were created by the torsion of one dolly ofstandard size relative to another in a special device; the adhesive wasplaced between the dollies. On reaching the prescribed shear stress(due to the increase of the adhesive viscosity) the torsion of the dolly
106 Chapter Three
Figure 3.2 Long-term strength �B of St3 adhesive-bonded joints at various loadings:(1, 3, 5), Sprut-5M; (4) polyester adhesive.

ceased spontaneously. The adhesive interlayer was post-cured andthen the adhesion strength was measured.
It was shown that the polymerization of the adhesive within thegradient of the shear stresses that ensures the stretching and corre-sponding reorientation of the adhesive macromolecules can increasethe adhesion strength more than twofold. If the torsion of the dolly isstopped while the viscosity of the adhesive is still low, the strengthdoes not increase as much, because the adhesive molecules have hadtime to acquire initial conformation before the polymerization. Thecemented dollies were tested for shear.
The increase of strength is observed not only in the direction ofaction of the load but to some extent perpendicular to it (see Fig.3.3). Thus, orientation of the marcomolecules alone is not enough toexplain the increase of strength, and one must assume other mechan-isms.
It was shown earlier that contrary to the well-known case, thestrengthening of some resins under single-axial tension occurs notonly parallel to the axis of orientation but also perpendicular to it.Some authors [117] assume that a similar effect is produced by thestrong forces of transverse compression that result in the increaseof contact between the polymer globules. In the case under con-sideration, a similar mechanism of transverse strengthening of theadhesive cannot operate. As Fig. 3.3 shows, the transversestrengthening of the adhesive is observed under both normal andtangential loads. Although transverse compression of the adhesivemay occur in the latter case, it is excluded under normal loadbecause of the adhesion interaction of the adhesive with the unde-formed substrates.
Chains of macromolecules are known to fail at even small loads.Electron paramagnetic resonance (EPR) studies showed correlationbetween the long-term strength of some polymers and the formationand accumulation of free radicals. Depending on the environmental
Properties of Adhesives Based on Polymeric Mixtures 107
Figure 3.3 Adhesion strength ofthe adhesive-bonded joints fordifferent relationships of thenormal and tangential stresses100 days after cementing: (1)unloaded specimens; (2) shearload 0.3 GPa; (3) normal load0.36 GPa.

and operational conditions, macroradicals can cause loss of eitherstructure or structurization. In all cases the failure of the polymerunder mechanical load depends more or less on the development ofthese processes. The course of various processes, including chemicalones, is determined to a great extent by the medium the macroradicalcontacts. The final result of the mechanical processes depends on thedirection of the subsequent secondary conversions of free macroradi-cals, which are multistage, complex, and at the same time typical ofthe free-radical processes that occur in polymeric systems.
The polymer strength depends on both the probability of destructionof the polymer chains and the recombination of the free macroradicalsformed. The potential barrier to restore a terminated chain increasesthe stress. A liquid with which the free radicals react without second-ary chemical reactions further decreases the probability of the recom-bination of macroradicals. In this case one may consider the mediumto be the catalyst of the polymer destruction process.
The alteration of the material strength by different media (alcohol,for example) depends on the length of the molecular chain: the mate-rial strength falls with the decrease of the number of carbon atoms inthe alcohol molecule. This is related to the fact that with decrease inthe size of the alcohol molecules the chance of their recombination andof R—R molecule formation decreases and the probability increases ofthe stabilization of alcohol radicals due to the separation of the hydro-gen atoms from the polymer macromolecules, which results in theformation of R—H molecules.
The macroradicals formed in the course of destruction of the Sprut-5M polyester network or the peroxide radicals resulting from theinteraction of the macroradicals with atmospheric oxygen most prob-ably react with liquid MDI. Thus, MDI can serve as a bridge thatconnects the terminated chains of the polyester. The polyurethanenetwork formed heals the defects of the polyester network. In thatthe most highly stressed polymer networks are the first to terminate,the formation of such ‘‘bridges’’ must result in more uniform distribu-tion of stresses and in increase of the polymer strength. There was anincrease of the fatigue strength of polymethyl methacrylate ðEMMAÞunder the effect of farina, fructose, or glucose dissolved in the waterin which the polymer was deformed. These materials result in cross-linking of the terminated macromolecules and in strengthening of thepolymer.
Let us consider one more feature of polymer failure and the effect ofMDI thereon. The termination of molecular chains causes formation ofsubmicrocracks and cavities in the direction perpendicular to the ten-sion in the polymer. The concentration of the submicrocracksincreases the effect of the load over time, which asymptotically
108 Chapter Three

approaches a limiting value in the final stages of the failure. Suchcavities can be filled with MDI or even with segments of the liquidcomponent.
The formation of cavities in the polymer results in increase in itsvolume. Thus, the volume increase of a specimen made of PN-1polyester resin is 0.1% in 1 h after loading, 0.15% in 3 h, and0.2% in 10 days at 208C and 5 MPa. The addition of 20–60% ofMDI into the resin decreases the volume defect of the specimentwofold to fourfold.
Thus, one can identify at least three factors that increase the long-term strength of Sprut-5M adhesive at the stage of formation of thepolyurethane network but which have no further effect after theadhesive cures completely. Actually, in this state of the adhesivethere is no indication of the structure that is observed with theorientation of the molecular chains; there is an abrupt reduction ofthe opportunity for macroradicals to recombine and for the submi-crocracks to be filled. At this stage of curing, despite some decreaseof the long-term strength under a load of 50% of the fracture load,the Sprut-5M adhesive has much better resistance to the effect ofconstant loads than does the polyester adhesive (see Fig. 3.2, curve 1(after 102 days) and curve 4).
After the formation of interpenetrating networks is complete, it istheir specificity that results in the increase of the adhesive long-termstrength. As we noted before, IPNs are characterized by the availabil-ity of the loose transition region. In this case sections of the polymermain chains can shift more freely, and consequently the load betweenthem can be distributed more uniformly, which must enhance thepolymer lifetime.
The adhesive layer can be strengthened by the effect of both con-stant external load and internal stresses. Consequently, the latter canfacilitate the strengthening of the adhesive interlayer but not its soft-ening.
3.2.1 Properties of Sprut-5M adhesive-based reinforced coatings
When applying polymeric strengthening coatings, the issue arises ofthe mutual operation of the metal and the coating in terms of theindifferent moduli of elasticity. Let us consider this issue in detail.Dog-bone-shaped specimens manufactured to GOST 11262-68 stan-dard were used for the investigations. The specimens were made of3 mm thick St3 sheet hot-rolled steel, of 3 mm thick glass-reinforcedplastic based on Sprut-5M adhesive and T-11–GVS9 fiberglass, as wellas of biplates representing metal with glass-reinforced plastic molded
Properties of Adhesives Based on Polymeric Mixtures 109

onto it. The glass-reinforced plastics were molded under contact pres-sure.
Figure 3.4 presents curves of specimen deformation. As one mightexpect, the contribution of the polymeric coatings to the total rigidityand carrying capacity of the bispecimens subjected to the loads withinthe elastic limits of the steel is not great. Calculation indicates thatthe surplus of rigidity and of the limit of load proportionality amountsto 7.5%.
Let us consider the sections of the tension diagrams that correspondto steel deformation. On section II of the diagram, which correspondsto the steel yield plateau, the polymeric coating takes the whole loadgain, which amounts to 7500 N.
The value of the yield limit and the extent of the yield plateaudepend on a number of factors related to the steel structure and thetest conditions. In our experiments, the yield plateau ended at defor-mations " of 1.2%. Under further deformation the steel began toharden (section III of Fig. 3.4). It is evident that at this stage of speci-men failure the glass-reinforced plastic coating facilitates the increaseof strength.
Thus, Sprut-5M adhesive-based reinforced coatings allow anincrease in the strength of the metal, mainly under the conditions inwhich the load on the specimen exceeds the elastic limit of the steel.
110 Chapter Three
Figure 3.4 Patterns of deformation of specimensmade of glass-reinforced plastic (1), steel (2), andmetal–glass-reinforced plastic (3).

These are frequently the condtions under which structures operatethat are weakened by intensive metal corrosion—pipelines, oiltanks, ships. Sprut-5M adhesive is successfully used for strengtheningthese.
The serviceability of the coatings in the region of metal elastic defor-mation can be enhanced in many ways—by using high-modulus rein-forcing materials, by altering the temperature at which the coating isapplied, or by preloading the metal before applying the coating. Thereinforced coating on pipelines is in the stressed condition due to thenormal internal stresses that arise in the course of formation of thecoating, and enhances the pipeline strength even when the pressure ofliquid or gas within is inconsiderable. It should be noted that if thestresses in the coating are too high, its adhesion and cohesion strengthwill decrease rapidly. Application of Sprut-5M adhesive avoids thisdanger because the internal stresses for this adhesive do not exceed5 MPa in any case.
Let us consider some mechanical properties of biplates. These aresteel plates onto which glass-reinforced plastics are molded, withSprut-5M adhesive used as a binder. The types of mechanical loadselected were those that were encountered in the course of the coatingoperation.
For a 2 mm thick coating the average energy of impact resulting inrupture of the binder is 325 J; in the glass-reinforced plastic, theenergy of layer separation is 475 J; and in the glass-reinforced plasticfibers, the energy of rupture is 625 J. For a 3 mm thick coating thesevalues increase to 373, 525, and 675 J, respectively.
The relative elongation of the metal on bonding of the biplates to theextent that the fibers of the fiberglass break and wrinkles and foldsappear in the external layer of the glass-reinforced plastic amounts to0.19–0.22%.
Sprut-5M adhesive is widely used to seal blowholes in pipelines. Thepressure that breaks a glass-reinforced plastic coating made of 10layers of the fiberglass through a 15 mm blowhole is 8 MPa. A coatingwith 15 layers of fiberglass withstands the 8 MPa pressure through a35 mm blowhole.
When adhesives are applied for the repair of ships, blowholes inpipelines, and other objects, the adhesive interlayers are frequentlysubjected to impact loads under tension; this occurs, for example, inhydraulic impacts on pipelines, in ships during mooring, and so on. Inthis context it is interesting to investigate the effect of the modifyingadditives in Sprut-5M upon the strength of adhesive-bonded jointsunder tensile impact loads.
The investigations were carried out using the Charpy machine. Aspecial device was used to apply the tensile impact load. The specific
Properties of Adhesives Based on Polymeric Mixtures 111

impact viscosity a was calculated by the well-known formula a ¼ A=Swhere A is the work (in kJ) performed to destroy the specimen; S is thespecimen cross-sectional area in m2. Adhesive based on PN-1 polyesterresin without modifying additives and Sprut-5M adhesive were thesubjects of the investigations. Specimens of 8 mm and 18 mm diameterand made of steel were cemented by butt ends. The investigationswere carried out at 208C.
The impact viscosity of the 8 mm diameter specimens cemented withthe PN-1 and Sprut-5M adhesives was 10 and 20 kJ/m2 at 10 daysafter cementing, and for 18 mm diameter specimens was 60 and95 kJ/m2. It is evident that even in the 10 days after cementing, i.e.,long before the Sprut-5M adhesive acquires full strength, its impactviscosity is 1.5–2 times higher than that of the PN-1 based adhesive.The specific impact viscosity increases with the increase of the speci-men diameter, which seems to be related to the decrease of the ratio ofthe effective zone of the concentration factor of the internal stressesinside the edge of the adhesive interlayer to the cementing area.
3.3 Adhesives Based onThermodynamically IncompatiblePolymeric Mixtures
The properties of polymeric mixtures depend on the compatibility ofthe system components. Mixtures in which the polymeric componentsare incompatible can be considered by analogy with filled polymers. Insuch systems one component distributed within the continuous phaseof another serves as filler. The principal regularity of the physical-chemical and mechanical behavior of the filled polymers, the boundarylayers in particular, is maintained when the filler is also a polymer.
Of special interest are the systems obtained in the course of poly-merization of monomers in which another polymer is dissolved but isnot compatible with the polymers obtained from these monomers. Insuch a case, at certain degrees of polymerization the dissolved polymerprecipitates in form of the dispersed phase owing to the appearance ofincompatibility; the content and size of the particles of the dispersedphase can be controlled by changing the polymers’ compatibility, theirweight ratio, the system viscosity, and the rate of polymerization.
3.3.1 Adhesives based on acrylic polymermixtures
Let us consider the effect of PBMA particles precipitated from poly-merizing MMA or from its mixture with butyl methacrylate (BMA) on
112 Chapter Three

the properties of the polymeric mixture in the adhesive interlayer.PBMA is dissolved in a reactive system.
For the monomer polymerization at room temperature, the adhesivewas augmented with a redox system of 3% BP and 0.75% DMA. Tostudy, explain, and predict the development of the elastic failure of thepolymer in the adhesive interlayer, an improved method of investigat-ing adhesive layer crack resistance with modeling of the formation andgrowth of a crack at the adhesive-bonded joint loading was used [119].Five adhesive-bonded joints with the adhesive mixture compositionsshown in Table 3.1 were subjected to static tests for crack resistance atroom temperature. The characteristics of the static crack resistance ofthe adhesive-bonded joint (KIC is the coefficient of the stresses inten-sity: GIC is the intensity of the elastic energy release; �IC is the openingin the crack tip) were determined at the moment of onset of the crackin double-cantilever specimens DCB (Fig. 3.5). The specimen cantile-vers were made of PMMA of TOCH type.
The optical transparency of the cemented material allowed visualdetection of the moment of crack onset. In this case the load P1, theshift of the point of its application #P, and the crack face displacementclose to the mid-point of its front were recorded (Fig. 3.5).Determination of the critical load PC from graphs of P�#P and P�#C
using the secant method gave good agreement with the resultsobtained by visual detection of the crack onset.
The configuration of the DCB specimen provides for the multipleinitiation and arrest of the crack growth within the working rangeof its length 1:5h < l < W � 1:5h. The cycle (specimen loading–crackonset–specimen unloading–crack arrest) was repeated on average 15times on each specimen. All the adhesive-bonded joints under testwere subjected to cohesion fracture along the adhesive inerlayer mate-rial. The values of the stress intensity critical coefficient KQ werecalculated from the values of the load PC at the moment of the crackonset and from the equation [120]
Properties of Adhesives Based on Polymeric Mixtures 113
TABLE 3.1 Compositions of the Adhesive Compounds
Content (%)
Composition # MMA BMA PBMA
1 60 — 402 60 5 353 60 10 304 60 15 255 60 20 20

KQ ¼
ffiffiffiffiffiffiffiffiffiffiffiffiffiffiffiffiffiffiffiffiffiffiffiffiffiffiffiffiffiffiffiffiffiffiffiffiffiffiffiffiffiffiffiffiffiffiffiffiffiffiffiffiffiffiffiffiffiffiffiffiffiffiffiffiffiffiffiffi12P2l2
B2h31 þ 1:32
h
lþ 0:542
h2
l2
� �sð3:2Þ
where l is the crack length, 2h is the height, and B is the specimenthickness.
The values of KQ for the specimens and the crack sizes met the well-known requirements of applicability of plane deformation conditionsthat ensure the equality KQ ¼ KIC. The fact that the acquired values ofKQ are equal to the characteristic KIC of the adhesive interlayer indi-cates their independence of the crack length, the insignificant devia-tion from linearity of the P�#P and P��C graphs, the absence ofdrawing of the crack tip, and the approximation of its front to astraight line.
The possibility of multiple initiation and arrest of the crack in theDCB specimen validates the application of the method of mechanicalcompliance for determining the characteristic energy GIC. Values ofGIC for the adhesive-bonded joints under test were calculated from
GIC ¼ PC2
2B
@�
@lð3:3Þ
in which � ¼ #P=P is the elastic compliance measured at variouslengths of cracks in the specimen.
Within the framework of failure linear mechanics, the relationshipbetween the cracking resistance characteristics KIC and GIC was writ-ten as
114 Chapter Three
Figure 3.5 Schematic of specimen and diagram measuring the crackdisplacement and the crack opening displacement measurements.

KIC ¼ffiffiffiffiffiffiffiffiffiffiffiffiffiffiffiffiffiffiffiffiffiffiffiffi
EP
1 � �p2
GIC
sð3:4Þ
where EP is the modulus of elasticity and �p is the Poisson coefficient.For adhesive-bonded joints the values of EP and p (in Equation 3.4)
are customarily related not to the adhesive interlayer but to thematerials to be cemented. This commonly accepted assumption isnot completely correct due to ignorance of the effect of the adhesiveelastic constants upon the failure process. For composition 5(Table 3.1) the reduced modulus of elasticity EnP, calculatedfrom Equation (3.4) using the independently determined characteris-tics KIC ¼ 30003=2 MPa and GIC ¼ 0:0033 N/mm, is equal to245 � 103 MPa, noticeably below the modulus of elasticity of PMMA,EP ¼ 300 � 103 MPa.
The reduced modulus EnP does not depend on the deformation rate "of the material in the crack tip. In our tests the rate calculated from
" ¼2ð1 þ �pÞ
EP
�P0;2
KICKIC ð3:5Þ
(where �P0;2 is the adhesive yield limit under the single-axial tension;KIC is the rate of increase of the stress intensity coefficient) decreasedsignificantly along with the increase of the initial crack length.
The experimentally determined modulus of elasticity E of the adhe-sive interlayer of composition 5 decreased approximately from130 � 103 to 100 � 103 MPa. Some disparity between the obtainedvalues of the cracking resistance characteristics KIC and GIC isaccounted for by the excessive simplification of the common mathema-tical models of a crack in a thin film of polymer that connects twoelastic plates.
With reference to the earlier information, the deformation charac-teristic �IC looks more promising for the evaluation of the crackingresistance of adhesive-bonded joints. This characteristic, in contrastto KIC and GIC, can be measured directly on a specimen without anylimitation typical of the force and energy analysis of the linearmechanics of failure. The characteristics of an adhesive-bonded jointwere determined using the engineering method of measuring thecrack displacement close to the mid-point of its front line in the loadedspecimen. The displacement �I in the medium thickness plane of thespecimen at various distances from the crack tip for composition 5 (seeTable 3.1) are given in Fig. 3.6. Extrapolation for the case when l ¼ 0results in �IC ¼ 0:021 mm, which is the same for various crack lengthsin the specimen.
Properties of Adhesives Based on Polymeric Mixtures 115

The value of �IC can be used not only as a comparative but also as anestimated characteristic of the cracking resistance of adhesive-bondedjoints. For this purpose it is necessary to find a relationship betweenthe displacements �I, load, body geometry, and crack length. The rela-tionship for a crack with yield zone localized within its plane can bewritten
GIC ¼ k�0;2�I ð3:6Þ
where GIC is a known function of the load and of the geometry of thebody with a crack and k is a coefficient.
For polymers that fail as a result of formation of so-called silvercracks the coefficient �k is customarily considered as equal to 1. Inthis case, calculation using Equation (3.6) and using the character-istics GIC and �IC for composition 5 (see Table 3.1) gives�P0:2 ¼ 1:6 � 103 MPa. The adhesive interlayer yield limit deter-mined experimentally at deformation rates " ¼ 1 � 103�1 � 10�4 s�1
changes within the range ð2:2�2:6Þ � 103 MPa. If the relationship�k ¼ �=4 is assumed for the plane stressed state, the estimatedvalue of �P0:2 ¼ 2:0 � 103 MPa will come close to that found experi-mentally.
When BMA is added to the system, MMA and BMA copolymerize.The compatibility of the polymer formed with PBMA increases, whichresults in change of the number and the size of the colloid particles ofPBMA formed.
The number of the PBMA particles and their radii in the curedadhesive were determined from the turbidity spectrum. As Fig. 3.7
116 Chapter Three
Figure 3.6 Value of the displa-cement of the crack faces ofvarious length measured atdifferent distances l from thecrack tips.

shows, the size of the PBMA particles in the polymer decreaseswith increase of the BMA concentration in the initial mixture.The curve of particle concentration has a maximum around 5%BMA that correlates with the maximum value of the stressesintensity coefficient KIC and with the dependence on the BMAcontent in the adhesive mixture. The effect of the dispersedphase on the polymer’s capacity to resist the growth of cracksseems to consist in energy dissipation and in the decrease of theoverstress close to the initial crack tip in the particle of the low-modulus PBMA polymer.
Let us consider the properties of VAK (water-resistant acrylate)adhesives and of Sprut-5M adhesive, both based on the PMMA–PBMA mixture for cementing under water. The VAK adhesive consistsof the base (40% solution of PBMA in MMA) 100 parts by weight andATG 10 parts, BP 3 parts and DMA 1 part. Sprut-5M also has fluori-nated alcohol added. In the system under consideration, ATG is sur-face-active and can decrease the adhesive surface tension at theboundary with the high-energy surface. Adding 10% ATG to VAKadhesive decreases the interphase tension on the boundary betweenthe adhesive and mercury to 240 mN/m. ATG increases the adhesionstrength as well as making the adhesive capable of cementing in waterand in oil products.
In this system, ATG performs other functions as well. In the courseof the adhesive cure, ATG copolymerizes with MMA to form a copoly-mer that contains isocyanate able to form intermolecular crosslinksconsisting of disubstituted urea groups when it reacts with moisturethat diffuses into the adhesive interlayer. Such separation in time ofthe processes of formation of linear polymer and of the intermolecular
Properties of Adhesives Based on Polymeric Mixtures 117
Figure 3.7 Dependence of the critical stress intensity coefficientKIC, particle sizes rw, and their number N on the BMA content.

crosslinks results in decrease of the internal stresses in the adhesiveinterlayer.
In Sprut-4, the quantity of ATG is increased to 30%. Increase of thenumber of intermolecular crosslinks and of polar groups enhances theresistance of this adhesive to oil products. The fluorinated alcoholintroduced into the adhesive works as reactive surfactant because itcan react with the isocyanate groups of ATG. The amount of fluori-nated alcohol is selected to bond not more than 30% of the isocyanategroups in the adhesive. The fragment of the macromolecule of thepolymer formed in this case has the structure
The additional introduction of the fluorinated alcohol into the adhe-sive enhances its water resistance. Thus, the adhesion strength ofadhesive-bonded joints of steel using Sprut-4 adhesive does not changesignificantly over time even with many years in water.
To demonstrate the roles of the double bond and of the ATG isocya-nate group, which make this surfactant reactive, the adhesionstrength was determined for adhesive containing, instead of ATG,analogues in which these groups were substituted by others. Theadhesion strength of adhesives with substituted ATGs was lowerthan that with ATG itself (Table 3.2).
Using the ATG product, the minimal possible temperature of theadhesive cure was reduced. MMA containing ATG polymerizesunder the effect of the CHP (cumene hydroperoxide)–DMA redox sys-tem even at �108C. Compounds with isocyanate groups generally
118 Chapter Three

accelerate the polymerization reaction of the unsaturated compounds,but with ATG this acceleration is much stronger. The higher activityof ATG compared with TDI and other isocyanate-containing com-pounds is assumed to be related to the integration of the isocyanategroup into the growing polymer chain.
We also studied the interaction of the ATG isocyanate groups withthe MMA double bonds. In this case substituted amide groups mustbe formed that can act as crosslinks in the branching of the polymerchain R1R2 —N—CO— . A weak band of carbonyl group absorptionin the 1730 cm�1 region that is typical of substituted amines appearsin the polymer IR spectrum, recorded by the differential method. Thereaction of the ATG isocyanate group with MMA must result in for-mation of the crosslinked polymer, but it is not observed with theVAK adhesive—the cured adhesive dissolves completely in acetone.The number of isocyanate groups which initiate the copolymerizationreaction seems not to be great. This is confirmed by the band ofvalence oscillations of the free isocyanate groups with a maximumat 2280 cm�1 seen in the IR spectrum of the cured VAK adhesive.The insoluble fraction appears in the cured adhesive when the ATGcontent is above 15%, while the noticeable accelerating effect of ATGupon the polymerization reaction appears when its concentration inthe adhesive is only 1%. Thus the accelerating effect of the ATGisocyanate group upon the MMA polymerization reaction is notexplained in this case by chemical reaction of this isocyanate groupwith MMA.
Let us analyze the strength characteristics of VAK adhesive. Theadhesive for investigation was taken from a commercial lot manufac-tured by the pilot plant of the Institute of Macromolecular Chemistryof the Academy of Sciences of the Ukraine.
Properties of Adhesives Based on Polymeric Mixtures 119
TABLE 3.2 Adhesion Strength of Steel Adhesive-Bonded Joints Using AdhesiveBased on 40% Solution of PBMA in MMA with Different Additives
Quantity Adhesive strengthAdditive (%) (MPa)
CH3C6H3(NCO)NHCOOCH2CH——CH2 10 40.5
CH3C6H3(NCO)NHCOOCH2CH2CH3 5 24.0
CH3C6H3(NCO)NHCOOCH2CH2H3 10 22.0
CH3C6H3(NHCOOCH3)NHCOOCH2CH——CH2 5 25.5
CH3C6H3(NHCOOCH3)NHCOOCH2CH——CH2 10 18.0

The following couples of specimens were used:
Epoxy glass-reinforced plastic–epoxy glass-reinforced plastic
Steel–epoxy glass-reinforced plastic
Steel–steel.
The specimens were tested 10 days after cementing.It was demonstrated that cohesion failure, i.e., failure of the adhe-
sive, was typical for these specimens. The qualitative similarity ofphenomena in the course of specimen failure allowed comparativeanalysis of the strength characteristics by applying probability-statis-tical methods. The results of tests of specimens cemented with VAKadhesive for a short-time strength at normal pull-off are given inTable 3.3.
To evaluate the test results for various combinations of specimens,the confidence index � was calculated and compared with the bound-ary confidence index � 0 (tabulated value). Table 3.3 shows that at aprobability of 0.95, � is less than 1 for all the specimens, i.e., thedifference between the specimens can be considered insignificant.
Analysis of the experimental data indicated that the strength indexof the adhesive specimens is distributed normally. Comparing themean values of strength and evaluation of the systematic errors, weproceed from the preconditions that
�MM�1 ffi �MM�2 ffi �MM�3 ffi �MM
where �MM is the mathematical expectation of the average strength.This relationship was estimated by means of the tabulated values ofthe distribution of the standard deviations t:
120 Chapter Three
TABLE 3.3 Characteristics of Bonded Specimensa
Mean MeanSample strength, Variation square
Sample Combinations of size M� factor, deviation Dispersionnumber bonded materials n (MPa) vB (%) of �B of �2
B
1 Epoxy glass-reinforced 100 29.2 13.7 40.0 1600plastic–epoxy glass-reinforced plastic
2 Steel–epoxy glass- 100 30.8 14.2 43.8 1920reinforced plastic
3 Steel–steel 100 29.7 16.1 45.9 2110
a The specimens were tested 10 days after cementing.

t ¼ j �MM�1 � �MM�2jS�
S� ¼
ffiffiffiffiffiffiffiffiffiffiffiffiffiffiffiffiffiffiffiffiffiffiffiffiffiffiffiffiffiffiffiffiffiffiffiffiffiffiffiffiffiffiffiffiffiffiffiffiffiffiffiffiffiffiffin1S1
2 þ n2S22
n1 þ n2 � 2
1
n1þ 1
n2
� �s !ð3:7Þ
because this value is subject to the distribution with the number ofdegrees of freedom for two specimens, k ¼ n1 þ n2 � 2. This is why atthe prescribed reliability the means can differ not more than the valuetS�, i.e.,
j �MM�1 � �MM�2j < tS� ð3:8Þ
This condition is met for all the combinations of the specimens (seeTable 3.4). At B ¼ 0:999, the results become confident.
Thus, for the combinations of the cemented materials that are con-sidered, one can guarantee a reliable joint under standard (normal)loads that produce tension up to 25 MPa inside the adhesive inter-layer. In connection with the retarded formation of the intermolecularcrosslinks and with the more complete consumption of the monomer,the VAK and Sprut-4 adhesives acquire the maximum strength in 1–2months after cementing, although even at 1 day the adhesion strengthof the adhesive-bonded joints already exceeds 10 MPa and is sufficientfor the majority of applications. Similar character of the change ofadhesion strength is observed during cementing in water. Whencementing takes place in oil products, the VAK adhesive is elasticizedby the oil, as a result of which the adhesion strength decreases withtime. Sprut-4 adhesive has no such shortcoming.
Properties of Adhesives Based on Polymeric Mixtures 121
TABLE 3.4 Evaluation of the Differences of the Dispersion and the MeanShort-Term Strength of Specimens Cemented with the VAK Adhesive under VariousCombinations of Specimens
Confidence index Difference ofof specimen combination
Combination strength mean values of twoof specimens � ¼ �2=�1
2a S� t�S�b specimens
1, 21920
1600¼ 1:2 5.96 19.6 16
1, 22110
1600¼ 1:32 6.12 20.1 8
2, 32110
1920¼ 1:1 6.34 20.9 11
a The boundary value of � for all cases is equal to 1.35.b The tabular value of t� at �B ¼ 0:999 is equal to 3.29.

Let us consider the change of the long-term strength of VAK adhe-sive in air and in water. The investigations were carried out at 208Cand 608C in air and at 208C in water. Analysis of the results by prob-ability-statistical methods with the probability of �B ¼ 0:95 showedthat the difference of dispersions and mean values is insignificant.The curves of the long-term strength of steel adhesive-bonded jointsunder normal pull-off in air and in the water (Fig. 3.8) are approxi-mated by the equations log �ad ¼ 8:5 � 0:0289� (curve 1) andlog �ad ¼ 4:5 � 0:0226� (curve 2), where �ad is the tangential stress.Further holding of the specimens under load in water and in air doesnot practically affect the adhesive strength properties, and the ��log �curve kinks and runs parallel to the y-axis.
As Fig. 3.8 shows, the adhesive long-term strength in water is lowerthan that in air; this could be accounted for by the adsorption andplasticizing effect of water, although at loads <10 MPa the adhesivereliability in water is higher than in the air. Insofar as in the actualfull-size adhesive structures the stresses are designed to be belowthe above limit, VAK adhesive can be characterized as highly water-resistant. In actual operational conditions the adhesive-bonded joint ispractically always subjected to the effect of both tangential and normal
122 Chapter Three
Figure 3.8 Long-term strength of specimens made of St3 steelcemented with VAK adhesive: (1) in air at 208C and 608C; (3)in water at 208C. Time is given in seconds; broken lines indi-cate the confidence interval.

stresses. In this connection the strength of the adhesive-bonded jointsfor various combinations is of great interest. A set described in [122]was used for the investigations.
The strength of adhesive-bonded joints under the combined effect oftangential and normal stresses at 20, 40, 60, 90, and 100 days aftercementing of St3 steel is displayed in Fig. 3.9 as surface stress plottedin coordinates ���ad�time: Surface I characterizes the extreme stres-ses of the joints using VAK adhesive; surface II is the same withoutaddition of ATG to the adhesive.
Let us consider the dependence of the shear strength of specimenscemented with VAK adhesive on the stress–strain state of one of thecemented parts. The investigation consisted in determining thestrength of the adhesive interlayer for high-frequency (up to 20 kHz)longitudinal-mode oscillations of a specimen in the shape of a cylind-rical rod with half-cylinders cemented on. The magnetostriction vibra-tor to which the specimen was rigidly fixed generated the longitudinaloscillations. The adhesive-bonded joint was loaded and sheared byinertial volume forces, which originate in the specimen under theeffect of vibration.
The shear stresses in the adhesive interlayer are
ad�k2AC
m
kð3:9Þ
Properties of Adhesives Based on Polymeric Mixtures 123
Figure 3.9 Surfaces of the maximum stresses ofcemented steel specimens: (I) VAK adhesive; (II)the same without ATG added.

where �k is the circular frequency; AC is the amplitude of the specimenoscillations in the loop; m is the mass of the part; and k is the area ofthe cemented surface.
The amplitude of the rod’s oscillations in the loop zone was mea-sured by means of a microscope, and to determine the amplitude atany point within the section between the node and the loop of oscilla-tions a recalculation was performed using
Ax ¼ AC sin4x
�Bð3:10Þ
where x is the distance between the node and the point under consid-eration; and �B is the length of the oscillation wave. The relativedeformation "x in the rod changes in the following way:
"x ¼ "y cos4x
�Bð3:11Þ
Here "y is the maximum relative deformation of the rod in the vibra-tional mode determined in the following way:
"y ¼ �kAC
ffiffiffiffiffiffiffiffiffiffiffi�=EP
pð3:12Þ
where � is the density and EP is the modulus of elasticity of the rodmaterial.
The location of labels on any section between the node and the loopof oscillations designates the respective relationship of the shearstress and the deformation of the cemented part.
The above method of determining the adhesion strength for thestress–strain state of one of the cemented parts enables analysis ofthe reasons for failure of adhesive-bonded joints when, at first glance,there are no loads in the joint, as when using the adhesive for repair ofships’ decks or for cementing any part onto a high-pressure bottle. Fordeformation of 0.01% of the cemented surfaces, the adhesive-bondedjoint based on UP 5-177-1 epoxy adhesive is destroyed completely.With application of VAK or Sprut-4 adhesives, the joint strength isdecreased by 70% and 54%, respectively, at 0.2% deformation of thesubstrate. Consequently, there is no failure of the adhesive-bondedjoints even at this degree of deformation.
Because of high adhesion strength and deformability of the VAKand Sprut-4 adhesives, low internal stresses in the adhesive-bondedjoints ensured their serviceability when used as binders for the forma-tion of reinforced coatings on metal and other surfaces. The thicknessof such coatings can reach some centimeters and their strength iscomparable with that of metals. Such coatings are suitable to
124 Chapter Three

strengthen metal structures, for the repair of pipelines, and for sealingoil tanks and other reservoirs.
Good technological applicability of these adhesives is of great impor-tance in terms of low viscosity (6.0–8.0 Pa�cm) and their capacity forfast cure even at low temperatures and for good impregnation of theglass cloth and other reinforcing materials. Glass-reinforced plasticscan be formed using the above adhesives in air, in water, and in oilproducts. In the last case the glass cloth is preimpregnated with theadhesive in air and the reinforcing material is subsequently used foroperations in water and oils. For formation of the glass-reinforcedplastics under liquids, e.g., when strengthening pipelines or repairingships and oil tanks, special mechanisms and appliances have beendeveloped to mechanize the formation process [124, 125].
Let us consider the results of physical-mechanical tests of glass-reinforced plastics based on VAK adhesive and of steel specimenswith glass-reinforced plastic molded on to them. The tests were per-formed to model to some extent the types of loads to which suchcemented structures are subjected in actual use.
Table 3.5 displays the data for the strength properties of the glass-reinforced plastic. The reinforced material was T-11-GVS9 glass cloth,which made up 50% of the glass-reinforced plastic. One concludes thatthe strength of the glass-reinforced plastic, even when molded inwater or oil, is in the majority of cases sufficient for mounting variousstructures or for the repair and strengthening of metal structures inliquid media. It should be noted that the glass-reinforced plastics werecontact pressure-molded for tests under conditions simulating those oftheir operational application.
The glass-reinforced plastics formed using VAK adhesive as binderhave good resistance to vibration (Table 3.6). Specimens of 5 mm thickSt3 steel with glass-reinforced plastic coating cemented on (bispeci-mens) were also vibration tested. The coating was applied either to
Properties of Adhesives Based on Polymeric Mixtures 125
TABLE 3.5 Mechanical Properties of Glass-Reinforced Plastics Based on VAKAdhesive Binder
Glass-reinforced plastic failure stress (MPa)
Load type In oil In air Under water
TensionAlong warp 320 240 152Along weft 190 117 96
CompressionAlong warp 290 220 140Along weft 210 145 98

both sides or to one side only. The coating was 1–2 mm thick. The testswere carried out under conditions of alternating cyclic loading at 18–19 Hz frequency of deformation; the flexural vibrations were excited bya vibration electrodynamics test bench. The frequency of the naturalfree vibrations was practically the same for all bispecimens and was18–19 Hz. The amplitude of vibration at the ends of the specimens waswithin the range 25–30 mm. The value of stresses (strains) that act ina marked cross-section of the specimen was determined using wireresistance tensometers. The stresses acting at the boundaries of layersin the marked cross-section were found to be 40–45 MPa. All thespecimens were subjected to 10 cycles of load alternation.
Visual inspection of the specimens and checking with the DIK-1defectoscope did not register any failure of the glass-reinforced plasticcoating or its separation from the metal plate.
Biplates of 800 � 800 mm size with 5 mm thick steel plate were usedfor impact testing of the glass-reinforced plastic coating, which was 2–3 mm thick and applied on one side. A 14 kg free-falling ball providedthe impact onto the plates. Table 3.7 shows the changes that occur inthe glass-reinforced plastic coating under the effect of the impact load.These changes are of local character and do not spread beyond theregion of application of the force. It is evident that even in the caseof considerable impact energy, which results in failure of the glass-reinforced plastic coating, there is no separation of the coating fromthe metal.
126 Chapter Three
TABLE 3.6 Vibration Resistance of Glass-Reinforced Plastics Based on VAKAdhesive Binder
Failure tensile stress (MPa)
Direction of load Initial state Under effect ofapplication �B 107 cycles, �BC
�B � �BC
�B� 100 ð%Þ
Along warp 320 297 7Along weft 190 173 9
TABLE 3.7 Results of the Biplate Impact Tests
Type of failure Coating thickness (mm) Failure engery (J)
Binder crushing 2 4253 525
Plastic ply separation 2 6253 700
Plastic fiber rupture 2 7253 825

For flexural tests, 3 mm, 10 mm, and 14 mm thick metal specimenswere coated with VAK-based glass-reinforced plastic on both sides andon one side only. The coating was 1–3 mm thick. The sag of the pushedand pulled fibers was measured using sagmeters.
The relative elongations of the pulled ð"pullÞ and pushed ð"pushÞfibers of the specimen were determined by the following equations:
"pull ¼2f
ðah � f Þ2
"push ¼ 2f
ðbh � f Þ2
where f is the sag, ah is the half-base of the sagmeter, and bh is thehalf-thickness of the specimen metal base.
Table 3.8 shows the results of the static bending tests, the relativeelongations of the metal substrate at which the fibers of the glass clothbroke and wrinkles and folds appeared on its external surface. Theflexural tests indicated that in the case of the pulled fibers, the threadsof the glass cloth broke; in the case of the pushed fibers, wrinkles andfolds appeared on the external layer of the glass cloth while the innerlayers were firm on the metal surface. The static tests of the specimenswith the metal base extension showed that the glass-reinforced plasticpeeled off the metal for stress in the metal not less than 355 MPa.
For comparison, tests on biplates made of steel and glass-reinforcedplastic with VAK as binder were carried out along with tests of similarspecimens with UP 5-177-1 epoxy compound as binder. Impact resis-tance of the VAK specimens exceeded that of the UP 5-177-1 speci-mens by 14–19%; for the bending resistance the difference was 33–34%. The plastic with UP 5-177-1 binder peeled off the metal at astress in the metal of 302 MPa, which is 15% less than that for theplastic with VAK binder. The glass-reinforced plastic was formed inair at 208C.
Properties of Adhesives Based on Polymeric Mixtures 127
TABLE 3.8 Results of the Biplate Flexural Tests
Failure deformationMetal specimenthickness (mm) "pull "push
3 0.37–0.41 0.39–0.4310 0.36–0.41 0.39–0.4214 0.35–0.40 0.38–0.42

The adhesion strength of the glass-reinforced plastic–steel systemwas determined using steel dollies and layers of the glass clothimpregnated with the adhesive were placed between the dollies orplates. The glass-reinforced plastic in the adhesive-bonded joint wasformed in air, in water, and in oil with subsequent placing of thecemented specimens into water.
The results of tests at 10–12 days after cementing and holding in thecorresponding medium are presented in Table 3.9. The adhesionstrength decreases with increase of the number of glass cloth layers,although in all cases the rupture is of cohesive character (for theadhesive). The drop in strength seems to be due to the glass-reinforcedplastic formed under contact pressure having many faults in its struc-ture, such as uncemented sections, non-uniformities of the adhesivelayer, and so on.
3.3.2 Controlling the properties ofadhesives based on epoxy rubberpolymeric mixtures
The properties of existing epoxy adhesives fail to meet a number ofrequirements of current engineering, bringing the problem of theirmodification to the forefront because, despite the good adhesion anddielectric properties of the epoxy polymers, their elasticity and resis-tance to impact loads are not high.
Among the most effective modifiers allowing an increase in theimpact viscosity and cracking resistance of epoxy polymers are theoligobutadiene acrylonitrile rubbers with reactive end groups. Thestructures of the reactive rubbers that are commonly used to increasethe impact viscosity of the epoxy resins are as follows. CTBN is a
128 Chapter Three
TABLE 3.9 Adhesion Strength of the Metal–Glass-Reinforced Plastic System
Failure stress �n (MPa) forrupture of cemented specimens Shear
failure stressIn air �ad (MPa)
Specimen In In then in In for cementedtype air water water oil specimens in air
Without glass cloth 26.0 16.8 24.5 12.0 21.3
With glass cloth1 layer 22.8 13.4 21.5 7.2 16.22 layers 19.0 11.4 17.4 4.0 —4 layers 13.6 7.8 13.0 — —
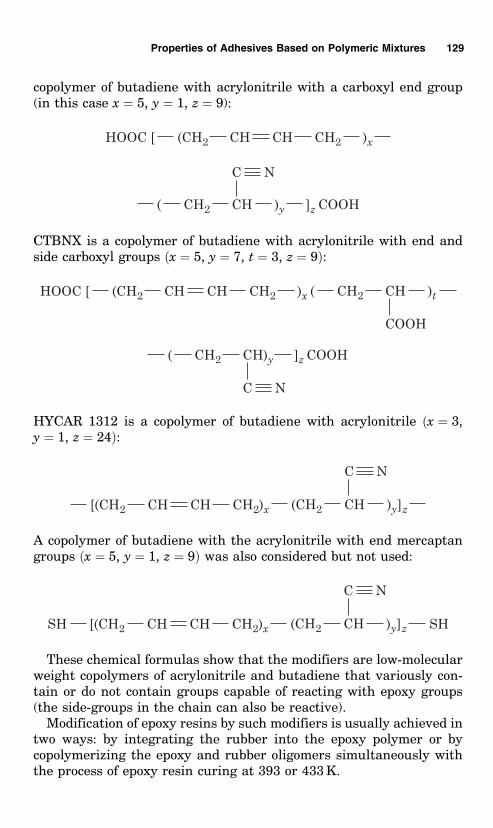
copolymer of butadiene with acrylonitrile with a carboxyl end group(in this case x ¼ 5, y ¼ 1, z ¼ 9):
CTBNX is a copolymer of butadiene with acrylonitrile with end andside carboxyl groups ðx ¼ 5, y ¼ 7, t ¼ 3, z ¼ 9Þ:
HYCAR 1312 is a copolymer of butadiene with acrylonitrile ðx ¼ 3,y ¼ 1, z ¼ 24Þ:
A copolymer of butadiene with the acrylonitrile with end mercaptangroups ðx ¼ 5, y ¼ 1, z ¼ 9Þ was also considered but not used:
These chemical formulas show that the modifiers are low-molecularweight copolymers of acrylonitrile and butadiene that variously con-tain or do not contain groups capable of reacting with epoxy groups(the side-groups in the chain can also be reactive).
Modification of epoxy resins by such modifiers is usually achieved intwo ways: by integrating the rubber into the epoxy polymer or bycopolymerizing the epoxy and rubber oligomers simultaneously withthe process of epoxy resin curing at 393 or 433 K.
Properties of Adhesives Based on Polymeric Mixtures 129

The best modifiers are the rubbers containing reactive groups—COOH, —OH, or —SH. For rubbers with carboxyl groups, thefollowing chemical reactions can occur:
ð3:13Þ
ð3:14Þ
ð3:15Þ
Reaction (3.13) proceeds up to the moment of complete consumption ofall the carboxyl groups, and the remaining epoxy groups react accord-ing to mechanism (3.15).
With the appropriate curing agent present, both epoxy rings open,forming the centers of branching in the molecular chains; that is, themolecule of the bisphenol A diglycidyl ester (DGEBA) is tetrafunc-tional. The reaction of the epoxy group with primary amines wasshown to proceed according to mechanism (3.16), while with secondaryamines and acids it runs according to the mechanisms (3.17) and (3.18)[126].
ð3:16Þ
ð3:17Þ
130 Chapter Three

ð3:18Þ
When epoxy resins modified by rubbers are cured with the tertiaryamines, the following processes occur:
ð3:19Þ
The salt formed then reacts quickly with the epoxy group:
ð3:20Þ
As the cited paper [126] notes, the product seems to be similar toan ABA block polymer in which A consists of the DGEBA fragmentsand a curing agent, and B is represented by the butadiene–acryloni-trile chain of one OBDANC molecule (an oligomeric butadiene–acry-lonitrile copolymer with the end carboxyl groups) with the followingstructure:
The usual process of epoxy resin curing runs alongside the above reac-tions.
The principal requirement of the modifier is usually considered to besolubility in the epoxy oligomer, but when the epoxy is cured themodifier must precipitate into a separate phase. This requirement ismet by OBDANC because the difference in the solubility parameters ofOBDANC and DGEBA is quite small, which makes its solution in theepoxy oligomer possible and its subsequent phase separation in thecourse of curing.
Integration of such modifiers as SKD–KTRA oligobutadiene rubberwith the carboxyl end groups into an epoxy resin increases the adhe-
Properties of Adhesives Based on Polymeric Mixtures 131

sion strength, with a noticeable tendency to phase separation onmixing the epoxy and rubber oligomers that makes for difficulty inthe uniform distribution of the modifier molecules in the epoxy oli-gomer. A noticeable improvement of compatibility of epoxy and rub-ber oligomers is observed in the oligobutadiene–acrylonitriliccopolymers (CTBM or OBDANC). Exact coincidence of the solubilityparameters of DGEBA and OBDANC is achieved at 28.5% of theacrylonitrile in the rubber. In this connection, the majority of studiesaiming to obtain impact-resistant epoxy compounds have beendevoted to elastomers based on OBDANC and to epoxy resinsbased on DGEBA.
Now let us analyze what the properties of epoxy rubber compounds(ERC) depend on. As the authors of [128] note, the properties aredetermined by the epoxy oligomer used, by the type and concentrationof the curing agent, by the content of the acrylonitrile in the rubber,and by its molecular weight. According to various authors, the optimalcontent of the rubber is from 0.25% to 20%. The region in which themaximum modifying effect is displayed is determined mainly by thereactivity of the rubber. Thus, when using chemically inert rubbersthey are precipitated as a separate phase; when reactive rubbers areused, the epoxy rubber copolymer is precipitated into a separatephase. The molecular weight of rubbers with similar reactivities influ-ences the extent of the modifying effect as well as the limit of thecomponents’ compatibility.
Studies of the dependence of ERC properties obtained as above onthe formation method showed that the precipitated finely dispersedrubber that is not bonded to the epoxy matrix does not endow it withhigh mechanical characteristics. When reactive oligomers are appliedwith high-temperature cure, there is a sharp enhancement of the mod-ifying efficiency, accounting for the more intensive separation of thephases in the system and for the increase of the yield of the epoxyrubber copolymer. Thus, the structure and properties of epoxy resinsmodified by rubbers are mainly determined by the mode of systemcuring, but the quantitative relationships between curing mode andfinal properties have not been sufficiently studied.
Of special interest are investigations reported in [129] in which theepoxy resin was modified by rubbers using a third method—preester-ification reaction (PER) between the epoxy and carboxyl groups of therubber and the resin and the subsequent curing of the copolymerobtained at room temperature. In particular, it was shown that withthorough blending of the epoxy and rubber oligomers and subsequentheating of the mixture at 423 K for 2 h there is a noncatalytic interac-tion of the carboxyl and epoxy groups that results in formation of thehydroxyester; the resin obtained has the following structure:
132 Chapter Three

ð3:21Þ
The etherification between the epoxy and rubber oligomers canoccur also at 353 K but requires such catalysts as chromium salts,diisopropylsalicylic acid, triphenylphosphine, betaine, triethanol-amine, triethanolamine borate, benzyldiethylamine, or acetyltriethy-lene ammonium bromide.
For modification of epoxy resins with rubbers containing doublebonds, the principal difficulty lies in the formation of hydroperoxidegroups. These in turn can fragment into radicals, which cause unde-sirable and uncontrolled side-reactions.
3.3.2.1 Phase separation in epoxy rubber compounds and their morpholo-
gical structure. The most important factor that ensures phase separa-tion of ERC is the difference between the solubility parameters of theresin and of the rubber. If this difference is small, the phase separationappears to be incomplete. On the other hand, with a large differencethe elastomer does not form a homogeneous solution in the initialstage of the modification process. The molecular weight of the rubberalso affects the efficiency of the phase separation because at highmolecular weight the rubber is poorly dissolved in the epoxy oligomer;at low molecular weight the phase separation does not occur and as aresult an elasticized epoxy resin is formed. The use of rubber withaverage molecular weight of 3800 results in satisfactory phase separa-tion and in good resistance to failure.
The efficiency of the phase separation cannot be always predictedfrom thermodynamic considerations; in some systems it does not occurat all. Thus, in the case of fast-curing epoxy resins the separation canpractically cease due to the increase of viscosity (this is observed incases of a curing agent with high reactivity such as triethylenetetra-
Properties of Adhesives Based on Polymeric Mixtures 133

mine, especially at higher content and with no mixing). The use of aless active curing agent such as piperidine ensures better phaseseparation.
The approach taken by the authors of [131] is of interest; they stu-died the problem of the dependence of the phase separation in ERC onthermodynamic and kinetic factors. They show that in epoxy materialmodified by rubber there is an upper temperature limit—the solubilitytemperature Ts above which the rubber and the resin are sufficientlycompatible with one another that the phases do not separate before gelformation.
The efficiency of phase separation in ERC has been controlled by theintegration of bisphenol A. In this case the resin molecular weightincreases as a result of interaction of the phenol and epoxy groups.Optimal phase separation can be expected only when the difference�1 � �2 is very small and negative at the beginning of the reaction.Only under these conditions does the rubber dissolve in the epoxyoligomer; it precipitates into an independent phase as the molecularweight of the epoxy resin increases. From this it was concluded thatthe poor phase separation in the mixture can be improved by allowingfor the increase of the molecular weight of the resin or rubber (i.e., forthe increase of the difference of the solubility of the epoxy and rubberoligomers).
Increase of the phase separation efficiency in ERC can be achievedby various additives [133]. The effect of the rubber particle dispersionin the epoxy resin is enhanced by application of surfactants with activegroups able to participate in the formation of hydrogen bonds betweenthe structural elements. Similar regularity is noted with some aro-matic and aliphatic resins (for example, resins with the brand nameStructol 60NS) and ABC-copolymer used for this purpose. With theABC-copolymer, which contains a large quantity of polybutadiene, theelastomer represents a dispersed phase of particles of a defined size.The advantage of such a modification is the higher glass-transitiontemperature Tg compared with the OBDANC rubber.
Study of the morphological features of ERC indicate precipitation inthe course of the epoxy resin cure of particles of the discrete phase ofthe rubber, the dispersion of which in the epoxy polymer matrix has aconsiderable effect on the mechanical properties of the latter. If therubber particles are large enough, they can be detected by opticalmicroscopy, but the most important results are obtained by electronmicroscopy.
The morphological structure of ERC has been studied [134] byapplying osmium tetroxide, which is frequently used for the detectionof unsaturated bonds. In this case it reacts with the double bonds ofthe rubber, with the formation of the osmium cyclic ester (see (3.22)).
134 Chapter Three

This results in additional curing of the rubber that in its turn makes iteasy to prepare with enhanced surface contrast.
ð3:22Þ
In studies of the ERC heterogeneous structure obtained in copoly-merization between the epoxy and rubber oligomers that occurs alongwith the epoxy resin cure (i.e., hot cure compounds), the average sizeof the rubber particles was found to be dependent on its polarity andon the level of compatibility with the epoxy resin as well as on thechemical composition of the modifier [132]. The author also showedthat the size of the rubber inclusions decreases and the structure ofthe composition becomes more homogeneous with increase of thepolarity of the elastomers and the curing temperature of the ERC.
Studies of the thermodynamic compatibility of the epoxy and rubberoligomers by the interferometric micromethod also showed [135] thatthe region of homogeneous mixing expands noticeably with increase ofthe rubber polarity. In this case the nucleation mechanism of hetero-phase formation is realized in which growth of the nuclei is the limit-ing stage. With active curing agents, occlusions of the epoxy resin inthe rubber are formed during phase separation, which results inincrease in the volume of the rubber particles. This was said [132] tobe due to reaction of the epoxy resin with the rubber.
Many of the particles, especially the smallest ones, are homogeneous.Although this does not mean that there is no epoxy resin in the elas-tomer phase, it indicates that the epoxy resin is possibly dispersed atthe molecular level as a result of the etherification reaction betweenthe epoxy and carboxyl groups of the resin and the rubber. The usualsize of the rubber particles is 0.1–0.8 mm. The phase separation in themixture of the epoxy and rubber oligomers is assumed to proceed in twostages. In the initial stage the usual phase separation with formation ofthe rubber particles (0.8 mm) occurs. The level of phase separation isdetermined by the interphase tension, by the viscosity of the epoxy andrubber oligomers, by the difference of the parameters of their solubility,and other factors. The finer particles (0.1 mm) are formed after theepoxy resin is cured due to the formation of the block polymer ofthe resin and the rubber. Varying the modification conditionsalters the degree of cross-linking within rather narrow limits,while the size of the rubber particles can change from 0.5 to 5mm.
Properties of Adhesives Based on Polymeric Mixtures 135

Correlation of the size distribution curves of the particles of therubber dispersed phase with the compatibility of the initial ERC com-ponents showed [135] that the widest particle distribution is observedfor the rubber that is of poor compatibility with the epoxy oligomer.Using a rubber with better compatibility, the particle size distributionbecomes noticeably narrower. From this observation it was concludedthat there is a correlation between the thermodynamic compatibility ofthe ERC components at the mixing stage and the phase state of thecured compound.
3.3.2.2 Relaxation properties of epoxy rubber compounds and mechanisms
of the rubber strengthening effect. Usually ERC displays two regions ofrelaxation. The first is at a temperature much higher than room tem-perature and depends on the glass-transition of the matrix (epoxy)component of the compound. The glass-transition of the rubberphase is related to the second relaxation region, which is detected attemperatures below room temperature.
The basic methods of detecting the secondary relaxation transitionsare dynamic mechanical spectroscopy (DMS) and differential thermalanalysis; in some cases information can be obtained by evaluation ofthe dielectric characteristics, by NMR, and by DSC.
Studies of ERC by the DMS [136] found that the rubber dissolved inthe matrix of the epoxy polymer plasticized it, with a decrease of theglass transition. The content of dissolved rubber was evaluated bymeans of the Gordon–Taylor equation:
1
Tg¼ 1
W1 þ kW2
W1
Tg1þ kW2
Tg2
� �ð3:23Þ
where W1 and W2 are the contents (in %) of the epoxy resin and therubber; Tg1;Tg2, and Tg are the glass-transition temperatures of theinitial epoxy resin, the rubber, and the homogeneous matrix phaseenriched with the rubber; and k is the normalizing constant.
The authors [136] showed that, within the range of small rubberadditions, the glass-transition temperature drop is determined bythe position of the main maximum of the mechanical losses. Withfurther increase of the modifier content in the system, the glass-tran-sition remains practically constant.
Four regions of ERC mechanical relaxation related to types of mole-cular mobility were found. One study [137] determined a direct depen-dence between the ERC impact resistance and the height of peaks ofthe mechanical losses. From the experimental data obtained in thatstudy, the authors affirm that the physical basis of this correlation isthat the relaxation mechanism makes a contribution to the energy
136 Chapter Three

dissipation in the material. It was also found that in combining theepoxy resin with the rubbers the conditions of molecular motionchange in both the primary and the secondary regions of the mechan-ical relaxation (in this case both transitions shift to lower tempera-tures), which is related to the formation of a number of neighboringregions of mechanical relaxation due to the structural heterogeneity ofthe ERC.
Investigation of ERC by dielectric and ultrasound methods [138]detected three relaxation transitions. The low-temperature transition(220–246 K at 102–105 Hz) is related to the molecular mobility of thepolyacrylonitrile butadiene. Relaxation transitions related to molecu-lar mobility, either in the boundary layer between the rubber and theresin or in the regions of structure formed in the course of the cross-linking, correspond to higher temperatures. But, as this paper pointsout, the higher-temperature relaxation transitions do not appear inthe frequency dependences. They can be detected only in the depen-dence of the modulus of elasticity on the temperature.
In the heterophasic system comprising poorly compatible compo-nents, the degree of the heterophasicity has a noticeable effect onthe dynamics of molecular mobility. In this case the homogeneoussystem of properly compatible components displays their strongmutual effect on the molecular mobility, while the poorly compatiblerubber that forms an independent phase has no effect on it. Properlycompatible oligomeric rubber has a plasticizing effect, and a poorlycompatible one serves as a structural modifier or an antiplasticizer.
Let us consider the possible mechanisms of strengthening of epoxypolymers by rubbers. The failure of a polymeric material, as of anysolid, proceeds through the development of cracks. In the failure oflinear polymers the material structure can change under the influenceof mechanical stresses in the tip of the growing crack, which in turnresults in orientation and consequently in the strengthening of thepolymer in the area of the crack tip. In network polymers (epoxy inparticular) the possibility of plastic deformation in the crack tip islower due to the additional limits on the chain mobility applied bythe network chemical crosslinks. This is why one observes a lowvalue of the effective failure surface energy compared with linear poly-mers.
Hypotheses have been advanced to explain the increase of theimpact strength of the epoxy resins by the integration of finely dis-persed rubbers. There is an assumption [139] that the rubber particlesin the epoxy polymer matrix absorb the impact energy in the mannerof mechanical damping. In this case the dissipation of the excessenergy occurs mainly inside the formed interphase layer withdecreased density of the cohesion energy. In addition, to provide max-
Properties of Adhesives Based on Polymeric Mixtures 137

imum impact strength of ERC a strong adhesion interaction is neededat the interface between the epoxy polymer and the rubber (in thiscase the cracks formed penetrate into the rubber particle and do notpass over it). The decrease of the brittleness of the epoxy resinobserved with similar modification occurs as a result of the increaseof elasticity, insofar as the looseness of the epoxy polymer increaseswith integration of rubber into the matrix of the epoxy polymer. Therole of the rubber particles consists in providing for a free volume,which is necessary for the formation of cold flow, as well as in disturb-ing the chain regularity, which facilitates the course of relaxation anddecreases the internal (residual) stresses.
Of definite interest is the finding of two flow mechanisms for epoxyresins containing elastomeric particles: these are the formation ofcrazes and shear yield [130] similar to that found for linear polymerscontaining rubber particles [126]. The role of the latter consists in thefact that they can both initiate and limit the growth of crazes. With therubber present, a large number of small crazes rather than a smallnumber of large crazes are formed and in this case the energy dissi-pates in a much greater volume. The rubber particles also facilitateshear deformation of the epoxy polymer matrix.
There are many other hypotheses regarding the mechanism of therubber’s influence on the strengthening of the epoxy polymers, but thematter is not yet resolved. Generally one can say that the ERCmechanical properties depend on the properties of the initial compo-nents of the compound and that their change under the mutual effect,both in bulk and at the interface, depends on the morphological struc-ture of the mixture and on the properties of the interface between thecomponents. When ERC are used as adhesives or coatings, the proper-ties of the polymeric mixture depend on the substrate.
Determination of the properties of the system components and theirinteractions that affect the mechanical behavior of ERC is at presentquite a complicated problem. In this connection it is assumed that themost convenient method of analyzing processes that occur during ERCformation is the thermodynamic method [141–149]. At the same time,the thermodynamic approach is the most rigorous because it allowsone to evaluate completely all kinds of interactions in the system.However, this approach has not so far acquired wide applicationbecause of difficulties related to the nonequilibrium nature of the pro-cess of ERC formation, which is determined not only by thermody-namics but also by kinetic considerations. As the conversion level ofthe system increases, its viscosity increases, which prevents the reach-ing of thermodynamic equilibrium.
To characterize the effect of the degree of the intermolecular inter-action or, equivalently, the level of thermodynamic compatibility (sta-
138 Chapter Three

bility) of the initial components (the epoxy and rubber oligomers) onthe final properties of ERC, at the equilibrium conditions, highly vis-cid systems with subsequent high cure rate were studied. In this casethe rapid formation of the fragments of the three-dimensional networkof the epoxy polymer ‘‘freezes’’ the structure of the reactive mixture ofthe eopxy and rubber oligomers.
3.3.2.3 Thermodynamic compatibility of epoxy and rubber mixtures with
crosslinking agents. The thermodynamic compatibility of the epoxyoligomers of various structures with the rubbers containing variousquantities of acrylonitrile groups was evaluated by the RGC methodby determining the thermodynamic interaction parameter �2;3
�. In thesame way, the compatibility of mixtures containing the product ofinteraction of the epoxy resins with the rubbers was determined.The viscosity values of the initial components and the gel formationtimes of the systems are presented in Tables 3.10 and 3.11.
The mixture of UP-637 and SKD-KTRA oligomers is thermodyna-mically compatible up to 5% rubber at 298 K. The increase in therubber polarity results in this case in widening of the region of mutualsolubility of the epoxy and rubber oligomers, with two regions of com-position with less stable thermodynamic equilibrium for the UP-637and SKN-3KTR mixture below 10% and 50% of the rubber in themixture.
Figure 3.10 displays dependences of the �2;3� parameter on the
composition of mixtures of ED-20 epoxy resin with rubbers of variouspolarity. For a mixture of ED-20 with SKD-KTRA nonpolar rubber,positive values of �2;3
� are observed practically throughout the con-
Properties of Adhesives Based on Polymeric Mixtures 139
TABLE 3.10 Initial Viscosity of the Components of the ERG
Epoxy oligomer or (and) modifier Curing agent
Viscosity at Viscosity atBrand name 298 K (Pa�s) Brand name 293 K (Pa�s)
ED-20 17.0 PEPA 7.0Modified by 20% SKD-KTRA 125.5 UP-583 15.0
UP-652 6.0Modified by 20% SKD-KTRA 100.0 UP-0639 20.0
UP-637 5.0Modified by 20% SKD-KTRA 90.5 PO-300 35.0
SKD-KTRA 21.0
SKN-1KTR 50.5
SKN-3KTR 73.5

centration range that shows thermodynamic incompatibility of theepoxy and rubber oligomers. Analysis of the temperature dependencereveals that �2;3
� decreases with temperature elevation, which is thecriterion for a top critical temperature of blending (TCTB) for thegiven mixture of the oligomers. Change of the rubber polarity resultsin widening of the region of homogeneous blending; the mixture of ED-20–SKN-3KTR polar rubber oligomers is compatible up to 40% of therubber at 298 K.
140 Chapter Three
TABLE 3.11 Gel Formation Time of Epoxy and Epoxy–Rubber Compounds at 296 K
Gel formation time (min)
Compound PEPA UP-583 UP-0639 PO-300
Ed-20 20 15 35 150Modified by SKD-KTRA (20%) 5 30 50 180
UP-652 15 12 28 201Modified by SKD-KTRA (20%) 30 25 40 130
UPK-637 16 12 30 110
Modified by SKD-KTRA (20%) 30 25 40 150
Figure 3.10 Concentration dependence of the para-meter �2;3
� of the systems (a) ED-20–SKD-KTRAand (b) ED-20–SKN-30 KTR at (1) 298 K, (2) 323 K,and (3) 333 K.

Let us consider the reasons for the improvement of the thermody-namic compatibility of the epoxy and rubber oligomers that is observedwith increase of the polarity of the rubber. One of the factors thatfacilitate the compatibility of the compound components is the abilityof their molecules to form various bonds between each other; in parti-cular, the molecules of the rubber and the epoxy resins under studyhave functional groups that can form hydrogen bonds (Table 3.12).
In the spectrum of SKN-3KTR there are two bands of equal inten-sity: in the region of the carbonyl absorption at 1710 cm�1 (hydrogen-bonded C——O) and at 1740 cm�1 (C——O groups free of the hydrogenbonding). When SKN-3KTR is mixed with ED-20 there is no noticeableabsorption in the region of 1710 cm�1. Only the band of C——O groupsfree of the hydrogen bonding appears at 1740 cm�1. In the region of3300–3600 cm�1 there are bands that indicate that all the OH-groupsof the compound are linked by hydrogen bonds. These observationsindicate that all the OH-groups of the SKN-3KTR molecules free ofthe hydrogen bonding with the C——O groups can form hydrogen bondswith the ED-20 acceptor groups; that is, there is redistribution of theintermolecular hydrogen bonds in the mixture, which enhances thecompatibility of the components.
Proceeding from this concept of the solubility parameter one canexpect the oligomer mixture to be compatible if the components haveclose values of this parameter. Table 3.13 shows that the parameter ofthe rubber solubility � changes with acrylonitrile content from1:84 � 10�3 J/kg1=2 for SKD-KTRA to 2:07 � 10�3 J/kg1=2 for SKN-3KTR. The solubility parameter of the epoxy oligomer is2:41 � 10�3 J/kg1=2.
The solubility parameter was calculated from the equation
�2 ¼P
�Ei
NA
X�Vi ð3:24Þ
where �Ei is the contribution of each atom and of each type of inter-molecular interaction to the value of the cohesion effective molarenergy; NA is the Avogadro number;
P�Vi is the van der Waals
volume of the molecule, equal to the sum of the van der Waals volumesof the constituent atoms. Thus, in this case there is a correlationbetween the difference of the solubility parameters and the region ofmutual blending determined by the RGC method. IR spectroscopydata confirm the relationship.
Let us consider the thermodynamic compatibility of the crosslinkingagents with the modifiers in use, which occurs at the stage of the ERCformation. The mixture of the PEPA–SKD-KTRA oligomers is thermo-dynamically compatible up to 2% of SKD-KTRA at 298 K, while for 5%
Properties of Adhesives Based on Polymeric Mixtures 141

142
TABLE 3.12 Characteristics of Components of Epoxy and Epoxy–Rubber Compositions
Type Brand name Chemical formula
Epoxy oligomers
Epoxide–diane resin ED-20(MW¼410)
1,2-Epoxypropoxydiphenyl UP-652ester of ethylene glycol(MW¼304)
Diglycidyl ester of resorcin UP-637(MW¼210)

143
Modifying agents
Oligobutadiene rubber SKD-KTRA(MW¼2880)
Oligobutadiene– SKN-10 KTRacrylonitrile rubber ðx ¼ 5; y ¼ 1; z ¼ 10Þ(MW¼2900)
(MW¼3200) SKN-30 KTRðx ¼ 5; y ¼ 1; z ¼ 30Þ
Laproxide 503 M(MW¼490)
(MW¼ 700) 703 M
(Continued)

144 TABLE 3.12 Characteristics of Components of Epoxy and Epoxy-Rubber Compositions (Continued)
Type Brand name Chemical formula
Modifying agents (Continued)
Oxyethylated ester of alkylphenol OP-10(MW¼ 790)
Monoalkyl ester of polyethylene DS-10glycol on base of primary fattyalcohols (SAS)(MW¼ 709)
Linking agents
Polyethylenepolyamine PEPA(MW¼ 120)
Diethylenetriaminomethylphenol UP-583(MW¼ 210)
Imidazoline on base of sebacic acid UP-0639(MW¼ 336)

of the rubber in the mixture at the same temperature maximum ther-modynamic instability is when parameter �2;3
� is maximal. The higherrubber polarity in the case of SKN-40KTR results in some widening ofthe region of the homogeneous blending. For the UP-583–SKD-KTRmixture the values of �2;3
� are lower than the critical value that exhi-bits the thermodynamic compatibility.
Note a somewhat unusual dependence of the parameter �2;3� on
temperature. With up to 40% of rubber in the mixture the value of�2;3
� increases with falling temperature, while at high rubber concen-trations �2;3
� falls with falling temperature. The thermodynamic com-patibility becomes poorer with increase of the rubber polarity in thesemixtures. For the UP-583–SKN-30 oligomers the magnitude of �2;3
� ismuch higher than the critical value.
The mixture of the UP-0639–SKD-KTRA oligomers has limited ther-modynamic compatibility up to 10% of SKD-KTRA at 298 K. Withincreasing temperature �2;3
� decreases, which indicates the existenceof a blending top critical temperature in this mixture of oligomers. Theincrease of the rubber polarity in the case of SKN-30KTR results indecline of the thermodynamic compatibility, and the values of �2;3
�
increase with increasing temperature, indicating the existence of ablending bottom critical temperature for this mixture of oligomers.
The concentration dependence of the parameter �2;3� for the mix-
ture of PO-300–SKD-KTRA oligomers indicates the complex thermo-dynamic behavior of the mixture. The function �2;3
� ¼ f ð�3Þ, where �3
is the volume fraction, is of bimodal character with the maximum ofthe thermodynamic instability observed at 5% and 45% of SKD-KTRA;that is, the above mixture has two regions of composition with theleast stable thermodynamic equilibrium. In this case the stability isitself a function of temperature and increases with temperature, indi-cating the existence of a blending bottom critical temperature for thismixture of oligomers.
Thus, mixtures of epoxy resins or curing agents with rubbers aresystems with strong specific interactions, which ultimately determineall the features of the thermodynamic behavior of these systems. The
Properties of Adhesives Based on Polymeric Mixtures 145
TABLE 3.13 Values of the Solubility Parameter d of Epoxy and Rubber Oligomers ofVarious Brands
Epoxy oligomer Rubber oligomer
Brand name 103 � (J/kg1=2) Brand name 103 � (J/kg1=2)
ED-20 2.41 SKD-KTRA 1.84UP-652 2.36 SKN-1KTR 1.93UP-638 2.5 SKN-3KTR 2.07

mutual solubility of oligomer mixtures is affected by the epoxy oligo-mer composition, by the modifier’s polarity, by the compound composi-tion, and by temperature. The structure of the composite can becontrolled by varying the temperature during curing of the epoxyresins by various crosslinking agents as well as with different quan-tities of the oligobutadiene rubber or OBDANC present.
3.3.2.4 Mechanical properties of epoxy rubber compounds. The shape ofthe phase diagram can be judged to some extent by the type of con-centration dependence of the thermodynamic interaction parameter�2;3
� of the cured polymeric compound. The parameter �2;3� for the
UP-637 system (cured by the UP-0639 crosslinking agent) withSKD-KTRA rubber is positive and essentially does not change when5–40% of the rubber is added. But the evaluation of the fraction of therubber (which is in the form of a dispersion in the epoxy matrix) bydetermination of the enthalpy component of �2;3
�ð�H ¼ �T @�2;3
�=@=TÞ
showed that this fraction does not have a constant increase with rub-ber content growth but has a maximum at 20% of the rubber.
Let us consider the effect of the ERC thermodynamic state on themechanical properties. Figure 3.11 presents the temperature relation-ships of the dynamic modulus of elasticity E 0 and the tangent of theangle of the mechanical losses tan � for the epoxy polymers based on
146 Chapter Three
Figure 3.11 Temperature dependences of tan � (1–5) and E 0 (1 0–5 0) forepoxy compounds based on UP-637 (1–3, 1 0–3 0) and ED-20 (4, 4 0, 5, 5 0)oligomers modified by SKD-KTRA rubber; curing agent is UP-0639; theratio of the oligomer to the rubber is 100:0 (1, 1 0, 4, 4 0); 90:10 (2, 2 0);70:30 (3, 3 0); and 80:20 (5, 5 0).

UP-637 and ED-20 cured by UP-0639 with and without addition of thelow-molecular-weight rubber. As in systems based on diene oligomers,the integration of the rubber into oligomers based on UP-637 results ina peak in the temperature relationship of tan � at 213 K. Increase ofthe rubber content produces increase of the peak intensity only, with-out any practical change in the temperature at which tan � is maximal.
Note that whereas a broad region of �-relaxation within the tem-perature range 203–303 K is observed for the epoxy polymer based onED-20 unmodified oligomer, no �-relaxation is observed for the poly-mer based on UP-637. In this case the �-relaxation is related [140] tothe motion of the group of atoms
In connection with the facts that the peak at 213 K correspondsexactly to the glass transtion of the SKD-KTRA rubber and that sys-tem softening at 328 K coincides with the glass transition of the epoxymatrix, one can affirm the incompatibility of the rubber and epoxycomponents of the above ERC. Electron-microscopic data also indicatethe existence of the ERC two-phase structure only in the case of SKD-KTRA as a modifier, which is thermodynamically incompatible at thestage of blending with the epoxy oligomer.
Thus, the phase separation that runs in parallel with the reaction offormation of the three-dimensional epoxy polymer network in ERC,obtained by the PER method with application of SKN-3KTR rubberthat is thermodynamically compatible with the epoxy oligomer, doesnot occur, indicating the conservation of the phase structure of thecompound formed at the blending stage and in the cured state. Thissupports the possibility of using the thermodynamic approach fordescribing the physical-mechanical properties of ERC obtained bythe PER method.
Let us consider the effect of the ERC phase state upon its crackresistance. The maximum modifying effect from addition of the rubberinto the epoxy resin is achieved for rubber particles in the form of theindividual phase being available in the epoxy polymer matrix. As wasshown for ERC obtained by the PER method, this condition is observedwhen using SKD-KTRA as a modifier.
Consider the critical value of the stress intensity coefficient, whichlike the classical mechanical characteristics (strength and yield limit,ultimate elongation per unit length, etc.) reflects an objective propertyof the material—its capacity to resist the development of cracks.
Properties of Adhesives Based on Polymeric Mixtures 147

For mechanically mixed resin and rubber, the SKD-KTRA rubberconcentration has essentially no effect upon the value of KIC. Forthermally treated mechanical mixtures, the value of KIC increasesabout twofold. If the thermal treatment of the specimens was per-formed after the compound was completely cured (degree of conversionnot less than 93%), the heating does not effect the level of phaseseparation but it alters the interphase interaction between the compo-nents not only by increasing the strength of the resin itself but alsothrough the abrupt increase of the effect of the rubber upon KIC.
Comparison of the concentration dependence of the KIC values of thecompounds obtained by the above two methods with the concentrationdependence of the �2;3
� thermodynamic interaction parameter ofoligomer mixtures (epoxy resin–modifier and curing agent–modifier)displays the same dependences. The maximum value of KIC of1.1 MPa�m1=2 is observed at 5% content of the SKD-KTRA rubber.This is the region of maximal thermodynamic instability of theoligomer mixture.
For compounds obtained with PER, the maximal modifying effect isobserved at 20% of SKD-KTRA ðKIC ¼ 1:45 MPa�m1=2Þ. The concentra-tion dependence of �2;3
� (see Fig. 3.10) shows that this region is char-acterized by the maximal thermodynamic instability of the mixture ofthe epoxy resin with the modifier.
Thus, from the above data one could conclude that to achieve themaximal values of KIC the method of modification with PER is mosteffective. Additionally, this method is more technologically applicablebecause it can be used in formation of cold-cure compounds. Specialattention must be paid to the correlation of the KIC characteristicwith �2;3
� for mixtures such as epoxy resin–modifier and curingagent–modifier. The presented characteristics of the ERC crackingresistance indicate the strong dependence of KIC on the structureof these materials, which enables the use of this characteristic inoptimizing the compositions of new and already known epoxy rubbermaterials.
Now let us consider how the addition of the SKD-KTRA rubberinfluences the ultimate strength properties of ERC based on ED-20and UPR-637 oligomers obtained by the method with PER and curedby UP-0639.
With increase of the rubber content in a compound, the specimensbecome more elastic and can develop larger deformations, but thestrength of the compounds decreases (this decrease becomes insignif-icant at high concentrations of the rubber). In this context there ismuch more work to be done on their failure due to the increase ofdeformability. Note that in the course of deformation of the modifiedspecimens turbidity is observed that seems to be a direct consequence
148 Chapter Three

of the appearance of microcracks in the matrix adjacent to the rubberparticles at the start of the development of high elastic deformation.
The rupture strength of the initial epoxy polymers and of thosemodified by the rubber decreases monotonically with increase of thetest temperature for all the specimens under study (Fig. 3.12). Forpolymers based on the UP-637 oligomer, the drop in strength ismore precipitous. As a result, the strength properties of the UP-637oligomer-based polymers exceed those of the ED-20-based polymersonly within a narrow range of low temperatures. At higher tempera-tures the diene polymers are somewhat stronger. In addition, thestrength of the UP-637-based modified polymer is lower than that ofthe unmodified polymer within the whole range of temperatures stu-died, while for the polymer based on the diene oligomer the modifiedspecimen (beginning at about 340 K) becomes stronger due to thelower rate of decline of �p with the temperature drop.
The temperature dependence of the rupture deformation "p showsthat the modified polymers have higher deformability compared withthe initial polymers throughout the whole temperature range men-tioned above. This difference is especially noticeable at low tempera-tures (up to about 323 K), which correspond to the glass-transitionstate of the polymers under investigation. The rupture elongation "p
Properties of Adhesives Based on Polymeric Mixtures 149
Figure 3.12 Temperature dependences of the strength �p (1–4)and the deformations "p (1 0–4 0) for polymers based on theinitial oligomers (1, 1 0, 3, 3 0) and oligomers modified by SKD-KTRA rubber (2, 2 0, 4, 4 0). The ratio of the oligomer to therubber in the modified oligomer is 80:20.

increases sharply at temperatures above Tg due to the development ofhigh-elasticity deformation, and then runs through a maximum atabout 333 K. The exception is the specimen based on the modifieddiane oligomer, for which the enhanced deformability is observed athigh temperatures as well. Consequently, in epoxy oligomers based onthe diane oligomer the modification by the rubber facilitates improve-ment of their deformation features at both low and high temperatures.
It is interesting to compare the strength �p and the elongation "p
during extension of the film and block specimens. Figure 3.13 showsthe dependences of �p and "p on the rubber content in compoundsbased on ED-20 and UP-637 oligomers cured by UP-0639. It is evidentthat in UP-637-based compounds the values of �p for the film speci-mens (Fig. 3.13, curve 1) and for the block specimens (curve 2) almostcoincide for any quantity of the rubber. For compounds based on theED-20 modified oligomer and containing up to 4% of the rubber, theblock specimens have smaller �p (curve 4) than the film specimens(curve 3). With increase of the rubber content, �p for the film speci-mens decreases monotonically, while for the block specimens an extre-mal dependence is observed, and in the case of the rubber contentabove 4% the breaking strength of the block specimen becomes higher
150 Chapter Three
Figure 3.13 Dependence of �p (1–6) and "p (1 0–4 0) on the SKD-KTRA rubber content w(%) for epoxy polymers based on ED-20(2–5) and UP-637 (1, 2, 6) oligomers; (1, 3, 5, 6) are filmspecimens; (2, 4) are specimens in block. The value of �p iscalculated for the initial (1–4) and true (5, 6) cross-sections ofthe polymer specimen.

than that of the film ones. The rupture deformation for both types ofspecimens increases monotonically with increase of the rubber con-tent. Hence, for the film specimens "p is essentially higher than forthe block specimens, especially when the quantity of rubber is above10%. It should also be noted that for the block specimens �p is higherfor the compound based on the UP-637 oligomer (curve 2), while forthe films this parameter is higher when the specimens are based onthe diane oligomer. The comparatively small deformations at ruptureof the block specimens seem to be governed by the higher probability ofdefect formation compared with the fine films. Note in particular that,although �p for the film specimens decreases with the increase of thequantity of added rubber (this decrease becomes insignificant for largequantities of rubber), the abrupt increase of the system deformabilityis more important.
It should be noted that the values of �p (Fig. 3.13, curves 1–4) arecalculated for the value of the initial cross-section of the specimen, butin the course of deformation the specimen cross-section decreases. AsFig. 3.13 shows, the value of the true stress at rupture of the polymericfilms decreases with increasing rubber content to a lesser extent than�0. At large rubber content, �p true increases somewhat (possibly due toorientation strengthening).
The mechanical characteristics and the moduli of elasticity ofUP-652-based polymers modified by the SKD-KTRA and SKN-3KTRrubbers and cured by the UP-0639 curing agent are presented in Table3.14. These data indicate that the decrease of the tensile strength �p
Properties of Adhesives Based on Polymeric Mixtures 151
TABLE 3.14 The Effects of Addition of SKD-KTRA and SKN-3KTR Rubbers upon theMechanical Properties of Epoxy Oligomers Based on UP-652 Epoxy Resin Cured byUP-0639
Oligomer torubber ratio �p (MPa)a "p (%)a E (MPa)a
SKD-KTRA
100:00 30.6/60.8 10.2/12.9 580/89095:5 30.8/52.3 10.8/13.5 520/84090:10 30.1/42.2 11.8/15.0 460/76580:20 28.2/31.5 26.5/20.3 211/39670:30 26.5/27.8 72.3/56.4 123/16560:40 18.5/20.3 100.8/89.5 82/104
SKN-3KTR
95:5 29.5/52.3 10.5/12.9 608/85890:10 27.5/45.1 10.8/13.0 610/81280:20 21.5/39.7 14.7/16.5 515/70370:30 14.8/31.8 53.2/28.5 352/574

and of the modulus of elasticity E (about 2.5-fold with addition of 40%of the modifier) is accompanied by much greater (about 8-fold) increaseof the films’ breaking deformation.
So far as �p"p=2 gives an approximate characteristic of the materialfailure work, the considerable increase of the deformability of themodified polymers with the comparatively small drop in strengthmust improve the serviceability of the polymeric material. This isalso true for the heat-treated specimens, which have increased �p
and E as a result of heating. The value of "p increases somewhatafter heat treatment for the unmodified polymer containing compara-tively small amounts (up to 20%) of the rubber, and decreases insig-nificantly for large quantities of the modifier. The increase of thedeformability as a result of the heat treatment seems to be due tothe formation of the looser structure of the glassy polymer, that is,to the free volume increase. Thus, mesurement of the density of themodified polymer revealed the decrease of this parameter followingheat treatment (to 1.192 from 1.208 kg/m3 for the unheated specimen).
The integration of liquid rubbers into the epoxy polymers is usedmainly to increase the impact strength. For systems based on theED-20, UP-652, and UP-637 epoxy oligomers, the addition of SKD-KTRA rubber with UP-0639 as curing agent results in �3-fold increaseof the polymer’s specific impact viscosity. This is observed most clearlywith addition of small quantities of the rubber (less than 10%). Thepolymer based on the unmodified diane oligomer is characterized by acomparatively small value of the impact viscosity of about 6 kJ/m2, butincreasing the quantity of the integrated rubber results in rapidincrease in the impact strength, as a result of which the specific impactviscosity of the polymer is 26 kJ/m2 at 25% content of the modifier. Withaddition of more than 5% of the rubber into an epoxy polymer of anytype there is a practically linear growth of the impact viscosity with theincrease of the elastomer content (up to 30%).
Let us consider the dependence of the bending strength �bend of thesystems based on ED-20, UP-652, and UP-637 epoxy oligomers curedby UP-0639 on the concentration of the SKD-KTRA modifier. In thecase of the UP-637-based polymer �bend decreases monotonically withthe increase of the quantity of added rubber, this decrease being espe-cially considerable at small (less than 5%) and large (over 20%) con-tents of the rubber. In the intermediate region, the decrease of �bend iscomparatively small. In the case of the ED-20- and UP-652-based poly-mers, �bend increases along with the growth of the rubber content. Forthe ED-20-based polymers, a small maximum is observed at 5% con-tent of the rubber; as the rubber content increases, �bend begins todecrease monotonically. For the UP-652-based polymers, the �bend
maximal values are observed at 10% of rubber with rather substantial
152 Chapter Three

increase of �bend. This amount of rubber seems to be optimal forobtaining impact-resistant engineering materials based on UP-652.
Modification of epoxy polymers by rubbers results in decrease of theresidual stresses �dresid cured in. Thus, for the polymers based on UP-637 and cured by UP-0639, �dresid falls monotonically from 5.5 to2.0 MPa as the SKD-KTRA rubber content increases from 0% to 30%.For the compounds based on the diane oligomer, the stresses decreaseunder the same conditions from 10.2 to 5.5 MPa because of the increaseof the deformation characteristics and of the acceleration of relaxation.
The above considerations suggest that modification of epoxy poly-mers of various chemical structures (based on diene oligomer andresorcinol diglycidyle ethers) by the carboxyl-containing oligobuta-diene and oligobutadiene-acrylonitrile rubbers by the method withPER produces ERC with valuable properties. In this case the relativebreaking elongation "r, specific impact viscosity a, and failure work Ap
increase, and the residual stress �dresid decreases. Note also thatdespite the lower efficiency of the modifying effect of the rubbers onthe impact viscosity and the bending strength, the UP-637-based poly-mers have better mechanical characteristics, accounting for betterproperties of the initial (unmodified) polymer in comparison of theUP-637 oligomer with the ED-20 diane oligomer within a very broadand practically important range of rubber content (up to 25%).
Let us consider the static relaxation properties of ERC. There arenumerous publications dedicated to the investigation of the morphol-ogy and the extreme mechanical characteristics of ERC obtained byapplying high-temperature cure. But there is no information on thestatic relaxation properties of epoxy polymers modified by the low-molecular weight rubbers obtained by the method with PER. Suchcharacteristics of polymers are of interest in so far as the polymericmaterials may be unusable not only because of failure but also due tointolerable changes of shape and size. As Fig. 3.14 shows, the integra-tion of different quantities of rubber (up to 30%) does not produce agreat decrease of the glass-transition temperature. For small additions(of about 10%) some increase of Tg is observed compared with theunmodified oligomers. A distinguishing feature of the UP-637-basedpolymers is the large temperature range of the high-elasticity state(about 323–523 K) compared with that of the ED-20-based compound.
A further peculiarity of the thermomechanical behavior of the stu-died compounds is important. The temperature at which the deforma-tion increases abruptly is not very sensitive to the rubber content (Fig.3.14).
The effect of addition of SKD-KTRA and SKN-3KTR rubbers on theheat resistance of the UP-652 based epoxy polymer cured by UP-0639is similar. The addition of SKN-3KTR does not practically change the
Properties of Adhesives Based on Polymeric Mixtures 153

glass transition temperature of the specimen within a quite broadrange (up to 30%). At the same time, the addition of only 10% ofSKD-KTRA produces a sharp decrease of the polymer’s heat resis-tance. Heat treatment at 393 K for 3 h enhances the heat resistancedue to the increase of the chemical crosslinking density as a result ofthe system postcure. The conversion level of the epoxy groups at ERCheat-up was 99%, with the molecular weight of the chain sectionbetween the adjacent crosslinks of the space network ðMCÞ decreasingfrom 780 to 630.
The effect of addition of SKD-KTRA rubber on the static relaxationproperties of the epoxy polymers was determined by studying thecreep under conditions of single-axial extension at all possible levelsof the mechanical stress (up to film failure) within the temperaturerange 298–353 K. For the initial polymer and that modified by a small(10%) amount of rubber, the creep rates coincide at similar loads whenthe polymers are in the glassy state. But at stresses close to thestrength limit the creep of the modified polymer is substantiallyhigher than that of the initial specimen. In the case of the polymercontaining 30% rubber, a fairly large creep deformation substantiallyexceeding those of the initial specimens develops at comparativelysmall loads (10 and 20 MPa).
If the temperature is raised to 323 K rates of creep for the modifiedand initial polymers increase but to different extents for specimenswith different rubber contents (Fig. 3.15). Under these conditions the
154 Chapter Three
Figure 3.14 Thermal-mechanical curves for epoxy polymers based on the UP-637 (1–4)and ED-20 (5, 6) oligomers. The ratio of the oligomer to the rubber is 100:0 (1, 5), 90:10(2, 6), 80:20 (3), 70:30 (4).

development of the creep process is resisted most by the specimenmodified with 10% rubber. For the initial epoxy polymers and forthose modified by 30% rubber, the creep deformation and the rate ofits development are substantially higher, especially for much higherlevels of the mechanical stress. Consequently, the introduction of smallquantities of the modifying additive (about 10%) not only decreases thecreep deformation compared with the unmodified polymer but widenssomewhat the serviceable temperature range of the material.
This conclusion is confirmed by the generalized pliability curves (seeFig. 3.16) in the range of 298–353 K using a reduced temperatureðT=T0Þ relative to 298 K. The generalized pliability curves show thatthe value and the rate of creep of the epoxy polymer modified with 10%rubber are less than those of the initial polymer. For the specimenwith 30% modifier, these parameters are much higher, especially athigh levels of mechanical stress.
The generalized pliability curves determined for two levels of themechanical stress (5 and 10 MPa) for the initial polymer and thatmodified by 10% rubber within the region of small duration of thecreep process practically overlap one another, indicating the linearityof their mechanical behavior. In the case of the longer process, thelinearity is disturbed for both types of polymers, with larger deviationsobserved for the initial (unmodified) polymer.
The increase of the glass-transition temperature and the decrease ofcreep of epoxy polymers with 10% SKD-KTRA demonstrate the effectof the rubber upon the epoxy matrix itself. Such abnormal behavior ofERC can be explained thermodynamically. An SKD-KTRA content of10% in ERC ensures thermodynamic conditions for separation of the
Properties of Adhesives Based on Polymeric Mixtures 155
Figure 3.15 Alteration of the creep of epoxy poly-mers based on UP-637 initial oligomer (2, 5) andthat modified by 10% (1, 4) and 30% (3, 6) of SKD-KTRA plotted at stresses of 5 MPa (1–3) and 10 MPa(4–6) and at a temperature of 323 K.

system into two phases, which results in a fairly developed interface ofepoxy polymer–rubber.
As the authors of [16] note, polymer boundary layers of up to0.05 mm on a low-energy surface are characterized by higher packingdensity, by a glass transition temperature 5–78C higher than thatof the polymers in block, and by other characteristics. The mostprobable reason for these findings seems to be the restriction ofthe macromolecules’ conformation set and their adsorption inter-action with a solid at the interface. Alteration of the properties ofthe epoxy matrix results also in the improvement of a number ofother physical and mechanical characteristics of ERC containing10% SKD-KTRA, particularly in enhancement of the flexural andtensile strength.
Let us consider the adhesion properties of ERC. The mechanism ofthe effect of the low-molecular-weight additives on the properties ofthe polymers in block has been studied in detail, though their effect onthe strength of adhesive-bonded joints has not yet been studied insufficient detail.
Figure 3.17 presents the concentration dependences of �ad for ED-20-based ERC modified with SKD-KTRA rubber and cured by UP-0639 and produced in different ways. It is evident that the maximum
156 Chapter Three
Figure 3.16 Generalized curves of the pliability I (Pa�1) for filmspecimens based on UP-637 initial oligomer (3, 4) and thatmodified by 10% (1, 2) and 30% (3, 6) of SKD-KTRA obtainedfor stresses of 5 MPa (1, 3, 5) and 10 MPa (2, 4, 6). The reducedtemperature is calculated relative to 298 K.

increase of the adhesion strength is observed when obtaining ERC bythe PER method with less than 20% rubber. For ERC obtained bymechanical blending of the epoxy and rubber oligomers, the adhesionstrength changes little for small quantities of the modifier, while atgreater additive concentration its adhesion strength decreases. Someimprovement of the ERC properties after the heat treatment can begained through the formation of chemical links between the moleculesof the modifier and the epoxide, accounting for etherification of thegroups that have not reacted in the course of curing at room tempera-ture. In addition, the annealing enhances the homogeneity of theepoxy matrix structure due to the decrease of the number of defectsand internal stresses.
For compounds of epoxy resins based on epoxy-diane oligomers andresorcinol diglycidyle esters set with amine curing agents, the depen-dence of �ad on the content and type of the modifying additive displaysdistinct maxima. The adhesion strength is enhanced most when theSKD-KTRA rubber is applied at 20% (see Figs. 3.17 and 3.18). WithSKN-KTR as modifier the effect is less.
The adhesion properties of ERC are directly related to their phasestructure. When comparing the values of �2;3
� that characterizethe thermodynamic stability of the oligomer mixtures (epoxy resins–rubbers and curing agents–rubbers) with the values of �ad, a similardependence is observed for ERC obtained by the method with PER.The maximum value of the ERC adhesion strength corresponds to thatquantity of the rubber at which �2;3
� is maximal.For compounds containing SKD-KTRA rubber incompatible with
the epoxy oligomer, the higher adhesion strength can be explainedboth by the increase of the ERC cohesion strength and by the pos-sible concentration of impurities at the interface between the epoxy
Properties of Adhesives Based on Polymeric Mixtures 157
Figure 3.17 Effect of the quan-tity of SKD-KTRA rubber on adfor ERC based on ED-20 curedby UP-0639 obtained by themethod with PER (1) and bymechanical blending with heat-ing for 2 h at 372 K (3).

matrix and the rubber, as a result of which the probability of theirsorption on the boundary between the adhesive and the substratedecreases, a weak boundary zone appears, and the adhesionstrength is reduced [151]. Note that for the compounds containingSKN-3KTR rubber the adhesion strength also increases in theregion of concentrations in which the thermodynamic compatibilityof the epoxy and rubber oligomers is observed to decrease. For com-pounds cured by PO-300 (Fig. 3.18) the adhesion strength has max-ima at 5% and 20% of the modifier. The first corresponds to themaximal thermodynamic incompatibility of the curing agent–modi-fier mixture; the second maximum corresponds to that of the epoxyoligomer–modifier mixture.
Thus, the formation of the two-phase system by the method withPER ensures optimal values of some of the physical-mechanical char-acteristics. These conclusions are confirmed by the results of electron-microscopic studies. With chemical bonds between the epoxy polymersand the rubber particles, the developing crack does not pass round therubber particle but penetrates it, which causes delocalization of stres-ses at the tip of the crack and results in improvement of the physicaland mechanical properties of the ERC.
These findings allow control of the modification of epoxy resins byrubbers. For example, to obtain ERC with improved adhesion strengthit is necessary to use a quantity of the rubber at which thermodynamicincompatibility with the epoxy oligomer is observed.
ERC with improved cracking resistance can be obtained using 20%of SKD-KTRA rubber by the method with PER; for hot-cure com-pounds the maximal values of the cracking resistance can be achievedby adding 5% of the rubber.
When using UP-0639 as the curing agent, the addition of 10% ofSKD-KTRA to the epoxy oligomers results in compounds with lower
158 Chapter Three
Figure 3.18 Dependence of adfor ED-20 cured by PEPA (1–3)and PO-300 (4) on the quantityof rubber: (1) SKD-KTRA; (2)SKN-10 KTR; (3) SKN-30 KTR;(4) SKD-KTRA.

creep rate than the unmodified polymer and with improved heat resis-tance and bending strength, which are related to the thermodynamicstate of the ERC components.
To obtain compounds that have improved impact resistance and arecharacterized by high failure work as well as high values of relativeelongation before break-off, it is necessary to add not more than 30–40% of the SKD-KTRA rubber.
3.3.2.5 Effect of surface-active substances on the properties of epoxy rubber
compounds. ERC have a long interface boundary between the systemcomponents, and surfactant concentrating here can alter both thecomponents’ thermodynamic stability and the interface energy char-acteristics. In addition, the addition of surfactant changes the proper-ties of the epoxy matrix itself [152–155]. Consequently, the addition ofsurfactant to ERC must change its thermodynamic and physical-mechanical properties.
As Fig. 3.19 shows, the maximal values of KIC are obtained whenSKN-3KTR rubber is used as a modifier, which has a similar solubilityparameter (see Table 3.13) to that of the epoxy oligomer. Addition ofsurfactant (OP-10) to ERC obtained by mechanical blending of the ED-20 epoxy oligomer with the SKD-KTRA and SKN-3KTR rubber oligo-mers gives considerable improvement of their cracking resistance. Thecritical value of the stress intensity coefficient increases twofold whenSKD-KTRA rubber, which differs from the epoxy oligomer in the solu-bility parameter, is used as a modifier.
Let us consider the results in detail. OP-10 is thermodynamicallyincompatible with SKD-KTRA rubber but is compatible with SKN-3KTR. It exerts a structurizing effect on the epoxy polymer when
Properties of Adhesives Based on Polymeric Mixtures 159
Figure 3.19 Effect of surface-active additives (%) onthe cracking resistance KIC of ERC based on ED-20cured by PEPA: (1) ED-20; its mechanical mixtureswith (2) 20% of SKN-30 KTR, (3) 20% of SKD-KTRA,(4) 20% of SKN-30 KTR and OP-10 additive, (5) 20%of SKD-KTRA and OP-10 additive, (6) ED-20 withOP-10.

added at 6%. In this connection, it can be assumed that for ERC basedon ED-20 epoxy resin and SKD-KTRA rubber the maximal values ofKIC are due to the fact that surfactant spreads uniformly inside theepoxy oligomer, affecting its formed structure. In addition, OP-10 issurface active at the interface between the epoxy resin and the low-energy surface, which alters the intensity of interphase interactionsbetween the epoxy polymer and the rubber and changes the dispersionlevel. This assumption is confirmed by electron-microscopic analysis.
From the above, one can conclude that for ERC with SKN-3KTR theconditions are met for maximal adhesion interaction between theepoxy polymer and the rubber due to the components’ compatibility.The maximal values of KIC are determined for ERC obtained by themethod with PER (Fig. 3.20). It should also be noted that these con-ditions ensure the higher adhesion strength of ERC (Fig. 3.21). Smalladditions of surfactant to ERC obtained by the method with PER allowadditional improvement of their adhesion characteristics.
3.3.3 Modification of EP-20 epoxy-dianeresin by epoxided polypropyleneglycol (Laproxides 503M and 703)
Rubberlike materials are formed in the course of curing of Laproxidesby amine-type crosslinking agents. In connection with the fact that therelaxation capacity of the Laproxides is much lower than that of ED-20
160 Chapter Three
Figure 3.20 Effect of the methodof ED-20 epoxy resin modifica-tion on the cracking resistanceKIC: (1) mechanical mixturewith 20% SKN-30 KTR; (2) mod-ification with 20% SKN-30 KTR;(3) modification with 20% SKD-KTRA with preformed PER; (4)heat-treated mixture with 20%SKD-KTRA; (5) heat-treatedresin; (6) mechanical mixturewith 20% SKD-KTRA; (7) curedresin without heat treatment.

resin, their mutual cure results in polymeric mixtures similar to theepoxy rubber ones.
Before considering the particularities of ED-20 epoxy resin modifi-cation by Laproxides of different molecular weight, it is necessary tonote that low-viscosity systems, with more time for formation of thethree-dimensional network fragments, are formed with application oflow-activity curing agents (like UP-0633). This is why in such systemsthe formation of the polymeric mixture structure must keep step withthe thermodynamic changes that occur during curing of these twocrosslinked polymers. Consequently, in this case one should not expectthe correlation between the properties of the polymeric mixture andthe thermodynamic stability of the initial components of the compoundthat is observed at the stage of its formation. The molecular weight ofthe modifier (epoxide oligoester) affects the thermodynamic compat-ibility of ED-20 mixtures with Laproxides. The mixture of ED-20–Laproxide 503M oligomers is thermodynamically compatible withinthe whole range of concentrations studied, while the mixture of ED-20 and Laproxide 703M is compatible only up to 40% of the modifiercontent at 298 K. In this case �2;3
� increases as temperature decreasesfor these mixtures of oligomers, indicating the existence of a top blend-ing critical temperature.
The phase separation in systems based on the high-molecularweight compounds is known to occur not only due to alteration ofcomposition, temperature or pressure but also as a result of chemicalreaction [19]. In the course of curing of these epoxy oligomers (con-taining two or more reactive groups) two crosslinked polymers are
Properties of Adhesives Based on Polymeric Mixtures 161
Figure 3.21 Dependence of adon the rubber content (1–4) andsurfactant content (3–7) forepoxy resins based on ED-20cured by PEPA (1–6) and UP-583 (7). Mechanical mixtureswith (1) SKD-KTRA, (2) SKN-30 KTR, (3) SKN-30 KTR and6% OP-10, (4) SKD-KTRA and6% OP-10; (5) modified with20% SKD-KTRA with PER; (6)ED-20 modified with 20% SKN-30 KTR; (7) UP-652 modifiedwith 20% SKD-KTRA.

formed. The formation of their fragments is accompanied by theappearance of thermodynamic incompatibility, which determinesthe initiation of the microheterogeneous structure. Because of thedifficulties in studies of systems of this type, there are few papers[156, 157] at present that deal with the study of processes of phaseseparation by small-angle X-ray scattering. Let us consider how thethermodynamic analysis (RGC proximate method) can be used tostudy the changes of the thermodynamic stability of the ERC compo-nents that occur as a result of chemical reaction (the setting of twoepoxy oligomers by one and the same curing agent up to a degreeconversion not less than 85%).
For systems based on the above two epoxy polymers, the concentra-tion dependence of the parameter log Vq represents a nonmonotoni-cally increasing deviation from the additive value. Hence, for smalladditions of one polymer to another a decrease of Vq is observed; interms of the absorption process this can be explained by the decreaseof the system sorption activity, probably due to closer packing of thepolymer mixture.
As seen from Fig. 3.22, the concentration dependence of the thermo-dynamic interaction parameter �2;3
� of the above mixtures is nonmo-notonic and is bimodal in character (the maxima are observed at 20%and 70% of Laproxide 703M). The existence of two maxima indicatesthat these systems have two regions of composition with least-stablethermodynamic equilibrium, which is a function of temperature. Itfollows from the temperature dependence of �2;3
� that the thermody-namic compatibility of these mixtures of polymers declines as thetemperature drops—there is the top mixture critical temperature.Whereas at the blending stage there is thermodynamic compatibilityof the ED-20 oligomers and Laproxide 703M for modifier contents upto 40% at 298 K, the parameter �2;3
� of the mixture of the two epoxy
162 Chapter Three
Figure 3.22 Concentration dependence of the �2;3� parameter of ED-20 systems
(with Laproxides 503M (a) and 703M (b)) cured by UP-0633 at (1) 363 K, (2)373 K, and (3) 383 K.

polymers is negative for low contents of the polymeric modifier, up toapproximately 20% of Laproxide 703M at 393 K.
Figure 3.23 presents physical-mechanical properties of ERC basedon two epoxy polymers. The concentration dependence of the adhesionstrength and of the breaking strength has its maximum at 5% ofLaproxide 703M. Evidently, the enhancement of the breaking andadhesion strength after adding the second component can be explainedby a high level of energetic interactions between unlike molecules,which is confirmed by enhancement of the packing of these polymermixtures and by increase of the parameter �2;3
� at low contents of thepolymeric modifier, approximately up to 5%.
Compounds of this type are characterized by the fact that enhance-ment of the adhesion strength (Fig. 3.23a) and increase of the breakingstrength (Fig. 3.23b) are accompanied by decrease of the impact visc-osity (Fig. 3.23c) and vice versa. Apparently, this effect can be relatedto the beginning of microphase separation of two crosslinked polymers,which occurs at more than 5% of the modifier (Laproxide 703M) con-tent. This assumption is also confirmed by electron-microscopic ana-lysis and by the positive values of the thermodynamic interactionparameter �2;3
� (see Fig. 3.22).Summing up the results regarding the modification of ED-20 epoxy
resin by oligoester epoxides of different molecular weights, thermody-namic incompatibility of the formed epoxy polymers appears duringthe curing of the homogeneous mixtures of the epoxy oligomers by oneand the same curing agent. For ERC of the given type (low-viscosity,slowly formed systems) there is no correlation between the degree ofthermodynamic compatibility of the oligomers’ initial mixtures and
Properties of Adhesives Based on Polymeric Mixtures 163
Figure 3.23 Concentration dependence of the adhesion strength (a), tensile strength(b), and impact viscosity (c) for ED-20 systems with (1) Laproxide 703M and (2)Laproxide 503M cured by UP-0633; (3) reactive oligomer.

the physical-mechanical properties of the completely cured polymericcompound. The optimal physical-mechanical characteristics wereobtained for ERC using an oligoester epoxide of higher molecularweight (Laproxide 703M) as modified, which ensures the maximaldegree of heterogeneity during curing. Use of Laproxide 503 M alsoresults in improvement of the physical-mechanical properties, but to alesser extent.
3.3.4 Influence of surfactants on structureand properties of polyurethanesbased on oligomer mixtures
3.3.4.1 Investigation of thermodynamic compatibility of initial oligogly-
cols. In the selection of oligomer pairs featuring the compatibilityrequired for investigation, reversed-phase gas chromatography wasused [132], with an accuracy of 10% in parameter determination. Thecompatibility criterion was taken as a negative value of free energyof mixing ð�GmÞ for thermodynamically compatible systems. The oli-gomer pair polyoxypropylene glycol (PPG)–polyoxytetramethyleneglycol (PTMG) is characterized by �Gm � 0, with a feeble tempera-ture dependence. Excess enthalpy of mixing is low and has positivesign, and thus it may be assumed that mixture formation requiresadditional energy and is accompanied by heat absorption. �Sm atdifferent temperatures is characterized by values close to zero andincreasing weakly as temperature decreases. These findings indicatethat this oligomer pair is compatible and that this mixture is close toideal.
Mixtures of PPG with oligodiethyleneglycol adipate (ODA) are char-acterized by entirely different thermodynamic conditions. �Gm is posi-tive and increases with temperature, characterizing the mixture asincompatible; the incompatibility increases with increase in the tem-perature. Negative values of excess mixing entropy demonstrate thehigh tendency of the components to self-association. The mixing pro-cess is accompanied by evolution of heat.
Another typically incompatible system is the mixture of PTMG andODA [133]. Hence, one of the three systems considered is ideally com-patible and two pairs of oligoglycols are incompatible.
3.3.4.2 Thermodynamic functions of surfactant surface layers in the initial
oligomer. Investigation of the thermodynamic functions of the surfac-tant surface layers in the initial oligomers is based on experimentalvalues of the surface tension measured for solutions of KEP-2 surfac-tant of various concentrations at various temperatures by the methodof Wilgelmi [126]. Temperature dependences of surface pressure ðPÞ for
164 Chapter Three

various molar concentrations of surfactant are determined from experi-mental isotherms. The thermodynamic functions of the surfactant sur-face layers are defined through an equation relating surface pressureto the entropy change and the enthalpy of the surface layers [134]:
�Hs ¼ P þ dP
dTð3:25Þ
where �Hs ¼ change of the surface layer enthalpy [cal/(mol�K)]P ¼ surface pressure, presenting the difference between
surface tension of the solvent and solution (mN/m)dP=dT ¼ rate of change of the surface layer entropy
[cal/(mol�deg2)]T ¼ temperature (K)
See Table 3.15 for isotherms of surface tension of KEP-2 (polyorgano-siloxane and polyoxyalkylene block copolymer) solutions in PTMGmeasured in the temperature interval of 323–353 K. The data pre-sented in the table demonstrate that the critical concentration ofmicelle formation in such solutions is observed for a surfactant frac-tion around 2:5 � 10�4.
If the KEP-2 solubility from the isotherms of surface tension ofsurfactant solutions in PTMG is compared with the data in [11],which reports that the KEP-2 fraction in PPG corresponding to thecritical concentration of micelle formation (CCMF) is 2:5 � 10�3, it isevident that KEP-2 solubility in these simple oligoglycols differs ten-fold. Temperature dependences of the surface pressure of KEP-2 solu-tions in PTMG obtained from the experimental isotherms of surfacetension at all the investigated mass fractions of KEP-2 are linear.
Properties of Adhesives Based on Polymeric Mixtures 165
TABLE 3.15 Surface Tension–Temperature Dependences of Surfactant Solutions inPTMG
Surfactantmass fraction Surface tension, (mN/m) ( 0:2) at the temperature
in thesolution ( 3%) 323 0.1 K 333 0.1 K 343 0.1 K 353 0.1 K
0 38.90 38.00 37.10 30.502�10�5 34.30 33.30 32.50 31.503�10�5 30.80 30.30 29.10 28.505�10�5 29.30 28.20 27.60 27.061�10�4 27.00 26.40 25.90 28.50
1.8� 10�4 23.60 23.20 22.90 22.603�10�4 23.40 22.90 22.60 22.30
0.99� 10�3 23.40 22.90 22.60 22.30

Thus the change of the surface pressure with the temperature is aconstant for each solution, whose values are presented in Table 3.16,under �Ss. The table also gives �Hs values calculated from Equation(3.25). It is clear from the surface entropy values that the concentra-tion change of the surface layer entropy is temperature-invariant. Theenthalpy of the surface layer of the surfactant depends on the tem-perature of investigation, though �Hs concentration dependencesappear to be of the same type as the �Ss ¼ f ðcsurfÞ (Table 3.16) depen-dence with the minimum exhibited at the same surfactant content.From the surface entropy and enthalpy values the most well-orderedadsorption layers are formed at temperatures of 333–353 K and aKEP-2 mass fraction in PTMG of 1:8 � 10�4. We refer to high contentsof surfactant molecules in the surface layer because CCMF of theseKEP-2 solutions is mass fraction 2:5 � 10�4 (see Table 3.15). Thus,with KEP-2 solutions in PTMG more and more ordered adsorptionlayers are formed with increase of the surfactant mass fraction(�Ss < 0 for almost all the surfactant contents studied) and are alsocharacterized by negative values of the surface enthalpy.Furthermore, the concentration dependences of �Hs and �Ss at dif-ferent temperatures are of the same character, unlike the thermody-namic functions of similar solutions of PPG [11].
Let us consider the results of similar investigation of KEP-2 solu-tions in ODA. Table 3.17 shows that the introduction of this surfactantinto a complex oligoester can reduce the surface tension by approxi-mately 40% and that a mass fraction of KEP-2 of the order (5–7)� 10�5
is sufficient. The system reaches a constant value of surface tensionstarting at 7:5 � 10�5 surfactant mass fraction and this amount ofKEP-2 is the critical concentration for micelle formation.Consequently, the solubility of this oligomer surfactant in ODA isthe lowest of all three of the oligoglycols investigated. The surfacepressure changes linearly with temperature although for differentsurfactant concentrations the sign of the slope varies and accordinglythe surface entropy (Table 3.18) changes depending on temperatureand concentration of the surfactant. It follows from these data thatsurface entropy changes with concentration are described by an extre-mal dependence with a maximum around 3 � 10�5 mass fraction ofKEP-2. As in PTMG solutions, the concentration change of �Ss isexpressed as a single curve for all investigated temperatures, i.e.,�Ss does not depend on temperature. The significant difference isthat the �Ss of the surface layer is negative only for a surfactantmass fraction �1.7� 10�5.
Thus, it is at the extremum that the most disordered state of adsorp-tion (surface) layer is observed. The positive extremum of �Hs values(Table 3.18) is observed in the same region of surfactant mass frac-
166 Chapter Three

167
TABLE 3.16 Values of Surface Enthalpy and Entropy of KEP-2 Solutions in PTMG at Different Temperatures
KEP-2 323 0.1 K 333 0.1 K 343 0.1 K 353 0.1 Kmass
fraction 105�Ss 103�Hs 105�Ss 103�Hs 105�Ss 103�Hs 105�Ss 103�Hs
( 3%) (J/m2�K) (J/m2�K) (J/m2�K) (J/m2�K) (J/m2�K) (J/m2�K) (J/m2�K) (J/m2�K)
2� 10�5 1.20 8.40 1.20 8.60 1.20 8.60 1.20 9.103� 10�5 0.0 8.10 0.0 7.70 0.0 8.00 0.0 8.005� 10�5 70.90 6.90 70.90 6.90 70.90 6.50 70.90 6.501� 10�4 73.00 2.20 73.00 1.6 73.00 1.00 73.00 0.40
1.8�10�4 75.3 70.80 75.3 71.8 75.3 72.20 75.3 73.703�10�4 74.3 0.4 74.3 70.25 74.3 71.70 74.3 72.30
9.9�10�4 74.0 1.0 74.0 0.20 74.0 70.90 74.0 71.60

tions. Accordingly, KEP-2 surface layers in ODA solutions are mainlycharacterized by high degree of disorder and maximum values of thepower component of total surface energy.
From comparison of the concentration dependences of surfaceentropy and enthalpy of KEP-2 solutions in PTMG, ODA, and PPG[10, 11] it may be concluded that in all cases considered they haveextremal character, although these extrema are observed for KEP-2mass fractions differing tenfold and more for different oligoglycols.Additionally, there are two specific surfactant concentrations inPPG: apart from the extremal region there is another at which �Ss
is observed to be independent of temperature. Thermodynamic analy-sis of the surface layers of KEP-2 surfactant in ODA and PTMGshowed that entropy is temperature-invariant for practically all con-centrations considered. Since hydrogen bonding is a very temperature-sensitive factor, it can be supposed that its role for KEP-2 solutions inPPG is demonstrably greater than in the other cases.
3.3.4.3 Investigation of interactions in oligomer–surfactant systems by spec-
tral methods. Infrared (IR) spectroscopy was used for this part of theinvestigation. Surfactant concentrations for spectral comparison werechosen according to their solubility in different oligomers. It was foundthat KEP-2, regardless of its concentration, does not practically influ-ence the state of the hydroxyl groups of PTMG and ODA oligomers. Adifferent pattern was observed for KEP-2 in PPG. For mole fractions of3 � 10�4 and 1:5 � 10�4 the surfactant does not influence the OH-group band. With other surfactant concentrations, regular reductionof the band maximum below 3460–3480 cm�1 is observed (Table 3.19).Furthermore, at those surfactant contents the band at 3590 cm�1 dis-appears, i.e., the profile of this part of the spectrum changes. The band
168 Chapter Three
TABLE 3.17 Surface Tension Temperature Dependences of KEP-2 Solutions in ODA
Surfactant Surface tension, (mN/m) ( 0:2) at the temperaturemass fraction
( 0.3%) 323 0.1 K 333 0.1 K 343 0.1 K 353 0.1 K
0 38.3 37.7 37.1 36.61� 10�5 33.5 33.2 32.9 32.6
1.5�10�5 31.1 30.8 30.2 29.72� 10�5 30.1 29.42 28.8 28.2
2.8�10�5 26.6 26.0 24.7 23.93.5�10�5 25.0 24.4 23.2 22.6
5� 10�5 24.3 23.7 22.9 22.37.5�10�5 23.8 23.3 22.6 22.01.0�10�4 23.8 23.3 22.6 22.0

169
TABLE 3.18 Values of Surface Enthalpy and Entropy for KEP-2 and ODA Solutions at Different Temperatures
KEP-2 323 0.1 K 333 0.1 K 343 0.1 K 353 0.1 Kmass
fraction 105�Ss 103�Hs 105�Ss 103�Hs 105�Ss 103�Hs 105�Ss 103�Hs
( 3%) (J/m2�K) (J/m2�K) (J/m2�K) (J/m2�K) (J/m2�K) (J/m2�K) (J/m2�K) (J/m2�K)
1� 10�5 73.2 75.4 73.2 76.0 73.2 76.6 73.2 77.21.5� 10�5 71.5 2.40 71.5 2.1 71.5 1.8 71.5 1.5
2� 10�5 0.0 8.00 0.0 8.3 0.0 8.3 0.0 8.32.8� 10�5 5.5 26.50 5.5 28.4 5.5 31.3 5.5 32.13.5� 10�5 5.5 29.4 5.5 30.0 5.5 32.8 5.5 34.0
5� 10�5 3.7 26.0 3.7 26.3 3.7 27.0 3.7 27.67.5� 10�5 0.0 14.6 0.0 14.6 0.0 14.6 0.0 14.61.0� 10�4 0.0 14.6 0.0 14.6 0.0 14.6 0.0 14.6

at 3590 cm�1 characterizes intramolecular hydrogen bonding in fivecycles, which is nonreactive in uncatalysed reactions of urethane for-mation, as shown in [135].
Comparing the IR spectral results with data from thermodynamicanalysis of adsorption layers of the surfactant, it is concluded thatwhen hydrophobic parts of the surfactant molecules, regardless oftheir conformation, are characterized by extremely dense packing inthe surface layer, the surfactant does not influence the state of thehydroxyl groups of the solvent oligomers.
3.3.4.4 Physical and mechanical properties of polyurethane networks and
surfactant additives. The cohesion and adhesion properties of thecured polymers were investigated to elucidate the influence of KEP-2 on the physical and mechanical properties of polyurethane networksbased on PPG in the presence of individual oligomers.
Results for polyurethanes based on PPG with various surfactantconcentrations are shown in Table 3.20. When these data are analysedit is seen that introduction of a certain surfactant concentrationincreases cohesion and adhesion strength but that changes in � and�p for the same surfactant concentrations are inverse: if � increases,�p falls, and vice versa. It was found that the extremal character of thebreaking strength with concentration (Table 3.20) corresponds essen-tially to the dependences of the thermodynamic functions [10].Therefore, for very dense surface layer packing, cohesion strengthincreases and adhesion strength decreases. Growth of adhesionstrength is observed for those surfactant concentrations at which the
170 Chapter Three
TABLE 3.19 Band Parameters of the Individual Oligoglycol Hydroxyl Groups andTheir Mixtures Without Surfactant and in the Presence of KEP-2
KEP-2 Band Rated integralconcentration integral intensity of Bandmole fraction intensity the band half-width
Oligoglycol ( 3%) g ( 10%) g ( 10%) (cm�1)
PPG 0 0.1635 — 1.62PPG 2�10�3 0.1203 — 1.65PTMG 0 0.2124 — 1.90PTMG 2�10�4 0.2116 — 1.90ODA 0 0.4077 — 2.50DA 2�10�5 0.4077 — 2.50PPG, PTMG 1�10�3 0.0812 0.1660 1.55PPG, PTMG 0 0.1368 0.1729 2.00PG, ODA 0 0.2032 0.2978 2.00PPG, ODA 1.1� 10�3 0.2784 0.2783 2.00

structure of the surface layer is characterized at the given tempera-ture by constancy of �Hs and �Ss.
The physical and mechanical properties of polyurethane networkssynthesized using ODA oligoesters at 343 1 K were also studied; theresults are presented in Table 3.21. Polyurethane specimens weresynthesized with various KEP-2 concentrations, including that ofmass fraction 3:5 � 10�5 at which the extremum in the dependencesof thermodynamic functions was observed for oligoglycol solutions. Itis especially notable that KEP-2 results in considerable (twofold) wor-sening of cohesion strength, significant reduction of elasticity, andsubsequent insensitivity of the ultimate strength under normal frac-ture to the presence of surfactant in the system. Thus, the cohesionand adhesion characteristics of polyurethane networks synthesizedusing ODA do not depend on the structure of KEP-2 adsorption layersin the initial oligomer.
Analogous results for polyurethane networks based on PTMG arealso presented in Table 3.21. Polyurethane specimens were synthe-sized with various concentrations of KEP-2 in the oligomer, includingthe mass fraction 1:8 � 10�4 at which extrema are observed in thethermodynamic functions in PTMG solutions. Clearly, KEP-2 pro-duces considerable worsening of cohesion strength, reduction of thepercent elongation of polyurethane specimens, and constancy of theultimate strength value under normal fracture. Thus, as with ODA,the cohesion and adhesion characteristics of polyurethane networks donot depend on the structure of KEP-2 adsorption layers in the initialoligomer.
Hence, if there is no specific interaction between the initial oligomerand the surfactant, there is also no connection between thermody-namic functions characterizing the surface layers at the start of the
Properties of Adhesives Based on Polymeric Mixtures 171
TABLE 3.20 Physical and Mechanical Properties of Polyurethane Networks Basedon PPG, Trimethylolpropane, and TDI at 343 1 K
UltimateKEP-2 Tensile strength under Percent
mass fraction strength normal fracture elongation( 3%) � (MPa) ( 10%) �p (MPa) ( 10%) (%) ( 10%)
0 3.0 4.0 4007.5�10�5 3.5 4.0 4201.5�10�4 3.6 3.9 450
3�10�4 2.6 6.0 3805�10�4 2.5 6.2 400
7.5�10�4 4.6 3.0 4001.0�10�3 4.6 3.0 4201.5�10�3 4.5 2.9 420

172
TABLE 3.21 Physical and Mechanical Properties of Polyurethane Networks Based on Different Oligoglycols (ODA, PTMG),Trimethylolpropane, and TDI at (343S1) K
ODA PTMG
Ultimate UltimateKEP-2 Tensile strength under Percent Tensile strength under Percent
mass fraction strength normal fracture elongation strength normal fracture elongation( 3%) (MPa) ( 10%) (MPa) ( 10%) (%) ( 10%) (MPa) ( 10%) (MPa) ( 10%) (%) ( 10%)
0 4.0 3.6 650 5.0 5.0 5003.5� 10�5 3.9 3.6 600 5.0 5.0 400
7�10�5 2.6 3.5 530 4.0 5.0 3501.8� 10�4 2.6 3.5 400 3.5 4.8 3005.0� 10�4 2.5 3.45 500 3.5 4.8 3501.0� 10�3 2.4 3.5 500 3.4 4.9 3801.5� 10�3 2.4 3.5 500 3.4 5.0 350

reaction and the properties, and therefore the structure, of the poly-urethanes in the cured condition.
3.3.4.5 Kinetics of formation of polyurethanes based upon oligoethers and
oligoesters. A promising direction in the production of polyurethane(PU) adhesives is the creation of one-component resilient adhesivesbased on prepolymers with free isocyanate (NCO) groups and withoutthe use of solvent; these represent highly efficient bonds that are lowin toxicity and form strong adhesive joints with different materials[85, 136, 137]. The adhesion strength of these adhesives can beincreased by the use of appropriate polymer–polymer compositions[138]. Polymer mixtures are obtained without solvents by mixingtheir melts [139] or by matching of polymerizing monomers to formnetwork polymers. Properties typical of crosslinked three-dimensionalnetworks can be achieved as a result of only physical interactions insystems based on linear or branched polymers [140].
This part of the work is devoted to the study of adhesive joint for-mation based on urethane polymer mixtures with free NCO groups.The materials under investigation were adhesives obtained fromtoluylene diisocyanate (TDI) and hydroxyl-containing polyesters. Thehydroxyl-containing components were oligooxypropylenetriols (L-3003and P-2200 oligoester, the product of reaction of diethylene glycol,trimethylolpropane and adipic acid interaction).
From kinetic investigation of the curing of macro-triisocyanates(MTI) based on L-3003, P-2200, and their mixtures, kinetic curves ofthe polymerization process were obtained at 298 K. Kinetic curves forthe curing of polyurethane prepolymer mixtures obtained by reactionof TDI with L-3003, P-2200, and various mixtures with a double excessof NCO groups with respect to OH groups are linear. These depen-dences show that NCO group reactions continue until high fractionalconversions comply with the second-order equation
1
1 � P¼ KC0t ð3:26Þ
where P¼ extent of reaction; K ¼ rate constant; C0 ¼ initial concentra-tion of NCO groups in the reaction mixture; t¼ time.
The rate constants calculated for total conversion of NCO groups inPU adhesive compositions are shown in Table 3.22. An obvious andsignificant difference (fivefold) is observed in the reactivity of pre-polymer NCO groups based on each oligoester and oligoether sepa-rately. This allows the use of an approach originally devised todescribe parallel reaction behavior with similar functional groups[142] for the kinetic evaluation of the curing of these incompatible
Properties of Adhesives Based on Polymeric Mixtures 173

reagents. As was shown in [133], when thermodynamically compatiblereagents have the same functional groups, their interaction withchemically active substances is described by reactions running in par-allel provided that their reactivities differ. In accordance with [141]and [142], the effective rate constant in the mixture and the observedrate constant for the components are related by
Keff ¼ K1 þ ðK2 � K1Þ½C�2½C�0
ð3:27Þ
where K1 and K2 are the rate constants of the less and more reactivegroups respectively, and ½C�2 and ½C�0 are concentrations of the moreactive NCO groups and of all isocyanate groups in the system,respectively. Rate constants calculated from Equation (3.27) are alsopresented in Table 3.22. Comparison of the rated and experimentalvalues shows these values are properly correlated when the volu-metric content of the component based on L-3003 oligomer exceeds0.88. With the further increase of dispersed phase in the mixture(i.e., with P-2200 concentration) a discrepancy is encountered: theexperimental values increase while calculated values decrease notice-ably. This behavior is connected with existence of not only two internalphases but also a developed interphase layer with altered properties.The larger the contribution this layer makes to the kinetics, thegreater is the volumetric fraction of the component base on P-2200and, consequently, the longer is the interphase boundary. Hence,description of the process using only concepts of parallel reactions ineach phase does not provide a complete picture of the curing kineticsfor the oligourethanes investigated, since the phenomena at theboundary are not taken into account, although comparison of theexperimental and rated values provides a qualitative characterizationof the role of reactions occurring close to the interphase boundary.
174 Chapter Three
TABLE 3.22 Experimental and Rated Values of Curing Reaction Rate Constants forReactive Oligourethanes of Various Compositions at 298 K
VolumetricComponent fraction of the
mole component based 107Keff 107Kr
ratio I:II on oligomer I [l/(mol�s)] [l/(mol�s)]
0:1 0.0 7 —1:1 0.61 43 232:1 0.76 40 275:1 0.89 31 31
40:1 0.98 35 341:0 1.0 35 —

3.3.4.6 Cohesion and adhesion characteristics of polymer networks based
on polyurethane mixtures. The curing of macro-polyisocyanatesbetween the bonded surfaces provides adequately strong adhesivejoints between different materials. Investigation of the adhesionstrength to steel of compositions based on oligourethanes [143]showed that increase of strength at normal fracture occurs overtime and is especially rapid during the first 10 days. Prepolymercompositions based on oligoethers possess good strength characteris-tics (4.9–5.3 MPa). As the breaking of adhesive joints has cohesivecharacter and is determined by the strength of the cured polymer,reduction of adhesion strength is to be expected with increase ofmolecular mass of the polyol component due to the decrease of con-centration of urethane groups in the oligourethane [144]. With thetri-functional polyol L-3003, despite the increase of the initial poly-ester molecular mass, a strength increase is observed, connected withthe formation of branched macromolecules of oligourethane capable ofstronger interphase interaction with the metal. The strength of MTIbased on P-2200 polyester is somewhat higher, due to stronger inter-molecular interaction, than is found with oligoethers [145]. A consider-able increase in strength (8.0–8.5 MPa) is noted with adhesivescontaining an MTI mixture based on P-2200 and L-3003 combinedduring synthesis. This is apparently connected with formation of amore compact spatial grid.
The strength increase for specimens cured at higher temperature(333 K, in comparison with 293 K) probably occurs because tempera-ture increase provides polymerization by NCO groups as well as thechemical and permolecular crosslinking at the polymer–substrateboundary.
The use of UP-606/2 [2,4,6-tri(dimethylaminomethyl)phenol] is ofinterest as a catalyst for acceleration of the system curing because ofits influence on the physical and mechanical indices of the corre-sponding adhesives. As has been shown [143], introduction of thecatalyst reduces the strength of the adhesive joint, probably due tofoaming in the adhesive seam because of intense liberation of carbondioxide upon interaction of NCO groups with moisture. The drop inadhesion strength in the system investigated depends on the quan-tity of the catalyst used: only small quantities (0.05–0.1 mass%) ofcatalyst can be introduced without considerable reduction of adhe-sion strength.
Study of the influence of water on the adhesion strength of PUadhesives based on individual isocyanate-containing oligourethaneshas revealed low water resistance [45]. Increase of strength andwater resistance in adhesives based on mixtures of branched oligo-urethanes with free isocyanate groups, as well as of these mixtures
Properties of Adhesives Based on Polymeric Mixtures 175

modified by perchlorvinyl resin (PPCV), may be expected. The materi-als investigated were PU compositions with free NCO groups based ontoluylene diisocyanate (TDI) and hydroxyl-containing oligoesters andoligoethers: oligo-oxypropylenetriol (L-3003), P-2200, ODA-800, andtheir mixtures in 1:1 mole ratio at a total NCO/OH ratio of 2. Oneof the compositions investigated contained predried perchlorvinylresin (PPCV-LS) as the additive introduced into the system duringsynthesis.
The adhesion properties of the compositions and their water resis-tance were studied by observing the changes over time of the adhesionstrength of joints cured by the ambient moisture during 30 days ofexposure under water. Macro-triisocyanates based on L-3003 and P-2200 are characterized by similar strength values. In mixtures of oligo-urethanes with these polyols a sharp increase in adhesion strength isobserved, which may be explained by more compact spatial packing ofpolar groups on the substrate surface. Introduction of PPCV-LS intothe system leads to sharper increase of adhesion strength as a resultof ‘‘bond in the net’’ structure formation [146] and due to the increasein the number of polar groups at the interphase boundary, providingstructual ordering and strengthening of interphase polymer–metalinteraction. Maximum adhesion strength reaches 12 MPa and isobtainable in 30 days.
The water resistance of these systems of oligourethanes underconditions of increased humidity has been studied in connectionwith their possible use as adhesives. The low water resistance ofprepolymers obtained through TDI reaction and of individual polyols,especially of oligourethanes based on ODA-800 and P-2200, may beexplained by the high interphase tension, which facilitates theconditions of selective water sorption at the interphase boundary ofadhesive and substrate [145].
For mixtures of macro-polyisocyanates, there is typically anincrease of adhesion strength before and after the soaking of adhesivejoints in water that is more significant with introduction of PPCV-LSinto them, and a subsequent reduction of adhesion strength in waterfor all the mixtures investigated within 30 days such that �=�30 ¼2:0–2.5. That is, there is no noticeable increase of water resistanceof the adhesive joint by means of PPCV-LS additives. Lower waterresistance of adhesive joints based on isocyanate-containing oligo-urethane than with films of the same material was found in [146]and was explained by faster water penetration along the adhesive–substrate boundary due to defectiveness of the permolecular structureof the polymer and selective water sorption at the metal surface, aswell as by formation of carbon dioxide bubbles on reaction of NCOgroups with this moisture. This explanation is confirmed by studying
176 Chapter Three

the influence of PU-oligomer curing catalysts on the adhesion andwater resistance. Introduction of tin into the system of octoanateand dibutyl dilaurate accelerated interaction of the isocyanate groupswith moisture and, correspondingly, caused more intensive liberationof carbon dioxide, producing a very sharp fall of adhesion strength andwater resistance of the adhesive contact with the metal. The reductionof adhesion strength and water resistance of compositions using cata-lysts exceeds the positive effect from introduction of PPCV-LS when nocatalyst is used.
Enhancement of the interphase interaction of adhesive with metaland ordering of the structure of the mixtures results in considerableimprovement of their physical and mechanical properties and, corre-spondingly, considerable increase of adhesion strength, which remainshigher after long-term soaking in water, in comparison with indivi-dual oligourethanes.
3.3.4.7 Investigation of the structure of prepolymers with isocyanate end
groups based on mixtures of incompatible oligoesters and of their polymers
by contrast optical microscopy. As has been shown, oligourethanesbased on oligoester mixtures and cured by moisture in air and withisocyanate end groups exhibit an increase of adhesion strength atnormal fracture in comparison with corresponding adhesives basedon the individual polyesters. The reasons for this change in the proper-ties of the cured composition remains uncertain. The regularities char-acterizing the formation of polymer compositions with improvedproperties based on self-cured oligourethanes obtained from mixturesof oligoethers and oligoesters were therefore of interest.
Oligourethanes with the NCO end groups based on oligoester mix-tures were investigated. L-3003 and P-2200 oligoester were used asthe hydroxyl-containing components and the ratio of hydroxyl groupsin oligoether to those in oligoester was varied from 100:1 to 1:1.
Using contrast microscopy [147] it was established that theoligourethanes generated are mutually insoluble under the conditionsstudied. Mutual insolubility is the result of the different polarityof prepolymers based on oligoethers and oligoesters, representedby values of surface tension of, respectively, 28 0:4 and40 0:4 mN/m. This results in formation of either kinetically stableemulsions (from 100:1 up to 5:1) or emulsions that partially split whenstored (above 5:1). When the drop sizes of emulsions formed in oligour-ethanes of different composition are compared it appears that thestructures that are stable over time form drops of 1 � 10�5 m diameteror less. Thus, the synthesis of oligourethanes from polyether andpolyester mixtures is a process of formation of stable emulsions with-out introduction of special stabilizing additives. It should be noted that
Properties of Adhesives Based on Polymeric Mixtures 177

by mixing of macro-triisocyanates based upon each polyester sepa-rately, it is impossible to obtain a nondelaminating mixture. Hence,the substances exerting stabilizing action are formed during the oligo-urethane synthesis. The appearance of substances able to sorb at theinterphase boundary and reducing the value of interphase tension isdemonstrated by experimental data.
3.3.4.8 Determination of the interphase tension of reaction mixtures during
synthesis of oligourethanes. The kinetics of interphase tension changeat the boundary with air and mercury during the formation of pre-polymers with isocyanate end groups was investigated as follows. Thecharge of hydroxyl-containing component was placed into a reactor,dried at 373 � 5 K, and mixed intensively using a magneic mixer for5–6 h. Then, at 323 � 0:1 K, a defined quantity of a distilled mixtureof 65% 2,4- and 35% 2,6-isomers of TDI was added and was inten-sively mixed for 5–10 min and a measuring cell located in a thermo-stated chamber of the unit for measuring interphase tension wasfilled with the reaction mixture at 323 � 0:1 K. If the interphase ten-sion was measured at the boundary with mercury, then a mercurydrop was placed onto the backing of the measuring cell. If the mea-surement was performed at the boundary with air, a drop of themixture under investigation was placed onto the backing of the mea-suring cell. The drop was photographed during 240–300 min atdefined time intervals. The photographed drop dimensions were mea-sured with a UIM-21 measuring microscope. To study the influenceof different order of mixing of the initial components on the proper-ties of the systems obtained, the reagents were also mixed in reverseorder: the distilled mixture of 2,4- and 2,6-isomers of TDI was placedinto the reactor and the charge of dried hydroxyl-containing compo-nent was added, with subsequent mixing for 5–10 min. The remain-der of the experiment was performed as described.
It is apparent from Table 3.23 that for both orders of mixing theprocess of system formation is accompanied by reduction of the inter-phase tension, though when macro-triisocyanate (MTI) is formed thisreduction is greater with diisocyanate in excess.
For the interphase tension change at the boundary with air duringprepolymers formation based on individual polyesters and mixtures,the surface tension displayed no change and was 28 mN/m for theprepolymer based on L-3003 polyether, 40 mN/m for that based on P-2200 polyester, and 32 mN/m for that based on a 40:1 mixture of poly-ether and polyester (Table 3.23). For the interphase tension at theboundary with mercury, it was shown that formation of prepolymersbased on individual oligoethers and oligoesters and on mixtures isaccompanied by significant reduction of interphase tension, this
178 Chapter Three

179
TABLE 3.23 Kinetics of Interphase and Surface Tension Change in the Process of Formation of Prepolymers Based on IndividualComplex Oligomers and Their Mixtures at 323S0.1 K
Interphase tension (mN/m) ( 2%) Surface tension (mN/m) ( 1%)of MTI formation process based on of MTI formation process based on
TDI L-3003 TDI TDI and TDI TDI TDI andTime and and and L-3003þP-2200 and and L-3003þP-2200(min) L-3003 TDI P-2200 40:1 L-3003 P-2200 40:1
25 — — — 347 — — —40 302 302.0 299.0 310 27.8 42.0 32.060 254 253.0 297.0 240 28.2 40.6 31.690 222 246.0 295.0 222 29.0 40.4 31.6
120 226 241.0 282.0 214 28.6 40.0 31.6150 206 237.0 247.5 215 27.0 40.0 31.8180 224 235.0 231.0 217 27.2 40.0 31.8210 214 233.5 226.5 217 27.6 40.0 31.8230 211 233.0 225.0 215 28.0 40.0 32.0250 210 233.0 225.0 215 28.0 40.0 32.0

reduction being of the same order (100–110 mN/m) and character forall the systems investigated (Table 3.23).
As well as interphase phenomena in polyurethane compositions,their adhesion properties were also studied; bonding of steel dollieswas done immediately after the synthesis and two days later. Tests fornormal fracture were performed 30 days after bonding. Table 3.24shows that specimens bonded immediately after synthesis are not dis-tinguished by high adhesion strength. The adhesion strength of pre-polymers based on oligoesters and oligoethers is somewhat higherthan that of prepolymers based on mixtures. Another picture isobserved in bonding of specimens two days after synthesis. In thiscase considerable increase of the strength characteristics (to9.0 MPa) of prepolymers containing MTI mixtures and those basedon P-2200 and L-3003 is observed. Fivefold reduction of the amountof polyester in MTI based on oligoether and oligoester mixture doesnot alter the adhesion properties of the compositions investigated. Theadhesion strength data of as-synthesized polyurethane compositionsagreed with the results for interphase tension at the formation stage.The values of interphase tension are the same and the adhesionstrength is of the same type for all the systems considered.
IR spectroscopic investigation of MTI specimens as-prepared or heldfor several days showed a gradual shift of carbonyl group absorptionfrom 1740 cm�1 (free C——O) to 1720 cm�1, demonstrating [148] theaccumulation of hydrogen-bonded carbonyls, i.e., associated and self-associated urethane groups. Thus, the increase of adhesion strengthobserved may be subsequent to ordering due to formation of hydrogenbonds in the system structure during storage with exclusion of moist-ure. This creates conditions preventing delamination (components are
180 Chapter Three
TABLE 3.24 Adhesion Properties of Specimens Bonded by PolyurethaneCompositions Based on Individual Oligoethers and Mixtures
Strength under Strength undernormal fracture normal fracture
Initial components of specimens of specimensbonded directly bonded 2 days
POPT after synthesis after synthesisNCO P-2200 L-3003 (MPa) ( 10%) (MPa) ( 10%)
2:1 0 2 5.1 4.72:1 2 0 6.0 5.62:1 1 1 5.0 9.02:1 1 2 4.6 8.52:1 1 3 4.6 8.72:1 1 5 5.5 9.12:1 1 10 3.1 —

mutually insoluble) and also induces the composite in the adhesivejoint to act as a single unit.
3.3.4.9 Rheological behaviour of polyurethane mixtures. The colloidchemistry of oligourethanes as stable heterogeneous systems is ofinterest and estimation of the rheological behavior of the prepolymersmay be useful. Oligourethanes based on oligoethers and on mixtureswith mass fraction of L-3003 of more than 85% (by hydroxyl groups)are Newtonian liquids. At the same time, oligourethanes with a highercontent of oligoester are characterized by non-Newtonian behavior asregards low shift speeds and established flow pattern at other shiftvoltages. Thus, typical rheological behavior is observed during thetransition from diluted to concentrated emulsions [149]. In the lattercase there is the possibility of dispersed phase particles with solvationspheres in the continuous phase interacting with each other (struc-ture-forming interaction), as a result of which the system acquiresviscoelastic properties. The concentration dependence of the dynamicviscosity ð�Þ of oligourethanes under established flow has extremalcharacter (Fig. 3.24). Figure 3.24 shows that the viscosity ofoligourethanes based on polyester mixtures is always less than thatof oligourethanes based on P-2200. Moreover, there is a region of poly-ether and polyester ratios (from 5:1 up to 100:1) where the viscosity ofoligourethanes of mixed structure is less than for minimal initialoligourethane (obtained from L-3003 only). Experimental data also
Properties of Adhesives Based on Polymeric Mixtures 181
Figure 3.24 Dependence of the cured adhesivejoint strength (1) and viscosity of initial isocya-nate-containing oligourethanes (2) on the polyetherand polyester ratio.

show reduction of density in oligourethanes based on mixturesð1:04 � 0:04 kg/m3
Þ compared with those based on each polyesterseparately ð1:35 � 0:04 and 1:11 � 0:04 kg/m3, respectively, forsimple and complex ones). The extremal character of the dependenceof viscosity on oligourethane composition is evidence of the inverselyacting factors displayed in rheological behavior. A factor promotingviscosity increase is the introduction of a high-viscosity componentbased on P-2200 (�60� 0.1 Pas). Its contribution is reduced with thedecrease of the amount of this substance in the mixture. The secondfactor is formation of a layer promoting stability of the emulsion, aso-called structural–mechanical barrier [150], at the boundary of twoliquid phases, since it is known that long-term existence of theemulsions is provided by stabilization connected with formation ofan adsorption layer at the interphase boundary [150] and stability isprovided when this layer is located outside the drop only, that is, in thedispersion medium. Apparently, this intermediate layer possesses alooser structure due to conformational difficulties appearing near theboundary [138]. The more developed is the boundary between existingphases, the greater is the contribution to the rheology of interphaselayer properties. As shown in Fig. 3.24, this influence is maximallydisplayed at a polyether to polyester ratio of 15:1. As specificinteractions [151] play a very significant role in polyurethanes, achange in the character of hydrogen bonding [152] may be expectedin the components’ incompatibility conditions for polyurethanestructure formation. The rheological behavior of polyurethanes issensitive to such changes. Figure 3.24 shows that for curing ofoligourethanes with polyester ratio between 1:1 and 5:1 there ismaximum increase of adhesion strength compared with the initialcompositions. Thus, the optimal adhesion characteristics are achievedfor compositions at which the oligourethanes are characterized bynon-Newtonian behavior. This may be connected with microstructuralordering typical of dispersed systems and, as a result, with theappearance of oriented macrostructures. The distances between thedrops of emulsified phase are comparable with the size of dispersedliquid particles at high mass fractions of oligourethanes based onP-2200. The effect of dispersion medium structuring is lost withdecrease in the number of dispersed particles in unit volume.
3.3.4.10 Microstructure of polyurethane networks based on oligomer
mixtures. The morphological structure of cured MTI based on L-3003 and mixtures of oligomers of varied structure has been studiedby electron microscopy. The morphological pattern is practically thesame for a polymer surface formed in air and for bulk polymer, but itis expressed more clearly in the latter. Cured compositions based
182 Chapter Three

on oligomer mixtures with larger mass fractions of P-2200 arecharacterized by groups of globules having diameters of 30–100 nmin chains of varied length. With increase in the composite of the initialMTI product based on L-3003 and random location of permolecularformations, globule sizes increase up to 200 nm, approaching thoseof polyurethanes based on a single L-3003, and regrouping ofpermolecular formations from chain structures to a cellulararrangement of globules also occurs. Thus, microstructure of thecured MTI is characterized by the occurrence of order in the form ofchains or cells according to the oligomer mixture used; for strongerstructure formations and better adhesion characteristics, the former ispreferable.
It should thus be possible to synthesize macrodiisocyanates in theform of stable emulsions from mixtures of mutually insoluble poly-esters without special stabilizing additives. In this case oligourethaneswith various (including low) viscosity may be obtained according to theoligoester ratio. It was shown that the observed adhesion strengthincrease depends on the amount of the substance present in dispersedstate and that the maximum adhesive joint strength is achieved withcuring of oligourethanes characterized by non-Newtonian behavior,i.e., structured systems featuring a microstructure with enhancedordering.
3.3.4.11 Phase division in polymers obtained by oligourethane-triisocyanate
curing. It is known that the mechanical properties of dispersed sys-tems are determined by four main factors: the volumetric fraction ofthe dispersed phase; the size and shape of the particles; the mechan-ical properties of the phases; and the strength of the bond at theinterphase boundary between dispersed phase and dispersed medium.The role of the interphase layer in polymer structure formation wasstudied in the present investigation. The glass-transition temperaturewas used for characterization of polymer structures; for mixing ofincompatible polymers the individual phases maintain their Tg, as arule, and change in this parameter is evidence of change of chemicalcomposition or phase structure [153]. Differential scanning calorime-try (DSC) was used in this investigation.
To outline the features of the glass-transition temperature of thepolymers investigated, the change in their thermal capacity in thetemperature interval 140–300 K was studied. Polymer specimenscured with MTI based on individual oligomers were compared. Asseen in Fig. 3.25 (curves 2, 4), specimens based on L-3003 and P-2200 are both characterized by curves with one thermal capacityjump and have glass-transition temperatures of 226 and 243 K, respec-tively. A polymer based on MTI of an oligomer mixture (curve 1) is
Properties of Adhesives Based on Polymeric Mixtures 183

characterized by a temperature dependence with two jumps, at tem-peratures of 190 and 228 K. However, a mechanical mixture of thesepolymers representing a 5:1 quantitative ratio exhibits a thermalcapacity curve with a single temperature transition at 227 K (curve3): in other words, the second oligoester-based component provides nocontribution. Consequently, DSC data characterize polymers based onan oligomer mixture having the same main glass-transition tempera-ture as a specimen based on oligoether plus an additional transition atlower temperature. As has been noted [154] for mixtures of nonmixingpolymers, various mixing levels are possible—from a distinct two-phase system with interphase layers of various lengths up to such adegree of dispersion of one component in the other that the dispersedphase does not display the properties of a separate phase and either Tg
shows values typical of or close to those of the individual phases ornew structures exhibit new Tg values. In the case considered, judgingfrom DSC data the cured composition is a polymer serving as dis-persed medium in which a loose interphase layer with a less denselycrosslinked network appears characterized by Tg. The second compo-nent displays no properties of a separate phase, though its existence ismanifest as formations less than 1 � 10�5 m in size under contrastmicroscopy. Besides this, it follows from the DSC data that curing ofoligourethane isocyanates based on L-3003 (synthesized with variousorders of mixing of the components) produces polymers with the sameglass-transition temperature but different values of the thermal capa-city jump (Fig. 3.25, curves 2, 4). The full jump in thermal capacity at
184 Chapter Three
Figure 3.25 Thermal capacity/temperature change curves forcuring of compositions based on: (1) MTI of TDI and 5:1 L-3003and P-2200 oligomer mixture; (2) MTI of TDI and L-3003; (3) MTIof L-3003 and TDI; (4) mechanical mixture of polymers based onL-3003 and P-2200; (5) MTI of TDI and P-2200.

the glass-transition is determined by the change of two molecularstates, i.e., their oscillation spectrum and configuration behavior[155]. Thus, the method of initial MTI synthesis defines this charac-teristic in the finished polymer.
Dynamic spectroscopy (this method is more sensitive to Tg modifica-tions) characterized cured MTI as polymer networks. The existence ofthe high-elasticity plateau typical for cross-linked organic polymersmakes it possible to determine values of high elastic modulus in thepseudoequilibrium zone. Systems based on oligoethers and mixtureswith oligoesters are characterized by E values of 5.0 and 8.5 MPa,respectively, which comply with adhesion strength data.
Data from dynamic mechanical spectroscopy also define more pre-cisely the behavior of polymers at the transition from glasslike to ahighly elastic condition. Polymers based on L-3003 and oligoester mix-tures in different ratios only are characterized by various tan � tem-perature dependences. Two maxima at temperatures of 201 and 245 Kare observed in the cured MTI based on 5:1 oligoether–oligoester,while the polymer network based on L-3003 is described by a curvewith one maximum at 239 K. An even larger tan � maximum shift to249 K is experienced for the cured MTI with 1:1 oligomer ratio. On theassumption that this method is also insensitive for resolution of Tg
values of small separation ðTgc � Tgn ¼ 158CÞ, curing of MTI with 1:1ratio was used at increased temperature (333 K) as in the study ofcuring kinetics [145]; it was found that MTI based on oligoethersand oligoesters are cured with different temperature coefficients. Itwas found that for a 5:1 ratio the initial MTI is a stable emulsionand at 1:1 ratio of components the latter delaminates on storage.
Thus, polymers cured at less than 298 K based on MTI of oligoethersand two areas of mechanical losses characterize oligoester mixtures.The position of the main maximum and, consequently, Tg depends onthe ratio of polymers based on simple and complex oligomers and anew area of structural transition may be referred to the loosenedinterphase layer. Hence, polymers of heterogeneous composition maybehave as single phases in curing, which explains the improvement ofproperties in comparison with individual polymers.
3.3.4.12 Thermodynamic functions of surfactant surface layers in oligomer
mixtures. For task-oriented investigation of the influence of surfac-tant on the formation of polyurethane networks, information concern-ing the structure of the surfactant surface layers is required forvarious surfactant contents as well as identification of the concentra-tion interval in which the surfactant is fully soluble in the oligomermixtures. For this reason, surface tension isotherms of surfactantsolutions were studied and thermodynamic analysis was undertaken.
Properties of Adhesives Based on Polymeric Mixtures 185

Mixtures of a single compatible oligomer pair (PPG–PTMG) and oftwo incompatible ones (PPG–ODA and PTMG–ODA) were chosen forinvestigation. KEP-2 was used as surfactant. The principal conditionfor thermodynamic analysis and qualitative determination of surfacefunctions is that the systems should be binary [133]. Accordingly,surfactant solutions cannot be analyzed in thermodynamically incom-patible oligomer pairs (ODA–PPG and ODA–PTMG). We thus limitourselves to analysis of thermodynamic surface functions of KEP-2solution mixtures of compatible oligoglycols. This research is basedon experimental values of the surface tension measured for KEP-2solutions of various concentrations at different temperatures by theWilgelmi method [126].
Thermodynamic functions of the surfactant surface layers for simpleoligoglycol mixtures were derived from surface tension data presentedin Table 3.25. The results show that KEP-2 solubility in PPG–PTMGis halved in comparison with that in a single PPG oligomer.Temperature dependences of surface pressure P for various KEP-2mass fractions in oligomer mixtures are determined from experimen-tal isotherms of surface tension (Fig. 3.26). As is obvious from Fig.3.26, surface pressure depends nonmonotonically on temperature forpractically all mass contents of KEP-2 despite the P�T dependencesobserved earlier in PTMG or ODA solutions. This dependence alsodetermines the complex character of the concentration and tempera-ture dependences of �Ss shown in Table 3.26. This table also givesenthalpy values �Hs. From Table 3.26 it follows that in solutions withKEP-2 mass fraction of 2:25 � 10�4–5 � 10�4 the values of �Hs and�Ss are temperature-invariant and the entropy change does notdepend on surfactant content in the solution, as it is equal to zero.Thus, for these KEP-2 contents at all the studied temperatures thesurface layer is characterized by high structural stability.
Furthermore, concentration changes of enthalpy and entropy (Table3.26) with increase of temperature are characterized by regular trans-formation of the dependences observed, i.e., gradual transition of thecurves to negative values of entropy and enthalpy and the appearanceof two extrema for solutions with KEP-2 mass fractions of 1:5 � 10�4
and 7:5 � 10�4. In this case, the intensity of the second maximumincreases with increase in temperature. The dependences obtainedfor thermodynamic functions can be interpreted from the point ofview of the phenomena considered in Section 2.8.1.
The maximum values of the adsorption constant for KEP-2 solutionsin PPG–PTMG mixtures were determined by the transformed Gibbsequation [160]:
186 Chapter Three

187
TABLE 3.25 Surface Tension Temperature Dependences in Systems Based on PPG–PTMG–KEP-2
KEP-2 mass Surface tension (mN/m) ( 0.2) at the temperaturefraction( 3%) 328 0.1 K 333 0.1 K 338 0.1 K 343 0.1 K 348 0.1 K 353 0.1 K
0 33.0 32.7 32.4 32.1 31.5 30.97.5� 10�5 28.8 28.2 27.6 27.3 26.7 26.11.5� 10�4 26.4 25.9 25.6 25.1 24.7 24.3
2.25�10�4 25.9 25.6 25.3 25.0 24.4 24.13� 10�4 25.6 25.3 25.0 24.7 24.1 23.85� 10�4 24.7 24.4 24.1 23.8 23.2 22.9
7.5� 10�4 24.1 23.8 23.5 23.2 22.9 22.31.0� 10�3 23.7 23.2 23.2 22.8 22.5 22.1
1.25�10�3 23.3 23.0 22.9 22.6 22.3 22.01.5� 10�3 23.3 23.0 22.9 22.6 22.3 22.0

�1 ¼ 1
RT� d�
d ln Cð3:28Þ
where �1 ¼maximum surfactant adsorption (mol/m2), � ¼ surfacetension (J/m2), C ¼ surfactant concentration (mol/m3), T ¼ tempera-ture (K), and R ¼ gas constant.
� values and calculated areas for a molecule of surfactant in a satu-rated sorption layer are given in Table 3.27.
From the results presented in Table 3.27 and in accordance with theresults of [157, 158], for our case at 333 K, the surface layer atmaximum adsorption (surfactant mass fractions from 2:25 � 10�4 to7:5 � 10�4Þ is an extremely compressed monolayer, whereas themajority of dimethylsiloxane units lie on the surface of the liquid. Athigher temperatures (343–353 K) but in a narrower concentrationrange (from 5 � 10�4 to 7:5 � 10�4Þ the polydimethylsiloxane chaintears off the surface, forming spiral turns of 6–8 elements, aswitnessed by a single element area of 0.09–0.11 nm2, which may bereferred to one spiral turn [157]. From the concentration and tempera-
188 Chapter Three
Figure 3.26 Dependence on tem-perature of surface tension ofKEP-2 solutions in PPG andPTMG equimolar mixture.Surfactant mass fraction in thesolution: (1) 0.0015; (2) 0.00125;(3) 0.00075; (4) 0.0005; (5)0.0003; (6) 0.000225; (7)0.00015; (8) 0.00075.

189
TABLE 3.26 Surface Enthalpy and Entropy Values for Solutions with Various KEP-2 Mass Fractions in PPG–PTMG Mixtures at VariousTemperatures
328 0.1 K 333 0.1 K 338 0.1 K 343 0.1 K 348 0.1 K 351 0.1 KKEP-2mass 103�Hs 105�Ss 103�Hs 105�Ss 103�Hs 105�Ss 103�Hs 105�Ss 103�Hs 105�Ss 103�Hs 105�Ss
fraction (J/m2) (J/m2 � K) (J/m2) (J/m2 � K) (J/m2) (J/m2 � K) (J/m2) (J/m2 � K) (J/m2) (J/m2 � K) (J/m2) (J/m2 � K)( 3%) ( 5%) ( 5%) ( 5%) ( 5%) ( 5%) ( 5%) ( 5%) ( 5%) ( 5%) ( 5%) ( 5%) ( 5%)
7.5�10�5 21.1 5.2 17.0 3.8 12.4 2.3 4.7 0 4.8 0 4.8 01.5�10�4 25.7 5.8 25.2 5.4 7.1 0 71.1 72.4 72.6 72.7 72.7 72.7
2.25� 10�4 7.1 0 7.1 0 7.1 0 7.1 0 7.1 0 6.8 03�10�4 7.4 0 7.4 0 7.4 0 7.4 0 7.4 0 7.1 05�10�4 8.3 0 8.3 0 8.3 0 8.3 0 8.3 0 8.0 0
7.5�10�4 8.9 0 8.9 0 2.4 71.9 79.0 75.2 79.0 77.4 730.0 710.91�10�3 9.5 0 9.5 0 1.5 72.4 72.9 73.6 72.9 75.5 718.7 77.9
1.25� 10�3 9.5 0 9.5 0 1.5 72.4 72.9 73.6 72.9 75.5 718.7 77.91.5�10�3 722.7 710.0 710.5 76.1 76.2 74.6 70.2 72.7 70.2 0 9.2 0

ture dependences of surface tension and other derived characteristicsof the surfactant adsorption layer the structure could be characterizedfor various concentrations and temperatures to elucidate the effects ofthese factors.
3.3.4.13 Study of interactions in polyurethane mixtures in the presence of
surfactants by spectral methods. NMR spectroscopic investigation wasundertaken to discover whether there was interaction between thatpart of the adsorption layer formed by oxyalkylene lateral extensionsand molecules of the solvent (oligoglycol). The integrated intensities(II) of proton signals in equimolar mixtures of compatible andincompatible oligomer pairs without surfactant and with KEP-2 atmass fraction 1 � 10�3 were compared. It was found that in botholigomer pairs the introduction of KEP-2 results in changes of theII of proton signals, but in compatible systems the surfactant leads toII reduction, and in mixtures of incompatible oligomers the reverse isobserved. It is of paramount importance that in the range oftemperatures investigated the influence of the surfactant for eacholigomer pair does not depend on temperature. Preliminary resultsobtained by NMR are qualitative, but they form the basis for moredirected IR spectral investigation of oligomer mixtures withsurfactant additives.
It was shown that in KEP-2 solutions in equimolar mixtures of PPGand PTMG containing 7:5 � 10�4 and 1:5 � 10�4 surfactant mole frac-tions the presence of surfactant does not influence the OH group band.At other surfactant concentrations the normal reduction of the bandmaximum to less than 3460–3480 cm�1 is observed. In addition, atthese surfactant contents the band at 3590 cm�1 disappears, i.e., thespectral profile contour changes. The 3590 cm�1 band characterizesintramolecular hydrogen bonding in five-element cycles, which arenonreactive in uncatalyzed reactions of urethane formation. A similarinfluence of KEP-2 is observed in pure PPG.
The data show that KEP-2 solutions in equimolar mixtures and inpure PPG show the same behavior for surfactant concentrations dif-fering twofold, which may be a result of differing KEP-2 solubility in
190 Chapter Three
TABLE 3.27 Rated Values of Surfactant Maximum Adsorption and Area Occupiedby a Surfactant Molecule and One Siloxane Element for KEP-2 Solutions in PPG–PTMG Mixtures
T (K) ( 0.1) � (mol/m2) Am (nm2) Ael (nm2)
333 5.3� 10�7 3.13 0.156343 7.4� 10�7 2.24 0.112353 9.2� 10�7 1.82 0.091

PPG and PTMG. From the chemical composition of the oligomers andof KEP-2 it may be supposed that PPG is the surfactant solvent andthe second oligomer acts as diluent. Therefore, the integral intensity ofOH groups in PPG containing 2 � 10�3 mole fraction of KEP-2 (seeTable 3.19) was taken into account in calculation of the integralintensity of the OH group band in the PPG–PTMG mixture. Datagiven in Table 3.19 show that in the PPG–PTMG system strongspecific interactions arise between molecules of these oligomers, asthe intensity of the OH group band in the mixture is 1.5 times lessthan the additive value in the presence of KEP-2, which may beevidence of participation of both glycol molecules in specific inter-actions with KEP-2. This may be due to formation of hydrogenbonds with a surfactant not by separate molecules but by associationswith hydrogen bonds of oligomer molecules. The fact that at certainsurfactant concentrations the intramolecular five-cycles are broken inPPG itself and in PPG–PTMG mixtures may be related to the changeof conformation of the polyoxypropylene glycol molecules under theinfluence of hydrophilic fragments of KEP-2 molecules located in theboundary layer.
Let us compare the results from IR spectral studies with data fromthermodynamic analysis of the surfactant adsorption layers. It followsthat when hydrophobic parts of surfactant molecules, regardless oftheir conformation, are characterized by extremely compact packingin the surface layer, the surfactant does not influence the state of thehydroxyl groups of solvent oligomers. In all the other cases hydrophiliclateral extensions of the surfactant change the character of specificinteractions in the oligomer mixture: the OH group band contour ischanged and its intensity is reduced.
IR spectra of mixtures of incompatible PPG and ODA oligoetherswith various KEP-2 contents show that at certain surfactant concen-trations ð1:7 � 10�4 and 8:5 � 10�4 mole fractionÞ KEP-2 has no effecton the form or magnitude of the OH group band in the spectrum of theoligomer mixture, while other surfactant concentrations cause thegrowth of the hydroxyl group band. As seen from Table 3.28, in PPGand ODA the band integral intensity is 1.5 times less than the additivevalue without surfactant, and with KEP-2 at 1 � 10�3 mole fraction itshows essentially additive behavior of the hydroxyl group mixture.This may be considered evidence of participation of some of the PPGand ODA molecules in the formation of intermolecular hydrogenbonds, despite their thermodynamic incompatibility. Surfactant at1 � 10�3 mole fraction results in independent contributions of theOH groups of each oligomer to the common band, i.e., ODA and PPGessentially do not form mutual hydrogen bonds at these KEP-2 con-centrations. The following observation deserves attention in relation
Properties of Adhesives Based on Polymeric Mixtures 191

192
TABLE 3.28 Physical and Mechanical Properties of Polyurethanes Based on Compatible Oligoethers, Trimethylolpropane, and ToluyleneDiisocyanate
Curing temperature (K) ( 1)
KEP-2 343 333 343 333 343 333mass
fraction Tensile strength Ultimate strength under Elongation at( 3%) (MPa) ( 10%) normal fracture (MPa) ( 10%) breaking (%) ( 10%)
0 3.0 2.0 9.0 9.0 800 4707.5� 10�5 4.0 1.5 8.0 9.0 820 6001.5� 10�4 5.0 0.7 7.0 12.3 850 960
3� 10�4 3.0 4.2 16.0 14.0 440 6005� 10�4 3.8 3.5 17.0 13.0 600 450
7.5� 10�4 6.0 3.6 9.0 9.0 750 4101.0� 10�3 4.5 3.5 10.0 11.0 400 5101.5� 10�3 4.0 5.0 13.0 13.0 500 640

to this oligomer system, as in the compatible one. In the solutionscontaining 1:7 � 10�4 and 8:5 � 10�4 mole fraction of KEP-2 it appearsthat the surfactant additive does not participate in specific interac-tions with oligomers (or more precisely, as investigation showed, withone of the oligomers, namely, PPG) since ODA hydroxyl groups do notshow specific interaction with KEP-2 at any concentration. As theoligomers investigated are incompatible and only PPG is related toKEP-2 by chemical composition (KEP-2 solubility in ODA is 70times lower than in PPG), the surfactant is predominantly dissolvedin PPG. Thus, surfactant additive behavior is determined by its con-centration of PPG. This concentration is 1.8 times higher than speci-fied. Taking the above into account, the results in [10, 11] may be usedfor discussion of IR spectral data, from which it follows that KEP-2‘‘indifference’’ is observed at solution concentrations for which thestructure of the surfactant surface layer in PPG is in precritical con-dition. At low surfactant concentration, reorientation with respect tothe surface occurs; and under high concentration, there is disorderingof the structures formed by spiral fragments of molecules.
Thus, in both types of oligomer systems the surfactant influencesspecific interactions at all concentrations in addition to those corre-sponding to maximally ordered surface layer structures.
3.3.4.14 Microstructure of polyurethane networks based on oligomer
mixtures. As KEP-2 is a chemically unreactive surfactant, it may besupposed that one of the essential factors controlling modification ofpolyurethane properties under its influence is their morphologicalstructure. From comparison of micrographs of the morphologicalstructure of polyurethane networks based on compatible oligomer mix-tures cured at 343 � 1 K and 333 � 1 K, it is obvious that the micro-structures of polyurethanes based on individual oligomers of PPG andof PTMG have different characters. In the first case these are disor-dered permolecular formations of irregular shape with two types ofmicrostructural heterogeneity; in the second case the structure isfairly homogeneous with elements of order. These polyurethanes arecharacterized by corresponding tensile strengths of 3.0 and 7.0 MPa.Morphological elements typical of the polymer based on a singlePTMG prevail in the microstructures of polyurethanes based onPPG–PTMG mixtures. Polymer morphological structure becomeshomogeneous and is characterized by less globule-like form anddimensions with the introduction of KEP-2 at 1:5 � 10�4 mass fractionat the stage of polyurethane synthesis. Further increase of surfactantcontent in the system leads again to the formation of irregular mor-phological structure with numerous large, irregularly shaped ele-ments. A polyurethane network obtained in the presence of KEP-2
Properties of Adhesives Based on Polymeric Mixtures 193

at 7:5 � 10�4 mass fraction is characterized by fairly homogeneousmicrostructure similar to that of polymers based on a single PTMG.Increase of the KEP-2 concentration causes generation of irregularstructure with areas of larger structural elements and smaller glob-ules. Thus, microstructural elements in the polyurethane system aresmaller than in the same systems with surfactant at mass fractions of1:5 � 10�4 and 7:5 � 10�4.
Investigation of microstructure in polyurethanes cured at 333 1 Khas shown that two levels of heterogeneity characterize polyurethanesbased on mixtures of compatible oligomers when smaller globule-likestructural elements are grouped into macroglobules. Introduction of1:5 � 10�4 mass fraction of KEP-2 results in these macroglobulesbreaking and the appearance of larger formations that are 2–3 timeslarger and have irregular shape at the macro level. Further increase ofthe surfactant content in polyurethane leads to complete disappear-ance of structural elements, typical of the initial polyurethane withoutsurfactant, from the morphological structure of specimens.
Morphological analysis of polyurethane networks based on mixturesof PPG and ODA incompatible oligomers shows that polymers based onODA are distinguished by a regular microglobular structure. Typically,an emulsion structure with a drop size of order 100 mm and havingregular shape is seen in the microstructure of polyurethanes basedon mixtures of oligoethers and oligoesters. The micro level structuresof this polyurethane are characterized by elements typical of polyur-ethanes based on PPG but are smaller in size and are more uniform.Introduction of 1:7 � 10�4 and 1:1 � 10�3 mass fraction of surfactantresults in formation of fairly homogeneous microstructure consisting ofsmaller globules even showing elements of order. For a KEP-2 contentof 5:5 � 10�4 mass fraction in polyurethane based on an incompatibleoligomer mixture, the microstructure does not essentially differ fromthe morphology of the polymer without surfactant. Heterogenization ofthe microstructure with the formation of irregularly shaped macroglo-bules from quite large microformations is typical for polymers with8:5 � 10�4 mass fraction of KEP-2. All the polyurethanes obtained inthe presence of surfactant are characterized by the disappearance ofthe emulsion structure observed in the initial polyurethane.
3.3.4.15 Swelling of polyurethane networks. Proceeding from the generalconception of the role of surfactants in the formation of the secondarystructure of polyurethanes, studies of the influence of KEP-2 on thedistribution of hydrogen bonds in polyurethane networks wererequired. The literature on the thermodynamic properties of polymersolutions and gels was searched and, in particular, the work ofthe authors of [117] is of direct interest in this context. This work
194 Chapter Three

considers values of the heat and free energy of polymer mixing withsolvent for rubbers and the energy of polymer cohesion and the liquidphase (solvent) with derivation of equations. The equations derivedshow good correlation with experimental data. This work has servedas the conceptual basis for development of ideas of the swelling ofcompletely insoluble vulcanized rubbers. In conformity with these con-ceptions, the equality of specific cohesion values of the polymer andsolvent represents the thermodynamic condition for maximum swel-ling of crosslinked polymers. As the value of the specific cohesion isequal to the square of the solubility parameter ð�Þ, it is more conve-nient to use the latter. Thus, the ideas of [117], whose application topolar polymers was demonstrated in [118], may be used to revealspecific interactions in polyurethanes of various compositions. Theessence of the method is that solubility parameters ð�nÞ may be deter-mined by the position of the maximum in the dependence of equili-brium swelling ðQpÞ on the solvent solubility parameter ð�pÞ, even forcrosslinked polymers. In [119] this approach was used for character-ization of redistribution of hydrogen bonds in polyurethane networksunder the influence of fillers. This qualitative evaluation proved to bepossible because it was shown that the polyurethanes investigated hadtwo extremal swelling areas differing in energy. It is known that thereare two types of proton acceptors in polyurethanes, namely, the oxy-gen atom of the glycol fragment and the oxygen atom of the urethanegroup, allowing for the formation of two types of hydrogen bond withdiffering energies [163]. Qualitative correlation of the two types ofhydrogen bonds is determined by the particular polyurethane’s abilityto self-associate [164, 165]. In accordance with data on relaxationbehavior, the localization of various structure types formed by homo-geneous hydrogen bonds should be observed in polyurethane nets[165], regardless of the nature of the initial simple oligoglycol. Thus,all the findings reported support the contention that application of theideas of [117] to polyurethanes allows us to distinguish types of hydro-gen bonds with differing energies. The first maximum in the Qp¼ f ð�pÞ
dependence may be attributed to weaker hydrogen bonds of the NHgroup with the oxygen atom in the glycol chain; the second maximumcharacterizes the breaking of both types of bonds [165]. For systematicstudies of specific interactions in polyurethanes by the swellingmethod it is essential to use a number of solvents with various solu-bility parameters but having a common type of interaction with poly-mer [162], which is accomplished by the use of ethers and esters in thepresent investigation. The required values of the solvent solubilityparameters are taken from [118, 119, 120].
The results of equilibrium swelling studies on polyurethanes basedon oligomer mixtures are presented in Figs. 3.27 and 3.28. Qp values in
Properties of Adhesives Based on Polymeric Mixtures 195
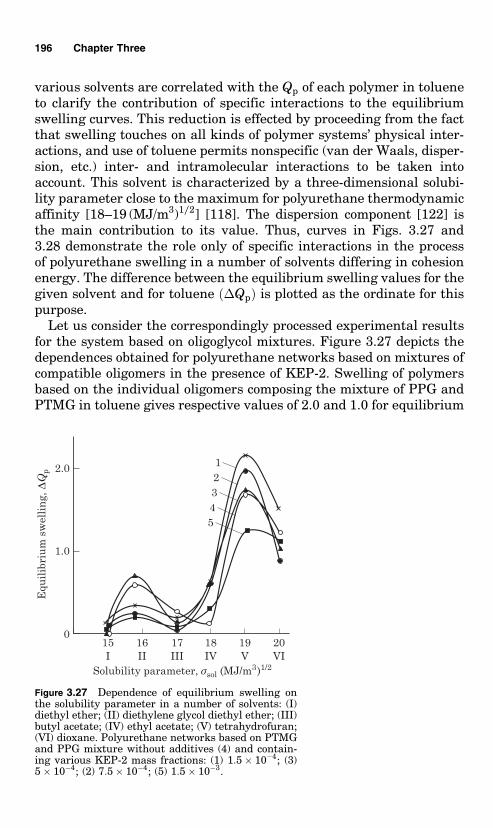
various solvents are correlated with the Qp of each polymer in tolueneto clarify the contribution of specific interactions to the equilibriumswelling curves. This reduction is effected by proceeding from the factthat swelling touches on all kinds of polymer systems’ physical inter-actions, and use of toluene permits nonspecific (van der Waals, disper-sion, etc.) inter- and intramolecular interactions to be taken intoaccount. This solvent is characterized by a three-dimensional solubi-lity parameter close to the maximum for polyurethane thermodynamicaffinity [18–19 (MJ/m3)1=2] [118]. The dispersion component [122] isthe main contribution to its value. Thus, curves in Figs. 3.27 and3.28 demonstrate the role only of specific interactions in the processof polyurethane swelling in a number of solvents differing in cohesionenergy. The difference between the equilibrium swelling values for thegiven solvent and for toluene ð�QpÞ is plotted as the ordinate for thispurpose.
Let us consider the correspondingly processed experimental resultsfor the system based on oligoglycol mixtures. Figure 3.27 depicts thedependences obtained for polyurethane networks based on mixtures ofcompatible oligomers in the presence of KEP-2. Swelling of polymersbased on the individual oligomers composing the mixture of PPG andPTMG in toluene gives respective values of 2.0 and 1.0 for equilibrium
196 Chapter Three
Figure 3.27 Dependence of equilibrium swelling onthe solubility parameter in a number of solvents: (I)diethyl ether; (II) diethylene glycol diethyl ether; (III)butyl acetate; (IV) ethyl acetate; (V) tetrahydrofuran;(VI) dioxane. Polyurethane networks based on PTMGand PPG mixture without additives (4) and contain-ing various KEP-2 mass fractions: (1) 1:5 � 10�4; (3)5 � 10�4; (2) 7:5 � 10�4; (5) 1:5 � 10�3.

swelling; for polymers based on mixtures with and without surfactantadded, values close to the average rated values of order 1.4–1.5 areobserved. Figure 3.27, curve 4, shows that the Qp ¼ f ð�pÞ dependencefor polyurethane based on an oligomer mixture is characterized by acurve with two well-expressed maxima at 15.8 and 19.0 (MJ/m3)1=2.Other curves indicate that introduction of 5 � 10�4 mass fractions ofsurfactant (curve 3) into the polyurethane system does not signifi-cantly influence the number and types of hydrogen bonds and theirbalance in the system. The contribution of different types of hydrogenbonds to the polyurethane secondary structure remains close to thatobserved in the initial polymer when the surfactant content is1:5 � 10�3 mass fraction (curve 5), but the number of hydrogenbonds due to the ether group oxygen is reduced. Nevertheless, curves1 and 2 indicate that the polyurethane systems are characterized byimportant redistribution of the physical structures in favor of self-associated urethane domains at two surfactant concentrations of1:5 � 10�4 and 7:5 � 10�4 mass fractions.
Let us consider the data from swelling studies in polyurethanesbased on two incompatible oligoglycols. Figure 3.28 shows depen-dences found for polymer networks synthesized from PPG and ODA
Properties of Adhesives Based on Polymeric Mixtures 197
Figure 3.28 Dependence of equilibrium swellingon the solubility parameter in a number of solvents:(I) diethyl ether; (II) diethylene glycol diethyl ether;(III) butyl acetate; (IV) ethyl acetate; (V) tetra-hydrofuran; (VI) dioxane. Polyurethane networksbased on ODA and PPG mixture without additives(6) and containing various KEP-2 mass fractions:(1) 1:7 � 10�4; (3) 5:5 � 10�4; (2) 1:1 � 10�3;(4) 8:5 � 10�4. (5) Polyurethane based on ODA.

mixtures. The equilibrium swelling of polyurethanes based on thecorresponding individual oligomers in toluene varies tenfold and is0.2 for the complex oligomers. All the mixtures in this solvent swellequally and Qp is characterized by a value of 1.0, close to the ratedvalue. The role of specific interactions in the formation of this polyur-ethane mix structure is demonstrated in Fig. 3.28, which shows that,in contrast to polyurethanes based on the single ODA (curve 5), all theother polymers investigated exhibit two maxima (curves 1–4) whoseintensity ratio depends on the quantities of surfactant in the system.The occurrence of the first maximum in Qp ¼ f ð�pÞ (Fig. 3.28) demon-strates the involvement of hydrogen bonds, due to the oxygen atom ofthe PPG ether group, in the polyurethane network structure based onmixtures of simple and complex oligoglycols. Comparing the curvescorresponding to various surfactant concentrations, there is no directrelationship between increase in KEP-2 content and its influence onthe contribution of hydrogen bonds to the polymer structure.Combining the intensity of maxima with the number of broken hydro-gen bonds of a given strength suggests that an approximately 1.5-foldincrease of hydrogen bonds due to self-associated urethane segmentsoccurs for KEP-2 concentrations of 1:7 � 10�4 and 1:1 � 10�3 massfraction (curves 1, 2). The lower of these concentrations promotes for-mation of the greater number of hydrogen bonds with lower energy(curve 1). At the same time, the introduction of 8:5 � 10�4 mass frac-tions of KEP-2 into the polyurethane system results in proportional(1.4-fold) reduction in the number of hydrogen bonds typical for higherpolyurethane cohesion energy and an increase in the number of hydro-gen bonds whose breaking is described by the low-energy maximum(curve 4). The data on specific interactions in polyurethane systemsbased on PPG and ODA mixture show that for the same surfactantcontents the growth of self-association and formation of more orderedmicrostructure is observed as in polyurethane systems based on com-patible oligomer pairs.
Specific interaction studies on the polyurethane nets based on ODAand PTMG incompatible oligomers shows that, similarly to the poly-urethane system based on a single ODA (Fig. 3.28, curve 5), thosebased on ODA–PTMG mixtures are characterized by swelling curveswith one extremum in the area of 19–20 (MJ/m3)1=2. Therefore, thesepolyurethanes retain the tendency to segregation of the chain urethanefragments in mixtures with PTMG, with and without the surfactantpresent. In all cases the introduction of surfactant results in a consid-erable decrease of hydrogen bonds formed in self-associations. KEP-2mass fractions of 1:9 � 10�4 and 1:5 � 10�3 in the cured polyurethanesystem cause a two-fold reduction of the swelling intensity maximum.It can be supposed that macromolecules based on both glycols partici-
198 Chapter Three

pate in self-association of the urethane segments in these polyur-ethanes; and that introduction of surfactant prevents the possibilityof such interaction in principle. The effect is strongest in the range ofsurfactant concentrations for which adsorption layers with maximallyordered structure are formed of large KEP-2 associations.
3.3.4.16 Influence of surfactant on physical and mechanical properties of
polyurethane networks based on oligomer mixtures. Table 3.28 showsresults of investigations on the cohesion and adhesion properties ofpolyurethanes based on compatible oligomer mixture in the presenceof different amounts of surfactant. As was shown in Table 3.26, thecharacters of the concentration dependences of entropy and enthalpyin PPG and PTMG equimolar mixture at 333 � 1 K and 343 � 1 K areessentially different. It was thus of interest to investigate their influ-ence on the physical and mechanical properties of cured polyur-ethanes. Analysis of the data in Table 3.28 indicates thatintroduction of surfactant at certain concentrations increases thecohesion and adhesion strength of polyurethane networks and alterstheir elasticity at both curing temperatures. The trends of change incohesion and adhesion strength for a given surfactant concentrationare inversely related—if cohesion strength increases, adhesionstrength falls. The extremal character of the concentration depen-dence of the breaking strength characteristics (Table 3.28) actuallycorresponds to the same dependences of the thermodynamic functions(Table 3.26). It follows that cohesion strength increases and adhesionstrength is reduced for the maximum packing density of the surfacelayer structure, regardless of the surfactant molecules’ conformation,at 333 � 0:1 K; this is the most highly compressed KEP-2 monolayer.Growth of adhesion strength is observed for surfactant concentrationsat which the surface layer structure is characterized for the giventemperature by constancy of the surface enthalpy and entropy values.If these results are compared with the data for swelling and morphol-ogy of these polyurethanes, it is obvious that the increase in polymercohesion strength is observed and the formation of more ordered andhomogeneous microstructure occurs at surfactant mass fractions of1:5 � 10�4 and 7:5 � 10�4.
Physical and mechanical characteristics of polyurethane nets basedon PPG and ODA mixtures at 343 1 K were studied—that is, theproperties of polymers formed in the conditions of macrolevel hetero-geneity were investigated. As has been shown [167], the separation ofthe system into phases occurs much earlier than the emergence ofmicroheterogeneous structures connected with network formationswhen the formed polyurethanes are incompatible. This process isaccompanied by stick-slip increase of surface tension in the system
Properties of Adhesives Based on Polymeric Mixtures 199

of several m/Nm. Consequently, the appearance of microheteroge-neous structure and surfactant redistribution due to the appearanceof new boundary occurs competitively at two boundaries. In the systemconsidered (Table 3.29), the same cohesion and adhesion strengthvalues are observed as in the system without surfactant, with minimain the concentration dependences of surface enthalpy and entropy(Csurf ¼ 8:5 � 104 mass fraction) characterizing the ordered layerstate [10,11]. For all other KEP-2 concentrations in the incompatiblesystem, adhesion strength falls and cohesion strength rises to 24 MPa(a 2.5-fold increase in the initial value). Ultimate strength at normalfracture and tensile strength are characterized by concentrationdependences with two extrema. Maximum growth of cohesion strengthin these systems at low surfactant contents is observed for a KEP-2concentration of 1.7� 104 mass fraction when the enthalphy andentropy of the surfacant surface layer in PPG are temperature invar-iant and characterized by positive values [11]. The largest tensilestrength increase, as is obvious from Table 3.29, is observed at suchsurfactant concentrations that its presence ensures independent beha-vior of ODA and PPG oligoglycols in the mixture. Table 3.29 shows thesame regularity observed in investigation of polyurethanes based oncompatible oligoglycols, namely, adhesion and cohesion strength varyinversely in the presence of KEP-2. There is no essential change in thepolyurethanes’ elasticity with surfactant present (Table 3.29).
The data obtained in cohesion characteristics studies of polyur-ethane systems based on PPG and ODA mixtures are well correlatedwith the results of specific interactions studies. As in the case of poly-urethane systems based on compatible oligomer pairs, growth in thenumber of self-associations, formation of more ordered microstructure,and increase of polyurethane cohesion strength are observed for thesame surfactant contents.
200 Chapter Three
TABLE 3.29 Physical and Mechanical Properties of Polyurethane Nets Based onODA and PPG Incompatible Oligoether Mixtures, Trimethylolpropane, and ToluyleneDiisocyanate at 343S 1 K
KEP-2 Ultimate strength Percentmass fraction Tensile strength under normal fracture elongation
( 3%) (MPa) ( 10%) (MPa) ( 10%) (%) ( 10%)
0 10.0 12.0 6601.7� 10�4 16.0 9.0 7003.3� 10�4 13.0 9.0 6305.5� 10�4 12.0 9.0 6508.5� 10�4 9.0 13.0 8501.1� 10�3 19.6 11.0 700
1.65� 10�3 24.0 10.0 670

Physical and mechanical properties of polyurethane networks basedon another incompatible oligoglycol pair, ODA and PTMG at theirequimolar ratio, are presented in Table 3.30. As the table shows, poly-urethane specimens were synthesized with various KEP-2 concentra-tions in the oligomer mixture, including those for which extrema wereobserved for the thermodynamic functions. This concentration is3:5 � 10�5 surfactant mass fraction for ODA, and ð1:8�1:9Þ � 10�4
mass fractions of KEP-2 for PTMG. Analysis shows that KEP-2 pre-sence generally leads to twofold worsening of cohesion strength, reduc-tion of percent elongation, and insensitivity to surfactant of theultimate strength value at normal fracture. A small (20%) adhesionstrength reduction and a large (3-fold) decrease in percent elongationoccur at a KEP-2 mass fraction of 1:9 � 10�4. The lowest cohesion andadhesion strength values are observed for surfactant concentration of1:5 � 10�3 mass fraction. At this surfactant concentration the solutionbecomes turbid and KEP-2 and oligomer incompatibility may beobserved visually. Hence, the cohesion and adhesion characteristicsof polyurethane nets do not depend on the structure of KEP-2 adsorp-tion layers in the initial oligomers of the ODA and PTMG mixture.There is an insignificant reduction of adhesion strength, and cohesionproperties fall to a significant degree only at the surfactant concentra-tion corresponding to the maximally packed surface layer.
Data from specific interaction studies in the polyurethane systembased on ODA and PTMG incompatible oligomer mixtures show cor-relation between the change in cohesion strength and the number ofhydrogen bonds formed due to self-associated urethane groups. A two-fold decrease of the number of hydrogen bonds formed in self-associa-tions in the presence of 1:9 � 10�4 surfactant mass fraction results in atwofold reduction in cohesion strength.
Properties of Adhesives Based on Polymeric Mixtures 201
TABLE 3.30 Physical and Mechanical Properties of Polyurethane Nets Based onODA and PTMG Incompatible Oligoether Mixtures, Trimethylolpropane, andToluylene Diisocyanate at 343S 1 K
KEP-2 Ultimate strength Percentmass fraction Tensile strength under normal fracture elongation
( 3%) (MPa) ( 10%) (MPa) ( 10%) (%) ( 10%)
0 20.0 19.0 11003.5�10�5 10.0 18.0 800
7�10�5 10.0 18.0 8001.9�10�4 8.0 15.0 400
5�10�4 10.0 18.0 8001�10�3 10.6 18.0 800
1.5�10�3 7.0 14.0 800

The investigation showed that the physical and mechanical concen-tration dependences of polyurethanes formed in the presence of sur-factant are distinguished by extremal character. The changes inphysical and mechanical properties in compatible polyurethane sys-tems are connected with the concentration dependences of the entropyand enthalpy of the surfactant surface layers in the initial oligomermixture. When polyurethanes are formed in conditions of incompat-ibility, the change in physical and mechanical characteristics is deter-mined by the particular concentration dependences of the surfacethermodynamic functions of KEP-2 solutions in one of the componentsof the oligomer mixture, namely, polyoxypropyleneglycol. The rela-tionship between the change in physical and mechanical characteris-tics and the structure of the KEP-2 adsorption (surface) layer is notseen for the initial oligomers when there is no PPG in the mixture.Hence, the existence of a relationship between the thermodynamicfunctions characterizing surface layers in the initial reaction mixtureand the properties and structure of cured polyurethanes depends onthe possibility of specific interaction between the initial oligomers (orone of the initial oligomers) and a surfactant.
3.4 Organo-Mineral Composites
Organic and inorganic polymer mixtures were chosen as organo-mineral composites (OMC). The organic polymer used is the productof MDI (crude dihpenylmethane diisocyanate) curing, and the inor-ganic polymer is the product of waterglass curing (waterglass is liquidglass, i.e., a solution in water of SiO2).
Polyisocyanates can initiate tripolymerization reactions in the pre-sence of a catalyst, leading to the formation of strong triisocyanuratecycles [67]. Alkalis, acetates, alcoholates of alkali metals, tertiaryamines, and many other substances are efficient catalysts of diisocya-nate trimerization [50, 55, 57]. However, many of these catalystsproved to be of low effciency for trimerization of industrial polyisocya-nates containing large quantities of impurities. Consequently, twocatalysts—an alkaline medium formed by sodium waterglass and atertiary amine [2,4,6-tri(dimethylaminomethyl)phenol]—were usedfor the polyisocyanate trimerization process.
The organic component (polyisocyanate) and the inorganic compo-nent of the OMC (sodium waterglass) constitute a poorly combinedtwo-phase system. The use of interphase catalysts in heterophase sys-tems is well known [103, 106]. The search for an inter-phase catalystfor our system suggested MGF-9 oligoetheracrylate for this purpose.Oxyethyleneglycol fragments can adopt the crown configuration in theMGF-9 chain structure and the presence of sodium silicate ions
202 Chapter Three

together with MGF-9 in our system allows formation of complexesbetween waterglass sodium cations and oxyethyleneglycol fragmentsof MGF-9 oligoetheracrylate similar to crown type:
Crown-complexes and their open-chain analogs, of which MGF-9may considered one, are known to act as catalysts carrying ions intwo-phase processes and to be efficient catalysts of isocyanate additionpolymerization [103, 106].
3.4.1 Consumption of polyisocyanateisocyanate groups in OMC formationprocesses
A variety of reactive fragments (isocyanate, hydroxyl and ester groups,unsaturated bonds, aromatic rings) are known to facilitate and sup-port parallel and serial competing reactions in the system underinvestigation: polyisocyanate–waterglass–MGF-9–UP 606/2. The impu-rities in the commercial products on which OMC development is basedfurther complicate studies of this system. Consequently, investigationsof OMC formation were performed on model systems.
The simplest representative of aromatic isocyanates, phenylisocya-nate (PHI), served as the polyisocyanate (PIC) model. The choice ofphenylisocyanate as the model PIC is connected with the absence fromits absorption spectrum of the 1440–1420 cm�1 band that could impedespectral interpretation with triisocyanurates in the end products.
The kinetics of NCO group consumption at 295 K was investigatedby IR spectroscopy in the following model systems:
1. PHI–benzene
2. PHI–benzene–MGF-9
3. PHI–benzene–waterglass
4. PHI–benzene–waterglass–MGF-9
5. PHI–benzene–waterglass–triethyleneglycol
PHI concentration was 0.1 mol/l, with adduct equimolar NCO ratio.
Properties of Adhesives Based on Polymeric Mixtures 203

The content of NCO groups in the model systems remained constantover a period of 24 h; thus no interaction occurred at the ingredientratios and under the conditions used in the study. The constancy ofNCO groups concentration in system No. 2 demonstrates the absenceof free triethyleneglycol in MGF-9 resin and of interactions throughdouble bonds. In benzene medium, PHI shows no interaction withthe waterglass in sample No. 3, as the system investigated is in-compatible. Within 1 h a white-colored deposit had formed in themodel system No. 4. Apparently, there was precipitation of sodiumphthalate and sodium methacrylate, insoluble in benzene, as theproducts of MGF-9 oligoetheracrylate hydrolysis in the alkalinemedium. In the spectrum an NH band appeared at 1520 cm�1, witha peak at 1220 cm�1 characterizing urethane formation. In this caseimprovement of the compatibility of the mixture components isobserved with introduction of MGF-9.
The possibility of MGF-9 ester alkaline hydrolysis was investigatedin detail and it was established that both in caustic soda and sodiumwaterglass media hydrolysis occurs through MGF-9 ester bonds, form-ing sodium phthalate, sodium methacrylate, and triethyleneglycol.MGF-9 hydrolysis is demonstrated by absorption bands in the regionsof 1365–1415 and 1555–1585 cm�1 caused by symmetric and asym-metric stretching vibrations of NaOOC, phthalate, and methacrylategroups, as well as by reduction of the 945, 1265, and 1710 cm�1 bandhalf-widths, confirming the formation of substances with crystallinestructure.
System No. 5 displayed monotonic change of NCO group contentwith diurethane formation, shown by the appearance of NH bandsat 1530 cm�1, amide III bands at 1220 cm�1, and CO absorptionbands at 1735 cm�1.
NCO group concentration falls more rapidly for the system withtriethyleneglycol than for that with MGF-9. This indicates that incom-plete MGF-9 hydrolysis takes place and less TEG is formed as a resultthan in system No. 5.
Triisocyanurates appear in the end products, while oligoetheracry-late is present with fivefold excess of isocyanate groups in the phenyl-isocyanate–waterglass mixture, as confirmed by the bands at 760,1420, and 1715 cm�1. The bands at 760 and 1420 cm�1 correspond tothe deformation vibrations of triisocyanurate ring bonds and the1715 cm�1 band corresponds to C——O group stretching vibrations inthe isocyanate trimer [165]. Loose ion pairs formed by sodium silicatein combination with oxyethylene glycol fragments of MGF-9 resin[104] are responsible for isocyanate transformation up to the cyclo-trimer.
204 Chapter Three

3.4.2 Influence of ‘‘silica modulus’’ onOMC end product composition
We characterize the sodium waterglass used by the ‘‘silica modulus’’—the ratio of SiO2 to NaOH used in their production, characterizing thedegree of transformation of SiO2 to Na2SiO3. The effects of silica mod-ulus on the composition of organo-mineral composite end productswere studied using model systems. 2,4-Toluylene diisocyanate wastaken as the polyisocyanate model. Sodium waterglasses of varioussilica modulus in the model systems are generated by using aqueousNaOH solutions of various concentrations.
The end products of the following reaction systems were identifiedby IR spectroscopy:
Waterþ 2,4-TDI (1)
NaOH (5.8%)þ 2,4-TDI (2)
NaOH (11.9%)þ 2,4-TDI (3)
NaOH (21.8%)þ 2,4-TDI (4)
NaOH (37.2%)þ 2,4-TDI (5)
NaOH (42%)þ 2,4-TDI (6)
Reactions were run at 295 K at 1:1 and 1:3 ratios of NCO:OH reactivegroups. Reaction product spectra were taken on a JR-75 device in therange of 400–4000 cm�1 at 295 K with specimens in the form of KBrdisks.
It was found that the position and intensity of the IR absorptionbands of the products of (1)–(3) were approximately the same.Increase in the initial alkali concentration (to more than 20%) pro-duces changes in the spectra of reaction products of (4)–(6) at 600–1750, 3000–3500, and 2275 cm�1 bands, the intensity of which isnoticeably reduced. This indicates that the composition of the productsof reaction of 2,4-TDI with alkalis differs for low (up to 20%) and high(more than 20%) concentration of alkali.
It is known [67] that the reactions below will proceed provided astrong base is available with isocyanate interaction with water:
RNCO þ NaOH þ H2O�!RNHCOONa ðaÞ
Carbamate
RNHCOONa þ NaOH þ H2O�!RNH2 þ Na2CO3 ðbÞ
Amine
Properties of Adhesives Based on Polymeric Mixtures 205

RNH2 þ RNCO�!RNHCONHR ðcÞ
Disubstituted urea
IR spectra of the reaction products of (1)–(3) display clear-cut absorp-tion bands at 1550, 1620, 1640, and 3300 cm�1. Comparison of thespectra of diphenylurea and the (1)–(3) reaction products togetherwith published values allowed distinguishing bands to be assigned,since the bands at 1550 and 3300 cm�1 are due to deformation andstretching vibrations of the urea NH group and the 1640 cm�1 bandmay be explained by stretching vibrations of the urea group C——Oparticipating in hydrogen bonding [165]. A symmetric band at1620 cm�1 characterizes NH bond deformation vibrations in theamine NH2 group [166]. Hence, the main products of reactions(1)–(3) are amine [reaction (b) above)] and disubstituted urea[reaction (c)].
The relative band intensities in the spectra of the reaction end pro-ducts (4)–(6) change as alkali concentration is increased: the bands at1550 and 1640 cm�1 develop shoulders; the absorption intensity variesaround 1620 cm�1; and bands appear at 1320, 1580, 1715, and1920 cm�1. The 1320 and 1580 cm�1 absorption bands are explainedby symmetric and asymmetric stretching vibrations of the carbamateNaOOC group [164] [reaction (a)] and the 1920 cm�1 band is typical forabsorption by sodium salts. Consequently, in 2,4-TDI interactionswith high-concentration NaOH solutions, mainly reactions (a) and(b) occur: that is, carbamates, amines, and sodium carbonate are pre-dominantly formed and the contribution of the disubstituted urea[reaction (c)] is insignificant.
For the ultimate identification of compositions (2), (5), and (6), thereaction products were washed with double-distilled water and thewashed product was dried (product I) and the filtrate was evaporatedunder vacuum (product II). As may be expected, the amount of pro-ducts soluble in water increases with increasing alkali concentration.Absorption bands at 760, 1420, 1550, 1640, 1690, 1715, and3345 cm�1 are observed in the product I spectrum. The 760 and1420 cm�1 bands correspond to deformation vibrations of triisocyanu-rate ring bonds and the 1715 cm�1 band to C——O group stretchingvibrations in the isocyanate trimer [167]. It may be concluded thatisocyanate trimer is formed in 2,4-TDI reactions with high concen-trations (over 20%) of alkali. Salts of basic nature, whose productionincreases with alkali concentration, probably act as catalysts of iso-cyanate trimerization. This accords with results in [67, 168] showingthat strong bases and basic salts catalyze isocyanate cyclotrimeriza-tion processes.
206 Chapter Three

The bands at 1550, 1640, 1690, and 3345 cm�1 are attributable toabsorption of N—H and C——O bonds of disubstituted ureas. In thiscase appearance of bands with maxima at 1690 and 3345 cm�1 demon-strates hydrogen-bond breakage and formation of free C——O(1690 cm�1) and NH groups (3345 cm�1) [169]; this does not conflictwith the opinion of the authors of [165] concerning breakdown of theurea cyclic self-associations in strong base media.
Absorption bands at 1320, 1580, and 1920 cm�1 are observed in thespectra of product II. The attribution of the absorption bands madeabove suggests that sodium carbamates, sodium carbonate, and par-tially amines are formed on contact with water. To demonstrate thepresence of amine in the filtrate, the following experiment was per-formed: 2,4-TDI was added to the product II; product III resultingfrom this reaction was washed with CCl4 and dried, and the IR spec-trum was obtained. In the product III spectrum the 1620 cm�1 absorp-tion band disappeared; the 1550, 1640, and 3300 cm�1 bands appeared;and the 1320 and 1580 cm�1 bands remained the same. It is concludedthat for isocyanate interaction in strong bases (concentration of morethan 20%), the carbamates formed in reaction (a) decompose moreslowly [reaction (b)] than the amine–isocyanate [reaction (c)].
IR spectral analysis shows that isocyanate trimerization with aqu-eous alkali solutions takes place independently of the formation ofdisubstituted urea, amine, carbamates, and sodium carbonate. Thequalitative output of these reaction products varies depending onthe NaOH concentration and the ratio of NCO and OH groups.
Figure 3.29 depicts individual band intensities of the end productscalculated by comparison with internal standard (1600 cm�1) versusNaOH concentration. The quantity of NCO groups failing to react(2275 cm�1 band) in the end products of reactions (2)–(6) is sharplyreduced at NaOH concentrations above 20%, and the output of disub-stituted urea (1640 cm�1 band) shows almost no modification withNaOH concentration change. Sodium carbamate (1580 cm�1 band),amine (1620 cm�1 band), and isocyanate trimer (1715 cm�1 band) nota-bly increase. The qualitative ratio of these compounds in reactions (2)–(6) products is probably determined by hydration in the NaOH–H2Osystem.
In accordance with [170], ‘free’ water (3400 cm�1), ‘‘bound’’ water (inthe hydroxyl ion solvation sphere, 2800 cm�1), and OH-hydrated ions(2500–3200 cm�1, broad absorption) are found in aqueous alkali solu-tions from 3% up to 42% concentration. Judging from the reduction inall the end products of the 2800 cm�1 band and the disappearance ofthe 3400 cm�1 band, formation of amines and disubstituted urea pro-ceeds with both ‘‘bound’’ and ‘‘free’’ water. The OH ion absorptionremains (wide bands at about 2100 and 3100 cm�1): i.e., OH ions are
Properties of Adhesives Based on Polymeric Mixtures 207

208 Chapter Three
not consumed in isocyanate reactions with alkali but act as the cata-lysts of the isocyanate trimerization reaction together with sodiumcarbamates [67, 168].
Change in the ratio of NCO and OH groups leads to redistributionof the end products. When the NCO/OH ratio is 1:3 rather than 1:1,output of isocyanate trimer and amines increases, whereas thedisubstituted urea production remains practically the same. It maybe concluded that disubstituted urea formation is determined byavailability of ‘‘free’’ water molecules, while alkali concentrationand NCO/OH group ratio influence the reactions of isocyanatecyclotrimerization and amine and sodium carbamate formationsignificantly.
Studies of isocyanate interactions with alkalis of various concentra-tion are of scientific and practical interest as they permit prediction ofthe chemical composition of the end products and hence the properties
Figure 3.29 Relative intensity ¼ Di=Dcr of absorption bandsin IR spectra of the reactionproducts depending on NaOHconcentration (%).

of compositions including isocyanates and sodium waterglasses withvarious values of silica modulus.
3.4.3 The role of MGF-9 oligoetheracrylatein the OMC formation process
It was noted earlier that introduction of MGF-9 oligoetheracrylate intoorgano-mineral compositions together with an ionic compound ofsodium silicate creates the conditions for complexation. Flexible oxy-ethyleneglycol fragments of MGF-9 resin are, evidently, able to form‘‘crown’’-configured cavities and trap sodium cations from waterglassin them. The ability of MGF-9 oligoetheracrylate for complex forma-tion is explained by the presence of negatively charged oxygen donoratoms in its chain structure. The magnitude of the negative charge isto a first approximation determined by the electronegativity of thedonor atom. Oxygen is first in the electronegativity table and thereforecomplexing agents containing oxygen can form strong and stablecomplexes with the cations of alkali and rare-earth metals as well aswith small molecules [105, 108]. A priori the possibility of electrostaticinteraction of negative charges located on the oxygen donor atomswith positively charged cations in a macrocycle cavity may besupposed.
The most important characteristic of the cation from the point ofview of complex formation possibility is its outer electronic structure.The sodium cation has an electron configuration permitting donor–acceptor interaction, as its unpaired electron is located in the 3s sub-shell. The principle of maximum correspondence of the macrocyclecavity to the metal ion [108, 109] should be observed for the formationof strong complexes of metal ions with macrocyclic ligands. Evidencethat the requirements for complex formation were met, and that com-plexes are formed in OMC, was obtained from electric conductivitydata [171].
The electrical conductivity of individual components (Table 3.31)and of OMC mixture (Table 3.32) was investigated. Conductivity mea-surement was performed on a series of waterglasses with various silicamoduli prepared by introducing various quantities of NaOH and hold-ing for one day to allow equilibrium to be reached [174].
In the most general case the waterglass conductivity is definedby mobility of three ion types, namely, alkali metal cations, silicicacid anions of various degrees of polycondensation, and hydroxyl ionsformed by hydrolysis [172]. The contribution of hydroxyl ions to theconductivity can be neglected, as the degree of hydrolysis in sodiumwaterglasses is low. Silica anions in waterglass solutions undergoassociation, leading to considerable reduction of their mobility.
Properties of Adhesives Based on Polymeric Mixtures 209

Their role in the conductivity is also not large. The conductivityof waterglass is determined mainly by the motion of alkali cationsand depends on the silicate anion structure and on the solution’sviscosity.
It is known [128, 172] that three-dimensional polymerization of thesilica backbone of sodium waterglasses gives way to layered polymer-ization when the silica modulus of the waterglass is near 2.5, and withincrease of alkali metal cation content it proceeds by chain growth.Chain silica anions of low-modulus waterglass, due to their denseinterlacing, do not leave the free space required for cation motion.Anions in high-modulus glasses are branched and form three-dimen-sional networks through the ‘‘holes’’ of which alkali metal cations canpass. This is the case for concentrated waterglasses.
Silica anions of low-modulus glasses form chain fragments at med-ium concentrations of the waterglass. Electrical conductivity measuredin these glasses is higher than in high-modulus glasses (Table 3.31).
MGF-9 complexing agent at 10 vol% per 45 vol% of the waterglasswas introduced into waterglasses with various silica moduli. The resis-tance of thoroughly mixed waterglass–MGF-9 mixtures (with 0.5 acidnumber) was measured during 10 days. Measurements showed thatthe resistance did not change during the first 8 h. At one day andwithin a further 10 days increase in the resistance was observed,demonstrating reduction of conductivity (Table 3.32). At that pointviscosity increase became noticeable and resistance measurementswere terminated.
The reduction of electrical conductivity with time can serve as oneline of evidence for complexation, as the highly mobile Naþ ion of thewaterglass is localized by MGF-9 oxyethyleneglycol fragments thatcreate pseudo-crown complexes. The same pattern is observed withintroduction of dibenzo-18-crown-6 crown-ester into waterglasseswith various silica moduli.
The initial stage of the complex formation process is extended intime. This is caused by slow destruction of the hydration spheres
210 Chapter Three
TABLE 3.31 Characteristics of Sodium Waterglasses
Silica modulus Density Water mass Resistance( 0.01) (g/cm3) ( 0.01) fraction (%) (ohm) ( 2.5)
3.00 1.48 53.9 2.95�104
2.44 1.47 57.6 2.90�104
2.15 1.46 56.7 2.75�104
1.87 1.46 57.1 2.75�104
1.62 1.44 58.6 2.60�104
1.42 1.41 48.9 2.50�104

211
TABLE 3.32 Variations in Resistance of Mixtures of Waterglasses with Different Silica Modulus and MGF-9 over Timea
Resistance (ohm) ( 2.5%)
Time (days)Silica
modulus 0 1 2 4 5 6 8 10
3.0 2.90� 104 3.4� 104 4.2� 104 8.1� 104 2.1� 105 2.8� 106 4.9� 106 7.3� 106
2.44 2.90� 104 3.4� 104 3.9� 104 7.8� 104 2.4� 105 0.8� 106 2.7� 106 7.1� 106
2.15 2.75� 104 2.95� 104 3.4� 104 7.1� 104 8.7� 105 1.0� 106 1.7� 106 2.9� 106
1.87 2.75� 104 2.95� 104 3.6� 104 6.9� 104 1.1� 105 0.5� 106 1.1� 106 3.1� 106
1.62 2.60� 104 3.05� 104 3.2� 104 8.1� 104 0.9� 105 0.7� 106 2.7� 106 3.9� 106
1.42 2.50� 104 4.05� 104 4.2� 104 9.0� 104 0.3� 106 0.9� 106 2.0� 106 4.3� 106
a Investigated mixture composition was waterglass 45 vol%, MGF-9 10 vol%.

around sodium ions in aqueous solutions and prolonged approach toequilibrium [109]. Triethanolamine, methanol, and other additives areoften used to speed up the destruction of the solvation spheres.However, in our case these additives proved to be inapplicable asthey cause structuring of the glass.
Sodium cations binding into crown-complexes with the help of MGF-9 ethylene glycol fragments should result in increase of the silica mod-ulus [149]. In practice, the silica modulus of the waterglass–MGF-9mixture increases noticeably after mixing of the reagents, and there-after grows insignificantly (Table 3.33). The increase in modulus isfurther evidence of complex formation.
The efficiency of catalytic systems based on alkali metals and poly-oxyethylene glycols depends on the molecular weight of the latter. Thedependence of salt binding constant on polymer molecular weight hasbeen discussed in a number of works. For example, the equilibriumconstant increased 20 times [109] at the transition from polyethyleneglycol with polymerization degree of 300 to the polymer with 2000links. The explanation of this phenomenon was found in statisticalfactors. The electronic influence of the end groups in long chainsdoes not play a considerable role in the binding process. Usually thebinding constant first increases, and then for MW¼ 10 000–20 000remains practically constant. It was noted that polyethylene glycolof MW¼ 200 can not retain Kþ ions.
Let us consider the influence of catalytic activity of ethylene glycolhomologues on the rate of organo-mineral composite formation.Polyoxyethylene glycols (POEG) were taken in equal mole contentwith the MGF-9 content in actual OMC, where the waterglass/poly-isocyanate/MGF-9 ratio is 9:9:2.
As Table 3.34 shows, the gel formation time and composite curingtime are reduced with increase of oxyethylene glycol chain length. Thefirst homologues of the POEG series do not possess enough chainflexibility for enfolding of Naþ cations and complex formation, andtherefore do not exert catalytic influence on the system.
The results obtained are well correlated with the data from an inves-tigation [50] of the catalytic activity of the glycol dimethyl ether homo-
212 Chapter Three
TABLE 3.33 Variations of Waterglass–MGF-9 Mixture Silica Modulus with Time
MGF-9/ Initial Modulus after mixing at given timewaterglass silica
ratio modulus 0 h 1 h 3 h 6 h 24 h
1:9 1.69 2.53 2.59 2.64 2.75 2.751:9 2.85 3.06 3.06 3.07 3.12 3.442:9 2.85 2.90 3.04 3.25 3.25 3.45

logues with potassium acetate in cyclotrimerization reactions. Theseauthors showed that lower homologues of glycol dimethyl ethers influ-ence potassium acetate catalytic activity less in the investigated con-ditions than do their higher molecular analogue oligooxyethylene. Theefficiency of glycol dimethyl ethers increases with transition fromethylene glycol dimethyl ether to di- and tetraethylene glycol dimethylether. These conclusions were reached on the basis of calorimetrictitration.
The authors of [175] established that high flexibility of POEGmacromolecules also provides more strength of the complexes in com-parison with polypropylene glycol. In 96% ethyl alcohol solution thealkali metal cations each coordinate almost six elementary macro-molecules.
Complex formation in aqueous solutions of alkaline salts is extendedin time due to slow breaking of hydration spheres and prolongedapproach to equilibrium [109]. Results in Table 3.35 show that withincrease of waterglass/MGF-9 component hold-up time, the compres-sion strength of the cured composite grows monotonically. This isprobably explained by breaking of sodium cation hydration spheresand attainment of equilibrium in the period of preliminary hold-up,which further promotes increase in strength and activity of the com-plexes formed with the participation of sodium cations and MGF-9resin oxyethylene glycol fragments.
Properties of Adhesives Based on Polymeric Mixtures 213
TABLE 3.34 Characteristics of OMC Modifications Cured with POEG of VariousMolecular Weight
OMC modification Gel formation time (min) Curing time (h)
OMC 520 32.0OMC with EG 480 27.0OMC with DEG 120 14.3OMC with TEG 22 11.5OMC with POEG, MW¼400 15 3.3OMC with MGF-9 25 10.3
TABLE 3.35 Dependence of OMC Strength Characteristics on Waterglass–MGF-9Component Hold-up Time
Waterglass–MGF-9 componenthold-up time (h)
0 8 24 72 240
Compression strength at 17.3 19.8 21.0 24.3 29.83 days (MPa)
Compression strength at 25.1 27.3 29.9 39.8 52.410 days (MPa)

The important factor in heterophase systems is the intensity of mix-ing of the ingredients [106]. Time and intensity of mixing were notvaried in these investigations. The systems investigated were mixedusing a mechanical mixer for 3 min at 600 rev/min.
All the results of the organo-mineral composition investigations cor-related well with published data, giving sufficiently conclusive evi-dence of complex proceeding by ‘‘crown’’ type processes.
Complexes of macrocyclic esters and their open-chain analogueswith metal ions possess unique properties, and interest in these com-pounds is continuously growing [103, 109]. The catalytic action ofcrown-ethers and their analogues as catalysts of phase transfer con-sists in activation of reagents due to the increase of ion pair dissocia-tion with the formation of nonsolvated reactive anions owing to thetransformation of contact ion pairs into solvation-separated ones.
It was considered previously that the most effective phase transfercatalysts are quaternary ammonium bases. However, preliminaryexperiments with crown-ethers had already shown that these com-pounds are more powerful phase transfer catalysts than quaternaryammonium bases and are more selective [106, 177]. This is explainedby differences in the mechanism of catalytic action. The mechanismsof reaction acceleration in two-phase systems with crown-ethers areas yet little studied, but simple examination of salt extraction withcrown-ethers shows that the salt in the aqueous phase (both anionand cation) passes into the organic layer, whereas only anions pairedwith the ‘‘onium’’ cation pass from the aqueous into the organicphase during extraction with ‘‘onium’’ salts. This considerable differ-ence in the mechanism of action of the two groups of ion-carryingcatalysts is the basis for the prospective use of crown-ethers andtheir analogs instead of quaternary ammonium bases in many fields.
According to the earlier discussion, in the organo-mineral composi-tions under investigation with MGF-9 interphase transfer catalyst,anions of silicic acid of various degrees of polycondensation, hydroxylanions, and sodium cations of waterglass will pass from the aqueousphase into the organic as a result of electrostatic interaction withelectron-donating oxygen atoms of the MGF-9 resin. Therefore, intro-duction of MGF-9 oligoester leads to superposition of OMC organicand inorganic components. Due to the action of ion-carrying cata-lysts, chemical transformations taking phase in the formation ofthe composition are transferred into the organic phase, with possiblereaction also at the phase boundary. Many cases are known [106,107, 177] when addition of polyether causes dissolution of salts andrelated compounds in solvents in which they are normally practicallyinsoluble. For example, addition of crown-6 leads to dissolution ofsuch crystalline substances as KMnO4, tert-C4H9OK, or K2PdCl4 in
214 Chapter Three

aromatic hydrocarbons. Crown-ethers and their open-chain ana-logues are effective catalysts of isocyanate trimerization [103, 114,168].
Among the anions formed in aqueous alkaline solutions as a resultof complexation, the hydroxyl ion is of particular interest. In [47, 67]hydroxyl ion is indicated by the authors as the catalyst of linear homo-polymerization and cyclic trimerization of isocyanate. Iwakura et al.showed that output of isocyanate linear polymer grows with theincreasing alkaline nature of the aqueous salt solution [312].
Investigations of isocyanate interaction with aqueous NaOH solu-tions [178] conducted by us established that triisocyanurates areformed with increase of sodium hydroxide concentration above 20%and the output of isocyanate cyclic trimer grows monotonically withthe increase of sodium hydroxide concentration above 20%. There arethree ion types in the aqueous alkali solutions, namely, Naþ, H3Oþ,and OH�, but it is reasonable to regard hydroxyl ion as the initiatingspecies in isocyanate polymerization. Hydroxyl ion in the aqueousalkali solutions is enclosed in a hydration sphere, but despite this itdisplays the initiating action in isocyanate addition polymerizationreactions.
The result of MGF-9 pseudo-crown complexation with waterglasssodium cations is a desolvated active hydroxyl ion whose initiatingability is considerably higher in the organo-mineral compositionsinvestigated. Participation of phthalic, methacrylic, and carbamicacids, and silicon-oxygen anions forms ‘‘loose’’ ion pairs with sodiumcations whose activity in the cyclotrimerization process is more thantwofold higher [50, 94, 103].
3.4.4 Influence of hydroxyl anion on theprocesses occurring in the inorganiccomponent during OMC formation
Hydroxyl anion action is not limited by the organic component of thecomposite investigated. According to many authors [128, 132, 179],hydroxyl ion is the catalyst of the waterglass polycondensation pro-cess. The essence of hydroxyl ion catalytic action is reduced to protonremoval from nonionized molecules of silicic acid. Further polyconden-sation process can be considered as the result of nucleophilic substitu-tion by ion formed from the hydroxyl group in nonionized molecules ofsilicic acid. The removed hydroxyl ion, being the catalyst of the water-glass polycondensation reaction, should again neutralize one proton oforthosilicic acid, producing silicate ion, and so on. The presentedmechanism of silicic acid polycondensation is based on the ability ofsilicon compounds to undergo complexation [132].
Properties of Adhesives Based on Polymeric Mixtures 215

In accordance with the existing notions about silicic acid polycon-densation process based on numerous experimental studies, there isseen a clear dependence of influence of the medium alkalinity (silicamodulus) on the polymer-homologue composition of silicate anions.This influence of waterglass silica modulus on polymer-homologuecomposition may be explained on the assumption of the existence oftwo forms of silicic acid hydrates [136]: Si(OH)4 and SiO(OH)2. For thesodium waterglasses stable in alkali media it is more reasonable toassume a hydrate SiO(OH)2 existing in the form of the correspondingsodium salt, HO—SiOONa. This structure of monomer alkali silicateexplains the availability of only the following silicic acid monomersand dimers in the waterglasses with modulus M < 2:
Dimer formation results in disappearance of OH� functional groups,which prevents silicate dimer enlargement. This structure of low-modulus waterglasses is confirmed by numerous experimental data[128, 130, 131, 172].
Free metasilicic acid is contained in waterglasses with M > 2 andthus formation of linear polymers becomes possible:
216 Chapter Three

A branched structure [128, 172] is supposed for sodium silicatescharacterized by silica modulus equal to 3 and more:
This hydrate, being tetrafunctional, will form spatial polymers as aresult of polycondensation.
It thus may be concluded that introduction of sodium waterglasswith various silica moduli into organo-mineral compositions leads tomultiple influences on the composite formation process. First, changeof the medium alkalinity alters the ratios of disubstituted ureas,amines, triisocyanurates, sodium carbamates, and carbonates in thecured OMC end products [178]. These changes are probably closelyconnected with catalysis of interactions occurring in the OMC organiccomponent, with pseudo-crown complexes, and with the formedsodium cations and oxyalkylene fragments of the MGF-9 resin.Second, the composition of silicon-oxygen anions depends on water-glass silica modulus.
Composite structure investigations by optical microscopy haveshown that increase in waterglass silica modulus leads to sphericalparticles enlarging due to the larger size of silicon-oxygen anions.
Considerable changes in OMC organic and inorganic components,depending on the waterglass silica modulus, affect the physical,mechanical, chemical, and technological characteristics of the compo-sites investigated.
3.4.5 Strength characteristics of organo-mineral composites
Chemical studies of the cured organo-mineral composition end pro-ducts by IR spectroscopy showed that the ratio of triisocyanurates,disubstituted ureas, amines, sodium carbamates, carbonates, phtha-lates, and methacrylates, as well as the composition of the silicic acid
Properties of Adhesives Based on Polymeric Mixtures 217

polymer-homologues, changes with the variation of the initial charac-teristics of the waterglass (silica modulus). It is important to trace howthose changes influence the compression strength of the composite andits deformability indices.
Compression strength tests of the organo-mineral composition wereperformed on cylindrical specimens of 16 mm diameter and 40 mmheight, prepared at 295 K. The results showed that the nature of thestrength dependence on the waterglass silicate modulus changes withaging (Fig. 3.30). At 1 day, for compositions curing with silica modulusincreasing from 1.35 to 2.35, the compression strength ð�pÞ of thespecimens grows twofold, and is then sharply reduced. This depen-dence is also exhibited with specimen hold-up in air for up to 24days. With more extended aging of the composites and with increaseof waterglass silica modulus, the rate of achievement of optimalstrength under compression is significantly reduced.
In the aging process of cured compositions, their compressionstrength noticeably increases, more so for compositions with lowerwaterglass silica modulus. For example, �p of cured compositionswith M ¼ 1:35–2.35 after 15 days of aging increases 4–5 times,whereas the compositions with M ¼ 2:35–3.0 show only 1.8–2 timesgrowth of this index. The compression strength is reduced to a mini-mum with introduction of waterglass with M ¼ 3:2.
The influence of the waterglass silica modulus on physical andmechanical properties of organo-mineral composites is explainedmainly by change in the composition of the products of reaction of
218 Chapter Three
Figure 3.30 Compression strength ð�pÞ versus timefor OMC containing waterglass with various valuesof silica modulus M: (1) M ¼ 1:35; (2) M ¼ 1:64; (3)M ¼ 2:35; (4) M ¼ 3:2.

the polymer organic component. Silica modulus increase leads toreduction of sodium cation concentration. In the composition investi-gated, sodium ions participate in several processes:
& Complex formation of ‘‘crown’’ type with oxyethylene fragments ofMGF-9 resin as the catalysts of ion phase transfer and isocyanatecyclotrimerization.
& The formation of sodium carbonate, a structure-loosening agent[182].
& The formation of sodium mono- and disilicates in low-modulusglasses and of linear polymers in waterglasses of average concentra-tion.
Change of sodium ion content will cause variation of contribution ofthe above factors in OMC formation. Thus, composite materialsincluding low-modulus glasses are distinguished by increased Naþ
concentration as compared with composites with high-modulus glassesand, consequently, interphase catalysis, increased content of triisocya-nurates, formation of little sodium carbonate amount, and primaryformation of polymer-homologue silicic acid of low degree of polymer-ization ðn ¼ 1–2Þ. Consequently, composites with low-modulus glasseshave high physical and mechanical indices. Low strength properties inthe material with waterglass having M � 3:2 (Fig. 3.30, curve 4) areapparently connected with the fact that the contribution of interphasecatalysis and triisocyanurates is less, due to the low concentration ofsodium cations. As a result, a material with a poorly ordered, defectivestructure that does not provide strength is obtained.
Compression strength increase in compositions with low-moduluswaterglass is observed over 30 days. The rate of achieving maximumstrength increases with silica modulus, but absolute values of thisindex are reduced considerably. For example, the maximum strengthof cured composites with M ¼ 3:2 is achieved in 2 days but is only1 MPa, whereas for the composites with M ¼ 1:35 the maximumstrength is reached over 30 days but reaches 49 MPa.
This character of specimens’ �p dependence on time can be connectedwith prolonged chemical or physical structuring or with the purelyphysical process of moisture loss by the specimens. The kinetics ofmoisture loss by the specimens under hold-up in air in normal condi-tions was investigated to test the last assumption. Moisture loss wasassessed by the change over time in specimen mass relative to initialspecimen mass. It was established that the rate of moisture loss duringhold-up in the air gradually reduces, but even at 30 days it remainsimportant and the maximum moisture loss by specimens was 11.9%.
Properties of Adhesives Based on Polymeric Mixtures 219

The rates of change of moisture loss kinetic curves and those ofcompression strength against time differ noticeably for compositionswith the same silica modulus over the same duration of aging, despitetheir qualitative correspondence. In addition, loss of moisture produ-cing a plasticizing action in the cured composition should reduce thedeformability ð"pÞ of specimens in the aging process, but experimentindicated that both �p and "p increase with time. Consequently, moist-ure loss from the cured specimens is not the main reason for theirstrength change with time.
Along with the analysis of the kinetics of moisture loss from OMCspecimens, the kinetics of NCO groups consumption was also investi-gated by IR spectroscopy. The results indicated that consumption ofpolyisocyanate NCO groups occurs monotonically during 30 days, asshown by reduction of the 2275 cm�1 band intensity. Thus, compositechemical structuring is extended in time and continues when thematerial is in the solid state. Parallel running of the physical structur-ing process is possible.
Triisocyanurates were detected in the composition of cured OMCproducts by IR spectroscopy [104, 178]. The isocyanate cyclotrimeriza-tion reaction is often used for obtaining branched network structures[50, 92, 93] possessing unique properties. Sodium waterglasses arealso able to form inorganic polymer network materials, according tonumerous publications [128, 130, 131]. This is an obvious preconditionfor obtaining interpenetrating networks (IPN) or semi-IPN in the sys-tems under investigation. Detailed studies are needed to identify theopportunities for forming inorganic networks in OMC.
Gel-sol analysis was used to obtain further structure information.Cured OMC specimens were studied in toluene and dimethyl forma-mide. For washout, five samples were loaded in parallel into Soxhletapparatus. An average 50% washout was obtained for OMC end pro-ducts, the remainder appearing to be powderlike toluene and dimethylformamide insoluble substances.
The theoretical and practical significance of polymer dynamic/mechanical properties is well appreciated [180, 183]. The dynamic elas-tic modulus and mechanical losses are the most sensitive indicators forall forms of polymer molecular mobility, especially for the glasslikestate. The dynamic elastic modulus is the primary index for polymerdeformation properties. Apart from their purely theoretical interest,understanding of the mechanisms of molecular motion within polymersand of mechanical losses may have significant practical importance inproperly defining other polymer mechanical properties.
Dynamic mechanical spectroscopy using a device described in [157]at 100 Hz frequency and over a 243–533 K temperature intervalwas used to investigate the viscous-elastic behavior of OMC. Cured
220 Chapter Three

composite blocks obtained from industrial sodium waterglass, D-gradepolyisocyanate, and MGF-9 oligoether acrylate by serial input of com-ponents and thorough mixing were used to prepare specimens forfurther study. Waterglass featuring a variety of silica modulus (1.42to 3.0) was used to make specimens.
Elastic modulus temperature dependences obtained for all speci-mens thus studied (see Fig. 3.31) have the typical appearance of poly-mer composites based on linear binders. A sharp fall of elastic modulusfor all composites studied above the glass-transition temperature andthe absence of a viscoelasticity plateau indicate that the compositepolymer binder is not a network polymer.
From the OMC viscous-elastic behavior and gel-sol analyses, it isclear that no continuous network is formed in systems thus investi-gated. Apparently, the OMC dispersion medium studied here consti-tutes the organic component interaction products, displaying the basic
Properties of Adhesives Based on Polymeric Mixtures 221
Figure 3.31 Elastic modulus ðlog EÞ temperature dependence on OMCstructure (% of vol.): (1–3) WG-45 of M ¼ 3:0, 2.15, and 1.42, respec-tively, and MGF-9; (4, 5) WG-45 of M ¼ 3:0 and 1.42, respectively, with-out MGF-9; (6, 7) WG-30 and -20 of M ¼ 2:15 and MGF-9.

polymer index of glass transition, and the OMC inorganic polyconden-sation products represent the dispersed phase.
The temperature dependence of elastic modulus for curves 7, 6, and2 in Fig. 3.31 indicates that for 20% and 30% contents of waterglassthe elasticity moduli are practically the same, and a rapid drop ofelasticity module for 45 vol% of waterglass is observed, which is prob-ably explained by polymer matrix transition to the boundary layerstate. Enhanced elastic modulus might be expected for a compositecontaining 10 vol% of waterglass, but a fragile material displaying0.2 MPa compression strength was obtained in this case, and speci-mens could not be made for OMC viscous-elastic studies. When thewaterglass content is low, sharp modifications of the polymer matrixoccur that are apparently connected with insufficient formation ofcrown-complexes by waterglass sodium cations and the MGF-9 oxy-ethyleneglycol fragments that are responsible for isocyanate additionpolymerization catalysis as well as being the interphase catalyst. Themain interest of the systems studied here lies in the fact that no phaseinversion is observed even for 60–80 vol% of waterglass content andbulk material is formed as from large waterglass contents. The shift ofthe glass-transition temperature of the polymer component to lowertemperatures (523–507 K) is noted when sodium silicate (Fig. 3.31,curves 7, 6, and 2) is increased, again due to polymer transition intothe boundary layer state.
The influence of waterglass silica modulus on the viscous-elasticbehavior of the composite has to be considered. Although there is nofirm consensus concerning the nature of sodium waterglass, a numberof researchers agree that its structure and properties depend upon thesilica modulus. We earlier described the influence of silica modulus onthe polymer matrix content of the composites studied. Silica modulusmodification leads to correlative changes in the end products of curedOMC triisocyanurates, amines, disubstituted ureas, sodium carbo-nate, phthalate, carbamate, and methacrylate. The physical andchemical properties of composites with dispersed fillers are definedby the dispersion medium [183]. Therefore, waterglass silica modulusmay be expected to influence all of the OMC viscous-elastic propertiesas well.
Figure 3.31 shows temperature dependences of viscous-elastic func-tions of composites that include 45 vol% waterglass with various silicamodulus. Comparing curves 4 and 5 ðM ¼ 3 and M ¼ 1:42Þ, note thatincrease of silica modulus leads to increase in the elastic modulus ofthe composite.
More complicated OMC viscous-elastic behavior may be observedwhen MGF-9 modifier is introduced (see Fig. 3.31, curves 1–3).First, increase of elastic modulus is seen for all composites regardless
222 Chapter Three

of silica modulus when MGF-9 modifying additive is introduced; atM ¼ 1:42 the increase is most marked (see curves 5 and 3), and isless apparent at M ¼ 3:0 (see curves 4 and 1).
The decisive influence appears to be due to crown-complexes formedby waterglass sodium cations and MGF-9 fragments. The catalyticactivity of this system in isocyanate cyclotrimerization reactions forinterphase catalysis conditions is determined by the concentrations ofsodium cations and MGF-9. For a given MGF-9 content, sodium ionconcentration is higher in compositions comprising low-modulusglasses than in those with high modulus, and the influence ofcrown-complexes is thus more apparent. In composites featuringlow-modulus glasses a shift occurs toward greater formation ofisocyanurate structures, with no carbon dioxide liberation. As a result,sodium carbonate, which acts as a loosening agent of the compositepermolecular structure [182], is present in significantly lowerquantities and can only be formed from CO2 liberated by reaction ofpolyisocyanate isocyanate groups with waterglass water.
These are not the only limiting influences exerted by the silica mod-ulus on the viscous-elastic properties of OMC. An influence on thestructure of the polycondensation products has also been established[128–132]. Thus, silica modulus induces significant changes of themorphology and structure of both composite material phases, andthe viscous-elastic behavior observed supports this.
When mechanical loss temperature dependences are considered(see Fig. 3.32) variable levels of ‘‘background’’ loss in the compositeglass state (273–453 K) are noted. High background loss (tan � ¼ 0:1–0.12Þ in specimens 4 and 5 is apparently caused by absence of MGF-9modifier, and demonstrates the increased molecular mobility in thesestructures.
Studies of the viscous-elastic behavior of OMC with various water-glass silica moduli and MGF-9 contents have revealed the consider-able influence of these factors on composite viscous-elastic properties.Evidently, study of the viscous-elastic properties of OMC is an effec-tive method for prediction of physical, mechanical, and operating char-acteristics of the composites investigated.
Composite structure was studied using an MBS-9 optical microscopeand an EM-100C electron microscope. Specimens for morphologicalinvestigation were prepared from cured composite blocks and initialcomponents by thorough grinding and polishing of their surfaces.Specimens for electron-microscopic investigation were obtained by ametal–carbon replica method. Specimens for study had fixed composi-tion of organic component (45 vol% polyisocyanateþ 10 vol% MGF-9oligoetheracrylateþ 0.02 vol% UP 606/2), and the inorganic content(waterglass with M ¼ 2:15) was varied from 0 to 60 vol%.
Properties of Adhesives Based on Polymeric Mixtures 223

Optical microscopy showed that the composite material formed is aheterophase system consisting of a continuous polymer matrix and adispersed phase comprising spherical particles. Increasing the water-glass content resulted in increased size of the spherical particles.Polycondensation products of the glass form the dispersed phase.The fact that no phase inversion is observed up to a waterglass contentof 60 vol% is of particular interest.
The omission of MGF-9 leads to a sharp change in the compositestructure: no spherical particles are seen. The composite structurebecomes heterogeneous, with structural elements of irregular shapeand a wide scatter of sizes (10–170 mm).
The dispersion medium in the composites studied includes triisocya-nurates, disubstituted ureas, and amines observed in the cured OMCend products by IR spectroscopy [104, 178]. Sodium carbonate, carba-mate, phthalate, and methacrylate also found in the end productsprobably form intermediate layers that cannot be detected by opticalmicroscopy.
The volume of a spherical particle is related to its surface area by
V ¼ 13RS ð3:29Þ
224 Chapter Three
Figure 3.32 Mechanical losses ðtan �Þ temperature dependence on OMC structure(% of vol.): (1–3) WG-45 of M ¼ 3:0, 2.15, and 1.42, respectively, and MGF-9. (4, 5)WG-45 of M ¼ 3:0 and 1.42, respectively, without MGF-9; (6, 7) WG-30 and -20 ofM ¼ 2:15 and MGF-9

where V ¼ volume (cm3), R¼particle radius (cm), and S¼ surface area(cm2). For compositions containing n1 particles with concentration C1
and n2 particles with concentration C2, the following ratios hold:
C1V
n1¼ 1
3R1S1 ð3:30Þ
C2V
n2¼ 1
3R2S2 ð3:31Þ
where V ¼ composition volume (cm3), C1;C2 ¼waterglass volumetricfractions, and n1;n2 ¼numbers of particles in the composition.
Dividing Equation (3.30) by Equation (3.31) we obtain
C1
C2
n1
n2¼ R1
R2
S1
S2ð3:32Þ
From the experimental data,
C1
C2¼ R1
R2ð3:33Þ
so that
n2
n1¼ S1
S2
or
n1S1 ¼ n2S2 ð3:34Þ
The product W ¼ nS is the magnitude of the interphase surface.Thus, from the above and the fact that the dispersed phase particle
size depends linearly on the waterglass content, we conclude that theinterphase boundary area is constant and does not depend on thevolumetric content of sodium waterglass in the composite.
Optical microscopy was used to study the change of composite struc-ture with silica modulus. It was found that increase of the silica mod-ulus leads to structural changes similar to those caused by increase ofthe content of waterglass, namely, enlargment of the spherical parti-cles of waterglass polycondensation products. Composites with low-modulus glasses ðM ¼ 1:42Þ are distinguished by 8–20 mm sphericalstructural elements. With M ¼ 2:6, a size of 20–40 mm is typical forthe structural elements. Spherical particles of 40–100 mm are observedin composites containing high-modulus glasses. The change in theparticle size is connected, among other factors, with the structure ofthe silicion-oxygen anions, which depends on the silica modulus.
Properties of Adhesives Based on Polymeric Mixtures 225

Optical microscopy allows assessment of dispersed phase morphol-ogy but provides little information about the dispersion medium. Incontrast, electron microscopy gives more comprehensive informationon the morphology of the continuous phase.
Electron micrographs show that the matrix is of globular structure,containing mainly structural elements of two specific sizes, whichdepend monotonically on the waterglass content in the composite. At15 vol% sodium silicate content, the structural elements are 0.4 and0.18 mm; at 25 vol% the corresponding values are 0.1 and 0.04 mm. Oneparticular size, namely, 0.07 mm, becomes typical at less than 35 vol%waterglass. Large structural formations in specimens with 15 vol%waterglass make up approximately one-third of the total volume,and large particles make up to 50% of the volume in specimens with25 vol% waterglass. Thus change of waterglass content in the compo-sites results in changes in the structural elements of both dispersedphase and dispersion medium.
Comparing specimens differing in chemical composition, the struc-ture of the composite containing polyisocyanate, sodium waterglass,MGF-9 interphase catalyst, and UP 606/2 polymerization catalyst isidentical to that of the composite consisting of polyisocyanate and UP606/2 only. Similar distribution and size of the structural elements areobserved.
It is known that compounds with mobile oxyalkylene chains similarto those available in MGF-9 are able to form crown-complexes with thealkali metal cations in waterglass and to act as interphase catalysts inheterophase systems [103–109]. According to the supposed mechanismof their action [106], they act at the phase boundary. Therefore, in thesystems investigated, MGF-9 enters the waterglass–polyisocyanateboundary, leading to the formation of waterglass particles of sphericalshape and to the independence of the phase boundary area on thewaterglass content in the composite. It can be assumed that MGF-9forms gel-like films of dual action at the waterglass boundary: thesefilms prevent phase inversion and also localize dispersed particles ofwaterglass polycondensation products, preventing their enlargement.
226 Chapter Three

Chapter
4Internal Stresses in Adhesive-
Bonded Joints and Ways ofDecreasing Them
4.1 Effect of Internal Stresses onProperties of Adhesive-Bonded Joints
The internal stresses in adhesive-bonded joints arise for two reasons.In the course of setting of the adhesive, its volume decreases due tovolatilization of solvents, polymerization or physical structurization.As a result of the adhesion interaction of the adhesive and the sub-strate, the film can contract only in thickness, which is why stressesthat appear in it are parallel to the surface. The film extends whilecontraction stresses appear in the substrates. Rapid growth of stres-ses, which tend to reduce the length of the film, begins from themoment the polymer loses yield.
The second component of the internal stresses is thermal stresscaused by differences of the coefficients of linear thermal expansionof the adhesive and the substrate. They appear in the course of heatingor cooling of the adhesive-bonded joint. The mechanism of the internalstresses occurring in adhesive-bonded joints does not generally differfrom that in coatings, but because there are two solid surfaces themagnitude of the stresses in the first case appears to be substantiallygreater.
In some cases the adhesive film cannot contract in thickness duringcuring—for example, in the case of ‘‘tube-in tube’’ adhesive-bondedjoints. Then the tangential internal stresses are added to the normalones. The total stresses in this case increase substantially. The occur-rence of internal stresses during formation of the polymeric film on the
227
solid surface results in decrease of the adhesion strength because thestresses are directed oppositely to the forces of the adhesion bond andtend to pull the film off the substrate. The stronger the bond of thepolymer with the surface, the greater is the effect of the internalstresses because the strong interaction of the polymer chains withthe substrate prevents the relaxation processes on the interphaseboundary. In this connection there is a fairly clear dependence of theinternal stresses on the adhesion strength [158–160]. Hence, becausethe internal stresses act oppositely to the forces of adhesion, thisdependence is of complex character as the increase of the internalstresses is accompanied by decrease of the adhesion strength.
The internal stresses can be equated to a long-period acting load[161]. They can cause spontaneous peel-off of the polymer and fractureof the adhesive-bonded joint [160–163], even at 15–50% of the instan-taneous breaking stress. In this case there is a linear dependence insemi-log coordinates between the lifetime of the joint and the internalstresses [164]. An analytical dependence has been proposed thatrelates the strength of the adhesive-bonded joint to the internal stres-ses in the adhesive layer [160].
The value of the internal stresses in the adhesive does not dependsignificantly on the layer thickness [160]; with the increase of layerthickness the tangential stresses grow linearly [160, 165]. But at acertain film thickness the internal stresses begin to decrease andreach a minimum value. This decrease was found to be induced bythe disturbed contact between the film and the substrate.
The internal stresses in adhesive-bonded joints are not distributeduniformly, being concentrated on the edges and especially at corners.The edge effect is more noticeable the higher the ratio of the length ofbonding adhesive in contact with air to the contact surface. Theabsence of proportionality between the failure stress and the area ofthe adhesive-bonded joint is explained to a great extent by the influ-ence of edge effects upon the adhesion strength. Stresses can concen-trate on the solid surface [166, 167]. The stresses have been shown[168] to reach 30 MPa on the boundary between fiber and phenol–formaldehyde resin. Such overloads cause failure of the binder, occur-ring especially at low temperatures and under cyclic loads and heatand mechanical impacts. In this case the crack grows from the bound-ary of the polymer contact with the solid surface.
The presence of stresses in the adhesive layer alters the polymer’sphysical and chemical properties. The glass-transition temperaturedepends on the internal stresses that appear in the polymer. Forexample, the glass-transition temperature is known to decrease withincrease in internal stresses in films based on polystyrene [169] andother polymers. Note that restriction of the macromolecular mobility
228 Chapter Four

due to adsorption interaction with the solid surface increases theglass-transition temperature to greater extent than it is decreasedby the internal stresses [170]. This is why in practice one observesincrease of the glass-transition temperature of filled polymers.
Effects due to changes in the internal stresses in the binder seem toexplain the changes in the temperatures of softening and glass-transi-tion with various quantities of binder in reinforced plastics [171, 172].This was confirmed by studies of internal stresses in specimens whichuse nonwoven polyamide fiber fabric cemented with polystyrene [171].
Increase of internal stresses in the polymer causes increased vaporpermeability of the polymer and corrosion failure [173], and the for-mation of cracks that accelerate oxidation; the abrasion resistancedecreases [174], and the thermal and physical properties change.
This brief review of the literature shows that the effect of internalstresses on the properties of adhesive-bonded joints is considerable.The creation of adhesives with predetermined properties, providinghigh strength and joint stability, requires that the level of the internalstresses be minimized: efficient and practically acceptable ways ofreducing internal stresses are necessary. Structural adhesives andcoatings that do not create undue internal stresses on the boundarywith the substrate can be applied in novel ways in engineering, suchas cementing uneven surfaces, when the adhesive layer may need tobe quite thick, or applying thick reinforced coatings onto metal sur-faces; these coatings themselves can serve as structural elements andcan be used to strengthen elements of structures.
4.2 Determination of Internal Stresses inAdhesive-Bonded Joints
Methods for determining the internal stresses in coatings have beendeveloped. In our experience the photoelasticity method is suitable fortransparent materials, the tensometric method is subject to substan-tial error at high temperatures. The internal stresses in coatings havealso been studied using the Polani instrument with a rigid ring. Thequadrupole resonance method, which requires microwave spectrosco-pically active substances, and IR spectroscopy, which allows determi-nation of the concentration of overstressed bonds, have been proposedfor study of the internal stresses in filled polymers. At present themost widely used method is the cantilever method [160] because ofits experimental simplicity and because the calculations can be per-formed with the need to determine only one value—deflection of thecantilever end. All of these methods determine only averaged values ofthe internal stresses.
Internal Stresses in Adhesive-Bonded Joints and Ways of Decreasing Them 229

Given the requirement for knowledge of how to specify and preservethe properties of adhesive-bonded joints and for efficient methods ofreducing the internal stresses, let us consider the distribution of inter-nal stresses throughout the cross-section of a nontransparent adhesiveinterlayer both perpendicular and parallel to the cemented surfaces.
4.2.1 Thermal stresses in adhesive-bondedjoints
Thermal internal stresses in polymeric paint coatings and adhesiveshave been less studied than shrinkage stresses, although they canconsiderably exceed shrinkage stresses [168]. Let us consider amethod for determining the thermal internal stresses in an adhe-sive-bonded joint that permits investigation of the stress distributionin the adhesive, in the substrates, and at the interface. The specimenused comprised a three-layer plate of length l much greater than thewidth b. The interlayer of the plate consists of adhesive, while the topand bottom layers may be of metals with various linear thermalexpansion coefficients (Fig. 4.1).
4.2.1.1 Calculation of stresses. The stress in each of the layers of theplate is determined by the equation
�i ¼ Ei "0 þ yi
R� � �i �t� �
ð4:1Þ
230 Chapter Four
Figure 4.1 Design of the cemented plate and thedefinition of displacements.

where yi are displacements, with the conditions that �h2 � y � 0 (inthe interlayer) and �ðh2 þ h3Þ � y3 � �h2 (in the bottom layer), whereEi is the modulus of elasticity of the material of the respective layer; �i
is the linear thermal expansion coefficient of the material; h1, h2, h3
are the layer thicknesses; "0 is the relative elongation of the layer,assumed to be zero; and 1=R� and �t are the change of the layercurvature and temperature, respectively.
1=R� is given by
1
R� ¼1
R� 1
R0ð4:2Þ
where 1=R is the curvature that corresponds to the final equilibriumstate of the plate after cementing, and 1=R0 is the initial curvature ofthe plate.
To determine the values "0 and 1=R� let us specify the conditionsthat reflect the fact that the normal effort and bending moment in thecross-section are equal to zero. The condition under which the normalforce is equal to zero is
ðh1
0
E1 "0 þ y1
R� � �1 �t� �
b�y1 þð0
�h2
E2 "0 þ y2
R� � �2 �t� �
b�y2
þð�h2
�ðh2þh3Þ
E3 "0 þ y33
R� � �3 �t
!b�y3 ¼ 0 ð4:3Þ
The condition under which the bending moment is equal to zero is
ðh1
0
E1 "0 þ y1
R� � �1 �t� �
by1�y1 þð0
�h2
E2 "0 þ y2
R� � �2 �t� �
by2�y2
þð�h2
�ðh2þh3Þ
E3 "0 þ y33
R� � �3 �t
!by3�y3 ¼ 0 ð4:4Þ
After integration, Equations (4.3) and (4.4) take the forms
A"0 þ B1
2R� ¼ C ð4:5Þ
B
2"0 þ D
1
3R� ¼ F ð4:6Þ
Internal Stresses in Adhesive-Bonded Joints and Ways of Decreasing Them 231

where
A ¼ E1h1 þ E2h2 þ E3h3
B ¼ E1h12 � E2h2
2 � E3h32 � 2E3h2h3
C ¼ E1�1 �th1 þ E2�2 �th2 þ E2�3 �th1
D ¼ E1h13 þ E2h2
3 þ E3ðh33 þ 3h2h3
2 þ 3h22h3Þ
F ¼ E1�1�th1
2
2� E2�2 �t
h22
2� E3�3�t2h2h3 þ h3
2
From Equation (4.5),
"0 ¼ C
A� 1
2R�B
Að4:7Þ
Substituting Equation (4.6) into (4.7), we obtain the following equationfor 1=R�:
1
R� ¼E1E2ð�1 � �2ÞL1
3 þ E1E3ð�1 � �3ÞL23 þ E2E3ð�2 � �3ÞL3
3
E12h1
4 þ E22h2
4 þ E32h3
4 þ E1E2H14 þ E1E3H2
4 þ E2E3h34
ð4:8Þ
where the following designations are introduced:
L13 ¼ h1h2ðh1 þ h2Þ L2
3 ¼ h1h3ðh1 þ 2h2 þ h3Þ
L33 ¼ h2h3ðh2 þ h3Þ H1
4 ¼ 2h1h2ð2h22 þ 3h1h2 þ 2h1
2Þ
H24 ¼ 2h1h3ð2h3
2 þ 6h2h3 þ 6h22 þ 3h1
2 þ 3h1h3 þ 6h1h2Þ
H34 ¼ 2h2h3ð2h3
2 þ 3h2h3 þ 2h22Þ
Using Equations (4.7) and (4.8), we can find the value of stresses in therespective layers according to Equation (4.1).
4.2.1.2 Determining displacements. Under the condition 1/R0!0, thedifferential equation of displacements can be presented as
v 00
½1 þ ðv 0Þ23=2¼ 1
Rð4:9Þ
232 Chapter Four

where 1=R is determined experimentally; v is the displacement mea-sured along the normal to the undeformed surface of the plate. If oneedge of the plate is fixed, the other free edge is displaced by a certainvalue (l).
Multiplying both sides of Equation (4.9) by dv we obtain
v 00 dv
½1 þ ðv 0Þ23=2¼ dv
Rð4:10Þ
After integrating the l.h.s. of Equation (4.10) with respect to v 0 and ther.h.s. with respect to v, we obtain
� 1ffiffiffiffiffiffiffiffiffiffiffiffiffiffiffiffiffiffiffi1 þ ðv 0 Þ2
q ¼ v
Rþ C ð4:11Þ
The arbitrary constant C is determined by the boundary conditions:
x ¼ 0 v ¼ 0 � ¼ 0 ð4:12Þ
In this case
v 0 ¼ tan� cos� ¼ 1ffiffiffiffiffiffiffiffiffiffiffiffiffiffiffiffiffiffiffi1 þ ðv 0Þ2
q ð4:13Þ
Equation (4.11) then takes the form
� cos� ¼ 1
Rvþ C ð4:14Þ
Using conditions (4.12) we find
C ¼ �1
Thus, the equation for the displacement is
v ¼ Rð1 � cos�Þ ð4:15Þ
where � ¼ 1=R.To determine the modulus of elasticity of the adhesive layer taking
account of temperature, solving Equation (4.8) for E2 we find
E22 þ E2ðE1aE3dÞ þ E1
2ðh1=h2Þ4 þ E32ðh3=h2Þ4 þ E1E3C ¼ 0 ð4:16Þ
where
Internal Stresses in Adhesive-Bonded Joints and Ways of Decreasing Them 233

a ¼ H14
h24� ð�1 � �2ÞL1
3
h42ð1=R�Þ
6�t
C ¼ H24
h24� ð�1 � �3ÞL2
3
h42ð1=R�Þ
6�t
d ¼ H34
h24� ð�1 � �2ÞL3
3
h42ð1=R�Þ
6�t
In Equation (4.16) the value 1=R� is determined experimentallyaccording to Equation (4.15).
Equation (4.16) gives the following expression for E2:
E2 ¼ �E1a þ E3d
2�
ffiffiffiffiffiffiffiffiffiffiffiffiffiffiffiffiffiffiffiffiffiffiffiffiffiffiffiffiffiffiffiffiffiffiffiffiffiffiffiffiffiffiffiffiffiffiffiffiffiffiffiffiffiffiffiffiffiffiffiffiffiffiffiffiffiffiffiffiffiffiffiffiffiffiffiffiffiffiffiffiffiffiffiffiffiffiffiffiffiffiffiffiffiffiffiffiffiffiffiffiffiffiE1a þ E3d
2
� 2
�E1h1
h2
� 4
þE32 h3
h2
� 4
þE1E3C
s
ð4:17Þ
Taking Sprut-5M adhesive as an example, consider the modulus ofelasticity of the polymer in the adhesive layer in terms of the distanceto the substrate.
The adhesive layer thickness was controlled within the limits 5 �10�3 to 3 � 10�2 cm, and the cemented materials were 1Kh18N10Tsteel and aluminum. The thickness of the substrates h, their moduliE, and the linear thermal expansion coefficients � were
h1 ¼ 7 � 10�3; h3 ¼ 5 � 10�3
E1 ¼ 2 � 105 MPa; E3 ¼ 7:7 � 105 MPa
�1 ¼ 0:12 � 10�4; �3 ¼ 0:24 � 10�4
The results obtained are presented in Fig. 4.2 (curve 2). Beginningwith some value, the modulus of elasticity increases abruptly onapproaching the substrate [175, 176]. The general shape of curve 2(Fig. 4.2), which represents the form of the distribution of the polymermodulus of elasticity through the thickness of the adhesive layer, isclose to parabolic.
Now consider the dynamic method of determining the modulus ofelasticity Ec of the polymer in the adhesive layer. To determine E0 ofthe adhesive directly in the joint, we set up an equation for the rigidityparameter D of the three-layer plate for bending relative to the neutralsurface:
234 Chapter Four

D ¼ D1 þ D2 þ D3 � B1H12 þ B2H2
2 ð4:18Þ
where
D1 ¼ E1�13
12ð1 � v12Þ
¼ B1�12
12D2 ¼ E2ðh1
2 þ h23Þ
3ð1 � v02Þ
D3 ¼ E3�23
12ð1 � v22Þ
¼ B3�22
12
H1 ¼ h1 þ�1
2H2 ¼ h2 þ
�2
2
The polymer rigidity parameter Dc can be expressed as
Dc ¼ B2h2
3þ B3
B1ðh þ �1=2Þ � B3ðh þ �2=2ÞB2 þ B�
� �ð4:19Þ
The rigidity parameter D is determined experimentally by finding thefrequency of vibrations of the model under consideration.
Internal Stresses in Adhesive-Bonded Joints and Ways of Decreasing Them 235
Figure 4.2 Dependence of thepolymer elastic modulus in theadhesive layer on the distanceto the substrate. The modulusis determined by the dynamic(1) and static (2) methods.

Using Equation (4.19), the relationship (4.18) can be converted intoan equation to determine Ec:
D3 ¼ B2h2
3þ B2
2 B1�1
2
4þ �1h þ h2Þ
!"
þ B3�2
2
4þ �2 þ h2
!� D þ 2B� h2
3
#
þ B2 B1B3�1
2
2þ �2
2
2þ �1�2 þ 8h2 þ 4�1h
!(
� 2D�B� h2
3þ B1 h þ �1
2
� �� B3 h þ �2
2
� �h i2�
þ 12B1B3B� �1
2
2þ �2
2
2þ �1�2 þ 8h2 þ 4�1h þ 4�2h
!� D�B�2 ¼ 0
Dc ¼ D � D1 � D3 ð4:20Þ
The cubic equation (4.20) allows determination of the adhesive mod-ulus of elasticity E2 in a plate made of three layers. For this purpose itis necessary to find the frequency of the natural vibrations of thethree-layer plate under investigation with one edge fixed and theother free.
The transcendental equation to determine the frequency of the nat-ural vibrations has the following shape in this case:
Chkl cos kl þ 1 ¼ 0
k4 ¼ �!2
D; � ¼ 1
g�1 þ
c
g2h þ 2
g�2
ð4:21Þ
where ! is the natural frequency of vibrations, is the specific weight,and � is the weight per unit of surface.
The first root of Equation (4.21) is kl ¼ 1:875. Then the equation forthe rigidity parameter D for bending of the three-layer plate has theform
D ¼ !2l4
1:875
1
g1 þ
c
g2h þ 2
g2
� ð4:22Þ
236 Chapter Four

Having determined D experimentally and applying Equation (4.20),we find the value of the dynamic modulus of elasticity of the adhesivelayer in the joint (see Fig. 4.2, curve 1). The figure presents satisfac-tory coincidence of the value and functional form of the modulus ofelasticity determined by the two methods. The value of the modulus ofelasticity of the polymer in the adhesive interlayer shows good agree-ment with the data presented in Chapter 1 in its dependence on thedistance to the substrate.
4.2.1.3 Determining thermal internal stresses. Experimentally, the stresswith a particular temperature change is determined by the deflectionof the free end of the cemented three-layer plate fixed as a cantilever.The deflection of the plate end was determined by means of aprojection optical system. Figure 4.3 displays the distribution of thethermal internal stresses in a Sprut-5M adhesive-bonded joint fortemperature change from 20 to 428C. Plates made of 1Kh18N10Tsteel 0.07 mm thick and aluminum foil 0.02 mm thick were used assubstrates. It is evident that the internal stresses are characterizedby maximum values on the interfaces.
To check the method of determining internal stresses, resistancetensometers were cemented to the external surfaces of the substrates.From a series of experiments it was found that the values of the stresson the external surfaces of the plate calculated by the quoted formulasand determined by means of the resistance tensometers differ by notmore than 9%.
4.2.2 Shrinkage internal stresses inadhesive-bonded joints
There are established methods for evaluating the shrinkage internalstresses in the adhesive-bonded joint using cantilevered three-layerbeams [160, 175], but in practice these methods are frequently toocomplicated.
Internal Stresses in Adhesive-Bonded Joints and Ways of Decreasing Them 237
Figure 4.3 Internal stresses (MPa) in the adhesive-bonded joint occurring on temperature elevation from208C to 438C.

A paper of Myshko and Garf [175] was the first to attempt to createa method of calculating the distribution of the shrinkage internalstresses along an adhesive-bonded joint cross-section for a canti-levered specimen made of two plates of different flexural rigiditywith an adhesive layer between them—i.e., to generalize the equationsfrom [160] for adhesive-bonded joints.
Consider the effect of internal stresses in two cases: between rigidsubstrates (only the adhesive layer deforms) and between flexible sub-strates (combined deformation). The pattern of the tension–contrac-tion forces P0;P1;P2 of the substrates and the adhesive layer and theirbending moments M0;M1;M2 caused by shrinkage is represented by asystem of four equations:
P1 � P0 � P2 ¼ 0 ð4:23Þ
M1 þ M2 � M0 þ P0h0
2þ h1 þ
h2
2
� � P1
ðh1 � h2Þ2
¼ 0 ð4:24Þ
"full ¼P1
E1F1þ M1
EW1¼ P0
E0F0þ M0
E0W0ð4:25Þ
"full ¼P1
E1F1� M1
E1W1¼ P2
E2F2þ M2
E2W2ð4:26Þ
where F0;F1;F2 are the areas of the cross-section; W0;W1;W2 are themoments of resistance; h0;h1;h2 is the thickness; E0;E1;E2 are themoduli of elasticity of the top and bottom substrates and of the adhe-sive layer; and "full is the relative shrinkage of the adhesive layerwithout substrates (free shrinkage).
Analyzing equations (4.25) and (4.26), it is easy to note that theauthors proceed from the equality of the relative deformations of theadhesive layer and the substrates. Such an approach raises somedoubts insofar as the bond between the adhesive and the substrateis not absolutely rigid, as a result of which Equation (4.27) has nodefinite solutions for real systems:
"full ¼2
l2
AD � BC
A � Cf ð4:27Þ
where f is the sag value on the beam end; l is the length of thebeam; and A;B;C;D are parameters that depend on the thicknessand the modulus of elasticity of the substrates and the adhesivelayer.
238 Chapter Four

Actually, if
A ¼ 1
E1F1þ 1
E0F0
� h1 þ h2
h0 þ h1þ 1
E0F1ð4:28Þ
C ¼ h1 þ h2
h0 þ h1þ 1
� 1
E1F1þ 1
E2F2ð4:29Þ
with A ¼ C, we have
1
E0F0
h1 þ h2
h0 þ h1¼ 1
E2F2ð4:30Þ
or
E2
E0¼ h0
h2
h0 þ h1
h1 þ h2ð4:31Þ
With the steel (E ¼ 2 � 105 MPa) and aluminum (E ¼0:7 � 105 MPa) substrates and at h1 ¼ h0, Equation (4.30) is reducedto the quadratic equation
2ðh1=h2Þ2 � 0:35h1=h2 � 0:35 ¼ 0 ð4:32Þ
the roots of which produce thickness relationships of the adhesivelayer and the substrates, reducing Equation (4.27) to indeterminacy.
Thus, the approach proposed in [98] and [177] is not rigorous, whichrestricts its application. In addition, this method cannot be applied todetermine the distribution of the internal stresses through the cross-section of the adhesive interlayer.
The authors of [178] attempted to remove these shortcomings byproposing a method for calculating the distribution of stresses in theadhesive layer and the substrates as well as for determining the inter-nal stresses in the adhesive layer and the stresses that originate ineach substrate in accordance with the Dugamel–Neimann hypothesis.The position of the neutral surface was determined by means of theequations obtained for three-layer plates. Hence, the proposed methodhas a number of unjustified assumptions that do not allow its applica-tion in practice. For example, the relaxation processes in the polymer-izing adhesive are not taken into account in determining the modulusof elasticity of the polymer in the adhesive interlayer by tensometeringthe free surface of one of the substrates.
The method provides too high values of the modulus of elasticity. Letus analyze the formula to calculate the adhesive elasticity proposed bythe authors [178]. Applying the designations adopted in [178], theproposed equation can be presented as
Internal Stresses in Adhesive-Bonded Joints and Ways of Decreasing Them 239

B1 ¼ 2
h12fB0ðh0
2 þ 32h0h1Þ � B2ð2h2
2 þ 3h12 þ 9
2h1h2 þ 3h0h1 þ 3h0h2Þ
þ 3"0ex�½ðh2 þ h1Þ � B0ðh0 þ h1Þg ð4:33Þ
where "0ex is the relative deformation of the substrate free surfacedetermined experimentally; and B0 and B2 are the reduced rigidityof the top and bottom substrates. The modulus of elasticity of theadhesive layer E1 can be expressed through the reduced rigidity B1
in the following way:
E1 ¼ B1ð1 � �12Þ
h1ð4:34Þ
where �1 is the Poisson coefficient of the adhesive layer.Let us analyze Equation (4.33) for a certain adhesive-bonded joint
with h0 ¼ 5 � 10�5 m, h2 ¼ 10 � 10�5 m, h1 ¼ 10 � 10�5 m, B0 ¼ 3:846�102 N=m (aluminum foil), B2 ¼ 21:978 � 102 N=m (steel). The expres-sion takes the form
B1 ¼ 11:45"0ex�� 106 � 541:758 � 103 ð4:35Þ
The authors of [178] determine the value "0ex by tensometering thefree surface of the top substrate.
Figure 4.4 presents a portion of the length of the adhesive-bondedjoint. BB 0 is the deformation of the free surface of the top substrateand corresponds to "0ex; AA 0 is the layer elongation, assumed zero, andcorresponds to "1; AO is the radius of curvature of the adhesive inter-layer deformed by shrinkage. As the figure displays,
"0ex ¼ "0 þ CB 0 ð4:36Þ
From the similarity of OAA 0 and A 0CB 0 we obtain
CB 0 ¼ h0"1
�ð4:37Þ
i.e.,
"0ex� ¼ "1�þ h0 ð4:38Þ
After substituting the values of � and "1 obtained experimentally bydeflection of the cantilever-fixed specimen, we find "0ex� ¼6:303 � 10�3 cm, E1 ¼ 40:562 � 105 MPa. The value obtained for themodulus of elasticity of the polymer in the adhesive layer exceedsthat of steel, which clearly indicates the inadequacy of the method.
240 Chapter Four

Let us consider a method of determining internal stresses that lacksthe above shortcomings by applying it to an adhesive-bonded jointrepresented by a three-layer plate (substrate–adhesive–substrate).The adhesive layer shrinkage causes deformation of the whole plate.The resistance forces appearing in this case can be represented as asystem of normal forces and bending moments, which act layer bylayer throughout the plate, and stresses can be represented as
�0 ¼ E0 "1 þ z1
�
� ð4:39Þ
�1 ¼ E1 "1 þ z1
�þ ð1 þ �cÞ�
� �ð4:40Þ
�2 ¼ E2 "1 þ z1
�
� ð4:41Þ
where �0; �1; �2 are the stresses in the top substrate, adhesive layer,and bottom substrate, respectively; 1=� and "1 are the curvature and
Internal Stresses in Adhesive-Bonded Joints and Ways of Decreasing Them 241
Figure 4.4 Element of the adhesive-bonded joint.

linear deformation of the coordinate surface; � is the elastic shrinkageof the adhesive layer; and z is the current coordinate representing thedistance from the coordinate surface.
Further calculations substantially simplify the representation of theforces and bending moments as integrals of stresses through the cross-sectional area of the respective layers:
P0 ¼ðz�0b dz ð4:42Þ
P1 ¼ðz�1b dz ð4:43Þ
P2 ¼ðz�2b dz ð4:44Þ
M0 ¼ðz�0bz dz ð4:45Þ
M1 ¼ðz�1bz dz ð4:46Þ
M2 ¼ðz�2bz dz ð4:47Þ
To determine the values of "1 and �, let us set up a system ofequations that reflect the fact that the sums of the bendingmoments and of the forces across the specimen cross-section areequal to zero:
Xi¼1;3
Pi ¼ 0
Xi¼1;3
Mi ¼ 0ð4:48Þ
The values of "1 and � are found after the respective conversions:
� ¼ 1
C�
B02h0
2 þ B22h2
2 þ B12h1
2 þ 2B0B1H12 þ 2B2B1H2
2 þ 2B0B1H12
B1½B0ðh0 þ h1Þ � B2ðh2 þ h1Þ
ð4:49Þ
242 Chapter Four

" ¼ 1
3�
B0L12 þ B2L2
2 þ B1h12=2
B0ðh0 þ h1Þ � B2ðh2 þ h1Þð4:50Þ
where
M12 ¼ 2h1
2 þ 2h02 þ 3h0h1
H2 ¼ 2h12 þ 2h2
2 þ 3h2h1
H32 ¼ 2h0
2 þ 2h22 þ 6h1
2 þ 6h0h1 þ 6h2h1 þ 3h0h1
L12 ¼ 2h0 þ
3
2h1
2 þ 3h1h0 � 3h1h0 � 3h2h0
L22 ¼ 2h2
2 þ 3
2h1
2 þ 3h2h1 þ 3h1h0 þ 3h2h0
The coordinate h0 determines the position of the neutral surfaceassumed as a coordinate:
h 01 ¼ B0ðh1 þ h0Þ � B2ðh1 þ h2Þ
2ðB0 þ B1 þ B2Þð4:51Þ
Let us consider how to determine experimentally the shrinkageinternal stresses. An optical system similar to that described inSection 4.2.1 was used to determine the displacement of the free endof the cantilever-fixed adhesive-bonded plate. Plates made of alumi-num foil 5 � 10�5 m thick (E ¼ 0:7 � 105 MPa) and of steel 10 � 10�5 mthick (E ¼ 2 � 105 MPa), both with areas of 1 � 10 cm2, served as sub-strates. Sprut-5M adhesive was used to cement the plates. The shrink-age internal stresses were determined at 293 K 2 days after thespecimens were prepared.
To determine the modulus of elasticity of the adhesive layer, thetemperature of the specimens was elevated to 314 K at a rate of0.1 K/min. The values of the modulus of elasticity of the adhesive asE1 � 10 MPa for two specimens at temperatures in the above range,calculated by the formula (4.17), are tabulated below.
Internal Stresses in Adhesive-Bonded Joints and Ways of Decreasing Them 243
10E (MPa)
Specimen thickness, h (10�5 m) 294 K 298 K 302 K 306 K 310 K 314 K
13 0.086 0.086 0.085 0.085 0.085 0.0846 0.089 0.089 0.089 0.088 0.088 0.087

It is evident that with temperature elevation from 293 to 314 K themodulus of elasticity of the Sprut-5M adhesive changes insignifi-cantly, demonstrating the applicability of the method of temperaturestresses.
Figure 4.5 displays the calculated distribution of the shrinkgestresses over the adhesive-bonded plate cross-section. At the adhe-sive–metal interface a concentration of stresses is observed that canexceed twice those in the bulk adhesive.
4.2.3 Calculation of internal stresses bythe lattice cell method
Due to complexity and limited capacity of the analytical methods,recourse is more frequently had to numerical modeling methods,above all the finite elements method (FEM), to determine thestress–strain state.
In models based on FEM, either the composite material is consid-ered as a homogeneous body whose physical and mechanical charac-teristics correspond to the averaged characteristics of the system, oraccount is taken of the structural features of the composite material.For this purpose one introduces the physical and mechanical charac-teristics of the system components into the designed model and canthus study their mutual effects. For all its advantages, FEM also hasits shortcomings. The most serious is that the method is based on theassumption of infinitesimal deformations, which is why when calculat-ing the stressed state of articles made of high-elasticity materials bymeans of FEM one applies multistage iteration procedures using thefinite deformations obtained as a result of a number of solutions withsmall deformations [179]. In addition, the limitations on the shape ofthe finite element (triangular elements must be close to equiangular)make the modeling of the fine adhesive interlayer difficult because oflimited computer memory.
244 Chapter Four
Figure 4.5 Shrinkage internalstresses (MPa) in the adhesive-bonded joint.

Discretization of the elastic medium is achieved by dividing it intoseparate elements along the coordinate lines of the selected coordinatesystem. Each discrete element of the initial medium based on an elec-tromechanical equivalent is replaced by a cell of an electrical networkinvolving electric components with concentrated parameters. The lat-ter are determined by similarity between Hooke’s law written for sepa-rate elastic elements of the initial medium and Ohm’s law written forthe lattice cells.
The lattice cells integrate into a single system, which models theinitial medium. The integration is performed by means of the Kronconversion [181]. According to this, the variety of electrical systemsthat can be obtained as a result of various combinations of a set of theelectrical elements is considered a consequence of the transformationof the coordinated system. This means that a concrete method of con-necting the electrical components determines the concrete system ofgeneralized coordinates that are the electrical variables.
Kron showed that processes that occur in similar electric circuits aredescribed by tensor equations. The network parameters and electricalvariables are the physical objects that are the components of theseequations.
Such an approach makes it possible to find components of a physicalobject in a new system of coordinates from its components in a knownsystem. This can be done by means of a formal procedure involvingapplication of special matrices. The analysis of any electrical circuitgoes through the following stages:
1. Formulation of an equation of the circuit state in the coordinatesystem that is characterized by minimal analytical difficulty.
2. Setting up of the conversion matrix that connects the new and oldsystems of coordinates.
3. Application of this matrix to determine the electrical variables andparameters in the new system of coordinates.
A set of separate elements that are not interconnected is a conveni-ent choice as an initial system that produces no analytical difficulties.Kron called similar cross-cut systems ‘‘primitive.’’
The equation of the primitive network can be obtained by means ofthe Kron postulate of generalization [181], which helps to find the typeof system equation. The postulate is based on the fact that integrationof elements into a single system is not accompanied by addition of newphysical phenomena or objects that would not have been in the initialelement.
The equation of the lattice cell state is defined by Ohm’s law in thesymbolic form
Internal Stresses in Adhesive-Bonded Joints and Ways of Decreasing Them 245

fIgci ¼ ½ycifEgci ð4:52Þ
Here fIgci is the current that affects the ith cell; fEgci is the potentialdifference that occurs on the cross-link couples; and ½yci is the matrixof cell conductivity.
In the primitive, i.e. cross-cut, network consisting of n lattice cells,there are three physical objects: fIgp represents the points that comein and out of the cells; fEgp represents the potential differences thatoccur on the cross-link couples; and ½yp represents the intrinsic andmutual conductivity of individual cells.
Consequently, from Kron’s Postulate I on generalization, the equa-tion of the primitive system will also have the form of Ohm’s law:
fIgp ¼ ½ypfEgp ð4:53Þ
The same equation expressed in the form of block matrices that corre-spond to each lattice cell of the system, takes the form
fIgc1
fIgc2
� � �
fIgcn
8>>>>><>>>>>:
9>>>>>=>>>>>;
p
¼
½yc1 0 � � � 0
0 ½yc2 � � � 0
� � � � � � � � � � � �
0 0 � � � ½ycn
2666664
3777775
p
fEgc1
fEgc2
� � �
fEgcn
8>>>>><>>>>>:
9>>>>>=>>>>>;
p
ð4:54Þ
As was noted earlier, the transition from the equations of the pri-mitive system to the equations of the integrated system can be treatedas a transformation of the system of coordinates. Values indicated bysubscript p belong to the primitive system and those indicated by sub-script b belong to the integrated system within the system of coordi-nates of which there are the objects fIgb; fEgb; ½yb.
The state equation of the integrated system has the form
fIgb ¼ ½ybfEgb ð4:55Þ
According to [181], the transition from the primitive variables to theintegrated ones is performed by means of the transformation matrix[A]. As a result we have
fEgp ¼ ½AfEgb ð4:56Þ
The currents of the integrated system are defined by
fIgb ¼ ½AtfIgp ð4:57Þ
and the conductivity is defined by
246 Chapter Four

½yb ¼ ½At½yp½A ð4:58Þ
Expressions (4.56)–(4.58) and the state equation (4.55) allow definitionof the unknown variables of the integrated circuit.
The key provision of the Kron approach is the application of therearrangement matrix ½A. The distinguishing feature of this matrixis that it is constructed using the specific regularities typical of cir-cuits, Kirchhoff’s law in particular. Application of the Kron approachto the theory of elasticity is defined by the possibility of forming therearrangement matrix ½A. For this purpose it is necessary to introducea network model of an elastic body. Such a model can be based on theelectromechanical analogy. The method of formation of the networkmodel and the matrix ½A are described in [180].
The ability to form the matrix ½A as well as the existence of analo-gues fIgci � fFgci, fEgci � f�gci, ½yci � ½kci, where fFgci is the vectorof forces, f�gci is the vector of absolute deformations, and ½kci is thematrix of rigidity of the ith elastic element, permit Equations (4.56)–(4.58) to be applied for solution of problems of elasticity theory.
To define the stress–strain state of the elastic body by the method oflattice cells, the following actions should be performed. To form aprimitive system, an elastic body should be cross-cut along the coordi-nate lines of the selected system of coordinates into a certain numberof discrete elements that are not interconnected. Based on Hooke’slaw, each element is described by the relationship
fFgci ¼ ½kcif�gci ð4:59Þ
The force vector of the primitive system is defined by the forces of eachof the elements in the following way:
fFgp ¼
fFgc1
fFgc2
� � �
fFgcn
8>>>>><>>>>>:
9>>>>>=>>>>>;
p
ð4:60Þ
The rigidity matrix of the primitive system represents a set ofblocks, which are the rigidity matrices of separate elements:
½kp ¼
½kc1 0 � � � 0
0 ½kc2 � � � 0
0 0 � � � ½kcn
2664
3775
p
ð4:61Þ
Internal Stresses in Adhesive-Bonded Joints and Ways of Decreasing Them 247

To obtain the matrix equation that describes the stressed state of abody, the parameters and the variables of the primitive system shouldbe converted to the respective values of the solid system by means ofthe matrix ½A. To form the matrix ½A the elastic body should bereplaced by an equivalent electrical circuit.
With the known matrix ½A, the known forces and rigidities of theprimitive system can be converted to the respective variables andparameters of the solid body:
fFgb ¼ ½AtfFgp ð4:62Þ
½kb ¼ ½At½kp½A ð4:63Þ
The equation of state of the solid body takes the form
fFgb ¼ ½kbf�gb ð4:64Þ
Unknown here is the vector f�gb, which is defined by the relationship
f�gb ¼ ½k�1b fFgb ð4:65Þ
The solution obtained cannot be applied directly to define the dis-tribution of deformations over the body insofar as it is necessary toknow absolute deformations of each elastic element into which thebody is notionally cross-cut. These data are obtained by the conversion
f�gp ¼ ½Af�gb ð4:66Þ
Now, substituting the found solution into Equation (4.59), one can findstresses of each of the elements.
The sequence of defining the stress–strain state by the lattice cellmethod is the following:
1. The body is cut into separate elastic elements along the coordinatelines of the selected system of coordinates.
2. The matrix of rigidities and the vector of specified forces are for-mulated.
3. The matrices of rigidity and of force of each elastic element areintegrated into the respective matrix and force vector of thecross-cut system.
4. Using the electrical–mechanical analogy, the body consisting ofseparate elastic elements is replaced by the equivalent electricalcircuit, which is the basic tool for formation of the Kron conversionmatrix.
248 Chapter Four

5. By means of the Kron conversion matrix, the rigidity matrix andthe force vector of the cross-cut system are converted to the respec-tive characteristics of the integrated system, which serve for for-mulation of the system state equation.
6. After this equation is solved, the vector of absolute deformation isdetermined in the integrated variables.
7. By applying the Kron matrix and the obtained solution in the inte-grated variables, we find absolute deformations for each elasticelement.
8. The stresses are calculated by the defined deformations and theknown rigidities of each element.
The thermal-stressed state of a polymer layer in the shape of arectangle that is characterized by arbitrary internal structure wasdetermined with the help of a computer. The configuration of thestructure is represented with precision of up to the size of an indivi-dual element. Its components may differ in physical characteristicsdue to combining a number of these components into the number ofelements into which the rectangle is cross-cut.
The effect of the relative sizes of the elements on the results of thesolution is of interest. The analysis showed that with sides of therectangular element in the ratio 1:100, the solution is not distorted.With a ratio of 1:200, possible distortion should be taken into consid-eration.
The rectangular region should be cross-cut along the coordinatelines. Within the limits of the allowable ratios of the element sides,the coordinate lines can be arbitrarily thickened, but narrow elementsmust be placed right after the broad ones. These two conditions areimportant when studying the stress-state of thin interlayers: forexample, polymers in adhesive-bonded joints.
Within the limits of the given rectangular region, the transitionfrom structure to structure is fairly fast and simple, because of thesmall amount of initial data. The data include four data files and twoparameters. The modulus of elasticity, the Poisson coefficient, and thecoefficient of linear expansion are pointed to in the EM data array foreach of the media or material components coded by a number. The Mat
data file points to the coordinates and the number of the material ofthat element with which the medium properties begin to change.Parameters Nj and Ni are the numbers of elements into which thesides of the rectangle are cross-cut along the x and y axes. The Njx
and Niy data files enumerate the distances between the coordinatelines along the x and y axes along which the body is cross-cut intoelements.
Internal Stresses in Adhesive-Bonded Joints and Ways of Decreasing Them 249

4.2.3.1 Structure of the program. The primary relationships of thelattice cell method, (4.62)–(4.66), are related to the matrixrearrangements and to the solutions of the matrix equations. Allthese standard operations are included in the software of moderncomputers. Application of the transformation matrix [A] and thematrix of rigidities of the primitive system [k]p (the first is sparse,consisting of zeros and units; the second is a narrow ribbon-shapedmatrix) would consume intolerable amounts of computer resources,memory in particular. For this reason, the primitive variables andthe system parameters were not transformed in the form of thematrix equations (4.62) and (4.63) but by a software application.
In addition to determining stresses in the adhesive layer and over-stress at the adhesive–substrate interface, the lattice method permitscalculation of the stressed state of any polymer layer of interest becauseof the possibility of arbitrary densing of the cross-cutting network of theregion under study into elements along the coordinate lines.
Figure 4.6 presents the distribution of internal stresses in the epoxyrubber coating determined by the lattice cell method. A feature of thecalculation is the large ratio of the length to the width of the specimen,with a substantial difference of the elastic characteristics that char-acterize the system:
250 Chapter Four
Figure 4.6 Distribution of defor-mations (1) and stresses (2) inthe two-layer specimen along thecross-section of the polymericcoating with division into cellsand subsequent densing.

Ecoat ¼ 9 � 102 MPa, � ¼ 0:122; linear thermal expansion coefficientðLTECÞ ¼ 30 � 10�6
Ebasic ¼ 2 � 105 MPa, � ¼ 0:3; LTEC ¼ 12:6 � 10�6
The temperature range is 30 K. One layer of elements modeled thebase; the coating was divided into five layers of similar width. As Fig.4.6 displays, the maximal value of the internal stresses in the epoxyrubber coating is observed at the interface with metal.
4.2.4 Edge internal stresses in adhesive-bonded joints
The determination of edge stresses in adhesive-bonded joints is basedon their property of counteracting the bonding forces between theadhesive and the substrate—in other words, of decreasing the adhe-sion strength.
The pin-shaped specimens used to determine edge stresses areshown in Fig. 4.7. They consist of substrates 1 and 3, adhesive layer2, and pin 4 lapped to a conical hole in the substrate 3. An axial force Por a torsion moment Medge that cause normal and tangential failurestresses can be applied to the pin. The internal stresses, the pattern of
Internal Stresses in Adhesive-Bonded Joints and Ways of Decreasing Them 251
Figure 4.7 Patterns of edge stresses in the adhesive-bonded joint.

which is also presented in Fig. 4.7, occur in the adhesive in the courseof curing. A 40% solution of PBMA in MMA was used as adhesive,which was cured by the redox system of benzoyl peroxide (b.p.) (1%)–dimethylaniline (DMA) (0.5%) at 208C. The peak stresses on the edgesof the adhesive-bonded joint are the issue of attention. The edges arebrought closer to the hole in a step-by-step way by decreasing the sizeof the top substrate. At each step the pin is pulled out, with measure-ment of the failure force P or the torsion moment Medge, and the failurestresses are calculated. The pattern of their dependence on the dis-tance from the edge was plotted. With observed �0 or �ad0 adopted asinitial values, i.e., when the zone of influence of the edge internalstresses is substantially far from the pulled-out pin and does not affectits pull-out force, the coefficient of stress concentration in the edges iscalculated by the formula
kis ¼�a;b;c;...;i
�0ð4:67Þ
or
kis ¼ a;b;c;...;i
0ð4:68Þ
where �a;b;c;...;i and a;b;c;...;i are the normal and tangential failure stres-ses at the edge positions a; b; c; . . . ; i.
As Fig. 4.7 displays, the concentration of stresses on the edges of theadhesive-bonded joint in this case reached 1.12, although a compara-tively elastic adhesive was used. For the adhesive based on the PN609-21-RK polyester resin, the overstresses on the edges exceed 2.1;for epoxy adhesives they are 2–10.
This method for studying the edge internal stresses can be used forcoatings as well, but in this case there is no second substrate.
4.3 Method of Decreasing InternalStresses in Adhesive-Bonded Joints
All the practically acceptable methods of decreasing the internalstresses in adhesive-bonded joints can be divided into three groups:decrease of the adhesive shrinkage in the course of cure; increase ofthe relaxation rate of the internal stresses in the adhesive; anddecrease of the difference between the coefficients of linear thermalexpansion of the adhesive and the substrate.
Widely used methods for decreasing the internal stresses relate toincreasing their rate of relaxation, for example, by decreasing themodulus of elasticity when adding plasticizers to adhesives or whenthey are combined with elastomers. The residual stresses were found
252 Chapter Four

to begin to relax noticeably only after the elastic modulus of the poly-mer becomes less than 2:4 � 103 MPa [182]. The decrease of polymerrigidity commonly results in decrease of its heat resistance and stress–strain behavior stability, and decrease of strength limits under bend-ing, contraction, and shear [182]. The mechanism of the decrease ofinternal stresses when plasticizers are added to the polymeric adhe-sive is related to the decrease of the intermolecular interaction due toadsorption along the interfaces of the structural elements [183]. Inthis case a large amount of plasticizer is added, which enhances thedecrease of strength and adhesion of the polymer. During operation ofthe adhesive-bonded joint, the plasticizer is redistributed and removedfrom the system, resulting in loss of elasticity and an increase of theinternal stresses.
A more convenient method is not to decrease the elastic modulus ofthe whole adhesive but to form an elastic finish coat [182] not less than30 mm thick [183] on the adhesive–substrate interface. With lowerelastic modulus, the mobility of structural elements decreases.Application of an elastic sublayer decreased the internal stresses dur-ing the formation of coatings made of unsaturated polyester resins[185], epoxides [186], and polymer solutions [187]. The use of elasticfinish coats found comparatively wide application for paint coatingsbut seems less promising for adhesive-bonded joints because ofdecrease of the adhesion strength due to the low cohesion strengthof the finish coat itself and because of the labor requirements in pro-ducing the adhesive-bonded joints.
Some papers [183, 188, 189] have stated that internal stresses can bedecreased and the coating lifetime can be increased by means of addi-tives that create an ordered crosslinked structure in solutions and dis-persions as well as in coatings based on them. The formation of thisstructure promotes the rapidity of the relaxation processes [190]. Themechanism of such a process [191] is related to transition of the systeminto the gelatinous state due to the formation of local physical or che-mical links between structural elements, which shortens the relaxationtime [192]. In oligomeric systems the thixotropic structure can beformed before polymerization begins by introducing polyfunctionaladditives that interact with oligomer active groups, resulting in forma-tion of hydrogen bonds and physical links [183]. The rate of relaxationof the internal stresses in polymers can also be increased by addingother substances such as fillers or alloying additives [193].
High adhesion strength with simultaneous minimization of theinternal stresses can be obtained in the formation of adhesive-bondedjoints under conditions in which the rates of internal stress relaxationand polymer formation are compatible. This approach to decreasing
Internal Stresses in Adhesive-Bonded Joints and Ways of Decreasing Them 253

the internal stresses is acceptable when their rate of relaxation iscomparatively high.
The thermal stresses in the layers and films of the polymer can bedecreased by heat treatment due to the increase in the rate of theirrelaxation [194].
Let us consider in more detail methods of decreasing the internalstresses that are most acceptable for application in adhesive-bondedjoints. These are based on the increase of the relaxation rate at thetime of formation of the adhesive layer, on decrease of the adhesiveshrinkage, and on the decrease of overstresses at the adhesive–sub-strate interface.
4.3.1 Effect of surfactant on internalstresses in adhesive-bonded joints
Addition of the IS agent OP-10 into adhesive based on ED-20 epoxyresin results in abrupt decrease of the internal stresses in the adhe-sive layer (Fig. 4.8a). With the RS substance L-19, which is close toOP-10 in composition, the internal stresses again decrease, but muchless so. Similar dependences are observed when the internal stressesare studied in adhesive-bonded joints based on acrylate adhesives(Fig. 4.8b).
As Fig. 4.8 shows, RS and IS agents have a noticeable effect on thekinetics of both the growth and relaxation of stresses. In the caseunder consideration, the failure stress of the adhesive-bonded jointsand the internal stresses do not correlate (Fig. 4.8a). Thus, addition ofRS substances to the adhesive results in increase of the adhesionstrength and in decrease of the internal stresses. IS substancesdecrease both the adhesion strength and the internal stresses. A simi-lar dependence is observed for the acrylate adhesives. The adhesivecontaining ATG and fluorinated alcohol has maximal adhesionstrength and minimal internal stresses.
Let us consider these results. IS substances separating as an indi-vidual phase during the oligomer polymerization concentrate in theinterstructural regions of the polymer and close to the solid surface,thus increasing the rate of stress relaxation. The adhesive interlayercan ‘‘slide’’ along the boundary polymolecular layer of surfactant rela-tive to the substrates, with a drop in the internal stresses.
RS agents do not form weak interface layers and increase the adhe-sion interaction of the adhesive with the substrate. It might be sup-posed that addition of RS substances to the adhesive results inincrease of the internal stresses, while the actual picture is quite theopposite. Molecules of RS substances, low-molecular weight sub-
254 Chapter Four
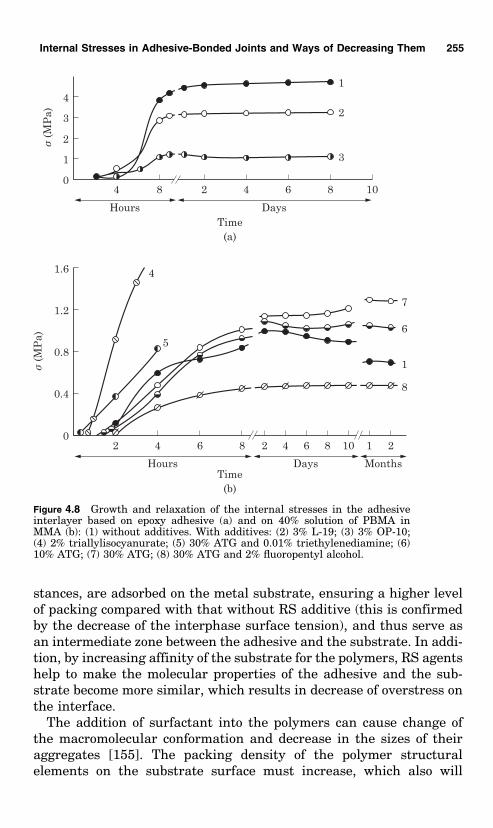
stances, are adsorbed on the metal substrate, ensuring a higher levelof packing compared with that without RS additive (this is confirmedby the decrease of the interphase surface tension), and thus serve asan intermediate zone between the adhesive and the substrate. In addi-tion, by increasing affinity of the substrate for the polymers, RS agentshelp to make the molecular properties of the adhesive and the sub-strate become more similar, which results in decrease of overstress onthe interface.
The addition of surfactant into the polymers can cause change ofthe macromolecular conformation and decrease in the sizes of theiraggregates [155]. The packing density of the polymer structuralelements on the substrate surface must increase, which also will
Internal Stresses in Adhesive-Bonded Joints and Ways of Decreasing Them 255
Figure 4.8 Growth and relaxation of the internal stresses in the adhesiveinterlayer based on epoxy adhesive (a) and on 40% solution of PBMA inMMA (b): (1) without additives. With additives: (2) 3% L-19; (3) 3% OP-10;(4) 2% triallylisocyanurate; (5) 30% ATG and 0.01% triethylenediamine; (6)10% ATG; (7) 30% ATG; (8) 30% ATG and 2% fluoropentyl alcohol.

result in the decrease of overstress on the interface. Actually, asshown in [195], the decrease in the size of polymer structural ele-ments results not only in increase of the adhesion strength but alsoin decrease of the internal stresses. Thus, even without adsorbing onthe polymer–substrate interface, surfactant can decrease the over-stress in this zone.
When added to the adhesive, surfactant that can form hydrogenbonds with the polymer macromolecules can promote ordering of itsstructure [196], which increases the rate of relaxation of the internalstresses. Hence, with addition of RS surfactants this rate remainsinsignificant (Fig. 4.8a). Moreover, the internal stresses at the initialstage of formation of the joint in adhesives containing RS surfactantare higher than those in adhesives without the additive, whereas theformation of thixotropic structure most abruptly decreases the inter-nal stresses at the initial stage of polymer formation [183].
Thus, when an IS substance is added to the adhesive, the decrease ofthe internal stresses occurs due to increase of the rate of the stressrelaxation and due to ‘‘sliding’’ of the adhesive layer relative to sub-strates; the most probable mechanism of action of RS substances liesin the increase of the packing density of adhesive molecules on thesubstrate surfaces and the related decrease of the overstress on theinterface.
4.3.2 Controlling internal stresses inadhesive-bonded joints by takingaccount of the separation in time ofthe formation of linear and cross-linked polymers
For there to be substantial separation in time of the processes of linearpolymer formation and of intermolecular crosslink formation, theywould have to proceed by different mechanisms. For the relaxationof the internal stresses that occur at the stage of formation of thelinear polymer, the polymer must possess sufficient pliability undercreep. Because internal stresses may also appear at the stage of for-mation of the intermolecular crosslinks, the concentration and rate offormation of crosslinks must be minimal.
Let us consider the above method for decreasing the internal stressesin acrylic adhesives based on 40% solution of PBMA in MMA. Theadhesive was cured in the course of copolymerization of MMA andBMA under effect of the b.p.–DMA redox system at room temperature.The cured adhesive has comparatively low elastic modulus of6:2 � 102 MPa. The polymer has a high rate of relaxation of the internalstresses, which does not exceed 0.5 MPa in the adhesive interlayer.
256 Chapter Four

The internal stresses in the adhesive under consideration candecrease for another reason. As pointed out in Chapter 1, the substratesurface can inhibit the polymerization of MMA and BMA, which plas-ticizes the adhesive layer on the interface and facilitates the increaseof the rate of relaxation of the internal stresses for some time after theadhesive in bulk has cured. In fact, noticeable growth of the internalstresses in the joint begins to be observed only 10–15 min after theadhesive has cured in bulk. The relationship between the residualstresses in a polymer and the differences in rates of curing in bulkand on the surface was discussed in [197].
The linear structure of the macromolecules of the polymers compris-ing adhesive components and the adhesive’s capacity to creep do notactually allow application of the adhesive in liquid solvent media andtheir use for structural purposes because the long-term strength of theadhesive will be low despite there being internal stresses.
ATG crosslinking was added to increase the strength and resistanceof the adhesive to solvents. ATG copolymerizes with MMA and BMAduring curing of the adhesive and a copolymer of linear structureresults with side-branches containing isocyanate groups. Under theinfluence of the moisture that diffuses into the adhesive interlayer,the isocyanate groups react one with another and form urea bridges.
Internal Stresses in Adhesive-Bonded Joints and Ways of Decreasing Them 257

Table 4.1 presents data on the alteration with time of the isocyanategroups in the adhesive, the amount of gel fraction, the elastic modulus,and the adhesion strength. The adhesive layer was 0.3 mm thick; theATG concentration in the adhesive was 10%. The concentration of theisocyanate groups was determined by differential IR spectroscopy ofthe band of valence oscillations at 2280 cm�1. The adhesive film forinvestigation was obtained by separating it from the foil substrates.Acetone was used as a solvent for determining the concentration of gelfractions. As Table 4.1 shows, increase of the gel fraction concentra-tion, of the elastic modulus, and of the adhesion strength accompaniesconsumption of the isocyanate groups in the adhesive.
Let us consider the effect of crosslink formation on the internalstresses in the adhesive layer. After the adhesive is cured (in onehour after cementing) the internal stresses are low both in the adhe-sive with ATG and in that without ATG (see Fig. 4.8b). Crosslinkformation in the adhesive with ATG does not cause increase of theinternal stresses if ATG concentration is 10%; the internal stressesincrease at 30% concentration of ATG.
The internal stresses in the adhesive can be decreased using surfac-tant before formation of the intermolecular crosslinks. Addition of 2%of fluorinated alcohol into the adhesive containing 30% of ATGdecreased the internal stresses almost 3-fold.
Thus, it is the separation in time of the formation processes of thelinear polymer and the intermolecular crosslinks that produces adhe-sive-bonded joints with low internal stresses. In the adhesive containing20% of gel fraction but in which the crosslinks were formed using triallylisocyanurate along with the polymer formation, the internal stresseswere substantially higher than in the adhesive containing ATG only(see Fig. 4.8b, curve 4). Increase of the crosslink formation rate by add-ing triethylenediamine, as catalyst of the reaction of the isocyanategroups with water, to the adhesive simultaneously with addition ofATG also increased the internal stresses (see Fig. 4.8b, curve 5).
258 Chapter Four
TABLE 4.1 Alteration of Acrylic Adhesive Properties with Time
Time after cementing (days)
Index 0 1 3 5 10 30 60
Relative concentration of isocyanategroups (%) 100 98 80 71 53 28 22
Gel fraction concentration (%) 0 3 6 16 20 21Adhesive elastic modulus, E (10�2 MPa) 0.5 8.2 9.4 11 12 12.1Adhesion strength (MPa) 14.6 17.9 11.2 29.3 36.1 38

4.3.3 Decrease of internal stresses inadhesive-bonded joints usingadhesives based on interpenetratingnetworks
Obtaining interpenetrating networks (IPNs) is in principle a newmethod of blending nonmelting and insoluble three-dimensional poly-mers. IPNs are known to be characterized by a number of thermo-dynamic and physical-mechanical peculiarities. Application of IPNsbased on crosslinked polymers of various chemical compositionsshould produce adhesives with a wide range of properties.
The components of IPNs are thermodynamically incompatible, and atransition region of two phases of these components is formed in thesystem. All the properties are determined by the existence and char-acteristics of this region. In particular, the density of macromolecularpacking in IPNs is less than in the individual networks, which resultsin decrease of shrinkage during IPN formation. The mobility of thechain segments between the crosslinks of the network is higher thanin the individual networks, which can be explained by the formation ofa loose transition region in the systems of such a type; the extent of thelooseness depends on the ratio of components. The increase of mobilityof the chain segments may result in increase of the rate of relaxation ofthe internal stresses in polymers.
Thus, the application of IPNs as adhesives allows control of suchproperties as shrinkage and relaxation processes, which directly affectthe internal stresses inside the adhesive layer. New ways of decreas-ing the internal stresses in the adhesives are based on differences inthe curing rates of two individual networks that comprise the IPN. Weconsider adhesives consisting of a mixture of polyester and poly-urethane. The IPN resulted from simultaneous formation of two net-works. For this purpose a styrene solution of maleate–phthalateoligodiethylene glycol (PE resin) was blended with MDI, which isthe product of reaction of 1 mole of oligodiethylene glycol adipatewith 2 moles of TDI, and this was cured with 2% MEKP(O) and 1%CN (cobalt naphthenate). The end hydroxyl and carboxyl groups of thePE resin were prebonded by phenyl isocyanate to prevent chemicalreaction between the individual networks. The resin was cured at208C for 40 min. MDI was polymerized by the reaction of the isocya-nate groups with atmospheric moisture that diffused into the adhesivelayer (the polymerization ran for 90–100 days) and was monitored byIR spectroscopy of the band of valence oscillations of the isocyanategroups in the region of 2200 cm�1. The ratio of polyester to MDI wasassumed to be 1:0.8.
In connection with the low rate of MDI polymerization one can con-sider two stages of the state of the adhesive in the layer. At the first
Internal Stresses in Adhesive-Bonded Joints and Ways of Decreasing Them 259

stage, after the PE resin is polymerized, the adhesive comprises apolyester plasticized by MDI; at the second stage, the IPN is formed.
The properties of the system change in the course of IPN formation:both the modulus of elasticity (Table 4.2) and the adhesion strength(Fig. 4.9) increase. The adhesion strength of IPN exceeds that withpolyester or polyurethane adhesive. One reason is the low level of theinternal stresses in the adhesive layer of IPN compared with polyester(Fig. 4.10). The decrease of the internal stresses in this case isexplained by the increased rate of relaxation of the internal stressesin the adhesive layer due to the presence of a substantial amount ofliquid MDI. Because polymerization of MDI runs for a long time, theinternal stresses manage to relax completely; even 100 days after theadhesive polymerization, the stresses do not exceed 1–1.5 MPa.
A second reason for the decrease in internal stresses in IPN-basedadhesives is their low shrinkage. To separate these two factors, therate of MDI curing was increased by adding 2,4-butylene glycol tothe adhesive. As Fig. 4.9 displays, the internal stresses increasedsomewhat but nevertheless remained much lower than those of thepure polyester adhesive. The shrinkage of the adhesive layer, whichcauses the internal stresses, was determined by Equation (4.49). Forthe IPN-based adhesive (with added 2,4-butylene glycol) it appearedon average to be 2.6 times less than that of the adhesive based onpolyester.
4.3.4 Methods of decreasing edge internalstresses in adhesive-bonded joints
The methods of controlling the edge stresses are based on addingsubstances that produce different mechanisms of adhesive cure inthe bulk and at the interface with air. This results in alteration ofthe physical-mechanical properties of the adhesive depending on thedistance to the edge—i.e., decrease of the adhesive modulus of elasti-city at the edge and increase of the rate of relaxation of the internalstresses.
260 Chapter Four
TABLE 4.2 Change of Elastic Modulus of IPN Adhesive Layer with Time
Modulus of elasticity (MPa)
Time after adhesive cure (days) Torsion shear Tension shear
3 3.8 3.610 0:5 � 102 0:6 � 102
100 2:1 � 102 4:9 � 102
200 2:2 � 102 4:9 � 102

Let us consider methods of decreasing the edge stresses of a systembased on unsaturated compounds. For this purpose the capacity ofoxygen to inhibit the process of radical polymerization of unsaturatedcompounds is exploited. In addition to other factors, the location of thelayer under study determines the oxygen concentration in the system.
At the stage of inhibition of radical polymerization by the oxygen,the following reactions occur [200]:
Development of oxidation chain
R þ O2 !k1RO2 RO2 þ M !k2
R
Growth of polymer chain
R þ M !k3R
Termination of chain
RO2 þ RO2 ! nonreactive products
Internal Stresses in Adhesive-Bonded Joints and Ways of Decreasing Them 261
Figure 4.10 Kinetics of internalstress elevation and relaxation:(1) polyester adhesive; (2) IPN-based adhesive with added 2,4-butylene glycol; (3) the samewith additives.
Figure 4.9 Change of the adhesionstrength of the adhesive-bondedjoints with time: (1) adhesivebased on IPN; (2) polyester adhe-sive; (3) polyurethane adhesive.

Given that, for example, for MMA k3=k1 ¼ 3 � 10�5, practically all thepolymer radicals react with oxygen but not with a monomer, althoughthe concentration of the latter is 104 times higher than the oxygenconcentration (oxygen solubility in MMA is 10�3 mol/l when saturatedwith air). As the reactivity of RO2 relative to monomer is far less thanthat of R, the conversion of R into RO2 is similar to chain termination.The monomer that has not reacted volatilizes from the adhesive layer.
Let us add to an adhesive a substance containing two or more doublebonds of allyl type, which is not able to undergo the reaction of radicalhomopolymerization. In the bulk of the adhesive this substance co-polymerizing with a monomer serves as a crosslink of the polymerchains. Due to the inhibiting effect of the oxygen and to the volatiliza-tion of the monomer, it cannot copolymerize at the edge and is in theinitial state in the adhesive, exerting a plasticizing effect and increas-ing the rate of relaxation of the internal stresses. Thus, depending onthe distance to the boundary between the adhesive and the air, thesame substance may act as a crosslink or a plasticizer.
As Fig. 4.11 shows, the addition of 10% of CH2——CH—CH2 —O—
CO—NH2ÞC6H12 to an adhesive results in practically complete disap-pearance of the edge stresses. A 40% solution of PBMA in MMA wasused as adhesive, which was cured at standard temperature under theeffect of b.p. and DMA. The modulus of elasticity of the adhesive film is1:5 � 103 MPa, and that of the 0.2 mm thick polymer on the boundarywith air is 22 MPa.
262 Chapter Four
Figure 4.11 Effect of the cross-linking/plasticizing agent on theinternal stress concentration (Kkis the concentration coefficient)at the edges of the adhesive-bonded joints

Chapter
5Cementing and Operation of
Adhesive-Bonded Joints inLiquid Media
5.1 Cementing in Liquid Media
The principles considered so far of controlling the properties ofadhesives are related to the cementing of dry surfaces. Practicalexperience reveals the necessity for adhesives to be operated indifferent liquid media. In fact the use of adhesives is often demandedoutdoors where it is almost impossible to remove liquid from thesurfaces to be cemented—for example, in the repair of oil pipelinesor oil tanks when working in rain or actually under water. Thepresence of liquids on the substrate prevents the formation of a strongadhesive joint. Because of the possible formation of water adsorptionfilms of substantial thickness on the surfaces to be cemented, evenatmospheric humidity affects the adhesion strength in the course ofcementing.
The formation and operation of adhesive-bonded joints in liquids ischaracterized by a number of features, some physical-chemical aspectsof which will be considered in the present chapter.
As has been stressed in earlier chapters, wetting of the substrate byan adhesive is one of the principal conditions for formation of a strongadhesive-bonded joint. Without the formation of a close contactbetween the adhesive molecules and the solid surface, the formationof a strong adhesive-bonded joint is in fact impossible.
When applying adhesive to a solid in a liquid environment, theprocess of wetting the solid surface with adhesive, i.e., of forcing liquidout, is of primary importance. When the cementing is performed in air,
263

the adhesive-bonded joint is formed even with incomplete wetting. Ifthe adhesive is applied to a solid surface in a medium of anotherliquid, their simultaneous presence on the surface is observed onlyfor a narrow range of interfacial angle of wetting of the solid by theliquids. In other cases, the solid surface is wetted by only one liquid.Thus, if the adhesive does not preferentially wet the solid surface in aliquid ambience, there will be a layer of liquid between the adhesiveand the surface. In this case the strength of cementing is close to zero.It is impossible to increase the degree of filling of the surface defectswith the adhesive under these conditions because of the incompressi-bility of liquids.
Analysis of the theoretical underpinnings indicates [201–206]that to provide for wetting of the solid surface by adhesive it isnecessary first to achieve the minimal value of the interphase ten-sion between the adhesive and the solid. Actually, cementing oflow-energy surfaces (polymers, for example) under water poses noproblem, while cementing of metals is impeded because of thehigher affinity of water to metals than of adhesive. At first glance,hydrocarbons do not seem to hinder formation of strong adhesive-bonded joints because the affinity of the majority of the adhesivesto metal is higher than that of hydrocarbons. In practice it is verydifficult to perform cementing in oils, lubricants, and diesel fuelsbecause they contain impurities with surface-active properties [202]that decrease the interphase tension between oil and metal.Additionally, many oil products have high viscosity, which stronglydecreases the rate at which they can be forced from the surface bythe adhesive.
The addition of surfactant to the adhesive changes the surfaceproperties of the polymers, and consequently changes the wetting ofthe solid surface. As Fig. 5.1 shows, the addition of 1% OP-10 or of thefluorinated alcohol CF3(CF2)CH2OH to an adhesive based on a 40%solution of PBMA in MMA decreases the interfacial angle for wettingof the steel surface by the adhesive from 728 to 30–508.
The liquid in which cementing is performed can affect the pro-cess of adhesive polymerization. Thus, when cementing underwater with VAK and Sprut-4 adhesives containing MMA as anactive solvent, the rate of cure increases to 1.2–1.5 times thatwhen cementing in air. This seems to be explained by the highercontent of oxygen, which inhibits MMA polymerization, in the airthan in water. When cementing under water, the molecular weightof the polymethyl methacrylate can also increase, which results inchange in some of the physical-mechanical characteristics of theadhesive. It is well known that when 1.25% of water is added toa monomer the molecular weight of the polymethyl methacrylate
264 Chapter Five

increases almost 2-fold from 3:68 � 106 to 7:13 � 106. This occursbecause water is not a solvent for polymethyl methacrylate and,although the polymerization process remains homogeneous withthis addition of water, the increase of the coiling probability ofthe growing macrochains decreases their termination rate [208].With the increase of the water content in the monomer, the systembecomes heterogeneous and adopts a colloid-dispersed state thatdoes not result in further increase of the molecular weight of thepolymethyl methacrylate formed.
The water present can chemically react with components of theadhesives. Thus, adhesives containing large quantities of isocya-nate groups cannot be used for cementing under water if theirtime and area of contact with water will be considerable becausethe carbon dioxide released forms pores and pits in the adhesive(Equation 5.1).
ð5:1Þ
The water can also inhibit the polymerization of unsaturated com-pounds at the boundary between the adhesive and the metal, whichdecreases the adhesion strength. To obtain a strong adhesive-bondedjoint the adhesive also must not dissolve and swell in the liquidmedium in which the cementing is performed.
In the case of selective wetting of a solid surface by liquid 1 in amedium of liquid 2, mechanical work has to be performed at the inter-
Cementing and Operation of Adhesive-Bonded Joints in Liquid Media 265
Figure 5.1 Dependence of theinterfacial angle of wetting ofsteel by the cured adhesiveunder water on the surfactantconcentration: (1) without sur-factant; (2) OP-10; (3) fluori-nated alcohol.

face to separate a drop of liquid 2 from the surface. Similar processeshave been fairly well investigated in studies of the mechanism ofdetergency. Equation (5.2) determines the specific mechanical worknecessary for complete replacement of liquid 2 on the solid surfaceby liquid 1:
Aliq ¼ vliq1 liq2ð1 þ cos �Þ þ vliq1 liq2S1 � S2 � S3
S2
� �ð5:2Þ
Here, S1, S2, S3 are the interfaces of solid–liquid 1, solid–liquid 2, andliquid 1–liquid 2, and v is the rate of separation. When cementing inwater and oil products, the adhesive is liquid 1 and the medium isliquid 2. Equation (5.2) indicates that spontaneous wetting (withoutmechanical work to the interface) is possible when the surface ten-sions of the adhesive and the liquid are equal, i.e., for �ad liq ¼ 0,although the maximal value of �ad liq is desirable because it is directlyproportional to the adhesion thermodynamic work.
Thus, it is impossible to obtain a strong adhesive-bonded joint whencementing in liquid media without supplying mechanical work to theadhesive–substrate interface, even when thermodynamic conditionsare appropriate for selective wetting of the substrate by the adhesive.Practically, the mechanical work can be supplied by mutual displace-ment of the adhesive and the cemented surfaces, for example, bypumping the adhesive into the gap between the surfaces, by pressingthe surfaces together so that the adhesive is expelled from the gap, byultrasonic treatment of the adhesive layer, and so on.
The influence of this work on the strength of the adhesive-bondedjoint is illustrated by Fig. 5.2. Compounds containing surfactant andcapable of cementing in water and oils were used as adhesives. Thecompositions of the adhesives were as follows (parts by mass):
A. 40% solution of PBMA in MMA 100
Product (CH3(C6H3)(NCO)NHCOOCH2 —— CH2 10
B. PN-1 resin (styrene solution of PDEGMP) 100
Polyurethane prepolymer (product of reaction of 1 mol ofpolyethylene glycoladipate and 2 mol of TDI) 50
Product CH3(C6H3)(NCO)NHCOOCH2 — CH —— CH2 30
C. NPS609-21S (solvent TGM) 100
Polyurethane prepolymer 50
Product CH3(C6H3)(NCO)NHCOOCH2 — CH —— CH2 30
266 Chapter Five

The viscosity of the adhesives was increased to 20 PA � s by addingAM-1 aerosil. The adhesives were cured at room temperature by theredox system b.p.–DMA for adhesive A, and by MEKP(O)–CN foradhesives B and C. The curing time was 0.5–1 h. The specimens forcementing were made of St3 steel in the shape of a dolly. The speci-mens were tested 24 h after cementing.
Application of mechanical work to the adhesive–metal interface (byadhesive flow through the gap between the dollies at various speeds)had greater effect on the adhesion strength when cementing wasperformed in the liquids than in the air (see Fig. 5.2). This can beexplained by the fact that the work done facilitates the selectivewetting of the substrate by the adhesive: the flowing adhesivepicks up drops of liquid from the substance surface and removesthem.
5.2 Effect of Liquids on the Properties ofAdhesive-Bonded Joints
When adhesive-bonded joints are operated in liquids, their adhesionstrength frequently decreases. For example, the decrease in strength
Cementing and Operation of Adhesive-Bonded Joints in Liquid Media 267
Figure 5.2 Dependence of the failure stress of the adhesive-bonded joint on the feed ratebetween two surfaces of adhesives C (a), A and B (b) in air (1;1 0), in water (2; 2 0), and inoil (3). Primed numbers refer to adhesive A.

of steel adhesive-bonded joint held in water at 208C for 72 h is 22%(21.0) for the VK-3 adhesive, 50% (26.7) for VK-13M, 18% (21.0) forVK-32-200, 16% (16.1) for VK-24M, 5% (27.9) for VK-24-50, and 16%(26.5) for VK-24-100 adhesive (figures in parentheses are the initialstrength of the joint in MPa). When treated with cold or hot water for7–30 days, the strength of the epoxy-based adhesive-bonded jointsdecreases by 40–50%. Even when the joints are operated in air theirstrength depends on the air humidity [210].
The water resistance of adhesive-bonded joints also depends on thenature of the materials cemented. The maximal decrease of strength ischaracteristic for aluminum and seems to occur due to the high hydro-philicity of the porous oxide film on the aluminum surface. The waterresistance of steel adhesive-bonded joints increases if the steel isetched.
Impurities in the water have a great effect on the water resistance ofthe joints. The maximal strength decrease of glass-reinforced plasticsis caused by distilled water. The strength of steel joints cemented withadhesive based on the Epoxy-1000 resin decreased by 44% when sub-jected for 60 days to rainwater, by 21% with river water, and by 18%with sea water. Adhesives based on PN polyester resin form compara-tively water-resistant joints with glass-reinforced plastics [211], whilesteel joints cemented by these adhesives are not water-resistant.When subjected to warm (608C) water for 400 h and to boiling waterfor 120 h, the strength of steel joints bonded by polyester adhesivesdecreased 3–4 times.
One of the principal reasons for failure of the adhesion bonds isa specific adsorption reaction of the medium with the material tobe cemented at the boundary with the adhesive. There is anadsorption substitution of adhesive–substrate bonds by medium–substrate bonds. Surface structural defects that are present ineach solid are the first to be subjected to adsorption. It is to beexpected that the probability of appearance of such defects ishigher at an interface of two materials with different properties.The rate of penetration of the medium along the polymer–substrateinterface frequently substantially exceeds the rate of diffusion ofthe medium in pure polymer [212]. Adsorption substitution of thepolymer macromolecules by water molecules on the metal surfaceexplains the low water resistance of such adhesive-bonded joints asfluoroplastic–steel or polyethylene–steel [34]. The adhesionstrength, which decreases during hold-up of adhesive-bonded jointsin water, is frequently reestablished after the joints are dried[213].
It can be assumed that when metals are cemented by nonpolaradhesives there is a layer of water molecules (always present on
268 Chapter Five

the metal under normal conditions) between the adhesives and themetal surface. The reversibility of the adhesion strength will be gov-erned by the thickness of the water layer at the polymer–metal inter-face. It should be noted that the properties of thin water layers onmetal surfaces differ from those of bulk water [214]. Thin layers ofpolar liquids, including water, on hydrophilic surfaces are known tohave abnormally high shear elasticity. From this point of view, thedecrease of adhesion in liquid water or in humid atmospheres isexplained by the increase of the water layer thickness at the poly-mer–substrate interface. When the properties of the water in thelayer approach those of bulk water, the strength of the adhesive-bonded joint drops practically to zero. The decrease of the layerthickness at the interface when the adhesive-bonded joint is driedresults in enhancement of the strength of the joint, i.e., in reestab-lishment of adhesion.
Enhancement of the reliability of adhesive-bonded joints operatedin liquid media is a high-priority task. A metal–polymer interlayercan be exploited for this purpose. Substances forming strong bondswith both the polymer and the substrate are often used as inter-layers. For example, to enhance the water resistance of some coat-ings on glass, silanes are applied that form chemical bonds with bothglass and coating [215]. To enhance the adhesion strength, as well aswater resistance, of polyethylene with metals a monolayer of fattyacids can be applied to the metal surfaces. Mechanical treatment,such as finishing, of metal surfaces with a fatty acid present furtherincreases the liquid-resistance of coatings. The water resistance ofpolyester compounds can be enhanced by adding surfactant [216].The water resistance of adhesives based on epoxy and alkyd resinscan be enhanced by adding low-viscosity organosilicon liquids. Tarsand bitumen are used [217] to modify epoxy resins, wherebyincreased water resistance is accompanied by decrease of the adhe-sion strength.
As this brief literature review displays, at present there are noscientifically substantiated and practically applicable methods forenhancing the water resistance of adhesive-bonded joints.
Let us consider the effect of water on the adhesion strength of elasticpolyurethane adhesives (for example), which exhibit the lowest waterresistance. The adhesives were based on MDI which was synthesizedfrom polyoxypropylene glycol (POPG) or polytetramethylene (PTMG)glycol of molecular weight 1000 or 2000 and TDI or diphenylmethanediisocyanate (DPMDI). In the course of synthesis of MDI, the ratio ofisocyanate and hydroxyl groups was assumed to be 2:1, i.e., the MDIlooked like:
Cementing and Operation of Adhesive-Bonded Joints in Liquid Media 269

270 Chapter Five
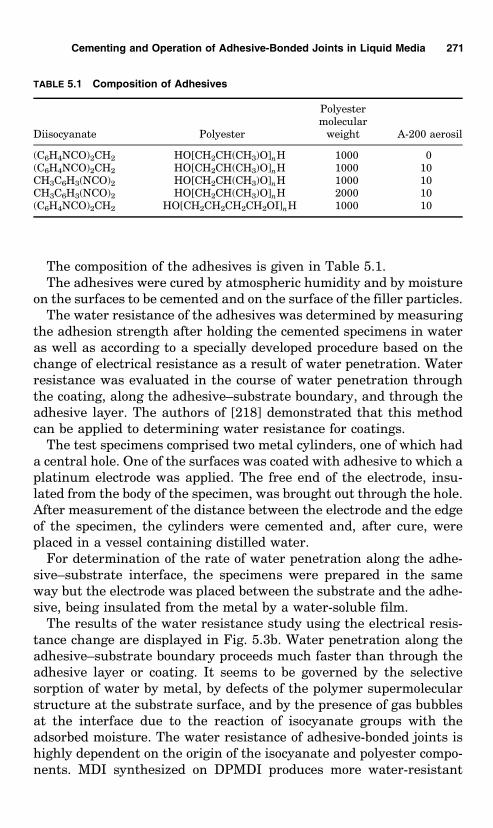
The composition of the adhesives is given in Table 5.1.The adhesives were cured by atmospheric humidity and by moisture
on the surfaces to be cemented and on the surface of the filler particles.The water resistance of the adhesives was determined by measuring
the adhesion strength after holding the cemented specimens in wateras well as according to a specially developed procedure based on thechange of electrical resistance as a result of water penetration. Waterresistance was evaluated in the course of water penetration throughthe coating, along the adhesive–substrate boundary, and through theadhesive layer. The authors of [218] demonstrated that this methodcan be applied to determining water resistance for coatings.
The test specimens comprised two metal cylinders, one of which hada central hole. One of the surfaces was coated with adhesive to which aplatinum electrode was applied. The free end of the electrode, insu-lated from the body of the specimen, was brought out through the hole.After measurement of the distance between the electrode and the edgeof the specimen, the cylinders were cemented and, after cure, wereplaced in a vessel containing distilled water.
For determination of the rate of water penetration along the adhe-sive–substrate interface, the specimens were prepared in the sameway but the electrode was placed between the substrate and the adhe-sive, being insulated from the metal by a water-soluble film.
The results of the water resistance study using the electrical resis-tance change are displayed in Fig. 5.3b. Water penetration along theadhesive–substrate boundary proceeds much faster than through theadhesive layer or coating. It seems to be governed by the selectivesorption of water by metal, by defects of the polymer supermolecularstructure at the substrate surface, and by the presence of gas bubblesat the interface due to the reaction of isocyanate groups with theadsorbed moisture. The water resistance of adhesive-bonded joints ishighly dependent on the origin of the isocyanate and polyester compo-nents. MDI synthesized on DPMDI produces more water-resistant
Cementing and Operation of Adhesive-Bonded Joints in Liquid Media 271
TABLE 5.1 Composition of Adhesives
Polyestermolecular
Diisocyanate Polyester weight A-200 aerosil
(C6H4NCO)2CH2 HO[CH2CH(CH3)O]nH 1000 0(C6H4NCO)2CH2 HO[CH2CH(CH3)O]nH 1000 10CH3C6H3(NCO)2 HO[CH2CH(CH3)O]nH 1000 10CH3C6H3(NCO)2 HO[CH2CH(CH3)O]nH 2000 10(C6H4NCO)2CH2 HO[CH2CH2CH2CH2OI]nH 1000 10

272
Figure 5.3 Effect of water on the specific electrical resistance and the adhesion strength(steel 3–steel 3) of the adhesive based on macrophenylmethane diisocyanate (a), and onmacrodiisocyanates made of POPG-1000 and diphenylmethadiisocyanate (b), POPG-2000and TDI (c), and POPG-1000 and TDI (d) containing 0.2% catalyst and 10% filler (b, A; c; d),and without filler (b, B): (1) adhesive 0.25 mm thick applied to steel foil; (2) electrode in thebulk adhesive; (3) electrode on the substrate–adhesive boundary; (4) pull-off adhesionstrength.

adhesive-bonded joints compared with MDI based on TDI. So, for thefirst 2–3 days the specific electrical resistance of the adhesive-bondedjoint made with MDI based on TDI drops virtually at the moment ofcontact with water (Fig. 5.3b, d).
The addition of aerosil as a filler of the polyurethane adhesive hin-ders the rate of water penetration. Along the boundary betweenunfilled adhesive and steel, water penetrates twice as fast as alongthe boundary with the filled adhesive; and through the bulk of theunfilled adhesive, water penetrates four times faster than throughthat of the filled adhesive. The specific electrical resistance of awater-submerged coating made of filled MDI is higher throughoutthe test range than that of the unfilled coating (Fig. 5.3b).
The enhancement of MDI water resistance with added aerosil iscaused both by the additional structurization of the adhesive whenthe isocyanate groups interact with the active centers of the fillersurface, and by the adsorption of the diffusing moisture by aerosil.
The water resistance of polyurethane adhesive depends to a greatextent on the molecular weight of the initial polyester (Fig. 5.3c, d). Asthis increases, the electrical resistance and water resistance ofthe adhesive decrease. This is displayed most clearly when thewater penetrates along the adhesive–steel boundary. Similarð3 � 106 � � cmÞ specific electrical resistance was obtained with thepolyurethane adhesive based on POPG-1000 for 4 days, and with thepolyurethane adhesive based on POPG-2000 for 1 day.
Increase of the POPG molecular weight noticeably decreases notonly the adhesive’s water resistance but also the adhesion strength(Fig. 5.3c, d, curves 4), which seems to be related to the decrease of theconcentration of urethane groups.
The initial effect of water on the coating can increase its electricalresistance (Fig. 5.3d). This seems to be related to the adhesive post-cure. The water diffuses very slowly through the coating, since thenoticeable drop in electrical resistance begins to be observed aftersome months of submersion of the coating in water.
Replacement of POPG by PTMG of the same molecular weight sub-stantially decreases the rate of water diffusion along the adhesive–steel boundary and along the adhesive, and increases the originaladhesion strength and delays its decrease in water (Fig. 5.3a).
Note that in all cases the initial strength is reestablished after theadhesive-bonded joint is dried. Thus, the drop in strength of adhesive-bonded joints operated in water is explained mainly by diffusion ofwater at the adhesive–substrate interface. Methods that increasewater resistance decrease the rate of water diffusion along the inter-face, although it still takes place. Increase in the rate seems to becaused by both adsorption and diffusion mechanisms of the medium.
Cementing and Operation of Adhesive-Bonded Joints in Liquid Media 273

Resolution of the effect of the medium into separate components is ofgreat interest, but the problem presents substantial difficulties in thatthe various factors act simultaneously and the result is not simply thesum of separate components but the resultant of their interaction. Insome cases it is advisable to restrict the approach to treatment of thepredominant mechanism, which in our opinion is adsorption. In thiscase the principal means of increasing the water resistance of thejoints is the creation of conditions that decrease or eliminate theselective sorption of water onto the substrate surface under theadhesive layer. This condition is decrease of the interphase tensionof solid adhesive–substrate.
Figure 5.4 shows the correlation between the water resistance ofsteel adhesive-bonded joints and the adhesive–mercury interphasetension. Given the different states of aggregation of the steel andthe mercury, such a correlation can only be qualitative, but it never-theless clearly indicates ways of controlling the water resistance ofadhesive-bonded joints.
The epoxy, acrylate, polyurethane, and polyester adhesivesdescribed earlier in Chapter 2 were used for investigations, and RSagents were used to control the interphase tension. Water resistancewas evaluated by the retention of strength of the joints after hold-upin water for 30 days; no noticeable hydrolysis was observed in thisperiod.
For interphase tension below 220–230 mN/m and use of hydrolyti-cally stable adhesives, the joints do not fail along the adhesive–metalinterface even after hold-up in water for periods of years. Presumablywith this interphase tension the process of substitution of adhesive
274 Chapter Five
Figure 5.4 Dependence of the water resis-tance B of adhesive-bonded joints on theadhesive–mercury interphase tension.

macromolecules by the water molecules at the metal surface is ener-getically disadvantageous, which implies retention of adhesionstrength with time. For example, adding two RS agents,CF3(CF2)CHOH and CH3C6H3(NCO)NHCOOCH2CH —— CH2, to theadhesive based on a 40% solution of PBMA in MMA produced anadhesive–mercury interphase tension less than 230 mN/m. The adhe-sion strength of metal joints cemented with adhesive does not decreaseeven after six years in water.
Let us consider a particular example of the effect of RS substanceson the water resistance of adhesive-bonded joints. Adhesives based onunsaturated polyester resins, such as PN-1, are distinguished by lowwater resistance. The influence of water on a steel joint cemented bysuch an adhesive actually results in some initial increase of the spe-cific electrical resistance along the adhesive–steel interface and thenin an abrupt drop (Fig. 5.5). The increase is explained by more com-plete consumption of the monomer in the system. When ATG is addedto the adhesive (which decreases the interphase tension) the specificelectrical resistance stabilizes after a drop. The decrease seems to berelated to the processes of relaxation of the internal stresses in theadhesive interlayer. The stresses facilitate the diffusion of liquids inpolymeric materials, in particular the stress concentration at the poly-mer–metal interface.
Thus, minimizing the adhesive–substrate interphase tension is anecessary condition for obtaining both strong and liquid-resistantadhesive-bonded joints. But it is not necessarily sufficient, becausethe strength and the water resistance can be determined by variousfactors, such as internal stresses, low hydrolytic stability, etc.
Cementing and Operation of Adhesive-Bonded Joints in Liquid Media 275
Figure 5.5 Dependence of the specific electrical resistance atthe polyester adhesive–steel interface on the holding time ofthe joint in water: (1) initial adhesive; (2) with addition of10% ATG.

Figure 5.6 shows the dependence of the adhesion strength of steeladhesive-bonded joints on the holding time in liquids. Acrylate (curves1 and 3) and polyester (curve 2) adhesives were used. In this particularcase the polyester adhesive was based on PN 609-21M unsaturatedpolyester resin, and the acrylate adhesives were based on MMA (1)and ethyl methacrylate (3).
The adhesive-bonded joints were placed into water for 3 monthsafter cementing. It is evident that the adhesion strength changesover time, although the failure of the adhesive-bonded joints is alwaysof cohesive character. Thus, when operating adhesive-bonded joints inliquid media it is necessary to take into account the effect of the mediaon the polymeric adhesive itself.
The strength characteristics of polymeric materials deformed inliquid media depend on the change of the free surface energy of thesystem and of the material structure at the tip of the fracture crack,which govern the successive processes of adsorption and diffusion ofthe medium [219–222]. Penetration of liquid medium into the materi-als at the crack tip can induce failure of the polymer intermolecularbonds and the formation of weaker polymer–liquid–polymer bonds,facilitating conformational displacements of the polymer chains.This is why the orientation of the polymeric chain segments inmicro-bulk at the crack tip is more intensive when the material isdeformed in liquid than in air [219]. Consequently, in general thestrength of polymeric materials in liquid media will decrease due toadsorption of the medium and to the formation of weaker bonds, butthe increase of the rate of orientation at the tip of the fracture crack
276 Chapter Five
Figure 5.6 Effect of time of holding in water on the adhesion strengthof joints based on (1) MMA; (2) PM 609-21M resin; and (3) ethyl metha-crylate.

can enhance the strength. Thus, the cohesion strength can decrease orincrease compared with the strength in air, depending on the origin ofthe polymer and the medium.
The liquid medium diffusing into the adhesive interlayer plasticizesit and causes a volume change that affects the internal stresses.Figure 5.7 indicates that the rate of relaxation of the internal stressesin adhesive-bonded joints in water or gasoline is substantiallyincreased. The increase of the adhesive layer volume can change thesign of the internal stresses, as in the case of gasoline. Stresses due tohumidity, shrinkage, and thermal effects can decrease the strength ofthe adhesive-bonded joints. Methods of decreasing the humiditystresses and of increasing the hydrolytic stability of adhesives lie inthe application of space-linked polymers resistant to polymer hydro-lysis, in increasing their hydrophobicity by adding fluorine- or silicon-containing additives, and in adding water adsorbents and hydrophobicfillers.
Cementing and Operation of Adhesive-Bonded Joints in Liquid Media 277
Figure 5.7 Kinetics of internal stress elevation and relaxation in the adhe-sive interlayer based on 40% solution of PBMA in MMA in various media:(1, 2) water; (3) gasoline; the adhesive interlayer is 0.008, 0.016 and0.003 mm thick, respectively

Chapter
6Adhesion and Molecular Mobility
of Filled Polymers
6.1 Control of Polymer-to-Solid SurfaceAdhesive Bond Strength by Addition ofFillers
The present chapter deals with the possibility of controlling adhesivebonds from an essentially new point of view, based on the principle ofdirected change of the interaction of polymer chains in systems con-taining two fillers of different chemical natures and macrostructures,namely, fibrous reinforcing fillers and finely dispersed ones. Mineralfiller with lyophilic or lyophobic surface character, imparted by chemi-sorbed long-chain aliphatic molecules, was used as the finely dispersedfiller. These interactions occur in two types of surface layers formed inpolymeric composite materials: polymer on the surface of finely dis-persed fillers, and a surface layer of the filled polymer on the surface ofthe fibrous reinforcing component. The principal feature here is thecontribution of organic molecules grafted to the filler surface in chan-ging the polymer properties in the boundary layer, since the modifiedfiller surface of this kind promotes polymer plasticization at the phaseboundary under the influence of modifier molecules, resulting inimprovement of the physical-mechanical properties of the compositematerial.
This section gives experimental support for the novel method ofimproving adhesion of polymer coatings by introduction of dispersedor reinforcing filler, or both, into the polymer.
Polyurethanes were used that were based on trimethylolpropane–toluylene diisocyanate (TMP-TDI) and tetrahydrofuran and propyleneoxide copolymer (THF-PO) obtained with various ratios of isocyanate
278

and hydroxyl groups; as fillers, amorphous silicon dioxide (aerosil)with specific surface area of 1:75 � 105 m2=kg (A-175) and aerosil mod-ified by ethylene glycol (ATG), diethylene glycol (ADEG), and butylalcohol (ABA) were used.
Let us consider the experimental data presented in Table 6.1 on theadhesion strength to steel of polyurethane coatings characterized byvarious spatial network densities determined by the NCO:OH groupratio. It is obvious that higher network density leads to increase in thecoating adhesion. Reinforcement of the coating with cloth based onpoly-"-caproamide fiber containing — CO — NH — functional groups,close to urethane groups, in the main chain results in noticeableincrease in adhesion strength (by 10–20%). This effect is probablyexplained by increase in cohesion strength of the reinforced coatingitself, in accordance with a conception of the rate of cohesion strengthin adhesion developed earlier [329].
Now let us consider the influence on adhesion of the fillers intro-duced into the coating. Data presented in Figs. 6.1 and 6.2 show thatin all cases the introduction of fillers differing in surface propertiesinfluences the adhesion strength. This influence, slight for aerosilA-175, is displayed to a greater extent by ADEG and ABA. At thesame time, there is an optimal filler concentration at which adhesionstrength reaches a maximum and is increased by 75–95% in compar-ison with that of unfilled coatings.
The dependence of the adhesion strength of polyurethane coatingson the concentration of unmodified aerosil has an indistinctly markedmaximum in the region of 1–2 wt% concentrations. Note in particularthe results showing that modified lyophobic (ABA) and lyophilic(ADEG) filler surfaces result in the same maximum breakaway force(Figs. 6.1 and 6.2, curves 1). For polyurethane containing modifiedfiller with lyophobic surface, increase in the filler content beyond themaximum adhesion strength does not cause as sharp a drop as occursfor polyurethane filled with ADEG. These results show good correla-
Adhesion and Molecular Mobility of Filled Polymers 279
TABLE 6.1 Influence of the Reinforcing Component on Equilibrium Force ofBreakdown from Steel of Polyurethane Coatings with Various Network Densities
Equilibrium force of breakdown of the polyurethane coatingfrom steel (N/m)
NCO:OH groupratio Plain Reinforced
1.1:1 22 251.5:1 32 372.0:1 45 523.0:1 51 63

tion with those obtained earlier from study of the mobility of polymermolecules at the solid boundary that show the same molecular mobi-lity changes in the layers on fillers characterized by various surfaceenergies [334, 336, 339]. This demonstrates that, in the systems inves-tigated, lyophobic filler surfaces interact with the binder similarly to
280 Chapter Six
Figure 6.1 Dependence of equi-librium force of breakaway fromsteel ðFequilÞ of polyurethanefilms based on TMP-TDI andTHF-PO on ADEG content (C):(1) plain film; (2) film reinforcedwith polyamide cloth.
Figure 6.2 Dependence of equi-librium force of breakawayfrom steel ðFequilÞ of poly-urethane films based on TMP-TDI and THF-PO on ABA con-tent ðCÞ: (1) plain film; (2) filmreinforced with polyamide cloth.

lyophilic, so that lyophobic interactions also contribute to changing theproperties of polyurethane surface layers.
Introduction into polymer of both reinforcing fiber and filler pro-duces considerable increase in the coating–substrate adhesive bond(Figs. 6.1 and 6.2, curves 2).
Since the increase in adhesion is considerably greater for reinforcedpolyurethane compositions filled with modified aerosils, it is of inter-est to clarify the influence of the nature of the organic modifier mole-cule. Comparison of the data in Figs. 6.1 and 6.2 shows that the natureof the organic component change influences the filler concentrationboundaries. In this case we observed the influence of both reinforcingcomponent and filler on the adhesive bond strength. Thus, for aerosilmodified with diethylene glycol high adhesion strength is observedonly up to 0.8% filler content; and for coatings containing aerosil mod-ified with butyl alcohol the region of increased bond strength of sub-strate ranges from 0.2% to 2.5% filler.
In filled polyurethane coatings containing ADEG and ABA weobserve a similar character of adhesion change with modified aerosilconcentrations (Figs. 6.1 and 6.2, curves 1) that does not depend on thevalue of the modified filler’s surface energy. The only difference lies inthe ranges of concentration at which extremal values of adhesionstrength are observed: for systems with ADEG at 0.5–0.6% aerosiland for the system with ABA at 0.9–1.0%. This difference can beattributed to different states of aggregation of the particles of thefillers used, as is detailed below. Another feature of this dependenceis observed in the system containing unmodified aerosil: the presenceon the filler surface of organic modifier molecules that are chemicallybound to the surface is also important for the formation of the coating–substrate adhesive bond.
The patterns established should be explained starting from thenotion of the generation of two surface layer types in the compositesystem, namely, polymer on the filler particles and filled polymer onthe fibrous reinforcing material [335]. We may take it that existence oftwo surface types, differing in chemical nature and the potential forchemical interaction of binder components with them in the course ofcuring, changes the structure of the network formed and will certainlyresult in microheterogeneity of the polymeric coating. In conformitywith Bikerman’s concept of the role of weak boundary layers in adhe-sion [329] and the role of surface energy in the formation of the inter-phase layer [330], we may assume that the affinity of the surfaces forthe components of the rating system determines the migration of low-molecular weight impurities, including low-molecular weight fractionsformed during curing, from the binder volume to the filler boundary.As a result, low-molecular weight fractions, bound by the filler, leave
Adhesion and Molecular Mobility of Filled Polymers 281

the polymer–metal substrate boundary, thus allowing the formation ofa less defective boundary layer. This assumption is confirmed by theextremal character of the dependence of adhesion strength on fillercontent. Evidently, in the region of the maximum the filler surface issaturated with fractions sorbing onto it, and further increase in fillercontent does not result in growth of adhesion strength. The otherpossible explanation of the observations is increase in the cohesionstrength of the coating itself, which in accordance with theory [329]leads to growth in adhesion strength. However, within this conceptualframework it is difficult to explain the very sharp drop in the 1–3%region of dispersed phase concentrations. Decrease in the internalstresses system plays a clear role in increasing the polymer–substrateadhesive bond strength. Experiment shows that residual internalstresses in the filled polyurethane coating for small amounts of mod-ified filler (0.5% ADEG; 1.0% ABA) are less than those in unfilledcoatings (Table 6.2). The internal stresses in the coating grow as thefiller content increases. The form of internal stress change can beexplained on the assumption that modified filler simultaneously dis-plays effects of restriction of mobility and polymer structural plastici-zation in the boundary layer due to the presence of long-chain modifiermolecules. Structural plasticization of the polymer in the region ofhigh solid phase concentrations improves the mobility of segmentsat the phase boundary with the filler and increases their packingdensity. Also, the filled polymer system contracts, increasing internalstresses due to polymer–substrate adhesion contact. Increased inter-nal stresses result in reduced strength of the coating–metal substrateadhesive bond.
The regularities observed in the changes of adhesion strength andinternal stresses at low concentration of the filler particles are appar-ently connected with the breaking of permolecular aggregations in thepolymer and formation of more homogeneous structure of the polymermaterial, producing better adhesion interaction with the metal sub-strate. This is supported by the results of investigations of the polymer
282 Chapter Six
TABLE 6.2 Residual Internal Stresses in Polyurethane Coatings Based on TMP-TDIand THF-PO (NCO:OH¼2:1) Containing Modified Filler, 48 h after Curing at 353 K
Filler Filler concentration (mass %) Residual internal stresses (MPa)
Without filler – 1.50ADEG 0.5 0.47ADEG 2.0 1.80ABA 1.0 0.55ABA 2.0 1.35

interphase layer structure at the boundary with the metal substrate.Undoubtedly, the influence of filler on the polymerization reaction
kinetics [336–338] is very important for the polymer/substrate adhe-sive bond strength and formation of polymer layer structure at thephase boundary with the filling. To eliminate this influence, all sub-sequent investigations were performed with filled polymers derivedfrom solutions of linear polyurethanes, synthesized in the absence offiller.
The results presented thus demonstrate the possibility ofinfluencing the adhesion interaction by a novel method—introductionof reinforcing and dispersed fillers without resort to modification of thebinder or the surfaces being glued or coated.
The experimental data and their explanation necessitate investiga-tion of the dependence of adhesion and of the molecular mobility ofpolymer filled with modified filler on the linear dimensions of modifiermolecules chemisorbed on the surface of the filler.
6.2 Influence of the Molecular Size of theFiller Surface Modifier on the Strengthof Adhesive Bonds with SolidSubstrates and the Molecular Mobilityof the Filled Polyurethane
Studies of the influence of the molecular size of the modifier, chemi-cally bound on the filler surface, on the strength of the polymer–sub-strate adhesive bond and the relaxation processes were performed onspecimens of polyurethane based on ODA, 2,4-TDI, and OPG contain-ing 2.0% filler by mass. Aerosil was used as the filler, to which surfaceglycols of various molecular masses were bound.
Figure 6.3 presents the temperature dependences of the tangent ofdielectric loss angle in the polyurethane specimens investigated, inwhich two clearly expressed maxima are seen and a third maximum,that is less marked, at low temperature. The maximum of dielectriclosses in the 245–247 K region is governed by the mobility of macro-molecular chain segments and is related to the dipole-segmentalrelaxation process; the indistinct maximum at 150–190 K is relatedto relaxation of main-chain groups and side-chains. The maximumaround 373–393 K can be attributed to the mobility of large kineticaggregates—nodes of the network of physical bonds.
A shift of 18 K toward higher temperature of the tan � maximum dueto dipole-segmental relaxation in the polymer filled with A-175 incomparison with the unfilled polymer indicates restriction of the mole-cular mobility by the solid surface, in accordance with the resultsobtained earlier.
Adhesion and Molecular Mobility of Filled Polymers 283

Introduction of glycol-modified aerosils into the polyurethane leadsto an increase in segment mobility (Fig. 6.3, curves 3, 4) in comparisonwith A-175. For example, the maximum in the dielectric losses in thepolyurethane composition containing AEG shifts 9 K toward highertemperature, and in the polyurethane–ADEG system the maximumcorresponding to relaxation of macromolecule chain segments isobserved at even lower temperature than that in the unfilled polyur-ethane. The shift of the tan � maximum toward lower temperature forthis composite material is 5 K relative to unfilled polyurethane and22 K relative to polyurethane filled with A-175. The dependence of thetemperature of the tan � maximum for relaxation of nodes of the net-work of physical bond on the size of the glycol molecule on the aerosilsurface has similar character.
Consequently, for filling with modified aerosils, two competingprocesses occur: stiffening of polyurethane macromolecules by thefiller surface, and their plasticization by glycol molecules graftedonto filler surface. The double influence of these fillers on the
284 Chapter Six
Figure 6.3 Dependence of tan � on temperature ðTÞ of polyurethanesbased on OPG, 2,4-TDI, and ODA at 1 kHz frequency: (1) unfilledpolymer; (2) with 2 wt% A-175; (3) with 2 wt% AEG; (4) with 2 wt%ADEG.

relaxation processes occurring in filled polymers is reflected in thedensity of macromolecular packing in the boundary layer and in themorphology of the polymer surface layers as a whole.
Comparison of the experimental results of dielectric relaxationinvestigations with data on the strength of adhesion to steel of poly-urethanes filled with A-175, AEG, ADEG, and ATEG show that, withthe growth of the molecular mass of the glycol modifying the fillersurface, increase in polyurethane chain mobility is accompanied byincrease in polymer–metal adhesive bond strength. Thus, in thiscase with polymer plasticization, there is a relation between adhesionstrength and molecular mobility. Hence, modification of the filler byorganic molecules chemically bound to its surface changes both poly-mer interaction with the filler and polymer composite interaction withthe substrate.
The regularities revealed in the strength of filled polyurethane–steel adhesive bonds permit the preliminary conclusion that, fromthe nature of its influence on adhesion strength, increase in the lengthof modifier molecule grafted to the filler surface cannot be reproducedby increase in the content of modified filler with grafted molecules oflesser length, since larger linear dimensions of the modifier moleculelead to improved relaxation conditions, i.e., improve its own mobility,and consequently promote the creation of a more balanced state of thepolymer in the boundary layer and better interaction of the filledbinder with substrate.
To evaluate this conclusion, it is necessary to consider the molecularmobility and adhesion strength of the filled polyurethane elastomeraccording to the concentration of modified filler.
6.3 Molecular Mobility in FilledPolyurethanes and Their AdhesionProperties at Different FillerConcentrations
As already noted, introduction of filler into a polymer matrix causeschanges in molecular mobility, manifest in a rightward shift of high-temperature process connected with dipole-segmental relaxation, anda leftward shift of low-temperature dipole-group process. Molecularinterpretation of these phenomena was based on ideas of adsorptionlimitation of the mobility of polymer chains close to the solid boundaryand, as a result, worsening of the conditions of macromolecular pack-ing. This causes an increase in mobility of the polymer chain kineticunits in the dipole-group relaxation process. This mechanism had beenstudied in detail and confirmed for many linear and crosslinked poly-mers. Thus, if aerosils in amounts of 20 wt% containing chemisorbed
Adhesion and Molecular Mobility of Filled Polymers 285

aliphatic alcohols on their surface are used as fillers for epoxy oligo-mer, the character of the effects depends on the length of the graftedchain. The shift of the high-temperature relaxation process towardhigher temperatures is reduced in comparison with that observed forthe filler without organic molecules on its surface, due to the plasticiz-ing action of the grafted molecules in the oligomer boundary layer. Atthe same time, the low-temperature relaxation process is shifted lesstoward low temperatures. These observations are explained by theattainment of a more balanced polymer condition at the boundarylayer.
The changes in polymer matrix relaxation behavior in the presenceof surface-modified fillers are important when the filler is introducedinto the polymer matrix to provide better adhesion to the solid surface.It was shown above that by introducing dispersed filler into a polymercomposition (adhesive) it is possible to increase the polymer–substrateadhesive bond strength considerably with certain filler contents. Fromthis it was discovered that the effect on adhesion strength increase isgreater for a filler whose surface is chemically bound with organicmolecules sufficiently long to display their own mobility. Thus, whenaerosil modified by butyl alcohol or diethylene glycol is used as thefiller for crosslinked polyurethane, the equilibrium force of breakawayof the filled polymer from metal substrate exhibits a maximum forcertain concentrations, and the maximum is the same for both fillers(Figs. 6.1 and 6.2).
To establish the dependence of the filled polymer coating–metalsubstrate adhesive bond strength on the modified filler concentration,let us consider experimental data for adhesion strength in comparisonwith the results of molecular mobility investigations.
Figure 6.4 shows the dependence on ADEG concentration of theequilibrium force of breakdown from steel of linear polyurethanebased on OTMG, 2,4-TDI, and 4,4 0-diamino-3,3 0-dichlorodiphenyl-methane. At low filler content (up to 2%) the equilibrium breakdownforce increases, reaches a maximum, and then begins to decrease withfurther increase of the filler content. Recall that in crosslinked poly-urethane, as was shown above (Fig. 6.1), the strength of the adhesivebond with substrate falls more sharply than the linear decreaseobserved here.
However, crosslinked polyurethanes are not considered a goodmodel for investigation of molecular mobility and its dependence onthe amount of filler because at high temperatures there is no cleartan � maximum for dipole-segmental relaxation processes. For linearpolyurethanes, the clearly expressed dipole-group relaxation processat 168–179 K and dielectric losses connected with macromolecule seg-ments relaxation at 238–248 K are typical (Fig. 6.5). As seen from the
286 Chapter Six

287
Figure 6.4 Dependence of equilibrium force of breakaway fromsteel ðFequilÞ of polyurethane films based on OTMG, 2,4-TDI, and4,4 0-diamino-3,3 0-dichlorodiphenylmethane on ADEG concentra-tion ðCÞ.
Figure 6.5 Dependence of tan � on the temperature ðTÞ of polyur-ethanes based on OTMG, 2,4-TDI, and 4,4 0-diamino-3,3 0-dichlorodi-phenylmethane at 1 kHz frequency: (1) unfilled polymer; (2) polymerwith 0.5 wt% ADEG; (3) polymer with 1.0 wt% ADEG; (4) polymerwith 3.2 wt% ADEG.

data presented, increasing ADEG content in the polymer results in anoticeable temperature shift of the tan � maximum by nearly 10 K forboth relaxation processes. Dipole-segmental relaxation processes shifttoward higher temperature up to 1.0–1.2% ADEG content, after whichglycol molecules evidently begin to exert a plasticizing influence, andthe segmental relaxation process shifts toward lower temperatures,even below the temperature of the tan � maximum for unfilled poly-urethane. At the same time, the dipole-group relaxation process ischaracterized by nonlinear dependence of the tan � maximum tem-perature shift toward high temperatures with ADEG concentration.
The data reveal previously unknown features of the relaxation beha-vior of filled polymer systems. In contrast to earlier observations, seg-mental mobility limitation was observed only at small amounts offiller. After reaching the maximum possible mobility limitation itbegins to grow considerably (the tan � maximum temperaturedecreases). Along with this, and in contrast to the effects observedearlier, there is a reduction of mobility of kinetic units in the low-temperature relaxation process, i.e., increase in the temperature ofdipole-group losses. This unusual behavior can only be attributed tothe fact that organic molecules grafted onto the filler surface act as theplasticizer. Typical effects of segmental mobility in the system aredisplayed at low content of filler particles, but on reaching a certainconcentration the grafted molecules begin to play the role of ‘‘surface’’plasticizer, reducing the temperature of the tan � maximum. At someconcentrations it becomes lower than that for unfilled polymer.Appealing to the ideas about the influence of the surface on relaxationprocesses, it is clear that plasticization and increase in mobilityimprove the conditions of macromolecular packing in the surfacelayer. As a result, temperature of the maximum for dipole-group lossesincreases. Both effects tend to saturation with increasing fillercontent.
Consequently, in respect of its influence on the relaxation processesin polymer matrix, filler modified with long organic chains should beconsidered as a component combining the functions of filler andplasticizer.
Referring now to the adhesion strength data, it can be seen that themaximum is located at a filler concentration exceeding that causingmaximum segmental mobility restriction, and the most intensiveincrease in polyurethane–metal substrate bond strength occurswhen the mobility of small kinetic units of the chain is not consider-ably reduced. It may be supposed that precisely this concentrationrange provides maximum interaction with substrate, i.e., adhesion,due to good contact of polymer chain groups as a result of their
288 Chapter Six

redistribution and changes in the conformation set of the polymersurface layers.
Evidently, a prerequisite of high adhesion is enough bonds with thesurface under conditions of optimal molecular mobility. Together withthis, the explanation offered does not exclude a contribution to adhe-sion from the cohesion strength of the filled polymer matrix [329]. Inreality, the polymer strength does not grow with increase of ADEGcontent at low concentrations (up to 0.5%); it achieves its maximum at1.0%, and is slightly reduced at higher degrees of filling. However, themost considerable growth of adhesion strength (from 35 to 50 MPa) atfiller concentrations up to 0.5% indicates that the governing factorinfluencing polymer–substrate adhesive bond strength in this concen-tration range of dispersed phase particles is the change of polymermicroheterogeneity due to formation of boundary layers, distinguishedby the optimal correlation of kinetic unit mobility in both high-temperature and low-temperature relaxation processes.
It follows that for polymer interaction with the filler surface as aresult of adsorption and orientation effects, caused by interphaseboundaries, redistribution of the segments and small portions ofmacromolecular chains caused by conformation changes occurs inthe polymer surface layers. At the same time, a boundary layer isformed, which might conditionally be termed ‘‘rigidly elastic.’’Formation of this layer determines the maximum strength of the filledpolymer–solid substrate adhesive bond.
There is thus a correlation between the adhesion strength of thefilled polymer material and the molecular mobility of the polymermatrix. Taking into account that changes in the character of therelaxation processes reflect changes occurring in the polymer materialstructure with introduction of modified filler, we now consider thepolymer structure, and in particular the structure of polymer layerformed in contact with metal substrate surface.
6.4 Influence of Aerosil Modification onthe Aggregation of Particles inOligomer Medium
The introduction of mineral or polymer filler into polymers is done toserve multiple purposes [339]. One of the essential effects of the fillerparticles is regulation of the structure formation process [340]. That is,the dispersed filler is used to create artificial structure formationcenters. It has been demonstrated in practice that in most cases theoptimal physical and mechanical properties of polymer materials areachieved when their structure comprises fine-scale and homogeneouselements. One of the factors for production of homogeneous structure
Adhesion and Molecular Mobility of Filled Polymers 289
in filled polymers is a uniform distribution of the filler in the polymermatrix. There is every reason to assume that changing the fillerparticles’ surface energy through chemical modification of their sur-face by organic molecules comparable in size but differing in thenature of the end group will change the interaction between theparticles and alter their degree of aggregation. As a result, the useof fillers varying in surface character will permit polymer materials tobe obtained with different heterogeneities and, correspondingly, withdifferent properties.
Filler particle distribution has been studied in the model systems offilled oligoester glycol, this being the initial component in the produc-tion of polyurethane elastomers. As the introduction of filler intooligoester glycol affects its rheological behavior most of all, we studiedviscosity first. Filler dispersion in low-molecular weight glycol wasused for comparison. Studies were done in three dispersed systems:ADEG in ethylene glycol (system No. 1), ADEG in OTMG (system No.2), and ABA in OTMG (system No. 3).
The concentration dependence viscosity at small contents of solidphase are described by the Einstein equation:
� ¼ �0ð1 þ �’volÞ ð6:1Þ
where � is the viscosity of the dispersed system; �0 is the viscosity ofthe dispersed medium; ’vol is the volume fraction of solid phase par-ticles in the dispersed system; and � is a coefficient equal to 2.5 forspherical particles.
It was found experimentally that system 1 complies with theEinstein model up to volume content of solid phase particles notexceeding 0.07; system 2 does so up to ’vol ¼ 0:034; system 3 up to’vol ¼ 0:01. The coefficient �, calculated from experimental results andrepresenting the tangent of the slope of the dependence of relativeviscosity �=�0 on volume content of the filler particles, does not varywith temperature in the interval examined, but it is different for eachof the three dispersions studied and takes values of 19.5, 29.6, and78.8 for systems 1, 2, and 3, respectively.
Fine (highly dispersed) solid particles, including aerosil, are in anaggregated state in organic liquids [341–343]. The size of theaggregates and their packing density ratio depend on many factors:solid phase dispersity, interfacial tension, viscosity of the dispersionmedium, and other parameters. The fact that � exceeds 2.5 is appar-ently explained not only by the presence of solvation spheres on theparticle surfaces, as was mentioned in [344], but also by the aggrega-tion of solid phase particles. The authors of [345] propose that 2.5/½��correlation is the coefficient of packing density of monodispersed
290 Chapter Six

spheres in the aggregate and the characteristic viscosity ½�� is equiva-lent to the � coefficient in the Einstein model; consequently, � ¼ 2:5=�.Calculation of � for the three dispersions examined gave values of0.130, 0.084, and 0.032 for systems 1, 2, and 3, respectively. The radiusr of the primary aerosil particles, equal to 7 � 109 m (calculated fromthe specific surface area), and R, the radius of the aggregate, arerelated by [345]
� ¼ r
R
� �31=zð6:2Þ
where z ¼ 0:429, the statistical mean coefficient.The respective aggregate dimensions calculated using this
equation for systems 1, 2, and 3 are 1:5 � 107 m, 2:8 � 107 m, and12:0 � 107 m; that is, ADEG is better distributed in low-molecularweight glycol than in an oligomeric glycol, and ABA is worse distrib-uted in OTMG compared with ADEG.
To verify the results obtained, the mean aggregate dimensions weredetermined by turbidity spectral methods. The results of dispersedparticle size measurements (Table 6.3) show that radii of the aggre-gates of the dispersions under study, obtained using rotational visco-metry, are higher than those determined by turbidity spectralmethods. This may be caused by the fact that in the conditions ofshearing motion, aggregates move in a complex rotational and advan-cing manner, which leads to their expansion under the action of cen-trifugal forces, enhanced by the structural component of adsorption–solvate layer separation pressure.
Accordingly, it was established that aerosils modified by diethyleneglycol and butyl alcohol are in an aggregated state in the oligomerglycol medium, and that the degree of ADEG distribution is higherthan that of ABA.
Let us estimate the thickness of the adsorption–solvate layer, �, onwhich particles of radius r, composing an aggregate, are moved awayfrom each other, causing increase in size compared with R values in
Adhesion and Molecular Mobility of Filled Polymers 291
TABLE 6.3 Dimensions of Aerosil Particle Aggregates in Glycols of VariousMolecular Masses
Radius of aerosil particle aggregates 10 R (m)
Dispersed system Opacity spectrum method Viscometry method
ADEG-EG 0.9 1.5ADEG-OTMG 1.2 2.8ABA-OTMG 2.6 12.0

static conditions. It is easy to demonstrate that the density of packingof n particles in static conditions is given by the ratio
�st ¼nr3
Rst3
ð6:3Þ
Under shearing action, the particles repack in the aggregate withthe formation of a looser structure with lower density of particles. Wedenote the increase in the aggregate radius as y. Then, Equation (6.3)becomes
� ¼ nr3
ðR þ yÞ3ð6:4Þ
Taking account of the invariability of the particle number n, weassume the formal transition to random dense packing [334] ofspheres of effective radius r þ�, where � is the effective thicknessof the adsorption–solvate layer, giving
nðr þ�Þ3
ðR þ yÞ3¼ 0:64 ð6:5Þ
Combining the solutions of the last two equations gives the followingexpression for �:
� ¼ r
ffiffiffiffiffiffiffiffiffiffi0:64
�
3
s 1
!ð6:6Þ
Calculation of adsorption–solvate layer thickness in conditions ofsimple shear for the dispersions under study shows that it is largestat 120 � 1010 m on the surface of ABA particles; for ADEG particles inOTMG it is less, at 70 � 1010 m; and for ADEG particles in EG it is50 � 1010 m.
Thus adsorption–solvate layers are formed on the aerosil surface onits introduction into the oligomer glycol, as a result of which the aggre-gates expand in shear conditions, and this expansion is greater forABA and OTMG aggregates.
The results obtained show that a modified filler with a lyophobicsurface in an oligomer medium is structured into aggregates thatare larger than the aerosil modified by diethylene glycol. Due to thisaggregation, for the same filler content in the oligomer the overallsurface of oligomer interaction with lyophobic filler will be less thanwith use of a filler with higher surface energy. It may be supposed thatthe difference in the size of modified filler particle aggregates observed
292 Chapter Six

in oligomer glycol will be maintained after the formation of poly-urethane elastomer, even taking into account some possible changein aggregate size. Therefore, the conclusion reached above will alsobe true in relation to filled polymer. These ideas about the aggregationability of modified aerosil particles explain the occurrence of maxi-mum strength values for adhesive bonds of polyurethanes containingABA at higher filler content than for the polymer filled with ADEG(Figs. 6.1 and 6.2). This is because with higher aggregation of ABAparticles for equivalent changing of the transition layer of the polymerphase boundary, the amount of filler should be larger.
Differences in the filler aggregation ability are certainly reflected inthe heterogeneity of the polymer material, and thereby in its cohesionstrength. Increase in cohesion strength in accordance with [329] pro-motes growth in adhesion strength. However, comparison with theresults given in the previous chapter that we obtained in studies ofadhesion and strength properties of polyurethane coatings does notpermit us to refer the intense adhesion strength growth at low fillerconcentrations to cohesion strength increase. The important role ofmolecular mobility in the adhesive bond was also pointed out there.We may suppose that the increase in adhesion strength observed onintroduction of modified filler is the result of variations in microhetero-geneity of the polyurethane coating interphase layer on the metal sub-strate surface, leading to better adhesive–substrate interaction.
6.5 Structure of the Filled PolyurethaneInterphase Layer at the MetalSubstrate Boundary
The results of polyurethane elastomer structural studies are general-ized comprehensively in several monographs [331, 346–348]. It wasestablished that the physical-chemical and mechanical properties ofpolyurethanes are determined mainly by microsegregation of oligo-ester and urethane segments into two phases due to their thermo-dynamic incompatibility [349–352]. The degree of microphaseseparation of the flexible and rigid blocks in polyurethanes is influ-enced considerably by availability of hydrogen bonding and by thecorrelation of two types of it: rigid segment–rigid segment, and rigidsegment–flexible segment [353, 354].
As shown above, introduction of filler into polyurethane results inthe growth of adhesion strength, most intensively for small amounts offiller. This change in adhesion is certainly caused by reconstruction ofpolyurethane structure under the influence of the introduced fillersurface (demonstrated by the data on molecular mobility variation),and in particular of the polymer adhesive layer structure. In this con-
Adhesion and Molecular Mobility of Filled Polymers 293

nection, it was of particular interest to study the influence of the sur-face of the solid particles of filler on the polyurethane structure andparticularly on the microphase separation of flexible and rigid blocks.At the same time, it was important to clarify the influence of thepolymer–substrate boundary on microphase separation in surfacelayers, which is essential from the point of view of adhesion.
The structure of the surface layers was investigated by IR spectro-scopy of disturbed total reflection at the polyurethane film specimensbased on OTMG, 2,4-TDI, and 4,4 0-diamino-3,3 0-dichlorodiphenyl-methane, filled with ADEG. To describe the change in the absorptionband with change of filler content, optical densities were determinedin accordance with the baseline method. The valence and deformationfluctuation bands of CH2 groups at 2860 and 1370 cm1 and of benzenerings at 1600 cm1 were used as an internal standard.
The presence of four peaks in the multiplet band of carbonyl groupvalence fluctuations (amide I band) demonstrates self-association ofurethane and carbamide groups (bands at 1690 and 1660 cm1) lead-ing to the formation of domain structure [355]. There are many non-self-associated groups recorded (bands at 1725 and 1710 cm1Þ andcorrelation of the corresponding band intensities indicates a degreeof self-association of 50–60%. On the other hand, in the area of valencefluctuations of N — H bonds we observe a wide band at 3300 cm1,evidence that all NH groups participate in hydrogen bond formation.Free NH groups in similar systems appear near 3430–3450 cm1 [332].Along with this, C —— O groups free of hydrogen bonding (1725 and1710 cm1) show that a considerable portion of NH groups are boundwith ester oxygen. The presence and concentration of the filler influ-ence the correlation of the intensities of multiplet band components ofcarbonyl absorption. This is connected with redistribution of hydrogenbond types and change in the degree of segregation of blocks of similarchemical composition [356]. It is especially evident for specimens withsmall amounts of filler (0.5%).
Figures 6.6 and 6.7 present correlations of the optical densities ofseveral absorption bands (located far or less far from each other) forspecimens with various filler contents. Bands at 1220, 1540, 1600, and3300 cm1 are due to fluctuations in rigid blocks: amide III, amide II,benzene ring, and (NH), respectively [357]. Correlation of the inten-sities of bands due to flexible blocks does not change with filler con-centration in specimens for filled polymer surface layers, formed bothin contact with metal substrate (adhesive layers) and in conditions ofno contact. The bands connected with fluctuations in groups partici-pating in hydrogen bonding proved to be sensitive to the additives(Figs. 6.6 and 6.7).
294 Chapter Six

It is remarkable that very small amounts of filler change the 1220,1540, and 3300 cm1 band intensities. ‘‘Peaks’’ observed for smallamounts of additive cannot be attributed to measurement errors,because they are not observed for bands connected with fluctuationsin groups not participating in hydrogen-bond formation. On the otherhand, while the decrease in intensity of the 3300 cm1 band may berelated to the reduction of hydrogen bond concentration, the increasein the intensity of amide II and amide III bands may be caused by the
Adhesion and Molecular Mobility of Filled Polymers 295
Figure 6.6 Dependence of rela-tive intensities of absorptionbands in IR spectra of MNPVOpolyurethane films based onOTMG, 2,4-TDI, and 4,4 0-di-amino-3,3 0-dichlorodiphenyl-methane on the fillerconcentration ðCÞ: (1) polymersurface layer formed in theabsence of contact with metalsubstrate; (2) surface layerformed in contact with metalsubstrate.
Figure 6.7 Dependence of rela-tive intensities of absorptionbands in IR spectra of MNPVOpolyurethane films based onOTMG, 2,4-TDI, and 4,4 0-di-amino-3,3 0-dichlorodiphenyl-methane on filler concentrationðCÞ: (1) polymer surface layerformed in the absence of contactwith metal substrate; (2) surfacelayer formed in contact withmetal substrate

change in rigid block conformation, by higher association density, orby other factors (increased efficiency of dispersion forces may increasethe index coefficient in the absorption band, necessarily leading togreater penetration depth in the MNPVO method and, correspond-ingly, to the growth of its intensity).
Without clarification of the real causes of these changes in the inten-sity of bands, connected with fluctuations in rigid segments, we canonly assert that they are determined by the influence of optimal con-centrations of chemically modified filler on the polymer structure as awhole, and in the case under discussion on the structure of permole-cular formations of rigid blocks in particular. Alteration of the wholeassociation structure is not necessary; the transition layer at thephase boundary is enough. Probably, the extremal character of thedependences of certain physical and mechanical properties of the filledpolymers on the filler concentration (mainly for the extremum at smallconcentrations) is connected with this. In any case, the extremalvalues of adhesion strength that we observed may be explained fromthis starting point.
Where CH2 group deformations appear at 1440–1490 cm1 there is atendency to redistribution of intensities between the bands at 1445and 1480 cm1, indicating conformation changes in oligoglycol frag-ment chains toward trans–trans conformations [333], which isprobably connected with regrouping of hydrogen bonds in rigiddomains.
Let us consider what differences are observed in the case of polymerfilling for the adhesion layers and those not subject to the influence ofthe high-energy surfaces. In general, the curves for polymer films thatdiffer in the conditions of surface layer formation show similar trends(Figs. 6.6 and 6.7), but differences are also found. Thus, for the corre-lation D1370=D2860 (the bands at 1370 and 2860 cm1 correspond toflexible polymer components) the experimental points for both inves-tigated surfaces with uniform scatter are located near the samestraight line. For the correlation D1370=D1600 (the bands for flexibleand rigid blocks) we observe separation of the areas occupied by theexperimental points for these layers, and the points for polymericlayers not formed in contact with metal surface are situated somewhatlower. It may be supposed that the concentration of benzene rings inthis layer is slightly higher and, consequently, the content of flexibleblocks in the polymer adhesive layer is increased.
It should also be noted that in the amide I region of the polymeradhesive layer spectrum the band intensity at 1725 cm1 is noticeablyincreased, and that at 1690 cm1 is decreased. At the same time,increase in the band intensity occurs at 1710 cm1 and a decreaseoccurs at 1660 cm1. These changes indicate the interaction of both
296 Chapter Six

filled and unfilled polymer with substrate, resulting in decreasedparticipation of carbonyl groups in hydrogen-bond formation in thepolymer layer contacting the metal substrate surface—i.e., a decreasein self-association of urethane and carbamide groups in this layer.Correlation of the absorption band intensities at 1660, 1710 cm1
and 1690, 1725 cm1 is also altered with variation of the filler concen-tration in the polymer. The difference in optical densities of IR absorp-tion bands of the surface adhesive and nonadhesive layers ofpolyurethane carbamide is evidently connected with the change ofmacromolecular conformation in the polymer layer bordering on thesolid surface and, consequently, with changes in the conditions ofhydrogen-bond formation.
The results presented show that polyurethane boundary layerschange under the influence of aerosil surface modified by organicmolecules and of the metal substrate surface, and this change consistsin a reduced degree of self-association of urethane and carbamidegroups as a result of cohesion redistribution. Owing to these changes,most pronounced at low filler concentrations, electron-donor orelectron-acceptor groups of rigid and flexible segments, not mutuallyconnected by hydrogen bonds, become capable of interacting withactive centers of the filler surface (or its modifier molecules) andwith the substrate surface, depending on the nature of the donor–acceptor centers on them.
Adhesion and Molecular Mobility of Filled Polymers 297

Chapter
7Criteria of Adhesive Joint
Strength
7.1 Adhesive Joint Strength underCombined Action of Various Stresses
Let us consider the influence of various combinations of stress con-ditions, namely, normal fracture, shear, normal compression, and thecombined action of direct and tangential stresses of specified ratio, onthe strength of adhesive joints, as well as their dependences on mate-rials, adhesion conditions, and polymerization kinetics. Adhesivesthat were analyzed in Chapter 3 were taken as the objects of inves-tigation.
The specific character of adhesive contact consists in the timedependence of strength, starting from adhesive solidification to thebeginning of the test. This dependence for various adhesive composi-tions may be manifested in different ways. However, the kinetics ofstrength variation with time is not always taken into account inresearch and engineering practice, which causes difficulties in com-parison of test results and errors in calculation of the bearing capacityof adhesive joints. Thus, examination of the regularities of the varia-tion of adhesion strength with time is a necessary condition for mak-ing a reasonable choice of adhesive composition and ensuring itsworking capacity.
The variation of specimen strength with the time of adhesion usingthe Sprut-5M composition is represented in Fig. 7.1a by the curves 1–3. As shown, strength of adhesion with Sprut-5M (28 and 24 MPaunder normal fracture and shear) is considerably higher than thatachieved by PN-1 and PU (18, 12, and 8.5 MPa, respectively). Thestrength of the specimens tested increases in the course of time, but
298

the intensity and duration of the increase differ. The strength of jointsusing PU is achieved slowly, during 24 � 102 h; with PN-1 it is farmore intensive and ends in 6 � 102 h. The duration of adhesivestrength increase in the Sprut-5M joint is comparable with the timeof strengthening of PU. This may be explained by the fact that Sprut-5M is a mechanical mixture of two homopolymers [(PN-1 (polydiethy-lene glycol maleate phthalate solution in styrene) and PU (product ofinteraction of 2 moles of toluylene diisocyanate and 1 mole ofpolydiethylene glycol adipinate)] that have different polymerizationrates. PN-1 polymerized first, with the formation of a strong network;PU cures much more slowly, with simultaneous occurrence of relaxa-tion processes in PN-1.
Criteria of Adhesive Joint Strength 299
Figure 7.1 Strength of steel specimens under normal compressionbonded with (a) Sprut-5M and (b) VAK: (1) in air; (2) under water;(3) in oil.

The strength of VAK composition adhesion (33 and 32 MPa undernormal fracture and shear) is considerably higher than the adhesionstrength of AK mixture (solution of polybutyl methacrylate in methylmethacrylate) (25 and 22 MPa) (Fig. 7.1b). This is also explainedby the effect of ATZh product action. The intensity and durationof the increase in strength with time differ slightly for the two compo-sitions.
No great dependence of adhesion strength on the material of thespecimens is observed. Specimens made of stainless steel are charac-terized by the highest value of adhesion strength, while those of alu-minum alloy are the least strong. However, the difference in adhesionstrengths does not exceed 20 MPa. The curves of strength variationwith time for stainless steel and aluminum alloy specimens are vir-tually the same. These regularities are also observed for specimenscemented under water and in oil.
Visual inspection of the specimens’ working surfaces after tests indi-cates that fracture takes place in the adhesion film (cohesion fracturepattern).
The kinetics of strength variation for adhesive joints, under water oroil, had not previously been investigated. When formed in liquids,PN-1, PU, and AK compositions do not display adhesion properties.The adhesion strength for underwater fixing with Sprut-5M is 14 and12 MPa under uniform fracture and shear; for VAK adhesive thevalues are 13 and 12 MPa.
A gradual decrease in strength is noted for specimens cementedwith Sprut-5M. The strength decreases under water over 24 � 102 h,by cohesion fracture pattern. The strength decrease practically stopsthen, but fracture occurs predominantly by mixed or adhesion pattern.This is probably connected with diffusion of water at the polymer–metal phase boundaries and with low water resistance, typical ofpolyester resin-based adhesives.
Over time, the underwater strength of specimens using VAK com-position increases 1.4–1.5 times. The intensity of the strength increaseunder water is lower than that in air, and its duration is twice as long,with a cohesion fracture pattern. Strength increase with exposureunder water ceases after 24 � 102 h.
The strength of steel specimens cemented in oil with Sprut-5Mincreases during 24 � 102 h from 8.2 MPa to 12.8 MPa, and the curveasymptotically approaches a constant value. Specimen fracture occursby cohesion pattern. The mechanism of strengthening in oil is mostlikely similar to that in air [358, 359]; the high oil resistance of poly-ester resins is also an important consideration.
Reduction in the strength of specimens cemented with VAK compo-sition in oil practically stops after 24 � 102 h. Gradual strength
300 Chapter Seven

decrease is accompanied by a change in specimen fracture pattern:cohesion fracture turns into mixed and adhesion fracture. This is prob-ably connected with the low oil resistance of acrylate compositions.
Thus, the experimental dependences show that the strength of theseadhesive joints under normal fracture and shear depend substantiallyon the time from the moment of cementing to the beginning of the test.Variations in intensity and duration of the strength depend on theformulation of the adhesive composition and on polymerization condi-tions, which in principle allows for active control of these processes.The results enable the recommendation of Sprut-5M mainly for adhe-sive joints operating in oil media and the VAK composition for use inunderwater conditions.
Given the observed dependence of specimen strength on time, it isnecessary to standardize exposure in the test media from the time ofadhesive film solidification to testing in order to be able to compareresults. Statistical analysis of the results for strength tests undernormal fracture and shear shows that the largest deviation from theaverage values is observed in the interval from 0:72 � 102 to 2 � 102 hof specimen exposure. During this period, the intensity of variation ofadhesion strength in the air is so great that only a small discrepancyin the time to testing leads to significant errors. For specimensexposed for 2:4 � 102 h and more, the mean-square deviation doesnot exceed 2.4 MPa, making it possible to compare test results undervarious loads after exposure for 2:4 � 102 h. In view of this, investiga-tions of adhesive joint strength under normal compression, as well asunder the combined action of direct and tangential stresses, were per-formed after holding in media for 2:4 � 102 h.
The strength of glued specimens under normal compression wasinvestigated by construction and analysis of curves of normal fracturestresses against values of specimen precompression stresses.
Results under normal compression for steel specimens glued withSprut-5M and VAK compositions in air, under water, and in oil aregiven in Fig 7.1. As is obvious, the strength of adhesive joints undernormal fracture is practically the same up to a certain critical value ofprecompression stress. Evidently, the applied normal compressionstresses do not result in essential fractures in the adhesive joint; thefracture occurs in the elastic zone. Using Sprut-5M composition (Fig.7.1a), these compression stresses remain within 0–43.0 MPa in air,within 0–50.0 MPa under water, and within 0–52.0 in oil; the corre-sponding values for VAK are 0–104.0 MPa, 0–90.0 MPa, and 0–84.0 MPa (Fig. 7.1b).
Further increase of normal compression stresses leads to a sharpreduction of the normal fracture stresses. Evidently, increase in thenormal compression stresses causes an irreversible process of adhe-
Criteria of Adhesive Joint Strength 301

sive joint fracture. For specimens fixed with Sprut-5M these compres-sion stresses are within the limits of 43.0–80.0 MPa in air; 50.0–90.0 MPa under water, and 52.0–75.0 MPa in oil; the correspondingvalues for VAK are 104.0–125.0 MPa, 90.0–104.0 MPa, and 84.0–91.0 MPa. Apparently, under normal compression stresses of 80.0,90.0, and 75.0 MPa, specimens fixed with the Sprut-5M in air, underwater and in oil fail completely; fracture of specimens fixed with VAKin corresponding conditions occurs at compression stresses of 125.0,104.0, and 91.0 MPa.
Insignificant strength after the action of compression stresses, cor-responding to practically complete failure of the adhesive joint, cannotbe explained unambiguously. Under large enough compression stres-ses, the processes of mechanical penetration of adhesive into irregula-rities in the specimen, mutual diffusion, molecular and chemicalinteraction, and so on, may occur concurrently with adhesive filmfracture, and probably ensure the adherence of secondary surfaces.
Upon analysis of the curves in Fig. 7.1, it is easily seen that theyhave various slopes at the sections of specimen fracture. The curveslope with respect to the abscissa axis may be taken as the measure ofa glued specimen’s brittleness under compression. The more brittle thejoint, the steeper the angle. Evidently, the brittleness of specimensglued with Sprut-5M composition under normal compression is lessthan that of specimens glued with VAK, which may be explained byhigher elasticity of the Sprut-5M as a result of the plasticizing effect ofthe PU compound.
The brittleness of specimens under normal compression dependsalso on the ambient medium and on exposure. Specimens fixed withSprut-5M under water and in oil are less brittle than specimens fixedin air. Reduction of brittleness under water and in oil is somewhatcharacteristic of the specimens glued with VAK also. This may beexplained by the plasticizing influence of the liquid medium on theadhesive joint borders, leading to partial elimination of the stressconcentration factor [360] that occurs with adhesive shrinkage inthe process of polymerization.
The absolute values of the strength of glued specimens under nor-mal fracture and normal compression on the section, corresponding tothe fracture initiation, differ substantially. The coefficient x ¼ �p=�c,characterizing the different tensile and compression strengths of steelspecimens fixed with Sprut-5M, is 0.53 for gluing in air, 0.22 underwater, and 0.16 in oil; for specimens glued with VAK, the values are0.27, 0.17, and 0.14, respectively. Evidently, the adhesive joints underconsideration belong to systems of different resistance to the tensionand compression stresses, regardless of the gluing medium.
302 Chapter Seven

Investigation of the adhesive specimens under the combined actionof normal fracture and shear was made using fixed ratios of direct andtangential stresses ð�=�Þ of 0.5, 1.4, 3.0, and 8.0 in the plane of theadhesive line. Values of strength under normal fracture ð� ¼ 0Þ andshear ð�p ¼ 0Þ were also used in constructing the limiting state dia-grams. Results are presented in Fig. 7.2. Inclined lines from the origincorrespond to the above-mentioned fixed ratios of direct and tangentialstresses. Tests were performed after fixing and exposure of the speci-mens in air, under water, and in oil.
Figure 7.2 presents diagrams of the limiting state of specimensmade of stainless steel and aluminum alloy fixed with Sprut-5M com-position and VAK in air. Evidently, the values of adhesion strength forspecimens made from different materials differ only slightly, and theirlimiting state diagrams are practically equidistant.
Criteria of Adhesive Joint Strength 303
Figure 7.2 Diagrams of the limiting stressed state of adhesive specimens under thecombined action of normal fracture and shear (bonded in air): (a, c) bonding of specimensmade of stainless steel (1), steel (2), and aluminum alloy (3) using Sprut-5M and VAK;(b) bonding of steel specimens with PN-1 (1) and PU (2); (d) the same as (b) for AKadhesive.

Diagrams of the limiting stressed state for steel specimens fixedwith PN-1 and PU compounds in air are presented in Fig. 7.2b, andfor those glued with VAK in Fig. 7.2d. Evidently, the strength of thesespecimens under the combined action of the direct and tangentialstresses is less than that of specimens fixed with Sprut-5M and VAKcompositions. This is in conformity with the results of separate testsfor normal fracture and shear.
Changes in the strength of specimens fixed under water and in oil,obtained with various combinations of the normal fracture and shearstresses, are similar to the analogous changes for specimens fixed inair. In the areas limited by the reference axes and curves of the limit-ing state, short-term static strength is guaranteed with any combina-tion of the direct and tangential stresses. Estimation of the bearingcapacity of the adhesive assembly from the results of separate tests ofspecimens for normal fracture ð� ¼ 0Þ or shear ð�p ¼ 0Þ, may lead toconsiderable errors. For example, as shown in Fig. 7.2a, strength ofSt3 steel specimens fixed with Sprut-5M in air is 23.0 MPa undernormal fracture and 16.5 MPa under shear. At present, only thesevalues are taken into account for evaluating the potential composi-tions for gluing, ignoring the fact that combined action of the stresseswill inevitably result in joint fracture.
Special attention was paid to the kinetics of short-term strengthvariation for adhesive specimens under the combined action ofbreaking stresses of normal fracture and shear after exposure to thetest media. Tests were performed under direct and tangential stressratios in the plane of the adhesive line of 0.5, 1.4, 3.0, and 8.0. Surfacesof limiting stressed state were constructed in �p–�–time coordinates(time in hours). Curves of short-term strength change kinetics of adhe-sive specimens from separate tests of breaking stresses of normalfracture ð� ¼ 0Þ and shear ð� ¼ 0Þ were used in constructing the sur-faces.
The kinetics of short-term strength change with the time under thecombined action of normal fracture and shear is presented in Fig. 7.3.The oblique planes going through the time axis correspond to theabove-mentioned ratios of direct and tangential stresses.
Surfaces of the limiting stressed states for steel specimens fixed inair using Sprut-5M, PN-1, as well as VAK and AK, are presented inFig. 7.3. As is obvious, specimen strength increases with time. Thekinetics of short-term adhesion strength change with time under thecombined action and under the separate actions of normal fractureand shear breaking stresses shows similar patterns. Thus, theincrease in the strength with Sprut-5M and PU stops in 24 � 102 h,with PN-1 in 6 � 102 h, and with VAK and AK in 8–12 � 102 h. In allthe cases failure of specimens occurs by cohesion pattern.
304 Chapter Seven

Criteria of Adhesive Joint Strength 305
Figure 7.3 Kinetics of strength change for steel specimens fixed in airand tested under the combined action of normal fracture and shear. (a)Sprut-5M (surface I), PN-1 (surface II), and PU (surface III); (b) VAK(surface I), AK (surface II).

The strength of steel specimens fixed under water using Sprut-5Munder the combined action of breaking stresses decreases over24 � 102 h, after which it stops decreasing. Toward the end of theexposure time, transition of cohesion fracture to adhesion and mixedpattern is observed. Specimens fixed with VAK also exhibit thestrength increase, which again stops in 24 � 102 h, but in this casethe joint fracture occurs by cohesion pattern. The dependences ofshort-term strength with underwater fixation are similar for specimenbreakdown under the combined and the separate actions of direct andtangential stresses.
For specimens fixed with Sprut-5M in oil and held in oil untilstrength testing under normal fracture and shear, gradual strengthincrease throughout the time of holding in oil is observed; the strengthof specimens fixed with VAK decreases. For the separate tests also,this process is practically finished in 24 � 102 h. Specimens fixed withSprut-5M maintain the cohesion fracture pattern throughout holdingin oil, whereas specimens fixed with VAK display a transition fromcohesion fracture to adhesion and mixed pattern.
Specially developed methods were used for investigation of thestrength of adhesive specimens under normal compression andshear. Specimens fixed with Sprut-5M and VAK in air, under water,and in oil remained in these media until tests began. The specimenswere exposed to compression in the stresses range �c ¼ 0–28.0 MPaand failed under the action of shear stresses � .
Figure 7.4a shows diagrams of the limiting stressed state of speci-mens fixed with Sprut-5M. Values of tangential stresses at �c ¼ 0correspond to the data given previously. With increase of the normalcompression stresses, shear breaking stresses also increase, regard-less of the gluing medium. Thus, the breaking tangential stresses ofspecimens glued in air (curve 1) increase from 16.5 MPa at �c ¼ 0 to46.0 MPa at �c ¼ 28:0 MPa; under water (curve 2) the correspondingvalues are from 9.4 MPa to 37.0 MPa; and in oil (curve 3) they arefrom 7.3 MPa to 34.0 MPa. Increase in shear breaking stresses isproportional to the normal compression stress in the interval consid-ered.
Diagrams of the limiting stressed state of specimens glued withVAK composition are presented in Fig. 7.4b. In this case thereis also a practically proportional increase in the shear breaking stres-ses with increasing compression stresses, regardless of the gluingmedium.
It should be noted that proportional increase in the shear breakingstresses with compression stresses is probably the characteristic fea-ture of adhesive joints. Evidently, adhesive joints resist the combinedaction of normal compression and shear much better than the actions
306 Chapter Seven

of normal fracture and shear. Further investigation and elucidation ofthe regularities of the resistance of adhesive joints to the combinedaction of normal compression and shear will facilitate their use forbonding of structures in conditions of all-round compression in liquidmedia, as well as of structures made of materials that cannot be joinedusing traditional methods (welding, bonding, riveting, bolting, etc.)not only in air but directly in liquid media as well.
Criteria of Adhesive Joint Strength 307
Figure 7.4 Diagrams of the limiting stressed state of adhe-sive specimens made of steel under the combined action ofnormal compression and shear. (a) Sprut-5M and (b) VAK;(1) in air; (2) under water; (3) in oil.

7.2 Analysis of Strength Criteria asApplied to Adhesive Joints
Much research effort is aimed at the accumulation of experimentaldata on the strength of adhesive joints, and attempts are made toexplain the phenomena accompanying their fracture process.However, as shown by the experience of adhesive joint usage, appar-ently highly encouraging results from wide-ranging laboratorystrength tests under normal fracture or shear are often far from guar-anteeing the efficiency of adhesive assembly. This causes distrust ofthe adhesive method of joining; sometimes it is used only when othermethods are impossible.
These contradictions can to a considerable degree be resolved by asuccessfully chosen or properly developed theory of limiting stressedstates, with the help of which it should be possible to find an explana-tion of the discrepancies between design, laboratory, and operatingvalues of breaking stresses in adhesive joints.
Investigation of strength under the action of normal or tangentialstresses only is common to all the existing theories of adhesion and themajority of experimental developments. At the same time, the increaseof the areas and volumes of adhesive joints is interrelated with theneed to develop engineering methods of calculation of their strengthtaking account of various kinds of stressed state.
The work [361] presents investigation of applicability of variousstrength criteria for anisotropic materials to a widely used type ofadhesive joint, namely, glass-reinforced plastic, by comparison ofexperimental and design contours of breakability under biaxial com-pression. Design contours of breakability were constructed by criteriadue to Mises [367], Fisher [369], Hu and Marin [370], Norris [371], andWarren [372], developed for materials possessing the same resistanceto compression and tension, as well as by the criteria of Marin [373](generalization of anisotropic material strength condition on the basisof the Mises–Genky plasticity theory), Zakharov [374], Malmeister etal. [375], and Goldenblatt and Kopnov [376]. Ashkenazi [377] devel-oped criteria for materials unequally resistant to compression andtension. It has been shown that for the glass-reinforced plasticCAST-V, with the ratio of compression strength limits along themain axes of anisotropy equal to 1.0:1.11:3.67, none of the stated cri-teria permits construction of a breakability contour that deviates posi-tively from the experimental points by less than 10%. Also,unacceptability of the I and III strength theories, producing deviationsup to 19%, was established. For the glass-reinforced plastic PPN witha ratio of ultimate compression strength values along the main axes ofanisotropy of 1.0:1.35:1.51, the I and III strength theories give up to
308 Chapter Seven

26% deviation from the experimental points. Application of the criteriadeveloped by Prager, Fisher, Hu–Marin, and Norris leads to consider-able overestimation of design strength, and use of the Mises andMarin criteria result in strength margins of up to 11% and 18%. Forglass-reinforced PPN, the strength criteria of Warren, Zakharov,Goldenblatt–Kopnov, and Ashkenazi are the preferred ones, as thedesign contours deviate from the experimental points by 4–6% atmost in the direction of increased safety margin.
Adhesive joint strength criteria developed recently do not have suf-ficiently rigorous substantiation and are based on the fact that thelimiting surface in six-dimensional space of stresses is described byan equation of the second or higher order. By tailoring the equation,any degree of approach to the real strength surface is possible, but thisnecessitates determining a large number of constants experimentally.Thus, the criterion of [374] is represented by six input equations; thecriterion of [376], taking account of dependence of strength on the signof tangential stresses, by seven equations; the criterion of [378],including the value of elastic potential for anisotropic material, byeight equations; and so on. These criteria are given in general form,and their applicability is shown only for certain kinds of adhesivejoints: paper–bakelite, textolite, and glass fiber-reinforced plasticjoints.
Equations for the layered medium for investigation of the inter-laminar fracture and shear stresses in glass-reinforced plastic withfabric reinforcement are given in [379]. The medium considered is aset of orthotropic glass-reinforced plastic plates; each of them includesone layer of reinforcing fabric and is joined without intermediatelayers, and mechanical characteristics of separate plates and thewhole set are assumed equal. Experimental validation of the equationsis not produced.
On the basis of the equations [379], it is possible to determine [380]critical stresses of the reinforcing layer of a plate made of orthotropicglass-reinforced plastic under uniaxial and biaxial compression.Compression failure is considered as the result of violation of theoperational compatibility of reinforcing material layers under theaction of interlaminar fracture and shear stresses, occurring due toloss of separate layer stability. Since compression strength is equal toor less than the critical stress calculated by the formulas obtained,only the maximum possible strength value for the glass-reinforcedplastic is determined. Experimental validation of the analytical depen-dences was not done.
The work reported in [381] deals with interlaminar fracture andshear stresses under compression in the plane of the layers, whichoccurs due to natural bending of reinforcing fibers as a result of
Criteria of Adhesive Joint Strength 309

their interweaving. Similarly to [379], the equations of a layered med-ium are derived, obtained with the use of an energetic smoothingprinciple and a hypothesis of straight lines for the layers. The formof the curving of the fibers is assumed sinusoidal. It was shown thatthe binding agent/glass-reinforced plastic ultimate strength relationchanges insignificantly. On this basis, it was concluded that fractureoccurs due to interlaminar fracture. The investigation is reduced tothe development of analytical dependences.
In [382] the results are reported of an investigation of the strengthof glass-reinforced plastic under the combined action of radial normaland interlaminar tangential stresses. The investigations were per-formed on ring specimens with one cross-cut under conditions ofnon-axisymmetrical loading. Maximum radial and tangential stresseswere determined by the formulas
�r;max ¼ 3
2
M
bhR�r’;max ¼ 3
2
Q
bh
where M ¼ the bending moment in the section considered; Q ¼ thetransverse force; b and h are the thickness and width of the ring;and R ¼ the sum of the internal and external radii of the ring.
A plot of the limiting state for specimens of glass-cloth T-I impreg-nated with binding agent IF-ED-6 approximated a straight line, andthe strength condition was
�r’
�r’;bþ �r
�r;b� 1
where �r;’;b and �r;b are ultimate strengths under simple shearand normal fracture. It was shown that the Mohr criterion is accep-table for the estimation of strength of the given glass-reinforcedplastic. The method offered does not permit investigation of the mate-rial strength under the combined action of the stresses of shear andradial compression, as the reason for fracture lies in the circumferen-tial direct stresses.
The criterion of short-term adhesion strength for the case of inter-phase failure under combined action of direct and tangential stressesis suggested in [382]. This criterion presumes the existence of a defi-nite dependence between octahedral stresses, which is assumed linearin the first approximation. The hypothesis of the octahedral direct andtangential stress dependence was proposed by Nadai for continuousisotropic materials and was further developed by Balandin [384] intothe strength criterion, presenting a linear function from the compo-nent of the spherical stress tensor.
Criteria for the contact layer strength have the form
310 Chapter Seven

� �ffiffiffi3
p
3
ffiffiffiffiffiffiffiffiffiffiffiffiffiffiffiffiffiffiffiffiffiffiffiffiffiffiffiffiffiffiffiffiffiffiffiffiffiffiffiffiffiffiffiffiffiffiffiffiffiffi3
p Tadh
Radh� 1
� �2
�1
" #vuut �2 � 2ffiffiffi3
pTadh
ffiffiffi3
p Tadh
Radh� 1
� ��þ 3T2
adh
where Tadh and Radh are the adhesion strength under shear and nor-mal fracture.Under the action of tangential stresses � and normal tensile stresses�:
� �
ffiffiffi3
pTadh
ffiffiffi3
p Tadh
Radh� 1
ffiffiffi3
p Tadh
Radh� 1
2
�1
1 �
ffiffiffiffiffiffiffiffiffiffiffiffiffiffiffiffiffiffiffiffiffiffiffiffiffiffiffiffiffiffiffiffiffiffiffiffiffiffiffiffiffiffiffiffiffiffiffiffiffiffiffiffiffiffiffiffiffiffiffiffiffiffiffiffiffiffiffiffiffiffiffiffiffi3
p Tadh
Radh� 1
� �2
�1
" #ðT2
adh � �2Þ
T2adh
ffiffiffi3
p Tadh
Radh� 1
2
vuuuuuuut
26666664
37777775
Under the action of tangential stresses � and normal compressivestresses �:
� �ffiffiffi3
p
3
ffiffiffiffiffiffiffiffiffiffiffiffiffiffiffiffiffiffiffiffiffiffiffiffiffiffiffiffiffiffiffiffiffiffiffiffiffiffiffiffiffiffiffiffiffiffiffiffiffiffi3
p Tadh
Radh� 1
� �2
�1
" #vuut �2 þ 2ffiffiffi3
pTadh
ffiffiffi3
p Tadh
Radh� 1
� ��þ 3T2
adh
The given dependences allow calculation of the diagrams of limitingstate from three parameters determined experimentally ðTadh, Radh,and � or � ) and are useful only for the case of adhesion fracture, whichis not typical for high-quality adhesive joints. The criteria have beenvalidated experimentally for polyester resin/glass film adhesion sys-tems under the action of normal fracture and shear (quadrant I of thediagram of limiting states). The applicability of the criteria for the caseof normal compression and shear is not shown.
Considerable attention is given to the criteria for estimating thestrength of wood as a laminated material under the action of load atvarious angles to the fiber direction. In this case, direct and tangentialstresses occur simultaneously on areas parallel to the fibers.Ashkenazi [385] developed a criterion for the strength of anisotropicwooden and synthetic materials in the following form:
�b ¼ �0
cos4 �þ sin2 2�þ C sin4 �C ¼ �0
�90
where �0, �90 are the ultimate strengths along and across the fibers.
Criteria of Adhesive Joint Strength 311

Diagrams of the limiting state of pinewood under the action of nor-mal fracture and shear are presented in [364]. These are adequatelyapproximated by the expression
0:67�y2 � 0:94�y�xy þ 0:32�xy
2 þ 40�xy þ 28�y � Ra¼908
where �y, �xy are the actual stresses on the area parallel to the fiberand Ra¼908 is the ultimate strength under extension across fibers. Itwas shown that design diagrams of the limiting state constructed bythe criterion of Ashkenazi [385] for wooden and synthetic materialsdisagree with the experimental ones considerably. A generalizedstrength criterion is not produced.
Diagrams of the limiting state of veneer sheet and delta-wood,depending on the slope angle of the wood fibers, are given in [386].Correspondence of the experimental diagrams to design diagrams con-structed by criteria in [395] was demonstrated. Limiting state curvesfor glass-reinforced plastic on epoxy–phenol binder were not checkedfor correspondence with the strength criteria.
Strength criteria for anisotropic materials do not directly take intoaccount the dependence of the adhesion–cohesion interaction. At thesame time, increase in cohesion strength does not always result inadhesion strengthening, and vice versa. An attempt to optimize theratio of adhesion and cohesion strengths for composite materials rein-forced with fibers was made in [378]. For complete realization of cohe-sion strength �� of the reinforcement fibers of diameter d and length l,the minimum adhesive resistance under shear �adh should fulfill thecorrelation
�adh ��
d
2l
A criterion of adhesion and cohesion strength [360] based on mechan-ical concepts of the optimal nature of the structure with full strengthelements was developed for the coating–substrate system. Moskvitinhad already stated the principle of full strength adhesion, cohesion,and self-adhesion, but it was not presented analytically. A physicalsense of the criterion of full strength adhesion and cohesion is foundin the fact that the coating should not separate from the substratebeing deformed before complete exhaustion of its capacity in respectof cohesion strength. The condition of full strength adhesion and cohe-sion presents a linear dependence between deformation of the sub-strate "cr and adhesive resistance �adh taking into account thethicknesses of the coating and substrate, as well as their elastic prop-erties, which favors the criterion described in [360] over that of [378].
312 Chapter Seven

The possibility of generalizing this criterion for other types of adhesivejoints is not shown.
There are thus only few investigations of the applicability of existingstrength criteria, and the number of new ones developed for adhesivejoints is limited. Investigation of the strength of conical adhesive jointswith epoxy compound UP-5-169c in the system of metal–glass-rein-forced plastic resulted in the following dependences for calculation ofthe normal compression and shear stresses [362]:
� ¼ G cos�Q
ðG cos2 �þ E sin2 �ÞF
� ¼ E sin�Q
ðG cos2 �þ E sin2 �ÞF
ð7:1Þ
where E and G are moduli of normal elasticity and shear of the com-pound ðE ¼ 1:9 � 102 MPa; G ¼ 0:2 � 102 MPa); Q is the load on themetal cone; F is the aea of the conical surface; and � is the slopeangle of the conical joint.
For tubular specimens loaded with axial compression force and tor-que, the stresses are defined by
� ¼Qcomp
�ðr2out � r2
inÞ
� ¼ M
2�r2outðrout � rinÞ
ð7:2Þ
where Qcomp is the axial compression load; M is the limit torque; androut and rin are the outer and inner radii of the specimen.
It has been shown that the strength of an adhesive joint is bestcharacterized by the Mohr criterion, and experimental data areapproximated using the following expression:
� �ffiffiffiffiffiffiffiffiffiffiffiffiffiffiffiffiffiffiffiffiffiffiffiffiffiffiffiffiffiffiffiffiffiffiffiffiffiffiffiffiffiffiffiffiffiffiffiffi�2
p � k�p�þ �p�� k�2
ðk þ 1Þ2
s
where k ¼ �=� .It should be noted that the diagram of the limiting state constructed
using formulas (7.1), including the elastic constants of the compound,agrees with that constructed using formulas (7.2). Evidently, thisagreement will not be observed with substitution of values of the elas-tic modulus of the compound in the joint that differ quantitatively andqualitatively from those assumed.
Criteria of Adhesive Joint Strength 313

An attempt was made in [360] to generalize the criterion presentedthere for adhesive joints on the assumption that the thickness of thesecond substrate h ! 0. However, the applicability of the analyticaldependences obtained is restricted by the necessity of defining themodulus of elasticity of the adhesive layer, which, as was shown inChapter 1, may differ quantitatively and qualitatively from that of thematerial in the free state.
The paper [363] gives general formulas for the calculation of stressesin the adhesive layer of a bushing-pivot joint loaded with tensileforces, transverse forces, and bending moment. For the case of com-bined tension and shear, estimation of the strength of the joint usingVK-1 adhesive was been made on the basis of the unified theory ofDavidenko–Friedman [388], permitting definition of the fracture typedepending on the type of stressed state. Plots of the mechanical stateindicate that the III strength theory is applicable to the adhesivecylindrical joints. Hence, the condition of adhesive layer strength isrepresented in the following form:
�0 ��cp
n
ffiffiffiffiffiffiffiffiffiffiffiffiffiffiffiffiffiffiffiffiffiffiffiffiffik�
2
� �2
þk�2
s
where n is the safety factor; k� and k� are coefficients of concentrationof direct and tangential stresses, depending on the geometric dimen-sions of the joint, the Poisson ratio, and the modulus of elasticity of theadhesive layer.
It should be noted that the mechanical state diagram by Davidenkoand Friedman is constructed using the values Ek and �k for the freestate of the adhesive layer. Severe deviations of these parameters forthe layer in the joint may influence the conclusions about applicabilityof the III strength theory considerably.
This brief review of attempts at estimation of criteria of adhesivejoint strength illustrates the variety of approaches to this problem,which lead to a similar diversity of results, sometimes conflictingwith each other. This is a reflection of the complex nature of the adhe-sive contact process. Development of the criteria of adhesive jointstrength is restricted to only a small number of investigations,which need more rigorous experimental validation and cannot yetpretend to completeness. In addition, to date there are no sufficientlydetailed investigations in respect of the applicability of existingstrength theories to estimate the bearing capacity of adhesive joints.
We will consider further the principal features of the criteria ofadhesive joint strength.
314 Chapter Seven

7.3 Applicability of the Limiting StressedStates Theories for MaterialsUnequally Resistant to Tension andCompression
As is well known, classic strength theories are based on the hypoth-eses of continuity and uniformity of substance distribution in the bodybeing deformed. It is supposed that any arbitrarily small solid parti-cles possess the same properties. However, this does not correspond toreality. The heterogeneity of the structure consists in local distur-bances of chemical composition, the presence of various impurities,polycrystalline material structure, microcracks, and other defectscausing considerable concentration of stresses. This applies equallyto adhesive joints of various materials.
Restricted applicability of the classic strength theories (I–IV the-ories) is to a great extent the result of simplified interpretation ofthe structure and properties of real materials. Various measures aretaken to eliminate this contradiction. For example, Coulomb long agoconsidered maximum tangential stress as a linear function of the aver-age direct stress, to extend the maximum tangential stresses theory tomaterials possessing anisotropy of properties expressed as differentresistance to tension and compression. In addition, there were theoriesdeveloped by Mohr, reduced to the empirical determination of thecurve � ¼ f ð�Þ, turning round the family of main limit circles; theenergetic strength theories of Beltramy–Heig and Guber–Genky; thelatest energetic theories; and more.
As shown earlier, adhesive joints are considered to be systemsunequally resistant to the stresses of normal fracture and compres-sion. Thus, it is expedient to limit our analysis to strength theories andthe Mohr theory as the pure experimental one.
The majority of the latest energetic theories are based on thehypothesis of functional dependence of octahedral tangential anddirect stresses proposed by Nadai [384]. According to Nadai, the con-dition for occurrence of the limiting state takes the form
�oct ¼ f ð�octÞ
According to Schleicher [384], the limiting state occurs at a specificvalue of total specific potential energy. The strength condition for theflat stressed state similar to the stressed state of adhesive joints beinginvestigated ð�2 ¼ 0Þ is of the form
�12 þ �3
2 � 2�3�1 þ ð�c � �pÞð�1 þ �3Þ � �p�c ð7:3Þ
Criteria of Adhesive Joint Strength 315

This criterion is applicable to materials with any correlation of X ¼�p=�c within the limits 1 > X > 0, as well as the other latest energetictheories. For �p ¼ �c, the criterion of Schleicher (together with thosestated below) corresponds to the theory of Beltramy–Heig.
Schleicher’s hypothesis is poorly validated by experimental data andis therefore not widely used. It is impossible to investigate thecriterion’s applicability for adhesive joints, since at present there areno methods available for determination of the Poisson ratio for theadhesive layer in the joint.
Buzhinsky’s hypothesis [384] is more universal. According to this,the failure condition occurs when the energy of deformation and a partof the energy of volume change reach definite critical values, being alinear function of a spherical tensor. The design equation for the volu-metric stressed state is
�12 þ �2
2 þ �32 � 2
�c�p
2�k2� 1
� �ð�1�2 þ �2�3 þ �3�1Þ
þ ð�c � �pÞð�1 þ �2 þ �3Þ ¼ �c�p ð7:4Þ
and for �2 ¼ 0,
�12 þ �3
2 � 2�c�p
2 �k2� 1
� ��3�1 þ ð�c � �pÞð�1 þ �3Þ ¼ �c�p ð7:5Þ
Yagn’s strength theory [390] agrees with the hypothesis put forwardby Buzhinsky, although it is based upon entirely different concepts.Yagn proposed finding the condition of occurrence of the limiting statein the form of a second-order equation, symmetrical in all three mainstresses. The following equation meets this requirement for �2 ¼ 0:
�12 þ �3
2 þ ð�3 � �1Þ2 þ6�k
2 � 2�p�c
�p�cð�1 þ �3Þ2
þ6�k
2ð�c � �pÞ�p�c
ð�1 þ �3Þ ¼ 6�k2 ð7:6Þ
As was shown in [384], Yagn’s theory is based on a more detailedphysical conception of the mechanism of material fracture than is theBuzhinsky hypothesis.
Balandin’s strength theory [384] is based on assumptions about thefunctional dependence of the specific potential energy of deformationon the spherical stress tensor. In first approximation, this function isassumed linear and for �2 ¼ 0 it results in the following strengthcondition:
316 Chapter Seven

�12 þ �3
2 � �3�1 þ ð�c � �pÞð�1 þ �3Þ ¼ �p�c ð7:7Þ
As shown in [384], Balandin’s hypothesis is a particular case of theBuzhinsky hypothesis, and it is interpreted by a paraboloid of rotationin the stress space that, in accordance with Equation (7.4), is observedfor the condition
� >
ffiffiffiffiffiffiffiffiffiffi�p�c
3
r
Results of adhesive joint strength tests under normal fracture andcompression, given earlier, prove observance of this condition.
Several strength theories [384, etc.] are based on the linear depen-dence between tangential and direct stresses in the octahedral plane.According to Botkin [389], one constant—the traction coefficient—isrequired for estimation of strength of plastic materials whose bondingstrength considerably exceeds internal friction. For the estimation ofloose materials’ strength, only the coefficient of internal friction isrequired. Since most real materials occupy an intermediate positionbetween plastic and loose ones, their strength should be estimatedusing two coefficients. Fracture occurs precisely at the momentwhen the shear stresses are sufficient to overcome the forces of frictionand cohesion between these particles. The strength condition�oct < mðn þ �octÞ, with the coefficient of internal friction m and trac-tion coefficient n expressed through the values of ultimate strengthunder tension and compression, and transformation to main stressesð�2 ¼ 0), takes the form
ffiffiffiffiffiffiffiffiffiffiffiffiffiffiffiffiffiffiffiffi�1
2 þ �32
qþ ð�3 � �1Þ2 �
2ffiffiffi2
p�c�p
�c þ �p�
ffiffiffi2
pð�c � �pÞ�c þ �p
ð�1 þ �3Þ ð7:8Þ
Investigation of the applicability of Botkin’s theories to adhesive jointsis interesting also because one of the constants determining materialstrength is the traction coefficient.
Miroliubov [391] considers that the strength of a material is definedby its shearing resistance in the octahedral plane. The criterion is aquadratic function of the components of the spherical stress tensor.This function for �2 ¼ 0 gives
ffiffiffiffiffiffiffiffiffiffiffiffiffiffiffiffiffiffiffiffiffiffiffiffiffiffiffiffiffiffiffiffiffiffiffiffiffiffiffiffiffiffiffiffiffiffiffiffiffiffiffiffiffiffiffiffiffiffiffiffiffiffiffiffiffiffiffiffiffiffiffiffiffiffiffiffiffiffiffiffiffiffiffiffiffiffiffiffiffiffiffiffiffiffi12½ð�L1 � �L2Þ2 þ ð�L2 � �L3Þ2 þ ð�L3 � �L1Þ2�
q
þ 1 � X
1 þ Xð�L1 þ �L2 þ �L3Þ ¼
ffiffiffiffiffiffiffiffiffiffiffiffiffi2
1 � X
r�p ð7:9Þ
Criteria of Adhesive Joint Strength 317

where �L1, �L2, �L3 are the ultimate stresses of the similar stressedstate for �2 ¼ 0:
ffiffiffiffiffiffiffiffiffiffiffiffiffiffiffiffiffiffiffiffiffiffiffiffiffiffiffiffiffiffiffiffiffiffiffiffiffiffiffiffiffiffiffiffiffiffiffiffiffiffiffiffiffiffiffiffiffiffiffiffiffi12½�L1
2 þ �L32 þ ð�L3 � �L1Þ2�
qþ 1 � X
1 þ Xð�L1 þ �L3Þ ¼
ffiffiffiffiffiffiffiffiffiffiffiffiffi2
1 þ X
r�p
As mentioned earlier, the criterion of adhesion strength under theaction of direct and tangential stresses due to Skudra and Kirulis isalso based on the functional dependence between octahedral stressesat the moment of fracture.
The strength criterion proposed by Pisarenko and Lebedev [383]suggests that the occurrence of limiting state is controlled by the abil-ity of the material to resist both tangential and direct stresses.Actually, the limiting state is defined by the appearance of cracks(under shearing resistance) and by crack propagation (under resis-tance to normal fracture). Thus, the strength criterion is in the formof tangential stress functions independent of the stressed condition,and [383] represents this in the following expression:
�oct þ m1�1 � m2 ð7:10Þ
The constants m1 and m2 expressed through the ultimate stresses �p
and �c, under uniaxial tension and compression, allow the criterion tobe written in the form [365]
3ffiffiffi2
p X�oct þ ð1 � XÞ�1 � �p ð7:11Þ
This brief analysis of the latest energetic strength theories suggeststhe possibility of investigating their applicability to adhesive jointsfrom the following considerations:
(a) The theories are applicable for materials unequally resistant totension and compression ð1 > X > 0Þ. The objects considered—adhesive joints of metals—meet this condition.
(b) The equations formulating the theories (apart from Schleicher’s)do not include material constants (for example, modulus of elasti-city, Poisson ratio, etc.), and methods for their determination foradhesive layers in joints are under development.
(c) The analytical expressions of the theories permit calculation of thediagrams of limiting states from the results of tests under normalfracture, shear, and normal compression of adhesive joints andtheir comparison with experimental diagrams obtained under com-bined action of direct and tangential stresses.
318 Chapter Seven

Thus, investigation of the applicability of strength theories of con-tinuous uniform materials to adhesive joints can be restricted to thetheory of Mohr [384] as a purely experimental one, the energetic the-ories of Yagn [390], Balandin [384], Botkin [389], Miroliubov [391],and Pisarenko–Lebedev [383], as well as the adhesion strength criter-ion of Skudra–Kirulis [382]. The accuracy of this correspondence maybe estimated by comparison of design and experimental diagrams ofthe limiting stressed state.
7.4 Analysis of Design and ExperimentalDiagrams of the Limiting StressedState
Calculation of the limiting stressed state diagrams of adhesive jointshas been performed using strength criteria [361, 384, 389–391] formaterials unequally resistant to tension and compression. Initial for-mulas of these criteria, obtained by substitution of values of �oct and�1;3, and algebraic transformations, are presented in Table 7.1, in theform of corresponding equivalents for calculation on adhesive joints.
For the construction of design diagrams of the limiting state ofadhesive joints it is enough to have the results of strength testsunder normal fracture, compression, and shear. These values ofstrength for adhesive compositions Sprut-5M and VAK are given inthe following figures and in Table 7.2. Experimental diagrams of thelimiting state of adhesive joints are constructed by the results of testsunder combined action of the direct and tangential stresses, and aregiven in Figs. 7.2 to 7.4.
Design and experimental diagrams of the limiting stressed state ofthe specimens fixed in air, under water, and in oil using Sprut-5M areshown in Fig. 7.5; those for VAK are shown in Fig. 7.6. Diagrams werecomputed using the following strength theories: 1, Balandin; 2,Miroliubov; 3, Botkin; 4, Yagn; 5, Pisarenko–Lebedev; 6, Skudra–Kirulis; 7, Mohr; diagram 8 is the experimental one.
Analyzing Figs. 7.5 and 7.6, it should be noted that under combinedaction of the stresses of normal fracture and shear (quadrant I of thediagram), the design and experimental curves of the limiting state aresimilar, regardless of the medium in which specimens are fixed. Undercombined action of normal compression and shear (quadrant II) thissimilarity is not observed.
The largest relative errors of the design diagrams of quadrant I weredetermined by statistical processing (Table 7.3). Evidently, consider-able deviations (up to 74.9%) are typical for diagrams constructedby the Balandin theory, and it probably should be considered un-
Criteria of Adhesive Joint Strength 319

320
TABLE 7.1 Formulas for Calculation of Diagrams of Limiting State of Adhesive Joints
Strength Initial formula for materials unequally Equivalences (after substitution of �oct; �1;3
theory resistant to tension and compression ð�2 ¼ 0Þ and algebraic transformations)
Yagn �12þ �3
2þ ð�3 � �1Þ
2þ��k
2� 2�p�c
�p�cð�3 � �1Þ
2 �eq ¼ ��c � �p1
2
ffiffiffiffiffiffiffiffiffiffiffiffiffiffiffiffiffiffiffiffiffiffiffiffiffiffiffiffiffiffiffiffiffiffiffiffiffiffiffiffiffiffiffiffiffiffiffiffiffiffiffiffiffiffiffiffiffiffi�c � �p
2
� �2
þ�c�p
3�b2ð�2 þ 3�2Þ
s
þ��k
2� 2ð�p�cÞ
�p�cð�1 þ �3Þ ¼ ��k
2þ 1 �
�p�p
3�b2
� ��2
þ ð�c � �pÞ�
where �k ¼ � at initiation of fracture
Balandin �12þ �3
2� �3�1 þ ð�c � �pÞð�1 þ �3Þ ¼ �p�c �eq ¼
1 � X
2� þ
1
2
ffiffiffiffiffiffiffiffiffiffiffiffiffiffiffiffiffiffiffiffiffiffiffiffiffiffiffiffiffiffiffiffiffiffiffiffiffiffiffiffiffiffiffiffiffiffiffiffiffiffiffiffiffiffiffiffið1 � XÞ
2�2 þ 4Xð�2 þ 3r2Þ
qwhere X ¼ �p=�c
Miroliubovffiffiffiffiffiffiffiffiffiffiffiffiffiffiffiffiffiffiffiffiffiffiffiffiffiffiffiffiffiffiffiffiffiffiffiffiffiffiffiffiffiffiffiffiffiffiffiffiffiffiffiffiffiffiffiffiffiffi12 ½�L1
2 þ �L32 þ ð�L3 � �1Þ
2�
qþ
1 � X
1 þ Xð�L1 þ �L3Þ ¼
ffiffiffiffiffiffiffiffiffiffiffiffiffiffiffiffiffiffiffiffi4
1 þ X�p
2
r�eq ¼
1 � X
2� þ
1 � X
2
ffiffiffiffiffiffiffiffiffiffiffiffiffiffiffiffiffiffi�2 þ 3�2
pwhere �L1; �L3 are the principal stresses similar to specified ones

321
Botkinffiffiffiffiffiffiffiffiffiffiffiffiffiffiffiffiffiffiffiffi�1
2 þ �32
pþ ð�3 � �1Þ
2�
2ffiffiffiffiffiffiffiffiffiffiffiffi2�c�p
p�c þ �p
�
ffiffiffiffiffiffiffiffiffiffiffiffiffiffiffiffiffiffiffiffiffi2ð�c � �pÞ
p�c þ �p
ð�1 þ �3Þ �eq ¼1 þ
ffiffiffiffiffiffiffiffiffiffiffiffiffiffiffiffiffiffiffiffi�2 þ 3�2
pþ ð1 � XÞ�
2
Pisarenko–Lebedev3ffiffiffi2
p x�dev þ ð1 � xÞ �1 � �p 2�cð�c � ��Þ þ �2ð�2
� 2Þ þ 2�2ð�2
� 3Þ
¼ffiffiffiffiffiffiffiffiffiffiffiffiffiffiffiffiffiffi�2 þ 4�2
pð��2
� 2�c�Þ
where � ¼ ð�c=�pÞ � 1
Skudra–Kirulis (a) Tension and shear:
� �
ffiffiffi3
p
3
ffiffiffiffiffiffiffiffiffiffiffiffiffiffiffiffiffiffiffiffiffiffiffiffiffiffiffiffiffiffiffiffiffiffiffiffiffiffiffiffiffiffiffiffiffiffiffiffiffiffiffiffiffiffiffiffiffiffiffiffiffiffiffiffiffiffiffiffiffiffiffiffiffiffiffiffiffiffiffiffiffiffiffiffiffiffiffiffiffiffiffiffiffiffiffiffiffiffiffiffiffiffiffiffiffiffiffiffiffiffiffiffiffiffiffiffiffiffiffiffiffiffiffiffiffiffiffiffi3
p Tcoh
Rcoh� 1
� �2
�1
" #�2 � 2
ffiffiffi3
pTcoh
ffiffiffi3
p Tcoh
Rcoh� 1
� �� þ 3T2
coh
vuut —
(b) Compression and shear:
� �
ffiffiffi3
p
3
ffiffiffiffiffiffiffiffiffiffiffiffiffiffiffiffiffiffiffiffiffiffiffiffiffiffiffiffiffiffiffiffiffiffiffiffiffiffiffiffiffiffiffiffiffiffiffiffiffiffiffiffiffiffiffiffiffiffiffiffiffiffiffiffiffiffiffiffiffiffiffiffiffiffiffiffiffiffiffiffiffiffiffiffiffiffiffiffiffiffiffiffiffiffiffiffiffiffiffiffiffiffiffiffiffiffiffiffiffiffiffiffiffiffiffiffiffiffiffiffiffiffiffiffiffiffiffiffi3
p Tcoh
Rcoh� 1
� �2
�1
" #�2 þ 2
ffiffiffi3
pTcoh
ffiffiffi3
p Tcoh
Rcoh� 1
� �� þ 3T2
coh
vuut —

acceptable for adhesive joints of metals with polyester and acrylatecompositions.
The largest relative errors of diagrams constructed from the the-ories of Miroliubov, Botkin, Yagn, Pisarenko–Lebedev, and Skudra–Kirulis, do not exceed 9.6%. The diagrams constructed from the cri-teria of Miroliubov and Botkin are practically the same. Deviation ofthe diagrams based on the theories of Miroliubov, Botkin, Yagn, andSkudra–Kirulis from the experimental values occurs toward decreaseof the safety margin of the adhesive joint, and that of the diagrams
322 Chapter Seven
TABLE 7.2 Initial Data for Calculation of Diagrams of Limiting Stressed State ofAdhesive Joints
Strength (MPa)
Sprut-5M adhesive VAK adhesiveGluingmedium �p �c � �p �c �
Air 23.0 43.0 16.5 28.5 104.0 23.8Water 10.8 50.0 9.4 15.0 90.0 12.8Oil 9.5 52.0 7.3 12.0 84.0 10.9
50.0 40.0 30.0 20.0 10.0 0 10.0 20.0 30.0
�c (MPa) �p (MPa)
(a)
40.0
30.0
20.0
10.0
50.0
8
7
65
42,3
1
�(M
Pa)
Figure 7.5 Diagrams of limiting stressed state of specimens made of steel St3, fixedwith Sprut-5M (a) in air, (b) under water, (c) in oil. (1–7) Design diagrams on thecriteria of Balandin (1), Miroliubov (2), Botkin (3), Yagn (4), Pisarenko–Lebedev (5),Skudra–Kirulis (6), and Mohr (7). Curve (8) is the experimental diagram.

constructed on the Pisarenko–Lebedev theory in the direction ofincrease. These strength theories are acceptable for the adhesive jointsinvestigated.
Let us consider quadrant II of the limiting state diagram. Withincrease of the normal compressive stresses, the experimental dia-grams deviate sharply from the design ones toward increase of theshear breaking stresses. Long ago, Amonton and then Coulomb sug-gested that the critical value of shearing stress � in the plane
Criteria of Adhesive Joint Strength 323
60.0
�c (MPa)
50.0 40.0 30.0 20.0 10.0 0 10.0
(c)
20.0
�p (MPa)
30.0
40.0
20.0
�(M
Pa)
8
7
1
62,3 4 5
10.0
Figure 7.5 (Continued)

324 Chapter Seven
120.0
�c (MPa)
100.0 80.0 60.0 40.0 20.0 0 20.0
(a)
40.0
�p (MPa)
60.0
40.0
�(M
Pa)
8
7
1
2,3 4 5 6
20.0
90.0
�c (MPa)
(b)
20.0
�p (MPa)
�(M
Pa)
50.0
40.0
30.0
20.0
10.0
80.0 70.0 60.0 50.0 40.0 30.0 20.0 10.0 0 10.0
8
7
1
62,3 4 5
Figure 7.6 Diagrams of limiting stressed state of specimens made of steel St3, fixedwith VAK (a) in air, (b) under water, (c) in oil. (1–7) Design diagrams on the criteriaof Balandin (1), Miroliubov (2), Botkin (3), Yagn (4), Pisarenko–Lebedev (5), Skudra–Kirulis (6), and Mohr (7). Curve (8) is the experimental diagram.

increases in proportion to the normal stress of compression �N appliedto this plane:
� ¼ �c þ �N
where �c is the value characterizing the cohesion strength of the mate-rial and is the friction coefficient.
Word [387] considers that the Coulomb criterion is of great interestfor description of the behavior of polymeric materials. For uniaxialloading of monoliths under the action of compressive stress �1, if thefracture takes place in a plane the normal to which forms the angle �with the direction of action �1, the critical value of tangential stress is
�c ¼ �1ðcos� sin�� cos2 �Þ
However, as seen in [392] and [393], the Amonton law and theCoulomb criterion hold when the forces of intermolecular interactionbetween the shifted bodies are not taken into account. This interactionwas taken into consideration by Derjagin [392, 393] in a binomialfriction law. Analyzing the applicability of a binomial friction law,Derjagin notes that it should be used when equilibrium conditionsare considered between two adjacent bodies with large area of actualcontact, which are subjected not only to the forces perpendicular to thecontact surface but also to forces parallel to it. An adhesive joint is justthe contact of at least two surfaces by means of adhesive that fills themicrorelief and ensures a large area of the true contact.
The binomial law for two bodies with large areas of true contact hasthe form
Criteria of Adhesive Joint Strength 325
TABLE 7.3 Results of Calculation of the Largest Relative Errors for Limiting StateDiagrams of Adhesive Joints
Largest relative error "max (%)
Composition and Miroliubov– Pisarenko– Skudra–gluing medium Balandin Botkin Yagn Lebedev Kirulis
Sprut-5M adhesive
Air 9.4 6.1 3.0 72.1 4.9Water 38.2 8.5 4.2 73.8 6.4Oil 74.9 9.6 9.5 73.7 7.6
VAK adhesive
Air 25.0 7.9 5.0 74.2 4.6Water 61.5 8.7 3.8 75.3 4.8Oil 59.1 9.1 5.4 75.2 5.9

P ¼ ðN þ F0P0Þ ð7:12Þ
where P is the friction force corresponding to the beginning of move-ment; N is the loading; F0 is the area of true contact, as against thegeometric one, which considerably exceeds the true area; is the truefriction coefficient, as against the design one, equal to the ratio P=N;and P0 is the specific cohesion at the section F0.
Dividing Equation (7.12) by F0, we get
� ¼ ð�þ P0Þ ð7:13Þ
where � is the tangential stress at the start of slippage and � is thenormal stress, which according to Derjagin [392] may have negativesign under tearing forces.
According to Derjagin, the area of true contact should increasewith increase of the compression stress, and checking the binomialfriction law in normal conditions (i.e., direct contact of two bodies) isdifficult. This difficulty does not exist for adhesive joints, since theadhesive layer impedes direct contact of the substrates. For example,Derjagin and Lazarev, in [393], deal with friction of paraffin withglass. Equality of the area of true contact and the geometric valuewas provided by building up paraffin on the glass surface, which alsocaused independence of the contact area from the value of normalloading. It was established that the friction force is in direct propor-tion to normal load, and the curve slope angle is equal to the truefriction coefficient �. In this case the straight line P ¼ f ðNÞ does notpass through the origin of coordinates, making an intercept on theordinate equal to �P0, similar to the diagrams presented in Figs. 7.5and 7.6.
An investigation of the boundary friction of paraffin on glass in thepresence of a stearic acid soap intermediate layer is also very impor-tant [393]. This showed that with increase in the number of mono-layers applied, the true friction coefficient does not depend on where inthe lubricating layer the slip plane is.
From the above, an adhesive joint may be considered as a pair ofsolids joined by an adhesive layer that acts as a so-called solid lubri-cant, initiating adhesion interaction with the pair. For relative move-ment of the solids, both this interaction and the friction force have tobe overcome. Under compression of the adhesive joint, the frictionforce increases as well as the shearing stress; under tension, the con-verse process takes place. Thus, by the action of the friction force wecan explain the sharp deviation of the experimental diagrams of limit-ing state (Figs. 7.5 and 7.6) from the design diagrams. However, thisexplanation needs to be validated experimentally. The task consists indetermining the strength components (adhesion and friction compo-
326 Chapter Seven

nents) of the adhesive joint subjected to simultaneous action of bothnormal compression and shear.
It should be noted that the binomial friction law of Derjagin statesthat the adhesion bonds of two bodies and the friction forces determinea tangential load. The aggregate of these values is represented by theconcept of static friction. Experimental validation [392, 393] of thebinomial friction law allows the determination of this sum, but notof each item separately. As has been noted [392], this method servesonly as an indirect estimation of adhesive joint strength.
In [366] an attempt was made to define the adhesion componentunder the combined action of normal compression and shear on thecontacting metal surfaces. The cut-off strength [394] of the adhesiveline under normal load is assumed as the initial dependence:
�n ¼ �0 þ �N
where N is the actual pressure on the contact; �0 is the adhesive linecut-off strength in the absence of normal stresses; � is a coefficientcharacterizing the influence of normal stresses on tangential strength.This method is also indirect and permits determination only of thetorque value required for overcoming static friction. The adhesioncomponent is found by calculation.
Components of the adhesive specimen strength—adhesion compo-nent ð�adhÞ and friction component ð�frÞ—were determined in accor-dance with the method we have developed, using diagrams ofshearing deformation (Fig. 7.7). If the glued specimen is subjectedonly to shear (Fig. 7.7a), the most typical deformation diagram lookslike curve 1. If the specimen is compressed perpendicularly to theplane of adhesive layer, and the diagram of shearing deformation isrecorded in compressed state, it will be in the form of curve 2, whichmay be explained by the following considerations. On a certain level ofshear stress (point A) being achieved, the combined action of the fric-tion and adhesion forces is overcome. With a generalization of thebinomial friction law of Derjagin, this may be presented as overcomingof the static friction forces. The diagram of deformation displays asharp stepwise reduction of the shearing stress until the point B isreached. The AB ordinate represents the value of the adhesion ð�adhÞcomponent of adhesive joint strength. The ordinates of the sloped por-tion of the section BC are determined by the forces of boundary fric-tion, which are caused by the compression stress value and decreasewith the reduction of contact area.
To validate the method described, it is necessary to match the frac-ture surfaces of the adhesive specimen after recording the deformationdiagram, to exert compression until the previous level of stress is
Criteria of Adhesive Joint Strength 327

reached, and then to record the shearing deformation diagram oncemore (Fig. 7.7b). Then the point A should practically coincide with thepoint B and occupy a position A 0B 0 due to insignificant influence ofadhesion forces. The ordinates of the points B and A 0B 0 should be thesame.
The presence of the friction forces component and its considerableinfluence on the strength of the adhesive joint are confirmed by thefollowing experiments. Steel specimens were fixed with Sprut-5M andVAK in air, under water, and in oil. Using the Instron test unit, theshearing diagrams of specimens were recorded, as well as diagrams ofspecimens precompressed to 28.0 MPa. In this case the values of theadhesion component of the strength of compressed adhesive specimensdefined by the steps in the deformation diagrams coincide with thestrength values under shear of adhesive specimens given in Figs. 7.1and 7.2 and in Table 7.2. Recording of the deformation diagrams ofspecimens compressed to stresses of 5.0 and 15.0 MPa also continuesthis coincidence. The ordinates of the deformation diagrams determinethe dependence of the strength components of specimens on frictionforces after failure of adhesion bonds. For specimens fixed with Sprut-5M the resistance from friction forces amounts to 28.5 MPa in air, to27.5 MPa under water, and to 26.5 MPa in oil; for specimens gluedwith VAK the corresponding values are 29.0, 29.5, and 30.0 MPa,which agree with the data given in Figs. 7.1 and 7.2. Recording ofthe deformation diagrams for specimens compressed to stresses of5.0 and 15.0 MPa has validated the above coincidence, as well as the
328 Chapter Seven
Figure 7.7 Methods of determining components of the strength of adhesive joint adhe-sion ð�adhÞ and friction ð�frÞ under the combined action of direct compression and shear.(a) Shear deformation of (1) initial specimen; (2) precompressed specimen. (b) Sheardeformation of the specimen joined by fractured surfaces and repeatedly compressedto the initial level.

facts that the sharp increase in the specimen strength under the com-bined action of normal compression and shear occurs due to increase inthe friction forces, and that resistance from the adhesion forces ispractically the same.
The recording of the adhesive joint deformation diagram isattended by certain difficulties and errors, since substrates aredeformed together with the adhesive layer. In this connection, wedeveloped a simpler method for determination of the strength com-ponents under the combined action of normal compression and shear.This is based on the fact that specimens compressed to various levelsof stress fracture with tangential stresses, and the dependence of thebreaking stress on compression value is constructed. The fracturedspecimen surfaces are then matched, compressed to the initial levels,and repeatedly fractured with tangential stresses. Due to the insig-nificant influence of adhesion forces, the ordinate of any point on thecurve of shear breaking stress versus compression value in repeatedtests represents the friction force component of the adhesive jointstrength ð�frÞ. The adhesion component of the adhesive joint strengthfor any specified value �c is found as the difference of the ordinatesof point A in Fig. 7.7. The tangent of the angle � for the adhesivejoint is a true coefficient of friction. The usual tearing machines maybe used for this technique.
Figure 7.8 presents curves 1–3 of the strength dependence for steelspecimens glued with Sprut-5M and VAK in air, under water, and inoil, under the combined action of normal compression and shear (seeFigs. 7.5 and 7.6), as well as curves 1 0–3 0 obtained from the results of
Criteria of Adhesive Joint Strength 329
Figure 7.8 Determination of the friction component in shearing stength tests of frac-tured, matched working surfaces ð1 0�3 0Þ and repeatedly compressed specimens ð1�3Þfixed in air (1), under water (2), and in oil (3) using (a) Sprut-5M and (b) VAK.

tests on specimens with matched working surfaces compressed to var-ious levels of stress and fractured by shear. As is obvious, the frictionforce component of strength is essentially independent of the gluingmedium, and the curves 1–3 and 1 0–3 0 are similar. From this one canconclude that the value of �adh depends insignificantly on compressionstress, and only �fr increases proportionally with �c. For any value of�c in the interval 0–28.0 MPa, simple subtraction of the ordinates ofcurves 1–3 and 1 0–3 0 in accordance with the method described givesvalues of shear breaking stresses similar to those given earlier. Thevalues of the true friction coefficients are characterized by the angle �.
Subtracting the friction component ð�frÞ from corresponding ordi-nates of experimental diagrams of limiting state obtained under thecombined action of normal compression and shear (Figs. 7.5 and 7.6,quadrant II), we can construct the diagram sections (dashed line); themaximum relative deviation from the diagrams calculated fromstrength theories [382, 384] does not exceed 9%.
On the basis of the above, we conclude that a sharp increase intangential breaking stress of the compressed adhesive specimen isthe result of the friction force component.
330 Chapter Seven

Chapter
8Control of Polymer Properties forImpregnation of Porous Materials
8.1 Introduction
In their end uses, structural units and buildings made of concrete,brick, or wood are subject to aging, during which their strengthand/or hardness are reduced and their decorative properties deteri-orate. Remediation is usually effected by means of replacement andreinforcing, and the cost of such work often exceeds the cost ofnew construction. Recently great interest has been shown in theproblem of renovating structures by impregnation, both with solu-tions of inorganic salts and with organic monomers and oligomers[403, 404].
Impregnation with monomers and oligomers that achieve a poly-meric state within the structure is preferable, as it permits the treat-ment of practically all types of porous materials, such as concrete, soil,wood, brick and other ceramic materials, asphalt, and so on, and theimpregnated material exceeds the original in strength. The treatedmaterials’ capacity for deformation without breaking also increases,and density, tightness, chemical stability, and immunity to insects isimproved.
The main obstacle to wide employment of organic compositions forimpregnation purposes lies in selective adsorption of certain compo-nents by the pores of the surface of the impregnated materials. If thishappens, the components are separated, leading to disturbance of thesystem’s stoichiometry and to lack of curing. For example, when con-crete is impregnated with epoxy resin/amine hardener mixture, theupper part of the concrete becomes impregnated with epoxy resin only,and the deeper parts with hardener.
331

To avoid selective separation of the components, one-componentsystems are usually used for impregnation; their cure is effected byinteraction of monomers and oligomers with substances contained inthe material being impregnated, mainly water. Unsaturated com-pounds or compounds with isocyanate groups are most often used.Polymerization of cyanoacrylates in the bulk of an impregnatedmaterial occurs by the catalytic action of water, which is alwayspresent on the surface of pores. Polyisocyanates react chemicallywith water, producing polyureas; acrylate polymerization, becauseof the necessity for high-purity materials, is achieved with ionizingradiation.
The use of one-component organic systems for impregnating struc-tures is attended by considerable difficulties: for example, the cost ofcyanoacrylate monomers is high; they can be used only for the impreg-nation of absolutely dry structures; they are quickly polymerized andhence cannot penetrate deeply into materials. The use of radiation foracrylate polymerization is hazardous, expensive, and technically com-plicated. When polyisocyanates cure by interaction with water, carbondioxide is liberated and comes out to the surface where it forms con-tinuous pores:
NCO—R—NCO þ HOH ! —NH—CO—NH— þ CO2
In addition, gas-generated pressure impedes deep penetration of thestructure.
The problem faced was the development of organic materialsand technologies for impregnation of porous structures, includingthose saturated with water, that would possess high permeability,cure with specified speed inside the structure, and provide con-siderable increase of strength, air-tightness, and chemical stabi-lity. We approached this probem with the help of the followingtechniques:
1. Changing the surface energy of impregnated materials to provideselective wetting of pore surfaces by polymer compositions in aqu-eous medium.
2. Use of one-component compositions, including functional groupsand crown-ethers, for impregnation. These crown-ethers formcomplexes with metal atoms located on the surface of thematerials being impregnated. The complexes possess catalyticactivity and can initiate and accelerate polymerization of thecompositions.
332 Chapter Eight

8.2 Physical-Chemical Aspects of theImpregnation of Porous Materials
Two main factors exert direct influence on the impregnation of porousmaterials—thermodynamic and kinetic. Whereas thermodynamicfactors define the conditions of adsorption of compositions onto thesurface of material pores, kinetic factors influence the speed of impreg-nation, which is determined primarily by the size of the pores in thematerial, the viscosity of the composition, and the wetting of the poresurface with the composition.
If the pores in the material are too small, the impregnation processis governed mainly by composition–material interaction; large-sizedpores are mechanically filled with the composition.
Adsorption interaction largely controls such processes as formationof adhesive bonds between the material surface and the composition,selective adsorption of the composition components by the surface ofmaterial pores, and displacement of water by the composition from thepores of the impregnated material. Let us consider these processes indetail, as they are essential for determination of the properties ofimpregnated materials.
8.2.1 Adhesion of the composition toimpregnated materials
The level of adhesion of the composition to the material largely deter-mines the strengthening of the material after impregnation. Adhesionwork is thermodynamically defined by the well-known Dupret equa-tion [405] and depends on surface tension and interphase tension ofboth the material and the composition. As the material being impreg-nated possesses high surface tension and the organic composition isdistinguished by a low one, the composition will wet materials well,ensuring high adhesion. Two exceptions are when the porous materialis previously impregnated with surfactant solution to reduce selectiveadsorption of composition components, which decreases surface ten-sion, and when the impregnation of wet material is undertaken. Bothcases will be described below.
8.2.2 Selective adsorption of componentsof the composition
Substances such as concrete are characterized by high sorption activ-ity, leading to separation of composition components during theimpregnation process and, consequently, to disturbance of the sys-tem’s stoichiometry.
Control of Polymer Properties for Impregnation of Porous Materials 333

We have investigated selective adsorption processes in concreteusing compositions consisting of epoxy resin and amine hardener;polyurethane compositions of polyisocyanate and polyols based onpolyethers and polyesters; and polyester compositions consisting ofunsaturated polyester resin and a curing initiator. The polyesterresin was a styrene solution of polydiethylene glycol maleate phtha-late. Common chromatographic methods were used for the investiga-tion. It was shown that in the process of penetration through a layer ofconcrete, the epoxy composition is divided into epoxy resin (upperlayer) and hardener (lower layer); the polyurethane compositiondivides into polyisocyanate and polyol, and the polyester compositioninto polyester–initiator–styrene. The sorption capacity of concrete var-ies greatly depending on the type of concrete and its method of pre-paration. In impregnation of porous concrete or structures with badlydamaged concrete showing numerous pores, adsorption separation ofcomponents is observed to a lesser degree.
To investigate the possibility of eliminating selective sorption ofcomponents in impregnation, we studied the properties of polymerboundary layers on the surfaces of glass and granite as model materi-als. The glass-transition temperature Tg characterizing the polymercondition was the parameter investigated. The glass-transition tem-perature in boundary layers was determined using reversed-phase gaschromatography by the dependence of the logarithm of retentionvolume on inverse temperature. As is obvious from Fig. 8.1, the poly-mer glass-transition temperature is reduced with the decrease of itsthickness at the glass and granite boundary, indicating incompletepolymer curing due to disturbance of the equimolar stoichiometry. A
334 Chapter Eight
Figure 8.1 Dependence of glass-transition temperature (Tg) onthe thickness of the epoxy polymer layer applied to a granitesurface waterproofed with surfactant (1), glass (2), and granite(3)
composition boundary layer of up to 0:03 � 10�6 m thickness does notgo over to polymer and its properties are similar to those of the initialepoxy resin. The data were confirmed with infrared spectra of polymerboundary layers [406].
There is no sorption separation of components when the material’ssurface tension is reduced. As is obvious from Fig. 8.1, treatment of thegranite surface with surfactant excludes selective adsorption. We alsoobserved these patterns in earlier investigations of iron and basalt [407,408], and surfactants were used extensively in the modification of adhe-sives and coatings [409, 410]. Accordingly, preliminary impregnation ofthe material to be impregnated with the surfactant solution shouldeliminate the separation of components and ensure constancy of theproperties of the impregnated material at all depths of impregnation.
Our experiments have shown that substances containing estergroups are the most effective for preliminary impregnation of concrete.As was shown by Adamson [413], ester groups undergo hydrolysis onalkaline surfaces and the hydrolysis products are chemically bondedwith the surface. This reduces the free energy of the surface and at thesame time prevents surfactant desorption during material impregna-tion.
A chromatographic column of 1 cm diameter filled with concreteprepared from a moist sand/cement mixture in 3:1 ratio was used.The concrete was characterized by 10% porosity and its compressionstrength was 18 MPa. The concrete was impregnated with a composi-tion consisting of epoxy resin and amine hardener. After resin curing,the concrete-filled column was cut into specimens 1 cm long. In theother experiment, the concrete was impregnated beforehand withpolyester-based surfactant solution. Test results for these specimensare presented in Table 8.1. It is obvious that preliminary processing of
Control of Polymer Properties for Impregnation of Porous Materials 335
TABLE 8.1 Influence of Impregnation on the Strength of Concrete Specimens
Specimen Specimen length from Concrete impregnation Compressive strengthno. the column top (cm) with the surfactant of concrete (MPa)
1 1 No 862 2 No 323 3 No 234 4 No 205 6 No 206 10 No 217 1 Yes 1138 2 Yes 1079 6 Yes 95
10 10 Yes 91

concrete with surfactant solution leads to considerable increase in itsstrength after impregnation.
8.2.3 Impregnation of wet materials
There are at least two problems in impregnating wet materials. First,water is a mechanical obstacle for permeation of the organic composi-tion into the volume of the material. Second, water impedes the wet-ting of the surface of the pores of the material by the composition. If awater film exists between the cured composition and the solid, thestrengthening effect of the impregnation will be minimal.
Theoretical analysis shows that to ensure the wetting of pore sur-faces by the composition, it is necessary to achieve a composition–solidinterphase tension less than the water–solid interphase tension.Preliminary impregnation of the material with surfactant solutionreduces tension at the composition–solid boundary, improving wettingof the solid by the organic composition. In gluing of materials under-water, surfactant may be introduced directly into the composition.Introduction of only 1% of alkylphenol oxyethylized ester or fluori-nated alcohol (CF3(CF2)CH2OH) into a composition based on methylmethacrylate leads to reduction of the limiting angle of granite surfacewetting from 648 to 30–348.
Ensuring selective wetting of the pore surfaces of the material bythe composition in aqueous medium is not alone sufficient for dis-placement of water by the composition. Application of mechanicalwork to the phase boundary is also required. The specific mechanicalwork necessary for complete water displacement by the composition ona solid surface is given by [410–412]
A ¼ �c;wð1 þ cos �Þ þ �c;wS1 � S2 � S3
S2ð8:1Þ
where �c;w is the composition–water interphase tension; � is the limit-ing wetting angle; and S1, S2, and S3 are the solid–composition, solid–water, and composition–water boundary surfaces.
Equation (8.1) shows that spontaneous (without work applied to theboundary) solid surface wetting by the composition in aqueous med-ium is possible for equality of surface tension values in adhesive andliquid, i.e., for �c;w ¼ 0. The maximum attainable �c;w is advisable,however, as it is in direct proportion to thermodynamic work of adhe-sion. Therefore, it is impossible to ensure high-quality impregnation ofporous materials with organic compositions without application ofwork to the composition–solid boundary, even if the thermodynamicconditions for selective wetting of material pores by the composition
336 Chapter Eight

are provided. Mechanical work can be applied by feeding the composi-tion into the material volume under pressure, or effecting the impreg-nation process using ultrasound.
Water can exert a direct influence on the process of compositioncuring. For example, impregnating wet concrete with a compositionbased on methyl methacrylate, the speed of curing is 1.2–1.5 timeshigher than in the impregnation of dry concrete, and the molecularmass almost doubles—from 3:68 � 106 to 7:13 � 106. This may beexplained by the fact that a small amount of water in methyl meth-acrylate enhances the possibility of folding of the growing chains,decreasing the rate of their breaking. Water can inhibit the curingof unsaturated polyester resins and sharply increases the curingspeed of cyanacrylate; water reacts chemically with certain groupsthat may be included in compositions, for example, isocyanate groups.
8.3 One-Component Organic Compositionsfor Impregnation of Porous Materials
Curing of one-component compositions in the material volume isachieved by physical or chemical means. Physical factors include pri-marily heating or the use of penetrative radiation. Curing can occurthrough the action of substances located on the surface of the pores ofimpregnated materials. In the case of concrete impregnation thesesubstances comprise water, alkalis, and cations of mainly alkaline-earth and alkali metals. Water hardens compositions containing iso-cyanate groups with the liberation of carbon dioxide, leading to gen-eration of a polymer foam. These compositions are sometimes used asso-called fast blocking compositions. Alkali under certain conditionsmay cause polymerization of composites containing epoxy groups. Thepossibility of curing compositions by the action of metal compounds ismost interesting. Metals can cause polymerization of compounds con-taining unsaturated bonds, including isocyanate and alkylene oxidegroups. However, salts contained in concrete are characterized by lowdegrees of dissociation and are not very active as catalysts. We inves-tigated the possibility of creating catalytic complexes based on thesemetals and crown-ethers introduced into the oligomer chain. As shownin Section 3.4, these complexes are highly effective interphase cata-lysts and catalyze polymerization reactions. Specific catalytic actionwas provided by the particular crown-ether used to form complexeswith the required metal atom.
Consider isocyanate trimerization as an example. This reaction inthe presence of alkali and alkaline-earth metals was described indetail earlier. With crown-ether in contact with the concrete surface,it forms a crown-complex with the calcium cation of calcium oxide
Control of Polymer Properties for Impregnation of Porous Materials 337

hydrate. A loose ion pair is formed and the released anion catalyzesthe process of trimerization of isocyanate groups:
3 O——C——N—R ! ðO——C——N—RÞ3
These isocyanurate groups are the points of oligomer binding and,due to isocyanate group trimerization, the diisocyanate-based oligo-mer turns into a strong, chemically stable network polymer. The for-mation of isocyanurate groups under the influence of crown-complexescan proceed so actively that water–isocyanate group interaction is notpractically observed, and similarly the liberation of carbon dioxide inimpregnating concrete structures.
The purposes of impregnating structures may vary from increasingbearing capacity to strengthening surface layers and enhancement oftheir chemical stability. Because of this, it is necessary to be able tocontrol the properties of organic compositions for impregnation. Forexample, for deep impregnation of dense concrete structures, the com-position should have low viscosity, good wetting ability, and very lowrate of polymerization. When it is required to protect ferroconcrete-reinforcing elements from corrosion, the composition should possessinhibiting properties. At the same time ‘‘fast blocking’’ compositionsshould have curing times of tens of seconds or minutes. The creation ofone-component compositions with controlled properties became possi-ble with introduction of crown-ethers into them, and resulted in com-plexes with various catalytic activities.
The main obstacle to wide usage of crown-ethers in compositionformulations is their comparatively high cost. One way of reducingcosts is replacement of traditional crown-ethers with open-chain‘‘pseudo-crown-ethers.’’ Furthermore, the use of crown-ethers allowsthe utilization for impregnation of very cheap monomers that mayeven be wastes from chemical production.
8.4 Influence of Impregnation on MaterialProperties
Wooden structures are impregnated to protect them from variousenvironmental factors such as water, aggressive chemicals, ultravioletradiation, and so on. Impregnation can reduce wood’s combustibility,increase its strength, protect from decay and the depradations ofinsects, and impart desirable decorative properties. After impregna-tion, softwood, such as lime-tree or aspen, becomes similar to tropicalhardwood and can be used in novel fields, for example, as machineelements operating in aggressive conditions. Impregnated wood chip-
338 Chapter Eight

boards and fiberboards can be used in humid conditions or as struc-tural materials.
Impregnation of wood may be effected by applying the polymer com-position onto the wood surface with a brush, by spraying, or by dippingof a wooden item into the composition. The degree of impregnationdepends on the type of wood, its quality, the time of contact of thewood and composition, and the composition curing speed.
The changes in properties of concrete upon impregnation are con-sidered below. Dry, wet, or water-saturated concrete of 400 grade wasused and impregnation was performed without preliminary treatmentof the concrete with surfactant. An isocyanate-containing composition(variant 1), a composition with glycidyl groups (variant 2), and anacrylic composition (variant 3) were used. Impregnation was effectedby immersing concrete specimens into the composition for 6 h. All thetests on concrete specimens were made in conformity with standardmethods seven days after impregnation.
1. Water absorption. Before impregnation specimens were dried toconstant mass. Tests showed that water absorption of impregnatedspecimens was zero, and check samples were characterized by 4.5–4.7% water absorption.
2. Radiation stability. Radiation stability was checked by exposingimpregnated specimens to �-radiation from a 60Co source. Testsshowed that variants 1 and 2 are the most radiation-stable compo-sitions. At doses of less than 120 Mrad, no change was observed inthe properties of the impregnated specimens.
3. Chemical stability. Chemical stability was determined by immer-sing the impregnated specimens in various chemicals. At 6 and 12months after exposure in different media, specimens were removed,dried, and subjected to compression tests. The tests indicated thatimpregnated specimens are stable to the action of solutions of salts,acids, and alkalis and unstable to the action of concentrated nitric,sulfuric, and hydrochloric acids. The most chemically stable is theacrylic composition.
4. Permeability to chloride ions. Of various chemicals, concretes comeinto contact with chloride-containing salts the most often, espe-cially in places where streets are cleaned of snow with the help ofsalts. This leads to intensive deterioration of the concrete elementsof roads and underground service lines.
Impregnated concrete specimens, simultaneously with check spe-cimens, were immersed in 10% NaCl solution for 5 days. Dry, wet,and water-saturated specimens were impregnated to a depth of3 mm. After testing, the specimens were split, and AgNO3 solution
Control of Polymer Properties for Impregnation of Porous Materials 339

was applied onto the chip surface. The presence of chlorides wasdetermined visually by the appearance of a white sediment. Nochlorides were found in concrete impregnated by any of the threecompositions whereas in check samples chlorides were found at adepth of 2–3 mm.
5. Freeze resistance. Freeze resistance was determined by a rapidmethod involving freezing of concrete specimens in 5% NaCl solu-tion, at �508C and thawing in the same solution. Impregnatedspecimens displayed no changes after 200 cycles of freezing andthawing, featuring F 200 grade freeze resistance. Check samplesdisplayed strength losses, and flaking and chipping were found atspecimen surface ribs.
340 Chapter Eight
TABLE 8.2 Adhesion of Protective Coatings to Concrete
Adhesion (MPa)
Number of freeze/thaw cyclesSpecimen Concreteno. Composition condition 0 10 15 20
1 1 Dry 3.3 3.0 2.7 2.42 2 Dry 3.1 2.9 2.8 2.73 3 Dry 2.9 2.6 2.4 2.44 1 Wet 3.1 2.8 2.6 2.55 1 Water-saturated 3.1 2.7 2.6 2.5
TABLE 8.3 Influence of Impregnation on Concrete Properties
Concrete afterProperty Initial concrete impregnation
Ultimate strength (MPa)Compressive strength 40 160Tensile strength 2.5 16Bending strength 5 22
Elastic modulus under compression (MPa) 3 � 104 4 � 104
Ultimate strain under compression 0.001 0.002Fitting bond resistance (MPa) 1 13Dynamic tensile strength (�) (103 MPa � s) 6 27Shrinkage deformation 50 � 10�5 4 � 10�5
Creep deformation 50 � 10�5 7 � 10�5
Electrical resistance (�) 105 1014
Water absorption (wt%) 4 0.2Freeze resistance (cycles) 200 8000Stability to acids Low High

6. External crack resistance under alternating loads. Impregnation ofspecimens to a depth of only 2 mm results in 3-fold to 8-fold increaseof external crack resistance. The best results were obtained forspecimens impregnated with isocyanate-containing compositions.
7. Adhesion of the protective coating to concrete. To explore the possi-bility of using polymeric compositions as protective coatings, theadhesion of all the compositions to dry, wet, and water-saturatedconcrete was studied, as well as adhesion changes after specimenswere frozen and thawed. B30 class heavyweight concrete was usedin the studies.
Table 8.2 shows that adhesion of coatings to concrete exhibits lowdependence on concrete moisture content and the number of freezingand thawing cycles, thus significantly increasing the requirementsshown by specifications.
Table 8.3 contains data on the influence of impregnation on concreteproperties. Composition No. 3 was used for impregnation.
Control of Polymer Properties for Impregnation of Porous Materials 341

Chapter
9Practical Applications of Polymer
Adhesion Studies
The practical use of polymeric composite materials (PCMs) inspecific branches of industry requires resolution of the problem of con-trol of their properties. Means of achieving this control may be foundwhen the regularities outlined under the descriptions of studies ofphenomena connected with polymer adhesion strength are analyzed.It should be noted, however, that despite the fact that the principalproperty of PCMs is polymer adhesion stength, their use requires thecontrol of a great number of other polymer properties and the develop-ment of special technical and operational methods, comprehensive test-ing, and so on. Thus, the Adhesive Research and Development Centerincludes basic departments, as listed below, dealing with the introduc-tion of high technology into the field of PCMs.
1. Fundamental Research Department, whose employees contributeda great deal to these studies.
2. Applied Research Department, established to focus on the control ofPCM properties, taking into account the results obtained in theFundamental Research Department, and to study the use ofPCMs for specific industrial and civil engineering branches, aswell as to develop PCMs.
3. Pilot Plant Department develops ‘‘know-how’’ for manufacturingPCMs and produces pilot plants to undertake in-situ testing.
4. Technological Department develops methods of operation in PCMusage.
5. Certification Department is engaged in full-scale tests of PCMs anditems made of them.
342

Here we describe the possibilities of utilizing the regularitiesalready described for the development of PCMs featuring novel prop-erties that help provide solutions currently unattainable with PCMsnow available on the market.
9.1 Adhesives for In-situ Maintenance andRepair Work
Adhesives of this type were developed for repair and maintenance intransport facilities, plants, pipelines, ships, etc. in the open air. In-situconditions require development of adhesives usable at all ambient airtemperatures, in wet weather, in deep waters, and in oil productmedia and other liquids. Surfaces to be glued together may be coveredwith corrosion layers, and glue line thickness cannot be limited. Thereis no need for any additional alteration of the joints.
9.1.1 Ship repairs
9.1.1.1 Hull repairs. The main costs incurred when ships are repairedin shipyards are due to replacements of corroded hull parts, i.e., decksections, partitions, pipes, holds, drinking water tanks, drainageinstallations, etc. Large costs are caused by certain features ofcurrently used repair procedures, involving electric welding andentailing huge amounts of auxiliary operations. Thus, to replace acorroded upper deck, the complete cleaning of rooms underneath isrequired, i.e., dismantling and removal of heat insulation coverings,furniture, and instruments. Afterwards, using electric welding, thedeck is removed and replaced with a new one. These procedures forships of 20–60 thousand tonnes of displacement take 4–6 months.
We have proposed specially developed polymer compositions for usein ship repair. Repairs are performed by impregnation of corrodedstructures with a composite involving reinforcing element layers anda face layer. Glass fabric is mainly used as the reinforcing element.When basalt flakes are used as reinforcing elements, they are appliedonto metalwork surfaces together with atomized polymer composition.The surface of these flakes is specially modified to promote formationof strong flake-to-PCM ahesion bonds, permitting significant increaseof the compositie material strength. The properties of these flakes willbe discussed in a later section.
High cohesion and adhesion bond strength to corroded metals, highwater resistance, low levels of interior stress, and glue line resistanceto vibration stresses are basic requirements for polymer compositesutilized for these operations. To achieve these goals, a polymer mix-ture featuring interpenetrating polymer networks has been used. The
Practical Applications of Polymer Adhesion Studies 343

composition includes two types of surfactant—reactive (RS) and che-mically indifferent (IS)—the latter playing the role of corrosion inhi-bitor. In addition, the composition also contains corrosion protectors.
This method is most widely used to repair fishing vessels. This typeof vessel often operates thousands of kilometers from home ports.When back home, crews are comparatively idle and may be engagedin repair and maintenance works. Six to seven days is the averagetime required to repair a fishing boat’s upper deck while the vesselis afloat.
We offer an attractive procedure for corrosion-resistant protection oftanks, cisterns and holds. A polymer composition layer is poured tocover a tank bottom, and a water solution of density greater than thecomposition’s density is delivered below it. The composition floats upslowly, coating interior tank surfaces thoroughly. This operation maybe repeated several times to increase the coating layer thickness.
9.1.1.2 Gluing of pilothouse to the deck. Ships’ decks aremanufactured of steel, and light-metal alloys are the preferredmaterials for construction of the pilothouse. The pilothouse isfastened to the deck by electric welding with the help of a bimetalplate, one side made of steel and the other of light alloy. This plateis essentially a galvanic cell. When it is exposed to seawater, intensivemetal corrosion occurs, sharply reducing durability of the fastening tothe deck.
To eliminate this phenomenon, we propose gluing the pilothouseusing Sprut-12 adhesive. Tests performed immediately after gluinghave shown that the durability of the pilothouse fastening is not infer-ior to that made by electric welding; and after one year the durabilityof the glued pilothouse fastening was already twice that of the weldedfastening.
9.1.1.3 Wreckage work. Hull repair in the case of a breach isperformed in dry dock, but ships often cannot reach dry dockthemselves. Use of adhesives in this case obviates the problem oftransporting ships to dry dock and can eliminate dock serviceentirely for minor damage. Divers using Sprut-4, TSAU, or LINGadhesive types and special tools make glued repairs to breaches.These tools provide for fixation of plasters on the breach withadhesive curing and safe plaster fastening. The simplest toolcomprises a plastic bag inflated from the scuba, and more complexdevices are equipped with special suction cups. This combination oftools and polymeric composition properties promises the possibility ofovercoming such frequently encountered problems as breaches of
344 Chapter Nine

considerable size, badly deformed edges of hull plating, and flow ofwater into the ship.
The most interesting example of such work took place in theCaspian Sea. A floating drilling rig produced at the shipbuildingyard in Sevastopol, for oil recovery in the Caspian Sea, navigatedthe Black Sea, the Sea of Azov, and the river Don, but on going overto the river Volga it was found that the lock was 30 cm narrower thanthe width of the rig. It was resolved to cut the rig into two parts and toconvey them separately to the river Volga, where they were to beglued; the rig was then supposed to be transferred to the town ofAstrakhan on the Caspian Sea, where the parts were to be weldedtogether in dry dock.
To achieve this, a metal box was glued underwater onto the rigbottom. Water was removed from the box, allowing the rig body tobe cut into two parts by electric welders. After passage of the righalves through the lock, the body was glued together again, allowingthe rig to arrive at the dock unaided.
In the 1980s a Bulgarian merchant ship sank in the Black Sea nearthe town of Odessa. It was proposed to use adhesive to haul it up. Forthis purpose the breach, holes, and all the sites of leakage in the hullwere thoroughly sealed with VAK adhesive, whereupon compressedair was pumped into the hull. Once all the water had been expelledfrom the ship, it floated to the surface.
9.1.2 Damage control in the oil and gasindustry
9.1.2.1 Oil tank reconstruction. Oil recovered in the field ischaracterized by a high content of water in which salts, acids, andhydrogen sulfide are dissolved: such oil results in metal corrosion.The service life of corrosion-resistant coatings in use does not exceed2–4 years when the oil contains large amounts of hydrogen sulfide.
At the same time, replacement or repair of oil tanks at the site of oilrecovery is usually excessively complicated, since tanks are oftenlocated in regions difficult to access. In addition, preparation of thetank for application of corrosion-resistant coatings involves labor-intensive operations such as thorough cleaning of oil products frommetal surfaces, degreasing and sandblasting, as well as electric weld-ing and steaming of the tank when necessary.
The properties of Sprut-12 and Sprut-14 polymeric compositionsdeveloped for tank repair allow these labor-intensive operations tobe avoided. The compositions can be applied onto the metal surfacewithout thorough cleaning off of oil products, water, and metal corro-
Practical Applications of Polymer Adhesion Studies 345

sion products. The speed of curing of the compositions can be con-trolled over a wide range, even at temperatures below 08C.
If intensive corrosion damage of the tank body is observed, the bodyis strengthened by means of reinforcing elements, namely, glass fabricor basalt flakes applied onto the inner surface of the tank togetherwith the polymeric composition. These operations are most often per-formed on the lower part of the tank, where aqueous solutions ofaggressive substances accumulate, and on the roof, which experienceshigh concentrations of hydrogen sulfide vapors.
The most secure corrosion-resistant protection of the metal isobserved with use of basalt flakes. These flakes of 2�3 mm lengthand 1–2 mm diameter are laid parallel to the metal surface with theapplication of the coating and form a durable corrosion-preventivebarrier of ‘‘cold ceramics’’ type. There are 200–300 flake layers in atypical coating layer.
9.1.2.2 Repair of pipelines. Problems emerging during pipelineoperation include failure of rust-preventing coatings on the internaland external parts of a pipe, decrease in pipe strength due to corrosionfailure, appearance of flute cracks in the pipe body, and diffusion ofgas through leaks in welds.
Corrosion inhibition of internal surface of pipelines. Corrosion of internalsurfaces is observed, primarily in pipelines used in crude oil produc-tion, where the oil contains a great amount of water. An interestingfeature, so-called ‘‘stream’’ corrosion, characterizes the corrosivedamage to pipes when water and solid suspended matter makegrooves in the bottom of a pipe.
For corrosion inhibition and strengthening of such pipes we haveproposed the use of polymer compositions that provide high adhesionstrength in application to metals in water–oil mixtures. A plungerstretched lengthwise and made of rubberized tissue is placed intothe pipe; the length of the plunger is generally 2–5 times the pipe’sdiameter. Water is pumped in between the plunger walls until theyclose, providing secure tightness of the pipe section. If pressure isapplied, the plunger starts to roll along the pipe like a volumetric‘‘caterpillar.’’ Compared with pistons (pigs), usually used for workinside pipes, plungers ensure considerably better air-tightness of thepipe cavity even if there are foreign objects in it; they are not worn inthe course of moving along the pipe, as there is no friction betweenplunger and pipe. The plunger may be filled with water or oil afterbeing placed in the pipe.
After introduction of the plunger into the pipe, a second one isplaced immediately after it, and the space between them is filled
346 Chapter Nine

with polymer composition. The required amount of composition is cal-culated from the length of pipe to be processed and the thickness of thecoating layer to be applied. After the second plunger, a metallic brush(hog) is introduced, supplied with an electric voltage. The main func-tion of the hog is to provide curing of the coating and high coating–metal adhesion strength.
On application of pressure in the pipe using water, oil, or air, theplungers start to move along the pipe, leaving on the pipe walls a layerof composition. Electrical pulses cause curing of the coating even atlow temperatures. The polymer composition contains basalt or ceramicflakes which, by the action of the plunger, are deposited parallel to thepipe wall surface, ensuring high strength and chemical stability of thecoating.
Corrosion inhbition of the pipeline’s outer surface. We have developed acomposition based on nonsaturated polyester resin (Sprut-9) for inhi-bition of corrosion in pipelines and, in particular, in gas-lines. Thiscomposition contains surfactants allowing application of the composi-tion onto metal surfaces without the need for thorough cleaning fromcorrosion or onto wet surfaces; as well as corrosion inhibitors, a con-troller allows variation of curing from 5 minutes up to 2 days. A highspeed of composition curing is required for repair work or insulation ofpipe joints during laying pipelines, and low speed is needed to allowthe mechanization of procedures during insulation. Pipeline insulationis done by winding onto the pipeline fiberglass wetted with polymercomposition, or by spraying of composition including basalt flakes.
Properties of some polymer compositions are given in Tables 9.1 and9.2.
The most interesting example of the use of Sprut-9 took place inKazakhstan on the Mangyshlak oil field. Very viscous oil is producedon this field, and it has to be preheated for pipelining. Part of a pipe-line passed along the bottom of a saline lake, and the water producedrapid breakdown of the thermal insulation and antirust coating of thepipe, sharply decreasing the pipe’s transfer capacity. A group of divers
Practical Applications of Polymer Adhesion Studies 347
TABLE 9.1 Studies of the Stability of 2.3 mm Thickness Coatings to CathodicLifting
Exposure duration (days) E2 ðVÞ E1 ðVÞ I1 ðmAÞ Lifting area (cm2)
1 71.45 71.0 1.5 07 71.45 71.0 2.0 0
14 71.45 71.1 1.5 030 71.40 71.0 3.0 0
Note: No corrosion was found under the coating.

from the Adhesive Research and Development Center applied an anti-rust coating to the submerged line and with Sprut-9 adhesive gluedhermetic heat-insulating elements to the pipe surfaces, providing athermal shield for the pipeline. These operations allowed the volumeof oil transferred to be increased threefold and gave secure protectionof the pipe from corrosion.
Now let us consider some properties of basalt flakes widely used byus in reinforcement of polymer compositions.
Effect of basalt surface on the properties of boundary layers of network
polymers. Epoxy-resins ED-20 and MP-400 were used, with hardenerspolyethylene polyamine (PEPA), dicyanethyl ethylenetriamine(DDETA), and monocyanethyl diethylenetriamine (MDETA).Samples were made from polyester resin IIH609-21M, which is a60% solution of oligodiethylene glycol maleate naphthalate(DEGMF) in triethylene glycol dimethacrylate (TGM-3). The resinwas hardened by an oxidation–reduction system in the form of methyl-ethylacetone peroxide–cobalt naphthenate. Octyltrimethylammo-nium bromide (OAB) and cetyltrimethylammonium bromide (CAB),the product of interaction of allyl alcohol and 2,4-toluylene isocyanate(ATI), were used as surfactants.
The hardening of the boundary layer of epoxy and polyester compo-sitions was studied by IR spectroscopy (of repeatedly disturbed totalinternal reflection—RDTIR) on a UR-20 spectrometer. A KRS-5 prismðN ¼ 18, C ¼ 458Þ and a germanium prism ðN ¼ 14, C ¼ 458Þ wereused for simulation of the substrate surface. The thickness of a poly-mer layer was 0.5–1 nm for the element made of germanium and 2–3 nm for KRS-5. Inhibition of polyester resin polymerization by atmo-spheric oxygen was eliminated by applying a polyethylene film to thesurface of a system to be hardened. The thickness of the applied epoxyand polyester composition was up to 20–30 nm. To evaluate the glass-transition temperature and the polymer–solvent interaction para-meter, we used reversed-phase gas chromatography. Basalt-1 andbasalt-2 (see below) served as fillers and as a model substrate. The
348 Chapter Nine
TABLE 9.2 Physical-Mechanical and Dielectric Properties of Coatings Before andAfter Tests for Stability to Cathodic Lifting
Absence of breakdown Transient electrical Impact strength Adhesion,under test voltage (kV) resistance (� � m2
Þ (kgf�cm) number
Before8:5 � 0:2 1:2 � 108 125 1
After8:5 � 0:2 3:7 � 104 125 1

glass-transition temperature Tg was determined from the experimen-tal curve of the logarithm of retention volume against inverse tem-perature ðlog Vg�1=TÞ. Mercury was used as the high-energy surface.The basalt disks and flakes were obtained from melt by the method ofinflation; the two types of basalt flakes were basalt-1 from ordinarybasalt and basalt-2 from activated basalt produced by adding surface-active elements to the melt. The surface tension was 430 mN/m and405 mN/m, respectively. The surface of the basalt flakes was treatedwith bianchor urethane-containing surfactants.
To determine the adhesion strength, basalt disks were cemented toeach other and then the package obtained was cemented using a stron-ger cement between steel ‘‘mushrooms’’; this specimen was ruptured ata normal tension.
The properties of both types of basalt flakes were investigated usingelectron paramagnetic resonance (EPR) and electron-energy spectro-scopy. EPR spectra were measured at 300 K on a YES-ME-3X spectro-meter, the first derivative of absorption lines being recorded. Theelementary composition of basalt flakes and of the variation of thecontent of elements through the thickness of a specimen during acti-vation was studied using a Came-Bacs scanning electron microscopeequipped with a Link-860 energy dispersion system intended for X-raymicroanalysis.
Investigations included qualitative analysis of the distribution ofelements from a predetermined area of a specimen; qualitative analy-sis of the distribution of the elements through the cross-section of aspecimen; and qualitative analysis of several local areas of a specimenwith respect to the scanning line.
The results of the electron microscopy examinations confirm thatthe elemental distribution in ordinary basalt flake is characterizedby uniform distribution of elements in the field and through thecross-section of a flake. The uniformity of distribution of Si, Fe, andCa is confirmed by the characteristic Si K�, Fe K�, and Ca K� radia-tion as well as by qualitative analysis by scanning a probe across theplate and by quantitative analysis in local areas of a specimen atvarious distances from the flake edge.
The data show that, unlike the initial specimen, the flake structureis heterogeneous. Near the surface of the flake we observe thin (15 nm)layers of a phase that differs in composition from the central part.Increase in the content of Si and decrease of such elements as Feand Ca is typical for these sections. The content of Si is greatestnear the surface of the flake. In this case we observe slow disappear-ance of silicon from one surface to the center and rapid increase in thenarrow (1.5 nm) zone at the other surface of the specimen. Theincreased content of Fe and Ca is observed on one of the flake surfaces.
Practical Applications of Polymer Adhesion Studies 349
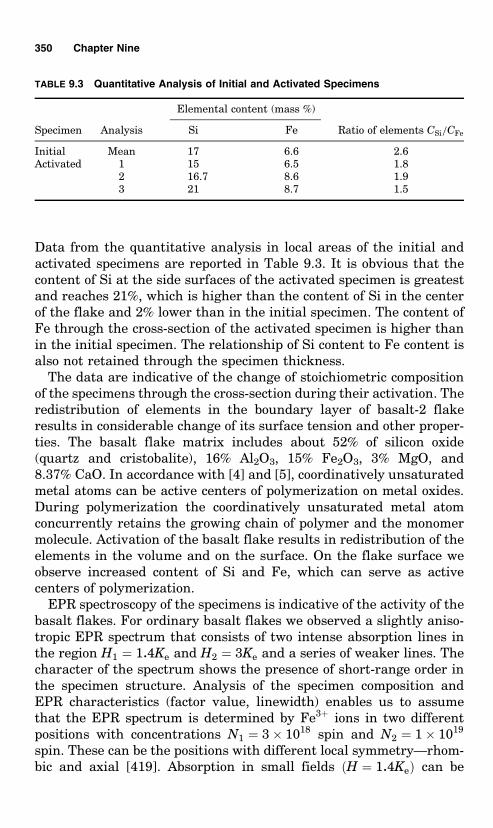
Data from the quantitative analysis in local areas of the initial andactivated specimens are reported in Table 9.3. It is obvious that thecontent of Si at the side surfaces of the activated specimen is greatestand reaches 21%, which is higher than the content of Si in the centerof the flake and 2% lower than in the initial specimen. The content ofFe through the cross-section of the activated specimen is higher thanin the initial specimen. The relationship of Si content to Fe content isalso not retained through the specimen thickness.
The data are indicative of the change of stoichiometric compositionof the specimens through the cross-section during their activation. Theredistribution of elements in the boundary layer of basalt-2 flakeresults in considerable change of its surface tension and other proper-ties. The basalt flake matrix includes about 52% of silicon oxide(quartz and cristobalite), 16% Al2O3, 15% Fe2O3, 3% MgO, and8.37% CaO. In accordance with [4] and [5], coordinatively unsaturatedmetal atoms can be active centers of polymerization on metal oxides.During polymerization the coordinatively unsaturated metal atomconcurrently retains the growing chain of polymer and the monomermolecule. Activation of the basalt flake results in redistribution of theelements in the volume and on the surface. On the flake surface weobserve increased content of Si and Fe, which can serve as activecenters of polymerization.
EPR spectroscopy of the specimens is indicative of the activity of thebasalt flakes. For ordinary basalt flakes we observed a slightly aniso-tropic EPR spectrum that consists of two intense absorption lines inthe region H1 ¼ 1:4Ke and H2 ¼ 3Ke and a series of weaker lines. Thecharacter of the spectrum shows the presence of short-range order inthe specimen structure. Analysis of the specimen composition andEPR characteristics (factor value, linewidth) enables us to assumethat the EPR spectrum is determined by Fe3þ ions in two differentpositions with concentrations N1 ¼ 3 � 1018 spin and N2 ¼ 1 � 1019
spin. These can be the positions with different local symmetry—rhom-bic and axial [419]. Absorption in small fields ðH ¼ 1:4KeÞ can be
350 Chapter Nine
TABLE 9.3 Quantitative Analysis of Initial and Activated Specimens
Elemental content (mass %)
Specimen Analysis Si Fe Ratio of elements CSi=CFe
Initial Mean 17 6.6 2.6Activated 1 15 6.5 1.8
2 16.7 8.6 1.93 21 8.7 1.5

altered by crystal fields of axial symmetry [420]. After activation, theintensity of EPR lines in the region H2 ¼ 3Ke increases sharply. Thisis caused by increase of the proportion of rhombohedral phase in theflake structure. In this case the total concentration of the paramag-netic centers reaches a value of 6 � 1019 spin. The presence ofunpaired electrons with concentration of 6 � 1019 spin in the activatedbasalt flakes suggests that the surface of the activated basalt flakespossesses initiating centers responsible for the polymerization in theabsorption layer [417].
It was earlier shown that a layer of epoxy polymer on a metal surfacedoes not change the polymer condition [422, 423]. Treatment of thebasalt surface with surfactant affects the glass-transition temperatureof the polymer. As seen from Fig. 9.1, for a low-energy surface (basalt,treated with surfactant) the polymer glass-transition temperature doesnot depend on variation of the thickness of the polymer layer.
The increase in the glass-transition temperature Tg of a film0:01 � 10�6 m thick is associated with limitation of the mobility of thepolymer chains near the solid surface. The character of Tg change forthe surfaces of basalt-1 and basalt-2 is indicative of a complex structureof the boundary layer. For films ð0:01�0:03Þ � 10�6 m thick on the logVg�1=T curve, no fracture is observed in the investigated temperaturerange. We assume that a boundary layer of epoxy composition0:03 � 10�6 m thick does not change the polymer condition. The high-energy surface can selectively sorb the epoxy resin, as a result of whichthe adhesive layer is improved by hardener, and the stoichiometry ofthe composition becomes disturbed. The polymer layer enriched in
Practical Applications of Polymer Adhesion Studies 351
Figure 9.1 Dependence of glass transition temperature Tg on filmthickness for ED-20–PEPA on basalt-2 with a layer of surfactant(1), basalt-2 (2), basalt-1 (3).

epoxy resin has a considerable expansion. In addition, the incompletehardening of the boundary layer of the adhesive can be caused bydecrease of the mobility of polymer chains due to the interaction energylimitation of the conformation set and blocking of the active groups ofcomponents of the composition by the solid surface.
Heating specimens at 423 K for 5 h results in the appearance of abreak on the log Vg�1=T curves, corresponding to the glass-transitiontemperature of the polymer in films ð0:01�0:03Þ � 10�6 m thick. In thiscase the surface nature of basalt-1 affects the glass-transition tem-perature more than that of basalt-2. Heating at the same temperaturefor 10 h results in increase of Tg. Further heating for 15 h causes noincrease of Tg. The increase of the glass-transition temperature of thepolymer in the 0:5 � 10�6 m thick film can be explained by the factthat this layer contains an excessive quantity of hardener, whichreacts with resin during long-term thermal treatment.
Starting from a thickness of 0:3 � 10�6 m, the properties of theboundary layer of the polymer approach the volumetric values. Thedata enable determination of specific changes of the retention volumeVg with change in the film thickness. For the polymer located on thesurfactant-treated basalt surface we observe a negligible change of Vg
with variation of the film thickness. When the untreated basalt flakeswith a film thickness of 0:03 � 10�6 m are used, we observe a sharpincrease of Vg that can be explained by the decrease of structure den-sity. Figure 9.2 presents the dependence of the thermodynamic inter-action parameter of polymer solvent �1;2 on the film thickness. As is
352 Chapter Nine
Figure 9.2 Dependence of the polymer solvent inter-action parameter �1;2 on film thickness for ED-20 (1)and ED-20–PEPA (2, 3). Supports: (1) basalt-2 with alayer of surfactant; (2) basalt-2; (3) basalt-1.

seen, the values of the parameter for an epoxy film 0:03 � 10�6 m thickwith and without hardener are approximately the same, indicatingincompleteness of the gel-formation process. Heating the0:03 � 10�6 m thick film on the basalt surface results in increase of�1;2, which is associated with additional hardening reaction of thepolymer during heating. With increase of the film thickness, the effectof the polymer support on the value of �1;2 becomes much less, thoughit is still observable up to 0:3 � 10�6 m thickness.
Increasing the polarity of the hardeners (i.e., their surface activityat the polymer–high-energy surface boundary upon replacement ofMDETA by DDETA) results in the attainment of approximatelyequal surface activities of resin and amine, such that the interfacialtension of the mercury–ED-20 boundary is 342 mN/m, of that withMDETA is 372 mN/m, and of that with DDETA is 354 mN/m. Theincrease of the surface activity of the hardener results in increaseddegree of conversion of the epoxy groups in the boundary layer (Fig.9.3). It is known that considerable increase of the polymer adhesionstrength can be attained by the addition of surfactants. With this aim,the halogen salts of quaternary ammonium bases have been added tothe epoxy compounds. The adsorption of surfactant molecules on theinterface partly eliminates the preferential sorption of epoxy resin andformation of an insufficiently hardened boundary layer. While increas-
Practical Applications of Polymer Adhesion Studies 353
Figure 9.3 Dependence of the degree of conversion of epoxide (1–5)and polyester (6–8) compositions on the film thickness one dayafter mixing (1) ED-20þPEPA, 293 K; (2) ED-20þPEPA with 2%CAB; (3) ED-20þPEPA with 3% CAB; (4) ED-20þMDETA, 293 K;(5) ED-20þMDETA, 423 K; (6) PN-609-29Mþ 2% PMEKþ1% NK,293 K; (7) composition 6 with addition of 10% ATJ, 293 K; (8) com-position 7 with addition of 10% ATJ, 357 K

ing the degree of hardening of the epoxy compound in a thin layer (Fig.9.3), the surfactants exert practically no influence on the degree ofhardening of the polymer in the bulk, and the adhesive strength ofcemented basalt disks varies in parallel with the degree of conversionof the epoxy groups in the thin layer (Table 9.4). The adhesive strengthincreases especially sharply upon treatment of the basalt surface withsurfactant. Treatment of the surface of the disks made of basalt-2 withbianchor urethane containing surfactant has enabled an adhesivestrength of 56 MPa to be obtained in application of the polyester base.
As is seen in Fig. 9.3, the degree of conversion of the polyestercomposition at the boundary layer is also considerably lower than inthe volume. To clarify the causes of this, the composition of the ingre-dients of polyester resin with TGM-3 and DEGMF was investigated byRDTIR. It was established that DEGMF is practically not polymerizedeither in the volume or on the boundary with the KRS-5 elements.Upon polymerization of TGM-3, the degree of transformation of doublelinks in a 2–3 nm thick layer and the rate of hardening in the thinlayer differ from the values in the volume.
While investigating the dependence of the rate of polymerization ofthe composition in relation to the copolymerizing components, weestablished that insufficient hardening of the boundary layer of poly-ester resin is caused by the concentration of STGM-3.
The increase of the content of DEGMF in the boundary layer isconfirmed by the 4.5-fold rise in the intensity of the benzene ringabsorption band in the 1580 cm�1 region for hardened resin IIH-609-21M in the layer 2–3 nm thick compared with the value in the volume.We concluded that the insufficient hardening of polymer near thehighly effective solid surface is associated with preferential sorptionof DEGMF at the phase boundary. Heating the polymeric filmincreases its degree of hardening. However, even then, the degree of
354 Chapter Nine
TABLE 9.4 Strength of Adhesion Joint of Basalt Disks
Adhesive strength (MPa)Hardening
Resin Hardener Additive temperature Basalt-1 Basalt-2
ED-20 PEPA – 293 11.2 16.8ED-20 PEPA CAB 293 22.8 24.7ED-20 PEPA OAB 293 23.3 24.9ED-20 MDETA – 423 59.6 67.4ED-20 DDETA – 423 69.1 69.6
II H-609-21M PMEKþ IK – 293 28.0 30.6II H-609-21M PMEKþ IK ATJ 293 40.0 44.6II H-609-21M PMEKþ IK ATJ 353 38.6 38.7

transformation of double bonds near the solid surface is lower than inthe volume of the composition. Heating for 6 h at 353 K increased thedegree of transformation of polyester resin in the 2–3 nm thick layer to65% and in the volume to 87%.
Adding ATJ, which displays surface activity at the polymer–high-energy surface boundary, to the polyester resin increases the degree ofpolymer hardening in the boundary layer to 15–20% (Fig. 9.3). ATJ ispresumed to have dual action at the phase boundary. First, the for-mation of an adsorption layer of ATJ must change the conditions ofadsorption interaction of the composition components on the interface,which has been observed upon adding surfactant to the epoxy resin.Second, the allyl groups of ATJ can be copolymerized with the doublelinks of DEGMF, increasing the degree of hardening of the system inthe boundary layer. Thus, the degree of system hardening at a ratio of40:60 has been as high as 97%.
The increase of the degree of transformation of the reaction systemin the boundary layer increases the strength of cementing of thebasalt. The strength of cementing of basalt-2 is in all cases higherthan that of basalt-1. The adhesion strength of polyester polymerupon warming to 352 K also increased by more than 30%, and theaddition of surfactant (ATJ) resulted in still greater strengthincrease.
Pipeline strengthening. In the case of partial damage to a pipeline as aresult of metal corrosion, it is preferable from the economic point ofview to strengthen the pipeline rather than replace it with a new one.The method of pipeline strengthening by winding onto it glass fabricwith polymer composition is of low efficiency, as the modulus of elas-ticity of glass-reinforced plastic is approximately 10 times lower thanthat of steel. A more effective method consists in winding the surfaceof the pipe with steel wire. For this method, a 1 mm thick layer ofSprut-9 composition was first applied onto the surface of a corrodedpipe of 600 mm diameter. To increase the viscosity of the composition,10% hydrophobic aerosil was introduced into it. Then 5 mm diametersteel wire was wound onto the pipe with a tension of 200 kgf. Antirustcoating was applied over the wire. Hydrostatic tests show thatwhereas the source pipe ruptured at a stress of 9 MPa, the repairedtube withstood a stress of 16 MPa.
Repair of underwater pipelines. Failures of underwater pipelines areobserved most often because of damage by ships or anchors. In riverswith strong currents, scours may appear beneath pipelines: the pipe-lines sag, and as a result of the vibration and stresses generated,cracks may appear, most often observed in the weld area. The pipe
Practical Applications of Polymer Adhesion Studies 355

is usually collapsed in the area of flute cracks; it is often ellipsoidal,which impedes the process of sealing it.
Two other specific problems complicate the process of sealing pipe-lines with adhesives. One is that gas in gas mains is transported under70–75 atmospheres pressure, and noticeable increase of gas main dia-meter is observed under this pressure. Thus, on the adhesive–metalinterphase boundary heavy internal stresses occur, which can lead tostrength reduction or to failure of the adhesive joint. Joint failure willalso be promoted by vibration, which occurs with passage of fluid orgas through a deformed section of the pipe.
To solve this problem, we have suggested the use of two adhesiveswhen sealing a flute crack. High-viscosity adhesive, which will forma highly elastic polymer after curing, is applied to the flute crack.High-strength reinforced adhesive is laid over the elastic adhesive;along the edges of a crack this adhesive forms pockets or gulleysfilled with highly elastic adhesive. The system is fastened fromabove with a secure metallic or glass fabric clamp. The highly elasticadhesive seals the edge of the adhesive joint and transmits pressureto the pockets or gulleys. In this case, the high-strength adhesive ispressed to the body of the pipe, ensuring increase of adhesionstrength. Thus, the larger the pressure in the pipe, the more securelyit is sealed.
The only alternative to the adhesive method for underwater pipe-lines repair is replacement. The cost of construction of underwatermains crossing large rivers amounts to 10–50 million dollars. Thecost of repair by the adhesive method is 10–50 thousand dollars.These data were obtained for repair of pipeline junctions throughthe Volga, Yenisei, and Moscow rivers, and for operations in theOkhotsk Sea, in swamps near the river Goryn (Belarus), in Bulgaria(Stevis Corporation), and from other projects.
9.1.3 Reconstruction of structural unitsand buildings
Reconstruction of structural units and buildings is a comprehensiveproblem, as they usually consist of different materials, such as con-crete, metal, wood, gypsum, ceramics, and so on. These materials aresubject to various environmental factors that result in their break-down. These factors and, therefore, the nature of failure differ depend-ing on their location. In this connection, let us consider thepossibilities of using polymer composites for restoration of ground-based, underground, and underwater structural units and buildings.
356 Chapter Nine

9.1.3.1 Reconstruction of ground-based buildings and structures. Theexploitation of industrial and engineering structures results incorrosion of metal and concrete and incurs considerable expensesfor maintenance procedures. Among the most rapidly damagedbuildings one can identify industrial buildings, effluent treatmentplants, drinking water treatment plants, bridges and overpasses,crossings over railroads, road coatings, and the foundations ofbuildings.
In the overwhelming majority of cases the basic causes of damageare corrosive processes developed as a result of unfavorable environ-mental impacts. So, most industrial buildings deteriorate due toaggressive gases and vapors in the air. The breakdown of floors iscaused by spillage of aggressive fluids; the concrete structures ofwater treatment plants are destroyed by chlorine and coagulants.The majority of overpasses and bridges, as well as road coatings,break down due to the application of anti-icing reagents and becauseof atmospheric nitric oxides, and sulfur dioxide emitted by automobileengines and industrial plants. Frost greatly reduces the durability ofconcrete. The failure of constructions through the action of mold isoften encountered, which unfavorably affects people’s health espe-cially that of children. Considerable trouble is connected with theappearance of salt on the surfaces of concrete and brick buildings.Fluctuating loads strongly affect the service life of concrete bridgesand overpasses. Carbon dioxide in the atmosphere affects reinforedconcrete, resulting in carbonization—the transformation of CaO intoCaCO3. Thus, concrete loses its anticorrosive properties and corrosionof metal armatures in the bulk of the concrete begins. Such corrosioncauses increase of armature volume, the appearance of stresses in theconcrete, and ultimately its breakdown. Thus, the properties of poly-mer materials used for recovery of industrial and engineering struc-tures should take into account features of the corrosive breakdownprocess.
Silor is most widely used for impregnation of damaged concrete andrepair of corrosion. Regulation of the impregnation depth is achievedby variation of the speed of curing of the composition. It was foundthat to increase concrete’s hardness, its chemical stability, and itsfreeze resistance, and to decrease water absorption, it is sufficient toimpregnate only 0.5 mm of the concrete. At a concrete porosity of 4%,the composition penetrates to this depth in 4 h. It is interesting tocompare the economic efficiency of concrete protection by impregna-tion and by application of polymer coating to the surface of the con-crete. At 0.5 mm coating thickness, 500 g of polymer is required forprotection of 1 m2 of concrete. With impregnation of the concrete tothe same depth, only 40 g of polymer is required.
Practical Applications of Polymer Adhesion Studies 357

We consider some examples of the use of Silor composition for thesolution of particular problems of reconstruction of industrial andengineering structures.
Reconstruction of bridges. Let us consider the particular case of recon-struction of the Harbor Bridge (length 400 m) over the river Dnieper inKiev, Ukraine. The bridge was closed to traffic in 1994 when it was indanger of falling down. Inspection showed that concrete piers andbridge superstructures were cracked; part of the concrete had fallenout, and in the openings the corroded metal armature was visible. Thedesign cost of recovery was 1.2 million dollars. The repair cost usingpolymer compositions was calculated as only 0.3 million dollars.
Portions of concrete that were falling out were removed first. Thenthe rusty armature and concrete were impregnated with Silor compo-sition, air-placed concrete was formed onto defective sites, and aftercuring the surface of the reconstruction was impregnated by Silorcomposition with a pigment additive. Tests following these proceduresshowed that impregnation of defective concrete increased its hardnessto a level exceeding that of the source concrete. The adhesion strengthof the concrete with air-placed concrete bonding was higher than thecohesive strength of the concrete.
Repair of systems for potable water treatment. Water treatment plants arebuilt of reinforced concrete and processes employed in water purifi-cation cause breakdown of concrete. These processes include prepara-tion of coagulant and its mixing with water, chlorination of water,and preventive bactericidal treatment of reservoirs. Leakage ofwater, especially at sites of wall and floor joints, is frequentlyobserved.
For repair, the concrete of reservoirs is impregnated with Silor com-position to seal the concrete, strengthen it, and increase its chemicalstability. Polyester cloth is glued at wall/floor joints using the one-component polyurethane adhesive UTK-M.
Repair of drain siphons—pipes of 3 m diameter and 21 km length—has also been undertaken. The pipe was intended for water supply at0.6 MPa pressure.
At the start of the drain siphon operation it was found that certainparts of the pipe were of poor quality and that its walls leaked.Leaking water washed away the foundations of the pipe, which hadresulted in its deformation and the appearance of slots at sites of pipejoints. To eliminate defects the concrete of the pipe was sealed withSilor, and at pipe joints corrugated polyester tissue impregnated withUTK-M composition was pasted. This ensured air-tightness of thedrain siphon despite variation of width of gaps between pipes.
358 Chapter Nine

Rehabilitation of industrial structures. A major factor causing damage toindustrial constructions is the influence on them of aggressive gasesand vapors that are released into the air during technological pro-cesses. Thus in metallurgical, chemical and galvanization shops, sul-fur dioxide gas and hydrochloric acid vapors, salts formed in theproduction of mineral fertilizers, and so on, lead to both metal andconcrete failure. Floors are often damaged due to spills of acids, alka-lis, or compositions used for washing machinery. The most dangerouseffect is corrosion of pillars, girders, and floor slabs and numerousexamples of building failure are encountered worldwide.
The repair of pillars and floor slabs of buildings does not differessentially from repair of bridge structures. Silor composition isused for protection of concrete against chemical corrosion, applied tothe surface of concrete structures. For the protection of floors againstchemical corrosion, the joints between acid-resisting tiles are impreg-nated with Silor. Such procedures are often performed at plants manu-facturing beer or wine.
When buildings are covered with ceramic tiles bonded using custom-ary cement formulations instead of a pozzolanic one, falling of tiles isinevitable due to water freezing in the gaps between tiles.Impregnation of gaps with Silor eliminates this.
Repair of power stations. Various tanks for chemicals, cooling towers,and chimney flues are frequently in need of repair at power stations.To repair concrete cooling towers, the pores and fractures in the cool-ing tower body are sealed with Silor, whereby the concrete is strength-ened and its freeze resistance is increased. For repair of cooling towersconstructed of miscellaneous materials—wood, metal, asbestos-cement—a set of polymer materials including Silor, UTK-M, andLING will be used.
Using Silor composition it is very easy to repair concrete and brickchimney flues. The outside parts of chimney flues are impregnateduntil complete filling of pores and defects in the pipe body is achieved.In the upper part of a damaged pipe, in addition to impregnation,defects are filled with sand and cement impregnation, laid immedi-ately onto a layer of Silor. After setting, the repair is impregnated tofull saturation.
Repair of aerodromes and roads. The primary problem in the use ofaerodromes is the condition of the runways. A pebble that breaksaway from the concrete of the runway can enter the turbine of anaircraft and damage or destroy it; air service providers incur heavyexpenses for the use of special vacuum cleaners for removal ofsuch debris.
Practical Applications of Polymer Adhesion Studies 359

Impregnation of runways with Silor eliminates such breakaway ofstone fragments, and increases the strength and freeze resistance ofthe concrete. In addition, it is possible to increase considerably thecoefficient of friction between aircraft wheels and runway. For thispurpose, the runway is covered with sand following impregnation;the sand adheres securely to the runway and enhances the coefficientof friction.
Taxi-ing tracks where concrete is intensively damaged by antifreezeare also impregnated with Silor, and the holes and potholes are filledwith sand mixed with the same composition. Potholes on asphalt–con-crete roads are filled similarly.
9.1.3.2 Reconstruction of underground structures. Development ofunderground space is now of growing importance all over the worldin the design and layout of large cities. Underground objects,buildings, and engineering systems include:
& Items concerned with urban ‘‘off-street’’ high-speed passenger railtransport, especially subway tunnels and stations
& Underground structures connected with urban ‘‘street’’ traffic—traf-fic and pedestrian tunnels
& Sewage collectors
& Structures connected with storage and maintenance of urban trans-port, including underground automobile garages
& Multifunctional and all-level units for various purposes—ware-houses, shopping centers, stations, etc.
The underground structures are built in soil masses having variousphysical, and mechanical, and hydrogeological performances andproperties that can negatively influence construction. Soil minerali-zation and underground waters present a special hazard to under-ground structures, especially by corrosive activity in relation toconcrete and metallic constructions; and cases of biological corrosionare increasingly often encountered. For sewage collection tunnelsthese circumstances are aggravated by the fact that large massesof wastewaters are transferred through them that differ in chemicalcomposition, with predominance of hydrogen sulfide, carbon dioxide,and sulfur dioxide, causing so-called ‘‘gas’’ corrosion. Hydrogen sul-fide is the most dangerous of these; it reacts with alkaline compo-nents of cement with the formation of hydrated gypsum andunconnected masses of silicic acids, and hydroxides of aluminumand iron.
360 Chapter Nine

Corrosion is sharply accelerated by the vital activity of aerobic car-bothionic bacteria, transforming hydrogen sulfide into sulfuric acid,and destroying concrete and reinforcement elements. As an example,during tunnel operation a case of local corrosion failure piercing tun-nel walls was found in the Blackwall tunnel of the London under-ground, and was fixed. Underground waters containing oil wastesand heavy metals salts destroyed a Tashkent subway section, result-ing in serious contamination of the environment by toxic substances.Similar events took place when a subway in Los Angeles, California,was constructed. There are many examples of sewage collectors hav-ing been fixed.
One of the basic factors causing concrete collapse in transportationtunnels is the increased content of carbon dioxide. Carbon dioxideconcentrations continuously exceed tolerances and cannot be reducedby ventilation because of significant aerodynamic resistance. The pro-tective layer of concrete undergoes carbonization and no longer con-tains calcium oxide hydrate, resulting in accelerated corrosion ofreinforcements. Water oozing into underground constructions fromthe surface contains dissolved salts used for cleaning highways inwinter, or as lawn fertilizers. As a result, chloride concentrations inconcrete constructions fluctuate within 0.11–2.07% of the cementmass, often exceeding the limit of 0.4%, which is sufficient to initiatesteel corrosion.
The features of corrosive destruction of concrete in undergroundconditions require the use of polymer materials exhibiting specificproperties. Thus, when underground spaces are sealed, it is necessaryto apply polymer compositions onto wet concrete walls or leaking con-crete surfaces. We have developed two sealing variants for suchspaces. With the first, surfactant solution containing crown-ethersand ester groups is applied onto a wall surface. The surfactant pene-trates into the concrete balk, hydrophobicizing the concrete pores andgiving the opportunity to use Silor for the final hydrophobicization. Inthe second variant, a modified Silor composition is used that is able tocoat a wet concrete surface. The first variant is operationally morecomplicated, though it permits deeper impregnation of concrete,which is often important since the impregnated concrete must havesufficient strength to withstand the hydrostatic pressure of water onthe other side of the wall. Concrete cohesion strength, especially insewage systems, may be very poor and sealing of this concrete withoutstrengthening may lead to collapse of the wall.
Such work frequently has to be performed when sealing submergedpumping stations. If a pumping station pumps fecal material, the con-crete loses density and strength because of gas corrosion. In emer-gency switch-off of power, the pumps overflow with fecal matter,
Practical Applications of Polymer Adhesion Studies 361

resulting in serious damage. Impregnation of the concrete wall shouldtherefore be done to the full depth. The strength of concrete thusimpregnated exceeds that of standard concrete.
In the case of large water flows, so-called fast-blocking foamingpolyurethane compositions are used worldwide. Shot holes in thewall or tunnel lining are bored to allow composition to be pumpedin. We have developed a cheaper variant involving drilling the wall,to allow the water to leak. The wall is sealed and the hole may be gluedafterwards.
The North Muy tunnel on the Baikal–Amur railroad illustrates amost interesting case of sealing near Lake Baikal. At a depth of 1 kma water flow at up to 40 atmospheres of pressure intruded into thetunnel. Hundreds of pumps expelled water and there was no possi-bility of shutting off the flow. To eliminate the damage, a polymercomposition was promptly manufactured featuring high underwateradhesion capacity to granite. Crown-complexes were developed ascuring catalysts, ensuring a 5-second time of composition curing.Access to the site from the ground surface was impossible becausethere were no roads and there was a large lake at the top of themountain. A shot hole was drilled to the flow-bed; composition waspumped in through the shot hole and component mixing was donedirectly before pumping into the shot hole. Composition entering theflow adhered to the walls and cured immediately. The flow wasblocked within several minutes.
In early June, 2000, a large sewage collector collapsed near the townof Cherkassy (Ukraine). It was decided to repair it without interrupt-ing the water supply to the town. In 2 hours a group of divers usingLING adhesive directly in the contents of the sewers had sealed thecollector.
Silor was widely used for the first time in Holland in 2000 for therepair of sewer systems, not only strengthening and sealing concretebut also protecting it from biological destruction.
Repair of transportation tunnels, underground passages, under-ground structures, and storm drains is traditionally undertakenwith the help of Silor composition: this is applied onto the surface ofconcrete structures until its penetration into the concrete ceases. If theconcrete surface is wet, a two-stage method of concrete hydrophobici-zation and sealing is commonly used. In cases of partial breakage ofstructures, concrete or organic concrete is applied to defective sitesthrough a Silor layer after impregnation.
9.1.3.3 Reconstruction of submerged structures. Water, particularlysalt water, leads to breakdown of submerged concrete structures,piers, piles, foundations, bridge footings, dikes, and dams. The most
362 Chapter Nine

rapid breakdown of concrete is observed in variable dampening zonesand at sites of contact between old and newly laid concrete undermonolithic concreting.
Airtightness and surface strength of concrete structures areoptimally reconstructed with the polymer composition LING. Glassweb is impregnated with this composition, laid onto polyethylenefilm, and transferred to a diver who attaches this web to a specificsection of concrete surface with the help of a roller. The operation isthen repeated on the adjacent section. For repair of piles, the pile isspiral-wrapped with the web. The adhesive cures in 40 min at watertemperatures of 0–308C. The film is removed after curing of the adhe-sive. For cracks in concrete, Silor composition is injected into the bodyof the concrete; if the crack reaches the surface, for example, in thecase of old–new concrete contact, it is glued with LING compositionbefore injection.
The largest volume of work on sealing of concrete and brick surfacesunder water is in relation to protective casings located along mainlines. Here cathodic protection from corrosion is located. Whenwater gets into the casing, often through its walls, cathodic protectionceases and there is danger of pipeline corrosion. If the casing is filledwith water, a diver goes down and puts glass web onto the walls; thewater is pumped out after the adhesive is cured.
Underwater functional joints are filled with UTK-M compositionand if the joint width varies considerably, polyester cloth impregnatedwith UTK-M is glued on.
9.2 Manufacture of Pressware fromCellulose-Containing Materials
Wood chip produced by grinding wood, with binding agents based onurea–formaldehyde resin, is used for the manufacturing of presswaretermed ‘‘wood-base plastic laminate’’ (WPL). The amount of bindingagent used is 12–15%. The main problems connected with WPL manu-facture consist in the necessity to use wood of a comparatively goodgrade for making the chips and the requirement for drying to 2–2.5%moisture; thus the cost of WPL is relatively high. Furthermore, thestrength and water-resistance of WPL are low and after the pressingprocess, toxic formalin impurities remain in the product.
To overcome these problems, we have developed a new bindingagent that allows gluing of wood particles containing up to 50% moist-ure. Usually wood with equilibrium moisture content (12–20%) is usedfor pressing, and in this case there is no possibility of pressware cast-ing due to their dampening or drying. The binder composition includesa substance that sharply reduces the stiffness of cellulose-containing
Practical Applications of Polymer Adhesion Studies 363

materials for the time of pressing and adds plasticity. It allows bindercontent to be reduced 6–7 times (to 2%) and the use for pressing ofwastes from woodworking and agricultural production, such as saw-dust, bark, and chaff, wastes from cotton and linen making, and flourindustries, leaves, etc. For example, using sawdust, products obtainedare characterized by the following indices:
Density (g/cm3) 0.85–0.95
Transverse stress under breaking (MPa) 21.7
Bending modulus (MPa) 2080
Failure stress under compression (MPa) 143
Impact elasticity 7.4
Water absorption over 24 h (%) 3.5
By pressing, irregularly shaped items can be produced in the form ofboxes, tubes, or finished house structures. As well as flat presses,worm presses may also be used. If wet veneer, for example, of oak,is pressed in a tool whose die is made in relief, the pressware will bevery similar to carved items manufactured by a cabinet-maker.
9.3 Adhesive for Fixing Organic SoftTissues: KL-3
The cyanacrylate adhesives Eastman (USA), ‘‘Aron-Alfa’’ (Japan),Kanokonlit (Bulgaria), and MK (CIS) are widely used in medicine,but they have disadvantages: decrease of adhesive properties withexcess moisture, insufficient film elasticity, comparatively high histo-toxicity, and non-universal applicability as medical adhesives.
The polyurethane adhesive KL-3 developed by us does not have anytopical or systemic toxic effects. Its polymeric film is porous and ofhigh elasticity, and the highly developed surface of the polymer facil-itates rapid healing. KL-3 combines the properties of a medical adhe-sive and of a filling material. Its use is especially indicated when it isnecessary to seal tissue defects of considerable size or for closingpathological cavities.
9.3.1 Biodegradation of KL-3 polyurethaneadhesive
The biodegradation of KL-3 as a hardened composition was studied[419–423]. The degradation of KL-3 in animal tissues is facilitated bytwo mutually complementary mechanisms: nonenzymatic hydrolysis,and cellular processes.
364 Chapter Nine

The acellular (hydrolytic) mode of biodegradation is identical inmodel media (in vitro) and in living organisms (in vivo). It consistsin breaking ester urethane, and then ether bonds [423, 424].Biodegradation of polyurethane is also accompanied by breaking ofthe secondary biurethic and allophane bonds, a decrease in the effec-tive density of the polymer suture, and a change in its supramolecularstructure [422–424].
Study of the cellular type of biodegradation was possible as aresult of investigations on the specific staining of polyurethanefragments in archived preserved preparations with the use ofSudan III-IV stain [425, 426]. Binding of polymer fragments tothis stain produces a red-orange color, which makes it possible toidentify not only free polyurethane particles but also intracellularparticles.
The resorption of the KL-3 polymeric film begins soon after implan-tation and is connected with the productive response in situ [419, 420,426]. Cellular resportion depends on two groups of cells: macrophages,which absorb the finest particles of polymer, and the so-called giantcells that absorb foreign bodies. Cellular biodegradation plays themore important role when the surface of an implant is more developed[420, 427]. Its importance increases with advancing destruction of thepolymeric implants.
The products of biodegradation of KL-3 polymeric films are excretedby the organism via the urinary system and the gastrointestinal tractand do not accumulate in tissues and organs [428].
Response of tissues to KL-3 adhesive. The use of medical adhesives onorgans and tissues represents a reliable methodology that allows ame-lioration of the traumatic consequences of surgical operations.
The response of tissues to KL-3 was studied on the surface ofliver, kidney, small and large intestines, and gluteal muscle ofrabbits and white rats [429]. Asepsis was observed in the tissuesadjacent to the KL-3 polymeric film, with the typical sequence ofleukocyte, macrophage, and fibroblast phases. Each of these phaseshas its own features, which depend upon the polymer structure.The leukocyte and macrophage phases are characterized by consid-erable duration.
None of the organs examined showed any histological changesdue to the polymeric film. Such a favorable tissue response [419,429] to the adhesive was achieved by using ingredients of high purity.It was facilitated in particular by the development of a method ofpurifying the polymerization accelerator that was used in the adhesivecomposition [430].
Practical Applications of Polymer Adhesion Studies 365

9.3.2 Use of KL-3 in experimental andclinical surgery
Joining striated muscle using KL-3 adhesive. The gluing together of cross-sectioned rabbit’s skeletal muscles using KL-3 adhesive was describedin [431–437]. The study of energy and protein turnover in musclesrejoined with KL-3 or MK-2 or sutured with silk has showed themto occur in ways typical of the process of reparative regeneration. Aporous polymeric film of KL-3 adhesive does not prevent connectivetissue growing through. Moreover, it facilitates the regeneration ofsuch highly specialized structures as newly formed striated musclesand peripheral nerve endings [437].
The antibody composition of skeletal muscles joined with KL-3 doesnot differ from that of conventionally sutured muscles [438], whichindicates that the preparation has no allergenic effects.
The KL-3 adhesive allows reliable gluing together of the musculo-aponeurotic leaves of anterior abdominal wall in rabbits under condi-tions of high mechanical loading [438], which allows use of thispreparation in the clinical plasty of massive hernias.
Closing fistulas and filling cavities. Closing fistulas of various etiologies isone of the most complicated problems in modern surgery. The polyur-ethane composition KL-3, which combines the properties of a medicaladhesive and a filling mass, shows high efficiency in managing intest-inal and bronchial fistulas.
In experiments on rabbits and dogs, a method was worked out forclosing colonic fistulas with the KL-3 adhesive [439] as follows. Apolyvinyl chloride probe with 1–1.5 ml of the adhesive at its end isdrawn into the fistula canal. Then the probe is gradually drawn outand simultaneously the adhesive fills the fistula canal, being pressur-ized by means of a syringe. Adhesive polymerization occurs immedi-ately in the fistula canal.
Pneumopression tests showed that there is no loss of integrity of theintestine in the region of a colonic fistula closed with the adhesive[441]. Tests using the adhesive labeled with 14C showed that the bio-degradation products do not cumulate in organs and tissues [442].
Fragmentation of the adhesive mass and the through-growth of con-nective tissue occurred in 14 days [443]; 2–3 months later, connectivetissue scarring was formed at the site of inflammatory infiltrate in thegut wall. Replacement of the adhesive filling for the connective tissuewas necessary only after one year. This method of closing intestinalfistulas has been successfully used in clinical practice [444, 445].
KL-3 adhesive was successfully used in managing bronchial fistulas[446, 447]. The adhesive composition was supplied to the damaged
366 Chapter Nine

area via the drawtube of a bronchoscope with the use of speciallydesigned apparatus. This method allowed closure of bronchial fistulaswithout thoracotomy.
Filling of the pathological pleural cavity for chronic emphysema ofthe chest was conducted successfully with twenty 50-year-old patients[448]. Positive results were noted in 80% of the cases. The accessibil-ity, simplicity, and safety of the method recommend it as promising inpatients for whom surgical treatment is impossible or is connectedwith high risk.
Use of KL-3 adhesive in abdominal surgery. KL-3 adhesive was used clini-cally for resection in ulcerative disease of the stomach and duodenum,in appendectomies, for sealing sutures of the bile duct in choledochos-tomies, and to close the gallbladder bed following cholecystectomies[449]. The use of KL-3 adhesive is proven in traumatic injuries of theliver [450].
Techniques have been developed for termino-terminal anastomoseswith KL-3 adhesive covering, an incomplete eversion of the mucousmembrane and the use of a loop-shaped intestinal suture [451, 453].Such anastomoses are simple to make and lack the disadvantageinherent in an operation carried out by the routine method: the devel-opment of an adhesive process in the region of anastomosis with sub-sequent deformation of the anastomosis because of eversion of themucous membrane. It was noted that the KL-3 adhesive, used forthe ‘‘peritonization’’ of the zone of classic everted anastomosis, pre-vents the development of adhesive processes and the deformation inthe region of the anastomosis reliably restricts the everted mucousmembrane from the organs of the abdominal cavity, consolidates thezone of anastomosis, and induces minimal inflammatory response inthe adjacent tissues.
The method has been widely used in clinical practice. No postopera-tive complications associated with these techniques were noted ineither the short or the long term.
Management of ulcers of the stomach and duodenum using KL-3adhesive has been practiced on a large scale [452, 454, 455]. Theadhesive is supplied to the site of the ulcerative defect via a gastro-scope; following its polymerization an elastic porous ‘‘dressing’’ isobtained under which the regeneration of tissues occurs. This porouselastic dressing is permeable to secretions of mucous membranes. Anyinfluence of the active gastric juice upon the ulcer is eliminated owingto the permanent flux from the mucous membrane to the stomachlumen.
The method has been used in more than 200 patients; the averageterm of scarring of the duodenum amounted to 15:3 � 0:5 days and
Practical Applications of Polymer Adhesion Studies 367

that of the stomach to 20:8 � 0:8 days. This method of closing ulcera-tive defects can be widely used in the endoscopy rooms of hospitals andpolyclinics.
The KL-3 adhesive is successfully used to stop bleeding from the bedof the gallbladder [456]. Following resection of the gallbladder,thermocoagulation of the wounded surface of the liver is carried outand then KL-3 is additionally introduced into the liver parenchyma inthe vicinity of both the bleeding vessels and the open bile ducts untilthey are completely closed. This method was used in 48 patients withresections of the gallbladder; no complications were noted.
In pancreatic surgery, KL-3 adhesive has been used to fill the ductsystem in cases of cancer of the head [457], allotransplantation of thegland [458], and acute [459, 460] and chronic pancreatitis [461].Occlusion of the pancreas leads to rapid atrophy of the exocrine tissueof the pancreas while saving its endocrine part. Ablation of the mostaffected part of the gland and processing of the stump by occlusion ofthe pancreatic duct allows a patient to be spared pain while saving theinsular apparatus of the rest of the pancreas. Of great importance isthe fact that occlusion of the pancreatic duct considerably reduces thenumber of severe postoperative complications connected with thestump treatment as well as pancreatonecrosis, incompetence of ana-stomoses, and the formation of a pancreatic fistula.
Polyurethane adhesives in neurosurgery. KL-3 has been widely used inthe following surgical situations [421]: recovery of potency of cerebralarteries with saccular aneurysms that cannot be eliminated from thecirculation; plasty of cerebral fistulas in the anterior cranial fossa; theclosing of defects in the dura mater; plasty of trepanation holes; fixa-tion of bone fragments in craniotomic defects; and sealing of extra- andintracranial anastomoses.
Also of great importance is the method of managing cerebral tumors,glioblastomas in particular, by concurrent use of KL-3 compositionand a cytostatic drug, methotrexate [421].
Use of KL-3 in urology. KL-3 adhesive ensures good hemostasis andreliable sealing in the management of various lesions of the kidneyof rabbits [464]: linear (longitudinal and transverse) incised woundsthat penetrate into the pelvic-caliceal system; stab wounds; cutting offthe kidney’s pole and subsequent rejoining by the adhesive method;perforating wounds made by a punch in the form of a metal tube of0.5 cm diameter; and severe crush wounds.
The functional activity of kidneys glued together was determined byexcretory urography, radioisotopic renography, and magnetic reso-nance imaging; function recovered 1–2 months postoperatively [462,463].
368 Chapter Nine

The KL-3 composition was also used in a clinic to seal surgicallesions of the kidney following resection of its lower segment for multi-ple concretions in the pelvic-caliceal system and to consolidate thesutures following plastic operations performed in connection withhydronephrosis [465].
KL-3 adhesive was used in a clinic [466, 467] in managing 101patients with various operative interventions on the kidneys andurinary tract: closing lesions on the kidneys; nephrotomy; nephro-lithotomy; enucleation of tumorlike nodes of the kidneys; plane andwedgelike resections of the kidneys; sealing anastomoses in the intest-inal plasty of ureters; sealing the wall of the urinary bladder followingadenectomy and prostatectomy; sealing the sutures in urethroplastyfor hypostasis and traumatic damage; and in plasty of resected vesico-vaginal fistulas.
A combination of suturing with synthetic thread in an atraumaticneedle and the use of KL-3 adhesive was employed to close lesions ofthe kidneys. The renal defect in nephrolithotomy was treated with acontinuous suture before application of KL-3 adhesive to the wall ofthe renal parenchyma. The ligation of large intraorgan vessels (morethan 7 mm in diameter) has been performed and appeared to be bene-ficial when the adhesive joining the renal tissue was followed withsuturing of the defect of the renal fibrous capsule, which allowed thewound to be sealed and isolated the adhesive from adjacent tissues.
KL-3 adhesive was used for patients with terminal renal insuffi-ciency and renal transplants for the conservative and surgical treat-ment of postoperative complications [467]. Spontaneous rupture of thetransplanted kidney was eliminated in 21 cases by means of additionalsealing with glued flaps of aponeurotic tissue.
The technique for closing urinary fistulas was as follows: KL-3 adhe-sive was applied over the first row of sutures, and then the second rowof sutures was laid over the adhesive film. The porous adhesive filmdid not deform the sutures in any of 11 operations and reliably sealedthe wound [468].
Filling of urinary point-fistulas (no longer than 0.3–0.5 mm) wasdone for 18 patients. KL-3 composition was supplemented with anti-bacterial drugs as the filler. The choice of antibacterial drug wasdetermined beforehand on the basis of the patient’s antibioticogram.The technique consists in administering the polymer mass via anexternal hole of the fistula using a polyvinyl chloride catheter.
For closing parenchymatous renal hemorrhages, a needleless injec-tor was used [468]. This method consists in obtaining a hemostaticinfiltrate on the wound surface, which is achieved by introducingeasily polymerized cyanoacrylate adhesives into the organ paren-chyma using a needleless injector. A thin adhesive film that is formed
Practical Applications of Polymer Adhesion Studies 369

serves as a reliable sealant. Over time, the polymeric film undergoesbiodegradation and is replaced with regenerative connective tissue.
Maxillofacial surgery. Fixation of mucous-periosteal grafts to the palateduring uranostaphyloplasty was carried out with a use of KL-3 adhe-sive in 58 children with congenital cleft palate [469]. The followingadvantages of the adhesive method were noted:
1. The preoperative period is shortened by 2–3 days, by avoidance ofthe need to make up a protective palatal plate.
2. The patient does not experience any discomfort connected withobtaining the cast and bearing the plate during the postoperativeperiod.
3. The postoperative wound care is simplified considerably.
4. The good clinical effect is combined with cost-saving considerations.
9.4 Cyanoacrylate Adhesive
Cyanoacrylate adhesives fix various materials quickly and securelyand are now widely used. Their only drawback is low water resistanceof adhesive joints, especially when bonding metals, glass, and cera-mics. For example, the adhesion strength when gluing metal reducesby 80% after a month in water. To increase water resistance we pro-posed to modify cyanoacrylate adhesive with an oligomer that curesmuch less rapidly than cyanoacrylate. Internal stresses in the sealwere sharply reduced, and adhesion strength reached 364 MPa whenmetal was glued. This strength displayed only 3% decrease after theglued joint was exposed to salt water for one year.
‘‘Tsvet’’ adhesive thus obtained may also be used for gluing in wateror oil media and at any ambient temperature. It is widely used wheninstruments and sensors are to be glued to aircraft and watercrafthulls and when bonding polyethylene to fluoroplastics.
9.5 Use of Polymer Compositions forNuclear Energy Applications
One of the basic problems of the nuclear power industry is avoidanceof environmental pollution, which is directly related to the necessity ofreliable burial of radioactive waste. One type of waste comprises ion-exchange resins used to purify process waters and render them free ofradioactive cations. The problem of disposal of used radioactive ion-exchange resins is rather difficult and we have suggested using Silorcomposition for this purpose. This composition envelops the swollen
370 Chapter Nine

resin granules. This envelope is resistant to radiation exposure, and a150 Mrad dose produces no alterations in it. It reliably eliminates thepossibility of escape of water and salts from the granules. In addition,crown-ethers included into the Silor act as traps for cations if theyshould diffuse into the envelope volume. After the envelope is formed,the granules are mixed with cement paste to form tubes that arestored in repositories.
Silor is also used to impregnate the interior cavities of tankscontaining radioactive water. This impregnation strengthens theconcrete, improves its radiation resistance, and eliminates thepossibility of radioactive cations penetrating into the body of theconcrete.
9.6 Quality Enhancement for Articles Madeof Porous Materials
Impregnation of tiles, roofing slate, figured sidewalk elements, gyp-sum items, and wood increases their strength, avoids various types ofcorrosion including those of chemical and biological origin, andimproves the appearance. For example, impregnation of the uppersurface of a concrete highway prolongs its service life significantlyand removes the need for asphalt coating; and impregnation of woodshuttering for concreting may increase its service life several times;impregnation of tiles prevents soaking; and so on.
9.7 Brick and Concrete Paints
The use of inorganic binding materials and components based onorganic binding acrylic, predominantly as dispersions in water or dis-solved in organic solvents, led to first-generation brick and concretepaints. The main drawback of these coatings is comparatively shortservice life.
Silor-F, a brick and concrete paint of the third generation, displays amajor difference from other paints in not only forming attractive andstrong films on building facades but also impregnating into concrete,wood, plaster, brick, etc., wall materials and interacting chemicallywith the material, eliminating the boundary layer between wall sur-face and paint layer.
Certification tests undertaken by the Construction, Architectureand Geodesy University of Sofia, Bulgaria and NIIZhB of Moscow,Russia showed that concrete strength after application of the paintsis increased 3–8 times under fluctuating and vibration loads. Increasein wall surface strength is of the most value when softening of the
Practical Applications of Polymer Adhesion Studies 371

wall material occurs. Thus, when Silor-F is applied onto sand only, amaterial exhibiting strength in excess of 500 kgf/cm2 is obtainable.
Poor water resistance of wall surfaces (e.g., paint) is a basic factorleading to destruction of facade coatings. Water getting into a wallsurface layer beneath a paint layer and freezing there results in de-lamination. Apart from this, at a borderline the concentration of inter-nal stresses from shrinkage, temperature, or moisture and theappearance of fungi, lichens, and micoorganisms is always observed.Silor-F penetrating into a wall practically eliminates the opportunityfor these negative developments. As was shown by numerous tests,operational usage of paint to obtain 0.2–5 mm of wall impregnation isquite sufficient to obtain a positive result.
Notwithstanding that Silor-F painting of facades is performed to asignificant depth, paint consumption negligibly exceeds that when aconventional paint is used. Thus, even when wall porosity is 5% andprovided that total filling of pores by paint is achieved, 50 g of paintper 1 m2 of facade will be required to impregnate a wall to a depth of1 mm. Furthermore, the majority of the as-applied weight of conven-tional paint constitutes water or volatile solvents lost on drying; Silor-F paint, being based on low-viscosity oligomers, can have 100% dryresidue and therefore no weight decrease on curing.
Cured Silor-F paint is characterized by high strength and chemicalstability, providing for prolonged facade coating service life. Thus, thepaint withstands the impact of salt, acids, alkali solutions, solvents,and oil products and may be used for covering interior wall surfaces ofindustrial premises affected by aggressive gases, and painted surfacesmay be allowed contact with aggressive liquids. When Silor-F isapplied to walls contaminated with fungi or lichens, the organismsare completely destroyed and no recurrence is possible. Silor-F is notflammable and does not support combustion.
The paint is available in several modifications. Painted surfacesmay be matt or glossy, hydrophobic or hydrophilic; impregnated wallsurface layers may be porous or smooth. Gloss painting onto a smoothimpregnated wall may be used when a wall is in contact with water orsplashes; water absorption will be zero. Matt hydrophobic paint pre-vents the infiltration of walls by salts, offers rain resistance and apermanent fresh appearance, and at the same time provides no obsta-cle for water vapor to penetrate the wall when outer-layer pores arenot filled with paint and their surface is not hydrophobicized.Hydrophilic paint accelerates drying of the wall in damp or wetroom interiors.
The paint consists of two components. After the components aremixed the solution may last for several days, which allows the paintto be applied onto surfaces by any conventional means.
372 Chapter Nine
9.8 Manufacture of Floors
There is large demand for so-called dust-free floors. These floorsmay be manufactured by pouring polymer compositions onto a con-crete floor. They are easily cleaned of dirt, feature attractiveappearance and strength, and form no dust particles in operation.For these reasons they are widely used at enterprises producingnuclear power, pharmaceuticals, and food products, as well as inoffices, etc., although their cost is estimated at $50–100 per squaremeter.
We have developed know-how for manufacturing floors similar inquality significantly more cheaply. Techniques include embeddingcolored stones or chips into cement–sand tie placed onto a floorbody. After the ties are dried off, a Silor composition is applied ontothe stones. This composition impregnates, strengthens, and seals theupper part of the tie, and stones and chips become securely bonded in.Consumption of composition may be only 100–200 g per square meter.A wear-resistant polyurethane composition of 0.1–0.2 mm thickness isapplied to the floor. In this way, polymer consumption in floor manu-facturing may be reduced 3–5 times.
9.9 Manufacture of Heat Insulation Panels
One of the most important tasks in civil engineering is increasingbuildings’ heat resistance. The majority of current methods forheat saving in buildings use mineral wool or heat-insulating poly-meric materials. These methods have a number of drawbacks,including the hygroscopic properties and inadequate service life ofmineral wool, high costs, vulnerability to biological impacts, andhigh toxicity of gases evolved when polymeric heat-insulation mate-rials burn.
We have developed techniques for manufacturing heat insulationmaterials from mineral sources, i.e., perlite and vermiculite. Thesematerials may be pressed with the addition of inorganic gluecontaining specific additives introduced to prevent its suction byporous materials. In this way, glue consumption may be reduced by2–5% of the weight of the heat insulation material. Heat insulationmaterial may be made as bricks, plates, envelopes, etc. and the outerheat insulation layer impregnated with the Silor. The compositionmay be coated to imitate a desirable stone look. This processing mayprevent soaking of the insulation, increase its strength and attractiveappearance, and facilitate gluing of the product onto building facades.
Practical Applications of Polymer Adhesion Studies 373

For example, a brick made of swollen perlite wastes has the char-acteristics listed below:
& 40 MPa compression strength
& 0.79% water absorption
& 0.048 W/m�K heat conductivity
& Over 35 cycles of freeze–thaw resistance
This brick may be used not only to increase heat resistance of build-ings, engineering facilities, tanks, etc., but also as an independentconstruction material.
9.10 Strengthening and Sealing of Rocks
Methods for the control of adhesive properties described herein havebeen used successfully in creating polymer compositions intended forstrengthening and sealing rocks. These compositions were used for thefirst time to construct the North Muy tunnel of 19 km length on theBaikal–Amur railroad (Russia). This tunnel cuts through granite mas-sifs in a zone of stretching of the earth’s crust. This causes formation ofan abundance of cracks: about 100 cracks were found along the tunnelaxis, mostly of length of 1000 m. The cracks were filled with sedimen-tary rock in soil-like form, and stratum pressures reached dozens ofatmospheres. We were approached to develop a polymer compositionfor injection into cracks to strengthen sedimentary rocks sufficiently towithstand these stratum pressures after the tunnel was advanced. Asimilar situation was faced when the Leningrad subway tunnel wasengineered. This was attempted by freezing rocks with liquid nitrogen,resulting in numerous accidents, including fatal ones.
The task set was solved by introduction of a composition based on apolymer–surfactant mixture. This composition ensured displacementof water from rocks and their impregnation, with a subsequent curingprocess. About 100 tonnes of composition was used.
Regularities measured were used to develop a composition intendedto strengthen rocks for mining purposes, e.g., in coal production.Compositions used currently comprise polyisocyanate and polyolmixed before pumping into the rocks. Usually the pump-in procedureis performed using 150 atmospheres pressure and tiny cracks areopened in rocks for the composition to penetrate into and glue aftercuring.
Current compositions are still not able to strengthen water-satu-rated rocks, because they do not wet such rocks, which are usuallyclay shale in water. In addition, polyisocyanate reacts not only with
374 Chapter Nine

the polyols but also with water, and water destroys the equimolarnature of the system and causes a sharp decrease in molecular weightof the polymer formed. Moreover, sorption separation of componentsoccurs as the composition moves along narrow cracks.
Epoxy, polyester, and polyurethane resins were used as the basisfor our compositions; all of which display the ability to reliablystrengthen rocks containing water, thus demonstrating the possibilityof using the techniques developed to adjust polymer composite proper-ties irrespective of their content.
Practical Applications of Polymer Adhesion Studies 375

References
[1] I. Ludinov, A. Voronov, Dokl. Akad. Nauk Ukraine, 4, 93 (1995).[2] G. Fourche, Polym. Eng. Sci., 35, 957 (1995).[3] J. Joraelachvili, D. Tabor, Proc. Roy. Soc., 331, 19 (1972).[4] A. Kornev, in Glues, Mending Plastics and Metals, LDNTP, Leningrad, p. 51
(1979).[5] J. Bikerman, Uspekhi Khimii, 16, 1431 (1972).[6] S. Spring, in Cleaning of Metal Surfaces, Mir, Moscow, p. 349 (1966).[7] A. Berlin, in Aspects of Polymers Adhesion, Khimiya, Moscow, p. 390 (1974).[8] E. Ovchinnikov, V. Struk, in 2nd Intl. Symp. on Theory and Applications of
Plasma Chemistry (ISTAPS–95) (1995).[9] L. Barish, J. Appl. Polym. Sci., 6, 617 (1962).
[10] J. Bikerman, J. Appl. Chem., 11, 81 (1961).[11] N. Demarouette, M. Kamal, Polym. Eng. Sci., 34, 1823 (1994).[12] V. Denisenko, R. Veselovsky, in Advantages in the Field of Creation and Applying
of Glues, MDNTP, Moscow (1983).[13] F. Fabulyak, J. Lipatov, Questions Chem. Tech., 32, 3 (1974).[14] P. Klegt, in Polymers Manufacturing, Khimiya, Moscow, p. 254 (1965).[15] B. Kamensky, Kauchuk i Rezina, 8, 35 (1964).[16] J. Lipatov, A. Filipovich, R. Veselovsky, Dokl. Akad. Nauk USSR, 275, 118 (1984).[17] E. Trostyanskaya, in Fillers for Polymers, MDNTP, Moscow, p. 3 (1969).[18] Yu. Lipatov, in Polymer Reinforcement, ChemTec Publishing, Canada, p. 406
(1994).[19] R. Veselovsky, V. Kestelman, Int. J. Polym. Mater., 23, 139 (1994).[20] R. Veselovsky, A. Filipovich, Vysokomol. Soed., B, 27, 497 (1985).[21] F. Fabulyak, in Molecular Flexibility of Polymers in the Border Layers, Naukova
Dumka, Kiev, p. 144 (1983).[22] T. Lipatova, in Composite Polymer Materials, Naukova Dumka, Kiev, p. 37 (1974).[23] L. Sergeeva, Yu. Lipatov, Kauchuk i Rezina, 5, 11 (1995).[24] E. Morosova, in Structure and Properties of the Boundary Layers of Polymers,
Naukova Dumka, Kiev, p. 221 (1972).[25] V. Berstain, in Thermodynamical and Structural Properties of the Boundary
Layers of Polymers, Naukova Dumka, Kiev, p. 66 (1976).[26] E. Trostyanskaya, A. Poymanov, Mech. Polym., 1, 26 (1965).[27] V. Berstain, V. Nikitin, Plasticheskiye Massy, 10, 30 (1963).[28] E. Trostyanskaya, Plasticheskiye Massy, 11, 67 (1965).[29] A. Nufury, T. Lipatova, R. Veselovsky, in Physical Chemistry of Polymer
Compositions, Naukova Dumka, Kiev, p. 25 (1974).[30] D. Balar, in Chemistry of Co-ordinate Compounds, Inostr. Literatura, Moscow,
p. 154 (1960).[31] W. Zisman, H. Fox, E. Hare, J. Phys. Chem., 59, 1097 (1955).
377

[32] V. Babich, Yu. Lipatov, in Composite Polymer Materials, Naukova Dumka, Kiev,p. 175 (1975).
[33] V. Zelenov, Y. Krasnov, Plasticheskiye Massy, 9, 54 (1976).[34] Y. Lobanov, in Adhesion of Polymers, Publ. Acad. Sci. USSR, p. 1979 (1963).[35] A. Petrova, Plasticheskiye Massy, 9, 55 (1971).[36] Yu. Lipatov, B. Kargin, J. Phyz. Khymii, 32, 131 (1958).[37] V. Gul, Vysokomol. Soed., 32, 2077 (1963).[38] V. Gromov, J. Phys. Khymii, 32, 2077 (1963).[39] J. Huntsberger, J. Polym. Sci., A1, 1339 (1963).[40] E. Hamurcu, B. Baysal, in 35 IUPAC Congress, Istanbul, Abstr. 2, Sec. 4–6, p. 822
(1995).[41] E. Tremein, Plast. Technol., 9, 11 (1963).[42] N. Shonhorn, Khymiya i Technol. Polym., 8, 138 (1964).[43] G. Voronkov, E. Lasskaya, Prikl. Khymiya, 38, 1430 (1965).[44] F. Borisova, Plasticheskiye Massy, 11, 57 (1968).[45] T. Lotmentseva, in Thermodynamic and Structural Properties of the Boundary
Layers of Polymers, Naukova Dumka, Kiev, p. 146 (1976).[46] V. Spitsin, Dokl. Akad. Nauk USSR, 177, 1138 (1967).[47] A. Lyubimov, in NMR in Polymers, Nauka, Moscow (1966).[48] E. Amelina, R. Yusupov, Colloid J., 37, 332 (1975).[49] E. Amelina, R. Yusupov, Colloid J., 36, 931 (1974).[50] Y. Taubman, S. Tolstaya, Colloid J., 26, 356 (1964).[51] S. Tolstaya, S. Shabanova, in Application of Surfactants in Coating Industry,
Khimiya, Moscow, p. 141 (1976).[52] S. Tolstaya, S. Michaylova, in Macromolecules in Interface, Naukova Dumka,
Kiev, p. 78 (1971).[53] S. Mikhaylova, I. Kuleshova, in Structure and Properties of the Boundary Layers
of Polymers, Naukova Dumka, Kiev, p. 113 (1972).[54] Y. Sinitsina, R. Gadjieva, Lakokras. Mater., 3, 22 (1965).[55] T. Shtiupel, in Synthetic Detergents, Goskhymizdat, Moscow, p. 448 (1960).[56] V. Rudoy, V. Ogarev, Colloid J., 37, 401 (1975).[57] L. Floyd, in Polyamides, Goskhymizdat, Moscow, p. 132 (1960).[58] V. Tikhomirova, in Polymeric Coatings in the Atomic Industry, Atomizdat,
Moscow, p. 35 (1965).[59] P. Zubov, L. Sukhareva, Colloid J., 26, 454 (1964).[60] A. Freydin, I. Sokolnikova, in Structure and Properties of the Boundary Layers of
Polymers, Naukova Dumka, Kiev, p. 233 (1972).[61] S. Hoiland, H. Hoiland, in 13th IUPAC Conf. Chemical Thermodynamics, 25th
AFCAT Conf., Clermont-Ferrand, p. 165 (1994).[62] A. Yakovlev, O. Ruban, in Heterogenic Polymeric Materials, Naukova Dumka,
Kiev, p. 23 (1973).[63] P. Rebinder, J. Vsesoyuzn. Khymicheskogo Obschestva im. Mendeleeva, 11, 362
(1966).[64] Z. Markina, Colloid J., 26, 76 (1964).[65] A. Taubman, in 2nd Conf. USSR on Colloid Chemistry, Moscow, p. 52 (1952).[66] A. Taubman, Dokl. Acad. Nauk USSR, 74, 759 (1950).[67] A. Shwarts, D. Perry, in Surfactants and Detergents, Inostr. Literatura, Moscow,
p. 540 (1960).[68] K. Shinova, T. Nakagava, in Colloid Surfactants, Mir, Moscow, p. 32 (1966).[69] A. Petrov, G. Nikitin, Masloboyno-Zhirov. Promyshlennost, 8, 12 (1960).[70] G. Simakova, Colloid J., 6, 893 (1969).[71] M. Kusakov, A. Koshevnik, J. Phyz. Khymii, 27, 1887 (1953).[72] V. Zisman, Khymiya i Technol. Polymerov, 11, 107 (1964).[73] T. Amphiteatrova, Colloid J., 27, 489 (1965).[74] P. Zubov, L. Sukhareva, Colloid J., 38, 643 (1976).[75] L. Sukhareva, L. Krylova, Colloid J., 34, 268 (1972).[76] R. Veselovsky, V. Kestelman, Intl. J. Polym. Mater., 23, 117 (1994).[77] V. Myshko, R. Veselovsky, Vysokomolek. Soed., B, 13, 114 (1971).
378 References

[78] I. Vlasova, I. Chudina, Plasticheskiye Massy, 2, 14 (1962).[79] C. Hare, Polyurethanes, in J. Prof. Coat. Linings, 12, 71 (1994).[80] R. Veselovsky, B. Kuporev, Compos. Polym. Mater., 19, 25 (1983).[81] P. Flory, in Principles of Polymer Chemistry, Cornell Univerity Press, New York,
p. 270 (1953).[82] K. Mittal, in Adhesion Science and Technology, Plenum Press, New York, p. 129
(1975).[83] B. Damaskin, in Adsorption of Organic Compositions on Electrodes, Nauka,
Moscow, p. 260 (1968).[84] R. Veselovsky, G. Shapoval, Ukrain. Khymich. J., 37, 554 (1971).[85] V. Gul, N. Dvoretskaya, Mech. Polym., 4, 625 (1966).[86] V. Gul, N. Dvoretskaya, Dokl. Acad. Nauk USSR, 172, 637 (1967).[87] V. Gul, N. Dvoretskaya, in Physics of Composites Strength, Leningrad, p. 96
(1979).[88] V. Basin, Mech. Polym., 4, 731 (1971).[89] V. Basin, G. Artemova, Mech. Polym., 4, 731 (1971).[90] Yu. Lipatov, V. Babich, Dokl. Acad. Nauk USSR, 239, 371 (1978).[91] V. Babich, in New Methods for Investigation of Polymers, Naukova Dumka, Kiev,
p. 118 (1975).[92] V. Moshev, Ukrain. Polym. J., 1, 267 (1992).[93] R. Veselovsky, Y. Znachkov, Dokl. Acad. Nauk Ukraine, A4, 373 (1977).[94] Y. Malinsky, Uspekhi Khimii, 39, 1511 (1970).[95] L. Maders, G. Zeltserman, Vysokomol. Soed., A, 17, 551 (1975).[96] V. Myshko, R. Veselovsky, Synth. Phys. Chem. Polym., 10, 77 (1974).[97] Yu. Lipatov, R. Veselovsky, Synth. Phys. Chem. Polym., 9, 123 (1971).[98] Yu. Lipatov, R. Veselovsky, Ukrain. Khym. J., 39, 465 (1973).[99] A. Sholokhov, Plasticheskiye Massy, 5, 72 (1965).
[100] A. Chistyakov, M. Suchareva, Plasticheskiye Massy, 5, 53 (1967).[101] S. Davies, Patent Great Britain 9309943.0 (2277890) 14.05.93, Publ. 16.11.94.[102] Yu. Lipatov, V. Myshko, Vysokomol. Soed., A, 16, 1148 (1974).[103] Yu. Lipatov, Eur. Conf. EURADN ’94, 272, 14 (1994).[104] S. Lee, S. Kit, Polym. Eng. Sci., 33, 598 (1993).[105] E. Shchukin, XVI Intl. Conf. Surfactants, Khimiya, Moscow, vol. 2, pp. 1–15
(1985).[106] S. Krause, in Polymer Mixtures, Mir, Moscow, p. 26 (1981).[107] J. Gibbs, in Collected Works, Yale University Press, New Haven, p. 360 (1948).[108] A. Tager, L. Kolmakova, Vysokomol. Soed., A, 22, 483 (1980).[109] G. Allen, G. Gee, J. Nicholson, Polymer, 2, 8 (1961).[110] A. Tager, Vysokomol. Soed., A, 10, 1659 (1977).[111] A. Farooque, D. Deshpande, Eur. Polym. J., 28, 1597 (1992).[112] L. Yee, M. Maxwell, J. Macromol. Sci., B17, 543 (1980).[113] D. Patterson, Macromolecules, 4, 690 (1978).[114] L. Sperling, in Interpenetrating Polymer Networks, Mir, Moscow, p. 328 (1984).[115] S. Omel’chenko, V. Matyushov, Vysokomol. Soed., B, 11, 7 (1968).[116] L. Nilsen, in Mechanical Properties of Polymer and Polymer Compositions,
Khimiya, Moscow, p. 310 (1978).[117] A. Komolinova, Y. Zuev, Vysokomol. Soed., B, 20, 149 (1978).[118] A. Tinny, in Strength and Failure of Polymers under Influence of Liquid Media,
Naukova Dumka, Kiev, p. 206 (1975).[119] Yu. Lipatov, R. Veselovsky, in VIII Kongress o Lepeni Kovov ‘‘Intermetalbond ’81,’’
Bratislava, p. 37 (1981).[120] S. Wiederhorn, A. Shorb, J. Appl. Phys., 39, 1569 (1968).[121] I. Galinga, B. Vegemund, Patent USSR 227211, Publ. 14.12.1966.[122] R. Veselovsky, B. Lyashenko, Zavodskaya Labor., 43, 1510 (1977).[123] B. Lyashenko, R. Veselovsky, in Advanced Glues and Bonding Plastics and
Metals, LDNTP, Leningrad, p. 13 (1971).[124] R. Veselovsky, S. Koryagin, in Avt. Svid. USSR 529201, publ. 25.09.76.[125] R. Veselovsky, K. Zabela, in Avt. Svid. USSR 529340, publ. 25.09.76.
References 379

[126] K. Backnell, in Reinforced Plastics, Khimiya, Leningrad, p. 328 (1981).[127] D. Verchero, J. Pascault, J. Appl. Polym. Sci., 43, 293 (1991).[128] A. Meeks, Polymer, 15, 675 (1974).[129] N. Paul, D. Richards, Polymer, 18, 945 (1977).[130] A. Yamanaka, A. Kaji, K. Kan, in 4th SPSJ Intl. Polymer Conf. ‘‘New
Developments in Polymer Science and Technology,’’ Yokohama, Tokyo, p. 113(1992).
[131] Ashida Tadashi, J. Adhes. Soc. Jpn., 31, 250 (1995).[132] J. Koenig, in Abstr.: MACROAKRON’ 94: 35th IUPAC Symp. Macromolecules,
Akron, Ohio, p. 778 (1994).[133] R. Drake, W. McCarthy, Rubber World, 159, 51 (1968).[134] K. Koto, Polymer, 8, 33 (1967).[135] G. Roginskaya, V. Volkov, Vysokomol. Soed., A, 21, 2111 (1979).[136] L. Manzione, J. Gillham, J. Appl. Polym. Sci., 26, 907 (1981).[137] E. Merz, G. Claver, M. Baer, J. Polym. Sci., 22, 326 (1965).[138] J. Duly, R. Pethrick, Polymer, 22, 37 (1981).[139] Yu. Lipatov, in Physical Chemistry of Filled Polymers, Khimiya, Moscow, p. 304
(1977).[140] I. Perepechko, in Methods for Investigation of Polymers, Khimiya, Moscow, p. 226
(1973).[141] R. Veselovsky, Yu. Lipatov, Dokl. Akad. Nauk USSR, 248, 915 (1979).[142] A. Nesterov, R. Veselovsky, Compos. Polym. Mater., 7, 11 (1980).[143] G. Vysotskaya, R. Veselovsky, in Reactive Polymers, NIITEHIM, Moscow, p. 74
(1983).[144] R. Veselovsky, Y. Kochergin, Ukrain. Khim. J., 49, 325 (1983).[145] R. Bagnetri, R. Pearson, in MACROAKRON ’94: 35th IUPAC Intl. Symp.
Macromolecules, Akron, Ohio, p. 1026 (1994).[146] T. Kulik, Y. Kochergin, Compos. Polym. Mater., 19, 11 (1983).[147] Y. Kochergin, T. Kulik, Compos. Polym. Mater., 19, 37 (1983).[148] R. Veselovsky, A. Nesterov, Compos. Polym. Mater., 20, 50 (1984).[149] Y. Kochergin, G. Vysotskaya, Compos. Polym. Mater., 25, 42 (1985).[150] V. Vakula, L. Pritykin, in Physical Chemistry Adhesion of Polymers, Khimiya,
Moscow, p. 224 (1984).[151] E. Lebedev, Yu. Lipatov, Compos. Polym. Mater., 3, 18 (1979).[152] R. Veselovsky, T. Lipatova, Dokl. Akad. Nauk USSR, 233, 1146 (1977).[153] R. Veselovsky, in New Methods of Manufacturing and Investigation of Polymers,
Naukova Dumka, Kiev, p. 78 (1978).[154] A. Mel’nichenko, R. Veselovsky, in The Problems of Polymer Composite Materials,
Naukova Dumka, Kiev, p. 53 (1979).[155] R. Veselovsky, Yu. Lipatov, Dokl. Akad. Nauk USSR, 248, 915 (1979).[156] Yu. Lipatov, V. Shilov, Dokl. Akad. Nauk USSR, 270, 912 (1983).[157] O. Vakshteyn, in Diffraction of X-rays on Chain Molecules, Izdat. Akad. Nauk
USSR, Moscow, p. 372 (1963).[158] Sato Toso, Finish and Paints, 6, 52 (1994).[159] P. Zubov, L. Suchareva, Lakokras. Mater., 6, 28 (1963).[160] A. Sanzharovsky, in Physical and Mechanical Properties of Polymer and Paint
Coatings, Khimiya, Moscow, p. 183 (1978).[161] A. Freydin, A. Sholokhova, Mech. Polym., 2, 240 (1966).[162] P. Zubov, L. Suchareva, Colloid J., 38, 643 (1976).[163] P. Zubov, L. Lepilkina, Colloid J., 5, 564 (1961).[164] P. Zubov, L. Suchareva, Mech. Polym., 3, 67 (1965).[165] P. Zubov, L. Suchareva, Vysokomol. Soed., B, 14, 103 (1972).[166] Y. Kolekov, V. Solomko, in Thermodynamical and Structural Properties of
Boundary Layers of Polymers, Naukova Dumka, Kiev, p. 74 (1976).[167] F. Jones, P. Jacobs, in 5th Intl. Conf. Fibre Reinforced Composites, Newcastle-
upon-Tyne, 1992: FRC ’92, London, p. 23 (1992).[168] V. Vinogradov, Plasticheskiye Massy, 11, 51 (1976).
380 References

[169] V. Solomko, I. Usov, in Modification of Properties of Polymers, Naukova Dumka,Kiev, p. 25 (1965).
[170] Yu. Lipatov, in Physical Chemistry of Filled Polymers, Khimiya, Moscow, p. 304(1977).
[171] V. Tikhomirov, in Physical Chemical Base Fabrication of Manufacture, LegkayaIndustr., Moscow, p. 73 (1969).
[172] P. Seliverstov, Y. Polyakov, Plasticheskiye Massy, 1, 47 (1967).[173] B. Dolezhal, in Corrosion of Plastics and Rubbers, Khimiya, Moscow, p. 75 (1964).[174] P. Zubov, M. Kadyrov, Mech. Polym., 2, 123 (1968).[175] V. Myshko, S. Garf, in New Methods of Investigation of Polymers, Naukova
Dumka, Kiev, p. 154 (1975).[176] V. Myshko, S. Garf, T. Lipatova, Synth. Phys. Chem. Polym., 16, 77 (1975).[177] V. Belyi, N. Egorenkov, Y. Pleskachevsky, in Adhesion of Polymers to Materials,
Nauka i Tekhnika, Minsk, p. 3 (1971).[178] M. Kobrin, in Determination of Internal Strength, Mashinostroenie, Moscow,
p. 196 (1965).[179] L. Sedov, in Mechanics of Media, Nauka, Moscow, p. 492 (1970).[180] D. Argiris, in Advanced Methods of Matrix, Inostr. Literatura, Moscow, p. 240
(1968).[181] G. Kron, in Tensor Analysis of Nets, Sovets. Radio, Moscow, p. 720 (1978).[182] E. Trostyanskaya, Plasticheskiye Massy, 6, 50 (1976).[183] P. Zubov, Colloid J., 38, 643 (1976).[184] L. Sukhareva, Colloid J., 20, 266 (1967).[185] P. Zubov, in Adhesion of Polymers, Khimiya, Moscow, p. 85 (1963).[186] L. Sukhareva, Lakokras. Mater., 2, 26 (1968).[187] P. Zubov, Colloid J., 25, 438 (1963).[188] L. Sukhareva, Colloid J., 25, 743 (1963).[189] A. Narinskaya, L. Sukhareva, Vysokomol. Soed., A, 9, 2571 (1967).[190] L. Sukhareva, Doctoral thesis, Academy of Sciences, USSR, 1968.[191] P. Zubov, Vestnik Akad. Nauk USSR, 12, 32 (1963).[192] L. Sukhareva, P. Zubov, in Polymers, Symp., Baku, p. 120 (1972).[193] A. Berlin, Avt. Svid. USSR 129328, publ. 1960.[194] V. Malyanov, Mech. Polym., 4, 734 (1968).[195] L. Sukhareva, A. Zemtsov, Colloid J., 36, 992 (1974).[196] L. Sukhareva, L. Krylova, Colloid J., 34, 268 (1972).[197] V. Vinogradov, in Plastics, Khimiya, Moscow, p. 46 (1974).[198] Yu. Lipatov, L. Sergeeva, in Synthesis and Properties of Interpenetrating
Networks, Special Issue, Uspekhi Khimii, 45, 138 (1970).[199] Yu. Lipatov, L. Sergeeva, in Interpenetrating Polymer Networks, Naukova Dumka,
Kiev, p. 170 (1979).[200] E. Morozova, in Formation of Polymer Films, Khimiya, Moscow, p. 84 (1971).[201] P. Rebinder, in Physical Chemistry of Flotation, Metalurgizdat, Moscow, p. 133
(1933).[202] G. Babalyan, in Application of Surfactants in the Oil Industry, Gostoptech,
Moscow, p. 30 (1961).[203] V. Kulikov, Lakokras. Mater., 4, 37 (1977).[204] V. Kulikov, Lakokras. Mater., 1, 85 (1977).[205] E. Klenikov, E. Kameper, Colloid J., 27, 828 (1965).[206] E. Klenikov, Colloid J., 34, 68 (1972).[207] E. Morozova, in Formation of Polymer Films, Khimiya, Moscow, p. 84 (1971).[208] A. Ryabov, L. Smirnov, Khimiya i Khim. Tech. Gorky, 2, 78 (1970).[209] A. Koretsky, Izves. Sibirs. Otdel. Akad. Nauk USSR, Khimiya, 4, 32 (1972).[210] A. Freydin, Doctoral thesis, Moscow, 1972.[211] A. Freydin, K. Chanskiy, in The Technology of Manufacturing of Glued Goods,
Gosstroyizdat, Moscow, p. 45 (1966).[212] E. Brostow, C. Roger, in Failure of Plastics, Hanse, Munich, vol. XXII, p. 486
(1986).
References 381

[213] V. Belyi, N. Egorenkov, Yu. Pleskachevsky, Adhesion of Polymers to Metals,Nauka i Tekhnika, Minsk, p. 255 (1971).
[214] U. Basaron, B. Deryagin, in Investigation in the Field of Surface Forces, Izd. Akad.Nauk USSR, Moscow, p. 122 (1967).
[215] G. Voronkov, J. Prikl. Khimii, 38, 1483 (1965).[216] B. Kuporev, R. Veselovsky, Compos. Polym. Mater., 19, 25 (1983).[217] A. Freydin, in Strength of Glued Materials, Khimiya, Moscow, p. 256 (1971).[218] M. Orshakovsky, Lakokras. Mater., 5, 52 (1965).[219] A. Tinny, in Phys. Chem. Mech. Mater., 4, 312 (1969).[220] A. Tinny, in Strength and Failure of Polymers under Influence of Liquids,
Naukova Dumka, Kiev, p. 206 (1975).[221] E. Sinevitch, A. Ryzhkov, Plasticheskiye Massy, 2, 23 (1978).[222] N. Pertsov, E. Sinevitch, N. Ivanova, Plasticheskiye Massy, 1, 25 (1978).[223] R. Veselovsky, in Physicochemistry of Multicomponent Polymeric Systems,
Naukova Dumka, Kiev, vol. 1, p. 250 (1986).[224] T. Lipatova, Sh. Vengerovskaya, A. Feinerman, L. Sheinina, J. Polym. Sci., 21,
2085 (1983).[225] T.E. Lipatova, S.A. Zubko, Vysokomol. Soed. A, 12, 1555 (1970).[226] L. Gallacher, J.A. Battelcheim, J. Polym. Sci., 58, 697 (1962).[227] A.E. Nesterov, T.E. Lipatova, F. Dusek, L. Pelzbauer, M. Houska, J. Hradill, Yu.
Lipatov, Angew. Makromol. Chem., 52, 39 (1976).[228] V.A. Ogarev, Colloid. Polym. Sci., 252, 582 (1974).[229] V.A. Ogarev, V.V. Arslanov, A.A. Trapeznikov, Kolloid Zhurn., 34(3), 372 (1972).[230] T. Lipatova, Sh. Vengerovskaya, L. Sheinina, T. Khramova, Vysokomol. Soed. A,
27(1), 174 (1985).[231] J. Spevacek, P. Schneider, Makromol. Chem., 176(11), 310 (1975).[232] J.J. Jasper, B.L. Housman, J. Phys. Chem, 69(1), 310 (1965).[233] P.A. Rebinder, in Uspekhi Kolloidnoi Khimii, Nauka, Moscow, p. 9 (1973).[234] G. Nemethy, H.A. Sheraga, J. Phys. Chem., 66(10), 1773 (1962).[235] A.B. Taubman, S.A. Nikitina, Dokl. Akad. Nauk SSSR, 135, 1179 (1960).[236] M.A. Markevich, B.L. Rytov, L.V. Vladimirov, D.P. Shashkin, P.A. Shiryaev, A.G.
Solovyev, Vysokomol. Soed. A, 28(8), 1595 (1986).[237] V.A. Zakupra, Methods of Analysis and Control in Production of Surface Active
Substances, Khimiya, Moscow, p. 367 (1977).[238] R.A. Veselovsky, L.S. Sheinina, Sh.G. Vengerovskaya, A.Yu. Filipovich, Ukrain.
Khim. Zhurn., 54(7), 759 (1988).[239] P.P. Kushch, B.A. Komarov, B.A. Rozenberg, Vysokomol. Soed. A, 21(8), 1697
(1979).[240] A.A. Shvartz, Anionic Polymerization Carbanions, Living Polymers and Processes
with Electron Transfer, Mir, Moscow, 1971, p. 669.[241] J. Brandt, G. Aglinton, Application of Spectroscopy in Organic Chemistry, Mir,
Moscow, p. 279 (1967).[242] N.P. Shusherina, T.I. Likhomanova, E.V. Adamskaya, Khim. Geterocyk. Soed., B,
1, 72 (1978).[243] A.M. Noshov, in VINITI 28.07.75 #3503-75, p. 16 (1975).[244] A. Trapeznikov, T. Zatsepina, T. Gracheva, R. Shcherbakova, V. Ogarev, Dokl.
Akad. Nauk SSSR, 160, 174 (1965).[245] A. Nesterov, Yu. Lipatov, High-molecular Compounds, 15(11), 2601–2606 (1973).[246] S. Zubko, A. Nesterov, Sh. Vengerovskaya, L. Sheynina, High-molecular
Compounds, 17(5), 1054–1057 (1975).[247] A. Feinerman, Yu. Lipatov, Device for Surface Tension Determination, Inform.
Letter No. 6, ICHM Acad. Sci. Ukrain. SSR, 1969.[248] J. Jasper, L. Houseman, J. Phys. Chem., 69(1), 310–314 (1965).[249] T. Lipatova, Sh. Vengerovskaya, L. Sheinina, High-molecular Compounds, 27(1),
174–179 (1985).[250] T. Lipatova, Sh. Vengerovskaya, A. Feinerman, L. Sheinina, J. Polym. Sci., Polym.
Chem. Ed., 21, 2085–2094 (1983).[251] T. Novikova, T. Lipatova, Yu. Nizel’sky, Rep. Acad. Sci. Ukraine B, 8, 45–48.
382 References

[252] Dow offers surfactants. Dow Chemical Co., Urethanes Technol., 13(6), 36 (1996–1997).
[253] D. Kardashov, A. Petrova, Polymer Adhesives, Khimiya, Moscow, p. 256 (1983).[254] H. Brandle, Converter, 17(9), 12–14 (1980).[255] Yu. Lipatov, Physical Chemistry of the Filled Polymers, Khimiya, Moscow, p. 304
(1977).[256] G. Zdorikova, S. Blagova, L. Samoylenko, et al., Avt. Svid. 749864 USSR, CI 08 L
27/06.[257] Yu. Kercha, Yu. Lipatov, Uspekhi Khimiyi, 46(2), 336–366 (1977).[258] P. Write, L. Cumming, Polyurethane Elastomers, Khimiya, Leningrad, p. 304
(1973).[259] V. Grigorieva, S. Baturin, S. Entelis, High-molecular Compounds, 14(7), 1345–
1349 (1972).[260] A. Degtiareva, L. Markovskaya, N. Voloshina, R. Veselovsky, Compos. Polym.
Mater., 3(34), 33–36 (1987).[261] B. Kupor’ev, Yu. Kuksin, R. Veselovsky, Compos. Polym. Mater., 2(1), 24–29
(1979).[262] E. Terman, L. Kalinina, N. Seraya, L. Suhkareva, Colloid J., 37(3), 601–603
(1975).[263] A. Freydin, Adhesive Joints Durability and Strength, Khimiya, Moscow, p. 272
(1981).[264] L. Aristovskaya, P. Babyevsky, S. Vlasov, et al., Practical Work on Polymer
Material Science, Khimiya, Moscow, p. 255 (1980).[265] L. Kopusov, Thesis Abstract, 02.00.06, Kiev, p. 16 (1976).[266] F. Sherman, Rheology of Emulsions, Khimiya, p. 217 (1972).[267] D. Fridrihsberg, Colloid Chemistry Course, Khimiya, Leningrad, p. 358 (1964).
Year[268] S. Paik, N. Scheider, Macromolecules, 8(11), 68–73 (1975).[269] R. Bonart, J. Morbitzer, H. Rinke, Kolloid Z., 240(5), 39–45 (1970).[270] I. Kuleznev, Polymer Mixtures, Khimiya, Moscow, p. 304 (1980).[271] N. Bespalov, N. Konovalenko, Multi-component Systems on Polymer Base,
Khimiya, Leningrad, p. 88 (1981).[272] Yu. Godovsky, Polymer Thermal Physics, Khimiya, Moscow, p. 280 (1982).[273] J. Adamson, Physical Chemistry of Surfaces, Mir, Moscow, p. 568 (1979).[274] Yu. Trapeznikov, T. Zatsepina, I. Gracheva, et al., Rep. Acad. Sci. USSR, 160(1),
174–177 (1965).[275] V. Ogarev, V. Arslanov, Yu. Trapeznikov, Colloid J., 34(3), 372–378 (1972).[276] Yu. Ol’khov, S. Baturin, S. Entelis, High-molecular Compounds, 19(6), 1307–1311
(1977).[277] T. Tanaka, T. Yokogama, J. Yamaguchi, J. Polym. Sci., A-1, 6(8), 2137–2152
(1968).[278] G. Kozlova, V. Zharkov, High-molecular Compounds, B, 20(4), 285–286 (1978).[279] G. Kozlova, B. Naymark, V. Zharkov, High-molecular Compounds, 17(6), 1277–
1281 (1975).[280] T. Lipatova, L. Sheynina, L. Vladimirova, et al., High-molecular Compounds,
29(4), 747–752 (1987).[281] A. Askadsky, L. Kolmakova, G. Gaprh, et al., High-molecular Compounds, 19(5),
1004–1008 (1977).[282] J. Rabek, Experimental Methods in Polymer Chemistry, Mir, Moscow, vol. 1, p. 382
(1983).[283] Investigation of Small Polymer Additives Influence, Report on R&D Works, ICHM
Acad. Sci. Ukrain. SSR, Kiev, p. 77 (1990).[284] D. Gee, Macromolecule Chemistry, Mir, Moscow, p. 137 (1948).[285] D. Mangray, Macromol. Chem., B, 65(1), 2946 (1963).[286] D.X. Saunders, K.K. Frisch, Polyurethane Chemistry, Khimiya, Moscow, p. 470
(1968).[287] A.K. Zhitinkina, O.G. Tarakanov, N.A. Tolstykh et al., Polym. Synth. Phys. Chem.,
6(21), 3–14 (1977).
References 383

[288] R.P. Tiger, L.M. Sarynina, S.G. Entelis, Uspekhi Khimii, 41(9), 1672–1695 (1972).[289] L.A. Onosova, Diss. Cand. Chem. Sci., Moscow, p. 22 (1974).[290] S.S. Medved’, N.A. Belova, L.I. Gracheva, et al., Plasticheskiye Massy, (3), 711
(1986).[291] S.S. Yufit, Inter-phase Catalysis Mechanism, Nauka, Moscow, p. 263 (1984).[292] T.V. Kozlova, N.A. Kozlov, V.V. Zharkov, J. Phys. Chem., 45(8), 2110–2111 (1971).[293] L.A. Bakalo, R.A. Veselovsky, N.L. Zbanatskaya, et al., Plasticheskiye Massy, 5(3),
34–35 (1986).[294] L.I. Tarushina, F.O. Pozdnyakova, Polymer Spectral Analysis, Khimiya,
Leningrad, p. 248 (1986).[295] L.L. Shevchenko, Uspekhi Khimii, 32(4), 457–462 (1963).[296] V.V. Zharkov, L.I. Kopusov, T.V. Kozlova, Plasticheskiye Massy, (12), 41–45
(1983).[297] A.K. Zhitinkina, N.A. Shibanova, O.G. Tarakanov, Uspekhi Khimii, 6(11), 1866–
1899 (1985).[298] T.E. Pavlova, A.A. Fedorov, I.S. Pominov, et al., J. Appl. Spectrosc., 13, 544–546
(1970).[299] V.D. Mayorov, N.V. Librovich, J. Phys. Chem., 50(11), 2817–2820 (1976).[300] K.B. Yatsymirsky, Coordination Chemistry Problems, Naukova Dumka, Kiev,
p. 180 (1977).[301] K.B. Yatsymirsky, Ya.D. Lampeka, Physical Chemistry of Metal Complexes with
Macrocyclic Ligands, Naukova Dumka, Kiev, p. 256 (1985).[302] V.A. Barabanov, S.L. Davydova, Vysokomol. Soed., A, 24(5), 899–926 (1982).[303] K.D. Pedersen, H.K. Frensdorf, Uspekhi Khimii, 42(3), 492–510 (1973).[304] N.K. Ivanov, I.P. Maximova, T.G. Guryeva, J. Appl. Chem., 48(4), 873–875 (1975).[305] M.A. Matveyev, A.I. Rabukhin, J. Appl. Chem., 35(6), 1254–1259 (1962).[306] R.K. Ailer, Silica Chemistry, Mir, Moscow, vols. 1–2 (1982).[307] Guide for Injection Works under Tunnel Construction in Complex Engineering
Conditions, Ministry for Transport Construction, All-Union TransportConstruction Research Institute, Moscow (1983).
[308] S.L. Davydova, V.A. Barabanov, Koordinatsionnaya Khimiya, 6(6), 823–855(1980).
[309] N.A. Tsarenko, V.V. Yakshin, N.G. Zhukova, et al., Rep. Acad. Sci. USSR, 258(2),366–368 (1981).
[310] L.A. Yanovskaya, S.S. Yufit, Organic Synthesis in Two-phase Systems, Khimiya,Moscow, p. 184 (1982).
[311] R.P. Tiger, I.G. Badayeva, S.P. Bondarenko, et al., High-molecular Compounds,19(2), 419–427 (1977).
[312] Y. Iwakura, K. Uno, V. Kobayashi, J. Polym. Sci., 48(6) (1983).[313] R.A. Veselovsky, S.S. Ischenko, T.I. Novikova, N.L. Zbanatskaya, J. Appl. Chem.,
49(8), 1872–1876 (1988).[314] Z.N. Medved’, N.A. Starikova, A.K. Zhitinkina, et al., Polymer Synthesis and
Physical Chemistry, Naukova Dumka, Kiev, No. 18, pp. 39–43 (1976).[315] V.V. Strelko, Colloid J., 32(3), 430–436 (1970).[316] Ya.I. Lankin, S.I. Kontorovich, E.D. Shchukin, J. Colloid Chem., 42(4), 653–655
(1980).[317] D.I. Mendeleyev, Selected Lectures on Chemistry, Vysshaya Shkola, Moscow, p.
352 (1968).[318] N.K. Ivanov, A.M. Arbuzov, N.V. Vorontsova, et al., J. Appl. Chem., 49(9), 1897–
1900 (1976).[319] N.K. Ivanov, A.M. Arbuzov, I.P. Maximova, J. Appl. Chem., 51(3), 572–577 (1978).[320] U. Mason (ed.), Physical Acoustics, Mir, Moscow, p. 419 (1969).[321] A.K. Zhitinkina, N.A. Tolstykh, L.V. Turetsky, et al., Avt. Svid. 727659 USSR
(1980).[322] A.K. Zhitinkina, O.G. Tarakanov, in All-Union Conference on Polyurethane
Chemistry and Physical Chemistry, Naukova Dumka, Kiev, pp. 17–18 (1975).[323] A.A. Tager, Polymer Physical Chemistry, Khimiya, Moscow, p. 544 (1978).
384 References

[324] L. Nilsen, Mechanical Properties of Polymers and Polymer Compositions (transl.from English), Khimiya, Moscow, p. 310 (1978).
[325] V.F. Rossovitsky, V.V. Shifrin, in Physical Methods of Polymer Investigation,Naukova Dumka, Kiev, p. 82 (1982).
[326] I.G. Ganeyev, V.I. Pakhomov, Dokl. Akad. Nauk SSSR, 191(2), 351–354 (1970).[327] F. Fabuljak, Yu. Lipatov, Vysokomol. Soedin., A, 12(4), 738–752 (1970).[328] Yu. Lipatov, F. Fabuljak, Vysokomol. Soedin., A, 11(4), 708–716 (1969).[329] J. Bikerman, Uspekhi Khimii, 41(8), 1431–1464 (1972).[330] Yu. Lipatov, Yu. Feinerman, O. Anokhin, Dokl. Akad. Nauk SSSR, 231(2), 381–
384 (1976).[331] P. Write, A. Cumming, Polyurethane Elastomers, Khimiya, Leningrad, p. 304
(1973).[332] V. Yakushin, O. Strukov, Uspekhi Khimii, 41(8), 1504–1535 (1972).[333] I. Dekhant, R. Dantz, V. Kimmer, R. Shmolke, IR-Spectroscopy of Polymers,
Khimiya, Moscow, p. 472 (1976).[334] Yu. Lipatov, F. Fabuljak, in Surface Phenomena in Polymers, Naukova Dumka,
Kiev, pp. 15–19 (1970).[335] F. Fabuljak, Yu. Lipatov, S. Suslo, D. Vovchuk, Vysokomol. Soedin., B, 22(4), 282–
286 (1980).[336] T. Lipatova, V. Ivashchenko, Synth. Phys. Chem. Polym., 6, 73–76 (1970).[337] T. Lipatova, L. Sheinina, Vysokomol. Soedin., B, (1), 44–47 (1976).[338] A. Berlin, T. Keffeli, V. Korolev, Polyetheracrylics, Nauka, Moscow, p. 372 (1967).[339] Yu. Lipatov, in Composite Polymeric Materials, Naukova Dumka, Kiev, pp. 75–82
(1975).[340] T. Sogolova, N. Bessonova, Vysokomol. Soedin., B, 18(7), 528–537 (1976)[341] M. Buleva, J. Petkanebin, H. Sonntag, S. Stoylov, Colloid Polym. Sci., 257(3), 324–
327 (1979).[342] S. Kontorovich, V. Kononenko, N. Shchukin, Colloid. J., 43(5), 980–981 (1981).[343] S. Kontorovich, V. Kononenko, E. Shchukin, Colloid. J., 39(3), 569–570 (1977).[344] Yu. Lipatov, V. Privalko, V. Shumsky, Vysokomol. Soedin. B, 15(9), 2106–2109
(1973).[345] T.I. Smith, P.A. Bruce, J. Colloid Interface Sci., 72(1), 13–26 (1979).[346] J. Saunders, K. Frish, Chemistry of Polyurethanes, Khimiya, Moscow, p. 270
(1968).[347] Yu. Lipatov, Yu. Kercha, L. Sergeeva, Structure and Properties of Polyurethanes,
Naukova Dumka, Kiev, p. 280 (1970).[348] Yu. Kercha, Physical Chemistry of Polyurethanes, Naukova Dumka, Kiev, p. 224
(1979).[349] S. Glough, N. Schneider, J. Macromol. Sci. Phys., 2(4), 553–566 (1968).[350] R. Bonart, L. Morbitzer, G. Hentze, J. Macromol. Sci. Phys., 3(2), 337–356 (1969).[351] Yu. Lipatov, T. Gritsenko, F. Fabuljak, Dokl. Akad. Nauk SSSR, 234(2), 375–378
(1977).[352] Yu. Kercha, Yu. Lipatov, S. Krafchik, et al., Vysokomol. Soedin. A, 17(7), 1596–
1599 (1975).[353] R.W. Seymour, G.M. Estes, S.L. Cooper, Macromolecules, 3(5), 579–583 (1970).[354] R.W. Seymour, S.L. Cooper, Macromolecules, 6(10), 48–53 (1973).[355] V. Zharkov, L. Kopusov, T. Kozlova, Plasticheskiye Massy, (12), 41–45 (1981).[356] T. Kozlova, V. Zharkov, in Surface Phenomena in Polymers, Naukova Dumka,
Kiev, pp. 51–61 (1976).[357] V. Khranovskii, L. Gul’ko, J. Macromol. Sci. Phys., 22(4), 497–508 (1983).[358] R. Veselovsky, V. Mishko, Yu. Lipatov, Ukrain. Chem. J., 39(5), 465–471 (1973).[359] R. Veselovsky, T. Lipatova, Yu. Lipatov, Dokl. Akad. Nauk SSSR, 233(6), 1146–
1149 (1977).[360] Yu. Znachkov, R. Veselovsky, B. Lyashenko, K. Zabela, in Transport and Storage
of Oil and Petroleum, VNIIOENG, Moscow, No.12, pp. 17–19 (1976).[361] B. Deryagin, N. Krotova, V. Smilga, Adhesion of Solids, Nauka, Moscow, p. 280
(1973).
References 385

[362] M. Syomin, I. Skoriy, in Reliability and Durability of Elements of Machines,Saratov University, pp. 22–31 (1975).
[363] V. Kukovjakin, I. Skoriy, Bulletin of the Machine Industry, (4), 41–44 (1972).[364] F. Belyankin, V. Yatzenko, G. Margolin, Durability and Deformability of Glass-
Reinforced Plastics under Biaxial Squeezing, Naukova Dumka, Kiev, p. 156(1971).
[365] G. Pisarenko, V. Agarev, A. Kvitka, V. Popkov, E. Umansky, Resistance ofMaterials, Vishcha Shkola, Kiev, p. 672 (1973).
[366] I. Kragelsky, M. Mikhin, K. Ljapin, N. Dobichin, Factory Laboratory, (7), 852–854(1970).
[367] R. Mises, Z. Angew. Math. Mech., p. 3 (1928).[368] I. Goldenblatt (ed.), Glass-Reinforced Plastics Resistance, Mashinostroyenie,
Moscow, p. 303 (1968).[369] L. Fisher, Modern Plast., 37(10), 120, 122, 127–128 (1960).[370] L. W. Hu, J.J. Marin, Appl. Mech., 271(6) (1955).[371] P.B. Norris, Forest Prod. Labor. Rep. (1950).[372] F. Warren, Trans. ASME, 76(4) (1953).[373] J.J. Marin, Aeronaut. Sci., 29(4) (1957).[374] K. Zakharov, Plastics, 8, 59–62 (1961).[375] A. Malmeister, V. Tamuzh, G. Teters, Resistance of Rigid Polymeric Materials,
Zinatne, Riga, p. 398 (1967).[376] I. Goldenblatt, V. Kopnov, Proc. Acad. Sci. USSR, Mechanics, 6, 77–83 (1965).[377] E. Ashkenazi, Anisotropy of Machine-Building Materials, Mashinostroyenie,
Leningrad, p. 111 (1969).[378] Yu. Tarnopolsky, A. Skudra, Structural Durability and Deformability of Glass-
Reinforced Plastics, Zinatne, Riga, p. 260 (1966).[379] A. Antipov, M. Morozov, Works of the Nikolaev Shipbuilding Institute, 98, 50–57
(1975).[380] A. Antipov, M. Morozov, Works of the Nikolaev Shipbuilding Institute, 98, 58–64
(1975).[381] M. Morozov, Works of the Nikolaev Shipbuilding Institute, 98, 103–108 (1975).[382] V. Nikolaev, V. Perevozchikov, Problems of Durability, (11), 62–64 (1974).[383] G. Pisarenko, A. Lebedev, Strength of Materials to Deformation and Shattering
under Composite Tension, Naukova Dumka, Kiev, p. 210 (1969).[384] P. Balandin, Bulletin of the Engineers and Technicians, No. 1 (1937).[385] E. Ashkenazi, Durability of Anisotropic Wood and Synthetic Materials, Lesnaya
Promyshlennost, Moscow, 1966.[386] P. Ogibalov, Yu. Suvorova, Mechanics of Reinforced Plastics, MGU Publisher,
Moscow, p. 480 (1965).[387] A. Malkin (ed.), Mechanical Characteristics of Rigid Polymers, Khimiya, Moscow,
p. 358 (1975).[388] J. Friedman, Mechanical Characteristics of Metals, Oborongiz, Moscow, p. 556
(1952).[389] A. Botkin, Proceedings of the Research Institute of Hydraulic Engineering, 36,
205–236 (1940).[390] U. Yagn, Bulletin of the Engineers and Technicians, No. 6 (1931).[391] I. Miroliubov, Works of the Leningrad Technological Institute, No. 25 (1953).[392] B. Deryagin, Proc. Acad. Sci. USSR, 280 (1963)[393] B. Deryagin, V. Lazarev, Proc. Acad. Sci. USSR, 106 (1949).[394] P.W. Brigman, J. Appl. Phys., 8, 328 (1937).[395] A. Rabinovich, M. Shtarkov, E. Dmitrieva, Works of the Moscow Physical and
Engineering Institute, Explorations in Mechanics and Applied Mathematics, I(1958).
[396] V. Nalimov, N. Chernova, Statistical Methods of Scheduling of ExtremeExperiments, Nauka, Moscow, p. 340 (1965).
[397] V. Nalimov (ed.), New Ideas in Scheduling Experiments, Nauka, Moscow, p. 334(1969).
[398] V. Nalimov, Mendeleyev’ Soc. J., (1), 3–4 (1980).
386 References

[399] M. Katz, Automation of Chemical Manufactures, (2), 13–19 (1982).[400] M. Katz, Development of Methods of Identification and Suboptimization, Doctoral
thesis, Kharkov, p. 40 (1992).[401] M. Katz, Automation of Chemical Manufactures, (2), 5–8 (1980).[402] M. Katz, Chem. Technol., (10), 55–57 (1988).[403] Yu.M. Bazhenov, Organic Concrete, Stroyizdat, Moscow (1983).[404] E. Tazawa, S. Kobayashi, Properties and Applications of Polymer Impregnated
Cementitious Materials, in Polymers in Concrete, Publ. SP-30, AmericanConcrete Institute, Detroit (1973).
[405] Eric Baer (ed.), Engineering Design for Plastics, Reinhold, New York (1960).[406] R.A. Veselovsky, Digest of Physical Chemistry of Multicomponent Polymer
Systems, Vol. 1, Naukova Dumka, Kiev, p. 375 (1986).[407] R. Veselovsky, K. Veselovsky, V. Kestelman, Intl. J. Polym. Mater., 23, 117–138
(1994).[408] Yu.C. Lipatov, A.Yu. Filipovitch, R.A. Veselovsky, Dokl. Acad. Nauk USSR,
275(1), 118–121 (1984).[409] I.G. Manets, R.A. Veselovsky, Polymeric Composite Materials in Mining, Nedra,
Moscow, p. 235 (1988).[410] R.A. Veselovsky, Control of Adhesion Strength of Polymers, Naukova Dumka,
Kiev, p. 176 (1988).[411] R.A. Veselovsky, V.V. Efanova, Mech. Compos. Mater., 30(1), 3–11 (1994).[412] R.A. Veselovsky, V.N. Kestelman, Adhesion Strength of Polymers, Swissbonding,
1994.[413] A.W. Adamson, Physical Chemistry of Surfaces, Wiley, New York, p. 134 (1987).[414] M.T. Bryk, Khimia i Technol. Vysokomol. Soed., 4, 142–184 (1973).[415] Yu.N. Savvin, N.D. Zverev, E.P. Nikolaeva, J. Tech. Phys., 60, 138–140 (1990).[416] J. Klivava, Phys. Stat. Sol. (B), 134, 411–457 (1986).[417] R.A. Veselovsky, A.Yu. Filipovich, V.A. Khranovskyj, Vysokomol. Soed., B, 27,
497–500 (1985).[418] Yu.S. Lipatov, A.Yu. Filipovich, R.A. Veselovsky, Proc. Acad. Sci. USSR, 275,
118–121 (1984).[419] P.W. Lipatova, G.A. Pkhakadze, Use of Polymers in Surgery, Naukova Dumka,
Kiev, p. 129 (1977).[420] T.E. Lipatova, G.A. Pkhakadze, Medical Adhesives, Naukova Dumka, Kiev, p. 44
(1979).[421] T.E. Lipatova, G.A. Pkhakadze, Polymers in Endoprosthetics, Naukova Dumka,
Kiev, p. 160 (1983).[422] G.A. Pkhakadze, The Morphological and Biochemical Aspects of Polymeric
Biodestruction, Naukova Dumka, Kiev, p. 159 (1986).[423] T.E. Lipatova, O.E. Novikova, G.A. Pkhakadze, Proc. Acad. Sci. Ukraine B, 810–
814 (1974).[424] T.E. Lipatova, G.A. Pkhakadze, Vestnik Acad. Sci. Ukraine, 12, 22–30 (1980).[425] G.A. Pkhakadze, T.L. Tereshchenko, V.P Yatsenko, A.K. Kolomiytsev, Polymers in
Medicine, Vroslav, 2, 105–112 (1977).[426] V.P. Yatsenko, et al., Current Problems in Modern Pathophysiology, Naukova
Dumka, Kiev, pp. 425–427 (1981).[427] G.A. Pkhakadze, T.T. Alekseyeva, Biodestructible Polymeric Materials, Naukova
Dumka, Kiev, pp. 12–19 (1982).[428] G.A. Pkhakadze, L.V. Shchukina, R.A. Veselovsky, T.E. Lipatova, Clin. Surg., 9,
60–62 (1973).[429] M.M. Kovalev, T.L Tereshchenko., E.I. Suslov, G.A. Pkhakadze, Polymers in
Medicine, Vroslav, 14, 277–283 (1974).[430] T.E. Lipatova, V.A. Mironov, G.A. Pkhakadze, Avt. Svid. USSR No. 566832 (1977).[431] T.E. Lipatova, R.A. Veselovsky, G.A Pkhakadze, Avt. Svid. USSR No. 884705
(1975).[432] T.E. Lipatova., R.A. Veselovsky, G.A. Pkhakadze, USA Patent No. 4057535 (1977).[433] G.A. Pkhakadze, L.V. Shchukina, T.L. Tereshchenko, Ukrain. Biochem. J., 25–33
(1978).
References 387

[434] G.A. Pkhakadze, G.V. Burenko, S.V. Komisaranko, Ukrain. Biochem. J., 703–708(1970).
[435] G.A. Pkhakadze, Proc. Acad. Sci. Ukr. SSR, B, 7B, 656–659 (1972).[436] N.O. Mezhiborskaya, G.V. Burenko, G.A. Pkhakadze, Proc. Acad. Sci. Ukrain.
SSR, 271–274 (1971).[437] G.A. Pkhakadze, T.L. Tereshchenko, in The Morphological and Biochemical
Aspects of Polymeric Biodestruction, Naukova Dumka, Kiev, p. 101 (1986).[438] G.A. Pkhakadze, L.V. Shchukina, T.E. Lipatova, Ukrain. Biochem. J., 568–572
(1976).[439] A.I. Snegirev, G.V. Burenko, G.A. Pkhakadze, in The Morphological and
Biochemical Aspects of Polymeric Biodestruction, Naukova Dumka, Kiev, p. 31(1986).
[440] I.M. Kebuladze, M.M. Kovalev, G.V. Burenko, in Polymers in Medicine, NaukovaDumka, Kiev, p. 83 (1976).
[441] I.M. Kebuladze, M.M. Kovalev, T.E. Lipatova, et al., Sabchota Med., 5, 53–55(1973).
[442] G.A. Pkhakadze, L.V. Shchukina, T.E. Lipatova, et al., Proc. 29th Congress ofSurgeons, Zdorov’ya, Kiev, pp. 222–223 (1974).
[443] M.M. Kovalev, G.V. Burenko, I.M. Kebuladze, et al., Polymers in Medicine,Vroslav, 2, 117–123 (1973).
[444] M.M. Kovalev, I.M. Kebuladze, V.A. Mironov, in The Problems of ProducingMedical Drugs and Polymeric Materials for Medicine, Naukova Dumka, Kiev,pp. 76–78 (1979).
[445] V.P. Roy, I.M. Kebuladze, Clin. Surg., 2, 45–47 (1979).[446] G.G. Gorodenko, I.M. Slepukha, V.R. Belkin, et al., Thoracic Surgery, 5, 57–62
(1974).[447] V.I. Titarenko, G.G. Gorodenko, I.M. Slepukha, et al., in Polymers in Medicine,
Naukova Dumka, Kiev, p. 41 (1976).[448] V.Ya. Djugostran, Thoracic Surgery, 5, 58–60 (1987).[449] R.V. Mikulyak, Clin. Surg., 1, 25–27 (1984).[450] R.V. Mikulyak, Ya.Ya. Bondar, I.K. Loyko, V.I. Polovchik, Clin. Surg., 1, 71–72
(1985).[451] Yu.N. Mokhnyuk, A.I. Poyda, Avt. Svid. USSR No. 990199 (1983).[452] S.G. Vainshtein, M.N. Zhukovski, Z.I. Shust, et al., Avt. Svid USSR No. 1172541
(1985).[453] A.I. Poyda, Clin. Surg., 2, 41–42 (1982).[454] S.G. Vainshtein, M.N. Zhukovski, Z.I. Shust, Clin. Surg., 10, 67–68 (1985).[455] S.G. Vainshtein, M.N. Zhukovski, Z.I. Shust, Ya.N. Fedorov, Kazan’ Med. J., 6,
403–404 (1986).[456] Yu.Z. Livshits, I.S. Dyachuk, L.S. Belyansky, Z.I. Murtazaev, Clin. Surg., 9, 67–68
(1987).[457] S.A. Shalimov, V.S. Zemskov, A.P. Podpryatov, et al., Clin. Surg., 6, 47–50 (1982).[458] S.G. Shtofin, Surgery, 2, 126–127 (1987).[459] V.S. Zemskov, Yu.Z. Livshits, G.I. Litvinenko, et al., Clin. Surg., 11, 8–11 (1981).[460] A.A. Shalimov, V.S. Zemskov, S.A. Shalimov, et al., Clin. Surg., 11, 1–7 (1981).[461] T.L. Tereshchenko, in Polymers in Medicine, Naukova Dumka, Kiev, p. 53 (1976).[462] T.E. Lipatova, G.A. Pkhakadze, T.L. Tereshchenko, Vojenske Zdravotnickelisty
(CSSR), 1, 25–29 (1976).[463] P.A. Malinovsky, V.A. Mironov, in The Problems of Producing Medical Drugs and
Polymeric Materials for Medicine, Naukova Dumka, Kiev, pp. 76–78 (1979).[464] B.S. Gekman, P.A. Malinovsky, G.A. Pkhakadze, Urol. Nephrol., 560–564 (1981).[465] Proc. 31st All-Union Congress of Surgeons, FAM, Tashkent, p. 186 (1986).[466] A.A. Polyakov, 10th All-Union Congress on Transplantation of Organs, Kiev, pp.
70–73 (1985).[467] A.A. Polyakov, V.A. Tkhor, Transplantation of Kidneys, Thesis of III All-Union
Symposium, Riga, pp. 35–36 (1984).[468] L.V. Khar’kov, Stomatology, 5, 53–55 (1984).[469] T.E. Lipatova, Yu. Lipatov, Mendeleyev’ Soc. J., 483–496 (1985).
388 References

Index

AAbsorption, 14Acrylic, 112Additives, 3, 22–33, 278Adipate polydiethylene glycol, 57Adhesion, 1–98, 278–293
strength, 67, 298Adhesive, 1
strength, 298Adhesive-bonded joints, 227–263Adhesives, 22, 98, 227, 263, 278, 298,
342in medicine, 364in nuclear energy, 370in surgery, 366
Adsorption, 1–26, 278–298properties, 38
Aerodromes, repair, 359Aerosil, 291Aggregation of particles, 289Alcohol, 13Alkyl phenol oxyethylated ester
(OP-10), 3, 25Allophanic groups, 15Aluminum, 18Amalgamated, 62Amines, 13Aminoepoxide, 83Ammonium salts, 81Anomalous effect, 58Application, 342–375Aqueous solutions, 61Aromatic compound, 60Aromatic heterocycle, 87
Atomized composition, 343Autographic recorder, 61
BBand intensity, 296Basalt flakes, 343Basalt surface, 345–354Bending stress, 152Benzoyl peroxide, 4Binary solutions, 76Block copolymers, 74Boundary layers 9, 89, 278–293Breaking elongation, 152Brick paints, 371Bridges, repair, 358Bromides, 85Buildings, repair, 357Butanol, 3Butyl alcohol, 291Butylmethacrylate, 4
CCarbamide groups, 294Carbonyl groups, 88, 294Cellulose-containing materials, 363Cementing, 263Ceramics, 346Chemically indifferent surfactant,
344Chemosorption, 2Chlorides, 85Chlorobenzene, 13
391

Chloroform, 63Chromatography, 6Cleaning, 346Cobalt naphthenate, 57Coefficient of transmission, 57Cohesion, 1
energy, 137Colloid, 25–27
particles, 43Compatibility, 51Concentration, 24Concrete chimney, repair, 359Concrete impregnating, 371Concrete reservoirs, repair, 358Conformation, 53Construction, 345Consumption, 57Contamination, 2Conversion, 40Copper chloride, 61Copper concentration, 61Corrosion inhibition, 345Corrosion-resistant coating, 345Crack, 114Cracking resistance, 158Creep, 155Crosslink, 98–217Crosslinked polymers, 22–89, 98–217,
278–293Curing agents, 227–263, 278–293Curing oligomers, 38Curing process, 89–98Cyanoacrylate adhesives, 370
DDamage control, 345Decane, 3Deck, 343Deep water, 343Deformation, 115Degreasing, 346Delocalization, 158Dielectric relaxation, 9Dielectric studies, 57Diethylene glycol, 291Diethylenetriaminomethylphenol,
144
Differential scanning calorimetry, 99Diffraction, 99Diffusion, 346Diglycidyl ester of resorcin, 142Dilatometry, 99Dimethylacrylate triethylene glycol,
57Dimethylaniline, 4Dimethylformamide (DMFA), 5Dimethylsiloxanes, 74Dipole group, 57Disintegration, 52Dispersion, 99Displacement of crack, 116Distribution, 348Divalent copper, 61Dock, 344Dodecyl nitrile (DDN), 25Double links, 354Dust-free floors, 373Dynamic conditions, 50Dynamic mechanical spectroscopy, 99
EElastic properties, 17Elastomeric particles, 138Electric welding, 344Electrode, 64Electron paramagnetic resonance
(EPR), 348Electrostatic forces, 87Elongation, 127Enthalpy, 81Entropy, 81Epoxide-diane resin (ED-20), 3, 17,
160Epoxided polypropylene glycol
(Laproxides 503M and 703), 160Epoxy oligomers, 145Epoxy–rubber compositions, 142Equilibrium process, 49Ethanol, 65Extremum, 81
FFace layer, 343
392 Index

Filled polymers, 278–297Filler surface, 98, 278Flake, 343Floors, 373Flory–Huggins parameter, 59Fluorinated alcohol, 118Fraction, 54Free energy, 32Friction, 99
GGas chromatography, 72Gas diffusion, 346Gel-formation process, 25, 278Glass, 13Glass fiber, 13
winding, 354Glass-reinforced plastic, 278–298Glass-transition temperature, 99Glycidyl groups, 87Grafted molecules, 288
HHardener, 2, 354Heat insulation panels, 342, 373Heptylpyridinium chloride, 87Heterochain oligomers, 25Hexane, 3Homogeneity, microscopic, 99Homogeneous blending, 140Homogenization, 99Hull repairs, 342Hybrid binders, 98Hydrogen sulfide, 346Hydrophilic, 55Hydrophobic aerosil, 354
IImpact test, 126Impregnation, 331–342Impurities, 2Incompatibility, 55Inhibition, 346Initiator, 5In-situ maintenance, 343
Insulation covering, 343Integral intensity, 78Intermolecular bonds, 94Intermolecular interaction, 138Interpenetrating polymer network,
102Interphase boundary, 4Interphase tension, 3, 60Ion, 61Ionic polymerization, 84Ionization, 6IR absorption, 104Isocyanate group, 104Isotherms, 26
JJoints, adhesive-bonded, 1, 227–263
KKinetic curves, 66Kinetic units, 288Kinetics of polymerization, 298KL-3 adhesive for organic soft tissue,
364
LLaproxides, 160Latent period, 5Layer thickness, 72Layers, saturated, 27Linear polymers, 137Liquid media, 263–278, 342–374Long–term strength, 106Lyophobic filler, 292Lyophobic groups, 80
MMacromolecular conformation, 106Magnesium chloride, 13Maleate phthalate polydiethylene
glycol, 57Marshallite, 4–18, 278–298Matrix, 289Mechanical damping, 137
Index 393

Medical adhesives, 365Mercury, 3Metal substrate, 293Metallic brush, 347Methyl ethyl ketone peroxide
(MEKP), 4, 57Methyl methacrylate, 4MGF-9 oligoetheracrylate, 209Micellar weight, 36Micelle formation, 79Microdiscontinuities, 90Microsegregation, 293Modification of surface, 23Modified filler, 289Modulus of elasticity, 98–227,
298–319Molecular mobility, 278–298Molecular weight, 2Monolayer, 227–263Monomer, 5Morphology, 77
NNetwork, 102Nonaqueous solution, 61Nonsaturated polyester, 347Nuclear magnetic resonance (NMR),
77Nuclear power station, 370
OOctane, 3Oil and gas, 345Oil tank, 345Oligoamide amine, 33Oligoamines, 34Oligobutadiene–acrylonitrile rubber,
143Oligobutadiene rubber, 131Oligoester glycol, 290Oligoetheracrylate MGF-9, 209Oligoethylene glycol, 90Oligomer medium, 289Oligomer–metal interphase, 60Oligomer polymerization, 50Oligomers, 22–89
Olyoxypropylene glycol, 80Optical density, 42Organic compounds, 61Organic tissue, adhesive, 364Organo-mineral composites, 202, 331Oscillogram, 62Oscillopolarographic, 64
PPaints, 371Panels, heat-insulating, 373Particle distribution, 290Perlite, 373Phase separation, 133Phenylglycidyl ether, 81, 87Photoelectric calorimeter, 57Pillar, repair, 359Pilothouse, 344Pilot plant, 342Pipeline, repair, 345Pipes, strengthening, 355Pipes, underwater, 354Plaster, 344Plasticization, 73Plating, 344Plunger, 346Polar groups, 16Polarograph, 4Polyamide, 1Polyepoxides, 81Polyesters, 89Polyethylene polyamine (PEPA), 6Polyethylene terephthalate, 4Polyisocyanite groups, 203Polymer film, 57Polymer structure, 74Polymeric composites, 22–89,
278–293Polymeric matrix, 98–217Polymeric mixtures, 112Polymerization level, 41Polymerization system, 12Polymerizing solvent, 50Polymers, cross-linked, 256Polymers, linear, 256Polyoxypropylenetriol (POPT), 25Polypropylene glycol, 98, 160
394 Index

Polysilicon, 6Polyurethane, 22, 74, 164
adhesive, 364filled, 285, 293networks, 170–227
Porous materials, 331, 342, 371Potential, 60Properties of adhesives, 98Protein, 79Proton, 85Pyridine, 84
RRadiation thermal luminescence, 99Reactive surfactant, 344Reactive system, 14Rearrangement, 55Reinforced coating, 109Reinforcing elements, 343Relaxation process, 98, 227, 298Relaxation properties, 136Relaxation transition, 137Resin, 45, 354Rheology, 91Rig, 345Roads, repair, 359Rocks, strengthening, 374Rubber–polymer mixtures, 128Rust-preventing coating, 346
SSandblasting, 346Sealing of rocks, 374Seawater, 344Segmental mobility, 288Segmental solubility, 195Shear stresses, 107Ship repairs, 343Shipyard, 343Softeners, 2Solid polymers, 45Solvent, 44Space-network polymer, 74–84,
98–217, 278–293Spectrometer, 348Spectroscopy, 8
Spinodal mechanism, 98Sprut adhesives, 109–120, 342–374Sprut-4 adhesive, 118Sprut-5M adhesive, 103Stabilizers, 2, 98–202, 227–260Static bending, 58Steaming, 346Stearic acid, 24Stoichiometric composition, 348Stoichiometry, 6Strength of adhesive joints, criteria,
298Stresses, internal, 227–260
calculation, 244edge, 250
Stresses, normal, tangential, 107Stresses, thermal, 230Stretching, 54Structure of polymers, 74Structuring, 99Structurizing effect, 54Submerged structures, repair, 362Submicrocracks, 108Substrate, 1–22, 293Suction cup, 344Supermolecular structure, 55Surface-active molecules, 52Surface-active substances, 22–98Surface energy, 25Surface entropy, 25Surface pressure, 78Surface tension, 33Surfactant, 22–98
additives, 33concentration, 27molecules, 49solubility, 35
Swelling, 12Symmetry, 348System viscosity, 49
TTank, 346Teflon, 1Tensile stress, 151Tetrabutylammonium iodide, 5Thermal motion, 49
Index 395

Thermodynamic compatibility, 139Thermodynamic equilibrium, 46Thermodynamic function, 79Thermodynamic parameter, 30Thermodynamically incompatible
mixtures, 112Thermostated polymer, 10Thickness of coating, 19Toluene, 2Toluene diisocyanate, 57Transformation, 354Transition layer, 98Tunnel, repair, 362Turbidity, 93
UUltraviolet microscopy, 86Underground structure, repair, 360Underwater pipelines, repair, 354Unsaturated polyester, 97
Upper deck, 343Urethane groups, 41
VVacuum treatment, 5VAK adhesive, 109–128Vermiculite, 373Viscometer, 54Viscosity, 163–217
WWater–oil mixture, 346Water-resistant acrylate (VAK), 117Wear-resistant coating, 373Wetting agent, 47Winding, 347Wreckage, 344Wood impregnation, 371Wood particles, 363
396 Index
Copyright © 2022 FDOKUMEN