Sequential Coating of Nanopores with Charged Polymers
119
ETH Library Sequential Coating of Nanopores with Charged Polymers: A General Approach for Controlling Pore Properties of Self-Assembled Block Copolymer Membranes Doctoral Thesis Author(s): Baettig, Julia Publication date: 2014 Permanent link: https://doi.org/10.3929/ethz-a-010385318 Rights / license: In Copyright - Non-Commercial Use Permitted This page was generated automatically upon download from the ETH Zurich Research Collection . For more information, please consult the Terms of use .
-
Upload
khangminh22 -
Category
Documents
-
view
1 -
download
0
Transcript of Sequential Coating of Nanopores with Charged Polymers

ETH Library
Sequential Coating of Nanoporeswith Charged Polymers: A GeneralApproach for Controlling PoreProperties of Self-AssembledBlock Copolymer Membranes
Doctoral Thesis
Author(s):Baettig, Julia
Publication date:2014
Permanent link:https://doi.org/10.3929/ethz-a-010385318
Rights / license:In Copyright - Non-Commercial Use Permitted
This page was generated automatically upon download from the ETH Zurich Research Collection.For more information, please consult the Terms of use.
DISS.-NO. ETH 22337
Sequential Coating of Nanopores with Charged
Polymers: A General Approach for Controlling
Pore Properties of Self-Assembled Block
Copolymer Membranes
A dissertation submitted to the
ETH ZÜRICH
for the degree of
Doctor of Sciences
presented by
Julia Baettig
M. A., State University of New York at Buffalo, U.S.A.
born May 14th
, 1980
citizen of the United States of America
accepted on the recommendation of
Prof. Dr. Dieter A. Schlüter, examiner
Prof. Dr. Anders Egede Daugaard, co-examiner
Prof. Dr. Lucio Isa, co-examiner
Dr. Anzar Khan, co-examiner
2014


Acknowledgements
I would like to thank several people for their time and effort, without which this dissertation
work would not have been possible. First, I would like to thank Prof. Dr. Dieter Schlüter for
allowing me to join the research group and giving me generous support, which was both
necessary and extraordinarily helpful, to complete my PhD.
For being the best supervisor I could ever imagine or ask for, I shall always be indebted to
Dr. Anzar Khan, whose constant guidance and help was the foundation for the work
contained here. For both the freedom to explore my own ideas and the direction to keep
working on a logical path, I will be forever grateful.
I thank my labmates, Dr. Jingyi Rao, Dr. Ikhlas Gadwal, Dr. Nergiz Cengiz, Selmar Binder,
and all of the other coworkers in the Schlüter group who have made the working environment
a happy place to be every day.
Special thanks go to Ms. Daniela Zehnder, for all of the help with administrative problems
and difficulties, whose support was invaluable. Also, to Dr. Thomas Schweizer for all of the
training and help making a glovebox, as well as the kind help with my GPC results.
An enormous amount of thanks goes to my husband, Pio Bättig, for the construction of all the
electronic equipment that I needed to perform my thesis work and the two years of being a
stay-at-home dad, without which I am certain this would not have been possible.
Finally, I would like to thank my committee members, Prof. Dr. Lucio Isa, Prof. Dr. Anders
Egede Daugaard, and Prof. Dr. Hans Christian Öttinger, who made my defense both a
constructive and relatively painless experience.


Table of Contents
Summary ................................................................................................................................................. ii
Zusammenfassung .................................................................................................................................. iii
Chapter 1: Introduction and Background ................................................................................................ 1
Aim and Organization of this Thesis ................................................................................................ 17
Chapter 2: Development and Testing of a Pressure Sensor Platform ................................................... 23
2.1 Amplification Data Collection Box Development ................................................................... 24
2.2 Software ................................................................................................................................... 28
2.3 Sensor Testing and Calibration ................................................................................................ 29
References ......................................................................................................................................... 32
Chapter 3: Membrane Formation and Layer-by-Layer Polyelectrolyte Deposition ............................. 33
3.1 Introduction, Membrane Formation and Characterization ...................................................... 33
3.2 Base Layer Deposition: Poly(Acrylic Acid) and Introduction to Pore Characterization through
Pressure Measurements ..................................................................................................................... 43
3.3 Layer-by-Layer Deposition of a Weak and a Strong Polyelectrolyte inside the Nanopores ... 51
3.4 Layer by layer Deposition: Weak-Weak and Strong-Strong Polyelectrolytes ........................ 67
3.5 Multilayer Testing and Characterization ................................................................................. 70
3.6 Conclusions ............................................................................................................................. 74
References ......................................................................................................................................... 77
Chapter 4: Separations Using Polyelectrolyte Multilayers in Nanostructured Phase-Inversion
Membranes ............................................................................................................................................ 81
4.1 Dye Separation ........................................................................................................................ 81
4.2 Size separation: Sieving curves ............................................................................................... 89
Chapter 5: Experimental Details ........................................................................................................... 99
General Conclusions ........................................................................................................................... 103
Appendix ............................................................................................................................................. 105
Symbols and Abrreviations ............................................................................................................. 105
Curriculum Vitae ................................................................................................................................ 107

i

ii
Summary
ecent advances in membrane technology have led to the development of block
copolymer membranes with an ordered isoporous structure formed by self-
assembly. The functionalization of such membranes imparts them with huge
potential in the fields of catalysis, water treatment, enzyme immobilization, and
chemical separations. Membranes can be functionalized by covalent modification or by the
addition of polymers that bind to the outermost membrane material, through ionic
interactions, hydrogen bonding, or hydrophobic interactions.
In this thesis, progress was made towards the development of a general strategy for the
functionalization of block copolymer membranes. Constructed from poly(styrene)-b-poly(4-
vinylpyridine) (PS-b-P4VP), these polymeric phase-inversion membranes possess a
polystyrene core and a surface entirely coated with P4VP. The initial functionalization of this
membrane was performed by using poly(acrylic acid), which has the unique property of being
able to both hydrogen bond with the 4-vinylpyridine groups and also simultaneously present
negatively charged carboxylate groups to the interior of the nanopore. Therefore, PAA was
used for a base layer from which to begin layer-by-layer assembly. This was then followed by
the layering of oppositely charged polyelectrolyte chains onto the pore wall by pushing
polyelectrolyte solutions in sequence through the membrane. A method was developed for
depositing polyelectrolyte multilayers onto and in the pores of a polystyrene-b-poly(4-
vinylpyridine) membrane. By using a strong and a weak polyelectrolyte, poly(styrene
sulfonate) and protonated poly(ethylene imine), we looked at layer development as it relates
to pH, and correspondingly charge of the poly(ethyleneimine). Weak-weak and strong-strong
polyelectrolyte combinations were also explored. A pressure sensor was used to monitor the
change in pore size during the layer deposition, providing valuable insight into the layer-by-
layer process inside of the nanopore. Using charged polyelectrolytes we made inroads to
control the pore size and chemistry. The pore size and chemistry was then explored with dye
separation and sieving curve analyses.
R

iii
Zusammenfassung
eit kurzem ist es möglich, Copolymermembranen herzustellen, bei denen eine
geordnete isopore Struktur durch Selbstorganisation erzielt wird. Werden diese
Membranen zusätzlich noch funktionalisiert, können sie in den Bereichen Katalyse,
Wasserbehandlung, Enzymimmobilisierung oder chemischer Trennung eingesetzt werden.
Diese Funktionalisierung geschieht entweder durch kovalente Verknüpfung oder durch das
Hinzufügen von Polymeren an die äusserste Membranschicht, wobei die Polymere entweder
durch ionische oder hydrophobe Wechselwirkungen oder durch Wasserstoffbrücken
gebunden werden.
Diese Dissertation dokumentiert die Fortschritte, die bei der Entwicklung einer allgemeinen
Strategie zur Funktionalisierung von Blockcopolymermembranen erzielt wurden. Ausgehend
von Polystyrol-b-poly(4-vinylpyridin) (PS-b-P4VP), besitzen diese durch Phasenumkehr
hergestellten Membranen einen Polystyrol-Kern und eine vollständig mit P4VP bedeckte
Oberfläche. Die erste Funktionalisierung dieser Membran wurde mit Polyacrylsäure (PAA)
durchgeführt. Diese hat die einzigartige Eigenschaft, einerseits Wasserstoffbrücken mit den
4-Vinylpyridin-Gruppen zu bilden und andererseits im Inneren der Nanoporen negativ
geladene Carboxylatgruppen zur Verfügung zu stellen. Aus diesen Gründen ist PAA ein
idealer Unterbau, um eine schichtweise Selbstorganisation zu beginnen. Auf die PAA folgen
mehrere Lagen von entgegengesetzt geladenen Polyelektrolytketten, die durch abwechselndes
Spülen der Membran mit Polyelektrolytlösungen an die Porenwände angebracht wurden. Es
wurde eine Methode entwickelt, um mehrlagige Polyelektrolyte auf und in die Poren einer
Polystyrol-b-poly(4-vinylpyridin)-Membran anzubringen. Ein starkes und ein schwaches
Polyelektrolyt wurden eingesetzt, d.h. Natriumpoly(styrolsulfonat) und protoniertes
Polyethylenimin, und der Schichtaufbau und seine pH-Abhängigkeit und damit die Ladung
des Polyethylenimins wurden untersucht. Darüber hiraus galt es schwach-schwache und
stark-starke Polyelektrolytkombinationen zu untersuchen. Mittels eines Drucksensors konnte
die Veränderung der Porengrösse während der Ablagerung der Schichten untersucht werden.
Dies ergab wertvolle Erkenntnisse über den schichtweisen Aufbau im Inneren der
S

iv
Nanoporen. Durch die Verwendung von geladenen Polyelektrolyten erzielten wir Fortschritte
in der Steuerung der Porengrösse und Porenchemie. Mit den so erhaltenen Membranen
wurden dann Trennungsexperimente an Farbstoffmischungen sowie Siebkurvenanalysen
durchgeführt.

v

1
Chapter 1: Introduction and Background
Membranes
The use of membranes in everyday life, both in and outside of a lab environment, has become
pervasive. In a water purification environment, advanced membranes provide reliable low-
fouling water purification through long lasting membranes. Pore sizes for these membranes
range from 3-5 Å in reverse osmosis membranes to several microns in microfiltration
membranes. In the chemistry lab as well, membranes provide easy filtration through syringe
filtration, ultrafiltration, and dialysis membranes. Choice of material, surface modification,
and pore size are each critical for the development of next-generation membranes – aiming to
increase selectivity, flux, and functionality.1
Membranes have also been used as supports for designed functionality – as catalytic supports
in membrane reactors,2 or to separate specific molecules by size or ionic character.
3 In the
biomedical realm as well, they have been suggested for uses in drug delivery and tissue
engineering.4
In general, a membrane performs as a barrier, in that it is designed to allow certain entities to
pass while preventing others from doing the same. The separation can be based on size,
shape, or chemical properties and used to perform such separation processes as filtration,
ultrafiltration, or dialysis (based on pore size), adsorption, absorption, or ion exchange (based
on affinity or charge).5 Considerations are taken for surface properties such as hydrophilicity
and for bulk properties – an inorganic membrane made of silica or alumina may be brittle but
considerably stronger than a polymeric membrane for example. For commercial membranes,
the most important properties are selectivity and flux – how well something can be separated
at what rate.5 For academic research on membranes, the goals are more far-ranging – from
catalysis6 to drug delivery
7 to tissue engineering,
8 adding new functionality and potential for
specific applications is key.

2
Membrane formation
A number of different methods are used for the formation of membranes. Electrospinning,
for example, can quickly produce fibers that are pressed into membranes of differing pore
sizes. Track-etched membranes consist of monodisperse pores that are etched into a solid
polymer disc, although the pore density is relatively low. Immersion precipitation occurs
when a polymer solution is spread in a nonsolvent and allowed to coagulate. By varying the
solvent, temperature, and time it is possible to gain a reasonable amount of control over pore
size and structure. Another method that is used is interfacial polymerization, which is
polymerizing a monomer at the interface of two incompatible liquids (such as oil and water).
This method is the most important for the fabrication of reverse osmosis membranes and
allows for a huge variety of monomers to be polymerized, forming membranes with
controlled functionality and hydrophilicity.1
Phase inversion membranes are formed when a polymer in a good solvent is immersed in a
miscible nonsolvent. Initially, these membranes were made with a single polymer and it was
observed that the types of voids that formed within the membrane were controllable by the
rate of solvent mixing, the bath temperature, and the evaporation rate and time of solvent
before entering the nonsolvent bath.9 For example, in the image shown in Figure 1, the
authors were able to significantly change the membrane structure simply by changing the
method of applying the nonsolvent to the polymer mixture.10

3
Figure 1-1: From Reference 10, changes in phase inversion membrane structure due to changes
in the nonsolvent application method; a: water bath, b: flowing water, c: 5mL of water, d: 5 mL
of 25 wt% NMP water.
Isoporous membranes
While membranes have become more controlled in pore size, they are still relatively
disordered - there are limited options when looking for a membrane with truly uniform pore
size. Track-etched membranes are one of these options, although the pore density is not
extremely high. Another option has been the anodization of alumina. These membranes can
be made in a wide range of pore sizes and form extremely ordered morphologies with
uniform pore size (Figure 2).11
On the other hand, these membranes are extremely brittle,
which can make them difficult to work with. Additionally, they need some either sort of

4
chemical modification or reliance of hydrophobic forces in the case of layer-by-layer self-
assembly in order to functionalize the surface.
Figure 1-2: From Reference 11, structure and pore size of porous anodized aluminum oxide membrane.
Finally, the recent development in phase-inversion membrane technology has provided a
breakthrough in block copolymer phase-inversion membranes. The paper of Peinemann et.al.
demonstrated the discovery of a phase-inversion method using polystyrene-b-poly(4-vinyl
pyridine) (PS-b-P4VP) which provided a well-ordered surface (Figure 3) reminiscent of the
structures found in solvent annealed block copolymer thin films, sitting atop a less-ordered
typical phase inversion membrane structure.12

5
Figure 1-3: From Reference 12, structure and pore size of PS-b-P4VP ordered phase inversion membrane, a: cross
section and b: top view. Scale bar is 500 nm.
Since the development of this membrane, a variety of additives have been probed in order to
improve the structure of the membranes, including magnesium acetate,13
2-(4'-
hydroxybenzeneazo) benzoic acid,14
and carbohydrates.15
Membrane Functionalization Overview
Because membrane functionalization is such an expansive topic, the background here has
been limited to the areas closest to the subject matter of the thesis – the functionalization and
modification of isoporous membranes and the important points of layer-by-layer self-
assembly in membranes of all types. A summary of the important points of layer-by-layer
self-assembly, which has been studied in extraordinary depth on surfaces, will be covered
later in the introduction.
Membrane Functionalization – Track-etched Membranes
Membranes can be functionalized by including a functional polymer in the membrane
formation process or by modifying the surface of a membrane with a small molecule. For
track-etched membranes, a few groups have used different techniques to achieve
modifications of these membranes.
Armstrong et.al. used single and multiple polyelectrolyte multilayers of poly(styrene
sulfonate) and poly(allylamine hydrochloride) to separate K+ from Mg
2+ ions in aqueous
solution.16
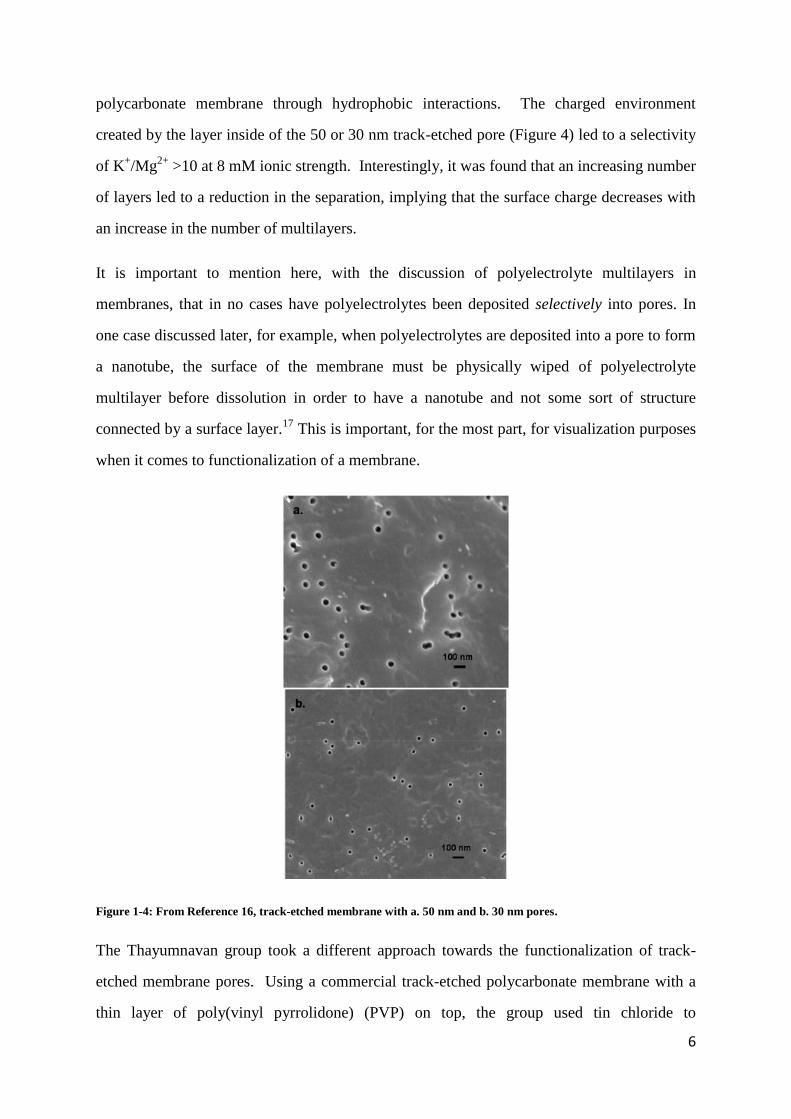
The initial layer of poly(styrene sulfonate) was bound to the track-etched
6
polycarbonate membrane through hydrophobic interactions. The charged environment
created by the layer inside of the 50 or 30 nm track-etched pore (Figure 4) led to a selectivity
of K+/Mg
2+ >10 at 8 mM ionic strength. Interestingly, it was found that an increasing number
of layers led to a reduction in the separation, implying that the surface charge decreases with
an increase in the number of multilayers.
It is important to mention here, with the discussion of polyelectrolyte multilayers in
membranes, that in no cases have polyelectrolytes been deposited selectively into pores. In
one case discussed later, for example, when polyelectrolytes are deposited into a pore to form
a nanotube, the surface of the membrane must be physically wiped of polyelectrolyte
multilayer before dissolution in order to have a nanotube and not some sort of structure
connected by a surface layer.17
This is important, for the most part, for visualization purposes
when it comes to functionalization of a membrane.
Figure 1-4: From Reference 16, track-etched membrane with a. 50 nm and b. 30 nm pores.
The Thayumnavan group took a different approach towards the functionalization of track-
etched membrane pores. Using a commercial track-etched polycarbonate membrane with a
thin layer of poly(vinyl pyrrolidone) (PVP) on top, the group used tin chloride to

7
functionalize the membrane surface with Sn2+
ions and then deposited anionic polymers
inside of the membrane to create different functionalities. Using only one or two layers of
polyelectrolyte, they were able to separate mixtures, through diffusion of water, of anionic
and cationic dyes (Figure 5c,d), mixtures of differently sized molecules with similar charges,
and mixtures of differently sized and charged proteins.18
Especially of interest was the way
that they were able to monitor the membrane pressure using a low-cost sensor (Figure 5a,b) –
this became the inspiration for the system design discussed later.
Figure 1-5: From Reference 18, a: sensor calibration using track-etched membrane pores, b: Sensor pressure
response from a change in membrane pore size, c and d: separation of positively charged rhodamine dye (red) from
negatively charged calcein dye (orange) with pores containing a positively charged (c) polymer and a negatively
charged (d) polymer.
Approaching smaller size ranges, the Martin group has performed extraordinary separations
using track-etched membranes with 30nm pores into which either gold or silver was
electroplated onto the interior pore wall. Controlling the thickness of the metallic film
allowed the pore to be reduced to molecular dimensions, allowing the separation of a larger
molecule like quinine from the relatively smaller pyridine.19
In another earlier study, polyelectrolyte multilayers were formed in track-etched membranes
using polypeptides (PLGA/PLL) and synthetic polyelectrolytes (PSS/PAH) to form
multilayers within a 200 nm pore size track-etched membrane. The membrane was then
studied for ion selectivity.20
One study that looked at pairs of strong polyelectrolytes in track-etched membrane pores of
different sizes, polystyrene sulfonate and poly(vinylbenzyl ammonium chloride) made layers
as thick as 50 nm inside of nanopores, filling even a 200 nm pore after just a few layers.21
a b c d

8
The potential applicability of layer-by-layer assemblies in track-etched membranes was
shown when in 2003 the Caruso group made layer-by-layer nanotubes from the pores of 400
nm track-etched membranes. Depositing positively charged PEI and then successive layers of
positively and negatively charged PAH and PSS or PAA on the surface of a polycarbonate
track etched membrane through immersion in polyelectrolyte solution and then dissolving the
polycarbonate membrane in DCM gave, in most cases, nanotubes which could then be
imaged through SEM.17
Hydrogen bonded polyelectrolyte multilayer nanotubes made in 200 nm pores were later
published, made from layers of poly(4-vinylpyridine) and poly(acrylic acid).22
These were
able to be made porous by dissolving the PAA layer in a NaOH solution.
In a study that provided insight into the differences between layer-by-layer assembly in
nanopores as opposed to on surfaces, the Jonas group made PAH/PSS multilayers in 100,
200, and 500 nm track-etched pores and then estimated the pore size using gas-flow
porometry. By observing pore diameters, it was determined that two “regimes” exist for
polyelectrolyte multilayer buildup in pores – a regime where layers behave like typical
multilayers (Regime 1 in Figure 6) and a regime in which a gel fills the pore due to
polyelectrolyte entanglement (Regime 2 in Figure 6). After drying, these layers shrink, as
they contain 20-40 percent water, to form the polyelectrolyte multilayer pore.23

9
Figure 1-6: From Reference 23, depiction of two layer-by-layer regimes in nanopores – Regime 1 where layer-by-
layer assembly proceeds as it does on surfaces, and Regime 2 where a more dense interwoven structure is present.
Membrane functionalization – Alumina membranes
Also published in 2003, the Li group made flexible polyelectrolyte nanotubes using an
alumina membrane as opposed to a track-etched one. The advantage of an alumina membrane
is that it can be dissolved easily in a NaOH solution. The PAH/PSS multilayers here were
extremely thick as well, with three layer-pairs being 50-80 nm thick. Another advantage of
using the alumina membrane was the pore density, which is much higher than that of track
etched membranes, and the group was able to create large numbers of nanotubes with
diameters of approximately 200 nm and lengths of up to 60 µm (Figure 7).24

10
Figure 1-7: From Reference 24: polyelectrolyte nanotubes at different magnifications, created from deposition in
alumina membranes followed by membrane dissolution. A, B, C, and D represent different views and magnifications
of the nanotubes.
The Bruening group has published by far the most literature on layer-by-layer assembly in the
pores of and on the surface of alumina membranes, exploring the area systematically and
exploiting the assembly to create new functional membranes. In one of the most elegant
examples, gold colloid nanoparticles were deposited onto PAA/PAH multilayers in 200 nm
pores (Figure 8), and then used to catalyze the reduction of 4-nitrophenol with extreme
efficiency in a flow-through reactor.25
This study also highlighted the potential utility of
layer-by-layer assembly in nanopores.

11
Figure 1-8: From Ref. 25, a) bare alumina membrane with 200 nm pore diameter and b) gold nanoparticles
immobilized onto one PAA/PAH multilayer.
Another innovative approach to layer-by-layer assembly in nanopores was taken this year by
the Nakashima group.26
Instead of using two polyelectrolytes, the group used a combination
of poly(acrylic acid) and Fe3+
ions in alternating layers to form nanotubes from 35 nm pores
in an alumina membrane.
Membrane functionalization – Highly Ordered Phase-Inversion Membranes
The Abetz group has already made some progress towards functionalizing the pore interior
by applying a layer of polydopamine, which can then be functionalized with an atom transfer
radical polymerization (ATRP) initiator or with another polymer.27
By prefunctionalizing
poly(dopamine) with 2-bromoisobutyryl bromide, a typical ATRP initiator, they were then
able to deposit the initiator onto the membrane surface with hydrogen bonding interactions
and grow hydroxyethyl methacrylate from the membrane surface, introducing new
functionality to the membrane.28
Using a different tactic for functionalization, the Stamm group functionalized PS-P4VP phase
inversion membranes by using either diiodobutane vapors or propane sultone to quaternize
the P4VP, resulting in a charged antifouling membrane surface.14
However, the

12
functionalization process reduced the flux, and most likely also was not a complete
functionalization of the surface as the pore remained open.
In general though, this type of isoporous membrane remains relatively unexplored as far as
functionalization is concerned. It presents an advantage in that the pore density is as high as
the alumina membrane but the membrane is much less brittle. The phase inversion process is
very simple and effective method of forming ordered membranes.
Layer-by-layer deposition in other types of pores
It is important to mention a couple of additional studies in order to understand the
mechanisms underlying layer-by-layer assembly in nanopores. First is the work of the
Azzaroni group, who deposited polyelectrolyte multilayers in a single conical nanopore, then
measured the current voltage curve to obtain information about surface charge within the
nanopore. What they found was that as layer-by-layer deposition proceeded the surface
charge inside of the pore decreased.29
In a second study, the Azzaroni group studied P4VP brushes inside of a solid state nanopore.
Especially relevant to the current project was the observation that the pH behavior of the
P4VP inside the nanopore was much different than the bulk. The ionic character of the P4VP
inside the nanopore reached into a much wider range of pH, especially as the pore was closed
to as little as 5 nm in size. What this meant was that a P4VP lined nanopore at pH 6 was
much more charged than the corresponding bulk P4VP would be. This charge difference
disappeared above approximately pH 7. 30
Ordered Nanoporous Thin Films – The Connection
The inspiration for the project came from the recent advances in nanoporous thin film
functionality. Highly ordered nanoporous thin films with pores lined with P4VP from blends
of PS-b-P4VP and poly(vinyl phenol)-b-poly(ethylene oxide) (PVPh-b-PEO) were
developed,31
and the next logical step was to find a way to functionalize and utilize these thin
films, perhaps as a membrane-type material. However, the manufacture of such a large area

13
of thin film without finding holes and defects is extraordinarily difficult. It is difficult enough
to float a thin film on water for examination with TEM, but to have an area the size of a
membrane would be performing the near-impossible. Membranes require highly uniform
surfaces in order to ensure complete filtration. In addition, starting from a pore diameter of 17
nm seemed to be quite limiting. So, as the Hillmyer group did when they moved from
polystyrene-polylactide (PS-PLA) block copolymer thin films to making PS-PLA
membranes,32
we looked towards the PS-P4VP membrane as a beginning for a membrane
system.
Because these highly ordered phase-inversion membranes are positioned at the juncture of the
two areas of block copolymer self-assembly and membrane science, these highly ordered
phase-inversion membranes seemed an ideal starting point for studying the potential for
modification – the membranes were relatively robust when compared to a block copolymer
thin film and the 4-vinylpyridine interior offered functionality with which to modify the
membrane. However, as the Nunes group had discovered when studying the pH responsive
character of the membrane, the protonation of the 4-vinylpyridine decorated pore interior
causes the polymer to swell and the pore to close.33
While this is potentially appealing for
some applications, it removes the most straightforward method for functionalization of the
interior of the uppermost layer of pores.
The goal of the project, then, became the combination of PS-P4VP membrane
functionalization with the enormous variety and potential found within layer-by-layer self-
assembly. By examining closely the formation of multilayers within the pore, it would be
potentially possible to control both the pore size and the pore chemistry, an appealing target
for advanced membranes. The PS-P4VP membrane would be advantageous, as it contains
inherent functionality in the nature of the P4VP polymer, which is both protonatable and an
excellent hydrogen bonding receptor. The isoporous nature of the membrane would help
ensure that the pore size was being reduced uniformly across the membrane.
Layer-by-layer Self-Assembly Overview

14
The world of polyelectrolyte multilayers was introduced by Decher, who first introduced the
idea of producing ultrathin polyelectrolyte films through the alternating deposition of layers
of alternately charged polyelectrolytes.34
As depicted in Figure 9, this extraordinarily simple
method of making thin organic films opened up an entire new arena of scientific research, to
which a large number of studies have been devoted over the past 20 years.
Figure 1-9: Depiction of polyelectrolyte multilayer buildup with poly(styrene sulfonate) and poly(allylamine
hydrochloride); from Reference 34.
It was later verified that the layer buildup is caused by an overcharging of the surface layer
after deposition, resulting in a positively or a negatively charged surface which is then
available for further deposition.35
Since the amount of research in polyelectrolyte multilayers is so enormous, this introduction
will cover only the necessary points for the present research. The first important message in
the body of research covering these systems is that every detail is important. The charge of
the polymer, the charge density of the polymer, the added electrolyte, the amount of time
spent in solution – even seemingly minute changes can lead to a change in the resulting layer
buildup.36

15
The type of polyelectrolyte used in the formation of multilayers plays an enormous role in the
buildup of the film. For example, polyelectrolytes poly(glutamic acid) and poly(allylamine
hydrochloride) have been shown to grow exponentially on surfaces.37
By simply switching
the poly(glutamic acid) to poly(styrene sulfonate), a strong polyelectrolyte, the growth was
changed to a linear process rather than an exponential one.38
Polyelectrolyte multilayers are deposited from water, and so the hydration level of the
multilayers is also a significant area of research. 39
This relates in particular to the Jonas work
mentioned earlier (Reference 23). Water content in multilayers is usually measured by some
type of reflectivity – either X-ray or neutron, and differences between dry thickness and
hydrated thickness show a hydration level between 20 and 50 percent of the film, depending
on whether D2O or H2O (as they have differing densities) is used in the study. However, it is
clear that water is a significant portion of any polyelectrolyte assembly. 39
The significant message of the research into polyelectrolyte multilayers is that every factor is
important and must be considered, and that conditions must be carefully controlled when
depositing multilayers.
Conclusion
A large amount of work has been done in the field of membrane functionalization. Recent
developments in membrane technology has allowed the formation of “isoporous” membranes
in which pore size is ordered and uniform. This thesis, following up on previous work done in
PS-b-P4VP nanoporous thin films, will explore possibilities of performing layer-by-layer
self-assembly in the pores of PS-b-P4VP phase inversion membranes. While layer-by-layer
assembly of two polyelectrolytes has been performed in larger pores (generally around 100-
200 nm) before, it has not been shown in a pore under 50 nm in size to the best of our
knowledge. Therefore, the development of polyelectrolyte multilayers in these membranes
will explore new “nano-scale” layer-by-layer deposition of polyelectrolytes and explore the
lower limits of deposition in nanopores. This will be made possible by the use of controlled
water flow and a pressure sensor as a real-time monitoring device to gain insight into the
deposition rates and layer thickness. Finally, some exploration of the potential of size and

16
charge based separations will be performed using dye (charge) and polymer (size) solutions.
With the combination of visualization (electron microscopy) techniques, separation
experiments, and pressure measurements, we will be able to gain new understanding into
polyelectrolyte multilayer formation in nanopores.

17
Aim and Organization of this Thesis
Modification of a membrane to control the chemistry and pore size is a challenging subject,
and the present thesis seeks to move towards the control of these by performing layer-by-
layer self-assembly inside the nanopores of a self-assembled polystyrene-b-poly(4-
vinylpyridine) phase inversion membrane. The thesis will develop a method both for
examining the layer-by-layer assembly as the process takes place using pressure
measurements and explore the possibilities of controlling the layer-by-layer assembly process
in a membrane with sub-50 nm pores. The potential for separations due to chemical
properties or size will then be explored.
Chapter 2
This chapter describes the development of a sensor platform that will allow a piezoelectric
pressure sensor to function as an in-line and real-time pore size monitoring system.
Chapter 3
This chapter will describe the layer-by-layer self-assembly of poly(styrene sulfonate) and
protonated poly(ethylene imine).
Chapter 4
This chapter describes the attempts at separations due to chemical properties such as charge
and hydrophilicity and size separation through sieving curves.
Chapter 5
This chapter describes the experimental details of the processes described herein.

18
References
1. Lalia, B. S.; Kochkodan, V.; Hashaikeh, R.; Hilal, N., A review on membrane
fabrication: Structure, properties and performance relationship. Desalination 2013, 326, 77-
95.
2. Westermann, T.; Melin, T., Flow-through catalytic membrane reactors-Principles and
applications. Chem Eng Process 2009, 48 (1), 17-28.
3. Gega, J.; Walkowiak, W.; Gajda, B., Separation of Co(II) and Ni(II) ions by
supported and hybrid liquid membranes. Sep Purif Technol 2001, 22-3 (1-3), 551-558.
4. Stamatialis, D. F.; Papenburg, B. J.; Girones, M.; Saiful, S.; Bettahalli, S. N. M.;
Schmitmeier, S.; Wessling, M., Medical applications of membranes: Drug delivery, artificial
organs and tissue engineering. J Membrane Sci 2008, 308 (1-2), 1-34.
5. Mulder, M., Basic principles of membrane technology. 2nd ed.; Kluwer Academic:
Dordrecht ; Boston, 1996; p 564 p.
6. Xu, J.; Bhattacharyya, D., Fe/Pd nanoparticle immobilization in microfiltration
membrane pores: Synthesis, characterization, and application in the dechlorination of
polychlorinated biphenyls. Ind Eng Chem Res 2007, 46 (8), 2348-2359.
7. Tao, S. L.; Desai, T. A., Microfabricated drug delivery systems: from particles to
pores. Adv Drug Deliver Rev 2003, 55 (3), 315-328.
8. Hadjizadeh, A.; Mohebbi-Kalhori, D., Porous hollow membrane sheet for tissue
engineering applications. J Biomed Mater Res A 2010, 93A (3), 1140-1150.
9. Guillen, G. R.; Pan, Y. J.; Li, M. H.; Hoek, E. M. V., Preparation and
Characterization of Membranes Formed by Nonsolvent Induced Phase Separation: A Review.
Ind Eng Chem Res 2011, 50 (7), 3798-3817.
10. Shao, X.; Dong, D. H.; Parkinson, G.; Li, C. Z., Microstructure control of oxygen
permeation membranes with templated microchannels. J Mater Chem A 2014, 2 (2), 410-417.
11. Lee, W.; Ji, R.; Gosele, U.; Nielsch, K., Fast fabrication of long-range ordered porous
alumina membranes by hard anodization. Nat Mater 2006, 5 (9), 741-747.
12. Peinemann, K. V.; Abetz, V.; Simon, P. F. W., Asymmetric superstructure formed in
a block copolymer via phase separation. Nat Mater 2007, 6 (12), 992-996.

19
13. Gallei, M.; Rangou, S.; Filiz, V.; Buhr, K.; Bolmer, S.; Abetz, C.; Abetz, V., The
Influence of Magnesium Acetate on the Structure Formation of Polystyrene-block-poly(4-
vinylpyridine)-Based Integral-Asymmetric Membranes. Macromol Chem Physic 2013, 214
(9), 1037-1046.
14. Tripathi, B. P.; Dubey, N. C.; Choudhury, S.; Simon, F.; Stamm, M., Antifouling and
antibiofouling pH responsive block copolymer based membranes by selective surface
modification. J Mater Chem B 2013, 1 (27), 3397-3409.
15. Clodt, J. I.; Rangou, S.; Schroder, A.; Buhr, K.; Hahn, J.; Jung, A.; Filiz, V.; Abetz,
V., Carbohydrates as Additives for the Formation of Isoporous PS-b-P4VP Diblock
Copolymer Membranes. Macromol Rapid Comm 2013, 34 (2), 190-194.
16. Armstrong, J. A.; Bernal, E. E. L.; Yaroshchuk, A.; Bruening, M. L., Separation of
Ions Using Polyelectrolyte-Modified Nanoporous Track-Etched Membranes. Langmuir 2013,
29 (32), 10287-10296.
17. Liang, Z. J.; Susha, A. S.; Yu, A. M.; Caruso, F., Nanotubes prepared by layer-by-
layer coating of porous membrane templates. Adv Mater 2003, 15 (21), 1849-1853.
18. Savariar, E. N.; Krishnamoorthy, K.; Thayumanavan, S., Molecular discrimination
inside polymer nanotubules. Nat Nanotechnol 2008, 3 (2), 112-117.
19. Wirtz, M.; Yu, S. F.; Martin, C. R., Template synthesized gold nanotube membranes
for chemical separations and sensing. Analyst 2002, 127 (7), 871-879.
20. Hollman, A. M.; Bhattacharyya, D., Pore assembled multilayers of charged
polypeptides in microporous membranes for ion separation. Langmuir 2004, 20 (13), 5418-
5424.
21. Alem, H.; Blondeau, F.; Glinel, K.; Demoustier-Champagne, S.; Jonas, A. M., Layer-
by-layer assembly of polyelectrolytes in nanopores. Macromolecules 2007, 40 (9), 3366-
3372.
22. Tian, Y.; He, Q.; Cui, Y.; Tao, C.; Li, J. B., Assembly of nanotubes of poly(4-
vinylpyridine) and poly(acrylic acid) through hydrogen bonding. Chem-Eur J 2006, 12 (18),
4808-4812.

20
23. Roy, C. J.; Dupont-Gillain, C.; Demoustier-Champagne, S.; Jonas, A. M.; Landoulsi,
J., Growth Mechanism of Confined Polyelectrolyte Multilayers in Nanoporous Templates.
Langmuir 2010, 26 (5), 3350-3355.
24. Ai, S. F.; Lu, G.; He, Q.; Li, J. B., Highly flexible polyelectrolyte nanotubes. J Am
Chem Soc 2003, 125 (37), 11140-11141.
25. Dotzauer, D. M.; Dai, J. H.; Sun, L.; Bruening, M. L., Catalytic membranes prepared
using layer-by-layer adsorption of polyelectrolyte/metal nanoparticle films in porous
supports. Nano Lett 2006, 6 (10), 2268-2272.
26. Sada, T.; Fujigaya, T.; Nakashima, N., Layer-by-layer Assembly of Trivalent Metal
Cation and Anionic Polymer in Nanoporous Anodic Aluminum Oxide with 35 nm Pore.
Chemistry Letters 2014, 43 (9), 1478-1480.
27. Clodt, J. I.; Filiz, V.; Rangou, S.; Buhr, K.; Abetz, C.; Hoche, D.; Hahn, J.; Jung, A.;
Abetz, V., Double Stimuli-Responsive Isoporous Membranes via Post-Modification of pH-
Sensitive Self-Assembled Diblock Copolymer Membranes. Adv Funct Mater 2013, 23 (6),
731-738.
28. Keskin, D.; Clodt, J. I.; Hahn, J.; Abetz, V.; Filiz, V., Postmodification of PS-b-P4VP
Diblock Copolymer Membranes by ARGET ATRP. Langmuir 2014, 30 (29), 8907-8914.
29. Ali, M.; Yameen, B.; Cervera, J.; Ramirez, P.; Neumann, R.; Ensinger, W.; Knoll,
W.; Azzaroni, O., Layer-by-Layer Assembly of Polyelectrolytes into Ionic Current Rectifying
Solid-State Nanopores: Insights from Theory and Experiment. J Am Chem Soc 2010, 132
(24), 8338-8348.
30. Tagliazucchi, M.; Azzaroni, O.; Szleifer, I., Responsive Polymers End-Tethered in
Solid-State Nanochannels: When Nanoconfinement Really Matters. J Am Chem Soc 2010,
132 (35), 12404-12411.
31. Rao, J. Y.; Ma, H.; Baettig, J.; Woo, S.; Stuparu, M. C.; Bang, J.; Khan, A., Self-
assembly of an interacting binary blend of diblock copolymers in thin films: a potential route
to porous materials with reactive nanochannel chemistry. Soft Matter 2014, 10 (31), 5755-
5762.
32. (a) Querelle, S. E.; Jackson, E. A.; Cussler, E. L.; Hillinyer, M. A., Ultrafiltration
Membranes with a Thin Poly(styrene)-b-poly(isoprene) Selective Layer. Acs Appl Mater

21
Inter 2013, 5 (11), 5044-5050; (b) Zalusky, A. S.; Olayo-Valles, R.; Wolf, J. H.; Hillmyer,
M. A., Ordered nanoporous polymers from polystyrene-polylactide block copolymers. J Am
Chem Soc 2002, 124 (43), 12761-12773; (c) Phillip, W. A.; O'Neill, B.; Rodwogin, M.;
Hillmyer, M. A.; Cussler, E. L., Self-Assembled Block Copolymer Thin Films as Water
Filtration Membranes. Acs Appl Mater Inter 2010, 2 (3), 847-853.
33. Nunes, S. P.; Karunakaran, M.; Pradeep, N.; Behzad, A. R.; Hooghan, B.; Sougrat, R.;
He, H. Z.; Peinemann, K. V., From Micelle Supramolecular Assemblies in Selective Solvents
to Isoporous Membranes. Langmuir 2011, 27 (16), 10184-10190.
34. (a) Decher, G., Fuzzy nanoassemblies: Toward layered polymeric multicomposites.
Science 1997, 277 (5330), 1232-1237; (b) Decher, G.; Hong, J. D.; Schmitt, J., Buildup of
Ultrathin Multilayer Films by a Self-Assembly Process .3. Consecutively Alternating
Adsorption of Anionic and Cationic Polyelectrolytes on Charged Surfaces. Thin Solid Films
1992, 210 (1-2), 831-835; (c) Decher, G.; Hong, J. D., Buildup of Ultrathin Multilayer Films
by a Self-Assembly Process .2. Consecutive Adsorption of Anionic and Cationic Bipolar
Amphiphiles and Polyelectrolytes on Charged Surfaces. Ber Bunsen Phys Chem 1991, 95
(11), 1430-1434; (d) Decher, G.; Hong, J. D., Buildup of Ultrathin Multilayer Films by a
Self-Assembly Process .1. Consecutive Adsorption of Anionic and Cationic Bipolar
Amphiphiles on Charged Surfaces. Makromol Chem-M Symp 1991, 46, 321-327.
35. Sukhorukov, G. B.; Donath, E.; Lichtenfeld, H.; Knippel, E.; Knippel, M.; Budde, A.;
Mohwald, H., Layer-by-layer self assembly of polyelectrolytes on colloidal particles. Colloid
Surface A 1998, 137 (1-3), 253-266.
36. von Klitzing, R., Internal structure of polyelectrolyte multilayer assemblies. Phys
Chem Chem Phys 2006, 8 (43), 5012-5033.
37. Boulmedais, F.; Ball, V.; Schwinte, P.; Frisch, B.; Schaaf, P.; Voegel, J. C., Buildup
of exponentially growing multilayer polypeptide films with internal secondary structure.
Langmuir 2003, 19 (2), 440-445.
38. Hubsch, E.; Ball, V.; Senger, B.; Decher, G.; Voegel, J. C.; Schaaf, P., Controlling the
growth regime of polyelectrolyte multilayer films: Changing from exponential to linear
growth by adjusting the composition of polyelectrolyte mixtures. Langmuir 2004, 20 (5),
1980-1985.

22
39. Schonhoff, M.; Ball, V.; Bausch, A. R.; Dejugnat, C.; Delorme, N.; Glinel, K.;
Klitzing, R. V.; Steitz, R., Hydration and internal properties of polyelectrolyte multilayers.
Colloid Surface A 2007, 303 (1-2), 14-29.

23
Chapter 2: Development and Testing of a Pressure
Sensor Platform
Introduction
A measurement setup was developed in order to allow the in-situ measurement of layer-by-
layer deposition in the membrane. This would ideally be measured with a real time output to
monitor the layer as it was deposited, then recorded for further later data analysis. For ease
of calibration purposes, the sensor PX26-001DV from Omega Engineering was used. This
same sensor was also used in the Savariar et.al. paper on molecular discrimination inside of
nanotubules.1 This calibration would be done using a 70 cm high water column, providing an
easy method of measuring and calibrating the sensor with each set of measurements. For
ease of calculation, the effect on pressure due to altitude was neglected. This sensor has been
used as well for the use of hydraulic measurements in soil science using a commercial data
logger and a INA125 instrumentation amplifier setup.2 The circuit was developed prior to
knowledge of this publication.
The overall setup was envisioned as such: a syringe pump would provide a constant and
adjustable flow of water to the membrane holder, connected to the pressure transducer
through a T-piece. The pressure transducer would be connected to the amplification/data
collection box via the provided connector (Omega Engineering). The scale would provide
flow rate data through a serial cable, connected to the amplification/data collection box,
which would then provide output data to the computer, which would act as a data logger
(Figure 1). A photo of the actual setup is also provided in Figure 1. This provided a basic
setup for low-cost membrane measurements with easy calibration and as little introduction of
new variables as possible. The major development performed was in the construction of the
instrumentation amplifier/data collection box, which will be described further in this chapter.

24
Figure 2-1: Schematic (top) and picture (bottom) of the sensor and filter-holder setup.
2.1 Amplification Data Collection Box Development
This section describes the development and layout of the amplification and data collection
box used to gather membrane pressure data from the PX26-001DV sensor. The circuit board
layout can be found in Figure 11, and the electrical schematic can be found in the appendix.

25
Figure 2-2: Layout of data collection box circuit board.
Power supply and stabilization circuitry
An external supply with 9-12 volts was fed to linear regulator (7805), which furnishes a
stabilized 5V for the digital electronics. For the sensor, instrumentation amplifier and op-amp
(operational amplifier), higher positive and negative supply voltages are needed. For this
purpose a Traco Power TMA0512D Dual output +/- 12 V DC/DC converter was used. The
voltages are stabilized with LC (inductance-capacity) low pass filters (L1-C14 for +12 V and
L2-C15 for -12 V) with a cutoff frequency of about 5.9 kHz (Fcut=1/(2*Pi*Sqrt(L*C))). This
reduces noise in the output signal. As the output voltage of the unloaded DC-DC-converter is
higher than 12 V, it is then limited to +/- 12 V over two Zener-Diodes (D3 and D4).
Microcontroller and Support Circuitry
An Atmel ATmega1284p was chosen as microcontroller (MCU) to control the circuitry,
interface to the scale, provide the reference voltage and digitize the sensor output signal. The
ATmega1284p was chosen for the following reasons:
It is easily programmable with the Arduino (www.arduino.cc) environment.
It has a second serial port that can be used to interface with a scale, the first serial port
is used for interfacing with the computer via a UART-USB converter.
It is available reasonably cheaply in single quantities (about 9.25 CHF)

26
The programming of the bootloader requires a 6-pin ISP (In System Programming) interface.
Clock generation for the MCU is provided via a 16 MHz crystal and two 22 pF load
capacitors. Jumper JP4 interfaces to two buttons (with 2 10 kOhm pullup resistors R16 and
R17) and two LEDs via 2 270 Ohm current limiting resistors (R14 and R15) to prevent the
LEDs from pulling too much current and burning up.
There are two I2C interfaces provided on the board. One is used by the 2*16 character
HD44780 display via a PCF8574 port expander, the second one is for possible additional
peripherals but was not needed in this case. A reset switch with its 10 kOhm pullup resistor is
provided. All power supply pins are connected to the 5V VCC rail via 100 nF bypass
capacitors. These stabilize the rail for transient load and “short circuit” noise to ground,
which serve to stabilize the supply network.
USB interface
Once the bootloader is written to the microcontroller via an external programmer, the
ATmega1284p can be easily programmed via its’ built in serial port. Also, once in operation,
a way to get the data from the microcontroller to the computer is needed, and conveniently
provided by the same port. In order to interface this port to a computer a USB to serial
converter is required.
This interface is provided by a FTDI FT231X USB-UART converter in a TSSOP-20
package, a USB-to-serial interface. Circuitry follows the data sheet for a FT231X in Self
Powered Configuration. Another possibility would have been to forgo the external supply and
use the power supplied via USB from the computer but that would have necessitated more
stabilization circuitry.
The FT231X connects to the ATmega1284P via the serial input (RXD0) and output (TXD0)
pins as well as to the reset pin via capacitor C.
Scale Interface
In lieu of a dedicated flowmeter, a Mettler Toledo DeltaRange PG4002-S was used. The scale
provides a RS-232 serial interface through which the current weight on its load cell can be

27
exported. As the RS-232 protocol sends the strings of bits (0 or 1) by alternating between
logic 0: [3..15 V RS-232] and logic 1: [-15..-3 V RS-232] and the serial interface of the MCU
works with 0 and 5 V for logic 0 and 1 respectively, a converter chip was needed, provided in
the form of a STMicroelectronics ST232C with four external capacitors for the charge
pumps. On the PCB a 3-pole header is provided which is connected to a DB9 connector at the
back of the interface. The ST232 is connected to the second serial port (RX1/TX1 on the
MCU).
Sensor Interface
In order to measure the pressure at the membrane, a differential pressure sensor Omega
PX26-001DV was used. One port is connected to the water circuit, the other port is left open
to the atmospheric air pressure. The sensor outputs a differential volrFW between
MOUTSENS and POUTSENS proportional to the applied pressure (0: 0 V, 1 Psi: 16.7 mV)
for an input voltage of 10.0 volts. As the sensor is ratiometric, its output is also proportional
to the applied supply voltage; a fact that we could turn to our advantage by producing the
supply voltage from the ADC reference voltage. Any fluctuation of the full-scale reference
would thus be the same for the sensor and the ADC and cancel out.
The ADC of the ATmega1284p can either be supplied with an external analog reference
voltage, use the 5 V supply voltage or generate “Selectable 2.56V or 1.1V ADC Reference
Voltage”[1] via bandgap references. In the case that the internal references are used, they are
provided at the AREF- pin (analog Reference) of the MCU.
It was decided to use the 2.56 V reference from the MCU and multiply it by four to 10.24 V
using a STMicroelectronics LM324 Op-Amp (operational amplifier) in non-inverting voltage
amplifier configuration.
The LM324 is a quad Op-Amp (contains four individual op amps). IC2C is used for the
multiplicaton. The multiplication factor is set as 4 by two 0.1% tolerance precision resistors
R22 (10 kOhm) and R23 (30 kOhm). The amplification is calculated via the following
equation:
Amp=(R22+R23)/R22

28
The op-amp serves the purpose of having a high input impedance which prevents a voltage
drop of the source that may have become problematic.
The 10.24 Volt from the op-amp are then provided:
As supply voltage for the pressure sensor.
To the zero reference input for the instrumentation amplifier via a 10 kOhm precision
resistor and a 200 Ohm trimmer so the zero output can be adjusted from 0 to about
200 mV (200 Ω* 10.24 V/10200 Ω) via a second Op Amp in voltage follower
configuration. For digitalization of the signal with the ADC it is advantageous that the
zero point be set slightly above (the noise at) 0V.
The signal from the pressure amplifier is directly fed into the differential inputs of the
instrumentation amplifier (U3, Texas Instruments INA126), which is “basically” constructed
from two operational amplifiers and precision trimmed resistors that determine the voltage
gain with the external resistor RG following this relation:
G=5+(80 kΩ/RG)
In our case we use a 0.1% tolerance 680 Ohm resistor, resulting in an amplification factor of
122.647.
The maximum output voltage from the sensor at 1 psi is calculated as follows:
10.24 V*16.7 mV/10.0 V = 17.1008 mV
while the maximum output voltage after instrumentation amplifier INA126 is:
17.1mV*122.65=2097.3628 mV
The output voltage from the INA126 is fed into the ADC via a 4.7 kOhm resistor and a diode
from ground both of which serve to protect the ADC input. We are using the 2.56 V internal
reference of the microcontroller as the full scale comparison voltage for the ADC.
2.2 Software
A program running on the microcontroller serves to interface with the computer by outputting
the data via serial interface on the microcontroller, which is output to the computer via a USB
to serial interface. The program runs through its initialization routine where the interface to

29
the scale and to the computer are set up, the display is initialized, the analog reference voltage
for the ADC (2.56 V) is set up. Simultaneously, the timer function is started.
The user is then asked if he wants to calibrate the sensor with 2 water pressures (0 and 70 cm)
and if the scale should be tared to 0. Otherwise, the measuring mode is started and runs
forever in a loop.
In the measurement mode, the function runacqdisp is run at an interval of one second
(triggered by an interrupt). That function outputs a counter value, the weight from the scale,
the raw sensor data, and the calculated pressure (from raw data using the calibration values)
to the serial port and starts a function displaying the weight and the raw sensor data on the
display. After that, the function runmeasure is called which gets the measurements for the
next cycle. The current weight is polled off the scale and 256 measurements of the sensor
data are called every 2 ms. The calibration routine asks for the application of 0 pressure (no
water level above the sensor input) and for the application of 703 mm H2O (corresponding to
the full measurement scale of the sensor. These values are measured and stored to the
EEPROM (nonvolatile memory in the microcontroller).
2.3 Sensor Testing and Calibration
The sensor was tested and calibrated using a 1m high water column made of PVC tubing. A
buret was not used due to problems with air bubbles. Water levels of 10 cm difference were
recorded; the output can be found in Figure 12.

30
Figure 2-3: Sensor testing raw data output for different water levels. Bottom graph is a subset of top graph to show
data points.
As can be seen in the graph, there is no visible noise while pressure is being recorded, and the
pressure measurements can be taken over long periods of time without change (200 minutes
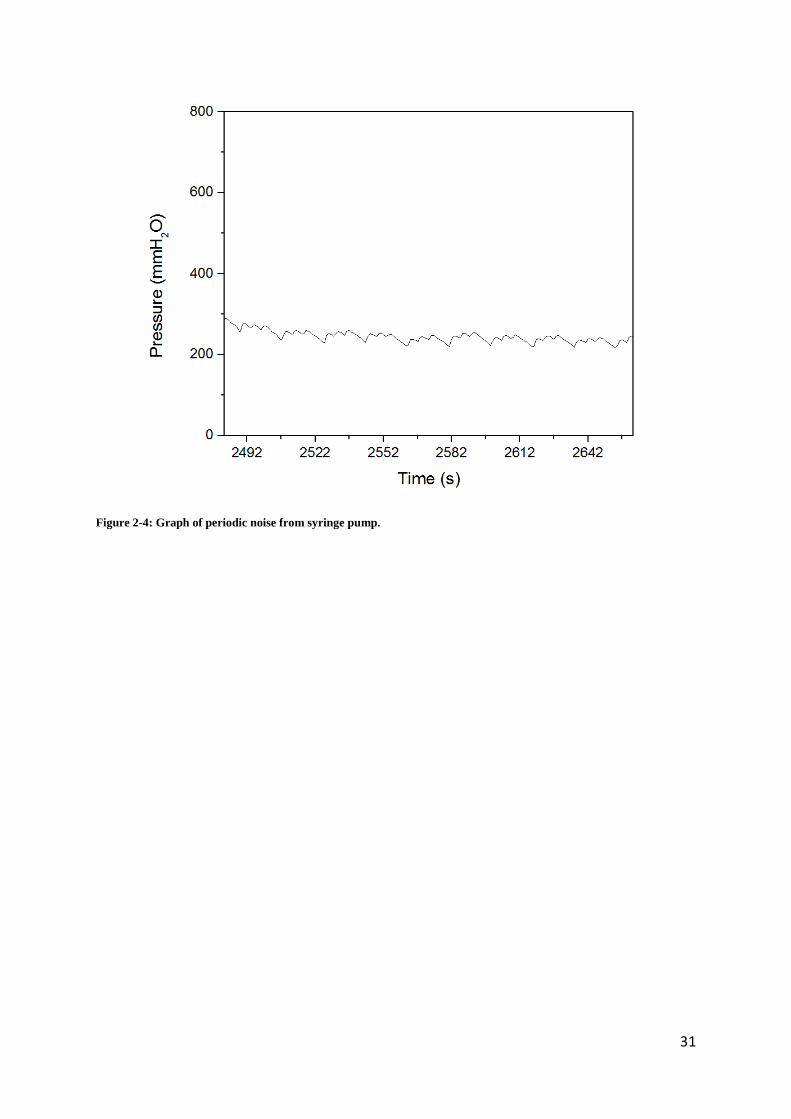
total for the graph shown). The major unavoidable source of noise was the syringe pump,
which contains a stepper motor that produces a periodic noise seen in Figure 13. While this
did produce a relatively large noise spectrum, it could be averaged out and did not
significantly increase the standard deviation of the results.
31
Figure 2-4: Graph of periodic noise from syringe pump.

32
References
1. Savariar, E. N.; Krishnamoorthy, K.; Thayumanavan, S., Molecular discrimination
inside polymer nanotubules. Nat Nanotechnol 2008, 3 (2), 112-117.
2. Gnecchi, J. A. G., Instrumentation for Measurement of Laboratory and In-Situ Soil
Hydraulic Conductivity Properties. Self 4 (7.0), 11.2.

33
Chapter 3: Membrane Formation and Layer-by-
Layer Polyelectrolyte Deposition
3.1 Introduction, Membrane Formation and Characterization
3.1.1 Introduction
The most studied layer-by-layer self-assemblies on surfaces have been through ionic
interactions between layers,1 and this seemed an ideal place to begin for layer-by-layer
deposition in nanopores. As mentioned earlier as well, the Bruening group utilized these
electrostatic interactions to perform layer-by-layer self-assembly in larger-pored aluminum
oxide membranes and were able to immobilize gold nanoparticles within the pores
successfully.2 The goal of this chapter was to successfully perform layer-by-layer deposition
in isoporous membranes, the formation of which (as described in the introduction) was
introduced by Peinemann et.al3 and further developed by Nunes et.al.
4 By doing so, it would
be possible to both control the pore size within the membrane and open up new possibilities
for additional functionalization within the membrane pores.
3.1.2 Isoporous Phase-Inversion Membrane Formation and Characterization
The membrane was formed by the phase inversion method using 1:1:1 DMF:THF:dioxane as
a solvent mixture using a commercially available block copolymer. These membranes consist
entirely of a single block copolymer, PS-b-P4VP of high molecular weight: PS(145 kDa)-b-
P4VP(50 kDa), Mw/Mn=1.07 (Figure 1).

34
Figure 3-1: Structure of the block copolymer, poly(styrene)-b-poly(4-vinylpyridine).
This high molecular weight is necessary for the fast phase separation that occurs in the
membrane and for the relatively (compared to typical block copolymer thin films) large pore
size. The polystyrene block composes the majority of the membrane, with the interior of the
pores, both in the ordered and disordered areas of the membrane, are coated with a P4VP
brush, the minor portion of the block copolymer. The top ~500 nm of the membrane are an
ordered PS-b-P4VP structure reminiscent of block copolymer self-assembled cylindrical thin
films, while the bottom portion of the membrane is a typical disordered phase-inversion
membrane, with a pore size much larger than the nanoporous top layer.
The ordered morphology (Figure 2) on the surface of the membrane is caused by the fast
evaporation of THF in a similar manner to block copolymer self-assembled cylindrical
morphology that has been demonstrated in thin films upon evaporation.5 During the “phase
inversion” process the more hydrophilic DMF remains in the P4VP block, allowing the
evaporation of the THF to form ordered cylinders while keeping the P4VP cylinder swollen
with solvent since DMF has a much higher boiling point. Membrane thickness was measured
by examining a cross-section by SEM. While the phase inversion membrane was formed
using a doctor blade with a gate height of 250 μm, once the solvent had evaporated the
membrane height had been reduced to 65 μm in size, as measured by SEM (Figure 2).

35
Figure 3-2: SEM images of surface and bottom (top left and right), cross section (middle) and wide top views
(bottom) of formed PS-b-P4VP membrane.

36
It was possible to see the pore morphology through cross-section images of the initial
membrane as well. From these images (Figure 3) it was determined that the pore was straight,
up to 750 nm in length, and possessed the same diameter as the surface pores (between 40
and 50 nm). As seen in the right image in Figure 3, a less-ordered portion of the surface
served to add cohesion to the structure and gave better pore cross-section images.
Figure 3-3: SEM cross-sections showing straight pores through the surface layer of the membrane.
Further examination of the membrane surface revealed that the edges of the as-formed
membrane contained a less ordered morphology than the central portion (Figure 4, top). Parts
of the formed membrane had defects as well (Figure 4, bottom), which could potentially
affect the final pore size distribution of the membrane. Because of these observations, a
sample of each membrane was examined by SEM prior to use.

37
Figure 3-4: SEM of defects observed in different portions of membranes. The top right image is a magnified view of
the darker regions of the top left image. The bottom images show defective portions near the edge of the membrane
area.
3.1.3 Pore polydispersity
As a beginning measure for characterization of the membrane, it was important to understand
the membrane structure and quantify the “isoporous” nature of the pores. If the pores would
then be slowly closed, then the dispersity of the pores would become increasingly important
as the smallest pores would be blocked completely before larger pores. A crude calculation of
the pore polydispersity could be obtained using Matlab, which is capable of image processing
(program found in Appendix B). A SEM picture containing a 2x2 µm area of the polymer
membrane surface was used for the calculation (Figure 5). The average pore size was found
to be 40.6 nm with a standard deviation of 6.72 nm and a PDI of 1.03.

38
Figure 3-5: Histogram showing pore size distribution (left), and image with pores outlined in red as processed by
MATLAB (right, 2x2 µm).
3.1.4 Flux calculation at low flow rates
Membrane flux is defined as the volume of liquid through a membrane divided by the time
and the area:
J =Q
S
where J is the filtrate flux (L/h*m2) where L is liters, h is hours, and m is meters, Q is the
filtrate flow (L/h), and S is the membrane surface area. When pressure is factored in, the
instantaneous specific flux is found by the equation:
JS =J
ΔP
Where Js is the instantaneous specific flux (L*h-1
*m-2
*bar-1
) and ΔP is the transmembrane
pressure (TMP, bar).6
In general, membrane flux calculations are carried out using commercial equipment at high
pressures (1 bar or more). However, due to the limitations of the sensor (a maximum pressure
of 1 psi (0.069 bar), all of the experiments and flux calculations were performed at a much
lower flow rate and pressure. It was verified that the pressure within the range of the sensor
was linear with the flow rate (Figure 6). With this knowledge, the pressure could be scaled

39
from one flow rate to another for easy comparison when the pressure exceeded the limitations
of the pressure sensor. The exception to this was at very low flow rates and very low
pressure, <0.01471 bar, where the pressure essentially leveled off. At higher pressures, the
flow rate maintained the proper ratio with pressure.
Solution viscosity is also a consideration when calculating membrane flux values. Because of
this, the pressure value was always taken after the layer deposition using buffer solutions
rather than during the addition of the polyelectrolyte, so that viscosity considerations may be
neglected.
Figure 3-6: Pressure vs. flow rate at different syringe pump settings. This allowed the flux to be compared despite
different flow rates during deposition (to maintain a pressure under 1 PSI).
There were some variations in flux values for the membranes as well (Table 1), which can be
attributed to the number of defects in the membrane surface, as was seen in Figure 4. In
addition, the membranes were made by hand with a doctor blade, while commercial
membranes are made using belt-driven membrane forming machines. The measured
membrane flux was close to flux measurements published by the Stamm group using a
commercial membrane setup, which reported 600 Lm-2
h-1
bar-1
.7

40
Table 3-1: Initial pressure and flow rate of membranes.
Flux (Lm-2
h-1
bar-1
) Std. Dev.
Membrane A 547.12 0.593
Membrane B 601.44 0.732
Membrane C 439.99 0.440
Membrane D 792.60 0.565
Membrane E 501.86 0.816
Membrane F 370.02 0.491
Membrane G 415.09 0.393
Some experiments were attempted before the pressure sensor was completed at a much
higher flow rate as well. In these cases, the higher deposition rate seemed to either promote
membrane fouling, to form layers that were so thick that the membrane fouled after only a
few layers, or both. It seemed after these initial experiments that the low flow rate was
necessary for the controlled deposition of polyelectrolyte multilayers.
3.1.5 Flux decrease with 50% methanol/water mixture
Because of the study by Cho et.al concerning layer-by-layer assembly with poly(acrylic acid)
and P4VP where the layers were deposited in 1:1 methanol:water,8 a 50% methanol solution
was tested in the membrane. Unfortunately, due to the solubility of the P4VP chains in
methanol and the insolubility in water, the 50% methanol environment caused the chains to
swell and closed the pore substantially, causing the pressure to increase dramatically, the
corresponding flux decreasing from 507 to 30 L/h*m2*bar. It was for this reason that
methanol was not considered as an option for the deposition of layers within the pores.

41
3.1.6 Flux increase after rinsing with 50% methanol water solution
Fortuitously, after rinsing with methanol and removal of the methanol by flushing with water
for 24 hours, the flux through the membrane was noticeably increased, as observed by a
decrease in the pressure at a constant flow rate. This could be understood as a rearrangement
and collapse of the P4VP chains, which was not possible in water, in which P4VP is
insoluble. The methanol could partially solubilize the P4VP chains and as the methanol was
removed by rinsing with water, the chains would be forced into a collapsed state along the
pore wall. This made an ideal base layer for multilayer deposition, as will be discussed at a
later point.
Solution Flux (Lm-2
h-1
bar-1
) Std. Dev.
Buffer pH 7.4 506.86 0.4533
50/50 MeOH/H2O 30.426 0.6121
Buffer pH 7.4 1584.5 0.9061
Table 3-2: Pressure difference before, during, and after a solution of 50% methanol water.
3.1.7 Flux rate with different pH buffer solutions
To test the effect of pH on pore size and flux, a few different buffer solutions were tested
(Table 3). At the low flow rates used in this set of experiments, and in contrast to the pH
responsive behavior reported by Nunes,4 the pressure at a constant flow rate did not increase
until the pH was dropped to 4, and even then the pressure did not rise dramatically. One
explanation would be that with the low force exerted on the membrane (because of the low
flow rate and low pressure), the hydrophobic P4VP surface screened the interior pyridine
moieties from the acidic solution, and thus only the P4VP at the surface layer was protonated,
causing the pore to close only slightly. As the pressure sensor was limited to approximately

42
70 mbar, and the pH responsiveness of the membrane has been demonstrated before, this was
not explored further.
Table 3-3: Pressure testing with different pH buffer solutions, at a flow rate of 4.6x10⁻⁴.
Solution Pressure
(bar)
Std. Dev. Flux
(Lm-2
h-1
bar-1
)
Millipore water 0.0348 0.00130 473
0.1M buffer solution, pH 7.4 0.0325 0.00126 507
0.1M buffer solution, pH 5 0.0328 0.00177 502
0.1M buffer solution, pH 4 0.0357 0.00130 461
Millipore water (after buffer solutions) 0.0287 0.00131 572
3.1.8 Crosslinking results
In an effort to potentially stabilize and charge the P4VP layer, the membrane was crosslinked
using diiodopropane vapors. After three days of exposure to vapors, the membrane could no
longer be dissolved in dichloromethane, indicating successful crosslinking. However, upon
examination with SEM it was seen clearly that the pores had reacted in a similar manner to
the application of low pH aqueous solution and the pores had closed as the 4-vinylpyridine
became positively charged (Figure 7). Some of the pores had become smaller, while many
appeared to have been eliminated entirely. The Stamm group had functionalized the P4VP
portion of PS-b-P4VP membranes by crosslinking with diiodobutane vapors in previous
reports;7 but it is likely that the degree of protonation was lower, and as a decrease in flux
was reported as well it was decided not to pursue this method of functionalization.

43
Figure 3-7: SEM image of the membrane surface after crosslinking with diiodopropane vapor.
3.2 Base Layer Deposition: Poly(Acrylic Acid) and Introduction to Pore
Characterization through Pressure Measurements
3.2.1 Poly(acrylic acid) as a base layer for pore functionalization – interactions between
PAA and P4VP
Because of the limited options for functionalization of P4VP, and the pore-closing effects of
lowering the pH, poly(acrylic acid) was chosen as a base layer for attachment. Poly(acrylic
acid) has the advantage of being able to both hydrogen bond with the P4VP layer and to
present deprotonated and negatively charged carboxylate groups for further ionic deposition
at the interior of the pore surface (Figure 8).

44
Figure 3-8: Depiction of poly(acrylic acid) layer adhesion to P4VP layer inside the pore wall. Counterions are
omitted.
It was critical to understand the interaction between poly(acrylic acid) and P4VP as this base
layer would be the “glue” for the entire assembly above it. While interactions between P4VP
and PAA have been studied before in neutral micelle solutions,9 and indeed used for
polyelectrolyte multilayers from methanol solutions in much larger nanopores,10
it was
critical to have some understanding of the interactions between the two polymers before
attempting to use PAA inside of the membrane pores. Infrared spectroscopy was used to gain
an understanding of the ionization of the poly(acrylic acid) and the way that it interacts in a
neutral aqueous solution. IR spectra were carried out on solid polymer samples, after freeze-
drying in the case of mixing experiments. It was also important to note that the poly(acrylic
acid) used was in its protonated form (not the sodium salt) as received from Sigma-Aldrich.
This is important because in some studies which look at the ionization titrations of PAA, the
anionic poly(acrylic acid) is nearly fully deprotonated at pH 7 and would therefore be
unlikely to hydrogen bond.8 In an alternate study which looked at the ionization of films of
PAA cast from different pH solutions, this number was closer to 60% ionization at pH 7.11
It
was clear from looking at the interaction in solution between poly(acrylic acid) and low
molecular weight P4VP that there is at least some hydrogen bonding present, as the P4VP is
partially solubilized by the poly(acrylic acid), an interaction that takes place neither with
PEI·HCl or PSS, the positively and negatively charged electrolytes used in this chapter

45
(Figure 9). The P4VP, which is insoluble in water, remains unchanged in solutions of pure
water, PSS, and PEI·HCl, while P4VP combined with an aqueous PAA solution in pH 7.4
buffer becomes cloudy.
Figure 3-9: Solutions of polymer mixtures, from left to right: P4VP in water; PAA in water; PAA and P4VP in water;
P4VP and PSS in water; P4VP and PEI·HCl in water. Each solution sat with water-insoluble P4VP (visible in far-left
vial) for 1 week.
This solubilization can be seen by looking at infrared spectra of P4VP, PAA and both PAA
adsorbed onto P4VP and a freeze-dried mixture of P4VP+PAA from pH 7.4 buffer solution
(Figure 10). In the mixture of PAA and P4VP, the PAA concentration is much higher as the
P4VP is only partially solubilized. However, the peak at 1710-1730 cm-1
, which represents
the protonated carboxylic acid group, is visible, despite the much larger deprotonated acid
group at 1590 cm-1
. The amount of PAA vs. P4VP can be seen in the peaks around 2938 cm-1
for PAA which represents the –OH stretching frequency12
– the P4VP peaks have nearly
disappeared, while being overwhelmed by the PAA peak. When PAA is adsorbed onto a solid
piece of P4VP and then washed thoroughly with water, the P4VP peaks are much clearer as it
is the overwhelming majority of the material. However, the interesting feature of this IR
spectrum is the visibility of the peak at 1700 cm-1
. This peak indicates either that the pyridine
nitrogen has been protonated, which is unlikely at pH 7.4, or that the adhered poly(acrylic
acid) is nearly all protonated, as the peak at 1590 cm-1
for deprotonated PAA is not visible.
Therefore, it is clear that the conditions at the surface are much different than conditions in

46
solution. This is supported by a study which looked at the propensity for P4VP to be
protonated when in the presence of a strong anion. The study concluded that, while it is
possible to induce ionic interactions with a strong anion, the interaction between poly(acrylic
acid) and P4VP is predominantly one of hydrogen bonding.13
Overall, in a pH 7.4 solution,
the majority of both P4VP and PAA chains are deprotonated, but when a layer of PAA is
adhered to the surface of P4VP there is an increase in the number of protonated chains,
allowing the layer deposition to take place.
Figure 3-10: IR spectra of solid poly(acrylic acid), solid poly(4-vinylpyridine), poly(acrylic acid) adsorbed onto a solid
piece of P4VP, and a mixture of PAA and P4VP freeze-dried from pH 7.4 buffer solution. Relevant IR peaks:
protonated PAA carbonyl at 1700 cm-1, deprotonated PAA at 1590 cm-1, protonated pyridine nitrogen at1700 cm-1,
deprotonated pyridine nitrogen at 1610 cm-1, PAA –OH group at2930 cm-1.

47
3.2.2 Poly(acrylic acid) Deposition and Pore Characterization through Pressure
Measurements
Deposition of the PAA layer at low flow rates showed little increase in pressure. This was
expected, as pore diameter vs. area does not change in a linear fashion because the pore is
circular, as the basic graph of pore size vs pressure (assuming a constant flow rate) in Figure
11 shows. This can be modeled through the Hagen-Poiseuille equation, which is used in fluid
dynamics to describe a fluid as it passes through a cylindrical pipe:
𝐽 =𝜋∆𝑃𝑟𝑝
4𝜏𝑛𝑝
8𝜂∆𝑥
where J is the solvent flux (not the specific flux, which involves pressure, but the filtrate flux
involving flow rate and surface area), ΔP is the pressure rp is the pore radius,τ is the tortuosity
factor, Δx is the membrane thickness, and η is the viscosity of the solution.14
It has been
noted in the literature that very few membranes follow this equation closely due to their
structure.15
However, using it as a basic model for the expected increase in pressure, and
assuming that all of the other factors are a constant k, we can plot
∆𝑃 = 𝑘 ∗1
𝑟𝑝4
to get a general idea of what the pressure data should look like as a pore closes. As is seen in
Figure 11, we would expect to see a very slow increase in pressure up to a point, and then a
rapid increase as the pore becomes progressively narrow.
Unfortunately, this also becomes problematic when attempting to reach very small pore sizes.
Using the average pore size of 40.6 nm as a starting number, it is possible to roughly
determine pore size using flux data calculated from the pressure data. Rearranging the Hagen-
Poiseuille equation once more and making the factors that are constant into a constant k,
where dp is the diameter of the pore:
𝐽
∆𝑃= 𝑘 ∗ 𝑑𝑝
4

48
so that when comparing two pore sizes, this rearranges again to the equation:
𝑑𝑝1 = (𝐽2 ∗ 𝑑𝑝1
4 ∗ ∆𝑃1
∆𝑃2 ∗ 𝐽1)1 4⁄
and from this it is possible to gain a rough determination of the final pore size. Since J/ΔP is
the definition of the specific flux, this is basically comparing the two specific flux
measurements to get a pore size estimate. This is a rough estimate because the tortuosity of
the pore most likely changes during layer deposition, the surface properties of the pore differ
due to more or less hydrophilic polymers on the surface, and the fact that as the pores
becomes more and more closed the smallest of the pores in the distribution found in Figure 5
may be blocked entirely. A disclaimer must be made here, that since neither the flow rate or
the pressure is held constant for the entire experiment, and just the ratios compared, that it
would be extremely difficult to determine additional information from the calculations here,
for example to examine the other parameters of the Hagen-Poiseuille equation.
Another limitation arises due to the same situation portrayed in Figure 11: as the pressure
increases according to a power function; while the pore size approaches zero, the lowest
possible pore size that can be measured with the sensor limitation of 1 psi and the slowest
setting on the syringe pump would be 10.5 nm. With a pressure sensor able to read 10 psi, the
pore size limitation would be 5.9 nm and with 100 psi 3.3 nm. A 1 nm pore size could nearly
be measured with a 1000 psi sensor. This could also be worked around to a small extent by
using a larger membrane surface area. Overall, this provides an explanation for why
commercial systems work on much larger pressure scales with larger membranes; however,
such a sensor which operated at 1000 psi would not be as sensitive.

49
Figure 3-11: Graph of y=1/x4 as pore size approaches zero.
The layer deposition did increase the pressure though, and then leveled off as the P4VP
groups on the pore surface became saturated with hydrogen-bound PAA chains (Figure 12).
There was no evidence of membrane fouling, which would be seen by a constant increase in
pressure.

50
Figure 3-12: Pressure increase with time as 0.01 M WRT monomer 5k poly(acrylic acid) is added to the pore in
millipore water (around pH 6).
However, the hydrogen bonding capability of the poly(acrylic acid) could be enhanced by
depositing the layer at pH 5. This led to a somewhat thicker layer, as seen by a pressure
increase from 0.01036 to 0.04578 bar (a 442% increase), compared to the increase at pH 7.4,
from 0.02611 to 0.03672 bar (a 141% increase). This demonstrates that the thickness of the
initial PAA layer is at least partially tunable by the pH of deposition. A possible reason for
this film thickness difference is this: the poly(acrylic acid) at pH 5 is much more protonated
(approximately 50% as opposed to the minimal protonation at pH 7) and therefore interacts
much more with the P4VP, partially solubilizing it and forming a thicker layer of P4VP-PAA
complex in the center of the pore. When a smaller percentage of PAA units are protonated,
the polymer will adhere to the pore wall but not solubilize the P4VP as much, acting more
like a polyelectrolyte layer in the typical “layer by layer” study.
One effect of this first layer of poly(acrylic acid) was that the pores were more visible
compared to the bare membrane under a cross-section by SEM (Figure 13). It is possible that
even this initial layer had a stabilizing effect on the interior of the pores. The pores at this

51
point were more clearly characterizable, with a depth of at least 500 nm and a diameter that
matched the pore size on the surface, approximately 45 nm.
Figure 3-13: Profile views (different views of the same membrane) of membrane pores following one layer of 5k PAA.
3.3 Layer-by-Layer Deposition of a Weak and a Strong Polyelectrolyte inside the
Nanopores
3.3.1 Electrostatic layer-by-layer assembly in nanopores: PSS/ PEI·HCl
Poly(styrene sulfonate) and protonated poly(ethylene imine) were chosen for layer-by-layer
assembly on top of the poly(acrylic acid) layer because low molecular weight samples of
each polymer were commercially available (as opposed to poly(allylamine hydrochloride) for
example), and because the layer-by-layer self-assembly of these two polymers has been
studied in detail on surfaces using a variety of techniques.16
A low molecular weight was
chosen to avoid the risk of the polymer spanning the pore as the layer-by-layer assembly

52
decreases the pore size. This was evidenced by the fast fouling of the membrane with an
attempt to use poly(styrene sulfonate) with a molecular weight of 75kDa during initial tests
(Figure 14). In addition, polyelectolyte degree of polymerization has been shown not to
affect multilayer deposition, rather, differing amounts of salt in the solution will affect the
layer thickness.17
Figure 3-14: Fouling of the membrane after using high molecular weight poly(styrene sulfonate) as a second layer
above 5kPAA.
3.3.2 Surface layer-by-layer assembly study on a silicon wafer
As a first test for the layer-by-layer self-assembly, the experiment was performed on a silicon
wafer that had been spin-coated with P4VP. The experiment was tried first with low
molecular weight P4VP, but it was found that the PAA solution solubilized the P4VP enough
to mostly remove the film. Therefore, high molecular weight P4VP was used as a base layer.
The wafers were coated with PAA, and then successive layers of PSS and PEI·HCl in a pH
7.4 buffer solution (Figure 15). It was clear after 15 layer pairs of deposition that a multilayer
was forming, and that it possessed the same anti-reflective quality found in other multilayer
films.8 It was also observed that before drying the multilayer films possessed an iridescent

53
quality that was removed upon drying, suggesting that the films are swollen with water and
the film is thinned upon removal of the water.
Figure 3-15: Multilayers without (top) and with (bottom) a light source. From left to right, P4VP film, P4VP-PAA,
P4VP-PAA-PEI, P4VP-PAA-PEI-PSS, P4VP,PAA-(PEI-PSS)2.5, PAA-(PEI-PSS)4, PAA-(PEI-PSS)6.5, PAA-(PEI-
PSS)9,PAA-(PEI-PSS)15.
3.3.3 Deposition of Initial Layers – Differences in Preparation
When experimenting with differences between deposition at different pH levels or
with/without collapsing the P4VP chains with methanol, the first layers were the most
dramatically affected by these changes. When all of the layers were deposited in pH 7.4
buffer or water, the PEI·HCl layer caused the pressure to decrease rather than increase – the
only layer that behaved in this manner. This is possibly attributed to a collapse of the mostly-
ionized poly(acrylic acid) against the pore wall when combined with the PEI·HCl layer –
going from a loosely bound brush inside of the pore to a more defined layer. In comparison,
when the PAA layer was deposited at pH 5 and the PEI·HCl layer at pH 6, the pressure
increased dramatically upon addition of the PEI·HCl layer. As was mentioned previously, the
solublization of the P4VP chains by the more protonated PAA made a thicker base layer,
which allowed for considerably more PEI·HCl to be deposited in the pore. The results of
these initial layer depositions can be seen in Table 4. In all cases the pressure increased as
expected with the first PSS layer deposited.
As a note here, it is important to mention that each layer deposition is carried out until the
pressure levels off – ideally this means that the pore is coated to its fullest extent. At the very
least, it means that the pore coating process has ceased the changing of the pore size and has
reached some sort of equilibrium.

54
Table 3-4: Pressure differences before, during, and after rinse with 50/50 methanol/water mixture.
Initial
Pressure (bar)
After PAA
layer (bar)
After PEI
layer 1 (bar)
After PSS
layer 1 (bar)
Membrane A: Deposited with
no methanol
0.0261 0.0367 0.0212 0.0275
Membrane B: Methanol rinse,
all layers in pH 7.4 buffer
0.0167 0.0189 0.0171 0.0195
Membrane C: Methanol rinse,
pH 5 for PAA, pH 6 for
PEI·HCl, pH 7.4 for PSS
0.0104 0.0313 0.1041 0.0473
3.3.4 Layer by Layer Deposition – Pressure Data and Analysis
Subsequent layer-by-layer deposition of polyelectrolyte pairs showed substantial differences
depending on conditions. For example, membrane A, which had layers deposited in Millipore
water without first collapsing the P4VP chains, showed very unusual behavior upon
successive layer deposition. With every successive PSS layer, the pressure would increase,
followed by the PEI·HCl layer, which decreased the pressure (Figure 16). This was attributed
to the remaining P4VP chains in the central portion of the pore, coated with anionic PAA,
which caused a nonlinear layer deposition. The pressure increase in the layers exceeded the
capacity of the sensor, and so the flow rate was changed and then the resulting pressure data
scaled for comparison. The flux data, or the ratio between flow rate and pressure (with no
scaling involved) is therefore also included for an additional comparison.

55
Figure 3-16: Pressure increase (left) and corresponding flux/pore size decrease with layer increase for an as-formed
membrane, all layers deposited in Millipore water. Note the zig-zag pattern of pressure increase with PSS followed by
pressure decrease with PEI.
Upon examination of the SEM images of the membranes (Figure 17), the pores did appear
smaller on both the surface and cross-section, but the pressure data was difficult to interpret
with the nonlinear pattern of pore decrease. After reviewing these data, it was concluded that
the methanol rinse before layer deposition was necessary for the formation of clear
polyelectrolyte multilayers. It was at this point that the water was changed for pH 7.4 buffer
to ensure that it was not the acidity of the poly(acrylic acid) that was closing the pore and that
it was indeed the interaction between PAA and P4VP.

56
Figure 3-17: Cross section (left) and top-view of the membrane following the deposition shown in Figure 16.
At this point, the plan for layer-by-layer deposition was clear – with the low molecular
weight PSS and protonated PEI using a base layer of PAA (Scheme 1), the assembly would
be studied at different pH levels and characterized using pressure and SEM data.

57
Scheme 1: Overall plan for layer-by-layer deposition of polyelectrolytes in PS-b-P4VP membrane pores.
Layers were again deposited, in a buffer solution pH 7.4 for membrane B, but this time with
the initial methanol rinse. Although the pressure increased much faster, nearly 0.16 bar with 9

58
layers for membrane B vs. 0.06 bar with 12 layers for membrane A, the pressure increased
(Figure 18) in a manner similar to the predicted pore-closing model using the simplified
Hagen-Poiseuille equation. Since the other factors are unknown and most likely
unpredictable, as attempts from the Abetz group to measure pore diameters from flux in PS-
P4VP membranes have shown,18
it is not possible to derive the pore diameter from a single
pressure measurement accurately. This is most likely due to a reasonable number of dead-end
pores, combined with some amount of hydrophobic P4VP polymer present in the middle of
the pore rather than around the edge. However, using the Hagen-Poiseuille equation
presented earlier a pore size estimate was made from the flux data. The estimation of pore
size based on an assumed initial pore diameter of 40.6 nm is given in Figure 18. From this
graph, it appears that for the initial layer deposition the pore size changes very little, followed
by a steady decrease in pore size; the rate will be discussed in a subsequent section.
Figure 3-18: Deposition in 0.1M pH 7.4 phosphate buffer solution.

59
Looking at the membrane by SEM (Figure 19) confirmed the pressure data. The pores are
clearly significantly smaller, both on the surface and the cross-section images. Moreover, the
layers appear to have significantly stabilized the pores, as large sections of the pores are now
visible. While there is some uneven deposition within the pores, the pore size has been
reduced to 17-22 nm, compared to the initial 37-47 nm.
Another factor which must be considered here is the permeability of polyelectrolyte
multilayers to water. Polyelectrolytes have been used to build up surface layers on porous
membranes and are still permeable to water.19
Indeed, studies of polyelectrolyte multilayer
hydration have showed water contents of 78% for polyelectrolyte multilayer capsules, while
other studies have found hydration levels between 20 and 40 percent.20
So while the pore
appears to be 17-22 nm by SEM, after drying, it is almost certain that within the pore is a gel-
like network rather than a solid polymer. If this is indeed the case, then the term “pore
reduction” can only be applied after drying in the traditional sense of adding solid layers to a
pore wall. An unknown that is presented here is the amount of water that may be going
through the polyelectrolyte layers as opposed to the pore, and to what extent.

60
Figure 3-19: Cross-section (left) and top-view (right) of the final product of deposition in pH 7.4 buffer solution, as
shown in Figure 18.
A visual inspection of both the layered (Figure 20 bottom) and the beginning structure
(Figure 20 top) serves further to illustrate the large difference between the starting pore size
and the final pore size.

61
Figure 3-20: Direct comparison of cross sections (right) and top views (left). The top pair of images is from the initial
membrane, and the bottom pair of images is from the membrane after layer-by-layer deposition at pH 7.4.
An additional membrane was made later at these (pH 7.4) conditions to test what would
happen if many layers were added at these conditions. Interestingly, after a point that
corresponded to (approximately) the 10th
or 11th
layer, the pressure began to fluctuate with
each layer in a “zig-zag” fashion that could not be explained until afterwards, when observing
the SEM image of the final membrane (Figure 23). At this point it was clearly visible that the
layers had started to be deposited on the surface at some point. This zig-zag pattern can
potentially be explained by the observations of Schwarz and Schoenhoff, who noted an odd-
even effect in poly(allylamine hydrochloride)/PSS multilayers (Figure 21) due to differing
amounts of hydration in the layers after each deposition step.21
However, the conclusion of
this study was that water immobilization was increased during polycation deposition, and
decreased during polyanion deposition. In the case of the membrane shown in Figure 22,
flux decreased after each polyanion layer deposition and increased after each polycation

62
deposition. It appears in this case that there is at least some potential correlation between
water immobilization and flux through a polyelectrolyte multilayer on top of a membrane.
Figure 3-21: From Ref. 21, increase and decrease in relaxation rate of water during deposition of PAH/PSS
multilayers, corresponding to differing amounts of hydration after layer deposition.
In any case, it is presumed that it is this point at layer 10-11 at which the membrane begins
the polyelectrolyte surface layer buildup, first because the 9-layer membrane preceding it
showed no sign of different behavior, and second because of the unusual odd-even behavior
of the membrane. It is also notable that the layer thickness of the deposited multilayers on
top of the membrane after this point is incredibly thick – the entire multilayer thickness on
top of the membrane is at least 10 microns. Also interesting is the fact that, although 10
microns of multilayers were building up on the top of the membrane, the flux did not
decrease faster than it did during the pore-filling segment, in fact, the rate of flux decrease
slowed at this point. It appears from this that the pore-filling vertical multilayers decrease
flux more than the altogether thicker but unconfined horizontal multilayers. This also has a
potential explanation – in multilayers deposited into 800 nm pores of track-etched

63
membranes by the Cohen group, the degree of swelling in confined spaces is lower than that
of free polyelectrolyte multilayers.22
If the layer is less swollen, then the water flow through
the space could be more restricted.
Supporting the idea of a gel-like filled pore, as was originally described by the Jonas group,23
is the SEM image of the pores beneath the 10 microns of polyelectrolyte multilayers (Figure
23). These pores, although also considerably reduced from the initial pore size, still do not
appear completely closed. This would suggest that there is some reduction of the
polyelectrolyte multilayers during the drying process.
Figure 3-22: Deposition of a large number of PSS/PEI·HCl layers at pH 7.4.

64
Figure 3-23: Surface multilayer buildup after deposition of 25 multilayers.
3.3.5 Deposition at varied pH – More Highly Charged Polyelectrolytes
As an additional test, and because in general multilayers are constructed using solutions at a
range of pH values, the layers were deposited using the pH previously reported for PSS-PEI
multilayer films.16a
Each PSS layer was deposited at pH 7.4, and each PEI·HCl layer was
deposited at pH 6, while the base PAA layer was deposited at pH 5. At these pH levels, the
polyelectrolytes are more ionized. The effects were dramatic – the layer thickness for PAA
and PEI·HCl were increased significantly. As is seen in the pressure graph (Figure 24), after
the initial three layers (which were discussed previously), the pressure went up nearly three
times higher than the layers deposited at pH 7.4.

65
Figure 3-24: Layer-by-layer deposition with more charged polyelectrolytes – PAA at pH 5, PEI at pH 6, and PSS at
pH 7.4.
It seemed at this point that it was feasible to have some control over layer deposition
thickness within the pore simply by tuning the pH values of the weak polyelectrolyte in a
weak-strong polyelectrolyte layer-by-layer setup. However, as in the deposition at pH 7.4,
small variations in the conditions caused large variations in the layer thickness. Figure 25
shows three additional depositions, where it was discovered that a variation as small as
rinsing the membrane with a different pH solution before layer deposition caused a
significant difference in the layer thickness. In addition, when a new solution was made of
PEI·HCl between two sets of membrane depositions, the slope of the decrease in layer
thickness changed considerably. So, as is seen for polyelectrolyte multilayers on surfaces,24
a
large number of very small changes can contribute to the layer thickness within the nanopore.

66
The results of thicker layers from more charged PEI is surprising, because the opposite has
been shown to be true on traditional flat-surface polyelectrolyte multilayers. In a study of the
degree of ionization in weak-strong pairs of polyelectrolyte layers, the more charged
polyelectrolyte pair was the thinner rather than the thicker one.11
Figure 3-25: Three additional membrane polyelectrolyte deposition sets (top, middle, bottom), PAA deposited at pH
5, PEI·HCl at pH 6, and PSS at pH 7.4. The bottom membrane had one additional PEI·HCl layer deposited which
was not able to be monitored using the pressure sensor.
Although the membrane showed in Figure 24 was not observed by SEM, as it was then used
to test multilayer deposition reversibility, the membranes shown in Figure 24 were all
examined by SEM. As in the case of many multilayers, the beginning of multilayer buildup
on the surface of the membrane begins after just 1.5 PEI/PSS multilayer pair (Figure 26). The
point of surface deposition for more charged polyelectrolytes in this case is clearly between 1
and 1.5 multilayer pairs.

67
Figure 3-26: Polyelectrolyte buildup on surface of membranes after 0.5 (left, no surface buildup), 1 (middle) and 1.5
(right) layer-pairs deposited at pH 7.4 for PSS and pH 6 for PEI·HCl.
3.4 Layer by layer Deposition: Weak-Weak and Strong-Strong Polyelectrolytes
3.4.1 Layer by Layer Deposition of Two Strong Polyelectrolytes: PSS and qPEI
At this point, a strong and weak polyelectrolyte combination had been tested at different pH
levels, and it was of interest to see how the deposition would work with a combination of two
strong polyelectrolytes. PEI was quaternized using methyl iodide to create a strong
polyelectrolyte and then deposited using the same procedure as the PSS/PEI HCl multilayers.
Assuming that the higher charge of the PEI was responsible for the thicker layer, the
quaternized PEI should represent maximum charge and give the thickest possible layer. The
layers deposited in these membranes were extremely thick, and despite the pressure
decreasing steadily across five layers (Figure 27), showed layer buildup on the top of the
membrane upon examination with SEM (Figure 28). Unusually, though the pressure buildup
seems to be faster with the weak polyelectrolyte PEI at pH 6. Clearly, in this case, charge is
not the only factor involved in layer thickness; it is likely that factors such as hydrophilicity
also play a role.

68
Figure 3-27: Pressure, pore size, and flux data for deposition of two strong polyelectrolytes, qPEI and PSS.
Figure 3-28: Cross section view of polyelectrolyte multilayer buildup on the qPEI/PSS membrane depicted through
pressure data in Figure 27.

69
3.4.2 Layer by Layer Deposition of Two Weak Polyelectrolytes: PAA and PEI·HCl
Two weak polyelectrolytes were then deposited at pH values at which they are reasonably
charged, PAA at pH 7.4 and PEI·HCl at pH 6. Unsurprisingly, following past observations,
the layer thickness was extremely high (Figure 29) and multilayer buildup was shown on the
surface with SEM after only three layers being deposited (Figure 30). More interesting was
that this membrane was the first to show obvious asymmetry where it came to layer
deposition thickness, with the PAA layers being thinner and the PEI·HCl layer being
extremely thick. This may be partially explained by the hydrophilicity of PAA increasing the
water flux through the pores, but without more data it is impossible to draw any conclusions.
Figure 3-29: Deposition of two weak polyelectrolytes; PAA and PEI·HCl, in the membrane pores.

70
Figure 3-30: Picture showing polyelectrolyte multilayer buildup on top and pore cross-section after deposition of
PAA/ PEI·HCl, pressure data found in Figure 29.
3.5 Multilayer Testing and Characterization
3.5.1 Effect of methanol and pH after deposition
The effect of a mixture of methanol and water on the initial membrane was profound – the
P4VP within the membrane swelled to the point that the pressure increased dramatically,
nearly closing the pore. It was therefore of interest to test the effect of methanol post-
deposition of the multilayers. What was observed was that the pressure did increase with the
methanol/water mixture, but not nearly as dramatically as with the initial membrane. (Figure
31) More interestingly, the water flux increased after this rinse with methanol/water,
suggesting a potential method for collapsing the multilayers without drying the membrane,
which might cause defects in the structure. Further layers could be added after this methanol
treatment, although since the pore was at maximum loading already it reached the limit of the
pressure sensor capabilities quickly.

71
Figure 3-31: Membrane flux before, during, and after 50/50 MeOH/H2O rinse with layers in the pore.
3.5.2 Deposition rates
As the layer deposition was being monitored in real time, another interesting aspect that
could be explored was the rate of deposition of the layers. The flow rate was known for each
setting of the syringe pump, so by calculating the amount of solution that had passed through
the membrane the deposition rates of layers could be compared. The deposition rate was
determined by looking at the pressure data and taking the beginning and end points of
pressure increase (Figure 32). This gives a view into layer by layer deposition that is unique
to membranes – in order to monitor layer-by-layer deposition rates on surfaces a technique
such as neutron scattering or ellipsometry is required. By using pressure as a sensor, a truly
different glimpse into the deposition of polyelectrolyte multilayers in the nanopore is gained.

72
Figure 3-32: Example of a layer deposition for determination of rates. The amount of time between point A,
beginning of pressure increase and point B, end of pressure decrease, is used with flow rate to determine the amount
of solution used to deposit each layer.
The comparison of the deposition rates between PSS and PEI·HCl at pH 7.4 and the
deposition rates between PSS and PEI·HCl at pH 6 for PEI·HCl showed interesting trends
(Figure 33).
Figure 3-33: Comparison of polyelectrolyte deposition rates between deposition at different pH (left) and deposition
at pH 7.4 (right).

73
The first and most obvious difference is the difference in the deposition rates of poly(acrylic
acid), which takes nearly twice the amount of volume to reach an endpoint at pH 7.4. This
makes sense, as the minimal amount of protonated PAA units present at pH 7.4 would make
the deposition much slower. The layer PSS1, which is where the pressure drops due to a
potential collapse in the layers, appears to be finished much faster than the other layers,
although that may be because the pressure is dropping rather than increasing as well. Most
interesting, though, is that with more highly charged polyelectrolytes the deposition rates of
both cationic and anionic polyelectrolytes appear to slow down with each sequential layer.
With the less charged PEI·HCl solution, however, only the deposition rate of PEI·HCl slows
down whereas the PSS remains approximately the same. It is possible that this relates to the
decrease in charge as layer-by-layer deposition proceeds, which is observed in nanopores by
the Azzaroni group. With more charged polyelectrolytes, the decrease in charge affects the
next layer substantially. However, with fewer charges on PEI·HCl, there could potentially be
less of an effect on the following PSS layer – leading to a constant deposition rate of PSS
without regard to the layer. However, without current-potential experiments that would give
some insight into the pore charge, this is impossible to verify.
3.5.3 Reversibility of deposition
Since the layers are held together by ionic interactions (and hydrogen bonding at the base),
they were presumably able to be reversed by application of a strong base. With the extremely
high pressure, though, it was uncertain whether or not this would be possible, and so a
solution of NaOH at pH 12 was applied to a membrane in which thick layers had been
deposited, most likely having some buildup on the surface as well. However, after a
considerable amount of time, slowly increasing the flow rate as the pressure dropped, the
pressure dropped from 0.36 bar to 0.049 bar, only about twice its initial pressure, a
considerable drop. When examining the SEM images (Figure 34), there appeared to be some
deposits on the surface of the membrane, either from NaOH salts or from polyelectrolyte-salt
buildup. Looking at the cross-section view, it was clear that the pores were once again open

74
and that this buildup was the likely cause of the small increase in pressure. Significant as
well is the amount of layers that were initially deposited – five layers deposited at more
highly charged pH means almost certainly that there was a considerable amount of
polyelectrolyte layer buildup on the surface of the membrane, which did not hinder the
reversibility. It is likely that the ionic interactions as well as the hydrogen bonding is
disrupted by extremely high pH, as the removal of the polyelectrolyte multilayers would be
difficult with only the base layer disrupted.
Figure 3-34: Cross-section (left) and top-view (right) of membrane after removal of polyelectrolyte multilayers with a
NaOH solution.
3.6 Conclusions
Exploration of the potential controllability of polyelectrolyte deposition within the nanopores
of ordered block copolymer phase inversion membranes with an average pore diameter of
~41 nm, after a pre-treatment of the brushlike pore wall with a methanol/water mixture in
order to collapse the chains, was performed using different combinations of polyelectrolytes
in order to vary charge. Low molecular weight polyelectrolytes poly(styrene sulfonate),
protonated poly(ethylene imine), quaternized poly(ethylene imine) and poly(acrylic acid)
were tested to determine the deposition properties of strong and weak polyelectrolyte
combinations. In order to guarantee complete charge overcompensation for each layer, the
polyelectrolyte solution was pushed through the membrane pores using a syringe pump while

75
monitoring the pressure at a constant flow rate. This flow rate monitoring allowed the
deposition to be stopped only when polyelectrolyte was unable to be further deposited on the
surface, which ensured equal charge overcompensation through the entire length of the
nanopore and maximum layer thickness. The pressure level after deposition and rinsing with
buffer solution was then recorded while buffer solution was passing through the pore to
ensure a standard solution for each measurement, as viscosity can affect the pressure
measurements.
The first layer, poly(acrylic acid) in all cases, was used to connect the poly(4-vinyl pyridine)
to the rest of the polyelectrolyte layers by hydrogen bonding to the P4VP layer and
presenting a negative charge to the interior of the nanopore, which was then built upon by
positively charged PEI·HCl or quaternized PEI. The layer thickness of the PAA could be
varied by changing the pH of the solution – a lower pH of 5 meant that the PAA was close to
50% protonated, and so the PAA layer was much thicker. Deposition at pH 7.4 where PAA
has extremely few protonated repeat units led to a very thin layer which, nonetheless,
supported additional layers. While in many cases the extraordinarily thick layer deposition
seen in past studies of polyelectrolyte deposition in nanopores was seen in multilayers of
PSS/ PEI·HCl, PSS/qPEI, and PSS/PAA, the combination of PSS/ PEI·HCl in particular
proved to be extremely promising in its controllability, providing very thick layers at pH
levels where the PEI·HCl was more protonated and considerably thinner and better controlled
deposition at a steady pH of 7.4 where PEI·HCl is less protonated, a finding contrary to those
previously reported for layer-by-layer assembly on surfaces. With the thick layers deposited
at varied pH, or with two strong or two weak polyelectrolytes, the pore became filled quickly
and polyelectrolyte multilayers began to build up on the surface of the membrane. These
multilayers were water permeable despite considerable thickness in one case, but behaved
differently in terms of pressure increase – displaying a zig-zag pattern of pressure increase
then decrease as successive layers were added. This may be due to a change in hydration of
the multilayers that has been seen in studies of layer-by-layer assembly on surfaces.
This hydration of polyelectrolyte multilayers, however, makes it extremely difficult to get an
accurate picture of the structure inside the pores. In one attempt to make a large number of

76
layers, the polyelectrolyte began to build up substantially on the surface. However, the
swelling of the polyelectrolyte layers may have some effect on the flow through the pore. By
examination with SEM, however, the layers collapse after drying, leaving a pore diameter
that matches the calculated “diameter” estimated by using the Hagen-Poiseuille equation.
Measurement of pressure as a real-time analytical tool was also useful for looking at rates of
deposition, which were different depending on whether the polyelectrolytes were deposited at
different pH levels (more highly charged PEI·HCl) or at pH 7.4 (less highly charged
PEI·HCl).
Reversibility of the multilayers was demonstrated by nearly completely removing the layers
deposited using an aqueous NaOH solution at pH 12 to disrupt the ionic interactions holding
the multilayers together.
It was also possible to collapse the multilayers by passing through a solution of 50/50
methanol/water and then returning to water, at which point the flux increased. The potential
here is for the system to remain wetted while compacting the layers. This controllable layer-
by-layer deposition has potential for future additions of functionality to nanoporous
membranes, either through reactions of polymers within the pores or by immobilizing
functional objects such as enzymes or nanoparticles within the nanopore.

77
References
1. (a) Decher, G., Fuzzy nanoassemblies: Toward layered polymeric multicomposites.
Science 1997, 277 (5330), 1232-1237; (b) Decher, G.; Hong, J. D., Buildup of Ultrathin
Multilayer Films by a Self-Assembly Process .2. Consecutive Adsorption of Anionic and
Cationic Bipolar Amphiphiles and Polyelectrolytes on Charged Surfaces. Ber Bunsen Phys
Chem 1991, 95 (11), 1430-1434; (c) Decher, G.; Hong, J. D., Buildup of Ultrathin Multilayer
Films by a Self-Assembly Process .1. Consecutive Adsorption of Anionic and Cationic
Bipolar Amphiphiles on Charged Surfaces. Makromol Chem-M Symp 1991, 46, 321-327; (d)
Decher, G.; Hong, J. D.; Schmitt, J., Buildup of Ultrathin Multilayer Films by a Self-
Assembly Process .3. Consecutively Alternating Adsorption of Anionic and Cationic
Polyelectrolytes on Charged Surfaces. Thin Solid Films 1992, 210 (1-2), 831-835.
2. Dotzauer, D. M.; Dai, J. H.; Sun, L.; Bruening, M. L., Catalytic membranes prepared
using layer-by-layer adsorption of polyelectrolyte/metal nanoparticle films in porous
supports. Nano Lett 2006, 6 (10), 2268-2272.
3. Peinemann, K. V.; Abetz, V.; Simon, P. F. W., Asymmetric superstructure formed in
a block copolymer via phase separation. Nat Mater 2007, 6 (12), 992-996.
4. Nunes, S. P.; Karunakaran, M.; Pradeep, N.; Behzad, A. R.; Hooghan, B.; Sougrat, R.;
He, H. Z.; Peinemann, K. V., From Micelle Supramolecular Assemblies in Selective Solvents
to Isoporous Membranes. Langmuir 2011, 27 (16), 10184-10190.
5. Kim, S.; Briber, R. M.; Karim, A.; Jones, R. L.; Kim, H. C., Environment-controlled
spin coating to rapidly orient microdomains in thin block copolymer films. Macromolecules
2007, 40 (12), 4102-4105.
6. Adham, S. e. a., Optimization of Membrane Treatment for Direct and Clarified Water
Filtration (Subject Area: High-Quality Water). American Water Works Research Foundation:
2006.
7. Tripathi, B. P.; Dubey, N. C.; Choudhury, S.; Simon, F.; Stamm, M., Antifouling and
antibiofouling pH responsive block copolymer based membranes by selective surface
modification. J Mater Chem B 2013, 1 (27), 3397-3409.

78
8. Cho, J.; Hong, J. K.; Char, K.; Caruso, F., Nanoporous block copolymer
micelle/micelle multilayer films with dual optical properties. J Am Chem Soc 2006, 128 (30),
9935-9942.
9. Zhang, W. Q.; Shi, L. Q.; An, Y. L.; Wu, K.; Gao, L. C.; Liu, Z.; Ma, R. J.; Meng, Q.
B.; Zhao, C. J.; He, B. L., Adsorption of poly(4-vinyl pyridine) unimers into polystyrene-
block-poly(acrylic acid) micelles in ethanol due to hydrogen bonding. Macromolecules 2004,
37 (8), 2924-2929.
10. Tian, Y.; He, Q.; Cui, Y.; Tao, C.; Li, J. B., Assembly of nanotubes of poly(4-
vinylpyridine) and poly(acrylic acid) through hydrogen bonding. Chem-Eur J 2006, 12 (18),
4808-4812.
11. Choi, J.; Rubner, M. F., Influence of the degree of ionization on weak polyelectrolyte
multilayer assembly. Macromolecules 2005, 38 (1), 116-124.
12. Hameed, N.; Guo, Q. P., Self-Assembled Complexes of Poly(acrylic acid) and
Poly(styrene)-block-Poly(4-vinyl pyridine). J Polym Sci Pol Phys 2009, 47 (12), 1192-1202.
13. Shibata, M.; Kimura, Y.; Yaginuma, D., Thermal properties of novel supramolecular
polymer networks based on poly(4-vinylpyridine) and disulfonic acids. Polymer 2004, 45
(22), 7571-7577.
14. Schafer, A., Natural Organics Removal Using Membranes. Technomic Publishing
Company, Inc.: Pennsylvania, USA, 2001.
15. Lalia, B. S.; Kochkodan, V.; Hashaikeh, R.; Hilal, N., A review on membrane
fabrication: Structure, properties and performance relationship. Desalination 2013, 326, 77-
95.
16. (a) Singh, S.; Junghans, A.; Waltman, M. J.; Nagy, A.; Iyer, R.; Majewski, J., Neutron
reflectometry characterization of PEI-PSS polyelectrolyte multilayers for cell culture. Soft
Matter 2012, 8 (45), 11484-11491; (b) Lvov, Y.; Ariga, K.; Ichinose, I.; Kunitake, T.,
Assembly of Multicomponent Protein Films by Means of Electrostatic Layer-by-Layer
Adsorption. J Am Chem Soc 1995, 117 (22), 6117-6123.
17. Spruijt, E.; Westphal, A. H.; Borst, J. W.; Cohen Stuart, M. A.; van der Gucht, J.,
Binodal Compositions of Polyelectrolyte Complexes. Macromolecules 2010, 43 (15), 6476-
6484.

79
18. Rangou, S.; Buhr, K.; Filiz, V.; Clodt, J. I.; Lademann, B.; Hahn, J.; Jung, A.; Abetz,
V., Self-organized isoporous membranes with tailored pore sizes. J Membrane Sci 2014, 451,
266-275.
19. Tripathi, B. P.; Dubey, N. C.; Stamm, M., Functional polyelectrolyte multilayer
membranes for water purification applications. J Hazard Mater 2013, 252, 401-412.
20. Schonhoff, M.; Ball, V.; Bausch, A. R.; Dejugnat, C.; Delorme, N.; Glinel, K.;
Klitzing, R. V.; Steitz, R., Hydration and internal properties of polyelectrolyte multilayers.
Colloid Surface A 2007, 303 (1-2), 14-29.
21. Schwarz, B.; Schonhoff, M., Surface potential driven swelling of polyelectrolyte
multilayers. Langmuir 2002, 18 (8), 2964-2966.
22. Lee, D.; Nolte, A. J.; Kunz, A. L.; Rubner, M. F.; Cohen, R. E., pH-induced hysteretic
gating of track-etched polycarbonate membranes: Swelling/deswelling behavior of
polyelectrolyte multilayers in confined geometry. J Am Chem Soc 2006, 128 (26), 8521-8529.
23. Roy, C. J.; Dupont-Gillain, C.; Demoustier-Champagne, S.; Jonas, A. M.; Landoulsi,
J., Growth Mechanism of Confined Polyelectrolyte Multilayers in Nanoporous Templates.
Langmuir 2010, 26 (5), 3350-3355.
24. El Haitami, A. E.; Martel, D.; Ball, V.; Nguyen, H. C.; Gonthier, E.; Labbe, P.;
Voegel, J. C.; Schaaf, P.; Senger, B.; Boulmedais, F., Effect of the Supporting Electrolyte
Anion on the Thickness of PSS/PAH Multilayer Films and on Their Permeability to an
Electroactive Probe. Langmuir 2009, 25 (4), 2282-2289.

80

81
Chapter 4: Separations Using Polyelectrolyte
Multilayers in Nanostructured Phase-Inversion
Membranes
4.1 Dye Separation
4.1.1 Introduction
Dyes are used as model charged compounds in both polyelectrolyte multilayer absorption
studies1 and in membrane separation studies, such as the aforementioned research by Savariar
et.al.2, in which track-etched membranes were functionalized with a layer of a
polyelectrolyte. Passing dyes through a membrane can give valuable information about
surface charge and the interior chemistry of the nanopore that might otherwise be impossible
to obtain. On a flat surface which is built up with polyelectrolyte multilayers, it is possible to
run experiments to find zeta potential, look at IR spectroscopy, ellipsometry, or neutron
scattering measurements to find information about layer thickness and composition,3 and
AFM measurements to look at surface roughness.4 Advances in carbon nanotube membranes,
for example, have shown surprising results and exceptionally high flux due to the interior
properties of the nanotube, such as slip length and hydrogen bonding networks.5 In charged
networks as well, the interior environment of a pore lined with a charged polymer may differ
from that of a charged polymer on a surface.6
The Rubner group at MIT has done several studies on dye absorption into polyelectrolyte
multilayers7 to simulate the absorption of charged drugs. Methylene blue was used as a
model cationic drug and loaded up to 17.3 nm deep into a PAA/PAH multilayer film, and the
slow release of the dye into water was studied in both buffered and nonbuffered solutions.
Interestingly, the release of the model drug into pure water and into buffer solution was
different depending on the conditions. It was also found that buffered solutions led to better
loading of the thin film with the dye.7b

82
Dye separation was chosen for these membranes for ease of characterization using UV-Vis
spectroscopy as well as being a visual aid to determine separation, and also as the rhodamine
6g/calcein combination provided an easy comparison to the previous studies of dye
separations using polyelectrolyte lined track-etched membranes. Ion separations are also
typically performed using polyelectrolyte lined membranes, but require mass or flame
spectroscopy for detection.8
Several sets of dyes were considered: rhodamine 6g and calcein, as was previously used by
Savariar et.al. 2, methylene blue which was used by Rubner as a model cationic dye,
7b and
Coomassie brilliant blue due to its relatively large molecular size and use in dye separation
studies done on polyelectrolyte multilayers on disordered membranes9 the list and structures
of which can be found in Figure 1. The dyes were pushed through the membrane using low
flow rates with a syringe pump, and fractions were collected to assess the rate of flow of each
dye through the membrane. This could then be analyzed using UV-Vis spectroscopy but also
visually as the dyes were differently colored enough to be easily seen.
4.1.2 Dye Absorption or Rejection by Multilayers – Unexpected Results
It was expected originally with these membranes that they would behave as the membranes in
the Savariar et.al. 2 paper did under diffusion conditions – separating dyes via charge effects.
Several membranes later, though, it was clear that membrane dye separation was not as
simple with polyelectrolyte multilayers. The membrane in the experiments appeared to be
acting much more as an ion-exchange resin type process and much less with charge
screening. It became clear that dye separation by charge with these membranes was not at all
straightforward.

83
Figure 4-1: Structure of dyes used for separation experiments.
A first experiment shed light on two different aspects of these dye separation experiments. A
membrane with 1 pair of thick PSS/PEI·HCl layers was formed and then used to separate
rhodamine and calcein in an aqueous solution which contained equal concentrations of both.
This could be compared with a membrane where the pores were not only filled but large
amounts of multilayers had been deposited on the surface (25 total layers). Interestingly,
because they were made using different methods, the flux rates of the two membranes were
similar. Despite these similar flux rates, which would typically indicate a similar pore size,
the difference was very clear: the more multilayers were present, the more dye could be
absorbed and therefore separated. So there was an inherent limitation in doing layer-by-layer
assembly in the pores as a separation technique which was that a limited number of layers
could be placed without building up on the surface as well. However, when layers were built

84
up on the surface they were capable of separating large amounts of dye. This was the first
indication that an absorption process was taking place rather than a charge-based separation.
If the process were charge based, and assuming that the assertion that charge decreases with
an increased number of layers, then the dye separation would be worse with an increased
number of layers and not better.
Figure 4-2: 25-layer membrane (top) vs. 2-layer membrane (bottom) for separation of calcein and rhodamine). The
left portion of the black line represents the dye separation, the right portion represents dye recovered after switching
to water. This is depicted both visually (A) and with UV-vis data (B).
This also gave some answers to size separation limitations as well – if a dye as large as
calcein could pass through the filled membrane, then the amount of space in the layers due to
hydration is quite substantial, especially given that 15 microns of surface multilayer buildup
A
B

85
were present. Another interesting observation was that while the membrane was separating
the dyes, the concentration of calcein emerging on the other side, while reaching a constant
concentration, was still much less than the initial dye concentration of 10-4
M. The indication
here was that either both dyes were being absorbed, but at different rates, or that each dye had
a different rate with which it passed through the multilayer-coated membrane. It is also
possible that both of these are true.
However, this gave no indication of charge-based dye separation. In fact, with all dye
combinations used, no matter what layer was present in the outer portion of the membrane,
PAA, PEI, qPEI, PSS, and no matter which layers were present underneath, the separation
was the same every time (Figure 3). With the thick layers, there was no easily defined
difference between a single layer and three layers in separation.
Figure 4-3: Separation from membranes of different configurations. Top: PAA-PEI, middle: PAA-PEI-PSS-PEI,
bottom: PAA-qPEI-PSS-qPEI (some buildup on surface).
It is important as well to comment that all of the experiments were done in a buffer solution.
This was initially chosen as well to mirror the reported rhodamine/calcein separation
experiments. This may have had the effect of hindering any charge screening while helping
absorption. However, previously reported differences in charge separation between higher
and lower buffer concentrations, while present, were not significant. 2 Because of this, most

86
likely a difference between water and buffer may have affected the rate of travel through the
pore some for each dye but probably would not have affected the outcome of the experiment.
4.1.3 Reusability of membranes
It was important before starting to test whether a single membrane could be reused for
separations. There was precedent to the answer – in studies of multilayers and dyes the
Caruso group found that after dyes had been absorbed and released by polyelectrolyte
multilayers that a small portion of dye remained on the surface, but the surface retained its
overall charge and ability to absorb more dye.1 This was verified by doing successive
separations with the same membrane. Layers were still then able to be absorbed into the pore
after separations were complete. At this point, it was clear that Caruso’s assertions that the
majority of a dye is able to be released from polyelectrolyte multilayers, save a small surface
layer,1 held true for these membranes as well, and that they could be used for multiple
separations.
Figure 4-4: Calcein-rhodamine dye separation done sequentially - left 3 vials first, then the membrane was rinsed
with water, then the right 2 vials, membrane with a single layer of PAA.
4.1.4 Addition of more dye pairs
At this point, the question was: how could this dye separation be explained? It was possible
that the extreme hydrophilic nature of the calcein, with its four exterior carboxylate groups,
would cause it to travel in and out of the pores more easily. There was also the question of

87
charge – did it matter that one was negatively charged? It was possible that there was some
overall positive or negative charge of the layers that was affecting the separation.
At this point another pair of dyes were chosen: methyl orange and methylene blue. Using
solubility as a measure of hydrophilicity in this case, the methylene blue is much more
soluble than methyl orange. In this case, the methylene blue was separated out first from the
membrane, no matter which layer was present on the surface.
Figure 4-5: Separation of methylene blue and methyl orange mixture (shown on left) with various amounts of
multilayers. Top: poly(acrylic acid), middle: PAA-PEI, bottom: PAA-PEI-PSS. Left side of black line is dye
separation, right side is dye release after switching to water.
One set of dyes were chosen to see whether the size of the dye (though much larger than the
pore) would affect the separation. Calcein and Coomassie brilliant blue were separated
(Figure 4) and it was clear that the separation was still proceeding with calcein first, but that
brilliant blue followed quickly.
Figure 4-6: Dye separation of mixture of brilliant blue and calcein (shown on left). Layers present are PAA-PEI-PSS.
It seems that, despite the relatively large size of brilliant blue, it has no problem infiltrating
into the polyelectrolyte to become immobilized, allowing the calcein to pass through the

88
membrane first. With the relatively high concentration of dye in the membrane, it is highly
unlikely that the dye is confined exclusively to the surface. Also, the surface of the
membrane was covered with poly(styrene sulfonate), so the anionic charge of the brilliant
blue and the anionic charge of the PSS should not have caused any complexation to occur.
This speaks to a high percentage of hydration in the multilayers, into which large dye
molecules can penetrate.
In all of the membranes the dye which was retained was then released afterwards once the
solution was switched to water or buffer. It did not appear to make a significant difference
which was used, though buffer could potentially have an effect if the ions present were able
to displace the dye more easily in the multilayers.
The phenomena of “concentration polarization” cannot be completely discounted as well –
when charge screening occurs then a buildup of one charged species will appear on the flow
side of the membrane. However, in this case, it seems clear that absorption and/or
hydrophilic effects are overcoming the charge effects. Concentration polarization was
therefore discounted as a reason for the slow release of dye from the membrane after
switching to water.
4.1.5 Conclusions
In the end, the conclusion was that the dye interactions with all of the possible polyelectrolyte
interactions are too complex to be explained completely by simple charge, hydrophilicity,
functional groups, or counterions. However, it seemed clear by the end that absorption-based
processes dominated clearly over a charge separation. The best correlation that could be
drawn from these few dye separations is that the more water-soluble compound seemed to be
the one that would emerge first, no matter the surface layer or charge. The multilayers seem
much too complex to be used as a simple “exchange resin” type process, and it is clear that
more investigation is required to understand fully the process of separation which takes place
in the unique environment of the nanopore. Slow release of the absorbed dye also has
potential, as was seen with the multilayers used by Rubner for model cationic drug release. It
89
may be that multilayers in membrane form will find unforeseen uses in this area.
Additionally, membranes could be used as an easy test for polyelectrolyte multilayer
absorption, especially as a preliminary test for absorption by polyelectrolyte-coated particles
or surfaces.
4.2 Size separation: Sieving curves
When membranes are tested for pore size, there are several options. A bubble point test, in
which air is forced upwards through the membrane and the point at which the bubbles appear
on the surface is recorded.10
An alternative method is a “sieving curve”, where a solution
with broad molecular weight distributions of a noninteracting polymer is passed through the
membrane. The curve can then be analyzed by GPC and compared to the curve of other
membranes.11
In this case, it was of interest to test the size reduction of the pore, especially as
the multilayers within the pore seemed to be permeable to large dyes.
Sieving curves are typically done with dextran since it has a broad molecular weight
distribution and with the possible exception of hydrogen bonding has a very low chance of
interacting with any membrane type. In this case, though, we chose poly(ethylene glycol) as
the sieving polymer since dextran is insoluble in chloroform, the GPC solvent. Sieving was
done using a 1 mg/mL solution of four different molecular weights of PEG, which are found
along with their radius of hydration in Table 1.
The goal of using a sieving curve in this project was to explore the structure of the layers
within the nanopore. With two options in mind – one in which the layers are very loosely
joined and fill the nanopore while further layers infiltrate between these layers, increasing the
pressure; and another where the layers are more compact and lining the edges of the
nanopore, a more traditional picture of layer-by-layer self-assembly, the picture of the
loosely-filled nanopore would present a far smaller pore space than the edge-lined layer
picture. So, a sieving curve, in which a broad spectrum of PEG molecular weights is pushed
through the membrane, should give some answers. GPC would provide a method of looking
at the separation of the membrane, provided that each membrane separation was done using
the same flow rate and amount of solution separated.

90
Table 4-1: Hydrodynamic radii of PEG molecular weights used, from Ref. 12.
PEG Molecular Weight (kDa) Rh (nm) Diameter (nm)
11.84 3.49 6.98
100 11.95 23.90
300 23.36 46.72
600 32.95 65.90
As is seen in Table 1, the PEG with a radius of about 3.4 nm (10kDa PEG was used as
opposed to the 11.84kDa PEG reported in the literature)12
should pass through the membrane
easily and is included as a point of reference. The 600kDa PEG with a radius of 33 nm
(diameter of 66 nm) should be filtered out by even the bare unmodified membrane. And the
100kDa and 300kDa PEG with diameters of 24 and 46 nm respectively should be the most
conclusive as to how much the pore size has actually changed during layer-by-layer
deposition.
The first step was to get a calibration curve from the PEG samples available in order to have
a reasonable estimate of relative pore size. The four PEG samples were run through the GPC
and peaks were recorded in order to make a crude calibration curve (Figure 7).

91
Figure 4-7: Separate GPC curves for the PEG samples used in the sieving experiment. Inset graph shows GPC
calibration for PEG samples.
The three membranes that were tested and the calculated pore sizes based on pressure
measurements are listed in Table 2. The purpose of running sieving curves for these pore
sizes was twofold: one, they would give an idea of whether the pressure data accurately
matched the actual pore size; and two, from this correlation we could gain a better
understanding of the structure within the nanopore.
Table 4-2: List of membranes used for PEG sieving experiment.
Membrane Name Membrane Flux (Lm-2
h-1
bar-1
) Estimated Pore Size
Sieve 1 365 35 nm
Sieve 2 580 40.6 nm (unmodified
membrane)
Sieve 3 162 23.8 nm

92
Typically for a sieving curve, an ideal feed solution is one in which the same amount of
polymer is present at each molecular weight. Because of the narrow molecular weight of the
10kDa PEG though, it unfortunately showed a sharp peak at this molecular weight (Figure 8).
However, since no membrane with a pore size below 20nm was tested, this was deemed not
to be problematic.
Figure 4-8: GPC of feed solution for sieving curves. Peak positions from separate GPC curves of each solution are
marked.
If smaller pores were to be tested, though, a different feed solution would need to be used.
Another problem with sieving tests is membrane fouling. With the 40 and 35 nm pore size
membranes, the pressure increased within a measurable quantity during sieving. With the 20
nm pore sizes, the pressure increased beyond the ability of the sensor to measure it during the
filtration. This meant that the high molecular weight PEG was building up on the feed side of
the membrane. While the flow rate that matched that of the unmodified membrane could be
maintained, a pore size any smaller than this would probably have been fouled to the point
where the flow rate could not be maintained, affecting the accuracy of the sieving curves. It
has been shown that the flow rate and the pressure affect rejection coefficients calculated
during sieving measurements.13

93
The measure of how well a membrane performs is known as a “rejection coefficient”. This is
defined by the equation, from Ref. 13:
𝑅𝑖 = 1 − 𝐶𝑖,𝑝/𝐶𝑖,0
where R is the rejection coefficient, Ci,p is the permeate concentration and Ci,0 is the feed
concentration. For a partial rejection coefficient, the same equation can be used (also from
Ref. 13):
𝑅 = 1 − 𝐶𝑝/𝐶0
where R is the partial rejection coefficient, Cp is the permeate concentration, and C0 is the
feed concentration.
Figure 4-9: From Ref. 13, sample sieving curve and calculation of partial rejection coefficients.
Measuring concentration was somewhat problematic in this case, as there were some
insoluble salts in the freeze-dried output which affected the weight that was measured.
Therefore, it was decided to use a reference point at the low molecular weight end of the

94
10kDa PEG peak to normalize the intensity so that the rejection coefficient could be
calculated. A reference point of 14.7 mL retention volume was chosen and all refractive
index was normalized to this point after being baseline corrected. There was some
inconsistency in the baseline, however, which led to a reasonable amount of error. Because of
this it was difficult to make any conclusions from the graph of the bare membrane and the
graph of just a few layers from looking at only the GPC curve (Figure 9). It is possible,
however, to see clearly the difference between these two sieves and the sieve of the ~25 nm
pore size.
Figure 4-10: GPC curve of the initial feed mixture, and the three sieve membrane tests listed in Table 2.
The rejection coefficients were then plotted, but due to the uneven PEG distribution ended up
being quite uneven (Figure 11). A dip in the rejection curve that occurs halfway through the
graph is not due to a change in the rejection but a low point in the PEG distribution. So,
ignoring this dip, it appears that the pore size estimate only from GPC data for the initial
membrane would be very close to the hydrated diameter of 300 kDa PEG, or 46 nm.

95
Figure 4-11: Total sieve curve (top) and portion of interest (bottom) for PEG mixture filtration.
This is further corroborated by the GPC UV data, which is not used for calibration due to
inconsistencies in the molecular weight vs. retention time plot.
Figure 4-12: UV GPC curve for sieving and feed mixture.

96
In this curve, however, there is a clear difference in the high molecular weight portion – the
600kDa PEG shows up at around 12.5 mL in the feed mixture and then disappears in the
portion filtered by the unmodified membrane. So the assertion that the sieving data for the
unmodified membrane is around the hydrated diameter of 300kDa PEG (46 nm) is verified by
the UV curve. The retention coefficient in Figure 11 for Sieve curve 3, the ~25 nm pore size
membrane, makes a sharp increase from around 20% to nearly 100% between 12.6 and 13.5
mL retention time. This would point towards a pore diameter around 27 nm, but as the
sieving curve estimate for the unmodified membrane is higher than the SEM, the
measurements from sieving most likely run high and the measured pore diameter of ~25 nm
would be close to the sieving curve measurement. It is clear from this, however, that there is
no gel-filled pore with water filtering through polyelectrolyte layers. The sieving curve data
shows an open pore which is closed gradually by the addition of polyelectrolyte layers.
Conclusion
A sieving curve is a way to measure pore diameter in a membrane by filtering a broad
molecular weight solution through the membrane and then looking at the permeate with GPC.
Using membranes of three different pore sizes, it was possible to correlate the pore size
calculated by the pressure data to the pore size determined by the sieving curve. This is
valuable information about the interior structure of the nanopore, and verifies that the layer-
by-layer assembly happens along the walls of the nanopore, gradually closing the pore, rather
than filling up the pore with a loosely packed gel.

97
References
1. Tedeschi, C.; Caruso, F.; Mohwald, H.; Kirstein, S., Adsorption and desorption
behavior of an anionic pyrene chromophore in sequentially deposited polyelectrolyte-dye thin
films. J Am Chem Soc 2000, 122 (24), 5841-5848.
2. Savariar, E. N.; Krishnamoorthy, K.; Thayumanavan, S., Molecular discrimination
inside polymer nanotubules. Nat Nanotechnol 2008, 3 (2), 112-117.
3. Schonhoff, M., Self-assembled polyelectrolyte multilayers. Curr Opin Colloid In
2003, 8 (1), 86-95.
4. McAloney, R. A.; Sinyor, M.; Dudnik, V.; Goh, M. C., Atomic force microscopy
studies of salt effects on polyelectrolyte multilayer film morphology. Langmuir 2001, 17
(21), 6655-6663.
5. Majumder, M.; Chopra, N.; Andrews, R.; Hinds, B. J., Nanoscale hydrodynamics -
Enhanced flow in carbon nanotubes. Nature 2005, 438 (7064), 44-44.
6. Tagliazucchi, M.; Azzaroni, O.; Szleifer, I., Responsive Polymers End-Tethered in
Solid-State Nanochannels: When Nanoconfinement Really Matters. J Am Chem Soc 2010,
132 (35), 12404-12411.
7. (a) Hiller, J.; Rubner, M. F., Reversible molecular memory and pH-switchable
swelling transitions in polyelectrolyte multilayers. Macromolecules 2003, 36 (11), 4078-
4083; (b) Chung, A. J.; Rubner, M. F., Methods of loading and releasing low molecular
weight cationic molecules in weak polyelectrolyte multilayer films. Langmuir 2002, 18 (4),
1176-1183.
8. Armstrong, J. A.; Bernal, E. E. L.; Yaroshchuk, A.; Bruening, M. L., Separation of
Ions Using Polyelectrolyte-Modified Nanoporous Track-Etched Membranes. Langmuir 2013,
29 (32), 10287-10296.
9. Baburaj, M. S.; Aravindakumar, C. T.; Sreedhanya, S.; Thomas, A. P.; Aravind, U.
K., Treatment of model textile effluents with PAA/CHI and PAA/PEI composite membranes.
Desalination 2012, 288, 72-79.
10. Gribble, C. M.; Matthews, G. P.; Laudone, G. M.; Turner, A.; Ridgway, C. J.;
Schoelkopf, J.; Gane, P. A. C., Porometry, porosimetry, image analysis and void network

98
modelling in the study of the pore-level properties of filters. Chem Eng Sci 2011, 66 (16),
3701-3709.
11. (a) Meireles, M.; Bessieres, A.; Rogissart, I.; Aimar, P.; Sanchez, V., An Appropriate
Molecular-Size Parameter for Porous Membranes Calibration. J Membrane Sci 1995, 103 (1-
2), 105-115; (b) Michaels, A. S., Analysis and Prediction of Sieving Curves for Ultrafiltration
Membranes - a Universal Correlation. Separ Sci Technol 1980, 15 (6), 1305-1322; (c) Aimar,
P.; Meireles, M.; Sanchez, V., A Contribution to the Translation of Retention Curves into
Pore-Size Distributions for Sieving Membranes. J Membrane Sci 1990, 54 (3), 321-338.
12. Armstrong, J. K.; Wenby, R. B.; Meiselman, H. J.; Fisher, T. C., The hydrodynamic
radii of macromolecules and their effect on red blood cell aggregation. Biophys J 2004, 87
(6), 4259-4270.
13. Nobrega, R.; Debalmann, H.; Aimar, P.; Sanchez, V., Transfer of Dextran through
Ultrafiltration Membranes - a Study of Rejection Data Analyzed by Gel-Permeation
Chromatography. J Membrane Sci 1989, 45 (1-2), 17-36.

99
Chapter 5: Experimental Details
Instrumentation
Membrane structures were characterized using scanning electron microscopy (FEG-SEM,
Zeiss LEO Gemini 1530, Germany) with an in-lens detector. Prior to imaging, the thin films
were coated with platinum in order to avoid charging and to allow imaging at higher
resolutions. NMR spectra were recorded on a Bruker AV300 MHz and AV500 MHz
spectrometers, using CDCl3 as the solvent. Analytical GPC measurements were performed
using a Viscotek GPC system equipped with a pump and a degasser (GPCmax VE2001, flow
rate 1.0 mL/min), a detector module (Viscotek 302 TDA) and three columns (2 × PLGel Mix-
C and 1 × ViscoGEL GMHHRN 18055, 7.5 × 300 mm for each) using chloroform as an
eluent. UV/Vis measurements were carried out on a Lambda 20 double beam UV/Vis-
spectrophotometer from Perkin-Elmer.
Membrane formation
PS(145,000)-b-P4VP(50,000) block copolymer, Polymer Source, was dissolved in 1:1:1 w/w
DMF:THF:dioxane to form a 17 wt% solution. The solution was kept in a sealed jar under
shaking conditions for 3 days to dissolve. A glass substrate was used for membrane
formation with a doctor blade with 250 µm gate height. After spreading of the polymer
solution, the solution was allowed to sit for 20 s before immersion in a 20ºC water bath,
where it sat for several hours. The membrane was transferred to and stored in Millipore
water until use.

100
Layer deposition
Layers were deposited using a 10 mL syringe and an Orion Sage syringe pump. Between
each polyelectrolyte solution deposited, buffer solution was allowed to pass through the
membrane for at least 45 minutes.
Poly(acrylic acid), Acros, with a molecular weight of 5k was dissolved in a 0.1M buffer
solution to form a 0.01M PAA solution with respect to the monomer. The solution was
filtered through a 0.02 µM syringe filter before loading into a 10 mL syringe, after which it
was pushed through the membrane at a rate of 0.480 mg/s. This was continued until sensor
data showed that the pressure increase had leveled off.
Linear poly(ethylene imine), Mw=5000, was dissolved in a solution of ethanol and treated
with an excess of 2M HCl until the polymer had completely precipitated. This precipitate
was washed thoroughly with ethanol and dried, then dissolved in a 0.1M buffer solution to
form a 0.01M PEI·HCl solution with respect to monomer. The solution was filtered through
a 0.02 µM syringe filter before loading into a 10 mL syringe, after which it was pushed
through the membrane at a starting rate of 0.480 mg/s for initial layers, and lower rates for
subsequent layers to maintain a differential pressure under 0.07 bar (1.0 PSI). This was
continued until sensor data showed that the pressure increase had leveled off, or in cases
where the pressure did not change, was continued for at least 1 hour.
Poly(styrene sulfonate), Fluka, Mw=4300, was dissolved in 0.1M pH 7.4 buffer solution to
form a 0.01M PSS solution with respect to the monomer. The solution was filtered through a
0.02 µM syringe filter before loading into a 10 mL syringe, after which it was pushed through
the membrane at a starting rate of 0.480 mg/s for initial layers, and lower rates for subsequent
layers to maintain a differential pressure under 6900 Pa (1.0 PSI). This was continued until
sensor data showed that the pressure increase had leveled off.

101
Sensor calibration and data collection
The sensor was calibrated with a 70cm high column of water at two data points, 0 cm and 70
cm. This was then verified by taking data points at each 10cm of water height.
PEG size separation
A 1 mg/mL solution of poly(ethylene glycol) was made by using equal weights of 900 kDa,
600 kDa, 300 kDa, and 10 kDa PEG and diluting to 1 mg/mL with Millipore water. The PEG
solution was then loaded into a fresh 20 mL syringe and pushed through the membrane at a
rate between 0.34 and 1.3 mL/hour, keeping the pressure under 1 bar. A total mass of 2.5g
was collected for each separation.
Dye separation
Dye mixtures were made in 0.1 M phosphate buffer solution, pH 7.4. Each dye had a
concentration of 10-4
M and was pushed through the membrane at a rate of between 0.34 and
1.3 mL/hour. Pressure was not recorded during dye separation. Aliquots between 0.2 and 1.5
mL were collected during dye separation for analysis with UV-Vis.
PEI quaternization
Poly(ethyleneimine) was dissolved in ethanol and added to a 1:1 solution of ethanol/methyl
iodide which was stirred at 50ºC for three hours, after which a solid had formed in the
mixture. The solid was washed with ethanol and air dried. Precursor PEI 1H-NMR (δ, ppm,
300 MHz, CDCl3): 2.5 ppm (s, CH2CH2 backbone); qPEI after methylation 1H-NMR (δ,
ppm, 300 MHz, CDCl3): 2.3-4.8 ppm (multiple broad peaks, CH backbone, NCH3, N(CH3)

102

103
General Conclusions
The following general conclusions can be drawn from the work carried out in this thesis:
1. Layer by layer assembly inside of the ~40 nm nanopores present in polystyrene-b-
poly(4-vinylpyridine) phase inversion membranes is possible using a flow-through
system of layer deposition and polyelectrolytes including a partially hydrogen-
bonding base layer of poly(acrylic acid) and upper layers of poly(styrene sulfonate)
and poly(ethylene imine) HCl.
2. By monitoring the pressure during deposition at constant flow rates, the deposition
process can be monitored to ensure that complete coating of the nanopore is present.
From these pressure data, an approximation of the reduced size of the nanopore can
be made. By using a continuous monitoring process, the deposition rates can also be
studied.
3. The thickness of the PEI/PSS bilayers inside of the nanopore can be controlled to
some extent by changing the pH at which the PEI is deposited. At a lower pH the PEI
is more positively charged and, contrary to layer-by-layer deposition on surfaces,
deposits a thicker layer in the nanopore. The thickness of the initial PAA layer can
also be controlled. In this case, a less ionized PAA has more acid groups available for
hydrogen bonding and provides a thicker base layer.
4. These polyelectrolyte-modified membranes can be used for separations of dyes.
However, the mechanism of separation is not well-understood. The reduced pore size
of the polyelectrolyte-layered membrane can also be seen through sieving curves of a
broad molecular weight distributed solution of poly(ethylene oxide).

104

105
Appendix
Symbols and Abrreviations
PS Polystyrene
P4VP Poly(4-vinylpyridine)
PAA Poly(acrylic acid)
PVP Polyvinylpyrrolidone
PLGA Poly(L-glutamic acid)
PLL Poly(L-lysine)
PSS Poly(styrene sulfonate)
PAH Poly(allylamine hydrochloride)
WRT With respect to
DCM Dichloromethane
SEM Scanning electron microscopy
ATRP Atom-transfer radical polymerization
PVPh Poly(vinyl phenol)
PEO Poly(ethylene oxide)
PEG Poly(ethylene glycol)
DMF Dimethylformamide
THF Tetrahydrofuran
PDI Polydispersity index
TMP Transmembrane pressure
PEI Poly(ethylene imine)
qPEI Quaternized poly(ethylene imine)
GPC Gel permeation chromatography

106
Circuit Diagram Schematic

107
Curriculum Vitae
Personal Information
Full name Julia Ann Baettig
Date of Birth May 14, 1980
Present Address Im Binzacher 12, 8166 Niederweningen, Switzerland
Email [email protected] ; [email protected]
Skills
• Polymer synthesis skills including: Atom Transfer Radical Polymerization (ATRP), Reversible Addition-
Fragmentation Chain Transfer Polymerization (RAFT), Ring-Opening Polymerization (ROP)
• Thin film block copolymer self-assembly through solvent annealing • Experience in monomer synthesis, multi-step organic synthesis and purification • Nanostructure characterization and elucidation techniques: AFM, SEM, TEM, and SAXS
• Polymer and small molecule characterization and separation: NMR, GPC, IR, DSC, MPLC, UV-Vis • Electrochemistry techniques: CV, QCM • Proofreading, editing, and writing of scientific papers
• Software proficiency using Microsoft Office, iWork, ChemDraw, Adobe Illustrator and Photoshop, Igor
Pro, iNMR and MestreNova
Education
ETH Zürich, Zürich, Switzerland November 2014 (expected)
Doctoral studies, Materials Science Advisor: Dr. Anzar Khan
University at Buffalo, The State University of New York, USA July 2011
M.A., Chemistry Advisor: Prof. Dr. Javid Rzayev
State University of New York at Potsdam, USA Jul 2008
B.S., Chemistry Advisor: Prof. Dr. Maria Hepel
B.A., Anthropology Advisor: Prof. Dr. Bethany Usher
List of Publications
• “Self-assembly of an interacting binary blend of diblock copolymers in thin films: a potential route to
porous materials with reactive nanochannel chemistry” J. Rao, H. Ma, J. Baettig, S. Woo, M.C. Stuparu, J.
Bang, & A. Khan. Soft Matter 2014, 10(31), 5755-5762
• “Functionalized Molecular Bottlebrushes” I. Gadwal, J. Rao, J. Baettig, A. Khan. Macromolecules 2014,
47(1), 35-40 • “Interactions and reactivity of Hg(II) on glutathione modified gold electrode studied by EQCN technique”
M. Hepel, J. Dallas, M. D. Noble, J. Electroanal. Chem. 2008, 622, 173-183 • “Multifunctional polypeptide EQCN sensors: probing the cysteamine-glutathione film permeability with
Hg(II) ions” M. Hepel, J. Dallas, Sensors 2008, 8, 7224-7240

108
Experience
ETH Zürich: Doctoral Student Jan 2014-present
Block Copolymer Membrane Development
• Layer-by-layer self-assembly to control the size and chemistry of nanopores in ordered phase-inversion
membranes
• Development of a pressure-monitoring system to observe the rate of deposition during a flow-through
process for the layer-by-layer deposition of polyelectrolyte multilayers in a membrane
Nanostructured Block Copolymer/Homopolymer Thin Films
• Solvent annealing of PEO-b-PMMA thin films to obtain nanostructured morphology • Synthesis and characterization of functional diblock and triblock copolymers for use in block copolymer
self-assembled thin films
State University of New York at Buffalo: Master’s Student August 2008-July 2011
Synthesis and Melt Self-Assembly of Random Bottlebrush Copolymers
• Synthesis of PS-PLA random bottlebrush copolymers • Examination of melt self-assembly using SAXS State University of New York at Potsdam: Bachelor’s Student January 2006-July 2008
Glutathione Self-Assembled Monolayer Thin Films for Mercury Detection
• EQCN and Quartz Crystal Microbalance approach to detection of mercury using glutathione Administrative Assistant: Express Personnel, Kelly Services 2004-2005
Various administrative and secretarial duties including typing, working with Microsoft Office, record-
keeping, receptionist duties
GIS Technician, US Department of Agriculture 2002-2004
Digitized Texas farmland using ArcView GIS software
Presentations
Oral
• Jun 2010, 37th Northeast Regional Meeting (NERM 2010) of the American Chemical Society,
Potsdam, NY, USA
“Synthesis and characterization of polystyrene-polylactide random bottlebrush copolymers and their
self-assembly.”
Awards and Scholarships
• Gordon Harris fellowship at SUNY at Buffalo, 2008 (2000 USD/year)
• Departmental scholar in chemistry at SUNY Potsdam, 2008
• Departmental scholar in anthropology at SUNY Potsdam, 2008
• Canfield scholarship in anthropology at SUNY Potsdam, 2007&2008 (400 USD
Languages
• English (Native language)
• German (Basic knowledge, oral and written)
Teaching Experience
University at Buffalo, The State University of New York, USA Aug 2008 - May 2011
Teaching assistant, general and organic chemistry laboratory