Sequential multi-hypothesis testing for compound Poisson processes
Upload
khangminh22Category
view
0download
0
General rights Copyright and moral rights for the publications made accessible in the public portal are retained by the authors and/or other copyright owners and it is a condition of accessing publications that users recognise and abide by the legal requirements associated with these rights.
Users may download and print one copy of any publication from the public portal for the purpose of private study or research.
You may not further distribute the material or use it for any profit-making activity or commercial gain
You may freely distribute the URL identifying the publication in the public portal If you believe that this document breaches copyright please contact us providing details, and we will remove access to the work immediately and investigate your claim.
Downloaded from orbit.dtu.dk on: Jan 09, 2022
Compound imaging using Synthetic Aperture Sequential Beamformation
Jensen, Casper Bo; Jensen, Jonas; Hemmsen, Martin Christian; Hansen, Jens Munk; Jensen, JørgenArendt
Published in:Proceedings of 2011 IEEE International Ultrasonics Symposium
Link to article, DOI:10.1109/ULTSYM.2011.0565
Publication date:2011
Document VersionEarly version, also known as pre-print
Link back to DTU Orbit
Citation (APA):Jensen, C. B., Jensen, J., Hemmsen, M. C., Hansen, J. M., & Jensen, J. A. (2011). Compound imaging usingSynthetic Aperture Sequential Beamformation. In Proceedings of 2011 IEEE International UltrasonicsSymposium (pp. 2277-2280). IEEE. https://doi.org/10.1109/ULTSYM.2011.0565
Paper presented at the IEEE International Ultrasonics Symposium, Orlando Florida, 2011:
Compound imaging using
Synthetic Aperture Sequential Beamformation
Casper Bo Jensen, Jonas Jensen, Martin Christian Hemmsen,Jens Munk Hansen and Jørgen Arendt Jensen
Center for Fast Ultrasound Imaging,Biomedical Engineering group, Department of Electrical Engineering, Bldg. 349,Technical University of Denmark, DK-2800 Kgs. Lyngby, Denmark
To be published in Proceedings of IEEE International Ultrasonics Symposium, Orlando Florida, 2011.
Compound imaging usingSynthetic Aperture Sequential Beamformation
Casper Bo Jensen, Jonas Jensen, Martin Christian Hemmsen, Jens Munk Hansen and Jørgen Arendt JensenCenter for Fast Ultrasound Imaging, Department of Electrical Engineering, Technical University of Denmark, Lyngby, Denmark
Abstract— Synthetic Aperture Sequential Beamforming(SASB) is a technique with low complexity and the ability toyield a more uniform lateral resolution with range. However, thepresence of speckle artifacts in ultrasound images degrades thecontrast. In conventional imaging speckle is reduced by usingspatial compounding at the cost of a reduced frame rate. Theobjective is to apply spatial compounding to SASB and evaluateif the images have a reduced speckle appearance and therebyan improved image quality in terms of contrast compared toordinary SASB.Using the simulation software Field II, RF data are acquiredfor a phantom with cysts at different sizes and scatteringlevels. 192 scanlines are recorded for five steering angles (0,±2, ±4 degrees) using a 192 element linear array transducer.SASB is performed for each angle using a rectangular grid inthe second stage beamformation. After envelope detection thefive second stage images are added to form the compoundedimage. Using a ProFocus scanner and the 8804 linear arraytransducer (BK Medical, Herlev, Denmark) measurementsof a phantom containing water filled cysts are obtained tovalidate the simulation results. The setup is the same as in thesimulations and SASB second stage beamformation data areprocessed offline for each of the five angles. Contrast-to-noiseratio (CNR) and speckle-to-noise ratio (SNR) are extractedfor the compounded image and the reference image (ordinarySASB).CNR was calculated for the simulated cysts at depths of 40,50, 60, 70 and 80 mm. On average the CNR was improvedby 33.2% compared to the values obtained from the referenceimage. For regions of increasing depth SNR was on averageincreased by 9.3%. Results from the simulation were confirmedby calculations on the measured data. CNR of cysts at depthsfrom 18 to 78 mm with a separation of 10 mm was on averageimproved by 45.9%. On average an improvement of 16.6%in SNR was obtained. The calculations along with visualinspection revealed larger improvements in deeper regions, andthe compounded image for the measured phantom showed a 3mm diameter cyst not detectable in the reference image.Compounding applied to SASB improves CNR and SNR resultsin images with a reduced speckle appearance. This was shownfor simulations and confirmed on measured data.
I. INTRODUCTION
Ultrasound imaging is often used for many diagnostic pur-poses in clinical practice. Classifying e.g. a cyst as benignor malignant is dependent on high quality images having ahigh contrast and few artifacts. Synthetic Aperture SequentialBeamformation (SASB) is a method to construct B-modeimages and was introduced by Kortbek et al [1] for a multielement linear array transducer. The technique showed a morerange independent lateral resolution compared to DynamicReceive Focusing (DRF) and reduced system complexity com-pared to full Synthetic Aperture systems. SASB consists of two
seperate beamformers with the latter being the most complex.A single focal point in both transmit and receive are used in thefirst stage beamformer to construct scan lines in a similar wayconventional systems uses Single Receive Focusing (SRF). Inthe second stage beamformer information from multiple firststage scan lines are combined to calculate each image pointresulting in a high resolution image.Ultrasound is subject to a number of artifacts e.g. speckle,which causes otherwise homogeneous regions to appear gran-ular [2]. This reduces image contrast and makes identificationand classification of cysts and tumors difficult. Recordingimages from several angles and combining these to a singleimage is the principle in spatial compounding [3]. Entrekinet al [4] has shown that compound imaging in conventionalimaging systems significantly reduces speckle and reinforcesreal structures. This paper presents a novel implementation ofSASB for compound imaging and studies the feasibility ofapplying spatial compounding using SASB for 2-dimensionalmedical imaging. The objective is to evaluate if the advantagesof applying spatial compounding is obtained for improvedimage quality, compared to conventional SASB imaging. Themethod is evaluated on cyst phantoms using simulations andmeasurements.
II. METHOD
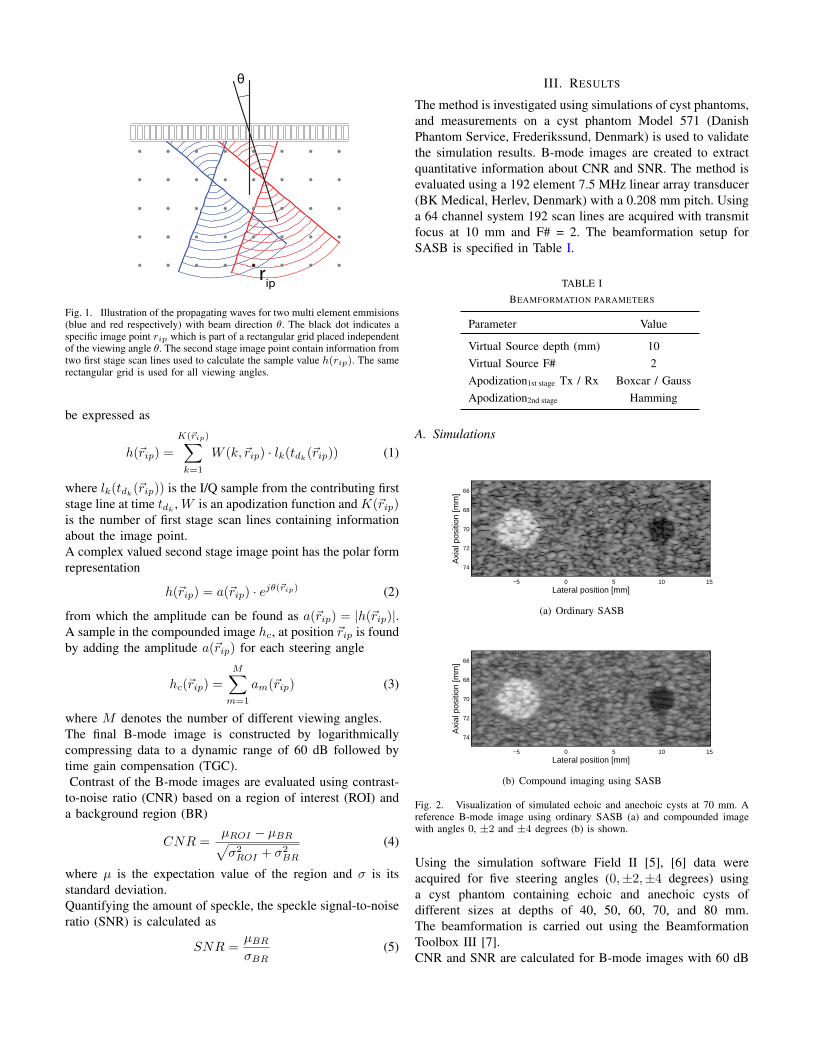
In SASB imaging data are recorded using a conventionalsliding subaperture with a single focal point in transmit. Toconstruct first stage scan lines a fixed receive time-delay profileis calculated from a receive focal point coincident with thetransmit focal point. The focal point is considered as a virtualsource and a number of virtual sources form a syntheticaperture used in the second stage beamformation. The result ofthe first stage beamformation is a real RF signal representingeach scan line. Complex I/Q data samples are obtained fromthe sampled and demodulated RF signal for each first stagescan line. Data acquisition and first stage beamformation canbe repeated for a number of different viewing angles M withindividual angles given by θi, i = 1, ...M .The second stage beamformation produces a high resolutionimage consisting of numerous image points. The spatial posi-tion of the image points are independent of the viewing angleand to ease compounding they can preferable be placed ona rectangular grid as illustrated in Fig. 1. Multiple first stagescan lines contain information about each image point andthe number of contributing lines increase with range. A singlesample h, representing the image point at the location ~rip can
θ
rip
Fig. 1. Illustration of the propagating waves for two multi element emmisions(blue and red respectively) with beam direction θ. The black dot indicates aspecific image point rip which is part of a rectangular grid placed independentof the viewing angle θ. The second stage image point contain information fromtwo first stage scan lines used to calculate the sample value h(rip). The samerectangular grid is used for all viewing angles.
be expressed as
h(~rip) =
K(~rip)∑k=1
W (k, ~rip) · lk(tdk(~rip)) (1)
where lk(tdk(~rip)) is the I/Q sample from the contributing first
stage line at time tdk, W is an apodization function and K(~rip)
is the number of first stage scan lines containing informationabout the image point.A complex valued second stage image point has the polar formrepresentation
h(~rip) = a(~rip) · ejθ(~rip) (2)
from which the amplitude can be found as a(~rip) = |h(~rip)|.A sample in the compounded image hc, at position ~rip is foundby adding the amplitude a(~rip) for each steering angle
hc(~rip) =M∑
m=1
am(~rip) (3)
where M denotes the number of different viewing angles.The final B-mode image is constructed by logarithmicallycompressing data to a dynamic range of 60 dB followed bytime gain compensation (TGC).Contrast of the B-mode images are evaluated using contrast-
to-noise ratio (CNR) based on a region of interest (ROI) anda background region (BR)
CNR =µROI − µBR√σ2ROI + σ2
BR
(4)
where µ is the expectation value of the region and σ is itsstandard deviation.Quantifying the amount of speckle, the speckle signal-to-noiseratio (SNR) is calculated as
SNR =µBR
σBR(5)
III. RESULTS
The method is investigated using simulations of cyst phantoms,and measurements on a cyst phantom Model 571 (DanishPhantom Service, Frederikssund, Denmark) is used to validatethe simulation results. B-mode images are created to extractquantitative information about CNR and SNR. The method isevaluated using a 192 element 7.5 MHz linear array transducer(BK Medical, Herlev, Denmark) with a 0.208 mm pitch. Usinga 64 channel system 192 scan lines are acquired with transmitfocus at 10 mm and F# = 2. The beamformation setup forSASB is specified in Table I.
TABLE IBEAMFORMATION PARAMETERS
Parameter Value
Virtual Source depth (mm) 10Virtual Source F# 2Apodization1st stage Tx / Rx Boxcar / GaussApodization2nd stage Hamming
A. Simulations
Lateral position [mm]
Axi
al p
ositi
on [m
m]
−5 0 5 10 15
66
68
70
72
74
(a) Ordinary SASB
Lateral position [mm]
Axi
al p
ositi
on [m
m]
−5 0 5 10 15
66
68
70
72
74
(b) Compound imaging using SASB
Fig. 2. Visualization of simulated echoic and anechoic cysts at 70 mm. Areference B-mode image using ordinary SASB (a) and compounded imagewith angles 0, ±2 and ±4 degrees (b) is shown.
Using the simulation software Field II [5], [6] data wereacquired for five steering angles (0,±2,±4 degrees) usinga cyst phantom containing echoic and anechoic cysts ofdifferent sizes at depths of 40, 50, 60, 70, and 80 mm.The beamformation is carried out using the BeamformationToolbox III [7].CNR and SNR are calculated for B-mode images with 60 dB
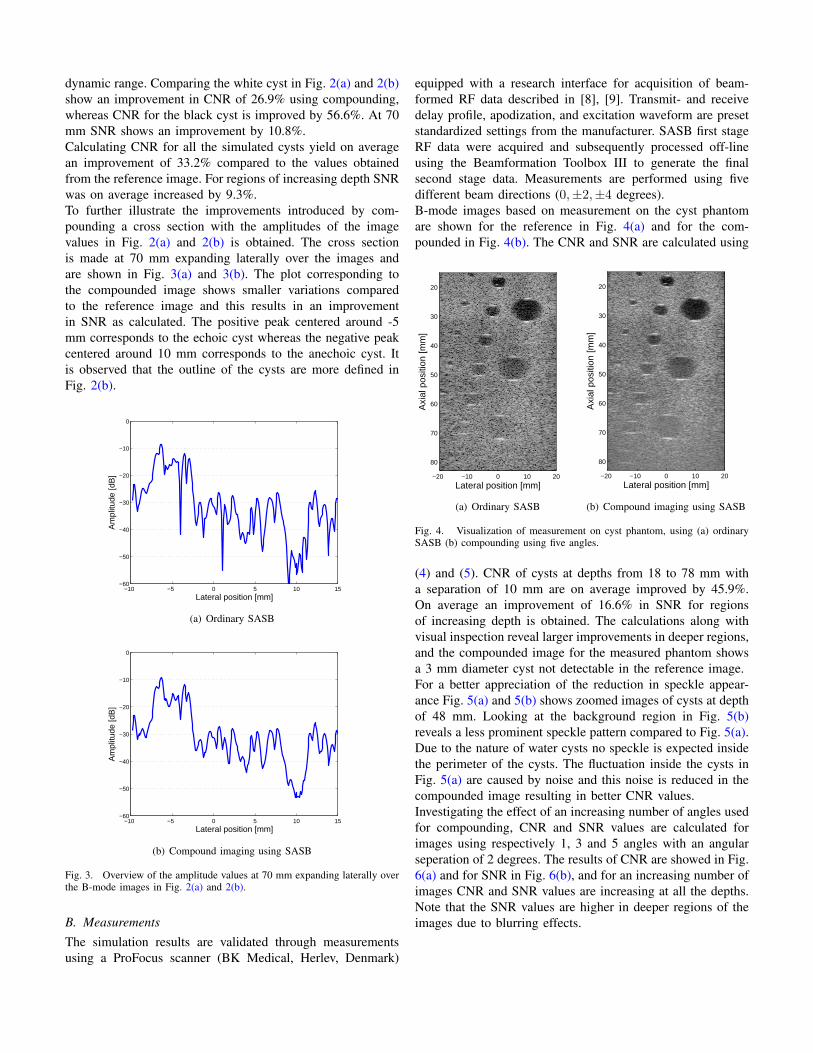
dynamic range. Comparing the white cyst in Fig. 2(a) and 2(b)show an improvement in CNR of 26.9% using compounding,whereas CNR for the black cyst is improved by 56.6%. At 70mm SNR shows an improvement by 10.8%.Calculating CNR for all the simulated cysts yield on averagean improvement of 33.2% compared to the values obtainedfrom the reference image. For regions of increasing depth SNRwas on average increased by 9.3%.To further illustrate the improvements introduced by com-pounding a cross section with the amplitudes of the imagevalues in Fig. 2(a) and 2(b) is obtained. The cross sectionis made at 70 mm expanding laterally over the images andare shown in Fig. 3(a) and 3(b). The plot corresponding tothe compounded image shows smaller variations comparedto the reference image and this results in an improvementin SNR as calculated. The positive peak centered around -5mm corresponds to the echoic cyst whereas the negative peakcentered around 10 mm corresponds to the anechoic cyst. Itis observed that the outline of the cysts are more defined inFig. 2(b).
−10 −5 0 5 10 15−60
−50
−40
−30
−20
−10
0
Lateral position [mm]
Am
plitu
de [d
B]
(a) Ordinary SASB
−10 −5 0 5 10 15−60
−50
−40
−30
−20
−10
0
Lateral position [mm]
Am
plitu
de [d
B]
(b) Compound imaging using SASB
Fig. 3. Overview of the amplitude values at 70 mm expanding laterally overthe B-mode images in Fig. 2(a) and 2(b).
B. MeasurementsThe simulation results are validated through measurementsusing a ProFocus scanner (BK Medical, Herlev, Denmark)
equipped with a research interface for acquisition of beam-formed RF data described in [8], [9]. Transmit- and receivedelay profile, apodization, and excitation waveform are presetstandardized settings from the manufacturer. SASB first stageRF data were acquired and subsequently processed off-lineusing the Beamformation Toolbox III to generate the finalsecond stage data. Measurements are performed using fivedifferent beam directions (0,±2,±4 degrees).B-mode images based on measurement on the cyst phantomare shown for the reference in Fig. 4(a) and for the com-pounded in Fig. 4(b). The CNR and SNR are calculated using
Lateral position [mm]
Axi
al p
ositi
on [m
m]
−20 −10 0 10 20
20
30
40
50
60
70
80
(a) Ordinary SASB
Lateral position [mm]
Axi
al p
ositi
on [m
m]
−20 −10 0 10 20
20
30
40
50
60
70
80
(b) Compound imaging using SASB
Fig. 4. Visualization of measurement on cyst phantom, using (a) ordinarySASB (b) compounding using five angles.
(4) and (5). CNR of cysts at depths from 18 to 78 mm witha separation of 10 mm are on average improved by 45.9%.On average an improvement of 16.6% in SNR for regionsof increasing depth is obtained. The calculations along withvisual inspection reveal larger improvements in deeper regions,and the compounded image for the measured phantom showsa 3 mm diameter cyst not detectable in the reference image.For a better appreciation of the reduction in speckle appear-ance Fig. 5(a) and 5(b) shows zoomed images of cysts at depthof 48 mm. Looking at the background region in Fig. 5(b)reveals a less prominent speckle pattern compared to Fig. 5(a).Due to the nature of water cysts no speckle is expected insidethe perimeter of the cysts. The fluctuation inside the cysts inFig. 5(a) are caused by noise and this noise is reduced in thecompounded image resulting in better CNR values.Investigating the effect of an increasing number of angles usedfor compounding, CNR and SNR values are calculated forimages using respectively 1, 3 and 5 angles with an angularseperation of 2 degrees. The results of CNR are showed in Fig.6(a) and for SNR in Fig. 6(b), and for an increasing number ofimages CNR and SNR values are increasing at all the depths.Note that the SNR values are higher in deeper regions of theimages due to blurring effects.

Lateral position [mm]
Axi
al p
ositi
on [m
m]
−10 −5 0 5 10 15
42
44
46
48
50
52
54
(a) Ordinary SASB
Lateral position [mm]
Axi
al p
ositi
on [m
m]
−10 −5 0 5 10 15
42
44
46
48
50
52
54
(b) Compound imaging using SASB
Fig. 5. Visualization of measured water cysts at depth of 48 mm. A referenceB-mode image using ordinary SASB (a) and compounded image with angles0, ±2 and ±4 degrees (b) is shown.
IV. CONCLUSIONS
Spatial compounding using SASB images has been succesfullyimplemented for a linear multi element array transducer. Com-pounding of a number of images is based on SASB secondstage image points positioned on a rectangular grid indepen-dent of individual beam directions. The effect of compoundingis evaluated on an ordinary SASB image and compounding offive images recorded for steering angles 0,±2,±4 degrees.Results obtained from simulated cysts show improvements inCNR and SNR which on average is improved by 33.2% and9.3% respectively. Measurements on a cyst phantom confirmedthe results from the simulation. CNR shows an improvementby 45.9% on average while SNR is improved by 16.6% onaverage. Results from Fig. 6(a) and 6(b) show higher contrastand less speckle using 5 angles for compounding compared tousing 3 and 1 angle.The method results in reduced speckle appearence in B-modeimages and a reduced level of noise especially evident inanechoic cysts. As a consequence, the contrast is improvedmaking classification of cysts and other structures easier.Implementing compounding using SASB on data acquiredwith a convex array transducer, and in-vivo studies are sug-gestions for further investigations.
ACKNOWLEDGEMENT
This work was supported by BK Medical ApS, Denmark,by providing an ultrasound scanner making data recordingpossible.
10 20 30 40 50 60 700
1
2
3
4
5
6
Depth [mm]
CN
R
(a) CNR
10 20 30 40 50 60 70 801.6
1.8
2
2.2
2.4
2.6
2.8
3
3.2
Depth [mm]
SN
R(b) SNR
Fig. 6. CNR values (a) and SNR values (b) at increasing depth computedfrom SASB images using 1 (blue), 3 (red) and 5 (green) images forcompounding.
REFERENCES
[1] J. Kortbek, J. A. Jensen, and K. L. Gammelmark, “Synthetic aperturesequential beamforming,” in Proc. IEEE Ultrason. Symp., 2008, pp. 966–969.
[2] C. Burckhardt, “Speckle in ultrasound b-mode scans,” IEEE Trans. Son.Ultrason., vol. SU-25, no. 1, pp. 1–6, Jan. 1978.
[3] S. K. Jespersen, J. E. Wilhjelm, and H. Sillesen, “Multi-angle compoundimaging,” Ultrason. Imaging, vol. 20, pp. 81–102, 1998.
[4] R. Entrekin, P. Jackson, and B. Porter, “Real time spatial compoundimaging in breast ultrasound: technology and early clinical experience,”medicamundi, vol. 43, pp. 35–43, September 1999.
[5] J. A. Jensen, “Field: A Program for Simulating Ultrasound Systems,”Med. Biol. Eng. Comp., vol. 10th Nordic-Baltic Conference on Biomed-ical Imaging, Vol. 4, Supplement 1, Part 1, pp. 351–353, 1996.
[6] J. A. Jensen and N. B. Svendsen, “Calculation of Pressure Fields fromArbitrarily Shaped, Apodized, and Excited Ultrasound Transducers,”IEEE Trans. Ultrason., Ferroelec., Freq. Contr., vol. 39, pp. 262–267,1992.
[7] J. M. Hansen, M. C. Hemmsen, and J. A. Jensen, “An object-orientedmulti-threaded software beam formation toolbox,” in Proc. SPIE - Med-ical Imaging - Ultrasonic Imaging and Signal Processsing, vol. 7968,2011, pp. 79 680Y–9.
[8] M. C. Hemmsen, M. M. Petersen, S. I. Nikolov, M. B. Nielsen, andJ. A. Jensen, “Ultrasound image quality assessment: A framework forevaluation of clinical image quality,” in SPIE Med. Imag. V Symp., vol.76291, 2010, pp. 76 290C–12.
[9] M. C. Hemmsen, S. I. Nikolov, M. M. Pedersen, M. J. Pihl, M. S.Enevoldsen, J. M. Hansen, and J. A. Jensen, “Implementation of aversatile research data acquisition system using a commercially availablemedical ultrasound scanner,” IEEE Trans. Ultrason., Ferroelec., Freq.Contr., p. Accepted for publication, 2011.
Copyright © 2022 FDOKUMEN