Optimal aperture sizes and positions for EMCD experiments
8
Optimal aperture sizes and positions for EMCD experiments J. Verbeeck a,c, , C. He ´ bert b,c , S. Rubino c , P. Nova ´k e , J. Rusz d,e , F. Houdellier f , C. Gatel f , P. Schattschneider c a EMAT, University of Antwerp, Groenenborgerlaan 171, B-2020 Antwerp, Belgium b CIME & LSME, EPFL, Station 12, 1015 Lausanne, Switzerland c Institut fu ¨r Festko ¨rperPhysik, Technische Universita ¨t Wien, Wiedner Hauptstrasse 8-10, A-1040 Wien, Austria d Department of Physics, Uppsala University, Box 530, S-751 21 Uppsala, Sweden e Institute of Physics, Academy of Sciences of the Czech Republic, Na Slovance 2, CZ-182 21 Prague, Czech Republic f CEMES, 29 rue Jeanne Marvig, BP 94347 31055 Toulouse cedex 4, France article info Article history: Received 7 December 2007 Received in revised form 21 February 2008 Accepted 26 February 2008 PACS: 82.80.P 61.16.B 32.80.Cy Keywords: Electron energy loss spectrometry Transmission electron microscopy Circular dichroism Coherence abstract The signal-to-noise ratio (SNR) in energy-loss magnetic chiral dichroism (EMCD)—the equivalent of X- ray magnetic circular dichroism (XMCD) in the electron microscope—is optimized with respect to the detector shape, size and position. We show that an important increase in SNR over previous experiments can be obtained when taking much larger detector sizes. We determine the ideal shape of the detector but also show that round apertures are a good compromise if placed in their optimal position. We develop the theory for a simple analytical description of the EMCD experiment and then apply it to dynamical multibeam Bloch wave calculations and to an experimental data set. In all cases it is shown that a significant and welcome improvement of the SNR is possible. & 2008 Elsevier B.V. All rights reserved. 1. Introduction Energy-loss magnetic chiral dichroism (EMCD) is a technique proposed in 2003 [1] to detect circular magnetic dichroism in the transmission electron microscope (TEM). EMCD is the counterpart of X-ray magnetic circular dichroism (XMCD), a nowadays standard technique for investigation of spin and orbital magnetic moments in the synchrotron. The fact that spin-related properties can now be studied with a standard commercial TEM equipped with an energy spectrometer or an energy filter explains the great attraction of this novel technique. The rapidly expanding field of spintronics has seen an increased interest in spin sensitive spectroscopies such as XMCD. Actual questions in spintronics relate to the existence of magnetic dead layers at interfaces posing a barrier for successful spin injection in spin transistors, interlayer coupling in magnetic multilayers [2], the determination and localization of magnetic moments in dilute magnetic semiconductors or Heusler alloys, to give some examples. As with common microelectronic devices, analytical methods for spin based devices call for spatial resolutions in the range of 10nm or below. Although there are at least two techniques with high spatial resolution in the range down to 20 nm available on the synchrotron, namely PEEM [3,4] and focusing X-ray optics, their resolution in practice is mostly 450 nm. Within a year after the successful experimental demonstration of EMCD [5] the spatial resolution of this technique could be pushed down to 30 nm, and is approaching the 10 nm level [6]. Since the TEM is the instrument of choice for materials characterization on the nm scale, it is obvious that a reliable procedure to measure EMCD, in combination with the many other analytical capabilities of the TEM, is of great importance for spintronics and other nanomagnetic studies. The chiral signal in the TEM is the difference of two energy loss spectra, taken at ionization edges of typically several 100 eV, and at non-zero scattering angle. These facts make the chiral signal much fainter than the XMCD signal, and questions of how to optimize the signal-to-noise ratio (SNR) by choosing an ideal scattering geometry arise. The problem is not straightforward ARTICLE IN PRESS Contents lists available at ScienceDirect journal homepage: www.elsevier.com/locate/ultramic Ultramicroscopy 0304-3991/$ - see front matter & 2008 Elsevier B.V. All rights reserved. doi:10.1016/j.ultramic.2008.02.007 Corresponding author at: EMAT, University of Antwerp, Groenenborgerlaan 171, B-2020 Antwerp, Belgium. Tel.: +3232653249; fax:+3232653257. E-mail address: [email protected] (J. Verbeeck). Ultramicroscopy 108 (2008) 865– 872
Transcript of Optimal aperture sizes and positions for EMCD experiments

ARTICLE IN PRESS
Ultramicroscopy 108 (2008) 865– 872
Contents lists available at ScienceDirect
Ultramicroscopy
0304-39
doi:10.1
� Corr
171, B-2
E-m
journal homepage: www.elsevier.com/locate/ultramic
Optimal aperture sizes and positions for EMCD experiments
J. Verbeeck a,c,�, C. Hebert b,c, S. Rubino c, P. Novak e, J. Rusz d,e, F. Houdellier f, C. Gatel f,P. Schattschneider c
a EMAT, University of Antwerp, Groenenborgerlaan 171, B-2020 Antwerp, Belgiumb CIME & LSME, EPFL, Station 12, 1015 Lausanne, Switzerlandc Institut fur FestkorperPhysik, Technische Universitat Wien, Wiedner Hauptstrasse 8-10, A-1040 Wien, Austriad Department of Physics, Uppsala University, Box 530, S-751 21 Uppsala, Swedene Institute of Physics, Academy of Sciences of the Czech Republic, Na Slovance 2, CZ-182 21 Prague, Czech Republicf CEMES, 29 rue Jeanne Marvig, BP 94347 31055 Toulouse cedex 4, France
a r t i c l e i n f o
Article history:
Received 7 December 2007
Received in revised form
21 February 2008
Accepted 26 February 2008
PACS:
82.80.P
61.16.B
32.80.Cy
Keywords:
Electron energy loss spectrometry
Transmission electron microscopy
Circular dichroism
Coherence
91/$ - see front matter & 2008 Elsevier B.V. A
016/j.ultramic.2008.02.007
esponding author at: EMAT, University of A
020 Antwerp, Belgium. Tel.: +32 32653249; f
ail address: [email protected] (J. Verbeeck
a b s t r a c t
The signal-to-noise ratio (SNR) in energy-loss magnetic chiral dichroism (EMCD)—the equivalent of X-
ray magnetic circular dichroism (XMCD) in the electron microscope—is optimized with respect to the
detector shape, size and position. We show that an important increase in SNR over previous
experiments can be obtained when taking much larger detector sizes. We determine the ideal shape of
the detector but also show that round apertures are a good compromise if placed in their optimal
position. We develop the theory for a simple analytical description of the EMCD experiment and then
apply it to dynamical multibeam Bloch wave calculations and to an experimental data set. In all cases it
is shown that a significant and welcome improvement of the SNR is possible.
& 2008 Elsevier B.V. All rights reserved.
1. Introduction
Energy-loss magnetic chiral dichroism (EMCD) is a techniqueproposed in 2003 [1] to detect circular magnetic dichroism in thetransmission electron microscope (TEM). EMCD is the counterpartof X-ray magnetic circular dichroism (XMCD), a nowadaysstandard technique for investigation of spin and orbital magneticmoments in the synchrotron. The fact that spin-related propertiescan now be studied with a standard commercial TEM equippedwith an energy spectrometer or an energy filter explains the greatattraction of this novel technique.
The rapidly expanding field of spintronics has seen anincreased interest in spin sensitive spectroscopies such as XMCD.Actual questions in spintronics relate to the existence of magneticdead layers at interfaces posing a barrier for successful spininjection in spin transistors, interlayer coupling in magneticmultilayers [2], the determination and localization of magnetic
ll rights reserved.
ntwerp, Groenenborgerlaan
ax:+32 32653257.
).
moments in dilute magnetic semiconductors or Heusler alloys, togive some examples. As with common microelectronic devices,analytical methods for spin based devices call for spatialresolutions in the range of 10 nm or below. Although there areat least two techniques with high spatial resolution in the rangedown to 20 nm available on the synchrotron, namely PEEM [3,4]and focusing X-ray optics, their resolution in practice is mostly450 nm.
Within a year after the successful experimental demonstrationof EMCD [5] the spatial resolution of this technique could bepushed down to �30 nm, and is approaching the 10 nm level [6].Since the TEM is the instrument of choice for materialscharacterization on the nm scale, it is obvious that a reliableprocedure to measure EMCD, in combination with the many otheranalytical capabilities of the TEM, is of great importance forspintronics and other nanomagnetic studies.
The chiral signal in the TEM is the difference of two energy lossspectra, taken at ionization edges of typically several 100 eV, andat non-zero scattering angle. These facts make the chiral signalmuch fainter than the XMCD signal, and questions of how tooptimize the signal-to-noise ratio (SNR) by choosing an idealscattering geometry arise. The problem is not straightforward

ARTICLE IN PRESS
J. Verbeeck et al. / Ultramicroscopy 108 (2008) 865–872866
since there are several options to setup the experiment. After thefirst publication of EMCD spectra [5] two other methods havebeen devised—taking ðq; EÞ diagrams [6] or using a series ofenergy filtered diffraction patterns so as to construct dichroicspectra [7]. Furthermore, it was thought originally that a highlyparallel incident beam of electrons is needed, but it has beenfound recently [6] that relatively high convergence angles can beused to advantage, thus increasing the signal strength by an orderof magnitude.
In this contribution we will investigate the SNR in EMCDexperiments via a statistical analysis of the dichroic signal, anduse this to optimize the parameters in the experimental setup. Wewill show that an important increase in SNR can be achieved byusing considerably larger detector acceptance angles. This studywill lead to recommendations about optimal shape and size of theentrance aperture of the spectrometer.
The paper is structured as follows: we start with a summary ofthe theory behind EMCD and use this to derive formulas for theSNR for the absolute dichroic signal assuming independentPoisson noise in the detector. Next we apply these findings to asimple analytical simulation, a dynamical Bloch wave simulationand finally to an experimentally obtained energy filtered TEM(EFTEM) series. We determine the optimal position, shape andsize of the detector aperture (in the diffraction plane) for thesecases and discuss the gain in SNR that can be expected.
2. SNR of the dichroic signal
When illuminating a sample with two incoming plane waveswith wave vector k1 and k2 and components g1 and g2 in thedirection perpendicular to the optical axis, we can write theintensity in the diffraction plane after inelastic scattering as [5,8]
I� ¼ I0d2s
dOdE
¼ I04g2
a20
M1
q2þ
M2
q02þ 2M0 cosF
q:q0
q2q02� 2M00 sinF
q� q0:ez
q2q02
� �(1)
with q and q0 the wave vector transfer (i.e. distance in thediffraction plane) between a point-like detector and the twodiffraction spots caused by the two plane waves as sketched inFig. 1 and F the phase difference between the two plane waves k1
and k2. ez is the unit vector in direction of the magnetization, hereassumed to be along the optical axis. I0 is the number of incomingelectrons, a0 the Bohr radius, g ¼ 1=
ffiffiffiffiffiffiffiffiffiffiffiffiffiffiffiffiffiffiffiffiffi1� v2=c2
pthe relativistic
factor and d2s=dOdE the double differential cross-section.In general, M1;M2;M
0;M00 are functions of the material, thethickness, the incidence angle of plane waves, the excitationenergy and elastic scattering. In the most general case, theparameters depend on the wave vector transfer q and numericalsimulations are needed.
I+
q
g1 g2
q'
I-
Fig. 1. Sketch of the dichroic setup assuming two incoming beams with wave
vector g1 and g2 . The detector position is determined by q and q0 .
The absolute dichroic signal is now defined as the differencebetween the intensity for two symmetrical detector positions [5]:
ID ¼ Iþ � I� ¼ DI (2)
From Eq. (1) we see that an optimal dichroic signal will beobtained on the so-called Thales circle [8] where the vectorproduct has a maximum. To obtain the SNR on the dichroic signalwe assume that the noise in the detector is Poisson counting noiseand the noise is independent for the two different detectorpositions. For Poisson noise we have
VA ¼ varðAÞ ¼ A (3)
Which gives for the variance on the dichroic signal:
varðIDÞ ¼ varðIþÞ þ varðI�Þ (4)
The SNR is then defined as
SNRD ¼Iþ � I�ffiffiffiffiffiffiffiffiffiffiffiffiffiffiffiIþ þ I�
p (5)
Note that this formula is generally applicable also in the morecomplicated case of dynamic diffraction and even for experi-mental data. It is based purely on the method of treating the dataand assuming Poisson noise and it is independent on the cross-section formula.
For a non-point-like detector we have to integrate the signalover the detector aperture.1 The SNR then becomes
SNRD;S ¼
RS Iþ ds�
RS I� dsffiffiffiffiffiffiffiffiffiffiffiffiffiffiffiffiffiffiffiffiffiffiffiffiffiffiffiffiffiffiffiffiffiffiffiffiR
S Iþ dsþR
S I� dsq ¼
RS ðIþ� I�ÞdsffiffiffiffiffiffiffiffiffiffiffiffiffiffiffiffiffiffiffiffiffiffiffiffiffiffiffiffiffiR
S ðIþþ I�Þds
q (6)
With S the area of the detector aperture.Note that the SNR for a fixed aperture S scales is expected as
SNR /ffiffiffiffiNp
(7)
With N the number of detected electrons in the aperture. Thisshows how important it is to optimize the SNR by choosing theright detector S since it is very hard to improve the SNRsignificantly by e.g. increasing exposure time or beam current.
3. Ideal shape and position of the detector
Although the relative strength of the chiral signal in the simpleanalytic model is strongest on the Thales circle as is evident fromEq. (1), one could argue that in terms of SNR in the final chiralsignal it would be advantageous to integrate over a larger detector.In this section we will show for the idealized two-beam case whatthe effect of non-point-like detectors is on the SNR in the chiralsignal.
We start with a simple round detector since that is readilyavailable in the microscope as the entrance aperture of thespectrometer. In a second step we show that we can improve theSNR if we optimize the shape of the detector to the signal.
For a round detector with radius rd and position qd wedetermine the SNR of the chiral signal by numerically integratingthe signal over the detector area and then applying the formulafor the SNR on this signal. We can check the effect of the differentpositions of the detector by convolving the detector shape withthe signal and then applying Eq. (5) on it. This will give an SNRmap for a given detector size for all possible positions. The
1 We integrate the intensities assuming that a real detector will actually detect
the arrival position of electrons effectively measuring the probability and not the
wave function. This is for instance the case if a scintillator is used in combination
with a photon detector.
ARTICLE IN PRESS
g y [g
110]
aperture size and position
−8 −6 −4 −2 0 2 4 6 8
−8
−6
−4
−2
0
2
4
6
8
gx [g110]
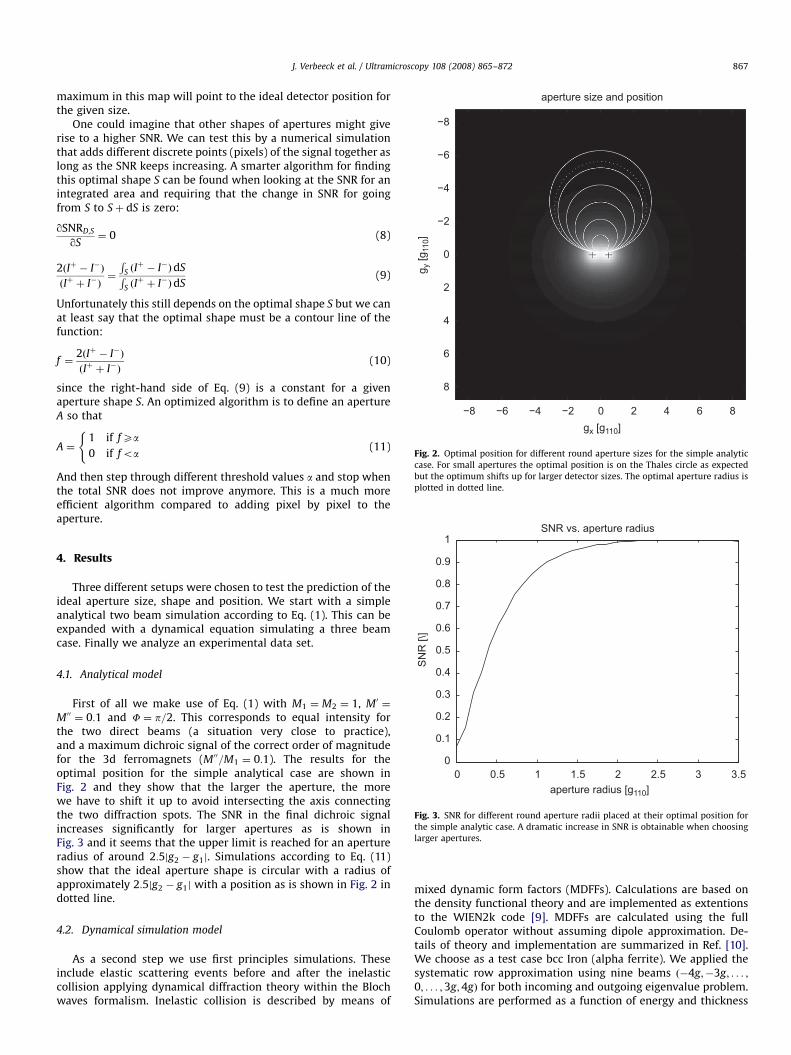
Fig. 2. Optimal position for different round aperture sizes for the simple analytic
case. For small apertures the optimal position is on the Thales circle as expected
but the optimum shifts up for larger detector sizes. The optimal aperture radius is
plotted in dotted line.
J. Verbeeck et al. / Ultramicroscopy 108 (2008) 865–872 867
maximum in this map will point to the ideal detector position forthe given size.
One could imagine that other shapes of apertures might giverise to a higher SNR. We can test this by a numerical simulationthat adds different discrete points (pixels) of the signal together aslong as the SNR keeps increasing. A smarter algorithm for findingthis optimal shape S can be found when looking at the SNR for anintegrated area and requiring that the change in SNR for goingfrom S to Sþ dS is zero:
qSNRD;S
qS¼ 0 (8)
2ðIþ � I�Þ
ðIþ þ I�Þ¼
RS ðIþ� I�ÞdSR
S ðIþþ I�ÞdS
(9)
Unfortunately this still depends on the optimal shape S but we canat least say that the optimal shape must be a contour line of thefunction:
f ¼2ðIþ � I�Þ
ðIþ þ I�Þ(10)
since the right-hand side of Eq. (9) is a constant for a givenaperture shape S. An optimized algorithm is to define an apertureA so that
A ¼1 if fXa
0 if foa
((11)
And then step through different threshold values a and stop whenthe total SNR does not improve anymore. This is a much moreefficient algorithm compared to adding pixel by pixel to theaperture.
0 0.5 1 1.5 2 2.5 3 3.50
0.1
0.2
0.3
0.4
0.5
0.6
0.7
0.8
0.9
1
SN
R [\
]
SNR vs. aperture radius
aperture radius [g110]
Fig. 3. SNR for different round aperture radii placed at their optimal position for
the simple analytic case. A dramatic increase in SNR is obtainable when choosing
larger apertures.
4. Results
Three different setups were chosen to test the prediction of theideal aperture size, shape and position. We start with a simpleanalytical two beam simulation according to Eq. (1). This can beexpanded with a dynamical equation simulating a three beamcase. Finally we analyze an experimental data set.
4.1. Analytical model
First of all we make use of Eq. (1) with M1 ¼ M2 ¼ 1, M0 ¼
M00 ¼ 0:1 and F ¼ p=2. This corresponds to equal intensity forthe two direct beams (a situation very close to practice),and a maximum dichroic signal of the correct order of magnitudefor the 3d ferromagnets (M00=M1 ¼ 0:1). The results for theoptimal position for the simple analytical case are shown inFig. 2 and they show that the larger the aperture, the morewe have to shift it up to avoid intersecting the axis connectingthe two diffraction spots. The SNR in the final dichroic signalincreases significantly for larger apertures as is shown inFig. 3 and it seems that the upper limit is reached for an apertureradius of around 2:5jg2 � g1j. Simulations according to Eq. (11)show that the ideal aperture shape is circular with a radius ofapproximately 2:5jg2 � g1j with a position as is shown in Fig. 2 indotted line.
4.2. Dynamical simulation model
As a second step we use first principles simulations. Theseinclude elastic scattering events before and after the inelasticcollision applying dynamical diffraction theory within the Blochwaves formalism. Inelastic collision is described by means of
mixed dynamic form factors (MDFFs). Calculations are based onthe density functional theory and are implemented as extentionsto the WIEN2k code [9]. MDFFs are calculated using the fullCoulomb operator without assuming dipole approximation. De-tails of theory and implementation are summarized in Ref. [10].We choose as a test case bcc Iron (alpha ferrite). We applied thesystematic row approximation using nine beams ð�4g;�3g; . . . ;0; . . . ;3g;4gÞ for both incoming and outgoing eigenvalue problem.Simulations are performed as a function of energy and thickness

ARTICLE IN PRESS
g y [g
110]
−2
−2.5
−2
−1.5
−1
−0.5
0
0.5
11.5
2
2.5
g y [g
110]
−2
−2.5
−2
−1.5
−1
−0.5
0
0.5
11.5
2
2.5
gx [g110] gx [g110]−1 0 1 2 −1 0 1 2
Fig. 4. Optimal position for different round aperture sizes for a Bloch wave calculation in a 3-beam case geometry with (a) t ¼ 8 nm and (b) t ¼ 16 nm displayed on top of
the integrated L3 signal.
0 1
1
SN
R [\
]
0 10.05
0.15
0.25
0.35
0.45S
NR
[\]
0.90.80.70.60.50.40.30.2
aperture radius [g110]0.5 1.5
aperture radius [g110]0.5 1.5
0.1
0.2
0.4
0.3
Fig. 5. Relative SNR for different round aperture radii placed at their optimal position for a Bloch wave calculation in a 3-beam case geometry with (a) t ¼ 8 nm and (b)
t ¼ 16 nm.
J. Verbeeck et al. / Ultramicroscopy 108 (2008) 865–872868
on a grid of 51� 51 pixels in a square area of the diffraction planespanning from �2:5g to 2:5g in both dimensions, g ¼ ð1 1 0Þ. TheLaue circle center for this three beam case is set to (0 0 0) and200 kV acceleration voltage is taken in agreement with theexperiments.
Applying the same detector integration techniques as beforewe see that the result depends sensitively on the thickness of thesample. The ideal position for different round apertures is shownin Fig. 4 for t ¼ 8 and 16 nm. As opposed to the analytical example,the optimal positions are shifted more towards the 110-beam.The SNR increases also considerably with radius much asfor the analytical case as shown in Fig. 5. Note that no maximumin the SNR is reached up to aperture radii of 1 reciprocal 110distance. Most likely, larger apertures would not be practical,because weakly excited beams like e.g. 110 (not included insystematic row simulations) will influence the signal in a non-trivial way.
The ideal shape of the aperture greatly depends on thicknessand has quite a complicated contour as shown in Fig. 6. It is clearthat the ideal shape is unpractical to use but fortunately Fig. 7shows that the difference between the SNR obtained with an idealaperture and the SNR obtained with a circular aperture is notmore than 50% for any thickness. The fact that around 50%increase in SNR is possible for the ideal aperture is mainly due tothe fact that two quadrants of the diffraction plane can be usedsimultaneously as opposed to a single circular aperture.
A surface plot of the SNR with respect to thickness (Fig. 8)shows that for all thicknesses the SNR goes up considerably withcircular aperture radius, and it also shows that there are optimumthickness ranges around 10 and 30 nm which give the best SNR forthis setup.
The dependence of the ideal aperture position on the thicknessis shown in Fig. 9. For all thicknesses it is advantageous to selectthe biggest possible aperture radius which was limited in thissimulation to one reciprocal vector. The optimal position is plottedfor thicknesses between 2 and 40 nm and all positions are in thelower left quadrant, closer to the 110 spot. The sensitivity of theSNR on the exact position is shown in Fig. 10 for a thickness oft ¼ 16 nm. It is shown that the SNR has a plateau around whichone can shift the position without affecting the SNR too much.One should, however, avoid that the aperture crosses thesymmetry line connecting 110 with 110. Therefore a reasonablerule of thumb could be to put a large aperture with radius r in aposition ð�1;�rÞ expressed in terms of the reciprocal g vector,since one rarely knows the exact thickness and specimen tilt inexperiments.
4.3. Experimental data
Experimental data for the Fe L2;3 edge was obtained as anEFTEM image series in the image plane using the LACDIF

ARTICLE IN PRESS
g y [g
110]
−2
−2.5
−2
−1.5
−1
−0.5
0
0.5
1
1.5
2
2.5
g y [g
110]
−2
−2.5
−2
−1.5
−1
−0.5
0
0.5
1
1.5
2
2.5
gx [g110] gx [g110]−1 0 1 2−1 0 1 2
Fig. 6. Numerically determined ideal shape and position of detector for a Bloch wave calculation in a 3-beam case geometry with (a) t ¼ 8 nm and (b) t ¼ 16 nm.
0 5 10 15 20 25 30 35 400
0.5
1
1.5
thickness [nm]
rela
tive
SN
R [/
]
optimal circularideal aperture
Fig. 7. Relative SNR for an optimal round aperture at optimal position compared to
an ‘ideal’ aperture as a function of thickness.
010
2030
40
00.5
1
1.50
0.2
0.4
0.6
0.8
1
thickness [nm]
SNR vs aperture radius for all thicknesses
rela
tive
SN
R [/
]
aperture radius [g110 ]
Fig. 8. Relative SNR for a circular aperture at optimal position vs. radius and vs.
sample thickness. Note the strong increase of SNR with increasing aperture radius
and the dependence on thickness due to pendellosung effects.
g y [g
110]
ideal aperture position for selected thicknesses
−2 −1 0 1 2
−2.5
−2
−1.5
−1
−0.5
0
0.5
1
1.5
2
2.5
gx [g110]
Fig. 9. Ideal position and size for a circular aperture for different thicknesses. For
all thicknesses the SNR keeps increasing with aperture radius so only the position
is important here. This figure shows the resulting optimal positions for thicknesses
between 2 and 40 nm. The optimal positions are all in the lower left quadrant and
closer to the 110-beam.
J. Verbeeck et al. / Ultramicroscopy 108 (2008) 865–872 869
technique on the SACTEM TOULOUSE microscope (TECNAI F20fitted with an image Cs-corrector and GIF tridiem) [7]. An energyslit of 1 eV was chosen and 50 images were taken in a totalexposure time of 30 min. The pure bcc Fe sample was oriented inthree beam condition with the 110 and 110 spots approximatelyequally excited. The Laue circle center is on the 000 spot. Theapproximate thickness of the sample is 16 nm as estimated bycomparison with dynamical Bloch wave calculations. LACDIFmode is used [7,11,12] with a convergence angle of 7.8 mrad andan illuminated sample area of around 40 nm diameter. Isochro-maticity and drift are measured and corrected directly from thedata cubes using scripts based on Gatan Digital Micrograph.Details on the numerical process used will be given in another

ARTICLE IN PRESS
g y [g
110]
effect of shift of round aperture onrelative SNR
−2 −1 0 1 2
−2.5
−2
−1.5
−1
−0.5
0
0.5
1
1.5
2
2.5
SN
R
−0.4
−0.3
−0.2
−0.1
0
0.1
0.2
0.3
0.4
gx [g110]
Fig. 10. Position sensitivity of the relative SNR using a circular aperture with r ¼
1g110 for a thickness of t ¼ 16 nm. Note that the SNR is rather insensitive to a
movement of the aperture. This could help to define a standard position which
gives a reasonable SNR for all thicknesses and all orientations.
g y [g
110]
−1 −0.5 0 0.5 1
−1
−0.5
0
0.5
1
gx [g110]
Fig. 11. Experimental optimal aperture positions drawn on an integrated energy
slice around the Fe L3 edge.
690 700 710 720 730 740 7500
0.05
0.10.15
0.20.25
−1
−0.5
0
0.5
1
E [eV]
r [g 11
0]
Fig. 12. Normalized absolute EMCD signal vs. aperture size obtained from Fig. 11,
note the reduction in noise as the aperture increases.
0 0.05 0.1 0.15 0.2 0.2580
100
120
140
160
180
200
220re
lativ
e S
NR
[/]
r [g110]
Fig. 13. Estimated relative SNR of the absolute dichroic signal vs. aperture size,
note the strong increase in SNR as the aperture radius increases.
J. Verbeeck et al. / Ultramicroscopy 108 (2008) 865–872870
paper [13]. Conventional power law background subtraction isperformed on each pixel in the x; y; E datacube. This datacube cannow be used to extract the EMCD signal making use of differentaperture size and positions, which is of special interest in thispaper since it allows to compare our theoretical findings withexperiments. Different apertures sizes are simulated by convolut-ing the data with a circular aperture of a given radius.
Fig. 11 shows an integrated slice of the datacube around the L3
edge with superimposed the optimal positions of different circularapertures. Note the reasonably good agreement between thepredicted optimal positions in Fig. 4b. The obtained dichroic
signal as a function of the aperture size normalized to themaximum in the signal is shown in Fig. 12. It is evident from thisfigure that the SNR increases significantly for bigger apertures. Arough estimate of the SNR can be made by calculating the rootmean square value of the signal in the L2;3 region and compare itto that of the pre-edge region which should only contain noise:
S
N¼
ffiffiffiffiffiffiffiffiffiffiffiffiffiffiffiffiffiffiPiedge
x2i
qffiffiffiffiffiffiffiffiffiffiffiffiffiffiffiffiP
iprex2
i
q (12)
with iedge running over the L2;3 region and ipre running over thepre-edge region, and xi the dichroic signal. Fig. 13 shows thisestimate and clearly indicates a strong increase in SNR as theaperture radius increases. As the maximum aperture size waslimited in this experiment, the expected plateau visible in Fig. 5bis not reached; however, the experiment clearly confirms thesignificant gain in SNR by taking a larger aperture in an optimalposition. The experimental dichroic signal, obtained for the largestaperture in Fig. 11 is shown in Fig. 14.

ARTICLE IN PRESS
700 705 710 715 720 725 730 735−0.5
0
0.5
1
1.5
2
2.5
3
3.5
4
energy loss [eV]
inte
nsity
[a.u
.]
I+I−5x (I+−I−)
Fig. 14. Experimentally obtained EELS spectra in two symmetrical positions I� and
absolute EMCD signal Iþ � I� for the optimal aperture size and position. The EMCD
signal is scaled by a factor of 5 to make it better visible.
J. Verbeeck et al. / Ultramicroscopy 108 (2008) 865–872 871
5. Discussion
Analytical and dynamical simulations showed unambiguouslythat a strong increase in SNR is possible for the absolute EMCDsignal. The results depend in a sensitive way on sampleorientation, thickness, position and shape of the collectionaperture. Comparing the simulated results with a series of energyfiltered diffraction patterns pointed out that non-isochromaticityand drift in the image plane must be removed in a first step sincethese artifacts can strongly distort the EMCD signal [13]. This stepis, however, only necessary for energy filtered series of diffractionpatterns and is far less a concern when experiments are taken asin [5], making use of two EELS spectra acquisitions in symmetricpoints in the diffraction pattern or with the E; q method [6]. Afterthe data pretreatment, a good qualitative agreement with thedynamic simulation at t ¼ 16 nm is found. The estimated SNRincreases by at least a factor 2 when changing the aperture radiusfrom r ¼ 0:04g110 to 0:24g110 (the maximum available in thisexperiment without hitting the boundaries of the CCD at thiscamera length). Comparing this to previously published results wesee that it was common to use somewhat smaller aperture sizesr � 0:1g200 in [8] and r � 0:2g200 in [6,12]. The ideal apertureradius according to dynamic simulations in Fig. 5b is close to r ¼
1:5g110 indicating that a considerable increase in SNR can beexpected. In view of the fact that typically the EMCD signal isquite weak, this improvement is of primary importance to obtainthe magnetic information from a nanoscale region of the sample.The position of this aperture can in principle be found fromanalytical simulations, but Fig. 10 shows that the positionsensitivity of the SNR is not so critical for large apertures, forsmall apertures it becomes more critical. The dynamical simula-tion and the experiment also showed that it is advantageous toshift the aperture slightly away to the Bragg reflection from thesymmetry position between the central (0 0 0) and the g spot. Thiscan be understood as the position where an equal inelasticscattering amplitude from 000 and 110 leads to a maximum in theEMCD effect. The final EMCD signal shown in Fig. 14 is relativelystrong, although the energy resolution is somewhat limited due tothe recording as an energy filtered series with energy selecting slitwidth of 1 eV. We note that the absolute EMCD effect for the L3
edge is stronger than for the L2 which might be explained by
multiple scattering effects that mix part of the L3 signal with theL2 signal. Because of the expected symmetry between the L3 andthe L2 excitations, this mixing will cancel out part of the expectedEMCD signal. The multiple scattering effect can in principle beremoved by deconvolution with a low loss spectrum, but theangular dependence of the scattering must be taken into accountin the deconvolution. This needs further investigation. It should benoted that the present discussion does not take into account noisearising from the dark count noise of the detector, which can beneglected only as long as it is much smaller than the Poissoniannoise assumed here. When recording the signal with an EELSdetector using two aperture positions, this is a good approxima-tion since the signal should be considerably larger than the darkcount noise. For the EFTEM series method, dark noise can play arole. We use the EFTEM series in this paper mainly to haveflexibility in defining the aperture off-line.
6. Conclusion
As a general trend, we have seen that increasing the circularaperture radius for EMCD experiments leads to a strong increasein SNR. More optimal aperture shapes are possible but impracticalsince they depend on the exact conditions of the sample and havefar too complex shapes. The suboptimal circular aperture,however, still performs quite well and is readily available in anymicroscope. As a rule of thumb, the aperture can be put near astrongly excited diffraction spot avoiding the crossing of the lineconnecting that diffraction spot with the 000 spot. Dynamicalsimulations can help to optimize the position and size further forspecific cases. We verified these simulated results for a set ofenergy filtered diffraction patterns. The trend is followedremarkably well and an increase of SNR of at least a factor 2was possible. This would require otherwise an increase in currentor exposure time by approximately a factor 4. Larger aperturesizes might even give stronger improvements and the dynamicsimulations showed that radii of about one reciprocal distance areclose to optimal. This size is larger than what was previously usedin experiments and shows that significant improvements arepossible. The use of EFTEM series to obtain the dichroic signal wasnecessary in this paper since it allows to define the apertures afterrecording. Based on the indication given, simple experimentsrecording two EELS spectra in symmetric positions in thediffraction pattern with a rather large collection angle is easierand faster.
Acknowledgments
This work was supported by the European Commission undercontract no. 508971 CHIRALTEM. J.V. and F.H. thank the financialsupport from the European Union under the Framework 6program under a contract for an Integrated InfrastructureInitiative. Reference 026019 ESTEEM. Thanks to J.P. Morniroli formaking the Fe sample available.
References
[1] C. Hebert, P. Schattschneider, Ultramicroscopy 96 (3–4) (2003) 463.[2] P. Grunberg, R. Schreiber, Y. Pang, M.B. Brodsky, H. Sowers, Phys. Rev. Lett. 57
(19) (1986) 2442.[3] A. Scholl, Thin-film magnetism: PEEM studies, in: K.H.J. Buschow, R.W. Cahn,
M.C. Flemings, P. Veyssiere, E.J. Kramer, S. Mahajan (Eds.), Encyclopedia ofMaterials: Science and Technology, pp. 1–5, in press, ISBN 0-08-043152-6.
[4] D.-H. Kim, P. Fischer, W. Chao, E. Anderson, M.-Y. Im, S.-C. Shin, S.-B. Choe,J. Appl. Phys. 99 (2006) 08H303.
[5] P. Schattschneider, S. Rubino, C. Hebert, J. Rusz, J. Kunes, P. Novak, E. Carlino,M. Fabrizioli, G. Panaccione, G. Rossi, Nature 441 (7092) (2006) 486.

ARTICLE IN PRESS
J. Verbeeck et al. / Ultramicroscopy 108 (2008) 865–872872
[6] P. Shattschneider, C. Hebert, S. Rubino, M. Stoger-Pollach, J. Rusz, P. Novak,Ultramicroscopy 108 (2008) 433–438.
[7] B. Warot-Fonrose, F. Houdellier, M.J. Hytch, L. Calmels, V. Serin, E. Snoeck,Ultramicroscopy 108 (2008) 393–398.
[8] P. Schattschneider, C. Hebert, S. Rubino, in: K.H.J. Buschow, R.W. Cahn, M.C.Flemings, P. Veyssiere, E.J. Kramer, S. Mahajan (Eds.), Encyclopedia ofMaterials: Science and Technology, in press, ISBN 0-08-043152-6.
[9] P. Blaha, K. Schwarz, G.K.H. Madsen, D. Kvasnicka, J. Luitz, in: WIEN2k, ViennaUniversity of Technology, 2001, ISBN 3-9501031-1-2.
[10] J. Rusz, S. Rubino, P. Schattschneider, Phys. Rev. B 75 (21) (2007) Art. No.214425.
[11] J.P. Morniroli, F. Houdellier, C. Roucau, J. Puiggali, S. Gesti, A. Redjaimia,Ultramicroscopy 108 (2008) 100–115.
[12] C. Hebert, P. Schattschneider, S. Rubino, P. Novak, J. Rusz, M. Stoger-Pollach,Ultramicroscopy 108 (2008) 277–284.
[13] C. Gatel, F. Houdellier, P. Schattschneider, B. Warot-Fonrose, Distortioncorrections of ESI data cubes for magnetic studies, unpublished.