Variable sizes of Escherichia coli chemoreceptor signaling teams
9
Variable sizes of Escherichia coli chemoreceptor signaling teams Robert G Endres 1,2,6 , Olga Oleksiuk 3,6 , Clinton H Hansen 4 , Yigal Meir 5 , Victor Sourjik 3, * and Ned S Wingreen 1, * 1 Department of Molecular Biology, Princeton University, Princeton, NJ, USA, 2 Division of Molecular Biosciences and Centre for Integrated Systems Biology at Imperial College, Imperial College London, London, UK, 3 Zentrum fu ¨ r Molekulare Biologie der Universita ¨ t Heidelberg (ZMBH), Heidelberg, Germany, 4 Department of Physics, Princeton University, Princeton, NJ, USA and 5 Department of Physics, Ben Gurion University, Beer Sheva, Israel 6 These authors contributed equally to this work * Corresponding authors. V Sourjik, Zentrum fu ¨ r Molekulare Biologie der Universita ¨ t Heidelberg (ZMBH), Im Neuenheimer Feld 282, Heidelberg, Germany. Tel.: þ 49 622154 6858; Fax: þ 49 622154 5894; E-mail: [email protected] or NS Wingreen, Department of Molecular Biology, Princeton University, Washington Road, Princeton, NJ 08544-1014, USA. Tel.: þ 1 609 258 1894; Fax: þ 1 609 258 8616; E-mail: [email protected] Received 3.4.08; accepted 21.6.08 Like many sensory receptors, bacterial chemotaxis receptors form clusters. In bacteria, large-scale clusters are subdivided into signaling teams that act as ‘antennas’ allowing detection of ligands with remarkable sensitivity. The range of sensitivity is greatly extended by adaptation of receptors to changes in concentrations through covalent modification. However, surprisingly little is known about the sizes of receptor signaling teams. Here, we combine measurements of the signaling response, obtained from in vivo fluorescence resonance energy transfer, with the statistical method of principal component analysis, to quantify the size of signaling teams within the framework of the previously successful Monod–Wyman–Changeux model. We find that size of signaling teams increases 2- to 3-fold with receptor modification, indicating an additional, previously unrecognized level of adaptation of the chemotaxis network. This variation of signaling-team size shows that receptor cooperativity is dynamic and likely optimized for sensing noisy ligand concentrations. Molecular Systems Biology 5 August 2008; doi:10.1038/msb.2008.49 Subject Categories: simulations and data analysis; signal transduction Keywords: adaptation; chemotaxis; FRET; principal component analysis; receptor clusters This is an open-access article distributed under the terms of the Creative Commons Attribution Licence, which permits distribution and reproduction in any medium, provided the original author and source are credited. Creation of derivative works is permitted but the resulting work may be distributed only under the same or similar licence to this one. This licence does not permit commercial exploitation without specific permission. Introduction Transmembrane receptors of the chemotaxis network in Escherichia coli allow bacteria to sense chemicals in the environment, allowing cells to swim toward nutrients (attrac- tant chemicals) and away from repellents (toxic chemicals). The chemotaxis network possesses remarkable signaling properties, including high sensitivity to small changes in chemical concentration over a wide range of ambient concentrations. These signaling properties rely on receptor clustering (Bray et al, 1998), which occurs at multiple length scales. At a small scale, the chemotaxis receptors form stable homodimers, which then assemble into larger complexes in which receptors of different chemical specificities are inter- mixed (Studdert and Parkinson, 2004; Lai et al, 2005). Trimers of dimers (Kim et al, 1999; Ames et al, 2002; Studdert and Parkinson, 2004) are believed to be the smallest signaling unit (Boldog et al, 2006). At a larger scale, B10 000 receptors form large polar and lateral receptor clusters (Maddock and Shapiro, 1993; Ames et al, 2002; Zhang et al, 2007). Theoretical analysis of in vivo fluorescence resonance energy transfer (FRET) data suggests that large receptor clusters are composed of smaller signaling teams each consisting of about 10 strongly coupled receptor dimers (see Box 1 for details) (Sourjik and Berg, 2004; Mello and Tu, 2005; Keymer et al, 2006; Skoge et al, 2006), which is consistent with receptor cooperativity (Hill coefficients of dose–response curves) observed in vitro (Li and Weis, 2000). Signal transduction by receptor signaling teams requires association with the kinase CheA, and the adapter protein CheW; both CheA and CheW affect receptor cooperativity (Sourjik and Berg, 2004) and large-scale clustering (Maddock and Shapiro, 1993; Liberman et al, 2004; Shiomi et al, 2005). CheA’s kinase activity is inhibited by attractant binding to receptors. When active, CheA autophosphorylates using ATP and transfers the phosphoryl group to the response regulator CheY. Phosphorylated CheY (CheY-P) diffuses to the flagellar motor and induces clockwise motor rotation and cell tumbling. CheY-P is dephosphorylated by its phosphatase CheZ. In the absence of CheY-P, flagellar motors rotate & 2008 EMBO and Nature Publishing Group Molecular Systems Biology 2008 1 Molecular Systems Biology 4; Article number 211; doi:10.1038/msb.2008.49 Citation: Molecular Systems Biology 4:211 & 2008 EMBO and Nature Publishing Group All rights reserved 1744-4292/08 www.molecularsystemsbiology.com
Transcript of Variable sizes of Escherichia coli chemoreceptor signaling teams

Variable sizes of Escherichia coli chemoreceptorsignaling teams
Robert G Endres1,2,6, Olga Oleksiuk3,6, Clinton H Hansen4, Yigal Meir5, Victor Sourjik3,* and Ned S Wingreen1,*
1 Department of Molecular Biology, Princeton University, Princeton, NJ, USA, 2 Division of Molecular Biosciences and Centre for Integrated Systems Biology at ImperialCollege, Imperial College London, London, UK, 3 Zentrum fur Molekulare Biologie der Universitat Heidelberg (ZMBH), Heidelberg, Germany, 4 Department of Physics,Princeton University, Princeton, NJ, USA and 5 Department of Physics, Ben Gurion University, Beer Sheva, Israel6 These authors contributed equally to this work* Corresponding authors. V Sourjik, Zentrum fur Molekulare Biologie der Universitat Heidelberg (ZMBH), Im Neuenheimer Feld 282, Heidelberg, Germany.Tel.: þ 49 622154 6858; Fax: þ 49 622154 5894; E-mail: [email protected] or NS Wingreen, Department of Molecular Biology, Princeton University,Washington Road, Princeton, NJ 08544-1014, USA. Tel.: þ 1 609 258 1894; Fax: þ 1 609 258 8616; E-mail: [email protected]
Received 3.4.08; accepted 21.6.08
Like many sensory receptors, bacterial chemotaxis receptors form clusters. In bacteria, large-scaleclusters are subdivided into signaling teams that act as ‘antennas’ allowing detection of ligands withremarkable sensitivity. The range of sensitivity is greatly extended by adaptation of receptors tochanges in concentrations through covalent modification. However, surprisingly little is knownabout the sizes of receptor signaling teams. Here, we combine measurements of the signalingresponse, obtained from in vivo fluorescence resonance energy transfer, with the statistical methodof principal component analysis, to quantify the size of signaling teams within the framework of thepreviously successful Monod–Wyman–Changeux model. We find that size of signaling teamsincreases 2- to 3-fold with receptor modification, indicating an additional, previously unrecognizedlevel of adaptation of the chemotaxis network. This variation of signaling-team size shows thatreceptor cooperativity is dynamic and likely optimized for sensing noisy ligand concentrations.Molecular Systems Biology 5 August 2008; doi:10.1038/msb.2008.49Subject Categories: simulations and data analysis; signal transductionKeywords: adaptation; chemotaxis; FRET; principal component analysis; receptor clusters
This is an open-access article distributed under the terms of the Creative Commons Attribution Licence,which permits distribution and reproduction in any medium, provided the original author and source arecredited. Creation of derivative works is permitted but the resulting work may be distributed only under thesame or similar licence to this one. This licence does not permit commercial exploitation without specificpermission.
Introduction
Transmembrane receptors of the chemotaxis network inEscherichia coli allow bacteria to sense chemicals in theenvironment, allowing cells to swim toward nutrients (attrac-tant chemicals) and away from repellents (toxic chemicals).The chemotaxis network possesses remarkable signalingproperties, including high sensitivity to small changes inchemical concentration over a wide range of ambientconcentrations. These signaling properties rely on receptorclustering (Bray et al, 1998), which occurs at multiple lengthscales. At a small scale, the chemotaxis receptors form stablehomodimers, which then assemble into larger complexes inwhich receptors of different chemical specificities are inter-mixed (Studdert and Parkinson, 2004; Lai et al, 2005). Trimersof dimers (Kim et al, 1999; Ames et al, 2002; Studdert andParkinson, 2004) are believed to be the smallest signaling unit(Boldog et al, 2006). At a larger scale, B10 000 receptors formlarge polar and lateral receptor clusters (Maddock and Shapiro,1993; Ames et al, 2002; Zhang et al, 2007). Theoretical analysis
of in vivo fluorescence resonance energy transfer (FRET) datasuggests that large receptor clusters are composed of smallersignaling teams each consisting of about 10 strongly coupledreceptor dimers (see Box 1 for details) (Sourjik and Berg, 2004;Mello and Tu, 2005; Keymer et al, 2006; Skoge et al,2006), which is consistent with receptor cooperativity(Hill coefficients of dose–response curves) observed in vitro(Li and Weis, 2000).
Signal transduction by receptor signaling teams requiresassociation with the kinase CheA, and the adapter proteinCheW; both CheA and CheW affect receptor cooperativity(Sourjik and Berg, 2004) and large-scale clustering (Maddockand Shapiro, 1993; Liberman et al, 2004; Shiomi et al, 2005).CheA’s kinase activity is inhibited by attractant binding toreceptors. When active, CheA autophosphorylates using ATPand transfers the phosphoryl group to the response regulatorCheY. Phosphorylated CheY (CheY-P) diffuses to the flagellarmotor and induces clockwise motor rotation and celltumbling. CheY-P is dephosphorylated by its phosphataseCheZ. In the absence of CheY-P, flagellar motors rotate
& 2008 EMBO and Nature Publishing Group Molecular Systems Biology 2008 1
Molecular Systems Biology 4; Article number 211; doi:10.1038/msb.2008.49Citation: Molecular Systems Biology 4:211& 2008 EMBO and Nature Publishing Group All rights reserved 1744-4292/08www.molecularsystemsbiology.com

counterclockwise and the cell runs straight. Adaptationin wild-type cells relies on methylation/demethylation ofglutamates at 4–6 specific modification sites (depending on thereceptor type) by the enzymes CheR/CheB, the latter beingactivated through phosphorylation by CheA.
Despite the excellent characterization of much of thebacterial chemotaxis network, very little is known about the
sizes of receptor signaling teams, which are difficult to resolveby fluorescence or electron microscopy. However, receptormethylation has been observed to affect polar clusteringslightly. Receptor clusters are relatively stable, as demon-strated for polar clusters using fluorescence recovery afterphotobleaching (Schulmeister et al, 2008) and for trimers ofdimers (Studdert and Parkinson, 2005) using crosslinking
LigandLigand
∆ε < 0
∆ε < 0
On
On
Off
OffOff
Off
RegimenIIRegimenI
CheACheACheA
CheA CheA CheAPPP
Off
On
Chemoreceptors cluster at multiple scales ranging from receptor dimers, to trimers of dimers, to large polar and lateral clusters. Signaling properties are believedto arise from groups of several trimers of dimers forming signaling teams. Within a signaling team, receptors are assumed to be coupled strongly enough thatthe receptors are either all in the on state or all in the off state (A). In the on state, the receptor-associated kinase CheA is assumed to be active,autophosphorylating itself and transferring the phospho-group to the response regulators CheY and CheB. In the off state, CheA is inactive and unable toautophosphorylate (B). Importantly, the two-state property of the receptor dimers and signaling teams leads to two characteristic regimens of activity asdescribed below.Single two-state receptor: We assume that an individual chemoreceptor (homodimer) has two states, on or off (Asakura and Honda, 1984). Attractant bindingfavors the off state, in which the receptor-bound kinase CheA is inactive, whereas modification of the receptor favors the on state, in which CheA is active. Atequilibrium, the probability that the receptor dimer is on is
pon ¼ e�fon
e�fonþe�foff¼ 1
1 þ eDf
where all energies are expressed in units of the thermal energy kBT. The receptor dimer free-energy difference between on and off states is given by
Df ¼ f on � f off ¼ DeðmÞ þ log1þ½L�=Koff
D
1þ½L�=KonD
� �
where ligand binding in the on (off) state with dissociation constant KDon (KD
off) is included. For attractant binding KDoffoKD
on, and for repellent binding, KDoff4KD
on. Themodification state of the receptor dimer enters only through the offset energy De(m). The probability of the on state is considered to be the receptor activity.
Two regimens of activity are apparent. (C) A schematic energy-level diagram as a function of attractant (ligand) concentration [L] for a fully demethylated(unmodified) receptor dimer (left, regimen I) and a fully modified receptor dimer (right, regimen II) is shown (Keymer et al, 2006). The receptor dimer can either beon or off. For clarity in the figure, only the off state can bind attractant (red disc), with ligand dissociation constant KD
off. Methyl groups or glutamines (diamonds)lower the free energy of the on state. In regimen I, the on-state free energy is above the off-state free energy (De40) in the absence of attractant, leading to a lowactivity; the crossing of the lowest levels occurs at [L]¼KD
off (black dot). In regimen II, the on-state free energy is below the off-state free energy (Deo0) in theabsence of a ligand, leading to a high activity; the crossing of the lowest levels occurs at an increased ligand concentration [L]¼KD
offexp(|De|) (black dot). In bothregimens I and II, the crossing of the lowest levels corresponds to the inhibition constant Ki (ligand concentration at half-maximal activity), obtainable fromdose–response curves.Receptor signaling team: Within the allosteric Monod–Wyman–Changeux (MWC) model (Monod et al, 1965), two-state receptor dimers form signaling teamswith all receptors in a team either on or off together (Sourjik and Berg, 2004; Mello and Tu, 2005; Keymer et al, 2006). Assuming for simplicity a single receptortype, such as Tar, the equilibrium probability that a signaling team of N receptor dimers will be on is
pon ¼ e�N fon
e�N fonþe�N f off ¼1
1 þ eNDf
Importantly, signaling-team formation enhances the difference between the two regimens (Keymer et al, 2006). In regimen I, where De40 (e.g. for Tar{EEEE}),receptor dimers have an even lower activity, Bexp(�NDe), and an inhibition constant KiBKD
off/N, indicating an N times higher sensitivity than that of a singlereceptor dimer. In regimen II, where Deo0 (e.g. for Tar{QQQQ}), receptor dimers are even more fully active, and turn off at attractant concentrationKiBKD
offexp(|De|) with enhanced cooperativity, specifically with a Hill coefficient nHBN.The strong effect of signaling-team size on the sensitivity of demethylated (unmodified) receptors and on the Hill coefficient of more highly modified receptors
allows us to deduce signaling-team size from signaling dose–response curves (Supplementary Table I; Keymer et al, 2006; Endres et al, 2007).
Box 1 Model for receptor signaling
Variable chemoreceptor signaling-team sizeRG Endres et al
2 Molecular Systems Biology 2008 & 2008 EMBO and Nature Publishing Group

experiments. However, there is some evidence that demethy-lation or attractant binding decreases the stability of polarreceptor clusters (Shrout et al, 2003; Homma et al, 2004;Lamanna et al, 2005; Vaknin and Berg, 2006), although theeffects on the size of the polar and lateral clusters appear to beminor or none (Lybarger and Maddock, 1999; Liberman et al,2004; Lybarger et al, 2005; Shiomi et al, 2005). In vitro,receptor cooperativity has been observed to increase withreceptor modification (Li and Weis, 2000), but such anincrease in cooperativity is expected with increasing activityeven for fixed-size signaling teams (see Box 1; Keymer et al,2006).
Here, we report a method to reliably extract the size ofreceptor signaling teams from variable in vivo FRET signalingdata (Figure 1), and apply the method to cells that express onlythe aspartate-specific Tar receptor. We examined both adaptingreceptors in the presence of the modification enzymes CheRand CheB, as well as genetically engineered receptors inparticular modification states in non-adapting cheRcheB cells.To analyze dose–response curves (activity versus MeAspconcentration), we first applied the statistical method ofprincipal component analysis (PCA) to properly treat corre-lated variability in the data. Next, we fitted our previouslyestablished two-state model of signaling to the PCA-treated
PCA
MeAsp (mM)
FR
ET
10–4 10–3 10–2 10–1
10–110–110–210–310–4
100
100
MeAsp (mM)
0
1
Rec
epto
r ac
tivity
MeAsp (mM)
FR
ET
Tar{QEEE} Tar{QQQQ}
N=6
N =18
Figure 1 Determining sizes of receptor signaling teams from signaling dose–response curves. Signaling-team size N, i.e. the number of receptor dimers per signalingteam, may differ depending on the receptor modification state (glutamate (E) or glutamine (Q) at four specific receptor modification sites). Variable signaling-team sizesare illustrated schematically by membrane patches of trimers of dimers (blue circles) with signaling teams of two trimers (N¼6 dimers) for Tar{QEEE}, or signaling teamsof six trimers (N¼18 dimers) for Tar{QQQQ}. When directly fitting the free-energy model of receptor activity to the noisy data, the fitted curves and model parameters varywidely, due to the large error bars (middle panel), preventing quantitative analysis of signaling-team sizes. However, use of principal component analysis (PCA)separates the reproducible variation of the data from the sampling noise, allowing quantitative evaluation of parameters, and revealing a systematic dependence ofsignaling-team size on receptor modification level in living cells.
Variable chemoreceptor signaling-team sizeRG Endres et al
& 2008 EMBO and Nature Publishing Group Molecular Systems Biology 2008 3
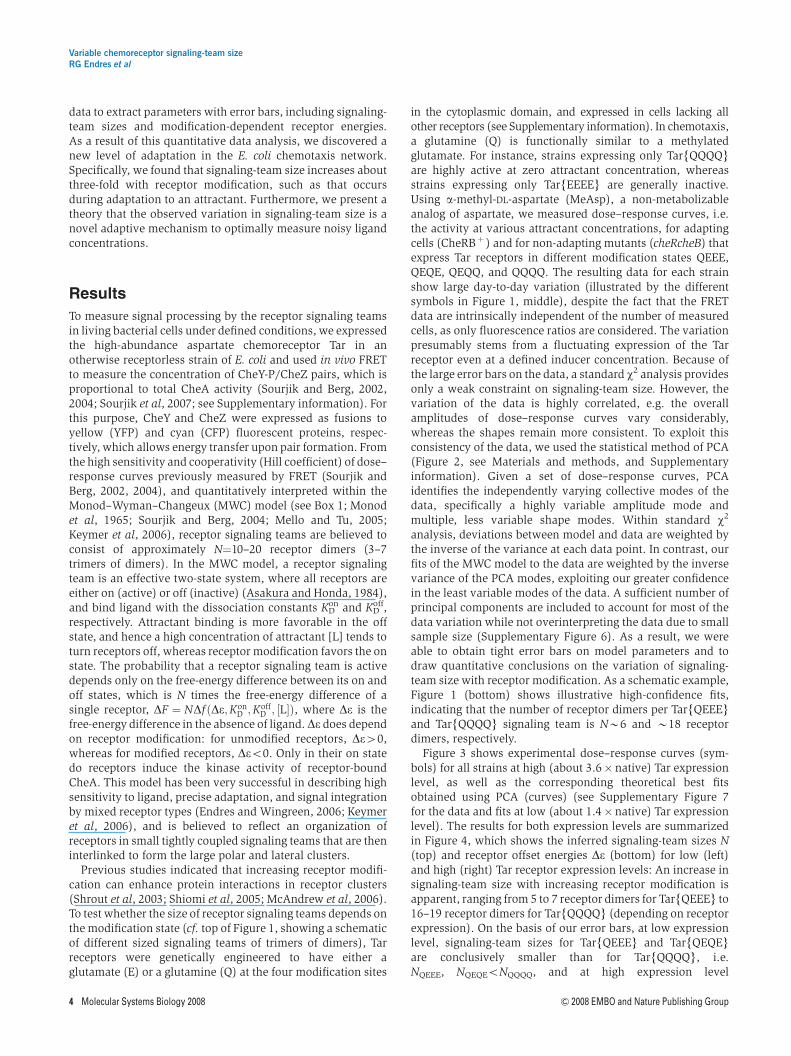
data to extract parameters with error bars, including signaling-team sizes and modification-dependent receptor energies.As a result of this quantitative data analysis, we discovered anew level of adaptation in the E. coli chemotaxis network.Specifically, we found that signaling-team size increases aboutthree-fold with receptor modification, such as that occursduring adaptation to an attractant. Furthermore, we present atheory that the observed variation in signaling-team size is anovel adaptive mechanism to optimally measure noisy ligandconcentrations.
Results
To measure signal processing by the receptor signaling teamsin living bacterial cells under defined conditions, we expressedthe high-abundance aspartate chemoreceptor Tar in anotherwise receptorless strain of E. coli and used in vivo FRETto measure the concentration of CheY-P/CheZ pairs, which isproportional to total CheA activity (Sourjik and Berg, 2002,2004; Sourjik et al, 2007; see Supplementary information). Forthis purpose, CheY and CheZ were expressed as fusions toyellow (YFP) and cyan (CFP) fluorescent proteins, respec-tively, which allows energy transfer upon pair formation. Fromthe high sensitivity and cooperativity (Hill coefficient) of dose–response curves previously measured by FRET (Sourjik andBerg, 2002, 2004), and quantitatively interpreted within theMonod–Wyman–Changeux (MWC) model (see Box 1; Monodet al, 1965; Sourjik and Berg, 2004; Mello and Tu, 2005;Keymer et al, 2006), receptor signaling teams are believed toconsist of approximately N¼10–20 receptor dimers (3–7trimers of dimers). In the MWC model, a receptor signalingteam is an effective two-state system, where all receptors areeither on (active) or off (inactive) (Asakura and Honda, 1984),and bind ligand with the dissociation constants KD
on and KDoff,
respectively. Attractant binding is more favorable in the offstate, and hence a high concentration of attractant [L] tends toturn receptors off, whereas receptor modification favors the onstate. The probability that a receptor signaling team is activedepends only on the free-energy difference between its on andoff states, which is N times the free-energy difference of asingle receptor, DF ¼ NDf ðDe;Kon
D ;KoffD ; ½L�Þ, where De is the
free-energy difference in the absence of ligand.De does dependon receptor modification: for unmodified receptors, De40,whereas for modified receptors, Deo0. Only in their on statedo receptors induce the kinase activity of receptor-boundCheA. This model has been very successful in describing highsensitivity to ligand, precise adaptation, and signal integrationby mixed receptor types (Endres and Wingreen, 2006; Keymeret al, 2006), and is believed to reflect an organization ofreceptors in small tightly coupled signaling teams that are theninterlinked to form the large polar and lateral clusters.
Previous studies indicated that increasing receptor modifi-cation can enhance protein interactions in receptor clusters(Shrout et al, 2003; Shiomi et al, 2005; McAndrew et al, 2006).To test whether the size of receptor signaling teams depends onthe modification state (cf. top of Figure 1, showing a schematicof different sized signaling teams of trimers of dimers), Tarreceptors were genetically engineered to have either aglutamate (E) or a glutamine (Q) at the four modification sites
in the cytoplasmic domain, and expressed in cells lacking allother receptors (see Supplementary information). In chemotaxis,a glutamine (Q) is functionally similar to a methylatedglutamate. For instance, strains expressing only Tar{QQQQ}are highly active at zero attractant concentration, whereasstrains expressing only Tar{EEEE} are generally inactive.Using a-methyl-DL-aspartate (MeAsp), a non-metabolizableanalog of aspartate, we measured dose–response curves, i.e.the activity at various attractant concentrations, for adaptingcells (CheRBþ ) and for non-adapting mutants (cheRcheB) thatexpress Tar receptors in different modification states QEEE,QEQE, QEQQ, and QQQQ. The resulting data for each strainshow large day-to-day variation (illustrated by the differentsymbols in Figure 1, middle), despite the fact that the FRETdata are intrinsically independent of the number of measuredcells, as only fluorescence ratios are considered. The variationpresumably stems from a fluctuating expression of the Tarreceptor even at a defined inducer concentration. Because ofthe large error bars on the data, a standard w2 analysis providesonly a weak constraint on signaling-team size. However, thevariation of the data is highly correlated, e.g. the overallamplitudes of dose–response curves vary considerably,whereas the shapes remain more consistent. To exploit thisconsistency of the data, we used the statistical method of PCA(Figure 2, see Materials and methods, and Supplementaryinformation). Given a set of dose–response curves, PCAidentifies the independently varying collective modes of thedata, specifically a highly variable amplitude mode andmultiple, less variable shape modes. Within standard w2
analysis, deviations between model and data are weighted bythe inverse of the variance at each data point. In contrast, ourfits of the MWC model to the data are weighted by the inversevariance of the PCA modes, exploiting our greater confidencein the least variable modes of the data. A sufficient number ofprincipal components are included to account for most of thedata variation while not overinterpreting the data due to smallsample size (Supplementary Figure 6). As a result, we wereable to obtain tight error bars on model parameters and todraw quantitative conclusions on the variation of signaling-team size with receptor modification. As a schematic example,Figure 1 (bottom) shows illustrative high-confidence fits,indicating that the number of receptor dimers per Tar{QEEE}and Tar{QQQQ} signaling team is NB6 and B18 receptordimers, respectively.
Figure 3 shows experimental dose–response curves (sym-bols) for all strains at high (about 3.6� native) Tar expressionlevel, as well as the corresponding theoretical best fitsobtained using PCA (curves) (see Supplementary Figure 7for the data and fits at low (about 1.4�native) Tar expressionlevel). The results for both expression levels are summarizedin Figure 4, which shows the inferred signaling-team sizes N(top) and receptor offset energies De (bottom) for low (left)and high (right) Tar receptor expression levels: An increase insignaling-team size with increasing receptor modification isapparent, ranging from 5 to 7 receptor dimers for Tar{QEEE} to16–19 receptor dimers for Tar{QQQQ} (depending on receptorexpression). On the basis of our error bars, at low expressionlevel, signaling-team sizes for Tar{QEEE} and Tar{QEQE}are conclusively smaller than for Tar{QQQQ}, i.e.NQEEE, NQEQEoNQQQQ, and at high expression level
Variable chemoreceptor signaling-team sizeRG Endres et al
4 Molecular Systems Biology 2008 & 2008 EMBO and Nature Publishing Group

NQEEEoNQEQEoNQEQQ, NQQQQ (see Supplementary Table I fornumerical values of parameters). Additionally, receptor offsetenergies De decrease systematically with modification stateand are approximately independent of receptor expressionlevel, as expected for an intrinsic single-receptor property,providing further evidence for the reliability of our dataacquisition and analysis.
Our results indicate that the size of receptor signalingteams depends directly on receptor modification state, noton receptor activity. The Tar{QEQE}, Tar{QEQQ}, andTar{QQQQ} strains are all fully active at low MeAspconcentrations (see Figure 3 and Supplementary Figure 7),
but signaling-team size nevertheless increases with thenumber of glutamines (Figure 4). To further test thedependence of signaling-team size on receptor modificationat high Tar expression level, we made use of the fact thatCheRBþ cells adapted to two different attractant concentra-tions, 0 and 0.1 mM MeAsp, have the same activity (indicatedby arrows in Figure 3), but, respectively, low and high receptormodification levels. Compared to cells adapted to zeroambient, the receptor methylation level (as evident from theoffset energy) and signaling-team size have significantlyincreased for cells adapted to 0.1 mM MeAsp (plus symbolsin Figure 3 and stripe pattern in Figure 4B and D).
To test whether our results for the sizes of receptor signalingteams depended on the MWC model, we also obtained fits ofthe FRET data using alternative models in which trimers ofdimers are coupled to their nearest neighbors in a triangular orin a honeycomb lattice (see Supplementary information).Although these Ising-type lattice models do not account wellfor the data from mostly demethylated receptors (Skoge et al,2006), adequate fits to dose–response curves were obtainedfor the more highly modified receptors. The results stronglyconfirm our conclusion that effective signaling-team sizeincreases significantly with receptor modification.
Do the observed variable complex sizes reflect an ‘optimal’receptor signaling-team size that changes with ligand con-centration? We address this question briefly here, with detailsin the Supplementary information. Complexes of N receptordimers respond more strongly to changes in ligand concentra-tion than do single receptor dimers, as the free-energydifference of a receptor signaling team is NDf, where Df isthe free-energy difference of a single receptor dimer. Hencelarger signaling teams are better for detecting weak signals.However, larger signaling teams are also noisier than smallersignaling teams, as ligand noise gets amplified as well. Forinstance, the standard deviation of the free-energy differenceof a signaling team due to ligand concentration noise d[L] is
sF ¼ NdðDfÞd½L� d½L� ð1Þ
10–3 10–2 10–1 100
MeAsp (mM)
0
0.05
0.1
FR
ET
FRET at [MeAsp]1
FR
ET
at [
MeA
sp] 2 v1, λ1
v2, λ2
σ2=Σλi
QEQEM=7
Figure 2 Illustration of principal component analysis (PCA) applied to dose–response curves of receptor activity to obtain principal modes of data variation. Receptoractivity at various concentrations of attractant (MeAsp) was measured through in vivo FRET for E. coli cells expressing only Tar receptors. (A) Measured dose–responsecurves show large variability, as exemplified by M¼7 individual curves for the receptor modification state QEQE in a cheRcheB mutant. (B) Illustration of a scatter plot ofdata from (A) in a space of dimension D equal to the number of different attractant concentrations (projected onto two dimensions for clarity). Each data point (square)corresponds to one dose–response curve. The average dose–response curve is shown as an open circle. PCA involves diagonalizing the covariance matrix C, where theprincipal components—eigenvectors ni and eigenvalues li of C with i¼1,y, D—indicate the direction and magnitude of variation of the data. The sum of theeigenvalues equals the total variance of the data. The open square illustrates our practice of leaving out one data point when determining the optimal number of principalcomponents to be included for fitting (see Supplementary Figure 6B).
10–4 10–3 10–2 10–1 100
MeAsp (mM)
0
0.2
0.4
0.6
0.8
1
Rec
epto
r ac
tivity
QQQQQEQQQEQEQEEECheRB+, 0 mMCheRB+, 0.1 mM
Figure 3 Individual receptor-activity dose–response curves (symbols) andcorresponding PCA fits (solid lines) for E. coli cells expressing only Tar receptorsat high (B3.6� native) expression level (see Supplementary information). Celltypes include adapting (CheRBþ ) and non-adapting, engineered cheRcheBmutants (QEEE, QEQE, QEQQ, and QQQQ). CheRBþ cells are adapted eitherto zero attractant (x symbols) or to 0.1 mM MeAsp (þ symbols). The arrowsindicate the adapted activity of 0.2. Measurement of the dose–response curves ofCheRBþ cells adapted to 0.1 mM MeAsp required not only addition but alsoremoval of MeAsp. The experimental data were normalized by the inverseamplitude f�1 (see Materials and methods, and Supplementary Table I).
Variable chemoreceptor signaling-team sizeRG Endres et al
& 2008 EMBO and Nature Publishing Group Molecular Systems Biology 2008 5

where the derivative is
dðDfÞd½L� ¼ 1
KoffD þ ½L�
� 1
KonD þ ½L� ð2Þ
A large standard deviation of the free-energy difference of asignaling team, i.e. sF41 in units of the thermal energy kBT,means that many signaling teams are either fully active or fullyinactive, making them unresponsive to small changes in themean ligand concentration, and therefore of no use forchemotaxis. A restriction to sFt1 sets an upper limit on thesize of signaling teams. The lowest possible uncertainty inligand concentration is given by the Berg and Purcell limit(Berg and Purcell, 1977) and generalized by Bialek andSetayeshgar (2005) d½L�=½L� ¼ 1=
ffiffiffiffiffiffiffiffiffiffiffiffiffiffiffiffipaD½L�t
p, where a is the
receptor dimension, D is the ligand diffusion constant, and t isthe averaging time. On the basis of this estimate, equation (1)can be solved for the upper limit on the signaling-team size
NtffiffiffiffiffiffiffiffiffiffiffiffiffiffiffiffipaD½L�t
p½L�=ð½L� þ Koff
D Þ–½L�=ð½L� þ KonD Þ
ð3Þ
As a result, to optimize sensitivity the signaling-team sizeincreases as NB[L]1/2 for intermediate ligand concentrations(KD
off [L] KDon). In a nutshell, larger signaling teams are
more sensitive to small changes in ligand concentration, but asa result are also more sensitive to ligand concentration noise.Optimally, signaling teams will be as large as possible withoutbeing saturated by this noise (i.e. fully active or fully inactive
and hence unresponsive to ligand concentration changes). Asthe relative ligand noise decreases with concentration, theoptimal signaling-team size will grow with ligand concentra-tion, as we observed.
Discussion
The chemotaxis network of E. coli exhibits remarkable sensingand signaling properties that rely on receptor signaling teams.Despite recent high-resolution electron microscopy (Weis et al,2003; McAndrew et al, 2004, 2005, 2006; Briegel et al, 2008),very little is known about what determines receptor signaling-team formation and size (Kentner and Sourjik, 2006; Kentneret al, 2006). Notably, because signaling-team size andsignaling sensitivity are closely related (Keymer et al, 2006;Endres et al, 2007; Mello and Tu, 2007), receptor kinaseactivity can be used to probe signaling-team size. Starting fromdose–response data on the activity of Tar receptors from in vivoFRET experiments, we developed a robust analysis method toextract signaling-team sizes and receptor offset energies(Figure 1), interpreted within a well-established model forcooperative receptor signaling (see Box 1). To achieve this, weapplied the unbiased statistical method of PCA (see Figure 2,Materials and methods, and Supplementary information) tothe data to separate correlated variation in the data from noisedue to small sample size. Conventional w2 fitting to individu-
–2
–1
0
∆ε
–2
–1
0
∆ε
0 5 10 15 20 25 30
N
0 5 10 15 20 25 30
N
QEEE
QEQE
QEQQ
QQQQ
CheRB+, 0 mM
CheRB+, 0.1 mM
Figure 4 Sizes of receptor signaling teams N (number of receptor dimers per signaling team, panels A and B) and offset energies De (panels C and D) obtained fromPCA fits shown in Figure 3 in the main text and Supplementary Figure 7. The left panels A and C correspond to low (B1.4� native) expression of Tar receptors,whereas the right panels B and D correspond to high (B3.6� native) expression (see Materials and methods). Cell types include adapting (CheRBþ ) and non-adapting, engineered cheRcheB mutants (QEEE, QEQE, QEQQ, and QQQQ). For numerical values of parameters and confidence intervals, see Supplementary Table I.
Variable chemoreceptor signaling-team sizeRG Endres et al
6 Molecular Systems Biology 2008 & 2008 EMBO and Nature Publishing Group

ally normalized data curves misses the comparison ofamplitudes, and when applied to averaged data values andtheir standard deviations overestimates the fluctuations bymissing the correlations among the data points within a dose–response curve measured on the same day. Using our PCAanalysis, we then fitted the MWC model for receptor signalingteams (see Box 1) to the principal components of the data,allowing us to obtain receptor parameters with tight con-fidence intervals (Figures 3 and 4, as well as SupplementaryFigure 7). Importantly for chemotaxis, we found that signal-ing-team size increases significantly with receptor modifica-tion level (Figure 4). Motivated by this discovery, we presenteda model describing how variable signaling-team size mayenable cells to optimally measure ligand concentrations.Whereas both small changes in ligand concentration (signal)and ligand concentration noise are increasingly amplified byincreasing signaling-team size, the noise decreases forincreasing ambient concentration. This allows the cell toutilize larger signaling teams at larger ambient concentrationsand hence receptor modification levels without saturation ofthe signaling teams by noise.
Our results based on Tar-only mutants suggest a previouslyunrecognized level of adaptation relying on increasingsignaling-team size with receptor modification. Interestingly,the opposite trend, i.e. a diminishing ability to cluster withincreasing receptor modification, was suggested to possiblydownregulate overall sensitivity with adaptation (Bray et al,1998). In the MWC model, however, this downregulationsimply emerges from the two-state property (Box 1 andKeymer et al, 2006). To show that variable signaling-team sizesalso apply to mixed receptor types, a similar detailed analysiswould need to be conducted on FRET data of wild-type cells.As Tsr and Tar are the most abundant receptor types, at leastthe numbers of Tsr and Tar receptor dimers per receptorsignaling team would need to be considered while ensuringthat the overall ratio of Tsr/Tar stays independent ofmodification state. Previous standard analysis of such FRETdata showed that mixed Tar/Tsr signaling teams contain a totalof around 10–20 receptor dimers, consistent with our Tarsignaling teams. Additionally, as wild-type cells show highdegree of polar clustering (Maddock and Shapiro, 1993;Sourjik and Berg, 2000; Liberman et al, 2004), the deducedclustering ability of Tar receptors is not an artifact of thehomogeneous receptor expression.
What are the possible mechanisms responsible for receptorsignaling-team formation and the increase in signaling-teamsize with increasing receptor modification? Receptor modifica-tion reduces the electrostatic repulsion between neighboringdimers by removing charged glutamate residues, potentiallystabilizing larger signaling teams. However, the modificationsites of neighboring receptor dimers are at least 3 nm apart inthe partial crystal structure (Kim et al, 1999). For a Debye–Huckel screening length of 1 nm, the resulting screenedelectrostatic interaction is only 1% of the thermal energy fora pair of charged glutamates. Therefore, other mechanismsmay contribute to the observed dependence of signaling-teamsize on receptor modification: (1) binding of CheA and CheWaffects both large-scale clustering of receptors (Maddock andShapiro, 1993; Sourjik and Berg, 2000; Liberman et al, 2004)and the sizes of signaling teams (Sourjik and Berg, 2004), and
the relevant binding affinities of CheA and CheW appear todepend on the level of receptor modification (Shrout et al,2003); (2) receptor activity has been shown to respond toreceptor–membrane interactions (Draheim et al, 2006) andchanges in osmotic pressure (Vaknin and Berg, 2006), sointer-dimer coupling could be mediated by elastic membranedeformations, as proposed for the approximate two-stateosmolarity-sensing MscL pore (Ursell et al, 2007). Our dataalso indicate that signaling-team size increases moderatelywith expression level (Figure 4 and Supplementary Table I),perhaps because more available receptors push the distribu-tion of signaling teams toward larger sizes (Endres et al, 2007).
Many other sensory systems cluster, including B cell(Schamel and Reth, 2000), T cell (Germain and Stefanova,1999), synaptic (Griffith, 2004), and ryanodine (Yin et al,2005), indicating that receptor clustering is an importantregulatory mechanism for the cell, e.g. to adjust signalingproperties or by recruiting auxiliary proteins. As eukaryotic G-protein-coupled receptors become covalently modified as well,e.g. by phosphorylation, receptor modification may prove tobe a general mechanism for dynamic regulation of cluster sizeand optimization of signal response.
Materials and methods
Model for receptor signaling team
To extract parameters of receptor signaling teams from fitting to in vivoFRET data, we describe signaling teams by the allosteric MWC model(Monod et al, 1965), as described in Box 1. Briefly, in this modelsignaling teams are composed of two-state receptors with all receptorsin a signaling team either on or off together (Sourjik and Berg, 2004;Keymer et al, 2006). The number of receptor dimers per signaling teamis treated as a continuous parameter, reflecting the degree ofcooperativity among receptors, independent of the suborganizationof dimers into trimers of dimers. Assuming a single receptor type, suchas Tar, the equilibrium probability that an MWC signaling team of Nreceptor dimers will be on is
pon ¼ 1 þ exp N DeðmÞ þ log1þ½L�=Koff
D1þ½L�=Kon
D
� �� � � ��1
ð4Þ
where De(m) is the offset energy, which depends on the receptormodification level m, [L] is the attractant concentration, and KD
on(off) isthe attractant dissociation constant in the on (off) state. All energiesare expressed in units of the thermal energy kBT. We obtain thesignaling-team size N and the modification-dependent off-set energiesDe(m) from the fitting procedure described next. The attractantdissociation constants for the on and off states are taken from Keymeret al (2006).
PCA
To obtain w2 fits, including confidence intervals for parameters, itrequires a representation of the data where deviations from averagevalues are uncorrelated. This is achieved by diagonalizing thecovariance matrix of the data for each strain to obtain the principal(uncorrelated) components of the data (see Supplementary Figure 5).Specifically, from the M dose–response curves xi¼1,y,M (L), eachmeasured for D different ligand concentrations L, the D�D covariancematrix C is calculated through
CðL1;L2Þ ¼1
M
XMi¼1
½xiðL1Þ � xaveðL1Þ�½xiðL2Þ � xaveðL2Þ� ð5Þ
where L1 and L2 are ligand concentrations, and xave(L) is the average ofall M curves at concentration L. Each covariance matrix is diagonalizedby V�1CV¼U where V is a matrix with the eigenvectors of C as the
Variable chemoreceptor signaling-team sizeRG Endres et al
& 2008 EMBO and Nature Publishing Group Molecular Systems Biology 2008 7

columns and U is the diagonal matrix of the eigenvalues lm¼1,y,D.These eigenvectors and eigenvalues are the principal components ofthe data. Standard fitting of a calculated curve c(n; L), which dependson a set of fitting parameters n, to xave would require minimizing
w2 ¼XD
j¼1
½cðLjÞ � xaveðLjÞ�sLj
!2
ð6Þ
where sL is the experimental standard deviation of the data at ligandconcentration L. But this neglects the observed correlations withineach dose–response curve (cf. Figure 2A). Instead, we express w2 inthe PCA basis set by using c¼V�1(c�xave) and replacing the sum overD ligand concentrations by the sum over D principal components
w2PCA ¼
XD
m¼1
~c2m
lmð7Þ
For fits using equation (7), we included only the 3–5 largest principalcomponents (see Supplementary Figure 6). We fitted the data for allfive strains QQQQ, QEQQ, QEQE, QEEE, and CheRBþ simultaneouslyby minimizing the total w2
PCA, as one fitting parameter, an overallamplitude factor f, is common to all five strains. The calculated dose–response curve for each strain also depends on an offset energy De andsignaling-team size N, leading to a total of 11 fitting parameters n¼(f,De1, N1,y, De5, N5) for the low expression level data (cf. Supplemen-tary Figure 7A and Figure 4A), and 13 fitting parameters n¼(f, De1,N1,y,De6, N6) for the high expression level data (cf. Figures 3 and 4B).The dissociation constants for MeAsp binding by Tar in the on and offstates were taken to be KD
on¼0.5 and KDoff¼0.02 mM, respectively
(Keymer et al, 2006).
Confidence intervals
We followed the method of Press et al (2002), but expressed thecurvature matrix
a ¼ q2w2
qnkqnl 2
XD
j¼1
1
s2Lj
qcðLjÞqnk
qcðLjÞqnl
ð8Þ
in the PCA basis by transforming c¼V�1(c�xave) and calculating
aPCA 2XD
m¼1
1
lm
q~cm
qnk
q~cm
qnl¼ 2BTAB ð9Þ
with A¼(V�1)TU�1V�1 and Bqk¼qc(Lq)/(qnk). Confidence intervalswere obtained from the total (aPCA
tot ) summed over the five strains.From the corresponding covariance matrix Ca¼(aPCA
tot )�1, the con-
fidence interval of parameter nk is given by dnk ¼ �ffiffiffiffiffiffiffiffiDw2
p ffiffiffiffiffiffiffiCa
kk
pwhere
Dw2¼4 for 95.4% confidence.
Experimental protocol
Cell growth, FRET measurements, and immunoblots were performedessentially as before (Sourjik and Berg, 2002, 2004; Sourjik et al, 2007).Briefly, receptorless cells co-expressing a CheZ-CFP/CheY-YFP FRETpair and Tar receptors in one of the modification states were grown tomid-exponential phase in the presence of appropriate antibiotics.Expression of the FRET pair was induced with 50mM isopropyl b-D-thiogalactoside. Expression of receptors was induced with either 1 or2mM sodium salicylate, corresponding to low and high levels,respectively. Cells were harvested, washed, and assayed for attrac-tant-induced changes in FRET signal in a flow chamber mounted on acustom-modified Zeiss Axiovert 200 microscope. Fluorescence of afield of 300–500 cells was monitored in each experiment. FRET wasdefined as the fractional change in cyan fluorescence due to energytransfer, and was calculated from changes in the ratios of yellow andcyan fluorescence signals (Sourjik and Berg, 2004). See Supplementaryinformation for measurement details and for the list of strains andplasmids used in this study.
Supplementary information
Supplementary information is available at the Molecular SystemsBiology website (www.nature.com/msb).
AcknowledgementsWe thank Fred Hughson, Tom Shimizu, Monica Skoge, and ChrisWiggins for helpful suggestions. All authors (except CHH) acknowl-edge funding from the Human Frontier Science Program (HFSP).
References
Ames P, Studdert CA, Reiser RH, Parkinson JS (2002) Collaborativesignaling by mixed chemoreceptor teams in Escherichia coli. ProcNatl Acad Sci USA 99: 7060–7065
Asakura S, Honda H (1984) Two-state model for bacterialchemoreceptor proteins. The role of multiple methylation. J MolBiol 176: 349–367
Berg HC, Purcell EM (1977) Physics of chemoreception. Biophys J 20:193–219
Bialek W, Setayeshgar S (2005) Physical limits to biochemicalsignaling. Proc Natl Acad Sci USA 102: 10040–10045
Boldog T, Grimme S, Li M, Sligar SG, Hazelbauer GL (2006) Nanodiscsseparate chemoreceptor oligomeric states and reveal their signalingproperties. Proc Natl Acad Sci USA 103: 11509–11514
Bray D, Levin MD, Morton-Firth CJ (1998) Receptor clustering as acellular mechanism to control sensitivity. Nature 393: 85–88
Briegel A, Ding HJ, Li Z, Werner J, Gitai Z, Dias DP, Jensen RB,Jensen G (2008) Location and architecture of the Caulobactercrescentus chemoreceptor array. Mol Microbiol 68: 30–41
Draheim RR, Bormans AF, Lai RZ, Manson MD (2006) Tuning abacterial chemoreceptor with protein–membrane interactions.Biochemistry 45: 14655–14664
Endres RG, Falke JJ, Wingreen NS (2007) Chemotaxis receptorcomplexes: from signaling to assembly. PLoS Compl Biol 3: e150
Endres RG, Wingreen NS (2006) Precise adaptation in bacterialchemotaxis through ‘assistance neighborhoods’. Proc Natl Acad SciUSA 103: 13040–13044
Germain RN, Stefanova I (1999) The dynamics of T cell receptorsignaling: complex orchestration and the key roles of tempo andcooperation. Annu Rev Immunol 17: 467–522
Griffith LC (2004) Receptor clustering: nothing succeeds like success.Curr Biol 14: R413–R415
Homma M, Shiomi D, Homma M, Kawagishi I (2004) Attractantbinding alters arrangement of chemoreceptor dimers within itscluster at a cell pole. Proc Natl Acad Sci USA 101: 3462–3467
Kentner D, Sourjik V (2006) Spatial organization of the bacterialchemotaxis system. Curr Opin Microbiol 9: 619–624
Kentner D, Thiem S, Hildenbeutel M, Sourjik V (2006) Determinants ofchemoreceptor cluster formation in Escherichia coli. Mol Microbiol61: 407–417
Keymer JE, Endres RG, Skoge M, Meir Y, Wingreen NS (2006)Chemosensing in Escherichia coli: two regimes of two-statereceptors. Proc Natl Acad Sci USA 103: 1786–1791
Kim KK, Yokota H, Kim SH (1999) Four-helical-bundle structure of thecytoplasmic domain of a serine chemotaxis receptor. Nature 400:787–792
Lai RZ, Manson JM, Bormans AF, Draheim RR, Nguyen NT, Manson MD(2005) Cooperative signaling among bacterial chemoreceptors.Biochemistry 44: 14298–14307
Lamanna AC, Ordal GW, Kiessling LL (2005) Large increases inattractant concentration disrupt the polar localization of bacterialchemoreceptors. Mol Microbiol 57: 774–785
Li G, Weis RM (2000) Covalent modification regulates ligand bindingto receptor complexes in the chemosensory system of Escherichiacoli. Cell 100: 357–365
Variable chemoreceptor signaling-team sizeRG Endres et al
8 Molecular Systems Biology 2008 & 2008 EMBO and Nature Publishing Group

Liberman L, Berg HC, Sourjik V (2004) Effect of chemoreceptormodification on assembly and activity of the receptor-kinasecomplex in Escherichia coli. J Bacteriol 186: 6643–6646
Lybarger SR, Maddock JR (1999) Clustering of the chemoreceptorcomplex in Escherichia coli is independent of the methyltransferaseCheR and the methylesterase CheB. J Bacteriol 181: 5527–5529
Lybarger SR, Nair U, Lilly AA, Hazelbauer GL, Maddock JR(2005) Clustering requires modified methyl-accepting sites inlow-abundance but not high-abundance chemoreceptors ofEscherichia coli. Mol Microbiol 56: 1078–1086
Maddock JR, Shapiro L (1993) Polar location of the chemoreceptorcomplex in the Escherichia coli cell. Science 259: 1717–1723
McAndrew RS, Ellis EA, Lai RZ, Manson MD, Holzenburg A (2005)Identification of Tsr and Tar chemoreceptor arrays in E. coli innermembranes. Microsc Microanal 11: 1190–1191
McAndrew RS, Ellis EA, Lai RZ, Manson MD, Holzenburg A (2006)Effects of chemoreceptor modification on the structures of Tsrarrays. Microsc Microanal 12: 378–379
McAndrew RS, Ellis EA, Manson MD, Holzenburg A (2004) TEManalysis of chemoreceptor arrays in native membranes of E. coli.Microsc Microanal 10: 416
Mello BA, Tu Y (2005) An allosteric model for heterogeneous receptorcomplexes: understanding bacterial chemotaxis responses tomultiple stimuli. Proc Natl Acad Sci USA 102: 17354–17359
Mello BA, Tu Y (2007) Effects of adaptation in maintaining highsensitivity over a wide range of backgrounds for Escherichia colichemotaxis. Biophys J 92: 2329–2337
Monod J, Wyman J, Changeux JP (1965) On the nature of allosterictransitions: a plausible model. J Mol Biol 12: 88–118
Press WH, Teukolsky SA, Vetterling WT, Flannery BP (2002) Chapter11. In Numerical Recipes in C++: the Art of Scientific Computing.Cambridge, MA, USA: Cambridge University Press
Schamel WW, Reth M (2000) Monomeric and oligomeric complexes ofthe B cell antigen receptor. Immunity 13: 5–14
Schulmeister S, Ruttorf M, Thiem S, Kentner D, Lebiedz D, Sourjik V(2008) Protein exchange dynamics at chemoreceptor clusters inEscherichia coli. Proc Natl Acad Sci USA 105: 6403–6408
Shiomi D, Banno S, Homma M, Kawagishi I (2005) Stabilization ofpolar localization of a chemoreceptor via its covalent modificationsand its communication with a different chemoreceptor. J Bacteriol187: 7647–7654
Shrout AL, Montefusco DJ, Weis RM (2003) Template-directedassembly of receptor signaling complexes. Biochemistry 42:13379–13385
Skoge ML, Endres RG, Wingreen NS (2006) Receptor–receptorcoupling in bacterial chemotaxis: evidence for strongly coupledclusters. Biophys J 90: 4317–4326
Sourjik V, Berg HC (2000) Localization of components of thechemotaxis machinery of Escherichia coli using fluorescentprotein fusions. Mol Microbiol 37: 740–751
Sourjik V, Berg HC (2002) Receptor sensitivity in bacterial chemotaxis.Proc Natl Acad Sci USA 99: 123–127
Sourjik V, Berg HC (2004) Functional interactions between receptors inbacterial chemotaxis. Nature 428: 437–441
Sourjik V, Vaknin A, Shimizu TS, Berg HC (2007) In vivo measurementby FRET of pathway activity in bacterial chemotaxis. MethodsEnzymol 423: 363–391
Studdert CA, Parkinson JS (2004) Crosslinking snapshots ofbacterial chemoreceptor squads. Proc Natl Acad Sci USA 101:2117–2122
Studdert CA, Parkinson JS (2005) Insights into the organizationand dynamics of bacterial chemoreceptor clusters throughin vivo crosslinking studies. Proc Natl Acad Sci USA 102:15623–15628
Ursell T, Huang KC, Peterson E, Phillips R (2007) Cooperative gatingand spatial organization of membrane proteins through elasticinteractions. PLoS Comput Biol 3: e81
Vaknin A, Berg HC (2006) Osmotic stress mechanically perturbschemoreceptors in Escherichia coli. Proc Natl Acad Sci USA 103:592–596
Weis RM, Hirai T, Chalah A, Kessel M, Peters PJ, Subramaniam S(2003) Electron microscopic analysis of membrane assembliesformed by the bacterial chemotaxis receptor Tsr. J Bacteriol 185:3636–3643
Yin CC, Blayney LM, Lai FA (2005) Physical coupling betweenryanodine receptor–calcium release channels. J Mol Biol 349:538–546
Zhang P, Khursigara CM, Hartnell LM, Subramaniam S (2007)Direct visualization of Escherichia coli chemotaxis receptorarrays using cryo-electron microscopy. Proc Natl Acad Sci USA 104:3777–3781
Molecular Systems Biology is an open-access journalpublished by European Molecular Biology Organiza-
tion and Nature Publishing Group.This article is licensed under a Creative Commons Attribution-Noncommercial-Share Alike 3.0 Licence.
Variable chemoreceptor signaling-team sizeRG Endres et al
& 2008 EMBO and Nature Publishing Group Molecular Systems Biology 2008 9