Volcanology: Lessons learned from Synthetic Aperture Radar imagery
191
Volcanology: Lessons learned from Synthetic Aperture Radar imagery V. Pinel a , M. P. Poland b , A. Hooper c a ISTerre, Universit´ e de Savoie, IRD, CNRS, F73376 Le Bourget du Lac, France b U.S. Geological Survey Hawai‘ian Volcano Observatory, PO Box 51, Hawai‘i National Park, HI 97818-0051, USA c COMET, School of Earth and Environment, University of Leeds, Leeds, LS2 9JT Abstract Twenty years of continuous Earth observation by satellite SAR has re- sulted in numerous new insights into active volcanism, including a better understanding of subsurface magma storage and transport, deposition of vol- canic materials on the surface, and the structure and development of volcanic edifices. This massive archive of data has resulted in fundamental leaps in our understanding of how volcanoes work–for example, identifying magma accumulation at supposedly quiescent volcanoes, even in remote areas or in the absence of ground-based data. In addition, global compilations of vol- canic activity facilitate comparison of deformation behavior between different volcanic arcs and statistical evaluation of the strong link between deforma- tion and eruption. SAR data are also increasingly used in timely hazards evaluation thanks to decreases in data latency and growth in processing and analysis techniques. The existing archive of SAR imagery is on the cusp of being enhanced by a new generation of satellite SAR missions, in addition Email address: [email protected] (V. Pinel) Preprint submitted to Journal of Volcanology and Geothermal Research October 7, 2014
Transcript of Volcanology: Lessons learned from Synthetic Aperture Radar imagery

Volcanology: Lessons learned from Synthetic Aperture
Radar imagery
V. Pinela, M. P. Polandb, A. Hooperc
aISTerre, Universite de Savoie, IRD, CNRS, F73376 Le Bourget du Lac, FrancebU.S. Geological Survey Hawai‘ian Volcano Observatory, PO Box 51, Hawai‘i National
Park, HI 97818-0051, USAcCOMET, School of Earth and Environment, University of Leeds, Leeds, LS2 9JT
Abstract
Twenty years of continuous Earth observation by satellite SAR has re-
sulted in numerous new insights into active volcanism, including a better
understanding of subsurface magma storage and transport, deposition of vol-
canic materials on the surface, and the structure and development of volcanic
edifices. This massive archive of data has resulted in fundamental leaps in
our understanding of how volcanoes work–for example, identifying magma
accumulation at supposedly quiescent volcanoes, even in remote areas or in
the absence of ground-based data. In addition, global compilations of vol-
canic activity facilitate comparison of deformation behavior between different
volcanic arcs and statistical evaluation of the strong link between deforma-
tion and eruption. SAR data are also increasingly used in timely hazards
evaluation thanks to decreases in data latency and growth in processing and
analysis techniques. The existing archive of SAR imagery is on the cusp of
being enhanced by a new generation of satellite SAR missions, in addition
Email address: [email protected] (V. Pinel)
Preprint submitted to Journal of Volcanology and Geothermal Research October 7, 2014

to ground-based and airborne SAR systems, which will provide enhanced
temporal and spatial resolution, broader geographic coverage, and improved
availability of data to the scientific community. Now is therefore an oppor-
tune time to review the contributions of SAR imagery to volcano science,
monitoring, and hazard mitigation, and to explore the future potential for
SAR in volcanology. Provided that the ever-growing volume of SAR data
can be managed effectively, we expect the future application of SAR data to
expand from being a research tool for analyzing volcanic activity after the
fact, to being a monitoring and research tool capable of imaging a wide va-
riety of processes on different temporal and spatial scales as those processes
are occurring. These data can then be used to develop new models of how
volcanoes work and to improve quantitative forecasts of volcanic activity as
a means of mitigating risk from future eruptions.
Keywords:
SAR, volcanoes, deformation, eruptive deposits, DEM
Contents
1 Introduction 4
2 Synthetic Aperture Radar analysis techniques and available
data 8
2.1 Synthetic Aperture Radar principles . . . . . . . . . . . . . . . 8
2.2 Surface change detection . . . . . . . . . . . . . . . . . . . . . 10
2.3 Retrieval of topography through InSAR . . . . . . . . . . . . . 11
2.4 Retrieval of displacement . . . . . . . . . . . . . . . . . . . . . 13
2

2.4.1 Displacement from InSAR . . . . . . . . . . . . . . . . 14
2.4.2 Pixel offset tracking . . . . . . . . . . . . . . . . . . . . 15
2.4.3 Multiple-aperture interferometry (MAI) . . . . . . . . 16
2.4.4 Precise positioning . . . . . . . . . . . . . . . . . . . . 17
2.5 Time series processing . . . . . . . . . . . . . . . . . . . . . . 18
2.5.1 Persistent scatterer InSAR . . . . . . . . . . . . . . . . 19
2.5.2 Small baseline InSAR . . . . . . . . . . . . . . . . . . . 20
2.5.3 Combined time series InSAR . . . . . . . . . . . . . . . 21
2.6 SAR platforms and available data . . . . . . . . . . . . . . . . 22
3 Mapping surface characteristics with SAR 26
3.1 Amplitude . . . . . . . . . . . . . . . . . . . . . . . . . . . . . 26
3.2 Coherence . . . . . . . . . . . . . . . . . . . . . . . . . . . . . 30
3.3 Phase used for topographic measurement . . . . . . . . . . . . 31
4 Insights from SAR into volcano deformation 35
4.1 Sources of deformation around volcanoes . . . . . . . . . . . . 36
4.2 Overview of volcano deformation studies based on SAR data . 41
4.2.1 Magma storage . . . . . . . . . . . . . . . . . . . . . . 42
4.2.2 Magma transport . . . . . . . . . . . . . . . . . . . . . 46
4.2.3 Temporal evolution of magmatic deformation . . . . . 49
4.2.4 Subsidence of volcanic deposits . . . . . . . . . . . . . 52
4.3 Main InSAR limitations for deformation measurements . . . . 55
5 Key constraints on volcanic edifice growth and stability 58
6 Discussion 63
3

6.1 Looking back: advances made possible from SAR studies of
volcanoes . . . . . . . . . . . . . . . . . . . . . . . . . . . . . 63
6.2 Looking forward: better understanding of volcanoes and fore-
casts of eruptions . . . . . . . . . . . . . . . . . . . . . . . . . 67
7 Conclusion 70
8 Acknowledgments 71
1. Introduction1
The advent of satellite remote sensing brought about a revolution in the2
field of volcanology. Before the availability of space-based observations, vol-3
cano monitoring and research relied on painstaking field work to measure4
such parameters as ground deformation, gas emissions, and deposit charac-5
teristics. While valuable and, in many cases, groundbreaking, such as the6
efforts that led to successful predictions of dome-building eruptions at Mount7
St. Helens in the 1980s (Swanson et al., 1983), this work was necessarily lim-8
ited in scope (both in terms of spatial coverage and temporal sampling), and9
relatively few volcanoes were intensely studied. Satellite data have made10
possible a new spectrum of measurements on a global scale that can com-11
plement more focused ground-based studies and can also reveal insights into12
remote or poorly understood volcanoes (Sparks et al., 2012; Pyle et al., 2013).13
Passive measurements in the visible, ultra-violet, and infrared parts of the14
spectrum have been used to detect eruptions, quantify the compositions and15
distributions of deposits, characterize structures, and monitor thermal, ash,16
and gas emissions in near-real time–a critical capability for such applications17
4

as eruption alerts (Wright et al., 2004a) and aviation safety (Hooper et al.,18
2012b). Active measurements from Synthetic Aperture Radar (SAR) have19
further transformed the field of volcano remote sensing, especially since the20
early 1990s. While useful for mapping structures and deposits, SAR offers21
the additional capabilities of quantifying topography and tracking surface de-22
formation, and it is not impacted by time of day or atmospheric conditions.23
Deformation studies, in particular, have exploded thanks to interferomet-24
ric SAR (InSAR). Biggs et al. (2014) reported that 198 volcanoes had been25
systematically observed by InSAR since the launch of the ERS-1 satellite,26
which is more than four times the number of volcanoes where deformation27
studies had been performed by the late 1990s (Dvorak and Dzurisin, 1997).28
Among these 198 volcanoes studied by InSAR over the course of 1992–2010,29
54 volcanoes displayed some indication of deformation, and 25 of those vol-30
canoes erupted during the same interval (Biggs et al., 2014). Including volca-31
noes that have not been systematically monitored on decadal timescales, In-32
SAR results have been reported from 620 volcanoes (out of a total of over 150033
subaerial Holocene volcanoes worldwide see http://www.volcano.si.edu/list volcano.cfm34
), with 161 observed to deform (Biggs et al., 2014). Dzurisin (2003) pointed35
out that aseismic inflation, which is readily detected by InSAR, might be an36
indicator of potential volcanic activity on intermediate timescales of years37
to months – a problematic forecasting window in volcanology – since such38
deformation would indicate magma accumulation that had not yet stressed39
the surrounding rocks to the point of breaking. His foresight has largely been40
borne out by InSAR surveys of entire volcanic arcs (e.g., Pritchard and Si-41
mons, 2002, 2004; Chaussard and Amelung, 2012; Ebmeier et al., 2013a; Lu42
5

and Dzurisin, 2014) that have detected deformation at a number of sup-43
posedly quiescent volcanoes, some of which subsequently erupted. Such44
applications demonstrate the power of InSAR – comprehensive, repeated45
deformation monitoring over broad regions that requires no ground-based46
instrumentation or field personnel.47
The utility of SAR extends beyond deformation monitoring. Variations48
in InSAR coherence over time, which provide a measure of the correlation49
in the scattering properties of the surface, can be used to map, for example,50
lava flow evolution (e.g., Dietterich et al., 2012). InSAR can also quantify51
topography – a critical base for general mapping, and an essential input to52
models of hazardous processes like lava flows (Harris and Rowland, 2001;53
Favalli et al., 2011), pyroclastic deposits (Kelfoun et al., 2009), lahars (Iver-54
son et al., 1998) and debris avalanches (Kelfoun et al., 2008). SAR amplitude55
data have proven their value by detecting structural changes at volcanoes,56
as emphatically demonstrated during the 2010 eruption of Merapi, Indonesia57
(Pallister et al., 2013; Surono et al., 2012). The ability of SAR imagery to see58
through dense cloud cover and the delivery of those data in near-real time59
facilitated hazards mitigation efforts that probably prevented extensive loss60
of life during that eruption (Pallister et al., 2013).61
Since the 1991 launch of the European Space Agency’s (ESA) ERS-1,62
there has always been at least one SAR satellite, and frequently more, in orbit63
around Earth. The first application of these data to assess volcano deforma-64
tion was monitoring subsidence of Mount Etna during 1992-1993 (Massonnet65
et al., 1995). In the 20 years since that landmark result, SAR satellites have66
evolved from mostly C-band sensors with ground-pixel resolutions of tens of67
6

meters to C-, X- and L-band systems that can have resolutions better than68
1 m, with some satellites flying in formation or as part of a constellation.69
The scientific community stands at the cusp of a “golden age” for SAR, with70
existing space-based missions about to be joined by a new generation of satel-71
lites in the forthcoming years, including the ESA’s Sentinel-1–the first SAR72
mission that is operational in nature rather than purely scientific, with data73
available within minutes of acquisition. These new satellites will provide74
data that volcanologists have identified as critical to detecting, tracking and75
understanding eruptive activity, as highlighted by a number of international76
programs. For example, the Geohazard Supersites and Natural Laboratories77
(GSNL) initiative ( http://supersites.earthobservations.org/) is designed to78
focus attention on areas prone to natural hazards by integrating ground-,79
air-, and space-based observations and making these data openly available80
to all researchers at no cost. SAR data are a particular focus of the GSNL81
program, and several volcanic regions have been identified as permanent Su-82
persites (including, as of 2014, Hawai‘i, Iceland, and Italy), with several83
candidate and event Supersites being established as well. Similarly, the 201284
International Forum on Satellite Earth Observations for Geohazards (also85
known as the Santorini conference) specifically advocated that SAR have an86
expanded role in volcano monitoring and research (Bally, 2012). Airborne87
and ground-based SAR are also seeing greater use at volcanoes around the88
world, adding a new dimension to volcanological investigations (e.g., Lund-89
gren et al., 2013; Intrieri et al., 2013).90
The imminent availability of satellite imagery from new SAR systems,91
greater use of ground and airborne SAR, and recent community efforts to92
7

ensure greater access to SAR data provide an opportune occasion to review93
20 years of progress in the volcanological applications of SAR and to an-94
ticipate future advances. Previous reviews, for example by Massonnet and95
Sigmundsson (2000) and Zebker et al. (2000) or also by Stevens and Wadge96
(2004) and d’Oreye et al. (2008), supply an important foundation upon which97
to build, and a reference to which we can relate results achieved since the turn98
of the current century. We begin our review by discussing those principles of99
SAR that make the technique valuable for volcano monitoring and research.100
We then describe application of SAR to volcanoes, including mapping of101
structures and deposits, quantifying topography, and especially tracking sur-102
face deformation, before concluding with an examination of how integrating103
results from SAR can elucidate large-scale dynamic processes and offering104
our perspective on the future of SAR in volcanology.105
2. Synthetic Aperture Radar analysis techniques and available data106
2.1. Synthetic Aperture Radar principles107
The SAR technique allows the formation of high-resolution radar images108
from data acquired by side-looking instruments installed on aircraft or space-109
craft, or even from the ground. The fundamentals underlying SAR image110
processing are presented in e.g., Curlander and McDonough (1992). Each111
pixel of an image corresponds to a resolution element on the ground, which112
receives and scatters back an electromagnetic signal emitted by the radar. A113
pixel is characterized by two values: the amplitude and the phase. The ampli-114
tude can be interpreted in terms of backscattering properties of the ground.115
The phase is not informative on its own because it is a pseudo-random contri-116
8

bution from the configuration of all scatterers within the resolution element.117
However, providing the scattering properties of the element remain stable118
between two acquisitions, the difference in phase between two images can be119
interpreted in terms of the difference in range between the radar instrument120
and the target, which is the principle of radar interferometry (see Section 2.3).121
122
SAR imaging geometry is characterized by two directions: the “azimuth”123
direction being the direction of satellite motion and the “range” direction124
corresponding to the look direction of the radar, which is approximately125
perpendicular to azimuth. Resolution elements in the range direction are126
distinguished by their distance from the satellite, which differs from the case127
of optical images where resolution elements are differentiated by viewing an-128
gle. The combination of the side-looking nature of the sensor and topography129
on the ground mean that the ground surface is often not completely imaged130
by the SAR. Surfaces oriented on ground sloping away from the sensor can131
be in a shadow zone not reached by the radar beam–an effect called ”shadow-132
ing”. When the ground slope is greater than the incidence angle (measured133
from vertical) of the radar signal, upslope becomes closer to the sensor than134
downslope, and the order of pixels in the image becomes reversed–the so-135
called “layover” effect (Figure 1).136
Two images acquired at the same time can be used to image the static137
topography, but to detect and quantify surface changes with time, at least138
two images acquired at different times need to be compared. Before proceed-139
ing with the processing, there is a need to put both images into the same140
geometry, as the sensor never acquires successive images from exactly the141
9

same position. The geometry of one image is chosen as the “master” geom-142
etry and the second “slave” image is resampled into the “master” geometry,143
such that corresponding pixels in both images correspond to the same area144
of ground. This co-registration is achieved based on orbit knowledge and re-145
fined using amplitude image correlation (see section 5.2.1 of Dzurisin (2007)146
for a detailed description of the processing).147
2.2. Surface change detection148
The radar echo for a given pixel depends on the coherent sum of the149
echo from all scatterers within the corresponding resolution element; thus,150
the amplitude and phase of the echo are sensitive to any change in the dis-151
tribution of scatterers within the element. It follows that if scatterers move152
with respect to each other or, as in case of new emplacement of surface lava153
flows, are replaced by a new set of scatterers, this can be detected in a series154
of SAR images. Detection methods are based either on the evolution of the155
reflectivity, that is to say, the amplitude of the radar images–or on changes156
in the correlation of the signal, which is a measure of the phase change.157
Variations in radar amplitude are most often quantified by differencing the158
amplitude between two successive acquisitions (e.g., Wadge et al., 2011) or by159
calculating the ratio between amplitudes (e.g., Wadge et al., 2002a). Decor-160
relation of the signal is estimated by calculation of the “coherence” between161
two acquisitions, which is a complex entity defined as (Zebker et al., 1996):162
ρ =E [z1z
∗2 ]√
E [|z1|2] E [|z2|2], (1)
where z1 and z2 are the signal values from the two images, represented as163
complex numbers, and E[x] refers to the expected value of x– in other words,164
10

the mean value of an infinite number of realisations of x. The expected values165
are usually estimated by spatial averaging over a finite region. A reduction in166
the magnitude of the coherence, which ranges between zero and one, indicates167
decorrelation. Various sources of decorrelation include: thermal decorrela-168
tion, which is due to the influence of thermal noise on the sensor and can be169
estimated theoretically by deriving the signal-to-noise ratio of a specific sys-170
tem; geometric and Doppler centroid decorrelation, which are, respectively,171
due to differences in the incidence angle and in Doppler centroid frequencies172
between two acquisitions; temporal decorrelation, which is caused by any173
change in the distribution of wavelength-scale scatterers within a resolution174
cell, or of their electrical characteristics; and volume decorrelation, which175
is related to the penetration of the radar waves and is dependent on the176
radar wavelength and the scattering medium. For a more complete review of177
decorrelation causes, see Lu and Dzurisin (2014) and references cited therein.178
179
2.3. Retrieval of topography through InSAR180
As mentioned above, while the phase of an individual SAR image cannot181
be easily interpreted, the phase difference between two coregistered images182
relates to the difference in range between the two images. This difference in183
range can in turn be related to the elevation of the ground. SAR interfer-184
ometry (InSAR) involves computing the product of a master image and the185
complex conjugate of a coregistered slave image. The phase of the resultant186
“interferogram” is equal to the difference in phase between the master and187
slave images (the InSAR technique is described in detail by Massonnet and188
Feigl, 1998; Burgmann et al., 2000; Dzurisin, 2007; Massonnet and Souyris,189
11

2008).190
There is a contribution to the interferometric phase from the differing191
viewing geometries of master and slave images, which can be divided into192
the phase expected if the surface of the Earth followed a reference ellipsoid193
(the so-called “flat Earth phase”, φFE) and the phase due to deviations of194
the real Earth surface from the reference surface due to topography (φtopo).195
In addition, there is a contribution from the displacement of the pixel in196
the satellite line-of-sight (LOS) direction (φdef ) and a contribution from the197
difference in the phase delay during propagation of the signal through the198
atmosphere between acquisitions (φatm). Thus, the interferometric phase for199
each pixel can be described as200
φ = W{φFE + φdef + φtopo + φatm + φN}, (2)
where φN is a phase noise term and W{·} is an operator that drops whole201
phase cycles (known as “wrapping”), as only the fractional part of the phase202
can actually be measured. The phase noise term includes thermal noise, but203
is usually dominated by decorrelation due both to the relative movement204
of scatterers (mentioned above) which typically increases with time, and205
differences in viewing angle between the two acquisitions, which also cause206
the scatterer echoes to sum differently. The difference in viewing angle is207
usually expressed as the “perpendicular baseline”, (B⊥) between the two208
acquisitions, which is the component of the baseline perpendicular to the209
line of sight.210
Given an accurate description of the satellite orbits, the flat Earth phase211
can be easily calculated. In the case where φdef and φatm can be considered212
negligible, e.g., for two images acquired at the same time, the interferometric213
12

phase difference can then be interpreted as being due to topography only to214
produce a digital elevation model (DEM):215
φtopo ≈ W
{−4πB⊥h
λR sin θ
}, (3)
where R is the distance between the surface and satellite, h is the elevation216
of the surface above the reference surface, λ is the radar wavelength and θ is217
the angle of incidence. Topography in InSAR phase can also be expressed in218
terms of the “altitude of ambiguity”, ha, which is defined as the change in219
elevation that results in one complete phase cycle, i.e., a topographic fringe,220
Equation 3 becoming221
φtopo ≈ W
{−2πh
ha
}. (4)
The accuracy of topographic measurement therefore improves with increased222
perpendicular baseline, which corresponds to a smaller altitude of ambiguity,223
although if the perpendicular baseline is too large the interferogram will not224
be coherent.225
InSAR does not provide absolute heights, as the phase only records the226
the fractional part of each phase cycle; however, the relative elevation be-227
tween two pixels in an interferogram can be estimated by integrating the228
phase gradient between them, a process known as “phase unwrapping” (Chen229
and Zebker, 2001).230
231
2.4. Retrieval of displacement232
Displacements can be retrieved from SAR data using a variety of methods,233
the most accurate of which is the InSAR technique, although this only gives234
displacement in the line-of-sight direction. Two other techniques can be used235
13

to retrieve displacement in the azimuth direction, but they are less accurate236
than InSAR (see below). When the line-of-sight deformation is very large,237
the InSAR technique may fail and the less accurate techniques are then also238
useful in the range direction. While the aforementioned techniques provide239
measurements of relative displacement between image pixels, with modern240
high-resolution sensors it is also possible to obtain absolute measurements of241
displacement for artificial scatterers using ranging.242
Combining the displacement information in azimuth and range directions243
for both ascending and descending acquisitions, it is then possible to invert244
for the 3D displacement field (Wright et al., 2004b). For a complete review245
on retrieval of the 3D displacement field using only SAR measurements or246
integrating SAR data with GPS, see Hu et al. (2014).247
2.4.1. Displacement from InSAR248
If an interferogram is created from two images acquired at different times,249
the component of displacement in the line of sight, l, can be retrieved from250
the interferometric phase,251
φdef = W
{−4πl
λ
}(5)
As the interferometric phase also contains other terms (Equation 2), these252
must be reduced as much as possible in order to retrieve the displacement.253
Orbit data can be used to calculate φFE and a DEM can be used to estimate254
φtopo. φN is usually reduced, at the cost of resolution, by summing many255
neighboring pixels in space (“multilooking”); however, the atmospheric term256
φatm can be significant and difficult to reduce. Although in principle the257
accuracy of displacement should be much smaller than the wavelength (λ),258
14

in practice it is limited by the atmospheric term (see Section 4.3).259
Similar to topography estimation (Section 2.3), InSAR does not provide260
an absolute value for l, as the phase only records the fractional part of each261
phase cycle; however, the relative line-of-sight displacement between any two262
pixels in an interferogram can be estimated by unwrapping the phase between263
them.264
In summary, InSAR allows to us quantify the projection of the ground265
displacement along the line-of-sight direction with an accuracy on the order266
of a cm or two. To quantify small displacement rates over a long period of267
time, specific algorithms for times series of SAR data processing have been268
developed (see Section 2.5).269
2.4.2. Pixel offset tracking270
Displacements in volcanic areas can be estimated from optical imagery271
by calculating pixel offsets, and the same principle can be applied to SAR272
imagery. Orbit information supplemented by amplitude image correlation273
is used to put all images in a common geometry by performing a global274
geometrical transformation. Pixels affected by large displacements between275
two acquisitions are characterized by residual offsets between the coregis-276
tered images. Their determination by finer amplitude correlation provides277
measurements of surface displacements in both azimuth and range directions.278
The accuracy of the technique depends on coherence (De Zan, 2014) but279
is on the order of one tenth of the spatial resolution, i.e., a few decimeters280
to a few meters. The troposphere has a limited effect on the accuracy pixel281
offsets, but the influence of ionospheric disturbances can be strong (e.g., Gray282
et al., 2000; Oyen et al., in prep). This method has been applied to quantify283
15

large displacement fields in volcanic areas (e.g., Wright et al., 2006; Grandin284
et al., 2009).285
2.4.3. Multiple-aperture interferometry (MAI)286
An alternative method for estimating pixel offsets between images relies287
on splitting the frequency spectrum into two or more sub-apertures. This288
idea was first developed by Scheiber and Moreira (2000) to estimate misreg-289
istration between images in range and azimuth and is referred to as “spectral290
diversity”. The specific application of this technique to measure displacement291
in the azimuth direction was termed “multiple-aperture interferometry” by292
Bechor and Zebker (2006), and its application has been further improved293
by e.g., Jung et al. (2009). The method consists of using sub-aperture pro-294
cessing techniques to form one forward-looking and one backward-looking295
image from one SAR image. Each of these images is then combined with the296
corresponding forward and backward looking images obtained from a second297
SAR acquisition to form one forward-looking and one backward looking inter-298
ferogram. The phase difference between the forward-looking and backward-299
looking interferograms is called an MAI image and contains the displacement300
between the two acquisition times in the azimuthal (along-track) direction.301
MAI measurements are independent of the radar wavelength but require co-302
herence between the images. Like pixel offset tracking, the accuracy of the303
MAI technique depends on coherence, but it is better than offset tracking by304
a factor of 3 for a coherence of 0.5 (De Zan, 2014), and by a higher factor for305
lower coherence. However, these theoretical factors apply only when the am-306
plitude variation is due to speckle. In the case of amplitude contrast caused307
by variations in actual radar reflectivity, the performance of offset tracking308
16

improves relative to MAI.309
Any tropospheric variations with wavelengths larger than 5 meters should310
have the same effect on both the forward and backward-looking interfer-311
ograms such that the displacement measurement is, in principle, not sig-312
nificantly limited by tropospheric contributions (Bechor and Zebker, 2006).313
However, in their study of the 2010 Merapi, Indonesia, eruption, De Michele314
et al. (2013) have shown that the presence of a volcanic ash plume may af-315
fect the backward and forward-looking images differently. As is the case for316
pixel offset tracking, the influence of ionospheric disturbances can also have317
a strong effect on MAI images (e.g., Jung et al., 2013; Oyen et al., in prep).318
2.4.4. Precise positioning319
The techniques for measuring displacement described above provide only320
the relative displacement between any two pixels within the acquisition area.321
With more recent high-resolution satellites, which also have better orbital322
tracking than earlier satellites, it is now possible to position individual point323
scatterers in a global reference frame with an accuracy of a few cm (Eineder324
et al., 2011; Schuber et al., 2012). This is achieved through ranging, and325
opens the door to measurement of displacement using individual artificial326
reflectors on the ground, by repeated point positioning. As with relative327
displacement techniques, a single acquisition geometry can only provide dis-328
placements in 2-D (azimuth and range), but a combination of ascending and329
descending images allows for 3D displacement measurement.330
17

2.5. Time series processing331
Displacements can be estimated more accurately by processing many im-332
ages together, rather than the two-image approaches described above. Most333
multi-image algorithms have concentrated on retrieving displacement from334
interferometric phase (Section 2.4.1), although in one approach, pixel offsets335
(Section 2.4.2) have also been incorporated (Casu et al., 2011). For a review336
on SAR interferometry time series analysis, see Hooper et al. (2012a).337
The simplest approach for combining many images is to sum or “stack”338
the unwrapped phase of many conventionally formed interferograms (e.g.,339
Zebker et al., 1997). Persistent deformation is highlighted in interferometric340
stacks, whereas other random signals, like atmospheric anomalies, are sup-341
pressed. This approach, however, is only appropriate when the deformation342
is episodic (with no change in source parameters over time) or steady-state,343
with no seasonal deformation. Another limitation comes from the fact that344
the non-deformation signals are reduced only by averaging and cannot be345
explicitly estimated. Algorithms for time series analysis of SAR data have346
therefore been developed to better address these issues facing conventional347
InSAR; decorrelation is addressed by using phase behavior over time to se-348
lect pixels for which decorrelation noise is minimized, and non-deformation349
signals are estimated by a combination of modeling and filtering of the time350
series. These time series algorithms fall into two categories, the first being351
persistent scatterer InSAR, which targets pixels whose scattering properties352
remain consistent both in time and from variable look directions, and the353
second being the more general small baseline approach.354
18

2.5.1. Persistent scatterer InSAR355
Decorrelation is caused by the contributions from scatterers within a res-356
olution element summing differently between SAR acquisitions. This can be357
due to relative movement of the scatterers, a change in the looking direction358
of the radar platform, or the appearance or disappearance of scatterers, as359
in the case of snow cover. If one scatterer returns significantly more energy360
than other scatterers within a resolution element, however, decorrelation is361
reduced. This is the principle behind a “persistent scatterer” (PS) pixel362
(sometimes referred to as a “permanent scatterer”). In urban environments,363
the dominant scatterers can be roofs oriented such that they reflect energy364
directly back to the radar, like a mirror, or the result of a “double-bounce”,365
where energy is reflected once from the ground, and once from a perpendic-366
ular structure, returning directly to the radar (Perissin and Ferretti, 2007).367
Dominant scatterers can also occur in areas without manmade structures368
(e.g., appropriately oriented rocks or blocks in lava fields), but there are369
fewer of them, and they tend to be less dominant.370
PS algorithms operate on a time series of interferograms all formed with371
respect to a single “master” SAR image. Phase unwrapping is achieved either372
using a temporal evolution model or algorithms that only assume that the373
temporal evolution should be generally smooth (Hooper, 2010). In both ap-374
proaches, deformation phase is separated from atmospheric phase and noise375
by filtering in time and space, the assumption being that deformation is cor-376
related in time, atmosphere is correlated in space but not in time, and noise377
is uncorrelated in space and time. In comparative studies between the two378
approaches, estimates for the deformation agree quite well, but the second379
19

approach tends to result in better coverage, particularly in rural areas where380
most volcanoes are located (Doin et al., 2010; Sousa et al., 2011).381
The result of PS processing is a time series of displacement for each PS382
pixel, with much reduced noise terms (figure 2). The technique also has the383
advantage of being able to associate the deformation with a specific scatterer,384
rather than a resolution element that has dimensions dictated by the radar385
system– usually on the order of many meters. For volcano deformation stud-386
ies this level of detail is generally not required, although it can be useful in387
separating broader deformation from the local displacements associated with388
specific structures (e.g., faults, small hydrothermal features, and localized389
subsidence features).390
2.5.2. Small baseline InSAR391
A drawback of the PS technique for volcanic applications is that the392
number of PS pixels in a volcanic environment may be limited. However,393
by forming interferograms only between images separated by a short time394
interval and with a small difference in look direction (i.e., a small baseline),395
decorrelation is minimized and for some resolution elements can be small396
enough that the underlying deformation signal is still detectable. Pixels for397
which the phase decorrelates little over short time intervals are the targets398
of small baseline methods.399
Interferograms are formed between SAR images with a small difference400
in time and look angle. In many small baseline algorithms, the interfer-401
ograms are multilooked to further decrease decorrelation noise (Berardino402
et al., 2002; Fornaro et al., 2009), however, there may be isolated ground res-403
olution elements with low decorrelation that are surrounded by elements with404
20

high decorrelation, such as a small clearing in a forest, for which multilooking405
will increase the noise. Other algorithms have therefore been developed that406
operate at full resolution (Lanari et al., 2004; Hooper, 2008), with the option407
to reduce resolution later in the processing chain by “smart” multilooking.408
Pixels are selected based on their estimated spatial coherence in each of the409
interferograms, using either standard coherence estimation, or enhanced tech-410
niques in the case of full-resolution algorithms. The phase is then unwrapped411
either spatially in two dimensions (e.g., Chen and Zebker, 2001), or using the412
additional dimension of time in 3-D approaches (e.g., Pepe and Lanari, 2006;413
Hooper, 2010). At this point, the phase can be inverted to give the phase414
at each acquisition time with respect to a single image, using least-squares415
(Schmidt and Burgmann, 2003), singular value decomposition (Berardino416
et al., 2002), or minimization of the L1-norm (Lauknes et al., 2011). Separa-417
tion of deformation and atmospheric signals can be achieved by filtering the418
resulting time series in time and space, as in the PS approach. Alternatively,419
if an appropriate model for the evolution of deformation in time is known,420
the different components can be directly estimated from the small baseline421
interferograms (Biggs et al., 2007).422
2.5.3. Combined time series InSAR423
Because persistent scatterer and small baseline approaches are optimized424
for resolution elements with different scattering characteristics, they are com-425
plimentary, and techniques that combine both approaches are able to extract426
the signal with greater coverage than either method alone (Hooper, 2008; Fer-427
retti et al., 2011). Depending on the data set, some pixels can be selected428
by both approaches, but some pixels are only selected by one method or the429
21

other (Figure 3).430
2.6. SAR platforms and available data431
Application of SAR to volcanoes began with the first deployments of432
orbital radar instruments in the 1970s and accelerated rapidly starting in433
the 1990s (Table 1). SEASAT was the first satellite SAR to orbit Earth (L-434
band, launched in 1978) but was only active for a matter of months before the435
satellite malfunctioned, although those data can be used for interferometry,436
including over volcanic terrains (Zebker and Villasenor, 1992). Short-term437
orbital radar experiments were also conducted in the 1980s and 1990s using438
NASA’s Space Shuttle as part of the Shuttle Imaging Radar (SIR) A, B,439
and C missions, which included a variety of wavelengths and good cover-440
age of volcanic targets (Gaddis et al., 1989; Zebker et al., 1996), although441
only SIR-C had the ability to measure topography and deformation. The442
first long-term, repeated SAR observations that could be applied to vol-443
cano research and monitoring began with the launch of the European Space444
Agency’s C-band ERS-1 SAR satellite in 1991, which subsequently led to445
the first published application of InSAR to volcano deformation, at Mount446
Etna (Massonnet et al., 1995). This mission was later joined by the ERS-2447
and ENVISAT satellites, which continued European Space Agency C-band448
monitoring of volcanoes for 20 years and formed the foundation of most vol-449
cano InSAR studies during the 1990s and 2000s (Figure 4). The launch450
of RADARSAT-1 in 1995 expanded this C-band catalog, with the excellent451
longevity of the satellite providing an especially valuable archive of data over452
the world’s volcanoes that could be exploited for studies of volcano defor-453
mation over decadal timescales (Baker and Amelung, 2012). RADARSAT-2,454
22

active since 2007, has continued this legacy of C-band observations through455
to the present.456
The launch of the Japanese Aerospace Exploration Agency’s JERS-1457
satellite in 1992 contributed to the realization of the importance of L-band458
SAR data for volcano deformation monitoring, given the much greater coher-459
ence of longer wavelengths in vegetated areas (Lu et al., 2005b) (Figure 5).460
Unfortunately, JERS-1 suffered mechanical failures that limited the num-461
ber of potential interferograms that could be generated. It was not until462
the launch of ALOS-1 in 2006 that comprehensive L-band studies of volca-463
noes located in tropical and other heavily-vegetated environments could be464
attempted. Such work revealed many deforming volcanoes that might not465
have been detected using C-band data (e.g., Chaussard and Amelung, 2012;466
Ebmeier et al., 2013b; Biggs et al., 2014).467
Since 2007, X-band data have been available to study volcanoes thanks468
to the TerraSAR-X, TanDEM-X, and COSMO-SkyMED missions. These469
data typically have a higher spatial resolution than those from C- and L-470
band–sometimes better than 1 m–and more frequent repeat times (especially471
in the case of COSMO-SkyMed, which is made up of a constellation of 4472
satellites that follow the same orbital path around Earth) (Table 1). The473
improved spatial and temporal resolution of these SAR systems has enhanced474
the potential of SAR imagery for change detection (e.g., Richter et al., 2013)475
and places these sensors on par with optical imagery in terms of ground-pixel476
size (Sansosti et al., 2014). The next generation of SAR satellites, beginning477
with the C-band Sentinel-1 and L-band ALOS-2 platforms, will complement478
the existing X- and C-band sensors, offering a range of wavelengths and479
23

repeat intervals that will prove invaluable for future SAR studies of active480
volcanism. As demonstrated by Lundgren et al. (2013) for a 4.5-day-long481
fissure eruption at Kılauea Volcano in 2011, a diversity of wavelengths and482
satellites, combined with frequent image acquisitions, is key to capturing483
rapidly evolving, dynamic volcanic processes–a capability that is now within484
reach thanks to the growing number of orbital SAR platforms.485
As the number of satellite SAR missions has increased, numbers of pub-486
lished volcano SAR studies have seen a commensurate rise with a step-like487
increase in 2010 (Figure 4). The same step is apparent in other fields (like488
tectonics, landslides, and subsidence), but occurs one year earlier, in 2009.489
While it is difficult to identify whether or not the delay of the step in volcanol-490
ogy is significant and, if so, what might have caused the delay, we speculate491
that it might indicate a need for additional efforts within the volcanologi-492
cal community to promote SAR volcano applications and educate volcano493
scientists in its use.494
Airborne SAR systems have provided a valuable complement to space-495
borne platforms, with NASA instruments supplying observations of volcanic496
landforms and eruptive activity starting in the 1980s (Zebker et al., 1987).497
Since the 1990s, airborne SARs that have seen extensive use are AIRSAR498
(e.g., Gaddis, 1992), TOPSAR (e.g., Rowland, 1996), and UAVSAR (e.g.,499
Lundgren et al., 2013). Only the latter was designed for repeat-pass interfer-500
ometry, and its flexibility in terms of rapid deployment and ability to remain501
on station for extended periods of time to monitor an evolving volcanic crisis502
make it a valuable tool for volcano surveillance. Many of these instruments,503
however, are cost-prohibitive for use in volcano research, and therefore have504
24

had limited operational uses. Future developments in airborne SAR instru-505
mentation would benefit from close collaboration between scientists an engi-506
neers, who can build on these past successes to design instrumentation that is507
both capable and cost-effective, thus ensuring its broad application for years508
to come. Perhaps the ultimate volcano-monitoring radar system in terms509
of ability to make near-continuous observations of topographic and surface510
change is ground-based SAR. Although expensive and not widely deployed at511
present, ground-based radars have contributed to an improved understand-512
ing of activity at several volcanoes, especially Soufriere Hills Volcano (Wadge513
et al., 2005, 2008) and Stromboli (e.g., Casagli et al., 2009; Di Traglia et al.,514
2013; Intrieri et al., 2013; Nolesini et al., 2013). Future improvements in515
instrument design and reduction in cost will increase the applications of this516
implementation of SAR volcano monitoring.517
The diversity of wavelengths and repeat intervals that are currently, or518
soon will be, available from a variety of satellite SARs, coupled with air-519
borne UAVSAR and ground-based radar measurements, provides a suite of520
resources for all-weather, near-daily (and sometimes continuous) measure-521
ment of volcano deformation at sites around the world. The initial appli-522
cations of InSAR to volcanology in the 1990s required weeks to months for523
processing and interpretation. By the 2010s, SAR data from many systems524
are available with a latency of just a few hours in some cases (e.g., SAR data525
are commonly delivered to customers in under 90 minutes once they have526
been received at the Alaska Satellite Facility ground station (Meyer et al.,527
2014)), and data processing can be completed in minutes. SAR has there-528
fore grown from a purely research tool appropriate for retrospective analysis529
25

of volcanic events to a research and monitoring tool that can contribute key530
insights during a volcanic crisis. In the sections that follow, we explore appli-531
cation of SAR data–especially space-based observations–for tracking volcanic532
activity both above and below ground.533
3. Mapping surface characteristics with SAR534
As detailed in the previous section, SAR signals have two components:535
amplitude, which measures the strength of the reflected signal, and phase,536
which includes information about the distance between the radar and the537
target. When the target is Earth’s surface, both components, as well as the538
coherence (see equation 1) between data acquired at different times, contain539
valuable information about the ground and have the ability to determine540
a range of attributes, including surface roughness, surface geometry, scat-541
tering properties, surface topography, electrical properties, and changes in542
these parameters. While SAR data are perhaps best known for mapping543
surface deformation using interferometric methods (discussed in section 4),544
the ability to quantify other surface characteristics is of equal importance,545
as these datasets constitute critical resources for assessment and monitoring546
of volcanic hazards.547
3.1. Amplitude548
The most important surface characteristics that control the strength of549
SAR backscatter are moisture content, roughness, and slope. Surfaces that550
are oriented towards the radar, rough on the scale of the radar wavelength,551
and/or moist will generally have stronger reflected returns that those that552
are not. On volcanoes, roughness and slope tend to be the most important553
26

of these factors, and they define much of the variation in amplitude within a554
radar image (Gaddis et al., 1989). Changes in these parameters may provide555
evidence of volcanic activity, including emplacement of new deposits and de-556
struction of existing landforms. Because radar images can be acquired at557
night and during cloudy conditions, SAR has a decisive advantage over opti-558
cal and infrared sensors for monitoring volcanism. This application is perhaps559
best demonstrated by recent activity at Soufriere Hills Volcano (Montserrat),560
Eyjafjallajokull (Iceland), and Merapi (Indonesia).561
The 1995 - present eruption of Soufriere Hills Volcano has been char-562
acterized by the extrusion and destruction of a series of silicic lava domes563
(Wadge et al., 2010). Tracking changes in SAR amplitude over time has564
been a valuable tool for mapping pyroclastic deposits and the evolution of565
the lava dome. Comparison of high-resolution (∼2-m pixel size) TerraSAR-X566
images acquired before and just after an explosion in July 2008 revealed that567
the dome remained stable and was not in danger of collapse–key information568
for civil defense officials that would not have otherwise been available in the569
days following the explosion due to dense cloud cover during that time period570
(Wadge et al., 2011). Pyroclastic deposits were also mapped using changes571
in SAR amplitude over time, with differences in radar shadows in valleys572
between pre- and post-eruptive imagery used to calculate the thicknesses of573
pyroclastic material that had been emplaced in those valleys (Wadge et al.,574
2011). These data were crucial for improving estimations of the eruption rate575
and its temporal evolution.576
At Eyjafjallajokull, the evolution of eruptive vents and ice cauldrons dur-577
ing the initial stage of the summit explosive eruption in 2010, when cloud578
27

and ash cover prevented visual observations, was tracked by a sequence of579
air- and space-borne SAR images (Hooper et al., 2012). The data were used580
to characterize meltwater generation that ultimately led to flooding far from581
the eruption site (Magnusson et al., 2012).582
Merapi experienced a “100-year” eruption in 2010 that threatened hun-583
dreds of thousands of residents on the flanks of the volcano (Surono et al.,584
2012). Interpretation of satellite SAR amplitude data (e.g., Figure 6) in585
near-real time allowed those observations to be combined with ground-based586
geological and geophysical results. The data made possible quantifications of587
dome growth rates and were essential in prompting warnings issued by local588
authorities that ultimately saved thousands of lives (Pallister et al., 2013).589
The amplitude of SAR images was also used to map pyroclastic deposits as-590
sociated with this event. The amplitude of co-polarized (HH) L-band radar591
data decreased where the valley-confined and overbank pyroclastic flow de-592
posits were emplaced (red area on figure 7 b). Reworked PDC deposits,593
the surge zone, and thick tephra deposits are characterized by an increase594
in ground-backscattering (blue area on figure 7 b). These patterns are not595
similar to those observed with X-band data from Montserrat (Wadge et al.,596
2011), demonstrating the importance of wavelength in backscattering prop-597
erties of volcanic (and probably other) deposits. Several airborne synthetic598
aperture radar systems and the Spaceborne Imaging Radar-C/X-Band Syn-599
thetic Aperture Radar (SIR-C/X-SAR) acquired data in L, C and X bands600
over a few active volcanoes. These data have shown that L band images give601
the best results for mapping lava flows and distinguishing multiple flow units602
(Schaber et al., 1980; Gaddis, 1992; MacKay and Mouginis-Mark, 1997).603
28

To date, studies of surface characteristics in volcanic areas using ampli-604
tude measurements from satellite SAR have been mostly restricted to co-605
polarized data, in which the polarizations (either horizontal-H or vertical-606
V) of the transmitted and received data are the same (HH or VV). Stud-607
ies using airborne SAR sensors indicate that cross-polarized data (HV or608
VH) are a more effective discriminator of lava flows having different tex-609
tures and surface roughness (Zebker et al., 1987; Gaddis, 1992). Cross-610
polarization is not available on most satellite SARs with the exception of611
RADARSAT-2 (Table 1). That satellite offers a wide range of beam modes,612
resolutions, and polarizations, including fully polarimetric (HH, HV, VH,613
and VV). RADARSAT-2 images from Kılauea Volcano, Hawai‘i demonstrate614
the utility of cross-polarized data in the study of volcanic regions. For exam-615
ple, distinguishing ‘a‘a from pahoehoe lava flows is relatively straightforward616
in cross-polarized data, but the distinction is less clear in co-polarized im-617
agery (figure 8). Likewise, identification of active lava flows can be aided by618
cross-polarized data. Mapping the extent of lava flows at Kılauea requires619
costly and time-consuming field visits or cloud-free optical/thermal satellite620
imagery. Cross-polarized RADARSAT-2 data, however, are able to easily621
distinguish the active flows from the surrounding forest–a distinction that is622
not clear from co-polarized data (figure 9)–and are not constrained by time623
of day or weather. Future use of cross-polarized SAR to map volcanic and624
other surface features and how they change over time will be facilitated not625
only by continued RADARSAT-2 acquisitions, but also cross-polarization626
modes available on SAR systems carried by both the Sentinel-1 and ALOS-2627
satellites.628
29

3.2. Coherence629
The reflected signal received by a SAR sensor is a function of the char-630
acteristics of the scatterers within a resolution cell on the ground. If the631
geometry of the scatterers changes between the times of two SAR acquisi-632
tions, the reflection from that resolution cell will not be correlated between633
the two images (low value of coherence as defined by equation 1). As an ex-634
ample, vegetated areas are commonly incoherent in SAR interferograms that635
span a given time period owing to rapid changes in the orientation of leaves636
and branches over time (although this can be mitigated to some extent by637
the use of longer wavelengths – particularly L-band; (Zebker and Villasenor,638
1992)). This lack of coherence in interferograms is typically regarded as a639
noise source in InSAR studies, since phase-difference information for defor-640
mation cannot be retrieved from incoherent regions, but there are important641
applications of coherence mapping in Earth science (Zebker and Villasenor,642
1992).643
In volcanology, incoherence can be caused by deposition of pyroclastic644
material, lahars, and lava, and by extreme deformation of the ground sur-645
face. As a result, maps of coherence that span eruptive activity may indicate646
areas covered by volcanic deposits or severely deformed (see Figure 7 c). At647
Unzen volcano, Japan, Terunuma et al. (2005) demonstrated the utility of648
coherence maps for delineating pyroclastic flows and lahars, and McAlpin649
and Meyer (2013) utilized coherence to map lahar deposits emplaced dur-650
ing the 2009 eruption of Redoubt volcano, Alaska. Similarly, lava-flow area651
can be mapped by means of SAR coherence, as demonstrated in Hawai‘i652
(Zebker et al., 1996) and the Galapagos (Rowland et al., 2003) as long as653
30

the lava flows are confined to previously coherent areas (in other words, not654
traversing vegetated areas). By combining lava-flow area determined from655
coherence with estimated flow thickness, it is possible to calculate the aver-656
age effusion rate of lava over the time spanned (Zebker et al., 1996; Poland,657
2014). Dietterich et al. (2012) extended the application of lava-flow mapping658
with coherence by developing a method for combining results from different659
satellites and look angles–datasets that are typically treated independently660
in deformation studies. Using 211 scenes from 6 ENVISAT tracks, they were661
able to map lava-flow activity at Kılauea with a temporal separation between662
coherence imagery of as little as 1 day, and on average less than 2 weeks (fig-663
ure 10A). The exceptional all-weather, day/night ability to map active areas664
over the entirety of Kılauea’s > 100 km2 lava flow field–all with high temporal665
and spatial resolution but without requiring ground-based equipment or field666
personnel–represents a quantum leap in tracking of lava flow emplacement.667
Not only are such data critical to tracking the hazard due to lava flows, they668
can also be used to constrain flow thickness (based on the time after emplace-669
ment for a new lava flow to become coherent: Dietterich et al. (2012))(figure670
10B) and therefore effusion rate–variables of obvious importance to volcano671
monitoring.672
3.3. Phase used for topographic measurement673
While phase differences in SAR scenes are most commonly used to de-674
termine surface deformation, the data can also be used to calculate surface675
elevations (see section 2.3)–one of the most important datasets in volcanol-676
ogy. For example, topographic information is critical input for models that677
forecast flow paths, particularly for lava (Harris and Rowland, 2001; Favalli678
31

et al., 2011) and lahars (Iverson et al., 1998), and it forms the base for most679
geologic mapping. Especially in flow-path applications, topographic data680
should have resolution that is sufficient to accurately forecast paths, and it681
should be updated frequently to account for changes that may impact the682
flow direction of lava and lahars as volcanic activity progresses. In addition,683
up-to-date topographic information is required for mapping surface deforma-684
tion using SAR (section 2.4.1).685
Topographic information is easily obtained from SAR data and, in fact,686
is the source of much current global topographic information (see Lu et al.687
(2012), for a review). Three methods are commonly used to extract ele-688
vation data from SAR phase: 1) repeat-pass measurements using a single689
radar instrument, 2) examination of topographic artifacts in deformation in-690
terferograms, and 3) single-pass measurements using two radar instruments691
concurrently.692
Repeat pass methods utilize data collected of the same point on the693
ground from about the same place in the air or space at two different times.694
Repeat-pass ERS-1/2 data produced some of the first space-based DEMs of695
volcanoes, including at Okmok, Alaska (Lu et al., 2003), and in the Galapagos696
(Rowland et al., 2003). Comparison between SAR-derived DEMs acquired697
before and after eruptions at those volcanoes revealed the volume of sub-698
aerial lava accumulation. The repeat-pass method requires knowledge of the699
baseline between the SAR systems at the times of image acquisition, since700
sensitivity to topography is directly proportional to baseline length (see equa-701
tion 3). Uncertainty is introduced by imprecisely known baselines (Zebker702
and Goldstein, 1986; Farr et al., 2007) and atmospheric conditions varying703
32

between acquisitions (Zebker et al., 1997), and no topographic information704
can be retrieved in areas that are incoherent between SAR acquisitions (Ze-705
bker and Villasenor, 1992). The coherence problem was mitigated somewhat706
by the tandem ERS-1/2 mission, when the orbits of the two satellites were707
configured such that acquisitions of the same area on Earth could be made708
with a temporal separation of 1 day, thus reducing the effects of temporal709
decorrelation.710
A variation on the repeat-pass method is to determine elevation from711
an examination of topographic artifacts in interferometric phase data. When712
processing interferograms to characterize surface deformation, the phase con-713
tribution from topography is removed using a preexisting DEM (see section714
2.4.1); any topographic change that occurred since the acquisition of the715
DEM will be manifested as residual phase. Using the baseline length, this716
phase can be converted to elevation change (through equation 3) and added717
to the preexisting DEM to derive an updated topographic map of the region.718
The use of a large number of interferograms can mitigate potential errors719
due to atmospheric artifacts. Ebmeier et al. (2012) were able to estimate720
lava flow thickness with an uncertainty of around 9 m using a minimum of 5721
interferograms that had large baselines (and, therefore, improved sensitivity722
to topography). As with repeat-pass DEM generation, however, topographic723
information in the interferogram is only retrievable where the interferogram724
is coherent. Nevertheless, this method provides a useful means of not only as-725
sessing deformation, but also solving for surface elevation changes over time726
that may not be represented in the initial DEM.727
Single-pass interferometry is by far the most efficient method for utilizing728
33

SAR to map surface elevations (Zebker and Goldstein, 1986). The technique729
uses two SAR sensors separated by an appropriate distance to simultaneously730
record the radar signal reflected from the surface, thus eliminating incoher-731
ence due to changes in the scattering properties of the surface over time and732
artifacts due to temporal variations in atmospheric conditions. The airborne733
TOPSAR (TOPographic SAR) system is one example that has been used734
to establish both pre- and post-eruption topography in volcanic areas (Lu735
et al., 2003; Rowland et al., 2003). Perhaps the most well-known use of736
the single-pass technique is the Shuttle Radar Topography Mission (SRTM),737
which was flown on the Space Shuttle in 2000. The mission recorded reflected738
radar signals on two SAR antennas on either end of a 60-m-long mast, the739
fixed distance of which helped to reduce uncertainty in the derived elevation740
data due to improper knowledge of the baseline (Farr et al., 2007). SRTM741
data are commonly used to remove topographic phase from deformation in-742
terferograms and have been an invaluable contribution to Earth science in743
general, but users should beware that topographic change since 2000 will744
not be represented in SRTM DEMs and will be manifested as residual phase745
that might be incorrectly interpreted as deformation. In such cases, users746
should attempt to obtain a more current DEM for their study area or employ747
a means of simultaneously solving for deformation and topographic change748
over time.749
Following the SRTM mission, it was over a decade before another satellite750
system was able to acquire SAR data in single-pass mode. The TanDEM-X751
mission of the German Space Agency consists of two nearly identical X-band752
SAR satellites that orbit in close proximity, separated only by about 200753
34

m. In bistatic mode, one satellite transmits a radar pulse to the surface754
and both receive the reflected signal. Applied to volcanoes, topographic755
information derived from TanDEM-X data has been used to construct post-756
eruptive DEMs that have documented volumes of both lava accumulation (Xu757
and Jonsson, 2014) and dome collapse (Kubanek et al., 2014a,b). At Kılauea,758
where lava effusion has been nearly continuous from vents on the volcano’s759
East Rift Zone since 1983, a time series of DEMs derived from TanDEM-X760
data was used to map the 4-dimensional evolution of the lava flow field (figure761
11a ) (Poland, 2014). Such data can be used to calculate the subaerial effusion762
rate of lava over time (figure 11b)–a parameter that may only be poorly763
estimated using other ground-based or remote-sensing techniques. SRTM764
and TanDEM-X data demonstrate the utility and importance of single-pass765
satellite InSAR for deriving Earth topography–a foundation for many Earth766
science datasets and especially important in volcanology. Future satellite767
SAR missions should attempt to incorporate single-pass InSAR to address the768
need for up-to-date high-quality topographic information, which is necessary769
when trying to retrieve displacement evolution through time on a volcano770
marked by significant topographic changes.771
4. Insights from SAR into volcano deformation772
In the previous section, we detailed how SAR imagery can distinguish773
changes in the surface characteristics of volcanoes over time by quantifying774
eruptive deposits and topographic evolution. The most common application775
of SAR to volcanology, however, remains deformation measurement. In this776
section, we first review the various phenomena that induce surface displace-777
35

ments in volcanic areas together with the models developed to interpret this778
deformation. We then discuss how InSAR has helped to understand vol-779
canic processes, like magma storage and transport, subsidence of volcanic780
deposits, and evolution of volcano deformation over time, before discussing781
the limitations of InSAR for volcano geodesy.782
4.1. Sources of deformation around volcanoes783
There are several potential sources of deformation in volcanic areas. Most784
of these sources are related to magmatic activity, but volcanoes are often also785
subject to tectonic deformation, and volcanic edifices can be subject to land-786
slides. In this section we focus on deformation associated with magmatism787
and volcanic eruptions. For additional information on volcano deformation788
modeling see, e.g., Dzurisin (2007) or Segall (2010).789
790
In volcanic areas, the first deformation source to be identified and in-791
terpreted though modeling was inflation/deflation induced by a localized792
magmatic storage zone at depth. Inflation is due to pressure increase by793
magma inflow or crystallization (e.g., Tait et al., 1989), while deflation can794
be caused by magma withdrawal (either to deeper levels or to feed a nearby795
eruption), thermal contraction or gas loss. The simplest model to interpret796
such a signal was proposed by Mogi (1958), who applied it to explain leveling797
and triangulation data collected at Kılauea, Hawai‘i, and Sakurajima, Japan.798
The “Mogi” model is still often applied and gives the surface displacement799
induced by an overpressurized point-source embedded in an elastic homoge-800
36

nous and isotropic half-space. Vertical displacement is expressed by:801
Uz(z = O, r) =∆PcR
3c
G(1− ν)
Hc
(H2c + r2)3/2
, (6)
where Hc and Rc are, respectively, the depth and the radius of the magma802
chamber, G and ν characterize the elastic crustal behavior (respectively, shear803
modulus and Poisson’s ratio), ∆Pc is the overpressure, and r is the radial804
distance at the surface from the axis of symmetry (a vertical axis though the805
center of the magma reservoir). The induced vertical displacement is thus806
at a maximum directly over the centre of the magma chamber and decreases807
monotonically in all directions. This formulation is valid only for reservoirs808
that are small in size compared to their depth, and does not permit determi-809
nation of the reservoir size. McTigue (1987) showed that, even considering a810
finite source, it was almost impossible to distinguish between a highly pres-811
surized source of small extent and a marginally pressurized larger source. To812
get around this ambiguity, the source amplitude is often described in terms813
of a volume change, ∆Vin, where814
∆Vsurf∆Vin
=2(1− ν)
1 + 4G3K
, (7)
with K being the effective bulk modulus for the stored magma. Note that the815
compressibility of magma can accommodate a certain degree of magma ac-816
cumulation or withdrawal without resulting in surface deformation (Johnson817
et al., 2000; Rivalta and Segall, 2008).818
Other analytical solutions have been proposed to account for an ellipsoidal819
reservoir (Yang et al., 1988; Newman et al., 2006) or a horizontal crack that is820
circular in plan view (Fialko et al., 2001). Improved analytical solutions also821
allow for the effects of topography (McTigue and Mei, 1981; Williams and822
37

Wadge, 2000) and viscous behaviour around the magmatic reservoir (e.g.,823
Dragoni and Magnanensi, 1989) to be taken into account. The use of nu-824
merical methods makes possible more complex source geometries, material825
rheologies and properties, considering, for instance, crustal layering (Currenti826
et al., 2010; Pearse and Fialko, 2010; Got et al., 2013).827
Magma storage at shallow depths can persist for months to years (e.g.,828
Sturkell et al., 2006; Elsworth et al., 2008), with any associated inflation rep-829
resenting a potential eruption precursor (Dzurisin, 2003). The rate of pres-830
surization often decreases exponentially, which can be interpreted as magma831
replenishment from a deep constant pressure source (e.g., Lengline et al.,832
2008) or reservoir (e.g., Reverso et al., 2014). At some point, the overpres-833
sure within a shallow reservoir may reach a critical state, leading to rupture834
of the reservoir walls and magma migration, which may eventually feed an835
eruption.836
837
When magma starts migrating, it propagates though the crust as pla-838
nar or curviplanar features called dikes or sills. Sills are usually horizontal839
structures, whereas dykes are steeply inclined or vertical. Intrusion path840
and velocity depend on the driving overpressure of the magma and the local841
stress field, as well as the physical properties of both the magma (primarily842
density and viscosity) and the surrounding crust (primarily density, elastic843
properties and fracture toughness) (Lister and Kerr, 1991; Maccaferri et al.,844
2011). This migration is usually a short-term phenomenon, lasting for hours845
to days. Intrusions can reach the surface or remain stalled at depth. Even in846
the case of eruption, a given amount of magma may remain trapped at depth,847
38

thus inducing a co-eruptive displacement field. The model most commonly848
used to interpret the deformation field resulting from a magmatic intrusion849
is the so-called “Okada” model (Okada, 1985), which gives the deformation850
field produced at the surface by a finite displacement applied on a rectan-851
gular dislocation in an elastic, homogeneous and isotropic half-space. This852
model can be discretized into a number of smaller rectangular elements to853
obtain a distribution of displacement over the plane. Numerical modeling854
can also be applied to constrain the stress distribution along the dislocation855
surface.856
857
In the case of andesitic volcanoes, curviplanar magmatic intrusions of-858
ten link at shallow levels to open conduits, which feed effusive and explosive859
summit eruptions (e.g., Costa et al., 2007). Viscous magma flow through860
open conduits induces both pressurization and shear forces causing near-861
field displacements in the vicinity of the summit (Beauducel et al., 2000;862
Green et al., 2006). Analytical solutions have been proposed to account for863
both pressurization (Bonaccorso and Davis, 1999) and shear stress (Anderson864
et al., 2010), and numerical models allow for investigation of the full coupling865
between magma flow and surface deformation (Albino et al., 2011; Anderson866
and Segall, 2011).867
868
Emplacement of magmatic or volcanic material, either as intrusions or869
eruptive deposits at the surface, contributes to volcanic edifice construction.870
Under the influence of magmatic forcing, local tectonic stresses, gravity and871
climatic effects, a volcanic edifice undergoes surface deformation. Summit872
39

extension in association with compressive structures at the base of an ed-873
ifice have been interpreted as spreading of a volcano under its own weight874
(Borgia, 1994). Large-scale flank sliding has also been identified as an im-875
portant feature of large volcanic edifices, especially for oceanic volcanoes,876
and has been addressed by stability studies taking into account the effect877
of magma accumulation at depth (e.g., Iverson, 1995; Apuani et al., 2005;878
Chaput et al., 2014). On a smaller spatial scale, eruptive deposits are sub-879
ject to compaction and also act as a surface load, inducing local subsidence880
(Beauducel et al., 2000). These loads can be analytically quantified by sum-881
mation of the Green’s function for the response of a point load on an elastic882
half-space (Grapenthin et al., 2010).883
884
At many volcanic areas, the interplay between shallow meteoric water885
and magma inflow leads to the development of active hydrothermal systems886
that are regularly perturbed by the injection of hot fluids. The evolution of887
hydrothermal systems can be manifested in deformation at volcanoes, and888
microgravity monitoring (e.g., Battaglia et al., 1999) and numerical models889
can help to distinguish between magmatic and hydrothermal activity (Hur-890
witz et al., 2007; Hutnak et al., 2009; Fournier and Chardot, 2012).891
892
As detailed above, magmatic activity can produce deformation in many893
different ways. Deformation certainly does not occur only during eruptive cri-894
sis, but may last for years before and after an eruption. From the perspective895
of hazard assessment, a key requirement is the ability to distinguish deforma-896
tion signals induced by magmatic activity from those caused by external phe-897
40

nomena, such as uplift induced by ice retreat for subglacial volcanoes (e.g.,898
Pinel et al., 2007). A further issue is to determine to what extent magma899
storage or migration is occurring, and whether magma migration will lead to900
eruption. In addition to other useful observations like gravity measurements,901
gas flux, seismicity or ground-based geodetic records, high-spatial-resolution902
displacement data from InSAR can make an obvious contribution to these903
problems. Another important goal of deformation studies, in addition to904
eruption forecasting, is to improve knowledge of the geometry and behaviour905
of magma plumbing systems, including changes in the associated stress field.906
Here, too, the contribution from InSAR can be of great benefit.907
4.2. Overview of volcano deformation studies based on SAR data908
As of 2014, InSAR has revealed deformation at more than 160 volcanoes909
around the world (Biggs et al., 2014), including all types of source processes910
discussed in section 4.1 (Figure 12; near-field deformation related to viscous911
magma flow in conduits was a potential exception but recently Salzer et al.912
(2014), taking advantage of the high spatial and temporal resolution provided913
by TerraSAR-X data, observed transient deformation induced at very shallow914
depth beneath the summit dome of Colima volcano that may be related to915
conduit flow). The resulting databases of volcano deformation (e.g., Fournier916
et al., 2010; Biggs et al., 2014) have demonstrated the strong link between917
deformation and eruption, although – just as importantly – not all volcanoes918
that erupt show signs of precursory, or even co-eruptive, deformation (e.g.,919
Moran et al., 2006; Chaussard et al., 2013; Ebmeier et al., 2013b; Biggs et al.,920
2014). Over 20 years of satellite SAR data have facilitated construction of921
time series to investigate the temporal evolution of volcano deformation and922
41

have even enabled observation of multiple eruption cycles at some volcanoes923
(e.g., Bagnardi et al., 2013; Wauthier et al., 2013). In addition, InSAR924
provides an opportunity to image exceptional volcanic events – for example,925
the caldera collapse, voluminous eruption, and associated flank slip at Piton926
de la Fournaise volcano, Reunion Island, in April 2007 (Froger et al., 2010;927
Clarke et al., 2013). Even more striking is the 2005 rifting event in Afar,928
Africa, which was associated with emplacement of a 65-km-long dike with a929
volume in excess of 1 km3 (Wright et al., 2006; Grandin et al., 2009) (see930
figure 13) and was followed in subsequent years by 13 additional intrusive931
events (Grandin et al., 2010; Hamling et al., 2010).932
A complete review of the numerous studies that have utilized InSAR to933
investigate volcano deformation is impossible owing to the ever-growing ap-934
plication of the technology (Figure 4) – a sure sign of its maturation. Instead,935
we discuss here the primary contributions of InSAR to volcano dynamics –936
specifically magma storage (section 4.2.1), magma transport (section 4.2.2),937
deposit subsidence (section 4.2.4) and temporal evolution of deformation938
(section 4.2.3) –while highlighting a few, but by no means all, examples939
of these processes as investigated by InSAR..940
4.2.1. Magma storage941
As documented previously, one of the great advantages of InSAR over942
other deformation-monitoring methods is the ability to scan entire volcanic943
arcs for localizations of cm-scale displacements – especially valuable in ar-944
eas where in-situ monitoring is limited or nonexistent (e.g., Amelung et al.,945
2000; Pritchard and Simons, 2002, 2004; Biggs et al., 2011; Henderson and946
Pritchard, 2013; Lu and Dzurisin, 2014). For the 1990s and most of the947
42

2000s, only C-band data were available, limiting arc-wide surveys to poorly-948
vegetated regions (Pritchard and Simons, 2002, 2004). L-band studies using949
the ALOS satellite starting in 2006 expanded this capability to tropical ar-950
eas (e.g., Fournier et al., 2010; Ebmeier et al., 2011; Philibosian and Simons,951
2012; Chaussard and Amelung, 2012; Chaussard et al., 2013; Ebmeier et al.,952
2013a,b), allowing for near-global remote mapping of volcano deformation.953
Such regional studies have recognized unrest at supposedly quiescent volca-954
noes and aided the construction and refinement of databases and catalogs of955
volcano characteristics. For example, based on the tables provided by Biggs956
et al. (2014), it is possible to ascertain global patterns of magma storage957
depth, which reveal that most subvolcanic magma storage is within 10 km958
of the surface (Figure 14), although this observation might be partly biased959
by the difficulty in imaging subtle deformation from deeper sources. Such960
catalogs facilitate investigations of the parameters that control magma stor-961
age. Chaussard and Amelung (2014) analyzed magma storage depth (based,962
in part, on InSAR results) at 70 volcanoes worldwide with respect to both963
crustal structure and stress regime, finding that magma reservoirs tend to be964
deeper where crust is older, thicker, and subject to compressive stress.965
The broad coverage of SAR provides an opportunity to image large-scale966
deformation due to deep magma storage (Figure 14) – a perspective that967
is not easily achievable using ground-based point measurements. Leveling968
data over the Socorro magma body in New Mexico were used to identify969
several mm/yr uplift associated with a low-seismic-velocity region at a depth970
of 20 km, but only vertical displacements were available, and only from971
a few transects over the deforming zone (Reilinger et al., 1980). InSAR,972
43

however, provided the improved temporal and spatial resolution needed to973
refine models of deformation (Fialko and Simons, 2001) and interpret the974
displacements in terms of heat transfer from a stalled magmatic intrusion975
(Pearse and Fialko, 2010). Areas of deep magma accumulation have also976
been identified using InSAR in South America and Iceland – in some cases,977
deformation that would not otherwise have been discovered. The pattern978
of uplift at Uturuncu, in Bolivia, is consistent with magma accumulation979
at 20-km depth within the Altiplano-Puna province – an area of intense980
silicic volcanism over the past 10 million years that is apparently still active981
(Pritchard and Simons, 2002, 2004; Sparks et al., 2008; Fialko and Pearse,982
2012; Henderson and Pritchard, 2013; Walter and Motagh, 2014). In Iceland,983
deep magma accumulation at 20-km depth has been recognized at Krafla984
(de Zeeuw-van Dalfsen et al., 2004), Hekla (Ofeigsson et al., 2011), and even985
as part of a dipping dike in the Northern Volcanic Zone (Hooper et al., 2011).986
InSAR has also helped to identify and refine the geometrical character-987
istics of magma storage, especially given that ground-based data are some-988
times insufficient to distinguish between spherical and more complex source989
shapes. Taking the Socorro example, InSAR data not only provided evi-990
dence the magma storage zone had a sill-like geometry (Fialko and Simons,991
2001), but also motivated the development of a new analytical solution for992
a circular penny-shaped crack (Fialko et al., 2001) that has seen extensive993
use in volcano deformation modeling (e.g., Baker and Amelung, 2012). In994
Hawai‘i at Mauna Loa – the largest active volcano by volume on Earth –995
inflation and deflation measured by tilt, Electronic Distance Measurement,996
and campaign GPS during the 1970s through 1990s suggested a spherical997
44

magma storage area at 3-4 km beneath the south part of the caldera (Lock-998
wood et al., 1987). InSAR measurements and expanded application of GPS,999
however, demonstrated that magma storage occurred not only beneath the1000
south caldera, but also in a dike-like structure that underlies and follows1001
the trend of the elongated caldera (Amelung et al., 2007). Deformation at1002
Yellowstone caldera, Wyoming, was mostly characterized by leveling mea-1003
surements for decades, which yielded an exceptional record of the ups and1004
downs of the active caldera system (Dzurisin et al., 1994) but was restricted1005
to, generally, a single transect across the eastern part of the caldera. InSAR1006
results demonstrated, for the first time, the outstanding complexity of de-1007
formation, which included multiple sources within and outside of the caldera1008
(Wicks et al., 1998, 2006; Chang et al., 2007, 2010). Finally, the number of1009
magma reservoirs, while possible to infer from GPS, leveling, tilt, and strain1010
monitoring, can be determined unequivocally by InSAR, as experience at1011
Kılauea demonstrates. While multiple storage areas have been hinted at1012
for decades by ground-based displacement data (Fiske and Kinoshita, 1969;1013
Miklius and Cervelli, 2003), InSAR results clearly delineated multiple, dis-1014
crete magma storage areas beneath the volcano’s summit region (Baker and1015
Amelung, 2012).1016
Even where only a single magma storage area is present, ground-based1017
monitoring may not be positioned in the best location to detect deformation1018
due to magma accumulation or withdrawal. Near South Sister, Oregon, for1019
example, InSAR detected inflation centered 5 km west of the volcano’s sum-1020
mit (Figure 15 ); it is not clear if the deformation would have been recognized1021
solely from in-situ measurements, which are traditionally centered on volcano1022
45

summits, even though the center of deformation may be far removed (Wicks1023
et al., 2002; Pritchard and Simons, 2004; Dzurisin et al., 2006). These exam-1024
ples provide clear evidence of the power of InSAR to not only detect magma1025
storage at a variety of locations and depth ranges, but also to elucidate the1026
geometry of magma storage, both in terms of reservoir shapes and numbers.1027
4.2.2. Magma transport1028
From storage areas, how does magma get to the surface? Seismicity pro-1029
vides obvious constraints on the process (e.g., Taisne et al., 2011), and defor-1030
mation data bracketing, for instance, a dike intrusion event can place bounds1031
on the volume of magma transport and also reveal the geometry of a volcano’s1032
magma plumbing system. The relatively poor temporal resolution of SAR1033
data (see section 4.3) limits its ability to catch magma transport ”in the act”,1034
which is usually much better imaged by high-rate GPS or tilt data (e.g., Aoki1035
et al., 1999). However, the literature is replete with exceptional examples of1036
InSAR as a tool for mapping magma transport pathways at volcanoes of1037
all tectonic settings and compositions (see Table 2). At Yellowstone, Wicks1038
et al. (2006) used InSAR data to reveal a complex pattern of surface displace-1039
ments over time, which they used to infer how magma enters, traverses, and1040
leaves the caldera system. InSAR-derived surface displacements associated1041
with the rhyolitic eruption of Chaiten volcano, Chile, beginning in 2008, not1042
only indicated the dike-like pathway that magma used to get to the surface,1043
but also showed that storage and segregation of low-density liquid were con-1044
trolled by existing faults (Wicks et al., 2011). On the lower-silica end of the1045
compositional spectrum, repeated intrusions detected by InSAR at Eyjaf-1046
jallajokull, Iceland (Pedersen and Sigmundsson, 2004, 2006), culminated in1047
46

2010 with an effusive basaltic eruption from flank vents followed about three1048
weeks later by an explosive andesitic eruption from the summit (Sigmunds-1049
son et al., 2010). Deformation from InSAR and, to a lesser extent, GPS1050
over the two decades before the 2010 eruptive activity revealed the plumbing1051
system of the volcano, which allowed for interpretation of other datasets,1052
such as seismicity and petrology (Sigmundsson et al., 2010). At Fernandina,1053
in the Galapagos, intrusion of sills several km beneath the flanks of the vol-1054
cano would not have been detected without InSAR. The recognition that sills1055
can intrude from subvolcanic storage areas may explain several exceptional1056
episodes of rapid uplift of coastal areas in the archipelago that occurred in1057
the early-mid 20th century (Bagnardi and Amelung, 2012). Thanks to the1058
improved understanding of the geometry and volume of magmatic intrusions1059
provided, in part, by models of InSAR data, it is now possible to quantify1060
the stress-field perturbation induced by magma emplacement at depth (e.g.,1061
Amelung et al., 2007; Hamling et al., 2009; Grandin et al., 2010; Bagnardi1062
et al., 2013; Biggs et al., 2013). The existing stress field may also affect1063
intruding dikes. A study of the Upptyppingar intrusion in northern Iceland1064
demonstrated that the dike was at an angle to the least compressive stress,1065
which induced a shear component to the dike opening (Hooper et al., 2011).1066
In this case, inversion of the deformation field using numerical methods pro-1067
vided a means to constrain the background stress field at the time of magma1068
emplacement (Figure 16).1069
Characterizing active magma transport via deformation measurements is1070
typically the domain of continuous, ground-based sensors, which can track1071
magma migration on the same time scales over which it occurs – generally1072
47

minutes to days (e.g., Montgomery-Brown et al., 2011). Catching the process1073
of magma transport “in the act” with InSAR, rather than bracketing an1074
event, requires serendipitous data acquisitions or long-lived transient activity,1075
but can yield exceptional results. For example, a SAR image acquired two1076
hours prior to the onset of the 2009 eruption of Fernandina revealed the1077
initial stages of sill propagation away from the subvolcanic magma reservoir1078
towards the surface (Figure 17). Those data not only aided interpretation1079
of that eruption, but also suggested the mechanism behind the pattern of1080
circumferential and radial eruptive fissures common to all western Galapagos1081
volcanoes – a problem that had vexed geologists for several decades (Bagnardi1082
et al., 2013). The March 5-9, 2011, Kamoamoa fissure eruption at Kılauea1083
Volcano lasted sufficiently long to be imaged by several SAR satellites over1084
the course of the activity, and models of derived interferograms revealed1085
progressive dike opening and volume increase over time (Lundgren et al.,1086
2013). Multiple SAR satellites were also used to track deformation associated1087
with lateral magma migration over the course of several months prior to1088
the 2011 offshore eruption of El Hierro, Canary Islands, demonstrating that1089
InSAR can even provide constraints on magma plumbing associated with1090
eruptive activity that cannot be observed directly (Gonzalez et al., 2013).1091
The capability of InSAR to image deformation associated magma migra-1092
tion that culminates in both eruptions and non-eruptive intrusions will only1093
grow with the launch of new satellites and continued operation of existing1094
systems. As of mid-2014, five orbital SAR systems were available for sci-1095
entific applications (Table 1) – TerraSAR-X/TanDEM-X, COSMO-SkyMed,1096
RADARSAT-2, Sentinel-1a, and ALOS-2. Given that some of these systems1097
48

include multiple satellites and have short repeat times (on the order of days),1098
and that they can be complemented in a few locations by repeated airborne1099
SAR acquisitions, the potential for imaging magma transport ”in the act”1100
with high spatial resolution is better than ever. Such data will provide new1101
input for models of magma transport that will aid in the development of mon-1102
itoring strategies and modeling approaches (Segall, 2013) and may reveal new1103
insights into the structure and dynamics of active volcanism (Bagnardi et al.,1104
2013).1105
4.2.3. Temporal evolution of magmatic deformation1106
More than two decades of InSAR have enabled not only detection of1107
volcano deformation at locations around the world, but also compilation of1108
deformation time series that have made possible an abundance of modeling1109
studies and revealed feedback patterns between various types of volcanic and1110
tectonic activity. Fernandina provides a spectacular example, with InSAR1111
data extending back to 1992. Although there were few acquisitions in the1112
1990s, frequent collects in the 2000s captured deflation due to multiple in-1113
trusions and eruptions superimposed on a background trend of inflation that1114
is measured in terms of meters (Figure 20). Dense time series have also been1115
used to characterize the onset and evolution of deformation at volcanoes1116
that had been quiescent, like South Sister, which began inflating in 19961117
(Dzurisin et al., 2006, 2009; Riddick and Schmidt, 2011), and Laguna del1118
Maule, Chile, which experienced high-rates of deformation during 2007-20121119
that may be a consequence of processes within a large silicic magma chamber1120
(Feigl et al., 2014). Further, high-spatial-resolution deformation time series1121
provide critical input to models of magma ascent and accumulation that go1122
49

beyond simple elastic approximations like those of Mogi (1958) and Okada1123
(1985). For example, deformation time series from Socorro indicate steady1124
uplift, but modeling argues against constant magma overpressure (the con-1125
clusion based on elastic models) and instead in favor of heat transfer and1126
ductile deformation above a giant, previously emplaced sill intrusion (Pearse1127
and Fialko, 2010). Tracking post-eruptive volcano inflation has provided an1128
indication of the replenishment of shallow reservoirs (Lu et al., 2010), which1129
places constraints on magma viscosity and connections with deep magma1130
sources.1131
Perhaps most importantly, temporally dense, high-spatial-resolution In-1132
SAR data supply information regarding interactions between different vol-1133
canic process, and between volcanic and tectonic activity. An outstanding ex-1134
ample is the response of volcanoes in Japan and South America to large earth-1135
quakes. Within days of the 2010 Mw8.8 Maule earthquake off the coast of1136
Chile, subsidence of up to 15 cm was detected at 5 volcanoes in the southern1137
Andes, attributed to coseismic hydrothermal fluid release (Pritchard et al.,1138
2013). Similarly, subsidence was detected at several volcanoes in Japan fol-1139
lowing the 2011 Mw9.0 Tohoku earthquake, possibly indicating deformation1140
of thermally-weakened areas around large magma chambers due to coseismic1141
stress changes (Ozawa and Fujita, 2013; Takada and Fukushima, 2013). It is1142
doubtful that the full extent of either of these earthquake-triggered deforma-1143
tion episodes would have been discerned without InSAR results. As always,1144
the information provided by InSAR should be interpreted together with other1145
geophysical datasets, especially seismic noise studies, which reveal a seismic1146
velocity drop localized below volcanic regions after the Tohoku earthquake1147
50

(Brenguier et al., 2014). InSAR data have also documented flank displace-1148
ments that have occurred as a consequence of eruptive and intrusive activity.1149
Etna has experienced multiple such episodes, with InSAR time series sug-1150
gesting that dike emplacement in 2001-2002 triggered asymmetric motion of1151
the volcano’s eastern flank (Solaro et al., 2011), while an episode of flank1152
motion in 2008 might have provided the motivation for a subsequent dike1153
intrusion (Bonforte et al., 2013). At Piton de la Fournaise, InSAR recorded1154
a complex interplay between co-eruptive deflation, dike intrusion, and flank1155
motion associated with caldera collapse in 2007 – the first well-documented1156
evidence for flank instability at that volcano (Clarke et al., 2013).1157
Ultimately, the importance of temporally dense, high-spatial-resolution1158
deformation maps from InSAR is the ability to combine those data with1159
other observations to better understand how volcanoes work – especially1160
relevant for investigating the mechanisms of large-scale eruptions that can1161
have global impact. Santorini, for instance, is well known as the source of1162
an eruption that might have played a major role in the devastation of the1163
Minoan civilization ∼3600 years ago, and uplift that began there in 20111164
served as a reminder that the volcano is still active. Considering the infla-1165
tion in light of the petrology of past eruptive products, however, argues that1166
the shallow, geodetically imaged storage area is less important in terms of1167
controlling eruptive activity than the deeper magmatic system (Parks et al.,1168
2011). InSAR-derived deformation also provides outstanding constraints on1169
magma supply to a given volcano (Poland et al., 2012), which is the dominant1170
control on the volumes and timings of surface eruptive activity. Improvement1171
of the temporal resolution of geodetic observations, showing for instance a1172
51

period of transient subsidence not associated with an eruptive crisis, has also1173
revealed the need to consider the petrological effects related to degassing and1174
crystallization in order to correctly interpret temporal evolution of displace-1175
ments recorded at the surface above a magmatic reservoir (Caricchi et al.,1176
2014). As the number of SAR satellites and their ability to image defor-1177
mation globally continues to grow, so too will the incorporation of InSAR1178
time series in models of volcano evolution and eruptive activity. These data1179
will eventually feed in to dynamic models that account for magma migra-1180
tion through a volcanic plumbing system, as proposed by Melnik and Costa1181
(2013), which have potential for eruption forecasting, especially when they1182
incorporate deformation data.1183
4.2.4. Subsidence of volcanic deposits1184
While SAR interferometry is rightly known for its use in measuring surface1185
displacements associated with magma accumulation/withdrawal, magma mi-1186
gration, and fault slip at volcanoes, an underappreciated capability is charac-1187
terization of post-emplacement behavior in lava flows and pyroclastic units.1188
That such deposits deform after they are erupted is well known. For exam-1189
ple, both subsidence and uplift –attributed to lava cooling/crystallization and1190
vesiculation, respectively – have been measured on the surfaces of solidifying1191
lava lakes at Kılauea Volcano (Wright et al., 1976; Wright and Okamura,1192
1977; Peck, 1978). These dominantly vertical displacements, at Kılauea and1193
elsewhere, were initially documented by time- and personnel-intensive lev-1194
eling surveys (Murray and Guest, 1982). InSAR offers better spatial and1195
temporal resolution (assuming data are acquired during regular orbital re-1196
peats), and therefore provides improved insights into deformation patterns1197
52

and source mechanisms.1198
The first InSAR observations of post-emplacement lava-flow deformation1199
were reported at Etna, where subsidence of tens of cm per year was measured1200
on lava that had erupted several years previously. Because the deformation1201
extended beyond the margins of these flows, the subsidence was attributed1202
to compaction of deposits and relaxation of the substrate due to loading1203
(Briole et al., 1997). A subsequent analysis by Stevens et al. (2001) on1204
a larger lava flow field at Etna corroborated the earlier results. Since the1205
initial report from Etna, lava flow subsidence, generally attributed to thermal1206
contraction, mechanical compaction, and loading over various timescales,1207
has been documented by InSAR at volcanoes around the world, including1208
Nyamulagira, Democratic Republic of the Congo (Wauthier et al., 2013);1209
Hekla, Iceland (Grapenthin et al., 2010; Ofeigsson et al., 2011); and Okmok,1210
Alaska (Lu et al., 2005a) (for a more complete list see Ebmeier et al. (2012)).1211
The subsidence rates measured by InSAR range from a few mm/yr to tens of1212
cm/year, the larger rate being observed in the months following the lava flow1213
emplacement. Indeed, even the now-solidified lava lakes of Alae, Makaopuhi,1214
and Kılauea Iki on Kılauea Volcano – sites of some of the original work on1215
post-eruptive deformation of lava – continue to deform decades after their1216
emplacement (see Figure 18).1217
Post-emplacement subsidence of pyroclastic flows and lahars has also1218
been documented by InSAR, for instance, at Mount St. Helens, Washing-1219
ton, and at Augustine and Redoubt volcanoes, Alaska. The 18 May 19801220
debris avalanche at Mount St. Helens emplaced approximately 2.5 km3 of1221
cold volcanic edifice, hot cryptodome, water, and ice in the upper part of the1222
53

North Fork Toutle river valley, with a maximum deposit thickness of ∼200 m1223
(Voight, 1981; Glicken, 1996). InSAR data spanning periods beginning more1224
than 12 years after the volcano collapsed revealed three distinct patches of1225
subsidence in the deposit (see Figure 19). Poland and Lu (2008)) attributed1226
the subsidence to a combination of substrate compaction, deposit consoli-1227
dation, and melting of buried ice – thermal contraction was not considered1228
likely because the emplacement temperature of the deposit was probably not1229
sufficiently high to be causing over 2 cm/yr of subsidence after 20 years, and1230
the subsidence did not correspond to the thickest areas of the avalanche.1231
Subsidence of up to 20 cm/yr in patches of lahar deposits associated with1232
the 2009 Redoubt eruption is also thought to be caused by compaction due1233
to melting of buried snow and ice (McAlpin and Meyer, 2013). In contrast,1234
pyroclastic flow deposits from the 1986 eruption of Augustine volcano were1235
found to be subsiding more than 13 years later at a roughly steady rate of up1236
to ∼3 cm/yr, with maximum subsidence corresponding to maximum deposit1237
thickness. Masterlark et al. (2006) modeled the subsidence as due entirely1238
to thermoelastic contraction of an initially hot deposit, and, using a finite1239
element analysis, they were able to constrain the maximum emplacement1240
temperature of the deposit, as well as the deposit volume and thickness1241
distribution to a higher degree of accuracy than possible from combining1242
poor-resolution pre- and post-eruption DEMs. For a more complete list of1243
post-depositional processes affecting ignimbrites, see Whelley et al. (2012).1244
The recognition of post-emplacement subsidence of lava, lahars, and py-1245
roclastic flows in InSAR data provides both a warning and an opportunity for1246
volcanological studies. Scientists must be cautious when employing InSAR or1247
54

other deformation data to interpret volcanic activity, as displacements of re-1248
cent surficial deposits may impact the manifestation of subsurface magmatic1249
activity (Stevens et al., 2001; Lu et al., 2005a). As an example, subsidence in1250
the north part of Kılauea’s summit caldera, possibly due to lava-flow cooling1251
and compaction, distorts deformation due to magma accumulation beneath1252
the surface (see Figure 18) and impacts the results of modeling of subsur-1253
face pressure change. To avoid bias in models of deep magma accumulation1254
at Hekla, Ofeigsson et al. (2011) masked areas of subsidence due to loading1255
and thermal contraction of recent lava flows near the summit of the volcano.1256
While a nuisance when modeling subsurface magmatic sources, deposit sub-1257
sidence can reveal important insights into the thermal, mechanical, and rhe-1258
ological behavior of volcanic materials. For example, deformation of lava and1259
pyroclastic flows can be used to estimate their thickness and emplacement1260
temperature, as well as the mechanical properties of the substrate (Master-1261
lark et al., 2006; Grapenthin et al., 2010) – parameters that might not be1262
discernible by other means but are important to geological and geochemical1263
investigations of eruptive activity.1264
4.3. Main InSAR limitations for deformation measurements1265
The applicability of SAR interferometry for measuring surface displace-1266
ments is not equal everywhere on Earth. Vegetated areas are usually prone1267
to temporal decorrelation (Zebker and Villasenor, 1992), which makes the1268
use of InSAR difficult in tropical zones, unless using L-band data. Other1269
phenomena, such as ice or snow cover and ash deposits, also lead to tem-1270
poral decorrelation, reducing the potential of InSAR (figure 21a). Where1271
scattering characteristics of the ground do remain stable, the geometry of1272
55

acquisition can affect the success of InSAR, with reduced spatial resolution1273
on slopes facing the sensor (Figure 21b) and the potential for slopes facing1274
away to be in shadow (Figure 1). In addition, the approximately polar orbits1275
of SAR satellites mean that InSAR measurements are mostly sensitive to1276
vertical and east-west displacements., and not to north-south movement.1277
Another strong limitation of InSAR results from the variation in atmo-1278
spheric conditions between acquisitions, inducing changes in the phase delay1279
that may be misinterpreted as surface displacement (Zebker et al., 1997;1280
Hanssen, 2001). Ionospheric effects can be an error source particularly in L-1281
band data but can be mitigated in a number of ways (Meyer, 2011). However1282
the main atmospheric noise contribution in SAR data comes from the tro-1283
posphere. Tropospheric properties vary on two characteristic lateral scales:1284
short (few km), induced by turbulent troposphere dynamics, and long (10s1285
of km), due to variations in temperature and humidity profiles within the1286
atmosphere.1287
The turbulent variation still remains difficult to model but can be re-1288
duced by temporal filtering (e.g., Schmidt and Burgmann, 2003; Hooper1289
et al., 2012a) (see section 2.5). The long-scale variation induces not only1290
long-wavelength artifacts, but also interferometric fringes that are strongly1291
correlated with topography, as phase delay depends on how far through the1292
troposphere the signal has traveled (figure 21c,d). Temporal filtering meth-1293
ods are not always sufficient to reduce the topographically correlated delay1294
because SAR data sets typically do not evenly sample seasonal atmospheric1295
fluctuations, resulting in biased estimates (Doin et al., 2009). Furthermore,1296
temporal filtering methods are never able to completely separate tropospheric1297
56

delay from deformation that is not steady-state.1298
Topographically correlated tropospheric artifacts can be partially cor-1299
rected using the information contained within the SAR data, based on the1300
correlation between phase and elevation in non-deforming areas (e.g., Cava-1301
lie et al., 2007; Remy et al., 2003; Lin et al., 2010; Shirzaei and Burgmann,1302
2012). In addition, the long-wavelength artifacts can be estimated over a1303
whole image by considering the variation of this correlation (Bekaert et al.,1304
in revision). Complementary data sets, such as dense GNSS or meteorological1305
measurements acquired at the same time as the SAR images, or meteorologi-1306
cal models, provide an alternative method for estimating the topographically1307
correlated and long-wavelength tropospheric artifacts (e.g., Webley et al.,1308
2002; Foster et al., 2006; Wadge et al., 2006; Doin et al., 2009; Jolivet et al.,1309
2011; Gong et al., 2011). As emphasized in section 4.2.2, the poor tempo-1310
ral sampling of SAR data has been an important limiting factor in tracking1311
magma migration. Transient deformation with a duration of hours, as some-1312
times occurs around the craters of andesitic volcanoes (Voight et al., 1998),1313
is also far below the temporal aliasing threshold of SAR data. The relatively1314
short period of satellite observations – twenty years for C-band data and even1315
less for L-band data that are more suitable for tropical areas – also limits1316
how representative probabilistic studies based on SAR data can be (Biggs1317
et al., 2014).1318
All of the difficulties described above are compounded for andesitic stra-1319
tovolcanoes. These edifices are often characterized by steep slopes, which1320
are highly vegetated due to long repose periods between eruptions, can be1321
partially covered by ice or snow, and undergo short-duration deformation1322
57

related to shallow conduit and dome activity. They are thus particularly1323
challenging to study with InSAR (Pinel et al., 2011).1324
5. Key constraints on volcanic edifice growth and stability1325
In the preceding sections we have reviewed the numerous applications1326
of SAR data, from mapping eruptive deposits (section 3) to constraining1327
various styles and mechanisms of deformation (section 4). While all of these1328
applications are of tremendous value individually, the real power of SAR lies1329
in the ability to integrate its uses to better constrain large-scale dynamic1330
processes related to active volcanism. An example of this capability is the1331
investigation of volcano growth and stability.1332
Volcano growth can occur both endogenously, via intrusions and cumulate1333
formation beneath the surface, and exogenously, through the addition of lava1334
and pyroclastic material to the surface. Assessing the dominant mode of1335
volcano growth at any given time is far from an academic exercise – in lava1336
domes, for example, endogenous growth may lead to over steepening, which1337
promotes dome collapse (Kaneko et al., 2002). Endogenous growth of an1338
entire volcanic edifice can similarly lead to flank instability, at both silicic1339
stratovolcanoes (Lipman et al., 1981; Moore and Albee, 1981) and basaltic1340
shield volcanoes (Clague and Denlinger, 1994). Changes over time in the1341
proportion of extruded to intruded material provide insights into the behavior1342
of a volcano, indicating, for example, that the propensity to erupt might1343
have decreased after a strong earthquake created more open space within the1344
magma plumbing system (Dzurisin et al., 1984). General quantification of1345
intruded plus erupted material can also help to constrain the magma supply1346
58

to the volcano – one of the primary controls on eruptive activity (Poland1347
et al., 2012) – as well as the ability of the volcanic edifice itself to modulate1348
magma storage (Got et al., 2013).1349
Exogenous volcano growth can be measured directly by a variety of tech-1350
niques, from geologic mapping of the thickness and distribution of lava or1351
pyroclastic material to remotely sensed changes in topography. Endogenous1352
growth, on the other hand, necessarily relies upon inferences from monitoring1353
data, including models of surface deformation (Biggs et al., 2010), thermal1354
emissions (Francis et al., 1993; Kaneko et al., 2002), gravity data (Johnson1355
et al., 2010; Flinders et al., 2010), and gas emissions (Allard, 1997). Defor-1356
mation monitoring with InSAR is uniquely suited to constrain edifice growth1357
caused by subsurface magma accumulation, as detailed in section 4.2.1. In-1358
SAR has detected large flank displacements associated with magmatic intru-1359
sions on several volcanoes, among them Etna (Solaro et al., 2010; Bonforte1360
et al., 2011; Ruch et al., 2012) and Piton de la Fournaise (Clarke et al., 2013).1361
Combining models of subsurface volume change from InSAR with measure-1362
ments of erupted volume can constrain the intrusive and extrusive growth1363
of an edifice. For example, Pritchard and Simons (2004), in an arc-wide1364
study over the Central Andes, constrained the intrusive growth rate to be1365
one to ten times larger than the extrusive rate. Biggs et al. (2010) found that1366
the volume of intrusion determined from InSAR data beneath Tungarahua1367
volcano, Ecuador, was roughly equivalent to the volume of extrusion over1368
the same time span, and the combined intrusive-extrusive volume was about1369
the same as the magma flux of the volcano over the past 2300 years. Sim-1370
ilarly, Fukushima et al. (2010) used InSAR data spanning activity of Piton1371
59

de la Fournaise volcano between 1998 and 2000 to show that only 17% of1372
the magma supplied to the volcano during that time was stored, with the1373
rest erupting during 5 discrete episodes of activity. Such estimates are nec-1374
essarily rough, since they do not account for magma compressibility in their1375
volume-change modeling (Rivalta and Segall, 2008); nevertheless, they pro-1376
vide important bounds on processes that would otherwise be unconstrained.1377
Understanding whether volcano growth is dominantly intrusive or extrusive1378
can even help to explain edifice morphology. For example, models to explain1379
the shapes of Galapagos shield volcanoes, which have steep middle slopes1380
but gentle upper and lower slopes, included both construction by effusion1381
(Simkin, 1981) and magmatic tumescence (Cullen et al., 1987). Only when1382
InSAR data that spanned multiple episodes of inflation, deflation, and erup-1383
tion became available could tumescence could be ruled out as a mechanism1384
(Bagnardi et al., 2013).1385
As detailed previously, SAR data can also be used to calculate the volume1386
of surfacial deposits through amplitude imagery (Wadge et al., 2011), phase1387
differences indicating topographic change over time (Ebmeier et al., 2012),1388
and direct determinations of topography and calculations of topographic dif-1389
ferences over time (Poland, 2014). Thus SAR can simultaneously quantify1390
the volumes of both intrusion and extrusion over a given time period. Kılauea1391
provides an excellent example of both the application of this capability and1392
the potential implications for evaluating the magma budget of a volcano, as1393
demonstrated by Poland (2014). During September 2011 through June 2013,1394
TanDEM-X data acquired over Kılauea were used to construct a time series of1395
DEMs, from which it was possible to calculate the erupted volume over that1396
60

span. The derived subaerial effusive volume over the ∼ 2 years was about1397
123 ∗ 106 m3 (Figure 11), but this volume is a minimum because some lava1398
entered the ocean. During periods of no ocean entry, the TanDEM-X-derived1399
lava discharge rate represents the entirety of Kılauea’s effusive output. SAR1400
data covering the same time period can be used to assess volumes of magma1401
storage as well. Deformation of Kılauea during the same time spanned by the1402
TanDEM-X time series indicates relatively minor deformation (Figure 22).1403
The pattern of displacements across the volcano is complex owing to interac-1404
tions among numerous processes, including subsidence of the Southwest Rift1405
Zone, uplift around the flanks of the East Rift Zone, subsidence of cooling1406
lava, faulting, and summit inflation due to magma accumulation. Although1407
obscured by long-term subsidence of the northern part of the caldera due to1408
lava flow cooling, summit deformation is otherwise consistent with inflation1409
of a magma reservoir at about 1.5 km beneath the caldera center (Lund-1410
gren et al., 2013). The modeled volume increase in this reservoir, however,1411
is probably less than 1 million m3 based on analogy with past inflation and1412
deflation of this source (Baker and Amelung, 2012; Lundgren et al., 2013).1413
Even accounting for magma compressibility, which could increase the volume1414
of stored magma by several orders, summit volume change is a very small1415
percentage (< 5%) of the effusive output. Magma may also be stored within1416
the East Rift Zone-especially in an area of uplift that is a result of transient1417
deformation following a dike intrusion and fissure eruption in March 2011.1418
This uplift, however, is not sufficient to account for the large discrepancy1419
between the erupted and intruded volume – even if the intruded volume is1420
increased by several times to account for magma compressibility. It there-1421
61

fore seems that most magma that was fed to Kılauea during mid-2011 to1422
mid-2013 was erupted.1423
By combining the erupted and intruded volumes, the total volume of1424
magma supply to the volcano during this period can be inferred. Since the1425
start of quasi-continuous eruptive activity in 1983, magma supply to Kılauea1426
has generally fallen within the range of 4−8 m3/s (Poland et al., 2012). Since1427
most magma supplied to Kılauea also erupted during mid-2011 to mid-2013,1428
and the eruption rate, determined from TanDEM-X-derived DEMs, is about1429
2 m3/s (Figure 11b), it seems probable that the magma supply to Kılauea1430
during this period was lower than at other times during the 1983-present1431
eruption. This valuable constraint on magma supply, which is consistent with1432
sluggish lava flow activity on Kılauea’s East Rift Zone, would not otherwise1433
be measurable, especially since changes in the pattern of degassing since1434
the start of summit eruptive activity in 2008 have introduced substantial1435
uncertainty in gas-based methods for measuring magma supply and lava1436
discharge rate (Poland, 2014). In addition to long-term supply (measured1437
over years), frequent repeats by SAR satellites over Kılauea provide evidence1438
for short-term changes in the rates of intrusion and effusion (measured over1439
weeks to months). In mid-2012, the effusion rate plummeted at the same time1440
as summit deformation, as indicated by InSAR time series and continuous1441
GPS data plateaued (Figure 11b,c). Because no lava was entering the ocean1442
at this time, the decreased lava discharge and lack of inflation may indicate1443
a short-term (2-month-long) decrease in magma supply to the volcano.1444
The Kılauea case cited above provides an illustrative example of the in-1445
sights that are possible thanks to the high temporal and spatial resolution of1446
62

SAR data, coupled with the capability of those data to provide information1447
on not only subsurface magma accumulation and withdrawal, but also vol-1448
ume change at the surface. No other data source currently in use offers such a1449
diversity of potential products, which range from tracking short-term, small-1450
scale changes in intrusive and eruptive activity to providing information that1451
constrains rates of magma supply to a given volcano.1452
6. Discussion1453
6.1. Looking back: advances made possible from SAR studies of volcanoes1454
For the past 20 years, satellite SAR imagery has provided repeat views1455
of Earth’s surface without regard to weather conditions or time of day, en-1456
abling detection and quantification of changes on the ground. In particular,1457
quantification of surface displacements on the order of a few millimeters is1458
possible over areas of thousands of square kilometers, and surface-change1459
data can be easily obtained from remote areas where ground-based observa-1460
tions are not practical. Volcanology and other Earth science disciplines have1461
derived outstanding benefits from this remote sensing technique by using the1462
imagery to address critical questions about how volcanoes work.1463
These capabilities provide more than just an additional dataset with1464
which to study a particular volcano. Instead, they have led to fundamen-1465
tal new insights into our understanding of volcano behavior. For example,1466
studies of the Galapagos archipelago were largely geological and petrologi-1467
cal in nature until InSAR revealed the dynamic nature of those volcanoes –1468
some of the fastest deforming in the world (Amelung et al., 2000). InSAR1469
results also demonstrated the mechanism for the pattern of eruptive vents1470
63

on western Galapagos volcanoes, where fissures are circumferential near the1471
summit calderas and radial on the flanks. Decades of geological field work1472
and modeling suggested a range of possibilities for that geometry, ranging1473
from stress reorientations near summit calderas to magma chamber shapes,1474
but it was pre- and co-eruptive interferograms that revealed that the under-1475
lying assumption of such studies – that all fissures were underlain by vertical1476
dikes – was incorrect, and that sill emplacement and rotation was the source1477
of the fissure pattern (Bagnardi et al., 2013). Without InSAR, it would1478
be doubtful if the range of deformation behavior of all Galapagos volcanoes1479
would be known, and the structure and growth patterns of the volcanoes1480
would certainly be unconstrained.1481
SAR data have also provided information on volcanoes that are deform-1482
ing and should be considered ”active” with respect to potential future erup-1483
tive activity. Such studies have come in the form of focused investigations1484
on individual volcanoes, like South Sister (Wicks et al., 2002), as well as1485
regional investigations of volcanic arcs (e.g., Pritchard and Simons, 2002,1486
2004; Chaussard and Amelung, 2012; Lu and Dzurisin, 2014). InSAR thus1487
demonstrates the potential to detect volcanoes under which magma is ac-1488
cumulating and that may become active within months to years (Dzurisin,1489
2003) – a capability borne out by the statistical correlation between defor-1490
mation and eruption (Biggs et al., 2014). Just as importantly, InSAR results1491
have demonstrated that some eruptions are not preceded, nor accompanied1492
by, measureable deformation (e.g., Zebker et al., 2000; Pritchard and Simons,1493
2002; Lu and Masterlark, 2003; Moran et al., 2006; Chaussard et al., 2013;1494
Ebmeier et al., 2013b). In some cases, frequently active volcanoes, like Mer-1495
64
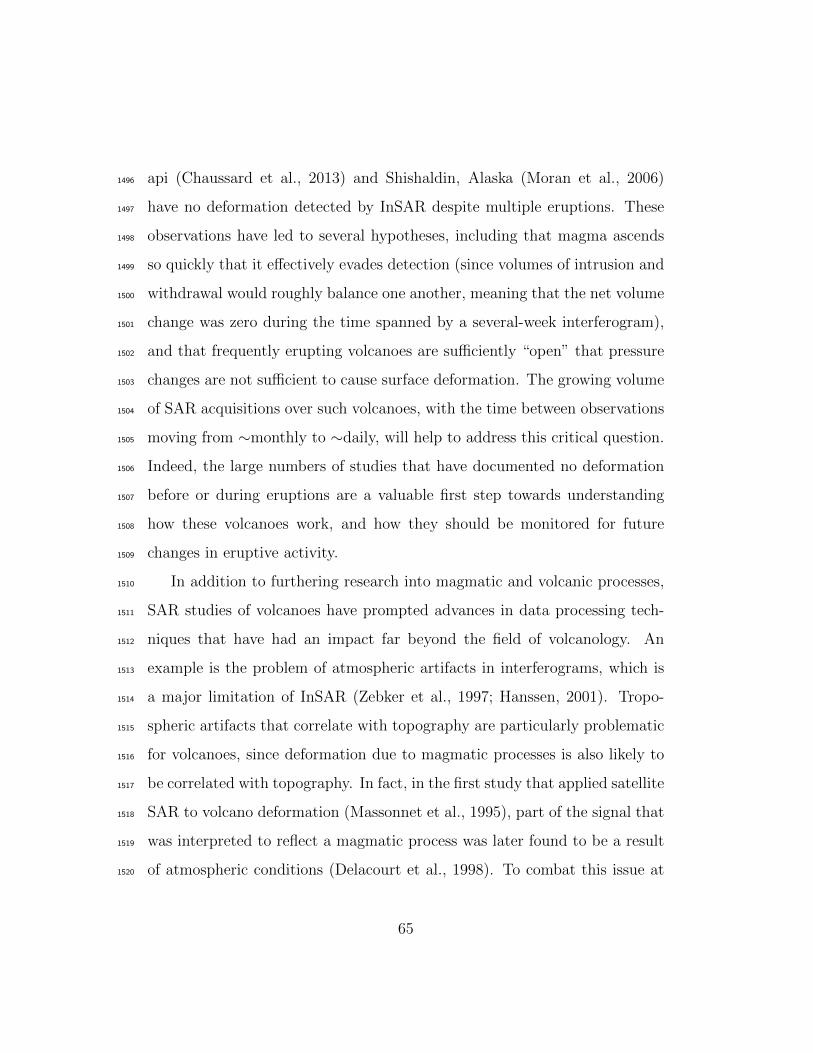
api (Chaussard et al., 2013) and Shishaldin, Alaska (Moran et al., 2006)1496
have no deformation detected by InSAR despite multiple eruptions. These1497
observations have led to several hypotheses, including that magma ascends1498
so quickly that it effectively evades detection (since volumes of intrusion and1499
withdrawal would roughly balance one another, meaning that the net volume1500
change was zero during the time spanned by a several-week interferogram),1501
and that frequently erupting volcanoes are sufficiently “open” that pressure1502
changes are not sufficient to cause surface deformation. The growing volume1503
of SAR acquisitions over such volcanoes, with the time between observations1504
moving from ∼monthly to ∼daily, will help to address this critical question.1505
Indeed, the large numbers of studies that have documented no deformation1506
before or during eruptions are a valuable first step towards understanding1507
how these volcanoes work, and how they should be monitored for future1508
changes in eruptive activity.1509
In addition to furthering research into magmatic and volcanic processes,1510
SAR studies of volcanoes have prompted advances in data processing tech-1511
niques that have had an impact far beyond the field of volcanology. An1512
example is the problem of atmospheric artifacts in interferograms, which is1513
a major limitation of InSAR (Zebker et al., 1997; Hanssen, 2001). Tropo-1514
spheric artifacts that correlate with topography are particularly problematic1515
for volcanoes, since deformation due to magmatic processes is also likely to1516
be correlated with topography. In fact, in the first study that applied satellite1517
SAR to volcano deformation (Massonnet et al., 1995), part of the signal that1518
was interpreted to reflect a magmatic process was later found to be a result1519
of atmospheric conditions (Delacourt et al., 1998). To combat this issue at1520
65

volcanoes, a variety of mitigation strategies have been explored, all of which1521
have applications to other uses of InSAR (e.g., Beauducel et al., 2000; Dela-1522
court et al., 1998; Wadge et al., 2002b; Webley et al., 2002; Remy et al., 2003;1523
Foster et al., 2006; Pinel et al., 2011), and work on the problem is ongoing.1524
Volcanoes are also often characterized by low coherence due to vegetation,1525
steep topography, ash deposition or lava emplacement, rapid deformation,1526
and ice and snow cover; new processing strategies have been developed to1527
overcome these challenges. To recover deformation associated with individ-1528
ual volcanic events, improved registration of phase data between SAR im-1529
ages (Yun et al., 2007) and pixel-offset tracking methods (Casu et al., 2011)1530
have yielded excellent results. Likewise, the non-linear nature of volcano1531
deformation over time, coupled with poor coherence, has been addressed by1532
time-series approaches, like Persistent Scatterer InSAR and the small base-1533
line approach (Hooper et al., 2004; Hooper, 2008). Modeling strategies have1534
also advanced in response to volcano deformation data provided by InSAR.1535
Most inverse models of displacement data from volcanoes are kinematic, but1536
newly developed dynamic inversions are capable of resolving the pressure1537
distribution within a magmatic body, thereby constraining the force respon-1538
sible for the measured displacements (e.g., Fukushima et al., 2005, 2010; Yun1539
et al., 2006; Hooper et al., 2011). Modeling methods that allow for increased1540
source complexity are also a direct consequence of high-spatial-resolution In-1541
SAR measurements of volcano deformation (Masterlark and Lu, 2004) and1542
the first attempt to use time-dependent optimization techniques on InSAR1543
data was at a volcanic field (Shirzaei and Walter, 2010).1544
66

6.2. Looking forward: better understanding of volcanoes and forecasts of1545
eruptions1546
Given that the SAR community is on the cusp of a ”golden age”, with1547
the recent or imminent arrival of new satellites and capabilities, how will1548
volcano SAR evolve over the next 20 years? And will these new data and1549
methods bring the community any closer to a better understanding of volcano1550
behavior and to the main expectation of society with regards to volcanology1551
– forecasting (or, dare we say, predicting) eruptive activity?1552
The main impact of SAR studies on risk assessment has so far been its1553
ability to detect unrest at volcanoes where no manifestations of activity had1554
previously been reported (e.g., Wicks et al., 2002; Pritchard and Simons,1555
2002). However the role of SAR data during an eruptive crisis has remained1556
subdued. Thus far, volcano SAR studies have, in general, been used to char-1557
acterize processes after they have occurred, which is valuable for advancing1558
understanding of volcanic behavior but is less useful for hazard mitigation1559
during volcanic crises. A noteworthy exception is the aforementioned case1560
of the 2010 Merapi eruption, in which timely SAR data, especially ampli-1561
tude imagery, provided much of the basis for maintaining evacuation zones1562
and preventing loss of life during explosive eruptions of the volcano (Pallis-1563
ter et al., 2013). In Iceland too, SAR data were used in hazard assessment1564
during the 2010 eruptions of Eyjafjallajkull (Sigmundsson et al., 2010). This1565
success was made possible by rapid availability of imagery to scientists, and1566
it provides an example of the potential value of SAR to volcano monitoring1567
and risk management. Efforts are currently in progress to integrate SAR data1568
into operational volcano monitoring systems (Meyer et al., 2014), and new1569
67

satellite missions will address this need – for example, the capability of near-1570
real-time data transmission from Sentinel-1 – so both amplitude imagery and1571
interferometric SAR should play a greater role in timely volcano monitoring1572
in the future. Additional satellites and the shorter repeat times of those mis-1573
sions will also help to address the need for better temporal resolution, since1574
many volcanic processes – like dike intrusions and dome growth – occur over1575
timescales of hours to days. In this new age for SAR, the community must1576
also take care to develop new processing and archiving strategies to deal1577
with the ever-increasing volume of data and to integrate SAR information1578
with ground-based observations. Only with such support systems can the1579
potential for InSAR as a near-real-time monitoring system be realized.1580
Another step that must be taken is the integration of the continuous flux1581
of SAR data with other observations into dynamic physics-based models of1582
volcanic processes. Such models have demonstrated outstanding potential1583
for investigating parameters like magma compressibility, magma reservoir1584
volume, and melt volatile content – factors that cannot be determined from1585
kinematic inversions (Anderson and Segall, 2011, 2013). Physics-based mod-1586
els also have the potential to transform our ability to forecast future activity1587
by coupling deformation, effusion rate, gas emissions, and other monitor-1588
ing data with a physically realistic model of a volcano (i.e., a model that1589
follows physics-based principles, like conservation of mass and momentum).1590
The great advantage of such an approach is that the probabilities of a spe-1591
cific outcome can not only be calculated, but also updated as new data are1592
acquired (Segall, 2013). Basic physics-based models of the evolution of an1593
eruption rely most heavily upon surface deformation and effusive volume –1594
68

two variables that can be constrained by SAR measurements. Those parame-1595
ters, derived from frequent SAR acquisitions by ground-based, airborne, and1596
satellite sensors, can therefore be fed directly into models that provide prob-1597
abilistic forecasts of, for example, the potential duration of eruptive activity.1598
As physics-based models of volcanoes continue to develop, broader forecasts1599
of parameters, like eruption onset and potential volume, will become pos-1600
sible. While these models will also need to incorporate other geological,1601
geophysical, and geochemical observations where they are available, remote1602
measurements from SAR will provide the foundation upon which to build.1603
At present, the knowledge needed to develop physics-based models is avail-1604
able from only a few well-studied volcanoes, like Kılauea, Etna, Mount St.1605
Helens, and Soufriere Hills. We expect more volcanoes to join these ranks,1606
however, as the record of space-based observations grows, even for remote1607
volcanoes that are not well monitored by terrestrial methods. Within a few1608
years, it is not unrealistic to think that volcano forecasts will be based not1609
on past experience, but instead on quantitative models that use near-real-1610
time SAR and other monitoring data, to dynamically update probabilistic1611
forecasts of activity.1612
In 20 years, SAR has gone from a specialized research tool that required1613
significant expertise and computing power and was available to only a few1614
researchers, to a broadly accessible technique that can be exploited using a1615
variety of software packages and that is close to becoming a vital volcano-1616
monitoring strategy. With the launch of new satellites, development of ad-1617
ditional ground-based and airborne systems, greater availability of data, and1618
continued refinement of data manipulation methods, we expect that barriers1619
69

to the use of SAR will continue to crumble, and that the technology will1620
evolve toward its logical place as a globally accessible volcano research and1621
monitoring tool.1622
7. Conclusion1623
Volcanology has derived outstanding benefits from SAR imagery by using1624
this remote sensing technique to address critical questions about how volca-1625
noes work, such as the timing of magma transfer, mechanisms of magma1626
ascent, construction of volcanic edifices, and volcano-volcano and volcano-1627
tectonic interactions. SAR amplitude data have documented eruptive de-1628
posits and surface change and have the advantage over optical data of being1629
able to operate at all times of day and in all weather conditions. Interfero-1630
metric data have been used to map deposits (from coherence), topography,1631
and deformation. Surface displacement fields derived from SAR benefit from1632
a large spatial coverage and unrivaled spatial resolution. They have thus1633
been key to assessing the shapes and volume changes of subvolcanic magma1634
plumbing systems, the impacts of magma storage and transport on local1635
stress field and future eruptive activity, and the stability of volcanic flanks.1636
SAR data should not, however, be considered independently of other vol-1637
canological datasets, but instead be integrated with these additional sources1638
of information, including both remote and ground-based data, to fully ex-1639
ploit the benefits of all. Thus far, the primary limitations in the use of SAR1640
for volcano monitoring have been the latency in data access and difficulty1641
in data processing, as well as poor temporal sampling. With the greater1642
availability of data made possible by the launch of new satellites, coupled1643
70

with recent computational and technical advances that facilitate processing1644
of large datasets, SAR imagery has become a common research and monitor-1645
ing tool across the Earth sciences. The current challenge for the volcanolog-1646
ical community is the effective use of these new SAR resources for better1647
understanding volcano behavior and addressing societys need for accurate1648
forecasts of hazardous activity. The key to overcoming this challenge rests1649
on expansion of efforts to educate volcano scientists around the world in SAR1650
utilization and interpretation, and the development of new modeling tools1651
that can more fully exploit the richness of insights provided by SAR data1652
from volcanoes.1653
8. Acknowledgments1654
We are grateful to Dan Dzurisin for his helpful comments on the manuscript1655
and we also thank reviewers Matt Pritchard and Valerio Acocella for their1656
suggestions, which greatly improved the overall quality of the paper.1657
References1658
Albino, F., Pinel, V., Massol, H., Collombet, M., 2011. Conditions for detec-1659
tion of ground deformation induced by conduit flow and evolution. Journal1660
of Geophysical Research: Solid Earth 116. doi:10.1029/2010JB007871.1661
Allard, P., 1997. Endogenous magma degassing and storage at Mount Etna.1662
Geophysical Research Letters 24, 2,219–2,222.1663
Amelung, F., Jonsson, S., Zebker, H., Segall, P., 2000. Widespread uplift1664
and ’trapdoor’ faulting on Galapagos volcanoes observed with radar inter-1665
ferometry. Nature 407, 993–996.1666
71

Amelung, F.and Yun, S.H., Walter, T.R., Segall, P., Kim, S.W., 2007. Stress1667
control of deep rift intrusion at Mauna Loa volcano, Hawaii. Science 316,1668
1,026–1,030. doi:10.1126/science.1140035.1669
Anderson, K., Lisowski, M., Segall, P., 2010. Cyclic ground tilt associated1670
with the 2004-2008 eruption of Mount St. Helens. Journal of Geophysical1671
Research: Solid Earth 115. doi:10.1029/2009JB007102.1672
Anderson, K., Segall, P., 2011. Physics-based models of ground deformation1673
and extrusion rate at effusively erupting volcanoes. Journal of Geophysical1674
Research: Solid Earth 116. doi:10.1029/2010JB007939.1675
Anderson, K., Segall, P., 2013. Bayesian inversion of data from effusive1676
volcanic eruptions using physics-based models: Application to Mount St.1677
Helens 20042008. Journal of Geophysical Research: Solid Earth 118, 2017–1678
2037. doi:10.1002/jgrb.50169.1679
Aoki, Y., Segall, P., Kato, T., Cervelli, P., Shimada, S., 1999. Imaging1680
magma transport during the 1997 seismic swarm off the Izu Peninsula,1681
Japan. Science 286, 927–930.1682
Apuani, T., Corazzato, C., Cancelli, A., Tibaldi, A., 2005. Stability of a1683
collapsing volcano (Stromboli, Italy): Limit equilibrium analysis and nu-1684
merical modelling. Journal of Volcanology and Geothermal Research 144,1685
191–210. doi:10.1016/j.jvolgeores.2004.11.028.1686
Bagnardi, M., 2014. Dynamics of magma supply, storage, and migration at1687
basaltic volcanoes: Geophysical studies of the Galapagos and Hawaiian1688
72

volcanoes. Ph.D. dissertation, Univ. Miami, Coral Gables, Florida, 1911689
pp.1690
Bagnardi, M., Amelung, F., 2012. Space-geodetic evidence for multiple1691
magma reservoirs and subvolcanic lateral intrusions at Fernandina Vol-1692
cano, Galapagos Islands. Journal of Geophysical Research: Solid Earth1693
117. doi:10.1029/2012JB009465.1694
Bagnardi, M., Amelung, F., Poland, M.P., 2013. A new model for the1695
growth of basaltic shields based on deformation of Fernandina volcano,1696
Galpagos Islands. Earth and Planetary Science Letters 377378, 358 – 366.1697
doi:10.1016/j.epsl.2013.07.016.1698
Baker, S., 2012. Investigating the dynamics of basaltic volcano magmatic sys-1699
tems with space geodesy. Ph.D. dissertation, Univ. Miami, Coral Gables,1700
Florida, 128 pp.1701
Baker, S., Amelung, F., 2012. Top-down inflation and deflation at the summit1702
of Kilauea Volcano, Hawaii observed with InSAR. Journal of Geophysical1703
Research: Solid Earth 117. doi:10.1029/2011JB009123.1704
Bally, P.E., 2012. Scientific and Technical Memorandum of The International1705
Forum on Satellite EO and Geohazards, 21-23 May 2012, Santorini Greece.1706
doi:10.5270/esa-geo-hzrd-2012.1707
Battaglia, M., Roberts, C., Segall, P., 1999. Magma intrusion beneath Long1708
Valley caldera confirmed by temporal changes in gravity. Science 285,1709
2,119–2,122.1710
73

Beauducel, F., Cornet, F.H., Suhanto, E., Duquesnoy, T., Kasser, M., 2000.1711
Constraints on magma flux from displacements data at Merapi volcano,1712
Java, Indonesia. Journal of Geophysical Research: Solid Earth 105, 8,193–1713
8,203.1714
Bechor, N.B.D., Zebker, H.A., 2006. Measuring two-dimensional move-1715
ments using a single insar pair. Geophysical Research Letters 33.1716
doi:10.1029/2006GL026883.1717
Bekaert, D.P.S., Hooper, A., Wright, T.J., in revision. A power-law tropo-1718
spheric correction technique for InSAR data, allowing for spatial variability1719
in tropospheric properties. Journal of Geophysical Research: Solid Earth1720
.1721
Berardino, P., Fornaro, G., Lanari, R., Sansosti, E., 2002. A new algo-1722
rithm for surface deformation monitoring based on small baseline differ-1723
ential SAR interferograms. IEEE Trans. Geosci. Remote Sens. 40, 2375 –1724
83.1725
Biggs, J., Bastow, I.D., Keir, D., Lewi, E., 2011. Pulses of defor-1726
mation reveal frequently recurring shallow magmatic activity beneath1727
the Main Ethiopian Rift. Geochemistry, Geophysics, Geosystems 12.1728
doi:10.1029/2011GC003662.1729
Biggs, J., Chivers, M., Hutchinson, M.C., 2013. Surface deformation and1730
stress interactions during the 2007-2010 sequence of earthquake, dyke in-1731
trusion and eruption in northern tanzania. Geophysical Journal Interna-1732
tional 195, 16–26. doi:10.1093/gji/ggt226.1733
74

Biggs, J., Ebmeier, S.K., Aspinall, W.P., Lu, Z., Pritchard, M.E., Sparks,1734
R.S.J., Mather, T.A., 2014. Global link between deformation and volcanic1735
eruption quantified by satellite imagery. Nature doi:10.1038/ncomms4471.1736
Biggs, J., Mothes, P., Ruiz, M., Amelung, F., Dixon, T. H.and Baker, S.,1737
Hong, S.H., 2010. Stratovolcano growth by co-eruptive intrusion: The1738
2008 eruption of Tungurahua Ecuador . Geophysical Research Letters 37.1739
doi:10.1029/2010GL044942.1740
Biggs, J., Wright, T., Lu, Z., Parsons, B., 2007. Multi-interferogram1741
method for measuring interseismic deformation: Denali fault, Alaska.1742
Geophysical Journal International 170, 1165–1179. doi:10.1111/j.1365-1743
246X.2007.03415.x.1744
Bonaccorso, A., Davis, P.M., 1999. Models of ground deformation from1745
vertical volcanic conduits with application to eruptions of Mount St. He-1746
lens and Mount Etna. Journal of Geophysical Research: Solid Earth 104,1747
10,531–10,542.1748
Bonforte, A., Federico, C., Giammanco, S., Guglielmino, F., Liuzzo, M., Neri,1749
M., 2013. Soil gases and SAR measurements reveal hidden faults on the1750
sliding flank of Mt. Etna (Italy). Journal of Volcanology and Geothermal1751
Research 251, 27 – 40. doi:10.1016/j.jvolgeores.2012.08.010.1752
Bonforte, A., Guglielmino, F., Coltelli, M., Ferretti, A., Puglisi, G.,1753
2011. Structural assessment of Mount Etna volcano from Perma-1754
nent Scatterers analysis. Geochemistry, Geophysics, Geosystems 12.1755
doi:10.1029/2010GC003213.1756
75

Borgia, A., 1994. Dynamic basis of volcanic spreading. Journal of Geophys-1757
ical Research: Solid Earth 99, 17,791–17,804.1758
Brenguier, F., Campillo, M., Takeda, T., Aoki, Y., Shapiro, N.M., Briand,1759
X., Emoto, K., Miyake, H., 2014. Mapping pressurized volcanic flu-1760
ids from induced crustal seismic velocity drops. Science 345, 80–82.1761
doi:10.1126/science.1254073.1762
Briole, P., Massonnet, D., Delacourt, C., 1997. Post-eruptive deformation1763
associated with the 1986-87 and 1989 lava flows of Etna detected by radar1764
interferometry. Geophysical Research Letters 24, 37–40.1765
Burgmann, R., Rosen, P.A., Fielding, E.J., 2000. Synthetic Aperture Radar1766
Interferometry to Measure Earths Surface Topography and Its Defor-1767
mation. Annual Review of Earth and Planetary Sciences 28, 169–209.1768
doi:10.1146/annurev.earth.28.1.169.1769
Caricchi, L., Biggs, J., Annen, C., Ebmeier, S., 2014. The influence of cooling,1770
crystallisation and re-melting on the interpretation of geodetic signals in1771
volcanic systems. Earth and Planetary Science Letters 388, 166 – 174.1772
doi:10.1016/j.epsl.2013.12.002.1773
Casagli, N., Tibaldi, A., Merri, A., Ventisette, C.D., Apuani, T., Guerri,1774
L., Fortuny-Guasch, J., Tarchi, D., 2009. Deformation of Strom-1775
boli Volcano (Italy) during the 2007 eruption revealed by radar in-1776
terferometry, numerical modelling and structural geological field data.1777
Journal of Volcanology and Geothermal Research 182, 182 – 200.1778
doi:10.1016/j.jvolgeores.2009.01.002.1779
76

Casu, F., Manconi, A., Pepe, A., Lanari, R., 2011. Deformation time-series1780
generation in areas characterized by large displacement dynamics: The1781
SAR amplitude Pixel-Offset SBAS Technique. IEEE Transactions on Geo-1782
science and Remote Sensing 99, 1–12. doi:10.1109/TGRS.2010.2104325.1783
Cavalie, O., Doin, M.P., Lasserre, C., Briole, P., 2007. Ground motion mea-1784
surement in the Lake Mead area (Nevada, USA), by DInSAR time series1785
analysis: probing the lithosphere rheological structure. Journal of Geo-1786
physical Research: Solid Earth 112. doi:10.1029/2006JB004344.1787
Chadwick, W.W.J., Jonsson, S. Geist, D.J., Poland, M., Johnson, D.J., Batt,1788
S., Harpp, K.S., Ruiz, A., 2011. The May 2005 eruption of Fernandina1789
volcano, Galapagos: The first circumferential dike intrusion observed by1790
GPS and InSAR. Bulletin of Volcanology 73, 679–697.1791
Chang, W.L., Smith, R.B., Farrell, J., Puskas, C.M., 2010. An extraordinary1792
episode of Yellowstone caldera uplift, 2004-2010, from GPS and InSAR ob-1793
servations. Geophysical Research Letters 37. doi:10.1029/2010GL045451.1794
Chang, W.L., Smith, R.B., Wicks, C., Farrell, J.M., Puskas, C.M., 2007.1795
Accelerated uplift and magmatic intrusion of the Yellowstone caldera, 20041796
to 2006. Science 318, 952–956. doi:10.1126/science.1146842.1797
Chaput, M., Pinel, V., Famin, V., Michon, L., Froger, J.L., 2014. Large-1798
scale sliding induced by sill intrusions: insights from numerical modeling.1799
Geophysical Research Letters , 1,937–1,943doi:10.1002/2013GL058813.1800
Charbonnier, S.J., Germa, A., Connor, C.B., Gertisser, R., Preece, K.,1801
Komorowski, J.C., Lavigne, F., Dixon, T., L., C., 2013. Evaluation of1802
77

the impact of the 2010 pyroclastic density currents at Merapi volcano1803
from high-resolution satellite imagery, field investigations and numeri-1804
cal simulations. Journal of Volcanology and Geothermal Research 261.1805
doi:10.1016/j.jvolgeores.2012.12.021.1806
Chaussard, E., Amelung, F., 2012. Precursory inflation of shallow magma1807
reservoirs at west Sunda volcanoes detected by InSAR. Geophysical Re-1808
search Letters 39. doi:10.1029/2012GL053817.1809
Chaussard, E., Amelung, F., 2014. Regional controls on magma ascent and1810
storage in volcanic arcs. Geochemistry, Geophysics, Geosystems 15, 1407–1811
1418. doi:10.1002/2013GC005216.1812
Chaussard, E., Amelung, F., Aoki, Y., 2013. Characterization of open and1813
closed volcanic systems in Indonesia and Mexico using InSAR time series.1814
Journal of Geophysical Research: Solid Earth doi:10.1002/jgrb.50288.1815
Chen, C.W., Zebker, H.A., 2001. Two-dimensional phase unwrapping with1816
use of statistical models for cost functions in nonlinear optimization. Jour-1817
nal of the Optical Society of America A (Optics, Image Science and Vision)1818
18, 338 – 51.1819
Clague, D., Denlinger, R., 1994. Role of olivine cumulates in destabilizing1820
the flanks of Hawaiian volcanoes. Bulletin of Volcanology 56, 425–434.1821
doi:10.1007/BF00302824.1822
Clarke, D., Brenguier, F., Froger, J.L., Shapiro, N.M., Peltier, A., Stau-1823
dacher, T., 2013. Timing of a large volcanic flank movement at Piton de la1824
78

Fournaise Volcano using noise-based seismic monitoring and ground defor-1825
mation measurements. Geophysical Journal International 195, 1132–1140.1826
doi:10.1093/gji/ggt276.1827
Costa, A., Melnik, O., Sparks, R.S.J., 2007. Controls of conduit geometry and1828
wallrock elasticity on lava dome eruptions. Earth and Planetary Science1829
Letters 260, 137–151.1830
Cullen, A.B., McBirney, A.R., Rogers, R.D., 1987. Structural controls on the1831
morphology of Galapagos shields. Journal of Volcanology and Geothermal1832
Research 34, 143 – 151. doi:10.1016/0377-0273(87)90099-0.1833
Curlander, J.C., McDonough, R.N., 1992. Synthetic Aperture Radar: Sys-1834
tems and Signal Processing. Wiley Series in Remote Sensing and Image1835
Processing.1836
Currenti, G., Bonaccorso, A., Del Negro, C., Scandura, D., Boschi, E., 2010.1837
Elasto-plastic modeling of volcano ground deformation. Earth and Plane-1838
tary Science Letters 296, 311–318.1839
de Zeeuw-van Dalfsen, E., Pedersen, R., Sigmundsson, F., 2004. Satellite1840
radar interferometry 1993-1999 suggests deep accumulation of magma near1841
the crust-mantle boundary at the Krafla volcanic system, Iceland. Geo-1842
physical Research Letters 31. doi:10.1029/2004GL020059.1843
De Michele, M., Raucoules, D., Wegmuller, U., Bignami, C., 2013. Synthetic1844
Aperture Radar (SAR) Doppler anomaly detected during the 2010 Merapi1845
(Java, Indonesia) eruption. IEEE Geoscience and Remote Sensing Letters1846
10, 1,319–1,323. doi:10.1109/LGRS.2013.2239602.1847
79

De Zan, F., 2014. Accuracy of incoherent speckle tracking for circular Gaus-1848
sian signals. IEEE Geoscience and Remote Sensing Letters 11, 264–267.1849
doi:10.1109/LGRS.2013.2255259.1850
Delacourt, C., Briole, P., Achache, J., 1998. Tropospheric corrections of SAR1851
interferograms with strong topography. Application to Etna. Geophysical1852
Research Letters 25, 2,849–2,852.1853
Di Traglia, F., Del Ventisette, C., Rosi, M., Mugnai, F., Intrieri, E.,1854
Moretti, S., Casagli, N., 2013. Ground-based InSAR reveals conduit1855
pressurization pulses at Stromboli volcano. Terra Nova 25, 192–198.1856
doi:10.1111/ter.12020.1857
Dietterich, H.R., Poland, M.P., Schmidt, D.A., Cashman, K.V., Sherrod,1858
D.R., Espinosa, A.T., 2012. Tracking lava flow emplacement on the east1859
rift zone of Kilauea, Hawaii, with synthetic aperture radar coherence. Geo-1860
chemistry, Geophysics, Geosystems 13. doi:10.1029/2011GC004016.1861
Doin, M., Lopez-Quiroz, P., Yan, Y., Bascou, P., Pinel, V., 2010. Time series1862
analysis of Mexico City subsidence constrained by radar interferometry.1863
7th EGU General Assembly 2010, Vienna 12, EGU2010–12031.1864
Doin, M.P., Lasserre, C., Peltzer, G., Cavalie, O., Doubre, C., 2009. Correc-1865
tions of stratified tropospheric delays in SAR interferometry: Validation1866
with global atmospheric models. J. of Applied Geophysics 69, 35–50.1867
d’Oreye, N., Fernandez, J., Gonzalez, P., Kervyn, F., Wauthier, C.,1868
Frischknecht, C., Calais, E., Heleno, S., Cayol, V., Oyen, A., Marinkovic,1869
P., 2008. Systematic InSAR monitoring of African active volcanic zones:1870
80

What we have learned in three years, or an harvest beyond our expecta-1871
tions, in: Use of Remote Sensing Techniques for Monitoring Volcanoes and1872
Seismogenic Areas, 2008. USEReST 2008. Second Workshop on, pp. 1–6.1873
doi:10.1109/USEREST.2008.4740361.1874
Dragoni, M., Magnanensi, C., 1989. Displacement and stress produced by a1875
pressurized, spherical magma chamber, surrounded by a viscoelastic shell.1876
Phys. Earth Planet. Int. 56, 316–328.1877
Dvorak, J.J., Dzurisin, D., 1997. Volcano geodesy: The search for magma1878
reservoirs and the formation of eruptive vents. Rev. Geophys. 35, 343–384.1879
Dzurisin, D., 2003. A comprehensive approach to monitoring volcano defor-1880
mation as a window on the eruption cycle. Rev. Geophys. 41, 1–29.1881
Dzurisin, D., 2007. Volcano deformation Geodetic monitoring techniques.1882
Springer-Praxis books in Geosphysical Sciences.1883
Dzurisin, D., Koyanagi, R.Y., English, T.T., 1984. Magma supply and stor-1884
age at Kilauea volcano, Hawaii, 19561983. Journal of Volcanology and1885
Geothermal Research 21, 177 – 206. doi:10.1016/0377-0273(84)90022-2.1886
Dzurisin, D., Lisowski, D., Wicks, C.W., 2009. Continuing inflation at Three1887
Sisters volcanic center, central Oregon Cascade Range, USA, from GPS,1888
leveling, and InSAR observations. Bulletin of Volcanology 71, 1,091–1,110.1889
doi:10.1007/s00445-009-0296-4.1890
Dzurisin, D., Lisowski, M., Wicks, C.W., Poland, M.P., Endo, E.T.,1891
2006. Geodetic observations and modeling of magmatic inflation at1892
81

the Three Sisters volcanic center, central Oregon Cascade Range,1893
USA. Journal of Volcanology and Geothermal Research 150, 35 – 54.1894
doi:10.1016/j.jvolgeores.2005.07.011.1895
Dzurisin, D., Yamashita, K., Kleinman, J., 1994. Mechanisms of crustal1896
uplift and subsidence at the Yellowstone caldera, Wyoming. Bulletin of1897
Volcanology 56, 261–270. doi:10.1007/BF00302079.1898
Ebmeier, S., Biggs, J., Mather, T.A., Amelung, F., 2011. InSAR measure-1899
ments of volcanoes in the tropics: examples from a survey of the Central1900
American Volcanic Arc. Fringe Workshop Proceedings, ESA Special Pub-1901
lication Fringe2011, September 2011, Italy.1902
Ebmeier, S.K., Biggs, J., Mather, T.A., Amelung, F., 2013a. Applica-1903
bility of InSAR to tropical volcanoes: insights from Central America.1904
doi:10.1144/SP380.2. in : Pyle, D. M. and Mather, T. A. and Biggs, J.1905
(eds) Remote Sensing of Volcanoes and Volcanic Processes: Integrating1906
Observation and Modelling Geological Society, London, Special Publica-1907
tions 380.1908
Ebmeier, S.K., Biggs, J., Mather, T.A., Amelung, F., 2013b. On the lack1909
of InSAR observations of magmatic deformation at Central American vol-1910
canoes. Journal of Geophysical Research: Solid Earth 118, 2571–2585.1911
doi:10.1002/jgrb.50195.1912
Ebmeier, S.K., Biggs, J., Mather, T.A., Elliott, J.R., Wadge, G.,1913
Amelung, F., 2012. Measuring large topographic change with In-1914
SAR: Lava thicknesses, extrusion rate and subsidence rate at Santia-1915
82

guito volcano, Guatemala. Earth and Planetary Science Letters , 216–1916
225doi:10.1016/j.epsl.2012.04.027.1917
Eineder, M., Minet, C., Steigenberger, P., Cong, X., Fritz, T., 2011. Imaging1918
Geodesy –Toward Centimeter-Level Ranging Accuracy With TerraSAR-1919
X. Geoscience and Remote Sensing, IEEE Transactions on 49, 661–671.1920
doi:10.1109/TGRS.2010.2060264.1921
Elsworth, D., Mattioli, G., Taron, J., Voight, B., Herd, R., 2008. Implications1922
of magma transfer between multiple reservoirs on eruption cycling. Science1923
, 246–248.1924
Farr, T., Rosen, P., Caro, E., Crippen, R., Duren, R., Hensley, S., Ko-1925
brick, M., Paller, M., Rodriguez, E., Roth, L., Seal, D., Shaffer, S.,1926
Shimada, J., Umland, J., Werner, M., Oskin, M., Burbank, D., Als-1927
dorf., 2007. The Shuttle Radar Topography Mission. Rev. Geophys. 45.1928
doi:10.1029/2005RG000183.1929
Favalli, M., Tarquini, S., Fornaciai, A., 2011. DOWNFLOW code and LIDAR1930
technology for lava flow analysis and hazard assessment at Mount Etna.1931
Annals of Geophysics doi:10.4401/ag-5339.1932
Feigl, K.L., Le Mvel, H., Tabrez Ali, S., Crdova, L., Andersen, N.L., DeMets,1933
C., Singer, B.S., 2014. Rapid uplift in Laguna del Maule volcanic field of1934
the Andean Southern Volcanic zone (Chile) 20072012. Geophysical Journal1935
International 196, 885–901. doi:10.1093/gji/ggt438.1936
Ferretti, A., Fumagalli, A., Novali, F., Prati, C., Rocca, F., Rucci, A., 2011.1937
83

A new algorithm for processing interferometric data-stacks: SqueeSAR.1938
IEEE Trans. Geosci. Remote Sens. 49, 3460–3470.1939
Fialko, Y., Khazan, Y., Simons, M., 2001. Deformation due to pressurized1940
horizontal circular crack in an elastic half-space, with applications to vol-1941
cano geodesy. Geophysical Journal International 146, 181–190.1942
Fialko, Y., Pearse, J., 2012. Sombrero Uplift Above the Altiplano-Puna1943
Magma Body: Evidence of a Ballooning Mid-Crustal Diapir. Science 338,1944
250–252. doi:10.1126/science.1226358.1945
Fialko, Y., Simons, M., 2001. Evidence for on-going inflation of the So-1946
corro magma body, New Mexico, from Interferometric Synthetic Aper-1947
ture Radar imaging. Geophysical Research Letters 28, 3549–3552.1948
doi:10.1029/2001GL013318.1949
Fiske, R.S., Kinoshita, W.T., 1969. Inflation of kilauea vol-1950
cano prior to its 1967-1968 eruption. Science 165, 341–349.1951
doi:10.1126/science.165.3891.341.1952
Flinders, A.F., Ito, G., Garcia, M.O., 2010. Gravity anomalies of the1953
Northern Hawaiian Islands: Implications on the shield evolutions of1954
Kauai and Niihau. Journal of Geophysical Research: Solid Earth 115.1955
doi:10.1029/2009JB006877.1956
Fornaro, G., Pauciullo, A., Serafino, F., 2009. Deformation monitoring over1957
large areas with multipass differential SAR interferometry: A new ap-1958
proach based on the use of spatial differences. Int. J. Rem. Sens. 30,1959
1455–1478.1960
84

Foster, J., Brooks, B., Cherubini, T., Shacat, C., Businger, S.,1961
Werner, C.L., 2006. Mitigating atmospheric noise for insar using1962
a high resolution weather model. Geophysical Research Letters 33.1963
doi:10.1029/2006GL026781.1964
Fournier, N., Chardot, L., 2012. Understanding volcano hydrothermal un-1965
rest from geodetic observations: Insights from numerical modeling and1966
application to White Island volcano, New Zealand. Journal of Geophysical1967
Research: Solid Earth 117. doi:10.1029/2012JB009469.1968
Fournier, T.J., Pritchard, M.E., Riddick, S.N., 2010. Duration, magnitude,1969
and frequency of subaerial volcano deformation events: New results from1970
Latin America using InSAR and a global synthesis. Geochemistry, Geo-1971
physics, Geosystems 11. doi:10.1029/2009GC002558.1972
Francis, P., Oppenheimer, C., Stevenson, D., 1993. Endogenous growth of1973
persistently active volcanoes. Nature 366, 554–557.1974
Froger, J.L., Augier, A., Cayol, V., Souriot, T., 2010. Some considerations1975
about the April 2007 eruption at Piton de la Fournaise suggested by InSAR1976
data. IAVCEI Third Workshop on Collapse Calderas, La Reunion, 20-22 .1977
Froger, J.L., Fukushima, Y., Briole, P., Staudacher, T., Souriot, T., Vil-1978
leneuve, N., 2004. The deformation field of the August 2003 eruption at1979
Piton de la Fournaise, Reunion Island, mapped by ASAR interferometry.1980
Geophysical Research Letters 31. doi:10.1029/2004GL020479.1981
Fukushima, Y., Cayol, V., Durand, P., 2005. Finding realistic dyke models1982
from interferometric synthetic aperture radar data: The February 20001983
85

eruption at Piton de la Fournaise. Journal of Geophysical Research: Solid1984
Earth 110. doi:10.1029/2004JB003268.1985
Fukushima, Y., Cayol, V., Durand, P., Massonnet, D., 2010. Evolution of1986
magma conduits during the 1998-2000 eruptions of Piton de la Fournaise1987
volcano, Reunion Island. Journal of Geophysical Research: Solid Earth1988
doi:10.1029/2009JB007023.1989
Gaddis, L., Mouginis-Mark, P., Singer, R., Kaupp, V., 1989. Geologic anal-1990
yses of Shuttle Imaging Radar (SIR-B) data of Kilauea Volcano, Hawaii.1991
Geological Society of America Bulletin 101.1992
Gaddis, L.R., 1992. Lava-flow characterization at Pisgah volcanic field, Cali-1993
fornia, with multiparameter imaging radar. Geological Society of America1994
Bulletin 104, 695–703.1995
Glicken, H., 1996. Rockslide-debris avalanche of May 18, 1980, Mount St.1996
helens volcano. U.S. Geological Survey Open-File Report 96-677, 90 pp..1997
Gong, W., Meyer, F., Webley, P., Lu, Z., 2011. Methods of insar atmosphere1998
correction for volcano activity monitoring, in: Geoscience and Remote1999
Sensing Symposium (IGARSS), 2011 IEEE International, pp. 1654–1657.2000
doi:10.1109/IGARSS.2011.6049550.2001
Gonzalez, P.J., Samsonov, S.V., Pepe, S., Tiampo, K.F., Tizzani, P., Casu,2002
F., Fernndez, J., Camacho, A.G., Sansosti, E., 2013. Magma storage and2003
migration associated with the 20112012 El Hierro eruption: Implications2004
for crustal magmatic systems at oceanic island volcanoes. Journal of Geo-2005
physical Research: Solid Earth doi:10.1002/jgrb.50289.2006
86

Got, J.L., Peltier, A., Staudacher, T., Kowalski, P., Boissier, P., 2013. Edifice2007
strength and magma transfer modulation at Piton de la Fournaise volcano.2008
Journal of Geophysical Research: Solid Earth 118. doi:10.1002/jrb.50350.2009
Grandin, R., Socquet, A., Binet, R., Klinger, Y., Jacques, E., de Chabalier,2010
J.B., King, G.C.P., Lasserre, C., Tait, S., Tapponnier, P., Delorme, A.,2011
Pinzuti, P., 2009. September 2005 Manda Hararo-Dabbahu rifting event,2012
Afar (Ethiopia): Constraints provided by geodetic data. Journal of Geo-2013
physical Research: Solid Earth 114. doi:10.1029/2008JB005843.2014
Grandin, R., Socquet, A., Jacques, E., Mazzoni, N., , de Chabalier, J.B.,2015
King, G.C.P., Lasserre, C., Tait, S., Tapponnier, P., Delorme, A., Pinzuti,2016
P., 2010. Sequence of rifting in Afar, Manda-Hararo rift, Ethiopia, 2005-2017
2009: Time space evolution and interactions between dikes from interfero-2018
metric synthetic aperture radar and static stress change modeling. Journal2019
of Geophysical Research: Solid Earth 115. doi:10.1029/2009JB000815.2020
Grapenthin, R., Ofeigsson, B., Sigmundsson, F., Sturkell, E., Hooper, A.,2021
2010. Pressure sources versus surface loads: Analysing volcano deforma-2022
tion signal composition with an application to Hekla volcano, Iceland.2023
Geophysical Research Letters 37. doi:10.1029/2010GL044590.2024
Gray, A.L., Mattar, K.E., Sofko, G., 2000. Influence of ionospheric electron2025
density fluctuations on satellite radar interferometry. Geophysical Research2026
Letters 27, 1451–1454. doi:10.1029/2000GL000016.2027
Green, D.N., Neuberg, J., Cayol, V., 2006. Shear stress along the conduit2028
87

wall as a plausible source of tilt at Soufriere Hills volcano, Montserrat.2029
Geophysical Research Letters 33. doi:10.1029/2006GL025890.2030
Hamling, I.J., Ayele, A., Bennati, L., Calais, E., Ebinger, C.J., Keir, D.,2031
Lewi, E., Wright, T.J., Yirgu, G., 2009. Geodetic observations of the on-2032
going Dabbahu rifting episode: new dyke intrusions in 2006 and 2007.2033
Geophysical Journal International 178, 989–1003. doi:10.1111/j.1365-2034
246X.2009.04163.x.2035
Hamling, I.J., Wright, T.J., Calais, E., Bennati, L., Lewi, E., 2010. Stress2036
transfer between thirteen successive dyke intrusions in Ethiopia. Nature2037
Geoscience 3, 713–717. doi:10.1038/ngeo967.2038
Hanssen, R.F., 2001. Radar interferometry - Data interpretation and error2039
analysis(Remote sensing and digital image processing, volume 2.). Kluwer2040
Academic Publishers, 1st edition. 328 pp.2041
Harris, A., Rowland, S., 2001. FLOWGO: a kinematic thermo-rheological2042
model for lava flowing in a channel. Bulletin of Volcanology 63, 20–44.2043
Henderson, S.T., Pritchard, M.E., 2013. Decadal volcanic deformation in the2044
Central Andes Volcanic Zone revealed by InSAR time series. Geochemistry,2045
Geophysics, Geosystems 14, 1358–1374. doi:10.1002/ggge.20074.2046
Hooper, A., 2008. A multi-temporal InSAR method incorporating bith persis-2047
tent scatterer and small baseline approaches. Geophysical Research Letters2048
35. doi:10.1029/2008GL034654.2049
Hooper, A., 2010. A Statistical-Cost Approach to Unwrapping the Phase of2050
88

InSAR Time Series. Fringe Workshop Proceedings, ESA Special Publica-2051
tion Frascati.2052
Hooper, A., Bekaert, D., Spaans, K., Arikan, M., 2012a. Recent advances in2053
SAR interferometry time series analysis for measuring crustal deformation.2054
Tectonophysics doi:10.1016/j.tecto.2011.10.013.2055
Hooper, A., Ofeigsson, B., Sigmundsson, F., Lund, B., Einarsson, P., Geirs-2056
son, H., Sturkell, E., 2011. Increased crustal capture of magma at volcanoes2057
with retreating ice cap. Nature Geoscience doi:10.1038/NGEO1269.2058
Hooper, A., Prata, F., Sigmundsson, F., 2012b. Remote sensing of Volcanic2059
Hazards and Their Precursors. Proceedings of the IEEE 100, 2,908–2,930.2060
Hooper, A., Segall, P., Zebker, H., 2007. Persistent scatterer interferometric2061
synthetic aperture radar for crustal deformation analysis, with application2062
to Volcan Alcedo, Galapagos. Journal of Geophysical Research: Solid2063
Earth 112. doi:10.1029/2006JB004763.2064
Hooper, A., Zebker, H., Segall, P., Kampes, B., 2004. A new method2065
for measuring deformation on volcanoes and other natural terrains us-2066
ing InSAR persistent scatterers. Geophysical Research Letters 31.2067
doi:10.1029/2004GL021737.2068
Hu, J., Li, Z., Ding, X., Zhu, J., Zhang, L., Sun, Q., 2014. Resolving three-2069
dimensional surface displacements from InSAR measurements: A review.2070
Earth-Science Reviews 133, 1 – 17. doi:10.1016/j.earscirev.2014.02.005.2071
Hurwitz, S., Christiansen, L.B., Hsieh, P.A., 2007. Hydrothermal2072
89

fluid flow and deformation in large calderas: Inferences from numer-2073
ical simulations. Journal of Geophysical Research: Solid Earth 112.2074
doi:10,1029/2006JB004689.2075
Hutnak, M., Hurwitz, S., Ingebritsen, S.E., Hsieh, P.A., 2009. Numerical2076
models of caldera deformation: Effects of multiphase and multicomponent2077
hydrothermal fluid flow. Journal of Geophysical Research: Solid Earth2078
114. doi:10,1029/2008JB006151.2079
Intrieri, E., Traglia, F.D., Ventisette, C.D., Gigli, G., Mugnai, F., Luzi, G.,2080
Casagli, N., 2013. Flank instability of Stromboli volcano (Aeolian Islands,2081
Southern Italy): Integration of GB-InSAR and geomorphological observa-2082
tions. Geomorphology 201, 60 – 69. doi:10.1016/j.geomorph.2013.06.007.2083
Iverson, R.M., 1995. Can magma-injection and groundwater forces cause2084
massive landslides on Hawaiian volcanoes. Journal of Volcanology and2085
Geothermal Research 66, 295–308.2086
Iverson, R.M., Schilling, S.P., Vallance, J.W., 1998. Objective delineation2087
of lahar-inundation hazard zones. Geological Society of America Bulletin2088
110, 972–984. doi:10.1130/0016-7606(1998)110¡0972:ODOLIH¿2.3.CO;2.2089
Johnson, D.J., Eggers, A.A., Bagnardi, M., Battaglia, M., Poland, M.P.,2090
Miklius, A., 2010. Shallow magma accumulation at klauea volcano,2091
hawaii, revealed by microgravity surveys. Geology 38, 1139–1142.2092
doi:10.1130/G31323.1.2093
Johnson, D.J., Sigmundsson, F., Delaney, P.T., 2000. Comment of ”Volume2094
of magma accumulation or withdrawal estimated fom surface uplift or sub-2095
90

sidence, with application to the 1960 collapse of Kilauea volcano” by P. T.2096
Delaney and D. F. McTigue. Bulletin of Volcanology 61, 491–493.2097
Jolivet, R., Grandin, R., Lasserre, C., Doin, M.P., Peltzer, G., 2011.2098
Systematic InSAR tropospheric phase delay corrections from global2099
meteorological reanalysis data. Geophysical Research Letters 38.2100
doi:10.1029/2011GL048757.2101
Jung, H.S., Lee, D.T., Lu, Z., Won, J.S., 2013. Ionospheric Correc-2102
tion of SAR Interferograms by Multiple-Aperture Interferometry. Geo-2103
science and Remote Sensing, IEEE Transactions on 51, 3191–3199.2104
doi:10.1109/TGRS.2012.2218660.2105
Jung, H.S., Won, J.S., W, K.S., 2009. An improvement of the per-2106
formance of multiple aperture SAR interferometry (MAI) . IEEE2107
Transactions on Geoscience and Remote Sensing 47, 2,859–2,869.2108
doi:10.1109/TGRS.2009.2016554.2109
Kaneko, T., Wooster, M.J., Nakada, S., 2002. Exogenous and endogenous2110
growth of the Unzen lava dome examined by satellite infrared image anal-2111
ysis. Journal of Volcanology and Geothermal Research 116, 151 – 160.2112
doi:10.1016/S0377-0273(02)00216-0.2113
Kelfoun, K., Druitt, T., Wyk de Vries, B., Guilbaud, M.N., 2008. Topo-2114
graphic reflection of the Socompa debris avalanche, Chile. Bulletin of2115
Volcanology 70, 1169–1187. doi:10.1007/s00445-008-0201-6.2116
Kelfoun, K., Samaniego, P., Palacios, P., Barba, D., 2009. Testing the suit-2117
ability of frictional behaviour for pyroclastic flow simulation by comparison2118
91

with a well-constrained eruption at tungurahua volcano (ecuador). Bulletin2119
of Volcanology 71, 1057–1075. doi:10.1007/s00445-009-0286-6.2120
Kubanek, J., M., W., Varley, N., James, M.R., Heck, B., 2014a. On using2121
bistatic TanDEM-X data for volcano monitoring. Proceedings of EUSAR2122
2014, Berlin, Germany, June 35, 2014 [doi not yet assigned].2123
Kubanek, J., Westerhaus, M., Heck, B., 2014b. On the use of bistatic2124
TanDEM-X images to quantify volumetric changes of active lava domes.2125
In : Proc. IAG Sci. Ass., Potsdam, Germany, September 1-6, 2013, IAG2126
Symp., 143, edited by C. Rizos and P. Willis, pp. [doi not yet assigned].2127
Lanari, R., Berardino, P., Borgstrom, S., Del Gaudio, C., De Martino, P.,2128
Fornaro, G., Guarino, S., Ricciardi, G.P., Sansosti, E., Lundgren, P., 2004.2129
The use of IFSAR and classical geodetic techniques for caldera unrest2130
episodes: Application to the Campi Flegrei uplift event of 2000. Journal2131
of Volcanology and Geothermal Research 133, 247–260.2132
Lauknes, T., Zebker, H., Larsen, Y., 2011. InSAR deformation time series2133
using an L1-Norm small-baseline approach. IEEE Trans. Geosci. Remote2134
Sens. 49, 536 –546. doi:10.1109/TGRS.2010.2051951.2135
Lengline, O., Marsan, D., Got, J.L., Pinel, V., Ferrazzini, V., Obuko, P.G.,2136
2008. Seismicity induced by magma accumulation at three basaltic volca-2137
noes. Journal of Geophysical Research: Solid Earth 113.2138
Lin, Y.N., Simons, M., Hetland, E.A., Muse, P., DiCaprio, C., 2010. A2139
multiscale approach to estimating topographically correlated propagation2140
92

delays in radar interferograms. Geochemistry, Geophysics, Geosystems 11.2141
doi:10.1029/2010GC003228.2142
Lipman, P.W., Moore, J.G., Swanson, D., 1981. Bulging of the north flank2143
before the may 18 eruption - geodetic data. In : Lipman, P. W. and2144
Mullineaux, D. R. (eds) The 1980 eruptions of Mount St. Helens, Wash-2145
ington, U.S. Geological Survey Professional Paper 1250.2146
Lister, J.R., Kerr, R.C., 1991. Fluid-mechanical models of crack propagation2147
and their application to magma transport in dykes. Journal of Geophysical2148
Research: Solid Earth 96, 10,049–10,077.2149
Lockwood, J.P., Dvorak, J.J., English, T.T., Koyanagi, R.Y., Okamura,2150
A.T., Summers, M.L., Tanigawa, W.R., 1987. Mauna Loa 1974-1984: A2151
decade of intrusive and extrusive activity. In R. W. Decker, T. L. Wright,2152
P. H. Stauffer, Eds. Volcanism in Hawaii, U.S. Geological Survey Profes-2153
sional Paper 1350.2154
Lu, Z., Dzurisin, D., 2014. InSAR Imaging of Aleutian Volcanoes: Monitoring2155
a Volcanic Arc from Space. Springer Praxis Books, Geophysical Sciences,2156
ISBN 978-3-642-00347-9, 388 pp.2157
Lu, Z., Dzurisin, D., Biggs, J., Wick Jr., C., McNutt, S., 2010. Ground2158
surface deformation patterns, magma supply, and magma storage at2159
Okmok volcano, Alaska, from InSAR analysis:1. Intereruption deforma-2160
tion, 1997-2008. Journal of Geophysical Research: Solid Earth 115.2161
doi:10.1029/2009JB006969.2162
93

Lu, Z., Fielding, E., Patrick, M., Trautwein, C., 2003. Estimating lava vol-2163
ume by precision combination of multiple baseline spaceborne and airborne2164
interferometry synthetic aperture radar: The 1997 eruption of Okmok vol-2165
cano, Alaska. IEEE Transactions on Geoscience and Remote Sensing 41.2166
Lu, Z., Jung, H.S., Zhang, L., Lee, W., Lee, C.W., Dzurisin, D., 2012. Digital2167
elevation model generation from satellite interferometric synthetic aperture2168
radar. In Advances in Mapping from Remote Sensor Imagery: Techniques2169
and Applications, edited by X. Yang and J. Li, CRC Press, Boca Raton,2170
Florida, doi: 10.1201/b13770-6.2171
Lu, Z., Masterlark, T., 2003. Magma supply dynamics of Okmok volcano2172
inferred from interferometric SAR. Eos. Trans. AGU 87. Fall. Meet. Suppl.,2173
Abstract V51J-0403.2174
Lu, Z., Masterlark, T., Dzurisin, D., 2005a. Interferometric synthetic aper-2175
ture radar study of Okmok volcano, Alaska, 1992-2003: Magma supply2176
dynamics and postemplacement lava flow deformation. Journal of Geo-2177
physical Research: Solid Earth 1110. doi:10.1029/2004JB003148.2178
Lu, Z., Wicks Jr., C., Kwoun, O., Power, J.A., Dzurisin, D., 2005b. Surface2179
deformation associated with the March 1996 earthquake swarm at Akutan2180
Island, Alaska, revealed by C-band ERS and L-band JERS radar interfer-2181
ometry. Canadian Journal of Remote Sensing 31, 7–20. doi:10.5589/m04-2182
054.2183
Lundgren, P., Poland, M., Miklius, A., Orr, T., Yun, S.H., Fielding, E., Liu,2184
Z., Tanaka, A., Szeliga, W., Hensley, S., Owen, S., 2013. Evolution of2185
94

dike opening during the March 2011 Kamoamoa fissure eruption, Klauea2186
Volcano, Hawai‘i. Journal of Geophysical Research: Solid Earth 118, 897–2187
914. doi:10.1002/jgrb.50108.2188
Maccaferri, F., Bonafede, M., Rivalta, E., 2011. A quantitative study2189
of the mechanisms governing dike propagation, dyke arrest and sill for-2190
mation. Journal of Volcanology and Geothermal Research 208, 39–50.2191
doi:10.1016/j.jvolgeores.2011.09.001.2192
MacKay, M.E., Mouginis-Mark, P.J., 1997. The effect of varying ac-2193
quisition parameters on the interpretation of SIR-C radar data: The2194
Virunga volcanic chain. Remote Sensing of Environment 59, 321 – 336.2195
doi:10.1016/S0034-4257(96)00144-7.2196
Magnusson, E., Gudmundsson, M.T., Roberts, M.J., Sigurdsson, G.,2197
Hoskuldsson, F., Oddsson, B., 2012. Icevolcano interactions during the2198
2010 Eyjafjallajkull eruption, as revealed by airborne imaging radar. Jour-2199
nal of Geophysical Research: Solid Earth 117.2200
Martins, J., Hooper, A., Sigmundsson, F., Hreinsdottir, S., Hanssen, R., in2201
prep. The 2010 Eyjafjallajokull volcano eruption through InSAR and GPS2202
time-series analysis. Journal of Geophysical Research: Solid Earth .2203
Massonnet, D., Briole, P., Arnaud, A., 1995. Deflation of Mount Etna mon-2204
itored by spaceborne radar interferometry. Nature 375, 567–570.2205
Massonnet, D., Feigl, K.L., 1998. Radar interferometry and its application2206
to changes in the Earth’s surface. Rev. Geophys. 36, 441–500.2207
95

Massonnet, D., Sigmundsson, F., 2000. Remote sensing of volcano deforma-2208
tion by radar interferometry from various satellites. In Remote Sensing of2209
Active Volcanism, vol 116, Washington, DC: AGU, pp. 207-221.2210
Massonnet, D., Souyris, J.C., 2008. Imaging with synthetic aperture radar.2211
EPFL-CRC Press. 280p.2212
Masterlark, T., Lu, Z., 2004. Transient volcano deformation sources im-2213
aged with interferometric synthetic aperture radar: Application to Seguam2214
Island, Alaska. Journal of Geophysical Research: Solid Earth 109.2215
doi:10.1029/2003JB002568.2216
Masterlark, T., Lu, Z., Rykhus, R., 2006. Thickness distribution of a2217
cooling pyroclastic flow deposit on Augustine Volcano, Alaska: Op-2218
timization using InSAR, FEMs, and an adaptive mesh algorithm.2219
Journal of Volcanology and Geothermal Research 150, 186 – 201.2220
doi:10.1016/j.jvolgeores.2005.07.004.2221
McAlpin, D., Meyer, F.J., 2013. Multi-sensor data fusion for remote sensing2222
of post-eruptive deformation and depositional features at Redoubt Vol-2223
cano. Journal of Volcanology and Geothermal Research 259, 414 – 423.2224
doi:10.1016/j.jvolgeores.2012.08.006.2225
McTigue, D.F., 1987. Elastic stress and deformation near a finite spherical2226
magma body: resolution of the point source paradox. Journal of Geophys-2227
ical Research: Solid Earth 92, 12,931–12,940.2228
McTigue, D.F., Mei, C.C., 1981. Gravity-induced stresses near topography of2229
small slope. Journal of Geophysical Research: Solid Earth 86, 9,268–9,278.2230
96

Melnik, O., Costa, A., 2013. Dual chamber-conduit models of non-linear2231
dynamics behaviour at Soufriere Hills volcano, Montserrat Special volume2232
”The Eruption of Soufriere Hills Volcano, Montserrat from 2000 to 2010”,2233
Editors: G. Wadge, R. Robertson, B. Voight, Memoir of the Geological2234
Society of London, in press.2235
Meyer, F., 2011. Performance Requirements for Ionospheric Correction of2236
Low-Frequency SAR Data. Geoscience and Remote Sensing, IEEE Trans-2237
actions on 49, 3694–3702. doi:10.1109/TGRS.2011.2146786.2238
Meyer, F., McAlpin, D., Gong, W., Ajadi, O., Arko, S., Webley, P., Dehn, J.,2239
2014. Integrating SAR and derived products into operational volcano mon-2240
itoring and decision support systems. ISPRS Journal of Photogrammetry2241
and Remote Sensing , –doi:10.1016/j.isprsjprs.2014.05.009.2242
Miklius, A., Cervelli, P., 2003. Vulcanology: Interaction between Kilauea2243
and Mauna Loa. Nature 421. doi:10.1038/421229a.2244
Mogi, K., 1958. Relations between the eruptions of various volcanoes and2245
the deformations of the ground surfaces around them. Bull. Earthquake2246
Res. Inst., Univ. Tokyo 36, 99–134.2247
Moore, J.G., Albee, W.C., 1981. Topographic and structural changes, march-2248
july 1980-photogrammetric data. In : Lipman, P. W. and Mullineaux,2249
D. R. (eds) The 1980 eruptions of Mount St. Helens, Washington, US2250
Geological Survey Professional Paper 1250.2251
Moran, S., Kwoun, O., Masterlark, T., Lu, Z., 2006. On the absence of2252
InSAR-detected volcano deformation spanning the 19951996 and 19992253
97

eruptions of Shishaldin Volcano, Alaska. Journal of Volcanology and2254
Geothermal Research 150, 119 – 131. doi:10.1016/j.jvolgeores.2005.07.013.2255
Murray, J., Guest, J., 1982. Vertical ground deformation on Mount Etna,2256
19751980. Geological Society of America Bulletin 93.2257
Newman, A.V., Dixon, T.H., Gourmelen, N., 2006. A four dimensional vis-2258
coelastic deformation model for Long Valley Caldera, California, between2259
1995 and 2000. Journal of Volcanology and Geothermal Research 150,2260
244–269. doi:10.1016/j.jvolgeores.2005.07.017.2261
Nolesini, T., Traglia, F.D., Ventisette, C.D., Moretti, S., Casagli, N., 2013.2262
Deformations and slope instability on Stromboli volcano: Integration of2263
GBInSAR data and analog modeling. Geomorphology 180181, 242 – 254.2264
doi:10.1016/j.geomorph.2012.10.014.2265
Ofeigsson, B.G., Sigmundsson, F., Hooper, A., Sturkell, E.O., 2011. InSAR2266
time series analysis at Hekla volcano, Iceland: Inflation periods and crustal2267
deformation associated with the 2000 eruption. Journal of Geophysical2268
Research: Solid Earth .2269
Okada, Y., 1985. Surface deformation due to shear and tensile faults in a2270
half-space. Bull. Seismol. Soc. Am. 75, 1,135–1,154.2271
Oyen, A.M., van Oostveen, J., Hooper, A., Hanssen, R.F., in prep. Advances2272
in accounting for ionospheric effects in InSAR. IEEE Transactions on2273
Geoscience and Remote Sensing .2274
Ozawa, T., Fujita, E., 2013. Local deformations around volcanoes associated2275
98

with the 2011 off the Pacific coast of Tohoku earthquake. Journal of Geo-2276
physical Research: Solid Earth 118, 390–405. doi:10.1029/2011JB009129.2277
Pallister, J.S., Schneider, D.J., Griswold, J.P., Keeler, R.H., Burton, W.C.,2278
Noyles, C., Newhall, C.G., Ratdomopurbo, A., 2013. Merapi 20102279
eruption-Chronology and extrusion rates monitored with satellite radar2280
and used in eruption forecasting. Journal of Volcanology and Geothermal2281
Research 261, 144–152. doi:10.1016/j.jvolgeores.2012.07.012.2282
Parks, M.M., Biggs, J., Mather, T.A., Pyle, D.M., Amelung, F., Mon-2283
salve, M.L., Narvaez, M., 2011. Co-eruptive subsidence at Galeras2284
identified during an InSAR survey of Colombian volcanoes (2006-2009).2285
Journal of Volcanology and Geothermal Research 202, 228 – 240.2286
doi:10.1016/j.jvolgeores.2011.02.007.2287
Pearse, J., Fialko, Y., 2010. Mechanics of active magmatic intraplating in2288
the Rio Grande Rift near Socorro, New Mexico. Journal of Geophysical2289
Research: Solid Earth 115. doi:10.1029/2009JB006592.2290
Peck, D.L., 1978. Cooling and vesiculation of Alae lava lake, Hawaii. U.S.2291
Geological Survey Professional Paper 935-B, 59 pp.2292
Pedersen, R., Sigmundsson, 2004. InSAR based sill model links spatially2293
offset areas of deformation and seismicity for the 1994 unrest episode2294
at Eyjafjallajokull volcano, Iceland. Geophysical Research Letters 31.2295
doi:10.1029/2004GL0202368.2296
Pedersen, R., Sigmundsson, 2006. Temporal development of the 1999 intru-2297
99

sive episode in the Eyjafjallajokull volcano, Iceland, derived from InSAR2298
images. Bulletin of Volcanology 68, 377–393.2299
Pepe, A., Lanari, R., 2006. On the extension of the minimum cost flow2300
algorithm for phase unwrapping of multitemporal differential SAR inter-2301
ferograms. IEEE Trans. Geosci. Remote. Sens. 44, 2374–2383.2302
Perissin, D., Ferretti, A., 2007. Urban-target recognition by means of re-2303
peated spaceborne SAR images. IEEE Trans. Geosci. Remote Sens. 45,2304
4043 –4058. doi:10.1109/TGRS.2007.906092.2305
Philibosian, B., Simons, M., 2012. A survey of volcanic deformation on Java2306
using ALOS PALSAR interferometric time series. Geochemistry, Geo-2307
physics, Geosystems 12. doi:10.1029/2011GC003775.2308
Pinel, V., Hooper, A., De la Cruz-Reyna, S., Reyes-Davila, G., Doin, M.P.,2309
Bascou, P., 2011. The challenging retrieval of the displacement field from2310
InSAR data for andesitic stratovolcanoes: Case study of Popocatepetl and2311
Colima Volcano, Mexico. Journal of Volcanology and Geothermal Research2312
200, 49–61. doi:10.1016/j.jvolgeores.2010.12.002.2313
Pinel, V., Sigmundsson, F., Sturkell, E., Geirsson, H., Einarsson, P., Gud-2314
mundsson, M.T., Hognadottir, T., 2007. Discriminating volcano deforma-2315
tion due to magma movements and variable surface loads: Application to2316
Katla subglacial volcano, Iceland. Geophysical Journal International 169,2317
325–338.2318
Poland, M., 2014. Time-averaged discharge rate of subaerial lava at Klauea2319
Volcano, Hawaii, measured from TanDEM-X interferometryimplications2320
100

for magma supply and storage during 201113. Journal of Geophysical2321
Research: Solid Earth 119, 5464–5481. doi:10.1002/2014JB011132.2322
Poland, M., Lu, Z., 2008. Radar interferometry observations of surface dis-2323
placements during pre- and coeruptive periods at Mount St Helens, Wash-2324
ington, 1992-2005. A volcano Rekindled: the Renewed Eruption of Mount2325
St. Helens, 2004-2006 edited by David R. Sherrod, William E. Scott, and2326
Peter H. Stauffer, chap 22, U.S. Geological Survey Professional Paper 1750.2327
Poland, M., Miklius, A., Orr, T., Sutton, A., Thornber, C., Wilson, D., 2008.2328
Constraints on the mechanism of long-term, steady subsidence at Medicine2329
Lake volcano, northern California, from GPS, leveling, and InSAR. EOS,2330
Transactions, American Geophysical Union 89, 37 – 38.2331
Poland, M.P., Miklius, A., Sutton, A.J., Thornber, C.R., 2012. A mantle-2332
driven surge in magma suply to Kilauea Volcano during 2003-2007. Nature2333
Geoscience 5, 295–300. doi:10.1038/NGEO1426.2334
Pritchard, M.E., Jay, J.A., Aron, F., Henderson, S.T., Lara, L.E., 2013.2335
Subsidence at southern andes volcanoes induced by the 2010 maule, chile2336
earthquake. Nature Geoscience 6, 632–636. doi:10.1038/ngeo1857.2337
Pritchard, M.E., Simons, M., 2002. A satellite geodetic survey of large-scale2338
deformation of volcanic centres in the central Andes. Nature 418, 167–171.2339
Pritchard, M.E., Simons, M., 2004. An InSAR-based survey of volcanic defor-2340
mation of volcanic centres in the central Andes. Geochemistry, Geophysics,2341
Geosystems 5. doi:10.1029/2003GC000610.2342
101

Pyle, D.M., Mather, T.A., Biggs, J., 2013. Remote sensing of volcanoes and2343
volcanic processes: integrating observation and modelling introduction.2344
In : Pyle, D. M. and Mather, T. A. and Biggs, J. (eds) Remote Sensing of2345
Volcanoes and Volcanic Processes: Integrating Observation and Modelling2346
Geological Society, London, Special Publications 380.2347
Reilinger, R., Oliver, J., Brown, L., Sanford, A., Balazs, E.,2348
1980. New measurements of crystal doming over the Socorro2349
magma body, New Mexico. Geology 8, 291–295. doi:10.1130/0091-2350
7613(1980)8¡291:NMOCDO¿2.0.CO;2.2351
Remy, D., Bonvalot, S., Briole, P., Murakami, M., 2003. Accurate measure-2352
ments of tropospheric effects in volcanic areas from SAR interferometry2353
data : application to Sakurajima volcano (Japan). Earth and Planetary2354
Science Letters 213, 299–310.2355
Reverso, T., Vandemeulebrouck, J., Jouanne, F., Pinel, V., Villemin, T.,2356
Sturkell, E., 2014. A two-magma chamber as a source of deformation at2357
Grimsvtn volcano, Iceland. Journal of Geophysical Research: Solid Earth2358
doi:10.1002/2013JB010569.2359
Riddick, S.N., Schmidt, D.A., 2011. Time-dependent changes in volcanic in-2360
flation rate near Three Sisters, Oregon, revealed by InSAR. Geochemistry,2361
Geophysics, Geosystems 12. doi:10.1029/2011GC003826.2362
Rivalta, E., Segall, P., 2008. Magma compressibility and the miss-2363
ing source for some dike intrusions. Geophysical Research Letters 35.2364
doi:10.1029/2007GL032521.2365
102

Rowland, S., Harris, A., Wooster, M., Amelung, F., Garbeil, H., Wilson,2366
L., Mouginis-Mark, P., 2003. Volumetric characteristics of lava flows from2367
interferometric radar and multispectral satellite data: the 1995 Fernandina2368
and 1998 Cerro Azul eruptions in the western Galapagos. Bulletin of2369
Volcanology 65, 311–330. doi:10.1007/s00445-002-0262-x.2370
Rowland, S.K., 1996. Slopes, lava flow volumes, and vent distributions on2371
Volcn Fernandina, Galpagos Islands. Journal of Geophysical Research:2372
Solid Earth 101, 27657–27672. doi:10.1029/96JB02649.2373
Ruch, J., Pepe, S., Casu, F., Acocella, V., Neri, M., Solaro, G., Sansosti,2374
E., 2012. How do volcanic rift zones relate to flank instability? Evi-2375
dence from collapsing rifts at Etna. Geophysical Research Letters 39.2376
doi:10.1029/2012GL053683.2377
Salzer, J.T., Nikkhoo, M., Walter, T.R., Sudhaus, H., Reyes-Dvila, G.,2378
Bretn, M., Arambula, R., 2014. Satellite radar data reveal short-term pre-2379
explosive displacements and a complex conduit system at Volcan de Col-2380
ima, Mexico. Frontiers in Earth Science 2. doi:10.3389/feart.2014.00012.2381
Sansosti, E., Berardino, P., Bonano, M., Cal, F., Castaldo, R., Casu, F.,2382
Manunta, M., Manzo, M., Pepe, A., Pepe, S., Solaro, G., Tizzani, P., Zeni,2383
G., Lanari, R., 2014. How second generation SAR systems are impacting2384
the analysis of ground deformation. International Journal of Applied Earth2385
Observation and Geoinformation 28, 1 – 11. doi:10.1016/j.jag.2013.10.007.2386
Schaber, G.G., Elachi, C., Farr, T.G., 1980. Remote sensing data of SP2387
103

Mountain and SP lava flow in North-Central Arizona. Remote Sensing of2388
Environment 9, 149–170.2389
Scheiber, R., Moreira, A., 2000. Coregistration of interferometric SAR images2390
using spectral diversity. IEEE Transactions on Geoscience and Remote2391
Sensing 38, 2179–2191.2392
Schmidt, D.A., Burgmann, R., 2003. Time-dependant land uplift and sub-2393
sidence in the Santa Clara valley, California, from a large interferometric2394
synthetic aperture radar data set. Journal of Geophysical Research: Solid2395
Earth 108. doi:10.1029/2002JB002267.2396
Schuber, A., Small, D., Jehle, M., Meier, E., 2012. COSMO-skymed,2397
TerraSAR-X, and RADARSAT-2 geolocation accuracy after compensation2398
for earth-system effects, pp. 3301–3304. Geoscience and Remote Sensing2399
Symposium (IGARSS), 2012 IEEE International.2400
Segall, P., 2010. Earthquake and Volcano deformation. Princeton University2401
Press, Princeton, NJ.2402
Segall, P., 2013. Volcano deformation and eruption forecasting.2403
doi:10.1144/SP380.4. in : D.M. Pyle, T.A. Mather and J. Biggs (Eds.),2404
Remote sensing of Volcanoes and Volcanic Processes: Integrating Obser-2405
vations and Modeling, Geol. Soc. London, SP 380.2406
Shirzaei, M., Burgmann, R., 2012. Topography correlated atmospheric delay2407
correction in radar interferometry using wavelet transforms. Geophysical2408
Research Letters 39. doi:10.1029/2011GL049971.2409
104

Shirzaei, M., Walter, T.R., 2010. Time-dependent volcano source monitoring2410
using InSAR time series: A combined Genetic Algorithm and Kalman2411
Filter approach . Journal of Geophysical Research: Solid Earth .2412
Sigmundsson, F., Hreinsdottir, S., Hooper, A., Arnadottir, T., Pedersen,2413
R., Roberts, M.J., Oskarsson, N., Auriac, A., Decriem, J., Einarsson, P.,2414
Geirsson, H., Hensch, M., Ofeigsson, B., Sturkell, E., Sveinbjornsson, H.,2415
Feigl, K.L., 2010. Intrusion triggering of the 2010 Eyjafjallajokull explosive2416
eruption . Nature 468, 426–430. doi:10.1038/nature09558.2417
Simkin, T., 1981. Geology of Galapagos Islands. In : : R. Perry (Editor),2418
Galapagos, Pergamon Press, New York.2419
Solaro, G., Acocella, V., Pepe, S., Ruch, J., Neri, M., Sansosti, E., 2010.2420
Anatomy of an unstable volcano from InSAR: Multiple processes affecting2421
flank instability at Mt. Etna, 1994-2008. Journal of Geophysical Research:2422
Solid Earth 115. doi:10.1029/2009JB000820.2423
Solaro, G., Casu, F., Paglia, L., Pepe, A., Pepe, S., Sansosti, E., Tiz-2424
zani, P., Lanari, R., 2011. Sbas-dinsar time series in the last eigh-2425
teen years at mt. etna volcano (italy), in: Geoscience and Remote2426
Sensing Symposium (IGARSS), 2011 IEEE International, pp. 3891–3894.2427
doi:10.1109/IGARSS.2011.6050081.2428
Solikhin, A., Pinel, V., Vandemeulebrouck, J., Thouret, J.C., in revision.2429
Mapping the 2010 Merapi erupted deposits using dual-polarization radar2430
data. Remote Sensing of Environment .2431
105

Sousa, J.J., Hooper, A.J., Hanssen, R.F., Bastos, L.C., Ruiz, A.M., 2011.2432
Persistent Scatterer InSAR: A comparison of methodologies based on a2433
model of temporal deformation vs. spatial correlation selection criteria.2434
Remote Sens. Env. 115, 2652 – 2663. doi:10.1016/j.rse.2011.05.021.2435
Sparks, R.S.J., Biggs, J., Neuberg, J.W., 2012. Monitoring volcanoes. Science2436
335, 1310–1311. doi:10.1126/science.1219485.2437
Sparks, S.R.J., Folkes, C.B., Humphreys, M.C.S., Barfod, D.N., Calvera, J.,2438
Sunagua, M.C., McNutt, S.R., Pritchard, M.E., 2008. Uturuncu volcano,2439
bolivia: Volcanic unrest due to mid-crustal magma intrusion. Asian. J.2440
Geoinformatics. 308, 727–769.2441
Stevens, N., Wadge, G., 2004. Towards operational repeat-pass SAR inter-2442
ferometry at active volcanoes. Natural Hazards 33, 47–73.2443
Stevens, N., Wadge, G., Williams, C., Morley, J., Muller, J.P., Murray, J.,2444
Upton, M., 2001. Surface movements of emplaced lava flows measured by2445
synthetic aperture radar interferometry. Journal of Geophysical Research:2446
Solid Earth 106.2447
Sturkell, E., Einarsson, P., Sigmundsson, F., Geirsson, H., Olafsson, H., Ped-2448
ersen, R., de Zeeuw-van Dalfsen, E., Linde, A.T., Sacks, S.I., Stefansson,2449
R., 2006. Volcano geodesy and magma dynamics in Iceland. Journal of2450
Volcanology and Geothermal Research 150, 14–34.2451
Surono, Jousset, P., Pallister, J., Boichu, M., Buongiorno, M.F., Budisan-2452
toso, A., Costa, F., Andreastuti, S., Prata, F., Schneider, D., Clarisse,2453
106

L., Humaida, H., Sumarti, S., Bignami, C., Griswold, J., Carn, S., Op-2454
penheimer, C., Lavigne, F., 2012. The 2010 explosive eruption of Java’s2455
Merapi volcano-A 100-year event. Journal of Volcanology and Geothermal2456
Research 241242, 121 – 135. doi:10.1016/j.jvolgeores.2012.06.018.2457
Swanson, D.A., Casadevall, T.J., Dzurisin, D., Malone, S.D., Newhall,2458
C.G., Weaver, C.S., 1983. Predicting Eruptions at Mount St. He-2459
lens, June 1980 Through December 1982. Science 221, 1369–1376.2460
doi:10.1126/science.221.4618.1369.2461
Taisne, B., Brenguier, F., Shapiro, N., Ferrazzini, V., 2011. Imaging the2462
dynamics of magma propagation using radiated seismic intensity. Geo-2463
physical Research Letters 38. doi:10.1029/2010GL046068.2464
Tait, S., Jaupart, C., Vergniolle, S., 1989. Pressure, gaz content and erup-2465
tion periodicity of a shallow, crystallising magma chamber. Earth and2466
Planetary Science Letters 92, 107–123.2467
Takada, Y., Fukushima, Y., 2013. Volcanic subsidence triggered by the2468
2011 Tohoku earthquake in Japan. Nature Geoscience 6, 637–641.2469
doi:10.1038/ngeo1857.2470
Terunuma, T., Nishida, K., Amada, T., Mizuyama, T., Sato, I., Urai, M.,2471
2005. Detection of traces of pyroclastic flows and lahars with satellite2472
synthetic aperture radars. Int. J. of Remote Sensing. 26.2473
Vadon, H., Sigmundsson, F., 1997. Crustal Deformation from 1992 to 19952474
at the Mid-Atlantic Ridge, Southwest Iceland, Mapped by Satellite Radar2475
Interferometry. Science 275, 194–197. doi:10.1126/science.275.5297.194.2476
107

Voight, B., 1981. Time scale for the first moments of the May 18 eruption.2477
In : : P.W. Lipman and D.R. Mullineaux (Editors), The 1980 Eruptions of2478
Mount St. Helens, Washington U.S. Geological Survey Professional Paper2479
1250.2480
Voight, B., Hoblitt, R.P., Clarke, A.B., Lockhart, A.B., Miller, A.D., Lynch,2481
L., 1998. Remarkable cyclic ground deformation monitored in real-time2482
on Montserrat, and its use in eruption forecasting. Geophysical Research2483
Letters 25, 3,405–3,408.2484
Wadge, G., Cole, P., Stinton, A., Komorowski, J.C., Stewart, R.,2485
Toombs, A.C., Legendre, Y., 2011. Rapid topographic change mea-2486
sured by high-resolution satellite radar at Soufrire Hills Volcano, Montser-2487
rat: 20082010. Journal of Volcanology and Geothermal Research 199.2488
doi:10.1016/j.volgeores.2010.10.011.2489
Wadge, G., Herd, R., Ryan, G., Calder, E.S., Komorowski, J.C., 2010. Lava2490
production at Soufrire Hills Volcano, Montserrat: 19952009. Geophysical2491
Research Letters 37. doi:10.1029/2009GL041466.2492
Wadge, G., Macfarlane, D.G., Odbert, H.M., James, M. R. andHole, J.K.,2493
Ryan, G., Bass, V., De Angelis, S., Pinkerton, H., Robertson, D.A., Lough-2494
lin, S.C., 2008. Lava dome growth and mass wasting measured by a time2495
series of ground-based radar and seismicity observations. Journal of Geo-2496
physical Research: Solid Earth 113. doi:10.1029/2007JB005466.2497
Wadge, G., Macfarlane, D.G., Robertson, D.A., Hale, A.J., Pinkerton,2498
H., Burrell, R.V., Norton, G.E., James, M.R., 2005. AVTIS: A2499
108

novel millimetre-wave ground based instrument for volcano remote sens-2500
ing. Journal of Volcanology and Geothermal Research 146, 307 – 318.2501
doi:10.1016/j.jvolgeores.2005.03.003.2502
Wadge, G., Mattioli, G.S., Herd, R.A., 2006. Ground deformation at2503
Soufriere Hills Volcano, Montserrat during 1998-2000 measured by radar2504
interferometry and GPS. Journal of Volcanology and Geothermal Research2505
152, 157–173.2506
Wadge, G., Scheuchl, B., Stevens, N.F., 2002a. Spaceborne radar measure-2507
ments of the eruption of Soufrire Hills Volcano, Montserrat. In: Druitt,2508
T. H., Kolelaar, B. P. (Eds.), The Eruption of the Soufriere Hills Volcano,2509
Montserrat, from 1995 to 1999, Memoirs Geological Society, London.2510
Wadge, G., Webley, P.W., James, I.N., Bingley, R., Dodson, A., Waugh, S.,2511
Veneboer, G., Puglisi, M., Mattia, D., Baker, D., Edwards, S.C., Edwards,2512
S.J., Clarke, P.J., 2002b. Atmospheric models, GPS and InSAR meausure-2513
ments of the troposphere water field over Mt. Etna, Italy polygenetic vol-2514
canoes. Geophysical Research Letters 29. doi:10.1029/2002GL015159.2515
Walter, T.R., Motagh, M., 2014. Deflation and inflation of a large magma2516
body beneath Uturuncu volcano, Bolivia? Insights from InSAR data, sur-2517
face lineaments and stress modelling. Geophysical Journal International2518
doi:10.1093/gji/ggu080.2519
Wauthier, C., Cayol, V., Poland, M., Kervyn, F., D’Oreye, N., Hooper, A.,2520
Samsonov, S., Tiampo, K., Smets, B., 2013. Nyamuragira’s magma plumb-2521
ing system inferred from 15 years of InSAR. In : Pyle, D. M. and Mather,2522
109

T. A. and Biggs, J. (eds) Remote Sensing of Volcanoes and Volcanic Pro-2523
cesses: Integrating Observation and Modelling Geological Society, London,2524
Special Publications 380.2525
Webley, P.W., Bingley, R.M., Dodson, A.H., Wadge, G., Waugh, S.J., James,2526
I.N., 2002. Atmospheric water vapour correction to insar surface motion2527
measurements on mountains: results from a dense gps network on Mount2528
Etna. Phys. Chem. Earth 27, 363–370.2529
Whelley, P., Jay, J., Calder, E., Pritchard, M., Cassidy, N., Alcaraz, S.,2530
Pavez, A., 2012. Post-depositional fracturing and subsidence of pumice2531
flow deposits: Lascar Volcano, Chile. Bulletin of Volcanology 74, 511–531.2532
doi:10.1007/s00445-011-0545-1.2533
Wicks, C.W., Dzurisin, D., Ingebritsen, S., Thatcher, W., Lu, Z., Iverson,2534
J., 2002. Magmatic activity beneath the quiescent Three Sisters volcanic2535
center, central Oregon Cascade Range, USA. Geophysical Research Letters2536
29, 26–1–26–4. doi:10.1029/2001GL014205.2537
Wicks, C.W., de la Llera, J.C., Lara, L.E., Lowenstern, J., 2011. The role of2538
dyking and fault control in the rapid onset of eruption at Chaiten volcano,2539
Chile. Nature Geoscience 478, 374–378. doi:10.1038/nature10541.2540
Wicks, C.W., Thatcher, W., Dzurisin, D., 1998. Migration of fluids beneath2541
yellowstone caldera inferred from satellite radar interferometry. Science2542
282, 458–462.2543
Wicks, C.W., Thatcher, W., Dzurisin, D., Svarc, J., 2006. Uplift, thermal2544
110

unrest and magma intrusion at Yellowstone caldera. Nature 440, 72–75.2545
doi:10.1038/nature04507.2546
Williams, C.A., Wadge, G., 2000. An accurate and efficient method for2547
including the effects of topography in three-dimensional elastic models of2548
ground deformation with applications to radar interferometry. Journal of2549
Geophysical Research: Solid Earth 105, 8,103–8,120.2550
Wright, R., Flynn, L.P., Garbeil, H., Harris, A.J.L., Pilger, E., 2004a. MOD-2551
VOLC: near-real-time thermal monitoring of global volcanism. Journal of2552
Volcanology and Geothermal Research 135, 29–49.2553
Wright, T., Ebinger, C., Biggs, J., Ayele, A., Yirgu, G., Keir, D., Stork, A.,2554
2006. Magma-maintained rift segmentation at continental rupture in the2555
2005 Afar dyking episode. Nature 442. doi:10.1038/nature04978.2556
Wright, T., Okamura, R., 1977. Cooling and crystallization of tholeiitic2557
basalt, 1965 Makaopuhi Lava Lake, Hawaii. U.S. Geological Survey Pro-2558
fessional Paper 1004, 78 pp.2559
Wright, T., Peck, D., Shaw, H., 1976. Kilauea lava lakes: natural labora-2560
tories for study of cooling, crystallization, and differentiation of basaltic2561
magma. In : G.H. Sutton, M.H. Manghnani and R. Moberly (Editors),2562
The Geophysics of the Pacific Ocean Basin and Its Margin Geophysical2563
Monograph 19. American Geophysical Union.2564
Wright, T.J., Parsons, B.E., Lu, Z., 2004b. Towards mapping surface defor-2565
mation in three dimensions using InSAR. Geophysical Research Letters2566
31. doi:10.1029/2003GL018827.2567
111

Xu, W., Jonsson, S., 2014. The 20078 volcanic eruption on Jebel at Tair2568
island (Red Sea) observed by satellite radar and optical images. Bulletin2569
of Volcanology 76.2570
Yan, Y., Pinel, V., Vernier, F., Trouve, E., 2014. Displacement measure-2571
ments. In F. Tupin, J.-M. Nicolas, J. Inglada (eds), Remote Sensing Im-2572
agery, ISTE Ltd, Wiley, John & Sons, Incorporated,ISBN 9781848215085.2573
Yang, X.M., Davis, P.M., Dieterich, J.H., 1988. Deformation from inflation2574
of a dipping finite prolate spheroid in an elastic half-space as a model2575
for volcanic stressing. Journal of Geophysical Research: Solid Earth 93,2576
4,249–4,257.2577
Yun, S., Segall, P., Zebker, H., 2006. Constraints on magma chamber geom-2578
etry at Sierra Negra Volcano, Galapagos Islands, based on InSAR obser-2579
vations. Earth and Planetary Science Letters 150, 232–243.2580
Yun, S.H., Zebker, H., Segall, P., Hooper, A., Poland, M., 2007. Interfero-2581
gram formation in the presence of complex and large deformation. Geo-2582
physical Research Letters 34. doi:10.1029/2007GL029745.2583
Zebker, H., Amelung, F., Jonsson, S., 2000. Remote sensing of volcano sur-2584
face and internal processes using radar interferometry. In Remote Sensing2585
of Active Volcanism, vol 116, P.J. Mouginis-Mark, J.A. Crisp, and J.H.2586
Finks, Eds, Washington, DC: AGU, pp. 179-205.2587
Zebker, H.A., Goldstein, R.M., 1986. Topographic mapping from interfero-2588
metric synthetic aperture radar observations. Journal of Geophysical Re-2589
search: Solid Earth 91, 4,993–4,999.2590
112

Zebker, H.A., Rosen, P.A., Hensley, S., 1997. Atmospheric effects in inter-2591
ferometric synthetic aperture radar surface deformation and topographic2592
maps. Journal of Geophysical Research: Solid Earth 102, 7,547–7,563.2593
Zebker, H.A., Rosen, P.A., Hensley, S., Mouginis-Mark, P.J., 1996. Anal-2594
ysis of active lava flows on Kilauea volcano, Hawaii, using SIR-C radar2595
correlation measurements. Geology 24, 495–498.2596
Zebker, H.A., Villasenor, J., 1992. Decorrelation in interferometric radar2597
echoes. IEEE Transactions on Geoscience and Remote Sensing 32, 823–2598
836.2599
Zebker, H.A., van Zyl, J.J., Held, D.N., 1987. Imaging radar polarimetry2600
from wave synthesis. Journal of Geophysical Research: Solid Earth 92,2601
683–701.2602
113

Table 1: Past and present side-looking orbital SAR missions used in vol-
canology (as of June 1, 2014). Additional data from Indian and Korean SAR
missions are also potentially available. For polarization description, ”single”
is for satellites providing SAR data acquired in only one given polarization,
”dual” is for satellites able to provide data acquired with two different po-
larizations (VV+VH or HH+HV) and ”quad” is for satellites able to provide
data in the fully polarimetric mode (HH,VV,HV,VH).
Table 2: Studies of magmatic intrusions though InSAR. If the event is clas-
sified as ”with eruption”, it means that at least one eruptive event associated
with the intrusion emplacement is observed during the period of activity. For
temporal evolution description, ’No’ means that the temporal evolution of
magma intrusion emplacement has not been described based on SAR data.
List of references can be found in Supplementary Material.
114

Figure 1: Imaging geometry. The lower colored line represents a 2-D slice
through a ground surface and the angled black line above represents a single
line in a SAR image acquired by a sensor located above, to the left, and flying
into the page. The black arrow shows the direction of signal propagation from
the SAR sensor and the dashed lines represent perpendicular wave fronts
separated by the spatial resolution of the sensor. The different colors indicate
how the ground surface maps to pixels in the range direction of the SAR
image. The blue slope facing the sensor is “foreshortened” in the SAR image,
whereas the red slope facing away from the sensor is lengthened, and appears
in more pixels despite both slopes having the same length on the ground. The
green section of the steeper mountain is “laid over”, appearing in the same
pixel as the ground surface well to the left, and the yellow lower section of
the mountain appears to the right of the upper section in the SAR image,
despite being located to the left of it on the ground. The steep gray slope
facing away from the sensor is not illuminated by the sensor at all – it is in
“shadow”– and does not appear in the SAR image.
115
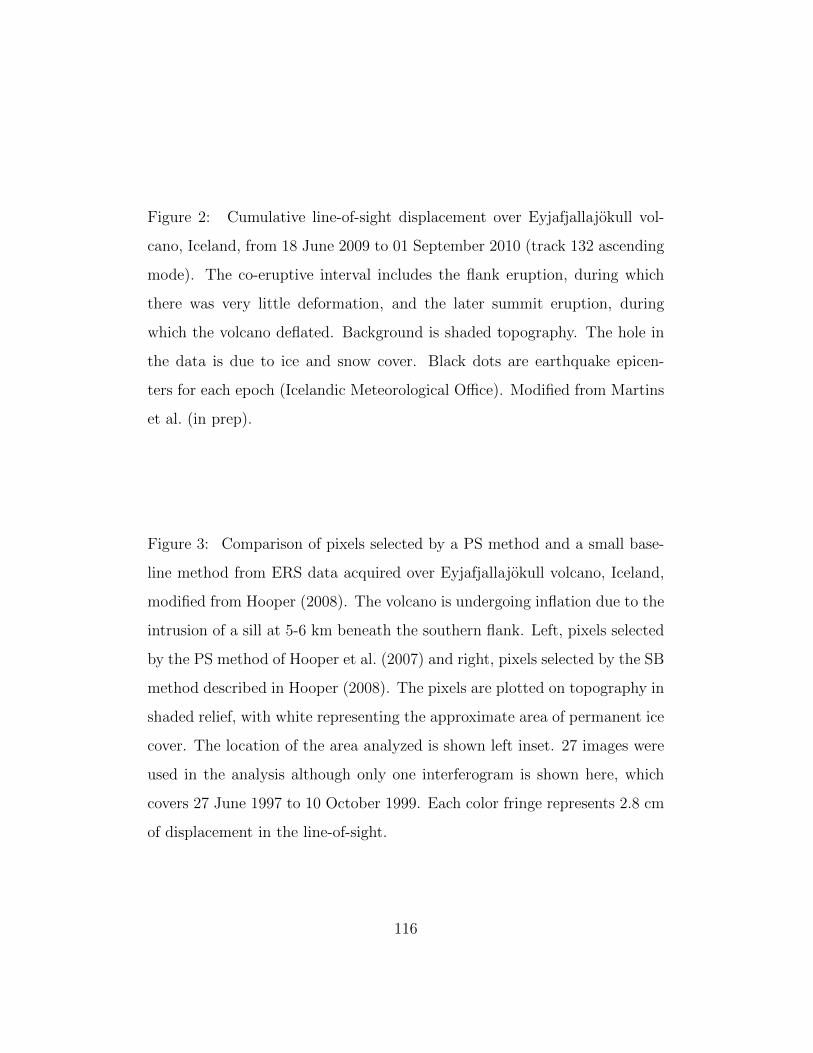
Figure 2: Cumulative line-of-sight displacement over Eyjafjallajokull vol-
cano, Iceland, from 18 June 2009 to 01 September 2010 (track 132 ascending
mode). The co-eruptive interval includes the flank eruption, during which
there was very little deformation, and the later summit eruption, during
which the volcano deflated. Background is shaded topography. The hole in
the data is due to ice and snow cover. Black dots are earthquake epicen-
ters for each epoch (Icelandic Meteorological Office). Modified from Martins
et al. (in prep).
Figure 3: Comparison of pixels selected by a PS method and a small base-
line method from ERS data acquired over Eyjafjallajokull volcano, Iceland,
modified from Hooper (2008). The volcano is undergoing inflation due to the
intrusion of a sill at 5-6 km beneath the southern flank. Left, pixels selected
by the PS method of Hooper et al. (2007) and right, pixels selected by the SB
method described in Hooper (2008). The pixels are plotted on topography in
shaded relief, with white representing the approximate area of permanent ice
cover. The location of the area analyzed is shown left inset. 27 images were
used in the analysis although only one interferogram is shown here, which
covers 27 June 1997 to 10 October 1999. Each color fringe represents 2.8 cm
of displacement in the line-of-sight.
116

Figure 4: Temporal evolution of the number of peer reviewed scientific papers
based on satellite SAR data and applied to the study of volcanoes published
before 2014. We make a distinction between studies using only data provided
by ESA (ERS-1, ERS-2 and ENVISAT). A significant increase is observed
since 2010 due to the broad exploitation of L- and C-band data. The list of
scientific paper is from ISI Web Of Science. (See supplementary material for
references.) In insert, for comparison, the list of scientific papers obtained a)
with the two topics “volcanoes” and “deformation” and b) with the topics
“SAR” and (“earthquake” or “landslide” or “subsidence”) using ISI Web Of
Science.)
Figure 5: C-band (top) and L-band (bottom) interferograms spanning June
17–19, 2007, East Rift Zone intrusion and eruption at Kılauea Volcano,
Hawai‘i. Data from the L-band ALOS satellite are more coherent than the
ENVISAT C-band satellite, which is important for interpreting deformation
patterns that extend into forested regions. Deformation patterns indicate
deflation of Kılauea Caldera and widening and uplift in its middle East Rift
Zone as magma drained from beneath the summit to feed a growing dike
within the rift zone (Poland et al., 2008). Both interferograms have the same
scale for line-of-sight surface displacements–5 cm per color cycle. Satellite
flight directions and look angles from vertical are given by the arrows in the
upper left of each image.
117

Figure 6: Amplitudes images (TerraSAR-X) of the summit area of Merapi
volcano during the October-November 2010 eruption. Large changes in the
dome were observed over the course of the eruption. A) Image acquired 26
October at 22:21 UTC (Descending Track 134, incidence angle: 36◦). The
first explosive event (26 October 10:00 UTC) has just removed the 2006 lava
dome, enlarging and deepening the crater. B) Image acquired 4 November
11:00 UTC (Ascending Track 96, incidence angle: 47◦) showing a large (≈
5∗106m3, (Pallister et al., 2013)) lava dome. C) Image acquired 6 November
22:21 UTC (Descending Track 134., incidence angle: 36◦). A new lava dome
has grown to a volume of approximately 1.5 ∗ 106m3 (Pallister et al., 2013)
after the total destruction of the former one by the explosion on 4 November
17:05 UTC. See Pallister et al. (2013) for a complete overview.
118

Figure 7: Deposits of the 2010 eruption of Merapi volcano observed by
SAR imagery. a) Location of Merapi volcano in the central part of Java
island (the white box corresponds to the area covered in parts b and c). b)
ALOS-PALSAR amplitude-change image of Merapi’s southern flank. The
false-color composite (R: earlier image; G: later image; B: ratio of the sec-
ond image divided by the first image) is obtained using pairs of amplitude
images acquired in HH polarization before the eruption (on 16 September
2010) and after the event (on 1 February 2011). Deposit characteristics are
known from field observations and optical imagery (Charbonnier et al., 2013)
c) Coherence image obtained when forming the interferogram between two
descending ALOS/PALSAR images acquired before the main eruptive phase
(on 1 November 2010) and after (on 17 December 2010). The area covered by
deposits from the eruptive activity is characterized by a strong decorrelation
and appears dark. Figure is modified from Solikhin et al. (in revision).
Figure 8: Co- (A) and Cross-polarized (B) RADARSAT-2 amplitude images
acquired on July 7, 2010, depicting the summit, south flank, and upper East
and Southwest Rift Zones of Kılauea Volcano, Hawai‘i. Variations in surface
roughness, particularly between recent ‘a‘a and pahoehoe lava flows (like
those erupted in December 1974 from the Southwest Rift Zone and during the
1969-1974 Mauna Ulu eruption on the East Rift Zone), appear as differences
in shading (light areas indicate high backscatter and dark regions, low) and
are best distinguished in the cross-polarized image.
119

Figure 9: Co- (A) and Cross-polarized (B) RADARSAT-2 amplitude images
acquired on January 23, 2014, depicting the 1983-2014 lava flow field from
the Pu‘u ‘O‘o eruption. At the time of image acquisition, the northern-most
portion of the pahoehoe flow field was the only area with active lava, which
was extending into forested areas. Co-polarized imagery is not useful for
discriminating lava from forest, but the cross-polarized data allow for easy
mapping of flow margins given the backscatter contrast between lava (dark)
and forest (light).
120

Figure 10: Example application of coherence to map lava flows, modified
from Figures 10-12 from Dietterich et al. (2012). (A) Extent of a lava break-
out from an eruptive vent located ∼2 km east of Pu‘u ‘O‘o crater based
on coherence mapping from Envisat interferograms. Breakout started on
November 21, 2007, and colors indicate lava extent over the subsequent ∼110
days. Advance rate (inset; green is western branch of flow indicated by green
arrow on map, and blue is eastern branch indicated by blue arrow on map)
can be calculated based on the position of the flow front over time. Gap
in flow is due to the presence of vegetation, which, like lava, is incoherent.
Gray dashed box indicates area covered by part B. (B) Length of time from
emplacement until lava, which erupted during July-November 2007, becomes
coherent (colors) compared to flow thickness as measured on the ground
in October 2007 (gray contours). Distal extent of flow was in the forest,
and therefore the length of decorrelation is not measurable, while vent area
remained incoherent for longer than other parts of the flow because it re-
mained active long after the main flow area ceased activity in November
2007. Decorrelation time and thickness correspond strongly, indicating that
the time from emplacement that is required for a lava flow to become coher-
ent can be a good indicator of flow thickness. Inset gives thickness versus
time until coherence for the mean length of time a pixel is decorrelated in the
areas between each of the thickness contours. Error bars show the standard
deviation, red line is the best fit, and shaded region indicates the time during
which the flow was active.
121

Figure 11: Four-dimensional growth of the East Rift Zone lava flow field at
Kılauea Volcano, Hawai‘i (modified from Poland (2014)). (A) Map showing
thickness of lava emplaced between August 2011 and June 2013. Colors cor-
respond to flow thickness. Map is calculated from the cumulative thicknesses
determined from 16 time-sequential TanDEM-X DEM difference maps, which
individually show topographic change during discrete time intervals within
the overall time spanned. (B) Time-averaged discharge rate of lava (left
axis = bulk; right axis = dense-rock equivalent assuming 25% vesicularity)
from Kılauea’s East Rift Zone during 2011-2013 based on a time series of
TanDEM-X DEMs. The volume of lava for each time interval was calculated
by multiplying the thickness over the area covered. Bar thickness is greater
than measurement uncertainty. Gray shaded areas indicate times when lava
entered the ocean. Discharge rates determined during these periods are min-
imum values, since lava that flows into the ocean is not accounted for by
changes in topography. (C) Deformation of Kılauea’s summit during mid-
2011 to mid-2013 measured at a GPS station near the center of the caldera
(gray line, left axis) and a nearby pixel located at the point of maximum LOS
deformation (black circles with error bars, right axis). InSAR time series is
from COSMO-SkyMed ascending data. GPS and InSAR measurement points
are given in Figure 22. Red box shows time period when the discharge rate
of lava decreased drastically, coupled with a plateau in long-term summit
inflation; these indicators suggest a short-term decrease in magma supply
rate to the volcano.
122

Figure 12: Various type of deformation related to volcanic activity and ob-
served by InSAR. Deformation may be due to magma storage/emplacement
at depth either as reservoirs or intrusions. Data used for illustration are
modified from Vadon and Sigmundsson (1997); Froger et al. (2004); Lu et al.
(2010); Bonforte et al. (2011); Pinel et al. (2011).
Figure 13: Vertical and horizontal surface displacements induced by the
September 2005 Manda Hararo-Dabbahu rifting event, Afar (Ethiopia) de-
duced from a pixel-by-pixel inversion of displacements provided by InSAR
and subpixel correlations of synthetic aperture radar and SPOT images.
Courtesy of R. Grandin and modified from Grandin et al. (2009).
Figure 14: Inferred depth of deformation sources beneath volcanoes that
have been systematically observed by InSAR, as listed by Biggs et al. (2014)
(their supplementary material, tables 3b, 4b, 4c and 5). Volcanoes showing
only subsidence related to eruptive deposits are excluded.
Figure 15: Perspective view of an interferogram, which spans 1996-2000,
draped over a 30-m DEM of South Sister volcano, central Oregon. Center of
inflation is located about 5 km west of the volcano’s summit. Modified from
Wicks et al. (2002).
123

Figure 16: A deep dike intruded beneath the Upptyppingar region of N.
Iceland in 2007. The orientation was not perpendicular to the direction of
least compressive stress, and slip was therefore induced across the dike. Top
panels show interferograms spanning the intrusion (left, ascending and right,
descending) with each colour fringe representing 28 mm of displacement. Also
shown are horizontal GPS velocities with 95% confidence ellipses, surface
projections of the model source patches (white rectangles) and catalogue
earthquake epicentres for the entire intrusion period (black circles). Bottom
left panel shows the surface projection of the modelled mean opening and slip
from the posterior probability distribution. The right panel shows the dike
position in profile, with the maximum posterior probability solution plotted
in red and other solutions from the probability distribution plotted in grey.
Modified from Hooper et al. (2011).
124

Figure 17: Deformation of Fernandina volcano, Galapagos, associated with
its 2009 eruption, modified from Bagnardi et al. (2013). All interferograms
acquired by ENVISAT, and arrows in lower right corners indicate satellite
flight direction (small arrow) and look direction (thick arrow). (A) Typi-
cal inter-eruptive inflation pattern, with deformation mostly confined to the
summit caldera. This particular interferogram spans January 16-August 14,
2010. (B) Interferogram spanning January 31-April 10, 2009, with the end
time just ∼ 2 hours before the onset of eruption. Deformation is consistent
with intrusion of a sill from the 1-2-km-depth subcaldera magma reservoir.
(C) Interferogram spanning March 31-May 5, 2009, which covers the entirety
of Fernandina’s 2009 eruption. Surface displacements are a consequence of
subcaldera reservoir deflation, sill intrusion, and rotation of that sill towards
the vertical on the flank, where it intersected the surface and erupted lava
flows (yellow area).
Figure 18: COSMO-SkyMed ascending interferogram covering the summit
caldera and upper East Rift Zone of Kılauea Volcano and spanning 2 April
2012 to 19 March 2014. While a number of deformation processes are rep-
resented, several stand out, including line-of-sight subsidence in the north
part of the caldera, as well as at the former Alae and Makaopuhi lava lakes.
These three areas are sites of thick accumulations of lava that, decades after
their emplacement, are still cooling and compacting.
125

Figure 19: Average line-of-sight displacement velocity at Mount St. Helens,
Washington, from a stack of 36 interferograms acquired by ERS-1/2 on track
156 during 1992-2001. With the exception of the debris avalanche deposit
on the north side of the volcano and extending down the North Fork Toutle
River valley, most of the area is incoherent owing to vegetation and snow
cover. Three patches of subsidence are apparent in the stack; these patches
also exist in data from other tracks and satellites, indicating that they are
not atmospheric artifacts and that they are long-term deformation sources.
Modified from Poland and Lu (2008).
Figure 20: Time series of vertical displacement at the caldera center of
Fernandina volcano, Galapagos, using data from a variety of SAR satellites.
Vertical deformation is derived by combining descending and ascending inter-
ferograms from each satellite. Note breaks in time scale (between 1992 and
1998) and vertical displacement scale (between 0.0 and 0.5 m). Throughout
the 19-year span, overall uplift is interrupted by episodes of deflation asso-
ciated with eruptive activity (Chadwick et al., 2011; Bagnardi et al., 2013)
and sill emplacement (Bagnardi and Amelung, 2012). 1995 eruption is not
indicated. Modified from Baker (2012) and Bagnardi (2014).
126

Figure 21: Illustration of some limitations of InSAR using the example of
a typical andesitic stratovolcano, Colima Volcano, Mexico (NCV: Nevado de
Colima Volcano, CV: Colima Volcano, GC: Guzman city, CC: Colima city).
a) Mean coherence obtained from 54 descending interferograms from 2003 to
2006. Good coherence is restricted to towns or villages located at the base of
the volcano and to recent lava flows covering the upper part of the volcano;
other areas are highly vegetated. Another cause of decorrelation is due to
ash fall and unconsolidated explosive deposits in the vicinity of the volcano’s
summit. b) Areas not well imaged on SAR images due to the acquisition
geometry, are superimposed in grey on the contour lines (200 m) derived from
the SRTM Digital Elevation Model. Data are acquired by a satellite traveling
from north to south (descending track) with a look angle of about 22 degrees.
The satellite motion is shown by the black arrow and the look direction is
shown by the gray one. 3.6 % of the scene represented is not well imaged,
mostly (98 %) because of layover effects on slopes which are oriented towards
the radar beam. c) Interferogram corrected for topographic errors obtained
from an ascending track and characterize by a perpendicular baseline of 5 m
and a temporal baseline of 385 days. Each color fringe represents a phase
difference of 2π. Fringes are strongly correlated to topography as shown by
comparison to the SRTM Digital Elevation Model (d). This signal is mostly
produced by tropospheric artifacts, which correlate with topography. a) and
b) are modified from Pinel et al. (2011); c) and d) are modified from Yan
et al. (2014).
127

Figure 22: Ascending-mode COSMO-SkyMed interferogram of Kılauea Vol-
cano overlain on a shaded relief map and spanning September 7, 2011 to
June 20, 2013 – about the same time spanned by the TanDEM-X-derived
DEM differences that constrain the subaerial eruption volume (Figure 11a).
A variety of deformation sources are interacting to form a complex pattern
of LOS displacements, including: Southwest Rift Zone subsidence; faulting
in June 2012; subsidence of lava accumulations along the East Rift Zone and
in the north part of the caldera; inflation of the summit; and LOS uplift of
the East Rift Zone flank, which appears to be a transient related to a dike
intrusion (thick red line) that fed a fissure eruption in March 2011. Black
dot gives location of GPS station from Figure 11c; white dot is location of
pixel from which Figure 11c time series is extracted.
128

Foreshortening
Lengthening
Layover
SAR image
Shadow
Ground surface
Angle of incidence
SAR sensor
Signalpropagation


0
5
10
15
20
1995
1996
1997
1998
1999
2000
2001
2002
2003
2004
2005
2006
2007
2008
2009
2010
2011
2012
2013
only ESA data
not only ESA data
25
30
3519
94
a) b)1995
2000
2005
2010
1995
2000
2005
2010
0
100
200
0
100
200

0 5 km
range change
0 5 cm
34°
C-band
39°
L-band
April 12 - June 21, 2007
May 5 - June 20, 2007
forested area
Kīlauea Caldera
East Rift Zone

26 oct. 2010
4 nov. 2010
6 nov. 2010
A)
B)
C)
~1 km ~1 km
N
~0.5 km

AA
114° E113° E112° E111° E110° E109° E108° E107° E106° E
6° S
7° S
8° S MERAPI
J a v a S e a
I n d i a n O c e a nN0
100200 km
J A V A
MERAPI
J a v a S e a
I n d i a n O c e a n
Bandung SemarangSurabaya
Yogyakarta
Banten Jakarta
Coherence01-11-2010 - 17-12-2010Coherence01-11-2010 - 17-12-2010
9150
000
9152
500
9155
000
9157
500
9160
000
9162
500
9165
000
9167
500
9170
000442500435000 440000437500
NN
Merapi
R: 16-09-2010 HHG: 17-12-2010 HHB: Band ratio
R: 16-09-2010 HHG: 17-12-2010 HHB: Band ratio
442500435000 440000437500
B
Valley confined and overbank PDCs
Surge and singe zone
Thick tephra
reworked PDCs
C
1
0
2 km

0 5 km
Kīlauea Caldera
East Rift Zone
Southwest Rift
Zone
Hilina Pali Fault System
Pacific Ocean
December 1974 ‘a‘ā
December 1974 pāhoehoe Mauna Ulu pāhoehoe
Mauna Ulu ‘a‘ā
HH HVA B

Nāpau Crater
Makaopuhi CraterPu‘u ‘Ō‘ō crater
1983–2014 lava-flow field
Forest
Pacific Ocean 0 5 km
active lava flow
Hilina Pali Fault System
HH HVA B

0 1 2 km
Flow thickness (m)
Duration of decorrelation
930 days
13 days
2
2
22
2
2
5
5
55
5
10
10
10
10
15
15
15
20
20
25
30
35
eruptive vent
0 5 10 15 20 25 30 35 400
100
200
300
400
500
Flow thickness (m)
Day
s dec
orre
late
d r2 = 0.97
155.1°W 155°W
19.3°N
19.4°NPu‘u ‘Ō‘ō crater
Flow extent on:Nov. 25, 2007Nov. 28, 2007Dec. 10, 2007Dec. 11, 2007Dec. 26, 2007Jan. 14, 2008Jan. 30, 2008Feb. 3, 2008Feb. 18, 2008Mar. 5, 2008Mar. 12, 2008
eruptive vent
0 20 40 60 80 100 1200
2
4
6
8
10
12
14
Days since Nov. 21, 2007
Dis
tanc
e (k
m)
13.6
m/h
r
2.4 m/hr
Flow advance rate
Flow throughvegetation
0 2 km
Pacific Ocean
A
B

0
0.5
1.0
1.5
2.0
2.5
3.0
Tim
e-av
erag
ed d
isch
arge
rate
(m3 /
s)
B
0
0.375
0.75
1.125
1.5
1.875
2.25
Tim
e-av
erag
ed d
isch
arge
rate
(den
se-r
ock
equi
vale
nt)
(m3 /
s)
0
10
20
30
40
Thic
knes
s (m
)
0 4 kmHawai‘i Island
A
-8
-4
-2
0
2
4
8
GP
S v
ertic
al c
hang
e (c
m)
Jul ‘11 Oct ‘11 Jan ‘12 Apr ‘12 Jul ‘12 Oct ‘12 Jan ‘13 Apr ‘13 Jul ‘13 Oct ‘13
B6
-6
GPS (vertical)
-3
-2
-1
0
1
2
3
4
5
6
InS
AR
LO
S d
efor
mat
ion
(cm
)InSAR (LOS)7

Hydrothermal system
Eruptive depositsload and compaction
Flank sliding
Magma storage
Intrusion propagation,emplacement
Etna,from Bonforte et al., 2011
Piton de la Fournaise,from Froger et al. 2004
Okmok,from Lu et al. 2010
Colima,from Pinel et al. 2011
64°.00’ N
63°.50’ N
64°.10’ N
64.0° N
22°.40’ W 21°.20’ W22°.20’ W 21°.40’ W22°.20’ W Reykjanes,from Vadon & Sigmundsson, 1997
-40 mm/yr 15 mm/yr
21 mm/yr
-32 mm/yr
Range Change
Satellite flight direction
Radar look direction
Reunion Island21°00’
21°10’
21°20’ 55°20’ 55°40’
SICILY
Tyrrhenian Sea
Ionian Sea

40.3
˚
40.4
˚
40.4
˚
40.5
˚
40.6
˚
40.6
˚
40.7
˚
40.8
˚
12.2˚
12.3˚
12.3˚
12.4˚
12.4˚
12.5˚
12.5˚
12.6˚
12.6˚
12.7˚
12.8˚
−5−4−3−2−1
012345
5 mHorizontal
Vertical (m)
10 km

3-10 km
<3 km
>15 km
10-15 km

Range Change
0 28.3 mm
South Sister
0
10 km
N


Typical inter-eruption inflation
2009 pre-eruption
2009 co-eruption
0 5 km
subsidence of1995 lava flow
A
B
C
2009 lava flow
0
2.8
1.4
LOS
(lin
e-of
-sig
ht)
disp
lace
men
t [cm
]
Pacific
Ocean

0 1.55 cm
Range change
2 km
Kīlauea Caldera
East Rift Zone
KīlaueaIki
Makaopuhi
Alae

−15 −10 −5 0 5 10
LOS displacement (mm/yr)
Elk Rock
JohnstonRidge
122˚ 30’ 122˚ 20’ 122˚ 10’
46˚ 10’
46˚ 20’
Figure 2
North Fork Toutle River Coldwater Lake
Castle Lake
Mount St. Helens
Washington
Oregon
Area of map South Fork Toutle River
Spirit
Lake
5 km
Subsidence

May
200
5 er
uptio
n
Dec.
200
6 in
trusio
n
Aug.
200
7 in
trusio
n
April
200
9 er
uptio
n
0.0
0.6
0.8
1.0
1.2
1.4
1.6
0.5
Verti
cal d
ispl
acem
ent (
m)
ERS-1/2Radarsat-1EnvisatALOS
1992 1998 2000 2002 2004 2006 20102008
Year

a) b)
c)
b)
19.8
-103.8
19.2
19.4
19.6
-103.2-103.4-103.6
1
0
0.2
0.4
0.6
0.8
c) d)-104 -103-103.6
20
19
19.2
19.6
19.8
19.4
-103.4 -103.2-103.8 -104 -103-103.6 -103.4 -103.2-103.8
4500 m
100 m
19.6
-103.7
19.4
19.5
-103.5-103.6
20
19
19.2
19.6
19.8
19.4
2000m
1000m

Decorrelation due to forest
PACIFIC OCEAN
subsidence due to cooling lava
SOUTHWEST RIFT ZONE
March 2011 dike
Decorrelation due to lava flows
June 2012faulting event
LOS uplift
LOS subsidence
KĪLAUEA CALDERA
Pu‘u ‘Ō‘ō
0 5 km0 5 cm
Range change
EAST RIFT ZONE

1From November 2010, Envisat operated in a new 30 day orbit, which was not optimal for interferometry at high latititudes.2In late 2015 a second Sentinel-1 satellite will be launched reducing the repeat time to 6 days

Mission Period of operation Wavelength Orbit repeat time PolarizationSEASAT Jun-Oct 1978 23.5 cm 17 days SingleERS-1 Jul 1991 to Mar 2000 5.66 cm 3 or 35 days SingleERS-2 Apr 1995 to Sep 2011 5.66 cm 3 or 35 days SingleJERS-1 Feb 1992 to Oct 1998 23.5 cm 44 days SingleSIR-C/X-SAR 9 to 20 Apr 1994 23.5, 5.8 and 3 cm N/A Quad
and 30 Sep to 11 Oct 1994RADARSAT-1 Nov 1995 to March 2013 5.6 cm 24 days SingleSRTM 11-22 Feb 2000 5.8 and 3.1 cm N/A SingleEnvisat Mar 2002 to Apr 2012 5.63 cm 35 days1 DualALOS Jan 2006 to Apr 2011 23.5 cm 46 days QuadCOSMO-SkyMed Jun 2007 to present 3.1 cm 16 days Dual(constellation of Dec 2007 to present 3.1 cm 16 days Dual4 satellites) Oct 2008 to present 3.1 cm 16 days Dual
Nov 2010 to present 3.1 cm 16 days DualTerraSAR-X Jun 2007 to present 3.1 cm 11 days DualTanDEM-X Jun 2010 to present 3.1 cm 11 days DualRADARSAT-2 Dec 2007 to present 5.6 cm 24 days QuadSentinel-1 2014 to present 5.6 cm 12 days2 DualALOS-2 2014 to present 23.5 cm 14 days Quad
Table 1: Past and present side-looking orbital SAR missions used in volcanology (as of June 1, 2014). Additional data from Indian and KoreanSAR missions are also potentially available. For polarization description, ”single” is for satellites providing SAR data acquired in only one givenpolarization, ”dual” is for satellites able to provide data acquired with two different polarizations (VV+VH or HH+HV) and ”quad” is for satellitesable to provide data in the fully polarimetric mode (HH,VV,HV,VH).

Type of event Location Date Duration Temporal Referencesevolution
Rifting eventsWith eruption Gelai 2007 2 months Yes Baer et al. (2008); Biggs et al. (2009)With no eruption Harrat Lunayyir 2009 4 months Yes Baer and Hamiel (2010)With eruption Manda Hararo-Dabbahu 2005 3 weeks No Wright et al. (2006),
(Main event) Grandin et al. (2009)With eruptions Manda Hararo-Dabbahu 2005-2009 5 years Yes Grandin et al. (2010a,b)
(All rifting episode) Hamling et al. (2010)With no eruption Upptyppingar 2007-2008 14 months No Hooper et al. (2011)
Volcanoes in a rift zoneWith 8 eruptions Nyamuragira 1996-2010 4-60 days No Toombs and Wadge (2012); Wauthier et al. (2013)With eruption Nyiragongo 2002 12-48 hours No Wauthier et al. (2012)
Other VolcanoesWith eruption Chaiten 2008 few hours No Wicks et al. (2011)With eruption El Hierro 2011-2012 8 months Yes Gonzalez et al. (2013)With eruption Etna 2001 23 days No Lundgren and Rosen (2003)With no eruption Eyjafjallajokull 1994 1 month No Pedersen and Sigmundsson (2004)With no eruption Eyjafjallajokull 1999 9 months Yes Pedersen and Sigmundsson (2006)With eruption Eyjafjallajokull 2010 3 months Yes Sigmundsson et al. (2010)With eruption Fernandina 1995 4 months No Jonsson et al. (1999); Amelung et al. (2000)With eruption Fernandina 2005 16 days No Chadwick et al. (2011); Bagnardi and Amelung (2012)With no eruption Fernandina 2006 1 day No Bagnardi and Amelung (2012)With no eruption Fernandina 2007 3 days No Bagnardi and Amelung (2012)With eruption Fernandina 2009 18 days Yes Bagnardi et al. (2013)With eruption Kilauea 2007 2 days No Montgomery-Brown et al. (2010)With eruption Kilauea 2011 4 days Yes Lundgren et al. (2013)With eruption Kizimen 2009-2010 >1 yr Yes Ji et al. (2013)With no eruption Mauna Loa 2002-2005 3.5 days No Amelung et al. (2007)With eruption Piton de la Fournaise 1998 3 months No Sigmundsson et al. (1999); Fukushima et al. (2010)With 4 eruptions Piton de la Fournaise 1999-2000 12 days-1 month No Fukushima et al. (2005, 2010)With eruption Piton de la Fournaise 2003 4 days No Froger et al. (2004)With eruption Tungurahua 2008 1 month No Biggs et al. (2010)With no eruption Yellowstone 1995-2000 few years No Wicks et al. (2006)
Table 2: Studies of magmatic intrusions though InSAR. If the event is classified as ”with eruption”, it means that at least one eruptive event associatedwith the intrusion emplacement is observed during the period of activity. For temporal evolution description, ’No’ means that the temporal evolutionof magma intrusion emplacement has not been described based on SAR data. List of references can be found in Supplementary Material.
3

References
Amelung, F., Jonsson, S., Zebker, H., Segall, P., 2000. Widespread uplift and’trapdoor’ faulting on Galapagos volcanoes observed with radar interferome-try. Nature 407, 993–996.
Amelung, F.and Yun, S.H., Walter, T.R., Segall, P., Kim, S.W., 2007. Stresscontrol of deep rift intrusion at Mauna Loa volcano, Hawaii. Science 316,1,026–1,030. DOI: 10.1126/science.1140035.
Baer, G., Hamiel, Y., 2010. Form and growth of an embryonic continentalrift: InSAR observations and modelling of the 2009 western Arabia riftingepisode. Geophysical Journal International 182, 155–167. doi:10.1111/j.1365-246X.2010.04627.x.
Baer, G., Hamiel, Y., Shamir, G., Nof, R., 2008. Evolution of a magma-driven earthquake swarm and triggering of the nearby Oldoinyo Lengai erup-tion, as resolved by InSAR, ground observations and elastic modeling, EastAfrican Rift, 2007. Earth and Planetary Science Letters 272, 339 – 352.doi:http://dx.doi.org/10.1016/j.epsl.2008.04.052.
Bagnardi, M., Amelung, F., 2012. Space-geodetic evidence for multiple magmareservoirs and subvolcanic lateral intrusions at Fernandina Volcano, Galapa-gos Islands. J. Geophys. Res. 117. Doi:10.1029/2012JB009465.
Bagnardi, M., Amelung, F., Poland, M.P., 2013. A new model for thegrowth of basaltic shields based on deformation of Fernandina volcano, Gal-pagos Islands. Earth and Planetary Science Letters 377378, 358 – 366.doi:http://dx.doi.org/10.1016/j.epsl.2013.07.016.
Biggs, J., Amelung, F., Gourmelen, N., Dixon, T.H., Kim, S.W., 2009. InSARobservations of 2007 Tanzania rifting episode reveal mixed fault and dykeextension in an immature continental rift. Geophys. J. Int. 179, 549–558.Doi: 10.1111/j.1365-246X.2009.04262.x.
Biggs, J., Mothes, P., Ruiz, M., Amelung, F., Dixon, T. H.and Baker, S.,Hong, S.H., 2010. Stratovolcano growth by co-eruptive intrusion: The2008 eruption of Tungurahua Ecuador . Geophysical Research Letters 37.L21302,doi:10.1029/2010GL044942.
Chadwick, W.W.J., Jonsson, S. Geist, D.J., Poland, M., Johnson, D.J., Batt, S.,Harpp, K.S., Ruiz, A., 2011. The May 2005 eruption of Fernandina volcano,Galapagos: The first circumferential dike intrusion observed by GPS andInSAR. Bull. Volcanol. 73, 679–697.
Froger, J.L., Fukushima, Y., Briole, P., Staudacher, T., Souriot, T., Villeneuve,N., 2004. The deformation field of the August 2003 eruption at Piton de laFournaise, Reunion Island, mapped by ASAR interferometry. GeophysicalResearch Letters 31. L14601, doi:10.1029/2004GL020479.
4

Fukushima, Y., Cayol, V., Durand, P., 2005. Finding realistic dyke mod-els from interferometric synthetic aperture radar data: The February 2000eruption at Piton de la Fournaise. J. Geophys. Res. 110. B03206,doi:10.1029/2004JB003268.
Fukushima, Y., Cayol, V., Durand, P., Massonnet, D., 2010. Evolution ofmagma conduits during the 19982000 eruptions of Piton de la Fournaise vol-cano, Reunion Island. J. Geophys. Res. Doi:10.1029/...
Gonzalez, P.J., Samsonov, S.V., Pepe, S., Tiampo, K.F., Tizzani, P., Casu,F., Fernndez, J., Camacho, A.G., Sansosti, E., 2013. Magma storage andmigration associated with the 20112012 El Hierro eruption: Implications forcrustal magmatic systems at oceanic island volcanoes. Journal of GeophysicalResearch: Solid Earth doi:10.1002/jgrb.50289.
Grandin, R., Socquet, A., Binet, R., Klinger, Y., Jacques, E., de Chabalier,J.B., King, G.C.P., Lasserre, C., Tait, S., Tapponnier, P., Delorme, A.,Pinzuti, P., 2009. September 2005 Manda Hararo-Dabbahu rifting event,Afar (Ethiopia): Constraints provided by geodetic data. J. Geophys. Res.114. B08404,doi:10.1029/2008JB005843.
Grandin, R., Socquet, A., Doin, M.P., Jacques, E., de Chabalier, J.B., King,G., 2010a. Transient rift opening in response to multiple dike injections inthe Manda Hararo rift (Afar, Ethiopia) imaged by time-dependent elasticinversion of interferometric synthetic aperture radar data. J. Geophys. Res.115. B09403,doi:10.1029/2009JB006883.
Grandin, R., Socquet, A., Jacques, E., Mazzoni, N., , de Chabalier, J.B., King,G.C.P., Lasserre, C., Tait, S., Tapponnier, P., Delorme, A., Pinzuti, P., 2010b.Sequence of rifting in Afar, Manda-Hararo rift, Ethiopia, 2005-2009 : Timespace evolution and interactions between dikes from interferometric syntheticaperture radar and static stress change modeling. J. Geophys. Res. 115.Doi:10.1029/2009JB000815.
Hamling, I.J., Wright, T.J., Calais, E., Bennati, L., Lewi, E., 2010. Stress trans-fer between thirteen successive dyke intrusions in Ethiopia. Nature Geoscience3, 713–717.
Hooper, A., Ofeigsson, B., Sigmundsson, F., Lund, B., Einarsson, P., Geirsson,H., Sturkell, E., 2011. Increased crustal capture of magma at volcanoes withretreating ice cap. Nature Geoscience DOI: 10.1038/NGEO1269.
Ji, L., Lu, Z., Dzurisin, D., Senyukov, S., 2013. Pre-eruption deformation causedby dike intrusion beneath Kizimen volcano, Kamchatka, Russia, observedby InSAR. Journal of Volcanology and Geothermal Research 256, 87 – 95.doi:http://dx.doi.org/10.1016/j.jvolgeores.2013.02.011.
Jonsson, S., Zebker, H., Cervelli, P., Segall, P., Garbeil, H., Mouginis-Mark,P., Rowland, S., 1999. A shallow-dipping dike fed the 1995 flank eruption at
5

Fernandina Volcano, Galapagos, observed by satellite Radar Interferometry.Geophysical Research Letters 26, 1,077–1,080.
Lundgren, P., Poland, M., Miklius, A., Orr, T., Yun, S.H., Fielding, E., Liu,Z., Tanaka, A., Szeliga, W., Hensley, S., Owen, S., 2013. Evolution of dikeopening during the March 2011 Kamoamoa fissure eruption, Klauea Vol-cano, Hawai‘i. Journal of Geophysical Research: Solid Earth 118, 897–914.doi:10.1002/jgrb.50108.
Lundgren, P., Rosen, P.A., 2003. Source model for the 2001 flank erup-tion of Mt. Etna volcano. Geophysical Research Letters 30, n/a–n/a.doi:10.1029/2002GL016774.
Montgomery-Brown, E.K., Simnett, D.K., Poland, M., Segall, P., Orr, T.,Zbker, H., Miklius, A., 2010. Geodetic evidence for en echelon dike emplace-ment and concurrent slow slip during the June 2007 intrusion and eruption atKilauea volcano, Hawaii. J. Geophys. Res. 115. Doi:10.1029/2009JB006658.
Pedersen, R., Sigmundsson, 2004. InSAR based sill model links spatiallyoffset areas of deformation and seismicity for the 1994 unrest episodeat Eyjafjallajokull volcano, Iceland. Geophysical Research Letters 31,L14610,doi:10.1029/2004GL0202368.
Pedersen, R., Sigmundsson, 2006. Temporal development of the 1999 intrusiveepisode in the Eyjafjallajokull volcano, Iceland, derived from InSAR images.Bull. Volcanol. 68, 377–393.
Sigmundsson, F., Durand, P., Massonnet, D., 1999. Opening of an eruptivefissure and seaward displacement at Piton de la Fournaise volcano measuredby RADARSAT satellite radar interferometry. Geophysical Research Letters26, 533–536.
Sigmundsson, F., Hreinsdottir, S., Hooper, A., Arnadottir, T., Pedersen, R.,Roberts, M.J., Oskarsson, N., Auriac, A., Decriem, J., Einarsson, P., Geirs-son, H., Hensch, M., Ofeigsson, B., Sturkell, E., Sveinbjornsson, H., Feigl,K.L., 2010. Intrusion triggering of the 2010 Eyjafjallajokull explosive erup-tion . Nature 468, 426–430. Doi:10.1038/nature09558.
Toombs, A., Wadge, G., 2012. Co-eruptive and inter-eruptive surface defor-mation measured by satellite radar interferometry at Nyamuragira volcano,D.R. Congo, 1996 to 2010. Journal of Volcanology and Geothermal Research245246, 98 – 122. doi:http://dx.doi.org/10.1016/j.jvolgeores.2012.07.005.
Wauthier, C., Cayol, V., Kervyn, F., d’Oreye, N., 2012. Magma sources involvedin the 2002 Nyiragongo eruption, as inferred from an InSAR analysis. Journalof Geophysical Research: Solid Earth 117. doi:10.1029/2011JB008257.
Wauthier, C., Cayol, V., Poland, M., Kervyn, F., D’Oreye, N., Hooper, A.,Samsonov, S., Tiampo, K., Smets, B., 2013. Nyamuragira’s magma plumbing
6

system inferred from 15 years of InSAR. In : Pyle, D. M. and Mather, T.A. and Biggs, J. (eds) Remote Sensing of Volcanoes and Volcanic Processes:Integrating Observation and Modelling Geological Society, London, SpecialPublications 380.
Wicks, C.W., de la Llera, J.C., Lara, L.E., Lowenstern, J., 2011. The role ofdyking and fault control in the rapid onset of eruption at Chaiten volcano,Chile. Nature Geoscience 478, 374–378. Doi:10.1038/nature10541.
Wicks, C.W., Thatcher, W., Dzurisin, D., Svarc, J., 2006. Uplift, thermalunrest and magma intrusion at Yellowstone caldera. Nature 440, 72–75.Doi:10.1038/nature04507.
Wright, T., Ebinger, C., Biggs, J., Ayele, A., Yirgu, G., Keir, D., Stork, A.,2006. Magma-maintained rift segmentation at continental rupture in the 2005Afar dyking episode. Nature 442. Doi:10.1038/nature04978.
7

Volcanology: Lessons learned from Synthetic Aperture
Radar imagery-Supplementary material
V. Pinela, M. P. Polandb, A. Hooperc
aISTerre, Universite de Savoie, IRD, CNRS, F73376 Le Bourget du Lac, FrancebU.S. Geological Survey–Hawaiian Volcano Observatory, PO Box 51, Hawaii National
Park, HI 97818-0051, USAcUniversity of Leeds, School of Earth and Environment
1. List of satellite SAR Studies applied to volcanoes
Figure 1 is only based on scientific papers included in the ISI Web ofScience. It takes into account only studies based on satellite data, such thatstudies using SIR-C data have been omitted (e.g., Rosen et al., 1996; Zebkeret al., 1997). We also haven’t considered the earliest studies performed withSEASAT data (e.g., Zebker and Villasenor, 1992).
Studies of volcanoes using only data provided by ESA (ERS-1,ERS-2 andENVISAT) appearing in figure 1 are listed below:Ali and Feigl (2012); Aly et al. (2009), Amelung et al. (2000a,b); Amelungand Day (2002); Anderssohn et al. (2009); Avallone et al. (1999); Bagnardiand Amelung (2012); Bathke et al. (2011, 2013); Beauducel et al. (2000);Bjornsson et al. (2001); Bonaccorso et al. (2004, 2006); Bonforte et al. (2007,2011, 2013b,a); Borgia et al. (2005); Biggs et al. (2009b, 2010a, 2011, 2013a),Biggs et al. (2013b); Briole et al. (1997); Brunori et al. (2013); Calais et al.(2008); Carnec and Fabriol (1999); Casu et al. (2011); Catalano et al. (2013);Chadwick et al. (2011); Chang et al. (2007, 2010); Clifton et al. (2002);D’Auria et al. (2012); Delacourt et al. (1998); de Zeeuw-van Dalfsen et al.(2004); Dietterich et al. (2012); Dzurisin et al. (2006, 2009); Feigl et al.(2000); Fernandez et al. (2003); Fernndez et al. (2005); Fernandez et al.(2009); Fialko and Simons (2000, 2001); Fialko and Pearse (2012); Frogeret al. (2001, 2004, 2007); Gonzalez et al. (2010); Gonzalez and Fernandez(2011); Grandin et al. (2009, 2010a),Grandin et al. (2010b); Hamling et al.
Email address: [email protected] (V. Pinel)
Preprint submitted to Journal of Volcanology and Geothermal Research October 6, 2014
vpine
Texte surligné
vpine
Texte surligné

0
5
10
15
20
1995
1996
1997
1998
1999
2000
2001
2002
2003
2004
2005
2006
2007
2008
2009
2010
2011
2012
2013
only ESA data
not only ESA data
25
30
35
1994
a) b)
Figure 1: Temporal evolution of the number of peer reviewed scientific papersbased on satellite SAR data and applied to the study of volcanoes publishedbefore 2014. We make a distinction between studies using only data providedby ESA (ERS-1, ERS-2 and ENVISAT). A significant increase is observedsince 2010 due to the broad exploitation of L- and C-band data. The list ofscientific paper is from ISI Web Of Science. In insert, for comparison, thelist of scientific papers obtained a) with the two topics “volcanoes” and “de-formation” and b) with the topics “SAR” and (“earthquake” or “landslide”or “subsidence”) using ISI Web Of Science.
2
vpine
Texte surligné

(2009); Heleno et al. (2010); Henderson and Pritchard (2013); Henriot et al.(2001); Henriot and Villemin (2005); Hole et al. (2007); Hooper et al. (2004,2007a,b); Hooper (2008); Hooper et al. (2011); Jonsson et al. (1999, 2005);Jonsson (2009); Keiding et al. (2010); Kwoun et al. (2006); Lagios et al.(2005); Lanari et al. (1998, 2002, 2004); Lee et al. (2008, 2013); Lu et al.(1997); Lu and Freymueller (1998); Lu et al. (2000a,b,c, 2002a,b,c, 2003a,b,2004, 2005, 2010); Lundgren et al. (2001, 2003); Lundgren and Rosen (2003);Lundgren et al. (2004); McAlpin and Meyer (2013); Mann et al. (2002); Man-coni et al. (2010); Manconi and Casu (2012); Massonnet et al. (1995, 1997);Masterlark and Lu (2004); Masterlark et al. (2006, 2010, 2012); Navarro et al.(2009); Newman et al. (2006); Neri et al. (2007, 2009); Nobile et al. (2012);Ofeigsson et al. (2011); Pagli et al. (2006, 2012); Palano et al. (2008); Pa-pageorgiou et al. (2012); Papoutsis et al. (2013); Pearse and Fialko (2010);Pearse and Lundgren (2013); Pedersen and Sigmundsson (2004, 2006); Peltieret al. (2010); Pepe et al. (2008); Perlock et al. (2008); Pinel et al. (2011);Poland et al. (2006); Poland and Lu (2008); Price (2004); Pritchard and Si-mons (2002); Remy et al. (2003); Riddick et al. (2012); Romero et al. (2003);Rowland et al. (1994, 2003); Ruch et al. (2008, 2009, 2010); Sachpazi et al.(2002); Salvi et al. (2004); Scharrer et al. (2007); Shirzaei and Burgmann(2012); Shirzaei et al. (2013); Sigmundsson et al. (1997); Solaro et al. (2010);Stevens et al. (2001a), Stevens et al. (2001b); Stevens and Wadge (2004);Sykioti et al. (2003); Tizzani et al. (2007); Thatcher and Massonnet (1997);Toombs and Wadge (2012); Yun et al. (2006, 2007); Vadon and Sigmundsson(1997); Vasco et al. (2002); Velez et al. (2011); Wadge et al. (2002b, 2006);Webley et al. (2002); Wicks et al. (1998, 2002, 2006); Wright et al. (2006).
Studies of volcanoes using acquired by other satellites, eventually alsoincluding data from ESA are listed below:Amelung et al. (2007); Aoyama et al. (2009); Baer et al. (2008); Baer andHamiel (2010); Baker and Amelung (2012); Bagnardi et al. (2013); Biggs et al.(2009a, 2010b); Bignami et al. (2013); Carn (1999); Chaussard and Amelung(2012); Chaussard et al. (2013); Chen et al. (2008); Clarke et al. (2013);Currenti et al. (2012); De Michele et al. (2013); Negro et al. (2013); de Zeeuw-van Dalfsen et al. (2012); Di Martino et al. (2012); Ebmeier et al. (2010,2012, 2013a), Ebmeier et al. (2013b); Foumelis et al. (2013); Fournier et al.(2010); Fukushima et al. (2005, 2009, 2010); Furuya (2004); Gonzalez et al.(2013); Guglielmino et al. (2011); Ji et al. (2013); Jung et al. (2011); Kanekoet al. (2001); Kerle et al. (2003); Koike et al. (2002); Kozono et al. (2013);
3
vpine
Texte surligné
vpine
Texte surligné
vpine
Texte surligné
vpine
Texte surligné
vpine
Texte surligné

Lu and Dzurisin (2010); Lundgren and Lu (2006); Lundgren et al. (2013);Matthews et al. (2003); Montgomery-Brown et al. (2010); Moran et al. (2006);Myer et al. (2008); Nishimura et al. (2001); Ohkura (1998); Ozawa and Ueda(2011); Ozawa and Fujita (2013); Ozawa and Kozono (2013); Pagli et al.(2012); Pallister et al. (2013); Parks et al. (2011, 2012); Patrick et al. (2003);Pavez et al. (2006); Philibosian and Simons (2012); Pritchard and Simons(2004a), Pritchard and Simons (2004b); Pritchard et al. (2013); Richter et al.(2013); Riddick and Schmidt (2011); Ruch et al. (2013); Saepuloh et al.(2010, 2013); Samsonov et al. (2011); Sandwell et al. (2008); Scharrer et al.(2008); Sigmundsson et al. (1999, 2010); Smets et al. (2010); Solaro et al.(2011); Takada and Fukushima (2013); Tobita et al. (2001); Terunuma et al.(2005); Toombs and Wadge (2012); Torres et al. (2004); Wadge et al. (2011,2012),Wadge et al. (2002a); Wauthier et al. (2012, 2013); Whelley et al.(2012); Wiart et al. (2000); Wicks et al. (2011); Yulianto et al. (2013).
References
Ali, S.T., Feigl, K.L., 2012. A new strategy for estimating geophys-ical parameters from InSAR data: Application to the Krafla cen-tral volcano in Iceland. Geochemistry, Geophysics, Geosystems 13.doi:10.1029/2012GC004112.
Aly, M., Rodgers, D., Thackray, G., Hughes, S., 2009. Recent magmatotec-tonic activity in the Eastern Snake River Plain-Island Park region revealedby SAR interferometry. Journal of Volcanology and Geothermal Research188, 297 – 304. doi:http://dx.doi.org/10.1016/j.jvolgeores.2009.05.015.
Amelung, F., Day, S., 2002. InSAR observations of the 1995 Fogo,Cape Verde, eruption: Implications for the effects of collapse eventsupon island volcanoes. Geophysical Research Letters 29, 47–1–47–4.doi:10.1029/2001GL013760.
Amelung, F., Jonsson, S., Zebker, H., Segall, P., 2000a. Widespread up-lift and ’trapdoor’ faulting on Galapagos volcanoes observed with radarinterferometry. Nature 407, 993–996.
Amelung, F., Oppenheimer, C., Segall, P., Zebker, H., 2000b. Ground defor-mation near Gada ‘Ale Volcano, Afar, observed by Radar Interferometry.Geophysical Research Letters 27, 3,093–3,096.
4
vpine
Texte surligné
vpine
Texte surligné

Amelung, F.and Yun, S.H., Walter, T.R., Segall, P., Kim, S.W., 2007. Stresscontrol of deep rift intrusion at Mauna Loa volcano, Hawaii. Science 316,1,026–1,030. DOI: 10.1126/science.1140035.
Anderssohn, J., Motagh, M., Walter, T.R., Rosenau, M., Kaufmann, H., On-cken, O., 2009. Surface deformation time series and source modeling for avolcanic complex system based on satellite wide swath and image mode in-terferometry: The Lazufre system, central Andes. Remote Sensing of Envi-ronment 113, 2062 – 2075. doi:http://dx.doi.org/10.1016/j.rse.2009.05.004.
Aoyama, H., Onizawa, S., Kobayashi, T., Tameguri, T., Hashimoto,T., Oshima, H., Mori, H.Y., 2009. Inter-eruptive volcanismat Usu volcano: Micro-earthquakes and dome subsidence. Jour-nal of Volcanology and Geothermal Research 187, 203 – 217.doi:http://dx.doi.org/10.1016/j.jvolgeores.2009.09.009.
Avallone, A., Zollo, A., Briole, P., Delacourt, C., Beauducel, F., 1999. Subsi-dence of Campi Flegrei (Italy) detected by SAR interferometry. Geophys-ical Research Letters 26, 2,303–2,306.
Baer, G., Hamiel, Y., 2010. Form and growth of an embryonic continen-tal rift: InSAR observations and modelling of the 2009 western Ara-bia rifting episode. Geophysical Journal International 182, 155–167.doi:10.1111/j.1365-246X.2010.04627.x.
Baer, G., Hamiel, Y., Shamir, G., Nof, R., 2008. Evolution of a magma-driven earthquake swarm and triggering of the nearby Oldoinyo Lengaieruption, as resolved by InSAR, ground observations and elastic modeling,East African Rift, 2007. Earth and Planetary Science Letters 272, 339 –352. doi:http://dx.doi.org/10.1016/j.epsl.2008.04.052.
Bagnardi, M., Amelung, F., 2012. Space-geodetic evidence for mul-tiple magma reservoirs and subvolcanic lateral intrusions at Fer-nandina Volcano, Galapagos Islands. J. Geophys. Res. 117.Doi:10.1029/2012JB009465.
Bagnardi, M., Amelung, F., Poland, M.P., 2013. A new model for thegrowth of basaltic shields based on deformation of Fernandina volcano,Galpagos Islands. Earth and Planetary Science Letters 377378, 358 – 366.doi:http://dx.doi.org/10.1016/j.epsl.2013.07.016.
5

Baker, S., Amelung, F., 2012. Top-down inflation and deflation at the summitof Kilauea Volcano, Hawaii observed with InSAR. J. Geophys. Res. 117.Doi:10.1029/2011JB009123.
Bathke, H., Shirzaei, M., Walter, T.R., 2011. Inflation and deflation atthe steep-sided Llaima stratovolcano (Chile) detected by using InSAR.Geophysical Research Letters 38. doi:10.1029/2011GL047168.
Bathke, H., Sudhaus, H., Holohan, E., Walter, T.R., Shirzaei, M., 2013. Anactive ring fault detected at Tendrek volcano by using InSAR. Journal ofGeophysical Research: Solid Earth doi:10.1002/jgrb.50305.
Beauducel, F., Briole, P., Froger, J.L., 2000. Volcano wide fringe in ERSsynthetic aperture radar interferograms of Etna (1992-1998): Deformationor tropospherique effect? J. Geophys. Res. 105, 16,391–16,402.
Biggs, J., Amelung, F., Gourmelen, N., Dixon, T.H., Kim, S.W., 2009a.InSAR observations of 2007 Tanzania rifting episode reveal mixed faultand dyke extension in an immature continental rift. Geophys. J. Int. 179,549–558. Doi: 10.1111/j.1365-246X.2009.04262.x.
Biggs, J., Anthony, E.Y., Ebinger, C.J., 2009b. Multiple inflation and defla-tion events at Kenyan volcanoes, East African Rift. Geology 37, 979–982.Doi:10.1130/G30133A.1.
Biggs, J., Bastow, I.D., Keir, D., Lewi, E., 2011. Pulses of defor-mation reveal frequently recurring shallow magmatic activity beneaththe Main Ethiopian Rift. Geochem. Geophys. Geosyst. 12. Q0AB10,doi:10.1029/2011GC003662.
Biggs, J., Chivers, M., Hutchinson, M.C., 2013a. Surface deformation andstress interactions during the 20072010 sequence of earthquake, dyke intru-sion and eruption in northern tanzania. Geophysical Journal International195, 16–26. doi:10.1093/gji/ggt226.
Biggs, J., Lu, Z., Fournier, T., Freymueller, J.T., 2010a. Magma flux atOkmok Volcano, Alaska, from a joint inversion of continuous GPS, cam-paign GPS, and interferometric synthetic aperture radar. J. Geophys. Res.115. B12401,doi:10.1029/2010JB007577.
6

Biggs, J., Mothes, P., Ruiz, M., Amelung, F., Dixon, T. H.and Baker, S.,Hong, S.H., 2010b. Stratovolcano growth by co-eruptive intrusion: The2008 eruption of Tungurahua Ecuador . Geophysical Research Letters 37.L21302,doi:10.1029/2010GL044942.
Biggs, J., Robertson, E., Mace, M., 2013b. ISMER-Active Magmatic Pro-cesses in the East African Rift: A Satellite Radar Perspective, in: RemoteSensing Advances for Earth System Science. Springer Berlin Heidelberg.SpringerBriefs in Earth System Sciences, pp. 81–91. doi:10.1007/978-3-642-32521-2-9.
Bignami, C., Ruch, J., Chini, M., Buongiorno, M.F., Hidayati, S., Sayudi,D.S., Surono, 2013. Pyroclastic density current volume estimation after the2010 Merapi volcano eruption using X-band SAR. J. Volcanol. Geotherm.Res. DOI: 10.1016/j.jvolgeores.2013.03.023.
Bjornsson, H., Rott, H., Gudmundsson, S., Fischer, A., Siegel, A., Gud-mundsson, M.T., 2001. Glacier-volcano interactions deduced by SAR in-terferometry. J. Geophys. 47, 58–70.
Bonaccorso, A., Bonforte, A., Guglielmino, F., Palano, M., Puglisi, G.,2006. Composite ground deformation pattern forerunning the 20042005Mount Etna eruption. Journal of Geophysical Research: Solid Earth 111.doi:10.1029/2005JB004206.
Bonaccorso, A., Sansosti, E., Berardino, P., 2004. Comparison of IntegratedGeodetic Data Models and Satellite Radar Interferograms to Infer MagmaStorage During the 19911993 Mt. Etna Eruption. pag 161, 1345–1357.
Bonforte, A., Carnazzo, A., Gambino, S., Guglielmino, F., Obrizzo,F., Puglisi, G., 2013a. A multidisciplinary study of an active faultcrossing urban areas: The Trecastagni Fault at Mt. Etna (Italy).Journal of Volcanology and Geothermal Research 251, 41 – 49.doi:http://dx.doi.org/10.1016/j.jvolgeores.2012.05.001.
Bonforte, A., Federico, C., Giammanco, S., Guglielmino, F., Li-uzzo, M., Neri, M., 2013b. Soil gases and SAR measurementsreveal hidden faults on the sliding flank of Mt. Etna (Italy).Journal of Volcanology and Geothermal Research 251, 27 – 40.doi:http://dx.doi.org/10.1016/j.jvolgeores.2012.08.010.
7

Bonforte, A., Gambino, S., Guglielmino, F., Obrizzo, F., Palano, M., Puglisi,G., 2007. Ground deformation modeling of flank dynamics prior tothe 2002 eruption of Mt. Etna. Bulletin of Volcanology 69, 757–768.doi:10.1007/s00445-006-0106-1.
Bonforte, A., Guglielmino, F., Coltelli, M., Ferretti, A., Puglisi,G., 2011. Structural assessment of Mount Etna volcano fromPermanent Scatterers analysis. Geochem. Geophys. Geosyst. 12.Q02002,doi:10.1029/2010GC003213.
Borgia, A., Tizzani, P., Solaro, G., Manzo, M., Casu, F., Luongo, G., Pepe,A., Berardino, P., Fornaro, G., Sansosti, E., Ricciardi, G.P., Fusi, N.,Di Donna, G., , Lanari, R., 2005. Volcanic spreading of vesuvius, a newparadigm for interpreting its volcanic activity. Geophysical Research Let-ters 32. Doi:10.1029/2004GL022155.
Briole, P., Massonnet, D., Delacourt, C., 1997. Post-eruptive deformationassociated with the 1986-87 and 1989 lava flows of Etna detected by radarinterferometry. Geophysical Research Letters 24, 37–40.
Brunori, C., Bignami, C., Stramondo, S., Bustos, E., 2013. 20 years of ac-tive deformation on volcano caldera: Joint analysis of InSAR and AInSARtechniques. International Journal of Applied Earth Observation and Geoin-formation 23, 279 – 287. doi:http://dx.doi.org/10.1016/j.jag.2012.10.003.
Calais, E., dOreye, N., Albaric, J., Deschamps, A., Delvaux, D., Deverchere,J., Ebinger, C., Ferdinand, R.W., Kervyn, F., Macheyeki, A.S., Oyen, A.,Perrot, J., Saria, E., Smets, B., Stamps, D.S., Wauthier, C., 2008. Strainaccommodation by slow slip and dyking in a youthful continental rift, EastAfrica. Nature 456, 783–787.
Carn, S.A., 1999. Application of synthetic aperture radar (sar) imagery tovolcano mapping in the hulid tropics: a case study in East Java, Indonesia.Bull. Volcanol. 61, 92–105.
Carnec, C., Fabriol, H., 1999. Monitoring and modeling land subsidenceat the Cerro Prieto Geothermal Field, Baja California, Mexico, us-ing SAR interferometry. Geophysical Research Letters 26, 1211–1214.doi:10.1029/1999GL900062.
8

Casu, F., Manconi, A., Pepe, A., Lanari, R., 2011. Deformation Time-SeriesGeneration in Areas Characterized by Large Displacement Dynamics: TheSAR Amplitude Pixel-Offset SBAS Technique. IEEE Transactions on Geo-science and Remote Sensing 99, 1–12. Doi: 10.1109/TGRS.2010.2104325.
Catalano, S., Bonforte, A., Guglielmino, F., Romagnoli, G., Tarsia,C., Tortorici, G., 2013. The influence of erosional processes on thevisibility of Permanent Scatterers Features from SAR remote sens-ing on Mount Etna (E Sicily). Geomorphology 198, 128 – 137.doi:http://dx.doi.org/10.1016/j.geomorph.2013.05.020.
Chadwick, W.W.J., Jonsson, S. Geist, D.J., Poland, M., Johnson, D.J., Batt,S., Harpp, K.S., Ruiz, A., 2011. The May 2005 eruption of Fernandinavolcano, Galapagos: The first circumferential dike intrusion observed byGPS and InSAR. Bull. Volcanol. 73, 679–697.
Chang, W.L., Smith, R.B., Farrell, J., Puskas, C.M., 2010. An extraordinaryepisode of Yellowstone caldera uplift, 2004-2010, from GPS and InSAR ob-servations. Geophysical Research Letters 37. doi:10.1029/2010GL045451.
Chang, W.L., Smith, R.B., Wicks, C., Farrell, J.M., Puskas, C.M., 2007.Accelerated Uplift and Magmatic Intrusion of the Yellowstone Caldera,2004 to 2006. Science 318, 952–956. doi:10.1126/science.1146842.
Chaussard, E., Amelung, F., 2012. Precursory inflation of shallow magmareservoirs at west Sunda volcanoes detected by InSAR. Geophysical Re-search Letters 39. Doi:10.1029/2012GL053817.
Chaussard, E., Amelung, F., Aoki, Y., 2013. Characterization of open andclosed volcanic systems in Indonesia and Mexico using InSAR time series.Journal of Geophysical Research: Solid Earth doi:10.1002/jgrb.50288.
Chen, G.H., Shan, X.J., Moon, W.M., Kim, K.R., 2008. A Modeling of theMagma Chamber Beneath the Changbai Mountains Volcanic Area Con-strained by Insar and GPS Derived Deformation. Chinese Journal of Geo-physics 51, 765–773. doi:10.1002/cjg2.1269.
Clarke, D., Brenguier, F., Froger, J.L., Shapiro, N.M., Peltier, A., Stau-dacher, T., 2013. Timing of a large volcanic flank movement at Piton de la
9

Fournaise Volcano using noise-based seismic monitoring and ground defor-mation measurements. Geophysical Journal International 195, 1132–1140.doi:10.1093/gji/ggt276.
Clifton, A.E., Sigmundsson, F., Feigl, K.L., Gumundsson, G., rnadt-tir, T., 2002. Surface effects of faulting and deformation resultingfrom magma accumulation at the Hengill triple junction, SW Iceland,19941998. Journal of Volcanology and Geothermal Research 115, 233 –255. doi:http://dx.doi.org/10.1016/S0377-0273(01)00319-5.
Currenti, G., Solaro, G., Napoli, R., Pepe, A., Bonaccorso, A., Del Negro,C., Sansosti, E., 2012. Modeling of alos and cosmo-skymed satellite dataat mt etna: Implications on relation between seismic activation of thepernicana fault system and volcanic unrest. Remote Sens. Environ. 125,64–72. doi:10.1016/j.rse.2012.07.008.
de Zeeuw-van Dalfsen, E., Pedersen, R., Sigmundsson, F., 2004. Satelliteradar interferometry 1993-1999 suggests deep accumulation of magma nearthe crust-mantle boundary at the Krafla volcanic system, Iceland. Geo-physical Research Letters 31. Doi:10.1029/2004GL020059.
de Zeeuw-van Dalfsen, E., Pedersen, R., Sigmundsson, F., Hooper, A.,2012. Subsidense of Askja caldera 2000-2009: modelling of deforma-tion processes at an extensional plate boundary, constrained by timeseries InSAR analysis. J. Volcanol. Geotherm. Res. 213214, 72 – 82.doi:http://dx.doi.org/10.1016/j.jvolgeores.2011.11.004.
D’Auria, L., Giudicepietro, F., Martini, M., Lanari, R., 2012. The 4Dimaging of the source of ground deformation at Campi Flegrei caldera(southern Italy). Journal of Geophysical Research: Solid Earth 117.doi:10.1029/2012JB009181.
De Michele, M., Raucoules, D., Wegmuller, U., Bignami, C., 2013. SyntheticAperture Radar (SAR) Doppler anomaly detected during the 2010 Mer-api (Java, Indonesia) eruption. IEEE Geosci. Remote Sensing Letters 10,1,319–1,323. 10.1109/LGRS.2013.2239602.
Delacourt, C., Briole, P., Achache, J., 1998. Tropospheric corrections of SARinterferograms with strong topography. Application to Etna. GeophysicalResearch Letters 25, 2,849–2,852.
10

Di Martino, G., Iodice, A., Riccio, D., Ruello, G., Zinno, I., 2012.On the fractal nature of volcano morphology detected via SAR imageanalysis: the case of Somma-Vesuvius Volcanic Complex 45, 177–187.doi:10.1029/2011GC004016.
Dietterich, H.R., Poland, M.P., Schmidt, D.A., Cashman, K.V., Sherrod,D.R., Espinosa, A.T., 2012. Tracking lava flow emplacement on the eastrift zone of Kilauea, Hawaii, with synthetic aperture radar coherence. Geo-chemistry, Geophysics, Geosystems 13. doi:10.1029/2011GC004016.
Dzurisin, D., Lisowski, D., Wicks, C.W., 2009. Continuing inflation atThree Sisters volcanic center, central Oregon Cascade Range, USA, fromGPS, leveling, and InSAR observations. Bull. Volcanol. 71, 1,091–1,110.Doi:10.1007/s00445-009-0296-4.
Dzurisin, D., Lisowski, M., Wicks, C.W., Poland, M.P., Endo, E.T.,2006. Geodetic observations and modeling of magmatic inflation atthe Three Sisters volcanic center, central Oregon Cascade Range,USA. Journal of Volcanology and Geothermal Research 150, 35 – 54.doi:http://dx.doi.org/10.1016/j.jvolgeores.2005.07.011.
Ebmeier, S.K., Biggs, J., Mather, T.A., Amelung, F., 2013a. Applicabilityof InSAR to tropical volcanoes: insights from Central America. In : Pyle,D. M. and Mather, T. A. and Biggs, J. (eds) Remote Sensing of Volcanoesand Volcanic Processes: Integrating Observation and Modelling GeologicalSociety, London, Special Publications 380.
Ebmeier, S.K., Biggs, J., Mather, T.A., Amelung, F., 2013b. On the lack ofInSAR observations of magmatic deformation at Central American volca-noes. Journal of Geophysical Research: Solid Earth 118, 2571–2585. URL:http://dx.doi.org/10.1002/jgrb.50195, doi:10.1002/jgrb.50195.
Ebmeier, S.K., Biggs, J., Mather, T.A., Elliott, J.R., Wadge, G.,Amelung, F., 2012. Measuring large topographic change with In-SAR: Lava thicknesses, extrusion rate and subsidence rate at San-tiaguito volcano, Guatemala. Earth Planet. Sci. Lett. , 216–225Doi:10.1016/j.epsl.2012.04.027.
Ebmeier, S.K., Biggs, J., Mather, T.A., Wadge, G., Amelung, F., 2010.Steady downslope movement on the western flank of Arenal volcano, CostaRica. Geochem. Geophys. Geosyst. 11. Doi:10129/2010GC003263.
11

Feigl, K.L., Gasperi, J., Sigmundsson, F., Rigo, A., 2000. Crustal deforma-tion near Hengill volcano, Iceland 1993-1998: Coupling between magmaticactivity and faulting inferred from elastic modeling of satellite radar inter-ferograms. J. Geophys. Res. 105, 25,655–25,670.
Fernandez, J., Tizzani, P., Manzo, M., Borgia, A., Gonzalez, P.J.,Marti, J., Pepe, A., Camacho, A.G., Casu, F., Berardino, P., Prieto,J.F., Lanari, R., 2009. Gravity-driven deformation of Tenerife mea-sured by InSAR time series analysis. Geophysical Research Letters 36.Doi:10.1029/2008GL036920.
Fernandez, J., Yu, T.T., Rodriguez-Velasco, G., Gonzalez-Matesanz, J.,Romero, R., Rodriguez, G., Quiros, R., Dalda, A., Aparicio, A., Blanco,M., 2003. New geodetic monitoring system in the volcanic islandof Tenerife, Canaries, Spain. Combination of InSAR and GPS tech-niques. Journal of Volcanology and Geothermal Research 124, 241 – 253.doi:http://dx.doi.org/10.1016/S0377-0273(03)00073-8.
Fernndez, J., Romero, R., Carrasco, D., Tiampo, K.F., Rodrguez-Velasco,G., Aparicio, A., Araa, V., Gonzlez-Matesanz, F.J., 2005. Detectionof displacements on Tenerife Island, Canaries, using radar interferome-try. Geophysical Journal International 160, 33–45. doi:10.1111/j.1365-246X.2005.02487.x.
Fialko, Y., Pearse, J., 2012. Sombrero Uplift Above the Altiplano-PunaMagma Body: Evidence of a Ballooning Mid-Crustal Diapir. Science 338,250–252. doi:10.1126/science.1226358.
Fialko, Y., Simons, M., 2000. Deformation and seismicity in the Cosogeothermal area, Inyo County, California: observation and modeling usingsatellite radar interrferometry. J. Geophys. Res. 105, 21,781–21,794.
Fialko, Y., Simons, M., 2001. Evidence for on-going inflation of the Socorromagma body, New Mexico, from Interferometric Synthetic Aperture Radarimaging. Geophysical Research Letters , –.
Foumelis, M., Trasatti, E., Papageorgiou, E., Stramondo, S., Parcharidis,I., 2013. Monitoring Santorini volcano (Greece) breathing from space.Geophys. J. Int. 193. Doi:10.1093/gji/ggs135.
12

Fournier, T.J., Pritchard, M.E., Riddick, S.N., 2010. Duration, magnitude,and frequency of subaerial volcano deformation events: New results fromLatin America using InSAR and a global synthesis. Geochem. Geophys.Geosyst. 11. Q01003,doi:10.1029/2009GC002558.
Froger, J.L., Fukushima, Y., Briole, P., Staudacher, T., Souriot, T., Vil-leneuve, N., 2004. The deformation field of the August 2003 eruption atPiton de la Fournaise, Reunion Island, mapped by ASAR interferometry.Geophysical Research Letters 31. L14601, doi:10.1029/2004GL020479.
Froger, J.L., Merle, O., Briole, P., 2001. Active spreading and regional ex-tension at mount etna imaged by {SAR} interferometry. Earth and Plane-tary Science Letters 187, 245 – 258. doi:http://dx.doi.org/10.1016/S0012-821X(01)00290-4.
Froger, J.L., Remy, D., S., B., Legrand, D., 2007. Two scales of inflationat Lastarria-Cordon del Azufre volcanic complex, central Andes, revealedfrom ASAR-ENVISAT interferometric data. Earth Planet. Sci. Lett. 255,148–163.
Fukushima, Y., Cayol, V., Durand, P., 2005. Finding realistic dyke mod-els from interferometric synthetic aperture radar data: The February2000 eruption at Piton de la Fournaise. J. Geophys. Res. 110. B03206,doi:10.1029/2004JB003268.
Fukushima, Y., Cayol, V., Durand, P., Massonnet, D., 2010. Evolution ofmagma conduits during the 19982000 eruptions of Piton de la Fournaisevolcano, Reunion Island. J. Geophys. Res. Doi:10.1029/...
Fukushima, Y., Mori, J., Hashimoto, M., Kano, Y., 2009. Subsidenceassociated with the LUSI mud eruption, East Java, investigated bySAR interferometry. Marine and Petroleum Geology 26, 1740 – 1750.doi:http://dx.doi.org/10.1016/j.marpetgeo.2009.02.001.
Furuya, M., 2004. Localized deformation at miyakejima volcano based onjers-1 radar interferometry: 19921998. Geophysical Research Letters 31.doi:10.1029/2003GL019364.
Gonzalez, P.J., Fernandez, J., 2011. Error estimation in multitempo-ral InSAR deformation time series, with application to Lanzarote, Ca-
13

nary Islands. Journal of Geophysical Research: Solid Earth 116.doi:10.1029/2011JB008412.
Gonzalez, P.J., Samsonov, S.V., Pepe, S., Tiampo, K.F., Tizzani, P., Casu,F., Fernndez, J., Camacho, A.G., Sansosti, E., 2013. Magma storage andmigration associated with the 20112012 El Hierro eruption: Implicationsfor crustal magmatic systems at oceanic island volcanoes. Journal of Geo-physical Research: Solid Earth doi:10.1002/jgrb.50289.
Gonzalez, P.J., Tiampo, K.F., Camacho, A.G., Fernndez, J., 2010. Shal-low flank deformation at Cumbre Vieja volcano (Canary Islands): Im-plications on the stability of steep-sided volcano flanks at oceanicislands. Earth and Planetary Science Letters 297, 545 – 557.doi:http://dx.doi.org/10.1016/j.epsl.2010.07.006.
Grandin, R., Socquet, A., Binet, R., Klinger, Y., Jacques, E., de Chabalier,J.B., King, G.C.P., Lasserre, C., Tait, S., Tapponnier, P., Delorme, A.,Pinzuti, P., 2009. September 2005 Manda Hararo-Dabbahu rifting event,Afar (Ethiopia): Constraints provided by geodetic data. J. Geophys. Res.114. B08404,doi:10.1029/2008JB005843.
Grandin, R., Socquet, A., Doin, M.P., Jacques, E., de Chabalier, J.B., King,G., 2010a. Transient rift opening in response to multiple dike injections inthe Manda Hararo rift (Afar, Ethiopia) imaged by time-dependent elasticinversion of interferometric synthetic aperture radar data. J. Geophys.Res. 115. B09403,doi:10.1029/2009JB006883.
Grandin, R., Socquet, A., Jacques, E., Mazzoni, N., , de Chabalier, J.B.,King, G.C.P., Lasserre, C., Tait, S., Tapponnier, P., Delorme, A., Pinzuti,P., 2010b. Sequence of rifting in Afar, Manda-Hararo rift, Ethiopia, 2005-2009 : Time space evolution and interactions between dikes from inter-ferometric synthetic aperture radar and static stress change modeling. J.Geophys. Res. 115. Doi:10.1029/2009JB000815.
Guglielmino, F., Bignami, C., Bonforte, A., Briole, P., Obrizzo, F., Puglisi,G., Stramondo, S., Wegmller, U., 2011. Analysis of satellite and insitu ground deformation data integrated by the SISTEM approach: TheApril 3, 2010 earthquake along the Pernicana fault (Mt. Etna - Italy)case study. Earth and Planetary Science Letters 312, 327 – 336.doi:http://dx.doi.org/10.1016/j.epsl.2011.10.028.
14

Hamling, I.J., Ayele, A., Bennati, L., Calais, E., Ebinger, C.J., Keir, D.,Lewi, E., Wright, T.J., Yirgu, G., 2009. Geodetic observations of theongoing Dabbahu rifting episode: new dyke intrusions in 2006 and 2007.Geophys. J. Int. 178, 989–1003.
Heleno, S., Frischknecht, C., dOreye, N., Lima, J., Faria, B., Wall,R., Kervyn, F., 2010. Seasonal tropospheric influence on SAR in-terferograms near the ITCZ - The case of Fogo Volcano and MountCameroon. Journal of African Earth Sciences 58, 833 – 856.doi:http://dx.doi.org/10.1016/j.jafrearsci.2009.07.013.
Henderson, S.T., Pritchard, M.E., 2013. Decadal volcanic deformation in theCentral Andes Volcanic Zone revealed by InSAR time series. Geochemistry,Geophysics, Geosystems 14, 1358–1374. doi:10.1002/ggge.20074.
Henriot, O., Villemin, T., 2005. Deformation at the northern end of theIcelandic rift mapped by InSAR (1992-2000), a decade after the KraflaRifting Episode. Geodinamica Acta 18, 43–57. doi:10.3166/ga.18.43-57.
Henriot, O., Villemin, T., Jouanne, F., 2001. Long period interferogramsreveal 1992-1998 steady rate of deformation at Krafla volcano (North Ice-land). Geophysical Research Letters 28, 1,067–1,070.
Hole, J., Bromley, C., Stevens, N., Wadge, G., 2007. Sub-sidence in the geothermal fields of the Taupo Volcanic Zone,New Zealand from 1996 to 2005 measured by InSAR. Jour-nal of Volcanology and Geothermal Research 166, 125 – 146.doi:http://dx.doi.org/10.1016/j.jvolgeores.2007.07.013.
Hooper, A., 2008. A multi-temporal InSAR method incorporating bith persis-tent scatterer and small baseline approaches. Geophysical Research Letters35. L16302, doi:10.1029/2008GL034654.
Hooper, A., Ofeigsson, B., Sigmundsson, F., Lund, B., Einarsson, P., Geirs-son, H., Sturkell, E., 2011. Increased crustal capture of magma at volcanoeswith retreating ice cap. Nature Geoscience DOI: 10.1038/NGEO1269.
Hooper, A., Segall, P., Zebker, H., 2007a. Persistent scatterer inter-ferometric synthetic aperture radar for crustal deformation analysis,with application to Volcan Alcedo, Galapagos. J. Geophys. Res. 112.B07407,doi:10.1029/2006JB004763.
15

Hooper, A., Segall, P., Zebker, H., 2007b. Persistent scatterer interferometricsynthetic aperture radar for crustal deformation analysis, with applicationto Volcan Alcedo, Galapagos. Journal of Geophysical Research: SolidEarth 112. doi:10.1029/2006JB004763.
Hooper, A., Zebker, H., Segall, P., Kampes, B., 2004. A new method formeasuring deformation on volcanoes and other natural terrains using In-SAR persistent scatterers. Geophysical Research Letters 31. L23611,doi:10.1029/2004GL021737.
Ji, L., Lu, Z., Dzurisin, D., Senyukov, S., 2013. Pre-eruption deformationcaused by dike intrusion beneath Kizimen volcano, Kamchatka, Russia,observed by InSAR. Journal of Volcanology and Geothermal Research256, 87 – 95. doi:http://dx.doi.org/10.1016/j.jvolgeores.2013.02.011.
Jonsson, S., 2009. Stress interaction between magma accumulation and trap-door faulting on Sierra Negra volcano, Galapagos . Tectonophysics 471,36–44.
Jonsson, S., Zebker, H., Amelung, F., 2005. On trapdoor faulting at SierraNegra volcano, Galapagos. J. Volcanol. Geotherm. Res. , –.
Jonsson, S., Zebker, H., Cervelli, P., Segall, P., Garbeil, H., Mouginis-Mark,P., Rowland, S., 1999. A shallow-dipping dike fed the 1995 flank eruptionat Fernandina Volcano, Galapagos, observed by satellite Radar Interfer-ometry. Geophysical Research Letters 26, 1,077–1,080.
Jung, H.S., Lu, Z., Won, J.S., Poland, M.P., Miklius, A., 2011. MappingThree-Dimensional surface deformation by combining Mulitple-ApertureInterferometry and Conventional Interferometry: Applicaiton to the June2007 eruption of Kilauea Volcnao, Hawaii . IEEE Geosci. Remote SensingLetters 8. Doi:10.1109/LGRS.2010.2051793.
Kaneko, T., Sudo, N., Wooster, M.J., Geshi, N., Shimano, T., Nagai, M.,Nakada, S., 2001. RADARSAT Determination of the outlines of the suc-cessively collapsing caldera at the Miyakejima 2000 eruption, Japan. Bull.Volcanol. Soc. Japan 46, 205–209.
Keiding, M., Arnadottir, T., Jonsson, S., Decriem, J., Hooper,A., 2010. Plate boundary deformation and man-made subsidence
16

around geothermal fields on the Reykjanes Peninsula, Iceland. Jour-nal of Volcanology and Geothermal Research 194, 139 – 149.doi:http://dx.doi.org/10.1016/j.jvolgeores.2010.04.011.
Kerle, N., Froger, J.L., Oppenheimer, C., Vries, B.V.W.D.,2003. Remote sensing of the 1998 mudflow at casita volcano,nicaragua. International Journal of Remote Sensing 24, 4791–4816.doi:10.1080/0143116031000068187.
Koike, K., Omura, M., Iguchi, M., Matsunaga, N., Tomiyama, N., 2002.Detection of distribution of the 1998 pyroclastic flow at Merapi volcano,Central Java, Indonesia using RADARSAT images 2, 9–18.
Kozono, T., Ueda, H., Ozawa, T., Koyaguchi, T., Fujita, E., Tomiya, A.,Suzuki, Y., 2013. Magma discharge variations during the 2011 eruptionsof Shinmoe-dake volcano, Japan, revealed by geodetic and satellite obser-vations. Bulletin of Volcanology 75, 1–13. doi:10.1007/s00445-013-0695-4.
Kwoun, .I., Lu, Z., Neal, C., Wicks, C.J., 2006. Quiescent deformationof the Aniakchak Caldera, Alaska, mapped by InSAR. Geology 34.Doi:10.1130/G22015.1.
Lagios, E., Sakkas, V., Parcharidis, I., Dietrich, V., 2005. Ground de-formation of Nisyros Volcano (Greece) for the period 19952002: Re-sults from DInSAR and DGPS observations. Bulletin of Volcanology68, 201–214. URL: http://dx.doi.org/10.1007/s00445-005-0004-y,doi:10.1007/s00445-005-0004-y.
Lanari, R., Berardino, P., Borgstrom, S., Del Gaudio, C., De Martino, P.,Fornaro, G., Guarino, S., Ricciardi, G.P., Sansosti, E., Lundgren, P., 2004.The use of IFSAR and classical geodetic techniques for caldera unrestepisodes: application to the Campi Flegrei uplift event of 2000. J. Volcanol.Geotherm. Res. 133, 247–260.
Lanari, R., De Natale, G., Berardino, P., Sansosti, E., Ricciardi, G.P.,Borgstrom, S., Capuano, P., Pingue, F., Troise, C., 2002. Evidence fora peculiar style of ground deformation inferred at Vesuvius volcano. Geo-physical Research Letters 29. Doi:10.1029/2001GL014571.
17

Lanari, R., De Natale, G., Lundgren, P., Sansosti, E., 1998. Dynamic defor-mation of Etna volcano observed by satellite radar interferometry. Geo-physical Research Letters 25, 1,541–1,548.
Lee, C., Lu, Z., Kwoun, O.I., Won, J.S., 2008. Deformation of the Augus-tine Volcano, Alaska, 1992-2005, measured by ERS and ENVISAT SARinterferometry. Earth Planets Space 60, 447–452.
Lee, C.W., Lu, Z., Won, J.S., Jung, H.S., Dzurisin, D., 2013. Dynamicdeformation of Seguam Island, Alaska, 19922008, from multi-interferogramInSAR processing. Journal of Volcanology and Geothermal Research 260,43 – 51. doi:http://dx.doi.org/10.1016/j.jvolgeores.2013.05.009.
Lu, Z., Dzurisin, D., 2010. Ground surface deformation patterns, magmasupply, and magma storage at Okmok volcano, Alaska, from InSAR anal-ysis:1. Co-eruptive deflation, July-August 2008. J. Geophys. Res. 115.(B00B03) doi:10.1029/2009JB006970.
Lu, Z., Dzurisin, D., Biggs, J., Wick Jr., C., McNutt, S., 2010. Ground sur-face deformation patterns, magma supply, and magma storage at Okmokvolcano, Alaska, from InSAR analysis:1. Intereruption deformation, 1997-2008. J. Geophys. Res. 115. (B00B02) doi:10.1029/2009JB006969.
Lu, Z., Fatland, R., Wyss, M., Li, S., Eichelberger, J., Dean, K., Freymueller,J., 1997. Deformation of new Trident Volcano measured by ERS-1 SAR in-terferometry, Katmai National Park, Alaska. Geophysical Research Letters24, 695–698.
Lu, Z., Fielding, E., Patrick, M., Trautwein, C., 2003a. Estimating lava vol-ume by precision combination of multiple baseline spaceborne and airborneinterferometry synthetic aperture radar: The 1997 eruption of Okmok vol-cano, Alaska. IEEE Transactions on Geoscience and Remote Sensing 41.
Lu, Z., Freymueller, J.T., 1998. Synthetic aperture radar interferometrycoherence analysis over Katmai volcano group, Alaska. J. Geophys. Res.103, 29,887–29,894.
Lu, Z., Mann, D., Freymueller, T., Meyer, D.J., 2000a. Synthetic apertureradar interferometry of Okmok volcano, Alaska: Radar observations. J.Geophys. Res. 105, 10,791–10,806.
18

Lu, Z., Masterlark, T., Dzurisin, D., 2005. Interferometric synthetic apertureradar study of Okmok volcano, Alaska, 1992-2003: Magma supply dynam-ics and postemplacement lava flow deformation. J. Geophys. Res. 1110.(B02403) doi:10.1029/2004JB003148.
Lu, Z., Masterlark, T., Dzurisin, D., Rykhus, R., Wicks, J.C., 2003b.Magma supply dynamics at Westdahl volcano, Alaska, modeled fromsatellite radar interferometry. J. Geophys. Res. 108. (B7) 2354,doi:10.1029/2002JB002311.
Lu, Z., Masterlark, T., Power, J., Dzurisin, D., Wicks, C., 2002a.Subsidence at Kiska Volcano, Western Aleutians, detected by satel-lite radar interferometry. Geophysical Research Letters 29, 2–1–2–4.doi:10.1029/2002GL014948.
Lu, Z., Power, J.A., McConnell, V.S., Wicks, J.C., Dzurisin, D., 2002b.Preeruptive inflation and surface interferometric coherence characteristicsrevealed by satellite radar interferometry at Makushin Volcano, Alaska:1993-2000. J. Geophys. Res. 107. (B11) 2266, doi:10.1029/2001JB000970.
Lu, Z., Rykhus, R., Masterlark, T., Dean, K.G., 2004. Mapping re-cent lava flows at Westdahl Volcano, Alaska, using radar and opti-cal satellite imagery. Remote Sensing of Environment 91, 345 – 353.doi:http://dx.doi.org/10.1016/j.rse.2004.03.015.
Lu, Z., Wicks, C., Dzurisin, D., Power, J.A., Moran, S.C., Thatcher, W.,2002c. Magmatic inflation at a dormant stratovolcano: 1996-1998 activityat Mount Peulik volcano, Alaska, revealed by satellite radar interferometry.J. Geophys. Res. 107. (B7) 2072, doi:10.1029/2001JB000471.
Lu, Z., Wicks, C., Dzurisin, D., Thatcher, W., Freymueller, J.T., McNutt,S.R., Mann, D., 2000b. Aseismic inflation of Westdahl volcano, Alaskarevealed by satellite radar interferometry. Geophysical Research Letters27, 1,567–1,570.
Lu, Z., Wicks, C., Power, J.A., Dzurisin, D., 2000c. Ground deformationassociated with the March 1996 earthquake swarm at Akutan volcano,Alaska, revealed by satellite radar interferometry. J. Geophys. Res. 105,21,483–21,495.
19

Lundgren, P., Berardino, P., Coltelli, M., Fornaro, G., Lanari, R., Puglisi,G., Sansosti, E., Tesauro, M., 2003. Coupled magma chamber inflation andsector collapse slip observed with synthetic aperture radar interferometryon Mt. Etna volcano. Journal of Geophysical Research: Solid Earth 108,n/a–n/a. doi:10.1029/2001JB000657.
Lundgren, P., Casu, F., Manzo, M., Pepe, A., Berardino, P., Sansosti, E.,Lanari, R., 2004. Gravity and magma induced spreading of Mount Etnavolcano revealed by satellite radar interferometry. Geophysical ResearchLetters 31. Doi:10.1029/2003GL018736.
Lundgren, P., Lu, Z., 2006. Inflation model of Uzon caldera, Kamchatka,constrained by satellite radar interferometry observations. GeophysicalResearch Letters 33. Doi:10.1029/2005GL025181.
Lundgren, P., Poland, M., Miklius, A., Orr, T., Yun, S.H., Fielding, E., Liu,Z., Tanaka, A., Szeliga, W., Hensley, S., Owen, S., 2013. Evolution ofdike opening during the March 2011 Kamoamoa fissure eruption, KlaueaVolcano, Hawai‘i. Journal of Geophysical Research: Solid Earth 118, 897–914. doi:10.1002/jgrb.50108.
Lundgren, P., Rosen, P.A., 2003. Source model for the 2001 flank erup-tion of Mt. Etna volcano. Geophysical Research Letters 30, n/a–n/a.doi:10.1029/2002GL016774.
Lundgren, P., Usai, S., Sansosti, E., Lanari, R., Tesauro, M., Fornaro,G., Berardino, P., 2001. Modeling surface deformation observedwith synthetic aperture radar interferometry at Campi Flegrei caldera.Journal of Geophysical Research: Solid Earth 106, 19355–19366.doi:10.1029/2001JB000194.
Manconi, A., Casu, F., 2012. Joint analysis of displacement time seriesretrieved from SAR phase and amplitude: Impact on the estimation ofvolcanic source parameters. Geophysical Research Letters 39. L14301,doi:10.1029/2012GL052202.
Manconi, A., Walter, T.R., Manzo, M., Zenni, G., Tizzani, P., Sansosti,E., Lanari, R., 2010. On the effects of 3-D mechanical heterogeneities atCampi Flegrei caldera, southern Italy. J. Geophys. Res. 115. B08405,doi:10.1029/2009JB007099.
20

Mann, D., Freymueller, J., Lu, Z., 2002. Deformation associated with the1997 eruption of Okmok volcano, Alaska. J. Geophys. Res. 107. (B4) 2072,doi:10.1029/2001JB000163.
Massonnet, D., Briole, P., Arnaud, A., 1995. Deflation of Mount Etna mon-itored by spaceborne radar interferometry. Nature 375, 567–570.
Massonnet, D., Holzer, T., Vadon, H., 1997. Land subsidence causedby the East Mesa Geothermal Field, California, observed using SARinterferometry. Geophysical Research Letters 24, 901–904. URL:http://dx.doi.org/10.1029/97GL00817, doi:10.1029/97GL00817.
Masterlark, T., Feigl, K.L., Haney, M., Stone, J., Thurber, C., Ronchin,E., 2012. Nonlinear estimation of geometric parameters in FEMs of vol-cano deformation: Integrating tomography models and geodetic data forOkmok volcano, Alaska. Journal of Geophysical Research: Solid Earth117. doi:10.1029/2011JB008811.
Masterlark, T., Haney, M., Dickinson, H., Tournier, T., Searcey, 2010. Rheo-logic and strutural controls on the deformation of Okmok volcano, Alaska:FEMs, InSAR, and ambient noise tomography. J. Geophys. Res. 115.
Masterlark, T., Lu, Z., 2004. Transient volcano deformation sources im-aged with interferometric synthetic aperture radar: Application to SeguamIsland, Alaska. Journal of Geophysical Research: Solid Earth 109.doi:10.1029/2003JB002568.
Masterlark, T., Lu, Z., Rykhus, R., 2006. Thickness distribution of acooling pyroclastic flow deposit on Augustine Volcano, Alaska: Op-timization using InSAR, FEMs, and an adaptive mesh algorithm.Journal of Volcanology and Geothermal Research 150, 186 – 201.doi:http://dx.doi.org/10.1016/j.jvolgeores.2005.07.004.
Matthews, J., Kamata, H., Okuyama, S., Yusa, Y., Shimizu, H., 2003. Sur-face height adjustments in pyroclastic-flow deposits observed at Unzen vol-cano by JERS-1 SAR interferometry. Journal of Volcanology and Geother-mal Research 125, 247 – 270. doi:http://dx.doi.org/10.1016/S0377-0273(03)00112-4.
21

McAlpin, D., Meyer, F.J., 2013. Multi-sensor data fusion for remote sensingof post-eruptive deformation and depositional features at Redoubt Vol-cano. Journal of Volcanology and Geothermal Research 259, 414 – 423.doi:http://dx.doi.org/10.1016/j.jvolgeores.2012.08.006.
Montgomery-Brown, E.K., Simnett, D.K., Poland, M., Segall, P., Orr,T., Zbker, H., Miklius, A., 2010. Geodetic evidence for en echelondike emplacement and concurrent slow slip during the June 2007 intru-sion and eruption at Kilauea volcano, Hawaii. J. Geophys. Res. 115.Doi:10.1029/2009JB006658.
Moran, S., Kwoun, O., Masterlark, T., Lu, Z., 2006. Onthe absence of InSAR-detected volcano deformation spanning the19951996 and 1999 eruptions of Shishaldin Volcano, Alaska. Jour-nal of Volcanology and Geothermal Research 150, 119 – 131.doi:http://dx.doi.org/10.1016/j.jvolgeores.2005.07.013.
Myer, D., Sandwell, D., Brooks, B., Foster, J., Shimada, M.,2008. Inflation along Kilauea’s Southwest Rift Zone in 2006.Journal of Volcanology and Geothermal Research 177, 418 – 424.doi:http://dx.doi.org/10.1016/j.jvolgeores.2008.06.006.
Navarro, A., Loureno, N., Chorowicz, J., Miranda, J., Catalo, J., 2009.Analysis of geometry of volcanoes and faults in Terceira Island (Azores):Evidence for reactivation tectonics at the EUR/AFR plate bound-ary in the Azores triple junction. Tectonophysics 465, 98 – 113.doi:http://dx.doi.org/10.1016/j.tecto.2008.10.020.
Negro, C.D., Currenti, G., Solaro, G., Greco, F., Pepe, A., Napoli, R., Pepe,S., Casu, F., Sansosti, E., 2013. Capturing the fingerprint of Etna vol-cano activity in gravity and satellite radar data. Scientific Reports 3.doi:10.1038/srep03089.
Neri, M., Casu, F., Acocella, V., Solaro, G., Pepe, S., Berardino, P., San-sosti, E., Caltabiano, T., Lundgren, P., Lanari, R., 2009. Deformationand eruptions at Mt. Etna (Italy): A lesson from 15 years of observations.Geophysical Research Letters 36. Doi:10.1029/2008GL036151.
Neri, M., Guglielmino, F., Rust, D., 2007. Flank instability on Mount Etna:Radon, radar interferometry, and geodetic data from the southwestern
22

boundary of the unstable sector. Journal of Geophysical Research: SolidEarth 112. doi:10.1029/2006JB004756.
Newman, A.V., Dixon, T.H., Gourmelen, N., 2006. A four dimen-sional viscoelastic deformation model for Long Valley Caldera, Califor-nia, between 1995 and 2000. J. Volcanol. Geotherm. Res. 150, 244–269.Doi:10.1016/j.jvolgeores.2005.07.017.
Nishimura, T., Fujiwara, S., Murakami, M., Tobita, M., Nakagawa, H.,Sagiya, T., Tada, T., 2001. The M6.1 earthquake triggered by vol-canic inflation of Iwate Volcano, northern Japan, observed by satel-lite radar interferometry. Geophysical Research Letters 28, 635–638.doi:10.1029/2000GL012022.
Nobile, A., Pagli, C., Keir, D., Wright, T.J., Ayele, A., Ruch, J., Acocella,V., 2012. Dike-fault interaction during the 2004 Dallol intrusion at thenorthern edge of the Erta Ale Ridge (Afar, Ethiopia). Geophysical Re-search Letters 39. doi:10.1029/2012GL053152.
Ofeigsson, B.G., Sigmundsson, F., Hooper, A., Sturkell, E.O., 2011. InSARtime series analysis at Hekla volcano, Iceland: Inflation periods and crustaldeformation associated with the 2000 eruption. J. Geophys. Res. .
Ohkura, H., 1998. Application of SAR data to monitoring Earth surfacechanges and displacement. Applied Scientific Research 21, 485–492.
Ozawa, T., Fujita, E., 2013. Local deformations around volcanoes associatedwith the 2011 off the Pacific coast of Tohoku earthquake. Journal of Geo-physical Research: Solid Earth 118, 390–405. doi:10.1029/2011JB009129.
Ozawa, T., Kozono, T., 2013. Temporal variation of the Shimnoe-dake craterin the 2011 eruption revealed by spaceborne SAR observations. eps 65,527–537.
Ozawa, T., Ueda, H., 2011. Advanced interferometric synthetic apertureradar (InSAR) time series analysis using interferograms of multiple-orbittracks: A case study on Miyake-jima. Journal of Geophysical Research:Solid Earth 116. doi:10.1029/2011JB008489.
Pagli, C., Sigmundsson, F., rnadttir, T., Einarsson, P., Sturkell, E., 2006.Deflation of the Askja volcanic system: Constraints on the deformation
23

source from combined inversion of satellite radar interferograms and GPSmeasurements. Journal of Volcanology and Geothermal Research 152, 97– 108. doi:http://dx.doi.org/10.1016/j.jvolgeores.2005.09.014.
Pagli, C., Wright, T.J., Ebdinger, C.J., Yun, S.H., Cann, J.R., Barnie, T.,Ayele, A., 2012. Shallow axial magma chamber at the slow-spreading ErtaAle Ridge. Nature Geoscience 5, 284–288. Doi:10.1038/NGEO1414.
Palano, M., Puglisi, G., Gresta, S., 2008. Ground deformation patternsat Mt. Etna from 1993 to 2000 from joint use of InSAR and GPS tech-niques. Journal of Volcanology and Geothermal Research 169, 99 – 120.doi:http://dx.doi.org/10.1016/j.jvolgeores.2007.08.014.
Pallister, J.S., Schneider, D.J., Griswold, J.P., Keeler, R.H., Burton, W.C.,Noyles, C., Newhall, C.G., Ratdomopurbo, A., 2013. Merapi 2010eruption-Chronology and extrusion rates monitored with satellite radarand used in eruption forecasting. J. Volcanol. Geotherm. Res. 261, 144–152. Doi:10.1016/j.jvolgeores.2012.07.012.
Papageorgiou, E., Foumelis, M., Parcharidis, I., 2012. Mapping inflation atsantorini volcano, greece, using gps and insar. IEEE JOURNAL OF SE-LECTED TOPICS IN APPLIED EARTH OBSERVATIONS AND RE-MOTE SENSING 5, 267–272. doi:10.1109/JSTARS.2012.2198871.
Papoutsis, I., Papanikolaou, X., Floyd, M., Ji, K.H., Kontoes, C., Par-adissis, D., Zacharis, V., 2013. Mapping inflation at santorini volcano,greece, using gps and insar. Geophysical Research Letters 40, 267–272.doi:10.1029/2012GL054137.
Parks, M.M., Biggs, J., England, P., Mather, T.A., Nomikou, P., Pala-martchouk, K., Papanikolaou, X., Paradissis, D., Parsons, B., Pyle, D.M.,Raptakis, C., Zacharis, V., 2012. Evolution of Santorini Volcano dom-nated by episodic and rapid fluxes of melt from depth. Nature Geoscience5, 749–754. Doi:10.1038/NGEO1562.
Parks, M.M., Biggs, J., Mather, T.A., Pyle, D.M., Amelung, F.,Monsalve, M.L., Narvaez, M., 2011. Co-eruptive subsidence atGaleras identified during an InSAR survey of Colombian volca-noes (2006-2009). J. Volcanol. Geotherm. Res. 202, 228 – 240.doi:http://dx.doi.org/10.1016/j.jvolgeores.2011.02.007.
24

Patrick, M., Dehn, J., Papp, K., Lu, Z., Dean, K., Moxey, L., Izbekov, P., Gu-ritz, R., 2003. The 1997 eruption of Okmok Volcano, Alaska: a synthesis ofremotely sensed imagery. Journal of Volcanology and Geothermal Research127, 87 – 105. doi:http://dx.doi.org/10.1016/S0377-0273(03)00180-X.
Pavez, A., Remy, D., Bonvalot, S., Diament, M., Gabalda, G., Froger, J.L.,Julien, P., Legrand, D., Moisset, D., 2006. Insight into ground deformationat Lascar volcano (Chile) from SAR interferometry, photogrammetry andGPS data: Imlications on volcano dynamics and future space monitoring.Remote Sens. Environ. 100, 307–320.
Pearse, J., Fialko, Y., 2010. Mechanics of active magmatic intraplating inthe Rio Grande Rift near Socorro, New Mexico. J. Geophys. Res. 115.B07413, doi:10.1029/2009JB006592.
Pearse, J., Lundgren, P., 2013. Source model of deformation at Lazufre vol-canic center, central Andes, constrained by InSAR time series. GeophysicalResearch Letters 40, 1059–1064. doi:10.1002/grl.50276.
Pedersen, R., Sigmundsson, 2004. InSAR based sill model links spatiallyoffset areas of deformation and seismicity for the 1994 unrest episodeat Eyjafjallajokull volcano, Iceland. Geophysical Research Letters 31,L14610,doi:10.1029/2004GL0202368.
Pedersen, R., Sigmundsson, 2006. Temporal development of the 1999 intru-sive episode in the Eyjafjallajokull volcano, Iceland, derived from InSARimages. Bull. Volcanol. 68, 377–393.
Peltier, A., Bianchi, M., Komorowski, J.C., Rucci, A., Staudacher, T., 2010.PSInSAR as a new tool to monitor pre-eruptive volcano ground defor-mation: Validation using GPS measurements on Piton de la Fournaise.Geophysical Research Letters 37. Doi:10.1029/2010GL043846.
Pepe, A., Manzo, M., Casu, F., Solaro, G., Tizzani, P., Zeni, G., Pepe,S., 2008. Surface deformation of active volcanic areas retrieved with theSBAS-DInSAR technique: an overview 51, 247–263.
Perlock, P.A., Gonzlez, P.J., Tiampo, K.F., Rodrguez-Velasco, G., Sam-sonov, S., Fernndez, J., 2008. Time Evolution of Deformation Using
25

Time Series of Differential Interferograms: Application to La Palma Is-land (Canary Islands). Pure and Applied Geophysics 165, 1531–1554.doi:10.1007/s00024-004-0388-7.
Philibosian, B., Simons, M., 2012. A survey of volcanic deformation on Javausing ALOS PALSAR interferometric time series. Geochem. Geophys.Geosyst. 12. Q11004,doi:10.1029/2011GC003775.
Pinel, V., Hooper, A., De la Cruz-Reyna, S., Reyes-Davila, G., Doin, M.P.,Bascou, P., 2011. The challenging retrieval of the displacement field fromInSAR data for andesitic stratovolcanoes: Case study of Popocatepetland Colima Volcano, Mexico. J. Volcanol. Geotherm. Res. 200, 49–61.Doi:10.1016/j.jvolgeores.2010.12.002.
Poland, M., Burgmann, R., Dzurisin, D., Lisowski, M., Masterlark, T., Owen,S., Fink, J., 2006. Constraints on the mechanism of long-term, steady sub-sidence at Medicine Lake volcano, northern California, from GPS, leveling,and InSAR. Journal of Volcanology and Geothermal Research 150, 55 –78. doi:http://dx.doi.org/10.1016/j.jvolgeores.2005.07.007.
Poland, M., Lu, Z., 2008. Radar interferometry observations of surface dis-placements during pre- and coeruptive periods at Mount St Helens, Wash-ington, 1992-2005. A volcano Rekindled: the Renewed Eruption of MountSt. Helens, 2004-2006 edited by W. E. S. D. R. Sherrod and P. H. Stauffer,chap 22, US Gov. Print. Off., Washington, D.C.
Price, E.J., 2004. Dynamic deformation of Seguam Island, Aleutian Is-lands, Alaska, 19932000: Implications for magmatic and hydrother-mal processes. Journal of Geophysical Research: Solid Earth 109.doi:10.1029/2003JB002671.
Pritchard, M.E., Jay, J.A., Aron, F., Henderson, S.T., Lara, L.E., 2013.Subsidence at southern andes volcanoes induced by the 2010 maule, chileearthquake. Nature Geoscience 6, 632–636. 10.1038/ngeo1857.
Pritchard, M.E., Simons, M., 2002. A satellite geodetic survey of large-scaledeformation of volcanic centres in the central Andes. Nature 418, 167–171.
Pritchard, M.E., Simons, M., 2004a. An InSAR-based survey of volcanicdeformation in the southern Andes. Geophysical Research Letters 31.Doi:10.1029/2004GL020545.
26

Pritchard, M.E., Simons, M., 2004b. An InSAR-based survey of volcanicdeformation of volcanic centres in the central Andes. Geochem. Geophys.Geosyst. 5. Q02002,doi:10.1029/2003GC000610.
Remy, D., Bonvalot, S., Briole, P., Murakami, M., 2003. Accurate measure-ments of tropospheric effects in volcanic areas from SAR interferometrydata : application to Sakurajima volcano (Japan). Earth Planet. Sci.Lett. 213, 299–310.
Richter, N., Poland, M.P., Lundgren, P.R., 2013. TerraSAR-X interferometryreveals small-scale deformation associated with the summit eruption ofKlauea Volcano, Hawaii. Geophysical Research Letters 40, 1279–1283.doi:10.1002/grl.50286.
Riddick, S., Schmidt, D., Deligne, N., 2012. An analysis of terrain propertiesand the location of surface scatterers from persistent scatterer interferom-etry. {ISPRS} Journal of Photogrammetry and Remote Sensing 73, 50 –57. doi:http://dx.doi.org/10.1016/j.isprsjprs.2012.05.010.
Riddick, S.N., Schmidt, D.A., 2011. Time-dependent changes in volcanic in-flation rate near Three Sisters, Oregon, revealed by InSAR. Geochemistry,Geophysics, Geosystems 12. doi:10.1029/2011GC003826.
Romero, R., Carrasco, D., Arana, V., Fernandez, J., 2003. A new approachto the monitoring of deformation on Lanzarote (Canary Islands): an 8-yearradar perspective. Bull. Volcanol. 66, 1–7. doi:10.1007/s00445-002-0232-3.
Rosen, P.A., Hensley, S., Zebker, H.A., Webb, F.H., Fielding, E.J., 1996. Sur-face deformation and coherence measurements of Kilauea Volcano, Hawaii,from SIR-C radar interferometry. Journal of Geophysical Research: Plan-ets 101, 23109–23125. doi:10.1029/96JE01459.
Rowland, S., Harris, A., Wooster, M., Amelung, F., Garbeil, H., Wilson,L., Mouginis-Mark, P., 2003. Volumetric characteristics of lava flows frominterferometric radar and multispectral satellite data: the 1995 Fernandinaand 1998 Cerro Azul eruptions in the western Galapagos. Bulletin ofVolcanology 65, 311–330. doi:10.1007/s00445-002-0262-x.
Rowland, S.K., Smith, G.A., Mouginis-Mark, P.J., 1994. PreliminaryERS-1 observations of Alaskan and Aleutian volcanoes. Remote Sens-
27

ing of Environment 48, 358 – 369. doi:http://dx.doi.org/10.1016/0034-4257(94)90010-8.
Ruch, J., Acocella, V., Storti, F., Neri, M., Pepe, S., Solaro, G., San-sosti, E., 2010. Detachment depth revealed by rollover deformation: Anintegrated approach at Mount Etna. Geophysical Research Letters 37.doi:10.1029/2010GL044131.
Ruch, J., Anderssohn, J., Walter, T.R., Motagh, M., 2008. Caldera-scale in-flation of the Lazufre volcanic area, South America: Evidence from InSAR.J. Volcanol. Geotherm. Res. 174, 337–344.
Ruch, J., Manconi, A., Zeni, G., Solaro, G., Pepe, A., Shirzaei, M., Walter,T.R., Lanari, R., 2009. Stress transfer in the Lazufre volcanic area, centralAndes. Geophysical Research Letters 36. doi:10.1029/2009GL041276.
Ruch, J., Pepe, S., Casu, F., Solaro, G., Pepe, A., Acocella, V., Neri, M.,Sansosti, E., 2013. Seismo-tectonic behavior of the Pernicana Fault System(Mt Etna): A gauge for volcano flank instability? Journal of GeophysicalResearch: Solid Earth doi:10.1002/jgrb.50281.
Sachpazi, M., Kontoes, C., Voulgaris, N., Laigle, M., Vougioukalakis, G.,Sikioti, O., Stavrakakis, G., Baskoutas, J., Kalogeras, J., Lepine, J.,2002. Seismological and SAR signature of unrest at Nisyros caldera,Greece. Journal of Volcanology and Geothermal Research 116, 19 – 33.doi:http://dx.doi.org/10.1016/S0377-0273(01)00334-1.
Saepuloh, A., Koike, K., Omura, M., Iguchi, M., Setiawan, A., 2010. SAR-and gravity change-based characterization of the distribution pattern ofpyroclastic flow deposits at Mt. Merapi during the past 10 years. Bull.Volcanol. 72, 221–232. DOI 10.1007/s00445-009-0310-x.
Saepuloh, A., Urai, M., Aisyah, N., Sunarta, Widiwijayanti, C., Subandriyo,Jousset, P., 2013. Observing ground surface changes prior to the 2010 largeeruption of Merapi volcano using ALOS/PALSAR and ASTER TIR datasets. J. Volcanol. Geotherm. Res. .
Salvi, S., Atzori, S., Tolomei, C., Allievi, J., Ferretti, A., Rocca, F., Prati,C., Stramondo, S., Feuillet, N., 2004. Inflation rate of the Colli Albani vol-canic complex retrieved by the permanent scatterers SAR interferometrytechnique. Geophysical Research Letters 31. doi:10.1029/2004GL020253.
28

Samsonov, S., Beavan, J., Gonzlez, P.J., Tiampo, K., Fernndez, J., 2011.Ground deformation in the Taupo Volcanic Zone, New Zealand, observedby ALOS PALSAR interferometry. Geophysical Journal International 187,147–160. doi:10.1111/j.1365-246X.2011.05129.x.
Sandwell, D., Myer, D., Mellors, R., Shimada, M., Brooks, B., Foster, J.,2008. Accuracy and Resolution of ALOS Interferometry: Vector Deforma-tion Maps of the Father’s Day Intrusion at Kilauea. IEEE Transactionson Geoscience and Remote Sensing 46, 3524–3534.
Scharrer, K., Malservisi, R., Mayer, C., Spieler, O., Munzer, U., 2007. Com-bination of SAR remote sensing and GIS for monitoring subglacial volcanicactivity and ash; recent results from Vatnajokull ice cap (Iceland). NaturalHazards and Earth System Science 7, 717–722. doi:10.5194/nhess-7-717-2007.
Scharrer, K., Spieler, O., Mayer, C., Munzer, U., 2008. Imprints of sub-glacial volcanic activity on a glacier surfaceSAR study of Katla volcano,Iceland. Bull. Volcanol. 70, 495–506.
Shirzaei, M., Burgmann, R., 2012. Topography correlated atmospheric delaycorrection in radar interferometry using wavelet transforms. GeophysicalResearch Letters 39. doi:10.1029/2011GL049971.
Shirzaei, M., Brgmann, R., Foster, J., Walter, T., Brooks, B., 2013. Aseismicdeformation across the Hilina fault system, Hawaii, revealed by waveletanalysis of InSAR and GPS time series. Earth and Planetary ScienceLetters 376, 12 – 19. doi:http://dx.doi.org/10.1016/j.epsl.2013.06.011.
Sigmundsson, F., Durand, P., Massonnet, D., 1999. Opening of an eruptivefissure and seaward displacement at Piton de la Fournaise volcano mea-sured by RADARSAT satellite radar interferometry. Geophysical ResearchLetters 26, 533–536.
Sigmundsson, F., Hreinsdottir, S., Hooper, A., Arnadottir, T., Pedersen,R., Roberts, M.J., Oskarsson, N., Auriac, A., Decriem, J., Einarsson, P.,Geirsson, H., Hensch, M., Ofeigsson, B., Sturkell, E., Sveinbjornsson, H.,Feigl, K.L., 2010. Intrusion triggering of the 2010 Eyjafjallajokull explosiveeruption . Nature 468, 426–430. Doi:10.1038/nature09558.
29

Sigmundsson, F., Vadon, H., Massonnet, D., 1997. Readjustement of theKrafla spreading segment to crustal rifting measured by Satellite RadarInterferometry. Geophysical Research Letters 24, 1,843–1,846.
Smets, B., Wauthier, C., d’Oreye, N., 2010. A new map of the lava flow fieldof Nyamuragira (D. R. Congo) from satellite imagery 58, 778–786.
Solaro, G., Acocella, V., Pepe, S., Ruch, J., Neri, M., Sansosti, E., 2010.Anatomy of an unstable volcano from InSAR: Multiple processes affect-ing flank instability at Mt. Etna, 1994-2008. J. Geophys. Res. 115.B10505,doi:10.1029/2009JB000820.
Solaro, G., Casu, F., Paglia, L., Pepe, A., Pepe, S., Sansosti, E., Tiz-zani, P., Lanari, R., 2011. Sbas-dinsar time series in the last eigh-teen years at mt. etna volcano (italy), in: Geoscience and RemoteSensing Symposium (IGARSS), 2011 IEEE International, pp. 3891–3894.doi:10.1109/IGARSS.2011.6050081.
Stevens, N., Wadge, G., 2004. Towards Operational Repeat-Pass SAR Inter-ferometry at Active Volcanoes. Natural Hazards 33, 47–73.
Stevens, N., Wadge, G., Williams, C., Morley, J., Muller, J.P., Murray, J.,Upton, M., 2001a. Surface movements of emplaced lava flows measured bysynthetic aperture radar interferometry. J. Geophys. Res. 106.
Stevens, N.F., Wadge, G., Williams, C.A., 2001b. Post-emplacementlava subsidence and the accuracy of ers insar digital elevation mod-els of volcanoes. International Journal of Remote Sensing 22, 819–828.doi:10.1080/01431160051060246.
Sykioti, O., Kontoes, C.C., Elias, P., Briole, P., Sachpazi, M., Paradissis, D.,Kotsis, I., 2003. Ground deformation at nisyros volcano (greece) detectedby ers-2 sar differential interferometry. International Journal of RemoteSensing 24, 183–188. doi:10.1080/01431160305000.
Takada, Y., Fukushima, Y., 2013. Volcanic subsidence triggered by the2011 Tohoku earthquake in Japan. Nature Geoscience 6, 637–641.10.1038/ngeo1857.
30

Terunuma, T., Nishida, K., Amada, T., Mizuyama, T., Sato, I., Urai, M.,2005. Detection of traces of pyroclastic flows and lahars with satellitesynthetic aperture radars. Int. J. of Remote Sensing. 26.
Thatcher, W., Massonnet, D., 1997. Crustal deformation at long valleycaldera, eastern california, 1992-1996 inferred from satellite radar inter-ferometry. Geophysical Research Letters 24, 2,519–2,522.
Tizzani, P., Beradino, P., Casu, F., Euillades, P., Manzo, M., Ricciardi, G.P.,Zeni, G., Lanari, R., 2007. Surface deformation of Long Valley calderaand Mono Basin, California, investigated with the SBAS-InSAR approach.Remote Sens. Environ. 108, 277–289. Doi:10.1016/j.rse.2006.11.015.
Tobita, M., Murakami, M., Nakagawa, H., Yarai, H., Fujiwara, S., Rosen,P.A., 2001. 3-D surface deformation of the 2000 Usu Eruption measuredby matching of SAR images. Geophysical Research Letters 28, 4291–4294.doi:10.1029/2001GL013329.
Toombs, A., Wadge, G., 2012. Co-eruptive and inter-eruptivesurface deformation measured by satellite radar interferometryat Nyamuragira volcano, D.R. Congo, 1996 to 2010. Jour-nal of Volcanology and Geothermal Research 245246, 98 – 122.doi:http://dx.doi.org/10.1016/j.jvolgeores.2012.07.005.
Torres, R., Mouginis-Mark, P., Self, S., Garbeil, H., Kallianpur, K.,Quiambao, R., 2004. Monitoring the evolution of the PasigPotrero al-luvial fan, Pinatubo Volcano, using a decade of remote sensing data. Journal of Volcanology and Geothermal Research 138, 371 – 392.doi:http://dx.doi.org/10.1016/j.jvolgeores.2004.08.005.
Vadon, H., Sigmundsson, F., 1997. Crustal Deformation from 1992 to 1995at the Mid-Atlantic Ridge, Southwest Iceland, Mapped by Satellite RadarInterferometry. Science 275, 194–197. doi:10.1126/science.275.5297.194.
Vasco, D.W., Wicks, C., Karasaki, K., Marques, O., 2002. Geodetic imaging:reservoir monitoring using satellite interferometry. Geophysical JournalInternational 149, 555–571. doi:10.1046/j.1365-246X.2002.01569.x.
Velez, M.L., Euillades, P., Caselli, A., Blanco, M., Diaz, J.M., 2011.Deformation of Copahue volcano: Inversion of InSAR data using
31

a genetic algorithm. J. Volcanol. Geotherm. Res. 202, 117–126.Doi:10.1016/j.jvolgeores.2011.01.012.
Wadge, G., Cole, P., Stinton, A., Komorowski, J.C., Stewart, R., Toombs,A.C., Legendre, Y., 2011. Rapid topographic change measured by high-resolution satellite radar at Soufrire Hills Volcano, Montserrat: 20082010.J. Volcanol. Geotherm. Res. 199. Doi:10.1016/j.volgeores.2010.10.011.
Wadge, G., Mattioli, G.S., Herd, R.A., 2006. Ground deformation atSoufriere Hills Volcano, Montserrat during 1998-2000 measured by radarinterferometry and GPS. J. Volcanol. Geotherm. Res. 152, 157–173.
Wadge, G., Saunders, S., Itikarai, I., 2012. Pulsatory andesite lavaflow at Bagana Volcano. Geochem. Geophys. Geosyst. 13. Q11011,doi:10.1029/2012GC004336.
Wadge, G., Scheuchl, B., Stevens, N.F., 2002a. Spaceborne radar measure-ments of the eruption of Soufrire Hills Volcano, Montserrat. In: Druitt,T. H., Kolelaar, B. P. (Eds.), The Eruption of the Soufriere Hills Volcano,Montserrat, from 1995 to 1999, Memoirs Geological Society, London.
Wadge, G., Webley, P.W., James, I.N., Bingley, R., Dodson, A., Waugh,S., Veneboer, G., Puglisi, M., Mattia, D., Baker, D., Edwards, S.C., Ed-wards, S.J., Clarke, P.J., 2002b. Atmospheric models, GPS and InSARmeausurements of the troposphere water field over Mt. Etna, Italy poly-genetic volcanoes. Geophysical Research Letters 29.
Wauthier, C., Cayol, V., Kervyn, F., d’Oreye, N., 2012. Magma sourcesinvolved in the 2002 Nyiragongo eruption, as inferred from an In-SAR analysis. Journal of Geophysical Research: Solid Earth 117.doi:10.1029/2011JB008257.
Wauthier, C., Cayol, V., Poland, M., Kervyn, F., D’Oreye, N., Hooper, A.,Samsonov, S., Tiampo, K., Smets, B., 2013. Nyamuragira’s magma plumb-ing system inferred from 15 years of InSAR. In : Pyle, D. M. and Mather,T. A. and Biggs, J. (eds) Remote Sensing of Volcanoes and Volcanic Pro-cesses: Integrating Observation and Modelling Geological Society, London,Special Publications 380.
Webley, P.W., Bingley, R.M., Dodson, A.H., Wadge, G., Waugh, S.J., James,I.N., 2002. Atmospheric water vapour correction to insar surface motion
32

measurements on mountains: results from a dense gps network on MountEtna. Phys. Chem. Earth 27, 363–370.
Whelley, P., Jay, J., Calder, E., Pritchard, M., Cassidy, N., Alcaraz, S.,Pavez, A., 2012. Post-depositional fracturing and subsidence of pumiceflow deposits: Lascar Volcano, Chile. Bulletin of Volcanology 74, 511–531.doi:10.1007/s00445-011-0545-1.
Wiart, P.A.M., Oppenheimer, C., Francis, P., 2000. Eruptive history ofDubbi volcano, northeast Afar (Eritrea), revealed by optical and SARimage interpretation. International Journal of Remote Sensing 21, 911–936. doi:10.1080/014311600210353.
Wicks, C.W., Dzurisin, D., Ingebritsen, S., Thatcher, W., Lu, Z., Iverson,J., 2002. Magmatic activity beneath the quiescent Three Sisters volcaniccenter, central Oregon Cascade Range, USA. Geophysical Research Letters29, 26–1–26–4. doi:10.1029/2001GL014205.
Wicks, C.W., de la Llera, J.C., Lara, L.E., Lowenstern, J., 2011. The role ofdyking and fault control in the rapid onset of eruption at Chaiten volcano,Chile. Nature Geoscience 478, 374–378. Doi:10.1038/nature10541.
Wicks, C.W., Thatcher, W., Dzurisin, D., 1998. Migration of fluids beneathyellowstone caldera inferred from satellite radar interferometry. Science282, 458–462.
Wicks, C.W., Thatcher, W., Dzurisin, D., Svarc, J., 2006. Uplift, thermalunrest and magma intrusion at Yellowstone caldera. Nature 440, 72–75.Doi:10.1038/nature04507.
Wright, T., Ebinger, C., Biggs, J., Ayele, A., Yirgu, G., Keir, D., Stork, A.,2006. Magma-maintained rift segmentation at continental rupture in the2005 Afar dyking episode. Nature 442. Doi:10.1038/nature04978.
Yulianto, F., Sofan, P., Khomarudin, M.R., Haidar, M., 2013. Extracting thedamaging effects of the 2010 eruption of Merapi volcano in Central Java,Indonesia. Natural Hazards 66, 229–247. Doi:10.1007/s11069-012-0438-4.
Yun, S., Segall, P., Zebker, H., 2006. Constraints on magma chamber geom-etry at Sierra Negra Volcano, Galapagos Islands, based on InSAR obser-vations. Earth Planet. Sci. Lett. 150, 232–243.
33

Yun, S.H., Zebker, H., Segall, P., Hooper, A., Poland, M., 2007. Interfero-gram formation in the presence of complex and large deformation. Geo-physical Research Letters 34. doi:10.1029/2007GL029745.
Zebker, H.A., Rosen, P.A., Hensley, S., 1997. Atmospheric effects in inter-ferometric synthetic aperture radar surface deformation and topographicmaps. J. Geophys. Res. 102, 7,547–7,563.
Zebker, H.A., Villasenor, J., 1992. Decorrelation in interferometric radarechoes. IEEE Transactions on Geoscience and Remote Sensing 32, 823–836.
34