Disaster Relief Using Satellite Imagery - Zenodo
29
Disaster Relief Using Satellite Imagery SEPTEMBER, 2017 AUTHOR: Muhammad Abu Bakr SUPERVISORS: Taghi Aliyev Lars Bromley
-
Upload
khangminh22 -
Category
Documents
-
view
0 -
download
0
Transcript of Disaster Relief Using Satellite Imagery - Zenodo

Disaster Relief Using Satellite Imagery
SEPTEMBER, 2017
AUTHOR: Muhammad Abu Bakr
SUPERVISORS: Taghi Aliyev Lars Bromley

CERN openlab Report // 2017
2 Disaster Relief Using Satellite Imagery
ABSTRACT
We have satellite images of disaster stricken areas such as refugee camps taken at different times. We want to analyse or compare these images to see the progress of disaster relief operations or to measure level of severity in that particular area over a period of time. For example, if we have satellite images of refugee camps, we want to count shelters to see if the number is increasing or decreasing. In these days, UNOSAT has staff dedicated to analyse and then classify objects in these images manually. This is an arduous task, takes a lot of time, inhibiting quick reaction from relief organizations.
Conventionally, objects in images are identified by using color or shape features. But in our case, all objects such as shelters are arbitrary in shapes and color. Sometimes the background surface has the same color as the shelter. So, it is not possible to employ any conventional color or shape based image segmentation method.
The solution we are proposing is "Automated Feature Classification using Machine Learning". My team at CERN openlab with UNOSAT are evaluating different machine learning based feature extraction algorithms. Currently, we have evaluated Facebook's DeepMask and SharpMask object proposal techniques.
CERN openlab Report // 2017
3 Disaster Relief Using Satellite Imagery
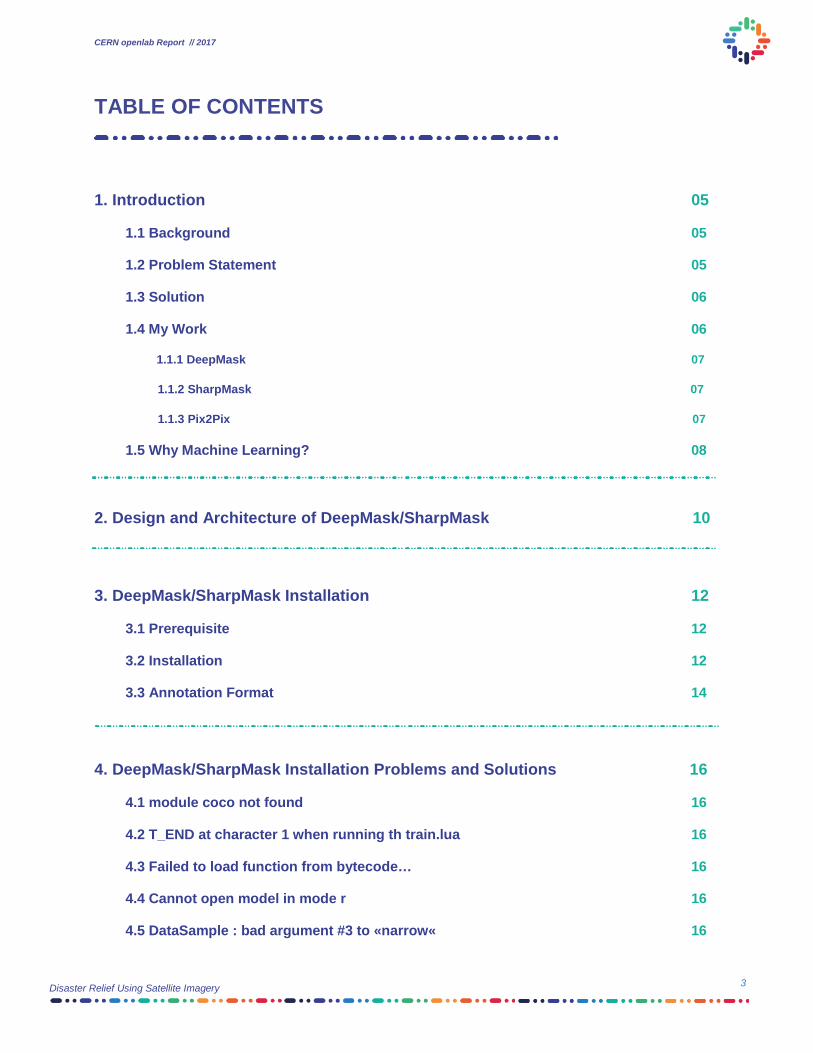
TABLE OF CONTENTS
1. Introduction 05
1.1 Background 05
1.2 Problem Statement 05
1.3 Solution 06
1.4 My Work 06
1.1.1 DeepMask 07
1.1.2 SharpMask 07
1.1.3 Pix2Pix 07
1.5 Why Machine Learning? 08
2. Design and Architecture of DeepMask/SharpMask 10
3. DeepMask/SharpMask Installation 12
3.1 Prerequisite 12
3.2 Installation 12
3.3 Annotation Format 14
4. DeepMask/SharpMask Installation Problems and Solutions 16
4.1 module coco not found 16
4.2 T_END at character 1 when running th train.lua 16
4.3 Failed to load function from bytecode… 16
4.4 Cannot open model in mode r 16
4.5 DataSample : bad argument #3 to «narrow« 16

CERN openlab Report // 2017
4 Disaster Relief Using Satellite Imagery
4.6 DataSample : bad argument #2 to «narrow« 17
4.7 Bad argument # 2 to «?« 17
4.8 Getting nan loss after few iterations 17
5. Preprocessing GeoTIFF Files 18
5.1 Tile Merging 18
5.1.1 Using QGIS 18
5.1.2 Using GDAL Python Library 18
5.2 Python ShapeFile Library 19
5.3 Simple Visualization 20
5.4 Tile Generation 22
5.5 Annotation File Creation 25
6. Training and Evaluation Results 27
7. References 29

CERN openlab Report // 2017
5 Disaster Relief Using Satellite Imagery
1. Introduction
Background CERN openlab and UNOSAT are currently exploring new approaches to image analysis and automated feature recognition to ease the task of identifying different classes of objects from satellite maps. UNOSAT is part of the United Nations Institute for Training and Research (UNITAR). It provides a rapid front-line service to turn satellite imagery into information that can aid disaster-response teams. By delivering imagery analysis and satellite solutions to relief and development organizations — both within and outside the UN system — UNOSAT helps to make a difference in critical areas such as humanitarian relief, human security, and development planning.
Since 2001, UNOSAT has been based at CERN and is supported by CERN's IT Department in the work it does. This partnership means UNOSAT can benefit from CERN's IT infrastructure whenever the situation requires, enabling the UN to be at the forefront of satellite-analysis technology. Specialists in geographic information systems and in the analysis of satellite data, supported by IT engineers and policy experts, ensure a dedicated service to the international humanitarian and development communities 24 hours a day, seven days a week.
Problem We are provided with satellite images of disaster affected areas such as refugee camps taken on different dates as shown in fig 1. We want to analyse or compare these images to see the pace of disaster relief efforts or to measure level of severity in that particular area over a period of time. For example, in the satellite images shown below, we want to count the number of shelters to see if the number of shelters is increasing or decreasing.
Time lapse of Jordan-Syria refugee camp [1]

CERN openlab Report // 2017
6 Disaster Relief Using Satellite Imagery
(a) (b)
The problem is, in these days, UNOSAT has staff dedicated to analyse and then classify objects in these images manually. For example, in the images shown below, objects are segmented out and marked manually by people.
Manually labelling shelters is a time consuming and difficult task which in turns hinder quick response from relief organizations.
Solution The solution we are proposing is "Automated Feature Classification using Machine Learning". Now a question can come into your mind: Why are we not using Conventional Image Processing methods? Conventionally, objects in images are identified by using color or shape features. In color based image segmentation, pixels with similar color range in the image corresponds to separate clusters and hence meaningful objects in the image. In our case, for example, we have satellite images of a refugee camp on the Syria-Jordan border, as shown above. All objects such as shelters are arbitrary in shapes and color. Sometimes the background surface has the same color as a shelter. So, it is not a good approach to employ any conventional color or shape based image segmentation method.
My Work My team at CERN openlab with UNOSAT are currently evaluating different machine learning algorithms. For this, I had to read research articles to understand architectures and implementations of various state of the art machine learning based feature classification algorithms. Few of them are Facebook's DeepMask [3] and SharpMask [4] object proposal algorithms and Conditional Adversarial Network based pix2pix [5] image-image translation approach.
Example of Image analysis. (a) Satellite image showing randomly shaped shelters. (b) Satellite image with manually labelled shelters [2]

CERN openlab Report // 2017
7 Disaster Relief Using Satellite Imagery
Overview of our approach
A brief overview of these algorithms according to their research articles are given below:
1.4.1 DeepMask In particular, as compared to other approaches DeepMask obtains substantially higher object recall using fewer proposals. It is also able to generalize to unseen categories more efficiently and unlike other approaches for generating object mask, it does not rely on edges, super pixels or any other form of low level segmentation. Super pixel is a group of connected pixels with similar color or grey levels.
1.4.2 SharpMask SharpMask is simple, fast, and effective. Building on the recent DeepMask network for generating object proposals, it showed accuracy improvements of 10-20% in average recall for various setups. Additionally, by optimizing the overall network architecture, it is 50% faster than the original DeepMask network.
1.4.3 Pix2Pix Pix2Pix uses conditional adversarial networks as a general-purpose solution to image-to-image translation problems. These networks not only learn the mapping from input image to output image, but also learn a loss function to train this mapping. This makes it possible to apply the same generic approach to problems that traditionally would require very different loss formulations.
Overview of my whole approach is shown in the below figure:

CERN openlab Report // 2017
8 Disaster Relief Using Satellite Imagery
Why machine learning? When we look at satellite images of refugee camps, we can easily distinguish between shelters and other different objects. If we want to do analysis on the basis of this information, it becomes a really laborious task due to the presence of hundreds of different objects and thus results in a considerable decrease in efficiency. To avoid this, we want to train our computers so that they can recognize different objects in the given images efficiently.
For machines, an image is just an array of numbers as shown in fig 3. To help them recognize different variations of a single object is a really complicated task. There are nearly infinite variabilities of objects and scenes in real world scenarios. A single object can have different shapes and appearances, colours and textures, sizes and positions. Combine with inherent complexity of real world settings (such as variable backgrounds and lightning conditions) it becomes really difficult for machines to recognize different objects in the images.
Deep learning can serve our purpose here. It is a branch of machine learning and involves algorithms that are inspired by the Human Nervous System and are known as Artificial Neural Networks. Rather than defining rules for each different pattern of a single object, neural networks are relatively simple architectures consisting of millions of parameters. These parameters are trained rather than defined. The training is done by providing millions of example images with their annotations or labels that provide information about the content of images to these networks. After seeing large number of example images these networks can start recognizing unseen variations of objects too. But we don't have millions of images of refugee camps [6].
No problem, transfer learning can be our solution. The earliest cited work on transfer in machine learning is attributed to Lorien Pratt, who formulated the discriminability-based transfer (DBT) algorithm in 1993. In 1997, the journal Machine Learning published a special issue devoted to transfer learning,[4] and by 1998, the field had advanced to include multi-task learning, along with a more formal analysis of its theoretical foundations. earning to Learn, edited by Pratt and Sebastian Thrun, is a 2012 review of the subject.
Transfer learning has also been applied in cognitive science, with the journal Connection Science publishing a special issue on reuse of neural networks through transfer in 1996.

CERN openlab Report // 2017
9 Disaster Relief Using Satellite Imagery
Notably, scientists have developed algorithms for transfer learning in Markov logic networks and Bayesian networks. Researchers have also applied techniques for transfer to problems in text classification, and spam filtering [7].
Let's move ahead by understanding: what is transfer learning? Let's start with a real-world example. A teacher has years of experience of a particular subject. In his/her lecture he/she tries to convey a precise overview of that particular subject to his/her students. The teacher is transferring his/her knowledge to his/her students. The subject becomes relatively easy for students and they don't have to understand everything from scratch by themselves. In a similar way (in the context of neural networks), let's say we have a network or model that is trained on a massive dataset. The knowledge gained by our neural network on this data is stored as "weights" or "parameters". We can extract these parameters and transfer them to another model. In this way we can transfer the learned features so that we don't have to train our new neural network from scratch.
After reading various research articles and consulting with my supervisor, at first, I am evaluating facebook's pretrained deepmask object proposal model. DeepMask's approach is proposed by Pedro O. Pinheiro, Ronan Collobert, Piotr Dollar and the title for its research article is " Learning to Segment Object Candidates".
The remaining of this report is organized as follows: Section 2 describes design and architecture of deepmask/sharpmask algorithms. Section 3 describes the deepmask installation process. Section 4 discusses installation problems and their solutions. Section 5 describes pre-processing steps of given satellite images for generation of dataset. Section 6 describes training, results and draws the conclusion.

CERN openlab Report // 2017
10 Disaster Relief Using Satellite Imagery
2. Design and architecture of DeepMask
In DeepMask, the authors proposed a new discriminative convolutional network-based approach for segmenting object masks. DeepMask consists of two parts and is trained by providing it with patches of sample images. The first part of this model outputs the segmentation mask around different objects without telling which class a particular segmentation mask belongs to. The second part of the model outputs a score which tells us whether the given patch contains an object. Compared to previous approaches, DeepMask can detect large number of real objects and is able to generalize on unseen categories more efficiently. Further, it does not rely on low level segmentation methods like edges or group of connected pixels with a similar color or grey levels.
As we know given an input patch, this algorithm predicts a segmentation mask with an object likelihood score. A score of 1 is assigned if an object is present at the centre of the patch and is not partially present but is fully present within the given patch. Otherwise the score of -1 is assigned. But during training, most objects are expected to be slightly offset from their precisely cantered positions. So, to increase tolerance and robustness, each cantered position is randomly jittered during training. At test time, the model is applied on the whole test image which generates segmentation masks with corresponding object likelihood scores.
Overview of DeepMask
Architecture of DeepMask

CERN openlab Report // 2017
11 Disaster Relief Using Satellite Imagery
More implementation and architecture details can be found in this paper. Here are some example results produced by DeepMask.
DeepMask proposals with highest IoU to the ground truth on selected images from COCO. Missed objects (no matching proposals with IoU > 0.5) are marked with a red outline.

CERN openlab Report // 2017
12 Disaster Relief Using Satellite Imagery
3. DeepMask/SharpMask Installation
3.1 Prerequisites First, we have to install torch following this link
Then clone the coco API repository:
git clone https://github.com/pdollar/coco.git After cloning, run this command under coco:
luarocks make LuaAPI/rocks/coco-scm-1.rockspec Install other packages too by running the following command:
luarocks install image luarocks install tds luarocks install json luarocks install nnx luarocks install optim luarocks install cunn luarocks install cutorch luarocks install cudnn
3.2 Installation After installing dependencies, create a directory for deepmask:
mkdir deepmask
Get its absolute path:
DEEPMASK=/data/mabubakr/deepmask
Clone DeepMask repository in the respective path:
git clone https://github.com/facebookresearch/deepmask.git $DEEPMASK
Create directory for pretrained deepmask and go to that directory.
mkdir -p $DEEPMASK/pretrained/deepmask; cd $DEEPMASK/pretrained/deepmask
Download pretrained deepmask.
wget https://s3.amazonaws.com/deepmask/models/deepmask/model.t7

CERN openlab Report // 2017
13 Disaster Relief Using Satellite Imagery
Go to the data directory of deepmask and create a new directory there for your training samples:
mkdir $DEEPMASK/data/train2014
Copy all your training data here.
In similar way create another directory in data directory of deepmask:
mkdir $DEEPMASK/data/val2014
Copy all your validation samples here.
Then create an annotations directory for your labels in the data directory:
mkdir $DEEPMASK/data/annotations
In the annotations directory transfer all your annotation files both for training and validation samples. The annotation files should be named as:
instances_train2014.json
instances_train2014.val

CERN openlab Report // 2017
14 Disaster Relief Using Satellite Imagery
3.3 Annotation Format Both of the annotation files should also follow DeepMask/SharpMask annotation format. DeepMask follows the following annotation format:
{ "info" : info, "images" : [images], "licenses" : [licenses], "annotations" : [annotation], "categories" : [categories] } info { "description" : str, "url" : str, "version" : str, "year" : int, "contributor" : str, "date_created" : datetime, } images{ "license" : int, "file_name" : str, "coco_url" : str, "height" : int, "width" : int, "date_captured" : datetime, "flickr_url" : str, "id" : int, } licenses{ "url" : str, "id" : int, "name" : str, } annotations{ "segmentation" : [segmentation], "area" : int, "iscrowd" : int, "image_id" : int, "bbox" : int, "category_id" : int, "id" : int, } segmentation{ "counts" : array, "size" : array, } categories{ "supercategory" : str, "id" : int, "name": str,}

CERN openlab Report // 2017
15 Disaster Relief Using Satellite Imagery
After doing the above steps, you have to run this command under deepmask to start training the pretrained deepmask model:
th train.lua -dm /path/to/pretrained/deepmask
This will start the training and at the same time it will produce a corresponding model that you can use for evaluations in the following directory.
/deepmask/exps/sharpmask/correspondingDirectory To evaluate the results during training, you have to run command like this again under deepmask/ with the image that you want to test:
th computeProposals.lua /deepmask/exps/sharpmask/corresponding directory -img /path/to/testing/image.jpg Follow the same above steps for sharpmask installation
The evaluation result is produced as res.jpg in the same directory.

CERN openlab Report // 2017
16 Disaster Relief Using Satellite Imagery
4. DeepMask/SharpMask Installation Problems and Solutions:
These are some problems that I encountered while installing and training DeepMask/SharpMask model.
4.1 module coco not found Install the lua coco package by following the steps mentioned below:
Clone coco repository:
git clone https://github.com/pdollar/coco Under coco/ run the following command:
luarocks make LuaAPI/rocks/coco-scm-1.rockspec
4.2 T_END at character 1 when running th train.lua You need to reinstall torch 7 with lua 5.2 version. There is a step-by-step guide which explains how to install torch with lua 5.2. on this link.
4.3 Failed to load function from bytecode: not a precompiled chunkWarning: Failed to load function from bytecode
You can resolve this problem by running the train.lua command with luajit instead of lua in following way:
luajit train.lua -dm /path/to/pretrained/deepmask
4.4 cannot open </pretrained/deepmask/model.t7> in mode r This error was occurring while I was using the laujit version 2.0.5. You need to install luajit version 2.1.0 to resolve this issue.
You can install this by following the steps given below:
wget http://luajit.org/download/LuaJIT-2.1.0-beta3.tar.gz tar zxf LuaJIT-2.1.0-beta3.tar.gz make sudo make install
Add the path for luajit in your .bashrc. Usually Luajit is installed in this path:
/usr/local/bin
4.5 DataSampler.lua:230: bad argument #3 to 'narrow' Although I was able to convert my JSON files to t7 files correctly, while I was doing training I was getting this weird error after some initial epochs. After a lot of brainstorming I was able to resolve this problem by simply rounding off numbers in my annotation file.

CERN openlab Report // 2017
17 Disaster Relief Using Satellite Imagery
4.6 DataSampler.lua:230: bad argument #2 to 'narrow' This error was occuring because of presence of negative values in my segmentation key for some images. After resolving this error, I was able to run training correctly.
4.7 Bad argument # 2 to '?' This was not a problem in my JSON file. I had only one category initially in my dataset, while in DeepMask, the number of categories is hardcoded to be 80. So I had to change this line of code to keep running the training correctly: local cat,ann = torch.random(80)
Changing 80 to 1 resolved the issue.
4.8 Getting 'nan' as loss after few iterations, when training with custom dataset It was because DeepMask uses default learning rate schedule. I solved this problem by changing my learning rate to 1e-06.

CERN openlab Report // 2017
18 Disaster Relief Using Satellite Imagery
5. Pre-Processing GeoTIFF files
For this project, UNOSAT is responsible for providing us with satellite images. At first, we will be using GeoTIFF files of Muna refugee camps, Nigeria. You can find the map analyzed by the UN on this link. Other than these images we were also provided with shapefile and geodatabase files.
We can handle images and data within a single file using a flexible and adaptable file format known as TIFF. Using TIFF, we can define the geometry of the image by including the header tags such as size, definition, image-data arrangement and applied image compression. GeoTIFF is a type of TIFF file format. It is a public domain metadata standard which allows relation between internal coordinate system of a map with ground system of geographic coordinates (e.g. longitudes and latitude information) to be embedded within a TIFF file.
I am using shapefile to extract label information for my dataset. Shapefile is a popular geospatial vector data format for geographic information system (GIS) software. Using shapefile, we can spatially describe vector features e.g. lines, points and polygons can represent rivers, shelters or other different features.
With these things, we want to generate annotations/labels for our dataset that follows the deepmask annotation format. I have already shown deepmask annotation format in the second blog. Firstly, we need to generate tiles from the given GeoTIFF files and then we will create labels for each tile.
5.1 Tile Merging To generate tiles, I was provided with seven GeoTIFF files of the refugee camp. The first step was to merge these satellite images into one. To do this we can follow any of the approaches given below:
5.1.1 Using QGIS You can install QGIS by following steps given below:
sudo add-apt-repository ppa:ubuntugis/ubuntugis-unstable sudo apt-get update sudo apt-get install qgis After installation, you need to follow this simple tutorial.
5.1.2 Using GDAL python library You can install GDAL by following the steps mentioned below:
sudo add-apt-repository ppa:ubuntugis/ppa && sudo apt-get update sudo apt-get install gdal-bin After installation, you can use one of the following commands:
Gdal_merge.py -ot Byte -o mergedMuna.tif -of GTiff Muna1.tif Muna2.tif Muna3.tif Muna4.tif Muna5.tif Muna6.tif Muna7.tif -co COMPRESS=DEFLATE -co PREDICTOR=2 -co BIGTIFF=YES I will recommend the below approach as it produces the desired merged TIFF most efficiently.
sudo add-apt-repository ppa:ubuntugis/ppa && sudo apt-get update sudo apt-get install gdal-bin

CERN openlab Report // 2017
19 Disaster Relief Using Satellite Imagery
5.2 Python shapefile library The Python Shapefile Library (pyshp) [8] provides read and write support for the Shapefile format can be installed using the following command:
pip install pyshp
After installation, to parse the given shapefile follow the steps mentioned below:
First, you have to import the library
import shapefile For reading the shapefile create a “Reader” object and pass it the name of your existing shapefile. The shapefile format consists of three files. You can simply specify the filename with the .shp extension. sf = shapefile.Reader("Muna_Structures.shp") To get the list of geometry of shapefile you can use shapes() method. The shapes method returns a list of shape objects where each shape object describes the geometry of each shape record shapes = sf.shapes() To find the number of shape objects in the given shapefile we can simply use len() method.
len(shapes) To iterate through the shapefile’s geometry you can use the iterShapes() method.
len(list(sf.iterShapes()))
Each shape record can consist of following attributes:
'bbox' 'parts' 'points' 'shapeType'
shapeType: returns an integer which defines type of the shape.
shapes[1].shapeType

CERN openlab Report // 2017
20 Disaster Relief Using Satellite Imagery
Types of shapes with their respective integer values are given below:
shapefile.NULL = 0 shapefile.POINT = 1 shapefile.POLYLINE = 3 shapefile.POLYGON = 5 shapefile.MULTIPOINT = 8 shapefile.POINTZ = 11 shapefile.POLYLINEZ = 13 shapefile.POLYGONZ = 15 shapefile.MULTIPOINTZ = 18 shapefile.POINTM = 21 shapefile.POLYLINEM = 23 shapefile.POLYGONM = 25 shapefile.MULTIPOINTM = 28 shapefile.MULTIPATCH = 31 bbox: If the shape type contains multiple points this tuple describes the lower left (x,y) coordinate and upper right corner coordinate. You can use this information to get a complete box around the points.
If shapeType == 0 then an Attribute Error is raised.
bbox = shapes[1].bbox parts: This attribute simply group collections of points into shapes. If the shape record has more than one part then this attribute contains the index of the first point of each part. If there is only one part then a list containing 0 is returned.
shapes[1].parts points: Returns a list containing an (x,y) coordinate for each point in the shape.
len(shapes[1].points) You can read a single shape by calling its index using the shape() method. The index for the shape count starts from 0. So, to read the 5th shape record you would use index of 4.
s = sf.shape(4)

CERN openlab Report // 2017
21 Disaster Relief Using Satellite Imagery
(a) (b)
5.3 Simple Visualization To understand how shape objects in the shapefile represent shelters or other different features, you can visualize shape objects overlaid on merged TIFF in QGIS.
To do this, in the menu bar add the raster layer and then select merged image, drag and drop shapefile, it will result in all shape objects pointing at respective shelters like the images given below:
Comparison of simple and labelled images. (a) Satellite image with refugee camps in white. (b) Points overlaid on shelters in QGIS.

CERN openlab Report // 2017
22 Disaster Relief Using Satellite Imagery
Figure 8. Comparison of simple and labelled images. (a) Satellite image with refugee camps in white. (b) Polygons overlaid on shelters in QGIS.
5.4 Tile Generation Now we have to split our merged image into tiles of a specific size as required by DeepMask/SharpMask model. We are generating tiles of size 224 x 224. To do this you can follow one of the following approaches:
5.4.1 ImageMagick method: convert mergedImage.tif -crop 224x224 +repage +adjoin muna_%d.jpg
5.4.2 Sliding Window Method: I created a python script to generate tiles by sliding window of size 224 x 224 over the merged image. I am sliding my window 50 pixels in the x direction and 50 pixels in the y direction. This results in the generation of significantly higher number of overlapping tiles as compared to ImageMagick method.
Now, I have enough number of tiles with their geometry information present in shapefile.
5.4.3 Problem (DeepMask annotation format requires Bounding Box): DeepMask annotation format, as shown in second blog, does not work with sole points but requires bounding box information, so I should modify my shapefile and change points to polygons.
I can modify my shapefile using QGIS. I can create a radius of influence around each point by following the steps mentioned below:
Start by buffering your points:
Go to the menu bar
Vector -> Geoprocessing Tools -> Fixed Distance Buffer -> Set Distance
I am setting the distance to 0.00002.
This gives me the radius of influence around that point. Now I have bounding box information for each shape. The resulted polygons are shown below:
(a) (b)

CERN openlab Report // 2017
23 Disaster Relief Using Satellite Imagery
Figure 9. Satellite image showing shelters of arbitrary shapes and sizes
I can also perform the above procedure without modifying my shapefile by creating a python script.
As in our shapefile each shape consists of just a single point and no bounding box for each shelter. I can take this single point as center and then can define my radius empirically.
We can get x and y points around any given point with an empirically defined radius by doing the following steps:
(i is in between 0 to 360) x = math.floor(radius * math.cos(i*(math.pi/180)) + XofPoint) y = math.floor(radius * math.sin(i*(math.pi/180)) + YofPoint) segmentation[0].append(x) segmentation[0].append(y) After converting a single point to multiple points, I can now add these points in the annotation file as segmentation pixels. Further, now I have bounding box pixels available too.
5.4.4 Problem (All circles will be of equal length):
Our radius of influence around all points will be of same area no matter how much a shelter structure is bigger or smaller. So, for small shelters it will include a considerable amount of background region. And for bigger shelters may be some of the region of shelter lies outside the boundaries of the radius. So, learning problems!!
As seen in the below example:
So, the next thing that I can do is to manually define the labels for each shelter. To do this you have to create your own shapefile by doing the following steps [9]:
Choose New → new_shapefile New Shapefile Layer from the Layer menu
Select polygon as type.
Choose same CRS (coordinate reference system) as of our given shapefile. In our case it is WGS84.

CERN openlab Report // 2017
24 Disaster Relief Using Satellite Imagery
(a) (b)
Comparison of automatically and manually labelled images. (a) Satellite image same sized labels. (b) Satellite image with Manually drawn Polygons according to shelters in QGIS.
Under new field, type name of new field (In my case shelters), click [Add to fields list] and then click [OK]. You will be prompted by the Save As dialog. Type the file name ("myShapeFile") and click [Save]. You will be able to see the new layer in the Layers list.
Now click on the layer name that you have just created in the Layers Panel. Click the Toggle editing option on the toolbar. Now our layer is editable. Now, click on the Add Feature icon. When you do this, the cursor will change from an arrowhead to a different icon. Left-click on your first shelter to create the first point of your new shape. Keep on left-clicking for each additional point you wish to include in your polygon. When you have finished adding points (i.e., the polygon represents the desired shelter area), right-click anywhere on the map area to confirm that you have finished entering the geometry of your feature. This will result in opening of the attribute window. Input the name you want for your polygon (e.g.,"shelter1"), and click [OK].
Then, click on
Save Layer Edits (either on the toolbar or under the Layer menu). Saving the project directly while you are editing your layer will not save unsaved edits and so you should explicitly save the edits in layer otherwise all efforts will be lost.
Comparison of modified shapefile with the older shapefile is given below:
At this time, I have an appropriate shapefile and enough number of tiles. So, the next step is to create an annotation/label file for our dataset.

CERN openlab Report // 2017
25 Disaster Relief Using Satellite Imagery
5.5 Annotation File Creation To create annotation/label file for our dataset, you can follow the steps mentioned below:
Split shape objects from shapefile in three parts appropriately: For testing, training and validation.
Load merged image using GEOIO library. You can do this in the following way:
mergedImage = merged.tif' img = geoio.GeoImage(mergedImage) For training, out of 2403 shapes, I am parsing 1803 shapes. As we have generated our tiles using overlapping approach, each shape lies in several tiles.
Our shapefile was created by using wgs84 coordinate reference system, so each shape point is represented by longitudes and latitudes. To convert longitudes and latitudes to pixels (rasterization) we can use geoio library. Since we have already loaded our merged image in GEOIO img object, now we can do this:
img.proj_to_raster(shapeLongitutde,shapeLatitude) After converting geo coordinates to pixels in the shapefile, we can get our labels for each shelter using these points but these points are according to merged image. We need to localize them according to each tile.
To do this, at first, we have to find all tiles in which the given point can be present. After identifying tiles, we need to find where in the merged image lies the upper left corner or origin (0,0) for corresponding tiles.
After finding upper left corner pixels for the tiles in the merged image we can simply subtract these pixels from corresponding shape points that are present in these tiles to get the local coordinates for each shape point.
Now we can simply include these points in the segmentation key of data header in json file.
Similarly, we can add bounding box information for each shape and can add this in bbox key of data header in json file.
Add appropriate information in all other keys of data header.
After each iteration we need to dump data in json object:
img.proj_to_raster(shapeLongitutde,shapeLatitude) After all the iterations are completed we need to dump/write jsonData object in json file:
d = jsonData d = json.loads(d) with open('instances_train2014.json','w') as outfile: json.dump(d,outfile)

CERN openlab Report // 2017
26 Disaster Relief Using Satellite Imagery
Figure 11. Examples of annotation/labels drawn on satellite images.
(a) (b)
Similarly, we have to produce json file for validation dataset.
To evaluate the validity of generated labels, I parsed my JSON file and checked for various tiles to see how my labels look. We can do json file parsing in the following way:
import json d = open('instances_train2014.json').read() d = json.loads(d) d.keys() d["any key name"] Two tiles with labels overlaid can be seen in the images shown below:

CERN openlab Report // 2017
27 Disaster Relief Using Satellite Imagery
Figure 12. Examples of evaluation results after 200 epochs
6. Training and Evaluation results
After following the directory structure as explained in the second blog we can start our training using the pretrained deepmask model with our own dataset using the command given below:
luajit train.lua -dm /path/to/pretrained/deepmask If you want to use pretrained SharpMask model or to resume training at any checkpoint model you can do this by the following command:
luajit train.lua -reload /data/mabubakr/mlMasks/pretrained/sharpmask This command will lead to an error of not finding a required class. To resolve this add the following line of code before line 63:
trainSm = true After 3 days of training and more than 350 iterations with learning rate of 1e-5, I am getting the results shown in the fig.
To check results run the following command:
luajit computeProposals.lua /path/to/evaluate/own/pretrained/model After 200 epochs these are the evaluation results that I am getting:

CERN openlab Report // 2017
28 Disaster Relief Using Satellite Imagery
Figure 13. Examples of evaluation results after 350 epochs
After 350 epochs I am getting the following results:
In my opinion, DeepMask/SharpMask did not work well with satellite images. At later stages of training, evaluation results do not show any labels at all. In the future, we are going to evaluate General Adversarial Network based pix2pix algorithm.
The project proved an excellent exercise for me to get an understanding of major steps involved in training a pre-trained model. Finally, I would like to thank my regular supervisor from CERN OpenLab Taghi Aliyev and my supervisor from UNOSAT Lars Bromley for all of their help and guidance.

CERN openlab Report // 2017
29 Disaster Relief Using Satellite Imagery
7. References
1. https://www.washingtonpost.com/news/worldviews/wp/2016/09/19/astonishing-time-lapse-satellite-imagery-shows-rapid-growth-of-refugee-camps/?utm_term=.c96bc20c8bb
2. https://reliefweb.int/map/nigeria/displaced-persons-shelters-dalakaleri-nigeria-imagery-analysis-5-september-2016
3. DeepMask, Learning to Segment Object Candidates, Pedro O. Pinheiro and Ronan Collobert and Piotr Dollár, NIPS, 2015
4. SharpMask, Learning to Refine Object Segments, Pedro O. Pinheiro and Tsung-Yi Lin and Ronan Collobert and Piotr Dollár, ECCV, 2016
5. Image-to-Image Translation with Conditional Adversarial Networks, Phillip Isola, Jun-Yan Zhu, Tinghui Zhou, Alexei A. Efros, In arxiv, 2016
6. https://code.facebook.com/posts/561187904071636/segmenting-and-refining-images-with-sharpmask/
7. https://en.wikipedia.org/wiki/Transfer_learning
8. https://pypi.python.org/pypi/pyshp
9. https://github.com/mtop/speciesgeocoder/wiki/Tutorial-for-creating-polygons-in-QGIS