Apoptose na infecção experimental de cães domésticos com Ehrlichia canis

THE ASTROPHYSICAL JOURNAL, 512 :351È361, 1999 February 101999. The American Astronomical Society. All rights reserved. Printed in U.S.A.(
THE LAST GASPS OF VY CANIS MAJORIS: APERTURE SYNTHESIS AND ADAPTIVEOPTICS IMAGERY
J. D. MONNIER,1 P. G. TUTHILL,1 B. LOPEZ,2 P. CRUZALEBES,3 W. C. DANCHI,1 AND C. A. HANIFF4Received 1998 July 6 ; accepted 1998 September 17
ABSTRACTWe present new observations of the red supergiant VY CMa at 1.25, 1.65, 2.26, 3.08, and 4.8 km. Two
complementary observational techniques were utilized : nonredundant aperture masking on the 10 mKeck I telescope, yielding images of the innermost regions at unprecedented resolution, and adaptiveoptics imaging on the ESO 3.6 m telescope at La Silla, attaining an extremely high (D105) peak-to-noisedynamic range over a wide Ðeld. For the Ðrst time the inner dust shell has been resolved in the near-infrared to reveal a one-sided extension of circumstellar emission within (D15 of the star. The0A.1 R
*)
line-of-sight optical depths of the circumstellar dust shell at 1.65, 2.26, and 3.08 km have been estimatedto be 1.86 ^ 0.42, 0.85^ 0.20, and 0.44^ 0.11, respectively. These new results allow the bolometric lumi-nosity of VY CMa to be estimated independent of the dust shell geometry, yielding AL
*B 2 ] 105 L
_.
variety of dust condensations, including a large scattering plume and a bow-shaped dust feature, wereobserved in the faint, extended nebula up to 4A from the central source. While the origin of the nebulousplume remains uncertain, a geometrical model is developed assuming the plume is produced by radiallydriven dust grains forming at a rotating Ñow insertion point with a rotational period between 1200 and4200 yr, which is perhaps the stellar rotational period or the orbital period of an unseen companion.Subject headings : circumstellar matter È dust, extinction È stars : individual (VY Canis Majoris) È
infrared : stars È techniques : interferometric
1. INTRODUCTION
VY CMa (spectral type M5eIbp) is a very unusual star,displaying intense radio maser emission from a variety ofmolecules, strong dust emission in the mid-infrared, highpolarization in the near-infrared, and large amplitude varia-bility in the visible. Lada & Reid (1978) estimated a distanceof D1.5 kpc for VY CMa by establishing its associationwith a known molecular cloud complex. Strong indepen-dent conÐrmation of this distance estimate has recentlycome from measuring the proper motions of long-lived
maser features in its outÑow (Marvel 1996 ; Richards,H2OYates, & Cohen 1998). This distance implies that VY CMais also one of the most intrinsically luminous stars known inthe Galaxy, (Le Sidaner & Le BertreL
*B 5 ] 105 L
_1996). Such high luminosity is only expected from massivestars and the extremely low e†ective tem-(M
*B 25 M
_),
perature, K (Le Sidaner & Le Bertre 1996), indi-T*
B 2800cates that VY CMa has D104 yr remaining beforeexploding as a supernova (Brunish & Truran 1982).Another sign of impending cataclysm is the extensive massbeing lost by VY CMa into an optically thick circumstellarenvelope. The mass loss rate for this star has been estimatedusing a variety of techniques (summarized in Danchi et al.1994), yielding a consensus value of yr~1.M0 B 2 ] 104 M
_Previous observations of the circumstellar envelope at avariety of wavelengths showed evidence of signiÐcant asym-metries. The dense molecular envelope surrounding the starsupports strong maser emission of SiO, and OH,H2O,showing spatial and redshift distributions that conform to
1 Space Sciences Laboratory, University of California at Berkeley,Berkeley, CA 94720-7450.
2 Observatoire de la dÏAzur, Departement Fresnel UMR 6528, BPCoü te4229, F-06034 Nice Cedex 4, France.
3 Observatoire de la dÏAzur, Departement Fresnel UMR 6528,Coü teAvenue Copernic, F-06130 Grasse, France.
4 Mullard Radio Astronomy Observatory, Cavendish Laboratory,Madingley Road, Cambridge, CB3 0HE, England, UK.
no simple geometrical interpretation yet proposed (e.g.,Benson & Mutel 1979 ; Marvel 1996 ; Richards et al. 1998).Optical observers have noted VY CMaÏs peculiar one-sidednebulosity for much of the century. While these early obser-vers described VY CMa as a binary or even multiple system(see Worley 1972 for some discussion), Herbig (1972), withthe aid of polarizing Ðlters, was able to show deÐnitivelythat the apparent companions were simply light scatteredfrom dust condensations in the nebula. Indeed, recentvisible images from the Hubble Space T elescope (HST ;Kastner & Weintraub 1998) show a one-sided reÑectionnebula with a complicated arrangement of scattering fea-tures. High values of near-IR linear polarization furthersuggest asymmetries in the circumstellar emission at highspatial resolution, although no such asymmetries had beendirectly detected until this work. McCarthy (1979) reportedasymmetry in the mid-IR emission of the dust shell, inter-preting this as evidence for thermal emission from a disklikestructure. Another important observational fact is that VYCMa is an irregular variable star showing 1È3 mag opticalvariation on the timescale of D2000 days (Marvel 1996).Recent changes in the near-IR polarization direction(Maihara et al. 1976) and mid-IR spectrum (Monnier,Geballe, & Danchi 1998) reveal that VY CMa is evolvingon a variety of timescales.
We present new IR observations of VY CMa at 1.25, 1.65,2.26, 3.08, and 4.8 km. These data detail new aspects of thedust shell, from both scattered light and direct thermal dustemission, at unprecedented spatial resolution and dynamicrange. After describing the novel observing techniquesemployed to make these images possible, we attempt tosynthesize a coherent history of the VY CMaÏs recent mass-loss.
2. OBSERVATIONS
2.1. Keck I ObservationsAperture masking interferometry was performed by
351

352 MONNIER ET AL. Vol. 512
FIG. 1.ÈPupil arrangement of a 21 hole, nonredundant aperture mask projected onto the hexagonal primary mirror of Keck I (left) ; single speckle frameobserved while utilizing the aperture mask (right). The wavelength of observation was 3.08 km, and the integration time was 0.149 s. The horizontal andvertical axes are labeled in units of pixels, the plate scale being 20.3 mas pixel~1.
placing custom-made plates in front of the Keck I second-ary mirror, reducing light from the 10 m primary mirror toa predeÐned set of subapertures. An example of a 21 holepupil arrangement and its corresponding interferencepattern can be found in Figure 1, where each hole is roughlyone atmospheric coherence patch in size (35 cm at j \ 2.2km). The introduction of such a mask creates a series ofoverlapping two hole interference patterns projected ontothe detector array, allowing the Fourier amplitude andphase of each baseline to be recovered without the additionof ““ redundancy ÏÏ noise (e.g., Baldwin et al. 1986). Bysumming the atmospherically degraded Fourier phasesaround each closed triangle, we obtain the closure phase, anobservable that is independent of the corrupting phase sheetabove the subapertures (e.g., Jennison 1958). In the brightsource limit, nonredundant aperture masking delivers amaximal signal-to-noise ratio of the closure phases, which iscritical for reconstructions of noncentrosymmetric images.For fainter sources, a doubly redundant mask geometry inthe shape of an annulus was used (Hani† & Buscher 1992),balancing the desire for stellar Ñux with that for limitedbaseline redundancy. Further engineering and performancedetails may be found in Tuthill et al. (1999).
Raw visibilities were calibrated for the mean telescope-atmosphere transfer function by utilizing nearly contempo-raneous observations of point-source stars. The observingregimen devoted an equal amount of time to such cali-bration stars, interleaved with the science targets undernearly identical conditions. Even so, seeing and otherchanges make the calibration process notoriously difficult,and mismatches between source and calibrator data intro-duced the greatest uncertainty into the Ðnal results.
Having obtained a set of calibrated visibilities andclosure phases, there are a number of image reconstruction
algorithms that minimize spurious artifacts, such as side-lobes arising from nonuniform or noisy sampling of theFourier plane. One of the most popular of these, known asthe ““Maximum Entropy Method ÏÏ (MEM; Gull & Skilling1984 ; Sivia 1987), has been used here. In order to check thereliability of the reconstructions, the MEM results havebeen compared with those from the CLEAN reconstructionalgorithm 1974 ; Cornwell & Wilkinson 1981 ;(Ho� gbomPearson & Readhead 1984), which is also widely used inradio astronomy. Image orientation calibration and tests ofthe entire data analysis pipeline were performed by observ-ing sets of known, close binary stars on each observingnight.
VY CMa was observed in both January and December of1997 at Keck I using the Near-Infrared Camera (NIRC), acryogenically cooled 256] 256 pixel InSb array (Matthews& Soifer 1994). The magniÐed plate scale of 20.3 maspixel~1 was sufficient to Nyquist-sample fringes formed bythe longest baselines at 2.2 km; however, still Ðner fringes,formed at shorter wavelengths, were undersampled(Matthews et al. 1996). The dates, Ðlter wavelengths, maskgeometries, and integration times are detailed in Table 1.The unresolved star p CMa (spectral type M0Iab) was usedfor all Keck I calibration. Masking techniques only requireD100 speckle frames of the calibrator and source in orderto produce high SNR maps of bright sources, such as VYCMa. Typical uncertainties in the closure phases obtainedwith nonredundant masks were ^2¡.
2.2. ESO 3.6 m ObservationsInfrared observations of VY CMa were also obtained at
the European Southern Observatory (ESO) 3.6 m telescopeat La Silla, Chile, in 1996 December and 1997 Januaryusing the SHARPII] and COMIC cameras. The

No. 1, 1999 VY CMa OUTFLOW 353
TABLE 1
JOURNAL OF OBSERVATIONS
Date j *j T int(UT) (km) (km) (ms) Number of Frames Telescope Camera Comments
1996 Dec 29 . . . . . . 1.253 0.296 100 480 ESO 3.6 m SHARPII] Adaptive optics suboptimal1997 Jan 2 . . . . . . . 1.259 0.229 2000 200 ESO 3.6 m COMIC With ADONIS adaptive optics system1997 Jan 2 . . . . . . . 4.832 0.590 10 700 ESO 3.6 m COMIC With ADONIS adaptive optics system1997 Jan 30 . . . . . . 1.647 0.018 134 100 Keck I NIRC With 15 hole aperture mask1997 Jan 30 . . . . . . 2.260 0.053 134 100 Keck I NIRC With 15 hole aperture mask1997 Jan 30 . . . . . . 3.083 0.101 134 100 Keck I NIRC With 15 hole aperture mask1997 Dec 17 . . . . . . 1.647 0.018 149 100 Keck I NIRC With annulus aperture mask1997 Dec 19 . . . . . . 1.647 0.018 149 100 Keck I NIRC With annulus aperture mask1997 Dec 19 . . . . . . 2.260 0.053 149 100 Keck I NIRC With 21 hole aperture mask1997 Dec 19 . . . . . . 3.083 0.101 149 100 Keck I NIRC With 21 hole aperture mask
SHARPII] camera (Lacombe et al. 1995), which is sensi-tive from 1È2.5 km, contains a 256 ] 256 pixel near-infraredcamera and mulitobject spectrometer 3 detector array, andthe high-resolution 35 mas pixel~1 plate scale was utilized.The COMIC camera (Lacombe et al. 1995) has a widerwavelength coverage (1.0È5.0 km) and was used to follow-up the SHARPII] results and enable 5 km observing.However, this camera is equipped with only a 128] 128pixel format array, yielding a smaller Ðeld-of-view butmaintaining the same high-resolution plate scale. Table 1contains details of the observations.
VY CMa and point-source calibrator observations wereinterleaved to calibrate for changing seeing conditions andto fully characterize the faint wings of the telescope pointspread function. u CMa (spectral type B2IV-Ve) was usedas a calibrator source for both 1.25 and 4.8 km obser-vations. The adaptive optics system was poorly adjustedwhile using the SHARPII] camera, resulting in uncer-tainty regarding the highest resolution image features.
The strength of the ESO system is the ability to obtainvery high dynamic range images with nearly di†raction-limited resolution. The peak-to-noise ratio for the rawJ-band images is D105. A simple MEM deconvolutionalgorithm (Varosi & Landsman 1995) was used to suppressthe scattering halo from the bright central source ; however,it is important to note that the prominent features discussedhere were easily observed in the raw images, and the decon-volution process yielded only minor adjustments to therelative Ñux levels. In addition to the uncertainties in theadaptive optics closed-loop performance, the extraction oftruly di†raction-limited images was hampered by the di†er-ent spectral types of our source and calibrator targets,making broadband observations difficult to calibrate ;however, the FWHM of the point-source calibrator imageswere always within 10% of those expected for a di†raction-limited 3.6 m telescope.
3. RESULTS
3.1. Keck I ResultsFigure 2 shows image reconstructions at 1.65, 2.26, and
3.08 km from two epochs ; observing details can be found inTable 1. Since VY CMa itself is completely unresolved bythe Keck I telescope, we chose to smooth each image so thatthe FWHM of the central, dominant component is some-what smaller than the Rayleigh criterion, #FWHM\1.22(j/D). The Ðlled circle in each image frame representsthe FWHM of the central component as displayed, 30 mas
for the 1.65 and 2.26 km images and 40 mas for the 3.08 kmobservations. In addition to eliminating spurious features inthe reconstructions as judged by internal consistency frommultiple data sets, this process allows comparison of imagecontours generated from pupil masks with slightly di†erentmaximum resolutions. Image structures that appear at orbelow the lowest plotted contours are the result of system-atic errors in the image reconstruction process, which isfundamentally limited by the calibration of the atmospherictransfer function.
The most dramatic feature in the high-resolution maps ofFigure 2 is the one-sided emission in the near-IR. With theexception of a weak extension at j \ 3.08 km, no circum-stellar Ñux above 1% of the peak was detected to the northand northeast of the central source. Although the dust emis-sion morphology is very similar at the three wavelengths,there are some departures at 1.65 km, where the scatteringefficiency of the grains is higher. Unfortunately, Ñuctuationsin the atmospheric conditions limit the dynamic range inour Ðnal maps to D100, preventing detection of low surfacebrightness features in the extended nebula.
The extended southern circumstellar emission is consis-tent with published near-IR polarization measurements.The 1È3 km Ñux is polarized with a position angle between60¡ and 105¡, with a trend toward higher angles for shorterwavelengths. Polarization angles and polarization strengthsboth appear to be slowly increasing in time with recentmeasurements giving linear polarizations of 7% at 1.65 kmand 2% at 2.2 km (Forbes 1971 ; Maihara et al. 1976 ;Takami et al. 1992). Assuming the polarization arises fromRayleigh scattering, these observations suggest an asym-metric near-IR brightness distribution extending towardP.A. 170¡ (or P.A. [10¡). This is in close agreement with thenew high-resolution results presented in Figure 2.
The 10 m baselines a†orded by the Keck I telescope allowus to discriminate stellar from nonstellar (extended) Ñuxwithin our 5@@] 5@@ Ðeld of view. Fits to the high-resolutionvisibility data indicate the central source diameter is smallerthan 20 mas ; this is consistent with its bolometric lumi-nosity and estimated e†ective temperature, which imply astellar diameter between 10 and 16 mas (e.g., Danchi et al.1994 and this paper). Extended emission (i.e., emission notoriginating from the unresolved central component) con-tributes 79.0% ^ 1.0%, 60.5%^ 1.0%, and 73.0%^ 1.0%of the total Ñux at 3.08, 2.26, and 1.65 km, respectively,appearing constant between January and December of 1997to within uncertainties. Note how the fraction of the totalÑux arising from the extended component goes through a
λ = 1.65 µm
-200
-100
0
100
200
Mill
iarc
seco
nds
a)
N
E
-200 -100 0 100 200Milliarcseconds
-200
-100
0
100
200
Mill
iarc
seco
nds
b)
N
E
N
E
λ = 2.26 µm
c)
-200 -100 0 100 200Milliarcseconds
d)
λ = 3.08 µm
e)
Janu
ary
1997
-200 -100 0 100 200Milliarcseconds
Dec
embe
r 19
97
f)
354 MONNIER ET AL. Vol. 512
FIG. 2.È(aÈb) Image reconstructions of VY CMa observed at 1.65 km in 1997 January and December. The unresolved central source is displayed with aFWHM of 30 mas, as indicated by the ““ beam ÏÏ circle in the lower left corner of each panel. The contour levels are 1.5%, 3.0%, 5.0%, 7.0%, 9.0%, 11.0%,15.0%, 20.0%, 30.0%, and 80.0% of the peak. (cÈd) Image reconstructions of VY CMa observed at 2.26 km in 1997 January and December. The unresolvedcentral source is displayed with a FWHM of 30 mas, while the contour levels are 0.7%, 1.0%, 2.0%, 3.0%, 4.0%, 5.0%, 6.0%, 10.0%, 30.0%, and 70.0% of thepeak. (eÈf ) Image reconstructions of VY CMa observed at 3.08 km in 1997 January and December. The unresolved central source is displayed with a FWHMof 40 mas, while the contour levels are 1.0%, 2.0%, 4.0%, 6.0%, 8.0%, 10.0%, 12.0%, 14.0%, 20.0%, 50.0%, and 80.0% of the peak.
minimum near 2.2 km. This behavior is expected when thedust emission mechanism changes from being mostlythermal (in the red) to mostly scattering (in the blue).
The dynamic range of D100 in the maps allows us toinvestigate the mass loss history of VY CMa for the last fewhundred yr. The bright knot of emission at P.A. 155¡ andseparation D65 mas appears in all the Keck I maps and isnear the expected dust condensation radius, probably aclump of recently formed dust. This separation is slightlylarger than the 50 mas dust shell inner radius from spher-ically symmetric models of the 11 km emission at maximumlight (Danchi et al. 1994). The observed clump-star separa-tion is a function of wavelength and is smaller for bluerwavelengths. In addition, the P.A. of the clump is larger forshorter wavelengths, which may also help explain the rota-tion of the polarization angle with wavelength discussedabove. This behavior may arise from the di†ering wave-length dependencies for thermal emission and scattering ofdust in the inner envelope. Because the clump-star separa-tion is close to the di†raction limit, higher resolution imageswill be necessary to eliminate possible mapping ambiguitiesin the clump location. Lastly, we note in passing that the2.26 and 3.08 km maps seem to exhibit a counterclockwisespiral structure.
3.2. ESO 3.6 m Results3.2.1. 1.25 km Imagery
The ADONIS adaptive optics system and the infraredcameras on the ESO 3.6 m telescope allowed the recovery ofnearly di†raction-limited (90 mas) images of a 6@@] 6@@ Ðeldaround VY CMa with a peak-to-noise dynamic range ofD105. Dust structures in the outÑow can be easily seen inscattered light at 1.25 km, revealing a record of the mass-loss history of the last thousand yr.
Figure 3 shows a wide-Ðeld image of the circumstellaremission around VY CMa, and one can see a number ofinteresting structures. A bow-shaped scattering feature lies
to the south, with a brightness of approximately 0.003%4A.2of the peak Ñux. In addition, an arcing plume of emissionextending west-northwest is observed, with a peak bright-ness of about 0.01% of the peak Ñux, terminating abruptlyat This is the Ðrst high-resolution image of the ““ curved4A.3.nebulous tail toward 290¡ ÏÏ described by Herbig (1972). Asimilar sized Ðeld toward the east of VY CMa was alsoobserved but revealed no nebulosity above 0.01% of thepeak.
A bright knot of emission is also present D1A from thestar at P.A. 220¡. The peak emission from this southwestknot is 0.5% of the peak Ñux and is nearly 2 orders ofmagnitude brighter than other circumstellar features. Thisfeature has been previously detected at 2.2 km by Cruza-lebes et al. (1998) in 1994 September using the same tele-scope with the COME-ON] adaptive optics system. Other

-1 0 1 2 3 4 5Arcseconds
-4
-3
-2
-1
0
1
2
Arc
seco
nds
N
E
No. 1, 1999 VY CMa OUTFLOW 355
FIG. 3.ÈAdaptive optics image of VY CMa observed at 1.25 km in 1996 December using the SHARPII] camera. The overplotted solid and dashedwhite lines indicate the rotation geometry and outÑow trajectory for the best-Ðt plume model discussed in ° 4.4. The contour levels are 0.001%, 0.003%,0.010%, 0.032%, 0.10%, 0.316%, 1.0%, 3.16%, 10.0%, and 31.6% of the peak.
weak features present include a ridge of emission extendingfrom the star toward the southwest knot and a north-southpartial shell of emission approximately 200 mas to the westof the central source.
A few detector artifacts must also be noted. The highbrightness of this source caused the detector rows andcolumns sharing the central source region to show artiÐ-cially high counts. Faint residual vertical and horizontalstripes can be seen extending from VY CMa caused by thise†ect. Additional spurious structure in the maps can betraced to di†raction spikes and scattering from variousoptical surfaces. Unfortunately, this scattering was not iden-tical for the source and calibrator and has led to somelow-level miscalibrations, such as some faint emissionwithin an arcsecond of the source, which is especiallyobvious to the east and north (less than 0.01% of peak).There is probably a similar amount of faint residual Ñux tothe west and south in the map, but it is not evident becauseof the bright dust features present.
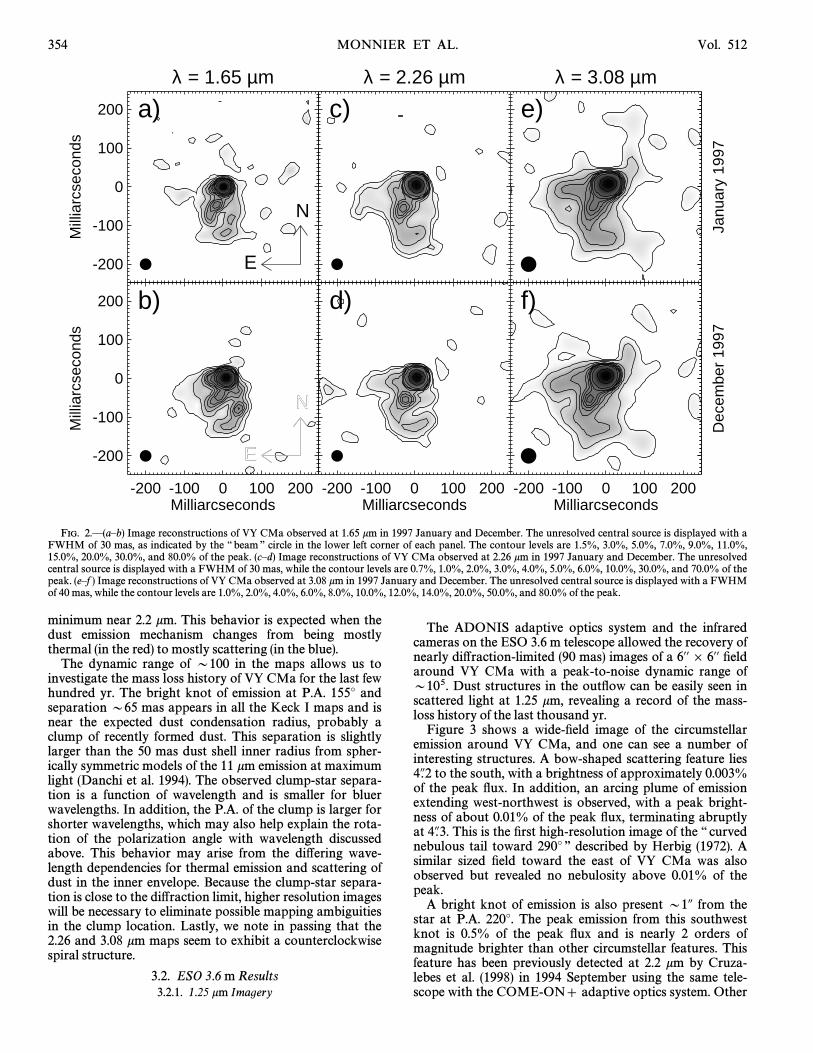
Figure 4 shows VY CMa observed by the COMICcamera when the adaptive optics system was performingwell. As can be seen, there is noticeably less emissionobserved within an arcsecond (especially to the east andnorth), while the other major features have remained largelyunchanged. This image has a smaller Ðeld of view and has
been included to show more detail of the nebulaÏs innerregion. The central source is partially resolved and slightlyelongated north-south ; however, a detailed Ðt to the sizewas not attempted because of uncertainties in the adaptiveoptics calibration at short wavelengths. As with theSHARPII] image in Figure 3, one can easily see the brightknot of emission to the southwest, and a partial shell ofemission to the west. A recent y-band (550 nm) image of VYCMa taken by HST (Kastner & Weintraub 1998) alsoshows evidence for a ridge of scattering material about 200mas to the west ; however, other features observed here (e.g.,the bright southwest knot) do not appear. The HST imageshave a signiÐcantly lower peak-to-noise ratio (D500), whichmay explain their absence.
3.2.2. 4.8 km Data
The analysis of the 4.8 km COMIC data of VY CMa washampered by poor background subtraction for the point-source calibrator. Because low surface brightness featureswithin D1A may be indicative of suboptimal adaptive opticsperformance as well as circumstellar dust emission, thepoint-source response of the entire telescope must be char-acterized before certain identiÐcation of dim, di†use outÑowcondensations. Unfortunately, the calibrator chosen (uCMa) was not bright enough to allow high-quality back-

-1.0 -0.5 0.0 0.5 1.0 1.5 2.0Arcseconds
-1.5
-1.0
-0.5
0.0
0.5
1.0A
rcse
cond
s
N
E
19281933
1945
1958
19701997
356 MONNIER ET AL. Vol. 512
FIG. 4.ÈAdaptive optics image of VY CMa observed at 1.25 km in 1997 January using the COMIC camera. The cross symbols and accompanying datesrepresent the mean location of VY CMaÏs ““ companion ÏÏ as observed in the visible by the U.S. Naval Observatory over the last 70 yr (see Wallerstein 1978 fora summary of these observations). The predicted position of the ““ companion ÏÏ in 1997 has been extrapolated from the historical data and included as a Ðlledcircle. The contour levels are 0.010%, 0.032%, 0.10%, 0.316%, 1.0%, 3.16%, 10.0%, and 31.6% of the peak.
ground subtraction. Hence, we feel that we can only reportthermal structures at 1% of the peak with high conÐdence.The only such feature to report is a D1% brightnessenhancement at 4.8 km, which appears at the same locationas the bright scattering knot seen at 1.25 km, D1A to thesouthwest of the central source.
At 4.8 km, the central source of VY CMa was partiallyresolved when compared with the point-source calibratorobserved before and after. To investigate the high-resolution morphology of the compact core of thermalemission, the data were analyzed utilizing the techniques ofspeckle interferometry. Frames were windowed to removethe relatively high background Ñuctuations, and then themean power spectra were accumulated and averagedtogether over many exposures. Simple models of the bright-ness distribution were then Ðtted directly to the calibratedpower spectra (or visibility data).
Drifts in the adaptive optics response precluded a mean-ingful measurement of thermal emission asymmetries in thecompact emission core around VY CMa, but circularlysymmetric Ðts to the visibility data do estimate the emissionregionÏs size. Uncertainty estimations were performed byanalyzing various subsets of the 200 calibrator s(Tint\ 1.0frame~1) and 700 source frames s frame~1), and(Tint\ 0.01
Figure 5 shows the results for the full data set. Visibilitydata at short baselines are poorly calibrated because ofseeing/adaptive optics changes and the di†erent spectraltypes of the source and calibrator, a common artifact inspeckle observations. Model Ðts were performed on databetween 0.9 arcsec~1 and 2.7 arcsec~1, a range chosen toexclude low spatial frequency corruption due to sourcegeometry, poor thermal background subtraction, low SNRdata near the telescope cuto† frequency, and spectral typemiscalibration. A single, circularly symmetric Gaussianbrightness distribution was Ðtted (allowing the visibility atthe origin to be a free parameter), yielding a FWHM of163 ^ 8 mas, which is marginally consistent with previouslypublished 4.8 km results of 137 ^ 21 mas by Dyck et al.(1984) and 152 mas by Bensammar et al. (1985). Possiblesystematic e†ects due to the di†erent spectral types of thesource and calibrator stars introduce another D10% uncer-tainty.
While the best-Ðt model shows systematic deviationsfrom the data, the observations are too uncertain to justifythe Ðtting of more complicated models. However, toemphasize the need for higher resolution and better cali-brated observations, we note that the best-Ðt model for aGaussian plus point source yields a radically di†erent dust

µ
0.0 0.5 1.0 1.5 2.0 2.5 3.0Spatial Frequency (arcsec-1)
0.0
0.2
0.4
0.6
0.8
1.0
1.2V
isib
ility
Best Fit Gaussian: FWHM = 163+8 masBest Fit Gaussian + Point Source: FWHM = 268 mas + 36% Point Source
No. 1, 1999 VY CMa OUTFLOW 357
FIG. 5.ÈAzimuthally averaged visibility measurements of VY CMa at4.8 km observed with the COMIC camera in 1997 January. The best-Ðtcircularly symmetric Gaussian distribution, FWHM 163 ^ 8 mas, isincluded on the Ðgure as a solid line. The plus symbols are data points notused for the Ðtting. To illustrate the importance of acquiring longer base-line information, an alternative model consisting of a Gaussian distribu-tion with FWHM 268 mas and a point source is shown as a dashed line.
shell geometry than the single Gaussian Ðt, with 36% of theÑux in a point source surrounded by a larger Gaussian withFWHM 268 mas. Long baseline data at 4.8 km that resolv-es out the dust shell and measures the contribution of theunresolved component are necessary to constrain circum-stellar models at this wavelength.
4. DISCUSSION
We proceed by dividing the wealth of structure observedin the circumstellar environment of VY CMa into size scalesfrom the smallest (highest resolution) to most extended, dis-cussing these in turn in the following subsections.
4.1. Emission Asymmetry within 10 R*
Based on classical spherical outÑow models, stars such asVY CMa might be expected to be surrounded by limb-brightened shells when observed in the near-IR, where theoptical depth is lower than in the visible. The high-resolution images from the Keck I telescope (Fig. 2),however, bear no resemblance at all to this preconceptionbut instead show emission to be one-sided, inhomogeneous,and highly asymmetric. Such structure may be interpretedin terms of one of three scenarios : less dust on the northernside of the nebula, high dust optical depth to the north ofthe star, or forward- scattering from the dust particles in atilted equatorial disk.
If the dust shell is optically thin at near-IR wavelengths,then the lack of emission to the north implies less or coolerdust. Because northern dust would be in equal proximity tothe star as the hot southern material, it seems unlikely thatthe dust could be cool. Furthermore, a dramatically rariÐedor evacuated region to the north also seems implausiblewhen we consider the shape of the reÑection nebula at bluerwavelengths. The almost total absence of scattered light tothe north and northeast in the 1.25 km images in Figures 3and 4 and also for images in the visible (Herbig 1972 ;Kastner & Weintraub 1998) argues strongly that thickobscuration blocks the observerÏs line of sight into thenorthern region of the nebula. masers present to theH2O
north and east of the VY CMa also indicate high dustdensities in these locations (Richards et al. 1998 ; Marvel1996).
Alternatively, we consider the case for an inner dust shellthat is optically thick even at our reddest wavelength of 3.08km. In this case, emission morphology traces lines-of-sightthat can penetrate into hot, dusty regions before encounter-ing unity optical depth. While spherically symmetric out-Ñows would appear as centrally peaked shells, axisymmetriccircumstellar density distributions can look quite di†erentdepending on the viewing angle (Efstathiou & Rowan-Robinson 1990 ; Lopez, Mekarnia, & Lefevre 1995). If theequatorial plane contains higher density material than thatfound near the poles, then the one-sided emission observedin the near-IR arises from warm dust in a polar region tiltedsomewhat south-southwest from our line of sight, a viewingangle consistent with the large-scale scattering asymmetryin the visible (the one-sided nebulosity). Furthermore, sincethe appearance of the object is determined to a great degreeby optical depth e†ects, it is not surprising that the overallthermal emission extension occurs in roughly the samedirection for 3.08 km as for the scattered light asymmetryobserved at 1.65 km. The only 10 km observations of VYCMa to detect asymmetry were by McCarthy (1979), whofound an extension in the northeast/southwest direction.This is consistent with a disklike dust distribution of highoptical depth with warm, evacuated polar regions, espe-cially if large dust grains are present, enhancing mid-IRscattering.
As a third scenario, the forward-scattering of stellar lightby dust contained in a tilted equatorial disk may contributeto the one-sided appearance of the nebula. If one assumesthat the VY CMa dust envelope is, in a Ðrst approximation,a disklike structure with its south-west side tilted toward us,then the high surface brightness of the southwest side maybe related to enhanced small-angle, forward-scattering bylarge dust particles. Such an e†ect has been observed in thecircumstellar disk of UY Aur (Close et al. 1998), where theratio between the bright side and faint one is about 10.Although the ratio between the bright and faint lobes islarger than 100 for VY CMa, the presence of larger dustparticles and a smaller disk inclination angle may helpexplain this di†erence.
The line-of-sight extinction due to the circumstellar shelland intervening interstellar dust can be estimated by using acombination of published infrared photometry, standardnear-IR optical dust constants, and the high-resolutioninterferometric observations presented here. The interfero-metric data and photometry allow us to determine theabsolute amount of Ñux at each wavelength that is comingfrom the star, separating out the circumstellar emission. Byusing an established extinction law (Ossenkopf, Henning, &Mathis 1992) and published near-IR photometry of VYCMa near maximum light (Le Bertre 1993), the 2800 Kblackbody spectrum of the star can be reddened until itmatches the observed Ñux ratios of the star at 1.65, 2.26, and3.08 km. When using three wavelengths, this procedure maynot have a solution, which would then imply the existenceof errors in the Ñux measurements, the dust constants, orthe e†ective stellar temperature. However, this proceduredoes yield a unique solution when applied to VY CMa,indicating that the set of initial assumptions are indeed self-consistent. The line-of-sight optical depths (which includesthe dust shell as well as interstellar extinction) for 1.65, 2.26,

358 MONNIER ET AL. Vol. 512
and 3.08 km are 2.1, 1.0, and 0.53, respectively. The bolo-metric luminosity of VY CMa can also be estimated bydereddening the observed stellar Ñux without additionalassumptions regarding the geometry of the dust shell.Assuming a distance of 1500 pc, this procedure yields L
*B
1.7] 105 K; mas B 8.3 AU). TheL_
(T*
B 2800 R*
B 5.5uncertainties in these values are dominated by systematicuncertainties relating to the choice of dust constants andthe e†ective temperature of the star. Calculations doneusing other dust constants (Draine & Lee 1984 ; David &Papoular 1990) and with e†ective temperatures as hot as3500 K, indicate an uncertainty of D20% in the values ofthe line-of-sight optical depths, and that the may be asL
*high as 3.0] 105 This determination of is somewhatL_
. L*smaller (by factor of D2) than the bolometric luminosity
found for the spherical models by Le Sidaner & Le Bertre(1996). However, spherical models of axisymmetric dustshells overestimate the bolometric luminosity when theviewing angle looks into less dense polar regions ratherthan through the optically thicker equatorial plane, and thismay explain the discrepancy.
We must correct for interstellar extinction in order toestimate the optical depth of the circumstellar shell. Efsta-thiou & Rowan-Robinson (1990) calculated various circum-stellar dust shell models of VY CMa using interstellarextinction, from between 1.2 and 1.5. Despite the uncer-A
V,
tainty in these estimates, we adopt and use theAV
\ 1.35Mathis (1990) extinction law to correct the optical depthdeterminations for interstellar extinction. The line-of-sightoptical depths of the circumstellar dust shell around VYCMa at 1.65, 2.26, and 3.08 km then become 1.86^ 0.42,0.85^ 0.20, and 0.44 ^ 0.11, respectively. These values areconsistent with the hypothesis that the optical depth in theequatorial plane is roughly equal to or greater than unity at3.08 km, as long as the dust density is enhanced in an equa-torial plane inclined to our line-of-sight.
High-resolution maps at our three infrared colors showsimilar structure ; however, marked di†erences exist, partic-ularly between the 1.65 km maps of Figures 2a and 2b andthose of Figures 2cÈ2f further in the red. Such wavelength-dependent changes are the result of a number of physicalphenomena. Regions of dust will yield varying spectral con-tributions depending on the local temperature, the impor-tance of scattering, and the overall optical depth ; all of thesee†ects are strongly wavelength-dependent. Although wecould make some attempt to disentangle these three e†ectswith our multiwavelength maps, such an e†ort is probablymore proÐtable in the context of the construction of adetailed, self-consistent radiative-transfer model of this star ;this is left for future work.
While no relative motion of the dusty clumps wasdetected between January and December of 1997, follow-uphigh-resolution imaging of this source over the comingdecades may show motion of individual clumps of emission,if they represent dust clouds being accelerated and drivenaway from the star. If the dusty clumps have an outÑowvelocity typical of the OH and molecules (D33 kmH2Os~1), this 4.6 mas yr~1 outward motion could be detectedwith a temporal baseline of only a few yr.
4.2. Southwestern Nebulosity and Bright KnotTurning our attention to the more extended structure
revealed by adaptive optics, circumstellar emission at 1.25,2.2, and 4.8 km within the inner arcsec (or of VYD150R
*)
CMa is dominated by the southwestern nebulosity andbright knot (see Fig. 4 and Cruzalebes et al. 1998). Thedirection of this extension is roughly perpendicular to thepossible equatorial plane, as deduced from the one-sidedreÑection nebula seen in the visible. This near-IR, south-western nebulosity supports the interpretation that light ispreferentially escaping through less dense polar regions of aroughly axisymmetric dust distribution inclined toward thesouthwest. However, we note the position angle of the knotis D30¡ di†erent from the extension observed at highresolution in the inner dust shell at 1.65 km (see Figs. 2a and2b). An overall axisymmetric dust distribution with an axislying roughly northeast/southwest would allow obser-vations of dust emission only in the forward-facing,southwest polar lobe. Hence, dust inhomogeneitiesobserved at higher resolution (see Fig. 2) may reÑect thechaotic nature of local dust formation and may not bedirectly associated with the global symmetry of the dustshell.
The bright knot at 1A to the southwest may be partly dueto an excess of stellar illumination through a hole in theinner dust shell. The relatively narrow line of emission con-necting the knot with the central region lends some supportfor this conjecture ; however, this may alternatively indicatea bridge of material extending from the star toward thebright knot. Figure 4 also summarizes a record of ““ binarycompanion ÏÏ observations in the visible stretching backover 70 yr (Wallerstein 1978). The current location of thesouthwest knot can be seen to lie along an extrapolatedlocus of these earlier points. Wallerstein (1978) attempted toexplain this motion with a ““ rotating hole ÏÏ hypothesiswherein the orbital motion of hole in the inner dust shellresults in a moving ““ searchlight ÏÏ beam. Rotation ratesderived from this model are too high to be reconciled withsingle-star evolution of a red supergiant, implying the pres-ence of a close binary companion or that VY CMa isactually a preÈmain-sequence object still in possession ofsigniÐcant disk angular momentum.
Firm conclusions on the physical meanings of these fea-tures are difficult to draw mainly because of the manyuncertainties of the dust shell geometry. For instance, thethree-dimensional location of the southwest knot is veryuncertain ; hence the knot could represent scattering from adust cloud existing above the pole or not far o† the equato-rial plane.
4.3. Faint Dust Structures in the Outer EnvelopeDust features were detected in scattered light at 1.25 km
at distances up to 4A from the central source, which corre-sponds to a separation of The two main featuresD600R
*.
observed at this size scale are the southern bow-shapedfeature and the ““ curved, nebulous tail ÏÏ stretching to thenorthwest in Figure 3.
The narrow arc- or bow-shaped feature to the south mayhave originated from a partial shell of dust formed duringan asymmetric ejection event or, alternatively, as a cloud ofhigher velocity dust that was subsequently distorted byinteractions with pre-existing circumstellar material. Thisdust material may be embedded in the expanding envelopearound this star ; if so, the dust cloudÏs velocity can be esti-mated from the expansion velocity of molecular gas (OH,
in this region, 33È38 km s~1 (Bowers, Johnston, &H2O)Spencer 1983 ; Richards et al. 1998). This would date thetime of ejection as D1000 yr ago.

No. 1, 1999 VY CMa OUTFLOW 359
In order to understand the origin of the dramatic westernarc seen at 1.25 km, we must consider two classes of expla-nations. The Ðrst class would not involve the actual trans-port (or collimated outÑow) of dust in forming the arcingshape. This class of theories would hold that the circumstel-lar envelope has been severely disrupted, perhaps from ves-tigial preÈmain-sequence material or the passage of a widebinary through the envelope. The nagging possibility thatVY CMa is actually a preÈmain-sequence object falls intothis category (Lada & Reid 1978 ; Kastner & Weintraub1998). Local obscuration and unusual illumination sce-narios play a role here in shaping the appearance of thecircumstellar environment. Until additional observationso†er further support for such scenarios, we decline furtherspeculation along these lines.
The second class of explanations involves the actualtransport of dust in a collimated outÑow. This idea is sup-ported by the large contrast of the plume emission withrespect to the surrounding nebulosity. The 1-2 orders ofmagnitude di†erence suggest that the density or albedo ofthe material along the plume is signiÐcantly higher.Assuming the plume material did indeed originate at thestar and is embedded in the outÑow, we further considertwo cases depending whether the Ñow is ““ fast ÏÏ or ““ slow.ÏÏ Ifthe plume arises from a ballistic jet of high-velocity materialejected from the star, one would expect shock waves to formin the outÑow. In order to investigate the ballistic jethypothesis for the plume, a coronagraphic study was under-taken at Keck I in 1997 December to search for line emis-sion. No emission above the continuum was observed inÐlters sensitive to the (l\ 1È0) and (l\ 2È1) lines,H2 H2transitions indicative of shocked hydrogen. The corona-graphic study did conÐrm the blue spectrum of the plume(as expected from scattering from grains) by mapping the[1.6 km]/[1.2 km] color.
On the other hand, if the dust in the plume has the““ slow ÏÏ outÑow velocity typical of the OH and theH2Omolecules, this 4.6 mas yr~1 radial motion implies that theplume process ““ turned on ÏÏ roughly 1000 yr ago. The longextension of the plume suggests that the ejection directionmaintained itself, except for some apparent rotation, duringmost of the time since the beginning of the Ñow. We pursuethis possibility below.
4.4. Geometrical Model of PlumeA simple geometrical model has been constructed to test
the hypothesis that the plume represents radially drivendust grains produced at a rotating, or precessing, Ñow inser-tion point ; for simplicity, we assume the plume lies in aplane. The velocity of the dust as a function of distance fromthe star has been based on the proper-motion study of the
masers by Richards et al. (1998). The dust is assumedH2Oto have an 8.5 km s~1 outÑow velocity at 75 mas, increasinglinearly to 33.0 km s~1 by 400 mas and staying constantthereafter, although our results are not critically dependenton the velocity law close to the star. We can now Ðt modelsbased on three input parameters : the initial ejection direc-tion, the period of rotation, and the inclination of the rota-tion axis (i.e., the viewing angle).
The model outÑow was constrained to Ðt the outer ridgeof the plume between and and to pass through the2A.5 4A.1southwest knot located approximately 1A away from thestar. The initial ejection direction was Ðtted to the directionof the near-IR curved extension seen toward the south in
the Keck I images (Figs. 2e and 2f ). The best-Ðt plumemodel appears in Figure 3, which contains the shape of theoutÑowing plume structure as well as the projection of therotation equator and the polar axis. The model Ðt indicatesa rotational period between 1200È4200 yr, with an equato-rial plane inclined 51¡^ 5¡ out of the plane of the sky andthe north (or south) polar axis projected onto P.A.200¡ ^ 15¡ with a 180¡ ambiguity (i.e., the Ðt cannot tell uswhich lobe is facing toward the observer). With thisgeometry, the estimated time that the Ñow began is 950 yrago, and the Ñow insertion point is rotating clockwise whenlooked upon from the north pole. Unfortunately, the largestuncertainties in this Ðt are in the model assumptions them-selves. The identiÐcation of the spiral-type morphologypassing inward from the plume through the southwest knotand on in the Keck I images is highly speculative ; hence ourmodel parameters should be considered tentative.
In spite of such uncertainties, our simple empirical modelshows a number of promising properties and furthermoreserves as a useful starting point in exploring the details ofthe circumstellar morphology. The model is consistent withthe assumption that the axisymmetry of the one-sidedreÑection nebula is due to an equatorial density enhance-ment with the equatorial plane inclined to the line-of-sightin such a way that scattering to the north and northeast isnot seen. Efstathiou & Rowan-Robinson (1990) constructeda radiative-transfer model of VY CMa based on a Ñared-disk geometry with an equatorial plane inclination angle ofD47¡. This is entirely consistent with the plume modeldeveloped above, although their model results dependgreatly on the assumed density distribution of the disk. Inaddition, the VY CMaÏs derived rotational period of D2700yr is the right order of magnitude for evolution from anO-star progenitor (Heger 1998, private communication).
However, there is no obvious explanation for how theoutÑow could persist for 1000 yr. For instance, the evolu-tionary timescale for the convective elements within thephotosphere has been found to be less than 1 yr (Tuthill,Hani†, & Baldwin 1997 ; Wilson, Dhillon, & Hani† 1997).However, this does not preclude the existence of long-lasting surface inhomogeneities supported by magneticÐelds, rotation, or some other complex phenomenon (e.g.,JupiterÏs Red Spot). If such a localized hot or cool spotexists, it may catalyze excess mass-loss or the creation ofdust with a peculiar grain size distribution or chemical com-position. The Ñow insertion point for this dust would beseen to turn at approximately the stellar rotation rate.
Alternatively, VY CMa may have experienced a dramaticstellar disruption about 1000 yr ago that resulted in signiÐ-cant asymmetrical mass loss. This would link the origin ofthe southern bow-shaped dust feature with the beginning ofthe plume Ñow, since they are at the same distance from thecentral source. Such a disruption could occur if the outersurface layers become unstable to large-amplitude pulsa-tions (Heger et al. 1997) or if the star undergoes an asym-metrical shell Ñash, although such internal, nova-likeoutbursts are not expected for stars more massive thanD11 (Iben 1998, private communication). This ejectedM
_material may persist in the inner envelope for years until thegas either disperses, falls back to rejoin the photosphere, ornucleates into dust grains and forms the arc. One problemwith this picture is that a large quantity of gas would berequired to form the high-contrast plume seen in the scat-tered light, the plume being at least 10È100 times brighter

360 MONNIER ET AL. Vol. 512
than its surrounding nebulosity. Such increased gas densityin the upper atmosphere would cause a large pressureimbalance, spreading the gas around the star within D100yr (local sound speed is D3 km s~1). However, the largescattering contrast in the plume could also be caused by thepresence of high-albedo dust grains instead of higher dustdensity. The scattering efficiency of grains can be dramat-ically increased by changing their size or their chemicalcomposition (Papoular & Pegourie 1983).
One last interpretation for the 2700 yr period would bethat it represents an orbital time period for a close binarycompanion. Between 31% and 62% of O stars (Garmany,Conti, & Massey 1980 ; Stone 1981), progenitors of redsupergiants, are found to be in binary systems. A low-masscompanion located approximately 400 mas from VY CMawould have an orbital period of about 2700 yr, but it isunknown whether such a wind/binary interaction couldproduce the high-contrast plume observed.
5. CONCLUSIONS
We have reported new high angular resolution and highdynamic range observations of the circumstellar outÑow ofVY CMa. In addition to conÐrming previously observedfeatures, several new structures were discovered.Di†raction-limited observations with the Keck I telescopeallow the star and inner dust shell to be observed throughthe dusty envelope, revealing one-sided emission within 10stellar radii. Combining these results with published photo-metry and existing optical dust constants, the line-of-sightoptical depths of the circumstellar dust shell at 1.65, 2.26,and 3.08 km were estimated to be 1.86^ 0.42, 0.85^ 0.20,and 0.44^ 0.11, respectively. In addition, these new resultsallow the bolometric luminosity of VY CMa to be esti-mated independent of dust shell geometry, yielding L
*B
2 ] 105 L_
.The adaptive optics system on the 3.6 m telescope has
mapped the circumstellar envelope out to D4A from thefaint stellar Ñux scattered o† grains in the outÑow. Thiscombination of high spatial resolution (D90 mas) and highdynamic range (D105) was critical in resolving a high-contrast, scattering plume and a narrow, bow-shapedfeature in the extended circumstellar environment.
The simplest density distribution consistent with thepresent data is an axisymmetric one with an equatorialdensity enhancement, the pole oriented roughly northeast/southwest with the southwest lobe tilted toward us. Thisgeometry attributes the lack of observed emission to thenorth and northeast to obscuration by dust near the equa-torial plane. The clumpy near-IR emission on spatial scalesof a few stellar diameters indicates the local mass-loss pro-cesses are strongly inhomogeneous. Although the presentsite of dust formation within (P.A. D155¡) does not10R
*strictly conform to the overall geometry of the dust shell,time-averaged axisymmetry around a northeast/southwestaxis is still possible and is most consistent with the full set ofobservations.
The curved, nebulous morphology of the dust plumeextending to the northwest is consistent with radially driven
dust grains formed at a rotating Ñow insertion point due toasymmetric mass-loss or a binary companion. A simple geo-metrical model indicates a rotational or orbital period ofD2700 yr. The outer edge of the plume and the southern,bow-shaped feature lie approximately the same distancefrom the star suggesting a common origin in a stellar dis-ruption D950 yr ago. If such a disruption could liberatecarbon-rich material from near the core, the long life of theplume and its high contrast with respect to the surroundingnebulosity might be explained as due to albedo variations ofchemical origin.
The inner envelopes of late-type stars are proving muchmore complicated and exciting than expected. The clumpyscattering features in high-resolution HST and Keck Iimages ; the nebulous curving plume and the southern, bow-shaped feature embedded in the outÑow; nonradial maserproper motions (Richards et al. 1998 ; Marvel 1996) ; thetime evolution of the polarization direction (Maihara et al.1976) ; and radical changes in mid-IR spectrum (Monnier etal. 1998) all testify to the presence of chaotic and violentdust formation processes around VY CMa, which occur ontimescales of decades to millennia. E†ects of stellar hot spot(Tuthill et al. 1997), high magnetic Ðelds (McIntosh, Pred-more, & Patel 1994 ; Kemball & Diamond 1997), rotation(Heger & Langer 1998), large amplitude pulsations (Hegeret al. 1997), and close binary companions (Morris 1980)may all play important roles in producing the thick circum-stellar envelopes observed during the dying days of redsupergiants and subsequently illuminated in the afterglowof supernova explosions.
We would like to thank Devinder Sivia for the maximum-entropy mapping program ““ VLBMEM, ÏÏ which we haveused to reconstruct di†raction-limited images. We wish toacknowledge the Keck Observatory personnel, especiallyPeter Gillingham, who have supported the aperturemasking experiment and to whom we owe great thanks.J. D. M. would also like to thank Chris Matzner for helpfuldiscussions. This research has made extensive use of theSIMBAD database, operated at CDS, Strasbourg, France,and NASAÏs Astrophysics Data System Abstract Service.Some of the data presented herein were obtained at the W.M. Keck Observatory, which is operated as a scientiÐc part-nership among Caltech, the University of California, andNASA. The Observatory was made possible by the gener-ous Ðnancial support of the W. M. Keck Foundation. Theresults presented here have been partly based on obser-vations collected at ESO, La Silla, Chile. C. A. H. is gratefulto the Royal Society for continued Ðnancial support. Thiswork is a part of a long-standing interferometry program atU. C. Berkeley, supported by the National Science Founda-tion (Grant AST-9315485 and AST-9731625) and by theOffice of Naval Research (OCNR N00014-89-J-1583). Inaddition, scientiÐc exchanges with the Observatoire de la
dÏAzur were supported in part by a 1997 France-Coü teBerkeley Fund grant to W. C. D.

No. 1, 1999 VY CMa OUTFLOW 361
REFERENCESBaldwin, J. E., Hani†, C. A., Mackay, C. D., & Warnier, P. J. 1986, Nature,
320, 595Bensammar, S., Friedjung, M., Letourneur, N., & Perrier, F. 1985, A&A,
149, L1Benson, J. M., & Mutel, R. L. 1979, ApJ, 233, 199Bowers, P. F., Johnston, K. J., & Spencer, J. H. 1983, ApJ, 274, 733Brunish, W. M., & Truran, J. W. 1982, ApJ, 256, 247Close, L. M., et al. 1998, ApJ, 499, 883Cornwell, T. J., & Wilkinson, P. N. 1981, MNRAS, 196, 1067Cruzalebes, P., Lopez, B., Bester, M., Gendron, E., & Sams, B. 1998, A&A,
338, 132Danchi, W. C., Bester, M., Degiacomi, C. G., Greenhill, L. J., & Townes,
C. H. 1994, AJ, 107, 1469David, P., & Papoular, R. 1990, A&A, 237, 425Draine, B. T., & Lee, H. M. 1984, ApJ, 285, 89Dyck, H. M., Zuckerman, B., Leinert, C., & Beckwith, S. 1984, ApJ, 287,
801Efstathiou, A., & Rowan-Robinson, M. 1990, MNRAS, 245, 275Forbes, F. F. 1971, ApJ, 165, L83Garmany, C. D., Conti, P. S., & Massey, P. 1980, ApJ, 242, 1063Gull, S. F., & Skilling, J. 1984, Proc. IEEE 131, 6Hani†, C. A., & Buscher, D. F. 1992, J. Opt. Soc. Am., 9, 203Heger, A., Jeannin, L., Langer, N., & Bara†e, I. 1997, A&A, 327, 224Heger, A., & Langer, N. 1998, A&A, 334, 210Herbig, G. H. 1972, ApJ, 172, 375
J. 1974, ApJS, 15, 417Ho� gbom,Jennison, R. C. 1958, MNRAS, 118, 276Kastner, J. H., & Weintraub, D. A. 1998, AJ, 115, 1592Kemball, A. J., & Diamond, P. J. 1997, ApJ, 481, L111Lacombe, F., Marco, O., Eisenhauer, F., & Hofmann, R. 1995, Messenger,
82, 16Lada, C. J., & Reid, M. J. 1978, ApJ, 219, 95Le Bertre, T. 1993, A&AS, 97, 729
Le Sidaner, P., & Le Bertre, T. 1996, A&A, 314, 896Lopez, B., Mekarnia, D., & Lefebre, J. 1995, A&A, 296, 752Maihara, T., Noguchi, K., Oishi, M., Okuda, H., & Sato, S. 1976, Nature,
259, 465Marvel, K. B. 1996, Ph.D. diss., New Mexico State Univ.Mathis, J. S. 1990, ARA&A, 28, 37Matthews, K., Ghez, A. M., Weinberger, A. J., & Neugebauer, G. 1996,
PASP, 108, 615Matthews, K., & Soifer, B. T. 1994, Infrared Astronomy with Arrays : the
Next Generation, ed. I. McLean (Dordrecht : Kluwer), 239McCarthy, D. W., Jr. 1979, in IAU Colloq. 50, High Angular Resolution
Stellar Interferometry, ed. J. Davis & W.J. Tango (Sydney, Australia :Univ. Sydney Press)
McIntosh, G. C., Predmore, C. R., & Patel, N. A. 1994, ApJ, 428, L29Monnier, J. D., Geballe, T. R., & Danchi, W. C. 1998, ApJ, 502, 833Morris, M. 1980, ApJ, 249, 572Ossenkopf, V., Henning, T., & Mathis, J. S. 1992, A&A, 261, 567Papoular, R., & Pegourie, B. 1983, A&A, 128, 335Pearson, T. J., & Readhead, A. C. S. 1984, ARA&A, 22, 97Richards, A. M. S., Yates, J. A., & Cohen, R. J. 1998, MNRAS, 299, 319Sivia, D. S. 1987, Ph.D. diss., Cambridge Univ.Stone, R. C. 1981, AJ, 86, 544Takami, H., Shiba, H., Sato, S., Yamashita, T., & Kobayahi, Y. 1992,
PASP, 104, 949Tuthill, P. G., Hani†, C. A., & Baldwin, J. E. 1997, MNRAS, 285, 529Tuthill, P., Monnier, J. D., Hani†, C. A., & Danchi, W. C. 1999, in prep-
arationVarosi, F., & Landsman, W. B. 1995, ASP Conf. Ser. 52, Astronomical
Data Analysis Software and Systems II, ed. R. J. Hanisch, V. Brissenden,& Jeannette Barnes (San Francisco : ASP), 515
Wallerstein, G. 1978, Observatory, 98, 224Wilson, R. W., Dhillon, V. S., & Hani†, C. A. 1997, MNRAS, 291, 819Worley, C. E. 1972, ApJ, 175, L93
Copyright © 2022 FDOKUMEN