Timeradartrees: Visualizing dynamic compound digraphs
8
Eurographics/ IEEE-VGTC Symposium on Visualization 2008 A. Vilanova, A. Telea, G. Scheuermann, and T. Möller (Guest Editors) Volume 27 (2008), Number 3 TimeRadarTrees: Visualizing Dynamic Compound Digraphs M. Burch and S. Diehl, University of Trier, Germany Abstract The evolution of dependencies in information hierarchies can be modeled by sequences of compound digraphs with edge weights. In this paper we present a novel approach to visualize such sequences of graphs. It uses radial tree layout to draw the hierarchy, and circle sectors to represent the temporal change of edges in the digraphs. We have developed several interaction techniques that allow the users to explore the structural and temporal data. Smooth animations help them to track the transitions between views. The usefulness of the approach is illustrated by examples from very different application domains. Categories and Subject Descriptors (according to ACM CCS): E.1 [Data Structures]: Graphs and Networks 1. Introduction Information hierarchies occur in many application domains such as the hierarchical organization of companies, news topics and subtopics, file/directory systems, products and product groups of a department store, or phylogenetic trees in biology. The evolution of dependencies in such infor- mation hierarchies can be modeled by sequences of com- pound digraphs with edge weights. While there has been a lot of work on visualizing information hierarchies [ RT81, YFDH01, JS91, AH98, SZ00], only few researchers have developed methods to visualize dependencies between ele- ments in the hierarchy [NSC05, FWD ∗ 03, ZMC05], see Sec- tion 4 for a more detailed discussion. The TimeRadarTree approach presented in this paper sup- ports the visualization of the evolution of weighted depen- dencies in information hierarchies in a single diagram. To this end the TimeRadarTree approach integrates three views into one: Interactive radial tree: It shows the whole hierarchy to an interactively selectable level. By clicking at a node on the circumference it is expanded, by clicking at an interme- diate node, the subtree starting at that node is collapsed and the node is put on the circumference. Expanding or collapsing subtrees of the hierarchy can help to detect re- lations at different levels of abstraction. Inner Circle (Time Radar): Incoming edges of leaf nodes or collapsed subtrees are shown as colored parts of a circle sector related to that node or subtree. The color of each part encodes the weight of the edge, i.e. the strength of the dependency. Outer Circles (Thumbnails): The smaller outer circles re- lated with each hierarchy node show the outgoing edges of the related node. The target node of each edge can be inferred from its direction, shape, and color. We have developed several interaction techniques that al- low the users to explore the data. Smooth animations help them to track the transitions between views. Thus, TimeR- adarTrees allow the user to detect when and how strong ele- ments of the hierarchy are related. The rest of this paper is organized as follows: In Section 2 we introduce the different constituents of the TimeRadar- Tree visualization by means of examples. Then, in Section 3 we illustrate the usefulness of our approach by looking at data sets from various application domains. Related work is discussed in Section 4. Finally, Section 5 gives some conclu- sions and possible directions for further work. 2. TimeRadarTrees – step by step We illustrate our visualization technique by starting with the representation of a single graph and then adding features step by step. As first example consider the node-link diagram of a single, directed graph (short: digraph) shown in Figure 1. Nodes are represented by circles, directed edges by arrows from one node to another. In TimeRadarTrees there is not a single representation of a node or an edge, see Figure 2. But for each node its in- coming edges are represented by sectors of the large circle in the middle, while the smaller circles on the circumference of the inner circle show the outgoing edges. These circles submitted to Eurographics/ IEEE-VGTC Symposium on Visualization (2008)
Transcript of Timeradartrees: Visualizing dynamic compound digraphs
Eurographics/ IEEE-VGTC Symposium on Visualization 2008A. Vilanova, A. Telea, G. Scheuermann, and T. Möller(Guest Editors)
Volume 27 (2008), Number 3
TimeRadarTrees: Visualizing Dynamic Compound Digraphs
M. Burch and S. Diehl, University of Trier, Germany
AbstractThe evolution of dependencies in information hierarchies can be modeled by sequences of compound digraphswith edge weights. In this paper we present a novel approach to visualize such sequences of graphs. It uses radialtree layout to draw the hierarchy, and circle sectors to represent the temporal change of edges in the digraphs. Wehave developed several interaction techniques that allow the users to explore the structural and temporal data.Smooth animations help them to track the transitions between views. The usefulness of the approach is illustratedby examples from very different application domains.
Categories and Subject Descriptors (according to ACM CCS): E.1 [Data Structures]: Graphs and Networks
1. Introduction
Information hierarchies occur in many application domainssuch as the hierarchical organization of companies, newstopics and subtopics, file/directory systems, products andproduct groups of a department store, or phylogenetic treesin biology. The evolution of dependencies in such infor-mation hierarchies can be modeled by sequences of com-pound digraphs with edge weights. While there has been alot of work on visualizing information hierarchies [RT81,YFDH01, JS91, AH98, SZ00], only few researchers havedeveloped methods to visualize dependencies between ele-ments in the hierarchy [NSC05,FWD∗03,ZMC05], see Sec-tion 4 for a more detailed discussion.
The TimeRadarTree approach presented in this paper sup-ports the visualization of the evolution of weighted depen-dencies in information hierarchies in a single diagram. Tothis end the TimeRadarTree approach integrates three viewsinto one:
Interactive radial tree: It shows the whole hierarchy to aninteractively selectable level. By clicking at a node on thecircumference it is expanded, by clicking at an interme-diate node, the subtree starting at that node is collapsedand the node is put on the circumference. Expanding orcollapsing subtrees of the hierarchy can help to detect re-lations at different levels of abstraction.
Inner Circle (Time Radar): Incoming edges of leaf nodesor collapsed subtrees are shown as colored parts of a circlesector related to that node or subtree. The color of eachpart encodes the weight of the edge, i.e. the strength ofthe dependency.
Outer Circles (Thumbnails): The smaller outer circles re-lated with each hierarchy node show the outgoing edgesof the related node. The target node of each edge can beinferred from its direction, shape, and color.
We have developed several interaction techniques that al-low the users to explore the data. Smooth animations helpthem to track the transitions between views. Thus, TimeR-adarTrees allow the user to detect when and how strong ele-ments of the hierarchy are related.
The rest of this paper is organized as follows: In Section 2we introduce the different constituents of the TimeRadar-Tree visualization by means of examples. Then, in Section 3we illustrate the usefulness of our approach by looking atdata sets from various application domains. Related work isdiscussed in Section 4. Finally, Section 5 gives some conclu-sions and possible directions for further work.
2. TimeRadarTrees – step by step
We illustrate our visualization technique by starting with therepresentation of a single graph and then adding features stepby step. As first example consider the node-link diagram ofa single, directed graph (short: digraph) shown in Figure 1.Nodes are represented by circles, directed edges by arrowsfrom one node to another.
In TimeRadarTrees there is not a single representation ofa node or an edge, see Figure 2. But for each node its in-coming edges are represented by sectors of the large circlein the middle, while the smaller circles on the circumferenceof the inner circle show the outgoing edges. These circles
submitted to Eurographics/ IEEE-VGTC Symposium on Visualization (2008)

2 M. Burch & S. Diehl / TimeRadarTrees
Figure 1: Node-link diagram of a graph.
are subdivided into sectors as follows. First, if we have nnodes, the circle is divided into n equally-sized sectors. Eachof these sectors is associated with a certain node. In the ex-ample, the lower left sector of all circles is associated withnode D. Next, each of the sectors is subdivided into a num-ber of smaller sectors depending on the number of incomingedges of the associated node. In the example, the three col-ored sectors related to the node D in the inner circle repre-sent the three incoming edges of node D, while the one bigcolored sector related with node A indicates that node A hasonly a single incoming edge, and finally, the white sectorsrelated to E and C show that these nodes have no incomingedges at all.
Figure 2: TimeRadarTree of a single graph.
Note, that by looking only at the inner circle, we can notidentify the nodes where the incoming edges start from. Thisinformation can be grasped by looking at the outer circles.For example, by looking at the outer circle related to nodeB, we see that there is only one outgoing edge, and this out-going edge is drawn in the part of the circle associated withthe node D. In comparison with node-link diagrams, an im-
portant advantage of the TimeRadarTree visualization is thatthere are no edge crossings leading to visual clutter.
While this sector-based representation might seem awk-ward at first and it needs some training to read this repre-sentation, it will turn out useful, once we add more features.Let’s start by trying to visualize a sequence of graphs in-stead of a single graph. As an example, we use the sequenceof graphs shown in Figure 3. Each graph of the sequence isshown by a separate node-link diagram.
Figure 3: Node-link diagrams of a sequence of graphs.
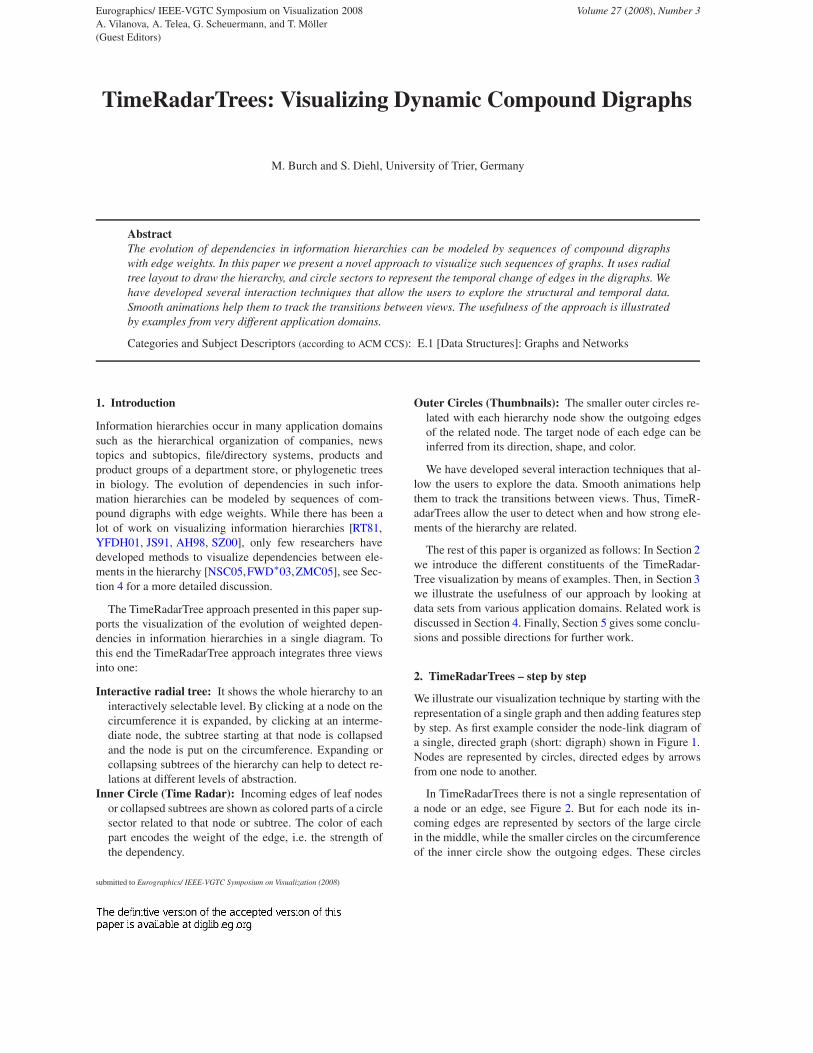
Figure 4 shows a TimeRadarTree representation of thesame sequence of graphs. Here the edges of each graph arerepresented by sectors of the same ring. Actually, in this ex-ample, the innermost circle corresponds to the first graph,that we have seen before, the next graph of the sequenceis represented by the inner ring, and the third graph by theouter ring. Looking at the lower left sector, we see for ex-ample, that there have been three incoming edges for nodeD in the first graph, one in the second, and none in the third.By looking at the lower left sectors of the small outer cir-cles, we see that two of the incoming edges of D start fromnode A, and its third incoming edge starts from node B. Fur-thermore, we see that the single incoming edge in the secondgraph starts also from A. In comparison with animated node-link diagrams, the integration of all graphs in the sequenceinto a single diagram helps the user to preserve the mentalmap.
In a compound digraph, like the one shown in Figure 5,the nodes of the graph are additionally related to leaves ofa hierarchy. In the example, the graph and the hierarchyare both shown as node-link diagrams with additional edgesconnecting the nodes of the graph with the leaf nodes of thehierarchy. In Figure 6 the same compound graph is shown asa TimeRadarTree using radial layout to embed the node-linkdiagram of the hierarchy in the sector-based visualization ofthe graph.
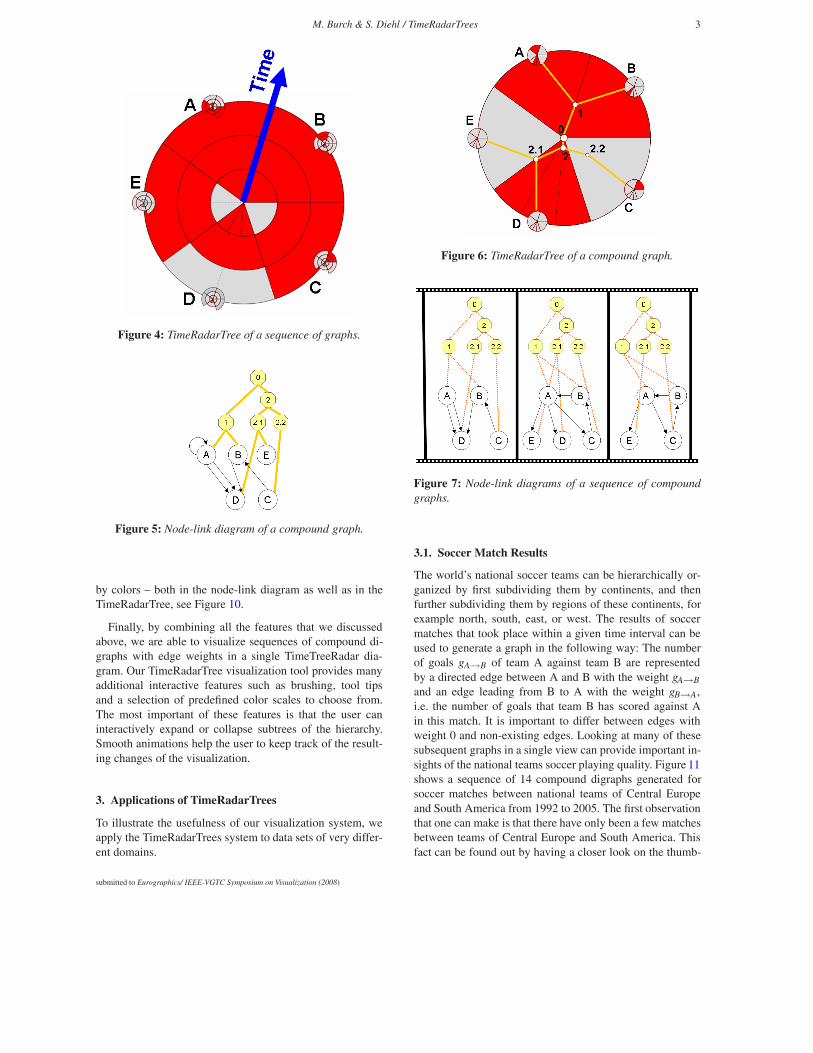
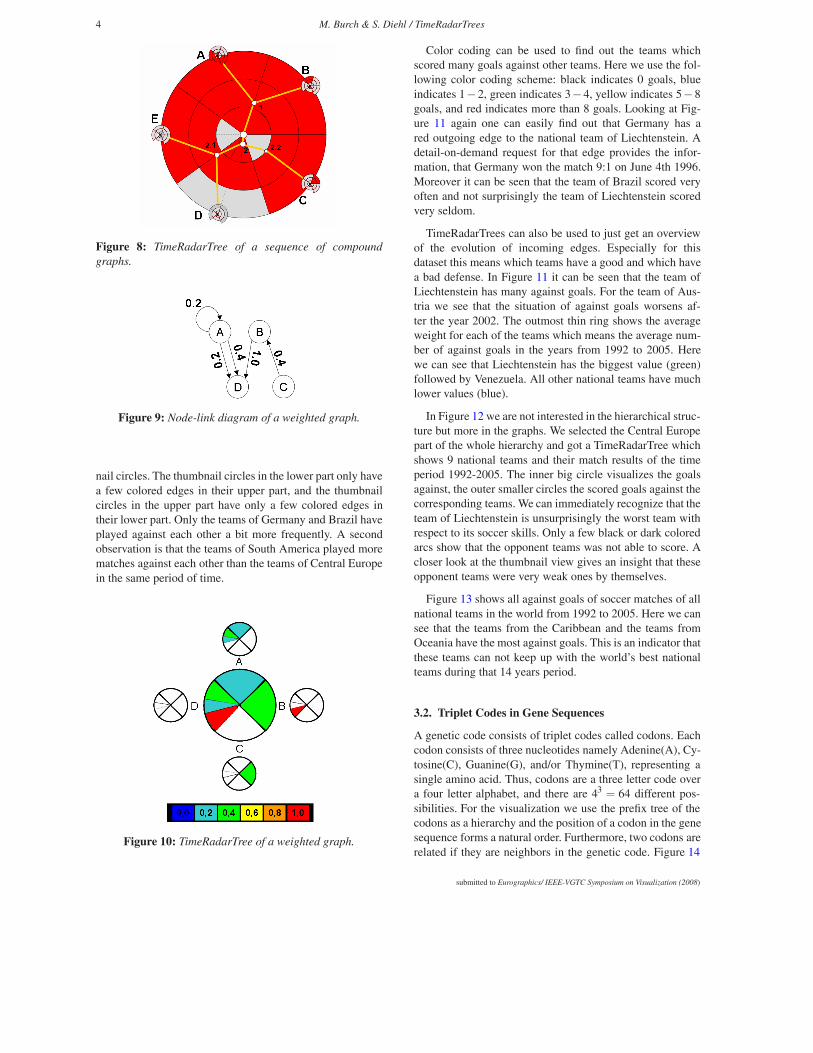
We can now combine both features, i.e. visualize se-quences of compound graphs. Figure 7 shows them as asequence of node-link diagrams, while Figure 8 combinesthe two approaches discussed above to integrate all informa-tion into a single TimeRadarTree diagram. Another way toextend the visualization is to consider directed graphs withedge weights as the one shown in the node-link diagram inFigure 9. Instead of using numbers, we can encode weights
submitted to Eurographics/ IEEE-VGTC Symposium on Visualization (2008)
M. Burch & S. Diehl / TimeRadarTrees 3
Figure 4: TimeRadarTree of a sequence of graphs.
Figure 5: Node-link diagram of a compound graph.
by colors – both in the node-link diagram as well as in theTimeRadarTree, see Figure 10.
Finally, by combining all the features that we discussedabove, we are able to visualize sequences of compound di-graphs with edge weights in a single TimeTreeRadar dia-gram. Our TimeRadarTree visualization tool provides manyadditional interactive features such as brushing, tool tipsand a selection of predefined color scales to choose from.The most important of these features is that the user caninteractively expand or collapse subtrees of the hierarchy.Smooth animations help the user to keep track of the result-ing changes of the visualization.
3. Applications of TimeRadarTrees
To illustrate the usefulness of our visualization system, weapply the TimeRadarTrees system to data sets of very differ-ent domains.
Figure 6: TimeRadarTree of a compound graph.
Figure 7: Node-link diagrams of a sequence of compoundgraphs.
3.1. Soccer Match Results
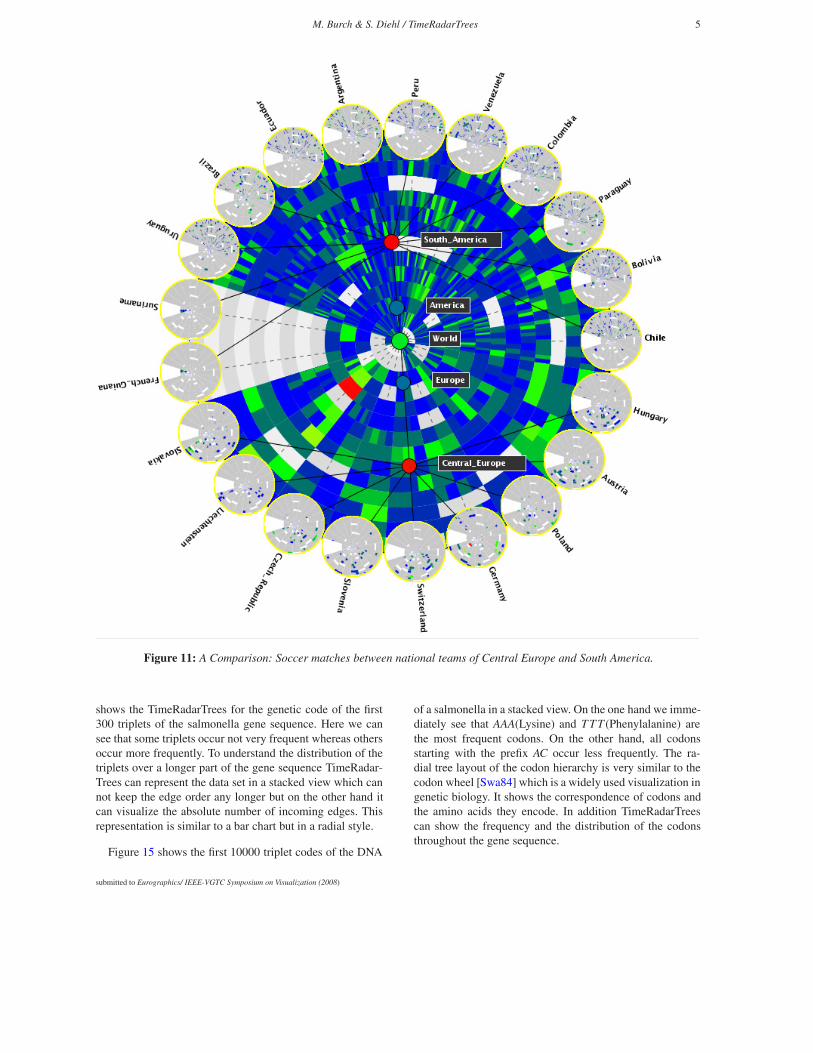
The world’s national soccer teams can be hierarchically or-ganized by first subdividing them by continents, and thenfurther subdividing them by regions of these continents, forexample north, south, east, or west. The results of soccermatches that took place within a given time interval can beused to generate a graph in the following way: The numberof goals gA→B of team A against team B are representedby a directed edge between A and B with the weight gA→Band an edge leading from B to A with the weight gB→A,i.e. the number of goals that team B has scored against Ain this match. It is important to differ between edges withweight 0 and non-existing edges. Looking at many of thesesubsequent graphs in a single view can provide important in-sights of the national teams soccer playing quality. Figure 11shows a sequence of 14 compound digraphs generated forsoccer matches between national teams of Central Europeand South America from 1992 to 2005. The first observationthat one can make is that there have only been a few matchesbetween teams of Central Europe and South America. Thisfact can be found out by having a closer look on the thumb-
submitted to Eurographics/ IEEE-VGTC Symposium on Visualization (2008)
4 M. Burch & S. Diehl / TimeRadarTrees
Figure 8: TimeRadarTree of a sequence of compoundgraphs.
Figure 9: Node-link diagram of a weighted graph.
nail circles. The thumbnail circles in the lower part only havea few colored edges in their upper part, and the thumbnailcircles in the upper part have only a few colored edges intheir lower part. Only the teams of Germany and Brazil haveplayed against each other a bit more frequently. A secondobservation is that the teams of South America played morematches against each other than the teams of Central Europein the same period of time.
Figure 10: TimeRadarTree of a weighted graph.
Color coding can be used to find out the teams whichscored many goals against other teams. Here we use the fol-lowing color coding scheme: black indicates 0 goals, blueindicates 1−2, green indicates 3−4, yellow indicates 5−8goals, and red indicates more than 8 goals. Looking at Fig-ure 11 again one can easily find out that Germany has ared outgoing edge to the national team of Liechtenstein. Adetail-on-demand request for that edge provides the infor-mation, that Germany won the match 9:1 on June 4th 1996.Moreover it can be seen that the team of Brazil scored veryoften and not surprisingly the team of Liechtenstein scoredvery seldom.
TimeRadarTrees can also be used to just get an overviewof the evolution of incoming edges. Especially for thisdataset this means which teams have a good and which havea bad defense. In Figure 11 it can be seen that the team ofLiechtenstein has many against goals. For the team of Aus-tria we see that the situation of against goals worsens af-ter the year 2002. The outmost thin ring shows the averageweight for each of the teams which means the average num-ber of against goals in the years from 1992 to 2005. Herewe can see that Liechtenstein has the biggest value (green)followed by Venezuela. All other national teams have muchlower values (blue).
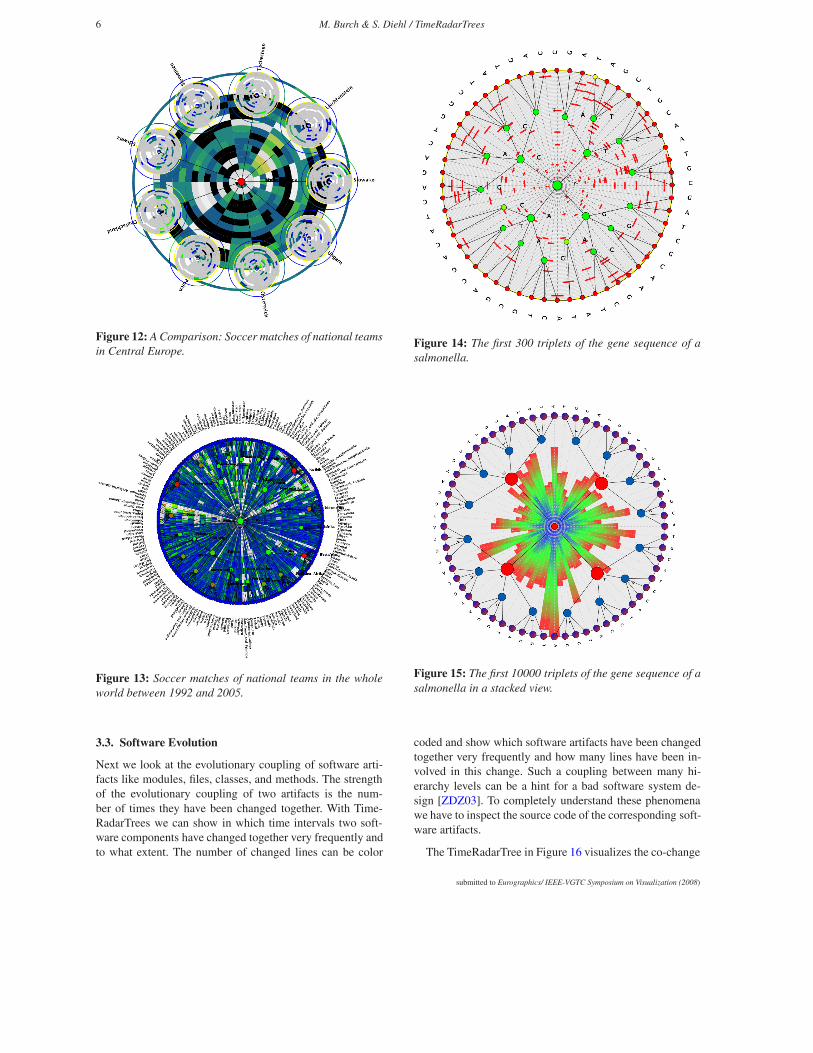
In Figure 12 we are not interested in the hierarchical struc-ture but more in the graphs. We selected the Central Europepart of the whole hierarchy and got a TimeRadarTree whichshows 9 national teams and their match results of the timeperiod 1992-2005. The inner big circle visualizes the goalsagainst, the outer smaller circles the scored goals against thecorresponding teams. We can immediately recognize that theteam of Liechtenstein is unsurprisingly the worst team withrespect to its soccer skills. Only a few black or dark coloredarcs show that the opponent teams was not able to score. Acloser look at the thumbnail view gives an insight that theseopponent teams were very weak ones by themselves.
Figure 13 shows all against goals of soccer matches of allnational teams in the world from 1992 to 2005. Here we cansee that the teams from the Caribbean and the teams fromOceania have the most against goals. This is an indicator thatthese teams can not keep up with the world’s best nationalteams during that 14 years period.
3.2. Triplet Codes in Gene Sequences
A genetic code consists of triplet codes called codons. Eachcodon consists of three nucleotides namely Adenine(A), Cy-tosine(C), Guanine(G), and/or Thymine(T), representing asingle amino acid. Thus, codons are a three letter code overa four letter alphabet, and there are 43 = 64 different pos-sibilities. For the visualization we use the prefix tree of thecodons as a hierarchy and the position of a codon in the genesequence forms a natural order. Furthermore, two codons arerelated if they are neighbors in the genetic code. Figure 14
submitted to Eurographics/ IEEE-VGTC Symposium on Visualization (2008)
M. Burch & S. Diehl / TimeRadarTrees 5
Figure 11: A Comparison: Soccer matches between national teams of Central Europe and South America.
shows the TimeRadarTrees for the genetic code of the first300 triplets of the salmonella gene sequence. Here we cansee that some triplets occur not very frequent whereas othersoccur more frequently. To understand the distribution of thetriplets over a longer part of the gene sequence TimeRadar-Trees can represent the data set in a stacked view which cannot keep the edge order any longer but on the other hand itcan visualize the absolute number of incoming edges. Thisrepresentation is similar to a bar chart but in a radial style.
Figure 15 shows the first 10000 triplet codes of the DNA
of a salmonella in a stacked view. On the one hand we imme-diately see that AAA(Lysine) and TTT (Phenylalanine) arethe most frequent codons. On the other hand, all codonsstarting with the prefix AC occur less frequently. The ra-dial tree layout of the codon hierarchy is very similar to thecodon wheel [Swa84] which is a widely used visualization ingenetic biology. It shows the correspondence of codons andthe amino acids they encode. In addition TimeRadarTreescan show the frequency and the distribution of the codonsthroughout the gene sequence.
submitted to Eurographics/ IEEE-VGTC Symposium on Visualization (2008)
6 M. Burch & S. Diehl / TimeRadarTrees
Figure 12: A Comparison: Soccer matches of national teamsin Central Europe.
Figure 13: Soccer matches of national teams in the wholeworld between 1992 and 2005.
3.3. Software Evolution
Next we look at the evolutionary coupling of software arti-facts like modules, files, classes, and methods. The strengthof the evolutionary coupling of two artifacts is the num-ber of times they have been changed together. With Time-RadarTrees we can show in which time intervals two soft-ware components have changed together very frequently andto what extent. The number of changed lines can be color
Figure 14: The first 300 triplets of the gene sequence of asalmonella.
Figure 15: The first 10000 triplets of the gene sequence of asalmonella in a stacked view.
coded and show which software artifacts have been changedtogether very frequently and how many lines have been in-volved in this change. Such a coupling between many hi-erarchy levels can be a hint for a bad software system de-sign [ZDZ03]. To completely understand these phenomenawe have to inspect the source code of the corresponding soft-ware artifacts.
The TimeRadarTree in Figure 16 visualizes the co-change
submitted to Eurographics/ IEEE-VGTC Symposium on Visualization (2008)

M. Burch & S. Diehl / TimeRadarTrees 7
of files in the browser and the doc subdirectories of theJEDIT software system (jedit.org). The color of an edgeindicates the size of the change in terms of the number ofchanged lines of code. Small changes are indicated by blue,bigger ones by green, and finally red indicates very largenumbers of changed code lines. In the example here we cansee that the files TODO.txt and CHANGES.txt have beenchanged together very frequently but only small changeshave been done. Many of the files in the browser sub-directory have been changed together and the green colorindicates that there are involved several lines of code. Thethumbnail can be used to find out that these files have beenmainly changed in the same transactions.
Figure 16: Commonly checked-in files of a part of the JEDITOpen Source Project.
3.4. Export/Import Behaviour
Another interesting application area is the export/import be-haviour of the world’s countries. Figure 17 gives an overviewabout the exported fuel of the world’s countries. A part ofthe worlds hierarchy is expanded so that the user can seeall the countries belonging to a part of Asia. Here red indi-cates a large amount of exported fuel, while green indicatesonly a small amount; yellow indicates the values in between.It catches ones eye that Saudi Arabia is one of the world’sbiggest fuel exporter followed by the United Arab Emirates.Jordan and Israel have not exported as much fuel as the onesmentioned above.
4. Related Work
In this section we discuss some of the related work with re-spect to the visualization of hierarchies, of dependencies inhierarchies, and of chronological data.
Figure 17: Exported fuel of the worlds countries in thousanddollars.
4.1. Visualization of Hierarchies
Information hierarchies can be seen as a special kind ofgraphs, namely trees. As a result, information hierarchiescan be visualized as node-edge diagrams using specializedgraph layout algorithms [RT81]. Radial layout does not onlyimprove the space-efficiency of these diagrams, but also en-ables new navigation techniques [YFDH01]. Space-fillingtechniques to visualize hierarchies include Treemaps [JS91],Information Slices [AH98], or Sunburst [SZ00]. Note, thatthe latter two approaches use circle sectors to representnodes of the tree, while we use circle sectors to representedges, i.e. dependencies.
4.2. Visualization of Dependencies in Hierarchies
Many approaches try to encode dependencies between ob-jects as directed or undirected edges in node-link dia-grams. In particular, specialized graph-drawing algorithmsfor compound digraphs have been developed [FT04, SM91,BM99]. The appearance of edges, for example, their color,shape, orientation, thickness or connection, can representthe strength of the dependencies. There are several ap-proaches that extend Treemaps [JS91] to also show differentkinds of relations [FWD∗03, ZMC05], For example, ARC-TREES [NSC05] is an interactive visualization tool for hi-erarchical and non-hierarchical relations. It extends the hier-archical view of the Treemap approach with arc diagrams topresent relations.
submitted to Eurographics/ IEEE-VGTC Symposium on Visualization (2008)
8 M. Burch & S. Diehl / TimeRadarTrees
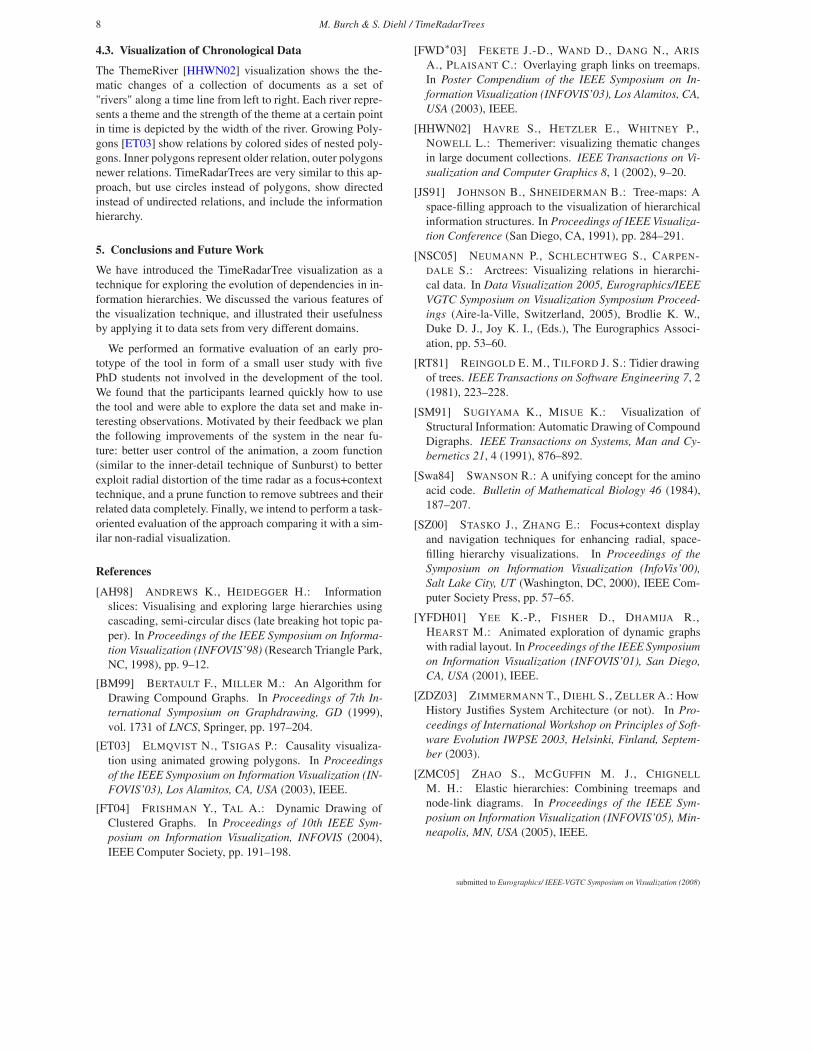
4.3. Visualization of Chronological Data
The ThemeRiver [HHWN02] visualization shows the the-matic changes of a collection of documents as a set of"rivers" along a time line from left to right. Each river repre-sents a theme and the strength of the theme at a certain pointin time is depicted by the width of the river. Growing Poly-gons [ET03] show relations by colored sides of nested poly-gons. Inner polygons represent older relation, outer polygonsnewer relations. TimeRadarTrees are very similar to this ap-proach, but use circles instead of polygons, show directedinstead of undirected relations, and include the informationhierarchy.
5. Conclusions and Future Work
We have introduced the TimeRadarTree visualization as atechnique for exploring the evolution of dependencies in in-formation hierarchies. We discussed the various features ofthe visualization technique, and illustrated their usefulnessby applying it to data sets from very different domains.
We performed an formative evaluation of an early pro-totype of the tool in form of a small user study with fivePhD students not involved in the development of the tool.We found that the participants learned quickly how to usethe tool and were able to explore the data set and make in-teresting observations. Motivated by their feedback we planthe following improvements of the system in the near fu-ture: better user control of the animation, a zoom function(similar to the inner-detail technique of Sunburst) to betterexploit radial distortion of the time radar as a focus+contexttechnique, and a prune function to remove subtrees and theirrelated data completely. Finally, we intend to perform a task-oriented evaluation of the approach comparing it with a sim-ilar non-radial visualization.
References
[AH98] ANDREWS K., HEIDEGGER H.: Informationslices: Visualising and exploring large hierarchies usingcascading, semi-circular discs (late breaking hot topic pa-per). In Proceedings of the IEEE Symposium on Informa-tion Visualization (INFOVIS’98) (Research Triangle Park,NC, 1998), pp. 9–12.
[BM99] BERTAULT F., MILLER M.: An Algorithm forDrawing Compound Graphs. In Proceedings of 7th In-ternational Symposium on Graphdrawing, GD (1999),vol. 1731 of LNCS, Springer, pp. 197–204.
[ET03] ELMQVIST N., TSIGAS P.: Causality visualiza-tion using animated growing polygons. In Proceedingsof the IEEE Symposium on Information Visualization (IN-FOVIS’03), Los Alamitos, CA, USA (2003), IEEE.
[FT04] FRISHMAN Y., TAL A.: Dynamic Drawing ofClustered Graphs. In Proceedings of 10th IEEE Sym-posium on Information Visualization, INFOVIS (2004),IEEE Computer Society, pp. 191–198.
[FWD∗03] FEKETE J.-D., WAND D., DANG N., ARIS
A., PLAISANT C.: Overlaying graph links on treemaps.In Poster Compendium of the IEEE Symposium on In-formation Visualization (INFOVIS’03), Los Alamitos, CA,USA (2003), IEEE.
[HHWN02] HAVRE S., HETZLER E., WHITNEY P.,NOWELL L.: Themeriver: visualizing thematic changesin large document collections. IEEE Transactions on Vi-sualization and Computer Graphics 8, 1 (2002), 9–20.
[JS91] JOHNSON B., SHNEIDERMAN B.: Tree-maps: Aspace-filling approach to the visualization of hierarchicalinformation structures. In Proceedings of IEEE Visualiza-tion Conference (San Diego, CA, 1991), pp. 284–291.
[NSC05] NEUMANN P., SCHLECHTWEG S., CARPEN-DALE S.: Arctrees: Visualizing relations in hierarchi-cal data. In Data Visualization 2005, Eurographics/IEEEVGTC Symposium on Visualization Symposium Proceed-ings (Aire-la-Ville, Switzerland, 2005), Brodlie K. W.,Duke D. J., Joy K. I., (Eds.), The Eurographics Associ-ation, pp. 53–60.
[RT81] REINGOLD E. M., TILFORD J. S.: Tidier drawingof trees. IEEE Transactions on Software Engineering 7, 2(1981), 223–228.
[SM91] SUGIYAMA K., MISUE K.: Visualization ofStructural Information: Automatic Drawing of CompoundDigraphs. IEEE Transactions on Systems, Man and Cy-bernetics 21, 4 (1991), 876–892.
[Swa84] SWANSON R.: A unifying concept for the aminoacid code. Bulletin of Mathematical Biology 46 (1984),187–207.
[SZ00] STASKO J., ZHANG E.: Focus+context displayand navigation techniques for enhancing radial, space-filling hierarchy visualizations. In Proceedings of theSymposium on Information Visualization (InfoVis’00),Salt Lake City, UT (Washington, DC, 2000), IEEE Com-puter Society Press, pp. 57–65.
[YFDH01] YEE K.-P., FISHER D., DHAMIJA R.,HEARST M.: Animated exploration of dynamic graphswith radial layout. In Proceedings of the IEEE Symposiumon Information Visualization (INFOVIS’01), San Diego,CA, USA (2001), IEEE.
[ZDZ03] ZIMMERMANN T., DIEHL S., ZELLER A.: HowHistory Justifies System Architecture (or not). In Pro-ceedings of International Workshop on Principles of Soft-ware Evolution IWPSE 2003, Helsinki, Finland, Septem-ber (2003).
[ZMC05] ZHAO S., MCGUFFIN M. J., CHIGNELL
M. H.: Elastic hierarchies: Combining treemaps andnode-link diagrams. In Proceedings of the IEEE Sym-posium on Information Visualization (INFOVIS’05), Min-neapolis, MN, USA (2005), IEEE.
submitted to Eurographics/ IEEE-VGTC Symposium on Visualization (2008)