Visualizing the Invisible Nanoscale Study
34
Introduction and Basic Questions In newspapers and magazines, one can see pictures, often colourful pictures, of structures at the nanoscale, i.e. with dimensions from one to one hundred billionths of a meter. In scientific journals ‘photographs’, or better, visualizations of digital data created by scanning probe microscopy, are offered to colleague nano-scientists. There is use of model drawings as well, which has by now almost become an art form. In all such cases, the challenge of visualizing the invisible has to be met. In this article we will focus on the visualisation practices of nano-scientists: how they meet the challenges of visualisation, and what sort of practices and routines emerge. What are these challenges of visualisation? Studying the invisible is built on inferences (Nordmann, 2008), for example about molecules and their structure, or about electrons and their charge. Over time, such inferences may cohere and form a plausible picture of what remains unknown in terms of direct observation. There may be instruments like microscopes purporting to show us worlds that are invisible to our eyes: that is how they have been hailed since their invention in the 17 th century. They mediate Science Studies 1/2010 Science Studies, Vol. 23 (2010) No. 1, 3-36 Visualizing the Invisible Nanoscale Study: Visualization Practices in Nanotechnology Community of Practice Martin Ruivenkamp and Arie Rip How does one know what is the right way to visualize the invisible nanoscale? Practices in the visualization processes are studied by moving about in the field of nanoscience/technology. Nine important aspects of visualization processes have been identified. Based on nanoscientists’ responses to a small survey, it is argued that some of these aspects–preparatory techniques–which link up to the experimenter’s and visualization regress, are invisible to nanoscientists. Here tacit rules are followed in the production process of visualizations. This contrasts with presentational aspects where nanoscientists are faced with choices, and have to discuss and defend them. Here it is still impossible to follow tacit rules. These presentational aspects might also be closed down in further development of nanotechnology. The paper asks whether it might be important to keep choices visible. Keywords: Visualization practices, science images, nanoscience/technology.
-
Upload
khangminh22 -
Category
Documents
-
view
1 -
download
0
Transcript of Visualizing the Invisible Nanoscale Study

Introduction and Basic Questions
In newspapers and magazines, one can see pictures, often colourful pictures, of structures at the nanoscale, i.e. with dimensions from one to one hundred billionths of a meter. In scientifi c journals ‘photographs’, or better, visualizations of digital data created by scanning probe microscopy, are offered to colleague nano-scientists. There is use of model drawings as well, which has by now almost become an art form. In all such cases, the challenge of visualizing the invisible has to be met. In this article we will focus on the visualisation practices
of nano-scientists: how they meet the challenges of visualisation, and what sort of practices and routines emerge.
What are these challenges of visualisation? Studying the invisible is built on inferences (Nordmann, 2008), for example about molecules and their structure, or about electrons and their charge. Over time, such inferences may cohere and form a plausible picture of what remains unknown in terms of direct observation. There may be instruments like microscopes purporting to show us worlds that are invisible to our eyes: that is how they have been hailed since their invention in the 17th century. They mediate
Science Studies 1/2010
Science Studies, Vol. 23 (2010) No. 1, 3-36
Visualizing the Invisible Nanoscale Study: Visualization Practices in Nanotechnology Community of Practice
Martin Ruivenkamp and Arie Rip
How does one know what is the right way to visualize the invisible nanoscale? Practices in the visualization processes are studied by moving about in the fi eld of nanoscience/technology. Nine important aspects of visualization processes have been identifi ed. Based on nanoscientists’ responses to a small survey, it is argued that some of these aspects–preparatory techniques–which link up to the experimenter’s and visualization regress, are invisible to nanoscientists. Here tacit rules are followed in the production process of visualizations. This contrasts with presentational aspects where nanoscientists are faced with choices, and have to discuss and defend them. Here it is still impossible to follow tacit rules. These presentational aspects might also be closed down in further development of nanotechnology. The paper asks whether it might be important to keep choices visible.
Keywords: Visualization practices, science images, nanoscience/technology.

Science Studies 1/2010
4
the invisible, but cannot make it visible as such. Thus, the reliance on inferences remains, now about the working of such instruments and how faithful they are to the invisible phenomena they transform into something that is visible to us.
Such problems have been highlighted by Collins (1992) when he introduced the notion of an experimenter’s regress. The unknown is to be captured in an experiment, using instruments adequate to the task. However, we do not know whether the instrument is adequate until we are sure it gives us the correct readings. But since the phenomenon itself is unknown yet, there is no way to decide what correct readings are;
we won’t know if we have built a good detector until we have tried it and obtained the correct outcome. But we don’t know what the correct outcome is until . . . and so on ad infi nitum (Collins, 1992, p. 84).
Such a principle regress can (and will) be stopped in practice when expectations about what the phenomenon is like, become shared. Millikan’s analysis of electrons presumably “riding” on the oil drops in his experiments is a case in point. While other expectations, as those of Ehrenhaft about sub-electrons, led to other assessments of what were correct readings in the experiments, over time closure occurred (Holton, 1978). From this brief description it is already clear that Millikan’s and Ehrenhaft’s research strategies were so-called bootstrap operations (as discussed by Agassi (1973) for tests in science): conduct the experiments as if the hypothesis to be tested were true, and if a coherent set of results emerges, and continues to emerge, that is a good reason to consider the hypothesis to be justifi ed. Such “virtuous
circles” are a general phenomenon, not limited to science, and the phrase ‘bootstrap operation’ is used widely.1
With the emergence of imaging techniques as valid instruments in their own right–from telescopes and microscopes to spectrometers, electron microscopy, magnetic resonance imaging, and now also scanning probe microscopy–the experimenter’s regress is stopped by reference to the validity of the imaging techniques: if a cell structure appears in the electron microscope image it must be real, because we trust electron microscopy. The decision about the reality of the image is delegated to the technique–until problems arise, and the role of expectations becomes visible.2
While the experimenter’s regress remains lurking in the background, with the reliance on imaging techniques, a further regress plays a role: the visualization regress. Which way of producing images/pictures leads to reliable representations of the invisible? A fi rst-round criterion would be replicability: the same pictures would be obtained with the same samples. But how to be sure that the samples are the same?3 And what counts as the ‘same picture’ if what one has to work on are dark and light grey blobs that have to be interpreted?4 Again, practitioners will bootstrap: start with an idea, experiment, share interpretations, and fi nd out what works when building on such preliminary insights. Some stabilisation will occur in the relevant communities of practice (Wenger, 1998).
In nano-science, so dependent on new instruments and imaging techniques, the visualisation regress is defi nitely a challenge. Thus, it is a site for science & technology studies (STS) scholars to study emerging ways of handling the visualisation regress, and how these ways

5
of handling may now become stabilized into accepted, and thus sometimes almost invisible, routines.
As we will discuss in more detail in section 2 when we present our research design, our entrance point is the nano-science community of practice. We observed what happens by moving around in this world, and also elicited responses to questions about visualisation practices. An important issue turned out to be how to clearly present fi ndings to colleagues and other audiences, even if it is not clear what they actually are. Thus, there is a third regress, the clarifi cation regress, already in communication and enrolment of colleagues. We expect some routinization to occur there as well.
Nano-science and the Visualization RegressExpectations about what is a good visualization (or a good experiment, for that matter) are the key in handling regresses productively. Once they are more or less stabilized, they turn the instrument or the picture into something that can be built upon in further work. Instruments are used to observe unknown phenomena, but when accepted as valid, these same instruments also create a reality for that phenomenon, and change from observing into creating instruments. “Facts can only be generated by ‘good’ instruments but ‘good’ instruments can only be recognized as such if they produce facts” (Godin & Gingras, 2002: 137). Such created phenomena then become the basis for further work. This is a general point about stopping an experimenter’s regress. In their examination of a controversy surrounding the Lumelsky protocol,5 Michael et al. (2007: 7) argue that “the discrediting of the protocol marks not only the breaking of the experimenters’ regress and the triumph
of a given faction within the core set [Moreover,] it also refl ects and mediates continuing research associations into the future”.
The prospect of such a change motivates expectations about what will be revealed about the unknown phenomenon. When shared, this will stop the experimenter’s regress. Of course, such expectations will be tested in ongoing practices as to their adequacy, and may thus come in for revision. There will be learning, even while there is no independent standard against which to check the fi ndings and claims.6
Similarly, expectations about how the invisible phenomena should “look” like can provisionally stop the visualization regress. An important aspect is that there can be references to visible phenomena, as when new infrared or radio-astronomical telescopes have to produce images that are like the visible images of bright stars, i.e. discrete, high-intensity points. Thus, the so-called “sharpening programs” should produce such discrete points (Lynch and Edgerton, 1988: 208). We will come back to the studies of Lynch and Edgerton (1988) of visualisation in astronomy based on digital image processing, which have a longer history and are thus instructive. The key difference is that imaging in astronomy is continuous with optical observations, while in nanotechnology no recourse to optical observation is possible.
For atoms and electrons, there is now a visual convention (at least for external consumption) in which they are pictured as a little billiard balls (see Figure 1). This is helpful to convey a message, but can become a constraint on visualizations. This happens for visualizations of the nanoscale: to speak to audiences, there must be discrete shapes, like balls or tubes. In other words, Scanning
Martin Ruivenkamp and Arie Rip

Science Studies 1/2010
6
Tunneling Microscopy (STM) and Atomic Force Microscopy (AFM) pictures can’t be just blobs of darker and lighter grey. To count as a good picture, some sharpening is necessary. For phenomena at the nanoscale, we tend to fall back on received conceptions, not of what molecules and surfaces actually look like (we don’t know), but how to picture them. There is some freedom to play with the images, though. When Eigler and Schweizer (1990) presented a picture of the IBM logo they had created with the same instrument, STM, with which they observed it, they made the Xenon atoms look like drops on a surface (see Figure 2). There is a further aspect. At the nanoscale, properties of materials differ from the properties of the same materials at the macro-scale. Even when the chemical composition of materials is the same, at the nanoscale there are novel surface effects and quantum phenomena. Characteristics such as strength, hardness, electric conductivity, melting point, and colour, can be different at the nanoscale.
Because materials at the nanoscale behave so differently from conventional materials, we’re starting all over again, in a way, to understand how and why these nanomaterials function (Foster, January 3, 2006, quoting Wiederrecht).
When ‘starting all over again’ the experimenter’s regress and the visualization regress have to be addressed together, because the nanoscale needs to be visualized in order to be able to study it. Indeed, to some extent analysis is now analysis of the pictures–which have been made so as to be accepted as a ‘good’ picture, using the right instruments and the right imaging techniques. Ideas of what can be ‘seen’ at the nanoscale evolve together with experience of what are right techniques and what counts as good pictures.
Actually, what we call ‘seeing’ at the nanoscale is actually more like ‘feeling’ (Pitt, 2004). Imaging techniques like the STM and AFM work with a probe, also called tip, which hovers over a surface
Figure 1. ‘Balls and Stick Model’Balls and stick models show an earlier tradition of making the invisibile visible.Source: http://www.pugetsound.edu/Images/Academics/Chemistry/ModelKitsFull.jpg
Figure 2. Eigler and Schweizer used an STM to position individual xenon atoms on a nickel surface and created the IBM logo at the nanoscale. Note how the xenon atoms look like little balls. Image originally created by IBM Corporation Cf. Eigler and Schweizer (1990).
7
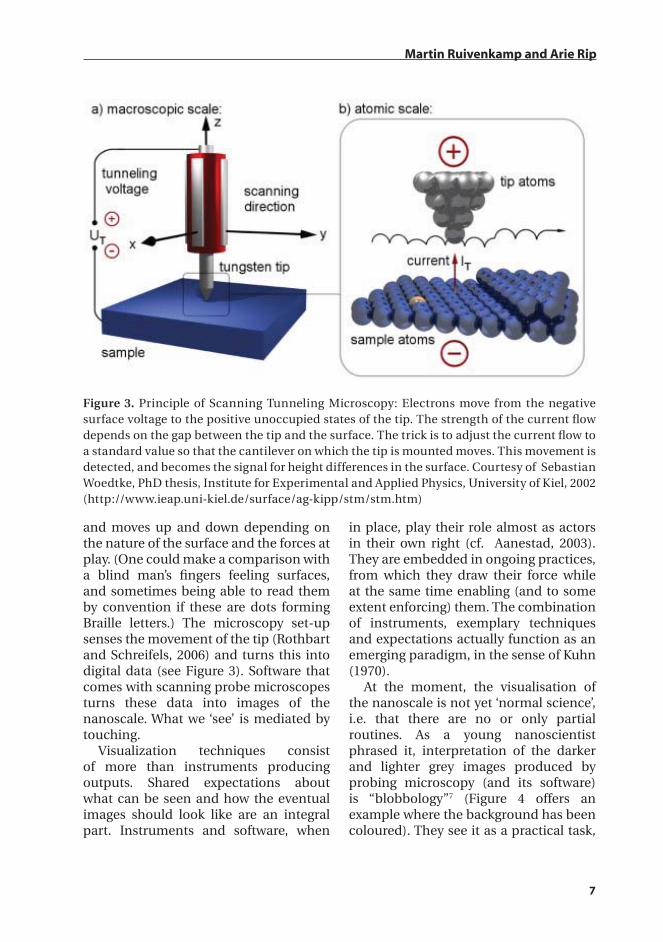
and moves up and down depending on the nature of the surface and the forces at play. (One could make a comparison with a blind man’s fi ngers feeling surfaces, and sometimes being able to read them by convention if these are dots forming Braille letters.) The microscopy set-up senses the movement of the tip (Rothbart and Schreifels, 2006) and turns this into digital data (see Figure 3). Software that comes with scanning probe microscopes turns these data into images of the nanoscale. What we ‘see’ is mediated by touching.
Visualization techniques consist of more than instruments producing outputs. Shared expectations about what can be seen and how the eventual images should look like are an integral part. Instruments and software, when
in place, play their role almost as actors in their own right (cf. Aanestad, 2003). They are embedded in ongoing practices, from which they draw their force while at the same time enabling (and to some extent enforcing) them. The combination of instruments, exemplary techniques and expectations actually function as an emerging paradigm, in the sense of Kuhn (1970).
At the moment, the visualisation of the nanoscale is not yet ‘normal science’, i.e. that there are no or only partial routines. As a young nanoscientist phrased it, interpretation of the darker and lighter grey images produced by probing microscopy (and its software) is “blobbology”7 (Figure 4 offers an example where the background has been coloured). They see it as a practical task,
Martin Ruivenkamp and Arie Rip
Figure 3. Principle of Scanning Tunneling Microscopy: Electrons move from the negative surface voltage to the positive unoccupied states of the tip. The strength of the current fl ow depends on the gap between the tip and the surface. The trick is to adjust the current fl ow to a standard value so that the cantilever on which the tip is mounted moves. This movement is detected, and becomes the signal for height differences in the surface. Courtesy of Sebastian Woedtke, PhD thesis, Institute for Experimental and Applied Physics, University of Kiel, 2002 (http://www.ieap.uni-kiel.de/surface/ag-kipp/stm/stm.htm)

Science Studies 1/2010
8
something that they have to become competent in. And they still see the risks of their bootstrap operation to overcome the visualization regress. As one respondent phrased it:
One can get stuck too much into his own ideas/expectations which could result in some sort of self-deception where one tends to show images that fi t one’s theory and neglect others. (Participant 16)
There will also be more or less authoritative rules for visualisation, for example set by journal editors who are concerned about communicating to their audiences. These are a further way to short-circuit visualization puzzles, by stipulating what the image producer has to conform to be accepted.
Visualization as a Core Activity of Nanotechnology Communities of Practice Expectations and emerging routines are carried by a community of practice. The term ‘community of practice’ has become widely known because of Wenger (1998) who focuses on (organizational) learning and knowledge management. But it is also useful to characterize distributed but mutually dependent communities
constituting a research area or specialty in science8. Wenger’s notions of ‘reifi cation’ and ‘participation’ still apply, but the practices are now oriented to open-ended search, under more or less controlled circumstances, for patterns and regularities in the natural and social world. There are other relevant concepts, like ‘social world’ (Strauss, 1978; Becker, 1982) defi ned by a core activity. And there is Activity Theory (Miettinen, 1998; Engeström, 1987), which includes the reconstruction of core activities. Our use of the notion of ‘community of practice’ serves to highlight, fi rst, that there are core activities around which the community builds itself, and second, that search strategies and interaction strategies co-evolve to become rules of practice for the community. Such rules include ways of handling artefacts and producing images. As D’Adderio (from the perspective of Performativity Theory) emphasizes, “routines are not simply people-embodied but highly distributed across a complex web of people and everyday artefacts.” (D’Adderio 2008: 770)
In nanotechnology’s communities of practice, visualization of the nanoscale is a core-activity. Scientists will not only “do” (and further develop) the practices necessary to study invisible phenomena, they will also realize that they are deliberately creating a specifi c reality. The work that needs to be carried out to produce visualizations is still ‘visible’ to the scientists but not completely routinized. In what they do, one still sees a process of inference toward best visualizations.
Figure 4. Visualizations of the nanoscale are sometimes described as ‘blobbology’. Courtesy of AFM image: Stuart Lindsay of Arizona State University; cf. Wang, et al., (2004).

9
However, after some time the specifi city of that work can become invisible to the scientists. Oudshoorn (2006) indicates various ways of work becoming invisible:
The ways in which work can become invisible to the scientists are manifold. Work may become invisible because it is taken for granted (secretaries, parents), because of its social status (cleaners), because it is unpaid (caring and domestic work), or because it is absent in formal representations of work (system design, protocols and standards) (Oudshoorn, 2006: 2).
In addition, when work is delegated to software, as in automation in organizations, it not only becomes invisible, but the software may be designed and implemented so as to structure the activities of its users, intentionally or unintentionally. In any case, in the process of visualizing the nanoscale the use of software, protocols and standards make the actual work that is necessary and now delegated to software and routines unproblematic, and thus ‘invisible’. The use of certain imaging techniques and the following specifi c expectations becomes taken for granted, and thus internalized in the behaviour of the scientists carrying out the research. Because of the regresses and precarious bootstrap operations to overcome them, this is not a simple and smooth process. In Lynch (1985), this is highlighted by showing how the suspicion of occurrence of an artefact in microscopy suddenly makes unquestioned techniques and procedures problematic–a natural breaching experiment, as ethnomethodologists would call it.
Such necessary and eventually unquestioned usages have been discussed in the literature as tacit rules.
“These rules may or may not be explicit or capable of reasoned justifi cation, but their distinctive feature is that of being tacit at the moment of use” (Eraut, 2000; p. 127). Giddens (1979) argues that tacit rules are linked to tacit knowledge, or as Giddens sometimes calls it ‘practical consciousness’ and “a redefi nition of knowledge as practice”; a ‘knowing’ of the rules, which through following these rules, one can realize activities. “Knowledge is thus something people have – even though most of them do not know they have it–by virtue of being competent individuals” (Carter, 2001; p 114; italics added). Tacit rules are a key ingredient of the internal functioning of a community of practice.
Rules are also important for the interaction with other communities of practice and with broader audiences. For images, the challenge then is to reach an audience that has little experience with the image and its’ construction. What is unknown now is the impact the image to-be-constructed will have on the intended audience. One way to learn is to test images, as designers tend to do for their designs. In practice, there is little testing and image construction is short-circuited, using preconceptions about the audience, earlier experiences, suggestions from colleagues and etcetera. But even with systematic testing, there is no guarantee that the image will reach the audience9. For our question of visualization, the additional problem is that there is a diffuse message about the nanoscale which has to be presented as clearly–and thus convincingly–as possible; while the actual content and thrust of the message is not yet clear. Thus, one can speak of a clarifi cation regress.
Design of nano-images can start as open-ended creative imagination, i.e. variation in its own right, but anticipation
Martin Ruivenkamp and Arie Rip

Science Studies 1/2010
10
on at best only partially known audience requirements kicks in quickly. It is a bootstrap operation again, so there is no guarantee that the picture, as designed, will have the intended effect. Over time, of course, rules may develop and become tacit.
Thus, in nanotechnology’s communi-ties of practice tacit rules may be followed to deal with the experimenter’s visualization, and/or clarifi cation regress. In other words, in visualizing the invisible world at the nano-scale, some aspects of the work carried out to do so become invisible to the scientists themselves (unless their routines are undermined by unexpected encounters).
Research Design
In mapping an emerging practice, where some aspects of the process of visualizing the nanoscale remain visible and other aspects become invisible to the scientists active in nanotechnology’s community of practice, we must also have ways to fi nd out about the tacit, invisible rules. This is not a simple task. There is the ethnomethodological approach of breaching experiments which force members to react and thus make rules visible–at least to the experimenter (Garfi nkel, 1986). Another approach, and the one which we have followed, is to move about in the world of the community of practice, here of nanoscientists, and observe what is happening and how that can be understood.
When moving about, we realized that we would be at fi rst seen as outsiders, and that this would have implications for what we would hear and not hear. As Gilbert and Mulkay (1984) have shown, there is a ‘contingent’ repertoire visible in informal talk within the community, where all the local and personal and
interest-led activities and ideas can be mentioned. And there is a repertoire (which Gilbert and Mulkay called ‘empiricist’) fi t for external consumption, because it demonstrates the rationality of the scientifi c endeavours. Rip (2006) has developed this point, arguing that the ‘rational’ repertoire is not just a façade, hiding the “soft underbelly” of science, but also a constraint on practices otherwise being driven by contingencies and circumstances10. For the visiting anthropologist to fi nd out about the ‘contingent’ repertoire,11 s/he has to become accepted as a temporary member who can participate in the informal interactions.12
Accordingly, a key step in the research design was to become a (temporary) insider to the community of practice. Both authors were involved in the European Union Network of Excellence (NoE) ‘Frontiers’.13 For this article, the involvement of the fi rst author (MR) was particularly important. As a visitor to the nanoscience and nanotechnology community constituted through NoE Frontiers, MR was present at meetings, conferences and workshops where nano-scientists presented their work. Over time, it consolidated MR’s position as somewhat of an insider to the community of practice. Such movement also allowed data collection. MR kept fi eld notes: “a running commentary to oneself and/or research team, and an important means to accomplish an overlap between collection, coding and analysis of data” (Eisenhardt 1989: 538).
More dedicated interactions occurred at a Winterschool organized by Frontiers ‘Exploring New Frontiers in Bio/Nano’ (Zermatt, March 2007), and at a seminar in Cambridge (May 2007). In both cases, MR gave a brief talk about the production, use and reading of images of the nanoscale

11
from a sociological perspective. He used the link with the Constructive Technology Assessment programme of Frontiers (http://www.technologyassessment.info/) to further reinforce in-group feelings with the audience. His other (social science) disciplinary background was accepted, and there was no barrier for participants to use the C-repertoire in discussing the processes of visualizing the nanoscale.
Another key step of the research design is to identify relevant aspects of the processes of visualizing the nanoscale, as a core activity of the community of practice. Simply asking the experts, i.e. members of the community with suffi cient experience, is not enough since aspects that have become invisible, in the sense of taken-for-granted routines, will not come up. The analyst might prod the experts about the tacit aspects, but to do so must have developed insights of his own about where to prod, and how. This is where ‘moving about’ in the nano-world comes in again: being an insider is not just a matter of being socially accepted, it also implies a competence that is gradually built up.
To create an independent basis for the analyst, we did not only rely on what we encountered in the nano-world, but also used functional analysis: what are socio-technological requirements of the visualisation process?
Instruments are needed that can reveal the nanoscale by providing raw (digital or analogue) data that need to be transformed into raw images.
Specifi c practices must occur in the manipulation of images, encouraged and constrained by the technical possibilities–making it possible to highlight what is of interest–and the strategic choices–about what needs to be highlighted.
Images will be displayed, so there are requirements to be met, linked to how these images will be (and should be) read by the community of practice. While there will be locally and/or individually preferred ways to do so, by following the rules of the community of practice (existing or emerging to address the challenge of making the nanoscale visible) there is some assurance of acceptance and uptake by others.
There are further outlets for the images, like covers of scientifi c journals which come with their own requirements. Uptake of images, e.g. by the media, is not in the hands of the image producer anymore, although s/he may be involved.
This adds up to a framework for our research, in which three clusters of relevant aspects are distinguished. We will develop these aspects in some detail in Findings, fi rst chapter on page 14. Here, we discuss the questionnaire that was handed out to participants in the Frontiers Winterschool and the Cambridge meeting, which was based on the three clusters. In the questionnaire, open questions for each of the three clusters were used, which stimulated participants to think about their own practices in the visualization of the nanoscale. Figure 5 offers a visualization of this part of our research design.
The way the fi rst question is formulated goes further than the production of raw data and raw images, and asks about the choices that need to be made in the production of publishable images. Thus, there will be overlap with the second cluster of aspects. We phrased the question this way to make sure that the respondents would be interested in thinking about it and coming up with a good response.
Martin Ruivenkamp and Arie Rip

Science Studies 1/2010
12
I. Within your fi eld of work different imaging techniques (AFM, STM, etc) are used which affect the sort of image you can produce. There are also further choices. What sort of choices do you have to make? Are there certain requirements on the images you produce? (Think of colours you want or are allowed to use; the size of the image; the clarity of the represented, etc). Possibly to the purpose these images have to serve. Can you give me examples where these choices are particularly clear?
The second question was phrased in terms of problems or challenges in the production processes of images and their use. Technological possibilities (including software and printing) are enabling as well as constraining, and we phrased the question so as to fi nd out how respondents handled the tensions.
II. Have you experienced problems or challenges in the production of images or in the use of images you produced? (For example while publishing or giving presentations). If so, what sort of problems or challenges did you come across? Can you give me three concrete examples?
The third question aimed to elicit responses about rules in the community of practice, and also took into account the heterogeneity of nanoscience. This is because in earlier research, we found clear differences between the images produced by chemists, physicists, biologists and engineers, and also a trend to more engineering-type pictures (Robinson & Ruivenkamp, 2006).
III. In your production and use of images, do you take into account what is usual in the fi eld you are working? What is actually usual in your fi eld? Can you give me a
Figure 5. Three clusters of aspects relevant for the visualization processes, leading to three open questions in the questionnaire.
Socio-technological Visualization process
Invisible
Question I ‘Choices’
Question II ‘Problems & Challenges’
Question III ‘What is usual in your field?’
Technical Possibilities & Strategic Choices
Functionalities of the instruments Nature of the
Community of Practice
Visible

13
few examples? What about the production and use of images in other fi elds? (Think of differences between chemistry, physics, biology, etc.) Do you take up some things from other fi elds? Why or why not? Can you give me a few examples?
The questionnaire included a fourth question, presented as an afterthought, which asked participants about the ways images produced in domains beyond the scientifi c domain are taken into account in the scientifi c fi eld in which they are active. This question was posed in order to gain insights about the circulation of images within and beyond the scientifi c domain. This is the topic of another study, and the responses to this fourth question will not be used in this paper.
Our sample of nanoscientists was defi ned by the opportunities we had to interact, and create a sense of rapport with. Thus, the quality of the responses was high. At the two meetings, a total of 50 questionnaires were handed out, of which 32 were fi lled out and returned. 15 PhD-students, 11 post-docs, 4 senior scientists and 2 respondents who did not mention their position, fi lled out the questionnaire. This is actually a good cross-section of the population of scientists active in the fi eld of nanotechnology. All respondents were members of Frontiers, and had a good research record. Some of the PhD-students and Post-docs had already co-authored publication(s) in journals like Nature and Science. Thus, there was no reason to separate, in the analysis, the responses of PhD-students, post-docs and senior scientists. Our sample captured scientists of all professional ages who were active in nanotechnology’s community of practice.
The responses, while varied in scope, turned out to provide rich data. We used them in two ways. First, they were
a source to check, perhaps qualify, the aspects of the socio-technological visualization process that we stipulated. Our original identifi cation of aspects is presented in Findings, fi rst chapter on page 14, as a fi nding from our analysis, and their further empirical qualifi cation is presented in the Findings subsection on page 21. Second, a content analysis was made of the responses, which we linked to the list of relevant aspects so as to fi nd out which aspects were mentioned out of the respondents’ own accord, and which were not. We interpret little or no mention as an indicator that the aspect has become tacit: routinized or otherwise backgrounded.
The content analysis took a grounded approach by starting with identifying items as these were distinguished discursively, and sometimes also through lay-out, by the respondents themselves. Items would be short sentences, or part of sentences with a single focus and thus addressing one specifi c topic. Some respondents used bullet points in their answers. If a bullet-point addressed one specifi c topic, it was used as an item. If the bullet-points addressed two or more topics, or if the response was extensive, a distinction was made between parts of the answer to be used as separate items. For example, in the quote below, there is continuity of thought, but clearly two different items, already indicated by the shift from “I” to “you”:
I have not had personal problems with the publication or presentation of images. … More and more, at conference you see cover art shown in presentations, suggesting that ‘making it to the cover’ indicates quality of the research” (Participant 11)
The number of items in the responses to the questions refl ects the degree of
Martin Ruivenkamp and Arie Rip

Science Studies 1/2010
14
articulation of that part of the response, and thus of the issues discussed. A high degree of articulation may be related to an absence of closure, i.e. when approaches are not yet standardized and must be tried-out and discussed, and/or to the salience of choices to be made, for example which research designs and instrumentation should be invested in.
This syntactic exercise was complemented with a semantic analysis. This step is necessary for linking the occurrence of certain items to the aspects of the visualisation process that we distinguished in our analysis, and fi nd out which aspects are articulated and which are less prominent, i.e. less visible in the practice. To remain close to the responses, we interpreted all syntactically distinguished items (in their context) as to the issue they addressed. Items could address the same issue. Through this further grounded step, we identifi ed 59 issues. These issues were then linked to the relevant aspects of the visualization process that we–as self-styled experts–had defi ned (see Findings, fi rst chapter on page 14). For example, the issue ‘Choosing the right imaging technique’ was addressed in 14 items (all under Question I) and was linked to the aspect ‘Imaging technique/instrument’. The issue ‘colours may be changed by publishers’ occurred in one item only (under Question II). It was linked to the aspect of ‘rules that have to be followed’.
The list of issues is thus a bridge between the items found in the responses and the aspects we specifi ed as relevant for the process of socio-technological visualisation of the nanoscale. It enabled us to use the number of items found to be relevant for each of the aspects as an indication of its visibility in the community of practice. Few items means little articulation in the responses, and thus (we claim) little need of being
articulate because these aspects have become accepted and routinized. In the presentation and analysis of our fi ndings, we do not discuss the list of issues anymore. The ‘bridge’ has served its purpose.
Findings
Moving about in nanotechnology’s community of practice allowed us to identify aspects important in the visualization practices of the nanoscale. Additional evidence for the identifi cation of these aspects has been obtained through qualitative analysis of the answers to the questionnaire. This analysis also offers an indication of how scientists cope with the experimenters’, the visualization and the clarifi cation regress. A quantitative analysis of the responses to the questionnaire was used to check the visibility of the various aspects in practice.
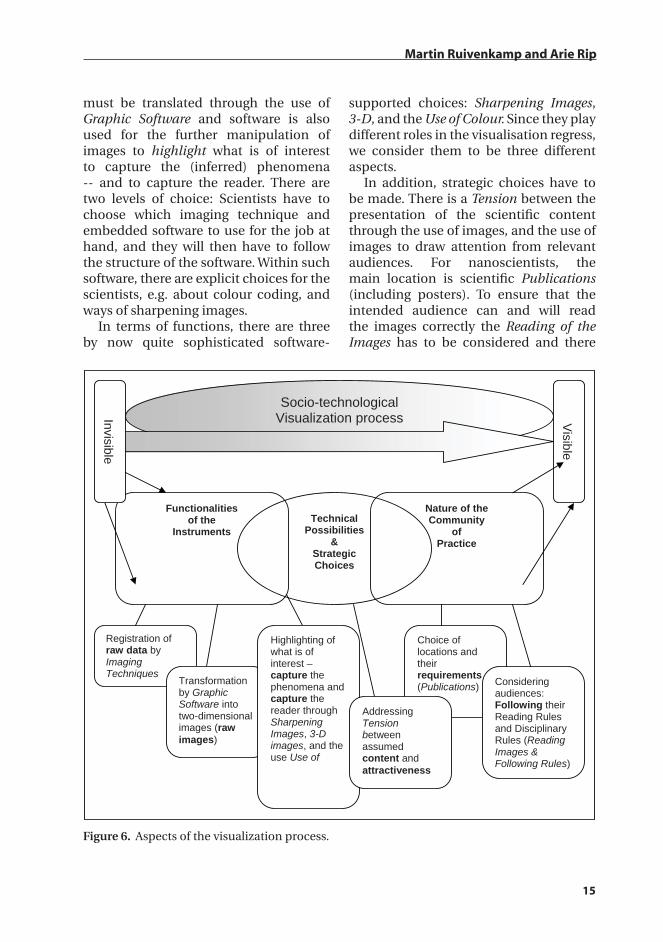
Aspects Relevant to the Socio-Technological Visualization ProcessThe functions that are necessary in visualization processes (cf. Figure 5) were further developed into six steps: Registration of raw data, their transformation, highlighting of what is of interest in the images, addressing tensions, choosing locations to display images, and considering audiences. When there are different activities, some steps contain more than one aspect. The net result (also depicted in Figure 6) is a set of nine relevant aspects.
In the visualization processes, instruments are needed that can register the nanoscale and provide raw data, which needs to be transformed into images. Some Imaging Techniques have software incorporated already where this transformation automatically takes place, providing raw images. Raw data
15
must be translated through the use of Graphic Software and software is also used for the further manipulation of images to highlight what is of interest to capture the (inferred) phenomena -- and to capture the reader. There are two levels of choice: Scientists have to choose which imaging technique and embedded software to use for the job at hand, and they will then have to follow the structure of the software. Within such software, there are explicit choices for the scientists, e.g. about colour coding, and ways of sharpening images.
In terms of functions, there are three by now quite sophisticated software-
supported choices: Sharpening Images, 3-D, and the Use of Colour. Since they play different roles in the visualisation regress, we consider them to be three different aspects.
In addition, strategic choices have to be made. There is a Tension between the presentation of the scientifi c content through the use of images, and the use of images to draw attention from relevant audiences. For nanoscientists, the main location is scientifi c Publications (including posters). To ensure that the intended audience can and will read the images correctly the Reading of the Images has to be considered and there
Martin Ruivenkamp and Arie Rip
Functionalities of the
Instruments
Nature of the Community
of Practice
TechnicalPossibilities
& Strategic Choices
Socio-technological Visualization process Invisible
Visible
Registration of raw data by Imaging Techniques
Choice of locations and their requirements (Publications) Transformation
by Graphic Software into two-dimensional images (raw images)
Considering audiences: Following their Reading Rules and Disciplinary Rules (Reading Images & Following Rules)
Highlighting of what is of interest – capture the phenomena and capture the reader through Sharpening Images, 3-D images, and the use Use of
Addressing Tension between assumed content and attractiveness
Figure 6. Aspects of the visualization process.

Science Studies 1/2010
16
are Rules to be Followed, e.g. as set by the journal. These same two aspects are also important in communication with non-scientifi c audiences, but we have no systematic data on this.
The exact labels that we use here are less important than that we capture to characterize relevant aspects in this way. Our brief descriptions of each of the aspects refer not only to relevant social-science and science and engineering literature, but are also are recognizable to nanoscientists. We present them as worthy of consideration in their own right. In the Findings subsection on page 21 we will expand on them, using (mainly) questionnaire responses from nanoscientists.
- Imaging Techniques include Scanning Tunneling Microscopy and Atomic Force Microscopy, both probing surfaces with a tip that moves up and down. Other instruments are available offering additional raw data. “Instrumentation is central to nanoscience” (Mody, 2004: 120), and their improvement and extension of scope (e.g. using Scanning Tunneling Microscopy in the liquid phase) are research projects in their own right (e.g. Binnig & Rohrer, 1986; Wiesendanger, 1994; Pan et al, 1998).
- Graphic Software which transforms raw data into two-dimensional images. Production of graphic software for scientifi c purposes is a business in its own right. For nanoscience, there is some dedicated supply, and there is some choice. By now, software can be integrated in the imaging instrument, so that the researcher can only specify parameters,
for example the shades of grey that will be used. This is linked to requirements in publications, for example to add a bar to the image showing the shades of grey chosen (cf. below, ‘Following Rules’). Graphic software allows for easy analysis and manipulation of images, “and is on its way to becoming an everyday laboratory instrument” (West & Starostina, 2004: 35). Moreover, it is an important nanoengineering tool as well, used for modelling virtual reality, molecular dynamics, and 3D images of the nanoscale (Sitti et al., 1998; Lee et al., 2004)
It is accepted to ‘manipulate’ images in order to present the scientifi c content more clearly–without changing it–or to attract attention to this content by making the image more appealing to specifi c audiences. Scientists often use terminology like “editing” or “smoothing” or “enhancing”. As Lynch (1991; 70) phrased it:
(...) the picture is progressively composed and shaped to “get the phenomenon out of the data” and, relatedly, to “make the thing look like what it is” (Garfi nkel et al. 1989).”
In the case of astronomical images, raw numerical data are by now “processed” in a dedicated Image Processing Facility. The available software comes with manuals to instruct the user, about settings used to isolate and enhance objects of interest, so that they appear to be coherent.
A sense of what the picture shows guides the project: a sense of how many pixels the object’s profi le should cover; what intensities and intensity gradients are appropriate for a “point

17
source” versus a nebular object; and what order of symmetry and asymmetry should be expected. This and the various other operations–for example, sharpening the contours and resolution of the image–are guided by a variety of practical and theoretical assumptions: about the operations of the equipment, about the sensitivities of the detecting system, about singular conditions at the observatory at the time the picture was taken, about the thermodynamic properties of light scattering, and so forth.” (Lynch, 1991; 70 – the text continues with the summary sentence quoted above)
In line with what Lynch (1991) highlights for astronomical images, we distinguish three ways of manipulating images. They serve the same overall purpose, but offer different opportunities for manipulation of the “raw data”.
- Sharpening Images; reducing noise and emphasizing edges are frequently used tools to sharpen images. Noise in radio communication is like a background hiss that makes it diffi cult to discern the signal. The ‘hiss’ of noise is a problem in the production of images as well. The ‘feeling’ of surfaces by probes offers numerical arrays of data which are full of noise, compromising the level of detail of the images. As Lynch (1991; 70) found for his case of astronomical image processing, “the data frame [or “raw data”] is not treated as a pristine refl ection of “reality” but as the residue from a confused fi eld where electronic noise, detector defects, ambient radiation, and cloudy skies mingle indiscriminately with the signal from a source object.
The processed image is often considered the more accurate and “natural” rendering.” Similarly, to see all details of the nanoscale, noise needs to be reduced. In this process, it is up to the scientist to recognize important details of the nanoscale and to improve visibility of these details. One way to achieve this is through the use of various fi lters (Wojnar, 1999). In addition to subtracting or otherwise managing noise, the image can be sharpened also by emphasizing edges–edges mark the boundaries between two surfaces–which leaves lines looking more contrasted. Emphasizing edges is one of the “basic tools for extracting features being detected from the original image” (Wojnar, 1999: 44). By emphasizing edges, visualizations of the nanoscale are sharpened, and what is relevant scientifi cally (hopefully) become
Martin Ruivenkamp and Arie Rip
Figure 7. Sharpening images increases vis-ibility at the nanoscale. This image depicts a carbon nanotube. Courtesy of Novascan (Image produced through the use of a No-vascan ESPM 3D Atomic Force Microscope).

Science Studies 1/2010
18
more clearly visible (see Figure 7).- 3-D (three dimensional images); 3D
images can be generated from 2D visualizations taken from different angles (Koster et al., 2000). 3D visualizations allow scientists to change viewing perspectives, and thus to use their own specialized knowledge to recognize structures and to understand the relationships of the components of structures at the nanoscale (Gates et al., 1999; Wörle-Knirsch et al., 2006). Thus, 3D images become objects of study in their own right.
- Use of Colour; “What is expressed in language through the choice between different word classes and clause structures, may, in visual communication, be expressed through the choice between different uses of colour…and this will affect meaning.” (Kress & Van Leeuwen, 2006: 2). In astronomy, with its legacy of visual observation and its possibility to detect infrared light which is then depicted in a red colour, the notion of making “realistic” and only “slightly colour enhanced” pictures is prevalent.15 At the same time, it is possible to use “false colour”, that is, colour as a code for any of a variety of values (Lynch, 1991). “The code [may be] selected intuitively to suggest properties the object should have” Lynch (1991: 71). This introduces tensions:
... a sense of responsibility to produce ‘kind of honest’ representations [... there are] innumerable possibilities for doing otherwise. [But]… these things have no true colour anyway. [Lynch interjects:] At this stage of the game, there seems not to be a very tight sense of what a picture should look like. So,
for instance, one astronomer said in an interview that virtually anything goes, as long as the ‘look up table’ (correspondence between palette and intensities) is published; at the same time, however, he indicated that using colours to ‘tease out’ slight variations in signal against backgrounds can be controversial (Lynch (1991: 71).
While there are no colours at the nanoscale, images are coloured, and thus given meanings. There appear to be informal standards. A PhD-student who studied surfaces of the nanoscale had produced an image of a nanosurface using a colour of her own choice. Her supervisor disagreed: she should have used blue, since this shows height differences easier, or orange, since orange is a ‘realistic’ colour to present the world at the nanoscale. Clearly, conventions have emerged, even if nanoscientists would not phrase it that way. Similarly, Lynch and Edgerton (1988: 201) found that their informants did not think that conventions for using false colour had emerged in astronomy. But they noted that in magazines like Sky and Telescope a particular colour palette dominated, where dark blue or black is used for low intensity ‘background’ sky, one or more lighter shades of blue for slightly higher intensities, and then yellow, red, and sometimes white for highest intensities. “When we raised the possibility that this was a ‘conventional’ palette, our informants seemed indifferent to the existence of such a convention and unaware of how it may have emerged, perhaps because, for them, this palette seemed so ‘natural’ as not to be worthy of interest.”
The next step is anticipation on eventual use: how to be attractive to an audience, including attracting their interest by offering a clear picture of the
19
object. This was already visible in our discussion of astronomical images, and leads on to the notion of ‘pretty pictures’, important for promoting astronomical research, directly in grant proposals, and indirectly in popular publications. As Lynch and Edgerton (1988) found, such aesthetic appeal to outside audiences was seen as separate from their professional work. But in actual practices, as one of their informants told them, a considerable amount of time would be spent in cleaning up the data set into a more visually attractive one.16
It is clear that there are tensions, and these are not limited to the aesthetics aspect. Anticipation on where, and to whom images will be presented, implies strategic choices about the purpose that the produced images will have to serve and how the audience can best be reached. Starting from the other side, audiences, especially professional audiences, will have their own requirements and sometimes stipulate them. The anticipations and interactions can be captured in four aspects.
- Tension between audiences: In concrete situations there is a tension: should the scientifi c content be foregrounded as such, or is attracting attention the priority -- if only to make sure the scientifi c content is taken up by the audience.
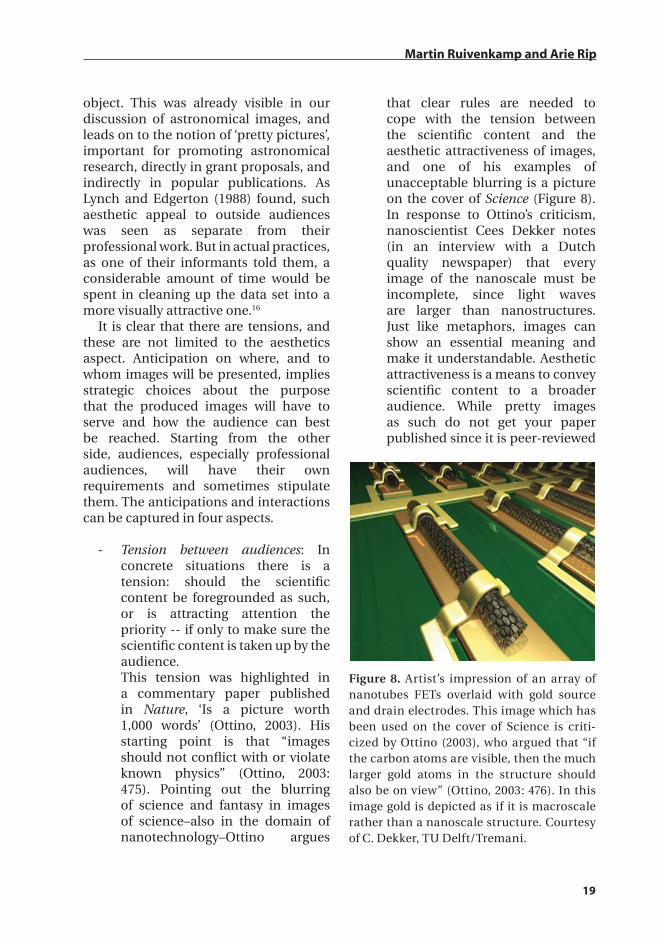
This tension was highlighted in a commentary paper published in Nature, ‘Is a picture worth 1,000 words’ (Ottino, 2003). His starting point is that “images should not confl ict with or violate known physics” (Ottino, 2003: 475). Pointing out the blurring of science and fantasy in images of science–also in the domain of nanotechnology–Ottino argues
that clear rules are needed to cope with the tension between the scientifi c content and the aesthetic attractiveness of images, and one of his examples of unacceptable blurring is a picture on the cover of Science (Figure 8). In response to Ottino’s criticism, nanoscientist Cees Dekker notes (in an interview with a Dutch quality newspaper) that every image of the nanoscale must be incomplete, since light waves are larger than nanostructures. Just like metaphors, images can show an essential meaning and make it understandable. Aesthetic attractiveness is a means to convey scientifi c content to a broader audience. While pretty images as such do not get your paper published since it is peer-reviewed
Martin Ruivenkamp and Arie Rip
Figure 8. Artist’s impression of an array of nanotubes FETs overlaid with gold source and drain electrodes. This image which has been used on the cover of Science is criti-cized by Ottino (2003), who argued that “if the carbon atoms are visible, then the much larger gold atoms in the structure should also be on view” (Ottino, 2003: 476). In this image gold is depicted as if it is macroscale rather than a nanoscale structure. Courtesy of C. Dekker, TU Delft/Tremani.

Science Studies 1/2010
20
by referees, nice images that make it to the cover of journals function as good PR for your research (Michael Persson, de Volkskrant, December 20, 2003). In fact, manuals have been published explaining what the best ways are to make images visually appealing and to improve the quality of images for submission to peer-reviewed academic journals and to make it to the cover 17.
- Publications; Images to be presented at different ‘locations’ and in different contexts shift out from the work in the lab or in a dedicated image processing facility, where data are handled in various ways to create images that are indices of the object being researched. Lynch (1991; 73) calls this a “lateral play” and continues:
The play is brought to a conclusion whenever practitioners attempt to select a picture for an article or slide show. At that point, the task becomes one of composing a picture to illustrate or exemplify a fi nished argument or set of fi ndings. Such pictures are selected to show concisely what will be said about them, and they can be adjusted to fi t their captions. A split thus emerges between the practitioner’s local historical grasp of the image as a moment in an eidetic fl ux versus a treatment of the image as a pure deictic reference conveying an appreciation of the things discussed in an article (Lynch, 1991; 73).
Bridging this “split” is visible in publication spaces for images, for example in the requirements on images as articulated by scientifi c journals and other publication media, and how these are addressed by practitioners producing images. Such
requirements can adhere to scientifi c quality considerations, as in Nano Letters ‘Guidelines for authors’: “images from high resolution transmission electron microscopy and scanning probe microscopy are an essential component of nanoscience and nanotechnology. Nano Letters is committed to providing the highest quality reproduction of such images” (https://paragon.acs.org/paragon/ShowDocServlet?contentId=paragon/menu_content/authorchecklist/nl_authguide.pdf).
Academic journals have their requirements (and guidelines) for the depiction of information through images, for the resolution and quality of submitted images. For example, Nature Nanotechnology notes that:
Figures that do not meet these standards will not reproduce well and may delay publication until we receive high-resolution images or high-quality printouts. We cannot be held responsible for assuming the cost of corrected reprints should poor quality images need to be used (http://www.nature.com/nnano/pdf/nnano_gta.pdf).
While such quality concerns are generally supported by the community of practice, they are external to the practices of generating “good” (and possibly pretty) images that are the immediate focus of the community of practice, and can change according to the pressures on, and priorities of, the publication contexts.
- Reading Images; when addressing audiences one should ensure that the audience knows how to read the scientifi c content, transformed into a message, and conveyed through the image. This implies that in the visualization

21
processes the audience and the ways images could be read need to be considered. But image-creators “[producers] can never really know their vast and absent audiences, and must, instead, create a mental image of ‘the’ viewers and ‘the’ way viewers make sense of their images [pictures]” (Kress & Van Leeuwen, 2006: 115)
For scientifi c presentations, including poster-presentations, there is an assurance of understanding within the own community of practice. When other communities of practice are involved (e.g. biologists versus chemists), there may be misunderstandings. There are defi nitely different traditions of picturing concerning what happens at the nano-scale. Outside science, anticipation on “reading abilities” is even more precarious.
- Following Rules; any community of practice has rules, and these can be more or less explicit, and their following more or less sanctioned. For example, in normal science, there are incentives to follow the rules of the paradigm, and sanctions when one does not. For visualization practices, Following Rules has the specifi c function that it short-circuits choices, and this is productive when these rules are adequate. Rules can be seen as instrumentally useful, or be a social requirement when part of a community. Rule following will be different for the one or the other. In practice, the two are entangled, sometimes inextricably so, as for the rule to avoid intentional misrepresentation when enhancing images.
Responses Showing the Aspects of VisualizationTo further embed the aspects we identifi ed in Findings, fi rst chapter on page 14, we consider how respondents actually see their practices. This is not meant as an empirical validation of our list of aspects. It enriches our functional analysis and prepares the ground for our later analysis (in 3.3) of which aspects turn out to be articulated.
We start with the availability of Imaging Techniques as an occasion for choices between different instruments (e.g. AFM, STM, TEM, STEM, fl uorescence microscopy, and DIC-optical microscope).
One needs to understand what kind of microscopy must be used e.g. AFM or STM, depending on the needs of the research and depending on the material we are studying and the nature of the sample like conductive, semi-conductive, isolating, etc. (Participant 24)
Such choices are constrained by the availability of instruments and other equipment in the lab. In nanoscience, there has been a push to create nanolabs which have all the basic equipment. Since this equipment is expensive, these would be dedicated labs, with access for researchers from other institutes. Then, the choice between techniques is relatively open.
Still, what remains important is whether the laboratory where the research is carried out has the right instruments. The overall research question may have to be adapted to suit the facilities present at the laboratory or institute. The alternative is that researchers do their experiments in another laboratory. Indicative is how researchers in the nanoworld are always keen to know which instruments are
Martin Ruivenkamp and Arie Rip

Science Studies 1/2010
22
available where, and how well they work. For our question about visualization, this implies that there are material infrastructures which de facto short-circuit the visualization regress: only those images can be created that are allowed by the material infrastructure that is available.
After choosing the right instrument for the job, further so-called technical decisions need to be made. Depending on the imaging techniques available, one needs to choose the right tip (probe), the right voltage, the right tunnelling current, the right resolution, the right scale, the right set-up for the instruments, the right angle, etc. What is ‘right’ is often not known beforehand, so there will be a process of inference to the best settings of the instruments.
When the imaging techniques produce numerical data (as with STM, AFM and FEM) on the distance between the tip and the surface, the data needs to be transformed into visualizations for which, as an interviewee noted, it is important to have a clear idea about what one wants to see and what one is supposed to see. Different Graphic Software can be chosen to transform numerical data into visualizations.
These same Graphic Software offer ways to manipulate the images, a practice accepted in the production of visualizations as long as the nanoscale is represented in a ‘correct’ way (the quotes indicate that this is an actor’s term). As an interviewee stated it, the manipulation of images should not be a problem as long as the scientifi c results themselves are not manipulated and the scientifi c results, i.e. what is scientifi cally interesting, are visible through these images.
The matter-of-fact attitude to what is done with Graphic Software in the production and manipulation of visualizations is quite common, as shown in these quotes:
To visualize an image I use the WS&M software that can give you the fl exibility to transform your image in a 3D representation and it is possible to change the properties of the images as well, like colours, scaling dimensions, light orientations, rotations, etc. (Participant 24)
And:
I am using different AFM post-processing software, since they have different capabilities regarding visualization modes. Photoshop is used to tweak the images. (Participant 14)
Being able to create images with the help of imaging techniques, the image producer will work towards, and select, the images that best fi t the research that is carried out. The researcher’s expectations about what counts as the best results come into play here, but there is also some commitment to present everything that one has found:
In past research I found myself having to use STM pictures that I thought were not representing well the bulk of the pictures taken. Obviously you need to choose the best picture but you need to make sure the info would be shared by all pictures you take. (Participant 29)
The tension between choosing the “best picture” or try to “represent well the bulk of the pictures taken” is noted by Participant 29, and when s/he says one “obviously” needs to choose the best picture, that is indicative for a general feature of the practice of science. Scientists recognize there are tensions and can joke about them. Lists of such jokes, which compare “what he said” and “what he meant” circulate and are

23
pinned on lab notice boards (Weber and Mendoza, 1973). An example from this list related to the question of selecting for the best is: The scientist wrote: “Three of the samples were chosen for detailed study”, but what actually happened was: “The results on the others didn’t make sense and were ignored”. The former is part of the offi cial or R-repertoire, the latter is part of the ‘contingent’ or C-repertoire. It is the C-repertoire which carries de facto and pragmatic choices necessary to make the research a going concern, and which is part of the state of the art within the community of practice.
Image producers have expectations about what the audience expects to see, or should see. Again, there might be a tension, even if it need not be felt as a tension. A scientifi cally ‘correct’ content offered by the images need not go well with the presentation of aesthetically attractive and appealing images. The reference to scientifi c correctness is common:
It’s important to clarify through the use of images the phenomena one is studying. It’s important that a scientifi c image is scientifi cally correct. (Participant 21)
But it is then emphasized that images need to be simplifi ed, already to be able to make the scientifi c content visible:
Images need not contain too much information. Preferably images need to be simple and conveniently arranged. (Participant 8)
Sharpening Images is an aspect linked up with the clear and sharp presentation of a scientifi c content. There are no quotes discussing this, because respondents did not talk about it – for them, it had become a technical matter.
The presentation of scientifi c results through images has become important, and becomes increasingly more important. One nanoscientist, in a conversation, referred to an increasing requirement of being able to rapidly understand and interpret results that are presented. There are two sides to this requirement in presentation: images need to show the scientifi c content as clearly as possible, and the (intended) audience need to know how to read these images. Within a community of practice this works through trial and discussion. When images circulate outside the original community of practice, such a reading competence cannot be assumed, and further modifi cation of the image, or further simplifi cation for clarity’s sake, is needed.
In this respect, the Use of Colours is widely recognized as important, already “to stress the main information of the image – however one needs to know what the main information is to avoid misleading conclusions” (Participant 9). Some choices have become technical: “the colour-scale, usually used in the AFM-community, is already delivered by the software of commercial instruments” (Participant 4). Again, the choices now follow tacit rules, as embedded in the instruments, together with their acceptance in the community.
Additionally, images need to be attractive to the intended audience, to catch their attention and tell their story. “Colours are added for visual appeal, but do not add a lot to the information” (Participant 31). But they attract the attention of the audience or “maximize the striking nature of the image to aid publication” (Participant 20).
A further aspect is that images can be an object of study in their own right. This is clearly visible in Three Dimensional images generated from two dimensional
Martin Ruivenkamp and Arie Rip

Science Studies 1/2010
24
visualizations. They make it possible to look at structures at the nanoscale from different angles, and hence gain understanding of their properties. (This continues a long tradition in chemistry where ball-and-stick or other molecular models were built to explore the nature and function of the molecules). At the same time, as the next quote shows, making 3D images interesting for an audience is important as well:
In my fi eld of 3D structures, electronic images are important and always shown. They need to be clear and uncoloured. The rest is left to the scientist to decide. That means, the range and scale need to be chosen carefully so that you can pass on as much info as possible to the reader about the quality of the structures how big they are and the short and long scale uniformity. These choices end up being important in giving “seriousness” to your result; e.g. “zoomed in” pictures give the impression of poor reproducibility over large scale. On a lighter note, I would normally try to fi nd the best angles contrast, magnifi cation to make the picture interesting as well. (Participant 29)
A further step would be to go for animations, e.g. where the viewer ‘fl ies through’ a nanoscale surface, but this is understood as not being serious science.Images must be readable for the audiences that are targeted, and this implies certain requirements on visualization. Already at conferences, and in formal and informal workshops, when images are used to present scientifi c results, there are a variety of considerations, from simple guidelines how to do a poster or a presentation, to explicit anticipation on the intended audience:
In presentations I prefer to use simple line colour scales, since beamers not always reproduce the used colours very well (Participant 6).
For presentations images need to be of the right size (Participant 7).
I fi nd out about the audience fi rst and then adapt the pictures (Participant 29).
I try to adapt myself to the audience and use ideas obtained from other presentations/publications (Participant 8).
I do generate images according to the common image styles. This in order to make it easier for the audience to read the image, since they are used to; I do modify the image incidentally to the audience (Participant 14).
Clearly, the question how images will be read is seen by the actors as a separate issue, different from the work on creating/preparing images. This supports our use of two different clusters of aspects for them (cf. Figures 5 and 6).
There is informal or formal peer pressure as well:
You could not come with an image/movie which cannot be accepted by an expert in the fi eld. Peer-reviewed journals are important to the selection of images (Participant 21).
By now, journals specify their own requirements for images,
Usually I have to spend some time to prepare images for the journal; more exactly to fi t the journal requirements for images. (Participant 22).

25
And some overall standardization may emerge:
In the production and use of images established standards are considered to communicate information more easily (Respondent 9).
Rules for readability of images thus refer to communicability as such, but quality of images is also linked to informal and formal peer responses, i.e. to relevant communities of practice. As we noted before, when addressing another community of practice, e.g. in another scientifi c specialty, images may have to be revised to conform to the rules of that community:
Previously when I worked in pure synthetic chemistry, all illustrations were 95% in black. When I moved into DNA nanotechnology the requirements for more complex illustrations became apparent. It is normal now to routinely use more complex graphic programs like Adobe Illustrator where previously I could just use ChemDraw. The interface between chemistry and molecular biology where I work, requires more efforts with regard to illustrations than synthetic chemistry, and we are obviously affected by the more vivid illustrations of the biologists (Participant 1).
And:
When I write about physics I try to adapt more to the fi eld and do maybe images that are more schematic but dull; no colours, square shapes. For other fi elds I think schematic when trying to produce a strictly scientifi c image but more artistic, when trying to reach a more general public I think that in a fi eld like biology images tend to be
more colourful and 3D, and I would try to make images more like that if I were making images for that fi eld. In any case, I like more colourful, powerful images than black and white images (Participant 26).
Interestingly, actors explicitly recognize the difference in rules. Practitioners in nanotechnology are almost forced to do so because of the strong interdisciplinary character of nanotechnology, at least in the sense that researchers can move from one specialty or disciplinary audience to another, and do so not infrequently.
We have not systematically discussed all the aspects developed in Findings, fi rst chapter on page 14. For actors, the aspects need not be separate. The last quote (from Participant 26) mentions various aspects together: “…trying to produce a strictly scientifi c image but more artistic…”, “trying to reach a more general public”, “I think that in a fi eld like biology images tend to be more colourful and 3D and I would try to make images more like that if I were making images for that fi eld”. Embedded in practices, the aspects need not be distinct, but when questioned or challenged, reactions of practitioners do separate them. In other words, they do relate to different components of the practices of visualization.
Analysis of Responses to the Questionnaire
The questionnaire allowed respondents to talk about their practices of making the invisible nanoscale visible. What they talked about, and what not, allows us to trace what is tacit. In the responses to the questionnaire a total of 225 items were identifi ed syntactically which could be related to the aspects distinguished in Findings, fi rst chapter on page 14 (see the next section for the methodology).
Martin Ruivenkamp and Arie Rip

Science Studies 1/2010
26
A fi rst fi nding is that fewer items (37 items) occurred in the responses to the second question (which asked respondents about the problems and challenges met in the production process of visualizations) than in the responses to the fi rst (125 items) and third question (63 items). Given our basic assumption that the number of items relates to the extent of articulation, does this mean that few problems or challenges are met in the production process of visualizing the nanoscale? This would be an overhasty conclusion. Respondents did refer to specifi c challenges or problems in the production of images, e.g. challenges in how to present information: “Images need not to contain too much information. Preferably images need to be simple and conveniently arranged” (Participant 8); “If too many colours are used important information can be suppressed and vice versa.” (Participant 14). Also, the tension experienced between the presentation
of a scientifi c content through visualization in the ‘best possible’ way and the production of images that attract attention to this scientifi c content, is quite visible.
A fi rst explanation why many respondents did not elaborate on the second question is that for them the fi rst two questions appeared to cover the same topic. 18 Also, since the questions were posed in such a way, that respondents were stimulated to think about the steps they take in the production of images, the fi rst question may have exhausted whatever they had to say. So there is a fl ood gate effect: the fi rst question was taken by the respondents as an opportunity to talk about all issues that concerned them. For them, choices were linked to problems and challenges, so the second question would not ask for something new.
A second explanation goes one step further. Problems and challenges may have become internalized in the practices,
Question ItemsAspect of the visualization process of the nanoscale
I. Choices made in the production of images
II. Problems or challenges
experienced in the production
of images
III. What is usual in the fi eld your active
in the process of producing images
Total
Imaging Technique / Instrument
30 5 0 35 (16%)
Graphic Software 17 3 1 21 (9%)
Sharpening Images 3 1 0 4 (1%)3D 6 0 1 7 (3%)Colours 20 5 9 34 (15%)
Tension 28 11 10 49 (22%)Publishing 10 4 4 18 (8%)Reading Images 4 7 6 17 (8%)Following Rules 7 1 32 40 (18%)Total 125 37 63 225 (100%)
Table 1. Number of items addressing, each aspect of the visualization process, in the responses to each of the questions.

27
so that respondents will treat them as part of the ongoing practice (unless, of course, something untoward happens that breaks up the closure). The difference in the number of items occurring in the responses to the fi rst and second question would then be an indication of emerging stabilisation of the practice of visualization, into something like normal science. We will return to this diagnosis of the situation after considering the responses in terms of the various aspects identifi ed in Findings, fi rst chapter on page 14.
When the items were linked (with the help of semantic analysis in terms of issues, see section 2) to the various aspects, further patterns became visible (Table 1).
The distribution of items over questions has also to do with how they were posed. The aspect Following Rules is directly linked with the way question III was formulated, so appears heavily there. General rules about presentation of images, as well as, fi eld-specifi c rules occur, and the aspect is salient to our respondents. That it is salient reinforces our diagnosis that there is still little routinization of rules in nanoscience.
Considering the responses to the three questions, the most striking fi nding in the distribution of items over the identifi ed aspects, is that the aspect Sharpening Images, so important to present a scientifi c content as clearly as possible, is hardly addressed in the responses. In contrast, the aspects Imaging Technique and Graphic Software remain more
visible to the scientist. Since imaging techniques and research questions are linked (‘the right imaging technique for the job’ has to be chosen), this aspect will be more upfront for practitioners than what they probably see as operational questions. The lesser visibility of Graphic Software may derive from the fact that some imaging techniques have their own specifi c software, so there is no reason to mention Graphic Software again. The whole issue of 3D images appears to be a minor concern, probably because it is a very specifi c technical issue, and worked on only by a small segment of the nano-practitioners.
The Use of Colour is addressed frequently. It is a pervasive issue, linked to clear presentation in scientifi c publications, as well as creating an attractive image for various audiences. It is relevant to community-internal as well as external use of images. And because of this dual function (refl ecting the general duality of images as representing content and attracting readers to the content), it remains open and in need of articulation.
Given the strong difference, in the second block of functional aspects, between Sharpening Images and 3D (which attract few items, and thus have become tacit), and Colour (which is still an open issue), one can rearrange Table 1 so as to bring out the difference between what has become technical (and thus tacit, or in need of discussion of technical performance only), and what is still deliberated, mainly because the issues of presentation to various audiences cannot
PreparatoryTechniques
Percentage Presentational aspects Percentage
Sharpening Images 1 Use of Colours 153D 3 Tension 22
Imaging Technique 16 Following Rules 18Graphic Software 9 Publishing 8
Reading Images 8Total 29 Total 71
Table 2. Relative visibility of preparatory techniques and presentational aspects.
Martin Ruivenkamp and Arie Rip

Science Studies 1/2010
28
be resolved easily. Table 2 shows this. It is a snapshot of the present situation. Over time, aspects in the second column may become domesticated in and across relevant communities, and move to the fi rst column.
Particularly in the early stages of development, the functionalities of the instruments and technical possibilities are important in overcoming the experimenter’s and visualization regresses. There are strategic choices involved and emerging and somewhat stabilized rules of the community of practice. This continues in the later stages, but then recourse to instruments and techniques is not in order anymore. Instead, institutional rules and communication strategies are upfront.
Regular microscopy is in such a later stage, and “preparatory techniques for visual display” are seen, after an initial exploratory phase, as reliable, even if artifacts can occur (Lynch 1985: 90). In nanoscale visualization, aspects referring to “preparatory techniques” are already less salient compared with the relative visibility of the other aspects (Table 2). In some fi elds, the aspect Use of Colour can be positioned as a preparatory technique, for example in aerial maps based on infrared radiation, but for nanoscience this is less easy because as we noted, at the nanoscale colours have no meaning. At the moment, Use of Colour is a matter of presentational choices: Judicious use of colouring will be appealing and attract attention to scientifi c content. Over time, it can become a subsidiary preparatory technique for visual display.
Conclusion and Discussion
Our discussion of experimenter’s, visualization and clarifi cation regresses that have to be resolved in practice
somehow, set the scene for a dedicated study of how nanoscientists address the various aspects of the visualization process. Choices are made all the time, often as try-outs shaped by the relevant contexts. There are earlier and emerging techno-social rules which can be followed and which are supported by an evolving community of practice–which enables and constrains choices. While we did not offer a detailed reconstruction of how these rules evolved, it is clear from the stories our nanoscientists tell, and from the discussions that take place every now and then, that the rules are not simply given. It takes practical and discursive efforts to evolve and articulate them. And then some of them become obvious, invisible as a tacit resource available to the insiders of the practice. Following tacit rules to alleviate the experimenter’s, visualization and clarifi cation regress implies an acceptance of specifi c expectations about how the nanoscale should be visualized and a closure of other possible trajectories of visualization practices of the nanoscale.
There are many technical issues that have to be addressed and resolved to make the nanoscale visible. But the key point is that making the nanoscale visible is an achievement of a community of practice (or perhaps better, a cluster of overlapping communities of practice), not just the result of instruments doing their job.
The invisible nanoscale is reached through a process of mediated touching, of ‘haptic access’ (Daston and Galison, 1992), leading to digitalized data (Lynch, 1991) which allow a variety of visualizations of the nanoscale. This opens up possibilities to mix preliminary thoughts about what one should be seeing and what one is seeing (in the images produced by available graphic

29
software). Based on a functional analysis of the visualization process, supported by what has been shown for other domains, in particular astronomy, and by what we had been observing when moving about in the nano-world, we identifi ed aspects with a fi rst cluster (Imaging Technique, Graphic Software, Sharpening Images, 3D) relating to the visualization regress, and with a second cluster mainly addressing the clarifi cation regress (Use of Colour, Tension, Following Rules, Publishing, and Reading Images).
Some aspects, Sharpening Images (1%), and 3D (3%) were not articulated in the responses to the questionnaire, and we interpreted this fi nding as showing that these aspects have become invisible to practitioners: for them, it is obvious how to do this, or at least, it is considered to be a technical-operational choice. For other aspects they are faced with choices explicitly, and have to discuss and defend them. This is the case for the choice of instrumentation (16%), linked to the research questions that are pursued but also to the availability of instruments in the own lab, or in another lab that one might be able to access. It is also the case for the aspects Use of Colour (15%), Tension (22%), and Following Rules (18%). These aspects relate to how visualizations need to meet specifi c requirements institutionalized in the practice in relation to relevant audiences. It is the combination of cumulative try-outs (learning by doing), sharing such experiences, and links to audiences ranging from colleagues in a workshop, editors (and reviewers) of scientifi c journals to visitors of the website and popular magazines and news media, which increase the stability of the visualization practices. Then, expectations about how the nanoscale should be visualized are stabilized as
well, and images and practices that do not meet the institutionalized requirements will be excluded.
With the visualization regress, some of the choices are now embedded in technical infrastructure, and thus seen as technical. The clarifi cation regress, with its links to intended audiences, is more diffi cult to close technically (outsiders are involved). The choice of colourings is important (for both regresses), where a tension is (still) visible between, on the one hand, the acceptance of specifi c colours that shape expectations about how the nanoscale should be visualized (cf. PhD-student that was instructed to use blue or orange when producing visualizations of the nanoscale), and on the other hand, the possibility to choose specifi c colours that make visualizations aesthetically appealing for specifi c audiences (“Colours; [I choose] simply what looks nice”; Participant 3’).
Thus, the mediated visibility of the nanoscale is an achievement, but not a simple technical achievement. Expectations and emerging guidelines or rules constitute what is made visible in practice. So what happens is domestication of the nanoscale (to borrow a phrase from culture studies and technology studies, cf. Silverstone & Hirsch, 1992) rather than establishing visibility of what is essentially invisible. Domestication means that one knows what to do with the untamed world at the nanoscale (Nordmann, 2006), at least in practice. In other words, it is a partial closure which allows the practice to continue, and continue productively.
This can lead to certain conservatism in the community of practice–until there is an anomaly or an externally–induced controversy. The grey zone where visualization regress and clarifi cation regress overlap could be an occasion
Martin Ruivenkamp and Arie Rip

Science Studies 1/2010
30
for opening up questions, but as the response to Ottino’s (2003) article and his proposal to be more ‘scientifi c’ in the images produced for various audiences shows, there is a tendency to see present practices as unproblematic. There is a trade-off between the short-term productivity of conforming to the stabilized approaches to making the nanoscale visible, and keeping alternatives and puzzles open, so as to be able to address new issues and challenges that might appear. Compared with astronomy, where the challenges are similar, and visualization processes have become quite domesticated (Lynch and Edgerton, 1988), there is a difference. Not just that domestication has not progressed as far yet, but also that visualizations based on transformations of the “raw” digital data are not enough to convey the message of the scientists about what is “out there”.This leads us to a feature of visualization of the nanoscale that is seen as quite unproblematic at the moment: the use of artist’s impressions (see for example Figure 9), often following the tradition of space-fi lling molecular models or engineering construction drawings. Artist’s impressions add or sometimes substitute for, the less striking images that result from the visualization process. One can position this acceptance of artist’s impressions as requirements to stop the clarifi cation regress taking over, without having to face the limitations that the visualization regress imposes, i.e. some link back to the raw data. This is often thought to be acceptable, if such artist’s images are meant for public consumption. (Cf. the discussion of “pretty pictures” in astronomy.) In the nano-world, artist’s impressions are also used to address insider audiences.19 At the moment, all of this appears to be accepted as unproblematic.
Given our overall diagnosis of potentially increasing routinization of actions and choices, becoming tacit rules in communities of practice, we can speculate about closure of the presentational aspects (cf. Table 2). Then, the distinction between artist’s impression and pictures linked to data may become invisible, and the image of nanotechnology becomes like a work of art. The Ottino’s of this world (cf. our discussion in Findings, fi rst chapter on page 14) will object in principle. In practice, one might still want to be careful about it, in the sense that opportunities to open up stabilized practices should remain.
Acknowledgements
This research is part of, and supported by the Dutch NanoNed programme (www.nanoned.nl). MR is grateful for additional support by the EU Network of Excellence Frontiers. We would like to thank Haico te Kulve and Michael Lynch for useful comments and suggestions, and two anonymous reviewers for constructively critical comments. And, of course, we are grateful to the nanoscientists who were willing to talk to us and fi ll in the questionnaire.
Notes
1 One further example of the use of the term bootstrap operation is a recognized statistical technique, for example for producing forensic evidence (Aitken and Taroni 2004).
2 While this is how users of imaging techniques tend to work (until problems arise), there is a body of literature recognizing the occurrence of artifacts deriving from the necessary preparation techniques

31
and the particularities of the imaging techniques, up to a handbook about the art and artifact of electron microscopy (Maunsbach and Afzelius, 1999). See also Lynch (1985), Ch. 4.
3 Early studies of radio-active compounds were inconclusive because radio-active degradation led samples that appeared to be the same to have different properties (Rip, 1982).
4 See also Pasveer (1992) on early X-ray photographs as “shadows of knowledge”.
5 Lumelsky et al. (2001) described a protocol through which pancreatic beta-cells could be converted from embryonic stem cells. These insulin producing beta-cells could ultimately be used to treat diabetes.
6 This is similar to the process of inference to the best explanation. Lipton (2004) offers a philosophical analysis, but neglects the role of instruments and the role of the “theory” of the instrument (why it works and how it produces valid results). Using falsifi cationist terminology, when a new fi nding appears to falsify a present theory (or view of the unknown) one can pursue this, or decide that the theory of the instrument might have to be revised. Striking examples of the latter route have occurred in high-energy physics (Galison, 1987).
7 At a seminar for visiting ASU students, University of Twente, July 2006.
8 There is a large literature, since the 1970s, in the history and sociology of science studying the life and activities of such communities (see for example Crane, 1972, and Pickering, 1992).
9 Designs cannot be made defi nitive, their implementation and eventual
functioning cannot be completely predicted (Roozenburg & Eekels, 1994).
10 The C- and R-repertoires (as Rip calls them, to avoid simplistic association with ‘contingent’ and ‘rational’), and their mutual dependencies, are visible in all professional communities of practice. In scientifi c communities of practice, there is the additional challenge of capturing the unknown world “out there”.
11 Our colleague Haico te Kulve pointed out that the visiting anthropologist can never know if s/he actually accesses all the inside interactions. Thus, there may be a visitor’s regress as well.
12 From social psychological insights it is known that people have a strong tendency to make a distinction between ‘us’ and ‘them’ – ingroup and outgroup – (Linville & Jones, 1980), which has important consequences for the production of illusions of outgroup homogeneity. Studies from Social Identity Theory (e.g. the ‘minimal group studies’ carried out by Tajfel and Turner (1986) show that for individuals categorizing themselves as group members this is enough for them to favour the ingroup at the expense of the outgroup. This positive evaluation to the ingroup relative to the outgroup has been a point of focus within the fi eld of Social Psychology since the beginnings of the 20th century. In his classic book The Nature of Prejudice (1954) Allport discusses the formation of ingroups and the Sherifs documented the ingroup/outgroup bias in their studies of intergoup dynamics. Sherif and Sherif (1953) showed that people have the tendency to have a positive attitude towards in-group members
Martin Ruivenkamp and Arie Rip

Science Studies 1/2010
32
and are more open and willing to share information with in-group members (Tindale, 2000). This tendency to share information more willingly with in-group members implies that C-repertoires can only be studied by being inside a community of practice
13 www.frontiers-eu.org. AR is member of the Ethics Board of Frontiers (which has not been very active). MR’s involvement is also linked to the Constructive Technology Assessment workshops organized by our colleague Douglas Robinson (http://www.mb.utwente.nl/stehps/about/staff/phdst/robinson.doc/).
14 Such a situation can also emerge when an existing cluster of approaches, or a paradigm, becomes uncertain, e.g. because of anomalies that cannot be repaired. Von Schomberg (1996) has discussed this for genetic modifi cation and its applications, and distinguished regularized “empirical-analytical discourse” which is quite focused (as in normal science), from “epistemic discourse” where foundational issues are taken up and closure is diffi cult. The latter would occur when the visualization regress itself would be a topic of deliberation.
15 Talking about his color-enhanced images, already because of conversion of infrared to red, an astronomer said: “In principle, he could have enhanced the colors to a much greater extent than he did, but he limited himself to about a 15 percent enhancement because, as he explained it, he did not want to “cheat” (like, he said, NASA did with Voyager’s planetary images. In his words, “It’s important to be kind of honest about what the colors are, because we don’t want people to have an exaggerated view of what the colors are.”” (Lynch (1991; 71).
16 Lynch and Edgerton (1988) argue that there defi nitely is an ‘aesthetic project’ involved in producing images, which goes much further than the concerns with ‘cosmetic defects’ that must be corrected. They note that the various manipulations of signal-noise ratios and of image sharpening may well be systematically designed and justifi ed by good reasons such as a knowledge of detector electronics and the peculiarities of the observational instrumentation, up to an assessment of astronomical entities and of their characteristic profi les. But “the progressive reconstitution of a ‘noisy picture’ into a visually coherent and naturally interpreted astronomical display [is] an aesthetic project. But, what aesthetics means here is not a domain of beauty or expression which is detached from representational realism. Instead, it is the very fabric of realism: the work of composing visible coherences, discriminating differences, consolidating entities, and establishing evident relations. (…) [It is] an art situated within the performance of scientifi c practices.” (Lynch and Edgerton (1988; 212)
17 Cf. Frankel (2002).18 One respondent did not fi ll out the
second question, but only mentioned: “see response to question 1”. More generally, some issues came up in responses to all three questions of the questionnaire.
19 The intentional simulacrums (Baudrillard, 1994) become mixed with the de facto simulacrums produced by instruments, software and choices supported by the community of practice.

33
References
Aanestad, M. (2003) ‘The Camera as an Actor: Design-in-Use of Telemedicine Infrastructure in Surgery’, Computer Supported Cooperative Work 12: 1 – 20.
Agassi, J. (1973) ‘Testing as a bootstrap operation in physics’, J. General Philosophy of Science 4(1): 1-24.
Aitken, C. G. G., & F. Taroni (2004) Statistics and the evaluation of evidence for forensics scientists (Hoboken, NJ: Wiley Interscience).
Allport, G.W. (1954) The Nature of Prejudice (New York: Addison-Wesley).
Balzani, V., M. Clemente-Leon, A. Credi, B. Ferrer, M. Venturi, A.H. Flood & J.F. Stoddart (2006) ‘Autonomous Artifi cial Nanomotor Powered by Sunlight’, PNAS 103 (5): 1178 – 1183.
Baudrillard, J. (1994) Simulacra and Simulation (Translated from French by Glaser, S. F.) (Ann Arbor, MI: The University of Michigan Press).
Becker, H. S. (1982) Art Worlds (Berkeley, CA: University of California Press).
Binnig, G. & H. Rohrer (1986) ‘Scanning Tunneling Microscopy’, IBM Journal of Research and Development 30 (4): 279 – 293.
Carter, B. (2001) ‘Un-Winching Wittgenstein’, Pedagogy, Culture and Society 9 (1): 111 – 117.
Chien, K.R. (ed) (1999) Molecular Basis of Cardiovascular Disease (Philadelphia, USA: W.B. Saunders Company).
Collins, H.M. (1992) Changing Order: Replication and Induction in Scientifi c Practice (Chicago, USA: University of Chicago Press).
Crane, D. (1972) Invisible Colleges: Diffusion of Knowledge in Scientifi c Communities (Chicago, USA: University of Chicago Press).
D’Adderio, L. (2008) ‘The Performativity of Routines: Theorising the Infl uence of Artefacts and Distributed Agencies on
Routines Dynamics’, Research Policy 37: 769 – 789.
Daston, L., & P. Galison (1992) ‘The image of objectivity’, Representations 40: 81–128.
Eigler, D.M., & E.K. Schweizer (1990) ‘Positioning Single Atoms with a Scanning Tunneling Microscope’, Nature 344: 524 – 526.
Eisenhardt, K.M. (1989) ‘Building Theories from Case Study Research’, Academy of Management Review 14 (4): 532 – 550.
Engeström, Y. (1987) Learning by Expanding (Helsinki: Orienta Konsultit).
Eraut, M. (2000) ‘Non-formal Learning and Tacit Knowledge in Professional Work’, British Journal of Educational Psychology 70: 113 – 136.
Fonash, S.J. (2001) ‘Education and Training of the Nanotechnology Workforce’, Journal of Nanoparticle Research 3: 79 – 82.
Foster, C. (2006) ‘Gold ‘Glitters’ in New Ways at the Nanoscale’ Retrieved from: http://www.innovations-report.de
Frankel, F. (2002) Envisioning Science: The Design and Craft of Science Images (Massachusetts: MIT Press).
Galison, P. (1987) How Experiments End (Chicago: University of Chicago Press).
Garfi nkel, H. (ed) (1986) Ethnomethodological Studies of Work (London: Routledge and Kegan Paul).
Gates, B., D. Qin & Y. Xia (1999) ‘Assembly of Nanoparticles into Opaline Structures over Large Areas’, Advanced Materials 11 (6): 466 – 469.
Giddens, A. (1979) Central Problems in Social Theory (London, England: MacMillan).
Gilbert, N.N. & M. Mulkay (1984) Opening Pandora’s Box: A Sociological Analysis of Scientists’ Discourse (Cambridge, England: Cambridge University Press).
Martin Ruivenkamp and Arie Rip

Science Studies 1/2010
34
Godin, B. & Y. Gringas (2002) ‘The Experimenters’ Regress: From Scepticism to Argumentation’, Stud. Hist. Phil. Sci. 33: 137 – 152.
Holton, G. (1978) ‘Subelectrons, Presuppositions, and the Millikan-Ehrenhaft Dispute’, Historical Studies in the Physical Sciences 9: 161 – 224.
Koster, A.J., U. Ziese, A.J. Verkleij, A.H. Janssen & K.P. de Jong (2000) ‘Three-Dimensional Transmission Electron Microscopy: A Novel Imaging and Characterization Technique with Nanometer Scale Resolution for Materials Science’, Journal of Physical Chemistry B 104: 9368 – 9670.
Kress, G. & T. Van Leeuwen (1996) Reading Images; The Grammar of Visual Design (London: Routledge).
Kuhn, T.S. (1970) The Structure of Scientifi c Revolutions (Chicago: Chicago University Press; Second enlarged edition).
Lee, Y.G., K.W. Lyons & S.C. Feng (2004) ‘Software Architecture for a Virtual Environment for Nano Scale Assembly (VENSA)’, Journal of Research of the National Institute of Standards and Technology 109 (2): 279 – 290.
Linville, P.W. & E.E. Jones (1980) ‘Polarized appraisals of outgroup members’, Journal of Personality and Social Psychology 38: 689 – 703.
Lipton, P. (2004) Inference to the Best Expanation (London: Routledge).
Lynch, M. (1985) Art and Artifact in Laboratory Science: A Study of Shop Work and Shop Talk in a Research Laboratory (London: Routledge & Kegan Paul).
Lynch, M. & S. Y. Edgerton Jr. (1988) ‘Aesthetic and digital image processing representational craft in contemporary astronomy’, in G. Fyfe & J. Law (eds), Picturing Power; Visual Depictions and Social Relations (London, Routledge): 184 – 220.
Lynch, M. (1990) ‘The externalized retina: Selection and mathematization in the visual documentation of objects in the life sciences’, in M. Lynch & S. Woolgar (eds), Representation in Scientifi c Practice (Cambridge, Massachusetts, London; The MIT Press): 153 – 186.
Lynch, M. (1991) ‘Laboratory Space and the Technological Complex: An Investigation of Topical Contextures’, Science in Context 4: 51-78.
Lumelsky, N., O. Blondel, P. Laeng, I. Velasco, R. Ravin &, R. McKay (2001) ‘Differentiation of Embryonic Stem Cells to Insulin-Secreting Structures Similar to Pancreatic Islets’, Science 292 (5520): 1389 – 1394.
Maunsbach, A. B., & B. A. Afzelius (1999) Arts and Artifacts of Electron Microscopy: Biomedical Electron Microscopy. Illustrated Methods and Interpretations (Academic Press).
Michael, M., S. Wainwright, C. Williams, B. Farsides & A. Cribb (2007) ‘From Core Set to Assemblage: On the Dynamics of Exclusion and Inclusion in the Failure to Derive Beta Cells from Embryonic Stem Cells’, Science Studies 20 (1): 5 – 25.
Miettinen, R. (1998) ‘Object Construction and Networks in Research Work: The Case of Research on Cellulose-Degrading Enzymes’, Social Studies of Science 28: 423 – 463.
Mody, C.C.M. (2004) ‘How Probe Microscopists Became Nanotechnologists’, in D. Baird, A. Nordmann & J. Schummer (eds), Discovering the Nanoscale (Amsterdam, The Netherlands: IOS Press): 119 – 135
Nordmann, A. (2006) ‘Noumenal Technology: Refl ections on the Incredible Tininess of Nano’, in J. Schummer & D. Baird (eds), Nanotechnology Challenges:

35
Implications for Philosophy, Ethics and Society (Singapore: World Scientifi c Publishing): 49 – 72.
Nordmann, A. (2008) ‘Philosophy of Nanotechnoscience’, in G. Schmid (ed), Nanotechnology. Volume 1: Principles and Fundamentals (Weinheim; Wiley-VCH): 217 – 243.
Ottino, J.M. (2003) ‘Is a picture worth 1,000 words? Exciting New Illustration Technologies Should Be Used With Care’, Nature 421: 474 – 476.
Oudshoorn, N. (2006) ‘Exploring and Rethinking Invisibility in the Context of Telemedicine’, paper presented at the workshop: ‘Material Narratives of Technology in Society’, University of Twente, Enschede, October 19-21.
Pan, S.H., E.W. Hudson & J.C. Davis (1998) ‘Vacuum Tunnelling of Superconducting Quasiparticles from Atomically Sharp Scanning Tunnelling Microscope Tips’, Applied Physics Letters 73 (20): 2992 – 2994.
Pasveer, B. (1992) Shadows of Knowledge. Making a representing practice in medicine:x-ray pictures and pulmonary tuberculosis, 1895 – 1930 (PhD Thesis, University of Amsterdam, defended 27 May 1992).
Persson, M. (2003) ‘Fraaie platen in saaie bladen’, De Volkskrant, December 20.
Pickering, A. (ed) (1992) Science as Practice and Culture (Chicago: University of Chicago Press).
Pitt, J. C. (2004) ‘The Epistemology of the Very Small’, in D. Baird, A. Nordmann & J. Schummer (eds), Discovering the Nanoscale (Amsteram: IOS Press):157 – 165.
Rip, A. (1982) ‘The Development of Restrictedness in the Sciences’, in N. Elias, H. Martins & R. Whitley (eds), Scientifi c Establishments and Hierarchies (Dordrecht: D. Reidel Publishing Company): 219 – 238.
Rip, A. (2006) ‘Interlocking Socio-Technical Worlds’, paper presented at STeHPS Colloquium, University of Twente, Enschede, 14 June 2006.
Robinson, D.K.R. & M. Ruivenkamp (2006) ‘Building the World Molecule by Molecule: Assessing the Visions of Molecular Machines’ paper presented at workshop: ‘Vision Assessment Day; Vision Assessment as Analytical Approach and in Constructive Technology Assessment’, University of Utrecht, Utrecht, 13 June 2006.
Rothbart, D. & J. Schreifels (2006) ‘Visualizing Instrumental Techniques of Surface Chemistry’, in D. Baird, L.C. McIntyre & E.R. Scerri (eds), Philosophy of Chemistry: Synthesis of a New Discipline (The Netherlands: Springer): 309 – 324.
Roozenburg, N.F.M. & J. Eekels (1994) Product Design: Fundamentals and Methods (Chichester: Wiley).
Sherif, M., & C.W. Sherif (1953) Groups in Harmony and Tension (New York: Harper & Row).
Silverstone, R. & E. Hirsch (eds) (1992) Consuming Technologies: Media and Information in Domestic Spaces (London: Routledge).
Sitti, M, S. Horiguchi & H. Hashimoto (1998) ‘Nano Tele-Manipulation Using Virtual Reality Interface’, IEEE Xplore 1 (1): 171 – 176.
Strauss, A. (1978) ‘A Social World Perspective’, Studies in Symbolic Interaction 1: 119 – 128.
Tajfel, H. & J.C. Turner (1986) ‘The Social Identity Theory of Intergroup Behavior’, in S. Worchel & W.G. Austin (eds), Psychology of Intergroup Relations (Chicago: Nelson-Hall): 7 – 24.
Tindale, R.S. (2000) ‘Social Sharedness’ as a Unifying Theme for Information Processing in Groups’, Group Processes & Intergroup Relations 3 (2): 123 – 140.
Martin Ruivenkamp and Arie Rip

Science Studies 1/2010
36
Von Schomberg, R. (1996) ‘The Laborious Transition to a Discursive Policy Process on the Release of Genetically Modifi ed Organisms’, in A. van Dommelen (ed), Coping with Deliberate Release: The Limits of Risk Assessment (Tilburg/Buenos Aires: International Centre for Human and Public Affairs): 147 – 156.
Wang, H., R. Bash, J.G. Yodh, G. Hager, S.M. Lindsay & D. Lohr (2004) ‘Using Atomic Force Microscopy to Study Nucleosome Remodeling on Individual Nucleosomal Arrays in Situ’, Biophysical Journal 87 (September): 1964 – 1971.
Weber, R.L. & E. Mendoza (eds) (1973) A Random Walk In Science: An Anthology (London: Institute of Physics/Russak and Co).
Wenger, E. (1998) Communities of Practice: Learning, Meaning, and Identity (Cambridge: Cambridge University Press).
West, P. & N. Starostina (2004) ‘Atomic Force Microscopy’, Advanced Materials & Processes 162 (2): 35.
Wiesendanger, R. (1994) Scanning Probe Microscopy and Spectroscopy: Methods and Applications (Cambridge: Cambridge University Press).
Wojnar, L. (1999) Image Analysis; Applications in Materials Engineering (London: CRC Press).
Wörle-Knirsch, J.M., K. Pulskamp & H.F. Krug (2006) ‘Oops They Did It Again! Carbon Nanotubes Hoax Scientists in Viability Assays’, Nano Letters 6 (6): 1261 – 1268.
Websites
Chris Ewels: http://www.ewels.info Institut für Experimentelle und Angewandte Physik der Universität Kiel:http://www.ieap.uni-kiel.de/surface/ag-kipp/stm/stm.htm Nano Letters:https://paragon.acs.org/paragon/ShowDocServlet?contentId=paragon/menu_content/authorchecklist/nl_authguide.pdfNature: http://www.nature.com/nnano/pdf/nnano_gta.pdfNoE Frontiers Technology Assessment Programme: http://www.technologyassessment.info/Novascan: http://www.novascan.com/gallery.phpPuget Sound: http://www.pugetsound.edu/Images/Academics/Chemistry/ModelKitsFull.jpg
Martin Ruivenkamp Science, Technology, and Policy Studies (STePS),School of Management and Governance University of Twente (The Netherlands)[email protected]
Arie RipScience, Technology, and Policy Studies (STePS),School of Management and Governance University of Twente (The Netherlands)[email protected]