Programmable nanoscale domain patterns in multilayers
8
Programmable nanoscale domain patterns in multilayers Wei Lu * , David Salac Department of Mechanical Engineering, University of Michigan, 2250 G.G. Brown Bldg. 2350 Hayward Street, Ann Arbor, MI 48109, USA Received 28 January 2005; received in revised form 19 March 2005; accepted 24 March 2005 Abstract The pattern formation in systems with multiple layers of adsorbate molecules is studied. We consider the presence of two types of molecules in each layer, which are characterized by different dipole moments. The patterns are characterized by the non-uniform distribution of the two molecules. A phase field model is developed to simulate the molecular motion and patterning under the com- bined actions of dipole moments, intermolecular forces, entropy and external electric field. The study reveals self-alignment, pattern conformation and the possibility to reduce the domain sizes via a layer by layer approach. It is also shown that the pattern in a layer may define the roadway for molecules to travel on top of. This, combined with electrodes embedded in the substrate, gives a great deal of flexibility to guide the molecular motion and patterning. Ó 2005 Acta Materialia Inc. Published by Elsevier Ltd. All rights reserved. Keywords: Self-organization and patterning; Phase field models; Spinoidal decomposition; Nanostructure 1. Introduction Self-organization is an efficient way to grow nano- structures with regular sizes and spacings on a substrate surface. As a representative system, the spontaneous do- main pattern formation of adsorbate monolayers has at- tracted widespread interest [1–3]. Adsorbate molecules carry electric dipole moments, and the magnitude can be engineered by adding polar groups [4]. These mole- cules are mobile on a surface [5,6]. Domains coarsen to reduce the domain boundary energy and refine to re- duce the electric dipole interaction energy. The competi- tion determines the feature sizes and leads to stable patterns. A dipole type of interaction is characterized by a 1/distance 3 variation in the energy, which can be in- duced by electric, magnetic or elastic fields. Similar pat- terns and analogous mechanisms have been observed in diverse material systems, such as Langmuir films at the air–water interface [7,8], ferrofluids in magnetic fields [9,10], organic molecules on metal surfaces [11–13], and surface stress induced self-organization on elastic substrates [14,15]. An external field may be applied to direct the self- organization process. Molecular monolayers composed of electric dipoles can be manipulated with an electric field induced by an AFM tip, a ceiling above the layer, or an electrode array in the substrate [16–19]. The elec- tric field also takes effect through dielectric inhomogene- ity, which has been shown to cause domain patterns in dielectric films [20–22]. The mechanism of monolayer pattern formation gives insight into the study of analogous phenomena in multilayers, where pertinent experiments are lacking. Electrostatic interactions have been utilized to construct functional multilayer systems by the approach of elec- trostatic self-assembly (ESA) [23–25]. ESA processing involves dipping a chosen substrate into alternate aque- ous solutions containing anionic and cationic molecules or nanoparticles, such as complexes of polymers, metal and oxide nanoclusters or proteins. This leads to alter- nating layers of polyanion and polycation monolayers. 1359-6454/$30.00 Ó 2005 Acta Materialia Inc. Published by Elsevier Ltd. All rights reserved. doi:10.1016/j.actamat.2005.03.029 * Corresponding author. Tel.: +1 734 647 7858; fax: +1 734 647 3170. E-mail address: [email protected] (W. Lu). Acta Materialia 53 (2005) 3253–3260 www.actamat-journals.com
Transcript of Programmable nanoscale domain patterns in multilayers

Acta Materialia 53 (2005) 3253–3260
www.actamat-journals.com
Programmable nanoscale domain patterns in multilayers
Wei Lu *, David Salac
Department of Mechanical Engineering, University of Michigan, 2250 G.G. Brown Bldg. 2350 Hayward Street, Ann Arbor, MI 48109, USA
Received 28 January 2005; received in revised form 19 March 2005; accepted 24 March 2005
Abstract
The pattern formation in systems with multiple layers of adsorbate molecules is studied. We consider the presence of two types of
molecules in each layer, which are characterized by different dipole moments. The patterns are characterized by the non-uniform
distribution of the two molecules. A phase field model is developed to simulate the molecular motion and patterning under the com-
bined actions of dipole moments, intermolecular forces, entropy and external electric field. The study reveals self-alignment, pattern
conformation and the possibility to reduce the domain sizes via a layer by layer approach. It is also shown that the pattern in a layer
may define the roadway for molecules to travel on top of. This, combined with electrodes embedded in the substrate, gives a great
deal of flexibility to guide the molecular motion and patterning.
� 2005 Acta Materialia Inc. Published by Elsevier Ltd. All rights reserved.
Keywords: Self-organization and patterning; Phase field models; Spinoidal decomposition; Nanostructure
1. Introduction
Self-organization is an efficient way to grow nano-
structures with regular sizes and spacings on a substrate
surface. As a representative system, the spontaneous do-
main pattern formation of adsorbate monolayers has at-tracted widespread interest [1–3]. Adsorbate molecules
carry electric dipole moments, and the magnitude can
be engineered by adding polar groups [4]. These mole-
cules are mobile on a surface [5,6]. Domains coarsen
to reduce the domain boundary energy and refine to re-
duce the electric dipole interaction energy. The competi-
tion determines the feature sizes and leads to stable
patterns. A dipole type of interaction is characterizedby a 1/distance3 variation in the energy, which can be in-
duced by electric, magnetic or elastic fields. Similar pat-
terns and analogous mechanisms have been observed in
diverse material systems, such as Langmuir films at the
air–water interface [7,8], ferrofluids in magnetic fields
1359-6454/$30.00 � 2005 Acta Materialia Inc. Published by Elsevier Ltd. A
doi:10.1016/j.actamat.2005.03.029
* Corresponding author. Tel.: +1 734 647 7858; fax: +1 734 647 3170.
E-mail address: [email protected] (W. Lu).
[9,10], organic molecules on metal surfaces [11–13],
and surface stress induced self-organization on elastic
substrates [14,15].
An external field may be applied to direct the self-
organization process. Molecular monolayers composed
of electric dipoles can be manipulated with an electricfield induced by an AFM tip, a ceiling above the layer,
or an electrode array in the substrate [16–19]. The elec-
tric field also takes effect through dielectric inhomogene-
ity, which has been shown to cause domain patterns in
dielectric films [20–22].
The mechanism of monolayer pattern formation
gives insight into the study of analogous phenomena
in multilayers, where pertinent experiments are lacking.Electrostatic interactions have been utilized to construct
functional multilayer systems by the approach of elec-
trostatic self-assembly (ESA) [23–25]. ESA processing
involves dipping a chosen substrate into alternate aque-
ous solutions containing anionic and cationic molecules
or nanoparticles, such as complexes of polymers, metal
and oxide nanoclusters or proteins. This leads to alter-
nating layers of polyanion and polycation monolayers.
ll rights reserved.
3254 W. Lu, D. Salac / Acta Materialia 53 (2005) 3253–3260
Design of the precursor molecules and control of the se-
quence of the multiple molecular layers allow control
over macroscopic electrical, optical, mechanical and
other properties. While applications such as nano-
filtration and photovoltaic devices have been demon-
strated, the ESA process is generally limited to simple,laminar multilayer systems, with little or no lateral var-
iation in the layer. We will show that for molecules car-
rying electric dipoles, dipole interaction can induce
self-assembled patterns within each layer in a multilayer
system. The capability is desirable for making complex
structures, especially the formation of nanointerfaces
and three dimensional nanocomposites.
Section 2 outlines a phase field model that describesthe dynamic pattern formation process. Section 3 solves
the electrostatic field in Fourier space. The numerical
method to solve the diffusion equation is discussed in
Section 4. Section 5 presents the numerical results. The
simulations reveal self-alignment, pattern conformation
and the possibility to reduce the domain sizes via a layer
by layer approach. It is also shown that the pattern in a
layer may define the roadway for molecules to travel ontop of. This, combined with electrodes embedded in the
substrate, gives a great deal of flexibility in guiding the
molecular motion and patterning.
2. The phase field model
Phase field model has recently been used to studynanoscale surface phenomena. For instance, it has been
applied to simulate the self-assembly of monolayers on a
solid surface due to surface stress [26–31]. In this paper,
we apply the approach to study multiple layers of mol-
ecules. We consider a domain size much larger than that
of an individual molecule, such as tens of nanometers.
Thus, a domain in each layer still contains many mole-
cules and the continuum approach is applicable. Themolecules evolve via a diffusion process. Fig. 1 shows
sφ , sε
aφ , aε
3x
1x fφ , fε
nφ , fε nh
Substrate
Electrodes
fh
sh
2x
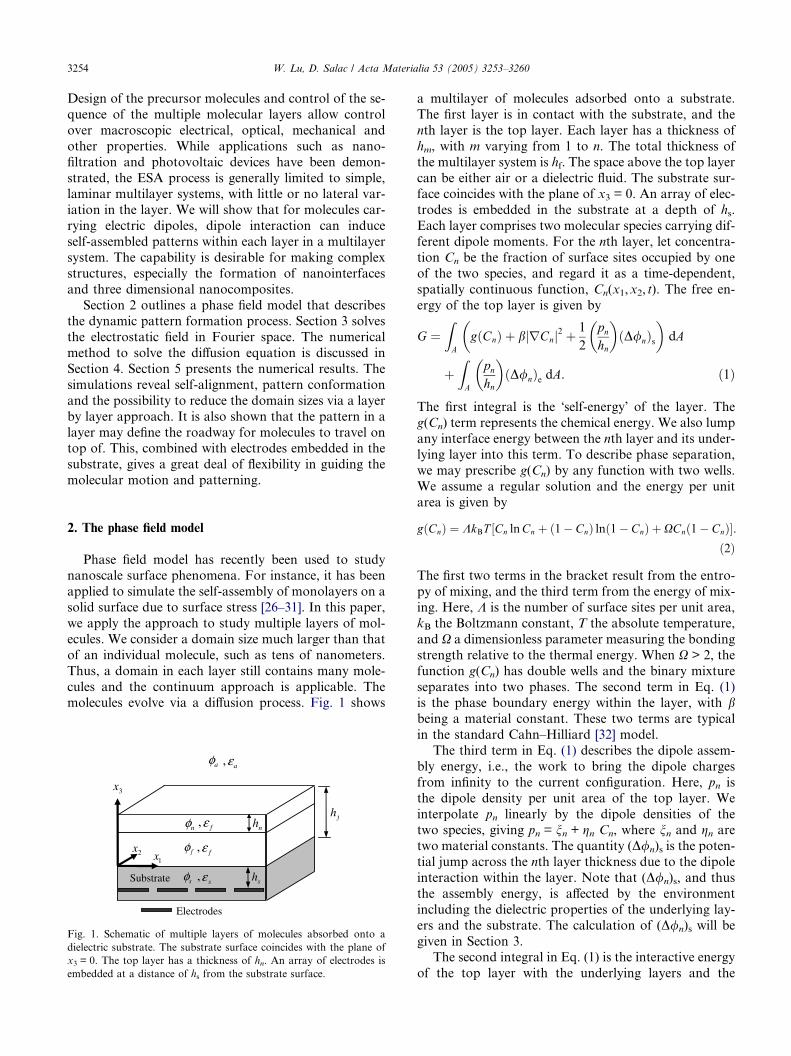
Fig. 1. Schematic of multiple layers of molecules absorbed onto a
dielectric substrate. The substrate surface coincides with the plane of
x3 = 0. The top layer has a thickness of hn. An array of electrodes is
embedded at a distance of hs from the substrate surface.
a multilayer of molecules adsorbed onto a substrate.
The first layer is in contact with the substrate, and the
nth layer is the top layer. Each layer has a thickness of
hm, with m varying from 1 to n. The total thickness of
the multilayer system is hf. The space above the top layer
can be either air or a dielectric fluid. The substrate sur-face coincides with the plane of x3 = 0. An array of elec-
trodes is embedded in the substrate at a depth of hs.
Each layer comprises two molecular species carrying dif-
ferent dipole moments. For the nth layer, let concentra-
tion Cn be the fraction of surface sites occupied by one
of the two species, and regard it as a time-dependent,
spatially continuous function, Cn(x1,x2, t). The free en-
ergy of the top layer is given by
G ¼ZA
gðCnÞ þ b rCnj j2 þ 1
2
pnhn
� �ðD/nÞs
� �dA
þZA
pnhn
� �ðD/nÞe dA. ð1Þ
The first integral is the �self-energy� of the layer. The
g(Cn) term represents the chemical energy. We also lump
any interface energy between the nth layer and its under-
lying layer into this term. To describe phase separation,
we may prescribe g(Cn) by any function with two wells.
We assume a regular solution and the energy per unit
area is given by
gðCnÞ ¼ KkBT Cn lnCn þ ð1� CnÞ lnð1� CnÞ þXCnð1� CnÞ½ �.ð2Þ
The first two terms in the bracket result from the entro-
py of mixing, and the third term from the energy of mix-
ing. Here, K is the number of surface sites per unit area,
kB the Boltzmann constant, T the absolute temperature,
and X a dimensionless parameter measuring the bonding
strength relative to the thermal energy. When X > 2, the
function g(Cn) has double wells and the binary mixture
separates into two phases. The second term in Eq. (1)is the phase boundary energy within the layer, with bbeing a material constant. These two terms are typical
in the standard Cahn–Hilliard [32] model.
The third term in Eq. (1) describes the dipole assem-
bly energy, i.e., the work to bring the dipole charges
from infinity to the current configuration. Here, pn is
the dipole density per unit area of the top layer. We
interpolate pn linearly by the dipole densities of thetwo species, giving pn = nn + gn Cn, where nn and gn aretwo material constants. The quantity (D/n)s is the poten-
tial jump across the nth layer thickness due to the dipole
interaction within the layer. Note that (D/n)s, and thus
the assembly energy, is affected by the environment
including the dielectric properties of the underlying lay-
ers and the substrate. The calculation of (D/n)s will be
given in Section 3.The second integral in Eq. (1) is the interactive energy
of the top layer with the underlying layers and the

W. Lu, D. Salac / Acta Materialia 53 (2005) 3253–3260 3255
substrate. The dipoles in other layers and the applied field
by the electrodes cause a potential difference, (D/n)e, be-
tween the x3 = hf and x3 = hf � hn surfaces in the dielec-
tric media. The term (pn/hn)(D/n)e represents the energy
of the top layer due to (D/n)e. The factor of 1/2 marks
the difference in the expressions of the dipole assemblyenergy, and the energy of dipoles in a given electric field.
The molecules in the top layer diffuse to reduce the
energy given in Eq. (1). It is known that molecules at
the surface have much higher mobility than those inside.
Thus, when considering the diffusion of the top layer, we
may assume that the buried layers do not diffuse. Fol-
lowing a procedure similar to [26,27], we obtain the dif-
fusion driving force in the nth layer,
f ¼ � 1
Kr og
oCn� 2br2Cn þ gn
ðD/nÞshn
þ gnðD/nÞehn
� �.
ð3ÞA pattern reaches equilibrium when the driving force
vanishes. Let J be the adsorbate flux.Assume that the flux
is linearly proportional to the driving force, J = Mf,
where M is the mobility. The adsorbate conservation re-quires KoCn/ot = �$ Æ J. These considerations together
with Eq. (3) give the following diffusion equation:
oCn
ot¼ M
K2r2 og
oCn� 2br2Cn þ gn
ðD/nÞshn
þ gnðD/nÞehn
� �.
ð4ÞThe last two terms in the bracket couple the evolution of
the molecules to the electrostatic field. The calculationstarts from the first layer. At a given time, the molecule
distribution C1 is known. The electrostatic field is deter-
mined by solving the boundary value problems. The
resulting (D/1)s and (D/1)e are entered in the right-hand
side of Eq. (4). The procedure is repeated for many time
steps till the prescribed time. Then the calculation is
started for the second layer, and so on. When consider-
ing the nth layer, the molecule distributions of Cm (m = 1to n � 1) are known from previous calculations. As will
be evident, (D/n)s depends on Cn and (D/n)e depends on
Cm (m = 1 to n � 1).
3. Electrostatic field in Fourier space
This section solves the electrostatic field to obtain(D/n)s and (D/n)e. First consider the calculation of
(D/n)s. The nth layer has an area dipole density of pn.
The dipole distribution is equivalent to a surface charge
density of pn/hn at x3 = hf and �pn/hn at x3 = hf � hn. The
electric potential fields for the air, the nth layer, the
underlying layers are denoted by /a, /n, /f and /s,
respectively, as shown in Fig. 1. For simplicity, we as-
sume that all the adsorbate layers have the same permit-tivity ef. The permittivities for the air and the substrate
are ea and es, respectively. The electric potential fields
satisfy the Laplace equation in each region, namely
r2/a ¼ r2/n ¼ r2/f ¼ r2/s ¼ 0. ð5ÞThe potential fields are continuous at the boundary,
giving
/aðx3 ¼ hfÞ ¼ /nðx3 ¼ hfÞ;/nðx3 ¼ hf � hnÞ ¼ /fðx3 ¼ hf � hnÞ;/fðx3 ¼ 0Þ ¼ /sðx3 ¼ 0Þ;/sðx3 ¼ �hsÞ ¼ 0.
ð6Þ
There is /s(x3 = �hs) = 0 since we are considering the
self-energy without any applied field. Gauss�s law relatesthe electric displacement to the surface charge by
� eao/a
ox3ðx3 ¼ hfÞ þ ef
o/n
ox3ðx3 ¼ hfÞ ¼
pnhn
;
� efo/n
ox3ðx3 ¼ hf � hnÞ þ ef
o/f
ox3ðx3 ¼ hf � hnÞ ¼ � pn
hn;
� efo/f
ox3ðx3 ¼ 0Þ þ es
o/s
ox3ðx3 ¼ 0Þ ¼ 0.
ð7ÞEquations (5)–(7) are solved analytically with Fourier
transform to x1 and x2. For instance, /ðk1; k2; x3Þ ¼R1�1R1�1 /ðx1; x2; x3Þe�iðk1x1þk2x2Þ dx1 dx2, where k1 and
k2 are the coordinates in Fourier space. The Laplace
equations become ordinary differential equations
d2/=dx23 ¼ k2/, where k ¼ffiffiffiffiffiffiffiffiffiffiffiffiffiffiffik21 þ k22
q. The solution takes
the form of / ¼ A expðkx3Þ þ B expð�kx3Þ. There is a
pair of A and B for each of the /a, /n, /f and /s, and
are determined by the boundary conditions (6) and (7).
The solution gives
ðD/nÞshn
¼ �kgneae2f
� �W kCn; ð8Þ
where
W k ¼ ½sinhðkhfÞ sinhðkhsÞ þ coshðkhfÞ coshðkhsÞðes=efÞ�=D;ð9Þ
and
D ¼ sinhðkhfÞ sinhðkhsÞ þ coshðkhsÞðeaes=e2f Þ� �
þ coshðkhfÞ sinhðkhsÞðea=efÞ þ coshðkhsÞðes=efÞ½ �.ð10Þ
A similar approach solves the electrostatic field induced
by the total n � 1 layers of dipoles and the prescribed
electrode potential of
/sðx1; x2;�hsÞ ¼ Uðx1; x2Þ. ð11Þ
We obtain that
ðD/nÞehn
¼ �kgneae2f
� �Rk; ð12Þ
3256 W. Lu, D. Salac / Acta Materialia 53 (2005) 3253–3260
where
Rk ¼Ues=gn
DþXn�1
m¼1
gmCm
gn
!
� sinhðkzmÞ sinhðkhsÞ þ coshðkzmÞ coshðkhsÞðes=efÞD
;
ð13Þ
and zm ¼Pm
j¼1hj is the distance between the upper sur-
face of the mth layer and the substrate.
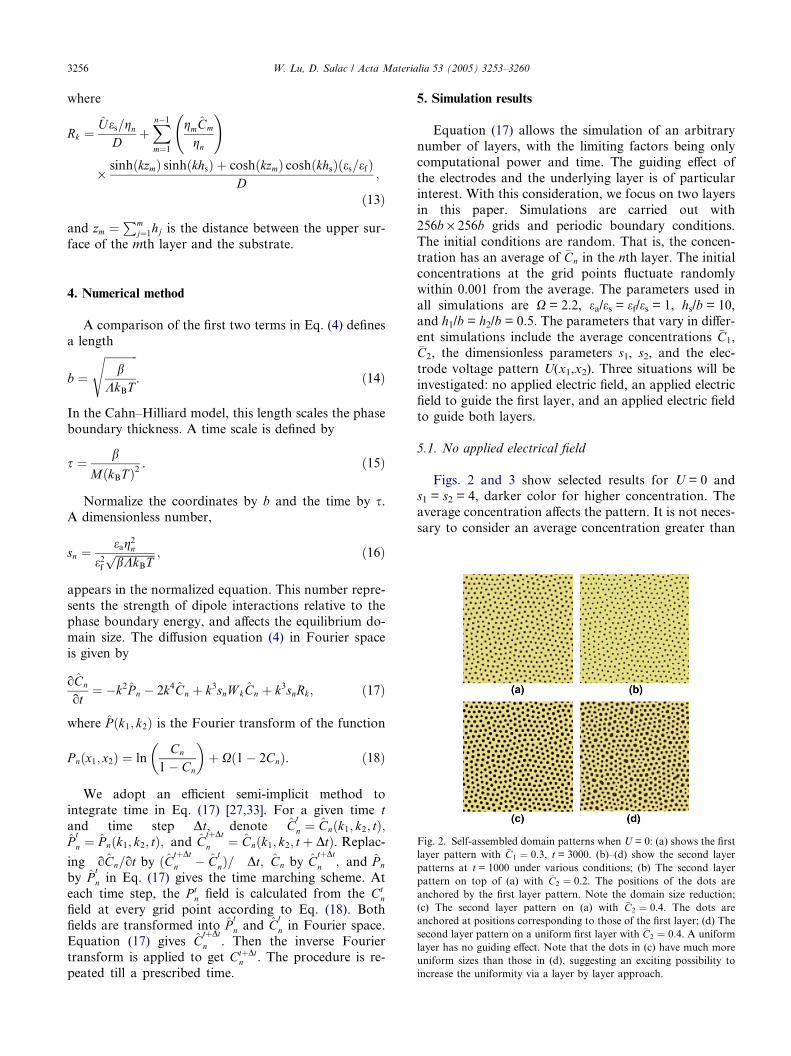
Fig. 2. Self-assembled domain patterns when U = 0: (a) shows the first
layer pattern with �C1 ¼ 0.3, t = 3000. (b)–(d) show the second layer
patterns at t = 1000 under various conditions; (b) The second layer
pattern on top of (a) with �C2 ¼ 0.2. The positions of the dots are
anchored by the first layer pattern. Note the domain size reduction;
(c) The second layer pattern on (a) with �C2 ¼ 0.4. The dots are
anchored at positions corresponding to those of the first layer; (d) The
second layer pattern on a uniform first layer with �C2 ¼ 0.4. A uniform
layer has no guiding effect. Note that the dots in (c) have much more
uniform sizes than those in (d), suggesting an exciting possibility to
increase the uniformity via a layer by layer approach.
4. Numerical method
A comparison of the first two terms in Eq. (4) defines
a length
b ¼
ffiffiffiffiffiffiffiffiffiffiffiffib
KkBT
s. ð14Þ
In the Cahn–Hilliard model, this length scales the phase
boundary thickness. A time scale is defined by
s ¼ b
M kBTð Þ2. ð15Þ
Normalize the coordinates by b and the time by s.A dimensionless number,
sn ¼eag2n
e2fffiffiffiffiffiffiffiffiffiffiffiffiffiffibKkBT
p ; ð16Þ
appears in the normalized equation. This number repre-
sents the strength of dipole interactions relative to the
phase boundary energy, and affects the equilibrium do-
main size. The diffusion equation (4) in Fourier spaceis given by
oCn
ot¼ �k2P n � 2k4Cn þ k3snW kCn þ k3snRk; ð17Þ
where P ðk1; k2Þ is the Fourier transform of the function
Pnðx1; x2Þ ¼ lnCn
1� Cn
� �þ Xð1� 2CnÞ. ð18Þ
We adopt an efficient semi-implicit method to
integrate time in Eq. (17) [27,33]. For a given time t
and time step Dt, denote Ct
n ¼ Cnðk1; k2; tÞ;Pt
n ¼ P nðk1; k2; tÞ; and CtþDt
n ¼ Cnðk1; k2; t þ DtÞ. Replac-
ing oCn=ot by ðCtþDt
n � Ct
nÞ= Dt; Cn by CtþDt
n ; and P n
by Pt
n in Eq. (17) gives the time marching scheme. At
each time step, the P tn field is calculated from the Ct
n
field at every grid point according to Eq. (18). Both
fields are transformed into Pt
n and Ct
n in Fourier space.Equation (17) gives C
tþDt
n . Then the inverse Fourier
transform is applied to get CtþDtn . The procedure is re-
peated till a prescribed time.
5. Simulation results
Equation (17) allows the simulation of an arbitrary
number of layers, with the limiting factors being only
computational power and time. The guiding effect of
the electrodes and the underlying layer is of particularinterest. With this consideration, we focus on two layers
in this paper. Simulations are carried out with
256b · 256b grids and periodic boundary conditions.
The initial conditions are random. That is, the concen-
tration has an average of �Cn in the nth layer. The initial
concentrations at the grid points fluctuate randomly
within 0.001 from the average. The parameters used in
all simulations are X = 2.2, ea/es = ef/es = 1, hs/b = 10,and h1/b = h2/b = 0.5. The parameters that vary in differ-
ent simulations include the average concentrations �C1,�C2, the dimensionless parameters s1, s2, and the elec-
trode voltage pattern U(x1,x2). Three situations will be
investigated: no applied electric field, an applied electric
field to guide the first layer, and an applied electric field
to guide both layers.
5.1. No applied electrical field
Figs. 2 and 3 show selected results for U = 0 and
s1 = s2 = 4, darker color for higher concentration. The
average concentration affects the pattern. It is not neces-
sary to consider an average concentration greater than

Fig. 3. Self-assembled domain patterns when U = 0: (a) shows the first
layer pattern with �C1 ¼ 0.5, t = 6000; (b) shows the second layer
pattern on top of (a) with �C2 ¼ 0.2, t = 2000. The dots arrange
themselves to follow the underlying serpentine stripes.
Fig. 4. (a) A voltage pattern. dark color: Ues/g1 = 0.1, bright color:
U = 0. (b)–(e) shows the evolution sequence of the first layer under the
voltage guidance. s1 = 2, �C1 ¼ 0.5. (b) t = 100. (c) t = 1000. (d) t = 104.
(e) t = 5 · 104. (f) The second layer pattern on top of (e) with s2 = 6,�C2 ¼ 0.2, t = 1000.
W. Lu, D. Salac / Acta Materialia 53 (2005) 3253–3260 3257
0.5, since this can be easily accommodated by redefining
the concentration with the other species.
Fig. 2(a) shows the pattern of the first layer at
t = 3000. The average concentration is �C1 ¼ 0.3. Thelayer self-organizes into a triangle of dots. The dots have
uniform size and form multiple grains. We have com-
puted to t = 106, and the dots remain the same size.
Without the dipole interaction, i.e., setting s1 = 0, the
simulation shows that the dots would have long coars-
ened into a single large dot. This confirms the refining
effect of dipole interaction, which is necessary to stabi-
lize the domain pattern.Fig. 2(b)–(d) show the second layer patterns at
t = 1000 under various conditions. Fig. 2(b) shows a sec-
ond layer pattern, which has an average concentration
of �C2 ¼ 0.2 and grows on top of the pattern in Fig.
2(a). We let the second layer evolve from a completely
different random initial condition. The dots of the sec-
ond layer stay at exactly the same positions as those in
Fig. 2(a), suggesting an anchoring effect of the first layer.The dot size of the second layer is smaller due to the
lower average concentration. Choosing a larger s2 is an-
other approach to reduce the domain size in the second
layer. Equation (16) shows that a larger sn indicates
stronger dipole interaction and thus more refining.
Fig. 2(c) shows another situation. The second layer
has an average concentration of �C2 ¼ 0.4, which is lar-
ger than that of the underlying layer. Similar correspon-dence between dot positions can be observed, though
the second layer now has a larger domain size.
Fig. 2(d) shows what the second layer pattern looks
like when there is no guidance of the first layer. The
average concentration is �C2 ¼ 0.4, the same as that in
Fig. 2(c). The simulation is performed by assigning a
uniform concentration to the first layer. The magnitude
of this concentration is insignificant since a uniform firstlayer has no contribution to the diffusion driving force
of the second layer. The comparison between Fig. 2(c)
and (d) clearly demonstrates the anchoring effect of
the underlying layer. It is also interesting to observe that
the dots in Fig. 2(c) have much more uniform sizes than
those in Fig. 2(d). This suggests an exciting possibility of
increasing the uniformity of self-organized domains via
a layer by layer approach.
Fig. 3 shows a simulation with a different guiding pat-
tern. The first layer has �C1 ¼ 0.5 and forms a serpentine
stripe pattern shown in Fig. 3(a). The pattern difference
between Fig. 3(a) and 2(a) indicates the effect of theaverage concentration. Fig. 3(b) shows the second layer
pattern with �C2 ¼ 0.2. The dots arrange themselves to
follow the underlying serpentine stripes, forming a pat-
tern different from that in Fig. 2(b).
The observation of Figs. 2 and 3 suggests that the
first layer pattern determines the ordering and lattice
spacing, while the second layer determines the feature
size. A scaling down of size can be achieved via multilay-ers. The interesting behavior suggests a potential fabri-
cation method. In addition to self-assembly, the first
layer pattern can be defined by embedded electrodes,
proximal probe technique, or nanoimprinting.
5.2. An applied electric field to guide the first layer
In the following simulations, we apply voltage pat-terns by the electrodes to guide the first layer. Fig. 4(a)
shows a voltage pattern composed of two dark stripes.

3258 W. Lu, D. Salac / Acta Materialia 53 (2005) 3253–3260
The dark color corresponds to a voltage of Ues=g1¼ 0.1,
and the bright color corresponds to U = 0. Fig. 4(b)–(e)
show the evolution sequence of the first layer with s1 = 2
and �C1 ¼ 0.5. The voltage guides the overall pattern of
the monolayer without directly imposing the final con-
figuration. In contrast to the serpentine stripe patternin Fig. 3(a), an ordered parallel stripe pattern is ob-
tained. Observe that concentration waves expand from
the voltage stripes and form ‘‘seeds’’ of superlattices.
These seeds grow into stripe colonies by consuming
the nearby serpentine structures. After the first layer
evolves to t = 5 · 104, i.e., Fig. 4(e), we remove the exter-
nal field, adsorb the second layer, and let it evolve. Fig.
4(f) shows the second layer pattern with s2 = 6 and�C2 ¼ 0.2. The dots organize into nicely ordered parallel
lines along the stripes in the first layer. The observation
again confirms that the second layer pattern conforms to
the first layer.
We next consider the guiding effect of a large applied
voltage, and the effect of a first layer pattern with much
larger feature sizes than those of the second layer. In the
simulation we use a voltage pattern shown in Fig. 5(a),which comprises a stripe and two disks. The dark color
region has a voltage of Ues=g1 ¼ 10. This magnitude is
two orders larger than that in Fig. 4(a). The bright color
region has U = 0. Fig. 5(b) shows the first layer pattern
with s1 = 2 and �C1 ¼ 0.3. The first layer replicates the
voltage pattern. We have tried other average concentra-
tions and obtained similar results. This suggests that a
high voltage can completely sweep away any intrinsicpatterns. We then remove the electric field and use the
first layer to direct the second layer. With s2 = 6 and�C2 ¼ 0.3, the second layer evolves into a pattern shown
in Fig. 5(c). The dots form a triangular lattice and orien-
tate to follow the edges of the first layer patterns. Com-
pared to Figs. 4(e) or 2(a), the domain size of the
guiding pattern in Fig. 5(b) is much larger. Fig. 5(c)
shows that the guiding effect originates from the domainedges of the first layer, which we call the ‘‘seed sites’’.
This is expected since a uniform first layer has not effect
on the diffusion of the second layer. The seed sites grad-
ually lose their influences on molecules farther away.
The molecules such as those between the stripe and
the disks feel an almost uniform underlying layer, and
thus do not receive any direct guidance. However, they
Fig. 5. (a) A voltage pattern. dark color: Ues/g1 = 10, bright color:
U = 0. (b) The first layer pattern with s1 = 2, �C1 ¼ 0.3, t = 2000. (c) The
second layer pattern with s2 = 6, �C2 ¼ 0.3, t = 1.5 · 104.
are influenced by the neighboring dots, which are fur-
ther influenced by those even closer to the seed sites.
This indirect way of guidance is analogous to crystal
growth.
The simulations in Figs. 4 and 5 demonstrate the flex-
ibility to use electrodes to construct a desired first layer.A second layer pattern can be engineered with the guid-
ance of the first layer.
5.3. An applied electric field to guide both layers
It has been shown in the previous sections that the
first layer has an anchoring effect on the second layer.
This behavior is further exploited by applying a voltagepattern during the evolution of the second layer. Specif-
ically, a particular voltage pattern is applied to construct
the first layer. After that, we adsorb the second layer and
apply a different voltage pattern. Different from the sim-
ulations in Figs. 4 and 5, the second layer is now under
the guidance of both the first layer and an applied elec-
tric field. The study gives more insight into the potential
application of multilayer systems.We first apply a high voltage to obtain the first layer
pattern shown in Fig. 6(a), which has s1 = 2 and�C1 ¼ 0.5. The first layer consists of four vertical stripes,
which replicates the voltage pattern. The voltage used is
Ues/g1 = 10. The second layer is then absorbed, which
has s2 = 2 and �C2 ¼ 0.3. The electrode is shifted to the
right by a small amount relative to the first layer pattern.
The new voltage pattern is shown in Fig. 6(b), with darkcolor corresponding to Ues/g2 = 1. Fig. 6(c) shows the
second layer pattern, which consists of four thin lines lo-
cated at the overlapping regions of Fig. 6(a) and (b). The
simulation suggests an exciting possibility to make well-
controlled fine structures from coarse patterns. The
structure size can be adjusted dynamically. The anchor-
ing effect also indicates a possibility to construct a
‘‘roadway’’ to guide the motion of molecules on top ofit, as shown in the following simulation.
Fig. 7(a) shows a monolayer roadway, which is ob-
tained by applying a high voltage of Ues/g1 = 10 at the
electrodes. The layer replicates the voltage pattern and
Fig. 6. (a) The first layer pattern with s1 = 2, �C1 ¼ 0.3, t = 1000. The
voltage used to obtain this pattern is Ues/g1 = 10. (b) The new voltage
pattern. dark color: Ues/g2 = 1, bright color: U = 0. Note the shift of
the voltage pattern relative to (a). (c) The second layer pattern under
the guidance of both the first layer and the applied voltage. s2 = 2,�C2 ¼ 0.3, t = 1500.

Fig. 7. (a) The first layer pattern with s1 = 2, �C1 ¼ 0.2, t = 5000. The
voltage used to obtain this pattern is Ues/g1 = 10. (b)–(f) show a
sequence of the second layer pattern guided by the first layer and a
vertical voltage line with Ues/g2 = 5. The line moves to the right at
a speed of 0.016. s2 = 1, �C2 ¼ 0.2. (b) t = 800. (c) t = 2000. (d) t = 4000.
(e) t = 6000. (f) t = 8000.
W. Lu, D. Salac / Acta Materialia 53 (2005) 3253–3260 3259
has s1 = 2 and �C1 ¼ 0.2. A second layer with s2 = 1 and�C2 ¼ 0.2 is then absorbed on the first layer. The voltage
pattern is set to be a straight vertical line centered in the
computational cell. The line has a voltage of Ues/g2 = 5.At t = 800 molecules accumulate at the intersection of
the roadway and the voltage line, forming a dot shown
in Fig. 7(b). We are going to move the dot and call it a
molecular car [34]. Functional groups can be attached to
the car, travel some distance and then be unloaded. We
allow the voltage line to move to the right at a velocity
of 0.016, which is normalized by b/s. Fig. 7(b)–(f) show a
sequence of the car�s movement. Due to the anchoringeffect of the first layer, the car follows the roadway
and makes turns automatically. The car travels to the
right at the same speed of the voltage line. The vertical
movement is prescribed by the first layer pattern. The
car changes its shape somewhat during the movement,
but does not break apart. Because the car is only a small
collection of molecules, the amount of materials moved
can be very small. This could lead to exciting applica-tions such as medical diagnostics, combinatorial chemis-
try and microfluidics. For instance, on a lab-on-a-chip it
may be possible to transport different doses of chemicals
from pools at the edges to the center of the chip, com-
bine them into a new compound and test the effect. This
process can be parallelized with many cars and multiple
roadways. Tests of new drugs could thus be performed
much more cheaply. Multilayer systems provide many
possibilities and the flexibility to control the molecular
motion.
6. Conclusion
Molecules absorbed onto a substrate are mobile and
have electric dipoles. This paper studies the domain
pattern formation of molecules in multilayer systems.
A phase field model is developed to simulate the molec-ular motion and patterning under the combined actions
of dipole moments, intermolecular forces, entropy, and
external electric field. The guiding effect of the under-
lying layers and the voltage pattern are of particular
interest. Taking a two-layer system as an example, we
consider three situations in Section 5. The study reveals
self-alignment, pattern conformation and the possibility
to reduce the domain sizes via a layer by layer approach.It is also shown that the pattern in a layer may define
the roadway for molecules to travel on top of. This
combined with electrodes embedded in the substrate
provides much flexibility. While the study focuses on
two-layer systems, it is straightforward to consider more
layers with Eq. (17). The overall picture should be sim-
ilar. We look forward to experimental demonstrations
of molecular assembly in multilayers.
Acknowledgment
The authors acknowledge financial support from Na-
tional Science Foundation Career Award No. DMI-
0348375.
References
[1] Bohringer M, Morgenstern K, Schneider W, Berndt R, Mauri F,
De Vita A, et al. Phys Rev Lett 1999;83:324.
[2] Dmitriev A, Lin N, Weckesser J, Barth J, Kern K. J Phys Chem B
2002;106:6907.
[3] Xu F, Street S, Barnard J. J Phys Chem B 2003;107:12762.
[4] Evans SD, Urankar E, Ulman A, Ferris N. J Am Chem Soc
1991;113:4121.
[5] Kellogg GL. Surf Sci Rep 1994;21:1.
[6] Barth JV. Surf Sci Rep 2000;40:75.
[7] McConnell HM. Annu Rev Phys Chem 1991;42:171.
[8] Seul M, Andelman D. Science 1995;267:476.
[9] Dickstein AJ, Erramilli S, Goldstein RE, Jackson DP, Langer SA.
Science 1993;261:1012.
[10] Richardi J, Ingert D, Pileni MP. Phys Rev E 2002;66:046306.
[11] Stranick SJ, Parikh AN, Tao YT, Allara DL, Weiss PS. J Phys
Chem 1994;98:7636.
[12] Tamada K, Hara M, Sasabe H, Knoll W. Langmuir 1997;13:1558.

3260 W. Lu, D. Salac / Acta Materialia 53 (2005) 3253–3260
[13] Schneider K, Lu W, Owens T, Fosnacht D, Holl M, Orr B. Phys
Rev Lett 2004;93.
[14] Ng KO, Vanderbilt D. Phys Rev B 1995;52:2177.
[15] Plass R, Last JA, Bartelt NC, Kellogg GL. Nature 2001;412:875.
[16] Heinrich A, Lutz C, Gupta J, Eigler D. Science 2002;298:1381.
[17] Gao Y, Suo Z. J Appl Phys 2003;93:4276.
[18] Rosei F, Schunack M, Naitoh Y, Jiang P, Gourdon A, Laegsg-
aard E, et al. Prog Surf Sci 2003;71:95.
[19] Suo Z, Gao Y, Scoles G. J Appl Mech 2004;71:24.
[20] Chou SY, Zhuang L. J Vac Sci Tech B 1999;17:3197.
[21] Schaffer E, Thurn-Albrecht T, Russell T, Steiner U. Nature
2000;403:874.
[22] Salac D, Lu W, Wang CW, Sastry AM. Appl Phys Lett
2004;85:1161.
[23] Iler RK. J Colloid Interf Sci 1966;21:569.
[24] Durstock MF, Spry RJ, Baur JW, Taylor BE, Chiang LY. J Appl
Phys 2003;94:3253.
[25] Jin WQ, Toutianoush A, Tieke B. Langmuir 2003;19:
2550.
[26] Suo Z, Lu W. J Mech Phys Solids 2000;48:211.
[27] Lu W, Suo Z. J Mech Phys Solids 2001;49:1937.
[28] Lu W, Suo Z. Phys Rev B 2002;65:205418.
[29] Lu W, Suo Z. Phys Rev B 2002;65:085401.
[30] Lu W, Kim D. Nano Lett 2004;4:313.
[31] Kim D, Lu W. Nanotechnology 2004;15:667.
[32] Cahn JW, Hilliard JE. J Chem Phys 1958;28:258.
[33] Chen L, Shen J. Comp Phys Commun 1998;108:147.
[34] Suo Z, Hong W. Proc Natl Acad Sci USA 2004;101:7874.