
Nanoscale - RSC Publishing
16
This is an Accepted Manuscript, which has been through the Royal Society of Chemistry peer review process and has been accepted for publication. Accepted Manuscripts are published online shortly after acceptance, before technical editing, formatting and proof reading. Using this free service, authors can make their results available to the community, in citable form, before we publish the edited article. We will replace this Accepted Manuscript with the edited and formatted Advance Article as soon as it is available. You can find more information about Accepted Manuscripts in the Information for Authors. Please note that technical editing may introduce minor changes to the text and/or graphics, which may alter content. The journal’s standard Terms & Conditions and the Ethical guidelines still apply. In no event shall the Royal Society of Chemistry be held responsible for any errors or omissions in this Accepted Manuscript or any consequences arising from the use of any information it contains. Accepted Manuscript Nanoscale www.rsc.org/nanoscale
-
Upload
khangminh22 -
Category
Documents
-
view
2 -
download
0
Transcript of Nanoscale - RSC Publishing

This is an Accepted Manuscript, which has been through the Royal Society of Chemistry peer review process and has been accepted for publication.
Accepted Manuscripts are published online shortly after acceptance, before technical editing, formatting and proof reading. Using this free service, authors can make their results available to the community, in citable form, before we publish the edited article. We will replace this Accepted Manuscript with the edited and formatted Advance Article as soon as it is available.
You can find more information about Accepted Manuscripts in the Information for Authors.
Please note that technical editing may introduce minor changes to the text and/or graphics, which may alter content. The journal’s standard Terms & Conditions and the Ethical guidelines still apply. In no event shall the Royal Society of Chemistry be held responsible for any errors or omissions in this Accepted Manuscript or any consequences arising from the use of any information it contains.
Accepted Manuscript
Nanoscale
www.rsc.org/nanoscale

Journal Name
Cite this: DOI: 10.1039/c0xx00000x
www.rsc.org/xxxxxx
Dynamic Article Links ►
ARTICLE TYPE
This journal is © The Royal Society of Chemistry [year] [journal], [year], [vol], 00–00 | 1
In-situ preparation of N-TiO2/graphene nanocomposite and its enhanced
photocatalytic hydrogen production by H2S splitting under solar light
Ashwini P. Bhirud,a Shivaram D. Sathaye,b Rupali P. Waichal,c Jalindar D. Ambekara, Chan -J. Parkc* and Bharat B. Kalea,* 5
Received (in XXX, XXX) Xth XXXXXXXXX 20XX, Accepted Xth XXXXXXXXX 20XX
DOI: 10.1039/b000000x
Highly monodispersed nitrogen doped TiO2 nanoparticles were successfully deposited on graphene (N-TiO2/Gr) by facile in-situ wet
chemical method for the first time. N-TiO2/Gr has been further used for the photocatalytic hydrogen production using naturally occurring 10
abundant source of energy i.e. solar light. The N-TiO2/Gr nanocomposite composition was optimized by varying the concentrations of
dopant nitrogen and graphene (using various concentration of graphene) for utmost hydrogen production. The structural, optical and
morphological aspects of nanocomposites were studied using XRD, UV-DRS, Raman, XPS, FESEM, and TEM. The structural study of
nanocomposite shows existence of anatase N-TiO2. Further, the details of the components present in the composition were confirmed
with Raman and XPS. The morphological study shows very tiny, 7-10 nm sized N-TiO2 nanoparticles are deposited on graphene sheet. 15
The optical study reveals drastic change in absorption edge (3.19-2.41 eV) and consequent total absorption due to nitrogen doping and
presence of graphene. Considering the extended absorption edge to visible region, further these nanocomposites were used as a
photocatalyst to transform hazardous H2S waste into eco-friendly hydrogen using solar light. The N-TiO2/Gr nanocomposite with 2%
graphene exhibits enhanced photocatalytic stable hydrogen production i.e. ~5941 µmole h-1 under solar light irradiation using just 0.2 gm
nanocomposite, which is much higher as compared to P25, undoped TiO2 and TiO2/Gr nanocomposite. The enhancement in the 20
photocatalytic activity is attributed to ‘N’ doping as well as high specific surface area and charge carrier ability of graphene. The
recycling of the photocatalyst shows the good stability of the nanocomposites. This work may provide new insights to design other
semiconductor deposited graphene novel nanocomposite as a visible light active photocatalyst.
1 Introduction 25
With the global depletion of fossil-based energy
resources, naturally occurring abundant source i.e. solar light has
been considered to be a promising route to generate alternative
source of energy for production of hydrogen.1,2 Thus, the
hydrogen is produced via H2O or H2S splitting using various 30
semiconductor photocatalysts. It would be important to point out
that H2 generation can also be achieved by H2O splitting; either
by photocatalysis or by electrolytic process. In the electrolytic
process, some electrical energy inputs are necessary to generate
H2. As against this, H2S splitting utilizes solar energy which 35
otherwise is not being used creatively as proposed in the present
work. Therefore, saving of energy and offering alternative energy
source makes H2S splitting to generate H2 has significance and 40
as a preferred topic of research at present. Toxic H2S gas is
available abundantly as a waste from coal and petroleum
industries, natural gas, oil wells and geothermal plants.3 H2S can
be effectively decomposed by photocatalytic process under solar
light irradiation to produce hydrogen, a clean fuel. Therefore, H2S 45
splitting will not only effectively harness the abundant solar
energy but also clean up the environment.
It is quite understood that solar light driven
photocatalysis by semiconductor has immense importance in the
area of water purification and catalysis. Among various 50
semiconductor photocatalysts such as TiO2, ZnO, CdS, MoS24,
titania has attracted much attention due to its fascinating
Page 1 of 15 Nanoscale
Nan
osca
leA
ccep
ted
Man
uscr
ipt
2 | Journal Name, [year], [vol], 00–00 This journal is © The Royal Society of Chemistry [year]
properties namely, biological and chemical inertness, cost-
effectiveness, and long-term stability against photocorrosion and
chemical corrosions.5 The band gap of TiO2 is 3.2 eV and hence
not effective for visible light driven photocatalysis. Therefore,
using pure TiO2, the solar energy conversion would be 5
unreasonable. Additionally, fast recombination rate of the photo-
induced electron–hole pairs in pure TiO2 reduces the efficiency of
the photocatalytic reactions significantly, thus limiting its
practical applications. Hence, many researchers tried to dope
TiO2 with transition metals and investigated photocatalytic 10
activity.6 However, it is found that such doping created a number
of defect-states which act as the recombination centers of
photogenerated electrons and holes which becomes detrimental
for the photocatalysis process. Therefore, creating suitable defect
states that would be favorable in three different ways, namely, 1) 15
enhancing visible light absorption 2) improving charge separation
and 3) improving overall photocatalytic reaction by facilitating
charge carrier-substrate interaction which is a challenging
problem. Considering the drawbacks of metal doping, anionic
doping in TiO2 has received much attention. The anionic doping 20
is expected to tune the band gap of TiO2 well within the visible
region of solar spectrum, which enhances the absorption in
visible light and consequently producing maximum number of
charge carriers. Additionally, it is reported that ‘p’ orbitals of
these dopants significantly overlap with the valence band O2p 25
orbitals in TiO2 which suppress the recombination of charge
carriers (electron-holes) and enhancing the photocatalytic
activity.7 Nevertheless, still the progress in enhancing quantum
yield and suppression of recombination of photogenerated
electron–hole pairs is not satisfactory.8 Another common method 30
for enhancing the photocatalytic efficiency of TiO2 is by
preventing the agglomeration of catalyst nanoparticles. A method
of achieving this is by confining the particle growth process in
the pores or at the interface of co-adsorbents such as mesoporous
materials, zeolites, alumina, silica or carbon-based or 35
carbonaceous materials.9 Such immobilization increases the
surface area available for the catalytic process. Among these,
carbonaceous materials are of great interest due to their unique
pore structure, electronic properties, absorption capacity and
charge carrier mobility. These materials include carbon 40
nanotubes, activated carbon and graphene.10-12
As it is well known that graphene is an attractive and
significant material due to its two-dimensional nanostructure with
remarkable properties specifically, superior mechanical strength,
excellent mobility of charge carriers, high thermal conductivity 45
and large specific surface area .13-16 These outstanding features
attracted graphene to be utilized as a promising support material
to disperse and stabilize N-TiO2 nanoparticles which in turn
enhance the photocatalytic hydrogen production by water
splitting.17 One of the most critical parameters that affect the 50
photocatalytic properties of N-TiO2/Gr composite is the
interfacial contact between the graphene sheet and N-TiO2
nanoparticles. Although, there are many reports on TiO2/ Gr
composite as photocatalyst18 many of these associated to dye
degradation using UV/Vis light. H2 generation using UV/Vis 55
light by photocatalysis or electro-catalysis through water/H2S
splitting need more specific parameters as compared to dye
degradation. Therefore the comparison of these works would be
superfluous. The present study reports the use of TiO2/Gr
composite as a solar light photocatalyst for H2 production through 60
H2S splitting.
To the best of our knowledge, there are few reports on
N-TiO2/Gr composites used for photocatalytic and other
applications. Shengang Xu and Shaokui Cao17 synthesized
nanocomposites of graphene oxide with nitrogen doped TiO2 via 65
hydrothermal method for photocatalytic hydrogen production by
water splitting. N. R. Khalid and Zhanglian Hong19 prepared
nitrogen doped TiO2 nanoparticles decorated on graphene sheets
by low temperature hydrothermal method for methyl orange dye
degradation. Jingquan Liu, Dongjiang Yang and Ziyang Huo20 70
prepared nitrogen doped TiO2/Gr nanohybrids for dye-sensitized
solar cell (DSSC). Considering the very limited study on N-
TiO2/Gr composites synthesis and its applications for hydrogen
production in general and by H2S splitting in particular, we have
attempted an in-situ preparation of N-TiO2 graphene 75
nanocomposite and its photocatalytic application for hydrogen
production under solar light.
In the present investigation, in-situ preparation of
deposition of highly mono-dispersed tiny nanoparticles of N-
TiO2 on multi-layer of graphene sheets using facile wet chemical 80
method has been demonstrated which is hitherto unattemped.
The structural and optical properties of these nanostructures have
been studied thoroughly. The prepared N-TiO2/Gr
nanocomposites showed wider spectral response and higher
photocatalytic activity in the visible-light region than P25, 85
undoped TiO2 and TiO2/Gr composite. We are reporting for the
Page 2 of 15Nanoscale
Nan
osca
leA
ccep
ted
Man
uscr
ipt
This journal is © The Royal Society of Chemistry [year] Journal Name, [year], [vol], 00–00 | 3
first time the enhanced photocatalytic activity of N-TiO2/Gr
composites for photodecomposition of H2S under solar light
illumination for hydrogen generation.
2 Exprimental part 5
Preparation of Graphene oxide (GO)
Graphene oxide was prepared from graphite powder (99.99% S d
fine) by a Hummers and Offeman method.21
Preparation of Nitrogen doped TiO2/graphene (N-TiO2/Gr) 10
N-TiO2/Gr was prepared by using a simple wet chemical method.
Analytical grade Titanium tetrachloride (TiCl4), urea and absolute
ethanol were purchased from the local chemical manufacturer
(Qualigene chemicals) and used as received. In a typical
synthesis, the as prepared GO, (0.5%, 1%, 2% and 4%) was 15
dispersed in a absolute ethanol and ultrasonicated for half an hour
[Solution A]. A solution of 0.05 mole of TiCl4 and 0.2 mole urea
(1:4 w/w of TiCl4:urea) was prepared in absolute ethanol with
constant stirring until a homogeneous solution was achieved
[solution B]. Then, solution B was slowly added into solution A 20
with constant stirring. The stirring was continued for additional
half an hour. This final solution was then kept in oven at 150oC to
obtained the black product i.e Ti-urea-graphene intermediate
complex, which was found to be hygroscopic. The hygroscopic
product was preserved in a desiccator and then further subdivided 25
for heat treatment at 300oC, 400oC, 500oC and 600oC for 3h to
obtain the desired products, which were no longer hygroscopic.
Simulteneously, undoped TiO2, N-TiO2 and TiO2-Gr were
prepared for comparison, following the same procedure. The
undoped TiO2 was synthesized by preparing a solution of 0.05 30
mole TiCl4 in absolute ethanol (without any additives like urea)
followed by heating it at 150oC to obtained the product which
was further annealed at 300oC for 3h and denoted as T1. We
synthesized N-TiO2 samples using different TiCl4:urea ratios i.e.
1:2, 1:4 and 1:6 (w/w) were also prepared and the better results 35
are obtained for 1:4 ratio. The N-TiO2 was prepared by heat
treating homogeneous 0.05 mole TiCl4 and 0.2 mole urea (1:4
w/w of TiCl4:urea) solution in absolute ethanol at 150oC to
obtained an intermediate product (Ti-urea complex) which was
further annealed at 300oC, 400oC and 500oC for 3h. The product 40
annealed at 300oC is named as T2. We discuss the results of the
final product i.e. N-TiO2/Gr with that of T2. The TiO2/Gr sample
was prepared by heat treating 0.05 mole TiCl4 and as prepared
GO (with 2% loading) in absolute ethanol (without any additives,
i.e. urea) at 150oC to obtained the intermediate product which 45
was further annealed at 300oC for 3h and denoted as T3. The
other products with dopants and graphene composites with 0.5%,
1% and 2% loading of GO were annealed at 300oC for 3h and
denoted as T4, T5 and T6, respectively. After annealing, all the
samples were washed with copious amounts of hot distilled water 50
until all chlorine is removed and these products were then
subjected to XRD, UV-DRS, Raman, XPS, FTIR, FESEM, TEM
and BET, PL analysis for their characterization.
Photodecomposition of H2S 55
The cylindrical quartz photochemical reactor was filled with 200
ml 0.25 M aqueous KOH and purged with argon for 1 h.
Hydrogen sulphide (H2S) was bubbled through the solution for
about 1 h at the rate of 2.5 ml min−1 at 299 K. Undoped TiO2, N-
TiO2, TiO2/Gr and N-TiO2/Gr (0.2 g) was introduced into the 60
reactor and irradiated with a solar light source Xe-lamp (300 W,
LOT ORIEL GRUPPE, EUROPA, LSH302) with constant
stirring. The escaped hydrogen sulfide was trapped in a NaOH
solution. The amount of hydrogen gas evolved was collected in a
graduated cylinder and measured. The evolved hydrogen was 65
then analyzed for its purity using a gas chromatograph (Model
Shimadzu GC-14B, MS-5 Å column, TCD, Ar carrier). All the
samples (T1–T6) were tested for their catalytic activity under
identical conditions. In an experiment, a composite was tested as
a catalyst for a continuous period of 420 minutes (7 hrs.). 70
Characterization
The crystalline phases and the crystallite size of the photocatalyst
was identified using an X-ray powder diffraction (XRD)
technique (XRD-D8, Advance, Bruker-AXS) with Cu Kα 75
radiation. The optical properties of the powder samples were
studied using an UV-visible-near infrared spectrometer (UV-VIS-
NIR, Perkin Elmer Lambda-950). Room temperature micro
Raman scattering (RS) was performed using a HR 800-Raman
Spectroscopy, Horiba Jobin Yvon, France, with an excitation at 80
632.81 nm by a coherent He–Ne ion laser and a liquid nitrogen
cooled CCD camera to collect and process the scattered data. The
nature of chemical bonds formed in N-TiO2 and reduction of GO
to graphene were examined using X-ray photoelectron
spectroscopy (XPS, ESCA-3000, VG Scientific Ltd, England) 85
with a base pressure greater than 1.0 × 10⁻⁹ Pa and Mg Kα
Page 3 of 15 Nanoscale
Nan
osca
leA
ccep
ted
Man
uscr
ipt
4 | Journal Name, [year], [vol], 00–00 This journal is © The Royal Society of Chemistry [year]
radiation (1253.6 eV) was used as an X-ray source operated at
150 W. FTIR spectra's were recorded with a Nicolet Magna 550
spectrometer. The morphologies of the N-TiO2/ Gr composites
nanostructures were characterized by field emission scanning
electron microscopy (FESEM, Hitachi, S-4800) and high 5
resolution transmission electron microscopy (HRTEM, JEOL,
2010F). For HRTEM studies, samples were prepared by
dispersing the powder in acetone, followed by sonication in an
ultrasonic bath for 2 min and then drop-casting the dispersion on
a carbon coated copper grid and by subsequent drying in a 10
vacuum. The Brunauer-Emmett-Teller (BET) specific surface
area (SBET) of the powders was analyzed by nitrogen adsorption
in a Micro-meritics ASAP 2020 nitrogen adsorption apparatus
(U.S.). All of the prepared samples were degassed at 180oC prior
to nitrogen adsorption measurements. Photoluminecence (PL) 15
emission spectra were recorded using
HORIBAJOBINYVON, F-3 Fluorescence spectrophotometer.
3 Results and discussion
20
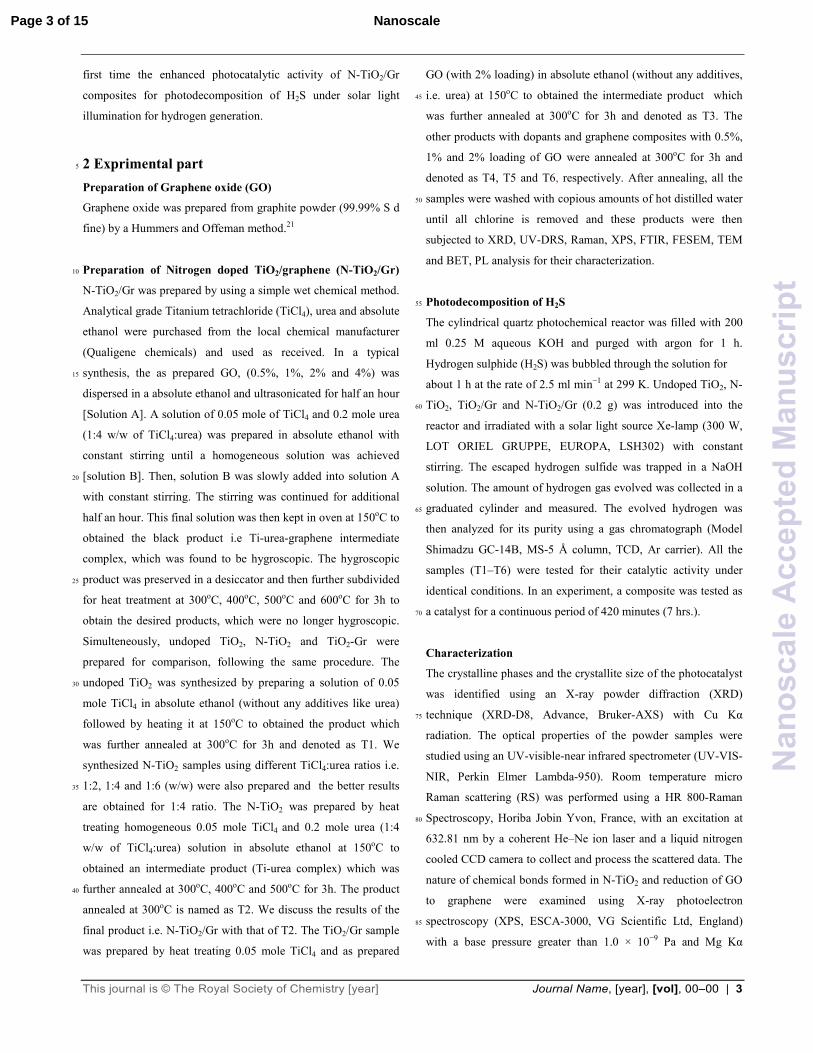
Fig. 1 XRD spectrum of samples (a) undoped TiO2 (T1) treated at
300oC for 3h (b) N-TiO2 treated at 300oC for 3h (T2) (c) TiO2/Gr
composite with 2% loading which treated at 300oC for 3h (T3)
and N-TiO2/Gr composites treated at 300oC for 3h with different
GO loading (d) 0.5% (T4), (e) 1% (T5) and (f) 2% (T6) 25
Fig. 1 shows the XRD pattern for the N-TiO2/Gr nanocomposites
(T4-T6) synthesized with different content of graphene which is
compared with the N-TiO2 (T2), TiO2/Gr (T3) and TiO2 (T1).
The peaks observed at 25.3o, 37.8o, 48.0o, 55.1o, 62.7o, 70.3o and
75.0o are indexed as (101), (004), (200), (211), (204), (220) and 30
(215) planes respectively, clearly reveals the formation of anatase
(JCPDS no. 21-1272) crystallites. No peaks were observed for
carbon species (multi-layer graphene) in the composite samples
T3-T6, which may be due to low amount of graphene.22 Further,
observation indicates that the full width at half maximum 35
(FWHM) is more for the anatase peaks of N-TiO2 (T2) which is
attributed to the induction of nitrogen into the TiO2 lattice. In
case of samples (T3-T6), the presence of increasing amount of
graphene may play an additional role in restricting the degree of
crystallization.23 Further, the existence of graphene and its 40
consequential effects is supported by Raman and XPS analysis.
Generally, the overall photocatalytic activity of a
semiconductor is mainly related to the optical absorption ability
in the desired spectral region, efficient separation of
photogenerated electrons, holes and fast transport of the 45
photogenerated electrons and holes to the surface which
ultimately decreases the recombination.
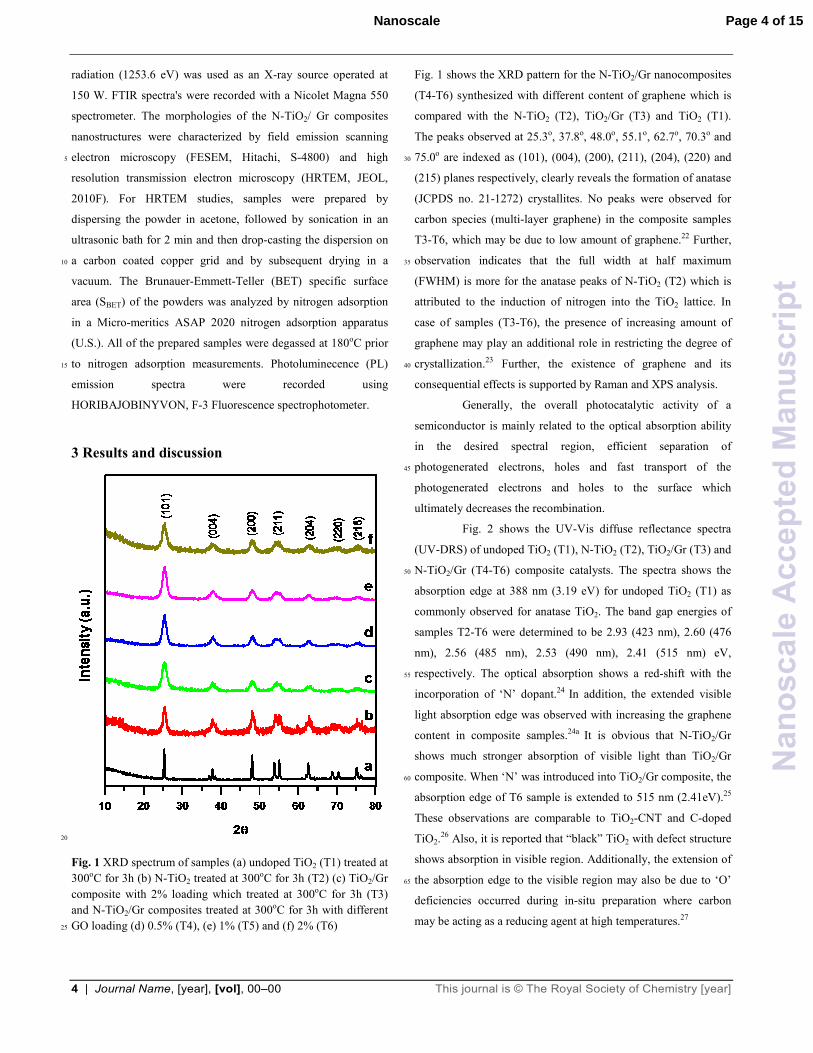
Fig. 2 shows the UV-Vis diffuse reflectance spectra
(UV-DRS) of undoped TiO2 (T1), N-TiO2 (T2), TiO2/Gr (T3) and
N-TiO2/Gr (T4-T6) composite catalysts. The spectra shows the 50
absorption edge at 388 nm (3.19 eV) for undoped TiO2 (T1) as
commonly observed for anatase TiO2. The band gap energies of
samples T2-T6 were determined to be 2.93 (423 nm), 2.60 (476
nm), 2.56 (485 nm), 2.53 (490 nm), 2.41 (515 nm) eV,
respectively. The optical absorption shows a red-shift with the 55
incorporation of ‘N’ dopant.24 In addition, the extended visible
light absorption edge was observed with increasing the graphene
content in composite samples.24a It is obvious that N-TiO2/Gr
shows much stronger absorption of visible light than TiO2/Gr
composite. When ‘N’ was introduced into TiO2/Gr composite, the 60
absorption edge of T6 sample is extended to 515 nm (2.41eV).25
These observations are comparable to TiO2-CNT and C-doped
TiO2.26 Also, it is reported that “black” TiO2 with defect structure
shows absorption in visible region. Additionally, the extension of
the absorption edge to the visible region may also be due to ‘O’ 65
deficiencies occurred during in-situ preparation where carbon
may be acting as a reducing agent at high temperatures.27
Page 4 of 15Nanoscale
Nan
osca
leA
ccep
ted
Man
uscr
ipt
This journal is © The Royal Society of Chemistry [year] Journal Name, [year], [vol], 00–00 | 5
Fig. 2 UV-DRS spectra of samples (a) undoped TiO2 (T1) treated
at 300oC for 3h (b) N-TiO2 treated at 300oC for 3h (T2) (c)
TiO2/Gr composite with 2% loading which treated at 300oC for
3h (T3) and N-TiO2/Gr composites treated at 300oC for 3h with 5
different GO loading (d) 0.5% (T4), (e) 1% (T5) and (f) 2% (T6)
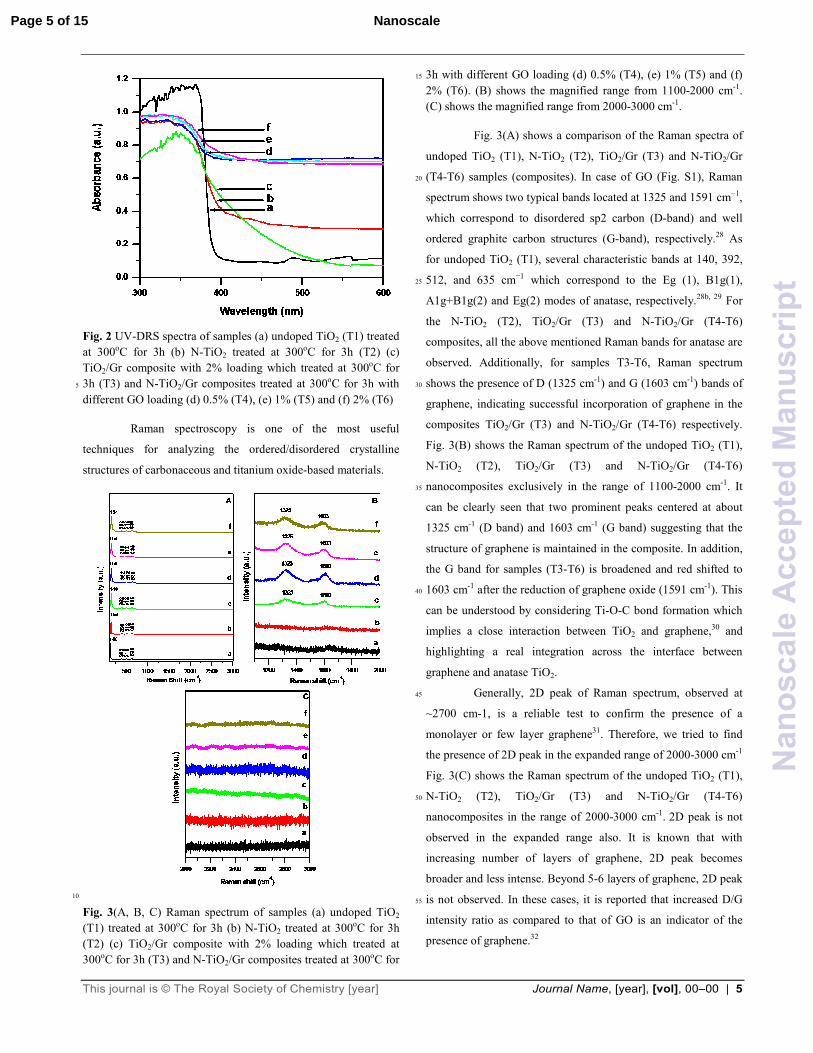
Raman spectroscopy is one of the most useful
techniques for analyzing the ordered/disordered crystalline
structures of carbonaceous and titanium oxide-based materials.
10
Fig. 3(A, B, C) Raman spectrum of samples (a) undoped TiO2
(T1) treated at 300oC for 3h (b) N-TiO2 treated at 300oC for 3h
(T2) (c) TiO2/Gr composite with 2% loading which treated at
300oC for 3h (T3) and N-TiO2/Gr composites treated at 300oC for
3h with different GO loading (d) 0.5% (T4), (e) 1% (T5) and (f) 15
2% (T6). (B) shows the magnified range from 1100-2000 cm-1.
(C) shows the magnified range from 2000-3000 cm-1.
Fig. 3(A) shows a comparison of the Raman spectra of
undoped TiO2 (T1), N-TiO2 (T2), TiO2/Gr (T3) and N-TiO2/Gr
(T4-T6) samples (composites). In case of GO (Fig. S1), Raman 20
spectrum shows two typical bands located at 1325 and 1591 cm−1,
which correspond to disordered sp2 carbon (D-band) and well
ordered graphite carbon structures (G-band), respectively.28 As
for undoped TiO2 (T1), several characteristic bands at 140, 392,
512, and 635 cm−1 which correspond to the Eg (1), B1g(1), 25
A1g+B1g(2) and Eg(2) modes of anatase, respectively.28b, 29 For
the N-TiO2 (T2), TiO2/Gr (T3) and N-TiO2/Gr (T4-T6)
composites, all the above mentioned Raman bands for anatase are
observed. Additionally, for samples T3-T6, Raman spectrum
shows the presence of D (1325 cm-1) and G (1603 cm-1) bands of 30
graphene, indicating successful incorporation of graphene in the
composites TiO2/Gr (T3) and N-TiO2/Gr (T4-T6) respectively.
Fig. 3(B) shows the Raman spectrum of the undoped TiO2 (T1),
N-TiO2 (T2), TiO2/Gr (T3) and N-TiO2/Gr (T4-T6)
nanocomposites exclusively in the range of 1100-2000 cm-1. It 35
can be clearly seen that two prominent peaks centered at about
1325 cm-1 (D band) and 1603 cm-1 (G band) suggesting that the
structure of graphene is maintained in the composite. In addition,
the G band for samples (T3-T6) is broadened and red shifted to
1603 cm-1 after the reduction of graphene oxide (1591 cm-1). This 40
can be understood by considering Ti-O-C bond formation which
implies a close interaction between TiO2 and graphene,30 and
highlighting a real integration across the interface between
graphene and anatase TiO2.
Generally, 2D peak of Raman spectrum, observed at 45
~2700 cm-1, is a reliable test to confirm the presence of a
monolayer or few layer graphene31. Therefore, we tried to find
the presence of 2D peak in the expanded range of 2000-3000 cm-1
Fig. 3(C) shows the Raman spectrum of the undoped TiO2 (T1),
N-TiO2 (T2), TiO2/Gr (T3) and N-TiO2/Gr (T4-T6) 50
nanocomposites in the range of 2000-3000 cm-1. 2D peak is not
observed in the expanded range also. It is known that with
increasing number of layers of graphene, 2D peak becomes
broader and less intense. Beyond 5-6 layers of graphene, 2D peak
is not observed. In these cases, it is reported that increased D/G 55
intensity ratio as compared to that of GO is an indicator of the
presence of graphene.32
Page 5 of 15 Nanoscale
Nan
osca
leA
ccep
ted
Man
uscr
ipt
6 | Journal Name, [year], [vol], 00–00 This journal is © The Royal Society of Chemistry [year]
A further observation reveals that the samples T3 and
T4-T6 composite show an increased D/G intensity ratio 1.17 and
1.1, 1.23, 1.78 respectively in comparison to that of GO (0.93)
(Fig. S1). This change suggests decrease in the average size of
the sp2 domains and enhancement in the number of defects 5
during reduction of the exfoliated GO to graphene in the
synthesis process.28b, 33 ‘N’ doping in TiO2, the Raman spectra
shows a shift in the TiO2 peak to the higher wavenumbers i.e.
from 140 to 154 cm-1 for samples T2, T4-T6 indicating an
increase in the surface oxygen vacancies.34 10
X-ray photoelectron spectroscopy (XPS) measurements
were performed to further investigate the chemical changes that
occurred on the surface during composite formation by
monitoring the signals of N, Ti, O and C to elucidate the
interaction between graphene, TiO2 and N-TiO2 nanoparticles. 15
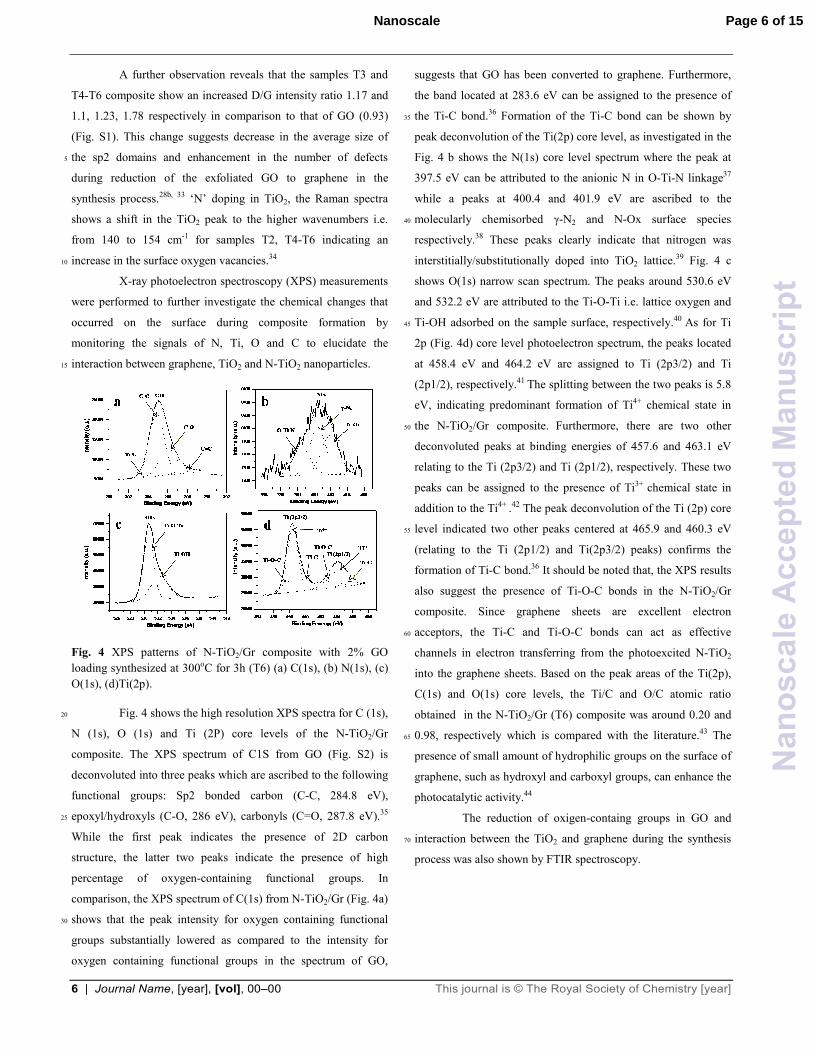
Fig. 4 XPS patterns of N-TiO2/Gr composite with 2% GO
loading synthesized at 300oC for 3h (T6) (a) C(1s), (b) N(1s), (c)
O(1s), (d)Ti(2p).
Fig. 4 shows the high resolution XPS spectra for C (1s), 20
N (1s), O (1s) and Ti (2P) core levels of the N-TiO2/Gr
composite. The XPS spectrum of C1S from GO (Fig. S2) is
deconvoluted into three peaks which are ascribed to the following
functional groups: Sp2 bonded carbon (C-C, 284.8 eV),
epoxyl/hydroxyls (C-O, 286 eV), carbonyls (C=O, 287.8 eV).35 25
While the first peak indicates the presence of 2D carbon
structure, the latter two peaks indicate the presence of high
percentage of oxygen-containing functional groups. In
comparison, the XPS spectrum of C(1s) from N-TiO2/Gr (Fig. 4a)
shows that the peak intensity for oxygen containing functional 30
groups substantially lowered as compared to the intensity for
oxygen containing functional groups in the spectrum of GO,
suggests that GO has been converted to graphene. Furthermore,
the band located at 283.6 eV can be assigned to the presence of
the Ti-C bond.36 Formation of the Ti-C bond can be shown by 35
peak deconvolution of the Ti(2p) core level, as investigated in the
Fig. 4 b shows the N(1s) core level spectrum where the peak at
397.5 eV can be attributed to the anionic N in O-Ti-N linkage37
while a peaks at 400.4 and 401.9 eV are ascribed to the
molecularly chemisorbed γ-N2 and N-Ox surface species 40
respectively.38 These peaks clearly indicate that nitrogen was
interstitially/substitutionally doped into TiO2 lattice.39 Fig. 4 c
shows O(1s) narrow scan spectrum. The peaks around 530.6 eV
and 532.2 eV are attributed to the Ti-O-Ti i.e. lattice oxygen and
Ti-OH adsorbed on the sample surface, respectively.40 As for Ti 45
2p (Fig. 4d) core level photoelectron spectrum, the peaks located
at 458.4 eV and 464.2 eV are assigned to Ti (2p3/2) and Ti
(2p1/2), respectively.41 The splitting between the two peaks is 5.8
eV, indicating predominant formation of Ti4+ chemical state in
the N-TiO2/Gr composite. Furthermore, there are two other 50
deconvoluted peaks at binding energies of 457.6 and 463.1 eV
relating to the Ti (2p3/2) and Ti (2p1/2), respectively. These two
peaks can be assigned to the presence of Ti3+ chemical state in
addition to the Ti4+ .42 The peak deconvolution of the Ti (2p) core
level indicated two other peaks centered at 465.9 and 460.3 eV 55
(relating to the Ti (2p1/2) and Ti(2p3/2) peaks) confirms the
formation of Ti-C bond.36 It should be noted that, the XPS results
also suggest the presence of Ti-O-C bonds in the N-TiO2/Gr
composite. Since graphene sheets are excellent electron
acceptors, the Ti-C and Ti-O-C bonds can act as effective 60
channels in electron transferring from the photoexcited N-TiO2
into the graphene sheets. Based on the peak areas of the Ti(2p),
C(1s) and O(1s) core levels, the Ti/C and O/C atomic ratio
obtained in the N-TiO2/Gr (T6) composite was around 0.20 and
0.98, respectively which is compared with the literature.43 The 65
presence of small amount of hydrophilic groups on the surface of
graphene, such as hydroxyl and carboxyl groups, can enhance the
photocatalytic activity.44
The reduction of oxigen-containg groups in GO and
interaction between the TiO2 and graphene during the synthesis 70
process was also shown by FTIR spectroscopy.
Page 6 of 15Nanoscale
Nan
osca
leA
ccep
ted
Man
uscr
ipt
This journal is © The Royal Society of Chemistry [year] Journal Name, [year], [vol], 00–00 | 7
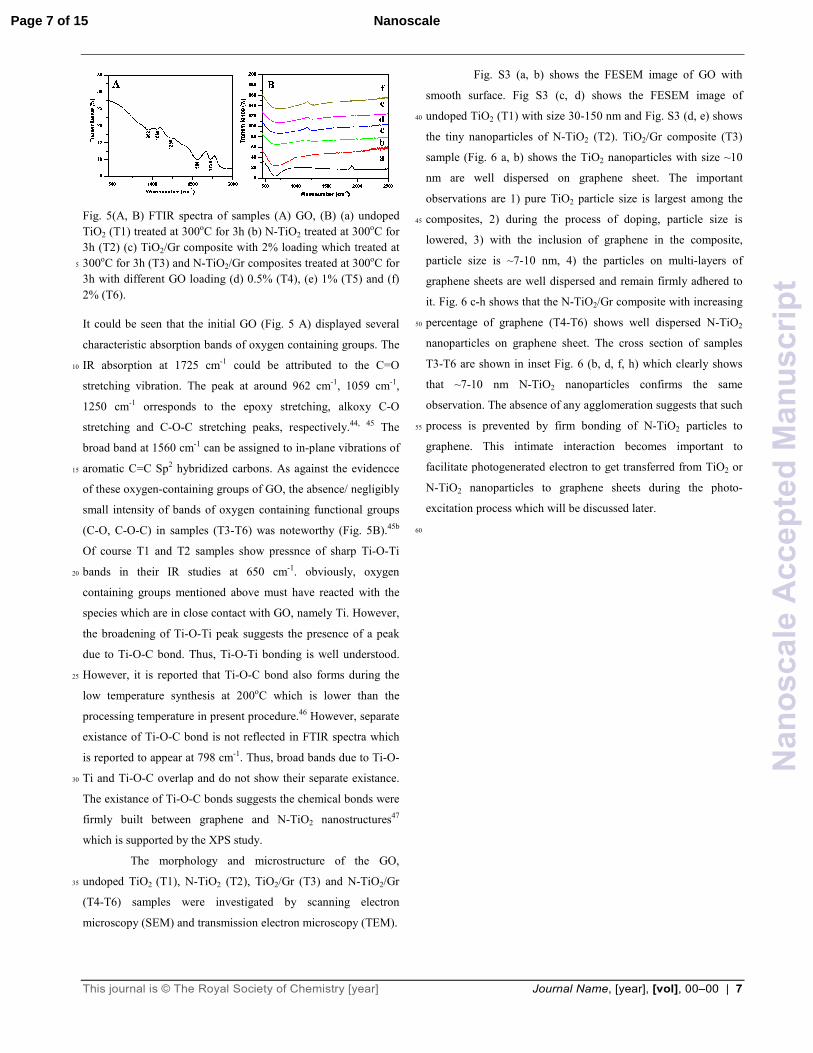
Fig. 5(A, B) FTIR spectra of samples (A) GO, (B) (a) undoped
TiO2 (T1) treated at 300oC for 3h (b) N-TiO2 treated at 300oC for
3h (T2) (c) TiO2/Gr composite with 2% loading which treated at
300oC for 3h (T3) and N-TiO2/Gr composites treated at 300oC for 5
3h with different GO loading (d) 0.5% (T4), (e) 1% (T5) and (f)
2% (T6).
It could be seen that the initial GO (Fig. 5 A) displayed several
characteristic absorption bands of oxygen containing groups. The
IR absorption at 1725 cm-1 could be attributed to the C=O 10
stretching vibration. The peak at around 962 cm-1, 1059 cm-1,
1250 cm-1 orresponds to the epoxy stretching, alkoxy C-O
stretching and C-O-C stretching peaks, respectively.44, 45 The
broad band at 1560 cm-1 can be assigned to in-plane vibrations of
aromatic C=C Sp2 hybridized carbons. As against the evidencce 15
of these oxygen-containing groups of GO, the absence/ negligibly
small intensity of bands of oxygen containing functional groups
(C-O, C-O-C) in samples (T3-T6) was noteworthy (Fig. 5B).45b
Of course T1 and T2 samples show pressnce of sharp Ti-O-Ti
bands in their IR studies at 650 cm-1. obviously, oxygen 20
containing groups mentioned above must have reacted with the
species which are in close contact with GO, namely Ti. However,
the broadening of Ti-O-Ti peak suggests the presence of a peak
due to Ti-O-C bond. Thus, Ti-O-Ti bonding is well understood.
However, it is reported that Ti-O-C bond also forms during the 25
low temperature synthesis at 200oC which is lower than the
processing temperature in present procedure.46 However, separate
existance of Ti-O-C bond is not reflected in FTIR spectra which
is reported to appear at 798 cm-1. Thus, broad bands due to Ti-O-
Ti and Ti-O-C overlap and do not show their separate existance. 30
The existance of Ti-O-C bonds suggests the chemical bonds were
firmly built between graphene and N-TiO2 nanostructures47
which is supported by the XPS study.
The morphology and microstructure of the GO,
undoped TiO2 (T1), N-TiO2 (T2), TiO2/Gr (T3) and N-TiO2/Gr 35
(T4-T6) samples were investigated by scanning electron
microscopy (SEM) and transmission electron microscopy (TEM).
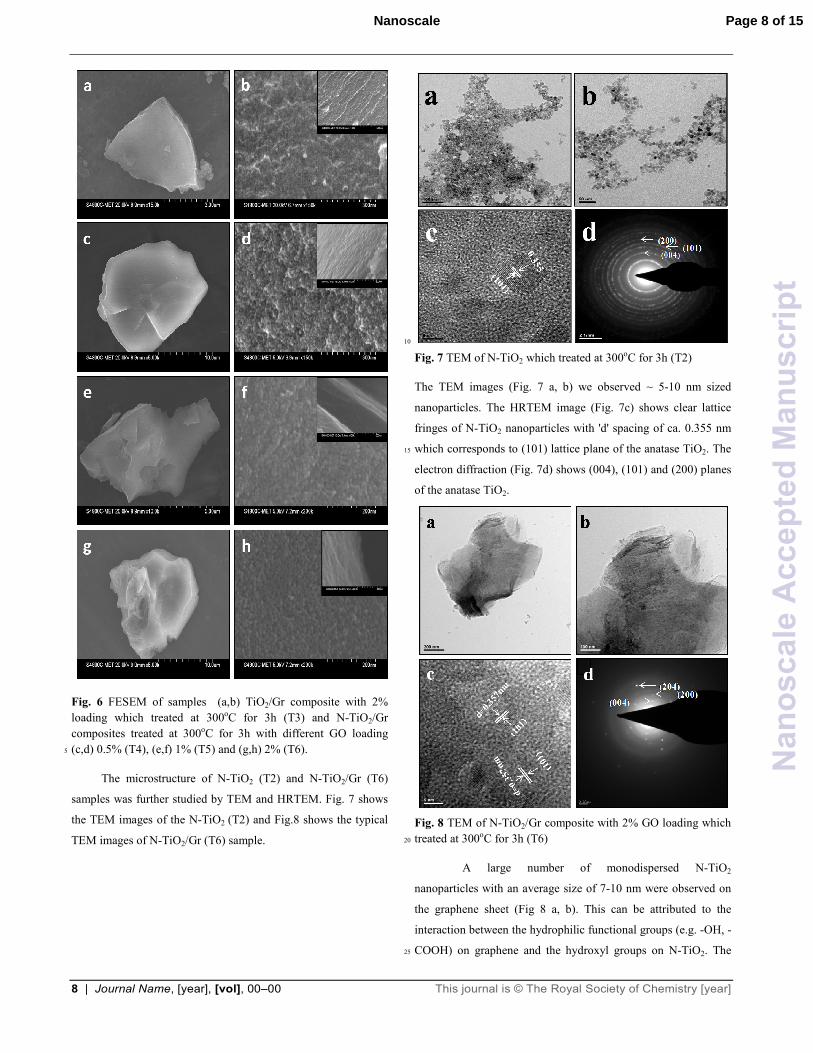
Fig. S3 (a, b) shows the FESEM image of GO with
smooth surface. Fig S3 (c, d) shows the FESEM image of
undoped TiO2 (T1) with size 30-150 nm and Fig. S3 (d, e) shows 40
the tiny nanoparticles of N-TiO2 (T2). TiO2/Gr composite (T3)
sample (Fig. 6 a, b) shows the TiO2 nanoparticles with size ~10
nm are well dispersed on graphene sheet. The important
observations are 1) pure TiO2 particle size is largest among the
composites, 2) during the process of doping, particle size is 45
lowered, 3) with the inclusion of graphene in the composite,
particle size is ~7-10 nm, 4) the particles on multi-layers of
graphene sheets are well dispersed and remain firmly adhered to
it. Fig. 6 c-h shows that the N-TiO2/Gr composite with increasing
percentage of graphene (T4-T6) shows well dispersed N-TiO2 50
nanoparticles on graphene sheet. The cross section of samples
T3-T6 are shown in inset Fig. 6 (b, d, f, h) which clearly shows
that ~7-10 nm N-TiO2 nanoparticles confirms the same
observation. The absence of any agglomeration suggests that such
process is prevented by firm bonding of N-TiO2 particles to 55
graphene. This intimate interaction becomes important to
facilitate photogenerated electron to get transferred from TiO2 or
N-TiO2 nanoparticles to graphene sheets during the photo-
excitation process which will be discussed later.
60
Page 7 of 15 Nanoscale
Nan
osca
leA
ccep
ted
Man
uscr
ipt
8 | Journal Name, [year], [vol], 00–00 This journal is © The Royal Society of Chemistry [year]
Fig. 6 FESEM of samples (a,b) TiO2/Gr composite with 2%
loading which treated at 300oC for 3h (T3) and N-TiO2/Gr
composites treated at 300oC for 3h with different GO loading
(c,d) 0.5% (T4), (e,f) 1% (T5) and (g,h) 2% (T6). 5
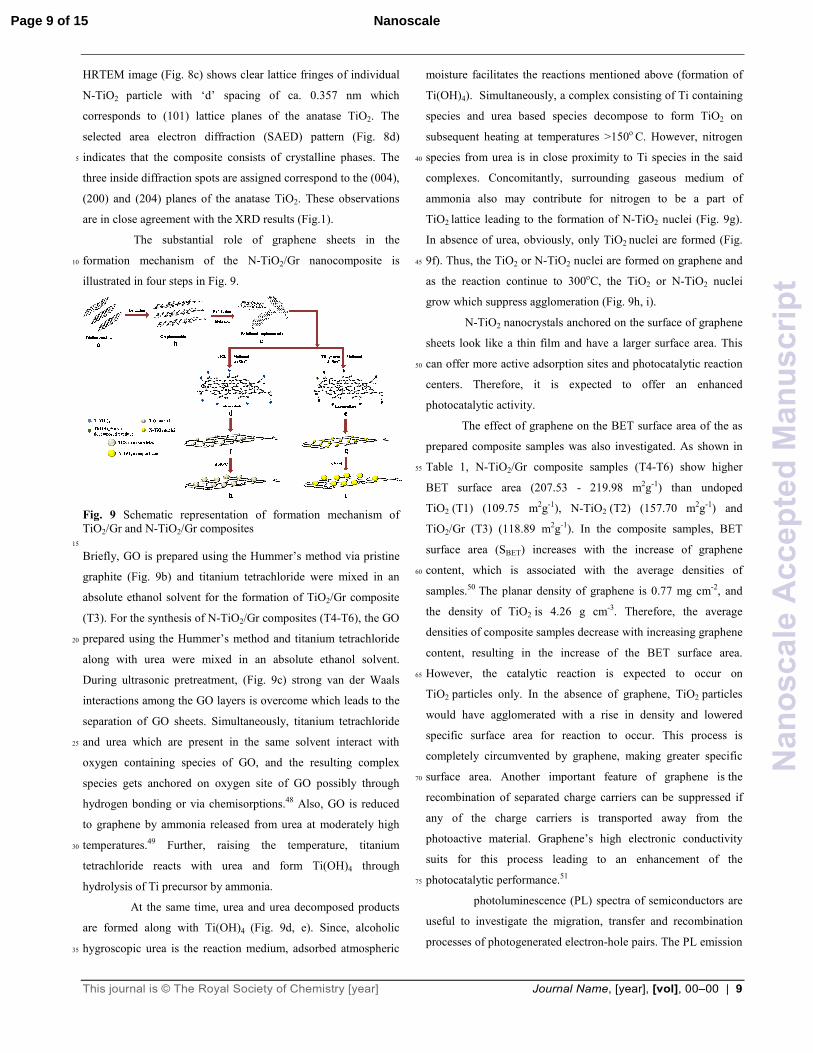
The microstructure of N-TiO2 (T2) and N-TiO2/Gr (T6)
samples was further studied by TEM and HRTEM. Fig. 7 shows
the TEM images of the N-TiO2 (T2) and Fig.8 shows the typical
TEM images of N-TiO2/Gr (T6) sample.
10
Fig. 7 TEM of N-TiO2 which treated at 300oC for 3h (T2)
The TEM images (Fig. 7 a, b) we observed ~ 5-10 nm sized
nanoparticles. The HRTEM image (Fig. 7c) shows clear lattice
fringes of N-TiO2 nanoparticles with 'd' spacing of ca. 0.355 nm
which corresponds to (101) lattice plane of the anatase TiO2. The 15
electron diffraction (Fig. 7d) shows (004), (101) and (200) planes
of the anatase TiO2.
Fig. 8 TEM of N-TiO2/Gr composite with 2% GO loading which
treated at 300oC for 3h (T6) 20
A large number of monodispersed N-TiO2
nanoparticles with an average size of 7-10 nm were observed on
the graphene sheet (Fig 8 a, b). This can be attributed to the
interaction between the hydrophilic functional groups (e.g. -OH, -
COOH) on graphene and the hydroxyl groups on N-TiO2. The 25
Page 8 of 15Nanoscale
Nan
osca
leA
ccep
ted
Man
uscr
ipt
This journal is © The Royal Society of Chemistry [year] Journal Name, [year], [vol], 00–00 | 9
HRTEM image (Fig. 8c) shows clear lattice fringes of individual
N-TiO2 particle with ‘d’ spacing of ca. 0.357 nm which
corresponds to (101) lattice planes of the anatase TiO2. The
selected area electron diffraction (SAED) pattern (Fig. 8d)
indicates that the composite consists of crystalline phases. The 5
three inside diffraction spots are assigned correspond to the (004),
(200) and (204) planes of the anatase TiO2. These observations
are in close agreement with the XRD results (Fig.1).
The substantial role of graphene sheets in the
formation mechanism of the N-TiO2/Gr nanocomposite is 10
illustrated in four steps in Fig. 9.
Fig. 9 Schematic representation of formation mechanism of TiO2/Gr and N-TiO2/Gr composites 15
Briefly, GO is prepared using the Hummer’s method via pristine
graphite (Fig. 9b) and titanium tetrachloride were mixed in an
absolute ethanol solvent for the formation of TiO2/Gr composite
(T3). For the synthesis of N-TiO2/Gr composites (T4-T6), the GO
prepared using the Hummer’s method and titanium tetrachloride 20
along with urea were mixed in an absolute ethanol solvent.
During ultrasonic pretreatment, (Fig. 9c) strong van der Waals
interactions among the GO layers is overcome which leads to the
separation of GO sheets. Simultaneously, titanium tetrachloride
and urea which are present in the same solvent interact with 25
oxygen containing species of GO, and the resulting complex
species gets anchored on oxygen site of GO possibly through
hydrogen bonding or via chemisorptions.48 Also, GO is reduced
to graphene by ammonia released from urea at moderately high
temperatures.49 Further, raising the temperature, titanium 30
tetrachloride reacts with urea and form Ti(OH)4 through
hydrolysis of Ti precursor by ammonia.
At the same time, urea and urea decomposed products
are formed along with Ti(OH)4 (Fig. 9d, e). Since, alcoholic
hygroscopic urea is the reaction medium, adsorbed atmospheric 35
moisture facilitates the reactions mentioned above (formation of
Ti(OH)4). Simultaneously, a complex consisting of Ti containing
species and urea based species decompose to form TiO2 on
subsequent heating at temperatures >150o C. However, nitrogen
species from urea is in close proximity to Ti species in the said 40
complexes. Concomitantly, surrounding gaseous medium of
ammonia also may contribute for nitrogen to be a part of
TiO2 lattice leading to the formation of N-TiO2 nuclei (Fig. 9g).
In absence of urea, obviously, only TiO2 nuclei are formed (Fig.
9f). Thus, the TiO2 or N-TiO2 nuclei are formed on graphene and 45
as the reaction continue to 300oC, the TiO2 or N-TiO2 nuclei
grow which suppress agglomeration (Fig. 9h, i).
N-TiO2 nanocrystals anchored on the surface of graphene
sheets look like a thin film and have a larger surface area. This
can offer more active adsorption sites and photocatalytic reaction 50
centers. Therefore, it is expected to offer an enhanced
photocatalytic activity.
The effect of graphene on the BET surface area of the as
prepared composite samples was also investigated. As shown in
Table 1, N-TiO2/Gr composite samples (T4-T6) show higher 55
BET surface area (207.53 - 219.98 m2g-1) than undoped
TiO2 (T1) (109.75 m2g-1), N-TiO2 (T2) (157.70 m2g-1) and
TiO2/Gr (T3) (118.89 m2g-1). In the composite samples, BET
surface area (SBET) increases with the increase of graphene
content, which is associated with the average densities of 60
samples.50 The planar density of graphene is 0.77 mg cm-2, and
the density of TiO2 is 4.26 g cm-3. Therefore, the average
densities of composite samples decrease with increasing graphene
content, resulting in the increase of the BET surface area.
However, the catalytic reaction is expected to occur on 65
TiO2 particles only. In the absence of graphene, TiO2 particles
would have agglomerated with a rise in density and lowered
specific surface area for reaction to occur. This process is
completely circumvented by graphene, making greater specific
surface area. Another important feature of graphene is the 70
recombination of separated charge carriers can be suppressed if
any of the charge carriers is transported away from the
photoactive material. Graphene’s high electronic conductivity
suits for this process leading to an enhancement of the
photocatalytic performance.51 75
photoluminescence (PL) spectra of semiconductors are
useful to investigate the migration, transfer and recombination
processes of photogenerated electron-hole pairs. The PL emission
Page 9 of 15 Nanoscale
Nan
osca
leA
ccep
ted
Man
uscr
ipt
10 | Journal Name, [year], [vol], 00–00 This journal is © The Royal Society of Chemistry [year]
mainly originates from the recombination of the excited electrons
and holes.52
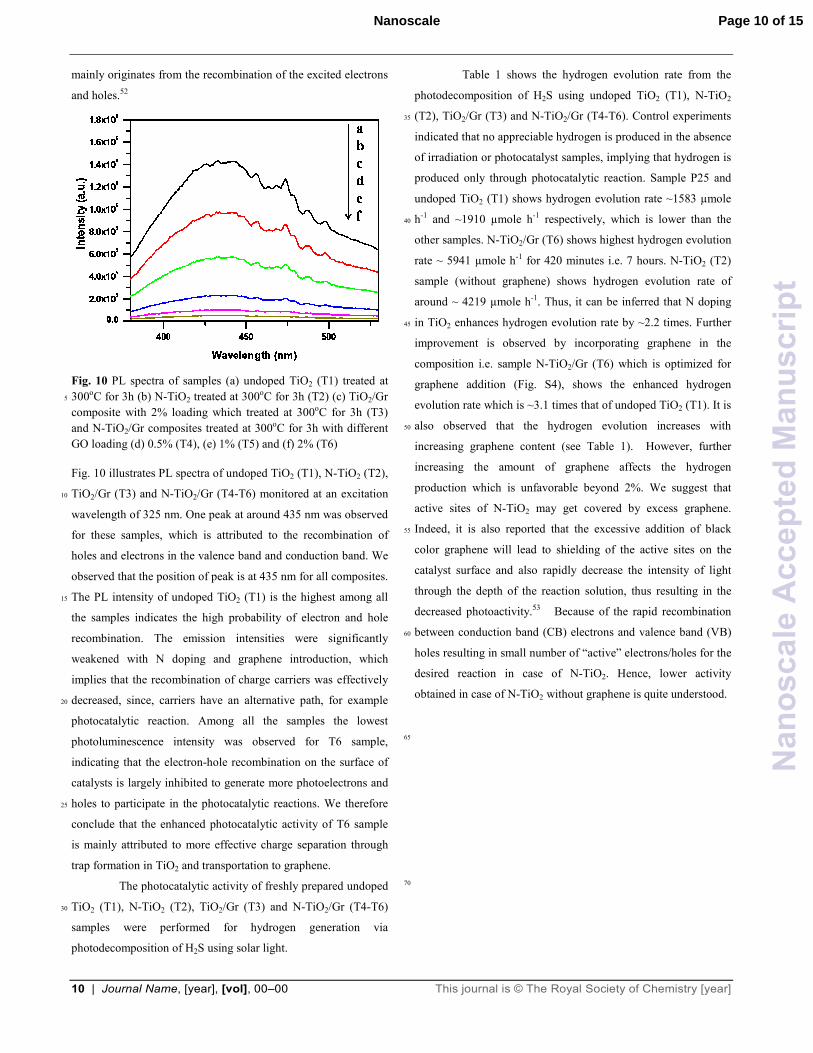
Fig. 10 PL spectra of samples (a) undoped TiO2 (T1) treated at
300oC for 3h (b) N-TiO2 treated at 300oC for 3h (T2) (c) TiO2/Gr 5
composite with 2% loading which treated at 300oC for 3h (T3)
and N-TiO2/Gr composites treated at 300oC for 3h with different
GO loading (d) 0.5% (T4), (e) 1% (T5) and (f) 2% (T6)
Fig. 10 illustrates PL spectra of undoped TiO2 (T1), N-TiO2 (T2),
TiO2/Gr (T3) and N-TiO2/Gr (T4-T6) monitored at an excitation 10
wavelength of 325 nm. One peak at around 435 nm was observed
for these samples, which is attributed to the recombination of
holes and electrons in the valence band and conduction band. We
observed that the position of peak is at 435 nm for all composites.
The PL intensity of undoped TiO2 (T1) is the highest among all 15
the samples indicates the high probability of electron and hole
recombination. The emission intensities were significantly
weakened with N doping and graphene introduction, which
implies that the recombination of charge carriers was effectively
decreased, since, carriers have an alternative path, for example 20
photocatalytic reaction. Among all the samples the lowest
photoluminescence intensity was observed for T6 sample,
indicating that the electron-hole recombination on the surface of
catalysts is largely inhibited to generate more photoelectrons and
holes to participate in the photocatalytic reactions. We therefore 25
conclude that the enhanced photocatalytic activity of T6 sample
is mainly attributed to more effective charge separation through
trap formation in TiO2 and transportation to graphene.
The photocatalytic activity of freshly prepared undoped
TiO2 (T1), N-TiO2 (T2), TiO2/Gr (T3) and N-TiO2/Gr (T4-T6) 30
samples were performed for hydrogen generation via
photodecomposition of H2S using solar light.
Table 1 shows the hydrogen evolution rate from the
photodecomposition of H2S using undoped TiO2 (T1), N-TiO2
(T2), TiO2/Gr (T3) and N-TiO2/Gr (T4-T6). Control experiments 35
indicated that no appreciable hydrogen is produced in the absence
of irradiation or photocatalyst samples, implying that hydrogen is
produced only through photocatalytic reaction. Sample P25 and
undoped TiO2 (T1) shows hydrogen evolution rate ~1583 µmole
h-1 and ~1910 µmole h-1 respectively, which is lower than the 40
other samples. N-TiO2/Gr (T6) shows highest hydrogen evolution
rate ~ 5941 µmole h-1 for 420 minutes i.e. 7 hours. N-TiO2 (T2)
sample (without graphene) shows hydrogen evolution rate of
around ~ 4219 µmole h-1. Thus, it can be inferred that N doping
in TiO2 enhances hydrogen evolution rate by ~2.2 times. Further 45
improvement is observed by incorporating graphene in the
composition i.e. sample N-TiO2/Gr (T6) which is optimized for
graphene addition (Fig. S4), shows the enhanced hydrogen
evolution rate which is ~3.1 times that of undoped TiO2 (T1). It is
also observed that the hydrogen evolution increases with 50
increasing graphene content (see Table 1). However, further
increasing the amount of graphene affects the hydrogen
production which is unfavorable beyond 2%. We suggest that
active sites of N-TiO2 may get covered by excess graphene.
Indeed, it is also reported that the excessive addition of black 55
color graphene will lead to shielding of the active sites on the
catalyst surface and also rapidly decrease the intensity of light
through the depth of the reaction solution, thus resulting in the
decreased photoactivity.53 Because of the rapid recombination
between conduction band (CB) electrons and valence band (VB) 60
holes resulting in small number of “active” electrons/holes for the
desired reaction in case of N-TiO2. Hence, lower activity
obtained in case of N-TiO2 without graphene is quite understood.
65
70
Page 10 of 15Nanoscale
Nan
osca
leA
ccep
ted
Man
uscr
ipt
This journal is © The Royal Society of Chemistry [year] Journal Name, [year], [vol], 00–00 | 11
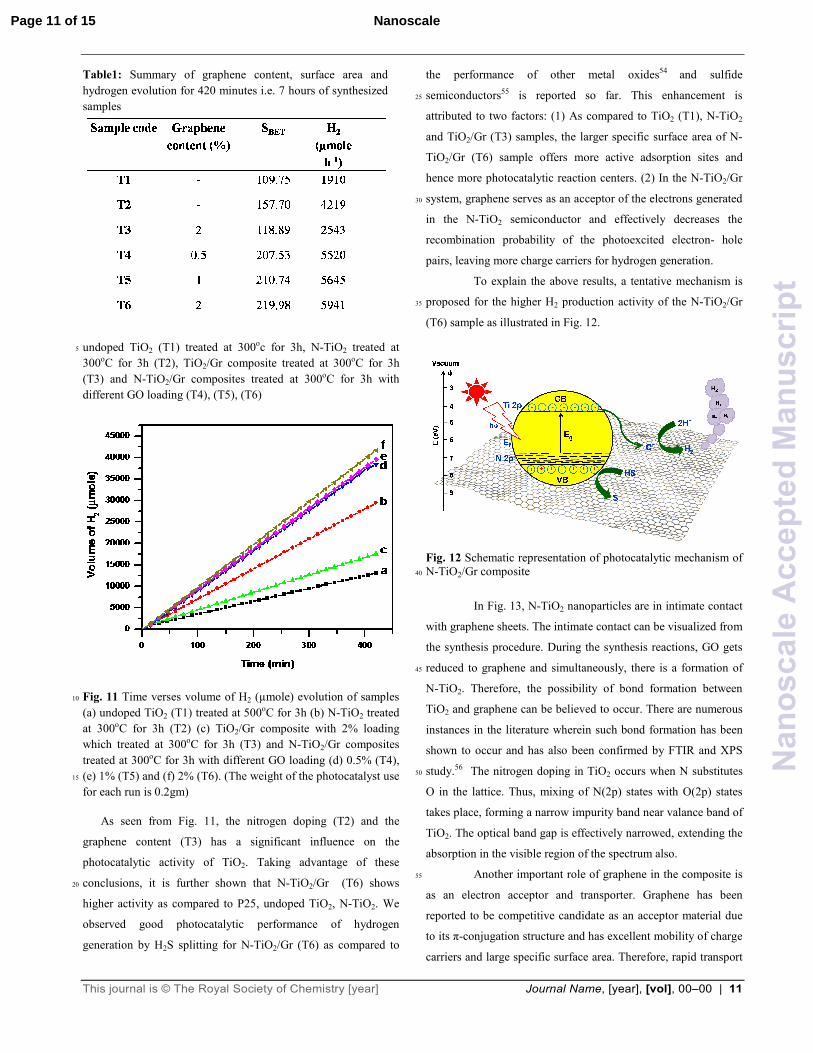
Table1: Summary of graphene content, surface area and
hydrogen evolution for 420 minutes i.e. 7 hours of synthesized
samples
undoped TiO2 (T1) treated at 300oc for 3h, N-TiO2 treated at 5
300oC for 3h (T2), TiO2/Gr composite treated at 300oC for 3h
(T3) and N-TiO2/Gr composites treated at 300oC for 3h with
different GO loading (T4), (T5), (T6)
Fig. 11 Time verses volume of H2 (µmole) evolution of samples 10
(a) undoped TiO2 (T1) treated at 500oC for 3h (b) N-TiO2 treated
at 300oC for 3h (T2) (c) TiO2/Gr composite with 2% loading
which treated at 300oC for 3h (T3) and N-TiO2/Gr composites
treated at 300oC for 3h with different GO loading (d) 0.5% (T4),
(e) 1% (T5) and (f) 2% (T6). (The weight of the photocatalyst use 15
for each run is 0.2gm)
As seen from Fig. 11, the nitrogen doping (T2) and the
graphene content (T3) has a significant influence on the
photocatalytic activity of TiO2. Taking advantage of these
conclusions, it is further shown that N-TiO2/Gr (T6) shows 20
higher activity as compared to P25, undoped TiO2, N-TiO2. We
observed good photocatalytic performance of hydrogen
generation by H2S splitting for N-TiO2/Gr (T6) as compared to
the performance of other metal oxides54 and sulfide
semiconductors55 is reported so far. This enhancement is 25
attributed to two factors: (1) As compared to TiO2 (T1), N-TiO2
and TiO2/Gr (T3) samples, the larger specific surface area of N-
TiO2/Gr (T6) sample offers more active adsorption sites and
hence more photocatalytic reaction centers. (2) In the N-TiO2/Gr
system, graphene serves as an acceptor of the electrons generated 30
in the N-TiO2 semiconductor and effectively decreases the
recombination probability of the photoexcited electron- hole
pairs, leaving more charge carriers for hydrogen generation.
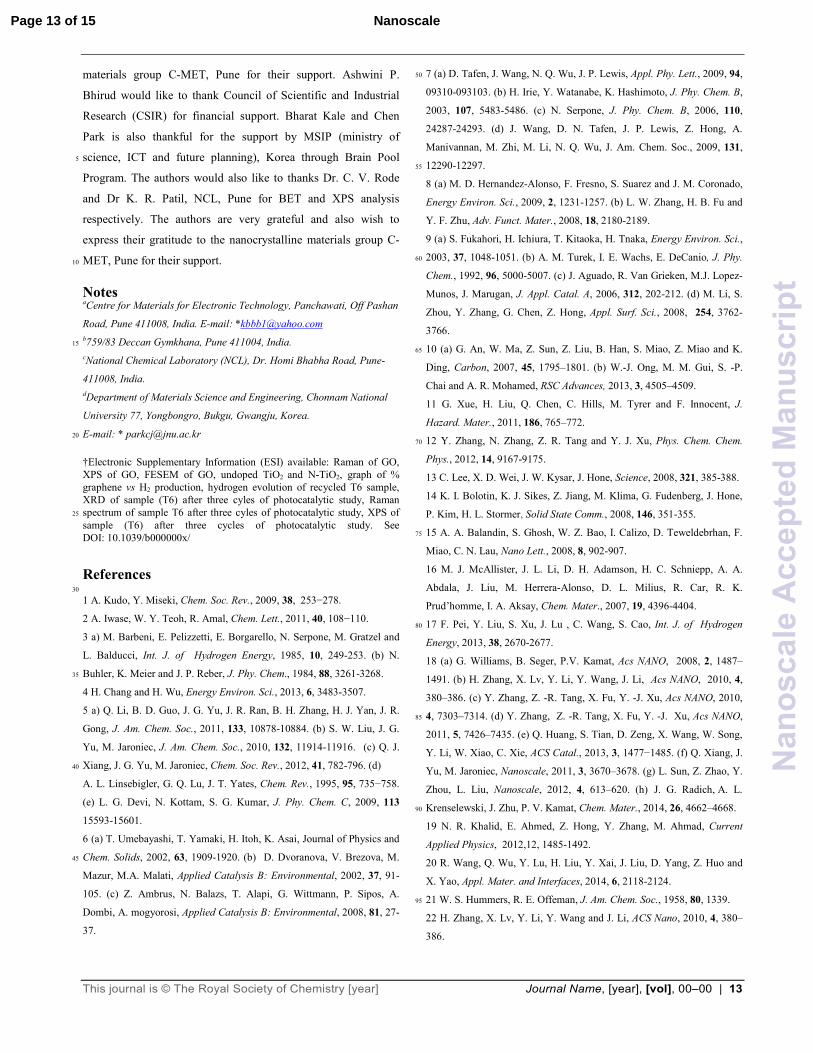
To explain the above results, a tentative mechanism is
proposed for the higher H2 production activity of the N-TiO2/Gr 35
(T6) sample as illustrated in Fig. 12.
Fig. 12 Schematic representation of photocatalytic mechanism of N-TiO2/Gr composite 40
In Fig. 13, N-TiO2 nanoparticles are in intimate contact
with graphene sheets. The intimate contact can be visualized from
the synthesis procedure. During the synthesis reactions, GO gets
reduced to graphene and simultaneously, there is a formation of 45
N-TiO2. Therefore, the possibility of bond formation between
TiO2 and graphene can be believed to occur. There are numerous
instances in the literature wherein such bond formation has been
shown to occur and has also been confirmed by FTIR and XPS
study.56 The nitrogen doping in TiO2 occurs when N substitutes 50
O in the lattice. Thus, mixing of N(2p) states with O(2p) states
takes place, forming a narrow impurity band near valance band of
TiO2. The optical band gap is effectively narrowed, extending the
absorption in the visible region of the spectrum also.
Another important role of graphene in the composite is 55
as an electron acceptor and transporter. Graphene has been
reported to be competitive candidate as an acceptor material due
to its π-conjugation structure and has excellent mobility of charge
carriers and large specific surface area. Therefore, rapid transport
Page 11 of 15 Nanoscale
Nan
osca
leA
ccep
ted
Man
uscr
ipt

12 | Journal Name, [year], [vol], 00–00 This journal is © The Royal Society of Chemistry [year]
of charge carriers could be achieved and an effective charge
separation consequently accomplished. Overall, both the electron
accepting and transporting properties of graphene in the
composite could contribute to the enhancement of photocatalytic
activity.57 Additionally, as per the PL study, the lower intensity 5
peaks observed in graphene doped samples indicating that the
electron-hole recombination on the surface of catalysts is largely
inhibited to generate more free photoelectrons and holes. Hence,
the enhanced photocatalytic activity of T6 sample is mainly
attributed to more effective charge transportation and separation 10
arisen from the strong chemical bonding of N-TiO2 and graphene.
The major reaction steps in this mechanism under visible-light
irradiation are described in following equations.
15
When the as-prepared samples were irradiated by a photon of
sufficient energy equal or larger than band gap, the valence
electrons (e-) of anatase are excited to the CB, creating holes (h+)
in the valence band VB. Normally, these charge carriers quickly 20
recombine and only a fraction of electrons and holes participate
in the photocatalytic reaction. This recombination of photo-
induced electrons and holes in TiO2 can be effectively lowered in
the composite. The lowering of recombination effect can be
explained by considering the energy level diagram of N-25
TiO2/graphene composite, as shown in Fig. 13. The conduction
band of TiO2 can be shown at -4.2 eV while valence band would
be at -7.4 eV (vs. vacuum).58 The work function of graphene is -
4.42 eV.59 Thus, transport of electrons from conduction band of
TiO2 to graphene is energetically a favorable process. Thus, 30
efficiently separation of photo-induced charge carriers leads to
lowering of charge recombination and effectively enhance the
photocatalytic performance.60 These electrons are accessible to
the adsorbed H+ ions (reaction 3) to form H2. Therefore, the
synergistic effect of H2 production on catalyst surface is because 35
of extended visible light absorption due to 'N' doping, graphene
content and efficient charge separation. To the best of our
knowledge, this is the first report showing that an inexpensive
carbon (graphene) material can be used as an effective co-catalyst
for photocatalytic H2S splitting for H2 production. 40
It has been reported that TiO2/graphene composite
degrades on exposure to UV light and the composition changes
from the original one.34 On this background, as well as, usual
practice in catalyst tasting, it was necessary to test the catalyst for
repeated reactions. Accordingly, the stability of N-TiO2/Gr 45
composite (T6) was evaluated by performing the recycle
experiments of the photocatalyst under similar conditions. After
three recycles (1260 minutes i.e. 21 hours) of reaction, H2
evolution did not decrease (supporting information Fig. S5). This
observation indicates good stability of the catalyst for hydrogen 50
generation for a limited period reported here. The XRD, Raman
and XPS of recycled catalyst (T6) did not show any change in the
phase purity and amount of graphene content, which further
supports good stability of the catalyst. (Fig. S6, S7 and S8) After
performing three cycles (1260 minutes i.e. 21 hours) of 55
photocatalytic study we observed the presence of elemental 'S'
and absence of 'SO4' in XPS studies (Fig. S9). The present study
shows that the N-TiO2 nanocomposite with graphene gives very
stable photocatalytic activity and can also be used in water
purification under sunlight. 60
4 Conclusion
Novel composite photocatalysts were prepared by depositing N-
TiO2 nanoparticles on graphene sheets by a facile in-situ wet
chemical method The well defined 7-10 nm N-TiO2 65
nanoparticles were deposited on graphene sheet, sucessfully.
Considering the absorption edge of N-TiO2/Gr well within visible
region, the photocatalyic hydrogen production from H2S under
solar light has been performed. Use of the developed catalyst
demonstrated an efficient solar hydrogen production from 70
copious, abundantly avilable H2S which is hitherto unattemted.
The prepared N-TiO2/Gr sample showed excellent photocatalytic
activity (~5941 µmoleh-1) for the hydrogen production under
solar light irradiation. A suitable mechanism of the catalytic
process is proposed. This study opens a new possibility in the 75
investigation of N-TiO2/Gr composites and promotes their
practical applications in environmental issues. The method
investigated will also be useful for the formation of other
semiconductor/graphene nanocomposite.
80
Acknowledgements
The authors would like to thank Dr. D. P. Amalnerkar, Executive
Director, C-MET for encouragement and nanocrystalline
Page 12 of 15Nanoscale
Nan
osca
leA
ccep
ted
Man
uscr
ipt
This journal is © The Royal Society of Chemistry [year] Journal Name, [year], [vol], 00–00 | 13
materials group C-MET, Pune for their support. Ashwini P.
Bhirud would like to thank Council of Scientific and Industrial
Research (CSIR) for financial support. Bharat Kale and Chen
Park is also thankful for the support by MSIP (ministry of
science, ICT and future planning), Korea through Brain Pool 5
Program. The authors would also like to thanks Dr. C. V. Rode
and Dr K. R. Patil, NCL, Pune for BET and XPS analysis
respectively. The authors are very grateful and also wish to
express their gratitude to the nanocrystalline materials group C-
MET, Pune for their support. 10
Notes aCentre for Materials for Electronic Technology, Panchawati, Off Pashan
Road, Pune 411008, India. E-mail: *[email protected]
b759/83 Deccan Gymkhana, Pune 411004, India. 15
cNational Chemical Laboratory (NCL), Dr. Homi Bhabha Road, Pune-
411008, India.
dDepartment of Materials Science and Engineering, Chonnam National
University 77, Yongbongro, Bukgu, Gwangju, Korea.
E-mail: * [email protected] 20
†Electronic Supplementary Information (ESI) available: Raman of GO, XPS of GO, FESEM of GO, undoped TiO2 and N-TiO2, graph of % graphene vs H2 production, hydrogen evolution of recycled T6 sample, XRD of sample (T6) after three cyles of photocatalytic study, Raman spectrum of sample T6 after three cyles of photocatalytic study, XPS of 25
sample (T6) after three cycles of photocatalytic study. See DOI: 10.1039/b000000x/
References 30
1 A. Kudo, Y. Miseki, Chem. Soc. Rev., 2009, 38, 253−278.
2 A. Iwase, W. Y. Teoh, R. Amal, Chem. Lett., 2011, 40, 108−110.
3 a) M. Barbeni, E. Pelizzetti, E. Borgarello, N. Serpone, M. Gratzel and
L. Balducci, Int. J. of Hydrogen Energy, 1985, 10, 249-253. (b) N.
Buhler, K. Meier and J. P. Reber, J. Phy. Chem., 1984, 88, 3261-3268. 35
4 H. Chang and H. Wu, Energy Environ. Sci., 2013, 6, 3483-3507.
5 a) Q. Li, B. D. Guo, J. G. Yu, J. R. Ran, B. H. Zhang, H. J. Yan, J. R.
Gong, J. Am. Chem. Soc., 2011, 133, 10878-10884. (b) S. W. Liu, J. G.
Yu, M. Jaroniec, J. Am. Chem. Soc., 2010, 132, 11914-11916. (c) Q. J.
Xiang, J. G. Yu, M. Jaroniec, Chem. Soc. Rev., 2012, 41, 782-796. (d) 40
A. L. Linsebigler, G. Q. Lu, J. T. Yates, Chem. Rev., 1995, 95, 735−758.
(e) L. G. Devi, N. Kottam, S. G. Kumar, J. Phy. Chem. C, 2009, 113
15593-15601.
6 (a) T. Umebayashi, T. Yamaki, H. Itoh, K. Asai, Journal of Physics and
Chem. Solids, 2002, 63, 1909-1920. (b) D. Dvoranova, V. Brezova, M. 45
Mazur, M.A. Malati, Applied Catalysis B: Environmental, 2002, 37, 91-
105. (c) Z. Ambrus, N. Balazs, T. Alapi, G. Wittmann, P. Sipos, A.
Dombi, A. mogyorosi, Applied Catalysis B: Environmental, 2008, 81, 27-
37.
7 (a) D. Tafen, J. Wang, N. Q. Wu, J. P. Lewis, Appl. Phy. Lett., 2009, 94, 50
09310-093103. (b) H. Irie, Y. Watanabe, K. Hashimoto, J. Phy. Chem. B,
2003, 107, 5483-5486. (c) N. Serpone, J. Phy. Chem. B, 2006, 110,
24287-24293. (d) J. Wang, D. N. Tafen, J. P. Lewis, Z. Hong, A.
Manivannan, M. Zhi, M. Li, N. Q. Wu, J. Am. Chem. Soc., 2009, 131,
12290-12297. 55
8 (a) M. D. Hernandez-Alonso, F. Fresno, S. Suarez and J. M. Coronado,
Energy Environ. Sci., 2009, 2, 1231-1257. (b) L. W. Zhang, H. B. Fu and
Y. F. Zhu, Adv. Funct. Mater., 2008, 18, 2180-2189.
9 (a) S. Fukahori, H. Ichiura, T. Kitaoka, H. Tnaka, Energy Environ. Sci.,
2003, 37, 1048-1051. (b) A. M. Turek, I. E. Wachs, E. DeCanio, J. Phy. 60
Chem., 1992, 96, 5000-5007. (c) J. Aguado, R. Van Grieken, M.J. Lopez-
Munos, J. Marugan, J. Appl. Catal. A, 2006, 312, 202-212. (d) M. Li, S.
Zhou, Y. Zhang, G. Chen, Z. Hong, Appl. Surf. Sci., 2008, 254, 3762-
3766.
10 (a) G. An, W. Ma, Z. Sun, Z. Liu, B. Han, S. Miao, Z. Miao and K. 65
Ding, Carbon, 2007, 45, 1795–1801. (b) W.-J. Ong, M. M. Gui, S. -P.
Chai and A. R. Mohamed, RSC Advances, 2013, 3, 4505–4509.
11 G. Xue, H. Liu, Q. Chen, C. Hills, M. Tyrer and F. Innocent, J.
Hazard. Mater., 2011, 186, 765–772.
12 Y. Zhang, N. Zhang, Z. R. Tang and Y. J. Xu, Phys. Chem. Chem. 70
Phys., 2012, 14, 9167-9175.
13 C. Lee, X. D. Wei, J. W. Kysar, J. Hone, Science, 2008, 321, 385-388.
14 K. I. Bolotin, K. J. Sikes, Z. Jiang, M. Klima, G. Fudenberg, J. Hone,
P. Kim, H. L. Stormer, Solid State Comm., 2008, 146, 351-355.
15 A. A. Balandin, S. Ghosh, W. Z. Bao, I. Calizo, D. Teweldebrhan, F. 75
Miao, C. N. Lau, Nano Lett., 2008, 8, 902-907.
16 M. J. McAllister, J. L. Li, D. H. Adamson, H. C. Schniepp, A. A.
Abdala, J. Liu, M. Herrera-Alonso, D. L. Milius, R. Car, R. K.
Prud’homme, I. A. Aksay, Chem. Mater., 2007, 19, 4396-4404.
17 F. Pei, Y. Liu, S. Xu, J. Lu , C. Wang, S. Cao, Int. J. of Hydrogen 80
Energy, 2013, 38, 2670-2677.
18 (a) G. Williams, B. Seger, P.V. Kamat, Acs NANO, 2008, 2, 1487–
1491. (b) H. Zhang, X. Lv, Y. Li, Y. Wang, J. Li, Acs NANO, 2010, 4,
380–386. (c) Y. Zhang, Z. -R. Tang, X. Fu, Y. -J. Xu, Acs NANO, 2010,
4, 7303–7314. (d) Y. Zhang, Z. -R. Tang, X. Fu, Y. -J. Xu, Acs NANO, 85
2011, 5, 7426–7435. (e) Q. Huang, S. Tian, D. Zeng, X. Wang, W. Song,
Y. Li, W. Xiao, C. Xie, ACS Catal., 2013, 3, 1477−1485. (f) Q. Xiang, J.
Yu, M. Jaroniec, Nanoscale, 2011, 3, 3670–3678. (g) L. Sun, Z. Zhao, Y.
Zhou, L. Liu, Nanoscale, 2012, 4, 613–620. (h) J. G. Radich, A. L.
Krenselewski, J. Zhu, P. V. Kamat, Chem. Mater., 2014, 26, 4662–4668. 90
19 N. R. Khalid, E. Ahmed, Z. Hong, Y. Zhang, M. Ahmad, Current
Applied Physics, 2012,12, 1485-1492.
20 R. Wang, Q. Wu, Y. Lu, H. Liu, Y. Xai, J. Liu, D. Yang, Z. Huo and
X. Yao, Appl. Mater. and Interfaces, 2014, 6, 2118-2124.
21 W. S. Hummers, R. E. Offeman, J. Am. Chem. Soc., 1958, 80, 1339. 95
22 H. Zhang, X. Lv, Y. Li, Y. Wang and J. Li, ACS Nano, 2010, 4, 380–
386.
Page 13 of 15 Nanoscale
Nan
osca
leA
ccep
ted
Man
uscr
ipt
14 | Journal Name, [year], [vol], 00–00 This journal is © The Royal Society of Chemistry [year]
23 S. Yoon, B. H. Ka, C. Lee, M. Park, and S. M. Oh, Electrochem. and
Solid-State Lett., 2009, 12 ,A28-A32.
24 (a) Y. Zhang, Z.-R. Tang, X. Fu and Y.-J. Xu, ACS Nano, 2010, 4,
7303-7314. (b) Q. Zhai, T. Bo and G. Hu, , J. Hazard. Mater., 2011, 198,
78-86. (c) Z. Jiang, L. Kong, F. S. Alenazey, Y. Qian, L. France, T. Xiao 5
and P. P. Edwards, Nanoscale, 2013, 5, 5396-5402.
25 H. Zhang, X. Lv, Y. Li, Y. Wang, J. Li, ACS Nano, 2009, 4 ,380–386.
26 (a) N. L. Yang, J. Zhai, D. Wang, Y. S. Chen, L. Jiang, ACS Nano,
2010, 4, 887-894. (b) Y. Su, Y. Xiao, Y. Li, Y. Du, Y. Zhang, Mater.
Chem. Phys., 2011, 126, 761-768. 10
27 (a) N. D. Petkovich, B. E. Wilson, S. G. Rudisill, and A. Stein, ACS
Appl. Mater. Interfaces, 2014, 6, 18215−18227 (b) T. Yu, Y. Deng, L.
Wang, R. Liu, L. Zhang, B. Tu, and D. Zhao, Adv. Mater., 2007, 19,
2301–2306 (c) C. –H. Huang, D. Gu, D. Zhao, and R. –A. Doong, Chem.
Mater., 2010, 22, 1760–1767. 15
28 (a) Q. J. Xiang, J. G. Yu, M. Jaroniec, J. Phys. Chem. C, 2011, 115,
7355-7363 (b) Q. J. Xiang, J. G. Yu, M. Jaroniec, Nanoscale, 2011, 3,
3670-3678.
29 J. G. Yu, T. T. Ma, G. Liu, B. Cheng, Dalton Trans., 2011, 40, 6635-
6644. 20
30 J. Yu, T. Ma and S. Liu, Phys. Chem. Chem. Phys., 2011, 13, 3491-
3501.
31 (a) O. Akhavan, Carbon, 2015, 81, 158-166 (b) I. Calizo, A. A.
Balandin, W. Bao, F. Miao, C. N. Lau, Nano Lett., 2007, 7, 2645-2649.
(c) K. N. Kudin, B. Ozbas, H. C. Schniepp, R. K. Prud’homme, I. A. 25
Aksay, R. Car, Nano Lett., 2008, 8, 36-41. (d) K S. Kim, Y. Zhao, H.
Jang, S. Y. Lee, J. M. Kim, K. S. Kim, J. -H. Ahn, P. Kim, J. -Y. Choi, B.
H. Hong, Nature, 2009, 457, 706-710. (e) A. C. Ferrari, J. C. Meyer, V.
Scardaci, C. Casiraghi, M. Lazzeri, F. Mauri, S. Piscanec, D. Jiang, K. S.
Novoselov, S. Roth, A. K. Geim, Phy. Rev. Lett., 2006, 97, 187401-30
187404.
32 (a) S. Liu, C. Liu, W. Wang, B. Cheng, J. Yu, Nanoscale, 2012, 4,
3193-3200. (b) W. Wang, J. Yu, Q. Xiang, B. Cheng, Applied Catalysis
B: Environmental, 2012, 119-120, 109-116 (c) N. Farhangi, R. Roy
Chowdhury, Y. M-. Gonzalez, M. B. Ray, P. A. Charpentier, Applied 35
Catalysis B: Environmental 2011, 110, 25-32.
33 E. Gao, W.Z. Wang, M. Shang, J.H. Xu, Phys. Chem. Chem. Phys.,
2011, 13, 2887-2893.
34 S. Kelly, F. H. Pollak, M. Tomkiewicz, J. Phys. Chem. B, 1997, 101,
2730–2734. 40
35 O. Akhavan, M. Abdolahad, A. Esfandiar and M. Mohatashamifar, J.
Phys. Chem. C, 2010, 114, 12955-12959.
36 O. Akhavan, E. Ghaderi, Nanoscale, 2013, 5, 10316-10326.
37 M. satish, , B. Viswanathan, R. P. Viswanath, C. S. Gopinath, Chem.
Mater., 2005, 17, 6349-6353. 45
38 (a) R. Asahi, T. morikawa, T. ohwaki, K. aoki, Y. taga, Science, 2001,
293, 269-271 (b) X. Wang, J. C. Tu, , L. Wu, X. Fu, Environ. Sci.
Technol., 2006, 40, 2369-2374.
39 M. Popa, D. Macovie, E. Indrea, Microp. Mesop. Mater., 2010, 132
80-86. 50
40 N. P. Zschoerper, V. Katzenmaier, U. Vohrer, M. Haupt, C. Oehr, T.
Hirth, Carbon, 2007, 47, 2174–2185.
41 F. B. Su, X. S. Zhao, Y. Wang, J. H. Zeng, J. Phys. Chem. B, 2005,
109, 20200–20206.
42 (a) G. An, W. Ma, Z. Sun, Z. Liu, B. Han, S. Miao, Z. Miao, K. Ding, 55
Carbon, 2007, 45, 1795–801. (b) H. Liu, W. Yang, Y. Ma, J. Yao, Appl.
Catal. A Gen., 2006, 299, 218–23.
43 (a) O. Akhavan, E. Ghaderia, K. Rahimi, J. Mater. Chem., 2012, 22,
23260–23266. (b) Y. Zhao, D. Zhao, C. Chen, X. Wangb, J. Colloid
Interf. Sci., 2013, 405, 211–217. 60
44 Q. Li, B. Guo, J. Yu, J. Ran, B. Zhang, H. Yan, and J. R. Gong, J. Am.
Chem. Soc., 2011, 133, 10878–10884.
45 (a) J. Ding, M. Wang, J. Deng, W. Gao, Z. Yang, C. Ran, X. Zhang,
Journal of Alloys and Compounds, 2014, 582, 29–32. (b) W. -S. Wang,
D. -H. Wang, W. -G. Qu, L. -Q. Lu, A. -W. Xu, J. Phys. Chem. C, 2012, 65
116, 19893−19901.
46 X. Pan, Y. Zhao, S. Liu, C. L. Korzeniewski, S. Wang, and Z. Fan,
ACS Appl. Mater. Interfaces, 2012, 4, 3944−3950.
47 (a) T. D. Nguyen-Phan, V. H. Pham, E. W. Shin, H. D. Pham, S. Kim,
J. S. Chung, E. J. Kim, S. H. Hur, Chem. Eng. J., 2011, 170, 226–232. (b) 70
A. A. Ismail, R. A. Geioushy, H. Bouzid, S. A. Al-Hajry, D. W.
Bahnermann, Appl. Catal. B: Environ., 2013, 129, 62–70.
48 Y. B. Tang, C. S. Lee, J. Xu, Z. T. Liu, Z. H. Chen, Z. B. He, Y. L.
Cao, G. D. Yuan, H. S. Song, L. M. Chen, L. B. Luo, H. M. Cheng, W. J.
Zhang, I. Bello, S. T. Lee, ACS Nano, 2010, 4, 3482−3488. 75
49 Z. Lei, L. Lu and X. S. Zhao, Energy Environ. Sci., 2012, 5, 6391–
6399.
50 Q. Li, B. Guo, J. Yu, J. Ran, B. Zhang, H. -J. Yan and J. R. Gong, J.
Am. Chem. Soc., 2011, 133, 10878-10884.
51 J. G. Yu, H. G. Yu, B. Cheng, M. H. Zhou, X. J. Zhao, J. Mol. Catal. 80
A, 2006, 253, 112-118.
52 J. Tang, Z. Zou, J. Ye, J. Phys. Chem. B, 2003, 107, 14265-14269. (b)
G. Eda, Y. -Y. Lin, C. Mattevi, H. Yamaguchi, H. -A. Chen, I. S. Chen,
C.-W. Chen, M. Chhowalla, Adv. Mater., 2010, 22, 505-509.
53 Q. Xiang, J. Yu, J. Phys. Chem. Lett., 2013, 4, 753−759. 85
54 (a) A. P. Bhirud, S. D. Sathaye, R. P. Waichal, L. K. Nikam and B. B.
Kale, Green Chem., 2012, 14, 2790-2798. (b) N. S. Chaudhari, S. S.
Warule, S. A. Dhanmane, M. V. Kulkarni, M. Valant and B. B.
Kale, Nanoscale, 2013, 5, 9383-9390.
55 (a) B. B. Kale, J. O. Baeg, S. M. Lee, H. Chang, S. J. Moon and C. W. 90
Lee, Adv. Funct. Mater., 2006, 16, 1349-1354. (b) A. P. Bhirud, N. S.
Chaudhari, L. K. Nikam, R. S. Sonawane, K. R. Patil, B. J. Ook and B. B.
Kale, Int. J. Hydrogen Energy, 2011, 36, 11628-11639. (c) S. k. Apte, S.
N. Garje, G. P. Mane, A. Vinu, A. D. Naik, D. P. Amalnerkar and B. B.
Kale, Small, 2011, 7, 957-964. (d) S. K. Apte, S. N. Garaje, S. D. Naik, R. 95
P. Waichal, J. -O. Baeg, B. B. Kale, Nanoscale, 2014, 6, 908-915.
Page 14 of 15Nanoscale
Nan
osca
leA
ccep
ted
Man
uscr
ipt
This journal is © The Royal Society of Chemistry [year] Journal Name, [year], [vol], 00–00 | 15
56 G. Lui, J. -Y. Liao, A. Duan, Z. Zhang, M. Flowler, A. Yu, J. Mater.
Chem. A, 2013, 1, 12255-12262.
57 N. L. Yang, J. Zhai, D. Wang, Y.S. Chen, L. Jiang, ACS Nano, 2010,
4, 887-894.
58 G. Zhu, L. K. Pan, T. Xu, Q. F. Zhao and Z. Sun, J. Alloys Compd., 5
2011, 509, 7814-7818.
59 N. L. Yang, J. Zhai, D. Wang, Y. S. Chen and L. Jiang, ACS Nano,
2010, 4, 887-894.
60 G. Zhu, T. Xu, T. A. Lv, L. K. Pan, Q. F. Zhao and Z. Sun, J.
Electroanal. Chem., 2011, 650, 248-251. 10
Page 15 of 15 Nanoscale
Nan
osca
leA
ccep
ted
Man
uscr
ipt