Soft Matter - RSC Publishing
42
This is an Accepted Manuscript, which has been through the Royal Society of Chemistry peer review process and has been accepted for publication. Accepted Manuscripts are published online shortly after acceptance, before technical editing, formatting and proof reading. Using this free service, authors can make their results available to the community, in citable form, before we publish the edited article. We will replace this Accepted Manuscript with the edited and formatted Advance Article as soon as it is available. You can find more information about Accepted Manuscripts in the Information for Authors. Please note that technical editing may introduce minor changes to the text and/or graphics, which may alter content. The journal’s standard Terms & Conditions and the Ethical guidelines still apply. In no event shall the Royal Society of Chemistry be held responsible for any errors or omissions in this Accepted Manuscript or any consequences arising from the use of any information it contains. Accepted Manuscript www.rsc.org/softmatter Soft Matter
-
Upload
khangminh22 -
Category
Documents
-
view
1 -
download
0
Transcript of Soft Matter - RSC Publishing

This is an Accepted Manuscript, which has been through the Royal Society of Chemistry peer review process and has been accepted for publication.
Accepted Manuscripts are published online shortly after acceptance, before technical editing, formatting and proof reading. Using this free service, authors can make their results available to the community, in citable form, before we publish the edited article. We will replace this Accepted Manuscript with the edited and formatted Advance Article as soon as it is available.
You can find more information about Accepted Manuscripts in the Information for Authors.
Please note that technical editing may introduce minor changes to the text and/or graphics, which may alter content. The journal’s standard Terms & Conditions and the Ethical guidelines still apply. In no event shall the Royal Society of Chemistry be held responsible for any errors or omissions in this Accepted Manuscript or any consequences arising from the use of any information it contains.
Accepted Manuscript
www.rsc.org/softmatter
Soft Matter

We show that flowing multicomponent suspensions of deformable capsules display
segregation based on shape. Theory shows excellent agreement with simulations.
Page 1 of 41 Soft Matter
Sof
tMat
ter
Acc
epte
dM
anus
crip
t

71x39mm (300 x 300 DPI)
Page 2 of 41Soft Matter
Sof
tMat
ter
Acc
epte
dM
anus
crip
t
Shape-mediated margination and demargination in flowing
multicomponent suspensions of deformable capsules
Kushal Sinha and Michael D. Graham∗
Department of Chemical and Biological Engineering
University of Wisconsin-Madison, Madison, WI 53706-1691
(Dated: December 1, 2015)
Abstract
We present detailed simulations and theory for flow-induced segregation in suspensions of de-
formable fluid-filled capsules with different shapes during simple shear flow in a planar slit. This
system is an idealized model for transport for blood cells and/or drug carriers in the microcircula-
tion or in microfluidic devices. For the simulations, an accelerated implementation of the boundary
integral method was employed. We studied the binary mixtures of spherical and ellipsoidal cap-
sules, varying the aspect ratio κ of the ellipsoid while keeping constant either (a) equatorial radius
or (b) volume. Effects of a variety of parameters was studied, including κ, volume fraction and
number fraction of the spherical capsules in the mixture. In suspensions where the ellipsoids have
the same equatorial radius as the spheres, capsules with lower κ marginate. In suspension where
the ellipsoids have the same volume as the spheres, ellipsoidal (both oblate and prolate) capsules
are seen to demarginate in a mixture of primarily spherical capsules. To understand these results,
a mechanistic framework based on the competition between wall-induced migration and shear-
induced collisions is presented. A simplified drift-diffusion theory based on this framework shows
excellent qualitative agreement with simulation results.
∗ Corresponding author. E-mail: [email protected]
1
Page 3 of 41 Soft Matter
Sof
tMat
ter
Acc
epte
dM
anus
crip
t

I. INTRODUCTION
Blood is a multicomponent suspension whose particulate components consist primarily
of red blood cells (RBCs) along with trace amounts of other components such as leukocytes
and platelets. The key physical differences between the leukocytes, platelets and RBCs are
their relative shape, size and rigidity: RBCs are biconcave discoids, while the leukocytes
are spherical and non-activated platelets are disk-like; the leukocytes are larger than RBCs,
while the platelets are smaller; both are considerably stiffer than RBCs [1, 2]. Under physi-
ological conditions, both the leukocytes and the platelets in blood segregate near the vessel
wall [3, 4], a phenomenon known as margination, while the RBCs migrate away from the
wall forming a so-called cell-free layer [1, 2]. Margination of leukocytes and platelets has
substantial physiological significance in the processes of inflammation and hemostasis [3, 4].
Recent advances in lab-on-a-chip (LOC) technology and vascular-targeted carriers (VTCs)
offer an unique opportunity to improve disease diagnosis and treatment by providing highly
localized delivery of therapeutic agents. Understanding the segregation behavior of confined
multicomponent suspensions as a function of physical parameters such as size, shape and
deformability can provide explanations for experimental observations and guiding principles
for design of LOC devices and VTCs. Recent work [5–7] has shed light on how particle size
and membrane deformability affects segregation behavior and the mechanisms behind it; the
role of particle shape is still poorly understood and is the focus of the present work.
The past decade has seen the emergence of particle shape as an important design pa-
rameter for controlling biological responses of drug delivery carriers [8–15]. The shape of
drug delivery carriers have been shown to affect their blood circulation, phagocytosis, en-
docytosis and targeting [8, 16–18]. Studies of the margination and adhesion propensity
with endothelial wall of ellipsoidal micro- and nanoparticles designed for vascular-targeted
drug delivery has also shown shape as an important parameter [12, 13, 19]. The effect of
particle shape on segregation has been characterized to some extent for suspension of rigid
micro- and nanoparticles. Gentile et al. [12] observed that disk-shaped and hemi-spherical
nanoparticles had higher “margination” propensity than spherical particles. However, what
they observed is not margination per se but rather sedimentation of particles and particles
of different shapes had different densities – their studies were of single-component suspen-
sions without a dominant component playing the role that RBCs play in blood. Doshi et
2
Page 4 of 41Soft Matter
Sof
tMat
ter
Acc
epte
dM
anus
crip
t

al. [19] studied spherical particles of three different sizes; 1, 3 and 6 µm and elliptical disks,
circular disks and rods stretched from them. They showed that adhesion propensity to
endothelial wall in a synthetic microvascular network (SMN) increased with higher aspect
ratio (prolateness increases with aspect ratio), with the difference amplifying at larger size
and bifurcation junction. The walls of the SMN were coated with bovine serum albumin
(BSA) while the particles were coated with anti-BSA antibody and increased adhesion of
higher aspect ratio particles can be attributed to enhanced contact area provided by them for
receptor-mediated adhesion than shape-induced localization near wall in single component
system. In an in vivo study, Decuzzi et al. [20] showed that discoidal particles accumulate
more than spherical, hemispherical or cylindrical particles in most organs aside from the
liver, where cylindrical particles have the highest accumulation. Toy et al. [21] showed that
gold nanorods marginate more than gold nanospheres. Mesoporous silicon particles of dif-
ferent shape were studied by Adriani et al. [22], who showed that disk-like particles showed
the highest adhesion propensity.
The inspiration to use physical properties like shape to control biological function comes
from biology itself where one can find, for example, a wide variety of bacterial shapes that
enable specific functions [23]. Moreover, the biconcave discoid shape of RBCs is often
attributed to the avoidance of filtration of RBCs in the spleen [24, 25]. In diseases such as
sickle-cell anemia or malaria, RBCs tend to change their shape and several continuous shape-
based separation techniques have been developed recently [26, 27] which could be used for
their diagnosis. These separation techniques could be used for cell-sorting and purification
as well. A recent discovery showing that proteins sense membrane curvature [28–31] has
escalated the position of vesicle shape from a passive consequence of cellular activity to
the prime player in cell growth, division and movement. These recent advancements and
opportunities point to the need for a systematic understanding of shape-mediated flow-
induced segregation in multicomponent suspensions.
It is important to note that all of the above-mentioned in vitro studies just described
suffer from a major drawback; they did not consider margination in the presence of RBCs but
rather examined only a single component in solution. This issue was recently experimentally
addressed by Thompson et al. [13], who studied margination of spherical and ellipsoidal
micro- and nanoparticles in reconstituted blood in a microfluidic chamber lined with human
umbilical vein endothelial cells. They reported that ellipsoidal microparticles with high
3
Page 5 of 41 Soft Matter
Sof
tMat
ter
Acc
epte
dM
anus
crip
t

aspect ratio showed higher margination compared to their spherical counterparts in both
laminar and pulsatile flow. The results reported above are for rigid VTCs and suggest that
rigid non-spherical particles with higher aspect ratio have a higher degree of margination
compared to rigid spherical particles. Researchers [32, 33] have been able to develop non-
spherical functional liquid-crystal deformable droplets which could be used as VTCs in
future. We would like to remind readers that our own RBCs, WBCs and platelets are
deformable as well. How shape would affect the segregation and margination of deformable
particle is not characterized and is the focus of this work.
Recently, there have been some computational studies on the margination of particles
in presence of the RBCs to complement the experimental studies noted above. Tan et al.
[34] showed that RBCs enhance the margination of rigid spherical nanoparticles leading to
higher binding. They also reported experimental observations validating results obtained in
simulations. Muller et al. [35] found that margination of stiffer micro- and nanoparticles
increases with increasing hematocrit and particle size. Spherical particles showed better
margination than ellipsoidal particles; however ellipsoidal particles have slower rotational
velocity in the cell-free layer which would result in higher binding seen in experiments. In a
simulation of nanoparticles with binding affinity at wall in absence of RBCs, Tan et al. [36]
showed that rods have higher binding than spherical particles which is dependent on their
initial contact points and orientations to the wall. They also found higher concentration
of nanoparticles in bifurcation region; an observation seen by Doshi et al. [19] in their
experiments. Apart from studies of nanoparticles of various shapes in both presence and
absence of RBCs, a number of computational studies have addressed leukocyte margination
[37–39] and platelet margination [40–43] in presence of RBCs, where authors varied size,
shape and membrane deformability altogether to study margination behavior. The absence
of a systematic variation of shape of deformable particles, which is critical for understanding
its role in the margination behavior and underlying mechanism, provides motivation for the
present work.
Relative deformability, size and shape are the primary physical properties that determine
segregation behavior in multicomponent suspensions. How each of these physical properties
alone lead to segregation behavior is still very poorly understood. Past direct simulation
studies that focus on the margination of platelets [40, 41], leukocytes [38, 39] and drug
delivery particles [34, 44] suffer from a major drawback that the individual components differ
4
Page 6 of 41Soft Matter
Sof
tMat
ter
Acc
epte
dM
anus
crip
t

simultaneously in size, shape and membrane deformability. Moreover, in these studies, one
component is always very dilute – the effect of the fraction of individual components in a
mixture on the overall segregation behavior has not been thoroughly explored.
A series of controlled computational studies on the effect of deformability and size on
margination was recently done [5, 7, 45]. The role of membrane deformability alone was
investigated [5, 7] in plane Poiseuille flow and simple shear flow respectively, of a binary
suspension of neo-Hookean capsules. In both flow situations, when stiffer particles are dilute
in suspension, they undergo margination. However, when flexible particles are the dilute
component, they enrich around the centerline, a phenomenon termed “demargination”. The
effect of particle size was also studied [7]. When small particles are dilute in suspension, they
undergo margination. On the other hand, when large particles are the dilute component,
they demarginate.
To explain the observations of size and membrane deformability, these authors proposed
a qualitative mechanism [5] incorporating the two key sources of wall-normal particle motion
in confined suspensions: (i) wall-induced hydrodynamic migration away from the wall; (ii)
hydrodynamic pair collisions. In multicomponent suspensions, two types of pair collisions
occur: (a) homogeneous collisions, which are between two particles of the same type and
(b) heterogeneous collisions, which are between two particles of different type. Pair collision
studies showed that stiff or small particles had larger post-collisional cross-stream displace-
ment than flexible or large particles in a heterogeneous pair collision, while the displacements
in homogeneous collisions of either species were between these two limits. They looked into
the escape tendency of the dilute component in the near wall region and suggested that larger
cross-stream displacement of stiff (or small) particle in heterogeneous collision compounded
by their slower migration velocity than flexible (or big) particle will pose a stronger barrier
for their escape to the bulk region leading to margination of the component. By the same
argument, demargination was suggested to occur for flexible (or big) particles in suspensions
of primarily stiff (or small) particles. They introduced an idealized master equation (ME)
model – a set of integrodifferential equations – and employed a novel hydrodynamic Monte
Carlo (HMC) simulation technique to solve it [6]. (See [46, 47] for related studies of single-
component confined suspensions.) The ME model incorporates both sources of wall-normal
particle motion and the HMC approach allows delineation of the role of each of these sources
in the segregation behavior. In the case of segregation by deformability at constant size, it
5
Page 7 of 41 Soft Matter
Sof
tMat
ter
Acc
epte
dM
anus
crip
t

was shown that at low volume fraction, heterogeneous collisions lead to segregation while
at higher volume fractions both wall-induced migration and heterogeneous collisions have
comparable contributions, while in size segregation the difference in migration velocities is
dominant [7]. Approximating the collisions as small and occurring only between particles
on nearby streamlines and considering a binary suspension where one component is present
only in trace amounts, Henrıquez et al. [48] reduced the ME model to a pair of differential
equations in drift-diffusion form – we denote this as the “simplified drift-diffusion” (SDD)
model. In simple shear, this model is analytically solvable, and the solution for the trace
component contains a “margination parameter” M , which incorporates the migration and
collision parameters and whose value determines the segregation behavior. If M < 1 then
the trace component marginates; otherwise it demarginates. Additionally, if M < −1 then
all particles of the trace component are driven to the wall, complete “drainage” of the trace
component from the bulk suspension is predicted. In the present work we apply this model
to shape segregation, showing that it qualitatively captures the observed simulation results.
In light of the above discussion, the aim of the present work is to investigate segrega-
tion behavior during plane Couette flow in binary suspensions of elastic capsules where
the components differ in shape alone. This study complements prior studies of the elastic
capsule model that focused on segregation by size and deformability [5–7, 45, 48]. While
the elastic capsule model does not capture all aspects of cell properties and dynamics, this
disadvantage is outweighed by the ability to use this model to separately consider effects of
size, deformability and shape contrast on the margination process. As will be illustrated in
Sections IV-V, margination can be understood based on a small number of general processes
that are applicable regardless of the details of the system at hand.
The setup, formulation and numerical methods are detailed in Sec. II. Detailed results
on the effect of relative concentration of individual components, aspect ratio and volume
fraction on segregation of capsules of different shapes is presented in Sec. III. A mechanistic
understanding based on the two key sources of wall-normal capsule motion is then provided
in Sec. IV, providing insight into the segregation behavior seen in Sec. III. Finally, in Sec. V,
we extend the SDD theory [48] to explain the shape-mediated segregation seen in our results.
6
Page 8 of 41Soft Matter
Sof
tMat
ter
Acc
epte
dM
anus
crip
t

II. PROBLEM FORMULATION AND IMPLEMENTATION
A. Overview
We consider here a suspension of deformable fluid-filled elastic capsules confined between
two parallel plates as shown in Fig. 1 and subjected to simple shear flow with shear rate γ.
Simple shear flow was intentionally chosen to isolate the effect of shear on margination. Shear
and how it mediates hydrodynamic interactions between cells and walls is the dominant effect
near blood vessel walls even in the case of pressure-driven flows. Only near the channel
center, where wall effects cancel out, does the gradient in shear rate present in pressure-
driven flow play a substantial role in dynamics of deformable-particle suspensions, as has
been demonstrated for stiffness segregation in prior computational work [5]. For this slit
geometry, periodic boundary conditions are applied in x and z directions with spatial periods
Lx and Lz, respectively (Fig. 1). In the y direction, no-slip velocity boundary conditions
are applied at the two walls y = 0 and y = 2H (Fig. 1). Both the suspending fluid and the
fluid enclosed by the capsules are Newtonian and incompressible with the same viscosity µ
and density ρ, i.e. the viscosity ratio λ = 1 is unity and the capsules are neutrally buoyant.
FIG. 1: Schematic of a binary suspension of spherical (in red) and ellipsoidal (in blue) capsules subjected to simple shearflow in a planar slit with height 2H.
A binary suspension of capsules with spherical and axisymmetric ellipsoidal (spheroidal)
rest shapes is considered. The two broad cases considered in this work are: (i) ellipsoidal
capsules having the same equatorial radius a as the radius as of spherical capsules, and (ii)
ellipsoidal capsules having the same volume V as the volume Vs of the spherical capsules.
7
Page 9 of 41 Soft Matter
Sof
tMat
ter
Acc
epte
dM
anus
crip
t

Shape is changed by varying aspect ratio κ = b/a, where b and a are the polar and equatorial
radii (or semi-axes), respectively. Thus, κ < 1 and κ > 1 represent oblate and prolate,
respectively. In case (i), the volume of the ellipsoidal capsules V = κVs, while in case
(ii), the equatorial radius of the ellipsoidal capsules is a = (as/κ)1/3. The non-dimensional
capillary number Ca = µγa/Gc measures the ratio of viscous and elastic stresses on the
capsule, where a is the equatorial radius of the capsule of interest and Gc is the surface shear
modulus of the capsule membrane. The capillary number is kept constant at Ca = 0.5 for
both components in all simulations. At Ca = 0.5 and λ = 1, spherical capsules are in tank-
treading regime while ellipsoidal particles are in the swinging regime as indicated by single
capsule simulations. Length is non-dimensionalized with as and time is non-dimensionalized
with γ. The scale of the cells and domain are taken to be small, so the Reynolds number
Re = ργH2/µ is much less than unity.
We will use the letter ‘S’ to denote spherical particles, the letter ‘P’ to denote prolate
particles, and the letter ‘O’ to denote oblate particles. The number fraction of the spherical
capsules in a given suspension is denoted Xs. The number fraction of the oblate (or prolate)
capsules can be obtained from Xs as: Xo(or Xp) = 1 − Xs. The suspension as a whole is
characterized by its overall volume fraction φ. In the case of suspensions of spheres and
constant-radius ellipsoids, as Xs changes the volume fraction will change (because the two
components do not have the same volume). In this case, we will report mixture volume
fraction as φs which is the volume fraction when all capsules are spherical.
B. Capsule model and surface discretization
The capsule membranes follow the neo-Hookean model. The strain-energy density W of
the membrane in this case can be expressed as function of the principal stretch ratios, λ1
and λ2 [49]:
W =Gc
2
[I1 − 1 +
1
I2 + 1
](1)
where I1 and I2 are given by
I1 = λ21 + λ2
2 − 2, I2 = λ21λ
22 − 1. (2)
8
Page 10 of 41Soft Matter
Sof
tMat
ter
Acc
epte
dM
anus
crip
t

The elastic forces in the membrane are computed using the finite element approach of Char-
rier et al. [50], which is based on the principle of virtual work. Implementation details of
this approach can be found in [51, 52]. The surface of each capsule is discretized into N∆
triangular elements with linear basis functions employed over each element. In the present
study, we took N∆ = 320, corresponding to 162 discretization nodes. As shown earlier [5],
very long simulation times are required to reach steady state, and this mesh resolution keeps
the computational time requirement manageable.
The computation of the boundary integral in Eq. 3 discussed below, requires the knowl-
edge of the hydrodynamic traction jump across the interface (∆f). This is obtained from
the membrane equilibrium condition, which requires that the hydrodynamic forces on any
infinitesimal area of the membrane balance by the elastic forces in the membrane. Hence
∆f can be obtained from the knowledge of the elastic stresses. In the model used here,
there is no bending resistance of the capsule membrane. In this case compressive stresses in
the membrane can lead to membrane buckling. To circumvent this problem, capsules were
slightly pre-inflated following the work of [53] with inflation ratio I = a/a0 − 1, where the
rest radius a of the capsule of interest is larger than the unstressed radius a0. Here we set
I = 0.1 as in previous studies [5, 45] and did not observe any buckling instabilities. Note
that preinflation can also arise naturally in experiments due to osmotic effects [54]. Prior
work has shown that aside from preventing buckling instabilities of the membrane, the effect
of preinflation on dynamics is small [53].
C. Fluid velocity calculation: Boundary integral method
The Reynolds number for the problem is sufficiently small so that the fluid motion is
assumed to be governed by the Stokes equation. Under these assumptions, one may write
the fluid velocity u at any point x0 in the domain as [55]:
uj(x0) = u∞j (x0)−
1
8πµ
Np∑
n=1
∫
Sn
∆fi(x)Gji(x0,x) dS(x) (3)
where u∞(x0) is the undisturbed simple shear velocity at the point x0, Sn denotes the surface
of capsule n, ∆f(x) is the hydrodynamic traction jump across the interface, while G is the
Green’s function. Note that the sum in the above expression is over all the Np capsules
9
Page 11 of 41 Soft Matter
Sof
tMat
ter
Acc
epte
dM
anus
crip
t

in the system. A crucial aspect of the above formulation is that the Green’s function G is
taken to satisfy the boundary conditions imposed at the system boundaries, so the integrals
above only involve the internal (interfacial) boundaries; if the Green’s function for any other
geometry is employed (e.g. free-space), additional integrals over the domain boundaries will
arise in Eq. 3. The undisturbed flow velocity u∞ is considered to be simple shear,
u∞(x, y, z) = γ(y −H)ex, (4)
where H is the half-height of the channel (Fig. 1), and ex is the unit vector in the x direction.
To determine the velocity field we use the accelerated boundary integral method of Kumar
et al. [51] which is based on general geometry Ewald like method (GGEM) developed by
Hernandez-Ortiz et al. [56]. The key idea in this approach is to split a Dirac-delta force
density into a smooth quasi-Gaussian global density ρg(r) and a second local density ρl(r)
given by the following expressions:
ρg(r) =α3
π3/2e−α2r2
(5
2− α2r2
), (5a)
ρl(r) = δ(r)− ρg(r), (5b)
where α−1 is the length scale over which the delta-function density δ(r) has been smeared
using the quasi-Gaussian form above, while r is the position vector relative to the pole
of the singularity. The solution associated with the local density is known analytically, is
short ranged and is neglected beyond a length scale of O(α−1) from its pole. The analytical
solution is obtained assuming a free-space boundary conditions while the solution associated
with global density is computed numerically ensuring that the boundary condition associated
with overall problem is satisfied [51, 56]. The periodic x and z directions are represented
using Fourier series while a Chebyshev Galerkin scheme is used in the y direction. The
number of corresponding modes in x, y and z directions are Nx, Ny and Nz, respectively.
Based on extensive tests in [51], we set αhm = 0.5 to minimize numerical error. Here, hm
is mean mesh spacing associated with the global solution and α is taken as 4/as. Kumar et
al. [51] have shown that the computational cost associated with this method is O(N lnN)
for the slit geometry, where N is proportional to the product of total number of capsules in
system, Np and the number of triangular elements N∆ on the capsule surface.
10
Page 12 of 41Soft Matter
Sof
tMat
ter
Acc
epte
dM
anus
crip
t

TABLE I: Parameter specification in various simulations. For all simulations, the capillary number based on equatorialradius Ca is 0.5, the confinement ratio C is 5.08 and neo-Hookean membrane law is used.
Set Shape1 Shape2 κ Xs a/as V/Vs φs
A S O {0.4,0.6,0.75} 0 – 1 1 {0.4,0.6,0.75} {0.05,0.1,0.15}
B S P {1.33,1.5,1.63} 0 – 1 1 {1.33,1.5,1.63} {0.05,0.1,0.15}
C S O {0.25,0.3,0.4} 0 – 1 {1.59,1.49,1.36} 1 {0.05,0.1,0.15}
D S P {1.63,1.8,2.0} 0 – 1 {0.85,0.82,0.79} 1 {0.05,0.1,0.15}
Each time step in the solution procedure begins with the computation of the hydrody-
namic traction jump ∆f – this is computed using the approach outlined above in Sec. II B.
Following this, we compute the velocity at all surface element nodes using the scheme just
described. The surface element nodes are then advanced in time using the second order ex-
plicit Adams-Bashforth method. The time step ∆t is set adaptively to satisfy ∆t = 0.1Cah,
where h is the minimum node to node distance (the closest nodes do not have to be on the
same capsule) [51]. We employ an overlap correction procedure in an auxiliary step [51],
which maintains a minimum separation δmin = 0.025as between the surfaces of any two
capsules. Briefly, a pair of overlapping capsules are moved apart along their line of center
in z direction until δmin is achieved. Several hundred to more than a thousand time (strain)
units are required for the capsule distribution to reach a statistically stationary state.
Table I shows the set of simulations performed in this study with their specific choices of
parameters. The domain is 20.31as × 10.15as × 10.15as in the x, y, and z directions for all
these simulations. Thus, the confinement ratio C = H/as for all sets of runs is 5.08. The
total number of capsules is 24, 48 and 72 at φ = 0.05, 0.10 and 0.15 respectively. As can be
seen, we have performed four main sets of simulations denoted by A, B, C and D in the table.
These sets of simulations address the effect of the number fraction of the spherical capsule
Xs on the segregation behavior in combination with several other parameters including
shape, equatorial radius and volume of the ellipsoidal capsules as well as volume fraction.
Additionally, to examine the effect of box size, simulations for set A were repeated in a
bigger box of size 20.31as × 20.31as × 10.15as with 96 capsules and φs = 0.10. The box size
effect was found to be negligible as seen in Fig. 14, which is presented in Sec. III C.
11
Page 13 of 41 Soft Matter
Sof
tMat
ter
Acc
epte
dM
anus
crip
t

(a) Xs = 0.1
(b) Xs = 0.9
FIG. 2: Simulation snapshot for the mixture of oblate (κ = 0.6, blue) and spherical capsules (red) with (a) Xs = 0.1 and (b)Xs = 0.9. Both species have same equatorial radius with φs = 0.10. Here and henceforth, we will represent oblate andspherical capsules by the colors blue and red, respectively.
III. RESULTS
A. Equatorial radius held constant
We begin this section with results for the case where both spherical and ellipsoidal cap-
sules have the same equatorial radius. This case corresponds to simulation sets A and B
in Table I. The volume of the ellipsoidal capsules varies linearly with aspect ratio κ and
thus, the overall volume fraction φ will vary with Xs. The volume fraction at any Xs is
φ = (Xs + κ(1 − Xs))φs in these cases. We will first discuss the case φs = 0.10 and the
cases κ = 0.6 and κ = 1.33. Results for varying κ and φs are discussed later in Sec. III A 2.
Simulation snapshots for different values of Xs are shown in Fig. 2 for set A and Fig. 3 for
set B.
12
Page 14 of 41Soft Matter
Sof
tMat
ter
Acc
epte
dM
anus
crip
t

(a) Xs = 0.1
(b) Xs = 0.9
FIG. 3: Simulation snapshots for mixtures of prolate (κ = 1.33, green) and spherical capsules (red) with (a) Xs = 0.1 and(b) Xs = 0.9. Both species have same equatorial radius with φs = 0.10. Here and henceforth, we will represent prolatecapsules by the color green.
1. Particle distribution in the wall normal direction
The simplest way to examine segregation is to look into the steady state mean absolute
distance of a species ‘α’ from the channel wall defined as dα = 〈〈|y−ywall|〉Nα〉ts , where 〈m〉n
represents the average of quantity m in the range of quantity n. Here, Nα is the number
of capsules of species α and ts is the time interval, after steady state is reached, in which
temporal averaging is done, which is taken to be ts = 2000−3000 for all the results presented
in this work. It is noteworthy that steady state is typically reached after initial 1000 strains
of the simulation.
We first consider the mixture of oblate and spherical capsules. From Fig. 4(a), we observe
that d for both species decreases with the increase in Xs . This is expected as the d for
the pure spherical capsule suspension is smaller than that for pure oblate capsules and the
mixture will behave more like the spherical capsule case as Xs increases. We also observe
that the oblate capsules stay closer to the wall and the margination tendency, quantified as
13
Page 15 of 41 Soft Matter
Sof
tMat
ter
Acc
epte
dM
anus
crip
t

0 0.2 0.4 0.6 0.8 1
0.3
0.4
0.5
0.6
0.7
0.8
0.9
Xs
d/H
O
S
total
0 0.2 0.4 0.6 0.8 1
0.3
0.4
0.5
0.6
0.7
0.8
0.9
Xs
d/H
P
S
total
FIG. 4: Steady state d as a function of Xs for the mixture of (a) oblate (κ = 0.6) and spherical, and (b) prolate (κ = 1.33)and spherical capsules. Also shown is the steady state d of the total suspension. Both capsules have same equatorial radiuswith φs = 0.10.
|ds − do|, increases with increase in Xs .
Now we turn to the mixture of prolate and spherical capsules. In Fig. 4(b), we observe that
as Xs increases, prolate capsules move toward the center while spherical capsules marginate.
The d for both species increases with increase in Xs . This is contrary to the behavior of
oblate capsules in mixture we saw in earlier paragraph.
To see more detail of the capsule distributions, we now examine the number density of
the center of mass of a given species as a function of the y-coordinate normalized by the
mean number density n of that species; we denote this as n(y). If the distribution were
uniform, then this quantity would have a value of one throughout. Note that a subscript
‘s’, ‘o’ or ‘p’ may be used in n to specifically refer to the spherical, the oblate or the prolate
capsules, respectively; the same convention is followed later for denoting other quantities.
To compute n(y), the channel height is divided into bins and then capsules are assigned
to bins based on their center of mass coordinates. The number of capsules in each of the
bins is then normalized by the value expected in that bin based on a uniform distribution
in the wall normal direction. Temporal averaging of distribution profile is done in the range
of ts = 2000 − 3000 using a block averaging technique [57] with blocks of 100 strain units.
Block size was selected such that auto-correlation between distribution profiles was less than
5%. Typical error bars are shown in Fig. 11(e).
Fig. 5(a),(b) shows the distribution of capsules in a pure suspension of oblate, spherical
or prolate capsules. Two things are immediately clear from these plots. First, there are two
peaks, one sharper peak closer to the wall and another broader peak closer to the centerline.
14
Page 16 of 41Soft Matter
Sof
tMat
ter
Acc
epte
dM
anus
crip
t
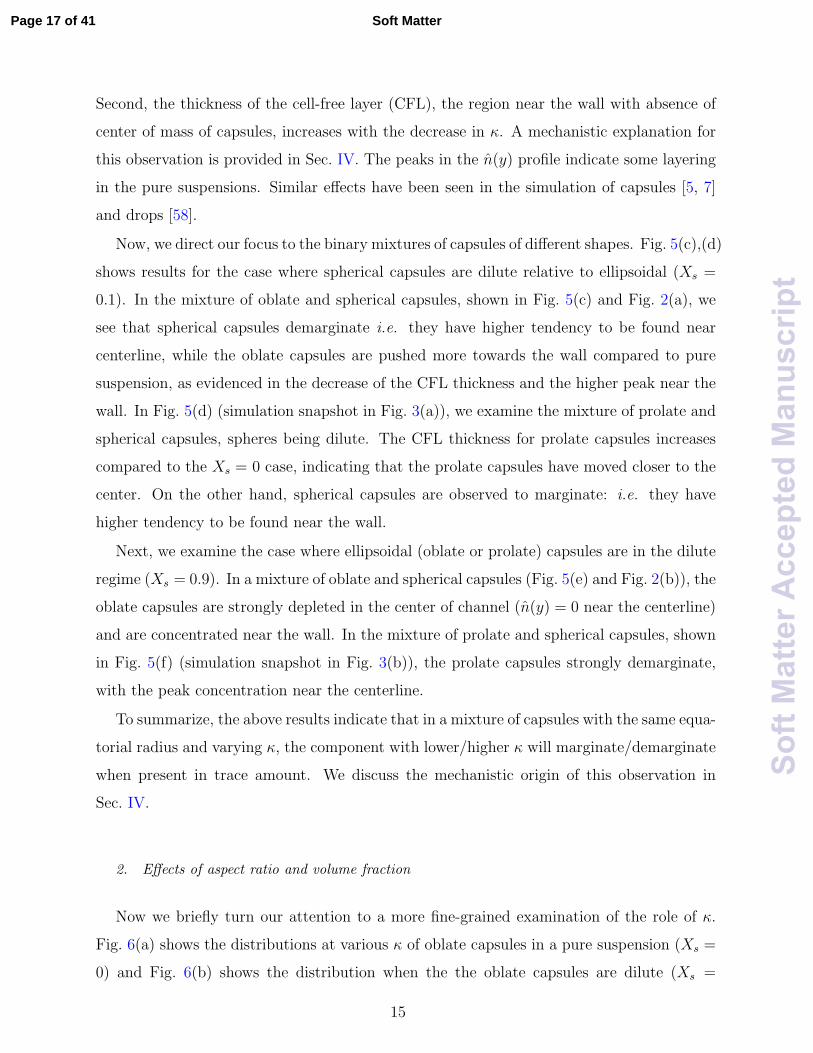
Second, the thickness of the cell-free layer (CFL), the region near the wall with absence of
center of mass of capsules, increases with the decrease in κ. A mechanistic explanation for
this observation is provided in Sec. IV. The peaks in the n(y) profile indicate some layering
in the pure suspensions. Similar effects have been seen in the simulation of capsules [5, 7]
and drops [58].
Now, we direct our focus to the binary mixtures of capsules of different shapes. Fig. 5(c),(d)
shows results for the case where spherical capsules are dilute relative to ellipsoidal (Xs =
0.1). In the mixture of oblate and spherical capsules, shown in Fig. 5(c) and Fig. 2(a), we
see that spherical capsules demarginate i.e. they have higher tendency to be found near
centerline, while the oblate capsules are pushed more towards the wall compared to pure
suspension, as evidenced in the decrease of the CFL thickness and the higher peak near the
wall. In Fig. 5(d) (simulation snapshot in Fig. 3(a)), we examine the mixture of prolate and
spherical capsules, spheres being dilute. The CFL thickness for prolate capsules increases
compared to the Xs = 0 case, indicating that the prolate capsules have moved closer to the
center. On the other hand, spherical capsules are observed to marginate: i.e. they have
higher tendency to be found near the wall.
Next, we examine the case where ellipsoidal (oblate or prolate) capsules are in the dilute
regime (Xs = 0.9). In a mixture of oblate and spherical capsules (Fig. 5(e) and Fig. 2(b)), the
oblate capsules are strongly depleted in the center of channel (n(y) = 0 near the centerline)
and are concentrated near the wall. In the mixture of prolate and spherical capsules, shown
in Fig. 5(f) (simulation snapshot in Fig. 3(b)), the prolate capsules strongly demarginate,
with the peak concentration near the centerline.
To summarize, the above results indicate that in a mixture of capsules with the same equa-
torial radius and varying κ, the component with lower/higher κ will marginate/demarginate
when present in trace amount. We discuss the mechanistic origin of this observation in
Sec. IV.
2. Effects of aspect ratio and volume fraction
Now we briefly turn our attention to a more fine-grained examination of the role of κ.
Fig. 6(a) shows the distributions at various κ of oblate capsules in a pure suspension (Xs =
0) and Fig. 6(b) shows the distribution when the the oblate capsules are dilute (Xs =
15
Page 17 of 41 Soft Matter
Sof
tMat
ter
Acc
epte
dM
anus
crip
t

0 0.2 0.4 0.6 0.8 1
0
0.5
1
1.5
2
2.5
3
y/H
n
OS
(a) pure oblate and spherical (Xs = 0, 1)
0 0.2 0.4 0.6 0.8 1
0
0.5
1
1.5
2
2.5
3
y/H
n
PS
(b) pure prolate and spherical (Xs = 0, 1)
0 0.2 0.4 0.6 0.8 1
0
1
2
3
4
5
6
y/H
n
OS
(c) Xs = 0.1
0 0.2 0.4 0.6 0.8 1
0
1
2
3
4
5
6
y/H
n
PS
(d) Xs = 0.1
0 0.2 0.4 0.6 0.8 1
0
2
4
6
8
y/H
n
OS
(e) Xs = 0.9
0 0.2 0.4 0.6 0.8 1
0
2
4
6
8
y/H
n
PS
(f) Xs = 0.9
FIG. 5: Normalized number density distributions n(y). The channel wall is at y = 0 and the centerline at y = H. The κ ofoblate and prolate capsules is 0.6 and 1.33, respectively with φs = 0.10. Both species in the mixture have the same equatorialradius. (a) Xs = 0 and Xs = 1: Pure species (oblate and spherical capsules), (b) Xs = 0 and Xs = 1: Pure species (prolateand spherical capsules), (c) Xs = 0.1 in oblate-sphere mixture, (d) Xs = 0.1 in prolate-sphere mixture, (e) Xs = 0.9 inoblate-sphere mixture and (f) Xs = 0.9 in prolate-sphere mixture.
16
Page 18 of 41Soft Matter
Sof
tMat
ter
Acc
epte
dM
anus
crip
t

0 0.2 0.4 0.6 0.8 1
0
0.5
1
1.5
2
2.5
3
3.5
y/H
no
κ = 0.4κ = 0.6κ = 0.75
0 0.2 0.4 0.6 0.8 1
0
2
4
6
8
10
12
y/H
no
κ = 0.4κ = 0.6κ = 0.75
FIG. 6: Normalized number density distribution of oblate capsules no(y) at several κ for the (a) Xs = 0 and (b) Xs = 0.9.Both capsules have the same equatorial radius with φs = 0.10.
0.9). For pure suspensions, the CFL thickness as well as the peak near wall increases as
κ decreases. At the lowest value of κ studied here, κ = 0.4, we observe multiple peaks in
the distribution function indicating multiple layers, however animations reveal that only the
peak near the walls is representative of layers, while much of the interior region consists of
disorganized particles. As the oblate capsules become the trace component in the mixture,
they are increasingly marginated as κ decreases and when κ < 0.6, we observe complete
depletion of oblate capsules from the central region of the channel.
For a suspension of pure spherical capsules, the CFL thickness decreases as φs increases as
seen in the distributions shown in Fig. 7(a). This result is consistent with prior simulations
and theory [7, 46, 59, 60]. Also, the near-wall peak diminishes as φs increases; this occurs in
conjunction with a more uniform distribution over the rest of the channel. Fig. 7(b) shows
ns for Xs = 0.9 in the mixture of spherical and prolate (κ = 1.33) capsules. Spherical cap-
sules occupy central region of channel at all φs, while prolate capsules increasingly undergo
demargination (not shown). The near-wall peak shifts toward the wall as well as peak-height
decreases with increasing φs, just as in pure suspensions of spherical particles.
B. Volume held constant
Now, we direct our attention to binary mixtures in which all capsules have the same
volume V , simulation sets C and D in Table I. As discussed earlier, the equatorial radius
a of ellipsoidal capsules will scale as κ−1/3 in these sets of runs. Thus, oblate and prolate
17
Page 19 of 41 Soft Matter
Sof
tMat
ter
Acc
epte
dM
anus
crip
t

0 0.2 0.4 0.6 0.8 1
0
1
2
3
4
y/H
ns
φ = 0.05φ = 0.10φ = 0.15
0 0.2 0.4 0.6 0.8 1
0
1
2
3
4
y/H
ns
φ = 0.05φ = 0.10φ = 0.15
FIG. 7: Normalized number density distribution of spherical capsules ns(y) at several φs for (a) Xs = 1 and (b) Xs = 0.9 ina mixture of spherical and prolate (κ = 1.33) capsules. Both capsules have same equatorial radius.
capsules will have larger and smaller a, respectively, compared to spherical capsules. We
first discuss the results for κ = 0.4 from simulation set C and κ = 2.0 from simulation
set D. Results for varying κ and φ are discussed in Sec. III B 2. Fig. 8 and Fig. 9 show
representative snapshots (taken at t = 3000). It is evident from these snapshots that both
oblate and prolate capsules demarginate when present in trace amount (Xs = 0.9), while
spherical capsules marginate when they are trace component (Xs = 0.1), in contrast to the
behavior we saw earlier in the constant radius case, Sec. III A.
1. Capsule distributions
We begin first by presenting in Fig. 10 the mean positions d of capsules at several Xs at
φ = 0.10. In Fig. 10(a), where κ = 0.4, d for both capsules increases with increasingXs , with
d of spherical capsules always staying below that of oblate capsules. Thus spheres marginate
when present as the trace component. Notably, this is the opposite of the behavior seen at
constant radius (Sec. III A). In simulations of platelet margination, Reasor et al. [43] found
that spherical platelets marginate more than disk-shaped platelets with the same volume,
a tendency seen here as well. (However, their platelets were rigid and all rigid particles
marginate strongly in a suspensions of larger flexible ones [48], so it is likely that the effect
they observed in more closely related to the dynamics of particles rolling along a vessel
wall.) Further insight into this phenomenon is provided in Sec. IV. Fig. 10(b) shows that
the prolate capsules (here κ = 2) demarginate when present as trace, very similar to their
18
Page 20 of 41Soft Matter
Sof
tMat
ter
Acc
epte
dM
anus
crip
t
(a) Xs = 0.1
(b) Xs = 0.9
FIG. 8: Simulation snapshots for mixtures of oblate (κ = 0.4, blue) and spherical capsules (red) with (a) Xs = 0.1 and (b)Xs = 0.9. Both species have same volume with φ = 0.10.
behavior seen in the constant-radius case.
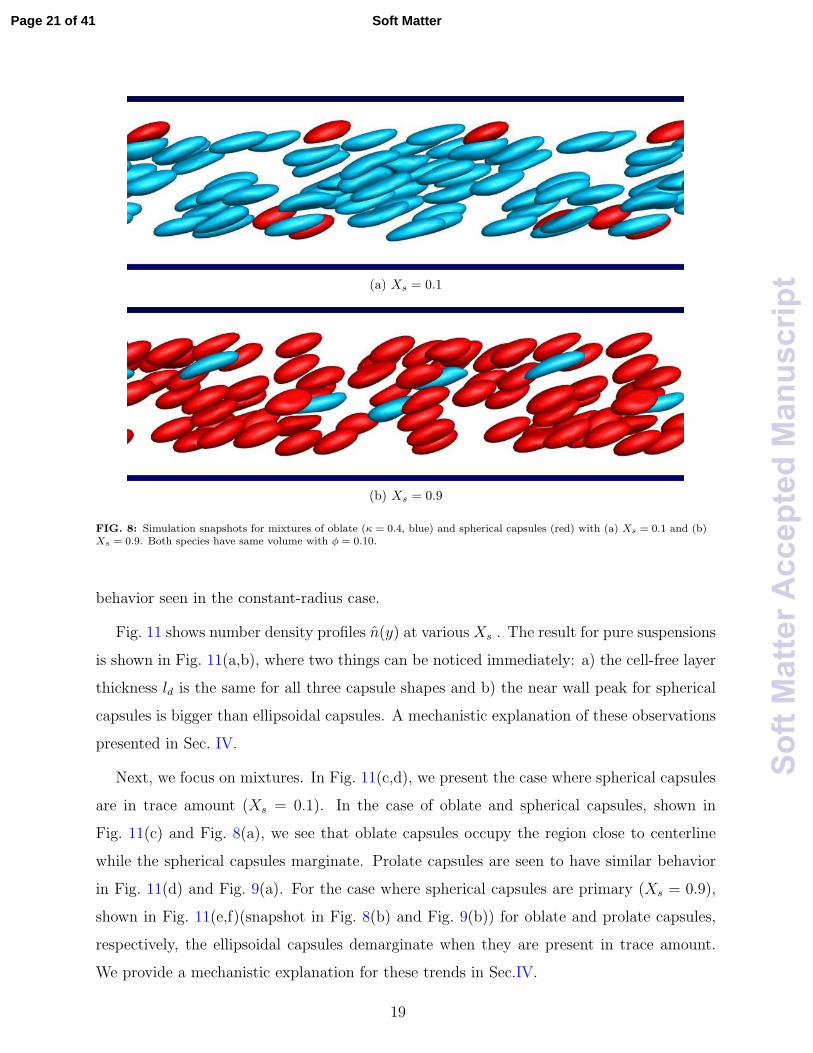
Fig. 11 shows number density profiles n(y) at various Xs . The result for pure suspensions
is shown in Fig. 11(a,b), where two things can be noticed immediately: a) the cell-free layer
thickness ld is the same for all three capsule shapes and b) the near wall peak for spherical
capsules is bigger than ellipsoidal capsules. A mechanistic explanation of these observations
presented in Sec. IV.
Next, we focus on mixtures. In Fig. 11(c,d), we present the case where spherical capsules
are in trace amount (Xs = 0.1). In the case of oblate and spherical capsules, shown in
Fig. 11(c) and Fig. 8(a), we see that oblate capsules occupy the region close to centerline
while the spherical capsules marginate. Prolate capsules are seen to have similar behavior
in Fig. 11(d) and Fig. 9(a). For the case where spherical capsules are primary (Xs = 0.9),
shown in Fig. 11(e,f)(snapshot in Fig. 8(b) and Fig. 9(b)) for oblate and prolate capsules,
respectively, the ellipsoidal capsules demarginate when they are present in trace amount.
We provide a mechanistic explanation for these trends in Sec.IV.
19
Page 21 of 41 Soft Matter
Sof
tMat
ter
Acc
epte
dM
anus
crip
t

(a) Xs = 0.1
(b) Xs = 0.9
FIG. 9: Simulation snapshots for mixtures of prolate (κ = 2.0, blue) and spherical (red) capsules with (a) Xs = 0.1 and (b)Xs = 0.9. Both species have same volume with φ = 0.10.
0 0.2 0.4 0.6 0.8 1
0.55
0.6
0.65
0.7
0.75
0.8
0.85
Xs
d/H
OStotal
0 0.2 0.4 0.6 0.8 1
0.55
0.6
0.65
0.7
0.75
0.8
0.85
Xs
d/H
PStotal
FIG. 10: Steady state d as a function of Xs for the mixture of (a) oblate (κ = 0.4) and spherical capsules and (b) prolate(κ = 2) and spherical. Also shown is the steady state 〈d〉 of the total suspension. Both capsules have same volume andφ = 0.10.
2. Effects of aspect ratio and volume fraction
Now, we turn our attention to the effect of κ, while keeping the other parameters fixed.
Fig. 12(a) shows the distribution of prolate capsules in wall-normal direction for a pure
20
Page 22 of 41Soft Matter
Sof
tMat
ter
Acc
epte
dM
anus
crip
t

0 0.2 0.4 0.6 0.8 1
0
1
2
3
4
y/H
n
OS
(a) pure oblate and spherical (Xs = 0, 1)
0 0.2 0.4 0.6 0.8 1
0
1
2
3
4
y/H
n
PS
(b) pure prolate and spherical (Xs = 0, 1)
0 0.2 0.4 0.6 0.8 1
0
1
2
3
4
5
6
y/H
n
OS
(c) Xs = 0.1
0 0.2 0.4 0.6 0.8 1
0
1
2
3
4
5
6
y/H
n
PS
(d) Xs = 0.1
0 0.2 0.4 0.6 0.8 1
0
1
2
3
4
5
y/H
n
OS
(e) Xs = 0.9
0 0.2 0.4 0.6 0.8 1
0
1
2
3
4
5
y/H
n
PS
(f) Xs = 0.9
FIG. 11: Normalized number density distributions n(y) for suspensions whose components have the same volume. Theaspect ratios κ of the oblate and prolate capsules are 0.4 and 2.0, respectively with φ = 0.10. (a) Xs = 0 and Xs = 1: Purespecies (oblate and spherical capsules), (b) Xs = 0 and Xs = 1: Pure species (prolate and spherical capsules), (c) Xs = 0.1 inoblate-sphere mixture, (d) Xs = 0.1 in prolate-sphere mixture, (e) Xs = 0.9 in oblate-sphere mixture and (f) Xs = 0.9 inprolate-sphere mixture.
21
Page 23 of 41 Soft Matter
Sof
tMat
ter
Acc
epte
dM
anus
crip
t

0 0.2 0.4 0.6 0.8 1
0
1
2
3
4
y/H
np
κ = 1.63κ = 1.8κ = 2.0
0 0.2 0.4 0.6 0.8 1
0
1
2
3
4
y/H
np
κ = 1.63κ = 1.8κ = 2.0
FIG. 12: Number density distribution of prolate capsules np(y) at several κ for the (a) Xs = 0 and (b) Xs = 0.9(prolate-sphere mixture). Both species have same volume with φ = 0.10.
suspension (Xs = 0) and Fig. 12(b) shows the distribution when they are present in the
trace limit (Xs = 0.9) at varying κ. For pure suspensions, we see that the CFL thickness
as well as the near-wall peak is the same for all three different κ (κ = 1.63, 1.8, 2). As the
prolate capsules become dilute, their near-wall peak decreases while their concentration at
the centerline increases (increasing demargination) with increasing κ.
To examine the effect of volume fraction, we present results for mixture of oblate (κ = 0.4)
and spherical capsules at Xs = 0.9 in Fig. 13. Normalized number density distribution of
oblate and spherical capsules is shown in Fig. 13(a) and (b), respectively. Oblate capsules
demarginates at all φ and are increasingly found near center of the channel as φ increase.
While for spherical capsules, the near-wall peak shifts toward the wall with increasing φ, just
as in pure suspensions of spherical particles (Fig. 7(a)), indicating that they are increasingly
pushed towards wall with increase in φ.
C. Effect of domain size
In order to ensure that the results presented above were generated in a large enough
simulation domain in the periodic directions, we conducted additional runs for a mixture
of oblate (κ = 0.75) and spherical capsules with the same equatorial radius a at φs = 0.10
in a simulation domain of 20.31as × 20.31as × 10.155as (with 96 capsules). Comparative
results for component distributions at Xs = 0.9 are shown in Fig. 14 and we note that the
differences are small.
22
Page 24 of 41Soft Matter
Sof
tMat
ter
Acc
epte
dM
anus
crip
t

0 0.2 0.4 0.6 0.8 1
0
1
2
3
4
5
y/H
no
φ = 0.05φ = 0.10φ = 0.15
0 0.2 0.4 0.6 0.8 1
0
1
2
3
4
5
y/H
ns
φ = 0.05φ = 0.10φ = 0.15
FIG. 13: Normalized number density distribution n(y) of (a) oblate and (b) spherical capsules at several φ for Xs = 0.9 in amixture of spherical and oblate (κ = 0.4) capsules. Both species have the same volume.
0 0.2 0.4 0.6 0.8 1
0
2
4
6
8
y/H
n
O
S
FIG. 14: Normalized number density distribution of components n(y) at Xs = 0.9, φs = 0.10 in the mixture of oblate(κ = 0.75, shown in blue closed circles) and spherical (shown in red closed triangles) capsules with same equatorial radius.Results are shown for two different box size: 20.31as × 10.155as × 10.155as (with 48 capsules, shown with solid curve) and20.31as × 20.31as × 10.155as (with 96 capsules, shown with dashed curve).
IV. MECHANISMS AND SIMPLIFIED MODEL
Above we presented detailed results for capsules having different shapes while maintaining
(a) same equatorial radius, and (b) same volume. On the surface, the results for these two
cases suggest contradictory trends. In this section, however, we show that the mechanistic
origins of binary suspension dynamics in both cases can be understood within the same
framework: as a competition between two key processes, (a) wall-induced migration, which
tries to push capsules toward the center of channel, and (b) shear-induced collisions, which
try to homogenize the capsule distribution.
23
Page 25 of 41 Soft Matter
Sof
tMat
ter
Acc
epte
dM
anus
crip
t

A. Wall-induced migration
In general, a suspended deformable object such as a drop, capsule, cell or flexible polymer
molecule subjected to shear flow near a no-slip wall will migrate normal to the wall even
in the Stokes flow limit [61, 62]. We have computed this migration velocity vm(y) for
isolated capsules in a slit domain of sized 10.155as × 10.155as × 10.155as. Again in all cases
Ca = 0.5. The simulation to compute vm at a given wall-normal position y begins by placing
the initially spherical capsule at that location. With time, the shape of the capsule as well
as the location of its center of mass evolves. We find the quasi-steady limit of the migration
velocity by holding the center of mass of the capsule fixed at a given location: at the end
of each time step, the capsule is translated so that its center of mass returns to its original
position; at steady state this displacement and the time step determine the quasi-steady
migration velocity. In general, the time scale of capsule shape evolution is much faster than
that of capsule motion in the wall-normal direction. As a result, except in the near-wall
region of the standard simulation (see [52]), the migration velocity obtained from the above
described scheme is very close to that from a standard simulation.
Fig. 15(a) shows vm(y) for capsules with the same equatorial radius and varying κ at
confinement ratio of C = 5.08. We observe that vm(y) increases with increasing κ; recall
that capsules with same equatorial radius have increasing volume as κ increases. Fig. 15(b)
shows vm(y) of capsules of the same volume and varying κ. Perhaps surprisingly, in this
case there is almost no change in vm with κ.
The trends shown in Fig. 15 clearly indicate that the volume of capsule plays a larger role
in determining migration velocity than its shape. Further insights into these results can be
gained from some theoretical considerations. To leading order far from walls a deformable
neutrally buoyant object in fluid can be treated as a symmetric force-dipole characterized
by the stresslet tensor S [61, 62]. In a semi-infinite domain with a no-slip wall at y = 0 the
migration velocity induced by the image of this dipole in the wall can be approximated as:
vm =Km
y2, (6a)
Km = −9Syy
64πµ. (6b)
For a spherical capsule in the limit of small Ca, Barthes-Biesel and Chhim [63] gave the
24
Page 26 of 41Soft Matter
Sof
tMat
ter
Acc
epte
dM
anus
crip
t

0.2 0.4 0.6 0.8 1
0
0.02
0.04
0.06
0.08
y/H
vm
κ = 0.4κ = 1.0κ = 1.63
0.2 0.4 0.6 0.8 1
0
0.02
0.04
0.06
0.08
y/H
vm
κ = 0.4κ = 1.0κ = 1.63
FIG. 15: Migration velocity of a single capsule for varying κ with (a) same equatorial radius and (b) same volume.
following expression for the yy component of the stresslet:
Syy ∼ −µγV Ca. (7)
Thus at constant Ca, the migration velocity is linearly proportional to its volume. Based
on our observations, we suggest that this dependence holds, at least to a very good approxi-
mation, for nonspherical capsules. This argument can be recast using dimensional analysis.
For a capsule with spherical rest shape in the point dipole limit,
vmγa
∼a2
y2f(Ca) (8)
or equivalently
vm ∼γV
y2f(Ca), (9)
since V ∼ a3. For a nonspherical capsule the additional dimensionless group κ appears and
the above result directly generalizes to
vm ∼γV
y2f(Ca, κ). (10)
Our results indicate that at least for the model under consideration here f(Ca, κ) is a very
weak function of κ.
25
Page 27 of 41 Soft Matter
Sof
tMat
ter
Acc
epte
dM
anus
crip
t
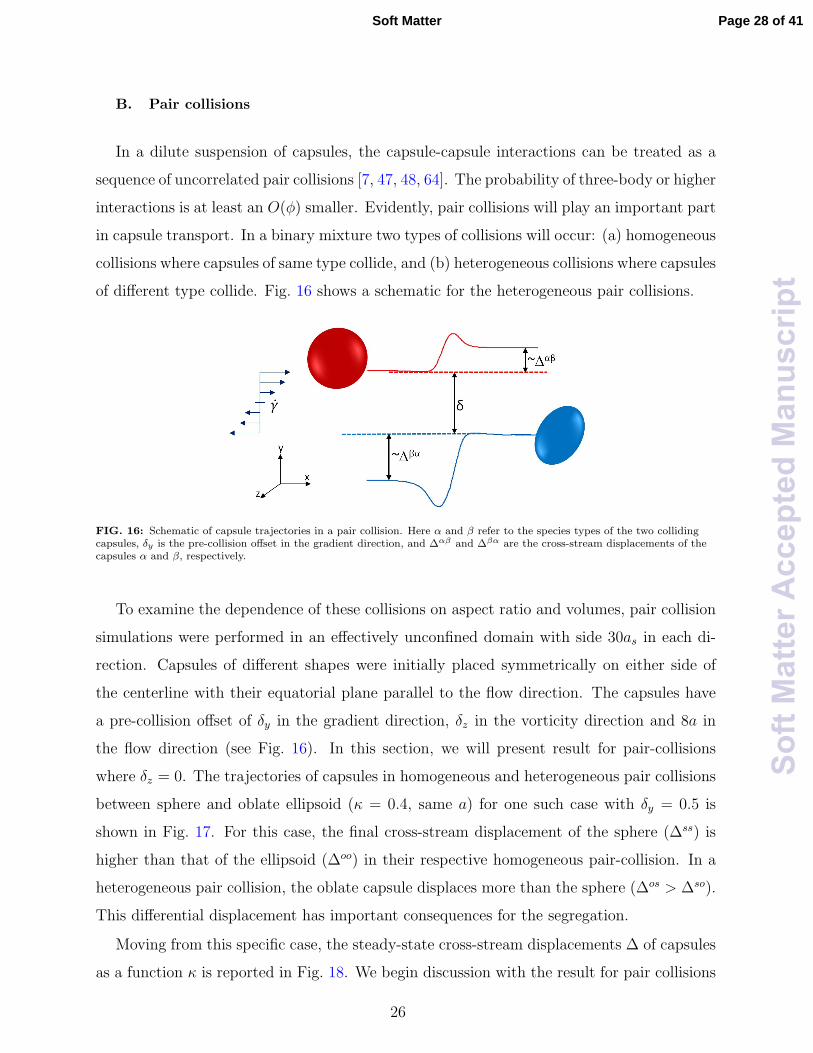
B. Pair collisions
In a dilute suspension of capsules, the capsule-capsule interactions can be treated as a
sequence of uncorrelated pair collisions [7, 47, 48, 64]. The probability of three-body or higher
interactions is at least an O(φ) smaller. Evidently, pair collisions will play an important part
in capsule transport. In a binary mixture two types of collisions will occur: (a) homogeneous
collisions where capsules of same type collide, and (b) heterogeneous collisions where capsules
of different type collide. Fig. 16 shows a schematic for the heterogeneous pair collisions.
FIG. 16: Schematic of capsule trajectories in a pair collision. Here α and β refer to the species types of the two collidingcapsules, δy is the pre-collision offset in the gradient direction, and ∆αβ and ∆βα are the cross-stream displacements of thecapsules α and β, respectively.
To examine the dependence of these collisions on aspect ratio and volumes, pair collision
simulations were performed in an effectively unconfined domain with side 30as in each di-
rection. Capsules of different shapes were initially placed symmetrically on either side of
the centerline with their equatorial plane parallel to the flow direction. The capsules have
a pre-collision offset of δy in the gradient direction, δz in the vorticity direction and 8a in
the flow direction (see Fig. 16). In this section, we will present result for pair-collisions
where δz = 0. The trajectories of capsules in homogeneous and heterogeneous pair collisions
between sphere and oblate ellipsoid (κ = 0.4, same a) for one such case with δy = 0.5 is
shown in Fig. 17. For this case, the final cross-stream displacement of the sphere (∆ss) is
higher than that of the ellipsoid (∆oo) in their respective homogeneous pair-collision. In a
heterogeneous pair collision, the oblate capsule displaces more than the sphere (∆os > ∆so).
This differential displacement has important consequences for the segregation.
Moving from this specific case, the steady-state cross-stream displacements ∆ of capsules
as a function κ is reported in Fig. 18. We begin discussion with the result for pair collisions
26
Page 28 of 41Soft Matter
Sof
tMat
ter
Acc
epte
dM
anus
crip
t

0 5 10 15 20 25 30
−0.2
0
0.2
0.4
0.6
t
(y−
y 0)/as
O − SS − OO − OS − S
FIG. 17: Relative trajectories for spherical (‘S’) and oblate (‘O’) with κ = 0.6 and same a in both homogeneous (S − S,O −O) and heterogeneous (S −O, O − S) pair collisions. y0 is the initial position in y direction of a capsule.
of capsules with the same a, shown in Fig. 18(a). In all cases, we studied the pair collision
of a spherical capsule with an ellipsoidal (either oblate or prolate) capsule. The solid curve
shows ∆ for homogeneous collision of ellipsoidal capsules, while the dashed curves show
∆αβ of each capsule in a heterogeneous collision. The curves meet at κ = 1, the case of
homogeneous collision of spheres. Notice that the cross-stream displacement of an oblate
capsule is larger than for a spherical capsule in heterogeneous collision, so ∆os > ∆so, while
for homogeneous collision, ∆oo < ∆ss. In general, the order of displacement is as follows:
∆so < ∆oo < ∆ss < ∆os. An obvious trend emerges here: the capsule of high κ gets displaced
less in heterogeneous collision compared to their homogeneous collision while displaces low κ
capsule more in heterogeneous collision compared to their homogeneous collision. This trend
continues for the pair collision of spherical and prolate capsules as well where we observe
the following order: ∆ps < ∆ss < ∆pp < ∆sp.
In Fig. 18(b) we turn to the constant volume case. Here as well, the solid curve shows
∆ for homogeneous collision of ellipsoidal capsules, while the dashed curves show the ∆αβ
of each capsule in a heterogeneous collision. In this case, all the curves are nonmonotonic.
We can divide the plot into three regions: a) κ < 0.5: here, ∆os < ∆oo < ∆ss < ∆so, b)
0.5 < κ < 1.3: in this region ∆αα and ∆αβ are nonlinear and close to each other, and c)
κ > 1.3: in this region, where ∆ps < ∆pp < ∆ss < ∆sp.
If we put the results discussed in previous sections Sec. IVA and IVB together, a clearer
picture of segregation starts to emerge. The question we ask ourselves here is whether a
capsule stuck in near-wall region be able to escape to central region. We focus discussion
on the case of oblate and spherical capsule mixture, where both species have same radius.
27
Page 29 of 41 Soft Matter
Sof
tMat
ter
Acc
epte
dM
anus
crip
t

0 0.5 1 1.5 2
0.1
0.2
0.3
0.4
0.5
0.6
κ
∆/as
E − S
S − E
E − E
0 0.5 1 1.5 2
0.1
0.2
0.3
0.4
0.5
0.6
κ
∆/as
E − S
S − E
E − E
FIG. 18: Post collisional cross-stream displacements of ellipsoidal (‘E’) and spherical (‘S’) capsules in homogeneous andheterogeneous collisions as a function of κ for (a) capsules with same equatorial radius and (b) same volume. Otherparameters: δy = 0.5, δz = 0 and C = 15.
Consider two scenarios: a) when a slow migrating capsule (here oblate) is in near-wall
region surrounded by fast migrating capsule (here sphere); case of Xs = 0.9. In subsequent
collisions, capsule which displaces less in collision (here sphere) will push other capsule which
displaces more (here oblate) towards the wall. As oblate is migrating slowly and is pushed
more, it will marginate. In scenario b) a fast migrating capsule (here sphere) is in near-wall
region surrounded by slow migrating capsule (here oblate); case of Xs = 0.1. In subsequent
collisions, less displacing capsule in collision (here sphere) will push more displacing capsule
(here oblate) away, making its way to central region. As sphere is migrating faster and
displacing less, it will demarginate.
Using the above framework, we can similarly explain the demargination of prolate capsules
seen in mixture of prolate and sphere with same radius in Sec. IIIA. For capsules of same
volume, they have similar vm as seen in Sec. IVA. In such cases, segregation will be driven
by heterogeneous collisions. Using above framework, we can deduce that a less displacing
capsule in collision will push the capsule which displaces more towards wall. For ellipsoidal
(‘e’) and spherical (‘s’) capsules, ∆es < ∆se, thus above framework predicts that both oblate
and prolate will demarginate when present in dilute limit (case of Xs = 0.9) and sphere will
marginate when present in dilute limit (case of Xs = 0.1), which indeed is the case as seen
in results presented in Sec. III B.
28
Page 30 of 41Soft Matter
Sof
tMat
ter
Acc
epte
dM
anus
crip
t

V. KINETIC DRIFT-DIFFUSION THEORY
In recent work, Henrıquez et al. [48] gave a mathematical model for predicting flow-
induced segregation that formalizes earlier mechanistic arguments by Kumar and Graham
[45]. In this section we present aspects of this theory and apply it to the shape segregation
problem. Consider a dilute suspension (φ ≪ 1) containing Ns types of deformable capsules
undergoing simple shear flow in a slit. Quantities referring to a specific component α in
the mixture will have subscript α: for example nα is the number density of component α.
Consistent with the diluteness assumption, the shear rate γ is assumed to be independent
of the local number densities and thus independent of position. In a dilute suspension
the capsule-capsule interactions can be treated as a sequence of uncorrelated pair collisions
[47, 58, 64]. The contributions of three-body or higher interactions is O(φ3) and is neglected
here. Since the capsules are deformable, they migrate away from the wall during flow
with velocity vαm(y) as described above. The evolution of the capsule number density
distributions can be idealized by a kinetic master equation that captures both the migration
and collision effects ([6, 7, 46, 47]). Assuming uniform capsule distributions in x and z, this
equation is
∂nα(y, t)
∂t= −
∂
∂y
(vαm(y)nα(y, t)
)+
Ns∑
β=1
(∫ y
−(2H−y)
∫ ∞
−∞
{nα(y −∆αβ
y , z −∆αβz , t)
× nβ(y −∆αβy − δy, z −∆αβ
z − δz, t)
− nα(y, z, t)nβ(y − δy, z − δz, t)
}γ |δy| dδzdδy
). (11)
The term γ|δy| in the integrand accounts for the relative velocity of approach of two capsules
separated far upstream by a wall-normal offset δy. In the important special case of a binary
suspension composed of a “primary” component (α =‘p’) and a “trace” component (α =‘t’),
such that np ≫ nt, only the term corresponding to β =‘p’ contributes to the sum – the trace
component is too dilute for its collisions to affect the behavior of the system. This is the
case we consider here.
Under the further conditions: (a) small collisional displacements i.e. ∆αβy /a ≪ 1, (b)
∆αβy are vanishingly small for large |δy|, and (c) terms involving (∆αβ)3 and smaller are
negligible, one can approximate the master equation by the following pair of drift-diffusion
29
Page 31 of 41 Soft Matter
Sof
tMat
ter
Acc
epte
dM
anus
crip
t

type equations [48]:
∂np
∂t= −
∂
∂y
[Kpm
(1
y2−
1
(2H − y)2
)np −Kpc
∂γnp
∂ynp −
∂
∂y
(Kpdγn
2p
)],
∂nt
∂t= −
∂
∂y
[Ktm
(1
y2−
1
(2H − y)2
)nt −Ktc
∂γnp
∂ynt −
∂
∂y(Ktdγnpnt)
]. (12)
We denote this as the simplified drift-diffusion (SDD) model. Notice that the primary
component dominates the collisional drift velocity (second term in RHS) and collisional-
diffusivity (third term in RHS) terms. Here, Kαm, Kαc and Kαd are migration, collisional
drift and collisional diffusivity coefficients, respectively, of capsules of type α, defined as:
vαm = Kαm
[1
y2−
1
(2H − y)2
], (13a)
Kαc = 2
∫ rcut
0
∆αpy (δy)δy|δy| dδy, (13b)
Kαd =
∫ rcut
0
(∆αpy )2(δy)|δy| dδy, (13c)
∆αpy (δy) =
∫ rcut
−rcut
∆αpy (δy, δz)dδz, (13d)
(∆αpy )2(δy) =
∫ rcut
−rcut
{∆αpy (δy, δz)}
2dδz. (13e)
In Eq. 13, rcut is the radius beyond which capsule-capsule interaction is assumed to be
negligible. An important feature of Eq. 12 is that steady state solutions with no-flux bound-
ary conditions at wall (y = 0) and centerline (y = H) can be solved analytically. Number
density distributions np and nt are found to be:
np =
0, y < ld
npc
(1−
(H−y
H−ld
)2
(y
ld
)(2H−y
2H−ld
)
), y > ld
, (14)
nt =
0, y < ld
ntc
(np(y)
npc
)M, y > ld
, (15)
Here, npc and ntc are the number density of primary and trace component at centerline,
30
Page 32 of 41Soft Matter
Sof
tMat
ter
Acc
epte
dM
anus
crip
t

100
0
0.1
0.2
0.3
0.4
δz/as
∆yss/as
δy = 0.25a
δy = 0.5a
δy = 0.75a
δy = 1.0a
δy = 1.5a
δy = 2.0a
δy = 2.5a
10−1
100
101
0
0.1
0.2
0.3
0.4
0.5
0.6
δy/a
∆y/a
O − SO − OS − SS − O
FIG. 19: (a) Post-collisional cross-stream displacement ∆ssy of spherical capsules in homogeneous collision as a function of
δz and (b) z-averaged post collisional cross-stream displacement (using Eq. 13(d)) ∆αβy (δy) as a function of δy for
pair-collisions between oblate (κ = 0.4) and spherical capsule.
respectively, ld is the cell-free layer thickness
ld = C
(1−
√Cφpc
2ηp + Cφpc
), (16)
where ηp = κm/(κc+2κd) is the ratio of nondimensional migration coefficient over collisional
coefficients and M is the so-called margination parameter,
M =Kpc +Kpd
Ktd
(Ktm
Kpm
−Ktc +Ktd
Kpc + 2Kpd
). (17)
This dimensionless group captures the competition between the migration velocities of two
component and their collisional terms. The qualitative nature of the concentration profile
of trace component is determined by M . Four distinct regimes can be identified: a) M > 1:
trace component demarginates, b) 0 < M < 1: trace component weakly marginates, c)
−1 < M < 0: trace component moderately marginates, and d) M ≤ −1: trace component
strongly marginates. In this last case there is no steady solution for nt(y): initial conditions
evolve to a delta-function localized at y = ld, i.e. at the edge of the cell-free layer.
We will evaluate the predictions of this theory for a suspension where ellipsoidal capsules
are the trace component, specifically the Xs = 0.9 case described above. To do this, the
migration velocities vαm must be computed as well as the collision integrals, Eq. 13, which
require knowledge of the cross-stream displacements ∆αβ in pair collisions. These were
31
Page 33 of 41 Soft Matter
Sof
tMat
ter
Acc
epte
dM
anus
crip
t

0 0.5 1 1.5 2
1
1.05
1.1
1.15
1.2
1.25
1.3
1.35
1.4
κ
Kαc/a5 s
Kpc
Ktc : same aKtc : same V
0 0.5 1 1.5 2
0.03
0.04
0.05
0.06
0.07
0.08
κ
Kαd/a5 s
Kpd
Ktd : same aKtd : same V
0 0.5 1 1.5 2
0.04
0.06
0.08
0.1
0.12
0.14
0.16
κ
Km/γa3 s
same asame V
FIG. 20: (a) Collisional drift coefficient Kαc, (b) collisional diffusion coefficient Kαd and (c) migration coefficient Kαm as afunction of κ for cases where capsule have same a and same V .
determined as described in the previous section. Pair collisions were studied with several δy
and δz for a capsule pair; these were varied in the range [0.1a, 2.5a] and [0.1a, 2.5a] for each
of the κ studied in table I. Fig. 19(a) shows results for homogeneous pair collisions while
Fig. 19(b) shows results for heterogeneous collision between oblate spheroids of κ = 0.4 and
spheres, where both capsules have same a. Observe that ∆y decays rapidly with δy and
δz. The trends of ∆y in Fig. 19(b) affirm the results shown earlier in Fig. 18. Similarly, to
compute wall-induced migration velocities vαm(y), simulations were performed for all κ listed
in table I.
Using the displacement functions ∆αβ(δy, δz), the integrals to compute Kαc and Kαd were
done using the trapezoid rule. In this work, rcut is kept at 2.5a based on results shown in
Fig. 19. Fig. 20(a) shows the Ktc, Fig. 20(b) shows Ktd and 20(c) shows Ktm for the cases
(a) capsules with same a and (b) capsules with same V . Values of Kpc, Kpd and Kpm are
given by these results evaluated at κ = 1. Trends in these parameters are all consistent with
32
Page 34 of 41Soft Matter
Sof
tMat
ter
Acc
epte
dM
anus
crip
t

0 0.5 1 1.5 2−10
−5
0
5
10
15
κ
M
0 0.5 1 1.5 20
5
10
15
κ
M
FIG. 21: Margination parameter M as a function of κ for (a) capsules with same equatorial radius and (b) same volume.The region above the solid line (M = 1) is the demargination regime, while the region below the dashed curve (M = −1) isthe strong margination (drainage) regime.
the trends on the displacements and migration velocities described above.
With these coefficients in hand, the margination parameter M can be computed using
Eq. 17. Fig. 21 shows M as a function of κ for the case of (a) same a and (b) same V .
Fig. 21(a) shows that for oblate capsules, M < −1 for all three values of κ studied in
Sec. IIIA. The SDD theory thus predicts strong margination of the oblate capsules. We
indeed see this in the simulation results of Sec. III A. For prolate capsules, M > 1 for all
three κ values studied in Sec. IIIA. In this case, theory predicts demargination of trace
component which is indeed seen in the simulation results of Sec. III A. For the case when
the ellipsoidal capsules have the same V as the spherical, we see that M > 1 for all values of
κ. In this case, the theoretical prediction is that both oblate and prolate will demarginate;
this is also found in the simulations in Sec. III B.
One can also calculate the theoretical number density profile of the trace component with
the knowledge of M using Eq. 15. Fig. 22 shows the centerline normalized number density
ntc of trace component as a function of M . Very good agreement between simulations and
theory is found.
The SDD theory also predicts the thickness of cell-free layer ld (Eq. 16). This prediction
and the simulation results as a function of overall volume fraction φ are shown in Fig. 23 for
(a) same a, and (b) same V . In Eq. 16, the normalized centerline volume fractions from their
pure suspension runs were used. With increase in φ, ld decreases for all three species in their
pure suspension as seen both in simulation and theory. Furthermore, for the same a at a
33
Page 35 of 41 Soft Matter
Sof
tMat
ter
Acc
epte
dM
anus
crip
t

−10 −5 0 5 10 15
0
1
2
3
4
5
6
M
ntc
sim : same a
sim : same V
SDD theory : same a
SDD theory : same V
FIG. 22: Normalized number density of trace component at the center of channel versus margination parameter. Solid linesare theoretical prediction while the symbols are taken from full boundary integral simulation presented earlier in Sec. III forφs = 0.10.
0.04 0.06 0.08 0.1 0.12 0.14 0.16
1
1.5
2
2.5
3
φ
ld
O
S
P
0.04 0.06 0.08 0.1 0.12 0.14 0.16
1
1.5
2
2.5
3
φ
ld
FIG. 23: Cell-free layer thickness obtained from SDD theory (dashed curve) and simulation (solid curve) as a function oftotal volume fraction for (a) capsules with same a (κ = 0.6 for ‘O’ and κ = 1.33 for ‘P’) and (b) capsules with same V(κ = 0.4 for ‘O’ and κ = 1.8 for ‘P’).
particular φ, lod > lsd > lpd: this trend is seen for both simulation and theory and is a reflection
of the trend of ∆αα in homogeneous pair collisions of these species. For capsules of same V ,
all three shapes studied have similar ld calculated from full simulation and predicted from
theory, a reflection of their migration trend (or more precisely, lack thereof). Although it is
not able to capture the precise values of ld, the simple theory clearly captures the correct
trends.
34
Page 36 of 41Soft Matter
Sof
tMat
ter
Acc
epte
dM
anus
crip
t

VI. CONCLUSIONS
In this work, we investigated the flow-induced segregation behavior in binary suspensions
on neo-Hookean capsules subjected to simple shear flows in a planar slit. The two species
in the suspension differ only in shape as characterized by their aspect ratio. Shape was
varied by two approaches: (a) the two components had the same equatorial radius and
their aspect ratio was varied to change shape (b) the two components had the same volume
and their aspect ratio as well as equatorial radius was varied to change shape. The detailed
boundary integral simulations revealed that when equatorial radius is held constant, capsules
of lower aspect ratio marginate when present in trace amount in mixture dominated by higher
aspect ratio capsules, while when volume is held constant, ellipsoidal capsules demarginate
in mixture with spherical capsules.
A unifying trend between different segregation behaviors is presented in Sec. IV. Segre-
gation can be understood to result from a competition between wall-induced migration of
deformable capsules and shear-induced collisions. When equatorial radius is held constant,
migration velocity at a wall-normal position is found to be proportional to aspect ratio,
while it shows only a weak dependence on aspect ratio when volume is held constant. In
heterogeneous pair collisions of capsules with same radius, the capsule having lower aspect
ratio displaces more than the higher aspect ratio one. However, for capsules having the
same volume, spherical particles displace more than ellipsoidal particles. These features of
particle migration and pair-collisions shed significant light on the mechanistic insights which
explains particle distribution in suspensions reported above. The recently-developed simpli-
fied drift-diffusion theory [48] was extended to understand shape-mediated segregation and
was found to capture the key qualitative features of shape-segregation remarkably well.
The simplified drift-diffusion theory comprises substantial progress in the understanding
and prediction of segregation behavior in multicomponent suspensions of deformable parti-
cles. As its input, it requires only migration, drift and diffusion coefficients, which can be
obtained via simple experiments or computationally inexpensive simulations. The various
margination regimes and the drainage transition predicted by the theory are seen in full
simulations. The comprehensive study of how each of the individual physical aspects of cell
deformability and size [5, 7] and shape (this work) lead to experimentally observed segrega-
tion behavior, and the corresponding theoretical framework [48] provide a foundation for the
35
Page 37 of 41 Soft Matter
Sof
tMat
ter
Acc
epte
dM
anus
crip
t

understanding of flow-induced segregation in blood and applications such as lab-on-a-chip
and targeted drug delivery. In these more complex systems different components differ in
multiple properties (e.g. red and white blood cells differ in size, shape and flexibility); the
results presented here help disentangle the effects of these various differences.
ACKNOWLEDGMENTS
This material is based upon work supported by the National Science Foundation under
Grants No. CBET-1132579 and No. CBET-1436082 and a BP graduate fellowship granted
to KS.
[1] R. Skalak, N. Ozkaya and T. C. Skalak, Annu. Rev. Fluid Mech., 1989, 21, 167–200.
[2] A. S. Popel and P. C. Johnson, Annu. Rev. Fluid Mech., 2005, 37, 43.
[3] G. Tangelder, H. C. Teirlinck, D. W. Slaaf and R. S. Reneman, Am. J. Physiol.: Heart Circ.
Physiol., 1985, 248, H318–H323.
[4] J. C. Firrell and H. H. Lipowsky, Am. J. Physiol.: Heart Circ. Physiol., 1989, 256, H1667–
H1674.
[5] A. Kumar and M. D. Graham, Phys. Rev. E, 2011, 84, 066316.
[6] A. Kumar and M. D. Graham, Soft Matter, 2012, 8, 10536–10548.
[7] A. Kumar, R. G. Henrıquez Rivera and M. D. Graham, J. Fluid Mech., 2014, 738, 423–462.
[8] J. A. Champion and S. Mitragotri, Proc. Natl. Acad. Sci. U. S. A., 2006, 103, 4930–4934.
[9] J. A. Champion, Y. K. Katare and S. Mitragotri, J. Controlled Release, 2007, 121, 3–9.
[10] S. E. Gratton, P. A. Ropp, P. D. Pohlhaus, J. C. Luft, V. J. Madden, M. E. Napier and J. M.
DeSimone, Proc. Natl. Acad. Sci. U. S. A., 2008, 105, 11613–11618.
[11] S. Mitragotri and J. Lahann, Nat. Mater., 2009, 8, 15–23.
[12] F. Gentile, C. Chiappini, D. Fine, R. Bhavane, M. Peluccio, M. M.-C. Cheng, X. Liu, M. Fer-
rari and P. Decuzzi, J. Biomech., 2008, 41, 2312–2318.
[13] A. J. Thompson, E. M. Mastria and O. Eniola-Adefeso, Biomaterials, 2013, 34, 5863–5871.
[14] R. Toy, P. M. Peiris, K. B. Ghaghada and E. Karathanasis, Nanomedicine, 2014, 9, 121–134.
[15] S. Mitragotri, P. A. Burke and R. Langer, Nat. Rev. Drug Discovery, 2014, 1474–1776.
36
Page 38 of 41Soft Matter
Sof
tMat
ter
Acc
epte
dM
anus
crip
t

[16] Y. Geng, P. Dalhaimer, S. Cai, R. Tsai, M. Tewari, T. Minko and D. E. Discher, Nat. Nan-
otechnol., 2007, 2, 249–255.
[17] J.-W. Yoo, D. J. Irvine, D. E. Discher and S. Mitragotri, Nat. Rev. Drug Discovery, 2011, 10,
521–535.
[18] P. Kolhar, A. C. Anselmo, V. Gupta, K. Pant, B. Prabhakarpandian, E. Ruoslahti and S. Mi-
tragotri, Proc. Natl. Acad. Sci. U. S. A., 2013, 110, 10753–10758.
[19] N. Doshi, B. Prabhakarpandian, A. Rea-Ramsey, K. Pant, S. Sundaram and S. Mitragotri, J.
Controlled Release, 2010, 146, 196–200.
[20] P. Decuzzi, B. Godin, T. Tanaka, S.-Y. Lee, C. Chiappini, X. Liu and M. Ferrari, J. Controlled
Release, 2010, 141, 320–327.
[21] R. Toy, E. Hayden, C. Shoup, H. Baskaran and E. Karathanasis, Nanotechnology, 2011, 22,
115101.
[22] G. Adriani, M. D. de Tullio, M. Ferrari, F. Hussain, G. Pascazio, X. Liu and P. Decuzzi,
Biomaterials, 2012, 33, 5504–5513.
[23] K. D. Young, Microbiol. Mol. Biol. Rev., 2006, 70, 660–703.
[24] P. Canham and A. C. Burton, Circ. Res., 1968, 22, 405–422.
[25] K. Chotivanich, R. Udomsangpetch, R. McGready, S. Proux, P. Newton, S. Pukrittayakamee,
S. Looareesuwan and N. J. White, Journal of Infectious Diseases, 2002, 185, 1538–1541.
[26] S. Sugaya, M. Yamada and M. Seki, Biomicrofluidics, 2011, 5, 024103.
[27] M. Masaeli, E. Sollier, H. Amini, W. Mao, K. Camacho, N. Doshi, S. Mitragotri, A. Alexeev
and D. Di Carlo, Phys. Rev. X, 2012, 2, 031017.
[28] B. J. Peter, H. M. Kent, I. G. Mills, Y. Vallis, P. J. G. Butler, P. R. Evans and H. T. McMahon,
Science, 2004, 303, 495–499.
[29] H. T. McMahon and J. L. Gallop, Nature, 2005, 438, 590–596.
[30] J. Zimmerberg and M. M. Kozlov, Nat. Rev. Mol. Cell Biol., 2006, 7, 9–19.
[31] B. Antonny, Annu. Rev. Biochem., 2011, 80, 101–123.
[32] D. S. Miller, X. Wang and N. L. Abbott, Chem. Mater., 2013, 26, 496–506.
[33] F. Mondiot, X. Wang, J. J. de Pablo and N. L. Abbott, J. Am. Chem. Soc., 2013, 135,
9972–9975.
[34] J. Tan, A. Thomas and Y. Liu, Soft Matter, 2012, 8, 1934–1946.
[35] K. Muller, D. A. Fedosov and G. Gompper, Sci. Rep., 2014, 4, 4871.
37
Page 39 of 41 Soft Matter
Sof
tMat
ter
Acc
epte
dM
anus
crip
t

[36] J. Tan, S. Shah, A. Thomas, H. D. Ou-Yang and Y. Liu, Microfluid. Nanofluid., 2013, 14,
77–87.
[37] C. Sun, C. Migliorini and L. L. Munn, Biophys. J., 2003, 85, 208–222.
[38] J. B. Freund, Phys. Fluids, 2007, 19, 023301.
[39] D. A. Fedosov, J. Fornleitner and G. Gompper, Phys. Rev. Lett., 2012, 108, 028104.
[40] L. Crowl and A. L. Fogelson, J. Fluid Mech., 2011, 676, 348–375.
[41] H. Zhao and E. S. G. Shaqfeh, Phys. Rev. E, 2011, 83, 061924.
[42] H. Zhao, E. S. Shaqfeh and V. Narsimhan, Phys. Fluids, 2012, 24, 011902.
[43] D. A. Reasor Jr, M. Mehrabadi, D. N. Ku and C. K. Aidun, Ann. Biomed. Eng., 2013, 41,
238–249.
[44] J. Freund and B. Shapiro, Phys. Fluids, 2012, 24, 051904.
[45] A. Kumar and M. D. Graham, Phys. Rev. Lett., 2012, 109, 108102.
[46] V. Narsimhan, H. Zhao and E. S. G. Shaqfeh, Phys. Fluids, 2013, 25, 061901.
[47] M. Zurita-Gotor, J. Blawzdziewicz and E. Wajnryb, Phys. Rev. Lett., 2012, 108, 68301.
[48] R. G. H. Rivera, K. Sinha and M. D. Graham, Phys. Rev. Lett., 2015, 114, 188101.
[49] D. Barthes-Biesel, A. Diaz and E. Dhenin, J. Fluid Mech., 2002, 460, 211–222.
[50] J. M. Charrier, S. Shrivastava and R. Wu, J. Strain Anal. Eng. Des., 1989, 24, 55–74.
[51] A. Kumar and M. D. Graham, J. Comput. Phys., 2012, 231, 6682–6713.
[52] P. Pranay, S. G. Anekal, J. P. Hernandez-Ortiz and M. D. Graham, Phys. Fluids, 2010, 22,
123103.
[53] E. Lac, A. Morel and D. Barthes-Biesel, J. Fluid Mech., 2007, 573, 149–169.
[54] J. Sherwood, F. Risso, F. Colle-Paillot, F. Edwards-Levy and M. C. Levy, J. Colloid Interface
Sci., 2003, 263, 202–212.
[55] C. Pozrikidis, Boundary Integral and Singularity Methods for Linearized Viscous Flow, Cam-
bridge University Press, 1992.
[56] J. P. Hernandez-Ortiz, J. J. de Pablo and M. D. Graham, Phys. Rev. Lett., 2007, 98, 140602.
[57] H. Flyvbjerg and H. G. Petersen, J. Chem. Phys., 1989, 91, 461–466.
[58] X. Li and C. Pozrikidis, Int. J. Multiphase Flow, 2000, 26, 1247–1279.
[59] S. D. Hudson, Phys. Fluids, 2003, 15, 1106–1113.
[60] P. Pranay, R. G. Henriquez Rivera and M. D. Graham, Phys. Fluids, 2012, 24, 061902.
[61] J. R. Smart and D. T. Leighton Jr, Phys. Fluids, 1991, 3, 21–28.
38
Page 40 of 41Soft Matter
Sof
tMat
ter
Acc
epte
dM
anus
crip
t

[62] H. Ma and M. D. Graham, Phys. Fluids, 2005, 17, 083103.
[63] D. Barthes-Biesel and V. Chhim, Int. J. Multiphase Flow, 1981, 7, 493–505.
[64] F. R. daCunha and E. J. Hinch, J. Fluid Mech., 1996, 309, 211–223.
39
Page 41 of 41 Soft Matter
Sof
tMat
ter
Acc
epte
dM
anus
crip
t