Analytical Methods - RSC Publishing
39
Registered Charity Number 207890 Accepted Manuscript This is an Accepted Manuscript, which has been through the RSC Publishing peer review process and has been accepted for publication. Accepted Manuscripts are published online shortly after acceptance, which is prior to technical editing, formatting and proof reading. This free service from RSC Publishing allows authors to make their results available to the community, in citable form, before publication of the edited article. This Accepted Manuscript will be replaced by the edited and formatted Advance Article as soon as this is available. To cite this manuscript please use its permanent Digital Object Identifier (DOI®), which is identical for all formats of publication. More information about Accepted Manuscripts can be found in the Information for Authors. Please note that technical editing may introduce minor changes to the text and/or graphics contained in the manuscript submitted by the author(s) which may alter content, and that the standard Terms & Conditions and the ethical guidelines that apply to the journal are still applicable. In no event shall the RSC be held responsible for any errors or omissions in these Accepted Manuscript manuscripts or any consequences arising from the use of any information contained in them. www.rsc.org/methods ISSN 1759-9660 Analytical Methods Advancing Methods and Applications 1759-9660(2010)2:1;1-A Volume 2 | Number 1 | 2010 Analytical Methods Pages 1–100 www.rsc.org/methods Volume 2 | Number 1 | January 2010 | Pages 1–100 PAPER Russell et al. Glycoprotein microarray for the fluorescence detection of antibodies produced as a result of erythropoietin (EPO) abuse PAPER Stefan-van Staden Enantioanalysis of S-Ibuprofen using [5-6]fullerene-C70and diethyl (1,2-methanofullerene C70)-71-71- dicarboxylate Analytical Methods
-
Upload
khangminh22 -
Category
Documents
-
view
2 -
download
0
Transcript of Analytical Methods - RSC Publishing

Registered Charity Number 207890
Accepted Manuscript
This is an Accepted Manuscript, which has been through the RSC Publishing peer review process and has been accepted for publication.
Accepted Manuscripts are published online shortly after acceptance, which is prior to technical editing, formatting and proof reading. This free service from RSC Publishing allows authors to make their results available to the community, in citable form, before publication of the edited article. This Accepted Manuscript will be replaced by the edited and formatted Advance Article as soon as this is available.
To cite this manuscript please use its permanent Digital Object Identifier (DOI®), which is identical for all formats of publication.
More information about Accepted Manuscripts can be found in the Information for Authors.
Please note that technical editing may introduce minor changes to the text and/or graphics contained in the manuscript submitted by the author(s) which may alter content, and that the standard Terms & Conditions and the ethical guidelines that apply to the journal are still applicable. In no event shall the RSC be held responsible for any errors or omissions in these Accepted Manuscript manuscripts or any consequences arising from the use of any information contained in them.
www.rsc.org/methods
ISSN 1759-9660
AnalyticalMethodsAdvancing Methods and Applications
1759-9660(2010)2:1;1-A
Volume 2 | N
umber 1 | 2010
Analytical M
ethods
Pages 1–100
www.rsc.org/methods Volume 2 | Number 1 | January 2010 | Pages 1–100
PAPERRussell et al.Glycoprotein microarray for the fluorescence detection of antibodies produced as a result of erythropoietin (EPO) abuse
PAPERStefan-van Staden Enantioanalysis of S-Ibuprofen using [5-6]fullerene-C70 and diethyl(1,2-methanofullerene C70)-71-71-dicarboxylate
Analytical Methods
First micellar HPLC method for the assay and comprehensive study of degradation behavior of flavoxate HCl as per ICH guidelines.
Page 1 of 38 Analytical Methods
An
alyt
ical
Met
ho
ds
Acc
epte
d M
anu
scri
pt

1
A Green HPLC Method for the Analysis and Stability Study of
Flavoxate HCl using Micellar Eluent
Rania Nabih El-Shaheny*, Nahed Mahmoud El-Enany and
Fathalla Fathalla Belal
Analytical Chemistry Department, Faculty of Pharmacy, Mansoura
University, 35516, Mansoura, Egypt.
*Corresponding author: Rania Nabih El-Shaheny, Tel & Fax:
+20/050/2247496, E-mail: [email protected].
Page 2 of 38Analytical Methods
An
alyt
ical
Met
ho
ds
Acc
epte
d M
anu
scri
pt

2
Abstract
An accurate, reliable and environmentally benign stability-indicating
micellar liquid chromatographic method was developed and validated for the
determination of flavoxate HCl (FLV) in presence of its stress induced
degradation products. Good resolution of FLV from its degradation products
was achieved using a reversed phase BDS Hypersil phenyl column (4.6 mm ×
250 mm, 5 µm particle size) with a micellar mobile phase consisting of 0.15
M sodium dodecyl sulphate, 15% n-propanol, 0.3% triethylamine and 0.02 M
orthophosphoric acid (pH 2.5). UV quantitation was set at 325 nm. The linear
regression analysis data for the calibration plot of FLV showed a good linear
relationship over the concentration range of 2.0-40.0 µg mL-1
with lower
detection limit of 0.40 µg mL-1
. Stability of FLV was investigated as per ICH-
prescribed stress conditions including acidic, alkaline, neutral, oxidative and
photolytic conditions. Significant degradation of FLV was observed under all
studied stress conditions. A kinetic study was conducted to investigate the
oxidative degradation of FLV at different temperature settings; reaction rate
constants, half-life times and activation energy were calculated. A proposal
for the degradation pathways was also postulated. The proposed method was
applied for the assay of FLV in its commercial tablets with mean percentage
recovery of 99.80 ± 1.41. Statistical comparison of the results of the proposed
method with those obtained by the comparison method revealed no significant
differences in the performance of the two methods regarding accuracy and
precision.
Keywords: Flavoxate HCl, MLC, Stability-indicating Assay, Tablets.
Page 3 of 38 Analytical Methods
An
alyt
ical
Met
ho
ds
Acc
epte
d M
anu
scri
pt
3
Introduction
Flavoxate hydrochloride(FLV), 2-piperidinoethyl 3-methyl-4-oxo-2-
phenyl-4H-chromene-8-carboxylate hydrochloride, Fig. 1) belongs to a series
of flavone derivatives, which exhibit strong smooth muscle relaxant activity
with selective action on the pelvic. It
has anticholinergic and antimuscarinic effects; it is used for the symptomatic
relief of pain, urinary frequency and incontinence associated with
inflammatory disorders of the urinary tract. FLV is also used for the relief of
vesicourethral spasms resulting from instrumentation or surgery.1
FLV is the subject of a monograph in the British Pharmacopoeia 2 that
recommends a non-aqueous titrimetric method for its determination in pure
form using perchloric acid as a titrant and a spectrophotometric method for its
determination in tablets, in which its absorbance was measured at 293 nm in
0.1 M HCl. A good guide to the analytical methods published for the assay of
FLV in pharmaceutical preparations and biological fluids until 2001 was
presented as a monograph in the series of “Analytical Profiles of Drug
Substances and Excipients” 3. Recently, some analytical methods were
developed for determination of FLV such as spectrophotometry, 4, 5
potentiometry 6 and HPLC.
7, 8 Also, some HPLC methods focused on the
analysis of FLV active metabolite (3-methylflavone-8-carboxylic acid) in
biological fluids. 9, 10
Literature survey revealed that; only one stability–indicating HPLC
method was reported for FLV. 7 This method was concerned only with the
study of alkaline and acidic degradation of FLV using acetonitrile-12 mM
ammonium acetate (45:55 v/v, pH 4.0) as a mobile phase with UV detection at
220 nm and flow rate of 1.5 mL min−1
. Moreover, a potentiometric method 6
based on ion selective electrodes was applied for the analysis of FLV in
presence of its degradation product. However, in this method the behavior of
FLV under different stress conditions was not studied. So, it was essential to
Page 4 of 38Analytical Methods
An
alyt
ical
Met
ho
ds
Acc
epte
d M
anu
scri
pt
4
develop a rapid, simple and cost-effective HPLC method to study the
degradation behavior of FLV under different stress degradation conditions as
recommended by ICH guidelines. 11, 12
Recently, micellar liquid chromatography (MLC) has received much
attention due to its advantages and capabilities, such as simultaneous
separation of charged and uncharged solutes, unique separation selectivity,
robustness, high reproducibility, low cost and safety of analysis. 13
The
presence of a surfactant not only modifies the interactions established inside
the column but also reduces the necessary amount of organic solvent in the
mobile phase. The low organic solvent contents (6-15%, v/v) in comparison
with those needed in classical RP-LC results in reduced cost and hazard effect
of organic solvents, which may become prominent for “green chemistry”.
Also, the stabilization of the organic solvent in the micellar medium decreases
the risk of evaporation. 14
The present study is aimed to develop a stability-indicating assay method
to study the degradation behavior of FLV under a variety of degradation
conditions including acidic, alkaline, neutral, oxidative and photolytic
conditions adopting MLC technique. Also, it is aimed to apply the proposed
method for quality control of FLV in commercial tablets. Herein, MLC
approach was adopted to develop a green methodology with minimum toxicity
to the analyst and the environment in addition to the high resolution power and
selectivity achieved by this technique.
Experimental
Apparatus
- HPLC system: separation was achieved with a Shimadzu HPLC system
(Shimadzu Corporation, Kyoto, Japan) equipped with an LC-20AD
delivery system, a Rheodyne injector valve with 20 µL loop and a SPD-
20A UV-Visible detector. Mobile phases were degassed using a DGU-
Page 5 of 38 Analytical Methods
An
alyt
ical
Met
ho
ds
Acc
epte
d M
anu
scri
pt
5
20A5 online solvent degasser. The apparatus was interfaced to a
computer for data acquisition with a CBM-20A communication bus
module.
- pH-Meter: A Consort P901 pH meter (Belgium) was used for pH-
adjustment.
- CAMAG UV-lamp (S/N 29000), dual wavelength (254/366), 2×8 W,
(Muttenz, Switzerland) was used in the photo-stability study.
Materials
- Flavoxate HCl pure sample with certified purity of 99.0% was kindly
provided by Amoun Pharmaceutical Co, Cairo, Egypt.
- Genurin S.F® 200 tablets labeled to contain 200 mg flavoxate HCl/tablet
(product of Medical Union Pharmaceuticals, Abu Sultan, Ismailia,
Egypt) was purchased from a local pharmacy.
Chemicals and Reagents
All solvents used were of HPLC grade and chemicals were of analytical
reagent grade:
- Methanol, n-propanol (HPLC grade) and sodium dodecyl sulfate (SDS,
99%) were purchased from Sigma-Aldrich Co. (Chemie Gmbh, Munich,
Germany).
- Triethylamine (TEA) and orthophosphoric acid (85% w/v) were
purchased from Riedel-deHäen (Seelze, Germany).
- Sodium hydroxide was purchased from Winlab (Middlesex, UK).
- Hydrochloric acid (32% w/v) and hydrogen peroxide (30% w/v) were
purchased from El-Nasr Pharm. Chem. Co. (Cairo, Egypt).
Page 6 of 38Analytical Methods
An
alyt
ical
Met
ho
ds
Acc
epte
d M
anu
scri
pt

6
Chromatographic conditions
- Column: BDS Hypersil phenyl column (4.6 x 250 mm, 5 µm particle
size), Thermo Electron Corporation, Runcorn, UK.
- Mobile phase: A micellar mobile phase containing 0.15 M SDS, 15% n-
propanol, 0.3% TEA and 0.02 M orthophosphoric acid. pH of the
mobile phase was adjusted to pH 2.5 with orthophosphoric acid . The
mobile phase was filtered through 0.45 µm Millipore membrane filter
and degassed by sonication for 30 min before use.
- Flow rate: 1 mL/min
- UV/VIS detector wavelength: 325 nm.
Preparation of standard solution
A standard solution containing 400.0 µg mL-1
of FLV was freshly
prepared in methanol and protected from light.
General recommended procedures
Construction of calibration graph
Working solutions containing 2.0-40.0 µg mL-1
of FLV were prepared
by serial dilution of the standard solution with the mobile phase. Twenty µL
aliquots were injected (triplicate) and eluted with the mobile phase under the
optimum chromatographic conditions. The average peak areas of FLV were
plotted versus the corresponding drug concentrations (µg mL-1
) to obtain the
calibration graph and the regression equation was derived.
Assay of Tablets
Ten Genurin S.F® 200 tablets were accurately weighed; finely
pulverized and thoroughly mixed. An accurately weighed amount of the
powder equivalent to 40.0 mg of declared active principle was transferred into
100 mL volumetric flask. About 90 mL of methanol was added and the
Page 7 of 38 Analytical Methods
An
alyt
ical
Met
ho
ds
Acc
epte
d M
anu
scri
pt

7
mixture was sonicated in an ultrasonic bath for 30 min. The volume was
completed to the mark with the same solvent, mixed well and filtered with
0.45 µm cellulose acetate syringe filter. Accurately measured aliquots of the
filtrate were transferred into a series of 10 mL volumetric flasks, diluted to the
mark with the mobile phase and mixed well to obtain different concentrations
within the working concentration range. Twenty µL aliquots were injected
(triplicate) and eluted with the mobile phase under the optimum
chromatographic conditions. The nominal contents of the tablets were
calculated from the corresponding regression equation.
Procedures for forced degradation studies
� Acidic, alkaline and neutral degradation
Aliquots of FLV standard solution (containing 400.0 µg) were
transferred into three small conical flasks; 5 mL aliquots of 0.1 M NaOH, 1.0
M HCl and distilled water, respectively were added. The alkali treated solution
was kept at room temperature for 10 min, the acid treated solution was heated
in a boiling water bath for 30 min, where the solution subjected to neutral
degradation was heated at 80 ºC in a thermostatically controlled water bath for
30 min. At the specified time, the contents of the flasks were cooled,
neutralized to pH 7.0 using either 0.1 M HCl or 1.0 M NaOH (except the
solution under neutral degradation) and the solutions were then transferred
into a series of 10 mL volumetric flasks. The volumes were completed with
the mobile phase and the solutions were mixed well. Triplicate 20 µL
injections were made for each sample.
� Oxidative degradation
Aliquots of FLV standard solution (containing 400.0 µg) were
transferred into a series of small conical flasks and 2 mL of H2O2 solution
(30% w/v) were added to each flask. The solutions were heated in a
Page 8 of 38Analytical Methods
An
alyt
ical
Met
ho
ds
Acc
epte
d M
anu
scri
pt

8
thermostatically controlled water bath at different temperature settings (60, 70,
80 °C) for different time intervals (10-40 min). At the specified time, the
contents of each flask were cooled. The solutions were transferred into a series
of 10 mL volumetric flasks, the volumes were completed with the mobile
phase and the solutions were mixed well. Triplicate 20 µL injections were
made for each sample.
� Photolytic degradation
FLV solutions (400.0 µg mL-1
) were prepared in different solvents
(methanol, methanol: water (1:1 v/v) and water) and exposed to UV-light at a
wavelength of 254 nm at a distance of 15 cm placed in a wooden cabinet for 3
hrs. At the specified time, 1.0 mL of each solution was transferred into 10 mL
volumetric flask, completed to the mark with the mobile phase and mixed
well. Triplicate 20 µL injections were made for each sample.
Results and Discussion
A rapid and sensitive liquid chromatographic method was developed
and validated as a suitable tool for the quality control and study of FLV
stability using micellar mobile phase as a green eluent. The development of a
stability-indicating assay method of FLV was necessary to study its
degradation behavior under different stress conditions. Only one HPLC
method 7 was reported to investigate its alkaline and acidic degradation. In this
method a mobile phase with a large proportion of organic solvent was used
(acetonitrile-12 mM ammonium acetate, 45:55 v/v at a flow rate of 1.5 mL
min-1
) with UV detection in the near UV region at 220 nm which may
introduce some interferences. This leads us to extend this study to investigate
the oxidative and photolytic degradation behavior of FLV to help
understanding its complete degradation profile. The proposed method has the
ability to resolve FLV from all degradation products generated under different
Page 9 of 38 Analytical Methods
An
alyt
ical
Met
ho
ds
Acc
epte
d M
anu
scri
pt

9
stress conditions including alkaline, acidic, neutral, oxidative and photolytic
conditions. It was also applied to investigate the kinetics of oxidative
degradation of the drug. The applicability of the method was extended to
determine FLV in its commercial tablets. The proposed method has the
advantages of being simple and environmentally benign due to the use of
small amount of organic solvents compared to conventional hydro-organic LC
methods. Currently, the use of MLC found pronounced applications due to its
agreement with the “green chemistry” concept.
Optimization strategy and mobile phase selection
Extensive experimental studies were carried out to select the most
efficient parameters for the analysis. The final experimental conditions were
chosen after testing the type of stationary phase, composition of the mobile
phases and detection wavelength.
Choice of column
For selection of the suitable stationary phase for separation of FLV
from its forced degradation products, three columns were investigated
including:
1. CLC Shim-pack C8 column (4.6 mm x 250 mm, 5 µm particle size),
Shimadzu Corporation, Japan.
2. CLC Shim-pack CN column (4.6 mm x 150 mm, 5 µm particle size),
Shimadzu Corporation, Japan.
3. BDS Hypersil phenyl column (4.6 mm x 250 mm, 5 µm particle size),
Thermo Electron Corporation, Runcorn, UK.
The phenyl column was found to be the most suitable one giving
symmetrical well resolved peaks for FLV and its degradation products within
a short analysis time. On the other hand, FLV was strongly retained on the C8
column so that no peaks appeared in the chromatogram even after 40 min.
Page 10 of 38Analytical Methods
An
alyt
ical
Met
ho
ds
Acc
epte
d M
anu
scri
pt

10
This can be explained by the high lipophilicity of FLV since it has Log P
(octanol/water) = 4.9, 15
so, it tends to bind strongly with this non-polar
stationary phase. On the other hand, the cyanopropyl column yielded
asymmetrical broad peak of FLV overlapped with its degradation product
(DP1).
Choice of appropriate detection wavelength
The absorption spectrum of FLV exhibits three maxima at 240, 290
and 325 nm. A wavelength of 325 nm was selected as the optimum detection
wavelength throughout this study.
Effect of pH of the mobile phase
FLV is a basic compound with pKa value of 7.3 15
corresponding to
the piperidine nitrogen. Over the normal working pH range for best life times
for most reversed phase columns (2.0-7.0), the cationic species of FLV is
predominant and it is expected that there will be no significant changes in its
retention behavior. This was confirmed by experimental study using mobile
phases of pH values over the normal working range. The retention of FLV was
scarcely affected by changes in the pH of the mobile phase (Fig. 2A). pH 2.5
was selected as the optimum pH value in the study. At this pH, the ionization
of silanol groups of the stationary phase is reduced thus, minimizing its
interaction with FLV, which is present as a cationic species. Moreover, at pH
2.5 the column efficiency was maximal as revealed by the highest number of
theoretical plates.
Effect of SDS concentration
SDS concentration in the mobile phase was studied over the range of
0.10-0.15 M. It was observed that, an increase in SDS molar concentration
produced a corresponding decrease in the retention factor (k') of FLV (Fig.
Page 11 of 38 Analytical Methods
An
alyt
ical
Met
ho
ds
Acc
epte
d M
anu
scri
pt

11
2B). A mobile phase containing 0.15 M SDS was finally selected as the
optimum one taking in consideration the total analysis time, peak symmetry
and column efficiency.
Effect of type of organic modifier
The presence of organic modifiers such as short chain alcohols in
micellar mobile phase is usual because their addition improves the retention
and the peak efficiency. 13, 14
In addition, the presence of an organic modifier
in the micellar mobile phase also alters the retention mechanism by shifting
equilibrium of the solutes from the stationary phase, and from the micelle
toward the bulk aqueous phase. This leads to a reduction in the retention
factors. 13, 14
To select the optimum organic modifier for separation of FLV from its
degradation products, four mobile phases containing n-propanol (15% v/v),
methanol (18% v/v), pentanol (7% v/v) and tetrahydrofuran (15% v/v) were
tested. The results obtained indicated that n-propanol is the best organic
modifier since it gave symmetrical peaks with best resolution. On the other
hand, pentanol caused co-elution of FLV with its degradation product (DP1).
The use of methanol or tetrahydrofuran as organic modifiers caused
broadening of FLV peak.
Effect of concentration of organic modifier
To study the effect of the concentration of n-propanol in the mobile
phase on the separation of FLV and its degradation products, its percentage in
the mobile phase was varied over the range of 10-15% v/v. The retention of
FLV decreased with the increase in n-propanol percentage (Fig. 2C). A
concentration of 15% v/v n-propanol was chosen as the optimal concentration,
where it provided a good combination of peak symmetry, sharpness,
resolution factor and short analysis time.
Page 12 of 38Analytical Methods
An
alyt
ical
Met
ho
ds
Acc
epte
d M
anu
scri
pt

12
After this experimental study, when maximum resolution-minimum
analysis time criteria was applied, the mobile phase selected as being optimal
was 0.15 M SDS-15% n-propanol-0.3%TEA-0.02 M H3PO4 at pH 2.5 with
UV-detection at 325 nm. TEA was used as a component in the mobile phase to
protect the silanol groups of the stationary phase and increase the peak
efficiency of FLV which is a basic compound. 15
Fig. 3A illustrates a
representative chromatogram for FLV in pure drug substance under the
optimum chromatographic conditions.
Method Validation
Following ICH guidelines Q2 (R1) for validation of analytical methods,
16 the proposed method was validated to demonstrate its linearity, range, limit
of quantification (LOQ), limit of detection (LOD), accuracy, specificity,
precision, stability of sample solution and mobile phase and system suitability
test parameters.
Linearity and range
Calibration plot for FLV was evaluated and checked by analyzing
standard solutions at 6 concentration levels, ranging from 2.0 to 40.0µg mL-1
.
The validity of the method was proven by statistical evaluation of the
regression line. 17
The data provide conclusive evidence of linearity between
concentrations and peak areas. The fairly small values of the standard
deviation of the residuals (Sy/x), slope (Sb) and intercept (Sa), and the %
relative error indicate low scattering of the calibration points around the
regression line (Table 1).
Page 13 of 38 Analytical Methods
An
alyt
ical
Met
ho
ds
Acc
epte
d M
anu
scri
pt

13
Limit of quantification (LOQ) and limit of detection (LOD)
According to ICH recommendation Q2 (R1), 16
the approach based on
the standard deviation of intercept of the regression line and the slope was
used for calculating LOQ and LOD adopting the following equations:
LOQ = 10Sa/b
LOD = 3.3Sa/b
Where: Sa is the standard deviation of the intercept of regression line and b is
its slope.
The obtained results are abridged in Table 1.
Accuracy
The accuracy of an analytical procedure expresses the closeness of
agreement between the value which is accepted either as a conventional true
value or an accepted reference value and the value found. 16
To test the validity
of the proposed method, it was applied for the determination of pure samples
of FLV over the concentration range of 2.0-40.0 µg mL-1
. The results obtained
were in good agreement with those obtained using the comparison HPLC
method. 7 Using the Student's t-test and the variance ratio F-test
17 revealed no
significant difference between the performance of the two methods regarding
accuracy and precision, respectively (Table 2).
Precision
Precision of the method was evaluated by intra-day precision
(repeatability) and inter-day precision (intermediate precision) experiments.
The intra-day precision was estimated from three consecutive injections for
three concentration levels over the whole linearity range. For evaluation of
inter-day precision, three standard solutions of FLV covering the entire
linearity range were analyzed over three successive days. All data from
precision study are summarized in Table 3. The obtained results indicate the
Page 14 of 38Analytical Methods
An
alyt
ical
Met
ho
ds
Acc
epte
d M
anu
scri
pt

14
high precision of the proposed method as revealed by small values of standard
deviation and relative standard deviation. 16
Specificity
The specificity of the proposed method was tested by assaying FLV in
the presence of its degradation products formed during exposure to different
accelerated degradation conditions. Results of specificity study revealed that
FLV and its degradants were well-separated and no peaks interfering with the
elution of FLV was observed, thus demonstrating that the proposed method is
specific and stability-indicating. Moreover, no interferences from common
tablet excipients with the peaks of interest were observed in the analysis of a
placebo formulation, confirming the specificity of the method.
Robustness
Robustness of the proposed method was evaluated by studying the
effect of small deliberate changes of the chromatographic conditions on
resolution and peak area. The method was found to be robust to small changes
in experimental conditions including SDS concentration (0.15 ± 0.001 M),
proportion of n-propanol (15 ± 0.5 %), and pH of the mobile phase (2.5 ± 0.2).
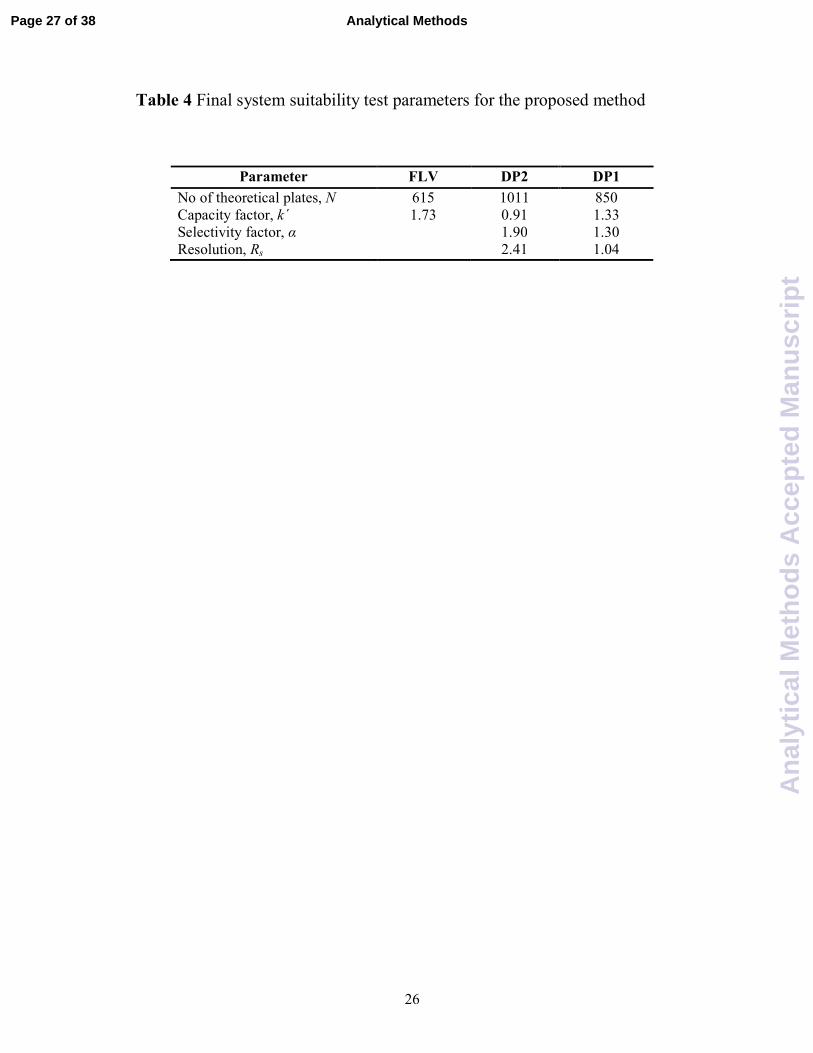
System suitability test
Resolution (Rs), number of theoretical plates (N), selectivity (α) and
retention factor (k') were measured as the criteria for system suitability testing
according to ICH guidelines Q2 (R1) 16
as shown in Table 4.
Page 15 of 38 Analytical Methods
An
alyt
ical
Met
ho
ds
Acc
epte
d M
anu
scri
pt

15
Applications
Application of the proposed method to investigate the degradation behavior of
FLV according to ICH recommendations
The developed MLC method was applied to study the degradation
behavior of FLV under different stress conditions such as alkaline, acidic,
neutral, oxidative and photolytic conditions according to ICH guidelines. 11, 12
A summary of this study is described below.
� Degradation behavior under hydrolytic conditions (acidic, alkaline and
neutral conditions)
FLV is an ester-type drug that is expected to be susceptible to
hydrolysis. So, it was necessary to study the degradation behavior of FLV
under different hydrolytic conditions including acidic, alkaline and neutral
hydrolysis.
Under acidic conditions (1.0 M HCl, 100 ºC, 30 min), about 17% of the
drug was degraded and two degradation products, DP1 and DP2, appeared in
the chromatogram at 5.9 and 4.9 min, respectively (Fig. 4A). Meanwhile, in
case of neutral hydrolysis (water, 80 ºC, 30 min), only 11% of the parent drug
was degraded with the appearance of DP1 and DP2 also (Fig. 4B). The
degradation behavior of FLV in water may be attributed to presence of HCl as
a part of drug substance itself. 3
In alkaline medium, the hydrolysis occurs faster. The alkaline
hydrolysis was investigated in 0.1 M NaOH at room temperature for 10 min,
where complete hydrolysis of FLV occurred with the appearance of DP1 and
DP2 (Fig. 4C).
Being an ester, the degradation of FLV under hydrolytic conditions is
expected to proceed via hydrolysis of the ester linkage yielding the
corresponding acid form, 3-methylflavone-8-carboxylic acid (DP1). 7 In
Page 16 of 38Analytical Methods
An
alyt
ical
Met
ho
ds
Acc
epte
d M
anu
scri
pt

16
addition, FLV belongs to chromone compounds which are reported to undergo
pyrone ring opening with the formation of a 2-hydroxyphenyl alkyl ketone
when heated with alkali or acid. 18
Thus, it can be inferred that FLV acid form
(DP1) undergoes pyrone ring opening yielding DP2 as illustrated in Scheme 1.
The degradation product of higher polarity (DP2) eluted first at 4.9 min where
that of lower polarity (DP1) eluted later at 5.9 min.
� Degradation behavior under oxidative conditions with kinetic investigation
The oxidative degradation of FLV was investigated by heating with
H2O2. .Preliminary studies revealed that FLV is susceptible to oxidative
degradation, where, considerable degradation was observed with the formation
of DP1 and DP2 (Fig. 5A). Consequently, the kinetics of oxidative
degradation was explored at different temperature settings (60-80 °C) for
increasing time intervals (10-40 min) (Fig. 5B). The oxidative degradation of
FLV was found to follow first order degradation kinetics. The apparent first
order reaction rate constants and the half-life times were calculated and the
results are presented in Table 5. By plotting log Kobs values versus 1/T,
Arrhenius plot was obtained 19
(Fig. 5C). Arrhenius equation 19
was found to
be:
Log K = 0.696-1079/T
Where: K is the reaction rate constant (min-1
) and T is the absolute
temperature (°Kelvin).
Hydrogen peroxide is known to react with tertiary amines to form
tertiary amine oxides. 20
It is expected that oxidation of FLV occurs through
the formation of N-oxide form. 3 Under the effect of heating; the N-oxide form
will undergo instant hydrolysis yielding DP1 which will further decomposed
to DP2 as previously illustrated (Scheme 1).
The activation energy (Ea) of the oxidative degradation of FLV was
calculated and was found to be 4.94 K. Cal. mol-1
. This value agreed with the
Page 17 of 38 Analytical Methods
An
alyt
ical
Met
ho
ds
Acc
epte
d M
anu
scri
pt

17
results of El-Gindy et al 7 who studied the kinetics of acidic hydrolysis of FLV
and calculate the activation energy of this reaction to be 4.343 K. Cal. mol-1
.
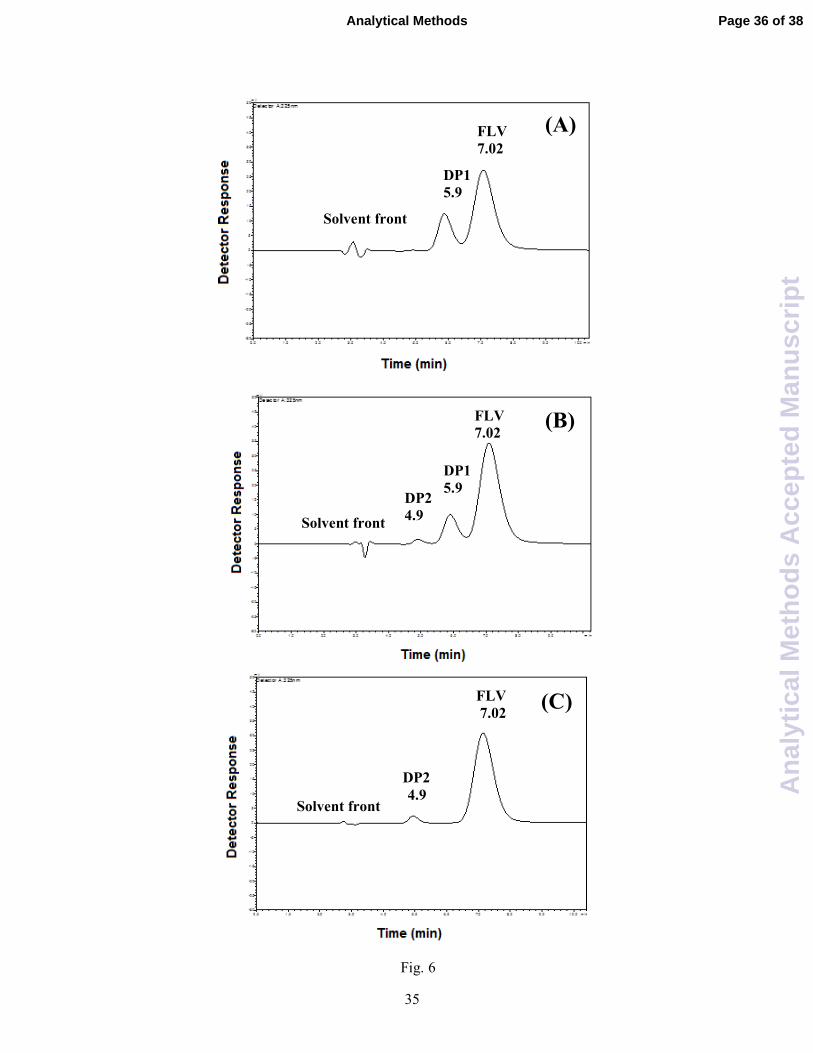
� Photolytic degradation in different solvent systems
FLV belongs to flavone derivatives which are known to be
photosensitive and their photosensitivity depends on the characteristics of the
reaction environment and is influenced by the medium polarity. 21
This fact
makes it essential to investigate the photostability of FLV in different solvents
under UV-irradiation. FLV solutions (400 µg mL-1
), in methanol, water and
methanol: water mixture (1:1 v/v), were exposed to UV irradiation at 254 nm
for 3 hrs. An interesting photodegradation pattern was observed. Irradiation of
FLV methanolic solution resulted in photodegradation of FLV with the
appearance of DP1 at 5.9 min, while aqueous solution of FLV underwent
photodegradation but with the appearance of DP2 at 4.9 min. On the other
hand, irradiation of FLV solution in methanol: water system (1:1 v/v) resulted
in photodegradaion with the appearance of both DP1 and DP2. The obtained
results agreed with published literature about flavone compounds
photoreactivity 21
which approves that the medium polarity affects the
photodegradation mechanism of flavone molecules on UV exposure. The
results of photodegradation studies revealed the photosensitivity of FLV.
These results are in accordance with precaution stated by the British
Pharmacopoeia 2 which recommended protection of FLV from light.
The results of the photodegradation study of FLV in different solvents
are represented in Fig. 6A-6C.
� Stability of FLV standard solution during normal analysis time and under
storage conditions
The normal time of analysis in a quality-control laboratory is around 6
hrs, so it is essential to evaluate the stability of standard solution over this
Page 18 of 38Analytical Methods
An
alyt
ical
Met
ho
ds
Acc
epte
d M
anu
scri
pt
18
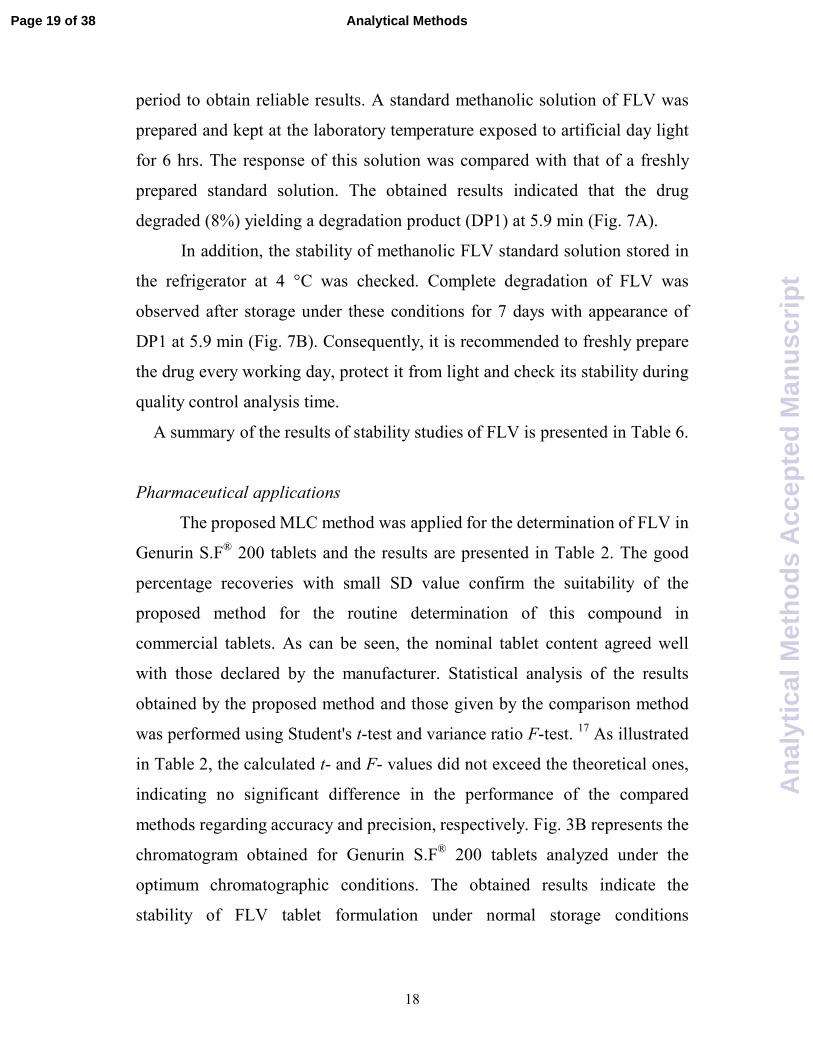
period to obtain reliable results. A standard methanolic solution of FLV was
prepared and kept at the laboratory temperature exposed to artificial day light
for 6 hrs. The response of this solution was compared with that of a freshly
prepared standard solution. The obtained results indicated that the drug
degraded (8%) yielding a degradation product (DP1) at 5.9 min (Fig. 7A).
In addition, the stability of methanolic FLV standard solution stored in
the refrigerator at 4 °C was checked. Complete degradation of FLV was
observed after storage under these conditions for 7 days with appearance of
DP1 at 5.9 min (Fig. 7B). Consequently, it is recommended to freshly prepare
the drug every working day, protect it from light and check its stability during
quality control analysis time.
A summary of the results of stability studies of FLV is presented in Table 6.
Pharmaceutical applications
The proposed MLC method was applied for the determination of FLV in
Genurin S.F® 200 tablets and the results are presented in Table 2. The good
percentage recoveries with small SD value confirm the suitability of the
proposed method for the routine determination of this compound in
commercial tablets. As can be seen, the nominal tablet content agreed well
with those declared by the manufacturer. Statistical analysis of the results
obtained by the proposed method and those given by the comparison method
was performed using Student's t-test and variance ratio F-test. 17
As illustrated
in Table 2, the calculated t- and F- values did not exceed the theoretical ones,
indicating no significant difference in the performance of the compared
methods regarding accuracy and precision, respectively. Fig. 3B represents the
chromatogram obtained for Genurin S.F® 200 tablets analyzed under the
optimum chromatographic conditions. The obtained results indicate the
stability of FLV tablet formulation under normal storage conditions
Page 19 of 38 Analytical Methods
An
alyt
ical
Met
ho
ds
Acc
epte
d M
anu
scri
pt
19
recommended by the manufacturer, where, no degradation products were
detected in the obtained chromatograms.
Conclusion
A rapid, reliable, specific and accurate stability-indicating MLC method
was developed and validated for the assay and stability study of FLV.
Specificity of the method in relation to degradation products was entirely
proved for FLV assay. Nevertheless, this paper is the first report that
investigates the oxidative and photodegradation processes of this drug. The
method is suitable for the quality control of commercial FLV tablets. MLC
analysis meets the requirements of “green chemistry” conception by using
environment-friendly reagents. Micellar mobile phase is less toxic and non-
flammable and has lower environmental impact compared to conventional
hydro-organic HPLC methods.
Authors' contributions
Rania N. El-Shaheny planned the study, carried out the experimental
work, performed statistical analysis of the data and wrote the manuscript,
Nahed El-Enany suggested the idea of the study and Fathalla Belal supervised
the work. All authors approved the final article.
Page 20 of 38Analytical Methods
An
alyt
ical
Met
ho
ds
Acc
epte
d M
anu
scri
pt

20
References
1 S. C. Sweetman, Martindale: The Complete Drug Reference, the
Pharmaceutical Press, London, 36th edn, 2009, P 1039.
2 The British Pharmacopoeia, Her Majesty's Stationary Office, London, 2012,
Electronic Version.
3 H.G. Brittain, Analytical Profiles of Drug Substances and Excipients,
Academic Press, USA, Vol. 28, 2001, pp. 77-116.
4 M. Attimarad, Simultaneous determination of ofloxacin and flavoxate
hydrochloride by absorption ratio and second derivative UV
spectrophotometry, J. Basic Clin. Pharm., 2011, 2(1), 53-61.
5 K. Siddappa, M. Tambe, M. Metre, T. Reddy and M. Kote,
Spectrophotometric determination of flavoxate hydrochloride in bulk and
pharmaceutical formulation, Trade Sci. Inc., 2009, 8(3).
6 M. Heba, N. Ramadan and M. El-Laithy, Polymeric matrix membrane
sensors for stability-indicating potentiometric determination of oxybutynin
hydrochloride and flavoxate hydrochloride urogenital system drugs, J. AOAC.
Int., 2008, 91(6), 1318-1330.
7 A. El-Gindy, R.A. Abdel-Salam and S. Sallam, High-performance liquid
chromatographic determination of flavoxate hydrochloride and its hydrolysis
product, Drug Dev. Ind. Pharm., 2008, 34(12), 1311-1322.
8 M. Attimarad, Liquid chromatographic determination of flavoxate HCl in
pharmaceutical formulation, J. Young Pharm., 2010, 2(3), 280-283.
9 R.N. Rao, P.K. Maurya, R. Kuntamukkala, W.D. Vitthal and M.V. Talluri,
Molecularly imprinted polymer for selective extraction of 3-methylflavone-8-
carboxylic acid from human urine followed by its determination using
zwitterionic hydrophilic interaction liquid chromatography, J. Sep. Sci., 2011,
34(22), 3265-3271.
10 A. El-Gindy, S. Sallam and R.A. Abdel-Salam, High performance liquid
chromatographic determination of 3-methylflavone-8-carboxylic acid, the
Page 21 of 38 Analytical Methods
An
alyt
ical
Met
ho
ds
Acc
epte
d M
anu
scri
pt

21
main active metabolite of flavoxate hydrochloride in human urine, J. Pharm.
Biomed. Anal., 2007, 44(1), 274-278.
11 ICH Harmonized Tripartite Guidelines. Stability Testing of New Drug
Substances and Products, Q1A(R2), 2003, Accessed 21 May 2013
at:http://www.fda.gov/RegulatoryInformation/Guidances/ucm128179.htm.
12 ICH Harmonized Tripartite Guidelines. Stability Testing: Photostability
Testing of New Drug Substances and Products, Q1B, 1996. Accessed 21 May
2013 at: http://www.ich.org/products/guidelines/quality/article/quality-
guidelines.html
13 P. Kawczak and T. Bączek, Recent theoretical and practical applications of
micellar liquid chromatography (MLC) in pharmaceutical and biomedical
analysis, Cent. Eur. J. Chem., 2012, 10(3), 570-584.
14 M. Rambla-Alegre, Basic Principles of MLC, Chromatogr. Res. Int., 2012,
1-6.
15 A. C. Moffat, Clarke's Analysis of Drugs and Poisons, The Pharmaceutical
Press, London, 3rd edn, 2006, Electronic version.
16 ICH Harmonized Tripartite Guidelines, Validation of Analytical
Procedures: Text and Methodology, International Conference on
Harmonization, 2005, Accessed 21 May 2013 at:
http://www.ich.org/products/guidelines/quality/article/quality-guidelines.html
17 J. N. Miller and J. C. Miller, Statistics and Chemometrics for Analytical
Chemistry, Pearson Education Limited: Harlow, England, 5th edn, 2005, pp.
39-73, 107-149, 256.
18 G. P. Ellis, The Chemistry of Heterocyclic Compounds. Chromenes,
Chromanones, and Chromones, John Wiley & Sons, Inc. New York, NY, 6th
edn, 2009, pp. 601-602.
Page 22 of 38Analytical Methods
An
alyt
ical
Met
ho
ds
Acc
epte
d M
anu
scri
pt

22
19 A.T. Florence and D. Attwood, Physicochemical Principles of Pharmacy,
the Pharmaceutical Press, London, 4th edn, 2006, pp. 118-119.
20 T.W. Graham Solomons and C.B. Fryhle, Organic chemistry, John Wiley
& Sons Inc., New York, NY, 9th edn, 2008, p. 920
21 M. Monici, N. Mulinacci, P. Baglioni and F.F. Vincieri,
Flavone photoreactivity. UV-induced reactions in organic solvents and
micellar systems, J. Photochem. Photobiol. B., 1993, 20(2-3), 167-172.
Page 23 of 38 Analytical Methods
An
alyt
ical
Met
ho
ds
Acc
epte
d M
anu
scri
pt

23
Table 1 Analytical parameters for the determination of FLV by the proposed
method
Parameter Results
Concentration range (µg mL-1
) 2.0-40.0
Limit of detection (LOD) (µg mL-1
) 0.40
Limit of quantification (LOQ) (µg mL-1
) 1.20
Correlation coefficient (r) 0.9998
Slope 4.52 x 10⁴
Intercept 1.08 x 10⁴
Standard deviation of the residuals (Sy/x) 1.19 x 10⁴
Standard deviation of the intercept (Sa) 5.42 x 10³
Standard deviation of the slope (Sb) 3.52 x 10²
% RSD 1.25
% Error (% RSD/√n) 0.51
Page 24 of 38Analytical Methods
An
alyt
ical
Met
ho
ds
Acc
epte
d M
anu
scri
pt

24
Table 2 Application of the proposed and comparison methods to the
determination of FLV in pure form and tablets.
Matrix
Proposed method Comparison
method (7)
Conc. taken
(µg mL-1
)
Conc. found
(µg mL-1
)
% Founda % Found
a
Pure form
2.0 1.973 98.65 101.49
4.0 3.945 98.63 98.01
10.0 9.883 98.83 100.33
20.0 20.073 100.37
30.0 30.506 101.69
40.0 39.620 99.05
X‾ ± SD 99.53 ± 1.24 99.94 ± 1.77
t 0.407 (2.365)*
F 2.045 (5.786)*
Genurin S.F.®
tablets (200 mg
FLV/tablet)
10.0 9.840 98.40 101.42
20.0 20.241 101.21 98.11
40.0 39.920 99.80 100.32
X‾ ± SD 99.80 ± 1.41 99.95 ± 1.69
t 0.116 (2.776)*
F 1.440 (19.00)*
a Each result is the average of three separate determinations.
* Values between parenthesis are the tabulated t and F values at P=0.05 (17).
Page 25 of 38 Analytical Methods
An
alyt
ical
Met
ho
ds
Acc
epte
d M
anu
scri
pt

25
Table 3 Precision data of the proposed method for determination of FLV in
pure form.
Conc. (µg mL-1) % Found ± SD % RSD % Error
Intra-day precision
4.0 99.13 ± 1.02 1.03 0.59
10.0 97.71±1.40 1.40 0.80
40.0 99.98±1.04 1.04 0.60
Inter-day precision
4.0 101.20±1.25 1.24 0.71
10.0 99.98 ± 1.10 1.10 0.64
40.0 98.60±0.90 0.90 0.50
Page 26 of 38Analytical Methods
An
alyt
ical
Met
ho
ds
Acc
epte
d M
anu
scri
pt
26
Table 4 Final system suitability test parameters for the proposed method
Parameter FLV DP2 DP1
No of theoretical plates, N 615 1011 850
Capacity factor, k´ 1.73 0.91 1.33
Selectivity factor, α 1.90 1.30
Resolution, Rs 2.41 1.04
Page 27 of 38 Analytical Methods
An
alyt
ical
Met
ho
ds
Acc
epte
d M
anu
scri
pt

27
Table 5 Reaction rate constants and half-life times of FLV in H2O2 solution
(30% w/v) at different temperature settings
K: reaction rate constant (min
-1), t½: half-life time (min).
Temperature (°C)
K (min-1
)
t½ (min)
60 2.8 ×10⁻³
247
70 3.9 ×10⁻³
178
80 4.6 ×10⁻³
151
Page 28 of 38Analytical Methods
An
alyt
ical
Met
ho
ds
Acc
epte
d M
anu
scri
pt

28
Table 6 Results of the degradation study of FLV
Stress condition
tR of degradation
product(s) (min)
% Assay of FLV
0.1M NaOH, 10 min, RT 4.9, 5.9 0
1.0 M HCl, 100 ºC, 30 min 4.9, 5.9 83
30% w/v H2O2, 80 ºC, 30 min 4.9, 5.9 86
Water, 80 ºC, 30 min 4.9, 5.9 89
Methanol, 7 days, 4 ºC 5.9 0
UV light, methanol, 3 hrs 5.9 76
UV light, water, 3 hrs 4.9 90
UV light, methanol: water (1:1 v/v), 3 hrs 4.9, 5.9 82
Artificial day light, methanol, RT, 5 hrs 5.9 92
tR: Retention time (min), RT: Room temperature
Page 29 of 38 Analytical Methods
An
alyt
ical
Met
ho
ds
Acc
epte
d M
anu
scri
pt
29
List of figures:
Fig. 1 Chemical structure of Flavoxate hydrochloride (FLV).
Fig. 2 Effect of: (A) pH, (B) SDS conc. [M] and (C) n-Propanol conc. (%) on
the retention factor of FLV.
Fig. 3 Representative chromatograms showing:
(A) FLV (40µg mL-1
) standard solution.
(B) FLV (40µg mL-1
) in Genurin SF® tablets.
Fig. 4 Representative chromatograms showing FLV (40µg mL-1
) after
exposure to different hydrolytic conditions:
(A) Acidic condition (1.0 M HCl, 80 ºC, 30 min)
(B) Neutral condition (water, 80 ºC, 30 min).
(C) Alkaline condition (0.1M NaOH, 10 min, RT).
Fig. 5:
(A) Representative chromatograms showing FLV (40µg mL-1
) after exposure
to oxidative degradation (30% w/v H2O2, 80 ºC, 30 min).
(B) 3D plot showing the effect of heating time with H2O2 (30% w/v) on FLV
(40µg mL-1
) at different temperature settings (a is the initial drug
concentration and a-x is the remaining concentration of the drug).
(C) Arrhenius plot for the oxidative degradation of FLV (40µg mL-1
) with
H2O2 (30% w/v).
Fig. 6 Representative chromatograms showing FLV (40µg mL-1
) after
exposure to UV irradiation at 254 nm for 3 hrs in different solvent systems:
(A) Methanol, (B) Methanol: water (1:1 v/v) and (C) Water.
Fig. 7 Representative chromatograms showing:
(A) FLV (40 µg mL-1
) after storage for 5 hr at room temperature.
(B) FLV (40 µg mL-1
) after storage for 7 days at 4 °C.
Page 30 of 38Analytical Methods
An
alyt
ical
Met
ho
ds
Acc
epte
d M
anu
scri
pt

30
Fig. 1
. HCl
Page 31 of 38 Analytical Methods
An
alyt
ical
Met
ho
ds
Acc
epte
d M
anu
scri
pt

31
Fig. 2
SDS Conc. [M]
Ret
enti
on
fa
cto
r (k
F)
B
pH
Ret
enti
on
fa
cto
r (k
F)
A
Ret
enti
on
fa
cto
r (k
F)
% n-propanol
C
Page 32 of 38Analytical Methods
An
alyt
ical
Met
ho
ds
Acc
epte
d M
anu
scri
pt

32
Fig. 3
(B)
(A)
Page 33 of 38 Analytical Methods
An
alyt
ical
Met
ho
ds
Acc
epte
d M
anu
scri
pt

33
Fig. 4
Solvent front
Page 34 of 38Analytical Methods
An
alyt
ical
Met
ho
ds
Acc
epte
d M
anu
scri
pt

34
0.0 1.0 2.0 3.0 4.0 5.0 6.0 7.0 8.0 9.0 10.0 11.0 12.0 13.0 14.0 min
-30
-25
-20
-15
-10
-5
0
5
10
15
20
25
30
35
40
45
50mV
Detector A:325nm
Fig. 5
FLV 7.02
DP2 4.9
DP1 5.9 Solvent front
(A)
(B)
(C)
Time (min)
Det
ecto
r re
spo
nse
Page 35 of 38 Analytical Methods
An
alyt
ical
Met
ho
ds
Acc
epte
d M
anu
scri
pt
35
FLV 7.02
DP1 5.9
DP2 4.9
FLV 7.02
DP1 5.9
A)(
B)(
(C) FLV 7.02
DP2 4.9
Solvent front
Solvent front
Solvent front
Fig. 6
Page 36 of 38Analytical Methods
An
alyt
ical
Met
ho
ds
Acc
epte
d M
anu
scri
pt

36
Fig. 7
(B)
(A)
FLV
Page 37 of 38 Analytical Methods
An
alyt
ical
Met
ho
ds
Acc
epte
d M
anu
scri
pt

37
O
O
OON
H2O2
O
O
OHO
N+
OH
OH
O
OHO
H+, OH- or H2O
+OH
O
DP1
DP2
Non UV-absorbing
No absorbance at 325 nm
Benzoic acid
FLV
O
O
OHO
N+
OH
DP1Weak UV-absorbing
O-
Scheme 1 Suggested degradation pathways of FLV
/ Heating H+, OH- or H2O / Heating
Page 38 of 38Analytical Methods
An
alyt
ical
Met
ho
ds
Acc
epte
d M
anu
scri
pt