View PDF Version - RSC Publishing
16
Green Chemistry PAPER Cite this: Green Chem., 2018, 20, 5358 Received 21st April 2018, Accepted 27th June 2018 DOI: 10.1039/c8gc01257a rsc.li/greenchem Economic and environmental potentials for natural gas to enhance biomass-to-liquid fuels technologies Yanan Zhang, Asad H. Sahir, Eric C. D. Tan, Michael S. Talmadge, Ryan Davis, Mary J. Biddy and Ling Tao * With the increased availabilityof low-cost natural gas (NG), co-conversion of natural gas and biomass-to- liquid (GBtL) fuels has gained interest from industry and the U.S. Department of Energy due to the poten- tial to improve liquid fuel yields while lowering greenhouse gas (GHG) emissions. In this article, we explore the conceptual process design and cost comparison of liquid biofuels using both biomass- derived gas intermediates and natural gas, as well as studies on quantification and assessment of sustain- ability metrics including life cycle/GHG emissions. Additionally, we have performed sensitivity analysis to understand the impact from variations of the biomass-to-NG ratio, design assumptions, and NG prices on process economics. This is to understand key cost drivers, parameters influencing the environment, and to discover opportunities to optimize the use of NG along with biomass. Our analysis shows that different blending ratios of natural gas/biomass have a large effect on the economic and environmental perform- ance of the GBtL fuels. Co-processing NG enables the economic feasibility of converting biomass to the liquid fuel but at the expense of environmental sustainability. This study determined that the maximum amount of NG that can be blended with biomass would be 28% to meet the Renewable Fuel Standard (RFS) GHG emission targets for advanced fuels, with a resulting minimum fuel selling price (MFSP) of $2.75 per gallon gasoline equivalent (GGE). In addition, the paper demonstrates the impact of the co- conversion operation on equipment design, raw materials, utilityconsumption, and overall process econ- omic performance for the GBtL system. A secondary outcome: This study shows that renewable liquid fuel could be cost competitive with fossil-derived liquid fuel if further improvements and optimizations could be made to blending ratios of NG, optimization of heat integration of the process, and reduction of excess hydrogen and excess electricity production. 1. Introduction According to recent U.S. Energy Information Administration (EIA) projections, the consumption of world petroleum and other liquid fuels will increase by 38% by 2040 from 2014, and the transportation and industrial sectors will account for 92% of the global liquid fuel demand in 2040. 1 This growing demand encourages the exploration of a variety of feedstocks for transportation fuels production with biomass being the only renewable energy source 2 that has the capability to present a viable substitute for petroleum-based liquid transportation fuels. 3 Literature has detailed the process configurations for biomass-to-liquid (BtL), 4 coal-to-liquid (CtL), and gas-to-liquid (GtL). 5–7 In the case of BtL and CtL, a gasification reactor is employed that converts the carbonaceous feedstock into syngas. The syngas is subsequently converted to hydrocarbon liquids through the Fischer–Tropsch (FT) process. The advan- tage of the FT process is that it can produce hydrocarbons of varying length from any carbonaceous feedstock (e.g., coal, NG, or biomass), provided that the desired H 2 /CO ratio is attained. The production of hydrocarbon liquids from FT syn- thesis using cobalt-based catalysts requires an optimum H 2 / CO ratio in the range of 2.0–2.2. 8 The H 2 /CO ratio plays an essential role in the FT process. In the case of biomass and coal gasification, the H 2 /CO ratio of the effluent syngas is adjusted via water–gas shift reaction followed with a subsequent CO 2 removal step. 9,10 Cobalt-based catalysts have a low water gas shift activity, which implies that syngas should have a H 2 /CO ratio of 2.15 to ensure a high conversion. 11 In comparison, iron-based catalysts possess a higher water–gas shift reaction activity. National Renewable Energy Laboratory, 15013 Denver West Parkway, Golden, CO 80401, USA. E-mail: [email protected]; Tel: +1-303-384-7809 5358 | Green Chem. , 2018, 20, 5358–5373 This journal is © The Royal Society of Chemistry 2018 Open Access Article. Published on 07 November 2018. Downloaded on 1/14/2022 1:15:50 AM. This article is licensed under a Creative Commons Attribution-NonCommercial 3.0 Unported Licence. View Article Online View Journal | View Issue
-
Upload
khangminh22 -
Category
Documents
-
view
3 -
download
0
Transcript of View PDF Version - RSC Publishing

Green Chemistry
PAPER
Cite this: Green Chem., 2018, 20,5358
Received 21st April 2018,Accepted 27th June 2018
DOI: 10.1039/c8gc01257a
rsc.li/greenchem
Economic and environmental potentials fornatural gas to enhance biomass-to-liquid fuelstechnologies
Yanan Zhang, Asad H. Sahir, Eric C. D. Tan, Michael S. Talmadge, Ryan Davis,Mary J. Biddy and Ling Tao *
With the increased availability of low-cost natural gas (NG), co-conversion of natural gas and biomass-to-
liquid (GBtL) fuels has gained interest from industry and the U.S. Department of Energy due to the poten-
tial to improve liquid fuel yields while lowering greenhouse gas (GHG) emissions. In this article, we
explore the conceptual process design and cost comparison of liquid biofuels using both biomass-
derived gas intermediates and natural gas, as well as studies on quantification and assessment of sustain-
ability metrics including life cycle/GHG emissions. Additionally, we have performed sensitivity analysis to
understand the impact from variations of the biomass-to-NG ratio, design assumptions, and NG prices on
process economics. This is to understand key cost drivers, parameters influencing the environment, and
to discover opportunities to optimize the use of NG along with biomass. Our analysis shows that different
blending ratios of natural gas/biomass have a large effect on the economic and environmental perform-
ance of the GBtL fuels. Co-processing NG enables the economic feasibility of converting biomass to the
liquid fuel but at the expense of environmental sustainability. This study determined that the maximum
amount of NG that can be blended with biomass would be 28% to meet the Renewable Fuel Standard
(RFS) GHG emission targets for advanced fuels, with a resulting minimum fuel selling price (MFSP) of
$2.75 per gallon gasoline equivalent (GGE). In addition, the paper demonstrates the impact of the co-
conversion operation on equipment design, raw materials, utility consumption, and overall process econ-
omic performance for the GBtL system. A secondary outcome: This study shows that renewable liquid
fuel could be cost competitive with fossil-derived liquid fuel if further improvements and optimizations
could be made to blending ratios of NG, optimization of heat integration of the process, and reduction of
excess hydrogen and excess electricity production.
1. Introduction
According to recent U.S. Energy Information Administration(EIA) projections, the consumption of world petroleum andother liquid fuels will increase by 38% by 2040 from 2014, andthe transportation and industrial sectors will account for 92%of the global liquid fuel demand in 2040.1 This growingdemand encourages the exploration of a variety of feedstocksfor transportation fuels production with biomass being theonly renewable energy source2 that has the capability to presenta viable substitute for petroleum-based liquid transportationfuels.3
Literature has detailed the process configurations forbiomass-to-liquid (BtL),4 coal-to-liquid (CtL), and gas-to-liquid
(GtL).5–7 In the case of BtL and CtL, a gasification reactor isemployed that converts the carbonaceous feedstock intosyngas. The syngas is subsequently converted to hydrocarbonliquids through the Fischer–Tropsch (FT) process. The advan-tage of the FT process is that it can produce hydrocarbons ofvarying length from any carbonaceous feedstock (e.g., coal,NG, or biomass), provided that the desired H2/CO ratio isattained. The production of hydrocarbon liquids from FT syn-thesis using cobalt-based catalysts requires an optimum H2/CO ratio in the range of 2.0–2.2.8
The H2/CO ratio plays an essential role in the FT process.In the case of biomass and coal gasification, the H2/COratio of the effluent syngas is adjusted via water–gas shiftreaction followed with a subsequent CO2 removal step.9,10
Cobalt-based catalysts have a low water gas shift activity,which implies that syngas should have a H2/CO ratio of 2.15to ensure a high conversion.11 In comparison, iron-basedcatalysts possess a higher water–gas shift reaction activity.
National Renewable Energy Laboratory, 15013 Denver West Parkway, Golden,
CO 80401, USA. E-mail: [email protected]; Tel: +1-303-384-7809
5358 | Green Chem., 2018, 20, 5358–5373 This journal is © The Royal Society of Chemistry 2018
Ope
n A
cces
s A
rtic
le. P
ublis
hed
on 0
7 N
ovem
ber
2018
. Dow
nloa
ded
on 1
/14/
2022
1:1
5:50
AM
. T
his
artic
le is
lice
nsed
und
er a
Cre
ativ
e C
omm
ons
Attr
ibut
ion-
Non
Com
mer
cial
3.0
Unp
orte
d L
icen
ce.
View Article OnlineView Journal | View Issue

Supported cobalt catalysts are preferred for the FT synthesis(FTS) step in the GtL process owing to its high activity andselectivity to linear paraffins.12 For instance, supported cobalt-based catalysts were employed in Shell’s Middle DistillateSynthesis process at Bintulu, Malaysia, a GtL plant with a14 700 barrels per day capacity using fixed bed reactors, andwas used in Shell’s Pearl project in Qatar.12,13
The recent interest in co-conversion of natural gas andbiomass-to-liquid (GBtL) makes it imperative to understandthe optimization and integration of natural gas (NG) andbiomass into a hydrocarbon liquid fuel conversion process.Recent studies have shown the possibility of reforming NG andbiomass-derived synthesis gas (syngas) in a single reactor; thisoffers research and development (R&D) opportunities for sub-sequent process intensification.4
The heating values of woody biomass, NG, and FT pro-ducts are listed in Table 1. With a relatively high NG heatingvalue, the liquid fuel yield would be enhanced when biomassis blended with NG. Process synthesis and optimizationstudies related to BtL,14,15 CtL,16 hybrid biomass andcoal,17,18 and hybrid biomass and NG processes19 have beenrecently reported.19–22 Process strategies associated with co-conversion of NG with biomass have drawn interest due tothe current lower cost of NG relative to biomass, and for itspotential for lower GHG emissions relative to petroleum.23
The methane-rich composition of NG offers a high hydrogen-to-carbon ratio, which could potentially increase the overallcarbon yield in liquid products and reduce the quantity ofCO2 produced.14 Process concepts on co-conversion ofbiomass and NG have been proposed previously for pro-duction of methanol with reduced CO2 emissions (Hynolprocess)24 and for generating hydrogen and methanol for fuelcell vehicles.25
The GtL process provides an effective mechanism inincreasing the supply of domestic transportation fuels by redu-cing dependence on oil imports, thus enhancing energy secur-ity.6 Studies have shown that the GtL process exhibits carbonconversion efficiency (i.e., carbon in the feedstock that is con-verted to fuels) as high as 52%,26 which is significantly higherthan those from CtL (28%–34%27) and BtL (43%28), as shownin Table 1. In addition to high carbon efficiency from GtL, sig-nificant drivers for the development of the GtL technologycould be attributed to the following factors:29
• The GtL process has high exothermicity, where the excessheat generated could be configured to produce electricity andsteam.
• It enables the diversification of market risks by offeringan opportunity to convert NG by providing an alternativeoption to liquefying NG.
• It offers an alternative to facilitate utilization of largequantities of gas associated with oil production on site, as wellas applied at offshore gas fields.
• The global demand for diesel has the potential toincrease from 25 million (MM) barrels per day in 2011 to 37MM barrels per day by 2035.30
Another significant motivation for the development oftechnologies based on the GtL platform is its potential toutilize stranded reserves that are located more than 5000 kmfrom consumption centers where traditional transport techno-logies could not be utilized, due to investment risks.29 Thestranded NG reserve is defined as NG discovered in conven-tional gas and oil fields that is not commercially producibleand is estimated to be 2612 trillion cubic feet in the world(outside North America).31
Furthermore, another possibility envisioned for GtL techno-logies is the opportunity to monetize smaller volumes of gas(<25 MM standard cubic feet per day [scfpd] of gas), whichmay be applied in a cost-effective conversion of NG streams tovaluable products. The small-scale GtL process provides analternative opportunity when combined with biomass gasifica-tion, instead of being flared. Process synthesis and optimiz-ation studies would be needed to address the conversion ofbiomass and NG to transportation fuels.32–34 An importantfocus in process design requires modularity, simplicity, auto-mation, and robustness of operation,35 especially for a widespectrum of facility sizes.
The focus of this article is to assess the techno-economicanalysis (TEA) of the co-conversion of biomass and NG (atvarious blending ratios) to transportation fuels. There arelimited studies that focus on the TEA for GBtL. Chakravartiet al. modeled the NG-enhanced BtL process based onPraxair’s patent.36,37 In the Chakravarti study, an H2-richsyngas stream is generated by a steam methane reformer(SMR), which is fed a combination of NG and tail gas gener-ated in the FT synthesis section.36 It was concluded that whenproducing gasoline, diesel, and kerosene in ratios commensu-rate with demands in the United States (U.S.), the overall costof liquid fuel production ranges are: $109 per barrel (bbl)–$129 per bbl for a 1-thousand-barrels-per-day (kBD) plant, $85per bbl–$106 per bbl for a 5-kBD plant, $75 per bbl–$95 perbbl for a 10-kBD plant, and $66 per bbl–$86 per bbl for a50-kBD plant.38 Onel et al. modified the process synthesis anda global optimization framework for the thermochemical con-version of biomass and GBtL to co-produce the liquid fuelsand olefins.39 It was observed that increasing the olefins pro-duction level significantly increases the profit of the refinery.39
Liu et al. developed two designs for coproduction of electri-city and FT to liquid from a co-feed of NG and biomass, onewith CO2 venting (OT-V) and the other with CO2 capture(OT-CCS) of 1.6 106 t CO2 per year GBtL-OT-CCS.40 In thisstudy, the electricity price was reported at 98.9 and 135.7 $ permegawatt per hour if FT liquid fuels sold at $75 per bbl for
Table 1 Heating value of fuels and feedstocks
Lower heating value (LHV)(BTU per lb) H/C ratio
Carbonefficiency
Wood 6622 7.2–8.4 43%NG 20 267 4.0 52%Coal 9773 (wet basis) 1.0 28–34%Naphtha 19 320 1.6–2.3 —Diesel 18 397 —
Green Chemistry Paper
This journal is © The Royal Society of Chemistry 2018 Green Chem., 2018, 20, 5358–5373 | 5359
Ope
n A
cces
s A
rtic
le. P
ublis
hed
on 0
7 N
ovem
ber
2018
. Dow
nloa
ded
on 1
/14/
2022
1:1
5:50
AM
. T
his
artic
le is
lice
nsed
und
er a
Cre
ativ
e C
omm
ons
Attr
ibut
ion-
Non
Com
mer
cial
3.0
Unp
orte
d L
icen
ce.
View Article Online

GBtL-OT-V and GBtL-OT-CCS, respectively.40 Wright et al.investigated the NG blending wall in biofuel production.41 Inthis study, they showed that less than 19.1% of NG on an LHVenergy basis (7.83 wt%) could be blended to avoid exceedingthe emissions limits established by the Renewable FuelStandard (RFS) 2.41
This GBtL TEA provides baseline cost results for hydrocarbonliquid fuel production, which can be viewed as a near-termdeployment opportunity for renewable jet fuel production.Sensitivity analyses are performed to identify key cost drivers andguide future R&D, as well as near-term deployment strategies.
In addition to the economic feasibility, overarching concernssuch as environmental sustainability also need to be addressedfor sustainable biofuel production. In this study, life cycleassessment (LCA) is also performed in tandem with TEA toassess life cycle impacts associated with the production ofhydrocarbon blendstock from biomass/NG co-processing via theFT process. The associated greenhouse gas and life cycle ana-lyses are included to provide insight on the carbon footprint forliquid fuels production from the GBtL technology. LCA resultsprovide a better understanding of the processes from theenvironmental aspects, and consequently, a more informedassessment and comparison of the technologies can be made.
2. Methods2.1 General TEA methodology
Detailed TEA of co-conversion of NG and woody BtL fuels isperformed at the plant scale of 50 MM gallon gasoline equi-
valent (GGE) hydrocarbon fuels production annually. The 2016U.S. Billion-Ton Update estimates that by 2030 there will beenough agricultural and forest resources to sustainably provideat least one billion dry tons of biomass annually. While allbiomass resources can be used as feedstocks for BtL processes,the scope of this study only focuses on woody biomass. Theeconomic analysis includes a conceptual process design thatleads to the development of a detailed process flow diagram(based on research or commercial data); rigorous material andenergy balance calculations (via a commercial simulation tool,i.e., Aspen Plus); capital and project cost estimations (via anin-house model using spreadsheets); a discounted cash floweconomic model; and the calculation of a minimum fuelselling price (MFSP). The conceptual process design for theGBtL process is illustrated in Fig. 1. The baseline processmodel is based on previous National Renewable EnergyLaboratory (NREL)-developed indirect gasification of biomassmodels,42 BtL via FT technology models.43
The operating expense (OPEX) calculation for the designedfacility is based on material and energy balance calculationsusing Aspen Plus process simulations.44 All of the unit costsfor materials are listed in Table 2 in 2011 U.S. dollars.
For coproduct yield of wax, we use an equivalent mass flowof wax based on low heating value, which means that the highmolecular hydrocarbon mass flows from distillation columnswere converted to the equivalent wax mass flow based on thelow heating value of wax. The unit wax price is based on theequivalent wax mass flow.
All costs are adjusted to 2011 U.S. dollars using the PlantCost Index from Chemical Engineering Magazine,45 the
Fig. 1 Process flow diagram for the GBtL process. Note that all areas have either been commercialized or demonstrated at commercially relevantscales.
Paper Green Chemistry
5360 | Green Chem., 2018, 20, 5358–5373 This journal is © The Royal Society of Chemistry 2018
Ope
n A
cces
s A
rtic
le. P
ublis
hed
on 0
7 N
ovem
ber
2018
. Dow
nloa
ded
on 1
/14/
2022
1:1
5:50
AM
. T
his
artic
le is
lice
nsed
und
er a
Cre
ativ
e C
omm
ons
Attr
ibut
ion-
Non
Com
mer
cial
3.0
Unp
orte
d L
icen
ce.
View Article Online

Industrial Inorganic Chemical Index from SRI Consulting,46
and the labor indices provided by the U.S. Department ofLabor Bureau of Labor Statistics.47
Hydrogen is a co-product and the hydrogen co-productcredit is based on the hydrogen price of $2 kg−1 for the base-line.48 This high hydrogen price would result in low MFSPs, soa sensitivity analysis has been performed for hydrogen pricesranging from $0.5 to $3 kg−1.
Most capital expenses are sized from process simulationwith base cost sourced from previous reports andmodels,42,43,49 with a few exceptions specifically for the GBtLmodels in this paper. For instance, we use a scaling factor of0.6 to estimate the gasifier cost with the gasifier quotationfrom the NREL gasification design report42 for an inletbiomass flow higher than 2000 metric tons per day. To cater tosmaller gasifier capital costs, we assume a fixed capital cost of$14MM based on a 200 dry metric tons per day biomass gasi-fier price,50 with a scaling factor of 0.6.
After the total capital investment, variable operating costs,and fixed operating costs are determined, a discounted cashflow rate of return analysis has been used to determine theMFSP. The discounted cash flow analysis is calculated by iter-ating the selling cost of the product until the net present valueof the project is zero with a 10% Internal Rate of Return (IRR).The analysis requires that the discount rate, depreciationmethod, income tax rates, plant life, and construction startupduration be specified. The discounted cash flow assumes 40%equity financing with a loan interest at 8% for 10 years.Working capital is assumed to be 5% of the fixed capitalinvestment. The plant is assumed to take three years to con-struct plus 6 months spent toward startup.
This GBtL TEA provides baseline cost results comparableto the other evaluated biojet fuel routes and could be viewedas a near-term deployment opportunity for biojet fuel pro-
duction. According to Hicks and Tacina, fuels produced fromthe FT process offer advantages as compared to conventionaljet fuel, including an increased thermal-oxidative stabilityand lower particulate emission.60,61 More importantly, para-meters or process-related variables such as material price,capital cost, operating conditions, and several processingconditions are scrutinized in the sensitivity analysis.Sensitivity analyses are performed to understand the impactof variations in the biomass-to-NG blending ratios, plantscales, design assumptions, and NG prices on the overallprocess economics.
A single-point sensitivity analysis is performed on theAspen Plus model to identify key cost drivers from the selectedvariables. Reasonable minima and maxima for each variablewith all other factors held constant are chosen to understandand quantify the resulting cost impact on overall MFSP. If thecorrelation is not linear, additional points might be analyzedto represent the cost impact, such as the curve for plantcapacity. For example, the total production capacity changesfrom 10 to 100 MMGGE on an NG blending ratio range of 10%to 90%. An NG blending ratio of 10% means 10 wt% of NG isco-fed with 90 wt% of cellulosic biomass to Area 100. The totalamount of feedstock is determined by the production capacity.The single-point sensitivity analysis is typically illustrated in atornado chart with the variable impacting cost the most on thetop and the variable impacting cost the least sequenced to thebottom. The single-point sensitivity analysis and scenariosanalysis are focused on a single aspect while keeping all otherparameters constant. However, it could be possible that severalparameters are changed simultaneously so that the resultswould be changed significantly.
3. Process design
The goal for the baseline TEA model is to perform the sensi-tivity analyses to understand the impact of variations in thebiomass-to-NG ratios, plant scales, reaction kinetics, processdesign assumptions, and NG prices on the process economics.
The process design for GBtL consists of feed handling,drying, indirect gasification, gas clean-up and conditioning,FT liquid fuel synthesis, and fractionation of liquid hydro-carbons. The NG is mixed with the biomass-derived syngasand the mixed syngas is then sent to the tar reforming areawhere the molar ratio of H2/CO is adjusted to 2.1 to meettargets for the FT process. After the tar reforming process, thesyngas is quenched and the acid gas (e.g., H2S and CO2) isremoved from the syngas. Then the conditioned syngas is sentfor FT synthesis to hydrocarbon fuels. The description for eacharea is shown in Table 3, with details in the following sections.The detailed process flow diagrams (shown in Fig. 1) and anAspen Plus model have been developed, and material andenergy flows have been evaluated. Aspects about energy inte-gration and process design (e.g., process equipment and esti-mation of operating costs) and complete economic evaluationof the GBtL integrated process have been studied. In this
Table 2 Unit prices for raw materials and products (2011$)42,43,48,51–59
Materials Cost
Woody biomass $80 per tonNG $239 per ton
($5 per MMBTU)Electricity $0.0572 kWhMagnesium oxide (MgO) $527 per tonFresh olivine makeup $249 per tonHydrotreating catalyst $20 lb−1
SMR catalyst $8 per tonhydrogen
Zinc oxide catalyst $6 lb−1
LO-CAT chemicals $1777 per tonTar reformer catalyst $22 lb−1
FT catalyst $32 lb−1
Boiler chemicals $5558 per tonCooling tower chemicals $3331 per tonCooling tower makeup $0.3 per tonWaste disposal $47 per tonWastewater treatment chemicals $0.7 per tonWax $0.4 lb−1
Gasoline $2.8 per galDiesel $3.2 per galHydrogen $1.3 kg−1
Green Chemistry Paper
This journal is © The Royal Society of Chemistry 2018 Green Chem., 2018, 20, 5358–5373 | 5361
Ope
n A
cces
s A
rtic
le. P
ublis
hed
on 0
7 N
ovem
ber
2018
. Dow
nloa
ded
on 1
/14/
2022
1:1
5:50
AM
. T
his
artic
le is
lice
nsed
und
er a
Cre
ativ
e C
omm
ons
Attr
ibut
ion-
Non
Com
mer
cial
3.0
Unp
orte
d L
icen
ce.
View Article Online
study, we selected a blending ratio of 10% NG and a pro-duction capacity of 50 MMGGE per year (MMGY) of hydro-carbon fuels as a baseline. Different blending ratios andcapacities have been studied in the sensitivity analysis section.
3.1 Biomass gasification
The indirect steam gasifiers are heated via heat transfer from ahot solid or through a heat transfer surface. Coproduct charand portions of the product gas can be combusted with air(external to the gasifier itself ) to provide the energy for gasifi-cation. In this study, indirect steam gasification is chosen asthe basis for the gasifier design, because previous NRELstudies42,62 have shown that it has an economic advantageover oxygen-blown high-temperature slagging gasification62 orlower temperature dry-ash direct gasification63 processes forthe scale typical of biomass gasification. The primary reactionin indirect gasification is the devolatilization of biomass togases, condensable vapors, and char as reaction products.64
Feedstock composition, gasifier type, residence time, operatingparameters (e.g., temperature and pressure), and the relativeimportance of gas-phase reactions such as water gas shift9,64
would affect the final gas composition of the gasifier. Thechoice of the gasification reactor influences the compositionof syngas considerably, as shown in Table 4.
3.2 Gas conditioning
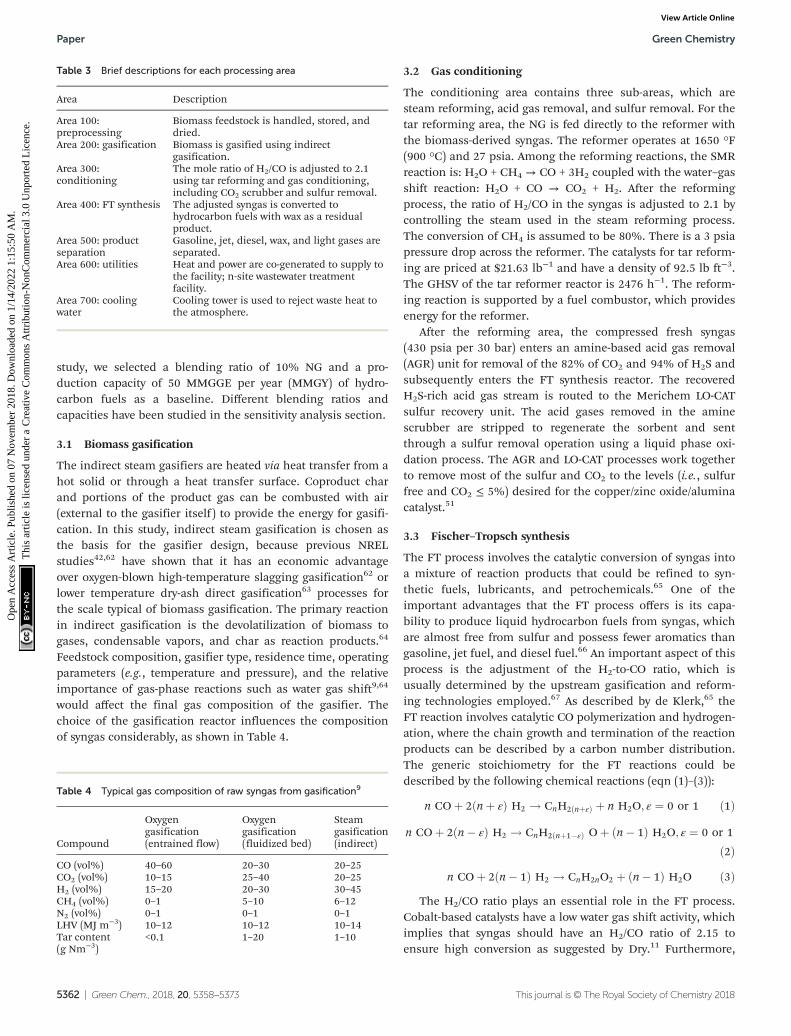
The conditioning area contains three sub-areas, which aresteam reforming, acid gas removal, and sulfur removal. For thetar reforming area, the NG is fed directly to the reformer withthe biomass-derived syngas. The reformer operates at 1650 °F(900 °C) and 27 psia. Among the reforming reactions, the SMRreaction is: H2O + CH4 → CO + 3H2 coupled with the water–gasshift reaction: H2O + CO → CO2 + H2. After the reformingprocess, the ratio of H2/CO in the syngas is adjusted to 2.1 bycontrolling the steam used in the steam reforming process.The conversion of CH4 is assumed to be 80%. There is a 3 psiapressure drop across the reformer. The catalysts for tar reform-ing are priced at $21.63 lb−1 and have a density of 92.5 lb ft−3.The GHSV of the tar reformer reactor is 2476 h−1. The reform-ing reaction is supported by a fuel combustor, which providesenergy for the reformer.
After the reforming area, the compressed fresh syngas(430 psia per 30 bar) enters an amine-based acid gas removal(AGR) unit for removal of the 82% of CO2 and 94% of H2S andsubsequently enters the FT synthesis reactor. The recoveredH2S-rich acid gas stream is routed to the Merichem LO-CATsulfur recovery unit. The acid gases removed in the aminescrubber are stripped to regenerate the sorbent and sentthrough a sulfur removal operation using a liquid phase oxi-dation process. The AGR and LO-CAT processes work togetherto remove most of the sulfur and CO2 to the levels (i.e., sulfurfree and CO2 ≤ 5%) desired for the copper/zinc oxide/aluminacatalyst.51
3.3 Fischer–Tropsch synthesis
The FT process involves the catalytic conversion of syngas intoa mixture of reaction products that could be refined to syn-thetic fuels, lubricants, and petrochemicals.65 One of theimportant advantages that the FT process offers is its capa-bility to produce liquid hydrocarbon fuels from syngas, whichare almost free from sulfur and possess fewer aromatics thangasoline, jet fuel, and diesel fuel.66 An important aspect of thisprocess is the adjustment of the H2-to-CO ratio, which isusually determined by the upstream gasification and reform-ing technologies employed.67 As described by de Klerk,65 theFT reaction involves catalytic CO polymerization and hydrogen-ation, where the chain growth and termination of the reactionproducts can be described by a carbon number distribution.The generic stoichiometry for the FT reactions could bedescribed by the following chemical reactions (eqn (1)–(3)):
n COþ 2ðnþ εÞ H2 ! CnH2ðnþεÞ þ n H2O; ε ¼ 0 or 1 ð1Þ
n COþ 2ðn� εÞ H2 ! CnH2ðnþ1�εÞ Oþ ðn� 1Þ H2O; ε ¼ 0 or 1
ð2Þn COþ 2ðn� 1Þ H2 ! CnH2nO2 þ ðn� 1Þ H2O ð3Þ
The H2/CO ratio plays an essential role in the FT process.Cobalt-based catalysts have a low water gas shift activity, whichimplies that syngas should have an H2/CO ratio of 2.15 toensure high conversion as suggested by Dry.11 Furthermore,
Table 3 Brief descriptions for each processing area
Area Description
Area 100:preprocessing
Biomass feedstock is handled, stored, anddried.
Area 200: gasification Biomass is gasified using indirectgasification.
Area 300:conditioning
The mole ratio of H2/CO is adjusted to 2.1using tar reforming and gas conditioning,including CO2 scrubber and sulfur removal.
Area 400: FT synthesis The adjusted syngas is converted tohydrocarbon fuels with wax as a residualproduct.
Area 500: productseparation
Gasoline, jet, diesel, wax, and light gases areseparated.
Area 600: utilities Heat and power are co-generated to supply tothe facility; n-site wastewater treatmentfacility.
Area 700: coolingwater
Cooling tower is used to reject waste heat tothe atmosphere.
Table 4 Typical gas composition of raw syngas from gasification9
Compound
Oxygengasification(entrained flow)
Oxygengasification(fluidized bed)
Steamgasification(indirect)
CO (vol%) 40–60 20–30 20–25CO2 (vol%) 10–15 25–40 20–25H2 (vol%) 15–20 20–30 30–45CH4 (vol%) 0–1 5–10 6–12N2 (vol%) 0–1 0–1 0–1LHV (MJ m−3) 10–12 10–12 10–14Tar content(g Nm−3)
<0.1 1–20 1–10
Paper Green Chemistry
5362 | Green Chem., 2018, 20, 5358–5373 This journal is © The Royal Society of Chemistry 2018
Ope
n A
cces
s A
rtic
le. P
ublis
hed
on 0
7 N
ovem
ber
2018
. Dow
nloa
ded
on 1
/14/
2022
1:1
5:50
AM
. T
his
artic
le is
lice
nsed
und
er a
Cre
ativ
e C
omm
ons
Attr
ibut
ion-
Non
Com
mer
cial
3.0
Unp
orte
d L
icen
ce.
View Article Online

for iron-based catalysts possessing a higher water gas shiftreaction activity, operating temperature plays a major role. At446 °F (230 °C) low-temperature Fischer–Tropsch (LTFT), a H2/CO ratio of 1.7 has been recommended to ensure high conver-sion. Another possibility exists to conduct the reaction at446 °F (340 °C) high-temperature FT where the water gas shiftreaction proceeds rapidly to equilibrium and CO2 can also beconverted into reaction products.11 As the FT reaction is sig-nificantly exothermic, an essential requirement is to removeheat rapidly so as to avoid temperature rise resulting in the for-mation of CH4 and leading to catalyst deactivation (sinteringand coking) and disintegration (due to Boudouard carbondeposition).11
A cobalt-based slurry column reactor is chosen and alterna-tive catalyst and reactor configurations can be accounted for inthe sensitivity analysis. The carbon number distribution in anFT process is typically described by the Anderson Schulz Flory(ASF) distribution, which essentially describes the molar con-centration (xn) of a carbon chain with n carbons in terms of achain growth probability (α), such that the carbon numbers (n)and molar concentrations (xn) have a logarithmic relation-ship65 (eqn (4)).
lnðxnÞ ¼ n lnðαÞ þ ln ðð1� αÞ=αÞ ð4ÞFor this TEA, we chose the FT reaction at LTFT (446 °F/
230 °C) using a cobalt-based slurry column reactor. The FTkinetics chosen to maximize the production of hydrocarbonfuel is calculated using the ASF distribution. A stoichiometricreactor model was formulated in Aspen Plus using the productyields determined on a mass basis by the ASF distribution forα = 0.84.
3.4 Process integration
In this model, the heat and power are integrated in the steamarea. The system includes a steam cycle that produces steamthrough the integrated recovery of heat from the hot processstreams throughout the plant. Power for plant operations isproduced from the steam cycle using a two-stage steamturbine with intermediate reheat to increase electricity pro-duction. The steam turbine efficiencies are assumed as 75%and the generator mechanical efficiencies are assumed to be97%.42,43 The plant energy balance is controlled by the rate ofsyngas combustion in the regenerator for the tar reformer cata-lyst. The energy from syngas combustion is recovered from theflue gas and contributes to the conversion to electricity insteam turbine generators.
The recycled water from the GBtL system is fed as the boilerfeed water. Then water is heated in the boiler to produce thesteam. Operations requiring steam include gasification,reforming, and acid gas removal sections. Steam is directlyinjected into the gasifier and the reformer. For the remaininghot streams that need to be cooled down, the cooling water isused to reduce the temperature to meet the temperaturerequirement. The cooling water is sourced from the blowdownwater in the steam area and the makeup cooling water. A
mechanical draft cooling tower provides cooling water toseveral heat exchangers in the plant. The cooling tower usesfans to force the air through circulated water.
In the GBtL Aspen Plus model considered in this study, therecycled syngas is split into two streams. One stream is sent tothe fuel combustor to generate the heat and meet the energybalance requirement for the GBtL process. The other stream issent to the tar reformer for improving the efficiency of thereforming process. The split of the recycled syngas process ismodeled by a splitter that requires a specific split ratio, whichrepresents the portion of recycled syngas that is sent to thetar reformer. This syngas split ratio has a significant effect onthe carbon efficiency as well as energy integration, and couldbe used to synthesize the hydrocarbon fuels. However, theoption of combusting the syngas and generating the electricityfrom the steam generation area exists. There is a trade-offbetween the MFSP of the hydrocarbon fuels and sale of electri-city, which may result in significant effect on the final MFSP.The syngas split ratio is a sensitive parameter for the MFSPand its effect has been studied in the section on sensitivityanalysis.
3.5 Greenhouse gas life cycle assessment
LCA on GHG emissions is performed to evaluate and compareGHG emissions associated with hydrocarbon blendstock pro-duced from the GBtL. It is wise to conduct LCA early in thedesign stages and throughout research and development. LCAenables the researchers to implement changes to modify andimprove the sustainability of the entire life cycle, resulting in amore environmentally friendly product or process than other-wise might be produced.
A complete LCA typically will evaluate multiple impact cat-egories, including global warming potential, acidification,eutrophication, resource depletion, and water use. While LCAcan certainly be employed to evaluate a wide range of sustain-ability indicators, this study focuses only on global warmingpotential as it will help determine the maximum amount ofnatural gas that can be co-processed and still meet theRenewable Fuel Standard (RFS) GHG emission targets foradvanced biofuels (i.e., a 50% reduction from petroleum fuel).
The scope of the LCA study concentrates on WTW life cycleGHG emissions represented in grams of carbon dioxide equi-valent (CO2e) using a 100-year GHG emission factor.68 Thesystem boundaries for the LCA analysis are shown in Fig. 2.LCA includes all the stages of a product’s life—from the extrac-tion of raw materials through the materials’ processing, manu-
Fig. 2 Life cycle stages considered in the GBtL pathway.
Green Chemistry Paper
This journal is © The Royal Society of Chemistry 2018 Green Chem., 2018, 20, 5358–5373 | 5363
Ope
n A
cces
s A
rtic
le. P
ublis
hed
on 0
7 N
ovem
ber
2018
. Dow
nloa
ded
on 1
/14/
2022
1:1
5:50
AM
. T
his
artic
le is
lice
nsed
und
er a
Cre
ativ
e C
omm
ons
Attr
ibut
ion-
Non
Com
mer
cial
3.0
Unp
orte
d L
icen
ce.
View Article Online
facturing, distribution, use, and disposal or recycling. For thisanalysis, we account for all the stages in the life cycle of thehydrocarbon fuel, including feedstock production and logis-tics, fuel production and transportation, and fuel consump-tion. The functional unit is 1 megajoule (MJ) of fuel consumed(i.e., WTW).
The LCA model is developed with SimaPro v.8.0.2 soft-ware,69 which is used to develop and link units quantifying lifecycle impacts. GHG basis values for biomass feedstock pro-duction and logistics, fuel transportation and end use, electri-city, hydrogen, and NG are applied consistently with the valuesutilized in Argonne National Laboratory’s GREET model soft-ware.70 The Ecoinvent v.2.2 database71 and the U.S. Life CycleInventory72 processes are used to fill the data gaps. It isassumed that carbon sequestered during growth of biomassends up in the fuel production step and returns to the atmo-sphere in the exhaust stream after the fuel combusts in theengine and is treated as credit. The material and energy flowsfor the GBtL conversion step capture the impacts of input rawmaterials, and outputs, such as emissions, wastes, and copro-ducts as predicted by the process model. The coproducts(excess electricity, wax, hydrogen, and sulfur) are treated asavoided products using the product displacement method.73
Coproduct displacement (also termed system boundary expan-sion) is based on the concept of displacing the existingproduct with the new product.
4. Results and discussion4.1 Baseline TEA results
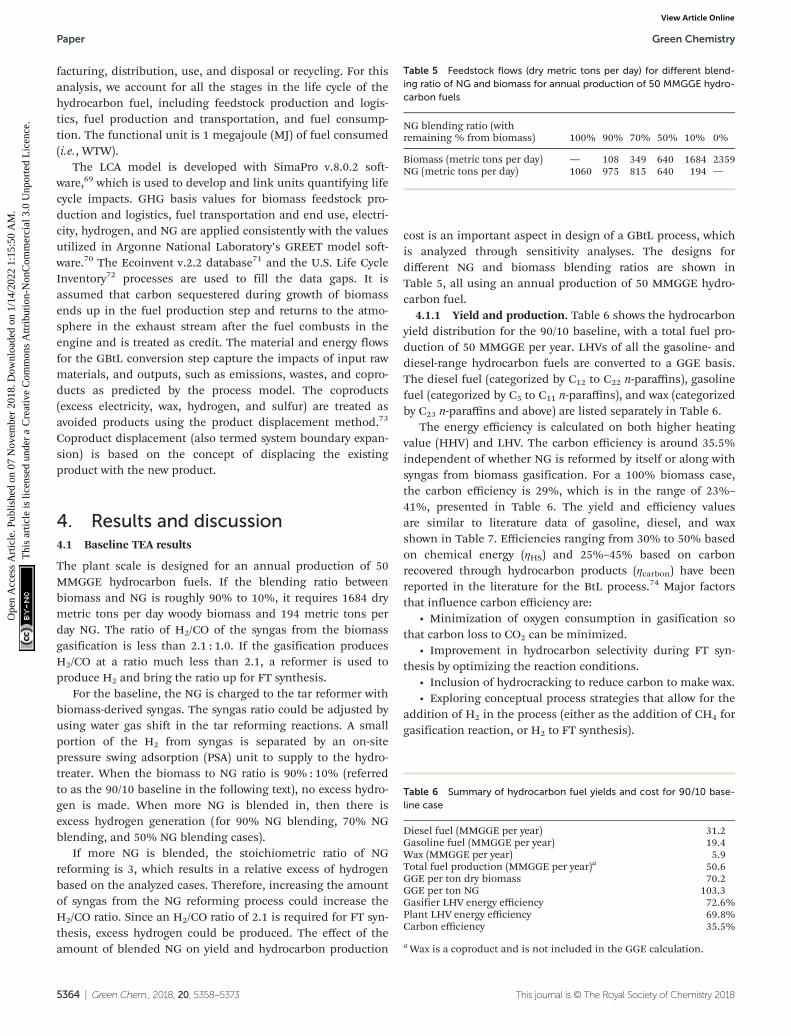
The plant scale is designed for an annual production of 50MMGGE hydrocarbon fuels. If the blending ratio betweenbiomass and NG is roughly 90% to 10%, it requires 1684 drymetric tons per day woody biomass and 194 metric tons perday NG. The ratio of H2/CO of the syngas from the biomassgasification is less than 2.1 : 1.0. If the gasification producesH2/CO at a ratio much less than 2.1, a reformer is used toproduce H2 and bring the ratio up for FT synthesis.
For the baseline, the NG is charged to the tar reformer withbiomass-derived syngas. The syngas ratio could be adjusted byusing water gas shift in the tar reforming reactions. A smallportion of the H2 from syngas is separated by an on-sitepressure swing adsorption (PSA) unit to supply to the hydro-treater. When the biomass to NG ratio is 90% : 10% (referredto as the 90/10 baseline in the following text), no excess hydro-gen is made. When more NG is blended in, then there isexcess hydrogen generation (for 90% NG blending, 70% NGblending, and 50% NG blending cases).
If more NG is blended, the stoichiometric ratio of NGreforming is 3, which results in a relative excess of hydrogenbased on the analyzed cases. Therefore, increasing the amountof syngas from the NG reforming process could increase theH2/CO ratio. Since an H2/CO ratio of 2.1 is required for FT syn-thesis, excess hydrogen could be produced. The effect of theamount of blended NG on yield and hydrocarbon production
cost is an important aspect in design of a GBtL process, whichis analyzed through sensitivity analyses. The designs fordifferent NG and biomass blending ratios are shown inTable 5, all using an annual production of 50 MMGGE hydro-carbon fuel.
4.1.1 Yield and production. Table 6 shows the hydrocarbonyield distribution for the 90/10 baseline, with a total fuel pro-duction of 50 MMGGE per year. LHVs of all the gasoline- anddiesel-range hydrocarbon fuels are converted to a GGE basis.The diesel fuel (categorized by C12 to C22 n-paraffins), gasolinefuel (categorized by C5 to C11 n-paraffins), and wax (categorizedby C23 n-paraffins and above) are listed separately in Table 6.
The energy efficiency is calculated on both higher heatingvalue (HHV) and LHV. The carbon efficiency is around 35.5%independent of whether NG is reformed by itself or along withsyngas from biomass gasification. For a 100% biomass case,the carbon efficiency is 29%, which is in the range of 23%–
41%, presented in Table 6. The yield and efficiency valuesare similar to literature data of gasoline, diesel, and waxshown in Table 7. Efficiencies ranging from 30% to 50% basedon chemical energy (ηHS) and 25%–45% based on carbonrecovered through hydrocarbon products (ηcarbon) have beenreported in the literature for the BtL process.74 Major factorsthat influence carbon efficiency are:
• Minimization of oxygen consumption in gasification sothat carbon loss to CO2 can be minimized.
• Improvement in hydrocarbon selectivity during FT syn-thesis by optimizing the reaction conditions.
• Inclusion of hydrocracking to reduce carbon to make wax.• Exploring conceptual process strategies that allow for the
addition of H2 in the process (either as the addition of CH4 forgasification reaction, or H2 to FT synthesis).
Table 5 Feedstock flows (dry metric tons per day) for different blend-ing ratio of NG and biomass for annual production of 50 MMGGE hydro-carbon fuels
NG blending ratio (withremaining % from biomass) 100% 90% 70% 50% 10% 0%
Biomass (metric tons per day) — 108 349 640 1684 2359NG (metric tons per day) 1060 975 815 640 194 —
Table 6 Summary of hydrocarbon fuel yields and cost for 90/10 base-line case
Diesel fuel (MMGGE per year) 31.2Gasoline fuel (MMGGE per year) 19.4Wax (MMGGE per year) 5.9Total fuel production (MMGGE per year)a 50.6GGE per ton dry biomass 70.2GGE per ton NG 103.3Gasifier LHV energy efficiency 72.6%Plant LHV energy efficiency 69.8%Carbon efficiency 35.5%
aWax is a coproduct and is not included in the GGE calculation.
Paper Green Chemistry
5364 | Green Chem., 2018, 20, 5358–5373 This journal is © The Royal Society of Chemistry 2018
Ope
n A
cces
s A
rtic
le. P
ublis
hed
on 0
7 N
ovem
ber
2018
. Dow
nloa
ded
on 1
/14/
2022
1:1
5:50
AM
. T
his
artic
le is
lice
nsed
und
er a
Cre
ativ
e C
omm
ons
Attr
ibut
ion-
Non
Com
mer
cial
3.0
Unp
orte
d L
icen
ce.
View Article Online

4.1.2 Operating cost. Raw materials costs include feedstock(biomass and NG), chemicals (e.g., boiler chemicals, coolingtower chemicals, ammonia, and catalysts), and waste disposal.All of the unit costs for materials are listed in Table 2 in 2011U.S. dollars. The biomass feedstock price has been consideredas $80 per dry short ton, contributing $1.0 per GGE. NG isanother raw feedstock, which contributes to $0.34 per GGE.NG price is considered as $238.80 per ton, equivalent to $5 perMMBTU in 2011$.78
The total hydrocarbon fuels production costs using GGE asa basis is shown in Table 8, with electricity and wax as copro-ducts. A portion of the electricity generated is used to powerthe facility, while the remaining electricity is sold to the gridas a coproduct. For the purpose of optimizing the overallprocess economics, the excess electricity is minimized in theprocess modeling, while maintaining energy integration of theentire facility.
4.1.3 Capital cost. Previous NREL studies have been uti-lized for sizing the equipment and for calculating capitalcosts, which are based on vendor quotes and literature.42,43
Table 9 shows the capital cost distribution of each section forboth processes. The baseline FT reactor is designed at 446 °F(230 °C) LTFT using a cobalt-based slurry column reactor. TheFT synthesis system has the largest cost contribution of 47% ofthe total capital cost. The gas conditioning and gasificationareas play an important role and constitute 21% of the totalcapital cost. The utility area also constitutes 11% of the totalcapital cost, indicating that heat integration is critical to thisthermochemical pathway. The Lang Factor is 4.0, whichincludes all the equipment cost, additional installation andindirect costs. The total capital investment is $570 MM for a
facility with an annual production of 50 MMGGE hydrocarbonfuels.
4.1.4 Minimum fuel selling price. Using a 10% IRR anddiscounted case flow methodologies, MFSP can be estimatedsimilar to previous TEA approaches.79,80 The total productioncost of gasoline- and diesel-range fuel production from GBtLincludes variable operating costs, fixed operating costs (labor,supplies, and overhead), capital depreciation, average incometax, and average return on investment. The plant capacity is 50MMGGE per year, which has an input of 1684 dry metric tonswoody biomass and the imported NG is calculated as 194 metrictons per day (10% NG co-feeding with 90% biomass). Fig. 3 and
Table 9 Capital cost for GBtL for hydrocarbon fuel production for 90/10 base case in 2011$ (MM)
Installed costs Cost
Gasification $57Gas conditioning $69FT synthesis $155Product separation $5Cooling water $4Utilities (combined heat and power) $37Total installed cost $327Total indirect cost $203Fixed capital investment $541Total capital investment $570
Fig. 3 MFSP cost distribution for 90/10 base case in GGE basis.
Table 7 Yield and efficiency values (carbon or heating value ratio of liquid hydrocarbon products and biomass feedstock) from FT process studies74
Tijmensen et al.66 Dimmig et al.75 Schaub76 Leible et al.77
Feed flow dry (tons per h) 80 100 100 20–25Feed flow dry (GW) 0.37 0.5 0.5 20–25Product flow 30–45Gasoline (tons per h) 6–7 6–12Diesel (tons per h) 9–10 0–1Total hydrocarbon (tons per h) 10–15 18 15–17 10–14ηcarbon
a % 23–41 36 34 23–27ηHS
b % 32–51 45 42 29–34
a ηcarbon is defined as the ratio of the mass of carbon (mC) in C5–C20 to the mass of carbon (mC) in biomass feed. b ηHS is defined as the conver-sion efficiency based on the HHV. It is defined as the ratio of HHV of C5–C20 to the HHV of the biomass feed.
Table 8 OPEX distribution for all hydrocarbons (C5–C23) for 90/10base case, per GGE basis
Parameters Cost ($ per GGE)
Feedstock $0.98NG $0.34Other raw materials $0.12Waste disposal $0.01Electricity ($0.14)Wax ($0.40)Total OPEX $0.90
Green Chemistry Paper
This journal is © The Royal Society of Chemistry 2018 Green Chem., 2018, 20, 5358–5373 | 5365
Ope
n A
cces
s A
rtic
le. P
ublis
hed
on 0
7 N
ovem
ber
2018
. Dow
nloa
ded
on 1
/14/
2022
1:1
5:50
AM
. T
his
artic
le is
lice
nsed
und
er a
Cre
ativ
e C
omm
ons
Attr
ibut
ion-
Non
Com
mer
cial
3.0
Unp
orte
d L
icen
ce.
View Article Online

Table 10 show the MFSP. The hydrocarbons (C5 to C23) are con-verted to GGE using the LHV. The coproducts considered areelectricity and wax, and hydrogen in some cases. As indicatedin Fig. 3, the average return on investment, NG, and feedstockcosts are the most important positive operating costs. TheMFSP is calculated based on the LHV of the produced hydro-carbons using diesel fuel and GGE basis. The MFSP is $2.99per GGE for the GBtL baseline (90% biomass and 10% NG).Table 10 shows the MFSP distributions on a GGE basis.
4.2 Sensitivity analysis results
For single-point sensitivity analysis, several critical parametersare explored, including variations of selected key parameters.The difference of scenario analysis and single-point sensitivityanalysis is that several processing parameters have beenadjusted with each α value while in single-point sensitivity ana-lysis; all other process parameters are kept unchanged.
4.2.1 Tornado chart. Fig. 4–6 show the sensitivity analysesfor 50 MMGY capacity cases whose NG blending ratios are10%, 50%, and 90%, respectively. These three cases areselected to see the impacts of the sensitivity parameters on thefinal MFSP for a facility with different NG blending ratios. Theselection of 90%, 10%, and 50% NG is intended to reflecthigh, middle, and low points on a blending curve, so thatdifferent ranges of NG blending ratios could be investigated.The mass flows of both NG and biomass for these three casesare given in Table 11, all targeting to produce 50 MMGY ofhydrocarbon fuels. The selected sensitivity parameters areplant scale, biomass price, total capital cost, syngas split ratioto syngas versus combustor, FT synthesis reactor capital cost,
Table 10 MFSP distribution (2011$) for 90/10 base case in GGE basis
Parameters $ per GGE
Total OPEX $0.9Fixed costs $0.4Capital depreciation $0.4Average income tax $0.2Average return on investment $1.0MFSP $2.99
Fig. 4 Tornado chart for 10% NG and 90% biomass GBtL process with annual 50 MMGY hydrocarbon fuels.
Fig. 5 Tornado chart for 50% NG and 50% biomass GBtL process with annual 50 MMGY hydrocarbons.
Paper Green Chemistry
5366 | Green Chem., 2018, 20, 5358–5373 This journal is © The Royal Society of Chemistry 2018
Ope
n A
cces
s A
rtic
le. P
ublis
hed
on 0
7 N
ovem
ber
2018
. Dow
nloa
ded
on 1
/14/
2022
1:1
5:50
AM
. T
his
artic
le is
lice
nsed
und
er a
Cre
ativ
e C
omm
ons
Attr
ibut
ion-
Non
Com
mer
cial
3.0
Unp
orte
d L
icen
ce.
View Article Online

gasifier capital cost, tar reformer capital cost and pressure,and electricity, wax, NG, and hydrogen prices for all threeblending ratios.
The syngas split ratio represents the portion of recycled.Syngas that is sent to the tar reformer. It is a significant para-meter for the GBtL system since it affects the yield of CO andH2 and the hydrocarbon fuel production capacity and cost.The tar reformer pressure could affect the heat requirement ofthe tar reformer and influence the heat balance of the GBtLsystem. The plant scale ranges from 10 to 100 MMGY. The gasi-fier cost, tar reformer cost, FT synthesis area cost, wax copro-duct credit, and the total capital cost is varied in the range of50%–150% of the baseline.
NG price range is defined from EIA data to be $3–$9.40 perMMBTU.78 The electricity price range is based on the historyof the minimum and maximum average retail monthly electri-city price during 2001 to 2015 from EIA81 to be 4.71–7.72 centsper kWh. For some cases, when co-feeding a high percentageof hydrogen-rich NG, there is excess hydrogen production forcoproduct revenue. The hydrogen price is assumed to be$1.29 kg−1 for the baseline and ranges from $0.50 to $3 kg−1.
Fig. 4 shows the sensitivity analyses for 10% NG in the 50MMGY capacity case, with calculated MFSP from $2.23 to$4.94 per GGE. Capital cost is second only to plant scale, influ-encing cost significantly. MFSP could be as high as $3.74 perGGE when the capital cost is increased to 150% of the baseline
capital cost. Higher α values also favor cost reduction. FT kine-tics are the third most important parameter, which results in arange of $2.75–$4.25 per GGE of MFSP. Among all the processareas, the FT synthesis area constitutes the largest portion ofthe total capital cost, and hence the FT reactor contributes tocapital cost significantly. Because the blended NG is only 10%of total feedstock, the mass flow of NG is 194 metric tons perday, which is much lower than mass flow of biomass at1684 metric tons per day. As a result, the NG price has asmaller effect on the MFSP than biomass cost.
In summary, plant scale is always the most important factorfor all three analyses in varying the blending ratio of NG andbiomass. Other factors like capital cost, raw materials, andcoproduct prices are the major cost drivers. Along with thechange of blending ratio of NG and biomass, the order ofimportance for the parameters changes accordingly. The moreNG that is blended in, the more important its cost. The keycost drivers are blending ratios of NG, optimization of heatintegration of the process, and the reduction of excess hydro-gen and electricity production.
4.2.2 Plant scale and blending ratio of NG and biomass. InTable 11, variations of the blending ratio between biomassand NG are studied for carbon efficiency and capital cost, witha targeted plant scale of 50 MMGY. The carbon efficiency forthe GBtL process is improved from 29% to 45% if the weightpercentage of NG blended is increased from 0% to 100%, so
Fig. 6 Tornado chart for 90% NG and 10% biomass GBtL process with annual production of 50 MMGY hydrocarbons.
Table 11 TEA results for different NG blending ratios (at capacity of 50 MMGY)
Blending NG %(remaining percentage from woody biomass) 100% of NG 90% of NG 70% of NG 50% of NG 10% of NG 0% NG
Biomass (metric tons per day) — 108 349 640 1684 2359NG (metric tons per day) 949 975 815 640 194 —MFSP ($ per GGE) 2.22 2.38 2.43 2.53 2.99 3.28Carbon efficiency (wt%) 50.13% 45.3% 45.1% 44.2% 35.5% 29.7%Fixed capital investment ($MM) 461 463 453 461 541 618GGE per ton biomass — 89.5 89.2 87.3 70.2 58.6GGE per ton NG 145.36 131.7 131.3 128.5 103.3 —Gal per dry ton biomass — 90.5 90.1 88.3 70.9 59.2
Green Chemistry Paper
This journal is © The Royal Society of Chemistry 2018 Green Chem., 2018, 20, 5358–5373 | 5367
Ope
n A
cces
s A
rtic
le. P
ublis
hed
on 0
7 N
ovem
ber
2018
. Dow
nloa
ded
on 1
/14/
2022
1:1
5:50
AM
. T
his
artic
le is
lice
nsed
und
er a
Cre
ativ
e C
omm
ons
Attr
ibut
ion-
Non
Com
mer
cial
3.0
Unp
orte
d L
icen
ce.
View Article Online

hydrocarbon production increases. Also, the capital cost isdecreased along with increasing of the NG blending ratiobecause the capital cost of gasifiers is reduced if comparativelyless amount of biomass is used. Fig. 7 shows the effect of bothplant scale (from 10 to 100 MMGY) and blending ratios of NGand biomass (0% to 100% mass flow of NG).
There are a few important insights that have been identi-fied by studying the variation of the blending ratio of NG andbiomass feedstocks. First, the MFSP decreases with theincrease of production capacity, due to economies of scale.Second, when the NG blending ratio is less than 50%, theratio of H2/CO for the syngas used for FT synthesis is lowerthan the targeted 2.1 for FT synthesis, which requires thewater gas shift reaction in the reforming step to increase theamount of hydrogen. As a result, there is no excess hydrogenproduced. When the NG blending ratio is higher or equal to50%, the ratio of H2/CO for the syngas would be higher than2.1, so water–gas shift is no longer needed. A PSA unit isemployed to split a portion of the hydrogen from the syngas.The excess hydrogen split from the PSA unit is sold as thecoproduct.
The co-feeding of biomass along with NG offers the advan-tage of the economies of scale associated with NG. Forinstance, if the cost target is $3 per GGE, the plant capacityhas to be more than 70 MMGY for BtL (0% NG curve shown inFig. 7). However, approaching the same cost target, the plantcapacity could be reduced to 50 MMGY with the blending of10% NG and 90% biomass. The plant capacity could befurther reduced to 20 MMGY if using 100% NG as feedstocks.This is not only because NG has a higher heating value perweight, but also because blending NG with cellulosic materialscould increase the total hydrocarbon yields. Co-feeding ofbiomass with NG would simultaneously reduce the carbondioxide emissions of NG by integrating it with a renewablefeedstock. Additional investigation on LCA on various blend-ing ratios of biomass and NG is discussed in the life cycleassessment results section.
4.2.3. Energy integration and its impacts to cost of liquidfuels. Unconverted syngas is recycled and split into two
streams. One stream is sent to the fuel combustor to generatethe heat for the whole GBtL energy demand (heating andpower), while the other stream is recycled to the tar reformerto improve total carbon efficiency of feedstocks. In the AspenPlus model, the split of the recycled syngas is modeled by asplitter with a specific split ratio. This specified split ratiorepresents the portion of recycled syngas that is sent to thetar reformer. It is a significant parameter for the GBtL systemsince it affects the yield of CO and H2, hydrocarbon fuel pro-duction, and ultimately cost. Ideally, only sufficient syngasshould be sent to the combustor so that the hydrocarbon pro-duction would be maximized if more syngas is sent to the tarreformer. On the other hand, the electricity production forthe GBtL system would be enhanced if more syngas is sent tothe combustor for heat generation. More electricity pro-duction means lower hydrocarbon yield, resulting in higherMFSP, even if excess electricity is sold to the grid as acoproduct.
Fig. 8 shows the effect of the syngas split ratio on MFSP andMMGY using 90% biomass and 10% NG. The split ratio rangesfrom 0.5 to 0.9 are studied. As indicated in Fig. 8, the MFSP islinearly reduced from $3.3 per GGE to $2.9 per GGE if the splitratio increases from 0.5 to 0.9 at an electricity selling price of5.72 cents per kWh.81 This is due to hydrocarbon productionthat is linearly increased from 38.5 to 53 MMGY. As also high-lighted in the figure, the impact of this syngas split ratio varieswhen assuming different electricity prices.
The trend of MFSP based on the 4.71 cents per kWh casehas a sharper slope than that based on the 7.72 cents perkWh. When the electricity price is high enough, the effect ofthe syngas split ratio on the MFSP is minimized due to animproved value obtained with the sale of electricity.
4.2.4 Tar reformer pressure. The tar reformer pressure isanother important factor that influences the MFSP. Fig. 9shows the effect of tar reforming pressure on the MFSP for the10% NG blending ratio (at a capacity of 50 MMGY hydrocarbonfuel production), assuming pressure changing from 30 to72.5 psia. The resulting MFSP increases from $2.99 to $3.24per GGE, due to incremental cost in constructing thicker reac-tors to meet pressure ratings. Aspen Economic Analyzer isused to detect the relationship between pressure rating andequipment cost for the tar reformer. It is found that the equip-
Fig. 8 The effect of syngas split ratio on MFSP and MMGY using 90%biomass and 10% NG.
Fig. 7 The effect of both plant scales and NG and biomass blendingratios on MFSP.
Paper Green Chemistry
5368 | Green Chem., 2018, 20, 5358–5373 This journal is © The Royal Society of Chemistry 2018
Ope
n A
cces
s A
rtic
le. P
ublis
hed
on 0
7 N
ovem
ber
2018
. Dow
nloa
ded
on 1
/14/
2022
1:1
5:50
AM
. T
his
artic
le is
lice
nsed
und
er a
Cre
ativ
e C
omm
ons
Attr
ibut
ion-
Non
Com
mer
cial
3.0
Unp
orte
d L
icen
ce.
View Article Online

ment cost increases linearly with the pressure rating, fromeqn (5):
Equipment cost ð$MMÞ ¼ 0:1934� pressure ðpsiaÞ þ 0:8361:
ð5Þ
4.3 Life cycle assessment results
The projected WTW GHG emissions for a compression–ignition, direct injection vehicle using hydrocarbon fuel pro-duced via the GBtL as a function of the NG blending ratio isshown in Fig. 9. The stacked bar depicts the contribution fromeach life cycle stage. The WTW GHGs increases with increasingNG blending ratio, ranging from 2.05 g CO2e per MJ (0% NG)to 102 g CO2e per MJ (100% NG). Stages that contributed themost are the fuel production and fuel combustion. It is note-worthy that GHGs for the fuel combustion stage for all casesare identical at 73.5 g CO2e per MJ (same vehicle); however,biogenic CO2 (from fuel originated from biomass) in the fuelcombustion emission is credited, and consequently the netGHGs for the fuel combustion stage is directly proportional tothe NG blending ratio. For the 0% and 100% NG blendingcases, the fuel is derived entirely from the biomass and NG,respectively; all the fuel combustion CO2 emissions are bio-genic CO2 for the former and fossil CO2 for the later.
Coproduct credits are only associated with the conversionstage. As a design constraint, the process was designedwithout the need to purchase electricity or fossil fuel for plantoperations. For the cases that result in excess heat or powerproduction, energy in the form of electricity will be exported tothe grid for a coproduct credit. The electricity coproductcredits for the 0% and 10% NG cases are 7.1 and 8.3 g CO2e
per MJ, respectively. Excess electricity diminishes at a higherNG blending ratio, partly due to lower production of biocharthat is used for heat and power generation.
As the biofuel industry develops, TEA coupled with LCA willplay a key role in process development and targeting of techni-cal and economic barriers for the emerging conversion path-ways. As exhibited in Fig. 10, co-processing NG readily offersan economic advantage predominantly due to factors such ashigher NG conversion efficiency, lower capital cost (smallergasifier), and richer hydrogen content in the feedstock.
The improved MFSP is at the expense of environmental sus-tainability, namely higher fossil GHG emissions. The life cycleGHGs increase with increasing the NG blending ratio. Withoutany NG co-processing (0% NG case), the life cycle GHGs wereestimated to be 2.05 g CO2e per MJ, corresponding to a 98%GHG reduction relative to the 2005 petroleum diesel baselineGHGs (96.7 g CO2e per MJ).82 The WTW GHGs for the 100%NG blending case are 102 g CO2e per MJ and are similar to theGREET result for the NG-to-diesel via FT pathway at 104 g CO2e
per MJ.70 Below 90% NG blending ratio, NG co-processingexhibits life cycle WTW GHGs less than that from petroleumdiesel.
It is also determined that the current GBtL pathway canreadily co-process up to 28% NG and still meet the GHGthreshold reduction target for the advanced biofuels set by theU.S. Environmental Protection Agency (EPA).83 At 28% NGblending, the corresponding WTW GHG reduction and MFSPare 50% and $2.75 per GGE, respectively.
While not included in this study, the WTW GHG emissionscan potentially be further mitigated by implementing carbonmanagement practices at the biorefinery, such as carboncapture and sequestration technologies. Other alternativesincluding co-processing renewable biogas instead of pipelineNG can also improve the carbon footprint. These approacheswill lead to higher allowable NG blending ratio that will enablethe GBtL technology by displaying both economic and environ-mental sustainability.
5. Conclusion
Detailed GBtL economic and environmental analyses were per-formed using a blended feedstock consisting of woodybiomass and NG. The integrated process includes biomassgasification to syngas, NG steam reforming to syngas, and con-version of syngas to hydrocarbon blendstocks through FT.Consistent with other TEA efforts, a biomass feedstock cost of$80 per dry ton, NG price of $5 per MMBTU, and 90% overall
Fig. 9 Life cycle GHG emissions of hydrocarbon blendstock via GBtL asa function of NG blending ratio.
Fig. 10 MFSP and life cycle GHG emissions for hydrocarbon blendstockproduced via GBtL as a function of NG blending ratio, assuming annualproduction of 50 MMGY hydrocarbon fuels.
Green Chemistry Paper
This journal is © The Royal Society of Chemistry 2018 Green Chem., 2018, 20, 5358–5373 | 5369
Ope
n A
cces
s A
rtic
le. P
ublis
hed
on 0
7 N
ovem
ber
2018
. Dow
nloa
ded
on 1
/14/
2022
1:1
5:50
AM
. T
his
artic
le is
lice
nsed
und
er a
Cre
ativ
e C
omm
ons
Attr
ibut
ion-
Non
Com
mer
cial
3.0
Unp
orte
d L
icen
ce.
View Article Online

process efficiency was considered with 2011 as the cost yearbasis. When co-feeding 10% NG with 90% biomass, the MFSPfor this baseline model predicts $2.99 per GGE consideringhydrocarbon fuel production (22 MM gallons of jet fuel, 19MM gallons of naphtha, and 9 MM gallons of diesel), withannual total hydrocarbon production of 50 MMGGE.Sensitivity analyses were performed to understand the impactof variations in the biomass-to-natural-gas ratio, plant scales,design assumptions and NG prices on the economics and thedesign of the GBtL process. Key findings from this analysis aredescribed below.
At a NG price of $5 per MMBTU, the MFSP from this GBtLprocess is reduced by co-feeding NG. As the blending ratio ofNG to biomass increases, the MFSP decreases. However, theLCA study reveals that less than 30% (by weight) of NG can beblended to meet a 50% GHG emission reduction threshold,shown in Fig. 10. The key cost drivers are blending ratios ofNG, optimization of heat integration of the process, and thereduction of excess hydrogen and excess electricity production.The addition of methane from NG helps to overcome the lowamount of H2 in biomass, to bring the H2/CO ratio closer tothe desired 2.1 : 1. Thus, when combining both NG andbiomass to product hydrocarbon liquid fuels, carbon efficiencyof the hydrocarbon fuels is improved.
The co-feeding of biomass along with NG also offers theadvantage of the economies of scale associated with eitherbiomass or NG, while simultaneously reducing the carbondioxide emissions of NG by integrating it with a renewablefeedstock. If the goal is to achieve the same cost target, ahigher blending ratio of NG will result in a facility with smallerproduction capacity. The GBtL process provides better econ-omies of scale with higher NG blending ratios (see Fig. 10).Other more advanced and recently developed syngas-to-olefins, syngas-to-mixed-oxygenates, or syngas-to-mixed-alco-hols pathway technologies could be considered as processalternatives for future studies, which will help in providing agreater understanding of GBtL.
LCA results reveal that co-processing NG enables the econ-omic feasibility of converting biomass to the liquid fuel but atthe expense of environmental sustainability. The life cycleGHG emissions increase with increasing co-fed NG. To meetthe 50% life cycle GHG reduction threshold for advanced bio-fuels set by the EPA, the maximum NG blending ratio is deter-mined to be about 28%, corresponding with the favorableMFSP of $2.75 per GGE. Achieving even lower MFSP requiresco-processing NG higher than 28% without violating the GHGreduction requirement, and this can potentially be accom-plished by implementing carbon management practices at thebiorefinery and or co-processing renewable biogas instead ofpipeline NG.
Abbreviations
AGR Acid gas removalASF Anderson Schulz Flory
bbl BarrelBtL Biomass-to-liquidBTU British thermal unitCO2e Carbon dioxide equivalentCtL Coal-to-liquidEIA U.S. Energy Information AdministrationEPA U.S. Environmental Protection AgencyFT Fischer–TropschGBtL Natural gas and biomass-to-liquidGGE Gallon gasoline equivalentGHG Greenhouse gasGtL Gas-to-liquidHHV Higher heating valueIRR Internal rate of returnkBD Thousand barrels per dayLCA Life cycle assessmentLHV Lower heating valueLTFT Low-temperature Fischer–TropschMFSP Minimum fuel selling price, cost based on the sum
of all the hydrocarbons using gallon gasoline equi-valent basis
MJ MegajouleMM MillionMMGY Million gallon gasoline equivalent per yearNG Natural gasNREL National Renewable Energy LaboratoryOPEX Operating expenseOT-CCS Once-through with CO2 captureOT-V Once-through with CO2 ventingPSA Pressure swing adsorptionR&D Research and developmentRFS Renewable Fuel Standardscfpd Standard cubic feet per daySMR Steam methane reformerTEA Techno-economic analysisU.S. United StatesWTW Well-to-wheel
Conflicts of interest
There are no conflicts to declare.
Acknowledgements
The work was supported by the U.S. Department of EnergyBioenergy Technologies Office under Contract No. DE-AC36-08GO28308 with the National Renewable Energy Laboratory.The views and opinions of the authors expressed herein do notnecessarily state or reflect those of the United StatesGovernment or any agency thereof. Neither the United StatesGovernment nor any agency thereof, nor any of their employ-ees, makes any warranty, expressed or implied, or assumes anylegal liability or responsibility for the accuracy, completeness,or usefulness of any information, apparatus, product, or
Paper Green Chemistry
5370 | Green Chem., 2018, 20, 5358–5373 This journal is © The Royal Society of Chemistry 2018
Ope
n A
cces
s A
rtic
le. P
ublis
hed
on 0
7 N
ovem
ber
2018
. Dow
nloa
ded
on 1
/14/
2022
1:1
5:50
AM
. T
his
artic
le is
lice
nsed
und
er a
Cre
ativ
e C
omm
ons
Attr
ibut
ion-
Non
Com
mer
cial
3.0
Unp
orte
d L
icen
ce.
View Article Online

process disclosed, or represents that its use would not infringeprivately owned rights. Author E. C. D. T. contributed the LCAstudy. We appreciate all the editing help from our technicaleditors, Justin A. Rickard, Kathy L. Cisar and Billie Christen.
Notes and references
1 U.S. Energy Information Administration, InternationalEnergy Outlook 2014: World Petroleum and Other LiquidFuels, Report DOE/EIA-0484(2014), 2014.
2 Bioenergy Technolgies Office, The Potential for Natural Gasto Enhance Biomass Technologies, 2014.
3 U.S. Department of Energy, EERE/BETO, Growing America’sEnergy Future, 2013.
4 A. Dutta, J. Hensley, R. Bain, K. Magrini, E. C. D. Tan,G. Apanel, D. Barton, P. Groenendijk, D. Ferrari,W. Jablonski and D. Carpenter, Technoeconomic Analysisfor the Production of Mixed Alcohols via IndirectGasification of Biomass Based on DemonstrationExperiments, Ind. Eng. Chem. Res., 2014, 53, 12149–12159.
5 A. H. Lillebø, A. Holmen, B. C. Enger and E. A. Blekkan,Fischer–Tropsch conversion of biomass-derived synthesisgas to liquid fuels, Wiley Interdiscip. Rev.: Energy Environ.,2013, 2, 507–524.
6 N. E. T. Laboratory (NETL), Analysis of Natural Gas-to LiquidTransportation Fuels via Fischer-Tropsch, Report DOE/NETL-2013/1597, U.S. Department of Energy, Office ofFossil Energy, 2013.
7 N. E. T. L. (NETL), Baseline Technical and EconomicAssessment of a Commercial Scale Fischer–Tropsch LiquidsFacility, Report DOE-NETL-2007/1260, 2007.
8 H. A. Wright, J. D. Allison, D. S. Jack, G. H. Lewis andS. R. Landis, ConocoPhillips GTL Technology: The COPox™Process as the SynGas Generator, Prepr. Pap.-Am. Chem.Soc., Div. Fuel Chem., 2003, 48, 791–792.
9 R. Rauch, J. Hrbek and H. Hofbauer, Biomass gasificationfor synthesis gas production and applications of thesyngas, Wiley Interdiscip. Rev.: Energy Environ., 2014, 3, 343–362.
10 C. Higman and S. Tam, Advances in Coal Gasification,Hydrogenation, and Gas Treating for the Production ofChemicals and Fuels, Chem. Rev., 2014, 114, 1673–1708.
11 M. E. Dry, High quality diesel via the Fischer–Tropschprocess – a review, J. Chem. Technol. Biotechnol., 2002, 77,43–50.
12 A. M. Saib, D. J. Moodley, I. M. Ciobîcă, M. M. Hauman,B. H. Sigwebela, C. J. Weststrate, J. W. Niemantsverdrietand J. van de Loosdrecht, Fundamental understanding ofdeactivation and regeneration of cobalt Fischer–Tropschsynthesis catalysts, Catal. Today, 2010, 154, 271–282.
13 Shell News, Pearl GTL – an overview, http://www.shell.com/global/aboutshell/major-projects-2/pearl/overview.html.
14 R. C. Baliban, J. A. Elia and C. A. Floudas, Biomass toliquid transportation fuels (BTL) systems: Process synthesis
and global optimization framework, Energy Environ. Sci.,2013, 6, 267–287.
15 R. C. Baliban, J. A. Elia, C. A. Floudas, B. Gurau,M. B. Weingarten and S. D. Klotz, Hardwood biomass togasoline, diesel, and jet fuel: 1. Process synthesis andglobal optimization of a thermochemical refinery, EnergyFuels, 2013, 27, 4302–4324.
16 G. Haarlemmer, G. Boissonnet, E. Peduzzi andP.-A. Setier, Investment and production costs ofsynthetic fuels – A literature survey, Energy, 2014, 66, 667–676.
17 USDoE, Coal and Biomass to Liquids, http://energy.gov/fe/coal-and-biomass-liquids, accessed May 19, 2015.
18 A. M. Niziolek, O. Onel, J. A. Elia, R. C. Baliban, X. Xiaoand C. A. Floudas, Coal and biomass to liquid transpor-tation fuels: Process synthesis and global optimizationstrategies, Ind. Eng. Chem. Res., 2014, 53, 17002–17025.
19 R. C. Baliban, J. A. Elia, V. Weekman and C. A. Floudas,Process synthesis of hybrid coal, biomass, and natural gasto liquids via Fischer-Tropsch synthesis, ZSM-5 catalyticconversion, methanol synthesis, methanol-to-gasoline, andmethanolto-olefins/distillate technologies, Comput. Chem.Eng., 2012, 47, 29–56.
20 J. A. Elia, R. C. Baliban and C. A. Floudas, Toward novelhybrid biomass, coal, and natural gas processes for satisfy-ing current transportation fuel demands, 2: Simultaneousheat and power integration, Ind. Eng. Chem. Res., 2010, 49,7371–7388.
21 R. C. Baliban, J. A. Elia and C. A. Floudas, Optimizationframework for the simultaneous process synthesis, heatand power integration of a thermochemical hybridbiomass, coal, and natural gas facility, Comput. Chem. Eng.,2011, 35, 1647–1690.
22 R. C. Baliban, J. A. Elia and C. A. Floudas, Simultaneousprocess synthesis, heat, power, and water integration ofthermochemical hybrid biomass, coal, and natural gasfacilities, Comput. Chem. Eng., 2012, 37, 297–327.
23 Z. Haq and P. Gupte, The Potential for Natural Gas toEnhance Biomass Technologies: Technical Barriers andGreenhouse Gas Emissions/Resource Potential, http://energy.gov/sites/prod/files/2014/04/f14/february2014_gbtl_webinar.pdf, accessed May 18, 2015.
24 Y. Dong and M. Steinberg, Hynol - An economical processfor methanol production from biomass and natural gaswith reduced CO2 emission, Int. J. Hydrogen Energy, 1997,22, 971–977.
25 R. H. Borgwardt, Biomass and natural gas as co-feedstocksfor production of fuel for fuel-cell vehicles, BiomassBioenergy, 1997, 12, 333–345.
26 I. S. Ermolaev, V. S. Ermolaev and V. Z. Mordkovich,Efficiency of gas-to-liquids technology with different syn-thesis gas production methods, Ind. Eng. Chem. Res., 2014,53, 2758–2763.
27 A. de Klerk, in Fischer-Tropsch Refining, Wiley-VCH VerlagGmbH & Co. KGaA, 2011, pp. 73–103, DOI: 10.1002/9783527635603.ch4.
Green Chemistry Paper
This journal is © The Royal Society of Chemistry 2018 Green Chem., 2018, 20, 5358–5373 | 5371
Ope
n A
cces
s A
rtic
le. P
ublis
hed
on 0
7 N
ovem
ber
2018
. Dow
nloa
ded
on 1
/14/
2022
1:1
5:50
AM
. T
his
artic
le is
lice
nsed
und
er a
Cre
ativ
e C
omm
ons
Attr
ibut
ion-
Non
Com
mer
cial
3.0
Unp
orte
d L
icen
ce.
View Article Online

28 P. M. Maitlis and A. de Klerk, Greener Fischer-TropschProcesses for Fuels and Feedstocks, John Wiley & Sons,2013.
29 E. C. University, GTL Technology and Its Role in the WorldEnergy Markets (online), http://www.eni.com/en_IT/attach-ments/lavoraconnoi/pdf/GTL-technology.pdf.
30 D. A. Wood, C. Nwaoha and B. F. Towler, Gas-to-liquids(GTL): A review of an industry offering several routes formonetizing natural gas, J. Nat. Gas Sci. Eng., 2012, 9, 196–208.
31 E. D. Attanasi and P. A. Freeman, Role of stranded gas inincreasing global gas supplies, Report 2013–1044, U.S.Geological Survey Open-File Report, 2013.
32 R. C. Baliban, J. A. Elia and C. A. Floudas, Biomass andnatural gas to liquid transportation fuels: Process syn-thesis, global optimization, and topology analysis, Ind. Eng.Chem. Res., 2013, 52, 3381–3406.
33 O. Onel, A. M. Niziolek, J. A. Elia, R. C. Baliban andC. A. Floudas, Biomass and natural gas to liquid transpor-tation fuels and olefins (BGTL+C2-C4): Process synthesisand global optimization, Ind. Eng. Chem. Res., 2015, 54,359–385.
34 A. M. Niziolek, O. Onel, J. A. Elia, R. C. Baliban andC. A. Floudas, Coproduction of liquid transportation fuelsand C6_C8 aromatics from biomass and natural gas, AIChEJ., 2015, 61, 831–856.
35 T. Fleisch, Associated Gas Monetization via miniGTLConversion of flared gas into liquid fuels & chemicals, GlobalGas Flaring Reduction Partnership, The World Bank, 2014.
36 S. Chakravarti, D. P. Bonaquist, R. F. Drnevich andM. M. Shah, Natural gas enhanced biomass to liquids:Project development and modeling, Comput. Chem. Eng.,2012, 47, 67–75.
37 S. Chakravarti, R. F. Drnevich, D. P. Bonaquist andG. Panuccio, Using fossil fuels to increase biomass-basedfuel benefits, Google Patents, 2013.
38 R. C. Baliban, J. A. Elia and C. A. Floudas, Biomass andNatural Gas to Liquid Transportation Fuels: ProcessSynthesis, Global Optimization, and Topology Analysis,Ind. Eng. Chem. Res., 2013, 52, 3381–3406.
39 O. Onel, A. M. Niziolek, J. A. Elia, R. C. Baliban andC. A. Floudas, Biomass and natural gas to liquid transpor-tation fuels and olefins (BGTL+C2_C4): process synthesisand global optimization, Ind. Eng. Chem. Res., 2015, 54,359–385.
40 G. Liu, R. H. Williams, E. D. Larson and T. G. Kreutz,Design/economics of low-carbon power generation fromnatural gas and biomass with synthetic fuels co-pro-duction, Energy Procedia, 2011, 4, 1989–1996.
41 M. M. Wright, N. Seifkar, W. H. Green and Y. Román-Leshkov, Natural Gas and Cellulosic Biomass: A Clean FuelCombination? Determining the Natural Gas Blending Wallin Biofuel Production, Environ. Sci. Technol., 2015, 49,8183–8192.
42 A. Dutta, M. Talmadge, J. Hensley, M. Worley, D. Dudgeon,D. Barton, P. Groenendijk, D. Ferrari, B. Stears,
E. M. Searcy, C. T. Wright and J. R. Hess, Process Design andEconomics for Conversion of Lignocellulosic Biomass toEthanol, Thermaochemical Pathway by Indirect Gasificationand Mixed Alcohol Synthesis, Report NREL/TP-5100-51400,National Renewable Energy Laboratory, 2011.
43 R. Davis, Techno-economic analysis of current technology forFischer-Tropsch fuels production (EPA TechnicalMemorandum), 2009.
44 AspenPlusTM, Release 7.2, Aspen Technology Inc., CambridgeMA, 2007.
45 Chemical Engineering Magazine, Chemical EngineeringMagazine Plant Cost Index, 2011.
46 SRI Consulting, Chemical Economics Handbook, 2008.47 Bureau of Labor Statistics Data website, National
Employment, Hours, and Earnings Catalog, Industry:Chemicals and Allied Products, 1980–2009.
48 K. Randolph, Hydrogen Production-2013 Annual MeritReview and Peer Evaluation Meeting, 2013.
49 H2A Production Model, Version 3., http://www.hydrogen.energy.gov/h2a_production.html.
50 H. Knoef, Handbook Biomass Gasification, BTG biomasstechnology group, 2005.
51 E. Tan, M. Talmadge, A. Dutta, J. Hensley, J. Schaidle,M. Biddy, D. Humbird, L. J. Snowden-Swan, J. Ross,D. Sexton, R. Yap and J. Lukas, Process Design andEconomics for the Conversion of Lignocellulosic Biomass toHydrocarbons via Indirect Liquefaction, 2015.
52 U. S. Energy Information Administration, U.S. Natural GasPrices, http://www.eia.gov/dnav/ng/ng_pri_sum_dcu_nus_a.htm, accessed July 2013.
53 U. S. EIA, Electricity Retail Price to Consumers, http://www.eia.gov/electricity/data.cfm#sales, accessed July 2013.
54 A. Dutta, A. Sahir, E. Tan, D. Humbird, L. J. Snowden-Swan, P. Meyer, J. Ross, D. Sexton, R. Yap and J. Lukas,Process Design and Economics for the Conversion ofLignocellulosic Biomass to Hydrocarbon FuelsThermochemical Research Pathways with In Situ and Ex SituUpgrading of Fast Pyrolysis Vapors, Report NREL/TP-5100-62455, National Renewable Energy Laboratory, 2015.
55 Syntroleum, Syntroleum Analyst Day, http://library.corporate-ir.net/library/83/834/83417/items/201092/AnalystDay_June2006.pdf.
56 ICIS, Paraffin wax US prices, markets & analysis, https://www.icis.com/chemicals/paraffin-wax/us/, 2013.
57 U. S. Energy Information Administration, Petroleum andother Liquid, Refiner Gasoline Prices by Grade and SalesType, https://www.eia.gov/dnav/pet/pet_pri_refoth_dcu_nus_m.htm, accessed in 2012.
58 U. S. Energy Information Administration, Weekly RetailGasoline and Diesel Prices, http://www.eia.gov/dnav/pet/pet_pri_gnd_dcus_nus_a.htm, 2014.
59 B. Suresh, R. Gubler, X. He and Y. Yamaguchi, ChemicalEconomics Handbook Hydrogen (743.5000), IHS, 2015.
60 Y. R. Hicks and K. M. Tacina, Spring Technical Meeting ofthe Central States Section of the Combustion Institute April22–24, 2012, Comparing a Fischer-Tropsch Alternate Fuel to
Paper Green Chemistry
5372 | Green Chem., 2018, 20, 5358–5373 This journal is © The Royal Society of Chemistry 2018
Ope
n A
cces
s A
rtic
le. P
ublis
hed
on 0
7 N
ovem
ber
2018
. Dow
nloa
ded
on 1
/14/
2022
1:1
5:50
AM
. T
his
artic
le is
lice
nsed
und
er a
Cre
ativ
e C
omm
ons
Attr
ibut
ion-
Non
Com
mer
cial
3.0
Unp
orte
d L
icen
ce.
View Article Online
JP-8 and their 50-50 Blend: Flow and Flame VisualizationResults.
61 J. Klettlinger, R. Rich and C. Yen, Energytech, 2011 IEEE,Thermal Stability Testing of Fischer-Tropsch Fuel and VariousBlends With Jet A, as well as Aromatic Blend Additives, 2012.
62 A. Dutta, R. L. Bain and M. J. Biddy, Techno-economics ofthe production of mixed alcohols from lignocellulosicbiomass via high-temperature gasification, Environ. Prog.Sustainable Energy, 2010, 29, 163–174.
63 A. Dutta and S. Phillips, Thermochemical ethanol via directgasification and mixed alcohol synthesis of lignocellulosicbiomass, National Renewable Energy Laboratory Golden,CO, 2009.
64 R. L. Bain, K. A. Magrini-Bair, J. Hensley, W. S. Jablonski,K. M. Smith, K. R. Gaston and M. M. Yung, Pilot ScaleProduction of Mixed Alcohols from wood, Ind. Eng. Chem.Res., 2014, 53, 2204–2218.
65 A. de Klerk, in Kirk-Othmer Encyclopedia of ChemicalTechnology, 2013, DOI: 10.1002/0471238961.fiscdekl.a01.
66 M. J. A. Tijmensen, A. P. C. Faaij, C. N. Hamelinck andM. R. M. van Hardeveld, Exploration of the possibilities forproduction of Fischer Tropsch liquids and power viabiomass gasification, Biomass Bioenergy, 2002, 23, 129–152.
67 A. d. Klerk, Fischer-Tropsch fuels refinery design, EnergyEnviron. Sci., 2011, 4, 1177–1205.
68 S. Solomon, D. Qin, M. Manning, Z. Chen, M. Marquis,K. B. Averyt and H. L. Miller, Contribution of WorkingGroups I to the Fourth Assessment Report of theIntergovernmental Panel on Climate Change: Physical ScienceBasis, Report 0961-9534, Cambridge University Press,New York, USA, 2007.
69 SimaPro, v8.2.2, Product Ecology Consultants, Amersfoort,the Netherlands, 2016.
70 GREET2, The Greenhouse Gases, Regulated Emissions, andEnergy use in Transportation (GREET) model, in rev1,Argonne National Laboratory, 2012.
71 Ecoinvent, Ecoinvent, v.2.2; Swiss, Center for Life CycleInventories, Duebendorf, Switzerland, 2010.
72 LCI, U.S. Life-Cycle Inventory, v.1.6.0, National RenewableEnergy Laboratory, Golden, CO, 2008.
73 Q. Wang, J. Luo, Z. Zhong and A. Borgna, CO2 capture bysolid adsorbents and their applications: Current status andnew trends, Energy Environ. Sci., 2011, 4, 42–55.
74 D. Unruh, K. Pabst and G. Schaub, Fischer–Tropsch syn-fuels from biomass: maximizing carbon efficiency andhydrocarbon yield, Energy Fuels, 2010, 24, 2634–2641.
75 T. Dimmig and M. Olschar, Sekund€arenergietr€ager ausBiomasse, Eine systemanalytische Untersuchung.
76 G. Schaub, D. Unruh and M. Rohde, Biomasse-Vergasung;Der Konigsweg für eine effiziente Strom- und Kraftstoff-Bereitstellung? Landwirtschaftsverlag GmbH, Münster,Germany, Schriftenreihe Nachwachsende Rohstoffe, 2004,vol. 24, pp. 351–362.
77 L. Leible, S. K€alber, G. Kappler, S. Lange, E. Nieke andP. Pro plesch, Kraftstoff, Strom und W€arme aus Stroh undWald restholz;Eine systemanalytische Untersuchung,Wissenschaftliche restholz;Eine systemanalytischeUntersuchung, Wissenschaftliche ruhe, Germany, 2007.
78 U. S. Energy Information Administration, Natural GasPrices, http://www.eia.gov/dnav/ng/ng_pri_sum_dcu_nus_a.htm, accessed in 2015.
79 R. P. Anex, A. Aden, F. K. Kazi, J. Fortman, R. M. Swanson,M. M. Wright, J. A. Satrio, R. C. Brown, D. E. Daugaard,A. Platon, G. Kothandaraman, D. D. Hsu and A. Dutta,Techno-economic comparison of biomass-to-transportationfuels via pyrolysis, gasification, and biochemical pathways,Fuel, 2010, 89(suppl), S29–S35.
80 D. Humbird, R. Davis, L. Tao, C. Kinchin, D. Hsu, A. Aden,P. Schoen, J. Lukas, B. Olthof, M. Worley, D. Sexton andD. Dudgeon, Process Design and Economics for BiochemicalConversion of Lignocellulosic Biomass to Ethanol:: Dilute-AcidPretreatment and Enzymatic Hydrolysis of Corn Stover, 2011.
81 U. S. Energy Information Administration, Electricity DataBrowser-Average Retail Price of Electricity, accessed in 2015.
82 Government Printing Office, Supplemental determinationfor renewable fuels produced under the final RFS2program from grain sorghum, Fed. Regist., 2012, 77, 74592–74607.
83 US-EPA, Fuels & Fuel Additives, Renewable Fuel Standard(RFS), http://www.epa.gov/otaq/fuels/renewablefuels.
Green Chemistry Paper
This journal is © The Royal Society of Chemistry 2018 Green Chem., 2018, 20, 5358–5373 | 5373
Ope
n A
cces
s A
rtic
le. P
ublis
hed
on 0
7 N
ovem
ber
2018
. Dow
nloa
ded
on 1
/14/
2022
1:1
5:50
AM
. T
his
artic
le is
lice
nsed
und
er a
Cre
ativ
e C
omm
ons
Attr
ibut
ion-
Non
Com
mer
cial
3.0
Unp
orte
d L
icen
ce.
View Article Online