Faraday Discussions - RSC Publishing
30
This is an Accepted Manuscript, which has been through the Royal Society of Chemistry peer review process and has been accepted for publication. Accepted Manuscripts are published online shortly after acceptance, before technical editing, formatting and proof reading. Using this free service, authors can make their results available to the community, in citable form, before we publish the edited article. We will replace this Accepted Manuscript with the edited and formatted Advance Article as soon as it is available. You can find more information about Accepted Manuscripts in the Information for Authors. Please note that technical editing may introduce minor changes to the text and/or graphics, which may alter content. The journal’s standard Terms & Conditions and the Ethical guidelines still apply. In no event shall the Royal Society of Chemistry be held responsible for any errors or omissions in this Accepted Manuscript or any consequences arising from the use of any information it contains. Accepted Manuscript Faraday Discussions www.rsc.org/faraday_d Faraday Discussions Royal Society of Chemistry This manuscript will be presented and discussed at a forthcoming Faraday Discussion meeting. All delegates can contribute to the discussion which will be included in the final volume. Register now to attend! Full details of all upcoming meetings: http://rsc.li/fd-upcoming-meetings This is an Accepted Manuscript, which has been through the Royal Society of Chemistry peer review process and has been accepted for publication. Accepted Manuscripts are published online shortly after acceptance, before technical editing, formatting and proof reading. Using this free service, authors can make their results available to the community, in citable form, before we publish the edited article. We will replace this Accepted Manuscript with the edited and formatted Advance Article as soon as it is available. You can find more information about Accepted Manuscripts in the Information for Authors. Please note that technical editing may introduce minor changes to the text and/or graphics, which may alter content. The journal’s standard Terms & Conditions and the Ethical guidelines still apply. In no event shall the Royal Society of Chemistry be held responsible for any errors or omissions in this Accepted Manuscript or any consequences arising from the use of any information it contains. Accepted Manuscript
-
Upload
khangminh22 -
Category
Documents
-
view
1 -
download
0
Transcript of Faraday Discussions - RSC Publishing

This is an Accepted Manuscript, which has been through the Royal Society of Chemistry peer review process and has been accepted for publication.
Accepted Manuscripts are published online shortly after acceptance, before technical editing, formatting and proof reading. Using this free service, authors can make their results available to the community, in citable form, before we publish the edited article. We will replace this Accepted Manuscript with the edited and formatted Advance Article as soon as it is available.
You can find more information about Accepted Manuscripts in the Information for Authors.
Please note that technical editing may introduce minor changes to the text and/or graphics, which may alter content. The journal’s standard Terms & Conditions and the Ethical guidelines still apply. In no event shall the Royal Society of Chemistry be held responsible for any errors or omissions in this Accepted Manuscript or any consequences arising from the use of any information it contains.
Accepted Manuscript
Faraday Discussions
www.rsc.org/faraday_d
Faraday DiscussionsRoyal Society of Chemistry
This manuscript will be presented and discussed at a forthcoming Faraday Discussion meeting. All delegates can contribute to the discussion which will be included in the final volume.
Register now to attend! Full details of all upcoming meetings: http://rsc.li/fd-upcoming-meetings
This is an Accepted Manuscript, which has been through the Royal Society of Chemistry peer review process and has been accepted for publication.
Accepted Manuscripts are published online shortly after acceptance, before technical editing, formatting and proof reading. Using this free service, authors can make their results available to the community, in citable form, before we publish the edited article. We will replace this Accepted Manuscript with the edited and formatted Advance Article as soon as it is available.
You can find more information about Accepted Manuscripts in the Information for Authors.
Please note that technical editing may introduce minor changes to the text and/or graphics, which may alter content. The journal’s standard Terms & Conditions and the Ethical guidelines still apply. In no event shall the Royal Society of Chemistry be held responsible for any errors or omissions in this Accepted Manuscript or any consequences arising from the use of any information it contains.
Accepted Manuscript

1
Spatio-Temporal Correlations in Aqueous Systems: Computational Studies of Static and Dynamic Heterogeneity
by 2D-IR Spectroscopy
Rikhia Ghosh, Tuhin Samanta, Saikat Banaerjee, Rajib Biswas and Biman Bagchi*
SSCU, Indian Institute of Science, Bangalore 560012, India
Abstract
Local heterogeneity is ubiquitous in natural aqueous systems. It can be caused locally by external
biomolecular subsystems like proteins, DNA, micelles and reverse micelles, nanoscopic materials
etc. but can also be intrinsic to the thermodynamic nature of the aqueous solution itself (like binary
mixtures or at gas-liquid interface). The altered dynamics of water in presence of such diverse
surfaces have attracted considerable attention in recent years. As these interfaces are quite narrow,
only a few molecular layers thick, they are hard to study by conventional methods. Recent
development of two dimensional infra-red (2D-IR) spectroscopy allows us to estimate length and
time scales of such dynamics fairly accurately. In this work, we present a series of interesting
studies employing two dimensional infra-red spectroscopy (2D-IR) to investigate (i) heterogeneous
dynamics of water inside reverse micelles of varying sizes, (ii) supercritical water near the Widom
line that is known to exhibit pronounced density fluctuations and also study (iii) collective and local
polarization fluctuation of water molecules in presence of several different proteins. Spatio-
temporal correlation of confined water molecules with varying size of reverse micelles is well
captured through the spectral diffusion of corresponding 2D-IR spectra. In the case of supercritical
water also, we observe strong signature of dynamic heterogeneity from the elongated nature of the
2D-IR spectra. In this case the relaxation is ultrafast. We find remarkable agreement between
different tools employed to study the relaxation of density heterogeneity. For aqueous protein
solutions, we find that the calculated dielectric constant of the respective systems unanimously show
a noticeable increment compared to that of neat water. However, ‘effective’ dielectric constant for
successive layers shows significant variation, with the layer adjacent to protein having much lower
value. Relaxation is also slowest at the surface. We find that the dielectric constant achieves bulk
value at distances more than 3 nm from the surface of the protein.
Page 1 of 29 Faraday Discussions
Fara
day
Dis
cuss
ions
Acc
epte
dM
anus
crip
t

2
I. Introduction
Understanding structure and dynamics of water molecules, in bulk as well as in aqueous
solutions of biomolecules (proteins, DNA, lipids) have been subjects of continuing interest for
many decades1-10. A common characteristic of these systems is found to be the appearance of a
local heterogeneity in the liquid near the interface that may propagate only up to 5-10 molecular
layers (that is, 2-4 nm)11. Existence of heterogeneity at such small length scale make interfacial
water a difficult system to study by using conventional techniques, such as light and neutron
scattering, nuclear magnetic resonance (NMR) or linear spectroscopic methods like Raman
linewidth measurements. Since the heterogeneity is found to be dynamic in nature, associated
with ultrafast time scales in many of the cases, even x-ray scattering or electron microscopic
techniques are not too useful.
Fortunately recently developed two dimensional infra-red spectroscopy (2D-IR) can serve as a
powerful technique for measuring the water dynamics with its femtosecond time resolution12,13.
In 2D-IR spectroscopy14, one can use the –O-H stretching frequency of water, or some other
molecule, as a reliable marker of the position of the molecule. The –O-H stretching frequency in
water is known to undergo large variation15. For example, those water molecules which are
hydrogen bonded to a charged group at the inner surface or reverse micelle, the –O-H stretching
frequency can be as low as 2800 cm-1 while the corresponding value in bulk is ~ 3600 cm-1. 2D-
IR spectroscopy thus provides a valuable method to obtain spatio-temporal resolution that is not
achievable by other conventional methods. Water dynamics at the interface of biomolecules can
also be explored through dielectric relaxation measurements, albeit with much poorer spatial
resolution.
Page 2 of 29Faraday Discussions
Fara
day
Dis
cuss
ions
Acc
epte
dM
anus
crip
t

3
Water at the surface of biological macromolecules, such as proteins, DNA and at extended
biological surfaces such as lipid bilayers, is now known as biological water4,9,16-18. Many of the
characteristics of water at such surfaces are markedly different from those of bulk water, marked
by lower values of an effective dielectric constant, slower dynamical responses and higher
density. In fact, proper hydration of proteins and enzymes is predominantly important for the
stability of the structure as well as functionality at the specified site. This explains the largely
growing attention to understand the underlying characteristics of biological water. Dielectric
spectra of aqueous protein solutions have been thoroughly studied for more than 60 years.
However, the effect of large dipole moments of proteins on polarization fluctuation of the
aqueous solution has still not been adequately addressed.
In this work, we employ 2D-IR spectroscopy to quantitatively measure the nature of water
dynamics (i) inside reverse micelle and (ii) in supercritical water. (iii) We also explore
heterogeneity of water at biomolecular interface, selectively measuring polarization fluctuation
of water for aqueous protein solutions. To understand the altered dynamics of water we perform
a layer wise decomposition of water inside reverse micelle, with an aim to enumerate the relative
contributions of different layers water molecules to the calculated 2D-IR spectrum. We further
quantify the variation of static and dynamic heterogeneity in super critical water across the
Widom line is studied by constructing the 2D-IR spectrum of the ‘-O-H’ stretch as well as from
non-linear density response function, 4( )tχ and non-Gaussian parameter 2( )tα . All the variables
beautifully capture the ultrafast time scale of heterogeneity prevalent near the Widom line.
Page 3 of 29 Faraday Discussions
Fara
day
Dis
cuss
ions
Acc
epte
dM
anus
crip
t
4
Next we carry out a systematic study of the polarization fluctuation by considering two proteins
immunoglobin binding domain protein G (GB1), lysozyme (Lys) immersed in a large number of
water molecules. Analysis of the total and local polarization fluctuation show surprisingly
different water dynamics for the two proteins.
In this report, we have attempted to bring together three different types of aqueous systems, by
using mostly 2D-IR spectroscopic technique, described in section II. e For two of
them, discussed in sections III and IV, we could construct 2D-IR spectra, and study
heterogeneous dynamics through anisotropy. In the third case, discussed in section V, we study
spatio-temporal correlation in polarization fluctuations.
II. Spectroscopic Modeling of 2D-IR
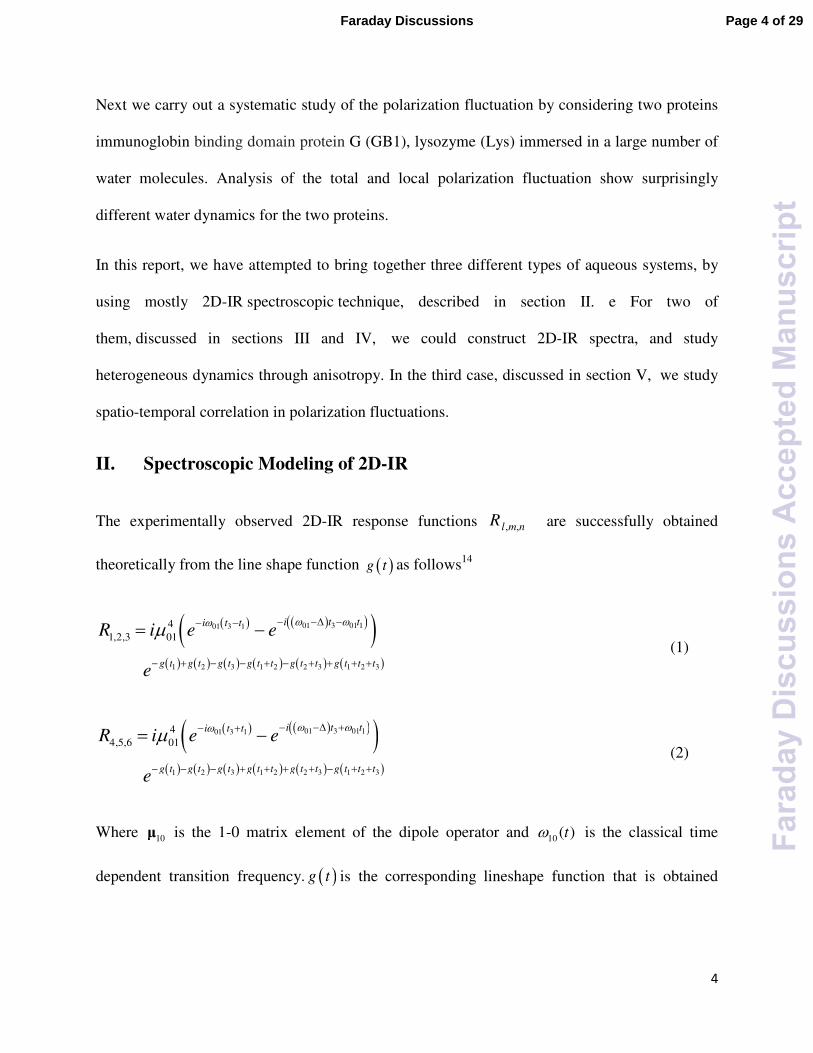
The experimentally observed 2D-IR response functions , ,l m nR are successfully obtained
theoretically from the line shape function ( )g t as follows14
( ) ( )( )( )( ) ( ) ( ) ( ) ( ) ( )
01 3 01 101 3 1
1 2 3 1 2 2 3 1 2 3
41,2,3 01
i t ti t t
g t g t g t g t t g t t g t t t
R i e e
e
ω ωωµ − −∆ −− −
− + − − + − + + + +
= − (1)
( ) ( )( )( )( ) ( ) ( ) ( ) ( ) ( )
01 3 01 101 3 1
1 2 3 1 2 2 3 1 2 3
44,5,6 01
i t ti t t
g t g t g t g t t g t t g t t t
R i e e
e
ω ωωµ − −∆ +− +
− − − + + + + − + +
= − (2)
Where 10µ is the 1-0 matrix element of the dipole operator and 10 ( )tω is the classical time
dependent transition frequency. ( )g t is the corresponding lineshape function that is obtained
Page 4 of 29Faraday Discussions
Fara
day
Dis
cuss
ions
Acc
epte
dM
anus
crip
t
5
analytically from Kubo’s lineshape theorem using the frequency fluctuation correlation function
(FFCF) ( ) ( ) ( )0c t tδω δω= . The exact form of ( )g t is given by the following expression,
( ) ( ) ( )0
0t
g t d d
τ
τ δω τ δω τ′
′ ′′ ′′= ∫ ∫
(3)
All the response functions are Fourier transformed to reveal purely absorptive 2D IR spectra.
Equations (2) employ Condon approximation. It has been shown that non-Condon effects are
significant for –O-H vibrational mode of water. We are currently investigating such non-Condon
effects. Results presented here, however, use Eq.2, and therefore, are only semi-quantitatively
reliable. However, some of the results are quite striking and we expect them to capture much of
the true behavior.
III. Reverse Micelles : From Spectra Resolution to Spatial Decomposition
Page 5 of 29 Faraday Discussions
Fara
day
Dis
cuss
ions
Acc
epte
dM
anus
crip
t

6
Figure 1. Schematic diagram showing layering of water inside a representative reverse micelle of
effective radius R.
As mentioned earlier, reverse micelles (RM) provide us with unique opportunity to study the
ability of 2D-IR spectroscopy to explore the length and time scales of local heterogeneity. Here
we adopt a two fold approach. First, we carry out detail simulations to obtain microscopic
details. Second, we use the simulation trajectories to construct the 2D-IR spectrum where water
molecules are selected from different layers from the surface. The comparison between the two
allows us to use spectral resolution available from 2D-IR spectroscopy to a spatial
decomposition of structure and dynamics.
A. Simulation details
Page 6 of 29Faraday Discussions
Fara
day
Dis
cuss
ions
Acc
epte
dM
anus
crip
t

7
We use united atom description for Isooctane and all atom description for the surfactant and
water molecules. We use TIP4P-2005 water like molecules19. The united atom description of
Isooctane is obtained from GROMOS53A6 force field. The initial spherical RMs structures are
prepared using packmol and then solvated with Isooctane like molecules in a cubic box. We use
GROMACS, version 4.5.520 for all the MD simulations in this study. Steepest descent method is
used for energy minimization of the initial configuration; followed by position restrained
simulation in the isothermal isobaric ensemble (constant pressure, NPT) for 2ns, by imposing
position restrain condition on oxygen of water and sulfur of AOT. We use fourth order Particle
Mesh Ewald (PME) summation for long range interaction with grid spacing of 0.16. We
equilibrate the system initially in NPT ensemble for 10 ns followed by 10 ns in the canonical
ensemble (constant volume, NVT). Finally data acquisitions are performed in NVT ensemble.
The system is maintained at constant temperature of 300 K and 1 atm pressure by using Nosé-
Hoover thermostat21,22 and Parrinello-Rahman barostat23. Periodic boundary conditions are
applied in all three directions. The details of different RMs constituents are summarized in Table
1 (size index is given as w0, which is the number of water molecules per surfactant molecule).
Table 1: Compositions of simulated RMs
w0 2H On AOTn / Nan ISOn
2.0 52 26 504 4.0 140 35 930 7.5 525 70 1138 10.0 980 98 1377
We calculate bulk properties by taking 1000 TIP4P-2005 water molecules in a cubic box.
Page 7 of 29 Faraday Discussions
Fara
day
Dis
cuss
ions
Acc
epte
dM
anus
crip
t

8
B. Evolution of water dynamics with increasing size of reverse micelle: 2D-IR
spectroscopic view of heterogeneity
Water dynamics inside reverse micelles of varying sizes is a striking example of heterogeneous
spatio-temporal correlations. We explore these aspects by considering reverse micelles of
different sizes into different number of layers based on the radial density distribution of water.
The layer-wise classifications of water in the RMs based on the radial density distribution of
water are summarized in Table 2.
From the radial density distributions of water from surface to center of reverse micelle,
we conclude the existence of distinct layering of water molecules (schematic diagram shown in
Figure 1). In the case of the lowest RM size i.e. w0 = 2.0, it is observed that almost all water
molecules are restricted in the vicinity of surface head groups of AOT molecules, forming a
single water layer. However, with increasing RM size presence of three distinct layers of water is
observed, based on structural and dynamical properties. The water molecules bound to the
surface head groups of AOT are named as surface layer (SL); subsequent to the SL there is an
intermediate water (IL) layer followed by the central water pool (CL).
Table – 2: Layer-wise classification of water in the reverse micelle based on the radial density
distribution of water. Distance from sulfur atom of AOT is denoted as r, and 2H On is the average
number of water molecules present in different layers. For w0 = 2.0 all AOT head groups are not solvated by water, which led us to assume a single water layer in this RM.
Reverse Micelles
Surface Layer (SL) Intermediate Layer (IL) Central Layer (CL)
r (Å) 2H On r (Å)
2H On r (Å) 2H On
w0 = 4.0 r ≤ 4.96Å 111 r> 4.96Å 29 - - w0 = 7.5 r ≤ 5.0 Å 332 5.0Å ≥ r > 5.9Å 72 r > 5.9Å 121
Page 8 of 29Faraday Discussions
Fara
day
Dis
cuss
ions
Acc
epte
dM
anus
crip
t

9
w0 = 10.0 r ≤ 5.0 Å 474 5.0Å ≥ r >6.9Å 269 r >6.9Å 237
Next we calculate layerwise hydrogen bond dynamics of water for reverse micelles of
different sizes by evaluating the corresponding frequency fluctuation correlation functions
(FFCF) of all the –O-H bonds. FFCF efficiently evaluates the spectral diffusion in terms of time
scales of the dynamics. Layer wise decomposition of FFCF gives rise to the following equation
( ) ( ) ( ) ( )
( )( ) ( )
1 2
1 2 1 2
1 2
1 2
1 1
1 1 1
1 10 0
10
1
LLWL
L LWL L
NNL L
i iLLL iL W
NN NL L L L
i iL LL L iL L W
t tN N
tN N N
δω δω δω δω
δδω δω
= =
= = =
=
+ −
∑ ∑
∑∑ ∑ (4)
where L
iδω is the frequency fluctuation of O-H bond of i-th water molecule staying in layer L,
LN is the total number of layers, LL
WN is the number of water molecules present in layer L
throughout the detection time and give the self-term ( ) ( )0L L
i itδω δω , similarly 1 2L L
WN is the
total number of water molecules which give the cross term ( ) ( )1 2 0L L
i itδω δω ,
1 2L Lδ has a value 0
if 1 2L L= and else 1.0. We compute the self-term of FFCF using the layer definition. The layer
wise calculation of FFCFs (shown in supporting information Figure S1) reveals clear distinction
of hydrogen bond dynamics in different reverse micelles.
To extract the corresponding 2D-IR spectra, we use the following fitting function to fit the
FFCFs,
( ) ( ) 31 21 OO 2 3cos tt t
c t a t e a e a eττ τω −− −= + + (5)
Using the fitting parameters we calculate the lineshape function ( )g t , and finally we obtain the
2D IR spectra from the corresponding response functions as described in Eq. (1) and Eq. (2). 2D
Page 9 of 29 Faraday Discussions
Fara
day
Dis
cuss
ions
Acc
epte
dM
anus
crip
t

10
IR spectra of different layers of reverse micelles as well as that of bulk are shown in Figure 2,
obtained using waiting time 500 fs.
2800 3000 3200 3400
3100
3200
3300
3400
3500
−4
−2
0
2
x 10−3
SL w0 = 2.0
2900 3000 3100 3200 3300 3400 3500
3100
3200
3300
3400
3500
−3
−2
−1
0
1
2
x 10−3
SL w0 = 4.0
2900 3000 3100 3200 3300 3400 3500
3100
3200
3300
3400
3500
−3
−2
−1
0
1
2
x 10−3
SL w0 = 7.5
2900 3000 3100 3200 3300 3400 3500
3100
3200
3300
3400
3500
−3
−2
−1
0
1
2
x 10−3
SL w0 = 10.0
2900 3000 3100 3200 3300 3400 3500
3100
3200
3300
3400
3500
−2
−1
0
1
2
x 10−3
IL w0 = 4.0
2900 3000 3100 3200 3300 3400 3500
3100
3200
3300
3400
3500
−2
−1
0
1
2
x 10−3
CL w0 = 10.0
2900 3000 3100 3200 3300 3400 3500
3100
3200
3300
3400
3500
−2
−1
0
1
2
x 10−3
CL w0 = 7.5
2900 3000 3100 3200 3300 3400 3500
3100
3200
3300
3400
3500
−2
−1
0
1
2
x 10−3
IL w0 = 10.0
2900 3000 3100 3200 3300 3400 3500
3100
3200
3300
3400
3500
−2
−1
0
1
2
x 10−3
IL w0 = 7.5
2800 3000 3200 3400
3100
3200
3300
3400
3500
−2
−1
0
1
2
x 10−3
Bulk
ω3(cm -1)
ω1(c
m -1)
Page 10 of 29Faraday Discussions
Fara
day
Dis
cuss
ions
Acc
epte
dM
anus
crip
t
11
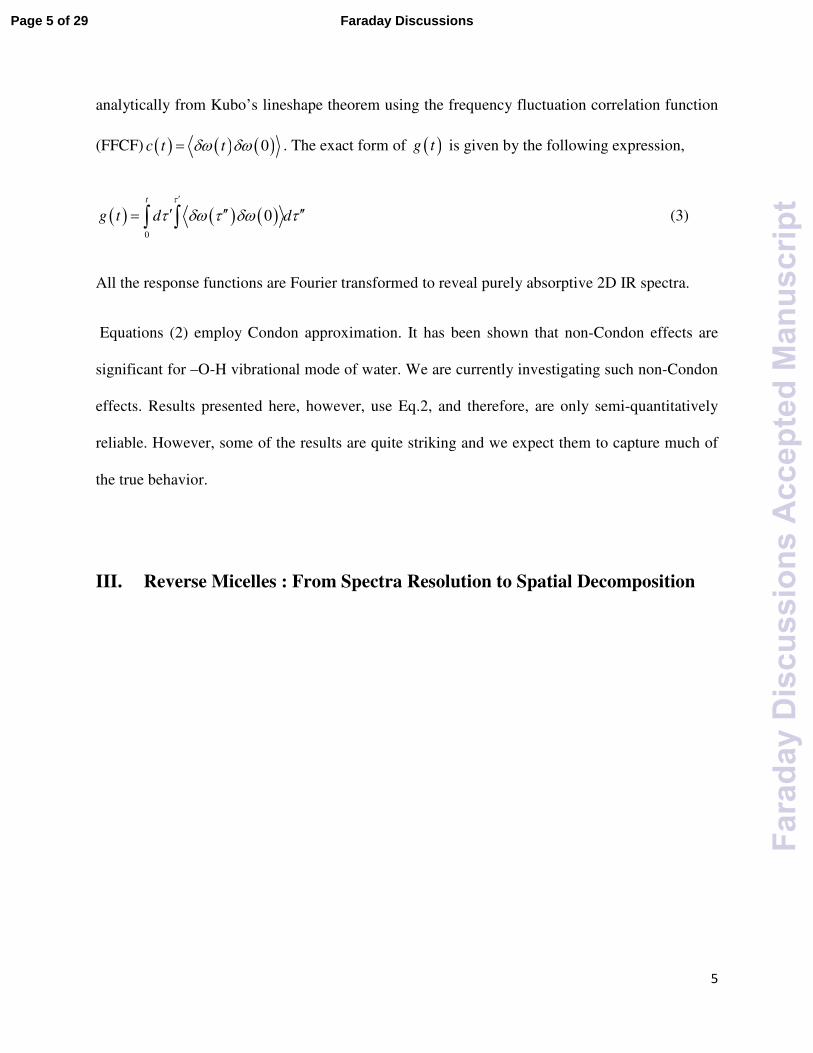
Figure 2. The 2D IR spectra of O-H stretch in bulk water and in different layers of reverse micelles (presented clockwise starting from the one for bulk water). Here the layer-wise 2D IR spectrum is calculated by tagging the water molecules which stay continuously in that layer during the data acquisition. All the spectra are obtained at waiting time of 500 fs. The shape of the spectrum depends on two factors: the size of the reverse micelles and the position of the layer we are looking at. It is clear from the figures that as reverse micelle size increases the spectrum become more bulk like in the central layer.
The red bands arise from the 0 1→ vibrational transition whereas the blue bands arise from the
vibrational echo emission at 1 2→ vibrational frequency. The spectra of 0 1→ transition clearly
show substantial elongation along the diagonal for surface water layer (SL) with increasing
reverse micelle size which is a measure of increasing inhomogeneity. In case of subsequent
intermediate layers (IL) also, considerable heterogeneity is prevalent, as can be seen from
elongated 0 1→ transition spectra. However the central layers (CL) for the corresponding
reverse micelles are found to be showing bulk-like behavior. The altered dynamics of water with
increasing reverse micelle size serves as a powerful example of spatio-temporal correlation of
heterogeneous water dynamics.
Page 11 of 29 Faraday Discussions
Fara
day
Dis
cuss
ions
Acc
epte
dM
anus
crip
t

12
Page 12 of 29Faraday Discussions
Fara
day
Dis
cuss
ions
Acc
epte
dM
anus
crip
t

13
Figure 3. Force trajectories (projected force in unit of KJ mol-1 nm-1) acting separately on oxygen atom (in black) and hydrogen atom (in red) of water in case of (a) bulk water (b) tagged surface water of reverse micelle size w0 = 2.0 (c) tagged water in the intermediate layer of reverse micelle
size w0 = 4.0 (d) tagged central water molecule of reverse micelle size w0 = 10.0.
It is broadly acknowledged that anti-correlation existing between forces on oxygen and hydrogen
atom of –O-H bonds plays an important role for the decay of FFCFs24. Bulk water is found to
exhibit ultrafast decay of FFCF, which essentially arises due to large amplitude angular jumps of
water molecules and appearance of large cross correlation of projected force on oxygen and
hydrogen atoms of the –O-H bonds. We find such evidences from the corresponding force
trajectories (Figure 3). It can be seen that surface effect significantly reduces anti-correlation
between forces on oxygen and hydrogen. However substantial anti-correlation is prevalent at the
center of larger reverse micelles (Figure 3(c)) which eventually reflects the faster decay of FFCF
in this case (as can be seen in Figure S1)
IV. Enhanced heterogeneity of supercritical water across the Widom line
Page 13 of 29 Faraday Discussions
Fara
day
Dis
cuss
ions
Acc
epte
dM
anus
crip
t

14
Figure 4. Representative snapshot of supercritical water. Prominent signature of co-existing high
density region (shown by solid circle) and low density region (marked by dashed circle) is found
here.
The upward line that originates at the critical temperature (TC) and separates (in the temperature-
pressure-density plane) a gas-like region from a liquid-like region above TC, is known as the
Widom line. The critical point of real water is located at pressure (Pc) 220.55 bar, temperature
(Tc) of 647.13 K and density (ρc) 0.322 gm/cm3. SCW is believed to exist at temperatures above
647.13 K. Because of the proximity to critical point, SCW exhibit properties of both liquid and
gas in a combined manner (representative snapshot provided in Figure 4). In our work we use
SPC/E water model whose critical parameters are Tc = 651.7 K, ρc = 0.326 g/cm3, and Pc = 189
bar. These values are very close to the experimental gas-liquid coexistence point.
Although the fluid here is macroscopically homogeneous, supercritical water (SCW) near the
Widom line is known to exhibit pronounced density fluctuations, remnant of critical phenomena.
Page 14 of 29Faraday Discussions
Fara
day
Dis
cuss
ions
Acc
epte
dM
anus
crip
t

15
Variation of static and dynamic heterogeneity in SCW across the Widom line is studied (i) by
constructing the 2D-IR spectrum of the ‘-O-H’ stretch (ii) from non-linear density response
function, 4( )tχ and (iii) non-Gaussian parameter 2( )tα . All of them show sudden and sharp
change close to the Widom line.
A. Simulation Details
All the simulations for supercritical water are carried out using 2048 SPC/E water in a cubic
box. Similar steps of equilibration, as that for water inside reverse micelle, are followed in this
case also. The temperature is kept constant at 670K using Nose-Hoover thermostat21,22 the
pressure is kept at 217.3 atm. Density is varied consistently along the Widom line keeping the
temperature constant ( ρ � 0.32, 0.33 and 0.34 gm/cm3 respectively).
B. 2D-IR spectroscopic study of supercritical water: Evidence of static and
dynamic heterogeneity
Page 15 of 29 Faraday Discussions
Fara
day
Dis
cuss
ions
Acc
epte
dM
anus
crip
t
16
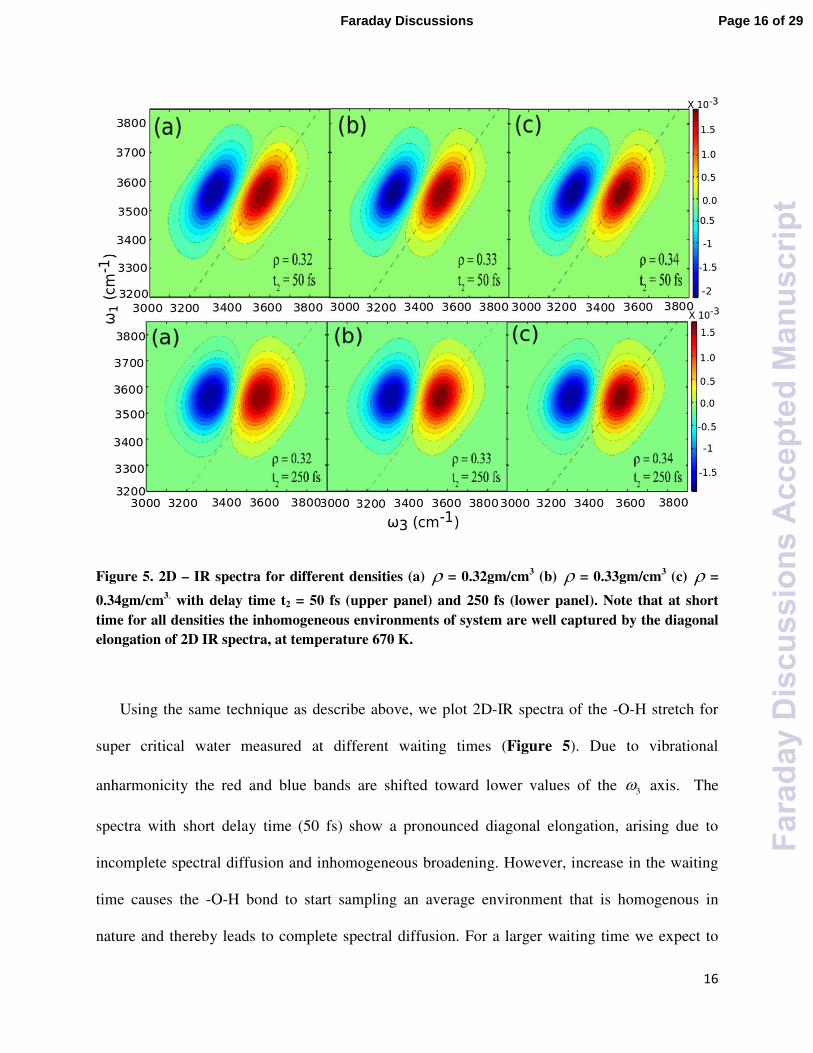
Figure 5. 2D – IR spectra for different densities (a) ρ = 0.32gm/cm3 (b) ρ = 0.33gm/cm3 (c) ρ =
0.34gm/cm3, with delay time t2 = 50 fs (upper panel) and 250 fs (lower panel). Note that at short time for all densities the inhomogeneous environments of system are well captured by the diagonal elongation of 2D IR spectra, at temperature 670 K.
Using the same technique as describe above, we plot 2D-IR spectra of the -O-H stretch for
super critical water measured at different waiting times (Figure 5). Due to vibrational
anharmonicity the red and blue bands are shifted toward lower values of the 3ω axis. The
spectra with short delay time (50 fs) show a pronounced diagonal elongation, arising due to
incomplete spectral diffusion and inhomogeneous broadening. However, increase in the waiting
time causes the -O-H bond to start sampling an average environment that is homogenous in
nature and thereby leads to complete spectral diffusion. For a larger waiting time we expect to
Page 16 of 29Faraday Discussions
Fara
day
Dis
cuss
ions
Acc
epte
dM
anus
crip
t
17
get a symmetric shape of the 2D-IR spectra. The observed 2D-IR spectra reflect the enhanced
inhomogeneity in the vicinity of the critical point ( 3( ~ 0.33 / )gm cmρ . This essentially gives
a slower spectral diffusion. However such spectral diffusion is relatively faster for other
densities.
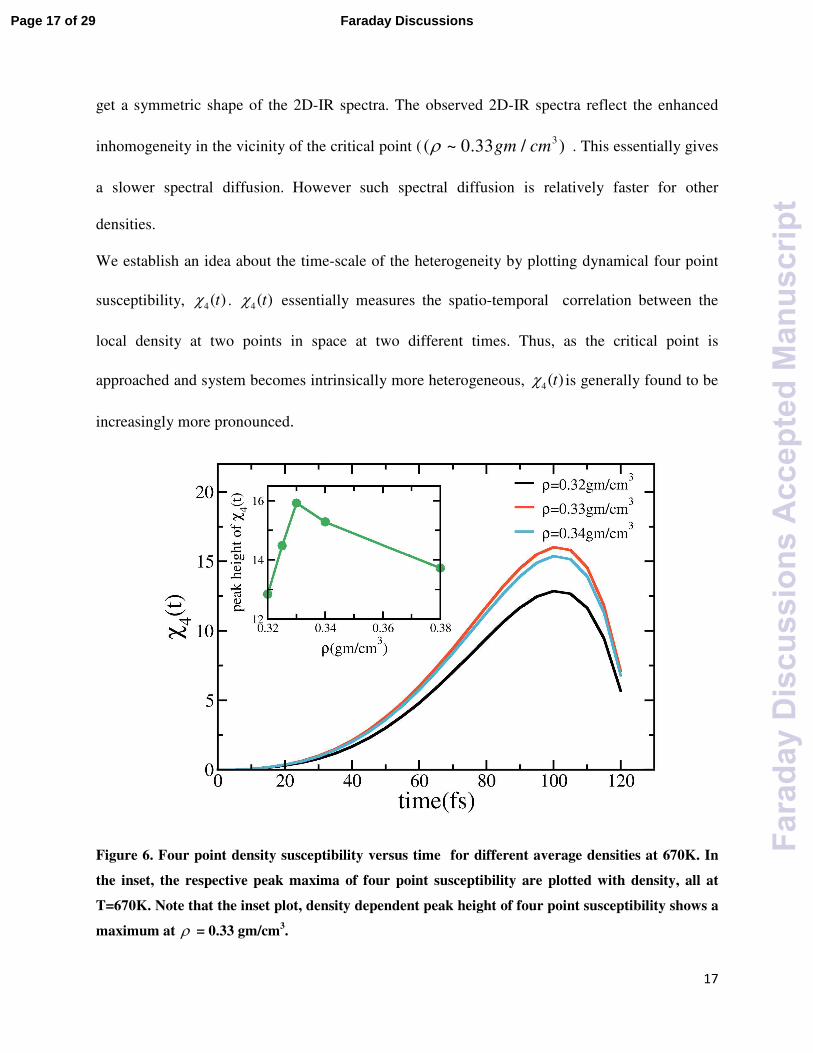
We establish an idea about the time-scale of the heterogeneity by plotting dynamical four point
susceptibility, 4( )tχ . 4( )tχ essentially measures the spatio-temporal correlation between the
local density at two points in space at two different times. Thus, as the critical point is
approached and system becomes intrinsically more heterogeneous, 4( )tχ is generally found to be
increasingly more pronounced.
Figure 6. Four point density susceptibility versus time for different average densities at 670K. In
the inset, the respective peak maxima of four point susceptibility are plotted with density, all at
T=670K. Note that the inset plot, density dependent peak height of four point susceptibility shows a
maximum at ρ = 0.33 gm/cm3.
Page 17 of 29 Faraday Discussions
Fara
day
Dis
cuss
ions
Acc
epte
dM
anus
crip
t

18
In Figure 6 we plot 4( )tχ for the density range of 0.32-0.34 gm/cm3 (around critical density) at
T=670K . For all densities, 4( )tχ is nearly zero at short time and peaks at around 100 fs. This
essentially suggests that dynamic heterogeneity present in SCW has a lifetime of the order of 100
fs. The variation of peak height of 4( )tχ with density is shown in the inset of Figure 6. The peak
height shows a maximum at the density ( ρ ) 0.33 gm/cm3, as expected. As we go beyond the
density ( ρ ) 0.33 gm/cm3 the peak height value of 4( )tχ again decreases. It signifies the system
becomes more homogeneous as we move away from critical point.
Figure 7. Temporal evolution of the non-Gaussian parameter for different densities (inset: variation
of peak maxima of non-Gaussian parameter along with varying density). Note that the inset plot
shows a transition of peak maximum again at ρ = 0.33 gm/cm3 where non-Gaussian behavior and
heterogeneity are maximum.
Page 18 of 29Faraday Discussions
Fara
day
Dis
cuss
ions
Acc
epte
dM
anus
crip
t

19
The well-known non-Gaussian parameter 2( )tα demonstrates the presence of static heterogeneity
in a system. It is not sensitive to dynamic heterogeneity and therefore a comparison between
4( )tχ and 2( )tα provides a useful way to separate static heterogeneity from dynamic
heterogeneity.
In Figure 7, we observe large value of 2( )tα due to presence of long lived heterogeneity near
critical density ( cρ =0.33 gm/cm3). Deviation from the Gaussian behavior becomes less
prominent in all densities except that of critical density. The time scale of static heterogeneity is
found to be prevailing at around ~ 70 fs (as observed from the peak position).
V. Spatio-temporal resolution of polarization fluctuations in aqueous
protein solutions
Aqueous protein solutions serve as an important subject of study, as the large dipole moment of
the protein molecules can significantly perturb dynamics of water molecules. One of the most
relevant properties that is anticipated to be affected due to presence of such large dipoles, is the
collective polarization fluctuation, related to the dielectric constant of the solution.
In this particular problem we have not yet been able to generate the 2D-IR spectra at different
layers. The difficulty is to account for the effects of all the atoms of the protein on the spectral
diffusion of –O-H vibrational mode. Even the calculation of the average frequency within the
Condon approximation is a non-trivial (but not an impossible) task. We leave this work for
future. But we can obtain some degree of information from study of various time correlation
function, particularly from the comparison of water dynamics for the two different proteins.
Page 19 of 29 Faraday Discussions
Fara
day
Dis
cuss
ions
Acc
epte
dM
anus
crip
t

20
We explore these aspects by studying aqueous solutions of two different proteins,
immunoglobulin binding domain protein G (GB1) and hen-egg white lysozyme (LYS) of
different characteristics (shown in Figure 8). We find that the calculated dielectric constant of
the system shows a noticeable increment in all the cases compared to that of neat water (for
SPC/E model water the estimated value is ~ 68). Total dipole moment auto time correlation
function of water (0) ( )W WM M tδ δ is found to be sensitive to the nature of the protein. A shell-
wise decomposition of water molecules around protein reveals higher density of first layer
compared to the succeeding ones.
(a) (b)
Figure 8. Representative conformational surface of the two proteins investigated in this work- (a)
protein G (56 residues) (b) lysozyme (129 residues). Purple surface represents the hydrophilic patch
whereas white surface represents the hydrophobic patch. Water layer around the protein up to 5 Å
is shown. Note that the two proteins are quite different.
Page 20 of 29Faraday Discussions
Fara
day
Dis
cuss
ions
Acc
epte
dM
anus
crip
t

21
A. Simulation Details
We have performed atomistic molecular dynamics simulation of the two proteins with
sufficiently large number of water molecules (number varied according to size of the proteins)
and at 300K temperature and 1 bar pressure. For protein G (PDB ID: GB1) we have used ~8.5
nm box and 20893 water molecules and for lysozyme (PDB ID: 1AKI) we have used ~9.5 nm
box and 29204 water molecules. We have used OPLS-AA25 force field and extended simple
point charge model (SPC/E)26 for water. After performing steepest descent energy minimization,
the solvent was further equilibrated for 10 ns by restraining the position of protein. Finally
production run was performed for 20 ns in NPT ensemble. Temperature was kept constant using
Nose-Hoover21,22 Thermostat and Parrinello-Rahman Barostat23 was used for pressure coupling.
After final equilibration of the system, a further 5 ns run was performed with 10 fs resolution to
generate trajectory for calculating the correlation functions.
B. Evaluation of total and local polarization fluctuation of water in aqueous
protein solutions
In Figure 9. we plot the correlation in the fluctuation of total dipole moment of water
(0) ( )W WM M tδ δ for the two proteins. The detailed nature of the correlation functions is
expected to be sensitive to the protein size, amino acid sequence as well as orientation of
corresponding dipoles. Whereas the correlation functions are decaying within 80 ps for
lysozyme, in case of GB1 the decay is found to be comparatively faster and reaching 0 within 40
ps. The correlation functions are fitted to exponential forms and the corresponding amplitudes
Page 21 of 29 Faraday Discussions
Fara
day
Dis
cuss
ions
Acc
epte
dM
anus
crip
t

22
and time constants are given in Table 3. We find that the corresponding correlation function for
GB1 fits to a single exponential form with a time constant of 10.9 ps that is a signature of the fast
water. However lysozyme fits to a bi-exponential with two time constants; first time constant
signifies fast dynamics of free water and the second time constant is a signature of slow
biological water. Interestingly, in both the cases we find that the estimated value of dielectric
constant of water is higher than the normal value (for SPC/E water, dielectric constant is ~ 68).
Protein a1 1ττττ (ps) a2
2ττττ (ps) εεεε
GB1 0.97 10.9 - - 75.4
LYS 0.749 6.9 0.251 31.7 70.9
(a)
Page 22 of 29Faraday Discussions
Fara
day
Dis
cuss
ions
Acc
epte
dM
anus
crip
t

23
(b)
Figure 9. Dipole-dipole auto-correlation functions of water (0) ( )W WM M tδ δ for (a) Protein G
(GB1) (b) Lysozyme (Lys). In both the cases the correlation is found to decay to zero within 100 ps.
In Figure 10 we show shell-wise decomposition of the partial dipole moment-dipole moment
time correlation function (0) ( )i i
M M tδ δ (i – shell index) for the first two shells (shells are
taken to be approximately ~ 1 nm thick). For lysozyme striking observation is the considerable
slowing down of polarization fluctuation for the first shell. By second shell, relaxation achieves
almost bulk-like behavior. However GB1 protein shows bulk like decay even for the first shell.
The slowing down of relaxation for lysozyme in the first shell emerges due to the appearance of
an additional relaxation channel in the relaxation of biological water that is found to be missing
in case of GB1. The associated slow relaxation time is of the order of 40 ps. Surprisingly, shell-
Page 23 of 29 Faraday Discussions
Fara
day
Dis
cuss
ions
Acc
epte
dM
anus
crip
t

24
wise calculation of dielectric constant gives much lower value for the both the shells (first shell:
49.2 for GB1 and 48.31 for lysozyme; second shell: 59.3 for GB1 and 53.3 for lysozyme)
compared to that of bulk.
(a)
Page 24 of 29Faraday Discussions
Fara
day
Dis
cuss
ions
Acc
epte
dM
anus
crip
t

25
(b)
Figure 6. Demonstration of shell-wise polarization fluctuation of water for (a) GB1 (b)
Lysozyme.
VI. Conclusion
Omnipresence of heterogeneity in natural aqueous systems has always been an intriguing subject
of study. The heterogeneity is mostly local, a few molecular layers thick and lead to unusual
dynamics. In this work we explore the consequences (both spatial and temporal) of heterogeneity
in different aqueous systems. In all the cases, we find that the heterogeneity is reflected through
significant alteration of water dynamics. In the case of reverse micelle, we find that with
increasing system size, the dynamical behavior of water in different layers varies substantially.
Thermodynamics induced heterogeneity in super critical water is also well reflected in the
corresponding spectral diffusion of 2D-IR spectra. Here the time scales of density relaxation are
ultrafast and captured faithfully by 2D-IR spectra. Finally, we evaluate local and collective
polarization fluctuation in aqueous protein solutions, where we also find prominent signature of
heterogeneity. The present work is thus successful in identifying and generalizing the existence
of heterogeneity in various aqueous systems.
In future we plan to calculate 2D-IR spectra of aqueous the –O-H mode in different hydration
layers of protein solutions.
ACKOWLEDGEMENT
We thank Ms. Susmita Roy and Milan Hazra for helpful discussions. This work was supported
in parts by DST (India) and BRNS (India). BB thanks DST for a Sir JC Bose Fellowship.
Page 25 of 29 Faraday Discussions
Fara
day
Dis
cuss
ions
Acc
epte
dM
anus
crip
t

26
VII. References
†Electronic Supplementary Information (ESI) available: [figures showing layerwise calculation of
frequency fluctuation correlation functions with increasing reverse micelle size, and comparison with that
of bulk]. See DOI:
(1) Bagchi, B.: Water in Biological and Chemical Processes: From Structure and
Dynamics to Function; Cambridge University Press, 2014.
(2) Fayer, M. D.; Levinger, N. E.: Analysis of Water in Confined Geometries and at
Interfaces. Annual Review of Analytical Chemistry 2010, 3, 89-107.
(3) Pal, S. K.; Zewail, A. H.: Dynamics of Water in Biological Recognition.
Chemical Reviews 2004, 104, 2099-2124.
(4) Nandi, N.; Bagchi, B.: Dielectric Relaxation of Biological Water†. The Journal of
Physical Chemistry B 1997, 101, 10954-10961.
(5) Telgmann, T.; Kaatze, U.: On the Kinetics of the Formation of Small Micelles. 1.
Broadband Ultrasonic Absorption Spectrometry. The Journal of Physical Chemistry B 1997, 101,
7758-7765.
(6) Ladanyi, B. M.: Computer simulation studies of counterion effects on the
properties of surfactant systems. Current Opinion in Colloid & Interface Science 2013, 18, 15-
25.
(7) Vajda, S.; Jimenez, R.; Rosenthal, S. J.; Fidler, V.; Fleming, G. R.; Castner, E.
W.: Femtosecond to nanosecond solvation dynamics in pure water and inside the [gamma]-
cyclodextrin cavity. Journal of the Chemical Society, Faraday Transactions 1995, 91, 867-873.
Page 26 of 29Faraday Discussions
Fara
day
Dis
cuss
ions
Acc
epte
dM
anus
crip
t
27
(8) Tucker, S. C.: Solvent Density Inhomogeneities in Supercritical Fluids. Chemical
Reviews 1999, 99, 391-418.
(9) Bagchi, B.: Water Dynamics in the Hydration Layer around Proteins and
Micelles. Chemical Reviews 2005, 105, 3197-3219.
(10) Biswas, R.; Furtado, J.; Bagchi, B.: Layerwise decomposition of water dynamics
in reverse micelles: A simulation study of two-dimensional infrared spectrum. The Journal of
Chemical Physics 2013, 139, -.
(11) Pronk, S.; Lindahl, E.; Kasson, P. M.: Dynamic heterogeneity controls diffusion
and viscosity near biological interfaces. Nat Commun 2014, 5.
(12) Zanni, M. T.; Hochstrasser, R. M.: Two-dimensional infrared spectroscopy: a
promising new method for the time resolution of structures. Current Opinion in Structural
Biology 2001, 11, 516-522.
(13) Zheng, J.; Kwak, K.; Fayer, M. D.: Ultrafast 2D IR Vibrational Echo
Spectroscopy. Accounts of Chemical Research 2006, 40, 75-83.
(14) Hamm, P.; Zanni, M.: Concepts and Methods of 2D Infrared Spectroscopy;
Cambridge University Press, 2011.
(15) Roberts, S. T.; Ramasesha, K.; Tokmakoff, A.: Structural Rearrangements in
Water Viewed Through Two-Dimensional Infrared Spectroscopy. Accounts of Chemical
Research 2009, 42, 1239-1249.
(16) Nandi, N.; Bagchi, B.: Anomalous Dielectric Relaxation of Aqueous Protein
Solutions. The Journal of Physical Chemistry A 1998, 102, 8217-8221.
(17) Pethig, R.: Protein-Water Interactions Determined by Dielectric Methods. Annual
Review of Physical Chemistry 1992, 43, 177-205.
Page 27 of 29 Faraday Discussions
Fara
day
Dis
cuss
ions
Acc
epte
dM
anus
crip
t

28
(18) Nandi, N.; Bhattacharyya, K.; Bagchi, B.: Dielectric Relaxation and Solvation
Dynamics of Water in Complex Chemical and Biological Systems. Chemical Reviews 2000, 100,
2013-2046.
(19) Abascal, J. L. F.; Vega, C.: A general purpose model for the condensed phases of
water: TIP4P/2005. The Journal of Chemical Physics 2005, 123, -.
(20) Hess, B.; Kutzner, C.; van der Spoel, D.; Lindahl, E.: GROMACS 4: Algorithms
for Highly Efficient, Load-Balanced, and Scalable Molecular Simulation. Journal of Chemical
Theory and Computation 2008, 4, 435-447.
(21) Nosé, S.: A unified formulation of the constant temperature molecular dynamics
methods. The Journal of Chemical Physics 1984, 81, 511-519.
(22) Hoover, W. G.: Canonical dynamics: Equilibrium phase-space distributions.
Physical Review A 1985, 31, 1695-1697.
(23) Parrinello, M.; Rahman, A.: Polymorphic transitions in single crystals: A new
molecular dynamics method. Journal of Applied Physics 1981, 52, 7182-7190.
(24) Roychowdhury, S.; Bagchi, B.: Vibrational phase relaxation of O–H stretch in
bulk water: Role of large amplitude angular jumps and negative cross-correlations among the
forces on the O–H bond. Chemical Physics 2008, 343, 76-82.
(25) Jorgensen, W. L.; Maxwell, D. S.; Tirado-Rives, J.: Development and Testing of
the OPLS All-Atom Force Field on Conformational Energetics and Properties of Organic
Liquids. Journal of the American Chemical Society 1996, 118, 11225-11236.
(26) Berendsen, H. J. C.; Grigera, J. R.; Straatsma, T. P.: The missing term in effective
pair potentials. The Journal of Physical Chemistry 1987, 91, 6269-6271.
Page 28 of 29Faraday Discussions
Fara
day
Dis
cuss
ions
Acc
epte
dM
anus
crip
t

29
Page 29 of 29 Faraday Discussions
Fara
day
Dis
cuss
ions
Acc
epte
dM
anus
crip
t