1 Qualitative baseline data focus group discussions ... - InfoNTD

59
CHAPTER 6
RESULTS AND DISCUSSIONS
In this chapter the results obtained have been discussed. The effect of machining parameters
such as cutting speed, feed, depth of cut, nose radius and rake angle on surface roughness has
been discussed in detail. The various levels of input parameters has mentioned in the table 6.1
below:
Table 6.1: Machining Parameters and Levels
PARAMETERS SYMBOLS UNITS LEVEL 1 LEVEL 2 LEVEL 3
CUTTING SPEED V m/min 175 225 275
FEED f mm/rev 0.05 0.1 0.15
DEPTH OF CUT d mm 0.1 0.2 0.3
NOSE RADIUS Nr mm 0.4 0.8 1.2
RAKE ANGLE Rk degrees 16 18 20
6.1 EFFECT OF CUTTING SPEED
The variation of cutting speed with surface roughness for different feed values, for different
depth of cut values, for different nose radius values and for different rake angle values by
keeping other input parameters as constant have been discussed through graphs.

60
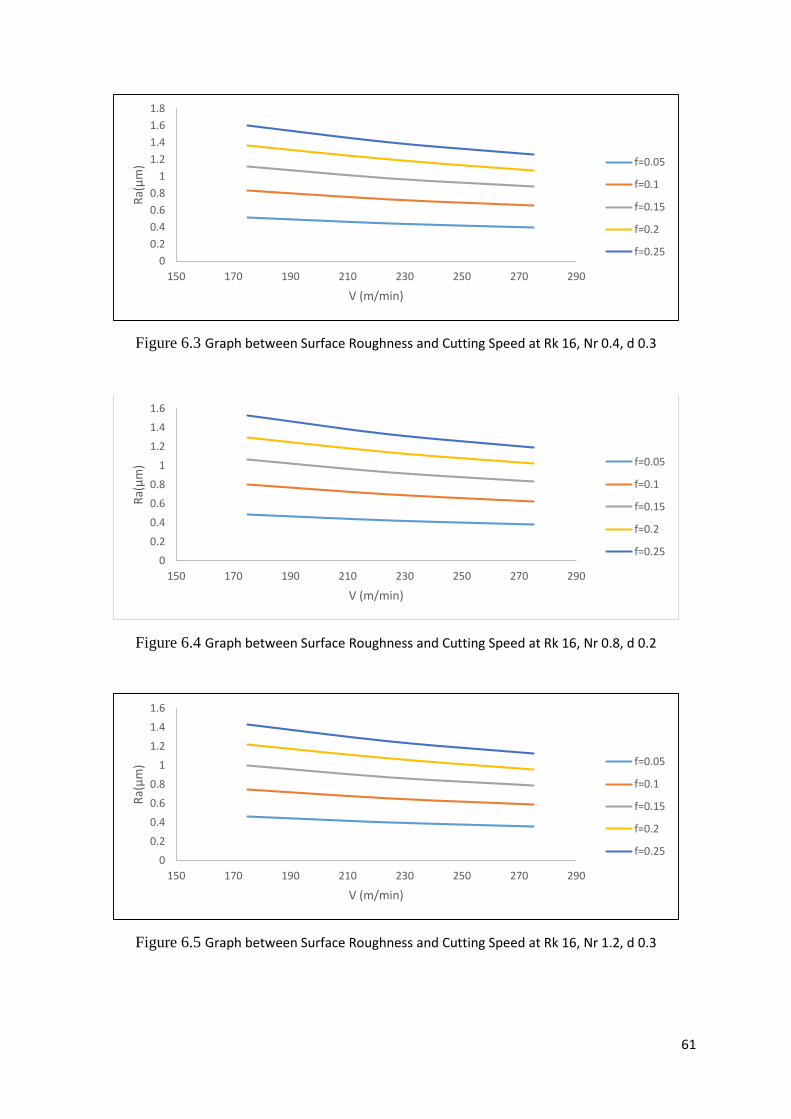
6.1.1 BY VARYING THE FEED
Graphs shows the variation of cutting speed (m/min) with surface roughness (µm) for
different feed (mm/rev) values by keeping depth of cut (mm), nose radius (mm) and rake
angle (deg) as constant. From the figures 6.1 – 6.11 it is evident that the surface roughness is
decreasing when speed is increasing. The minimum and maximum roughness values
observed are mentioned below.
The minimum Roughness value 0.263 is at Rk=18, Nr=1.2, d=0.1, V=275 and f=0.05.
The maximum Roughness value 1.865 is at Rk=16, Nr=0.4, d=0.3, V=175 and f=0.25.
Figure 6.1Graph between Surface Roughness and Cutting Speed at Rk 16, Nr 0.4, d 0.1
Figure 6.2Graph between Surface Roughness and Cutting Speed at Rk 16, Nr 0.4, d 0.2
0
0.2
0.4
0.6
0.8
1
1.2
1.4
1.6
150 170 190 210 230 250 270 290
Ra(
µm
)
V (m/min)
f=0.05
f=0.1
f=0.15
f=0.2
f=0.25
0
0.2
0.4
0.6
0.8
1
1.2
1.4
1.6
150 170 190 210 230 250 270 290
Ra(
µm
)
V (m/min)
f=0.05
f=0.1
f=0.15
f=0.2
f=0.25
61
Figure 6.3 Graph between Surface Roughness and Cutting Speed at Rk 16, Nr 0.4, d 0.3
Figure 6.4 Graph between Surface Roughness and Cutting Speed at Rk 16, Nr 0.8, d 0.2
Figure 6.5 Graph between Surface Roughness and Cutting Speed at Rk 16, Nr 1.2, d 0.3
0
0.2
0.4
0.6
0.8
1
1.2
1.4
1.6
1.8
150 170 190 210 230 250 270 290
Ra(
µm
)
V (m/min)
f=0.05
f=0.1
f=0.15
f=0.2
f=0.25
0
0.2
0.4
0.6
0.8
1
1.2
1.4
1.6
150 170 190 210 230 250 270 290
Ra(
µm
)
V (m/min)
f=0.05
f=0.1
f=0.15
f=0.2
f=0.25
0
0.2
0.4
0.6
0.8
1
1.2
1.4
1.6
150 170 190 210 230 250 270 290
Ra(
µm
)
V (m/min)
f=0.05
f=0.1
f=0.15
f=0.2
f=0.25

62
Figure 6.6 Graph between Surface Roughness and Cutting Speed at Rk 18, Nr 0.4, d 0.2
Figure 6.7 Graph between Surface Roughness and Cutting Speed at Rk 18, Nr 0.8, d 0.3
Figure 6.8 Graph between Surface Roughness and Cutting Speed at Rk 18, Nr 1.2, d 0.1
0
0.2
0.4
0.6
0.8
1
1.2
1.4
1.6
1.8
150 170 190 210 230 250 270 290
Ra(
µm
)
V (m/min)
f=0.05
f=0.1
f=0.15
f=0.2
f=0.25
0
0.2
0.4
0.6
0.8
1
1.2
1.4
1.6
150 170 190 210 230 250 270 290
Ra(
µm
)
V (m/min)
f=0.05
f=0.1
f=0.15
f=0.2
f=0.25
0
0.2
0.4
0.6
0.8
1
1.2
150 170 190 210 230 250 270 290
Ra(
µm
)
V (m/min)
f=0.05
f=0.1
f=0.15
f=0.2
f=0.25

63
Figure 6.9 Graph between Surface Roughness and Cutting Speed at Rk 20, Nr 0.4, d 0.3
Figure 6.10 Graph between Surface Roughness and Cutting Speed at Rk 20, Nr 0.8, d 0.1
Figure 6.11 Graph between Surface Roughness and Cutting Speed at Rk 20, Nr 1.2, d 0.2
0
0.2
0.4
0.6
0.8
1
1.2
1.4
1.6
1.8
150 170 190 210 230 250 270 290
Ra(
µm
)
V (m/min)
f=0.05
f=0.1
f=0.15
f=0.2
f=0.25
0
0.2
0.4
0.6
0.8
1
1.2
150 170 190 210 230 250 270 290
Ra(
µm
)
V (m/min)
f=0.05
f=0.1
f=0.15
f=0.2
f=0.25
0
0.2
0.4
0.6
0.8
1
1.2
150 170 190 210 230 250 270 290
Ra(
µm
)
V (m/min)
f=0.05
f=0.1
f=0.15
f=0.2
f=0.25

64
6.1.2 BY VARYING DEPTH OF CUT
Graphs shows the variation of cutting speed (m/min) with surface roughness (µm) for
different depth of cut(mm) values by keeping feed (mm/rev), nose radius (mm) and rake
angle (deg) as constant. From the figures 6.12 – 6.22 it is evident that the surface roughness is
decreasing when speed is increasing. The minimum and maximum roughness values
observed are mentioned below.
The minimum Roughness value 0.263 is at Rk 18, Nr 1.2, f 0.05, V 275 and d 0.1.
The maximum Roughness value 1.427 is at Rk 16, Nr 0.4, f 0.15, V 175 and d 0.5
Figure 6.12 Graph between Surface Roughness and Cutting Speed at Rk 16, Nr 0.4, f 0.05
Figure 6.13 Graph between Surface Roughness and Cutting Speed at Rk 16, Nr 0.4, f 0.1
0.3
0.35
0.4
0.45
0.5
0.55
0.6
0.65
0.7
150 170 190 210 230 250 270 290
Ra(
µm
)
V (m/min)
d=0.1
d=0.2
d=0.3
d=0.4
d=0.5
0.3
0.4
0.5
0.6
0.7
0.8
0.9
1
1.1
1.2
150 170 190 210 230 250 270 290
Ra(
µm
)
V (m/min)
d=0.1
d=0.2
d=0.3
d=0.4
d=0.5

65
Figure 6.14 Graph between Surface Roughness and Cutting Speed at Rk 16, Nr 0.4, f 0.15
Figure 6.15 Graph between Surface Roughness and Cutting Speed at Rk 16, Nr 0.8, f 0.1
Figure 6.16 Graph between Surface Roughness and Cutting Speed at Rk 16, Nr 1.2, f 0.15
0.3
0.5
0.7
0.9
1.1
1.3
1.5
150 170 190 210 230 250 270 290
Ra(
µm
)
V (m/min)
d=0.1
d=0.2
d=0.3
d=0.4
d=0.5
0.3
0.4
0.5
0.6
0.7
0.8
0.9
1
150 170 190 210 230 250 270 290
Ra(
µm
)
V (m/min)
d=0.1
d=0.2
d=0.3
d=0.4
d=0.5
0.3
0.4
0.5
0.6
0.7
0.8
0.9
1
1.1
150 170 190 210 230 250 270 290
Ra(
µm
)
V (m/min)
d=0.1
d=0.2
d=0.3
d=0.4
d=0.5

66
Figure 6.17 Graph between Surface Roughness and Cutting Speed at Rk 18, Nr 0.4, f 0.1
Figure 6.18 Graph between Surface Roughness and Cutting Speed at Rk 18, Nr 0.8, f 0.15
Figure 6.19 Graph between Surface Roughness and Cutting Speed at Rk 18, Nr 1.2, f 0.05
0.5
0.55
0.6
0.65
0.7
0.75
0.8
0.85
0.9
0.95
1
150 170 190 210 230 250 270 290
Ra(
µm
)
V (m/min)
d=0.1
d=0.2
d=0.3
d=0.4
d=0.5
0.5
0.6
0.7
0.8
0.9
1
1.1
1.2
150 170 190 210 230 250 270 290
Ra(
µm
)
V (m/min)
d=0.1
d=0.2
d=0.3
d=0.4
d=0.5
0.2
0.25
0.3
0.35
0.4
0.45
0.5
150 170 190 210 230 250 270 290
Ra(
µm
)
V (m/min)
d=0.1
d=0.2
d=0.3
d=0.4
d=0.5

67
Figure 6.20 Graph between Surface Roughness and Cutting Speed at Rk 20, Nr 0.4, f 0.15
Figure 6.21 Graph between Surface Roughness and Cutting Speed at Rk 20, Nr 0.8, f 0.05
Figure 6.22 Graph between Surface Roughness and Cutting Speed at Rk 20, Nr 1.2, f 0.1
0.6
0.7
0.8
0.9
1
1.1
1.2
1.3
150 170 190 210 230 250 270 290
Ra(
µm
)
V (m/min)
d=0.1
d=0.2
d=0.3
d=0.4
d=0.5
0.2
0.25
0.3
0.35
0.4
0.45
0.5
150 170 190 210 230 250 270 290
Ra(
µm
)
V (m/min)
d=0.1
d=0.2
d=0.3
d=0.4
d=0.5
0.1
0.2
0.3
0.4
0.5
0.6
0.7
0.8
150 170 190 210 230 250 270 290
Ra(
µm
)
V (m/min)
d=0.1
d=0.2
d=0.3
d=0.4
d=0.5

68
6.1.3 BY VARYING NOSE RADIUS
Graphs shows the variation of cutting speed (m/min) with surface roughness (µm) for
different nose radius (mm) values by keeping feed (mm/rev), depth of cut (mm) and rake
angle (deg) as constant. From the figure 6.23-6.33 it is evident that the surface roughness is
decreasing when speed is increasing. The minimum and maximum roughness values
observed are mentioned below.
The minimum Roughness value 0.284 is at Rk=16, f=0.05, d=0.1, V=275, and Nr=1.2
The maximum Roughness value 1.299 is at Rk=16, f=0.1, d=0.3, V=175 and Nr=0.4.
Figure 6.23 Graph between Surface Roughness and Cutting Speed at Rk 16, f 0.05, d 0.1
Figure 6.24 Graph between Surface Roughness and Cutting Speed at Rk 16, f 0.05, d 0.2
0.25
0.3
0.35
0.4
0.45
0.5
170 190 210 230 250 270 290
Ra(
µm
)
V (m/min)
n=0.4
n=0.6
n=0.8
n=1.0
n=1.2
0.3
0.35
0.4
0.45
0.5
0.55
0.6
170 190 210 230 250 270 290
Ra(
µm
)
V (m/min)
n=0.4
n=0.6
n=0.8
n=1.0
n=1.2

69
Figure 6.25 Graph between Surface Roughness and Cutting Speed at Rk 16, f 0.05, d 0.3
Figure 6.26 Graph between Surface Roughness and Cutting Speed at Rk 16, f 0.1, d 0.2
Figure 6.27 Graph between Surface Roughness and Cutting Speed at 16, f 0.1, d 0.3
0.3
0.35
0.4
0.45
0.5
0.55
0.6
0.65
170 190 210 230 250 270 290
Ra(
µm
)
V (m/min)
n=0.4
n=0.6
n=0.8
n=1.0
n=1.2
0.45
0.5
0.55
0.6
0.65
0.7
0.75
0.8
0.85
0.9
0.95
170 190 210 230 250 270 290
Ra(
µm
)
V (m/min)
n=0.4
n=0.6
n=0.8
n=1.0
n=1.2
0.5
0.6
0.7
0.8
0.9
1
1.1
1.2
1.3
1.4
170 190 210 230 250 270 290
Ra(
µm
)
V (m/min)
n=0.4
n=0.6
n=0.8
n=1.0
n=1.2

70
Figure 6.28 Graph between Surface Roughness and Cutting Speed at Rk 18, f 0.05, d 0.2
Figure 6.29 Graph between Surface Roughness and Cutting Speed at Rk 18, f 0.1, d 0.3
Figure 6.30 Graph between Surface Roughness and Cutting Speed at Rk 18, f 0.15, d 0.1
0.2
0.25
0.3
0.35
0.4
0.45
0.5
0.55
170 190 210 230 250 270 290
Ra(
µm
)
V (m/min)
n=0.4
n=0.6
n=0.8
n=1.0
n=1.2
0.2
0.3
0.4
0.5
0.6
0.7
0.8
0.9
1
170 190 210 230 250 270 290
Ra(
µm
)
V (m/min)
n=0.4
n=0.6
n=0.8
n=1.0
n=1.2
0.2
0.3
0.4
0.5
0.6
0.7
0.8
0.9
1
1.1
170 190 210 230 250 270 290
Ra(
µm
)
V (m/min)
n=0.4
n=0.6
n=0.8
n=1.0
n=1.2

71
Figure 6.31 Graph between Surface Roughness and Cutting Speed at Rk 20, f 0.05, d 0.3
Figure 6.32 Graph between Surface Roughness and Cutting Speed at Rk 20, f 0.1, d 0.1
Figure 6.33 Graph between Surface Roughness and Cutting Speed at Rk 20, f 0.15, d 0.2
0.2
0.25
0.3
0.35
0.4
0.45
0.5
0.55
170 190 210 230 250 270 290
Ra(
µm
)
V (m/min)
n=0.4
n=0.6
n=0.8
n=1.0
n=1.2
0.2
0.3
0.4
0.5
0.6
0.7
0.8
170 190 210 230 250 270 290
Ra(
µm
)
V (m/min)
n=0.4
n=0.6
n=0.8
n=1.0
n=1.2
0.2
0.3
0.4
0.5
0.6
0.7
0.8
0.9
1
1.1
170 190 210 230 250 270 290
Ra(
µm
)
V (m/min)
n=0.4
n=0.6
n=0.8
n=1.0
n=1.2

72
6.1.4 BY VARYING RAKE ANGLE
Graphs shows the variation of cutting speed (m/min) with surface roughness (µm) for
different rake angle (deg) values by keeping feed (mm/rev), depth of cut (mm) and nose
radius (mm) as constant. From the figures 6.34-6.44 it is evident that the surface roughness is
decreasing when speed is increasing. The minimum and maximum roughness values
observed are mentioned below.
The minimum Roughness value 0.282 is at Nr=1.2, f=0.05, d=0.3, V=275 and Rk=22.
The maximum Roughness value 1.418 is at Nr=0.4, f=0.15, d=0.3, V=175 and Rk=14.
Figure 6.34 Graph between Surface Roughness and Cutting Speed at Nr 0.4, f 0.05, d 0.1
Figure 6.35 Graph between Surface Roughness and Cutting Speed at Nr 0.4, f 0.05, d 0.2
0.2
0.25
0.3
0.35
0.4
0.45
0.5
0.55
160 180 200 220 240 260 280 300
Ra(
µm
)
V (m/min)
Rake 1=14
Rake 2=16
Rake 3=18
Rake 4=20
Rake 5=22
0.2
0.25
0.3
0.35
0.4
0.45
0.5
0.55
0.6
0.65
160 180 200 220 240 260 280 300
Ra(
µm
)
V (m/min)
Rake 1=14
Rake 2=16
Rake 3=18
Rake 4=20
Rake 5=22

73
Figure 6.36 Graph between Surface Roughness and Cutting Speed at Nr 0.4, f 0.05, d 0.3
Figure 6.37 Graph between Surface Roughness and Cutting Speed at Nr 0.4, f 0.1, d 0.2
Figure 6.38 Graph between Surface Roughness and Cutting Speed at Nr 0.4, f 0.15, d 0.3
0.2
0.25
0.3
0.35
0.4
0.45
0.5
0.55
0.6
0.65
0.7
160 180 200 220 240 260 280 300
Ra(
µm
)
V (m/min)
Rake 1=14
Rake 2=16
Rake 3=18
Rake 4=20
Rake 5=22
0.2
0.3
0.4
0.5
0.6
0.7
0.8
0.9
1
1.1
160 180 200 220 240 260 280 300
Ra(
µm
)
V (m/min)
Rake 1=14
Rake 2=16
Rake 3=18
Rake 4=20
Rake 5=22
0.2
0.4
0.6
0.8
1
1.2
1.4
1.6
160 180 200 220 240 260 280 300
Ra(
µm
)
V (m/min)
Rake 1=14
Rake 2=16
Rake 3=18
Rake 4=20
Rake 5=22

74
Figure 6.39 Graph between Surface Roughness and Cutting Speed at Nr 0.8, f 0.05, d 0.2
Figure 6.40 Graph between Surface Roughness and Cutting Speed at Nr 0.8, f 0.1, d 0.3
Figure 6.41 Graph between Surface Roughness and Cutting Speed at Nr 0.8, f 0.15, d 0.1
0.2
0.25
0.3
0.35
0.4
0.45
0.5
0.55
160 180 200 220 240 260 280 300
Ra(
µm
)
V (m/min)
Rake 1=14
Rake 2=16
Rake 3=18
Rake 4=20
Rake 5=22
0.2
0.3
0.4
0.5
0.6
0.7
0.8
0.9
1
160 180 200 220 240 260 280 300
Ra(
µm
)
V (m/min)
Rake 1=14
Rake 2=16
Rake 3=18
Rake 4=20
Rake 5=22
0.2
0.3
0.4
0.5
0.6
0.7
0.8
0.9
1
160 180 200 220 240 260 280 300
Ra(
µm
)
V (m/min)
Rake 1=14
Rake 2=16
Rake 3=18
Rake 4=20
Rake 5=22

75
Figure 6.42 Graph between Surface Roughness and Cutting Speed at Nr 1.2, f 0.05, d 0.3
Figure 6.43 Graph between Surface Roughness and Cutting Speed at Nr 1.2, f 0.1, d 0.1
Figure 6.44 Graph between Surface Roughness and Cutting Speed at Nr 1.2, f 0.15, d 0.2
0.2
0.25
0.3
0.35
0.4
0.45
0.5
160 180 200 220 240 260 280 300
Ra(
µm
)
V (m/min)
Rake 1=14
Rake 2=16
Rake 3=18
Rake 4=20
Rake 5=22
0.2
0.25
0.3
0.35
0.4
0.45
0.5
0.55
0.6
0.65
0.7
160 180 200 220 240 260 280 300
Ra(
µm
)
V (m/min)
Rake 1=14
Rake 2=16
Rake 3=18
Rake 4=20
Rake 5=22
0.2
0.3
0.4
0.5
0.6
0.7
0.8
0.9
1
1.1
160 180 200 220 240 260 280 300
Ra(
µm
)
V (m/min)
Rake 1=14
Rake 2=16
Rake 3=18
Rake 4=20
Rake 5=22

76
6.2 EFFECT OF FEED
The variation of feed with surface roughness for different cutting speed, for different depth of
cut values, for different nose radius values and for different rake angle values by keeping
other parameters as constant have been discussed through graphs.
6.2.1 BY VARYING CUTTING SPEED
Graphs shows the variation of feed (mm/rev) with surface roughness (µm) for different
cutting speed (m/min) values by keeping depth of cut (mm), nose radius (mm) and rake angle
(deg) as constant. From the figures 6.45-6.55 it is evident that the surface roughness is
increasing when feed is increasing. The minimum and maximum roughness values observed
are mentioned below.
The minimum Roughness value 0.263 is at Rk=18, Nr=1.2, d=0.1, f=0.05 and V=275.
The maximum Roughness value 1.299 is at Rk=16, Nr=0.4, d=0.3, f=0.15 and V=175.
Figure 6.45 Graph between Surface Roughness and Feed at Rk 16, Nr 0.4, d 0.1
0.25
0.35
0.45
0.55
0.65
0.75
0.85
0.95
1.05
1.15
0.04 0.06 0.08 0.1 0.12 0.14 0.16
Ra(
µm
)
f (mm/rev)
V=175
V=200
V=225
V=250
V=275

77
Figure 6.46 Graph between Surface Roughness and Feed at Rk 16, Nr 0.4, d 0.2
Figure 6.47 Graph between Surface Roughness and Feed at Rk 16, Nr 0.4, d 0.3
Figure 6.48 Graph between Surface Roughness and Feed at Rk 16, Nr 0.8, d 0.2
0.25
0.45
0.65
0.85
1.05
1.25
1.45
0.04 0.06 0.08 0.1 0.12 0.14 0.16
Ra(
µm
)
f (mm/rev)
V=175
V=200
V=225
V=250
V=275
0.25
0.45
0.65
0.85
1.05
1.25
1.45
0.04 0.06 0.08 0.1 0.12 0.14 0.16
Ra(
µm
)
f (mm/rev)
Graph between Ra and Feed
V=175
V=200
V=225
V=250
V=275
0.25
0.35
0.45
0.55
0.65
0.75
0.85
0.95
1.05
0.04 0.06 0.08 0.1 0.12 0.14 0.16
Ra(
µm
)
f (mm/rev)
V=175
V=200
V=225
V=250
V=275

78
Figure 6.49 Graph between Surface Roughness and Feed at Rk 16, Nr 1.2, d 0.3
Figure 6.50 Graph between Surface Roughness and Feed at Rk 18, Nr 0.4, d 0.2
Figure 6.51 Graph between Surface Roughness and Feed at Rk 18, Nr 0.8, d 0.3
0.25
0.35
0.45
0.55
0.65
0.75
0.85
0.95
1.05
0.04 0.06 0.08 0.1 0.12 0.14 0.16
Ra(
µm
)
f (mm/rev)
V=175
V=200
V=225
V=250
V=275
0.25
0.35
0.45
0.55
0.65
0.75
0.85
0.95
1.05
1.15
1.25
0.04 0.06 0.08 0.1 0.12 0.14 0.16
Ra(
µm
)
f(mm/rev)
V=175
V=200
V=225
V=250
V=275
0.25
0.35
0.45
0.55
0.65
0.75
0.85
0.95
1.05
0.04 0.06 0.08 0.1 0.12 0.14 0.16
Ra(
µm
)
f (mm/rev)
V=175
V=200
V=225
V=250
V=275

79
Figure 6.52 Graph between Surface Roughness and Feed at Rk 18, Nr 1.2, d 0.1
Figure 6.53 Graph between Surface Roughness and Feed at Rk 20, Nr 0.4, d 0.3
Figure 6.54 Graph between Surface Roughness and Feed at Rk 20, Nr 0.8, d 0.1
0.25
0.35
0.45
0.55
0.65
0.75
0.85
0.04 0.06 0.08 0.1 0.12 0.14 0.16
Ra(
µm
)
f (mm/rev)
V=175
V=200
V=225
V=250
V=275
0.25
0.35
0.45
0.55
0.65
0.75
0.85
0.95
1.05
1.15
1.25
0.04 0.06 0.08 0.1 0.12 0.14 0.16
Ra(
µm
)
f (mm/rev)
V=175
V=200
V=225
V=250
V=275
0.25
0.35
0.45
0.55
0.65
0.75
0.85
0.04 0.06 0.08 0.1 0.12 0.14 0.16
Ra(
µm
)
f (mm/rev)
V=175
V=200
V=225
V=250
V=275

80
Figure 6.55 Graph between Surface Roughness and Feed at Rk 20, Nr 1.2, d 0.2
6.2.2 BY VARYING DEPTH OF CUT
Graphs shows the variation of feed (mm/rev) with surface roughness (µm) for different depth
of cut (mm) values by keeping cutting speed (m/min), nose radius (mm) and rake angle (deg)
as constant. From the Figures 6.56-6.66 it is evident that the surface roughness is increasing
when feed is increasing. The minimum and maximum roughness values observed are
mentioned below.
The minimum Roughness value 0.273 is at Rk=20, Nr=1.2, V=225, f=0.05 and d=0.1
The maximum Roughness value 1.427 is at Rk=16, Nr=0.4, V=175, f=0.25 and d=0.3
Figure 6.56 Graph between Surface Roughness and Feed at Rk 16, Nr 0.4, V 175
0.25
0.35
0.45
0.55
0.65
0.75
0.85
0.04 0.06 0.08 0.1 0.12 0.14 0.16
Ra(
µm
)
f (mm/rev)
0.2
0.4
0.6
0.8
1
1.2
1.4
1.6
0 0.02 0.04 0.06 0.08 0.1 0.12 0.14 0.16
Ra(
µm
)
f (mm/rev)
d=0.1
d=0.2
d=0.3
d=0.4
d=0.5

81
Figure 6.57 Graph between Surface Roughness and Feed at Rk 16, Nr 0.4, V 225
Figure 6.58 Graph between Surface Roughness and Feed at Rk 16, Nr 0.4, V 275
Figure 6.59 Graph between Surface Roughness and Feed at Rk 16, Nr 0.8, V 225
0.2
0.4
0.6
0.8
1
1.2
1.4
0 0.02 0.04 0.06 0.08 0.1 0.12 0.14 0.16
Ra(
µm
)
f (mm/rev)
d=0.1
d=0.2
d=0.3
d=0.4
d=0.5
0.2
0.3
0.4
0.5
0.6
0.7
0.8
0.9
1
1.1
1.2
0 0.02 0.04 0.06 0.08 0.1 0.12 0.14 0.16
Ra(
µm
)
f (mm/rev)
d=0.1
d=0.2
d=0.3
d=0.4
d=0.5
0.2
0.3
0.4
0.5
0.6
0.7
0.8
0.9
1
1.1
0 0.02 0.04 0.06 0.08 0.1 0.12 0.14 0.16
Ra(
µm
)
f (mm/rev)
d=0.1
d=0.2
d=0.3
d=0.4
d=0.5

82
Figure 6.60 Graph between Surface Roughness and Feed at Rk 16, Nr 1.2, V 275
Figure 6.61 Graph between Surface Roughness and Feed at Rk 18, Nr 0.4, V 225
Figure 6.62 Graph between Surface Roughness and Feed at Rk 18, Nr 0.8, V 275
0.2
0.3
0.4
0.5
0.6
0.7
0.8
0.9
0 0.02 0.04 0.06 0.08 0.1 0.12 0.14 0.16
Ra(
µm
)
f(mm/rev)
d=0.1
d=0.2
d=0.3
d=0.4
d=0.5
0.2
0.4
0.6
0.8
1
1.2
1.4
0 0.02 0.04 0.06 0.08 0.1 0.12 0.14 0.16
Ra(
µm
)
f(mm/rev)
d=0.1
d=0.2
d=0.3
d=0.4
d=0.5
0.2
0.3
0.4
0.5
0.6
0.7
0.8
0.9
0 0.02 0.04 0.06 0.08 0.1 0.12 0.14 0.16
Ra(
µm
)
f(mm/rev)
d=0.1
d=0.2
d=0.3
d=0.4
d=0.5

83
Figure 6.63 Graph between Surface Roughness and Feed at Rk 18, Nr 1.2, V 175
Figure 6.64 Graph between Surface Roughness and Feed at Rk 20, Nr 0.4, V 275
Figure 6.65 Graph between Surface Roughness and Feed at Rk 20, Nr 0.8, V 175
0.2
0.3
0.4
0.5
0.6
0.7
0.8
0.9
1
1.1
0 0.02 0.04 0.06 0.08 0.1 0.12 0.14 0.16
Ra(
µm
)
f(mm/rev)
d=0.1
d=0.2
d=0.3
d=0.4
d=0.5
0.2
0.3
0.4
0.5
0.6
0.7
0.8
0.9
1
1.1
0 0.02 0.04 0.06 0.08 0.1 0.12 0.14 0.16
Ra(
µm
)
f(mm/rev)
d=0.1
d=0.2
d=0.3
d=0.4
d=0.5
0.2
0.3
0.4
0.5
0.6
0.7
0.8
0.9
1
1.1
0 0.02 0.04 0.06 0.08 0.1 0.12 0.14 0.16
Ra(
µm
)
f(mm/rev)
d=0.1
d=0.2
d=0.3
d=0.4
d=0.5
84
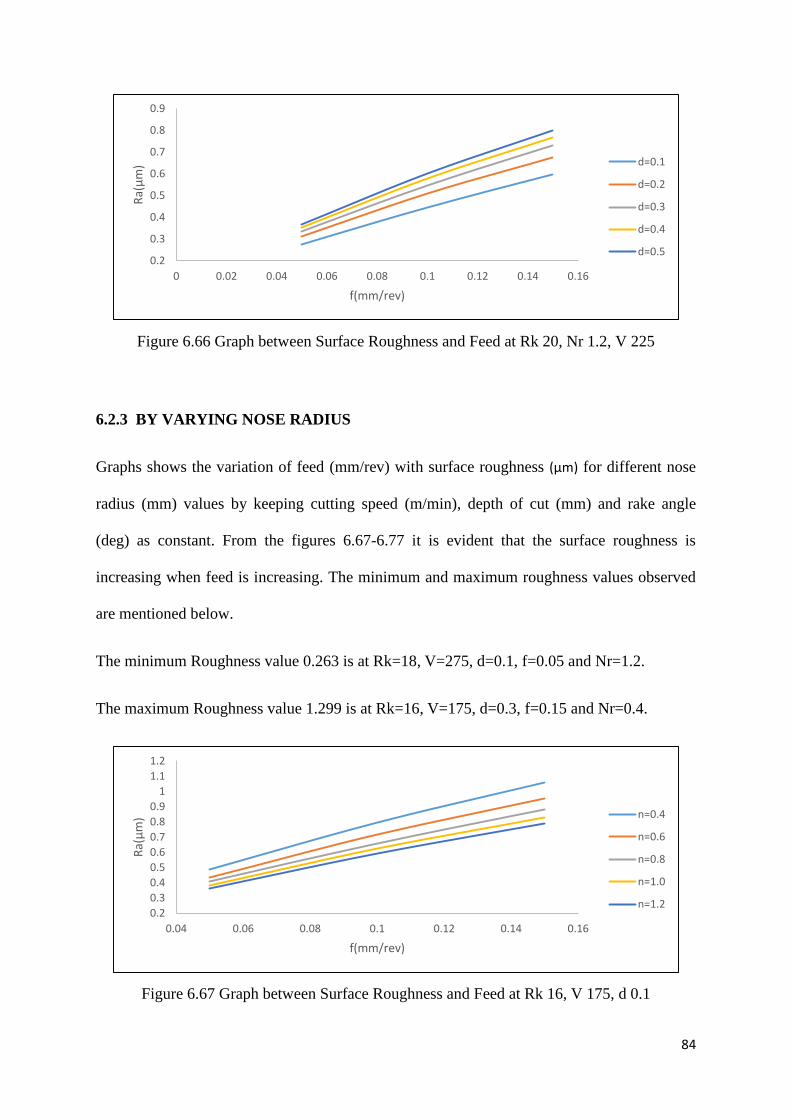
Figure 6.66 Graph between Surface Roughness and Feed at Rk 20, Nr 1.2, V 225
6.2.3 BY VARYING NOSE RADIUS
Graphs shows the variation of feed (mm/rev) with surface roughness (µm) for different nose
radius (mm) values by keeping cutting speed (m/min), depth of cut (mm) and rake angle
(deg) as constant. From the figures 6.67-6.77 it is evident that the surface roughness is
increasing when feed is increasing. The minimum and maximum roughness values observed
are mentioned below.
The minimum Roughness value 0.263 is at Rk=18, V=275, d=0.1, f=0.05 and Nr=1.2.
The maximum Roughness value 1.299 is at Rk=16, V=175, d=0.3, f=0.15 and Nr=0.4.
Figure 6.67 Graph between Surface Roughness and Feed at Rk 16, V 175, d 0.1
0.2
0.3
0.4
0.5
0.6
0.7
0.8
0.9
0 0.02 0.04 0.06 0.08 0.1 0.12 0.14 0.16
Ra(
µm
)
f(mm/rev)
d=0.1
d=0.2
d=0.3
d=0.4
d=0.5
0.2
0.3
0.4
0.5
0.6
0.7
0.8
0.9
1
1.1
1.2
0.04 0.06 0.08 0.1 0.12 0.14 0.16
Ra(
µm
)
f(mm/rev)
n=0.4
n=0.6
n=0.8
n=1.0
n=1.2

85
Figure 6.68 Graph between Surface Roughness and Feed at Rk 16, V 175, d 0.2
Figure 6.69 Graph between Surface Roughness and Feed at Rk 16, V 175, d 0.3
Figure 6.70 Graph between Surface Roughness and Feed at Rk 16, V 225, d 0.2
0.2
0.4
0.6
0.8
1
1.2
1.4
0.04 0.06 0.08 0.1 0.12 0.14 0.16
Ra(
µm
)
f(mm/rev)
n=0.4
n=0.6
n=0.8
n=1.0
n=1.2
0.2
0.4
0.6
0.8
1
1.2
1.4
0.04 0.06 0.08 0.1 0.12 0.14 0.16
Ra(
µm
)
f(mm/rev)
n=0.4
n=0.6
n=0.8
n=1.0
n=1.2
0.2
0.3
0.4
0.5
0.6
0.7
0.8
0.9
1
1.1
0.04 0.06 0.08 0.1 0.12 0.14 0.16
Ra(
µm
)
f(mm/rev)
n=0.4
n=0.6
n=0.8
n=1.0
n=1.2

86
Figure 6.71 Graph between Surface Roughness and Feed at Rk 16, V 275, d 0.3
Figure 6.72 Graph between Surface Roughness and Feed at Rk 18, V 175, d 0.2
Figure 6.73 Graph between Surface Roughness and Feed at Rk 18, V 225, d 0.3
0.2
0.3
0.4
0.5
0.6
0.7
0.8
0.9
1
1.1
0.04 0.06 0.08 0.1 0.12 0.14 0.16
Ra(
µm
)
f(mm/rev)
n=0.4
n=0.6
n=0.8
n=1.0
n=1.2
0.2
0.3
0.4
0.5
0.6
0.7
0.8
0.9
1
1.1
1.2
0.04 0.06 0.08 0.1 0.12 0.14 0.16
Ra(
µm
)
f(mm/rev)
n=0.4
n=0.6
n=0.8
n=1.0
n=1.2
0.2
0.3
0.4
0.5
0.6
0.7
0.8
0.9
1
1.1
0.04 0.06 0.08 0.1 0.12 0.14 0.16
Ra(
µm
)
f(mm/rev)
n=0.4
n=0.6
n=0.8
n=1.0
n=1.2

87
Figure 6.74 Graph between Surface Roughness and Feed at Rk 18, V 275, d 0.1
Figure 6.75 Graph between Surface Roughness and Feed at Rk 20, V 175, d 0.3
Figure 6.76 Graph between Surface Roughness and Feed at Rk 20, V 225, d 0.1
0.2
0.3
0.4
0.5
0.6
0.7
0.8
0.04 0.06 0.08 0.1 0.12 0.14 0.16
Ra(
µm
)
f(mm/rev)
n=0.4
n=0.6
n=0.8
n=1.0
n=1.2
0.2
0.3
0.4
0.5
0.6
0.7
0.8
0.9
1
1.1
1.2
0.04 0.06 0.08 0.1 0.12 0.14 0.16
Ra(
µm
)
f(mm/rev)
n=0.4
n=0.6
n=0.8
n=1.0
n=1.2
0.2
0.3
0.4
0.5
0.6
0.7
0.8
0.9
0.04 0.06 0.08 0.1 0.12 0.14 0.16
Ra(
µm
)
f(mm/rev)
n=0.4
n=0.6
n=0.8
n=1.0
n=1.2

88
Figure 6.77 Graph between Surface Roughness and Feed at Rk 20, V 275, d 0.2
6.2.4 BY VARYING RAKE ANGLE
Graphs shows the variation of feed (mm/rev) with surface roughness (µm) for different rake
angle (deg) values by keeping cutting speed (m/min), depth of cut (mm) and nose radius
(mm) as constant. From the figures 6.78-6.88 it is evident that the surface roughness is
increasing when feed is increasing. The minimum and maximum roughness values observed
are mentioned below.
The minimum Roughness value 0.2572 is at Nr=1.2, V=225, d=0.1, f=0.05 and Rk=22.
The maximum Roughness value 1.418 is at Nr=0.4, V=175, d=0.3, f=0.15 and Rk=14.
Figure 6.78 Graph between Surface Roughness and Feed at Nr 0.4, V 175, d 0.1
0.2
0.3
0.4
0.5
0.6
0.7
0.8
0.9
0.04 0.06 0.08 0.1 0.12 0.14 0.16
Ra(
µm
)
f(mm/rev)
n=0.4
n=0.6
n=0.8
n=1.0
n=1.2
0.2
0.4
0.6
0.8
1
1.2
1.4
0.05 0.1 0.15
Ra(
µm
)
f(mm/rev)
Rake 1=14
Rake 2=16
Rake 3=18
Rake 4=20
Rake 5=22

89
Figure 6.79 Graph between Surface Roughness and Feed at Nr 0.4, V 175, d 0.2
Figure 6.80 Graph between Surface Roughness and Feed at Nr 0.4, V 175, d 0.3
Figure 6.81 Graph between Surface Roughness and Feed at Nr 0.4, V 225, d 0.2
0.2
0.4
0.6
0.8
1
1.2
1.4
0.05 0.1 0.15
Ra(
µm
)
f(mm/rev)
Rake 1=14
Rake 2=16
Rake 3=18
Rake 4=20
Rake 5=22
0.2
0.4
0.6
0.8
1
1.2
1.4
1.6
0.05 0.1 0.15
Ra(
µm
)
f(mm/rev)
Rake 1=14
Rake 2=16
Rake 3=18
Rake 4=20
Rake 5=22
0.2
0.3
0.4
0.5
0.6
0.7
0.8
0.9
1
1.1
1.2
0.05 0.1 0.15
Ra(
µm
)
f(mm/rev)
Rake 1=14
Rake 2=16
Rake 3=18
Rake 4=20
Rake 5=22

90
Figure 6.82 Graph between Surface Roughness and Feed at Nr 0.4, V 275, d 0.3
Figure 6.83 Graph between Surface Roughness and Feed at Nr 0.8, V 175, d 0.2
Figure 6.84 Graph between Surface Roughness and Feed at Nr 0.8, V 225, d 0.3
0.2
0.3
0.4
0.5
0.6
0.7
0.8
0.9
1
1.1
1.2
0.05 0.1 0.15
Ra(
µm
)
f(mm/rev)
Rake 1=14
Rake 2=16
Rake 3=18
Rake 4=20
Rake 5=22
0.2
0.3
0.4
0.5
0.6
0.7
0.8
0.9
1
1.1
1.2
0.05 0.1 0.15
Ra(
µm
)
f(mm/rev)
Rake 1=14
Rake 2=16
Rake 3=18
Rake 4=20
Rake 5=22
0.2
0.3
0.4
0.5
0.6
0.7
0.8
0.9
1
1.1
0 0.02 0.04 0.06 0.08 0.1 0.12 0.14 0.16
Ra(
µm
)
f(mm/rev)
Rake 1=14
Rake 2=16
Rake 3=18
Rake 4=20
Rake 5=22

91
Figure 6.85 Graph between Surface Roughness and Feed at Nr 0.8, V 275, d 0.1
Figure 6.86 Graph between Surface Roughness and Feed at Nr 1.2, V 175, d 0.3
Figure 6.87 Graph between Surface Roughness and Feed at Nr 1.2, V 225, d 0.1
0.2
0.3
0.4
0.5
0.6
0.7
0.8
0 0.02 0.04 0.06 0.08 0.1 0.12 0.14 0.16
Ra(
µm
)
f(mm/rev)
Rake 1=14
Rake 2=16
Rake 3=18
Rake 4=20
Rake 5=22
0.2
0.3
0.4
0.5
0.6
0.7
0.8
0.9
1
1.1
0 0.02 0.04 0.06 0.08 0.1 0.12 0.14 0.16
Ra(
µm
)
f(mm/rev)
Rake 1=14
Rake 2=16
Rake 3=18
Rake 4=20
Rake 5=22
0.2
0.3
0.4
0.5
0.6
0.7
0.8
0 0.02 0.04 0.06 0.08 0.1 0.12 0.14 0.16
Ra(
µm
)
f(mm/rev)
Rake 1=14
Rake 2=16
Rake 3=18
Rake 4=20
Rake 5=22

92
Figure 6.88 Graph between Surface Roughness and Feed at Nr 1.2, V 275, d 0.2
5.3 EFFECT OF DEPTH OF CUT
The variation of depth of cut with surface roughness for different cutting speed values, for
different feed values , for different nose radius values and for different rake angle values have
been discussed through graphs.
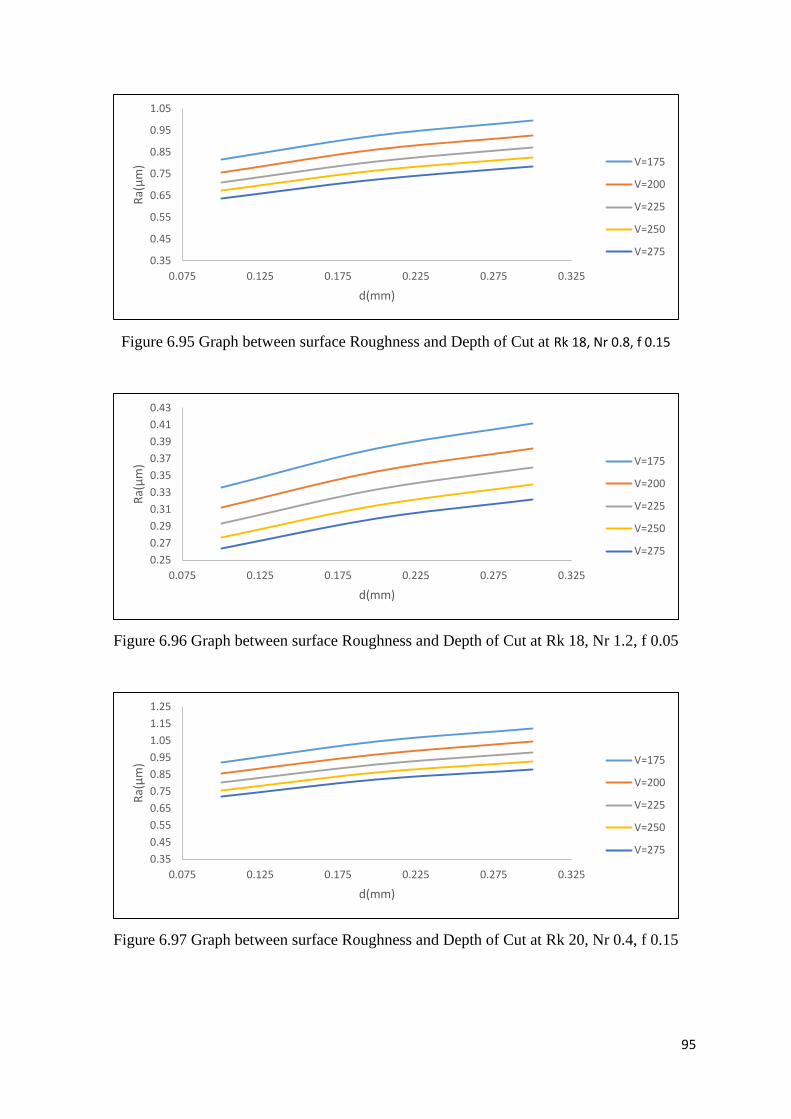
6.3.1 BY VARYING CUTTING SPEED
Graphs shows the variation of depth of cut (mm) with surface roughness (µm) for different
cutting speed (m/min) values by keeping feed (mm/rev), nose radius (mm) and rake angle
(deg) as constant. From the Figures 6.89-6.99 it is evident that the surface roughness is
increasing when depth of cut is increasing. The minimum and maximum roughness values
observed are as mentioned below.
The minimum Roughness value 0.263 is at Rk=18, Nr=1.2, f=0.05, d=0.1 and V=275.
The maximum Roughness value 1.299 is at Rk=16, Nr=0.4, f=0.15, d=0.3 and V=175.
0.2
0.3
0.4
0.5
0.6
0.7
0.8
0 0.02 0.04 0.06 0.08 0.1 0.12 0.14 0.16
Ra(
µm
)
f (mm/rev)
Rake 1=14
Rake 2=16
Rake 3=18
Rake 4=20
Rake 5=22

93
Figure 6.89 Graph between surface Roughness and Depth of Cut at Rk 16, Nr 0.4, f 0.05
Figure 6.90 Graph between surface Roughness and Depth of Cut at Rk 16, Nr 0.4, f 0.1
Figure 6.91 Graph between surface Roughness and Depth of Cut at Rk 16, Nr 0.4, f 0.15
0.35
0.4
0.45
0.5
0.55
0.6
0.65
0.075 0.125 0.175 0.225 0.275 0.325
Ra(
µm
)
d(mm)
V=175
V=200
V=225
V=250
V=275
0.35
0.45
0.55
0.65
0.75
0.85
0.95
1.05
0.075 0.125 0.175 0.225 0.275 0.325
Ra(
µm
)
d(mm)
V=175
V=200
V=225
V=250
V=275
0.35
0.45
0.55
0.65
0.75
0.85
0.95
1.05
1.15
1.25
1.35
0.075 0.125 0.175 0.225 0.275 0.325
Ra(
µm
)
d(mm)
V=175
V=200
V=225
V=250
V=275

94
Figure 6.92 Graph between surface Roughness and Depth of Cut at Rk 16, Nr 0.8, f 0.1
Figure 6.93 Graph between surface Roughness and Depth of Cut at Rk 16, Nr 1.2, f 0.15
Figure 6.94 Graph between surface Roughness and Depth of Cut at Rk 18, Nr 0.4, f 0.1
0.35
0.4
0.45
0.5
0.55
0.6
0.65
0.7
0.75
0.8
0.85
0.075 0.125 0.175 0.225 0.275 0.325
Ra(
µm
)
d(mm)
V=175
V=200
V=225
V=250
V=275
0.35
0.45
0.55
0.65
0.75
0.85
0.95
1.05
0.075 0.125 0.175 0.225 0.275 0.325
Ra(
µm
)
d(mm)
V=175
V=200
V=225
V=250
V=275
0.35
0.45
0.55
0.65
0.75
0.85
0.95
0.075 0.125 0.175 0.225 0.275 0.325
Ra(
µm
)
d(mm)
V=175
V=200
V=225
V=250
V=275
95
Figure 6.95 Graph between surface Roughness and Depth of Cut at Rk 18, Nr 0.8, f 0.15
Figure 6.96 Graph between surface Roughness and Depth of Cut at Rk 18, Nr 1.2, f 0.05
Figure 6.97 Graph between surface Roughness and Depth of Cut at Rk 20, Nr 0.4, f 0.15
0.35
0.45
0.55
0.65
0.75
0.85
0.95
1.05
0.075 0.125 0.175 0.225 0.275 0.325
Ra(
µm
)
d(mm)
V=175
V=200
V=225
V=250
V=275
0.25
0.27
0.29
0.31
0.33
0.35
0.37
0.39
0.41
0.43
0.075 0.125 0.175 0.225 0.275 0.325
Ra(
µm
)
d(mm)
V=175
V=200
V=225
V=250
V=275
0.35
0.45
0.55
0.65
0.75
0.85
0.95
1.05
1.15
1.25
0.075 0.125 0.175 0.225 0.275 0.325
Ra(
µm
)
d(mm)
V=175
V=200
V=225
V=250
V=275

96
Figure 6.98 Graph between surface Roughness and Depth of Cut at Rk 20, Nr 0.8, f 0.05
Figure 6.99 Graph between surface Roughness and Depth of Cut at Rk 20, Nr 1.2, f 0.1
6.3.2 BY VARYING FEED
Graphs shows the variation of depth of cut (mm) with surface roughness (µm) for different
feed (mm/rev) values by keeping cutting speed (m/min), nose radius (mm) and rake angle
(deg) as constant. From the Figures 6.100-6.110 it is evident that the surface roughness is
increasing when depth of cut is increasing. The minimum and maximum roughness values
observed are mentioned below.
The minimum Roughness value 0.273 is at Rk=20, Nr=1.2, V=225, d=0.1 and f=0.05.
The maximum Roughness value 1.865 is at Rk=16, Nr=0.4, V=175, d=0.3 and f=0.25
0.25
0.27
0.29
0.31
0.33
0.35
0.37
0.39
0.41
0.43
0.45
0.075 0.125 0.175 0.225 0.275 0.325
Ra(
µm
)
d(mm)
V=175
V=200
V=225
V=250
V=275
0.25
0.3
0.35
0.4
0.45
0.5
0.55
0.6
0.65
0.075 0.125 0.175 0.225 0.275 0.325
Ra(
µm
)
d(mm)
V=175
V=200
V=225
V=250
V=275

97
Figure 6.100 Graph between surface Roughness and Depth of Cut at Rk 16, Nr 0.4, V 175
Figure 6.101 Graph between surface Roughness and Depth of Cut at Rk 16, Nr 0.4, V 225
Figure 6.102 Graph between surface Roughness and Depth of Cut at Rk 16, Nr 0.4, V 275
0
0.2
0.4
0.6
0.8
1
1.2
1.4
1.6
1.8
2
0.05 0.1 0.15 0.2 0.25 0.3 0.35
Ra(
µm
)
d(mm)
f=0.05
f=0.1
f=0.15
f=0.2
f=0.25
0
0.2
0.4
0.6
0.8
1
1.2
1.4
1.6
1.8
0.05 0.1 0.15 0.2 0.25 0.3 0.35
Ra(
µm
)
d(mm)
f=0.05
f=0.1
f=0.15
f=0.2
f=0.25
0
0.2
0.4
0.6
0.8
1
1.2
1.4
1.6
0.05 0.1 0.15 0.2 0.25 0.3 0.35
Ra(
µm
)
d(mm)
f=0.05
f=0.1
f=0.15
f=0.2
f=0.25

98
Figure 6.103 Graph between surface Roughness and Depth of Cut at Rk 16, Nr 0.8, V 225
Figure 6.104 Graph between surface Roughness and Depth of Cut at Rk 16, Nr 1.2, V 275
Figure 6.105 Graph between surface Roughness and Depth of Cut at Rk 18, Nr 0.4, V 225
0
0.2
0.4
0.6
0.8
1
1.2
1.4
1.6
0.05 0.1 0.15 0.2 0.25 0.3 0.35
Ra(
µm
)
d(mm)
f=0.05
f=0.1
f=0.15
f=0.2
f=0.25
0
0.2
0.4
0.6
0.8
1
1.2
0.05 0.1 0.15 0.2 0.25 0.3 0.35
Ra(
µm
)
d(mm)
f=0.05
f=0.1
f=0.15
f=0.2
f=0.25
0
0.2
0.4
0.6
0.8
1
1.2
1.4
1.6
0.05 0.1 0.15 0.2 0.25 0.3 0.35
Ra(
µm
)
d(mm)
f=0.05
f=0.1
f=0.15
f=0.2
f=0.25

99
Figure 6.106 Graph between surface Roughness and Depth of Cut at Rk 18, Nr 0.8, V 275
Figure 6.107 Graph between surface Roughness and Depth of Cut at Rk 18, Nr 1.2, V 175
Figure 6.108 Graph between surface Roughness and Depth of Cut at Rk 20, Nr 0.4, V 275
0
0.2
0.4
0.6
0.8
1
1.2
0.05 0.1 0.15 0.2 0.25 0.3 0.35
Ra(
µm
)
d(mm)
f=0.05
f=0.1
f=0.15
f=0.2
f=0.25
0
0.2
0.4
0.6
0.8
1
1.2
1.4
0.05 0.1 0.15 0.2 0.25 0.3 0.35
Ra(
µm
)
d(mm)
f=0.05
f=0.1
f=0.15
f=0.2
f=0.25
0
0.2
0.4
0.6
0.8
1
1.2
1.4
0.05 0.1 0.15 0.2 0.25 0.3 0.35
Ra(
µm
)
d(mm)
f=0.05
f=0.1
f=0.15
f=0.2
f=0.25
100
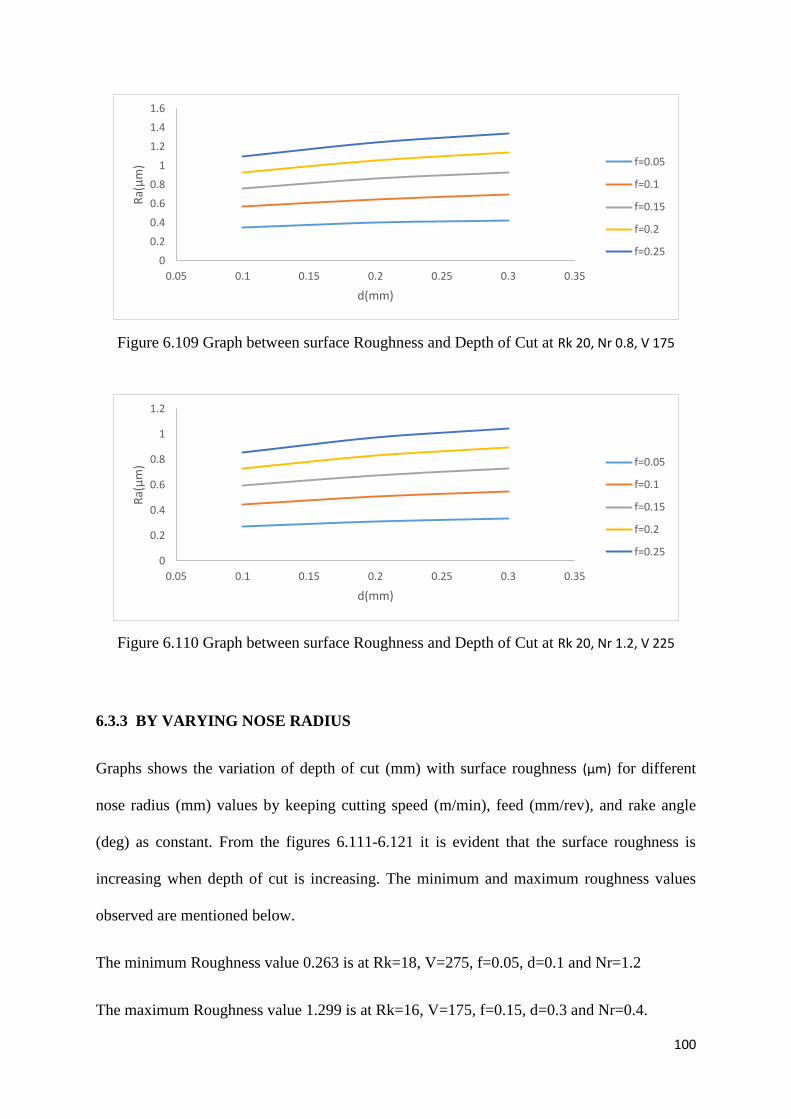
Figure 6.109 Graph between surface Roughness and Depth of Cut at Rk 20, Nr 0.8, V 175
Figure 6.110 Graph between surface Roughness and Depth of Cut at Rk 20, Nr 1.2, V 225
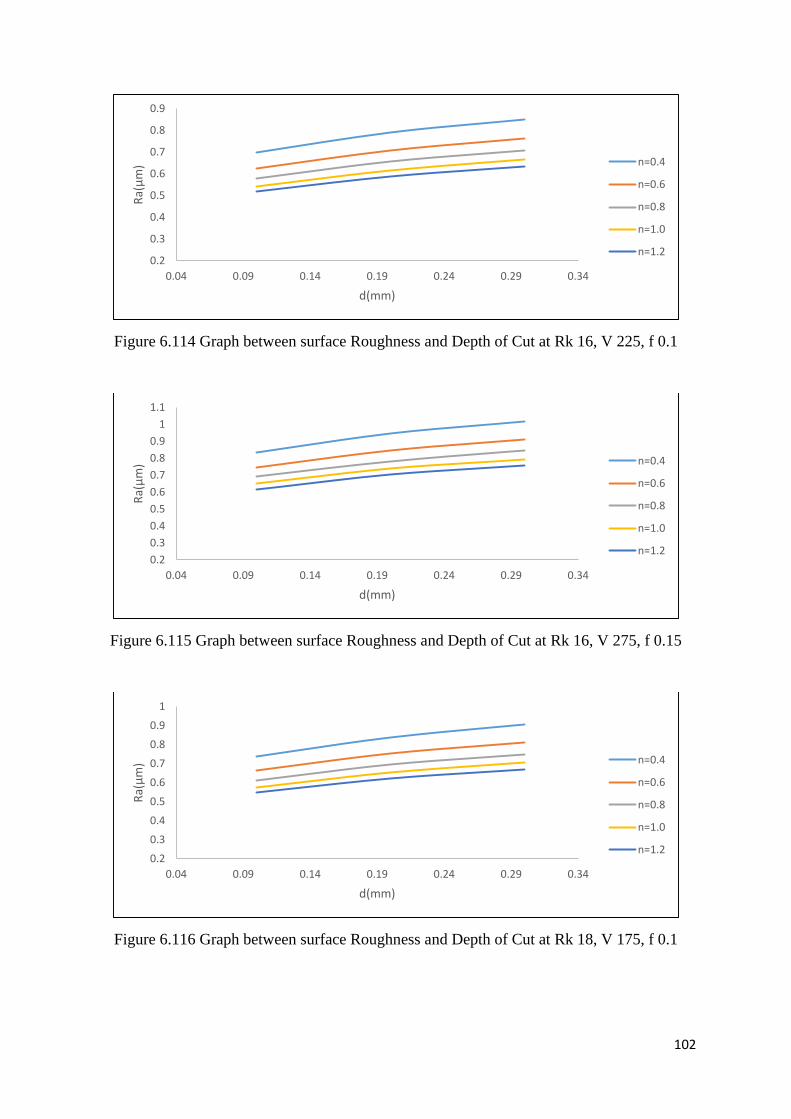
6.3.3 BY VARYING NOSE RADIUS
Graphs shows the variation of depth of cut (mm) with surface roughness (µm) for different
nose radius (mm) values by keeping cutting speed (m/min), feed (mm/rev), and rake angle
(deg) as constant. From the figures 6.111-6.121 it is evident that the surface roughness is
increasing when depth of cut is increasing. The minimum and maximum roughness values
observed are mentioned below.
The minimum Roughness value 0.263 is at Rk=18, V=275, f=0.05, d=0.1 and Nr=1.2
The maximum Roughness value 1.299 is at Rk=16, V=175, f=0.15, d=0.3 and Nr=0.4.
0
0.2
0.4
0.6
0.8
1
1.2
1.4
1.6
0.05 0.1 0.15 0.2 0.25 0.3 0.35
Ra(
µm
)
d(mm)
f=0.05
f=0.1
f=0.15
f=0.2
f=0.25
0
0.2
0.4
0.6
0.8
1
1.2
0.05 0.1 0.15 0.2 0.25 0.3 0.35
Ra(
µm
)
d(mm)
f=0.05
f=0.1
f=0.15
f=0.2
f=0.25

101
Figure 6.111 Graph between surface Roughness and Depth of Cut at Rk 16, V 175, f 0.05
Figure 6.112 Graph between surface Roughness and Depth of Cut at Rk 16, V 175, f 0.1
Figure 6.113 Graph between surface Roughness and Depth of Cut at Rk 16, V 175, f 0.15
0.2
0.25
0.3
0.35
0.4
0.45
0.5
0.55
0.6
0.65
0.04 0.09 0.14 0.19 0.24 0.29 0.34
Ra(
µm
)
d(mm)
n=0.4
n=0.6
n=0.8
n=1.0
n=1.2
0.2
0.3
0.4
0.5
0.6
0.7
0.8
0.9
1
1.1
0.04 0.09 0.14 0.19 0.24 0.29 0.34
Ra(
µm
)
d(mm)
n=0.4
n=0.6
n=0.8
n=1.0
n=1.2
0.2
0.4
0.6
0.8
1
1.2
1.4
0.04 0.09 0.14 0.19 0.24 0.29 0.34
Ra(
µm
)
d(mm)
n=0.4
n=0.6
n=0.8
n=1.0
n=1.2
102
Figure 6.114 Graph between surface Roughness and Depth of Cut at Rk 16, V 225, f 0.1
Figure 6.115 Graph between surface Roughness and Depth of Cut at Rk 16, V 275, f 0.15
Figure 6.116 Graph between surface Roughness and Depth of Cut at Rk 18, V 175, f 0.1
0.2
0.3
0.4
0.5
0.6
0.7
0.8
0.9
0.04 0.09 0.14 0.19 0.24 0.29 0.34
Ra(
µm
)
d(mm)
n=0.4
n=0.6
n=0.8
n=1.0
n=1.2
0.2
0.3
0.4
0.5
0.6
0.7
0.8
0.9
1
1.1
0.04 0.09 0.14 0.19 0.24 0.29 0.34
Ra(
µm
)
d(mm)
n=0.4
n=0.6
n=0.8
n=1.0
n=1.2
0.2
0.3
0.4
0.5
0.6
0.7
0.8
0.9
1
0.04 0.09 0.14 0.19 0.24 0.29 0.34
Ra(
µm
)
d(mm)
n=0.4
n=0.6
n=0.8
n=1.0
n=1.2

103
Figure 6.117 Graph between surface Roughness and Depth of Cut at Rk 18, V 225, f 0.15
Figure 6.118 Graph between surface Roughness and Depth of Cut at Rk 18, V 275, f 0.05
Figure 6.119 Graph between surface Roughness and Depth of Cut at Rk 20, V 175, f 0.15
0.2
0.3
0.4
0.5
0.6
0.7
0.8
0.9
1
1.1
0.04 0.09 0.14 0.19 0.24 0.29 0.34
Ra(
µm
)
d(mm)
n=0.4
n=0.6
n=0.8
n=1.0
n=1.2
0.2
0.25
0.3
0.35
0.4
0.45
0.04 0.09 0.14 0.19 0.24 0.29 0.34
Ra(
µm
)
d(mm)
n=0.4
n=0.6
n=0.8
n=1.0
n=1.2
0.2
0.3
0.4
0.5
0.6
0.7
0.8
0.9
1
1.1
1.2
0.04 0.09 0.14 0.19 0.24 0.29 0.34
Ra(
µm
)
d(mm)
n=0.4
n=0.6
n=0.8
n=1.0
n=1.2

104
Figure 6.120 Graph between surface Roughness and Depth of Cut at Rk 20, V 225, f 0.05
Figure 6.121 Graph between surface Roughness and Depth of Cut at Rk 20, V 275, f 0.1
6.3.4 BY VARYING RAKE ANGLE
Graphs shows the variation of depth of cut (mm) with surface roughness (µm) for different
rake angle (deg) values by keeping cutting speed (m/min), feed (mm/rev) and nose radius
(mm) as constant .From the figures 6.122-6.132 it is evident that the surface roughness is
increasing when depth of cut is increasing. The minimum and maximum roughness values
observed are mentioned below.
The minimum Roughness value 0.2572 is at Nr=1.2, V=225, f=0.05, d=0.1 and Rk=22.
The maximum Roughness value 1.418 is at Nr=0.4, V=175 f=0.15,d=0.3 and Rk=14.
0.2
0.25
0.3
0.35
0.4
0.45
0.5
0.04 0.09 0.14 0.19 0.24 0.29 0.34
Ra(
µm
)
d(mm)
n=0.4
n=0.6
n=0.8
n=1.0
n=1.2
0.35
0.45
0.55
0.65
0.05 0.1 0.15 0.2 0.25 0.3
Ra(
µm
)
d(mm)
Graph between Ra and Depth of Cut
n=0.4
n=0.6
n=0.8
n=1.0
n=1.2

105
Figure 6.122 Graph between surface Roughness and Depth of Cut at Nr 0.4, V 175, f 0.05
Figure 6.123 Graph between surface Roughness and Depth of Cut at Nr 0.4, V 175, f 0.1
Figure 6.124 Graph between surface Roughness and Depth of Cut at Nr 0.4, V 175, f 0.15
0.35
0.4
0.45
0.5
0.55
0.6
0.65
0.1 0.2 0.3
Ra(
µm
)
d(mm)
Rake 1=14
Rake 2=16
Rake 3=18
Rake 4=20
Rake 5=22
0.2
0.3
0.4
0.5
0.6
0.7
0.8
0.9
1
1.1
1.2
0.1 0.2 0.3
Ra(
µm
)
d(mm)
Rake 1=14
Rake 2=16
Rake 3=18
Rake 4=20
Rake 5=22
0.2
0.4
0.6
0.8
1
1.2
1.4
1.6
0.1 0.2 0.3
Ra(
µm
)
d(mm)
Rake 1=14
Rake 2=16
Rake 3=18
Rake 4=20
Rake 5=22

106
Figure 6.125 Graph between surface Roughness and Depth of Cut at Nr 0.4, V 225, f 0.1
Figure 6.126 Graph between surface Roughness and Depth of Cut at Nr 0.4, V 275, f 0.15
Figure 6.127 Graph between surface Roughness and Depth of Cut at Nr 0.8, V 175, f 0.1
0.2
0.3
0.4
0.5
0.6
0.7
0.8
0.9
1
0.1 0.2 0.3
Ra(
µm
)
d(mm)
Rake 1=14
Rake 2=16
Rake 3=18
Rake 4=20
Rake 5=22
0.2
0.3
0.4
0.5
0.6
0.7
0.8
0.9
1
1.1
1.2
0.1 0.2 0.3
Ra(
µm
)
d(mm)
Rake 1=14
Rake 2=16
Rake 3=18
Rake 4=20
Rake 5=22
0.2
0.3
0.4
0.5
0.6
0.7
0.8
0.9
1
0.1 0.2 0.3
Ra(
µm
)
d (mm)
Rake 1=14
Rake 2=16
Rake 3=18
Rake 4=20
Rake 5=22

107
Figure 6.128 Graph between surface Roughness and Depth of Cut at Nr 0.8, V 225, f 0.15
Figure 6.129 Graph between surface Roughness and Depth of Cut at Nr 0.8, V 275, f 0.05
Figure 6.130 Graph between surface Roughness and Depth of Cut at Nr 1.2, V 175, f 0.15
0.2
0.3
0.4
0.5
0.6
0.7
0.8
0.9
1
1.1
0.1 0.2 0.3
Ra(
µm
)
d(mm)
Rake 1=14
Rake 2=16
Rake 3=18
Rake 4=20
Rake 5=22
0.2
0.25
0.3
0.35
0.4
0.45
0.1 0.2 0.3
Ra(
µm
)
d(mm)
Rake 1=14
Rake 2=16
Rake 3=18
Rake 4=20
Rake 5=22
0.2
0.3
0.4
0.5
0.6
0.7
0.8
0.9
1
1.1
0.1 0.2 0.3
Ra(
µm
)
d(mm)
Rake 1=14
Rake 2=16
Rake 3=18
Rake 4=20
Rake 5=22

108
Figure 6.131 Graph between surface Roughness and Depth of Cut at Nr 1.2, V 225, f 0.05
Figure 6.132 Graph between surface Roughness and Depth of Cut at Nr 1.2, V 275, f 0.1
0.2
0.25
0.3
0.35
0.4
0.45
0.1 0.2 0.3
Ra(
µm
)
d(mm)
Rake 1=14
Rake 2=16
Rake 3=18
Rake 4=20
Rake 5=22
0.2
0.25
0.3
0.35
0.4
0.45
0.5
0.55
0.6
0.65
0.1 0.2 0.3
Ra(
µm
)
d (mm)
Rake 1=14
Rake 2=16
Rake 3=18
Rake 4=20
Rake 5=22
Copyright © 2022 FDOKUMEN