
Interactive Illustrations for Visualizing Complex 3D Objects
93
Interactive Illustrations for Visualizing Complex 3D Objects Wilmot W. Li A dissertation submitted in partial fulfillment of the requirements for the degree of Doctor of Philosophy University of Washington 2008 Program Authorized to Offer Degree: Computer Science & Engineering
-
Upload
khangminh22 -
Category
Documents
-
view
3 -
download
0
Transcript of Interactive Illustrations for Visualizing Complex 3D Objects

Interactive Illustrations for Visualizing Complex 3D Objects
Wilmot W. Li
A dissertation submitted in partial fulfillment ofthe requirements for the degree of
Doctor of Philosophy
University of Washington
2008
Program Authorized to Offer Degree: Computer Science & Engineering


University of WashingtonGraduate School
This is to certify that I have examined this copy of a doctoral dissertation by
Wilmot W. Li
and have found that it is complete and satisfactory in all respects,and that any and all revisions required by the final
examining committee have been made.
Chair of the Supervisory Committee:
David Salesin
Reading Committee:
David Salesin
Maneesh Agrawala
Brian Curless
Date:


In presenting this dissertation in partial fulfillment of the requirements for the doctoral degree atthe University of Washington, I agree that the Library shall make its copies freely available forinspection. I further agree that extensive copying of this dissertation is allowable only for scholarlypurposes, consistent with “fair use” as prescribed in the U.S. Copyright Law. Requests for copyingor reproduction of this dissertation may be referred to Proquest Information and Learning, 300 NorthZeeb Road, Ann Arbor, MI 48106-1346, 1-800-521-0600, or to the author.
Signature
Date

University of Washington
Abstract
Interactive Illustrations for Visualizing Complex 3D Objects
Wilmot W. Li
Chair of the Supervisory Committee:Professor David Salesin
Computer Science & Engineering
Illustrations are essential for conveying the internal structure of complex 3D objects. This disserta-
tion describes techniques for creating and viewing interactive digital illustrations that use dynamic
cutaway and exploded views to expose important internal parts, while retaining enough context from
surrounding structures to help the viewer mentally reconstruct the object. I incorporate these tech-
niques in three prototype illustration systems: the 3D cutaway views system generates dynamic,
browsable cutaway illustrations from 3D input models; the image-based exploded views system
converts static 2D exploded views into interactive 2.5D illustrations; and the 3D exploded views
system generates interactive exploded views from 3D models.
The contributions of my work include a formal survey of illustration conventions for creating
effective cutaways and exploded views, as well as new algorithmic encodings of these conventions
that enable interactive tools for cutting and exploding 3D objects. I also describe techniques for
authoring and viewing interactive illustrations. Overall, my work demonstrates that with the right
set of tools, it is possible and practical to create interactive cutaway and exploded view illustrations
that offer a compelling and dynamic viewing experience.


TABLE OF CONTENTS
Page
List of Figures . . . . . . . . . . . . . . . . . . . . . . . . . . . . . . . . . . . . . . . . . . ii
List of Tables . . . . . . . . . . . . . . . . . . . . . . . . . . . . . . . . . . . . . . . . . . iv
Chapter 1: Introduction . . . . . . . . . . . . . . . . . . . . . . . . . . . . . . . . . . 11.1 Overview . . . . . . . . . . . . . . . . . . . . . . . . . . . . . . . . . . . . . . . 5
Chapter 2: Related work . . . . . . . . . . . . . . . . . . . . . . . . . . . . . . . . . 62.1 Early digital illustration systems . . . . . . . . . . . . . . . . . . . . . . . . . . . 62.2 Illustrative rendering techniques . . . . . . . . . . . . . . . . . . . . . . . . . . . 72.3 Exposing internal structure . . . . . . . . . . . . . . . . . . . . . . . . . . . . . . 9
Chapter 3: Interactive cutaway views . . . . . . . . . . . . . . . . . . . . . . . . . . . 113.1 Cutaway view conventions from traditional illustration . . . . . . . . . . . . . . . 113.2 3D cutaway views . . . . . . . . . . . . . . . . . . . . . . . . . . . . . . . . . . . 15
Chapter 4: Interactive exploded views . . . . . . . . . . . . . . . . . . . . . . . . . . 354.1 Exploded view conventions from traditional illustration . . . . . . . . . . . . . . . 354.2 Image-based exploded views . . . . . . . . . . . . . . . . . . . . . . . . . . . . . 394.3 3D exploded views . . . . . . . . . . . . . . . . . . . . . . . . . . . . . . . . . . 53
Chapter 5: Conclusions . . . . . . . . . . . . . . . . . . . . . . . . . . . . . . . . . . 695.1 Contributions . . . . . . . . . . . . . . . . . . . . . . . . . . . . . . . . . . . . . 695.2 Future work . . . . . . . . . . . . . . . . . . . . . . . . . . . . . . . . . . . . . . 695.3 Summary . . . . . . . . . . . . . . . . . . . . . . . . . . . . . . . . . . . . . . . 73
Bibliography . . . . . . . . . . . . . . . . . . . . . . . . . . . . . . . . . . . . . . . . . . 74
i

LIST OF FIGURES
Figure Number Page
1.1 Techniques for reducing occlusions. . . . . . . . . . . . . . . . . . . . . . . . . . 2
2.1 Previous work in illustrative visualization. . . . . . . . . . . . . . . . . . . . . . . 7
3.1 Geometry-based cutting conventions. . . . . . . . . . . . . . . . . . . . . . . . . . 12
3.2 Inset cuts and illustrative shading techniques. . . . . . . . . . . . . . . . . . . . . 14
3.3 Cutaway views generated by the interactive cutaways system. . . . . . . . . . . . . 15
3.4 Cutting volumes. . . . . . . . . . . . . . . . . . . . . . . . . . . . . . . . . . . . 18
3.5 Precomputation for window cut mappings. . . . . . . . . . . . . . . . . . . . . . . 20
3.6 Sketch-based bounding curve construction. . . . . . . . . . . . . . . . . . . . . . 21
3.7 Computing occlusion graph. . . . . . . . . . . . . . . . . . . . . . . . . . . . . . 24
3.8 Illustrative shading techniques. . . . . . . . . . . . . . . . . . . . . . . . . . . . . 25
3.9 Beveled cuts. . . . . . . . . . . . . . . . . . . . . . . . . . . . . . . . . . . . . . 29
3.10 Illustrations generated using our automatic cutaway generation interface. . . . . . . 31
3.11 Automatically generated cutaway views of disk brake model. . . . . . . . . . . . . 32
4.1 Explosion conventions. . . . . . . . . . . . . . . . . . . . . . . . . . . . . . . . . 36
4.2 Cutting techniques for exploded views. . . . . . . . . . . . . . . . . . . . . . . . . 37
4.3 Image-based exploded view illustration of a master cylinder. . . . . . . . . . . . . 39
4.4 Flowchart for converting a static 2D exploded view illustration into an interactiveillustration. . . . . . . . . . . . . . . . . . . . . . . . . . . . . . . . . . . . . . . 40
4.5 Fragmenting parts to achieve the proper occlusion relationships in the catalytic con-verter. . . . . . . . . . . . . . . . . . . . . . . . . . . . . . . . . . . . . . . . . . 41
4.6 Explosion tree for the master cylinder. . . . . . . . . . . . . . . . . . . . . . . . . 42
4.7 Sketch-based stack creation. . . . . . . . . . . . . . . . . . . . . . . . . . . . . . 43
4.8 An interlocking situation in which the fragmentation assumptions hold. . . . . . . 44
4.9 Semi-automatic fragmentation of the bottom cover. . . . . . . . . . . . . . . . . . 45
4.10 Cavity with a non-planar opening. . . . . . . . . . . . . . . . . . . . . . . . . . . 45
4.11 An interlocking situation in which the fragmentation assumptions do not hold. . . . 46
4.12 A failure case for the cross-section heuristic that tests whether two parts interlock. . 46
ii

4.13 Multiple interlocking parts in the same stack. . . . . . . . . . . . . . . . . . . . . 474.14 Annotation interface. . . . . . . . . . . . . . . . . . . . . . . . . . . . . . . . . . 484.15 Direct manipulation. . . . . . . . . . . . . . . . . . . . . . . . . . . . . . . . . . 494.16 Searching for a part. . . . . . . . . . . . . . . . . . . . . . . . . . . . . . . . . . . 504.17 Interactive car illustration. . . . . . . . . . . . . . . . . . . . . . . . . . . . . . . 514.18 3D exploded view illustration of a turbine. . . . . . . . . . . . . . . . . . . . . . . 534.19 Explosion graph representation. . . . . . . . . . . . . . . . . . . . . . . . . . . . 564.20 Explosion graph construction. . . . . . . . . . . . . . . . . . . . . . . . . . . . . 574.21 Hierarchical explosion graph . . . . . . . . . . . . . . . . . . . . . . . . . . . . . 584.22 Handling interlocked parts. . . . . . . . . . . . . . . . . . . . . . . . . . . . . . . 594.23 Conditions for moving part p. . . . . . . . . . . . . . . . . . . . . . . . . . . . . . 624.24 Exposing a target part with a hierarchical explosion graph. . . . . . . . . . . . . . 634.25 Exploded view sequence of disk brake. . . . . . . . . . . . . . . . . . . . . . . . . 644.26 Exploded view with contextual cutaway. . . . . . . . . . . . . . . . . . . . . . . . 654.27 Illustrations produced by my automatic exploded view generation interface. . . . . 664.28 Exploded view of arm. . . . . . . . . . . . . . . . . . . . . . . . . . . . . . . . . 67
5.1 Cutaway illustrations of mathematical surfaces. . . . . . . . . . . . . . . . . . . . 715.2 Strange Immersion by Cassidy Curtis. . . . . . . . . . . . . . . . . . . . . . . . . 72
iii

LIST OF TABLES
Table Number Page
3.1 Rigging statistics. . . . . . . . . . . . . . . . . . . . . . . . . . . . . . . . . . . . 33
iv

ACKNOWLEDGMENTS
I want to acknowledge a few of the many people who have contributed to my graduate school career.
I thank my advisors, David Salesin, Maneesh Agrawala, and Brian Curless, for their guidance and
support. Working with these talented individuals has been a highly educational and always enter-
taining experience. I also want to thank all of my friends in Seattle, who most likely prolonged my
time in graduate school but also helped make the last seven years so enjoyable. Mira Dontcheva has
contributed in countless ways to my general well-being and overall happiness. Finally, I want to
thank my family, who have been a constant source of love, support, and humour.
v


1
CHAPTER 1
INTRODUCTION
Complex 3D objects composed of many distinct parts and structures arise in a number of domains,
including medicine, architecture and industrial manufacturing. Illustrations are often essential for
conveying the spatial relationships between the constituent parts that make up these objects. For
example, medical reference books are filled with anatomical illustrations that help doctors and med-
ical students understand how the human body is organized. Similarly, repair manuals and technical
documentation for industrially manufactured machinery (e.g., airplanes, cars) include many illus-
trations that show how the various parts in complex assemblies fit together. In all of these cases,
well designed illustrations reveal not only the shape and appearance of important parts, but also the
position and orientation of these parts in the context of the surrounding structures.
However, creating illustrations that clearly depict the spatial relationships between parts is not
an easy task. The primary problem is occlusion. Most complex 3D objects contain many tightly
connected and intertwined parts that occlude one another. As shown in Figures 1.1a–c, many sim-
ple solutions for reducing occlusions have significant drawbacks. Naively cutting a hole through
the occluding parts can reveal internal parts of interest, but such cutaways do not show how the
exposed parts are situated with respect to nearby parts (Figure 1.1a). Another approach is to in-
crease the transparency of the occluding parts as in Figure 1.1b. While the resulting image reveals
the highlighted muscle of interest and indicates the complexity of the arm’s internal structure, it is
extremely difficult to distinguish the layering relationships between the transparent muscles, espe-
cially because there are several layers of transparency. Finally, parts can simply be arranged such
that they are all visible, as shown in Figure 1.1c. However, this visualization provides no cues about
the spatial relationships between the parts. The challenge is to reduce occlusions to expose parts of
interest, while preserving enough context to allow the viewer to mentally reconstruct the object.

2
(a) Naive cutting (b) Partial transparency (c) Show all parts
(d)Disk brake
cutaway view
(e)Arm
cutaway view
(f )Turbine
exploded view
Figure 1.1: Techniques for reducing occlusions. Simple methods for reducing occlusions revealimportant parts, but they do not convey how parts are positioned and oriented with respect to eachother (a–c). Well designed cutaway views expose internal parts while preserving enough contextfrom occluding parts to help the viewer reconstruct the missing geometry(d–e). Exploded viewsreduce occlusions without removing geometry by separating parts along explosion directions thatrespect local blocking constraints (f). The bottom row of illustrations (d–f) were generated usingtechniques described in this dissertation.
My thesis work focuses on two common illustration techniques for reducing occlusions:
1. Cutaway views remove portions of occluding geometry to expose underlying parts. Illustrators
carefully choose the shape and extents of cutaways to help the viewer mentally reconstruct the
missing geometry. Furthermore, the best cutaways preserve some context from occluding structures
so that viewers can better understand the spatial relationships between all parts (Figures 1.1d–e).

3
2. Exploded views separate (or “explode”) parts away from each other so that all the parts of interest
are visible. In other words, exploded views rearrange rather than remove geometry in order to
eliminate occlusions. As a result, whereas cutaway views emphasize the in situ spatial relationships
between parts, exploded views highlight the details of individual parts and their local blocking
relationships (Figure 1.1f).
Although cutaway and exploded views are pervasive in traditional scientific and technical illus-
tration, they have some important limitations:
Most illustrations are static. Since most cutaway and exploded views are designed for print publi-
cation, they are necessarily static. As a result, the specific information contained in an illustration is
fixed and may not correspond to the viewer’s needs. Furthermore, for very complex objects, it can
be hard to interpret the exact spatial relationships between parts from a static image. Finally, since
static illustrations typically include all of the information that the viewer might want to see, they are
prone to visual clutter.
Illustrations are hard to create. Creating an effective cutaway or exploded view illustration by hand
requires a significant amount of time, effort, and expertise. As a result, the task of creating illustra-
tions can be a significant bottleneck in certain scenarios. For example, when Boeing manufactures
a new airplane, technical illustrations must be produced for roughly a terabyte of electronic doc-
umentation. Furthermore, hand crafted illustrations are simply not possible in applications where
visualizations of 3D datasets must be available on demand (e.g., clinical medicine).
The goal of my thesis work is to create interactive digital illustrations that address these limita-
tions while respecting the key design principles of traditional cutaway and exploded view illustra-
tions. My approach consists of the following steps:
Distill illustration conventions. To determine the characteristics of effective cutaway and exploded
views, I worked with illustrators, consulted instructional texts on scientific and technical illustration,
and examined a large corpus of example illustrations in order to distill general design conventions.

4
Implement illustration conventions. Next, I developed techniques for applying these conventions
algorithmically in order to generate cutaways and exploded views. My techniques expose a small
number of simple parameters that control how conventions are applied. By varying these parameters
in response to user interactions, my interactive illustrations can adapt to meet the user’s needs.
Design authoring and viewing tools. In order to be practical, interactive illustrations must be easy
to both author and view. To this end, I have developed tools that automate much of the authoring
process. With the help of these tools, users who have no training in illustration can create interactive
illustrations with just a small amount of effort. I have also designed viewing tools that provide both
direct manipulation and higher level modes for interacting with and exploring illustrations once they
have been authored. These viewing interactions make it possible for a viewer who is not familiar
with the depicted object to learn about its internal structure by browsing through the constituent
parts and seeing how they are positioned and oriented with respect to each other.
In this dissertation, I present three prototype systems that demonstrate my approach to creat-
ing interactive illustrations: the 3D cutaway views system generates dynamic, browsable cutaway
illustrations from 3D input models; the image-based exploded views system converts static 2D ex-
ploded views into interactive 2.5D illustrations; and finally, the 3D exploded views system generates
interactive exploded views from 3D input models. The techniques I have developed for these sys-
tems include several specific contributions. I introduce new methods for algorithmically encoding
cutaways and exploded views to enable the interactive application of these illustration techniques,
and I also present a number of techniques for authoring and viewing interactive illustrations. In
addition, my work makes two high-level contributions. First, this dissertation includes two surveys
of illustration conventions that, to my knowledge, are the first to explicitly define and generalize
the design rules for creating effective cutaway and exploded views. Finally, my work demonstrates
that with the right set of tools, it is possible and practical to create interactive cutaway and exploded
view illustrations that offer a compelling and dynamic viewing experience.

5
1.1 Overview
The remainder of this dissertation is organized as follows. First, I describe existing work on digital
illustration and position my own work in the context of this previous research. Chapter 3 presents
my work on interactive cutaway views, which includes a survey of illustration conventions for cre-
ating effective cutaways, and a detailed description of my 3D cutaway views system. Chapter 4
presents my work on interactive exploded views, which includes a survey of exploded view conven-
tions, and detailed descriptions of my image-based and 3D exploded views systems. I conclude by
summarizing my contributions, and describing some broad future research directions in interactive
visualization.

6
CHAPTER 2
RELATED WORK
Illustrative visualization has been an active topic of research for well over a decade. This survey
organizes existing work into three broad categories (see Figure 2.1). First, I mention some in-
spirational early work that introduces the problem of generating digital illustrations and proposes
a common high level architecture for digital illustration systems. Then, I touch on notable con-
tributions in the area of illustrative rendering techniques. Finally, I describe previous techniques
designed to expose internal structure and explain how my thesis research relates to this existing
work and advances the state-of-the-art.
2.1 Early digital illustration systems
Early forays in digital illustration, including the influential Intent-Based Illustration System (IBIS)
of Seligmann and Feiner [29, 69], Cooperative, Computer-Aided Design (CCAD) environment by
Kochar et al. [46], and A Workbench for Semi-automated Illustration Design (AWI) by Rist et
al. [65], all propose a similar high level approach to designing automatic illustration systems. In this
approach, the input consists of a model of the object to be depicted and a set of communicative goals
(either implicit or specified by the user) that indicate what information the generated illustration
must convey. The illustration system itself includes a set of design rules that describe how to apply
various illustration techniques in order to satisfy the communicative goals, as well as a rendering
component that actually generates an illustration in accordance with these principles.
Many subsequent digital illustration systems, including the three systems that I present in this
dissertation, share the basic framework proposed by this early work. However, the actual illustration
techniques implemented in systems like IBIS, CCAD and AWI are limited. Very few illustrative ren-
dering styles are provided, and higher level effects like cutaways and exploded views are generated
using rudimentary design rules. As a result, these systems produce images that are less clear and

7
Feiner & SeligmannVisual Computer 1992
DeCarlo et al.SIGGRAPH 2003
McGu�n et al.VIS 2003
Rist et al.AVI 1994
Luft et al.SIGGRAPH 2006
Viola et al.VIS 2005
Agrawala et al.SIGGRAPH 2003
(a)Early digital
illustration systems
(b)Illustrative
rendering techniques
(c)Exposing
internal structure
Figure 2.1: Previous work in illustrative visualization. Early work in the field produced digitalillustration systems that generate images designed to satisfy specific communicative goals (a). Muchwork has been devoted to reproducing illustrative rendering styles and effects, such as line drawingand false shadows (b). More recently, researchers have begun investigating techniques for exposinginternal structure (c).
informative than those designed by human illustrators. The rest of this chapter focuses on existing
methods for reproducing illustration techniques to create higher quality illustrative visualizations.
2.2 Illustrative rendering techniques
Many researchers in the field of nonphotorealistic (NPR) computer graphics have investigated the
problem of automatically reproducing various illustration rendering styles to create informative and
attractive images that effectively convey the shape, texture and material properties of the depicted
objects. Here, I survey a selection of significant contributions from the large corpus of NPR illus-
tration work.
Many NPR researchers have focused on the problem of generating effective line renderings.
Seminal contributions in this area include the work of Saito and Takahashi [68], who present a
method for rendering 3D objects by enhancing meaningful linear features, such as silhouettes and
sharp creases, and the work of Dooley and Cohen [24], who provide users with an intuitive interface
8
for customizing how different types of linear features are rendered. Because they are so effective at
conveying form, silhouettes in particular have received a wealth of attention from the NPR commu-
nity. Work by Hertzmann [36], Markosian [54] and many others has proposed numerous methods
for efficiently computing and rendering silhouettes. More recent work introduces new linear fea-
tures that help convey shape. DeCarlo et al. [21] propose the use of “suggestive contours,” defined
by Koenderink [47] as surface contours that turn into silhouettes in nearby views, and Judd et al. [44]
introduce “apparent ridges,” which indicate regions of maximal view-dependent curvature.
In addition to line drawing, researchers have investigated the use of other illustrative rendering
styles. Interrante and collaborators [32, 43, 42] propose line-based textures that help communicate
surface shape by following principle curvature directions. Techniques for generating pen-and-ink
style renderings were introduced by Winkenbach and Salesin [74, 75] and then extended by Praun
et al. [63] to support real-time hatching. Other rendering styles that have been considered include
stippling [50], charcoal [53], and watercolour [20].
Illustrative rendering techniques include the use of non-physical or exaggerated lighting and
shading models that emphasize the shape, texture and reflectance properties of the depicted ob-
ject. Gooch et al. [33] incorporate lighting principles from technical illustration to produce a
shading model that conveys shape through warm-cool colour variations. Hamel [35] introduces
a component-based model that supports standard lighting configurations such as back lighting, as
well as novel techniques like curvature lighting, which indicates surface curvature via variations in
luminance. More recent work includes Luft et al.’s [51] technique for emphasizing depth discontinu-
ities with false shadows, and Rusinkiewicz et al.’s [67] method for generating “exaggerated” shading
effects that emphasize surface detail. Researchers have also considered the use of image-based tech-
niques for creating illustrative lighting effects. Akers et al. [4] and Fattal et al. [28] propose methods
for combining photographs of an object under different illumination to create non-physical lighting
conditions that enhance shape cues and surface detail.
Advances in illustrative rendering have made it possible to create high-quality digital images
that emphasize important features such as shape, texture, and material properties. However, these
rendering techniques alone do not address the problem of occlusions in complex objects. In the next
section, I discuss the relatively recent work that focuses on exposing internal structure.
9
2.3 Exposing internal structure
Researchers have proposed several approaches for reducing occlusions in complex 3D objects. Here,
I describe previous techniques and discuss how my work relates to this existing body of research.
Interactive cutting
Interactive techniques for cutting 3D models allow users to directly specify the cuts they would like
to make. Hohne et al. [38] limit users to placing cutting planes oriented along principal axes. Bruyns
et al. [16] survey a number of mesh cutting algorithms that allow users to directly draw the cut they
would like to make. The goal of these algorithms is to simulate surgical tools such as scalpels and
scissors. More recently, Igarashi et al. [41] and Owada et al. [60, 61] have presented complete
sketch-based systems for creating and cutting solid models. A drawback of such techniques is that
there is little support for placing the cutting strokes. To expose a specific internal structure, users
may have to cut the object multiple times just to find it. Moreover, the strokes have to be drawn very
carefully to produce precise cuts.
Another approach is to interactively deform parts of the model to expose the internal structures.
LaMar et al. [48] and Wang et al. [73] extend Magic Lenses [9, 71] to perform non-linear defor-
mations that push away outer structures and increase the relative size of important inner structures.
However, such deformations can significantly distort the spatial relationships in the model. McGuf-
fin et al. [55], Correa et al. [18], and Bruckner and Groller [14] have developed techniques for
interactively cutting and deforming outer surfaces of volumetric models. Although these methods
do not require the user to directly draw cuts, the cutting tools must still be carefully configured in
order to generate good visualizations. Furthermore, these algorithms are designed primarily to ex-
pose perfectly layered structures in the volume, and as a result they cannot separate the intertwined
structures often found in complex 3D datasets (e.g., anatomical models).
Like some of the methods described above, my 3D cutaway views system gives the user the abil-
ity to create, resize and move cuts dynamically. However, in my approach, cuts are parameterized
such that they always adhere to conventions from traditional illustration, making it easy to produce
useful cutaways. In addition, since my cutting tools operate on individual parts, they can be applied
to intertwined structures.

10
Automatic cutting
Many automatic techniques for cutting 3D models ask users to specify the important internal struc-
tures of interest and then automatically design the appropriate cuts to reveal them. Feiner and Selig-
mann [29] and Diepstraten et al. [23] have demonstrated such importance-based automatic cutting
for surface models, while Burns et al. [17] and Viola et al. [72] apply a similar approach to volumet-
ric data. VolumeShop [15] extends the latter approach into a complete volume illustration system
with support for insets and labeling. In all of these systems the cuts are completely based on the
geometric shape of the important parts. Because the occluding parts and structures have no influ-
ence on the cutting geometry, it can be difficult for viewers to reconstruct the spatial relationships
between the structures that are removed and the remaining parts.
My cutaways system also supports automatic cutting to expose important parts specified by the
user. However, a key feature of my approach is that cuts respect the geometry of occluding parts.
Thus, when parts are exposed, the shape and extent of the cuts help the viewer mentally reconstruct
the missing geometry and understand how all the parts relate to each other spatially.
Exploded views
Several illustration systems support exploded views as a way of visualizing 3D assemblies [29, 65,
25, 57, 66]. However, most of these techniques require the user to manually specify the “assembly
order” (i.e., the order in which parts can be removed). Some systems [29, 65, 15] can automatically
generate exploded views that expose user-selected parts of interest. However, none of these existing
techniques explicitly take into account all local blocking relationships between touching parts when
generating exploded views. As a result, occluding parts that are moved in order to expose parts of
interest may violate blocking constraints and thus interpenetrate other portions of the model.
My work explores different techniques for generating exploded views. In my image-based ex-
ploded views system, I present sketch-based authoring tools for creating 2.5D illustrations. To
construct 3D exploded views, I describe an algorithm based on the approach of Agrawala et al. [2].
My technique automatically infers an assembly order while handling common situations in which
parts interlock. Furthermore, my 3D exploded views system introduces automatic techniques for
combining cuts with exploded views.

11
CHAPTER 3
INTERACTIVE CUTAWAY VIEWS
Well designed cutaway illustrations are often essential for conveying the in situ spatial relationships
between parts in complex 3D objects. In this chapter, I describe my 3D cutaway views system for
authoring and viewing interactive cutaway illustrations that help viewers understand and explore
the internal structure of complex 3D models. Before describing the details of this system, I survey
conventions from traditional illustration for creating effective cutaway views.
3.1 Cutaway view conventions from traditional illustration
Effective cutaway illustrations exhibit a variety of conventions that help emphasize the shape and
position of structures relative to one another. However, books on scientific and technical illustration
techniques [37, 49, 76, 77] mainly present low-level drawing and rendering methods. Thus, to
identify cutaway conventions, I worked with scientific illustrators and analyzed illustrations from
well-known anatomy atlases [59, 3], technical manuals [40, 27], and books on visualizing complex
buildings and machinery [10, 11]. Despite differences in artistic style, I noted a number of similar
cutting techniques across these sources.
3.1.1 Geometry-based conventions
The geometric shape of a part often determines the most appropriate cutting strategy. I consider
several common shapes and the cutting conventions appropriate to each of them (Figure 3.1).
Object-aligned box cuts. Illustrators often use box cuts that are aligned with the principal Cartesian
coordinate frame of a part. For man-made objects the shape of the part usually implies the orien-
tation of this frame. Such objects are typically designed with respect to three orthogonal principal
axes, and in many cases they resemble rectangular solids. Aligning a box cut to the principal axes of

12
Transversetube cut
Primaryaxis
(b) Transverse tube cut
Wedgetube cut
Primaryaxis
(c) Wedge tube cut
Object-alignedbox cutCoordinate frame axes
(a) Object-aligned box cut
Four-sidedwindow cutGeodesic
edge
Silhouetteedge
(d) Four-sided window cut
Background image credits: (a) Stephen Biesty, (c) Dorling Kindersley; (b) LifeART image; (c) Nick Lipscombe, Garry Biggin, (c) Dorling Kindersley; (d) LifeART image
Figure 3.1: Geometry-based cutting conventions. Illustrators choose different cutting strategiesbased on the geometric shape of parts. These examples show four common types of cuts. Object-aligned box cuts are used for rectangular solids (a). Transvserse tube cuts are used for long tubularparts (b). Wedge tube cuts are used for radially symmetric parts (c). Window cuts are used for thinextended enclosing structures (d).
a part helps to accentuate its geometric structure (Figure 3.1a) and makes it easier to infer the shape
of the missing geometry.
In some domains, models are oriented with respect to a canonical coordinate frame. For ex-
ample, in anatomy the canonical frame is defined by the saggital, coronal, and transverse viewing
directions. Box cuts are often aligned with these canonical axes to produce cross-sections that are
familiar to viewers who have some experience with the domain.
Tube cuts. 3D models of both biological and man-made objects contain many structures that resem-
ble tubes, either because they exhibit radial symmetry (e.g., pipes, gears), or because they are long

13
and narrow (e.g., long muscles and bones, plumbing). In cutting such parts, illustrators usually align
the cut with the primary axis running along the length of the part. Often, illustrators will remove
a section of the structure using a transverse cutting plane that is perpendicular to the primary axis
(Figure 3.1b). The orientation of the cutting plane provides a visual cue about the direction in which
the tube extends and thereby helps viewers mentally complete the missing part of the tube.
A second variant of the tube cut removes a wedge from the object (Figure 3.1c) to expose inte-
rior parts while removing less of the tube than the transverse tube cut. Since more of the exterior
structure remains visible, the viewer has more context for understanding the tube’s position and ori-
entation in relation to the exposed internal parts. In addition, the wedge shape of the cut emphasizes
the cylindrical structure of the tube and makes it easier for the viewer to mentally reconstruct the
missing geometry. Wedge cuts are typically used for radially symmetric (or nearly symmetric) parts.
Window cuts. Many complex 3D models include thin extended enclosing structures (e.g., skin, the
body of a car) that occlude much of the model’s internal detail. To expose internal parts, illustrators
often cut windows out of these structures.
The window boundaries can also provide a useful cue about the shape of the enclosing structure.
Boundary edges near silhouettes of the object help emphasize these contours (Figure 3.1d). Sim-
ilarly, boundary edges that are further from silhouettes often bend according to surface curvature.
Another convention, usually reserved for technical illustrations, is to make the window jagged. This
approach emphasizes that a cut was made and distinguishes the boundaries of the cut from other
edges in the scene. All three of these boundary conventions help viewers mentally reconstruct the
shape of the enclosing structure.
3.1.2 Viewpoint conventions
Illustrators carefully choose viewpoints that help viewers see the spatial relationships between the
internal target parts they are interested in and the occluding parts. Typically, the viewpoint not only
centers the target parts in the illustration, but also minimizes the number of occluding structures.
This strategy makes it possible to expose the parts of interest with relatively few cuts, leaving more
of the surrounding structures intact for context. In addition, illustrators often choose domain-specific
canonical views, such as the saggital, coronal, and transverse views used for human anatomy.

14
3.1.3 Insetting cuts based on visibility Occlusionboundary
Insetamount
Background image credit: LifeART image
Edge shading
Edgeshadows
Figure 3.2: Inset cuts and illustrative shading tech-niques.
Some models contain many layers of occlud-
ing structures between the internal target part
and the exterior of the model. Illustrators of-
ten reveal such layering by insetting cuts. Oc-
cluded parts are cut to a lesser extent than
(i.e., inset from) occluding parts, thus orga-
nizing the structures into a series of terraces
that accentuate the layering (see Figure 3.2).
Since the layering of the parts depends on
viewpoint, such inset cuts are viewpoint dependent.
3.1.4 Rendering conventions
Shading is a strong cue for conveying surface orientation and depth relationships between structures.
Illustrators often exaggerate shading to emphasize object shape. I describe two such illustrative
shading techniques that are shown in Figure 3.2.
Edge shadows. Cast shadows provide strong depth cues at discontinuity edges. However, physically
accurate shadows may also darken and obscure important parts. Instead, illustrators often darken a
thin region of the far surface along the discontinuity edge. Such edge shadows [31] pull the near
surface closer to the viewer while pushing back the far surface. The width and softness of edge
shadows usually vary with the discrepancy in depth at the discontinuity edge; overlapping structures
that are close to one another have a tighter, darker shadow than structures that are farther apart.
Edge shading. While simple diffuse shading provides information about surface orientation, it can
also cause planar surfaces that face away from the light source to be rendered in a relatively dark
shadow, making it difficult to see surface detail. Some illustrators solve this problem by darkening
only the edges of the cut surface to suggest diffuse shading [37]. As with edge shadows, the width
and softness of the darkened region may vary, but, in general, the overall darkness depends on the
surface orientation.

15
3.2 3D cutaway views
(a) Disk brake (b) Neck
Figure 3.3: Cutaway views generated by the interactive cutaways system. To create these illus-trations, I “rigged” 3D models of a disk brake and human neck using the authoring component ofthe system. The illustrations were then generated automatically from the rigged models to exposeuser-selected target structures (shown in red).
Complex geometric models with many constituent parts arise in several domains, including medicine,
architecture and industrial manufacturing. The system described here enables the creation of inter-
active cutaway illustrations of such 3D models. This work is based on two key ideas:
1. Cuts should respect geometry of occluding parts. After analyzing a variety of well designed
cutaway illustrations [37, 59, 3, 10], I have found that the most effective cuts are carefully designed
to partially remove occluding parts so that viewers can mentally reconstruct the missing geometry.
Thus, the shape and location of cuts depend as much on the geometry of the occluding parts as they
do on the position of the target internal parts that are to be exposed. As I will show, illustrators use
different cutting conventions depending on the geometry of the occluding structures. For example,
tubular structures are cut differently than rectangular parts. In addition, occluding structures that
are farther away from the viewer are cut away less than parts that are closer to the viewer. Such
insetting reveals the layers of occluders that hide the target parts. I instantiate these conventions in
a set of cutting tools that can be used in combination to produce effective cutaway illustrations like
those shown in Figure 3.3.

16
2. Cutaway illustrations should support interactive exploration. As noted earlier, static cutaway
illustrations can reveal only a limited amount of information and may not always depict the struc-
tures of interest. Interactive control over the viewpoint and cutting parameters make it easier for
viewers to understand the complex spatial relationships between parts. Yet low-level controls that
force viewers to precisely position individual cutting tools (e.g., cutting planes) are tedious to use
and assume viewers have the expertise to place the cuts in a way that reveals structures of interest.
At the other end of the spectrum are pre-rendered atlases of anatomy [1, 39], which allow viewers
to interactively control a few cutting parameters (e.g., sliding a cutting plane along a fixed axis) but
do not allow users to freely navigate the model. We provide an interactive viewing interface that
falls between these two extremes. Viewers are free to set any viewpoint and directly manipulate the
model with the mouse to create, resize, and move cuts dynamically. However, these cuts are param-
eterized such that they always adhere to the conventions of traditional illustration, making it easy to
produce useful cutaways. Alternatively, viewers can select a set of target parts, and the system will
automatically generate a set of cuts from an appropriate viewpoint to reveal the specified targets.
My 3D cutaway views system includes several new contributions. I identify a set of conventions
for creating effective cutaway illustrations. In addition, I describe an approach for algorithmically
encoding these conventions in a set of interactive cutaway tools. Finally, I demonstrate how my
system can be used to create effective cutaways for a variety of complex 3D objects including
human anatomy and mechanical assemblies.
3.2.1 Overview
My system consists of two components. The authoring interface allows an author to equip a 3D
geometric model with additional information (or rigging) that enables the formation of dynamic
cutaways. The viewing interface takes a rigged model as input and enables viewers to explore the
dataset with high-level cutaway tools. Although I do not make any assumptions about the viewer’s
familiarity with the object, I assume the author knows the structure of the object well enough to
specify the geometric type of each part (e.g., tube, rectangular parallelepiped, etc.) and to identify
good viewpoints for generating cutaway illustrations.

17
3.2.2 Creating 3D cutaway illustrations
In this section, I introduce a parametric representation for cutaways of individual parts that makes it
easy to create the different types of cuts outlined in Section 3.1.1. I then describe how my system de-
termines good views for exposing user-selected target structures, based on the conventions discussed
in Section 3.1.2. Next, I explain my constraint-based approach for generating view-dependent inset
cuts, as described in Section 3.1.3. Finally, I present simple rendering algorithms for generating the
effects discussed in Section 3.1.4.
Cutaway representation
The input to the system is a 3D solid model in which each part or structure is a separate geometric
object. The system cuts the model by removing volumetric regions — cutting volumes — using
CSG constructive solid geometry (CSG) subtraction. Each volume cuts exactly one part. As shown
in Figure 3.4, I parameterize each of the conventional cuts described in Section 3.1.1 using a 1D,
2D, or 3D parameter space that is mapped to a volume in model space (i.e., the local coordinates of
the structure to be cut). Under these mappings, cutting volumes are specified as simple parametric
ranges that get transformed to model space cutting volumes, which I represent as polyhedral solids.
Object-aligned box cutting volumes
For object-aligned box cuts, I map a 3D parameter space u, v, w to three orthogonal model-space
axes, u′, v′, w′ (Figure 3.4a). Under this mapping an axis-aligned box in parameter space transforms
to an axis-aligned box in model space.
As noted in Section 3.1.1, object-aligned cuts are often oriented along the principal axes of a
part. To compute these axes, the system samples the convex hull of the object and then performs
principal components analysis (PCA) on the resulting point cloud to determine the three principal
directions of variance. I also allow users to directly specify three orthogonal model-space axes as
the principal axes.
Tubular cutting volumes
Tube cuts are generally defined using a 3D parameter space. The u axis in parameter space maps
to the primary axis of the tube. The v and w axes then map to the angular and radial components

18
(a)Object-aligned
box cut
u’
v’(e)
Four-sidedwindow cut
1
0
1u
v
0
u
1(b) Transverse
tube cut
u’
0
1
u
(d)Freeform
window cut
u’
Parameter space Model space
(c)Wedge
tube cut
u’
w’
v’
2�
0
1
1
u
v
w
u’
v’w’
Model space cutting volume
Model space cutting volume
max extents
1
0
1
v
1
u
wParameter space cutting volume
max extents
Parameter space cutting volume
Figure 3.4: Cutting volumes. In my system, a cut is represented as a cutting volume that is definedin a one-, two-, or three-dimensional parameter space (left column) and then mapped to the model’slocal coordinate system (right column). For each type of cut, the cutting volume (purple) and itsmaximum extents (pink) are shown in both parameter and model space. The model space mappingsu′, v′, w′ of the parametric dimensions u, v, w are also illustrated on the right.

19
of a polar coordinate system defined on the normal plane of the Frenet frame of the primary axis
(Figure 3.4c). Under this mapping, an axis-aligned u, v, w box corresponds to a cutting volume that
removes a wedge from the structure. To create transverse cutting planes, the v and w ranges are set
to their maximum extents. Thus, transverse tube cuts are fully parameterized using a 1D parameter
space (Figure 3.4b).
To compute tubular cutting volumes efficiently from their parametric representation, the system
precomputes the primary axis for each tubular part. At runtime, the system constructs the cutting
volume for a transverse cut by extruding a rectangle at uniformly spaced intervals along the specified
portion of the axis. At each point along the axis, the rectangle is placed in the normal plane and made
large enough to enclose the tube’s cross-section. To form a polyhedral solid, the system creates faces
connecting the edges of consecutive rectangles and caps the cutting volume at both ends. Wedge
cutting volumes are computed similarly by extruding a planar wedge along the primary axis.
The primary axis for long, narrow parts is computed using the skeletal curve construction of
Verroust and Lazarus [70]. They define a skeletal curve as the locus of centroids of the level sets
of surface points computed with respect to their geodesic distance from an extremal point on the
surface. To find an extremal point, the algorithm picks an arbitrary query point on the surface and
then selects the point that is furthest away from it, in terms of geodesic distance. The surface vertices
are grouped into level set intervals of increasing geodesic distance from the extremal point, and the
centroids of the vertices within each interval are connected to form a piecewise linear skeletal curve,
which runs along the length of the tube and roughly passes through its center. The system computes
Frenet frames at the vertices of this curve using discrete derivatives.
For short, radially symmetric tubes, the skeletal curve is usually not a good approximation of
the primary axis (i.e., the axis of radial symmetry). For such structures, the system samples the
convex hull of the part and then computes the cylinder that best fits the resulting point cloud using
an iterative least-squares approach [26]. The user can also override the automatic computation and
directly specify the primary axis. In this case the user orients the model so that the view direction
coincides with the desired axis, and then clicks the point where the axis should be positioned. In this
mode, the author can tell the system to snap the orientation of the specified axis to run parallel to a
nearby canonical axis. Users can also snap the position of the axis so that it intersects the centroid
of the entire model or the centroid of any individual part.

20
Erodedcurves
u=1
u=0
Interpolatedwindow boundary
Geodesiccurves
v=0
v=1
u=1
u=0
Interpolatedwindow boundary
(a) Precomputed bounding curvesfor freeform window cut
(b) Precomputed grid of geodesic pathsfor four-sided window cut
Figure 3.5: Precomputation for window cut mappings. To accelerate the computation of freeformwindow cut mappings, the system precomputes bounding curves at uniformly spaced u values andthen interpolates between them at runtime (a). For four-sided window cut mappings, the systemprecomputes a grid of geodesic paths and then interpolates within this grid (b).
Window cutting volumes
The mapping for window cuts is defined with respect to a closed bounding curve on the surface of
the part being cut. The bounding curve represents the maximum extents of the cutting volume. My
system supports two variants of window cuts.
Freeform window cuts are defined by a bounding curve and a single parameter u that represents
the size of the window (Figure 3.4d). Each value of u defines a window boundary that is computed
by eroding the bounding curve along the surface of the part toward the curve’s centroid, using u as
the erosion parameter. The erosion is performed by moving curve points inwards along the curve’s
normal direction and then smoothing the curve (by averaging nearby points) to help eliminate self-
intersections. At u = 0, the bounding curve is fully eroded, and the window is fully closed. At u =
1, the window is fully open. To accelerate the computation of this mapping, the system precomputes
bounding curves at uniformly spaced u values (Figure 3.5a) and then interpolates between them at
runtime. From a given window boundary, the system forms a polyhedral cutting volume by first
triangulating the region R of the surface enclosed by the window boundary, and then creating a
second copy of these triangles. The two sheets of triangles are then offset a small amount (I use the
average triangle edge length of the surface) in opposite directions normal to the surface so that they
lie on either side of R. Finally, the sheets are sewn together with triangles to form a closed cutting
volume that completely encloses R.

21
Sketchedcurve
Sketchedcurve
Computedsilhouettesegments
Computedgeodesicsegment
Computedgeodesicsegment
(a) Sketched curves andcomputed segments
(b) Four-sided window cut(fully expanded)
Figure 3.6: Sketch-based bounding curve construction. The system automatically computes four-sided window boundaries from two curves sketched by the user (a). The segments of the resultingboundary either follow geodesics or hug silhouettes of the surface (b).
Four-sided window cuts are defined by a bounding curve that is partitioned into four segments, as
shown in Figure 3.4e. Each segment is an arc-length parameterized curve (normalized to a total
length of 1) corresponding to one of the four surface curves along u = 0, u = 1, v = 0, and
v = 1, as illustrated in Figure 3.5b. For a given u, v point, the corresponding model-space point is
the intersection of two geodesic paths, one connecting the model-space points at (u, 0) and (u, 1),
the other connecting points at (0, v) and (1, v). Thus, a rectangle in parameter space is mapped to
a window boundary in model space by transforming the four corners into model-space points that
are then connected using geodesics. As with freeform window cuts, the system uses the four-sided
boundary to construct a closed polyhedral cutting volume.
To accelerate the mapping for four-sided window cuts, the system precomputes a grid of geodesic
paths that connect the two pairs of opposing segments at uniformly spaced values of u and v, as
shown in Figure 3.5b. By interpolating within this grid, the system can quickly compute a model-
space window boundary from its parametric representation without having to compute geodesics at
runtime.
For both freeform and window cuts, the user can draw the initial, outermost bounding curve
directly on the surface of the part. I also provide more automated interfaces for specifying these
curves. The system can automatically compute a freeform window boundary by first determining
the regions of the surface that occlude underlying parts (with respect to the current viewpoint), and
then computing a closed window boundary that completely encloses all of these occluding regions.

22
For four-sided window boundaries, the user can sketch two curves that roughly denote the extent
of the window. The system projects the sketched curves onto the structure (again using the current
viewpoint) and discards the portions that do not project onto the surface. The system then computes
the four bounding curve segments by connecting the endpoints of the projected curves using paths
that either follow geodesics or hug the silhouette of the surface, as shown in Figure 3.6. A silhouette
curve is chosen only if the corresponding endpoints are near the silhouette and the length of the
silhouette curve is within a threshold of the geodesic distance between the endpoints. Otherwise,
the endpoints are connected with the geodesic path.
Viewpoints
To generate effective cutaway illustrations, the system asks the author to specify a set of good candi-
date views during the rigging process. When the model is examined using the viewing interface, the
system chooses amongst the candidates to determine the best view for exposing the user-selected
set of target structures. The view selection algorithm takes into account the layering relationships
between parts, which I encode as an occlusion graph that is computed for each viewpoint. The sys-
tem also uses the occlusion graph to create inset cuts (Section 3.2.2).
Occlusion graph
To compute an occlusion graph from a given viewpoint, the system first assigns each part to a vis-
ibility layer based on the minimum number of occluding structures that must be removed before
the part in question becomes sufficiently visible. This assignment is performed using an iterative
procedure. First, the current set of parts S is initialized to include all the parts in the model. The
algorithm then repeats the following three steps until all the parts have been placed in a layer:
1. Render all parts in S
2. Create new layer containing visible parts
3. Remove visible parts from S
In step two, I use an approximate visibility test whereby a part is considered visible if its visibility
ratio (i.e., the ratio of its visible screen space to its maximum unoccluded screen space) is greater
than an author-specified threshold. For most of the examples presented in this chapter, I set this

23
threshold to 0.9, which ensures that parts that are mostly, but not entirely visible are placed in the
same layer as parts that are fully visible. If no parts are sufficiently visible to be added to the current
visibility layer, the algorithm adds the part with the highest visibility ratio. Figure 3.7c illustrates
the visibility layers for an example model.
After computing the layering, the system computes an occlusion graph. For each part P , the
algorithm steps through the visibility layers starting from the layer containing the part and moving
towards the viewer. In each layer, the system identifies parts that directly occlude P with no inter-
vening occluding structures. As with the visibility test described above, I use an approximate notion
of occlusion whereby a part is identified as an occluder if it occludes more than 20% of P ’s visible
screen-space area. For each occluder, a directed edge from the occluder to P is added to the graph.
As shown in Figure 3.7d, this construction guarantees that edges flow only from shallower to deeper
visibility layers, resulting in a directed acyclic graph (DAG).
View selection
For a given set of target structures, the system evaluates each saved viewpoint v using a simple
metric that considers the projected screen space pixel area av and the average number of occluders
ov for the targets. To compute av, the system renders just the target parts from the given viewpoint
and counts the number of corresponding pixels. To compute ov, the system considers each target
and traverses the occlusion graph upwards (i.e., against the flow of the edges) starting at the node
corresponding to the target part. Since the graph is a DAG, this traversal will not encounter any
cycles. The system counts the number of traversed nodes and then computes the average number of
occluders for all the targets.
Given these definitions, I define the energy Ev of a viewpoint v as
Ev = 2ov +Amax − av
Amax, (3.1)
where the normalization constant Amax is the size of the application window. In accordance with
the conventions described earlier, this energy function penalizes views that result in more occluders.
The ov term is scaled by two so that the number of occluders always takes precedence over the
projected screen-space area of the targets. If ov is the same for two views, the area term breaks the
tie. After computing Ev for each view, the system chooses the minimum energy viewpoint.

24
fat
skin
m1
m2
m3
m4
m5 m6
b1
b2
skin
m2
b1 b2
m3
m4
fat
m1
m6m5
(a) Forearm cross-section(front view)
(b) Forearm cross-section(side view)
(c) Visibility layers wrt specified viewpoint
(d) Constraint graph (e) Inset cuts
skinfat
m2
b2
m3
m4
m6
fat
skin
m1
m2
m3
m4
m5 m6
b1
b2
skinfat
m2
b2
m3
m4
m6
1
2
3
4
5
6
7
skinfat
m2
b2
m3
m4
m6
Figure 3.7: Computing occlusion graph. Forearm cross-section viewed from front and side (a)–(b). Structures sorted into visibility layers based on depth complexity from specified viewpoint (c).Directed edges from occluders to occluded parts are added to graph (d). Edges flow only from lowerto higher layers. Nodes are sorted in topological order to produce a set of inset cuts (e).

25
(a) No shading (b) Edge shading (c) Edge shadows (d) Edge shading and shadows
Figure 3.8: Illustrative shading techniques. Some depth relationships are difficult to interpret whenthe scene is rendered with a standard lighting model (a). Edge shading helps convey the orientationof cutting surfaces (b). Edge shadows disambiguate depth relationships at occlusion boundaries(c). Combining these techniques produces a more comprehensible depiction (d).
Inset constraints
To generate inset cuts from a given viewpoint, the system applies an inset constraint at each edge of
the occlusion graph. Given the model space cutting volume C of a part, the cutting volume of each
occluded part is constrained to be smaller than C; conversely, the cutting volume of each occluder
is constrained to be larger than C. The system supports the propagation of constraints both up and
down the graph to enable the constrained manipulation of cuts, as described later in Section 3.2.4.
Propagating constraints in both directions allows the system to maintain insets for both the occluded
and occluding structures of the part being manipulated. Based on the structure of the graph, inset
constraints can produce a cascade of inset cuts, as shown in Figure 3.7e.
The system evaluates an inset constraint as follows. Let b2 and m3 be two structures, where m3
is constrained to be inset from b2 (see Figure 3.7e). To update m3’s cutting volume given b2’s cutting
volume, the system determines the unoccluded region of m3 and computes the smallest model-space
cutting volume (i.e., the tightest cutting parameter ranges) for m3 that encloses this region. These
cutting parameters are then shifted inwards by a specified inset amount to ensure that a portion of
m3 is visible behind b2. By default, I set the inset amount to be 5% of the largest dimension of
the cutting volume’s maximum model-space extents. This amount is mapped to parameter space in
order to compute the inset. To evaluate the constraint in the opposite direction, the system uses a
similar method to ensure that b2’s cutting volume is expanded enough to reveal a portion of m3.

26
Rendering algorithms
My system renders cutaways using OpenCSG [45], a freely available hardware-accelerated CSG
library. If the input includes 3D textures that model the appearance inside of parts (e.g., muscle
fibre), these textures are mapped onto cut surfaces to add visual detail to cross-sectional faces.
In addition, I have implemented several stylized rendering techniques that can make it easier
for viewers to understand the shape and orientation of parts as well as the layering between the
parts. The first two techniques, edge shadows and edge shading, take several seconds to compute
and therefore are only produced when the users asks for a high-quality rendering. Real-time depth-
cueing and label layouts are computed at interactive rates in the viewing interface.
Edge shadows. To render edge shadows, the system scans the depth buffer to identify pixels that
lie on the near side of depth discontinuities (i.e., the side that is closer to the viewer). For each of
these discontinuity pixels, the system determines the set of neighboring pixels that lie on the far
side of the discontinuity and identifies them as being in the edge shadow. Each shadow pixel is
then darkened based on its image space distance dimg and depth discrepancy ddepth from the near
side depth discontinuity pixel. These values are clamped to [0, Dimg] and [0, Ddepth] respectively.
Typically, I set Dimg to 10 pixels and Ddepth to 0.5% of the entire model’s average bounding box
dimension. For each shadow pixel, the system computes a scale factor γ that is multiplied with the
pixel’s current color.
γ = s ∗(|Dimg − dimg|
Dimg
)t
where
s = (1 − α) ∗ smax − α ∗ smin
t = (1 − α) ∗ tmax − α ∗ tmin
α = ddepth
Ddepth
The parameter s scales the overall amount of darkening linearly, and t controls how quickly the
shadow falls off with respect to dimg. Both s and t are restricted to user-specified ranges ([smin, smax]
and [tmin, tmax] respectively), and they both get smaller as ddepth gets larger. By default, I set the
range for s to [0.6, 0.9] and for t to [1, 3]. As a result, edge shadows are darker and tighter where the
depth discontinuity is small and are more diffuse where the depth discontinuity is large.
Edge shading. To generate edge shading, the system identifies pixels that correspond to creases (in
model space) where two faces of the same cutting volume meet, or where a cutting surface meets

27
the exterior surface of a part. For each of these crease pixels, the system determines the set of neigh-
boring pixels that correspond to a cutting surface and identifies them as edge shading pixels. The
system computes diffuse shading for each such edge shading pixel by looking up surface normals
that are stored in a corresponding per-pixel normal map. The pixel’s color is then determined by in-
terpolating between its unshaded (i.e., fully lit) color and its diffuse shaded value. The interpolation
is performed with respect to dimg so that the edge shading fades farther away from the edge.
Real-time depth-cueing. The system supports two real-time depth-cueing effects that make it easier
to distinguish parts from one another and to see how they layer in depth. To emphasize silhouettes
and sharp creases, the system first detects these contours by finding edges in the depth buffer (for
silhouettes) and a normal map (for creases). These edges are then darkened in the final shaded ren-
dering of the scene. To emphasize the relative depth of parts in the model, the system dims and
desaturates objects proportional to their distance from the viewer. Both effects are implemented as
fragment shaders on the GPU.
Label layout. To generate label layouts in real-time I have implemented the labeling algorithm of
Ali et al. [5]. Their approach organizes labels into two vertical columns on the left and right of the
illustration and then stacks them in a way that avoids intersections between leader lines. To make the
layout more compact, the system positions labels near the silhouette of the object. Figures 3.3,3.10,
and 3.11 show label layouts produced by my system.
3.2.3 Authoring workflow
To create an interactive cutaway illustration, the author rigs the input model using my authoring
interface. The rigging process has two stages. First, each structure is instrumented with the appro-
priate mapping. Second, the author identifies good viewpoints for generating cutaway views.
To specify the mappings, the author first categorizes each structure as either a rectangular paral-
lelepiped, a long narrow tube, a short radially symmetric tube, or an extended shell. Based on these
categories, the system automatically constructs the appropriate mapping for every part in the dataset
using the automatic techniques described in Section 3.2.2. This operation usually takes just a few
seconds per part.

28
After examining the results of the automatic computation, the author decides which mappings
he wants to edit. These modifications can be performed quickly using the interactive tools described
in Section 3.2.2. In practice, however, this type of manual editing is rarely necessary. As reported in
Section 3.2.5, the automatically constructed mapping was used for 90% of the parts for the datasets
shown in this paper.
Next, the author specifies good views for generating cutaway illustrations. To save a view, the
author simply manipulates the model to the desired orientation and then clicks a button. The system
automatically constructs an occlusion graph, as described earlier, and associates the graph with the
specified viewpoint. In many cases, I envision the author would have enough domain knowledge to
identify good viewpoints a priori. However, the author can also evaluate a viewpoint by generating
cutaways of a few parts from that view using the automatic cutaway generation interface described
in the next section. Typically, two or three views are sufficient to produce effective cutaway illustra-
tions of all the parts in the model.
3.2.4 Viewing interactive cutaway illustrations
My viewing interface allows the viewer to interactively explore a rigged model using both direct
manipulation and higher-level interaction modes.
Direct manipulation
My system allows users to directly resize and move cuts. Dragging with the left mouse button resizes
the cut by snapping the nearest cutting face to the surface point directly below the mouse position.
Dragging with the middle mouse button slides the cut without changing its extent, and holding down
a control key constrains the direction of motion to just one of the free parameter dimensions.
For complicated models, directly manipulating cuts one at a time can become tedious. Activating
inset constraints allows users to make multiple cuts at once. In this mode when the viewer resizes
or moves a cutting volume, the system updates all the cuts by enforcing the inset constraints in both
directions throughout the occlusion graph, starting from the part being manipulated. This two-way
propagation of constraints ensures that the insets (and thus, the layering relationships) both above
and below the manipulated part remain clear during the interaction.
The user can also expand or collapse cuts just by clicking on a structure. In one mode, the

29
system smoothly opens or closes the cutting volume of the clicked structure as much as possible
with respect to the inset constraints. In another mode, the system cuts away or closes entire layers
of structures either above or below the clicked part in the occlusion graph. Expanding cuts in
this manner allows the viewers to quickly expose underlying parts. Fast, animated transitions help
emphasize the layering relationships between structures.
(b) Beveled cuts
(a) Unbeveled cuts
Figure 3.9: Beveled cuts. The viewer ad-justs the amount of beveling to examine thecut surfaces of three tubular muscles andthe surrounding fat.
My system also allows the viewer to bevel (i.e.,
adjust the angle of) cuts to expose cross-sectional sur-
faces, as shown in Figure 3.9. The viewer controls
the amount of beveling by adjusting a single slider. In
response, the system rotates the faces of the selected
cutting volumes towards the viewer.
Automatic cutaway generation
Although direct interaction enables an immediate ex-
ploration experience, in some situations a higher-level
interface may be preferable. For instance, a mechanic
might want to see all of the bolts that fasten two parts
together, or an anatomy student might want to exam-
ine a particular muscle without knowing where it is
located. To support such exploration, I developed an automated algorithm for generating cutaways
that expose user-specified target structures.
Once the viewer has selected a set of target parts from a list, the system chooses a viewpoint
using the view-selection algorithm described earlier and then solves for a set of cutting parameters
in the following way. The model-space cutting volume for each part above a target structure in the
occlusion graph is fully expanded subject to the inset constraints. Conversely, the cuts for the target
structures and all of their descendants are completely closed. This initialization step exposes the
target structures as much as possible. Next, to provide some context from occluding structures, the
algorithm works upwards from the leaves of the occlusion graph, visiting each non-target part and
closing its corresponding cutting volume as much as possible subject to the inset constraints and
without occluding any portion of any target structure.

30
To make it easier for the viewer to see which parts must be cut to form the final solved cutaway,
the system smoothly animates cuts by interpolating cutting parameters from their current values. In
the current implementation, the system animates all of the cuts simultaneously. As future work, I
plan to investigate techniques for animating the cuts in sequence based on the visibility layers of the
parts in order to emphasize layering relationships.
Once the cuts have been updated, the system partitions the model into connected components
of touching parts and then detects small components that have been separated from the rest of the
model by the cuts. Since it is difficult for a viewer to interpret how such components attach to the rest
of the model, they are removed from the illustration. For the examples shown, I used a threshold
of 10% of the entire model’s bounding box volume to identify “small” components. Finally, the
system highlights the target structures by desaturating the other objects and labels the illustration.
3.2.5 Results
I have tested my system on a variety of 3D models as shown in Figures 3.3 and 3.10. All of these
results are rendered with edge shadows, edge shading, depth-cueing and labels. In each cutaway
visualization, the orientation and insetting of the cuts help convey the geometry and layering of
the parts that have been removed. For example, the wedge cuts in Figure 3.10c that remove the
occluding portions of the turbine’s nose cone and outer shell also accentuate the radial symmetry of
these parts. In Figure 3.3b, the insetting of the long tubular muscles emphasizes the fact that there
are multiple layers of muscle in the neck.
To evaluate the operating range of the system, I automatically generated cutaway illustrations
that expose each part of several models. Figure 3.11 shows four of the 27 results for the disk brake
model. Out of the 27 illustrations, I found artifacts in only two, one of which is shown on the right
of Figure 3.11. In these two cases, on close inspection I found that the cuts generated by the system
to expose the target part also leave it disconnected from the surrounding parts, making it difficult
for viewers to understand how the target relates spatially to its neighbors.
In terms of authoring effort, none of the models took more than 20 minutes to rig (see Ta-
ble 3.2.5). The most time-consuming step was identifying the type of cut to use for each part in
the dataset. However, even for the engine model, which contains well over one hundred parts, this
entire process took less than 5 minutes.

31
(b)Turbine
(a)Engine
(c)Thorax
Figure 3.10: Illustrations generated using my automatic cutaway generation interface. Axis-alignedand transverse tube cuts reveal the engine’s crank shaft (a). Wedge tube cuts expose target partswithin the turbine (b) A combination of window and transverse tube cuts removes the layers of skin,muscle and bone that occlude the internal organs of the thorax (c). In (a) and (b), cut surfaces arehighlighted in red.

32
Figure 3.11: Automatically generated cutaway views of disk brake model. We generated an illus-tration for each of the 27 parts in the model. Here, we show four representative images that use bothsaved viewpoints. The image on the right shows an artifact; the cuts that expose the target part alsoleave it disconnected from the surrounding parts. Out of the 27 illustrations, one other exhibited asimilar artifact.
As shown in Table 3.2.5, the system automatically computes good mappings for 90% of the
parts. For the remaining 10% of parts, I was able to specify a suitable mapping interactively in
just a few seconds. In most cases, this manual rigging was used to create wedge-cut mappings for
parts that are clearly derived from cylinders but exhibit a low degree of radial symmetry (e.g., parts
that resemble incomplete cylinders). In a few cases, I manually oriented the box-cut mappings for
parts whose principal axes do not correspond to the desired box-cut axes. Finally, for some parts, I
overrode the automatically computed window-cut mappings using the system’s sketch-based rigging
tools, which provide greater control over the shape of the window boundary.
Although I have not conducted a formal user study, I have demonstrated my system to medical
educators, architects, and airplane engineers. All of the people I spoke with were excited about the
system’s ability to effectively expose the internal structure of complex 3D datasets. Furthermore,
the medical educators I interviewed said they would be willing to invest some of the effort that they
typically spend preparing class materials to creating interactive cutaway illustrations that could be
used as teaching aids and study guides. This informal feedback suggests that my system could be
a useful and practical tool for creating and viewing 3D datasets in a variety of scenarios. As future
work, I would like to further validate the system with a more formal user evaluation.

33
Table 3.1: Rigging statistics. For each model, I report the number of long tubes Nlong, short radiallysymmetric tubes Nshort, rectangular parallelepipeds Nrect, and shells Nshell. I also indicate thenumber of parts for which the automatically computed mapping was used in the final rigged modelNauto. Finally, I report the user time (in minutes) required to rig each model Trig.
Model Nlong Nshort Nrect Nshell Nauto Trig
Disk brake 1 24 2 0 24 3m
Turbine 0 37 3 0 36 5m
Engine 22 84 28 0 122 20m
Thorax 39 0 6 4 37 10m
Arm 20 0 0 1 20 3m
Neck 58 0 0 1 58 8m
3.2.6 Discussion
In this section, I have introduced an approach for incorporating cutting conventions from traditional
illustration into an interactive visualization system. The authoring and viewing techniques I have
developed allow interactive cutaway illustrations of complex models to be authored with a small
amount of user effort, and to be explored in a simple and natural way. I believe my interactive
cutaway illustrations would be invaluable in educational material for medical students, repair docu-
mentation for airplanes and cars, technical manuals for complex machinery, and in fact, any scenario
where static illustrations are currently used.
I see several opportunities for future work:
Extending authoring tools. Although the authoring interface that I have developed makes it possible
to create interactive cutaway illustrations with little user effort, the rigging process could be further
streamlined. I would like to explore more automatic techniques for determining the geometric type
of parts. In addition, I believe existing view selection algorithms could be leveraged to suggest good
viewpoints to the author. I would also like to investigate geometric filtering techniques that would
allow the system to handle a wider range of datasets, including those that contains cracks.

34
Incorporating symmetry. In some cases, the symmetry of objects influences the shape and extent
of cuts. For instance, illustrators sometimes expose only half of a target part that exhibits bilateral
symmetry. In such cases, it is assumed that the viewer can infer that the hidden geometry is simply
a reflection of the half that is visible. The advantage is that the illustration retains more context from
occluding parts. I am interested to incorporate recent advances in automatic symmetry detection [56,
62] in order to incorporate such conventions into my cutaways system.

35
CHAPTER 4
INTERACTIVE EXPLODED VIEWS
Whereas cutaway illustrations emphasize in situ spatial relationships between the constituent parts
of complex objects, illustrators create exploded views to both highlight the details of individual
parts and reveal the global structure of the object. This chapter describes two systems that I have
developed for creating and viewing interactive exploded views. The image-based exploded views
system generates interactive layered diagrams from existing static 2D exploded views, whereas the
3D exploded views system takes 3D models as input and instruments them to enable dynamic,
browsable exploded views. Before describing this work in detail, I first present a broad summary of
exploded view illustration conventions that informed the design of these two interactive systems.
4.1 Exploded view conventions from traditional illustration
The conventions described below were distilled from a large corpus of example illustrations taken
from technical manuals, instructional texts on technical illustration, and educational books that focus
on complex mechanical assemblies [40, 22, 12].
4.1.1 Explosion conventions
When creating exploded views, illustrators carefully choose the directions in which parts should be
separated (explosion directions) and how far parts should be offset from each other based on the
following factors. The example illustration in Figure 4.1 incorporates several of these conventions.
Blocking constraints
Each part in the model is exploded away from touching parts in a direction in which there are no
blocking parts. The resulting arrangement of parts indicates how each part is free to move with
respect to its blockers, which helps the viewer understand the blocking relationships in the model.

36
{Drill bit
sub-assembly
Explosiondirections
Figure 4.1: Explosion conventions. This illustration of a drill incorporates several explosion con-ventions. Parts are exploded in unblocked directions, all parts are visible, and explosion directionsare restricted to the canonical axes of the object. Also, the illustration clearly indicates which partsbelong to the drill bit sub-assembly by separating it from the rest of the object.
Visibility
The offsets between parts are chosen such that all the parts of interest are visible.
Compactness
Exploded views often minimize how far parts are moved from their original positions to make it
easier for the viewer to mentally reconstruct the model. To allow occluded parts to be exposed using
the smallest possible offsets, illustrators choose explosion directions that are as perpendicular as
possible to the viewing direction (subject to the blocking constraints).
Canonical explosion directions
Many objects have a canonical coordinate frame that may be defined by a number of factors, in-
cluding symmetry (as in Figure 4.1), real-world orientation, and domain-specific conventions. In
most exploded views, parts are exploded only along these canonical axes. Restricting the number of
explosion directions makes it easier for the viewer to interpret how each part in the exploded view
has moved from its original position.

37
{Non-interlockingportion
Separation distance
Containerpart
(a)Split container part
(b)Contextual cutaway view
(c)Interlocked parts
Cutaway viewfor context
Exploded viewfor detail
Figure 4.2: Cutting techniques for exploded views. Container parts are often split with a singlecutting plane to expose internal parts (a). Cutaway views are sometimes used to provide contextfor the exploded object (b). Occasionally, cuts are used to isolate the non-interlocking portion ofinterlocked parts (c).
Part hierarchy
In many complex models, individual parts are grouped into sub-assemblies (i.e., collections of
parts). To emphasize how parts are grouped, illustrators often separate higher level sub-assemblies
from each other before exploding them independently, as shown in Figure 4.1.
4.1.2 Cutting conventions in exploded views
Illustrators often incorporate cuts in exploded views. Figure 4.2 shows examples of the three cutting
conventions described below.
Splitting container parts
In many complex models, internal parts are nested within container parts. To emphasize such con-
tainment relationships, illustrators split container parts into segments and then explode these seg-
ments apart to expose the internal parts. Typically, containers are split using a single cutting plane
through the centre of the part. The segments are then exploded away from each other in the normal
direction of the plane (Figure 4.2a). This simple relationship between the explosion direction and
the orientation of the cut helps the viewer understand how the segments fit back together.

38
As shown in Figure 4.2a, the orientation of the plane is chosen so that the two segments must
be separated as little as possible in order to expose the internal parts. Minimizing this separation
distance makes it easier for the viewer to see that the two segments originate from the same part. One
exception to this rule occurs when several nested containers must be split. To emphasize the relative
containment relationships between the various containers, the cutting planes for outer containers are
always oriented such that the outer container segments enclose the inner container segments, even if
a different orientation would have resulted in less separation between the outer container segments.
Combining exploded views with contextual cutaway views
In some cases, a cutaway view is used to provide additional context for an exploded view. As shown
in Figure 4.2b, the cutaway allows the viewer to see how an exploded sub-assembly is positioned
and oriented with respect to surrounding structures.
Cutting interlocked parts
In some cases, illustrators use cuts to explode collections of parts that are completely interlocked
(i.e., block each other from moving in any direction). In Figure 4.2c, cuts are used to isolate the non-
interlocking portions of the leg muscles, which are then exploded apart. Although this technique
reveals the spatial relationships between interlocked parts without violating blocking constraints, it
can be difficult for the viewer to mentally reconstruct all the parts that have been cut. For example,
in Figure 4.2c, it is hard to tell which exploded muscles connect to which unexploded ligaments.

39
4.2 Image-based exploded views
Figure 4.3: My system allows the user to convert a static 2D exploded view (left) into an interactiveillustration. The three frames on the right show the user interactively expanding a portion of themaster cylinder to examine it in more detail.
Illustrators apply the conventions described in the previous section to create exploded views that are
as clear and informative as possible. However, static exploded views are prone to visual clutter and
may not emphasize the parts that are of interest to the viewer. Furthermore, it is sometimes difficult
to see exactly how parts fit together from a static depiction. The key idea behind my image-based
exploded views system is to create interactive illustrations that address these limitations and at the
same time leverage the skill and expertise that have gone into the creation of existing static exploded
views.
My approach is to convert a static 2D exploded view illustration into a layered 2.5D diagram
representation that enables parts to dynamically expand and collapse while maintaining the appro-
priate occlusion relationships between parts. Although the lack of explicit 3D information puts some
limits on the viewing experience (e.g., arbitrary changes in viewpoint cannot be directly supported),
this image-based strategy has several key benefits: it makes it easy to support arbitrary rendering
styles (we just have to find or create pictures of each part of the object in the desired style); it does
not require the creation of 3D models; and, finally, using 2D images allows us to leverage the abun-
dance of existing static exploded views commonly found in textbooks, repair manuals, and other
educational material.
The contributions of this work fall into two categories:

40
Input diagram Segmentation Stacking Fragmentation Depth assignment Annotation
Figure 4.4: The flowchart for converting a static 2D exploded view illustration into an interactiveillustration. We segment the input illustration into parts, organize the parts into stacks, break theparts into fragments, layer the parts and fragments so that they properly occlude one another, andfinally, add desired annotations, such as labels and guidelines.
Semi-automatic authoring tools. The primary challenge in turning a 2D image into an interactive
exploded view diagram is specifying how parts interact with one another. My system provides a
suite of semi-automatic tools for constraining the motion of parts as they expand and collapse, and
for layering parts so that they properly occlude one another as they move. These tools allow users
to quickly create compelling interactive diagrams via simple, sketch-based interactions.
Interactive viewing interface. To help viewers explore the exploded view and to better understand
how parts fit together, the system provides a viewing interface that allows the user to directly expand
and collapse the exploded view and search for individual parts.
4.2.1 Creating image-based exploded views
Several steps are involved in creating an interactive image-based illustration (see Figure 4.4). As
input, the system accepts either a single image of an object with all of its constituent parts visible
(i.e., in a fully exploded state), or a set of images, one per part. We assume that the object is
rendered using an orthographic projection, as is typical in technical illustrations. With perspective
projections, parts may not fit together properly when the exploded view is collapsed. In the case
where a single image is used as input, the static diagram is first segmented into parts corresponding
to the constituent pieces of the depicted object. Next, these parts are organized into stacks that

41
define how parts move relative to one another as the object is expanded and collapsed. The parts
are then layered to produce the correct occlusion relationships between them. As I show later, this
layering step often involves breaking parts into smaller fragments before assigning depth values to
each piece in the diagram. Finally, the diagram can be annotated with labels and guidelines. The
remainder of this section outlines the stages of this pipeline in greater detail.
Explosion tree representation
(a) (b) (c)
(d) (e) (f)
Figure 4.5: The occlusion relationship betweenthe turbine (on top) and the bottom cover of thecatalytic converter shown in Figure 4.4. If theturbine and bottom cover are each given a sin-gle depth value, the turbine incorrectly occludesthe outer lip of the cover (a–c). Instead if we splitthe cover into two fragments and then layer theturbine between them we can produce the properocclusion relationship (d–f).
An interactive illustration in my system con-
sists of parts and stacks. Each part includes an
image of its corresponding component, as well
as an alpha mask that defines its bounding sil-
houette. To achieve the correct impression of
relative depth between the various portions of
the object, parts are also assigned depth val-
ues that determine how they are layered. When
two or more parts interlock such that they can-
not be correctly rendered using the “painter’s
algorithm,” [30] it is insufficient to assign a sin-
gle depth value to each part (Figure 4.5). To
solve this problem, parts can be divided into
fragments. By specifying the appropriate depth
value for each fragment, it is possible to achieve
the correct occlusion relationship between parts that overlap in complex ways.
To enable parts to expand and collapse dynamically, they are organized into stacks that define
how the parts are allowed to move in relation to one another. More precisely, a stack is an ordered
sequence of parts that share the same explosion direction (as defined by Agrawala et al. [2]). The
explosion direction is a 2D vector that specifies the line along which stack parts can move. I refer
to the first part in a stack as its root. In my diagrams I enforce the restriction that each part can be
a non-root member of only one stack. However, the same part can be the root for any number of
stacks. Thus, a collection of stacks always forms an explosion tree, as shown in Figure 4.6.

42
Figure 4.6: Explosion tree for the master cylinder. The arrows indicate the ordering of parts withineach stack. The stack parameters include the initial position of each part with respect to its prede-cessor and the maximum offset, which is the furthest distance a part can move with respect to itspredecessor (inset).
For each of its constituent parts, a stack stores three parameters. The initial position specifies the
position of a part in its fully collapsed state with respect to its predecessor, the current offset keeps
track of the part’s current displacement from its initial position, and the maximum offset indicates
how far a part can possibly move away from the preceding part in the stack. Given these stack
parameters, the position of each part depends only on the position of its predecessor.
Creating parts
To help the user segment a single static illustration into parts, the authoring system includes an
Intelligent Scissors (I-Scissors) tool [58] that makes it easy to cut out the individual parts of the
depicted object. The user simply loads the input image into the interface and then oversketches the
appropriate part boundaries using I-scissors. In some cases, a part that is partially occluded in the
input illustration might have holes in it that need to be filled. This can either be done manually using
Adobe Photoshop, or via automatic hole-filling techniques [8, 19].

43
Creating the explosion tree
Figure 4.7: Users draw a free-form stroke to organizeparts into a stack (a). The stroke indicates the orderof the parts in the stack as well as the explosion direc-tion (b). Users can interactively adjust the explosiondirection if necessary (c).
After the parts have been created, they
can be organized into stacks via a simple,
sketch-based interaction (see Figure 4.7).
To create a new stack, the user connects
the appropriate set of parts by drawing a
free-form stroke. These parts are then or-
ganized into a stack, preserving the part or-
der defined by the stroke. The system as-
sumes that the specified parts are currently
in their fully exploded configuration and
then infers an explosion direction, initial
positions, and maximum offsets for the new stack that are consistent with this layout.
To determine the explosion direction, the system connects the bounding box centers of the first
and last stack parts with a straight line. The initial position for each part is set by default to be a
small offset from its predecessor along the explosion direction. Since the parts start out in their fully
exploded layout, the system sets the maximum offset for each part to be the distance from the part’s
initial position to its current, fully exploded position.
The user can manually tweak the stack parameters once the new stack is created via a number
of simple direct-manipulation operations. To modify the explosion direction, the user drags out a
line anchored at the stack’s root, and then adjusts this vector to the desired direction. The stack’s
axis updates interactively during this operation so that the user can easily see how the parts line up.
To change a part’s initial position and maximum offset, the user switches to a “stack manipulation”
mode, and then drags the part to its appropriate fully collapsed and expanded positions.
Layering
After all of the stacks have been created, parts are fragmented if necessary and then layered to pro-
duce the correct impression of relative depth between them. The user can manually partition a part
into fragments with I-Scissors, and then explicitly assign a depth value to each part or fragment
in the diagram. However, for objects with more than a few components, this type of manual layer

44
specification can be tedious. To reduce the authoring burden, my system provides semi-automatic
fragmentation and depth assignment tools that can be used for a large class of interlocking parts.
r
p
BB
1C11
2C22
back
front
OCBB
r
v
C1CC C2
ImageplaneImageplane
Figure 4.8: A 3D point p that passes through theopening defined by B while traveling in the explo-sion direction r (left top). Since the fragmentationassumptions are satisfied, the system computes thecorrect front and back fragments (left bottom). Inthe same scene viewed from above, we can clearlysee that p passes in front of B at C1 and behindB at C2 (right).
Semi-automatic fragmentation
Typically when two parts interlock, one com-
ponent fits roughly inside the other (e.g., the
two parts in Figure 4.5). In this case, the cor-
rect layering can usually be achieved by split-
ting the outer part into front and back frag-
ments, and then layering the inner part to pass
between them. To fragment the outer part, the
user oversketches (with the help of I-Scissors)
the closed boundary of the cavity or opening
that encloses the inner piece. As shown in Fig-
ure 4.8, we refer to the 3D boundary of the cav-
ity as B. The curve that the user draws, C, is
B’s projection onto the image plane. Given C,
the system computes the occluding portion of this curve, CO, where the inner part passes behind the
outer part, and then uses it to divide the enclosing component into two fragments.
The system extracts CO by determining, for any 3D point p that goes through the opening,
where p passes behind B (i.e., out of the viewer’s sight). Since parts are constrained to move within
their stacks, we consider only points that go through the opening while traveling in the explosion
direction r (Figure 4.8). The system assumes that C does not self-intersect, and that any line parallel
to the explosion direction intersects C no more than twice. Given these restrictions on the shape of
C and ignoring the tangent cases, the projection of r onto the image plane will intersect C exactly
twice (at C1 and C2). Let C1 be the first intersection point as we follow r away from the viewer,
as shown in Figure 4.8. By default, we assume that p passes in front of B at C1 and behind B at
C2, which corresponds to the common case in which p enters the opening defined by B as it moves
away from the viewer.

45
(a) (b) (c) (d) (e) (f)
Figure 4.9: Semi-automatic fragmentation of the bottom cover. The user sketches the boundaryof the cavity C (a). The system casts a ray from each pixel on the curve in the direction of theexplosion axis pointing away from the viewer (b). For all rays that intersect C twice, the secondpoint of intersection is added to the occluding portion of the curve CO (c). The system extrudes CO
along the explosion axis (d). All pixels lying within the extruded region are classified as the frontfragment and the remaining pixels are classified as the back fragment (e). The system can now setthe depth value of the turbine to lie between the depth values of the front and back fragments toproduce the correct occlusion relationship (f).
r
p
BB
1C11
22C22
front
back
C
C
BB
r
vC1CC C2
ImageplaneImageplane
Figure 4.10: Cavity with a non-planar opening.The opening defined by B has a notch that causesB to be non-planar (left top). The system is stillable to compute the correct layering shown (leftbottom). As long as p always passes in front ofB at the first intersection point C1, the fragmen-tation algorithm obtains the correct result.
Given this assumption, Figure 4.9 depicts
the basic steps for computing CO. The user
must specify which end of the explosion direc-
tion points away from the viewer. We consider
the path of every point that passes through B, by
casting a ray from every pixel on C in the ex-
plosion direction. If the ray intersects C again,
we add the pixel corresponding to this second
intersection point to CO. Once we are done pro-
cessing the curve, we extrude CO by rasterizing
a line of pixels (using Bresenham’s algorithm) in
the explosion direction, starting from each pixel on the boundary. Every pixel that we encounter is
added to the part’s front fragment, and all remaining pixels comprise the back fragment. We stop
the extrusion once we reach the boundary of the image.
Note that my assumptions produce correct fragmentations for a whole class of enclosing cavities
of different shapes and orientations. Specifically, the assumptions do not restrict B to lie in a plane
that is orthogonal to the explosion direction. For example, the notched object shown in Figure 4.10
contains a cavity with a non-planar opening. In this situation, the system is able to compute the
correct fragmentation because all of the assumptions hold. Of course, there are situations that vio-

46
late one or more of the assumptions. In Figure 4.11, B is oriented such that p emerges from behind
C1 and passes in front of C2. In this case, the user can tell the system to invert the fragmentation
algorithm by reversing the explosion direction. This inverted computation obtains the correct frag-
mentation result. In practice, however, I have found the default fragmentation assumptions to be
valid for a large class of interlocking parts.
p
rBB
2CC221C11
front
back
OOCC BBr
v
C2C1CC
ImageplaneImageplane
Figure 4.11: In this case, B is oriented such thatthe fragmentation assumptions do not hold (lefttop). Without any user intervention, the systemcomputes an incorrect fragmentation (left bot-tom). This top-down view of the scene clearly il-lustrates that B is in front of r at C1(right). Toobtain the correct result, the user can tell the sys-tem to invert the fragmentation computation.
Semi-automatic depth assignment
Once all of the appropriate parts have been
fragmented, the system automatically com-
putes their layering relationships using a sim-
ple set of heuristics. The depth values for non-
interlocking parts within a stack are assumed to
be either strictly increasing or decreasing with
respect to their stacking order. For interlocking
parts, it is assumed that the inner part must be
layered between the outer part’s front and back
fragments. To compute a layering, the system
first infers which parts interlock and then deter-
mines an assignment of depth values that satis-
fies these rules.
Figure 4.12: A failure case for the cross-sectionheuristic that tests whether two parts interlock.The cross-section of the push rod shown in reddoes not fit within the cross-section of the hole inthe dust boot shown in blue (left). In general theheuristic fails when the inner part contains a bul-bous end that does not fit within the outer part.We can resolve this case by manually fragmentingthe push rod (right). Now the cross-section of thethin stem of the rod fits within the cross-section ofthe hole in the dust boot (inset).
To determine whether two parts interlock,
the system checks if the cross-section of one
part (with respect to the explosion direction) fits
within the cross-section of the curve that de-
fines the cavity opening (if there is one) in the
other part. If so, then the system assumes that
the first part fits inside the second. Otherwise,
the parts are assumed not to interlock. Although
this heuristic works in many cases, there are sit-

47
uations in which it will fail, as shown in Figure 4.12. To handle these cases, the user can manually
fragment a part so that the cross-section assumption holds for the fragment that actually fits into the
enclosing component.
In general, non-adjacent parts in the stack can overlap, such as in Figure 4.13. As a result, depth
values cannot simply be propagated outwards from the root in a single pass. Instead, my approach
is to cast depth assignment as a constraint satisfaction problem. For any two non-interlocking parts
in the same stack, add a constraint that the part closer to the near end of the stack be layered in
front of the other. For two parts that do interlock, add a constraint that the inner part be layered
in front of the back fragment and behind the front fragment of the outer part. If the interlocking
relationships are consistent, this system of inequality constraints is solved using local constraint
propagation techniques [13]. Otherwise, the constraint solver informs the user of the inconsistency.
Figure 4.13: Multiple parts in a stack can inter-lock. Here all three highlighted parts interlockwith the hole. Our semi-automatic depth assign-ment algorithm uses constraint propagation to au-tomatically choose depth values for all of theseparts so that they are properly layered betweenthe front and back fragments of the hole.
One feature of my authoring framework is
that it gracefully handles cases in which one
or more of the assumptions are violated. Since
the system is organized as a collection of semi-
automatic tools, it does not force the user to
choose either a fully automatic process or a
completely manual interaction. Instead, the
system can fluidly accept manual guidance at
any stage in the authoring process. For instance,
if the system is unable to find the proper fragments because one of the fragmentation assumptions
is invalid, the user can manually divide a part into front and back pieces and then use the automatic
depth assignment tool to infer a layering. Similarly, if the system guesses incorrectly whether or not
two parts fit together, the user can first explicitly specify the correct interlocking relationship and
then use the system’s constraint solver to assign depth values.
Adding annotations
As an optional final step, the user can annotate individual parts with labels and add guidelines that
indicate explicitly how parts move in relation to one another. For each part that requires a label, the
user specifies the appropriate label text. To indicate where a label should be placed, the user clicks

48
X
Figure 4.14: To position a label, the user clicks toset an anchor point (left). By default, the systemcenters the label on the anchor (middle). The userthen drags the label to the desired position (right).
to set an anchor point (typically on or near the
part being labelled), and then drags the label to
the desired position (Figure 4.14). When the
diagram is laid out, the system keeps the offset
between the label and its anchor constant so that
the label moves rigidly with its corresponding
part. To make the association between a part
and its label explicit, a line is rendered from the
center of the label to its anchor point. To create
a guideline, the user selects two parts and then drags out a line that connects them in the desired
fashion. Each endpoint of the line is treated as an anchor that sticks to its corresponding part. As a
result, the guideline adapts appropriately as the parts move. By default, guidelines are rendered as
dotted lines.
4.2.2 Viewing image-based exploded views
To display dynamic exploded view illustrations, I have developed software that supports a number
of useful interactions to help the human viewer extract information from the diagram.
Layout
To lay out the parts in a diagram, the system again uses a local propagation algorithm [13] that
works by traversing the explosion tree in topological order, successively computing and updating
the position of each part based on its predecessor and current offset. Once all part positions have
been calculated, the system renders each part and its fragments at their specified depths. The user can
also enable label and guideline rendering in the viewing interface to display annotations. To prevent
visual clutter, the system only renders labels and guidelines whose anchor points are unoccluded by
other parts.
Animated expand/collapse
The viewing interface supports a simple but useful interaction that allows the viewer to expand or
collapse the entire diagram with the click of a button. To produce the desired animation, the system

49
smoothly interpolates the current offset of each part either to its fully expanded or fully collapsed
state, depending on which animation the user selects.
Direct manipulation
Figure 4.15: The user clicks and drags to directlyexpand the stack. The system projects the initialclick point onto the explosion direction (left). Asthe user drags, the tip of the cursor is projectedonto the explosion direction, and the current off-set of the part is adjusted so that it lies on theprojected point (right).
To enable the human viewer to focus on the in-
teractions and spatial relationships between a
specific set of parts without seeing all of an ob-
ject’s components in exploded form, the system
allows the user to selectively expand and col-
lapse portions of the diagram via constrained
direct manipulation. After selecting a compo-
nent, the viewer can interactively modify its
current offset by dragging the part outwards or
inwards within its stack. The manipulation is constrained because a part can only move along its
explosion direction, no matter where the user drags.
When the user initiates this interaction, the system first records where the selected part is
grabbed, as shown in Figure 4.15. As the user drags, the current mouse location is projected onto
the explosion direction. The system then sets the current offset of the selected part such that the
grabbed point slides towards this projected point. If the user drags a part beyond its fully collapsed
or expanded state, the system tries to modify the current offsets of the predecessor parts to accom-
modate the interaction. Each predecessor is considered in order in order up until the root, so that
a part will only move if all of its descendants (up to the manipulated component) are either fully
collapsed or expanded. Thus, the user can effectively push a set of parts together or pull them apart
one by one. Three frames of interactive dragging are shown in Figure 4.3.
Part search
In some cases, the viewer may want to locate a part that is hidden from view when the object is in
its fully collapsed state. Instead of expanding the entire diagram and then searching visually for the
component in question, the viewing interface allows the user to search for a part by looking up its
name or picture in a list of all the object’s components (Figure 4.16). The system expands the object

50
to reveal the requested part as well as the parts immediately surrounding it in the stack in order to
provide the appropriate context.
4.2.3 Results
Figure 4.16: Visually searching for a particularpart can be difficult if the object contains lots ofparts (left). Here the viewer finally finds and se-lects the speaker for closer examination. In itsfully collapsed state, the diagram is less cluttered,but it is impossible to see internal parts (righttop). We provide an alternative search dialog thatallows viewers to search for any part by name orby picture. Here, the viewing software expands thephone to reveal the speaker as well as the partsimmediately surrounding it (right bottom).
In this section, I have already presented exam-
ple diagrams of a master cylinder (Figure 4.3),
a converter (Figure 4.4), and a phone (Fig-
ure 4.16) that were created using my system.
Another example depicting a car (Figure 4.17)
demonstrates how the image-based framework
can easily support arbitrary rendering styles. In
this case, the car is rendered using markers.
Not surprisingly, I found that the time re-
quired to author a diagram depends on the num-
ber of parts in the object. The car and converter
objects contain just a few parts, and as a result,
each of those examples took approximately five
minutes to create. For the master cylinder and
phone, I spent roughly fifteen minutes segment-
ing the original diagrams into parts. Although
both of these objects contain many parts that
interlock in complex ways, I manually frag-
mented only two parts for the master cylinder
and eight parts for the phone, six of which were screws. In both cases, I used semi-automatic
fragmentation to resolve the rest of the interlocking relationships. Once I obtained the correct frag-
mentation, depth assignment was completely automatic for the master cylinder. For the phone I had
to manually assign a depth value for one of the fragments. Fragmentation and layering took roughly
thirty minutes for the master cylinder and forty minutes for the phone. Most of this time was spent
sketching cavity curves and providing manual guidance when necessary.

51
Figure 4.17: Interactive car illustration in itsfully expanded (left) and fully collapsed configu-rations (right).
When viewing the objects, I found the direct
manipulation interface to be extremely effective
for conveying the spatial relationships between
components. This was especially true for the
master cylinder and phone because they con-
tain many parts. While the layering contributes
to the illusion of depth, the act of manipulation
itself produces a sensation of physically push-
ing components together or pulling them apart
one by one. This direct interaction clarifies and
reinforces the relationships between parts. Furthermore, I found the ability to pull apart specific
sections of each illustration very useful for browsing a localized set of components. In addition to
reducing the amount of visual clutter, the ability to expand selectively makes it possible to view a
diagram in a small window. For instance, the static phone illustration does not fit on a 1024x768
laptop screen when viewed at full resolution because the vertical stack is too tall in its fully exploded
state. However, the interactive exploded view of the phone can easily be viewed on such a display
by expanding only a subset of the object’s parts.
4.2.4 Discussion
The work described in this section introduces a novel framework for creating and viewing interactive
exploded view illustrations using static images as input. Specifically, I presented a set of semi-
automatic authoring tools that facilitates the task of creating such illustrations, and I described a
viewing interface that allows users to interactively browse and explore exploded views to better
understand the internal structure of complex objects.
The results from this work suggest several opportunities for future research:
Arbitrary explosion paths. To achieve a more compact exploded view layout, illustrators some-
times arrange parts using non-linear explosion paths that are often indicated with guidelines. One
approach would be to extend my system’s constraint-based layout framework to support arbitrary,
user-specified explosion paths.

52
Dynamic annotations. Although my system currently supports labels and guidelines, the way in
which these annotations are positioned (i.e., as constant offsets from specific parts) can sometimes
produce less-than-pleasing layouts. The main challenge here is determining how to arrange this
meta-information dynamically to take into account the changing layout of an interactive diagram.
Emphasis. It might be useful to provide diagram authors with image-based tools for emphasizing
and deemphasizing particular parts of the depicted object. These tools might be something like
intelligent filters that take into account the perceptual effect of performing particular image trans-
formations. Emphasis operations could also be used at display time to highlight important parts.
Semantic zooming [7]. For extremely complicated objects, it could be useful to introduce multiple
levels of detail that would allow the viewer to interactively control how much information is pre-
sented for particular portions of the subject matter.
Depth cues. I have noticed that interactive diagrams created from 2D images can sometimes have
a “flattened” appearance where layers overlap. It might be possible to automatically render sim-
ple depth cues (e.g., drop shadows) when viewing the diagram to clarify the spatial relationships
between these layers.

53
4.3 3D exploded views
Figure 4.18: 3D exploded view illustration generated by my system. My system instruments 3Dmodels to enable interactive exploded views. This illustration of a turbine model was automaticallycomputed to expose the user-selected target part labeled in red.
The second exploded views system I have developed addresses the problem of creating and viewing
interactive illustrations of complex 3D models. Although this work has the same high-level goal as
the image-based system described in the previous section, working with 3D data both requires and
enables the use of different techniques to address the following issues:
Incorporating cuts and cutaways
As described in Section 4.1, illustrators often apply cuts and cutaways in exploded views. This work
incorporates some of the 3D cutting techniques that I developed for the interactive cutaways system
to generate more effective exploded view visualizations.
View dependence
Unlike image-based exploded views, 3D exploded views can be viewed from any direction. I present
techniques for creating exploded views that adapt appropriately to different viewing directions.

54
Authoring techniques
Since the 3D input model is typically not in an exploded state, the sketch-based authoring tools that
I developed for the image-based exploded view system are not applicable. Instead, my 3D exploded
views system automatically determines how parts should explode by taking into account the 3D
geometry of parts, their blocking relationships and the viewpoint.
This work makes several contributions. I present an automatic technique for organizing 3D
models into layers of explodable parts that handles the most common classes of interlocking parts. I
also introduce two algorithms for exposing user-selected target parts, one that explodes the necessary
portions of the model in order to make the targets visible, and one that combines explosions with
dynamic cutaway views. I also present several interactive viewing tools that allow the user to directly
explore and browse my 3D exploded views. using both high-level and direct interaction modes.
4.3.1 Overview
My system consists of a precomputation component and an interactive viewing interface. In the pre-
computation phase, a 3D geometric model is automatically instrumented to enable parts to explode
and collapse dynamically. The instrumented model can then be explored in the viewing interface,
which allows viewers to interactively browse the model’s constituent parts using both high-level and
direct interaction modes.
As with the interactive cutaways system, the minimum input is a 3D solid model in which each
atomic part is a separate geometric object. The following additional information may be specified
to help the system generate higher quality exploded views.
Part hierarchy. If the input model is organized into a hierarchy of sub-assemblies, the system
generates hierarchical exploded views that enable exploration at any level of the part hierarchy.
Explosion directions. By default, the system allows parts to explode only in directions parallel
to the coordinate frame axes of the entire model. However, a different set of directions may be
specified as part of the input. All of the example illustrations shown in this chapter were generated
using the default explosion directions.

55
Cutaway instrumentation. If the input model is instrumented to enable cutaway views, as described
in Chapter 3, the system automatically combines exploded views with contextual cutaways to expose
user-selected sub-assemblies.
Since many of the algorithms in both the precomputation and viewing components of the sys-
tem need to need to know whether parts touch, block, or contain each other, our system computes
auxiliary data structures that encode these low-level spatial relationships. Contact and blocking re-
lationships are computed and stored in the manner described by Agrawala et al. [2]. For a given part
p, these data structures can be queried to determine all the parts that touch p and all the parts that
block p from moving in each of the possible explosion directions. We use an approximate defini-
tion of containment that is computed as follows. For each pair of parts (p1, p2), our system checks
whether the convex hull of p2 is completely inside the convex hull of p1 and if p1 blocks p2 from
moving in each of the possible explosion directions. If so, p1 is considered to contain p2.
4.3.2 Creating 3D exploded views
To enable interactive exploded views, the system computes an explosion graph data structure that
encodes how parts explode with respect to each other. The explosion graph is an extension of the
explosion tree data structure used in the image-based exploded views system. In this section, I
explain the explosion graph representation in detail and then describe an automatic algorithm for
constructing an explosion graph from a 3D input model.
Explosion graph representation
The explosion graph is a directed acyclic graph (DAG) in which nodes represent parts. The structure
of the graph defines the relative order in which parts can be exploded without violating blocking
constraints. In particular, a part can explode as long as all of its descendants in the explosion graph
have been moved out of the way, as shown in Figure 4.19c. As with the image-based system, each
part has an associated explosion direction, current offset and maximum offset. Each part is offset
with respect to one of its direct parents, which we refer to as the part’s explosion parent. Thus, the
subgraph defined by parts and their explosion parents form an explosion tree (Figure 4.19b).

56
a
b
c
d
e
f
g
h
a
b
c
d
e
f
g
h
a
b
c
d
e
f
g
h
a
b
c
d
e
f
g
h
(a) Input model (b) Explosion graph(explosion parent tree in red) (c) Partially exploded model
Figure 4.19: Explosion graph representation. Nodes represent parts and edges represent blockingrelationships (b). Each part is offset with respect to its explosion parent; the tree of explosionparents is shown in red. The graph is structured as a DAG such that a part can be exploded if itschildren have been exploded. Here, d can be exploded because a, b and e have been exploded (c).
Constructing the explosion graph
My basic approach for computing explosion graphs is similar to the method of Agrawala et al. [2]
for determining assembly sequences. I first describe this algorithm before introducing two important
extensions that allow my system to take into account part hierarchies and handle common classes of
interlocking parts.
Basic approach
To construct the explosion graph, I use an iterative algorithm that removes unblocked parts from the
model, one at a time, and adds them to the graph (see Figure 4.20). To begin, all model parts are
inserted into a set S of active parts. At each iteration, the system determines the set of parts P ⊆ S
that are unblocked in at least one direction by any other active part. For each part p ∈ P , the system
computes the minimum distance p would have to move (in one of its unblocked directions) to escape
the bounding box of the active parts in contact with p. The part pi ∈ P with the minimum escape
distance is added to the graph. An edge is added from every active part that touches pi, and the
direction used to compute the minimum escape distance is stored as the explosion direction for pi.
Finally, pi is removed from S. The algorithm terminates when no unblocked parts can be removed
from S.

57
a
b
c
d
e
f
g
h
1
2
3
4
Active set
Explosion graphafter iteration 4
a
h
e
b
c fgd
b c
de
fg
h
Active set
1 a
Explosion graphafter iteration 1
a
h
e
b
d
g
f
c
1
2
3
4
5
6
7
8
Fully constructedexplosion graph
b c
de
fg
h
Active set
a
Initialization
a
b
c
d
e
f
g
h
b
c
d f
g
Figure 4.20: Explosion graph construction. From left to right, the active set is initialized and thenparts are removed and added to the explosion graph one at a time. At each iteration, edges are addedfrom the remaining active set parts that are blocked by the newly added part. Thus, by construction,the resulting graph is guaranteed to be a DAG.
Using part hierarchies
If the model has a part hierarchy, the system computes a nested collection of explosion graphs, as
shown in Figure 4.21. This approach enables sub-assemblies at any level of the part hierarchy to
expand and collapse independently. For each sub-assembly A, the system computes an explosion
graph by treating all of the direct children of A in the part hierarchy (which may themselves be
sub-assemblies) as atomic parts and then applying the algorithm described above.
Handling interlocked parts
In some cases, the parts in the active set are interlocked such that no single unblocked part can be
removed. The system attempts to separate interlocked parts using the strategies described below. If
none of these techniques is successful, the set of interlocked parts is treated as an atomic part that
cannot be exploded.

58
Sub-assembly C
Sub-assembly A
a
b
c
d
e
f
g
h
{{
Sub-assembly B
(a) Hierarchicalinput model
(b) Hierarchicalexplosion graph
Figure 4.21: Hierarchical explosion graph. If the input model includes a part hierarchy (a), mysystem computes a hierarchical explosion graph (b) that allows parts and sub-assemblies to beexpanded at any level of the part hierarchy.
Splitting interlocked sub-assemblies
If any of the interlocked parts are sub-assemblies that contain more than one part, the system at-
tempts to eliminate interlocks by splitting these sub-assemblies into smaller collections of parts, as
shown in Figures 4.22a–b. Given an interlocked sub-assembly A, the system computes the largest
partial sub-assembly (i.e., subset of parts in A) that can be separated from the remaining active parts
and then removes this partial sub-assembly from the set of active parts. If there is more than one
interlocked sub-assembly, the system computes the largest removable partial sub-assembly for each
one. Amongst these computed partial sub-assemblies, the smallest one is removed from the set of
active parts.
Splitting container parts
If any of the interlocked parts is an atomic container part whose only blockers are contained parts,
the system splits the container into two segments that are then removed from the set of active parts,
as shown in Figures 4.22c–d. To split a container c, the system selects one of the candidate explosion
directions and then splits c into two segments c1 and c2 with a cutting plane that passes through the

59
Container
Splittingdirection
Cutting plane
Cutting plane
Container segment
Container segment
Partialsub-assembly
Sub-assemblyA
{ {
(a)Interlocked
sub-assembly
(b)Split
sub-assembly
(c)Interlocked
container part
(d)Split
container part
Figure 4.22: Handling interlocked parts. Sub-assembly A is interlocked (a). The system resolvesthis case by removing a partial sub-assembly (b). When a container part is interlocked (c), thesystem splits the container using a single cutting plane, creating two container segments that canbe removed separately (d). The splitting direction is chosen to minimize how far the two segmentsmust explode to disocclude and escape the bounding box of the contained parts.
bounding box centre of c and whose normal is parallel to the chosen explosion direction. The explo-
sion direction is determined in a view-dependent manner. The system explodes the set of contained
parts P and then, for each candidate direction, measures how far c1 and c2 would have to separate
in order to completely disocclude and escape the 3D bounding box of P (see Figure 4.22d). In
accordance with the cutting conventions described in Section 4.1.2, the container c is split in the
direction that requires the smallest separation distance.
If some of the parts in P are themselves containers, the system emphasizes their concentric
containment relationships by considering only explosion directions where the bounding boxes of the
nested containers remain inside the exploded bounding box of c. If none of the splitting directions
satisfy this constraint, the system chooses the splitting direction that causes the smallest total volume
of nested container bounding boxes to extend beyond the exploded bounding box of c.
Handling view-dependence
Since the viewing direction can influence how container parts are split, explosion graphs may be
view-dependent. Recomputing these data structures on the fly as the viewpoint changes can cause
some lag in the viewing interface. Instead, my system precomputes explosion graphs from the 26

60
viewpoints that correspond to the faces, edges and corners of an axis-aligned cube that is centered at
the model’s bounding box center and is large enough to ensure that the entire model is visible from
each viewpoint. At viewing time, the system automatically switches to the precomputed explosion
graph closest to the current viewpoint.
4.3.3 Viewing 3D exploded views
The system provides a viewing interface that allows the viewer to interactively browse 3D exploded
views using both direct manipulation and higher-level interaction modes. This interface extends the
set of features supported by the image-based system.
4.3.4 Layout
Parts are laid out using the same method as the image-based system; the algorithm traverses the
tree of explosion parents in topological order and successively computes and updates the position of
each part based on its explosion parent and current offset.
4.3.5 Animated expand/collapse
As with the image-based system, the viewing interface allows the user to expand or collapse the
entire exploded view with a single click. Each part is animated to its fully exploded or collapsed
position by updating its current offset. To ensure that parts do not violate blocking constraints
during the animation, the system expands parts in reverse topological order with respect to the
explosion graph. In other words, the descendants of each part are expanded before the part itself.
For hierarchical models, higher-level (i.e., larger) sub-assemblies are expanded before lower-level
sub-assemblies. The system collapses parts in the opposite order.
4.3.6 Direct manipulation
The system also supports a direct manipulation mode similar to the one provided by the image-
based system. As the user drags a part p, the system slides p along its explosion direction and
updates the current offset of p. If the user drags p past its fully exploded or collapsed position, the
system propagates the offset through the explosion ancestors of p until it encounters a part with a
different explosion direction. The system also maintains blocking constraints in real time during

61
direct manipulation. As the user drags part p, the system checks for blocking parts amongst the
descendants of p in the explosion graph and stops p from moving if such parts are found. A single
click causes the blocking parts to move out of the way, which allows the user to continue dragging.
4.3.7 Riffling
The viewing interface also provides a riffling mode, in which parts are exploded away from adjacent
portions of the model as the user hovers over them with the mouse. When the mouse moves away,
the part that was beneath the mouse returns to its initial position. If the user clicks, the selected
part remains separated as the mouse moves away. Riffling allows the user to quickly isolate parts or
sub-assemblies and to see which portions of the model can be expanded without actually dragging
on a part.
4.3.8 Automatically exposing target parts
In addition to the direct controls described above, the viewing system provides a high-level interface
for generating exploded views that expose user-selected target parts. The user just chooses the tar-
gets from a list of parts, and the system automatically generates a labeled exploded view illustration.
Parts are smoothly animated to their new positions to help the user see which portions of the model
have been expanded and collapsed. I describe two different techniques for generating illustrations.
By default, the system expands specific portions of the model to expose the target parts. If the model
has been instrumented for cutaway views, as described in Chapter 3, the system can also generate
illustrations that combine explosions with contextual cutaways.
Exposing target parts with explosions
For non-hierarchical models, the algorithm works as follows. Given a set of target parts T , the
system visits each part p in topological order with respect to the explosion graph and moves p if
necessary to ensure that no visited target part is occluded by any other visited part. That is, p is
moved to meet the following two conditions:
1. p does not occlude any previously visited target parts.
2. if p ∈ T , p is not occluded by any visited part.

62
p
p p
p
Visibility frustumfor target part
Targetpart
Condition 1:move p s.t. p does notocclude visited target
Condition 2:move p s.t. p is not
occluded by visited part
Condition 3:move p s.t. p is not occluded by
visited target that touches p
Condition 4:move p s.t. p does not occlude
visited part that touches p
Figure 4.23: Conditions for moving part p. For each condition, the target part is outlined in red.The orange visibility frusta show how unwanted occlusions have been eliminated in each case.
To visually isolate target parts from surrounding parts, the algorithm moves p to meet two additional
conditions that ensure each target is separated from its touching parts, even if those touching parts
do not actually occlude the target:
3. p is not occluded by any visited target part that touches p.
4. if p ∈ T , p does not occlude any visited part that touches p.
All four conditions are illustrated in Figure 4.23. To satisfy the conditions, the system performs
the relevant occlusion tests and if necessary, moves p the minimum distance along its explosion
direction such that all unwanted occlusions are eliminated. To successfully eliminate unwanted
occlusions, the explosion direction of p must not be exactly parallel to the viewing direction. If it is
parallel, the system informs the user that one of the targets cannot be exposed from this viewpoint;
in practice, such failure cases rarely arise. If p is moved, the explosion graph descendants of p
are also moved out of the way so that no blocking constraints are violated. Since the position of a
part only depends on the positions of its explosion graph ancestors, visited targets are guaranteed to
remain visible with respect to visited parts after each part is processed. Thus, once every part has
been processed, the resulting exploded view will have no occluded target parts.

63
Target part
Visibility frustumfor target part
{
Sub-assembly A
Iteration 1:move parts within
sub-assembly A
Iteration2:move
sub-assembly A
Iteration 3:move parts within
sub-assembly A
Figure 4.24: Exposing a target part with a hierarchical explosion graph. Sub-assembly A contains atarget part (left). To expose the target, the algorithm alternates moving the parts within A to removetarget occlusions (iteration 1) and moving A itself to enforce blocking constraints (iteration 2).When the algorithm converges at iteration 3, the target is visible and all blocking constraints aresatisfied.
For hierarchical models, the algorithm starts by processing the highest level sub-assembly in the
part hierarchy. Atomic parts and sub-assemblies that do not contain any target parts are processed
as described above to eliminate target occlusions. However, when the algorithm encounters a sub-
assembly A that contains one or more target parts, the algorithm recursively processes the parts
within A to expose these targets. Once this recursive procedure returns, the system checks whether A
(in its new configuration) violates blocking constraints with respect to any visited parts or occludes
any visited targets not contained in A. If so, the algorithm iteratively increases the current offset
of A and then repeats the recursive computation for A until no blocking constraints are violated and
all visited targets are visible (see Figure 4.24). At each iteration, the current offset of A is increased
by one percent of the bounding box diagonal for the entire model. The exploded views shown in
Figures 4.18, and 4.27 were generated using this algorithm.
Exposing target sub-assemblies with cutaways and explosions
If the input model is instrumented for cutaways and the user selects an entire sub-assembly A as
a target, the system first generates a cutaway view that exposes A in context and then explodes A

64
(a) (b) (c)
Figure 4.25: Exploded view sequence of disk brake. First, the caliper sub-assembly is separatedupwards from the rotor sub-assembly (b). Then, each of these two sub-assemblies is exploded toexpose the constituent parts (c).
away from the rest of the model through the cutaway hole. Finally, the system explodes A itself to
expose its constituent parts (see Figure 4.26). To generate the cutaway, the system first chooses an
explosion direction for A. Given the viewing direction v, the system chooses the explosion direction
d that allows A to escape the model’s bounding box as quickly as possible and satisfies the constraint
d · v < 0. Using the method described in Section 3.2.4, the system creates a cutaway that is large
enough to allow A to explode away from the rest of the model in direction d.
4.3.9 Results
I have used my system to generate exploded views of several 3D models, as shown in Figures 4.18,
4.26, 4.27, and 4.28. The disk brake, iPod, arm, turbine, and transmission datasets contain 18, 19,
22, 26, and 55 parts, respectively. The arm model has no part hierarchy. The other models include
part hierarchies with 3 to 4 levels of sub-assemblies. To generate the exploded view of the turbine

65
Figure 4.26: Exploded view with contextual cutaway. To expose the user-selected sub-assembly, thesystem first generates a cutaway view (left) and then explodes the sub-assembly through the cutawayhole (right).
shown in Figure 4.18, the system automatically determined how to split two container parts: the
outer shell and the exhaust housing. The exploded views shown in Figures 4.18, 4.26, and 4.27
were generated automatically to expose user-specified target parts. These illustrations clearly show
the parts of interest without exploding unnecessary portions of the model. In addition, Figure 4.26
shows how a contextual cutaway view helps convey the position and orientation of the exploded
sub-assembly with respect to the rest of the model.
Although exploded views are typically used to illustrate manufactured objects, I also tested my
system with a musculoskeletal model of a human arm. Since many of the muscles in the arm twist
around each other where they attach to bones, I manually sectioned off part of the arm where the
muscles are less intertwined and then used this portion of the dataset as the input to my system. To
emphasize how the muscles are layered from the outside to the inside of the arm, I also restricted
the system to use a single explosion direction. From this input, the system automatically computed
the exploded view shown in Figure 4.28.

66
(a) iPod
(b) Transmission
Figure 4.27: Illustrations produced by my automatic exploded view generation interface. To createthese exploded views of the iPod (a) and transmission (b), the user simply selected target parts ofinterest (labeled in red) from a list of parts.

67
Figure 4.28: Exploded view of arm. To create this visualization, I sectioned off a portion of thearm to explode. Within this portion, my system automatically computed the layering relationshipsbetween the muscles.
4.3.10 Discussion
In this section, I have described a system for creating and viewing interactive exploded views of
3D models composed of many distinct parts. My contributions include an automatic method for
decomposing models into explodable layers and algorithms for generating dynamic exploded views
that expose user-selected target parts. My system also incorporates several interaction modes that
allow the viewer to explore the illustration with both direct and high-level controls. The results
presented here demonstrate that my techniques can be used to produce dynamic, browsable exploded
views that help viewers understand the internal structure of complex 3D objects.
There are several avenues for future work in the domain of 3D exploded views:
Inferring parts to expose. My system allows users to directly specify target parts to expose. In
some cases, showing additional parts can provide more context for the specific parts of interest. It
would be interesting to explore techniques that automatically infer which additional parts to expose
based on the user-selected targets.

68
Global blocking constraints. Although my system generates exploded views that respect the lo-
cal blocking constraints between touching parts, it would be interesting to consider techniques that
handle global blocking constraints as well. Ideally, such techniques would not only detect but also
resolve situations where user interaction with the exploded view causes global blocking constraints
to be violated.
Continuous measure of blocking. Some 3D models contain geometric errors that introduce false
blocking relationships. For instance, surfaces that are meant to be adjacent sometimes end up inter-
penetrating. Such errors will cause many blocking computations (including the method used in my
system) to detect the wrong blocking relationships between parts. One potential approach would be
to measure the “amount” of blocking between parts in some continuous manner and then develop
an exploded view construction algorithm that operates on a continuous blocking graph.
Automatic guidelines. As I demonstrated in my image-based exploded views system, guidelines
can be useful for clarifying how exploded parts fit back together. Although some previous work [2]
has been done on computing guideline placement automatically, existing methods do not consider
all of the conventions that illustrators use to create effective guidelines.

69
CHAPTER 5
CONCLUSIONS
5.1 Contributions
In my thesis work, I have demonstrated that cutaways and exploded views can be used to pro-
duce compelling interactive illustrations that expose the internal structure of complex 3D objects.
Furthermore, I have shown that with the right authoring tools, such interactive illustrations can be
created with little or no manual effort. My work makes a number of specific contributions. I pre-
sented a survey of cutaway and exploded view conventions, as well as algorithmic encodings of
these conventions that support interactive cutaway and exploded view tools. In addition, I have
presented several authoring tools that make it easy to create interactive illustrations, including a
semi-automatic rigging interface for 3D cutaways, sketch-based authoring tools for image-based
exploded views, and a fully automatic algorithm for generating 3D exploded views. Finally, I have
presented working prototype systems to demonstrate that my techniques can be used to create effec-
tive cutaway and exploded view illustrations for a variety of complex 3D objects, including human
anatomy and mechanical assemblies.
5.2 Future work
Exposing internal structure is a fundamental challenge in depicting complex 3D objects, and it lies
at the heart of many higher level visualization and interaction problems. Thus, by addressing this
challenge, my thesis work provides the necessary groundwork to tackle several new problem do-
mains. Here, I describe these avenues of future research and mention some specific project ideas in
each area.
Visualizing very large models. The results presented in this dissertation demonstrate that the vi-
sualization techniques I have developed can produce effective interactive illustrations of complex
objects with up to roughly a hundred parts. Visualizing much larger models with a thousand or

70
more parts (e.g., an entire airplane) presents additional challenges. In order to directly apply my
cutaway and exploded view techniques to such models, there are a number of low-level perfor-
mance issues to address, including how to perform CSG cutting operations on thousands of parts
at interactive rates and how to efficiently compute contact, blocking, and containment relationships
between parts. Furthermore, it seems likely that my techniques would need to be augmented with
navigation and level-of-detail controls that help users explore the model without being overwhelmed
with excess visual information.
Exploring and combining other illustration modalities. My work has focused on cutaways and
exploded views as techniques for exposing internal structure. It would be interesting to experiment
with and integrate other illustration modalities, such as peeled-away structures (common in anatomi-
cal illustrations), transparency, and so on. In some illustrations, these other techniques are combined
with cuts and explosions to produce effective visualizations. Thus, one important challenge would
be to identify the design rules that determine which technique to apply in a given situation.
Visualizing complex objects in other domains. I am eager to extend my techniques to visualize
complex 3D models in more specialized domains, including mathematics and architecture. Al-
though in some cases my tools can already be used to create reasonable illustrations of such datasets
(see Figure 5.1), I believe more domain-specific techniques could be developed to generate bet-
ter visualizations. For instance, hand-designed visualizations of mathematical surfaces exhibit a
variety of interesting cutting and shading conventions for conveying surface orientation and self-
intersections, as shown in Figure 5.2.
Visualizing time-varying spatial data. Complex geometric datasets with a temporal component are
increasingly common. For example, in many of the earth sciences, 3D time-varying datasets are
captured from sensors and generated from simulations. Although the techniques I have developed
could already be used to expose the internal structure of such datasets at a particular moment in
time, it would be interesting to develop visualization methods that explicitly consider the data’s
time-varying nature.
One approach is to create time-varying cutaways or exploded views that adapt to expose spatial
features as they evolve over time. A potential problem with this strategy is that animated cuts or

71
(a) Boy’s Surface (b) Braided torus
Figure 5.1: Cutaway illustrations of mathematical surfaces. These illustrations of Boy’s Surface(a) and a braided torus (b) were generated using my cutaways system. I directly specified the extentsof cuts in order to expose occluded portions of the surfaces.
explosions can be difficult to understand, especially if the animations are long and result in large
changes in the cutting geometry or exploded parts. In general, one of the unique challenges in
developing visualization techniques for time-varying datasets is that there are no existing examples
from which to distill design conventions.
Interaction techniques for 3D environments. The interactive visualization tools I have developed
could be used to develop new interaction techniques for the large number of existing applications
in which users work with complex 3D geometry. For example, in the 3D modeling domain, my
cutaway tools could enable users to create or manipulate geometry in the context of surrounding
parts that would otherwise completely occlude the region of interest. Selection in 3D environments
is another common task that has received attention in recent years [34, 64]. My techniques for
reducing occlusions could be incorporated into new selection techniques that allow users to access
hidden geometry. Finally, navigation in complex 3D environments is another task that could benefit
from both cutaways and exploded views. My context-sensitive cutaways provide an alternative to
existing “X-ray vision” techniques [6] that reveal hidden geometry without providing much context
about occluding structures. Interactive exploded views could also be incorporated in the navigational
views that allow users to locate themselves in a 3D environment. In contrast to the standard overhead
map view, an exploded view provides full 3D context.
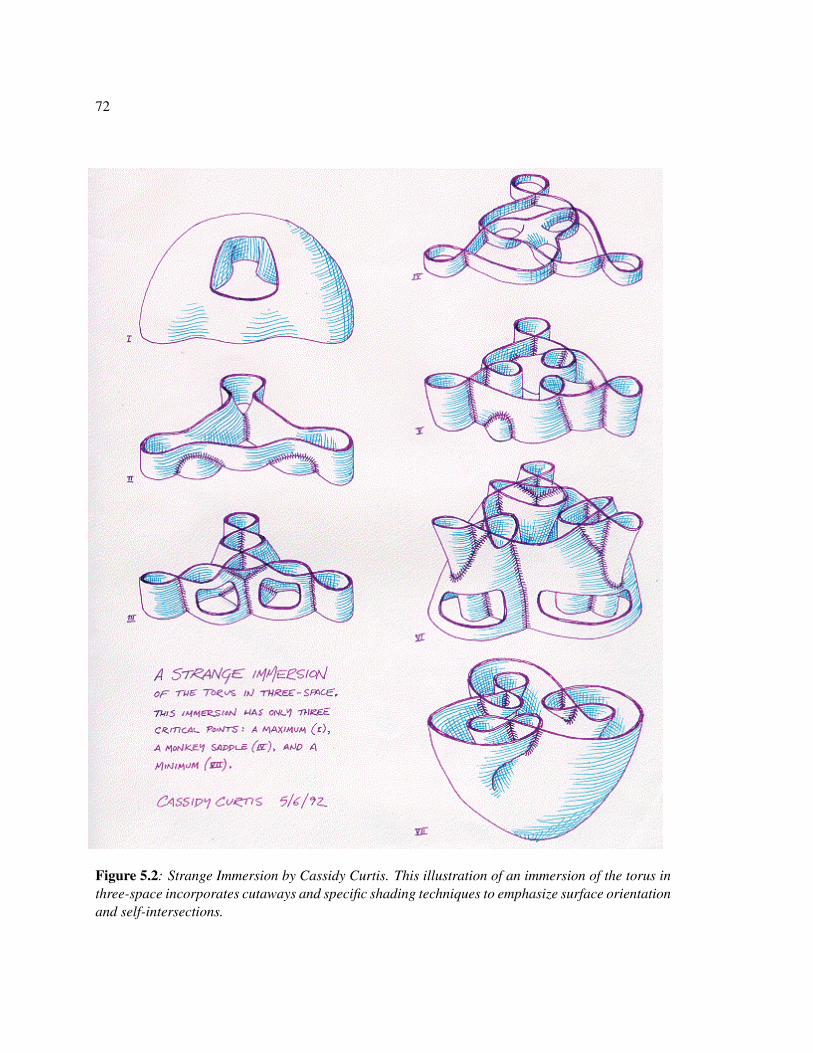
72
Figure 5.2: Strange Immersion by Cassidy Curtis. This illustration of an immersion of the torus inthree-space incorporates cutaways and specific shading techniques to emphasize surface orientationand self-intersections.

73
Visual explanations. This dissertation focuses on the role illustrations play in conveying internal
structure and spatial relationships in complex 3D objects. However, illustrations of 3D objects are
also used to communicate higher level concepts. For example Macaulay designs illustrations that
explain how machines work [52], and news sources often use 3D infographics to explain natural
phenomena. Although these visualizations make use of many illustration techniques, including
cutaways and exploded views, they incorporate additional design elements (e.g., arrows, multiple
views, and in some cases, short animations) that help convey functional and temporal relationships.
Developing good tools for creating such visual explanations remains an important open problem.
Although the existing work in illustrative visualization techniques provides a powerful set of tools
for creating informative imagery, identifying and encoding design rules that specify how and when
to apply these techniques in order to convey higher level concepts remains a challenge.
5.3 Summary
In summary, interactive visualization techniques provide users with powerful tools for exploring
and presenting 3D information. My thesis work contributes new interactive tools that significantly
advance the state-of-the-art in visualizing complex 3D objects. Looking forward, I see many more
open areas in this domain. In addition to the specific research problems mentioned above, I believe
there is a tremendous opportunity to invent fundamentally new interactive visualization tools that
not only incorporate techniques from traditional forms of illustration and design, but also take inspi-
ration from more recent disciplines that focus specifically on interaction design. As the amount and
variety of 3D data both created and captured continues to grow, it is my belief that such visualization
tools will have an enormous impact across many different domains.

74
BIBLIOGRAPHY
[1] A.D.A.M. Inc. A.D.A.M. Interactive Anatomy, 2005.
[2] Maneesh Agrawala, Doantam Phan, Julie Heiser, John Haymaker, Jeff Klingner, Pat Han-rahan, and Barbara Tversky. Designing effective step-by-step assembly instructions. ACMTransactions on Graphics, 22(3):828–837, July 2003.
[3] A. M. R. Agur and M. J. Lee. Grant’s Atlas of Anatomy. Lippincott Williams and Wilkins,2003.
[4] D. Akers, F. Losasso, J. Klingner, M. Agrawala, J. Rick, and P. Hanrahan. Conveying shapeand features with image-based relighting. In Proceedings of IEEE Visualization 2003, pages349–354, 2003.
[5] Kamran Ali, Knut Hartmann, and Thomas Strothotte. Label layout for interactive 3d illustra-tions. In WSCG (Journal Papers), pages 1–8, 2005.
[6] Ryan Bane and Tobias Hollerer. Interactive tools for virtual x-ray vision in mobile augmentedreality. In ISMAR ’04: Proceedings of the Third IEEE and ACM International Symposiumon Mixed and Augmented Reality (ISMAR’04), pages 231–239, Washington, DC, USA, 2004.IEEE Computer Society.
[7] Benjamin B. Bederson and James D. Hollan. Pad++: a zoomable graphical interface system.In CHI ’95: Conference companion on Human factors in computing systems, pages 23–24,New York, NY, USA, 1995. ACM.
[8] Marcelo Bertalmio, Guillermo Sapiro, Vicent Caselles, and Coloma Ballester. Image inpaint-ing. In Proceedings of ACM SIGGRAPH 2000, Computer Graphics Proceedings, Annual Con-ference Series, pages 417–424, July 2000.
[9] Eric A. Bier, Maureen C. Stone, Ken Pier, William Buxton, and Tony DeRose. Toolglass andmagic lenses: The see-through interface. In Proceedings of ACM SIGGRAPH 93, pages 73–80,August 1993.
[10] S. Biesty and R. Platt. Stephen Biesty’s Incredible Cross-sections. Dorling Kindersley, 1992.
[11] S. Biesty and R. Platt. Man-of-war. Dorling Kindersley, 1993.

75
[12] S. Biesty and R. Platt. Incredible Body: Stephen Biesty’s Cross-Sections. Dorling Kindersley,1998.
[13] Alan Borning, Richard Anderson, and Bjorn Freeman-Benson. Indigo: a local propagationalgorithm for inequality constraints. In UIST ’96: Proceedings of the 9th annual ACM sympo-sium on User interface software and technology, pages 129–136. ACM, 1996.
[14] S. Bruckner and M.E. Groller. Exploded views for volume data. IEEE Transactions on Visu-alization and Computer Graphics, 12(5):1077–1084, September/October 2006.
[15] Stefan Bruckner and M. Eduard Groller. Volumeshop: An interactive system for direct volumeillustration. In Proceedings of IEEE Visualization 2005, pages 671–678, 2005.
[16] Cynthia Bruyns, Steven Senger, Anil Menon, Kevin Montgomery, Simon Wildermuth, andRichard Boyle. A survey of interactive mesh-cutting techniques and a new method for imple-menting generalized interactive mesh cutting using virtual tools. Journal of Visualization andComputer Animation, 13(1):21–42, 2002.
[17] Michael Burns, Martin Haidacher, Wolfgang Wein, Ivan Viola, and Meister Eduard Groller.Feature emphasis and contextual cutaways for multimodal medical visualization. In A. Ynner-man K. Museth, T. Moller, editor, Data Visualization - EuroVis 2007, pages 275–282. IEEE, 52007.
[18] C. Correa, D. Silver, and Min Chen. Feature aligned volume manipulation for illustration andvisualization. IEEE Transactions on Visualization and Computer Graphics, 12(5):1069–1076,September/October 2006.
[19] A. Criminisi, P. Perez, and K. Toyama. Object removal by exemplar-based inpainting. In 2003Conference on Computer Vision and Pattern Recognition (CVPR 2003), pages 721–728, June2003.
[20] C. J. Curtis, S. E. Anderson, J. E. Seims, K. W. Fleischer, and D. H. Salesin. Computer-generated watercolor. In Proceedings of ACM SIGGRAPH 97, 1997.
[21] D. DeCarlo, A. Finkelstein, S. Rusinkiewicz, and A. Santella. Suggestive contours for con-veying shape. In Proceedings of ACM SIGGRAPH 2003, 2003.
[22] J. A. Dennison and C. D. Johnson. Technical Illustration: Techniques and Applications.Goodheart-Wilcox, 2003.
[23] J. Diepstraten, D. Weiskopf, and T. Ertl. Interactive cutaway illustrations. Computer GraphicsForum, 22(3):523–532, September 2003.

76
[24] Debra Dooley and Michael Cohen. Automatic illustration of 3d geometric models: Lines. In1990 Symposium on Interactive 3D Graphics, pages 77–82, March 1990.
[25] E. Driskill and E. Cohen. Interactive design, analysis and illustration of assemblies. In Pro-ceedings of the Symposium on Interactive 3D Graphics, 1995.
[26] David Eberly. Fitting 3d data with a cylinder, 2003.
[27] Ben G. Elliott, Earl L. Consoliver, and George W. Hobbs. The Gasoline Automobile. Mcgraw-Hill, 1924.
[28] Raanan Fattal, Maneesh Agrawala, and Szymon Rusinkiewicz. Multiscale shape and detailenhancement from multi-light image collections. ACM Transactions on Graphics (Proc. SIG-GRAPH), 26(3), August 2007.
[29] S. Feiner and D. D. Seligmann. Cutaways and ghosting: Satisfying visibility constraints indynamic 3d illustrations. The Visual Computer, pages 292–302, 1992.
[30] James D. Foley, Andries van Dam, Steven K. Feiner, and John F. Hughes. Computer Graphics:Principles and Practice in C. Addison-Wesley Professional, second edition, August 1995.
[31] George Francis. A Topological Picturebook. Springer, 1987.
[32] A. Girshick, V. Interrante, S. Haker, and T. Lemoine. Line direction matters: An argument forthe use of principal directions in 3d line drawings. In Proceedings of NPAR 00, 2000.
[33] Amy Gooch, Bruce Gooch, Peter S. Shirley, and Elaine Cohen. A non-photorealistic lightingmodel for automatic technical illustration. In Proceedings of ACM SIGGRAPH 98, ComputerGraphics Proceedings, Annual Conference Series, pages 447–452, July 1998.
[34] Tovi Grossman and Ravin Balakrishnan. The design and evaluation of selection techniquesfor 3d volumetric displays. In UIST ’06: Proceedings of the 19th annual ACM symposium onUser interface software and technology, pages 3–12, New York, NY, USA, 2006. ACM.
[35] J. Hamel. A new lighting model for computer generated line drawings. PhD thesis, Otto-von-Guericke University of Magdeburg, 2000.
[36] A. Hertzmann and D. Zorin. Illustrating Smooth Surfaces. In Proceedings of ACM SIG-GRAPH 2000, 2000.
[37] E. R. S. Hodges. The Guild Handbook of Scientific Illustration. Van Nostrand Reinhold, 1989.
[38] Karl Heinz Hohne, Michael Bomans, Martin Riemer, Rainer Schubert, Ulf Tiede, and WernerLierse. A 3d anatomical atlas based on a volume model. IEEE Computer Graphics andApplications, 12(4):72–78, 1992.

77
[39] Karl Heinz Hohne, Bernhard Pflesser, Andreas Pommert, Kay Priesmeyer, Martin Riemer,Thomas Schiemann, Rainer Schubert, Ulf Tiede, Hans Frederking, Sebastian Gehrmann, Ste-fan Noster, and Udo Schumacher. VOXEL-MAN 3D Navigator: Inner Organs. Regional,Systemic and Radiological Anatomy, 2003.
[40] Wade A. Hoyt. Complete Car Care Manual. Reader’s Digest Association, 1981.
[41] Takeo Igarashi, Satoshi Matsuoka, and Hidehiko Tanaka. Teddy: A sketching interface for 3dfreeform design. In Proceedings of ACM SIGGRAPH 99, pages 409–416, August 1999.
[42] V. Interrante. Illustrating surface shape in volume data via principal direction-driven 3d lineintegral convolution. In Proceedings of ACM SIGGRAPH 97, pages 109–116, 1997.
[43] V. Interrante, H. Fuchs, and S. Pizer. Enhancing transparent skin surfaces with ridge and valleylines. In Proceedings of IEEE Visualization 95, 1995.
[44] Tilke Judd, Fredo Durand, and Edward Adelson. Apparent ridges for line drawing. ACMTrans. Graph., 26(3), 2007.
[45] Florian Kirsch and Jurgen Dollner. OpenCSG: A library for image-based CSG rendering. InProceedings of USENIX 05, pages 129–140, 2005.
[46] S. Kochar, M. Friedell, and M. LaPolla. Cooperative, computer-aided design of scientificvisualizations. In Proceedings of IEEE Visualization 91, pages 306–313, 1991.
[47] J. J. Koenderink. What does the occluding contour tell us about solid shape? Perception, 13,1984.
[48] E. LaMar, B. Hamann, and K. I. Joy. A magnification lens for interactive volume visualization.In 9th Pacific Conference on Computer Graphics and Applications, pages 223–232, October2001.
[49] W. E. Loechel. Medical Illustration: A Guide for the Doctor-Author and Exhibitor. C. C.Thomas, 1964.
[50] A. Lu, C. J. Morris, D. S. Ebert, P. Rheingans, and C. Hansen. Non-photorealistic volumerendering using stippling techniques. In Proceedings of IEEE Visualization 2002, 2002.
[51] Thomas Luft, Carsten Colditz, and Oliver Deussen. Image enhancement by unsharp maskingthe depth buffer. ACM Transactions on Graphics, 25(3):1206–1213, July 2006.
[52] David Macaulay. The New Way Things Work. Houghton Mifflin/Walter Lorraine Books, 1998.

78
[53] A. Majumder and M. Gopi. Real-time charcoal rendering using contrast enhancement opera-tors. In Proceedings of NPAR 02, 2002.
[54] L. Markosian, M. A. Kowalski, S. J. Trychin, L. D. Bourdev, D. Goldstein, and J. F. Hughes.Real-time nonphotorealistic rendering. In Proceedings of ACM SIGGRAPH 97, pages 415–420, 1997.
[55] Michael J. McGuffin, Liviu Tancau, and Ravin Balakrishnan. Using deformations for browsingvolumetric data. In Proceedings of IEEE Visualization 2003, pages 401–408, 2003.
[56] Niloy J. Mitra, Leonidas J. Guibas, and Mark Pauly. Partial and approximate symmetry detec-tion for 3d geometry. ACM Trans. Graph., 25(3):560–568, 2006.
[57] R. Mohammad and E. Kroll. Automatic generation of exploded views by graph transformation.In Proc. of the Ninth Conference on Artificial Intelligence for Applications CAIA-93, pages368–374, Orlando, FL, 1993.
[58] Eric N. Mortensen and William A. Barrett. Interactive segmentation with intelligent scissors.Graphical Models and Image Processing, 60(5):349–384, 1998.
[59] F. H. Netter. Atlas of Human Anatomy. Icon Learning Systems, 3rd edition, 1989.
[60] Shigeru Owada, Frank Nielsen, Kazuo Nakazawa, and Takeo Igarashi. A sketching interfacefor modeling the internal structures of 3d shapes. In Smart Graphics 2003, Lecture Notes inComputer Science (LNCS), volume 2733, pages 49–57, 2003.
[61] Shigeru Owada, Frank Nielsen, Makoto Okabe, and Takeo Igarashi. Volumetric illustration:designing 3d models with internal textures. ACM Transactions on Graphics, 23(3):322–328,August 2004.
[62] Joshua Podolak, Philip Shilane, Aleksey Golovinskiy, Szymon Rusinkiewicz, and ThomasFunkhouser. A planar-reflective symmetry transform for 3d shapes. ACM Trans. Graph.,25(3):549–559, 2006.
[63] E. Praun, H. Hoppe, M. Webb, and A. Finkelstein. Real-time hatching. In Proceedings ofACM SIGGRAPH 2001, 2001.
[64] Gonzalo Ramos, George Robertson, Mary Czerwinski, Desney Tan, Patrick Baudisch, KenHinckley, and Maneesh Agrawala. Tumble! splat! helping users access and manipulate oc-cluded content in 2d drawings. In AVI ’06: Proceedings of the working conference on Ad-vanced visual interfaces, pages 428–435, New York, NY, USA, 2006. ACM.
[65] R. Rist, A. Kruger, G. Schneider, and D. Zimmermann. AWI: A worbench for semi-automatedillustration design. In Proceedings of Advanced Visual Interfaces 94, 1994.

79
[66] Felix Ritter, Bernhard Preim, Oliver Deussen, and Thomas Strothotte. Using a 3d puzzle as ametaphor for learning spatial relations. In Graphics Interface, pages 171–178, May 2000.
[67] Szymon Rusinkiewicz, Michael Burns, and Doug DeCarlo. Exaggerated shading for depictingshape and detail. ACM Transactions on Graphics, 25(3):1199–1205, July 2006.
[68] T. Saito and T. Takahashi. Comprehensible rendering of 3-d shapes. In Proceedings of ACMSIGGRAPH 90, pages 197–206, 1990.
[69] D. D. Seligmann and S. Feiner. Automated generation of intent-based 3D illustrations. InProceedings of ACM SIGGRAPH 91, pages 123–132, July 1991.
[70] Anne Verroust and Francis Lazarus. Extracting skeletal curves from 3d scattered data. TheVisual Computer, 16(1):15–25, 2000.
[71] John Viega, Matthew J. Conway, George Williams, and Randy Pausch. 3d magic lenses. InProceedings of UIST 96, pages 51–58, 1996.
[72] Ivan Viola, Armin Kanitsar, and Eduard Groller. Importance-driven feature enhancementin volume visualization. IEEE Transactions on Visualization and Computer Graphics,11(4):408–418, 2005.
[73] Lujin Wang, Ye Zhao, Klaus Mueller, and Arie E. Kaufman. The magic volume lens: An in-teractive focus+context technique for volume rendering. In Proceedings of IEEE Visualization2005, pages 367–374, 2005.
[74] G. Winkenbach and D. H. Salesin. Computer-generated pen-and-ink illustration. In Proceed-ings of ACM SIGGRAPH 94, 1994.
[75] G. Winkenbach and D. H. Salesin. Rendering parametric surfaces in pen and ink. In Proceed-ings of ACM SIGGRAPH 96, 1996.
[76] P. Wood. Scientific Illustration: A Guide to Biological, Zoological, and Medical RenderingTechniques, Design, Printing, and Display. Van Nostrand Reinhold, 1979.
[77] F. W. Zweifel. A Handbook of Biological Illustration. University of Chicago Press, 1961.