Visualizing Biological Membrane Organization and Dynamics
62
HAL Id: hal-02370047 https://hal.archives-ouvertes.fr/hal-02370047 Submitted on 19 Nov 2019 HAL is a multi-disciplinary open access archive for the deposit and dissemination of sci- entific research documents, whether they are pub- lished or not. The documents may come from teaching and research institutions in France or abroad, or from public or private research centers. L’archive ouverte pluridisciplinaire HAL, est destinée au dépôt et à la diffusion de documents scientifiques de niveau recherche, publiés ou non, émanant des établissements d’enseignement et de recherche français ou étrangers, des laboratoires publics ou privés. Visualizing Biological Membrane Organization and Dynamics Marc Baaden To cite this version: Marc Baaden. Visualizing Biological Membrane Organization and Dynamics. Journal of Molecular Biology, Elsevier, 2019, 431 (10), pp.1889-1919. 10.1016/j.jmb.2019.02.018. hal-02370047
-
Upload
khangminh22 -
Category
Documents
-
view
0 -
download
0
Transcript of Visualizing Biological Membrane Organization and Dynamics

HAL Id: hal-02370047https://hal.archives-ouvertes.fr/hal-02370047
Submitted on 19 Nov 2019
HAL is a multi-disciplinary open accessarchive for the deposit and dissemination of sci-entific research documents, whether they are pub-lished or not. The documents may come fromteaching and research institutions in France orabroad, or from public or private research centers.
L’archive ouverte pluridisciplinaire HAL, estdestinée au dépôt et à la diffusion de documentsscientifiques de niveau recherche, publiés ou non,émanant des établissements d’enseignement et derecherche français ou étrangers, des laboratoirespublics ou privés.
Visualizing Biological Membrane Organization andDynamicsMarc Baaden
To cite this version:Marc Baaden. Visualizing Biological Membrane Organization and Dynamics. Journal of MolecularBiology, Elsevier, 2019, 431 (10), pp.1889-1919. �10.1016/j.jmb.2019.02.018�. �hal-02370047�

Accepted Manuscript
Visualizing biological membrane organization and dynamics
Marc Baaden
PII: S0022-2836(19)30095-6DOI: https://doi.org/10.1016/j.jmb.2019.02.018Reference: YJMBI 66022
To appear in: Journal of Molecular Biology
Received date: 26 September 2018Revised date: 2 February 2019Accepted date: 13 February 2019
Please cite this article as: M. Baaden, Visualizing biological membrane organization anddynamics, Journal of Molecular Biology, https://doi.org/10.1016/j.jmb.2019.02.018
This is a PDF file of an unedited manuscript that has been accepted for publication. Asa service to our customers we are providing this early version of the manuscript. Themanuscript will undergo copyediting, typesetting, and review of the resulting proof beforeit is published in its final form. Please note that during the production process errors maybe discovered which could affect the content, and all legal disclaimers that apply to thejournal pertain.

ACC
EPTE
D M
ANU
SCR
IPT
Visualizing biological membrane organization and
dynamics
Marc Baaden[0000-0001-6472-0486]
Laboratoire de Biochimie Théorique, CNRS, UPR9080, Univ Paris Diderot,
Sorbonne Paris Cité, PSL Research University, 13 rue Pierre et Marie Curie, 75005, Paris,
France
Abstract. Biological membranes are fascinating. Santiago Ramón y Cajal, who
received the Nobel prize in 1906 together with Camillo Golgi for their work on
the nervous system, wrote “[..]in the study of this membrane[..] I felt more pro-
foundly than in any other subject of study the shuddering sensation of the un-
fathomable mystery of life”1. The visualization and conceptualization of these
biological objects have profoundly shaped many aspects of modern biology,
drawing inspiration from experiments, computer simulations, as well as from
the imagination of scientists and artists. The aim of this review is to provide a
fresh look on current ideas of biological membrane organization and dynamics
by discussing selected examples across fields.
Keywords: Molecular visualization, Lipid bilayer.
1 Introduction
The field of biological membranes. Membranes are and have always been essential
for biology, starting from their catalyzing role in the origins of life, be it by harness-
ing energy as ion gradients across them or by forming compartments for chemical
reactions to take place, later on shaping organelles and transportation vessels. In their
role as barriers they maintain concentrations, form (electrochemical) gradients used
for energy conversion, ward off access of unwanted substances, enable a fine control
over in- and efflux into a given compartment, and thereby complexify the delivery of
drugs. Furthermore they are essential as matrices to support other (macro)molecules,
in particular membrane proteins. They are able to store energy and they are intrinsi-
cally linked to signaling processes. Biological membranes have shaped important
parts of biophysics, structural and molecular biology as well as molecular modeling.
1 The full quotation is “I must not conceal the fact that in the study of this membrane I for the
first time felt my faith in Darwinism (hypothesis of natural selection) weakened, being
amazed and confounded by the supreme constructive ingenuity revealed not only in the reti-
na and in the dioptric apparatus of the vertebrates but even in the meanest insect eye. There,
in fine, I felt more profoundly than in any other subject of study the shuddering sensation of
the unfathomable mystery of life.” from the autobiography Recollections of My Life.
ACCEPTED MANUSCRIPT
ACC
EPTE
D M
ANU
SCR
IPT
2
A compelling image of several biological membrane structures in the neuron is de-
picted in Figure 1. The visualization of these objects is at the core of this review. By
visualization, a term that may depend very much on the question being addressed, is
meant the understanding that is gained about these objects and their properties by
making them visible to our eyes and minds through abstractions, images, pictures and
conceptualization. This interpretation closely follows the definition given by Ben
Shneiderman: “The purpose of visualization is insight, not pictures” [1].
Early days of biological membrane investigation. A brief (and by no means com-
plete) account on how membrane-related questions have accompanied the scientific
progress over the last 50 years may start with the early visualization of bilayers and
proteins in bilayers by freeze-fracture electron microscopy [2] as well as the observa-
tion of lateral diffusion of proteins in live cells [3, 4]. X-ray diffraction measurements
of Engelman [5] and calorimetric studies by Reinert and Steim [6] were critical to the
acceptance of the lipid bilayer as the fundamental structural element of the membrane.
The fluid mosaic model of the structure of cell membranes introduced by Singer and
Nicolson [7] provided a molecular vision that has deeply influenced many scientists.
At about the same time, it had become clear that the association of protein complexes
with membranes had functional consequences. Peter Mitchell's work [8] has signifi-
cantly contributed to this realization, for instance by recognizing the importance of
the electrochemical proton gradient for energy transformation. In these early days,
Henderson and Unwin’s pioneering investigation paved the way for profound and
consequential effects on the field of membrane structure through the determination of
the low-resolution electron microscopy (EM) structure of bacteriorhodopsin [9]. Early
computational attempts look at the order-disorder transition in model bilayers [10].
Between 1980 and 1995, the first molecular simulations of membrane systems ap-
peared, investigating first mono- [11], then bi-layers [12, 13] on a 10 to 100 ps time-
scale, and in particular their phase behavior and the diffusion of solutes [14]. This
progress made in molecular modeling enabled a straightforward atomic-level visuali-
zation of membrane systems filling an important gap with other existing techniques.
During this period, in 1985, the Nobel prize in Physiology or Medicine was awarded
jointly to Brown and Goldstein for their discoveries concerning the regulation of cho-
lesterol metabolism [15, 16]. Another Nobel prize rewarded Deisenhofer, Huber and
Michel for determining the three-dimensional structure of the photosynthetic reaction
center [17]. This seminal work proved that the structure of membrane proteins could
actually be determined, thereby providing detailed structural views of such objects
which represents an important turning point in membrane biophysics. Pioneering
structural studies use two- and three-dimensional electron and X-ray crystallography.
At this time, the 2-stage model of membrane protein folding and oligomerization was
introduced [18].
From 1995 to 1999, molecular simulations gained an order of magnitude in time-
scale, from 100 ps to 1 ns, examining peptides and small membrane proteins inserted
in lipid bilayers [19]. Nevertheless it became obvious that such calculations are ex-
ACCEPTED MANUSCRIPT

ACC
EPTE
D M
ANU
SCR
IPT
3
tremely expensive in terms of computational resources and specific methods as well
as simplified models were developed to go further. For instance, in coarse grained
models [20] the number of particles is typically reduced by about an order of magni-
tude. It became obvious that the structure determination of membrane proteins is
lengthy and complicated; hence many avenues were pursued to improve this situation.
In this context, lipidic cubic phases have been studied extensively [21, 22].
From 2000 to 2007, the 1 to 100 ns timescale becomes accessible and more complex
phenomena are investigated, such as for instance electroporation [23] and the behav-
ior of double bilayers. The scope of systems accessible through computational ap-
proaches has been strongly extended by the exponential development of coarse-
grained simulation methods and force fields, leading to depictions of large membrane
machinery and complex membrane mixtures. Membrane protein folding and insertion
receive continued attention [24, 25]. High-resolution microscopy techniques and cryo-
electron tomography enable to go further in understanding membrane systems at the
cell level [26, 27]. More Nobel prizes concern protein structure determination by
NMR, a technique later on applied to membrane proteins in a micellar environment
[28, 29], and the structural elucidation of important classes of membrane proteins
such as aquaporins [30] and ion channels [31, 32]. Around this time, the vision of
membrane architecture based on the classical fluid mosaic model was refined to take
into account the patchiness of the membrane [33], crowded by proteins, leading to
segregated domains and variability in properties such as thickness and lipid composi-
tion.
For 10 years now, simulation times are within the 100 ns to 10 microsecond regime,
and the complexity of systems under consideration has gone up steeply to reach mul-
tiple molecular assemblies such as membrane proteins in a trafficking organelle [34].
The attention received by these biomembrane investigations is due to several aspects.
First, concerning membrane proteins, but also the ability to overcome membrane bar-
riers, the pharmaceutical industry has major interests in these objects [35]. Membrane
proteins, and ion channels in particular, are linked to many conditions such as Alz-
heimer, Parkinson, general anesthesia, tobacco addiction, drug resistance, bioenerget-
ics and vision. Antimicrobial peptides [36, 37] bear importance as an alternative to
antibiotics, to complement immune defenses and to fight bugs. Fundamental process-
es related to membranes and membrane proteins such as electroporation and the world
of lipid phases are equally of interest. Some concepts continue to spawn animated
discussions among scientists, such as lipid rafts [38, 39]. Note that in this manuscript,
the term raft will be used in a broad sense to denominate nanodomains in biological
membranes, the existence of which seems beyond dispute. Lipids themselves are in-
trinsically linked to our health, be it through cholesterol levels or conditions such as
atherosclerosis, angina and infarct. Over recent years, the steep rise of the emerging
field of lipidomics has led to renewed interest in biological membranes and an in-
creasingly finer view on the role of individual lipid compositions [40-42].
ACCEPTED MANUSCRIPT

ACC
EPTE
D M
ANU
SCR
IPT
4
Scope of this review. In this review I will discuss how visualization contributes to
shaping our mental image of membranes, membrane proteins and related processes. It
is by no means an exhaustive review, but rather a personal view based on my own
experience as well as exchanges with colleagues active in the broad field of biological
membranes. The aspects of visualization - in the broad sense that was introduced
above - and conceptualization are central for the viewpoint adopted in this review.
The discussion will address three complementary aspects: depictions obtained from
experiments, visualizations from computational methods and illustrations representing
educated guesses to fill in missing data. The goal is to capture how the visualization
(again, in a rather broad sense) of biological membranes supports and in some cases
drives our understanding in the molecular biology of these objects.
A first focus concerns the organization of biological membranes in terms of a
molecular view of these objects, hence spatial arrangements, geometry and defor-
mations will represent important aspects. The focus may be on the lipids themselves,
on protein within the bilayer or on reporter molecules. Adding dynamics (and hence
to some extent noise) to initially static views is essential, as lipids are extremely dy-
namic objects with many different characteristic timescales, forming the second focus
of the review. Dynamic views do not always make things clearer or easier to under-
stand. On the other hand, many membrane properties can be described collectively,
without considering the detailed dynamics of each individual lipid, and hence such an
approximative averaged picture may be sufficient and convenient to gain insight into
certain questions. A general difficulty is that much of the information obtained pro-
vides an indirect view only, for instance by following a given species in the mem-
brane environment to better understand a biological process or mechanism. Hence the
required interpretation and extrapolation to all pieces of the membrane puzzle is in
itself a major challenge. The review attempts to highlight important ideas and advanc-
es on how visual cues are shaping scientists’ understanding of biomembrane land-
scapes and molecular interactions. It reflects my personal view of what may be a criti-
cal overview of the biomembrane field. The perspectives focus on current challenges
and the bottlenecks to future major advances. A few thoughts on areas that may de-
serve more attention from the scientific community are provided as well.
2 Experiments
2.1 Visualizing membrane structures
Experiment is a primary source of information for membrane objects and over the
years the great variety of experimental approaches and their improvements extended
the accessible window of observation to many levels of size, resolution and time-
scales. The lipid bilayer represents a fundamental object of interest. Different views
contribute to our understanding, such as a physico-chemical picture of lipids based on
model membranes, phase diagrams, diffraction of bilayer stacks, etc., complemented
by structural biology of isolated systems through X-ray diffraction and cryo-electron
microscopy of membrane proteins. Then, AFM provides another level of detail, fol-
ACCEPTED MANUSCRIPT
ACC
EPTE
D M
ANU
SCR
IPT
5
lowed by structural biology approaches on more or less intact systems through cryo-
tomography and superresolution optical microscopy. At the entire cell level, the reper-
toire includes depictions through fluorescence and optical microscopy. In all these
approaches, the resolution or underlying number of observables is a critical parame-
ter. Static images are complemented by dynamics (or disorder) by a variety of ap-
proaches, for instance NMR. Let us start our journey with detailed information on
bilayer structure, down to an atom level description, which can be gained in particular
from crystallographic and atomic force microscopic (AFM) studies as illustrated in
Figure 2.
Gaining detailed information on bilayer structure from experiment. The size
scale spanned is about 4 orders of magnitude, in the nanometer range, between 0,2
and 800 nm. Crystallographic and neutron diffraction provided important details
about lipid bilayers, going back to groundlaying neutron diffraction studies by Büldt
et al. [43] and subsequent joint X-ray and neutron diffraction studies of fluid bilayer
structure by Wiener and White [44, 45]. The archetypical visualization derived from
such studies are scattering density profiles (Fig. 2A) that allow to measure the bilayer
thickness in a direct way [44]. These early X-ray and neutron diffraction studies of
bilayers were crucial in the development and testing of MD simulations, as they pro-
vide an experimental metric to compare to. Actually, such lipid bilayer profiles played
a critical role in the acceptance of the bilayer hypothesis by showing the transbilayer
distribution and dynamics of the lipid component groups such as phosphates and car-
bonyls along the bilayer. A different visualization using an electron density map can
nicely depict the bigger picture of bilayer orientation in specific phases (Fig. 2B) [46].
This picture can be further refined through AFM at submolecular resolution depicting
the membrane surface as shown in Fig. 2C [47]. More complex processes can be ob-
served, such as membrane remodeling by peptides (Fig. 2D, [48]) or the formation of
raft-like structures (Fig. 2E, [49]). The question how these rafts are built in terms of
their thermodynamic equilibrium, their induction by raft fabric-binding proteins such
as bacterial toxins and other lectins, etc. is precisely at the heart of ongoing investiga-
tions. Some influential work was performed by Kai Simons trying to understand the
dynamic segregation of proteins and lipids into subdomains in the plasma membrane
[50, 51]. Important contributions to the raft topic are reviewed elsewhere [52, 53].
AFM is a tool of choice for imaging the surface topography of membrane domains
[54]. At the other end of the length scale, membrane objects in a cellular context have
been known and visualized for a long time with stunning details.
Towards larger-scale direct observations of membrane structure. We typically
jump x1000 from the nanometer to the micrometer scale, in the 1/100 to 10 micron
range, to observe cellular objects constituted by membranes. Much information on the
conformation of membranes can be obtained by optical light microscopy on a 10 mi-
cron scale [55]. The phenomena that have been observed include flexibility and undu-
lations of membranes and lipid vesicle shape transformations. On a 10x smaller scale,
Fig. 3A illustrates how electron-opaque stained lipids provide detailed transmission
electron microscopy (TEM) pictures of various tissues, here highlighting the Golgi
ACCEPTED MANUSCRIPT
ACC
EPTE
D M
ANU
SCR
IPT
6
apparatus and the distribution of very low density lipoprotein particles. Such staining
techniques enabled early estimates of the width of lipid bilayers [56]. A particular
interest has been devoted to the membrane curvature [57] and Fig. 3B to D depict
chosen examples from the review by McMahon and Gallop emphasizing its key role
in growth, division and movement [58]. Earlier images obtained by freeze etching
provided some of the first views on such objects, albeit with artifacts due to the sam-
ple preparation (Fig. 3E, [59]). Among others, visualizations of liposomes, lipid phas-
es and lipid rods could be obtained by this technique, at scales down to a tenth of a
micron [60]. In combination with thin section electron microscopy [61], the rapid-
freeze deep-etch images provide stunning details as shown in Fig. 3F for a plasma
membrane with a high density of caveolae, revealing their specific coat texture. Com-
plementary depictions of objects such as mitochondria can be obtained, for instance
globally highlighting their membranes (Fig. 3G, [62]) or focusing on small particles
attached to the surfaces of isolated mitochondrial membranes (Fig. 3H, [63]). With
techniques such as cryo-electron microscopy of vitreous sections (CEMOVIS), one
can zoom in to the very details of membrane structure in cell envelopes, for instance
revealing the fact that bacteria have an outer membrane (Fig. 3I, [64]). Another help-
ful approach is to focus on the membrane plane using supported phospholipid bilayers
and epifluorescence microscopy to depict liposomes, tubular structures and membrane
defects [65].
An obvious question arises about how we can fill the space between those two ex-
treme scales at the atomic level and the organelle one, as well as enrich the scope of
objects and processes that can be addressed. Several solutions exist. Several classes of
proteins may have intrinsic links with membranes and may hence act as reporters for
the underlying membrane structures as illustrated in Figure 4.
Using reporter molecules to bridge scales of observation. The red blood cell has
been studied for a long time, representing an emblematic membrane-based biological
object. Its membrane is supported by a spectrin-actin lattice termed the membrane
skeleton, which can be visualized for instance by negative staining EM (Fig. 4A,
[66]). Hemagglutinin membrane distributions in relation to its possible ability to clus-
ter in lipid rafts have been investigated by combining different approaches, for in-
stance fluorescence photoactivation localization microscopy (FPALM), reaching sub-
diffraction resolution [67] with EM (Fig. 4B,C). The question of recruitment to lipid
rafts has been investigated using single-molecule near-field optical microscopy
(NSOM), localizing reporter molecules to approximately 3 nm accuracy in 250 nm
small domains [68]. The sarcolemma is the cell membrane of a striated muscle fiber
cell and represents another source of insight into biological membranes. Figure 4D
shows sarcolemmal features revealed by staining the dystrophin network attached to it
[69]. The eukaryotic cell membrane as well features characteristic protein connections
to dense actin networks. Fluorescence correlation spectroscopy (FCS) and stimulated
emission depletion (STED) experiments imaged by confocal microscopy have been
used to illustrate the influence of this network on lipid phase separation [70].
ACCEPTED MANUSCRIPT

ACC
EPTE
D M
ANU
SCR
IPT
7
A zoom on EM, X-ray and AFM approaches. As mentioned above, EM and AFM
techniques have from their beginning been key approaches, sometimes in close link
to crystallography, shaping our mental images of membrane objects. Through subse-
quent refinement, and also by choosing specifically suitable objects, very in depth-
studies and visualizations could be achieved as depicted in Figure 5.
The purple membrane is one such particularly suited object studied extensively in
the literature. Early insights from electron microscopy revealed some of its features
with great detail, down to about 0.7 nm [9] as shown in Figure 5A and B. Crystallo-
graphic studies provided additional insight, also resolving the lipids surrounding the
membrane protein and essential water molecules for proton translocation (Fig. 5C,
[71]). AFM images refined the view by exposing the overall arrangement in the
membrane to a high precision [72] as in Figure 5D and recording conformational
changes, for example of surface-exposed loops [73], as in Figure 5E. These loops
could be further refined by a combined view from several techniques [74]. To what
extent X-ray crystallography provides an accurate picture of membrane lipids [75, 76]
has led to discussions and a critique in the scientific literature [77]. An alternative for
structural characterization of membrane proteins themselves is provided by NMR
spectroscopy [29] and can be extended to lipid-protein interactions [78]. The purple
membrane is not the only object suitable for in-depth characterization. Vesicle-bilayer
complexes have been visualized [79, 80] among the many important features on the
membrane surface. Figures 5F to I provide one other example on the stepwise visuali-
zation of membrane pore formation by a bacterial cytolysin that forms either ring- or
arc-shaped oligomers [81]. The time evolution of such processes can be followed.
Selected examples highlighting recent evolutions. Our insight into such membrane
structures has recently significantly been heightened by the most advanced EM ap-
proaches. In particular single particle cryo-EM reconstructions and tomographic stud-
ies have significantly enriched the portfolio of available techniques to probe complex
and large-scale membrane structures as depicted in Figure 6.
Membrane structures are ubiquitous and have diverse shapes, as for instance illustrat-
ed by the SEM image of vesicles at a nerve ending shown in Figure 6A or the various
membrane structures evidenced in the colored micrograph of Figure 1. Using more
recent cryo-EM approaches, through the so-called resolution revolution [82], even
more detailed depictions can be obtained. Specific interactions may be highlighted,
such as between liposomes and amyloid fibrils [83] in Figure 6B, the end binding of
actin filaments to the plasma membrane [26] in Figure 6C, or between SNARE pro-
teins and lipid bilayer nanodiscs [84]. Intermediate stages of important biological
processes such as mitochondrial fusion can also be witnessed as shown in Figure 6D
where two mitochondrial outer membranes are connected by a mitofusin docking
ring, leading to the formation of a pore [85]. Tomography now enables the 3 dimen-
sional reconstructions of whole cells, as illustrated in Figure 6E, that can be co-
refined by a combination with computational approaches [27]. Many membrane struc-
tures are thereby revealed. In specific cases such as viruses, this technique even per-
mits to resolve secondary structures of (membrane) proteins within their membrane
ACCEPTED MANUSCRIPT

ACC
EPTE
D M
ANU
SCR
IPT
8
environment [86]. An interesting extension to these approaches is to combine electron
microscopy with other techniques. For example, in vivo fluorescence video microsco-
py has been demonstrated as a suitable technique together with EM for following the
morpho-functional organization of the intracellular membrane trafficking pathways
and monitoring structures such as transport carriers [87].
2.2 Adding dynamics to the picture
Membranes are intrinsically fluid and dynamic objects as already mentioned in pass-
ing in the previous section. Specific experimental techniques have been developed to
be able to visualize the temporal dynamics of membrane phenomena. A very wide-
spread approach is to track the movement of domains or reporter molecules in mem-
branes.
Tracking the movement in the membrane. Using single dye tracing, Schuetz et al.
imaged the lateral motion of single fluorescence labeled lipid molecules in native cell
membranes on a millisecond time scale, achieving a positional accuracy of ca. 50 nm
(Figure 7EA, [88]). Thereby they followed lipid-specific membrane microdomains.
Such a spatial resolution is necessary to distinguish different cases of lipid diffusion
as induced by barriers such as rafts, which is illustrated in Figure 7B,C [89]. Such
tracking experiments can also be combined with high resolution imaging, for instance
enabling insight into how the actin meshwork may condition the diffusion of mem-
brane proteins [90] as depicted in figures 7D and E. This combination provides a view
on the compartmentalization and barriers inducing anomalous diffusion in a mem-
brane environment. High-speed single-particle tracking techniques and their influence
on our understanding of the plasma membrane dynamics have been reviewed in light
of different underlying concepts [91] and extend the accessible timescales down to
about 1 microseconds temporal resolution, by achieving 2 nm spatial precision [92].
Such techniques have enabled to observe single lipids moving about rafts [93]. How-
ever, maybe more important than the precise “image” produced by such approaches,
their statistical treatment and analysis provide further insight [94]. The tracking of
single molecules is not the only approach to gain temporal insights. With improve-
ments in the AFM technique, it has been possible to track the surface of membranes
in incredible detail and with continuously improving time-resolution as depicted in
Figure 8.
AFM-based membrane surface tracking. Early studies investigated phenomena
such as drug-membrane interactions, here the interaction of the antibiotic azithromy-
cin with lipid domains in model biomembranes (Figure 8A, [95]). By using time-lapse
images over 60 minutes a progressive erosion and disappearance of the bilayer gel
domains were observed with a certain type of bilayer, providing evidence that the
perturbation of lipid domains strongly depends on the lipid nature. Figure 8B revisits
the suilysin example discussed previously, now explicitly adding the temporal dimen-
sion completing the process on a ~20 min. scale. Much higher time resolution can
now be achieved using high-speed approaches [96]. Figure 8C features the sequence
ACCEPTED MANUSCRIPT

ACC
EPTE
D M
ANU
SCR
IPT
9
of separation of two OmpF proteins implying molecular shear and rotational move-
ments, visiting a range of interaction states fully compatible with a coarse-grained
simulation model. As previously discussed, our information is not always direct in
terms of observing the membrane or membrane proteins themselves, but can also be
guided by reporter molecules. Such is the case in the study of membrane fission relat-
ed dynamin helix changes depicted in figures 8D and E [97]. The dynamin helix acts
upon a membrane tubule. Another interesting feature of AFM is to probe force-
induced conformational changes as has been done by monitoring the unfolding path-
ways of individual bacteriorhodopsins from the purple membrane [98]. Other sources
of information on dynamics exist, often applied to model membranes from supported
lipid bilayers, giant unilamellar vesicles and giant plasma membrane vesicles [99,
100]. By combining several approaches, additional insight may be gained and com-
plementary pictures emerge as in the study of the formation of liquid ordered domains
combining confocal microscopy with fluorescence microscopy and AFM [101]. In
some cases, the dynamics of objects can be tracked in 3 dimensions [102, 103].
The dynamic information that is obtained by these various experimental approach-
es, either a series of fixed images at certain time intervals, or more recently videos,
depict the sequence of events, but cannot properly account for the stochastic and ran-
dom aspects of processes that are typically ensemble phenomena. Therefore one must
keep in mind that our (partial) observations are driven by a given kinetics and only
represent certain aspects of the true biological process.
Characterizing membrane dynamics naturally leads to imaging approaches, some
of which have already been touched upon.
2.3 Imaging, just imagine..
Much progress has been made in imaging and many techniques and variants there-
of are available. Lyman et al. point out the general progress made in visualizing dy-
namics and membrane organization through new experimental approaches [104],
some of which are directly related to imaging. At the core, we find fluorescence-based
approaches, able to reach submicron molecular dynamics measurements [105]. This
may require specific developments, such as for instance nano-antennas capable of
probing single-molecule dynamics in the plasma membrane of living cells [106, 107].
Improved spatial (super)resolution of the imaging has been achieved for electron and
near-field microscopy, as well as fluorescence-based approaches [108-110], which
had a clear impact on the study of membrane rafts [111, 112] and caveolae [113]. The
most recent advances deliver volumetric 3D image series of subcellular processes,
including endocytosis and membrane dynamics [114].
One of the many fluorescence-based techniques that provide useful insight into
membrane systems is fluorescence lifetime imaging microscopy (flimscopy), which
can for instance be applied to liposomes [115] and living cells [116]. Time-resolved
fluorescence images may provide detailed insight into phenomena such as cell mem-
brane permeabilization and DNA/membrane interaction by electric pulses at sub-
ACCEPTED MANUSCRIPT

ACC
EPTE
D M
ANU
SCR
IPT
10
second resolution [117] or in dynamin-catalyzed membrane fission and vesicle re-
lease [118].
Limiting the perturbation induced by labels and further progress. A general
concern with many approaches is that tags might interfere with in vivo function. In
comparison to single-particle tracking of membrane components [119], where rela-
tively large gold particles or antibodies are used for tracking, smaller molecular labels
can be used for imaging membrane regions, for instance to monitor plasma-membrane
proteins [120]. The smaller labels reduce the impact such particles may have on alter-
ing the very dynamics under study. Label-free approaches such as interferometric
scattering (iSCAT) microscopy [121] and coherent brightfield (COBRI) microscopy
[122] can completely elude the issue of probe perturbation [123]. Single dyes can be
detected as well in fluorescence images, enabling the imaging of single molecule
diffusion [124]. The combination of photoactivated localization microscopy (PALM)
with live-cell single-particle tracking leads to spatially resolved maps of single-
molecule membrane protein motions [125].
Some existing techniques that lacked imaging capabilities have been extended as is
the case for Fluorescence correlation spectroscopy (FCS). By imaging total internal
reflection fluorescence cross-correlation spectroscopy (ITIR-FCCS) data, diffusion
phenomena in lipid membranes could be probed with good temporal (millisecond)
and spatial (microns) resolution [126].
Another area of progress concerns the increasing repertoire of (membrane) probes,
some of which are capable of sensing properties of their environment such as mem-
brane polarity [127], orientation [128] or tension [129]. Ratiometric biosensors have
been developed as well [130, 131]. Alternatively, very detailed insight into physico-
chemical membrane properties may be obtained by combining techniques. For exam-
ple, by coupling laser confocal scanning microscopy to microelectrochemistry, a pH
profile for membrane permeation processes can be imaged [132]. Similarly, electrical
measurements co-recorded with second harmonic generation (SHG) micrographs lead
to images describing structural and dynamic variations within a single bilayer [133].
SHG is a powerful technique, able to probe even fine details such as water chirality
and environment in a membrane environment [134].
Many of the experimental techniques described so far rely on reporter molecules,
which can typically be among the lipids or among the membrane proteins. Hence the
acquired data is indirect and an important aspect is what is actually "seen" by a given
technique compared to what remains hidden. The probes may induce a preference for
specific lipid phases, hence introducing some bias in the measurements.
2.4 From average properties to simulations
Many ideas and concepts, less so comprehensive pictures, can be derived from the
measurement of average properties [135]. The bilayer density shown in Figure 2A is a
typical example, lipid order parameters as measured by NMR are another. Infor-
mation on the lipid-protein interface was obtained early on by ESR and NMR [136-
ACCEPTED MANUSCRIPT

ACC
EPTE
D M
ANU
SCR
IPT
11
138]. NMR spectra thereby enable insight into bilayer properties, polar lipid head-
group features, their angle with respect to the bilayer, etc., and are sensitive to the
environment, for instance the ionic force. To provide a single emblematic example of
the unique role such information may play to shape our conceptual images, lipid bi-
celles should be mentioned, for which indirect techniques such as NMR and neutron
diffraction provide measurements [139, 140], that are, however, compatible with a
range of models. They develop their full scope when combined with computational
approaches [141-144] that will be discussed in the next section.
3 Simulations and computational approaches
A distinctive feature of molecular simulations is that all ingredients of a simulation
system are seen with high fidelity, no reporter molecules or probes are necessary to
observe biological membranes in atomistic detail. Hence, molecular simulations, and
in particular the molecular dynamics (MD) technique, were crucially important as the
primary tool for direct membrane visualization. Their accuracy comes with the limita-
tion of comparatively small spatial scales, typically within the tenths of a nanometer
to 1000 nanometer range. This scale is appropriate to compare to above-mentioned
diffraction experiments, which were crucial for validating the transbilayer distribution
and dynamics in the bilayer in the early days of MD simulations, see for instance the
studies described in Refs. [12, 145, 146]. Timescales are short as well, from picosec-
onds to tens of microseconds, although this is somewhat depending on the underlying
model of representation. Both time and spatial resolutions are high, routinely on the
order of tenths of nanometers and picoseconds, respectively. An intrinsic limitation is
that one can only observe the molecular species that were built into the model to be
simulated. Hence, building accurate starting models for molecular membrane simula-
tions including all relevant compounds is essential.
3.1 Building biological membrane models
A famous quote by Richard Feynman states, “What I cannot create, I do not under-
stand”. Many tools for putting together membrane-related molecular constructions
exist and a few of them are discussed here as they represent an important cornerstone
for our molecular understanding of these systems. Unless the computational power
behind simulations is sufficient for a model to fully equilibrate, it is essential to build
the best possible initial systems for the computations to produce reliable results [147,
148].
Some of the available tools for building membrane systems [149] are directly inte-
grated into the molecular modeling workflow, for instance as extensions to the popu-
lar Visual Molecular Dynamics software [150] or as part of widely used web services
such as CHARMM-GUI [151-153]. Figure 9 illustrates a few examples of membrane
building tools. A central issue is the packing of the lipid bilayer [154], which has been
addressed for example through shape-based approaches [155], 2D bin-packing [156],
ACCEPTED MANUSCRIPT

ACC
EPTE
D M
ANU
SCR
IPT
12
or by using coarse-grain lipid templates [157]. Another trend is to take into account
the full complexity of lipid compositions [158-162]. Modern tools attempt to integrate
both aspects of packing and lipid composition as illustrated in Figure 9A-C. For set-
ting up membrane proteins in their environment, automated pipelines such as the
MemProtMD (http://memprotmd.bioch.ox.ac.uk) resource exist [163, 164]. The cur-
vature of membrane objects offers another challenge for building models, for instance
in the case of vesicles. If the strain induced by such curvature is not compensated for,
a model may be in a metastable tense state by construction, leading to biases that
could for instance substantially facilitate vesicle fusion. A link between curvature and
packing defects exists [165, 166]. Nowadays, the ambition is to build and visualize
cell-scale models with astonishing accuracy [167-172], see Figure 9 D and E for ex-
amples, an undertaking which can be greatly helped by efficiently exploiting GPUs
[173]. An emblematic example where such advanced model building yielded extreme-
ly valuable and scientifically sound insights is the study of a trafficking synaptic vesi-
cle [34] (Figure 10). The model provides a detailed picture in terms of protein and
lipid composition, vesicle size and copy number of its major constituents by integrat-
ing quantitative data and structural models.
Quite naturally, such models require a rich repertoire of complementary simulation
approaches to bridge the different time- and length-scales.
3.2 Simulating biological membrane dynamics at multiple scales
The vast majority of simulation and modeling approaches described hereafter inte-
grate motion and provide a dynamic view of lipid bilayer-related structure and func-
tion. An average image can be extracted as well, for instance in relation to aspects
such as ionic conductance, osmotic permeability, electrostatic potential, pressure pro-
file, etc. [174, 175]. Most simulations discussed here rely on a force field to represent
the lipid bilayer [176-180]. An overwhelming number of exciting studies exist in this
field, yet only a tiny fraction will be alluded to in the present review. For a more
complete account, the reader is referred to comprehensive reviews such as [181-188].
The fundamental role that MD simulations played and still play in our understanding
of membrane structure has to be stressed, as it cannot be discussed in detail within the
scope of the present review.
Challenges and limitations. Concerning the description of the various modeling
scales used to represent membrane systems, we will follow the nomenclature from
[189], mostly discussing representations at the bead- and elastic scales. Every detail
of a chosen model system can be followed using molecular dynamics, hence the
choice of the extent of the model and of the aspects that are to be analyzed is crucial.
Therefore, dealing with the complexity of membrane systems in terms of their repre-
sented size and the multiplicity of lipid components is essential. Examples include
attempts to capture plasma [161], thylakoid [190] and bacterial [159, 191] mem-
branes. An accurate representation of the diverse glycolipids poses some modeling
challenges; the asymmetry in membrane leaflet composition adds to the complexity.
Similar issues exist for the (membrane) protein representations. For example, the
ACCEPTED MANUSCRIPT
ACC
EPTE
D M
ANU
SCR
IPT
13
latter often neglect post-translational modifications that play crucial biological roles
as has been shown for the epidermal growth factor receptor [192]. In the spirit of the
famous quote “all science is either physics or stamp collecting” by Lord Rutherford,
one may point out that observing a single (or even a handful) of molecular trajectories
is more akin to stamp collecting than to capturing the true molecular dynamics
("physics") of a biological system, which is often overlooked when MD results are
interpreted. Much more extended sampling – in our experience typically tens of repli-
cas of relevant duration (which depends on system size, but as an order of magnitude
say on the order of several microseconds at least) – is needed to obtain statistically
reliable and significant data.
Atomistic molecular dynamics simulations were among the first approaches to
generate insight into membrane dynamics [10, 12-14, 193-195], for instance with
respect to long-range undulatory and peristaltic modes [146, 196-198]. At the same
time, the case of such membrane undulations illustrates the intrinsic time- and
lengthscale limits such simulations have to come up against. Figure 11 attempts to
retrace a small selection of historic landmarks in the field. Figures 11A to C depict a
progression in the simulations in terms of membrane complexity. Figure 11A is
among the first depictions of a simulated pure lipid bilayer. Inclusion of peptides and
proteins into the membrane simulations paved the way to study large biological ma-
chinery, starting from model systems such as the gramicidin A channel [19, 199]
shown in Figure 11B. The next step is to encompass a more complete membrane envi-
ronment, for instance including the cell wall structure as depicted in Figure 11C
[200]. Many membrane processes have been investigated and in addition to complexi-
fying the membrane itself, more intricate membrane phenomena have been simulated
and visualized even for pure membranes. Among these, electroporation is particularly
spectacular [23, 201] (Figure 11D). More recently cavitation bubble collapse has been
investigated for drug delivery [202, 203]. Fig. 11E shows another level moving to-
wards the simulation of large functional membrane patches: a landmark study investi-
gates a multicomplex photosynthetic membrane as it most likely appears in the cell
[204] (Figure 11E). It consolidates several experimental results in an MD simulation
of a large multi-protein-membrane system.
Coarse graining of membrane systems provided a significant step forward in
terms of improving sampling, spatial and temporal scales [205-209] involving many
simulation groups such as those of Essex [210], Klein [20, 211], Marrink [212], San-
som [213, 214] and Voth [215]. Observing the lipid phase behavior as illustrated in
figures 12A and B is a typical application [216] and bears for example some rele-
vance in relation to the previously mentioned hemagglutinin distribution of Figure 4C
[217]. Membrane fusion is another fascinating topic of foremost importance where
our ideas have been shaped at least in part by molecular simulations [218-221]. Mem-
brane remodeling in general can be investigated, for instance zooming in on tethers
[222] (Figure 12C). Complex membrane protein environments can be treated with
fewer limitations than at the all-atom level. For instance, the Escherichia coli cell
envelope incorporating two membranes and various native membrane proteins has
ACCEPTED MANUSCRIPT
ACC
EPTE
D M
ANU
SCR
IPT
14
been simulated, revealing that both membranes curve in a manner dependent on the
size of the embedded proteins [223] (Figure 12D). Similar approaches enabled the
simulation of enveloped viruses whose shells encompass complex compositions [224-
226]. A current challenge to further optimize coarse-grained membrane models is to
remove the explicit solvent [227-230], which calls for some treatment of hydrody-
namics [231]. We have recently set up an implicit water membrane model capable of
describing for instance hydrodynamics within a lipid vesicle nanoreactor by extending
previous work with the MUPHY software in line with the concepts described in
[232]. An example of a vesicle nano-reactor in its flowfield is illustrated in Figure
12F. This effort is part of a general trend to bridge coarse-grained scales with the
mesoscopic scale. Further examples involve understanding the formation of large
membrane protein clusters, which has been investigated by training a mesoscale mod-
el incorporating thousands of outer membrane proteins [233] on coarse-grained mo-
lecular dynamics simulations of large protein assemblies[234], as previously per-
formed on GPCRs [235, 236] (Figure 12E). A typical target of such mesoscale simu-
lations is to recapitulate the protein diffusion characteristics. Other groups have inves-
tigated lateral diffusion in membranes [237, 238].
Such mesoscale, as well as ad hoc modeling approaches enable another step to-
wards bigger biological objects. The previously described coarse-grained bead models
can be further approximated through coarser beads. A series of very coarse coarse-
grained models, some qualified as shape-based, others as ultra-coarse-grained [239],
have been derived in several cases, for instance for transmembrane proteins [240] and
as illustrated in Figure 13B for membrane sculpting BAR domains [241, 242]. Using
dissipative particle dynamics (DPD), very large membrane sections and their remod-
eling can be investigated, providing a step forward on topics such as the previously
mentioned fusion processes [243, 244] (Figure 13A). An alternative approach, already
alluded to above, is to use implicit representations, which has been described for the
membrane [245].
For specific questions, ad-hoc tuned coarse-grained representations can be de-
signed, as for instance in relation to the dynamics in the photosynthetic thylakoid
membranes [206]. The phase behavior of proteins in such photosynthetic membranes
is recapitulated by such a model [246]. Phase separation in mixed lipid bilayers has
also been investigated by bridging CG MD simulations to a mesoscopic model based
on the phenomenological Landau-Ginzberg free-energy functional [247]. The red
blood cell membrane was mentioned and depicted previously (Figure 4A). It can be
simulated using elastic modeling [248, 249] as depicted in Figure 13D. Such elastic
representations can be used to study protein mobility [250] and can be compared to
coarse-grained models [251], showing that discrepancies arise for large distances.
Another approach applied to the red blood cell, in particular to reproduce its static and
dynamic light scattering features, has been to model it as triangulated closed surfaces
[252] (Figure 13C), an approach that can also be applied to fluctuating membranes
[253]. Similar strategies have been used to understand lipid membrane-mediated at-
traction between curvature inducing objects [102, 103], in close link with experiment.
Such a link is needed, and adapted modeling techniques may fill an important gap in
ACCEPTED MANUSCRIPT

ACC
EPTE
D M
ANU
SCR
IPT
15
complementing the most recent experimental data on membranes, as convincingly
argued in [104].
3.3 Making sense: visualization and analysis
Visualization is key to understand and analyze the complex processes in molecular
membrane simulations [254]. For instance, taking the preponderant molecular dynam-
ics technique as an example, all information, visualization and analysis are derived
from the time series of positions and velocities of the atoms (or particles for coarse-
grained simulations) of the simulation system. The repertoire of visual representa-
tions is mostly the typical one for atomistic systems, applied to the membrane consti-
tuting molecular species, with a few additional ones that will be discussed hereafter.
To highlight the lipid bilayer in a non-intrusive and simplified way, one may fit a
deformable sheet through selected reference atoms or positions [255] (Figure 14A), or
connect reference atoms such as the phosphorus from lipid headgroups as illustrated
in Figure 14B. This representation is particularly useful with large systems, eventually
containing several lipid bilayers [256]. To recapitulate the dynamics of lipid flow
within the membrane, a combination of path line, vector field and streamline tech-
niques can be used [257] as illustrated in Figure 14C. Many membrane simulations
are carried out at coarse-grained resolution, hence an effortless way of displaying
such systems facilitates the visualization task. Molecular visualization software such
as UnityMol [258] start to incorporate native import filters for coarse grained topolo-
gies. This visualization capacity was used to visualize carbon nanotube perturbations
of a lipid bilayer [259] (Figure 14D). Zooming into the fine details of glycolipids,
specific – possibly abstracted – representations for the sugar moieties [260] (Figure
14E) are yet to be generalized, which applies to e.g. glycans as well. It seems likely
that volume rendering approaches, as already used for some experimental membrane
data representations in 3D [114], should bear promise for visualizing simulations of
biomembranes. Concerning the representation of membrane proteins and their proper-
ties, the particular example of the depiction of hydrophobicity is compelling. Typical-
ly it is implemented through color variations. A confusingly large number of different
color scales can be found in the scientific literature, without a clear consensus. An
original method combines a black-to-white gradient with animated field lines [261]
and has been applied to membrane proteins [262] (Figure 14F). Another aspect con-
cerns our ability to display large membrane systems, in line with building cell-scale
models as discussed above. Hence, performance and visualization efficiency are im-
portant aspects to be considered. The Wang tiling concept has been extended to mem-
branes for precisely this purpose [173] as shown in Figure 14G.
Visualization for analysis. Such visualizations are typically closely connected to
the analysis of simulation trajectories, a vast domain. Often the 2-dimensional nature
of the bilayer is exploited in these analyses, which requires defining membrane leaf-
lets in case of deformed membranes. Voronoi diagrams and Delaunay triangulation
can be used for such analysis [263] (Figure 15A), as well as grid-based approaches
[264]. Some solutions are extensions to visualization software such as VMD [265],
ACCEPTED MANUSCRIPT
ACC
EPTE
D M
ANU
SCR
IPT
16
others are intended for command-line use, such as FATSLiM [266]. The latter is par-
ticularly apt to handle curved membranes, as it relies on a local calculation of mem-
brane normals illustrated in Figure 15B. MDAnalysis is another feature-rich com-
mand-line analysis tool that has been applied to many large membrane systems featur-
ing a LeafletFinder algorithm [267]. A particular tool was developed to focus on local
rather than averaged membrane properties, including area per lipid, order parameters,
curvature and bilayer thickness [255]. Lipid bilayer packing defects are shown in
Figure 15C, representing intrinsically local properties that can be analyzed with a
geometrical approach [166, 268]. Image-processing techniques (Figure 15D) are an-
other source of specific membrane analysis tools, as applied to detection of lipid
phases during phase separation [269]. Concerning membrane proteins, the analysis of
helix geometry and its visual abstraction (Figure 15E) were proposed [270] as well as
the characterization of their particular topologies (Figure 15F), notably in relation to
water networks prefiguring solute transport, based on Laguerre tesselation [271].
4 Conceptual illustrations, animations and artistic depictions of
membrane systems
In order to conceptualize ideas about bilayer structure and fundamental principles of
biological membranes, researchers have from the early days on recognized the crucial
importance of visual representations thereof. Historically, illustrations as in figures 16
A and B were abundant in early papers on membranes in order to fill the gaps be-
tween the "raw" experimental and simulation data and their interpretation, often pre-
dating the realization of the first experimental approaches providing actual visualiza-
tions. Such illustrations typically represent schematic views of lipid bilayers [7] or
pseudo-three-dimensional representations of their phases [272]. These images were
triggered by research results requiring conceptualization to convey the underlying
new ideas to the scientific community, be it about membrane protein insertion [18,
273] (Figure 16C to E), hydrophobic mismatch [274] (Figure 16F), the fluid mosaic
model [7, 275] (Figure 16G), diffusion within the bilayer [276] (Figure 16H) or many
other ideas. Hence this figure is not only of historical importance, but also illustrates
the way in which the scientific community crystallizes ideas and concepts in this
field, which is intrinsically visual. A broad variety of membrane depictions can be
found in the literature, yet many among them are based on more (or sometimes less)
educated guesses. The sheer scales at which membranes operate require some mental
analogies for us to fully apprehend the characteristic size and length spectrum. To aid
our imagination of these dimensions, a ‘perceptive scale’ [277] has been proposed to
facilitate the interpretation of cellular scales.
Towards communication approaches. Subsequently the motivation for illustrations
expanded as recognition of the beauty and complexity of nanoscopic molecular as-
semblies grew. A move from data analysis, interpretation and (research) hypothesis
generation to broader education, communication and learning operated [278-280].
This evolution opened the available toolset towards software from animation, illustra-
ACCEPTED MANUSCRIPT

ACC
EPTE
D M
ANU
SCR
IPT
17
tion and cinema [281, 282], with specific extensions for biomolecules, and applica-
tions to membranes [283] as depicted in Figure 18A. Some new tools were designed
to tackle the challenges of illustrating biological complexity [284]. Such illustrations
have been marked by the touch of their creators with a certain artistic license [285],
with a range of famous contributors such as David Goodsell [286-290] (Figure 17B),
Janet Iwasa [280] (Figure 17A), Graham Johnson [291], Gaël McGill and many more.
Some general guidelines have been suggested for illustrating biomolecular structural
data [292]. The same content may be depicted differently according to the targeted
audience as shown in figures 18B and C. Illustrations may also serve to raise aware-
ness and stimulate scientific discussion. Such is the case for the pneumococcal life
cycle, visually reviewed through watercolor paintings (Figure 17D) with a consistent
scale recapitulating currently available experimental data [293]. Hence, quite natural-
ly, such depictions evolve over time, when new knowledge becomes available. A
good example, discussed in more detail in [294], may be the animation “The Inner
Life of the Cell” from 2006 by Harvard BioVisions and Xvivo
(https://www.youtube.com/watch?v=wJyUtbn0O5Y). Since then, our awareness of
the crowdedness of cellular environments has risen significantly, and is not conveyed
in the initial movie. Motions as well are unlike the very agitated perpetual molecular
jiggling that we are now aware of. An updated version of the animation, "Inner Life
of a Cell | Protein Packing" has since been released
(https://www.youtube.com/watch?v=uHeTQLNFTgU).
The efficiency of illustrations and animations for learning concepts such as struc-
ture and composition of the cell membrane, chemical properties of the relevant mole-
cules, membrane barrier function and transport mechanisms has been investigated
[295]. The visual language used needs to be adapted, and has to remain sufficiently
accurate and complex to convey for instance the dynamic nature of binding events in
a membrane [296] as illustrated in Figure 17C. Tangible models can be used, for in-
stance to convey the solubility properties of membrane proteins [297]. Serious games
[298] may offer new opportunities for learning and some already address membrane
systems, such as DocMolecules (Figure 18D, https://youtu.be/gZyneEqaWcQ), target-
ing to dock a drug to the right membrane receptor or Eukaryo (Figure 18E) [299]
simulating a eukaryotic cell.
5 Perspectives and conclusion
The perspectives on visualizing biological membrane organization and dynamics
are both extremely encouraging and full of challenges. The first challenge, already
mentioned, concerns the complexities in composition, in scales and in diversity that
are starting to be addressed by experiments, simulations and illustrations. On the ex-
perimental side, many key players remain largely hidden from scrutiny, such as for
instance the ubiquitous cholesterol. Finding an efficient yet non-perturbing fluores-
cent cholesterol analog would allow to attend to our "blindness" and work is under
way in that direction. On the simulation and visualization front, our tools are not yet
as mature as for proteins, DNA or even sugars, where many representations with vari-
ACCEPTED MANUSCRIPT

ACC
EPTE
D M
ANU
SCR
IPT
18
ous degrees of abstraction exist, tuned to capture essential parts of the biology of
these molecules. As has been discussed above, our repertoire for pictorial lipid repre-
sentations is still rather limited. Another tendency, that is to be largely welcomed, is
the convergence of the various methods, be it experimental, computational or illustra-
tive ones, to combine and confront related information. This is fully in line with what
Lyman et al. described in their "modeling manifesto" [104] for the pair of experiments
and simulations.
It should, however, be noted that we are still at the level where we attempt to accu-
rately describe structure and dynamics of membranes, and only to some limited extent
their (mostly) equilibrium energetics. In the future, such a molecular view may need
to embrace thermodynamics more fully, to characterize where and in what form ener-
gy is distributed in a given configuration. In addition to the molecular dynamics, it is
essential to capture the dynamics of energy flow. This requires to move beyond the
equilibrium picture, as life in its essence is a non-equilibrium state. Our conceptual
images need to evolve from a currently rather vague picture of enthalpy associated
with biological membranes to a comprehensive mental representation of energy fluc-
tuations and flow. This major challenge may become tractable by using modern tools
to render the multidimensional massive data that can nowadays be acquired intuitively
explorable [300]. Virtual reality approaches, visual analytics [301] and in general
advanced data display and mining technologies [302] will assist this transformation
[303, 304].
To conclude, our picture of biological membranes is already very rich and detailed,
with meso- to nanoscale information from a variety of complementary sources, ena-
bling us to relate molecular structures to the biological phenomena, as well as to char-
acterize the pertaining biophysical properties. Many of the underlying techniques
have seen significant progress enabling us to probe these membrane systems in depth.
These improvements enable a convergence between real (experiments), virtual (simu-
lations) and imaginary (illustrations) views. Yet we may still miss new comprehen-
sive representations for these systems, sometimes necessary to develop new ideas.
Therefore we may still be overlooking some fundamental concepts. For other biologi-
cal objects of studies, such breakthroughs were made in close relation to our pictorial
or mental conceptualization. Three emblematic examples include unraveling the mys-
tery of the alpha helix, to which Pauling contributed decisively, depicting the second-
ary structure of proteins by cartoon representations pioneered by Richardson, or un-
derstanding the DNA double helix based on the works by Watson, Crick and Franklin.
Entire branches of biology rely on these discoveries.
Acknowledgments
I would like to express my gratitude for many insightful remarks and stimulating dis-
cussions leading to this review, with support from B. Bechinger, A. Brandner, M.
Chavent, A. Duncan, M. Edwardson, J. Jenkinson, J. Hénin, S. Khalid, B. Kozlíková,
G. McGill, D. Picot, A. Rose, F. Samsudin, M. S. P. Sansom, T. Steck, F. Sterpone, J.
Sturgis, S. Timr, J. Tyrwhitt-Drake, D. Warschawski and D. Yuen. This work was
ACCEPTED MANUSCRIPT

ACC
EPTE
D M
ANU
SCR
IPT
19
supported by the "Initiative d'Excellence" program from the French State (Grants
"DYNAMO", ANR-11-LABX-0011-01 and ANR-11-EQPX-0008).
Conflict of Interest
The author declares that he has no conflict of interest.
References
[1] Card SK, Mackinlay JD, Shneiderman B. Readings in information visualization:
using vision to think: Academic Press; 1999.
[2] Tillack TW, Marchesi VT. Demonstration of the outer surface of freeze-etched red
blood cell membranes. J Cell Biol. 1970;45:649-53.
[3] Frye LD, Edidin M. The rapid intermixing of cell surface antigens after formation
of mouse-human heterokaryons. J Cell Sci. 1970;7:319-35.
[4] Poo M-M, Cone RA. Lateral diffusion of rhodopsin in the photoreceptor
membrane. Nature. 1974;247:438.
[5] Engelman DM. X-ray diffraction studies of phase transitions in the membrane of
Mycoplasma laidlawii. J Mol Biol. 1970;47:115-7.
[6] Reinert JC, Steim JM. Calorimetric detection of a membrane-lipid phase transition
in living cells. Science. 1970;168:1580-2.
[7] Singer SJ, Nicolson GL. The fluid mosaic model of the structure of cell
membranes. Science. 1972;175:720-31.
[8] Mitchell P. A general theory of membrane transport from studies of bacteria.
Nature. 1957;180:134.
[9] Henderson R, Unwin PN. Three-dimensional model of purple membrane obtained
by electron microscopy. Nature. 1975;257:28-32.
[10] Cotterill R. Computer simulation of model lipid membrane dynamics.
Biochimica et Biophysica Acta (BBA)-Biomembranes. 1976;433:264-70.
[11] Kox A, Michels J, Wiegel F. Simulation of a lipid monolayer using molecular
dynamics. Nature. 1980;287:317.
[12] Heller H, Schaefer M, Schulten K. Molecular dynamics simulation of a bilayer of
200 lipids in the gel and in the liquid crystal phase. The Journal of Physical
Chemistry. 1993;97:8343-60.
[13] Van der Ploeg P, Berendsen H. Molecular dynamics simulation of a bilayer
membrane. The Journal of Chemical Physics. 1982;76:3271-6.
[14] Bassolino-Klimas D, Alper HE, Stouch TR. Solute diffusion in lipid bilayer
membranes: an atomic level study by molecular dynamics simulation. Biochemistry.
1993;32:12624-37.
[15] Goldstein JL, Brown MS. Binding and degradation of low density lipoproteins
by cultured human fibroblasts. Comparison of cells from a normal subject and from a
patient with homozygous familial hypercholesterolemia. J Biol Chem.
1974;249:5153-62.
[16] Nair P. Brown and Goldstein: the cholesterol chronicles. Proc Natl Acad Sci U S
A. 2013;110:14829-32.
ACCEPTED MANUSCRIPT
ACC
EPTE
D M
ANU
SCR
IPT
20
[17] Deisenhofer J, Epp O, Miki K, Huber R, Michel H. Structure of the protein
subunits in the photosynthetic reaction centre of Rhodopseudomonas viridis at 3A
resolution. Nature. 1985;318:618-24.
[18] Popot JL, Engelman DM. Membrane protein folding and oligomerization: the
two-stage model. Biochemistry. 1990;29:4031-7.
[19] Woolf TB, Roux B. Structure, energetics, and dynamics of lipid-protein
interactions: A molecular dynamics study of the gramicidin A channel in a DMPC
bilayer. Proteins. 1996;24:92-114.
[20] Shelley JC, Shelley MY, Reeder RC, Bandyopadhyay S, Klein ML. A Coarse
Grain Model for Phospholipid Simulations. The Journal of Physical Chemistry B.
2001;105:4464-70.
[21] de Kruijff B. Biomembranes. Lipids beyond the bilayer. Nature. 1997;386:129-
30.
[22] Landau EM, Rosenbusch JP. Lipidic cubic phases: a novel concept for the
crystallization of membrane proteins. Proc Natl Acad Sci U S A. 1996;93:14532-5.
[23] Tieleman DP. The molecular basis of electroporation. BMC Biochem. 2004;5:10.
[24] Bowie JU. Solving the membrane protein folding problem. Nature.
2005;438:581-9.
[25] White SH, Wimley WC. Membrane protein folding and stability: physical
principles. Annu Rev Biophys Biomol Struct. 1999;28:319-65.
[26] Medalia O, Weber I, Frangakis AS, Nicastro D, Gerisch G, Baumeister W.
Macromolecular architecture in eukaryotic cells visualized by cryoelectron
tomography. Science. 2002;298:1209-13.
[27] Earnest TM, Watanabe R, Stone JE, Mahamid J, Baumeister W, Villa E, et al.
Challenges of Integrating Stochastic Dynamics and Cryo-Electron Tomograms in
Whole-Cell Simulations. J Phys Chem B. 2017;121:3871-81.
[28] Hiller S, Garces RG, Malia TJ, Orekhov VY, Colombini M, Wagner G. Solution
structure of the integral human membrane protein VDAC-1 in detergent micelles.
Science. 2008;321:1206-10.
[29] Fernandez C, Adeishvili K, Wuthrich K. Transverse relaxation-optimized NMR
spectroscopy with the outer membrane protein OmpX in dihexanoyl
phosphatidylcholine micelles. Proc Natl Acad Sci U S A. 2001;98:2358-63.
[30] Murata K, Mitsuoka K, Hirai T, Walz T, Agre P, Heymann JB, et al. Structural
determinants of water permeation through aquaporin-1. Nature. 2000;407:599-605.
[31] Jiang Y, Lee A, Chen J, Cadene M, Chait BT, MacKinnon R. The open pore
conformation of potassium channels. Nature. 2002;417:523-6.
[32] Jiang Y, Lee A, Chen J, Cadene M, Chait BT, MacKinnon R. Crystal structure
and mechanism of a calcium-gated potassium channel. Nature. 2002;417:515-22.
[33] Engelman DM. Membranes are more mosaic than fluid. Nature. 2005;438:578-
80.
[34] Takamori S, Holt M, Stenius K, Lemke EA, Gronborg M, Riedel D, et al.
Molecular anatomy of a trafficking organelle. Cell. 2006;127:831-46.
[35] Terstappen GC, Reggiani A. In silico research in drug discovery. Trends
Pharmacol Sci. 2001;22:23-6.
ACCEPTED MANUSCRIPT

ACC
EPTE
D M
ANU
SCR
IPT
21
[36] Bechinger B. Structure and functions of channel-forming peptides: Magainins,
cecropins, melittin and alamethicin. J Membr Biol. 1997;156:197-211.
[37] Bechinger B. The structure, dynamics and orientation of antimicrobial peptides
in membranes by multidimensional solid-state NMR spectroscopy. Biochim Biophys
Acta-Biomembr. 1999;1462:157-83.
[38] Brown DA, London E. Functions of lipid rafts in biological membranes. Annu
Rev Cell Dev Biol. 1998;14:111-36.
[39] Simons K, Toomre D. Lipid rafts and signal transduction. Nat Rev Mol Cell
Biol. 2000;1:31-9.
[40] Wenk MR. The emerging field of lipidomics. Nat Rev Drug Discov. 2005;4:594-
610.
[41] Shevchenko A, Simons K. Lipidomics: coming to grips with lipid diversity. Nat
Rev Mol Cell Biol. 2010;11:593-8.
[42] Quehenberger O, Armando AM, Brown AH, Milne SB, Myers DS, Merrill AH,
et al. Lipidomics reveals a remarkable diversity of lipids in human plasma. J Lipid
Res. 2010;51:3299-305.
[43] Buldt G, Gally HU, Seelig A, Seelig J, Zaccai G. Neutron diffraction studies on
selectively deuterated phospholipid bilayers. Nature. 1978;271:182-4.
[44] Wiener MC, White SH. Structure of a fluid dioleoylphosphatidylcholine bilayer
determined by joint refinement of X-ray and neutron diffraction data. III. Complete
structure. Biophys J. 1992;61:434-47.
[45] Wiener MC, White SH. Structure of a fluid dioleoylphosphatidylcholine bilayer
determined by joint refinement of X-ray and neutron diffraction data. II. Distribution
and packing of terminal methyl groups. Biophys J. 1992;61:428-33.
[46] Sun WJ, Tristram-Nagle S, Suter RM, Nagle JF. Structure of the ripple phase in
lecithin bilayers. Proc Natl Acad Sci U S A. 1996;93:7008-12.
[47] Egger M, Ohnesorge F, Weisenhorn AL, Heyn S, Drake B, Prater C, et al. Wet
lipid-protein membranes imaged at submolecular resolution by atomic force
microscopy. Journal of Structural Biology. 1990;103:89-94.
[48] Shaw JE, Epand RF, Hsu JC, Mo GC, Epand RM, Yip CM. Cationic peptide-
induced remodelling of model membranes: direct visualization by in situ atomic force
microscopy. J Struct Biol. 2008;162:121-38.
[49] Saslowsky DE, Lawrence J, Ren X, Brown DA, Henderson RM, Edwardson JM.
Placental alkaline phosphatase is efficiently targeted to rafts in supported lipid
bilayers. J Biol Chem. 2002;277:26966-70.
[50] van Meer G, Stelzer EH, Wijnaendts-van-Resandt RW, Simons K. Sorting of
sphingolipids in epithelial (Madin-Darby canine kidney) cells. J Cell Biol.
1987;105:1623-35.
[51] Simons K, Garoff H, Helenius A. How an animal virus gets into and out of its
host cell. Sci Am. 1982;246:58-66.
[52] Simons K, Sampaio JL. Membrane organization and lipid rafts. Cold Spring
Harb Perspect Biol. 2011;3:a004697.
[53] Lingwood D, Simons K. Lipid rafts as a membrane-organizing principle.
Science. 2010;327:46-50.
ACCEPTED MANUSCRIPT
ACC
EPTE
D M
ANU
SCR
IPT
22
[54] Giocondi MC, Yamamoto D, Lesniewska E, Milhiet PE, Ando T, Le Grimellec
C. Surface topography of membrane domains. Biochim Biophys Acta.
2010;1798:703-18.
[55] Lipowsky R. The conformation of membranes. Nature. 1991;349:475-81.
[56] Bangham AD, Horne RW. Negative Staining of Phospholipids and Their
Structural Modification by Surface-Active Agents as Observed in the Electron
Microscope. J Mol Biol. 1964;8:660-8.
[57] Bassereau P, Jin R, Baumgart T, Deserno M, Dimova R, Frolov VA, et al. The
2018 biomembrane curvature and remodeling roadmap. Journal of Physics D: Applied
Physics. 2018;51:343001.
[58] McMahon HT, Gallop JL. Membrane curvature and mechanisms of dynamic cell
membrane remodelling. Nature. 2005;438:590-6.
[59] Branton D. Fracture faces of frozen membranes. Proc Natl Acad Sci U S A.
1966;55:1048-56.
[60] Deamer DW, Leonard R, Tardieu A, Branton D. Lamellar and hexagonal lipid
phases visualized by freeze-etching. Biochim Biophys Acta. 1970;219:47-60.
[61] Rothberg KG, Heuser JE, Donzell WC, Ying YS, Glenney JR, Anderson RG.
Caveolin, a protein component of caveolae membrane coats. Cell. 1992;68:673-82.
[62] Angermuller S, Fahimi HD. Imidazole-buffered osmium tetroxide: an excellent
stain for visualization of lipids in transmission electron microscopy. Histochem J.
1982;14:823-35.
[63] Deutsch K, Krause W, Rosenthal S. An electron microscopical study of isolated
mitochondrial membranes treated with osmium tetroxide, potassium permanganate,
and formaldehyde. Journal of Cell Science. 1964;3:319-23.
[64] Zuber B, Chami M, Houssin C, Dubochet J, Griffiths G, Daffe M. Direct
visualization of the outer membrane of mycobacteria and corynebacteria in their
native state. J Bacteriol. 2008;190:5672-80.
[65] Tamm LK, McConnell HM. Supported phospholipid bilayers. Biophys J.
1985;47:105-13.
[66] Byers TJ, Branton D. Visualization of the protein associations in the erythrocyte
membrane skeleton. Proc Natl Acad Sci U S A. 1985;82:6153-7.
[67] Hess ST, Gould TJ, Gudheti MV, Maas SA, Mills KD, Zimmerberg J. Dynamic
clustered distribution of hemagglutinin resolved at 40 nm in living cell membranes
discriminates between raft theories. Proc Natl Acad Sci U S A. 2007;104:17370-5.
[68] van Zanten TS, Cambi A, Koopman M, Joosten B, Figdor CG, Garcia-Parajo
MF. Hotspots of GPI-anchored proteins and integrin nanoclusters function as
nucleation sites for cell adhesion. Proc Natl Acad Sci U S A. 2009;106:18557-62.
[69] Straub V, Bittner RE, Leger JJ, Voit T. Direct visualization of the dystrophin
network on skeletal muscle fiber membrane. J Cell Biol. 1992;119:1183-91.
[70] Honigmann A, Sadeghi S, Keller J, Hell SW, Eggeling C, Vink R. A lipid bound
actin meshwork organizes liquid phase separation in model membranes. Elife.
2014;3:e01671.
[71] Belrhali H, Nollert P, Royant A, Menzel C, Rosenbusch JP, Landau EM, et al.
Protein, lipid and water organization in bacteriorhodopsin crystals: a molecular view
of the purple membrane at 1.9 A resolution. Structure. 1999;7:909-17.
ACCEPTED MANUSCRIPT

ACC
EPTE
D M
ANU
SCR
IPT
23
[72] Muller DJ, Buldt G, Engel A. Force-induced conformational change of
bacteriorhodopsin. J Mol Biol. 1995;249:239-43.
[73] Miles M. Scanning probe microscopy. Probing the future. Science.
1997;277:1845-7.
[74] Heymann JB, Muller DJ, Landau EM, Rosenbusch JP, Pebay-Peyroula E, Buldt
G, et al. Charting the surfaces of the purple membrane. J Struct Biol. 1999;128:243-9.
[75] Fyfe PK, McAuley KE, Roszak AW, Isaacs NW, Cogdell RJ, Jones MR. Probing
the interface between membrane proteins and membrane lipids by X-ray
crystallography. Trends Biochem Sci. 2001;26:106-12.
[76] Essen L, Siegert R, Lehmann WD, Oesterhelt D. Lipid patches in membrane
protein oligomers: crystal structure of the bacteriorhodopsin-lipid complex. Proc Natl
Acad Sci U S A. 1998;95:11673-8.
[77] Pebay-Peyroula E, Rosenbusch JP. High-resolution structures and dynamics of
membrane protein--lipid complexes: a critique. Curr Opin Struct Biol. 2001;11:427-
32.
[78] Watts A. Nuclear magnetic resonance methods to characterize lipid-protein
interactions at membrane surfaces. J Bioenerg Biomembr. 1987;19:625-53.
[79] Kumar S, Hoh JH. Direct visualization of vesicle− bilayer complexes by atomic
force microscopy. Langmuir. 2000;16:9936-40.
[80] Schonherr H, Johnson JM, Lenz P, Frank CW, Boxer SG. Vesicle adsorption and
lipid bilayer formation on glass studied by atomic force microscopy. Langmuir.
2004;20:11600-6.
[81] Leung C, Dudkina NV, Lukoyanova N, Hodel AW, Farabella I, Pandurangan
AP, et al. Stepwise visualization of membrane pore formation by suilysin, a bacterial
cholesterol-dependent cytolysin. Elife. 2014;3:e04247.
[82] Kuhlbrandt W. Biochemistry. The resolution revolution. Science.
2014;343:1443-4.
[83] Milanesi L, Sheynis T, Xue WF, Orlova EV, Hellewell AL, Jelinek R, et al.
Direct three-dimensional visualization of membrane disruption by amyloid fibrils.
Proc Natl Acad Sci U S A. 2012;109:20455-60.
[84] Shi L, Shen Q-T, Kiel A, Wang J, Wang H-W, Melia TJ, et al. SNARE proteins:
one to fuse and three to keep the nascent fusion pore open. Science. 2012;335:1355-9.
[85] Brandt T, Cavellini L, Kuhlbrandt W, Cohen MM. A mitofusin-dependent
docking ring complex triggers mitochondrial fusion in vitro. Elife. 2016;5.
[86] Zhang W, Chipman PR, Corver J, Johnson PR, Zhang Y, Mukhopadhyay S, et al.
Visualization of membrane protein domains by cryo-electron microscopy of dengue
virus. Nat Struct Biol. 2003;10:907-12.
[87] Mironov AA, Polishchuk RS, Luini A. Visualizing membrane traffic in vivo by
combined video fluorescence and 3D electron microscopy. Trends Cell Biol.
2000;10:349-53.
[88] Schutz GJ, Kada G, Pastushenko VP, Schindler H. Properties of lipid
microdomains in a muscle cell membrane visualized by single molecule microscopy.
EMBO J. 2000;19:892-901.
ACCEPTED MANUSCRIPT

ACC
EPTE
D M
ANU
SCR
IPT
24
[89] Eggeling C, Ringemann C, Medda R, Schwarzmann G, Sandhoff K, Polyakova
S, et al. Direct observation of the nanoscale dynamics of membrane lipids in a living
cell. Nature. 2009;457:1159-62.
[90] Sadegh S, Higgins JL, Mannion PC, Tamkun MM, Krapf D. Plasma Membrane
is Compartmentalized by a Self-Similar Cortical Actin Meshwork. Phys Rev X.
2017;7.
[91] Kusumi A, Nakada C, Ritchie K, Murase K, Suzuki K, Murakoshi H, et al.
Paradigm shift of the plasma membrane concept from the two-dimensional continuum
fluid to the partitioned fluid: high-speed single-molecule tracking of membrane
molecules. Annu Rev Biophys Biomol Struct. 2005;34:351-78.
[92] Hsieh CL, Spindler S, Ehrig J, Sandoghdar V. Tracking single particles on
supported lipid membranes: multimobility diffusion and nanoscopic confinement. J
Phys Chem B. 2014;118:1545-54.
[93] Wu HM, Lin YH, Yen TC, Hsieh CL. Nanoscopic substructures of raft-mimetic
liquid-ordered membrane domains revealed by high-speed single-particle tracking.
Sci Rep. 2016;6:20542.
[94] Schutz GJ, Schindler H, Schmidt T. Single-molecule microscopy on model
membranes reveals anomalous diffusion. Biophys J. 1997;73:1073-80.
[95] Berquand A, Mingeot-Leclercq MP, Dufrene YF. Real-time imaging of drug-
membrane interactions by atomic force microscopy. Biochim Biophys Acta.
2004;1664:198-205.
[96] Casuso I, Khao J, Chami M, Paul-Gilloteaux P, Husain M, Duneau JP, et al.
Characterization of the motion of membrane proteins using high-speed atomic force
microscopy. Nat Nanotechnol. 2012;7:525-9.
[97] Colom A, Redondo-Morata L, Chiaruttini N, Roux A, Scheuring S. Dynamic
remodeling of the dynamin helix during membrane constriction. Proc Natl Acad Sci U
S A. 2017;114:5449-54.
[98] Oesterhelt F, Oesterhelt D, Pfeiffer M, Engel A, Gaub HE, Muller DJ. Unfolding
pathways of individual bacteriorhodopsins. Science. 2000;288:143-6.
[99] Sezgin E, Schwille P. Model membrane platforms to study protein-membrane
interactions. Mol Membr Biol. 2012;29:144-54.
[100] Veatch SL, Cicuta P, Sengupta P, Honerkamp-Smith A, Holowka D, Baird B.
Critical fluctuations in plasma membrane vesicles. ACS Chem Biol. 2008;3:287-93.
[101] Garcia-Saez AJ, Chiantia S, Schwille P. Effect of line tension on the lateral
organization of lipid membranes. J Biol Chem. 2007;282:33537-44.
[102] van der Wel C, Vahid A, Saric A, Idema T, Heinrich D, Kraft DJ. Lipid
membrane-mediated attraction between curvature inducing objects. Sci Rep.
2016;6:32825.
[103] van der Wel C, Vahid A, Saric A, Idema T, Heinrich D, Kraft DJ. Erratum:
Lipid membrane-mediated attraction between curvature inducing objects. Sci Rep.
2016;6:37382.
[104] Lyman E, Hsieh CL, Eggeling C. From Dynamics to Membrane Organization:
Experimental Breakthroughs Occasion a "Modeling Manifesto". Biophys J.
2018;115:595-604.
ACCEPTED MANUSCRIPT
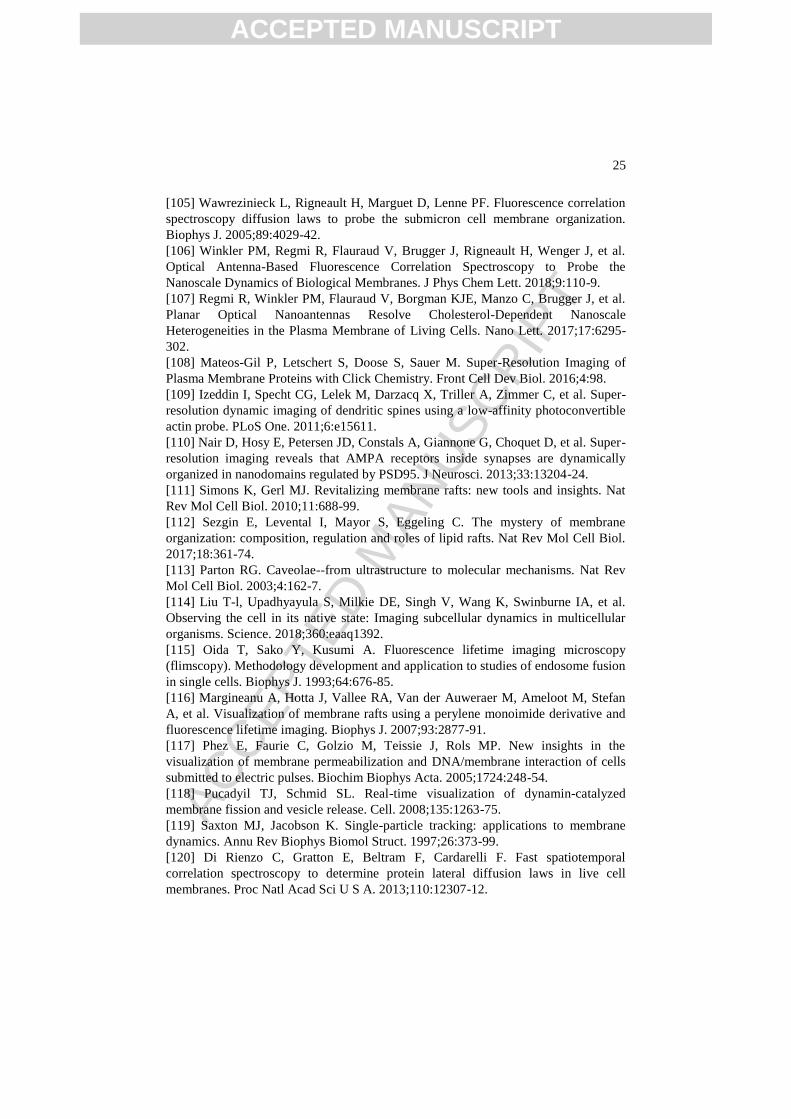
ACC
EPTE
D M
ANU
SCR
IPT
25
[105] Wawrezinieck L, Rigneault H, Marguet D, Lenne PF. Fluorescence correlation
spectroscopy diffusion laws to probe the submicron cell membrane organization.
Biophys J. 2005;89:4029-42.
[106] Winkler PM, Regmi R, Flauraud V, Brugger J, Rigneault H, Wenger J, et al.
Optical Antenna-Based Fluorescence Correlation Spectroscopy to Probe the
Nanoscale Dynamics of Biological Membranes. J Phys Chem Lett. 2018;9:110-9.
[107] Regmi R, Winkler PM, Flauraud V, Borgman KJE, Manzo C, Brugger J, et al.
Planar Optical Nanoantennas Resolve Cholesterol-Dependent Nanoscale
Heterogeneities in the Plasma Membrane of Living Cells. Nano Lett. 2017;17:6295-
302.
[108] Mateos-Gil P, Letschert S, Doose S, Sauer M. Super-Resolution Imaging of
Plasma Membrane Proteins with Click Chemistry. Front Cell Dev Biol. 2016;4:98.
[109] Izeddin I, Specht CG, Lelek M, Darzacq X, Triller A, Zimmer C, et al. Super-
resolution dynamic imaging of dendritic spines using a low-affinity photoconvertible
actin probe. PLoS One. 2011;6:e15611.
[110] Nair D, Hosy E, Petersen JD, Constals A, Giannone G, Choquet D, et al. Super-
resolution imaging reveals that AMPA receptors inside synapses are dynamically
organized in nanodomains regulated by PSD95. J Neurosci. 2013;33:13204-24.
[111] Simons K, Gerl MJ. Revitalizing membrane rafts: new tools and insights. Nat
Rev Mol Cell Biol. 2010;11:688-99.
[112] Sezgin E, Levental I, Mayor S, Eggeling C. The mystery of membrane
organization: composition, regulation and roles of lipid rafts. Nat Rev Mol Cell Biol.
2017;18:361-74.
[113] Parton RG. Caveolae--from ultrastructure to molecular mechanisms. Nat Rev
Mol Cell Biol. 2003;4:162-7.
[114] Liu T-l, Upadhyayula S, Milkie DE, Singh V, Wang K, Swinburne IA, et al.
Observing the cell in its native state: Imaging subcellular dynamics in multicellular
organisms. Science. 2018;360:eaaq1392.
[115] Oida T, Sako Y, Kusumi A. Fluorescence lifetime imaging microscopy
(flimscopy). Methodology development and application to studies of endosome fusion
in single cells. Biophys J. 1993;64:676-85.
[116] Margineanu A, Hotta J, Vallee RA, Van der Auweraer M, Ameloot M, Stefan
A, et al. Visualization of membrane rafts using a perylene monoimide derivative and
fluorescence lifetime imaging. Biophys J. 2007;93:2877-91.
[117] Phez E, Faurie C, Golzio M, Teissie J, Rols MP. New insights in the
visualization of membrane permeabilization and DNA/membrane interaction of cells
submitted to electric pulses. Biochim Biophys Acta. 2005;1724:248-54.
[118] Pucadyil TJ, Schmid SL. Real-time visualization of dynamin-catalyzed
membrane fission and vesicle release. Cell. 2008;135:1263-75.
[119] Saxton MJ, Jacobson K. Single-particle tracking: applications to membrane
dynamics. Annu Rev Biophys Biomol Struct. 1997;26:373-99.
[120] Di Rienzo C, Gratton E, Beltram F, Cardarelli F. Fast spatiotemporal
correlation spectroscopy to determine protein lateral diffusion laws in live cell
membranes. Proc Natl Acad Sci U S A. 2013;110:12307-12.
ACCEPTED MANUSCRIPT

ACC
EPTE
D M
ANU
SCR
IPT
26
[121] Hsieh C-L. Label-free, ultrasensitive, ultrahigh-speed scattering-based
interferometric imaging. Optics Communications. 2018;422:69-74.
[122] Huang YF, Zhuo GY, Chou CY, Lin CH, Chang W, Hsieh CL. Coherent
Brightfield Microscopy Provides the Spatiotemporal Resolution To Study Early Stage
Viral Infection in Live Cells. ACS Nano. 2017;11:2575-85.
[123] de Wit G, Danial JS, Kukura P, Wallace MI. Dynamic label-free imaging of
lipid nanodomains. Proc Natl Acad Sci U S A. 2015;112:12299-303.
[124] Schmidt T, Schutz GJ, Baumgartner W, Gruber HJ, Schindler H. Imaging of
single molecule diffusion. Proc Natl Acad Sci U S A. 1996;93:2926-9.
[125] Manley S, Gillette JM, Patterson GH, Shroff H, Hess HF, Betzig E, et al. High-
density mapping of single-molecule trajectories with photoactivated localization
microscopy. Nat Methods. 2008;5:155-7.
[126] Sankaran J, Manna M, Guo L, Kraut R, Wohland T. Diffusion, transport, and
cell membrane organization investigated by imaging fluorescence cross-correlation
spectroscopy. Biophys J. 2009;97:2630-9.
[127] Parasassi T, Krasnowska EK, Bagatolli L, Gratton E. Laurdan and Prodan as
polarity-sensitive fluorescent membrane probes. journal of fluorescence. 1998;8:365-
73.
[128] Sund SE, Swanson JA, Axelrod D. Cell membrane orientation visualized by
polarized total internal reflection fluorescence. Biophys J. 1999;77:2266-83.
[129] Colom A, Derivery E, Soleimanpour S, Tomba C, Molin MD, Sakai N, et al. A
fluorescent membrane tension probe. Nat Chem. 2018.
[130] Cicchetti G, Biernacki M, Farquharson J, Allen PG. A ratiometric expressible
FRET sensor for phosphoinositides displays a signal change in highly dynamic
membrane structures in fibroblasts. Biochemistry. 2004;43:1939-49.
[131] Tanimura A, Nezu A, Morita T, Turner RJ, Tojyo Y. Fluorescent biosensor for
quantitative real-time measurements of inositol 1,4,5-trisphosphate in single living
cells. J Biol Chem. 2004;279:38095-8.
[132] Grime JM, Edwards MA, Rudd NC, Unwin PR. Quantitative visualization of
passive transport across bilayer lipid membranes. Proc Natl Acad Sci U S A.
2008;105:14277-82.
[133] Ries RS, Choi H, Blunck R, Bezanilla F, Heath JR. Black lipid membranes:
visualizing the structure, dynamics, and substrate dependence of membranes. The
Journal of Physical Chemistry B. 2004;108:16040-9.
[134] Kocsis I, Sorci M, Vanselous H, Murail S, Sanders SE, Licsandru E, et al.
Oriented chiral water wires in artificial transmembrane channels. Sci Adv.
2018;4:eaao5603.
[135] Bloom M, Evans E, Mouritsen OG. Physical properties of the fluid lipid-bilayer
component of cell membranes: a perspective. Q Rev Biophys. 1991;24:293-397.
[136] Jost PC, Griffith OH. The lipid-protein interface in biological membranes. Ann
N Y Acad Sci. 1980;348:391-407.
[137] Seelig A, Seelig J. Effect of a single cis double bond on the structures of a
phospholipid bilayer. Biochemistry. 1977;16:45-50.
[138] Seelig J, Waespesarcevic N. MOLECULAR ORDER IN CIS AND TRANS
UNSATURATED PHOSPHOLIPID BILAYERS. Biochemistry. 1978;17:3310-5.
ACCEPTED MANUSCRIPT

ACC
EPTE
D M
ANU
SCR
IPT
27
[139] Triba MN, Devaux PF, Warschawski DE. Effects of lipid chain length and
unsaturation on bicelles stability. A phosphorus NMR study. Biophys J.
2006;91:1357-67.
[140] Triba MN, Warschawski DE, Devaux PF. Reinvestigation by phosphorus NMR
of lipid distribution in bicelles. Biophys J. 2005;88:1887-901.
[141] Pastor RW, Venable RM, Feller SE. Lipid bilayers, NMR relaxation, and
computer simulations. Acc Chem Res. 2002;35:438-46.
[142] König S, Sackmann E. Molecular and collective dynamics of lipid bilayers.
Current Opinion in Colloid & Interface Science. 1996;1:78-82.
[143] Berkowitz M. A Molecular Look at Membranes. Current topics in membranes:
Elsevier; 2016. p. 1-25.
[144] Beaugrand M, Arnold AA, Henin J, Warschawski DE, Williamson PT,
Marcotte I. Lipid concentration and molar ratio boundaries for the use of isotropic
bicelles. Langmuir. 2014;30:6162-70.
[145] Benz RW, Castro-Roman F, Tobias DJ, White SH. Experimental validation of
molecular dynamics simulations of lipid bilayers: a new approach. Biophys J.
2005;88:805-17.
[146] Tieleman DP, Marrink S-J, Berendsen HJ. A computer perspective of
membranes: molecular dynamics studies of lipid bilayer systems. Biochimica et
Biophysica Acta (BBA)-Reviews on Biomembranes. 1997;1331:235-70.
[147] Faraldo-Gómez JD, Smith GR, Sansom MS. Setting up and optimization of
membrane protein simulations. European Biophysics Journal. 2002;31:217-27.
[148] Yesylevskyy SO. ProtSqueeze: simple and effective automated tool for setting
up membrane protein simulations. Journal of chemical information and modeling.
2007;47:1986-94.
[149] Javanainen M, Martinez-Seara H. Efficient preparation and analysis of
membrane and membrane protein systems. Biochim Biophys Acta. 2016;1858:2468-
82.
[150] Humphrey W, Dalke A, Schulten K. VMD: visual molecular dynamics. J Mol
Graph. 1996;14:33-8, 27-8.
[151] Jo S, Lim JB, Klauda JB, Im W. CHARMM-GUI Membrane Builder for mixed
bilayers and its application to yeast membranes. Biophysical journal. 2009;97:50-8.
[152] Jo S, Kim T, Im W. Automated builder and database of protein/membrane
complexes for molecular dynamics simulations. PloS one. 2007;2:e880.
[153] Wu EL, Cheng X, Jo S, Rui H, Song KC, Dávila‐Contreras EM, et al.
CHARMM‐GUI membrane builder toward realistic biological membrane simulations.
Journal of computational chemistry. 2014;35:1997-2004.
[154] Sommer B. Membrane packing problems: a short review on computational
membrane modeling methods and tools. Computational and structural biotechnology
journal. 2013;5:e201302014.
[155] Sommer Br, Dingersen T, Gamroth C, Schneider SE, Rubert S, Kruger J, et al.
CELLmicrocosmos 2.2 MembraneEditor: a modular interactive shape-based software
approach to solve heterogeneous membrane packing problems. Journal of chemical
information and modeling. 2011;51:1165-82.
ACCEPTED MANUSCRIPT

ACC
EPTE
D M
ANU
SCR
IPT
28
[156] Bovigny C, Tamo G, Lemmin T, Maïno N, Dal Peraro M. LipidBuilder: a
framework to build realistic models for biological membranes. ACS Publications;
2015.
[157] Wassenaar TA, Ingolfsson HI, Bockmann RA, Tieleman DP, Marrink SJ.
Computational lipidomics with insane: a versatile tool for generating custom
membranes for molecular simulations. Journal of chemical theory and computation.
2015;11:2144-55.
[158] Wen PC, Mahinthichaichan P, Trebesch N, Jiang T, Zhao Z, Shinn E, et al.
Microscopic view of lipids and their diverse biological functions. Curr Opin Struct
Biol. 2018;51:177-86.
[159] Parkin J, Chavent M, Khalid S. Molecular Simulations of Gram-Negative
Bacterial Membranes: A Vignette of Some Recent Successes. Biophys J.
2015;109:461-8.
[160] Ingolfsson HI, Carpenter TS, Bhatia H, Bremer PT, Marrink SJ, Lightstone FC.
Computational Lipidomics of the Neuronal Plasma Membrane. Biophys J.
2017;113:2271-80.
[161] Ingolfsson HI, Melo MN, van Eerden FJ, Arnarez C, Lopez CA, Wassenaar TA,
et al. Lipid organization of the plasma membrane. J Am Chem Soc. 2014;136:14554-
9.
[162] Sharma S, Kim BN, Stansfeld PJ, Sansom MS, Lindau M. A Coarse Grained
Model for a Lipid Membrane with Physiological Composition and Leaflet
Asymmetry. PLoS One. 2015;10:e0144814.
[163] Stansfeld PJ. Computational studies of membrane proteins: from sequence to
structure to simulation. Current opinion in structural biology. 2017;45:133-41.
[164] Stansfeld PJ, Goose JE, Caffrey M, Carpenter EP, Parker JL, Newstead S, et al.
MemProtMD: Automated Insertion of Membrane Protein Structures into Explicit
Lipid Membranes. Structure. 2015;23:1350-61.
[165] Vanni S, Hirose H, Barelli H, Antonny B, Gautier R. A sub-nanometre view of
how membrane curvature and composition modulate lipid packing and protein
recruitment. Nature communications. 2014;5:4916.
[166] Vamparys L, Gautier R, Vanni S, Bennett WD, Tieleman DP, Antonny B, et al.
Conical lipids in flat bilayers induce packing defects similar to that induced by
positive curvature. Biophysical journal. 2013;104:585-93.
[167] Im W, Liang J, Olson A, Zhou H-X, Vajda S, Vakser IA. Challenges in
structural approaches to cell modeling. Journal of molecular biology. 2016;428:2943-
64.
[168] Johnson GT, Autin L, Al-Alusi M, Goodsell DS, Sanner MF, Olson AJ.
cellPACK: a virtual mesoscope to model and visualize structural systems biology.
Nature methods. 2014;12:85.
[169] Johnson GT, Goodsell DS, Autin L, Forli S, Sanner MF, Olson AJ. 3D
molecular models of whole HIV-1 virions generated with cellPACK. Faraday
discussions. 2014;169:23-44.
[170] Ingólfsson HI, Arnarez C, Periole X, Marrink SJ. Computational
‘microscopy’of cellular membranes. J Cell Sci. 2016:jcs. 176040.
ACCEPTED MANUSCRIPT

ACC
EPTE
D M
ANU
SCR
IPT
29
[171] Sommer B, Bender C, Hoppe T, Gamroth C, Jelonek L. Stereoscopic cell
visualization: from mesoscopic to molecular scale. Journal of Electronic Imaging.
2014;23:011007.
[172] Biere N, Ghaffar M, Doebbe A, Jäger D, Rothe N, Friedrich BM, et al.
Heuristic modeling and 3D stereoscopic visualization of a Chlamydomonas
reinhardtii cell. Journal of integrative bioinformatics. 2018;15.
[173] Klein T, Autin L, Kozlíková B, Goodsell DS, Olson A, Gröller ME, et al.
Instant Construction and Visualization of Crowded Biological Environments. IEEE
transactions on visualization and computer graphics. 2018;24:862-72.
[174] Aksimentiev A, Schulten K. Imaging alpha-hemolysin with molecular
dynamics: Ionic conductance, osmotic permeability, and the electrostatic potential
map. Biophysical Journal. 2005;88:3745-61.
[175] Gullingsrud J, Schulten K. Lipid bilayer pressure profiles and mechanosensitive
channel gating. Biophysical Journal. 2004;86:3496-509.
[176] Klauda JB, Venable RM, Freites JA, O'Connor JW, Tobias DJ, Mondragon-
Ramirez C, et al. Update of the CHARMM all-atom additive force field for lipids:
validation on six lipid types. J Phys Chem B. 2010;114:7830-43.
[177] Poger D, Van Gunsteren WF, Mark AE. A new force field for simulating
phosphatidylcholine bilayers. J Comput Chem. 2010;31:1117-25.
[178] Ulmschneider JP, Ulmschneider MB. United Atom Lipid Parameters for
Combination with the Optimized Potentials for Liquid Simulations All-Atom Force
Field. J Chem Theory Comput. 2009;5:1803-13.
[179] Dickson CJ, Madej BD, Skjevik AA, Betz RM, Teigen K, Gould IR, et al.
Lipid14: The Amber Lipid Force Field. J Chem Theory Comput. 2014;10:865-79.
[180] Piggot TJ, Pineiro A, Khalid S. Molecular Dynamics Simulations of
Phosphatidylcholine Membranes: A Comparative Force Field Study. J Chem Theory
Comput. 2012;8:4593-609.
[181] Ingolfsson HI, Lopez CA, Uusitalo JJ, de Jong DH, Gopal SM, Periole X, et al.
The power of coarse graining in biomolecular simulations. Wiley Interdiscip Rev
Comput Mol Sci. 2014;4:225-48.
[182] Marrink SJ, de Vries AH, Tieleman DP. Lipids on the move: simulations of
membrane pores, domains, stalks and curves. Biochim Biophys Acta. 2009;1788:149-
68.
[183] Lindahl E, Sansom MS. Membrane proteins: molecular dynamics simulations.
Curr Opin Struct Biol. 2008;18:425-31.
[184] Khalili-Araghi F, Gumbart J, Wen PC, Sotomayor M, Tajkhorshid E, Schulten
K. Molecular dynamics simulations of membrane channels and transporters. Curr
Opin Struct Biol. 2009;19:128-37.
[185] Stansfeld PJ, Sansom MS. Molecular simulation approaches to membrane
proteins. Structure. 2011;19:1562-72.
[186] Bennett WF, Tieleman DP. Computer simulations of lipid membrane domains.
Biochim Biophys Acta. 2013;1828:1765-76.
[187] Perilla JR, Goh BC, Cassidy CK, Liu B, Bernardi RC, Rudack T, et al.
Molecular dynamics simulations of large macromolecular complexes. Current opinion
in structural biology. 2015;31:64-74.
ACCEPTED MANUSCRIPT

ACC
EPTE
D M
ANU
SCR
IPT
30
[188] Chavent M, Duncan AL, Sansom MS. Molecular dynamics simulations of
membrane proteins and their interactions: from nanoscale to mesoscale. Current
opinion in structural biology. 2016;40:8-16.
[189] Baaden M, Lavery R. There’s plenty of room in the middle: multi-scale
modelling of biological systems. Recent Adv In Structural Bioinformatics, Research
Signpost India, AG de Brevern, ed. 2007.
[190] van Eerden FJ, de Jong DH, de Vries AH, Wassenaar TA, Marrink SJ.
Characterization of thylakoid lipid membranes from cyanobacteria and higher plants
by molecular dynamics simulations. Biochimica et Biophysica Acta (BBA)-
Biomembranes. 2015;1848:1319-30.
[191] Wu EL, Fleming PJ, Yeom MS, Widmalm G, Klauda JB, Fleming KG, et al. E.
coli outer membrane and interactions with OmpLA. Biophys J. 2014;106:2493-502.
[192] Azimzadeh Irani M. Correlation between experimentally indicated and
atomistically simulated roles of EGFR N-glycosylation. Molecular Simulation.
2018;44:743-8.
[193] Wendoloski J, Kimatian S, Schutt C, Salemme F. Molecular dynamics
simulation of a phospholipid micelle. Science. 1989;243:636-8.
[194] Venable RM, Zhang Y, Hardy BJ, Pastor RW. Molecular dynamics simulations
of a lipid bilayer and of hexadecane: an investigation of membrane fluidity. Science.
1993;262:223-6.
[195] Smit B, Hilbers P, Esselink K, Rupert L, Van Os N, Schlijper A. Computer
simulations of a water/oil interface in the presence of micelles. Nature. 1990;348:624.
[196] Lindahl E, Edholm O. Mesoscopic undulations and thickness fluctuations in
lipid bilayers from molecular dynamics simulations. Biophys J. 2000;79:426-33.
[197] Marrink S, Mark A. Effect of undulations on surface tension in simulated
bilayers. The Journal of Physical Chemistry B. 2001;105:6122-7.
[198] Sharma P. Entropic force between membranes reexamined. Proceedings of the
National Academy of Sciences. 2013;110:1976-7.
[199] Woolf TB, Roux B. Molecular dynamics simulation of the gramicidin channel
in a phospholipid bilayer. Proc Natl Acad Sci U S A. 1994;91:11631-5.
[200] Samsudin F, Boags A, Piggot TJ, Khalid S. Braun’s Lipoprotein Facilitates
OmpA Interaction with the Escherichia coli Cell Wall. Biophysical journal.
2017;113:1496-504.
[201] Tarek M. Membrane electroporation: a molecular dynamics simulation.
Biophys J. 2005;88:4045-53.
[202] Man VH, Truong PM, Li MS, Wang J, Van-Oanh NT, Derreumaux P, et al.
Molecular Mechanism of the Cell Membrane Pore Formation Induced by Bubble
Stable Cavitation. J Phys Chem B. 2018.
[203] Fu H, Comer J, Cai W, Chipot C. Sonoporation at Small and Large Length
Scales: Effect of Cavitation Bubble Collapse on Membranes. J Phys Chem Lett.
2015;6:413-8.
[204] Chandler DE, Strumpfer J, Sener M, Scheuring S, Schulten K. Light harvesting
by lamellar chromatophores in Rhodospirillum photometricum. Biophys J.
2014;106:2503-10.
ACCEPTED MANUSCRIPT

ACC
EPTE
D M
ANU
SCR
IPT
31
[205] Saiz L, Klein ML. Computer simulation studies of model biological
membranes. Acc Chem Res. 2002;35:482-9.
[206] Schneider AR, Geissler PL. Coarse-grained computer simulation of dynamics in
thylakoid membranes: methods and opportunities. Front Plant Sci. 2013;4:555.
[207] Marrink SJ, Tieleman DP. Perspective on the Martini model. Chemical Society
Reviews. 2013;42:6801-22.
[208] Ayton GS, Noid WG, Voth GA. Multiscale modeling of biomolecular systems:
in serial and in parallel. Curr Opin Struct Biol. 2007;17:192-8.
[209] Shinoda W, DeVane R, Klein ML. Computer simulation studies of self-
assembling macromolecules. Curr Opin Struct Biol. 2012;22:175-86.
[210] Orsi M, Essex JW. The ELBA force field for coarse-grain modeling of lipid
membranes. PLoS One. 2011;6:e28637.
[211] Shinoda W, DeVane R, Klein ML. Zwitterionic lipid assemblies: molecular
dynamics studies of monolayers, bilayers, and vesicles using a new coarse grain force
field. J Phys Chem B. 2010;114:6836-49.
[212] Marrink SJ, De Vries AH, Mark AE. Coarse grained model for semiquantitative
lipid simulations. The Journal of Physical Chemistry B. 2004;108:750-60.
[213] Bond PJ, Sansom MS. Insertion and assembly of membrane proteins via
simulation. J Am Chem Soc. 2006;128:2697-704.
[214] Bond PJ, Holyoake J, Ivetac A, Khalid S, Sansom MS. Coarse-grained
molecular dynamics simulations of membrane proteins and peptides. Journal of
structural biology. 2007;157:593-605.
[215] Izvekov S, Voth GA. A multiscale coarse-graining method for biomolecular
systems. J Phys Chem B. 2005;109:2469-73.
[216] Ackerman DG, Feigenson GW. Multiscale modeling of four-component lipid
mixtures: domain composition, size, alignment, and properties of the phase interface.
The Journal of Physical Chemistry B. 2015;119:4240-50.
[217] Parton DL, Tek A, Baaden M, Sansom MS. Formation of raft-like assemblies
within clusters of influenza hemagglutinin observed by MD simulations. PLoS
Comput Biol. 2013;9:e1003034.
[218] Risselada HJ, Kutzner C, Grubmuller H. Caught in the act: visualization of
SNARE-mediated fusion events in molecular detail. Chembiochem. 2011;12:1049-55.
[219] Marrink SJ, Mark AE. The mechanism of vesicle fusion as revealed by
molecular dynamics simulations. Journal of the American Chemical Society.
2003;125:11144-5.
[220] Durrieu MP, Bond PJ, Sansom MS, Lavery R, Baaden M. Coarse-grain
simulations of the R-SNARE fusion protein in its membrane environment detect long-
lived conformational sub-states. Chemphyschem. 2009;10:1548-52.
[221] Kasson PM, Kelley NW, Singhal N, Vrljic M, Brunger AT, Pande VS.
Ensemble molecular dynamics yields submillisecond kinetics and intermediates of
membrane fusion. Proc Natl Acad Sci U S A. 2006;103:11916-21.
[222] Baoukina S, Marrink SJ, Tieleman DP. Molecular structure of membrane
tethers. Biophys J. 2012;102:1866-71.
ACCEPTED MANUSCRIPT

ACC
EPTE
D M
ANU
SCR
IPT
32
[223] Hsu P-C, Samsudin F, Shearer J, Khalid S. It Is Complicated: Curvature,
Diffusion, and Lipid Sorting within the Two Membranes of Escherichia coli. The
journal of physical chemistry letters. 2017;8:5513-8.
[224] Reddy T, Sansom MS. The Role of the Membrane in the Structure and
Biophysical Robustness of the Dengue Virion Envelope. Structure. 2016;24:375-82.
[225] Reddy T, Sansom MS. Computational virology: From the inside out. Biochim
Biophys Acta. 2016;1858:1610-8.
[226] Reddy T, Shorthouse D, Parton DL, Jefferys E, Fowler PW, Chavent M, et al.
Nothing to sneeze at: a dynamic and integrative computational model of an influenza
A virion. Structure. 2015;23:584-97.
[227] Izvekov S, Voth GA. Solvent-free lipid bilayer model using multiscale coarse-
graining. The Journal of Physical Chemistry B. 2009;113:4443-55.
[228] Arnarez C, Uusitalo JJ, Masman MF, Ingolfsson HI, de Jong DH, Melo MN, et
al. Dry Martini, a coarse-grained force field for lipid membrane simulations with
implicit solvent. J Chem Theory Comput. 2015;11:260-75.
[229] Wang Z-J, Deserno M. A systematically coarse-grained solvent-free model for
quantitative phospholipid bilayer simulations. The Journal of Physical Chemistry B.
2010;114:11207-20.
[230] Brannigan G, Lin LCL, Brown FLH. Implicit solvent simulation models for
biomembranes. Eur Biophys J Biophys Lett. 2006;35:104-24.
[231] Zgorski A, Lyman E. Toward Hydrodynamics with Solvent Free Lipid Models:
STRD Martini. Biophysical journal. 2016;111:2689-97.
[232] Sterpone F, Melchionna S, Tuffery P, Pasquali S, Mousseau N, Cragnolini T, et
al. The OPEP protein model: from single molecules, amyloid formation, crowding
and hydrodynamics to DNA/RNA systems. Chem Soc Rev. 2014;43:4871-93.
[233] Chavent M, Duncan AL, Rassam P, Birkholz O, Hélie J, Reddy T, et al. How
nanoscale protein interactions determine the mesoscale dynamic organisation of
bacterial outer membrane proteins. Nature communications. 2018;9.
[234] Fowler PW, Hélie J, Duncan A, Chavent M, Koldsø H, Sansom MS. Membrane
stiffness is modified by integral membrane proteins. Soft Matter. 2016;12:7792-803.
[235] Koldsø H, Sansom MS. Organization and dynamics of receptor proteins in a
plasma membrane. Journal of the American Chemical Society. 2015;137:14694-704.
[236] Periole X, Knepp AM, Sakmar TP, Marrink SJ, Huber T. Structural
determinants of the supramolecular organization of G protein-coupled receptors in
bilayers. J Am Chem Soc. 2012;134:10959-65.
[237] Lu L, Voth GA. Systematic coarse-graining of a multicomponent lipid bilayer. J
Phys Chem B. 2009;113:1501-10.
[238] Vogele M, Hummer G. Divergent Diffusion Coefficients in Simulations of
Fluids and Lipid Membranes. J Phys Chem B. 2016;120:8722-32.
[239] Grime JM, Voth GA. Highly scalable and memory efficient ultra-coarse-
grained molecular dynamics simulations. Journal of chemical theory and computation.
2013;10:423-31.
[240] Madsen JJ, Sinitskiy AV, Li J, Voth GA. Highly Coarse-Grained
Representations of Transmembrane Proteins. J Chem Theory Comput. 2017;13:935-
44.
ACCEPTED MANUSCRIPT

ACC
EPTE
D M
ANU
SCR
IPT
33
[241] Arkhipov A, Yin Y, Schulten K. Four-scale description of membrane sculpting
by BAR domains. Biophys J. 2008;95:2806-21.
[242] Yu H, Schulten K. Membrane sculpting by F-BAR domains studied by
molecular dynamics simulations. PLoS Comput Biol. 2013;9:e1002892.
[243] Shillcock JC, Lipowsky R. The computational route from bilayer membranes to
vesicle fusion. Journal of Physics: Condensed Matter. 2006;18:S1191.
[244] Shillcock JC, Lipowsky R. Tension-induced fusion of bilayer membranes and
vesicles. Nature materials. 2005;4:225.
[245] Tanizaki S, Feig M. A generalized Born formalism for heterogeneous dielectric
environments: application to the implicit modeling of biological membranes. The
Journal of chemical physics. 2005;122:124706.
[246] Schneider AR, Geissler PL. Coexistence of fluid and crystalline phases of
proteins in photosynthetic membranes. Biophysical journal. 2013;105:1161-70.
[247] Shi Q, Voth GA. Multi-scale modeling of phase separation in mixed lipid
bilayers. Biophys J. 2005;89:2385-94.
[248] Brown FL. Elastic modeling of biomembranes and lipid bilayers. Annu Rev
Phys Chem. 2008;59:685-712.
[249] Lin LC-L, Brown FL. Brownian dynamics in Fourier space: membrane
simulations over long length and time scales. Physical review letters.
2004;93:256001.
[250] Brown FL. Regulation of protein mobility via thermal membrane undulations.
Biophysical journal. 2003;84:842-53.
[251] West B, Brown FL, Schmid F. Membrane-protein interactions in a generic
coarse-grained model for lipid bilayers. Biophys J. 2009;96:101-15.
[252] Mauer J, Peltomaki M, Poblete S, Gompper G, Fedosov DA. Static and
dynamic light scattering by red blood cells: A numerical study. PLoS One.
2017;12:e0176799.
[253] Gompper G, Kroll D. Triangulated-surface models of fluctuating membranes.
Statistical mechanics of membranes and surfaces: World Scientific; 2004. p. 359-426.
[254] Telenius J, Vattulainen I, Monticelli L. Visualization of Complex Processes in
Lipid Systems Using Computer Simulations and Molecular Graphics. Lipidomics:
Springer; 2009. p. 317-38.
[255] Gapsys V, de Groot BL, Briones R. Computational analysis of local membrane
properties. J Comput Aided Mol Des. 2013;27:845-58.
[256] Darre L, Tek A, Baaden M, Pantano S. Mixing atomistic and coarse grain
solvation models for MD simulations: let WT4 handle the bulk. Journal of chemical
theory and computation. 2012;8:3880-94.
[257] Chavent M, Reddy T, Goose J, Dahl AC, Stone JE, Jobard B, et al.
Methodologies for the analysis of instantaneous lipid diffusion in MD simulations of
large membrane systems. Faraday Discuss. 2014;169:455-75.
[258] Lv Z, Tek A, Da Silva F, Empereur-mot C, Chavent M, Baaden M. Game on,
science - how video game technology may help biologists tackle visualization
challenges. PLoS One. 2013;8:e57990.
[259] Lelimousin M, Sansom MS. Membrane perturbation by carbon nanotube
insertion: pathways to internalization. Small. 2013;9:3639-46.
ACCEPTED MANUSCRIPT

ACC
EPTE
D M
ANU
SCR
IPT
34
[260] Perez S, Tubiana T, Imberty A, Baaden M. Three-dimensional representations
of complex carbohydrates and polysaccharides--SweetUnityMol: a video game-based
computer graphic software. Glycobiology. 2015;25:483-91.
[261] Andrei RM, Callieri M, Zini MF, Loni T, Maraziti G, Pan MC, et al. Intuitive
representation of surface properties of biomolecules using BioBlender. BMC
bioinformatics. 2012;13:S16.
[262] Catoire LJ, Damian M, Baaden M, Guittet E, Baneres JL. Electrostatically-
driven fast association and perdeuteration allow detection of transferred cross-
relaxation for G protein-coupled receptor ligands with equilibrium dissociation
constants in the high-to-low nanomolar range. J Biomol NMR. 2011;50:191-5.
[263] Lukat G, Kruger J, Sommer Br. APL@ Voro: A voronoi-based membrane
analysis tool for GROMACS trajectories. Journal of chemical information and
modeling. 2013;53:2908-25.
[264] Allen WJ, Lemkul JA, Bevan DR. GridMAT‐MD: a grid‐based membrane
analysis tool for use with molecular dynamics. Journal of computational chemistry.
2009;30:1952-8.
[265] Guixa-Gonzalez R, Rodriguez-Espigares I, Ramirez-Anguita JM, Carrio-Gaspar
P, Martinez-Seara H, Giorgino T, et al. MEMBPLUGIN: studying membrane
complexity in VMD. Bioinformatics. 2014;30:1478-80.
[266] Buchoux S. FATSLiM: a fast and robust software to analyze MD simulations of
membranes. Bioinformatics. 2016;33:133-4.
[267] Michaud‐Agrawal N, Denning EJ, Woolf TB, Beckstein O. MDAnalysis: a
toolkit for the analysis of molecular dynamics simulations. Journal of computational
chemistry. 2011;32:2319-27.
[268] Vanni S, Vamparys L, Gautier R, Drin G, Etchebest C, Fuchs PF, et al.
Amphipathic lipid packing sensor motifs: probing bilayer defects with hydrophobic
residues. Biophysical journal. 2013;104:575-84.
[269] Jefferys E, Sansom MS, Fowler PW. NRas slows the rate at which a model lipid
bilayer phase separates. Faraday Discuss. 2014;169:209-23.
[270] Dahl AC, Chavent M, Sansom MS. Bendix: intuitive helix geometry analysis
and abstraction. Bioinformatics. 2012;28:2193-4.
[271] Esque J, Sansom MSP, Baaden M, Oguey C. Analyzing protein topology based
on Laguerre tessellation of a pore-traversing water network. Sci Rep. 2018;8:13540.
[272] Rosevear F. Liquid crystals: the mesomorphic phases of surfactant
compositions. J Soc Cosmet Chem. 1968;19:581-94.
[273] Steck TL. The organization of proteins in the human red blood cell membrane.
A review. J Cell Biol. 1974;62:1-19.
[274] Lee AG. How lipids affect the activities of integral membrane proteins.
Biochim Biophys Acta. 2004;1666:62-87.
[275] Jain MK, White HB, 3rd. Long-range order in biomembranes. Adv Lipid Res.
1977;15:1-60.
[276] Galla HJ, Hartmann W, Theilen U, Sackmann E. On two-dimensional passive
random walk in lipid bilayers and fluid pathways in biomembranes. J Membr Biol.
1979;48:215-36.
ACCEPTED MANUSCRIPT

ACC
EPTE
D M
ANU
SCR
IPT
35
[277] Zoppe M. Towards a perceptive understanding of size in cellular biology. Nat
Methods. 2017;14:662-5.
[278] Iwasa JH. Bringing macromolecular machinery to life using 3D animation.
Current opinion in structural biology. 2015;31:84-8.
[279] McGill G. Molecular movies… coming to a lecture near you. Cell.
2008;133:1127-32.
[280] Iwasa JH. Animating the model figure. Trends in cell biology. 2010;20:699-
704.
[281] Johnson GT, Autin L, Goodsell DS, Sanner MF, Olson AJ. ePMV embeds
molecular modeling into professional animation software environments. Structure.
2011;19:293-303.
[282] Andrei R, Pan C, Zoppè M. BioBlender: Blender for Biologists. BlenderArt
Magazine. 2010;31:27-32.
[283] Ghaffar M, Biere N, Jäger D, Klein K, Schreiber F, Kruse O, et al. 3D
modelling and visualisation of heterogeneous cell membranes in Blender.
Proceedings of the 11th International Symposium on Visual Information
Communication and Interaction: ACM; 2018. p. 64-71.
[284] Le Muzic M, Autin L, Parulek J, Viola I. cellVIEW: a tool for illustrative and
multi-scale rendering of large biomolecular datasets. Eurographics Workshop on
Visual Computing for Biomedicine: NIH Public Access; 2015. p. 61.
[285] Goodsell DS, Johnson GT. Filling in the gaps: artistic license in education and
outreach. PLoS Biology. 2007;5:e308.
[286] Goodsell DS. Visual methods from atoms to cells. Structure. 2005;13:347-54.
[287] Goodsell DS. Illustrating the machinery of life: Viruses. Biochemistry and
Molecular Biology Education. 2012;40:291-6.
[288] Goodsell D. Cellular Landscapes in Watercolor. Journal of Biocommunication.
2016;40.
[289] Goodsell DS. Eukaryotic cell panorama. Biochemistry and Molecular Biology
Education. 2011;39:91-101.
[290] Goodsell DS. Escherichia coli. Biochemistry and Molecular Biology Education.
2009;37:325-32.
[291] Gramling C. Illustration. Science. 2005;309:1990-.
[292] Johnson GT, Hertig S. A guide to the visual analysis and communication of
biomolecular structural data. Nature Reviews Molecular Cell Biology. 2014;15:690.
[293] Engholm DH, Kilian M, Goodsell DS, Andersen ES, Kjærgaard RS. A visual
review of the human pathogen Streptococcus pneumoniae. FEMS microbiology
reviews. 2017;41:854-79.
[294] Zimmer C. Watch Proteins Do the Jitterbug. New York Times. 2014;10.
[295] Rundgren CJ, Tibell LAE. CRITICAL FEATURES OF VISUALIZATIONS
OF TRANSPORT THROUGH THE CELL MEMBRANE-AN EMPIRICAL STUDY
OF UPPER SECONDARY AND TERTIARY STUDENTS' MEANING-MAKING
OF A STILL IMAGE AND AN ANIMATION. Int J Sci Math Educ. 2010;8:223-46.
[296] Jenkinson J, McGill G. Visualizing Protein Interactions and Dynamics:
Evolving a Visual Language for Molecular Animation. CBE-Life Sci Educ.
2012;11:103-10.
ACCEPTED MANUSCRIPT

ACC
EPTE
D M
ANU
SCR
IPT
36
[297] Cooper AK, Oliver-Hoyo MT. Creating 3D Physical Models to Probe Student
Understanding of Macromolecular Structure. Biochemistry and Molecular Biology
Education. 2017;45:491-500.
[298] Baaden M, Delalande O, Ferey N, Pasquali S, Waldispuhl J, Taly A. Ten simple
rules to create a serious game, illustrated with examples from structural biology.
PLoS Comput Biol. 2018;14:e1005955.
[299] Yuen D, Cartwright S, Jacob C, Acm. Eukaryo: Virtual Reality Simulation of a
Cell. New York: Assoc Computing Machinery; 2016.
[300] Sommer B, Baaden M, Krone M, Woods A. From Virtual Reality to Immersive
Analytics in Bioinformatics. Journal of integrative bioinformatics. 2018;15.
[301] Trellet M, Ferey N, Flotyński J, Baaden M, Bourdot P. Semantics for an
integrative and immersive pipeline combining visualization and analysis of molecular
data. Journal of integrative bioinformatics. 2018;15.
[302] Maes A, Martinez X, Druart K, Laurent B, Guégan S, Marchand CH, et al.
MinOmics, an Integrative and Immersive Tool for Multi-Omics Analysis. Journal of
integrative bioinformatics. 2018.
[303] Hirst JD, Glowacki DR, Baaden M. Molecular simulations and visualization:
introduction and overview. Faraday discussions. 2014;169:9-22.
[304] Doutreligne S, Cragnolini T, Pasquali S, Derreumaux P, Baaden M. UnityMol:
Interactive scientific visualization for integrative biology. Large Data Analysis and
Visualization (LDAV), 2014 IEEE 4th Symposium on: IEEE; 2014. p. 109-10.
[305] Bunnell TM, Jaeger MA, Fitzsimons DP, Prins KW, Ervasti JM. Destabilization
of the dystrophin-glycoprotein complex without functional deficits in alpha-
dystrobrevin null muscle. PLoS One. 2008;3:e2604.
[306] Edidin M. Lipids on the frontier: a century of cell-membrane bilayers. Nat Rev
Mol Cell Biol. 2003;4:414-8.
Figure Captions
Figure 1. Colorized Scanning Electron Micrograph showing the internal
structure of a single neuron. The membranes of the endoplasmic reticulum are
bright green. The ER and other parts of the cell are covered in membrane bound cyto-
plasmic proteins and ribosomes, which are blue. The Golgi complexes are a dull
green, their products, lysosomes and vesicles, are yellow. The mitochondria are red.
The outer membrane of the cell is turquoise. Microscopy and image processing:
James Tyrwhitt-Drake, UVic AMF. Sample preparation: Dr. Patrick Nahirney, UVic
Medical Sciences. See also: http://gigapan.com/gigapans/147187.
Figure 2. Visualization of lipid bilayer structural properties. A: Neutron scat-
tering density profile of a fluid dioleoylphosphatidylcholine bilayer determined by
joint refinement of X-ray and neutron diffraction data [44]. B: electron density map of
the ripple phase in lecithin bilayers [46]. Image copyright 1996 National Academy of
Sciences. C: AFM image of the surface of a DMPG membrane; the image is 2.4 x 3.0
nm2, its height about 0.05 nm [47]. D: Membrane remodeling by the melittin peptide
ACCEPTED MANUSCRIPT

ACC
EPTE
D M
ANU
SCR
IPT
37
showing a gross disruption at high peptide concentration [48]. E: sphyingomyelin
rafts protruding from a DOPC background with an almost exclusively raft-associated
glycosylphosphatidylinositol-anchored protein shown as yellow peaks [49].
Figure 3 : Cell-integral biological objects formed by membranes. A: Transmis-
sion electron microscopy (TEM) of stained lipid bilayers depicting the Golgi appa-
ratus [62]. B: fenestrations in the Golgi (from C. Hopkins and J. Burden, Imperial
College London) [58]. C: Tubule on endosomes (from P. Luzio and N. Bright, Uni-
versity of Utah) [58]. D: HIV-1 viral budding (from W. Sundquist and U. von
Schwedler, University of Utah) [58]. E: An onion root tip shown with etching and
featuring the surfaces of the cytoplasmic matrix (CM), vacuolar contents (VC), vac-
uolar membrane faces (VF), spherosomes (S), nuclear membrane (N) and endoplas-
mic reticulum (ER) [59]. F: Caveolae in the plasma membrane of a fibroblast from
ref. [61], Fig. 1. G: TEM image highlighting mitochondrial membranes [62]. H: Sec-
tion of an isolated mitochondrial membrane with a three-layered structure and small
particles attached [63]. I: Cryo-electron microscopy of vitreous sections (CEMOVIS)
of the cell envelope of mycobacteria smegmatis featuring plasma membrane (PM),
inner wall zone (IWZ), medial wall zone (MWZ), granular layer (GL) and outer
membrane (OM) [64].
Figure 4 : Insight on biological membranes through characteristic protein
structures. A: Protein associations in the erythrocyte membrane skeleton, in particu-
lar junctional complexes involving spectrin [66]. B: Hemagglutinin protein clusters in
live cells obtained by fluorescence photoactivation localization microscopy (FPALM)
[67]. Copyright 2007 National Academy of Sciences. C: TEM image of hemaggluti-
nin clusters in fibroblast membrane sheets [67]. Copyright 2007 National Academy of
Sciences. D: Dystrophin organization on the sarcolemma [305]. E: Actin network
influence on lipid phases in model membranes [70].
Figure 5 : Near atomic scale insights on membrane objects. A: Three-
dimensional potential map spanning the purple membrane obtained by electron mi-
croscopy [9]. B: A model of a single bacteriorhodopsin molecule constituting the
purple membrane [9]. C: Crystal structure highlighting protein, lipid and water organ-
ization in the purple membrane [71]. D: Cytoplasmic surface of the purple membrane
showing individual bacteriorhodopsin molecules at subnanometer resolution [72]. E:
Force-induced conformational change of bacteriorhodopsin surface loops [73]. F:
Negatively stained EM of arc- and ring-shaped suilysin oligomer assemblies that per-
forate a liposome membrane [81]. G: AFM topography of suilysin on a supported
lipid bilayer [81]. H: Detailed AFM topography of a complete suilysin ring [81]. I: A
suilysin arc only partially enclosing the dark hole in the membrane [81].
Figure 6 : Towards membrane machinery at a larger scale and in 3 dimen-
sions. A: Scanning electron microscope image by Tina Carvalho, University of Ha-
waii at Manoa depicting a nerve ending. It reveals vesicles shown in orange and blue
color. Image under a CC-BY-NC-SA license. B: A rendered 3D model of a distorted
ACCEPTED MANUSCRIPT

ACC
EPTE
D M
ANU
SCR
IPT
38
liposome interacting with fibrils and surrounded by small vesicles [83]. C: The actin
cytoskeleton of a eukaryotic cell visualized by cryoelectron tomography, here zoom-
ing in on the actin-membrane interaction [26]. D: Two docked mitochondria (red) at
an intermediate stage of outer membrane fusion with an apparent toroidal pore of 40
nm diameter [85]. The blue volumes at the interface are attributed to a docking ring,
possibly formed by mitofusin protein assemblies. E: Tomographic reconstruction of a
S. cerevisiae cell with a portion of the cell wall in magenta, mitochondrion in green,
ER in orange. Reprinted with permission from [27]. Copyright 2017 American Chem-
ical Society.
Figure 7 : Reporting on membrane dynamics by tracking individual molecules
or domains. A: Single molecule microscopic visualization of lipid microdomains in a
muscle cell membrane [88]. B: Following molecules in a confocal microscope is lim-
ited in detail due to the large detection area [89]. C: STED is able to discriminate
between freely diffusing and hindered lipids due to its small subdiffraction spot size
[89]. D: The image depicts the trajectories of individual potassium channels shown in
cyan overlaid on an actin PALM image shown in red [90], scale bar is 2 micrometer.
E: Enlargement of two areas of panel D illustrating confinement in a large compart-
ment (left) and hopping between two compartments (right) [90], scale is x4 compared
to panel D.
Figure 8 : (High-speed) AFM tracking of membrane processes. A: Real-time
imaging of drug-membrane interactions [95]. B: Real-time imaging of the prepore-to-
pore transition by suilysin with prepore intermediates appearing as diffuse streaks in
the top panel, becoming more clearly defined in the center panel, leading to the pore
state shown on the bottom [81]. C: High-speed AFM of the outer membrane protein F
extends timescale resolution to hundreds of microseconds [96]. D: Membrane tubule
constriction through the dynamin helix related to membrane fission [97] . E: Kymo-
graph illustrating morphological changes of the dynamin helix along the tubule axis
depending on GTP treatment or not [97].
Figure 9 : Membrane building tools. A: Molecular system representing a typical
gram-negative bacterial outer membrane with lipopolysaccharide [167]. B: Building
an outer mitochondrial membrane model with the CELLmicrocosmos MembraneEdi-
tor. Reprinted with permission from [155]. Copyright 2011 American Chemical Soci-
ety. C: Setting up a cytochrome bc1 complex in a hexagonal prism within a 5-
component bilayer. Reprinted with permission from [157]. Copyright 2015 American
Chemical Society. Views are from the side, from the bottom and overviewing the
lattice. D: Result of applying a cellPACK recipe for stochastic packing of a whole
HIV-1 virion model in its envelope [169] - published by The Royal Society of Chem-
istry. E: Modeling the Golgi apparatus in 3D from freeze-fracture SEM data [172].
On the left a cut model highlighting cleaved surfaces as in an SEM image. In the mid-
dle the 3D model, on the left rendering with final material.
ACCEPTED MANUSCRIPT

ACC
EPTE
D M
ANU
SCR
IPT
39
Figure 10 : Molecular model of an average synaptic vesicle. An outside view of
the vesicle based on space-filling models of all macromolecules at near atomic resolu-
tion [34].
Figure 11. Atomistic molecular simulation examples. A: Simulation of the gel
phase of the POPC bilayer. Reprinted with permission from [12]. Copyright 1993
American Chemical Society. B: Gramicidin A channel in a 1:8 ratio simulation in
DMPC [19]. C: Membrane protein simulation snapshot from the end of a 200 ns at-
omistic simulation with a cell wall model [200]. OmpA dimer is red and blue for each
protomer, Braun's lipoprotein is pink, the membrane is cyan (LPS) and grey (other
phospholipids), and cell wall is green. D: Top view of the lipid bilayer of initially ca.
25 × 29 nm at six different times during an electroporation simulation spanning ca. 4
ns [23]. © Tieleman; licensee BioMed Central Ltd. 2004. E: Modeling of a photosyn-
thetic membrane patch, showing a corresponding AFM topograph, the model of the
chromatophore patch containing 39 LH2 and 7 LH1-RC complexes, with a close-up
on an open and closed LH1 monomer [204].
Figure 12 : Examples of coarse-grained simulations. A: Determination of Lo
and Ld lipid phase patches demarcated by a thick black line in a coarse-grained simu-
lation of a 4-component DPPC (blue), PUPC (green) DUPC (red) and cholesterol
(yellow) lipid mixture. DUPC ratio increases from left to right. Reprinted with per-
mission from [216]. Copyright 2015 American Chemical Society. B: CG Model of a
hemagglutinin A cluster in domain-forming membranes of DPPC (headgroups in light
blue), DLiPC (headgroups in dark blue) and cholesterol in green [217]. The protein is
shown in orange, phospholipid tails in gray and white. C: A membrane tether pulled
by external force, shown in side and cross-section views [222]. D: Coarse-grained
model encompassing the two membranes of E. coli with several membrane proteins
[223]. The AcrABZ-TolC efflux pump is lime green, inner membrane protein AqpZ
and outer membrane protein OmpA are pink, the lipids are cyan (LPS), grey (POPE),
blue (POPG) and red (cardiolipin). This is a snapshot from the end of a 10 microsec-
ond CG simulation. E: Mesoscale fluctuations of a plasma membrane model with
increasing protein content [235] revealing organization and dynamics of recep-
tor proteins. On the left, without any proteins present, in the middle with single TM
helices (in red) from the gp130 cytokine receptor, on the right with GPCRs of the
S1P1 receptor (in pink). F: Illustration of a vesicle nano-reactor simulation using a
dry Martini-like lipid representation coupled with Lattice-Boltzmann hydrodynamics.
On the left, the exterior water flow around the vesicle is depicted, on the right a cross-
sectional cut reveals the overall fluid dynamics in the system. Unpublished results
courtesy of A. Brandner, S. Timr and F. Sterpone.
Figure 13 : Examples of mesoscopic membrane simulations. A: Tense vesicle
fusion with a tense square membrane patch observed by DPD [244]. B: Membrane
tubules induced by an F-BAR domain lattice, starting from an edge-to-edge fusion
forming a T-junction [242]. On the left, the membrane tubule is shown with F-BAR
domains from the side. In the middle and on the right, the tubule lipids are shown
ACCEPTED MANUSCRIPT

ACC
EPTE
D M
ANU
SCR
IPT
40
from top at 0 and 30 microseconds, respectively. C: Triangulated model of the red
blood cell used for studying its light scattering features [252]. D: An elastic represen-
tation of the red blood cell membrane with anchoring to the spectrin network high-
lighting specific pinning sites [230].
Figure 14 : Specific visualization methods applicable to membranes and
membrane proteins. A: Sheet representing the membrane center colored by local
order parameter with cholesterol molecules represented on top [255]. B: SNARE
complex in a double membrane system from [256] with each headgroup represented
by a green network connecting phosphor atoms. C: Correlated dynamics for upper
and lower leaflet of a planar membrane depicted by streamlines [257]. D: Native
coarse-grained representation of a membrane-inserted carbon nanotube filled with
water [259]. E: Representation of an LPS lipid combining SugarRibbons and Hyper-
Balls-licorice representations in SweetUnityMol [260]. F: Hydrophobicity representa-
tion of a GPCR following [261, 262] highlighting electric field lines through anima-
tion and hydrophilicity through darkening. See
http://www.baaden.ibpc.fr/pub/blt2/jbn11.html for an animated version on-line. G:
Cross-sectional view of a lipid-bilayer membrane populated by lipid tiles [173].
Figure 15 : Analysis examples producing visual representations. A:
APL@Voro user interface and typical color-coded analysis result [263]. B: Difference
between area per lipid analysis for a curved membrane patch. On the left, analysis in a
plane, on the right FATSLiM approach using local Voronoi cells [266]. C: Packing
defects determined by a geometrical method shown in blue, acyl chains in yellow,
polar heads in gray. A peptide inserting into the membrane is colocated [166, 268]. D:
Image processing to determine lipid domain boundaries from [269] - Published by
The Royal Society of Chemistry. E: Bendix membrane protein helix representations
colored by an angle-indicative heatmap [270]. F: Laguerre tesselation analysis of the
water network through the FepA membrane protein showing a water path through the
protein bridging the media on both sides of the membrane (left) and isolated water
inclusions (centre) with an inset zooming in on a selected inclusion [271].
Figure 16: Selected historic illustrations from the literature. A: Schematic
cross-sectional view of a phospholipid bilayer with filled circles representing head-
groups and wavy lines depicting the fatty acid chain [7]. B: Alternating layer structure
of a neat surfactant phase (left) and middle phase structure of surfactant/water sys-
tems (right) [272]. C: Hypothetical membrane protein insertion for the major eryth-
rocyte membrane [273, 306]. Carbohydrates exposed to the extracellular space are
drawn attached to the proteins. D: Cross-sectional view illustrating the lipid-globular
protein mosaic model of membrane structure [7]. E: Two-stage model of membrane
protein insertion illustrated for an alpha-helical integral membrane protein. Reprinted
with permission from [18]. Copyright 1990 American Chemical Society. First trans-
bilayer alpha-helices form, then they assemble into their final tertiary architecture. F:
Hydrophobic thickness illustrated. On the left a perfect match between protein and
bilayer, on the right a hydrophobic mismatch leading to a lipid bilayer distortion
ACCEPTED MANUSCRIPT
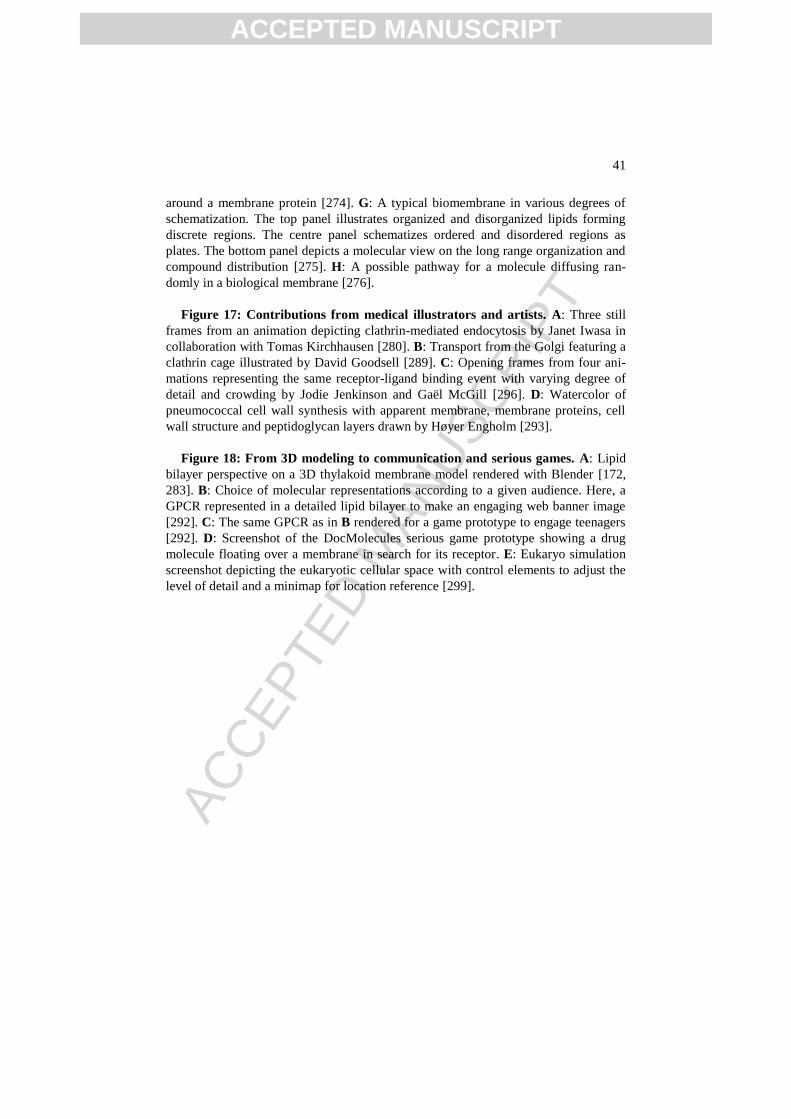
ACC
EPTE
D M
ANU
SCR
IPT
41
around a membrane protein [274]. G: A typical biomembrane in various degrees of
schematization. The top panel illustrates organized and disorganized lipids forming
discrete regions. The centre panel schematizes ordered and disordered regions as
plates. The bottom panel depicts a molecular view on the long range organization and
compound distribution [275]. H: A possible pathway for a molecule diffusing ran-
domly in a biological membrane [276].
Figure 17: Contributions from medical illustrators and artists. A: Three still
frames from an animation depicting clathrin-mediated endocytosis by Janet Iwasa in
collaboration with Tomas Kirchhausen [280]. B: Transport from the Golgi featuring a
clathrin cage illustrated by David Goodsell [289]. C: Opening frames from four ani-
mations representing the same receptor-ligand binding event with varying degree of
detail and crowding by Jodie Jenkinson and Gaël McGill [296]. D: Watercolor of
pneumococcal cell wall synthesis with apparent membrane, membrane proteins, cell
wall structure and peptidoglycan layers drawn by Høyer Engholm [293].
Figure 18: From 3D modeling to communication and serious games. A: Lipid
bilayer perspective on a 3D thylakoid membrane model rendered with Blender [172,
283]. B: Choice of molecular representations according to a given audience. Here, a
GPCR represented in a detailed lipid bilayer to make an engaging web banner image
[292]. C: The same GPCR as in B rendered for a game prototype to engage teenagers
[292]. D: Screenshot of the DocMolecules serious game prototype showing a drug
molecule floating over a membrane in search for its receptor. E: Eukaryo simulation
screenshot depicting the eukaryotic cellular space with control elements to adjust the
level of detail and a minimap for location reference [299].
ACCEPTED MANUSCRIPT

ACC
EPTE
D M
ANU
SCR
IPT
42
Highlights
- visualization of biological membranes has determined key aspects of modern bi-
ology
- experimental, computational and illustrative approaches shape our understanding
- membrane dynamics spans multiple time and length scales
- complexities in composition, in scales and in diversity are a major challenge
- describing membrane energetics and energy flow may be the next step
ACCEPTED MANUSCRIPT

Figure 1
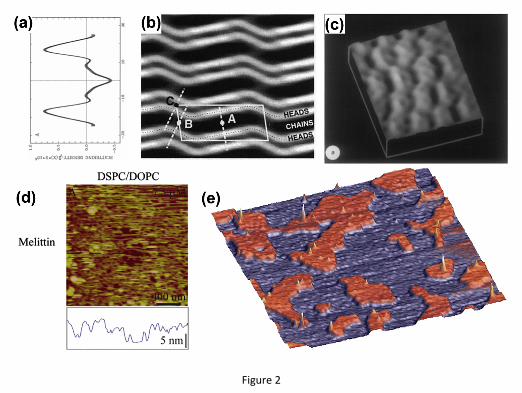
Figure 2

Figure 3
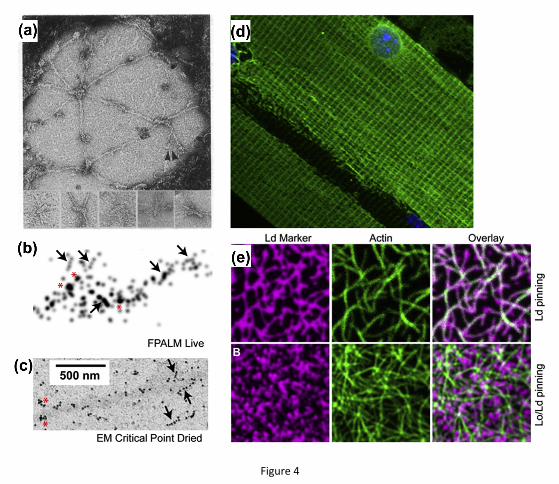
Figure 4
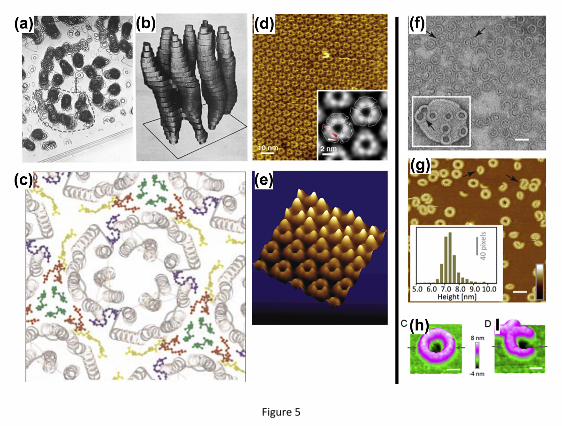
Figure 5

Figure 6
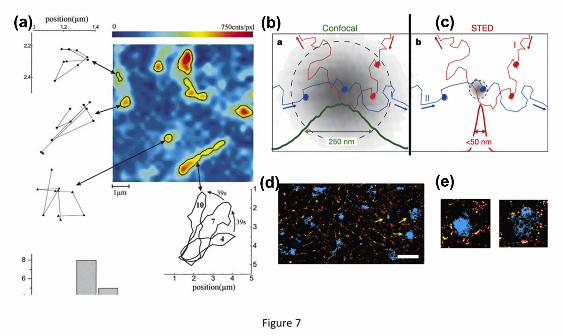
Figure 7

Figure 8

Figure 9
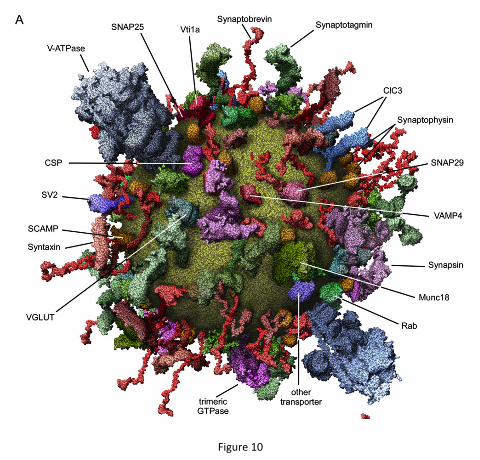
Figure 10

Figure 11

Figure 12
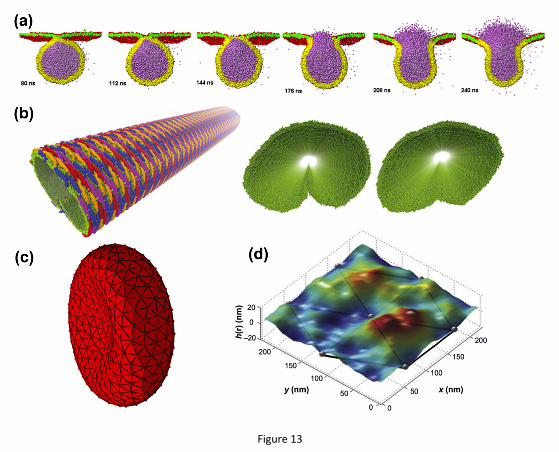
Figure 13

Figure 14

Figure 15

Figure 16
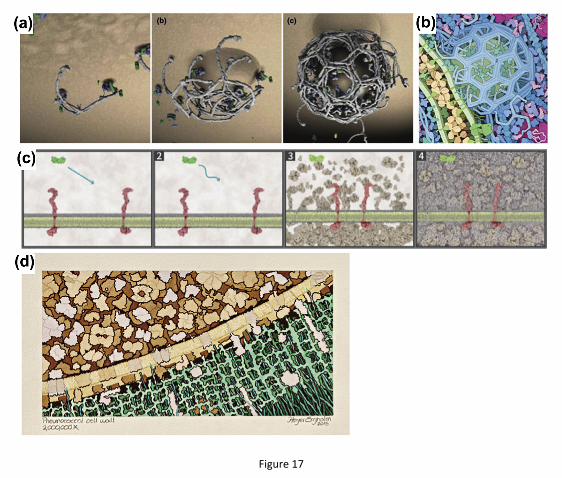
Figure 17
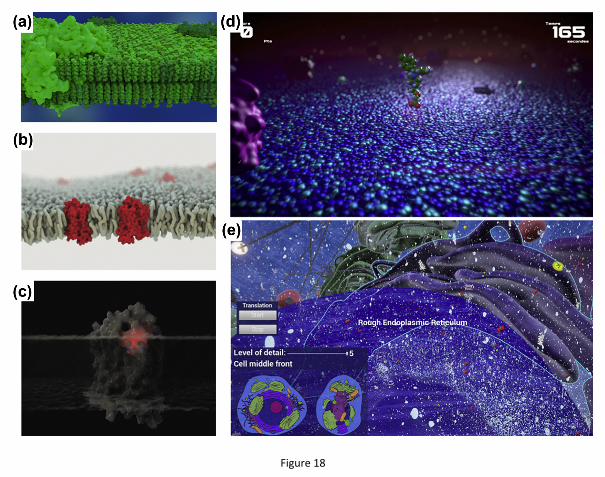
Figure 18