HEATMAPS FOR VISUALIZING CONTINUOUS DYADIC DATA
24
CSSS 569 · Visualizing Data GALLERY 6: HEATMAPS FOR VISUALIZING CONTINUOUS DYADIC DATA Christopher Adolph Department of Political Science and Center for Statistics and the Social Sciences University of Washington, Seattle CENTER for STATISTICS and the SOCIAL SCIENCES
-
Upload
khangminh22 -
Category
Documents
-
view
0 -
download
0
Transcript of HEATMAPS FOR VISUALIZING CONTINUOUS DYADIC DATA
CSSS 569 · Visualizing Data
GALLERY 6:HEATMAPS FOR VISUALIZING CONTINUOUS DYADIC DATA
Christopher Adolph
Department of Political Science
and
Center for Statistics and the Social Sciences
University of Washington, Seattle
CENTER for STATISTICS and the SOCIAL SCIENCES

Exploring Networks Without a Map
Patterns of trade among dyads often visualized using maps
Map based displays usually constrain amount of data we can plot & absorb
And hard to show direction of trade
Or make comparisons across years or transaction types
Alternative: move away from physical space
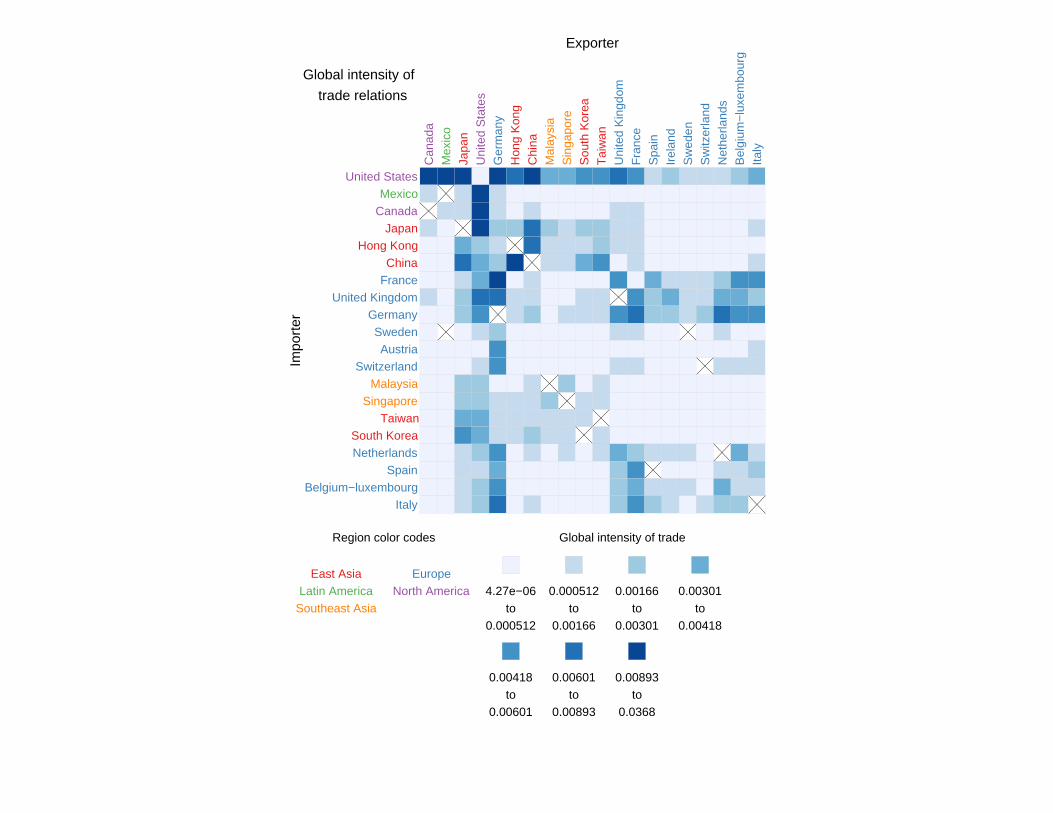
Plot a grid showing every country’s trade with every other country
This type of plot is known as an image plot

Region color codes Global intensity of trade
4.27e−06to
0.000512
0.000512to
0.00166
0.00166to
0.00301
0.00301to
0.00418
0.00418to
0.00601
0.00601to
0.00893
0.00893to
0.0368
East Asia EuropeLatin America North America
Southeast Asia
Global intensity of
trade relations
Exporter
Impo
rter
Can
ada
Mex
ico
Japa
nU
nite
d S
tate
sG
erm
any
Hon
g K
ong
Chi
naM
alay
sia
Sin
gapo
reS
outh
Kor
eaT
aiw
anU
nite
d K
ingd
omF
ranc
eS
pain
Irel
and
Sw
eden
Sw
itzer
land
Net
herla
nds
Bel
gium
−lu
xem
bour
gIta
ly
United StatesMexico
CanadaJapan
Hong KongChina
FranceUnited Kingdom
GermanySwedenAustria
SwitzerlandMalaysia
SingaporeTaiwan
South KoreaNetherlands
SpainBelgium−luxembourg
Italy

Questions raised by image plots of trade data
How do we select the countries to plot?
How do we order the countries in rows and columns?
What data are we plotting exactly?
How do we turn those data into color (selecting bins)?

How do we select the countries to plot?
Lots of options
Need not choose the same countries for rows and columns
Examples here: N largest importers and M largest exporters

Region color codes Dyadic intensity of trade
3.97e−09to
0.000348
0.000348to
0.00218
0.00218to
0.00563
0.00563to
0.00988
0.00988to
0.0135
0.0135to
0.0189
0.0189to
0.173
East Asia EuropeIndia Subcontinent Latin America
Middle East North AmericaOceania Southeast Asia
Dyadic strength of
trade relations
ExporterIm
port
er
Mex
ico
Can
ada
Uni
ted
Sta
tes
Hon
g K
ong
Japa
nC
hina
Sou
th K
orea
Tai
wan
Irel
and
Sw
itzer
land
Aus
tria
Indo
nesi
aA
ustr
alia
Tha
iland
Mal
aysi
aN
orw
ayD
enm
ark
Fin
land
Sw
eden
Sin
gapo
reB
razi
lIn
dia
Sau
di A
rabi
aF
ranc
eN
ethe
rland
sG
erm
any
Bel
gium
−lu
xem
bour
gU
nite
d K
ingd
omS
pain
Italy
United StatesCanada
ChinaJapan
FranceGermany
United KingdomBelgium−luxembourg
NetherlandsItaly

How do we order the countries?
Perhaps the key step
Alpha or random order will tend to hide interesting patterns
Solution: Plot “similar” rows and columns close to each other
Reveals clusters of traders and outliers from prevailing patterns of trade
We use cluster analysis to find which rows and columns cluster together
Heatmap: An image plot with rows & columns ordered by cluster analysis

What data are we plotting exactly?
How do we measure trading relationships?
Total dollars of trade between two countries?
Two problems with this:
1. Trade data is directional
US imports from China 6= US exports to China
2. Big countries have much higher absolute levels of trade
→ Graphs will tend to highlight well-known relationships only

What data are we plotting exactly?
Option 1:
Measure trade from country i to j as a % of world trade
Global Intensity of Tradei→j = Importsi→j/Imports•→•
This gives us two complementary measures for any pair of countries
Solves problem 1 (directionality), not problem 2 (big countries dominate)

What data are we plotting exactly?
Option 2:
Measure trade as a % of imports (by the importer) and exports (by the exporter)
Gives greater weight as dyads become more “exclusive”
Dyadic Intensity of Tradei→j =(Importsi→j/Imports•→j
)×(Importsi→j/Importsi→•
)
Solves problem 1; partially solves problem 2 (bigger countries have more “partners”)
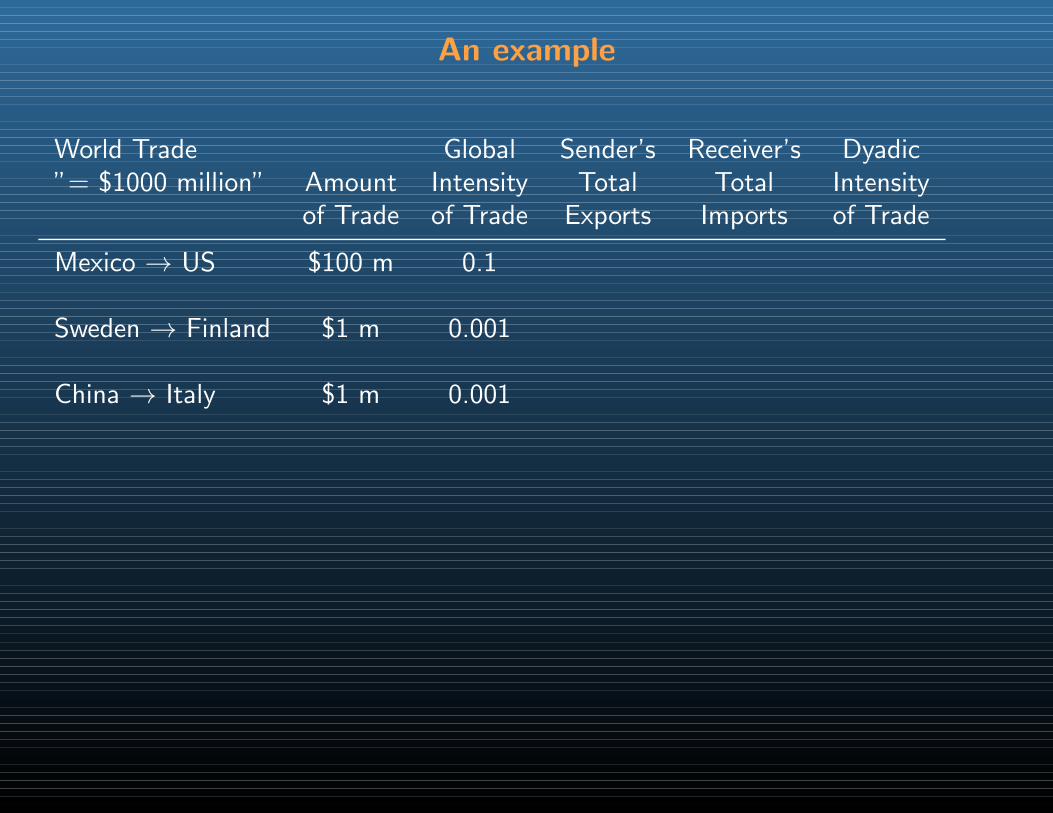
An example
World Trade Global Sender’s Receiver’s Dyadic”= $1000 million” Amount Intensity Total Total Intensity
of Trade of Trade Exports Imports of Trade
Mexico → US $100 m 0.1
Sweden → Finland $1 m 0.001
China → Italy $1 m 0.001

An example
World Trade Global Sender’s Receiver’s Dyadic”= $1000 million” Amount Intensity Total Total Intensity
of Trade of Trade Exports Imports of Trade
Mexico → US $100 m 0.1 $110 m $200 m 0.455
Sweden → Finland $1 m 0.001
China → Italy $1 m 0.001

An example
World Trade Global Sender’s Receiver’s Dyadic”= $1000 million” Amount Intensity Total Total Intensity
of Trade of Trade Exports Imports of Trade
Mexico → US $100 m 0.1 $110 m $200 m 0.455
Sweden → Finland $1 m 0.001 $2 m $1.5 m 0.333
China → Italy $1 m 0.001

An example
World Trade Global Sender’s Receiver’s Dyadic”= $1000 million” Amount Intensity Total Total Intensity
of Trade of Trade Exports Imports of Trade
Mexico → US $100 m 0.1 $110 m $200 m 0.455
Sweden → Finland $1 m 0.001 $2 m $1.5 m 0.333
China → Italy $1 m 0.001 $100 m $10 m 0.001
Region color codes Global intensity of trade
4.27e−06to
0.000512
0.000512to
0.00166
0.00166to
0.00301
0.00301to
0.00418
0.00418to
0.00601
0.00601to
0.00893
0.00893to
0.0368
East Asia EuropeLatin America North America
Southeast Asia
Global intensity of
trade relations
Exporter
Impo
rter
Can
ada
Mex
ico
Japa
nU
nite
d S
tate
sG
erm
any
Hon
g K
ong
Chi
naM
alay
sia
Sin
gapo
reS
outh
Kor
eaT
aiw
anU
nite
d K
ingd
omF
ranc
eS
pain
Irel
and
Sw
eden
Sw
itzer
land
Net
herla
nds
Bel
gium
−lu
xem
bour
gIta
ly
United StatesMexico
CanadaJapan
Hong KongChina
FranceUnited Kingdom
GermanySwedenAustria
SwitzerlandMalaysia
SingaporeTaiwan
South KoreaNetherlands
SpainBelgium−luxembourg
Italy

Region color codes Dyadic intensity of trade
3.97e−09to
0.000295
0.000295to
0.00183
0.00183to
0.00513
0.00513to
0.00851
0.00851to
0.0141
0.0141to
0.0238
0.0238to
0.173
East Asia EuropeLatin America North America
Southeast Asia
Dyadic strength of
trade relations
Exporter
Impo
rter
Uni
ted
Sta
tes
Mex
ico
Can
ada
Chi
naH
ong
Kon
gJa
pan
Mal
aysi
aS
inga
pore
Ger
man
yIr
elan
dS
wed
enS
witz
erla
ndS
outh
Kor
eaT
aiw
anN
ethe
rland
sF
ranc
eB
elgi
um−
luxe
mbo
urg
Uni
ted
Kin
gdom
Spa
inIta
ly
United StatesMexico
CanadaHong Kong
ChinaSingapore
MalaysiaJapan
FranceGermany
TaiwanSouth Korea
AustriaSweden
NetherlandsSpain
SwitzerlandItaly
Belgium−luxembourgUnited Kingdom

How do we turn those data into colors?
We have our transformed trade data by dyad.
To plot it on a heatmap, we need to discretize it, or place it in “bins”
Choosing the cutpoints between bins affects what patterns will emerge from the data
Our dyadic trade data is strongly skewed:

Distribution of Dyadic Trade Intensity, 2001
Dyadic Trade Intensity
Fre
quen
cy
0.00 0.05 0.10 0.15
050
100
150
200
250
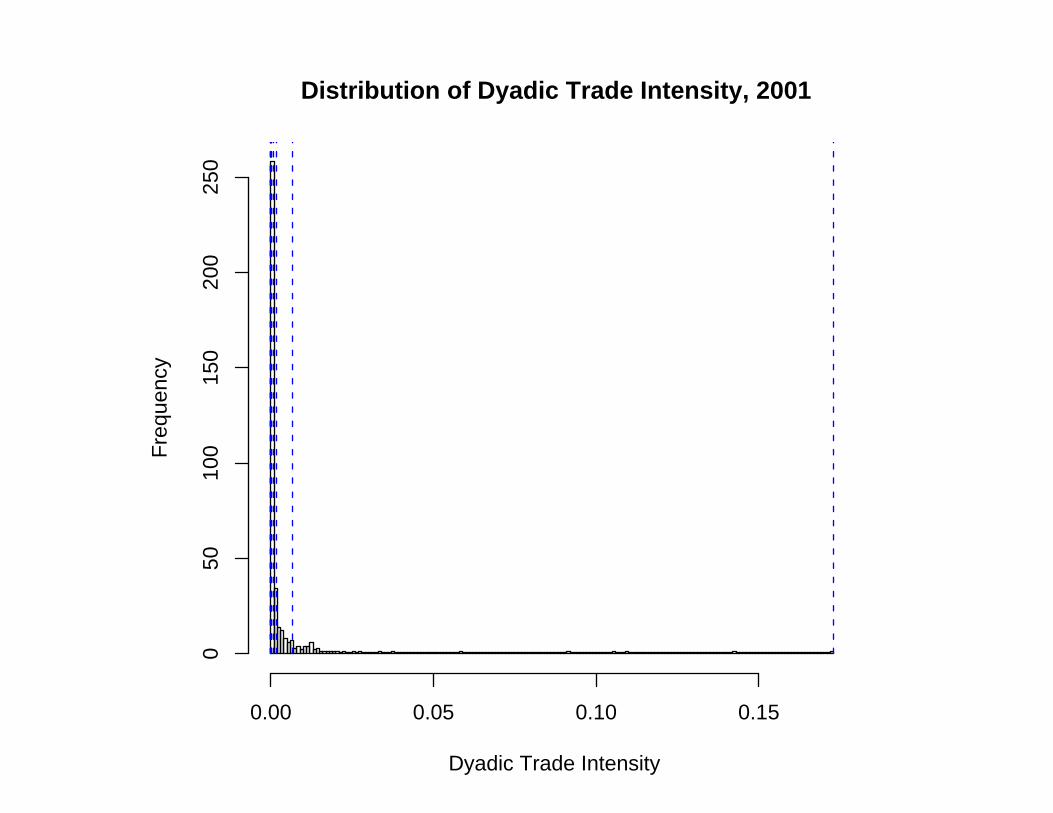
Distribution of Dyadic Trade Intensity, 2001
Dyadic Trade Intensity
Fre
quen
cy
0.00 0.05 0.10 0.15
050
100
150
200
250

How do we turn those data into colors?
Choosing equally spaced bins will thus submerge most of the variation, and highlightthe small handful of strong relationships
Alternatively, we could choose bins based on quantiles, e.g.,
Bin 1 50th percentile and belowBin 2 75th percentile down to 50thBin 3 85th percentile down to 75thBin 4 90th percentile down to 85thBin 5 95th percentile down to 90thBin 6 97.5th percentile down to 95thBin 7 100th percentile down to 97.5th
which is what we’ve been using for all our previous plots. . .

Region color codes Dyadic intensity of trade
−0.000173to
0.0191
0.0191to
0.0383
0.0383to
0.0576
0.0576to
0.0768
0.0768to
0.096
0.096to
0.115
0.115to
0.135
0.135to
0.154
0.154to
0.173
Africa East Asia EuropeIndia Subcontinent Latin America Middle East
North America Oceania Southeast Asia
Dyadic strength of
trade relations
Exporter
Impo
rter
Mex
ico
Can
ada
Uni
ted
Sta
tes
Sau
di A
rabi
aH
ong
Kon
gC
hina
Mal
aysi
aS
inga
pore
Japa
nG
erm
any
Spa
inU
nite
d K
ingd
omB
elgi
um−
luxe
mbo
urg
Net
herla
nds
Fra
nce
Arg
entin
aB
razi
lS
outh
Kor
eaT
aiw
anIr
elan
dS
outh
Afr
ica
Por
tuga
lIs
rael
Tur
key
Indi
aIta
lyA
ustr
iaS
witz
erla
ndP
olan
dH
unga
ryS
wed
enD
enm
ark
Fin
land
Nor
way
Uni
ted
Ara
b E
mira
tes
Vie
tnam
Phi
lippi
nes
Tha
iland
Aus
tral
iaIn
done
sia
United StatesMexico
CanadaTaiwan
Hong KongChina
SingaporeMalaysia
JapanFrance
GermanyPortugal
ArgentinaBrazil
IrelandUnited Kingdom
ThailandSouth Korea
SwedenNorwayFinland
DenmarkHungary
PolandSouth Africa
AustraliaIndonesia
PhilippinesUnited Arab Emirates
IndiaTurkey
GreeceSaudi Arabia
IsraelAustria
NetherlandsBelgium−luxembourg
SpainSwitzerland
Italy

Region color codes Dyadic intensity of trade
9.23e−12to
6.02e−05
6.02e−05to
0.000353
0.000353to
0.000918
0.000918to
0.00182
0.00182to
0.00543
0.00543to
0.0109
0.0109to
0.173
Africa East Asia EuropeIndia Subcontinent Latin America Middle East
North America Oceania Southeast Asia
Dyadic strength of
trade relations
Exporter
Impo
rter
Mex
ico
Can
ada
Uni
ted
Sta
tes
Sau
di A
rabi
aH
ong
Kon
gC
hina
Mal
aysi
aS
inga
pore
Japa
nG
erm
any
Spa
inU
nite
d K
ingd
omB
elgi
um−
luxe
mbo
urg
Net
herla
nds
Fra
nce
Arg
entin
aB
razi
lS
outh
Kor
eaT
aiw
anIr
elan
dS
outh
Afr
ica
Por
tuga
lIs
rael
Tur
key
Indi
aIta
lyA
ustr
iaS
witz
erla
ndP
olan
dH
unga
ryS
wed
enD
enm
ark
Fin
land
Nor
way
Uni
ted
Ara
b E
mira
tes
Vie
tnam
Phi
lippi
nes
Tha
iland
Aus
tral
iaIn
done
sia
United StatesMexico
CanadaTaiwan
Hong KongChina
SingaporeMalaysia
JapanFrance
GermanyPortugal
ArgentinaBrazil
IrelandUnited Kingdom
ThailandSouth Korea
SwedenNorwayFinland
DenmarkHungary
PolandSouth Africa
AustraliaIndonesia
PhilippinesUnited Arab Emirates
IndiaTurkey
GreeceSaudi Arabia
IsraelAustria
NetherlandsBelgium−luxembourg
SpainSwitzerland
Italy

More advanced features for heatmaps
Color coded nodes:I’ve used region here, but could be any variable, categorical or continuous
Change the axes:To explore the evolution of a single exporter’s trading partners,replace the exporter dimension with time, or with different categories of trade
Parquet plots:Split the square to show change over time, or differences across traded goods

Region color codes Global intensity of trade
5.77e−13to
5.57e−05
5.57e−05to
0.000358
0.000358to
0.000903
0.000903to
0.0018
0.0018to
0.005
0.005to
0.0122
0.0122to
0.147
Africa East Asia EuropeIndia Subcontinent Latin America Middle East
North America Oceania Southeast Asia
Dyadic strength of
trade relations
1990
2001
Exporter
Impo
rter
Can
ada
Uni
ted
Sta
tes
Hon
g K
ong
Chi
naJa
pan
Ger
man
yB
elgi
um−
luxe
mbo
urg
Net
herla
nds
Italy
Fra
nce
Irel
and
Uni
ted
Kin
gdom
Liby
aM
exic
oS
outh
Kor
eaT
aiw
anM
alay
sia
Sin
gapo
reA
ustr
alia
Sau
di A
rabi
aIn
done
sia
Uni
ted
Ara
b E
mira
tes
Sw
eden
Nor
way
Fin
land
Den
mar
kA
ustr
iaS
witz
erla
ndS
pain
Bra
zil
Ven
ezue
laN
iger
iaA
rgen
tina
Tha
iland
Iran
Por
tuga
lP
olan
dT
urke
yIn
dia
Sou
th A
fric
a
ChinaHong Kong
United StatesCanadaMexicoJapan
FranceAustria
SwitzerlandItaly
NetherlandsBelgium−luxembourg
GermanyMalaysia
SingaporeThailand
South KoreaTaiwanIreland
United KingdomSwedenNorwayFinland
DenmarkPortugal
SpainBrazil
IndonesiaAustralia
IsraelSaudi Arabia
AlgeriaGreece
IranSouth Africa
TurkeyEgypt
PhilippinesUnited Arab Emirates
India