Visualizing Testsuites to Aid in Software Understanding
10
Visualizing Testsuites to Aid in Software Understanding Bas Cornelissen 1 , Arie van Deursen 2 , Leon Moonen 2 , and Andy Zaidman 1 1 Delft University of Technology – [email protected], [email protected] 2 Delft University of Technology and CWI – [email protected], [email protected] Abstract Agile software development methods such as eXtreme Pro- gramming have brought renewed attention to testing during the software development process, both as a quality assurance method and as a form of live documentation. It is for this rea- son that a software system’s testsuite is an ideal starting point for gaining knowledge about its inner workings. In this paper, we propose to use sequence diagrams to visualize informa- tion that is dynamically obtained from testsuites. We employ abstraction techniques such as constructor hiding and stack depth limitation to make the diagrams more scalable. We use JPACMAN as a case study to validate our results by consult- ing with domain experts, and use their feedback to fine-tune our techniques. 1. Introduction When implementing and maintaining software systems, test- ing is of vital importance. The advent of Agile software de- velopment methods such as eXtreme Programming (XP) [4], Scrum [28] and DSDM [30] has ensured that testing is given much attention. In these processes, testing serves two dis- tinct purposes. Not only is testing considered to be essential when implementing and maintaining software to help increase the quality and correctness of code, but (unit) tests are also a means of documentation [10, 18, 19, 9, 11]. Test-driven development [5], which is related to Agile software devel- opment, implies creating and maintaining an extensive test- suite in order to guarantee that the various components work correctly, both individually (by means of unit tests) and as a whole (through use of acceptance tests). Various testing methodologies have been devised for a broad range of programming languages. Among these approaches are the well-known xUnit frameworks that were originally based on the JUNIT design by Beck and Gamma [6]. JUNIT allows for the specification of both unit tests and acceptance tests, and is relatively easy to use. A JUNIT testcase consists of several steps: the creation of a fix- ture, exercising the method(s) under test, comparing the re- sults (i.e., assertions), and the teardown. Typically, a set of testcases is run as a testsuite. Visualizing testsuites Although most testcases might seem easily comprehensible at first sight, they quickly tend to be- come relatively complex for someone who wants to have a look “under the hood”. When considering object-oriented sys- tems, typically there are lots of interactions taking place be- tween many objects, thus hindering comprehensibility. There- fore, we propose to visualize testcases in a way that is suffi- ciently detailed for comprehension purposes and, at the same time, remains human readable. As such, the general approach we follow can be described as either analyzing or tracing the testcases, applying certain abstractions and, finally, present- ing the results. Such visualizations can be extremely helpful in the context of Agile software development, in which tests serve as documentation. UML sequence diagrams [20, 27] are a useful means to visualize a system’s behavior [22]. A scenario diagram is a somewhat simplified version of a sequence diagram that de- scribes a single scenario, i.e., depicting one particular flow of control. Scenario diagrams provide detailed information on interactions at either the class level or the object level, and are easy to read because the chronological order is intuitive. How- ever, if no abstractions are applied, scenario diagrams tend to become too large: the complete execution of a sizeable soft- ware system would result in a scenario diagram that contains more information than the reader can handle [23]. Goal In general terms we want to gain more knowledge about the system at hand, while the ultimate goal is to facilitate the implementation of change requests. We propose that users build up this knowledge by studying reconstructed scenario diagrams from JUNIT testsuites. Our choice for using test- cases as scenarios is inspired by three major factors: (1) XP and Agile software development in general advocate the use of tests as a form of documentation [18, 19, 9, 11], (2) finding relevant scenarios for executing software and performing dy- namic analysis on them (e.g., constructing visualizations) is not straightforward when domain knowledge is lacking [33], and (3) scalability problems can in part be overcome by the careful selection of relatively concise execution scenarios, i.e., testcases. This also fits in the as-needed reverse engineering strategy that is often advocated in dynamic analysis [33]. Research Questions To structure our investigation towards these goals, we define the following research questions: • Are tests as typically written in JUNIT a suitable starting point for program comprehension? • Do scenario diagrams obtained from these tests offer in-
-
Upload
independent -
Category
Documents
-
view
0 -
download
0
Transcript of Visualizing Testsuites to Aid in Software Understanding

Visualizing Testsuites to Aid in Software Understanding
Bas Cornelissen1, Arie van Deursen2, Leon Moonen2, and Andy Zaidman1
1Delft University of Technology – [email protected], [email protected] University of Technology and CWI – [email protected], [email protected]
AbstractAgile software development methods such as eXtreme Pro-gramming have brought renewed attention to testing duringthe software development process, both as a quality assurancemethod and as a form of live documentation. It is for this rea-son that a software system’s testsuite is an ideal starting pointfor gaining knowledge about its inner workings. In this paper,we propose to use sequence diagrams to visualize informa-tion that is dynamically obtained from testsuites. We employabstraction techniques such as constructor hiding and stackdepth limitation to make the diagrams more scalable. We useJPACMAN as a case study to validate our results by consult-ing with domain experts, and use their feedback to fine-tuneour techniques.
1. Introduction
When implementing and maintaining software systems, test-ing is of vital importance. The advent of Agile software de-
velopment methods such as eXtreme Programming (XP) [4],
Scrum [28] and DSDM [30] has ensured that testing is given
much attention. In these processes, testing serves two dis-
tinct purposes. Not only is testing considered to be essential
when implementing and maintaining software to help increase
the quality and correctness of code, but (unit) tests are also
a means of documentation [10, 18, 19, 9, 11]. Test-driven
development [5], which is related to Agile software devel-
opment, implies creating and maintaining an extensive test-
suite in order to guarantee that the various components work
correctly, both individually (by means of unit tests) and as a
whole (through use of acceptance tests).
Various testing methodologies have been devised for a
broad range of programming languages. Among these
approaches are the well-known xUnit frameworks that
were originally based on the JUNIT design by Beck and
Gamma [6]. JUNIT allows for the specification of both unit
tests and acceptance tests, and is relatively easy to use. A
JUNIT testcase consists of several steps: the creation of a fix-
ture, exercising the method(s) under test, comparing the re-
sults (i.e., assertions), and the teardown. Typically, a set of
testcases is run as a testsuite.
Visualizing testsuites Although most testcases might seem
easily comprehensible at first sight, they quickly tend to be-
come relatively complex for someone who wants to have a
look “under the hood”. When considering object-oriented sys-
tems, typically there are lots of interactions taking place be-
tween many objects, thus hindering comprehensibility. There-
fore, we propose to visualize testcases in a way that is suffi-
ciently detailed for comprehension purposes and, at the same
time, remains human readable. As such, the general approach
we follow can be described as either analyzing or tracing the
testcases, applying certain abstractions and, finally, present-ing the results. Such visualizations can be extremely helpful
in the context of Agile software development, in which tests
serve as documentation.
UML sequence diagrams [20, 27] are a useful means to
visualize a system’s behavior [22]. A scenario diagram is a
somewhat simplified version of a sequence diagram that de-
scribes a single scenario, i.e., depicting one particular flow of
control. Scenario diagrams provide detailed information on
interactions at either the class level or the object level, and are
easy to read because the chronological order is intuitive. How-
ever, if no abstractions are applied, scenario diagrams tend to
become too large: the complete execution of a sizeable soft-
ware system would result in a scenario diagram that contains
more information than the reader can handle [23].
Goal In general terms we want to gain more knowledge about
the system at hand, while the ultimate goal is to facilitate the
implementation of change requests. We propose that users
build up this knowledge by studying reconstructed scenario
diagrams from JUNIT testsuites. Our choice for using test-
cases as scenarios is inspired by three major factors: (1) XP
and Agile software development in general advocate the use
of tests as a form of documentation [18, 19, 9, 11], (2) finding
relevant scenarios for executing software and performing dy-
namic analysis on them (e.g., constructing visualizations) is
not straightforward when domain knowledge is lacking [33],
and (3) scalability problems can in part be overcome by the
careful selection of relatively concise execution scenarios, i.e.,
testcases. This also fits in the as-needed reverse engineering
strategy that is often advocated in dynamic analysis [33].
Research Questions To structure our investigation towards
these goals, we define the following research questions:
• Are tests as typically written in JUNIT a suitable starting
point for program comprehension?
• Do scenario diagrams obtained from these tests offer in-

sight in the way the application works?
• Which abstractions do we need to make these diagrams
more easily understandable?
• JUNIT can be used to write tests focused on one class or
method (which are true unit tests), as well as for creating
high level testcases which act more like system or ac-
ceptance tests. Should these be treated differently when
leveraging testsuites for program comprehension?
In order to address these questions and to validate our tech-
niques, we conduct an extensive case study on JPACMAN, a
game written for educational purposes, that is a very suitable
case since it features a large testsuite. By consulting the de-
velopers we aim to collect useful feedback, particularly with
regard to (generic) abstractions that are needed in this context.
This paper is structured as follows. The next section out-
lines the issues and design choices. Section 3 presents our
Scenario Diagram Reconstruction (SDR) framework. Sec-
tion 4 discusses the prototype implementation that was used
for the case study in Section 5. Related work is described in
Section 6, and we conclude with Section 7.
2. Design Options and RequirementsIn the course of converting testsuites to scenario diagrams,
we face several challenges. This section addresses the most
prominent issues and requirements.
2.1. Design OptionsStatic vs. dynamic In obtaining scenario diagrams from
testcases, we can choose whether to capture the system’s be-
havior by means of static analysis (i.e., analyzing the code)
or through dynamic analysis (i.e., tracing the execution). The
well-known benefits of a static approach are the genericity and
compactness, whereas a dynamic technique potentially offers
more details on important aspects such as late binding.
A frequently mentioned drawback of dynamic analysis is
that one needs specific scenarios to exercise the system. These
scenarios, however, come for free when using testcases to
drive the comprehension process. Another drawback of dy-
namic analysis is that the information derived represents only
part of the system’s behavior. We take the position that in our
context, having more detailed information pertaining directly
to testcases is to be favored over genericity.
Recognizing stages in a scenario The second issue that
arises is how one can distinguish between particular stagesduring the execution of a scenario. In particular, we are inter-
ested in recognizing the various stages in executing a testcase,
i.e., the test initialization, test execution, result validation and
teardown1. Being able to separate these stages provides a
more focused view on the execution of a testcase and allows
the viewer to skip a stage (if desired), or to put it in a separate
1The earlier naming conventions for these stages were replaced by anno-
tations in JUNIT v4.
diagram. Furthermore, as we will see later, recognizing which
methods and objects play a role in the various stages allows
for particular filtering and abstraction techniques. For exam-
ple, the assertions made during the result validation stage of a
(unit) test are generally of less interest in the context of com-
prehending the inner workings of a software system.
Class vs. object level Another design choice concerns
whether we want to trace the interactions at the class level
or at the object level. The former is easier because it does
not require an administration of all runtime objects, whereas
being able to distinguish between objects provides detailed
information on object interactions, and exposes occurrences
of polymorphism and late binding, which is very suitable for
display in scenario diagrams. However, with diagrams at the
class level already being susceptible to size problems, one will
definitely encounter scalability issues with additional object
information.
Scalability Despite the fact that (in general) the execution
of a unit test is relatively short, scalability problems are in-
evitable. Most simple unit tests will probably fit on a single
or a limited number of “screens”, but more complex testcases
(i.e., acceptance tests) induce too many interactions to simply
put in a diagram without applying any form of abstraction.
Therefore, we will need abstraction and filtering techniques
that are both efficient and useful: we must determine which
interactions are presumably irrelevant and can therefore be
combined or omitted for an initial view.
2.2. Design RequirementsIn order to create a flexible and generic tool that can aid in the
understanding of a variety of software systems, we define the
following requirements:
Obliviousness The system-under-analysis should not require
any changes to its implementation to enable its examination.
Extensibility The framework should allow addition of new
or customized (1) event listeners to capture (dynamic) system
behavior, (2) abstraction and filtering techniques to combine
or omit information, and (3) output renderings to facilitate
flexible visualization and embedding in other environments
(e.g., a software development environment like Eclipse).
Interactivity The framework should allow interactive ex-
ploration of reconstructed diagrams. We take the position that
a human in the loop is required since no automated analy-
sis can capture which improvements in comprehensibility are
achieved by employing certain abstractions or filterings. The
user should remain in control of the level of detail.
Comprehensibility When talking about generating “under-standable” sequence diagrams, we need criteria that capture
comprehensibility. The following two properties, taken from
the realm of visual programming languages, seem appropri-
ate to determine when a diagram is understandable [32]: (1)
Accessibility of related information. Viewing related informa-
tion in close proximity is essential. When two screen objects
are not in close proximity, there is the psychological claim

executiontrace modeltest case
modeltransformation
scenariodiagram model
scenariodiagram
instrumentedexecution
abstractions
visualization
Figure 1. Overview of the SDR framework.
that these objects are not tightly related to each other or are
not dedicated to solving the same problem; (2) Use of screenreal estate. The term “screen real estate” refers to the size
of a physical display screen and connotes the fact that screen
space is a valuable resource. Making optimal use of the avail-
able screen real estate is necessary to save the user time when
locating information.
3. SDR Framework
Based on the design options and issues discussed earlier, we
have designed a framework for Scenario Diagram Reconstruc-
tion (SDR). Figure 1 provides an overview. It is an extensi-
ble framework in that there is a clear separation between the
tracing part, the abstraction part and the rendering of scenario
diagrams. In the remainder of this section we will discuss and
motivate various features of the framework.
3.1. Tracing testcases
There exist several methods to obtain traces from software
systems, among which the most commonly used are manu-
ally instrumenting code (e.g., [2]), using a debugger or pro-
filer [34], and instrumentation through aspects [1]. The ad-
vantages and shortcomings of each of these techniques are
mostly well-known (and, for example, discussed in [33]).
Our framework uses AOP (Aspect Oriented Programming)
since aspects offer a very flexible solution in this context.
Moreover, using AOP satisfies our requirement of oblivious-
ness: the system-under-analysis does not require any changes
to enable its examination. Aspects allow us to specify very
accurately which parts of the execution are to be considered,
where tracing must start and stop, and what postprocessing
needs to take place. In addition, aspects can obtain detailed
information on all interactions, such as the unique objects that
are involved, the runtime arguments, and the actual return val-
ues in case of method and constructor calls.
Finally, most aspect languages allow for patterns in the def-
inition of which classes and interactions are to be traced (i.e.,
pointcuts). This enables us to distinguish between the various
stages in a testcase by exploiting the naming conventions or
annotations used for these stages within xUnit frameworks.
Our traces are captured in a common format describing the
events that can take place during the execution of a system.
Figure 2. Trace metamodel.
We make a distinction between the beginnings and endings of
method calls, static method calls and constructor calls. An
execution trace consists of a set of events, each type of event
having its own characteristics. Associated with each method
start, for example, is a method identifier, two objects (i.e., the
caller and the callee), a signature, and zero or more (runtime)
parameters; A method end-event features a method identifier
and the actual return value.
Figure 2 shows the model describing our traces. Note that
due to space constraints, details for static method calls and
constructor calls were omitted, but these are similar to those
of the regular calls that are shown in the figure.
3.2. Abstraction and FilteringIn order to make large scenario diagrams easier to read, we
need several abstraction and filtering techniques to reduce the
amount of information. In the context of scenario diagrams,
one intuitively thinks of omitting or joining objects, classes
or combining interactions to shrink the dimensions of the di-
agram. But which messages and objects can be removed or
combined while ensuring that the essence of the testcase is
preserved? Below, we collect and discuss a catalog of ab-
stractions and filterings that we have defined in the context of
test-scenario diagrams.
• Constructor hiding. Omit all constructors and their con-
trol flows. This is especially applicable in the initializa-
tion stages of complex testcases.
• Selective constructor hiding. Omit irrelevant construc-
tors, i.e., those pertaining to objects that are never used.
This allows reduction of the diagram’s dimensions with-
out loss of essential information. The selection in one
particular stage can also be based on objects that appear
in certain other stages of the scenario. This can, for ex-
ample, be used to filter objects created for result valida-
tion in testcases.
• Maximum stack depth. Omit all interactions that occur
above a certain stack depth threshold. Intuitively, this fil-
ters low level messages that tend to be too detailed, at

Figure 3. Reconstructed scenario diagram at a lowabstraction level.
least for an initial viewing. This is illustrated by Fig-
ures 3 and 4. A similar abstraction was applied in [25],
in which (in a static context) the length of a call chain is
considered.
• Minimum stack depth. Omit all interactions below a cer-
tain threshold, i.e., remove high-level interactions. This
can be used to omit “control messages” that start up a
certain scenario.
• Fragment selection by using stack depths. Choose a set
of methods of interest and, by selecting appropriate min-
imum and maximum stack depths, highlight its direct en-
vironment. Method selection can e.g. be done using the
techniques described by Zaidman et al. [34].
• Fragment selection by zooming. Zoom in on areas of
interest [29].
• Pattern recognition. Summarize recurrent patterns [22,
31]. Patterns may be identical or very similar (sets of)
method calls.
• Object merging (clustering). Merge lifelines of closely
related (or manually selected) objects, thereby hiding
their mutual interactions [24].
• Colors. Use color techniques (e.g., graying out, or using
different colors for various fragments) to “distinguish”
between (ir-)relevant parts [29].
• Getters and setters. Omit simple getters and setters. We
will see this abstraction applied in the case study.
Figure 4. Reconstructed scenario diagram at a highabstraction level.
• Textual techniques. (1) Omit return values in case of void
methods, (2) abbreviate full parameters, and/or (3) ab-
breviate return values.
4. Implementation
The design mentioned in the previous section has been imple-
mented in a prototype tool, which we call the Sequence Dia-gram Reconstruction (SDR) tool. It is entirely implemented
in Java and AspectJ and was used to conduct the case studies
described later in the paper.
Scenario diagram model The scenario diagram metamodel
that we use is loosely based on the UML standard for se-
quence diagrams [20]. It is a simplified version in that we do
not focus on genericity: a scenario diagram corresponds with
the execution of one particular scenario (one testcase). As
such, constructs such as conditions and repetitions are omitted
in our model, whereas detailed information such as runtime
parameters and actual return values are included in each dia-
gram. A distinction is made between various types of events.
The model is depicted in Figure 5, and illustrates that we
define a scenario diagram to be a sequence of messages be-
tween objects. Each message is associated with a correspond-
ing method, has zero or more actual parameters and possibly
a return value.
Tracing Tracers are implemented by specializing the abstract
tracing aspect AbstractTracer that specifies the common (de-
fault) behavior. Upon initialization, it starts an event listener
Figure 5. Scenario diagram metamodel.

and contains only one advice: it notifies the current listener
before and after the startingPoint() pointcut is encountered.
In case of testsuites, this pointcut is useful for defining a test-
case’s toplevel methods. This pointcut, along with pointcuts
for the events that need to be traced and the type of listener, are
all abstract and defined in specific tracers for specific cases, so
as to provide maximum flexibility.
The prototype currently offers several “stock” tracers that
can be extended for specific cases, e.g., SimpleTracer for cap-
turing basic method and constructor calls and ObjectTracer
for doing so while distinguishing between objects. As an ex-
ample, consider the occasion in which one merely wants to
capture all method and constructor calls. In this case, the
SimpleTracer must be extended in a custom tracer that con-
tains definitions for the abstract pointcuts (see Listing 1).
import sdr.tracers.SimpleTracer;
public abstract aspect CustomTracer extends SimpleTracer {
protected pointcut theConstructors() :call(org.package..*.new(..));
protected pointcut theCallers() :call(* org.package..*.*(..));
protected pointcut startingPoint() :execution(* org.package..*.myStartMethod(..));
}
Listing 1. Extending an existing tracer to capturemethod and constructor calls.
Listening to events Attached to each tracer is an event lis-
tener. In event listeners, one can define how to process the
captured events. They implement the EventListener inter-
face and, as such, define routines for starting and stopping the
listening phase, and processing generic events.
Our prototype features listeners that perform various tasks,
among which are simply printing all events, writing trace-
files, and gathering statistics. Selecting a certain event lis-
tener is done by extending the tracer containing the pointcuts
and specifying the listener of choice.
Handling testcases For the purpose of tracing testcases,
our framework includes a tracer, PerStartTracer, that dis-
tinguishes between toplevel methods, i.e., the testcases in a
testsuite. It is an extension to the ObjectTracer and, as such,
identifies unique objects. It is extended by a custom tracer,
in which the startingPoint() is typically defined as a pattern
that matches testclasses that have ”Test” in their names. This
way, the listener will be informed whenever a (new) testcase
in a testclass is executed.
The SequenceListener is responsible for turning trace
events into scenario diagrams. It keeps track of all method
and constructor calls and performs the mapping between the
trace metamodel and the scenario diagram metamodel. The
output consists of a collection of scenario diagrams: one dia-
gram for each of the toplevel methods in the testcases that are
being executed.
5. The JPacman Case StudyThe objective of the JPACMAN case study is to validate our
approach, i.e., to verify the usefulness of visualizing testcases,
which abstractions are needed, and under which conditions
these are to be applied.
We will try to find answers to such questions by studying
the JPACMAN application and its testsuite. It is a fairly simple
Java (1.5) application consisting of approximately 20 classes
and 3000 lines of code, which implements a rudimentary ver-
sion of the well known Pacman game. JPACMAN is used for
teaching purposes in a software testing course at Delft Univer-
sity of Technology. In their lab work, students have to extend
both the testsuite and the functionality of JPACMAN using a
test-driven / test-first approach, and making use of such tools
as Eclipse, Ant, and the code coverage tool CLOVER 2.
JPACMAN features a JUNIT testsuite of approximately
1000 lines of code. The testcases have been derived systemati-
cally using various strategies mostly obtained from Binder [7],
including branch coverage (100%), exercising domain bound-
aries at on points as well as off points, testing class diagram
multiplicities, deriving tests from decision tables (describing,
e.g., whether moves on the board are possible), and state and
transition coverage (in the state machine describing the over-
all game behavior). The testsuite consists of 60 testcases in
total, divided over 15 high level acceptance tests exercising
the top level public interface only, as well as 45 class level
unit tests, all implemented in JUNIT (version 4.1).
We have investigated the role that scenario diagrams recov-
ered from these testcases can play when implementing two
change requests into JPACMAN. The first is adding an undofeature to JPACMAN, so that users can get back to life if they
missed a food element or unintendedly bumped into a mon-
ster. Relevant testcases include moving a player or a monster,
as well as losing a game. The second change request is turning
JPACMAN into a multi-level game including a stack of mazes
growing in complexity. Relevant testcases here deal with win-
ning and restarting the game with a different board.
We used SDR to derive scenario diagrams from all 60 test-
cases, and analyzed them in light of the above change scenar-
ios.3 Below we describe our findings, formulate a number of
observations, and establish a connection between the scenario
diagrams and program comprehension.
5.1. Unit TestsDynamically obtained key statistics for the JPACMAN case
study are shown in Table 1, including such data as the number
of constructors, objects and methods, as well as the maximum
and most common stack depth.
The data presented was derived from the actual tests them-
selves, e.g., it does not include the setup phase, in which the
2http://www.cenqua.com3A selection of these diagrams has been included in the most recent JPAC-
MAN distribution.
Unit Tests Acceptance TestsMin Max Median 0.75-Perc. Min Max Median 0.75-Perc.
# Constructors 0 22 1 1 0 543 1 3
# Methods 2 177 13 43 55 1,791 73 170
# Objects 1 32 4 8 39 578 13 14
Max. depth 1 7 4 5 7 9 8 8
Most common depth 1 5 1 3 3 6 5 6
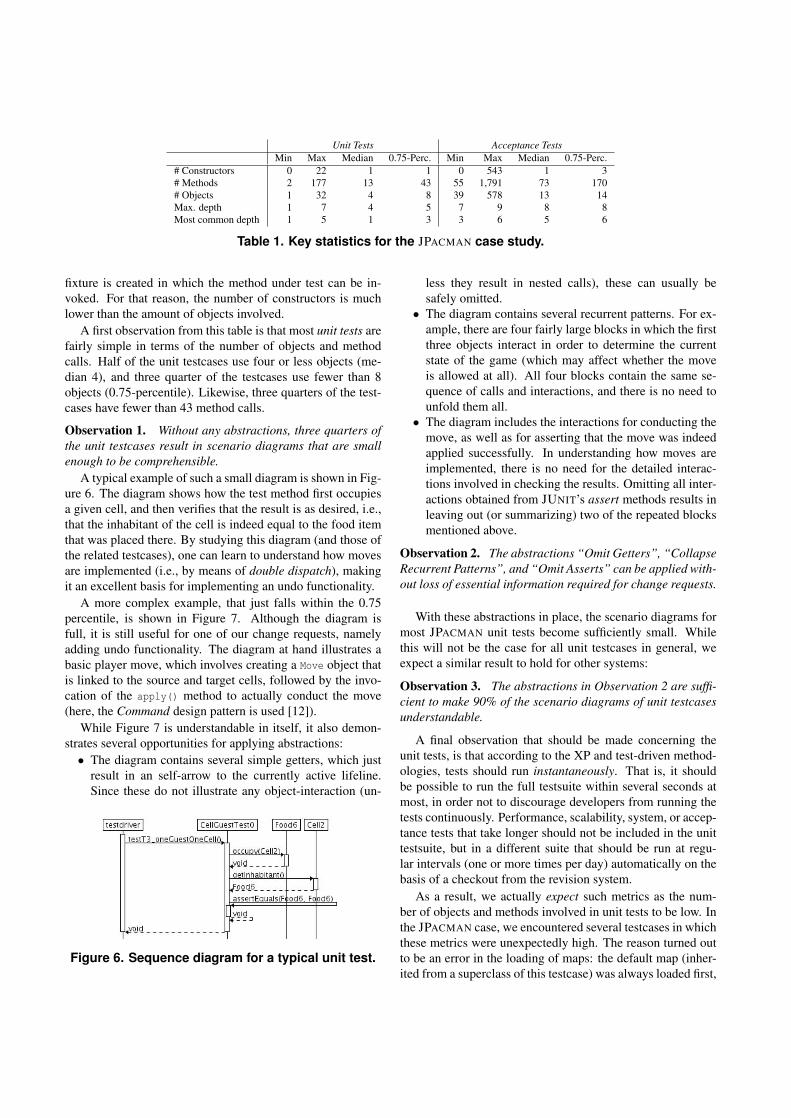
Table 1. Key statistics for the JPACMAN case study.
fixture is created in which the method under test can be in-
voked. For that reason, the number of constructors is much
lower than the amount of objects involved.
A first observation from this table is that most unit tests are
fairly simple in terms of the number of objects and method
calls. Half of the unit testcases use four or less objects (me-
dian 4), and three quarter of the testcases use fewer than 8
objects (0.75-percentile). Likewise, three quarters of the test-
cases have fewer than 43 method calls.
Observation 1. Without any abstractions, three quarters ofthe unit testcases result in scenario diagrams that are smallenough to be comprehensible.
A typical example of such a small diagram is shown in Fig-
ure 6. The diagram shows how the test method first occupies
a given cell, and then verifies that the result is as desired, i.e.,
that the inhabitant of the cell is indeed equal to the food item
that was placed there. By studying this diagram (and those of
the related testcases), one can learn to understand how moves
are implemented (i.e., by means of double dispatch), making
it an excellent basis for implementing an undo functionality.
A more complex example, that just falls within the 0.75
percentile, is shown in Figure 7. Although the diagram is
full, it is still useful for one of our change requests, namely
adding undo functionality. The diagram at hand illustrates a
basic player move, which involves creating a Move object that
is linked to the source and target cells, followed by the invo-
cation of the apply() method to actually conduct the move
(here, the Command design pattern is used [12]).
While Figure 7 is understandable in itself, it also demon-
strates several opportunities for applying abstractions:
• The diagram contains several simple getters, which just
result in an self-arrow to the currently active lifeline.
Since these do not illustrate any object-interaction (un-
Figure 6. Sequence diagram for a typical unit test.
less they result in nested calls), these can usually be
safely omitted.
• The diagram contains several recurrent patterns. For ex-
ample, there are four fairly large blocks in which the first
three objects interact in order to determine the current
state of the game (which may affect whether the move
is allowed at all). All four blocks contain the same se-
quence of calls and interactions, and there is no need to
unfold them all.
• The diagram includes the interactions for conducting the
move, as well as for asserting that the move was indeed
applied successfully. In understanding how moves are
implemented, there is no need for the detailed interac-
tions involved in checking the results. Omitting all inter-
actions obtained from JUNIT’s assert methods results in
leaving out (or summarizing) two of the repeated blocks
mentioned above.
Observation 2. The abstractions “Omit Getters”, “CollapseRecurrent Patterns”, and “Omit Asserts” can be applied with-out loss of essential information required for change requests.
With these abstractions in place, the scenario diagrams for
most JPACMAN unit tests become sufficiently small. While
this will not be the case for all unit testcases in general, we
expect a similar result to hold for other systems:
Observation 3. The abstractions in Observation 2 are suffi-cient to make 90% of the scenario diagrams of unit testcasesunderstandable.
A final observation that should be made concerning the
unit tests, is that according to the XP and test-driven method-
ologies, tests should run instantaneously. That is, it should
be possible to run the full testsuite within several seconds at
most, in order not to discourage developers from running the
tests continuously. Performance, scalability, system, or accep-
tance tests that take longer should not be included in the unit
testsuite, but in a different suite that should be run at regu-
lar intervals (one or more times per day) automatically on the
basis of a checkout from the revision system.
As a result, we actually expect such metrics as the num-
ber of objects and methods involved in unit tests to be low. In
the JPACMAN case, we encountered several testcases in which
these metrics were unexpectedly high. The reason turned out
to be an error in the loading of maps: the default map (inher-
ited from a superclass of this testcase) was always loaded first,

Figure 7. Sequence diagram for a player move.
Stack depth 1 2 3 4 5 6 7 8 9
Frequency 13 29 105 210 614 1035 245 88 4
Table 2. Depth frequencies in one of the acceptancetests.
and then immediately overwritten by a custom map. Since the
default maze was large, and the custom map was deliberately
chosen to be small for testing purposes, this was easily seen in
the metrics, i.e., the number of constructors involved. While
the code was exercised by the testcases, the unnecessary load-
ing was never observed, so no failure was generated.
Observation 4. Dynamically obtained testcase metrics canhelp to identify faults and refactorings.
5.2. Acceptance TestingWhen looking at acceptance tests, obviously the figures are
substantially larger than those of the unit tests. This is due
to the many interactions taking place, and the fact that these
tests require more elaborate fixtures, i.e., more objects. This
is illustrated by the rightmost portion of Table 1.
However, the figures for the tests would have been far
greater had the test stages not been separated. This holds true
especially for the acceptance tests, as in JPACMAN these re-
quire the construction of large fixtures, e.g., a map with certain
dimensions.
Observation 5. Separation of the testcase stages leads tomore readable diagrams without loss of essential information.
By filtering out these phases, we get a smaller diagram en-
abling us to fully concentrate on the testcase that is being ex-
ecuted. In case the viewer is interested in the initialization or
the assertions, it can be viewed in a separate diagram.
Observation 6. In the light of Observation 5, half of theacceptance tests lead to readable scenario diagrams withoutuse of abstractions.
Among the 15 acceptance tests is a relatively large test-
case (543 constructors and 1,791 methods) that involves sev-
eral consecutive movements and game restarts, making it the
most complex testcase by far. If we look closer at the metrics
for this testcase – the stack depth frequencies in particular –
we get the figures of Table 2.
Based on these metrics and an initial viewing, we applied
two abstractions: hiding the control flow of constructors, and
limiting the stack depth to 2 (Figure 8). This diagram effec-
tively depicts the essence of the testcase at hand: instantiat-
ing the Pacman-class (which would normally induce a large
amount of interactions), starting the Engine, and conducting
the moves. For a more detailed view, one can set the maxi-
mum stack depth to 3, resulting in a diagram that (according
to Table 2) features approximately 100 more calls. It is from
these detailed diagrams that the necessary information can be

Figure 8. Scenario diagram with a max. stack depthof 2.
derived for gaining insight into the procedure that concerns
loading maps: using this knowledge, the change request re-
garding multiple maps can be facilitated.
Observation 7. Using more advanced abstractions such asstack depth limitation and hiding control flows of construc-tors, all acceptance tests lead to readable scenario diagrams.
5.3. Discussion
The JPACMAN case has taught us several lessons.
First of all, the dynamically obtained scenario diagrams
contain lots of detail, such as runtime parameters, actual re-
turn values, and occurrences of late binding. While this is use-
ful, especially for change requests that require detailed knowl-
edge, we often get diagrams that are too large to comprehend.
This holds true especially in the case of acceptance tests, mak-
ing abstractions essential in this context.
Separating the testcase stages was clearly a useful measure,
as most scenario diagrams became significantly smaller when
leaving phases (e.g., the setup) to distinct diagrams.
Several abstractions have been succesfully applied in view-
ing the diagrams obtained from the JPACMAN testsuite. Hid-
ing constructors, omitting assertions and stack depth limita-
tion have proven useful to shrink the diagrams without losing
the essence of the testcases at hand. The viewer is constantly
in control of these abstractions and, by changing the diagram’s
specifications, can always adjust the abstraction parameters
and regenerate the diagram.
With many of the proposed abstraction techniques, how-
ever, it is preferable to use them in an interactive fashion,
i.e., apply them on-demand. One could think of making mes-
sages and objects clickable, and subject to (un-)folding. Using
metrics to automatically apply abstractions is a good starting
point, but the viewer must ultimately be in control of which
information to show and which to hide.
Each testcase that we have treated in our study was a re-
view, resulting in improvements in both our technique and the
testcases at hand. Various mistakes (such as duplicate setups)
were exposed and have been resolved in the next version.
Threats to validity The case study that we conducted has
some limitations that hinder the generalization of any conclu-
sions. First, in spite of its extensive testsuite, JPACMAN is
a relatively small system. While certain conclusions and hy-
potheses can be drawn from the results, they may not hold for
large cases: certain abstractions mentioned in this paper may
turn out to be insufficient. Second, JPACMAN is an educa-
tional example: it is a well-maintained system with a testsuite
that covers 100% of the system’s code. One must acknowl-
edge that this is not necessarily true for real life cases, e.g.,
industrial systems.
6. Related workUsing dynamic analysis for program comprehension purposes
is an active field of research. This section provides a short
overview of related work.
General approaches Various approaches reconstruct sce-
nario and interaction diagrams based on static analysis of pro-
gram code [25, 16, 26, 17]. The techniques that are used vary
from mapping of control flow graphs [26] to interprocedural
dataflow analysis [25]. A comparison of various approaches
is presented in [17].
Sequence diagrams UML sequence diagrams (and varia-
tions thereof) have since long been used to visualize dynami-
cally obtained information from a system. We now provide a
selection of the existing research in this area.
De Pauw et al. propose several abstractions in reconstruct-
ing sequence diagrams [22]. Among these techniques is pat-
tern recognition, and they introduce the concept of execu-
tion pattern notation [23]. Their techniques (formerly imple-
mented in Jinsight) are used in a plugin that is part of Eclipse’s
Test & Performance Tools Platform (TPTP) Project [3].
Systa et al. aid in the understanding of Java systems in
an environment called Shimba, which uses both static analy-
sis and dynamic information [31]. The Shimba environment

considers static and dynamic information to be complemen-
tary and uses static information to bring focus to dynamically
generated diagrams, and vice versa.
Jerding et al. have developed the ISVis (Interactive Sce-
nario Visualizer) environment [15]. Its main purpose is to al-
leviate the architecture localization problem, or the problem
of finding the exact location in a system’s architecture where
a specific enhancement can be inserted. Most of the abstrac-
tion techniques that are being used are not fully automatic.
Briand et al. [8] reverse engineer UML sequence diagrams
for (1) program understanding in the face of incomplete docu-
mentation, and (2) quality assurance, when reverse engineered
diagrams are compared with existing design sequence dia-
grams. Their major contribution lies in the fact that they are
among the first to tackle the reverse engineering of UML se-
quence diagrams from distributed (Java) systems. However,
they do not reason from the viewpoint of testsuites, and ab-
stractions play a minor role.
General visualizations Riva et al. [24] combine static and
dynamic analysis to reconstruct message sequence charts. In
their trace-based approach, they provide an abstraction mech-
anism based on the decomposition hierarchy that is extracted
from the system’s source code. It is not described how the
scenarios are defined, and in dealing with large diagrams, they
only offer manual abstraction techniques.
Furthermore, Pacione et al. make a comparison of dynamic
visualization techniques [21] and Hamou-Lhadj et al. discuss
trace visualization tools [14].
7. Conclusions and Future WorkTesting is an essential part of the software lifecycle. Not only
are tests important to guarantee correctness: in the context
of Agile methods and eXtreme programming, testcases are
used as documentation as well. Moreover, by understanding
a system’s testsuite, one can gain a great deal of knowledge
about its inner workings. It is for this reason that visualizing
both units tests and acceptance tests can be of great help in
program comprehension.
To this end, we have employed dynamic analysis and sce-
nario diagrams. By gathering knowledge of a system’s test-
suite, we gain more insight into the way the application works.
We have discussed the issues and design choices that we en-
countered and, through several examples, elaborated on our
choices for these techniques.
To compensate for scalability issues associated with dy-
namic analysis and scenario diagrams, we have established a
set of metrics that recommend a number of abstractions that
should be used to keep the scenario diagram (for each testcase
stage) readable, while preserving the desired amount of detail.
We performed a case study in which we sought to answer
the research questions that were posed in the introduction.
Based on our experiences with this case study, we can now
formulate answers to these questions:
• JUNIT tests are a useful starting point for program com-
prehension. They induce scenarios that effectively de-
compose a system’s functionalities.
• The scenario diagrams that are obtained from these tests
offer knowledge about a system’s inner workings. Our
case study has shown that through the application of sev-
eral abstractions, scenario diagrams effectively visualize
how testcases (and the associated functionalities) work,
which aids greatly in planning change requests.
• The amount and the type of abstractions that are nec-
essary to make the scenario diagram of a testcase suf-
ficiently understandable, depend greatly on the type of
tests. We have listed several abstraction techniques and
implemented part of them in our case study.
• Our experiences indicate that in case of unit tests, simple
techniques such as omission of getters and setters and
collapsing recurrent patterns suffice, whereas more com-
plex acceptance tests require more complicated filterings
such as stack depth limitation and control flow hiding.
Having answered our research questions, we now conclude
this section by listing our contributions:
• We have presented a technique to effectively trace the
various stages of a JUNIT testcase.
• We have listed a broad range of abstractions in the con-
text of scenario diagrams, some existing and some new,
of which some were implemented in a prototype tool.
These were automatically applied, based on metrics that
were collected during execution.
• By means of an extensive case study, we have shown the
extent to which our techniques are useful for testsuite and
program understanding.
Future work Developing visualizations that are specifically
optimized for testsuite comprehension is a relatively new field
of research. Besides investigating existing general purpose vi-
sualizations, we have established a number of research direc-
tions that we wish to pursue in the future.
Among others, we plan to examine new abstraction tech-
niques that help make test-scenario diagrams easier to under-
stand. Currently, we have a preliminary list of such abstrac-
tions (see Section 3.2), but further research on a set of diverse
case studies remains necessary to determine the adequacy of
these abstractions in the context of testing.
The JPACMAN case yielded interesting results, but focus-
ing on a more complex system will undoubtedly raise new
issues. Among the issues that we expect are: (1) how to deal
with threads, (2) how to handle incomplete testsuites, (3) how
to deal with software systems that have no clear unit testing
approach and rely merely on integration and acceptance tests
(e.g., Apache Ant [13]).
Finally, we feel that that we should integrate our tool within
the Eclipse framework, which would allow for a more interac-
tive approach to gathering knowledge about the testsuite and
the complete system. Moreover, integration into Eclipse will

make the tool more attractive to a broader audience.
Acknowledgments Part of the research described in this pa-
per was sponsored by NWO via the Jacquard Reconstructor
project and by the ESI TRADER project.
References[1] AspectJ: The AspectJ project at Eclipse.org, http://www.
eclipse.org/aspectj/.
[2] InsectJ: A generic instrumentation framework for collect-
ing dynamic information within Eclipse, http://insectj.sourceforge.net/.
[3] The Eclipse Test & Performance Tools Platform (TPTP)
Project, http://www.eclipse.org/tptp/.
[4] K. Beck. Extreme Programming Explained - Embrace Change.
Addison-Wesley, 1999.
[5] K. Beck. Test-Driven Development: By Example. Addison-
Wesley, 2003.
[6] K. Beck and E. Gamma. Test infected: Programmers love writ-
ing tests. Java Report, 3(7):51–56, 1998.
[7] R. Binder. Testing Object-Oriented Systems: Models, Patterns,and Tools. Addison-Wesley, 2000.
[8] L.C. Briand, Y. Labiche, and J. Leduc. Toward the reverse engi-
neering of uml sequence diagrams for distributed java software.
IEEE Transactions on Software Engineering, 32(9):642–663,
2006.
[9] S. Demeyer, S. Ducasse, and O. Nierstrasz. Object OrientedReengineering Patterns. Morgan Kaufmann, 2002.
[10] A. van Deursen. Program comprehension risks and benefits in
extreme programming. In Proc. 8th Working Conf. on ReverseEngineering (WCRE’01), pages 176–185, 2001.
[11] A. Forward and T. C. Lethbridge. The relevance of software
documentation, tools and technologies: a survey. In Proc. ACMsymposium on Document engineering (DocEng’02), pages 26–
33, 2002.
[12] E. Gamma, R. Helm, R. Johnson, and J. Vlissides. De-sign Patterns Elements of Reusable Object-Oriented Software.
Addison-Wesley, 1994.
[13] J. van Geet and A. Zaidman. A lightweight approach to deter-
mining the adequacy of tests as documentation. In Proc. 2ndInt. Workshop on Program Comprehension through DynamicAnalysis (PCODA’06), pages 21–26, 2006.
[14] A. Hamou-Lhadj and T.C. Lethbridge. A survey of trace ex-
ploration tools and techniques. In Proc. 2004 Conf. of theCentre for Advanced Studies on Collaborative Research (CAS-CON’04), pages 42–55, 2004.
[15] D. Jerding and S. Rugaber. Using visualization for architec-
tural localization and extraction. In Proc. 4th Working Conf. onReverse Engineering (WCRE’97), page 56, 1997.
[16] R. Kollmann and M. Gogolla. Capturing dynamic program be-
haviour with UML collaboration diagrams. In Proc. 5th Conf.on Software Maintenance and Reengineering (CSMR’01),pages 58–67, 2001.
[17] R. Kollmann, P. Selonen, E. Stroulia, T. Systa, and A. Zundorf.
A study on the current state of the art in tool-supported UML-
based static reverse engineering. In Proc. 9th Working Conf. onReverse Engineering (WCRE’02), pages 22–32, 2002.
[18] B. Marick. Agile methods and agile testing.
http://testing.com/agile/agile-testing-essay.html (accessed
October 9th, 2006), 2004.
[19] K. W. Miller. Test driven development on the cheap: text files
and explicit scaffolding. J. Comput. Small Coll., 20(2):181–
189, 2004.
[20] OMG. UML 2.0 infrastructure specification. Object Manage-
ment Group, http://www.omg.org/, 2003.
[21] M.J. Pacione, M. Roper, and M. Wood. Comparative evaluation
of dynamic visualisation tools. In Proc. 10th Working Conf. onReverse Engineering (WCRE’03), pages 80–89, 2003.
[22] W. De Pauw, E. Jensen, N. Mitchell, G. Sevitsky, J. Vlissides,
and J. Yang. Visualizing the Execution of Java Programs, pages
151–162. Springer-Verlag, 2001.
[23] W. De Pauw, D. Lorenz, J. Vlissides, and M. Wegman. Ex-
ecution patterns in object-oriented visualization. In Proc. 4thUSENIX Conf. on Object-Oriented Technologies and Systems(COOTS’98), pages 219–234, 1998.
[24] C. Riva and J. V. Rodriguez. Combining static and dynamic
views for architecture reconstruction. In Proc. 6th Conf. onSoftware Maintenance and Reengineering (CSMR’02), pages
47–55, 2002.
[25] A. Rountev and B. H. Connell. Object naming analysis for
reverse-engineered sequence diagrams. In Proc. 27th Int. Conf.on Software Engineering (ICSE’05), pages 254–263, 2005.
[26] A. Rountev, O. Volgin, and M. Reddoch. Static control-flow
analysis for reverse engineering of UML sequence diagrams.
In Proc. 6th Workshop on Program Analysis for Software Toolsand Engineering (PASTE’05), pages 96–102, 2005.
[27] J. Rumbaugh, I. Jacobson, and G. Booch. The Unified Model-ing Language Reference Manual. Addison-Wesley, 1998.
[28] K. Schwaber and M. Beedle. Agile Software Development withScrum. Prentice Hall, 2001.
[29] R. Sharp and A. Rountev. Interactive exploration of UML se-
quence diagrams. In Proc. 3rd Int. Workshop on VisualizingSoftware for Understanding and Analysis (VISSOFT’05), pages
8–15, 2005.
[30] J. Stapleton. Dynamic Systems Development Method: Themethod in practice. Addison-Wesley, 1997.
[31] T. Systa, K. Koskimies, and H. Muller. Shimba - an environ-
ment for reverse engineering Java software systems. Software- Practice and Experience, 31(4):371–394, 2001.
[32] S. Yang, M. M. Burnett, E. DeKoven, and M. Zloof. Repre-
sentation design benchmarks: a design-time aid for vpl naviga-
ble static representations. J. Visual Lang. & Computing, 8(5-
6):563–599, 1997.
[33] A. Zaidman. Scalability Solutions for Program Comprehensionthrough Dynamic Analysis. PhD thesis, University of Antwerp,
2006.
[34] A. Zaidman, T. Calders, S. Demeyer, and J. Paredaens. Ap-
plying webmining techniques to execution traces to support the
program comprehension process. In Proc. 9th Conf. on Soft-ware Maintenance and Reengineering (CSMR’05), pages 134–
142, 2005.