Understanding Illustrations of Origami Drill Books
17
Vol. 41 No. 6 IPSJ Journal June 2000 Regular Paper Understanding Illustrations of Origami Drill Books Jien Kato, † Toyohide Watanabe, † Hiroyuki Hase †† and Takeshi Nakayama ††† This paper introduces a new approach for understanding the folding process of origami based on interpreting a series of illustrations of origami drill books. Although many graphics recognition schemes have succeeded in dealing with individual graphical images, they cannot be adapted for recognition of a sequence of contextually related graphics such as origami illustrations. Our approach is based on a dynamically updated internal model of origami. The key characteristics of this approach are as follows: (1) It interprets not only what folding operations are specified in each single image, but how origami will change and what origami will seem to be in other images, according to the recognized operations. (2) It provides an efficient way to associate intermediate interpretation with a related image. (3) As a result of the understanding, the folding process can be completely described using the internal model. 1. Introduction Over the last three decades, many researchers have investigated methods for graphics recog- nition and interpretation with the objective to enable graphics components to be accessed as semantically complete entities, for applica- tions such as indexing image components from a pictorial database, determining locations in a geographical information system or modify- ing graphics in a CAD system 1)∼8) . From the viewpoint of the style of information process- ing, these methods can be divided into two types: top-down and bottom-up 9) . Usually, the former type is knowledge based. For top- down methods, Niyogi and Srihari 2) described a production system for document understand- ing. Antoine, et al. 3) proposed an approach for interpretation of different classes of techni- cal documents such as city maps and mechani- cal drawings using a priori knowledge. The lat- ter type is generally based on structure analy- sis, that is, structural analysis of lines and their interconnections is required to generate mean- ingful and succinct descriptions of the objects. For example, Kasturi, et al. 6) and Ejiri, et al. 7) proposed typical methods of this type for recog- nition of flow-charts, engineering drawings and maps. Although these methods are different with respect to style, they all deal with indi- vidual graphics images. In other words, these methods limit the focus to the same recogni- † Department of Information Engineering, Graduate School of Engineering, Nagoya University †† Faculty of Engineering, Toyama University ††† International Academy of Media Arts and Sciences tion issue: How can various graphical shapes and their spatial relationships be recognized? On the other hand, we need to observe graph- ics recognition and interpretation from another point of view, namely, that an object can be perceived not only as a simple static entity which is contained in individual image but as a changing object associated with a series of contextually related graphics images. We can easily find many examples in real-world appli- cations for such objects: weather maps, comic strips and illustrations of origami drill books for instance. In this paper, we distinguish inter- preting several related graphics from interpret- ing single graphics. The difference is that in the former case, the contents of a following image always depend on the contents of a previous im- age. So, in addition to the question “how can various graphical shapes and their spatial rela- tionships be recognized in each individual im- age? ”, a satisfactory solution has to be found to the issues such as • How can intermediate interpretation be de- scribed? • How can the interpretation results for a previous image be associated with a follow- ing image so that the interpretation process can be continued? • How can intermediate interpretation be used to help recognition of the following graphics images? Unfortunately, although the methods proposed so far have led to much success in coping with individual graphics, they have not discussed these issues. Of course these methods are inad- equate to the purpose of recognition and inter- 1857
-
Upload
khangminh22 -
Category
Documents
-
view
1 -
download
0
Transcript of Understanding Illustrations of Origami Drill Books

Vol. 41 No. 6 IPSJ Journal June 2000
Regular Paper
Understanding Illustrations of Origami Drill Books
Jien Kato,† Toyohide Watanabe,† Hiroyuki Hase††
and Takeshi Nakayama†††
This paper introduces a new approach for understanding the folding process of origamibased on interpreting a series of illustrations of origami drill books. Although many graphicsrecognition schemes have succeeded in dealing with individual graphical images, they cannotbe adapted for recognition of a sequence of contextually related graphics such as origamiillustrations. Our approach is based on a dynamically updated internal model of origami.The key characteristics of this approach are as follows: (1) It interprets not only what foldingoperations are specified in each single image, but how origami will change and what origamiwill seem to be in other images, according to the recognized operations. (2) It provides anefficient way to associate intermediate interpretation with a related image. (3) As a result ofthe understanding, the folding process can be completely described using the internal model.
1. Introduction
Over the last three decades, many researchershave investigated methods for graphics recog-nition and interpretation with the objectiveto enable graphics components to be accessedas semantically complete entities, for applica-tions such as indexing image components froma pictorial database, determining locations ina geographical information system or modify-ing graphics in a CAD system1)∼8). From theviewpoint of the style of information process-ing, these methods can be divided into twotypes: top-down and bottom-up 9). Usually,the former type is knowledge based. For top-down methods, Niyogi and Srihari 2) describeda production system for document understand-ing. Antoine, et al. 3) proposed an approachfor interpretation of different classes of techni-cal documents such as city maps and mechani-cal drawings using a priori knowledge. The lat-ter type is generally based on structure analy-sis, that is, structural analysis of lines and theirinterconnections is required to generate mean-ingful and succinct descriptions of the objects.For example, Kasturi, et al. 6) and Ejiri, et al. 7)
proposed typical methods of this type for recog-nition of flow-charts, engineering drawings andmaps. Although these methods are differentwith respect to style, they all deal with indi-vidual graphics images. In other words, thesemethods limit the focus to the same recogni-
† Department of Information Engineering, GraduateSchool of Engineering, Nagoya University
†† Faculty of Engineering, Toyama University††† International Academy of Media Arts and Sciences
tion issue: How can various graphical shapesand their spatial relationships be recognized?
On the other hand, we need to observe graph-ics recognition and interpretation from anotherpoint of view, namely, that an object can beperceived not only as a simple static entitywhich is contained in individual image but asa changing object associated with a series ofcontextually related graphics images. We caneasily find many examples in real-world appli-cations for such objects: weather maps, comicstrips and illustrations of origami drill books forinstance. In this paper, we distinguish inter-preting several related graphics from interpret-ing single graphics. The difference is that in theformer case, the contents of a following imagealways depend on the contents of a previous im-age. So, in addition to the question “how canvarious graphical shapes and their spatial rela-tionships be recognized in each individual im-age?”, a satisfactory solution has to be foundto the issues such as• How can intermediate interpretation be de-
scribed?• How can the interpretation results for a
previous image be associated with a follow-ing image so that the interpretation processcan be continued?
• How can intermediate interpretation beused to help recognition of the followinggraphics images?
Unfortunately, although the methods proposedso far have led to much success in coping withindividual graphics, they have not discussedthese issues. Of course these methods are inad-equate to the purpose of recognition and inter-
1857

1858 IPSJ Journal June 2000
pretation of a series of related graphic images.In this paper, we propose an approach for
understanding the folding process of origamibased on interpreting a series of illustrations.We select origami as the recognition object fordiscussing the issues stated above, because ofthe advantage that the domain of origami issmaller and closed. In a general origami drillbook, the folding process of origami is explainedby a sequence of illustrations 10). Each frame ofthe illustrations depicts the present state of theorigami, which results from the folding opera-tions indicated in previous frames, and specifiesa few new folding operations. So, the state ofthe origami always varies from frame to frame.The key characteristics of our approach are thatit interprets not only what operations happenedin a frame but how the origami changed fromone frame to another during the folding oper-ations. Moreover, folding process can be ac-curately represented in a dynamically updatedinternal model of origami as the recognition re-sults.
In the following sections, we first discuss somebasic problems when interpreting several re-lated illustrations of origami drill books, andintroduce an internal model to overcome theseproblems as the basis of our methodology. Wethen propose a method to associate the statesof origami, described in the internal model,with the illustrations for interpreting what fold-ing operation is specified and how origami ischanged, based on DTW (dynamic time warp-ing) and simulated annealing. Lastly, we eval-uate our approach through examples. This pa-per does not cover the topic of document imageanalysis. The issue of image analysis with thepurpose of recognition of various meaningfulgraphical entities has been discussed in Kato,et al. 11)
2. Approach
This section describes the basic concepts inour approach, introduces the internal model oforigami, and presents a summary of our recog-nition system.
2.1 Some Definitions about OrigamiWe know that there are more than 10 kinds
of folding operations used in traditional paperfolding art. But most of them are essentiallycomposed of a basic operation “folding back”.This operation divides a face into two, and ro-tates one partition by 180◦ around the divisionline. Moreover, as shown in Figs. 1 (a) and
(a)
(b)
(c)
Fig. 1 Folding operations are generally described inorigami drill books in the way shown in (a)–(c).(a)(b) Two types of the basic operation. (c)Compound operations “tucking in” and “cov-ering”. The shadowed faces denote the insidefaces of the origami.
(b), it can further be divided into two differenttypes: “mountain-folding” and “valley-folding”according to the rotation direction. Hence thefactors which can be specified in a basic op-eration are the folding line, folding directionand folded face. In contrast to basic opera-tions, more complicated operations are clas-sified as compound operations since they canbe a combination of two or more basic oper-ations under some physical restrictions. Forexample, in Fig. 1 (c) “tucking in” and “cov-ering” can be regarded as a combination ofa “mountain-folding” and a “valley-folding”where two neighboring faces have to be simul-taneously rotated in opposite directions.
On the other hand, we find that the fold-ing operations can be also categorized into thedifferent classes such as “single-face folding”and “multi-face folding” in accordance with thefolded faces. Namely, the operations where onlyone face is folded belong to the former class,and conversely, those where two or more facesare folded fall into the later class. Obviously,the compound operations are certainly multi-face folding. The basic operation “folding back”seems to be single-face folding, but it is not al-ways true. We would like to stress that when“folding back” is applied to a face, not only is

Vol. 41 No. 6 Understanding Illustrations of Origami Drill Books 1859
this face folded but any face that has connec-tivity or overlap relationships directly or indi-rectly with the folded face may folded or movedat the same time. The same thing can be saidfor the compound operations. As a result, weclassify the folded faces as follows:• Active face, the face an operation is imme-
diately applied to.• Passive face, the face is folded or moved
due to connectivity or overlay relationshipswith an active face.
• Divided passive face, the passive face thatis divided.
• Undivided passive face, the passive facethat is not divided but moved.
We give three examples in Fig. 2 to show thedistinctions between an active face and a pas-sive face, between a divided passive face andan undivided passive face and between con-nectivity relationships and overlap relationshipsamong faces. In particular, Fig. 2 (a) shows acase of undivided passive faces where a passive
(a)
Fp
Fa
(b)
Fp
Fa
(c)
Fp
Fa
Fig. 2 The distinctions between an active face and apassive face, between a divided passive face andan undivided passive face, and between con-nectivity relationships and overlap relationshipsare illustrated here. (a) An active face Fa andan undivided passive face Fp. Fp moves be-cause of the connectivity relationship with Fa.(b) An active face Fa and a divided passive faceFp. Fp (hidden behind Fa) is folded because ofthe connectivity relationship with Fa. (c) Anactive face Fa and a divided passive face Fp. Fp
(hidden behind Fa) is folded due to the overlaprelationship with Fa.
face Fp is moved because of the connectivity re-lationship with an active face Fa. Figures 2 (b)and (c) show the examples of divided passivefaces Fps due to the connectivity, overlap rela-tionships with active faces Fas, respectively.
The discussion until now has made it clearthat when interpreting a folding operation, thefolding lines, directions and folded faces whichdefine the operation must be recognized. Herethe folded faces include not only active faces butpassive faces, and moreover the passive facesmay exist due to either connectivity or overlaprelationships among faces.
2.2 Problems in Folding Process Rec-ognition
Besides explanatory text, we think that themost useful information in the illustrations oforigami drill books are indicative informationand contextual information. In this section, wedistinguish the two kinds of information, andargue the problems in interpreting several con-textually related illustrations that represent afolding process.
Indicative information helps us perceive theoperations at each step (frame). Figure 3shows seven images that illustrate a completefolding process called “cicada”. We find that in-dicative information in each image is conveyedto readers by certain of meaningful graphi-cal entities: polygons to express the states oforigami and some symbols to indicate the con-tents of folding operations. The second type ofthe entities includes broken lines and arrows.The broken lines are used to represent foldinglines, while two types of arrow-heads combinedwith different patterns of broken lines, that is,a filled arrow-head with a dashed line and anunfilled arrow-head with a dash-dot-dot lineare customarily to express two different fold-ing directions. Furthermore, the arrows indi-cate moving partitions of folded faces by thepositions of their end points. So, it is conve-nient to use indicative information for efficientrecognition of folding operations from each in-dividual image. However, indicative informa-tion is not enough to find all the folded facesbecause the connectivity and overlap relation-ships among faces are not visually evident in a2D drawing. What is more, the further a fold-ing process goes, the more complicated the re-lationships become. How to maintain the con-nectivity and overlap relationships during therecognition process is one of problems relatedto folding process recognition.

1860 IPSJ Journal June 2000
(a) (b) (c)
(d) (e) (f) (g)
Fig. 3 The folding process called “cicada”.
In addition to indicative information, contex-tual information is very important and avail-able to interpret individual operations and suc-cessive operations. Contextual information isprovided by neighboring frames in a series ofillustrations. It tells us both of the sequence offolding operations and the states of origami be-fore and after performing a certain operation.The states of origami in neighboring frames ofthe illustrations are usually expressed from thesame angle, but sometimes the view in the fol-lowing frame is rotated (mostly by 180◦) fromthe view in the previous frame. The variationbetween views is always clearly indicated by asymbol, a special arrow. To recognize succes-sive folding operations, if the operation speci-fied in the previous frame has been identified,not only do the new connectivity and overlaprelationships resulting from this operation haveto be registered, but the changs in the shape ofthe origami, taking the view into account, mustbe associated with the contents of the followingframe of illustrations so as to prepare for thenext recognition step. This is another difficultproblem for folding process recognition.
2.3 Internal Model of OrigamiWe introduce an internal model of origami to
solve the problems stated above. As we havepointed out, this model should be able to de-scribe the changes in the states of origami andmaintain the connectivity and overlap relation-ships among faces during the recognition pro-
cess. Furthermore, on the basis of this modelnot only the rotation, expansion/reduction oforigami, but its projection on any plane has tobe easily acquired.
We define the internal model as consisting ofthree layers: face layer for description of the di-vision of faces, edge layer for description of thedivision/generation of edges and vertex layerfor description of the movement of vertices. Ob-jects of three classes, namely tree, stack and listare used to construct this model.
2.3.1 Face LayerThe division course of origami is described as
a binary tree, called face tree. The nodes of thetree indicate faces. The root especially standsfor the initial state of the origami, a sheet ofpaper without any folding lines. When a faceis folded, the child nodes, corresponding to thetwo face segments, are generated and connectedto the node, corresponding to the folded face.Thus, the branches of the tree preserve the con-nectivity relationships between the faces thatare separated in the same operation. In thismanner, a face tree can describe successive fold-ing operations. The terminal nodes always rep-resent the current state of the origami.
During the folding process, the faces corre-sponding to the terminal nodes generally formone or more planes in space. It should be clearthat overlap relationships exist only amongfaces which are on the same plane and touchwith each other. Therefore, when a folding op-

Vol. 41 No. 6 Understanding Illustrations of Origami Drill Books 1861
���
(�������
F1
(���������
F3
(�������
F5
op1
op2
(���������
F2
(����������
F4
(����������
F6
op1
op2 op2
(���������
F7 op2
9� 9�
9� 9�
9�
9�
9�
9�
(��
(�
(��
(�� (��
(��
(��
(��
(�(�
)�)�
)�
)�
(��
(b)(a)
F4
F6
F5
F7
F2
F3
(d)
No. Type Face Groupop1
op2 valley
mountain F2->F3
F5->F4->F6->F7
���
(e)
C
C
C
C
Vertex
C
C
C
C
op1
C
C
C
C
op2 Initialization
V1
V2
V3
V4
V5
V6
V7
V8
)�
E1 V1,3
)�
E11 V1,5)�
E12 V3,5
op2 op2 )�
E2 V1,2
)�
E21 V1,6)�
E22 V2,6
op1 op1
)�
E4 V3,4
)�
E41 V3,7
)�
E42 V4,7
op1 op1 )���
E5 V6,7
)���
E51 V6,8
)���
E5,2 V7,8
op2 op2
)�
E3 V2,4
)���
E6 V5,8
)���
E7 V2,8
op1
op2op2
E1 E2 E4E3 E5 E6 E7
���
Fig. 4 Examples of descriptions of the internal model. (a) Illustrations. (b)The crease pattern of origami. (c) The face tree. (d) The operationlist. (e) The edge trees. (f) The vertex stacks.
eration has taken place, the faces related to theterminal nodes can be divided into groups sothat the faces in the same group have the over-lap relationships and others do not. We de-scribe the overlap relationships within a facegroup by using a stack. Naturally, the over-lap relationships depend on both of the currentsituation of origami and the folding operationbeing applied under this situation.
As a consequence, the face layer is composedof a face tree and an operation list as shownin Fig. 4. An operation list is used to de-scribe interpretation results such as operationtypes and the stacks that keep the overlap re-lationships resulting from the operations. Aface tree and an operation list for the exampleshown in Fig. 4 (a) are illustrated in Figs. 4 (c)and (d). Each node in Fig. 4 (c) contains theface number, edge numbers and operation num-ber. Figure 4 (d) shows that there is only oneface group. The faces are overlapped in theorder of F2 → F3 after “mountain-folding”,and in the order of F5 → F4 → F6 → F7 af-ter “valley-folding”. Connectivity relationshipsamong faces can be easily obtained by edgeinformation attached to each node. That is,the faces with connectivity relationships shouldhave a common edge. For example, F4 is con-nected to F5 and F6 because the common edgeE51 exists between F4 and F5, and E6 betweenF4 and F6, respectively.
2.3.2 Edge LayerAs a face is separated into smaller pieces,
some of the edges may be divided and some newedges may be yielded. A similar binary tree,called edge tree, is used to described the divi-sion course of edges as illustrated in Fig. 4 (e).When an edge is separated, the nodes corre-sponding with two edge segments are generatedand connected to the node corresponding to thedivided edge. Each node contains related face,vertex and operation numbers so as to conve-niently access the data in other layers.
The number of edge trees grows as new edgesappear. For example, in Fig. 4 (e) the tree withthe root E5 is generated as the face F1 is foldedinto two (F2 and F3), and the trees with theroot E6 and E7 are generated as the same faceis folded into four (F4, F5, F6 and F7). We usea list to preserve the roots of edge trees.
2.3.3 Vertex LayerThe vertex layer is composed of a group
of stacks, called vertex stacks, as shown inFig. 4 (f). Each stack is assigned to a vertexto maintain its coordinates in space. Whenevera new vertex is created or an existing vertexis moved, the new coordinates are stored intothe corresponding stack. We use “C” instead ofthe values and put it at the column correspond-ing to the related operation. The top of eachtack is at the left side. For example, in thefirst operation op1 the vertices V2 and V4 aremoved and V6 and V7 are newly generated, thusthe new coordinates are added into the stacksthese vertices belong to. In the second opera-tion op2 since the vertices V1 and V6 are moved

1862 IPSJ Journal June 2000
USG: Unrefined Shape GraphISG: Ideal Shape Graph
call
calla series ofdocument
images
GraphicsRecognition
OperationRecognition
USG
Contextual Information
Indicative Information
ISG Generation refer
update
internalmodel
Model Construction
,6*
UHVXOWV
Fig. 5 Framework of folding process recognition.
and V5 and V8 are newly generated, the newcoordinates are also put into the correspondingstacks. Accordingly, stacks for V3, V5, V7 andV8 preserve one set of coordinates since thesevertices never moved, whereas stacks for V1, V2,V4 and V6 keep two sets of coordinates becausethey moved once.
We have described the internal model oforigami using three data layers. Advantages ofthis model can be summarized as follows:• It can easily describe the connectivity and
overlap relationships among faces. Whenorigami turns over, the internal model canadjust the overlap relationships only by re-versing the order of faces in the face groups(it can be easily done when using stacks).
• The shape of the origami that will seem tobe in the following frames can be obtainedaccording to this model.
• Backtracking can be easily implementedjust by removing related nodes from facetree and edge trees, and related items fromoperation list and vertex stacks, which areaccompanied with target operation num-bers.
2.4 Outline of RecognitionThis section presents the overall view of our
recognition approach. Our approach consistsof two main stages 12). In the first stage, var-ious meaningful graphical entitiesare detectedfor recognizing the folding operations specifiedin each individual image. In the second stage ofour approach, the recognition results from thefirst stage is associated with the current state ofthe origami, obtained from the internal model.
Therefore, our recognition system is com-posed of graphics recognition module and op-eration recognition module as shown in Fig. 5.In Fig. 5, the ISG generation process and modelconstruction process are the sub-modules andinvoked by the operation recognition process.At first, the model construction process is in-
voked once to create the initial state of the in-ternal model of origami. The graphics recog-nition process then interprets the folding op-erations based on various meaningful graphicalentities that were detected, and describes therecognition results in a graph structure calledUSG (Unrefined Shape Graph). Once a USG isobtained, the ISG generation process is invokedto make an ISG (Ideal Shape Graph), a projec-tion of the internal model on x-y plane (perpen-dicular to the view of the image). An ISG hasa similar data structure to a USG, however itis not constructed from the current image butthe previous image. It shows how the origamiis expected to be in the current frame of the il-lustrations. The operation recognition processthen matches the ISG to the USG. If the corre-sponding relationships between the faces in theISG and USG can be precisely obtained, we canidentify the folding lines, directions and foldedfaces (active faces), and moreover discover allthe passive faces according to the connectivityand overlap relationships among faces describedin the internal model. Lastly, the model con-struction process is invoked to update the inter-nal model in accordance with the effects of thefolding operations. Such recognition steps willbe repeated until a folding process is completed.
3. Recognition of Folding Process
The main steps for recognition of folding pro-cess are as follows:( 1 ) Generation of ISGs( 2 ) Matching a USG to an ISG( 3 ) Updating the internal model
Now we describe these steps in the followingsections with an emphasis on Step (2).
3.1 USG and ISGThe issue of graphics recognition with the
aim of extracting various meaningful graphicalentities has been presented in Kato, et al. 11)
We summarise the details here for introducing
Vol. 41 No. 6 Understanding Illustrations of Origami Drill Books 1863
USGs.Graphics recognition consists of 5 steps:• Removing character strings• Separation of solid regions• Segmentation into line segments• Arrow detection• Broken line detection
Separation of text regions from an original im-age of origami illustrations is the first task. Af-ter the text regions have been separated, theimage almost contains thin entities except il-lustration numbers and filled arrow-heads asdepicted in Fig. 3. The solid regions are thendifferentiated. When solid regions have beenalso distinguished and removed, a thinning al-gorithm is applied to the image so that the re-maining entities can be described by thin lines.Then we find out all the feature points such asjunctions, intersections and sharp corners fromthe obtained thinned image, and segment theimage into line segments. Lastly, we detect thetwo types of arrows and two types of brokenlines.
It can be seen from the above discussion thatin the graphics recognition stage, we have notonly recognized the meaningful graphical enti-ties such as arrows and broken lines, but alsodecomposed remaining thin entities into linesegments at some places which include the sig-nificant feature points. Note that some of themmay not be feature points because the segmen-tation is based on a polygonal approximationalgorithm. Hence a part of these line segmentsand their ending points will be identified as theedges and vertices of origami in the subsequentoperation recognition stage.
A USG is mainly used to describe the resultsof graphics recognition where arrows and bro-ken lines have been removed for convenience. Itis characterized by edges and vertices:• Any edge in a USG stands for a line seg-
ment (a straight line).• Any vertex in a USG stands for a terminal
of a line segment.Thus the edges and vertices of a USG are in-terconnected in such a way that the shape oforigami are expressed as it is described in theillustration. Figure 6 gives us a pretty goodidea of what a USG is and where it comes from.
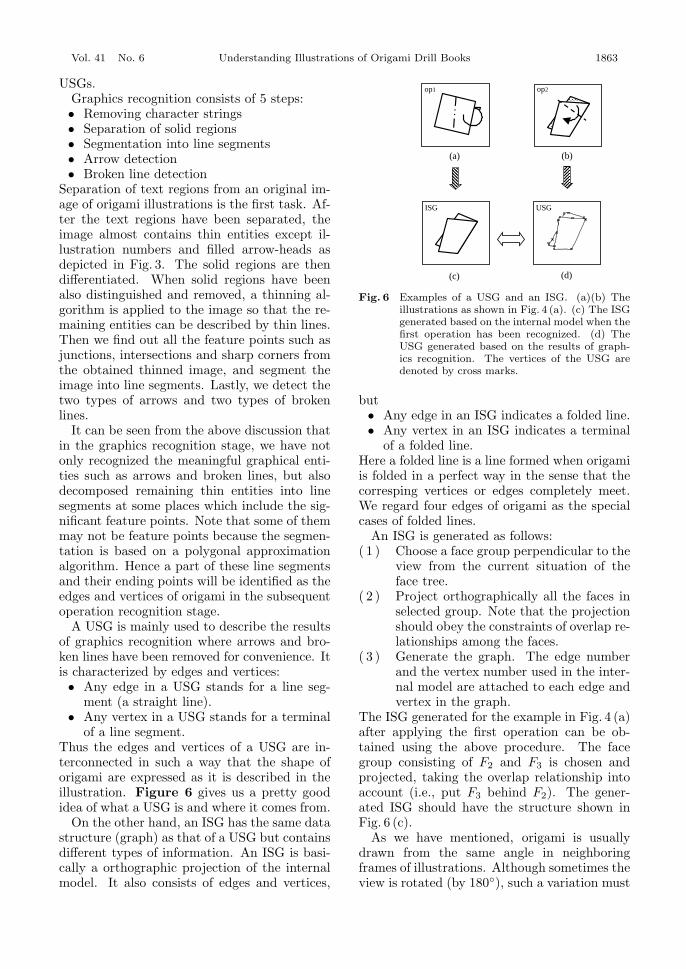
On the other hand, an ISG has the same datastructure (graph) as that of a USG but containsdifferent types of information. An ISG is basi-cally a orthographic projection of the internalmodel. It also consists of edges and vertices,
op1 op2
ISG USG
(a) (b)
(c) (d)
Fig. 6 Examples of a USG and an ISG. (a)(b) Theillustrations as shown in Fig. 4 (a). (c) The ISGgenerated based on the internal model when thefirst operation has been recognized. (d) TheUSG generated based on the results of graph-ics recognition. The vertices of the USG aredenoted by cross marks.
but• Any edge in an ISG indicates a folded line.• Any vertex in an ISG indicates a terminal
of a folded line.Here a folded line is a line formed when origamiis folded in a perfect way in the sense that thecorresping vertices or edges completely meet.We regard four edges of origami as the specialcases of folded lines.
An ISG is generated as follows:( 1 ) Choose a face group perpendicular to the
view from the current situation of theface tree.
( 2 ) Project orthographically all the faces inselected group. Note that the projectionshould obey the constraints of overlap re-lationships among the faces.
( 3 ) Generate the graph. The edge numberand the vertex number used in the inter-nal model are attached to each edge andvertex in the graph.
The ISG generated for the example in Fig. 4 (a)after applying the first operation can be ob-tained using the above procedure. The facegroup consisting of F2 and F3 is chosen andprojected, taking the overlap relationship intoaccount (i.e., put F3 behind F2). The gener-ated ISG should have the structure shown inFig. 6 (c).
As we have mentioned, origami is usuallydrawn from the same angle in neighboringframes of illustrations. Although sometimes theview is rotated (by 180◦), such a variation must

1864 IPSJ Journal June 2000
be distinctly indicated in the previous frame us-ing a special arrow. Therefore, the ISG beingmatched to the current image can be gained byprojecting the model on x-y plane or doing thatafter rotating the model by a specified angle.
3.2 Matching an ISG to a USGA USG is not a simple revolution or expan-
sion/reduction in size of an ISG. Here we stressthat:• A USG includes some extra parts that are
not found in an ISG, for example, noise andthe graphical entities which slightly expressorigami in 3D effect (see Fig. 3).
• A USG almost never has the completelysame topological structure as its corre-sponding ISG, since illustrations are notstrictly accurate copies of real origami.
Because of these problems, simple matchingtechniques based on comparing the coordinatesof all vertices or examining the connections ofall edges are inappropriate and useless 13).
A USG actually resembles its correspondingISG. It is proper to define the meaning of re-semblance as similarity in shape and topology.From this viewpoint, we propose a flexible andfeasible matching method with higher tolerancefor the local differences in shape and topol-ogy between a USG and an ISG. Our methodconsists of two stages. In the first stage wematch vertices of an ISG to those of a USGbased on dynamic programming, so as to esti-mate the expansion/reduction ratio of the twographs. Then in the second stage we associatethe ISG to the USG using simulated annealingtechnique. The solution obtained will be opti-mal in some meaningful sense, namely, it willbest “explain” the corresponding relation be-tween the ISG and the USG.
3.2.1 The First Stage of MatchingSuppose that a vertex A and a vertex B are
characterized as a sequence of vectors as shownin Fig. 7. Each of vectors is parallel to an edgeand connected to the vertex in the directionapart from it:
A = a0a1 · · · aI ,B = b0b1 · · · bJ .
To calculate the distance between A and B, howthe pattern A should be compared with B mustbe determined. We introduce a concept called“route” for this purpose. A route from (0, 0) to(I, J) is defined as
p̃ = (p0, p1, · · · , pK),pk = (i(k), j(k))
B
b0
b1
b3
b2A
a0
a1
a2
Fig. 7 The definition of vertices.
∈ {0, 1, · · · , I} × {0, 1, · · · , J},for k = 1, · · · ,K, and it must meet either oneof these conditions:
i(k) = i(k − 1) + 1 and j(k) = j(k − 1),i(k) = i(k − 1) + 1 and j(k) = j(k − 1) + 1,i(k) = i(k − 1) and j(k) = j(k − 1) + 1.
That is, a route gives a map from a set of el-ement positions of A ({0, 1, · · · , I}) into a setof element positions of B ({0, 1, · · · , J}). So, Acan be compared with B on the basis of a route.
However, if i(k − 1) = i(k), the point ai(k−1)
(= ai(k)) is related to two points bj(k−1) andbj(k) since j(k−1) = j(k). In this case, we thinkai(k) which should be related to bj(k) is omitted,or bj(k) which did not exist originally has beeninserted. Such kind of insertion/omission oftenhappens in USGs and ISGs because a USG isnever completely the same as its correspondingISG. We define the functions:
α(pk) ={
ai(k) if i(k) = i(k − 1) + 1;∗ if i(k) = i(k − 1),
β(pk) ={
bj(k) if j(k) = j(k − 1) + 1;∗ if j(k) = j(k − 1),
to cope with the insertion/omission case, wherean omission is denoted by “∗”.
Now, the distance between A and B con-nected with route p̃ can be defined as the sumof the distance between all the element pairs inp̃:
D(A,B; p̃) ≡K∑
k=1
d(α(pk), β(pk)). (1)
The distance between A and B is naturallyviewed as the minimum of the distances relatedto all the routes as
Vol. 41 No. 6 Understanding Illustrations of Origami Drill Books 1865
D(A,B) ≡min{D(A,B; p̃) | p̃ ∈ P ((0, 0), (I, J))},
(2)
where P ((0, 0), (I, J)) denotes all the routesfrom (0, 0) to (I, J). When A stands for a ver-tex of an ISG and B for a USG, the distanceof each element pair, d, is defined as the anglebetween vectors:
d(α(pk), β(pk)) =
acos(
ai(k)·bj(k)
|ai(k)||bj(k)|)
if α(pk) = ∗, β(pk) = ∗,4π
if α(pk) = ∗, β(pk) = ∗,0
if α(pk) = ∗, β(pk) = ∗.(3)
In Eq. (3), a large distance 4π is given if aninsertion arises in an ISG, while a zero-distanceis given if an omission occurs in an ISG. Thisis because the former case usually signals a badmatching and the latter can be accepted.
We efficiently compute Eqs. (1)–(3) using dy-namic programming 14). Some vertices whichare very close to each other are selected to cal-culate the expansion/reduction ratio betweenan ISG and a USG.
3.2.2 The Second Stage of MatchingFor convenience, we use the notation
ISG : v1, v2, · · · , vM ,USG : ν1, ν2, · · · , νM , · · · , νN .
to express an ISG and a USG. Suppose thatthe first M vertices of the USG correspond tothe first M vertices of the ISG. We speciallycall such an arrangement “state” for the USG.Let S be a finite set of the states, if each stateSj in S is given a cost c(Sj), the objective ofthe second stage of matching is to search for theoptimal state Sopt so that
c(Sopt) ≤ c(Sj), ∀Sj ∈ S. (4)Here the cost is a function which representsa quantitative measure of the “badness” ofmatching.
All exact methods for solving such a prob-lem require a computing effort that increasesexponentially with the size of S. When Sis very large, simulated annealing will becomea much more powerful means than any exactmethod 15). We use a simulated annealing algo-rithm to search for global optimal solutions forour problem because at the steps near to theend in a complicated folding process, the num-
ber of vertices in a USG may increase into tensof hundreds.
Our algorithm is described as follows. Theinitial temperature T0 and the initial state S0
are first given. Then, a basic annealing step isrepeated unless a stopping criterion is satisfied.In each iteration of this basic annealing step, asmall random alteration of states is produced byexchanging the positions of two vertices. Thecaused variation in the cost, ∆c, is then cal-culated based on a cost function. If the costis less than the old state, the alteration is ac-cepted and the new state is used as the startingpoint of the next repetition.
On the other hand, cases where the cost inthe new state is more than that in the old stateare treated probabilistically. The new stateis accepted with the probability p(∆c, T ) =exp(−∆c/T ). A random number uniformlydistributed in the interval (0, 1) is generatedand compared with p(∆c, T ). If it is less thanp(∆c, T ), the new state is accepted, otherwisethe old state is used to start the next itera-tion again. In any case the temperature is low-ered slightly. We repeat the basic annealingstep until a stopping criterion is satisfied, thatis, there is no any new state to be acceptedduring repeating the step n times (n is a largeinteger). When the temperature becomes suffi-ciently low, the final state can be expected tobe the optimal solution.
The above algorithm is described in C styleas follows.Simulated Annealing(S0,T0) {T = T0;
S = S0;
for (i = 0; “stopping criterion” is not satisfied; i++) {for (j = 0; j < n; j++) {
S′ = generate(S);
if (accept(c(S′), c(S),T)) {S = S′;
}t = i ∗ n + j;
T = update(T, t);
}}
}generate(S) {
m = random(1,N);
n = random(1,N);
S′ = exchange(S,m,n);
return(S′);}accept(c(S′), c(S),T)) {

1866 IPSJ Journal June 2000
(a) T0 = 0.72135, t = 0 (b) T = 0.5870, t = 5000 (c) T = 0.5429, t = 10000 (d) T = 0.4779, t = 35000
Fig. 8 An example of simulated annealing process. The USG and the ISGare shown in the center and the left-upper corner in each image. Thevertices of the USG are indicated by a cross mark, but the selectedM vertices which are supposed to match to the M vertices of the ISGare emphasised by thick rectangles. (a)–(d) show how the M verticesof the USG gradually approach the correct positions.
∆c = c(S′)− c(S);
y = p(∆c,T);
r = random(0, 1);
if (r< y)
return(1);
else
return(0);
}update(T, t) {
return(∆/log(t + 2)); / ∗∆ is a constant.*/
}Where the probability p is given by
p(∆c, T ) ={exp(−∆c/T ) if ∆c > 01 otherwise (5)
and the cost function is defined as the total dis-similarities of two graphs:
c(S) =M∑i=1
M∑j=1
(α · Ea(i, j) + β · Es(i, j)),
(6)Ea(i, j) = −−→vivj · −−→νiνj/|−−→vivj ||−−→νiνj |, (7)Es(i, j) = ||−−→vivj | −R · |−−→νiνj ||, (8)
where R denotes the expansion/reduction ratiobetween an ISG and a USG which has alreadybeen obtained in the first stage of matching.
It should be clear that the initial temperaturemust be high enough so that the most of states,especially the states leading to the cost increase,can be accepted. Hence the formula
T0 =∆c
(+)
lnχ−10
(9)
is often used, where ∆c(+)
is the average of in-creased costs and χ0 is a large positive num-ber 16). We adopt Eq. (9) to calculate T0 be-
cause we want to avoid local minimum solu-tions. If T0 is not high enough, the final solu-tion will be trapped in a local minimum. Thecoefficients of α and β in Eq. (6) can be set toα = β = 1 since it is reasonable to think thatthe discrepancy of one degree, the measure forthe direction, is roughly the same as that of onepixel, the measure for the distance.
An example of the simulated annealing pro-cess is shown in Figs. 8 (a)–(d). In the experi-ment T0 = 0.72135 and n = 5000. States underdifferent temperatures are expressed by thickrectangles at the first M vertices in the USGs.T and t indicate the temperature and the re-peating times of the basic annealing step.
3.3 Updating the Internal ModelIn this section, we show the principal rules for
modifying folding lines and determining passivefolded faces. We also briefly describe how torenew the internal model.
3.3.1 Modifying Folding LinesIf an ISG is correctly associated with a USG
using the method described in the previous sec-tions, the positions of the folding lines relatedto the specific folded faces can be obtainedthrough the ISG and the USG. Since small er-rors may exist, we apply some rules to revisethe positions. The basic rules are as follows:• If a terminal of a folding line is very close
to a vertex of a face, move the folding lineto pass through the vertex.
• If a folding line is very close to an edge,move the folding line so that it overlaps thisedge.
3.3.2 Searching for Passive FoldedFaces
Passive folded faces contain divided and un-divided ones. A divided face has a moving por-

Vol. 41 No. 6 Understanding Illustrations of Origami Drill Books 1867
(a) (b) (c)
(d) (e) (f)
Fig. 9 The extracted different types of arrows and different types of brokenlines in graphics recognition stage. They are used to interpret theindividual folding operations.
tion and a fixed portion, while an undividedface does not have any fixed portion becauseit is moved in its entirety. We search for thepassive folded faces according to the rules asfollows:• If a face Fp has a common edge with a mov-
ing portion of a folded face Fa, this face isdetermined to be a passive face. If the fold-ing line passes through it, Fp is a dividedface, otherwise it is an undivided face (seeFigs. 2 (a) and (b)).
• If a face Fp overlaps a moving portion ofa folded face Fa, and the moving portionis rotated toward Fp, the face Fp is deter-mined to be a passive face (see Fig. 2 (c)).
3.3.3 Renewing the Internal ModelThe internal model is updated in accordance
with identified folding lines, directions and allfolded faces. For an active face or a dividedpassive face, some terminal nodes are generatedand connected to the face tree and edge trees.Coordinates of moved vertices are pushed intocorresponding vertex stacks. The new edges, ifthey exist, are registered as a new edge tree andtheir terminals are newly registered in a vertexstack. For an undivided passive face, only thenew coordinates of vertices should be added tothe stacks. No node is connected to the facetree or the edges trees. A new face stack forthe overlap relationships among faces must be
generated according to the current state of theorigami.
4. Experimental Results
Our approach for recognition and interpreta-tion of the folding process has been tested witha number of origami illustrations. In this sec-tion, we evaluate our approach through an ex-ample: the folding process “cicada” consistingof seven images (see Figs. 3 (a)–(g)).
We show some of the outputs of our graph-ics recognition in Fig. 9. All the arrow-heads,including filled and unfilled types, and arcswere correctly detected and distinguished. InFig. 9, filled arrow-heads and arrow-tails are in-dicated by small and big cross marks, and un-filled arrow-heads, crossing points between anarc and a broken line by a thick rectangle. Asexpected, different types of broken lines are alsocorrectly extracted. For filled arrow-heads, thearrows crossing a dashed line are interpretedas an indication of “valley-folding”, while forunfilled arrow-heads, the arrows along with adash-dot-dot line are interpreted as “mountain-folding”.
Figure 10 shows the situation of USGs af-ter the first stage of matching. In addition to aUSG, each image includes an ISG, generated ac-cording to the internal model, in the left-uppercorner. Results of DP matching for estimat-

1868 IPSJ Journal June 2000
(a) (b) (c)
(d) (e) (f)
Fig. 10 The results of DP matching. Each image not only shows a USG butincludes the corresponding ISG in its left-upper corner. The verticesof USGs which have been associated with a short-distance vertex ofISGs are emphasised by a thick rectangle.
ing the expansion/reduction ratio can be seenfrom the vertices. The vertices of USGs whichhave been associated with a short-distance ver-tex of ISGs are indicated by a thick rectan-gle. It can be observed that all the verticesin ISGs have been almost matched to the cor-rect ones of USGs in the first three frames. Butbecause of the differences between an ISG anda USG or the similarities among vertex pat-terns within a graph, remaining images do notcompletely reach the correct solution. For ex-ample, in Fig. 10 (d) the vertex in the centerof the ISG cannot find a short-distance ver-tex, since the topology of the ISG is too dif-ferent from the USG in this part. On the otherhand, in the same image two vertices in the bot-tom of the ISG are mis-matched to the samevertex in the USG, since they closely resem-ble each other. Although the results of DPmatching contain some errors, they are satis-factory for estimating the expansion/reductionratio. We show the ratios of each edge in ISGsto the corresponding edge in USGs in Fig. 11.They are calculated according to the results ofDP matching of Figs. 10 (d)–(f). Clearly, theexpansion/reduction ratio can be decided asR = 0.50. The data greatly apart from R comefrom the mis-matched edges.
The results of DP matching constitute the
0 5 10 15 20 25 30 35 40 450
0.5
1
1.5
2
2.5
3
3.5dataC
dataD
dataE
dataF
Edges
The
Rat
ios
of IS
Gs
to U
SG
s
Fig. 11 The expansion/reduction ratio between theUSGs and ISGs at R = 0.50.
initial states of the simulated annealing algo-rithm. The final states of simulated annealingare shown in Figs. 12 (a)–(f). Note that un-like Fig. 10, Fig. 12 does not show USGs butthinned images where the M selected vertices inthe final state and the edges between them aredrawn. It is obvious that the USGs are almosta perfect match to the ISGs in all images. InFig. 12 (d), the ISG has fewer vertices than thatof the USG (see Fig. 10 (d)) because of the dif-ferent topological structures. It forces a face inthe right-lower part of the USG to have a com-

Vol. 41 No. 6 Understanding Illustrations of Origami Drill Books 1869
(a) (b) (c)
(d) (e) (f)
Fig. 12 The final states of simulated annealing process. On the thinnedimages of illustrations, the M selected vertices are indicated by thickrectangles. To show the recognized faces, we link the vertices if thereexists an edge between them.
V1E39 E38V16E34 V14V5V20 E46E47V2
V26
E66E48
F40
E67
E76
F41
F43
E40
E77
E68
E36
V8
V17
E69
E49
F24
V15
V27
F26
F42
F47
V19
V18
V28
E44
E74
F30
E72
E70
E50
F28
F45
V29
E51
E78
E42
V33F46
F44
F55
V35
E24
E75
E88
F52
V30
E25
E79
E92
E93
E86
V34
V11 E73
F53
E91
E84
E89E80 E30 V3V9V13V31
E71
E83 E85E90E87
F54
F51
F49
V32
F50
V23V7
V10
E43
E21
E20
E65
E60
E57
E59
F31
F29
F37
F39V25
E64F36
F38
E45
E61 V24
E56
E58
F48
V4
E28
E62
E53
E81
E52
E54
E82
F32
V21
V6
V22
E63F34V12
Fig. 13 The crease pattern for “cicada”.
mon vertex with its neighboring face, but sucha common vertex does not exist in the USG.This result can be improved by examining theconnections among vertices. Namely, if a ver-tex of a USG has inconsistent connections withthose of a corresponding vertex in an ISG, itshould be replaced by another appropriate one.Of course, the selected vertex and the replacedvertex have to be close with each other in thedistance. To show the recognized faces, we linkthe vertices in Fig. 12 if an edge exists betweenthem.
Fig. 14 The operation list for “cicada”.
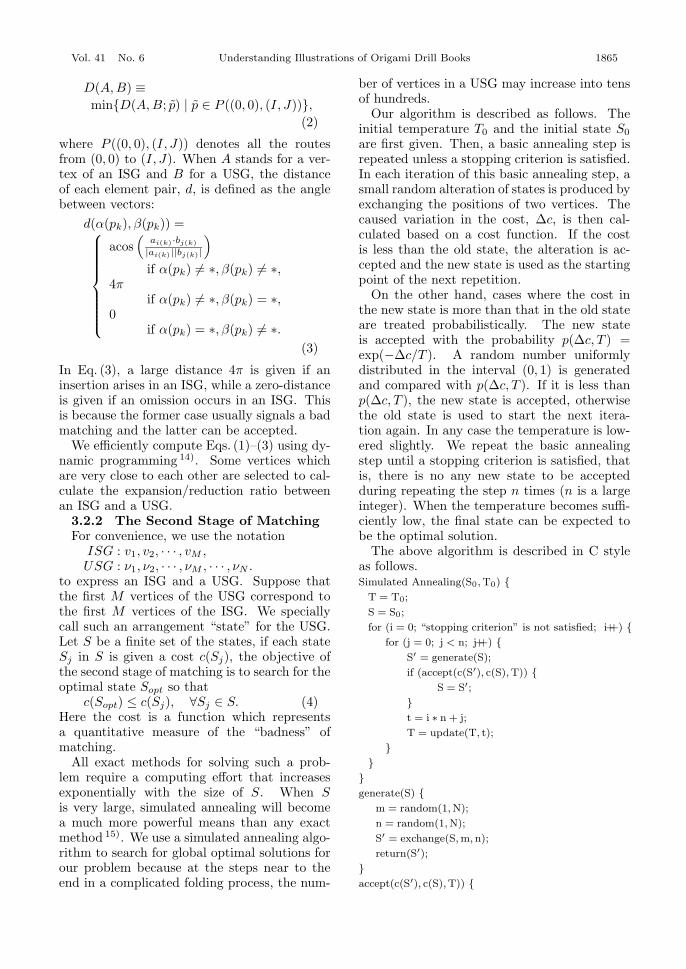
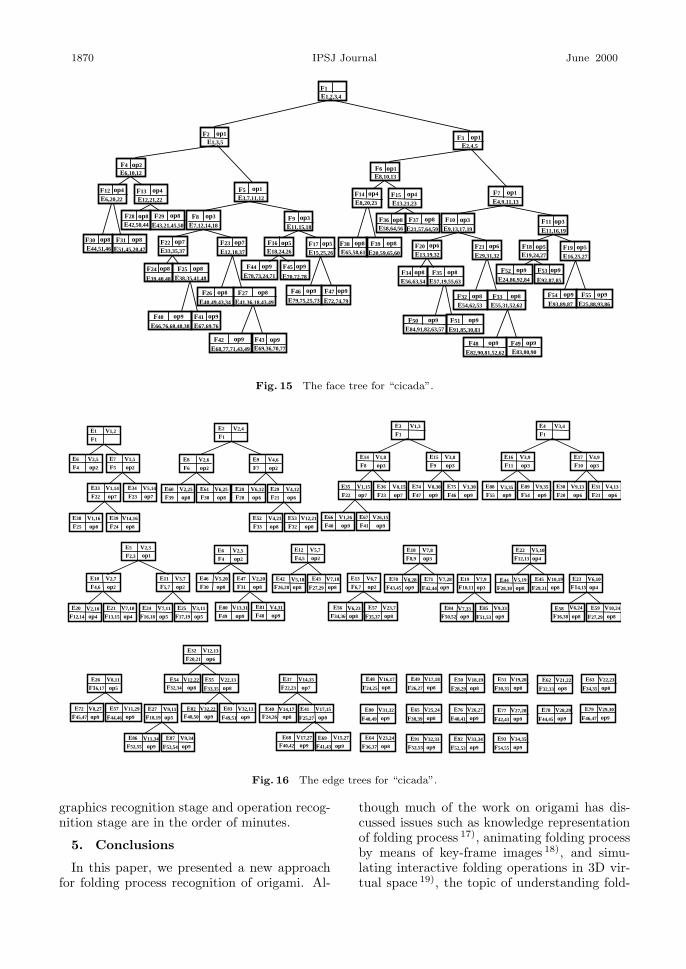
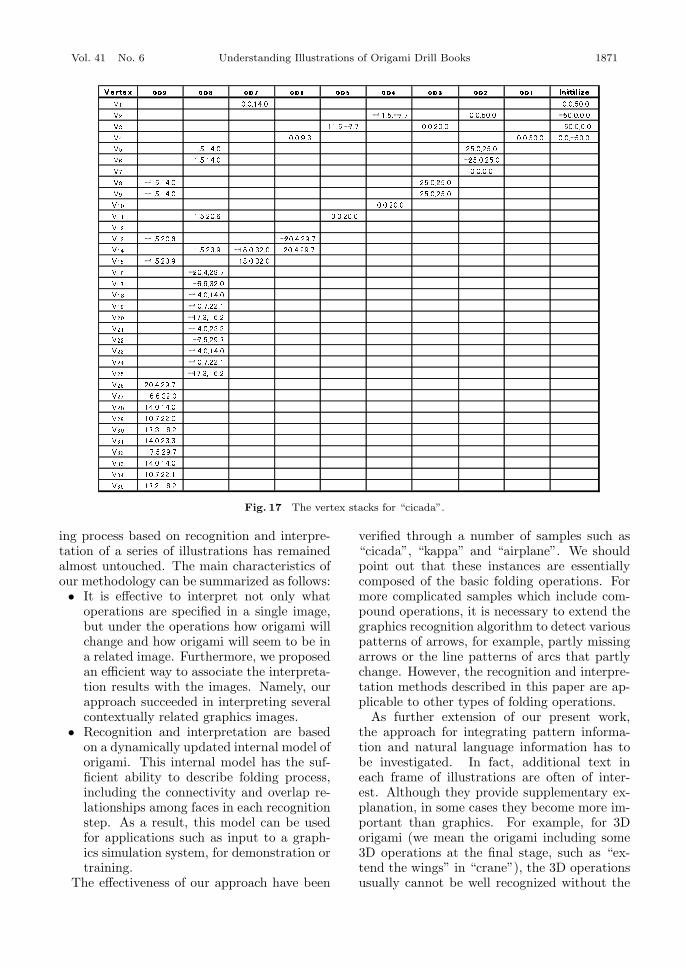
The internal model generated for “cicada” isshown in Figs. 13–17 for completeness. As theresult of understanding the folding process, itcan be used for the input of a graphics simula-tion system.
The experiments were performed on a SunSPARC station-10 with 40 MHz clock, runningSolaris version 1.0.2. We used C++ to imple-ment our approach. Typical CPU times foreach execution of the principal stages, namely,
1870 IPSJ Journal June 2000
F2 op1
E1,3,5
F4 op2E6,10,12
F12 op4
E6,20,22F13 op4
E12,21,22
F9 op3
E11,15,18
F30
E44,51,46
op8 F31 op8
E51,45,20,47
F28 op8
E42,50,44
F29 op8
E43,21,45,50
op5
E18,24,26
F16 op5
E15,25,26
F17
F44 op9
E78,73,24,71
F46 op9
E79,75,25,73
F45 op9
E70,72,78
F47 op9
E72,74,79
F5 op1
E3,7,11,12
F8 op3
E7,12,14,18
op7
E33,35,37
F22 op7
E12,18,37
F23
F24 op8
E39,40,48
F25 op8
E38,35,41,48
F26 op8
E40,49,43,34
F27 op8
E41,36,18,43,49
F40 op9
E66,76,68,48,38
op9
E67,69.76
F41
F42 op9
E68,77,71,43,49
F43 op9
E69,36,70,77
F3 op1
E2,4,5
F6 op1E8,10,13
F14 op4
E8,20,23F15 op4
E13,21,23
F11 op3
E11,16,19
F38
E65,58,61
op8 F39 op8
E20,59,65,60
F36 op8
E58,64,56
F37 op8
E21,57,64,59
op5
E19,24,27
F18 op5
E16,25,27
F19
F52 op9
E24,86,92,84
F54 op9
E93,89,87
F53 op9
E92,87,85
F55 op9
E25,88,93,86
F7 op1
E4,9,11,13
F10 op3
E9,13,17,19
op6
E13,19,32
F20 op6
E29,31,32
F21
F34 op8
E56,63,54
F35 op8
E57,19,55,63
F32 op8
E54,62,53
F33 op8
E55,31,52,62
F50 op9
E84,91,82,63,57
op9
E91,85,30,83
F51
F48 op9
E82,90,81,52,62
F49 op9
E83,80,90
F1E1,2,3,4
Fig. 15 The face tree for “cicada”.
F22
E33 V1,14
F23
E34 V5,14
op7 op7
F25
E38 V1,16
F24
E39 V14,16
op8 op8
F1
E1 V1,2
F4
E6 V2,5
F5
E7 V1,5
op2 op2
F1
E2 V2,4
F6
E8 V2,6
op2 F7
E9 V4,6
op2
F39
E60 V2,25
op8 F38
E61 V6,25
op8 F20
E28 V6,12
op6 F21
E29 V4,12
op6
F33
E52 V4,21
op8 F32
E53 V12,21
op8
F1
E3 V1,3
F8
E14 V1,8
op3 F9
E15 V3,8
op3
F22
E35 V1,15
op7 F23
E36 V8,15
op7 F47
E74 V8,30
op9 F46
E75 V3,30
op9
F40
E66 V1,26
op9 F41
E67 V26,15
op9
F1
E4 V3,4
F11
E16 V3,9
op3 F10
E17 V4,9
op3
F55
E88 V3,35
op9 F54
E89 V9,35
op9 F20
E30 V9,13
op6 F21
E31 V4,13
op6
F2,3
E5 V2,3
F4,6
E10 V2,7
op2 F5,7
E11 V3,7
op2
F12,14
E20 V2,10
op4 F13,15
E21 V7,10
op4 F16,18
E24 V7,11
op5 F17,19
V3,11
op5
op1
E25
F49
E80 V13,31
op9 F48
E81 V4,31
op9
F4
E6 V2,5
F30
E46 V5,20
F31
E47 V2,20
op8 op8
op2 F4,5
E12 V5,7
op2
F26,28
E42 V5,18
op8 F27,29
E43 V7,18
op8 F43,45
F8,9
E18 V7,8
op3
E70 V8,28
op9 F42,44
E71 V7,28
op9 F10,11
E19 V7,9
op3
F50,52
E84 V7,33
op9 F51,53
E85 V9,33
op9
F12,13
E22 V5,10
op4
F28,30
E44 V5,19
op8 F29,31
E45 V10,19
op8F6,7
E13 V6,7
op2
F34,36
E56 V6,23
op8 F35,37
E57 V23,7
op8
F14,15
E23 V6,10
op4
F36,38
E58 V6,24
op8 F27,29
E59 V10,24
op8
F20,21
E32 V12,13
op6
F32,34
E54 V12,22
op8 F33,35
E55 V22,13
op8
F48,50
E82 V32,22
op9 F49,51
E83 V32,13
op9
F16,17
E26 V8,11
op5
F45,47
E72 V8,27
op9 F44,46
E57 V11,29
op9 F18,19
E27 V9,11
op5
F52,55
E86 V11,34
op9 F53,54
E87 V9,34
op9
F22,23
E37 V14,15
op7
F40,42
E68 V17,27
op9 F41,43
E69 V15,27
op9
F24,26
E40 V14,17
op8 F25,27
E41 V17,15
op8
F34,35
E63 V22,23
op8
F46,47
E79 V29,30
op9F48,49
E90 V31,32
op9
F52,53
E91 V32,33
op9 F52,53
E92 V33,34
op9 F54,55
E93 V34,35
op9
F24,25
E48 V16,17
op8 F26,27
E49 V17,18
op8 F28,29
E50 V18,19
op8 F30,31
E51 V19,20
op8 F32,33
E62 V21,22
op8
F36,37
E64 V23,24
op8
F38,39
E65 V25,24
op8 F40,41
E76 V26,27
op9 F42,43
E77 V27,28
op9 F44,45
E78 V28,29
op9
Fig. 16 The edge trees for “cicada”.
graphics recognition stage and operation recog-nition stage are in the order of minutes.
5. Conclusions
In this paper, we presented a new approachfor folding process recognition of origami. Al-
though much of the work on origami has dis-cussed issues such as knowledge representationof folding process 17), animating folding processby means of key-frame images 18), and simu-lating interactive folding operations in 3D vir-tual space 19), the topic of understanding fold-
Vol. 41 No. 6 Understanding Illustrations of Origami Drill Books 1871
Fig. 17 The vertex stacks for “cicada”.
ing process based on recognition and interpre-tation of a series of illustrations has remainedalmost untouched. The main characteristics ofour methodology can be summarized as follows:• It is effective to interpret not only what
operations are specified in a single image,but under the operations how origami willchange and how origami will seem to be ina related image. Furthermore, we proposedan efficient way to associate the interpreta-tion results with the images. Namely, ourapproach succeeded in interpreting severalcontextually related graphics images.
• Recognition and interpretation are basedon a dynamically updated internal model oforigami. This internal model has the suf-ficient ability to describe folding process,including the connectivity and overlap re-lationships among faces in each recognitionstep. As a result, this model can be usedfor applications such as input to a graph-ics simulation system, for demonstration ortraining.
The effectiveness of our approach have been
verified through a number of samples such as“cicada”, “kappa” and “airplane”. We shouldpoint out that these instances are essentiallycomposed of the basic folding operations. Formore complicated samples which include com-pound operations, it is necessary to extend thegraphics recognition algorithm to detect variouspatterns of arrows, for example, partly missingarrows or the line patterns of arcs that partlychange. However, the recognition and interpre-tation methods described in this paper are ap-plicable to other types of folding operations.
As further extension of our present work,the approach for integrating pattern informa-tion and natural language information has tobe investigated. In fact, additional text ineach frame of illustrations are often of inter-est. Although they provide supplementary ex-planation, in some cases they become more im-portant than graphics. For example, for 3Dorigami (we mean the origami including some3D operations at the final stage, such as “ex-tend the wings” in “crane”), the 3D operationsusually cannot be well recognized without the

1872 IPSJ Journal June 2000
text. Incorporating natural language informa-tion and constructing a mechanism for integrat-ing the two different kinds of information is theultimate aim of this research project. The workpresented in this paper is an essential step to-ward such an intelligent graphics recognitionsystem.
References
1) Nagy, S., Seth, S.C. and Stoddard, S.D.:Document Analysis with an Expert System,Proc. Intl. Workshop on Pattern Recognition,Gelsema, E.S. and Kanal, L.N. (Eds.), Prac-tice 2, pp.149–159, Elsevier Science Publishers(North-Holland) (1985).
2) Niyogi, D. and Srihari, S.N.: A Rule-BasedSystem for Document Understanding, Proc.AAAI, Philadelphia, pp.789–793 (1986).
3) Antoine, D., Collin, S. and Tombre, K.: Anal-ysis of Technical Documents: The REDRAWSystem, Proc. IAPR Workshop on Structuraland Syntactic Pattern Recognition, New Jersey,pp.192–230 (1990).
4) Baird, H.S. and Thompson, K.: ReadingChess, IEEE Trans. PAMI, Vol.12, No.6,pp.552–559 (1990).
5) Fahn, C.S., Wang, J.F. and Lee, J.Y.:A Topology-Based Component Extractor forUnderstanding Electronic Circuit Diagrams,Computer Vision, Graphics and Images Pro-cessing, Vol.44, pp.119–138 (1988).
6) Kasturi, R., Bow, S.T., El-Masri, W., Shah,J., Gattiker, J. and Mokate, U.: A System forInterpretation of Line Drawings, IEEE Trans.PAMI, Vol.12, No.10, pp.978–992 (1990).
7) Ejiri, M., Kakumoto, S., Miyatake, T.,Shimada, S. and Iwamura, K.: AutomaticRecognition of Engineering Drawings and Mapsin Image Analysis Applications, Kasturi, R.and Trivedi, M.M. (Eds.), Marcel Dekker(1990).
8) Lysak, D.B. and Kasturi, R.: Interpretation ofLine Drawings with Multiple Views, Proc. 10thICPR (Pattern Recognition Systems and Appli-cations Subconference), pp.220–222 (1990).
9) Kasturi, R. and O’Gorman, L.: Techniquesfor Line Drawing Interpretation: An Overview,Proc. IAPR Workshop on Machine Vision Ap-plications, Tokyo, pp.151–160 (1990).
10) Yamaguchi, M.: A Cyclopaedia for PaperFolding Art (in Japanese), p.324, Seito Com-pany (1990).
11) Kato, J., Watanabe, T. and Nakayama, T.:Recognition of Essential Folding Operations:A Step for Interpreting Illustrated Books ofOrigami, Proc. 4th Intl. Conference on Docu-ment Analysis and Recognition, Ulm, Germany,
pp.81–85 (1997).12) Kato, J., Watanabe, T., Nakayama, T., Guo,
L. and Kato, H.: A Model-Based Approach forRecognizing Folding Process of Origami, Proc.14th Intl. Conference on Pattern Recognition,Brisbane, Australia, pp.1808–1811 (1988).
13) Maeda, N. and Hata, S.: A Global Identi-fication Method of Object Patterns in Pic-ture Book Using Positional Relation of Re-gion, Technical Report of IEICE (in Japanese),PRU93-72, HC93-46 (1993).
14) Sakoe, H. and Chiba, S.: Dynamic Program-ming Algorithm Optimization for Spoken WordRecognition, IEEE Trans. Acoust., Speech,Signal Processing, ASSP-26, Vol.1, pp.43–49(1978).
15) Kirkpatrick, S., Gelatt, C.D. and Vecchi,M.P.: Optimization by Simulated Annealing,Science, Vol.220, No.4598, pp.671–680 (1983).
16) Aarts, E. and Korst, J.: Simulated Annealingand Boltzmann Machines, Wiley (1990).
17) Uchida, T. and Itoh, H.: Knowledge Repre-sentation of Origami and Its Implementation,J. IPS Japan (in Japanese), Vol.32, No.12,pp.1566–1573 (1991).
18) Agui, T., Takeda M. and Nakajima, M.:Animating Planar Folds by Computer, Com-puter Vision, Graphics, and Image Processing,Vol.24, pp.244–254 (1983).
19) Miyazaki, S., Yasuda, T., Yoko, S. and Tori-waki, J.: An Origami Playing Simulator in theVirtual Space, J. Visualization and ComputerAnimation, Vol.7, pp.25–42 (1996).
(Received February 4, 1999)(Accepted March 2, 2000)
Jien Kato received the MEand PhD degrees from NagoyaUniversity in 1990 and 1993,respectively. After graduation,she became a research associatein the Faculty of Engineering atToyama University. In 1999, she
joined the Robotics Research Group at Univer-sity of Oxford. Presently she is an associateprofessor in the Department of Information En-gineering at Nagoya University. Her current re-search interests include document understand-ing, pattern recognition and computer vision.She is a member of the Information Process-ing Society of Japan, Institute of Electronics,Information, and Communication Engineers ofJapan and IEEE Computer Society.

Vol. 41 No. 6 Understanding Illustrations of Origami Drill Books 1873
Toyohide Watanabe re-ceived the BS, ME, and PhD de-grees from Kyoto University in1972, 1974, and 1983, respec-tively. In 1987, he became anassociate professor in the Infor-mation Engineering Department
at Nagoya University. He is currently a fullprofessor. Dr. Watanabe’s research interestsinclude the semantic data model, multi-mediadatabase, object-oriented paradigm, paralleland distributed processing, and document im-age understanding. He is a member of the In-formation Processing Society of Japan, Insti-tute of Electronics, Information, and Commu-nication Engineers of Japan, Japan Society forSoftware Science, Japan Society for ArtificialIntelligence, ACM, AAAI, and IEEE ComputerSociety.
Hiroyuki Hase received hisBE degree in electrical engi-neering from Toyama Universityin 1971, and PhD degree fromTohoku University in 1989. Heis associate professor of the De-partment of Intellectual Infor-
mation Systems Engineering, Toyama Univer-sity. His current research interests are doc-ument image analysis, character recognition,tracing of moving objects and face detection.He is a member of the Information Process-ing Society of Japan, the Institute of Elec-tronics, Information and Communication Engi-neers, the Institute of Image Information andTelevision Engineers, the Institute of ImageElectronics Engineers of Japan and IEEE Com-puter Society.
Takeshi Nakayama gradu-ated with a degree in Psychologyin 1957 from Waseda University,where he obtained a Master’s de-gree in 1960, and a Dr. of En-gineering in Electric Communi-cation in 1970. He joined the
Central Research Laboratory of Hitachi, Ltd. in1963, where he engaged in research on varioushuman interface systems including sound qual-ity evaluation, image quality evaluation, theevaluation of Japanese text entry systems, andthe evaluation of programming environments.Since 1987 he had been on the Faculty of En-gineering, Toyama University, Toyama, Japan,where, he was a Professor in the Departmentof Intellectual Information Systems. He retiredToyama University at the end of March, 1999.He started his work again in April, 2000, asa Professor of International Academy of Me-dia Arts and Sciences in Ogaki City, Gifu Pre-fecture. His current research interests includehuman computer interaction and intellectualagents. Dr. Nakayama is a member of the Infor-mation Processing Society of Japan, the Insti-tute of Electronics, Information and Communi-cation Engineers of Japan, the Japanese Psy-chological Association and Human Factors andErgonomics Society.