BCL2-modifying factor promotes germ cell loss during murine ...
Upload
khangminh22Category
view
4download
0
Predicting and modifying response to
neoadjuvant therapy in colorectal cancer
This thesis is submitted in accordance with the
requirements of the University of Liverpool for the
degree of Doctor in Philosophy
By
Paul Anthony Sutton
September 2015

i
Dedication
To my family. Without your love and support I would not be where I am today.

ii
Declaration
The work presented in this thesis was carried out in the Institute of Translational Medicine,
University of Liverpool and was undertaken while working as a research fellow at the
Liverpool Cancer Research (UK) Centre. The material contained within this thesis has not
been, nor is currently being presented wholly, or in part, for any other degree or
qualification.
I declare that all the work presented in this thesis has been carried out by me except where
indicated below:
Cation exchange prior to iTRAQ analysis was performed by Mrs Jane Hamlett
iTRAQ mass spectrometry was performed by Dr Roz Jenkins
Assessment of radiological response was performed by Dr G Abbott
Histopathological assessment of tumour response was performed by Dr M Terlizzo
and Dr T Andrews
Exome sequencing was performed at Genotypic Technology
Paul Sutton

iii
Acknowledgments
I am indebted to the many people who have helped me over the last few years.
First and foremost my supervisors: Professor Dan Palmer, Dr Chris Goldring, Mr Hassan
Malik and Mr Dale Vimalachandran. Thank you for your endless support, enthusiasm and
patience as I attempted to make the transition from clinician to scientist.
I’d also like to thank my ‘room-mate’, Dr Neil Kitteringham, who provided endless advice
and guidance as well as acting as a sounding board and telling me when I was wrong. I feel
extremely lucky to have been trained by you.
One of the most challenging aspects of this work was the bioinformatics analysis, for which
I am grateful for the time and assistance of Dr Puthen V Jithesh.
I am also grateful to all the staff in the Medical Research Council Centre for Drug Safety
Science who assisted me in the acquisition of laboratory technique, in particular Dr Cliff
Rowe and Dr Jo Henry.
The work presented in this thesis required the establishment of a regional network of
colorectal surgeons to facilitate the recruitment of patients and collection of clinical
samples. As such I am grateful to the following collaborators for their help and support:
Trust Principal Investigator
Royal Liverpool and Broadgreen Mr Paul Rooney
Aintree University Hospital Mr Hassan Malik
Countess of Chester Hospital Mr Dale Vimalachandran
Arrowe Park Hospital Mr Ciaran Walsh
Clatterbridge Centre for Oncology Professor Dan Palmer
Mid Cheshire Hospital (Leighton) Mrs Caroline Bruce
St Helens and Knowsley Hospital Mr Ajai Samad
Liverpool Heart and Chest Hospital Mr Michael Shackcloth
Southport and Ormskirk Mr Tarek Hany

iv
East Cheshire Hospital Mr Usman Khan
Royal Bolton Hospital Mr David Smith
North Wales Health Board Dr Simon Gollins
Warrington and Halton Hospital Mr Mark Tighe
My fellow surgical trainees have also made the research process much easier, and I wish to
thank Mr Rob Jones, Mr Jonathan Evans, Mr Derek McWhirter, Mr David Bowden and Mr
Declan Dunne.
I am grateful to Professor John Neoptolemos both for his mentorship, and for affording me
this opportunity.
Finally I wish to thank Cancer Research (UK) who funded me and this work.

v
Contents Dedication i Declaration ii Acknowledgements iii Contents v Abstract vii List of Tables viii List of Figures xv Abbreviations xxi Chapter 1 – General Introduction 1 1.1 Epidemiology of colorectal cancer 2 1.2 Risk factors for colorectal cancer 3 1.3 Genetics of colorectal cancer 3 1.4 Staging of colorectal cancer 9 1.5 Treatment of colorectal cancer with surgery 18 1.6 Treatment of colorectal cancer with radiotherapy 24 1.7 Chemotherapeutic agents used in colorectal cancer 29 1.8 Treatment of colorectal cancer with chemotherapy 35 1.9 Asssessment of response to chemoradiotherapy 43 1.10 Predictive and prognostic markers in colorectal cancer 49 1.11 Summary 58 1.12 Aims, hypotheses and study plan 59 Chapter 2 - Evaluation of a tissue stabilisation gel (AllprotectTM) to facilitate clinical sampling for translational research in surgical trials 63 2.1 Introduction 64 2.2 Methods 66 2.3 Results 71 2.4 Discussion 81 Chapter 3 - Exome sequencing of synchronously resected primary colorectal tumours and colorectal liver metastases to inform oncosurgical management 86 3.1 Introduction 87 3.2 Methods 91 3.3 Results 96 3.4 Discussion 117

vi
Chapter 4 - A global proteomic assessment of patient matched primary and metastatic colorectal tumours 126 4.1 Introduction 127 4.2 Methods 131 4.3 Results 137 4.4 Discussion 168 Chapter 5 - A global proteomic assessment of serial rectal tumour biopsies 177 5.1 Introduction 178 5.2 Methods 180 5.3 Results 184 5.4 Discussion 203 Chapter 6 – Targeted analysis of candidate biomarkers in the primary tumour for predicting response to neoadjuvant chemotherapy in colorectal liver metastases 208 6.1 Introduction 209 6.2 Methods 212 6.3 Results 226 6.4 Discussion 251 Chapter 7 – Concluding Discussion 261 7.1 Summary of aims and experimental design 262 7.2 Summary of results 263 7.3 Advances in the literature 267 7.4 Study limitations and further work 269 7.5 Review of hypotheses 270 7.6 Conclusions 271 Bibliography 273 Appendix 1 - Lists of single nucleotide variants from exome sequencing 299 Appendix 2 - Genetic variants in colorectal cancer identified by next generation sequencing studies 329 Appendix 3 - Proteomic comparison of metastatic tumour and normal adjacent liver parenchyma 337 Appendix 4 - Proteomic comparison of responders and non-responders in the primary tumour 353 Appendix 5 - Supporting Publications, Presentations, Prizes and Grants 361

vii
Abstract
Background Colorectal cancer is the fourth commonest cancer in the UK, and the second commonest cause of cancer-related death. A knowledge of the biology of colorectal liver metastases would be invaluable to inform clinical decision making; however, deriving this information from the metastatic lesions is not feasible until after resection. We aimed to use proteomic and genomic analysis to establish the degree of biological similarity across disease sites and identify biomarkers in the primary tumour which predict response to neoadjuvant chemotherapy in liver metastases. An identical approach was also used to identify predictors of response to neoadjuvant chemoradiotherapy in rectal cancer.
Methods Fresh tissue from both primary colorectal tumour and liver metastases from 16 patients was subjected to proteomic analysis using isobaric tagging for relative quantification (iTRAQ). Data were analysed with Protein Pilot (Ab Sciex, Framingham, MA, USA), with stratification of patients into those showing low or high response to chemotherapy permitting the identification of potential predictive biomarkers. These markers were subsequently investigated by immunohistochemistry on a tissue microarray of 56 patients, in parallel with a series of in vitro studies to investigate the concordance between primary and metastatic tumours of those proteins relevant to the activation and metabolism of 5-FU, irinotecan and oxaliplatin. The therapeutic potential of the identified biomarkers was also investigated by dosing SW480 cells with irinotecan/5FU with or without inhibition (using siRNA or a known competitive inhibitor) of the proteins of interest. Four of the 16 patients studied were resected synchronously, and tissue from these was also used for exome sequencing using the Ion Proton platform. Diagnostic, post-treatment and resection biopsies from 8 patients with rectal cancer were again subjected to iTRAQ with stratification into low or high response to neoadjuvant chemoradiotherapy to investigate potential response biomarkers.
Findings We identified 5766 discrete proteins, of which 2.54% were differentially expressed between primary and metastatic tumours. There were 170 potential response biomarkers in the primary tumour and 27 in the metastases. Two proteins were common to both tissue types and showed consistent dysregulation, including NQO1. Immunostaining of NQ01 in metastases revealed lower expression in patients responding to chemotherapy (p=0.041), with a significant correlation between primary and metastatic disease sites (r=0.44, p=0.001). Knockdown of NQO1 followed by treatment with irinotecan and 5FU reduced the IC50 from 100.1µM to 49.8µM and from 200.1µM to 25.0µM respectively. Pre-treating cells with dicoumarol prior to incubation in irinotecan and 5FU reduced the IC50 from 100.0µM to 50.0µM and from 183.7µM to 49.9µM respectively. Exome sequencing identified 585 non-synonymous missense SNVs of which 215 (36.8%) were unique to the primary tumour, 226 (38.6%) unique to the metastasis and 81 (13.8%) present in patient matched pairs. Aberrations in the ErbB pathway were identified in paired samples (ratio 0.07, p=5.87x10⁻⁷), which were validated by Sanger sequencing along with a potential response biomarker in the CDAN1 gene. Changes to the phenotype of the rectal tumour with chemoradiotherapy were modest, although it is clear that base excision repair (and in particular PARP1) remains of interest, and that acid ceramidase is a potential response biomarker and novel radiosensitiser.
Interpretation Proteomic sequencing of matched metastatic colorectal cancer samples is feasible with high coverage. The high degree of similarity between the primary and secondary tumours suggests that the primary tissue is predictive of the metastatic phenotype. NQO1 expression in the primary tumour predicts response to neoadjuvant chemotherapy in the liver metastases, and inhibition of this protein at both genetic and functional levels improves chemosensitivity.

viii
List of Tables
Table Legend Page
1.1 Percentage of cases and 5 year relative survival (%) by Dukes' stage at diagnosis for colorectal cancer patients diagnosed 1996-2002 in England. (Reproduced without permission from Cancer Research (UK)).
2
1.2 Genetics of inherited colorectal tumour syndromes. (Reproduced without permission from Fearon, 2011).
4
1.3 Summary of evidence highlighting complications from percutaneous needle biopsy of colorectal liver metastases. (Reproduced without permission from Cresswell, Welsh and Rees, 2009).
13
1.4 UICC/AJCC TNM staging of colorectal cancer; 7th edition (2010). Available online at https://cancerstaging.org/references-ools/quickreferences/Pages/default.aspx
15
1.5 UICC/AJCC stage groupings for colorectal cancer; 7th edition (2010). Available online at https://cancerstaging.org/references-ools/quickreferences/Pages/default.aspx.
16
1.6 The Jass classification combines a number of patient, histopathological and genetic factors to allocate tumours to a group (1-5). MSI, microsatellite instability; H, high; S, stable; L, low; Dip, diploid; An, aneuploid; Serration, serrated morphology; SP, serrated polyp; AD, adenoma; Circumscribed, circumscribed invasive margin. Reproduced without permission from Jass, 2007.
17
1.7 Summary of recent evidence pertaining to the synchronous management of liver limited metastatic colorectal cancer. Reproduced with permission from Lykoudis et al (2014). References: Martin et al; J Am Coll Surg (2003); 197; 233-241, Chua et al; Dis Colon Rectum (2004); 47; 1310-1316, Capussotti et al; Ann Surg Oncol (2007); 14; 195-201, Capussotti et al, Ann Surg Oncol (2007); 14; 1143-1150, Reddy et al; Ann Surg Oncol (2007); 14; 3481-3491, Thelen et al; Int J Colorectal Dis (2007); 14; 3481-3491, Turrini et al; Eur J Surg Oncol (2007); 33; 735-740, Vassiliou et al; World J Gastroenterol (2007); 13; 1431-1434, Martin et al; J Am Coll Surg (2009); 208; 842-850, Slupski et al; Can J Surg (2009); 52; E241-E244, Brouquet et al, J Am Coll Surg (2010); 210; 934-941, de Haas et al; Br J Surg (2010); 97; 1279-1289, Luo et al; J Gastrointest Surg (2010); 14; 1974-1980, Moug et al; Eur J Surg Oncol (2010); 36; 365-370, Mayo et al; J Am Coll Surg (2013); 216; 707-716.
23
1.8 The tumour regression grade proposed by Dworak, Keilholz and Hoffmann (1997) extends from 0-4 and includes an assessment of tumour mass as well as the degree of fibrosis and/or vasculopathy. Reproduced without permission from Santos et al, 2014.
46
1.9 The Basingstoke Prognostic Index allocates a score (out of 30) based on a number of clinicopathological features. Validated for use in both the pre- and post-operative situations, the score correlates well with outcome.
51
1.10 Prognostic biomarkers identified for colorectal cancer. The table demonstrates the frequency with which these biomarkers are identified, the evidence for its correlation with prognosis and its uptake into routine clinical practice. Reproduced without permission from Pritchard and Grady, 2011.
55
1.11 Predictive biomarkers identified for colorectal cancer. The table demonstrates the frequency with which these biomarkers are identified,
56

ix
the evidence for its correlation with response to treatment and its uptake into routine clinical practice. EGFR, epidermal growth factor receptor; 5-FU, 5- fluorouracil; LOH, loss of heterozygosity. Reproduced without permission from Pritchard and Grady, 2011.
2.1 Representative results following DNA extraction from patient 2 (primary tumour). Comparable quality control indices are seen highlighting the suitability of extracted DNA for downstream qPCR analysis. Comparable results following KRAS genotyping are seen: the patient is KRAS mutant at codon 12 but wild type at codons 13 and 61.
73
3.1 Demographic and clinical features of the four patients from whom tumours were sequenced. IrMdG – Irinotecan and modified de Gramont (5-fluoruracil and folinic acid).
96
3.2 Quality control data from samples undergoing exome sequencing with Ion Proton. Sample ID column identifies samples as follows: SO_2510 relates to project id; 1-4 relate to patient number; A-D relate to tissue type (A – colonic mucosa, B – primary tumour, C – liver parenchyma, D – liver metastasis). All quality control variables and yield were good, with the exception of the colonic mucosa from patient 4. DNA was suboptimal but still adequate for sequencing.
97
3.3 Total number of raw reads through Ion Proton exome sequencing. 98
3.4 Sequencing statistics for all samples. Sample ID (column 1) 1-4 relates to patient number, and A-D tissue type (A: normal mucosa, B: colorectal primary tumour, C: normal liver parenchyma, D: liver metastasis). The report attests to a high number of reads successfully on target, a 1x coverage of 96.58 – 98.07% and 20x coverage of 67.61 – 88.33% of the targeted exome.
99
3.5 Total number of high quality variants identified through Ion Proton exome sequencing.
100
3.6 Total number of somatic, non-synonymous, missense, biologically deleterious SNVs identified in each of the tumour samples.
101
3.7 Pathway analysis for SNVs unique to the primary tumours. P-value is adjusted using Benjamini-Hochberg correction. Ratio identifies the number of focus genes identified (numerator) in the pathway (denominator).
101
3.8 Network analysis for SNVs unique to the primary tumours. The score is derived from a p-value and indicates the probability of the focus genes in a network being found together due to random chance. Focus molecules is the total number of SNVs of interest identified in the respective network.
103
3.9 Pathway analysis for SNVs unique to the metastatic tumours. P-value is adjusted using Benjamini-Hochberg correction. Ratio identifies the number of focus genes identified (numerator) in the pathway (denominator).
103
3.10 Network analysis for SNVs unique to the metastatic tumours. The score is derived from a p-value and indicates the probability of the focus genes in a network being found together due to random chance. Focus molecules is the total number of SNVs of interest identified in the respective network.
105
3.11 Pathway analysis for SNVs present in at least one primary and metastatic tumour pertaining to the same patient. P-value is adjusted using Benjamini-Hochberg correction. Ratio identifies the number of focus genes identified (numerator) in the pathway (denominator).
106
3.12 Network analysis for SNVs present in at least one primary and metastatic tumour pertaining to the same patient. The score is derived from a p-value and indicates the probability of the focus genes in a network being found
108

x
together due to random chance. Focus molecules is the total number of SNVs of interest identified in the respective network.
3.13 Pathway analysis for SNVs unique to the responding tumours. P-value is adjusted using Benjamini-Hochberg correction. Ratio identifies the number of focus genes identified (numerator) in the pathway (denominator)
109
3.14 Network analysis for SNVs unique to the responding tumours. The score is derived from a p-value and indicates the probability of the focus genes in a network being found together due to random chance. Focus molecules is the total number of SNVs of interest identified in the respective network.
110
3.15 Pathway analysis for SNVs unique to the non-responding tumours. P-value is adjusted using Benjamini-Hochberg correction. Ratio identifies the number of focus genes identified (numerator) in the pathway (denominator).
111
3.16 Network analysis for SNVs unique to the non-responding tumours. The score is derived from a p-value and indicates the probability of the focus genes in a network being found together due to random chance. Focus molecules is the total number of SNVs of interest identified in the respective network.
113
3.17 Those SNVs identified for validation with Sanger sequencing. 114
3.18 Summary of the Sanger sequencing for 12 SNVs of interest in 8 samples (matched primary and metastatic tumours from 4 patients). The fields displayed in red highlight the location of SNVs identified through Ion Proton sequencing, with the content of the fields representing the identified base(s) on Sanger sequencing. Those marked undetermined failed due to inability to detect the amplicon.
115
3.19 Summary of next generation sequencing papers published on colorectal cancer.
120
3.20 Some of the ErbB inhibitors currently in clinical use (only ones approved by the Federal Drug Administration are shown). Adapted from Roskoski, 2004.
122
4.1 Clinical, demographic and disease characteristics of the 16 patients recruited to this study. Eleven patients underwent neoadjuvant chemotherapy, the remainder proceeding straight to surgery. Six patients were simultaneously resected. There was considerable variation in location of the primary tumour, disease stage and grade as well as metastatic burden.
139
4.2 Details of neoadjuvant chemotherapy agents and response evaluation. Five patients were chemonaive and 11 underwent neoadjuvant treatment. One of these patients failed to undergo resection of the liver metastasis. Response evaluation data is therefore available for 10 patients, 5 of which had a tumour regression grade of 1-2 (responders) with the remaining 5 having a tumour regression grade of 3-4 (non-responders).
140
4.3 Those proteins differentially expressed between the primary tumour and normal colorectal mucosa. 25 proteins were identified, 6 of which were upregulated (positive values for fold change) and 19 downregulated (negative values for fold change).
142
4.4 Pathway analysis for proteins both upregulated and downregulated in the primary tumour when compared to normal adjacent colorectal mucosa. P-value is adjusted using Benjamini-Hochberg correction. Ratio identifies the number of focus molecules identified (numerator) in the pathway (denominator).
143
4.5 Network analysis for proteins both upregulated and downregulated in the 144

xi
primary tumour when compared to normal adjacent colorectal mucosa. The score is derived from a p-value and indicates the probability of the focus molecules in a network being found together due to random chance. Focus molecules is the total number of proteins of interest identified in the respective network.
4.6 Those proteins differentially expressed between the metastatic tumour and normal colorectal mucosa. 53 proteins were identified, 13 of which were upregulated (positive values for fold change) and 40 downregulated (negative values for fold change).
147
4.7 Pathway analysis for proteins both upregulated and downregulated in the metastatic tumour when compared to normal adjacent colorectal mucosa. P-value is adjusted using Benjamini-Hochberg correction. Ratio identifies the number of focus molecules identified (numerator) in the pathway (denominator).
147
4.8 Network analysis for proteins both upregulated and downregulated in the metastatic tumour when compared to normal adjacent colorectal mucosa. The score is derived from a p-value and indicates the probability of the focus molecules in a network being found together due to random chance. Focus molecules is the total number of proteins of interest identified in the respective network.
149
4.9 Pathway analysis for proteins both upregulated and downregulated in the metastatic tumour when compared to normal adjacent colorectal mucosa. P-value is adjusted using Benjamini-Hochberg correction. Ratio identifies the number of focus molecules identified (numerator) in the pathway (denominator).
150
4.10 Network analysis for proteins both upregulated and downregulated in the metastatic tumour when compared to normal adjacent liver parenchyma. The score is derived from a p-value and indicates the probability of the focus molecules in a network being found together due to random chance. Focus molecules is the total number of proteins of interest identified in the respective network.
154
4.11 Those proteins differentially expressed between the metastatic tumour and the primary tumour. 67 proteins were identified, 58 of which were upregulated (positive values for fold change) and 9 downregulated (negative values for fold change).
156
4.12 Pathway analysis for proteins both upregulated and downregulated in the metastatic tumour when compared to the primary tumour. P-value is adjusted using Benjamini-Hochberg correction. Ratio identifies the number of focus molecules identified (numerator) in the pathway (denominator).
157
4.13 Network analysis for proteins both upregulated and downregulated in the metastatic tumour when compared to the primary tumour. The score is derived from a p-value and indicates the probability of the focus molecules in a network being found together due to random chance. Focus molecules is the total number of proteins of interest identified in the respective network.
158
4.14 Pathway analysis for proteins both upregulated and downregulated in the primary tumours of the responders compared to the primary tumours of the non responders. P-value is adjusted using Benjamini-Hochberg correction. Ratio identifies the number of focus molecules identified (numerator) in the pathway (denominator).
159
4.15 Network analysis for proteins both upregulated and downregulated in the 161

xii
primary tumours of the responders compared to the primary tumours of the non responders. The score is derived from a p-value and indicates the probability of the focus molecules in a network being found together due to random chance. Focus molecules is the total number of proteins of interest identified in the respective network
4.16 Those proteins differentially expressed between the metastatic tumours of the responders and non-responders. 27 proteins were identified, 17 of which were upregulated (positive values for fold change) and 10 downregulated (negative values for fold change).
163
4.17 Pathway analysis for proteins both upregulated and downregulated in the metastatic tumours of the responders compared to the metastatic tumours of the non responders. P-value is adjusted using Benjamini-Hochberg correction. Ratio identifies the number of focus molecules identified (numerator) in the pathway (denominator).
164
4.18 Network analysis for proteins both upregulated and downregulated in the metastatic tumours of the responders compared to the metastatic tumours of the non responders. The score is derived from a p-value and indicates the probability of the focus molecules in a network being found together due to random chance. Focus molecules is the total number of proteins of interest identified in the respective network.
165
4.19 Summary of predictive biomarkers common to both primary and metastatic tumours.
167
4.20 Summary proteomic data for the 2-group comparisons showing the total number of dysregulated proteins as well as those up/downregulated.
168
5.1 Response evaluation for patients having serial rectal cancer biopsies. The percentage viable tumour is displayed along with corresponding tumour regression grade (TRG). Those patients with TRG 1-2 were considered responders (patients 1, 2, 4 and 6) and patients with TRG 3-4 were considered non-responders (patients 3, 5, 7 and 8).
185
5.2 Clinical and demographic data for patients having serial rectal cancer biopsies. 8 patients were studied, all of which were male ranging in age from 50-78 and Dukes’ stage B-D. Two different neoadjuvant chemotherapeutic regimens were used alongside a number of different surgical interventions for formal resection of the rectal tumour
184
5.3 Those proteins differentially expressed between rectal tumours post chemoradiotherapy and diagnostic samples. 18 proteins were identified, 2 of which were downregulated (negative values for fold change) and 16 upregulated (positive values for fold change).
187
5.4 Pathway analysis for proteins both upregulated and downregulated in the rectal tumours post chemoradiotherapy compared to the diagnostic samples. P-value is adjusted using Benjamini-Hochberg correction. Ratio identifies the number of focus molecules identified (numerator) in the pathway (denominator).
188
5.5 Network analysis for proteins both upregulated and downregulated in the rectal tumours post chemoradiotherapy compared to the diagnostic samples. The score is derived from a p-value and indicates the probability of the focus molecules in a network being found together due to random chance. Focus molecules is the total number of proteins of interest identified in the respective network.
189
5.6 Those proteins differentially expressed between rectal tumours at resection and immediately following completion of chemoradiotherapy. 39
191

xiii
proteins were identified, 30 of which were downregulated (negative values for fold change) and 9 upregulated (positive values for fold change).
5.7 Pathway analysis for proteins both upregulated and downregulated in the rectal tumours at resection compared to immediately following completion of chemoradiotherapy. P-value is adjusted using Benjamini-Hochberg correction. Ratio identifies the number of focus molecules identified (numerator) in the pathway (denominator).
192
5.8 Network analysis for proteins both upregulated and downregulated in the rectal tumours at resection compared to immediately following completion of chemoradiotherapy. The score is derived from a p-value and indicates the probability of the focus molecules in a network being found together due to random chance. Focus molecules is the total number of proteins of interest identified in the respective network.
193
5.9 Those proteins differentially expressed between rectal tumours at resection and at diagnosis. 29 proteins were identified, 10 of which were downregulated (negative values for fold change) and 19 upregulated (positive values for fold change).
195
5.10 Pathway analysis for proteins both upregulated and downregulated in the rectal tumours at resection compared to at diagnosis. P-value is adjusted using Benjamini-Hochberg correction. Ratio identifies the number of focus molecules identified (numerator) in the pathway (denominator).
195
5.11 Network analysis for proteins both upregulated and downregulated in the rectal tumours at resection compared to at diagnosis. The score is derived from a p-value and indicates the probability of the focus molecules in a network being found together due to random chance. Focus molecules is the total number of proteins of interest identified in the respective network.
198
5.12 Those proteins differentially expressed between the primary tumours of the responders and non-responders. 8 proteins were identified, 3 of which were downregulated (negative values for fold change) and 5 upregulated (positive values for fold change).
199
5.13 Pathway analysis for proteins both upregulated and downregulated in the primary tumours of the responders compared to the primary tumours of the non-responders. P-value is adjusted using Benjamini-Hochberg correction. Ratio identifies the number of focus molecules identified (numerator) in the pathway (denominator).
200
5.14 Network analysis for proteins both upregulated and downregulated in the primary tumours of the responders compared to the primary tumours of the non-responders. The score is derived from a p-value and indicates the probability of the focus molecules in a network being found together due to random chance. Focus molecules is the total number of proteins of interest identified in the respective network.
202
5.15 Summary proteomic data for the 2-group comparisons showing the total number of dysregulated proteins as well as those up/downregulated.
203
6.1 Antibody incubation conditions for the proteins of interest with respect to the activation and metabolism of chemotherapeutics.
213
6.2 Preparation of standard controls for mass spectrometry analysis of irinotecan conversion to SN-38 by human CES1/CES2.
214
6.3 Median densitometry values for thymidylate synthase (TS), dihydropyrimidine dehydrogenase (DPYD) and orotate phosphorisobysltransferase (OPRT) expression in patient matched primary
228

xiv
and metastatic tumours. Correlation co-efficients (with Spearman’s rank test) showed positive correlations although these did not reach statistical significance.
6.4 Median densitometry values for carboxylesterase 1 (CES1), carboxylesterase 2 (CES2), topoisomerase I (TOP I), UDP glucuronosyltransferase 1A1 (UGT1A1) and cytochrome P450 3A4 (CYP3A4) expression in patient matched primary and metastatic tumours. Correlation co-efficients (with Spearman’s rank test) showed positive correlations, reaching statistical significance in the case of TOP I.
232
6.5 SN38 production in patient matched primary tumour, liver metastasis and liver parenchyma. Of the 12 patients studied there were significant differences between tissue types (by ANOVA) in all except two (highlighted in red). When specifically comparing the primary and metastatic tumours, significant differences (by student’s paired t-test) were seen in all except four (also highlighted in red).
235
6.6 KRAS (codon 12, 13 and 61), BRAF (codon 600 and 601) and microsatellite instability analysis for 16 patients undergoing resection at both sites for liver limited stage IV colorectal cancer. Five patients had KRAS codon 12 mutation, one patient had BRAF 600/601 mutation and one patient was MSI-Low.
237
6.7 Key clinical and pathological variables in the chemo-naive, responders and non-responders. Continuous data was assessed for significance using ANOVA* and categorical data using the X2 test#. Only T stage was considerably different between groups, with a greater proportion of T4 tumours in the chemo-naive group.
239
6.8 NQO1 expression in the responders and non-responders grouped by percentage of positively stained cells. No statistically significant difference was observed in the primary tumours (p=0.470) however in the metastases, NQO1 staining is considerably higher in the non-responders compared to the responders (p=0.041, X2 test).
241

xv
List of Figures
Figure Legend Page
1.1 Suggested genetic model for colorectal cancer. In (a) a number of hereditary and sporadic mutations drive the transformation of normal epithelia to an adenomatous lesion and latterly carcinoma. In (b) an inherited or acquired defect in DNA mismatch repair (MMR) function is the initiator for carcinogenesis. (Adapted from Fearon, 2011).
9
1.2 Invasive colonic adenocarcinoma penetrating the muscularis mucosa; stained with haematoxylin and eosin. Photomicrograph taken at x200 magnification.
12
1.3 5-Fluorouracil metabolism – 5-fluorouracil (F-FU) is converted to three main metabolites: fluorodeoxyuridine monophosphate (F-dUMP), fluorodeoxyuridine triphosphate (FUTP) and fluorouridine triphosphate (FUTP). The main mechanism of 5-FU activation is conversion to fluorouridine monophosphate (FUMP) by orotate phosphoribosyltransferase (OPRT). FUMP is then phosphorylated to fluorouridine disphoaphate (FUDP) and again to fluorouridine triphosphate (FUTP). Alternatively, thymidine phosphorylase (TP) can activate 5-FU by catalysing the conversion of 5-FU to fluorodeoxyuridine (FUDR) which is then phosphorylated by thymidine kinase (TK) to FdUMP. FdUMP can be phosphorylated to fluorodeoxyuridine diphosphate (FdUDP) and again to fluorodeoxyuridine triphosphate (FdUTP). 80% of 5-FU is catabolised in the liver by dihydropyrimidine dehydrogenase (DPYD). Adapated from Longley, Harkin and Johnston, 2003.
31
1.4 The metabolism of irinotecan (CPT-11). Irinotecan is converted to the active metabolite SN38 by carboxylesterase (CE), as well as to two other inactive metabolites (NPC and APC) by CYP3A4. NPC can subsequently be converted by SN-38 by CE. Inactivation to SN38-G is predominantly controlled by UGT1A1, however the inactive metabolite can be re-activated to SN38 by β-glucuronidation. Adapted from Mathijssen et al, 2001.
33
1.5 Binding of a ligand (EGF, TGFα) to EGFR stimulates receptor dimerisation, tyrosine kinase activation, EGFR autophosphorylation and ultimately initiates signal transduction cascades involved in cell proliferation and survival. Inhibition of EGFR by the monoclonal antibody cetuximab inhibits these downstream events. Adapted from Kirkpatrick, Graham and Muhsin, 2004.
35
1.6
Kaplan-Meir survival curves of patients with colorectal liver metastases treated with neoadjuvant chemotherapy, with greatest survival in those with complete response (a) followed by major response (b) and minor response (c). Reproduced with permission from Blazer et al, 2008.
48
1.7 The Cancer Research (UK) roadmap to the discovery, development and validation of a clinically useful biomarker. Available online at http://www.cancerresearchuk.org.
53
2.1 A schematic outline of the stability study. The available tissue was divided into 10 fragments, 5 of which were stabilised immediately in one of the storage conditions shown and the remaining 5 in a similar manner but at the end of the procedure. The study was designed to ask two specific questions: can sampling wait until the end of the procedure, and what is the optimal storage condition?
67
2.2 A schematic outline of the archiving study. The available tissue was divided 68

xvi
into 10 fragments, one of which was immediately snap frozen in liquid nitrogen and transferred to a -80oC freezer (control sample) and one was archived in AllprotectTM for each of the time points shown in the figure.
2.3 Representative micrographs of H&E stained sections of colorectal liver metastases showing a) tissue snap frozen in liquid nitrogen and b) tissue stabilised in AllprotectTM. Both are clearly identifiable as adenocarcinoma, although contain a degree of clear cell change/vacuolation (X). Histological appearances did not change significantly with the length of the time the sample was exposed to AllprotectTM. Micrographs were taken at 200x magnification.
71
2.4 Cycle threshold (Ct) values for miR-122 in the colorectal liver metastasis from patient 1. All samples are comparable irrespective of the method of tissue stabilisation used, and whether the samples were stabilised immediately following specimen extraction (samples 1-5) or following a delay of 1 hour (samples 6-10). ANOVA with post-hoc Dunnett’s test shows that no samples are statistically significant from the current gold standard (sample 1) i.e. tissue snap frozen in liquid nitrogen.
74
2.5 Western blot and corresponding densitometry of HMGB1 expression in primary colorectal cancer samples from patient 1. All samples are comparable irrespective of the method of tissue stabilisation used, and whether the samples were stabilised immediately following specimen extraction (samples 1-5) or following a delay of 1 hour (samples 6-10). ANOVA with post-hoc Dunnett’s test shows that no samples are statistically significant from the current gold standard (sample 1) i.e. tissue snap frozen in liquid nitrogen.
75
2.6 Western blot and corresponding densitometry of CES1 expression in colorectal liver metastasis samples from patient 2. All samples are comparable irrespective of the method of tissue stabilisation used, and whether the samples were stabilised immediately following specimen extraction (samples 1-5) or following a delay of 1 hour (samples 6-10). ANOVA with post-hoc Dunnett’s test shows that no samples are statistically significant from the current gold standard (sample 1) i.e. tissue snap frozen in liquid nitrogen.
76
2.7 Tissue homogenate was incubated with irinotecan and the production of SN-38 (active metabolite) quantified by liquid-chromatography mass-spectrometry. Data shown is from patient 3 (primary colorectal tumour). All samples are comparable irrespective of the method of tissue stabilisation used, and whether the samples were stabilised immediately following specimen extraction (samples 1-5) or following a delay of 1 hour (samples 6-10). ANOVA with post-hoc Dunnett’s test shows that no samples are statistically significant from the current gold standard (sample 1) i.e. tissue snap frozen in liquid nitrogen.
77
2.8 Immunohistochemistry for HMGB1 in samples from patient 3 (primary colorectal tumour): a) Negative control b) Snap frozen in liquid nitrogen c) AllprotectTM at room temperature d) AllprotectTM at 8oC. All sections were scored 3 for coverage (51-74%) and 3 for intensity (moderate). Haemotoxylin counterstain, x400 magnification.
78
2.9 Cycle threshold (Ct) values for miR122 in the liver metastasis from patient 4. Ct values increase with time archived in AllprotectTM, and by 2 weeks there is a statistically significantly difference from the current ‘gold standard’, i.e. tissue snap frozen in liquid nitrogen (0).
79

xvii
2.10 Western blot and corresponding densitometry of HMGB1 expression in primary colorectal cancer samples (patient 1) archived in AllprotectTM . The densitometric panels demonstrate the sharp reduction in protein abundance which occurs between 1 and 3 weeks, by which time it is statistically significantly different from the current ‘gold standard’, i.e. tissue snap frozen in liquid nitrogen (0).
80
3.1 The sequencing by synthesis of the Ion Proton platform. Sequencing is performed on a semiconductor chip containing small beads with clonally amplified template DNA. DNA polymerase is added with sequentially unmodified A, C, G or T dNTPs which are incorporated if complementary, releasing a hydrogen ion which is results in decreased pH that triggers an ion sensor in the chip. If the nucleotide is not complementary, no reaction takes place within that well. The unmodified dNTPs are then flushed out of the system and the next added. Figure taken from the European Bioinformatic Institute (with permission) http://www.ebi.ac.uk/training/online/course/ebi-next-generation-sequencing-practical-course/what-next-generation-dna-sequencing/ion-torre.
89
3.2 Bioinformatics analysis workflow for exome sequencing of synchronously resected primary colorectal tumours and colorectal liver metastases.
94
3.3 The ErbB signalling pathway was identified as the most statistically significant pathway arising from analysis of the SNVs present in at least one primary and metastatic tumour pertaining to the same patient. The focus genes in which the SNVs have arisen are highlighted in purple.
107
4.1 Samples are reduced and undergo a tryptic digest before being tagged with an isotope labelled molecule. These tags all have the same molecular weight although the reporter and balance moieties vary. After a cation exchange cleanup step the samples undergo nanoLC-MS/MS. The reporter and balance moieties are cleaved from each other and from the peptide to which they are bound, the ratio of which helps determine relative abundance. The peptide is also cleaved into fragment ions used to identify the protein.
129
4.2 Bioinformatics analysis workflow for global proteomic assessment of patient matched primary and metastatic colorectal tumours.
136
4.3 Venn diagram of predictive biomarkers identified in the primary tumour (170), metastatic tumour (27) and common to both (5).
166
5.1 Samples are reduced and undergo a tryptic digest before being tagged with an isotope labelled molecule. These tags all have the same molecular weight although the reporter and balance moieties vary. After a cation exchange cleanup step the samples undergo nanoLC-MS/MS. The reporter and balance moieties are cleaved from each other and from the peptide to which they are bound, the ratio of which helps determine relative abundance. The peptide is also cleaved into fragment ions used to identify the protein.
179
5.2 Bioinformatics analysis workflow for global proteomic assessment of serial rectal tumour biopsies.
183
5.3 The base excision repair (BER) signalling pathway was identified as being highly significant, with this data set suggesting downregulation induced by chemoradiotherapy. Only one of the 12 focus molecules was identified – PARP1 (highlighted in purple).
196
5.4 The ceramide degradation pathway was identified as being the most 200

xviii
significantly downregulated pathway in the diagnostic samples of those primary tumours responding to chemoradiotherapy. Only 1 of the 6 focus molecules was identified – acid ceramidase (highlighted in purple).
6.1 Antibody optimisation of NQO1 demonstrating the optimal concentration of antibody (1/1000) in the positive controls (left) and negative controls (right) of colonic mucosa (A) and breast cancer (B).
217
6.2 Images from a randomly selected core produced by Tissue Studio v.2.0 (Definiens AG, Munich, Germany), an immunohistochemical scoring package. The stained core as it appears under the light microscope is shown in (A), with the brown regions representing antibody binding and oxidation of DAB by horseradish peroxidase. Cellular identification and localisation is shown in (B), with the nuclei appearing blue and cytoplasm green. The degree of antibody staining is shown in (C) and can be seen to similarly correspond with the appearances on the micrograph (A). Areas shaded white have no antibody staining, yellow have weak antibody binding, orange have moderate antibody staining and brown have intense antibody staining (all considered positive).
218
6.3 Morphology of the SW480 cell line used for this investigation. Micrograph taken at x400 magnification.
219
6.4 Western blot for NQO1 in transfected S480 cells. From the left: DMSO treated cells were used as a control, and the transfection process (scrambled siRNA) had no effect on NQO1 expression. All 4 siRNAs (A-D) offered good knockdown of NQO1 at both concentrations. The optimum knockdown was achieved with siRNA-A at a concentration of 2.5pM.
220
6.5 Wells highlighted in red were transfected with siRNA to knockdown NQO1 and then incubated with irinotecan or 5FU over a range of concentrations. Wells highlighted in blue were transfected with a scrambled siRNA and then similarly treated. Wells highlighted in green were incubated in 0.5% DMSO (vehicle control) and wells highlighted in yellow were incubated in media only.
221
6.6 Wells highlighted in red were transfected with siRNA to knockdown NQO1, pre-treated with dicoumarol and then incubated with the irinotecan or 5FU over a range of concentrations. Wells highlighted in green were transfected but not pre-treated with dicoumarol and wells highlighted in blue were not transfected nor pre-treated. Wells highlighted in yellow were transfected with scrambled siRNA and then pre-treated with 0.5% NaOH and incubated in 0.5% DMSO, and those highlighted in purple were incubated in 0.5% DMSO only.
223
6.7 Wells highlighted in red were pre-treated with dicoumarol and then incubated with irinotecan or 5FU over a range of concentrations. Wells highlighted in blue were not pre-treated but treated with chemotherapy only. Wells highlighted in green were pre-treated with 0.5% NaOH and then incubated in 0.5% DMSO (vehicle control) and wells highlighted in yellow were not pre-treated but incubated in 0.5% DMSO only.
224
6.8 Western blots for thymidylate synthase (TS) in patient matched colonic mucosa (C), primary tumour (P), metastatic tumour (M) and liver parenchyma (L).
226
6.9 Western blots for dihydropyrimidine dehydrogenage (DPYD) in patient matched colonic mucosa (C), primary tumour (P), metastatic tumour (M) and liver parenchyma (L).
227
6.10 Western blots for orotate phosphoribosyltransferase (OPRT) in patient 227

xix
matched colonic mucosa (C), primary tumour (P), metastatic tumour (M) and liver parenchyma (L).
6.11 Western blots for human carboxylesterase 1 (CES1) in patient matched colonic mucosa (C), primary tumour (P), metastatic tumour (M) and liver parenchyma (L).
229
6.12 Western blots for human carboxylesterase 2 (CES2) in patient matched colonic mucosa (C), primary tumour (P), metastatic tumour (M) and liver parenchyma (L).
229
6.13 Western blots for human topoisomerase I (TOP I) in patient matched colonic mucosa (C), primary tumour (P), metastatic tumour (M) and liver parenchyma (L).
230
6.14 Western blots for UDP glucuronosyltransferase 1A1 (UGT1A1) in patient matched colonic mucosa (C), primary tumour (P), metastatic tumour (M) and liver parenchyma (L).
230
6.15 Western blots for cytochrome P450 3A4 (CYP3A4) in patient matched colonic mucosa (C), primary tumour (P), metastatic tumour (M) and liver parenchyma (L).
231
6.16 Western blots for DNA polymerase β (DNA POL β) in patient matched colonic mucosa (C), primary tumour (P), metastatic tumour (M) and liver parenchyma (L).
233
6.17 CES1/CES2 activity was measured by SN38 production in patient matched primary tumour, liver metastasis and liver parenchyma. Mean (SD) data are presented for each tissue type for the patients studied.
234
6.18 Mean, SD and 95% confidence interval for SN-38 production in the primary tumours, liver metastases and liver parenchyma. Analysis with ANOVA showed significant differences between groups (p=0.001).
234
6.19 Comparison of protein quantification by western blotting (densitometry iu) and iTRAQ (abundance) for NQO1 demonstrates a high statistically significant relationship (r=0.59; p=0.003).
238
6.20 Correlation between the percentage of cells staining positively for NQO1 in the primary tumour and metastatic tumour. Using Spearman’s rank correlation coefficient, r=0.44 (95% CI 0.20 – 0.64, p=0.001).
240
6.21 Dose response analysis for irinotecan in the SW480 cell line. Cells were incubated for 72 hours and cell viability assessed using the MTS assay and presented as a mean (95% CI) percentage of the control (0.5% DMSO). The IC50 is 90.2µM.
241
6.22 Dose response analysis for 5-FU in the SW480 cell line. Cells were incubated for 72 hours and cell viability assessed using the MTS assay and presented as a mean (95% CI) percentage of the control (0.5% DMSO). The IC50 is 202.2µM.
242
6.23 The effect of incubation with irinotecan on NQO1 expression was minimal. No samples were significantly different from the control value (0.5% DMSO).
243
6.24 Dose response analysis for irinotecan in the SW480 cell line with and without knockdown of NQO1 by siRNA transfection. Cells were incubated for 72 hours and cell viability assessed using the MTS assay and presented as a mean (95% CI) percentage of the control (0.5% DMSO). The IC50 is 100.1µM with the scrambled siRNA transfection, and 49.8µM following NQO1 knockdown. Statistical significance was achieved as follows: *p<0.05, **p<0.01, ***p<0.001.
244
6.25 Dose response analysis for 5-FU in the SW480 cell line with and without 245
xx
knockdown of NQO1 by siRNA transfection. Cells were incubated for 72 hours and cell viability assessed using the MTS assay and presented as a mean (95% CI) percentage of the control (0.5% DMSO). The IC50 is 200.1µM with the scrambled siRNA transfection, and 25.0µM following NQO1 knockdown. Statistical significance was achieved as follows: *p<0.05, **p<0.01, ***p<0.001.
6.26 Dose response analysis for dicoumarol in the SW480 cell line. Cells were incubated for 4 hours and cell viability assessed using the MTS assay and presented as a mean (95% CI) percentage of the control (media only).
246
6.27 The effect of pre-treating cells with dicoumarol prior to incubation with 100µM irinotecan. Cell viability is expressed as a percentage of control (0.5% NaOH only followed by irinotecan). The maximum effect was achieved at a dicoumarol dose of 100µM.
247
6.28 Dose response analysis for irinotecan in the SW480 cell line firstly showing the effect of NQO1 knockdown by siRNA transfection, and secondly the absence of any additional biological effect following dicoumarol pre-treatment in those cells not expressing NQO1. Cells were incubated for 72 hours and cell viability assessed using the MTS assay and presented as a mean (95% CI) percentage of the control (scrambled siRNA transfection, pre-treatment with 0.5% NaOH and incubation in 0.5% DMSO).
248
6.29 Dose response analysis for irinotecan in the SW480 cell line with and without pre-treatment with dicoumarol. Cells were incubated for 72 hours and cell viability assessed using the MTS assay and presented as a mean (95% CI) percentage of the control (0.5% NaOH followed by 0.5% DMSO). The IC50 is 100.0µM for irinotecan alone, and 50.0µM following NQO1 inhibition with dicoumarol. Statistical significance was achieved as follows: *p<0.05, **p<0.01, ***p<0.001.
250
6.30 Dose response analysis for 5-FU in the SW480 cell line with and without pre-treatment with dicoumarol. Cells were incubated for 72 hours and cell viability assessed using the MTS assay and presented as a mean (95% CI) percentage of the control (0.5% NaOH followed by 0.5% DMSO). The IC50 is 183.7µM for 5-FU alone, and 49.9µM following NQO1 inhibition with dicoumarol. Statistical significance was achieved as follows: *p<0.05, **p<0.01, ***p<0.001.
250
6.31 Nrf2 is bound to Keap1 until pathway activation causes its stabilisation. Nrf2 subsequently translocates to the nucleus where it dimerises with a number of transcription factors and the heterodimer binds to the antioxidant response elements of a number of genes thus activating transcription. Adapted from Bataille and Manautou (2012).
255

xxi
Abbreviations
5-FU 5-flourouracil
ACN acetonitrile
ACTB β-actin
AJCC American Joint Committee on Cancer
ANOVA analysis of variance
APC adenomatous polyposis coli
APE1 AP endonuclease 1
APER abdomino-perineal excision of rectum
ARE anti-oxidant response element
ASCO American Society of Clinical Oncology
Asf1 anti-silencing function 1
BER base excision repair
BETA bevacizumab expanded access trial
bFOL bolus fluorouracil and low-dose leucovorin with oxaliplatin
BOXER bevacizumab, oxaliplatin, xeloda in unresectable liver metastases
bp base pairs
BRiTE Bevacizumab Regimens: Investigation of Treatment Effects and Safety
BSA bovine serum albumin
CALGB Cancer and Leukemia Group B
CapeOXc apecitabine with oxaliplatin
CDAN1 codanin 1
CEA carcinoembryonic antigen
CENPE centromere protein E
CES1 carboxylesterase 1
CES2 carboxylesterase 2
ChIP chromatin-immunoprecipitation
CI confidence interval
CIMP CpG island methylator phenotype
CIN chromosomal instability
CLASSIC Conventional versus Laparoscopic-Assisted Surgery in Colorectal Cancer
CoLOR Colon cancer Laparoscopic or Open Resection
CRC colorectal cancer

xxii
CRM circumferential resection margin
CRT chemoradiotherapy
CRUK Cancer Research United Kingdom
CT computed tomography
Ct cycle threshold
CYP3A4 cytochrome P450 3A4
DAB diaminobenzidine tetrahydrochloride
DACH diaminocychlohexane
dbSNP database single nucleotide polymorphisms
DCC deleted in colorectal carcinoma
DHFU dihydrofluorouracil
DILI drug induced liver injury
DMSO dimethyl sulfoxide
DNA deoxyribonucleic acid
DNAPOL β DNA polymerase β
dNTP deoxynucleotide
DPYD dihydropyrimidine dehydrogenase
dUTP deoxyuridine triphosphate
EGF epidermal growth factor
EGFR endothelial growth factor receptor
ELISA enzyme-linked immunosorbent assay
EORTC European Organisation for Research and Treatment of cancer
EPIC European Prospective Investigation into Cancer and Nutrition
ErbB erythroblastic leukemia viral oncogene
ERK extracellular signal-regulated kinases
FAP familial adenomatous polyposis
FDA Food and drug administration
FDG fluorodeoxyglucose
FdUDP fluorodeoxyuridine diphosphate
FdUMP luorodeoxyuridine monophosphate
FdUTP fluorodeoxyuridine triphosphate
FFPE formalin-fixed and paraffin-embedded
FOLFIRI folinic acid, fluorouracil and irinotecan
FOLFIRINOX folinic acid, fluorouracil, irinotecan and oxaliplatin
FOLFOX folinic acid, fluorouracil and oxaliplatin

xxiii
FRL future remnant liver
FUDP fluorouridinedisphoaphate
FUTP fluorouridine triphosphate
H&E haematoxylin and eosin
HMGB1 high-mobility group protein B1
HNPCC hereditary nonpolyposis colorectal cancer
HPLC high pressure liquid chromatography
HPRT1 hypoxanthine phosphoribosyltransferase
HR hazard ratio
IC50 half maximal inhibitory concentration
Indels insertions and deletions
IORT intra-operative radiotherapy
IQR interquartile range
IRAS Integrated Research Application System
IrMdG Irinotecan and modified de Gramont
iTRAQ isobaric tagging for relative quantification
KEAP1 Kelch-like ECH-associated protein 1
KRAS Kirsten rat sarcoma
LC-MS/MS liquid chromatography-mass spectrometry/mass spectrometry
LOH loss of heterozygosity
Mad2 mitotic arrest deficient 2
MAGIC Medical Research Council Adjuvant Gastric Infusional Chemotherapy
MAPK mitogen-activated protein kinase
miRNA micro ribonucleic acid
MMR mismatch repair genes
MMTS methylmethanethiosulfate
MOSAIC Multicenter Study of Ox/ 5FU-LV in the adjuvant treatment of colon cancer
MRC Medical Research Council
MRI magnetic resonance imaging
MRM multiple reaction monitoring
mRNA messenger ribonucleic acid
MSH2 MutS protein homolog
MSI microsatellite instability
MTOR mammalian target of rapamycin
MW molecular weight

xxiv
MWA microwave ablation
N/A not applicable
NaOH sodium hydroxide
NCI National Cancer Institute
NER nucleotide-excision repair
NGS next generation sequencing
NICE National Institute for Health and Care Excellence
NIH National Institute Health
NQO1 NAD(P)H dehydrogenase [quinone 1]
NRAS neuroblastoma RAS viral oncogene homolog
Nrf2 nuclear factor (erythroid-derived 2)
OPRT orotate phosphoribosyl transferase
OPUS oxaliplatin and cetuximab in first line treatment of metastatic colon cancer
PAGE polyacrylamide gel electrophoresis
PARP1 poly(ADP-ribose) polymerase
PCR polymerase chain reaction
PET positron emission topography
PETACC-3 Pan-European Trials in Alimentary Cancer
PI3K phosphatidylinositol-4,5-bisphosphate 3-kinase
PIK3CA phosphatidylinositol-4,5-bisphosphate 3-kinase, catalytic subunit alpha
PMS2 postmeiotic segregation increased 2
PulMICC Pulmonary Metastasectomy in Colorectal Cancer
QC quality control
QUASAR Quick and Simple and Reliable
R&D Research and Development
RAF rapidly accelerated fibrosarcoma
RAS rat sarcoma
RCRG Rectal Cancer Regression Grade
REC Research Ethics Committee
RECIST Response Evaluation Criteria in Solid Tumours
RFA radiofrequency ablation
RIN ribonucleic acid integrity number
RIPA radioimmunoprecipitation assay
RNA ribonucleic acid
RPM revolutions per minute

xxv
SCPRT short-course pre-operative radiotherapy
SD standard deviation
SDS sodium dodecyl sulphate
shRNA short hairpin ribonucleic acid
siRNA small interfering ribonucleic acid
SN-38 7-Ethyl-10-hydroxy-camptothecin
SNV single nucleotide variant
TBST tris buffered saline with tween
TCEP Tris (2-carboxyethyl) phosphine hydrochloride
TEAB triethylammonium bicarbonate
TFA trifluoroacetic acid
TGFα transforming growth factor α
TK thymidine kinase
TMA tissue micro-array
TME total mesorectal excision
TNM tumour node metastasis
TOP I topoisomerase I
TP thymidine phosphorylase
TP53 tumour protein p53
TRG tumour regression grade
TS thymidylate synthase
UGT1A1 UDP glucuronyltransferase 1A1
UICC Union for International Cancer Control
UK United Kingdom
UP uridinephosphorylase
VEGF vascular endothelial growth factor
vs versus
WRT with respect to
WT Wild type
XRCC1 X-ray repair cross-complementing protein 1

1
Chapter 1
General Introduction

2
1.1 Epidemiology of colorectal cancer
The 2011 dataset published by Cancer Research (UK) declares colorectal cancer (CRC) as the
fourth commonest cancer in the United Kingdom, with around 41600 people diagnosed in
2011 alone. There is a slight male preponderance for the disease, and it is the third
commonest cancer in both men (after prostate and lung), and women (after breast and
lung). 95% of cases occur in those over the age of 50, the incidence of which has increased
by 6% over the last decade. These figures are representative of disease burden worldwide,
with 447 000 new cases diagnosed in Europe and 1.36 million worldwide in 2012.
(http://www.cancerresearchuk.org/cancer-info/cancerstats/types/bowel/).
Whilst the fourth commonest cancer, colorectal cancer is the second commonest cause of
cancer related death in the UK. The death rate remains high despite a two-fold increase in
five year survival over the past 40 years. The UK bowel cancer screening programme has
been gradually rolled out since 2006, however it is as yet unclear the effect this will have on
survival rates.
Dukes Stage at Diagnosis
Percentage of Cases Five-Year Survival
A 8.7% 93.2%
B 24.2% 77.0%
C 23.6% 47.7%
D 9.2% 6.6%
Unknown 34.3% 35.4%
Table 1.1 - Percentage of cases and 5 year relative survival (%) by Dukes' stage at
diagnosis for colorectal cancer patients diagnosed 1996-2002 in England. (Reproduced
without permission from Cancer Research (UK)).
The best known predictor of survival is disease stage, with over 93% of patients with Dukes
A disease surviving 5 years compared to less than 7% of those with Dukes D disease (Table
1.1). On separating the disease into tumours of the colon and rectum, survival is
comparable. Most recent figures from Cancer Research (UK) show that 1-year survival for
men and women with colon cancer is 73.0% and 72.2% respectively, with 5-year survival of

3
54.4% and 55.1%. In those with rectal cancer 1-year survival for men and women is 78.8%
and 78.8% respectively, and 5-year survival 54.6% and 57.5%.
1.2 Risk factors for colorectal cancer
A number of dietary and lifestyle factors have been linked to the development of colorectal
cancer, including diets rich in unsaturated fats and red meat, excess alcohol and a
sedentary lifestyle (Potter, 1999; Slattery et al, 2000; Huxley et al 2009). A number of other
risk factors have been studied, and a recent review attempted to describe the complex
interplay between energy intake, hormone levels, inflammation and gut flora which may
lead to colorectal cancer (Slattery and Fitzpatrick, 2009). Smoking is also associated with an
increased risk of colorectal cancer (Colangelo et al, 2004) as is a preceding diagnosis of
inflammatory bowel disease (Choi and Zelig, 1994). Isolated risk factors however have been
difficult to define, confounded by the fact that the majority of tumours arise in individuals
with poorly defined risk profiles.
1.3 Genetics of colorectal cancer
There are a number of identified gene defects known to predispose to colorectal cancer, as
well as a number of somatic mutations that are present in sporadic tumours. These
alterations may lead to novel or improved function in oncogenes, or loss of function of
tumour suppressor genes. It is estimated that approximately 15-30% of colorectal cancers
have a significant hereditary component, of which 5% have a Mendelian cancer syndrome
which predisposes to CRC (Lynch and de la Chapelle, 2003; Rustgi, 2007). The majority of
these are attributable to hereditary nonpolyposis colorectal cancer (HNPCC) and familial
adenomatous polyposis (FAP), with a number of other genetic alterations associated with
less common syndromes (Table 1.2).

4
Syndrome Common Features Gene defect(s)
FAP
Multiple adenomatous polyps (>100) and carcinomas of the colon and
rectum; duodenal polyps and carcinomas; fundic gland polyps in the
stomach; congenital hypertrophy of the retinal pigment epithelium
APC (>90%)
Gardner syndrome Same as FAP; also, desmoid tumors
and mandibular osteomas APC
Turcot's syndrome
Polyposis and colorectal cancer with brain tumors (medulloblastomas); colorectal cancer and brain tumors
(glioblastoma)
APC
MLH1, PMS2
Attenuated adenomatous polyposis coli
Fewer than 100 polyps, although marked variation in polyp number
(from ~5 to > 1,000 polyps) observed in mutation carriers within a single
family
APC (precominantly 5' mutations)
Hereditary nonpolyposis
colorectal cancer
Colorectal cancer without extensive polyposis; other cancers include
endometrial, ovarian and stomach cancer, and occasionally urothelial,
hepatobiliary, and brain tumors
MSH2
MLH1
PMS2
GTBP, MSH6
Peutz-Jeghers syndrome
Hamartomatous polyps throughout the GI tract; mucocutaneous
pigmentation; increased risk of GI and non-GI cancers
LKB1, STK11 (30-70%)
Cowden disease
Multiple hamartomas involving breast, thyroid, skin, central nervous system and GI tract; increased risk of breast, uterus and thyroid cancers; risk of GI
cancer unclear
PTEN (85%)
Juvenile polyposis syndrome
Multiple hemartomatous/juvinile polyps with predominance in colon and stomach: variable increase in
colorectal and stomach cancer risk; facial changes
DPC4 (15 %)
BMPRIa (25 %)
PTEN (5 %)
MYH - associated polyposis
Mutiple adenomatous GI polyps, autosomal recessive basis; colon
MYH

5
polyps often have somatic KRAS mutations
Table 1.2 – Genetics of inherited colorectal tumour syndromes. (Reproduced without
permission from Fearon, 2011).
Most tumours arise within dysplastic polyps, and therefore an understanding of the
adenoma-carcinoma sequence is crucial. Most polyps are hyperplastic and less than 5mm in
diameter, however it is the larger adenomas which have been shown to possess malignant
potential (Jass, 2007). An adenoma is a benign lesion of glandular epithelium with a
prevalence of approximately 25% by age 50 and 50% by age 70 (Rex et al, 1993). Only a
small number of polyps progress to malignancy, often over a period of years to decades;
polyp surveillance studies have shown that a 1cm polyp has a 10-15% chance of becoming
malignant within 10 years (Stryker et al, 1987). Adenoma-carcinoma progression was first
described by Vogelstein in 1990 as a series of genetic alterations responsible for sporadic
CRC, beginning with mutation in the adenomatous polyposis coli (APC) gene followed by
mutations in the KRAS and TP53 genes. These mutations are positively selected for during
carcinogenesis and are intrinsically involved in DNA repair, cell adhesion and proliferation
(Wood et al, 2007).
1.3.1 Adenomatous polyposis coli
The APC tumour suppressor gene encodes for a protein known to regulate cell-adhesion,
migration and apoptosis (Fearon and Vogelstein, 1990), and is the genetically defective
gene in FAP as well as some of the less common inherited cancer syndromes. The defect is
present in over 75% of colorectal cancers, and is widely believed to be an early step in
sporadic carcinogenesis due to its reported presence across the adenoma-carcinoma
sequence, including microscopic adenomas with a small number of dysplastic glands
(Kinzler and Vogelstein, 1996).
The most well understood downstream effect of APC mutation is disruption of the WNT
pathway. APC targets β-catenin for proteasomal degradation, and therefore mutation
results in the nuclear accumulation of β-catenin, increased WNT activity and cellular
proliferation (Polakis, 2007).

6
1.3.2 KRAS/BRAF
The RAS family of proteins (KRAS, HRAS and NRAS) are G-proteins which predominantly
fulfil the roles of molecular switches. KRAS is a proto-oncogene which, following activation
through the endothelial growth factor receptor (EGFR) pathway, triggers downstream
signalling through the PI3K/AKT/MTOR and RAF/MEK/ERK pathways resulting in cellular
proliferation (Fearon, 2011). Up to 40% of colorectal tumours have a mutated version of
the KRAS gene, most commonly in codons 12 with smaller subsets affecting codon 13 and
rarely codon 61 (Downward, 2003). The mutation is also found in a number of flat colonic
epithelial lesions without dysplasia, questioning its role in early carcinogenesis (Pretlow and
Pretlow, 2005). However disruption of mutant KRAS in advanced CRC has demonstrated
that inactivation inhibits tumour growth both in vitro and in animal studies, highlighting its
role in disease progression (Shirasawa et al, 1993).
BRAF is a downstream target of KRAS, exerting its effect through the MEK/ERK pathways.
Mutated in approximately 5-10% of colorectal cancers, BRAF mutation appears to be
independent of KRAS mutation, however mutation in either can result in pathway
upregulation and activation of relevant downstream transcription factors such as myc
(Rajagopalan et al, 2002).
1.3.3 TP53
TP53 (p53) is a tumour suppressor gene implicated in a wide range of malignancies, most
likely due to its significant role as a regulator of cell-cycle checkpoints, genomic stability,
apoptosis and angiogenesis (Vousden and Prives, 2009). Under conditions of DNA damage
resulting from cellular stress p53 activates DNA repair proteins, arrests growth by holding
the cell cycle at the G1/S regulation point and initiates apoptosis. Over 50% of all tumours
have ineffective p53 (Hollstein et al, 1991), thought to be a combination of loss of
heterogenezity (LOH) of one allelele of 17p and somatic mutation in the other (Fearon and
Vogelstein, 1990). This pattern is not observed in most adenomas, highlighting this
mutation as a significant event in the transition from adenoma to carcinoma (Baker et al,
1990).
1.3.4 Mismatch repair and microsatellite instability

7
Whilst germline mutations account for a relatively small proportion of tumours they offer a
unique opportunity to understand the genetic instability which contributes to the
development of CRC. Mismatch repair genes (MMR), for example MLH1, MSH2, MSH6 and
PMS2, are responsible for correcting base mismatches and short insertions or deletions
which normally occur during DNA replication (Grady and Carethers, 2008). Where these
genes are defective, DNA sequences are not faithfully replicated and microsatellites are
created - short sections of repeating DNA 1-6 base pairs long.
Germ-line mutations in MMR genes are present in only 2-4% of CRC patients, however 15%
of sporadic colorectal cancers exhibit microsatellite instability (MSI). A key mechanism for
this is thought to be hypermethylation of the promoter of MLH1 resulting in a loss of
function (Aaltonen et al, 1993). MSI tumours exhibit a specific phenotype; they tend to be
poorly differentiated right colonic tumours with high mucinogens and tumour related
lymphyocytes and are less likely to metastasise than microsatellite stable (MSS) tumours
(Buecher et al, 2013). These pathological features confer a survival advantage, despite a
reported resistance to fluorouracil based chemotherapeutic regimens (Ribic et al, 2003).
Tumours with MSI can be sub-classifed as MSI-Low or MSI-High by the presence of less than
or more than 30% unstable loci in a panel of 5-10 points respectively (Boland et al, 1998).
The distinction of MSI-High/Low is associated with further variations in tumour phenotype
and disease characteristics.
1.3.5 Chromosomal instability (CIN)
The chromosomal instability (CIN) phenotype is observed in approximately 70%–85% of
CRC. It is widely accepted that most MSS tumours follow the CIN mechanism of
tumourigenesis, however the MSI and CIN phenotypes are not mutually exclusive
(Lengauer, Kinzler and Vogelstein, 1997).
The cause of chromosomal instability is not known, although it is believed to be due to
defects in genes which regulate formation of the mitotic spindle and alignment and
segregation of chromosomes at mitosis (Grady, 2004). A small number of specific defects
have been suggested, including alterations in Mad2, BubR1, Bub3 and CENPE proteins as
well as LOH in chromosome 18q containing the tumour suppressor genes SMAD2, SMAD4,
and DCC (Barber et al, 2008). APC mutation is also thought to play a role, but its presence in
many other non-CIN tumour phenotypes suggests that the molecular basis for CIN tumours

8
is more heterogenous than the relationship between MMR genes and microsatellite
instability (Alberici and Fodde, 2006).
1.3.6 CpG island methylator phenotype (CIMP)
DNA methylation is thought to serve the biological function of silencing repetitive elements
of the genome (Yoder et al, 1997), and the significance of hypermethylation resulting in loss
of function of MLH1 has already been discussed. The majority of C-phosphate-G sites have
been lost from the human genome during evolution, however hypermethylation of any
residual islands, defined as methylation of at least 3 loci from a panel of 5 gene-associated
CpG islands, results in the silencing of tumour suppressor or other tumour related genes
and ultimately carcinogenesis (Carragher et al, 2010). The CPG island methylator phenotype
(CIMP) represents a further subset of colorectal cancers with a particular molecular and
biological profile. Specifically these tumours have a higher incidence of concurrent
mutations in KRAS/BRAF but wild type TP53, and are more frequently proximal tumours
with mucinous and poorly differentiated histopathological features most often presenting
in older female patients (Issa, 2004). Similarly to MSI, CIMP status of the tumour has been
used to infer potential response to chemotherapeutics (Shiovitz et al, 2014).
1.3.7 Summary of colorectal cancer genetics
Our understanding of colorectal carcinogenesis has progressed significantly since the model
first proffered by Vogelstein in 1990, and is summarised in Figure 1.1.

9
Figure 1.1 – Suggested genetic model for colorectal cancer. In (a) a number of hereditary
and sporadic mutations drive the transformation of normal epithelia to an adenomatous
lesion and latterly carcinoma. In (b) an inherited or acquired defect in DNA mismatch
repair (MMR) function is the initiator for carcinogenesis. (Adapted from Fearon, 2011).
The vast majority of colorectal tumours reflect a series of hereditary and somatic mutations
in key genes i.e APC, KRAS, BRAF and TP53. These mutations are most frequently associated
with a CIN phenotype and are often acquired in a different order, although the sequence
may be relevant to tumourogenicity. A subset of tumours initiate through inactivation of
MMR function, which may be through inherited or, less commonly, somatic mutation, or
alternatively epigenetic inactivation through hypermethylation (CIMP) leading to MSI-H.
Further cumulative mutations in the APC/KRAS/BRAF/TP53 genes ultimately lead to
carcinogenesis.
1.4 Staging of colorectal cancer
Given the relative immaturity of the Bowel Cancer Screening Programme, the vast majority
of patients with colorectal cancer still present symptomatically (Majumdar, Fletcher and
Evans, 1999). Lesions in the left side of the colon are associated with alteration in bowel
function, rectal bleeding and tenesmus, whereas lesions in the right side of the colon are

10
associated with abdominal pain and mass, anaemia and systemic symptoms of malignancy
such as malaise and anorexia. A timely and accurate diagnosis is imperative to establish the
diagnosis, accurately stage the disease and instigate an appropriate management plan.
1.4.1 Clinical assessment
Clinical assessment of the patient includes an understanding of comorbidity relevant to the
treatment of the disease as well as an assessment of the disease itself, for example the
tumour may be palpable via the abdomen or on per rectal examination.
1.4.2 Endoscopic assessment
Colonoscopy allows the visualisation of the entire colonic mucosa whilst also permitting
biopsies of any suspicious lesions to be taken as well as delivering therapy, for example
polypectomy. This is particularly important given the incidence of synchronous tumours
(5%) and concurrent polyps (28%) which may influence management decisions (Langevin
and Nivatvongs, 1984). The procedure also permits the marking of lesions with tattoo ink
for subsequent localisation during surgery and a better understanding of tumour location
and anatomy.
1.4.3 Radiological assessment
Computed tomography (CT) is the most widely used modality for staging local disease, as
well as the detection and characterisation of both hepatic and extra-hepatic metastases for
which it has a sensitivity of 60-90% (Ong and Leen, 2007). Modern techniques of multi-
detector helical scanning combined with rapid infusion of contrast allows visualisation of
the liver in a number of different vascular phases. Combined with multi-slice reconstruction
this technique has significantly improved lesion characterisation in the liver (Scott et al,
2001).
CT scanning is supplemented with magnetic resonance imaging (MRI) in two specific
situations. In the local staging of rectal cancer, pre-operative high resolution MRI images
provide information previously not normally available until the final surgical specimen had
been examined histopathologically. Knowledge of these features in advance of surgery
affords the opportunity to downstage disease and therefore influence outcome. On T2-

11
weighted images taken by a 1.5T system with phased array coils, details of tumour
morphology and stage, lymph node status and extramural vascular invasion can all be
observed (Taylor et al, 2011). Perhaps more importantly, close proximity (within 1mm) of
the tumour to the mesorectal fascia on MRI is a very sensitive predictor of circumferential
resection margin (CRM) positivity at the time of surgery (MERCURY Study Group, 2006). The
widespread adoption of treating these patients with so-called ‘threatened margins’ with
neoadjuvant chemoradiotherapy followed by total mesorectal excision (TME) surgery has
led to a significant reduction in margin positivity. Secondly, for indeterminate lesions in
the liver, further visualisation with MRI (combined with gadolinium contrast) is considered
the most effective imaging modality for accurate characterisation (Kamel and Bluemke,
2003).
Positron emission topography (PET) utilises the increased glucose metabolism in tumour
cells to uptake the radiotracer 18-fluorodeoxyglucose (FDG). On uptake the tracer is
phosphorylated, thus becoming metabolically inactive and accumulating in cells. Now
frequently combined with CT, PET scanning allows for the accurate localisation of small
disease deposits, for example extra-hepatic abdominal metastases or local disease
recurrence, on the understanding that metabolic changes in cells precede any anatomical
variance which may be detected on contrast CT (Arulampalam et al, 2004). This additional
information has been shown to alter disease management in 29% of patients with
colorectal liver metastases (Huebner et al, 2000).
1.4.4 Histopathological assessment
As previously discussed, endoscopic examination of the colon permits acquisition of tissue
for histopathological analysis. Given that the digestive tract can be considered as a
continuum which at all times from mouth to anus is outside the body, biopsies can be taken
without fear of seeding tumour into adjacent tumour free tissue.

12
Figure 1.2 - Invasive colonic adenocarcinoma penetrating the muscularis mucosa; stained
with haematoxylin and eosin. Photomicrograph taken at x200 magnification.
Tissue for analysis is formalin-fixed and paraffin-embedded (FFPE) and slices for
examination are stained with haematoxylin and eosin (H&E). The histological diagnosis of
colorectal cancer is based on invasion through the muscularis mucosae into the submucosa
(Figure 1.2) and further classification into a number of histopathological subtypes,
including: adenocarcinoma, mucinous adenocarcinoma, signet ring cell carcinoma and
medullary carcinoma.
Another important element of the histopathological assessment of colorectal cancer is
tumour grade; an interpretation of the degree of de-differentation from the morphology of
the original tissue assigned on a scale of G1-G4. Assignment of tumour grade considers
nuclear features such as pleomorphism, cellular architecture and mitotic count, with G1-2
tumours and G3-4 tumours grouped together for simplicity as low and high grade
respectively. Whilst some tumour types have specific grading systems shown to link closely
with prognosis, for example the Nottingham index for breast cancer and Gleason score for
prostate cancer, none has as yet been developed for colorectal adenocarcinoma.
Biopsy and histopathological assessment of lesions of presumed colorectal origin from
outside the gastrointestinal tract, for example in the liver, proves more challenging, with
uncertainty amongst clinicians both of its value and safety. Certainly given accurate
radiological assessment as previously discussed and the increasing role of serum
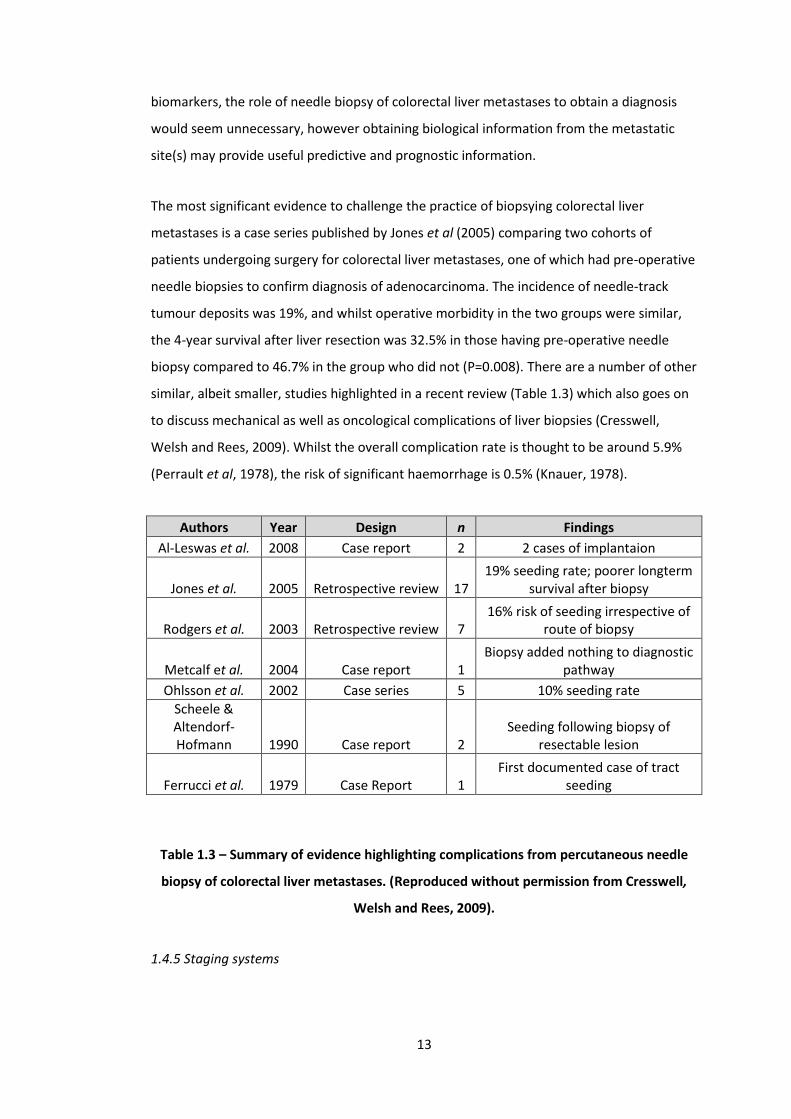
13
biomarkers, the role of needle biopsy of colorectal liver metastases to obtain a diagnosis
would seem unnecessary, however obtaining biological information from the metastatic
site(s) may provide useful predictive and prognostic information.
The most significant evidence to challenge the practice of biopsying colorectal liver
metastases is a case series published by Jones et al (2005) comparing two cohorts of
patients undergoing surgery for colorectal liver metastases, one of which had pre-operative
needle biopsies to confirm diagnosis of adenocarcinoma. The incidence of needle-track
tumour deposits was 19%, and whilst operative morbidity in the two groups were similar,
the 4-year survival after liver resection was 32.5% in those having pre-operative needle
biopsy compared to 46.7% in the group who did not (P=0.008). There are a number of other
similar, albeit smaller, studies highlighted in a recent review (Table 1.3) which also goes on
to discuss mechanical as well as oncological complications of liver biopsies (Cresswell,
Welsh and Rees, 2009). Whilst the overall complication rate is thought to be around 5.9%
(Perrault et al, 1978), the risk of significant haemorrhage is 0.5% (Knauer, 1978).
Authors Year Design n Findings
Al-Leswas et al. 2008 Case report 2 2 cases of implantaion
Jones et al. 2005 Retrospective review 17 19% seeding rate; poorer longterm
survival after biopsy
Rodgers et al. 2003 Retrospective review 7 16% risk of seeding irrespective of
route of biopsy
Metcalf et al. 2004 Case report 1 Biopsy added nothing to diagnostic
pathway
Ohlsson et al. 2002 Case series 5 10% seeding rate
Scheele & Altendorf-Hofmann 1990 Case report 2
Seeding following biopsy of resectable lesion
Ferrucci et al. 1979 Case Report 1 First documented case of tract
seeding
Table 1.3 – Summary of evidence highlighting complications from percutaneous needle
biopsy of colorectal liver metastases. (Reproduced without permission from Cresswell,
Welsh and Rees, 2009).
1.4.5 Staging systems
14
The first staging system for colorectal cancer was described by Dr Cuthbert Dukes in 1932.
Applied initially only to rectal cancer, tumours were assigned a classification or Dukes’ stage
from A-C: Dukes’ stage A cancers were confined to the bowel wall, stage B through the
bowel wall and stage C where there was lymph node involvement (Dukes, 1932). Duke
himself later correlated his pathological grading system with prognosis (Dukes and Bussey,
1958), at which time the subdivision of stages C1 (regional lymph node involvement) and C2
(apical node involvement) were made. Stage D representing distal disease was later added,
(Turnbull et al, 1967), and the scoring system informally applied to carcinomas arising in the
colon.
With significant improvement in both our understanding of disease biology, but perhaps
more so the advances in radiological techniques described above, the current standard of
care is the use of the Union for International Cancer Control/American Joint Committee for
Cancer TNM classification. This classification is a disease specific extension of the original
TNM system devised by Denoix et al in 1946 whereby the degree of invasion and tumour
spread is characterised by a T stage referring to the primary tumour, N stage recording the
presence and extent of local lymph node invasion, and M stage describing the presence or
absence of distant metastatic disease. The current version in widespread clinical use is the
7th edition published in 2010 (Table 1.4).

15
TNM Stage Description
TX Primary tumour cannot be assessed
T0 No evidence of primary tumour
Tis Carcinoma in situ: intraepithelial or invasion of lamina propria
T1 Tumour invades submucosa
T2 Tumour invades muscularis propria
T3 Tumour invades through the muscularis propria into pericolorectal
tissues
T4a Tumour penetrates to the surface of the visceral peritoneum
T4b Tumour directly invades or is adherent to other organs or
structures
NX Regional lymph nodes cannot be assessed
N0 No regional lymph node metastasis
N1 Metastasis in 1-3 regional lymph nodes
N1a Metastasis in 1 regional lymph node
N1b Metastasis in 2-3 regional lymph nodes
N1c
Tumour deposit(s) in the subserosa, mesentery, or non peritonealized pericolic or perirectal tissues without regional
nodeal metastasis
N2 Metastasis in 4 or more regional lymph nodes
N2a Metastasis in 4-6 regional lymph nodes
N2b Metastasis in 7 or more regional lymph nodes
M0 No distant metastasis
M1 Distant metastasis
M1a Metastasis confined to one organ or site (e.g. Liver, lung, ovary,
non regional node)
M1b Metastases in more than one organ/site or the peritoneum
Table 1.4 – UICC/AJCC TNM staging of colorectal cancer; 7th edition (2010). Available
online at https://cancerstaging.org/references-ools/quickreferences/Pages/default.aspx
Given that it is possible to stage disease on a number of parameters at a number of
different points along the patient’s journey, a number of prefixes to the TNM system have
been created to highlight the origin of the information used for staging. These include: c –
indicating the stage is given by clinical examination of the patient, p – indicating the stage is
given by histopathological examination of a surgical specimen, y – indicating the stage is
assessed after chemotherapy and/or radiation therapy (i.e. the patient received
neoadjuvant treatment), r – for recurrent tumours with a substantial disease-free period, a

16
– determined at autopsy (or post mortem examination) and u – determined by
ultrasonography.
As can be seen from the table above there are many potential combinations of Tumour,
Node and Metastasis stages which the UICC/AJCC have grouped together into stages (Table
1.5) for the benefit of simplifying treatment decisions (Carrato, 2008).
Stage Description TNM Stages
0 No tumour Tis, N0, M0
I
Primary tumour into but not through muscularis propria, and
no metastases T1-2, N0, M0
IIa Primary tumour grown through to serosa and peritoneal surface
but no metastases
T3, N0, M0
IIb T4a, N0, M0
IIc T4b, N0, M0
IIIa
Any size of primary tumour with lymph node metastases
T1-2, N1-N1c, M0 / T1, N2a, M0
IIIb T3-T4a, N1-N1c, M0 or T2-T3, N2a,
M0 or T1-T2, N2b, M0
IIIc T4a, N2a, M0 or T3-T4a, N2b, M0 or
T4b, N1-2, M0
IVa Presence of distant metastatic disease
Any T, Any N, M1a
IVb Any T, Any N, M1b
Table 1.5 - UICC/AJCC stage groupings for colorectal cancer; 7th edition (2010). Available
online at https://cancerstaging.org/references-ools/quickreferences/Pages/default.aspx.
Other staging systems have been established to further guide treatment or prognosticate.
The best utilised of these systems is the Jass classification (Table 1.6) which combines some
of the genetic aberrations previously discussed with a number of macroscopic and
microscopic pathological correlates and patient features (Jass, 2007).

17
Feature Group 1 Group 2 Group 3 Group 4 Group 5
MSI Status H S/L S/L S H
Methylation +++ +++ ++ +/- +/-
Ploidy Dip > An Dip > An An > Dip An > Dip An > Dip
APC +/- +/- + +++ ++
KRAS - + +++ ++ ++
BRAF +++ ++ - - -
TP53 - + ++ +++ +
Location R > L R > L L > R L > R R > L
Gender F > M F > M M > F M > F M > F
Precursor SP SP SP/AD AD AD
Serration +++ +++ + +/- +/-
Mucinous +++ +++ + + ++
Dirty Necrosis + + ? +++ +
Poor differentiation
+++ +++ + + ++
Circumscribed +++ + ? ++ ++
Tumour budding +/- + ? +++ +
Lymphocytes +++ + ? + +++
Table 1.6 – The Jass classification combines a number of patient, histopathological and
genetic factors to allocate tumours to a group (1-5). MSI, microsatellite instability; H,
high; S, stable; L, low; Dip, diploid; An, aneuploid; Serration, serrated morphology; SP,
serrated polyp; AD, adenoma; Circumscribed, circumscribed invasive margin. Reproduced
without permission from Jass, 2007.
Identifying features such as these in classification systems could potentially allow us to gain
a greater understanding of causation and pathogenesis. At the very least it acknowledges
that colorectal cancer is a complex and multi-pathway disease. The Jass group is often used
as a decision tool for those patients with Dukes’ Stage B (or Stage II) disease. A study of 183

18
patients with Dukes’ B disease who were also Jass grouped identified that cancer specific
mortality was considerably higher in those with Jass group III than I or II. This additional
prognostic information may facilitate the selection of patients who are most likely to
benefit from adjuvant chemotherapy (Mander et al, 2006).
1.5 Treatment of colorectal cancer with surgery
Surgical resection remains the mainstay of oncological treatment for colorectal cancer. The
exact oncosurgical strategy to employ and how to incorporate this with other treatment
modalities has been the subject of much study in recent years.
1.5.1 Resection of the primary tumour
The surgical approach to colorectal cancer is dependent upon the site and stage of the
disease, and in particular is somewhat different for the 37% of tumours present in the
rectum.
Small tumours contained within colonic polyps are often removed by polypectomy at the
time of colonoscopy, however a significant number of patients undergo formal resection of
the diseased segment of colon along with its arterial supply and accompanying lymphatic
drainage. For tumours in the right colon a right hemicolectomy is performed. A section of
bowel from the terminal ileum to transverse colon is excised, with ligation of the right colic
and ileocolic vessels close to their origins in order to ensure maximum lymphatic clearance.
For tumours in the transverse colon a more extensive version of this procedure is
performed, often referred to as an extended right hemicolectomy. For tumours in the left
colon a section of bowel extending from the sigmoid colon for a variable distance along the
descending colon, with or without the splenic flexure, is mobilised, and excised following
division of the inferior mesenteric artery and vein (usually to obtain full mobility of the
colon). In the elective setting of either scenario an anastomosis is usually performed,
although this may not be feasible or safe in the emergency setting. The concept of total
mesocolic excision and its potential oncological advantages are currently being explored.
The procedure consists of three essential components: dissection between the mesenteric
plane and the parietal fascia with subsequent removal of the mesentery, a central vascular
tie to completely remove all lymph nodes in the central (vertical) direction, and resection of

19
an adequate length of bowel to remove involved pericolic lymph nodes in the longitudinal
direction (West et al, 2009).
Tumours in the rectum may be amenable to local or trans-anal excision, with a significant
increase in uptake of a number of variations of this technique in recent years (Atallah and
Albert, 2013). Formal resection of the diseased segment of bowel however is more
frequently performed. In brief tumours of the upper third of the rectum are approached in
a similar manner to the operation for tumours in the left colon as previously described.
Tumours in the middle and lower thirds of the rectum are now almost universally excised
by low anterior resection using a technique known as total-mesorectal excision (TME).
Professor Bill Heald popularised this technique in 1982, recognising that the lateral, deep or
circumferential margins were much better predictors of local recurrence than distal margin
(Heald, Husband and Ryall, 1982). The technique of TME was published in 1988 and the
follow up data in 1998 reported a local recurrence rate of between 3-6%, considerably less
than the 30% historically quoted (Heald, 1988; Heald et al, 1998). It is now well established
that involvement of the circumferential resection margin is a good predictor of local
recurrence, distant metastasis and also survival (Nagtegaal and Quirke, 2008).
This technique brought about a considerable reduction in the number of abdomino-
perineal excision of rectum (APER) procedures, which involves removal of the entirety of
the rectum and anal canal. This operation removes the sphincters and results in a
permanent stoma, and therefore should be avoided if at all oncologically feasible. Rates of
this operation still remain extremely variable, however are universally reducing as
combinations of nejoadjuvant chemoradiation, total mesorectal excision, intersphincteric
proctectomy and colonic-J pouch to anal anastomosis means that sphincter preservation
can be achieved for most patients (Ludwig, 2007).
A number of international multi-centre studies have confirmed the oncological equivalence
of laparoscopic colorectal cancer surgery, two of the most significant being the Colon
cancer Laparoscopic or Open Resection (CoLOR) trial studying colonic cancer (Veldkamp et
al, 2005), and the Conventional versus Laparoscopic-Assisted Surgery in Colorectal Cancer
(CLASSIC) trial for rectal cancer(Bang et al, 2012). Whilst oncological outcomes are
comparable, laparoscopic surgery offers reduced wound infection rates, less pain and
narcotic use, less overall morbidity and a shorter hospital stay, at the cost of modest
increase in operative times (Abraham, Young and Solomon, 2004).

20
1.5.2 Resection of metastatic disease
Over the past 10-20 years there has been a rapid expansion in potentially curative surgery
for colorectal metastases, particularly those confined to the liver. This is in part a result of a
more aggressive approach to neoadjuvant chemotherapy combined with improved surgical
techniques, bringing an increasing number of patients who were initially thought not to be
resectable to resection. Those patients who do undergo resection experience a 10 year
survival of 9-69% (Taylor et al, 2012).
Prior to this there was a very conservative approach to the management of metastatic
disease in the liver, the traditional indications for which were 1-3 unilobar metastases
which were resectable with a generous margin. Patients presenting with liver metastases
(i.e. those with stage IV disease), those with a rectal primary, multiple diffuse metastases,
metastases larger than 5cm, a disease free interval of less than 1 year from the diagnosis of
the primary and high serum carcinoembryonic antigen (CEA) were not considered
appropriate for curative surgical resection due to poor prognosis (Poston, 2008). The
approach to surgical resection in the liver is now more of a consideration of both technical
and oncological feasibility.
In order to achieve adequate resection in the liver it must be feasible to remove all
macroscopic disease with negative margins, preserve vascular inflow and outflow and leave
sufficient future remnant liver (FRL) to ensure adequate hepatic function (Garden et al,
2006). The volume of FRL sufficient to ensure adequate hepatic function would clearly
depend upon the functional quality of the remaining liver parenchyma, with those patients
with cirrhosis, steatosis or, increasingly commonly, drug induced liver injury (DILI), requiring
a larger liver remnant than those with normal underlying liver parenchyma. Generally
speaking, 25% of the liver volume (approximately two Couinaud segments) is considered
adequate. Given the regenerative ability of the liver parenchyma, liver regrowth may allow
multi-stage resections (Narita et al, 2011).
Removal of all macroscopic and microscopic disease with negative margins is referred to as
an R0 resection. Where microscopic disease remains the resection is said to be R1 and
where macroscopic disease remains the resection is said to be R2. It has been clearly
demonstrated that those patients with R1 resections have better outcomes than those with

21
R2 (Pawlik et al, 2005), and whilst R0 is considered the optimum standard of care, survival
in those with R0 and R1 resections is comparable (de Haas, Wicherts and Adam, 2008).
A number of alternatives to surgical resection exist, all of which centre on the concept of
tumour ablation. This is now most commonly achieved by radiofrequency ablation (RFA) or
microwave ablation (MWA) either at open surgery or percutaneously. Given the
considerable variation in local recurrence and overall survival, the role of ablation in the
curative setting is unclear. This was highlighted by recent guidelines from the American
Society of Clinical Oncology (ASCO) who recommend that resection remains the gold
standard of treatment. As such the use of these ablative techniques is often reserved for
unfit patients with low volume disease, as an adjunct to formal resection or in the non-
curative setting.
Guidance from the National Institute for Health and Care Excellence (NICE) pertaining to
the management of colorectal cancer (CG131) now recommends that surgery for
metastatic disease in the liver be considered in those patients fit enough for surgery and in
whom complete resection can be obtained leaving adequate FRL. The guidance goes on to
suggest that liver resection is relatively contra-indicated in those with a non-treatable or
recurrent primary tumour, widespread pulmonary and/or metastatic disease, extensive
nodal disease or metastases in the bone or central nervous system.
Decision making in the context of extra-hepatic metastases is somewhat more complex,
although it is no longer a contra-indication to potentially curative surgery. One of the
largest series of pulmonary metastasectomy published by Pfannschmidt et al (2003) quotes
a five-year survival of 32.4% with number of metastases and lymph node positivity being
independently prognostic factors on both multivariate and univariate analysis. The
Pulmonary Metastasectomy in Colorectal Cancer (PulMICC) trial is a currently recruiting
feasibility study randomising to open/thoracoscopic surgery or active monitoring (no
treatment) and will hopefully add further clarity to the role of surgery for metastatic
colorectal cancer in the thorax. Extra-hepatic abdominal metastases again are no longer a
contra-indication to surgery at other sites, and resection of these sites is associated with a
5-year survival of around 25% (Adam et al, 2011).
1.5.3 Surgical management of synchronous disease

22
The above described strategies apply to those patients who present with a primary tumour,
and following a period of disease free survival develop metastastic disease. However, those
presenting with a resectable primary tumour and synchronous metastatic disease in the
liver, now thought to be approximately 14.5% of patients due to improvements in our
ability to detect this radiologically, have a number of surgical options (Manfredi et al, 2006).
In brief these are: traditional approach (primary first and then liver), reverse approach (liver
first and then primary) or to synchronously (often referred to as simultaneously) resect
disease at both sites within a single procedure. All of these approaches would require
integration with other treatment modalities, in particular peri-operative chemotherapy
and, in the case of rectal cancer, neoadjuvant radiotherapy.
It is safe to say the optimal strategy for the management of these patients remains unclear,
and there is certainly an absence of level 1 evidence. A recent systematic review identified
18 papers in which 21 comparisons had been performed between at least two of these
strategies (Lykoudis et al, 2014). A number of other smaller series exist, but for the purpose
of the published systematic review only those with patient groups greater than 10 were
included (Table 1.7).

23
Table 1.7 – Summary of recent evidence pertaining to the synchronous management of liver limited metastatic colorectal cancer. Reproduced with
permission from Lykoudis et al (2014). References: Martin et al; J Am Coll Surg (2003); 197; 233-241, Chua et al; Dis Colon Rectum (2004); 47; 1310-1316,
Capussotti et al; Ann Surg Oncol (2007); 14; 195-201, Capussotti et al, Ann Surg Oncol (2007); 14; 1143-1150, Reddy et al; Ann Surg Oncol (2007); 14;
3481-3491, Thelen et al; Int J Colorectal Dis (2007); 14; 3481-3491, Turrini et al; Eur J Surg Oncol (2007); 33; 735-740, Vassiliou et al; World J Gastroenterol
(2007); 13; 1431-1434, Martin et al; J Am Coll Surg (2009); 208; 842-850, Slupski et al; Can J Surg (2009); 52; E241-E244, Brouquet et al, J Am Coll Surg
(2010); 210; 934-941, de Haas et al; Br J Surg (2010); 97; 1279-1289, Luo et al; J Gastrointest Surg (2010); 14; 1974-1980, Moug et al; Eur J Surg Oncol
(2010); 36; 365-370, Mayo et al; J Am Coll Surg (2013); 216; 707-716.
Reference Year
Duration of operation (min)*
Blood loss (ml)* Transfused patients Hospital stay (days)* Morbidity (%)
In-hospital mortality
(%)
Simultaneous
approach
Staged approach
Total
Colorectal
surgery
Liver
surgery Simultaneous Staged Simultaneous Staged Simultaneous Staged Simultaneous Staged Simultaneous Staged
Cohort studies
Martin et al. 2003 235 411§ n.s. n.s. 550
1100§ 31 38 10 18§ 48 68§ 2 2
Chua et al. 2004 370 392 n.s. n.s. 600 575 n.s. 10 17§ 53 41 0 0
Capussotti et al. 2007 n.s. n.s. n.s. n.s. n.s. n.s. n.s. 36 37 Excluded
Thelen et al. 2007 260† n.s. n.s. 2091 n.s. 35 n.s. 20† n.s. 18 n.s. 10 n.s.
Turrini et al. 2007 325 n.s. n.s. 256 n.s. n.s. 18 n.s. 21 n.s. 4 n.s.
Vassiliou et al. 2007 260† 340†§ n.s. n.s. n.s. n.s. 12† 20†§ n.s. 0 0
Martin et al. 2009 180 235 n.s. n.s. 300 350 50 45 10 18§ 56 55 2 2
Slupski et al. 2009 250 290§ 90 200 950 1040 n.s. 12 15§ n.s. 0 0
de Haas et al. 2010 n.s. n.s. n.s. n.s. n.s. n.s. n.s. 11 25§ 0 1
Brouquet et al. 2010 n.s. n.s. n.s. n.s. 300 600§ 16 13 n.s. 19‡ 17‡ n.s.
Luo et al. 2010 255 415§ n.s. n.s. 400 650§ n.s. 8 14§ 47 54 2 2
Mayo et al. 2013 n.s. n.s. n.s. n.s. n.s. n.s. n.s. n.s. 3 3
Martin et al. 2003 290 423§ n.s. n.s. 800 1100§ n.s. 12 18§ 60 70§ 4 4
Capusotti et al. 2007 330 n.s. n.s. 280 n.s.
42 17¶ 14 21§ 33 56§ 3 0
Reddy et al. 2007 n.s. n.s. n.s. n.s. n.s. n.s. 9 14§ 44 45 n.s.
Martin et al. 2009 202 268 n.s. n.s. 450 750§ n.s. 12 18§ 50 60 0 4
de Haas et al. 2010 n.s. n.s. n.s. n.s. n.s. n.s. n.s. 8 31§ 0 0
Moug et al. 2010 n.s. n.s. n.s. n.s. 475 425 n.s. 12 20§ 34 59 0 0

24
No significant differences in mortality were found between groups. Statistically significant
differences were found in: duration of operation, blood loss, transfusion requirements,
length of hospital stay and morbidity. Five studies favoured synchronous resection in terms
of cumulative procedure duration and blood loss, however no difference was found in
either of these variables in 3 and 4 papers respectively. 12 studies examined for length of
hospital stay, all of which favoured synchronous resection. Five papers favoured the
synchronous approach in terms of overall morbidity, however 8 papers failed to detect any
difference. One study found increased transfusion requirements in those undergoing
synchronous resection.
The authors conclude that no one strategy is inferior to the others, and that all of them
should be considered in patients presenting with synchronous colorectal liver metastases.
The clear contra-indication to this approach would be those patients with a symptomatic
primary tumour, for example those that are bleeding and requiring transfusion, perforated
tumours and those obstructing or with an imminent threat of the same. The biggest
question arising from these studies is whether or not it is possible to identify subgroups of
patients who would benefit from one particular strategy over another, particularly if
considering that those patients presenting with synchronous disease may represent a
distinct biological subtype (Silvestrini et al, 1990). Unfortunately the evidence is lacking,
with a complete absence of prospective data and multiple inadequacies in existing cohort
studies, the most appropriate course of management for these patients should be
determined on an individual basis by specialty multidisciplinary teams (Abdalla et al, 2013).
1.6 Treatment of colorectal cancer with radiotherapy
Radiotherapy is an established adjuvant treatment for the management of colorectal
cancer. As with all adjuvant treatments, the majority of patients receiving treatment, along
with all the established risks, inconvenience and side-effects, will not actually benefit. This
could be either because surgery alone has been curative, or because the disease will
ultimately recur regardless of additional treatment received. The decision to treat cohorts
of patients with common cancers with adjuvant therapy therefore stems from the concept
that altering the outcome in a small proportion of patients will still translate to many
hundreds or thousands of lives saved.
1.6.1 Biological effects of radiation

25
Radiation causes ionisation of atoms, which in turn can affect cell, tissue and organ
function. Effects of radiotherapy can be divided into direct and indirect effects. Direct
effects occur when, for example, radiation causes ionisation of atoms in DNA molecules, or
in other molecules essential to the survival and reproduction of the cell. Given these
components make up a relatively small proportion of the cell, most of the radiation will
interact with intra-cellular water. The so-called indirect effects of radiation cause
fragmentation of water into hydrogen and hydroxyl ions, which may recombine as water or
other chemicals more harmful to the cell such as hydrogen peroxide.
The sensitivity of cells to radiation is proportional to its rate of replication. Dividing cells
require correct DNA for the progeny to survive, and direct interaction of radiation with DNA
may ultimately result in cellular mutation or death. The rapid cell division of a neoplastic
lesion is exploited in this manner; tumour cells divide rapidly and are therefore prone to the
effects of radiation. Dormant cells, which tend to be relatively hypoxic, are less sensitive to
the effects of ionising radiation.
The ability of the tumour to repair damage imparted by radiotherapy is thought at least in
part to reflect its resistance and response to treatment. Base excision repair proteins are a
key mechanism by which small, non-helix-distorting base lesions are repaired (compared to
the nucleotide excision repair pathway which repairs bulky helix-distorting lesions). Base
excision repair (BER) mechanisms remove damaged bases that could otherwise cause
mutations by mispairing or lead to breaks in DNA during replication. Some of the key
proteins involved in this mechanism include AP endonuclease 1 (APE1) which cleaves an AP
site for subsequent binding, DNA polymerase β which catalyses short-patch repair (i.e.
single nucleotide replacement), and DNA ligase III along with its cofactor XRCC1 which
catalyses the nick-sealing step in short-patch BER. The expression of these proteins has
been investigated for potential as both biomarkers and therapeutic targets, although as yet
there is insufficient evidence for incorporation into clinical practice (Vens and Begg, 2010).
Small bowel epithelia are rapidly dividing cells, and so too are prone to the effects of
radiation. The risk of so-called radiation enteritis combined with the relative mobility of the
colon within the abdomen poses difficulty for the use of radiation in colon cancer. As such
the use of radiation is almost exclusively limited to the treatment of rectal cancer.
1.6.2 Indications for radiotherapy
26
The most important distinction to be made is between those tumours initially felt to be
resectable and those where the planned resection margins are threatened by tumour.
Beyond that, the indications for radiotherapy in rectal cancer can be divided into two broad
classifications:
Reducing the risk of local recurrence
Shrinking locally advanced tumours to facilitate successful surgical resection
1.6.3 Short-course pre-operative radiotherapy (SCPRT)
Where the disease is already felt to be resectable, radiotherapy can be administered either
pre- or post-operatively. The main advantage of pre-operative treatment is that pelvic
anatomy is undisturbed and therefore toxic doses of radiation to the small bowel are less
likely. Conversely, delivering the treatment post-operatively allows for better
personalisation of treatment by focusing on those patients with adverse pathological
features.
A regimen of irradiation which did not delay definitive surgical treatment became popular,
and is now referred to as short-course pre-operative radiotherapy (SCPRT). A typical
regimen is the delivery of 25Gy in five 5Gy fractions over 5 days. This approach was
supported by a number of early randomised controlled trials (Goldberg et al, 1994; Marsh
et al, 1994; Cedermark et al, 1995), the largest and most significant of which being the
Swedish Rectal Cancer Trial which demonstrated improved survival and reduced local
recurrence rates compared to surgery alone (Swedish Rectal Cancer Trial, 1997).
To further evaluate the role of SCPRT in the post TME era, the Dutch Colorectal Cancer
Study Group trial compared SCPRT and TME surgery with TME surgery alone. A total of
1805 patients were randomised to the two groups, and whilst the overall survival at 2 years
was comparable, the rate of local recurrence was 2.4% in those receiving SCPRT-TME
compared to 8.2% in the group receiving TME alone (Kapiteijn et al, 2001). Similarly the
Medical Research Council CR07 trial compared SCPRT with selective post-operative
chemoradiotherapy (for those patients with CRM involvement). 1350 patients were
randomised to the study, the findings of which were a 61% reduction in local recurrence
and 6% increase in disease free survival at 3 years in those patients undergoing SCPRT
(Sebag-Montefiore et al, 2009).

27
1.6.4 Long-course neoadjuvant chemoradiotherapy
An alternative strategy to SCPRT is the use of a longer course of radiation with a lower dose
per fraction. With long-course radiotherapy, 45-50Gy is delivered over 5-6 weeks at 1.8-
2.0Gy per fraction. Similarly to SCPRT, there is good evidence for improved local control but
no evidence of an increase in survival benefit. Addition of concurrent chemotherapy has
been shown to be more effective than radiotherapy alone, with two significant trials
(EORTC 222921 and FFCD 9203) both attesting to yet further reductions in local recurrence
with this strategy (Bosset et al, 2006; Gerard et al, 2006).
Only one trial has compared SCPRT and long-course CRT in patients with resectable disease
(Bujko et al, 2006). Whilst longer courses of radiotherapy were associated with greater
tumour down-staging and CRM-negative resections, it was also associated with higher rates
of radiation toxicity and no improvement in local recurrence or survival.
Until recently there was doubt as to the optimum timing for long-course CRT, however the
recent CAO/ARO/AI0 94 trial compared pre-and post operative chemoradiotherapy in the
context of standardised TME surgery and adjuvant chemotherapy. The study reported
lower recurrence rates when the radiotherapy is delivered pre-operatively (6% vs. 12%), as
well as reduced early and late complications (Sauer, 2004).
1.6.5 Radiotherapy in locally advanced rectal cancer
Recognition of the importance of CRM involvement in predicting local recurrence has led to
an increase in the use of MRI to accurately stage rectal cancer. This increasingly
sophisticated technology is now being used to identify those patients with ‘locally advanced
disease’, defined in many different ways but for the purposes of this discussion should be
thought of as being tumour encroaching upon the mesorectal fascia and therefore likely to
result in a positive CRM given a satisfactorily performed TME resection (MERCURY, 2006). It
is from within this group of patients where the other indications for radiotherapy arises;
shrinking tumours to facilitate successful surgical excision.
Given the difficulties of treating these patients with surgery alone, little evidence exists to
support this strategy although two trials from the UK have attempted to answer this
question. A small trial (284 patients) compared SCPRT with surgery alone, with no

28
difference in survival benefit or local recurrence, although the authors did perceive a
marginal survival benefit in a subgroup analysis of those patients believed by the surgeon to
have had a curative resection (Marsh et al, 1994). A larger trial with longer follow-up
compared long-course CRT with surgery alone, favouring long-course CRT for local
recurrence (hazard ratio 0.68), distant recurrence (hazard ratio 0.66) and disease-free
survival (hazard ratio 0.76), all of which were statistically significant (Medical Research
Council Rectal Cancer Working Party, 1996).
One other potential advantage of neoadjuvant chemoradiotherapy is the potential for
converting a planned abomino-perineal resection of the rectum into an anterior resection
as a result of tumour shrinkage, thus performing a sphincter-preserving procedure and
sparing the patient from a permanent stoma and the morbidity of a significantly more
invasive operation. However it would seem that the evidence for this notion is anecdotal,
as a recent systematic review of 10 randomised controlled trials comparing neo-adjuvant
radiotherapy and surgery with surgery alone failed to find any difference in permanent
stoma rates between experimental and control arms (Bujko et al, 2006).
1.6.6 Other uses of radiotherapy
Thus far, the role of radiotherapy has only been considered in the curative setting. This may
be assumed to be external beam radiotherapy delivered by a linear accelerator, however
there are other roles for radiotherapy in patients with rectal cancer.
The application of direct contact radiotherapy, for example using the Papillon system, has
been shown to be a safe and effective treatment for early rectal cancers in those patients
not suitable for definitive surgical treatment. A study of 220 patients with T1-T3 tumours
less than 3cm in diameter was reported from the Clatterbridge Centre of Oncology. The
authors report a local control rate of 93% with no significant morbidity in any patient,
accepting that their population was highly selective and that close follow-up and plans for
salvage surgery are required (Myint et al, 2007).
Radiotherapy has also been shown to be advantageous in the palliative setting, be that in
those not suitable for surgical intervention or those who have experienced disease
recurrence. Radiotherapy at a total dose of 20-60Gy can provide relief of pain and bleeding
in 75% of patients for a median duration of 6-9 months (Saltz, 2004). The role of intra-

29
operative radiotherapy (IORT) for those patients with T4 disease is still under investigation,
with the most recent evidence suggesting an improved local recurrence free survival in
patients with microscopically involved margins at the time of resection. A study of 409
patients who underwent surgery for locally advanced or recurrent rectal cancer identified
48 with a microscopically involved CRM. Within this cohort those who received IORT (n=31
vs. n=17) benefited from a significant difference in cumulative 5-year local recurrence free
survival (84% vs. 41%; p=0.01) (Alberda et al, 2014). No evidence from randomised trials is
as yet available and case series remain small, however the results are promising for
appropriately selected patients.
1.7 Chemotherapeutic agents used in colorectal cancer
Before 2000, the only agent available for the treatment of metastatic and advanced
colorectal cancer was 5-flourouracil (5-FU), which still remains the cornerstone of
treatment. Indeed it is still an oral pro-drug of 5-FU (capecitabine) which is used as
monotherapy alongside neoadjuvant radiotherapy in the treatment of locally advanced
rectal cancer.
The development of alternative agents however has revolutionised our approach to the
management of these patients, with combination regimens now considered standard
therapy. The most commonly used chemotherapeutic agents in colorectal cancer are 5-
fluorouracil and oxaliplatin, which are combined with leucovorin in a regimen known as
FOLFOX. An alternative strategy is the combination of fluorouracil and irinotecan with
leucovorin (FOLFIRI), or 5-fluorouracil with oxaliplatin, irinotecan and leucovorin
(FOLFIRINOX). Our increasing understanding of tumour biology has also led to the
development of biological agents, the most common being cetuximab, panitumumab and
bevacizumab. These agents are frequently used in combination with existing
chemotherapeutic regimens.
Evidence for the use of specific regimens will be discussed, but first we shall consider the
mechanism of action of each of these agents individually.
1.7.1 5-fluorouracil (5-FU)

30
5-FU is a fluropyrimidine anti-metabolite. The drug was designed, synthesized and patented
in 1957 as an analogue of uracil, a normal component of RNA. The analogue substitutes a
hydrogen for fluorine atom at the C5 position and is a specific competitive antagonist for
uracil. Its misincorporation into RNA and DNA arrests RNA synthesis and therefore halts
tumour growth.
As well as being incorporated into macromolecules, 5-FU is converted intra-cellularly into a
number of active metabolites which disrupt biological function: fluorodeoxyuridine
monophosphate (FdUMP), fluorodeoxyuridine triphosphate (FdUTP) and fluorouridine
triphosphate (FUTP). It is these active metabolites which inhibit thymidylate synthetase
(TS), a nucleotide synthetic enzyme which is thought to be the main target for 5-FU (Figure
1.3). The exact downstream effect of this is unclear, although this action is thought to result
in dinucleotide pool imbalances and increased levels of deoxyuridine triphosphate (dUTP),
both of which can cause DNA damage (Yoshioka et al, 1987).
The drug is predominantly catabolised by dihydropyrimidine dehydrogenase (DPYD), which
converts 5-FU to dihydrofluorouracil (DHFU), with around 80% of this occurring in the liver
(Diasio and Harris, 1989).

31
Figure 1.3 – 5-Fluorouracil metabolism – 5-fluorouracil (F-FU) is converted to three main
metabolites: fluorodeoxyuridine monophosphate (F-dUMP), fluorodeoxyuridine
triphosphate (FUTP) and fluorouridine triphosphate (FUTP). The main mechanism of 5-FU
activation is conversion to fluorouridine monophosphate (FUMP) by orotate
phosphoribosyltransferase (OPRT). FUMP is then phosphorylated to fluorouridine
disphoaphate (FUDP) and again to fluorouridine triphosphate (FUTP). Alternatively,
thymidine phosphorylase (TP) can activate 5-FU by catalysing the conversion of 5-FU to
fluorodeoxyuridine (FUDR) which is then phosphorylated by thymidine kinase (TK) to
FdUMP. FdUMP can be phosphorylated to fluorodeoxyuridine diphosphate (FdUDP) and
again to fluorodeoxyuridine triphosphate (FdUTP). 80% of 5-FU is catabolised in the liver
by dihydropyrimidine dehydrogenase (DPYD). Adapated from Longley, Harkin and
Johnston, 2003.
Common side-effects include nausea, vomiting, diarrhoea, mucositis, headache,
myelosuppression, alopecia and photosensitivity.
1.7.2 Leucovorin
High intra-cellular levels of the reduced folate, leucovorin (folinic acid), are required for
optimal binding of FdUMP to TS. Leucovorin is transported into cells via the reduced folate
transporter, anabolised and polyglutamated. These steps not only increase intra-cellular
retention but further help stabilise the complex formed with FdUMP and TS, and as such it

32
is widely accepted that co-administration of leucovorin increases 5-FU toxicity both in vitro
and in vivo (Wright, 1989).
1.7.3 Capecitabine
An alternative approach to the delivery of 5-FU has been the design of oral pro-drugs which
avoid the DPYD mediated catabolism in the liver. Capecitabine is an oral fluoropyrimidine
which is absorbed via the gastrointestinal tract and converted in the liver to 5’-deoxy-5-
fluorouridine (5’DFUR) by the enzymatic action of carboxylesterase and cytidine deaminase
(Johnston and Kaye, 2001). 5-DFUR is ultimately converted to 5-FU by thymidine
phosphorylase (TP) and uridine phosphorylase (UP). The higher abundance of these
enzymes in tumour tissue is thought to account for the more tumour-specific conversion of
capecitabine to 5-FU (Schuller et al, 2000).
1.7.4 Irinotecan
Irinotecan is a semi-synthetic analogue of the alkaloid camptothecin. Its mechanism of
action is by direct interaction with topoisomerase I (Top I). The role of Top I is uncoiling
DNA ready for transcription by inflicting single-strand DNA breaks which ultimately are
repaired. Irinotecan binds to the DNA/Top I complex and stabilises these breaks, resulting
in DNA fragmentation and cell death.
Irinotecan is a pro-drug, which is converted to its active metabolite, SN-38, by human
carboxylesterases CES1 and CES2. Irinotecan can also undergo CYP3A4 mediated oxidative
metabolism to form APC and NPC, both of which are inactive however NPC can be further
hydrolysed by carboxylesterase to release SN-38 (Mathijssen et al, 2001). The biochemistry
of the drug is outlined in Figure 1.4.

33
Figure 1.4 – The metabolism of irinotecan (CPT-11). Irinotecan is converted to the active
metabolite SN38 by carboxylesterase (CE), as well as to two other inactive metabolites
(NPC and APC) by CYP3A4. NPC can subsequently be converted by SN-38 by CE.
Inactivation to SN38-G is predominantly controlled by UGT1A1, however the inactive
metabolite can be re-activated to SN38 by β-glucuronidation. Adapted from Mathijssen et
al, 2001.
Irinotecan is conjugated by UDP-glucuronosyl-transferases, the most active form of which is
1A1 (UGT1A1). A common polymorphism in UGT1A1, known as UGT1A1*28, is
characterised by the presence of an additional TA repeat in the TATA sequence of the
UGT1A1 promoter. Individuals with this polymorphism are at significantly higher risk of
developing the most common and severe side effects of irinotecan, diarrhoea and
neutropenia (Iyer et al, 2002). The glucuronidated product is SN38-G, which can be
deglucuronidated by intestinal β–glucuronidase (β-Glu) back to the active metabolite SN38.
1.7.5 Oxaliplatin
Oxaliplatin is a platinum based chemotherapeutic which was discovered in 1976. Its
chemical structure features a square planar platinum centre, the bidentate ligand 1,2-
diaminocychlohexane (DACH) and a bidentate oxalate group.
Its anti-tumour effects are non-targeted, although oxaliplatin undergoes intra-cellular
transformation into a number of active metabolites all of which contain a DACH ring. These

34
metabolites form inter- and intra-stand cross links in DNA which prevent replication and
transcription (Graham, Mushin and Kirkpatrick, 2004).
In a similar way to the patterns of resistance described for radiotherapy, resistance to
oxaliplatin is thought to stem from the cell’s ability to repair DNA damage. These
mechanisms include nucleotide-excision repair (NER) and mismatch repair (MMR), however
the major system responsible for the removal of corrupt DNA bases and repair of DNA
single strand breaks is the base excision repair (BER) system (Sharma and Dianov, 2007). In
particular deficiency in the most significant DNA polymerase, polymerase-β, has been
shown to render cells hypersensitive to oxaliplatin therapy (Yang et al, 2010).
1.7.6 Biological agents
In recent years significant advances have been made in developing novel small molecule
inhibitors of extracellular receptors. Extracellular growth factor receptor (EGFR) is a
transmembrane glycoprotein which is a member of the ErbB receptor tyrosine kinase
group, mutations in which are known to result in carcinogenesis (Zhang et al, 2007).
EGFR is activated by the binding of specific ligands, most commonly epidermal growth
factor (EGF) and transforming growth factor α (TGFα). Upon binding EGFR undergoes
transformation to an active homodimer stimulating intrinsic intracellular protein-tyrosine
kinase activity and a cascade of autophosphorylation resulting in increased signal
transduction principally through the PI3K/AKT/MTOR and RAS/RAF/MEK/ERK pathways.
This activation activates a number of cell-cell adhesion, DNA synthesis and cell proliferation
pathways responsible for carcinogenesis.
Cetuximab is a chimeric mouse/human monoclonal antibody and panitumumab is a fully
human monoclonal antibody, both of which target EGFR directly (Figure 1.5). Their use is
confined to those tumours who express EGFR and who are KRAS wild type, as the key role
of this gene in subsequent downstream signalling means that these drugs have little or no
effect if the KRAS gene is mutated (Messersmith and Ahnen, 2008). Specifically a mutated
KRAS will continue to trigger downstream signal activation even following inhibition of
EGFR.

35
Figure 1.5 – Binding of a ligand (EGF, TGFα) to EGFR stimulates receptor dimerisation,
tyrosine kinase activation, EGFR autophosphorylation and ultimately initiates signal
transduction cascades involved in cell proliferation and survival. Inhibition of EGFR by the
monoclonal antibody cetuximab inhibits these downstream events. Adapted from
Kirkpatrick, Graham and Muhsin, 2004.
An alternative approach to inhibiting this pathway is to use small molecule inhibitors, which
act on the cytoplasmic side of the receptor to reduce EGFR tyrosine kinase activity. Without
this activity, EGFR is unable to autophosphorylate, and therefore downstream signalling is
halted and tumour proliferation reduced. Drugs used in this category include gefitinib,
erlotinib and lapatanib although none of these are as yet in widespread use for colorectal
cancer.
Vascular endothelial growth factor (VEGF) is an important regulator of angiogenic factors
crucial for tumour growth and metastasis, activation of which is pro-angiogenic.
Bevacizumab is a human monoclonal antibody which binds directly to VEGF and forms a
complex which is unable to bind to any other VEGF receptors. This essentially reduces the
amount of VEGF available resulting in inhibition of angiogenesis (Los, Roodhart and Voest,
2007).
1.8 Treatment of colorectal cancer with chemotherapy

36
Chemotherapy regimens with 5-FU as the cornerstone remain a widely used treatment for
advanced colorectal cancer, which in the adjuvant setting is thought to confer a 5-10%
improvement in absolute survival (Haydon, 2003).
The vast majority of evidence for the use of chemotherapy in colorectal cancer pertains to
colon cancer only, with its use in rectal cancer inferred and therefore the subject of much
debate. A number of questions remain, including the optimum regimen, route of
administration and the potential for combination with other chemotherapeutic or
biological agents. Uncertainties still exist around optimum patient selection, in particular
the role of chemotherapy in patients with stage II disease.
1.8.1 The evidence for 5-FU
A number of early trials explored the role of 5-FU in advanced colorectal cancer. The
quality of these studies was poor, and a meta-analysis performed in 1988 failed to show
any survival benefit (Buyse, Zeleniuch-Jacquotte and Chalmers, 1988).
Shortly after this, a large randomised control trial clearly demonstrated a survival benefit
following 12 months of 5-FU combined with levamisole (an immunomodulator) when
compared to either agent as monotherapy or observation alone (Laurie et al, 1989). These
findings were confirmed in a subsequent larger trial of 1296 patients (Moertel et al, 1990),
which led to the recommendation and subsequent adoption of this regimen as standard
practice (NIH Consensus Conference, 1990).
Interest subsequently turned to the combination of 5-FU with leucovorin/folinic acid, with
one of the most significant trials addressing this being the Quick and Simple and Reliable
(QUASAR) study. The trial was a two x two design whereby 4927 patients with colorectal
cancer but without residual disease were randomly assigned to receive fluorouracil with
high dose or low-dose folinic acid, and either active of placebo levamisole. On an intention
to treat analysis for all cause mortality, the inclusion of levamisole in chemotherapy
regimens did not improve survival, and high dose folinic acid conferred no additional
benefit to low-dose folinic acid (QUASAR Collaborative Group, 2000). Although not
randomly allocated, those patients receiving a once weekly bolus regimen suffered less
toxicity with equivalent efficacy to those receiving five consecutive days every 4 weeks

37
(referred to as the ‘Mayo regimen’). As a result of this the weekly regimen of 5-FU with low
dose folinic acid was widely adopted in the UK.
1.8.2 Combination regimens
Over recent years a number of trials have combined 5-FU with other chemotherapy agents.
The MOSAIC trial of 2246 patients compared 5-FU/Folinic Acid with 5-FU/Folinic
Acid/Oxaliplatin, and found an increase in 3-year disease free survival from 72.9% to 78.2%
(Andre et al, 2009). A subgroup analysis within this study also reported a small
improvement (72.9% vs. 68.3%) in overall survival for stage III but not stage II patients. The
NSABP-C07 trial similarly reported 3-year disease free survival rates of 71.8% increasing to
76.1% with the addition of oxalipatin (Kuebler, 2007). Both trials noted the increased
disease-free survival came at the cost of significant neurosensory toxicity associated with
the use of oxaliplatin, however this regimen was widely adopted across Europe.
Few trials have looked at combining irinotecan in the adjuvant setting. The CALGB 89803
study randomised 1264 patients with completely resected stage III colon cancer to either 5-
FU/Leucovorin or 5FU/Leucovorin/Irinotecan, each regimen being delivered by single
weekly bolus infusion. Powered for disease free survival and overall survival, no differences
were found between groups although significant additional toxicity was reported with the
use of irinotecan (Saltz et al, 2000). Similar findings were seen in the Pan-European Trials in
Alimentary Cancer (PETACC-3) study, with 2094 patients recruited into a similar trial design
demonstrating comparable 5-year disease free survival (73.6% vs. 71.3%) (Van Cutsem et al,
2009). No trials have as yet compared 5-FU/Leucovorin/Oxaliplatin with 5-
FU/Leucovorin/Irinotecan for its efficacy in the adjuvant treatment of stage II-III disease.
1.8.3 Adjuvant chemotherapy for colorectal liver metastases
Chemotherapy following resection of colorectal liver metastases (i.e. patients with stage IV
disease) aims to maximise survivorship by treating occult residual disease (Chong and
Cunningham, 2005). The role of adjuvant chemotherapy in this setting however remains
unclear.
The FFCD AURC 9002 trial randomised 171 patients with complete R0 resection of liver
metastases to either observation or adjuvant chemotherapy with a 5-FU/Leucovorin

38
regimen. Whilst the trial failed to recruit to fulfil its primary end-point of overall survival,
there was a significant increase (33.5% vs. 26.7%) in 5-year disease free survival in the
chemotherapy group (Portier et al, 2006).The EORTC 0923 trial was a further similarly
designed trial which again failed to adequately recruit to demonstrate any potential
difference in overall survival (Mitry et al, 2008). The authors of this trial went on to pool
their data with the FFCD AURC 9002 trial, reporting a median overall survival of 62.2
months vs. 47.3 months favouring adjuvant chemotherapy, although this did not reach
statistical significance.
The efficacy of combination chemotherapeutic regimens is also unclear. A randomised trial
of patients having had R0 resection of colorectal liver metastases comparing 5-
FU/Leucovorin with FOLFIRI reported comparable 2-year disease free survival (51% vs. 46%)
(Ychou et al, 2009).
Despite an absence of clear trials evidence for its efficacy, many clinicians still opt to
manage this patient group with adjuvant chemotherapy. Decisions like this must take into
account the likelihood of disease clearance at the time of surgery, patient preference,
perceived efficacy and the burden of morbidity associated with treatment.
1.8.4 Neoadjuvant chemotherapy for colorectal liver metastases
The role of neo-adjuvant chemotherapy for gastrointestinal cancer was initially defined by
the MAGIC trial (Cunningham et al, 2006) for oesophago-gastric carcinoma. The potential
reduction in disease volume may ensure optimum clearance at the resection margin (for
example in the primary tumour) or greater sparing of the surrounding parenchyma (for
example in the liver and lung). In addition the chemotherapy will treat those micro-
metastases not detectable on cross-sectional imaging, which may result in longer disease-
free survival. Finally the test of systemic treatment and evaluation of its response provides
interesting and clinically useful information about the tumour biology, from which
predictive and prognostic information can be inferred.
The safety and tolerability of neoadjuvant chemotherapy was defined in a number of early
phase 2 studies. The successful delivery of 99% of scheduled 5-fluorouracil and 99% of
scheduled oxaliplatin associated with a 50% post-operative morbidity and 0% mortality
(Wein, 2003), and the comparable compliance between neoadjuvant FOLFOX and adjuvant

39
FOLFIRI associated with a 97% delivery and no operative mortality (Taieb et al, 2005) attest
to this.
The efficacy of neoadjuvant treatment has also been assessed, although available data is
limited. A large retrospective study of 1471 patients compared neoadjuvant chemotherapy
(FOLFOX) with surgery alone (Adam et al, 2010). Preoperative chemotherapy did not
appear to improve overall survival (60% at 5 years in both groups), however adjuvant
chemotherapy did (65% vs. 55%, p<0.01). Perhaps more concerningly the incidence of
postoperative complications was significantly higher in those patients who received
neoadjuvant chemotherapy (37.2% vs. 24.0%, p=0.006).
The largest trial to investigate this date is the EORTC 40983 study (EPOC trial) which
randomised 364 patients with up to four resectable colorectal liver metastases to 12 cycles
of peri-operative FOLFOX (half delivered prior to surgery and half after) or surgery alone
(Nordlinger et al, 2008). Powered for 3-year progression free survival, 152 patients from
each arm underwent resection with dropout attributed to disease progression. On an
intention to treat basis the median overall survival was 61.3 months in the perioperative
chemotherapy group and 54.3 months in the surgery alone group, with 5-year survival of
51.2% and 47.8% respectively (p=0.34). For those who underwent resection, 3-year
progression free survival was 36.2% in the perioperative chemotherapy arm compared to
28.1% in the surgery arm (HR 0.77, 95% CI 0.60-1.00; p=0.041). This finding combined with
the non-statistically significant trend towards increased survival has led to the uptake of
this management strategy in a number of units, however a potential criticism is the
exclusion of the higher risk population with more than 4 metastases.
The role of neoadjuvant chemotherapy in the context of non-metastatic disease is even less
clear. The FOXTROT trial is currently recruiting patients with colonic T3-4 tumours to be
randomised to receive preoperative oxaliplatin, folinic acid, fluorouracil and panitumumab
followed by surgery and adjuvant chemotherapy, or surgery and adjuvant chemotherapy
combined with panitumumab (Foxtrot Collaborative Group, 2012). The feasibility study has
been completed and the trial remains open.
1.8.5 Chemotherapy for irresectable disease

40
As our ability to accurately stage disease and our understanding of tumour biology
improves it is becoming increasingly clear that a significant proportion of patients have
irresectable disease. Treatment in this setting with the chemotherapeutic regimens already
discussed must be decided in partnership with the patient taking into account co-morbidity,
performance status, prognosis and quality of life. Irresectable disease of the primary is
unlikely to change significantly with systemic treatment, but it has become apparent that a
proportion of patients with colorectal liver metastases will have such a significant
treatment effect that their disease may in fact become technically resectable.
The conversion to resectability in the liver is estimated to be around 6-60%, with variation
reflecting patient and disease factors, choice of chemotherapeutic regimen, proportion of
treatment course completed and local unit approach to surgical resection (Poston, 2008). In
the situation where disease is converted to resectability, the 5 year survival is comparable
to those patients who underwent resection at the time of presentation – approximately 35-
50% (Adam et al, 2001). It is not surprising that tumour response to chemotherapy
correlates with resection rate; information which should be borne in mind when managing
this cohort (Folprecht et al, 2005).
NICE currently recommends the use of FOLFOX (with cetuximab if appropriate) as first line
treatment for all patients with unresectable liver-limited metastatic colorectal cancer with
FOLFIRI reserved for second line treatment. In this setting the efficacy of the two regimens
is thought to be comparable (Tournigand et al, 2004), although the significant toxicity
associated with FOLFIRI may limit its usefulness (Innocenti and Ratain, 2004).
1.8.6 Cetuximab
Extensive trial derived evidence exists for the incorporation of cetuximab into modern
chemotherapeutic regimens for selected patients determined by KRAS status.
In 2009 the CRYSTAL trial randomised 599 patients to each of FOLFIRI and FOLFIRI plus
cetuximab (Van Cutsem et al, 2009). All patients had unresectable disease and epidermal
growth factor receptor positive tumours. No difference was seen in overall survival
between the two groups, however progression-free survival was considerably greater in
those receiving cetuximab (hazard ratio 0.85; p=0.048). There was a significant interaction
between treatment group and KRAS mutation for tumour response, but not progression-

41
free or overall survival. Resectability rates (irrespective of KRAS status) were 7% for FOLFIRI
plus cetuximab compared with 3.7% for FOLFIRI alone, with R0 rates of 4.8% vs. 1.7%
(p=0.002). This increase in tumour response was associated with an increase in skin
reactions (19.7% vs. 0.2%), infusion-related reactions (2.5% vs. 0%) and diarrhoea (15.7%
vs. 10.5%).
The OPUS trial was again confined to patients with epidermal growth factor-expressing
tumours, however here the combination of cetuximab and FOLFOX was compared to
FOLFOX alone with treatment continued until disease progression or unacceptable toxicity.
A total of 337 patients were randomised, with no statistically significant difference in
response rate (46% vs. 36%; p=0.06). In those with tissue available for KRAS mutation status
(n=233), subgroup analysis showed that in KRAS wild-type tumours the addition of
cetuximab to FOLFOX was associated with a significant increase in treatment response (61%
vs. 37%; p=0.011). In this study cetuximab was generally well tolerated, with no reports of
significant adverse events (Bokemeyer et al, 2011).
The EPIC trial was a large trial of 1298 patients with metastatic colorectal cancer who had
experienced first line failure to 5-fluorouracil and oxaliplatin (Sobrero et al, 2008). Patients
received either irinotecan monotherapy or irinotecan plus cetuximab. No difference was
identified in overall survival (for which the trial was powered), with the authors attributing
this to significant variations in post-trial treatment. Cetuximab did however significantly
improve both tumour response rate (16.4% vs. 4.2%; p=<0.0001) and progression free
survival (4.0 vs. 2.6 months; p=<0.0001).
A smaller group of patients with irresectable colorectal liver metastases were studied in the
CELIM phase 2 trial (Folprecht et al, 2010). 114 patients were randomised to receive
cetuximab with either FOLFOX or FOLFIRI. Randomisation between groups was stratified by
technical resectability and number of metastases as determined by PET scan, as well as
epidermal growth factor receptor expression status. Patients were assessed every 8 weeks,
and if the locally treating multidisciplinary team deemed the disease to be potentially
resectable they were offered surgery. Whilst the trial showed largely comparable response
rates and toxicity between groups, a retrospective analysis of response by KRAS status
showed a partial or complete response in 70% of those with wild-type tumours compared
with 41% with KRAS mutated tumours (OR 3.42; p=0.008). Further review of the

42
retrospective data suggested that resectability rates increased from 32% at baseline to 60%
following chemotherapy (p<0.0001)
More recently the UK COIN trial (2012) compared continuous oxaliplatin/capecitabine
(OxCap) and oxaliplatin/leucovorin/infusional 5-FU (OxFU) with or without cetuximab. The
trial reported comparable efficacy between OxFU and OxCap, and the addition of
cetuximab to OxFU resulted in less diarrhoea and longer progression free survival than for
its combination with OxCap. As a natural progression to the EPOC trial (see Section 1.8.4),
New EPOC (2014) compared perioperative treatment with chemotherapy (FOLFOX/FOLFIRI)
with chemotherapy plus cetuximab for KRAS wild-type patients with resectable colorectal
liver metastases, and was halted after an interim analysis reported significantly shorter
progression free survival in the chemotherapy plus cetuximab group than in the
chemotherapy group alone (14.1 months vs. 20.5 months, HR 1.48). The trial authors
concluded that further translational investigation is needed to explore the molecular basis
for the unexpected interaction.
1.8.7 Bevacizumab
Hurwitz et al (2004) reported the first randomised trial of 813 patients with metastatic
disease to receive IFL (irinotecan, bolus 5-FU and leucovorin) or IFL plus bevacizumab.
Patients receiving bevacizumab benefited from increased median survival (20.3 vs. 15.6
months; p=<0.001) and progression free survival (10.6 vs. 6.2 months; p=<0.001).The GONO
group have also reported their experience of combining FOLFIRINOX with bevacizumab in
57 patients with unresectable metastatic disease (Masi et al, 2010). Progression free
survival at 10 months was 74% (95% CI 62-85), with similar incidences of adverse events to
those previously reported.
The bevacizumab expanded access trial (BEAT) is the largest study documenting the success
of this targeted biological agent in patients with unresectable colorectal liver metastases
(Van Cutsem et al, 2009). Patients were treated with their physician’s choice of
chemotherapy plus bevacizumab in a non-randomised fashion. The study was
predominantly designed to observe safety rather than efficacy, and of the 1914 patients
assessed the serious adverse events reported included bleeding (3%), gastrointestinal
perforation (2%), arterial thromboembolism (1%), hypertension (5.3%), proteinuria (1%)
and wound complications (1%). The sixty-day mortality was 3%, median progression free

43
survival 10.8 months and overall survival 22.7 months. Overall resection was performed in
7.6% of patients and 15.2% of those with disease confined to the liver, the 2-year survival
for which was 89%.
In the United States similar findings were reported in the BRiTE study (Grothey et al, 2008).
A large observational study of 1445 previously untreated patients with metastatic
colorectal cancer classified patients who experienced disease progression into: no
treatment post disease progression (n=253), treatment without bevacizumab (n=531) and
treatment with bevacizumab (n=642). Baseline factors were well balanced between groups,
with reported overall survival rates of 12.6, 19.9 and 31.8 months respectively. Multivariate
analyses strongly and independently associated the use of bevacizumab with improved
survival (HR 0.48; p<0.01), highlighting the role of continued vascular endothelial growth
factor inhibition in improving survival following the detection of recurrent disease.
The TREE study randomised patients into three different oxaliplatin/5-fluorouracil regimens
– mFOLFOX6 (bolus and infusion fluorouracil and leucovorin with oxaliplatin), bFOL (bolus
fluorouracil and low-dose leucovorin with oxaliplatin) or CapeOX (capecitabine with
oxaliplatin). A second cohort (referred to as TREE 2) received the above regimens in
combination with bevacizumab. For all patients the median overall survival was 18.2
months (95% CI 14.5-21.6) in TREE 1 and 23.7 months (95% CI 21.3-26.8) in TREE 2,
highlighting that the addition of bevacizumab to fluoropyrimidine based chemotherapy
regimens as first line treatment can significantly improve overall survival (Hochster et al,
2008).
Modest improvements in progression free survival attributed to the addition of
bevacizumab were also noted in the N016966 phase III randomised trial (9.4 vs. 8.0 months;
p=0.0023), where FOLFOX was used as the chemotherapeutic backbone (Cassidy et al,
2008). The smaller BOXER trial has also reported a conversion rate to resectability of 40% in
a cohort of 46 patients receiving neoadjuvant capecitabine, oxaliplatin and bevacizumab
(Wong et al, 2010).
1.9 Asssessment of response to chemoradiotherapy
There is an extremely variable response to both radiotherapy and chemotherapeutics,
irrespective of the setting in which the treatment is delivered. Uncertainty also exists as to

44
when this response to treatment should be assessed. Radiation, for example, induces an
inflammatory reaction such that re-staging the patient immediately after cessation of
treatment is likely to result in a considerable under-estimate of tumour response. In
addition, the response to radiotherapy continues for several weeks after the completion of
treatment. Radiation will initially affect those cells which are actively dividing, however its
effects will be latent in those cells which were in the resting (G0) part of the cycle when the
tumour was irradiated. As these cells begin the process of cell division it becomes apparent
that they will be unable to successfully divide, and therefore upon reaching checkpoints in
the cell-cycle are signalled to undergo apoptosis. Patients receiving chemotherapy also
exhibit variation in response to their treatment, and individuals with advanced disease are
commonly seen to suffer disease progression despite intense combination regimens.
In clinical practice, the response to neoadjuvant treatment is normally achieved with
radiological re-staging of the tumour in the manner previously described, i.e. CT scan of the
chest, abdomen and pelvis as well as MRI scan of the rectum in the case of rectal cancer
(with close attention to the proximity of the tumour to the mesorectal fascia). Alternatively
response to treatment can be determined histopathologically following tumour resection.
1.9.1 Radiological response to treatment
Standardisation of response reporting first began in the late 1970s as a collaboration
between the International Union Against Cancer and the World Health Organisation (Miller
et al, 1981). Given the rapid advances in both technology and medicine, an international
group consisting of members from the European Organisation for Research and Treatment
of cancer (EORTC), the United States National Cancer Institute (NCI) and the Canada Clinical
Trials Group set out to refine these response criteria in 1994. The guidelines published are
referred to as the Response Evaluation Criteria in Solid Tumours (RECIST) guidelines
(Therasse et al, 2000).
At baseline, all lesions are originally categorised as either measurable or nonmeasurable.
Measurable lesions can be accurately measured in at least one dimension (with the longest
dimension to be recorded) as ≥20mm with conventional techniques or as ≥10mm with
spiral CT scan. All measurable lesions up to a maximum of 5 lesions per organ and 10 in
total are measured with callipers or a rule. These so-called target lesions should be selected
on the basis of their size (those with the longest diameter) and suitability for repeated

45
measurements. The sum of these longest diameters is calculated and referred to as the
baseline sum longest diameter. All other lesions are referred to as non-target lesions;
measurements are not necessary however their presence or absence during treatment and
follow-up should be noted.
The same exercise is repeated following treatment, and an assessment of response
allocated to both the target (those previously identified as such) and non-target lesions. In
the target lesions: complete response is defined as the disappearance of all lesions, partial
response is at least a 30% reduction in the sum of the longest diameter when compared to
the baseline sum longest diameter, progressive disease is at least a 20% increase in the sum
of the longest diameter and stable disease as neither sufficient shrinkage to qualify for
progressive disease. In the non-target lesions: complete response is the disappearance of all
nontarget lesions, incomplete response/stable disease as the persistence of one of more
non target lesions, and progressive disease as the appearance of one or more new lesions
and/or unequivocal progression of existing nontarget lesions.
Following widespread adoption in clinical practice and cancer research, these criteria were
later modified in 2008 to RECIST v1.1. In brief, the changes made included a reduction in
the number of target lesions from 10 to 5, and a maximum of two per organ, an inclusion of
pathological lymph nodes as target lesions (assuming a short axis of ≥15mm), and a change
to the use of short axis measurements in the sum of lesions for the calculation of tumour
response. In addition the definition of disease progression was further clarified, in that in
addition to the previously defined 20% increase in the sum of the target lesions, a 5mm
absolute increase is also necessary to label the patient as having disease progression
(Eisenhauer et al, 2008).
1.9.2 Pathological response to treatment
The prequel to the majority of tumour regression grade (TRG) scoring systems originated
from an early paper whereby pathological response to treatment was correlated with
outcome in oesophageal cancer (Mandard et al, 1994). In this paper, TRG was quantified as
one of five grades: TRG1 (complete regression) showed absence of residual cancer and
fibrosis extending through the oesophageal wall; TRG 2 was characterised by the presence
of rare residual cancer cells scattered through the fibrosis; TRG 3 was characterised by an
increase in the number of residual cancer cells but fibrosis still predominated; TRG 4

46
showed residual cancer outgrowing fibrosis; and TRG 5 was characterised by absence of
regressive changes. On univariate analysis, tumour size, lymph node status, TRG and
oesophageal wall involved correlated with disease free survival, however after multivariate
analysis only TRG (at this point dichotomised as 1-3 vs. 4-5) remained a significant predictor
of disease free survival.
Shortly after this Dworak, Keilholz and Hoffman (1997) published a grading system
specifically for the regression of rectal tumours after neoadjuvant chemoradiotherapy,
grading regression from GR0-GR4 (Table 1.8) after assessing tumour mass, fibrotic change,
irradiation vasculopathy and peri-tumourous inflammatory reaction. Similarly to the
original report by Mannard et al, this system was later shown to have prognostic value in
predicting outcomes in rectal cancer (Losi et al, 2006).
Tumour Regression Grade
Description
0 No regression
1 Dominant tumour mass with obvious fibrosis and/or vasculopathy
2 Dominant fibrotic changes with few tumour cells or groups (easy to find)
3 Very few (difficult to find microscopically) tumour cells in fibrotic tissue with or without mucous substance
4 No tumour cells, only fibrotic mass (total regression)
Table 1.8 - The tumour regression grade proposed by Dworak, Keilholz and Hoffmann
(1997) extends from 0-4 and includes an assessment of tumour mass as well as the degree
of fibrosis and/or vasculopathy. Reproduced without permission from Santos et al, 2014.
The publication from Dworak, Keilholz and Hoffman (1997) was followed by a simplified 3
point scale known as the Rectal Cancer Regression Grade (RCRG): RCRG1 – the tumour is
either sterilised or only microscopic foci remain; RCRG2 – marked fibrosis but with
macroscopic tumour still present; and RCRG3 – little or no fibrosis in the presence of
abundant macroscopic tumour. RCRG1 and 2 are considered to represent significant
tumour regression (Wheeler et al, 2002).
More recently the Royal College of Pathologists have produced a minimum dataset for
reporting in colorectal cancer. Originally a 3 tier system was utilised, although a 4 tier
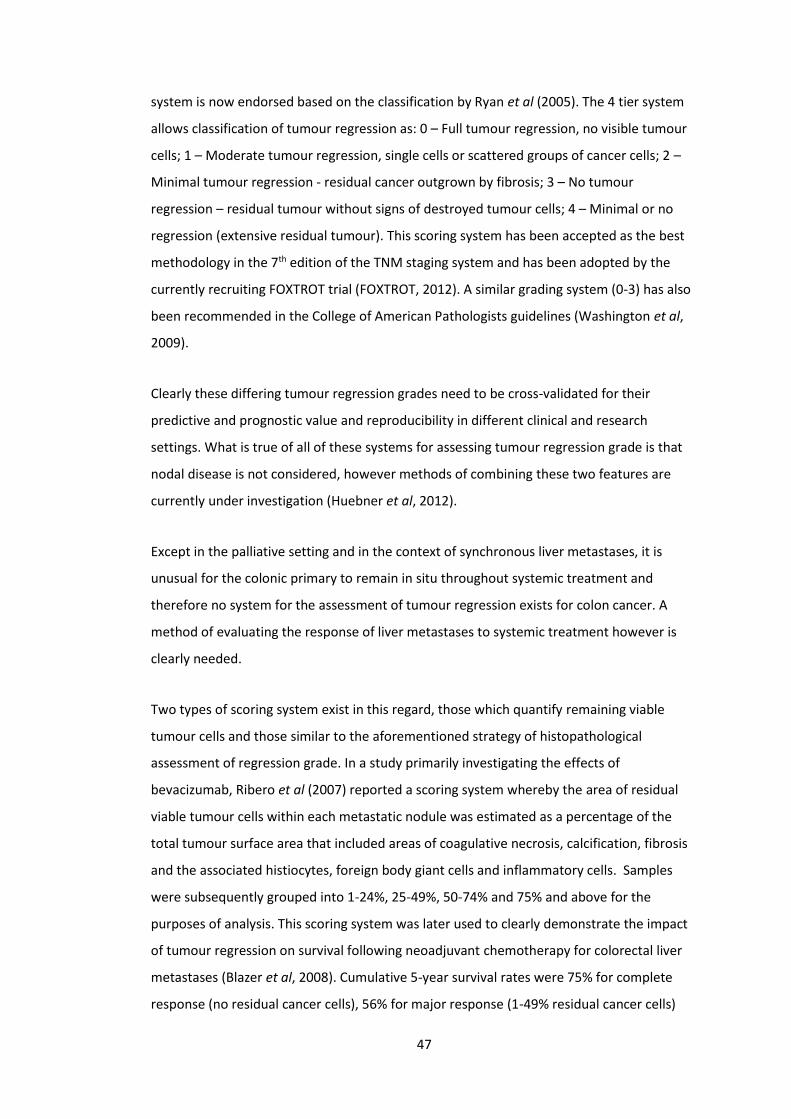
47
system is now endorsed based on the classification by Ryan et al (2005). The 4 tier system
allows classification of tumour regression as: 0 – Full tumour regression, no visible tumour
cells; 1 – Moderate tumour regression, single cells or scattered groups of cancer cells; 2 –
Minimal tumour regression - residual cancer outgrown by fibrosis; 3 – No tumour
regression – residual tumour without signs of destroyed tumour cells; 4 – Minimal or no
regression (extensive residual tumour). This scoring system has been accepted as the best
methodology in the 7th edition of the TNM staging system and has been adopted by the
currently recruiting FOXTROT trial (FOXTROT, 2012). A similar grading system (0-3) has also
been recommended in the College of American Pathologists guidelines (Washington et al,
2009).
Clearly these differing tumour regression grades need to be cross-validated for their
predictive and prognostic value and reproducibility in different clinical and research
settings. What is true of all of these systems for assessing tumour regression grade is that
nodal disease is not considered, however methods of combining these two features are
currently under investigation (Huebner et al, 2012).
Except in the palliative setting and in the context of synchronous liver metastases, it is
unusual for the colonic primary to remain in situ throughout systemic treatment and
therefore no system for the assessment of tumour regression exists for colon cancer. A
method of evaluating the response of liver metastases to systemic treatment however is
clearly needed.
Two types of scoring system exist in this regard, those which quantify remaining viable
tumour cells and those similar to the aforementioned strategy of histopathological
assessment of regression grade. In a study primarily investigating the effects of
bevacizumab, Ribero et al (2007) reported a scoring system whereby the area of residual
viable tumour cells within each metastatic nodule was estimated as a percentage of the
total tumour surface area that included areas of coagulative necrosis, calcification, fibrosis
and the associated histiocytes, foreign body giant cells and inflammatory cells. Samples
were subsequently grouped into 1-24%, 25-49%, 50-74% and 75% and above for the
purposes of analysis. This scoring system was later used to clearly demonstrate the impact
of tumour regression on survival following neoadjuvant chemotherapy for colorectal liver
metastases (Blazer et al, 2008). Cumulative 5-year survival rates were 75% for complete
response (no residual cancer cells), 56% for major response (1-49% residual cancer cells)

48
and 33% for minor response (50% or more residual cancer cells) (Figure 1.6). Multivariate
analysis revealed that only surgical margin and pathological response independently
predicted survival. The same scoring system has also been used by Kishi et al (2010) to
report the finding that extended pre-operative chemotherapy (more than 9 cycles)
increases the risk of hepatoxicity without improving the pathological response.
Figure 1.6 – Kaplan-Meir survival curves of patients with colorectal liver metastases
treated with neoadjuvant chemotherapy, with greatest survival in those with complete
response (a) followed by major response (b) and minor response (c). Reproduced with
permission from Blazer et al, 2008.
Alternatively the original Mandard tumour regression grade (scored 1-5) has also been used
to assess colorectal liver metastases in studies investigating the effects of neoadjuvant
chemotherapy (Rubbia-Brandt et al, 2007) and more recently the addition of bevacizumab
(Klinger et al, 2010).
Complete pathological response, whilst oncologically desirable, creates a number of
surgical problems (Grothey et al, 2008). Correlation between radiological and pathological
response is unclear, and up to 80% of lesions showing complete radiological response
continue to harbour viable tumour cells (Benoist et al, 2006). The optimum method of
managing these patients is still under investigation.

49
1.10 Predictive and prognostic markers in colorectal cancer
The variation in disease and tumour biology coupled with the mode of presentation,
rapidity of diagnosis and treatment strategy employed perhaps explains some of the
variation in both response to treatment and outcomes. The link between disease stage and
outcome has already been discussed however these other factors, and in particular tumour
biology, have not yet been incorporated into risk stratification and patient selection for
treatment.
The ability to predict response to treatment in the clinical setting would obviously be
extremely beneficial. To identify patients, by either patient or tumour factors, who are
likely to respond to chemotherapy and/or radiotherapy would allow those individuals to be
exposed to a prolonged course of treatment in order to maximise efficacy. It may also be
that the approach to managing adverse reactions and events to treatment could differ in
those individuals in whom we knew with a degree of certainty would respond to treatment.
Taking this one step further if the response to particular chemotherapeutic agents could be
predicted up-front prior to commencement then the regimen could be tailored specifically
towards the patient – a concept referred to as personalised medicine.
Conversely to identify those patients who are unlikely to respond to treatment is arguably
of greater clinical value. In the neoadjuvant setting, for example, failure of a patient with
rectal cancer to respond to neoadjuvant chemoradiotherapy commits the patient to
retaining their tumour in situ for approximately 4 months. Whilst not accurately studied, it
would be reasonable to assume that this confers the risk of tumour growth, dissemination
and increases the likelihood of tumour complications such as bleeding, perforation or
obstruction.
In the adjuvant setting or indeed in those patients with irresectable disease, the ability to
predict response to chemotherapy would allow for personalised treatment, and an open
and honest discussion between patient and physician about the appropriateness of
aggressive and morbid treatment. In the context of those with irresectable disease it would
also provide information to the patient and multidisciplinary team about the likelihood of
conversion to resectability.

50
A cancer diagnosis is clearly a significant life event for any individual, which is handled in
any number of different ways. The amount of clinical and prognostic information that
people wish to receive is extremely variable, but the option of providing patients with
accurate information could potentially assist a proportion of them deal with the
psychological impact of the disease.
1.10.1 Clinical prognostic scoring systems
A number of scoring systems are available to assist clinicians classify patients with advanced
disease by prognosis, although they are implemented with varying degrees of popularity.
The three most commonly used are the Clinical Risk Score (Fong et al, 1999), Nordlinger
Prognostic Index (Nordlinger et al, 1996) and Basingstoke Prognostic Index (Rees et al,
2008).
Fong’s clinical risk score pertains specifically to the prediction of recurrence after hepatic
resection for metastatic colorectal cancer. 1001 consecutive patients were analysed with
seven factors found to be significant and independent predictors of poor long-term
outcome by multivariate analysis: positive margin, extrahepatic disease, node-positive
primary, disease-free interval from primary to detection of metastases of less than 12
months, more than one hepatic tumour, the largest hepatic tumour being greater than 5cm
and a carcinoembryonic antigen level (CEA) greater than 200ng/ml. If the last five of these
are used pre-operatively, the sum of the number of criteria met was highly predictive of
outcome (p=<0.0001).
A similar approach was taken by Nordlinger, who identified seven adverse risk factors
associated with poor outcome: extension into serosa of primary tumour, lymphatic spread
of primary tumour, delay from diagnosis of primary tumour to resection of less than 24
months, number of liver metastases in preoperative imaging, the size of the largest liver
metastasis in preoperative imaging greater than or equal to 5cm, preoperatively estimated
clearance of normal parenchyma resected with liver metastasis less than 1cm, and age
greater than or equal to 60 years.
The Basingstoke Predictive Index was validated for use pre-operatively, given the significant
correlation between pre- and post-operative scores in the 929 consecutive patients
analysed. Patients are allocated a score based on 7 different risk factors all of which

51
independents predict poor survival: more than three hepatic metastases, lymph node
positivity of the primary tumour, poor differentiation of the primary tumour, the presence
of extrahepatic disease, tumour diameter greater than or equal to 5cm, CEA level greater
than 60ng/ml and positive resection margins. The first 6 of these criteria were used in a
preoperative scoring system and the last 6 in the postoperative setting (Table 1.9), with
each criterion multiplied by a weighted constant within a predictive model to give a score
out of 30. Patients with a score of 0, 10, 20 and 30 on preoperative scoring had 5-year
survival rates of 66%, 35%, 12% and 2% respectively, with comparable scores using the
post-operative prediction tool.
Risk Factor Status Preoperative Postoperative
Primary tumour lymph node status
Negative 0 0
Positive 2 2
Primary tumour differentiation
Well 0 0
Moderate 3 2
Poor 5 4
Carcinoembryonic antigen level
<6ng/mL 0 0
6-60ng/mL 2 1
>60ng/mL 3 3
Number of hepatic metastases
1-3 0 N/A
>3 3 3
Largest hepatic tumour diameter
<5cm 0 0
5-10cm 2 2
>10cm 8 7
Hepatic resection margin
Negative N/A 0
Positive N/A 11
Extrahepatic disease
No 0 0
Yes 7 4
Table 1.9 – The Basingstoke Prognostic Index allocates a score (out of 30) based on a
number of clinicopathological features. Validated for use in both the pre- and post-
operative situations, the score correlates well with outcome.
1.10.2 Biomarkers
A biomarker can be defined as a molecular marker that can be obtained by analysis of
mRNA, DNA, protein or circulating tumour cells (or tumour-derived nucleic acids) to stratify

52
patients for treatment benefit within clinical trials, prognosticate patient outcome or
predict and/or monitor response to therapy (Sikorski and Yao, 2010). In more simplistic
terms, it is a molecular marker which can in some way be measured upon which predictive
or prognostic information can be derived. The measurement can come from blood, urine,
or other material such as bile, stomach aspirate or stool. Alternatively biological
information can be directly obtained from the tumour itself. Broadly speaking biomarkers
can either be prognostic, i.e. provide information regarding patient outcome irrespective of
treatment received, or predictive i.e. provide information on the likely effectiveness of
therapy in a patient. Alternatively they can be used for early detection and risk
stratification, which when applied to the symptomatic and asymptomatic populations are
referred to as diagnostic and screening biomarkers respectively.
The previously described benefits of being able to predict response and offer patients
prognostic information has led to a significant drive to develop novel biomarkers. To
facilitate this, Cancer Research (UK) developed roadmaps to offer guidance as to how this
process should be conducted from biomarker discovery, through to assay development,
clinical correlation and ultimately application in the clinical setting (Figure 1.7).

53
Figure 1.7 – The Cancer Research (UK) roadmap to the discovery, development and validation of a clinically useful biomarker. Available online at
http://www.cancerresearchuk.org.

54
1.10.3 Biomarkers in colorectal cancer
The interest and growth in biomarkers means that the ability to personalise treatment for
the individual patient is becoming increasingly close. The best and most well known
example of this is the targeting of the use of cetuximab and, to a lesser degree,
panitumumab for patients with KRAS wild type tumours. This discovery has led to the
development of an accurate and cost-effective assay to direct these drugs to appropriate
patients.
Most biomarkers studies have focussed on our growing understanding of colorectal
carcinogenesis, and in particular the mutations in KRAS, BRAF, SMAD4, TP53 and APC as
well as the subsequent downstream pathways previously discussed, as well as markers of
microsatellite and chromosomal instability, defects in mismatch repair mechanisms and
identification of the CpG island methylator phenotype. The presence of defects in mismatch
repair genes (MLH1, MSH2, MSH6, PMS2) and microsatellite instability are commonly
tested for in the clinical setting in those individuals felt to be at high risk of having Lynch
syndrome. Outside of this context routine testing has not yet been adopted, although the
presence of a reliable assay to detect MSI status means it is likely to soon be incorporated
into clinical practice. To some extent this places the onus on clinicians to update their
understanding of colorectal carcinogenesis, and how this may impact on their patients.
Multiple meta-analyses have attempted to assess the value of these factors as prognostic
biomarkers, and although conceptually sound very few have actually been validated and
used in clinical practice (Pritchard and Grady, 2011). The incorporation of biomarkers as
one of multiple, compositive or correlative endpoints in trials is likely to improve the
evidence base necessary for further evaluation and adoption. Some of the recently
investigated prognostic markers identified are shown in Table 1.10.

55
Biomarker Mutation Frequency
Prognosis Evidence Status
Microsatellite instability (MSI)
15% Favourable Strong Testing available but
not widely used
Chromosome instability (CIN)
70% Unfavourable Strong No readily available test, not in clinical
use
18qLOH/SMAD4 loss
50% Unfavourable Moderate No readily available test, not in clinical
use
BRAF V600E mutations
10% Probably
unfavourable Moderate
Testing available but insufficient evidence to use for prognosis
KRAS codon 12/13
mutations 40%
Probably unfavourable in advanced
disease
Limited
Testing widely available but
insufficient evidence to use for prognosis
PIK3CA mutations
20% Possibly
unfavourable Limited
No readily available test, not in clinical
use
Table 1.10 – Prognostic biomarkers identified for colorectal cancer. The table
demonstrates the frequency with which these biomarkers are identified, the evidence for
its correlation with prognosis and its uptake into routine clinical practice. Reproduced
without permission from Pritchard and Grady, 2011.
Multiple effective agents now exist for the treatment of colorectal cancer, particularly for
stage III and IV disease. The degree of heterogeneity in response to treatment has
stimulated interest in predictive biomarkers, a summary of which can be seen in Table 1.11.
As might be expected, most relate to the incorporation of relatively new targeted therapies
into existing chemotherapeutic regimens.

56
Biomarker Mutation Frequency
Drug Selection Evidence Status
KRAS codon 12/13
mutations 40%
Predicts resistance to anti-EGFR therapy
Strong Validated, in
routine clinical use
KRAS codon 61/177/146 mutations
1% Probably predicts
resistance to anti-EGFR therapy
Moderate In clinical use, not
fully validated
BRAF V600E mutations
10%
Probably predicts resistance to anti-EGFR
therapy, may predict response to BRAF
inhibitors
Moderate In clinical use, not
fully validated
PIK3CA mutations
20% May predict resistance to anti-EGFR therapy
Limited No readily
avaliable test, not in clinical use
PTEN loss 30% May predict resistance to anti-EGFR therapy
Limited No readily
avaliable test, not in clinical use
Microsatellite instability (MSI)
15%
May predict adverse outcome with 5-FU and improved outcome with
Irinotecan
Moderate
Not yet in routine clinical use as a
predictive biomarker
18qLOH/SMAD4 loss
50% May predict resistance
to 5-FU Moderate
No readily avaliable test, not
in clinical use
Topo1 Low 50% May predice resistance
to Irinotecan Limited
No readily avaliable test, not
in clinical use
Table 1.11 – Predictive biomarkers identified for colorectal cancer. The table
demonstrates the frequency with which these biomarkers are identified, the evidence for
its correlation with response to treatment and its uptake into routine clinical practice.
EGFR, epidermal growth factor receptor; 5-FU, 5- fluorouracil; LOH, loss of heterozygosity.
Reproduced without permission from Pritchard and Grady, 2011.
Beyond targeted therapies it has been shown that MSI tumours are less likely to respond to
5-fluoruracil based regimens, and in a minority of patients this may even be detrimental
(Sargent, 2008). A potential explanation for this is the understanding that an effective MMR
system is required for the cytotoxic effect of the drug (Jo and Carethers, 2006), however
the finding of chemoresistance to 5-fluouracil in MSI tumours is not uniform (Liang et al,
2002). Conversely MSI tumours have been shown to be more response to
57
chemotherapeutic regimens containing irinotecan (Fallik et al, 2003), and therefore it is
easy to see how following evaluation of this biomarker on a larger scale that routine testing
would be incorporated into clinical practice, particularly for patient selection for adjuvant
therapy in stage II-III disease. LOH in 18q has also been shown to be associated with poor
response to 5-fluorouracil based therapy (Watanabe et al, 2001), with some evidence to
suggest this may be due to SMAD4 located in the 18q21 deleted region (Boulay et al, 2002).
The MRC FOCUS trial randomised patients to receive 5-fluorouracil, 5-fluorouracil plus
oxaliplatin or 5-fluorouracil with irinotecan. Expression of topoisomerase I, the target for
irinotecan, was established by immunohistochemistry and the study demonstrated
improved response to irinotecan containing regimens in those patients with high
expression of the protein (HR 0.98; 95% CI 0.78-1.22) (Braun et al, 2008). Germline
polymorphisms which may affect pharmacokinetics and pharmacodynamics have also been
studied, for example dihydropyrimidine dehydrogenase and thymidylate synthetase in the
metabolism of 5-fluorouracil. Whilst the results appeared promising, there remains
insufficient evidence at the current time for its adoption into clinical practice (Ezzeldin and
Diasio, 2008). Conversely there is good evidence for the use of the UGT1A1*28
polymorphism previously discussed to predict dose related toxicity to irinotecan, so much
so that a commercial genotyping kit was approved by the Food and Drug Administration in
2005 to help guide irinotecan dosing (Palomaki et al, 2009).
Biomarker research is challenging, requiring large scale multi-centre randomised trials with
good quality clinical material and validated laboratory techniques and reagents. Published
studies on biomarkers are often confounding and usually retrospective with small sample
sizes. The lack of methodological standardization involved in the detection of biomarkers is
perhaps why only the KRAS gene has become used routinely in clinical practice. The
potential for combining biomarkers in a panel to further increase the sensitivity and
specificity is currently being explored, for example the adaptive FOCUS4 trial is stratifying
patients by combination of KRAS/BRAF/PIK3CA and other biomarkers to further investigate
the role of novel agents.
The Oncotype DX® Recurrence Score® combines a panel of 7 genes (Ki-67, C-MYC, MYBL2,
FAP, BGN, INHBA and GADD45B) identified through the evaluation of 761 colon cancer
related genes in 1851 patients across 4 studies, with 5 housekeeping genes and MSI/MMR
status to produce personalised prognostic information for patients with Stage II-III disease.

58
The score has been shown to correlate with risk of recurrence (p=0.01), disease free
survival (p=0.01) and overall survival (p=0.04) using data from the QUASAR study (Kerr et al,
2009), however to date no prospective evaluation has been performed. Our understanding
of colorectal cancer genetics has evolved significantly over the past 10 years and will
continue to evolve over the next 10, and with this increased understanding comes the
opportunity to investigate biologically plausible biomarkers in a targeted fashion.
1.11 Summary
In the United Kingdom, colorectal cancer is the fourth commonest cancer and the second
commonest cause of cancer related death. Most recent figures from Cancer Research (UK)
show that 1-year survival for men and women with colon cancer is 73.0% and 72.2%
respectively, with 5-year survival of 54.4% and 55.1%. In those with rectal cancer 1-year
survival for men and women is 78.8% and 78.8% respectively, and 5-year survival 54.6%
and 57.5%. A number of dietary and lifestyle factors have been linked to the development
of colorectal cancer, including diets rich in unsaturated fats and red meat, excess alcohol
and a sedentary lifestyle. Smoking and inflammatory bowel disease have also been linked
to the development of colorectal cancer.
Over recent years our understanding of the genetics of colorectal carcinogenesis have
improved significantly. The vast majority of colorectal tumours reflect a series of hereditary
and somatic mutations in key genes i.e APC, KRAS, BRAF and TP53. These mutations are
most frequently associated with a CIN phenotype and are often acquired in a different
order. A subset of tumours initiate through inactivation of MMR function, which may be
through inherited or, less commonly, somatic mutation, or alternatively epigenetic
inactivation through hypermethylation (CIMP) leading to MSI-H.
The evaluation of a patient with colorectal cancer includes clinical, endoscopic,
histopathological and radiological assessment, the latter normally consisting of CT, PET and
for rectal tumours or further evaluation of liver metastases, MRI. This information can be
used to stage the patient and prognosticate outcome. Commonly used staging systems
include the Dukes’, UICC/AJCC TNM and Jass classifications. Obtaining biological
information from the liver metastases is not feasible due to seeding of the cutaneous tract
and worse outcomes, and therefore we are limited to information gathered from the
primary tumour.

59
Surgery remains the mainstay of treatment for colorectal cancer, which under normal
circumstances would be formal surgical resection of the primary and metastatic tumours.
Alternatives exist for the management of liver metastases, in particular radiofrequency
ablation or microwave ablation. Radiotherapy is frequently used in the treatment of rectal
cancer most commonly as either SCPRT or long course CRT, the aim of which is to reduce
the risk of local recurrence and downstage disease in order to reduce the risk of a positive
CRM at surgical resection. There remains a significant role for chemotherapy in the
neoadjuvant, adjuvant and unresectable settings with 5-fluoruracil (supplemented with
leucovorin) remaining the cornerstone of treatment. This is most frequently supplemented
with oxaliplatin and/or irinotecan, and increasingly bevacizumab or
cetuximab/panitumumab in those known to be KRAS wild type.
Response to treatment may be assessed both radiologically and histopathologically, the
latter being most commonly performed following surgical resection. Radiological
assessment is performed using the RECIST v1.1 guidelines, and histopathological
assessment is performed using any of a number of scoring systems which assess the degree
of necrosis, fibrosis and viable tumour in a specimen.
Prognostic information is currently derived from clinical and pathological features
combined into scoring systems, the three most commonly used being the Clinical Risk
Score, Nordlinger Prognostic Index and Basingstoke Prognostic Index. At present there are
no reliable prognostic, screening or diagnostic biomarkers in routine clinical use. The sole
predictive biomarker in clinical use is KRAS status; KRAS mutant tumours do not respond to
targeted anti-epidermal growth factor receptor treatments such as cetuximab and
panitumumab. A number of studies have attempted to correlate the previously discussed
genetic aberrations with response to chemotherapy, and germline polymorphisms which
may affect pharmacokinetics and pharmacodynamics have also been studied.
1.12 Aims, hypotheses and study plan
From the literature it is clear that there are a number of questions which clinicians face on a
daily basis to which there is as yet no satisfactory scientific explanation or rationale for a
particular treatment decision. Three of these key questions are:
60
In patients with rectal cancer is it possible to predict response to neoadjuvant
chemoradiotherapy?
In patients with colorectal liver metastases is it possible to predict response to
neoadjuvant chemotherapy?
Can biological information from the primary tumour be used to predict response to
treatment in colorectal liver metastases?
The aim of this thesis is to begin to address these research questions.
1.12.1 Hypotheses
These research questions can be used to formulate a number of testable hypotheses
investigated in this project:
1. Somatic non-synonymous mutations in the primary tumour correlate with those
present in the liver metastasis and predict response to treatment.
2. The phenotype of the primary tumour is biologically similar to the liver metastasis,
with markers present in the primary tumour which predict the response of the liver
metastasis to neoadjuvant chemotherapy.
4. The phenotype of a rectal tumour changes with neoadjuvant chemoradiotherapy,
and inter-patient variation in these changes predicts response to treatment.
5. Levels of expression of key proteins involved in the activation and metabolism of
chemotherapeutics are comparable between primary and metastatic tumours and
predict response to treatment.
6. Levels of expression of DNA base excision repair proteins in rectal tumours vary with
treatment, and inter-patient variation in the expression of these proteins predicts
response to neoadjuvant chemoradiotherapy.
1.12.2 Study plan
To investigate these hypotheses the following study plan was used:

61
1. Establish a research network across multiple sites to facilitate the collection of
patient matched primary and metastatic tissue, alongside normal liver parenchyma and
colonic mucosa, focussing on those receiving neoadjuvant chemotherapy.
2. Establish a research protocol to facilitate the collection of serial temporal biopsies
from patients with rectal cancer, acquiring tissue prior to chemoradiotherapy,
immediately following chemoradiotherapy and at the time of surgical resection.
3. Investigate alternative strategies to the standard mechanisms of tissue collection (i.e.
liquid nitrogen, dedicated research technician and archiving facilities in a -80oC freezer)
in order to facilitate 1 and 2.
4. Subject tumour samples (alongside normal adjacent tissue) from patients undergoing
synchronous resection to exome sequencing in order to establish the degree of
biological similarity between primary and metastatic tumours, specifically to identify
whether the presence of somatic non-synonymous mutations in the primary tumour
predicts the presence of the same mutations in the liver metastasis.
5. Perform isobaric tagging for relative quantification (iTRAQ) of patient matched
primary and metastatic tumours as well as adjacent normal liver parenchyma and
colonic mucosa on a discovery set of fresh tissue. Data will be analysed to assess the
degree of biological similarity between primary and metastatic tumours, as well as
identify potential biomarkers measurable in the primary tumour which will predict the
response to chemotherapy in the liver metastases.
6. Validate any potential biomarkers by immunohistochemistry on a larger validation
tissue set, with samples combined into a tissue micro-array. Any potential mechanisms
for validated biomarkers will be explored.
7. Perform isobaric tagging for relative quantification (iTRAQ) of serial rectal cancer
samples on a discovery set of fresh tissue. Data will be analysed to assess how the
tumour phenotype changes with treatment, as well as identify potential biomarkers
which may predict response of the primary tumour to neoadjuvant chemoradiotherapy.

62
8. Validate any potential biomarkers by immunohistochemistry on a larger validation
tissue set, with samples combined into a tissue micro-array. Any potential mechanisms
for validated biomarkers will be explored.
9. Undertake a targeted analysis of the expression and function of key proteins involved
in the activation and metabolism of oxaliplatin, 5-fluorouracil and irinotecan in patient
matched primary and metastatic tumour samples. Data will be analysed to assess the
correlation in expression and function between primary and metastatic tumours as well
as how this information may predict response to treatment.
10. Undertake a targeted analysis of the expression of key proteins involved in DNA
base excision repair in serial rectal cancer samples. Data will be analysed to assess how
levels of expression vary with treatment and how this information may be used to
predict response.

63
Chapter 2
Evaluation of a tissue stabilisation gel (AllprotectTM) to facilitate clinical sampling for
translational research in surgical trials

64
2.1 Introduction
2.1.1 Background
Successful translational research in surgery is dependent upon collaboration between
scientists and clinicians. Central to this is the acquisition of tissue samples following surgical
or endoscopic resection. In specialties such as thoracic surgery, neurosurgery and some
gastrointestinal subspecialties such as hepatopancreaticobiliary, centralisation of services
within large trusts or university teaching hospitals has facilitated routine collection of tissue
through biobanks. Higher volume specialties performing oncological resections, such as
colorectal surgery, have not been centralised. Indeed the majority of colorectal cancer
resections are still performed in the non-teaching hospital setting, making the harvest and
storage of fresh tissue problematic because of a lack of specialised facilities, such as a ready
supply of liquid nitrogen and -80oC storage (Shabihkhani et al, 2014). Consequently, most
colorectal biobanks contain only formalin-fixed paraffin embedded (FFPE) samples which
are of limited use for most bioanalytical applications.
2.1.2 The need for an alternative infrastructure
In order to facilitate the inclusion of high volume non-teaching hospitals in more
translational research projects and clinical trials, or for more ad-hoc tissue sampling, an
alternative method of tissue stabilisation is needed which does not require immediate
processing and freezing. Indeed, a system that allowed transfer of samples by post or
courier, without the need for specialist shipping conditions, would also increase the
potential recruitment of patients for large scale trials and reduce costs associated with on-
site processing. AllprotectTM is a new to the market tissue stabilisation gel which according
to the manufacturer overcomes the need for liquid nitrogen and -800C storage, allowing
tissue collection and stabilisation to be performed with limited infrastructure (Qiagen,
Venlo, Netherlands). As AllprotectTM is a proprietary compound, details of its composition
are currently unavailable.
2.1.3 Relevance to this thesis
Clinical samples used for the analysis which has informed later chapters of this thesis will
attest to the complex regional infrastructure which was created in order to facilitate the

65
work. On Merseyside all resections of colorectal liver metastases are performed at Aintree
University Hospital, a teaching hospital with a well developed research infrastructure. The
hospitals referring patients to this institution however are less well equipped for research,
and it is these institutions in which the vast majority of the primary tumours of the patients
recruited to these studies were resected. As such, a regional network was established to
facilitate the acquisition of patient matched clinical samples and corresponding clinical and
demographic data. The work described in this chapter was devised in order to facilitate
other translational work presented later in the thesis.
2.1.4 Aims and hypotheses
The aim of this study was to rigorously evaluate the use of AllprotectTM as an alternative to
liquid nitrogen for the short and long term storage of clinical samples from patients
undergoing surgical resection of colorectal primary and metastatic tumours. Tissue integrity
under all storage conditions was assessed across a range of typical biomolecules including
DNA, mRNA, microRNA and protein. In addition, retention of protein function following
storage in AllprotectTM was determined by enzyme activity measurements. Specifically, we
hypothesise that AllprotectTM offers comparable tissue stabilisation to liquid nitrogen for
downstream translational research.

66
2.2 Methods
2.2.1 Sample collection
The study was performed to facilitate an existing translational research project, for which
NHS Research Ethics Committee and Research and Development approval had already been
obtained (12/NW/0011). Samples were obtained from patients undergoing primary
resection for colorectal cancer (n=5). Following delivery of the surgical specimen, the
proximal staple line was incised and a linear cut was made down the anti-mesenteric
border being cautious to stop either 1cm away from the tumour or upon approaching the
mesorectum. Using forceps and a scalpel a peripheral section of tumour was excised.
Samples were obtained from a second cohort of patients undergoing resection for
colorectal liver metastases (n=5). Following delivery of the surgical specimen an incision
was made through the resected surface to the liver metastasis, with care being taken not to
breach the liver capsule, and peripheral samples of tumour were obtained as previously
described. All tissue sampling was performed in the operating theatre under aseptic
conditions.
2.2.2 Stability study
Each sample was cut into 10 discrete sections of approximately 4 mm3, 5 of which were
individually placed into sealed cryodorfs and processed immediately (within 5 minutes of
specimen delivery) as follows: 1. Snap frozen in liquid nitrogen and transferred to tissue
archiving freezer (-80oC) – control sample. 2. AllprotectTM at room temperature (190C). 3.
AllprotectTM in a fridge (80C). 4. AllprotectTM in a standard laboratory freezer (-200C) 5.
AllprotectTM in a tissue archiving freezer (-800C). Those samples processed in AllprotectTM
were submerged in a 10:1 ratio by volume as per manufacturer’s instructions; samples snap
frozen in liquid nitrogen were done so without additives. The remaining 5 sections per
sample were left exposed to the environment on a theatre trolley until the end of the
procedure (approximately 1 hour for both primary and metastatic resections) in an effort to
replicate ‘real world’ tissue sampling in the absence of a designated research technician.
Once the skin had been closed, the remaining samples were processed in an identical
manner to that already described. Samples remained under stabilisation conditions for 7
days prior to proceeding with biomolecule extraction. A schematic outline of the study
design can be seen in Figure 2.1.

67
Figure 2.1 – A schematic outline of the stability study. The available tissue was divided
into 10 fragments, 5 of which were stabilised immediately in one of the storage
conditions shown and the remaining 5 in a similar manner but at the end of the
procedure. The study was designed to ask two specific questions: can sampling wait until
the end of the procedure, and what is the optimal storage condition?
2.2.3 Archiving study
Further cohorts of patients undergoing resection for primary colorectal cancer (n=5) or liver
metastases (n=5) were sampled in the same manner and again tissue was divided into 10
sections. One sample was placed into liquid nitrogen and then transferred to a tissue
archiving freezer (-80oC) and the remaining 9 samples were submerged in AllprotectTM and
refrigerated (at 8oC). A single sample was removed following storage for 1, 2, 3, 4, 8, 12, 16,
20 and 24 weeks, and processed for biomolecule extraction. A schematic outline of the
study design can be seen in Figure 2.2.

68
Figure 2.2 – A schematic outline of the archiving study. The available tissue was divided
into 10 fragments, one of which was immediately snap frozen in liquid nitrogen and
transferred to a -80oC freezer (control sample) and one was archived in AllprotectTM for
each of the time points shown in the figure.
2.2.4 Biomolecule extraction
DNA and RNA extraction was performed using the Qiagen miRNeasy Mini Kit and EZ1 DNA
Tissue Kit respectively as per manufacturer’s instructions (Qiagen, Venlo, Netherlands).
Protein extraction was performed by a combination of both mechanical and ultrasonic
homogenisation in phosphate-buffered saline. Following centrifugation the protein
concentration of the supernatant was established using a Bradford assay (Bradford, 1976).
In addition, a section of tissue was taken from each of the samples, fixed in formalin and
embedded in paraffin. A slide was stained with haemotoxylin and eosin and reviewed by a
pathologist who was blind to the details of the study. Extracted biomolecules were used to
perform each of the following assays in triplicate on all samples.

69
2.2.5 DNA assays
DNA concentration was measured using the NanoDropTM ND-1000 spectrophotometer
(Thermo Scientific, Waltham, USA) and quality assessed using the Human DNAOK! kit
(Microzone, Haywards Heath, UK). KRAS mutational analysis was performed using an in-
house pyrosequencing assay capable of detecting all somatic mutations in codons 12, 13
and 61 of the KRAS gene. The lower limit of detection for the assay is 5% of mutated alleles.
2.2.6 RNA Assays
Extracted RNA was initially subjected to quantification and quality control using the
NanodropTM spectrophotometer and reverse transcription was performed with the RT2
First Strand Kit (Qiagen, Venlo, Netherlands). Further quality control assays were performed
using a Bioanalyzer (Agilent, Santa Clara, USA) and the commercially available RT2TM RNA
QC PCR Array (SABiosciences, Venlo, Netherlands). In order to assess the functional
integrity of the extracted RNA under different storage conditions, RT-PCR was performed
on two genes (HMGB1 and CES1) and two microRNAs (mir-122 and let7d) relevant to an on-
going translational project conducted within the Medical Research Council Centre for Drug
Safety Science. Specific primers were designed for HMGB1, CES1, miR122 and let7d
(Eurofins Scientific, Luxembourg, Luxembourg) and qPCR performed using the ABI-7900
(Applied Bioscience, Foster City, USA).
2.2.7 Protein expression by western blotting
Western blots for HMGB1 and CES1 as representative proteins were performed on both
primary colorectal cancer tissue and liver metastases. 10% SDS-PAGE gels were transferred
to a nitrocellulose membrane and blocked in 10% milk. Following overnight incubation with
the primary antibody (Abcam: ab18256 {HMGB1} or ab45957 {CES1}) membranes were
incubated with a LI-COR IRDye 680 LT secondary antibody (Biosciences, Lincoln USA) before
semi-quanitative analysis using the Oydssey scanner (LI-COR Biosciences, Lincoln USA).
2.2.8 Protein expression by immunohistochemistry
In order to assess the effect of AllprotectTM on tissue morphology, and the feasibility of
fixing tissue previously stabilised in this manner, the expression of HMGB1 in FFPE tissue

70
was established by immunohistochemistry. 4µm sections were de-waxed in xylene and
rehydrated with ethanol solutions of decreasing concentrations. After blocking with 3%
hydrogen peroxide in 100% methanol, antigens were retrieved by microwaving for 20
minutes in 10mM citrate buffer and further blocked with 10% goat serum in 0.1% tris-
buffered saline with tween. Slides were incubated with the primary antibody (Abcam,
ab18256) for 2 hours, and a 1:200 horseradish peroxidase conjugated secondary antibody
(Dako UK Ltd, E0432) for 30 minutes. Following incubation with the Vectastain Elite® ABC
reporter system (Vectorlabs, Burlingame, USA), slides were developed with
diaminobenzidine tetrahydrochloride (DAB) and counterstained with haematoxylin. Slides
were reviewed by light microscopy and HMGB1 expression was established using a
previously reported scoring system (Liu et al, 2012). Two reviewers independently scored
five fields at 400x magnification with a total cell count not less than 1000. The proportion of
positive cells allowed classification into one of four categories: 1 (<25%), 2 (25-50%), 3 (51-
75%) or 4 (>75%). The intensity of nuclear staining was also classified: 1 (no
staining/background of negative controls), 2 (weak staining detectable above background),
3 (moderate staining) or 4 (intense staining). The index was then calculated by multiplying
the intensity and percentage scores to give a total score out of 16.
2.2.9 Protein function by mass spectrometry
The activity of carboxylesterase was determined with irinotecan as a substrate in order to
assess protein function. Tissue homogenate (250µg protein) was incubated with 100nM
irinotecan (Sigma Aldrich, Poole, UK) for 30 minutes prior to termination of the reaction
using a methanol/acetonitrile solution. The supernatant was subjected to a functional assay
optimised to quantify the active metabolite, SN-38, by liquid-chromatography mass-
spectrometry (Jones et al, 2013).
2.2.10 Statistical analysis
Statistical analysis was based on the comparison of different methods of tissue
stabilisation/archiving to the current gold standard, i.e. tissue snap frozen in liquid nitrogen
and transferred to a tissue archiving freezer (-80oC). One-way ANOVA with post-hoc
Dunnett’s test was used to compare each sample in turn to the reference sample. Analysis
was performed using Stats Direct 2.7.9 (Stats Direct Ltd, Altrincham, UK).

71
2.3 Results
2.3.1 Assessment of tissue morphology
All samples were confidently identified as adenocarcinoma on review of the H&E slide,
irrespective of the method of tissue stabilisation used or length of time archived in
AllprotectTM (Figure 2.3). A degree of clear cell change/vacuolation was seen in all samples
which was slightly more apparent in those samples exposed to AllprotectTM, although this
did not vary significantly with the length of exposure. Tumour sampling did not compromise
a complete pathological assessment of the remaining surgical specimen in any of the cases.
Figure 2.3 – Representative micrographs of H&E stained sections of colorectal liver
metastases showing a) tissue snap frozen in liquid nitrogen and b) tissue stabilised in
AllprotectTM. Both are clearly identifiable as adenocarcinoma, although contain a degree
of clear cell change/vacuolation (X). Histological appearances did not change significantly
with the length of the time the sample was exposed to AllprotectTM. Micrographs were
taken at 200x magnification.
2.3.1 Short term (0 - 1 week) maintenance of biomolecule expression and function
DNA
Automated extraction of DNA from the snap frozen and AllprotectTM stabilised samples
yielded comparable quantities (2.1-3.3µg/mg tissue) of high quality DNA with 260:280
ratios of 1.8 - 1.9 and 260:230 ratios of 2.0 - 2.4. There was no correlation between the

72
spectrophotometric quality ratios and the method of stabilisation. The samples
immediately stabilised were also comparable to those stabilised after a one hour delay. All
samples passed the internal quality control check utilised by the EZ1 Advanced (Qiagen,
Venlo, Netherlands). Extracted DNA was successfully utilised for downstream qPCR analysis
of KRAS status at codons 12, 13 and 61 with 100% concordance between all samples
originating from the same biological specimen for all patients and both tissue types (Table
2.1).

73
Sample Stabilisation Method Processing Concentration (ng/µl)
260/280 260/230 Quality Check
KRAS Codon 12 KRAS Codon
13
KRAS Codon 61
1 Snap frozen (liquid
nitrogen) On specimen
extraction 257.24 1.82 2.23 Pass c.35G>A (p.Gly12Asp)
29.8% Wild-type
Wild-type
2 Allprotect (room
temperature) 259.57 1.86 2.14 Pass c.35G>A (p.Gly12Asp)
39.9% Wild-type
Wild-type
3 Allprotect (80C)
259.91 1.84 2.22 Pass c.35G>A (p.Gly12Asp)
33.3% Wild-type
Wild-type
4 Allprotect (-200C)
282.32 1.88 2.08 Pass c.35G>A (p.Gly12Asp)
10.6% Wild-type
Wild-type
5 Allprotect (-800C)
281.68 1.87 2.10 Pass c.35G>A (p.Gly12Asp)
30.8% Wild-type
Wild-type
6 Snap frozen (liquid
nitrogen) At end of
procedure 157.3 1.82 2.01 Pass c.35G>A (p.Gly12Asp)
11.8% Wild-type
Wild-type
7 Allprotect (room
temperature) 230.28 1.82 2.12 Pass c.35G>A (p.Gly12Asp)
30.1% Wild-type
Wild-type
8 Allprotect (80C)
301.85 1.86 2.18 Pass c.35G>A (p.Gly12Asp)
34% Wild-type
Wild-type
9 Allprotect (-200C)
256.85 1.86 2.15 Pass c.35G>A (p.Gly12Asp)
46.4% Wild-type
Wild-type
10 Allprotect (-800C)
284.41 1.87 2.31 Pass c.35G>A (p.Gly12Asp)
37.2% Wild-type
Wild-type
Table 2.1 – Representative results following DNA extraction from patient 2 (primary tumour). Comparable quality control indices are seen highlighting
the suitability of extracted DNA for downstream qPCR analysis. Comparable results following KRAS genotyping are seen: the patient is KRAS mutant at
codon 12 but wild type at codons 13 and 61.

74
RNA
The yield of extracted RNA was again comparable between samples (0.41-0.68µg/mg
tissue), with 260:280 ratios of 1.9 - 2.1 and RNA Integrity Numbers (RIN) of 7.7 - 8.0. The
commercially produced RT2TM Quality Control Array, which is based on a series of
housekeeping genes including ACTB (β-actin) and HPRT1 (hypoxanthine
phosphoribosyltransferase), confirmed the absence of relevant RNA impurities which would
adversely affect reverse transcription or PCR, and whilst there was a small amount of
genomic DNA contamination this did not affect PCR results. A minor degree of inter-patient
variation can be seen, however cycle threshold (Ct) values did not vary significantly with
either a) the method of tissue stabilisation implemented, or b) the timing of stabilisation
being either at specimen extraction or after a one hour delay. Figure 2.4 shows the mean Ct
values for miR122 in patient 1 (liver metastases). Similar data were seen for let7d and the
findings were comparable in the primary tumour, as were mRNA levels for HMGB1 and
CES1 in both primary and metastatic tissue.
Figure 2.4 – Cycle threshold (Ct) values for miR-122 in the colorectal liver metastasis from
patient 1. All samples are comparable irrespective of the method of tissue stabilisation
used, and whether the samples were stabilised immediately following specimen
extraction (samples 1-5) or following a delay of 1 hour (samples 6-10). ANOVA with post-
hoc Dunnett’s test shows that no samples are statistically significant from the current
gold standard (sample 1) i.e. tissue snap frozen in liquid nitrogen.

75
Protein
Protein yield was comparable between all samples (20.3-31.4µg/mg tissue). Coomassie
staining confirmed comparable protein coverage and, whilst considerable inter-individual
variation was observed, analysis of western blots demonstrated similar densitometry values
for both HMGB1 and CES 1 in all samples originating from the same biological specimen for
all patients and both tissue types irrespective of the method of tissue stabilisation used.
The samples immediately stabilised were also comparable to those stabilised after a one
hour delay. Representative data for HMGB1 expression in patient 1 (primary tumour) is
shown in Figure 2.5 (0.79 – 1.16iU; P=0.100 - >0.999).
Figure 2.5 – Western blot and corresponding densitometry of HMGB1 expression in
primary colorectal cancer samples from patient 1. All samples are comparable
irrespective of the method of tissue stabilisation used, and whether the samples were
stabilised immediately following specimen extraction (samples 1-5) or following a delay
of 1 hour (samples 6-10). ANOVA with post-hoc Dunnett’s test shows that no samples are
statistically significant from the current gold standard (sample 1) i.e. tissue snap frozen in
liquid nitrogen.
Similar findings were observed for CES1 expression, the data from patient 2 (liver
metastases) being displayed in Figure 2.6 (0.41 - 0.62iU; p=0.559 - >0.999).

76
Figure 2.6 – Western blot and corresponding densitometry of CES1 expression in
colorectal liver metastasis samples from patient 2. All samples are comparable
irrespective of the method of tissue stabilisation used, and whether the samples were
stabilised immediately following specimen extraction (samples 1-5) or following a delay
of 1 hour (samples 6-10). ANOVA with post-hoc Dunnett’s test shows that no samples are
statistically significant from the current gold standard (sample 1) i.e. tissue snap frozen in
liquid nitrogen.
Mass spectrometry analysis also showed a comparable rate of SN38 production from tissue
irrespective of tissue stabilisation method or timing. Representative data for the primary
colorectal tumour of patient 3 (4.01-5.58nm/mg tissue/min; p=0.062 - >0.999) can be seen
in Figure 2.7, with similar results seen in the liver metastases.

77
Figure 2.7 – Tissue homogenate was incubated with irinotecan and the production of SN-
38 (active metabolite) quantified by liquid-chromatography mass-spectrometry. Data
shown is from patient 3 (primary colorectal tumour). All samples are comparable
irrespective of the method of tissue stabilisation used, and whether the samples were
stabilised immediately following specimen extraction (samples 1-5) or following a delay
of 1 hour (samples 6-10). ANOVA with post-hoc Dunnett’s test shows that no samples are
statistically significant from the current gold standard (sample 1) i.e. tissue snap frozen in
liquid nitrogen.
Immunohistochemistry of sections of primary tumour again revealed no difference in the
semi-quantitative scoring of HMGB1 expression. A minor degree of inter-patient variation
was seen, however for each patient all sections stained adequately and received identical
scores for both coverage and intensity. Figure 2.8 highlights the comparable staining of
samples from patient 3 (primary tumour) which scored 3 for coverage (51-74%) and 3 for
intensity (moderate). Similar results were seen in colorectal liver metastases.

78
Figure 2.8 – Immunohistochemistry for HMGB1 in samples from patient 3 (primary
colorectal tumour): a) Negative control b) Snap frozen in liquid nitrogen c) AllprotectTM at
room temperature d) AllprotectTM at 8oC. All sections were scored 3 for coverage (51-
74%) and 3 for intensity (moderate). Haemotoxylin counterstain, x400 magnification.
2.3.3 Long term (0 – 24 weeks) maintenance of biomolecule expression and function
DNA
There was insufficient material available to perform DNA analysis on these samples due to a
number of smaller tumours in this cohort.
RNA
The yield of extracted RNA was comparable to that observed in the short term study (0.37-
0.61µg/mg tissue). All samples had a 260:280 ratio of 1.9 - 2.1, however the RIN fell below
7.0 for those samples archived in AllprotectTM for a period of more than 1 week. The RT2TM
Quality Control Array suggested that RNA impurities began to affect both reverse
transcription and PCR again after a period of 1 week. Figure 2.9 shows the representative Ct
values for miR122 in the liver metastasis of patient 4 clearly demonstrating a progressive

79
degradation in RNA, which was statistically significant by week 2 (23.60 vs. 25.07; p=0.049).
Similar data were seen for let7d as well as mRNA levels for HMGB1 and CES1 in both
primary and metastatic tissue.
Figure 2.9 – Cycle threshold (Ct) values for miR122 in the liver metastasis from patient 4.
Ct values increase with time archived in AllprotectTM, and by 2 weeks there is a
statistically significantly difference from the current ‘gold standard’, i.e. tissue snap
frozen in liquid nitrogen (0).
Protein
Protein stability after longer term storage proved much more variable than RNA, with
extraction yield ranging from 6.4-30.9 µg/mg tissue and Coomassie staining of
polyacrylamide gels identifying progressive degradation of samples with time. Whilst a
degree of inter-individual variation was observed in these samples, western blot analysis of
HMGB1 showed a marked reduction in protein expression after 2 weeks in AllprotectTM.
Representative data from patient 1 (primary tumour) is shown in Figure 2.10, which
demonstrates that the mean (SD) densitometry of 28.9(0.59)iU achieved by snap freezing
the tissue in liquid nitrogen was no longer comparable to tissue archived in AllprotectTM by
week 3 (12.43(1.15)iU (p=<0.001), with preservation of expression up until this point.
Similar findings were observed for the expression of CES1 and in colorectal liver
metastases, and negligible levels of SN-38 were detected in all samples archived in
AllprotectTM for periods beyond 2 weeks.

80
Figure 2.10 – Western blot and corresponding densitometry of HMGB1 expression in
primary colorectal cancer samples (patient 1) archived in AllprotectTM . The densitometric
panels demonstrate the sharp reduction in protein abundance which occurs between 1
and 3 weeks, by which time it is statistically significantly different from the current ‘gold
standard’, i.e. tissue snap frozen in liquid nitrogen (0).

81
2.4 Discussion
2.4.1 Summary of aims
The aim of this study was to rigorously evaluate the use of AllprotectTM as an alternative to
liquid nitrogen for the short and long term storage of clinical samples from patients
undergoing surgical resection of colorectal primary and metatastatic tumours. Tissue
integrity under all storage conditions was assessed across a range of typical biomolecules
including DNA, mRNA, microRNA and protein. In addition, retention of protein function
following storage in AllprotectTM was determined by enzyme activity measurements.
2.4.2 Summary of results
This study has demonstrated that effective tissue stabilisation can be achieved with
AllprotectTM, and that tissue stabilised in this manner yields high quality DNA, RNA and
protein suitable for commonly used laboratory techniques. Comparable protein (by
western blot and immunohistochemistry) and mRNA expression for HMGB1 and CES1 in
primary colorectal tumour and colorectal liver metastases was observed irrespective of the
method of tissue stabilisation employed. Beyond that, the demonstration of comparable
production of SN-38, an active metabolite of irinotecan, suggests that protein function
(CES1) as well as expression is preserved. miRNA yield was also consistent and all extracted
DNA was of sufficient quality for downstream PCR.
Whilst short term tissue stabilisation with AllprotectTM appears to be comparable to liquid
nitrogen, its role for long term archiving is less clear. Our study suggests that both protein
function and expression are significantly reduced by week 3, and, although densitometry
values do not reach statistical significance, visualisation of the western immunoblots
suggests that protein degradation may occur even earlier than this. RNA integrity also
begins to reduce after one week, with the RIN of samples rapidly falling below 7.0. These
findings are confirmed by the RT2 quality control array, and the increasing Ct values seen at
qPCR for both mRNA and miRNA. In light of this we have adopted a protocol whereby all
samples are removed from AllprotectTM and transferred to a definitive storage facility on a
weekly basis.
2.4.3 Current barriers to translational research

82
Access to good quality clinical material is a fundamental part of translational research
(LaBaer, 2012). The standard model for acquisition of clinical material requires a dedicated
individual, for example a research nurse or research fellow, being on hand to sample tissue
(Magner et al, 2007). This in itself has significant cost implications and frequently precludes
institutions from being able to contribute their own tissue samples to translational studies
(Thasler et al, 2013). Following the acquisition of clinical material, the research nurse/fellow
would routinely place the sample into a sealed container and snap freeze it in liquid
nitrogen. Again, the availability of liquid nitrogen may be variable and there are safety
concerns associated with its use. After tissue stabilisation in liquid nitrogen, the final stage
is the transfer to a -80oC storage facility which, again, is not available in every institution
(Day and Stacey, 2008).
2.4.4 Alternative methods of tissue stabilisation
A number of alternatives to liquid nitrogen have been developed in an attempt to provide
lower cost and less resource intense strategies for tissue collection. These tissue
stabilisation products also make the transfer of tissue between institutions significantly
easier and cheaper. For those institutions with the necessary infrastructure, these
approaches would also permit more ad hoc tissue sampling; for example, following
emergency resections out of hours or unexpected diagnoses on invasive investigations. The
best known tissue stabilisation product is RNALaterTM (Qiagen, Venlo, Netherlands), but it is
often used as an adjunct to liquid nitrogen in an effort to maximise yield rather than as a
stabilisation method in its own right (Hatzis et al, 2011). The RNA yield of tissue stabilised in
RNALaterTM and liquid nitrogen are comparable (Khaustova et al, 2014), as are those of
RNALaterTM and an alternative product, PaxGeneTM (Qiagen, Venlo, Netherlands) (Weber et
al, 2010). AllprotectTM offers two key advantages over these existing stabilisation
techniques - the ability to preserve DNA and protein structure and function as well as RNA,
and the preservation of tissue morphology (Roos-van Groningen et al, 2004). In our study,
all samples were clearly identifiable as adenocarcinoma with only a minor degree of
vacuolation seen in those samples stabilised with AllprotectTM. Only two papers have
previously investigated the role of AllprotectTM. Mee et al found lower DNA yield but
comparable quality when compared to liquid nitrogen, QIAampTM (Qiagen, Venlo,
Netherlands) and AllprepTM (Qiagen, Venlo, Netherlands), as well as comparable quality
RNA and protein yield (Mee et al, 2011). Conversely, Staff et al were unable to demonstrate
preserved antigenicity for immunohistochemical analysis following AllprotectTM

83
stabilisation, and report a mean RIN value of 2.1 (95% CI 0.8 – 3.4) for RNA extracted from 5
patients with benign gynaecological disease (Staff et al, 2013). A significant limitation of
AllprotectTM is its inability to stabilise DNA, RNA or protein in whole blood or serum, and
therefore an alternative strategy would need to be found if this material is also required.
2.4.5 Strengths and limitations of the study
The experimental design was conceived in such a way as to not only determine the
feasibility and optimum storage conditions for stabilising tissue in AllprotectTM, but also
permitted us to ask a further question: Can tissue stabilisation be performed following
completion of the surgical procedure? In the ‘stability’ study, samples 6-10 were all taken at
the end of the case, approximately 60 minutes following specimen delivery. The fact that
we have demonstrated comparable biomolecule extraction in these samples suggests that
an additional member of the research team need not necessarily be available to perform
the sampling, and that a member of the surgical team could acquire the tissue at the end of
the surgical procedure. Whilst this might not be surprising for protein and DNA retrieval,
studies have documented the potential for rapid degradation of RNA from as early as 15
minutes following the onset of tissue ischaemia (Von Euler et al, 2005). However Lee et al
(2013) characterised only a minor reduction in RNA quality which did not affect gene
expression levels up to 24 hours following surgical resection. Whilst we have demonstrated
comparable RNA quality and yield we would not advocate deliberate delay in the sampling
and stabilisation of clinical samples for scientific research, but merely highlight that where
this is unavoidable due to institutional constraints, adequate clinical samples can be
obtained in this manner.
Whilst our study demonstrates that AllprotectTM offers comparable tissue stabilisation to
liquid nitrogen, the panel of biomolecules and laboratory techniques we have studied is
narrow. We would therefore advocate that individual research groups validate the use of
AllprotectTM for their specific biomolecules and applications of interest. The mere addition
of a compound to a clinical sample will inevitably cause biological and chemical differences
when compared to samples snap frozen without additive. We have demonstrated no
significant difference over the panel we have tested and feel therefore that AllprotectTM is
likely to be appropriate for comparison of tissues acquired by the same sampling protocol,
however it must be acknowledged that the integration of tissue acquired in this way with
an existing tissue bank or comparison to tissue stabilised using an alternative approach may

84
not be scientifically meaningful. The same argument could however be made for samples
acquired across different institutions, all of which will undoubtedly have been sampled,
stabilised and processed following slightly different protocols.
2.4.6 Establishing a research infrastructure
This chapter highlights some of the preliminary work performed in order to provide a
platform for the remainder of the work contained within this thesis. The collection of
patient matched primary and metastatic tissue across multiple sites required the creation
of a suitable infrastructrue. In brief this comprised:
Registration of the project through the Integrated Research Application System
(IRAS) to include the completion of Research Ethics Committee (REC) and NHS
Research and Development (R&D) proformas
Responding to queries on the above and provision of patient information sheets,
consent forms and notifications to general practitioners
Attendance at the local meeting of the REC and obtaining final ethical approval
Attempts to place the study on the NIHR portfolio – failed due to technicalities
surrounding the funding stream (at the time Cancer Research (UK) centre awards
were ineligible)
Liaison with NHS R&D co-ordinating centre and global approval of the study
Establishing a sponsor for the study (Countess of Chester Hospital) and local R&D
approval
The recruitment of a local principal investigator at each of the required trusts
Following recruitment of a local principal investigator, at each site the following
was arranged
o Site visit and meeting
o Creation of the site specific information form on IRAS
o Local research and development approval
o Letter of access
o Materials transfer agreement
After the research sites had been added, the REC responsible for the study was
updated and an amendment made to include all research sites
The completion of ongoing local audit of recruitment figures and research
engagement at each of the sites

85
The infrastructure has since permitted the centralised collection of patient matched
primary and metastatic colorectal cancer samples for ongoing translational research in the
region. The project was also registered at the Liverpool Tissue Bank.
2.4.7 Conclusion
This study clearly demonstrates that AllprotectTM is appropriate for widening participation
in translational research. A major impediment to the recruitment of sampling sites for
clinical trials or translational studies is the lack of resources for tissue sampling and storage:
this often limits studies to major teaching hospitals simply because the required facilities
are not available in smaller hospitals. Foremost in this is the ability to instantly freeze the
sample upon collection, prior to transfer or analysis. A method to bypass this bottle-neck
could dramatically increase both the scale and recruitment rates of translational studies. In
this study, there was no difference between the quality of biological material extracted
from tissue samples following storage in AllprotectTM or after snap freezing in liquid
nitrogen. Storage for up to one week in AllprotectTM also led to no significant deterioration,
meaning that rapid sample retrieval from sampling sites is not required where it may be
impractical to accomplish this. After this time period, however, we did detect a significant
fall in the quality, and thus it would be imprudent to plan long term storage in this medium.
Across the range of different biomolecules investigated here, there was no evidence that
AllprotectTM couldn’t play a major role in sample procurement, and this may have profound
benefits for the recruitment of smaller or less well-resourced centres for translational
research studies.

86
Chapter 3
Exome sequencing of synchronously resected primary colorectal tumours and colorectal
liver metastases to inform oncosurgical management

87
3.1 Introduction
3.1.1 Genomics of colorectal cancer
Colorectal cancer (CRC) remains the fourth commonest cancer worldwide and the second
commonest cause of cancer related death. Like most solid tumours, CRC is a highly complex
disorder arising from an interplay between a number of genomic alterations, such as point
mutations, rearrangements, gene fusions or copy number alterations (Fearon, 2011) and
environmental factors such as diet and lifestyle (Huxley et al, 2009). A failure to identify the
disease at an early stage of carcinogenesis increases the likelihood of the development of
metastases, which, despite significant advances both oncologically and surgically, is still
associated with significantly poorer outcomes (Cancer Research UK, 2014).
Our understanding of the development of primary colorectal cancer is improving, with
sequential genetic alterations in APC, KRAS, mismatch repair genes, TP53 and loss of 18q
heterozygosity of great significance. However, how these cells evolve in the process of
metastagenesis and the clonal origin and genetic heterogeneity of colorectal liver
metastases remains unclear. The initial concept of monoclonal evolution of a tumour,
essentially the clonal expansion of dominant tumour clones, has been challenged. The self-
feeding polyclonal hypothesis proposes that tumour cells enter the systemic circulation via
the tumour vasculature and colonise at a different site therefore establishing a new
subpopulation, whereas the mutator phenotype suggests a small population of diverse
tumour cells may migrate (Navin and Hicks, 2010). Metastases therefore can be expected to
carry similar mutations to their corresponding primary tumour, but also harbour additional
mutations acquired after transformation (Siegmund et al, 2009). The accrual of these
genetic mutations in the metastases results in tumour heterogeneity between sites,
presenting problems for treating clinicians. These problems are further confounded in the
case of colorectal liver metastases with the knowledge that transcutaneous needle biopsy
of the liver lesion is associated with cutaneous seeding and poorer outcomes following
surgery (Cresswell, Welsh and Rees, 2009). A thorough understanding of genetic
heterogeneity between tumour sites is vital to the development of novel therapeutic
agents (Klein, 2009).
3.1.2 Next generation sequencing technology

88
For many years genomic profiling was conducted using hybridization based micro-array
technologies or low-throughput Sanger sequencing. The development of next generation
sequencing (NGS) technology has exponentially increased the rapidity and efficacy with
which the previously discussed genomic aberrations can be identified and studied.
There are numerous types of next generation sequencing available. Whole genome
sequencing uses genomic DNA to identify point mutations, indels, rearrangements and DNA
copy number changes; information which is generally detected by paired-end mapping
(Chen et al, 2009). More focussed exome sequencing can be performed on target regions of
genomic DNA which is capable of identifying point mutations and indels. Epigenome
sequencing targets genomic DNA to identify sites of DNA methylation and post-
translational histone modifications. This can either be achieved using chromatin-
immunoprecipitation (ChIP)-based methods (Park, 2009) or DNA methylation sequencing
for example using bisulfite-sequencing (Hansen et al, 2011). Finally, sequencing of RNA
allows for the examination of gene fusions, alternative splicing events, point mutations and
indels.
3.1.3 The ion proton platform
There are a number of different platforms available for next generation sequencing studies.
The commonest use either pyosequencing (Roche 454, GS FLX Titanium), reversible dye
terminators (Illumina HiSeq, Bioscience Heliscope), oligonucleotide chained ligation (Life
Technologies SOLiD) or native dNTPs and proton detection (Life Technologies Ion Proton).
The selection of an appropriate platform currently relies on a compromise between read
length (i.e the number of bases continually read), depth of read (the number of times each
section of the library will be read), run time (still a matter of days) and cost (which is
extremely variable).
In Ion Proton sequencing the library to be sequenced is a collection of DNA inserts of
~200bp. These are obtained from randomly fragmented genomic DNA of the samples to be
sequenced. During sequencing these single stranded inserts function as the template. Such
sequencing is referred to as "sequencing by synthesis", during which a complementary
strand is built based on the sequence of an adapter ligated template strand. Sequencing is
performed on a semiconductor chip containing small beads with clonally amplified
template DNA in each microwell. DNA polymerase is added with sequentially unmodified A,

89
C, G or T dNTPs. Sequencing is based on the detection of hydrogen ions that are released
during the polymerization of DNA. If the nucleotide is complementary it is added to the
strand. Addition of the nucleotide causes the release of a hydrogen ion, which in turn
results in decreased pH that triggers an ion sensor in the chip. The series of electrical pulses
transmitted from the chip to a computer is translated into a DNA sequence. If the
nucleotide is not complementary, no reaction takes place within that well. The unmodified
dNTPs are then flushed out of the system and the next added. This process is repeated 125
times for each base, with no intermediate signal conversion required due to the nucleotide
incorporation events being measured directly by the electronics. Signal processing and DNA
assembly is carried out using software inbuilt into the platform. Figure 3.1 is a graphical
representation of sequencing using the ion torrent platform.
Figure 3.1 – The sequencing by synthesis of the Ion Proton platform. Sequencing is
performed on a semiconductor chip containing small beads with clonally amplified
template DNA. DNA polymerase is added with sequentially unmodified A, C, G or T dNTPs
which are incorporated if complementary, releasing a hydrogen ion which is results in
decreased pH that triggers an ion sensor in the chip. If the nucleotide is not
complementary, no reaction takes place within that well. The unmodified dNTPs are then
flushed out of the system and the next added. Figure taken from the European
Bioinformatics Institute (with permission)
http://www.ebi.ac.uk/training/online/course/ebi-next-generation-sequencing-practical-
course/what-next-generation-dna-sequencing/ion-torre
3.1.4 Aims and hypotheses

90
The aim of this investigation was to compare and contrast the exome of synchronously
resected primary and metastatic colorectal tumours, specifically to identify those genetic
aberrations which:
- Are present in the primary tumour but not in the metastasis
- Are present in the metastasis but not in the primary tumour
- Are present in both primary and metastasis (i.e. the primary tumour is
predictive of the metastatic genotype)
- May predict response to neoadjuvant therapy

91
3.2 Methods
3.2.1 Patients and tissue collection
National Health Service Research Ethics Committee and Research and Development
approval was obtained for this study. Samples were obtained from four patients
undergoing synchronous resection of a primary colorectal tumour and liver metastases.
Following delivery of the colorectal specimen the proximal staple line was incised and a
linear cut made down the antimesenteric border before excising a peripheral section of
tumour using forceps and a scalpel. Following delivery of the liver specimen, an incision was
made through the resected surface to the liver metastasis, with care being taken not to
breach the liver capsule; a peripheral sample of tumour was obtained. Macroscopically
normal adjacent colonic mucosa and liver parenchyma were also obtained, with all tissue
sampling performed in the operating theatre under aseptic conditions followed by
immediate stabilisation in liquid nitrogen. An additional sample was obtained, formalin
fixed and paraffin embedded for concurrent histopathological assessment.
3.2.2 Evaluation of histopathological response
Given all four patients had undergone neoadjuvant treatment, an assessment of
histopathological response was made using a scoring system first described by Ribero et al
(2007), and used for this purpose by Blazer et al (2008). The number of residual viable
tumour cells within each metastatic nodule was estimated as a percentage of the total
tumour surface area that included areas of coagulative necrosis, calcification, fibrosis and
the associated histiocytes, foreign body giant cells and inflammatory cells. Samples were
subsequently scored as 1 (1-24%), 2 (25-49%), 3 (50-74%) or 4 (>75%) for the purposes of
analysis.
3.2.3 DNA extraction, quality control and library preparation
DNA was extracted from harvested material using the DNeasy Blood & Tissue Kit as per
manufacturer’s instructions (Qiagen, Venlo, Netherlands). Library preparation and
sequencing was performed using Ion TargetSeq™ exome enrichment for the Ion Proton™
System (Life Technologies, Carlsbad, USA). Genomic DNA (3.5µg) was fragmented using an
ion shear enzyme, and the resulting fragmented DNA cleaned up using Agencourt®
92
AMPure® XP beads (Beckman Coulter, Brea, USA). The size distribution was checked by
running an aliquot of the sample on 2% E-Gel® (Life Technologies, Carlsbad, USA). Adapter
ligation was performed using the Ion Plus Fragment Library Kit according to manufacturer’s
instructions (Life Technologies, Carlsbad, USA). The resulting samples were again cleaned
using Agencourt® AMPure® XP beads of 300bp in length using a 2% agarose gel and were
eluted using MinElute columns (Qiagen, Venlo, Netherlands). PCR amplification (10 cycles)
was subsequently performed to enrich the adaptor-ligated fragments.
3.2.4 Exome sequencing
For capture, 500ng of prepared library was concentrated using a vacuum concentrator and
then hybridized with the Ion TargetSeq™ Exome Probe Pool at 47°C for 66 hours. Hybridized
library fragments were isolated by magnetic capture using Dynal M-270 streptavidin coated
beads (Invitrogen, Carlsbad, USA). PCR amplification (8 cycles) was carried out to amplify
the captured library which was again cleaned using Agencourt® AMPure® XP beads. An
aliquot of the captured library was run on a High Sensitivity DNA Chip on the Agilent
Bioanalyser (Agilent, Santa Clara, USA). Real time PCR validation was performed with pre
and post capture libraries to observe the capture efficiency. The purified, exome-enriched
library was then used to prepare clonally amplified templated Ion PI™ Ion Sphere™ Particles
(ISPs) for sequencing on an Ion PI™ Chip to obtain the necessary data coverage. Sequencing
was performed on the Ion Proton™ sequencer at Genotypic Technology’s Genomics facility
(Bangalore, India).
3.2.5 Variant calling and annotation
Sequenced data was analyzed with Torrent SuiteTM v 3.6 (Life Technologies, Carlsbad, USA).
Following base calling, raw reads underwent trimming of undesired base calls at the 3' end
of the read, the adapter sequence, and low quality 3' ends. The resultant data were filtered
of low quality base calls. The raw reads obtained were then aligned to the reference
genome (HG19) using the Torrent Mapping Alignment Program for Ion Torrent Data (TMAP)
software. Variants were then called and detected using Variant Caller v 4.0, an inbuilt plugin
of Torrent Suite v 3.6. These variants were further annotated using Ion Reporter v 1.6 to
give location (intronic/exonic/utr), gene name, protein change, function and dbSNP
identifier (from the dbSNP database 137).
3.2.6 Somatic variant analysis

93
Data from tumorous and non-tumorous tissue was compared for each patient. The variants
of each sample were compared by chromosome number and position to identify those
mutations in the tumour samples which were somatic. The somatic single nucleotide
variants (SNVs) identified in both primary and metastatic samples were assessed for
functional consequence and biologically deleterious non-synonymous SNVs were selected.
The resulting SNVs were compared to identify those present in patient matched primary
and metastatic paired samples. Those mutations unique to primary tumour and those
unique to liver metastases were subsequently identified. Further analysis was performed to
compare and contrast the SNVs present in the responders and non-responders to
neoadjuvant systemic therapy.
3.2.7 Ingenuity pathway and network analysis
Genes identified from these lists of SNVs were subjected to pathway analysis using
Ingenuity Pathway Analysis (Redwood City, USA). Significant canonical pathways were
identified with a threshold p value of <0.05 for significance (after correction). If there are n
genes in a pathway, and f have been identified through sequencing, the p-value is the
probability of finding f or more genes in a set of n genes randomly selected from the global
molecular network.
With the aim of reducing the false discovery rate, the Benjamini-Hochberg multiple test
correction was used (Benjamini and Hochberg, 1995). In this correction p-values are sorted
and ranked, the smallest value receiving 1, second 2 and largest N. Each p-value is then
multiplied by N and divided by its assigned rank to give the adjusted p-values.
Ingenuity Pathways Analysis computes a score for each network according to the fit of that
network with the identified genes of interest (referred to as the focus genes).The score is
derived from a p-value and indicates the probability of the focus genes in a network being
found together due to random chance. A score of 2 indicates that there is a 1 in 100 chance
that the focus genes are together in a network due to random chance, therefore scores
greater than 2 have at least a 99% confidence of not being generated by random chance
alone. Analysis must also take into account both the number of focus genes identified and
total known genes in each network. A summary of the bioinformatics workflow can be seen
in Figure 3.2.

94
Figure 3.2 – Bioinformatics analysis workflow for exome sequencing of synchronously
resected primary colorectal tumours and colorectal liver metastases.
3.2.8 Validation of SNVs by Sanger sequencing
SNVs identified as being of interest during analysis (see Results) were subjected to
validation by Sanger sequencing on the same tissue set. Following reconfirmation of DNA
quality by agarose gel electrophoresis, samples were cleaned up with an Ultraclean® PCR
Clean Up Kit (Mobio, Carlsbad, USA) and quantified using the NanodropTM
spectrophotometer (Thermo Scientific, Waltham, USA). Targeted forward and reverse
1
•Base calling followed by trimming of undesired base calls, the adapter sequence and low quality 3’ ends using Torrent SuiteTM v3.6
2
•Alignment to reference genome (HG19) using Torrent Mapping Alignment Program for Ion Torrent (TMAP)
3
•Variant calling and annotation using Variant Caller v4.0 and Ion Reporter v 1.6
4
•Identification of somatic, non synonymous, missense, biologically deleterious (as per dbSNP 137) single nucleotide variants
5
•Identification of SNVs: unique to primary tumours, unique to liver metastases, present in both primary and metastatic tumours, predictive of favourable response (at either primary or metastatic sites) and predictive of poor response (at either primary or metastatic sites)
6
•Pathway and network analysis of variant lists using Ingenuity Pathway Analysis

95
primers were specifically designed and manufactured for each of the SNVs of interest.
Sanger sequencing was performed using a BigDye® Terminator v3.1 Cycle Sequencing Kit
(Life Technologies, Carlsbad, USA) and 3130XL Genetic Analyser (Life Technologies,
Carlsbad, USA), with the resultant FASTA sequence compared with both the reference
genome and exome sequencing data to confirm the presence of the previously identified
SNVs.

96
3.3 Results
3.3.1 Clinical information
Demographic and clinical information pertaining to the four patients sequenced is displayed
in Table 3.1.
Variable Patient 1 Patient 2 Patient 3 Patient 4
Age at diagnosis
67 70 59 75
Gender M M F M
Site of primary
Ascending Sigmoid Sigmoid Sigmoid
T stage 4 3 3 3
N stage 0 0 0 2
Metastatic burden
16 - Bilobar 7 - Bilobar 3 - Bilobar 4 - Unilobar
Neoadjuvant agents
IrMdG IrMdG Oxaliplatin, capecitabine,
cetuximab
IrMdG
Procedure performed
Right hemicolectomy
and multiple segmentectomies
Sigmoid colectomy and
multiple segmentectomies
Sigmoid colectomy and
multiple segmentectomies
Sigmoid colectomy and
left hemi-hepatectomy
Pathological features (primary)
Adenocarcinoma Well
differentiated No
lymphovascular invasion
Adenocarcinoma Moderately
differentiated No
lymphovascular invasion
Adenocarcinoma Moderately
differentiated No
lymphovascular invasion
Adenocarcinoma Poorly
differentiated Lymphoid invasion
No vascular invasion
Pathological features
(liver)
Adenocarcinoma Well
differentiated
Adenocarcinoma Moderately
differentiated
Adenocarcinoma Moderately
differentiated
Adenocarcinoma Poorly
differentiated
Tumour regression
grade
1 1 3 4
Table 3.1 – Demographic and clinical features of the four patients from whom tumours
were sequenced. IrMdG – Irinotecan and modified de Gramont (5-fluoruracil and folinic
acid).
All patients underwent 5-fluorouracil based neoadjuvant chemotherapy followed by
synchronous resection of a colonic primary and metastatic lesions at a single institution

97
during the course of the study. All resections were R0 with no significant complications. At
the time of writing, all patients were alive with no evidence of recurrent disease.
Two patients (1 and 2) were both scored as having a tumour regression grade of 1. For the
purposes of analysis these patients were regarded as the responders to neoadjuvant
treatment. Patients 3 and 4 had tumour regression grades of 3 and 4 respectively, and were
therefore regarded as the non-responders to neoadjuvant treatment.
3.3.2 Sequencing statistics
All DNA samples passed the necessary quality control steps with adequate 260:280 and
260:230. The colonic mucosa from patient 4 was the only sample regarded as being of
suboptimal quality DNA, although still adequate for sequencing (Table 3.2).
Table 3.2 – Quality control data from samples undergoing exome sequencing with Ion
Proton. Sample ID column identifies samples as follows: SO_2510 relates to project id; 1-4
relate to patient number; A-D relate to tissue type (A – colonic mucosa, B – primary
tumour, C – liver parenchyma, D – liver metastasis). All quality control variables and yield
were good, with the exception of the colonic mucosa from patient 4. DNA was
suboptimal but still adequate for sequencing.

98
Having established appropriate quality DNA, samples underwent library preparation
described above and were sequenced. The total number of reads obtained per sample
ranged from ~23-54x106 (Table 3.3).
Patient Sample Number of Reads
1 Colonic Mucosa 41846478
Primary Tumour 36382877
Liver Parenchyma 44525752
Liver Metastases 50127733
2 Colonic Mucosa 35296569
Primary Tumour 46092664
Liver Parenchyma 39611322
Liver Metastases 54105628
3 Colonic Mucosa 47251410
Primary Tumour 41224669
Liver Parenchyma 51992117
Liver Metastases 48375092
4 Colonic Mucosa 41328946
Primary Tumour 38052851
Liver Parenchyma 45159239
Liver Metastases 22924823
Table 3.3 – Total number of raw reads through Ion Proton exome sequencing.
Further analysis of the sequencing statistics identified that 62.96 - 83.17% of reads were
successfully on target areas of the genome, with average base depth per target of 34.68 –
79.63. The result of this coverage has ensured that a minimum of 96.58% of the target (the
whole exome) has been sequenced, with 67.61 – 88.33% of targets covered to a depth of at
least 20X (Table 3.4).

99
Table 3.4 – Sequencing statistics for all samples. Sample ID (column 1) 1-4 relates to
patient number, and A-D tissue type (A: normal mucosa, B: colorectal primary tumour, C:
normal liver parenchyma, D: liver metastasis). The report attests to a high number of
reads successfully on target, a 1x coverage of 96.58 – 98.07% and 20x coverage of 67.61 –
88.33% of the targeted exome.
3.3.3 Variant calling and annotation
The mapped reads described above were subjected to variant calling based on a number of
quality control criteria designed to optimise the analysis for high frequency variants and
minimal false positive calls. These include minimum coverage criteria and quality scores for
the SNV on each strand and a minimum observed allele frequency. The total number of
variants identified can be seen in Table 3.5.
Variant Category
Patient 1 Patient 2 Patient 3 Patient 4
Total 1B 1D 2B 2D 3B 3D 4B 4D
Synonymous Known 463 738 847 945 650 430 637 452 5162
Synonymous Novel 67 61 65 57 36 47 57 56 446
Synonymous Total 530 799 912 1002 686 477 694 508 5608
Frameshift deletion Known 42 35 67 66 37 37 56 57 397
Frameshift deletion
Novel 66 60 85 59 66 58 133 126 653
Frameshift deletion 108 95 152 125 103 95 189 183 1050

100
Total
Stop loss Known 3 0 2 3 3 4 4 4 23
Stop loss Novel 0 0 0 0 0 1 0 0 1
Stop loss Total 3 0 2 3 3 5 4 4 24
Nonsense Known 10 5 19 16 9 9 9 7 84
Nonsense Novel 6 9 5 5 0 9 11 3 48
Nonsense Total 16 14 24 21 9 18 20 10 132
Missense Known 514 754 901 1082 673 528 671 455 5578
Missense Novel 129 150 115 89 80 97 131 126 917
Missense Total 643 904 1016 1171 753 625 802 581 6495
Non-Synonymous
Known 527 759 922 1101 685 541 684 466 5685
Non-Synonymous
Novel 135 159 120 94 80 107 142 129 966
Non-Synonymous
Total 662 918 1042 1195 765 648 826 595 6651
Somatic Known 1693 2288 2973 3414 2072 1714 2134 1449 17737
Somatic Novel 463 458 429 369 321 353 532 517 3442
Somatic Total 2156 2746 3402 3783 2393 2067 2666 1966 21179
Total Variants 26881 28762 28303 29009 28768 29498 27562 23442 222225
Table 3.5 – Total number of high quality variants identified through Ion Proton exome
sequencing
Called variants were subjected to the analysis workflow outlined in Section 3.2.6. This
workflow was designed to remove germline mutations and identify somatic SNVs that are
non-synonymous, missense and biologically deleterious. It is these SNVs which have been
used for subsequent bioinformatics analysis, the numbers of which were identified in each
of the samples can be seen in Table 3.6. A total of 585 unique SNVs were identified.

101
Patient Sample Number of SNVs
1 Primary Tumour 94
Liver Metastases 110
2 Primary Tumour 106
Liver Metastases 120
3 Primary Tumour 93
Liver Metastases 88
4 Primary Tumour 98
Liver Metastases 85
Table 3.6 – Total number of somatic, non-synonymous, missense, biologically deleterious
SNVs identified in each of the tumour samples.
3.3.4 Variants unique to the primary tumours
This analysis identified all those eligible SNVs present in one or more of the primary
tumours but not present in any of the metastases. A total of 215 SNVs were identified
across 177 genes spanning all autosomes and the X chromosome. The complete list of
variants can be seen in Appendix 1 – Lists of single nucleotide variants from exome
sequencing Table 1: Single nucleotide variants exclusive to the primary tumours.
Ingenuity core analysis of direct and indirect relationships revealed the significant canonical
pathways in this group to be: α-tocopherol degradation, vitamin C transport, glycine
biosynthesis III, GDP-L fructose biosynthesis I and TCA cycle II. Statistics for these identified
pathways can be seen in Table 3.7.
Pathway p-value Ratio
α-tocopherol degradation 5.36E-04 2/4 (0.5)
Vitamin-c transport 7.64E-03 2/14 (0.143)
Glycine biosynthesis 1.90E-02 1/2 (0.5)
GDP-L-fucose biosynthesis I 1.90E-02 1/2 (0.5)
TCA cycle II (eukaryotic) 2.01E-02 2/23 (0.087)
Table 3.7 – Pathway analysis for SNVs unique to the primary tumours. P-value is adjusted
using Benjamini-Hochberg correction. Ratio identifies the number of focus genes
identified (numerator) in the pathway (denominator).

102
Further analysis of all (unfiltered) biological pathways identified 5 networks with scores
greater than 2 pertaining to: connective tissue disorders, drug metabolism, infectious
diseases, cell cycle and molecular transport. The focus genes and statistics pertinent to
these networks can be seen in Table 3.8.
ID Molecules in Network Score Focus Molecules
Top Diseases and Functions
1 26s Proteasome,ADAMTS1,Akt,APOB,C5orf22,CHRNA5,CLDN3,COL15A1,COL6A2,CTBP2,DROSHA,DUOX2,E2f,ELP2,ERK1
/2,estrogen receptor,FGFR3,FSH,GALNT2,GDNF,GLB1,Hsp70,INF2,KRT18,MUC4,MUC16,N
COR1,NFkB (complex),PABPC1,PI3K (complex),PRKRA,PTPRS,TCF3,TNS1,US
PL1
44 25 Connective Tissue Disorders,
Developmental Disorder, Skeletal
and Muscular Disorders
2 AGTR1,AURKA,CBX5,CDC27,CNN2,CTNNB1,CYP2C8,CYP2D6,DCLK1,DHTKD1,F
UT11,Histone h3,HIVEP3,HNF4A,KIFC1,MAGI1,MSH6,NFATC2IP,NR1I2,NUPR1,PABPC3,PAK7,PPP1R2,RAB11FIP5,RB1,RNF123,RPL19,SDHA,SOX7,SPATS2L,SRRM2,TFAP2
A,TNFRSF14,TNIK,TRAF2
22 15 Drug Metabolism, Small Molecule Biochemistry,
Cellular Assembly and Organization
3 ADD1,CCL5,CCRN4L,CD93,CD300C,CSRNP1,CX3CR1,CYP4F2,DMTN,EHD1,F2,F9,FERMT1,FMN2,HSPG2,KCNJ12,KHSR
P,KRT34,LILRA5,MAPK1,MT-CYB,PHF11,PI3,RELA,SAMHD1,SERPINB8,SERPINB10,SQLE,SREK1IP1,TDRD7,
TGM2,TNF,TPMT,TPSD1,ZNF318
20 14 Infectious Disease, Hematological
System Development and
Function, Organismal Functions
4 ABCC5,BMP2K,CDKN1A,CELF1,CHAT,COL5A3,COTL1,CSAD,ESR1,ESRRA,FAM102A,FKBPL,GPR6,HAMP,HSF1,IFI16,Int
erferon alpha,KLF16,KRT13,LOC100996763/NOTCH2NL,MAZ,MINOS1,MSR1,NDUFS2,NFYA,PAK2,Pkc(s),PLEKHG2,POU2F1,PTGS2,RASA4,SEC14L3,SMARCA4,TGM
1,UBALD1
20 14 Cell Cycle, Nervous System
Development and Function, Organ
Morphology
5 ABCC3,ACSL3,ADA,AMOTL2,ARPC1B,CASP1,DOCK7,EVL,HIST4H4,IL13,IL3RA,KIF24,KLK10,KMT2C,MLH1,NAA30,NLRC4,PFKP,PIEZO1,PRDM5,S100A2,SETD8,SKIV2L,SLC16A1,SLC25A5,SLC2A1,SLC43A3,SLC5A8,SYVN1,TMSB10/TMSB4X,TNFRSF10B,TP53,TPT1,WNT10B,YLP
M1
18 13 Molecular Transport, Cell
Death and Survival, Developmental
Disorder

103
Table 3.8 - Network analysis for SNVs unique to the primary tumours. The score is derived
from a p-value and indicates the probability of the focus genes in a network being found
together due to random chance. Focus molecules is the total number of SNVs of interest
identified in the respective network.
3.3.5 Variants unique to the liver metastases
This analysis identified all those eligible SNVs present in one or more of the metastatic
tumours but not present in any of the primaries. A total of 226 SNVs were identified across
199 genes spanning all autosomes and the X chromosome. The complete list of variants can
be seen in Appendix 1 – Lists of single nucleotide variants from exome sequencing Table 2:
Single nucleotide variants exclusive to the metastatic tumours.
Ingenuity core analysis of direct and indirect relationships revealed the significant canonical
pathways in this group to be: AMPK signalling, rennin-angiotensin signalling, role of NANOG
in mammalian embryonic stem cell pluripotency, basal cell carcinoma signalling and PEDF
signalling. Statistics for these identified pathways can be seen in Table 3.9.
Pathway p-value Ratio
AMPK signalling 5.84E-04 7/132 (0.053)
Renin-angiotensin signalling 6.36E-03 5/108 (0.046)
Role of NANOG in mammalian embryonic stem cell pleuripotency
6.61E-03 5/109 (0.046)
Basal cell carcinoma signalling 6.62E-03 4/69 (0.058)
PEDF signalling 7.32E-03 4/71 (0.056)
Table 3.9 – Pathway analysis for SNVs unique to the metastatic tumours. P-value is
adjusted using Benjamini-Hochberg correction. Ratio identifies the number of focus genes
identified (numerator) in the pathway (denominator).
Further analysis of all (unfiltered) biological pathways identified 8 networks with scores
greater than 2 pertaining to: Cancer, respiratory disease, dermatological disease and
conditions, infectious disease, DNA replication, recombination and repair, endocrine system
disorders, gastrointestinal disease, metabolic disease, cellular development,
haematological system development and function, haematopoiesis, developmental
disorder, organismal injury and abnormalities, inflammatory response, cellular movement,

104
cardiac infarction, cell cycle. The focus genes and statistics pertinent to these networks can
be seen in Table 3.10.
ID Molecules in Network Score Focus Molecules
Top Diseases and Functions
1 26s Proteasome,A4GALT,APOBEC3G,CALCA,calpain,caspase,CD1A,CHRNA3,CTBP2,DSG1,DUOX2,E2f,EP400,FANCA,FES,GATA3,Hsp27,Hsp90,HSPD1,Inte
rferon alpha,KMT2C,KRT14,NOTCH1,P38
MAPK,p70 S6k,PABPC1,PI3K (complex),Pkc(s),POU4F2,RBBP5,SET
D8,STK17A,TH,TLR2,TP53
39 23 Cancer, Respiratory Disease,
Dermatological Diseases and
Conditions
2 ACTN2,ASPM,ATXN1,BNIP3L,CLCN4,CORO1C,DNA2,DNAJC15,DPH6,ELMOD1,EME1,ERCC2,ERCC5,FLVCR1,GHR,ING2,ITIH1,KAT5,KCNJ12,MKL2,MPG,NAV1,NR3C1,NUPR1,PARN,PARP4,PDLIM2,PLK3,PRUNE2,PTX3,RAG1,RELA,SERF1A/SERF1B,SERTAD2,ZC3HA
V1
24 16 Infectious Disease, Respiratory Disease,
DNA Replication, Recombination, and
Repair
3 ADRA2A,ADRB3,AHSP,Akt,ALDH3B2,CDH8,CDH13,CFTR,ERK,ERK1/2,estro
gen receptor,FUT3,Histone h3,Histone
h4,HNF1A,HRAS,IgG,IL36A,INS,IRS,Jnk,Mapk,MBD1,NFkB
(complex),NHLRC1,NOD1,NUP98,PACSIN2,PAK2,PI3Kγ,PPL,PRKRA,RALGD
S,SYT6,TRPM2
22 16 Endocrine System Disorders,
Gastrointestinal Disease, Metabolic
Disease
4 ACTR1A,ASUN,BMP4,C21orf119,CCT8,CDK8,CDKN1A,COL5A3,E2F1,FAM86C1,FRG1,GZMM,HSD17B14,IFI30,K
MT2E,LRBA,LUM,MUC16,NFYA,PARP1,PTPRCAP,PTPRU,RAB33A,RRN3,SALL2,SLC22A16,SMARCA4,TAL1,TBP,TCF3,TMEFF1,TMEM180,TYR,WNT16,Z
P3
17 14 Cellular Development, Hematological
System Development and
Function, Hematopoiesis
5 ACE,ADORA1,ALG1,BCAS3,CHTOP,CNN2,CTNNB1,DDX54,DYNLL2,ERG,ESR1,GPR64,KMT2D,LAMA5,MAGI1,MUC6,NCOA4,NRCAM,NUP88,NUP214,PDZK1,PRSS1,PTEN,RANBP2,RBFOX2,RNF31,RYR3,TACC1,TFF1,TGFBR2,TMEM74,TNRC6A,TRIM65,WNT2,WNT11
15 12 Cancer, Developmental
Disorder, Organismal Injury and Abnormalities
6 ACACB,ADIPOQ,AGTR1,AZU1,CCRL2,CD300C,CEACAM3,COL4A3,CP,CXCL16,DCD,EHD1,EMR2,FCGR1B,GNAQ,H
12 10 Inflammatory Response, Cellular
Movement, Cardiac
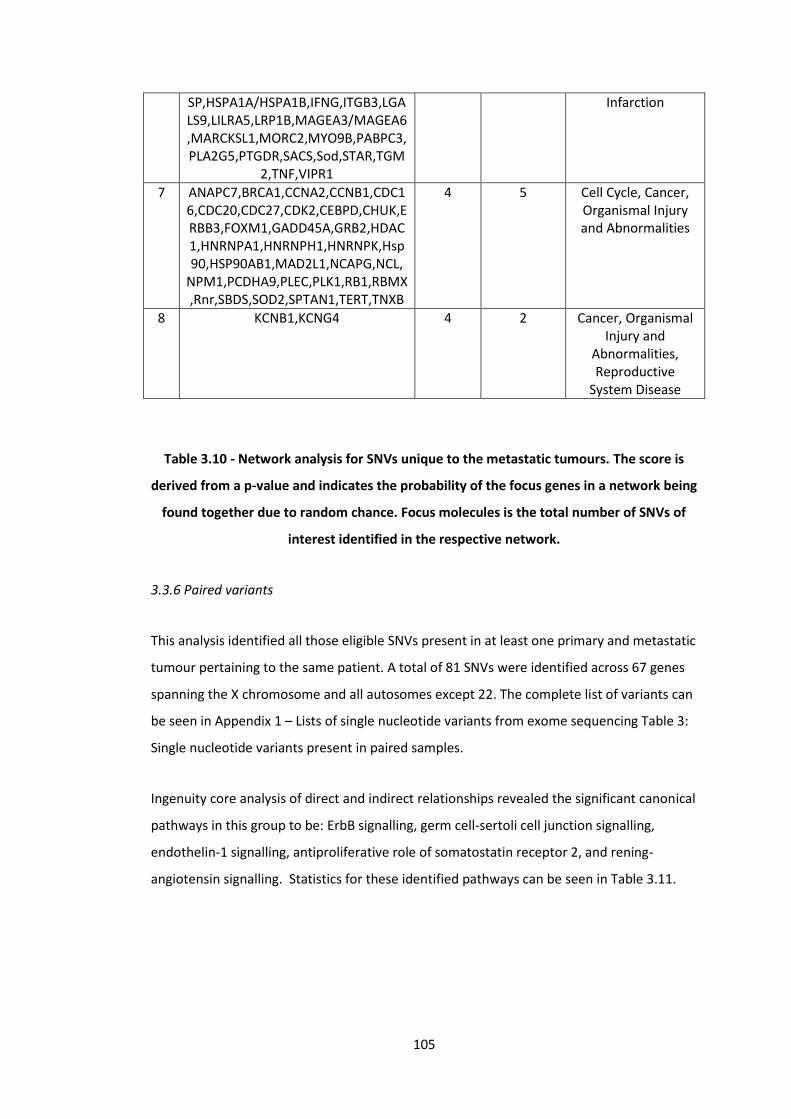
105
SP,HSPA1A/HSPA1B,IFNG,ITGB3,LGALS9,LILRA5,LRP1B,MAGEA3/MAGEA6,MARCKSL1,MORC2,MYO9B,PABPC3,PLA2G5,PTGDR,SACS,Sod,STAR,TGM
2,TNF,VIPR1
Infarction
7 ANAPC7,BRCA1,CCNA2,CCNB1,CDC16,CDC20,CDC27,CDK2,CEBPD,CHUK,ERBB3,FOXM1,GADD45A,GRB2,HDAC1,HNRNPA1,HNRNPH1,HNRNPK,Hsp90,HSP90AB1,MAD2L1,NCAPG,NCL,
NPM1,PCDHA9,PLEC,PLK1,RB1,RBMX,Rnr,SBDS,SOD2,SPTAN1,TERT,TNXB
4 5 Cell Cycle, Cancer, Organismal Injury and Abnormalities
8 KCNB1,KCNG4 4 2 Cancer, Organismal Injury and
Abnormalities, Reproductive
System Disease
Table 3.10 - Network analysis for SNVs unique to the metastatic tumours. The score is
derived from a p-value and indicates the probability of the focus genes in a network being
found together due to random chance. Focus molecules is the total number of SNVs of
interest identified in the respective network.
3.3.6 Paired variants
This analysis identified all those eligible SNVs present in at least one primary and metastatic
tumour pertaining to the same patient. A total of 81 SNVs were identified across 67 genes
spanning the X chromosome and all autosomes except 22. The complete list of variants can
be seen in Appendix 1 – Lists of single nucleotide variants from exome sequencing Table 3:
Single nucleotide variants present in paired samples.
Ingenuity core analysis of direct and indirect relationships revealed the significant canonical
pathways in this group to be: ErbB signalling, germ cell-sertoli cell junction signalling,
endothelin-1 signalling, antiproliferative role of somatostatin receptor 2, and rening-
angiotensin signalling. Statistics for these identified pathways can be seen in Table 3.11.

106
Pathway p-value Ratio
ErbB signalling 5.87E-07 6/85 (0.071)
Germ cell-sertoli cell junction signalling 1.40E-06 7/156 (0.045)
Endothelin-1 signalling 2.20E-06 7/167 (0.042)
Antiproliferative role of somatostatin receptor 2
2.37E-06 5/60 (0.083)
Renin angiotensin signalling 2.41E-06 6/108 (0.056)
Table 3.11 – Pathway analysis for SNVs present in at least one primary and metastatic
tumour pertaining to the same patient. P-value is adjusted using Benjamini-Hochberg
correction. Ratio identifies the number of focus genes identified (numerator) in the
pathway (denominator).
The ErbB signalling pathway was identified as the most significant pathway arising from the
analysis of SNVs meeting these criteria (Figure 3.3). Whilst only 6 (KRAS, MAP2K3, PAK2,
PIK3C2G, PLCG2, RRAS) of the 85 genes contained SNVs (ratio 0.07), the likelihood of this
combination of SNVs occurring due to chance alone is <5.87x10⁻⁷. The identified genes are
well known, i.e. KRAS, RRAS and a number of associated downstream kinases.
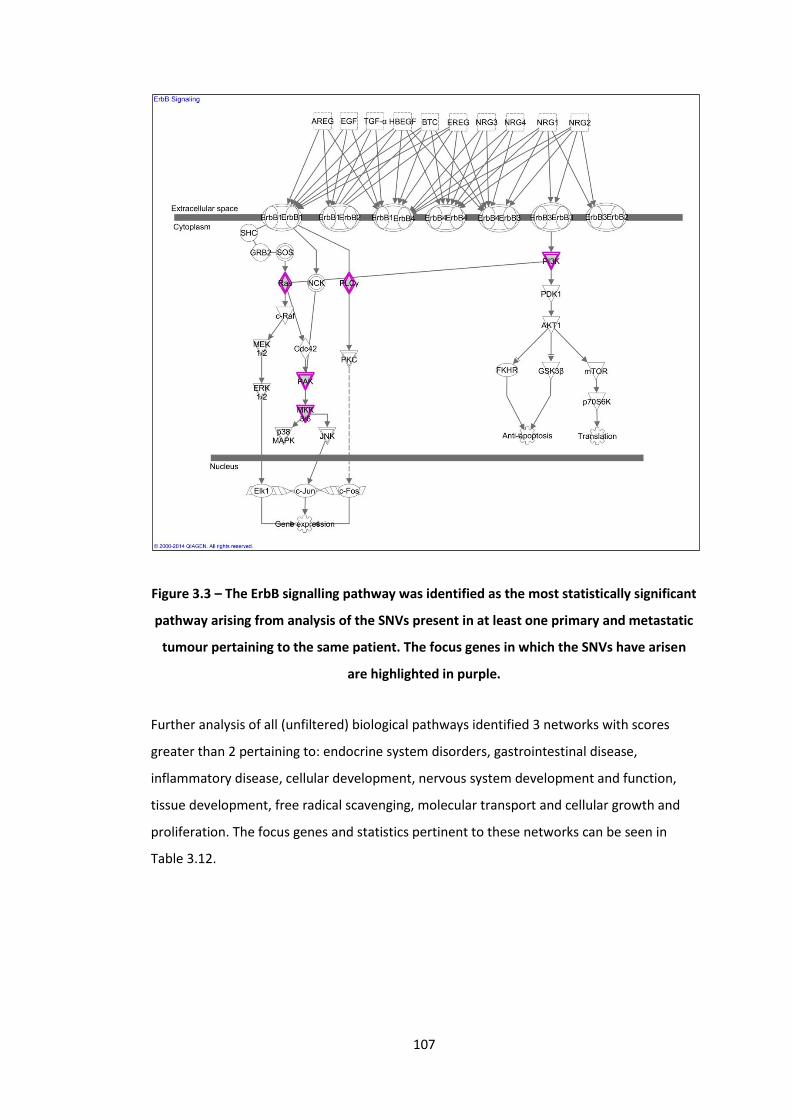
107
Figure 3.3 – The ErbB signalling pathway was identified as the most statistically significant
pathway arising from analysis of the SNVs present in at least one primary and metastatic
tumour pertaining to the same patient. The focus genes in which the SNVs have arisen
are highlighted in purple.
Further analysis of all (unfiltered) biological pathways identified 3 networks with scores
greater than 2 pertaining to: endocrine system disorders, gastrointestinal disease,
inflammatory disease, cellular development, nervous system development and function,
tissue development, free radical scavenging, molecular transport and cellular growth and
proliferation. The focus genes and statistics pertinent to these networks can be seen in
Table 3.12.
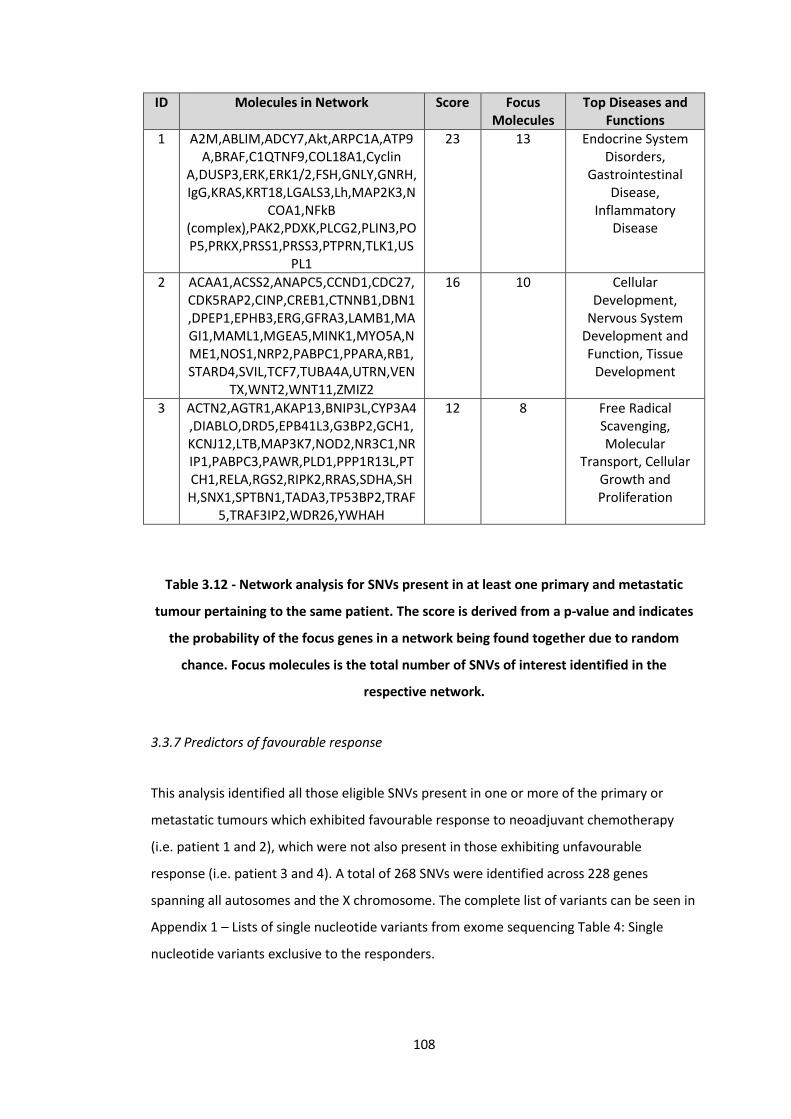
108
ID Molecules in Network Score Focus Molecules
Top Diseases and Functions
1 A2M,ABLIM,ADCY7,Akt,ARPC1A,ATP9A,BRAF,C1QTNF9,COL18A1,Cyclin
A,DUSP3,ERK,ERK1/2,FSH,GNLY,GNRH,IgG,KRAS,KRT18,LGALS3,Lh,MAP2K3,N
COA1,NFkB (complex),PAK2,PDXK,PLCG2,PLIN3,POP5,PRKX,PRSS1,PRSS3,PTPRN,TLK1,US
PL1
23 13 Endocrine System Disorders,
Gastrointestinal Disease,
Inflammatory Disease
2 ACAA1,ACSS2,ANAPC5,CCND1,CDC27,CDK5RAP2,CINP,CREB1,CTNNB1,DBN1,DPEP1,EPHB3,ERG,GFRA3,LAMB1,MAGI1,MAML1,MGEA5,MINK1,MYO5A,NME1,NOS1,NRP2,PABPC1,PPARA,RB1,STARD4,SVIL,TCF7,TUBA4A,UTRN,VEN
TX,WNT2,WNT11,ZMIZ2
16 10 Cellular Development,
Nervous System Development and Function, Tissue
Development
3 ACTN2,AGTR1,AKAP13,BNIP3L,CYP3A4,DIABLO,DRD5,EPB41L3,G3BP2,GCH1,KCNJ12,LTB,MAP3K7,NOD2,NR3C1,NRIP1,PABPC3,PAWR,PLD1,PPP1R13L,PTCH1,RELA,RGS2,RIPK2,RRAS,SDHA,SHH,SNX1,SPTBN1,TADA3,TP53BP2,TRAF
5,TRAF3IP2,WDR26,YWHAH
12 8 Free Radical Scavenging, Molecular
Transport, Cellular Growth and Proliferation
Table 3.12 - Network analysis for SNVs present in at least one primary and metastatic
tumour pertaining to the same patient. The score is derived from a p-value and indicates
the probability of the focus genes in a network being found together due to random
chance. Focus molecules is the total number of SNVs of interest identified in the
respective network.
3.3.7 Predictors of favourable response
This analysis identified all those eligible SNVs present in one or more of the primary or
metastatic tumours which exhibited favourable response to neoadjuvant chemotherapy
(i.e. patient 1 and 2), which were not also present in those exhibiting unfavourable
response (i.e. patient 3 and 4). A total of 268 SNVs were identified across 228 genes
spanning all autosomes and the X chromosome. The complete list of variants can be seen in
Appendix 1 – Lists of single nucleotide variants from exome sequencing Table 4: Single
nucleotide variants exclusive to the responders.
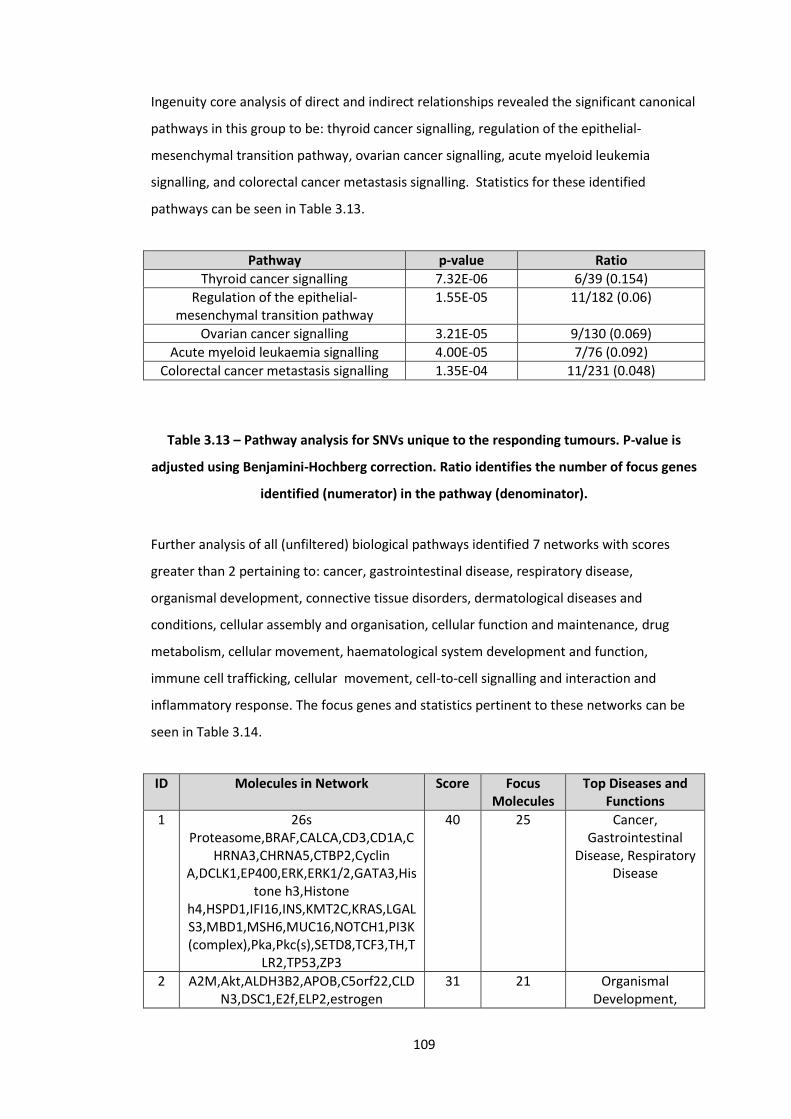
109
Ingenuity core analysis of direct and indirect relationships revealed the significant canonical
pathways in this group to be: thyroid cancer signalling, regulation of the epithelial-
mesenchymal transition pathway, ovarian cancer signalling, acute myeloid leukemia
signalling, and colorectal cancer metastasis signalling. Statistics for these identified
pathways can be seen in Table 3.13.
Pathway p-value Ratio
Thyroid cancer signalling 7.32E-06 6/39 (0.154)
Regulation of the epithelial-mesenchymal transition pathway
1.55E-05 11/182 (0.06)
Ovarian cancer signalling 3.21E-05 9/130 (0.069)
Acute myeloid leukaemia signalling 4.00E-05 7/76 (0.092)
Colorectal cancer metastasis signalling 1.35E-04 11/231 (0.048)
Table 3.13 – Pathway analysis for SNVs unique to the responding tumours. P-value is
adjusted using Benjamini-Hochberg correction. Ratio identifies the number of focus genes
identified (numerator) in the pathway (denominator).
Further analysis of all (unfiltered) biological pathways identified 7 networks with scores
greater than 2 pertaining to: cancer, gastrointestinal disease, respiratory disease,
organismal development, connective tissue disorders, dermatological diseases and
conditions, cellular assembly and organisation, cellular function and maintenance, drug
metabolism, cellular movement, haematological system development and function,
immune cell trafficking, cellular movement, cell-to-cell signalling and interaction and
inflammatory response. The focus genes and statistics pertinent to these networks can be
seen in Table 3.14.
ID Molecules in Network Score Focus Molecules
Top Diseases and Functions
1 26s Proteasome,BRAF,CALCA,CD3,CD1A,C
HRNA3,CHRNA5,CTBP2,Cyclin A,DCLK1,EP400,ERK,ERK1/2,GATA3,His
tone h3,Histone h4,HSPD1,IFI16,INS,KMT2C,KRAS,LGALS3,MBD1,MSH6,MUC16,NOTCH1,PI3K (complex),Pka,Pkc(s),SETD8,TCF3,TH,T
LR2,TP53,ZP3
40 25 Cancer, Gastrointestinal
Disease, Respiratory Disease
2 A2M,Akt,ALDH3B2,APOB,C5orf22,CLDN3,DSC1,E2f,ELP2,estrogen
31 21 Organismal Development,

110
receptor,GALNT2,GHR,HNF1A,Hsp70,Hsp90,HSPG2,IgG,Interferon
alpha,Jnk,KRT14,LDL,LDL-cholesterol,MAP2K3,Mek,NFkB
(complex),NOD1,NOS1,NUP98,P38 MAPK,PLCG2,PLEC,PRKRA,SACS,SYT6,T
GM1
Connective Tissue Disorders,
Dermatological Diseases and
Conditions
3 ADD1,AGTR1,APP,ARHGAP17,ATXN1,CD81,CNN2,CTNNB1,CYP2B6,CYP2C8,CYP2D6,DNM1,DVL1,EPB41L3,ERG,GNAQ,HNF4A,IGSF8,ITGB1,LAMA5,MAGI1,MYO5A,NAA10,NOTCH4,NR1I2,NRCA
M,PABPC3,PAK7,ROCK2,RPL19,RRAS,RYR3,VANGL2,WNT2,WNT11
19 15 Cellular Assembly and Organization, Cellular Function
and Maintenance, Drug Metabolism
4 Aldose Reductase,ATXN10,AZU1,CCND1,CCT8,CDC27,CEACAM3,CHAT,CP,CXCL16,FCGR1B,GGT1,GZMM,HSP,IFNG,IL17RB,KIF26B,MAGEA3/MAGEA6,MARCKSL1,MYO9B,NQO1,PARP1,Pkc(s),PLA2G5,PTGDR,SERPINB8,SERPINB10,SLC25A5,Sod,TNF,TNFRSF10B,TYMP,TYR,VIPR1,Y
LPM1
17 14 Cellular Movement, Hematological
System Development and Function, Immune
Cell Trafficking
5 ABCC5,ACSS2,CD93,CDCA7,COL4A3,COL5A3,CPE,CSAD,CX3CR1,ESR1,ESRRA,FAM102A,FBP1,FERMT1,FMN2,ITGB3,ITIH1,KRT13,LAMB1,MGEA5,MINOS1,NAV1,NFYA,PDLIM2,PHKB,PNRC1,POU2F1,PTX3,RELA,SLC7A2,TGM2,TMEM74,
UBALD1,WNT11,YPEL3
16 13 Cellular Movement, Cell-To-Cell Signaling
and Interaction, Inflammatory
Response
6 ABHD2,ACTN2,ACTR1A,ALDH3A1,CDKN1A,CELF1,CORO1C,DEDD2,DNASE1L3,E2F1,FOXG1,HNRNPA3,HSF1,IFI30,JMJD6,LOC100996763/NOTCH2NL,LUM,MT1L,NDUFS2,NPAT,NR3C1,NRP2,PAK2,PBRM1,POLA2,RIMS1,RRM1,RRN3,S
ALL2,SMARCA4,SRSF2,SWI-SNF,TAF1B,TBP,WNT16
14 12 Cell Cycle, Connective Tissue Development and Function, Cellular
Assembly and Organization
7 ASPM,ATF3,ATR,AURKA,CASP3,CCND1,CHUK,CXCL8,DHTKD1,DPH6,EREG,FLV
CR1,Histone h3,KAT5,KIF2C,MKL2,MYC,NUPR1,PAR
P1,PLK1,PPP1R2,RAG1,SCN2A,TP53
9 8 Cancer, DNA Replication,
Recombination, and Repair, Cell Cycle
Table 3.14 - Network analysis for SNVs unique to the responding tumours. The score is
derived from a p-value and indicates the probability of the focus genes in a network being
found together due to random chance. Focus molecules is the total number of SNVs of
interest identified in the respective network.

111
3.3.8 Predictors of poor response
This analysis identified all those eligible SNVs present in one or more of the primary or
metastatic tumours which exhibited poor response to neoadjuvant chemotherapy (i.e.
patient 3 and 4), which were not also present in those exhibiting favourable response (i.e.
patient 1 and 2). A total of 226 SNVs were identified across 187 genes spanning all
autosomes and the X chromosome. The complete list of variants can be seen in Appendix 1
– Lists of single nucleotide variants from exome sequencing Table 5: Single nucleotide
variants exclusive to the non-responders.
Ingenuity core analysis of direct and indirect relationships revealed the significant canonical
pathways in this group to be: regulation of cellular mechanics by calpain protease, renal cell
carcinoma signalling, PEDF signalling, thyroid cancer signalling, and UVC-induced MAPK
signalling. Statistics for these identified pathways can be seen in Table 3.15.
Pathway p-value Ratio
Regulation of cellular mechanics by calpain protease
2.43E-03 4/55 (0.073)
Renal cell carcinoma signalling 5.31E-03 4/69 (0.058)
PEDF signalling 5.87E-03 4/71 (0.056)
Thyroid cancer signalling 7.18E-03 3/39 (0.077)
UVC-induced MAPK signalling 8.82E-03 3/42 (0.071)
Table 3.15 – Pathway analysis for SNVs unique to the non-responding tumours. P-value is
adjusted using Benjamini-Hochberg correction. Ratio identifies the number of focus genes
identified (numerator) in the pathway (denominator).
Further analysis of all (unfiltered) biological pathways identified 7 networks with scores
greater than 2 pertaining to: cancer, endocrine system disorders, organismal injury and
abnormalities, cellular development, cell-to-cell signalling and interaction, cellular assembly
and organisation, cell cycle, cellular growth and proliferation, cellular movement, cell
signalling, haematological disease, lipid metabolism, molecular transport, small molecule
biochemistry and inflammatory response. The focus genes and statistics pertinent to these
networks can be seen in Table 3.16.

112
ID Molecules in Network Score Focus Molecules
Top Diseases and Functions
1 26s Proteasome,A4GALT,Akt,APOBEC3G,CDH8,CFTR,COL18A1,COL6A2,CTBP2,Cy
clin A,estrogen receptor,FANCA,FGFR3,GDNF,GLB1,HR
AS,Hsp90,INF2,Interferon alpha,Jnk,KMT2E,KRAS,KRT18,MUC4,N
COA1,NCOR1,NFkB (complex),PABPC1,PI3K
(complex),PRKRA,PTPRS,SEC14L3,TCF7,TNS1,VWF
46 26 Cancer, Endocrine System Disorders, Organismal Injury and Abnormalities
2 AIM1,ALG1,BCAS3,BMP2K,BTF3,CNN2,COTL1,CTNNA3,CTNNB1,DDX54,DNA2,ERCC2,FASTK,FUT3,GPR6,HAMP,IgG,IL17RB,MC4R,MINK1,MUC6,MYC,PERP,PLEKHG2,PLS3,PPL,RANBP2,RASA4,RGS3,SMARCA4,SNRK,TACSTD2,TFAP2A,T
FF1,ZMIZ2
16 12 Cellular Development, Cell-
To-Cell Signaling and Interaction, Cellular
Assembly and Organization
3 ABLIM,ADAMTS1,ADCY7,ARPC1A,ATP9A,CCNB1,CDC27,COL15A1,CTDSP2,CYP4F2,DOCK7,DUSP3,F2,FSH,GNLY,GNRH,Lh,MAPK1,PDXK,PHF11,PI4K2A,PLIN3,POP5,PPFIA4,PRKX,PRSS3,PTPRN,RB1,RBMX,SMAD1,SOX7,STK17A,TGFB1,
TLK1,TPSD1
16 12 Cell Cycle, Cellular Growth and
Proliferation, Cell-To-Cell Signaling and
Interaction
4 ADCYAP1,ALPPL2,BAI1,C1QTNF9,CCL21,CRIP2,CSPG4,DISP1,DROSHA,DUOX2,E2f,EFNA1,ENO3,ERK,ERK1/2,GMFG,G
PR183,Histone h3,HOXC6,HPSE,ITSN1,KMT2B,KMT2C,KMT2D,LGALS1,NANOG,NHLRC1,PAGR1,PAK2,PAXIP1,RBBP5,RNF41,SCRIB,TR
PM2,VRK2
14 11 Cellular Movement, Cancer, Cell
Signaling
5 ACTN2,AMOTL2,CDK11B,CLCN4,DAPK3,DNAJC15,EBAG9,GLIPR1,GRIN1,HIST4H4,KIF24,NR3C1,PARN,PDLIM2,PHLDA3,PPP1R13L,PRDM5,PRUNE2,SCARA3,SETD8,SKIV2L,SLC25A5,SLC2A1,SLC43A3,SON,STOM,SYVN1,TNFRSF14,TNFRSF10B,TNS4,TP53,TRAF2,TRIM24,WNT
10B,ZC3HAV1
14 12 Hematological Disease, Cancer,
Organismal Injury and Abnormalities
6 ABCC3,ACAA1,ACACB,ACE,APOA1,APOA4,APOA5,APOC2,APOC3,CD163,CPT1
A,DIABLO,DSG1,FABP2,HDL,HDL-cholesterol,Hsp27,IL6R,KCNJ12,KHSRP,LIPG,LPL,MSR1,MVP,NR1D1,NR1H3,NR1H4,PLA2G2A,POU4F2,PPARA,PTX3,S
ERPINB10,SREK1IP1,TAC1,TNF
12 10 Lipid Metabolism, Molecular
Transport, Small Molecule
Biochemistry

113
Table 3.16 - Network analysis for SNVs unique to the non-responding tumours. The score
is derived from a p-value and indicates the probability of the focus genes in a network
being found together due to random chance. Focus molecules is the total number of SNVs
of interest identified in the respective network.
3.3.9 Selection of SNVs for validation
The primary purpose of the study was to identify whether biological information from a
primary tumour is predictive of the metastatic genotype, and if this information could
potentially be used to predict response to neoadjuvant treatment. To that end, the list of all
those eligible SNVs present in at least one primary and metastatic tumour pertaining to the
same patient (i.e. paired) were combined with those SNVs exclusive to either the
responders or the non-responders. The resulting lists of variants can be seen in Appendix 1
– Lists of single nucleotide variants from exome sequencing Table 6: Single nucleotide
variants present in paired samples and exclusive to the responders, and Table 7: Single
nucleotide variants present in paired samples and exclusive to the non-responders.
In order to rationalise the use of resource, the following decisions were made for SNV
validation:
1. Those paired predictors of favourable response present in 3 or more samples would
be validated.
2. All paired predictors of poor response were only present in 2 samples. As such
those novel SNVs (as per dbSNP) would be validated.
3. Given its potential significance to the aim of the study, those SNVs identified in the
ErBb signalling pathway would be validated.
The resulting SNVs subjected to Sanger sequencing for validation can therefore be seen in
Table 3.17.

114
Paired predictors of favourable response (present in 3 or more samples)
Annotation Gene Chromosome Location Substituted Amino Acid
New Amino
Acid
CDAN1_15_43020983_G/A CDAN1 15 43020983 G A
LGALS3_14_55604935_C/A LGALS3 14 55604935 C A
PANK3_5_167988433_T/A PANK3 5 167988433 T A
CTDSP2_12_58220811_G/T CTDSP2 12 58220811 G T
Paired predictors of poor response (novel only)
Annotation Gene Chromosome Location Substituted Amino Acid
New Amino
Acid
ABCA13_7_48390326_G/A ABCA13 7 48390326 G A
CDC27_17_45214551_G/A CDC27 17 45214551 G A
ErbB signalling pathway (identified through pathway analysis)
Annotation Gene Chromosome Location Substituted Amino Acid
New Amino
Acid
KRAS_12_25398284_C/A KRAS 12 25398284 C A
MAP2K3_17_21207834_C/T MAP2K3 17 21207834 C T
PAK2_3_196529982_A/G PAK2 3 196529982 A G
PIK3C2G_12_18650667_A/T PIK3C2G 12 18650667 A T
PLCG2_16_81888178_C/T PLCG2 16 81888178 C T
RRAS_19_50140130_G/A RRAS 19 50140130 G A
Table 3.17 – Those SNVs identified for validation with Sanger sequencing
3.3.9 Sanger sequencing
Sanger sequencing was attempted for 12 SNVs (above) in 8 samples (primary tumour and
liver metastases from 4 patients). Eighty-eight of the 96 runs were successful; in 8 samples
there was failure to detect the amplicon. A summary of the Sanger sequencing results can
be seen in Table 3.18.

115
Patient 1 Patient 2 Patient 3 Patient 4
Annotation Count Primary Metastasis Primary Metastasis Primary Metastasis Primary Metastasis
Paired predictors of favourable response
CDAN1_15_43020983_G/A 3 G and A G and A G and A G and A G G G G
LGALS3_14_55604935_C/A 4 C C C C C C C C
PANK3_5_167988433_T/A 3 Undetermined Undetermined T T T Undetermined T T
CTDSP2_12_58220811_G/T 3 G G G G G G G G
Paired predictors of poor response
ABCA13_7_48390326_G/A 2 G G G G G G G G
CDC27_17_45214551_G/A 2 G and C G and C G and C G and C G and C G and C G and C G and C
ErbB signalling pathway
KRAS_12_25398284_C/A 2 C Undetermined Undetermined C C C C C and A
MAP2K3_17_21207834_C/T 2 C and T C and T C and T C and T C C C C
PAK2_3_196529982_A/G 3 A A A A A A A Undetermined
PIK3C2G_12_18650667_A/T 2 A and T A and T A A and T A A A A
PLCG2_16_81888178_C/T 2 C and T C and T Undetermined C C C C C
RRAS_19_50140130_G/A 2 G and A G and A G Undetermined G G G G
Table 3.18 – Summary of the Sanger sequencing for 12 SNVs of interest in 8 samples (matched primary and metastatic tumours from 4 patients). The
fields displayed in red highlight the location of SNVs identified through Ion Proton sequencing, with the content of the fields representing the identified
base(s) on Sanger sequencing. Those marked undetermined failed due to inability to detect the amplicon.
116
For those paired predictors of favourable response, only the SNV occurring in the CDAN1
gene was validated by Sanger sequencing. The table shows the presence of both G and A
nucleotides in all samples from the responders (patient 1 and 2), including the primary
tumour from patient 1 which was not seen on exome sequencing. Conversely only the G
nucleotide is present in the non-responders (patient 3 and 4). The remainder of the Sanger
sequencing failed to identify any of the substituted nucleotides seen on exome sequencing.
Where the amplicon was detected, the nucleotide identified was the same in all samples.
For the paired predictors of poor response, no SNVs were validated. The SNV observed in
the ABCA13 gene was not identified in any of the samples, whereas in the CDC27 gene a
substitution from G to C was seen in all samples rather than the expected G to A.
When considering the ErbB pathway, the SNV:
in the KRAS gene was confirmed in 1 of 2 expected samples and no others
in the MAP2K3 gene was confirmed in 2 of 2 expected samples and two others
(from the same patient)
in the PAK2 gene was not confirmed in any sample
in the PIK3C2G gene was confirmed in 2 of 2 expected samples and one other
in the PLCG2 gene was confirmed in 2 of 2 expected samples and no others
in the RRAS gene was confirmed in 2 of 2 expected samples and no others

117
3.4 Discussion
3.4.1 Summary of aims
In this study, a comprehensive exome analysis of four synchronously resected patient
matched primary and metastatic tumours was performed. Analysis of acquired data
focussed solely on the identified somatic, non-synonymous missense biologically
deleterious SNVs. The aims were to identify those genetic aberrations that:
- Are present in the primary tumour but not in the metastasis
- Are present in the metastasis but not in the primary tumour
- Are present in both primary and metastasis (i.e. the primary tumour is predictive of
the metastatic genotype)
- May predict response to neoadjuvant therapy
3.4.2 Summary of results
Of the 585 unique non-synonymous, missense SNVs identified 215 (36.8%) were unique to
the primary tumour, 226 (38.6%) unique to the metastasis and 81 (13.8%) present in at
least one primary and metastatic tumour pertaining to the same patient. The remaining 63
(10.8%) were neither unique to a tissue type or present in a pair of samples from the same
patient. Two hundred and sixty-eight (45.8%) predicted favourable response, whilst 226
(38.6%) predicted poor response. Of those, 43 and 23 respectively were present in patient
matched samples. The remaining 91 (15.6%) were neither unique to responders or non-
responders.
Pathway analysis identified putative pathways in those variants unique to the primary
tumour (α-tocopherol degradation, vitamin C transport, glycine biosynthesis III, GDP-L
fructose biosynthesis I and TCA cycle II), unique to the metastatic tumour (AMPK signalling,
rennin-angiotensin signalling, role of NANOG in mammalian embryonic stem cell
pluripotency, basal cell carcinoma signalling and PEDF signalling), present in at least one
primary and metastatic tumour pertaining to the same patient (ErbB signalling, germ cell-
sertoli cell junction signalling, endothelin-1 signalling, antiproliferative role of somatostatin
receptor 2, and rening-angiotensin signalling), unique to the responders (thyroid cancer
signalling, regulation of the epithelial-mesenchymal transition pathway, ovarian cancer

118
signalling, acute myeloid leukemia signalling, and colorectal cancer metastasis signalling)
and unique to the non-responders (regulation of cellular mechanics by calpain protease,
renal cell carcinoma signalling, PEDF signalling, thyroid cancer signalling, and UVC-induced
MAPK signalling).
The ErbB signalling pathway was identified as the most significant pathway arising from the
analysis of SNVs in paired patient samples, with 6 (KRAS, MAP2K3, PAK2, PIK3C2G, PLCG2,
RRAS) of the 85 pathway genes containing SNVs (Ratio 0.07, p=5.87x10⁻⁷).
Sanger sequencing validated the CDAN1_15_43020983_G/A SNV as a potential predictor of
favourable response where the primary tumour is predictive of the metastatic genotype.
For the 6 SNVs of interest in the ErbB pathway, 4 showed absolute concordance between
the primary and metastatic genotype (those in MAP2K3, PIK3C2G, PLCG2 and RRAS) thus
validating the results of the Ion Proton exome sequencing.
3.4.3 Next generation sequencing of colorectal cancer
For decades our understanding of the genetics of colorectal carcinogenesis has gone
unchallenged, however a complete catalogue of oncogenic drivers has yet to be
determined.
The largest published study to date remains The Cancer Genome Atlas Network (2012) of
276 colorectal samples subjected to exome sequencing, 97 of which also underwent whole
genome sequencing. This paper demonstrated that colon and rectal cancers had similar
patterns of genomic alteration, and that most of the 24 genes found to be significantly
mutated were known cancer-related genes such as APC, TP53, KRAS, PIK3CA and SMAD4.
A number of studies, published both before and after, have attempted to improve our
understanding of the genomic aberrations in colorectal cancer with three main aims:
identifying clinically actionable targets for personalised therapy, improving pathway-level
understanding of carcinogenesis, and identifying novel features or mutation types. A
summary of these papers can be seen in Table 3.19, and a complete list of accompanying
variants from these papers can be found in Appendix 2 – Genetic variants in colorectal
cancer identified by next generation sequencing studies.

119
Paper Number of Patients
Comparing Summary
The Cancer Genome Atlas Network Nature, 2012
276 Tumour and normal mucosa
Implicated pathways included WNT, RAS-MAPK, PI3K, TGF-B, P53, and DNA
mismatch repair.
The consensus coding sequences of human breast and colorectal cancers
Science, 2006
11 Tumour and normal mucosa
Sanger sequencing study identifying 189 genes, most of which not known to be
implicated in carcinogenesis
Patterns of somatic mutation in human cancer genomes
Nature, 2007
28 Tumour and normal mucosa
44 mutations identified, many of which were
protein kinases
Somatic mutation profiles of MSI and MSS colorectal cancer identified
by whole exome next generation sequencing and bioinformatics
analysis PLOS One, 2010
2 (1 MSI-S, 1
MSI-H)
Tumour and normal mucosa
359 significant mutations for the MSI tumour and 45
for the MSS, all with predicted altered protein
function
Exome capture sequencing of adenoma reveals genetic alterations in multiple cellular pathways at the
early stage of colorectal tumorigenesis
PLOS One, 2013
1 Tumour, adenoma
and normal mucosa
12 variants were identified in the adenoma and 42 in
the adenocarcinoma
Chromothripsis is a common mechanism driving genomic
rearrangements in primary and metastatic colorectal cancer
Genome Biology, 2011
4 Primary tumour, normal
mucosa, liver metastasis and liver
parenchyma
24 genes suggesting the relevance of
chromothripsis to metastagenesis
Genomic sequencing of colorectal adenocarcinomas identifies a
recurrent VTI1A-TCF7L2 fusion Nature Genetics, 2011
9 Tumour and normal mucosa
Eleven rearrangements encode predicted in-frame fusion proteins, including a fusion of TVI1A and TCF7L2 found in 3 out of 9 patients
Exome sequencing reveals frequent inactivating mutations in ARID1A,
ARID1B, ARID2 and ARID4 in microsatellite unstable colorectal
cancer International Journal of Cancer,
2013
21 Tumour and normal mucosa
Analysis focussed to ARID genes only which were
frequently mutated (13-39%)
Comprehensive genomic analysis of a metastatic colon cancer to the lung by whole exome sequencing
and gene expression analysis International Journal of Oncology,
2014
1 Metastatic lung tumour and normal
lung
8 of the 71 variants identified pertain to the
‘metastatic colorectal cancer signalling’ or
‘phospholipase C signalling’ pathways

120
Table 3.19 – Summary of next generation sequencing papers published on colorectal
cancer.
As can be seen, at the time of writing only one paper includes the sequencing of colorectal
liver metastases: Kloosterman et al (2011) demonstrated that chromothripsis is a
widespread phenomenon in colorectal primary and metastatic tumours with considerable
variation between sites, and that in the 24 genes they identified (including
APC, KRAS, SMAD4 and PIK3CA) considerable variation was seen between primary and
metastatic tumours. This will no doubt rapidly change, and as the technology grows the
challenge will increasingly be how to exploit this to better our understanding of the
mechanisms underlying colorectal carcinogenesis.
3.4.4 The ErbB receptor tyrosine kinases and pathway
The epidermal growth factor receptor (EGFR) family consists of 4 members, ErbB1-4. These
receptors consist of a glycosylated extracellular domain and an intracellular domain with a
juxtamembrane segment, protein kinase domain and carboxylterminal tail. ErbB1, ErbB3
and ErbB4 all have 7 biologically occurring ligands (EGF, EPG, TGFα, AR, BTC, HB-EGFEPR),
whereas Erb2 has none (Roskoski, 2004).
Downstream signalling of ErbB activation is by 3 integrated pathways: the
phosphatidylinositol 3-kinase/Akt (PKB) pathway, the Ras/Raf/Mek/ERK pathway and the
phospholipase C pathway (See Section 1.7.6). Many tumours besides colorectal tumours
are associated with mutation or increased expression of the gene family, which have a
number of designations: EGFR/ERBB1/HER1, ERBB2/HER2/NEU, ERBB3/HER3 and
ERBB4/HER4. These mutations results in aberrant activity of downstream pathways
(Miettinen et al, 1995).
Given their importance in a number of cell functions, including regulation of apoptosis, cell
cycle progression, cytoskeletal rearrangement, differentiation and development (Manning
et al, 2002), and their biological implication in colorectal cancer (Yao et al, 2013), the ErbB
Targeted sequencing of cancer related genes in colorectal cancer using next generation sequencing
PLOS One, 2013
60 Tumour and normal mucosa
183 genes selected for analysis from COSMIC
database (study designed to validate new platform)

121
family and downstream pathways have become a commonly utilised drug target (Table
3.20).
Small Molecule Inhibitors Manufacturer Target Year Application
Afatinib/Gilotrif® Boehringer Ingelheim ErbB1 2013
First-line treatment of non small cel lung cancer with
exom-19 deletions
Erlotinib/Tarceva® Genentech/OSI ErbB1 2004
(i) First-line treatment of non small cel lung cancer
with exom-19 deletions (ii) second-line treatment
following cytotoxic therapy and (iii) first-line treatment
of pancreatic cancer in combination with
gemcitabine
Gefitinib/Iressa® Astra Zeneca ErbB1 2003
Second-line treatment of non small cell lung cancer after cytotoxic therapies
Lapatinib/Tykerb® Glaxo SmithKline ErbB1/2 2007
Second-line treatment of patients with capecitabine for ErbB2 positive breast
cancer who have previously received
cytotoxic chemotherapy or trastuzumab
Monoclonal Antibodies Manufacturer Target Year Application
Ado-trastuzumab emtansine/Kadcyla® Genentech/OSI ErbB2 2013
ErbB2 positive metastatic breast cancer previously
treated with trastuzumab
Cetuximab/Erbitux® ImClone ErbB1 2004
(i) Wildtype KRAS colorectal cancer in
combination with cytotoxic therapies and (ii) head and
neck cancers in combination with radiation
therapy or cytotoxic chemotherapy
Panitumumab/Vectibix® Genentech/OSI ErbB1 2006
Second-line treatment for metastatic colorectal
cancer following cytotoxic therapies
Pertuzumab/Omnitarg® Abgenix ErbB2 2012
ErbB2 positive metastatic breast cancer in
combination with trastuzumab and docetaxel
in patients who have not received prior anti-ErbB2 therapy or chemotherapy

122
for metastatic disease
Trastuzumab/Herceptin® Genentech ErbB2 1998
ErbB2 positive breast, gastric and gastro-
oesophageal cancer
Table 3.20 – Some of the ErbB inhibitors currently in clinical use (only ones approved by
the Federal Drug Administration are shown). Adapted from Roskoski, 2004.
The efficacy of cetuximab in relation to KRAS status, and concordance of the primary and
metastatic genotype in this regard has been discussed in Section 1.7.6. Given the inter-
relation of the RAS/RAF pathway with other downstream effectors of ErbB signalling, our
study raises the question of whether the concordance seen in the case of KRAS can be
extrapolated to other members of the ErbB pathways. As our understanding of the role of
these genes in treatment response improves, this concordance could be exploited to create
personalised treatment regimens. Such a move would have the potential for improved
treatment efficacy as well as a reduction in unwanted off-target effects.
3.4.5 The CDAN1 gene
Codanin 1 (CDAN1) is located at 15q15.2 and codes for a protein which appears to play a
role in nuclear envelope integrity, possibly through microtubule attachments. Mutation of
this gene is known to cause the clinical condition congenital dyserythropoietic anaemia
type I, a rare autosomal recessive disorder resulting in morphological abnormalities of
erythroblasts, ineffective erythropoiesis, macrocytic anaemia and secondary
haemochromatosis (Tamary et al, 2005). The genetic variants responsible for this condition
have been well reported (Dgany et al, 2002), although their potential role in cancer and
treatment response have not yet been investigated.
The mechanism of action of the codanin 1 protein remains to be elucidated, however in an
immunofluorescence study of HeLa cells, Noy-Lotan et al (2009) localised it to
heterochromatin in interphase cells, found high levels in the S-phase of the cell cycle, and
noted its phosphorylation and exclusion from condensed chromosomes during mitosis. As
such they concluded that the protein is cell-cycle regulated and active during the S-phase.

123
Ask et al (2012) suggest that the function of the protein is direct interaction with the
histone chaperone anti-silencing function 1 (Asf1) complex, sequestering it in the
cytoplasm, blocking histone delivery and arresting S-phase progression.
A potential mechanism of action for carcinogenesis and treatment response could
therefore be hypothesised, however given the paucity of information in the literature it
would be prudent to first validate the presence of this SNV in a larger cohort of cancer
samples.
3.4.6 Study strengths and limitations
This study represents the first genomic sequencing of synchronously resected patient
matched primary colorectal tumour and colorectal liver metastases in the literature. As
such it is complementary to the paper by Kloosterman et al (2011), in which the patients
were metachronously resected. The significance of this is the exclusion of confounding
factors introduced by metachronous resection, be that merely the passage of time, other
neoadjuvant treatments or the stress response to the first operation.
Given the aims of this study clearly the numbers we have used are inadequate to draw any
firm conclusions. Our desire to perform exome sequencing is in part related to later
chapters of this thesis in which we perform a global proteomic analysis on the same (and
other) tissue sets. Focussing on the non-synonymous missense SNVs has allowed us to
make potentially more meaningful correlations between the datasets, but in doing so has
left little regard for the potential for significant findings in both the SNVs not meeting these
criteria as well as indels.
We opted to validate the SNVs of interest in the same tissue set but using an alternative
technology, specifically Sanger sequencing. The preferred alternative would have been
validation on a larger, different tissue set using either the same or a different platform. The
precious nature of these difficult to acquire samples meant that this was not feasible, as
synchronous resections are a relatively recent development in hepatobiliary surgery. The
incorporation of metachronous resections into the tissue set would have increased
numbers (and cost) at the expense of losing the novelty and scientific value we have
achieved with this study.

124
The final limitation is the inherent heterogeneity in the study population. Differences
existed in terms of patient age, gender, TNM stage, burden and distribution of metastases,
and the presence of adverse pathological features. It is advantageous that all of the primary
tumours were confined to the colon (rather than including rectal cancers also), although
there were primary tumours from both the right and left colon. It is now widely accepted
that right and left colonic tumours are to be regarded as different biological entities,
particularly where genomic aberrations are concerned (Zhu, 2013). Given the study partly
attempted to review SNVs which may account for differences in response to neoadjuvant
treatment, again there was heterogeneity between patients. All patients received a 5-
fluorouracil based regimen, although one patient received this as capecitabine. The same
patient (3) was the only patient to receive an EGFR inhibitor. As such the biomarkers
identified are likely to relate to the cellular response to chemotherapy, rather than the
mechanism of action of the specific agents involved. Indeed as the tumours have been
treated with chemotherapy, those cells remaining available for biopsy may represent those
that are particularly chemoresistant. Intra-tumoural heterogeneity has also already been
briefly discussed and is a key limitation of this study. Given that all patients had received
neoadjuvant therapy it is possible that only chemo-resistant cells remained for sampling
and analysis. This concept is explored further in Section 4.4.4.
3.4.7 Conclusion
Approximately one third of mutations identified in this study are present exclusively in the
primary tumour, one third are present exclusively in the metastases and one third are
present in tumours at both sites. In this cohort, only 13.8% of mutations were present in
patient matched samples, i.e. only 13.8% of the metastatic genotype can be predicted by
the genotype of the primary tumour.
We have identified a SNV in the CDAN1 gene which has potential to serve as a predictive
biomarker, with the presence of the SNV in the primary tumour predicting the metastatic
genotype. Further validation on a micro-array of multiple patient matched samples with
corresponding response and outcome data would assist with further evaluation.
SNVs identified in the ErbB pathway appear to be concordant between primary and
metastatic tumours. As our understanding of the relevance of this pathway (and genetic
variants within) to response to treatment with chemotherapy and targeted agents grows,

125
treatment decisions may increasingly be made on the basis of other genetic abberations
beyond the currently used KRAS status. This genotypic information can be acquired from
the primary tumour given its concordance with the metastatic genotype.

126
Chapter 4
A global proteomic assessment of patient matched primary and metastatic colorectal
tumours

127
4.1 Introduction
4.1.1 Background
The role of neoadjuvant therapy has already been discussed in some detail (Section 1.8.4).
In the context of colorectal liver metastases, neoadjuvant chemotherapy is often used to
downstage borderline resectable patients to facilitate safe and effective surgery with the
survival benefit we now know that it confers.
The ability to establish prospectively the likely response to neoadjuvant therapy would be
of tremendous benefit to clinicians. Those patients who are identifiable as likely to respond
could be subjected to potentially more effective systemic therapy, whilst conversely those
less likely to respond could be saved the unnecessary morbidity of systemic treatment and
the delay to surgical intervention necessary with the use of neoadjuvant treatments.
Access to the colon and rectum to obtain tumour samples for biological analysis is feasible
and safe by means of endoscopic assessment. In the context of metastatic disease in the
liver, studies have shown that pre-operative needle biopsy is associated with seeding of the
cutaneous tract and a considerable increase in morbidity (Cresswell, Welsh and Rees,
2009). As such we are limited to the primary tumour for biological information to help us
guide the treatment of the liver metastases. This is observed in current clinical practice with
the genotyping of KRAS performed on the archived primary tumour tissue to establish the
potential benefit of the inclusion of cetuximab alongside other systemic agents.
4.1.2 Proteomics
Proteomics is defined as the large scale study of proteins, and in particular their structure
and function. The term was first coined in 1997 to draw a parallel with the increasing
interest in genomics (James, 1997). The proteome is the entire set of proteins produced or
modified by an organism or system which varies with time and distinct requirements of the
cell or organism (Wilkins et al, 1996).
The study of proteomics is arguably more complicated than the genomics described in
Chapter 3. Firstly, an individual’s genome remains more or less constant, however the
proteome can vary between cells and over time. Secondly, modification of the translated

128
protein, for example by phosphorylation or glycosylation, is common and can have a
significant impact on protein function. Thirdly, many proteins form complexes with other
proteins, and only exert their biological effect as part of this complex. Fourthly, protein
degradation plays a significant part in any attempt at quantification. Finally, as a
combination of the above factors, reproducibility between experimental runs, with
alternative equipment and in different laboratories can prove challenging (Peng et al,
2003). These challenges however represent an opportunity to help us understand the
complexities of tumour biology, which is critical in helping us develop the most effective
diagnostic tools and treatment strategies for the future (Ceciliani et al, 2014).
The investigation of protein expression, structure and protein-protein interactions is all
feasible. Proteomic data can also be used to enhance gene annotations, with parallel
genomic studies assisting to further characterise post-translational modifications and
proteolytic events (Gupta et al, 2007). Monitoring these post-translational modifications is
critical, as for many cellular events protein abundance does not change rather their
function is altered by these modifications. A current area of significant method
development is the advancement of quantitative proteomics, data from which would
permit a more detailed analysis of cell systems and biological functions (Yin et al, 2013).
4.1.3 Isobaric tagging for relative (and absolute) quantification
Isobaric tagging for relative and absolute quantification (iTRAQ) is a quantitative
proteomics technique designed to determine the absolute or relative amount of proteins
from a number of different samples within a single experiment. Samples are prepared by
reducing and alkylating cysteine residues and subjecting them to an overnight tryptic
digest, whereby proteins are cleaved at the carboxyl side of the amino acids lysine and
arginine (except when either is followed by proline) to produce peptides.
Each sample is incubated with a specific isotope labelled molecule which covalently binds
to the N-terminus and side chains of all peptides within the sample. The iTRAQ tag consists
of a reporter moiety which is used for quantification during analysis and a balance moiety.
All tags have the same total mass of 145Da, however the reporter moieties in each tag are
different in mass. When each tag binds to a peptide that is present in all eight samples, all
eight iTRAQ labelled peptides should have the same mass.

129
For ease of mass spectrometry, samples first undergo a ‘clean up’ step where the peptides
are separated into fractions of certain ionic charge by cation exchange. During mass
spectrometry, the peptides within a particular fraction are separated by mass and ionised
thus producing parent ion molecules. Each parent ion is represented by a single peak and is
isolated and directed to a collision chamber where the peptides are bombarded with a
collision gas causing the tagged peptides to fragment. During fragmentation, the reporter
and balance moieties are cleaved from each other and from the peptide to which they are
bound. The peptide itself is also cleaved into fragment ions and these ions are used to
identify the protein that this peptide represents by cross-referencing with a known
database. The released reporter molecules, which should be a combination of the eight
varying masses, are used to quantify the relative abundance of the peptide to which they
were bound in each of the original samples by calculating the ratios of the reporter
molecules. The abundance is compared to a common pool of a number of samples, use of
which across multiple runs allows for efficient and accurate multiplexing (Zieske, 2006).
Figure 4.1 is a schematic representation of this laboratory technique as applied to the
experimental design.
Figure 4.1 – Samples are reduced and undergo a tryptic digest before being tagged with
an isotope labelled molecule. These tags all have the same molecular weight although the
reporter and balance moieties vary. After a cation exchange cleanup step the samples
undergo nanoLC-MS/MS. The reporter and balance moieties are cleaved from each other
and from the peptide to which they are bound, the ratio of which helps determine
relative abundance. The peptide is also cleaved into fragment ions used to identify the
protein.

130
4.1.4 Study aim
The aim of this investigation is to compare the proteomic profile of the primary and
metastatic tumours, both with each other and with their normal adjacent tissue, to
establish the degree of similarity and identify potential response biomarkers present in the
primary tumour which may predict response to neoadjuvant therapy in the liver metastasis.
131
4.2 Methods
National Health Service Research Ethics Committee and Research and Development
approval was obtained for this study and informed consent obtained from each of the study
participants.
4.2.1 Patient recruitment and tissue collection
Samples were obtained from consecutive patients undergoing synchronous or staged
resection of a primary colorectal tumour and liver metastases at any of the institutions
within the research infrastructure constructed to facilitate this study.
Following delivery of the colorectal specimen the proximal staple line was incised and a
linear cut made down the antimesenteric border before excising a peripheral section of
tumour using forceps and a scalpel. Following delivery of the liver specimen, an incision was
made through the resected surface to the liver metastasis, with care being taken not to
breach the liver capsule; a peripheral sample of tumour was obtained as described
previously. Macroscopically normal adjacent colonic mucosa and liver parenchyma were
also obtained, with all tissue sampling performed in the operating theatre under aseptic
conditions followed by immediate stabilisation in liquid nitrogen and transfer to a -80oC
storage facility.
4.2.2 Exclusion criteria
For this study, the exclusion criteria were:
Recent (last 12 months) personal history of malignancy at another site
Patients under the age of 18
Patients without capacity to provide informed consent
Patients identified by the multidisciplinary team as being at significant risk of
emotional distress by additional hospital visits and/or procedures that may be
required
4.2.3 Evaluation of histopathological response to treatment
132
Additional tumour samples were obtained for the purposes of formalin fixation and
embedding in paraffin. All samples were reviewed by a consultant histopathologist to verify
the diagnosis of adenocarcinoma.
For those patients who had received neoadjuvant chemotherapy the histopathological
response to treatment was assessed. The number of residual viable tumour cells within
each sample was estimated as a percentage of the total tumour surface area that included
areas of coagulative necrosis, calcification, fibrosis and the associated histiocytes, foreign
body giant cells and inflammatory cells. Samples were subsequently scored as tumour
regression grade 1 (1-24%), 2 (25-49%), 3 (50-74%) or 4 (>75%) for the purposes of analysis.
This scoring system was first described by Ribero et al (2007), and used for this purpose by
Blazer et al (2008).
4.2.4 Sample preparation
Protein was extracted from sampled tissue by mechanical dissolution and sonication in
500mM triethylammonium bicarbonate (TEAB) with 0.1% sodium dodecyl sulphate (SDS).
After centrifugation at 4oC at 2000 g for 15 minutes, the supernatant was removed and
protein concentration determined by Bradford assay (Bradford, 1976).
4.2.5 Protein quantification
Standard protein concentrations of bovine serum albumin (BSA) (Sigma Aldrich) were
prepared at 0.1, 0.2, 0.4, 0.8, 1.0 and 1.4mg/ml and 20µl placed in triplicate on a 96 well
plate. Serial dilutions of each sample were made at concentrations of 1:10, 1:20, 1:50 and
1:100, and 20µl placed in triplicate on the same 96 well plate. Bradford reagent (BioRad)
was diluted 1:5 with dH2O and 180µl placed in each of the wells and then mixed.
Absorbance at 570nm was measured using the Dynex MRXe plate reader (Magellan
Biosciences, Chelmsford, UK), and protein concentration of the sample calculated by
comparison to the standard curve.
4.2.6 Creation of a reference pool
In order to infer relative protein abundance between samples, a reference pool was
created for each study. For each sample to be quantified 100µg of protein was combined

133
together in a common pool i.e. 100µg of each of normal mucosa, primary tumour, liver
metastasis and liver parenchyma for each patient in the study. Once the reference pool had
been created it was re-quantified as above and prepared in an identical fashion to the other
samples as follows.
4.2.7 Allocation across and within experimental runs
iTRAQ reagents are available in 4-plex and 8-plex formats, thus restricting the number of
samples to 8 per run. Inclusion of the reference pool as a sample further limits each
experimental run to 7. Given some of the inherent difficulties in reproducibility with
proteomics discussed in Section 4.1.2, all samples to be analysed were randomly allocated
across all experimental runs in a stratified fashion thus ensuring even distribution of tissue
types and patients. In order to facilitate rigorous bioinformatics analysis across sample runs
the same reference pool was included. Within experimental runs allocation to iTRAQ label
was performed on a purely random basis.
4.2.8 iTRAQ labelling
Labelling with iTRAQ reagents was carried out according to the Applied Biosystems protocol
for an 8-plex procedure (Life Technologies, Paisley, UK). In brief, 100μg of protein from
each sample was reduced with Tris (2-carboxyethyl) phosphine hydrochloride (TCEP) and
capped with methylmethanethiosulfate (MMTS), before overnight digestion with trypsin
(Promega, Southampton, UK). Peptides were then labelled with isobaric tags and pooled
and diluted to 5ml with 10mM potassium dihydrogen phosphate/25% acetonitrile (ACN)
and acidified to <pH3 with phosphoric acid.
4.2.9 Cation exchange
Samples were fractionated on a Polysulfoethyl A strong cation-exchange column (200 ×
4.6mm, 5m, 300Å; Poly LC, Columbia, MD) at 2ml/minute using a gradient from 10mM
potassium dihydrogen phosphate/25% ACN (w/v) to 0.5M potassium chloride/10mM
potassium dihydrogen phosphate/25% ACN (w/w/v) in 75 minutes. Fractions of 2ml were
collected and dried by centrifugation under vacuum (SpeedVac, Eppendorf UK Ltd,
Stevenage, UK). Fractions were reconstituted in 1ml of 0.1% trifluoroacetic acid (TFA) and
were desalted using a mRP Hi Recovery protein column 4.6 x 50mm (Agilent, Berkshire UK)

134
on a Vision Workstation (Applied Biosystems/Life Technologies, Paisley, UK) prior to mass
spectrometric analysis.
4.2.10 Mass spectrometry
Desalted fractions were reconstituted in 40l 0.1% formic acid and 5l aliquots were
delivered into a Triple TOF 5600 (AB Sciex, Warrington, UK) via an Eksigent NanoUltra
cHiPLC System (AB Sciex) mounted with a microfluidic trap and analytical column (15 cm ×
75 μm) packed with ChromXP C18−CL 3 μm. A NanoSpray III source was fitted with a 10μm
inner diameter PicoTip emitter (New Objective, Woburn, USA). The trap column was
washed with 2% ACN/0.1% formic acid for 10 minutes at 2μL/minute before switching in-
line with the analytical column. A gradient of 2−50% ACN/0.1% formic acid (v/v) over 90
minutes was applied to the column at a flow rate of 300nl/min. Spectra were acquired
automatically in positive ion mode using information-dependent acquisition powered by
Analyst TF 1.5.1. software (AB Sciex). Up to 25 MS/MS spectra were acquired per cycle
(approximately 10Hz) using a threshold of 100 counts per second and with dynamic
exclusion for 12 seconds. The rolling collision energy was increased automatically by
selecting the iTRAQ check box in Analyst, and manually by increasing the collision energy
intercepts by 5.
4.2.11 Protein identification and quantification
Data were searched using ProteinPilot 4.2 and the Paragon algorithm (AB Sciex) against the
latest version of the SwissProt database, with MMTS as a fixed modification of cysteine
residues and biological modifications allowed. The data were also searched against a
reversed decoy database and only proteins lying within a 1% global false discovery rate
(FDR) were taken forward for analysis. Quantitation of proteins was relative to the common
pooled sample present in each iTRAQ-MS experiment. iTRAQ data for proteins identified by
2 or more peptides with at least 90% confidence of correct sequence assignment, or by a
single peptide with at least 99% confidence were log2 transformed, batch corrected and
included in subsequent analyses.
4.2.12 Bioinformatics analysis
Proteins present in at least 50% of all samples were taken forward for bioinformatics
analysis. A number of direct two group comparisons were made using Partek® (St Louis,

135
USA) to identify proteins significantly different between the groups. A two-way Analysis of
Variance (ANOVA) was employed to identify the differential proteins whilst accounting for
batch effect. With the aim of reducing the false discovery rate, the Benjamini-Hochberg
multiple test correction was used (Benjamini and Hochberg, 1995). In this correction p
values are sorted and ranked, the smallest value receiving 1, second 2 and largest N. Each p
value is then multiplied by N and divided by its assigned rank to give the adjusted p-values.
Statistical significance was taken as log2 fold change >2 with an adjusted p value of <0.05.
Those proteins identified as statistically significantly different were subjected to analysis
with Ingenuity Pathway Analysis (Redwood City, USA). Ingenuity Pathways Analysis
computes a score for each network according to the fit of that network with the identified
proteins of interest (referred to as the focus proteins). The score is derived from a p-value
and indicates the probability of the focus proteins in a network being found together due to
random chance. A score of 2 indicates that there is a 1 in 100 chance that the focus proteins
are together in a network due to random chance, therefore scores greater than 2 have at
least a 99% confidence of not being generated by random chance alone. Analysis must also
take into account both the number of focus proteins identified and total known proteins in
each network. Significant canonical pathways were identified with a threshold p value of
<0.05 (after correction). If there are n proteins in a pathway, and f have been identified
through iTRAQ, the p-value is the probability of finding f or more proteins in a set of n
proteins randomly selected from the global molecular network.
In addition, the lists of single nucleotide variants identified in Chapter 3 will be combined
with the proteomic dataset to identify those proteins in which SNVs have also been found.
A summary of the bioinformatics workflow can be seen in Figure 4.2.

136
Figure 4.2 – Bioinformatics analysis workflow for global proteomic assessment of patient
matched primary and metastatic colorectal tumours.
1
•iTRAQ data for proteins identified by 2 or more peptides with at least 90% confidence of correct sequence assignment, or by a single peptide with at least 99% confidence
2•Log 2 transformation and batch correction
3•Proteins present in at least 50% of the samples
4
•Two group comparisons (using Partek®) of: primary tumour and normal colorectal mucosa, metastatic tumour and normal colorectal mucosa, metastatic tumour and normal adjacent liver parenchyma, primary and metastatic tumour, primary tumour in responders and non-responders and metastatic tumour in responders and non-responders
5
•Statistical analysis using ANOVA, and multiple test correction using Benjamini-Hochberg (significance taken as log2 fold change > 2 and unadjusted p<0.05)
6
•Pathway and network analysis of protein lists using Ingenuity Pathway Analysis

137
4.3 Results
4.3.1 Clinical and demographic data
Sixteen patients presenting with liver limited stage IV disease were recruited to this study.
Of these patients, 12 were male and 4 female ranging in age from 59-84 years at the time
of diagnosis. Eleven patients underwent neoadjuvant chemotherapy, with 5 proceeding
straight to surgery. Six patients underwent simultaneous resection of disease at both sites,
with the remainder undergoing staged resections. The distribution of disease across the
colon ranged from the rectum through to the caecum, with T-stage varying from 2-4 and a
mixture of node positive and negative disease. Similarly 1-17 liver metastases were
identified in one or both lobes of the liver and there was variation in tumour grade at both
sites. All patients with the exception of patient 14 underwent resection at both sites. In this
particular case the liver metastasis was unresectable due to its proximity to major vascular
structures. A summary of the clinical and demographic data can be seen in Table 4.1.

138
Patient Age at
Diagnosis Sex Neoadjuvant
Chemotherapy Synchronously
Resected Location of
Primary Primary
Histology T
Stage N
Stage Number of Mets
Distribution of Mets
Mets Histology
1 66 M Y N Rectum Moderately
differentiated 3 1 4 Unilobar Moderately
differentiated
2 73 M N N Sigmoid Poorly
differentiated 3 1 2 Unilobar Moderately
differentiated
3 64 F Y Y Caecum Moderately
differentiated 2 0 5 Bilobar Moderately
differentiated
4 84 M N N Rectum Moderately
differentiated 3 1 2 Unilobar Moderately
differentiated
5 75 F Y N Rectum Poorly
differentiated 3 0 2 Unilobar Moderately
differentiated
6 76 M N N Sigmoid Moderately
differentiated 3 1 1 Unilobar Moderately
differentiated
7 73 F N N Sigmoid Moderately
differentiated 4 0 1 Unilobar Moderately
differentiated
8 81 M N N Sigmoid Moderately
differentiated 4 0 2 Unilobar Moderately
differentiated
9 79 M Y N Caecum Moderately
differentiated 4 0 3 Bilobar Moderately
differentiated
10 62 M Y N Caecum Moderately
differentiated 3 1 1 Unilobar Moderately
differentiated
11 76 M Y N Rectum Moderately
differentiated 3 1 2 Bilobar Moderately
differentiated

139
12 70 M Y Y Sigmoid Moderately
differentiated 3 0 7 Bilobar Moderately
differentiated
13 67 M Y Y Ascending Well
differentiated 4 0 16 Bilobar Well
differentiated
14 70 M Y Y Caecum Moderately
differentiated 2 0 1 Unilobar Unavailable
15 59 F Y Y Sigmoid Moderately
differentiated 3 0 3 Bilobar Moderately
differentiated
16 75 M Y Y Sigmoid Poorly
differentiated 3 2 4 Unilobar Poorly
differentiated
Table 4.1 – Clinical, demographic and disease characteristics of the 16 patients recruited to this study. Eleven patients underwent neoadjuvant
chemotherapy, the remainder proceeding straight to surgery. Six patients were simultaneously resected. There was considerable variation in location of
the primary tumour, disease stage and grade as well as metastatic burden.

140
4.3.2 Response evaluation
Eleven of the 16 patients recruited underwent neoadjuvant chemotherapy, for which there
was considerable variation in the regimen. One of these 11 patients did not undergo
resection of the liver metastasis. As such, response evaluation data is available for 10
patients (Table 4.2).
Table 4.2 – Details of neoadjuvant chemotherapy agents and response evaluation. Five
patients were chemonaive and 11 underwent neoadjuvant treatment. One of these
patients failed to undergo resection of the liver metastasis. Response evaluation data is
therefore available for 10 patients, 5 of which had a tumour regression grade of 1-2
(responders) with the remaining 5 having a tumour regression grade of 3-4 (non-
responders).
Patient Neoadjuvant
Chemotherapy Agents Viable
Tumour (%)
Tumour Regression
Grade Responder
1 Y
Oxaliplatin and
capecitabine 60 3 No
2 N 3 Y IrMdG 60 3 No
4 N 5 Y FOLFOX 20 1 Yes
6 N 7 N 8 N 9 Y FOLFOX 20 1 Yes
10 Y IrMdG 90 4 No
11 Y FOLFOX 40 2 Yes
12 Y IrMdG 25 2 Yes
13 Y IrMdG 40 2 Yes
14 Y
Irinotecan and
capecitabine
15 Y
Oxaliplatin, capecitabine
and cetuximab 80 4 No
16 Y IrMdG 80 4 No

141
There was considerable variation (20-80%) in histopathological response to neoadjuvant
treatment. Five patients had a tumour regression grade of 1-2 and five patients had a
tumour regression grade of 3-4. For the purposes of analysis these two groups are referred
to as responders and non-responders respectively.
4.3.3 Overview of iTRAQ data
A total of 5766 unique proteins were identified. Of these, 2637 were present in at least half
of the samples and therefore taken forwards for analysis. The data were acquired over 12
experimental runs, with a mean (SD) of 10.2 (3.3) peptides used to identify the proteins of
origin. This corresponds to a mean (SD) coverage of 21.04% (8.92%) for identified proteins.
4.3.4 Comparison of primary tumour and normal colorectal mucosa
This analysis identified all those proteins dysregulated in the primary tumour compared to
the normal colorectal mucosa. A total of 25 proteins were identified, 6 of which were
upregulated in the tumour and 19 downregulated (Table 4.3).
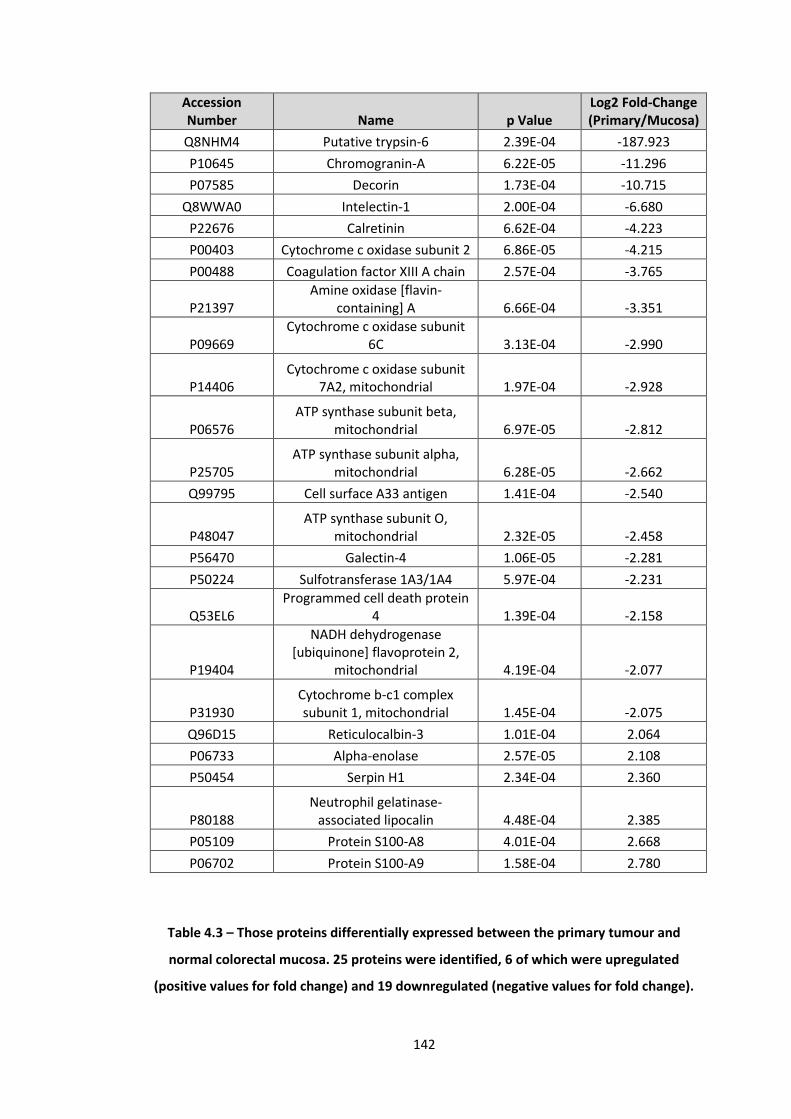
142
Accession Number Name p Value
Log2 Fold-Change (Primary/Mucosa)
Q8NHM4 Putative trypsin-6 2.39E-04 -187.923
P10645 Chromogranin-A 6.22E-05 -11.296
P07585 Decorin 1.73E-04 -10.715
Q8WWA0 Intelectin-1 2.00E-04 -6.680
P22676 Calretinin 6.62E-04 -4.223
P00403 Cytochrome c oxidase subunit 2 6.86E-05 -4.215
P00488 Coagulation factor XIII A chain 2.57E-04 -3.765
P21397 Amine oxidase [flavin-
containing] A 6.66E-04 -3.351
P09669 Cytochrome c oxidase subunit
6C 3.13E-04 -2.990
P14406 Cytochrome c oxidase subunit
7A2, mitochondrial 1.97E-04 -2.928
P06576 ATP synthase subunit beta,
mitochondrial 6.97E-05 -2.812
P25705 ATP synthase subunit alpha,
mitochondrial 6.28E-05 -2.662
Q99795 Cell surface A33 antigen 1.41E-04 -2.540
P48047 ATP synthase subunit O,
mitochondrial 2.32E-05 -2.458
P56470 Galectin-4 1.06E-05 -2.281
P50224 Sulfotransferase 1A3/1A4 5.97E-04 -2.231
Q53EL6 Programmed cell death protein
4 1.39E-04 -2.158
P19404
NADH dehydrogenase [ubiquinone] flavoprotein 2,
mitochondrial 4.19E-04 -2.077
P31930 Cytochrome b-c1 complex subunit 1, mitochondrial 1.45E-04 -2.075
Q96D15 Reticulocalbin-3 1.01E-04 2.064
P06733 Alpha-enolase 2.57E-05 2.108
P50454 Serpin H1 2.34E-04 2.360
P80188 Neutrophil gelatinase-
associated lipocalin 4.48E-04 2.385
P05109 Protein S100-A8 4.01E-04 2.668
P06702 Protein S100-A9 1.58E-04 2.780
Table 4.3 – Those proteins differentially expressed between the primary tumour and
normal colorectal mucosa. 25 proteins were identified, 6 of which were upregulated
(positive values for fold change) and 19 downregulated (negative values for fold change).

143
Analysing those proteins upregulated separately from those downregulated, Ingenuity core
analysis of direct and indirect relationships revealed the significant upregulated canonical
pathways in this group to be: Role of IL-17A in psoriasis, differential regulation of cytokine
production in intestinal epithelial cells by IL-17A and IL-17F, glycolysis I, gluconeogenesis I
and IL-17A signalling in fibroblasts. Similarly the downregulated canonical pathways were:
Mitochondrial dysfunction, oxidative phosphorylation, melatoning degradation II,
phenylalanine degradation IV and extrinsic prothrombin activation pathway. Statistics for
these identified pathways can be seen in Table 4.4.
Upregulated Pathways p-value Ratio
Role of IL-17A in psoriasis 7.10E-06 2/13 (0.154)
Differential regulation of cytokine production in intestinal epithelial cells
7.59E-03 1/23 (0.043)
Glycolysis I 7.91E-03 1/24 (0.042)
Gluconeogenesis I 8.24E-03 1/25 (0.04)
IL-17A signalling in fibroblasts 1.15E-02 1/35 (0.029)
Downregulated Pathways p-value Ratio
Mitochondrial dysfunction 7.35E-15 9/165 (0.055)
Oxidative phosphorylation 2.07E-14 8/104 (0.077)
Melatonin degradation II 3.74E-03 1/4(0.25)
Phenylalanine degradation IV 1.30E-02 1/14 (0.071)
Extrinsic prothrombin activation pathway
1.49E-02 1/16 (0.062)
Table 4.4 – Pathway analysis for proteins both upregulated and downregulated in the
primary tumour when compared to normal adjacent colorectal mucosa. P-value is
adjusted using Benjamini-Hochberg correction. Ratio identifies the number of focus
molecules identified (numerator) in the pathway (denominator).
Further analysis of all (unfiltered) biological pathways identified 1 upregulated network
with a score greater than 2 pertaining to: cellular movement, haematological system
development and function and immune cell trafficking. Similarly 5 downregulated networks
were identified pertaining to: Cellular development, haematological system development
and function, haematopoiesis, cell morphology, cell death and survival, cell-to-cell signalling
and interaction, cancer, cellular growth and proliferation and cellular assembly and
organisation. The focus molecules and statistics pertinent to these networks can be seen in
Table 4.5.

144
Upregulated Networks
ID Molecules in Network Score Focus Molecules
Top Diseases and Functions
1 A4GALT,APOC2,CCL11,CTSS,ENO1,GSTA1,HEXA,HEXB,HIF1A,HLA-
DQ,HSF2,HTR4,HTR7,IL25,IL37,IL1B,LAMA3,LCN2,LILRA5,lymphotoxin-alpha1-
beta2,MMP8,MMP12,PGF,PLA2G3,PLA2G5,POPDC2,PROK2,S100A8,S100A9,SERPIN
B9,SERPINH1,SHH,Sod,TAB3,TNF
13 5 Cellular Movement,
Haematological System
Development and Function, Immune Cell Trafficking
Downregulated Networks
1 AGTR1,ATP5A1,ATP5B,C10orf10,CALB2,CHGA,CHST2,COA3,COX5A,COX6C,CTNNAL
1,CTNNB1,DCD,DCN,estrogen receptor,F13A1,HSPE1,IFNE,IL6,IL10,IL13,
LGALS4,LILRA5,MAOA,MKK3/6,MT-CO2,NID1,PDCD4,PDGFC,SEMA3C,SLC8A1
,STAT1,SURF1,TIMP4,TNF
26 11 Cellular Development, Hematological
System Development and Function,
Hematopoiesis
2 GPA33,KLF4 3 1 Cellular Development,
Hematopoiesis, Cell Morphology
3 ITLN1,LTF 3 1 Cell Death and Survival, Cell Morphology, Cell-To-Cell
Signaling and Interaction
4 NDUFV2,RBM5 3 1 Cancer, Cellular Development,
Cellular Growth and Proliferation
5 RTN4,UQCRC1 3 1 Cell Death and Survival, Cell Morphology,
Cellular Assembly and Organization
Table 4.5 - Network analysis for proteins both upregulated and downregulated in the
primary tumour when compared to normal adjacent colorectal mucosa. The score is
derived from a p-value and indicates the probability of the focus molecules in a network
being found together due to random chance. Focus molecules is the total number of
proteins of interest identified in the respective network.
4.3.5 Comparison of metastatic tumour and normal colorectal mucosa

145
This analysis identified all those proteins dysregulated in the metastatic tumour compared
to the normal colorectal mucosa. A total of 53 proteins were identified, 13 of which were
upregulated in the tumour and 40 downregulated (Table 4.6).
Accession Number Name p Value
Log2 Fold-Change (Metastasis/Mucosa
Q8NHM4 Putative trypsin-6 2.21E-04 -231.682
P20774 Mimecan 5.66E-04 -67.140
Q03135 Caveolin-1 3.51E-04 -20.544
P10645 Chromogranin-A 2.75E-05 -12.934
P02511 Alpha-crystallin B chain 1.50E-03 -10.484
P07585 Decorin 1.63E-04 -10.388
O60844 Zymogen granule membrane
protein 16 7.41E-04 -9.924
Q8WWA0 Intelectin-1 2.20E-05 -9.843
P43121 Cell surface glycoprotein
MUC18 9.46E-04 -8.682
Q96BQ1 Protein FAM3D 2.90E-04 -7.850
A8K7I4 Calcium-activated chloride
channel regulator 1 8.23E-04 -5.347
Q9Y6R7 IgGFc-binding protein 1.35E-03 -4.591
Q96A26 Protein FAM162A 1.30E-03 -4.281
Q02952 A-kinase anchor protein 12 1.37E-04 -4.268
P22676 Calretinin 9.49E-04 -4.166
Q09666 Neuroblast differentiation-associated protein AHNAK 4.27E-05 -4.085
Q9NR45 Sialic acid synthase 3.98E-04 -3.972
P00403 Cytochrome c oxidase
subunit 2 1.14E-04 -3.839
O75489
NADH dehydrogenase [ubiquinone] iron-sulfur protein 3, mitochondrial 1.73E-04 -3.469
P23946 Chymase 2.27E-04 -3.391
O00159 Myosin-Ic 2.81E-04 -3.185
P14406 Cytochrome c oxidase
subunit 7A2, mitochondrial 7.69E-05 -3.171
Q9Y639 Neuroplastin 1.24E-04 -3.166
P09669 Cytochrome c oxidase
subunit 6C 1.66E-04 -3.146
P56470 Galectin-4 2.42E-07 -2.95662

146
Q99795 Cell surface A33 antigen 5.44E-05 -2.950
P00488 Coagulation factor XIII A
chain 1.27E-03 -2.910
P09936 Ubiquitin carboxyl-terminal
hydrolase isozyme L1 1.36E-03 -2.888
Q99798 Aconitate hydratase,
mitochondrial 1.21E-03 -2.602
P05023
Sodium/potassium-transporting ATPase subunit
alpha-1 6.41E-05 -2.590
P25705 ATP synthase subunit alpha,
mitochondrial 7.71E-05 -2.567
Q53EL6 Programmed cell death
protein 4 1.46E-05 -2.523
P50224 Sulfotransferase 1A3/1A4 1.43E-04 -2.504
P06576 ATP synthase subunit beta,
mitochondrial 2.10E-04 -2.490
P19404
NADH dehydrogenase [ubiquinone] flavoprotein 2,
mitochondrial 6.70E-05 -2.362
P48047 ATP synthase subunit O,
mitochondrial 3.48E-05 -2.344
O95571 Protein ETHE1, mitochondrial 3.86E-07 -2.202
P01877 Ig alpha-2 chain C region 2.59E-04 -2.185
Q14651 Plastin-1 1.21E-04 -2.165
Q9P2B2 Prostaglandin F2 receptor
negative regulator 1.01E-03 -2.098
P34897
Serine hydroxymethyltransferase,
mitochondrial 5.92E-05 2.038
P17096 High mobility group protein
HMG-I/HMG-Y 8.96E-04 2.072
P06733 Alpha-enolase 2.08E-05 2.107
Q53H82 Beta-lactamase-like protein 2 1.11E-03 2.114
P50454 Serpin H1 6.50E-04 2.130
Q96HE7 ERO1-like protein alpha 4.37E-04 2.212
P08195 4F2 cell-surface antigen
heavy chain 1.56E-03 2.398
Q06787 Fragile X mental retardation
1 protein 5.60E-04 2.667
P13797 Plastin-3 4.66E-05 3.007
P19971 Thymidine phosphorylase 4.73E-04 3.656
P40261 Nicotinamide N- 1.21E-03 4.242

147
methyltransferase
P05181 Cytochrome P450 2E1 1.12E-03 6.000
P05177 Cytochrome P450 1A2 7.07E-04 32.731
Table 4.6 – Those proteins differentially expressed between the metastatic tumour and
normal colorectal mucosa. 53 proteins were identified, 13 of which were upregulated
(positive values for fold change) and 40 downregulated (negative values for fold change).
Analysing those proteins upregulated separately from those downregulated, Ingenuity core
analysis of direct and indirect relationships revealed the significant upregulated canonical
pathways in this group to be: bupronion degradation, acetone degradation I, estrogen
biosynthesis, nicotine degradation III and melatonin degradation I. Similarly the
downregulated canonical pathways were: oxidative phosphorylation, mitochondrial
dysfunction, CMP-N-acetylneuramine biosynthesis I, extrinsic prothrombin activation
pathway and Parkinson’s signalling. Statistics for these identified pathways can be seen in
Table 4.7.
Upregulated Pathways p-value Ratio
Bupropion degradation 1.34E-04 2/24 (0.083)
Acetone degradation I 1.41E-04 2/25 (0.08)
Estrogen biosynthesis 2.95E-04 2/36 (0.056)
Nicotine degradation III 4.41E-04 2/44 (0.045)
Melatonin degradation I 5.03E-04 2/47 (0.043)
Downregulated Pathways p-value Ratio
Oxidative phosphorylation 3.77E-11 8/104 (0.077)
Mitochondrial dysfunction 4.46E-11 9/165 (0.055)
CMP-N-acetylneuraminate biosynthesis I 1.04E-02 1/5 (0.2)
Extrinsic prothrombin activation pathway 3.30E-02 1/16 (0.062)
Parkinson’s signalling 3.30E-02 1/16 )0.062)
Table 4.7 – Pathway analysis for proteins both upregulated and downregulated in the
metastatic tumour when compared to normal adjacent colorectal mucosa. P-value is
adjusted using Benjamini-Hochberg correction. Ratio identifies the number of focus
molecules identified (numerator) in the pathway (denominator).

148
Further analysis of all (unfiltered) biological pathways identified 3 upregulated networks
with a score greater than 2 pertaining to: cellular assembly and organisation, drug
metabolism, energy production, post-translational modification, protein folding,
cardiovascular disease, cellular movement, inflammatory disease, and nervous system
development and function. Similarly 2 downregulated networks were identified pertaining
to: cardiovascular system development and function, cell-to-cell signalling and interaction,
tissue development, cellular compromise, tissue morphology and cellular growth and
proliferation. The focus molecules and statistics pertinent to these networks can be seen in
Table 4.8.

149
Upregulated Networks
ID Molecules in Network Score Focus Molecules
Top Diseases and Functions
1 C9orf3,CDK5R1,CTNNB1,CYP1A2,CYP2E1,DVL3,DYNLL1,ENO1,EPHB2,FAF1,FMR1,GFER,GLI2,HAS3,Hat,HIF1AN,HMGA1,LTBP
2,mir-24,MYC,NFkB (complex),PI3K (complex),PLS3,RAB31,RGS3,SERPINH1,SFRP1,SHMT2,SLC3A2,SNRK,ST3GAL1,TDG,T
GFB1,TYMP,ZMIZ2
24 10 Cellular Assembly and Organization,
Drug Metabolism,
Energy Production
2 ERO1L,PDIA2 3 1 Post-Translational Modification,
Protein Folding, Cardiovascular
Disease
3 CHI3L1,EIF2AK2,NNMT 3 1 Cellular Movement,
Inflammatory Disease, Nervous
System Development and Function
Downregulated Networks
1 ACO2,AGTR1,Akt,ANXA9,ATP5A1,ATP5B,CALB2,CAV1,CD44,CDH13,CMA1,COA3,C
OX5A,COX6C,DCN,estrogen receptor,F12,FAT1,IL6,IL1B,LGALS4,LILRA
5,MAP1B,MAP3K14,MCAM,MT-CO2,MYO1C,ORM1,PDCD4,PIK3R2,RPL6,R
PL35A,RPS11,S1PR2,SURF1
26 13 Cardiovascular System
Development and Function,
Cell-To-Cell Signaling and Interaction,
Tissue Development
2 AHNAK,AIM1,AKAP12,APP,ATP1A1,CD81,CHGA,CLCA1,CLEC4A,CRYAB,CTNNAL1,CTNNB1,DVL1,ERK1/2,ETHE1,F13A1,FAM162A,GPR183,IL13,MAPK8IP1,MN1,MT1L,MUC5AC,PERP,PLS1,PPP3CA,PTGFRN,RAD23A,SEMA3C,SMARCA4,SORT1,STXBP1,TP5
3,tyrosine kinase,UCHL1
23 12 Cellular Compromise,
Tissue Morphology,
Cellular Growth and Proliferation
Table 4.8 - Network analysis for proteins both upregulated and downregulated in the
metastatic tumour when compared to normal adjacent colorectal mucosa. The score is
derived from a p-value and indicates the probability of the focus molecules in a network
being found together due to random chance. Focus molecules is the total number of
proteins of interest identified in the respective network.

150
4.3.6 Comparison of metastatic tumour and normal adjacent liver parenchyma
This analysis identified all those proteins dysregulated in the metastatic tumour compared
to the normal liver parenchyma. A total of 444 proteins were identified, 164 of which were
upregulated in the tumour and 280 downregulated. The data set can be found in Appendix
3 – Proteomic comparison of metastatic tumour and normal adjacent liver parenchyma.
Analysing those proteins upregulated separately from those downregulated, Ingenuity core
analysis of direct and indirect relationships revealed the significant upregulated canonical
pathways in this group to be: acute phase response signalling, LXR/RXR activation, FXR/RXR
activation, complement system and coagulation system. Similarly the downregulated
canonical pathways were: serotonin degradation, LPS/IL mediated inhibition of RXR, fatty
acid β-oxidation I, noradrenaline and adrenaline degradation and xenobiotic metabolism
signalling. Statistics for these identified pathways can be seen in Table 4.9.
Upregulated Pathways p-value Ratio
Acute phase response signalling 6.23E-30 29/168 (0.173)
LXR/RXR activation 2.10E-26 24/121 (0.198)
FXR/RXR activation 1.56E-24 23/125 (0.184)
Complement system 2.15E-19 13/32 (0.406)
Coagulation system 2.22E-13 10/35 (0.286)
Downregulated Pathways p-value Ratio
Serotonin degradation 4.85E-27 22/52 (0.423)
LPS/IL mediated inhibition of RXR 8.04E-27 35/208 (0.168)
Fatty acid β-oxidation I 2.31E-24 17/29 (0.586)
Noradrenaline and adrenaline degradation
2.42E-23 17/32 (0.531)
Xenobiotic metabolism signalling 1.52E-21 33/256 (0.129)
Table 4.9 – Pathway analysis for proteins both upregulated and downregulated in the
metastatic tumour when compared to normal adjacent colorectal mucosa. P-value is
adjusted using Benjamini-Hochberg correction. Ratio identifies the number of focus
molecules identified (numerator) in the pathway (denominator).
Further analysis of all (unfiltered) biological pathways identified 8 upregulated networks
with a score greater than 2 pertaining to: cell-to-cell signalling and interaction,
haematological system development and function, immune cell trafficking, cellular
movement, cancer, digestive system development and function, developmental disorder,

151
haematological disease, cellular movement, organismal injury and abnormalities,
dermatological diseases and conditions, hereditary disorder, organismal survival, cellular
development, embryonic development, organismal development and gene expression.
Similarly 10 downregulated networks were identified pertaining to: lipid metabolism, small
molecule biochemistry, vitamin and mineral metabolism, energy production, molecular
transport, endocrine system development and function, drug metabolism, nucleic acid
metabolism, amino acid metabolism, infectious disease, carbohydrate metabolism, cancer,
organismal injury and abnormalities, reproductive system disease, antimicrobial response,
metabolic disease, neurological disease and psychological disorders. The focus molecules
and statistics pertinent to these networks can be seen in Table 4.10.
Upregulated Networks
ID Molecules in Network Score Focus Molecules
Top Diseases and Functions
1 Alpha Actinin,ANXA1,APOA1,APOA2,APOA4,APOB,APOE,APOH,C3,C5,C7,C9,CFB,CLU,Cre
b,EPCAM,Fibrinogen,HDL,HDL-cholesterol,HPX,ITGAM,ITGB2,KNG1,LCN
2,LDL,LTF,MPO,NFkB (complex),PLG,PLTP,PRELP,PRTN3,S100A1
2,TES,TSPAN8
49 27 Cell-To-Cell Signaling and Interaction,
Hematological System
Development and Function, Immune Cell Trafficking
2 Akt,Ap1,ATP1B3,AZGP1,CAPG,CD9,CFH,CFL1,CLDN3,COL12A1,DCN,estrogen
receptor,FSH,GPRC5A,GSTP1,HMGA1,Hsp90,IgG,Jnk,KRT19,LGALS3,LGALS3BP,MYH
14,PADI4,PDGF BB,PI3K (family),POSTN,S100A4,S100A6,SDCBP,SL
C12A2,TF,TFRC,THBS1,VIM
44 26 Cellular Movement,
Cancer, Digestive System
Development and Function
3 A2M,Alp,ANXA2,CD44,COL1A1,Cyclin A,ERK,ERK1/2,F2,FGA,FGB,FGG,FLNA,FN1,
Focal adhesion kinase,GC,Igm,IL12 (complex),Iti,ITIH1,ITIH2,MVP,MYH11,P38
MAPK,PI3K (complex),Pkc(s),S100A10,SERPINC1,SERP
IND1,SET,SFN,TIMP1,TNC,Vegf,VTN
37 22 Cellular Movement,
Developmental Disorder,
Hematological Disease
4 ABCC5,CDH17,CHMP4B,CHMP4C,COL1A2,CTNNB1,EFEMP1,ESR1,FBLN2,FBN1,GJB1,GTSE1,HIST1H1B,KIFC1,KRT20,LDHB,MA
GI1,NUPR1,PDCD6IP,PKM,PPARG,RAD23A,S100P,SEMA3C,SLC2A1,SLC2A12,SLC39A8,TAGLN2,TCF4,TMEM97,TMSB10/TMSB4
X,TP53,UNC5B,VEGFA,VENTX
18 14 Cellular Movement,
Cancer, Organismal Injury
and Abnormalities
5 ACTC1,AGTR1,AHSG,ANXA3,APCS,ASPN,C1R,C1S,C4BPA,CDX2,CKAP4,CLDN7,CLIC1,
18 14 Organismal Injury and

152
DEPTOR,F5,F11,GLS,HNF1A,IFI44,LAMA4,LBR,LIPA,MAPK1,MEP1A,MT1X,MUC13,MX2,PLA1A,SERPINB1,SERPING1,SMAD3,SO
AT2,TCR,UGT1A9 (includes others),YWHAZ
Abnormalities, Dermatological
Diseases and Conditions, Hereditary Disorder
6 Actin,AGR2,ALDOA,BGN,CDKN1A,CSF2,CX3CR1,CYP4F3,EPHB2,FFAR2,FSTL3,GSN,HEXB,HIF1A,HSPH1,LOXL2,Ltbp,LUM,MAPK1
3,mir-145,NOV,OLFM4,PBRM1,S100A8,S100A9,S100A11,SERPINH1,SLPI,SMARCA4,SPAG4
,TAGLN,TEC,TGFB1,TGFBI,TGM2
16 13 Cancer, Organismal
Survival, Cellular Movement
7 AIF1,APOL1,AUTS2,C8A,CABP7,CAV1,CP,DSG2,EFCAB6,ELAVL1,EMID1,HMOX1,HSP,I
FNG,IGHM,IGLL1/IGLL5,IL6,Interferon alpha,MARCKSL1,miR-146a-5p (and other
miRNAs w/seed GAGAACU),MORC2,ORM1,PCOLCE,PGLYRP2,PIGR,PTMA,RTDR1,SLC2A11,SMC1B,T
HBS2,TNF,TRIL,TRIOBP,TTC28,TTR
16 13 Cellular Development,
Embryonic Development,
Organismal Development
8 26s Proteasome,BCL2,CCND1,CEACAM1,CEACAM5,CTNNB1,CXCL8,DICER1,DPEP1,GFI1,IGHG1,IL2,IL6,IL1A,IRS1,ITGB3,KLK2,MAPT,MGEA5,MYC,SERPINA1,SERPINA3,SERPI
NF1,SP1,STAT3,TCF,TGFB1,TNF
8 7 Cellular Development, Cancer, Gene
Expression
Downregulated Networks
1 ABLIM,AIFM1,ALDH1A1,ALDH3A2,CAT,CRAT,CYP2E1,CYP3A4,CYP4F2,CYP8B1,DHCR7,ENO3,FASN,FSH,GOT1,GPT,GSTA2,Histo
ne h3,HSD11B1,HSD17B2,IDH1,Jnk,Lh,MGST
1,MTTP,NFkB (complex),NQO2,PGRMC1,POR,RNA
polymerase II,Rxr,SLC27A2,SOD2,SULT2A1,TCF
41 26 Lipid Metabolism,
Small Molecule Biochemistry, Vitamin and
Mineral Metabolism
2 AADAC,ACADS,ACADVL,ADH1A,AK4,AKR1C4,AKR1C1/AKR1C2,BHMT2,CCDC87,CDKN1A,CYB5A,CYP3A5,DECR1,DYNC1I2,FH,G
LUD1,HADHA,HADHB,HNF1A,LDL-cholesterol,LOH12CR1,MAT1A,MCCC1,mediator,MTORC1,PCK2,SKIV2L2,SREBF1,TAL1,TFR2,TFRC,TUBB6,TXLNG,UGT2B15,Z
FC3H1
28 21 Energy Production, Lipid
Metabolism, Small Molecule
Biochemistry
3 ABCB11,ACAA1,ACAA2,ACOX1,ACSL1,ACSM2B,ADH1B,APOA5,APOC3,APOM,CPT2,CPT1A,CYP3A4,CYP4A11,CYP7A1,DDX20,FABP2,FABP6,G6PC,GLYATL1,HADH,HMGCS2,KNG1,mir-21,mir-27,miR-124-3p (and
other miRNAs w/seed
17 15 Lipid Metabolism,
Small Molecule Biochemistry,
Molecular Transport

153
AAGGCAC),NR1H4,PPARA,Rxr,RXRA,RXRG,SLC10A2,SUCLG2,TCF7,UGT2B4
4 ACAT1,ACAT2,ALDH2,ALDH5A1,ALOX15,APOBEC3B,AQP9,CA2,CSRNP1,DAPK2,ELM
OD1,EPB41L4A-AS1,FANCC,H6PD,ING2,KYNU,LILRA5,LSS,NCKIPSD,NPPB,NR3C1,NUPR1,P4HB,PAX3,PEBP1,PRDX3,RAF1,SAMD4A,SLC25A20,SRGAP2,TGM2,TNF,UGT2B7,WDR3,YWHA
G
15 13 Endocrine System
Development and Function,
Lipid Metabolism,
Small Molecule Biochemistry
5 ACADM,AGTR1,ATP5B,CYP1A2,CYP2A6 (includes
others),CYP2C8,CYP2C9,CYP7A1,ENO1,ESRRA,FOXA3,GFER,HNRNPA2B1,HNRNPM,
HSD17B4,mir-122,MUT,NR1I2,NR1I3,P110,p85
(pik3r),PIPOX,PPARGC1A,PPIA,RPL6,RPS2,SDHA,SDHB,SEC14L2,SEMA3B,SULT1A2,T
DGF1,TMPO,TUBA1A,ZNF217
15 13 Drug Metabolism,
Endocrine System
Development and Function,
Energy Production
6 ACSM3,BDH1,BRD4,CDC45,CDC42EP5,CDCA7L,CDK4,CES1,DCTPP1,ENO1,ENPP2,EPAS1,FOSL2,GCDH,GYS2,HAMP,IL17RB,IQGAP2,LAMP2,MC4R,miR-145-5p (and other
miRNAs w/seed UCCAGUU),MTHFD1,MYC,PBLD,PIM2,PNN,RGS3,SERINC3,SHMT1,SHMT2,SORD,SO
X5,TMPRSS6,TYMS,UGP2
13 12 Nucleic Acid Metabolism,
Small Molecule Biochemistry,
Amino Acid Metabolism
7 ABCD3,ABLIM1,ACO1,ADAP1,CRYL1,DAK,DHX58,DRD3,ERP29,FBP1,FLNA,GATM,ICK,IFI44,IFIH1,ITGB7,KHK,LBR,MAPK1,MGEA5,MMP14,MX2,NIPSNAP1,NNT,NREP,OASL,PAK1,PECR,PFKM,PGM1,SLC2A3,SOX1
1,TCR,TGFBR2,TUBA1A
13 13 Infectious Disease,
Carbohydrate Metabolism,
Small Molecule Biochemistry
8 AKR1C3,ALDH6A1,AR,ASGR1,ASS1,CDH1,COMT,ENTPD5,EPHX1,ESR1,ESR2,FKBP4,FKBPL,FMN1,FOXA1,GREB1,HSD17B6,Hsp90,IDH2,KDM4B,LTBP1,MAOA,MARC2,MGAT3,NCOA4,NEUROG1,NFATC4,PRKCD,RPRM,SIAH2,SOD1,SOST,TMEM74,TMOD1,V
AV3
13 12 Cancer, Organismal Injury
and Abnormalities, Reproductive
System Disease
9 ADH5,AIM2,ARG1,CBS/LOC102724560,CCNG2,CLEC4M,CSNK2A1,CTH,CYP17A1,DDB2,ECHDC3,EIF2AK2,EPHX2,FAM213A,GBP1,HAS1,HEBP1,HRH2,IFI27,IL18RAP,Inter
feron alpha,ISG20,MAOB,MAPKAPK2,miR-483-
3p (miRNAs w/seed CACUCCU),MKNK1,NF1,OAS1,P38
MAPK,SMAD4,SP1,TRIB1,UGDH,UNC93B1,USP18
12 11 Amino Acid Metabolism,
Small Molecule Biochemistry, Antimicrobial
Response
10 ACTB,APBA2,APOE,APP,ASL,ATP5A1,CCN 10 12 Metabolic

154
D1,CEP55,CES2,DDT,GART,GSTO1,HSD17B10,HSPA1L,ITM2B,MLH1,MYBL1,PDX1,PFAS,PFKP,PHGDH,Pp2b,PPAT,PPP3CA,PRDX6,RFC1,RNF219,SCP2,SLC2A2,SNRK,SNR
NP70,TAGLN2,TMSB15A,TP53,UCHL1
Disease, Neurological
Disease, Psychological
Disorders
Table 4.10 - Network analysis for proteins both upregulated and downregulated in the
metastatic tumour when compared to normal adjacent liver parenchyma. The score is
derived from a p-value and indicates the probability of the focus molecules in a network
being found together due to random chance. Focus molecules is the total number of
proteins of interest identified in the respective network.
4.3.7 Comparison of primary and metastatic tumours
This analysis identified all those proteins significantly differentially expressed in the
metastatic tumour compared to the primary tumour. A total of 67 proteins were identified,
58 of which were more abundant in the metastatic tumour and 9 were less abundant (Table
4.11).
Accession Number Name p Value
Log2 Fold-Change (Metastasis/Primary)
P08311 Cathepsin G 6.05E-03 -5.220
P48539 Purkinje cell protein 4 1.46E-02 -4.063
P24158 Myeloblastin 5.40E-03 -3.844
P84157 Matrix-remodeling-associated protein 7 3.21E-02 -2.579
P25815 Protein S100-P 2.50E-02 -2.505
P06702 Protein S100-A9 1.05E-03 -2.077
P05106 Integrin beta-3 3.78E-02 -2.068
P23142 Fibulin-1 9.89E-03 -2.040
Q02952 A-kinase anchor protein 12 1.55E-02 -2.037
P01019 Angiotensinogen 4.10E-02 2.012
P13671 Complement component C6 4.65E-02 2.032
P04114 Apolipoprotein B-100 1.28E-02 2.048
P15153 Ras-related C3 botulinum
toxin substrate 2 2.02E-02 2.152
O14773 Tripeptidyl-peptidase 1 1.69E-02 2.212
Q9BX68
Histidine triad nucleotide-binding protein 2,
mitochondrial 1.93E-02 2.260
P42765 3-ketoacyl-CoA thiolase, 4.04E-02 2.292

155
mitochondrial
P36269 Gamma-glutamyltransferase
5 4.61E-03 2.360
P08571 Monocyte differentiation
antigen CD14 1.10E-03 2.364
P02792 Ferritin light chain 3.17E-02 2.385
P07858 Cathepsin B 2.86E-03 2.388
P40261 Nicotinamide N-
methyltransferase 1.59E-02 2.437
P19971 Thymidine phosphorylase 4.02E-03 2.438
P02787 Serotransferrin 1.55E-02 2.469
P01834 Ig kappa chain C region 1.42E-02 2.477
P01857 Ig gamma-1 chain C region 3.23E-02 2.482
P34896
Serine hydroxymethyltransferase,
cytosolic 2.06E-02 2.494
P05177 Cytochrome P450 1A2 3.40E-03 2.557
P21695
Glycerol-3-phosphate dehydrogenase [NAD+],
cytoplasmic 3.34E-02 2.578
P08123 Collagen alpha-2(I) chain 3.97E-02 2.743
P51884 Lumican 3.26E-02 2.779
Q00796 Sorbitol dehydrogenase 1.43E-02 2.839
Q8IUX7 Adipocyte enhancer-binding
protein 1 5.60E-03 2.872
P15104 Glutamine synthetase 4.91E-02 2.994
Q9UJS0
Calcium-binding mitochondrial carrier
protein Aralar2 1.94E-02 3.037
Q7Z4W1 L-xylulose reductase 3.03E-02 3.065
Q4G0N4 NAD kinase domain-containing protein 1 6.71E-03 3.146
Q16719 Kynureninase 3.73E-02 3.158
P01011 Alpha-1-antichymotrypsin 2.36E-03 3.186
P22307 Non-specific lipid-transfer
protein 3.28E-02 3.235
P00367 Glutamate dehydrogenase
1, mitochondrial 1.95E-02 3.410
P02749 Beta-2-glycoprotein 1 3.82E-02 3.589
P28845 Corticosteroid 11-beta-
dehydrogenase isozyme 1 2.32E-02 3.649
P28332 Alcohol dehydrogenase 6 1.30E-02 3.674
P01033 Metalloproteinase inhibitor
1 6.73E-03 3.685
P09467 Fructose-1,6-bisphosphatase
1 2.75E-02 3.972
P35442 Thrombospondin-2 4.00E-03 4.321

156
P02649 Apolipoprotein E 5.18E-03 4.333
P04196 Histidine-rich glycoprotein 1.27E-02 4.599
P10620 Microsomal glutathione S-
transferase 1 4.56E-02 4.652
P04004 Vitronectin 1.25E-02 4.721
P32754 4-hydroxyphenylpyruvate
dioxygenase 5.36E-03 6.385
Q06828 Fibromodulin 2.79E-03 6.766
P11498 Pyruvate carboxylase,
mitochondrial 1.17E-02 7.180
P00167 Cytochrome b5 3.30E-02 7.915
P05089 Arginase-1 3.85E-02 9.069
P05181 Cytochrome P450 2E1 3.98E-04 9.526
P00325 Alcohol dehydrogenase 1B 3.47E-02 12.136
P33121 Long-chain-fatty-acid--CoA
ligase 1 4.67E-02 14.035
P24752
Acetyl-CoA acetyltransferase,
mitochondrial 2.70E-02 15.347
P51888 Prolargin 7.03E-03 17.972
P05062 Fructose-bisphosphate
aldolase B 4.04E-02 22.005
P50440 Glycine amidinotransferase,
mitochondrial 2.12E-02 34.116
O75891
Cytosolic 10-formyltetrahydrofolate
dehydrogenase 4.02E-02 34.809
P31513
Dimethylaniline monooxygenase [N-oxide-
forming] 3 2.52E-02 36.361
P30038
Delta-1-pyrroline-5-carboxylate dehydrogenase,
mitochondrial 2.68E-02 54.551
P08319 Alcohol dehydrogenase 4 3.35E-02 253.897
Q06520 Bile salt sulfotransferase 4.40E-03 954.271
Table 4.11 – Those proteins differentially expressed between the metastatic tumour and
the primary tumour. 67 proteins were identified, 58 of which were upregulated (positive
values for fold change) and 9 downregulated (negative values for fold change).
Analysing those proteins upregulated separately from those downregulated, Ingenuity core
analysis of direct and indirect relationships revealed the significant upregulated canonical
pathways in this group to be: FXR/RXR activation, ethanol degradation II, LXR/RXR
activation, LPS/IL-I mediated inhibition of RXR and noradrenaline and adrenaline

157
degradation. Similarly the downregulated canonical pathways were: role of IL-17A in
psoriasis, glioma invasiveness signalling, agrin interactions at neuromuscular junction,
macropinocytosis signalling and caveolar-mediated endocytosis signalling. Statistics for
these identified pathways can be seen in Table 4.12.
Upregulated Pathways p-value Ratio
FXR/RXR activation 5.06E-09 8/125 (0.064)
Ethanol degradation II 3.44E-08 5/30 (0.167)
LXR/RXR activation 9.91E-08 7/121 (0.058)
LPS/IL-I mediated inhibition of RXR 2.67E-07 8/208 (0.038)
Noradrenaline and adrenaline degradation
2.95E-06 4/32 (0.125)
Downregulated Pathways p-value Ratio
Role of IL-17A in psoriasis 5.72E-03 1/13 (0.077)
Glioma invasiveness signalling 2.49E-02 1/57 (0.018)
Agrin interactions at neuromuscular junction
2.92E-02 1/67 (0.015)
Macropinocytosis signalling 2.96E-02 1/68 (0.015)
Caveolar-mediated endocytosis signalling
3.13E-02 1/72 (0.014)
Table 4.12 – Pathway analysis for proteins both upregulated and downregulated in the
metastatic tumour when compared to the primary tumour. P-value is adjusted using
Benjamini-Hochberg correction. Ratio identifies the number of focus molecules identified
(numerator) in the pathway (denominator).
Further analysis of all (unfiltered) biological pathways identified 3 upregulated networks
with a score greater than 2 pertaining to: lipid metabolism, small molecule biochemistry,
vitamin and mineral metabolism, cellular movement, haematological system development
and function and immune cell trafficking. Similarly, 1 downregulated network was identified
pertaining to: cell-to-cell signalling and interaction, haematological system development
and function and immune cell trafficking. The focus molecules and statistics pertinent to
these networks can be seen in Table 4.13.

158
Upregulated Networks
ID Molecules in Network Score Focus Molecules
Top Diseases and Functions
1 ABHD2,ACAT1,ACSL1,ADH4,AIM1,AKAP13,CTNNB1,CTSB,CYB5A,CYP1A2,CYP2E1,DYNLL1,DYNLL2,GFER,GLA,GLUL,HNF1A,HSD11B1,HSD17B2,IGHG1,LUM,MGST1,MSX2,MT1L,NFIC,NR3C1,PGR,PTP4A1,S100P,SERPINA5,SMARCA4,TFEB,TNS4,TPP1,VTN
26 16 Lipid Metabolism,
Small Molecule Biochemistry, Vitamin and
Mineral Metabolism
2 ACPP,APOB,APOE,ARG1,CDCA7L,Cg,DHCR7,EIF2AK2,FBP1,FDFT1,FMOD,FTL,GLIPR1,HMGCS1,LAMP2,LOC102724788/PRODH,LSS,MGEA5,MYC,NAP1L1,NNMT,PERP,PFKM,Pp2b,S100A2,SCP2,SHC1,SHMT1,SNRK,SULT2A1,TAF5L,TIMP1,TMSB10/TMSB4
X,TP53,TPD52L1
19 12 Lipid Metabolism,
Small Molecule Biochemistry, Vitamin and
Mineral Metabolism
3 ABCC3,AFP,AGT,APOH,C3,CASP3,CD14,CFB,COL1A2,CYP27A1,FCGR1B,FGA,GMFG,HMOX1,HSPE1,IL6,IL17D,KYNU,LGALS4,LILRA4,LILRA5,MMP8,PRELP,RAC2,S100A10,
SCAVENGER receptor CLASS A,SERPINA3,SIRT6,SREBF1,TF,THBS2,TNF,
TNFRSF18,TNIP3,TYMP
19 11 Cellular Movement,
Hematological System
Development and Function, Immune Cell Trafficking
Downregulated Networks
1 AKAP12,BCAN,CCL5,CDKN3,CELSR2,CTSG,ENPP1,ESR1,FBLN1,Fibrin,FN1,GUSB,HEXA,IL1B,ITGB3,ITPA,MAPK12,mir-224,miR-224-5p (miRNAs w/seed AAGUCAC),miR-
24-3p (and other miRNAs w/seed GGCUCAG),PCP4,PPIF,PRIM1,PRTN3,S100A9,S100P,SEMA3A,SERPINH1,SLC39A8,So
d,SQLE,TGFB1,TMEM97,TOP2B,TP53
21 7 Cell-To-Cell Signaling and Interaction,
Hematological System
Development and Function, Immune Cell Trafficking
Table 4.13 - Network analysis for proteins both upregulated and downregulated in the
metastatic tumour when compared to the primary tumour. The score is derived from a p-
value and indicates the probability of the focus molecules in a network being found
together due to random chance. Focus molecules is the total number of proteins of
interest identified in the respective network.
4.3.8 Predictive biomarkers in the primary tumours

159
Patients from whom matched primary and metastatic tissue had been obtained and
neoadjuvant chemotherapy had been given(n=10) were classified as being responders or
non-responders to chemotherapy on the basis of histopathological assessment (Section
4.2.3). Proteins differentially expressed between responders and non-responders (log2 fold
change >2, unadjusted p<0.05) were again identified and subjected to pathway and
network analysis.
A total of 170 proteins were differentially expressed between the primary tumours of the
responders and the primary tumours of the non-responders. 59 proteins were upregulated
in the responders, and 111 downregulated. Details of these can be seen in Appendix 4 –
Proteomic comparison of responders and non-responders in the primary tumour.
Analysing those proteins upregulated separately from those downregulated, Ingenuity core
analysis of direct and indirect relationships revealed the significant upregulated canonical
pathways in this group to be: TR/RXR activation, Huntington’s disease signalling, role of
PI3K/AKT signalling, cell cycle: G1/S checkpoint regulation and IL4 signalling . Similarly the
downregulated canonical pathways were: mitochondrial dysfunction, fatty acid β-oxidation
I, oxidative phosphorylation, serotonin degradation and glutaryl-CoA degradation. Statistics
for these identified pathways can be seen in Table 4.14.
Upregulated Pathways p-value Ratio
TR/RXR activation 1.68E-04 4/85 (0.047)
Huntington’s disease signalling 8.33E-04 5/226 (0.022)
Role of PI3K/AKT signalling 1.03E-03 3/61 (0.049)
Cell cycle: G1/S checkpoint regulation 1.13E-03 3/63 (0.048)
IL-4 signalling 1.73E-03 3/73 (0.041)
Downregulated Pathways p-value Ratio
Mitochondrial dysfunction 6.22E-07 9/165 (0.055)
Fatty acid β-oxidation I 7.23E-07 5/29 (0.172)
Oxidative phosphorylation 2.89E-06 7/104 (0.067)
Serotonin degradation 1.42E-05 5/52 (0.096)
Glutaryl-CoA degradation 3.27E-05 3/11 (0.273)
Table 4.14 – Pathway analysis for proteins both upregulated and downregulated in the
primary tumours of the responders compared to the primary tumours of the non
responders. P-value is adjusted using Benjamini-Hochberg correction. Ratio identifies the
number of focus molecules identified (numerator) in the pathway (denominator).

160
Further analysis of all (unfiltered) biological pathways identified 4 upregulated networks
with a score greater than 2 pertaining to: cellular movement, haematological system
development and function, immune cell trafficking, cancer, dermatological diseases and
conditions, immunological disease, hematological disease, organismal injury and
abnormalities, cell cycle, lipid metabolism, small molecule biochemistry and vitamin and
mineral metabolism. Similarly 5 downregulated networks were identified pertaining to:
cellular assembly and organization, cellular function and maintenance, cell death and
survival, energy production, lipid metabolism, small molecule biochemistry, cell-to-cell
signalling and interaction, infectious disease, amino acid metabolism, cell signalling,
molecular transport, lymphoid tissue structure and development, cancer and organismal
injury and abnormalities. The focus molecules and statistics pertinent to these networks
can be seen in Table 4.15.
Upregulated Networks
ID Molecules in Network Score Focus Molecules
Top Diseases and Functions
1 ANXA1,AQP9,ATM,CLEC11A,DPY30,ENO3,ERK1/2,FANCC,FKBP5,Histone
h3,Hsp90,IDH1,IL36A,KPNA3,LSP1,MAPK10,miR-491-5p (and other miRNAs w/seed
GUGGGGA),MT-TY,MTOR,MYL1,MYO1E,NFKB1,NFkB
(complex),P2RY6,PPP1R18,PPP1R16B,RLN2,SH3GLB2,SLC52A1,SSRP1,TGM2,TOP1,T
PCN1,TPM3,UGT2B7
20 12 Cellular Movement,
Hematological System
Development and Function, Immune Cell Trafficking
2 ABHD2,ACAT1,ARFGEF1,ARFGEF2,BCOR,CDC34,CDCA7L,COTL1,DYNLL1,ENO1,GLIPR
1,HEXB,HLA-DRA,Hla-Drb,HSD11B1,IRF1,MT1L,MTHFD1,MXD1,MYC,NFIC,NFKBIA,NR3C1,ODC1,PERP,PRKAC,PRKACB,PRKAR1A,PSME1,ROCK1,SERP
INE2,SH3KBP1,SKP1,SMARCA4,THY1
18 11 Cancer, Dermatological
Diseases and Conditions,
Immunological Disease
3 AIMP1,C4BPA,CCT5,CCT6A,CDKN2AIP,COL6A3,CTNNB1,CTSD,GNAI2,GNL3,GRB2,GRIN1,HINT1,HNF1A,HNMT,HSD17B2,ITGA
1,mir-224,miR-224-5p (miRNAs w/seed AAGUCAC),miR-24-3p (and other miRNAs
w/seed GGCUCAG),PDE6B,PRIM1,RAD23A,RPL8,RPL23,RPL26,RPL7A,RPS7,RPS4X,SEMA3C,S
LC2A12,SLC39A8,SP1,TGFB1,TP53
18 12 Hematological Disease,
Organismal Injury and
Abnormalities, Cell Cycle
4 AP2M1,APOB,BST2,CD74,COL14A1,Cpla2,CXCL5,CYP27A1,EFEMP1,EIF2S1,HLA-
DRB4,HSPG2,IGFBP2,LDL,LGALS3,LIPG,MCTS1,MHC Class II
16 11 Lipid Metabolism,
Small Molecule Biochemistry,

161
(complex),NBN,Nr1h,NR1H3,OSCAR,PCK2,PCSK9,PLA2G4A,PON1,PPA1,PTAFR,PTGS
2,RPLP0,SMC1A,SREBF1,TF,TNF,TRAF1
Vitamin and Mineral
Metabolism
Downregulated Networks
1 AIFM1,ANXA2,ATP1B1,BAX,calpain,caspase,CAST,CD3,CLTC,CSK,CYP27A1,DSP,ERK
1/2,ERP29,estrogen receptor,Hsp90,IgG,INF2,IRF6,Jnk,KRT7,K
RT17,KRT18,KRT19,MVP,MYH14,NFkB (complex),P38
MAPK,PHB,PHB2,PPP2R1A,PPP2R2A,SERPINB5,VDAC2,XIAP
47 24 Cellular Assembly and Organization, Cellular Function
and Maintenance, Cell Death and
Survival
2 ACAA2,ACADS,ACADVL,ACP1,ATM,CCNA2,CDKN2AIP,CHMP4C,CNOT1,COPG2,CTTN,E4F1,ETHE1,FDPS,GRB2,GSR,HADH,HIST1H4A,HSD17B4,KIF24,LPIN1,MAT1A,PDCD6IP,PLEC,RGS6,RPL13,RPL23,RPL26,RPL7A
,RPS7,RXRG,SREBF1,SYK,TP53,TUFM
25 16 Energy Production, Lipid
Metabolism, Small Molecule
Biochemistry
3 ABLIM,ADCY7,AKR1B10,AKT1,ARPC1A,ATP9A,CASK,CRYL1,DUSP3,ETV5,FANCC,FH,FSH,GNLY,GNRH,LAD1,Lh,MAPK1,MMP2,
MYO6,MYRF,NQO1,NR3C1,PDXK,PKP2,PKP3,PLIN3,PPIH,PRKX,PRPF4B,PTPRN,RAB5
A,S100A14,TLK1,VCL
17 12 Cell-To-Cell Signaling and Interaction, Infectious
Disease, Amino Acid Metabolism
4 ABCC3,ACAA1,ACOX1,ALDH2,APOB,CHST2,EHD1,EPB41L1,ERMAP,G0S2,HDAC10,Hi
stone h3,Hsp90,IL13,KDM5B,KLHDC10,LIMCH1,
LONP1,MKK3/6,MT-CO2,MT-CYB,NID1,PDIA3,PDIA4,PLXNC1,PPARA,R
NA polymerase II,SLC8A1,SORT1,SPTA1,SWAP70,SYNPO,T
AF10,TNF,TPM3
15 10 Cell Signaling, Molecular
Transport, Small Molecule
Biochemistry
5 AQP3,BCL6,CCND1,CCR6,CD72,EPB41L2,FCGRT,FES,FOLR1,FUT7,HNF1A,HNF1B,HNMT,HNRNPA2B1,KIF20A,KLK1,PBLD,PBX1,PCBP1,PLD2,SEL1L,SKIV2L,SPI1,STOM,SULT1A1,SYVN1,TARS,TLE1,TNFRSF14,TUBA3C/TUBA3D,UGT2B17,UQCRC2,USP5,UTRN
,VIL1
12 10 Lymphoid Tissue Structure and Development,
Cancer, Organismal Injury
and Abnormalities
Table 4.15 – Network analysis for proteins both upregulated and downregulated in the
primary tumours of the responders compared to the primary tumours of the non
responders. The score is derived from a p-value and indicates the probability of the focus
molecules in a network being found together due to random chance. Focus molecules is
the total number of proteins of interest identified in the respective network.

162
4.3.9 Predictive biomarkers in the metastatic tumours
A total of 27 proteins were differentially expressed between the metastatic tumours of the
responders and the metastatic tumours of the non-responders. 17 proteins were
upregulated in the responders, and 10 downregulated. Details of these can be seen in Table
4.16.
Accession Number Name p Value
Log2 Fold-Change (Responders/Non-
Responders)
P01719 Ig lambda chain V-V region DEL 2.27E-02 -78.793
P13760 HLA class II histocompatibility antigen, DRB1-4 beta chain
4.63E-03 -67.649
Q7L5L3 Glycerophosphodiester phosphodiesterase domain-
containing protein 3
2.56E-03 -15.402
P15559 NAD(P)H dehydrogenase [quinone] 1
4.09E-02 -3.767
Q9Y6D6 Brefeldin A-inhibited guanine nucleotide-exchange protein 1
4.24E-02 -3.112
O76003 Glutaredoxin-3 2.77E-02 -2.284
P02745 Complement C1q subcomponent subunit A
1.84E-02 -2.271
Q29865 HLA class I histocompatibility antigen, Cw-18 alpha chain
1.64E-02 -2.239
P15311 Ezrin 2.85E-02 -2.132
Q99439 Calponin-2 3.85E-02 -2.060
Q99735 Microsomal glutathione S-transferase 2
3.69E-02 2.034
P51570 Galactokinase 6.66E-03 2.210
Q9Y2S2 Lambda-crystallin homolog 3.12E-02 2.358
P43155 Carnitine O-acetyltransferase 2.42E-02 2.365
O14773 Tripeptidyl-peptidase 1 2.50E-02 3.401
Q14508 WAP four-disulfide core domain protein 2
3.12E-02 3.850
P04040 Catalase 4.62E-02 4.088
P01880 Ig delta chain C region 4.16E-02 4.671
Q02252 Methylmalonate-semialdehyde dehydrogenase [acylating],
mitochondrial
4.81E-02 4.898
Q08257 Quinone oxidoreductase 2.95E-02 6.470
Q02318 Sterol 26-hydroxylase, mitochondrial
3.47E-02 13.663
P05089 Arginase-1 4.61E-02 32.760
P51888 Prolargin 4.08E-02 61.579

163
P80404 4-aminobutyrate aminotransferase,
mitochondrial
3.90E-02 66.207
P07099 Epoxide hydrolase 1 4.46E-02 100.906
O75891 Cytosolic 10-formyltetrahydrofolate
dehydrogenase
2.07E-02 397.163
Q08AH3 Acyl-coenzyme A synthetase ACSM2A, mitochondrial
4.51E-02 56001.100
Table 4.16 – Those proteins differentially expressed between the metastatic tumours of
the responders and non-responders. 27 proteins were identified, 17 of which were
upregulated (positive values for fold change) and 10 downregulated (negative values for
fold change).
Analysing those proteins upregulated separately from those downregulated, Ingenuity core
analysis of direct and indirect relationships revealed the significant upregulated canonical
pathways in this group to be: β-alanine degradation I, valine degradation I, LPS/IL-1
mediated inhibition of RXR, xenobiotic metabolism signalling and D-glucuronate
degradation I. Similarly the downregulated canonical pathways were: antigen presentation
pathway, allograft rejection signalling, OX40 signalling pathway, communication between
innate and adaptive immune cells and crosstalk between dendritic cells and natural killer
cells. Statistics for these identified pathways can be seen in Table 4.17.

164
Upregulated Pathways p-value Ratio
β-alanine degradation I 7.30E-07 2/2 (1)
Valine degradation I 1.11E-04 2/18 (0.111)
LPS/IL-1 mediated inhibition of RXR 7.46E-04 3/208 (0.014)
Xenobiotic metabolism signalling 1.36E-03 3/256 (0.012)
D-glucuronate degradation I 2.64E-03 1/3 (0.333)
Downregulated Pathways p-value Ratio
Antigen presentation pathway 1.44E-04 2/37 (0.054)
Allograft rejection signalling 2.44E-04 2/48 (0.042)
OX40 signalling pathway 3.09E-04 2/54 (0.037)
Communication between innate and adaptive immune cells
7.12E-04 2/82 (0.024)
Crosstalk between dendritic cells and natural killer cells
8.38E-04 2/89 (0.022)
Table 4.17 – Pathway analysis for proteins both upregulated and downregulated in the
metastatic tumours of the responders compared to the metastatic tumours of the non
responders. P-value is adjusted using Benjamini-Hochberg correction. Ratio identifies the
number of focus molecules identified (numerator) in the pathway (denominator).
Further analysis of all (unfiltered) biological pathways identified 5 upregulated networks
with a score greater than 2 pertaining to: infectious disease, organismal injury and
abnormalities, neurological disease, cell-to-cell signalling and interaction, tissue
development, increased levels of potassium, DNA replication, recombination and repair,
drug metabolism, cancer, cellular assembly and organization, developmental disorder,
hereditary disorder, lipid metabolism, molecular transport and small molecule
biochemistry. Similarly 1 downregulated network was identified pertaining to: cell death
and survival, cell cycle, and cell-to-cell signalling and interaction. The focus molecules and
statistics pertinent to these networks can be seen in Table 4.18.

165
Upregulated Networks
ID Molecules in Network Score Focus Molecules
Top Diseases and Functions
1 ABCC3,ALDH6A1,APLN,ARG1,C3,CAT,CFB,CYP27A1,EPHX1,ESR1,FCGR1B,FGA,FMN1,FOXA1,GMFG,GREB1,HSPE1,IL6,IL17D,LGALS4,LILRA4,LILRA5,PRELP,PR
SS23,RPRM,S100A10,SCAVENGER receptor CLASS
A,SIRT6,Sod,TM4SF1,TMEM74,TNF,TNFAIP2,TNFRSF18,TNIP3
13 7 Infectious Disease, Organismal Injury
and Abnormalities, Neurological Disease
2 CRYL1,MAPK1 3 1 Cell-To-Cell Signaling and Interaction,
Tissue Development, Increased Levels of
Potassium
3 CRYZ,REXO4 3 1 DNA Replication, Recombination, and
Repair, Drug Metabolism, Cancer
4 TFEB,TPP1 3 1 Cellular Assembly and Organization,
Developmental Disorder, Hereditary
Disorder
5 CRAT,CTNNB1,TCF 3 1 Lipid Metabolism, Molecular
Transport, Small Molecule
Biochemistry
Downregulated Networks
1 ARFGEF1,C1QA,CDKN1A,CEACAM3,CNN2,CTNNB1,CXCL16,EZR,FCGR1B,Ferrit
in,GLRX3,HLA-C,HLA-DRB4,HSP,IFNG,IL17RB,KIR,KIR2DL1/KI
R2DL3,KIR2DS4 (includes others),LAIR1,MAGEA3/MAGEA6,MARCKSL1,NQO1,PLA2G5,PRKAR2A,PTGDR,SEMA3C,SERPINA5,SOAT1,Sod,TNF,TY
MP,U1 snRNP,ULBP1,VIPR1
21 8 Cell Death and Survival, Cell
Cycle, Cell-To-Cell Signaling and Interaction
Table 4.18 – Network analysis for proteins both upregulated and downregulated in the
metastatic tumours of the responders compared to the metastatic tumours of the non
responders. The score is derived from a p-value and indicates the probability of the focus
molecules in a network being found together due to random chance. Focus molecules is
the total number of proteins of interest identified in the respective network.

166
4.3.10 Predictive biomarkers common to primary and metastatic tumours
170 proteins in the primary tumours were significantly differentially expressed between
responders and non-responders. In the metastases 22 proteins were identified. 5 proteins
were common to both primary and metastatic tissues, none of which were significantly
differentially expressed between the two tissue types (Figure 4.3).
Figure 4.3 – Venn diagram of predictive biomarkers identified in the primary tumour
(170), metastatic tumour (27) and common to both (5).
The 5 proteins identified as predictors of response alongside the P value and log2 fold
change for both tissue types are shown in Table 4.19. Of these 5, 2 proteins were
upregulated in the primary tumour but downregulated in the metastasis and 1 was
downregulated in the primary tumour but upregulated in the metastasis. Only 2 proteins
had consistent dysregulation between primary and metastatic tissue: NAD(P)H
dehydrogenase [quinone 1] and lambda-crystallin homolog were both downregulated in
the primary and metastatic tumours of those patients responding to neoadjuvant
chemotherapy.

167
Accession Number Name
Primary Metastasis
p Value Log2 Fold Change p Value
Log2 Fold Change
P13760
HLA class II histocompatibility
antigen, DRB1-4 beta chain 5.91E-03 88.035 4.63E-03 -67.649
P15559
NAD(P)H dehydrogenase
[quinone] 1 2.64E-04 -9.918 4.09E-02 -3.767
Q02318
Sterol 26-hydroxylase,
mitochondrial 6.70E-03 -2.114 3.47E-02 13.663
Q9Y2S2 Lambda-crystallin
homolog 3.25E-03 -2.085 3.25E-03 -2.085
Q9Y6D6
Brefeldin A-inhibited guanine nucleotide-exchange protein 1 7.37E-03 4.595 4.24E-02 -3.112
Table 4.19 – Summary of predictive biomarkers common to both primary and metastatic
tumours.
4.3.11 Phenotypic anchoring of exome sequencing
Of the 5766 proteins identified through iTRAQ, SNVs were identified in the protein coding
region of 2627. For 3 of these proteins the SNV was present in 14 samples, for 10 it was
present in 10 samples, 9 present in 9, 3 present in 7, 8 present in 6, 16 present in 5,
92present in 4, 93 present in 9, 498 present in 2 and 1895 present in 1.

168
4.4 Discussion
4.4.1 Summary of aims
In this study a comprehensive proteomic analysis of paired primary and metastatic samples
from 16 patients was performed. The aim of this investigation was to compare the
proteomic profile of the primary and metastatic tumours, both with each other and with
their normal adjacent tissue, to establish the degree of similarity and identify potential
response biomarkers present in the primary tumour which may predict response to
neoadjuvant therapy in the liver metastasis.
4.4.2 Summary of results
Matched primary and metastatic tissue from 16 patients was subjected to iTRAQ. Eleven
patients had undergone neoadjuvant chemotherapy, 10 of which achieved resection. Five
of these patients had a tumour regression grade of 1-2 and the remaining 5 had a tumour
regression grade of 3-4. A total of 5766 proteins were identified, of which 2637 were taken
forwards for bioinformatics analysis. A summary of the proteomic data is shown in Table
4.20.
Table 4.20 - Summary proteomic data for the 2-group comparisons showing the total
number of dysregulated proteins as well as those up/downregulated.
Comparing primary tumour with normal colon, 25 proteins were significantly differentially
expressed (6 upregulated and 19 downregulated) and for metastatic tumour compared
with normal colon there were 53 (13 upregulated and 40 downregulated). Comparison of
the metastatic tumour with liver parenchyma identified 444 proteins differentially
Comparison Total Dysregulated
Upregulated Downregulated
Primary Tumour / Colonic Mucosa 25 6 19
Metastatic Tumour / Colonic Mucosa 53 13 40
Metastastic Tumour / Liver Parenchyma 444 164 280
Metastatic Tumour / Primary Tumour 67 58 9
Responders / Non Responders (Primary) 170 59 111
Responders / Non Responders (Metastasis) 27 17 10

169
expressed, 164 of which were upregulated and 280 downregulated. Only 67 of the 2637
(2.54%) proteins studied were significantly different between primary and metastatic
tissue, with 58 upregulated in the metastatic tumour and 9 downregulated. One hundred
and seventy proteins were identified in the primary tumour which were significantly
differentially expressed between responders and non-responders with 59 upregulated and
111 downregulated in the responders. In the metastases there were 27 (17 upregulated
and 10 downregulated). Five proteins were common to both tissue types, only two of which
showed consistent dysregulation between responders and non-responders (NAD(P)H
dehydrogenase [quinone 1] and lambda-crystallin homolog). Of the 5766 proteins identified
by iTRAQ, SNVs were previously identified in the protein coding region of 2627. Further
bioinformatics analysis of these comparator groups revealed putative pathways and
networks involved in carcinogenesis.
4.4.3 iTRAQ for evaluation of tumour biology
Proteomic studies using techniques such as iTRAQ offer a significant advantage over
genomic approaches to similar questions. The level of transcription of a gene only gives an
estimate of its level of translation into a protein, as an mRNA produced in abundance may
be degraded rapidly or translated inefficiently. Other proteomics approaches may help to
investigate post-translational modification of proteins, investigate alternative splicing,
evaluate the formation of protein complexes and account for protein degradation by
providing quantitative data, although the technique we have adopted for this study is
currently unable to provide such insight.
A number of studies have attempted to use iTRAQ to further our understanding of tumour
biology. Lin et al (2014) characterised the profile of the human colon adenocarcinoma cell
line HCT-116 with its metastatic derivative E1. A total of 547 proteins were identified with
31 differentially expressed including translationally controlled tumour protein 1, A-kinase
anchor protein 12 and Drebrin (DBN1). Western blotting subsequently validated these
findings.
In 2014, Liu et al characterised the cancer stroma expression profile of muscle-invasive
bladder cancer. 30 clinical samples of 3 different metastatic risk groups were profiled to
identify differentially expressed proteins. A total of 1049 differentially expressed proteins
were identified by paired comparisons (high risk vs. median risk, low risk and normal;

170
median risk vs. low risk and normal, low risk vs. normal group), with 510, 549 and 548
proteins significantly altered respectively. On pathway analysis the differentially expressed
proteins were mainly located in the focal adhesion pathway, systemic lupus erythematosus
pathway and ECM-receptor interaction pathway. This group also identified several
candidate biomarkers (EXOC4, MYH10 and MMP-9) of invasion.
Wang et al (2012) compared the proteome of ovarian cancer tissues and normal ovarian
epithelium. One thousand two hundred and fifty-nine unique proteins were identified, with
205 differentially expressed between ovarian cancer and normal ovarian tissue. A number
of these proteins were validated by western blotting, RT-PCR or immunohistochemistry.
Similarly pancreatic adenocarcinoma tissues of varying histological differentiation were
sequenced by Wang et al in 2013. A total of 1623 proteins were identified of which 15 were
differentially expressed. Myoferlin was validated initially by western blotting and latterly
by immunohistochemistry in a further 154 samples. The authors conclude that iTRAQ
identified this protein as correlating with histological expression, and evaluation against
corresponding clinical data suggests its expression is an independent prognostic factor for
survival.
Similarly to this study, Leong et al (2012) attempted to identify predictors of response to
chemotherapy in breast cancer. To focus their assessment on apoptosis, iTRAQ of enriched
mitochondria and endoplasmic reticulum cells was performed leading to the identification
of several differentially abundant proteins in breast cancer cells treated with doxorubicin.
Pathway analysis suggested cellular assembly and organization, molecular transport,
oxidative stress, cell motility, cell death, and cancer were key pathways upregulated with
treatment. In another in vitro study, Nishimura et al (2014) investigated four human
tumour derived cell lines: cisplatin-sensitive UM-SCC-23, UM-SCC-23-CDDPR with acquired
cisplatin resistance, naturally cisplatin-resistant UM-SCC-81B, and UM-SCC-23/WR with
acquired 5-fluorouracil resistance. In total, 13 multiple drug resistance proteins were
identified with a further 7 specifically associated with resistance to cisplatin.
Perhaps of most clinical interest is a translational study reported by Rehman et al in 2012.
Pooled serum samples were analysed from 4 groups of patients characterised as benign
prostatic hyperplasia, localised cancer, apparently localised cancer but with biochemical
suggestion of spread and advanced disease. Only 122 proteins were identified, although 25
were differentially abundant in those with progressive disease. The authors reported

171
eukaryotic translation elongation factor 1 alpha 1 (eEF1A1) as significantly upregulated in
osteoblasts adjacent to metastatic tumour cells compared with osteoblasts in control bone
(p = 0.035). This study highlights the potential use of iTRAQ in identifying serum biomarkers
rather than those dependent upon the evaluation of tumour tissue.
What is apparent from these studies is that the level of protein coverage we have obtained
with our samples is significantly higher than has been obtained in tumour derived cell lines
or serum/tissue from cancer patients. The implication of this is that a greater degree of
coverage will assist in formulating a better understanding of tumour biology and an
increased likelihood of identifying relevant biomarkers. Similar study designs have not been
reported.
4.4.4 Tumour heterogeneity
One of the largest challenges facing the delivery of tumour biomarkers to clinical practice is
the issue of tumour heterogeneity. Whilst inter-individual variation is to be expected, intra-
tumour heterogeneity has also been shown in a number of studies, for example in
metastasis-initiating cells in pancreatic cancer (Campbell et al, 2010). Carcinogenesis is an
evolutionary process of naturally selected cells which have acquired a selective advantage,
which may also explain drug resistance during systemic therapy (Gerlinger and Swanton,
2010). Whilst most tumours are thought to arise from a monoclonal population, its
expansion combined with the acquisition of further mutations creates subclones and
heterogeneity. Phylogenetic trees constructed from sequencing data are increasingly being
used to demonstrate the relationships between subclones (Campbell et al, 2008). A recent
study from Gerlinger et al (2002) used this phylogenetic approach to analyse next
generation sequencing data and report the branched evolutional tumour growth in a renal
cell carcinoma and its associated metastatic sites, with 63-69% of all somatic mutations not
detectable across every tumour region.
This heterogeneity clearly has significant implications for biomarker studies such as this
which rely on a single tumour biopsy sample to be representative of the whole tumour
phenotype (Poste, 2011). Despite this it remains clear that some mutations are common
between tumours and across tumour sites, located in the so-called ‘trunk’ of the
phylogenetic tree, and it is perhaps these which offer the most potential to serve as reliable
clinical biomarkers. It may be that the analysis of circulating tumour cells or DNA allows for

172
more comprehensive, accurate and translatable biomarker studies, although this is based
on the assumption that cancer cells are shed into the circulation in a manner proportional
to their clonal frequency.
A small number of studies comparing the genotype of primary and metastatic colorectal
tumours have already been discussed in Chapter 3, and the concordance of KRAS status
between primary and metastatic tumours is now widely accepted (Paligioannis et al, 2014).
With respect to global proteomic studies, none have compared the phenotype of the
primary and metastatic lesions of any tumour type. Some groups have however attempted
to correlate specific proteins of interest, for example in 2013, Laird et al characterised the
correlation of Ki67, p53 and VEGF between primary renal cell carcinomas, renal vein
thrombus and metastasis. Similarly Gao et al (2013) compared the protein expression of
VEGF, HIF-1α, Met, P53, TGF-β1, Cox-2 and TNF-α by immunohistochemistry in eleven
patients who had received resection of lung cancers and distant metastases, finding no
statistical significance between primary cancers and matched metastases for the expression
of these selected biomarkers.
Our data suggests a high degree of biological similarity (97.46%) between the primary and
secondary tumours, which will require further analysis and validation. Combined with this
evidence in the literature, it may be feasible that despite the issues of tumour
heterogeneity and clonal selection, the phenotype of the primary tumour is sufficiently
similar to the metastasis to derive useful biological information in order to inform
treatment strategy.
4.4.5 NAD(P)H dehydrogenase [quinone 1]
NQO1 encodes the cytosolic flavoenzyme NAD(P)H dehydrogenase [quinone 1], which is
involved in the 2-electron reduction of a broad range of substrates including quinones to
hydroquinones (Sarbia et al, 2003). This 2-electron reduction of the quinone to
hydroquinone prevents the generation of semiquinone free radicals and reactive oxygen
species, thus protecting cells from oxidative damage (Rauth, Goldberg and Misra, 1996).
NQO1 also acts as an antioxidant enzyme which is of significant importance during the
detoxification of environmental carcinogens (Ross et al, 2000).

173
The importance of NQO1 activity in carcinogenesis was demonstrated by a study which
reported that the effects of chemical carcinogens on skin cells were more likely to result in
skin cancer in NQO1 knockout mice than their wild type control group (Long et al, 2001).
Other studies have shown that NQO1 expression increases with disease progression in
colorectal cancer (Mikami et al, 1998). In 2006 a case-control study conducted by Beglieter
et al demonstrated an association between NQO1 polymorphism and the development of
colorectal cancer. Within this study serum blood samples were taken from 298 patients
with colon cancer and 349 healthy control subjects. They were able to demonstrate that
polymorphisms of the NQO1 gene which lead to a loss of function were statistically higher
in patients with colorectal cancer. Contradictory to this, a case-control study by Hart et al
(2000) investigated serum blood samples for polymorphic mutation of NQO1 in 323
patients with colorectal cancer and 205 healthy volunteers, failing to demonstrate any
association with colorectal cancer risk.
NQO1 has been of specific interest for the design of many new chemotherapeutic agents
due to its high levels of expression in many tumours (Winski et al, 2001). Its involvement in
the bioactivation of quinones such as β-lapachone and 17-AAG has highlighted its potential
use as a predictive biomarker when considering cancer treatment with these therapies.
Testing for the NQO1*2 polymorphism, which leads to null NQO1 individuals, provides an
indicator of poor response to quinones thus suggesting the avoidance of these therapies
(Siegel, Yan and Ross, 2012).
Our study has suggested that low NQO1 levels are associated with favourable response to
chemotherapy, and that levels in the primary tumour may be predictive of the metastatic
phenotype. NQO1 loss and the resultant loss of cyto-protection has already been linked to
carcinogenesis, although given the agents used in our study are not quinones the currently
suggested mechanism of 2-electron reduction may not be relevant. Further evaluation is
needed both to establish the role of NQO1 as a predictive biomarker and also as a
therapeutic target.
4.4.6 Lambda-crystallin homolog
Lambda-crystallin homolog was identified during bioinformatic analysis as a potential
biomarker. Specifically levels appeared to be reduced in the responders to neoadjuvant
chemotherapy, and expression between primary and metastasis not significantly different.

174
The protein is a cytosolic enzyme known to have greatest expression in the liver and kidney
(Chen et al, 2003). The corresponding CRYL-1 gene is located at 13q12.11, and codes for an
enzyme which catalyzes the dehydrogenation of L-gulonate into dehydro-L-gulonate in the
uronate cycle. The enzyme requires NAD(H) as a cofactor, and is inhibited by inorganic
phosphate (Bando et al, 2006). Very little information exists on this protein in the literature,
with the overwhelming majority of references focusing on the structural role of this protein
in the rabbit lens (Mulders et al, 1998). The only discernable reference to malignancy was
the incidental finding of downregulation in 58% of 60 hepatocellular carcinomas in a
Chinese population (Chen et al, 2003). With little understood about its exact role beyond an
enzyme in the uronate cycle, it would be challenging to explore the functional potential of
this biomarker. Investigation in a larger tissue set to confirm these findings before
embarking upon further work would therefore be prudent.
4.4.7 Study strengths and limitations
This study represents the first attempt to characterise the proteome of primary and
metastatic colorectal tumours with a view to establishing biological similarity and
identifying novel predictive biomarkers.
The relative merits and difficulties of a proteomic approach to these questions have already
been discussed, but it should be remembered that a number of factors can contribute to
difficulties in reproducibility between experimental runs, with alternative equipment and in
different laboratories (Peng et al, 2003).
As with most clinical studies there is inherent heterogeneity in the study population.
Differences exist in terms of patient age, gender, TNM stage, location of the primary
tumour, burden and distribution of metastases and the presence of adverse pathological
features. Ten of the 16 patients were metachronously resected, 5 of which received
neoadjuvant chemotherapy prior to resection of the liver metastases. In this cohort,
considerable variation should be expected between the chemonaive primary tumour and
chemotherapy treated liver metastases. Furthermore the differences in neoadjuvant
therapies received limit the conclusions we can draw to issues of sensitivity to treatment
rather than allowing us to explore mechanisms per se. That said, all patients received a 5-
fluorouracil based regimen.

175
The study we have designed and performed utilises biological material obtained from
patients at the time of resection. If the intent is to look for up-front predictive biomarkers
of response it would be necessary to assay the levels in the diagnostic biopsy. By the very
nature of these biopsies there is little biological material available, and therefore obtaining
them from clinical institutions (i.e. outside of the context of a clinical trial) is not feasible.
To address this, in vitro studies to demonstrate that observed changes in protein expression
are likely to be a biological feature of the tumour rather than a treatment effect would be
necessary. Direct comparison of the proteome of those tumours which are chemonaive
with those tumours treated with neoadjuvant chemotherapy may also assist with
identifying which protein changes are induced by chemotherapy and which are biological
features of the tumour i.e. present pre-treatment and expressed in the diagnostic samples.
The analyses were constructed in such a way that a protein could feature in a list of
dysregulated proteins even if the relationship was identified in a single sample. For
example, the analysis of primary tumour and colonic mucosa was performed by compiling
pooled lists of proteins dysregulated in one or more sample in one tissue type with respect
to the other. Whilst statistical attempts were made to reduce the false discovery rate, this
approach does risk over-fitting of the data. An alternative approach of quantifying the
number of sample pairs in which the dysregulation was observed could have helped
minimise that risk and provide further insight into the extent of the differences between
the proteomes.
The yield of our mass spectrometry in terms of confidently identified and accurately
mapped proteins is excellent, and considerably more (often many fold) than many other
oncology based proteomic studies. The tissue resources we have collected are high value
and the research questions are novel.
4.4.8 Conclusion
This study has evaluated the biological similarity of primary and metastatic tumours, and
found that only 2.54% of proteins quantified are significantly differentially expressed
between primary and metastatic tissues. As such, it may be feasible to utilise biological
information from the primary tumour to predict the phenotype of the metastasis.

176
Bioinformatic analysis of proteins significantly differentially expressed between tissue types
identified putative pathways of carcinogenesis. Of the two biomarkers identified, NQO1
shows both biological plausibility and a part-understood role in cancer making it a suitable
candidate for further validation and exploration of relevant mechanisms.

177
Chapter 5
A global proteomic assessment of serial rectal tumour biopsies

178
5.1 Introduction
5.1.1 Background
The role of neoadjuvant therapy has already been discussed in some detail (Section 1.8.4).
Patients with rectal cancer who have threatened margins on initial MRI are frequently
subjected to long-course neoadjuvant chemoradiotherapy in an attempt to downstage
disease and reduce the risk of a positive margin at resection.
The ability to establish prospectively the likely response to neoadjuvant therapy would be
of tremendous benefit to clinicians. Those patients who are identifiable as likely to respond
could be subjected to potentially more aggressive systemic therapy, whilst conversely those
less likely to respond could be saved the unnecessary morbidity of systemic treatment and
the delay to surgical intervention necessary with the use of neoadjuvant treatments.
One final quandary still remains with the neoadjuvant treatment of rectal cancer with
chemoradiotherapy, which is the continued downstaging seen for many weeks following
cessation of treatment. One potential explanation for this is the fact that radiation only has
its desired effect on actively dividing cells, not those with slow cell turnover or that remain
in the G0 (rest) phase. The treatment effect is dependent on the amount and type of
radiation reaching the cell and the speed of cell growth, and as such it may take several
days or weeks for the treatment effect to manifest (Willet et al, 1995).
5.1.2 Proteomics and iTRAQ
Proteomic assessment of tumours and the technique of iTRAQ have already been discussed
in Sections 4.1.2 and 4.1.3 respectively. This investigation applies the previously described
approach to the study design shown in Figure 5.1.

179
Figure 5.1 – Samples are reduced and undergo a tryptic digest before being tagged with
an isotope labelled molecule. These tags all have the same molecular weight although the
reporter and balance moieties vary. After a cation exchange cleanup step the samples
undergo nanoLC-MS/MS. The reporter and balance moieties are cleaved from each other
and from the peptide to which they are bound, the ratio of which helps determine
relative abundance. The peptide is also cleaved into fragment ions used to identify the
protein.
5.1.3 Aims
The aim of this investigation is to compare the proteomic profile of serial rectal cancer
biopsies taken at diagnosis, immediately after long course neoadjuvant chemoradiotherapy
and at resection, to establish how this profile changes with treatment and identify potential
response biomarkers that are detectable and measurable on the initial diagnostic biopsy.

180
5.2 Methods
National Health Service Research Ethics Committee and Research and Development
approval was obtained for this study and informed consent obtained from each of the study
participants.
5.2.1 Patient recruitment and tissue collection
Patients recently having received a diagnosis of rectal cancer and who had been identified
by the multidisciplinary team as requiring long course chemoradiotherapy were
approached for inclusion in the study. Those agreeing to participate in the study were
invited back to the endoscopy unit at the Countess of Chester Hospital for a repeat limited
flexible sigmoidoscopy and biopsy. Three ‘double bites’ of a standard endoscopic forcep
(approximately 3mm3 tissue in total) of peripheral tumour was biopsied, with deliberate
attempts to avoid the area of necrotic tissue in the centre of the tumour.
Patients were contacted one week after cessation of their chemoradiotherapy and invited
to return for a further limited flexible sigmoidoscopy and biopsy. On the day of resection, a
sample of tumour and normal adjacent mucosa were obtained. Following delivery of the
colorectal specimen the proximal staple line was incised and a linear cut made down the
antimesenteric border before excising a peripheral section of tumour using forceps and a
scalpel. All samples were placed in individually labelled cryodorfs, snap frozen in liquid
nitrogen and transferred to a -80oC storage facility.
5.2.2 Exclusion criteria
For this study the exclusion criteria were:
Recent (last 12 months) personal history of malignancy at another site
Patients under the age of 18
Patients without capacity to provide informed consent
Patients identified by the multidisciplinary team as being at significant risk of
emotional distress by additional hospital visits and/or procedures that may be
required

181
5.2.3 Evaluation of histopathological response to treatment
Additional tumour samples were obtained for the purposes of formalin fixation and
embedding in paraffin. All samples were reviewed by a consultant histopathologist to verify
the diagnosis of adenocarcinoma. Histopathological response was assessed in the resection
specimens and recorded as described in Section 4.2.3.
5.2.4 Evaluation of radiological response to treatment
The radiological response to treatment was also assessed and noted. Pre-treatment and 10
week post-treatment MRI scans were reviewed by a consultant radiologist, and response
determined in line with the RECIST v1.1 guidelines (Eisenhauer et al, 2009). In brief, this
comprises an initial assessment of tumour burden and documentation of target and non-
target lesions, followed by an allocation to one of four response groups as follows:
Complete response – Disappearance of all target lesions. Any pathological lymph
nodes must have reduction in short axis to <10mm.
Partial response – At least a 30% decrease in the sum of diameters of target lesions,
taking as reference the baseline sum diameters.
Progressive disease – At least a 20% increase in the sum of diameters of target
lesions, taking as reference the smallest sum on study.
Stable disease – Neither sufficient shrinkage to qualify for partial response nor
sufficient increase to qualify for progressive disease, taking as reference the
smallest sum diameters on study.
5.2.5 Sample preparation
Sample preparation was performed as described in Section 4.2.4.
5.2.6 Protein quantification
Protein quantification was performed as described in Section 4.2.5.
5.2.7 Creation of a reference pool
In order to infer relative protein abundance between samples, a reference pool was

182
created as described in Section 4.2.6. For each time point from every patient, 100µg of
protein was added to the reference pool. Once the reference pool had been created it was
re-quantified and prepared in an identical fashion to the other samples as follows.
5.2.8 Allocation across and within experimental runs
Allocation across and within experimental runs was performed as described in Section
4.2.7.
5.2.9 iTRAQ labelling
iTRAQ labelling was performed as described in Section 4.2.8.
5.2.10 Cation exchange
Cation exchange was performed as described in Section 4.2.9.
5.2.11 Mass spectrometry
Mass spectrometry was performed as described in Section 4.2.10.
5.2.12 Protein identification and quantification
Protein identification and quantification was performed as described in Section 4.2.11.
5.2.13 Bioinformatics analysis
Bioinformatics analysis was performed as described in Section 4.2.12. Proteins
differentially expressed (log2 fold change >1.5, unadjusted p<0.05) were identified and
subjected to pathway and network analysis. A summary of the bioinformatics analysis can
be seen in Figure 5.2.

183
Figure 5.2 – Bioinformatics analysis workflow for global proteomic assessment of serial
rectal tumour biopsies.
1
•iTRAQ data for proteins identified by 2 or more peptides with at least 90% confidence of correct sequence assignment, or by a single peptide with at least 99% confidence
2•Log 2 transformation and batch correction
3•Proteins present in at least 50% of the samples
4
•Two group comparisons (using Partek®) of rectal tumours: post chemoradiotherapy and at diagnosis, at resection and post chemoradiotherapy, at resection and at diagnosis, and in the diagnostic samples of the responders and non-responders
5
•Statistical analysis using ANOVA, and multiple test correction using Benjamini-Hochberg (significance taken as log2 fold change > 2 and unadjusted p<0.05)
6
•Pathway and network analysis of protein lists using Ingenuity Pathway Analysis

184
5.3 Results
5.3.1 Clinical and demographic data
Eight patients were recruited to this study, all of which were male with an age range of 50-
78 years at the time of diagnosis. Dukes’ Stage of the tumours ranged from B-D with
variation in T (2-4), N (0-1) and M (0-1) stage seen. Patients received oral capecitabine plus
either 45Gy in 25 fractions or 50.4Gy in 28 fractions at the discretion of the treating
radiation oncologist. Following this, participants underwent formal excision of the rectum
in a manner appropriate for both the patient and the tumour (Table 5.1).
5.3.2 Response evaluation
Response evaluation can be seen in Table 5.2. For the purposes of analysis, responders
were those with a histopathological tumour regression grade of 1-2 (n=4) and non
responders those with a tumour regression grade of 3-4 (n=4). Given the small numbers of
patients recruited, radiological response was noted but not used for analysis.
Patient Number Radiological
Response Viable
Tumour (%) Tumour
Regression Grade Responder
1 PR 5 1 Yes
2 SD 10 1 Yes
3 SD 55 3 No
4 PR 40 2 Yes
5 SD 60 3 No
6 PR 45 2 Yes
7 PD 55 3 No
8 PD 75 4 No
Table 5.2 – Response evaluation for patients having serial rectal cancer biopsies. The
percentage viable tumour is displayed along with corresponding tumour regression grade
(TRG). Those patients with TRG 1-2 were considered responders (patients 1, 2, 4 and 6)
and patients with TRG 3-4 were considered non-responders (patients 3, 5, 7 and 8).

185
Table 5.1 – Clinical and demographic data for patients having serial rectal cancer biopsies. 8 patients were studied, all of which were male ranging in age
from 50-78 and Dukes’ stage B-D. Two different neoadjuvant chemotherapeutic regimens were used alongside a number of different surgical
interventions for formal resection of the rectal tumour.
Patient Sex Age at Diagnosis
Dukes' Stage
Nodes Harvested
Nodes Involved
T Stage
N Stage
M Stage
Histology Neoadjuvant Treatment
Procedure
1 M 77 C2 1 1 3 1 0 Moderately differentiated
Capecitabine plus 45Gy in 25 fractions
Open low anterior resection
2 M 50 B 9 0 2 0 0 Moderately differentiated
Capecitabine plus 50.4Gy in 28
fractions
Laparoscopic low anterior resection
3 M 77 C1 36 1 3 1 0 Moderately differentiated
Capecitabine plus 45Gy in 25 fractions
Open low anterior resection
4 M 77 B 10 0 3 0 0 Moderately differentiated
Capecitabine plus 50.4Gy in 28
fractions
Ultra-low Hartmann's
5 M 63 D 20 2 3 1 1 Moderately differentiated
Capecitabine plus 50.4Gy in 28
fractions
Laparoscopic low anterior resection
6 M 71 B 2 0 4 0 0 Moderately differentiated
Capecitabine plus 50.4Gy in 28
fractions
Laparoscopic low anterior resection
7 M 57 B 21 0 3 0 0 Moderately differentiated
Capecitabine plus 50.4Gy in 28
fractions
Laparoscopic low anterior resection
8 M 78 B 17 0 3 0 0 Moderately differentiated
Capecitabine plus 45Gy in 25 fractions
APER

186
5.3.3 Overview of iTRAQ data.
A total of 3359 unique proteins were identified, all of which were present in at least half of
the samples and therefore taken forwards for analysis. The data were acquired over 3
experimental runs, with a mean (SD) of 7 (21.2) peptides used to identify the proteins of
origin. This corresponds to a mean (SD) coverage of 15.18% (15.72%) for identified proteins.
5.3.4 Comparison of rectal tumours post chemoradiotherapy with diagnostic samples
A total of 18 proteins were differentially expressed in the tumours after chemoradiotherapy
compared with the initial diagnostic samples. Of these proteins, 2 were downregulated and
16 upregulated (Table 5.3).

187
Accession Number Name P Value
Log2 Fold-Change (Post chemoradiotherapy/diagnostic)
P12109 Collagen alpha-1(VI) chain
1.34E-02 -1.953
P12429 Annexin A3 9.71E-03 -1.757
Q1KMD3 Heterogeneous nuclear ribonucleoprotein U-
like protein 2
3.76E-02 1.521
P51648 Fatty aldehyde dehydrogenase
1.11E-02 1.525
Q13162 Peroxiredoxin-4 1.84E-02 1.572
Q96PD5 N-acetylmuramoyl-L-alanine amidase
3.04E-02 1.686
P02652 Apolipoprotein A-II 1.02E-02 1.758
Q9BY50 Signal peptidase complex catalytic subunit SEC11C
1.69E-02 1.760
Q9Y6R7 IgGFc-binding protein 3.22E-03 1.761
P01023 Alpha-2-macroglobulin 1.54E-02 1.783
P01859 Ig gamma-2 chain C region
2.67E-02 1.801
Q8NBS9 Thioredoxin domain-containing protein 5
1.17E-02 1.823
P01591 Immunoglobulin J chain 2.57E-02 1.861
O75795 UDP-glucuronosyltransferase
2B17
3.03E-02 1.946
P02765 Alpha-2-HS-glycoprotein
2.18E-02 2.105
P01275 Glucagon 2.77E-04 2.381
P04114 Apolipoprotein B-100 1.75E-02 2.429
P10645 Chromogranin-A 6.10E-03 3.357
Table 5.3 – Those proteins differentially expressed between rectal tumours post
chemoradiotherapy and diagnostic samples. 18 proteins were identified, 2 of which were
downregulated (negative values for fold change) and 16 upregulated (positive values for
fold change).
Analysing those proteins upregulated separately from those downregulated, Ingenuity core
analysis of direct and indirect relationships revealed the significant upregulated canonical
pathways in this group to be: LXR/RXR activation, FXR/RXR activation, acute phase response
signalling, serotonin degradation and phenylethylamine degradation I. Similarly the

188
downregulated canonical pathways were: hepatic fibrosis/hepatic stellate cell activation.
Statistics for these identified pathways can be seen in Table 5.4.
Upregulated Pathways p-value Ratio
LXR/RXR activation 1.24E-04 3/121 (0.025)
FXR/RXR activation 1.37E-04 3/125 (0.024)
Acute phase response signalling 3.27E-04 3/168 (0.018)
Serotonin degradation 8.27E-04 2/52 (0.038)
Phenylethylamine degradation I 3.30E-03 1/4 (0.25)
Downregulated Pathways p-value Ratio
Hepatic fibrosis/hepatic stellate cell activation
2.15E-02 1/196 (0.005)
Table 5.4 – Pathway analysis for proteins both upregulated and downregulated in the
rectal tumours post chemoradiotherapy compared to the diagnostic samples. P-value is
adjusted using Benjamini-Hochberg correction. Ratio identifies the number of focus
molecules identified (numerator) in the pathway (denominator).
Further analysis of all (unfiltered) biological pathways identified 5 upregulated networks
with a score greater than 2 pertaining to: lipid metabolism, molecular transport, small
molecule biochemistry, cancer, cell-to-cell signalling and interaction, cell-mediated immune
response, cellular function and maintenance, cellular growth and proliferation,
haematological system development and function, cell death and survival, cell cycle, cell
morphology, cardiovascular system development and function, carbohydrate metabolism
and post-translational modification. Similarly 2 downregulated networks were identified
pertaining to: cancer, organismal injury and abnormalities, reproductive system disease,
hereditary disorder, skeletal and muscular disorders and connective tissue disorders. The
focus molecules and statistics pertinent to these networks can be seen in Table 5.5.
Upregulated Networks
ID Molecules in Network Score Focus Molecules
Top Diseases and Functions
1 26s Proteasome,A2M,ABCC2,AHSG,ALDH3A2,APOA2,APOB,AQP3,CCND1,CDC73,CHGA,CTNNA2,CTNNB1,EPCAM,GCG,GPLD1,HNF1A,HSD17B2,KIF20A,LRP,MAML1,MTTP,PCDH11Y,PKM,PSMD14,RAD23A,RB1CC1,SLCO1B1,SNRK,SP4,TMSB15A,TSPAN8,UG
T2B17,VENTX,ZMIZ2
18 8 Lipid Metabolism,
Molecular Transport, Small
Molecule Biochemistry

189
2 CD40,IGHG2 3 1 Cancer, Cell-To-Cell Signaling and Interaction, Cell-
mediated Immune
Response
3 miR-146a-5p (and other miRNAs w/seed GAGAACU),PGLYRP2
3 1 Cellular Function and
Maintenance, Cellular Growth
and Proliferation, Hematological
System Development and Function
4 BLM,HNRNPUL2,MDC1 3 1 Cell Death and Survival, Cell
Cycle, Cell Morphology
5 MGEA5,PRDX4,SRXN1 3 1 Cardiovascular System
Development and Function, Carbohydrate Metabolism,
Post-Translational Modification
Downregulated Networks
1 ANXA3,CLDN7 3 1 Cancer, Organismal Injury
and Abnormalities, Reproductive
System Disease
2 CHI3L1,COL6A1,COL6A2,COL6A3,estrogen receptor,HR,SPDEF
3 1 Hereditary Disorder, Skeletal
and Muscular Disorders, Connective
Tissue Disorders
Table 5.5 – Network analysis for proteins both upregulated and downregulated in the
rectal tumours post chemoradiotherapy compared to the diagnostic samples. The score is
derived from a p-value and indicates the probability of the focus molecules in a network
being found together due to random chance. Focus molecules is the total number of
proteins of interest identified in the respective network.

190
5.3.5 Comparison of rectal tumours at resection with post chemoradiotherapy samples
A total of 39 proteins were differentially expressed in the tumours at resection compared
with the samples taken immediately following completion of chemoradiotherapy. Of these
proteins, 30 were downregulated and 9 upregulated (Table 5.6).
Accession Number Name P Value
Log2 Fold-Change (Resection/Post
chemoradiotherapy)
P10645 Chromogranin-A 1.12E-02 -3.430
P04114 Apolipoprotein B-100 2.22E-02 -2.630
P01275 Glucagon 4.03E-04 -2.562
P12532 Creatine kinase U-type, mitochondrial
3.62E-02 -2.427
O75795 UDP-glucuronosyltransferase 2B17
2.21E-02 -2.293
Q9Y5M8 Signal recognition particle receptor subunit beta
3.61E-02 -2.226
Q9Y6R7 IgGFc-binding protein 1.62E-03 -2.095
P01833 Polymeric immunoglobulin receptor
3.21E-02 -2.078
P01591 Immunoglobulin J chain 2.99E-02 -1.992
Q07654 Trefoil factor 3 9.92E-03 -1.952
P21397 Amine oxidase [flavin-containing] A
4.66E-02 -1.882
P17931 Galectin-3 3.48E-02 -1.830
Q16836 Hydroxyacyl-coenzyme A dehydrogenase, mitochondrial
1.91E-02 -1.787
P00966 Argininosuccinate synthase 2.71E-02 -1.757
Q96EY8 Cob(I)yrinic acid a,c-diamide adenosyltransferase,
mitochondrial
9.12E-03 -1.726
Q8NBS9 Thioredoxin domain-containing protein 5
3.23E-02 -1.725
P31930 Cytochrome b-c1 complex subunit 1, mitochondrial
3.25E-02 -1.714
P38117 Electron transfer flavoprotein subunit beta
2.28E-02 -1.691
P19075 Tetraspanin-8 3.31E-02 -1.686
O75874 Isocitrate dehydrogenase [NADP] cytoplasmic
3.49E-02 -1.682
P80303 Nucleobindin-2 4.17E-02 -1.661
Q96FQ6 Protein S100-A16 1.44E-02 -1.648
Q9HAT2 Sialate O-acetylesterase 9.52E-03 -1.626
P17980 26S protease regulatory 2.19E-02 -1.624

191
subunit 6A
Q1KMD3 Heterogeneous nuclear ribonucleoprotein U-like
protein 2
3.93E-02 -1.614
P51648 Fatty aldehyde dehydrogenase
1.33E-02 -1.596
P15880 40S ribosomal protein S2 4.52E-02 -1.583
Q13510 Acid ceramidase 1.35E-02 -1.568
O96000 NADH dehydrogenase [ubiquinone] 1 beta
subcomplex subunit 10
2.29E-03 -1.538
P30049 ATP synthase subunit delta, mitochondrial
1.15E-03 -1.537
Q16658 Fascin 7.94E-03 1.628
P61106 Ras-related protein Rab-14 2.03E-02 1.706
Q9H4M9 EH domain-containing protein 1
2.25E-02 1.769
P08572 Collagen alpha-2(IV) chain 4.48E-02 2.006
P12429 Annexin A3 6.90E-03 2.009
P98160 Basement membrane-specific heparan sulfate
proteoglycan core protein
2.73E-02 2.021
P12109 Collagen alpha-1(VI) chain 1.45E-02 2.136
P13674 Prolyl 4-hydroxylase subunit alpha-1
9.64E-03 2.569
P24821 Tenascin 3.63E-02 3.329
Table 5.6 – Those proteins differentially expressed between rectal tumours at resection
and immediately following completion of chemoradiotherapy. 39 proteins were
identified, 30 of which were downregulated (negative values for fold change) and 9
upregulated (positive values for fold change).
Analysing those proteins upregulated separately from those downregulated, Ingenuity core
analysis of direct and indirect relationships revealed the significant upregulated canonical
pathways in this group to be: hepatic fibrosis/stellate cell activation, inhibition of
angiogenesis by TSP1, inhibition of matrix metalloproteases, crosstalk between dendritic
cells and natural killer cells and dendritic cell maturation. Similarly the downregulated
canonical pathways were: serotonin degradation, mitochondrial dysfunction, phenylalanine
degradation IV, tryptophan degradation and putrescine degradation. Statistics for these
identified pathways can be seen in Table 5.7.

192
Upregulated Pathways p-value Ratio
Hepatic fibrosis/hepatic stellate cell activation
3.98E-03 2/196 (0.01)
Inhibition of angiogenesis by TSP1 1.58E-02 1/32 (0.031)
Inhibition of matrix metalloproteases 1.87E-02 1/38 (0.026)
Crosstalk between dendritic cells and natural killer cells
4.33E-02 1/89 (0.011)
Dendritic cell maturation 8.08E-02 1/169 (0.006)
Downregulated Pathways p-value Ratio
Serotonin degradation 7.71E-05 3/52 (0.058)
Mitochondrial dysfunction 1.31E-05 4/165 (0.024)
Phenylalanine degradation IV 2.22E-04 2/14 (0.143)
Tryptophan degradation 2.92E-04 2/16 (0.125)
Putrescine degradation 2.92E-04 2/16 (0.125)
Table 5.7 – Pathway analysis for proteins both upregulated and downregulated in the
rectal tumours at resection compared to immediately following completion of
chemoradiotherapy. P-value is adjusted using Benjamini-Hochberg correction. Ratio
identifies the number of focus molecules identified (numerator) in the pathway
(denominator).
Further analysis of all (unfiltered) biological pathways identified 2 upregulated networks
with a score greater than 2 pertaining to: organismal injury and abnormalities, connective
tissue disorders, dermatological diseases and conditions, cancer and reproductive system
disease. Similarly 1 downregulated network was identified pertaining to: tissue
development, cell death and survival and dermatological diseases and conditions. The focus
molecules and statistics pertinent to these networks can be seen in Table 5.8.

193
Upregulated Networks
ID Molecules in Network Score Focus Molecules
Top Diseases and Functions
1 AFP,BGN,CDH11,CLDN4,COL4A1,COL4A2,COL5A1,COL6A1,COL6A2,COL6A3,COL7A1
,EHD1,estrogen receptor,FGA,FSCN1,HEXA,HEXB,HIF1A,HSPG2,KRT7,KRT15,LAMC2,LOXL2,LTBP2,m
ir-31,MMP12,NOV,P4HA1,SPAG4,TGFB1,TN
C,TNF,TYMP,WISP1,WNT5B
17 7 Organismal Injury and
Abnormalities, Connective
Tissue Disorders, Dermatological
Diseases and Conditions
2 ANXA3,CLDN7 3 1 Cancer, Organismal Injury
and Abnormalities, Reproductive
System Disease
Downregulated Networks
1 AIM1,AJAP1,Akt,ALDH3A2,CDH1,CHGA,CNN2,CRAT,CTNNB1,CXCL8,DEFA5,DPEP1,EDN3,F13A1,GAD1,GCG,GPX2,HSD17B2,IDH1,IHH,IL4,KLK3,LGALS3,MAOA,MUC6,PCCA,PIGR,QPCT,RCN1,SLC26A2,TCF,TFF3,
TOB2,TSPAN8,UGT2B17
20 9 Tissue Development, Cell Death and
Survival, Dermatological
Diseases and Conditions
Table 5.8 – Network analysis for proteins both upregulated and downregulated in the
rectal tumours at resection compared to immediately following completion of
chemoradiotherapy. The score is derived from a p-value and indicates the probability of
the focus molecules in a network being found together due to random chance. Focus
molecules is the total number of proteins of interest identified in the respective network.
5.3.6 Comparison of rectal tumours at resection with diagnostic samples
A total of 29 proteins were differentially expressed in the tumours at resection compared
with the samples taken at diagnosis. Of these proteins, 10 were downregulated and 19
upregulated (Table 5.9).

194
Accession Number Name P Value
Log2 Fold-Change (Resection/Diagnostic)
O95881 Thioredoxin domain-containing protein 12
3.98E-02 -2.779
P16444 Dipeptidase 1 3.35E-02 -2.740
Q13228 Selenium-binding protein 1 2.03E-02 -2.013
P05783 Keratin, type I cytoskeletal 18
3.44E-02 -1.835
Q9BY42 UPF0549 protein C20orf43 2.97E-02 -1.732
P09874 Poly [ADP-ribose] polymerase 1
5.82E-03 -1.599
O96008 Mitochondrial import receptor subunit TOM40
homolog
8.41E-03 -1.566
Q9NX63 Coiled-coil-helix-coiled-coil-helix domain-
containing protein 3, mitochondrial
4.29E-02 -1.548
P11940 Polyadenylate-binding protein 1
4.44E-02 -1.530
P05455 Lupus La protein 3.78E-02 -1.525
P07099 Epoxide hydrolase 1 4.17E-02 1.504
O14773 Tripeptidyl-peptidase 1 1.17E-02 1.590
Q99536 Synaptic vesicle membrane protein VAT-1 homolog
2.76E-02 1.644
Q92930 Ras-related protein Rab-8B 1.03E-02 1.690
Q9H4M9 EH domain-containing protein 1
1.24E-02 1.714
Q9UJ70 N-acetyl-D-glucosamine kinase
1.59E-02 1.737
P08758 Annexin A5 2.30E-02 1.770
P53004 Biliverdin reductase A 1.61E-02 1.842
P04271 Protein S100-B 4.74E-02 1.882
P02765 Alpha-2-HS-glycoprotein 3.26E-02 1.896
Q9BUF5 Tubulin beta-6 chain 4.44E-02 2.002
P01824 Ig heavy chain V-II region WAH
1.80E-02 2.073
P13674 Prolyl 4-hydroxylase subunit alpha-1
1.06E-02 2.141
B9A064 Immunoglobulin lambda-like polypeptide 5
2.80E-02 2.249
P01860 Ig gamma-3 chain C region 4.99E-02 2.271
P08603 Complement factor H 4.15E-02 2.310
P01008 Antithrombin-III 2.61E-02 2.317
P01834 Ig kappa chain C region 4.25E-02 2.731
P10909 Clusterin 4.97E-02 4.945

195
Table 5.9 – Those proteins differentially expressed between rectal tumours at resection
and at diagnosis. 29 proteins were identified, 10 of which were downregulated (negative
values for fold change) and 19 upregulated (positive values for fold change).
Analysing those proteins upregulated separately from those downregulated, Ingenuity core
analysis of direct and indirect relationships revealed the significant upregulated canonical
pathways in this group to be: primary immunodeficiency signalling, haematopoiesis from
pluripotent stem cells, haem degradation, N-acetylglucosamine degradation II and CMP-N-
acetylneuraminate biosynthesis I. Similarly the downregulated canonical pathways were:
glutathione redox reactions II, BER pathway, DNA double-strand break repair by non-
homologous end joining, leukotriene biosynthesis and granzyme B signalling. Statistics for
these identified pathways can be seen in Table 5.10.
Upregulated Pathways p-value Ratio
Primary immunodeficiency signalling 1.21E-05 3/46 (0.065)
Haematopoiesis from pluripotent stem cells
8.59E-04 2/44 (0.045)
Haem degradation 3.96E-03 1/4 (0.25)
N-acetylglucosamine degradation II 3.96E-03 1/4 (0.25)
CMP-N-acetylneuraminate biosynthesis I 4.95E-03 1/5 (0.2)
Downregulated Pathways p-value Ratio
Glutathione redox reactions II 1.49E-03 1/3 (0.333)
BER pathway 5.94E-03 1/12 (0.083)
DNA double-strand break repair by non-homologous end joining
6.93E-03 1/14 (0.071)
Leukotriene biosynthesis 6.93E-03 1/14 (0.071)
Granzyme B signalling 7.91E-03 1/16 (0.062)
Table 5.10 – Pathway analysis for proteins both upregulated and downregulated in the
rectal tumours at resection compared to at diagnosis. P-value is adjusted using
Benjamini-Hochberg correction. Ratio identifies the number of focus molecules identified
(numerator) in the pathway (denominator).
The base excision repair (BER) signalling pathway was identified as being highly significant,
with this data set suggesting downregulation induced by chemoradiotherapy (Figure 5.3).

196
Figure 5.3 – The base excision repair (BER) signalling pathway was identified as being
highly significant, with this data set suggesting downregulation induced by
chemoradiotherapy. Only one of the 12 focus molecules was identified – PARP1
(highlighted in purple).
Further analysis of all (unfiltered) biological pathways identified 6 upregulated networks
with a score greater than 2 pertaining to: cell death and survival, tissue morphology,
cellular development, gastrointestinal disease, hepatic system disease, organismal injury
and abnormalities, cell-to-cell signalling and interaction, cellular assembly and organization,
cellular function and maintenance, cancer, carbohydrate metabolism, endocrine system
disorders, cell morphology, developmental disorder and hereditary disorder. Similarly 3
downregulated networks were identified pertaining to: cancer, organismal injury and
abnormalities, reproductive system disease, cell death and survival, energy production,
nucleic acid metabolism, cardiovascular system development and function, endocrine
system disorders and gastrointestinal disease. The focus molecules and statistics pertinent
to these networks can be seen in Table 5.11.

197
Upregulated Networks
ID Molecules in Network Score Focus Molecules
Top Diseases and Functions
1 ANXA5,BMP2,BMP4,CDC25B,CDC25C,CDKN1A,CHRNA3,CLU,GDF15,HMGB1,HRAS,I
D1,IL1R1,JAG1,LTF,NFkB (complex),NUMBL,NUP98,PLAA,PP2A,PYCARD,RASSF5,RBPJ,REL,RNF34,S100B,SERPINB2,SNW1,SOD2,TCP1,TFRC,TNFSF13,US
P11,VHL,XRCC5
5 3 Cell Death and Survival, Tissue
Morphology, Cellular
Development
2 BLVRA,IL13 3 1 Gastrointestinal Disease, Hepatic System Disease,
Organismal Injury and
Abnormalities
3 miR-30a-3p (and other miRNAs w/seed UUUCAGU),RAB8B
3 1 Cell-To-Cell Signaling and Interaction,
Cellular Assembly and Organization, Cellular Function and Maintenance
4 AHSG,HNF1A 3 1 Cancer, Carbohydrate Metabolism,
Endocrine System Disorders
5 CD24,NAGK 3 1 Cell Morphology, Cellular Function
and Maintenance, Carbohydrate Metabolism
6 TFEB,TPP1 3 1 Cellular Assembly and Organization,
Developmental Disorder,
Hereditary Disorder
Downregulated Networks
1 APH1B,BRCA1,CASP3,CSTF1,EMILIN2,KRT18,MIR585,mir-95,mir-128,mir-182,mir-
183,mir-188,mir-191,mir-193,mir-224,mir-320,mir-330,mir-486,mir-
500,miR-125b-5p (and other miRNAs w/seed CCCUGAG),miR-17-3p (and other miRNAs w/seed CUGCAGU),miR-330-3p
(and other miRNAs w/seed CAAAGCA),miR-378a-3p (and other
miRNAs w/seed CUGGACU),miR-486-5p
12 5 Cancer, Organismal Injury
and Abnormalities, Reproductive
System Disease

198
(and other miRNAs w/seed CCUGUAC),miR-501-5p (miRNAs w/seed
AUCCUUU),PABPC1,PARP1,PARP2,PEBP4,PINK1,PPT1,SSB,TEP1,TOMM40,TP53
2 CHCHD3,CHCHD6 3 1 Cell Death and Survival, Energy
Production, Nucleic Acid Metabolism
3 CTNNB1,DPEP1,MGEA5,TCF 3 1 Cardiovascular System
Development and Function,
Endocrine System
Disorders, Gastrointestinal
Disease
Table 5.11 - Network analysis for proteins both upregulated and downregulated in the
rectal tumours at resection compared to at diagnosis. The score is derived from a p-value
and indicates the probability of the focus molecules in a network being found together
due to random chance. Focus molecules is the total number of proteins of interest
identified in the respective network.
5.3.7 Predictive biomarkers in the diagnostic samples
A total of 8 proteins were differentially expressed between the initial diagnostic samples of
the responders and non-responders. Of these proteins, 3 were downregulated and 5
upregulated (Table 5.12).

199
Accession Number Name P Value
Log2 Fold-Change (Responders/Non-
responders)
Q9NZM1 Myoferlin 4.35E-02 -1.633
Q13510 Acid ceramidase 1.17E-02 -1.526
P09525 Annexin A4 1.93E-02 -1.524
P41219 Peripherin 2.13E-02 1.583
P12109 Collagen alpha-1(VI) chain 3.61E-02 1.800
P80748 Ig lambda chain V-III region LOI 4.82E-02 1.866
P07602 Proactivator polypeptide 5.90E-04 1.943
P01860 Ig gamma-3 chain C region 2.74E-02 2.549
Table 5.12 – Those proteins differentially expressed between the primary tumours of the
responders and non-responders. 8 proteins were identified, 3 of which were
downregulated (negative values for fold change) and 5 upregulated (positive values for
fold change).
Analysing those proteins upregulated separately from those downregulated, Ingenuity core
analysis of direct and indirect relationships revealed the significant upregulated canonical
pathways in this group to be: hepatic fibrosis/stellate cell activation, inhibition of
angiogenesis by TSP1, inhibition of matrix metalloproteases, crosstalk between dendritic
cells and natural killer cells and dendritic cell maturation. Similarly the downregulated
canonical pathways were: serotonin degradation, mitochondrial dysfunction, phenylalanine
degradation IV, tryptophan degradation and putrescine degradation. Statistics for these
identified pathways can be seen in Table 5.13.

200
Upregulated Pathways p-value Ratio
Lipid antigen presentation by CD1 5.28E-03 1/24 (0.042)
Autoimmune thyroid disease signalling 9.23E-03 1/42 (0.024)
Haematopoiesis from pleuripotent stem cells
9.67E-03 1/44(0.024)
Primary immunodeficiency signalling 1.01E-02 1/46 (0.022)
Allograft rejection signalling 1.05E-02 1/48 (0.021)
Downregulated Pathways p-value Ratio
Ceramide degradation 9.92E-04 1/6 (0.167)
Sphingosine and sphingosine-1-phosphate metabolism
1.32E-03 1/8 (0.125)
Sphingosine-1-phosphate signalling 1.78E-02 1/108 (0.009)
Table 5.13 – Pathway analysis for proteins both upregulated and downregulated in the
primary tumours of the responders compared to the primary tumours of the non-
responders. P-value is adjusted using Benjamini-Hochberg correction. Ratio identifies the
number of focus molecules identified (numerator) in the pathway (denominator).
The ceramide degradation pathway was identified as being the most significantly
downregulated pathway in those tumours responding to chemoradiotherapy (Figure 5.4).
This is based on the significantly lower levels of acid ceramidase identified in the diagnostic
samples.
Figure 5.4 – The ceramide degradation pathway was identified as being the most
significantly downregulated pathway in the diagnostic samples of those primary tumours
responding to chemoradiotherapy. Only 1 of the 6 focus molecules was identified – acid
ceramidase (highlighted in purple).

201
Further analysis of all (unfiltered) biological pathways identified 4 upregulated networks
with a score greater than 2 pertaining to: cancer, cell cycle, cell morphology and
haematological disease, hereditary disorder, immunological disease, lipid metabolism,
small molecule biochemistry, molecular transport, skeletal and muscular disorders and
connective tissue disorders. Similarly 2 downregulated networks were identified pertaining
to: cancer, cell cycle, cell death and survival, cardiovascular system development and
function, tissue morphology and cell death and survival. The focus molecules and statistics
pertinent to these networks can be seen in Table 5.14.

202
Upregulated Networks
ID Molecules in Network Score Focus Molecules
Top Diseases and Functions
1 CCND1,PRPH 3 1 Cancer, Cell Cycle, Cell
Morphology
2 CD40,FCGR2C,IGHG3 3 1 Hematological Disease,
Hereditary Disorder,
Immunological Disease
3 CDKN1A,GBA,mir-19,PSAP,TFEB 3 1 Lipid Metabolism,
Small Molecule Biochemistry,
Molecular Transport
4 CHI3L1,COL6A1,COL6A2,COL6A3,estrogen receptor,HR,SPDEF
3 1 Hereditary Disorder, Skeletal
and Muscular Disorders, Connective
Tissue Disorders
Downregulated Networks
1 ANXA4,PLAA,TP53 3 1 Cancer, Cell Cycle, Cell Death
and Survival
2 FANCC,KDR,MYOF,SYVN1,TGFBR2 3 1 Cardiovascular System
Development and Function,
Tissue Morphology, Cell
Death and Survival
Table 5.14 – Network analysis for proteins both upregulated and downregulated in the
primary tumours of the responders compared to the primary tumours of the non-
responders. The score is derived from a p-value and indicates the probability of the focus
molecules in a network being found together due to random chance. Focus molecules is
the total number of proteins of interest identified in the respective network.

203
5.4 Discussion
5.4.1 Summary of aims
In this study a comprehensive proteomic analysis of serial rectal cancer biopsies from 8
patients was performed. The aim of this investigation was to compare the proteomic profile
of serial rectal cancer biopsies taken at diagnosis, immediately after long course
neoadjuvant chemoradiotherapy and at resection, to establish how this profile changes
with treatment and identify potential response biomarkers which are detectable and
measurable on the initial diagnostic biopsy.
5.4.2 Summary of results
Serial rectal cancer biopsies were obtained at 3 time points (diagnosis, post
chemoradiotherapy and resection) from 8 patients which were dichotomised by
histopathological response into responders and non-responders. 3359 proteins were
identified, all of which were subjected to bioinformatics analysis. A summary of the
proteomic data is shown in Table 5.15.
Table 5.15 - Summary proteomic data for the 2-group comparisons showing the total
number of dysregulated proteins as well as those up/downregulated.
When comparing the post chemoradiotherapy samples with the diagnostic biopsies 18
proteins were significantly dysregulated, 2 of which were downregulated and 16
upregulated. Comparing the samples at resection with post chemoradiotherapy samples
identified 39 proteins dysregulated, 30 of which were downregulated and 9 upregulated.
Similarly a comparison of the resection and diagnostic samples identified 29 proteins, 10 of
which were downregulated and 19 upregulated. The base excision repair pathway was the
most significantly downregulated pathway in this analysis as a result of a reduction in
Comparison Total Dysregulated
Upregulated Downregulated
Post chemoradiotherapy / Diagnosis 18 16 2
Resection / Post chemoradiotherapy 39 9 30
Resection / Diagnosis 29 19 10
Responder / Non-responder (Diagnosis) 8 5 3

204
PARP1 abundance with treatment. Eight candidate biomarkers were identified in the
primary tumours which appeared to predict response to chemoradiotherapy, 3 of which
were downregulated and 5 upregulated. The most statistically significantly downregulated
pathway was ceramide degradation as a result of low expression of acid ceramidase in
those patients responding favourably to chemoradiotherapy. Again, further bioinformatic
analysis of these comparator groups revealed putative pathways and networks involved in
carcinogenesis.
5.4.3 iTRAQ for evaluation of tumour biology
The use of iTRAQ for the evaluation of tumour biology has previously been discussed
(Section 4.4.3). Again this study reports protein coverage greater than that commonly seen
in the literature and a novel study design. No other studies have attempted to characterise
how the phenotype of any tumour changes with treatment.
5.4.4 Base excision repair
Base excision repair proteins are a key mechanism by which small, non-helix-distorting base
lesions are repaired (compared to the nucleotide excision repair pathway which repairs
bulky helix-distorting lesions). Base excision repair (BER) mechanisms remove damaged
bases that could otherwise cause mutations by mispairing or lead to breaks in DNA during
replication. Some of the key proteins involved in this mechanism include AP endonuclease 1
(APE1) which cleaves an AP site for subsequent binding, DNA polymerase β which catalyses
short-patch repair (i.e. single nucleotide replacement), and DNA ligase III along with its
cofactor XRCC1 which catalyses the nick-sealing step in short-patch BER. The expression of
these proteins has been investigated for potential as both biomarkers and therapeutic
targets, although as yet there is insufficient evidence for incorporation into clinical practice
(Vens and Begg, 2010).
The BER pathway was one of the most significantly downregulated pathways identified
between the initial diagnostic samples and resection, and was identified due to the
decreased abundance in poly(ADP-ribose) polymerase (PARP1) at resection. PARP1
modifies nuclear proteins by poly ADP-ribosylation and is therefore relevant to
differentiation, proliferation and tumour transformation, predominantly by repairing single
stranded DNA breaks. Failure to repair these breaks, for example in the case of absent

205
PARP1, leads to an increase in the frequency of double-strand DNA breaks which are
subsequently repaired by homologous recombination. Cells lacking PARP1 therefore exhibit
a compensatory hyper-recombinagenic phenotype (Schultz et al, 2003). Interestingly the
BRCA1 and BRCA2 genes are required for the adequate function of the homologous
recombination pathway. BRCA mutated tumours are therefore highly sensitive to PARP1
loss (Farmer et al, 2005).
This knowledge has led investigators to consider the potential for PARP1 inhibition as a
radiosensitiser. In an in vitro study of Ewing sarcoma cell lines, Lee et al (2013)
demonstrated that inhibiting PARP1 with shRNA amplified both the level and duration of
DNA damage caused by radiotherapy which ultimately resulted in increased apoptosis and
cell death. Wang et al (2012) considered the effects of PARP1 inhibition with an inhibitor
currently in phase 1 clinical trials (MK-4827) in lung and breast cancer xenografts,
demonstrating improved chemosensitivity irrespective of p53 status.
Only one pre-clinical study is reported for colorectal cancer. Shelton et al (2013)
investigated the radiosensitisation of ABT-888, an orally available inhibitor of PARP1,
compared to and in combination with other chemotherapeutics (5-FU, irinotecan,
oxaliplatin). In the HCT116 and HT26 colorectal tumour derived cell lines ABT-888
radiosensitised at higher levels than the chemotherapeutics and acted synergistically with
these when assessed by clonogenic assays.
When considering the findings from this investigation in light of the literature it is clear that
the role of PARP-1 requires further investigation both as a biomarker and potential
chemosensitiser for rectal cancer. What remains unclear is why we may be observing a
reduction in abundance following chemoradiotherapy in our samples.
5.4.5 Acid ceramidase
Acid ceramidase is a sphingolipid - a group of biomolecules known to be responsible for
important signalling functions in the control of cell growth and differentiation (Garcia-
Barros et al, 2014). Importantly, a recent study from Mahdy et al (2009) has convincingly
demonstrated that downregulation of the corresponding gene with siRNA in a prostate
cancer cell line confers radiosensitivity. This in vitro study in PPC-1 cells assessed radiation
response by clonogenic and cytotoxic assays, and also demonstrated that upregulation of

206
acid ceramidase decreased sensitivity to radiation and created cross-resistance to
chemotherapy. The small molecule acid ceramidase inhibitor, LCL385, was also sufficient to
sensitize PPC-1 cells to radiation. These data support our finding of low levels of acid
ceramidase in those tumours responding to radiotherapy, with our data suggesting the
potential for its use as an up-front predictive biomarker of response. Further evaluation in a
larger patient cohort is clearly required however.
Carmofur, in common to the widely used radiosensitiser capecitabine, is a fluorouracil
analogue currently in widespread clinical use in the US in the adjuvant setting for colorectal
cancer. In addition to its presumed primary mode of action as a thymidylate synthetase
inhibitor it has also independently been shown to inhibit acid ceramidase in the human
tumour derived cell lines SW403 (colorectal) and LNCaP (prostate), a property not shared
by fluorouracil or capecitabine (Realini et al, 2013). In light of our study, further work is
needed to compare the radiosensitisation of capecitabine (thymidylate synthase inhibition)
and carmofur (thymidylate synthase and acid ceramidase inhibition).
5.4.6 Study strengths and limitations
The relative merits and difficulties of a proteomic approach to these questions have already
been discussed (Peng et al, 2003). As with most clinical studies there is inherent
heterogeneity in the study population; differences exist in terms of patient age, TNM stage
and tumour grade as well as the total dose of radiation received. That said, all patients
received oral capecitabine as a radiosensitiser.
One of the clear strengths of the study (in contrast with that described in Chapter 4) is the
utilisation of fresh tissue taken prior to treatment to prospectively identify novel response
biomarkers. In addition, the yield of our mass spectrometry in terms of confidently
identified and accurately mapped proteins is excellent, and considerably more (often many
fold) than many other oncology based proteomic studies. The tissue resources we have
collected are high value and the research questions are novel.
Given the aims of this study the numbers we have used are inadequate to draw any firm
conclusions. This combined with the heterogeneity in the study sample, and the issue of
tumour heterogeneity previously discussed (Section 4.4.4) mandates a degree of caution in
the interpretation of the results and validity of any conclusions.

207
5.4.7 Conclusion
This study has evaluated the changes to the phenotype of a rectal tumour with
chemoradiotherapy. Whilst the changes we have seen are modest in absolute figures, it is
clear that base excision repair (and in particular PARP1) remains of interest in both
carcinogenesis and treatment response. We have also identified acid ceramidase as a
potential response biomarker, which complements existing understanding of its role in
radiosensitisation.

208
Chapter 6
Targeted analysis of candidate biomarkers in the primary tumour for predicting response
to neoadjuvant chemotherapy in colorectal liver metastases

209
6.1 Introduction
6.1.1 Background
Previous chapters in this thesis have described a global approach to both genomic and
proteomic analysis of patient matched primary and metastatic colorectal tumours. The
biological similarity of the tumours has been discussed at both a genomic and proteomic
level, and the issues surrounding the problems of tumour heterogeneity and clonal
selection on biomarker studies such as this have also been explored. Further necessary
targeted work has been identified to explore these findings in more detail.
6.1.2 Pharmacology of chemotherapeutics
The bioinformatics analyses described have identified a number of potential pathways and
networks involved in metastagenesis and treatment response. Accepting that for all
patients the cornerstone of neoadjuvant therapy received has been 5-FU, the treatments
have been heterogenous and as such any conclusions drawn relate to chemosensitivity of
the tumour rather than a precise understanding of the mechanism of action of the
chemotherapeutic agents received. The global proteomic study failed to confidently
identify, in sufficient samples to make any meaningful interpretation, those proteins most
relevant to the metabolism and biological effect of:
5-FU – dihydropyrimidine dehydrogenase (DPYD), thymidylate synthase (TS),
orotate phosphoribosyl transferase (OPRT)
Irinotecan – carboxylesterase 1 (CES1), carboxylesterase 2 (CES2), topoisomerase I
(TOP I), UDP glucuronyltransferase 1A1 (UGT1A1) and cytochrome P450 3A4
(CYP3A4)
Oxaliplatin – DNA polymerase β (DNAPOL β)
Therefore, a more targeted approach to their investigation is required.
As yet the focus has purely been on protein expression, however the potential for post-
translational modification affecting protein function is well understood. To characterise the
similarity in protein function (in addition to expression) between primary and metastatic
tumours would provide further insight into the potential for using biomarkers from the
210
primary tumour to target therapy in the liver metastases. A mass-spectrometry assay of
irinotecan conversion to SN-38 by action of human CES1 and CES2 has already been
described (Section 2.2.9), however such an assay does not exist for 5-FU. It is however well-
established that MSI-H tumours are less likely to respond to 5-fluoruracil-based regimens,
and in a minority of patients, treatment may even be detrimental (Sargent, 2008). As such,
establishing MSI status in these patients may provide further useful insight. In addition,
given the increasing use of EGFR inhibitors evaluating the concordance of KRAS and BRAF
status in our patients would also add to the existing body of knowledge in this regard.
6.1.3 Biomarker validation (NQO1)
The bioinformatics analysis of patient-matched primary and metastatic tumours identified 5
potential response biomarkers, two of which were similarly dysregulated in the primary and
metastatic tumours and one of these (NQO1) appeared biologically plausible and worthy of
further investigation.
The original discovery tissue set was the 16 patients from which fresh tissue was obtained.
Validation of the iTRAQ findings on the same samples by another laboratory technique, for
example western blotting, would be necessary before any further work could be
undertaken. Beyond that the next step would be validation in a larger tissue set to further
evaluate the potential for the use of this protein as a predictive biomarker. In addition the
nature of the dysregulation, i.e. reduced abundance in the responders, raises the question
about the potential for this protein to be used as a therapeutic target.
6.1.4 Aims and hypotheses
The aim of this investigation was to further explore the potential for utilising biological
information from the primary tumour to inform and predict response to treatment for the
liver metastases using a targeted approach of previously-identified markers of interest.
Specifically we hypothesise that:
1. Expression of those proteins known to be relevant to the activation and metabolism of
chemotherapeutics (DPYD, TS, OPRT, CES1, CES2, TOP I, UGT1A1, CYP3A4 and DNAPOL β) in

211
the primary tumour correlate with expression in the liver metastases and predict response
to treatment.
2. Activity of CES1/CES2 (and therefore conversion of irinotecan to SN-38) in the primary
tumour correlates with CES1/CES2 activity in the metastasis and predicts response to
treatment.
3. MSI status in the primary tumour predicts status in the metastasis (and therefore likely
response to 5-FU).
4. KRAS and BRAF status in the primary tumour predicts status in the metastasis (and
therefore likely response to EGFR inhibitors).
5. NQO1 expression by western blot confirms the validity of the iTRAQ data.
6. Immunohistochemical analysis of NQO1 expression in a larger patient cohort confirms its
status as a predictive biomarker to (5FU based) neoadjuvant chemotherapy.
7. Inhibition of NQO1 in an in vitro model (by siRNA and/or use of a known competitive
inhibitor) improves chemosensitivity.

212
6.2 Methods
6.2.1 Western blotting of proteins relevant to the activation and metabolism of
chemotherapeutics
Fresh frozen samples of 16 patients undergoing synchronous or staged resection of
metastatic colorectal cancer were collected as previously described (Section 4.2.1). Those
samples with sufficient remaining material were used for this study. Protein extraction was
performed by a combination of both mechanical and ultrasonic homogenisation in
phosphate-buffered saline.
Following centrifugation the protein concentration of the supernatant was established
using a Bradford assay (Bradford, 1976). Standard protein concentrations of bovine serum
albumin (BSA) (Sigma Aldrich) were prepared at 0.1, 0.2, 0.4, 0.8, 1.0 and 1.4mg/ml and
20µl placed in triplicate on a 96 well plate. Serial dilutions of each sample were made at
concentrations of 1:10, 1:20, 1:50 and 1:100, and 20µl placed in triplicate on the same 96
well plate. Bradford reagent (BioRad) was diluted 1:5 with dH2O and 180µl placed in each of
the wells and then mixed. Absorbance at 570nm was measured using the Dynex MRXe
plate reader (Magellan Biosciences, Chelmsford, UK), and protein concentration of the
sample calculated by comparison to the standard curve.
Samples containing 20µg total protein were prepared with 2X Laemmli buffer (BioRad),
boiled at 100oC for 10 minutes and run on 10% SDS-PAGE gels at 110V for 1 hour. A rainbow
molecular marker (Sigma Aldrich, Poole, UK) was used to assist with the analysis of the
molecular weight of protein samples.
After electrophoresis, membranes were washed in transfer buffer (1 x running buffer with
20% methanol) and transferred to a Hybond nitrocellulose membrane (GE Lifescience)
within a blotting sandwich in a transfer unit containing transfer buffer at 230A for 1 hour.
Membranes were washed briefly in 1x TBST (20mM Tris-Cl pH 7.6, 150mM NaCl, 0.1%
Tween 20) and the quality of transfer assessed with Ponceau S stain. The stain was
removed with TBST and the membrane blocked overnight in 10% Marvel milk in TBST with
constant agitation.

213
The optimum conditions for antibody incubation were determined by experimentation,
with the final conditions used shown in Table 5.1. All primary antibodies were diluted in 2%
Marvel milk with TBST and incubated overnight with constant agitation in a cold room (4oC).
Primary Antibody
Manufacturer Reference Dilution Secondary Antibody
Molecular Weight (kDA)
TS Abcam ab3145 1:100 Mouse 35
DPYD Abcam ab54797 1 1:1000 Mouse 111
OPRT Abcam ab155763 1:2500 Rabbit 55
CES1 Abcam ab64867 1 1:1000 Rabbit 58
CES2 Abcam ab64867 1 1:1000 Rabbit 58
TOP I Abcam ab109374 1 1:2500 Rabbit 91
UGT1A1 Abcam ab170858 1:2500 Rabbit 55
CYP3A4 Sigma 1400064 1:2500 Mouse 50
DNA POL β Kind gift from Dr J Parsons
N/A 1:2500 Rabbit 33
β-Actin Abcam ab6726 1:5000 Mouse 42
Table 6.1 – Antibody incubation conditions for the proteins of interest with respect to the
activation and metabolism of chemotherapeutics.
After incubation, membranes were washed with TBST for 3 x 10 minutes and then
incubated with the appropriate LI-COR IRDye 680 LT secondary antibody (Biosciences,
Lincoln USA) as shown in Table 6.1. The incubation was performed at a concentration of
1/20000 at room temperature for 1 hour with constant agitation in a light-tight box. Semi-
quantitative analysis was performed using the Odyssey scanner (LI-COR Biosciences, Lincoln
USA), with the same intensity adjustments used for all membranes being blotted for the
same protein. Densitometry measurements were taken at the time of first scanning.
To permit inter-gel comparisons the same reference sample was included on all blots which
were performed and analysed in triplicate with β-actin used as a loading control. Data were
normalised to the reference sample.
6.2.2 CES1/CES2 activity assessment by mass spectrometry
The activity of CES1/CES2 was determined with irinotecan as a substrate in order to assess
protein function. Tissue homogenate (250µg protein) from all patients with sufficient
remaining primary and metastatic tumour was incubated with 200nM irinotecan (Sigma
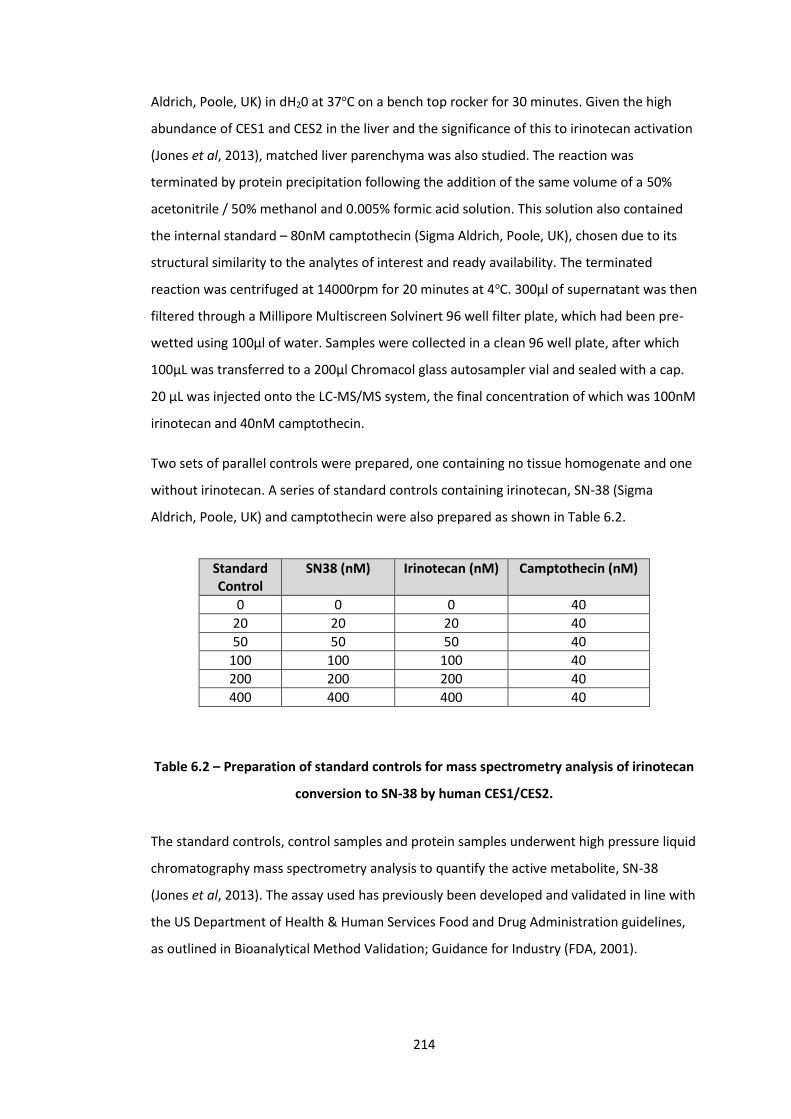
214
Aldrich, Poole, UK) in dH20 at 37oC on a bench top rocker for 30 minutes. Given the high
abundance of CES1 and CES2 in the liver and the significance of this to irinotecan activation
(Jones et al, 2013), matched liver parenchyma was also studied. The reaction was
terminated by protein precipitation following the addition of the same volume of a 50%
acetonitrile / 50% methanol and 0.005% formic acid solution. This solution also contained
the internal standard – 80nM camptothecin (Sigma Aldrich, Poole, UK), chosen due to its
structural similarity to the analytes of interest and ready availability. The terminated
reaction was centrifuged at 14000rpm for 20 minutes at 4oC. 300μl of supernatant was then
filtered through a Millipore Multiscreen Solvinert 96 well filter plate, which had been pre-
wetted using 100μl of water. Samples were collected in a clean 96 well plate, after which
100μL was transferred to a 200μl Chromacol glass autosampler vial and sealed with a cap.
20 μL was injected onto the LC-MS/MS system, the final concentration of which was 100nM
irinotecan and 40nM camptothecin.
Two sets of parallel controls were prepared, one containing no tissue homogenate and one
without irinotecan. A series of standard controls containing irinotecan, SN-38 (Sigma
Aldrich, Poole, UK) and camptothecin were also prepared as shown in Table 6.2.
Standard Control
SN38 (nM) Irinotecan (nM) Camptothecin (nM)
0 0 0 40
20 20 20 40
50 50 50 40
100 100 100 40
200 200 200 40
400 400 400 40
Table 6.2 – Preparation of standard controls for mass spectrometry analysis of irinotecan
conversion to SN-38 by human CES1/CES2.
The standard controls, control samples and protein samples underwent high pressure liquid
chromatography mass spectrometry analysis to quantify the active metabolite, SN-38
(Jones et al, 2013). The assay used has previously been developed and validated in line with
the US Department of Health & Human Services Food and Drug Administration guidelines,
as outlined in Bioanalytical Method Validation; Guidance for Industry (FDA, 2001).
215
Sample separation was performed on a Dionex HPLC stack using an Ultimate 3000 system
and an Altima c18 (150 x 2.1mm, 5μM) column. A dual-buffer technique of an aqueous
buffer A (LC-MS grade H20 with 0.25% formic acid) and organic buffer B (LC-MS grade
acetonitrile with 0.25% formic acid) was used with a run time of 15 minutes. The elution
time of SN38 was 5.5 minutes with a clearly detectable peak and m/z of 393.2. Conditions
for optimal detection of SN-38 were based on existing literature (Chen et al, 2012) and a
multiple reaction monitoring (MRM) method implemented. All samples were run in
triplicate. The concentration of SN-38 in the samples was calculated by reference to the
standard curve, normalised to the internal standard by peak area ratio and a rate of
production (nmol/µg protein/minute) calculated.
6.2.3 Microsatellite instability analysis and KRAS/BRAF pyrosequencing
DNA extraction was performed using the Qiagen EZ1 DNA Tissue Kit as per manufacturer’s
instructions (Qiagen, Venlo, Netherlands). DNA concentration was measured using the
NanoDropTM ND-1000 spectrophotometer (Thermo Scientific, Waltham, USA) and quality
assessed using the Human DNAOK! kit (Microzone, Haywards Heath, UK). KRAS mutational
analysis was performed on the PyroMark Q96 ID (Qiagen, Venlo, Netherlands) using an in-
house pyrosequencing assay capable of detecting all somatic mutations in codons 12, 13
and 61 of the KRAS gene with a lower limit of detection of 5% mutated alleles. BRAF
mutational analysis for codons 600 and 601 with a lower limit of detection of 10% mutated
alleles was similarly performed. The MSI Analysis System v1.2 (Promega) was used, with
samples subsequently run on the Applied Biosystems 3130XL genetic analyser and data
analysed using GeneMapper® (Life Technologies).
6.2.4 Validation of iTRAQ data
Western blotting for NQO1 was performed on all samples with sufficient remaining
material. A mouse monoclonal antibody for NQO1 (Abcam, ab28947) was used at a dilution
of 1:500. An anti-mouse LI-COR IRDye 680 LT secondary antibody (Biosciences, Lincoln USA)
was used to detect a protein with a molecular weight of 30kDa. All conditions were
otherwise as described in Section 6.2.1. Densitometry values were normalised to a common
sample to allow inter-gel comparisons and the correlation between densitometry on
western blotting and protein expression by iTRAQ was established.
6.2.5 Tissue micro-array construction

216
Archived samples of formalin-fixed paraffin embedded patient matched primary and
metastatic colorectal cancer tissues were obtained from the contributing research sites
within the Merseyside and Cheshire cancer network (n=56). Where available, normal
adjacent colonic mucosa and liver parenchyma were also obtained. Blocks and
corresponding haematoxylin and eosin (H&E) stained slides were reviewed and marked by a
consultant pathologist in order to identify representative areas of both tumour and normal
tissue. The H&E slides of the liver metastases of those patients who had received
neoadjuvant chemotherapy were also reviewed and scored for histopathological response
to treatment as previously described (Blazer et al, 2008).
The method of tissue micro-array (TMA) construction is described in full elsewhere
(Kononen et al, 1998). TMAs were constructed using a tissue microarrayer (Beecher
Instruments Inc) with 0.6mm cores retrieved from donor blocks and transferred into the
recipient master paraffin block in triplicate. Triplicate samples of breast and tonsillar tissue
were also transferred to each TMA to act as controls. Samples of primary tumour, normal
colon, normal liver and colorectal liver metastases were randomised over four TMAs which
were produced in duplicate to ensure sufficient material for immunohistochemical staining.
To allow inter-array comparisons, a sample set consisting of all four sample types from a
single patient were placed on each of the 4 TMAs. TMAs were incubated at 37°C overnight,
placed on ice and then 5µm sections were cut on a rocking microtome. Sections were then
placed onto coated glass slides.
6.2.6 Immunohistochemical analysis of NQO1
To establish optimal conditions three dilutions of the primary antibody were used on a
series of test slides with concentrations centred around that suggested by the
manufacturer (1/100, 1/500, 1/1000). Appropriate positive controls (breast tumour and
colonic mucosa) identified using Protein Atlas (www.proteinatlas.org) were included
alongside these samples. Antibody diluent only and a mouse IgG1 isotype control (Abcam,
ab91353) were used as negative controls to assess for background staining.
Sections were de-waxed in xylene and rehydrated with ethanol solutions of decreasing
concentrations. After blocking with 3% hydrogen peroxide in 100% methanol, antigens
were retrieved by microwaving for 20 minutes in 10mM citrate buffer and further blocked
with 10% goat serum in 0.1% TRIS-buffered saline with tween. Slides were incubated with

217
the primary antibody for 2 hours (Abcam, ab28947) followed by a 1:200 horseradish
peroxidase conjugated secondary antibody for 30 minutes (Dako UK Ltd, E0433). Following
incubation with the Vectastain Elite® ABC reporter system (Vectorlabs, Burlingame, USA),
slides were developed with diaminobenzidine tetrahydrochloride (DAB) and counterstained
with haematoxylin. The optimisation slides and positive/negative controls were reviewed
by a consultant histopathologist who confirmed the appropriateness of the staining and
advised the optimum concentration to be used (1/1000). The control slides can be seen in
Figure 6.1.
Figure 6.1 – Antibody optimisation of NQO1 demonstrating the optimal concentration of
antibody (1/1000) in the positive controls (left) and negative controls (right) of colonic
mucosa (A) and breast cancer (B).
After optimisation, sections of the TMAs were taken and stained in triplicate using the
previously described methodology. Stained sections of the TMA were initially reviewed by
light microscopy, and slides then scanned using the Aperio Scanscope (Leica Biosystems).
Semi-quantification of protein expression was performed using Tissue Studio v.2.0
(Definiens AG, Munich, Germany). Prior to quantification the system required
programming. In brief this consisted of nuclear and cell membrane identification to enable
the recognition of cells, followed by setting the intensity thresholds for negative and
positive (weak, moderate and intense) staining. Minor adjustments were made until
concordance with a 10% sample similarly scored by eye had been achieved and then the
TMA slides were scored (Figure 6.2).

218
Figure 6.2 - Images from a randomly selected core produced by Tissue Studio v.2.0
(Definiens AG, Munich, Germany), an immunohistochemical scoring package. The stained
core as it appears under the light microscope is shown in (A), with the brown regions
representing antibody binding and oxidation of DAB by horseradish peroxidase. Cellular
identification and localisation is shown in (B), with the nuclei appearing blue and
cytoplasm green. The degree of antibody staining is shown in (C) and can be seen to
similarly correspond with the appearances on the micrograph (A). Areas shaded white
have no antibody staining, yellow have weak antibody binding, orange have moderate
antibody staining and brown have intense antibody staining (all considered positive).
The data generated by Tissue Studio allowed a scoring system to be implemented based on
that previously used by Yang et al (2014). A score was allocated for the proportion of
positively stained cells as follows: 1 (<25%), 2 (25-50%), 3 (51-75%) or 4 (>75%).
6.2.7 Cell culture of the SW480 cell line and dose response analysis
The SW480 cell line is an immortal colorectal tumour derived cell line originating from a
Dukes B adenocaricnoma of the colon. The cells were provided as a kind gift from the
Department of Molecular and Clinical Cancer Medicine, University of Liverpool.
Cells were maintained in Dulbecco’s Modified Eagle Medium (Sigma), 10% foetal bovine
serum (Sigma) and 1% Penicillin/Streptomycin (Sigma). Cells were kept incubated at 37oC
and their morphology/confluence observed every 3-4 days at which time the media was
changed (Figure 6.3). Upon establishing confluence, cells were trypsinised with 0.25%
trypsin-EDTA (Sigma), filtered through a sterile needle and syringe, passaged in a 1:20 ratio
and subcultured in the same media. Where the experimental intent was to establish cell
viability, cells were cultured in 96-well plates at 5000 cells/well. Where sufficient material
was needed for western blot analysis, 12-well plates were seeded with 3x10⁵ cells/well.

219
Figure 6.3 – Morphology of the SW480 cell line used for this investigation. Micrograph
taken at x400 magnification.
Initially, the toxic effect of irinotecan and 5-FU on the cell lines was determined. A 160mM
stock concentration of each of the drugs was made by dissolving 4.2mg of 5FU (MW
130.10Da) in 200µl of dimethyl sulfoxide (DMSO) and 5.0mg of irinotecan (MW 623.14Da)
in 50µl DMSO. A series of 7 1:2 dilutions were then performed with DMSO. 7.5µl of each of
these solutions combined with 1493µl of media produced solutions of 800 µM, 400µM,
200µM, 100µM, 50µM, 25µM, 12.5µM and 6.25µM each with 0.5% DMSO. The control
sample (0.5% DMSO) was prepared by diluting 25µl of DMSO in 4975µl of media. Wells
were dosed in triplicate with 100µl of each of the prepared solutions with the control
samples and media-only controls also placed in triplicate on the same 96 well plate. Cells
were incubated at 37oC for 72 hours before assessing cell viability. The experiment was
repeated in triplicate for both irinotecan and 5FU.
An MTS [3-(4,5-dimethylthiazol-2-yl)-5-(3-carboxymethoxyphenyl)-2-(4-sulfophenyl)-2H-
tetrazolium, inner salt] assay was used to assess cell viability. The assay utilises MTS
tetrazolium which is reduced into a formazan-coloured product by viable cells. The
solubility of the product reduces the need for detergents, and the rapid colour change and
ease of storage make it desirable for studies such as this (Buttke et al, 1993). 20µL MTS
reagent (Promega) was introduced to all wells and the plates incubated for 2 hours at 37°C.
A microplate reader (Multiskan, Thermo Labsystems, Ventaa, Finland) was used to measure
optical density at 490nm. Cell viability was expressed as a percentage of control cells.
6.2.8 Effect of chemotherapy on NQO1 expression
The experiment described in 6.2.7 was repeated in 12 well plates. Following a 72 hour
incubation period at 37°C, cells were lysed with 50µL of radioimmunoprecipitation assay

220
(RIPA) buffer and incubated at room temperature for 5 minutes. Cells were scraped from
the wells and the lysate centrifuged at 15,000 RPM for 15 minutes at 4oC. The resulting
supernatant was quantified using the Bradford assay and underwent western blotting for
NQO1 as previously described.
6.2.9 siRNA transfection of NQO1
A set of four human NQO1 siGENOME siRNAs (Thermoscientific) each targeting different
coding regions of the gene was obtained and reconstituted according to manufacturer’s
instructions. Twelve well plates with each well containing 3 X 10⁵ cells in 1ml media were
seeded and incubated overnight prior to transfection with one of the four siRNAs.
Lipofectamine® RNAimax (Invitrogen) and opti-MEM® (Life technologies) were combined
with the siRNA as per manufacturer’s instructions and incubated for 10 minutes prior to
application of 15µl to the 85µl of media already placed in the wells. Each siRNA was used at
two different concentrations (1.25pM and 2.5pM) and placed in triplicate. As a negative
control, a non-targeting scrambled human siRNA was used to transfect the cells.
Following a 48 hour incubation period at 37°C, cells were lysed with 50µL of RIPA buffer and
incubated at room temperature for 5 minutes. Cells were scraped from the wells and the
lysate centrifuged at 15,000 RPM for 15 minutes at 4oC. The resulting supernatant was
quantified using the Bradford assay and underwent western blotting for NQO1 as
previously described. The blot was examined to identify the siRNA (and concentration)
conferring the best knockdown of NQO1 (Figure 6.4)
Figure 6.4 – Western blot for NQO1 in transfected S480 cells. From the left: DMSO treated
cells were used as a control, and the transfection process (scrambled siRNA) had no effect
on NQO1 expression. All 4 siRNAs (A-D) offered good knockdown of NQO1 at both
concentrations. The optimum knockdown was achieved with siRNA-A at a concentration
of 2.5pM.

221
As can be seen, the transfection process (scrambled siRNA) had no effect on NQO1
expression. All 4 siRNAs (A-D) offered good knockdown of NQO1 at both concentrations.
The optimum knockdown was achieved with siRNA-A at a concentration of 2.5pM.
Transfecting the cells with this siRNA alone produced no reduction in cell viability at 72
hours, and therefore this was used for subsequent experimental work.
6.2.10 Effect of NQO1 knockdown on chemosensitivity
The experiment described in section 6.2.7 was repeated in NQO1 knocked down cells
following siRNA transfection as previously described. 96 well plates were seeded, incubated
overnight and transfected in triplicate for each drug dose to be used. After a 48 hour
incubation period, the media was removed and cells dosed in triplicate with irinotecan at
concentrations of 800µM, 400µM, 200µM, 100µM, 50µM, 25µM, 12.5µM or 6.25µM.
Scrambled siRNA followed by irinotecan dosing was used as the control arm. Further sets of
0.5% DMSO and media only controls were included. Cells were incubated for 72 hours at
37°C before assessing cell viability with an MTS assay as previously described. The
experiment was repeated using 5-FU, and each plate was run in triplicate. A plate plan for
this experiment is shown in Figure 6.5.
Figure 6.5 – Wells highlighted in red were transfected with siRNA to knockdown NQO1
and then incubated with irinotecan or 5FU over a range of concentrations. Wells
highlighted in blue were transfected with a scrambled siRNA and then similarly treated.
Wells highlighted in green were incubated in 0.5% DMSO (vehicle control) and wells
highlighted in yellow were incubated in media only.
6.2.11 Evaluating dicoumarol as an inhibitor of NQO1 and chemosensitiser

222
Dicoumarol, a coumarin currently in clinical use, has been shown to competitively inhibit
the action of NQO1 (Tsvetkov et al, 2005). Dicoumarol competes with NAD(P)H for the
binding of NQO1, thus inhibiting the transfer of electrons from NAD(P)H to the FAD
cofactor and ultimately preventing the substrate from being reduced (Asher et al, 2006).
The effects of dicoumarol on SW480 cells
Firstly the effect of dicoumarol on SW480 cells was established. A 1mM stock concentration
was made by dissolving 3.6mg of dicoumarol (MW 336.3) in 10ml NaOH and performing a
series of dilutions as previously described to produce 500µM, 250µM, 100µM, 50µM, 25µM
and 10µM solutions of dicoumarol in 0.5% NaOH. A control sample (0.5% NaOH) was
prepared by diluting 25µl of NaOH in 4975µl of media and a media only control also used.
Wells were dosed in triplicate with 100µl of each of the prepared solutions with the control
samples also placed in triplicate on the same 96 well plate. Cells were incubated at 37oC for
4 hours (the intended duration of pre-treating for future studies) before assessing cell
viability using the MTS assay as previously described. The experiment was repeated in
triplicate.
Establishing the optimum concentration of dicoumarol
A 96 well plate was seeded and incubated overnight before pre-treating triplicate wells
with each of the dicoumarol concentrations described above. After 4 hours the media was
removed and the cells dosed with 100µM irinotecan (the closest dose to the IC50). The
control wells were incubated with 0.5% NaOH for 4 hours (vehicle control for dicoumarol)
followed by irinotecan. Plates were incubated at 37oC for 72 hours before assessing cell
viability using the MTS assay as previously described. The experiment was repeated in
triplicate and again for 5FU at a concentration of 200µM (the closest dose to the IC50). The
maximal effective concentration (lowest concentration to exert the full biological effect)
was identified and used for the remainder of the experiments.
Attributing the effects of dicoumarol to NQO1 activity
The optimum scientific strategy would be the correlation of any biological effect seen by
the addition of dicoumarol with cellular NQO1 activity. However, without access to a well-
validated activity assay for NQO1 we adopted an alternative strategy. Given the well
established knock down already demonstrated with siRNA it would perhaps be reasonable

223
to assume that if dicoumarol were exerting its biological effect through NQO1 inhibition,
then the addition of dicoumarol to cells in which NQO1 had already been knocked down
would not result in any further effect than that already achieved with siRNA. This would
provide at least some circumstantial evidence to confirm that dicoumarol is exerting its
biological effect through NQO1 inhibition and not another pathway or mechanism.
A 96 well plate was seeded and incubated overnight before transfecting 6 wells for each
dose of chemotherapy to be used. After transfection, half of those cells were pre-treated
with dicoumarol at a dose of 100µM (as previously determined), and the media changed in
the remainder. After 4 hours all media was removed and the transfected wells, transfected
and dicoumarol pre-treated wells, and a parallel set of wells which had not been
transfected or treated were dosed with irinotecan at the range of concentrations previously
described. The control samples were transfected with scrambled siRNA, incubated for 4
hours in 0.5% NaOH (vehicle control for dicoumarol) and then incubated for 72 hours in
0.5% DMSO (vehicle control for irinotecan). A further set of 0.5% DMSO only controls were
also included. Plates were incubated at 37oC for 72 hours before assessing cell viability
using the MTS assay. The experiment was repeated using 5-FU, and each plate was run in
triplicate. A plate plan for this experiment is shown in Figure 6.6.
Figure 6.6 - Wells highlighted in red were transfected with siRNA to knockdown NQO1,
pre-treated with dicoumarol and then incubated with the irinotecan or 5FU over a range
of concentrations. Wells highlighted in green were transfected but not pre-treated with
dicoumarol and wells highlighted in blue were not transfected nor pre-treated. Wells
highlighted in yellow were transfected with scrambled siRNA and then pre-treated with
0.5% NaOH and incubated in 0.5% DMSO, and those highlighted in purple were incubated
in 0.5% DMSO only.

224
Effect of NQO1 inhibition on chemosensitivity by pre-treating cells with dicoumarol
The experiment described in section 6.2.7 was repeated in cells pre-treated with
dicoumarol as previously described. 96 well plates were seeded, incubated overnight and
pre-treated with 100µM dicoumarol in triplicate for each drug concentration to be used. A
parallel set of wells within the same plate were not pre-treated with dicoumarol. After a 4
hour incubation period, the media was removed and cells dosed in triplicate with irinotecan
at concentrations of 800µM, 400µM, 200µM, 100µM, 50µM, 25µM, 12.5µM or 6.25µM.
Pre-treatment with 0.5% NaOH followed by incubation with 0.5% DMSO (the vehicle
control for irinotecan), and 0.5% DMSO only wells were used as controls. Cells were
incubated for 72 hours at 37°C before assessing cell viability with an MTS assay as
previously described. The experiment was repeated using 5-FU, and each plate was run in
triplicate. A plate plan for this experiment is shown in Figure 6.7.
Figure 6.7 – Wells highlighted in red were pre-treated with dicoumarol and then
incubated with irinotecan or 5FU over a range of concentrations. Wells highlighted in blue
were not pre-treated but treated with chemotherapy only. Wells highlighted in green
were pre-treated with 0.5% NaOH and then incubated in 0.5% DMSO (vehicle control) and
wells highlighted in yellow were not pre-treated but incubated in 0.5% DMSO only.
6.2.12 Statistical analysis
Protein expression in primary and metastatic tumours by western blotting was compared
using Spearman’s rank correlation co-efficient. SN38 production was compared between
primary and metastatic tumours using the student’s paired t-test, and between all three
groups (primary, metastasis and liver parenchyma) using one-way ANOVA. Correlation

225
between densitometry on immunoblot and iTRAQ expression was established using
Pearson’s rank correlation co-efficient.
With respect to the immunohistochemistry, key clinicopathological variables were
compared between groups using ANOVA for continuous data and the X2 test for categorical
data. Spearman’s rank correlation coefficient was used to assess for correlation in the
percentage of positively stained cells in the primary and metastatic tumours, with a two-
way test for significance. The X2 test was used to compare the positively stained cells in the
responders and non-responders.
For the in vitro work data were normalised to the experimental control and experimental
arms compared using the student’s un-paired t-test. Where multiple testing across doses
was used, the Bonferroni correction was applied.

226
6.3 Results
6.3.1 Western blotting of proteins relevant to the activation and metabolism of
chemotherapeutics
For this investigation samples were available from 12 patients: 1, 2, 3, 5, 7, 9, 10, 11, 12, 13,
15 and 16. After optimisation of the laboratory technique, western blotting demonstrated a
band at the expected molecular weight for each target protein. Wide variation was seen in
protein expression both in different tissue types and also across individuals. Given the small
number of patients for whom samples were available and the heterogeneity between
chemotherapeutic regimens received, correlation between expression and treatment
response would not have been scientifically meaningful. The expression between primary
and metastatic tumours however was compared.
Proteins relevant to 5-FU
Western blots for TS, DPYD and OPRT are shown in Figures 6.8, 6.9 and 6.10 respectively.
Figure 6.8 - Western blots for thymidylate synthase (TS) in patient matched colonic
mucosa (C), primary tumour (P), metastatic tumour (M) and liver parenchyma (L).

227
Figure 6.9 - Western blots for dihydropyrimidine dehydrogenage (DPYD) in patient
matched colonic mucosa (C), primary tumour (P), metastatic tumour (M) and liver
parenchyma (L).
Figure 6.10 - Western blots for orotate phosphoribosyltransferase (OPRT) in patient
matched colonic mucosa (C), primary tumour (P), metastatic tumour (M) and liver
parenchyma (L).

228
Densitometry values were normalised to a common sample included on all gels to allow
inter-gel comparisons and the correlation between primary and metastatic tumour samples
were compared using Spearman’s rank test (Table 6.3). Whilst a positive correlation was
seen for all proteins, this did not reach statistical significance.
Table 6.3 – Median densitometry values for thymidylate synthase (TS), dihydropyrimidine
dehydrogenase (DPYD) and orotate phosphorisobysltransferase (OPRT) expression in
patient matched primary and metastatic tumours. Correlation co-efficients (with
Spearman’s rank test) showed positive correlations although these did not reach
statistical significance.
Proteins relevant to irinotecan
Western blots for CES1, CES2, TOP I, UGT1A1 and CYP3A4 are shown in Figures 6.11, 6.12,
6.13, 6.14 and 6.15 respectively.
Protein Median (IQR) primary tumour
densitometry
Mean (SD) metastatic tumour
densitometry
Correlation co-efficient
p value
TS 830.05 (630.89 – 1245.12)
597.04 (509.60 – 1798.08)
0.64 0.054
DPYD 5.52 (4.56 – 7.11)
11.21 (7.82 – 17.34)
0.63 0.054
OPRT 17.50 (10.31 – 24.10)
32.40 (24.67 – 39.75)
0.05 0.882

229
Figure 6.11 - Western blots for human carboxylesterase 1 (CES1) in patient matched
colonic mucosa (C), primary tumour (P), metastatic tumour (M) and liver parenchyma (L).
Figure 6.12 - Western blots for human carboxylesterase 2 (CES2) in patient matched
colonic mucosa (C), primary tumour (P), metastatic tumour (M) and liver parenchyma (L).

230
Figure 6.13 - Western blots for human topoisomerase I (TOP I) in patient matched colonic
mucosa (C), primary tumour (P), metastatic tumour (M) and liver parenchyma (L).
Figure 6.14 - Western blots for UDP glucuronosyltransferase 1A1 (UGT1A1) in patient
matched colonic mucosa (C), primary tumour (P), metastatic tumour (M) and liver
parenchyma (L).
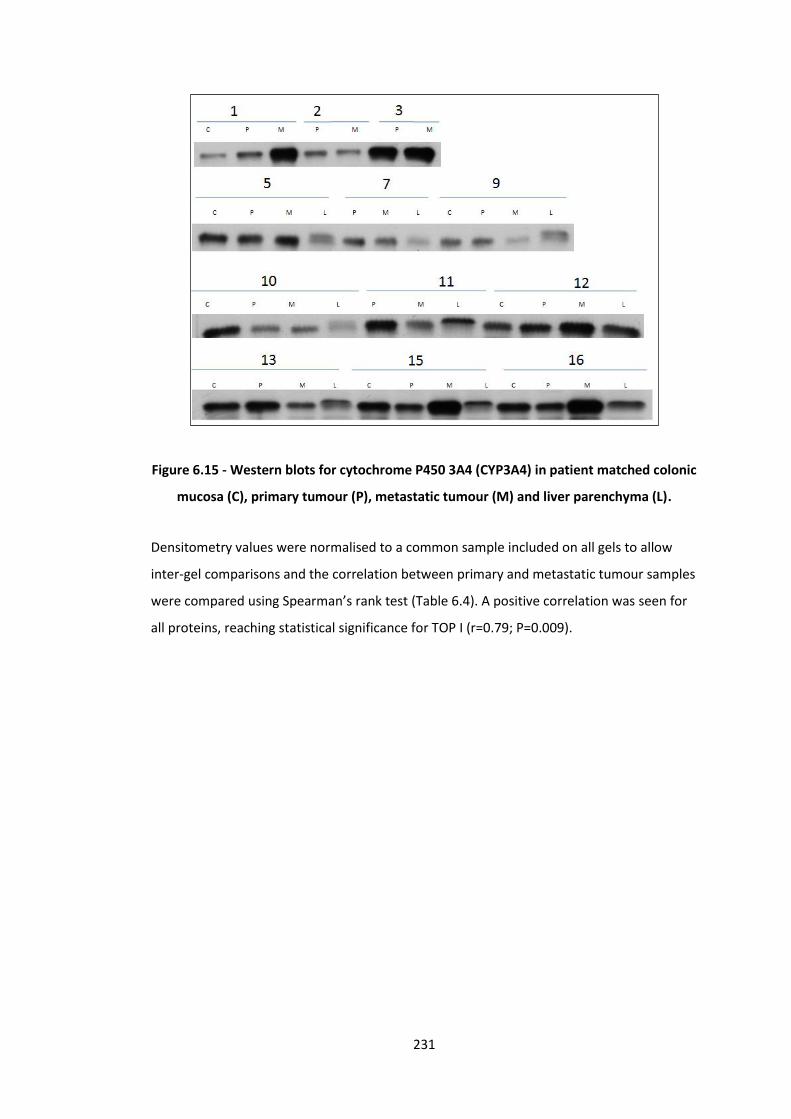
231
Figure 6.15 - Western blots for cytochrome P450 3A4 (CYP3A4) in patient matched colonic
mucosa (C), primary tumour (P), metastatic tumour (M) and liver parenchyma (L).
Densitometry values were normalised to a common sample included on all gels to allow
inter-gel comparisons and the correlation between primary and metastatic tumour samples
were compared using Spearman’s rank test (Table 6.4). A positive correlation was seen for
all proteins, reaching statistical significance for TOP I (r=0.79; P=0.009).

232
Table 6.4 – Median densitometry values for carboxylesterase 1 (CES1), carboxylesterase 2
(CES2), topoisomerase I (TOP I), UDP glucuronosyltransferase 1A1 (UGT1A1) and
cytochrome P450 3A4 (CYP3A4) expression in patient matched primary and metastatic
tumours. Correlation co-efficients (with Spearman’s rank test) showed positive
correlations, reaching statistical significance in the case of TOP I.
Proteins relevant to oxaliplatin
Western blots for DNA POL β are shown in Figure 6.16.
Protein Median (IQR) primary tumour
densitometry
Mean (SD) metastatic tumour
densitometry
Correlation co-efficient
p value
CES1 4.28 (1.59 - 7.30)
15.23 (6.47 – 37.75)
0.41 0.248
CES2 363.04 (219.33 – 498.44
518.55 (255.42 – 837.22)
0.50 0.144
TOP I 7.89 (5.05 – 12.80)
8.50 (5.38 – 17.75)
0.79 0.009
UGT1A1 2.54 (1.89 – 4.45)
29.20 (4.51 – 55.57)
0.09 0.811
CYP3A4 520.23 (465.13 – 645.98)
543.80 (356.28 – 1288.73)
0.26 0.470

233
Figure 6.16 - Western blots for DNA polymerase β (DNA POL β) in patient matched colonic
mucosa (C), primary tumour (P), metastatic tumour (M) and liver parenchyma (L).
Densitometry values were normalised to a common sample included on all gels to allow
inter-gel comparisons and the correlation between primary and metastatic tumour samples
were compared using Spearman’s rank test. The median (IQR) densitometry values in the
primary and metastatic tumours were 4.21 (1.47 – 5.01) and 4.52 (3.07 – 8.32) respectively.
Spearman rank correlation was 0.58 (p=0.088).
6.3.2 CES1/CES2 activity assessment by mass spectrometry
Patient matched primary tumour, liver metastasis and liver parenchyma were available for
patients 1, 2, 3, 5, 7, 9, 10, 11, 12, 13, 15 and 16. SN-38 production in these samples ranged
from 0.77-5.36 nmol/µg protein/minute (Figure 6.17).

234
Figure 6.17 - CES1/CES2 activity was measured by SN38 production in patient matched
primary tumour, liver metastasis and liver parenchyma. Mean (SD) data are presented for
each tissue type for the patients studied.
When considering the variation in SN38 production across tissue types, the mean (SD) rate
was 2.80 (0.13) nmol/µg protein/minute in the primary tumours, 3.13 (0.11) nmol/µg
protein/minute in the metastatic tumours, and 3.73 (0.08) nmol/µg protein/minute in the
liver parenchymal samples (Figure 6.18). Comparison across groups with one-way ANOVA
showed a statistically significant difference (p=0.001).
Figure 6.18 – Mean, SD and 95% confidence interval for SN-38 production in the primary
tumours, liver metastases and liver parenchyma. Analysis with ANOVA showed significant
differences between groups (p=0.001).

235
Having identified significant differences between tissue types, patients were analysed on an
individual basis both across all three tissue types (using ANOVA) and in light of the specific
hypothesis the rate of production was compared between the primary and metastatic
tumours (using student’s paired t-test). Of the 12 patients studied, there were significant
differences between tissue types in all except two. When comparing primary and
metastatic tumours, significant differences were seen in all except four (Table 6.5). As such
the activity of carboxylesterase in the primary tumour does not predict that in the
metastasis, and neither correlate well with activity in the liver parenchyma.
Sample Mean (SD)
Primary Mean (SD) Metastasis
Mean (SD) Liver
All Groups (ANOVA)
Primary vs. Mets (Paired t-test)
1 1.82 (0.14) 3.11 (0.06) 3.66 (0.12) 0.006 0.003
2 4.08 (0.23) 3.60 (0.13) 4.82 (0.08) 0.018 0.051
3 2.76 (0.11) 2.70 (0.08) 3.26 (0.05) 0.003 0.055
5 4.13 (0.11) 4.93 (0.22) 5.37 (0.07) 0.003 0.024
7 2.79 (0.06) 3.56 (0.12) 3.95 (0.07) 0.004 0.001
9 4.02 (0.14) 2.81 (0.12) 3.27 (0.08) 0.002 0.000
10 2.65 (0.27) 2.87 (0.09) 3.34 (0.07) 0.052 0.112
11 0.82 (0.10) 0.77 (0.09) 2.84 (0.17) 0.001 0.029
12 4.10 (0.10) 4.23 (0.11) 4.61 (0.11) 0.039 0.175
13 2.34 (0.07) 4.01 (0.08) 4.24 (0.06) 0.002 0.001
15 2.16 (0.09) 2.27 (0.12) 2.62 (0.06) 0.061 0.228
16 1.95 (0.10) 2.76 (0.08) 2.83 (0.05) 0.003 0.000
Table 6.5 – SN-38 production in patient matched primary tumour, liver metastasis and
liver parenchyma (nmol/µg protein/minute). Of the 12 patients studied there were
significant differences between tissue types (by ANOVA) in all except two (highlighted in
red). When specifically comparing the primary and metastatic tumours, significant
differences (by student’s paired t-test) were seen in all except four (also highlighted in
red).
6.3.3 KRAS/BRAF pyrosequencing and microsatellite instability analysis
With the exception of patient 14, sufficient material was available for analysis of primary
and metastatic tumours from all patients. Corresponding colonic mucosa and liver
parenchyma was also sequenced where available. Five patients (3, 6, 10, 12, and 16) had
mutations in KRAS codon 12, with 100% concordance between primary and metastatic
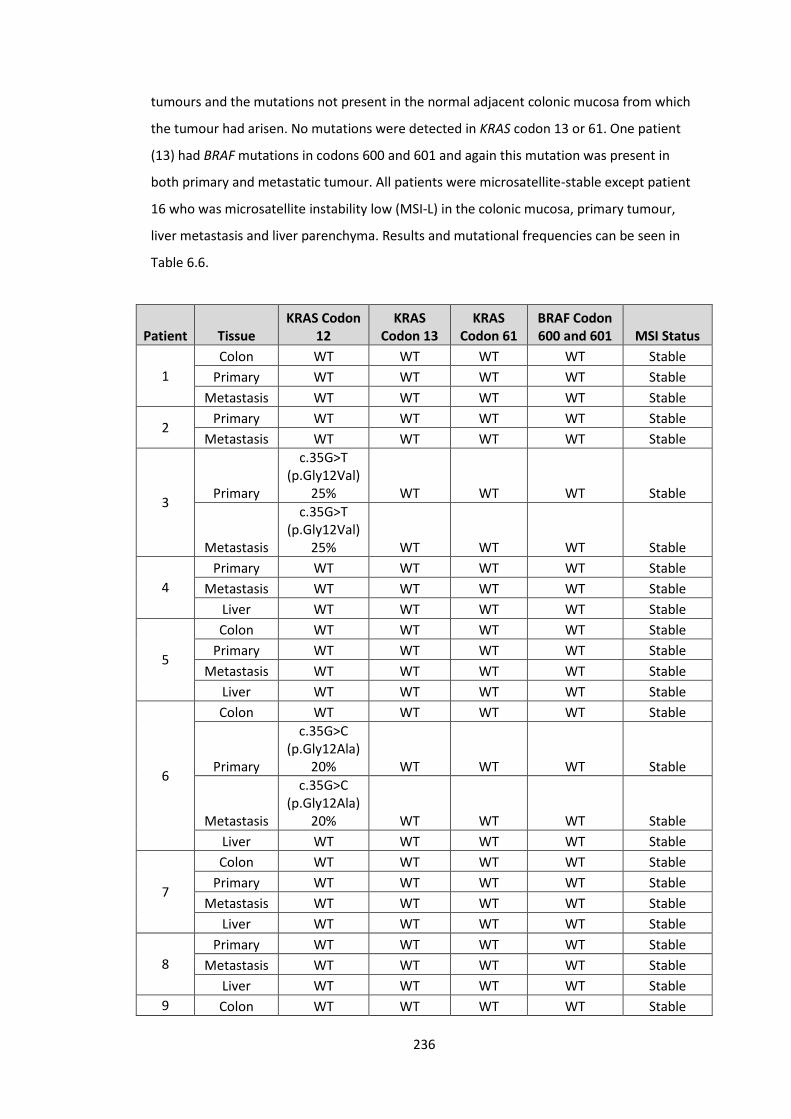
236
tumours and the mutations not present in the normal adjacent colonic mucosa from which
the tumour had arisen. No mutations were detected in KRAS codon 13 or 61. One patient
(13) had BRAF mutations in codons 600 and 601 and again this mutation was present in
both primary and metastatic tumour. All patients were microsatellite-stable except patient
16 who was microsatellite instability low (MSI-L) in the colonic mucosa, primary tumour,
liver metastasis and liver parenchyma. Results and mutational frequencies can be seen in
Table 6.6.
Patient Tissue KRAS Codon
12 KRAS
Codon 13 KRAS
Codon 61 BRAF Codon 600 and 601 MSI Status
1
Colon WT WT WT WT Stable
Primary WT WT WT WT Stable
Metastasis WT WT WT WT Stable
2 Primary WT WT WT WT Stable
Metastasis WT WT WT WT Stable
3 Primary
c.35G>T (p.Gly12Val)
25% WT WT WT Stable
Metastasis
c.35G>T (p.Gly12Val)
25% WT WT WT Stable
4
Primary WT WT WT WT Stable
Metastasis WT WT WT WT Stable
Liver WT WT WT WT Stable
5
Colon WT WT WT WT Stable
Primary WT WT WT WT Stable
Metastasis WT WT WT WT Stable
Liver WT WT WT WT Stable
6
Colon WT WT WT WT Stable
Primary
c.35G>C (p.Gly12Ala)
20% WT WT WT Stable
Metastasis
c.35G>C (p.Gly12Ala)
20% WT WT WT Stable
Liver WT WT WT WT Stable
7
Colon WT WT WT WT Stable
Primary WT WT WT WT Stable
Metastasis WT WT WT WT Stable
Liver WT WT WT WT Stable
8
Primary WT WT WT WT Stable
Metastasis WT WT WT WT Stable
Liver WT WT WT WT Stable
9 Colon WT WT WT WT Stable

237
Primary WT WT WT WT Stable
Metastasis WT WT WT WT Stable
Liver WT WT WT WT Stable
10
Colon WT WT WT WT Stable
Primary
c.34G>T (p.Gly12Cys)
35% WT WT WT Stable
Metastasis
c.34G>T (p.Gly12Cys)
20% WT WT WT Stable
Liver WT WT WT WT Stable
11
Colon WT WT WT WT Stable
Primary WT WT WT WT Stable
Metastasis WT WT WT WT Stable
Liver WT WT WT WT Stable
12
Colon WT WT WT WT Stable
Primary
c.35G>A (p.Gly12Asp)
20% WT WT WT Stable
Metastasis
c.35G>A (p.Gly12Asp)
30% WT WT WT Stable
Liver WT WT WT WT Stable
13
Colon WT WT WT WT Stable
Primary WT WT WT
c.1799T>A (p.Val600Glu)
23% Stable
Metastasis WT WT WT
c.1799T>A (p.Val600Glu)
44% Stable
Liver WT WT WT WT Stable
15
Colon WT WT WT WT Stable
Primary WT WT WT WT Stable
Metastasis WT WT WT WT Stable
Liver WT WT WT WT Stable
16
Colon WT WT WT WT MSI-Low
Primary
c.35G>T (p.Gly12Val)
50% WT WT WT MSI-Low
Metastasis
c.35G>T (p.Gly12Val)
50% WT WT WT MSI-Low
Liver WT WT WT WT MSI-Low
Table 6.6 – KRAS (codon 12, 13 and 61), BRAF (codon 600 and 601) and microsatellite
instability analysis for 16 patients undergoing resection at both sites for liver limited
stage IV colorectal cancer. Five patients had KRAS codon 12 mutation, one patient had
BRAF 600/601 mutation and one patient was MSI-Low. WT = wild type.

238
With respect to KRAS/BRAF mutation, as only patient received cetuximab (Table 4.2) it is
not possible to make any further comment on patient selection or treatment response.
Although all patients undergoing neoadjuvant chemotherapy received 5-FU, only one
patient had microsatellite instability and therefore again no comment on patient selection
or treatment response can be made.
6.3.4 Validation of iTRAQ data
Data acquired by iTRAQ were validated by western immunoblotting for NQO1. Evaluation
of protein expression was directly comparable (Figure 6.19), with a Pearson correlation co-
efficient of 0.59 (95% CI 0.47 – 0.69; p=0.003).
Figure 6.19 – Comparison of protein quantification by western blotting (densitometry iu)
and iTRAQ (abundance) for NQO1 demonstrates a high statistically significant
relationship (r=0.59; p=0.003).
6.3.5 Immunohistochemical analysis of NQO1
A tissue micro-array of 56 patient matched primary and metastatic tumour samples was
assembled. Where available, normal colonic mucosa and liver parenchyma were also
included. Of the 56 patients, 37 had received neoadjuvant treatment and 19 were chemo-

239
naive. As discussed in previous chapters, there was again considerable variation in the
agents and regimens received. Of the 37 patients, 14 (37.8%) had a tumour regression
grade of I-II (the responders), and 23 (62.2%) had a tumour regression grade of III-IV. Key
clinical and pathological characteristics between these groups were compared (Table 6.7).
Table 6.7 – Key clinical and pathological variables in the chemo-naive, responders and
non-responders. Continuous data was assessed for significance using ANOVA* and
categorical data using the X2 test#. Only T stage was considerably different between
groups, with a greater proportion of T4 tumours in the chemo-naive group.
Continuous data was assessed for significance using ANOVA and categorical data using the
X2 test. Only T stage was considerably different between groups, with a greater proportion
of T4 tumours in the chemo-naive group (42.1% vs 7.1% in the responders and 4.3% in the
non-responders, P=0.017). This discrepancy is most likely to be explained by the ‘straight to
surgery’ approach usually taken with T4 tumours given their tendency to be symptomatic
and at high risk of obstruction and perforation.
Variable Responders Non-
responders Chemo-naive P value
Median age (range) 66.1 (49-80) 61.8 (37-77) 67.2 0.363*
Sex (%) Male 10 (71.4) 17 (73.9) 13 (68.4)
0.926# Female 4 (28.6) 6 (26.1) 6 (31.6)
Simultaneous resection (%) 3 (21.4) 2 (8.7) 2 (10.5) 0.617#
Location of primary (%)
Rectum 5 (35.7) 6 (26.1) 3 (15.8)
0.506# Left 8 (57.1) 11 (47.8) 11 (57.9)
Right 1 (7.1) 6 (26.1) 5 (26.3)
T stage
1 0 (0.0) 0 (0.0) 0 (0.0)
0.017#
2 4 (28.6) 8 (34.8) 5 (26.3)
3 9 (64.3) 14 (60.9) 6 (31.6)
4 1 (7.1) 1 (4.3) 8 (42.1)
N stage
0 4 (28.6) 11 (47.8) 12 (63.2)
0.118# 1 5 (35.7) 10 (43.5 5 (26.3)
2 5 (35.7) (35.7) 2 (10.5)
Differentiation
Poor 1 (7.1) 0 (0.0) 1 (5.3)
0.444# Moderate 8 (57.1) 15 (65.2) 15 (78.9)
Well 5 (35.7) 8 (34.8) 3 (15.8)
Mean (SD) number of metastases
2.2 (1.2) 2.4 (1.9) 3.0 (4.3) 0.756*
Total patients 14 23 19 N/A

240
The percentage of positive cells stained was calculated as previously described. To establish
the correlation between primary and metastatic tumour expression, the raw data were
plotted as x and y variables (Figure 6.20).
Figure 6.20 – Correlation between the percentage of cells staining positively for NQO1 in
the primary tumour and metastatic tumour. Using Spearman’s rank correlation
coefficient, r=0.44 (95% CI 0.20 – 0.64, p=0.001).
Given the skewed appearance towards high expression, correlation was assessed
statistically using Spearman’s rank correlation coefficient. A moderate positive association
reaching statistical significance was seen: r=0.44 (95% CI 0.20 – 0.64, p=0.001).
NQO1 expression in the responders and non-responders grouped by percentage of
positively stained cells (Section 6.2.6) can be seen in Table 6.8. X2 test applied to the
primary tumour scores was not significant (p=0.470) however analysis of the metastases
showed that NQO1 staining is considerably higher in the non-responders compared to the
responders (p=0.041).

241
Cell Staining Primary Metastasis
Responders Non
responders Responders
Non responders
1 (<25%) 1 1 2 0
2 (25-50%) 3 3 7 6
3 (51-75%) 10 19 5 12
4 (>75%) 0 0 0 5
Table 6.8 - NQO1 expression in the responders and non-responders grouped by
percentage of positively stained cells. No statistically significant difference was observed
in the primary tumours (p=0.470) however in the metastases, NQO1 staining is
considerably higher in the non-responders compared to the responders (p=0.041, X2 test).
6.3.6 Cell culture of the SW480 cell line and dose response analysis
Dose-response data for irinotecan in the SW480 cell line is shown in Figure 6.21.
Figure 6.21 – Dose response analysis for irinotecan in the SW480 cell line. Cells were
incubated for 72 hours and cell viability assessed using the MTS assay and presented as a
mean (95% CI) percentage of the control (0.5% DMSO). The IC50 is 90.2µM.
As can be seen, doses up to ~50µM have little toxic effect, after which a sharp reduction in
cell viability is seen. At 800µM, less than 20% of cells were viable at 72 hours. The IC50

242
(concentration of drug required to render 50% of cells non-viable) under these
experimental conditions is 90.2µM.
Dose-response data for 5-FU in the SW480 cell line is shown in Figure 6.22.
Figure 6.22 – Dose response analysis for 5-FU in the SW480 cell line. Cells were incubated
for 72 hours and cell viability assessed using the MTS assay and presented as a mean
(95% CI) percentage of the control (0.5% DMSO). The IC50 is 202.2µM.
As can be seen, doses up to ~100µM have little toxic effect, after which a sharp reduction in
cell viability is seen. At 800µM, less than 20% of cells were viable at 72 hours. The IC50
(concentration of drug required to render 50% of cells non-viable) under these
experimental conditions is 202.2µM.
6.3.7 Effect of chemotherapy on NQO1 expression
To establish the effect of the chemotherapy agents on NQO1 expression, western blots
were performed on cell lysates following incubation with the drug for 72 hours. The blot
and corresponding densitometry values for irinotecan can be seen in Figure 6.23. The
effect was negligible, did not reach statistical significance and was similarly observed
following incubation with 5-FU.

243
Figure 6.23 – The effect of incubation with irinotecan on NQO1 expression was minimal.
No samples were significantly different from the control value (0.5% DMSO).
6.3.8 Effect of NQO1 knockdown on chemosensitivity
The effect of NQO1 knockdown by siRNA transfection on chemosensitivity to irinotecan can
be seen in Figure 6.24.

244
Figure 6.24 – Dose response analysis for irinotecan in the SW480 cell line with and
without knockdown of NQO1 by siRNA transfection. Cells were incubated for 72 hours
and cell viability assessed using the MTS assay and presented as a mean (95% CI)
percentage of the control (0.5% DMSO). The IC50 is 100.1µM with the scrambled siRNA
transfection, and 49.8µM following NQO1 knockdown. Statistical significance was
achieved as follows: *p<0.05, **p<0.01, ***p<0.001.
An increase in chemosensitivity was seen following knockdown of NQO1 when compared to
the scramble siRNA transfection, reaching statistical significance at 25µM (p=0.038), 50µM
(p=0.002), 100µM (p=<0.001), 200µM (p=0.004) and 400µM (p=0.001) doses of irinotecan.
The IC50 is 100.1µM with the scrambled siRNA transfection, and 49.8µM following NQO1
knockdown.
The effect of NQO1 knockdown by siRNA transfection on chemosensitivity to 5-FU can be
seen in Figure 6.25.

245
Figure 6.25 – Dose response analysis for 5-FU in the SW480 cell line with and without
knockdown of NQO1 by siRNA transfection. Cells were incubated for 72 hours and cell
viability assessed using the MTS assay and presented as a mean (95% CI) percentage of
the control (0.5% DMSO). The IC50 is 200.1µM with the scrambled siRNA transfection,
and 25.0µM following NQO1 knockdown. Statistical significance was achieved as follows:
*p<0.05, **p<0.01, ***p<0.001.
An increase in chemosensitivity was seen following knockdown of NQO1 when compared to
the scramble siRNA transfection, reaching statistical significance at 25µM (p=<0.001), 50µM
(p=0.007), 100µM (p=0.010) and 200µM (p=0.044) doses of 5-FU. The IC50 is 200.1µM with
the scrambled siRNA transfection, and 25.0µM following NQO1 knockdown.
6.3.9 Evaluating dicoumarol as an inhibitor of NQO1 and chemosensitiser
The effect of dicoumarol on SW480 cell viability
The effect of dicoumarol alone on cell viability can be seen in Figure 6.26. The effects are
negligible, with no significant difference between doses.

246
Figure 6.26 - Dose response analysis for dicoumarol in the SW480 cell line. Cells were
incubated for 4 hours and cell viability assessed using the MTS assay and presented as a
mean (95% CI) percentage of the control (media only).
Establishing the optimum concentration of dicoumarol
The maximal effective concentration for dicoumarol was calculated by pre-treating cells for
4 hours prior to incubation in irinotecan for 72 hours (Figure 6.27).

247
Figure 6.27 – The effect of pre-treating cells with dicoumarol prior to incubation with
100µM irinotecan. Cell viability is expressed as a percentage of control (0.5% NaOH only
followed by irinotecan). The maximum effect was achieved at a dicoumarol dose of
100µM.
In these experimental conditions, the maximal effective concentration was ~100µM, and
therefore this dose was used for subsequent investigations. Similar data were also seen
following incubation with 5-FU.
Attributing the effects of dicoumarol to NQO1 activity
Treatment with dicoumarol following siRNA knockdown of NQO1 was performed to
establish whether dicoumarol may be exerting its pharmacological effect via another
pathway.
The results for irinotecan dosing can be seen in Figure 6.28. When comparing the NQO1
knockdown with irinotecan only, similar data to that previously described are seen.
Negligible differences are seen between the ‘knockdown’ and ‘knockdown and dicoumarol’
experimental arms, and analysis with the student’s un-paired t-test showed no significant
difference at any data points. As such, dicoumarol does not appear to have any effect on
chemosensitivity in cells not-expressing NQO1. Similar data were also seen following 5-FU
incubation.

248
Figure 6.28 - Dose response analysis for irinotecan in the SW480 cell line firstly showing
the effect of NQO1 knockdown by siRNA transfection, and secondly the absence of any
additional biological effect following dicoumarol pre-treatment in those cells not
expressing NQO1. Cells were incubated for 72 hours and cell viability assessed using the
MTS assay and presented as a mean (95% CI) percentage of the control (scrambled siRNA
transfection, pre-treatment with 0.5% NaOH and incubation in 0.5% DMSO).
Effect of NQO1 inhibition on chemosensitivity by pre-treating cells with dicoumarol
To establish the effect of NQO1 inhibition with dicoumarol on chemosensitivity, cells were
pre-treated with 100µM dicoumarol prior to being dosed with irinotecan. Results are
shown in Figure 6.29.

249
Figure 6.29 – Dose response analysis for irinotecan in the SW480 cell line with and
without pre-treatment with dicoumarol. Cells were incubated for 72 hours and cell
viability assessed using the MTS assay and presented as a mean (95% CI) percentage of
the control (0.5% NaOH followed by 0.5% DMSO). The IC50 is 100.0µM for irinotecan
alone, and 50.0µM following NQO1 inhibition with dicoumarol. Statistical significance
was achieved as follows: *p<0.05, **p<0.01, ***p<0.001.
An increase in chemosensitivity was seen following inhibition of NQO1 with dicoumarol
compared to the control, reaching statistical significance at 12.5µM (p=0.013), 25µM
(p=0.005), and 50µM (p=0.002) doses of irinotecan. The IC50 is 100.0µM for irinotecan
alone, and 50.0µM following NQO1 inhibition with dicoumarol. The experiment was
repeated with 5-FU, with the results shown in Figure 6.30.

250
-
Figure 6.30 – Dose response analysis for 5-FU in the SW480 cell line with and without pre-
treatment with dicoumarol. Cells were incubated for 72 hours and cell viability assessed
using the MTS assay and presented as a mean (95% CI) percentage of the control (0.5%
NaOH followed by 0.5% DMSO). The IC50 is 183.7µM for 5-FU alone, and 49.9µM
following NQO1 inhibition with dicoumarol. Statistical significance was achieved as
follows: *p<0.05, **p<0.01, ***p<0.001.
An increase in chemosensitivity was seen following inhibition of NQO1 with dicoumarol
compared to the control, reaching statistical significance at 25µM (p=0.008), 50µM
(p=0.002), 100µM (p=0.003) and 200µM (p=0.030) doses of 5-FU. The IC50 is 183.7µM for
5-FU alone, and 49.9µM following NQO1 inhibition with dicoumarol.

251
6.4 Discussion
6.4.1 Summary of aims
The aim of this investigation was to further explore the potential for utilising biological
information from the primary tumour to inform and predict response to treatment for the
liver metastases using a targeted approach of previously identified markers of interest.
Specific hypotheses were formulated relating to protein expression and activity levels of
proteins relevant to the activation and metabolism of chemotherapeutics as well as the
concordance between primary and metastatic tumours of KRAS, BRAF and MSI status.
The main objective of this investigation, however, was to validate the findings of the
proteomic work previously undertaken and progress our understanding of the role of NQO1
as a predictive biomarker of treatment response. This entailed a direct comparison of the
iTRAQ data by western blotting and validation of these findings in a larger tissue set. The
finding that NQO1 levels are reduced in those tumours responding to chemotherapy also
prompted the investigation of its role as a potential drug target.
6.4.2 Summary of results – patient matched clinical samples
Western blotting for the proteins of interest with respect to the activation and metabolism
of key chemotherapeutics (TS, DPYD, OPRT, CES1, CES2, TOPI, UGT1A1, CYP3A4 and DNA
POL β) all showed a positive correlation in expression between primary and metastatic
tumours, although this only reached statistical significance for TOP I (p=0.009). Given the
variation in neoadjuvant treatment regimens received by these patients no response
analysis was considered feasible.
Mass spectrometry analysis of CES1/CES2 activity (by irinotecan conversion to SN-38)
showed significant differences across primary tumour, metastatic tumour and liver
parenchyma (p=0.001). When analyses were made for individual patients, all except 2 had
statistically significant differences in the CES1/CES2 activity in the primary tumour,
metastatic tumour and liver parenchyma. When interrogating the data pertaining to the
primary and metastatic tumour only, all patients except 4 had statistically significant
differences between protein activity levels at the two disease sites. As such the activity of

252
carboxylesterase in the primary tumour does not predict that in the metastasis, and neither
correlate well with activity in the liver parenchyma.
Pyrosequencing for KRAS and BRAF mutations identified the KRAS codon 12 mutation in 5
patients with 100% concordance between primary and metastatic tumours and no
mutation similarly detected in the adjacent normal colonic mucosa. No mutations were
seen in codons 13 or 61. One patient had BRAF mutation in both codons (600 and 601)
again with concordance between primary and metastatic tumours. One patient had
microsatellite instability, which was detected in the colonic mucosa as well as the primary
and metastatic tumours. Given the low numbers of mutations detected and the
heterogeneity in the neoadjuvant treatment regimens received, no analysis of correlation
with response was feasible.
Western blotting for NQO1 was used to validate the iTRAQ proteomic data reported in
Chapter 4. Correlation of protein expression by western blotting densitometry and iTRAQ
abundance data showed a statistically significant positive correlation (r=0.59, p=0.003).
Having confirmed the validity of the original proteomic data the investigation was
expanded to validate these findings in a larger tissue set.
Of the 56 patients for whom patient matched primary and metastatic FFPE blocks were
available, 37 received neoadjuvant treatment. Fourteen of these patients responded to
chemotherapy (TRG1-2), 23 did not (TRG3-4). Comparing clinicopathological features
between groups revealed a higher proportion of T4 tumours in the chemonaive group
(p=0.017), most likely reflecting a clinical preference for prompt surgery in this patient
cohort. No other potentially confounding variables were different between groups. A
statistically significant positive correlation between immunohistochemical protein
expression in the primary and metastatic tumours was seen (r=0.44, p=0.001). NQO1
expression in the primary tumour was not statistically significantly different between
responders and non-responders (p=0.470), however expression in the metastases was
considerably lower in those patients responding to chemotherapy (p=0.041), mirroring the
conclusion of the proteomic data.
6.4.3 Summary of results – in vitro model of colorectal cancer

253
Under the experimental conditions studied, the IC50 for irinotecan and 5-FU in the SW480
cell line was 90.2µM and 202.2µM respectively. Western blotting for NQO1 after treating
cells with chemotherapy demonstrated no effect on protein expression. Knockdown of
NQO1 with siRNA had no direct effect on cell viability. Knockdown of NQO1 followed by
treatment with irinotecan reduced the IC50 from 100.1µM to 49.8µM, with statistically
significant differences at doses between 25-400µM. Similarly with respect to 5-FU, NQO1
knockdown reduced the IC50 from 200.1µM to 25.0µM, with statistically significant
differences at doses between 25-200µM.
Dosing cells with dicoumarol alone had no effect on cell viability. When cells were pre-
treated with dicoumarol over a range of doses prior to incubation with a chemotherapeutic,
a reduction in cell viability was seen which reached its maximal effectiveness at ~100µM.
Cells in which NQO1 had been knocked down with siRNA experienced no further reduction
in viability by the addition of dicoumarol, suggesting this drug is acting by inhibition of
NQO1 rather than through an alternative pathway. Pre-treating cells with dicoumarol prior
to incubation in irinotecan reduced the IC50 from 100.0µM to 50.0µM, with statistically
significant differences at irinotecan doses between 12.5-50µM. Similarly with respect to 5-
FU, inhibition of NQO1 with dicoumarol reduced the IC50 from 183.7µM to 49.9µM, with
statistically significant differences at 5FU doses between 25-200µM.
6.4.4 NQO1 as a chemosensitiser
The role of the NQO1 protein as a biomarker has already been discussed in Section 4.4.5.
Two polymorphisms of NQO1 however have been well defined and characterised. The
NQO1*2 polymorphism is a C609T substitution (on 16q) resulting in a proline to serine
substitution at amino acid 187. The resulting protein is inactive, and therefore homozygotes
(up to 40% of the population) are NQO1 null with heterozygotes demonstrating reduced
activity (Traver et al, 1992). The less common (0.05%) NQO1*3 polymorphism is a C465T
substitution resulting in an arginine to tryptophan amino acid change. This variant however
is similar to the wildtype and is catalytically active but with major differences in the rate of
metabolism of quinone substrates (Pan et al, 1995). Given that NQO1 activity and protein
expression could potentially be rapidly induced by a host of dietary and other factors,
genotyping patients for the NQO1*2 polymorphism may be more clinically beneficial than
immunostaining if it were to be further considered as a predictive biomarker.
254
The in vitro data from this study confirms the likelihood that the NQO1 expression levels
seen in the proteomic study are determined by the phenotype of the tumour rather than
an effect of treatment with chemotherapy. Furthermore, the immunohistochemical
analysis suggests that the primary tumour is predictive of the metastatic phenotype and
confirms the findings of reduced expression in chemo-responsive metastases. Knockdown
of this protein alone (with siRNA or dicoumarol) had no effect on cell viability, and
therefore its potential therapeutic role is as a chemosensitiser rather than a cytotoxic.
In common with many other cytoprotective proteins, NQO1 is transcriptionally regulated
through the Keap1-Nrf2 pathway. Under normal conditions Nrf2 (nuclear factor (erythroid-
derived 2)) is sequestered in the cytoplasm physically bound to Keap1 (Kelch-like ECH-
associated protein 1). Inducers of the pathway, which may be endogenous or exogenous,
interact with cysteine residues of Keap1 rendering it unable to target Nrf2 for degradation.
Consequently Nrf2 is stabilised and subsequently translocates to the nucleus (Figure 6.31).
Here it dimerises with a number of transcription factors and the heterodimer binds to the
antioxidant response elements (ARE) of a number of genes thus activating transcription
(Bataille and Manautou, 2012).

255
Figure 6.31 - Nrf2 is bound to Keap1 until pathway activation causes its stabilisation. Nrf2
subsequently translocates to the nucleus where it dimerises with a number of
transcription factors and the heterodimer binds to the antioxidant response elements of
a number of genes thus activating transcription. Adapted from Bataille and Manautou
(2012).
NQO1 is a multifunctional antioxidant enzyme and exceptionally versatile cytoprotector.
The cytosolic enzyme catalyses the beneficial two-electron reduction of quinines to
hydroquinones, reducing the formation of reactive oxygen species (Lind et al, 1990). This
mechanism of action explains the reductive activation of chemotherapeutic quinines such
as mitomycins and aziridinyl-benzoquinones, but not those studied in this investigation
(Siegel et al, 1990). The hydroquinones derived from these agents are more chemically
reactive and produce reactive species which kill malignant cells, and therefore if acting
through this or a similar mechanism we would expect to see high levels of NQO1 in patients
responding to chemotherapy.
So if inhibition of NQO1 is not directly increasing the efficacy of the chemotherapeutic
agent by biochemical modulation, it may be inhibiting the cytoprotective features of the
cells and rendering them more susceptible to chemotherapy through a mechanism other
than its enzymatic activity. NQO1 appears to exert cytoprotective effects through another

256
mechanism, by regulating the proteasomal degradation of specific proteins. NQO1 has been
shown to regulate the ubiquitin-independent 20S proteasomal degradation of p73α (Asher
et al, 2005), p33 (Garate et al, 2008) and perhaps of most relevance p53. In 2001, Asher et
al reported that NQO1 inhibits the degradation of p53 in HCT-116 cells, and exposure to an
inhibitor of NQO1 enhances p53 proteasomal degradation. This degradation appears to be
most prominent under conditions of oxidative stress, and independent of both Mdm-2 and
ubiquitin (Gong et al, 2007).
We report low levels of NQO1 in chemoresponsive tumours, both in clinical samples and
following manipulation in in vitro studies, potentially therefore associated with enhanced
degradation of p53. Whilst some studies have reported that p53 is necessary for efficient
execution of the death programme following treatment with chemotherapeutics and that
increased expression causes chemosensitivity by promoting apoptosis (Lowe et al, 1993),
others have suggested that p53 inhibition actually improves response to chemotherapy. If
apoptosis is suppressed, a frequent finding in tumour cells, the residual functions of p53
(growth arrest at cell cycle checkpoints and modulation of DNA repair) may contribute to
cells surviving anticancer treatment (Xu, Mymryk and Cairncross, 2005). Browder et al
(2000) treated p53-null and p53-WT mouse xenografts with a chemotherapeutic regimen,
demonstrating increased efficacy in the p53-null mice and concluding that p53 is playing a
protective role. A similar protective role is observed in the epithelium of the small intestine
following γ irradiation, where p53 is suggested to allow cells to reside in a growth arrested
state thus reducing the risk of a mitotic catastrophe (Gudkov and Komarova, 2003).
Whether or not the observed effects of NQO1 inhibition are a result of its catalytic activity,
p53 stabilisation, regulation of the proteasomal degradation of another protein or an
entirely different mechanism has not been answered by this investigation and should be
the subject of further study.
6.4.5 Topoisomerase I
A large randomised control trial comparing 5FU with 5FU and irinotecan demonstrated that
high expression of TOP I measured by immunohistochemistry correlated with
responsiveness to treatment (HR 0.98; 95% CI 0.78 – 1.22) (Braun et al, 2008). A similar trial
from Dutch Colorectal Cancer Group however failed to replicate these findings, with no
association seen between TOP I expression and response to irinotecan (Koopman et al,

257
2007). The concordance we have found between expression at different disease sites is
novel, and contradictory to the evidence presented by Boonsong et al (2002) who found no
concordance between the expression in primary tumour and lymph node metastases.
There is clearly conflicting evidence both in terms of concordance of expression across
disease sites and the potential for its use as a biomarker, however it is clear that TOP I is
worthy of further investigation.
6.4.6 Strengths and limitations of the study
Undertaking investigations on clinical samples has brought the known challenges of small
numbers and a diverse patient population, resulting in difficulty drawing accurate scientific
conclusions. The issues surrounding the relevance of tumour heterogeneity and clonal
selection on biomarker studies such as these have already been discussed in previous
chapters.
The in vitro cancer model used shares the same advantages and disadvantages of all in vitro
experimental models. The complexities of an organism are simplified to basic functions,
allowing the investigator to focus on and manipulate a small number of conditions (Vignais,
2010). In this study, for example, it has allowed the manipulation of a single protein’s
expression using siRNA which would prove challenging in alternative models of cancer.
Conversely, investigators must be wary about their conclusions and the potential difficulties
in extrapolating data back to the intact organism. This is particularly true for drug-based
studies such as these where issues of drug formulation and delivery, pharmacokinetics and
toxicity have not been studied (De Clercq, 2005).
The strengths of this study, and in particular the work examining NQO1, is that it has arisen
from, validates and builds on the iTRAQ proteomic data described in Chapter 4. NQO1 was
identified through an unbiased shotgun proteomic screen and has now been validated in a
larger tissue set as a predictive biomarker of chemoresponsiveness. Moreover,
investigations into its potential use as a novel drug target have begun. The quality of the
western blot for NQO1 protein and the well-demonstrated knockdown achieved with siRNA
lead us to a degree of confidence in these findings.
6.4.7 Future work

258
With respect to the analysis of patient matched tissues for expression of proteins involved
in the activation and metabolism of chemotherapeutics, very little can be conclusively
stated given the small number of patients studied and also the heterogeneity of the
treatment regimens received by the patients. To address the hypothesis of whether protein
expression in the primary tumour predicts the metastatic phenotype, a sensible next step
would be immunostaining the TMA constructed within this study for these proteins. To
answer questions related to the potential use of these proteins as response biomarkers, a
more homogenous population would need to be defined and studied. Given the difficulty in
acquiring primary and metastatic tissue which was encountered for this study, the most
efficient way to accomplish this is likely to be its incorporation as a translational arm in a
clinical trial.
Similarly with regards to protein activity, a larger and more homogenous population is
required. The mass spectrometry assay used for this study is reliant upon tissue
homogenate, and therefore a method of extracting protein from FFPE blocks which is
suitable for other proteomic studies besides immunohistochemistry is required. This work
has already commenced with a comparison of two techniques, one reported by Scicchitano
et al (2009) and the commercially available Qproteome FFPE tissue kit (Qiagen, Venlo,
Netherlands).
Cancer Research UK published a roadmap to assist clinicians and scientists in bringing
biomarker studies to a clinically useful endpoint. As such, the next steps to further evaluate
NQO1 as a predictive biomarker would be:
Developing and refining a reproducible assay
Defining biomarker distribution in the target population and subsequently
validating the assay
Studying the relationship between the biomarker and clinical outcome
retrospectively
Defining the relationship of the biomarker to clinical outcome in a prospective
analysis of a retrospective tissue collection
Validating the correlation between the biomarker and clinical outcome as a primary
or secondary endpoint in a prospective study
Undertaking a clinical trial where the biomarker defines randomisation

259
To some extent this study has addressed many of these issues, although to drive this work
forwards there would be need for the early development of an alternative strategy for
assaying the protein or exploring the option for genotyping. As previously discussed,
incorporating this work as a translational arm into a prospective clinical trial would address
many of the problems encountered in this study.
The work presented in this thesis confidently identifies NQO1 as a therapeutic target,
although the evidence for the use of dicoumarol as a competitive inhibitor is somewhat
lacking. This is largely a result of difficulties encountered in attributing the effect of
dicoumarol to NQO1 inhibition. As previously discussed the approach taken with the
complementary siRNA inhibition provides some circumstantial evidence, although this is
insufficient. Since the commencement of this project, Mitosciences® (Oregon, USA)
released a series of microplate kits which are essentially a sandwich-ELISA for
immunocapture of the protein combined with a measurement of substrate/product
turnover to generate specific activity data. One of these plates is for NQO1, the activity of
which is determined following the simultaneous reduction of menadione (with NADH as a
cofactor) and WST1 (a cell proliferation reagent) which leads to increased absorbance at
440nm. This would be the essential next step in determining whether dicoumarol is
exerting the observed effects via this pathway, although it would be unhelpful unless the
cytoprotective effects we are inhibiting are related to the enzymatic activity of the protein.
Other in vitro work which would potentially be of interest would be the co-incubation of
dicoumarol with the chemotherapeutic rather than the pre-treatment approach opted for
in this study, and repeating the investigation in a p53-deficient cell line.
Beyond establishing reduced NQO1 activity, to further evaluate the chemosensitising
effects of NQO1 inhibition it would be necessary to transfer to an in vivo model. A simple
xenograft model would provide useful scientific information and allow tumour
measurements to be compared into two animal cohorts: chemotherapeutic drug(s) vs.
chemotherapeutic drug(s) and dicoumarol. To properly test the hypothesis in the
metastatic setting however the most suitable model would be surgical orthotopic
implantation, reported to reliably produce liver metastases in 100% of mice after 11
passages (Sun et al, 1999).
6.4.8 Conclusion

260
We have convincingly demonstrated concordance between the primary and metastatic
tumour for Topoisomerase I expression. KRAS, BRAF and MSI status also appear concordant
although numbers of mutations detected in this regard were small.
Western blotting for NQO1 validated the proteomic data set and the conclusions drawn in
Chapter 4. Immunohistochemical analysis has demonstrated that with respect to NQO1 the
primary tumour is predictive of the metastatic phenotype. Furthermore, NQO1 expression
in the metastatic tumour is lower in those patients responding favourably to neoadjuvant
chemotherapy.
In vitro work has suggested that this finding is a biological feature of the tumour rather
than a phenomenon seen as a result of treatment with chemotherapeutics. Knockdown of
this protein alone had no effect on cell viability, and therefore the potential therapeutic
role of NQO1 is as a chemosensitiser rather than a cytotoxic. Indeed knockdown of NQO1
with siRNA considerably improved chemosensitivity to both irinotecan and 5-FU in an in
vitro model.
Dicoumarol, a known inhibitor of NQO1, has shown potential for its use in this regard. Pre-
treatment of cells with dicoumarol again improved chemosensitivity to both irinotecan and
5-FU in the same in vitro model, although evidence to suggest it is exerting the observed
effect through NQO1 inhibition is circumstantial.
Further evaluation of these findings in a larger and more homogenous population, for
example in the context of a clinical trial, is necessary. Attributing the effects of dicoumarol
to NQO1 inhibition is also necessary prior to any further translational work, the next step
for which would be transfer to an in vivo model.

261
Chapter 7
Concluding Discussion

262
7.1 Summary of aims and experimental design
The starting point for the thesis was the identification of three key questions faced by
clinicians treating patients with colorectal cancer on a daily basis, which as yet have no
satisfactory scientific explanation or rationale for the selection of one particular course of
action. These questions are:
In patients with rectal cancer is it possible to predict response to neoadjuvant
chemoradiotherapy?
In patients with colorectal liver metastases is it possible to predict response to
neoadjuvant chemotherapy?
Can biological information from the primary tumour be used to predict response to
treatment in colorectal liver metastases?
In order to investigate these research questions, the following study plan was
implemented:
1. Establish a research network across multiple sites to facilitate the collection of
patient matched primary and metastatic tissue, as well as serial biopsies of rectal
tumours. Establish a research protocol and a satisfactory means of tissue collection.
2. Subject tumour samples (alongside normal adjacent tissue) from patients
undergoing synchronous resection to exome sequencing, in order to establish the
degree of biological similarity between primary and metastatic tumours, and
specifically to identify whether the presence of somatic non-synonymous mutations
in the primary tumour predicts the presence of the same mutations in the liver
metastasis.
3. Perform an unbiased assessment of the proteome of patient-matched primary and
metastatic tumours, as well as adjacent normal liver parenchyma and colonic
mucosa on a discovery set of fresh tissue. Analyse data to assess the degree of
biological similarity between primary and metastatic tumours, as well as identify
potential biomarkers measurable in the primary tumour which may predict the
response to chemotherapy in the liver metastases.

263
4. Validate any potential biomarkers by immunohistochemistry on a larger validation
tissue set, with samples combined into a tissue micro-array. Explore any potential
mechanisms for validated biomarkers.
5. Perform an unbiased assessment of the proteome of serial rectal cancer samples on
a discovery set of fresh tissue. Analyse data to assess how the tumour phenotype
changes with treatment, as well as identify potential biomarkers which may predict
response of the primary tumour to neoadjuvant chemoradiotherapy.
6. Validate any potential biomarkers by immunohistochemistry on a larger validation
tissue set, with samples combined into a tissue micro-array. Explore any potential
mechanisms for validated biomarkers.
7. Undertake a targeted analysis of the expression and function of key proteins
involved in the activation and metabolism of oxaliplatin, 5-fluorouracil and
irinotecan in patient matched primary and metastatic tumour samples. Analyse
data to assess the correlation in expression and function between primary and
metastatic tumours and establish how this information may predict response to
treatment.
8. Undertake a targeted analysis of the expression of key proteins involved in DNA
base excision repair in serial rectal cancer samples. Data will be analysed to assess
how levels of expression vary with treatment and how this information may be
used to predict response.
The experimental plan was followed and completed with the exception of steps 6 and 8,
the further evaluation of biomarkers and DNA base excision repair proteins in rectal cancer.
These steps were purely omitted due to time constraints and remain valid lines of enquiry
to address the research questions described above. Given the small numbers of samples
collected, response analysis was not feasible for step 7.
7.2 Summary of results
Chapter 2 evaluated the use of a novel tissue stabilisation gel, AllprotectTM. The study
demonstrated that effective tissue stabilisation was achieved with AllprotectTM, and that

264
tissue stabilised in this manner yields high quality DNA, RNA and protein suitable for
commonly used laboratory techniques. Comparable protein (by western blot and
immunohistochemistry) and mRNA expression for HMGB1 and CES1 in primary colorectal
tumour and colorectal liver metastases was observed irrespective of the method of tissue
stabilisation employed. Beyond that, the demonstration of comparable production of SN-
38, an active metabolite of irinotecan, suggested that protein function (CES1) as well as
expression is preserved. miRNA yield was also consistent and all extracted DNA was of
sufficient quality for downstream PCR.
Whilst short term tissue stabilisation with AllprotectTM appeared to be comparable to liquid
nitrogen, its role for long term archiving was less clear. Our study suggested that both
protein function and expression were significantly reduced by week 3, and, although
densitometry values did not reach statistical significance, visualisation of the western
immunoblots suggested that protein degradation may occur even earlier than this. RNA
integrity also began to reduce after one week, with the RIN of samples rapidly falling below
7.0. These findings were confirmed by the RT2 quality control array, and the increasing Ct
values seen by qPCR for both mRNA and miRNA.
Chapter 3 reported the exome sequencing of 4 simultaneously resected primary and
metastatic tumours alongside normal colonic mucosa and liver parenchyma. Of the 585
unique non-synonymous, missense SNVs identified, 215 (36.8%) were unique to the
primary tumour, 226 (38.6%) unique to the metastasis, and 81 (13.8%) present in at least
one primary and metastatic tumour pertaining to the same patient. The remaining 63
(10.8%) were neither unique to a tissue type nor present in a pair of samples from the same
patient. 268 (45.8%) predicted favourable response, whilst 226 (38.6%) predicted poor
response. Of those, 43 and 23 respectively were present in patient-matched samples. The
remaining 91 (15.6%) were neither unique to responders nor non-responders.
The ErbB signalling pathway was identified as the most significant pathway arising from the
analysis of SNVs in paired patient samples, with 6 (KRAS, MAP2K3, PAK2, PIK3C2G, PLCG2,
RRAS) of the 85 pathway genes containing SNVs (Ratio 0.07, p=5.87x10⁻⁷). Sanger
sequencing validated the CDAN1_15_43020983_G/A SNV as a potential predictor of
favourable response, where the primary tumour is predictive of the metastatic genotype.
For the 6 SNVs of interest in the ErbB pathway, 4 showed absolute concordance between

265
the primary and metastatic genotype (those in MAP2K3, PIK3C2G, PLCG2 and RRAS) thus
validating the results of the Ion Proton exome sequencing.
Chapter 4 reported the results of the isobaric tagging for relative quantification in patient
matched primary and metastatic tissues. Of the 16 patients sampled, 11 had undergone
neoadjuvant chemotherapy 10 of which achieved resection. Five of these patients had a
tumour regression grade of 1-2 and the remaining 5 had a tumour regression grade of 3-4.
A total of 5766 proteins were identified, of which 2637 were taken forwards for
bioinformatics analysis. Comparing primary tumour with normal colon, 25 proteins were
significantly differentially expressed (6 upregulated and 19 downregulated) and for
metastatic tumour compared with normal colon there were 53 differentially expressed (13
upregulated and 40 downregulated). Comparison of the metastatic tumour with liver
parenchyma identified 444 proteins differentially expressed, 164 of which were
upregulated and 280 downregulated. Only 67 of the 2637 (2.54%) proteins studied were
significantly different between primary and metastatic tissue, with 58 upregulated in the
metastatic tumour and 9 downregulated. One hundred and seventy proteins were
identified in the primary tumour which were significantly differentially expressed between
responders and non-responders with 59 upregulated and 111 downregulated in the
responders. In the metastases, there were 27 differentially expressed (17 upregulated and
10 downregulated). Five proteins were common to both tissue types, only two of which
showed consistent dysregulation between responders and non-responders (NAD(P)H
dehydrogenase [quinone 1] and lambda-crystallin homolog). Of the 5766 proteins identified
by iTRAQ, SNVs were previously identified in the protein coding region of 2627.
Chapter 5 reported the results of the isobaric tagging for relative quantification in serial
rectal cancer biopsies. A total of 3359 proteins were identified all of which were subjected
to bioinformatics analysis. When comparing the post chemoradiotherapy samples with the
diagnostic biopsies 18 proteins were significantly dysregulated, 2 of which were
downregulated and 16 upregulated. Comparing the samples at resection with post
chemoradiotherapy samples identified 39 proteins dysregulated, 30 of which were
downregulated and 9 upregulated. Similarly a comparison of the resection and diagnostic
samples identified 29 proteins, 10 of which were downregulated and 19 upregulated. The
base excision repair pathway was the most significantly downregulated pathway in this
analysis as a result of a reduction in PARP1 abundance with treatment. Eight candidate
biomarkers were identified in the primary tumours which appeared to predict response to

266
chemoradiotherapy, 3 of which were downregulated and 5 upregulated. The most
statistically significantly downregulated pathway was ceramide degradation as a result of
low expression of acid ceramidase in those patients responding favourably to
chemoradiotherapy.
Chapter 6 reported the targeted analysis of previously identified biomarkers of interest.
Western blotting of those proteins relevant to the activation and metabolism of key
chemotherapeutics (TS, DPYD, OPRT, CES1, CES2, TOPI, UGT1A1, CYP3A4 and DNA POL β)
all showed a positive correlation in expression between primary and metastatic tumours,
although this only reached statistical significance for TOP I (P=0.009). Mass spectrometry
analysis of CES1/CES2 activity (by irinotecan conversion to SN-38) showed significant
differences across primary tumour, metastatic tumour and liver parenchyma (p=0.001). All
patients except 4 had statistically significant differences between protein activity levels at
the primary and metastatic disease sites.
Pyrosequencing for KRAS and BRAF mutations identified the KRAS codon 12 mutation in 5
patients with 100% concordance between primary and metastatic tumours and no
mutation similarly detected in the adjacent normal colonic mucosa. No mutations were
seen in codons 13 or 61. One patient had BRAF mutation in both codons (600 and 601)
again with concordance between primary and metastatic tumours. One patient had
microsatellite instability, which was detected in the colonic mucosa as well as the primary
and metastatic tumours.
Western blotting for NQO1 was used to validate the iTRAQ proteomic data reported in
Chapter 4. Correlation of protein expression by western blotting densitometry and iTRAQ
abundance data showed a statistically significant positive correlation (r=0.59, p=0.003), and
therefore the findings were investigated by immunohistochemistry. Of the 56 patients for
whom patient matched primary and metastatic FFPE blocks were available, 37 received
neoadjuvant treatment. Fourteen of these patients responded to chemotherapy (TRG1-2),
23 did not (TRG3-4). Comparing clinicopathological features between groups revealed a
higher proportion of T4 tumours in the chemo-naive group (p=0.017), most likely reflecting
a clinical preference for prompt surgery in this patient cohort. No other potentially
confounding variables were different between groups. A statistically significant positive
correlation between immunohistochemical protein expression in the primary and
metastatic tumours was seen (r=0.44, p=0.001). NQO1 expression in the primary tumour

267
was not statistically significantly different between responders and non-responders
(p=0.470), however expression in the metastases was considerably lower in those patients
responding to chemotherapy (p=0.041), mirroring the conclusion of the proteomic data.
Functional investigation of these findings in an in vitro model demonstrated that treating
cells with chemotherapy had no effect on protein expression, and that knockdown of NQO1
with siRNA had no direct effect on cell viability. Knockdown of NQO1 followed by treatment
with irinotecan reduced the IC50 from 100.1µM to 49.8µM, with statistically significant
differences at doses between 25-400µM. Similarly with respect to 5-FU, NQO1 knockdown
reduced the IC50 from 200.1µM to 25.0µM, with statistically significant differences at doses
between 25-200µM. Dosing cells with dicoumarol alone had no effect on cell viability.
When cells were pre-treated with dicoumarol over a range of doses prior to incubation with
a chemotherapeutic, a reduction in cell viability was seen which reached its maximal
effectiveness at ~100µM. Cells in which NQO1 had been knocked down with siRNA
experienced no further reduction in viability by the addition of dicoumarol, suggesting this
drug is acting by inhibition of NQO1 rather than through an alternative pathway. Pre-
treating cells with dicoumarol prior to incubation in irinotecan reduced the IC50 from
100.0µM to 50.0µM, with statistically significant differences at irinotecan doses between
12.5-50µM. Similarly with respect to 5-FU, inhibition of NQO1 with dicoumarol reduced the
IC50 from 183.7µM to 49.9µM, with statistically significant differences at 5FU doses
between 25-200µM.
7.3 Advances in the literature
Since the commencement of this thesis the only significant developments in the literature
have been the publication of 3 papers in 2014 reporting next generation sequencing of
patient matched primary and metastatic colorectal tumours. This reflects the significant
increase in the availability of this technology coupled with the associated reduction in cost.
Xie et al (2014) performed whole genome sequencing of patient matched primary and
metastatic colorectal tumours. Comparing the data to germline DNA they characterised
somatic alterations including single nucleotide variants, insertions and deletions, copy
number aberrations and structural alterations. The focus of the analysis was to identify
those novel mutations in the metastasis which may be drivers of disease progression, as
both patients were chemo-naive and simultaneously resected. In both patients clones and

268
subclones of mutational clusters were identified. In one patient 75% of the mutations in the
primary tumour were present in the metastasis, whereas the other patient had 95% of
mutations also present in the metastasis. Having attempted to model clonal evolution, the
authors conclude that this discrepancy occurred as a result of temporal differences in
metastatic dissemination with respect to the evolution of the founding clone at the primary
site. The proportion of somatic SNVs shared between primary tumour and liver metastasis
were 68.4% and 52.8%, compared to 13.8% in our study. The authors focus their discussion
on the concordance of TP53, APC and KRAS and highlight aberrations in FBXW7, DCLK1,
FAT2 and PHF6 as being functional and exclusive to the metastases.
Brannon et al (2014) performed targeted sequencing of 230 key genes in 69 matched
primary and metastatic tumours, alongside whole genome sequencing of 4 patients.
Overall, 434 distinct non-synonymous somatic mutations were identified, with 79%
concordance between primary and metastatic tumour. The analysis differs to the one we
performed in that indels were also included. The authors focus their discussion on the
absolute concordance of APC, KRAS, NRAS and BRAF mutations in their samples, concluding
that these early carcinogenic mutations persist through tumour evolution. The authors
attempted to correlate mutational concordance with key clinicopathological features but
found no such association. The whole genome sequencing in this study was used to validate
the concordance demonstrated by the capture-based assay used (IMPACT), and as such the
two concordant samples were also concordant on whole genome sequencing (80% and
83%)and vice versa for the non-concordant samples (38% and 25%).
Lee et al (2014) performed exome sequencing of 15 patient matched micro-satellite stable
primary and metastatic tumours. In total, 1079 and 4366 mutations were identified in the
primary and metastatic tumours respectively. 60.8% of those mutations in the primary
tumour were non-synonymous compared to 54.9% in the metastases. Whilst the data is
available in supplementary information, the authors merely state that the findings were
consistent with previous observations (Greenman et al, 2007) and not significantly different
between primary and metastatic samples. No analysis is provided to justify this conclusion,
and the remainder of the paper focuses on the parallel somatic copy-number alteration
(SCNA) analyses.
Our data are complementary to these publications, and the finding of concordance in the
SNVs within the ErbB family remains novel. The discrepancy in the proportion of mutations

269
concordant between primary and metastatic tumours may possibly be explained by the
biopsy of clones/subclones within a tumour, but also the inclusion of other genetic
aberrations (for example indels) included in the reported figures.
7.4 Study limitations and further work
The limitations of specific investigations and experimental techniques have been discussed
throughout the thesis, however there are two key themes. Firstly the acquisition of fresh
material from patient matched primary and metastatic tumours, as well as serial rectal
tumour samples, was conducted prospectively within the study resulting in small numbers.
Given the nature of the disease and the complexities involved in its management, there
was also considerable heterogeneity both in clinicopathological features and treatment
received. Secondly, whilst most tumours are thought to arise from a monoclonal
population, its expansion combined with the acquisition of further mutations creates
subclones and tumour heterogeneity. This heterogeneity clearly has significant implications
for biomarker studies such as this which rely on a single tumour biopsy sample to be
representative of the whole tumour (Poste, 2011). The first limitation could be addressed
by incorporating this work as a translational arm in a clinical trial. The second is more
challenging to address, and even though alternative (but non-translatable) strategies such
as laser capture microdissection or the acquisition of circulating tumour cells may remove
stromal contamination, they still fail to address this crucial problem (Curran et al, 2000).
The exome sequencing study has generated two lines of enquiry. The potential role of the
SNV identified in the CDAN1 gene should be explored by characterisation in a larger
dataset, in parallel with an analysis of the ErbB pathway genes. The co-analysis of the
exome and proteome datasets performed thus far has been rudimentary, and further
integration would require super-specialist bioinformatic support.
By their very nature, studies which include sequencing of any form, proteomic or genomic,
generate large amounts of data. In order to handle such volumes of data it is necessary to
approach the analysis with a clear series of questions. The disadvantage of this approach is
the potential to overlook key findings in the data. In this study for example the numerous
pathway and network analyses are likely to provide key insights into carcinogenesis, disease
progression and treatment response, however it has been necessary to select only a small
number of findings from these preliminary studies for further analysis. Revisiting these

270
pathway and network analyses in conjunction with a literature review would very likely
generate a number of research questions worthy of further work.
Evaluation of the base excision repair proteins relevant to radiotherapy response (PARP1,
APE1, DNAPOL β and XRCC1) and the potential for the use of acid ceramidase as a
biomarker and/or chemosensitiser requires further work and validation, although this
proved unfeasible within the time constraints of this study. The next steps in the further
evaluation of NQO1 as a biomarker have been recently highlighted in a roadmap by Cancer
Research UK. Prior to exploring its role as a drug target in an in vivo model, further in vitro
work to establish whether the effects seen by inhibiting NQO1 relate to its enzymatic
activity, protein stabilisation function or another mechanism are necessary.
7.5 Review of hypotheses
A number of testable hypotheses were generated at the commencement of the thesis.
1. Somatic non-synonymous mutations in the primary tumour correlate with those present
in the liver metastasis and predict response to treatment.
Disproved – only 13.8% of single nucleotide variants identified were concordant between
primary and metastatic tumours in the small number of samples we studied.
2. The phenotype of the primary tumour is biologically similar to the liver metastasis, with
markers present in the primary tumour which predict the response of the liver metastasis
to neoadjuvant chemotherapy.
Proved - Only 67 of the 2637 (2.54%) proteins studied were significantly different between
primary and metastatic tissue. NQO1 and lambda-crystallin homolog appeared to predict
response to treatment. NQO1 levels in the primary tumour predict the metastatic
phenotype, and low protein abundance in the metastatic tumour is associated with
favourable treatment response. Inhibiting the protein (with siRNA or a competitive
inhibitor) improved chemosensitivity in an in vitro model.
3. The phenotype of a rectal tumour changes with neoadjuvant chemoradiotherapy, and
inter-patient variation in these changes predicts response to treatment.

271
Partially Proved – Only minor changes in tumour phenotype were detected with
neoadjuvant chemoradiotherapy. The most statistically significantly downregulated
pathway in those patients responding favourably to chemoradiotherapy was ceramide
degradation as a result of low expression of acid ceramidase.
4. Levels of expression of key proteins involved in the activation and metabolism of
chemotherapeutics are comparable between primary and metastatic tumours and predict
response to treatment.
Partially Proved – All proteins studied had a positive correlation although this was only
statistically significant for Topoisomerase I.
5. Levels of expression of DNA base excision repair proteins in rectal tumours vary with
treatment, and inter-patient variation in the expression of these proteins predicts response
to neoadjuvant chemoradiotherapy.
Inconclusive – This hypothesis was incompletely tested due to time constraints. iTRAQ data
of serial rectal cancer samples did however suggest that base excision repair (and in
particular PARP1) remains of interest in both carcinogenesis and treatment response.
7.6 Conclusions
This thesis has generated a number of lines of enquiry and ideas for further work as well as
providing sufficient evidence to conclude the following:
AllprotectTM confers comparable tissue stabilisation to liquid nitrogen for up to 1
week for the extraction and downstream laboratory analysis of DNA, RNA and
protein.
Approximately one third of single nucleotide mutations identified are present
exclusively in the primary tumour, one third are present exclusively in the
metastases and one third are present in tumours at both sites. In our data, only
13.8% of mutations were present in patient matched samples.
A SNV in the CDAN1 gene has potential to serve as a predictive biomarker, with the
presence of the SNV in the primary tumour predicting the metastatic genotype.

272
SNVs across the ErbB pathway appear to be concordant between primary and
metastatic tumours, and not limited to KRAS alone.
Only 2.54% of proteins are significantly differentially expressed between primary
and metastatic tumours. As such, it may be feasible to utilise biological information
from the primary tumour to predict the phenotype of the metastasis.
Phenotypic changes induced by chemoradiotherapy in rectal cancers are modest.
Base excision repair (and in particular PARP1) remains of interest in both
carcinogenesis and treatment response, and acid ceramidase is a potential novel
response biomarker.
Topoisomerase I expression in the primary tumour correlates significantly with
expression in colorectal liver metastases. A positive correlation was also seen in
other proteins responsible for the activation and metabolism of
chemotherapeutics, as well as KRAS, BRAF and MSI status.
NQO1 expression in the primary tumour is predictive of the metastatic phenotype,
and expression in the metastatic tumour is lower in those patients responding
favourably to neoadjuvant chemotherapy.
Inhibition of NQO1 with siRNA is not directly therapeutic but enhances the cytotoxic
effect of irinotecan and 5-FU. The NQO1 inhibitor dicoumarol has similar potential,
although requires further evaluation.

273
Bibliography
Aaltonen, L., Peltomäki, P., Leach, F., Sistonen, P., Pylkkanen, L., Mecklin, J., Jarvinen, H.,
Powell, S., Jen, J., Hamilton, S., et al. (1993). Clues to the pathogenesis of familial colorectal
cancer. Science, 260(1509), 812-166.
Abdalla, E., Bauer, T., Chun, Y., D'Angelica, M., Kooby, D. and Jarnagin, W. (2013)
Locoregional surgical and interventional therapies for advanced colorectal cancer liver
metastases: expert consensus statements. HPB (Oxford), 15(2), 119-130.
Abraham, N., Young, J. and Solomon, M. (2004) Meta-analysis of short-term outcomes after
laparoscopic resection for colorectal cancer. British Journal of Surgery, 91(9), 1111–1124
Adam, R., Avisar, E., Ariche, A., Giachetti, S.,Azoulay, D., Castaing, D., Kunstilinger, F. and
Bismuth, F. (2001). Five year survival following hepatic resection after neoadjuvant therapy
for nonresectable colorectal disease. Annals of Surgical Oncology, 8(4), 347-353.
Adam, R., Bhangui, P., Poston, G., Mirza, D., Nuzzo, G., Barroso, E., Ijzermans, J., Hubert, C.,
Ruers, T., Capussotti, L., Ouellet, J., Laurent, C., Cugat, E., Colombo, P. and Milicevic, M.
(2010). Is perioperative chemotherapy useful for solitary, metachronous, colorectal liver
metastases? Annals of Surgical Oncology, 252(5), 774-787.
Adam, R., de Haas, R., Wicherts, D., Vibert, E., Salloum, C., Azoulay, D. and Castaing, D.
(2011). Concomitant extrahepatic disease in patients with colorectal liver metastases: when
is there a place for surgery? Annals of Surgical Oncology, 253(2), 349-359.
Alberda, W., Verhoef, C., Nuyttens, J., van Meerten, E., Rothbarth, J., de Wilt, J. and Burger,
J. (2014). Intraoperative radiation therapy reduces local recurrence rates in patients with
microscopically involved circumferential resection margins after resection of locally
advanced rectal cancer. International Journal of Radiation Oncology, Biology, Physics, 88(5),
1032-1040.
Alberici, P. and Fodde, R. (2006). The role of the APC tumor suppressor in chromosomal
instability. Genome Dynamics, 1,149-170.
Andre, T., Boni, C., Navarro, M., Tabernero, J., Hickish, T., Topham, C., Bonetti, A., Clingan,
P., Bridgewater, J., Rivera, F. and de Gramont, A. (2009). Improved overall survival with
oxaliplatin, fluoruracil and leucovorin as adjuvant treatment in stage II or III colon cancer in
the MOSAIC trial. Journal of Clinical Oncology, 27(19), 3109-3116.
Anwar, A., Dehn, D., Siegel, D., Kepa, J., Tang, L., Pietenpol, J. and Ross, D. (2003).
Interaction of human NAD(P)H: quinone oxidoreductase 1 (NQO1) with the tumor
suppressor protein p53 in cells and cell-free systems. Journal of Biological Chemistry,
278(12), 10368 – 10373.

274
Arulampalam, T., Francis, D., Visvikis, D., Taylor, I. and Ell, P. (2004). FDG-PET for the pre-
operative evaluation of colorectal liver metastases. European Journal of Surgical Oncology,
30(3), 286-291.
Asher, G., Dym, O., Tsvetkov, P., Adler, J. and Shaul, Y. (2006). The crystal structure of NAD
(P) H quinone oxidoreductase 1 in complex with its potent inhibitor dicoumarol.
Biochemistry, 45(20), 6372-6378.
Asher, G., Lotem, J., Cohen, B., Sachs, L. and Shaul, Y. (2001). Regulation of p53 stability and
p53-dependent apoptosis by NADH quinone oxidoreductase 1. Proceedings of the National
Academy of Science of the United States of America, 98(3), 22559-22564.
Asher, G., Tsvetkov, P., Kahana, C. and Shaul, Y. (2005). A mechanism of ubiquitin-
independent proteasomal degradation of the tumor suppressors p53 and p73. Genes and
Development, 19(3), 316-321.
Ask, K., Jasencakova, Z., Menard, P., Feng, Y., Almouzni, G. and Groth, A. (2012). Codanin-1,
mutated in the anaemic disease CDAI, regulates Asf1 function in S-phase histone supply.
EMBO Journal, 31(8), 2013-2023.
Atallah, S. and Albert, R. (2013). Transanal minimally invasive surgery (TAMIS) versus
transanal endoscopic microsurgery (REM): is one better than the other? Surgical
Endoscopy, 27(12), 4750-4751.
Bakalakos, E., Burak, W., Young, D. and Martin, E. (1999). Is carcino-embryonic antigen
useful in the follow-up management of patients with colorectal liver metastases? The
American Journal of Surgery, 177(1), 2-6.
Baker, S., Preisinger, A., Jessup, J., Paraskeva, C., Markowitz, S., Wilson, J., Hamilton, S. and
Vogelstein, B.(1990). p53 gene mutations occur in combination with 17p allelic deletions as
late events in colorectal tumorigenesis. Cancer Research, 50(23), 7717-7722.
Bando, M., Oka, M., Kawai, K., Obazawa, H., Kobayashi, S. and Takehana, M. (2006). NADH
binding properties of rabbit lens lambda-crystallin. Molecular Vision, 12, 692-697.
Bang, Y., Kim, Y., Yang, H., Chung, H., Park, Y., Lee, K., Lee, K., Kim, Y., Noh, S., Cho, J., Mok,
Y., Kim, Y., Ji, J., Yeh, T., Button, P., Sirzén, F. and Noh, S. (2012). Adjuvant capecitabine and
oxaliplatin for gastric cancer after D2 gastrectomy (CLASSIC): a phase 3 open-label,
randomised controlled trial. Lancet, 379(9813), 315-321.
Barber, T., McManus, K., Yuen, K., Reis, M., Parmigiani, G., Shen, D.,Barrett, I., Nouhi,
Y., Spencer, F.,Markowitz, S., Velculescu, V., Kinzler, K., Vogelstein, B., Lengauer, C.
and Hieter, P.(2008). Chromatid cohesion defects may underlie chromosome instability in
human colorectal cancers. Proceedings of the National Academy of Sciences of the United
States of America, 105(9), 3443-3448.
Bass, A., Lawrence, M., Brace, L., Ramos, A., Drier, Y., Cibulskis, K., Sougnez, C., Voet, D.,
Saksena, G., Sivachenko, A., Jing, R., Parkin, M., Pugh, T., Verhaak, R., Stransky, N., Boutin,
A., Barretina, J., Solit, D., Vakiani, E., Shao, W., Mishina, Y., Warmuth, M., Jimenez, J.,

275
Chiang, D., Signoretti, S., Kaelin, W., Spardy, N., Hahn, W., Hoshida, Y., Ogino, S., Depinho,
R., Chin, L., Garraway, L., Fuchs, C., Baselga, J., Tabernero, J., Gabriel, S., Lander, E., Getz, G.
and Meyerson, M. (2011). Genomic sequencing of colorectal adenocarcinomas identifies a
recurrent VTI1A-TCF7L2 fusion. Nature Genetics, 43(10), 964-968.
Bataille, A. and Manautou, J. (2012). Nrf2: A Potential Target for New Therapeutics in Liver
Disease. Clinical Pharmacology & Therapeutics, 92 (3), 340-348.
Begleiter, A., Hewitt, D., Maksymiuk, A., Ross, D. and Bird, R. (2006). A NAD (P) H: quinone
oxidoreductase 1 polymorphism is a risk factor for human colon cancer. Cancer
Epidemiology Biomarkers & Prevention, 15 (12), 2422-2426.
Benjamini, Y. and Hochberg, Y. (1995). Controlling the False Discovery Rate: A Practical and
Powerful Approach to Multiple Testing. Journal of the Royal Statistical Society, Series B
(Methodological), 57(1), 289-300.
Benoist, S., Brouquet, A., Penna, C., Julie, C., El Hajjam, M., Chagnon, S., Mitry, E., Rougier,
P. and Nordlinger, B. (2006). Complete response of colorectal liver metastases after
chemotherapy: does it mean cure? Journal of Clinical Oncology, 24(24), 3939-3945.
Blazer, D., Kishi, Y., Maru, D., Kopetz, S., Chun, Y., Overman, M., Fogelman, D., Eng, C.,
Chang, D., Wang, H., Zorzi, D., Ribero, D., Ellis, L., Glover, K., Wolff, R., Curley, S., Abdalla, E.
and Vauthey, J. (2008). Pathologic response to preoperative chemotherapy: a new outcome
end point after resection of hepatic colorectal metastases. Journal of Clinical Oncology,
26(33), 5344-5351.
Bokemeyer, C., Bondarenko, I., Hartmann, J., de Braud, F., Schuch, G., Zubel, A., Celik, I.,
Schlichting, M. and Koralewski, P. (2011). Efficacy according to biomarker status of
Cetuximab plus FOLFOX-4 as first-line treatment for metastatic colorectal cancer: the OPUS
study. Annals of Oncology, 22(7), 1535-1546.
Bokemeyer, C., Bondarenko, I., Makhson, A., Hartman, J., Aparicio, J., de Braud, F., Donea,
S., Ludwig, H., Schuch, G., Stroh, C., Loos, A., Zubel, A. and Koralewski, P. (2009).
Fluorouracil, leucovorin, and oxaliplatin with and without Cetuximab in the first-line
treatment of metastatic colorectal cancer. Journal of Clinical Oncology, 27(5), 663-671.
Boland, C., Thibodeau, S., Hamilton, S., Sidransky, D., Eshleman, J., Burt, R., Meltzer, S.,
Rodriguez-Bigas, M., Fodde, R., Ranzani, G. and Srivastava, S. (1998). A National Cancer
Institute Workshop on Microsatellite Instability for cancer detection and familial
predisposition: development of international criteria for the determination of microsatellite
instability in colorectal cancer. Cancer Research, 58(22), 5248-5257.
Boonsong, A., Curran, S., McKay, J., Cassidy, J., Murray, G. and McLeod, H. (2002)
Topoisomerase I protein expression in primary colorectal cancer and lymph node
metastases. Human Pathology, 33(11), 1114-1119.

276
Bosslet, K., Straub, R., Blumrich, M., Czech, J., Gerken, M., Specker, B., Kroemer, H., Gesson,
J., Koch, M. and Monneret, C. (1998). Elucidation of the mechanism enabling tumor
selective prodrug monotherapy. Cancer Research, 58(6), 1195-1201.
Boulay, J., Mild, G., Lowy, A., Reuter, J., Lagrange, M., Terracciano, L., Laffer, U., Herrmann,
R. and Rochilitz, C. (2002). SMAD4 is a predictive marker for 5-Fluorouracil-based
chemotherapy in patients with colorectal cancer. British Journal of Cancer, 87(6), 630-634.
Bradford, M. (1976). A rapid and sensitive method for the quantificationof microgram
quantities of protein utilizing the principle of protein-dye binding. Analytical Biochemistry,
7(72), 248-254.
Braun, M., Richman, S., Quirke, P., Daly, C., Adlard, J., Elliott, F., Barrett, J., Selby, P., Meade,
A., Stephens, R., Parmar, M. and Seymour, M. (2008). Predictive biomarkers
of chemotherapy efficacy in colorectal cancer: results from the UK MRC FOCUS trial.
Journal of Clinical Oncology, 26(16), 2690-2698.
Browder, T., Butterfield, C., Kraling, B., Shi, B., Marshall, B., O'Reilly, M. and Folkman, J.
(2000). Antiangiogenic scheduling of chemotherapy improves efficacy against experimental
drug-resistant cancer. Cancer Research, 60(7), 1878–1886.
Buecher, B., Cacheux, W., Rouleau, E., Dieumegard, B., Mitry, E. and Lièvre, A. (2013). Role
of microsatellite instability in the management of colorectal cancers. Digestive Liver
Disease, 45(6), 441-449.
Bujko, K., Nowacki, M., Nasierowska-Guttmejer, A., Michalski, W., Bebenek, M. and Kryj, M.
(2006). Long-term results of a randomized trial comparing preoperative short-course
radiotherapy with preoperative conventionally fractionated chemoradiation for rectal
cancer. British Journal of Surgery, 93(10), 1215-1223.
Buttke, T. and Sandstrom, P. (1994). Oxidative stress as a mediator of apoptosis.
Immunology Today. 15(1), 7-10.
Buttke, T., McCubrey, J. and Owen, T. (1993). Use of an aqueous soluble
tetrazolium/formazan assay to measure viability and proliferation of lymphokine-
dependent cell lines. Journal of Immunological Methods, 157(1-2), 233–240.
Buyse, M., Zeleniuch-Jacquotte, A. and Chalmers, T. (1988). Adjuvant therapy of colorectal
cancer. Why we still don't know. JAMA, 259(24), 3571-3578.
Campbell, P. and Pleasance, E. (2008). Subclonal phylogenetic structures in cancer revealed
by ultra-deep sequencing. Proceedings of the National academy of Sciences of the USA,
105(35), 13081-13086.
Campbell, P., Yachida, S., Mudie, L., Stephens, P., Pleasance, E., Stebbings, L., Morsberger,
L., Latimer, C., McLaren, S., Lin, M., McBride, D., Varela, I., Nik-Zainal, S., Leroy, C., Jia,
M., Menzies, A., Butler, A., Teague, J., Griffin, C., Burton, J., Swerdlow, H., Quail,
M., Stratton, M., Iacobuzio-Donahue, C. and Futreal, P. (2010). The patterns and dynamics
of genomic instability in metastatic pancreatic cancer. Nature, 467(7319), 1109-1113.

277
Cancer Research UK (2012) Cancer Research UK Prognostic/Predictive Biomarker
Development Roadmap. Available at:
http://www.cancerresearchuk.org/prod_consump/groups/cr_common/@fre/@fun/docum
ents/generalcontent/cr_027486.pdf [Accessed 23 October 2014].
Cancer Research UK. 2012. Bowel Cancers Statistics [on-line]. Available at:
http://www.cancerresearchuk.org/cancer-info/cancerstats/types/bowel [Accessed 29
September 2014].
Carragher, L., Snell, K., Giblett, S., Aldridge, V., Patel, B. and Cook, S. (2010). V600EBraf
induces gastrointestinal crypt senescence and promotes tumour progression through
enhanced CpG methylation of p16INK4a. EMBO Molecular Medicine, 2(11), 458-471.
Carrato, A. (2008). Adjuvant treatment of colorectal cancer. Gastrointestinal Cancer
Research, 2(4), S42-S46.
Cassidy, J., Clarke, S., Díaz-Rubio, E., Scheithauer, W., Figer, A., Wong, R., Koski, S.,
Lichinitser, M., Yang, T., Rivera, F., Couture, F., Sirzén, F. and Saltz, L. (2008).Randomized
phase III study of capecitabine plus oxaliplatin compared with fluorouracil/folinic acid plus
oxaliplatin as first-line therapy for metastatic colorectal cancer. Journalof Clinical Oncology,
26(12), 2006-2012.
Ceciliani, F., Eckersall, D., Burchmore, R. and Lecchi, C. (2014). Proteomics in veterinary
medicine: applications and trends in disease pathogenesis and diagnostics. Veterinary
Pathology, 51(2), 351–362.
Cedermark, B., Johansson, H., Rutqvist, L. and Wilking, N. (1995). The Stockholm I trial of
preoperative short term radiotherapy in operable rectal carcinoma. A prospective
randomized trial. Stockholm Colorectal Cancer Study Group.Cancer, 75(9), 2269-2275.
Center for Drug Evaluation and Research (CDER), Centre for Veterinary Medicine (CVM).
(2001). Guidance for industry: bioanalytical method validation. Rockville, MD: CDER.
Chen, J., Yu, L., Li, D., Gao, Q., Wang, J., Huang, X., Bi, G., Wu, H. and Zhao, S. (2003).Human
CRYL1, a novel enzyme-crystallin overexpressed in liver and kidney and downregulated in
58% of livercancer tissues from 60 Chinese patients, and four new homologs from other
mammalians. Gene, 302(1-2), 103-113.
Chen, K., Wallis, J., McLellan, M., Larson, D., Kalicki, J., Pohl, C., McGrath, S., Wendl, M.,
Zhang, Q., Locke, D., Shi, X., Fulton, R., Ley, T., Wilson, R., Din, L. and Mardis, E. (2009).
Break Dancer: an algorithm for high-resolution mapping of genomic structural variation.
Nature Methods, 6(9), 677-681.
Choi, P. and Zelig, M. (1994). Similarity of colorectal cancer in Crohn's disease and
ulcerative colitis: implications for carcinogenesis and prevention. Gut, 35 (7), 950-954.
Chong, G., Cunningham, D. (2005). Improving long-term outcomes for patients with liver
metastases from colorectal cancer. Journal of Clinical Oncology, 23(36), 9063-9066.

278
Choti, M., Sitzmann, J., Tiburi, M., Sumetchotimetha, W., Rangsin, R., Schulick, R., Lillemoe,
K., Yeo, C. and Cameron, J. (2002). Trends in long-term survival following liver resection for
hepatic colorectal metastases. Annals of Surgery, 235(6), 759-766.
Colangelo, L., Gapstur, S., Gann, P. and Dyer, A. (2004). Cigarette smoking and colorectal
carcinoma mortality in a cohort with long-term follow-up. Cancer, 100(2), 288-293.
Creswell, A., Welsh, F. and Rees, M. (2009). A diagnostic paradigm for resectable liver
lesions: to biopsy or not to biopsy? HPB (Oxford), 11(7), 533-540.
Cunningham, D., Allum, W., Stenning, S., Thompson, J., Van de Velde, C., Nicolson,
M., Scarffe, J., Lofts, F., Falk, S., Iveson, T., Smith, D., Langley, R., Verma, M., Weeden,
S., Chua, Y. and MAGIC Trial Participants. (2006). Perioperative chemotherapy versus
surgery alone for resectable gastroesophageal cancer. New England Journal of
Medicine. 355(1), 11-20.
Curran, S., McKay, J., McLeod, H. and Murray, G. (2005). Laser capture microscopy.
Molecular Pathology, 53(2), 64-68.
Day, J. and Stacey, G. (2008). Biobanking. Molecular Biotechnology, 40(2), 202-213.
De Clercq, E. (2005). Recent highlights in the development of new antiviral drugs. Current
Opinion in Microbiology, 8 (5), 552-560.
de Haas, R., Wicherts, D. and Adam, R. (2008). Resection of colorectal liver metastases with
extrahepatic disease. Digestive Surgery, 25(6), 461-466.
Denoix, P. (1946). Enquete permanent dans les centres anticancereaux. Bulletin de l'Institut
national d'hygiene, 1, 70–75.
Dgany, O., Avidan, N., Delaunay, J., Krasnov, T., Shalmon, L., Shalev, H., Eidelitz-Markus,
T., Kapelushnik, J., Cattan, D., Pariente, A., Tulliez, M., Cretien, A., Schischmanoff, P.-O.,
Iolascon, A., Fibach, E., Koren, A., Roessler, J., Le Merrer, M. and Tamary, H. (2002).
Congenital dyserythropoietic anemia type I is caused by mutations in codanin-1. American
Journal of Human Genetics, 71(6), 1467-1474.
Diasio, R. and Harris, B. (1989). Clinical pharmacology of 5-fluorouracil. Clinical
Pharmacokinetics, 16(4), 215-237.
Downward, J. (2003). Targeting RAS signalling pathways in cancer therapy. Nature Reviews
Cancer, 3(1), 11-22.
Dukes, C. (1932). The classification of cancer of the rectum. The Journal of Pathology and
Bacteriology, 35(3), 323-332.
Dukes, C. and Bussey, H. (1958). The spread of rectal cancer and its effect on prognosis.
British Journal of Cancer, 12(3), 309-320.
Dworak, O., Keilholz, L. and Hoffmann, A.(1997). Pathological features of rectal cancer after
preoperative radiochemotherapy. International Journal of Colorectal Disease, 12(1), 19-23.
279
Eisenhauer, E., Therasse, P., Bogaerts, J., Schwartz, L., Sargent, D., Ford, R., Dancey, J.,
Arbuck, S., Gwyther, S., Mooney, M., Rubinstein, L., Shankar, L., Dodd, L., Kaplan, R.,
Lacombe, D. and Verweil, J. (2009). New response evaluation criteria in solid tumours:
revised RECIST guideline (version 1.1). European Journal of Cancer, 45(2), 228-247.
Ezzeldin, H. and Diasio, R. (2008). Predicting fluorouracil toxicity: can we finally do it?
Journal of Clinical Oncology, 26(12), 2080-2082.
Fallik, D., Borrini, F., Boige, V., Viguier,J., Jacob, S., Miquel, C., Sabourin, J., Ducreux, M. and
Praz, F. (2003) Microsatellite instability is a predictive factor of the tumor response to
irinotecan in patients with advanced colorectal cancer. Cancer Research, 63(18), 5738-5744.
Fang, L., Lee, S., Choi, H., Kim, H., Jew, G., Kang, H., Chen, L., Jablons, D. and Kim, I. (2014).
Comprehensive genomic analyses of a metastatic colon cancer to the lung by
whole exome sequencing and gene expression analysis. International Journal of Oncology,
44(1), 211-221.
Farmer, H., McCabe, N., Lord, C., Tutt, A., Johnson, D., Richardson, T., Santarosa, M., Dillon,
K., Hickson, I., Knights, C., Martin, N., Jackson, S., Smith, G. and Ashworth, A. (2005).
Targeting the DNA repair defect in BRCA mutant cells as a therapeutic
strategy. Nature, 434(7035), 917–921.
Fearon, E. (2011). Molecular genetics of colorectal cancer. Annual Review of Pathology,6,
479-507.
Fearon, E. and Vogelstein, B. (1990). A genetic model for colorectal tumorigenesis. Cell,
61(5), 759-767.
Folprecht, G., Grothey, A., Alberts, S., Raab, H. and Kohne, C. (2005). Neoadjuvant
treatment of unresectable colorectal liver metastases: correlation between tumour
response and resection rates. Annals of Oncology, 16(8), 1311-1319.
Folprecht, G., Gruenberger, T., Bechstein, W., Raab, H., Lordick, F., Hartman, J., Lang, H.,
Frilling, A., Stoehlmacher, J., Weitz, J., konopke, R., Stroszcynski, C., Liersch, T., Ockert, D.,
Herrmann, T., Goekkurt, E., Parisi, F and Kohne, C. (2010). Tumour response and secondary
resectability of colorectal liver metastases following neoadjuvant chemotherapy with
Cetuximab: the CELIM randomised phase 2 trial. The Lancet Oncology, 11(1), 38-47.
Fong, Y., Fortner, J., Sun, R., Brennan, M. and Bulmgart, L. (1999). Clinical score for
predicting recurrence after hepatic resection for metastatic colorectal cancer: analysis of
1001 consecutive cases. Annals of Surgery, 230(3), 309-318; discussion 318-321.
Gao, D., Zhang, T., Li, S., Liu, Q. and Du, J. (2013). A comparison on expression of selected
biomarkers between primary lung cancers and matched metastases. Medical Oncology,
30(4), 742.
Garate, M., Wong, R., Campos, E., Wang, Y. and Li, G. (2008) NAD(P)H quinone
oxidoreductase 1 inhibits the proteasomal degradation of the tumour suppressor
p33(ING1b). EMBO Reports, 9(6) 576-581.

280
García-Barros, M., Coant, N., Truman, J., Snider, A. and Hannun, Y. (2014).
Sphingolipids in colon cancer. Biochimica et Biophysica Acta, 1841(5), 773-782.
Garden, O., Rees, M., Poston, G., Mirza, D., Saunders, M., Leaderman, J., Primrose, J. and
Parks, R. (2006). Guidelines for resection of colorectal cancer liver metastases. Gut, 55 (3),
iii 1-8.
Gérard, J., Conroy, T., Bonnetain, F., Bouché, O., Chapet, O., Closon-Dejardin, M.,
Untereiner, M., Leduc, B., Francois, E., Maurel, J., Seitz, J., Buecher, B., Mackiewicz, R.,
Ducreux, M. and Bedenne, L. (2006)Preoperative radiotherapy with or without concurrent
fluorouracil and leucovorin in T3-4 rectal cancers: results of FFCD 9203. Journal of Clinical
Oncology, 24(28), 4620-4625.
Gerlinger, M. and Swanton, C. (2010).
How Darwinian models inform therapeutic failure initiated by clonal heterogeneity in
cancer medicine. British Journal of Cancer, 103(8), 1139-1143.
Goldberg, P., Nicholls, R., Porter, N., Love, S. and Grimsey, J. (1994). Long-term results of a
randomised trial of short-course low-dose adjuvant pre-operative radiotherapy for rectal
cancer: reduction in local treatment failure. European Journal of Cancer, 30A(11), 1602-
1606.
Gong, X., Kole, L. Iskander, K. and Jaiswal, A. (2007). NRH:quinone oxidoreductase 2 and
NAD(P)H: quinone oxidoreductase 1 protect tumor suppressor p53 against 20s proteasomal
degradation leading to stabilization and activation of p53. Cancer Research, 67(11), 5380 –
5388.
Grady, W. and Carethers, J. (2008). Genomic and epigenetic instability in colorectal cancer
pathogenesis. Gastroenterology, 135 (4), 1079-1099.
Grady, W. (2004). Genomic instability and colon cancer. Cancer Metastasis Review, 23(1-2),
11-27.
Graham, J., Mushin, M. and Kirkpatrick, P. (2004). "Oxaliplatin". Nature Reviews Drug
Discovery, 3 (1), 11–12.
Greenman, C., Stephens, P., Smith, R., Dalgliesh, G., Hunter, C., Bignell, G., Davies,
H., Teague, J., Butler, A., Stevens, C., Edkins, S., O'Meara, S., Vastrik, I., Schmidt, E., Avis,
T., Barthorpe, S., Bhamra, G., Buck, G., Choudhury, B., Clements, J., Cole, J., Dicks,
E., Forbes, S., Gray, K., Halliday, K., Harrison, R., Hills, K., Hinton, J., Jenkinson, A., Jones,
D., Menzies, A., Mironenko, T., Perry, J., Raine, K., Richardson, D., Shepherd, R., Small,
A., Tofts, C., Varian, J., Webb, T., West, S., Widaa, S., Yates, A., Cahill, D., Louis,
D., Goldstraw, P., Nicholson, A., Brasseur, F., Looijenga, L., Weber, B., Chiew, Y., DeFazio,
A., Greaves, M., Green, A., Campbell, P., Birney, E., Easton, D., Chenevix-Trench, G., Tan,
M., Khoo, S., Teh, B., Yuen, S., Leung, S., Wooster, R., Futreal, P. and Stratton, M. (2007).
Patterns of somatic mutation in human cancer genomes. Nature, 446(7132), 153–158.

281
Grothey, A., Hedrick, E., Mass, R., Sarkar, S., Suzuki, S., Ramanathan, R., Hurwitz, H.,
Goldberg, R. and Sargent, D. (2008). Response-independent survival benefit in metastatic
colorectal cancer: a comparative analysis of N9741 and AVF2107. Journal of Clinical
Oncology, 26(2), 183-189.
Gudkov, A. and Komarova, E. (2003). The role of p53 in determining sensitivity to
radiotherapy. Nature Reviews Cancer, 3(2), 117–129.
Gupta, N., Tanner, S., Jaitly, N., Adkins, J., Lipton, M., Edwards, R., Romine, M., Osterman,
A., Bafna, V., Smith, R. and Pevzner, P.(2007). Whole proteome analysis of post-
translational modifications: applications of mass-spectrometry for proteogenomic
annotation. Genome Research, 17(9), 1362–1377.
Hansen, K., Timp, W., Bravo, H., Sabunciyan, S., Langmead, B., McDonald, O., Wen, B., Wu,
H., Liu, Y., Diep, D., Briem, E., Zhang, K., Irizarry, R. and Feinberg, A. (2011). Increased
methylation variation in epigenetic domains across cancer types. Nature Genetics, 43(8),
768-775.
Harth, V., Donat, S., Ko, Y., Abel, J., Vetter, H. and Brüning, T. (2000). NAD (P) H quinone
oxidoreductase 1 codon 609 polymorphism and its association to colorectal cancer.
Archives of Toxicology, 73(10-11), 528-531.
Hatzis, C., Sun, H., Yao, H., Hubbard, R., Meric-Bernstam, F., Babiera, G., Wu, Y., Pusztai, L.
and Symmans, W. (2011). Effects of tissue handling on RNA integrity and microarray
measurements from resected breast cancers. Journal of the National Cancer Institute,
103(24), 1871-1883.
Haydon, A. (2003). Adjuvant chemotherapy in colon cancer: what is the evidence? Internal
Medicine Journal, 33(3), 119-124.
Heald, R. (1988). The 'Holy Plane' of rectal surgery.Journal of the Royal Society of Medicine,
81(9), 503-508.
Heald, R., Husband, E. and Ryall, R. (1982). The mesorectum in rectal cancer surgery-the
clue to pelvic recurrence? British Journal of Surgery, 69(10), 613-616.
Heald, R., Moran, B., Ryall, R., Sexton, R. and MacFarlane, J. (1998). Rectal cancer: the
Basingstoke experience of total mesorectal excision, 1978-1997.Archives of Surgery, 133(8),
894-899.
Hochster, H., Hart, L., Ramanathan, R., Childs, B., Hainsworth, J., Cohn, A., Wong,
L., Fehrenbacher, L.,Abubakr, Y., Saif, M., Schwartzberg, L. and Hedrick, E. (2008). Safety
and efficacy of oxaliplatin and fluropyrimidine regimens with or without bevacizumab as
first line treatment of metastatic colorectal cancer: results of the TREE Study. Journal of
Clinical Oncology, 26(21), 3523-3529.
Hollstein, M., Sidransky, D., Vogelstein, B. and Harris, C. (1991). p53 mutations in human
cancers. Science, 253(5015), 49-53.

282
Huebner, M., Wolff, B., Smyrk, T., Aakre, J. and Larson, D. (2012). Partial pathologic
response and nodal status as most significant prognostic factors for advanced rectal cancer
treated with preoperative chemoradiotherapy. World Journal of Surgery, 36(3), 675-683.
Huebner, R., Park, K., Shepherd, J., Schwimmer, J., Czernin, J., Phelps, M. and Gambhir, S.
(2000). A meta-analysis of the literature for whole-body FDG PET detection of recurrent
colorectal cancer. Journal of Nuclear Medicine, 41(7), 1177-1189.
Hurwitz, H., Fehrenbacher, L., Novotny, W., Cartwright, T., Hainsworth, J., Heim, W., Berlin,
J., Baron, A., Griffing, S., Holmgren, E., Ferrara, N., Fyfe, G., Rogers, B., Ross, R and
Kabbinavar, F. (2004). Bevacizumab plus irinotecan, fluorouracil, and leucovorin for
metastatic colorectal cancer. New England Journal of Medicine, 350(23), 2335-2342.
Huxley, R., Ansary-Moghaddam, A., Clifton, P., Czernichow, S., Parr, C. and Woodward, M.
(2009).The impact of dietary and lifestyle risk factors on risk of colorectal cancer: a
quantitative overview of the epidemiological evidence. International Journal of Cancer,
125(1), 171-180.
Innocenti, F. and Ratain, M.(2004). "Irinogenetics" and UGT1A: from genotypes to
haplotypes. Clinical Pharmacology and Therapeutic, 75(6), 495-500.
Innocenti, F., Undevia, S., Iyer, L., Chen, P., Das, S., Kocherginsky, M., Karrison, T., Janisch,
L., Ramirez, J., Rudin, C., vokes, E. and Ratain, M. (2004). Genetic variants in the UDP-
glucuronosyltransferase 1A1 gene predict the risk of severe neutropenia of irinotecan.
Journal of Clinical Oncology, 22 (8), 1382-1388.
Issa, J. (2004).CpG island methylator phenotype in cancer. National Review of Cancer, 4(12),
988-993.
Iyer, L., Das, S., Janisch, L., Wen, M., Ramirez, J., Karrison, T., Fleming, G., Vokes, E., Schilsky,
R. and Ratain, M. (2002). UGT1A1*28 polymorphism as a determinant of irinotecan
disposition and toxicity. The Pharmacogenomics Journal, 2(1), 43-47.
Iyer, L., Ramírez, J., Shepard, D., Bingham, C., Hossfeld, D., Ratain, M. and Mayer, U. (2002).
Biliary transport of irinotecan and metabolites in normal and P-glycoprotein-deficient mice.
Cancer Chemotherapy and Pharmacology, 49 (4), 336-341.
James, P. (1997). Protein identification in the post-genome era: the rapid rise of
proteomics. Quarterly reviews of biophysics, 30(4), 279–331.
Jass, J. (2007). Classification of colorectal cancer based on correlation of clinical,
morphological and molecular features. Histopathology, 50(1), 113-130.
Jo, W. and Carethers, J. (2006). Chemotherapeutic implications in microsatellite unstable
colorectal cancer. Cancer Biomarkers, 2(1-2), 51-60.
Johnston, P. and Kaye, S. (2001). Capecitabine: a novel agent for the treatment of solid
tumors. Anticancer Drugs, 12(8), 639-646.

283
Jones, R., Sutton, P., Greensmith, R., Santoyo-Castelazo, A., Carr, D., Jenkins, R., Rowe, C.
Hamlett, J., Park, B., Terlizzo, M., O’Grady, E., Ghaneh, P., Fenwick, S., Malik, H., Poston, G.
and Kitteringham, N. (2013). Hepatic activation of irinotecan predicts tumour response in
patients with colorectal liver metastases treated with DEBIRI: exploratory findings from a
phase II study. Cancer Chemotherapy and Pharmacology, 72(2), 359-368.
Jones, O., Rees, M., John, T., Bygrave, S. and Plant, G. (2005). Biopsy of resectable
colorectal liver metastases causes tumour dissemination and adversely affects survival
after liver resection. British Journal of Surgery, 92(9), 1165-1168.
Kamel, I. and Bluemke, D. (2003). MR imaging of liver tumors. Radiologic Clinics of North
America, 41(1), 51-65.
Kapiteijn, E., Marijnen, C., Nagtegaal, I., Putter, H., Steup, W., Wiggers, T., Rutten, H.,
Pahlman, L., Glimelius, B., van Krieken, J., Leer, J., van de Velde, C. and The Dutch Colorectal
Cancer Group. (2001). Preoperative radiotherapy combined with total mesorectal excision
for resectable rectal cancer. New England Journal of Medicine, 345(9), 638-646.
Kerr, D., Gray, R., Quirke, P., Watson, D., Yothers, G., Lavery, I.C., Lee, M., O’Connell, M.J.,
Shak, S., and Wolmark, N. (2009). A quantitative multigene RT-PCR assay for prediction of
recurrence in stage II colon cancer: selection of the genes in four large studies and results
of the independent, prospectively designed QUASAR validation study. Journal of Clinical
Oncology, 27(15S), 4000.
Khaustova, N., Makeeva, D., Kondrashina, O., Fedotov, N., Savelov, N., Grinevich, V.,
Maltseva, D., Galatenko, V. and Shkurnikov, M. (2014). Comparison of the results of PCR
analysis of gene expression in breast cancer tissue specimens stabilized in formalin and
RNAlater. Bulletin of Experimental Biology and Medicine, 156(4), 486-490.
Kinzler, K. and Vogelstein, B. (1996). Lessons from hereditary colorectal cancer. Cell, 87(2),
159-170.
Kirkpatrick, P., Graham, J. and Muhsin, M.(2004). Cetuximab. Nature Reviews Drug
Discovery, 3 (7), 549-550.
Kishi, Y., Zorzi, D., Contreras, C., Maru, D., Kopetz, S., Ribero, D., Motta, M., Ravarino,
N., Risio, M., Curley, S.,Abdalla, E., Capussotti, L. and Vauthey, J. (2010). Extended
preoperative chemotherapy does not improve pathologic response and increases
postoperative liver insufficiency after hepatic resection for colorectal liver metastases.
Annals of Surgical Oncology, 17(11), 2870-2876.
Klein, C. (2009). Parallel progression of primary tumours and metastases. Nature Reviews
Cancer, 9(4), 302-312.
Klinger, M., Tamandl, D., Eipeldauer, S., Hacker, S., Herberger, B., Kaczirek, K., Dorfmeister,
M., Gruenberger, B. and Gruenberger, T. (2010). Bevacizumab improves pathological
response of colorectal cancer liver metastases treated with XELOX/FOLFOX. Annals of
Surgical Oncology, 17(8), 2059-2065.

284
Kloosterman, W., Hoogstraat, M., Paling, O., Tavakoli-Yaraki, M., Renkens, I., Vermaat, J.,
van Roosmalen, M., van Lieshout, S., Nijman, I., Roessingh, W., van 't Slot, R., van de Belt, J.,
Guryev, V., Koudijs, M., Voest, E. and Cuppen, E. (2011). Chromothripsis is a common
mechanism driving genomic rearrangements in primary and metastatic colorectal cancer.
Genome Biology, 12(10), R103.
Knauer, C. (1978). Percutaneous biopsy of the liver as a procedure for outpatients.
Gastroenterology, 74(1), 101–102.
Kononen, J., Bubendorf, L., Kallionimeni, A., Bärlund, M., Schraml, P., Leighton, S., Torhorst,
J., Mihatsch, M., Sauter, G. and Kallionimeni, O. (1998). Tissue microarrays for high-
throughput molecular profiling of tumor specimens. Nature medicine, 4(7), 844-847.
Koopman, M., Antonini, N., Douma, J., Wals, J., Honkoop, A., Erdkamp, F., de Jong, R.,
Rodenburg, C., Vreugdenhil, G., Loosveld, O., van Bochove, A., Sinnige, H., Creemers, G.,
Tesselaar, M., Slee, P., Werter, M., Mol, L., Dalesio, O. and Punt, C. (2007).
Sequential vs. combination chemotherapy with capecitabine, irinotecan, and oxaliplatin in
advanced colorectal cancer (CAIRO): a phase III randomised controlled
trial. Lancet, 370(9582), 135–142.
Kuebler, J., Wieand, H., O'Connell, M., Smith, R., Colangelo, L., Yothers, G., Petrelli, N.,
Findlay. M,, Seay, T., Atkins, J., Zapas, J., Goodwin, J., Fehrenbacher, L., Ramanathan, R.,
Conley. B,, Flynn, P., Soori, G., Colman, L., Levine, E., Lanier, K. and Wolmark, N. (2007).
Oxaliplatin combined with weekly bolus fluorouracil and leucovorin as surgical adjuvant
chemotherapy for stage II and III colon cancer: results from NSABP C-07. Journal of Clinical
Oncology, 25(16), 2198-2204.
LaBaer, J. (2012) Improving international research with clinical specimens: 5 achievable
objectives. Journal of Proteome Research, 11(12), 5592-5601.
Lancet (2000). Comparison of fluorouracil with additional levamisole, higher-dose folinic
acid, or both, as adjuvant chemotherapy for colorectal cancer: a randomised
trial. QUASAR Collaborative Group, 355(9215), 1588-1596.
Langevin, J. and Nivatvongs, S. (1984). The true incidence of synchronous cancer of the
large bowel. A prospective study. American Journal of Surgery, 147(3), 330-333.
Laurie, J., Moertel, C., Fleming, T., Wieand, H., Leigh, J., Rubin, J., McCormack, G., Gerstner,
J., Krook, J., Malliard, J,. et al. (1989). Surgical adjuvant therapy of large-bowel carcinoma:
an evaluation of levamisole and the combination of levamisole and fluorouracil. The North
Central Cancer Treatment Group and the Mayo Clinic. Journal of Clinical Oncology, 7(10),
1447-1456.
Lee, H., Yoon, C., Schmidt, B., Park do, J., Zhang, A., Erkizan, H., Toretsky, J., Kirsch, D.
and Yoon, S. (2013). Combining PARP-1 inhibition and radiation in Ewing sarcoma results in
lethal DNA damage. Molecular Cancer Therapeutics, 12(11), 2591-2600.
285
Lee, S., Schelcher, C., Gashi, S., Schreiber, S., Thasler, R., Jauch, K and Thasler, W. (2013).
RNA stability in human liver: comparison of different processing times, temperatures and
methods. Molecular Biotechnology, 53(1), 1-8.
Lengauer, C., Kinzler, K. and Vogelstein, B. (1997). Genetic instability in colorectal cancers.
Nature, 386(6625), 623-627.
Leong, S., Nunez, A., Lin, M., Crossett, B., Christopherson, R. and Baxter, R.(2012). AQ-based
proteomic profiling of breast cancer cell response to doxorubicin and TRAIL. Journal of
Proteome Research, 11(7), 3561-3572.
Liang, J., Huang, K., Lai, H., Lee, P., Cheng, Y., Hsu, H., Cheng, A., Hsu, C., Yeh, K., Wang, S.,
Tang, C and Chang, K. (2002). High-frequency microsatellite instability predicts better
chemosensitivity to high-dose 5-fluorouracilplus leucovorin chemotherapy for stage IV
sporadic colorectal cancer after palliative bowel resection. International Journal of Cancer,
101(6), 519-525.
Lin, Q., Tan, H., Lim, T., Khoo, A., Lim, K. and Chung, M. (2014). iTRAQ analysis of colorectal
cancer cell lines suggests Drebrin (DBN1) is overexpressed during liver metastasis.
Proteomics, 14(11), 1434-1443.
Lind, C., Cadenas, E., Hochstein, P. and Ernster, L. (1990). DT-diaphorase. Purification,
properties and function. Methods in Enzymology, 186, 287-301.
Liu, F., Zhang, Y., Peng, Z., Gao, H., Xu, L. and Chen, M. (2012). High expression of high
mobility group box 1 (HMGB1) predicts poor prognosis for hepatocellular carcinoma after
curative hepatectomy. Journal of Translational Medicine, 10, 135.
Liu, P., Wang, Y., Cao, Y., Jiang, H., Yang, X., Wang, X. and Niu, H. (2014). Far from resolved:
stromal cell-based iTRAQ research of muscle-invasive ladder cancer regarding
heterogeneity. Oncology Reports, 32(4),1489-1496.
Long, D., Waikel, R., Wang, X.-J., Roop, D. and Jaiswal, A. (2001). NAD (P) H: quinone
oxidoreductase 1 deficiency and increased susceptibility to 7, 12-dimethylbenz [a]-
anthracene-induced carcinogenesis in mouse skin. Journal of the National Cancer Institute,
93(15), 1166-1170.
Longley, D., Harkin, D. and Johnston, P. (2003). 5 Fluorouracil: mechanisms of action and
clinical strategies. Nature Reviews Cancer, 3(5), 330-338.
Los, M., Roodhart, J. and Voest, E. (2007). Target Practice: Lessons from Phase III Trials with
Bevacizumab and Vatalanib in the Treatment of Advanced Colorectal Cancer. The
Oncologist, 12(4), 443–450.
Losi, L., Luppi, G., Gavioli, M., Iachetta, F., Bertolini, F., D'Amico, R., Jovic, G., Bertoni, F.,
Falchi, A. and Conte, P. (2006). Prognostic value of Dworak grade of regression (GR) in
patients with rectal carcinoma treated with preoperative radiochemotherapy. International
Journal of Colorectal Disease, 21(7), 645-651.

286
Lowe, S., Ruley, H., Jacks, T. and Housman, D. (1993). p53-dependent apoptosis modulates
the cytotoxicity of anticancer agents. Cell, 74(6), 957-967.
Ludwig, K. (2007). Sphincter-sparing resection for rectal cancer. Clinics in Colon and Rectal
Surgery, 20(3), 203-212.
Lykoudis, P., O'Reilly, D., Nastos, K. and Fusai, G. (2014). Systematic review of surgical
management of synchronous colorectal liver metastases. British Journal of Surgery, 101(6),
605-612.
Lynch, H. and de la Chapelle, A. (2003). Hereditary colorectal cancer. The New England
Journal of Medicine, 348(10), 919-932.
Mager, S., Oomen, M., Morente, M., Ratcliffe, C., Knoxa, K., Kerr, D., Pezzella, F. and
Riegman, P. (2007). Standard operating procedure for the collection of fresh frozen tissue
samples. European Journal of Cancer, 43(5), 828–834.
Mahdy, A., Cheng, J., Li, J., Elojeimy, S., Meacham, W., Turner, L., Bai, A., Gault,
C., McPherson, A., Garcia, N., Beckham, T., Saad, A., Bielawska, A., Bielawski, J., Hannun,
Y., Keane, T., Taha, M., Hammouda, H., Norris, J. and Liu, X. (2009). Acid
ceramidase upregulation in prostate cancer cells confers resistance to radiation: AC
inhibition, a potential radiosensitizer. Molecular Therapy, 17(3), 430-438.
Majumdar, S., Fletcher, R. and Evans, A. (1999). How does colorectal cancer present?
Symptoms, duration, and clues to location. American Journal of Gastroenterology, 94(10),
3039-3045.
Mandard, A., Dalibard, F., Mandard, J., Marnay, J., Henry-Amar, M., Petiot, J., Roussel, A.,
Jacob, J., Segol, P., Samama, G., et al. (1994). Pathologic assessment of tumor regression
after preoperative chemoradiotherapy of esophageal carcinoma. Clinicopathologic
correlations. Cancer, 73(11),2680-2686.
Mander, B., Carney, L., Scott, H. and Donaldson, D. (2006). Jass staging is a predictor of
outcome following "curative" resection of Dukes' B colorectal carcinoma. The Surgeon, 4(4),
227-230.
Manfredi, S., Lepage, C., Hatem, C., Coatmeur, O., Faivre, J. and Bouvier, A.(2006).
Epidemiology and management of liver metastases from colorectal cancer. Annals of
Surgery, 244(2), 254-259.
Manning, G., Whyte, D., Martinez, R., Hunter, T. and Sudarsanam, S. (2002). The protein
kinase complement of the human genome. Science, 298(5600), 1912-1934.
Masi, G., Loupakis, F., Salvatore, L., fornaro, L., Cremolini, C., Cupini, S., Ciarlo, A., Del
Monte, F., Cortesi, E., Amoroso, D., Granetto, C., Fontanono, G., Sennsi, E., Lupi, C.,
Andreuccetti, M and Falcone, A. (2010). Bevacizumab with FOLFOXIRI (irinotecan,
oxaliplatin, fluorouracil, and folinate) as first-line treatment for metastatic colorectal
cancer: a phase 2 trial. The Lancet Oncology, 11(9), 845-852.

287
Mathijssen, R., van Alphen, R., Verweij, J., Loos, W., Nooter, K., Stoter, G. and Sparreboom,
A. (2001). Clinical pharmacokinetics and metabolism of irinotecan (CPT-11). Clinical Cancer
Research, 7(8), 2182-2194.
Mee, B., Carroll, P., Donatello, S., Connolly, E., Griffin, M., Dunne, B., Burke, L., Flavin, R.,
Rizkalla, H., Ryan, C., Hayes, B., D'Adhemar, C., Banville, N., Faheem, N., Muldoon, C. and
Gaffney, E. (2011). Maintaining Breast Cancer Specimen Integrity and Individual or
Simultaneous Extraction of Quality DNA, RNA, and Proteins from Allprotect-Stabilized and
Nonstabilized Tissue Samples. Biopreservation and Biobanking, 9(4), 389-398.
Madi, A., Fisher, D., Wilson, R.H., Adams, R.A., Meade, A.M., Kenny, S.L., Nichols, L.L.,
Seymour, M.T., Wasan, H., Kaplan, R., Maughan, T.S. and the COIN Research Group. (2012).
Oxaliplatin/capecitabine vs. oxaliplatin/infusional 5-FU in advanced colorectal cancer: the
MRC COIN trial. British Journal of Cancer, 107(7), 1037-1043.
MERCURY Study Group. (2006). Diagnostic accuracy of preoperative magnetic resonance
imaging in predicting curative resection of rectal cancer: prospective observational study.
British Medical Journal, 333(7572), 779.
Messersmith, W. and Ahnen, D. (2008). Targeting EGFR in colorectal cancer. New England
Journal of Medicine, 359(17), 1834–1836.
Miettinen, P., Berger, J., Meneses, J., Phung, Y., Pederson, R., Werb, Z. and Derynck, R.
(1995). Epithelial immaturity and multiorgan failure in mice lacking epidermal growth factor
receptor. Nature, 376(6538), 337-341.
Mikami, K., Naito, M., Ishiguro, T., Yano, H., Tomida, A., Yamada, T., Tanaka, N., Shirakusa,
T. and Tsuruo, T. (1998). Immunological Quantitation of DT‐Diaphorase in Carcinoma Cell
Lines and Clinical Colon Cancers: Advanced Tumors Express Greater Levels of DT‐
Diaphorase. Cancer Science, 89(9), 910-915.
Miller, A,, Hoogstraten, B., Staquet, M. and Winkler, A. (1981). Reporting results of cancer
treatment. Cancer, 47(1), 207-214.
Mitry, E., Fields, A., Bleiberg, H., Labianca, R., Portier, G., Tu, D., Nitti, D., Torri, V., Elias, D.,
O’Callaghan, C., Langer, B., Martigoni, G., Bouche, O., Lazorthes, F., Van Cutsem, E.,
Bedenne, L., Moore, M. and Rougier, P. (2008). Adjuvant chemotherapy after potentially
curative resection of metastases from colorectal cancer: a pooled analysis of two
randomized trials. Journal of Clinical Oncology, 26 (30), 4906-4911.
Moertel, G., Fleming, T., Macdonald, J., Haller, D., Laurie, J., Goodman, P., Ungerleider, J.,
Emerson, W., Tormey, D., Glick, J., Veeder, M., and Milliard, J. (1990). Levamisole and
fluorouracil for adjuvant therapy of resected colon carcinoma. New England Journal of
Medicine, 322(6), 352-358.
Mulders, J., Hendriks, W., Blankesteijn, W., Bloemendal, H. and De Jong, W. (1988).
Lambda-crystallin, a major rabbit lens protein, is related to hydroxyacyl-coenzyme a
dehydrogenases. The Journal of Biological Chemistry, 263(30), 15462–15466.

288
Nagtegaal, I. and Quirke, P. (2008). What is the role for the circumferential margin in the
modern treatment of rectal cancer? Journal of Clinical Oncology, 2, 303-312.
Narita, M., Oussoultzoglou, E., Jaeck, D., Fuchschuber, P., Rosso, E., Pessaux, P., Marzano, E.
and Bachellier, P. (2011). Two-stage hepatectomy for multiple bilobar colorectal liver
metastases. British Journal of Surgery, 98 (10), 1463-1475.
Navin, N. and Hicks, J. (2010). Tracing the tumor lineage. Molecular Oncology, 4(3), 267-
283.
New England Journal of Medicine. (1997) Improved survival with preoperative radiotherapy
in resectable rectal cancer. Swedish Rectal Cancer Trial. 336(14), 980-987.
Nishimura, K., Tsuchiya, Y., Okamoto, H., Ijichi, K., Gosho, M., Fukayama, M., Yoshikawa,
K., Ueda, H., Bradford, C., Carey, T. and Ogawa, T. (2014). Identification of chemoresistant
factors by protein expression analysis with iTRAQ for head and neck carcinoma. British
Journal of Cancer, 111(4), 799-806.
Nordlinger, B., Guiguet, M., Vaillant, J., Balladur, P., Boudjema, K., Bachellier, P. and Jaeck,
D. (1996). Surgical resection of colorectal carcinoma metastases to the liver. A prognostic
scoring system to improve case selection, based on 1568 patients. Association Française de
Chirurgie. Cancer, 77 (7), 1254-1262.
Nordlinger, B., Sorbye, H., Glimelius, B., Poston, G., Schlag, P., Rougier, P., Bechstein,
W., Primrose, J.,Walpole, E., Finch-Jones, M., Jaeck, D., Mirza, D., Parks, R., Collette,
L., Praet, M., Bethe, U., Van Cutsem, E.,Scheithauer, W., Gruenberger, T., EORTC Gastro-
Intestinal Tract Cancer Group, Cancer Research UK, Arbeitsgruppe Lebermetastasen und-
tumoren in der Chirurgischen Arbeitsgemeinschaft Onkologie (ALM-CAO), Australasian
Gastro-Intestinal Trials Group (AGITG), Fédération Francophone de Cancérologie Digestive
(FFCD).(2008). Perioperative chemotherapy with FOLFOX4 and surgery versus surgery alone
for resectable liver metastases from colorectal cancer (EORTC Intergroup trial 40983): a
randomised controlled trial. The Lancet, 371(9617), 1007-1016.
Noy-Lotan, S., Dgany, O., Lahmi, R., Marcoux, N., Krasnov, T., Yissachar, N., Ginsberg,
D., Motro, B., Resnitzky, P., Yaniv, I., Kupfer, G. and Tamary, H. (2009). Codanin-1, the
protein encoded by the gene mutated in congenital dyserythropoietic anemia type I
(CDAN1), is cell cycle-regulated. Haematologica, 94(5), 629-637.
Ong, K. and Leen, E. (2007). Radiological staging of colorectal liver metastases. Surgical
Oncology, 16(1),7-14.
Paliogiannis, P., Cossu, A., Tanda, F., Palmieri, G. and Palomba, G. (2014). <i>KRAS</i>
mutational concordance between primary and metastatic colorectal adenocarcinoma.
Oncology Letters, 8(4), 1422-1426.
Palomaki, G., Bradley, L., Douglas, M., Kolor, K. and Dotson, W. (2009). Can UGT1A1
genotyping reduce morbidity and mortality in patients with metastatic colorectal cancer
treated with irinotecan? An evidence-based review. Genetic Medicine, 11(1), 21-34.

289
Pan, S., Forrest, G., Akman, S. and Hu, L. (1995). NAD(P)H:quinone oxidoreductase
expression and mitomycin C resistance developed by human colon cancer HCT166 cells.
Cancer Research, 55 (2), 330-335.
Park, P. (2009). ChIP-seq: advantages and challenges of a maturing technology. Nature
Reviews, Genetics, 10(10), 669-680.
Pawlik, T., Scoggins, C., Zorzi, D., Abdalla, E., Andres, A., Eng, C., Curley, S.Loyer, E.,
Muratore, A., Mentha, G., Capussotti, L. and Vauthey, J. (2005). Effect of surgical margin
status on survival and site of recurrence after hepatic resection for colorectal metastases.
Annals of Surgery, 241 (5), 715-722, discussion 722-724.
Peng, J., Elias, J., Thoreen, C., Licklider, L. and Gygi, S. (2003). Evaluation of
multidimensional chromatography coupled with tandem mass spectrometry (LC/LC-
MS/MS) for large-scale protein analysis: The yeast proteome. Journal of Proteome
Research, 2(1), 43–50.
Perrault, J., McGill, D., Ott, B., and Taylor, W. (1978). Liver biopsy: complications in 1000
inpatients and outpatients. Gastroenterology, 74(1), 103–106.
Pfannschmidt, J., Muley, T., Hoffmann, H. and Dienemann, H. (2003). Prognostic factors and
survival after complete resection of pulmonary metastases from colorectal carcinoma:
experiences in 167 patients. The Journal of Thoracic and Cardiovascular Surgery, 126 (3),
732-739.
Polakis, P. (2007). The many ways of Wnt in cancer. Current Opinion in Genetics and
Development, 17(1), 45-51.
Portier, G., Elias, D., Bouche, O., Rougier, P., Bosset, J., Saric, J., Belghiti, J., Piedbois, P.,
Guimbaud, R., Nordlinger, B., Bugat, R., Lazorther, F. and Bedenne, L. (2006). Multicenter
randomized trial of adjuvant fluorouracil and folinic acid compared with surgery alone after
resection of colorectal liver metastases: FFCD ACHBTH AURC 9002 trial. Journal of Clinical
Oncology, 24 (31), 4976-4982.
Poste, G. (2011). Bring on the biomarkers. Nature, 469(7329), 156-157.
Poston, G. (2008). Staging of advanced colorectal cancer. Surgical Oncology Clinics of North
America, 17(3), 503-517, viii.
Potter, J. (1999). Colorectal cancer: molecules and populations. Journal of the National
Cancer Institute, 91(11), 916-932.
Pretlow, T. P. and Pretlow, T.G. (2005). Mutant KRAS in aberrant crypt foci (ACF): initiation
of colorectal cancer? Biochimica et Biophysica Acta, 1756(2), 83-96.
Primrose, J., Falk, S., Finch-Jones, M., Valle, J., O’Reilly, D., Siriwardena, A., Hornbuckle, J.,
Peterson, M., Rees, M., Iveson, T., Hickish, T., Butler, R., Stanton, L., Dixon, E., Little, L.,
Bowers, M., Pugh, S., Garden, O., Cunningham, D., Maughan, T. and Bridgewater, J. (2014).

290
Systemic chemotherapy with or without cetuximab in patients with resectable colorectal
liver metastasis: the New EPOC randomised controlled trial. The Lancet, 15 (1), 601-611.
Pritchard, C. and Grady, W.(2011). Colorectal cancer molecular biology moves into clinical
practice. Gut, 60 (1), 116-129.
Rajagopalan, H., Bardelli, A., Lengauer, C., Kinzler, K., Vogelstein, B. and Velculescu, V.
(2002). Tumorigenesis: RAF/RAS oncogenes and mismatch-repair status. Nature, 418(6901),
934.
Rauth, A., Goldberg, Z. and Misra, V. (1996). DT-diaphorase: possible roles in cancer
chemotherapy and carcinogenesis. Oncology Research, 9(6-7), 339-349.
Raymond, E., Boige, V., Faivre, S., Sanderink, G., Rixe, O., Vernillet, L., Jacques, C., Gatineau,
M., Ducreux, M. and Armand, J. (2002). Dosage adjustment and pharmacokinetic profile of
irinotecan in cancer patients with hepatic dysfunction. Journal of Clinical Oncology, 20(21),
4303-4312.
Realini, N., Solorzano, C., Pagliuca, C., Pizzirani, D., Armirotti, A., Luciani, R., Costi,
M., Bandiera, T. and Piomelli, D. (2013). Discovery of highly potent acid
ceramidase inhibitors with in vitro tumor chemosensitizing activity. Scientific Reports, 3,
1035.
Rees, M., Tekkis, P., Welsh, F., O’Rourke, T. and John, T. (2008). Evaluation of long-term
survival after hepatic resection for metastatic colorectal cancer: a multifactorial model of
929 patients. Annals of Surgery, 247(1), 125-135.
Rehman, I., Evans, C., Glen, A., Cross, S., Eaton, C., Down, J., Pesce, G., Phillips, J., Yen,
O., Thalmann, G., Wright, P. and Hamdy, F. (2012). iTRAQ identification of candidate serum
biomarkers associated with metastatic progression of human prostatecancer. PLoS One,
7(2), e30885.
Rex, D., Lehman, G., Ulbright, T., Smith, J., Pound, D., Hawes, R., Helper, D., Wiersema, M.,
Langefeld, C and Li, W. (1993). Colonic neoplasia in asymptomatic persons with negative
fecal occult blood tests: influence of age, gender, and family history. American Journal of
Gastroenterology, 88(6), 825-831.
Ribero, D., Wang, H., Donadon, M., Zorzi, D., Thomas, M., Eng, C., Chang, D., Curley, S.,
Abdalla. E., Ellis, L. and Vauthey, J. (2007). Bevacizumab improves pathologic response and
protects against hepatic injury in patients treated with oxaliplatin-based chemotherapy for
colorectal liver metastases. Cancer, 110(12), 2761-2767.
Ribic, C., Sargent, D., Moore, M., Thibodeau, S., French, A., Goldberg, R., Hamilton,
S., Laurent-Puig, P., Gryfe, R., Shepherd, L., Tu, D., Redston, M. and Gallinger, S. (2003).
Tumor microsatellite-instability status as a predictor of benefit from fluorouracil-based
adjuvant chemotherapy for colon cancer. New England Journal of Medicine, 349(3), 247-
257.

291
Roos-van Groningen, M., Eikmans, M., Baelde, H., Baelde, H., de Heer, E. and Bruijn, J.
(2004). Improvement of extraction and processing of RNA from renal biopsies. Kidney
International, 65(1), 97-105.
Rose, C. and Wu, H. (2010). Morphologic Criteria of Invasive Colonic Adenocarcinoma on
Biopsy Specimens. The Internet Journal of Pathology, 12 (1), 1.
Roskoski, R. (2014). The ErbB/HER family of protein-tyrosine kinases and cancer.
Pharmacological Research, 79, 34-74.
Ross, D., Kepa, J., Winski, S., Beall, H., Anwar, A. and Siegel, D. (2000). NAD (P) H: quinone
oxidoreductase 1 (NQO1): chemoprotection, bioactivation, gene regulation and genetic
polymorphisms. Chemico-biological interactions, 129(1-2), 77-97.
Rubbia-Brandt, L., Giostra, E., Brezault, C., Roth, A., Andres, A., Sartoretti, P., Dousset, B.,
Majno, P., Soubrane, O., Chaussade, S., Mentha, G. and Terris, B. (2007). Importance of
histological tumor response assessment in predicting the outcome in patients with
colorectal liver metastases treated with neo-adjuvant chemotherapy followed by liver
surgery. Annals of Oncology, 18 (2), 299-304.
Rustgi, A. K. (2007). The genetics of hereditary colon cancer. Genes and Development,
21(20), 2525-2538.
Ryan, R., Gibbons, D., Hyland, J., Treanor, D., White, A., Mulcahy, H., O'Donoghue, D.,
Moriarty, M., Fennelly, D. and Sheahan, K. (2005). Pathological response following long-
course neoadjuvant chemoradiotherapy for locally advanced rectal cancer. Histopathology,
47(2), 141-146.
Saltz, L. (2004). Palliative management of rectal cancer: the roles of chemotherapy and
radiation therapy. Journal of Gastrointestinal Surgery, 8 (3), 274–276.
Saltz, L., Cox, J., Blanke, C., Rosen, L., Fehrenbacher, L., Moore, M., Maroun, J., Ackland, S.,
Locker, P., Pirotta, N., Elfring, G. and Miller, L. (2000). Irinotecan plus fluorouracil and
leucovorin for metastatic colorectal cancer. Irinotecan Study Group. New England Journal
of Medicine, 343(13), 905-914.
Santos, M., Silva, C., Rocha, A., Matos, E., Nogueira, C. and Lopes, C. (2014). Prognostic
value of mandard and dworak tumor regression grading in rectal cancer: study of a single
tertiary centre. ISRN Surgery, 310542, 1-8.
Sarbia, M., Bitzer, M., Siegel, D., Ross, D., Schulz, W., Zotz, R., Kiel, S., Geddert, H.,
Kandemir, Y. and Walter, A. (2003). Association between NAD (P) H: quinone
oxidoreductase 1 (NQO1) inactivating C609T polymorphism and adenocarcinoma of the
upper gastrointestinal tract. International Journal of Cancer, 107(3), 381-386.
Sargent, D. (2008). Advances in defective mismatch repair colon cancer. Clinical Advances in
Hematology and Oncology, 6(9), 639-641.

292
Sauer, R., Fietkau, R., Wittekind, C., Rödel, C., Martus, P., Hohenberger, W., Tschmelitsch,
J., Sabitzer, H., Karstens, J., Becker, H., Hess, C., Raab, R. and The German Rectal Cancer
Group. (2003). Adjuvant vs. neoadjuvant radiochemotherapy for locally advanced rectal
cancer: the German trial CAO/ARO/AIO-94. Colorectal Disease, 5(5), 406-415.
Schüller, J., Cassidy, J., Dumont, E., Roos, B., Durston, S., Banken, L., Utoh, M., Mori, K.,
Weidekamm, E. and Reigner, B. (2000). Preferential activation of capecitabine in tumor
following oral administration to colorectal cancer patients. Cancer Chemotherapy and
Pharmacology, 45(4), 291-297.
Schultz, N., Lopez, E., Saleh-Gohari, N. and Helleday, T. (2003). Poly(ADP-ribose) polymerase
(PARP-1) has a controlling role in homologous recombination. Nucleic Acids
Research, 31(17), 4959–4964.
Scicchitano, M., Dalmas, D., Boyce, R., Thomas, H. and Frazier, K. (2009). Protein Extraction
of Formalin-fixed, Paraffin-embedded Tissue Enables Robust Proteomic Profiles by Mass
Spectrometry. Journal of Histochemistry and Cytochemistry, 57(9),849-860.
Scott, D., Guthrie, J., Arnold, P., Ward, J., Atchley, J., Wilson, D. and Robinson, P. (2001).
Dual phase helical CT versus portal venous phase CT for the detection of colorectal liver
metastases: correlation with intra-operative sonography, surgical and pathological findings.
Clinical Radiology, 56(3), 235-242.
Sebag-Montefiore, D., Stephens, R., Steele, R., Monson, J., Grieve, R., Khanna, S., Quirke, P.,
Couture, J., de Metz, C., Myint, A., Bessell, E., Griffiths, G., Thompson, L. and Parmar, M.
(2009). Preoperative radiotherapy versus selective postoperative chemoradiotherapy in
patients with rectal cancer (MRC CR07 and NCIC-CTG C016): a multicentre, randomised
trial. Lancet, 373(9666), 811-820.
Shabihkhani, M., Lucey, G., Wei, B., Mareninov, S., Lou, J., Vinters, H., Singer, E., Cloughesy,
T. and Yong, W. (2014). The procurement, storage, and quality assurance of frozen blood
and tissue biospecimens in pathology, biorepository, and biobank settings. Clinical
Biochemistry, 47(4), 258-266.
Sharma, R. and Dianov, G. (2007). Targeting base excision repair to improve cancer
therapies. Molecular Aspects of Medicine, 28(3-4), 345-374.
Shelton, J., Waxweiler, T., Landry, J., Gao, H., Xu, Y., Wang, L., El-Rayes, B., Shu, H. (2013). In
vitro and in vivo enhancement of chemoradiation using the oral PARP inhibitor ABT-888 in
colorectal cancer cells. International Journal of Radiation Oncology, Biology and Physics,
86(3), 469-476.
Shiovitz, S., Bertagnolli, M., Renfro, L., Nam, E., Foster, N., Dzieciatkowski, S., Luo, Y., Lao,
V., Monnat, R. Jr, Emond, M., Maizels, N., Niedzwiecki, D., Goldberg, R., Saltz, L., Venook,
A., Warren, R., Grady, W. amd The Alliance for Clinical Trials in Oncology. (2014). CpG island
methylator phenotype is associated with response to adjuvant irinotecan-based therapy for
stage III colon cancer. Gastroenterology, 147(3), 637-645.

293
Shirasawa, S., Furuse, M., Yokoyama, N. and Sasazuki, T. (1993). Altered growth of human
colon cancer cell lines disrupted at activated Ki-ras. Science, 260(5104), 85-88.
Siegel, D. Gibson N., Preusch, P. and Ross, D. (1990). Metabolism of mitomycin C by DT-
diaphorase: Role in mitomycin C-induced DNA damage and cytotoxicity in human colon
carcinoma cells. Cancer Research, 50(23), 7483-7489.
Siegel, D., Yan, C. and Ross, D. (2012). NAD (P) H: quinone oxidoreductase 1 (NQO1) in the
sensitivity and resistance to antitumor quinones. Biochemical pharmacology, 83(8), 1033-
1040.
Siegmund, K., Marjoram, P., Tavare, S. and Shibata, D. (2009). Many colorectal cancers are
“flat” clonal expansions. Cell Cycle, 8(14), 2187-2193.
Sikorski, R. and Yao, B. (2010). Visualizing the landscape of selection biomarkers in current
phase III oncology clinical trials. Science Translational Medicine, 2(34), 34 ps 27.
Silvestrini, R., Costa, A., Gennari, L., Doci, R., Bombardieri, E. and Bombelli, L. (1990). Cell
kinetics of hepatic metastases as a prognostic marker in patients with advanced colorectal
carcinoma. HPB Surgery, 2(2), 135-143.
Sjöblom, T., Jones, S., Wood, L., Parsons, D., Lin, J., Barber, T., Mandelker, D., Leary, R., Ptak,
J., Silliman, N., Szabo, S., Buckhaults, P., Farrell, C., Meeh, P., Markowitz, S., Willis,
J., Dawson, D., Willson, J., Gazdar, A., Hartigan, J., Wu, L., Liu, C., Parmigiani, G., Park,
B., Bachman, K., Papadopoulos, N., Vogelstein, B., Kinzler, K. and Velculescu, V. (2006). The
consensus coding sequences of human breast and colorectal cancers. Science, 314(5797),
268-274.
Slattery, M. and Fitzpatrick,F. (2009). Convergence of hormones, inflammation, and energy-
related factors: a novel pathway of cancer etiology. Cancer Prevention Research
(Philadelphia), 2(11), 922-930.
Slattery, M., Curtin, K., Anderson, K., Ma, K., Ballard, L., Edwards, S., Schaffer, D., Potter, J.,
Leppert, M. and Samowitz, W. (2000). Associations between cigarette smoking, lifestyle
factors, and microsatellite instability in colon tumors. Journal of the National Cancer
Institute, 92(22), 1831-1836.
Sobrero, A., Maurel, J., Fehrenbacher, L., Scheithauer, W., Abubakr, Y., Lutz, M., Vega-
Villegas, M., Eng, C.,Steinhauer. E., Prausova, J., Lenz, H., Borg, C., Middleton, G., Kröning,
H., Luppi, G., Kisker, O., Zubel, A., Langer, C., Kopit, J. and Burris, H. 3rd. (2008). EPIC: phase
III trial of cetuximab plus irinotecan after fluoropyrimidine and oxaliplatin failure in patients
with metastatic colorectal cancer. Journal of Clinical Oncology, 26(14), 2311-2319.
Staff, S., Kujala, P., Karhu, R., Rokman, A., Ilvesaro, J., Kares, S. and Isola, J. (2013).
Preservation of nucleic acids and tissue morphology in paraffin-embedded clinical samples:
comparison of five molecular fixatives. Journal of Clinical Pathology, 66(9), 807-810.
Stryker, S., Wolff, B., Culp, C., Libbe, S., Ilstrup, D. and MacCarthy, R. (1987). Natural history
of untreated colonic polyps. Gastroenterology, 93 (5), 1009-1013.

294
Sun Myint, A., Grieve, R., McDonald, A., Levine, E., Ramani, S., Perkins, K., Wong, H., Makin,
C. and Hershman, M.(2007). Combined modality treatment of early rectal cancer: the UK
experience. Clinical Oncology, 19(9), 674-681.
Sun, F., Sasson, A., Jiang, P., An, Z., Gamagami, R., Li, L., Moossa, A. and Hoffman, R. (1999).
An ultra-metastatic model of human colon cancer in nude mice. Clinical and Experimental
Metastasis, 17(1), 41– 48.
Taïeb, J., Artru, P., Paye, F., Louvet, C., Perez, N., Andre, T., Gayet, B., Hebbar, M., Goebel,
F., Tournigand, C., Parc, R. and de Gramont, A. (2005). Intensive systemic chemotherapy
combined with surgery for metastatic colorectal cancer: results of a phase II study. Journal
of Clinical Oncology, 23(3), 502-509.
Tamary, H., Dgany, O., Proust, A., Krasnov, T., Avidan, N., Eidelitz-Markus, T., Tchernia, G.,
Geneviève, D., Cormier-Daire, V., Bader-Meunier, B., Ferrero-Vacher, C., Munzer, M.,
Gruppo, R., Fibach, E., Konen, O., Yaniv, I. and Delaunay, J. (2005). Clinical and molecular
variability in congenital dyserythropoietic anaemia type I. British Journal of Haematology,
130(4), 628-634.
Taylor, A., Kanas, G., Primrose, J., Langeberg, W., Kelsh, M., Mowat, F., AAlexander, D.,
Choti, M. and Poston, G.(2012) Survival after liver resection in metastatic colorectal cancer;
review and meta-analysis of prognostic factors. Clinical Epidemiology, 4(1), 283-301.
Taylor, F., Quirke, P., Heald, R., Moran, B., Blomqvist, L., Swift, I., Sebag-Montefiore, D.,
Tekkis, P., Brown, G. and MERCURY study group. (2011). Preoperative high-
resolution magnetic resonance imaging can identify good prognosis stage I, II, and III rectal
cancer best managed by surgery alone: a prospective, multicenter, European study. Annals
of Surgery, 253(4), 711-719.
Thasler, W., Thasler, R., Schelcher, C. and Jauch, K. (2013). Biobanking for research in
surgery: are surgeons in charge for advancing translational research or mere assistants in
biomaterial and data preservation? Langenbecks Archives of Surgery, 398(4), 487-499.
Therasse, P., Arbuck, S., Eisenhauer, E., Wanders, J., Kaplan, R., Rubinstein, L., Verweij, J.,
Van Glabbeke, M., van Oosterom, A., Christian, M and Gwyther, S. (2000). New guidelines
to evaluate the response to treatment in solid tumors. European Organization for Research
and Treatment of Cancer, National Cancer Institute of the United States, National Cancer
Institute of Canada. Journal of the National Cancer Institute, 92(3), 205-216.
Timmermann, B., Kerick, M., Roehr, C., Fischer, A., Isau, M., Boerno, S., Wunderlich, A.,
Barmeyer, C., Seemann, P., Koenig, J., Lappe, M., Kuss, A., Garshasbi, M., Bertram, L.,
Trappe, K., Werber, M., Herrmann, B., Zatloukal, K., Lehrach, H. and Schweiger, M. (2010).
Somatic Mutation Profiles of MSI and MSS Colorectal Cancer Identified by Whole Exome
Next Generation Sequencing and Bioinformatics Analysis. PLoS One, 5(12), e15661.
Tournigand, C., André, T., Achille, E.,Lledo, G., Flesh, M., Mery-Mignard, D., Quinaux,
E., Couteau, C., Buyse M,Ganem, G., Landi, B., Colin, P., Louvet, C. and de Gramont,

295
A.(2004). FOLFIRI followed by FOLFOX6 or the reverse sequence in advanced colorectal
cancer: a randomized GERCOR study. Journal of Clinical Oncology, 22(2), 229-237.
Traver, R., Horikoshi, T., Danenberg, K., Stadlbauer, T., Danenberg, P., Ross, E. and Gibson,
N. (1992). NADPH:quinone oxidoreductase gene expression in human colon carcinoma
cells: characterisation of a mutation which modules DT-diaphorase activity and mitomycin
sensitivity. Cancer Research, 52(4), 797-802.
Tsvetkov, P., Asher, G., Reiss, V., Shaul, Y., Sachs, L. and Lotem, J. (2005). Inhibition of NAD
(P) H: quinone oxidoreductase 1 activity and induction of p53 degradation by the natural
phenolic compound curcumin. Proceedings of the National Academy of Sciences of the
United States of America, 102 (15), 5535-5540.
Turnbull, R. Jr, Kyle, K., Watson, F. and Spratt, J. (1967) Cancer of the colon: the influence of
the no-touch isolation technic on survival rates. Annals of Surgery, 166(3), 420-427.
Van Cutsem, E., Köhne, C., Hitre, E., Zaluski, J., Chang Chien, C., Makhson, A., D'Haens,
G., Pintér, T., Lim, R.,Bodoky, G., Roh, J., Folprecht. G., Ruff, P., Stroh, C., Tejpar.
S., Schlichting, M., Nippgen, J. and Rougier, P.(2009).Cetuximab and chemotherapy as initial
treatment for metastatic colorectal cancer. New England Journal of Medicine, 360(14),
1408-1417.
Van Cutsem, E., Labianca, R.,Bodoky, G., Barone, C., Aranda, E., Nordlinger, B., Topham, C.,
Tabernero, J., Andre, T., Sobrero, A., Mini, E., Greil, R., Di Constanzo, F., Colette, L., Cisar, L.,
Zhang, X., Kayat, D., Bokemeyer, C., Roth, A. and Cunningham, D. (2009). Randomized phase
III trial comparing biweekly infusional fluouracil/leucovorin alone or with irinotecan in the
adjuvant treatment of stage III colon cancer: PETACC-3. Journal of Clinical Oncology, 27(19),
3117-3125.
Van Cutsem, E., Rivera, F., Berry, S.,Kretzschmar, A., Michael, M., DiBartolomeo, M., Mazier,
M., Canon, J.,Georgoulias, V., Peeters, M., Bridgewater, J., Cunningham, D. and First BEAT
investigators. (2009). Safety and efficacy of first-line bevacizumab with FOLFOX, XELOX,
FOLFIRI and fluoropyrimidines in metastatic colorectal cancer: the BEAT study. Annals of
Oncology, 20 (11), 1842-1847.
Veldkamp, R., Kuhry, E., Hop, W., Jeekel, J., Kazemier, G., Bonjer, H., Haglind, E., Påhlman,
L., Cuesta, M., Msika, S., Morino, M, and Lacy, A. (2005). Laparoscopic surgery versus open
surgery for colon cancer: short-term outcomes of a randomised trial. Colon cancer
Laparoscopic or Open Resection Study Group (COLOR). Lancet Oncology, 6(7), 477-484.
Vens, C. and Begg, A. (2010).Targeting base excision repair as a sensitization strategy in
radiotherapy. Seminars in Radiation Oncology, 20(4), 241-249.
Vignais, P. M. and Vignais, P. (2010). Discovering Life, Manufacturing Life: How the
experimental method shaped life sciences. Berlin: Springer.
Von Euler, H., Khoshnoud, R., He, Q., Khoshnoud, A., Fornander, T., Rutqvist, L. and Skog, S.
(2005). Time-dependent RNA degradation affecting cDNA array quality in spontaneous

296
canine tumours sampled using standard surgical procedures. International Journal of
Molecular Medicine, 16(6), 979-985.
Vousden, K. and Prives, C. (2009). Blinded by the Light: The Growing Complexity of p53.
Cell, 137(3), 413-431.
Wang, L., Mason, K., Ang, K., Buchholz, T., Valdecanas, D., Mathur, A., Buser-Doepner,
C., Toniatti, C. and Milas, L. (2012). MK-4827, a PARP-1/-2 inhibitor, strongly enhances
response of human lung and breast cancer xenografts to radiation. Investigational New
Drugs, 30(6), 2113-2120.
Wang, L., Tong, S., Hu, H., Ye, F., Li, S., Ren, H., Zhang, D., Xiang, R. and Yang, Y.(2012).
Quantitative proteome analysis of ovarian cancer tissues using a iTRAQ approach. Journal of
Cell Biochemistry, 113(12), 3762-3772.
Wang, W., Liu, X., Liu, L., Lou, W., Jin, D., Yang, P. and Wang, X.(2013). iTRAQ-based
quantitative proteomics reveals myoferlin as a novel prognostic predictor in pancreatic
adenocarcinoma. Journal of Proteomics, 91, 453-465.
Washington, M., Berlin, J., Branton,P.,Burgart, L., Carter, D., Fitzgibbons, P., Halling,
K., Frankel, W., Jessup, J., Kakar, S., Minsky, B., Nakhleh, R., Compton, C. and Members of
the Cancer Committee, College of American Pathologists. (2009). Protocol for the
examination of specimens from patients with primary carcinoma of the colon and rectum.
Archives of Pathology and Laboratory Medicine, 133(10), 1539-1551.
Watanabe, T., Wu, T., Catalano, P., Ueki, T., Satriano, R., Haller, D., Benson, A. 3rd, and
Hamilton, S. (2001). Molecular predictors of survival after adjuvant chemotherapy for colon
cancer. New England Journal of Medicine, 344(16), 1196-1206.
Weber, D., Casjens, S., Rozynek, P., Lehnert, M., Zilch-Schoneweis, S., Bryk, O., Taeger, D.,
Gomolka, M., Kreuzer, M., Otten, H., Pesch, B., Johnen, G. and Brüning, T. (2010).
Assessment of mRNA and microRNA stabilization in peripheral human blood for multicenter
studies and biobanks. Biomarker Insights, 5, 95-102.
West, N., Hohenberger, W., Weber, K., Perrakis, A., Finan, P. and Quirke, P. (2010).
Complete mesocolic excision with central vascular ligation produces an oncologically
superior specimen compared with standard surgery for carcinoma of the colon. Journal of
Clinical Oncology, 28(2), 272-278.
Wheeler, J., Warren, B., Mortensen, N., Ekanyaka, N., Kulacoglu, H., Jones, A., George, B.
and Kettlewell, M. (2002) Quantification of histologic regression of rectal cancer after
irradiation: a proposal for a modified staging system. Diseases of the Colon and Rectum,
45(8), 1051–1056.
Wilkins, M., Pasquali, C., Appel, R., Ou, K., Golaz, O., Sanchez, J-J., Yan, J., Gooley, A.,
Hughes, G., Humphery-Smith, I., Williams, K. and Hochstrasser, D. (1996). From Proteins to
Proteomes: Large Scale Protein Identification by Two-Dimensional Electrophoresis and
Arnino Acid Analysis. Nature Biotechnology, 14(1), 61–65.

297
Willett, C., Warland, G., Coen, J., Shellito, P. and Compton, C. (1995). Rectal cancer: the
influence of tumor proliferation on response to preoperative irradiation. International
Journal of Radiation Oncology, Biology and Physics, 32(1), 57-61.
Winski, S., Swann, E., Hargreaves, R., Dehn, D., Butler, J., Moody, C. and Ross, D. (2001).
Relationship between NAD (P) H: quinone oxidoreductase 1 (NQO1) levels in a series of
stably transfected cell lines and susceptibility to antitumor quinones. Biochemical
pharmacology, 61(12), 1509-1516.
Wong, S., Mangu, P., Choti, M., Crocenzi, T., Dodd, G. 3rd, Dorfman, G., Eng, C., Fong,
Y., Giusti, A., Lu D,Marsland, T., Michelson, R., Poston, G., Schrag, D., Seidenfeld, J.
and Benson, A. 3rd. (2010). American Society of Clinical Oncology 2009 clinical evidence
review on radiofrequency ablation of hepatic metastases from colorectal cancer. Journal of
Clinical Oncology, 28(3), 493-508.
Wood, L., Parsons, D.,Jones, S., Lin, J., Sjöblom, T., Leary, R., Shen, D., Boca, S., Barber,
T., Ptak, J., Silliman, N., Szabo, S., Dezso, Z., Ustyanksky, V., Nikolskaya, T., Nikolsky,
Y., Karchin, R., Wilson, P., Kaminker, J., Zhang, Z., Croshaw, R., Willis, J., Dawson,
D., Shipitsin, M., Willson, J., Sukumar. S., Polyak, K., Park, B., Pethiyagoda, C., Pant,
P., Ballinger, D., Sparks, A., Hartigan, J., Smith, D., Suh, E., Papadopoulos, N., Buckhaults, P.,
Markowitz, S., Parmigiani, G., Kinzler, K., Velculescu, V. and Vogelstein, B. (2007). The
genomic landscapes of human breast and colorectal cancers. Science, 318(5853), 1108-
1113.
Wright, J., Dreyfuss, A., el-Magharbel, I., Trites, D., Jones, S., Holden, S., Rosowsky, A. and
Frei, E. 3rd. (1989). Selective expansion of 5,10-methylenetetrahydrofolate pools and
modulation of 5-fluorouracil antitumor activity by leucovorin in vivo. Cancer
Research, 49(10), 2592-2596.
Xu, G., Mymryk, J. and Cairncross, J. (2005). Inactivation of p53 sensitizes astrocytic glioma
cells to BCNU and temozolomide, but not cisplatin. Journal of Neuro-oncology, 74(2), 141–
149.
Yang, J., Parsons, J., Nicolay, N., Caporali, S., Harrington, C., Singh, R., Finch, D., D'Atri, S.,
Farmer, P., Johnston, P., McKenna, W., Dianov, G. and Sharma, R.(2010) Cells deficient in
the base excision repair protein, DNA polymerase beta, are hypersensitive to oxaliplatin
chemotherapy. Oncogene, 29(3), 463-468.
Yang, Y., Zhang, Y., Wu, Q., Cui, X., Lin, Z., Liu, S. and Chen L. (2014). Clinical implications of
high NQO1 expression in breast cancers. Journal of Experimental & Clinical Cancer
Research, 33(1), 14.
Yao, Y., Shao, J., Zhang, C., Wu, J., Zhang, Q., Wang, J. and Zhu, W. (2013). Proliferation
of colorectal cancer is promoted by two signaling transduction expression patterns:
ErbB2/ErbB3/AKT and MET/ErbB3/MAPK. PLoS One, 8(10), e78086.
Ychou, M., Hohenberger, W., Thezenas, S., Navarro, M., Maurel, J., Bokemeyer,
C., Shacham-Shmueli, E., Rivera, F., Kwok-Keung Choi, C. and Santoro, A. (2009). A

298
randomized phase III study comparing adjuvant 5-fluorouracil/folinic acid with FOLFIRI in
patients following complete resection of liver metastases from colorectal cancer. Annals of
Oncology, 20(12), 1964-1970.
Yin, H., Zhang, L., Xie, L., Huang, L., Xu, Y., Cai, S., Yang, P. and Lu, H. (2013). Hyperplex-
MRM: a hybrid multiple reaction monitoring method using mTRAQ/iTRAQ labeling for
multiplex absolute quantification of human colorectal cancer biomarker. Journal of
Proteome Research, 12(9), 3912-3919.
Yoder, J., Soman, N., Verdine, G. and Bestor, T. (1997). DNA (cytosine-5)-methyltransferases
in mouse cells and tissues. Studies with a mechanism-based probe. Journal of Molecular
Biology, 270(3), 385-395.
Yoshioka, A., Tanaka, S., Hiraoka, O., Koyama, Y., Hirota, Y., Ayusawa, D., Seno, T., Garrett,
C. and Wataya, Y. (1987). Deoxyribonucleoside triphosphate imbalance. 5-
Fluorodeoxyuridine-induced DNA double strand breaks in mouse FM3A cells and the
mechanism of cell death. Journal of Biological Chemistry, 262(17), 8235-8241.
Zhang, H., Berezov, A., Wang, Q., Zhang, G., Drebin, J., Murali, R. and Greene,M. (2007).
ErbB receptors: from oncogenes to targeted cancer therapies. Journal of Clinical
Investigation, 117(8), 2051–2058.
Zhou, D., Yang, L., Zheng, L., Ge, W., Li, D., Zhang, Y., Hu, X., Gao, Z., Xu, J., Huang, Y., Hu, H.,
Zhang, H., Zhang, H., Liu, M., Yang, H., Zheng, L. and Zheng, S. (2013). Exome Capture
Sequencing of Adenoma Reveals Genetic Alterations in Multiple Cellular Pathways at the
Early Stage of Colorectal Tumorigenesis. PLoS One, 8(1), e53310.
Zhu, H., Wu, T., Chen, W., Zhou, L., Wu, Y., Zeng, L. and Pei, H. (2013). Screening for
differentially expressed genes between left- and right-sided colon carcinoma by microarray
analysis. Oncology Letters, 6(2), 353-358.
Zieske, L. (2006). A perspective on the use of iTRAQ reagent technology for protein complex
and profiling studies. Journal of Experimental Botany, 57(7), 1501–1508.

299
Appendix 1
Lists of single nucleotide variants from exome sequencing

300
Table 1 – Single nucleotide variants exclusive to the primary tumours
Annotation Gene Chromosome Location Substituted Amino Acid
New Amino Acid
ABCC3_17_48761053_G/A ABCC3 17 48761053 G A
ACAD11_3_132338346_T/G ACAD11 3 132338346 T G
ACADL_2_211060050_T/G ACADL 2 211060050 T G
ADAMTS1_21_28212761_G/A ADAMTS1 21 28212761 G A
ADD1_4_2916762_C/G ADD1 4 2916762 C G
AGXT_2_241808314_C/T AGXT 2 241808314 C T
ALPP_2_233243586_C/T ALPP 2 233243586 C T
APOB_2_21250914_G/A APOB 2 21250914 G A
ARHGEF19_1_16532498_G/A ARHGEF19 1 16532498 G A
BAIAP3_16_1394822_C/T BAIAP3 16 1394822 C T
BMP2K_4_79832411_A/G BMP2K 4 79832411 A G
C18orf25_18_43796346_G/C C18orf25 18 43796346 G C
C2orf43_2_20974689_C/T C2orf43 2 20974689 C T
C5orf22_5_31532534_G/C C5orf22 5 31532534 G C
CACNA1H_16_1254369_C/T CACNA1H 16 1254369 C T
CACNA1H_16_1268376_G/A CACNA1H 16 1268376 G A
CADM4_19_44130960_A/G CADM4 19 44130960 A G
CCDC136_7_128454762_G/A CCDC136 7 128454762 G A
CCDC78_16_774760_T/C CCDC78 16 774760 T C
CCRN4L_4_139966431_C/T CCRN4L 4 139966431 C T
CCT6B_17_33269648_C/G CCT6B 17 33269648 C G
CD93_20_23065209_G/A CD93 20 23065209 G A
CDC27_17_45214615_G/C CDC27 17 45214615 G C
CDC27_17_45214617_G/C CDC27 17 45214617 G C
CEP135_4_56819375_A/G CEP135 4 56819375 A G
CHAT_10_50835687_C/T CHAT 10 50835687 C T
CHRNA5_15_78880752_G/A CHRNA5 15 78880752 G A
CHRND_2_233398698_C/T CHRND 2 233398698 C T
CHST15_10_125769672_G/A CHST15 10 125769672 G A
CLCNKA_1_16356501_G/A CLCNKA 1 16356501 G A
CLCNKB_1_16371067_G/T CLCNKB 1 16371067 G T
CLDN3_7_73183979_G/A CLDN3 7 73183979 G A
CNGA4_11_6265242_G/C CNGA4 11 6265242 G C
CNN2_19_1036211_C/T CNN2 19 1036211 C T
CNN2_19_1037715_T/C CNN2 19 1037715 T C
CNN2_19_1037716_G/A CNN2 19 1037716 G A
CNN2_19_1037718_G/T CNN2 19 1037718 G T
COL15A1_9_101778346_C/G COL15A1 9 101778346 C G
COL5A3_19_10085054_G/A COL5A3 19 10085054 G A

301
COL6A2_21_47551942_G/A COL6A2 21 47551942 G A
CPAMD8_19_17025292_G/A CPAMD8 19 17025292 G A
CTBP2_10_126681824_G/A CTBP2 10 126681824 G A
CTBP2_10_126681831_C/G CTBP2 10 126681831 C G
CTBP2_10_126681838_C/G CTBP2 10 126681838 C G
CTBP2_10_126681848_T/A CTBP2 10 126681848 T A
CTBP2_10_126683099_G/A CTBP2 10 126683099 G A
CTBP2_10_126683111_C/T CTBP2 10 126683111 C T
CTBP2_10_126683132_A/T CTBP2 10 126683132 A T
CTBP2_10_126683243_C/T CTBP2 10 126683243 C T
CTBP2_10_126683244_C/G CTBP2 10 126683244 C G
CTBP2_10_126686629_G/A CTBP2 10 126686629 G A
CTBP2_10_126691552_T/G CTBP2 10 126691552 T G
CTDSP2_12_58217770_G/C CTDSP2 12 58217770 G C
CX3CR1_3_39307162_G/A CX3CR1 3 39307162 G A
CYP2C8_10_96818119_G/C CYP2C8 10 96818119 G C
CYP2D6_22_42526694_G/A CYP2D6 22 42526694 G A
CYP4F12_19_15784377_C/T CYP4F12 19 15784377 C T
CYP4F2_19_15989696_G/C CYP4F2 19 15989696 G C
D2HGDH_2_242690675_G/A D2HGDH 2 242690675 G A
DCLK1_13_36686139_G/C DCLK1 13 36686139 G C
DHTKD1_10_12143122_C/T DHTKD1 10 12143122 C T
DIS3L2_2_233127938_C/G DIS3L2 2 233127938 C G
DLAT_11_111916647_G/A DLAT 11 111916647 G A
DNAH17_17_76456017_C/G DNAH17 17 76456017 C G
DOCK7_1_62993881_T/C DOCK7 1 62993881 T C
DROSHA_5_31508739_C/T DROSHA 5 31508739 C T
DUOX2_15_45393014_G/C DUOX2 15 45393014 G C
EFCAB8_20_31480028_A/T EFCAB8 20 31480028 A T
EHBP1_2_63176139_A/C EHBP1 2 63176139 A C
ELP2_18_33736498_C/T ELP2 18 33736498 C T
ESRRA_11_64083320_T/C ESRRA 11 64083320 T C
ESRRA_11_64083328_C/T ESRRA 11 64083328 C T
ESRRA_11_64083331_C/T ESRRA 11 64083331 C T
EXTL3_8_28575417_T/C EXTL3 8 28575417 T C
FAM70B_13_114504663_G/A FAM70B 13 114504663 G A
FAM8A1_6_17606159_C/A FAM8A1 6 17606159 C A
FCGBP_19_40376675_G/A FCGBP 19 40376675 G A
FERMT1_20_6088265_G/A FERMT1 20 6088265 G A
FGFR3_4_1806629_C/T FGFR3 4 1806629 C T
FMN2_1_240370985_C/T FMN2 1 240370985 C T
FOXN4_12_109725707_G/A FOXN4 12 109725707 G A
FRG1_4_190876196_G/A FRG1 4 190876196 G A
FRG1_4_190883039_T/C FRG1 4 190883039 T C

302
GALNT2_1_230391032_G/A GALNT2 1 230391032 G A
GDNF_5_37816112_G/A GDNF 5 37816112 G A
GGT2_22_21576218_G/A GGT2 22 21576218 G A
GLB1_3_33138549_G/A GLB1 3 33138549 G A
GLIS2_16_4385158_A/G GLIS2 16 4385158 A G
GLOD4_17_685752_G/A GLOD4 17 685752 G A
GSTT1_22_24379402_T/G GSTT1 22 24379402 T G
HEXDC_17_80391684_A/G HEXDC 17 80391684 A G
HMCN1_1_186101539_A/G HMCN1 1 186101539 A G
HMCN2_9_133294224_C/T HMCN2 9 133294224 C T
HSPG2_1_22179244_C/T HSPG2 1 22179244 C T
IFI16_1_159024668_A/T IFI16 1 159024668 A T
IL3RA_X_1471083_C/G IL3RA X 1471083 C G
INF2_14_105180785_C/T INF2 14 105180785 C T
INPP5B_1_38329999_C/G INPP5B 1 38329999 C G
IQSEC3_12_247544_C/T IQSEC3 12 247544 C T
IRX4_5_1878325_C/T IRX4 5 1878325 C T
IRX6_16_55362942_T/C IRX6 16 55362942 T C
KCNH8_3_19574945_A/G KCNH8 3 19574945 A G
KCNJ12_17_21319523_C/T KCNJ12 17 21319523 C T
KCNJ12_17_21319786_G/A KCNJ12 17 21319786 G A
KIAA1958_9_115422069_G/A KIAA1958 9 115422069 G A
KIF24_9_34254413_G/C KIF24 9 34254413 G C
KIF26B_1_245848798_C/T KIF26B 1 245848798 C T
KLHL33_14_20897676_T/C KLHL33 14 20897676 T C
KLK10_19_51519365_C/G KLK10 19 51519365 C G
KRT18_12_53343225_C/T KRT18 12 53343225 C T
KRT18_12_53343231_G/C KRT18 12 53343231 G C
KRT32_17_39616430_G/T KRT32 17 39616430 G T
KRT40_17_39135089_G/A KRT40 17 39135089 G A
KRT40_17_39137154_C/G KRT40 17 39137154 C G
LYPD2_8_143833856_C/T LYPD2 8 143833856 C T
MATN2_8_98943447_G/C MATN2 8 98943447 G C
MLL3_7_151935866_G/A MLL3 7 151935866 G A
MLL3_7_151935871_C/A MLL3 7 151935871 C A
MPPED1_22_43831057_G/T MPPED1 22 43831057 G T
MSH6_2_48027136_A/G MSH6 2 48027136 A G
MSR1_8_16026181_T/C MSR1 8 16026181 T C
MTCH2_11_47640398_T/C MTCH2 11 47640398 T C
MTCH2_11_47660334_C/T MTCH2 11 47660334 C T
MUC16_19_8999530_C/T MUC16 19 8999530 C T
MUC4_3_195495916_G/C MUC4 3 195495916 G C
MYH3_17_10542257_A/G MYH3 17 10542257 A G
MYOM3_1_24409191_C/T MYOM3 1 24409191 C T
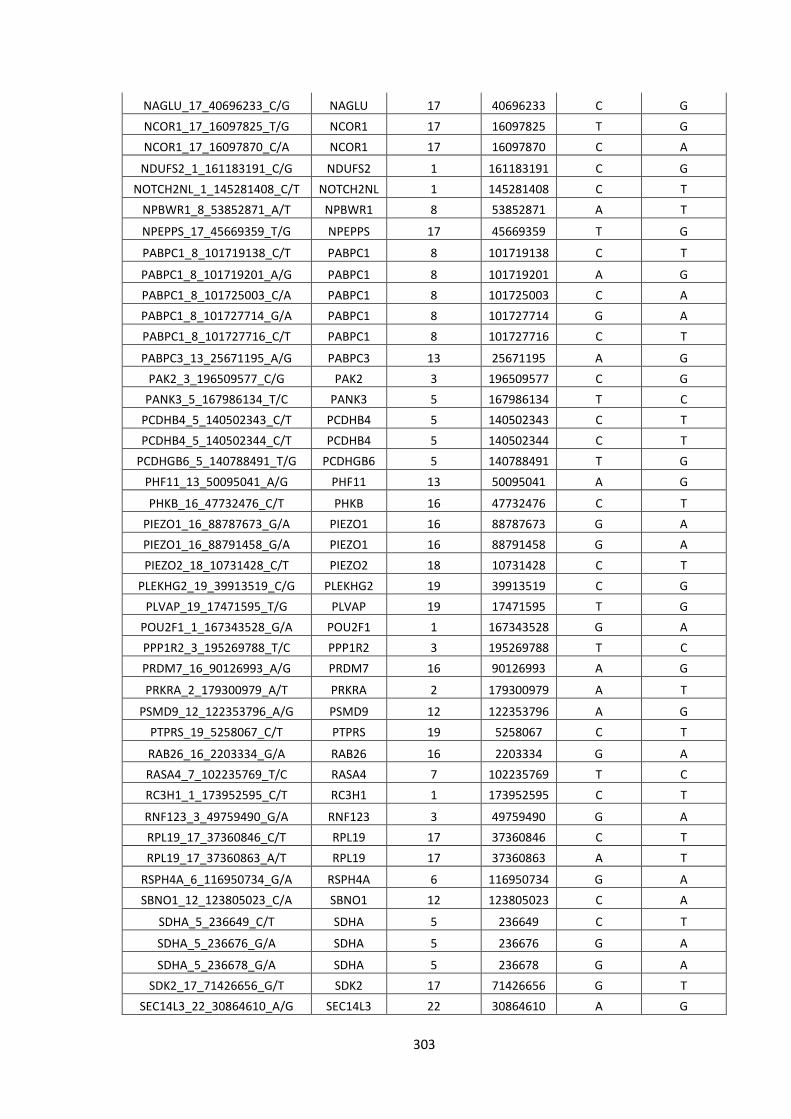
303
NAGLU_17_40696233_C/G NAGLU 17 40696233 C G
NCOR1_17_16097825_T/G NCOR1 17 16097825 T G
NCOR1_17_16097870_C/A NCOR1 17 16097870 C A
NDUFS2_1_161183191_C/G NDUFS2 1 161183191 C G
NOTCH2NL_1_145281408_C/T NOTCH2NL 1 145281408 C T
NPBWR1_8_53852871_A/T NPBWR1 8 53852871 A T
NPEPPS_17_45669359_T/G NPEPPS 17 45669359 T G
PABPC1_8_101719138_C/T PABPC1 8 101719138 C T
PABPC1_8_101719201_A/G PABPC1 8 101719201 A G
PABPC1_8_101725003_C/A PABPC1 8 101725003 C A
PABPC1_8_101727714_G/A PABPC1 8 101727714 G A
PABPC1_8_101727716_C/T PABPC1 8 101727716 C T
PABPC3_13_25671195_A/G PABPC3 13 25671195 A G
PAK2_3_196509577_C/G PAK2 3 196509577 C G
PANK3_5_167986134_T/C PANK3 5 167986134 T C
PCDHB4_5_140502343_C/T PCDHB4 5 140502343 C T
PCDHB4_5_140502344_C/T PCDHB4 5 140502344 C T
PCDHGB6_5_140788491_T/G PCDHGB6 5 140788491 T G
PHF11_13_50095041_A/G PHF11 13 50095041 A G
PHKB_16_47732476_C/T PHKB 16 47732476 C T
PIEZO1_16_88787673_G/A PIEZO1 16 88787673 G A
PIEZO1_16_88791458_G/A PIEZO1 16 88791458 G A
PIEZO2_18_10731428_C/T PIEZO2 18 10731428 C T
PLEKHG2_19_39913519_C/G PLEKHG2 19 39913519 C G
PLVAP_19_17471595_T/G PLVAP 19 17471595 T G
POU2F1_1_167343528_G/A POU2F1 1 167343528 G A
PPP1R2_3_195269788_T/C PPP1R2 3 195269788 T C
PRDM7_16_90126993_A/G PRDM7 16 90126993 A G
PRKRA_2_179300979_A/T PRKRA 2 179300979 A T
PSMD9_12_122353796_A/G PSMD9 12 122353796 A G
PTPRS_19_5258067_C/T PTPRS 19 5258067 C T
RAB26_16_2203334_G/A RAB26 16 2203334 G A
RASA4_7_102235769_T/C RASA4 7 102235769 T C
RC3H1_1_173952595_C/T RC3H1 1 173952595 C T
RNF123_3_49759490_G/A RNF123 3 49759490 G A
RPL19_17_37360846_C/T RPL19 17 37360846 C T
RPL19_17_37360863_A/T RPL19 17 37360863 A T
RSPH4A_6_116950734_G/A RSPH4A 6 116950734 G A
SBNO1_12_123805023_C/A SBNO1 12 123805023 C A
SDHA_5_236649_C/T SDHA 5 236649 C T
SDHA_5_236676_G/A SDHA 5 236676 G A
SDHA_5_236678_G/A SDHA 5 236678 G A
SDK2_17_71426656_G/T SDK2 17 71426656 G T
SEC14L3_22_30864610_A/G SEC14L3 22 30864610 A G

304
SERPINB10_18_61582751_T/G SERPINB10 18 61582751 T G
SERPINB10_18_61600384_C/T SERPINB10 18 61600384 C T
SERPINB8_18_61654463_A/G SERPINB8 18 61654463 A G
SETD8_12_123892186_T/C SETD8 12 123892186 T C
SKIV2L_6_31931747_G/A SKIV2L 6 31931747 G A
SLC15A1_13_99337138_A/G SLC15A1 13 99337138 A G
SLC25A5_X_118604030_T/C SLC25A5 X 118604030 T C
SLC25A5_X_118604399_C/G SLC25A5 X 118604399 C G
SLC25A5_X_118604428_T/C SLC25A5 X 118604428 T C
SLC2A1_1_43393457_T/C SLC2A1 1 43393457 T C
SLC44A4_6_31846741_C/A SLC44A4 6 31846741 C A
SLC46A3_13_29292117_C/T SLC46A3 13 29292117 C T
SLC6A7_5_149578877_C/T SLC6A7 5 149578877 C T
SMPD4_2_130930380_A/G SMPD4 2 130930380 A G
SOX7_8_10683685_A/G SOX7 8 10683685 A G
SPNS1_16_28990588_G/A SPNS1 16 28990588 G A
SREK1IP1_5_64020269_T/C SREK1IP1 5 64020269 T C
STAB2_12_104048454_C/A STAB2 12 104048454 C A
SYT8_11_1857751_C/G SYT8 11 1857751 C G
TAS2R46_12_11214025_A/T TAS2R46 12 11214025 A T
TAS2R46_12_11214080_G/A TAS2R46 12 11214080 G A
TCF3_19_1650228_A/G TCF3 19 1650228 A G
TEKT4_2_95541427_G/T TEKT4 2 95541427 G T
TEKT4_2_95541447_C/T TEKT4 2 95541447 C T
TFAP2A_6_10410556_C/T TFAP2A 6 10410556 C T
TGM1_14_24729863_G/A TGM1 14 24729863 G A
TIAM2_6_155561796_C/T TIAM2 6 155561796 C T
TNFRSF14_1_2488153_A/G TNFRSF14 1 2488153 A G
TNS1_2_218713282_G/A TNS1 2 218713282 G A
TPSD1_16_1306986_C/T TPSD1 16 1306986 C T
TPTE_21_10943003_C/T TPTE 21 10943003 C T
TSPAN32_11_2325427_T/C TSPAN32 11 2325427 T C
TSTA3_8_144697051_T/C TSTA3 8 144697051 T C
TXNRD2_22_19907099_C/A TXNRD2 22 19907099 C A
USP40_2_234394477_A/G USP40 2 234394477 A G
WDR33_2_128525866_A/G WDR33 2 128525866 A G
WDR72_15_53907948_G/A WDR72 15 53907948 G A
WNT10B_12_49364239_C/T WNT10B 12 49364239 C T
YLPM1_14_75248652_C/G YLPM1 14 75248652 C G
ZNF404_19_44377669_G/A ZNF404 19 44377669 G A
ZNF527_19_37879853_C/T ZNF527 19 37879853 C T
ZNF544_19_58774094_C/T ZNF544 19 58774094 C T
ZNF717_3_75790880_A/G ZNF717 3 75790880 A G
ZNF730_19_23329194_A/G ZNF730 19 23329194 A G

305
Table 2 – Single nucleotide variants exclusive to the metastatic tumours
Annotation Gene Chromosome Location Substituted Amino Acid
New Amino Acid
A4GALT_22_43089654_C/T A4GALT 22 43089654 C T
ABCA9_17_67017930_T/C ABCA9 17 67017930 T C
ABCB5_7_20762646_G/T ABCB5 7 20762646 G T
ABCC9_12_22017410_C/T ABCC9 12 22017410 C T
ACACB_12_109650663_A/G ACACB 12 109650663 A G
ACE_17_61568577_C/T ACE 17 61568577 C T
ACTN2_1_236902618_G/A ACTN2 1 236902618 G A
ACTR1A_10_104241913_C/T ACTR1A 10 104241913 C T
ADNP2_18_77895325_T/G ADNP2 18 77895325 T G
AK2_1_33478931_G/C AK2 1 33478931 G C
ALDH3B2_11_67433662_C/T ALDH3B2 11 67433662 C T
ALG1_16_5128817_G/A ALG1 16 5128817 G A
ALPPL2_2_233271669_C/T ALPPL2 2 233271669 C T
AMY2A_1_104163266_G/A AMY2A 1 104163266 G A
ANKK1_11_113269792_C/A ANKK1 11 113269792 C A
ANKRD36_2_97860487_T/C ANKRD36 2 97860487 T C
APOBEC3G_22_39482396_C/A APOBEC3G 22 39482396 C A
ARHGEF19_1_16534255_C/G ARHGEF19 1 16534255 C G
ARSD_X_2836002_C/T ARSD X 2836002 C T
ASPM_1_197070442_G/T ASPM 1 197070442 G T
ASPM_1_197070697_T/C ASPM 1 197070697 T C
ATP11A_13_113530199_G/A ATP11A 13 113530199 G A
ATP13A4_3_193209178_T/C ATP13A4 3 193209178 T C
ATP6V0D2_8_87151837_A/T ATP6V0D2 8 87151837 A T
ATXN1_6_16306751_G/A ATXN1 6 16306751 G A
AZU1_19_830841_G/A AZU1 19 830841 G A
BCHE_3_165491184_A/C BCHE 3 165491184 A C
BMP3_4_81967150_G/A BMP3 4 81967150 G A
BPI_20_36954670_G/A BPI 20 36954670 G A
C16orf96_16_4625938_A/T C16orf96 16 4625938 A T
C3orf39_3_43121884_G/C C3orf39 3 43121884 G C
CACNA1B_9_140777306_C/G CACNA1B 9 140777306 C G
CALCA_11_14991511_A/G CALCA 11 14991511 A G
CCBL2_1_89448608_G/A CCBL2 1 89448608 G A
CCDC138_2_109408208_G/A CCDC138 2 109408208 G A
CCT8_21_30439894_C/A CCT8 21 30439894 C A
CD1A_1_158226621_G/T CD1A 1 158226621 G T
CDC27_17_45214523_A/C CDC27 17 45214523 A C
CDC27_17_45214531_G/A CDC27 17 45214531 G A

306
CDC27_17_45214606_G/T CDC27 17 45214606 G T
CDC27_17_45214623_G/A CDC27 17 45214623 G A
CDC27_17_45214690_G/A CDC27 17 45214690 G A
CDC27_17_45219296_G/C CDC27 17 45219296 G C
CDC27_17_45219332_T/G CDC27 17 45219332 T G
CDC27_17_45247298_A/G CDC27 17 45247298 A G
CDH8_16_61859047_T/C CDH8 16 61859047 T C
CELA1_12_51740416_C/G CELA1 12 51740416 C G
CFTR_7_117188750_C/T CFTR 7 117188750 C T
CHRNA3_15_78894026_C/T CHRNA3 15 78894026 C T
CHRNE_17_4806020_G/A CHRNE 17 4806020 G A
CLCN4_X_10176599_T/C CLCN4 X 10176599 T C
CLEC18C_16_70211379_C/T CLEC18C 16 70211379 C T
CNGB1_16_57996933_C/A CNGB1 16 57996933 C A
CNN2_19_1037756_G/A CNN2 19 1037756 G A
CNN2_19_1037766_G/A CNN2 19 1037766 G A
COL24A1_1_86512536_C/T COL24A1 1 86512536 C T
COL4A3_2_228135631_C/T COL4A3 2 228135631 C T
COL5A3_19_10071347_C/T COL5A3 19 10071347 C T
CORO1C_12_109094907_A/G CORO1C 12 109094907 A G
COSM45060_17_7577581_A/G COSM45060 17 7577581 A G
CP_3_148916235_T/A CP 3 148916235 T A
CTBP2_10_126691979_C/G CTBP2 10 126691979 C G
CTDSP2_12_58217770_G/T CTDSP2 12 58217770 G T
CYP21A2_6_32006387_A/T CYP21A2 6 32006387 A T
DISP1_1_223116472_G/A DISP1 1 223116472 G A
DNA2_10_70191724_C/G DNA2 10 70191724 C G
DNAH9_17_11651057_A/G DNAH9 17 11651057 A G
DSG1_18_28909921_G/T DSG1 18 28909921 G T
DUOX2_15_45392075_G/A DUOX2 15 45392075 G A
EME1_17_48457758_C/G EME1 17 48457758 C G
EMR2_19_14875388_G/A EMR2 19 14875388 G A
ENOX2_X_129837156_G/A ENOX2 X 129837156 G A
EP400_12_132445675_G/A EP400 12 132445675 G A
EPPK1_8_144944226_G/A EPPK1 8 144944226 G A
ESPNL_2_239039981_A/G ESPNL 2 239039981 A G
FAM126A_7_23016393_C/G FAM126A 7 23016393 C G
FAM136A_2_70524515_T/A FAM136A 2 70524515 T A
FAM136A_2_70524576_C/G FAM136A 2 70524576 C G
FAM136A_2_70524606_G/A FAM136A 2 70524606 G A
FAM65C_20_49209710_C/T FAM65C 20 49209710 C T
FANCA_16_89857935_G/A FANCA 16 89857935 G A
FCRLB_1_161697072_G/C FCRLB 1 161697072 G C
FES_15_91433090_A/G FES 15 91433090 A G
FLVCR1_1_213068595_C/T FLVCR1 1 213068595 C T

307
FNDC1_6_159655103_T/G FNDC1 6 159655103 T G
FRG1_4_190876293_C/A FRG1 4 190876293 C A
FRG1_4_190878563_C/A FRG1 4 190878563 C A
FRG1_4_190878569_T/C FRG1 4 190878569 T C
FUT3_19_5843784_A/T FUT3 19 5843784 A T
GATA3_10_8100641_G/A GATA3 10 8100641 G A
GHR_5_42719239_A/C GHR 5 42719239 A C
GNAQ_9_80537112_T/A GNAQ 9 80537112 T A
GPATCH2_1_217604654_T/C GPATCH2 1 217604654 T C
GPRC6A_6_117130544_A/C GPRC6A 6 117130544 A C
GXYLT1_12_42499825_A/C GXYLT1 12 42499825 A C
GZMM_19_548612_G/A GZMM 19 548612 G A
HIP1R_12_123345509_G/T HIP1R 12 123345509 G T
HMGXB3_5_149390148_G/A HMGXB3 5 149390148 G A
HNF1A_12_121435427_G/A HNF1A 12 121435427 G A
HRAS_11_533880_G/A HRAS 11 533880 G A
HSD17B11_4_88278497_C/T HSD17B11 4 88278497 C T
HSPD1_2_198363406_C/T HSPD1 2 198363406 C T
IFI30_19_18285944_G/A IFI30 19 18285944 G A
INS_11_2181060_T/G INS 11 2181060 T G
ITIH1_3_52820981_A/T ITIH1 3 52820981 A T
ITSN2_2_24435599_G/A ITSN2 2 24435599 G A
KCNB1_20_47991468_G/A KCNB1 20 47991468 G A
KCNG4_16_84256410_C/T KCNG4 16 84256410 C T
KCNH6_17_61615545_A/G KCNH6 17 61615545 A G
KCNJ12_17_21319230_G/C KCNJ12 17 21319230 G C
KCNJ16_17_68128332_G/A KCNJ16 17 68128332 G A
KCNK13_14_90651135_G/T KCNK13 14 90651135 G T
KCNV1_8_110984553_G/A KCNV1 8 110984553 G A
KIAA0141_5_141309824_G/A KIAA0141 5 141309824 G A
KIAA0753_17_6513329_G/A KIAA0753 17 6513329 G A
KIF19_17_72340981_G/A KIF19 17 72340981 G A
KRT14_17_39742807_C/T KRT14 17 39742807 C T
KRT36_17_39643340_T/G KRT36 17 39643340 T G
LAMA5_20_60889385_G/T LAMA5 20 60889385 G T
LDHAL6B_15_59500180_C/G LDHAL6B 15 59500180 C G
LRP1B_2_141459344_C/T LRP1B 2 141459344 C T
LRRC17_7_102574920_G/C LRRC17 7 102574920 G C
MASP2_1_11090916_C/A MASP2 1 11090916 C A
MBD1_18_47800179_G/C MBD1 18 47800179 G C
MGAT2_14_50089014_A/C MGAT2 14 50089014 A C
MKL2_16_14341144_A/G MKL2 16 14341144 A G
MLL2_12_49430947_T/C MLL2 12 49430947 T C
MLL3_7_151927021_C/A MLL3 7 151927021 C A
MLL3_7_151927067_T/C MLL3 7 151927067 T C

308
MLL3_7_151935910_C/T MLL3 7 151935910 C T
MLL5_7_104717522_A/G MLL5 7 104717522 A G
MLPH_2_238449007_T/C MLPH 2 238449007 T C
MOGAT1_2_223559089_T/C MOGAT1 2 223559089 T C
MTCH2_11_47663951_A/G MTCH2 11 47663951 A G
MTCH2_11_47663986_C/T MTCH2 11 47663986 C T
MTCH2_11_47663996_C/T MTCH2 11 47663996 C T
MTMR11_1_149906167_T/G MTMR11 1 149906167 T G
MUC16_19_9002597_C/T MUC16 19 9002597 C T
MUC6_11_1027811_C/T MUC6 11 1027811 C T
MYH4_17_10355371_C/T MYH4 17 10355371 C T
MYO1H_12_109872909_C/T MYO1H 12 109872909 C T
MYO9B_19_17213218_G/A MYO9B 19 17213218 G A
MZT2B_2_130948087_C/T MZT2B 2 130948087 C T
NAV1_1_201754444_G/C NAV1 1 201754444 G C
NHLRC1_6_18122258_C/T NHLRC1 6 18122258 C T
NIN_14_51202311_G/C NIN 14 51202311 G C
NOD1_7_30492237_C/T NOD1 7 30492237 C T
NOTCH1_9_139412350_G/A NOTCH1 9 139412350 G A
NUP88_17_5289554_T/C NUP88 17 5289554 T C
NUP98_11_3744435_C/G NUP98 11 3744435 C G
OGDHL_10_50950976_G/A OGDHL 10 50950976 G A
OLFM1_9_138011540_T/C OLFM1 9 138011540 T C
OR51G1_11_4945199_C/T OR51G1 11 4945199 C T
PABPC1_8_101730043_G/C PABPC1 8 101730043 G C
PABPC1_8_101730064_G/A PABPC1 8 101730064 G A
PABPC1_8_101730110_A/C PABPC1 8 101730110 A C
PABPC3_13_25670868_G/A PABPC3 13 25670868 G A
PABPC3_13_25670877_G/A PABPC3 13 25670877 G A
PABPC3_13_25670955_C/T PABPC3 13 25670955 C T
PAK2_3_196529902_G/C PAK2 3 196529902 G C
PARN_16_14576574_A/C PARN 16 14576574 A C
PARP4_13_25016762_G/A PARP4 13 25016762 G A
PCDHA9_5_140228164_C/A PCDHA9 5 140228164 C A
PEX6_6_42935117_G/A PEX6 6 42935117 G A
PIK3C2G_12_18649057_C/T PIK3C2G 12 18649057 C T
PLEC_8_144995494_C/T PLEC 8 144995494 C T
POTED_21_14987871_G/T POTED 21 14987871 G T
POU4F2_4_147561758_C/T POU4F2 4 147561758 C T
PPIAL4G_1_143767544_T/A PPIAL4G 1 143767544 T A
PPIAL4G_1_143767547_G/A PPIAL4G 1 143767547 G A
PPL_16_4935985_C/G PPL 16 4935985 C G
PPP1R9A_7_94540527_G/A PPP1R9A 7 94540527 G A
PRKRA_2_179309165_G/A PRKRA 2 179309165 G A
PRR23C_3_138762854_G/T PRR23C 3 138762854 G T

309
PRSS1_7_142458451_A/T PRSS1 7 142458451 A T
PRUNE2_9_79320847_G/C PRUNE2 9 79320847 G C
PSAPL1_4_7435721_C/T PSAPL1 4 7435721 C T
RAB40B_17_80615774_T/G RAB40B 17 80615774 T G
RAG1_11_36597313_A/G RAG1 11 36597313 A G
RANBP2_2_109382348_T/C RANBP2 2 109382348 T C
RBBP5_1_205068225_T/C RBBP5 1 205068225 T C
RBMX_X_135958704_G/C RBMX X 135958704 G C
RRN3_16_15162102_G/A RRN3 16 15162102 G A
RRP7A_22_42912136_G/T RRP7A 22 42912136 G T
RYR3_15_33954652_C/T RYR3 15 33954652 C T
SACS_13_23905771_C/A SACS 13 23905771 C A
SALL2_14_21991626_C/G SALL2 14 21991626 C G
SETD8_12_123889492_A/C SETD8 12 123889492 A C
SIGLEC11_19_50463982_T/G SIGLEC11 19 50463982 T G
SLC25A5_X_118603958_G/A SLC25A5 X 118603958 G A
SLC25A5_X_118604006_A/G SLC25A5 X 118604006 A G
SLC25A5_X_118604467_C/T SLC25A5 X 118604467 C T
SLC25A5_X_118605017_C/T SLC25A5 X 118605017 C T
SLC35E2_1_1666175_C/T SLC35E2 1 1666175 C T
SLC39A12_10_18270341_A/G SLC39A12 10 18270341 A G
SNCAIP_5_121761114_C/T SNCAIP 5 121761114 C T
SRMS_20_62174830_C/T SRMS 20 62174830 C T
SRPK3_X_153047251_A/G SRPK3 X 153047251 A G
STK17A_7_43659260_T/C STK17A 7 43659260 T C
SYT6_1_114641758_A/G SYT6 1 114641758 A G
TBX10_11_67402362_T/G TBX10 11 67402362 T G
TGM4_3_44929287_G/C TGM4 3 44929287 G C
TH_11_2190951_C/T TH 11 2190951 C T
TIMM23_10_51620361_G/C TIMM23 10 51620361 G C
TLR2_4_154625951_C/A TLR2 4 154625951 C A
TMEM41B_11_9308058_A/G TMEM41B 11 9308058 A G
TMEM74_8_109796955_G/A TMEM74 8 109796955 G A
TMPRSS13_11_117789345_G/C TMPRSS13 11 117789345 G C
TNRC6A_16_24834859_T/C TNRC6A 16 24834859 T C
TNXB_6_32010272_T/A TNXB 6 32010272 T A
TP53_17_7577139_G/A TP53 17 7577139 G A
TP53_17_7579472_G/C TP53 17 7579472 G C
TPD52L3_9_6328947_T/C TPD52L3 9 6328947 T C
TROAP_12_49724370_G/A TROAP 12 49724370 G A
TRPM2_21_45825813_G/C TRPM2 21 45825813 G C
TYR_11_89017961_G/A TYR 11 89017961 G A
USP32_17_58285542_G/A USP32 17 58285542 G A
VWA3B_2_98928429_C/G VWA3B 2 98928429 C G
WNT16_7_120969745_G/T WNT16 7 120969745 G T

310
WWC3_X_10090689_G/T WWC3 X 10090689 G T
ZBTB9_6_33423004_C/G ZBTB9 6 33423004 C G
ZCWPW1_7_100017260_T/C ZCWPW1 7 100017260 T C
ZNF717_3_75790837_C/A ZNF717 3 75790837 C A
ZNF813_19_53995266_C/T ZNF813 19 53995266 C T
ZNF880_19_52888071_G/T ZNF880 19 52888071 G T
ZP3_7_76071228_A/G ZP3 7 76071228 A G

311
Table 3 – Single nucleotide variants present in paired samples
Annotation Gene Chromosome Location Substituted Amino Acid
New Amino Acid
A2M_12_9262564_G/T A2M 12 9262564 G T
ABCA13_7_48390326_G/A ABCA13 7 48390326 G A
ABCA7_19_1045173_G/A ABCA7 19 1045173 G A
ACAA1_3_38167095_A/G ACAA1 3 38167095 A G
ACTN2_1_236911005_G/A ACTN2 1 236911005 G A
ADCY2_5_7789872_C/A ADCY2 5 7789872 C A
AK2_1_33478888_C/T AK2 1 33478888 C T
AK2_1_33478900_T/A AK2 1 33478900 T A
BRAF_7_140453136_A/T BRAF 7 140453136 A T
C1orf109_1_38151996_A/C C1orf109 1 38151996 A C
C1QTNF9_13_24895805_G/A C1QTNF9 13 24895805 G A
CDAN1_15_43020983_G/A CDAN1 15 43020983 G A
CDC27_17_45214551_G/A CDC27 17 45214551 G A
CDC27_17_45214648_G/C CDC27 17 45214648 G C
CDC27_17_45214654_C/T CDC27 17 45214654 C T
CDC27_17_45247317_A/G CDC27 17 45247317 A G
CDC27_17_45247338_T/G CDC27 17 45247338 T G
CDC27_17_45258951_A/G CDC27 17 45258951 A G
CDC27_17_45258954_A/G CDC27 17 45258954 A G
COL18A1_21_46911188_C/G COL18A1 21 46911188 C G
CTDSP2_12_58217698_G/T CTDSP2 12 58217698 G T
CTDSP2_12_58220784_A/T CTDSP2 12 58220784 A T
CTDSP2_12_58220811_G/T CTDSP2 12 58220811 G T
DRD5_4_9784542_A/C DRD5 4 9784542 A C
EPB41L3_18_5398020_C/G EPB41L3 18 5398020 C G
KCNJ12_17_21319285_C/T KCNJ12 17 21319285 C T
KRAS_12_25398284_C/A KRAS 12 25398284 C A
KRAS_12_25398284_C/T KRAS 12 25398284 C T
KRT18_12_53343209_G/A KRT18 12 53343209 G A
KRT32_17_39619115_G/A KRT32 17 39619115 G A
KRT40_17_39137387_C/T KRT40 17 39137387 C T
LAMB1_7_107594098_C/A LAMB1 7 107594098 C A
LGALS3_14_55604935_C/A LGALS3 14 55604935 C A
MAP2K3_17_21207834_C/T MAP2K3 17 21207834 C T
MDGA2_14_47770622_G/A MDGA2 14 47770622 G A
MEOX2_7_15725874_C/G MEOX2 7 15725874 C G
MINK1_17_4797305_G/A MINK1 17 4797305 G A
MTCH2_11_47660294_C/T MTCH2 11 47660294 C T
MTCH2_11_47660295_A/G MTCH2 11 47660295 A G

312
MTCH2_11_47663948_C/T MTCH2 11 47663948 C T
MYO5A_15_52664445_C/T MYO5A 15 52664445 C T
NCOA1_2_24888632_G/A NCOA1 2 24888632 G A
NOS1_12_117669907_G/A NOS1 12 117669907 G A
NRP2_2_206610510_G/A NRP2 2 206610510 G A
PABPC1_8_101721705_G/T PABPC1 8 101721705 G T
PABPC1_8_101721709_T/A PABPC1 8 101721709 T A
PABPC3_13_25671015_A/G PABPC3 13 25671015 A G
PAK2_3_196529982_A/G PAK2 3 196529982 A G
PANK3_5_167988433_T/A PANK3 5 167988433 T A
PAPPA2_1_176679244_G/T PAPPA2 1 176679244 G T
PCDHB8_5_140558628_T/C PCDHB8 5 140558628 T C
PHACTR1_6_13283706_G/A PHACTR1 6 13283706 G A
PIGT_20_44048972_A/C PIGT 20 44048972 A C
PIK3C2G_12_18650667_A/T PIK3C2G 12 18650667 A T
PKHD1L1_8_110457064_G/T PKHD1L1 8 110457064 G T
PLCG2_16_81888178_C/T PLCG2 16 81888178 C T
PPIAL4G_1_143767513_A/T PPIAL4G 1 143767513 A T
PRSS1_7_142460744_G/C PRSS1 7 142460744 G C
PRSS3_9_33797951_A/C PRSS3 9 33797951 A C
PTCH1_9_98209594_G/A PTCH1 9 98209594 G A
RIMS1_6_73016976_A/T RIMS1 6 73016976 A T
RRAS_19_50140130_G/A RRAS 19 50140130 G A
SCN2A_2_166245924_G/C SCN2A 2 166245924 G C
SCN4A_17_62041068_T/C SCN4A 17 62041068 T C
SDHA_5_236628_C/T SDHA 5 236628 C T
SDR16C5_8_57228812_G/A SDR16C5 8 57228812 G A
SIPA1L1_14_72054755_C/A SIPA1L1 14 72054755 C A
SLC25A5_X_118604911_C/A SLC25A5 X 118604911 C A
SLC25A5_X_118604935_T/C SLC25A5 X 118604935 T C
SLC45A4_8_142228160_C/T SLC45A4 8 142228160 C T
SLCO5A1_8_70617423_C/G SLCO5A1 8 70617423 C G
SVIL_10_29779847_A/C SVIL 10 29779847 A C
TAS2R31_12_11183066_A/T TAS2R31 12 11183066 A T
TCF7_5_133451683_C/A TCF7 5 133451683 C A
TIMM23_10_51623147_C/T TIMM23 10 51623147 C T
TRPV5_7_142625304_C/T TRPV5 7 142625304 C T
TSPAN31_12_58139552_G/T TSPAN31 12 58139552 G T
TTPAL_20_43117986_C/T TTPAL 20 43117986 C T
VANGL2_1_160388913_G/A VANGL2 1 160388913 G A
WDR62_19_36577616_G/C WDR62 19 36577616 G C
WNK2_9_96021312_G/A WNK2 9 96021312 G A

313
Table 4 – Single nucleotide variants exclusive to the responders
Annotation Gene Chromosome Location Substituted Amino Acid
New Amino Acid
A2M_12_9262564_G/T A2M 12 9262564 G T
ABCA7_19_1045173_G/A ABCA7 19 1045173 G A
ABCA9_17_67017930_T/C ABCA9 17 67017930 T C
ABCB5_7_20762646_G/T ABCB5 7 20762646 G T
ABCC9_12_22017410_C/T ABCC9 12 22017410 C T
ACTN2_1_236911005_G/A ACTN2 1 236911005 G A
ACTR1A_10_104241913_C/T ACTR1A 10 104241913 C T
ADCY2_5_7789872_C/A ADCY2 5 7789872 C A
ADD1_4_2916762_C/G ADD1 4 2916762 C G
ALDH3B2_11_67433662_C/T ALDH3B2 11 67433662 C T
ANKK1_11_113269792_C/A ANKK1 11 113269792 C A
APOB_2_21250914_G/A APOB 2 21250914 G A
ARHGEF19_1_16532498_G/A ARHGEF19 1 16532498 G A
ARHGEF19_1_16534255_C/G ARHGEF19 1 16534255 C G
ARSD_X_2836002_C/T ARSD X 2836002 C T
ASPM_1_197070442_G/T ASPM 1 197070442 G T
ATP11A_13_113530199_G/A ATP11A 13 113530199 G A
ATP13A4_3_193209178_T/C ATP13A4 3 193209178 T C
ATXN1_6_16306751_G/A ATXN1 6 16306751 G A
AZU1_19_830841_G/A AZU1 19 830841 G A
BAIAP3_16_1394822_C/T BAIAP3 16 1394822 C T
BCHE_3_165491184_A/C BCHE 3 165491184 A C
BMP3_4_81967150_G/A BMP3 4 81967150 G A
BPI_20_36954670_G/A BPI 20 36954670 G A
BRAF_7_140453136_A/T BRAF 7 140453136 A T
C16orf96_16_4625938_A/T C16orf96 16 4625938 A T
C1orf109_1_38151996_A/C C1orf109 1 38151996 A C
C5orf22_5_31532534_G/C C5orf22 5 31532534 G C
CACNA1B_9_140777306_C/G CACNA1B 9 140777306 C G
CACNA1H_16_1268376_G/A CACNA1H 16 1268376 G A
CADM4_19_44130960_A/G CADM4 19 44130960 A G
CALCA_11_14991511_A/G CALCA 11 14991511 A G
CCDC136_7_128454762_G/A CCDC136 7 128454762 G A
CCDC138_2_109408208_G/A CCDC138 2 109408208 G A
CCDC78_16_774760_T/C CCDC78 16 774760 T C
CCT6B_17_33269648_C/G CCT6B 17 33269648 C G
CCT8_21_30439894_C/A CCT8 21 30439894 C A
CD1A_1_158226621_G/T CD1A 1 158226621 G T
CD93_20_23065209_G/A CD93 20 23065209 G A

314
CDAN1_15_43020983_G/A CDAN1 15 43020983 G A
CDC27_17_45214606_G/T CDC27 17 45214606 G T
CDC27_17_45214648_G/C CDC27 17 45214648 G C
CDC27_17_45214654_C/T CDC27 17 45214654 C T
CDC27_17_45214690_G/A CDC27 17 45214690 G A
CDC27_17_45214699_T/C CDC27 17 45214699 T C
CELA1_12_51740416_C/G CELA1 12 51740416 C G
CHAT_10_50835687_C/T CHAT 10 50835687 C T
CHRNA3_15_78894026_C/T CHRNA3 15 78894026 C T
CHRNA5_15_78880752_G/A CHRNA5 15 78880752 G A
CHRND_2_233398698_C/T CHRND 2 233398698 C T
CLCNKA_1_16356501_G/A CLCNKA 1 16356501 G A
CLDN3_7_73183979_G/A CLDN3 7 73183979 G A
CLEC18C_16_70211379_C/T CLEC18C 16 70211379 C T
CNGB1_16_57996933_C/A CNGB1 16 57996933 C A
CNN2_19_1037715_T/C CNN2 19 1037715 T C
CNN2_19_1037716_G/A CNN2 19 1037716 G A
CNN2_19_1037718_G/T CNN2 19 1037718 G T
CNN2_19_1037756_G/A CNN2 19 1037756 G A
CNN2_19_1037766_G/A CNN2 19 1037766 G A
COL24A1_1_86512536_C/T COL24A1 1 86512536 C T
COL4A3_2_228135631_C/T COL4A3 2 228135631 C T
COL5A3_19_10071347_C/T COL5A3 19 10071347 C T
CORO1C_12_109094907_A/G CORO1C 12 109094907 A G
CP_3_148916235_T/A CP 3 148916235 T A
CPAMD8_19_17025292_G/A CPAMD8 19 17025292 G A
CTBP2_10_126683058_T/G CTBP2 10 126683058 T G
CTBP2_10_126683099_G/A CTBP2 10 126683099 G A
CTBP2_10_126683111_C/T CTBP2 10 126683111 C T
CTBP2_10_126683132_A/T CTBP2 10 126683132 A T
CTBP2_10_126683244_C/G CTBP2 10 126683244 C G
CTBP2_10_126686629_G/A CTBP2 10 126686629 G A
CTBP2_10_126691979_C/G CTBP2 10 126691979 C G
CTDSP2_12_58220784_A/T CTDSP2 12 58220784 A T
CTDSP2_12_58220811_G/T CTDSP2 12 58220811 G T
CX3CR1_3_39307162_G/A CX3CR1 3 39307162 G A
CYP21A2_6_32006387_A/T CYP21A2 6 32006387 A T
CYP2C8_10_96818119_G/C CYP2C8 10 96818119 G C
CYP2D6_22_42526694_G/A CYP2D6 22 42526694 G A
CYP4F12_19_15784377_C/T CYP4F12 19 15784377 C T
D2HGDH_2_242690675_G/A D2HGDH 2 242690675 G A
DCLK1_13_36686139_G/C DCLK1 13 36686139 G C
DHTKD1_10_12143122_C/T DHTKD1 10 12143122 C T
DIS3L2_2_233127938_C/G DIS3L2 2 233127938 C G

315
DLAT_11_111916647_G/A DLAT 11 111916647 G A
DNAH9_17_11651057_A/G DNAH9 17 11651057 A G
EFCAB8_20_31480028_A/T EFCAB8 20 31480028 A T
EHBP1_2_63176139_A/C EHBP1 2 63176139 A C
ELP2_18_33736498_C/T ELP2 18 33736498 C T
EP400_12_132445675_G/A EP400 12 132445675 G A
EPB41L3_18_5398020_C/G EPB41L3 18 5398020 C G
EPPK1_8_144944226_G/A EPPK1 8 144944226 G A
ESRRA_11_64083320_T/C ESRRA 11 64083320 T C
ESRRA_11_64083328_C/T ESRRA 11 64083328 C T
ESRRA_11_64083331_C/T ESRRA 11 64083331 C T
FAM136A_2_70524515_T/A FAM136A 2 70524515 T A
FAM136A_2_70524576_C/G FAM136A 2 70524576 C G
FAM136A_2_70524606_G/A FAM136A 2 70524606 G A
FAM65C_20_49209710_C/T FAM65C 20 49209710 C T
FAM70B_13_114504663_G/A FAM70B 13 114504663 G A
FCRLB_1_161697072_G/C FCRLB 1 161697072 G C
FERMT1_20_6088265_G/A FERMT1 20 6088265 G A
FLVCR1_1_213068595_C/T FLVCR1 1 213068595 C T
FMN2_1_240370985_C/T FMN2 1 240370985 C T
FRG1_4_190878563_C/A FRG1 4 190878563 C A
FRG1_4_190878569_T/C FRG1 4 190878569 T C
GALNT2_1_230391032_G/A GALNT2 1 230391032 G A
GATA3_10_8100641_G/A GATA3 10 8100641 G A
GGT1_22_25011031_C/T GGT1 22 25011031 C T
GHR_5_42719239_A/C GHR 5 42719239 A C
GNAQ_9_80537112_T/A GNAQ 9 80537112 T A
GPRC6A_6_117130544_A/C GPRC6A 6 117130544 A C
GZMM_19_548612_G/A GZMM 19 548612 G A
HIP1R_12_123345509_G/T HIP1R 12 123345509 G T
HMCN1_1_186101539_A/G HMCN1 1 186101539 A G
HMCN2_9_133294224_C/T HMCN2 9 133294224 C T
HMGXB3_5_149390148_G/A HMGXB3 5 149390148 G A
HNF1A_12_121435427_G/A HNF1A 12 121435427 G A
HSD17B11_4_88278497_C/T HSD17B11 4 88278497 C T
HSPD1_2_198363406_C/T HSPD1 2 198363406 C T
HSPG2_1_22179244_C/T HSPG2 1 22179244 C T
IFI16_1_159024668_A/T IFI16 1 159024668 A T
IFI30_19_18285944_G/A IFI30 19 18285944 G A
INPP5B_1_38329999_C/G INPP5B 1 38329999 C G
INS_11_2181060_T/G INS 11 2181060 T G
ITIH1_3_52820981_A/T ITIH1 3 52820981 A T
ITSN2_2_24435599_G/A ITSN2 2 24435599 G A
KCNB1_20_47991468_G/A KCNB1 20 47991468 G A
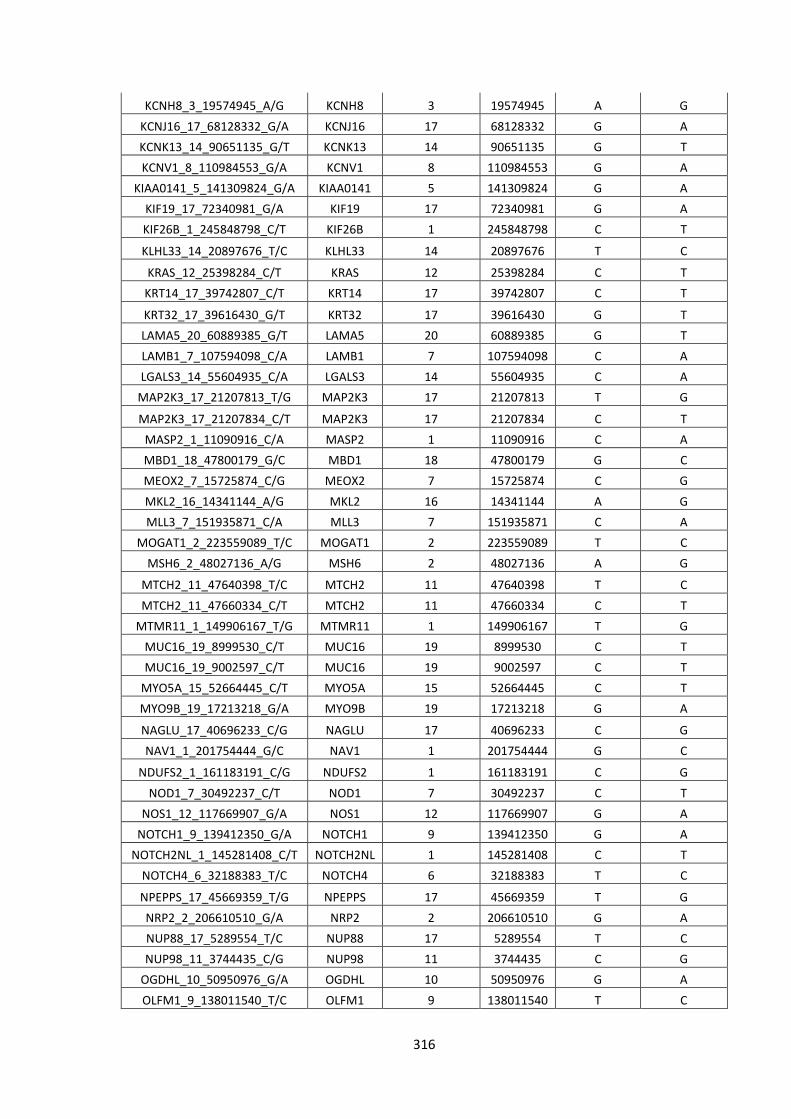
316
KCNH8_3_19574945_A/G KCNH8 3 19574945 A G
KCNJ16_17_68128332_G/A KCNJ16 17 68128332 G A
KCNK13_14_90651135_G/T KCNK13 14 90651135 G T
KCNV1_8_110984553_G/A KCNV1 8 110984553 G A
KIAA0141_5_141309824_G/A KIAA0141 5 141309824 G A
KIF19_17_72340981_G/A KIF19 17 72340981 G A
KIF26B_1_245848798_C/T KIF26B 1 245848798 C T
KLHL33_14_20897676_T/C KLHL33 14 20897676 T C
KRAS_12_25398284_C/T KRAS 12 25398284 C T
KRT14_17_39742807_C/T KRT14 17 39742807 C T
KRT32_17_39616430_G/T KRT32 17 39616430 G T
LAMA5_20_60889385_G/T LAMA5 20 60889385 G T
LAMB1_7_107594098_C/A LAMB1 7 107594098 C A
LGALS3_14_55604935_C/A LGALS3 14 55604935 C A
MAP2K3_17_21207813_T/G MAP2K3 17 21207813 T G
MAP2K3_17_21207834_C/T MAP2K3 17 21207834 C T
MASP2_1_11090916_C/A MASP2 1 11090916 C A
MBD1_18_47800179_G/C MBD1 18 47800179 G C
MEOX2_7_15725874_C/G MEOX2 7 15725874 C G
MKL2_16_14341144_A/G MKL2 16 14341144 A G
MLL3_7_151935871_C/A MLL3 7 151935871 C A
MOGAT1_2_223559089_T/C MOGAT1 2 223559089 T C
MSH6_2_48027136_A/G MSH6 2 48027136 A G
MTCH2_11_47640398_T/C MTCH2 11 47640398 T C
MTCH2_11_47660334_C/T MTCH2 11 47660334 C T
MTMR11_1_149906167_T/G MTMR11 1 149906167 T G
MUC16_19_8999530_C/T MUC16 19 8999530 C T
MUC16_19_9002597_C/T MUC16 19 9002597 C T
MYO5A_15_52664445_C/T MYO5A 15 52664445 C T
MYO9B_19_17213218_G/A MYO9B 19 17213218 G A
NAGLU_17_40696233_C/G NAGLU 17 40696233 C G
NAV1_1_201754444_G/C NAV1 1 201754444 G C
NDUFS2_1_161183191_C/G NDUFS2 1 161183191 C G
NOD1_7_30492237_C/T NOD1 7 30492237 C T
NOS1_12_117669907_G/A NOS1 12 117669907 G A
NOTCH1_9_139412350_G/A NOTCH1 9 139412350 G A
NOTCH2NL_1_145281408_C/T NOTCH2NL 1 145281408 C T
NOTCH4_6_32188383_T/C NOTCH4 6 32188383 T C
NPEPPS_17_45669359_T/G NPEPPS 17 45669359 T G
NRP2_2_206610510_G/A NRP2 2 206610510 G A
NUP88_17_5289554_T/C NUP88 17 5289554 T C
NUP98_11_3744435_C/G NUP98 11 3744435 C G
OGDHL_10_50950976_G/A OGDHL 10 50950976 G A
OLFM1_9_138011540_T/C OLFM1 9 138011540 T C

317
PABPC3_13_25670868_G/A PABPC3 13 25670868 G A
PABPC3_13_25670877_G/A PABPC3 13 25670877 G A
PABPC3_13_25670955_C/T PABPC3 13 25670955 C T
PABPC3_13_25671015_A/G PABPC3 13 25671015 A G
PABPC3_13_25671195_A/G PABPC3 13 25671195 A G
PAK2_3_196529902_G/C PAK2 3 196529902 G C
PANK3_5_167986134_T/C PANK3 5 167986134 T C
PANK3_5_167988433_T/A PANK3 5 167988433 T A
PAPPA2_1_176679244_G/T PAPPA2 1 176679244 G T
PCDHA9_5_140228164_C/A PCDHA9 5 140228164 C A
PEX6_6_42935117_G/A PEX6 6 42935117 G A
PHACTR1_6_13283706_G/A PHACTR1 6 13283706 G A
PHKB_16_47732476_C/T PHKB 16 47732476 C T
PIEZO1_16_88787673_G/A PIEZO1 16 88787673 G A
PIEZO2_18_10731428_C/T PIEZO2 18 10731428 C T
PIK3C2G_12_18649057_C/T PIK3C2G 12 18649057 C T
PIK3C2G_12_18650667_A/T PIK3C2G 12 18650667 A T
PKHD1L1_8_110457064_G/T PKHD1L1 8 110457064 G T
PLCG2_16_81888178_C/T PLCG2 16 81888178 C T
PLEC_8_144995494_C/T PLEC 8 144995494 C T
PLVAP_19_17471595_T/G PLVAP 19 17471595 T G
POTED_21_14987871_G/T POTED 21 14987871 G T
POU2F1_1_167343528_G/A POU2F1 1 167343528 G A
PPIAL4G_1_143767513_A/T PPIAL4G 1 143767513 A T
PPIAL4G_1_143767544_T/A PPIAL4G 1 143767544 T A
PPIAL4G_1_143767547_G/A PPIAL4G 1 143767547 G A
PPP1R2_3_195269788_T/C PPP1R2 3 195269788 T C
PPP1R9A_7_94540527_G/A PPP1R9A 7 94540527 G A
PRKRA_2_179300979_A/T PRKRA 2 179300979 A T
PSAPL1_4_7435721_C/T PSAPL1 4 7435721 C T
PSMD9_12_122353796_A/G PSMD9 12 122353796 A G
RAB26_16_2203334_G/A RAB26 16 2203334 G A
RAB40B_17_80615774_T/G RAB40B 17 80615774 T G
RAG1_11_36597313_A/G RAG1 11 36597313 A G
RC3H1_1_173952595_C/T RC3H1 1 173952595 C T
RIMS1_6_73016976_A/T RIMS1 6 73016976 A T
RNF123_3_49759490_G/A RNF123 3 49759490 G A
RPL19_17_37360863_A/T RPL19 17 37360863 A T
RRAS_19_50140130_G/A RRAS 19 50140130 G A
RRN3_16_15162102_G/A RRN3 16 15162102 G A
RSPH4A_6_116950734_G/A RSPH4A 6 116950734 G A
RYR3_15_33954652_C/T RYR3 15 33954652 C T
SACS_13_23905771_C/A SACS 13 23905771 C A
SALL2_14_21991626_C/G SALL2 14 21991626 C G
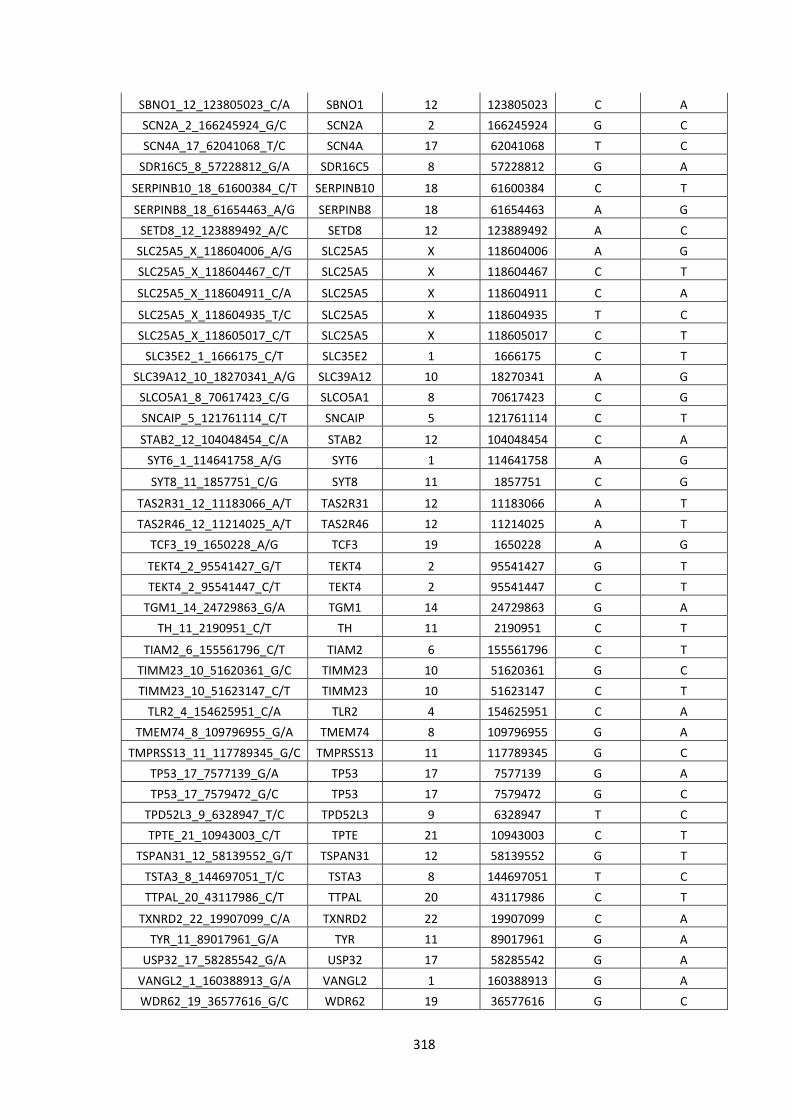
318
SBNO1_12_123805023_C/A SBNO1 12 123805023 C A
SCN2A_2_166245924_G/C SCN2A 2 166245924 G C
SCN4A_17_62041068_T/C SCN4A 17 62041068 T C
SDR16C5_8_57228812_G/A SDR16C5 8 57228812 G A
SERPINB10_18_61600384_C/T SERPINB10 18 61600384 C T
SERPINB8_18_61654463_A/G SERPINB8 18 61654463 A G
SETD8_12_123889492_A/C SETD8 12 123889492 A C
SLC25A5_X_118604006_A/G SLC25A5 X 118604006 A G
SLC25A5_X_118604467_C/T SLC25A5 X 118604467 C T
SLC25A5_X_118604911_C/A SLC25A5 X 118604911 C A
SLC25A5_X_118604935_T/C SLC25A5 X 118604935 T C
SLC25A5_X_118605017_C/T SLC25A5 X 118605017 C T
SLC35E2_1_1666175_C/T SLC35E2 1 1666175 C T
SLC39A12_10_18270341_A/G SLC39A12 10 18270341 A G
SLCO5A1_8_70617423_C/G SLCO5A1 8 70617423 C G
SNCAIP_5_121761114_C/T SNCAIP 5 121761114 C T
STAB2_12_104048454_C/A STAB2 12 104048454 C A
SYT6_1_114641758_A/G SYT6 1 114641758 A G
SYT8_11_1857751_C/G SYT8 11 1857751 C G
TAS2R31_12_11183066_A/T TAS2R31 12 11183066 A T
TAS2R46_12_11214025_A/T TAS2R46 12 11214025 A T
TCF3_19_1650228_A/G TCF3 19 1650228 A G
TEKT4_2_95541427_G/T TEKT4 2 95541427 G T
TEKT4_2_95541447_C/T TEKT4 2 95541447 C T
TGM1_14_24729863_G/A TGM1 14 24729863 G A
TH_11_2190951_C/T TH 11 2190951 C T
TIAM2_6_155561796_C/T TIAM2 6 155561796 C T
TIMM23_10_51620361_G/C TIMM23 10 51620361 G C
TIMM23_10_51623147_C/T TIMM23 10 51623147 C T
TLR2_4_154625951_C/A TLR2 4 154625951 C A
TMEM74_8_109796955_G/A TMEM74 8 109796955 G A
TMPRSS13_11_117789345_G/C TMPRSS13 11 117789345 G C
TP53_17_7577139_G/A TP53 17 7577139 G A
TP53_17_7579472_G/C TP53 17 7579472 G C
TPD52L3_9_6328947_T/C TPD52L3 9 6328947 T C
TPTE_21_10943003_C/T TPTE 21 10943003 C T
TSPAN31_12_58139552_G/T TSPAN31 12 58139552 G T
TSTA3_8_144697051_T/C TSTA3 8 144697051 T C
TTPAL_20_43117986_C/T TTPAL 20 43117986 C T
TXNRD2_22_19907099_C/A TXNRD2 22 19907099 C A
TYR_11_89017961_G/A TYR 11 89017961 G A
USP32_17_58285542_G/A USP32 17 58285542 G A
VANGL2_1_160388913_G/A VANGL2 1 160388913 G A
WDR62_19_36577616_G/C WDR62 19 36577616 G C

319
WDR72_15_53907948_G/A WDR72 15 53907948 G A
WNK2_9_96021312_G/A WNK2 9 96021312 G A
WNT16_7_120969745_G/T WNT16 7 120969745 G T
YLPM1_14_75248652_C/G YLPM1 14 75248652 C G
ZCWPW1_7_100017260_T/C ZCWPW1 7 100017260 T C
ZNF404_19_44377669_G/A ZNF404 19 44377669 G A
ZNF544_19_58774094_C/T ZNF544 19 58774094 C T
ZNF880_19_52888071_G/T ZNF880 19 52888071 G T
ZP3_7_76071228_A/G ZP3 7 76071228 A G

320
Table 5 – Single nucleotide variants exclusive to the non-responders
Annotation Gene Chromosome Location Substituted Amino Acid
New Amino Acid
A4GALT_22_43089654_C/T A4GALT 22 43089654 C T
ABCA13_7_48390326_G/A ABCA13 7 48390326 G A
ABCC3_17_48761053_G/A ABCC3 17 48761053 G A
ACAA1_3_38167095_A/G ACAA1 3 38167095 A G
ACACB_12_109650663_A/G ACACB 12 109650663 A G
ACAD11_3_132338346_T/G ACAD11 3 132338346 T G
ACADL_2_211060050_T/G ACADL 2 211060050 T G
ACE_17_61568577_C/T ACE 17 61568577 C T
ACTN2_1_236902618_G/A ACTN2 1 236902618 G A
ADAMTS1_21_28212761_G/A ADAMTS1 21 28212761 G A
ADNP2_18_77895325_T/G ADNP2 18 77895325 T G
AGXT_2_241808314_C/T AGXT 2 241808314 C T
AK2_1_33478931_G/C AK2 1 33478931 G C
ALG1_16_5128817_G/A ALG1 16 5128817 G A
ALPP_2_233243586_C/T ALPP 2 233243586 C T
ALPPL2_2_233271669_C/T ALPPL2 2 233271669 C T
AMY2A_1_104163266_G/A AMY2A 1 104163266 G A
ANKRD36_2_97860487_T/C ANKRD36 2 97860487 T C
APOBEC3G_22_39482396_C/A APOBEC3G 22 39482396 C A
ATP6V0D2_8_87151837_A/T ATP6V0D2 8 87151837 A T
BMP2K_4_79832411_A/G BMP2K 4 79832411 A G
C18orf25_18_43796346_G/C C18orf25 18 43796346 G C
C1QTNF9_13_24895805_G/A C1QTNF9 13 24895805 G A
C2orf43_2_20974689_C/T C2orf43 2 20974689 C T
C3orf39_3_43121884_G/C C3orf39 3 43121884 G C
CACNA1H_16_1254369_C/T CACNA1H 16 1254369 C T
CCBL2_1_89448608_G/A CCBL2 1 89448608 G A
CDC27_17_45214523_A/C CDC27 17 45214523 A C
CDC27_17_45214531_G/A CDC27 17 45214531 G A
CDC27_17_45214551_G/A CDC27 17 45214551 G A
CDC27_17_45214615_G/C CDC27 17 45214615 G C
CDC27_17_45214617_G/C CDC27 17 45214617 G C
CDC27_17_45214623_G/A CDC27 17 45214623 G A
CDC27_17_45219296_G/C CDC27 17 45219296 G C
CDC27_17_45219332_T/G CDC27 17 45219332 T G
CDC27_17_45247298_A/G CDC27 17 45247298 A G
CDC27_17_45247301_A/G CDC27 17 45247301 A G
CDC27_17_45258951_A/G CDC27 17 45258951 A G
CDC27_17_45258954_A/G CDC27 17 45258954 A G

321
CDH8_16_61859047_T/C CDH8 16 61859047 T C
CEP135_4_56819375_A/G CEP135 4 56819375 A G
CFTR_7_117188750_C/T CFTR 7 117188750 C T
CHRNE_17_4806020_G/A CHRNE 17 4806020 G A
CHST15_10_125769672_G/A CHST15 10 125769672 G A
CLCN4_X_10176599_T/C CLCN4 X 10176599 T C
CLCNKB_1_16371067_G/T CLCNKB 1 16371067 G T
CNGA4_11_6265242_G/C CNGA4 11 6265242 G C
CNN2_19_1036211_C/T CNN2 19 1036211 C T
COL15A1_9_101778346_C/G COL15A1 9 101778346 C G
COL18A1_21_46911188_C/G COL18A1 21 46911188 C G
COL6A2_21_47551942_G/A COL6A2 21 47551942 G A
COSM45060_17_7577581_A/G COSM45060 17 7577581 A G
CTBP2_10_126681824_G/A CTBP2 10 126681824 G A
CTBP2_10_126681831_C/G CTBP2 10 126681831 C G
CTBP2_10_126681838_C/G CTBP2 10 126681838 C G
CTBP2_10_126681848_T/A CTBP2 10 126681848 T A
CTBP2_10_126683235_C/A CTBP2 10 126683235 C A
CTBP2_10_126691552_T/G CTBP2 10 126691552 T G
CTDSP2_12_58217698_G/T CTDSP2 12 58217698 G T
CTDSP2_12_58217770_G/T CTDSP2 12 58217770 G T
CYP4F2_19_15989696_G/C CYP4F2 19 15989696 G C
DISP1_1_223116472_G/A DISP1 1 223116472 G A
DNA2_10_70191724_C/G DNA2 10 70191724 C G
DNAH17_17_76456017_C/G DNAH17 17 76456017 C G
DOCK7_1_62993881_T/C DOCK7 1 62993881 T C
DROSHA_5_31508739_C/T DROSHA 5 31508739 C T
DSG1_18_28909921_G/T DSG1 18 28909921 G T
DUOX2_15_45392075_G/A DUOX2 15 45392075 G A
DUOX2_15_45393014_G/C DUOX2 15 45393014 G C
EME1_17_48457758_C/G EME1 17 48457758 C G
EMR2_19_14875388_G/A EMR2 19 14875388 G A
ENOX2_X_129837156_G/A ENOX2 X 129837156 G A
ESPNL_2_239039981_A/G ESPNL 2 239039981 A G
EXTL3_8_28575417_T/C EXTL3 8 28575417 T C
FAM126A_7_23016393_C/G FAM126A 7 23016393 C G
FAM8A1_6_17606159_C/A FAM8A1 6 17606159 C A
FANCA_16_89857935_G/A FANCA 16 89857935 G A
FCGBP_19_40376675_G/A FCGBP 19 40376675 G A
FES_15_91433090_A/G FES 15 91433090 A G
FGFR3_4_1806629_C/T FGFR3 4 1806629 C T
FNDC1_6_159655103_T/G FNDC1 6 159655103 T G
FOXN4_12_109725707_G/A FOXN4 12 109725707 G A
FRG1_4_190876196_G/A FRG1 4 190876196 G A
FRG1_4_190876293_C/A FRG1 4 190876293 C A

322
FRG1_4_190883039_T/C FRG1 4 190883039 T C
FUT3_19_5843784_A/T FUT3 19 5843784 A T
GDNF_5_37816112_G/A GDNF 5 37816112 G A
GLB1_3_33138549_G/A GLB1 3 33138549 G A
GLIS2_16_4385158_A/G GLIS2 16 4385158 A G
GLOD4_17_685752_G/A GLOD4 17 685752 G A
GPATCH2_1_217604654_T/C GPATCH2 1 217604654 T C
GSTT1_22_24379402_T/G GSTT1 22 24379402 T G
HEXDC_17_80391684_A/G HEXDC 17 80391684 A G
HRAS_11_533880_G/A HRAS 11 533880 G A
IL3RA_X_1471083_C/G IL3RA X 1471083 C G
INF2_14_105180785_C/T INF2 14 105180785 C T
IQSEC3_12_247544_C/T IQSEC3 12 247544 C T
IRX4_5_1878325_C/T IRX4 5 1878325 C T
IRX6_16_55362942_T/C IRX6 16 55362942 T C
KCNG4_16_84256410_C/T KCNG4 16 84256410 C T
KCNH6_17_61615545_A/G KCNH6 17 61615545 A G
KCNJ12_17_21319087_G/A KCNJ12 17 21319087 G A
KCNJ12_17_21319523_C/T KCNJ12 17 21319523 C T
KCNJ12_17_21319786_G/A KCNJ12 17 21319786 G A
KIAA0753_17_6513329_G/A KIAA0753 17 6513329 G A
KIAA1958_9_115422069_G/A KIAA1958 9 115422069 G A
KIF24_9_34254413_G/C KIF24 9 34254413 G C
KLK10_19_51519365_C/G KLK10 19 51519365 C G
KRAS_12_25398284_C/A KRAS 12 25398284 C A
KRT18_12_53343209_G/A KRT18 12 53343209 G A
KRT18_12_53343225_C/T KRT18 12 53343225 C T
KRT18_12_53343231_G/C KRT18 12 53343231 G C
KRT32_17_39619115_G/A KRT32 17 39619115 G A
KRT36_17_39643340_T/G KRT36 17 39643340 T G
KRT40_17_39135089_G/A KRT40 17 39135089 G A
KRT40_17_39137154_C/G KRT40 17 39137154 C G
KRT40_17_39137387_C/T KRT40 17 39137387 C T
LDHAL6B_15_59500180_C/G LDHAL6B 15 59500180 C G
LRP1B_2_141459344_C/T LRP1B 2 141459344 C T
LRRC17_7_102574920_G/C LRRC17 7 102574920 G C
LYPD2_8_143833856_C/T LYPD2 8 143833856 C T
MATN2_8_98943447_G/C MATN2 8 98943447 G C
MDGA2_14_47770622_G/A MDGA2 14 47770622 G A
MGAT2_14_50089014_A/C MGAT2 14 50089014 A C
MINK1_17_4797305_G/A MINK1 17 4797305 G A
MLL2_12_49430947_T/C MLL2 12 49430947 T C
MLL3_7_151927021_C/A MLL3 7 151927021 C A
MLL3_7_151927067_T/C MLL3 7 151927067 T C
MLL3_7_151935910_C/T MLL3 7 151935910 C T

323
MLL5_7_104717522_A/G MLL5 7 104717522 A G
MPPED1_22_43831057_G/T MPPED1 22 43831057 G T
MSR1_8_16026181_T/C MSR1 8 16026181 T C
MTCH2_11_47663948_C/T MTCH2 11 47663948 C T
MTCH2_11_47663951_A/G MTCH2 11 47663951 A G
MUC4_3_195495916_G/C MUC4 3 195495916 G C
MUC6_11_1027811_C/T MUC6 11 1027811 C T
MYH3_17_10542257_A/G MYH3 17 10542257 A G
MYH4_17_10355371_C/T MYH4 17 10355371 C T
MYO1H_12_109872909_C/T MYO1H 12 109872909 C T
MYOM3_1_24409191_C/T MYOM3 1 24409191 C T
MZT2B_2_130948087_C/T MZT2B 2 130948087 C T
NCOA1_2_24888632_G/A NCOA1 2 24888632 G A
NCOR1_17_16097870_C/A NCOR1 17 16097870 C A
NHLRC1_6_18122258_C/T NHLRC1 6 18122258 C T
NIN_14_51202311_G/C NIN 14 51202311 G C
NPBWR1_8_53852871_A/T NPBWR1 8 53852871 A T
OR51G1_11_4945199_C/T OR51G1 11 4945199 C T
PABPC1_8_101725003_C/A PABPC1 8 101725003 C A
PABPC1_8_101727714_G/A PABPC1 8 101727714 G A
PABPC1_8_101727716_C/T PABPC1 8 101727716 C T
PABPC1_8_101730043_G/C PABPC1 8 101730043 G C
PABPC1_8_101730064_G/A PABPC1 8 101730064 G A
PABPC1_8_101730110_A/C PABPC1 8 101730110 A C
PAK2_3_196509577_C/G PAK2 3 196509577 C G
PARN_16_14576574_A/C PARN 16 14576574 A C
PCDHB3_5_140480852_G/A PCDHB3 5 140480852 G A
PCDHB4_5_140502343_C/T PCDHB4 5 140502343 C T
PCDHB4_5_140502344_C/T PCDHB4 5 140502344 C T
PCDHB8_5_140558628_T/C PCDHB8 5 140558628 T C
PCDHGB6_5_140788491_T/G PCDHGB6 5 140788491 T G
PHF11_13_50095041_A/G PHF11 13 50095041 A G
PIEZO1_16_88791458_G/A PIEZO1 16 88791458 G A
PIGT_20_44048972_A/C PIGT 20 44048972 A C
PLEKHG2_19_39913519_C/G PLEKHG2 19 39913519 C G
POU4F2_4_147561758_C/T POU4F2 4 147561758 C T
PPL_16_4935985_C/G PPL 16 4935985 C G
PRDM7_16_90126993_A/G PRDM7 16 90126993 A G
PRKRA_2_179309165_G/A PRKRA 2 179309165 G A
PRR23C_3_138762854_G/T PRR23C 3 138762854 G T
PRSS3_9_33797951_A/C PRSS3 9 33797951 A C
PRUNE2_9_79320847_G/C PRUNE2 9 79320847 G C
PTPRS_19_5258067_C/T PTPRS 19 5258067 C T
RANBP2_2_109382348_T/C RANBP2 2 109382348 T C
RASA4_7_102235769_T/C RASA4 7 102235769 T C

324
RBBP5_1_205068225_T/C RBBP5 1 205068225 T C
RBMX_X_135958704_G/C RBMX X 135958704 G C
SDK2_17_71426656_G/T SDK2 17 71426656 G T
SEC14L3_22_30864610_A/G SEC14L3 22 30864610 A G
SERPINB10_18_61582751_T/G SERPINB10 18 61582751 T G
SETD8_12_123892186_T/C SETD8 12 123892186 T C
SIGLEC11_19_50463982_T/G SIGLEC11 19 50463982 T G
SIPA1L1_14_72054755_C/A SIPA1L1 14 72054755 C A
SKIV2L_6_31931747_G/A SKIV2L 6 31931747 G A
SLC15A1_13_99337138_A/G SLC15A1 13 99337138 A G
SLC25A5_X_118603958_G/A SLC25A5 X 118603958 G A
SLC25A5_X_118604030_T/C SLC25A5 X 118604030 T C
SLC25A5_X_118604399_C/G SLC25A5 X 118604399 C G
SLC25A5_X_118604428_T/C SLC25A5 X 118604428 T C
SLC2A1_1_43393457_T/C SLC2A1 1 43393457 T C
SLC44A4_6_31846741_C/A SLC44A4 6 31846741 C A
SLC45A4_8_142228160_C/T SLC45A4 8 142228160 C T
SLC46A3_13_29292117_C/T SLC46A3 13 29292117 C T
SLC6A7_5_149578877_C/T SLC6A7 5 149578877 C T
SMPD4_2_130930380_A/G SMPD4 2 130930380 A G
SOX7_8_10683685_A/G SOX7 8 10683685 A G
SPNS1_16_28990588_G/A SPNS1 16 28990588 G A
SREK1IP1_5_64020269_T/C SREK1IP1 5 64020269 T C
SRMS_20_62174830_C/T SRMS 20 62174830 C T
SRPK3_X_153047251_A/G SRPK3 X 153047251 A G
STK17A_7_43659260_T/C STK17A 7 43659260 T C
TAS2R46_12_11214080_G/A TAS2R46 12 11214080 G A
TBX10_11_67402362_T/G TBX10 11 67402362 T G
TCF7_5_133451683_C/A TCF7 5 133451683 C A
TFAP2A_6_10410556_C/T TFAP2A 6 10410556 C T
TGM4_3_44929287_G/C TGM4 3 44929287 G C
TMEM41B_11_9308058_A/G TMEM41B 11 9308058 A G
TNFRSF14_1_2488153_A/G TNFRSF14 1 2488153 A G
TNRC6A_16_24834859_T/C TNRC6A 16 24834859 T C
TNS1_2_218713282_G/A TNS1 2 218713282 G A
TNXB_6_32010272_T/A TNXB 6 32010272 T A
TPSD1_16_1306986_C/T TPSD1 16 1306986 C T
TROAP_12_49724370_G/A TROAP 12 49724370 G A
TRPM2_21_45825813_G/C TRPM2 21 45825813 G C
TRPV5_7_142625304_C/T TRPV5 7 142625304 C T
TSPAN32_11_2325427_T/C TSPAN32 11 2325427 T C
USP40_2_234394477_A/G USP40 2 234394477 A G
VWA3B_2_98928429_C/G VWA3B 2 98928429 C G
VWF_12_6128067_G/A VWF 12 6128067 G A
WDR33_2_128525866_A/G WDR33 2 128525866 A G

325
WNT10B_12_49364239_C/T WNT10B 12 49364239 C T
WWC3_X_10090689_G/T WWC3 X 10090689 G T
ZBTB9_6_33423004_C/G ZBTB9 6 33423004 C G
ZNF717_3_75790837_C/A ZNF717 3 75790837 C A
ZNF717_3_75790880_A/G ZNF717 3 75790880 A G
ZNF730_19_23329194_A/G ZNF730 19 23329194 A G
ZNF813_19_53995266_C/T ZNF813 19 53995266 C T
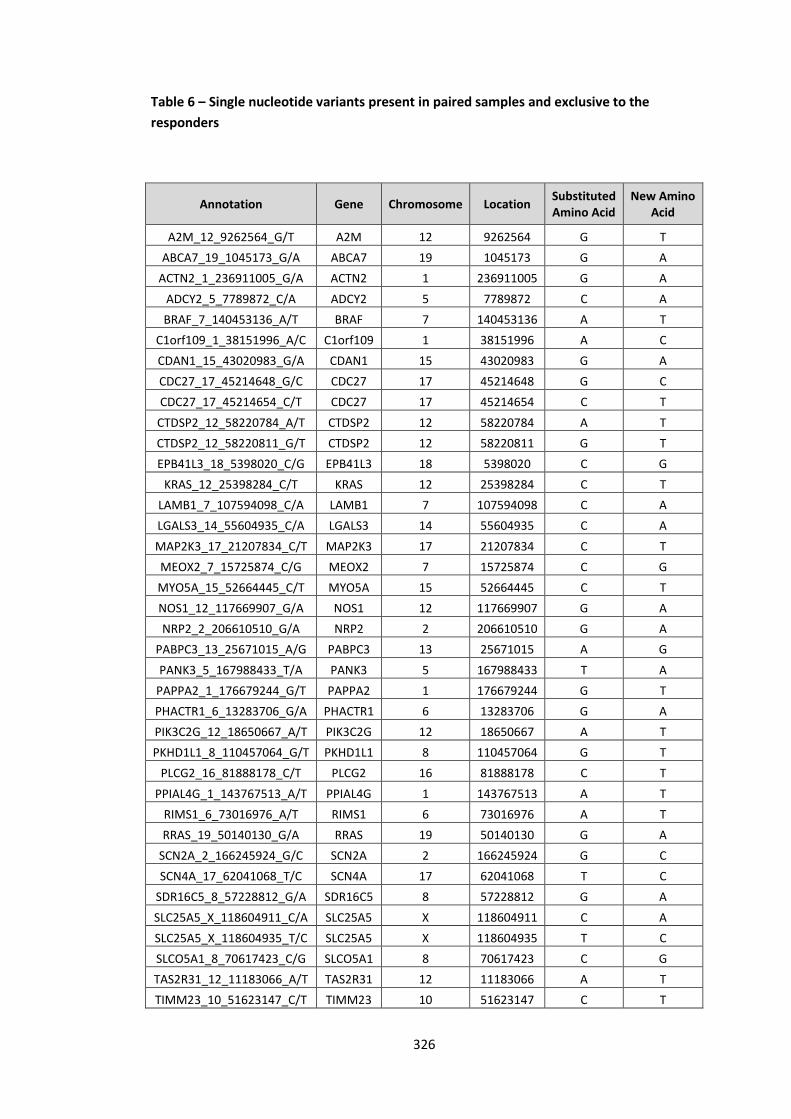
326
Table 6 – Single nucleotide variants present in paired samples and exclusive to the
responders
Annotation Gene Chromosome Location Substituted Amino Acid
New Amino Acid
A2M_12_9262564_G/T A2M 12 9262564 G T
ABCA7_19_1045173_G/A ABCA7 19 1045173 G A
ACTN2_1_236911005_G/A ACTN2 1 236911005 G A
ADCY2_5_7789872_C/A ADCY2 5 7789872 C A
BRAF_7_140453136_A/T BRAF 7 140453136 A T
C1orf109_1_38151996_A/C C1orf109 1 38151996 A C
CDAN1_15_43020983_G/A CDAN1 15 43020983 G A
CDC27_17_45214648_G/C CDC27 17 45214648 G C
CDC27_17_45214654_C/T CDC27 17 45214654 C T
CTDSP2_12_58220784_A/T CTDSP2 12 58220784 A T
CTDSP2_12_58220811_G/T CTDSP2 12 58220811 G T
EPB41L3_18_5398020_C/G EPB41L3 18 5398020 C G
KRAS_12_25398284_C/T KRAS 12 25398284 C T
LAMB1_7_107594098_C/A LAMB1 7 107594098 C A
LGALS3_14_55604935_C/A LGALS3 14 55604935 C A
MAP2K3_17_21207834_C/T MAP2K3 17 21207834 C T
MEOX2_7_15725874_C/G MEOX2 7 15725874 C G
MYO5A_15_52664445_C/T MYO5A 15 52664445 C T
NOS1_12_117669907_G/A NOS1 12 117669907 G A
NRP2_2_206610510_G/A NRP2 2 206610510 G A
PABPC3_13_25671015_A/G PABPC3 13 25671015 A G
PANK3_5_167988433_T/A PANK3 5 167988433 T A
PAPPA2_1_176679244_G/T PAPPA2 1 176679244 G T
PHACTR1_6_13283706_G/A PHACTR1 6 13283706 G A
PIK3C2G_12_18650667_A/T PIK3C2G 12 18650667 A T
PKHD1L1_8_110457064_G/T PKHD1L1 8 110457064 G T
PLCG2_16_81888178_C/T PLCG2 16 81888178 C T
PPIAL4G_1_143767513_A/T PPIAL4G 1 143767513 A T
RIMS1_6_73016976_A/T RIMS1 6 73016976 A T
RRAS_19_50140130_G/A RRAS 19 50140130 G A
SCN2A_2_166245924_G/C SCN2A 2 166245924 G C
SCN4A_17_62041068_T/C SCN4A 17 62041068 T C
SDR16C5_8_57228812_G/A SDR16C5 8 57228812 G A
SLC25A5_X_118604911_C/A SLC25A5 X 118604911 C A
SLC25A5_X_118604935_T/C SLC25A5 X 118604935 T C
SLCO5A1_8_70617423_C/G SLCO5A1 8 70617423 C G
TAS2R31_12_11183066_A/T TAS2R31 12 11183066 A T
TIMM23_10_51623147_C/T TIMM23 10 51623147 C T

327
TSPAN31_12_58139552_G/T TSPAN31 12 58139552 G T
TTPAL_20_43117986_C/T TTPAL 20 43117986 C T
VANGL2_1_160388913_G/A VANGL2 1 160388913 G A
WDR62_19_36577616_G/C WDR62 19 36577616 G C
WNK2_9_96021312_G/A WNK2 9 96021312 G A

328
Table 7 – Single nucleotide variants present in paired samples and exclusive to the non-
responders
Gene Chromosome Location Substituted Amino Acid
New Amino Acid
ABCA13_7_48390326_G/A 7 48390326 G A
ACAA1_3_38167095_A/G 3 38167095 A G
C1QTNF9_13_24895805_G/A 13 24895805 G A
CDC27_17_45214551_G/A 17 45214551 G A
CDC27_17_45258951_A/G 17 45258951 A G
CDC27_17_45258954_A/G 17 45258954 A G
COL18A1_21_46911188_C/G 21 46911188 C G
CTDSP2_12_58217698_G/T 12 58217698 G T
KRAS_12_25398284_C/A 12 25398284 C A
KRT18_12_53343209_G/A 12 53343209 G A
KRT32_17_39619115_G/A 17 39619115 G A
KRT40_17_39137387_C/T 17 39137387 C T
MDGA2_14_47770622_G/A 14 47770622 G A
MINK1_17_4797305_G/A 17 4797305 G A
MTCH2_11_47663948_C/T 11 47663948 C T
NCOA1_2_24888632_G/A 2 24888632 G A
PCDHB8_5_140558628_T/C 5 140558628 T C
PIGT_20_44048972_A/C 20 44048972 A C
PRSS3_9_33797951_A/C 9 33797951 A C
SIPA1L1_14_72054755_C/A 14 72054755 C A
SLC45A4_8_142228160_C/T 8 142228160 C T
TCF7_5_133451683_C/A 5 133451683 C A
TRPV5_7_142625304_C/T 7 142625304 C T

329
Appendix 2
Genetic variants in colorectal cancer identified by next generation sequencing studies
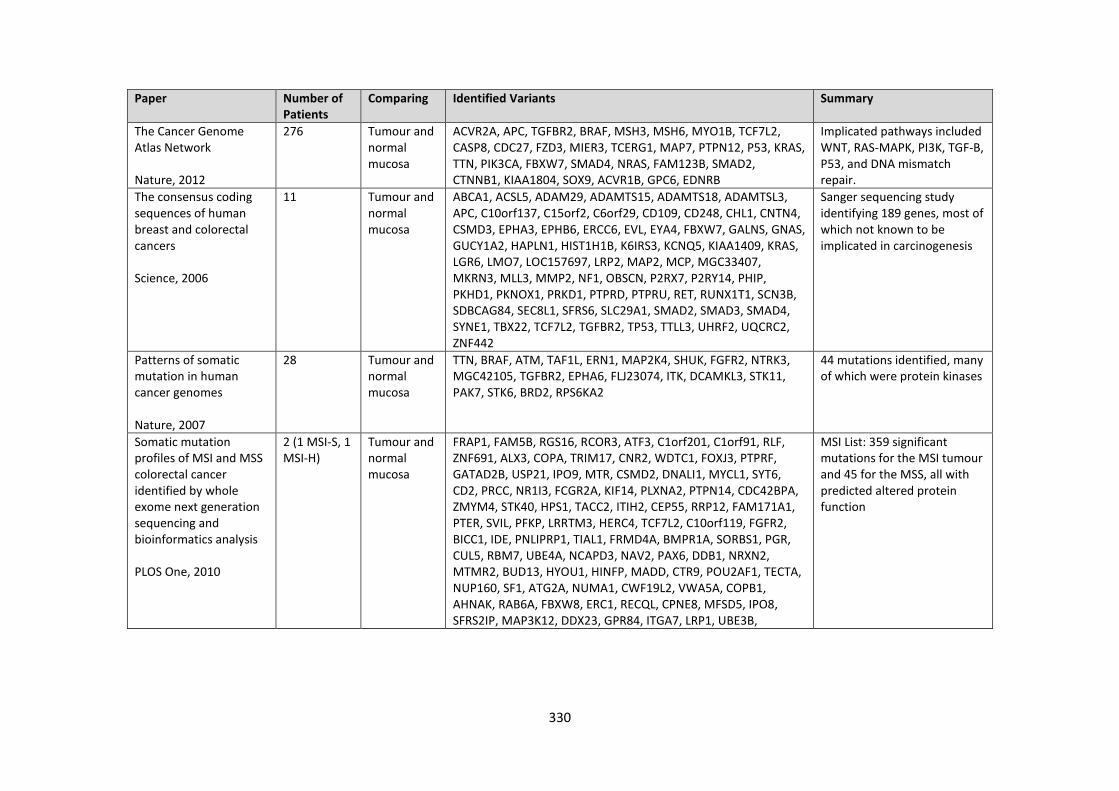
330
Paper Number of Patients
Comparing Identified Variants Summary
The Cancer Genome Atlas Network Nature, 2012
276 Tumour and normal mucosa
ACVR2A, APC, TGFBR2, BRAF, MSH3, MSH6, MYO1B, TCF7L2, CASP8, CDC27, FZD3, MIER3, TCERG1, MAP7, PTPN12, P53, KRAS, TTN, PIK3CA, FBXW7, SMAD4, NRAS, FAM123B, SMAD2, CTNNB1, KIAA1804, SOX9, ACVR1B, GPC6, EDNRB
Implicated pathways included WNT, RAS-MAPK, PI3K, TGF-B, P53, and DNA mismatch repair.
The consensus coding sequences of human breast and colorectal cancers Science, 2006
11 Tumour and normal mucosa
ABCA1, ACSL5, ADAM29, ADAMTS15, ADAMTS18, ADAMTSL3, APC, C10orf137, C15orf2, C6orf29, CD109, CD248, CHL1, CNTN4, CSMD3, EPHA3, EPHB6, ERCC6, EVL, EYA4, FBXW7, GALNS, GNAS, GUCY1A2, HAPLN1, HIST1H1B, K6IRS3, KCNQ5, KIAA1409, KRAS, LGR6, LMO7, LOC157697, LRP2, MAP2, MCP, MGC33407, MKRN3, MLL3, MMP2, NF1, OBSCN, P2RX7, P2RY14, PHIP, PKHD1, PKNOX1, PRKD1, PTPRD, PTPRU, RET, RUNX1T1, SCN3B, SDBCAG84, SEC8L1, SFRS6, SLC29A1, SMAD2, SMAD3, SMAD4, SYNE1, TBX22, TCF7L2, TGFBR2, TP53, TTLL3, UHRF2, UQCRC2, ZNF442
Sanger sequencing study identifying 189 genes, most of which not known to be implicated in carcinogenesis
Patterns of somatic mutation in human cancer genomes Nature, 2007
28 Tumour and normal mucosa
TTN, BRAF, ATM, TAF1L, ERN1, MAP2K4, SHUK, FGFR2, NTRK3, MGC42105, TGFBR2, EPHA6, FLJ23074, ITK, DCAMKL3, STK11, PAK7, STK6, BRD2, RPS6KA2
44 mutations identified, many of which were protein kinases
Somatic mutation profiles of MSI and MSS colorectal cancer identified by whole exome next generation sequencing and bioinformatics analysis PLOS One, 2010
2 (1 MSI-S, 1 MSI-H)
Tumour and normal mucosa
FRAP1, FAM5B, RGS16, RCOR3, ATF3, C1orf201, C1orf91, RLF, ZNF691, ALX3, COPA, TRIM17, CNR2, WDTC1, FOXJ3, PTPRF, GATAD2B, USP21, IPO9, MTR, CSMD2, DNALI1, MYCL1, SYT6, CD2, PRCC, NR1I3, FCGR2A, KIF14, PLXNA2, PTPN14, CDC42BPA, ZMYM4, STK40, HPS1, TACC2, ITIH2, CEP55, RRP12, FAM171A1, PTER, SVIL, PFKP, LRRTM3, HERC4, TCF7L2, C10orf119, FGFR2, BICC1, IDE, PNLIPRP1, TIAL1, FRMD4A, BMPR1A, SORBS1, PGR, CUL5, RBM7, UBE4A, NCAPD3, NAV2, PAX6, DDB1, NRXN2, MTMR2, BUD13, HYOU1, HINFP, MADD, CTR9, POU2AF1, TECTA, NUP160, SF1, ATG2A, NUMA1, CWF19L2, VWA5A, COPB1, AHNAK, RAB6A, FBXW8, ERC1, RECQL, CPNE8, MFSD5, IPO8, SFRS2IP, MAP3K12, DDX23, GPR84, ITGA7, LRP1, UBE3B,
MSI List: 359 significant mutations for the MSI tumour and 45 for the MSS, all with predicted altered protein function

331
MED13L, DHX37, SLC39A5, ALG5, CARS2, WASF3, UBL3, RAB2B, EXDL2, PCNX, KCNK10, C14orf102, ADCY4, NIN, PTPN21, TDP1, CPSF2, CTSG, CDKN3, SIX6, SLC10A1, FLVCR2, SSTR1, ACTR10, RDH12, MLH3, SPG11, GLDN, SNX1, OCA2, GJD2, ALDH1A2, MYO1E, KIAA1024, C15orf29, INO80, DMXL2, RORA, ARNT2, DNAJA3, LONP2, GRIN2A, NUP93, GAN, ZNF597, C16orf62, SEZ6L2, RBL2, RFWD3, BCAR1, TLK2, ALDH3A1, OR1A1, ZNF403, ETV4, CA10, MTMR4, APPBP2, ELAC2, PRPF8, FBXL20, CACNG4, TMEM104, DRG2, PIGS, PLXDC1, SPAG9, COIL, KCTD2, DOK6, TXNL1, ROCK1, WDR7, ZADH2, ANGPTL6, CREB3L3, ZNF569, LENG8, ARHGEF18, COPE, STXBP2, RNASEH2A, TSSK6, C19orf47, HAS1, SF4, IL1A, DHRS9, ITGAV, TRAK2, MAP2, HDAC4, AGXT, MAPRE3, EHD3, FSHR, MGAT4A, GLI2, MBD5, SCN3A, SSFA2, NRP2, GALNT14, WDR33, UGCGL1, ACVR2A, LRP2, RBM45, DYSF, CNNM4, CHRNA1, MARCH4, SPHKAP, SPTBN1, SMEK2, C20orf6, TNNC2, SLC2A10, TSHZ2, NCOA6, GMEB2, ACSS1, JAG1, FLRT3, SEC23B, CSE1L, DSCR3, DYRK1A, ERG, FAM3B, PCNT, USP25, KIAA0179, HMGXB4, TMPRSS6, SULT4A1, CYTSA, RBM5, ALAS1, CCDC37, SUCNR1, FNDC3B, OSBPL10, CTNNB1, C3orf23, HYAL2, TBC1D23, HRH1, TIPARP, LARS2, WDR6, NFKBIZ, UROC1, SLC25A38, CXCR6, PRKCD, PHF17, GRIA2, KDR, PCDH18, CCRN4L, GABRB1, COX18, MTTP, MANBA, MFSD8, GALNT7, IRF2, WDFY3, LMNB1, PCDHB3, LARP1, GABRA6, PCDH24, ADAMTS12, DMGDH, CSPG2, MAN2A1, TRIM36, SIL1, GRM6, PARP8, WDR55, POU4F3, C5orf42, ACOT12, ALDH7A1, LAMA4, ROS1, ENPP3, TAAR2, TAAR1, IL20RA, CNPY3, PLA2G7, POPDC3, TULP4, ZNF318, RP3-337H4.1, CDC2L6, AIG1, ITPR3, ZFAND3, FRS3, MEP1A, IGF2R, TFAP2B, SLC17A5, PRSS35, MAP3K7, PLOD3, BRAF, PDIA4, TRA2A, AEBP1, GRM3, MCM7, STAG3, RELN, LAMB4, GLI3, DDX56, PCOLCE, SMURF1, C8orf41, CNGB3, HTRA4, ASPH, SULF1, ANXA13, RB1CC1, ARFGEF1, CSMD3, NOV, PPM2C, LAPTM4B, UGCG, UNC13B, RORB, KIF12, GLE1, NUP214, DBC1, ENDOG, ADAMTS13, SNAPC3, EXOSC2, SLC24A2, L1CAM, KIF4A,

332
ABCB7, GPR174, GABRE, NHS, PRICKLE3, DMD
Somatic mutation profiles of MSI and MSS colorectal cancer identified by whole exome next generation sequencing and bioinformatics analysis PLOS One, 2010
2 (1 MSI-S, 1 MSI-H)
Tumour and normal mucosa
PLA2G2D, MEF2D, AKR7A3, WDTC1, IL12RB2, ARHGAP21, SUPV3L1, BMPR1A, CTR9, MLL, DAGLA, MICAL2, TNKS1BP1, RCOR2, PRICKLE1, KRAS, MTERFD3, DAO, FREM2, UGCGL2, SETDB2, RBBP6, TP53, KCNJ12, ADNP2, CD22, NUP62, STAT1, PNPT1, GPR45, EHD3, ATP9A, USP13, PLD1, ITGA9, DNAH5, SNX18, TNFRSF21, ASCC3, THEM2, HCRTR2, SRRT, CREB3L2, HOXA1, ABRA
MSS List: 359 significant mutations for the MSI tumour and 45 for the MSS, all with predicted altered protein function
Exome capture sequencing of adenoma reveals genetic alterations in multiple cellular pathways at the early stage of colorectal tumorigenesis PLOS One, 2013
1 Tumour, adenoma and normal mucosa
OR6X1, SLC15A3, KRTHB4, RBFOX1, LAMA3, CDH20, BIRC6, APC, NMBR, GLCCI1, EFR3A, FTHL17, , PGM1, DTL, PPP1R3C, OR51E2, RRP8, NARS2, FAM109A, FAM181A, NRXN3, KIAA1409, TGM7, CORO1A, KRTHA1, GNAL, PPAP2C, FLJ37549, RYR1, GSK3A, ATF2, AFP36L2, NFATC2, ZFP64, GRIK1, KRTAP19-7, DESK1, KLHL22, ALPK1, FBXW7, APC, POU4F3, FLT4, FAM54A, KIF25, SDK1, TRF2, CUX1, NRG1, OR13J1, COL4A6, WDR44
12 variants were identified in the adenoma and 42 in the adenocarcinoma
Chromothripsis is a common mechanism driving genomic rearrangements in primary and metastatic colorectal cancer Genome Biology, 2011
4 Primary tumour, normal mucosa, liver metastasis and liver parenchyma
APC, DDR2, KRAS, PTPRF, SMAD2, SMAD4, TP53, MLL3, PART14, PIK3CA, KDR, PRKCD, RFC1, EXOC4, TSC1, FGFR2, NUP98, ERBB3, RASA3, DNAH9, TAOK1, ATRX, TTN, EPHA4
24 genes suggesting the relevance of chromothripsis to metastagenesis
Genomic sequencing of colorectal adenocarcinomas identifies a recurrent VTI1A-TCF7L2 fusion
9 Tumour and normal mucosa
TARDBP, INADL, CFH, CYS1, RASGRP3, CCDC88A, C2orf78, FER1L5, TTN, IGFBP5, RAF1, LTF, PPP2R3A, PCCB, KLHL6, PAK2, SLC10A7, ACSL1, CMYA5, FAM81B, APC, APC, PCDHGC3, DHX16, SYNGAP1, C6orf204, POT1, GRM8, DMRT1, KIAA1539, ECM2, BAAT, ABL1, SEC16A, ITIH5, ITPRIP, IRF7, TRIM6-TRIM34, IPO7, ANO3, OR8H2, CEP164, CASC1, KRAS, DDX11, PUS7L, PAN2,
Eleven rearrangements encode predicted in-frame fusion proteins, including a fusion of TVI1A and TCF7L2 found in 3 out of 9 patients

333
Nature Genetics, 2011 ZFP106, BBS4, UBFD1, TP53, MAP2K3, TOP2A, TRIM47, FAM38B, ROCK1, NFATC1, OR10H3, TMEM147, SAE1, PPP2R1A, GZF1, PTPRT, CASS4, GTPBP5, CHAF1B, LCA5L, CHEK2, FAM47A, FAM123B, CACNA1S, C1orf107, TAF5L, C2orf78, FIGN, COBLL1, GLB1, TOPBP1, KCNAB1, TMPRSS11F, RGMB, APC, APC, OPRM1, PCLO, AKAP9, PRKAR2B, PLXNA4, FOXD4, C9orf95, CYLC2, TAF3, C10orf82, OR51B4, C11orf65, WNK1, KRAS, MDM1, CLLU1, DNAH10, DHX37, KIAA1409, RYR3, PLIN1, OR4F15, NSMCE1, HYDIN, ZNF521, EMR1, OR7E24, KIAA1683, ZNF761, EYA2, UBASH3A, MXRA5, FAM47C, TBC1D8B, CHD5, CSMD2, PODN, NTNG1, HAO2, SEMA6C, SLC27A3, DHX9, HHIPL2, SUSD4, ABCG8, SCN1A, TTN, TTN, MYO1B, COL6A3, FLNB, STXBP5L, PCOLCE2, P2RY12, MED12L, DCAF4L1, FAM13A, DCHS2, CYP4V2, FYB, PCDHGA6, CSF1R, SNCB, TBC1D9B, HIST1H1D, ZNF323, NKAIN2, PLG, SP4, RABGEF1, CYP3A43, DGKI, OR2A5, TM7SF4, CSMD3, TG, DMRT3, PDCD1LG2, GABBR2, JMJD1C, ANXA11, GRID1, SORCS1, PRMT3, RAG1, ATG2A, GPR83, NCAM1, DSCAML1, OR8D1, NDUFA9, ADAMTS20, KRT76, NBEA, SIAH3, ATP7B, SCEL, RTN1, ALDH6A1, NRXN3, SERPINA1, DICER1, RYR3, CYP1A2, DNAH3, SCNN1G, MYH3, ATPAF2, PNMT, ASB16, USH1G, ASXL3, SMAD4, ABCA7, SEMA6B, EMR1, SYDE1, PSG3, LILRB3, CYP2D6, FLJ44635, MAGEE2, MAGEA11, SYTL1, PHACTR4, KIAA0467, C8A, PTPRC, CAPN2, PLB1, CTNNA2, SNRNP200, LRP2, HAT1, TTN, HECW2, CADPS, CADPS, PVRL3, UROC1, NFXL1, RNF150, C5orf44, SLCO6A1, APC, PCDHA3, PCDHGA7, FAT2, TBC1D9B, TRIM26, MUC21, BAT2, PI16, MDGA1, TCTE1, PGK2, ASCC3, RBM16, IGF2R, C6orf118, C6orf118, ISPD, ADCY1, IMMP2L, ZNF425, ADRA1A, MMP16, DEPDC6, EPPK1, AK3, TAF1L, FANCG, DAPK1, DBC1, CDK5RAP2, LRIT2, CSRP3, PDHX, OR4D9, HSPA8, WNK1, C3AR1, PHC1, PDZRN4, C12orf56, TMCC3, CUX2, FLT1, FARP1, HDC, TMOD3, IREB2, ACAN, RBBP6, TAT, PHF23, TP53, EFCAB5, BPTF, TCEB3CL, ARHGEF18, CACNA1A, LAIR1, HM13, B4GALT5, SLC9A8, KRTAP6-2, PRAME, MYO18B, RANGAP1, ATP6AP2,

334
USP9X, UBE4B, NRAS, USH2A, OBSCN, XDH, VRK2, ANKRD36B, LIPT1, TTN, TTN, ICA1L, SCN10A, PCBP4, DZIP3, PIK3CA, HTT, ANK2, PRSS48, CDH12, IL31RA, TNPO1, APC, SLC27A6, HIST1H2AJ, BRD2, COL12A1, EPM2A, SYNE1, MRPS17, PTPN12, AKAP9, SSPO, DLC1, SLC7A2, PREX2, FLJ43860, EPPK1, GLT6D1, NEBL, PTCHD3, ANK3, C10orf4, TCF7L2, TUB, BTBD10, LDHA, OR4C13, OR8K3, OR1S2, TMEM218, CACNA1C, PIK3C2G, LRRK2, PDZRN4, ZFC3H1, ZNF84, PCDH17, SIPA1L1, SPTLC2, EFTUD1, C15orf32, SYNM, TP53, ABCA10, OTOP2, ZNF750, CXXC1, CPAMD8, ZNF568, ZNF569, SYNGR4, ZNF578, KIR2DL1, TSHZ2, ADAMTS5, COL4A5, KIAA1210, EIF4G3, SFRS4, HDAC1, LPHN2, LCE4A, GREB1, SCLT1, APC, SRA1, CRIP3, HCRTR2, AKD1, RP1L1, TRPA1, ZFHX4, OR1L4, KCNT1, PNPLA7, CNTN5, KRAS, FLT3, DCLK1, ADPRHL1, WWP2, CDC27, SCN4A, SMAD4, MUC16, GPR32, MAGEC1, SLITRK2, VPS13D, NRAS, DDR2, PRG4, SRBD1, UXS1, PTPN4, LRP1B, GAD1, TTN, ITGAV, NOP58, DNAJB2, PDCD6IP, DCLK3, SCN11A, BOC, STXBP5L, ENOPH1, C4orf31, FBXW7, PPWD1, APC, APC, RBM27, PEG10, PSMC2, BCAP29, PLXNA4, CSMD3, CSMD3, FLJ46321, BAT2L, C9orf96, CARD9, FRMD4A, PTER, CUBN, CACNB2, SVIL, PCBD1, EXOC6, DMBT1, GRIK4, KRT1, DNAJC14, ESYT1, KCNMB4, PPP1R12A, ANKS1B, ACACB, PDS5B, SLITRK5, HECTD1, RHOJ, SFRS5, FAM181A, HERC1, MFGE8, NLRC5, COG4, TP53, SLFN5, GAS2L2, FBXO47, NPEPPS, TXNDC2, SMAD2, MBD1, GRWD1, FPR2, NLRP9, NLRP4, FRMPD4, TRO, FAM70A, HSPG2, GMEB1, TNNI3K, EPS8L3, ARNT, SHC1, KIF14, BTG2, ANGEL2, TARBP1, APOB, USP34, FAM136A, TBR1, COL6A3, MYRIP, CD200R1L, C4orf49, GALNTL6, SORBS2, MTRR, FBXL7, OSMR, C7, RASA1, MEP1A, PTP4A1, PHIP, HTR1E, C6orf167, FAM184A, GRM1, VSTM2A, C7orf42, CCDC146, DOCK4, ST7, UBE2H, MGAM, DLC1, KIAA1967, NRG1, UBR5, MTSS1, COL22A1, DNTT, GSTO2, MUC2, FOLH1, NUMA1, PCF11, FAT3, CUL5, OR10G7, PRMT8, KCNA6, KCNA1, KRAS, OVCH1, SFRS2IP, DDX23, ANKRD33, HELB, NAV3, C12orf51, RPL6, SACS,

335
FNDC3A, KPNA3, TDRD3, FAM155A, OR4K14, PNN, FBN1, SLC27A2, VPS13C, TP53, KCNJ12, RAB11FIP4, NFE2L1, TLK2, ABCA9, PTPRM, HNRNPM, ZNF667, ZNF329, ITCH, ELFN2, SAMM50, ESPN, MTHFR, PPT1, ZCCHC11, DPT, FAM129A, HMCN1, HMCN1, NFASC, CENPF, PRSS38, ARID4B, RYR2, OR14C36, C2orf71, EHBP1, TEX261, FER1L5, CNTNAP5, TLK1, ALS2CR11, CXCR2, TMBIM1, COL4A4, COL6A3, OR6B2, USP19, TOPBP1, EPHB1, LEKR1, APBB2, REST, RAPGEF2, WDR17, CDH9, ZFYVE16, ST8SIA4, APC, APC, KIF3A, ATP10B, C5orf41, CAPN11, GABRR2, WBSCR17, SEMA3C, STAG3, TFR2, LRRN3, CPA5, MGAM, GIMAP8, PXDNL, RP1, NCOA2, CA2, FBXO43, RANBP6, ACO1, FAM189A2, GABBR2, OR13D1, FAM129B, NTNG2, MAMDC4, C10orf18, PRKCQ, USP6NL, C10orf140, KIAA1462, GJD4, CSGALNACT2, RTKN2, CHUK, PKD2L1, SHOC2, ATRNL1, BNIP3, OR52A5, CCKBR, DENND5A, SAA2, NAV2, C11orf49, OR4C11, GLYATL1, FAM111B, FAT3, BCL9L, FLI1, GLB1L2, AKAP3, NOP2, A2M, DUSP16, RERGL, KRAS, KRT75, KRT2, OR6C2, TIMELESS, APAF1, CKAP4, RNFT2, CLIP1, FLJ10357, ZNF219, SPTB, NDN, RTF1, PML, SNX33, UNC45A, C16orf38, DCI, STX1B, CHD9, CCDC135, TSNAXIP1, SLC12A4, DHX38, CBFA2T3, ZNF778, SHBG, KRT12, GPATCH8, SPATA20, TEX14, C18orf34, MYO9B, WDR88, HRC, C20orf12, RALGAPA2, WFDC3, C20orf108, UCKL1, PRPF6, IGSF5, CCT8L2, GAB4, MCAT, CELSR1, ARSH, TLR8, PHEX, TCEAL3, COL4A5
Exome sequencing reveals frequent inactivating mutations in ARID1A, ARID1B, ARID2 and ARID4 in microsatellite unstable colorectal cancer International Journal of
21 Tumour and normal mucosa
ARID1A, ARID1B, ARID2, ARID3A, ARID4A, ARID4B, ARID5A, JARID2, KDM5A, KDM5B, KDM5C, KDM5D
Analysis focussed to ARID genes only which were frequently mutated (13-39%)

336
Cancer, 2013
Comprehensive genomic analysis of a metastatic colon cancer to the lung by whole exome sequencing and gene expression analysis International Journal of Oncology, 2014
1 Metastatic lung tumour and normal lung
ADCY2, ADCY9, APC, GNB5, KRAS, LRP6, HDAC6, ARHGEF17 8 of the 71 variants identified pertain to the ‘metastatic colorectal cancer signalling’ or ‘phospholipase C signalling’ pathways
Targeted sequencing of cancer related genes in colorectal cancer using next generation sequencing PLOS One, 2013
60 Tumour and normal mucosa
AATK, ABL1, ABL2, ACVR2A, AKT1, AKT2, ALK, APC, ATM, AXIN2, BCL2, BCL9, BLM, BMPR1A, BRCA1, BRAF, BRCA2, BUB1B, BCL10, BRIP1, CARD11, CBL, CCND1, CDH1, CDK4, CDK6, CDKN1B, CDKN2A, CDX2, CEBPA, CHEK2, CREB1, CREBBP, CSF1, CSF1R, CSMD3, CTNNB1, CYLD, DCC, EGFR, ELK1, ELN, ENG, EP300, EPHA1, EPHB1, EPM2A, ERBB2, ERCC1, ERCC2, ERCC3, ERCC4, ERCC5, EWSR1, EXT1, EXT2, EZH2, FANCA, FANCC, FANCE, FANCF, FGFR1, FGFR3, FGFR2, FLI1, FLT3, FBXW7, FOXN1, FOXL2, GATA1, GATA2, GATA3, GNAS, GPC3, HIP1, HNF1A, HRAS, IDH1, IL21R, IL6ST, ITK, JAK1, JAK2, JAK3, KIT, KRAS, LCK, MAF, MAFB, MAP2K4, MDM2, MEN1, MET, MLH1, MLH3, MLL, MMP14, MPL, MSH2, MSH6, MUTYH, MUSK, MYC, MYCN, MYH11, MYH9, NEK11, NF1, NF2, NFKB2, NOTCH1, NPM1, NRAS, NTRK1, NTRK3, OBSCN, PALB2, PARP1, PDGFRA, PDGFRB, PHOX2B, PIK3CA, PIK3R1, PIM1, PLAG1, PML, PMS1, PMS2, PRDM16, PRKAR1A, PTGS2, PTEN, PTPN11, PTK7, RAD51L1, RAF1, RARA, RASSF1, RB1, RECQL4, REL, RET, ROR1, ROS1, RUNX1, RYR1, SH3GL1, SMAD2, SMAD4, SMARCB1, SMO, SPP1, SPTAN1, SRC, STAT1, STAT3, STK11, STK11IP, SUFU, SYK, TAF15, TAF1L, TEK, TGFBR1, TGFBR2, TGFA, TLX1, TLX3, TOP1, TOP2A, TP53, TRRAP, TSC1, TSC2, TTN, VHL, VEGFA, WAS, WHSC1, WRN, WT1, XPA, XPC
183 genes selected for analysis from COSMIC database (study designed to validate new platform)

337
Appendix 3
Proteomic comparison of metastatic tumour and normal adjacent liver parenchyma

338
Accession Number Name p Value Log2 Fold Change (Metastasis/Parenchyma)
P09210 Glutathione S-transferase A2 3.92E-09 -5.472
P23141 Liver carboxylesterase 1 5.38E-09 -5.215
Q68CK6 Acyl-coenzyme A synthetase ACSM2B, mitochondrial
1.10E-10 -5.201
P11509 Cytochrome P450 2A6 9.30E-08 -5.094
Q93088 Betaine--homocysteine S-methyltransferase 1
6.84E-10 -5.021
P09110 3-ketoacyl-CoA thiolase, peroxisomal
1.19E-10 -4.897
P10632 Cytochrome P450 2C8 2.59E-08 -4.883
P00367 Glutamate dehydroge0se 1, mitochondrial
6.38E-11 -4.759
P16662 UDP-glucuronosyltransferase 2B7
4.67E-08 -4.733
P45954 Short/branched chain specific acyl-CoA dehydroge0se,
mitochondrial
8.59E-12 -4.690
Q16822 Phosphoenolpyruvate carboxyki0se [GTP],
mitochondrial
8.59E-11 -4.683
P30039 Phe0zine biosynthesis-like domain-containing protein
1.44E-07 -4.662
Q9UJM8 Hydroxyacid oxidase 1 1.46E-09 -4.651
P50440 Glycine amidinotransferase, mitochondrial
5.74E-10 -4.582
P28845 Corticosteroid 11-beta-dehydroge0se isozyme 1
2.94E-11 -4.552
P05091 Aldehyde dehydroge0se, mitochondrial
2.66E-11 -4.547
P11712 Cytochrome P450 2C9 7.21E-08 -4.523
P21549 Serine--pyruvate aminotransferase
6.46E-10 -4.497
Q3LXA3 Bifunctio0l ATP-dependent dihydroxyacetone ki0se/FAD-
AMP lyase (cyclizing)
4.01E-08 -4.489
Q00796 Sorbitol dehydroge0se 9.97E-09 -4.479
Q08426 Peroxisomal bifunctio0l enzyme
5.57E-10 -4.474
P00352 Reti0l dehydroge0se 1 4.66E-09 -4.468
O95954 Formimidoyltransferase-cyclodeami0se
2.03E-09 -4.437
P00325 Alcohol dehydroge0se 1B 2.72E-07 -4.425
P07099 Epoxide hydrolase 1 1.68E-09 -4.398
P55157 Microsomal triglyceride transfer protein large subunit
1.45E-09 -4.386
P00480 Ornithine carbamoyltransferase,
mitochondrial
1.55E-11 -4.383
P30084 Enoyl-CoA hydratase, 1.00E-09 -4.341

339
mitochondrial
P08684 Cytochrome P450 3A4 9.61E-09 -4.333
P24752 Acetyl-CoA acetyltransferase, mitochondrial
2.54E-10 -4.315
P42765 3-ketoacyl-CoA thiolase, mitochondrial
7.98E-11 -4.304
P54868 Hydroxymethylglutaryl-CoA synthase, mitochondrial
8.37E-09 -4.299
P33121 Long-chain-fatty-acid--CoA ligase 1
9.84E-10 -4.269
P07327 Alcohol dehydroge0se 1A 5.89E-07 -4.240
P00966 Argininosucci0te synthase 2.59E-09 -4.227
Q14749 Glycine N-methyltransferase 1.88E-08 -4.213
P05089 Argi0se-1 1.88E-10 -4.202
P16152 Carbonyl reductase [0DPH] 1 8.85E-11 -4.163
Q9P0Z9 Peroxisomal sarcosine oxidase 9.10E-10 -4.145
P10620 Microsomal glutathione S-transferase 1
9.58E-08 -4.141
P30046 D-dopachrome decarboxylase 2.87E-07 -4.117
P80404 4-aminobutyrate aminotransferase,
mitochondrial
4.38E-11 -4.083
P04040 Catalase 1.11E-09 -4.064
P52895 Aldo-keto reductase family 1 member C2
7.97E-06 -4.055
P30038 Delta-1-pyrroline-5-carboxylate dehydroge0se, mitochondrial
9.86E-10 -4.039
P05062 Fructose-bisphosphate aldolase B
7.22E-09 -4.038
P00326 Alcohol dehydroge0se 1C 2.73E-07 -4.016
O75521 Enoyl-CoA delta isomerase 2, mitochondrial
7.57E-10 -4.013
P00505 Aspartate aminotransferase, mitochondrial
1.50E-10 -4.004
Q9UBQ7 Glyoxylate reductase/hydroxypyruvate
reductase
3.57E-09 -4.004
Q7Z4W1 L-xylulose reductase 2.61E-08 -3.962
Q9UI17 Dimethylglycine dehydroge0se, mitochondrial
1.26E-08 -3.958
P23378 Glycine dehydroge0se [decarboxylating],
mitochondrial
4.07E-06 -3.956
P20132 L-serine dehydratase/L-threonine deami0se
3.70E-03 -3.955
P16930 Fumarylacetoacetase 3.06E-09 -3.899
Q14032 Bile acid-CoA:amino acid N-acyltransferase
5.92E-07 -3.896
P21695 Glycerol-3-phosphate dehydroge0se [0D+],
cytoplasmic
2.35E-06 -3.893

340
P16219 Short-chain specific acyl-CoA dehydroge0se, mitochondrial
1.07E-08 -3.877
P35914 Hydroxymethylglutaryl-CoA lyase, mitochondrial
1.89E-09 -3.849
O75452 Retinol dehydroge0se 16 4.42E-08 -3.837
O75891 Cytosolic 10-formyltetrahydrofolate
dehydroge0se
3.31E-09 -3.825
P05181 Cytochrome P450 2E1 1.95E-06 -3.820
P30042 ES1 protein homolog, mitochondrial
3.84E-08 -3.818
P00167 Cytochrome b5 5.81E-10 -3.811
P32754 4-hydroxyphenylpyruvate dioxyge0se
2.86E-09 -3.800
P34896 Serine hydroxymethyltransferase,
cytosolic
9.55E-09 -3.796
P22307 Non-specific lipid-transfer protein
5.34E-11 -3.769
P11310 Medium-chain specific acyl-CoA dehydroge0se, mitochondrial
2.06E-07 -3.769
P30086 Phosphatidylethanolamine-binding protein 1
8.69E-09 -3.766
P52758 Ribonuclease UK114 1.92E-09 -3.762
P22310 UDP-glucuronosyltransferase 1-4
1.07E-08 -3.762
P51648 Fatty aldehyde dehydroge0se 1.15E-08 -3.756
P49419 Alpha-aminoadipic semialdehyde dehydroge0se
1.78E-10 -3.721
P49189 4-trimethylaminobutyraldehyde
dehydroge0se
2.60E-09 -3.702
P27338 Amine oxidase [flavin-containing] B
4.97E-09 -3.685
P30613 Pyruvate ki0se isozymes R/L 1.47E-06 -3.670
P51857 3-oxo-5-beta-steroid 4-dehydroge0se
3.04E-06 -3.654
P54855 UDP-glucuronosyltransferase 2B15
8.05E-07 -3.630
P04424 Argininosucci0te lyase 2.90E-10 -3.624
Q06520 Bile salt sulfotransferase 3.44E-07 -3.615
P40939 Trifunctio0l enzyme subunit alpha, mitochondrial
3.25E-09 -3.612
P34913 Epoxide hydrolase 2 3.16E-08 -3.610
P48735 Isocitrate dehydroge0se [0DP], mitochondrial
1.57E-07 -3.600
P28332 Alcohol dehydroge0se 6 9.97E-07 -3.599
A6NLP5 Tetratricopeptide repeat protein 36
2.67E-08 -3.599
Q02252 Methylmalo0te-semialdehyde dehydroge0se [acylating],
mitochondrial
1.62E-08 -3.590

341
Q16851 UTP--glucose-1-phosphate uridylyltransferase
1.76E-09 -3.589
Q9H8H3 Methyltransferase-like protein 7A
1.19E-08 -3.582
P31513 Dimethylaniline monooxyge0se [N-oxide-forming] 3
1.08E-06 -3.581
Q6YN16 Hydroxysteroid dehydroge0se-like protein 2
6.56E-09 -3.578
Q00266 S-adenosylmethionine synthase isoform type-1
3.32E-07 -3.550
Q14117 Dihydropyrimidi0se 2.73E-09 -3.527
Q9H2M3 Betaine--homocysteine S-methyltransferase 2
2.25E-07 -3.521
Q02928 Cytochrome P450 4A11 9.11E-08 -3.515
P11498 Pyruvate carboxylase, mitochondrial
9.27E-07 -3.513
P11182 Lipoamide acyltransferase component of branched-chain alpha-keto acid dehydroge0se
complex, mitochondrial
7.68E-09 -3.512
P25705 ATP synthase subunit alpha, mitochondrial
3.70E-08 -3.508
Q16762 Thiosulfate sulfurtransferase 5.35E-09 -3.500
Q13228 Selenium-binding protein 1 3.18E-10 -3.499
Q16698 2,4-dienoyl-CoA reductase, mitochondrial
2.60E-08 -3.484
Q13011 Delta(3,5)-Delta(2,4)-dienoyl-CoA isomerase, mitochondrial
1.34E-10 -3.483
P36871 Phosphoglucomutase-1 1.80E-08 -3.462
P23786 Carnitine O-palmitoyltransferase 2,
mitochondrial
8.17E-08 -3.457
Q6IB77 Glycine N-acyltransferase 2.04E-07 -3.439
P38117 Electron transfer flavoprotein subunit beta
4.54E-09 -3.429
Q9Y2P5 Bile acyl-CoA synthetase 3.49E-08 -3.426
P06737 Glycogen phosphorylase, liver form
2.48E-08 -3.421
P35573 Glycogen debranching enzyme 1.53E-08 -3.418
Q93099 Homogentisate 1,2-dioxyge0se 4.25E-07 -3.413
P26440 Isovaleryl-CoA dehydroge0se, mitochondrial
2.95E-09 -3.412
Q02338 D-beta-hydroxybutyrate dehydroge0se, mitochondrial
1.37E-08 -3.400
Q9H2X3 C-type lectin domain family 4 member M
7.42E-06 -3.400
P46952 3-hydroxyanthranilate 3,4-dioxyge0se
8.79E-08 -3.373
P51649 Succi0te-semialdehyde dehydroge0se, mitochondrial
3.03E-08 -3.371

342
Q9H2A2 Aldehyde dehydroge0se family 8 member A1
3.59E-07 -3.368
Q96HR9 Receptor expression-enhancing protein 6
3.51E-08 -3.360
Q16836 Hydroxyacyl-coenzyme A dehydroge0se, mitochondrial
1.24E-09 -3.341
P13804 Electron transfer flavoprotein subunit alpha, mitochondrial
1.98E-09 -3.335
Q9UNU6 7-alpha-hydroxycholest-4-en-3-one 12-alpha-hydroxylase
1.27E-07 -3.332
Q9BRX8 Redox-regulatory protein PAMM
7.44E-10 -3.311
O14975 Very long-chain acyl-CoA synthetase
1.38E-07 -3.304
Q7Z5P4 17-beta-hydroxysteroid dehydroge0se 13
8.32E-07 -3.299
P49327 Fatty acid synthase 5.55E-06 -3.286
P22033 Methylmalonyl-CoA mutase, mitochondrial
1.53E-07 -3.279
Q6UX53 Methyltransferase-like protein 7B
7.92E-08 -3.274
A2VDF0 Fucose mutarotase 1.39E-06 -3.257
O95563 Brain protein 44 2.57E-07 -3.254
P36537 UDP-glucuronosyltransferase 2B10
4.92E-06 -3.249
P30041 Peroxiredoxin-6 9.49E-08 -3.246
Q9UBR1 Beta-ureidopropio0se 1.38E-06 -3.237
Q9UJS0 Calcium-binding mitochondrial carrier protein Aralar2
1.86E-07 -3.236
P13929 Beta-enolase 1.04E-03 -3.232
Q9NR77 Peroxisomal membrane protein 2
9.39E-07 -3.229
P09467 Fructose-1,6-bisphosphatase 1 6.65E-06 -3.215
P24298 Alanine aminotransferase 1 3.13E-08 -3.204
P21399 Cytoplasmic aconitate hydratase
1.49E-07 -3.193
Q06278 Aldehyde oxidase 2.66E-07 -3.173
Q96DG6 Carboxymethylenebutenolidase homolog
4.86E-09 -3.161
O75874 Isocitrate dehydroge0se [0DP] cytoplasmic
9.23E-08 -3.159
P00918 Carbonic anhydrase 2 2.26E-07 -3.148
P47989 Xanthine dehydroge0se/oxidase
2.52E-07 -3.139
O14756 17-beta-hydroxysteroid dehydroge0se type 6
1.23E-06 -3.129
P11168 Solute carrier family 2, facilitated glucose transporter
member 2
9.98E-07 -3.126
P42330 Aldo-keto reductase family 1 2.49E-04 -3.116

343
member C3
P13716 Delta-aminolevulinic acid dehydratase
3.83E-08 -3.114
P07954 Fumarate hydratase, mitochondrial
1.87E-09 -3.112
Q14914 Prostaglandin reductase 1 7.04E-07 -3.111
P50226 Sulfotransferase 1A2 1.56E-03 -3.104
P11586 C-1-tetrahydrofolate synthase, cytoplasmic
1.85E-07 -3.080
Q96I99 Succinyl-CoA ligase [GDP-forming] subunit beta,
mitochondrial
9.26E-10 -3.064
O95154 Aflatoxin B1 aldehyde reductase member 3
5.86E-07 -3.061
P07237 Protein disulfide-isomerase 2.25E-08 -3.053
Q9BWD1 Acetyl-CoA acetyltransferase, cytosolic
1.03E-06 -3.042
P50053 Ketohexoki0se 7.29E-07 -3.031
Q86WU2 Probable D-lactate dehydroge0se, mitochondrial
3.30E-05 -3.020
Q86WA6 Valacyclovir hydrolase 2.42E-06 -3.020
O60701 UDP-glucose 6-dehydroge0se 9.44E-08 -3.008
Q96DC8 Enoyl-CoA hydratase domain-containing protein 3,
mitochondrial
1.88E-05 -2.983
O76054 SEC14-like protein 2 4.38E-07 -2.948
Q9BPW8 Protein NipS0p homolog 1 1.57E-07 -2.911
P32929 Cystathionine gamma-lyase 1.46E-05 -2.905
P55084 Trifunctio0l enzyme subunit beta, mitochondrial
7.96E-09 -2.898
Q9BY49 Peroxisomal trans-2-enoyl-CoA reductase
3.21E-07 -2.897
P31937 3-hydroxyisobutyrate dehydroge0se, mitochondrial
1.10E-05 -2.895
O43175 D-3-phosphoglycerate dehydroge0se
1.09E-07 -2.884
O95831 Apoptosis-inducing factor 1, mitochondrial
1.39E-09 -2.882
Q86TX2 Acyl-coenzyme A thioesterase 1 3.06E-08 -2.867
O00264 Membrane-associated progesterone receptor
component 1
2.65E-07 -2.864
Q96AB3 Isochorismatase domain-containing protein 2,
mitochondrial
3.75E-07 -2.856
P25325 3-mercaptopyruvate sulfurtransferase
1.71E-07 -2.852
Q9H0W9 Ester hydrolase C11orf54 1.90E-06 -2.847
Q15166 Serum paraoxo0se/lacto0se 3 9.24E-06 -2.843
Q9UI32 Glutami0se liver isoform, mitochondrial
6.92E-04 -2.832

344
Q96EY8 Cob(I)yrinic acid a,c-diamide adenosyltransferase,
mitochondrial
2.64E-07 -2.822
Q4G0N4 0D ki0se domain-containing protein 1
3.97E-08 -2.822
Q9Y281 Cofilin-2 3.80E-08 -2.820
Q16134 Electron transfer flavoprotein-ubiquinone oxidoreductase,
mitochondrial
6.80E-07 -2.818
P51659 Peroxisomal multifunctio0l enzyme type 2
1.58E-10 -2.813
P35520 Cystathionine beta-synthase 1.72E-07 -2.807
Q92947 Glutaryl-CoA dehydroge0se, mitochondrial
2.16E-07 -2.805
Q9Y2Q3 Glutathione S-transferase kappa 1
1.13E-06 -2.800
P49638 Alpha-tocopherol transfer protein
1.58E-06 -2.782
Q9UL12 Sarcosine dehydroge0se, mitochondrial
4.04E-08 -2.781
P30048 Thioredoxin-dependent peroxide reductase,
mitochondrial
2.83E-08 -2.781
Q15067 Peroxisomal acyl-coenzyme A oxidase 1
7.92E-06 -2.780
P37059 Estradiol 17-beta-dehydroge0se 2
1.62E-04 -2.769
Q08AH3 Acyl-coenzyme A synthetase ACSM2A, mitochondrial
6.28E-05 -2.761
Q6NVY1 3-hydroxyisobutyryl-CoA hydrolase, mitochondrial
1.23E-05 -2.760
P06576 ATP synthase subunit beta, mitochondrial
2.78E-06 -2.759
Q13576 Ras GTPase-activating-like protein IQGAP2
1.09E-06 -2.759
P27144 Adenylate ki0se isoenzyme 4, mitochondrial
1.33E-07 -2.752
Q86VD7 Solute carrier family 25 member 42
3.76E-05 -2.748
Q53FZ2 Acyl-coenzyme A synthetase ACSM3, mitochondrial
5.86E-07 -2.716
O43708 Maleylacetoacetate isomerase 3.64E-04 -2.702
P22760 Arylacetamide deacetylase 2.37E-04 -2.700
Q99424 Peroxisomal acyl-coenzyme A oxidase 2
1.17E-06 -2.687
P48449 Lanosterol synthase 8.01E-08 -2.687
Q86YB7 Enoyl-CoA hydratase domain-containing protein 2,
mitochondrial
1.96E-06 -2.677
O15229 Kynurenine 3-monooxyge0se 1.52E-05 -2.674
Q99714 3-hydroxyacyl-CoA dehydroge0se type-2
5.39E-10 -2.664
Q9ULD0 2-oxoglutarate dehydroge0se- 9.73E-07 -2.649

345
like, mitochondrial
P54840 Glycogen [starch] synthase, liver
2.50E-06 -2.625
Q9BX68 Histidine triad nucleotide-binding protein 2,
mitochondrial
3.45E-07 -2.622
P42126 Enoyl-CoA delta isomerase 1, mitochondrial
2.11E-10 -2.598
Q08257 Quinone oxidoreductase 3.53E-06 -2.590
P34897 Serine hydroxymethyltransferase,
mitochondrial
5.12E-10 -2.588
Q9NQR4 Omega-amidase NIT2 1.53E-06 -2.581
O00748 Cocaine esterase 2.83E-06 -2.574
P06133 UDP-glucuronosyltransferase 2B4
7.26E-08 -2.570
P20815 Cytochrome P450 3A5 2.61E-02 -2.565
P05177 Cytochrome P450 1A2 1.09E-04 -2.564
Q13423 0D(P) transhydroge0se, mitochondrial
4.39E-07 -2.561
Q96CN7 Isochorismatase domain-containing protein 1
1.50E-08 -2.558
P28288 ATP-binding cassette sub-family D member 3
1.46E-05 -2.557
P17174 Aspartate aminotransferase, cytoplasmic
1.91E-05 -2.536
Q96LJ7 Dehydroge0se/reductase SDR family member 1
8.40E-06 -2.527
Q9NQ94 APOBEC1 complementation factor
8.17E-06 -2.491
Q969Z3 MOSC domain-containing protein 2, mitochondrial
3.12E-05 -2.468
P14550 Alcohol dehydroge0se [0DP+] 1.42E-06 -2.466
Q709F0 Acyl-CoA dehydroge0se family member 11
2.26E-04 -2.458
P43155 Carnitine O-acetyltransferase 1.14E-05 -2.433
Q9NPJ3 Acyl-coenzyme A thioesterase 13
5.53E-06 -2.428
P17516 Aldo-keto reductase family 1 member C4
1.52E-05 -2.420
P31040 Succi0te dehydroge0se [ubiquinone] flavoprotein
subunit, mitochondrial
7.73E-08 -2.395
Q03154 Aminoacylase-1 1.15E-05 -2.393
Q96GK7 Fumarylacetoacetate hydrolase domain-containing protein 2A
1.34E-06 -2.388
O14832 Phytanoyl-CoA dioxyge0se, peroxisomal
4.37E-06 -2.369
P30043 Flavin reductase (0DPH) 1.32E-05 -2.355
Q8NBX0 Saccharopine dehydroge0se-like oxidoreductase
1.46E-06 -2.351

346
Q9NPD5 Solute carrier organic anion transporter family member 1B3
1.02E-03 -2.336
Q9Y6B6 GTP-binding protein SAR1b 5.38E-07 -2.335
Q96I15 Selenocysteine lyase 5.78E-06 -2.327
P49326 Dimethylaniline monooxyge0se [N-oxide-forming] 5
1.57E-05 -2.322
P54819 Adenylate ki0se 2, mitochondrial
7.53E-06 -2.321
Q8WW59 SPRY domain-containing protein 4
8.13E-07 -2.319
P16083 Ribosyldihydronicoti0mide dehydroge0se [quinone]
8.43E-04 -2.314
Q15493 Regucalcin 1.13E-05 -2.314
Q96KP4 Cytosolic non-specific dipeptidase
8.57E-07 -2.312
O75356 Ectonucleoside triphosphate diphosphohydrolase 5
3.11E-07 -2.310
Q9Y2S2 Lambda-crystallin homolog 3.52E-06 -2.310
P21953 2-oxoisovalerate dehydroge0se subunit beta, mitochondrial
6.02E-05 -2.308
P09417 Dihydropteridine reductase 1.09E-04 -2.307
Q96EK6 Glucosamine 6-phosphate N-acetyltransferase
7.81E-05 -2.300
P11766 Alcohol dehydroge0se class-3 2.22E-06 -2.297
P49748 Very long-chain specific acyl-CoA dehydroge0se,
mitochondrial
1.59E-06 -2.296
Q96NU7 Probable imidazolonepropio0se 1.04E-05 -2.294
Q9UBM7 7-dehydrocholesterol reductase
6.33E-06 -2.288
Q9H9B4 Sideroflexin-1 3.37E-05 -2.285
P05166 Propionyl-CoA carboxylase beta chain, mitochondrial
7.36E-07 -2.285
Q969I3 Glycine N-acyltransferase-like protein 1
5.84E-04 -2.275
P48047 ATP synthase subunit O, mitochondrial
4.80E-06 -2.266
P21397 Amine oxidase [flavin-containing] A
1.57E-04 -2.264
P23434 Glycine cleavage system H protein, mitochondrial
1.11E-04 -2.259
Q8N0X4 Citrate lyase subunit beta-like protein, mitochondrial
1.73E-08 -2.257
P16435 0DPH--cytochrome P450 reductase
1.95E-07 -2.245
Q9UP52 Transferrin receptor protein 2 1.63E-04 -2.236
Q9NUI1 Peroxisomal 2,4-dienoyl-CoA reductase
4.41E-06 -2.225
Q6NUM9 All-trans-retinol 13,14- 7.29E-05 -2.223

347
reductase
Q7L5Y1 Mitochondrial enolase superfamily member 1
1.18E-02 -2.221
Q96IU4 Abhydrolase domain-containing protein 14B
1.64E-05 -2.208
O95479 GDH/6PGL endoplasmic bifunctio0l protein
5.60E-04 -2.205
O75964 ATP synthase subunit g, mitochondrial
2.24E-05 -2.201
Q96RQ3 Methylcrotonoyl-CoA carboxylase subunit alpha,
mitochondrial
2.07E-05 -2.183
Q9Y2T3 Guanine deami0se 6.65E-07 -2.178
P78417 Glutathione S-transferase omega-1
4.80E-05 -2.177
Q6NUN0 Acyl-coenzyme A synthetase ACSM5, mitochondrial
3.48E-05 -2.177
P04179 Superoxide dismutase [Mn], mitochondrial
9.69E-04 -2.176
P30040 Endoplasmic reticulum resident protein 29
3.30E-08 -2.153
P00441 Superoxide dismutase [Cu-Zn] 3.61E-04 -2.150
P07306 Asialoglycoprotein receptor 1 1.11E-03 -2.137
P78329 Leukotriene-B(4) omega-hydroxylase 1
3.44E-06 -2.128
P51570 Galactoki0se 5.10E-06 -2.123
P21964 Catechol O-methyltransferase 1.93E-04 -2.110
P21912 Succi0te dehydroge0se [ubiquinone] iron-sulfur subunit, mitochondrial
4.42E-07 -2.105
O43772 Mitochondrial carnitine/acylcarnitine carrier
protein
2.43E-04 -2.092
Q5R3I4 Tetratricopeptide repeat protein 38
1.13E-05 -2.053
Q9NRV9 Heme-binding protein 1 3.48E-06 -2.029
P40925 Malate dehydroge0se, cytoplasmic
3.88E-06 -2.019
Q16719 Kynureni0se 1.50E-05 -2.019
P36269 Gamma-glutamyltransferase 5 2.46E-04 -2.005
P04208 Ig lambda chain V-I region WAH 1.44E-03 2.013
P24158 Myeloblastin 9.71E-03 2.019
P60903 Protein S100-A10 8.84E-04 2.022
P35555 Fibrillin-1 3.19E-03 2.029
P55011 Solute carrier family 12 member 2
2.51E-03 2.050
Q96PD5 N-acetylmuramoyl-L-alanine amidase
2.83E-03 2.060
P02647 Apolipoprotein A-I 9.89E-04 2.107
P05546 Heparin cofactor 2 3.09E-02 2.109

348
P07195 L-lactate dehydroge0se B chain 1.01E-03 2.132
P05155 Plasma protease C1 inhibitor 1.77E-03 2.148
Q01105 Protein SET 3.17E-03 2.151
P30740 Leukocyte elastase inhibitor 1.57E-04 2.155
P68032 Actin, alpha cardiac muscle 1 1.06E-02 2.171
P98095 Fibulin-2 2.33E-05 2.204
P00751 Complement factor B 3.50E-04 2.208
P62328 Thymosin beta-4 1.40E-02 2.211
P01766 Ig heavy chain V-III region BRO 5.99E-04 2.213
P37802 Transgelin-2 3.13E-05 2.214
Q14126 Desmoglein-2 7.40E-06 2.233
P00736 Complement C1r subcomponent
7.20E-03 2.247
Q12805 EGF-containing fibulin-like extracellular matrix protein 1
2.55E-04 2.254
P25311 Zinc-alpha-2-glycoprotein 9.84E-04 2.260
P63104 14-3-3 protein zeta/delta 1.35E-05 2.262
P23528 Cofilin-1 1.79E-05 2.267
P43652 Afamin 1.74E-03 2.297
O14791 Apolipoprotein L1 5.69E-03 2.308
P06331 Ig heavy chain V-II region ARH-77
2.62E-03 2.309
P04003 C4b-binding protein alpha chain
2.59E-03 2.357
P04217 Alpha-1B-glycoprotein 3.39E-02 2.364
Q9H299 SH3 domain-binding glutamic acid-rich-like protein 3
1.44E-04 2.376
P01023 Alpha-2-macroglobulin 4.31E-03 2.378
P16070 CD44 antigen 2.35E-04 2.379
Q16363 Laminin subunit alpha-4 3.26E-07 2.395
Q16819 Meprin A subunit alpha 2.64E-02 2.424
P01024 Complement C3 1.76E-03 2.443
Q9UM07 Protein-arginine deimi0se type-4
1.04E-02 2.454
P21333 Filamin-A 4.40E-06 2.457
Q9UGI8 Testin 4.34E-03 2.459
P19827 Inter-alpha-trypsin inhibitor heavy chain H1
1.84E-04 2.469
P01591 Immunoglobulin J chain 9.02E-04 2.470
P16402 Histone H1.3 3.73E-03 2.473
P02786 Transferrin receptor protein 1 1.93E-03 2.499
P01717 Ig lambda chain V-IV region Hil 5.64E-03 2.507
P07585 Decorin 4.01E-04 2.535
P01859 Ig gamma-2 chain C region 2.23E-03 2.553
P35749 Myosin-11 9.25E-05 2.590
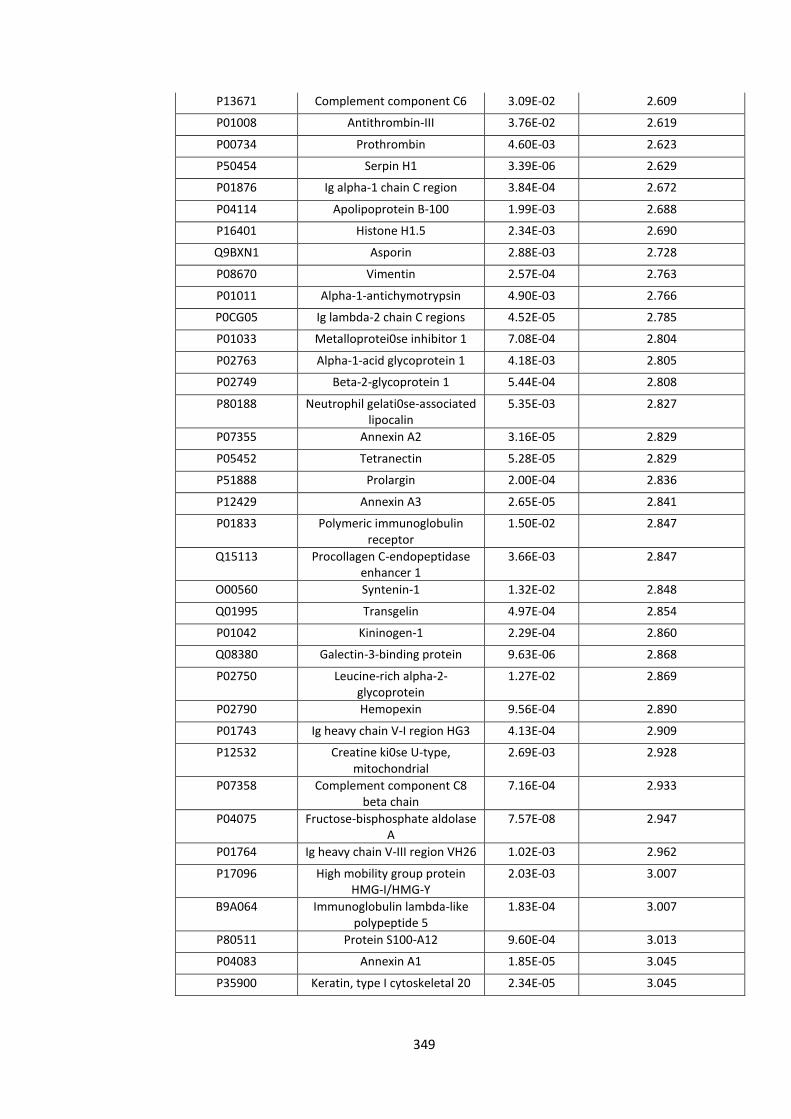
349
P13671 Complement component C6 3.09E-02 2.609
P01008 Antithrombin-III 3.76E-02 2.619
P00734 Prothrombin 4.60E-03 2.623
P50454 Serpin H1 3.39E-06 2.629
P01876 Ig alpha-1 chain C region 3.84E-04 2.672
P04114 Apolipoprotein B-100 1.99E-03 2.688
P16401 Histone H1.5 2.34E-03 2.690
Q9BXN1 Asporin 2.88E-03 2.728
P08670 Vimentin 2.57E-04 2.763
P01011 Alpha-1-antichymotrypsin 4.90E-03 2.766
P0CG05 Ig lambda-2 chain C regions 4.52E-05 2.785
P01033 Metalloprotei0se inhibitor 1 7.08E-04 2.804
P02763 Alpha-1-acid glycoprotein 1 4.18E-03 2.805
P02749 Beta-2-glycoprotein 1 5.44E-04 2.808
P80188 Neutrophil gelati0se-associated lipocalin
5.35E-03 2.827
P07355 Annexin A2 3.16E-05 2.829
P05452 Tetranectin 5.28E-05 2.829
P51888 Prolargin 2.00E-04 2.836
P12429 Annexin A3 2.65E-05 2.841
P01833 Polymeric immunoglobulin receptor
1.50E-02 2.847
Q15113 Procollagen C-endopeptidase enhancer 1
3.66E-03 2.847
O00560 Syntenin-1 1.32E-02 2.848
Q01995 Transgelin 4.97E-04 2.854
P01042 Kininogen-1 2.29E-04 2.860
Q08380 Galectin-3-binding protein 9.63E-06 2.868
P02750 Leucine-rich alpha-2-glycoprotein
1.27E-02 2.869
P02790 Hemopexin 9.56E-04 2.890
P01743 Ig heavy chain V-I region HG3 4.13E-04 2.909
P12532 Creatine ki0se U-type, mitochondrial
2.69E-03 2.928
P07358 Complement component C8 beta chain
7.16E-04 2.933
P04075 Fructose-bisphosphate aldolase A
7.57E-08 2.947
P01764 Ig heavy chain V-III region VH26 1.02E-03 2.962
P17096 High mobility group protein HMG-I/HMG-Y
2.03E-03 3.007
B9A064 Immunoglobulin lambda-like polypeptide 5
1.83E-04 3.007
P80511 Protein S100-A12 9.60E-04 3.013
P04083 Annexin A1 1.85E-05 3.045
P35900 Keratin, type I cytoskeletal 20 2.34E-05 3.045

350
P54709 Sodium/potassium-transporting ATPase subunit
beta-3
1.76E-05 3.057
P35858 Insulin-like growth factor-binding protein complex acid
labile subunit
8.85E-03 3.082
P06396 Gelsolin 4.81E-06 3.084
P00747 Plasminogen 3.27E-04 3.100
Q12864 Cadherin-17 6.88E-04 3.109
P02649 Apolipoprotein E 1.21E-03 3.120
P08603 Complement factor H 2.60E-05 3.129
P06454 Prothymosin alpha 2.30E-02 3.130
P17931 Galectin-3 1.88E-05 3.130
P36955 Pigment epithelium-derived factor
1.94E-06 3.146
Q8WVV4 Protein POF1B 2.45E-04 3.166
P16444 Dipeptidase 1 5.43E-05 3.169
Q7Z406 Myosin-14 6.83E-06 3.177
P02452 Collagen alpha-1(I) chain 1.33E-04 3.178
P00450 Ceruloplasmin 3.16E-04 3.191
O15551 Claudin-3 7.97E-03 3.200
P07357 Complement component C8 alpha chain
4.67E-03 3.209
P02743 Serum amyloid P-component 4.14E-04 3.246
P02671 Fibrinogen alpha chain 9.40E-04 3.256
P10643 Complement component C7 6.01E-03 3.263
P26447 Protein S100-A4 6.37E-05 3.265
O00299 Chloride intracellular channel protein 1
9.57E-06 3.304
P07996 Thrombospondin-1 2.81E-06 3.327
Q92598 Heat shock protein 105 kDa 2.91E-06 3.337
P19823 Inter-alpha-trypsin inhibitor heavy chain H2
6.42E-05 3.346
P02788 Lactotransferrin 1.15E-03 3.377
P02787 Serotransferrin 8.27E-05 3.408
P09211 Glutathione S-transferase P 4.77E-08 3.439
P06314 Ig kappa chain V-IV region B17 5.25E-05 3.485
P21810 Biglycan 5.67E-06 3.547
P02774 Vitamin D-binding protein 1.07E-05 3.566
P55058 Phospholipid transfer protein 5.77E-05 3.571
P01857 Ig gamma-1 chain C region 2.10E-05 3.574
P01871 Ig mu chain C region 1.55E-04 3.600
P40121 Macrophage-capping protein 3.63E-08 3.651
P08123 Collagen alpha-2(I) chain 3.43E-05 3.656
P02766 Transthyretin 2.21E-03 3.669
P02765 Alpha-2-HS-glycoprotein 2.16E-05 3.674

351
P01861 Ig gamma-4 chain C region 1.69E-02 3.679
P13688 Carcinoembryonic antigen-related cell adhesion molecule
1
6.13E-03 3.681
P02679 Fibrinogen gamma chain 1.02E-03 3.710
Q8NFJ5 Retinoic acid-induced protein 3 5.13E-04 3.712
Q14764 Major vault protein 3.73E-09 3.752
P06727 Apolipoprotein A-IV 2.88E-05 3.799
P02652 Apolipoprotein A-II 5.84E-05 3.813
P31949 Protein S100-A11 3.50E-08 3.869
Q15582 Transforming growth factor-beta-induced protein ig-h3
7.34E-06 3.893
P24821 Te0scin 1.54E-07 3.927
P14618 Pyruvate ki0se isozymes M1/M2
5.51E-09 3.927
Q9H444 Charged multivesicular body protein 4b
4.25E-06 3.937
P31947 14-3-3 protein sigma 9.06E-04 3.946
P07360 Complement component C8 gamma chain
1.04E-03 3.970
P06702 Protein S100-A9 8.84E-05 3.971
P06703 Protein S100-A6 6.13E-06 3.993
P11166 Solute carrier family 2, facilitated glucose transporter
member 1
5.16E-03 3.995
P05107 Integrin beta-2 2.63E-03 4.036
P02751 Fibronectin 1.68E-08 4.059
P59665 Neutrophil defensin 1 1.22E-03 4.069
P08727 Keratin, type I cytoskeletal 19 2.77E-06 4.077
P51884 Lumican 7.04E-06 4.097
P25815 Protein S100-P 1.36E-04 4.127
P02675 Fibrinogen beta chain 1.20E-04 4.128
P05109 Protein S100-A8 4.42E-04 4.202
P01009 Alpha-1-antitrypsin 6.42E-04 4.293
P02748 Complement component C9 1.66E-04 4.363
P11215 Integrin alpha-M 6.70E-04 4.400
P05164 Myeloperoxidase 5.23E-04 4.425
Q8IUX7 Adipocyte enhancer-binding protein 1
6.98E-08 4.429
P35442 Thrombospondin-2 5.61E-08 4.620
O95994 Anterior gradient protein 2 homolog
9.84E-06 4.621
Q6UX06 Olfactomedin-4 4.59E-05 4.640
Q9H3R2 Mucin-13 5.42E-07 4.643
P01031 Complement C5 8.03E-05 4.708
P16422 Epithelial cell adhesion molecule
3.64E-06 4.751

352
P04004 Vitronectin 3.43E-05 4.790
P10909 Clusterin 8.79E-05 4.928
P19075 Tetraspanin-8 1.49E-03 4.960
P06731 Carcinoembryonic antigen-related cell adhesion molecule
5
5.12E-07 5.132
Q99715 Collagen alpha-1(XII) chain 9.58E-09 5.181
Q15063 Periostin 2.53E-08 5.322
P21926 CD9 antigen 7.72E-06 5.684

353
Appendix 4
Proteomic comparison of responders and non-responders in the primary tumour

354
Accession Number Name P Value Log2 Fold Change
(Responder/Non-Responder)
Q04695 Keratin, type I cytoskeletal 17 3.71E-02 -165.421
O95831 Apoptosis-inducing factor 1,
mitochondrial 1.37E-04 -13.086
O00217
NADH dehydrogenase [ubiquinone] iron-sulfur protein
8, mitochondrial 2.13E-03 -12.553
P13804 Electron transfer flavoprotein subunit alpha, mitochondrial 1.72E-03 -12.381
Q07812 Apoptosis regulator BAX 2.07E-03 -11.959
P08729 Keratin, type II cytoskeletal 7 1.25E-02 -11.876
Q08426 Peroxisomal bifunctional enzyme 2.33E-04 -9.918
P15559 NAD(P)H dehydrogenase
[quinone] 1 2.64E-04 -9.918
O75494 Serine/arginine-rich splicing
factor 10 1.50E-05 -9.448
P30101 Protein disulfide-isomerase A3 2.10E-03 -9.063
P05091 Aldehyde dehydrogenase,
mitochondrial 1.18E-02 -9.063
P50225 Sulfotransferase 1A1 1.29E-02 -7.781
P05783 Keratin, type I cytoskeletal 18 2.35E-02 -7.727
P36952 Serpin B5 1.58E-02 -7.111
Q9HCY8 Protein S100-A14 1.70E-03 -6.916
Q12788 Transducin beta-like protein 3 3.30E-03 -6.727
P58107 Epiplakin 4.30E-05 -6.277
O43704 Sulfotransferase family cytosolic
1B member 1 4.09E-02 -6.233
P08727 Keratin, type I cytoskeletal 19 1.41E-02 -5.856
P36776 Lon protease homolog,
mitochondrial 1.72E-03 -5.657
Q9NUV9 GTPase IMAP family member 4 3.06E-03 -5.579
Q00266 S-adenosylmethionine synthase
isoform type-1 2.19E-02 -5.426
Q9Y6N5 Sulfide:quinone oxidoreductase,
mitochondrial 4.74E-04 -5.278
P22695 Cytochrome b-c1 complex subunit 2, mitochondrial 4.27E-03 -5.098
P49411 Elongation factor Tu,
mitochondrial 1.18E-02 -5.098
Q15084 Protein disulfide-isomerase A6 1.62E-02 -5.063
O00515 Ladinin-1 2.93E-02 -5.028
Q9BW92 Threonyl-tRNA synthetase,
mitochondrial 4.75E-03 -4.724
Q15477 Helicase SKI2W 2.09E-02 -4.691

355
P63151
Serine/threonine-protein phosphatase 2A 55 kDa
regulatory subunit B alpha isoform 9.31E-03 -4.659
P09327 Villin-1 2.32E-02 -4.659
P49748 Very long-chain specific acyl-CoA dehydrogenase, mitochondrial 1.25E-02 -4.595
P35900 Keratin, type I cytoskeletal 20 2.16E-02 -4.469
P20339 Ras-related protein Rab-5A 3.00E-02 -4.469
P42765 3-ketoacyl-CoA thiolase,
mitochondrial 1.81E-03 -4.438
P41240 Tyrosine-protein kinase CSK 2.84E-04 -4.228
Q56VL3 OCIA domain-containing protein
2 1.39E-02 -4.170
P30039 Phenazine biosynthesis-like domain-containing protein 7.25E-04 -4.141
P05026 Sodium/potassium-transporting
ATPase subunit beta-1 4.09E-04 -4.056
Q9NX46 Poly(ADP-ribose) glycohydrolase
ARH3 5.11E-04 -4.028
P24666
Low molecular weight phosphotyrosine protein
phosphatase 2.93E-02 -4.000
P12532 Creatine kinase U-type,
mitochondrial 8.75E-03 -3.945
O15438 Canalicular multispecific organic
anion transporter 2 4.04E-05 -3.918
Q16836 Hydroxyacyl-coenzyme A
dehydrogenase, mitochondrial 1.96E-03 -3.681
P09110 3-ketoacyl-CoA thiolase,
peroxisomal 2.84E-03 -3.605
P13667 Protein disulfide-isomerase A4 2.07E-02 -3.555
Q99959 Plakophilin-2 2.05E-02 -3.506
Q99623 Prohibitin-2 1.07E-03 -3.482
P62424 60S ribosomal protein L7a 1.52E-02 -3.482
Q6UX53 Methyltransferase-like protein 7B 2.86E-02 -3.434
P26373 60S ribosomal protein L13 1.46E-03 -3.411
Q9BRX8 Redox-regulatory protein PAMM 2.12E-02 -3.411
P20810 Calpastatin 2.48E-02 -3.364
P15924 Desmoplakin 8.44E-04 -3.340
Q6YN16 Hydroxysteroid dehydrogenase-
like protein 2 4.58E-03 -3.294
Q15067 Peroxisomal acyl-coenzyme A
oxidase 1 2.15E-02 -3.294

356
Q27J81 Inverted formin-2 8.85E-03 -3.249
Q13523 Serine/threonine-protein kinase
PRP4 homolog 2.10E-04 -3.204
P16219 Short-chain specific acyl-CoA
dehydrogenase, mitochondrial 1.41E-02 -3.182
Q8NE62 Choline dehydrogenase,
mitochondrial 3.82E-04 -3.010
O60218 Aldo-keto reductase family 1
member B10 1.08E-03 -2.928
P14324 Farnesyl pyrophosphate synthase 3.17E-02 -2.908
Q9NYK5 39S ribosomal protein L39,
mitochondrial 1.48E-02 -2.888
Q9UM54 Myosin-VI 2.04E-02 -2.888
P07332 Tyrosine-protein kinase Fes/Fps 1.07E-03 -2.868
O95487 Protein transport protein Sec24B 8.33E-04 -2.848
Q7Z406 Myosin-14 1.95E-02 -2.848
P98170 Baculoviral IAP repeat-containing
protein 4 1.44E-02 -2.828
P56134 ATP synthase subunit f,
mitochondrial 1.79E-02 -2.789
P21912
Succinate dehydrogenase [ubiquinone] iron-sulfur subunit,
mitochondrial 1.84E-02 -2.789
Q9H4G0 Band 4.1-like protein 1 7.41E-03 -2.770
Q9UHG3 Prenylcysteine oxidase 1 3.59E-02 -2.770
Q9NX40 OCIA domain-containing protein
1 2.18E-03 -2.676
Q99523 Sortilin 1.34E-02 -2.676
Q9Y394 Dehydrogenase/reductase SDR
family member 7 1.65E-04 -2.639
O14936 Peripheral plasma membrane
protein CASK 7.48E-04 -2.621
Q9BRP8 Partner of Y14 and mago 3.54E-02 -2.621
O95571 Protein ETHE1, mitochondrial 3.68E-04 -2.567
P07355 Annexin A2 4.91E-02 -2.567
Q9UBF2 Coatomer subunit gamma-2 2.16E-02 -2.532
O75795 UDP-glucuronosyltransferase
2B17 1.86E-04 -2.497
Q9Y446 Plakophilin-3 8.78E-03 -2.497
Q15149 Plectin 1.33E-02 -2.497
Q6NUK1 Calcium-binding mitochondrial
carrier protein SCaMC-1 1.94E-02 -2.445
P06753 Tropomyosin alpha-3 chain 3.27E-02 -2.412
P07954 Fumarate hydratase, 1.04E-02 -2.395

357
mitochondrial
O14896 Interferon regulatory factor 6 1.79E-02 -2.395
Q9NVS9 Pyridoxine-5'-phosphate oxidase 2.00E-02 -2.395
Q00610 Clathrin heavy chain 1 2.75E-02 -2.378
P30153
Serine/threonine-protein phosphatase 2A 65 kDa
regulatory subunit A alpha isoform 3.68E-03 -2.362
Q14764 Major vault protein 7.77E-03 -2.362
Q8N1S5 Zinc transporter ZIP11 2.24E-02 -2.282
P45880 Voltage-dependent anion-selective channel protein 2 4.92E-02 -2.282
Q12962 Transcription initiation factor
TFIID subunit 10 5.44E-03 -2.250
Q16718
NADH dehydrogenase [ubiquinone] 1 alpha subcomplex
subunit 5 2.06E-03 -2.219
O43491 Band 4.1-like protein 2 1.81E-02 -2.204
P05141 ADP/ATP translocase 2 2.20E-02 -2.204
Q8WUM4 Programmed cell death 6-
interacting protein 4.71E-03 -2.173
P24539 ATP synthase subunit b,
mitochondrial 8.16E-03 -2.158
P38117 Electron transfer flavoprotein
subunit beta 1.29E-02 -2.158
Q9BTZ2 Dehydrogenase/reductase SDR
family member 4 1.77E-02 -2.144
A5YKK6 CCR4-NOT transcription complex
subunit 1 6.41E-03 -2.114
Q02318 Sterol 26-hydroxylase,
mitochondrial 6.70E-03 -2.114
P35232 Prohibitin 3.53E-03 -2.099
P30040 Endoplasmic reticulum resident
protein 29 2.40E-02 -2.099
Q9Y2S2 Lambda-crystallin homolog 3.25E-03 -2.085
Q6NUM9 All-trans-retinol 13,14-reductase 4.99E-02 -2.085
P45974 Ubiquitin carboxyl-terminal
hydrolase 5 6.28E-03 -2.056
O95168
NADH dehydrogenase [ubiquinone] 1 beta subcomplex
subunit 4 4.86E-02 -2.056
P51659 Peroxisomal multifunctional
enzyme type 2 2.65E-02 -2.042
Q9UNZ2 NSFL1 cofactor p47 2.50E-02 -2.028
Q9NPJ3 Acyl-coenzyme A thioesterase 13 1.40E-03 2.014

358
Q9BVP2 Guanine nucleotide-binding
protein-like 3 1.15E-03 2.042
P63208 S-phase kinase-associated protein
1 4.18E-02 2.071
Q13451 Peptidyl-prolyl cis-trans
isomerase FKBP5 2.86E-02 2.085
Q6NYC8 Phostensin 2.41E-02 2.114
Q4VC31 Coiled-coil domain-containing
protein 58 7.64E-03 2.129
Q9ULC4 Malignant T cell-amplified
sequence 1 3.02E-02 2.173
P17931 Galectin-3 5.40E-03 2.219
P49591 Seryl-tRNA synthetase,
cytoplasmic 1.51E-02 2.362
P42345 Serine/threonine-protein kinase
mTOR 3.09E-03 2.395
Q96IJ6 Mannose-1-phosphate
guanyltransferase alpha 4.98E-03 2.428
Q13315 Serine-protein kinase ATM 1.55E-02 2.462
Q15181 Inorganic pyrophosphatase 4.43E-02 2.479
Q08945 FACT complex subunit SSRP1 4.70E-02 2.532
P61970 Nuclear transport factor 2 6.29E-03 2.657
P04003 C4b-binding protein alpha chain 4.76E-02 2.676
O00505 Importin subunit alpha-3 2.00E-04 2.751
O43708 Maleylacetoacetate isomerase 2.73E-02 2.751
Q96CW1 AP-2 complex subunit mu 4.68E-03 2.828
P07686 Beta-hexosaminidase subunit
beta 2.26E-02 2.828
P29622 Kallistatin 2.85E-02 2.888
Q5SSJ5 Heterochromatin protein 1-
binding protein 3 4.86E-02 2.928
P04083 Annexin A1 2.96E-02 2.969
P48643 T-complex protein 1 subunit
epsilon 1.20E-02 3.010
P27169 Serum paraoxonase/arylesterase
1 6.80E-03 3.031
P01903 HLA class II histocompatibility
antigen, DR alpha chain 1.33E-02 3.117
P28845 Corticosteroid 11-beta-
dehydrogenase isozyme 1 8.77E-04 3.182
Q06323 Proteasome activator complex
subunit 1 3.88E-04 3.272
P04899 Guanine nucleotide-binding protein G(i) subunit alpha-2 1.92E-03 3.411

359
P62917 60S ribosomal protein L8 8.21E-04 3.434
P56199 Integrin alpha-1 1.04E-03 3.458
Q14019 Coactosin-like protein 2.49E-02 3.458
P05388 60S acidic ribosomal protein P0 4.43E-02 3.555
P62701 40S ribosomal protein S4, X
isoform 1.94E-02 3.655
P11387 DNA topoisomerase 1 4.28E-02 3.811
P04216 Thy-1 membrane glycoprotein 1.52E-02 3.837
P31513 Dimethylaniline monooxygenase
[N-oxide-forming] 3 2.00E-02 3.864
Q12805 EGF-containing fibulin-like
extracellular matrix protein 1 1.30E-03 3.891
Q9C005 Protein dpy-30 homolog 2.71E-02 4.028
O75874 Isocitrate dehydrogenase [NADP]
cytoplasmic 3.10E-03 4.347
P21953 2-oxoisovalerate dehydrogenase
subunit beta, mitochondrial 1.32E-03 4.563
P21980 Protein-glutamine gamma-
glutamyltransferase 2 2.99E-03 4.595
Q9Y6D6 Brefeldin A-inhibited guanine
nucleotide-exchange protein 1 7.37E-03 4.595
O94826 Mitochondrial import receptor
subunit TOM70 3.15E-03 4.857
P40227 T-complex protein 1 subunit zeta 1.93E-02 5.063
P50135 Histamine N-methyltransferase 1.82E-04 5.618
P07339 Cathepsin D 6.55E-04 5.657
P16662 UDP-glucuronosyltransferase 2B7 2.29E-02 5.657
Q8TEX9 Importin-4 5.29E-03 5.816
Q99536 Synaptic vesicle membrane
protein VAT-1 homolog 1.85E-02 5.856
P09417 Dihydropteridine reductase 1.40E-02 6.021
Q9H1E5 Thioredoxin-related
transmembrane protein 4 3.43E-02 6.190
P12111 Collagen alpha-3(VI) chain 4.77E-02 6.409
P24752 Acetyl-CoA acetyltransferase,
mitochondrial 9.73E-03 8.282
Q05707 Collagen alpha-1(XIV) chain 2.32E-02 8.694
P06733 Alpha-enolase 7.48E-03 8.754
P11586 C-1-tetrahydrofolate synthase,
cytoplasmic 1.73E-05 15.242
P13760 HLA class II histocompatibility
antigen, DRB1-4 beta chain 5.91E-03 88.035

360
Q16822
Phosphoenolpyruvate carboxykinase [GTP],
mitochondrial 3.11E-05 194.012

361
Appendix 5
Supporting Publications, Presentations, Prizes and Grants

362
Manuscripts Accepted
The use of a tissue stabilization gel (AllprotectTM) to facilitate clinical sampling in
translational surgical trials. Sutton, Jones, Morrison, Goldring, Palmer, Park, Malik,
Vimalachandran, Kitteringham. Accepted by the British Journal of Surgery.
Predicting response to neoadjuvant treatment in advanced colorectal cancer – A review
of relevant mechanisms and potential biomarkers. P A Sutton, R P Jones, J P Evans, C
Goldring, D Palmer, N Kitteringham, D Vimalachandran, H Z Malik. Accepted by Colorectal
Cancer.
Hepatic activation of irinotecan predicts tumour response in patients with colorectal liver
metastases treated with DEBIRI: exploratory findings from a phase II study.
Jones, Sutton, Greensmith, Santoyo-Castelazo, Carr, Jenkins, Rowe, Hamlett, Park, Terlizzo,
O’Grady, Ghaneh, Fenwick, Malik, Poston, Kitteringham. Cancer Chemotherapy and
Pharmacology. 2013. 72(2):359-68.
Manuscripts In Preparation
Exome sequencing of synchronously resected primary and metastatic colorectal tumours.
Sutton, Puthen, Jones, Evans, Goldring, Palmer, Park, Malik, Vimalachandran, Kitteringham.
Proteomic profiling of primary and metastatic colorectal cancers identifies NQO1 as a
potential response biomarker and therapeutic target. Sutton, Jones, Evans, Andrews,
Terlizzo, Hamlett, Jenkins, Puthen, Goldring, Palmer, Park, Malik, Vimalachandran,
Kitteringham.

363
Presentations and Published Abstracts
Proteomic analysis to identify biomarkers in the primary tumour which predict response
to neoadjuvant chemotherapy in liver metastases
Paul Sutton, Jonathan Evans, Robert Jones, Hassan Malik, Dale Vimalachandran, Daniel
Palmer, Chris Goldring, Neil Kitteringham
Abstract to be published in The Lancet
Academy of Medical Science – 02/15 [Poster]
NQO1 expression in the primary colorectal tumour is a predictive biomarker and
therapeutic target for the neoadjuvant treatment of metastatic colorectal cancer
Paul Sutton, Rob Jones, Jonathan Evans, Chris Goldring, Daniel Palmer, Neil Kitteringham,
Dale Vimalachandran, Hassan Malik
Published in the meeting proceedings
Liverpool and North West Society of Surgeons Annual Meeting – 12/14 [Oral Plenary]
High NQO1 expression in primary colorectal cancer predicts chemoresistance in colorectal
liver metastases
Sutton, Jones, Jenkins, Vimalachandran, Goldring, Kitteringham, Malik, Palmer
European Journal of Surgical Oncology, 2014. 40(11)S50-51.
BASO-ESSO Annual Meeting – 11/14 [Oral]
High expression of acid ceramidase confers radioresistance in rectal cancer
Sutton, Bowden, Jithesh, Hamid, Abbott, Palmer, Goldring, Kitteringham, Vimalachandran
European Journal of Surgical Oncology, 2014. 40(11)S99-100.
BASO-ESSO Annual Meeting – 11/14 [Poster]
Exome sequencing of synchronously resected primary colorectal cancer and colorectal
liver metastases to identify novel response biomarkers and drug targets
Sutton, Jithesh, Jones, Vimalachandran, Goldring, Kitteringham, Malik, Palmer
European Journal of Surgical Oncology, 2014. 40(11)S21-22.
BASO-ESSO Annual Meeting – 11/14 [Oral]

364
Proteomic profiling of the diagnostic tumour biopsy to predict response to neoadjuvant
chemoradiotherapy in rectal cancer
Sutton, Jones, Goldring, Malik, Vimalachandran, Kitteringham, Palmer
Journal of Clinical Oncology, 2014. 32(suppl; abstr e14579)
American Society of Clinical Oncology – 06/14 [Poster]
Proteomic analysis of primary colorectal cancer to generate response biomarkers for liver
metastases
Sutton, Jones, Goldring, Malik, Vimalachandran, Kitteringham, Palmer
Journal of Clinical Oncology, 2014. 32(suppl; abstr e14535)
American Society of Clinical Oncology – 06/14 [Poster]
Phenotypic analysis of primary colorectal cancer to inform the management of metastatic
disease
Sutton, Jones, Jithesh, Andrews, Park, Malik, Kitteringham, Vimalachandran
Colorectal Disease, 2014. 16(s2) p1-226
Tripartite Colorectal Meeting – 06/14 [Oral]
Temporal phenotypic profiling of rectal cancer to predict response to neoadjuvant
chemoradiotherapy
Sutton, Jithesh, Bowden, Abbott, Hamid, Jenkins, Palmer, Goldring, Vimalachandran
Colorectal Disease, 2014. 16(s2) p1-226
Tripartite Colorectal Meeting – 06/14 [Oral]
Evaluation of a tissue stabilization gel to facilitate clinical sampling for translational
research in colorectal cancer
Sutton, Jones, Morrison, Goldring, Kitteringham, Palmer, Vimalachandran
Colorectal Disease, 2014. 16(s2) p1-226
Tripartite Colorectal Meeting – 06/14 [Lunchtime Poster]
Evaluation of a tissue stabilisation gel to facilitate clinical sampling in translational
surgical trials
Sutton, Jones, Malik, Vimalachandran, Kitteringham
Published in the meeting proceedings
ASGBI – 04/14 [Poster]

365
Phenotypic analysis of primary colorectal cancer to inform the management of metastatic
disease
Sutton, Jones, Malik, Jenkins, Vimalachandran, Goldring, Palmer, Kitteringham
The Lancet, 2014. 383, pS98
Academy of Medical Science – 02/14 [Poster]
Phenotypic analysis of primary colorectal cancer to inform the management of metastatic
disease
Sutton, Jones, Malik, Jenkins, Vimalachandran, Goldring, Palmer, Kitteringham
British Journal of Surgery, 2014. 101(s4) p11
Society of Academic and Research Surgery – 01/14 [Oral]
Validation of AllprotectTM – a commercially available tissue stabilisation gel
Sutton, Goldring, Palmer, Kitteringham, Vimalachandran
Colorectal Disease, 2013. 15(s1) p1-65
Association of Coloproctology of Great Britain and Ireland – 07/13 [Poster]
A strategy for identifying novel therapeutic targets in the management of colorectal liver
metastases
Sutton, Goldring, Palmer, Kitteringham, Vimalachandran
Colorectal Disease, 2013. 15(s1) p1-65
Association of Coloproctology of Great Britain and Ireland – 07/13 [Poster]
A global proteomic assessment to compare biological characteristics of primary and
metastatic colorectal cancer
Sutton, Goldring, Palmer, Kitteringham, Vimalachandran
Colorectal Disease, 2013. 15(s1) p1-65
Association of Coloproctology of Great Britain and Ireland – 07/13 [Poster]

366
Prizes
Roger Croton Prize for Best Oral Presentation
Mersey Deanery Regional Meeting – 09/14
ASiT Annual Travelling Fellowship
Association of Surgeons in Training – 08/14
Royal College of Surgeons of England Travelling Fellowship
Royal College of Surgeons of England – 01/14
European Society of Surgical Oncology Travelling Fellowship
European Society of Surgical Oncology – 01/14
Ronald Raven Prize
British Association of Surgical Oncology – 11/13
Cancer Research UK (Liverpool Centre) Travel Award
Cancer Research UK – 11/13
Niru Goenka Research Prize
Countess of Chester Hospital/University of Chester – 06/13
The travelling fellowships were awarded for a visit to the colorectal/surgical oncology units
at the Cleveland Clinic, Cleveland OH and Mayo Clinic, Rochester MN in May-June 2014.

367
Grants
Arising from and for the continuation of work presented in this thesis.
Wellcome Trust (2013) £2000
Clatterbridge Centre for Oncology (2013) £20000
Cancer Research UK (2014) £3000
NHS Health Education North West Madel Fellowship (2014) £80000
Bowel Disease Research Federation (2014) £12400
The Madel Fellowship was awarded to a Mersey surgical trainee for the continuation of the
work presented in Chapter 5 - A global proteomic assessment of serial rectal tumour
biopsies.

Copyright © 2022 FDOKUMEN