
Modifying Third-Party Android Apps for Fun and Profit | Trellix

Chromatin modifying enzymes as modulators of reprogramming
Tamer T. Onder1,2,3,4, Nergis Kara5, Anne Cherry1,2,3,4, Amit U. Sinha6,7, Nan Zhu3,6,7,Kathrin M. Bernt3,6,7, Patrick Cahan1,2,3,4, Ogan. B. Mancarci8, Juli Unternaehrer1,2,3,4,Piyush B. Gupta9,10, Eric S. Lander9,11,12, Scott A. Armstrong3,6,7, and George Q.Daley1,2,3,4,6,13,14
1Stem Cell Transplantation Program, Division of Pediatric Hematology and Oncology, MantonCenter for Orphan Disease Research, Children’s Hospital Boston and Dana Farber CancerInstitute, Boston, Massachusetts, USA2Department of Biological Chemistry and Molecular Pharmacology, Harvard Medical School,Boston, Massachusetts, USA3Harvard Stem Cell Institute, Cambridge, Massachusetts, USA4Stem Cell Program, Children’s Hospital Boston, Boston, Massachusetts, USA5German Cancer Research Center, Heidelberg, Germany6Division of Hematology/Oncology, Children’s Hospital, Harvard Medical School, Boston,Massachusetts, USA7Department of Pediatric Oncology, Harvard Medical School, Boston, Massachusetts, USA8Department of Molecular Biology and Genetics, Bilkent University, Ankara, Turkey9Department of Biology, Massachusetts Institute of Technology, Cambridge, Massachusetts, USA10Whitehead Institute for Biomedical Research, Cambridge, Massachusetts, USA11The Broad Institute of Harvard and Massachusetts Institute of Technology, Cambridge,Massachusetts, USA12Department of Systems Biology, Harvard Medical School, Boston, Massachusetts, USA13Division of Hematology, Brigham and Women’s Hospital, Boston, Massachusetts, USA14Howard Hughes Medical Institute, Chevy Chase, Maryland, USA
AbstractGeneration of induced pluripotent stem cells (iPSCs) by somatic cell reprogramming involvesglobal epigenetic remodeling1. While several proteins are known to regulate chromatin marksassociated with the distinct epigenetic states of cells before and after reprogramming2,3, the role ofspecific chromatin modifying enzymes in reprogramming remains to be determined. To address
Correspondence and requests for materials should be addressed to: [email protected]. is a consultant for Epizyme Inc.GQD is a member of the scientific advisory boards and holds stock in or receives consultingfees from the following companies: Johnson & Johnson, Verastem, Epizyme, iPierian, Solasia KK, and MPM Capital, LLP.
Supplementary Information is linked to the online version of the paper at www.nature.com/nature.
Author contributionsT.T.O. performed project planning, experimental work, data interpretation and preparation of the manuscript. N.K., A.C, N.Z., J.U.and O.B.M. performed experimental work. P.C. and A.U.S. participated in data analysis. K.M.B. and S.A.A. provided criticalmaterials and participated in the preparation of the manuscript. P.B.G. and E.S.L., participated in data acquisition, data interpretationand preparation of the manuscript. G.Q.D supervised research and participated in project planning, data interpretation and preparationof the manuscript.
NIH Public AccessAuthor ManuscriptNature. Author manuscript; available in PMC 2012 November 19.
Published in final edited form as:Nature. ; 483(7391): 598–602. doi:10.1038/nature10953.
$waterm
ark-text$w
atermark-text
$waterm
ark-text

how chromatin-modifying proteins influence reprogramming, we used shRNAs to target genes inDNA and histone methylation pathways, and have identified positive and negative modulators ofiPSC generation. While inhibition of the core components of the polycomb repressive complex 1and 2, including the histone 3 lysine 27 methyltransferase Ezh2, reduced reprogrammingefficiency, suppression of SUV39H1, YY1, and Dot1L enhanced reprogramming. Specifically,inhibition of the H3K79 histone methyltransferase Dot1L by shRNA or a small moleculeaccelerated reprogramming, significantly increased the yield of iPSC colonies, and substituted forKlf4 and c-Myc. Inhibition of Dot1L early in the reprogramming process is associated with amarked increase in two alternative factors, Nanog and Lin28, which play essential functional rolesin the enhancement of reprogramming. Genome-wide analysis of H3K79me2 distribution revealedthat fibroblast-specific genes associated with the epithelial to mesenchymal transition loseH3K79me2 in the initial phases of reprogramming. Dot1L inhibition facilitates the loss of thismark from genes that are fated to be repressed in the pluripotent state. These findings implicatespecific chromatin-modifying enzymes as barriers to or facilitators of reprogramming, anddemonstrate how modulation of chromatin-modifying enzymes can be exploited to moreefficiently generate iPSCs with fewer exogenous transcription factors.
To examine the influence of chromatin modifiers on somatic cell reprogramming, weemployed a loss-of-function approach to interrogate the role of 22 select genes in DNA andhistone methylation pathways. We tested a pool of 3 hairpins for each of 22 target genes andobserved knockdown efficiencies of >60% for 21 out of 22 targets (Supplementary Fig. 1).We infected fibroblasts differentiated from the H1 human embryonic stem cell (ESC) line(dH1fs) with shRNA pools, transduced them with reprogramming vectors expressing Oct4,Sox2, Klf4 and c-Myc (OSKM), and identified the resulting iPSCs by Tra-1-60 staining(Fig. 1a)4. Eight shRNA pools reduced reprogramming efficiency (Fig. 1b). Among thetarget genes were Pou5F1/Oct4 (included as a control), and Ehmt1 and SetDB1, two H3K9methyltransferases whose histone mark is associated with transcriptional repression. Theremaining five shRNA pools targeted components of polycomb repressive complexes(PRC), major mediators of gene silencing and heterochromatin formation5. Inhibition ofPRC1 (Bmi1, Ring1) and PRC2 components (Ezh2, Eed, Suz12) significantly decreasedreprogramming efficiency while having negligible effects on cell proliferation (Fig. 1c,Supplementary Fig. 2). This finding is of particular significance given that Ezh2 is necessaryfor fusion-based reprogramming6 and highlights the importance of transcriptional silencingof the somatic cell gene expression program during generation of iPSCs.
In contrast to genes whose functions appear to be required for reprogramming, inhibition ofthree genes enhanced reprogramming: YY1, Suv39H1, and Dot1L (Fig. 1b, 1d). YY1 is acontext-dependent transcriptional activator or repressor7, whereas Suv39H1 is a histoneH3K9 methyltransferase implicated in heterochromatin formation8. Interestingly, enzymesthat modify H3K9 were associated with both inhibition and enhancement of reprogramming,which suggested that unraveling the mechanisms for their effects might be challenging.Thus, we focused on Dot1L, a histone H3 Lysine 79 methyltransferase that has notpreviously been studied in the context of reprogramming9. We utilized two hairpin vectorsthat resulted in the most significant downregulation of Dot1L and concomitant decrease inglobal H3K79 levels (Supplementary Fig. 3a, b). Fibroblasts expressing Dot1L shRNAsformed significantly more iPSC colonies when tested separately or in a context where theywere fluorescently labeled and co-mixed with control cells (Fig 2a, Supplementary Fig. 4).This enhanced reprogramming phenotype could be reversed by overexpressing an shRNA-resistant wildtype Dot1L, but not a catalytically-inactive Dot1L, suggesting that inhibition ofcatalytic activity of Dot1L is key to enhance reprogramming10 (Fig. 2a). Our findings withdH1fs were applicable to other human fibroblasts, as IMR-90 and MRC-5 cells alsoexhibited 3-fold and 6-fold increases in reprogramming efficiency, respectively, upon Dot1L
Onder et al. Page 2
Nature. Author manuscript; available in PMC 2012 November 19.
$waterm
ark-text$w
atermark-text
$waterm
ark-text

suppression (Supplementary Fig. 5). To validate our findings independently of shRNA-mediated knockdown, we utilized a recently discovered small molecule inhibitor of Dot1Lcatalytic activity. EPZ00477711 (referred to as iDot1L) abrogated H3K79 methylation atconcentrations ranging from 1uM to 10uM and increased reprogramming efficiency 3–4 fold(Fig. 2b, Supplementary Fig. 6a, b). Combination of inhibitor treatment with Dot1Lknockdown did not further increase reprogramming efficiency, reinforcing our previousobservation that inhibition of Dot1L’s catalytic activity is key to reprogramming(Supplementary Fig. 6c). iPSCs generated through Dot1L inhibition exhibited characteristicESC morphology, immunoreactivity for SSEA4, SSEA3, Tra-1-81, Oct4 and Nanog, anddifferentiated into all three embryonic germ layers in vitro and in teratomas (SupplementaryFig. 7 a–c). Therefore, iPSCs generated following Dot1L inhibition display all of thehallmarks of pluripotency.
We next assessed Dot1L inhibition in murine reprogramming. iDot1L treatment led to 3-foldenhancement of reprogramming of Oct4-GFP MEFs (Fig. 2c). Reprogramming of tail-tipfibroblasts (TTFs) derived from a conditional knockout Dot1L mouse strain yieldedsignificantly more iPSC colonies upon deletion of Dot1L12 (Supplementary Fig. 8a). Cre-mediated excision of both floxed Dot1L alleles in iPSC clones derived from homozygousTTFs was confirmed by genomic PCR (Supplementary Fig. 8b). Dot1L inhibition alsoincreased reprogramming efficiency of MEFs and peripheral blood cells derived from aninducible secondary iPSC mouse strain13 (Supplementary Fig. 8c, d). Taken together, theseresults demonstrate that Dot1L inhibition enhances reprogramming of both mouse andhuman cells.
We next examined the cellular mechanisms by which Dot1L inhibition promotesreprogramming. Dot1L inhibition affected neither retroviral transgene expression norcellular proliferation (Supplementary Fig. 9 a–c). Although previous studies indicated thatDot1L null cells have increased apoptosis and accumulation of cells in G2 phase9, we failedto observe a significant increase in apoptosis or change in the cell cycle profile of Dot1L-inhibited fibroblasts (Supplementary Fig. 9d, e). In human iPSC clones derived fromshDot1L fibroblasts, Dot1L inhibition was no longer evident, reflecting the known silencingof retroviruses that occurs during reprogramming (Supplementary Fig. 10a). qPCR analysisrevealed that the silencing occurred by day 15 after OSKM transduction (SupplementaryFig. 10b, c). To define the crucial time window for Dot1L inhibition, we treated fibroblastswith iDot1L at 1-week intervals during reprogramming. iDot1L treatment in either the firstor second week was sufficient to enhance reprogramming, whereas treatment in the thirdweek or a 5-day pretreatment had no effect (Supplementary Fig. 10d, e).Immunofluorescence analysis revealed significantly greater numbers of Tra-1-60-positivecell clusters on day 10 and day 14 in shDot1L cultures (Supplementary Fig. 11a, b),indicating that the emergence of iPSCs is accelerated upon Dot1L inhibition. When weextended the reprogramming experiments by 10 more days, shDot1L cells still yielded moreiPSC colonies than controls (Supplementary Fig. 11c). Taken together, these findingsindicate that Dot1L inhibition acts in early to middle stages to accelerate and increase theefficiency of the reprogramming process.
To assess whether Dot1L inhibition could replace any of the reprogramming factors, weinfected control and Dot1L-inhibited fibroblasts with 3 factors, omitting one factor at a time.In the absence of Oct4 or Sox2 no iPSC colonies emerged (Fig. 2d). When we omitted eitherKlf4 or c-Myc, Dot1L-inhibited fibroblasts gave rise to robust numbers of Tra-1-60 positivecolonies, while control cells generated very few colonies, as reported previously4 (Fig. 2d–f,Supplementary Fig. 12a). Importantly, Dot1L-inhibited fibroblasts transduced with onlyOct4 and Sox2 gave rise to Tra-1-60-positive colonies, whereas control fibroblasts did not(Fig. 2d–f). These two-factor iPSCs exhibited typical ESC morphology, silenced the
Onder et al. Page 3
Nature. Author manuscript; available in PMC 2012 November 19.
$waterm
ark-text$w
atermark-text
$waterm
ark-text

reprogramming vectors and had all of the hallmarks of pluripotency as gauged byendogenous pluripotency factor expression and the ability to form all three embryonic germlayers in vitro and in teratomas (Supplementary Fig. 7a–c, 12b). PCR on genomic DNAisolated from expanded colonies confirmed the absence of integrated Klf4 and c-Myctransgenes (Supplementary Fig. 12c). Thus, we were able to generate two-factor iPSCseither by suppression of Dot1L expression or chemical inhibition of its methyltransferaseactivity.
To gain insights into the molecular mechanisms of how Dot1L inhibition promotesreprogramming and replaces Klf4 we performed global gene-expression analyses on controland shDot1L fibroblasts prior to and 6 days after OSKM and OSM transduction along withcells that were treated with iDot1L. Relatively few genes were differentially expressed inshDot1L cells on Day 6 of reprogramming (22 up, 23 down; Supplementary Table 3).Inhibitor treated cells exhibited broader gene expression changes (405 up and 175 down;Supplementary Table 3), presumably due to more complete inhibition of K79me2 levels(Fig. 3a). In the absence of Klf4, 94 genes were differentially upregulated in shDot1L cells;intersection of this set of genes with the set differentially upregulated in 4-factorreprogramming of Dot1L-inhibited cells yielded only 5 common genes (Fig. 3a, b). We wereparticularly intrigued to find Nanog and Lin28 upregulated in all three instances of Dot1Linhibition, because these two genes are part of the core pluripotency network of human EScells14,15 and can reprogram human fibroblasts into iPSCs when used in combination withOct4 and Sox216.
We explored the possibility that Nanog and Lin28 upregulation might account for theenhanced reprogramming observed following Dot1L inhibition, and validated theirupregulation in shDot1L fibroblasts upon OSM or OS transduction (Supplementary Fig. 13a,b). Interestingly, at this early time-point Rex1 and Dnmt3b, two other well-characterizedpluripotency genes, were not upregulated suggesting that Dot1L inhibition does not broadlyupregulate the pluripotency network. Suppression of either Nanog or Lin28 abrogated the 2-factor (OS) reprogramming of shDot1L fibroblasts, indicating the essential roles of Nanogand Lin28 in this process (Fig. 3c, Supplementary Fig. 13c). Dot1L inhibition also led toincreased Nanog expression in the context of Oct4, Sox2 and Lin28 (OSL) and Lin28expression in the context of Oct4, Sox2 and Nanog (OSN) (Supplementary Fig. 14a).Furthermore, Dot1L inhibition significantly increased the efficiency of three-factorreprogramming in the context of OSN and OSL (Supplementary Fig. 14b). Finally, inclusionof Nanog and Lin28 in the OSKM reprogramming cocktail did not confer any additionalenhancement to shDot1L cells (Fig. 4d, Supplementary Fig. 14c). Taken together, these dataimplicate Nanog and Lin28 in the enhancement of reprogramming and replacement of Klf4and c-Myc with Dot1L inhibition.
To gain insight into the genome-wide chromatin changes that are facilitated by Dot1Linhibition, we performed Chromatin ImmunoPrecipitation followed by DNA sequencing(ChIP-seq) for H3K79me2 and H3K27me3 in human ES cells as well as fibroblastsundergoing reprogramming, with or without iDot1L treatment (Supplementary Fig. 15). Inboth ES cells and fibroblasts, H3K79me2 is positively associated with transcriptionallyactive genes and negatively associated with genes marked by H3K27me3 (SupplementaryFig. 16a-c). ES cell specific genes marked by H3K79 included pluripotency factors, a subsetof their downstream targets, and genes involved in epithelial cell adhesion such as CDH1(280 genes; Supplementary Fig. 17a, b and Supplementary Table 4, 5). In contrast, infibroblasts, genes marked by H3K79me2 were significantly enriched in genes inducedduring the epithelial to mesenchymal transition (EMT) (377 genes, Supplementary Fig. 17a).
Onder et al. Page 4
Nature. Author manuscript; available in PMC 2012 November 19.
$waterm
ark-text$w
atermark-text
$waterm
ark-text

Among the 348 genes that showed reduced H3K79me2 six days after OSKM expression, welikewise found a significant enrichment of gene sets associated with the induction of amesenchymal state, including Snai2, TGF-β2 and TGFBR1 (Supplementary Fig. 18a)17,18.Only a few of these genes showed decreased expression at Day 6 (12 out of 348), but thevast majority of them lacked this mark in the pluripotent state (272 out of the 348 devoid ofH3K79me2 in ESCs), suggesting they were destined for transcriptional silencing duringreprogramming. This finding prompted us to ask whether Dot1L inhibition results in theremoval of K79me2 from such fibroblast-specific, EMT-associated genes. Upon Dot1Linhibitor treatment, K79me2 levels were reduced on almost all loci, with the exception of asubset comprised mostly of housekeeping genes that also had high levels of K79me2 in EScells (Supplementary Fig. 19a). Strikingly, the genes that lost proportionally the mostK79me2 in inhibitor-treated fibroblasts during reprogramming (8-fold or more) were againhighly enriched in genes induced in EMT (Fig. 19b). Mesenchymal master regulators suchas Snai1/2, Zeb1/2, and Tgfb2 were among these genes (Fig. 4a)19. In the presence of theDot1L inhibitor, these regulators were more strongly repressed during reprogramming,while epithelial genes such as E-cadherin and Occludin were more robustly upregulated(Fig. 4b). The extinction of fibroblast gene expression was accompanied by increaseddeposition of the repressive H3K27me3 mark on the majority of fibroblast specificregulators examined (Supplementary Fig. 20). In contrast, K27me3 was depleted to a greaterextent on Sox2 and E-cadherin promoters, reflecting their activation during reprogramming.Finally, the H3K27me3 status of master regulators of other lineages, such as Olig2, MyoD1,Nkx2-1 and Gata4, remained unchanged upon Dot1L inhibitor treatment, suggesting that thedeposition of H3K27me3 was specific to fibroblast specific regulators.
To test the functional importance of downregulation of mesenchymal regulators in theDot1L-mediated enhancement of reprogramming, we overexpressed Twist1, Snail1 andZeb1 or added soluble TGF-β2 to cells undergoing reprogramming in the presence of theDot1L inhibitor. All of these perturbations significantly counteracted the enhancementobserved with Dot1L inhibition (Fig. 4c). Interestingly, expression of these factors alsoabrogated the iDot1L-mediated upregulation of Nanog and Lin28, suggesting that the effectof Dot1L inhibition on these two pluripotency genes is likely to be indirect (Fig. 4d, e).Conversely, we tested whether destabilization of the mesenchymal state by inhibition ofTGF-β signaling would be redundant with Dot1L inhibition. A small molecule inhibitor ofTGF-β signaling (SB431542) increased reprogramming efficiency, but in combination withthe Dot1L inhibitor, showed no significant further increase in iPSC colonies (SupplementaryFig. 21). Taken together these data indicate that in fibroblasts, downregulation of themesenchymal gene expression program is critical to enhancement of reprogramming byDot1L inhibition.
Our loss of function survey indicates that chromatin-modifying enzymes play critical rolesfor both reactivating silenced loci as well as reinstating closed domains of heterochromatinduring the global epigenetic remodeling of differentiated cells to pluripotency, thusimplicating specific enzymes as facilitators or barriers to cell fate transitions. Dot1Linhibition appears to enhance reprogramming at least in part by facilitating loss of K79me2from fibroblast genes whose silencing is required for reprogramming (Supplementary Fig.22). Interestingly, Klf4, which can be replaced by Dot1L inhibition, has been shown tofacilitate MET by inducing E-cadherin expression20. Persistent K79me2 at the fibroblastmaster regulators during the initial phases of reprogramming seems to prevent shutdown ofthese genes, thus hindering the acquisition of an epithelial phenotype concomitant withdelayed activation of Nanog and Lin28. In this regard H3K79me2 acts as a barrier toefficient repression of the somatic program by the reprogramming factors. This notion isconsistent with the role of Dot1 in yeast, where it antagonizes gene repression21. Asreprogramming of blood cells is also enhanced by Dot1L inhibition, we speculate that
Onder et al. Page 5
Nature. Author manuscript; available in PMC 2012 November 19.
$waterm
ark-text$w
atermark-text
$waterm
ark-text

Dot1L inhibition may enhance reprogramming in a broad range of cell types by facilitatingthe silencing of lineage-specific programs of gene expression. Finally, our results alsodemonstrate that specific chromatin modifiers can be modulated to generate iPSCs moreefficiently and with fewer exogenously introduced transcription factors.
Methods SummaryshRNAs were designed using the RNAi Codex22. 97-mer oligonucleotides (SupplementaryTable 1) were PCR amplified and cloned into MSCV-PM23 vector. Reprogramming assayswere carried out with either retroviral4 or lentiviral16 reprogramming vectors. dH1f cellswere previously described4. For gene expression analyses, total RNA was extracted fromtwo or three independent culture plates for each condition and transcriptional profiling wasperformed using Affymetrix U133A microarrays. ChIP-seq was performed as described withslight modifications12.
METHODSshRNA cloning
shRNAs were designed using the RNAi Codex22. 97-mer oligos (Supplementary Table 1)were amplified with the following primer pair: Forward:GATGGCTGCTCGAGAAGGTATATTGCTGTTGACAGTGAGCG, Reverse:GTCTAGAGGAATTCCGAGGCAGTAGGC. PCR products were gel purified, digestedwith EcoRI and XhoI and ligated into the MSCV-PM vector. Clones were verified bysequencing. shRNA targeting the firefly luciferase was used as a control23. Nanog shRNAwas previously described24.
Production of viral supernatants293T cells were plated at a density of 2.5 × 10⁶ cells per 10-cm dish. The next day, cellswere transfected with 2.5 μg viral vector, 2.25 μg Gag-Pol vector and 0.25 μg VSV-Gplasmid using 20 μl Fugene 6 (Roche Applied Science) in 400 μl DMEM per plate.Supernatant was collected 48 h and 72 h post-transfection and filtered through 45 μm poresize filters. For concentration, viral supernatants were mixed with PEG3350 solution (SigmaP3640, dissolved in PBS, 10% final concentration) and left overnight at 4°C. The next day,supernatants were centrifuged at 2500 rpm for 20minutes, and the pellets were re-suspendedin PBS. Titering was performed on 293Ts. For shRNA infections, 500 μl of unconcentratedviral supernatant was used to infect 25,000 cells in the presence of 10ug/ml protaminesulfate. For fluorescent labeling of dh1fs, we used lentiviruses PRRL-GFP (Addgene#12252) and FUdGW-Tomato (Addgene #22771).
Reprogramming assaysdH1f cells were first infected with shRNA viruses at high MOI to ensure all cells received atleast one vector (Gauged by puromycin resistance of parallel infected wells). 25,000shRNA-infected dH1f cells were then plated per well in 12-well plates and infectedovernight with either retroviral (MOI 2.5)25 or lentiviral (Addgene #21162, 21164; 100–200μl supernatant)26 reprogramming factors. For 2-factor reprogramming, Oct4 and Sox2viruses were used at an MOI of 5. 6 days later, cells were trypsinized and re-plated 1:4 or1:6 onto 6-well plates. Medium was changed to hES medium daily until Day 21 when plateswere fixed. Small molecule inhibitor of Dot1L, EPZ004777 (a gift from Epizyme, Inc.,Cambridge, MA) was dissolved in DMSO as a 10mM stock and was added at the indicatedconcentrations. For Dot1L rescue experiments, an MSCV-based retroviral vector encodinghuman Dot1L with or without mutations in the SAM binding site (gifts of Y. Zhang) weremutagenized at the shRNA target site using QuikChange II XL Site-Directed Mutagenesis
Onder et al. Page 6
Nature. Author manuscript; available in PMC 2012 November 19.
$waterm
ark-text$w
atermark-text
$waterm
ark-text

Kit (Agilent Technologies). In certain experiments, Nanog and Lin28 expression wasachieved using lentiviruses (Addgene #21163). IMR-90 and MRC5 human diploidfibroblasts were purchased from ATCC and 50000 cells were used in reprogrammingexperiments. SB431542 (Stemgent) was used at a final concentration of 2 μM. TGF-beta2(R&D Systems) was added daily at a concentration of 2ng/ml. Twist1 (Addgene #1783),Snai1 (Addgene #23347) and Zeb1 (a gift of R.A.Weinberg) were overexpressed usingretro- or lentiviruses. Statistical analysis was performed using a Student’s t-test.
Microarray analysisTotal RNA was extracted from two or three independent culture plates for each conditionwith an RNeasy Mini kit (Qiagen). Synthesis of cRNA from total RNA and hybridization/scanning of microarrays were performed with Affymetrix GeneChip products (HGU133A)as described in the GeneChip manual. Normalization of the raw gene expression data,quality control checks, and subsequent analyses were done with the open-source R-projectstatistical software (R Development Core Team, 2007)(http://www.r-project.org/) togetherwith Bioconductor packages. Raw data files (.CEL) were converted into probe set values byRMA normalization. Genes were selected at a threshold of Log Ratio 0.4. The microarraydata have been deposited in National Center for Biotechnology Information GeneExpression Omnibus (GEO) and are accessible through GEO Series accession numberGSE29253.
SYBR-Green Real-Time RT-PCRTotal RNA was extracted using RNeasy Mini kit coupled with RNase-free DNase set(Qiagen) and reverse transcribed with Hexanucleotide Mix (Roche). The resulting cDNAswere used for PCR using SYBR-Green Master PCR mix (Applied Biosystem) in triplicates.All quantitations were normalized to an endogenous Beta-Actin control. The relativequantitation value for each target gene compared to the calibrator for that target is expressedas 2−(Ct-Cc) (Ct and Cc are the mean threshold cycle differences after normalizing to Beta-Actin). List of primers can be found in supplementary table 2.
ImmunostainingImmunostaining of reprogramming plates were performed as described27. Briefly, cells werefixed with 4% p-formaldehyde and stained with biotin-anti-Tra-1-60 (eBioscience,#13-8863-82, 1:250) and streptavidin horseradish peroxidase (Biolegend, #405210, 1:500)diluted in PBS (3%), FCS (0.3%) Triton X-100. Staining was developed with the Vectorlabs DAB kit (#SK-4100), and iPSC colonies quantified with ImageJ software. For thecharacterization of shDot1l-iPS cells, we picked single colonies onto MEF coated 96-wellplates. The plates were fixed for 20 min with 4% p-formaldehyde/PBS (+/+), washed severaltimes with PBS (+/+) and incubated overnight at 4°C with primary antibody and Hoechstdiluted in 3% donkey serum/3% BSA Fraction VII/0.01% Triton X-100/PBS (+/+); Hoechst,Invitrogen #H3570 (1:20,000), Tra-1-81/A488 (BD #560174), SSEA-4/A647 (BD#560219), Tra-1-60/A647 (BD #560122), Nanog, rabbit polyclonal (Abcam #ab21624),Oct4, rabbit polyclonal (Abcam #ab19857). For Nanog and Oct4, donkey anti-rabbit IgG/A555 (Molecular Probes #A31572) secondary antibody was used. After several washes withPBS (+/+), images were acquired using a BD Pathway 435 imager equipped with a ×10objective.
Teratoma formation assayiPSCs grown on MEFs were harvested with Collagenease IV (1 mg/ml in DMEM/F12). Cellclumps from one 6-well plate were resuspended in 50 μl DMEM/F12, 100 μl collagen I(Invitrogen-#A1064401) and 150 μl hESC-qualified matrigel (BD Biosciences#354277).
Onder et al. Page 7
Nature. Author manuscript; available in PMC 2012 November 19.
$waterm
ark-text$w
atermark-text
$waterm
ark-text

Cell clumps were then injected into the hind limb femoral muscles (100 μl suspension perleg) of Rag2 γ/c mice. After 6–8 weeks, teratomas were harvested and fixed in Bouin’ssolution overnight. Samples were then embedded in paraffin, and sections were stained withhematoxylin/eosin (Rodent Histopathology Core, Harvard Medical School, Boston, MA,USA).
Characterization of iPS cellsEmbryoid body differentiation was performed as described28. To check for the presence ofthe reprogramming transgenes, genomic DNA was isolated using DNeasy Blood & TissueKit (Qiagen) and PCR was performed with specific primers to the endogenous or the viraltrangenes4.
ChIP-sequencingChIP-seq was performed as described with slight modifications12. 300000 cells were fixedat room temperature in PBS 1% formalin (v/v) for 10 minutes with gentle agitation. Fixationwas stopped by the addition of glycine (125 mM final concentration) and agitation for 5 minat room temperature. Fixed cells were washed twice in ice-cold PBS, resuspended in 100μlof SDS lysis buffer (1% SDS, 10mM EDTA, 50 mM Tris-HCl, pH 8.1). Chromatin wassheared by sonication to about 100–500bp fragments using bioruptor (diagenode, Denville,NJ) and diluted ten fold with dilution buffer (0.01% SDS, 1.1% Triton-X100, 1.2 mMEDTA, 16.7 mM Tris-HCl, pH 8.1,167 mM NaCl). Antibodies against specific histonemodifications was added to sonicated chromatin solution and incubated at 4°C overnightwith gentle agitation. The antibodies used were anti-H3K27me3 (Millipore 07–449) andanti-H3K79me2 (abcam 3594). Immune complexes were collected by incubation with 20ulof Protein A/G agarose beads (Millipore) for an hour at 4 degree with gentle agitation.Precipitates were washed sequentially with ice cold low salt wash (0.1% SDS, 1% Triton-X-100, 2mM EDTA, 20mM Tris-HCl, pH8.1, 150mM NaCl), high salt wash (0.1% SDS,1% Triton-X-100, 2mM EDTA, 20mM Tris-HCl, pH 8.1, 500mM NaCl), LiCl wash (0.25MLiCl, 1% IGEPAL CA-630, 1% deoxycholic acid, 1mM EDTA, 10mM Tris-HCl, pH 8.1)and TE wash (1mM EDTA, 10mM Tris-HCl, pH 8.1) for 5 mins each at 4°C with gentleagitation. Samples were centrifuged briefly in between washes to collect the beads.Immunoprecipitated DNA was eluted by incubating beads wtih 150ul elution buffer(1%SDS, 0.1 M NaHCO3) with gentle agitation for 15mins at room temperature. Elutionwas repeated once and eluates were combined, sodium chloride (final concentration of0.2M) were added to the eluate and eluates were incubated at 65°C overnight to reversecrosslinking. DNA was purified using PCR purification spin column (Qiagen). For ChIPsequencing, ChIP DNA libraries were made following Illumina ChIP-seq library preparationkit and subjected to Solexa sequencing (Illumina) at Center for Cancer ComputationalBiology, Dana Faber Cancer Institute. Sequencing was performed on Illumina HiSeq2000.The reads were aligned to the human genome hg18 using Bowtie29 and the reads thatmapped to multiple locations in the genome were discarded. We quantified the histonemodification level as the number of reads per million per kb in a window of interest. Thewindow was 1 Kb upstream to 1 Kb downstream from the Transcription Start Site (TSS) forK27me3 and 1 Kb upstream to 2 Kb downstream of the TSS for K79me2. To determine thesignificance of signal at a gene, an empirical background model was estimated. Genes thatshowed interesting pattern of histone methylation change were identified using iCanPlot(www.icanplot.org). Geneset Overlap Analysis was performed by finding the overlap of aset of genes of our interest with the genesets in the collections c2.all, c3.all and c5.all inMSigDB (Total number of genesets in these collections is 5562)30. Hypergeometric test,with Bonferroni correction for multiple hypothesis testing, was performed to generate the p-values associated with gene set overlap analysis. ChIP-Seq data have been deposited at theNCBI Gene Expression Omnibus with accession number GSE35791.
Onder et al. Page 8
Nature. Author manuscript; available in PMC 2012 November 19.
$waterm
ark-text$w
atermark-text
$waterm
ark-text

Supplementary MaterialRefer to Web version on PubMed Central for supplementary material.
AcknowledgmentsWe thank G. Hu and S.J. Elledge for providing the MSCV-PM vector, K. Ng and M.W. Lensch for teratomainjections and assessment and S. Loewer for discussions. We also thank Ed Olhava and Epizyme Inc. forsynthesizing and providing the Dot1L inhibitor, EPZ004777. G.Q.D. is an investigator of the Howard HughesMedical Institute. Research was funded by grants from the US National Institutes of Health (NIH) to S.A.A.(CA140575) and G.Q.D., and the CHB Stem Cell Program.
References1. Takahashi K, Yamanaka S. Induction of pluripotent stem cells from mouse embryonic and adult
fibroblast cultures by defined factors. Cell. 2006; 126:663–76. [PubMed: 16904174]
2. Hawkins RD, et al. Distinct Epigenomic Landscapes of Pluripotent and Lineage-Committed HumanCells. Cell Stem Cell. 2010; 6:479–491. [PubMed: 20452322]
3. Mikkelsen TS, et al. Genome-wide maps of chromatin state in pluripotent and lineage-committedcells. Nature. 2007; 448:553–60. [PubMed: 17603471]
4. Park I-H, et al. Reprogramming of human somatic cells to pluripotency with defined factors. Nature.2008; 451:141–6. [PubMed: 18157115]
5. Margueron R, Reinberg D. The Polycomb complex PRC2 and its mark in life. Nature. 2011;469:343–9. [PubMed: 21248841]
6. Pereira CF, et al. ESCs Require PRC2 to Direct the Successful Reprogramming of DifferentiatedCells toward Pluripotency. Cell Stem Cell. 2010; 6:547–556. [PubMed: 20569692]
7. Shi Y, et al. Transcriptional repression by YY1, a human GLI-Krüippel-related protein, and relief ofrepression by adenovirus E1A protein. Cell. 1991; 67:377–388. [PubMed: 1655281]
8. Schotta G, Ebert A, Reuter G. SU(VAR)3–9 is a conserved key function in heterochromatic genesilencing. Genetica. 2003; 117:149–58. [PubMed: 12723694]
9. Jones B, et al. The histone H3K79 methyltransferase Dot1L is essential for mammaliandevelopment and heterochromatin structure. PLoS genetics. 2008; 4:e1000190. [PubMed:18787701]
10. Okada Y, et al. hDOT1L links histone methylation to leukemogenesis. Cell. 2005; 121:167–78.[PubMed: 15851025]
11. Daigle SR, et al. Selective Killing of Mixed Lineage Leukemia Cells by a Potent Small-MoleculeDOT1L Inhibitor. Cancer cell. 2011; 20:53–65. [PubMed: 21741596]
12. Bernt KM, et al. MLL-Rearranged Leukemia Is Dependent on Aberrant H3K79 Methylation byDOT1L. Cancer cell. 2011; 20:66–78. [PubMed: 21741597]
13. Carey BW, et al. Single-gene transgenic mouse strains for reprogramming adult somatic cells.Nature Methods. 2010; 7
14. Boyer, La, et al. Core transcriptional regulatory circuitry in human embryonic stem cells. Cell.2005; 122:947–56. [PubMed: 16153702]
15. Mikkelsen TS, et al. Dissecting direct reprogramming through integrative genomic analysis.Nature. 2008; 454:49–55. [PubMed: 18509334]
16. Yu J, et al. Induced pluripotent stem cell lines derived from human somatic cells. Science (NewYork, NY). 2007; 318:1917–20.
17. Charafe-Jauffret E, et al. Gene expression profiling of breast cell lines identifies potential newbasal markers. Oncogene. 2006; 25:2273–84. [PubMed: 16288205]
18. Onder TT, et al. Loss of E-cadherin promotes metastasis via multiple downstream transcriptionalpathways. Cancer research. 2008; 68:3645–54. [PubMed: 18483246]
19. Taube JH, et al. Core epithelial-to-mesenchymal transition interactome gene-expression signatureis associated with claudin-low and metaplastic breast cancer subtypes. Proceedings of the NationalAcademy of Sciences of the United States of America. 2010; 107:15449–54. [PubMed: 20713713]
Onder et al. Page 9
Nature. Author manuscript; available in PMC 2012 November 19.
$waterm
ark-text$w
atermark-text
$waterm
ark-text

20. Samavarchi-Tehrani P, et al. Functional Genomics Reveals a BMP-Driven Mesenchymal-to-Epithelial Transition in the Initiation of Somatic Cell Reprogramming. Cell Stem Cell. 2010;7:64–77. [PubMed: 20621051]
21. Stulemeijer IJ, et al. Dot1 binding induces chromatin rearrangements by histone methylation-dependent and -independent mechanisms. Epigenetics & chromatin. 2011; 4:2. [PubMed:21291527]
22. Olson A, et al. RNAi Codex: a portal/database for short-hairpin RNA (shRNA) gene-silencingconstructs. Nucleic acids research. 2006; 34:D153–7. [PubMed: 16381835]
23. Schlabach MR, et al. Cancer proliferation gene discovery through functional genomics. Science(New York, NY). 2008; 319:620–4.
24. Zaehres H, et al. High-efficiency RNA interference in human embryonic stem cells. Stem cells(Dayton, Ohio). 2005; 23:299–305.
25. Park I-H, et al. Generation of human-induced pluripotent stem cells. Nature protocols. 2008;3:1180–6.
26. Yu J, et al. Human induced pluripotent stem cells free of vector and transgene sequences. Science(New York, NY). 2009; 324:797–801.
27. Chan EM, et al. Live cell imaging distinguishes bona fide human iPS cells from partiallyreprogrammed cells. Nature biotechnology. 2009; 27:1033–7.
28. Loewer S, et al. Large intergenic non-coding RNA-RoR modulates reprogramming of humaninduced pluripotent stem cells. Nature Genetics. 2010; 42:1113–1117. [PubMed: 21057500]
29. Langmead B, et al. Ultrafast and memory-efficient alignment of short DNA sequences to thehuman genome. Genome biology. 2009; 10:R25. [PubMed: 19261174]
30. Subramanian A, et al. GSEA-P: a desktop application for Gene Set Enrichment Analysis.Bioinformatics (Oxford, England). 2007; 23:3251–3.
Onder et al. Page 10
Nature. Author manuscript; available in PMC 2012 November 19.
$waterm
ark-text$w
atermark-text
$waterm
ark-text
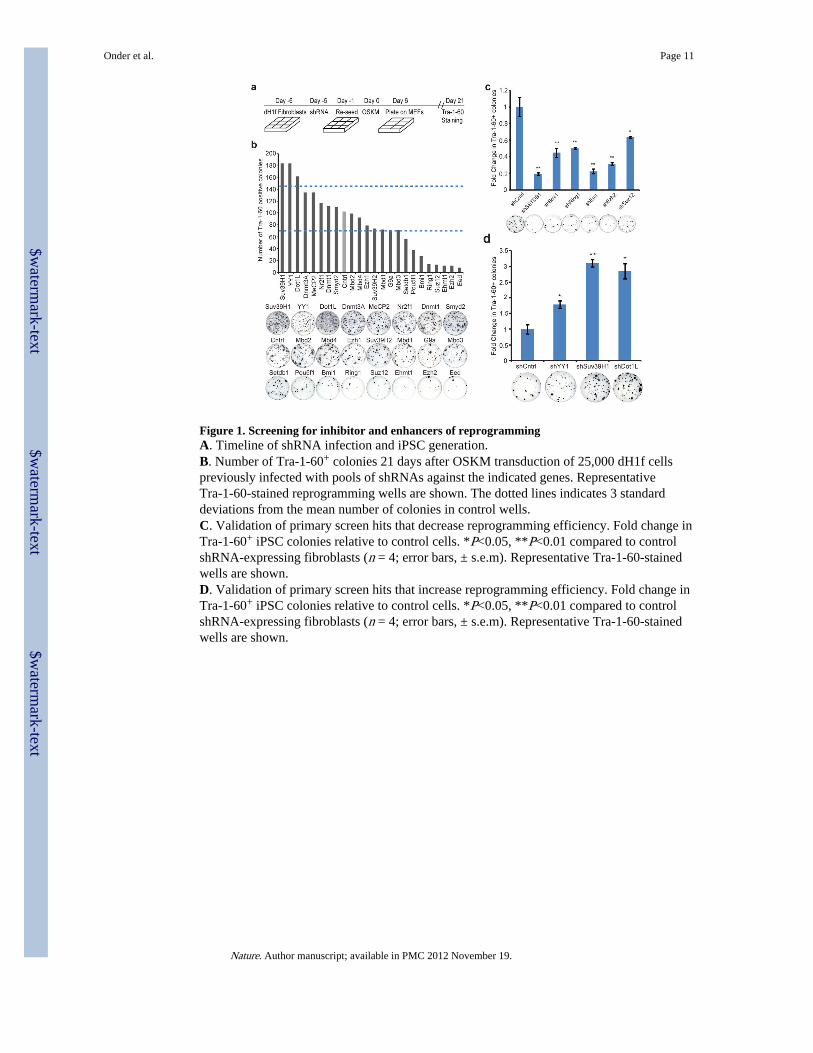
Figure 1. Screening for inhibitor and enhancers of reprogrammingA. Timeline of shRNA infection and iPSC generation.B. Number of Tra-1-60+ colonies 21 days after OSKM transduction of 25,000 dH1f cellspreviously infected with pools of shRNAs against the indicated genes. RepresentativeTra-1-60-stained reprogramming wells are shown. The dotted lines indicates 3 standarddeviations from the mean number of colonies in control wells.C. Validation of primary screen hits that decrease reprogramming efficiency. Fold change inTra-1-60+ iPSC colonies relative to control cells. *P<0.05, **P<0.01 compared to controlshRNA-expressing fibroblasts (n = 4; error bars, ± s.e.m). Representative Tra-1-60-stainedwells are shown.D. Validation of primary screen hits that increase reprogramming efficiency. Fold change inTra-1-60+ iPSC colonies relative to control cells. *P<0.05, **P<0.01 compared to controlshRNA-expressing fibroblasts (n = 4; error bars, ± s.e.m). Representative Tra-1-60-stainedwells are shown.
Onder et al. Page 11
Nature. Author manuscript; available in PMC 2012 November 19.
$waterm
ark-text$w
atermark-text
$waterm
ark-text

Figure 2. Dot1L inhibition enhances reprogramming efficiency and substitutes for Klf4 and MycA. Fold change in the reprogramming efficiency of dH1f cells infected with 2 independentDot1L shRNAs or co-infected with shRNA-1 and a vector expressing an shRNA-resistantwild-type or catalytically dead mutant Dot1L. Data correspond to the average and s.e.m.;n=independent experiments. *P<0.01 control shRNA-expressing fibroblasts.B. Fold change in the reprogramming efficiency of dH1f cells treated with iDot1L at theindicated concentrations for 21 days. Data correspond to the mean ± s.d.; n=3. *P<0.001compared to untreated fibroblasts.C. Number of AP+ colonies derived from OSKM transduced untreated or iDot1L treated(10um) Oct4-GFP MEFs. *P<0.001 compared untreated MEFs (n = 4; error bars, ± s.d).Representative AP-stained wells are shown.D. Tra-1-60 stained of plates of shCntrl and shDot1L fibroblasts in the absence of eachfactor or both Klf4 and c-Myc.E. Tra-1-60 stained of plates of untreated and iDot1L treated (3.3uM) fibroblasts in theabsence of each factor or both Klf4 and c-Myc.F. Quantification of the Tra-1-60+ colonies in Figs. 2d, e representing mean and s.d. of 2independent experiments done in triplicate.
Onder et al. Page 12
Nature. Author manuscript; available in PMC 2012 November 19.
$waterm
ark-text$w
atermark-text
$waterm
ark-text

Figure 3. Nanog and Lin28 are required for enhancement of reprogramming by Dot1LinhibitionA. Overlap of differentially upregulated genes in shDot1L cells 6 Days post-OSKM andOSM transduction with the genes upregulated in OSKM transduced iDotL-treated cells.B. Heat maps showing differential expression levels of commonly upregulated genes inOSKM transduced Dot1L-inhibited cells.C. Number of Tra-1-60+ iPSC colonies upon knockdown of Nanog or Lin28 in 2-factorreprogramming of shDot1L cells. Data represent mean and s.e.m of 2 independentexperiments done in triplicate.D. Fold-change in Tra-1-60+ iPSC colonies in 4-factor (OSKM) and 6-factor (OSKMNL)reprogramming of shCntrl and shDot1L fibroblasts. Data represent mean and s.e.m. of 2independent experiments done in duplicate. Representative Tra-1-60 stained wells are shownabove.
Onder et al. Page 13
Nature. Author manuscript; available in PMC 2012 November 19.
$waterm
ark-text$w
atermark-text
$waterm
ark-text

Figure 4. Genome-wide analysis of H3K79me2 marks during reprogrammingA. H3K79me2 ChIP-sequencing tracks (blue) for select EMT-associated genes in fibroblastsand ES cells along with the corresponding H3K27me3 tracks in ES cells (red).B. Expression of EMT-associated transcription factors (EMT-TF) and epithelial genes incontrol and iDot1L-treated fibroblasts at the indicated time-points during reprogramming.qPCR was normalized to uninfected fibroblasts for EMT-TFs and H1ES cells for Cdh1 andOcln.C. Number of Tra-1-60+ colonies derived from untreated and iDot1L treated (3.3uM) dH1fcells that are either infected with Snail, Twist or Zeb1 expression vectors or treated withsoluble TGF-β2 (2ng/ml) (n = 3; error bars, ± s.d.). Representative Tra-1-60-stained wellsare shown.D. qRT-PCR quantification of Nanog mRNA level on Day 6 of OSKM expressing untreatedor iDot1L-treated (3.3uM) fibroblasts expressing the indicated EMT-factors. Expressionlevels were normalized to those observed in H1ES cells.E. qRT-PCR quantification of Lin28A mRNA level on Day 6 of OSKM expressinguntreated or iDot1L-treated (3.3uM) fibroblasts expressing the indicated EMT-factors.Expression levels were normalized to those observed in H1ES cells.
Onder et al. Page 14
Nature. Author manuscript; available in PMC 2012 November 19.
$waterm
ark-text$w
atermark-text
$waterm
ark-text
Copyright © 2022 FDOKUMEN