Targeted Immune Modulators for Rheumatoid Arthritis - ICER
569
©Institute for Clinical and Economic Review, 2017 Targeted Immune Modulators for Rheumatoid Arthritis: Effectiveness & Value Evidence Report April 7, 2017 Prepared for NOTICE: On April 14, 2017, the FDA issued a complete response letter for baricitinib indicating that the FDA is unable to approve the application in its current form and requires additional data to determine the most appropriate doses and to further characterize safety concerns across treatment arms.
-
Upload
khangminh22 -
Category
Documents
-
view
0 -
download
0
Transcript of Targeted Immune Modulators for Rheumatoid Arthritis - ICER

©Institute for Clinical and Economic Review, 2017
Targeted Immune Modulators for
Rheumatoid Arthritis: Effectiveness & Value
Evidence Report
April 7, 2017
Prepared for
sNOTICE: On April 14, 2017, the FDA issued a complete response letter for baricitinib indicating that the FDA is unable to approve the application in its current form and requires additional data to determine the most appropriate doses and to further characterize safety concerns across treatment arms.

©Institute for Clinical and Economic Review, 2017 Page i Evidence Report: Targeted Immune Modulators for Rheumatoid Arthritis
ICER Staff/Consultants University of Colorado School of Pharmacy
(Anschutz Medical Campus) Modeling Group*
Daniel A. Ollendorf, PhD
Chief Scientific Officer
Institute for Clinical and Economic Review
Rick Chapman, PhD, MS
Director of Health Economics
Institute for Clinical and Economic Review
Steven D. Pearson, MD, MSc
President
Institute for Clinical and Economic Review
Varun Kumar, MBBS, MPH, MSc Health Economist Institute for Clinical and Economic Review
Foluso Agboola, MBBS, MPH
Research Scientist
Institute for Clinical and Economic Review
Patricia Synnott, MALD, MS
Senior Research Associate
Institute for Clinical and Economic Review
Shanshan Liu, MS, MPH
Research Associate
Institute for Clinical and Economic Review
Celia Segel, MPP
Program Manager, New England CEPAC
Institute for Clinical and Economic Review
Sonya Khan, MPH
Program Director, Midwest CEPAC
Institute for Clinical and Economic Review
Jonathan Campbell, PhD
Associate Professor
Department of Clinical Pharmacy
Center for Pharmaceutical Outcomes Research
Melanie D. Whittington, PhD
Professional Research Assistant
Department of Clinical Pharmacy
R. Brett McQueen, PhD Assistant Professor Department of Clinical Pharmacy Center for Pharmaceutical Outcomes Research
*The role of the University of Colorado Skaggs School
of Pharmacy Modeling Group is limited to the
development of the cost-effectiveness model, and the
resulting ICER reports do not necessarily represent
the views of UCD.
DATE OF
PUBLICATION: APRIL 7, 2017
We would also like to thank Margaret Webb, Noah Mwandha, and Erin Lawler of ICER for their
contributions to this report.

©Institute for Clinical and Economic Review, 2017 Page ii Evidence Report: Targeted Immune Modulators for Rheumatoid Arthritis
About ICER
The Institute for Clinical and Economic Review (ICER) is an independent non-profit research
organization that evaluates medical evidence and convenes public deliberative bodies to help
stakeholders interpret and apply evidence to improve patient outcomes and control costs. ICER
receives funding from government grants, non-profit foundations, health plans, provider groups,
and health industry manufacturers. For a complete list of funders, visit http://www.icer-
review.org/about/support/. Through all its work, ICER seeks to help create a future in which
collaborative efforts to move evidence into action provide the foundation for a more effective,
efficient, and just health care system. More information about ICER is available at http://www.icer-
review.org
About New England CEPAC
The New England Comparative Effectiveness Public Advisory Council (New England CEPAC) – a core
program of ICER – provides a public venue in which the evidence on the effectiveness and value of
health care services can be discussed with the input of all stakeholders. New England CEPAC seeks
to help patients, clinicians, insurers, and policymakers interpret and use evidence to improve the
quality and value of health care.
The New England CEPAC is an independent committee of medical evidence experts from across
New England, with a mix of practicing clinicians, methodologists, and leaders in patient engagement
and advocacy. All Council members meet strict conflict of interest guidelines and are convened to
discuss the evidence summarized in ICER reports and vote on the comparative clinical effectiveness
and value of medical interventions. More information about New England CEPAC is available at
http://icer-review.org/programs/new-england-cepac/.

©Institute for Clinical and Economic Review, 2017 Page iii Evidence Report: Targeted Immune Modulators for Rheumatoid Arthritis
Expert Review
In the development of this report, ICER’s researchers consulted with clinical experts, patients,
manufacturers and other stakeholders. In addition, the Arthritis Foundation worked with ICER to
deploy surveys of the Foundation’s membership on access to care issues, patient experience per type
of treatment received, and other concerns. The results of these surveys are summarized in the report.
The following experts provided input and data that helped guide the ICER team as we shaped our
scope and report. None of these individuals is responsible for the final contents of this report or should
be assumed to support any part of this report, which is solely the work of the ICER team and its
affiliated researchers. Conflict of Interest disclosures are included in Appendix H of the report.
For a complete list of stakeholders from whom we requested input, please visit: https://icer-review.org/material/ra-stakeholder-list/ Patient/Advocacy Reviewers
Kayla Amodeo, PhD
Legislative Research Manager, Arthritis Foundation
Guy S. Eakin, PhD
Senior Vice President, Scientific Strategy, Arthritis Foundation
Sandie Preiss, MPA National Vice President, Advocacy and Access, Arthritis Foundation
Janet Stearns Wyatt, PhD, RN, FAANP Patient, Volunteer for the Arthritis Foundation and Retired Nurse Practitioner
Clinical Reviewers
Andrew L. Concoff, MD Medical Policy Committee, United Rheumatology Rheumatologist, St. Jude Heritage Medical Group
Max Hamburger MD President, United Rheumatology
Andrew J Laster MD FACR Board of Directors, United Rheumatology Arthritis & Osteoporosis Consultants of the Carolinas
Kent Johnson, MD Kent Johnson Consulting LLC University of New South Wales—Sydney
Matthew H. Liang, MD, MPH Professor of Medicine, Harvard Medical School Professor of Health Policy and Management, Harvard TH Chan School of Public Health Division of Rheumatology, Immunology, and Allergy Brigham and Women's Hospital
Elizabeth Tindall, MD, FACR Medical Director Rheumatology Consultants of Oregon, LLC
©Institute for Clinical and Economic Review, 2017 Page iv Evidence Report: Targeted Immune Modulators for Rheumatoid Arthritis
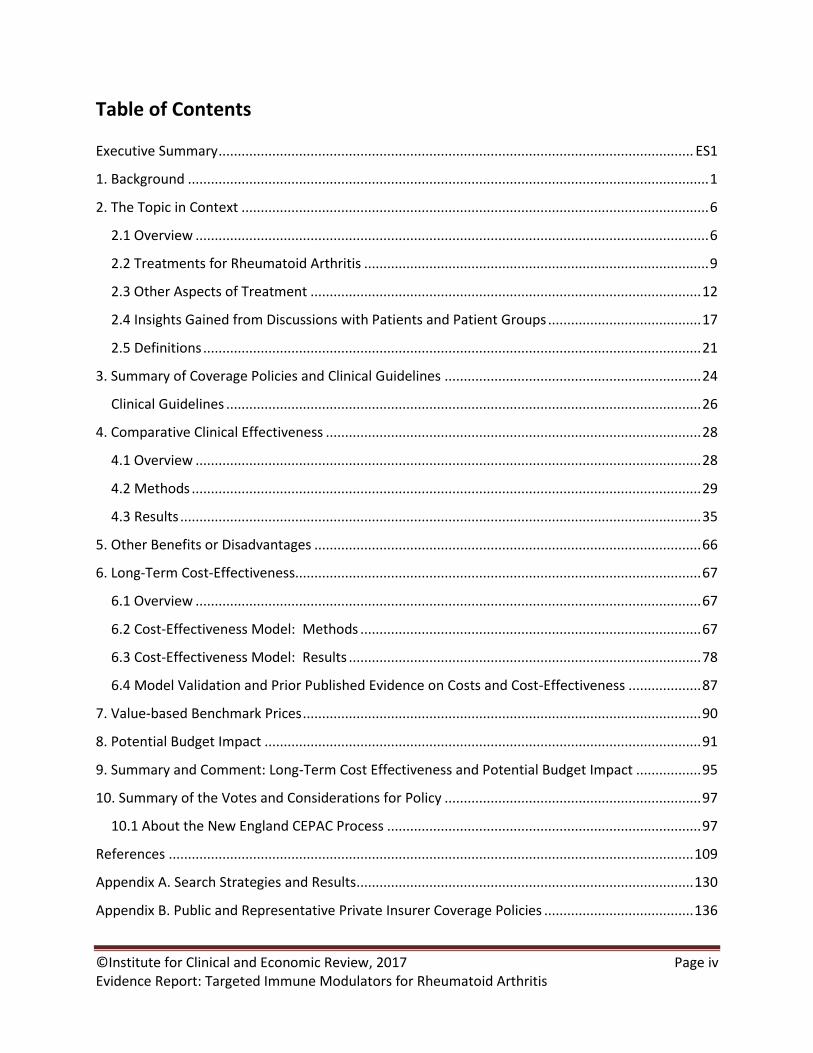
Table of Contents
Executive Summary ............................................................................................................................ ES1
1. Background ........................................................................................................................................ 1
2. The Topic in Context .......................................................................................................................... 6
2.1 Overview ...................................................................................................................................... 6
2.2 Treatments for Rheumatoid Arthritis .......................................................................................... 9
2.3 Other Aspects of Treatment ...................................................................................................... 12
2.4 Insights Gained from Discussions with Patients and Patient Groups ........................................ 17
2.5 Definitions .................................................................................................................................. 21
3. Summary of Coverage Policies and Clinical Guidelines ................................................................... 24
Clinical Guidelines ............................................................................................................................ 26
4. Comparative Clinical Effectiveness .................................................................................................. 28
4.1 Overview .................................................................................................................................... 28
4.2 Methods ..................................................................................................................................... 29
4.3 Results ........................................................................................................................................ 35
5. Other Benefits or Disadvantages ..................................................................................................... 66
6. Long-Term Cost-Effectiveness.......................................................................................................... 67
6.1 Overview .................................................................................................................................... 67
6.2 Cost-Effectiveness Model: Methods ......................................................................................... 67
6.3 Cost-Effectiveness Model: Results ............................................................................................ 78
6.4 Model Validation and Prior Published Evidence on Costs and Cost-Effectiveness ................... 87
7. Value-based Benchmark Prices ........................................................................................................ 90
8. Potential Budget Impact .................................................................................................................. 91
9. Summary and Comment: Long-Term Cost Effectiveness and Potential Budget Impact ................. 95
10. Summary of the Votes and Considerations for Policy ................................................................... 97
10.1 About the New England CEPAC Process .................................................................................. 97
References ......................................................................................................................................... 109
Appendix A. Search Strategies and Results ........................................................................................ 130
Appendix B. Public and Representative Private Insurer Coverage Policies ....................................... 136

©Institute for Clinical and Economic Review, 2017 Page v Evidence Report: Targeted Immune Modulators for Rheumatoid Arthritis
Appendix C. Comparative Clinical Effectiveness Supplemental Information .................................... 141
Methods: Supplemental Information ............................................................................................ 141
Methods of Network Meta-Analysis .............................................................................................. 142
Additional Comparative Clinical Effectiveness Results .................................................................. 144
Appendix D. Comparative Value Supplemental Information ............................................................ 202
Appendix E. Previous Systematic Reviews and Technology Assessments ......................................... 224
Appendix F. Evidence Tables .............................................................................................................. 227
Appendix G. Ongoing Studies............................................................................................................. 514
Appendix H. Conflict of Interest Disclosures for Expert Reviewers ................................................... 519
Appendix I. Public Comments ............................................................................................................ 521

©Institute for Clinical and Economic Review, 2017 Page vi Evidence Report: Targeted Immune Modulators for Rheumatoid Arthritis
List of Acronyms Used in this Report
ABT Abatacept ACPA Anticitrullinated Protein Antibody ACR American College of Rheumatology ADA Adalimumab AE Adverse Event AHRQ Agency for Healthcare Research and Quality ARHP Association of Rheumatology Health Professionals BAR Baricitinib CADTH Canadian Agency for Drugs and Technologies in Health CCP Cyclic Citrullinated Peptide CDAI Clinical Disease Activity Index cDMARD Conventional Disease-Modifying Anti-Rheumatic Drugs CMS Centers for Medicare and Medicaid Services COPD Chronic Obstructive Pulmonary Disease CORRONA Consortium of Rheumatology Researchers of North America CRP C-reactive Protein CTZ Certolizumab pegol DAS28 Disease Activity Score with 28-Joint Counts DIC Deviance Information Criterion DMARDs Disease-Modifying Anti-Rheumatic Drugs DREAM Dutch Rheumatoid Arthritis Monitoring EQ-5D EuroQol-5 domain ESR Erythrocyte Sedimentation Rate ETN Etanercept EULAR European League Against Rheumatism GOL Golimumab HAQ Health Assessment Questionnaire HAQ-DI Health Assessment Questionnaire for Rheumatoid Arthritis Disability Index ICER Incremental Cost-Effectiveness Ratio IFAA International Foundation for Autoimmune Arthritis IFX Infliximab iv Intravenous JAK Janus Kinase JIA Juvenile Idiopathic Arthritis MCID Minimum Clinically Important Difference MCS Mental Component Score MDHAQ Multi-Dimensional Health Assessment Questionnaire mTSS Modified Total Sharp Score MTX Methotrexate NICE National Institute for Health and Care Excellence NMA Network Meta-Analysis PAS Patient Activity Scale PCS Physical Component Score PML Progressive Multifocal Leukoencephalopathy PRISMA Preferred Reporting Items for Systematic Reviews and Meta-Analyses PROMIS Patient-Reported Outcomes Measurement Information System QALY Quality-Adjusted Life Year RA Rheumatoid Arthritis RAPID-3 Routine Assessment of Patient Index Data RCT Randomized Controlled Trial

©Institute for Clinical and Economic Review, 2017 Page vii Evidence Report: Targeted Immune Modulators for Rheumatoid Arthritis
RF Rheumatoid Factor RISE Rheumatology Informatics System for Effectiveness RTX Rituximab SAE Serious Adverse Event SAR Sarilumab sc Subcutaneous SDAI Simplified Disease Activity Index SF-36 Short Form-36 SMD Standardized Mean Difference TB Tuberculosis TCZ Tocilizumab TIMs Targeted Immune Modulators TNF Tumor Necrosis Factor TOF Tofacitinib TRD Total Residual Deviance USPSTF U.S. Preventive Services Task Force VAS Visual Analog Scale WAC Wholesale Acquisition Cost

©Institute for Clinical and Economic Review, 2017 Page ES1 Evidence Report: Targeted Immune Modulators for Rheumatoid Arthritis
Executive Summary
Background
Rheumatoid arthritis (RA) is the most common chronic inflammatory arthritis in adults, affecting
between 1.3 and 1.8 million Americans.1,2 It is a disease of unknown but immunologically mediated
origin. RA is more common in women and may occur at any age, with peak incidence occurring at
ages 50-60 years.3 RA is typically characterized by morning stiffness and symmetrical joint swelling
of the feet, hands, and knees, although any joint (and in some cases, internal organs and skin) may
be involved.3 RA is considered a clinical syndrome that, if not controlled, leads to permanent joint
damage and deformity in some individuals.4 The course of RA may also occasionally be complicated
by skin, eye, heart, lung, hematologic, and other extra-articular manifestations.3
Over its course, the management of RA involves patient education, psychosocial support and
therapy, physical and occupational therapy, medications, and joint surgery as required. The
medications used are distinguished by whether they treat symptoms only versus those that target
mechanisms of tissue damage, collectively referred to as disease-modifying anti-rheumatic drugs
(DMARDs). Conventional DMARDs include older systemic agents with broad immunomodulatory
effects such as methotrexate, leflunomide, hydroxychloroquine, and sulfasalazine. More recently, a
number of biologic and non-biologic agents targeted at mediators of inflammation in RA known
collectively as “targeted immune modulators” (TIMs) have come into widespread use. Historically,
RA was associated with both progressive disability and a shortened lifespan, but improvements in
earlier diagnosis as well as aggressive use of TIMs have greatly improved survival and other key
outcomes in the past 20 years.5 This review focuses on the comparative clinical effectiveness,
potential harms, and comparative value of the major TIMs used in the treatment of moderately-to-
severely active RA despite prior conventional DMARD treatment, as well as two agents (baricitinib
and sarilumab) currently under regulatory review for this indication.
The Topic in Context
Despite advances in treatment, RA remains a remarkably complex disease to diagnose and manage.
There are multiple phenotypic and genotypic variations in the pathogenesis of the disease that
affect both the course of RA and the outcome of therapy.6 Some patients may have milder disease
that never progresses to significant joint damage or functional impairment regardless of treatment
received, while others experience a highly aggressive course that may require multiple attempts at
treatment before the disease is brought under control. Similarly, both initial response to a given
treatment and the durability of that response may vary even within phenotypically-similar
populations; some individuals may have initial response with a short-lived remission, others may
have a more robust initial and subsequent response, and still others may have inadequate response

©Institute for Clinical and Economic Review, 2017 Page ES2 Evidence Report: Targeted Immune Modulators for Rheumatoid Arthritis
to many TIMs before finding an appropriate treatment. The patient-physician relationship is
therefore key to monitoring and managing ongoing therapy.
While earlier treatment focused on symptom management, actual and prolonged remission of
symptoms is now a realistic goal for many patients. In 2012, the American College of Rheumatology
(ACR) recommended several disease activity measures be used for routine clinical practice (see
“Definitions” below), each with criteria to define remission of symptoms.7 In addition, the College
published treatment guidelines for RA in 2015 that strongly recommended a “treat-to-target”
approach for both early and established disease.8 Briefly, this approach involves (a) a goal of clinical
remission, or alternatively, low disease activity as early as possible in the disease course; (b)
adjustments in therapy at least every three months to reach the target; (c) strict and regular
monitoring for disease activity, as frequently as monthly for patients with moderate to high activity;
(d) separate monitoring for structural damage and functional impairment; and (e) discussion of all
elements with the patient in a shared decision-making framework.9
Despite the evolution of diagnosis and treatment in RA, challenges remain in the management of
the disease. For one, there is a general shortage of rheumatologists in the US, making the referral
process protracted. The current situation is also unlikely to improve in the near future; a workforce
study conducted by the ACR and the Association of Rheumatology Health Professionals (ARHP)
projects a 31% decline in U.S. rheumatologists by 2030 due to aging of the workforce and an
insufficient number of trainees to meet future demand.10 In addition, early symptoms are similar
across multiple forms of inflammatory arthritis, which also may prolong diagnosis. According to a
recent patient survey conducted by the International Foundation for Autoimmune Arthritis, the
average time from the onset of RA symptoms to formal diagnosis was 2.6 years.11 Clinicians must
also separately monitor patients for signs of increased disease activity and structural damage, as
disease activity indices appear to be predictive of functional decline, but evidence is mixed on
whether measures of radiographic joint damage are correlated with functional indices.12
Targeted Immune Modulator Therapies for RA
The TIMs of interest for this review are summarized in Table ES1. Through a variety of mechanisms,
the TIMs are intended to modulate or inhibit signaling pathways, auto-reactive processes, or excess
production of proteins, all of which are components of the inflammatory cascade in RA. The
outcomes of near-term interest are remission in disease activity or reduction to very low levels, as
well as slowing of progression of joint erosion or narrowing of the space between joints as assessed
on radiography. Longer-term outcomes of interest include improvements in daily function as well
as reductions in requirements for joint replacement surgery and/or assistive devices.

©Institute for Clinical and Economic Review, 2017 Page ES3 Evidence Report: Targeted Immune Modulators for Rheumatoid Arthritis
Table ES1. Targeted Immune Modulators: Dosage Forms and Administration Schedules
TIM Recommended Dose (mg) Route of
Administration
FDA
approval
WAC in
February
2017*
Adalimumab
(Humira®, AbbVie)
TNFα inhibitor
40 mg every other week; some patients
not receiving MTX may benefit from
taking 40 mg every week
Subcutaneous,
self-injection or
administered by
healthcare
professional
12/31/2002 $2,221 per
40 mg
syringe
Certolizumab pegol
(Cimzia®, UCB)
TNFα inhibitor
With or without concomitant MTX, 400
mg at Weeks 0, 2, and 4, followed by
200 mg every other week; for
maintenance dosing, 400 mg every 4
weeks
Subcutaneous,
self-injection or
administered by
healthcare
professional
5/13/2009 $3,680 for 2
200 mg/1mL
syringes or 2
200 mg vials
of lyophilized
powder
Etanercept
(Enbrel®, Amgen)
TNFα inhibitor
50 mg once weekly with or without
MTX
Subcutaneous,
self-injection or
administered by
healthcare
professional
11/2/1998 $1,111 per
0.98 mL of a
50 mg/mL
syringe
Golimumab
(Simponi®/Simponi Aria®,
Janssen)
TNFα inhibitor
In combination with MTX, 50 mg sc
injection once a month or 2 mg/kg iv
infusion at weeks 0 and 4, then every 8
weeks
Subcutaneous,
self-injection or
administered by
healthcare
professional;
Intravenous
4/24/2009
(sc);
07/19/2013
(iv)
$4,150 per
50 mg
syringe (sc)
or $1,592 per
50 mg (iv)
Infliximab
(Remicade®, Janssen
Biotech)
TNFα inhibitor
In combination with MTX, 3 mg/kg at 0,
2 and 6 weeks, then every 8 weeks;
may increase dose up to 10 mg/kg or
treat as often as every 4 weeks
Intravenous 11/10/1999 $1,168 per
100 mg
Abatacept
(Orencia®, Bristol Myers-
Squibb)
T-cell inhibitor
Use as monotherapy or with DMARDs
other than TNFα inhibitors; iv infusion
dosed by weight [<60 kg 500 mg, 60-
100 kg 750 mg, >100 kg 1000 mg], at
weeks 0, 2, and 4, then every 4 weeks
or 125 mg sc injection once weekly
Subcutaneous or
Intravenous
12/27/2005
(iv);
07/31/2011
(sc)
$957 per 125
mg (sc) or
$987 per 250
mg (iv)
Rituximab
(Rituxan®,
Genentech/Biogen)
CD20-directed cytolytic B-cell
antibody
In combination with MTX, two-1000 mg
iv infusions separated by 2 weeks every
24 weeks or based on clinical
evaluation, but not sooner than every
16 weeks
Intravenous 2/28/2006 $835 per 10
mg/1 mL vial
($8352 per
1000 mg
dose)

©Institute for Clinical and Economic Review, 2017 Page ES4 Evidence Report: Targeted Immune Modulators for Rheumatoid Arthritis
TIM Recommended Dose (mg) Route of
Administration
FDA
approval
WAC in
February
2017*
Sarilumab
(Kevzara™,
Sanofi/Regeneron)
IL-6 inhibitor
150 mg-200 mg every 2 weeksǂ Subcutaneous
Injection
Expected
mid 2017
Tocilizumab
(Actemra®, Genentech)
IL-6 inhibitor
In combination with DMARDs or as
monotherapy, start with 4 mg/kg every
4 weeks followed by an increase to 8
mg/kg every 4 weeks based on clinical
response; 16 2mg subcutaneous
injection every other week, increased
to every week based on clinical
response (or if patient weighs ≥100 kg)
Subcutaneous or
Intravenous
1/8/2010
(iv)
10/22/2013
(sc)
$898 per
syringe (sc)
or $95 per 20
mg (iv)
Baricitinib
(Olumiant™, Eli Lilly)
JAK inhibitor
2 mg -4 mg once dailyǂ Oral Expected
4/19/2017
Tofacitinib
(Xeljanz®, Pfizer)
JAK inhibitor
5mg twice daily with or without
conventional DMARDs or 11 mg once-
daily (extended-release form)
Oral 11/16/2012 $63 per
tablet ($127
for extended
release)
* Price reflects the wholesale acquisition price listed on Red Book Online (Greenwood Village, CO: Truven Health
Analytics. http://www.micromedexsolutions.com/. Accessed February 24th, 2017); ǂ dosage at which investigational
agents have been evaluated in clinical trials
All TIMs are associated with an increased risk of serious infection (including reactivation of
tuberculosis in previously-infected individuals). While early reports of lymphomas in patients
receiving TNFα inhibitors were a cause of concern, subsequent observational studies have shown
lymphoma risks to be more closely aligned with the disease than with treatment.13,14 While all
patients with RA are at increased risk of herpes zoster (“shingles”) infection, it is a particular
concern with JAK inhibition. Rituximab and TNFα inhibitors have also been associated with Hepatitis
B reactivation, while abatacept is associated with higher rates of respiratory complications in
patients with Chronic Obstructive Pulmonary Disease (COPD). Other rare but serious adverse
effects include progressive multifocal leukoencephalopathy (PML) with rituximab; worsening heart
failure, demyelinating disease, and lupus-like syndromes with TNFα inhibitors; and bowel
perforation with IL-6 and JAK inhibitors.
In addition to concerns regarding costs associated with dose increases, TIMs have also received
considerable attention for rising prices in recent years. List prices for the two TIMs with the leading
market share in RA, adalimumab and etanercept, have risen 70-80% in the last three years, to
approximately $4,000 per month.15 These prices do not consider discounts, rebates, or payment
assistance programs provided by manufacturers. However, even after discounts and rebates, TIM

©Institute for Clinical and Economic Review, 2017 Page ES5 Evidence Report: Targeted Immune Modulators for Rheumatoid Arthritis
costs remain substantial. A recent examination of both list and net price changes from 2009-2015
found that percentage increases in net prices for adalimumab and etanercept were close to or even
exceeded increases in list price, and both prices increased at rates 12-15 times higher than general
inflation over the same time period.16 In fact, adalimumab, etanercept, infliximab, and rituximab
were #1, 3, 4, and 5 in global sales among the top 20 prescription drugs; while these figures were
across all therapeutic indications, RA represents a substantial proportion of these sales.17
Insights Gained from Patients and Patient Groups
We received valuable input from individual patients and patient advocacy groups. A complete
discussion of the insights from these conversations is presented in the full report, but several
important themes are summarized below.
• Health-system challenges with RA are present from the very beginning. Diagnosis is often
delayed, due in large part to a shortage of available rheumatologists in many areas of the
US. Even after diagnosis, coordination of care across providers and settings is problematic,
particularly for patients who self-administer medication and therefore do not get the
opportunity to discuss multiple aspects of their care at an infusion clinic.
• Perhaps in part because of coordination of care challenges, patients stressed the
importance of involving family, informal caregivers, and others as a critical component for
successful management of the disease.
• It is not uncommon for patients to cycle through various therapies before finding a
treatment option to which they both respond to and tolerate. We also received input that
“fail-first” or step-therapy insurance policies often require patients to follow a specific
sequence of TIM therapies, most commonly requiring a trial of methotrexate followed by
multiple attempts with TNFα inhibitors.
• Because of the cyclical nature of the disease and its treatment, patients fear restrictions on
access to certain types of drugs, as well as more general restrictions (e.g., stopping and re-
starting therapy, requirements to repeat step therapy after switching health plans, etc.).
• The financial burden of RA treatment on patients and their families is also substantial and
are not limited to out-of-pocket costs alone. Issues with coordination of care, navigation of
insurance requirements by both patient and provider, lost time at work or school, and other
challenges contribute to patient and family burden.
• Additional quantitative, patient-centric measures of treatment success are warranted, as
many of the recent developments in defining disease remission and treatment response
focus primarily on disease activity and not enough on symptom control, activities of daily
living, and management of treatment-related side effects.
• “Point-in-time” measures often fail to capture the lability of RA—the disease’s burden varies
over time, as does the patient’s ability to accommodate to the realities of the condition.

©Institute for Clinical and Economic Review, 2017 Page ES6 Evidence Report: Targeted Immune Modulators for Rheumatoid Arthritis
• The Arthritis Foundation also deployed two online surveys as part of their engagement in
this process to document the RA patient experience (complete details available in the full
report). The first survey included nearly 1,600 patients with primarily longstanding disease;
41% of the sample had been diagnosed 15 or more years ago. High levels of comorbidity
were reported, as well as profound lifestyle impacts during periods when the disease was
not well-controlled—nearly two-thirds required medication for pain and/or mental health
concerns, and 20% were forced to leave work or school. In addition, one-third of patients
reported difficulties in accessing their medication of choice.
• The second survey compared the experiences of patients who had received TIM therapy
with a cohort of patients who had remained on conventional DMARDs. While comparisons
were descriptive in nature only, conventional DMARD patients reported higher rates of joint
damage, major surgery, and hospitalization or emergency-room visits related to their RA.
Comparative Clinical Effectiveness
To inform our analysis of the comparative clinical effectiveness of TIMs for moderately-to-severely
active RA despite prior conventional DMARD therapy, we abstracted evidence from available clinical
studies of these agents, whether in published or abstract/presentation form. In total, we included
132 reports of 67 RCTs and 17 observational studies. The 67 RCTs provided data on more than
28,000 patients. Of these RCTs, 60 focused on TIM combination therapy with methotrexate or
other conventional DMARDs, five focused exclusively on TIM monotherapy, and two included both
combination and monotherapy. We identified a total of 19 RCTs that involved head-to-head
comparisons. Of these, eight involved comparisons of one TIM to another, and 11 were
comparisons of a biosimilar form of a TIM to the originator product (biosimilar studies are
summarized in Appendix C, and not a primary focus of the report). The majority of RCTs were
determined to be of good quality, based on comparable study arms at baseline, use of validated
outcome measures, and high levels of study retention. Most observational studies were considered
of fair quality, due primarily to differences in patient populations at baseline.
Data were analyzed both descriptively and using techniques of network meta-analysis (NMA).
Outcomes in the NMA included 20%, 50%, and 70% symptom response using ACR criteria, as well as
radiographic progression (as assessed by the “Sharp” score) in a more limited dataset (see Appendix
C for further details). Measures of disease activity were variably employed, and so are described in
descriptive fashion only.
Clinical Benefits
All TIMs produced statistically- and clinically-superior improvements in symptom response, disease
activity, radiographic progression, and other important outcomes when compared to conventional
©Institute for Clinical and Economic Review, 2017 Page ES7 Evidence Report: Targeted Immune Modulators for Rheumatoid Arthritis
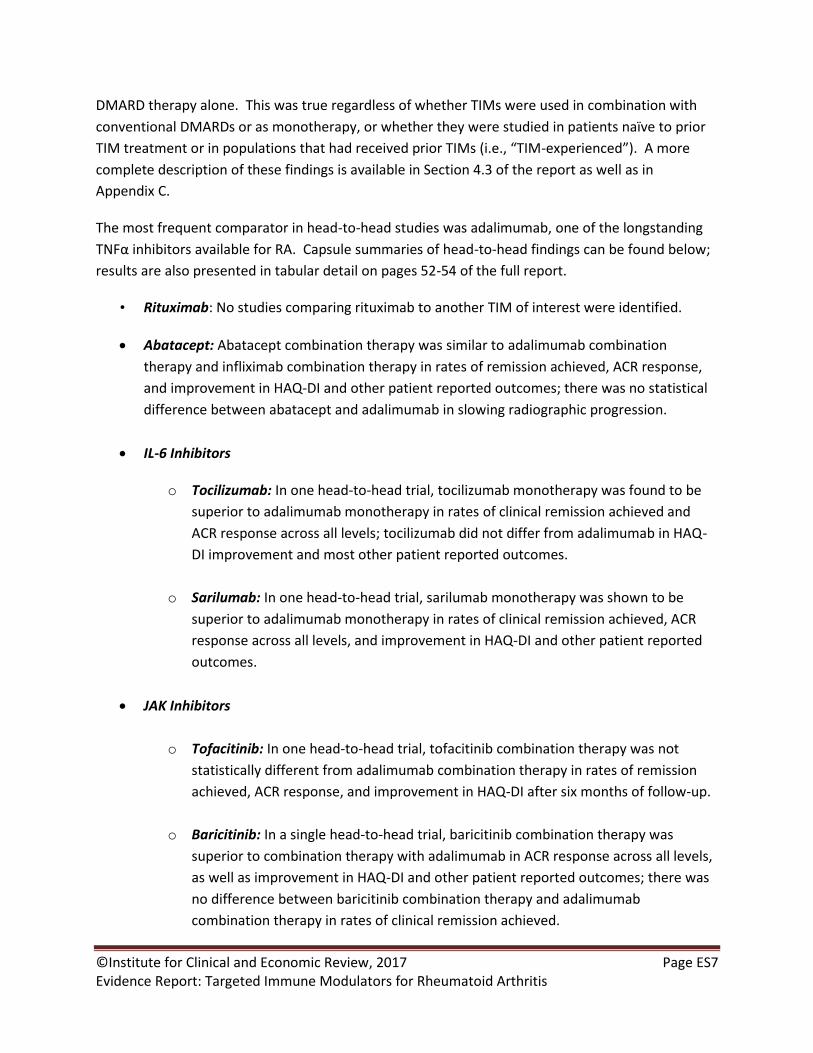
DMARD therapy alone. This was true regardless of whether TIMs were used in combination with
conventional DMARDs or as monotherapy, or whether they were studied in patients naïve to prior
TIM treatment or in populations that had received prior TIMs (i.e., “TIM-experienced”). A more
complete description of these findings is available in Section 4.3 of the report as well as in
Appendix C.
The most frequent comparator in head-to-head studies was adalimumab, one of the longstanding
TNFα inhibitors available for RA. Capsule summaries of head-to-head findings can be found below;
results are also presented in tabular detail on pages 52-54 of the full report.
• Rituximab: No studies comparing rituximab to another TIM of interest were identified.
• Abatacept: Abatacept combination therapy was similar to adalimumab combination
therapy and infliximab combination therapy in rates of remission achieved, ACR response,
and improvement in HAQ-DI and other patient reported outcomes; there was no statistical
difference between abatacept and adalimumab in slowing radiographic progression.
• IL-6 Inhibitors
o Tocilizumab: In one head-to-head trial, tocilizumab monotherapy was found to be
superior to adalimumab monotherapy in rates of clinical remission achieved and
ACR response across all levels; tocilizumab did not differ from adalimumab in HAQ-
DI improvement and most other patient reported outcomes.
o Sarilumab: In one head-to-head trial, sarilumab monotherapy was shown to be
superior to adalimumab monotherapy in rates of clinical remission achieved, ACR
response across all levels, and improvement in HAQ-DI and other patient reported
outcomes.
• JAK Inhibitors
o Tofacitinib: In one head-to-head trial, tofacitinib combination therapy was not
statistically different from adalimumab combination therapy in rates of remission
achieved, ACR response, and improvement in HAQ-DI after six months of follow-up.
o Baricitinib: In a single head-to-head trial, baricitinib combination therapy was
superior to combination therapy with adalimumab in ACR response across all levels,
as well as improvement in HAQ-DI and other patient reported outcomes; there was
no difference between baricitinib combination therapy and adalimumab
combination therapy in rates of clinical remission achieved.

©Institute for Clinical and Economic Review, 2017 Page ES8 Evidence Report: Targeted Immune Modulators for Rheumatoid Arthritis
• TNFα Inhibitors
o Adalimumab: Adalimumab monotherapy was inferior to monotherapy with
tocilizumab and sarilumab in rates of clinical remission achieved and ACR responses
across all levels; adalimumab also resulted in significantly less improvement in HAQ-
DI compared with sarilumab. Adalimumab combination therapy was inferior to
baricitinib combination therapy in ACR response across all levels, as well as on
improvement in HAQ-DI, but the two were similar in rates of clinical remission
achieved. In all other head-to-head trials of combination therapy, adalimumab was
similar to abatacept, etanercept, tofacitinib, and certolizumab pegol in rates of
remission achieved, ACR response across all levels, and improvement in HAQ-DI;
there was also no statistical difference between abatacept and adalimumab in
slowing radiographic progression.
o Certolizumab Pegol: Evidence from one head-to-head trial of certolizumab pegol
plus methotrexate versus adalimumab plus methotrexate found no differences
between agents in disease activity, ACR response, or HAQ-DI.
o Etanercept: One head-to-head trial of etanercept and adalimumab (primarily in
combination with concomitant conventional DMARDs) reported similar changes in
disease activity and quality of life; observational data suggest no difference in
remission or ACR response between etanercept and adalimumab.
o Golimumab: No studies comparing golimumab to another TIM of interest were
identified.
o Infliximab: Similar improvements in disease activity, ACR response, and HAQ-DI
were observed with both infliximab and abatacept combination therapy in a single
head-to-head trial.
Network Meta-Analyses
A detailed discussion of our NMA methods can be found in Appendix C. We used NMAs to assess
differences in ACR response between TIMs, by combining both direct (i.e., head-to-head) and
indirect (comparison to conventional DMARDs) evidence. The discussion below focuses on the
larger NMA, comprised of studies conducted in TIM-naïve or mixed populations (i.e., ≤20% TIM-
experienced). Results for TIM-experienced patients can be found in the full report.

©Institute for Clinical and Economic Review, 2017 Page ES9 Evidence Report: Targeted Immune Modulators for Rheumatoid Arthritis
A forest plot of the results for ACR20 or better response for combination therapy and monotherapy
regimens in TIM-naïve/mixed populations can be found in Figures ES1 and ES2 respectively. The
pattern of findings was similar to that observed in the individual studies. All TIMs were between
two and three times more likely to achieve ACR20 or better response when used in combination
with conventional DMARDs in comparison to conventional DMARDs alone (Figure ES1). However,
there were wide and overlapping estimates of the credible intervals around the estimates for each
TIM combination; as a result, none of the comparisons between TIMs differed statistically.

©Institute for Clinical and Economic Review, 2017 Page ES10 Evidence Report: Targeted Immune Modulators for Rheumatoid Arthritis
Figure ES1. Relative Risk (Likelihood) of Patients Achieving ACR20 or Better with Combination Therapy Versus Conventional DMARDs
Alone TIM-Naïve/Mixed Population
Treatment
CTZ + cDMARD 2.6 (1.82,4.15)
ETN + cDMARD 2.56 (1.59,4.56)
TCZiv + cDMARD 2.28 (1.64,3.5)
SAR + cDMARD 2.17 (1.36,3.67)
GOLsc + cDMARD 2.16 (1.54,3.33)
ABTiv + cDMARD 2.15 (1.59,3.21)
BAR + cDMARD 2.11 (1.29,3.6)
GOLiv + cDMARD 2.12 (1.5,3.27)
TCZsc + cDMARD 2.08 (1.28,3.52)
ABTsc + cDMARD 2.08 (1.23,3.57)
IFX + cDMARD 2.04 (1.48,3.07)
ADA + cDMARD 2.02 (1.54,2.9)
TOF + cDMARD 1.95 (1.45,2.85)
RTX + cDMARD 1.9 (1.27,2.99)
Int cDMARD 1.83 (0.82,3.47)
0 1 2 3 4 5
Relative Risk (CrI)

©Institute for Clinical and Economic Review, 2017 Page ES11 Evidence Report: Targeted Immune Modulators for Rheumatoid Arthritis
Similarly, in monotherapy comparisons, tocilizumab, etanercept, and sarilumab all produced
significantly greater likelihoods of achieving ACR response in comparison to conventional DMARDs
alone. However, tocilizumab and sarilumab also produced significantly greater likelihoods of
achieving ACR20 or better response than adalimumab, echoing the findings of head-to-head trials.
Figure ES2. Relative Risk (Likelihood) of Patients Achieving ACR20 or Better with Monotherapy
Versus Conventional DMARDs Alone, TIM-Naïve/Mixed Population
Standardized mean differences (SMD) were used in analyses of Sharp score to control for variation
in scoring methods used; findings for the TIM-naïve/mixed population are presented in league table
format in Appendix C, Figure C10. Both monotherapy regimens with data available (tocilizumab and
etanercept) produced significant improvements in Sharp score relative to conventional DMARDs, as
denoted by credible intervals that did not cross zero. These two TIMS did not differ when indirectly
compared, however. Among combination regimens, all produced significant relative improvements
versus conventional DMARDs except for tofacitinib, subcutaneous golimumab, and certolizumab
pegol, which had credible intervals that included zero.
Harms
Data on adverse events, discontinuations due to adverse events, as well as specific adverse events
of interest observed in clinical trials with conventional DMARD controls are presented as weighted
averages (i.e., according to total sample size across trials) in Table ES2. Of note, these represent
events as recorded before treatment-arm crossover was permitted. Limited data from longer-term
trials are available and are summarized in Table 11 of the full report. The most frequently reported
Treatment
TCZ 2.46 (1.88,3.42)
ETN 2.37 (1.76,3.45)
SAR 2.33 (1.74,3.34)
ADA 1.87 (1.43,2.57)
0 1 2 3 4
Relative Risk (CrI)

©Institute for Clinical and Economic Review, 2017 Page ES12 Evidence Report: Targeted Immune Modulators for Rheumatoid Arthritis
adverse events were mild infections (upper respiratory tract infection, bronchitis, nasopharyngitis),
injection site reactions and infusion related reactions. The overall incidence of serious infections,
deaths, and all serious adverse events were comparable between treatments, including
conventional DMARD therapy. As noted in the table, however, adverse-event rates for tofacitinib
were calculated over a 12-week pre-crossover period, versus 24-28 weeks for the other TIMs.
The rates of serious infection, serious adverse events and discontinuation due to adverse events
were generally comparable in the head-to-head trials comparing sarilumab, tocilizumab,
etanercept, and baricitinib with adalimumab18-21 (see Appendix C, Table C17). In the AMPLE trial,
however, abatacept had a lower rate of discontinuation due to adverse events at year 2 compared
with adalimumab (9.5% vs. 3.8%, estimate of difference: −5.7 [95% CI −9.5 to −1.9).22 In a separate
trial comparing infliximab with abatacept, the incidence of serious adverse events and
discontinuation due to AEs were numerically lower with abatacept compared with infliximab (SAEs:
9.6 vs 18.2%; discontinuations due to AEs: 3.2 vs 7.3%, respectively), although statistical significance
was not tested.23 There was no evidence of material differences in the rates of malignancies or
death between treatment groups across trials.

©Institute for Clinical and Economic Review, 2017 Page ES13 Evidence Report: Targeted Immune Modulators for Rheumatoid Arthritis Return to Table of Contents
Table ES2. Adverse Events During the Conventional DMARD Controlled Period
Estimate (%) Targeted immune modulators plus conventional DMARD Conventional
DMARD + Placebo RTX ABT TCZ SAR TOF† BAR ADA CTZ ETN GOL IFX
Total (N)1 170 217 1,819 184 454 943 780 299 446 704 594 4,683
Any AE 76 79.7 70.7 65.2 50.2 72.1 77.3 74 68.7 54 73.5 64.5
Serious AEs 9 6 6.8 5.4 3.1 5.8 4.2 7.9 3.6 4.2 8.9 5.5
D/C due to AEs 2 0.9 5 9.2 4.3 2.5 2.9 4.8 3.1 3.6 4.8 2.7
Any infection 36 32.8 37.4 30.4 NR 38.2 41.9 30 43.7 44.1 14 29.5
Serious infection 1 1.3 2.9 1.6 NR 1.8 0.9 1.8 1.8 1 2.5 1.5
Tuberculosis 0 0 0 0 NR 0 0.5 0 0 NR 0 0
Injection site reaction NR 10.1 8.2 N/A N/A 16.4 2.5 20.8 3.7 N/A 5
Infusion related reaction 25 5.1 NR N/A N/A N/A N/A N/A N/A 3.3 6.2 4.9
Malignancy 0.5 0.6 0.9 NR NR 0.5 0.3 0 0 0.3 0.8 0.4
Death NR 0 0.4 0 0.6 0.3 0.2 0 0.5 0 0 0.2
NOTE: Serious AEs include specific listed events (e.g., serious infection, malignancy) as well as other events deemed life-threatening or requiring hospitalization by study investigators * Values are weighted averages of the percentage of patients with event across key trials; color scheme identifies drugs of the same class. 1-Maximum contributing to the weighted average.; not every study contributes to all adverse events therefore, N contributing may be less in some AEs. †Assessment period was between week 24 and 28 for all studies except for TOF that was at week 12; AE=adverse event; D/C=discontinuation
©Institute for Clinical and Economic Review, 2017 Page ES14 Evidence Report: Targeted Immune Modulators for Rheumatoid Arthritis Return to Table of Contents
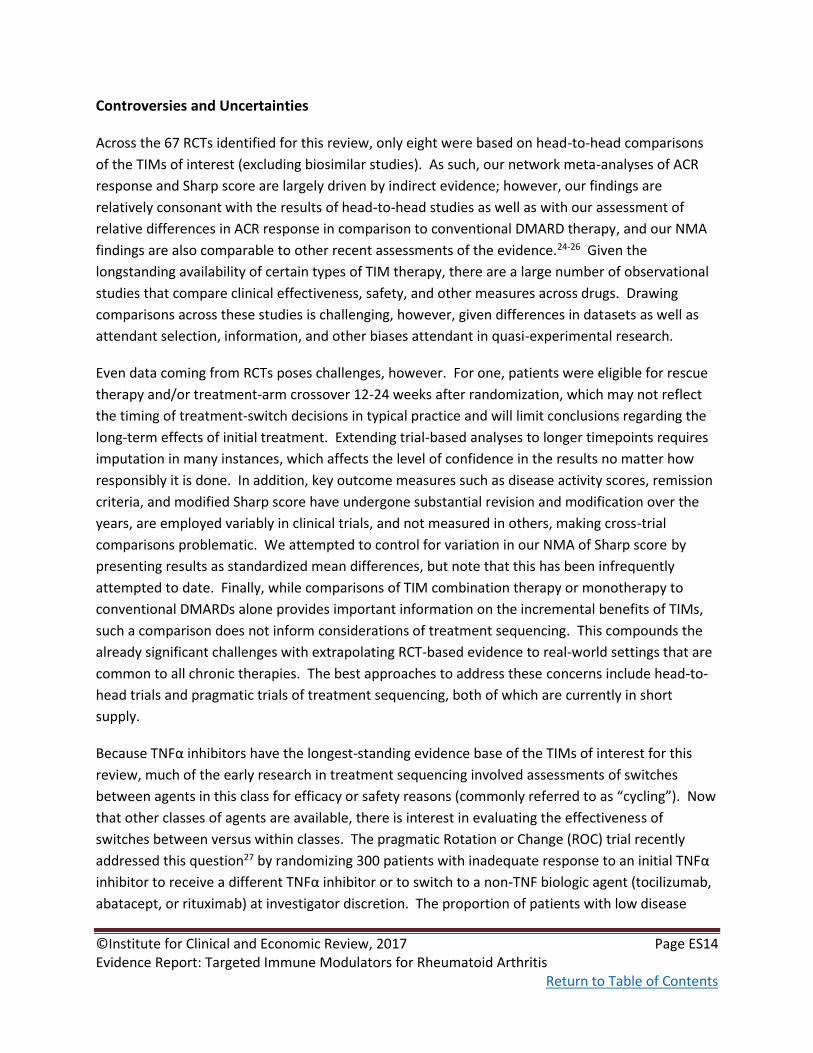
Controversies and Uncertainties
Across the 67 RCTs identified for this review, only eight were based on head-to-head comparisons
of the TIMs of interest (excluding biosimilar studies). As such, our network meta-analyses of ACR
response and Sharp score are largely driven by indirect evidence; however, our findings are
relatively consonant with the results of head-to-head studies as well as with our assessment of
relative differences in ACR response in comparison to conventional DMARD therapy, and our NMA
findings are also comparable to other recent assessments of the evidence.24-26 Given the
longstanding availability of certain types of TIM therapy, there are a large number of observational
studies that compare clinical effectiveness, safety, and other measures across drugs. Drawing
comparisons across these studies is challenging, however, given differences in datasets as well as
attendant selection, information, and other biases attendant in quasi-experimental research.
Even data coming from RCTs poses challenges, however. For one, patients were eligible for rescue
therapy and/or treatment-arm crossover 12-24 weeks after randomization, which may not reflect
the timing of treatment-switch decisions in typical practice and will limit conclusions regarding the
long-term effects of initial treatment. Extending trial-based analyses to longer timepoints requires
imputation in many instances, which affects the level of confidence in the results no matter how
responsibly it is done. In addition, key outcome measures such as disease activity scores, remission
criteria, and modified Sharp score have undergone substantial revision and modification over the
years, are employed variably in clinical trials, and not measured in others, making cross-trial
comparisons problematic. We attempted to control for variation in our NMA of Sharp score by
presenting results as standardized mean differences, but note that this has been infrequently
attempted to date. Finally, while comparisons of TIM combination therapy or monotherapy to
conventional DMARDs alone provides important information on the incremental benefits of TIMs,
such a comparison does not inform considerations of treatment sequencing. This compounds the
already significant challenges with extrapolating RCT-based evidence to real-world settings that are
common to all chronic therapies. The best approaches to address these concerns include head-to-
head trials and pragmatic trials of treatment sequencing, both of which are currently in short
supply.
Because TNFα inhibitors have the longest-standing evidence base of the TIMs of interest for this
review, much of the early research in treatment sequencing involved assessments of switches
between agents in this class for efficacy or safety reasons (commonly referred to as “cycling”). Now
that other classes of agents are available, there is interest in evaluating the effectiveness of
switches between versus within classes. The pragmatic Rotation or Change (ROC) trial recently
addressed this question27 by randomizing 300 patients with inadequate response to an initial TNFα
inhibitor to receive a different TNFα inhibitor or to switch to a non-TNF biologic agent (tocilizumab,
abatacept, or rituximab) at investigator discretion. The proportion of patients with low disease

©Institute for Clinical and Economic Review, 2017 Page ES15 Evidence Report: Targeted Immune Modulators for Rheumatoid Arthritis Return to Table of Contents
activity on the DAS28-ESR was statistically-significantly greater in the non-TNF group vs. the second
TNFα-inhibitor group at both weeks 24 (45% vs. 28%, p=.004) and 52 (41% vs. 23%, p=.003). Results
from earlier observational studies and systematic reviews of trials in TNF-experienced patients
echoed these findings.28-30
In the US setting, the potential for even observational study of different treatment sequences is
complicated by payer formulary and benefit design. As described earlier in this report and
highlighted further in Section 3, most private payers require initial TIM therapy and sometimes
second TIM therapy to be within the TNFα-inhibitor class. Many payers also stipulate that
etanercept and adalimumab hold preferred status as the first TIM of choice.
The course of RA may feature multiple periods of remission and flares of symptoms due to the
complex and heterogeneous nature of the disease. TIM therapies are chronic, and the long-term
effects of prolonged immunomodulation – both clinical benefits and potential harms -- are not well-
understood for all therapies, particularly for newer classes of TIMs. Evidence is beginning to
emerge on the question of whether TIM doses can be modulated or therapy suspended in patients
with evidence of durable remission, but early results are limited and mixed. In addition, as noted in
the Topic in Context section, the decision to initiate TIM treatment may in part be due to a missed
opportunity to optimize conventional DMARD therapy; such challenges are common to other
chronic diseases such as diabetes and heart failure as well.
Finally, while the introduction of TIMs has transformed clinical practice in RA and improved the
quality of life and functional capacity of many patients, there are still unanswered questions,
including the relationship between levels of disease activity and radiographic evidence of joint
damage, whether there are patient or clinical factors that predict response to specific therapies,
and the totality of the disease’s impact on patients, families, and caregivers. As noted in the Topic
in Context section, patient groups do not feel that the current tools for patient-reported outcomes
sufficiently capture their experience, but to date no new instruments have been accepted into
common use in clinical trials.
Summary
Using the ICER evidence rating matrix, our evidence ratings for selected comparisons of interest are
provided in Table ES3 for patients with moderately-to-severely active RA who have had an
inadequate response to prior conventional DMARD therapy. As described previously, findings of
studies using conventional DMARDs as the control indicate clinically- and statistically-significant
improvements in most important disease measures for all TIMs whether delivered as monotherapy
or combination therapy, so all FDA-approved TIMs would receive a letter grade of “A” (high
certainty of substantial net health benefit) relative to conventional DMARD therapy alone.
However, the evidence on long-term effectiveness and safety of the two investigational TIMs

©Institute for Clinical and Economic Review, 2017 Page ES16 Evidence Report: Targeted Immune Modulators for Rheumatoid Arthritis Return to Table of Contents
(baricitinib and sarilumab) is still emerging, so we judge the comparative clinical effectiveness of
these two agents to have moderate certainty of an incremental or better net health benefit (“B+”).
Table ES3. Evidence Ratings for Comparative Clinical Effectiveness: Selected Comparisons
Regimen Type/Comparison Intervention Comparator Rating
Vs. Conventional DMARDs
Mono- or Combination
Therapy
Sarilumab Conventional DMARDs B+
Baricitinib Conventional DMARDs B+
All other TIMs Conventional DMARDs A
Head-to-Head Comparisons
Monotherapy Sarilumab Adalimumab B+
Tocilizumab Adalimumab B+
Combination Therapy Baricitinib Adalimumab C+
Tofacitinib Adalimumab C
Abatacept (sc) Adalimumab C
Certolizumab pegol Adalimumab C
Abatacept (iv) Infliximab B+
Etanercept Adalimumab C
All Other Head-to-Head
Comparisons
--- --- I
TIM Monotherapy
The presence of direct comparative data allowed us to be reasonably confident about the relative
net health benefit for some between-agent comparisons. Among monotherapy regimens,
sarilumab and tocilizumab (iv form) have been compared to adalimumab for impact on both disease
activity and ACR response. Both agents produced statistically significantly higher rates of response,
improvement in disease activity, and remission, as well as improvement in pain, fatigue, and quality
of life, leading to moderate certainty of an incremental or better net health benefit for these agents
relative to adalimumab (“B+”). Certainty was moderate because only a single trial was available for
each comparison.

©Institute for Clinical and Economic Review, 2017 Page ES17 Evidence Report: Targeted Immune Modulators for Rheumatoid Arthritis Return to Table of Contents
TIM Combination Therapy with Conventional DMARDs
Single RCTs have also evaluated combination therapy regimens with methotrexate plus baricitinib,
tofacitinib, abatacept (subcutaneous form), or certolizumab pegol in comparison to adalimumab+
methotrexate. In the RA-BEAM study, baricitinib + methotrexate was associated with a statistically-
significantly but modestly higher rate of ACR20 response (74% vs. 66% for adalimumab +
methotrexate), and no differences were observed in remission rates. Rates of serious harm or
discontinuation due to adverse events were also similar, so we judge the evidence for combination
therapy with baricitinib vs. adalimumab to represent a comparable or better net health benefit
(“C+”). There were no significant differences in clinical outcomes between combination regimens
using tofacitinib, abatacept sc, or certolizumab pegol versus adalimumab combination therapy; the
addition of indirect evidence through the NMA also yielded no statistical differences between these
TIMs. We therefore assign a net health benefit rating of “C” for all three comparisons.
An additional study (RED SEA) compared adalimumab and etanercept in addition to existing
conventional DMARD therapy, but was a noninferiority study focused primarily on continuation of
therapy after one year and did not measure ACR response; in addition, disease activity measures
did not statistically differ between arms. Given these findings, and bolstered by NMA results that
showed no statistical differences between treatment arms, we consider the two agents to provide
comparable net health benefits (“C”).
Finally, the IV form of abatacept was compared to infliximab, both in combination with
methotrexate, in a single trial (ATTEST). The proportion of patients achieving an ACR20 or better
response was statistically-significantly greater with abatacept (72% vs. 56%), but neither changes in
disease activity nor rates of remission differed between groups. However, rates of serious adverse
events, discontinuation due to adverse events, and infusion reactions were lower with abatacept vs.
infliximab, leading to a judgment of incremental or better net health benefit (“B+”).
There is much greater uncertainty in assessing the relative comparative clinical effectiveness of
TIMs that have never been compared head to head in a randomized setting. Observational studies
might fill in these gaps, but findings have been inconsistent and design and population biases
preclude any definitive conclusions. Finally, as presented earlier, our network meta-analysis
produced variable estimates of ACR response and radiographic progression; for example, non-
response rates ranged from 29-48% across the TIM combination therapy regimens. However,
credible intervals were wide and included 0 for nearly all comparisons between TIMs. As a result,
we judge there to be insufficient evidence (“I”) to differentiate the remaining TIM comparisons,
including intra-class comparisons of the remaining TNFα inhibitors, IL-6 inhibitors, and JAK
inhibitors.

©Institute for Clinical and Economic Review, 2017 Page ES18 Evidence Report: Targeted Immune Modulators for Rheumatoid Arthritis Return to Table of Contents
Other Benefits or Disadvantages
Among the TIMs of focus in our analysis, two (baricitinib and tofacitinib) are oral agents, which may
provide a benefit to individuals without ready access to infusion centers and those who prefer oral
treatment to self-injection (assuming the treatments are clinically comparable for a given patient).
In addition, self-injected and infused products are administered at different frequencies that may
be more or less convenient for patients given their specific circumstances. Also, because of RA’s
heterogeneous nature and likelihood that multiple TIMs will be required for many patients, as well
as emerging evidence suggesting that switching to an alternative class of agent rather than “cycling”
within class may provide clinical benefit, the availability of five distinct classes of TIMs for the
treatment of moderately-to-severely active RA with inadequate response to conventional DMARDs
is an important consideration. Finally, the ability of each TIM to address key patient-centric
concerns such as rapid improvement in function and work capacity, other downstream clinical
benefits such as reduced need for joint replacement, and reduced caregiver burden are critically
important issues, although we note that the current evidence to distinguish the TIMs on these
measures is sparse.
Long-Term Cost-Effectiveness
We developed a sequential treatment cohort model that assessed the cost-effectiveness of each of
the TIMs detailed above relative to conventional DMARDs, as well as against the TIM market leader,
adalimumab. Model parameters were estimated from the network meta-analysis described earlier,
as well as from the published literature. The primary outcomes of the model included discounted
lifetime total payer costs, life years, quality-adjusted life years (QALYs) and incremental cost-
effectiveness ratios, using a payer/health-system perspective. Quality of life was estimated based
on the correlation between ACR response and radiographic progression with function and disability
based on the Health Assessment Questionnaire (HAQ).
The sequential treatment cohort model simulated a hypothetical homogeneous cohort of patients
from the initiation of a TIM until death; a lifetime time horizon was used to reflect the chronic
nature of RA. The model was developed in Microsoft Excel®. Patients could discontinue a TIM due
to lack of effectiveness and/or adverse events. Patients discontinued treatment due to lack of
effectiveness if they received an ACR score less than 20 (defined as non-responders) in the first
treatment cycle. Thus, ACR scores >20 were considered treatment responders. A cycle length of six
months was used to reflect the time needed to evaluate a treatment’s effectiveness.31 Patients
discontinued treatment beyond the first six months only due to the occurrence of adverse events.
Upon therapy withdrawal, the model simulated the patient switching therapy up to three different
times: first to a TIM within the same class as the initial therapy, then to a TIM in a different class,

©Institute for Clinical and Economic Review, 2017 Page ES19 Evidence Report: Targeted Immune Modulators for Rheumatoid Arthritis Return to Table of Contents
and finally to a palliative care state involving conventional DMARDs alone. Patients remaining on
TIMs could experience quality-of-life improvements from level of ACR response as well as continued
reductions in radiographic progression, while those on conventional DMARDs experienced
continued degradation of quality of life. Further details on model structure, data inputs, and key
assumptions can be found in Section 6 of the full report.
Model Parameters
The economic evaluation was primarily from a health-system perspective, and thus focused on
direct medical and pharmacy costs. A separate scenario analysis was conducted to extend the
perspective to a modified societal one that included indirect costs due to potential productivity
gains or losses.114 All future costs and outcomes were discounted 3% per year.
The model was informed by several key assumptions, which are detailed below.
• Patients can discontinue treatment for two reasons: (1) lack of effectiveness, and (2)
occurrence of an adverse event.
• A treatment was administered for at least six months before a decision to discontinue was
allowed in the model.
• After three different TIM failures, a patient reverts to conventional DMARD palliative care
and stays with that therapy for the rest of his/her life.
• Each TIM is used in combination with methotrexate for the base-case combination therapy
results. For subsequent lines of treatment, all relevant TIM therapies in the market basket
were averaged and weighted equally.
• Those patients who had an ACR score less than 20 were assumed to be non-responders to
TIM therapy.110 These patients discontinue due to lack of effectiveness after the first TIM
treatment cycle (six months).
• Responders experienced a constant probability of discontinuation due to adverse events for
each TIM treatment for cycles two and above.110
• The cost calculations for intravenously administered therapies accounted for vial wastage
(i.e., no vial sharing was allowed).
• The conventional DMARD comparator assumes the continued treatment costs of
methotrexate and the clinical outcomes consistent with the clinical review over the
remaining lifetime of the cohort. This comparator represents the long-term costs and
outcomes in an environment without TIM treatment.

©Institute for Clinical and Economic Review, 2017 Page ES20 Evidence Report: Targeted Immune Modulators for Rheumatoid Arthritis Return to Table of Contents
Base Case Results
Table ES4 presents the drug cost, total payer cost, average HAQ, life years gained, and QALYs gained
over the lifetime horizon for each treatment pathway for TIMs added on to conventional DMARD.
Total payer costs included the drug costs (drug costs, administration costs if any, and monitoring
costs) as well as other payer-related costs that may differ by treatment including: hospitalization
costs and serious adverse event-related costs. The results indicate that a lower HAQ score
corresponded to a higher QALY gain, as expected. The base-case results indicate that treatment
with TIMs over a lifetime horizon leads to substantial QALY improvements, ranging from 1.88
(tofacitinib) to 2.43 (etanercept) as compared to conventional DMARD therapy. Note that data for
the two investigational agents (sarilumab and baricitinib) are limited to clinical outcomes only, as no
price is available.
Table ES4. Results for the Base-Case for TIMs Added on to Conventional DMARDs
Treatment 1 Drug Cost Total Cost Average
HAQ
Life Years QALYs
rituximab $366,768 $464,864 1.25 16.79 12.70
abatacept (iv) $367,724 $466,733 1.22 16.82 12.78
abatacept (sc) $452,292 $566,053 1.18 16.87 12.90
tocilizumab (iv) $369,876 $470,205 1.19 16.85 12.88
tocilizumab (sc) $329,324 $424,674 1.21 16.83 12.81
sarilumab - - 1.21 16.83 12.81
tofacitinib $467,784 $579,140 1.28 16.75 12.57
baricitinib - - 1.25 16.78 12.67
adalimumab $425,929 $530,720 1.25 16.78 12.68
certolizumab pegol $417,742 $522,473 1.20 16.84 12.86
etanercept $470,007 $583,449 1.12 16.94 13.12
golimumab (sc) $408,413 $512,875 1.25 16.79 12.69
golimumab (iv) $386,971 $488,380 1.23 16.81 12.75
infliximab $381,243 $480,448 1.24 16.79 12.73
cDMARD $18,209 $67,819 1.78 16.16 10.69

©Institute for Clinical and Economic Review, 2017 Page ES21 Evidence Report: Targeted Immune Modulators for Rheumatoid Arthritis Return to Table of Contents
Three FDA-approved TIMs (adalimumab, etanercept, tocilizumab iv) had data for monotherapy
administration, and thus, treatment with these TIMs as monotherapy (i.e., not in conjunction with
conventional DMARDs) was modeled. Table ES5 presents the drug cost, total payer cost, average
HAQ, life years gained, and QALYs gained over the lifetime horizon for each treatment pathway for
TIMs as monotherapy. Results indicate that treatment with TIMs over a lifetime horizon leads to
QALY improvements ranging from 2.20 (adalimumab) to 2.60 (tocilizumab iv) as compared to
conventional DMARD therapy (conventional DMARD resulted in a lifetime discounted QALY of 10.75
for the monotherapy simulation).
Table ES5. Results for TIMs as Monotherapy
Treatment 1 Drug Cost Total Cost Average
HAQ
Life
Years
QALYs
tocilizumab
(iv)
$384,441 $489,541 1.05 17.03 13.35
sarilumab - - 1.07 17.00 13.28
adalimumab $449,224 $562,748 1.17 16.89 12.95
etanercept $469,981 $584,952 1.11 16.95 13.16
cDMARD* $18,235 $67,525 1.76 16.18 10.75
*cDMARD costs and outcomes were slightly different as compared to the combination findings in Table ES4 given
the different ACR clinical findings for cDMARD in the monotherapy network meta-analysis as compared to the
combination therapy network meta-analysis.
Table ES6 presents the discounted lifetime incremental cost-effectiveness ratios for each of the
TIMs as compared to conventional DMARDs and to the TIM market leader, adalimumab. When
comparing the TIMs to conventional DMARD therapy, the incremental comparisons showed that
tocilizumab sc produced the lowest ratios. Tofacitinib produced the highest cost-effectiveness
ratios compared to conventional DMARD therapy. Importantly, however, the cost-effectiveness of
all TIMs in combination with conventional DMARDs relative to conventional DMARDs alone
exceeded commonly-cited thresholds for cost-effectiveness of $50,000 - $150,000 per QALY gained.
When comparing the TIMs to the market leader adalimumab, eight TIMs were dominant, meaning
they were less costly and more effective than adalimumab. Two other TIMs (abatacept sc and
etanercept) were more costly but also more effective than adalimumab, with estimated cost-
effectiveness ratios of $163,000 and $119,000 per QALY respectively. The final TIM (tofacitinib) was
dominated by adalimumab, indicating that it was more costly and less effective. Importantly,
however, we note that deterministic point estimates, particularly for QALY gains, are both subject
to uncertainty and differ modestly between most of the TIM regimens evaluated. Indeed, findings
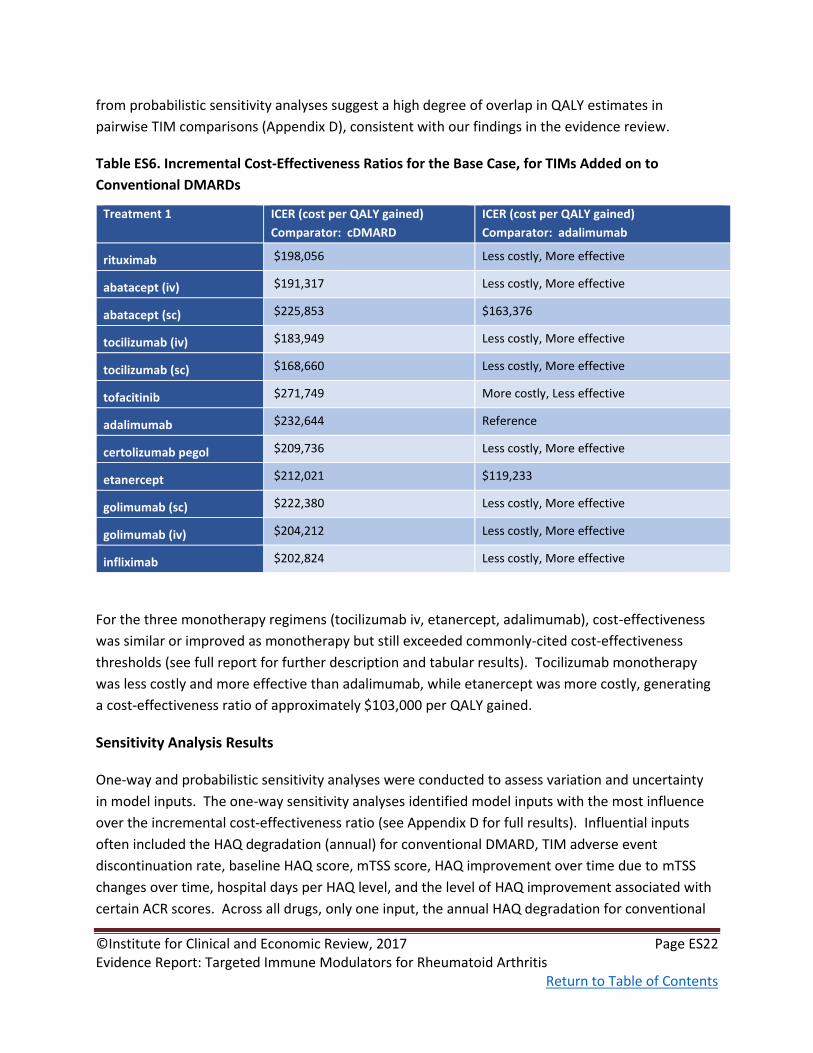
©Institute for Clinical and Economic Review, 2017 Page ES22 Evidence Report: Targeted Immune Modulators for Rheumatoid Arthritis Return to Table of Contents
from probabilistic sensitivity analyses suggest a high degree of overlap in QALY estimates in
pairwise TIM comparisons (Appendix D), consistent with our findings in the evidence review.
Table ES6. Incremental Cost-Effectiveness Ratios for the Base Case, for TIMs Added on to
Conventional DMARDs
Treatment 1 ICER (cost per QALY gained)
Comparator: cDMARD
ICER (cost per QALY gained)
Comparator: adalimumab
rituximab $198,056 Less costly, More effective
abatacept (iv) $191,317 Less costly, More effective
abatacept (sc) $225,853 $163,376
tocilizumab (iv) $183,949 Less costly, More effective
tocilizumab (sc) $168,660 Less costly, More effective
tofacitinib $271,749 More costly, Less effective
adalimumab $232,644 Reference
certolizumab pegol $209,736 Less costly, More effective
etanercept $212,021 $119,233
golimumab (sc) $222,380 Less costly, More effective
golimumab (iv) $204,212 Less costly, More effective
infliximab $202,824 Less costly, More effective
For the three monotherapy regimens (tocilizumab iv, etanercept, adalimumab), cost-effectiveness
was similar or improved as monotherapy but still exceeded commonly-cited cost-effectiveness
thresholds (see full report for further description and tabular results). Tocilizumab monotherapy
was less costly and more effective than adalimumab, while etanercept was more costly, generating
a cost-effectiveness ratio of approximately $103,000 per QALY gained.
Sensitivity Analysis Results
One-way and probabilistic sensitivity analyses were conducted to assess variation and uncertainty
in model inputs. The one-way sensitivity analyses identified model inputs with the most influence
over the incremental cost-effectiveness ratio (see Appendix D for full results). Influential inputs
often included the HAQ degradation (annual) for conventional DMARD, TIM adverse event
discontinuation rate, baseline HAQ score, mTSS score, HAQ improvement over time due to mTSS
changes over time, hospital days per HAQ level, and the level of HAQ improvement associated with
certain ACR scores. Across all drugs, only one input, the annual HAQ degradation for conventional

©Institute for Clinical and Economic Review, 2017 Page ES23 Evidence Report: Targeted Immune Modulators for Rheumatoid Arthritis Return to Table of Contents
DMARD, resulted in an incremental cost-effectiveness ratio lower than $150,000 per QALY gained
from the base-case payer perspective, and this was only seen for tocilizumab.
A probabilistic sensitivity analysis was also conducted to assess variation in all parameters for each
TIM compared to cDMARD (see Appendix D for further details). Tocilizumab (sc and iv) had the
greatest number (10-27%) of iterations beneath a threshold of $150,000 per QALY gained; no other
TIM had more than 4% of iterations below this threshold. Comparative results suggest that the
TIMs with favorable deterministic ICERs as compared to adalimumab (either ICER < 150,000/QALY
OR less costly and more effective), were also highly likely (>90% likely) to be cost-effective
compared to adalimumab at a willingness to pay of $150,000/QALY.
Scenario Analyses Results
Because there is not one standard treatment pathway in RA, the sequential treatment pathway was
varied in scenario analyses. The first scenario analysis changed the fourth treatment strategy from
palliative care in the base-case to a market basket of all TIMs. Findings were similar to those of the
base case. A second scenario analysis explored a sequential treatment pathway that modeled only
one switch. Results were relatively consistent with the first scenario analysis and seemed to move
all ICER findings closer to that of the average TIM versus conventional DMARD.
Additionally, to account for indirect costs due to absenteeism and unemployment (and the
potential for reductions in each), the perspective was extended to a modified societal one.
Compared to the health care system perspective, the cost-effectiveness ratios for a modified
societal perspective were lower, and results were lower than $150,000 per QALY for both the iv and
sc formulations of tocilizumab.
Other scenario analyses focused on results for regimens used in TIM-experienced patients and
findings using shorter time horizons (1-3 years). Results exceeded $150,000 per QALY in all
instances, and worsened as the time horizon became shorter.
Threshold Analyses Results
Table ES7 presents the results of the threshold analysis of the base-case using a lifetime horizon and
health care system perspective. Each TIM in combination with conventional DMARD therapy was
compared to conventional DMARD alone. The table presents the WAC per unit, net price per unit
and discount needed to obtain the commonly cited cost-effectiveness thresholds of $50,000,
$100,000, and $150,000 per QALY gained. The estimated net price was higher than the $150,000
threshold price for all TIMs, indicating that larger discounts from current WAC would be required to
achieve even the higher end of the cost-effectiveness threshold range.

©Institute for Clinical and Economic Review, 2017 Page ES24 Evidence Report: Targeted Immune Modulators for Rheumatoid Arthritis Return to Table of Contents
Table ES7. Threshold Analysis Results
WAC per
unit
Net price
per unit
Unit
Price to
Achieve
$50,000
per QALY
Unit Price to
Achieve
$100,000
per QALY
Unit Price
to Achieve
$150,000
per QALY
Discount from
WAC to reach
thresholds
Rituximab
(100mg) $835.22 $709.94 $198.78 $369.17 $539.55 35% to 76%
Abatacept iv
(250mg) $987.03 $690.92 $193.46 $366.19 $538.92 45% to 80%
Abatacept sc
(125mg) $957.14 $813.57 $203.39 $374.24 $545.09 43% to 79%
Tocilizumab
iv 20mg $94.87 $75.89 $21.25 $41.74 $61.48 35% to 78%
Tocilizumab
sc (162mg) $898.31 $718.65 $237.15 $438.38 $639.60 29% to 74%
Sarilumab* ----------- $237.15 $445.56 $646.78 -
Tofacitinib
(5mg) $63.26 $60.10 $13.22 $23.44 $34.26 46% to 79%
Baricitinib* ----------- $13.82 $24.64 $36.06 -
Adalimumab
(40mg) $2,220.62 $1,554.43 $373.06 $699.49 $1,010.38 55% to 83%
Certolizumab
pegol
(200mg)
$1,839.94 $1,287.95 $347.75 $643.98 $927.33 50% to 81%
Etanercept
(50mg) $1,110.5 $777.35 $209.88 $380.90 $559.69 50% to 81%
Golimumab
sc (50mg) $4,150.38 $2,905.27 $726.32 $1,365.48 $1,975.58 52% to 82%
Golimumab
iv (50mg) $1,592.09 $1,114.46 $300.91 $557.23 $824.70 48% to 81%
Infliximab
(100mg) $1,167.82 $817.47 $220.72 $416.91 $604.93 48% to 81%
*WAC prices for the two investigational drugs were not available as of the date of this report.
Value-based Benchmark Prices
Our value-based benchmark prices for the two investigational agents as well as their in-class
counterparts are provided in Table ES8. The value-based benchmark price for a drug is defined as
the price that would achieve cost-effectiveness ratios between $100,000 and $150,000 per QALY

©Institute for Clinical and Economic Review, 2017 Page ES25 Evidence Report: Targeted Immune Modulators for Rheumatoid Arthritis Return to Table of Contents
gained. For all TIMs, the discounts required to achieve both threshold prices are greater than the
current discounts from WAC, which are lowest (at 5%) for tofacitinib and highest (at 30%) for the
TNFα inhibitors as well as abatacept iv. Tocilizumab sc could achieve a $150,000 cost per QALY with
a 29% discount, but the best available estimate of current discount levels for tocilizumab is
approximately 20%.
Table ES8. Value-based Benchmark Prices for RA Targeted Immune Modulators
WAC per unit* Unit Price to
Achieve $100,000
per QALY
Unit Price to
Achieve $150,000
per QALY
Discount from WAC
to reach
thresholds*
Average Net Price
Within Benchmark
Range?
Rituximab (100mg) $835.22 $369.17 $539.55 35% to 56% No
Abatacept iv
(250mg) $987.03 $366.19 $538.92 45% to 63%
No
Abatacept sc
(125mg) $957.14 $374.24 $545.09 43% to 61%
No
Tocilizumab iv
20mg $94.87 $41.74 $61.48 35% to 56%
No
Tocilizumab sc
(162mg) $898.31 $438.38 $639.60 29% to 51%
No
Sarilumab* ------------ $445.56 $646.78 - N/A
Tofacitinib (5mg) $63.26 $23.44 $34.26 46% to 63% No
Baricitinib* ------------ $24.64 $36.06 - N/A
Adalimumab
(40mg) $2,220.62 $699.49 $1,010.38 55% to 69%
No
Certolizumab pegol
(200mg) $1,839.94 $643.98 $927.33 50% to 65%
No
Etanercept (50mg) $1,110.5 $380.90 $559.69 50% to 66% No
Golimumab sc
(50mg) $4,150.38 $1,365.48 $1,975.58 52% to 67%
No
Golimumab iv
(50mg) $1,592.09 $557.23 $824.70 48% to 65%
No
Infliximab (100mg) $1,167.82 $416.91 $604.93 48% to 64% No
*WAC as of February 24th, 2017
Potential Budget Impact
We used the cost-effectiveness model to estimate the potential total budgetary impact of two new
treatments for moderate-to-severe RA patients: sarilumab (including monotherapy) and baricitinib

©Institute for Clinical and Economic Review, 2017 Page ES26 Evidence Report: Targeted Immune Modulators for Rheumatoid Arthritis Return to Table of Contents
(for both of which FDA approval is pending). We did not include other therapies modeled above in
this potential budget impact analysis, given their established presence in the market.
Potential budget impact was defined as the total differential cost of using the new therapy rather
than relevant existing therapy for the treated population, calculated as differential health care costs
(including drug costs) minus any offsets in these costs from averted health care events. All costs
were undiscounted and estimated over one- and five-year time horizons. The five-year timeframe
was of primary interest, given the potential for cost offsets to accrue over time and to see a more
realistic impact on the number of patients treated with the new therapies.
The potential budget impact analysis included the entire candidate population for treatment, which
consisted of adults with moderate-to-severe RA who have previously failed treatment with
conventional DMARDs. To estimate the size of the potential candidate population for treatment
with sarilumab or baricitinib, we first determined the estimated prevalence of RA in the US, which
has been reported as 0.6%.32 Based on our review of the literature, we assumed that 50% of these
patients were moderate-to-severe cases, and 50% of this subset had failed initial treatment with
conventional DMARDs. Applying these proportions to the projected 2016 US population resulted in
an estimate of approximately 486,000 patients in the US over a five-year period.
Based on input from clinical experts and payers, we assumed that sarilumab would take market
share from tocilizumab (the other drug in its class) and adalimumab (a head-to-head comparator in
clinical trials); similarly, baricitinib would take market share from tofacitinib and adalimumab. In
both cases, we assumed that 70% of new users on the drug would come from patients using the
other drug in its class, and 30% would come from adalimumab. We tested the potential budget
impact of the two new drugs by assuming different unit price points for each (including
monotherapy for sarilumab) - namely price to reach cost-effectiveness thresholds of $50,000/QALY,
$100,000/QALY and $150,000/QALY, against the calculated discounted WAC for existing drugs.
Table ES9 below illustrates the per-patient budget impact calculations in more detail, based on the
prices to reach $150,000 per QALY for sarilumab ($647 per syringe) and baricitinib ($36 per tablet),
and the discounted WAC price of the TIMs they would be displacing. Note that no data matching
our study entry criteria are available for baricitinib monotherapy, so budget impact was not
calculated.

©Institute for Clinical and Economic Review, 2017 Page ES27 Evidence Report: Targeted Immune Modulators for Rheumatoid Arthritis Return to Table of Contents
Table ES9. Illustration of Per-Patient Budget Impact Calculation over Five-year Time Horizon
Drugs
Combination therapy Monotherapy
Avg. Annual Per-Patient
Budget Impact
Avg. Annual Per-Patient
Budget Impact
Sarilumab $24,812 $25,324
Adalimumab +
Tocilizumab* $31,185 $33,445
Net -$6,373** -$8,121**
Baricitinib $27,077 N/A
Adalimumab +
Tofacitinib* $42,450 N/A
Net -$15,373** N/A
*Weighted in the ratio 30:70 for adalimumab:tocilizumab and adalimumab:tofacitinib
†For five-year horizon, drug costs and cost offsets apportioned assuming 20% of patients in uptake target initiate
therapy each year. Those initiating in year 1 receive full drug costs and cost offsets, those initiating in year 2 receive 80% of drug costs and cost offsets, etc. **Indicates cost-saving
When treating the eligible cohort with sarilumab combination therapy, the average potential
budgetary impact (adjusted for differing periods of drug utilization and associated cost-offsets over
a five-year period) results in cost savings at all three cost-effectiveness threshold prices for the
drug, ranging from approximately -$18,400 per patient using the price ($647) to achieve $150,000
per QALY to -$60,800 using the price ($237) to achieve a $50,000 per QALY cost-effectiveness
threshold.
Treating the eligible cohort with sarilumab monotherapy also resulted in cost savings across the
three cost-effectiveness thresholds ranging from approximately -$23,400 per patient using the price
($647) to achieve $150,000 per QALY to approximately -$64,600 using the price ($237) to achieve
the $50,000 per QALY threshold over a five-year time-horizon.
Finally, when treating eligible patients with baricitinib combination therapy, the potential budgetary
impact over five years resulted in cost savings ranging from approximately -$45,200 using the price
($36) to achieve a cost-effectiveness threshold of $150,000 per QALY to approximately -$90,300
using the price ($14) to achieve $50,000 per QALY.

©Institute for Clinical and Economic Review, 2017 Page ES28 Evidence Report: Targeted Immune Modulators for Rheumatoid Arthritis Return to Table of Contents
Summary and Comment
The base-case findings from our analysis suggest that all TIMs provide substantial clinical benefit in
comparison to conventional DMARDs alone; however, their additional costs translate into cost-
effectiveness estimates that exceed commonly-cited thresholds, ranging from approximately
$170,000 to $270,000 per QALY gained. The deterministic findings suggest that all add-on TIMs
were in a relatively small cluster with respect to QALYs gained. Compared to the market leader
adalimumab, most TIMs in combination with conventional DMARD were more favorable (i.e., had
deterministic findings with lower costs and higher QALYs), except for abatacept sc, tofacitinib, and
etanercept. Assuming a willingness-to-pay threshold of $150,000/QALY, etanercept plus
conventional DMARDs was found to be cost-effective as a first-line TIM, while abatacept sc in
combination with conventional DMARDs was estimated to exceed $150,000/QALY, and tofacitinib
was estimated to have higher costs and fewer QALYs gained.
The base-case results were generally robust to the sensitivity analyses. In one-way sensitivity
analyses of deterministic results, annual HAQ degradation was the most influential parameter, with
estimated cost-effectiveness going below $150,000/QALY for abatacept iv, tocilizumab iv, and
tocilizumab sc. In probabilistic sensitivity analysis, tocilizumab iv and tocilizumab sc versus
conventional DMARD therapy (the TIMs with the lowest cost-effectiveness ratio) fell below a
threshold of $150,000 per QALY gained in 10% and 27% of iterations, respectively; for all other
TIMs, that fraction was 4% or less. The probabilistic sensitivity analysis suggested TIMs with
favorable deterministic ICERs as compared to adalimumab (either ICER < $150,000/QALY or less
costly and more effective), were also highly likely (>90% likely) to be cost-effective compared to
adalimumab at a cost-effectiveness threshold of $150,000/QALY.
Additionally, multiple scenario analyses were conducted to assess the impact of certain model
assumptions and parameters on the results and conclusions. When adding in productivity effects,
tocilizumab iv and sc fell below the cost-effectiveness threshold of $150,000/QALY gained, but
results for other TIMs remained above this threshold.
Limitations to the present study are described in detail in the full report, and include assumptions
regarding reduced effectiveness of later-line treatment based on data from only one class of TIMs
(TNFα inhibitors), assuming all TIMs have equal opportunity for first-line use, considering only a
single homogenous cohort of patients for treatment, and assuming no effects on TIM adherence
other than initial switching due to non-response and subsequent switching for adverse events only.
Finally, results from our budget impact analyses suggest that baricitinib and sarilumab would
decrease costs over the TIMs they would displace (i.e., the other agent in class and adalimumab) if

©Institute for Clinical and Economic Review, 2017 Page ES29 Evidence Report: Targeted Immune Modulators for Rheumatoid Arthritis Return to Table of Contents
priced to cost $150,000 per QALY or less. We note, however, that because these two agents are
investigational their prices (and consequent cost-effectiveness ratios) are currently unknown.
Conclusions
In summary, our analyses indicate that all the TIMs of interest in this evaluation substantially
improved health outcomes compared to conventional DMARDs alone. However, their additional
cost led to cost-effectiveness estimates that were well above commonly cited thresholds for cost-
effectiveness, and the discounts required to achieve these thresholds are greater than estimated
current discounts from WAC. Compared to the market leader adalimumab, most TIMs in
combination with conventional DMARDs were more favorable (i.e., had deterministic findings with
lower costs and higher QALYs).
Public Deliberation and Evidence Votes
At the March 24, 2017 meeting, the New England CEPAC Panel discussed issues regarding the
application of the available evidence to help patients, clinicians, and payers address important
questions related to the use of targeted immune modulators for the treatment of rheumatoid
arthritis. The New England CEPAC Panel voted on key questions concerning the comparative clinical
effectiveness and comparative value of treatment options for rheumatoid arthritis. The results of
the votes are presented below. More detail on the voting results is provided in Section 10 of the full
report.
Comparative Effectiveness of Targeted Immune Modulators as Monotherapy: 1. Is the evidence adequate to demonstrate that the net health benefit of tocilizumab
monotherapy is superior to that provided by adalimumab monotherapy?
2. Is the evidence adequate to demonstrate that the net health benefit of sarilumab
monotherapy is superior to that provided by adalimumab monotherapy?
3. Is the evidence adequate to distinguish the net health benefit between tocilizumab
monotherapy and sarilumab monotherapy?
Yes: 11 No: 0
Yes: 11 No: 0
Yes: 0 No: 11

©Institute for Clinical and Economic Review, 2017 Page ES30 Evidence Report: Targeted Immune Modulators for Rheumatoid Arthritis Return to Table of Contents
4. Is the evidence adequate to demonstrate that the net health benefit of tofacitinib
monotherapy is superior to that provided by adalimumab monotherapy?
5. Is the evidence adequate to demonstrate that the net health benefit of baricitinib
monotherapy is superior to that provided by adalimumab monotherapy?
6. Is the evidence adequate to distinguish the net health benefit between tofacitinib
monotherapy and baricitinib monotherapy?
Comparative Effectiveness of Targeted Immune Modulators in Combination With cDMARDs:
7. Is the evidence adequate to demonstrate that the net health benefit of tocilizumab +
cDMARD therapy is superior to that provided by adalimumab + cDMARD therapy?
8. Is the evidence adequate to demonstrate that the net health benefit of sarilumab +
cDMARD therapy is superior to that provided by adalimumab + cDMARD therapy?
9. Is the evidence adequate to distinguish the net health benefit between tocilizumab +
cDMARD therapy and sarilumab + cDMARD therapy?
10. Is the evidence adequate to demonstrate that the net health benefit of tofacitinib
+cDMARD therapy is superior to that provided by adalimumab + cDMARD therapy?
Yes: 0 No: 11
Yes: 0 No: 11
Yes: 0 No: 11
Yes: 1 No: 10
Yes: 0 No: 11
Yes: 0 No: 11
Yes: 0 No: 11

©Institute for Clinical and Economic Review, 2017 Page ES31 Evidence Report: Targeted Immune Modulators for Rheumatoid Arthritis Return to Table of Contents
11. Is the evidence adequate to demonstrate that the net health benefit of baricitinib +
cDMARD therapy is superior to that provided by adalimumab + cDMARD therapy?
12. Is the evidence adequate to distinguish the net health benefit between tofacitinib +
cDMARD therapy and baricitinib + cDMARD therapy?
Comparative Value of Targeted Immune Modulators (TIM): 13. Given the available evidence on comparative effectiveness and incremental cost-
effectiveness, and considering other benefits, disadvantages, and contextual
considerations, what is the long-term value for money for tocilizumab monotherapy in
comparison to adalimumab monotherapy?
*Remaining votes on value not taken due to clinical effectiveness votes finding insufficient evidence
to show net health benefit.
Key Policy Implications and Recommendations
The New England CEPAC engaged in a moderated discussion with a Policy Roundtable of subject-
matter experts about how best to apply evidence on targeted immunomodulators for plaque
psoriasis in policy and practice. The Roundtable included a patient and patient advocate, clinical
experts, drug manufacturer representatives, and public and private payer representatives. Many of
the Roundtable themes focused on price negotiations which are based on manufacturer rebates
and concessions and drive coverage policies for payers.
The discussion reflected multiple perspectives and opinions, and therefore, none of the statements
below should be taken as a consensus view held by all participants. Below are the top-line policy
implications; for more informatioSn please see Section 10.4 in the full report.
Yes: 6 No: 5
Yes: 0 No: 11
Low: 0 Intermediate: 4 High: 7

©Institute for Clinical and Economic Review, 2017 Page ES32 Evidence Report: Targeted Immune Modulators for Rheumatoid Arthritis Return to Table of Contents
Payers and Pharmacy Benefit Managers
1. Consider including in prior authorization processes the requirement that conventional
DMARD therapy dosing be optimized before initiating TIM therapy.
2. If step therapy protocols require patients to fail one or two TNFα inhibitors before switching
to another TIM, develop a quick and transparent exception process for specific situations.
3. Payers should reach out to providers to learn from their experience with prior authorization
in order to streamline and improve the process.
4. Allow patients who are stable on effective treatment to remain on therapy when they
change insurers.
5. Reconsider step therapy if pricing becomes better aligned with clinical value.
6. Negotiate better rebates and share savings with patients.
7. Increase transparency around the role of discounting and rebate practice in formulary
design.
8. Design innovative risk-sharing payment agreements, including pay-for-performance
contracts with manufacturers, value-based contracting with accountable care organizations,
and indication-specific pricing.
Providers, Clinical Societies, and Payers
9. Develop clinical guidelines and coverage policies that closely align with the evidence on
outcomes of patients stratified by prognostic factors, allowing for earlier use of TIM therapy
in patients with poor prognostic factors.
Clinical Societies and Manufacturers
10. Establish standardized assessments to allow for rigorous direct and indirect comparisons of
evidence across studies and therapeutic alternatives.
Public Policy Decision Makers
11. In a dysfunctional market system, in order to protect patients today and improve their
future access to innovative therapies, policy makers may need to consider some form of
regulatory intervention to ensure that drug prices and price increases do not continue their
current upward trajectory, taking them further from reasonable alignment with the added
benefits to patients.

©Institute for Clinical and Economic Review, 2017 Page 1 Evidence Report: Targeted Immune Modulators for Rheumatoid Arthritis Return to Table of Contents
1. Background
1.1 Introduction
Background
Rheumatoid arthritis (RA) is the most common chronic inflammatory arthritis in adults, affecting
between 1.3 and 1.8 million Americans.1,2 It is a disease of unknown but immunologically mediated
origin. RA is more common in women and may occur at any age, with peak incidence occurring at
ages 50-60 years.3 RA is typically characterized by morning stiffness and symmetrical joint swelling
of the feet, hands, and knees, although any joint (and in some cases, internal organs and skin) may
be involved.3 RA is considered a clinical syndrome that, if not controlled, leads to permanent joint
damage and deformity in some individuals.4 The course of RA may also occasionally be complicated
by skin, eye, heart, lung, hematologic, and other extra-articular manifestations.3
Over its course, the management of RA involves patient education, psychosocial support and
therapy, physical and occupational therapy, medications, and joint surgery as required. The
medications used are distinguished by whether they treat symptoms only versus those that target
mechanisms of tissue damage, collectively referred to as disease-modifying anti-rheumatic drugs
(DMARDs). Conventional DMARDs include older systemic agents with broad immunomodulatory
effects such as methotrexate, leflunomide, hydroxychloroquine, and sulfasalazine. More recently, a
number of biologic and non-biologic agents targeted at mediators of inflammation in RA known
collectively as “targeted immune modulators” (TIMs) have come into widespread use. Historically,
RA was associated with both progressive disability and a shortened lifespan, but improvements in
earlier diagnosis as well as aggressive use of TIMs have greatly improved survival and other key
outcomes in the past 20 years.5
Methotrexate is the most widely used conventional DMARD and is considered the “anchor drug”
because of its effectiveness and relative tolerability as well as its potential to enhance the
effectiveness of TIMs.3 However, only about 50% of patients treated with methotrexate alone will
experience sufficient reduction in disease activity or symptoms. Over the past two decades, the
introduction of TIMs has transformed the clinical course of disease for many RA patients.
Uncertainty remains, however, regarding the relative effectiveness and value of the different types
of TIMs and the most effective sequence of TIM therapy. This review focuses on the comparative
clinical effectiveness, potential harms, and comparative value of the major TIMs used in the
treatment of RA as well as several currently under regulatory review for this indication.

©Institute for Clinical and Economic Review, 2017 Page 2 Evidence Report: Targeted Immune Modulators for Rheumatoid Arthritis Return to Table of Contents
Scope of the Assessment
The scope for this assessment is described on the following pages using the PICOTS (Population,
Intervention, Comparators, Outcomes, Timing, and Settings) framework.33 We conducted a
systematic literature review using best practices for search strategy development and article
retrieval. Data and evidence from randomized controlled trials, systematic reviews, and
comparative cohort studies were assembled and reviewed; the focus in cohort studies was primarily
on long-term outcomes and uncommon adverse events. Our evidence review included input from
patients and patient advocacy organizations, data from regulatory documents, information
submitted by manufacturers, and other grey literature when the evidence met ICER standards (for
more information, see https://icer-review.org/methodology/icers-methods/icer-value-assessment-
framework/grey-literature-policy/).
Wherever possible, we sought head-to-head studies of these interventions. We also included
studies with an active comparison to conventional DMARDs as well as placebo-controlled studies.
In addition, we combined direct and indirect evidence in network meta-analyses (NMAs) of selected
outcomes. In these analyses, we explored methods to account for differences in trial populations
using regression-based adjustment for control arm response rates as well as a variety of sensitivity
analyses.26,34
Analytic Framework
The general analytic framework for assessment of targeted immune modulators for moderately-to-
severely active RA is depicted in Figure 1.

©Institute for Clinical and Economic Review, 2017 Page 3 Evidence Report: Targeted Immune Modulators for Rheumatoid Arthritis Return to Table of Contents
Figure 1. Analytic Framework: Targeted Immune Modulators for Moderately-to-Severely Active
Rheumatoid Arthritis
Populations
The population of focus for the review included adults ages 18 and older with moderately-to-
severely active rheumatoid arthritis and inadequate response to or intolerance of conventional
DMARDs. Classification of disease severity and treatment response were based on investigator
assessment; in other words, we did not restrict study selection based on the use of specific tools for
such assessments. Studies focusing exclusively on milder disease or on populations first initiating
conventional DMARD therapy were excluded.
Studies of children, adolescents, or adults with a history of pediatric forms inflammatory arthritis
were excluded. Feedback from patient groups and clinicians suggested that the clinical
presentation and disease trajectory of these patients differs substantially from those with the adult
onset form of RA.35
We also sought evidence on key subpopulations and/or data stratifications of interest. Among
those suggested by stakeholders during the open input period were: (a) evaluation of both TIM-
naïve patients and those with inadequate response to or intolerance of initial TIM therapy; (b) use
of TIMs as monotherapy and in combination with conventional DMARDs; (c) route of administration
(i.e., oral vs. self-injected vs. infused); and (d) setting of care (e.g., hospital-based vs. ambulatory
infusion centers). Feedback received during the public comment period indicated additional
subpopulations or stratifications of interest, including (e) presence of comorbidities (e.g.,
Adults with moderately-to-severely active
rheumatoid arthritis and inadequate
response to conventional DMARDs
Drug therapy
with targeted
immune
modulators
Intermediate outcomes
• Clinical response
• Physical functioning
• Structural damage
• Remission
• Quality of life
• Fatigue
• Pain
• Patient satisfaction
• Hospitalization
• Work loss
Long term clinical outcomes
• Extra-articular manifestations
• Structural damage/deformity
• Mortality
• Joint replacement surgery
Adverse effects of treatment
DMARDs: disease-modifying anti-rheumatic drugs

©Institute for Clinical and Economic Review, 2017 Page 4 Evidence Report: Targeted Immune Modulators for Rheumatoid Arthritis Return to Table of Contents
cardiovascular, psychiatric, malignancy); (f) both “early” (i.e., within 2 years of symptom onset) and
established RA; (g) seropositivity for prognostic markers such as anti-cyclic citrullinated peptide
(CCP) antibodies; (h) geography, in particular U.S.-based versus non-U.S. settings; and (i) study
funding (i.e., industry-sponsored vs. other funding sources).
Interventions
While guidelines from relevant clinical societies recommend use of TIMs in patients who have not
received adequate benefit from conventional DMARD therapy, the most appropriate sequence of
use for specific populations remains unclear. For this reason, we considered a comprehensive list of
TIMs with FDA indications for RA as well as two investigational therapies presently undergoing FDA
review. However, we note that multiple stakeholders indicated that, while the IL-1 inhibitor
anakinra is frequently used for pediatric forms of inflammatory arthritis, it is rarely used for adult
RA in the U.S., so we removed this agent from consideration. Interventions of interest are listed by
class below.
• TNF inhibitors (adalimumab, certolizumab pegol, etanercept, golimumab, infliximab)
• CD20-directed cytolytic antibody (rituximab)
• T-cell receptor signaling inhibitor (abatacept)
• IL-6 inhibitors (tocilizumab, sarilumab [investigational])
• JAK inhibitors (tofacitinib, baricitinib [investigational])
We sought evidence for all agents listed above, including biosimilar forms as data permitted. We
note, however, that the evidence on biosimilars is presented separately, given differences in study
design and intent (e.g., non-inferiority vs. superiority, focus on pharmacokinetics) relative to clinical
studies of the originator products.
Comparators
Most clinical trials of TIMs have been conducted in patients without adequate response to initial
therapy with conventional DMARDs, yet involved comparisons to conventional agents nonetheless
for purposes of regulatory approval. We examined studies comparing TIMs to conventional DMARD
monotherapy or combination therapy (including triple therapy with the conventional DMARDs
methotrexate, sulfasalazine, and hydroxychloroquine) to assess performance versus historical
standard treatments, but also evaluated head-to-head studies between TIMs to evaluate for more
contemporary comparisons. Conventional DMARDs were included regardless of treatment delivery
mechanism (e.g., oral vs. injectable methotrexate).

©Institute for Clinical and Economic Review, 2017 Page 5 Evidence Report: Targeted Immune Modulators for Rheumatoid Arthritis Return to Table of Contents
Finally, while studies with an active comparator arm were preferred, we also included placebo-
controlled trials as necessary to complete network meta-analyses of the effects of treatment on key
measures of effectiveness that combined direct and indirect evidence.
Outcomes
This review examined key clinical outcomes associated with RA, as noted below:
• Mortality
• Standardized criteria for RA treatment response (e.g., ACR20, ACR50, and ACR70, area-
under-the-curve analysis)
• Measures of disease activity, remission, and remission loss (e.g., DAS28, CDAI, SDAI)
• Radiographic evidence of structural damage
• Disease-specific and general health-related quality of life (e.g., HAQ-DI, SF-36)
• Pain (e.g., visual analog scales)
• Other patient-reported outcomes (e.g., patient satisfaction, fatigue, morning joint stiffness)
• Productivity loss and caregiver burden
• Requirements for joint replacement or other surgical intervention
• Utilization of healthcare resources (e.g., hospitalization, rehabilitation, assisted living)
• Cardiovascular events
• Treatment-related adverse events (e.g., serious infection, malignancy, liver abnormalities)
• Costs and cost-effectiveness of TIMs
Based on stakeholder feedback, we also assessed the impact of dose increases, dose decreases, and
drug cessation during periods of sustained control or remission on long-term outcomes, as well as
the effects of dose levels on clinical outcomes and the rates of serious adverse events. Where
available, we also sought information on the clinical rationale for dose adjustments.
Timing
Evidence on intervention effectiveness was derived from studies of at least six months’ duration,
while information on potential harms was obtained from studies of at least three months’ follow-
up.
Settings
All settings were considered, including home and other outpatient settings, as well as ambulatory
and hospital-based infusion centers.

©Institute for Clinical and Economic Review, 2017 Page 6 Evidence Report: Targeted Immune Modulators for Rheumatoid Arthritis Return to Table of Contents
2. The Topic in Context
2.1 Overview
In summarizing the contextual considerations for appraisal of a health care intervention, we seek to
highlight the four following specific issues:
• Is there a particularly high burden/severity of illness?
• Do other acceptable treatments exist?
• Are other, equally or more effective treatments nearing introduction into practice?
• Would other societal values accord substantially more or less priority to providing access to
this treatment for this patient population?
As described in the Background section, the clinical course of RA historically featured increasing
disease activity and joint damage. The images below show the deformities can result from
longstanding and severely active RA, although these are generally seen in the clinical care of
patients first diagnosed prior to aggressive use of conventional DMARDs and TIMs.
Figure 2. Advanced Rheumatoid Arthritis
Sources: https://www.hopkinsarthritis.org/arthritis-info/rheumatoid-arthritis/ra-symptoms/
http://www.thehealthsite.com/diseases-conditions/how-rheumatoid-arthritis-affects-the-foot-and-ankle-
b1016/
Following the introduction of targeted immune modulator therapy beginning in the late 1990s,
there are multiple signs that the clinical course of RA has been transformed. Data from a series of
cross-sectional surveys conducted at rheumatology clinics in the UK between 1996-2014 found
marked declines in measures of disease activity and improvement in the frequency of remission.36
©Institute for Clinical and Economic Review, 2017 Page 7 Evidence Report: Targeted Immune Modulators for Rheumatoid Arthritis Return to Table of Contents
There is also evidence that the introduction of TIMs has had beneficial effects on longer-term
clinical outcomes. For example, the annual frequency of major joint replacement surgery among
patients with RA declined by nearly one-third following the introduction of the first TIMs in the late
1990s, while the frequency of such surgery increased for all other indications.37 In addition, the
prevalence of specific extra-articular manifestations such as rheumatoid carditis and Felty’s
syndrome has markedly declined in the biologic era.38 Finally, there is also evidence from several
cohort studies and registries indicating that excess mortality risks in RA have modulated over time,
although mortality rates remain higher than those of the general population.39,40
Despite these advances, RA remains a remarkably complex disease to diagnose and manage. There
are multiple phenotypic and genotypic variations in the pathogenesis of the disease that affect both
the course of RA and the outcome of therapy.6 Some patients may have milder disease that never
progresses to significant joint damage or functional impairment regardless of treatment received,
while others experience a highly aggressive course that may require multiple attempts at treatment
before the disease is brought under control. Similarly, both initial response to a given treatment
and the durability of that response may vary even within phenotypically-similar populations; some
individuals may have initial response with a short-lived remission, others may have a more robust
initial and subsequent response, and still others may have inadequate response to many TIMs
before finding an appropriate treatment. The patient-physician relationship is therefore key to
monitoring and managing ongoing therapy.
Attempts to identify and risk-stratify patients who might benefit most from treatment have been
longstanding. Classification criteria were first proposed in 1956 to identify RA before end-stage
joint damage and major disability occurred.41 The criteria were revised in 1987 and over the next
several decades, studies suggested the benefits of early, aggressive, combination therapy in slowing
joint damage and the number of treatment options expanded.
The American College of Rheumatology (ACR) and the European League Against Rheumatism
(EULAR) developed new criteria to facilitate the study of subjects with RA in its earliest stages. The
resultant criteria of 2010 (Appendix E) added new predictive biomarkers such as anti-citrullinated
protein antibody (ACPA) and C-reactive protein.4 Current recommendations suggest risk
stratification based on clinical presentation, biomarker data, and radiographic findings to guide
treatment selection. For example, patients with poor prognostic markers would likely receive
aggressive TIM therapy at diagnosis, while those with milder presentation may begin with a trial of
conventional DMARD therapy.42 While these criteria are now in widespread use, their evolution
over time makes comparisons of 20+ years of clinical study challenging.
While earlier treatment focused on symptom management, actual and prolonged remission of
symptoms is now a realistic goal for many patients. In 2012, the ACR recommended several disease
activity measures be used for routine clinical practice (see “Definitions” below), each with criteria to

©Institute for Clinical and Economic Review, 2017 Page 8 Evidence Report: Targeted Immune Modulators for Rheumatoid Arthritis Return to Table of Contents
define remission of symptoms.7 In addition, the College published treatment guidelines for RA in
2015 that strongly recommended a “treat-to-target” approach for both early and established
disease.8 Briefly, this approach involves (a) a goal of clinical remission, or alternatively, low disease
activity as early as possible in the disease course; (b) adjustments in therapy at least every three
months to reach the target; (c) strict and regular monitoring for disease activity, as frequently as
monthly for patients with moderate to high activity; (d) separate monitoring for structural damage
and functional impairment; and (e) discussion of all elements with the patient in a shared decision-
making framework.9 It was acknowledged, however, that these recommendations were made
based on a low-moderate strength of evidence, as most Phase III clinical trials of TIMs have focused
on general measures of symptom improvement such as ACR response criteria (i.e., ACR20/50/70)
rather than remission targets.
Despite the evolution of diagnosis and treatment in RA, challenges remain in the management of
the disease. For one, there is a general shortage of rheumatologists in the US, making the referral
process protracted. The current situation is also unlikely to improve in the near future; a workforce
study conducted by the ACR and the Association of Rheumatology Health Professionals (ARHP)
projects a 31% decline in U.S. rheumatologists by 2030 due to aging of the workforce and an
insufficient number of trainees to meet future demand.10 In addition, early symptoms are similar
across multiple forms of inflammatory arthritis, which also may prolong diagnosis. According to a
recent patient survey conducted by the International Foundation for Autoimmune Arthritis, the
average time from the onset of RA symptoms to formal diagnosis was 2.6 years.11 Clinicians must
also separately monitor patients for signs of increased disease activity and structural damage, as
disease activity indices appear to be predictive of functional decline, but evidence is mixed on
whether measures of radiographic joint damage are correlated with functional indices.12
We received additional input from a variety of clinical experts, clinical organizations, and drug
manufacturers that added further nuance to published recommendations. The ACR response
criteria were felt to be difficult to interpret across studies, as determination of improvement is
clinician-directed and somewhat subjective; the response criteria are also rarely used in clinical
practice given the switch to disease activity measures. An additional limitation is a general lack of
head-to-head randomized controlled trials (RCTs) comparing treatments within or across classes.
As a result, clinicians reported an increasing dependence on published findings and/or data releases
from long-term registry studies to us, including the ongoing Consortium of Rheumatology
Researchers of North America (CORRONA) studies (http://www.corrona.org/registries/rheumatoid-
arthritis) and the ACR’s Rheumatology Informatics System for Effectiveness (RISE) registry
(http://www.rheumatology.org/I-Am-A/Rheumatologist/Registries/RISE/RISE-for-Research).
Clinicians largely agreed with a focus on treat-to-target approaches and aggressive treatment where
warranted, for several reasons. First, a shorter time to achieve treatment success correlates with

©Institute for Clinical and Economic Review, 2017 Page 9 Evidence Report: Targeted Immune Modulators for Rheumatoid Arthritis Return to Table of Contents
better patient retention in treatment. In addition, periods of remission, relapse, and refractory
disease are now a given for many RA patients, so close monitoring is of benefit if and when the
effectiveness of current treatment wanes. Clinicians also felt that managing disease activity and
drug side effects were their primary day-to-day concerns, along with periodic surveillance for joint
damage.
2.2 Treatments for Rheumatoid Arthritis
Conventional DMARDs and Other Systemic Agents
Conventional DMARD treatments may be used alone or in combination (either with each other or
more commonly, with TIMs).43 Steroids are also used to control inflammation. The most common
agents are described below:
• Methotrexate is an antimetabolite that interferes with folate synthesis on rapidly dividing
cells. Low-dose methotrexate is recommended as the first-line use agent for RA. In
addition, it can be used with many TIMs and such combination treatment produces results
generally superior to TIM monotherapy. However, methotrexate may be associated with
potential hepatotoxicity, requires regular laboratory monitoring and folic acid
supplementation, interacts with multiple types of other drugs, and should not be used in
patients with significant liver or kidney disease, or in couples planning on conceiving.
Methotrexate is generally given weekly (either orally or subcutaneously); many patients also
describe a post-dose fatigue (“methotrexate fog”) that can last for several days.
Either nuisance or severe side effects may contribute to early discontinuation of
methotrexate. In addition, recent research indicates that early discontinuation may also be
associated with physician prescribing practices, namely an incomplete trial of methotrexate,
use of sub-optimal doses, and/or failure to switch to subcutaneous administration.44
Several RCTs and observational studies have shown better bioavailability, treatment
response, and adherence to subcutaneous versus oral methotrexate, although most of
these studies were sponsored by manufacturers of injectable methotrexate
formulations.45,46,47,48 Regardless of form, emerging data suggest that methotrexate dosing
is lower than that recommended by current guidance in many patients. 49,50,51
• Sulfasalazine is a sulfa drug that combines salicylate (the active ingredient in aspirin) with
sulfapyridine, an antibiotic. Daily oral use has been shown to have beneficial effects in
reducing joint inflammation in RA, particularly in the earlier and milder stages of the
disease. Common side effects include nausea and abdominal discomfort; sulfasalazine can

©Institute for Clinical and Economic Review, 2017 Page 10 Evidence Report: Targeted Immune Modulators for Rheumatoid Arthritis Return to Table of Contents
also increase sensitivity to sunlight and/or cause skin discoloration. Rarely, sulfasalazine can
cause liver function abnormalities and neutropenia. Finally, potentially severe reactions can
occur in patients with allergies to sulfa drugs, and as with methotrexate, drug interactions
are common.
• Hydroxychloroquine (Plaquenil®, Concordia) is an oral anti-malarial medication that is often
used in early milder forms of RA as well as in combination with other DMARDs. It likely has
a variety of beneficial mechanisms of action, including but not limited to inhibition of toll-
like receptor signaling and alteration of a number of cell proliferative effects dependent on
an acidic pH. Hydroxychloroquine also appears to have a favorable effect on cardiovascular
risk by lowering total, low density, and very low density cholesterol and inhibiting platelet
aggregation without prolonging bleeding time. The most common side effects are
gastrointestinal, including abdominal cramps that often resolve if the drug is withheld for
several days and then resumed as a night time dose. Approximately 10% of patients
develop skin rashes and hair loss can occur. Hyperpigmentation of skin and mucosal
membranes are seen infrequently. Ocular side effects, including reversible corneal deposits
are uncommon and irreversible retinopathy is rare when dose is limited to < 5 mg/kg/day
and appropriately timed funduscopic evaluations are performed.
• Leflunomide (Arava®, Sanofi-Aventis) is an oral isoxazole derivative and pyrimidine synthesis
inhibitor that works by inhibiting dihydroorotate dehydrogenase and is often used in those
who are intolerant or fail to respond to methotrexate. It is occasionally combined with
methotrexate in individuals who are not candidates for TIMs or triple conventional DMARD
therapy. A previously recommended loading dose of 100 mg/day for three days is now
rarely used. The most common side effects occurring in 10-15 % of patients include
diarrhea, nausea, abnormal LFTs, alopecia, and skin rash. Far less commonly, hypertension,
neuropathy, and cytopenias including agranulocytosis have been reported. The drug is
contraindicated in pregnancy and in patients with pre-existing liver disease. Due to the
drug’s enterohepatic recirculation, active metabolites may persist for up to two years and
therefore may require elimination with a bile acid resin binder such as cholestyramine prior
to attempted conception.
• Steroids, most commonly prednisone or equivalent, are recommended for reducing
inflammation in RA when disease activity cannot be controlled with a combination of TIMs
and conventional DMARDs or as short-term (<3 months) treatment when patients
experience a flare of RA symptoms. Steroids can be given using multiple routes of
administration, including orally, as an intramuscular injection, intravenously, or as an intra-
articular injection for local joint flares. Long-term management of RA with intermediate to

©Institute for Clinical and Economic Review, 2017 Page 11 Evidence Report: Targeted Immune Modulators for Rheumatoid Arthritis Return to Table of Contents
high dose steroids is not recommended; the health effects of such use are well-
documented, and include increased susceptibility to infection, thinning of skin, hirsutism,
weight gain, hypertension, diabetes, cataracts, osteoporosis, cardiovascular complications,
and serious infections.
Targeted Immune Modulators
The targeted immune modulators of interest for this review are described in the sections that
follow, and summarized in Table 1.52
1) TNFα inhibitors: adalimumab (Humira®, AbbVie), certolizumab pegol (Cimzia®, UCB),
etanercept (Enbrel®, Amgen), golimumab (Simponi® and Simponi Aria®, Janssen),
infliximab (Remicade®, Janssen Biotech): These are the longest-tenured TIMs on the
market, with the first approved in 1998. They work by blocking or reducing the activity of
tumor necrosis factor alpha (TNFα), which occurs in excess in RA and other joint diseases,
and is a major driver of synovial inflammation.
2) CD20-directed cytolytic B-cell antibody: rituximab (Rituxan®, Genentech/Biogen):
Rituximab is indicated for use in patients who have failed at least one prior TNFα therapy.
B-cells play multiple roles in RA, including presentation of antigen to T-cells, activating them
and magnifying autoreactive T-cell responses in RA; generation of autoantibodies that
perpetuate the inflammatory cascade; and production of pro-inflammatory cytokines
including TNFα, interleukin (IL)-1, and IL-6.
3) T-cell inhibitor: abatacept (Orencia®, Bristol Myers-Squibb): Abatacept prevents the CD28
protein from binding to its counter-receptor, CD80/CD86, which in turn reduces the activity
of T cells. In addition to T-cell inhibition, abatacept has been found to reduce TNFα, IL-6,
and other RA inflammatory markers in clinical trials.
4) IL-6 inhibitors: tocilizumab (Actemra®, Genentech), sarilumab (Kevzara™,
Sanofi/Regeneron): The cytokine IL-6 activates T cells, B cells, macrophages, and
osteoclasts, and is a pivotal mediator of the hepatic acute phase response to inflammation.
IL-6 inhibitors bind to both soluble and membrane-bound IL-6 receptors (sIL-6R and mIL-6R)
and have been shown to inhibit IL-6-mediated signaling through these receptors.
Sarilumab’s manufacturers received FDA notification of a delay in a decision on the agent
(from October 2016 to an undetermined timepoint) due to manufacturing deficiencies
observed during a routine plant inspection.53
©Institute for Clinical and Economic Review, 2017 Page 12 Evidence Report: Targeted Immune Modulators for Rheumatoid Arthritis Return to Table of Contents
5) JAK inhibitors: tofacitinib (Xeljanz®, Pfizer), baricitinib (Olumiant™, Eli Lilly): While the
TIMs listed above are biologic agents or other large molecules requiring subcutaneous
injection or intravenous infusion, JAK inhibitors are oral agents. They work by inhibiting the
Janus kinase enzymes, which mediate intracellular signaling pathways involved in the
production of inflammatory cytokines, including IL-2, -4, -7, -9, -15, and -21. In January, the
manufacturer of baricitinib announced that the FDA had extended the review period for the
drug by three months, to April 2017, to allow time for the company to respond to FDA
requests for additional data.54
All TIMs are associated with an increased risk of serious infection (including reactivation of
tuberculosis in previously-infected individuals). While early reports of lymphomas in patients
receiving TNFα inhibitors were a cause of concern, subsequent observational studies have shown
lymphoma risks to be more closely aligned with the disease than with treatment.13,14 While all
patients with RA are at increased risk of herpes zoster (“shingles”) infection, it is a particular
concern with JAK inhibition. Rituximab and TNFα inhibitors have also been associated with Hepatitis
B reactivation, while abatacept is associated with higher rates of respiratory complications in
patients with COPD. Other rare but serious adverse effects include progressive multifocal
leukoencephalopathy (PML) with rituximab; worsening heart failure, demyelinating disease, and
lupus-like syndromes with TNFα inhibitors; and bowel perforation with IL-6 and JAK inhibitors.
2.3 Other Aspects of Treatment
Dosing Forms, Schedule, and Changes
As listed in Table 1, the TIMs are available in a variety of dosage forms and administration
schedules. With the exceptions of the oral agents tofacitinib and baricitinib, all are delivered via
subcutaneous injection or intravenous infusion. Abatacept, golimumab, and tocilizumab are
available in both forms. As shown in Table 1, agents differ with respect to use of a “loading dose”
and frequency of administration during the maintenance period.
For some of the TIMs, dosing adjustments are frequent in clinical practice. Infliximab (3-10 mg/kg)
and tocilizumab (4-8 mg/kg) allow for flexible dosage strength in their labeling, and several other
agents allow for modifications to the frequency of administration. Increases in dose and reductions
in the interval between doses have been reported for these agents, as well as for adalimumab
(intensification from every-other-week to weekly dosing). Moreover, despite recommendations for
some TIMs to be used with methotrexate (see Table 1 below), in clinical practice, methotrexate may

©Institute for Clinical and Economic Review, 2017 Page 13 Evidence Report: Targeted Immune Modulators for Rheumatoid Arthritis Return to Table of Contents
not be used in conjunction with a TIM because it was poorly tolerated. This has not prevented use
of TIM monotherapy.
The shift to a treat-to-target approach and concern about the rising costs of RA medications (see
below) have led to increased experimentation with dose-tapering or drug-cessation strategies.
Some clinical groups have argued that, for patients with a durable remission of symptoms (generally
considered to be 12 months or longer), attempts can be made to reduce the TIM dose or eliminate
the drug altogether, with careful monitoring for flares. Several studies have been conducted to
assess the effectiveness of dose-sparing strategies with selected TIMs; results are summarized in
the full report.55
Table 1. Targeted Immune Modulators: Dosage Forms and Administration Schedules
TIM Recommended Dose (mg) Route of
Administration
FDA
approval
WAC in
February
2017*
Adalimumab
(Humira®, AbbVie)
TNFα inhibitor
40 mg every other week; some patients
not receiving MTX may benefit from
taking 40 mg every week
Subcutaneous,
self-injection or
administered by
healthcare
professional
12/31/2002 $2,221 per
40 mg
syringe
Certolizumab pegol
(Cimzia®, UCB)
TNFα inhibitor
With or without concomitant MTX, 400
mg at Weeks 0, 2, and 4, followed by
200 mg every other week; for
maintenance dosing, 400 mg every 4
weeks
Subcutaneous,
self-injection or
administered by
healthcare
professional
5/13/2009 $3,680 for 2
200 mg/1mL
syringes or 2
200 mg vials
of lyophilized
powder
Etanercept
(Enbrel®, Amgen)
TNFα inhibitor
50 mg once weekly with or without
MTX
Subcutaneous,
self-injection or
administered by
healthcare
professional
11/2/1998 $1,111 per
0.98 mL of a
50 mg/mL
syringe
Golimumab
(Simponi®/Simponi Aria®,
Janssen)
TNFα inhibitor
In combination with MTX, 50 mg sc
injection once a month or 2 mg/kg iv
infusion at weeks 0 and 4, then every 8
weeks
Subcutaneous,
self-injection or
administered by
healthcare
professional; or
Intravenous
4/24/2009
(sc);
07/19/2013
(iv)
$4,150 per
50 mg
syringe (sc)
or $1,592 per
50 mg (iv)
Infliximab
(Remicade®, Janssen
Biotech)
TNFα inhibitor
In combination with MTX, 3 mg/kg at 0,
2 and 6 weeks, then every 8 weeks;
may increase dose up to 10 mg/kg or
treat as often as every 4 weeks
Intravenous 11/10/1999 $1,168 per
100 mg

©Institute for Clinical and Economic Review, 2017 Page 14 Evidence Report: Targeted Immune Modulators for Rheumatoid Arthritis Return to Table of Contents
TIM Recommended Dose (mg) Route of
Administration
FDA
approval
WAC in
February
2017*
Abatacept
(Orencia®, Bristol Myers-
Squibb)
T-cell inhibitor
Use as monotherapy or with DMARDs
other than TNFα inhibitors; iv infusion
dosed by weight [<60 kg 500 mg, 60-
100 kg 750 mg, >100 kg 1000 mg], at
weeks 0, 2, and 4, then every 4 weeks
or 125 mg sc injection once weekly
Subcutaneous or
Intravenous
12/27/2005
(iv);
07/31/2011
(sc)
$957 per 125
mg (sc) or
$987 per 250
mg (iv)
Rituximab
(Rituxan®,
Genentech/Biogen)
CD20-directed cytolytic B-cell
antibody
In combination with MTX, two-1000 mg
iv infusions separated by 2 weeks every
24 weeks or based on clinical
evaluation, but not sooner than every
16 weeks
Intravenous 2/28/2006 $835 per 10
mg/1mL vial
($8352 per
1000 mg
dose)
Sarilumab
(Kevzara™,
Sanofi/Regeneron)
IL-6 inhibitor
150-200 mg every 2 weeksǂ Subcutaneous
Injection
Expected
mid 2017
Tocilizumab
(Actemra®, Genentech)
IL-6 inhibitor
In combination with DMARDs or as
monotherapy, start with 4 mg/kg every
4 weeks followed by an increase to 8
mg/kg every 4 weeks based on clinical
response; 16 2mg subcutaneous
injection every other week, increased
to every week based on clinical
response (or if patient weighs ≥100 kg)
Subcutaneous or
Intravenous
1/8/2010
(iv)
10/22/2013
(sc)
$898 per
syringe (sc)
or $95 per 20
mg (iv)
Baricitinib
(Olumiant™, Eli Lilly)
JAK inhibitor
2-4 mg once dailyǂ Oral Expected
4/19/2017
Tofacitinib
(Xeljanz®, Pfizer)
JAK inhibitor
5 mg twice daily with or without
conventional DMARDs or 11 mg once-
daily (extended-release form)
Oral 11/16/2012 $63 per
tablet ($127
for extended
release)
*ǂ Price reflects the wholesale acquisition price listed on Red Book Online (Greenwood Village, CO: Truven Health
Analytics. http://www.micromedexsolutions.com/. Accessed February 24, 2017); ǂ dosage at which investigational agents
have been evaluated in clinical trials
Drug Costs
In addition to concerns regarding costs associated with dose increases, TIMs have also received
considerable attention for rising prices in recent years. List prices for the two TIMs with the leading
market share in RA, adalimumab and etanercept, have risen 70-80% in the last three years, to
approximately $4,000 per month.15 These prices do not consider discounts, rebates, or payment
assistance programs provided by manufacturers. However, even after discounts and rebates, TIM

©Institute for Clinical and Economic Review, 2017 Page 15 Evidence Report: Targeted Immune Modulators for Rheumatoid Arthritis Return to Table of Contents
costs remain substantial. A recent examination of both list and net price changes from 2009-2015
found that percentage increases in net prices for adalimumab and etanercept were close to or even
exceeded increases in list price, and both prices increased at rates 12-15 times higher than general
inflation over the same time period.16 In fact, adalimumab, etanercept, infliximab, and rituximab
were #1, 3, 4, and 5 in global sales among the top 20 prescription drugs; while these figures were
across all therapeutic indications, RA represents a substantial proportion of these sales.17
As a result, out-of-pocket expenses for patients – especially Medicare patients - have also risen
dramatically. The Centers for Medicare and Medicaid Services 2015 Drug Spending Dashboard56
reports annual out-of-pocket payments for selected drugs, six of which have indications for RA. As
shown in Table 2, patient payments average approximately $1,600 per year for self-administered
drugs received as a Part D benefit, but approach $4,500 annually for infused agents. In addition,
some Medicare beneficiaries only have partial-year Part D coverage or forego such coverage
entirely, making most of the TIMs out of their financial reach. It should be noted, however, that the
extent to which any gaps in Part B/D coverage are addressed by manufacturer-sponsored programs
or other supplemental drug coverage is unknown.
Table 2. Estimated Annual Out-Of-Pocket Payments for Medicare Beneficiaries Receiving
Selected RA Medications (2015)
Medication Type of Benefit Average Annual Out-of-Pocket
Expense
Adalimumab Part D $1,588
Etanercept Part D $1,590
Certolizumab pegol Part B $3,581
Infliximab Part B $4,280
Rituximab Part B $4,367
Abatacept Part B $4,369
Source: Medicare 2015 Drug Spending Dashboard (https://www.cms.gov/Research-Statistics-Data-and-Systems/Statistics-
Trends-and-Reports/Dashboard/2015-Medicare-Drug-Spending/medicare-drug-spending-dashboard-2015-data.html)
This information was echoed in a recent survey conducted by the Arthritis Foundation, in which
nearly half of survey respondents (n=6,256) indicated that out-of-pocket costs for medications is
the greatest challenge they face, and nearly 40% sought copayment assistance from manufacturers
or other sources, or switched to a more affordable medication.57 While this survey was conducted
among individuals with any form of arthritis, 51% of respondents reported that they had RA. It
should also be noted that the majority of respondents had employer-based health insurance;
financial challenges would likely be more pressing for patients enrolled in public programs or on the
individual market.

©Institute for Clinical and Economic Review, 2017 Page 16 Evidence Report: Targeted Immune Modulators for Rheumatoid Arthritis Return to Table of Contents
Biosimilars
One circumstance with the potential to affect drug costs is the development of biosimilar agents.
The FDA has already approved three biosimilars to the TNFα inhibitors adalimumab (adalimumab-
atto, Amjevita™, Amgen), etanercept (etanercept-szzs, Erelzi™, Sandoz), and infliximab (infliximab-
dyyb, Inflectra™, Celltrion). Inflectra is now on the market, at a WAC price ($946 per 100 mg) that is
a 15% discount from the WAC price of originator infliximab.58 However, many of the long-term
price and competitive implications of biosimilars are unknown given the emerging nature of this
market. Findings from a recent systematic review suggest that the performance of biosimilar TNFα
inhibitors is functionally equivalent to that of the originator products based on head-to-head
studies focused on patient-centric outcomes.59
Treatment Sequencing
There is little study or guidance on the optimal sequence of treatments in patients over their entire
course with moderate-to-severe RA. Guidelines consider combination conventional DMARD
therapy (including triple therapy with methotrexate, sulfasalazine, and hydroxychloroquine) to be a
low-cost alternative to TIMs in patients with inadequate response to a single conventional DMARD;
however, data are mixed on the performance of these regimens relative to TIMs as well as levels of
adherence to treatment, and are currently a subject of intense debate.
Most clinical guidelines consider the TIMs to be equivalent, and suggest that initial changes due to
lack of efficacy remain in the same class. However, recent evidence suggests that switches to a
different class of TIM may be more efficacious.27 Many payers have created coverage policies that
force a particular sequence of treatment. In addition to standard elements of step-therapy
protocols, such as matching clinical trial entry criteria and integrating uncertainty on safety for
newer versus established agents, it is also possible that these sequences are informed by
medications carrying the largest negotiated discounts and/or rebates rather than compelling clinical
evidence. Specifically, the companies producing adalimumab and etanercept have negotiated first-
line use and preferred status in RA and their other indications (e.g., psoriasis, psoriatic arthritis,
Crohn’s disease), limiting the potential for other drugs with a narrower indication set to compete.60
Further details on public and private payer coverage policies can be found in Section 3.
Updates to clinical guidance on treatment are at various stages of study and consensus. Elements
under study include testing methotrexate polyglutamate in patients without adequate clinical
response to ensure that therapeutic levels of methotrexate are circulating in the blood (and
adjusting dose or switching treatment accordingly), considering dose tapering in individuals who
appear to be in continued and durable remission, and allowing greater switching flexibility at first
treatment failure.

©Institute for Clinical and Economic Review, 2017 Page 17 Evidence Report: Targeted Immune Modulators for Rheumatoid Arthritis Return to Table of Contents
2.4 Insights Gained from Discussions with Patients and Patient Groups
We received valuable input from individual patients and patient advocacy groups throughout the
scoping and evidence development process. Patients and patient organizations advised us that
health-system challenges with RA are present from the very beginning. Diagnosis is often delayed,
due in large part to a shortage of available rheumatologists in many areas of the US. Even after
diagnosis, coordination of care across providers and settings is problematic, particularly for patients
who self-administer medication and therefore do not get the opportunity to discuss multiple
aspects of their care at an infusion clinic. Perhaps in part because of coordination of care
challenges, patients stressed the importance of involving family, informal caregivers, and others as
a critical component for successful management of the disease.
Regarding treatment, we were advised that it is not uncommon for patients to cycle through
various therapies before finding a treatment option to which they both respond to and tolerate;
this mirrored the input received from clinicians. We also received input that “fail-first” or step-
therapy insurance policies often require patients to follow a specific sequence of TIM therapies,
most commonly requiring a trial of methotrexate followed by multiple attempts with TNFα
inhibitors. Because of the cyclical nature of the disease and its treatment, patients fear restrictions
on access to certain types of drugs, as well as more general restrictions (e.g., stopping and re-
starting therapy, requirements to repeat step therapy after switching health plans, etc.).
The financial burden of RA treatment on patients and their families is also substantial. Patients did
mention that manufacturers have increased their recent activity around coupons and other
copayment assistance programs, but that the financial problems associated with their care remain
significant and are not limited to out-of-pocket costs alone. Issues with coordination of care,
navigation of insurance requirements by both patient and provider, lost time at work or school, and
other challenges contribute to patient and family burden.
Patient organizations advised us that clinical trials are often lacking robust information on patient-
centric outcomes, and suggested a focus on recently-developed measures such as those described
in the federally-funded Patient-Reported Outcomes Measurement Information System (PROMIS)
toolkit (http://www.healthmeasures.net/explore-measurement-systems/promis). We revised our
list of possible outcomes considerably based on this feedback. However, patients also felt that
much work remains to be done on quantitative, patient-centric measures of treatment success, as
many of the recent developments in defining disease remission and treatment response focus
primarily on disease activity and not enough on symptom control, activities of daily living, and
management of treatment-related side effects. Patients also told us that “point-in-time” measures
often fail to capture the lability of RA—the disease’s burden varies over time, as does the patient’s
ability to accommodate to the realities of the condition.

©Institute for Clinical and Economic Review, 2017 Page 18 Evidence Report: Targeted Immune Modulators for Rheumatoid Arthritis Return to Table of Contents
Arthritis Foundation Surveys
Patient Experiences
As part of their engagement with ICER, the Arthritis Foundation, the leading patient advocacy group
for patients with RA and other forms of arthritis, deployed an online survey during the first two
weeks of November 2016 to gather information about the RA patient experience. Over 3,000
responses were recorded; a total of 1,582 individuals confirmed that they had been diagnosed with
rheumatoid arthritis. The population was comparable to the demographic profile in other US-based
RA cohort studies. Eighty-eight percent of RA patients were female, 83% were white (10% were
African American or Hispanic), and more than half of the sample were age 55 or older (mean 59.5).
Most respondents reported insurance coverage with a commercial carrier (58%) or Medicare (41%).
Experience with RA was generally longstanding—41% of the sample had been diagnosed 15 or more
years ago.61 The clinical picture for many was complex, with over one-quarter of patients also
diagnosed with obesity or depression, and over 10% prevalence of comorbid cancer, heart disease,
and diabetes. In addition to clinical complications, RA also has profound lifestyle impacts during
periods of greater disease activity. Figure 2 presents impacts experienced during periods when RA
was not well-controlled. Nearly 60% of patients required additional medications for pain or mental
health concerns, 42% missed some work or school, and nearly one in five had to discontinue work
or school because of their condition.

©Institute for Clinical and Economic Review, 2017 Page 19 Evidence Report: Targeted Immune Modulators for Rheumatoid Arthritis Return to Table of Contents
Figure 3. Reported Impacts of Rheumatoid Arthritis During Periods When Disease Was Not Well-
Controlled
Source: Arthritis Foundation Survey of Rheumatoid Arthritis Patient Treatment Experiences, November 17, 2016
The survey also indicated that most patients have received multiple TIMs during the course of their
disease, without clearly discernible patterns regarding treatment sequence. In addition, changes in
medication generally happen relatively early. As shown in Figure 3, while the proportions vary by
TIM, 50-93% of patients are on the same therapy for only 1-2 years, and relatively small
percentages of patients have a course of treatment that is 5 years or longer. The agents with the
greatest proportions of long-duration users were the earliest TIMs approved for RA in the late
1990s (etanercept and infliximab), which may be at least in part a reflection of their time on market
rather than any durability advantage they hold over other TIMs.
7%
8%
11%
15%
19%
22%
32%
40%
40%
42%
57%
Developed a comorbid condition
My spouse/partner had to miss work/school
Was hospitalized
Required surgery
Lost or had to leave my job/school
Developed non-joint related complications from my disease
Required physical or occupational therapy
Gained weight
Developed new/worse damage in joints that had previously not…
Missed work/school
Required additional medications for pain, depression, anxiety, etc.

©Institute for Clinical and Economic Review, 2017 Page 20 Evidence Report: Targeted Immune Modulators for Rheumatoid Arthritis Return to Table of Contents
Figure 4. Duration of Therapy, by Type of Targeted Immune Modulator Therapy
Source: Arthritis Foundation Survey of Rheumatoid Arthritis Patient Treatment Experiences, November 17, 2016
Finally, those surveyed reported few difficulties with accessing treatment facilities or scheduling
regular doctor visits, which was surprising given the reported dearth of available rheumatologists.
This may be a reflection on the surveyed population (e.g., covered by employer-sponsored health
insurance). However, reflecting our conversations with individual patients and patient groups, one-
third of patients reported problems with access to their medication of choice and restarting a
medication they had been using if they stopped for some reason, and over 40% reported problems
with care coordination across providers and settings.
Outcomes of Biologic-Naïve versus Biologic-Experienced Patients
The Arthritis Foundation deployed a second survey to assess outcomes of care in RA patients who
had been treated with conventional DMARDs only for at least five years (n=222) as well as those
who had received at least one TIM during this time period (n=337).62 While findings are descriptive
in nature only (i.e., not adjusted for clinical or demographic differences between groups), they echo
93%
82%
77%
77%
52%
88%
91%
56%
84%
7%
10%
15%
12%
16%
11%
8%
13%
7%
0%
8%
8%
10%
32%
1%
1%
30%
9%
Tofacitinib
Tocilizumab
Abatacept
Rituximab
Infliximab
Golimumab
Certolizumab pegol
Etanercept
Adalimumab
1-2 years 3-4 years 5+ years

©Institute for Clinical and Economic Review, 2017 Page 21 Evidence Report: Targeted Immune Modulators for Rheumatoid Arthritis Return to Table of Contents
those of cross-sectional and other observational studies that have documented the clinical effects
of the introduction of TIMs. For example, while substantial proportions of both groups reported
that they had experienced some level of joint damage, the proportion was statistically-significantly
greater in the TIM-naïve group (90% vs. 65%, p<.0001). Similarly, the proportion reporting at least
one joint replacement or other major orthopedic surgery (e.g., spinal fusion) was nearly three times
greater among TIM-naïve patients (56% vs. 19%, p<.0001. Finally, while disease impacts were
pronounced in both patient subsets, greater percentages of biologic-naïve patients reported
hospitalization or ER visits due to their condition/symptoms as well as receipt of disability benefits
at some point.
2.5 Definitions
• ACR Classification Criteria (2010): Scoring algorithm for determination of definite RA based
(a) number and level of joints involved; (b) diagnostic serology testing; (c) testing for acute-
phase reactants; and (d) duration of symptoms.
• ACR Response Criteria: Known as ACR20, 50, or 70, represents at least 20%, 50%, or 70%
improvement in tender/swollen joint counts as well as at least these levels of improvement
in at least three of the following five criteria:
a) Patient global assessment
b) Physician global assessment
c) Pain
d) Disability/function
e) Acute-phase reactant values
Historically, ACR20 was the primary endpoint in most clinical trials of RA treatments. With
the advent of greater efficacy from treatment with TIMs, the ACR50 and ACR70 are also
commonly included as secondary endpoints. With the shift toward treat-to-target
approaches, however, measures of disease activity and/or remission are now commonly
used (see below).
• Acute-phase reactants: These are blood-based biomarkers for systemic inflammation
characteristic of RA and other autoimmune diseases, typically C-reactive protein (CRP) and
erythrocyte sedimentation rate (ESR).
• Anticitrullinated protein antibody (ACPA): A blood test that measures the level of
autoantibodies against cyclic citrullinated peptides, which are produced in excess in patients

©Institute for Clinical and Economic Review, 2017 Page 22 Evidence Report: Targeted Immune Modulators for Rheumatoid Arthritis Return to Table of Contents
with RA. The test has been used to establish risk for RA as well as to assess disease severity
and/or prognosis.
• Disease activity measures: Multiple measures of disease activity, generally divided into
patient-driven, patient/provider composite, and patient/provider/laboratory composite
tools. All instruments differentiate low, moderate, and high disease activity:
− Patient-driven tools
Patient Activity Scale (PAS): Scored 0-10 on a continuous scale based on
questionnaire items regarding disability (HAQ, see below)), pain, and global
assessment (visual analog scales [VAS]). A second version (PAS-II) has been
developed using the same format but with a different disability measure
(HAQ-II)
Routine Assessment of Patient Index Data (RAPID-3): Scored 0-10 on a
continuous scale based on pain and global assessment VAS scales and
disability measured via the MDHAQ
− Patient/provider composite tool
Clinical Disease Activity Index (CDAI): Scored on a 0-76 continuous scale
based on tender and/or swollen joint counts (up to 28 each), as well as
patient and provider global VAS scores
− Patient/provider/laboratory composite tools:
Disease Activity Score with 28-Joint Counts (DAS28): Scored on a 0-9.4
continuous scale based on tender and/or swollen joint counts (up to 28
each), ESR or CRP findings, and patient global VAS score
Simplified Disease Activity Index (SDAI): Scored on a 0-86 continuous scale
based on tender and/or swollen joint counts (up to 28 each), CRP findings,
provider global and patient global VAS score
• Health Assessment Questionnaire (HAQ): A 20-item RA-specific patient questionnaire
designed to measure ability to perform activities of daily living in multiple domains:
dressing, standing, eating, walking, hygiene, reach, grip, other activities, and requirements
for assistance from devices or other persons for any of these. Also available in an
abbreviated 10-item format (HAQ-II) as well as in an expanded multi-dimensional format
(MDHAQ) that includes complex activities and psychological status.

©Institute for Clinical and Economic Review, 2017 Page 23 Evidence Report: Targeted Immune Modulators for Rheumatoid Arthritis Return to Table of Contents
• Patient-Reported Outcomes Measurement Information System (PROMIS): A relatively new
set of person-centered measures that monitors physical, mental, and social health. Early
tool development has focused on neurological diseases and sickle cell anemia, and initial
validation of general health questionnaires has been conducted in RA samples.63
Instruments are not yet widely used in clinical trials, however.
• Remission: Most commonly defined based on a zero or minimal score on measures of
disease activity (see above), with upper limits ranging from 0.25-1.0 on the 10-point patient-
driven scales to 2.6-3.3 on the patient/provider/laboratory composite tools.
• Rheumatoid Factor (RF): A blood test that measures for the presence of an immunoglobulin
(most commonly IgM, but can be IgG and/or IgA) that binds to IgG. The test is positive in
approximately 80% of patients with RA but is not diagnostic of the disease, as a positive RF
can also be seen in other autoimmune and chronic inflammatory diseases as well as in some
otherwise healthy older individuals.
• Sharp Score: The most widely-accepted method used to measure radiographic joint damage
in RA. Multiple modifications are used, but all focus on both erosion and narrowing of the
spaces between joints. The most common modifications include the van der Heijde
method, which focuses on 43 areas of the hands and feet (score range: 0-448), and that of
Genant, which examines 39 hand/foot areas (score range: 0-290).

©Institute for Clinical and Economic Review, 2017 Page 24 Evidence Report: Targeted Immune Modulators for Rheumatoid Arthritis Return to Table of Contents
3. Summary of Coverage Policies and Clinical Guidelines
To understand the insurance landscape for therapies for moderate to severe rheumatoid arthritis,
we reviewed publicly available 2017 coverage policies and formularies for the six New England state
Medicaid programs, Centers for Medicare and Medicaid Services (CMS) and 12 major Silver-level
plans on individual marketplaces across New England.
All public and private carriers in New England managed the 11 drugs in this review through both
step therapy and prior authorization. As a general sequence in step therapy protocols for private
plans, patients were required to first try one conventional DMARD, usually methotrexate, before
treatment with one or two TNFα inhibitors; treatment with other TIMs is only allowed as a third
step in most of these algorithms (see Table 3). Adalimumab and etanercept were preferred in all
but one plan surveyed. 25% of plans required step therapy with both etanercept and adalimumab
before further treatment—and on average, just over half of the plans surveyed required step
therapy with two TNFα inhibitors before moving to non-TNF agents. All TIMs were considered in
the highest tier for cost- sharing purposes.
Table 3. Drug Management and Step Therapy Requirements* (requirements by % of plans
surveyed)
Preferred
drug
status?
DMARDs
required
before use:
# of TNFs
required
before use:
Adalimumab
&
Etanercept
required
before use
Not
listed/
non-
formulary 1 2
TNF Inhibitors
adalimumab 100% 92% 8% 0% N/A 0%
certolizumab pegol 42% 92% 17% 58% 25% 0%
etanercept 92% 92% 0% 0% N/A 0%
golimumab 58% 92% 17% 42% 25% 0%
infliximab 58% 83% 0% 42% 17% 8%
CD20- directed cytolytic antibodies
rituximab 8% 58% 33% 42% 17% 25%
T-cell inhibitors
abatacept 0% 92% 33% 67% 22% 0%
IL-6 inhibitors
tocilizumab 17% 83% 17% 58% 25% 8%
JAK inhibitors
tofacitinib 25% 75% 0% 50% 17% 17%
*all agents require prior authorization

©Institute for Clinical and Economic Review, 2017 Page 25 Evidence Report: Targeted Immune Modulators for Rheumatoid Arthritis Return to Table of Contents
In nearly a quarter of the plans surveyed, rituximab was either not listed or explicitly considered a
medical benefit. For patients with rheumatoid arthritis, rituximab is only FDA-approved for those
who have failed one or more TNFα inhibitors. In our survey, 42% of plans required patients to fail
two TNFα inhibitors before receiving rituximab.
An October 2016 review of 10 of the largest private payers nationwide examined 94 TIM coverage
policies in relationship to ACR and FDA guidance.64 Over two-thirds of the payment policies
surveyed were more restrictive than the FDA-labeled indications, and one-third were more
restrictive than ACR guidelines. As with our own review, the study concluded that there is
substantial variation in coverage policy by payer and medication.
Medicaid
As with the private carriers, all but one of the New England Medicaid programs (Massachusetts)
identify etanercept and adalimumab as preferred agents. Maine and Rhode Island do not require
prior authorization for etanercept or adalimumab, but require prior authorization for all other
agents. New Hampshire Medicaid has the most restrictive policy, requiring use of two conventional
DMARDs and failure of both etanercept and adalimumab before allowing coverage for other TIMs.
Connecticut and Vermont both require failure of one conventional DMARD and one TNFα inhibitor
before providing payment for other agents. Massachusetts requires an inadequate response or
adverse reaction to conventional DMARDs or a biologic DMARD before allowing treatment with
tocilizumab or tofacitinib.

©Institute for Clinical and Economic Review, 2017 Page 26 Evidence Report: Targeted Immune Modulators for Rheumatoid Arthritis Return to Table of Contents
Clinical Guidelines
American College of Rheumatology (ACR)8
http://www.rheumatology.org/Portals/0/Files/ACR%202015%20RA%20Guideline.pdf
The American College of Rheumatology Guidelines were updated in 2015. Upon failure of
conventional DMARD monotherapy in patients with early disease (<6 months from diagnosis), the
guidelines recommended conventional DMARD combination therapy, a TNFα inhibitor, or non-TNFα
therapy with or without methotrexate. In this instance, recommendations were for TNFα inhibitors
over tofacitinib due to the paucity of long-term safety data as well as cost considerations.
Recommendations were similar for patients with established disease, although tofacitinib is
considered a viable alternative in patients with inadequate response to a single conventional
DMARD; in patients without response to initial TIM or combination DMARD therapy, however,
other non-TNFα therapies were preferred over tofacitinib.
In general, the ACR recommended combining TIM therapy with methotrexate for improved
response. There was some acknowledgement of evidence of tocilizumab’s superiority as a
monotherapy over TNFα inhibitors after failed conventional DMARD treatment, although there was
no consensus among the panel. ACR recommended continued treatment for patients with disease
in remission. They also recommended continuation of current dosing, rather than tapering or
discontinuing upon disease stabilization.
National Institutes for Health and Care Excellence (NICE)65
https://www.nice.org.uk/guidance/cg79?unlid=10194813432016226224059
The NICE guidelines on treating adults with rheumatoid arthritis were l updated in 2016. All but one
of the therapies in our review have been recommended by NICE for treatment of moderate-to-
severe rheumatoid arthritis. Guidelines on tofacitinib are expected in January 2018 (see project
documents here).
If conventional DMARD therapy has failed for a patient, NICE recommends combining methotrexate
therapy with at least one TNFα therapy, before treatment with other TIMs. For those patients who
cannot take methotrexate because it is contraindicated, NICE recommends monotherapy with
adalimumab, etanercept, certolizumab pegol or tocilizumab. NICE recommends continuing
treatment if there is a moderate response after six months of therapy, and switching therapy if a
patient has no response after six months.

©Institute for Clinical and Economic Review, 2017 Page 27 Evidence Report: Targeted Immune Modulators for Rheumatoid Arthritis Return to Table of Contents
The European League Against Rheumatism42,66
http://ard.bmj.com/content/early/2017/03/06/annrheumdis-2016-210715
The European League Against Rheumatism (EULAR) Recommendations were most recently updated
in March 2017. A focused recommendation on treating early arthritis was released in December
2016.
If there is no disease response to initial methotrexate monotherapy (or other conventional DMARDs
if methotrexate is contraindicated) at three months, or treatment target is not achieved by six
months, EULAR recommends risk stratification. If factors indicating unfavorable prognosis are
absent, EULAR encourages continuing switching to or adding another conventional DMARD. If
these factors are present, EULAR recommends combination therapy of methotrexate with a TIM.
Current practice suggests use of a biologic TIM because of the long-term data available versus JAK
inhibitors, although JAK inhibitors and IL-6 inhibitors are felt to have some advantages in patients
who cannot use conventional DMARDs as co-medication. If a TIM+conventional DMARD strategy is
unsuccessful, EULAR recommends switching to any other TIM, although the organization considers
the efficacy and safety to be unknown for use of another TIM after insufficient response to a JAK
inhibitor as well as use of another IL-6 inhibitor after failure of initial IL-6 inhibitor therapy.
In contrast to the ACR, EULAR recommends consideration of tapering treatment whenever possible
in patients who have achieved stable disease remission.
Patient-Based Recommendations
Patient Panel (Coordinated by the American College of Rheumatology)67
http://www.rheumatology.org/Portals/0/Files/When%20Patients%20Write%20the%20Guidelines.pdf
In January 2015, the ACR convened a panel of 10 patients to develop recommendations for treating
rheumatoid arthritis. The patient panel voted on recommendations after several days of training
led by ACR on how to evaluate evidence. The patient panel recommended combination therapy
with two conventional DMARDs after monotherapy non-response. Unlike the ACR professional
panel, the patients were more inclined to consider triple conventional DMARD therapy when
appropriate. Upon treatment failure of conventional DMARD mono- or combination therapy, these
patients recommended a treatment plan that included all TIMs. In contrast to the ACR panel,
patients also recommended tofacitinib as an option in early RA. While physicians were cautious
about the long-term safety of tofacitinib and preferred methotrexate because of its strong track
record, patients thought that the side effects of methotrexate were worse than that of tofacitinib
and felt that the evidence demonstrated superior outcomes for tofacitinib. Still, patients preferred
TNFα treatment over tofacitinib in therapy sequencing.

©Institute for Clinical and Economic Review, 2017 Page 28 Evidence Report: Targeted Immune Modulators for Rheumatoid Arthritis Return to Table of Contents
4. Comparative Clinical Effectiveness
4.1 Overview
To inform our analysis of the comparative clinical effectiveness of targeted immune modulators for
patients with moderately-to-severely active RA who experienced an inadequate response to
previous methotrexate or other conventional DMARD therapy, we abstracted evidence from
available clinical studies, whether in published, unpublished, or abstract form. The drugs and
regimens of interest are included in Table 1.
As described in the Background section, we focused on evidence of the comparative clinical
effectiveness of TIMs in the target population (i.e., moderate-to-severe disease with inadequate
response to or intolerance of conventional DMARDs); we also included evidence from studies
evaluating combination therapy (TIM + conventional DMARD) or TIM monotherapy in comparison
to single or combination therapy with conventional DMARDs. Note that, while combination
conventional DMARD therapy (including triple therapy) is included as a comparator in our scope, it
was not a focus of our review given the paucity of available randomized comparisons.
Our review focused on key clinical outcomes common to RA trials, as well as patient-reported
outcomes, healthcare system utilization, and work loss where evidence was available.
• Clinical benefits
o Trial outcomes
ACR20/50/70 response
Disease activity (DAS28, SDAI, CDAI)
Radiographic progression (modified total Sharp score)
Function (HAQ-DI)
o Patient-reported outcomes
Health-related quality of life (e.g., Short Form [SF]-36)
Pain
Fatigue
• Non-clinical benefits
o Healthcare system utilization and associated costs
o Productivity
• Harms
o Treatment-related adverse events (e.g., deaths, rates of infection, malignancies)
o Treatment tolerability (e.g., discontinuation due to adverse events)

©Institute for Clinical and Economic Review, 2017 Page 29 Evidence Report: Targeted Immune Modulators for Rheumatoid Arthritis Return to Table of Contents
4.2 Methods
We included evidence from randomized controlled trials (RCTs), comparative observational studies,
and high-quality systematic reviews. We excluded single-arm studies as well as early clinical studies
focused on very short-term tolerability; Phase II studies were included if they reported on outcomes
of interest and met other specified selection criteria. We required studies to include minimum total
sample sizes of 100 and 1,000 for RCTs and observational studies respectively. Our sample set was
further limited to studies with at least six months’ duration of follow-up for adequate surveillance
of outcomes. However, long-term extension studies that evaluated outcomes more than three
years after comparator-arm crossover was allowed were excluded, given challenges with attributing
study findings to initial treatment.
Study comparisons must have been between active agents: we excluded trials in which the only
comparator was placebo without background methotrexate or another conventional DMARD, as
well as studies that pooled individual agents into a single treatment arm (e.g., TNFα inhibitors). We
also excluded studies that only compared combination therapy (TIM + conventional DMARD) to
monotherapy with the same TIM, but we did include data on both TIM monotherapy and
combination therapy from trials with a third arm that represented conventional DMARD therapy
alone. We excluded studies that only compared two different methods of administration (e.g.,
intravenous vs. subcutaneous) of the same agent. Biosimilar studies were included if they involved
comparisons between the biosimilar and originator molecule and focused on the outcomes of
interest; studies examining only pharmacodynamics or pharmacokinetics were excluded. Finally,
because two of the TIMs have been studied using multiple dosage strengths and are not yet FDA-
approved, we focused attention on the dosage most likely to be in the label based on clinical expert
input (baricitinib 4 mg and sarilumab 200 mg).
In recognition of the evolving evidence base for RA, we supplemented our review of published
studies with data from conference proceedings, regulatory documents, information submitted by
manufacturers, and other grey literature that met ICER standards for review (for more information,
see https://icer-review.org/methodology/icers-methods/icer-value-assessment-framework/grey-
literature-policy/). We excluded abstracts that reported data available in peer-reviewed
publications as well as abstracts on therapies that have been on the market in the United States for
at least three years.
Data Sources and Searches
Procedures for the systematic literature review assessing the evidence on targeted immune
modulators for moderately-to-severely active RA followed established methods in systematic
review research.68 We conducted the review in accordance with the Preferred Reporting Items for

©Institute for Clinical and Economic Review, 2017 Page 30 Evidence Report: Targeted Immune Modulators for Rheumatoid Arthritis Return to Table of Contents
Systematic Reviews and Meta-Analyses (PRISMA) guidelines.33 The PRISMA guidelines include a
checklist of 27 items, further detail of which is available in Appendix A, Table A1.
The evidence base for many of the agents included in our scope is relatively long-standing, and
several recent systematic reviews and health technology assessments have evaluated the
comparative clinical effectiveness of these therapies.24,25,69 Rather than conduct a de novo
literature search, we reviewed these systematic reviews for studies published prior to 2010 that
met our inclusion criteria.
The timeframe was intended to build upon and update that of a comprehensively scoped report
from the Agency for Healthcare Research and Quality (AHRQ).69 Our search spanned the period
from January 2010 to September 2, 2016 and focused on MEDLINE®-, Embase®-, and Cochrane-
indexed articles. We limited each search to studies of human subjects and excluded articles
indexed as guidelines, letters, editorials, narrative reviews, case reports, or news items.
To supplement the above searches and ensure optimal and complete literature retrieval, we
performed a manual check of the references of recent relevant reviews and meta-analyses. We
included several articles published after our initial search data when the data appeared to inform
this report. Further details on the search algorithms, methods for study selection, data extraction,
quality assessment, assessment for publication bias, and our approach to meta-analyses are
available in Appendices A and C.
Data Synthesis and Statistical Analyses
Evidence tables were generated based on the data abstracted above and are presented
descriptively in the sections that follow (see Appendix F). In addition, because the treatments of
interest have usually not been directly compared, we developed quantitative, indirect comparisons
among all agents using a Bayesian network meta-analysis (NMA) for both ACR and Sharp score
outcomes. Consistent with prior published methods,70 ACR20/50/70 response outcomes from
clinical trials were tabulated to create numbers of patients in mutually exclusive categories (i.e.,
<20, 20-49, 50-69, ≥70); these data were analyzed using a random-effects, multinomial likelihood
model to generate proportions of patients in each category. An adjusted model was specified with a
covariate for conventional DMARD response rates as a possible control for between-study
heterogeneity and general confounding. Model residuals (i.e., deviance information criterion [DIC]
and total residual deviance) were evaluated to determine whether conventional DMARD response
represented an important effect modifier.
The Sharp score data were analyzed based on the mean change from baseline to week 52. A fixed-
effects model was used due to the small number of eligible trials and high degree of single-study
connections. To aggregate and synthesize the multiple modifications of Sharp score into a common

©Institute for Clinical and Economic Review, 2017 Page 31 Evidence Report: Targeted Immune Modulators for Rheumatoid Arthritis Return to Table of Contents
metric, the standardized mean difference (SMD) method was calculated to accommodate the
various Sharp score modifications and adaptions that have been reported across trials. As
described further in Section 6, SMD data were also retransformed to estimates of absolute Sharp
score change on the Van der Heijde scale relative to conventional DMARDs to support the
comparative value analysis.
All statistical analyses were run within a Bayesian framework with WinBUGS 1.4.3. Criteria for trial
selection, statistical methods and WinBUGS code are detailed in Appendix C.
Assessment of Level of Certainty in Evidence
We used the ICER Evidence Rating Matrix (see Figure 2) to evaluate the evidence for a variety of
outcomes. The evidence rating reflects a joint judgment of two critical components:
f) The magnitude of the difference between a therapeutic agent and its comparator in “net
health benefit” – the balance between clinical benefits and risks and/or adverse effects AND
g) The level of certainty in the best point estimate of net health benefit.71

©Institute for Clinical and Economic Review, 2017 Page 32 Evidence Report: Targeted Immune Modulators for Rheumatoid Arthritis Return to Table of Contents
Figure 5. ICER Evidence Rating Matrix
Comparative Clinical Effectiveness
Leve
l of
Cer
tain
ty in
th
e Ev
iden
ce High
Certainty D C B A
Moderate Certainty
B+
C+
P/I
C-
Low Certainty
Low Certainty
I I Negative
Net Benefit Comparable Net Benefit
Small Net Benefit
Substantial Net Benefit
Comparative Net Health Benefit A = “Superior” - High certainty of a substantial (moderate-large) net health benefit
B = “Incremental” - High certainty of a small net health benefit C = “Comparable”- High certainty of a comparable net health benefit D = “Negative”- High certainty of an inferior net health benefit B+ = “Incremental or Better” - Moderate certainty of a small or substantial net health benefit, with high certainty of at least a small net health benefit C+ = “Comparable or Better” - Moderate certainty of a comparable, small, or substantial net health benefit, with high certainty of at least a comparable net health benefit P/I = “Promising but Inconclusive” - Moderate certainty of a comparable, small, or substantial net health benefit, and a small (but nonzero) likelihood of a negative net health benefit C- = “Comparable or Inferior” - Moderate certainty that the point estimate for comparative net health benefit is either comparable or inferior I = “Insufficient” - Any situation in which the level of certainty in the evidence is low

©Institute for Clinical and Economic Review, 2017 Page 33 Evidence Report: Targeted Immune Modulators for Rheumatoid Arthritis Return to Table of Contents
Study Selection
Our literature search identified 4,042 potentially relevant references (see Appendix A, Figure A1), of
which 118 met our inclusion criteria. These citations were comprised of 96 publications and 22
conference abstracts/posters. In addition, we reviewed three high quality systematic reviews for
studies published prior to 2010 that met our inclusion criteria and identified 31 publications from
18 additional studies.24,25,69 In total, we included 132 reports of 67 RCTs and 17 observational
studies. Primary reasons for study exclusion included the use of regimens or dosing schedules not
approved by the FDA, study populations that included patients who were naïve to methotrexate
and/or other conventional DMARDs, and smaller sample sizes (<100 for RCTs or <1,000 for
observational studies). Additional details of the included references are described in Appendix F.
The 67 RCTs provided data on more than 28,000 patient enrollments. Of these RCTs, 60 focused on
TIM combination therapy with methotrexate or other conventional DMARDs, five focused
exclusively on TIM monotherapy, and two included both combination and monotherapy. The
majority (n=61) of the RCTs focused on populations that were primarily (80% or more) TIM-naïve, or
exclusively so. We identified six RCTs conducted only in patients with prior use of one or more
TIMs.
We identified a total of 19 RCTs that involved head-to-head comparisons. Of these, eight involved
comparisons of one TIM to another, and eleven were comparisons of a biosimilar form of a TIM to
the originator product. The remainder of the trials included comparisons to conventional DMARD
therapy alone.
Biosimilar trials were identified for adalimumab, etanercept, infliximab, and rituximab. Details of
these studies are presented in Appendix C. We do not discuss results in detail in this report,
however, as findings uniformly demonstrated non-inferiority of the biosimilar to the originator
product in all studies.
Quality of Individual Studies
We rated all 67 trials to be of good (83%) or fair (18%) quality using criteria from the U.S. Preventive
Services Task Force (USPSTF).72 Trials of good quality had study arms that were comparable at
baseline, employed valid instruments to evaluate outcomes, and did not demonstrate differential
attrition. Fair quality studies typically used a modified intent-to-treat or per-protocol analysis, or
reported slight imbalances in baseline characteristics. Of the 17 observational studies, two were
judged to be good, eleven fair, and four poor quality. We did not assign a quality rating to
references that were obtained from grey literature sources (e.g., conference proceedings).

©Institute for Clinical and Economic Review, 2017 Page 34 Evidence Report: Targeted Immune Modulators for Rheumatoid Arthritis Return to Table of Contents
Most of the trials permitted use of rescue medication as early as three months following
randomization, and treatment-arm crossover was generally allowed at six months. While these
trials had good internal validity during the pre-crossover period, extrapolation to longer-term
effects poses challenges. In addition, because some measures (e.g., radiographic progression) are
relatively insensitive to short-term changes, these required imputations due to crossover effects or
missing data.
Outcome-Specific Considerations
Our discussion of results is focused on the major clinical and functional outcomes of the available
studies, including measures of disease activity and remission, ACR response, radiographic
progression, and function or disability. Specific considerations regarding these measures are
described below.
Disease Activity Score [DAS28]-ESR was the most frequent measure of disease activity across all
trials, reported in about 80% of the trials that included disease activity measures. Other types of
disease activity measures reported less frequently included: DAS28-CRP, Clinical Disease Activity
Index [CDAI] and Simplified Disease Activity Index [SDAI]. Most studies used remission rates as one
of the study endpoints, defined as DAS28 score ≤2.6, SDAI score ≤3.3, or CDAI score ≤2.8. Given the
multiplicity of measures as well as their evolution over time, we opted to describe our findings in
descriptive fashion only rather than conduct a network meta-analysis.
As noted in the Topic in Context section of this report, the American College of Rheumatology
response criteria represent at least 20%, 50%, or 70% improvement in the core measures of RA
activity. The primary endpoint in the majority of RCTs included in our analysis set was ACR20.
However, ACR20 is generally considered minimal improvement, while ACR50/70 are regarded to be
more clinically significant levels of response.73 We present findings for all levels of response and
note where results are similar or inconsistent across these levels.
Structural damage is most commonly assessed using the Sharp score. The Sharp score sums
measures of both joint erosion and joint space narrowing across several joints in the hands, wrists,
and feet.0F
a The score has been modified and adapted over time, with iterations from Van der
Heijde74,75 and Genant76 appearing most commonly in our review.
However, within the studies included in our review, the Genant and Van der Heijde methods were
not applied consistently. Maximum possible scores were frequently not specified by trial
investigators, and across the studies that did provide detail on the maximum achievable score,
there was considerable variation (e.g., total scores using the Van der Heijde method ranged from
a The Van der Heijde modified Sharp score includes an analysis of several joints in the feet, although other approaches focus solely on the hands

©Institute for Clinical and Economic Review, 2017 Page 35 Evidence Report: Targeted Immune Modulators for Rheumatoid Arthritis Return to Table of Contents
380 to 448).77,78 Consequently, there is substantial uncertainty in the degree of comparability of
results between studies. Furthermore, because radiographic progression occurs gradually over
time, this outcome is most frequently reported after at least 12 months of follow-up. Trials that
permit early escape and/or crossover must extrapolate how much joint damage would likely occur
had the patient continued with the initial treatment. These imputations are often based on a very
short duration of observation (e.g., 16 weeks) and may underestimate the true progression that
patients would experience had no adjustment to their therapy occurred. Missing or post-rescue
therapy data were typically imputed using linear extrapolation of data from baseline and post-
baseline radiographic assessment timepoints. Finally, we note that, in addition to issues of multiple
methods and variants to assess radiographic progression, all such measures rely on clinician
interpretation of radiographic data.
The HAQ-DI, a patient completed disability assessment, was the most widely reported measure of
function in most the studies we identified. HAQ-DI Score ranges from 0 to 3, with higher scores
indicating greater disability. In many published trials, a change of 0.22 in the HAQ-DI score,79 or a
more stringent 0.3,80 is considered a minimum clinically important difference (MCID).
4.3 Results
Because our study entry criteria involved patient populations with an inadequate response to
conventional DMARD therapy, it is unsurprising that the results of conventional DMARD-controlled
studies consistently favored TIMs for all major outcomes. These findings are summarized across all
TIMs in the report, but are presented by TIM in Appendix F. As noted above, our focus of attention
in the report is on the four major clinical outcomes of the trials (disease activity/remission, ACR
response, radiographic progression, and function/disability) as well as harms. A summary
discussion of other outcomes (e.g., pain, fatigue, quality of life) can be found in Appendix C.
Findings from head-to-head studies are organized by TIM in the sections that follow. For each TIM,
we describe results according to their use as monotherapy as well as in combination with
conventional DMARDs. We also characterize the findings (as available) in primarily or exclusively
TIM-naïve patients as well as those with prior TIM use, and describe any available findings in key
subgroups.

©Institute for Clinical and Economic Review, 2017 Page 36 Evidence Report: Targeted Immune Modulators for Rheumatoid Arthritis Return to Table of Contents
Comparisons to Conventional DMARD Therapy
TIM-Naïve/Mixed Populations
All 11 TIMs generated superior improvements in disease activity, remission, and ACR response
relative to conventional DMARD therapy alone in TIM-naïve/mixed populations. Incremental
improvements were more modest for the JAK inhibitors and rituximab than other TIMs, and
findings were limited for TIM monotherapy. Radiographic progression was also statistically-
significantly reduced with most TIMs in comparison to conventional DMARDs, but differences in
measures used made comparisons across studies difficult. Improvements in function and
disability were statistically superior for all TIMs, and data were available that indicated greater
proportions of patients receiving TIMs met clinically-important thresholds for HAQ-DI change
except certolizumab pegol, etanercept, and tofacitinib (which did not report these data).
Findings for the four major clinical outcomes of interest can be found in Appendix C Tables C1, C3,
C5 & C7. Appendix C summarizes results for other important outcomes, including patient-reported
data on pain, fatigue, and health-related quality of life as well as work productivity and healthcare
resource use.
A total of 49 RCTs compared combination therapy with TIMs and conventional DMARD therapy with
conventional DMARDs alone in TIM-naïve or mixed populations. The proportions of patients
achieving remission, measured primarily using the DAS28-ESR at 24 weeks, were substantially
greater in the TIM groups relative to conventional DMARDs alone (Appendix C, Table C1). Results
achieved statistical significance for all TIMs except abatacept and infliximab (statistical testing was
not performed). Numbers needed to treat to achieve remission over 24 weeks were approximately
10 or less for all TIMs except tofacitinib (17-20), baricitinib (17), and rituximab (14).
An additional four RCTs compared TIM monotherapy with conventional DMARDs alone on
remission measures. Findings showed statistically-significantly higher rates of remission for
etanercept and tocilizumab.
The percentages of patients achieving ACR response at 24 weeks was also statistically-significantly
greater for TIMs in combination with conventional DMARDs versus conventional DMARDs alone in
33 available RCTs (Appendix C Table C3). This was true not only for ACR20 response (the primary
endpoint in most studies), but for ACR50 and 70 as well. As with measures of remission,
incremental differences in response were more modest for the JAK inhibitors and rituximab. For
example, the incremental percentage of patients achieving ACR20 response ranged from 21-27% for
the JAK inhibitors and rituximab, but averaged >30% for all other TIMs.
We also identified five studies of monotherapy, two of tocilizumab and three of etanercept; 81-85
both trials of tocilizumab and two of the three etanercept trials81,82 demonstrated substantial and
statistically-significantly greater percentages of patients achieving ACR response across all
thresholds.

©Institute for Clinical and Economic Review, 2017 Page 37 Evidence Report: Targeted Immune Modulators for Rheumatoid Arthritis Return to Table of Contents
A total of 17 RCTs evaluated radiographic progression using a variety of modifications of Sharp
score (Appendix C, Table C5). As noted previously, the use of multiple modifications and variations
makes even descriptive comparisons of incremental benefit problematic across studies. Fifteen of
these included TIM combination therapy versus conventional DMARDs alone, and statistically-
significantly reduced progression was demonstrated in the TIM arm for all except golimumab and
tofacitinib. Findings for etanercept were mixed; in a comparison with methotrexate monotherapy,
improvement in Sharp score was demonstrated for the etanercept combination arm versus a
worsening with methotrexate alone.86 No significant differences were observed between
etanercept-methotrexate therapy and triple conventional DMARD therapy in another study, but
this trial employed a non-inferiority design.77
An additional three monotherapy RCTs (two of etanercept and one of tocilizumab) showed
statistically-significantly reduced radiographic progression in the TIM arm relative to methotrexate
or other conventional DMARD therapy.
A total of 17 trials of combination TIM+conventional DMARD therapy evaluated the change from
baseline on the HAQ-DI in relation to previously-published minimum clinically-important differences
(i.e., changes from baseline of either 0.22 or 0.3). Statistically-significantly greater proportions of
patients achieved these thresholds in the TIM combination groups versus conventional DMARDs
alone for all agents except certolizumab pegol, etanercept, and tofacitinib, where we found no trials
that employed the thresholds in this manner.
In four trials examining TIM monotherapy, etanercept and tocilizumab achieved a statistically-
significantly greater mean improvement in HAQ-DI score relative to conventional DMARD therapy.81 84,85
About other outcomes, all TIMs showed superior improvements in pain, fatigue, and health-related
quality of life in comparison to conventional DMARDs (Appendix C). Trial-based data on work
productivity and healthcare resource use were more limited and findings were mixed.
TIM-Experienced Populations
Data from TIM-experienced populations were limited. Five of the 11 TIMs have been studied in
this setting, all as combination therapy versus conventional DMARDs alone. Abatacept,
baricitinib, rituximab, sarilumab, and tocilizumab all produced statistically- and clinically-
significant improvements in ACR response and HAQ improvement versus conventional DMARDs
alone.
RCT evidence was limited in patients with inadequate response to one or more TIMs. A total of six
studies were identified, all of combination therapy with conventional DMARDs versus conventional

©Institute for Clinical and Economic Review, 2017 Page 38 Evidence Report: Targeted Immune Modulators for Rheumatoid Arthritis Return to Table of Contents
DMARDs alone (see Appendix C, Table C1, C2 & C5). Two studies examined the clinical impact of
sarilumab combination therapy; one was a published RCT of 546 patients receiving one of two
doses of sarilumab or placebo with background conventional DMARDs, 88 and the other was a
conference paper describing a subgroup analysis of TIM-experienced patients (N=327) from a
similarly-designed RCT of nearly 1,200 individuals.89 In both analyses, sarilumab 150 and 200 mg
combination therapy produced statistically-significantly greater levels of ACR20/50/70 response at
24 weeks; improvements in disease activity and HAQ-DI were also observed.
Single RCTs were also available for combination therapy involving abatacept (iv form), baricitinib,
tocilizumab, and rituximab. In all studies, TIM combination therapy resulted in statistically- and
clinically-significant improvements in ACR response and HAQ-DI in comparison to conventional
DMARDs alone.90-93 Findings were more limited with regard to disease activity and radiographic
progression, but improvements in these measures as well as health-related quality of life were also
noted in individual studies.90,93 91,92
Head-to-Head Studies of TIMs
Head-to-head studies are described for each TIM in the sections that follow. All were conducted in
TIM-naïve or mixed populations only. Key results of these studies are summarized in Tables 4-7
beginning on page 52.
Rituximab
We did not identify any head-to-head studies comparing rituximab to any of the TIMs of interest.
Abatacept
Abatacept combination therapy was similar to adalimumab combination therapy and infliximab
combination therapy in rates of remission achieved, ACR response, and improvement in HAQ-DI
and other patient reported outcomes; there was no statistical difference between abatacept and
adalimumab in slowing radiographic progression.
We identified two head-to-head trials (AMPLE & ATTEST) comparing combination
abatacept+methotrexate with TNFα inhibitors infliximab and adalimumab combination therapy in
primarily TIM-naïve patients.23,94 We did not identify any head-to-head studies comparing
abatacept monotherapy to at TIM of interest.
Disease Activity and Remission
In the ATTEST trial, combination therapy of intravenous abatacept+methotrexate did not produce a
statistically significant difference in the proportion of patients achieving DAS28-ESR clinical

©Institute for Clinical and Economic Review, 2017 Page 39 Evidence Report: Targeted Immune Modulators for Rheumatoid Arthritis Return to Table of Contents
remission and low disease activity when compared with infliximab+methotrexate at week 24. At
week 52, although the proportion of patient on intravenous abatacept (plus methotrexate)
achieving low disease activity was higher compared with infliximab combination therapy (35.3%
versus 22.4%, estimate of difference (95% CI) =12.9 (2.1, 23.7)), patients achieving clinical remission
did not reach clinical significance. Subcutaneous abatacept+methotrexate was also similar to
adalimumab+methotrexate in proportion of patients achieving DAS28-ESR clinical remission and
low disease activity at week 52; differences in other measures of remission as well as mean changes
from baseline were also non-significant (see Table 4).23,94
ACR20/50/70
In the non-inferiority AMPLE trial, investigators did not detect discernible differences between
subcutaneous abatacept+methotrexate and adalimumab+methotrexate in the proportion of
patients achieving ACR20, 50, or 70 at year 1.94 Although ACR20 response was significantly higher
for intravenous abatacept (plus methotrexate) than infliximab combination therapy (72.4 vs 55.8%)
at year 1 of the ATTEST trial, ACR50 and 70 did not reach statistical significance.23
Radiographic Progression
Radiographic progression was reported in the AMPLE trial of subcutaneous
abatacept+methotrexate versus adalimumab+methotrexate.22 Both treatment arms experienced a
similar change in Sharp score at years 1 and 2; at year 2, for example, the mean change in Sharp
score was 1.1 in the abatacept group vs. 0.9 in the adalimumab group). Patients exhibited little
radiographic progression from the start of the study, with 84.8% and 88.6% showing no progression
at Year 1 in the abatacept and adalimumab groups, respectively (statistical significance not
reported) (see Table 6).
HAQ-DI
In the two head-to-head RCTs, abatacept+methotrexate arm did not differ from TNFα inhibitor
adalimumab+methotrexate arm (at 1 year) and TNFα inhibitor infliximab+methotrexate arm (at 6
months) in achieving an improvement greater or equal to the minimum clinically important
difference threshold of 0.3 in HAQ-DI.23,94 There was also no statistically significant difference
between the mean HAQ-DI change from baseline between abatacept+methotrexate and
adalimumab+methotrexate (see Table 7).94
Other Patient-Reported Outcomes
In the ATTEST trial of combination abatacept (intravenous) or infliximab therapy, slightly greater
improvements were observed with abatacept after one year of follow-up with the physical
component score (PCS) of the SF-36 (difference of 1.93; 95% CI 0.02 to 3.84) while both treatment
arms had similar changes in the mental component score (MCS).23

©Institute for Clinical and Economic Review, 2017 Page 40 Evidence Report: Targeted Immune Modulators for Rheumatoid Arthritis Return to Table of Contents
Relative to adalimumab combination therapy, abatacept plus methotrexate-treated patients
experienced similar improvements in both pain and fatigue.94
IL-6 Inhibitors: Tocilizumab
In one head-to-head trial, tocilizumab monotherapy (8 mg/kg) was found to be superior to
adalimumab monotherapy in rates of clinical remission achieved and ACR response across all
levels; tocilizumab did not differ from adalimumab in HAQ-DI improvement and most other
patient reported outcomes.
We identified one head-to-head trial that compared tocilizumab infusion monotherapy to TNFα
inhibitor adalimumab monotherapy in TIM-naïve patients.19 It should be noted, however, that this
trial employed a starting dose of 8 mg/kg for tocilizumab, rather than the FDA-approved starting
dose of 4 mg/kg. We did not identify any head-to-head combination studies.
Disease Activity and Remission
In the head-to-head that compared tocilizumab monotherapy to TNFα inhibitor adalimumab
monotherapy, tocilizumab was found to be superior to adalimumab in achieving low disease activity
at week 24 (51.5% vs. 19.8%, p<0.0001), as well as clinical remission (39.9% vs. 10.5%, p<.0001),
using the DAS28-ESR disease activity measure; differences in DAS28-ESR mean changes from
baseline were also significant (-3.3 vs. -1.8, p<0.0001). Similar findings were observed using CDAI
and SDAI disease activity measures.19
ACR20/50/70
Relative to adalimumab monotherapy, a significantly greater proportion of TIM-naïve patients
achieved ACR20, 50, and 70 with single agent intravenous tocilizumab in the ADACTA trial. The
proportion of patients achieving ACR20 was 65% with tocilizumab (vs. 49% with adalimumab;
p=0.0038); a similar relative difference was observed at the 50% and 70% response levels.19
Radiographic Progression
We did not identify any studies of tocilizumab in comparison to another TIM that reported on
radiographic progression.
HAQ-DI
There was no difference observed between tocilizumab monotherapy and adalimumab
monotherapy in the mean HAQ-DI change from baseline at 24 weeks.19
Other Patient-Reported Outcomes
Comparisons of tocilizumab to adalimumab monotherapy in the ADACTA trial revealed statistically
greater improvement in the mental component summary (MCS) score of the SF-36 at 24 weeks with

©Institute for Clinical and Economic Review, 2017 Page 41 Evidence Report: Targeted Immune Modulators for Rheumatoid Arthritis Return to Table of Contents
tocilizumab (7.9 vs. 5.0 for adalimumab; p=0.0497), but similar improvements in the PCS as well as
in measures of fatigue.19
IL-6 Inhibitors: Sarilumab
In one head-to-head trial, sarilumab monotherapy was shown to be superior to adalimumab
monotherapy in rates of clinical remission achieved, ACR response across all levels, and
improvement in HAQ-DI and other patient reported outcomes.
We identified one head-to-head trial that compared sarilumab monotherapy to adalimumab
monotherapy in TIM-naïve patients.18 We did not identify any combination therapy studies.
Disease Activity and Remission
Sarilumab monotherapy was found to be superior to TNFα inhibitor adalimumab monotherapy in
achieving low disease activity (42.9% vs. 14.1%, p<0.0001) and clinical remission (26.6% vs. 7%,
p<.0001) using the DAS28-ESR; differences in mean changes from baseline were also significantly
higher in the sarilumab group (-3.28 vs. -2.2, p<0.0001) Similar findings were observed in achieving
clinical remission using the CDAI disease activity measure.18
ACR20/50/70
Relative to adalimumab monotherapy, a significantly greater proportion of TIM-naïve patients
achieved ACR20, 50, and 70 with single agent sarilumab in the MONARCH trial. The proportion of
patients achieving ACR20 was 72% for sarilumab (vs. 58% for adalimumab; p=0.0074); a similar
relative difference was observed at the 50% and 70% response levels.18
Radiographic Progression
We did not identify any studies of sarilumab in comparison to another TIM that reported on
radiographic progression.
HAQ-DI
Compared to TNFα inhibitor adalimumab, the percentage of patients achieving an improvement
greater or equal to the minimum clinically important difference threshold of 0.22 and the more
stringent 0.3 in HAQ-DI, was statistically-significantly higher in the sarilumab group (0.22 threshold:
67.4% vs. 54.1%; 0.3 threshold: 62% vs. 47.6%, all p<0.01). Difference in mean change in HAQ-DI
from baseline was also significantly higher in the sarilumab group (-0.61 vs. -0.43, p=0.0037).18
Other Patient-Reported Outcomes
In the MONARCH trial, sarilumab-treated patients experienced a statistically greater improvement
in PCS at week 24 (8.7 vs. 6.1; p=0.0006) but a similar change in MCS score; improvements in
fatigue were also comparable.18

©Institute for Clinical and Economic Review, 2017 Page 42 Evidence Report: Targeted Immune Modulators for Rheumatoid Arthritis Return to Table of Contents
JAK Inhibitors: Tofacitinib
In one head-to-head trial, tofacitinib combination therapy was not statistically different from
adalimumab combination therapy in rates of remission achieved, ACR response, and improvement
in HAQ-DI after 6 months of follow-up.
We identified one head-to-head study that compared tofacitinib plus methotrexate with
adalimumab plus methotrexate conducted in a mostly TIM-naïve population.95
Disease Activity and Remission
There was no statistically significant difference observed in the proportion of patients achieving
DAS28-ESR clinical remission between combination therapy with tofacitinib plus methotrexate
versus adalimumab plus methotrexate.95
ACR20/50/70
Relative to adalimumab combination therapy, tofacitinib plus methotrexate showed statistical
differences only at the ACR70 level (20% achieved ACR70 with tofacitinib vs. 10% with adalimumab;
p≤0.01) at 24 weeks of follow-up.95
Radiographic Progression
We did not identify any studies of tofacitinib in comparison to another TIM that reported on
radiographic progression.
HAQ-DI
In the trial comparing tofacitinib combination therapy with TNFα inhibitor adalimumab combination
therapy, there was no statistically significant difference observed between the mean HAQ-DI
change from baseline at 24 weeks in the two groups.95
Other Patient-Reported Outcomes
After twelve weeks of follow-up, patients experienced comparable improvement in quality of life,
pain, and fatigue with combination tofacitinib or adalimumab therapy.96
JAK Inhibitors: Baricitinib
Baricitinib combination therapy was superior to combination therapy with adalimumab in ACR
response across all levels, as well as improvement in HAQ-DI and other patient reported
outcomes; there was no difference between baricitinib combination therapy and adalimumab
combination therapy in rates of clinical remission achieved.

©Institute for Clinical and Economic Review, 2017 Page 43 Evidence Report: Targeted Immune Modulators for Rheumatoid Arthritis Return to Table of Contents
We identified one head-to-head trial that compared baricitinib plus methotrexate to adalimumab
plus methotrexate in mostly TIM-naïve patients.21 We did not identify any studies comparing
baricitinib monotherapy to another TIM that met our inclusion criteria.
Disease Activity and Remission
In the one trial that compared combination therapy of baricitinib+methotrexate with
adalimumab+methotrexate, disease activity improved in both groups, but there was no statistical
difference observed in the proportion of patients achieving low disease activity and clinical
remission using DAS28-ESR and other measures of remission at week 24.21 At week 52, baricitinib
was statistically but modestly better than adalimumab in achieving low disease activity using
DAS28-CRP (56% vs. 48%, p<0.01), CDAI (57% vs. 49%, p<0.01) and SDAI (57% vs. 49%, p<0.01) but
not DAS28-ESR; differences in clinical remission, however, did not reach statistical significance for
all measures of disease activity.
ACR20/50/70
Relative to adalimumab combination therapy, a statistically significantly greater proportion of TIM-
naïve patients treated with baricitinib+methotrexate achieved ACR20/50/70 at Week 12 (p<0.05),
and ACR20 and 70 at Week 24; 74% achieved at least 20% improvement at Week 24 in the
baricitinib group versus 66% in the adalimumab group.21
Radiographic Progression
After 52 weeks of follow-up, radiographic progression did not statistically differ between
baricitinib+methotrexate and adalimumab+methotrexate (0.71 change in Sharp score with
baricitinib vs. 0.60 with adalimumab); approximately 90% of patients in both arms had no evidence
of progression (see Table 6).97
HAQ-DI
Compared with adalimumab combination therapy, the percentage of patients achieving an
improvement greater or equal to the minimum clinically important difference threshold of 0.22 in
HAQ-DI, was statistically-significantly higher in the baricitinib group (73% vs. 64%, p<0.05).21
Difference in mean change in HAQ-DI from baseline was also significantly higher in the baricitinib
group (-0.76 vs. -0.6, p<0.001).98
Other Patient-Reported Outcomes
Compared with adalimumab+methotrexate, baricitinib combination therapy had a statistically
greater improvement in pain (p≤0.01) , fatigue (p≤0.05) and PCS score of the SF-36 (p≤0.01) at 24
weeks, but had a similar level of improvement on the MCS.21,98

©Institute for Clinical and Economic Review, 2017 Page 44 Evidence Report: Targeted Immune Modulators for Rheumatoid Arthritis Return to Table of Contents
TNFα inhibitors: Adalimumab
Adalimumab monotherapy was inferior to monotherapy with tocilizumab and sarilumab in rates
of clinical remission achieved and ACR responses across all levels; adalimumab also resulted in
significantly less improvement in HAQ-DI compared with sarilumab.
Adalimumab combination therapy was inferior to baricitinib combination therapy in ACR
response across all levels, as well as on improvement in HAQ-DI, but the two were similar in rates
of clinical remission achieved.
In all other head-to-head trials of combination therapy, adalimumab was similar to abatacept,
etanercept, tofacitinib, and certolizumab in rates of remission achieved, ACR response across all
levels, and/or improvement in HAQ-DI; there was also no statistical difference between abatacept
and adalimumab in slowing radiographic progression.
We identified seven adalimumab head-to-head trials: two of the seven trials compared adalimumab
monotherapy to other TIMs monotherapy, and adalimumab combination therapy was compared to
combination therapy with other TIMs in five trials. All seven trials were conducted in TIM-naïve or
mostly TIM-naïve populations.18-21,66,94,95
Disease Activity and Remission
Six of the seven adalimumab head-to-head RCTs reported on clinical remission. Of the seven, four
compared adalimumab plus methotrexate to abatacept, tofacitinib, baricitinib, and certolizumab
combination therapy (i.e., plus conventional DMARD), while the remaining two trials compared
adalimumab monotherapy to sarilumab and tocilizumab monotherapy. In the two monotherapy
trials, adalimumab was found to be inferior to sarilumab and tocilizumab in achieving clinical
remission using DAS28-ESR: sarilumab (7% vs. 27% at 24 weeks, p≤0.0001); tocilizumab (10.5% vs.
39.9% at 24 weeks, p<0.0001).18,19 Results of other measures of remission, low disease activity and
mean changes in disease activity from baseline were consistent with the result of the DAS28-ESR
clinical remission (see Table 4).
Among the combination therapy trials, adalimumab did not differ from abatacept, tofacitinib,
baricitinib and certolizumab pegol in achieving clinical remission.21,66,94,95 Results of other measures
of remission, and mean changes in disease activity from baseline were consistent with the result of
the DAS28-ESR clinical remission (see Table 4).
In the seventh trial comparing adalimumab with etanercept,20 only the mean changes from baseline
were reported; adalimumab had a similar level of change from baseline compared with etanercept
(see Table 4).

©Institute for Clinical and Economic Review, 2017 Page 45 Evidence Report: Targeted Immune Modulators for Rheumatoid Arthritis Return to Table of Contents
ACR20/50/70
Five head-to-head RCTs of TIMs reported ACR response using adalimumab as a comparator (see
Table 5). In the two trials that evaluated TIM monotherapy, adalimumab was inferior to sarilumab
and intravenous tocilizumab across all levels of ACR response.18,19 The proportion of patients
achieving ACR20, for example, was 58% for adalimumab in the MONARCH trial (vs. 72% for
sarilumab; p=0.0074), and 49% in the ADACTA trial (vs. 65% with tocilizumab; p=0.0038). Similarly,
the RA-BEAM trial of adalimumab plus methotrexate versus baricitinib plus methotrexate reported
a statistically significantly lower proportion of patients who achieved ACR20/50/70 at Week 12 with
adalimumab (p<0.05), and ACR20 and 70 at Week 24: 66% of patients achieved at least 20%
improvement at Week 24 in the adalimumab group versus 74% in the baricitinib group.21
Two additional trials compared adalimumab+methotrexate to either abatacept or tofacitinib
combination therapy; neither trial detected discernible differences between TIMs in the proportion
of patients achieving ACR20 and ACR50 at month 6, although a significantly smaller proportion of
patients achieved ACR70 with adalimumab in the tofacitinib study (10% vs. 20%; p≤0.01).94,95
Relative to other TNFα inhibitors, adalimumab showed comparable efficacy. In the head-to-head
EXXELERATE trial of adalimumab+methotrexate versus certolizumab pegol+methotrexate, patients
in both groups achieved comparable levels of response during 104 weeks of follow-up.66 Our
review identified two observational studies that reported on ACR response.99,100 In one study from
the CORRONA registry, significant differences were not demonstrated between the three TIMs that
were evaluated (adalimumab, etanercept, or infliximab) for any level of response.99 Another
observational study of the same TIMs used data from the Danish DANBIO registry and found no
differences between adalimumab and etanercept in ACR70 response but found adalimumab to be
superior to infliximab (adjusted OR for adalimumab 2.05; 95% 1.52 to 2.76).100
Radiographic Progression
Two head-to-head studies reported on radiographic progression.22 The AMPLE trial was a two-year,
phase IIIb RCT in TIM-naïve patients who were randomized to receive either
adalimumab+methotrexate or subcutaneous abatacept+methotrexate. At Years 1 and 2, similar
Sharp scores were reported in both treatment arms (e.g., at year 2, the mean change in Sharp score
was 0.9 in the adalimumab group vs. 1.1 in the abatacept group). Patients exhibited little
radiographic progression from the start of the study, with 88.6% and 84.8% showing no progression
at Year 1 in the adalimumab and abatacept groups, respectively (statistical significance not
reported) (see Table 6).
In the RA-BEAM trial of adalimumab and baricitinib combination therapy, radiographic progression
did not statistically differ between adalimumab+methotrexate and baricitinib+methotrexate after
52 weeks of follow-up (0.60 change in Sharp score with adalimumab versus 0.71 with baricitinib);
approximately 90% of patients in both arms had no progression.97

©Institute for Clinical and Economic Review, 2017 Page 46 Evidence Report: Targeted Immune Modulators for Rheumatoid Arthritis Return to Table of Contents
HAQ-DI
Six of the identified adalimumab head-to-head RCTs reported on HAQ-DI. Of the six, two compared
adalimumab monotherapy to sarilumab and tocilizumab monotherapy, while the remaining four
compared adalimumab+methotrexate to abatacept, baricitinib, tofacitinib and certolizumab
combination therapy (i.e. plus conventional DMARD).
In the monotherapy trials, adalimumab was observed to be similar to tocilizumab in HAQ-DI
improvement,19 but inferior to sarilumab in HAQ-DI improvement (47.6% vs. 62% for MCID of 0.3,
p<0.01; mean change from baseline: -0.43 vs. -0.61, p=0.0037).18
Among the four trials that compared adalimumab plus methotrexate with combination TIM
therapies, adalimumab was found to be inferior to baricitinib in HAQ-DI improvement (percentage
of patient achieving an improvement greater or equal to MCID threshold of 0.22 in HAQ-DI was 64%
vs. 73%, p<0.05),21 while adalimumab was found to be similar to abatacept, tofacitinib and
certolizumab in HAQ-DI improvement.66,94,95
Other Patient-Reported Outcomes
In the MONARCH trial, adalimumab-treated patients experienced less improvement in PCS at week
24 than patients treated with sarilumab monotherapy (6.1 vs. 8.7; p=0.0006) but a similar change in
MCS and fatigue.18
In comparison to tocilizumab monotherapy, treatment with single-agent adalimumab led to less
improvement in MCS at 24 weeks (5.0 vs. 7.9; p=0.0497) but similar improvements in PCS and
fatigue.19
Relative to tofacitinib plus methotrexate, adalimumab-treated patients experienced similar
improvements in quality of life, pain, and fatigue at month 3.96
In the RA-BEAM trial, patients treated with adalimumab+methotrexate had less improvement in
pain, fatigue and PCS at 24 weeks (p≤0.05) versus baricitinib+methotrexate, but a similar change in
MCS.21,98
Comparable improvements in quality of life were observed among patients in the adalimumab and
etanercept arms of the RED-SEA trial using the EuroQol-5 domain health state profile (EQ-5D).20
TNFα inhibitors: Certolizumab Pegol
Evidence from one head-to-head trial of certolizumab pegol plus methotrexate versus
adalimumab plus methotrexate found no differences between agents in disease activity, ACR
response, or HAQ-DI.

©Institute for Clinical and Economic Review, 2017 Page 47 Evidence Report: Targeted Immune Modulators for Rheumatoid Arthritis Return to Table of Contents
We identified one trial that directly compared combination therapy of TNFα inhibitor certolizumab
pegol plus methotrexate with another TNFα inhibitor adalimumab plus methotrexate in TIM-naive
patients.66 We did not identify any monotherapy studies.
Disease Activity and Remission
In the single head-to-head trial comparing certolizumab combination therapy with adalimumab
combination therapy, there was no statistical differences observed in the proportion of patients
achieving low disease activity and clinical remission using the DAS28-ESR measure and other
measures of disease activity.66 There was no report of mean change from baseline.
ACR20/50/70
Evidence from the EXXELERATE trial showed no discernible differences between certolizumab pegol
and adalimumab (both in combination with methotrexate) across all levels of response during 104
weeks of follow-up.66
Radiographic Progression
We did not identify any studies of certolizumab pegol in comparison to another TIM that reported
on radiographic progression.
HAQ-DI
Compared with adalimumab combination therapy, certolizumab did not show statistically
significant differences in the mean HAQ-DI change from baseline to week 104 in the two groups
(see Table 7).
Other Patient-Reported Outcomes
We did not identify any studies of certolizumab pegol in comparison to another TIM that reported
on health-related quality of life, pain, or fatigue.
TNFα inhibitors: Etanercept
One head-to-head trial of etanercept and adalimumab (primarily in combination with
concomitant conventional DMARDs) reported similar changes in disease activity and quality of
life; observational data suggest no difference in remission or ACR response between etanercept
and adalimumab.
We identified one head-to-head trial that compared etanercept with adalimumab added to existing
conventional DMARD therapy in TIM-naïve patients.20 In addition, we identified three observational
studies that compared the three TNFα inhibitors adalimumab, infliximab and etanercept.99-101

©Institute for Clinical and Economic Review, 2017 Page 48 Evidence Report: Targeted Immune Modulators for Rheumatoid Arthritis Return to Table of Contents
Disease Activity and Remission
In the one trial that directly compared etanercept with adalimumab primarily in combination with
existing conventional DMARDs in TIM-naive patients, the rates of clinical remission and low disease
activity were not reported. The mean change from baseline in disease activity (based on DAS28-
CRP) showed a similar level of change between adalimumab and etanercept at week 24.20
In addition to the RCT, we reviewed three observational studies for disease activity. In the first
observational study based on data from the CORRONA registry in the US, no statistically significant
difference was found in rates of clinical remission among the three TNFα inhibitors evaluated
(infliximab, adalimumab and etanercept).99 The second study, based on the Hellenic Registry of
Biologic Therapies in Greece, found no statistically-significant difference in remission between the
three agents using the DAS28-ESR definition, but found adalimumab to be superior to both
infliximab and etanercept based on CDAI and SDAI defined remission (15% vs. 8% vs. 7%, p=0.022
using CDAI; and 17% vs. 8% vs. 8% using SDAI, p=0.009).101 The third study, based on the DANBIO
registry in Denmark, did not find a significant difference between etanercept and adalimumab.100
ACR20/50/70
We identified head-to-head evidence of ACR response for etanercept in two observational
studies.99,100 In one study from the CORRONA registry, significant differences were not
demonstrated between adalimumab, etanercept, or infliximab for any level of response.99 Another
observational study of the same TIMs used data from the Danish DANBIO registry and found no
differences between adalimumab and etanercept in ACR70 response but found etanercept to be
superior to infliximab (adjusted OR 1.78; 95% CI 1.28-2.50).100
Radiographic Progression
We did not identify any studies of etanercept in comparison to another TIM that reported on
radiographic progression.
HAQ-DI
We did not identify any head-to-head studies of etanercept that reported on HAQ-DI.
Other Patient-Reported Outcomes
Comparable improvements in quality of life were observed among patients in the adalimumab and
etanercept arms of the RED-SEA trial using the EuroQol-5 domain health state profile (EQ-5D).20
TNFα inhibitors: Golimumab
We did not identify any head-to-head studies comparing golimumab to another TIM of interest.

©Institute for Clinical and Economic Review, 2017 Page 49 Evidence Report: Targeted Immune Modulators for Rheumatoid Arthritis Return to Table of Contents
TNFα inhibitors: Infliximab
Similar improvements in disease activity, ACR response, and HAQ-DI were observed with both
infliximab and abatacept combination therapy.
We identified one head-to-head trial in TIM-naïve populations comparing infliximab plus
methotrexate with abatacept plus methotrexate.23 We did not identify any monotherapy studies.
In addition, we identified three observational studies that compared three TNFα inhibitors:
adalimumab, infliximab and etanercept.99-101
Disease Activity and Remission
In the one head-to-head trial that compared combination therapy with infliximab plus
methotrexate with abatacept plus methotrexate,23 disease activity improved in both groups, but
there was no statistical difference observed in the proportion of patients achieving DAS28-ESR low
disease activity and clinical remission at week 24.23 At week 52, the proportion of patient achieving
low disease activity was lower with infliximab combination therapy compared with abatacept
combination therapy (22.4% vs. 35.3%, estimate of difference (95% CI) =12.9 (2.1, 23.7)) while there
was no statistical significant difference in patients achieving clinical remission.
In addition to the RCT, we evaluated three observational studies for disease activity. In the first
observational study based on data from the CORRONA registry in the US, no statistically significant
difference was found in the rates of clinical remission among the three TNFα inhibitors evaluated
(infliximab, adalimumab and etanercept).99 The second study, based on the Hellenic Registry of
Biologic Therapies in Greece, found no statistically-significant difference between the rates of
remission of the three agents using the DAS28-ESR definition, but found adalimumab to be superior
to both infliximab and etanercept based on CDAI and SDAI defined remission(15% vs. 8% vs. 7%,
p=0.022 using CDAI; and 17% vs. 8% vs. 8% using SDAI, p=0.009).101 The third study, based on the
DANBIO registry in Denmark, also found adalimumab to be superior to infliximab based on DAS28-
CRP clinical remission (39% vs. 27%; OR=1.78 (95%CI=1.32-2.55).100
ACR20/50/70
A smaller proportion of patients achieved ACR20 at year 1 of the ATTEST trial with infliximab
combination therapy versus abatacept (56% vs 72%; p≤0.05); statistical differences were not
detected at the ACR50 and 70 levels, however.23
Our review also identified two observational studies that reported on ACR response.99,100 In one
study from the CORRONA registry, significant differences were not demonstrated between the
three TIMs that were evaluated (adalimumab, etanercept, or infliximab) for any level of response.99
Another observational study of the same TIMs used data from the Danish DANBIO registry and

©Institute for Clinical and Economic Review, 2017 Page 50 Evidence Report: Targeted Immune Modulators for Rheumatoid Arthritis Return to Table of Contents
found both adalimumab and etanercept to be superior to infliximab in ACR70 response (adjusted
OR for adalimumab 2.05; 95% 1.52 to 2.76; adjusted OR for etanercept 1.78; 95% CI 1.28-2.50).100
Radiographic Progression
We did not identify any studies of infliximab in comparison to another TIM that reported on
radiographic progression.
HAQ-DI
In the one trial that compared combination therapy of infliximab plus methotrexate with abatacept
plus methotrexate, there was no statistically significant difference observed between treatment
arms in the mean HAQ-DI change from baseline to 24 weeks (see Table 7).
Other Patient-Reported Outcomes
In comparison to intravenous abatacept+methotrexate, patients treated with infliximab therapy
had slightly less improvement in the PCS (difference of 1.93; 95% CI 0.02 to 3.84) after one year of
follow-up but similar changes in the MCS.23

©Institute for Clinical and Economic Review, 2017 Page 51 Evidence Report: Targeted Immune Modulators for Rheumatoid Arthritis Return to Table of Contents
Table 4. Disease Activity Outcomes Across Head-To-Head Trials
†statistical significance not reported; ***p <0.001; **p<0.01; *p<0.05
Treatment N DAS28-ESR
or CRP
DAS28
change from
baseline
(mean)
DAS28 low
disease
activity (%)
DAS28
remission
(%)
CDAI
remission
(%)
SDAI
remission
(%)
ATTEST trial at 24 weeks23
Abatacept (iv) + MTX 156 DAS28-ESR -2.53† 20.7 11.3 NR NR
Infliximab + MTX 165 DAS28-ESR -2.25† 25.6 12.8 NR NR
AMPLE trial at 52 weeks94
Abatacept (sc) + MTX 318 DAS28-CRP -2.3 59.3 43.3 23.5 23.3
Adalimumab + MTX 328 DAS28-CRP -2.27 61.4 41.9 24 24.8
ADACTA trial at 24 weeks19
Tocilizumab monotherapy 162 DAS28-ESR -3.3*** 51.5*** 39.9*** 17.2* 18.4**
Adalimumab monotherapy 163 DAS28-ESR -1.8 19.8 10.5 9.3 8
MONARCH trial at 24 weeks18
Sarilumab monotherapy 184 DAS28-ESR -3.28*** 42.9*** 26.6*** 7.1* NR
Adalimumab monotherapy 185 DAS28-ESR -2.2 14.1 7 2.7 NR
ORAL Standard trial at 24 weeks95
Tofacitinib + MTX 204 DAS28-ESR NR NR 6.2 NR NR
Adalimumab + MTX 204 DAS28-ESR NR NR 6.7 NR NR
RA-BEAM at 24 weeks21
Baricitinib + MTX 487 DAS28-ESR
& CRP
NR 32-ESR; 52-
CRP
18-ESR; 35-
CRP
16 16
Adalimumab + MTX 330 DAS28-ESR
& CRP
NR 34-ESR;48-
CRP
18-ESR; 32-
CRP
12 14
EXXELERATE at 24 weeks66
Certolizumab + MTX 353 DAS28-ESR NR 51.8 32.9 24.9 NR
Adalimumab + MTX 361 DAS28-ESR NR 46 29.4 22.2 NR
RED SEAⱡ at 24 weeks20
Etanercept +cDMARD 60 DAS28-CRP -1.76 NR NR NR NR
Adalimumab +cDMARD 60 DAS28-CRP -1.44 NR NR NR NR

©Institute for Clinical and Economic Review, 2017 Page 52 Evidence Report: Targeted Immune Modulators for Rheumatoid Arthritis Return to Table of Contents
Table 5. ACR20/50/70 Outcomes Across Head-To-Head Trials
Study arm N ACR20, % ACR50, % ACR70, %
MONARCH18 at 24 weeks
Adalimumab monotherapy 185 58.4 29.7 11.9
Sarilumab monotherapy 184 71.7* 45.7* 23.4*
ADACTA19 at 24 weeks
Adalimumab monotherapy 163 49.4 27.8 17.9
Tocilizumab (iv) monotherapy 162 65* 47.2* 32.5*
RA-BEAM21 at 12/24 weeks
Adalimumab + methotrexate 330 61/66 35/46 13/22
Baricitinib + methotrexate 487 70**/74** 45*/50 19**/30**
ORAL Standard95 at 24 weeks
Adalimumab + methotrexate 204 47.2 29.1 10.1
Tofacitinib + methotrexate 204 51.5 36.2 19.9*
AMPLE94 at 1 year
Adalimumab + methotrexate 328 63.4 46.0 26.2
Abatacept (sc) + methotrexate 318 64.8 46.2 29.2
EXXELERATE66 at 104 weeks
Adalimumab + methotrexate 454 67% 57% 41%
Certolizumab pegol + methotrexate 454 65% 53% 40%
ATTEST23 at 1 year
Abatacept (iv) + methotrexate 156 72.4 45.5 26.3
Infliximab + methotrexate 156 55.8** 36.4 20.6
†statistical significance not reported; ***p<0.001; **p<0.01; *p<0.05
Table 6. Radiographic Progression Outcomes Across Head-To-Head Trials
Study arm Mean change in mTSS
from baseline (SD)
Time of
evaluation
(weeks)
Significance
% Non-
progression at
Year 1α
AMPLE22,94
ADA+cDMARD (n=289) 0.4 (5.0)
0.9 (4.1) 52
104 p=NR
88.6
ABTsc+cDMARD (n=290) 0.6 (3.2)
1.1 (8.7) 84.8
RA-BEAM97
ADA+cDMARD (n=330) 0.33 (NR)
0.60 (NR) 24
52
p≤0.05 at week 24
p=NS at week 52
90.1
BAR+cDMARD (n=487) 0.41 (NR)
0.71 (NR) 89.4
α change from baseline in total score ≤ smallest detectable change using cut-off of 2.8 for AMPLE and 1.47 for RA-
BEAM; van der Heijde modified Sharp score; NR=not reported; NS=not significant

©Institute for Clinical and Economic Review, 2017 Page 53 Evidence Report: Targeted Immune Modulators for Rheumatoid Arthritis Return to Table of Contents
Table 7. HAQ-DI Outcomes Across Head to Head Trial
†statistical significance not reported; ***p <0.001; **p<0.01; *p<0.05
Network Meta-Analysis Findings
We employed a random-effects approach to evaluating ACR responses. We assessed information
separately for TIM naïve/mixed populations and TIM-experienced populations. Further details on
our methods, including data input tables, network diagrams, and league tables of results, can be
found in Appendix C. Our approach included both direct and indirect evidence in our calculations.
Also, as described further in Appendix C, the model adjusted for control arm response produced
similar model-fit statistics to the unadjusted model, suggesting limited or no effect modification.
Results presented below are therefore from the unadjusted model.
Treatment N HAQ-DI mean change from baseline:
% change ≥ predefined threshold
Predefined MCID threshold
ATTEST trial at 24 weeks23
Abatacept + MTX 156 NR 61.5 0.3
Infliximab + MTX 165 NR 58.8 0.3
ADACTA trial at 24 weeks19
Tocilizumab monotherapy
162 -0.7 NR --
Adalimumab monotherapy
163 -0.5 NR --
MONARCH trial at 24 weeks18
Sarilumab monotherapy 184 -0.61*** 62** 0.3
Adalimumab monotherapy
185 -0.43 47.6 0.3
ORAL Standard trial at 24 weeks95
Tofacitinib + MTX 204 -0.55 NR --
Adalimumab + MTX 204 -0.49 NR --
RA-BEAM at 24 weeks21,98
Baricitinib + MTX 487 -0.76*** 73* 0.22
Adalimumab + MTX 330 -0.6 64 0.22
EXXELERATE at 104 weeks66
Certolizumab + MTX 353 -0.62 NR NR
Adalimumab + MTX 361 -0.72 NR NR

©Institute for Clinical and Economic Review, 2017 Page 54 Evidence Report: Targeted Immune Modulators for Rheumatoid Arthritis Return to Table of Contents
TIM-Naïve/Mixed Populations
A forest plot of the results for ACR20 response for combination therapy and monotherapy regimens
in TIM-naïve/mixed populations can be found in Figures 6 and 7 respectively. The pattern of
findings was similar to that observed in the individual studies. All TIMs were between two and
three times more likely to achieve ACR20 or better response when used in combination with
conventional DMARDs in comparison to conventional DMARDs alone (Figure 6). However, there
were wide and overlapping estimates of the credible intervals around the estimates for each TIM
combination; as a result, none of the comparisons between TIMs differed statistically.
For example, TIMs that had shown superiority to adalimumab on a head-to-head basis generally
generated a greater likelihood of achieving ACR response, while these measures were similar for
drugs that had comparable results in head-to-head comparisons with adalimumab. It should be
noted, however, that there were wide and overlapping 95% credible intervals (the Bayesian
equivalent of confidence intervals) around all estimates. As a result, comparisons between nearly
all of the TIM combination therapy regimens yielded showed no statistical differences, as the
likelihood of ACR20 response included 1.0 (no difference) in the credible interval (see Appendix C,
Figures C2-C4). The only exceptions were certolizumab pegol in comparison to adalimumab and
tofacitinib, and etanercept in comparison to combination conventional DMARDs. However, the
lower end of the credible interval was also very close to 1.0 in these comparisons.
In monotherapy comparisons between TIMs, tocilizumab, etanercept, and sarilumab all produced
significantly greater likelihoods of achieving ACR response in comparison to conventional DMARDs
alone. However, tocilizumab and sarilumab also produced significantly greater likelihoods of
achieving ACR20 or better response than adalimumab, echoing the findings of head-to-head trials
(Appendix C, Figures C6-C8).

©Institute for Clinical and Economic Review, 2017 Page 55 Evidence Report: Targeted Immune Modulators for Rheumatoid Arthritis Return to Table of Contents
Figure 6. Relative Risk (Likelihood) of Patients Achieving ACR20 or Better with Combination Therapy Versus Conventional DMARDs
Alone, TIM-Naïve/Mixed Population
Treatment
CTZ + cDMARD 2.6 (1.82,4.15)
ETN + cDMARD 2.56 (1.59,4.56)
TCZiv + cDMARD 2.28 (1.64,3.5)
SAR + cDMARD 2.17 (1.36,3.67)
GOLsc + cDMARD 2.16 (1.54,3.33)
ABTiv + cDMARD 2.15 (1.59,3.21)
BAR + cDMARD 2.11 (1.29,3.6)
GOLiv + cDMARD 2.12 (1.5,3.27)
TCZsc + cDMARD 2.08 (1.28,3.52)
ABTsc + cDMARD 2.08 (1.23,3.57)
IFX + cDMARD 2.04 (1.48,3.07)
ADA + cDMARD 2.02 (1.54,2.9)
TOF + cDMARD 1.95 (1.45,2.85)
RTX + cDMARD 1.9 (1.27,2.99)
Int cDMARD 1.83 (0.82,3.47)
0 1 2 3 4 5
Relative Risk (CrI)

©Institute for Clinical and Economic Review, 2017 Page 56 Evidence Report: Targeted Immune Modulators for Rheumatoid Arthritis Return to Table of Contents
Figure 7. Relative Risk (Likelihood) of Patients Achieving ACR20 or Better with Monotherapy
Versus Conventional DMARDs Alone, TIM-Naïve/Mixed Population
The NMA model was also used to generate mutually-exclusive proportions of individuals with
different levels of ACR response, primarily as an input to the cost-effectiveness model. As shown in
Tables 8 and 9, which are ordered from lowest rate of non-response (ACR <20) to highest, rankings
were similar regardless of level of ACR response. However, as noted above, any differences
between TIMs should be interpreted with caution.
Treatment
TCZ 2.46 (1.88,3.42)
ETN 2.37 (1.76,3.45)
SAR 2.33 (1.74,3.34)
ADA 1.87 (1.43,2.57)
0 1 2 3 4
Relative Risk (CrI)

©Institute for Clinical and Economic Review, 2017 Page 57 Evidence Report: Targeted Immune Modulators for Rheumatoid Arthritis Return to Table of Contents
Table 8. Network Meta-Analysis Derived Proportions of Patients in Each ACR Response Category,
by Targeted Immune Modulator Combination Regimen: Mixed Population
Treatment ACR <20 ACR 20-50 ACR 50-70 ACR 70-100
Etanercept + cDMARD 29% 23% 21% 27% Certolizumab pegol + cDMARD 29% 23% 21% 26% Tocilizumab (iv) + cDMARD 38% 23% 19% 19% Sarilumab + cDMARD 40% 23% 19% 18% Golimumab (sc) + cDMARD 41% 23% 18% 17% Abatacept (iv) + cDMARD 42% 23% 18% 17% Golimumab (iv) + cDMARD 42% 23% 18% 17% Baricitinib + cDMARD 42% 23% 18% 16% Tocilizumab (sc) + cDMARD 43% 23% 18% 16% Abatacept (sc) + cDMARD 43% 23% 18% 16% Infliximab + cDMARD 45% 23% 17% 15% Adalimumab + cDMARD 45% 23% 17% 15% Tofacitinib + cDMARD 47% 23% 17% 14% Rituximab + cDMARD 48% 23% 16% 13% Intensive cDMARD* 50% 23% 16% 12%
Conventional DMARD 73% 16% 8% 4%
*combination therapy with 2-3 conventional DMARDs
Table 9. Network Meta-Analysis Derived Proportions of Patients in Each ACR Response Category,
by Targeted Immune Modulator Monotherapy Regimen: Mixed Population
Treatment ACR <20 ACR 20-50 ACR 50-70 ACR 70-100
Tocilizumab (iv) 25% 24% 21% 30%
Etanercept 27% 24% 20% 28%
Sarilumab 28% 25% 20% 27%
Adalimumab 43% 25% 16% 16%
Conventional DMARD 70% 18% 8% 4%
TIM-Experienced Populations
Data were available for only five regimens for TIM-experienced patients, all involving combination
therapy with conventional DMARDs. While point estimates differed, findings were similar – all were
statistically superior to conventional DMARDs alone, and most comparisons between TIMs
suggested no statistical differences (see Appendix C, Figure C14-C16).

©Institute for Clinical and Economic Review, 2017 Page 58 Evidence Report: Targeted Immune Modulators for Rheumatoid Arthritis Return to Table of Contents
Table 10. Network Meta-Analysis Derived Proportions of Patients in each ACR Response
Category, by Targeted Immune Modulator Regimen: TIM-Experienced Population
Treatment ACR <20 ACR 20-50 ACR 50-70 ACR 70-100
Tocilizumab (iv) + cDMARD 38% 24% 19% 19%
Rituximab + cDMARD 42% 24% 18% 17%
Abatacept (iv) + cDMARD 46% 23% 17% 14%
Sarilumab + cDMARD 52% 22% 15% 11%
Baricitinib + cDMARD 56% 21% 13% 9%
Conventional DMARD 77% 14% 6% 3%
Radiographic Progression
Standardized mean differences (SMD) were used in analyses of Sharp score to control for variation
in scoring methods used; findings for the TIM-naïve/mixed population are presented in league table
format in Appendix C, Figure C18. Both monotherapy regimens with data available (tocilizumab and
etanercept) produced significant improvements in Sharp score relative to conventional DMARDs, as
denoted by credible intervals that did not cross zero. These two TIMS did not differ when indirectly
compared, however. Among combination regimens, all produced significant relative improvements
versus conventional DMARDs except for tofacitinib, subcutaneous golimumab, and certolizumab
pegol, which had credible intervals that included zero.
Data were insufficient to analyze Sharp score changes based on studies conducted in TIM-
experienced populations.
Harms
Rates of short term serious adverse events (within six months) were generally comparable across
all treatments, including TIMs and conventional DMARD therapy. Infections (e.g. upper
respiratory tract infection, bronchitis, nasopharyngitis), injection site reactions, and infusion
related reactions were the most common adverse events during treatment. Based on long term
(one year or more) trial data, etanercept, golimumab, infliximab, tocilizumab and abatacept
showed comparable overall safety profiles, although the serious infection rate appears to be
higher with infliximab.
Data on adverse events, discontinuations due to adverse events, as well as specific adverse events
of interest observed in clinical trials with conventional DMARD controls are presented as weighted
averages (i.e., according to total sample size across trials) in Table 11. Of note, these represent
events as recorded before treatment-arm crossover was permitted. Most adverse events were of
mild to moderate severity. The most frequently reported adverse events were mild infections

©Institute for Clinical and Economic Review, 2017 Page 59 Evidence Report: Targeted Immune Modulators for Rheumatoid Arthritis Return to Table of Contents
(upper respiratory tract infection, bronchitis, nasopharyngitis), injection site reactions and infusion
related reactions. The overall incidence of serious infections, deaths, and all serious adverse events
were comparable between treatments, including conventional DMARD therapy. As noted in the
table, however, adverse-event rates for tofacitinib were calculated over a 12-week pre-crossover
period, versus 24-28 weeks for the other TIMs.
The rates of serious infection, serious adverse events and discontinuation due to adverse events
were generally comparable in the head-to-head trials comparing sarilumab, tocilizumab,
etanercept, and baricitinib with adalimumab18-21 (see Appendix C, Table C18). In the AMPLE trial,
however, abatacept had a lower rate of discontinuation due to adverse events at year 2 compared
with adalimumab (9.5% vs. 3.8%, estimate of difference: −5.7 [95% CI −9.5 to −1.9).22 In a separate
trial comparing infliximab with abatacept, the incidence of serious adverse events and
discontinuation due to AEs were numerically lower with abatacept compared with infliximab (SAEs:
9.6 vs 18.2%; discontinuations due to AEs: 3.2 vs 7.3%, respectively), although statistical significance
was not tested.23 There was no evidence of material differences in the rates of malignancies or
death between treatment groups across trials.
Results of adverse events reported from longer term trials (i.e., 1 year or more) are presented in
Table 11. Results are presented as rates per 100 patient-years exposure to intervention of interest.
Etanercept, golimumab, tocilizumab, abatacept and infliximab had comparable safety profiles in
these trials, although the rate of infection and serious infection in infliximab appears to be generally
higher than the other TIMs.
Observational study
In a prospective cohort study analyzing data from the Dutch rheumatoid arthritis monitoring
(DREAM) registry, patients with RA who have had prior treatment with at least two conventional
DMARDs including methotrexate, starting their first TNF inhibitor (adalimumab, infliximab or
etanercept), were followed for up to 5 years.102
The unadjusted incidence rate of a first serious infection per 100 patient-years was 2.61 (95% CI
2.21 to 3.00) for adalimumab, 3.86 (95% CI 3.33 to 4.40) for infliximab and 1.66 (95% CI 1.09 to
2.23) for etanercept. Age, year of starting anti-TNF therapy, comorbidities at baseline, and DAS28
score over time were included as confounders. No difference in risk for serious infections was
found between adalimumab and infliximab (adjusted HR: 0.90 (95% CI 0.55 to 1.48)), but the risk of
serious infections was significantly lower for etanercept than both infliximab (adjusted HR=0.49
(95% CI 0.29 to 0.83)) and adalimumab (adjusted HR=0.55 (95% CI 0.44 to 0.67).102

©Institute for Clinical and Economic Review, 2017 Page 60 Evidence Report: Targeted Immune Modulators for Rheumatoid Arthritis Return to Table of Contents
Table 11. Adverse Events During the Conventional DMARD Controlled Period
Estimate (%) Targeted immune modulators plus conventional DMARD Conventional
DMARD + Placebo RTX ABT TCZ SAR TOF† BAR ADA CTZ ETN GOL IFX
Total (N)1 170 217 1,819 184 454 943 780 299 446 704 594 4,683
Any AE 76 79.7 70.7 65.2 50.2 72.1 77.3 74 68.7 54 73.5 64.5
Serious AEs 9 6 6.8 5.4 3.1 5.8 4.2 7.9 3.6 4.2 8.9 5.5
D/C due to AEs 2 0.9 5 9.2 4.3 2.5 2.9 4.8 3.1 3.6 4.8 2.7
Any infection 36 32.8 37.4 30.4 NR 38.2 41.9 30 43.7 44.1 14 29.5
Serious infection 1 1.3 2.9 1.6 NR 1.8 0.9 1.8 1.8 1 2.5 1.5
TB 0 0 0 0 NR 0 0.5 0 0 NR 0 0
Injection site reaction NR 10.1 8.2 N/A N/A 16.4 2.5 20.8 3.7 N/A 5
Infusion related reaction 25 5.1 NR N/A N/A N/A N/A N/A N/A 3.3 6.2 4.9
Malignancy 0.5 0.6 0.9 NR NR 0.5 0.3 0 0 0.3 0.8 0.4
Death NR 0 0.4 0 0.6 0.3 0.2 0 0.5 0 0 0.2
Note: Serious AEs include specific listed events (e.g., serious infection, malignancy) as well as other events deemed life-threatening or requiring hospitalization by study investigators * Values are weighted averages of the percentage of patients with event across key trials; color scheme identifies drugs of the same class. 1-Maximum contributing to the weighted average.; not every study contributes to all adverse events therefore, N contributing may be less in some AEs. †Assessment period was between week 24 and 28 for all studies except for TOF that was at week 12
Table 12. Long Term Adverse Events
Abatacept23 Abatacept103 Tocilizumab104 Etanercept105 Golimumab106 Infliximab23
Length of follow up (Yrs) 1 2 5 2 2 1
Total AEs 326 257 248 170 57 449
Serious AEs 11.8 15.2 11.7 7 10.5 21.1
D/C due to AEs NR NR NR NR 4.48 NR
Total infection 99.8 86.2 NR 59 41.9 134
Serious infection 2 1.6 3.4 2 2.24 9.2
TB NR NR NR 0 NR NR
Malignancy 0.7 0.4 1 1 1.9 1.3
Death 0.7 0.7 0.5 NR 0 1.3

©Institute for Clinical and Economic Review, 2017 Page 61 Evidence Report: Targeted Immune Modulators for Rheumatoid Arthritis Return to Table of Contents
Dose Modifications
While not a focus of our systematic review per se, we also examined the available evidence for
studies documenting modifications to initial dosing and/or assessments of specific dosing
strategies. As described in the Topic in Context section, dose intensification may have major cost
consequences, particularly to the patient, and dose-tapering strategies have been employed partly
to help mitigate these concerns. The impact of these changes on clinical effectiveness is a subject
of much debate, however. Findings from recent studies suggest that dose escalation is common for
some TIMs, but no clear association between dose escalation and improved clinical outcomes has
been demonstrated. Dose-tapering strategies have been employed in variable settings, and their
study is complicated in part by the degree of heterogeneity of the disease course following clinical
remission. In general, studies have found that dose reductions provide superior results to
discontinuation of treatment among patients in remission.
A summary of the recent literature on dose modifications can be found in Appendix C.
Controversies and Uncertainties
Across the 67 RCTs identified for this review, only eight were based on head-to-head comparisons
of the TIMs of interest (excluding biosimilar studies). As such, our network meta-analyses of ACR
response and Sharp score are largely driven by indirect evidence; however, our findings are
relatively consonant with the results of head-to-head studies as well as with our assessment of
relative differences in ACR response in comparison to conventional DMARD therapy, and our NMA
findings are also comparable to other recent assessments of the evidence.24-26 Given the
longstanding availability of certain types of TIM therapy, there are a large number of observational
studies that compare clinical effectiveness, safety, and other measures across drugs. Drawing
comparisons across these studies is challenging, however, given differences in datasets as well as
attendant selection, information, and other biases in quasi-experimental research.
Even data coming from RCTs poses challenges, however. For one, patients were eligible for rescue
therapy and/or treatment-arm crossover 12-24 weeks after randomization, which may not reflect
the timing of treatment-switch decisions in typical practice and will limit conclusions regarding the
long-term effects of initial treatment. Extending trial-based analyses to longer timepoints requires
imputation in many instances, which affects the level of confidence in the results no matter how
responsibly it is done. In addition, key outcome measures such as disease activity scores, remission
criteria, and modified Sharp score have undergone substantial revision and modification over the
years, are employed variably in clinical trials, and not measured in others, making cross-trial
comparisons problematic. We attempted to control for variation in our NMA of Sharp score by
presenting results as standardized mean differences, but note that this has been infrequently
attempted to date. Finally, while comparisons of TIM combination therapy or monotherapy to

©Institute for Clinical and Economic Review, 2017 Page 62 Evidence Report: Targeted Immune Modulators for Rheumatoid Arthritis Return to Table of Contents
conventional DMARDs alone provides important information on the incremental benefits of TIMs,
such a comparison does not inform considerations of treatment sequencing. This compounds the
already significant challenges with extrapolating RCT-based evidence to real-world settings that are
common to all chronic therapies. The best approaches to address these concerns include head-to-
head trials and pragmatic trials of treatment sequencing, both of which are currently in short
supply.
Because TNFα inhibitors have the longest-standing evidence base of the TIMs of interest for this
review, much of the early research in treatment sequencing involved assessments of switches
between agents in this class for efficacy or safety reasons (commonly referred to as “cycling”). Now
that other classes of agents are available, there is interest in evaluating the effectiveness of
switches between versus within classes. The pragmatic Rotation or Change (ROC) trial recently
addressed this question27 by randomizing 300 patients with inadequate response to an initial TNFα
inhibitor to receive a different TNFα inhibitor or to switch to a non-TNF biologic agent (tocilizumab,
abatacept, or rituximab) at investigator discretion. The proportion of patients with low disease
activity on the DAS28-ESR was statistically-significantly greater in the non-TNF group versus the
second TNFα-inhibitor group at both weeks 24 (45% vs. 28%, p=.004) and 52 (41% vs. 23%, p=.003).
Results from earlier observational studies and systematic reviews of trials in TNF-experienced
patients echoed these findings.28-30
In the US setting, the potential for even observational study of different treatment sequences is
complicated by payer formulary and benefit design. As described earlier in this report and
highlighted further in Section 3, most private payers require initial TIM therapy and sometimes
second TIM therapy to be within the TNFα-inhibitor class. Many payers also stipulate that
etanercept and adalimumab hold preferred status as the first TIM of choice.
The course of RA may feature multiple periods of remission and flares of symptoms due to the
complex and heterogeneous nature of the disease. TIM therapies are chronic, and the long-term
effects of prolonged immunomodulation – both clinical benefits and potential harms -- are not well-
understood for all therapies, particularly for newer classes of TIMs. Evidence is beginning to
emerge on the question of whether TIM doses can be modulated or therapy suspended in patients
with evidence of durable remission, but early results are limited and mixed. In addition, as noted in
the Topic in Context section, the decision to initiate TIM treatment may in part be due to a missed
opportunity to optimize conventional DMARD therapy; such challenges are common to other
chronic diseases such as diabetes and heart failure as well.
Finally, while the introduction of TIMs has transformed clinical practice in RA and improved the
quality of life and functional capacity of many patients, there are still unanswered questions,
including the relationship between levels of disease activity and radiographic evidence of joint
damage, whether there are patient or clinical factors that predict response to specific therapies,

©Institute for Clinical and Economic Review, 2017 Page 63 Evidence Report: Targeted Immune Modulators for Rheumatoid Arthritis Return to Table of Contents
and the totality of the disease’s impact on patients, families, and caregivers. As noted in the Topic
in Context section, patient groups do not feel that the current tools for patient-reported outcomes
sufficiently capture their experience, but to date no new instruments have been accepted into
common use in clinical trials.
Summary
Using the ICER evidence rating matrix, our evidence ratings for selected comparisons of interest are
provided in Table 12 for patients with moderately-to-severely active RA who have had an
inadequate response to prior conventional DMARD therapy. As described previously, findings of
studies using conventional DMARDs as the control indicate clinically- and statistically-significant
improvements in most important disease measures for all TIMs whether delivered as monotherapy
or combination therapy, so all FDA-approved TIMs would all receive a letter grade of “A” (high
certainty of substantial net health benefit) relative to conventional DMARD therapy alone.
However, the evidence on long-term effectiveness and safety of the two investigational TIMs
(baricitinib and sarilumab) is still emerging, so we judge the comparative clinical effectiveness of
these two agents to have moderate certainty of an incremental or better net health benefit (“B+”).
Table 13. Evidence Ratings for Comparative Clinical Effectiveness: Selected Comparisons
Regimen Type/Comparison Intervention Comparator Rating
Vs. Conventional DMARDs
Mono- or Combination
Therapy
Sarilumab Conventional DMARDs B+
Baricitinib Conventional DMARDs B+
All other TIMs Conventional DMARDs A
Head-to-Head Comparisons
Monotherapy Sarilumab Adalimumab B+
Tocilizumab Adalimumab B+
Combination Therapy Baricitinib Adalimumab C+
Tofacitinib Adalimumab C
Abatacept (sc) Adalimumab C
Certolizumab pegol Adalimumab C
Abatacept (iv) Infliximab B+
Etanercept Adalimumab C
All Other Head-to-Head
Comparisons
--- --- I

©Institute for Clinical and Economic Review, 2017 Page 64 Evidence Report: Targeted Immune Modulators for Rheumatoid Arthritis Return to Table of Contents
TIM Monotherapy
The presence of direct comparative data allowed us to be reasonably confident about the relative
net health benefit for some between-agent comparisons. Among monotherapy regimens,
sarilumab and tocilizumab (iv form) have been compared to adalimumab for impact on both disease
activity and ACR response. Both agents produced statistically-significantly higher rates of response,
improvement in disease activity, and remission, as well as improvements in pain, fatigue, and
quality of life, leading to moderate certainty of an incremental or better net health benefit for these
agents relative to adalimumab (“B+”). Certainty was moderate because only a single trial was
available for each comparison.
TIM Combination Therapy with Conventional DMARDs
Single RCTs have also evaluated combination therapy regimens with methotrexate plus baricitinib,
tofacitinib, abatacept (subcutaneous form), and certolizumab pegol in comparison to adalimumab +
methotrexate. In the RA-BEAM study, baricitinib + methotrexate was associated with a statistically-
significantly but modestly higher rate of ACR20 response (74% vs. 66% for adalimumab +
methotrexate), and no differences were observed in remission rates. Rates of serious harm or
discontinuation due to adverse events were also similar, so we judge the evidence for combination
therapy with baricitinib versus adalimumab to represent a comparable or better net health benefit
(“C+”). There were no significant differences in clinical outcomes between combination regimes
using tofacitinib, abatacept sc, or certolizumab pegol versus adalimumab; the addition of indirect
evidence through the NMA also yielded no statistical differences between these TIMs. We
therefore assign a net health benefit rating of “C” for all three comparisons.
An additional study (RED SEA) compared adalimumab and etanercept in addition to existing
conventional DMARD therapy, but was a noninferiority study focused primarily on continuation of
therapy after one year and did not measure ACR response; in addition, disease activity measures
did not statistically differ between arms. Given these findings, and bolstered by NMA results that
showed no statistical differences between treatment arms, we consider the two agents to provide
comparable net health benefits (“C”).
Finally, the iv form of abatacept was compared to infliximab, both in combination with
methotrexate, in a single trial (ATTEST). The proportion of patients achieving an ACR20 or better
response was statistically-significantly greater with abatacept (72% vs. 56%), but neither changes in
disease activity nor rates of remission differed between groups. However, rates of serious adverse
events, discontinuation due to adverse events, and infusion reactions were lower with abatacept
versus infliximab, leading to a judgment of incremental or better net health benefit (“B+”).

©Institute for Clinical and Economic Review, 2017 Page 65 Evidence Report: Targeted Immune Modulators for Rheumatoid Arthritis Return to Table of Contents
There is much greater uncertainty in assessing the relative comparative clinical effectiveness of
TIMs that have never been compared head to head in a randomized setting. Observational studies
might fill in these gaps, but findings have been inconsistent and design and population biases
preclude any definitive conclusions. Finally, as presented earlier, our network meta-analysis
produced variable estimates of ACR response and radiographic progression; for example, non-
response rates ranged from 29-48% across the TIM combination therapy regimens. However,
credible intervals were wide and included 0 for nearly all comparisons between TIMs. As a result,
we judge there to be insufficient evidence (“I”) to differentiate the remaining TIM comparisons,
including intra-class comparisons of the remaining TNFα inhibitors, IL-6 inhibitors, and JAK
inhibitors.

©Institute for Clinical and Economic Review, 2017 Page 66 Evidence Report: Targeted Immune Modulators for Rheumatoid Arthritis Return to Table of Contents
5. Other Benefits or Disadvantages
Our reviews seek to provide information on other benefits or disadvantages offered by the
intervention to the individual patient, caregivers, the delivery system, other patients, or the public
that would not have been considered as part of the evidence on comparative clinical effectiveness.
Examples include but are not limited to:
1. Methods of administration that improve or diminish patient acceptability and adherence
2. A public health benefit, e.g., reducing new infections
3. Treatment outcomes that reduce disparities across various patient groups
4. More rapid return to work or other positive effects on productivity (if not considered a
benefit as part of comparative clinical effectiveness)
5. New mechanisms of action for treatments of clinical conditions for which the response to
currently available treatments varies significantly among patients for unknown reasons
(substantial heterogeneity of treatment effect)
Among the TIMs of focus in our analysis, two (baricitinib and tofacitinib) are oral agents, which may
provide a benefit to individuals without ready access to infusion centers and those who prefer oral
treatment to self-injection (assuming the treatments are clinically comparable for a given patient).
In addition, self-injected and infused products are administered at different frequencies that may
be more or less convenient for patients given their specific circumstances. Also, because of RA’s
heterogeneous nature and likelihood that multiple TIMs will be required for many patients, as well
as emerging evidence suggesting that switching to an alternative class of agent rather than “cycling”
within class may provide clinical benefit, the availability of five distinct classes of TIMs for the
treatment of moderately-to-severely active RA with inadequate response to conventional DMARDs
is an important consideration. Finally, the ability of each TIM to address key patient-centric
concerns such as rapid improvement in function and work capacity, other downstream clinical
benefits such as reduced need for joint replacement and reduced caregiver burden are critically
important issues, although we note that the current evidence to distinguish the TIMs on these
measures is sparse.

©Institute for Clinical and Economic Review, 2017 Page 67 Evidence Report: Targeted Immune Modulators for Rheumatoid Arthritis Return to Table of Contents
6. Long-Term Cost-Effectiveness
6.1 Overview
The aim of this analysis was to estimate the lifetime cost-effectiveness of TIMs for patients with
moderately-to-severely active RA who have had an inadequate response to conventional DMARDs
alone. We developed a sequential treatment cohort model that assessed the cost-effectiveness of
each of the TIMs detailed above relative to conventional DMARDs, as well as against the TIM
market leader, adalimumab. Model parameters were estimated from the network meta-analysis
described earlier in this report, as well as from the published literature. The primary outcomes of
the model included discounted lifetime total payer costs, life years, quality-adjusted life years
(QALYs) and incremental cost-effectiveness ratios, using a payer/health-system perspective.
Uncertainty in the data inputs and assumptions were evaluated using sensitivity and scenario
analyses.
6.2 Cost-Effectiveness Model: Methods
Model Structure
The sequential treatment cohort model simulated a hypothetical homogeneous cohort of patients
from the initiation of a TIM until death; a lifetime time horizon was used to reflect the chronic
nature of RA. The model was developed in Microsoft Excel®. The model framework is depicted in
Figure 8. Key risk and benefit evidence from the clinical review (see Section 4) that flowed directly
into the cost-effectiveness model included: the American College of Rheumatology (ACR) categories
(<20, 20-50, 50-70, >70), the modified Total Sharp Score (mTSS), adverse events associated with
treatment discontinuation, and severe adverse events. Note that the primary focus in the model
was on TIM-naïve/mixed populations, although TIM-experienced data were used in a separate
scenario analysis.
Patients could discontinue a TIM due to lack of effectiveness and/or adverse events. Patients
discontinued treatment due to lack of effectiveness if they received an ACR score less than 20
(defined as non-responders) in the first six-month’s cycle. Thus, ACR scores >20 were considered
treatment responders. A cycle length of six months was used to reflect the time needed to evaluate
a treatment’s effectiveness.31 Patients discontinued treatment beyond the first six months only due
to the occurrence of adverse events. Upon therapy withdrawal, the model simulated the patient
switching therapy up to three different times.

©Institute for Clinical and Economic Review, 2017 Page 68 Evidence Report: Targeted Immune Modulators for Rheumatoid Arthritis Return to Table of Contents
Consistent with prior US and European peer-reviewed RA models,31,107-110 the Health Assessment
Questionnaire for Rheumatoid Arthritis Disability Index (HAQ-DI) was the primary metric that was
correlated with the two domains within the QALY (i.e., mortality and morbidity), as well as
correlations with hospitalization-related and productivity-related costs (the latter were used only in
a modified societal perspective scenario). A lower HAQ suggests lower RA disease activity and
better overall functioning. Qualitative and independent directional relationships in the model were
as follows: higher general treatment response (defined as ACR>20) lowered HAQ and higher levels
of ACR response (e.g., ACR>70) further lowered HAQ; drops in mTSS lowered HAQ; and fewer
adverse events associated with treatment discontinuation lowered the HAQ score. A lower HAQ
was associated with lower likelihood of death, improved health-related quality-of-life measures
(i.e., utilities), fewer RA-related hospitalizations, and better productivity (for the modified societal
perspective). Quantitative directional relationships in the model are described below and defined
in Appendix D Table D5.
After starting a TIM, the ACR categories were correlated to HAQ improvements.110,111 In addition to
relating ACR response to HAQ, this model framework also related the HAQ score to joint damage
and radiographic progression, as measured through the mTSS.109 HAQ scores were not used
directly from the trial evidence, given that the majority of trials did not sub-categorize this measure
with respect to treatment responders and non-responders. HAQ scores were simulated through
separate contributions of ACR and mTSS,109 given baseline characteristics of the cohort. The HAQ
score was linked to utility, mortality, and hospitalization rates. The simulated utility score and
mortality were used to calculate the QALYs gained, and the simulated hospitalization rate factored
into total costs from the payer perspective. A link from HAQ to productivity was explored in a
scenario analysis that extended the perspective to a modified societal one. The model continued to
estimate the long-term HAQ score every six months until last-line treatment or death.
Two additional model structural assumptions were built into this analysis: 1) Time on conventional
DMARD therapy alone was assumed to be associated with disease progression and consequent
degradation in HAQ, consistent with the US evidence analyzed in the National Institute for Health
and Care Excellence Decision Support Unit report,112 and; 2) the mean difference in mTSS score
comparing a TIM to conventional DMARD alone was assumed to be a linear function with time on
unique TIM.109,113 Thus, the longer patients were simulated to be on a TIM, the larger mTSS benefit
they were given and the shorter amount of time they were assumed to be on the 4th line
conventional DMARD palliative care treatment.

©Institute for Clinical and Economic Review, 2017 Page 69 Evidence Report: Targeted Immune Modulators for Rheumatoid Arthritis Return to Table of Contents
Figure 8. Model Framework
*Productivity losses were investigated in a scenario analysis. ACR=American College of Rheumatology improvement criteria; cDMARD=conventional disease-modifying antirheumatic drug; DMARD=disease-modifying antirheumatic drug; HAQ=Health Assessment Questionnaire; IR= inadequate responder; QALYs=quality-adjusted life years
Model Parameters
The economic evaluation was primarily from a health-system perspective, and thus focused on
direct medical and pharmacy costs. A separate scenario analysis was conducted to extend the
perspective to a modified societal one that included indirect costs due to potential productivity
gains or losses.114 All future costs and outcomes were discounted 3% per year.
The model was informed by several assumptions, which are detailed below.
• Patients can discontinue treatment for two reasons: (1) lack of effectiveness, and (2)
occurrence of an adverse event. Consistent with prior models, as compared to real-world
observation, the discontinuation assumptions likely overestimate discontinuation in the
short-run (lack-of-effectiveness discontinuation), but underestimate discontinuation in the
long-run (adverse-event discontinuation).
• A treatment was administered for at least six months before a decision to discontinue was
allowed in the model. This is consistent with prior models and consistent with the follow-up
duration of many clinical trials.

©Institute for Clinical and Economic Review, 2017 Page 70 Evidence Report: Targeted Immune Modulators for Rheumatoid Arthritis Return to Table of Contents
• Those that discontinue TIM treatment move to the next treatment in the sequence.
• After three different TIM failures, a patient reverts to conventional DMARD palliative care
and stays with that therapy for the rest of his/her life. Scenario analyses varied the
treatment sequential pathway, including: 1) having the fourth and final treatment be a
market basket of all TIMs (instead of palliative care) without an option for discontinuation,
and 2) having treatment 2 be the final treatment (removing treatments 3 and 4), consisting
of a market basket of all TIMs without an option for discontinuation.
• Each TIM is used in combination with methotrexate for the base-case combination therapy
results. For subsequent lines of treatment, all relevant TIM therapies in the market basket
were averaged and weighted equally (see Figure 8). For TIMs with available monotherapy
evidence, an additional analysis was undertaken that explored these TIMs’ cost-
effectiveness when used as monotherapy.
• Those patients who had an ACR score less than 20 were assumed to be non-responders to
TIM therapy.110 These patients discontinue due to lack of effectiveness after the first TIM
treatment cycle (six months).
• Cost of treatment for those that do not respond was assumed for the full length of the cycle
(six months).
• Responders experienced a constant probability of discontinuation due to adverse events for
each TIM treatment for cycles two and above.110
• A patient’s HAQ score was a function of their baseline characteristics, ACR score and mTSS.
• HAQ improved (decreased) with higher ACR scores. An ACR score less than 20 was
associated with a HAQ improvement of 0.11 units, ACR between 20 and 49 with a HAQ
improvement of 0.44 units, between 50 and 69 with a HAQ improvement of 0.76 units, and
an ACR score of 70 or higher was associated with a HAQ improvement of 1.07 units.110,111
• HAQ improved (decreased) with lower mTSS scores. The coefficient relating mTSS to HAQ is
a weighted average of the remission-like response, as proxied by ACR >70 (coefficient=0.02;
29.6% of weighted average) and the remaining 70.4% with lower levels of response (i.e.,
ACR 20-69) and corresponding coefficient = 0.0031.109 This resulted in the weighted
coefficient of 0.0081. Further, mean change in mTSS was assumed to be a linear function of
time on the same TIM, such that mean change in mTSS at time T = mean change in mTSS
from the clinical review * T, where T = years on the same TIM. This continued change in
mTSS is consistent with evidence from the PREMIER 109,113
• The resulting changes in progression for response to TIM treatment over time as measured
by mTSS changes generate small improvements in HAQ over time (approximately a 0.05
lower HAQ over time on continued TIM treatment beyond initial improvement). The
generated HAQ improvements over time from TIM treatment are consistent with
observational studies.115
• The cost calculations for intravenously administered therapies accounted for vial wastage
(i.e., no vial sharing was allowed).
• The conventional DMARD comparator assumes the continued treatment costs of
methotrexate and the clinical outcomes consistent with the clinical review over the

©Institute for Clinical and Economic Review, 2017 Page 71 Evidence Report: Targeted Immune Modulators for Rheumatoid Arthritis Return to Table of Contents
remaining lifetime of the cohort. This comparator represents the long-term costs and
outcomes in an environment without TIM treatment. Using the findings from the National
Databank for Rheumatic Diseases, for each year on conventional DMARD alone, we applied
an increase in HAQ of 0.0269 per year up to 15 years. After 15 years on conventional
DMARD, the HAQ increase was fixed at the 15-year value of 15*0.0269 = 0.4035.112
Target Population
The primary population for this review included adults with moderately-to-severely active RA and
inadequate response to or intolerance to conventional DMARDs. The model simulated a
hypothetical homogeneous cohort of patients, with baseline characteristics similar to United States
RA registries as summarized by Curtis and colleagues.116 Table 14 depicts the model characteristics
for the population naïve to TIMs or mixed (with a minority [<20%] of those who were TIM
experienced). Curtis and colleagues reported baseline mean HAQ values of approximately 1.5. Due
to the model’s assumption from the clinical review of ACR treatment benefits in the conventional
DMARD arm, a baseline HAQ of 1.7 was used so that after the first conventional DMARD treatment
cycle the cohort’s HAQ was approximately 1.5.
Table 14. Base-Case Model Cohort Characteristics
Value Primary Source
Mean age 55 years
(range 50 to 60 years old) Curtis et al., 2010116
Female 79%
(range 73%,86%) Curtis et al., 2010116
Caucasian 84% Curtis et al., 2010116
Mean weight 170 pounds
National Health and
Nutrition Examination
Survey data117
Baseline HAQ prior to
cDMARD treatment
benefit
1.7
(range: 1.37 to 2.03) Curtis et al., 2010116
Baseline mTSS 54 (SD: 64) Lillegraven et al., 2011118
HAQ=Health Assessment Questionnaire for Rheumatoid Arthritis Disability Index;
mTSS= modified Total Sharp Score
Of these model cohort characteristics, age and gender were used in calculating the risk of mortality.
The mean weight was used to calculate average dosing for TIMs administered intravenously, and
the baseline HAQ and mTSS score served as the starting point for the model-simulated HAQ score.

©Institute for Clinical and Economic Review, 2017 Page 72 Evidence Report: Targeted Immune Modulators for Rheumatoid Arthritis Return to Table of Contents
Treatment Strategies
The TIMs included for review are those assessed in the evidence review and NMA; their
administration schedules are listed in Appendix D. All but two TIMs (baricitinib and sarilumab) are
FDA approved. Regimens are based on labeled dosing recommendations (see Table 1 in Section
2).119-128 For investigational agents, assumed dosing was based on clinical expert input as described
in Section 4.
In the clinical setting, it is not uncommon for patients to cycle through multiple therapies before
finding a treatment option to which they best respond and tolerate. To partially account for
treatment cycles while balancing the number of scenarios and lack of long-term sequential
treatment evidence, the model allowed patients who discontinue a TIM (due to lack of
effectiveness and/or adverse events) to switch therapy up to three times. The first switch was to an
agent within the same treatment category; the second was to an agent within a different treatment
category; and the third and final switch was to a palliative care state that involved conventional
DMARD therapy. A separate scenario analysis was conducted where treatment 4 consisted of a
market basket of all TIMs instead of conventional DMARD therapy. Another scenario analysis was
conducted that only allowed patients to switch once (from treatment 1 to treatment 2), where
treatment 2 consisted of a market basket of all TIMs. Figure 2 outlines the sequential treatment
pattern used in the model’s base-case. Note that, based on published clinical data, we assumed
that the effectiveness of subsequent treatment was reduced relative to initial treatment using a
universal hazard ratio of 0.84.110,129
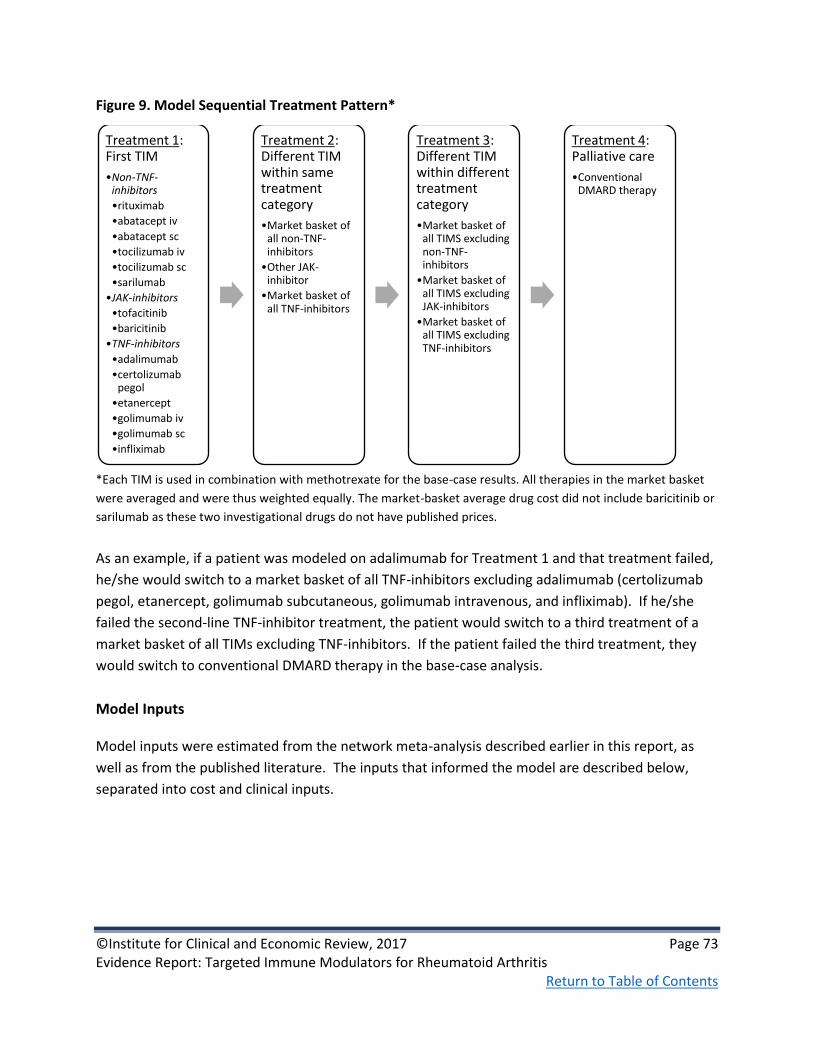
©Institute for Clinical and Economic Review, 2017 Page 73 Evidence Report: Targeted Immune Modulators for Rheumatoid Arthritis Return to Table of Contents
Figure 9. Model Sequential Treatment Pattern*
*Each TIM is used in combination with methotrexate for the base-case results. All therapies in the market basket
were averaged and were thus weighted equally. The market-basket average drug cost did not include baricitinib or
sarilumab as these two investigational drugs do not have published prices.
As an example, if a patient was modeled on adalimumab for Treatment 1 and that treatment failed,
he/she would switch to a market basket of all TNF-inhibitors excluding adalimumab (certolizumab
pegol, etanercept, golimumab subcutaneous, golimumab intravenous, and infliximab). If he/she
failed the second-line TNF-inhibitor treatment, the patient would switch to a third treatment of a
market basket of all TIMs excluding TNF-inhibitors. If the patient failed the third treatment, they
would switch to conventional DMARD therapy in the base-case analysis.
Model Inputs
Model inputs were estimated from the network meta-analysis described earlier in this report, as
well as from the published literature. The inputs that informed the model are described below,
separated into cost and clinical inputs.
Treatment 1: First TIM
•Non-TNF-inhibitors
•rituximab
•abatacept iv
•abatacept sc
•tocilizumab iv
•tocilizumab sc
•sarilumab
•JAK-inhibitors
•tofacitinib
•baricitinib
•TNF-inhibitors
•adalimumab
•certolizumab pegol
•etanercept
•golimumab iv
•golimumab sc
•infliximab
Treatment 2: Different TIM within same treatment category
•Market basket of all non-TNF-inhibitors
•Other JAK-inhibitor
•Market basket of all TNF-inhibitors
Treatment 3: Different TIM within different treatment category
•Market basket of all TIMS excluding non-TNF-inhibitors
•Market basket of all TIMS excluding JAK-inhibitors
•Market basket of all TIMS excluding TNF-inhibitors
Treatment 4: Palliative care
•Conventional DMARD therapy

©Institute for Clinical and Economic Review, 2017 Page 74 Evidence Report: Targeted Immune Modulators for Rheumatoid Arthritis Return to Table of Contents
Costs
Drug Acquisition Costs
Each intervention was associated with an annual cost based on the acquisition cost, dosing,
administration, and monitoring. For drug costs, we obtained data from SSR Health130 that
combined information on net US dollar sales with information on unit sales to derive net pricing at
the unit level across all payer types. Data on the approved agents of interest were current through
the fourth quarter of 2016. We estimated net prices for these agents by comparing the four-
quarter rolling averages (i.e., first quarter 2016 through fourth quarter 2016) of both net prices and
wholesale acquisition cost (WAC) per unit to arrive at an average discount from WAC for each drug
class. Finally, we applied this average discount (rounded to the nearest 5%) to the most current
WAC131 for each drug to arrive at an estimated net price. The drug discount by class is as follows:
• TNF inhibitors – 30%
• CD-20 directed cytolytic antibody – 15%
• T-cell inhibitors – 30%
• IL-6 inhibitors – 20%
• JAK inhibitors – 5%
Table 15 details the drug unit, current WAC per unit, derived net price per unit, and annual drug
cost calculated using the discounted WAC per unit (WAC unit prices updated in February 2017). SSR
Health does not track net unit sales and associated price for generic drugs. As there are multiple
manufacturers of generic methotrexate, we used the median WAC per unit for conventional
DMARD drug costs in the model. The annual drug costs reported in this table were an average over
three years of treatment assuming 100% compliance to reduce the variation in the loading dosing
schedule for some TIMs. Note that a cost was not assumed for investigational drugs; generated
results were limited to clinical outcomes as well as unit prices that would achieve certain cost-
effectiveness thresholds. Additional drug inputs, including dose and frequency of administration,
can be found in Table D1-D3 of Appendix D.

©Institute for Clinical and Economic Review, 2017 Page 75 Evidence Report: Targeted Immune Modulators for Rheumatoid Arthritis Return to Table of Contents
Table 15. Drug Cost Inputs
Intervention Administration Unit Unit WAC* Net price per
unit
Annual Drug
Costǂ
rituximab iv 100mg $835 $710 $30,764
abatacept iv 250mg $987 $691 $27,637
abatacept sc 125mg $957 $814 $42,306
tocilizumab iv 20mg $95 $76 $27,627
tocilizumab sc 162mg $898 $719 $21,861
sarilumab** sc ---------- ---------------- --------------- -------------
tofacitinib ORAL 5mg $63 $60 $43,873
baricitinib** ORAL ---------- ----------------- ---------------- -------------
adalimumab sc 40mg $2,221 $1,554 $40,415
certolizumab pegol sc 200mg $1840 $1,288 $34,775
etanercept sc 50mg $1,111 $777 $40,422
golimumab sc 50mg $4,150 $2,905 $34,863
golimumab iv 50mg $1,592 $1,114 $29,719
infliximab iv 100mg $1,168 $817 $28,906
cDMARD
(methotrexate) ORAL 2.5mg $2.78 - $1,155
*WAC as of February 2017
**For investigational drugs, no annual cost was assumed except the cost needed to achieve thresholds.
ǂThe annual drug cost only includes the cost of drug therapy, and does not include any costs associated with
administration or monitoring. The annual drug costs reported in this table were an average over three years of
treatment assuming 100% compliance to reduce the variation of some TIMs loading dosing schedule.
Administration and Monitoring Costs
Oral treatments were assumed to have no administration costs. Subcutaneous treatments included
costs for an annual office visit for training on self-administration and for one subcutaneous
administration. The administration cost for treatments administered intravenously included the
cost for an intravenous infusion administered in a physician’s office, calculated by multiplying the
hourly infusion cost by the number of hours required for the infusion. Administration cost inputs
for each drug are detailed in Table 2 of Appendix D.
Drug monitoring included office visits, tuberculosis tests, liver tests, and complete blood count
tests, as appropriate for each medication. Table 3 of Appendix D details monitoring cost inputs.

©Institute for Clinical and Economic Review, 2017 Page 76 Evidence Report: Targeted Immune Modulators for Rheumatoid Arthritis Return to Table of Contents
Health Care Utilization Costs
The cost per hospital day and cost per office visit were used as health care utilization cost inputs.
The cost per hospital day was $2,040132 and the cost per office visit was $73.40 (HCPCS code
99213).133 The relationship between hospital days and HAQ is provided in Table D5 of Appendix D.
Severe Adverse Event Costs
Two severe adverse event categories, serious infections and tuberculosis infections, were assumed
to impact costs. The cost of a serious infection was assumed to be $13,747 based on weighted
average costs of pneumonia and cellulitis (two common serious infections in RA patients) and the
cost of a tuberculosis infection was $12,220.134 Adverse event inputs are detailed in Table D4 of
Appendix D.
Productivity Costs
Productivity costs were included in a scenario analysis that extended the perspective to a modified
societal one. The average hourly wage used to value time in the model was $23.23.135 The number
of hours missed from work is detailed in Table D5 of Appendix D.
Clinical Events
Response to Treatment
Response to treatment was measured by ACR score. The proportion of patients in each ACR
response category (not achieving ACR20, ACR20 but not ACR50, ACR50 but not ACR70, and ACR70)
was used in the model to measure response and improvement due to therapy. These categories
are mutually exclusive and exhaustive, and were related to the HAQ score using a previously
published relationship.110,111 In addition to relating ACR response to HAQ, the model also
accommodated the association of joint damage with HAQ, as measured through mTSS.109 The
model assumed the mTSS TIM benefit based on averages from clinical studies without respect to
treatment response. Categorical results for ACR response and mTSS change can be found in Section
4 and Appendix D (Table D6) of this report.
The adverse event discontinuation rates are summarized in Section 4 and specific rates for serious
infections and tuberculosis infections (severe adverse events) are summarized in Appendix D.
Model-wide clinical inputs and functions are detailed in Table D5 of Appendix D.

©Institute for Clinical and Economic Review, 2017 Page 77 Evidence Report: Targeted Immune Modulators for Rheumatoid Arthritis Return to Table of Contents
Mortality
Prior evidence suggests that improved (lower) HAQ scores are associated with lower likelihood of
death.136 A US observational study found that HAQ was the most significant predictor of mortality
in RA patients.136 The quantitative relationship between HAQ and mortality was assumed to be the
same as that used in a recent US RA cost-effectiveness study.110 This relationship is detailed in
Table D5 of Appendix D.
Utilities
The relationship between HAQ and utility score was based on the Wailoo and colleagues’
publication, as shown in Table D5 of Appendix D.107 The utility scores from Wailoo and colleagues
were based on health state time-tradeoff evaluations made by a US general population sample
using the EuroQol (EQ-5D) Index, one of the most widely used instruments in health state
valuation.137 We compared the Wailoo et al. utility change from HAQ score moving from 1.0 to 1.5
to the utility change from a more advanced mathematical model.138 Although the Wailoo et al.
relationship produces a higher utility within the HAQ range of 1.0 to 1.5, the change in utility for
this HAQ range was approximately 0.1 and this change was deemed consistent with the other
model. Further the more complex model138 included a pain dimension (based on visual analogue
scale) that we were not able to estimate across all TIMs. Uncertainty in the Wailoo et al. mapping
was evaluated in parameter sensitivity analyses.
Additionally, a disutility (-0.156) was assigned to individuals who experienced a severe adverse
event.139 The disutility lasted for one month139 for those who experienced a serious infection and
for two months140 for those who contracted tuberculosis. Additional details on adverse event
disutilities can be found in Table D4 of Appendix D.
Sensitivity Analyses
The model programming allowed for flexible and comprehensive sensitivity analyses. One-way
sensitivity analyses used the low and high bounds from 95% confidence intervals for key model
inputs where available. For inputs for which 95% confidence intervals were not available,
uncertainty ranges were based on plausible values from the published literature. Tornado diagrams
are used to display the results of the one-way sensitivity analyses, focusing on the pairwise
comparisons of TIM + conventional DMARDs versus conventional DMARDs alone. Additionally, a
probabilistic sensitivity analysis was conducted to vary parameter estimates across their plausible
ranges simultaneously.

©Institute for Clinical and Economic Review, 2017 Page 78 Evidence Report: Targeted Immune Modulators for Rheumatoid Arthritis Return to Table of Contents
Scenario Analyses
Multiple scenario analyses were conducted based on feedback from stakeholders: 1) having a
market basket of all TIMs as the fourth treatment in the sequential treatment pattern rather than
palliative care, 2) having a market basket of all TIMs as treatment two and not modeling any
additional switches, 3) extending the perspective to a modified societal one including indirect costs
due to potential reduced absenteeism and unemployment, 4) estimating the cost-effectiveness for
those TIMs studied in TIM-experienced populations, and 5) evaluating the deterministic results over
short-term time horizons (one year and three years) to determine cost-effectiveness and cost per
additional first TIM responder.
6.3 Cost-Effectiveness Model: Results
Base Case Results
Table 16 presents the drug cost, total payer cost, average HAQ, life years gained, and QALYs gained
over the lifetime horizon for each treatment pathway for TIMs added on to conventional DMARD.
Total payer costs included the drug costs (drug costs, administration costs if any, and monitoring
costs) as well as other payer-related costs that may differ by treatment including: hospitalization
costs and serious adverse event-related costs. The results indicate that a lower HAQ score
corresponded to a higher QALY gain, as expected. As discussed in the methods section, HAQ was
derived from separate contributions of ACR score and mTSS. Table D6 in Appendix D details the
relative contributions of ACR score and mTSS to HAQ. The base-case results indicate that treatment
with TIMs over a lifetime horizon leads to substantial QALY improvements, ranging from 1.88
(tofacitinib) to 2.43 (etanercept) as compared to conventional DMARD therapy.

©Institute for Clinical and Economic Review, 2017 Page 79 Evidence Report: Targeted Immune Modulators for Rheumatoid Arthritis Return to Table of Contents
Table 16. Results for the Base-Case for TIMs Added on to Conventional DMARD
Treatment 1 Drug Cost Total Cost Average
HAQ
Life Years QALYs
rituximab $366,768 $464,864 1.25 16.79 12.70
abatacept (iv) $367,724 $466,733 1.22 16.82 12.78
abatacept (sc) $452,292 $566,053 1.18 16.87 12.90
tocilizumab (iv) $369,876 $470,205 1.19 16.85 12.88
tocilizumab (sc) $329,324 $424,674 1.21 16.83 12.81
sarilumab - - 1.21 16.83 12.81
tofacitinib $467,784 $579,140 1.28 16.75 12.57
baricitinib - - 1.25 16.78 12.67
adalimumab $425,929 $530,720 1.25 16.78 12.68
certolizumab pegol $417,742 $522,473 1.20 16.84 12.86
etanercept $470,007 $583,449 1.12 16.94 13.12
golimumab (sc) $408,413 $512,875 1.25 16.79 12.69
golimumab (iv) $386,971 $488,380 1.23 16.81 12.75
infliximab $381,243 $480,448 1.24 16.79 12.73
cDMARD $18,209 $67,819 1.78 16.16 10.69
Three FDA-approved TIMs (adalimumab, etanercept, tocilizumab iv) had data for monotherapy
administration, and thus, treatment with these TIMs as monotherapy (i.e., not in conjunction with
conventional DMARDs) was modeled. Table 17 presents the drug cost, total payer cost, average
HAQ, life years gained, and QALYs gained over the lifetime horizon for each treatment pathway for
TIMs as monotherapy. The TIM monotherapy results indicate that treatment with TIMs over a
lifetime horizon leads to QALY improvements ranging from 2.20 (adalimumab) to 2.60 (tocilizumab
iv) as compared to conventional DMARD therapy (conventional DMARD resulted in a lifetime
discounted QALY of 10.75 for the monotherapy simulation).

©Institute for Clinical and Economic Review, 2017 Page 80 Evidence Report: Targeted Immune Modulators for Rheumatoid Arthritis Return to Table of Contents
Table 17. Results for TIMs as Monotherapy
Treatment 1 Drug Cost Total Cost Average
HAQ
Life
Years
QALYs
tocilizumab
(iv)
$384,441 $489,541 1.05 17.03 13.35
sarilumab - - 1.07 17.00 13.28
adalimumab $449,224 $562,748 1.17 16.89 12.95
etanercept $469,981 $584,952 1.11 16.95 13.16
cDMARD* $18,235 $67,525 1.76 16.18 10.75
*cDMARD costs and outcomes were slightly different as compared to the combination findings in Table 16 given
the different ACR clinical findings for cDMARD in the monotherapy network meta-analysis as compared to the
combination therapy network meta-analysis.
Table 18 presents the discounted lifetime incremental cost-effectiveness ratios for each of the TIMs
as compared to conventional DMARDs and to the TIM market leader, adalimumab. When
comparing the TIMs to conventional DMARD therapy, the incremental comparisons showed that
tocilizumab (sc) produced the lowest ratios. Tofacitinib produced the highest cost-effectiveness
ratios compared to conventional DMARD therapy. Importantly, however, the cost-effectiveness of
all TIMs in combination with conventional DMARDs relative to conventional DMARDs alone
exceeded commonly-cited thresholds for cost-effectiveness of $50,000 - $150,000 per QALY gained.
When comparing the TIMs to the market leader adalimumab, eight TIMs were dominant, meaning
they were less costly and more effective than adalimumab. Two other TIMs (abatacept sc and
etanercept) were more costly but also more effective than adalimumab, with estimated cost-
effectiveness ratios of $163,000 and $119,000 per QALY respectively. The final TIM (tofacitinib) was
dominated by adalimumab, indicating that it was more costly and less effective. Importantly,
however, we note that deterministic point estimates, particularly for QALY gains, are both subject
to uncertainty and differ modestly between most of the TIM regimens evaluated. Indeed, findings
from probabilistic sensitivity analyses suggest a high degree of overlap in QALY estimates in
pairwise TIM comparisons (Appendix D), consistent with our findings in the evidence review.

©Institute for Clinical and Economic Review, 2017 Page 81 Evidence Report: Targeted Immune Modulators for Rheumatoid Arthritis Return to Table of Contents
Table 18. Incremental Cost-Effectiveness Ratios for the Base Case, for TIMs Added on to
Conventional DMARD
Treatment 1 ICER (cost per QALY gained)
Comparator: cDMARD
ICER (cost per QALY gained)
Comparator: adalimumab
rituximab $198,056
Less costly, More effective
abatacept (iv) $191,317
Less costly, More effective
abatacept (sc) $225,853
$163,376
tocilizumab (iv) $183,949
Less costly, More effective
tocilizumab (sc) $168,660
Less costly, More effective
tofacitinib $271,749
More costly, Less effective
adalimumab $232,644
Reference
certolizumab pegol $209,736
Less costly, More effective
etanercept $212,021
$119,233
golimumab (sc) $222,380
Less costly, More effective
golimumab (iv) $204,212
Less costly, More effective
infliximab $202,824
Less costly, More effective
Table 19 presents the discounted lifetime incremental cost-effectiveness ratios for each of the TIMs
as monotherapy as compared to conventional DMARDs and to the TIM market leader, adalimumab.
Cost-effectiveness was comparable as monotherapy (slightly lower for tocilizumab (iv) and
adalimumab vs. conventional DMARD alone) but still exceeded commonly-cited cost-effectiveness
thresholds. As was the case with combination therapy, monotherapy results were driven primarily
by ACR response and mTSS changes.
Table 19. Incremental Cost-Effectiveness Ratios for TIMs as Monotherapy
Treatment 1 ICER (cost per QALY gained)
Comparator: cDMARD
ICER (cost per QALY gained)
Comparator: adalimumab
tocilizumab (iv) $162,038 Less costly, More effective
adalimumab $225,423 Reference case
etanercept $214,427 $102,697

©Institute for Clinical and Economic Review, 2017 Page 82 Evidence Report: Targeted Immune Modulators for Rheumatoid Arthritis Return to Table of Contents
Sensitivity Analysis Results
One-way and probabilistic sensitivity analyses were conducted to assess variation and uncertainty
in model inputs. The one-way sensitivity analyses identified model inputs with the most influence
over the incremental cost-effectiveness ratio. The one-way sensitivity analysis results are
presented in a series of tornado diagrams for each TIM in combination with conventional DMARD
versus conventional DMARD alone (see Appendix D for all tornado diagrams). Influential inputs
often included the HAQ degradation (annual) for conventional DMARD, TIM adverse event
discontinuation rate, baseline HAQ score, mTSS score, HAQ improvement over time due to mTSS
changes over time, hospital days per HAQ level, and the level of HAQ improvement associated with
certain ACR scores.
Figure 9 presents the tornado diagram for the TIM with the most favorable cost-effectiveness ratio
from the base-case results (tocilizumab sc at approximately $168,700 per QALY). The resulting
incremental cost-effectiveness results from the one-way sensitivity analysis ranged from
approximately $132,000 to $230,000 per QALY. Only one input, the annual HAQ degradation for
conventional DMARD, resulted in an incremental cost-effectiveness ratio lower than $150,000 per
QALY gained from the base-case payer perspective. Table 20, beneath Figure 9, details the range of
inputs used in the sensitivity analysis and the resulting cost effectiveness ratios.
Figure 10. Tornado Diagram for Tocilizumab Subcutaneous versus Conventional DMARD

©Institute for Clinical and Economic Review, 2017 Page 83 Evidence Report: Targeted Immune Modulators for Rheumatoid Arthritis Return to Table of Contents
Table 20. Tornado Diagram Inputs and Results for Tocilizumab sc versus Convention DMARD
Input Name Lower ICER Upper
ICER
Lower
Input*
Upper
Input*
HAQ degradation (annual) for cDMARD $132,125 $230,732 0.01 0.05
tocilizumab (sc) Adverse Event Discontinuation
Rate (per person half year) $156,829 $193,928 0.01 0.06
Baseline HAQ $156,332 $189,031 1.37 2.03
Coefficient on mTSS for HAQ $152,772 $181,819 0.00 0.02
HAQ >70 Drop $159,598 $178,971 -1.28 -0.86
HAQ 50-70 Drop $162,611 $175,272 -0.91 -0.61
tocilizumab (sc) mTSS mean difference $164,748 $172,866 -1.34 -3.32
HAQ 20-50 Drop $165,118 $172,410 -0.53 -0.35
HAQ <20 Drop $165,558 $171,870 -0.13 -0.09
Cost per hospital day $165,353 $171,253 1,166 3,154
Hospital days per HAQ $165,353 $171,253 0.22 0.59
HAQ correction for time on trt related to mTSS
change $166,254 $171,141 0.40 0.60
Efficacy of secondary DMARDs after failure $167,422 $170,118 0.75 0.92
Cost of intravenous treatment administration
(first hour) $167,577 $170,041 77.97 210.93
Baseline mTSS $168,052 $169,274 43.42 64.58
*Note lower input may reflect either upper or lower ICER value depending on the direction that the input has on
the ICER output.
Figure 10 presents the tornado diagram for the TIM with the least favorable cost-effectiveness ratio
from the base-case results (tofacitinib, at approximately $272,000 per QALY). The resulting ratios
from the one-way sensitivity analysis ranged from $210,000 to $380,000 per QALY. No incremental
cost-effectiveness ratio fell below $200,000 per QALY gained. Table 21, beneath the figure, details
the lower and upper inputs used in the sensitivity analysis and the resulting ratios for each input.
Figure 11. Tornado Diagram for Tofacitinib versus Conventional DMARD

©Institute for Clinical and Economic Review, 2017 Page 84 Evidence Report: Targeted Immune Modulators for Rheumatoid Arthritis Return to Table of Contents
Table 21. Tornado Diagram Inputs and Results for Tofacitinib versus Conventional DMARD
Input Name Lower
ICER
Upper
ICER
Lower
Input*
Upper
Input*
HAQ degradation (annual) for cDMARD $210,460 $379,770 0.01 0.05
Baseline HAQ $252,628 $303,968 1.37 2.03
HAQ >70 Drop $257,072 $288,452 -1.28 -0.86
Coefficient on mTSS for HAQ $258,162 $282,002 0.00 0.02
HAQ 50-70 Drop $261,599 $282,879 -0.91 -0.61
HAQ 20-50 Drop $265,581 $278,302 -0.53 -0.35
HAQ <20 Drop $266,505 $277,188 -0.13 -0.09
Efficacy of secondary DMARDs after failure $267,006 $277,414 0.75 0.92
tofacitinib Adverse Event Discontinuation Rate (per
person half year) $266,427 $276,455 0.02 0.06
tofacitinib mTSS mean difference $267,302 $276,392 0.04 -2.00
Cost per hospital day $268,462 $274,327 1,166.04 3,154.38
Hospital days per HAQ $268,462 $274,327 0.22 0.59
HAQ correction for time on treatment related to mTSS
change $269,783 $273,747 0.40 0.60
Disease Duration $271,241 $272,263 14.99 22.31
Baseline mTSS $271,256 $272,245 43.42 64.58
*Note lower input may reflect either upper or lower ICER value depending on the direction that the input has on
the ICER output.
A probabilistic sensitivity analysis was also conducted to assess variation in all parameters for each
TIM compared to conventional DMARD. None of the Monte Carlo iterations were below $100,000
per QALY gained for any of the TIMs. Table D8 in Appendix D details the percent of iterations under
certain willingness-to-pay thresholds for each TIM when compared to conventional DMARD.
Tocilizumab (sc and iv) had the greatest number (10-27%) of iterations beneath a threshold of
$150,000 per QALY gained. Table D9 in Appendix D details the percent of iterations under certain
willingness-to-pay thresholds for each TIM when compared to the TIM market leader, adalimumab.
Results suggest that the TIMs with favorable deterministic incremental cost-effectiveness ratios as
compared to adalimumab (either < $150,000/QALY or less costly and more effective), were also
highly likely (>90% likely) to be cost-effective compared to adalimumab at a cost-effectiveness
threshold of $150,000/QALY. Figure 4 in Appendix D presents a panel of cost-effectiveness clouds
that compare tocilizumab sc, tofacitinib, and adalimumab. The cost-effectiveness cloud depicts all
the uncertainty in the outputs that was built into the probabilistic sensitivity analysis. Although
there was significant overlap between TIMs in the QALY domain, there is very little overlap between
these featured TIMs when comparing together the two domains of QALYs and costs.

©Institute for Clinical and Economic Review, 2017 Page 85 Evidence Report: Targeted Immune Modulators for Rheumatoid Arthritis Return to Table of Contents
Scenario Analyses Results
Because there is not one standard treatment pathway in RA, the sequential treatment pathway was
varied in scenario analyses. The first scenario analysis changed the fourth treatment strategy from
palliative care in the base-case to a market basket of all TIMs (Table D10 in Appendix D). Findings
were similar to those of the base case.
A second scenario analysis explored a sequential treatment pathway that modeled only one switch
(Table D11 in Appendix D). Results were relatively consistent with the first scenario analysis and
seemed to move all cost-effectiveness findings closer to that of the average TIM versus
conventional DMARD.
Additionally, to account for indirect costs due to absenteeism and unemployment (and the
potential for reductions in each), the perspective was extended to a modified societal one (Table
D12 in Appendix D). Compared to the health care system perspective, the cost-effectiveness ratios
for a modified societal perspective were lower, and tocilizumab (iv and sc) ratios were below the
cost-effectiveness threshold of $150,000 per QALY gained.
Table D13 in Appendix D focuses on three TIMs with evidence in the TIM-experienced population as
combination therapy, using a different set of patient characteristics to better reflect this population
(see Appendix D). The three TIMs with evidence in the TIM-experienced population included:
rituximab, abatacept (iv), and tocilizumab (iv). Across all three TIMs, the cost-effectiveness ratios
remained in the approximate range of $190,000 to $200,000 per QALY.
The final scenario analysis evaluated the base-case results over shorter time horizons (one year and
three years). Results are also presented on a cost per additional responder basis (based on ACR
results) to inform interim clinical findings. Cost-effectiveness of all TIMs worsened as the time
horizon became shorter, approaching $400,000-$820,000 per QALY for a one-year horizon, for
example (see Appendix D, Tables D14-15). While the cost-per-responder analysis is more difficult to
interpret given the absence of a natural benchmark, results tended to follow the same rank order as
the cost-per-QALY scenarios.
Threshold Analyses Results
Table 22 presents the results of the threshold analysis of the base-case using a lifetime horizon and
health care system perspective. Each TIM in combination with conventional DMARD therapy was
compared to conventional DMARD alone. The table presents the WAC per unit, net price per unit
and discount needed to obtain the commonly cited cost-effectiveness thresholds of $50,000,
$100,000, and $150,000 per QALY gained. The estimated net price was higher than the $150,000

©Institute for Clinical and Economic Review, 2017 Page 86 Evidence Report: Targeted Immune Modulators for Rheumatoid Arthritis Return to Table of Contents
threshold price for all TIMs, indicating that larger discounts from current WAC would be required to
achieve even the higher end of the cost-effectiveness threshold range.
Table 22. Threshold Analysis Results
WAC per
unit
Net price
per unit
Unit Price
to Achieve
$50,000
per QALY
Unit Price to
Achieve
$100,000 per
QALY
Unit Price
to Achieve
$150,000
per QALY
Discount from
WAC to reach
thresholds
Rituximab
(100mg)
$835.22 $709.94 $198.78 $369.17 $539.55 35% to 76%
Abatacept iv
(250mg)
$987.03 $690.92 $193.46 $366.19 $538.92 45% to 80%
Abatacept sc
(125mg)
$957.14 $813.57 $203.39 $374.24 $545.09 43% to 79%
Tocilizumab iv
20mg
$94.87 $75.89 $21.25 $41.74 $61.48 35% to 78%
Tocilizumab sc
(162mg)
$898.31 $718.65 $237.15 $438.38 $639.60 29% to 74%
Sarilumab* ------------ $237.15 $445.56 $646.78 -
Tofacitinib
(5mg)
$63.26 $60.10 $13.22 $23.44 $34.26 46% to 79%
Baricitinib* ------------ $13.82 $24.64 $36.06 -
Adalimumab
(40mg)
$2,220.62 $1,554.43 $373.06 $699.49 $1,010.38 55% to 83%
Certolizumab
pegol (200mg)
$1,839.94 $1,287.95 $347.75 $643.98 $927.33 50% to 81%
Etanercept
(50mg)
$1,110.5 $777.35 $209.88 $380.90 $559.69 50% to 81%
Golimumab sc
(50mg)
$4,150.38 $2,905.27 $726.32 $1,365.48 $1,975.58 52% to 82%
Golimumab iv
(50mg)
$1,592.09 $1,114.46 $300.91 $557.23 $824.70 48% to 81%
Infliximab
(100mg)
$1,167.82 $817.47 $220.72 $416.91 $604.93 48% to 81%
*WAC prices for the two investigational drugs were not available as of the date of this report.
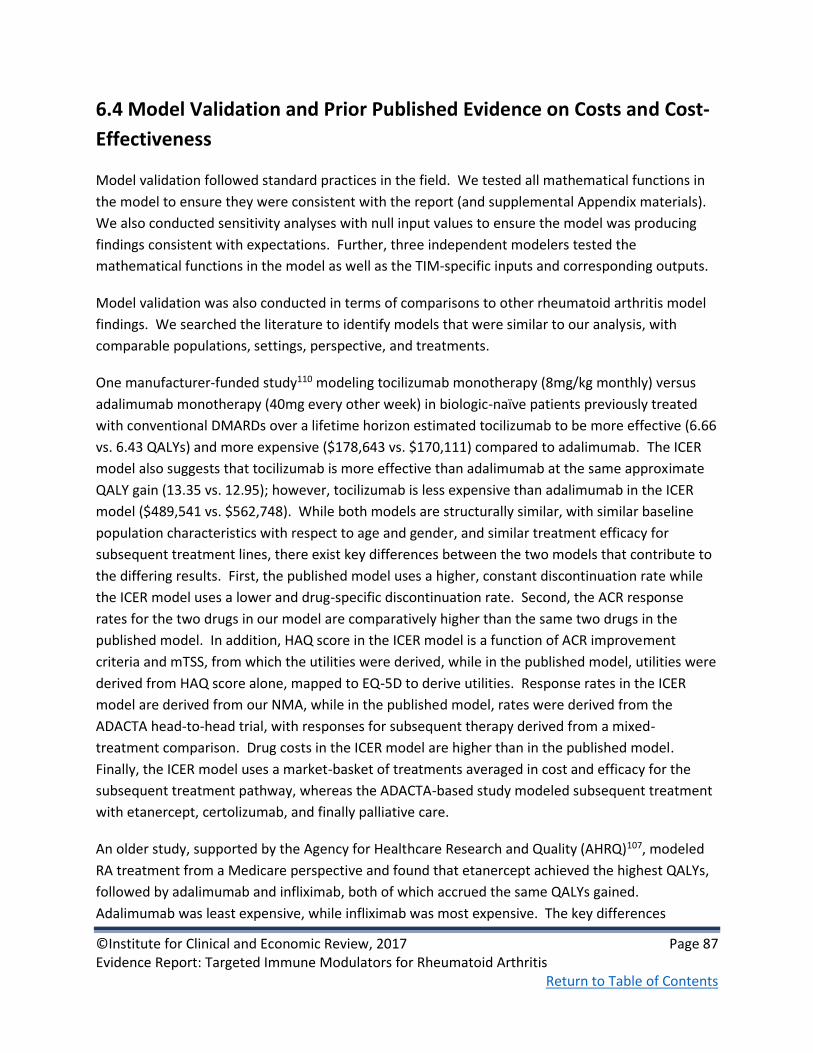
©Institute for Clinical and Economic Review, 2017 Page 87 Evidence Report: Targeted Immune Modulators for Rheumatoid Arthritis Return to Table of Contents
6.4 Model Validation and Prior Published Evidence on Costs and Cost-
Effectiveness
Model validation followed standard practices in the field. We tested all mathematical functions in
the model to ensure they were consistent with the report (and supplemental Appendix materials).
We also conducted sensitivity analyses with null input values to ensure the model was producing
findings consistent with expectations. Further, three independent modelers tested the
mathematical functions in the model as well as the TIM-specific inputs and corresponding outputs.
Model validation was also conducted in terms of comparisons to other rheumatoid arthritis model
findings. We searched the literature to identify models that were similar to our analysis, with
comparable populations, settings, perspective, and treatments.
One manufacturer-funded study110 modeling tocilizumab monotherapy (8mg/kg monthly) versus
adalimumab monotherapy (40mg every other week) in biologic-naïve patients previously treated
with conventional DMARDs over a lifetime horizon estimated tocilizumab to be more effective (6.66
vs. 6.43 QALYs) and more expensive ($178,643 vs. $170,111) compared to adalimumab. The ICER
model also suggests that tocilizumab is more effective than adalimumab at the same approximate
QALY gain (13.35 vs. 12.95); however, tocilizumab is less expensive than adalimumab in the ICER
model ($489,541 vs. $562,748). While both models are structurally similar, with similar baseline
population characteristics with respect to age and gender, and similar treatment efficacy for
subsequent treatment lines, there exist key differences between the two models that contribute to
the differing results. First, the published model uses a higher, constant discontinuation rate while
the ICER model uses a lower and drug-specific discontinuation rate. Second, the ACR response
rates for the two drugs in our model are comparatively higher than the same two drugs in the
published model. In addition, HAQ score in the ICER model is a function of ACR improvement
criteria and mTSS, from which the utilities were derived, while in the published model, utilities were
derived from HAQ score alone, mapped to EQ-5D to derive utilities. Response rates in the ICER
model are derived from our NMA, while in the published model, rates were derived from the
ADACTA head-to-head trial, with responses for subsequent therapy derived from a mixed-
treatment comparison. Drug costs in the ICER model are higher than in the published model.
Finally, the ICER model uses a market-basket of treatments averaged in cost and efficacy for the
subsequent treatment pathway, whereas the ADACTA-based study modeled subsequent treatment
with etanercept, certolizumab, and finally palliative care.
An older study, supported by the Agency for Healthcare Research and Quality (AHRQ)107, modeled
RA treatment from a Medicare perspective and found that etanercept achieved the highest QALYs,
followed by adalimumab and infliximab, both of which accrued the same QALYs gained.
Adalimumab was least expensive, while infliximab was most expensive. The key differences

©Institute for Clinical and Economic Review, 2017 Page 88 Evidence Report: Targeted Immune Modulators for Rheumatoid Arthritis Return to Table of Contents
between this model and ours are: 1) the AHRQ model used a Medicare perspective with
substantially discounted costs while the ICER model uses a broader payer perspective, and 2)
patients move to conventional DMARDs alone immediately following loss of efficacy or AEs
resulting from TIM therapy in the AHRQ model, while in the ICER model conventional DMARDs are
used as a fourth-line option.
A UK-focused microsimulation model, by Stephens et al,109 comparing adalimumab + conventional
DMARD with conventional DMARD alone, yielded 6.83 and 3.79 QALYs for each therapy
respectively, over a 30-year time period. The ICER base-case analysis reflect similar clinical results.
The Stephens model informs the ICER model, relating the mTSS score to HAQ, along with the
contribution of ACR response to HAQ. While both models simulate subsequent therapies after
failure of first therapy, there are certain key differences between both models: 1) Non-responders
in the ICER model are those with ACR<20 while in the Stephens model, are defined as those with
ACR<50; 2) all subsequent therapies after failure of first-line therapy are non-biologics in the
Stephens model, while in the ICER model, a market-basket of biologics is assumed to be second-
and third-line therapy in the base case; 3) the relationship between HAQ and utilities are different
in both models, with the Stephens model using the Health Utility Index Mark 3 and the ICER model
using the EQ-5D (based on the publication by Wailoo et al)107 to derive utilities from HAQ changes;
and 4) lastly, the Stephens model uses a 30-year time horizon while the ICER model uses a lifetime
horizon.
Figure 5 from Appendix D features additional model validation as compared to Stephens et al. 109
for selected TIMs plus conventional DMARD versus conventional DMARD alone on HAQ scores and
undiscounted QALYs over the modeled time horizon. As shown in both Figure 5 in Appendix D and
Figure 3 from Stephens et al., the HAQ score features a distinctive “swoosh-like” shape (i.e., an
initial decline followed by an approximately linear increase over time) with the trend for
conventional DMARD being higher in HAQ across time compared to TIMs plus conventional
DMARD. The HAQ score does not go above 2 in our model for conventional DMARD, whereas the
HAQ increases above 2 after a time horizon of 10 to 15 years in Stephens et al. This difference is
likely due to differences assumed in the HAQ degradation, projected over a long time horizon (and
different data sources due to differences in jurisdiction/perspective). QALY curves also look to have
consistent shapes across models, with the TIM QALY curves being higher than conventional DMARD
alone. The starting QALYs in our model are higher than in Stephen et al., owing to differences in
HAQ-to-utility mappings as well as different HAQ degradation assumptions.
A US-based study by Claxton et al.141 modeled the treatment of tofacitinib monotherapy and
combination therapy versus other TIMs, namely, adalimumab, etanercept, certolizumab pegol and
tocilizumab, in moderate-to-severe RA patients who had failed methotrexate. Unlike in the ICER
model, subsequent lines of therapies were limited to abatacept and rituximab in patients who failed

©Institute for Clinical and Economic Review, 2017 Page 89 Evidence Report: Targeted Immune Modulators for Rheumatoid Arthritis Return to Table of Contents
the first TIM. This decision tree model, with a hypothetical health plan cohort, used a one- and
two-year time horizon and a 6-month cycle length. Treatment efficacy estimates for study drugs,
defined as ACR20 response at six months, were obtained from individual trials directly, unlike in our
model, which derived these estimates from an NMA. The model did not report QALYs, but instead a
cost per-member per-year, total costs, and costs per ACR20 responder. WAC was used for drug
pricing, unlike in the ICER model which used net price per unit. While the one-year tofacitinib costs
in both models were similar (Claxton: $47,788; ICER: $46,793), costs for other TIMs were
substantially higher in the Claxton model. When comparing the cost per additional ACR20
responder, the ICER model showed results almost twice as high for tofacitinib and adalimumab, and
similar costs for etanercept, certolizumab pegol and tocilizumab, compared to the Claxton model.
The higher cost per additional responder for tofacitinib and adalimumab in the ICER model is due to
the significantly lower percentage of initial TIM responders in the ICER model compared to the
Claxton model for these two drugs.
We reviewed other models25,142,143,144,145 as well, but have not included them here owing to factors
such as differences in population setting, perspective, and health care systems. While there may be
distinct differences in model structure and/or key assumptions between these models and ours, it is
clear that a major difference with the older studies in this set relates to estimates of TIM prices,
given the high rate of year-over-year prices increases in this therapeutic area.

©Institute for Clinical and Economic Review, 2017 Page 90 Evidence Report: Targeted Immune Modulators for Rheumatoid Arthritis Return to Table of Contents
7. Value-based Benchmark Prices
Our value-based benchmark prices for each RA treatment are provided in Table 23. As noted in the
initial ICER methods document (http://icer-review.org/wp-content/uploads/2016/02/Value-
Assessment-Framework-slides-for-July-29-webinar-FINAL-corrected-8-22-1.pdf), the value-based
benchmark price for a drug is defined as the price range that would achieve cost-effectiveness
ratios between $100,000 and $150,000 per QALY gained.
For all TIMs, the discounts required to achieve both threshold prices are greater than the current
discounts from WAC, which are lowest (at 5%) for tofacitinib and highest (at 30%) for the TNF
inhibitors as well as abatacept iv. Tocilizumab sc could achieve a $150,000 cost per QALY with a
29% discount, but the best available estimate of current discount levels for tocilizumab is
approximately 20%.
Table 23. Value-based Benchmark Prices for RA Targeted Immune Modulators
WAC per
unit*
Unit Price to Achieve
$100,000 per QALY
Unit Price to Achieve
$150,000 per QALY
Discount from WAC
to reach thresholds*
Average Net Price
Within Benchmark
Range?
Rituximab (100mg) $835.22 $369.17 $539.55 35% to 56% No
Abatacept iv (250mg) $987.03 $366.19 $538.92 45% to 63% No
Abatacept sc (125mg) $957.14 $374.24 $545.09 43% to 61% No
Tocilizumab iv 20mg $94.87 $41.74 $61.48 35% to 56% No
Tocilizumab sc
(162mg)
$898.31 $438.38 $639.60 29% to 51% No
Sarilumab* ------------ $445.56 $646.78 - N/A
Tofacitinib (5mg) $63.26 $23.44 $34.26 46% to 63% No
Baricitinib* ------------ $24.64 $36.06 - N/A
Adalimumab (40mg) $2,220.62 $699.49 $1,010.38 55% to 69% No
Certolizumab pegol
(200mg)
$1,839.94 $643.98 $927.33 50% to 65% No
Etanercept (50mg) $1,110.5 $380.90 $559.69 50% to 66% No
Golimumab sc
(50mg)
$4,150.38 $1,365.48 $1,975.58 52% to 67% No
Golimumab iv (50mg) $1,592.09 $557.23 $824.70 48% to 65% No
Infliximab (100mg) $1,167.82 $416.91 $604.93 48% to 64% No
*WAC as of February 24th, 2017

©Institute for Clinical and Economic Review, 2017 Page 91 Evidence Report: Targeted Immune Modulators for Rheumatoid Arthritis Return to Table of Contents
8. Potential Budget Impact
We used the cost-effectiveness model to estimate the potential total budgetary impact of two new
treatments for moderate-to-severe RA patients: sarilumab (including monotherapy) and baricitinib
(for both of which FDA approval is pending). As the price of these two drugs is currently not known,
we used the prices required to achieve cost-effectiveness thresholds of $50,000, $100,000 and
$150,000 per QALY in our estimates of budget impact. We did not include other therapies modeled
above in this potential budget impact analysis, given their established presence in the market.
Potential Budget Impact Model: Methods
We used results from the same model employed for the cost-effectiveness analyses to estimate
total potential budget impact. Potential budget impact was defined as the total differential cost of
using the new therapy rather than relevant existing therapy for the treated population, calculated
as differential health care costs (including drug costs) minus any offsets in these costs from averted
health care events. All costs were undiscounted and estimated over one- and five-year time
horizons. The five-year timeframe was of primary interest, given the potential for cost offsets to
accrue over time and to see a more realistic impact on the number of patients treated with the new
therapies.
The potential budget impact analysis included the entire candidate population for treatment, which
consisted of adults with moderate-to-severe RA who have previously failed treatment with
conventional DMARDs. To estimate the size of the potential candidate population for treatment
with sarilumab or baricitinib, we first determined the estimated prevalence of RA in the US, which
has been reported as 0.6%.32 Based on our review of the literature, we assumed that 50% of these
patients were moderate-to-severe cases, and 50% of this subset had failed initial treatment with
conventional DMARDs. Applying these proportions to the projected 2016 US population resulted in
an estimate of approximately 486,000 patients in the US over a five-year period.
ICER’s methods for estimating potential budget impact are described in detail elsewhere and have
recently been updated. The intent of our revised approach to budgetary impact is to document the
percentage of patients that could be treated at selected prices without crossing a budget impact
threshold that is aligned with overall growth in the US economy.
Briefly, we evaluate a new drug or device that would take market share from one or more drugs,
and calculate the blended budget impact associated with displacing use of existing therapies with
the new intervention. Based on input from clinical experts and payers, we assumed that sarilumab
and would take market share from tocilizumab (the other drug in its class) and adalimumab (a head-
to-head comparator in clinical trials); similarly, baricitinib would take market share from tofacitinib

©Institute for Clinical and Economic Review, 2017 Page 92 Evidence Report: Targeted Immune Modulators for Rheumatoid Arthritis Return to Table of Contents
and adalimumab. In both cases, we assumed that 70% of new users on the drug would come from
patients using the other drug in its class, and 30% would come from adalimumab. We tested the
potential budget impact of the two new drugs by assuming different unit price points for each
(including monotherapy for sarilumab) - namely price to reach cost-effectiveness thresholds of
$50,000 per QALY, $100,000 per QALY and $150,000 per QALY, against the calculated discounted
WAC for existing drugs.
Using this approach to estimate potential budget impact, we then compared our estimates to an
updated budget impact threshold that represents a potential trigger for policy mechanisms to
improve affordability, such as changes to pricing, payment, or patient eligibility. As described in
ICER’s methods presentation (http://icer-review.org/wp-content/uploads/2016/02/ICER-Value-
Assessment-Proposed-Updates-Webinar-021317.pdf), this threshold is based on an underlying
assumption that health care costs should not grow much faster than growth in the overall national
economy. From this foundational assumption, our potential budget impact threshold is derived
using an estimate of growth in US gross domestic product (GDP) +1%, the average number of new
drug approvals by the FDA over the most recent two-year period, and the contribution of spending
on retail and facility-based drugs to total health care spending. Calculations are performed as
shown in Table 24.
For 2017-18, therefore, the five-year annualized potential budget impact threshold that should
trigger policy actions to manage access and affordability is calculated to total approximately $915
million per year for new drugs.

©Institute for Clinical and Economic Review, 2017 Page 93 Evidence Report: Targeted Immune Modulators for Rheumatoid Arthritis Return to Table of Contents
Table 24. Calculation of Potential Budget Impact Threshold
Item Parameter Estimate Source
1 Growth in US GDP, 2017 (est.) +1% 3.20% World Bank, 2016
2 Total health care spending, 2016 ($) $2.71 trillion CMS NHE, 2014
3 Contribution of drug spending to total health
care spending (%)
17.7% CMS National Health
Expenditures (NHE), 2016;
Altarum Institute, 2014
4 Contribution of drug spending to total health
care spending ($) (Row 2 x Row 3)
$479 billion Calculation
5 Annual threshold for net health care cost
growth for ALL new drugs (Row 1 x Row 4)
$15.3 billion Calculation
6 Average annual number of new molecular
entity approvals, 2013-2014
33.5 FDA, 2016
7 Annual threshold for average cost growth
per individual new molecular entity
(Row 5 ÷ Row 6)
$457.5 million Calculation
8 Annual threshold for estimated potential
budget impact for each individual new
molecular entity (doubling of Row 7)
$915 million
Calculation
Potential Budget Impact Model: Results
Table 25 below illustrates the per-patient budget impact calculations in more detail, based on the
prices to reach $150,000 per QALY for sarilumab ($647 per syringe) and baricitinib ($36 per tablet),
and the discounted WAC price of the TIMs they would be displacing. Note that no data matching
our study entry criteria are available for baricitinib monotherapy, so budget impact was not
calculated.

©Institute for Clinical and Economic Review, 2017 Page 94 Evidence Report: Targeted Immune Modulators for Rheumatoid Arthritis Return to Table of Contents
Table 25. Illustration of Per-Patient Budget Impact Calculation over Five-year Time Horizon
Drugs
Combination therapy Monotherapy
Avg. Annual Per-
Patient Budget Impact
Avg. Annual Per-
Patient Budget Impact
Sarilumab $24,812 $25,324
Adalimumab +
Tocilizumab* $31,185 $33,445
Net -$6,373** -$8,121**
Baricitinib $27,077 N/A
Adalimumab +
Tofacitinib* $42,450 N/A
sNet -$15,373** N/A
*Weighted in the ratio 30:70 for adalimumab:tocilizumab and adalimumab:tofacitinib
†For five-year horizon, drug costs and cost offsets apportioned assuming 20% of patients in uptake target initiate
therapy each year. Those initiating in year 1 receive full drug costs and cost offsets, those initiating in year 2 receive 80% of drug costs and cost offsets, etc. **Indicates cost-saving
When treating the eligible cohort with sarilumab combination therapy, the average potential
budgetary impact (adjusted for differing periods of drug utilization and associated cost-offsets over
the five-year period) results in cost savings at all three cost-effectiveness threshold prices for the
drug, ranging from approximately -$18,400 per patient using the price ($647) to achieve $150,000
per QALY to -$60,800 using the price ($237) to achieve a $50,000 per QALY cost-effectiveness
threshold.
Treating the eligible cohort with sarilumab monotherapy also resulted in cost savings across the
three cost-effectiveness thresholds ranging from approximately -$23,400 per patient using the price
($647) to achieve $150,000 per QALY to approximately -$64,600 using the price ($237) to achieve
the $50,000 per QALY threshold over a five-year time-horizon.
Finally, when treating eligible patients with baricitinib combination therapy, the potential budgetary
impact over five years resulted in cost savings ranging from approximately -$45,200 using the price
($36) to achieve a cost-effectiveness threshold of $150,000 per QALY to approximately -$90,300
using the price ($14) to achieve $50,000 per QALY.

©Institute for Clinical and Economic Review, 2017 Page 95 Evidence Report: Targeted Immune Modulators for Rheumatoid Arthritis Return to Table of Contents
9. Summary and Comment: Long-Term Cost
Effectiveness and Potential Budget Impact
The base-case findings from our analysis suggest that all TIMs provide substantial clinical benefit in
comparison to conventional DMARDs alone; however, their additional costs translate into cost-
effectiveness estimates that exceed commonly-cited thresholds, ranging from approximately
$170,000 to $270,000 per QALY gained. The deterministic findings suggest that all add-on TIMs
were in a relatively small cluster with respect to QALYs gained. Compared to the market leader
adalimumab, most TIMs in combination with conventional DMARD were more favorable (i.e., had
deterministic findings with lower costs and higher QALYs), except for abatacept sc, tofacitinib, and
etanercept. Assuming a willingness-to-pay threshold of $150,000/QALY, etanercept plus
conventional DMARDs was found to be cost-effective as a first-line TIM, while abatacept sc in
combination with conventional DMARDs was estimated to exceed $150,000/QALY, and tofacitinib
was estimated to have higher costs and fewer QALYs gained.
The base-case results were generally robust to the sensitivity analyses. In one-way sensitivity
analyses of deterministic results, annual HAQ degradation was the most influential parameter, with
estimated cost-effectiveness going below $150,000/QALY for abatacept iv, tocilizumab iv, and
tocilizumab sc. In probabilistic sensitivity analysis, tocilizumab iv and tocilizumab sc versus
conventional DMARD therapy (the TIMs with the lowest cost-effectiveness ratio) fell below a
threshold of $150,000 per QALY gained in 10% and 27% of iterations, respectively; for all other
TIMs, that fraction was 4% or less. The probabilistic sensitivity analysis suggested TIMs with
favorable deterministic ICERs as compared to adalimumab (either ICER < $150,000/QALY or less
costly and more effective), were also highly likely (>90% likely) to be cost-effective compared to
adalimumab at a cost-effectiveness threshold of $150,000/QALY. The probabilistic separation
across TIMs appeared to be more in the cost domain rather than in the QALY domain.
Additionally, multiple scenario analyses were conducted to assess the impact of certain model
assumptions and parameters on the results and conclusions. When adding in productivity effects,
tocilizumab iv and sc fell below the cost-effectiveness threshold of $150,000/QALY gained, but
results for other TIMs remained above this threshold. Results for TIMs with evidence in the TIM-
experienced population (rituximab, abatacept iv, and tocilizumab iv) resulted in better cost-
effectiveness ratios, but these remained above $150,000 per QALY gained in all instances.
Finally, results from our budget impact analyses suggest that baricitinib and sarilumab would
decrease costs over the TIMs they would displace (i.e., the other agent in class and adalimumab) if

©Institute for Clinical and Economic Review, 2017 Page 96 Evidence Report: Targeted Immune Modulators for Rheumatoid Arthritis Return to Table of Contents
priced to cost $150,000 per QALY or less. We note, however, that because these two agents are
investigational their prices (and consequent cost-effectiveness ratios) are currently unknown.
Limitations
Limitations to the present study include using one universal hazard ratio for the reduced efficacy of
subsequent treatments, due to the limited drug class-specific data available. This reduced efficacy
was tested in a one-way sensitivity analysis and suggested limited impact on the findings.
Additionally, modeling a homogeneous RA patient cohort limits the ability to account for the
diverse nature of RA treatment. In clinical practice, treatment choice is often based on patients’
individual characteristics and risk factors, which may not be consistent with the model’s sequential
treatment pattern. With a lifetime horizon and a modelling approach that attempts to approximate
reality, treatment discontinuation and switching should be included in the modeling framework. By
averaging over TIM-specific clinical, discontinuation, and cost inputs in the subsequent TIM
treatment patterns modeled, the differential impact of TIMs beyond that of the first-line TIM is
minimized. However, the sequential patterns that were modeled tended to move the cost-
effectiveness findings closer to the average TIM with less possible separation across TIMs.
Note that TIM adherence was not included in this evaluation over and above that of TIM
discontinuation and TIM switching; however, simulated discontinuation rates were similar to those
seen in observational studies. Finally, given the desire to understand comparative value with
measures other than the QALY, we included treatment 1 response estimates (i.e. those remaining
on the first TIM at the one-year and three-year time points) over the one-to-three-year time range,
as well as the average HAQ over time. These disease-specific metrics may be more relevant to
specific decision-makers and stakeholders, but overall tended to follow the same rank order as the
lifetime incremental cost-per-QALY findings.
Conclusions
In summary, our analyses indicate that all the TIMs of interest in this evaluation substantially
improved health outcomes compared to conventional DMARDs alone. However, their additional
cost led to cost-effectiveness estimates that were well above commonly cited thresholds for cost-
effectiveness, and the discounts required to achieve these thresholds are greater than estimated
current discounts from WAC. Compared to the market leader adalimumab, most TIMs in
combination with conventional DMARDs were more favorable (i.e., had deterministic findings with
lower costs and higher QALYs).
©Institute for Clinical and Economic Review, 2017 Page 97 Evidence Report: Targeted Immune Modulators for Rheumatoid Arthritis Return to Table of Contents
10. Summary of the Votes and Considerations for Policy
10.1 About the New England CEPAC Process
During New England CEPAC public meetings, the New England CEPAC Panel deliberates and votes
on key questions related to the systematic review of the clinical evidence, an economic analysis of
the applications of treatments under examination, and the supplementary information presented.
Panel members are not pre-selected based on the topic being addressed and are intentionally
selected to represent a range of expertise and diverse perspectives.
Acknowledging that any judgment of evidence is strengthened by real-life clinical and patient
perspectives, subject matter experts are recruited for each meeting topic and provide input to New
England CEPAC Panel members before the meeting to help clarify their understanding of the
different interventions being analyzed in the evidence review. The same clinical experts serve as a
resource to the New England CEPAC Panel during their deliberation, and help to shape
recommendations on ways the evidence can apply to policy and practice.
At each meeting, after the New England CEPAC Panel votes, a Policy Roundtable discussion is held
with the New England CEPAC Panel, clinical experts, and representatives from payers,
manufacturers and patient groups. The goal of this discussion is to bring stakeholders together to
apply the evidence to guide patient education, clinical practice, and coverage and public policies.
Participants on Policy Roundtables are selected for their expertise on the specific meeting topic, are
different for each meeting, and do not vote on any questions.
At the March 24, 2017 meeting, the New England CEPAC Panel discussed issues regarding the
application of the available evidence to help patients, clinicians, and payers address important
questions related to the use of targeted immune modulators for the treatment of rheumatoid
arthritis. Following the evidence presentation and public comments (public comments from the
meeting can be accessed here, starting at 2:20:29), the New England CEPAC Panel voted on key
questions concerning the comparative clinical effectiveness and comparative value of treatment
options for rheumatoid arthritis. These questions are developed by the ICER research team for each
assessment to ensure that the questions are framed to address the issues that are most important
in applying the evidence to support clinical practice, medical policy decisions, and patient decision-
making. The voting results are presented below, along with comments reflecting considerations
mentioned by New England CEPAC Panel members during the voting process.
In its deliberations and votes related to value, the New England CEPAC Panel made use of a value
assessment framework with four different components of “long term value for money,” a concept
that represents the long-term perspective, at the individual patient level, on patient benefits with a

©Institute for Clinical and Economic Review, 2017 Page 98 Evidence Report: Targeted Immune Modulators for Rheumatoid Arthritis Return to Table of Contents
given intervention and the incremental costs to achieve those benefits. The four components of
long term value for money are comparative clinical effectiveness, estimated incremental cost-
effectiveness, other benefits or disadvantages, and contextual considerations regarding the illness
or therapy. These four components are defined below.
1. Comparative clinical effectiveness is a judgment of the overall difference in clinical
outcomes between two interventions (or between an intervention and placebo), tempered
by the level of certainty possible given the strengths and weaknesses of the body of
evidence. The New England CEPAC uses the ICER Evidence Rating Matrix as its conceptual
framework for considering comparative clinical effectiveness.
2. Estimated incremental cost-effectiveness is the average per-patient incremental cost of one
intervention compared to another to achieve a desired “health gain,” such as an additional
stroke prevented, case of cancer diagnosed, or gain of a year of life. Alternative
interventions are compared in terms of cost per unit of effectiveness, and the resulting
comparison is presented as a cost-effectiveness ratio. Relative certainty in the cost and
outcome estimates continues to be a consideration. As a measure of cost-effectiveness,
ICER follows common academic and World Health Organization (WHO) standards by using
cost per quality-adjusted life years (QALYs) and adopting thresholds at $100,000 per QALY
and $150,000 per QALY as guides to reasonable ratios for cost-effectiveness.
3. Other benefits or disadvantages refers to any significant benefits or disadvantages offered
by the intervention to the individual patient, caregivers, the delivery system, other patients,
or the public that would not have been considered as part of the evidence on comparative
clinical effectiveness. Examples of other benefits include better access to treatment centers,
mechanisms of treatment delivery that require fewer visits to the clinician’s office,
treatments that reduce disparities across various patient groups, and new potential
mechanisms of action for treating clinical conditions that have demonstrated low rates of
response to currently available therapies. Other disadvantages could include increased
burden of treatment on patients or their caregivers. For each intervention evaluated, it will
be open to discussion whether other benefits or disadvantages such as these are important
enough to factor into the overall judgment of care value. There is no quantitative measure
for other benefits or disadvantages.
4. Contextual considerations include ethical, legal, or other issues (but not cost) that influence
the relative priority of illnesses and interventions. Examples of contextual considerations
include whether there are currently any existing treatments for the condition, whether the
condition severely affects quality of life or not, and whether the condition affects priority
populations. There is no quantitative measure for contextual considerations.
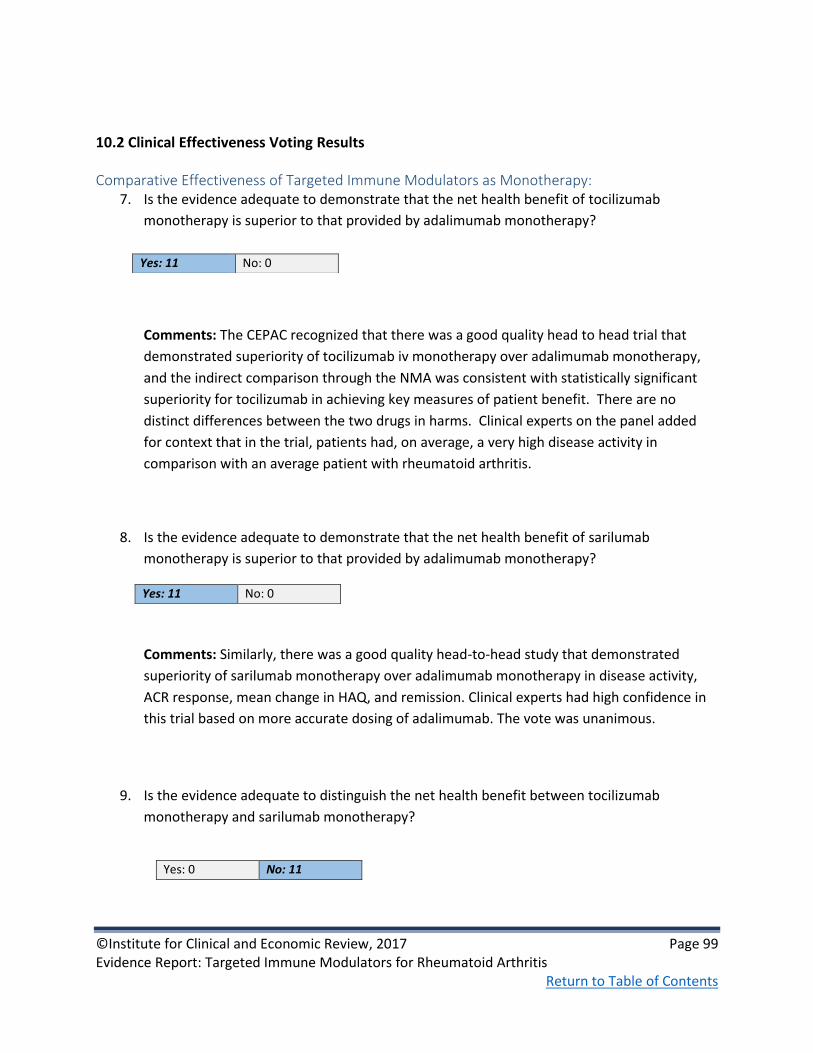
©Institute for Clinical and Economic Review, 2017 Page 99 Evidence Report: Targeted Immune Modulators for Rheumatoid Arthritis Return to Table of Contents
10.2 Clinical Effectiveness Voting Results
Comparative Effectiveness of Targeted Immune Modulators as Monotherapy: 7. Is the evidence adequate to demonstrate that the net health benefit of tocilizumab
monotherapy is superior to that provided by adalimumab monotherapy?
Comments: The CEPAC recognized that there was a good quality head to head trial that
demonstrated superiority of tocilizumab iv monotherapy over adalimumab monotherapy,
and the indirect comparison through the NMA was consistent with statistically significant
superiority for tocilizumab in achieving key measures of patient benefit. There are no
distinct differences between the two drugs in harms. Clinical experts on the panel added
for context that in the trial, patients had, on average, a very high disease activity in
comparison with an average patient with rheumatoid arthritis.
8. Is the evidence adequate to demonstrate that the net health benefit of sarilumab
monotherapy is superior to that provided by adalimumab monotherapy?
Comments: Similarly, there was a good quality head-to-head study that demonstrated
superiority of sarilumab monotherapy over adalimumab monotherapy in disease activity,
ACR response, mean change in HAQ, and remission. Clinical experts had high confidence in
this trial based on more accurate dosing of adalimumab. The vote was unanimous.
9. Is the evidence adequate to distinguish the net health benefit between tocilizumab
monotherapy and sarilumab monotherapy?
Yes: 11 No: 0
Yes: 11 No: 0
Yes: 0 No: 11

©Institute for Clinical and Economic Review, 2017 Page 100 Evidence Report: Targeted Immune Modulators for Rheumatoid Arthritis Return to Table of Contents
Comments: There were no head to head studies that compared these two therapies, and
the findings through the network meta-analysis did not find significant differences between
the two. The vote was unanimous.
10. Is the evidence adequate to demonstrate that the net health benefit of tofacitinib
monotherapy is superior to that provided by adalimumab monotherapy?
Comments: There were no head to head trials that compared these two therapies, and the
findings through the network meta-analysis were not statistically significant. The vote was
unanimous.
11. Is the evidence adequate to demonstrate that the net health benefit of baricitinib
monotherapy is superior to that provided by adalimumab monotherapy?
Comments: There were no head to head trials that compared these two therapies, and the
findings through the network meta-analysis were not statistically significant. The vote was
unanimous.
12. Is the evidence adequate to distinguish the net health benefit between tofacitinib
monotherapy and baricitinib monotherapy?
Comments: There were no head to head trials that compared these two therapies, and the
findings through the network meta-analysis were not statistically significant. The vote was
unanimous.
Comparative Effectiveness of Targeted Immune Modulators in Combination With cDMARDs:
14. Is the evidence adequate to demonstrate that the net health benefit of tocilizumab +
cDMARD therapy is superior to that provided by adalimumab + cDMARD therapy?
Yes: 0 No: 11
Yes: 0 No: 11
Yes: 0 No: 11
Yes: 1 No: 10

©Institute for Clinical and Economic Review, 2017 Page 101 Evidence Report: Targeted Immune Modulators for Rheumatoid Arthritis Return to Table of Contents
Comments: There were no head to head trials that compared these two therapies, and the
findings through the network meta-analysis were not statistically significant. However,
there was a discussion about whether the evidence demonstrating superiority of
tocilizumab monotherapy versus adalimumab monotherapy was sufficient to conclude that
tocilizumab would be superior when used in combination therapy as well. The vote of one
CEPAC panel member was swayed by this consideration.
15. Is the evidence adequate to demonstrate that the net health benefit of sarilumab +
cDMARD therapy is superior to that provided by adalimumab + cDMARD therapy?
Comments: There were no head to head trials that compared these two therapies, and the
findings through the network meta-analysis were not statistically significant. The vote was
unanimous.
16. Is the evidence adequate to distinguish the net health benefit between tocilizumab +
cDMARD therapy and sarilumab + cDMARD therapy?
Comments: There were no head to head trials that compared these two therapies, and the
findings through the network meta-analysis were not statistically significant. The vote was
unanimous.
17. Is the evidence adequate to demonstrate that the net health benefit of tofacitinib
+cDMARD therapy is superior to that provided by adalimumab + cDMARD therapy?
Comments: There was one good quality head to head trial that compared tofacitinib
combination therapy with adalimumab combination therapy. The comparison yielded no
statistical differences between the two therapies. The vote was unanimous.
Yes: 0 No: 11
Yes: 0 No: 11
Yes: 0 No: 11

©Institute for Clinical and Economic Review, 2017 Page 102 Evidence Report: Targeted Immune Modulators for Rheumatoid Arthritis Return to Table of Contents
18. Is the evidence adequate to demonstrate that the net health benefit of baricitinib +
cDMARD therapy is superior to that provided by adalimumab + cDMARD therapy?
Comments: There was one head to head trial that compared these two therapies when
used in combination therapy. The findings suggested statistically significant, modest
improvements in disease activity, ACR response, and HAQ. There was a discussion about
other findings in the study that were not statistically different, such as remission. One panel
member also acknowledged the improvement in pain and fatigue for those patients in the
baricitinib arm. The vote on this question was split. Those who voted yes said that the
statistical improvement in many of the primary measurements was sufficient to
demonstrate superiority of baricitinib. Several panel members who voted no noted the
inconsistent outcomes, and that there was no difference in clinical remission, which is
important to patients and clinicians. They also emphasized the unknown safety effects of
baricitinib as new drug that has not yet entered the market.
19. Is the evidence adequate to distinguish the net health benefit between tofacitinib +
cDMARD therapy and baricitinib + cDMARD therapy?
Comments: There were no head to head trials that compared these two therapies, and the
findings through the network meta-analysis were not statistically significant. The vote was
unanimous.
Comparative Value of Targeted Immune Modulators (TIM):
10.3 Care Value Voting Results
20. Given the available evidence on comparative effectiveness and incremental cost-
effectiveness, and considering other benefits, disadvantages, and contextual
considerations, what is the long-term value for money for tocilizumab monotherapy in
comparison to adalimumab monotherapy?
Yes: 6 No: 5
Yes: 0 No: 11
Low: 0 Intermediate: 4 High: 7
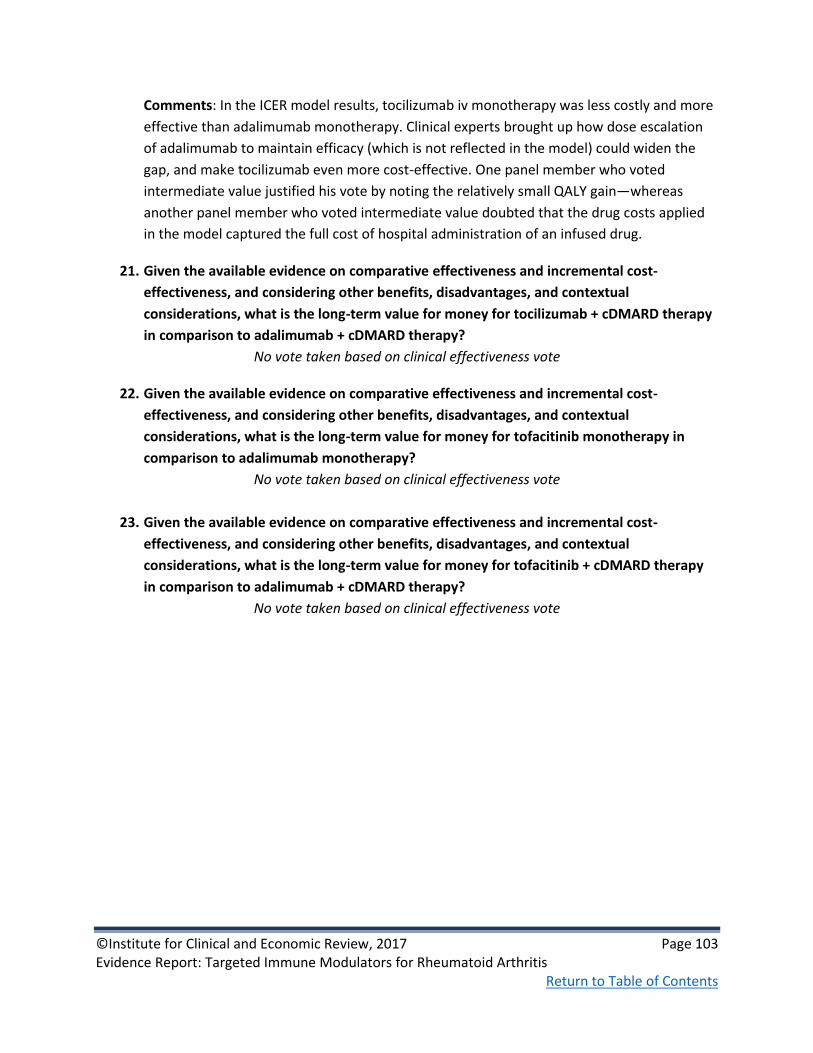
©Institute for Clinical and Economic Review, 2017 Page 103 Evidence Report: Targeted Immune Modulators for Rheumatoid Arthritis Return to Table of Contents
Comments: In the ICER model results, tocilizumab iv monotherapy was less costly and more
effective than adalimumab monotherapy. Clinical experts brought up how dose escalation
of adalimumab to maintain efficacy (which is not reflected in the model) could widen the
gap, and make tocilizumab even more cost-effective. One panel member who voted
intermediate value justified his vote by noting the relatively small QALY gain—whereas
another panel member who voted intermediate value doubted that the drug costs applied
in the model captured the full cost of hospital administration of an infused drug.
21. Given the available evidence on comparative effectiveness and incremental cost-
effectiveness, and considering other benefits, disadvantages, and contextual
considerations, what is the long-term value for money for tocilizumab + cDMARD therapy
in comparison to adalimumab + cDMARD therapy?
No vote taken based on clinical effectiveness vote
22. Given the available evidence on comparative effectiveness and incremental cost-
effectiveness, and considering other benefits, disadvantages, and contextual
considerations, what is the long-term value for money for tofacitinib monotherapy in
comparison to adalimumab monotherapy?
No vote taken based on clinical effectiveness vote
23. Given the available evidence on comparative effectiveness and incremental cost-
effectiveness, and considering other benefits, disadvantages, and contextual
considerations, what is the long-term value for money for tofacitinib + cDMARD therapy
in comparison to adalimumab + cDMARD therapy?
No vote taken based on clinical effectiveness vote
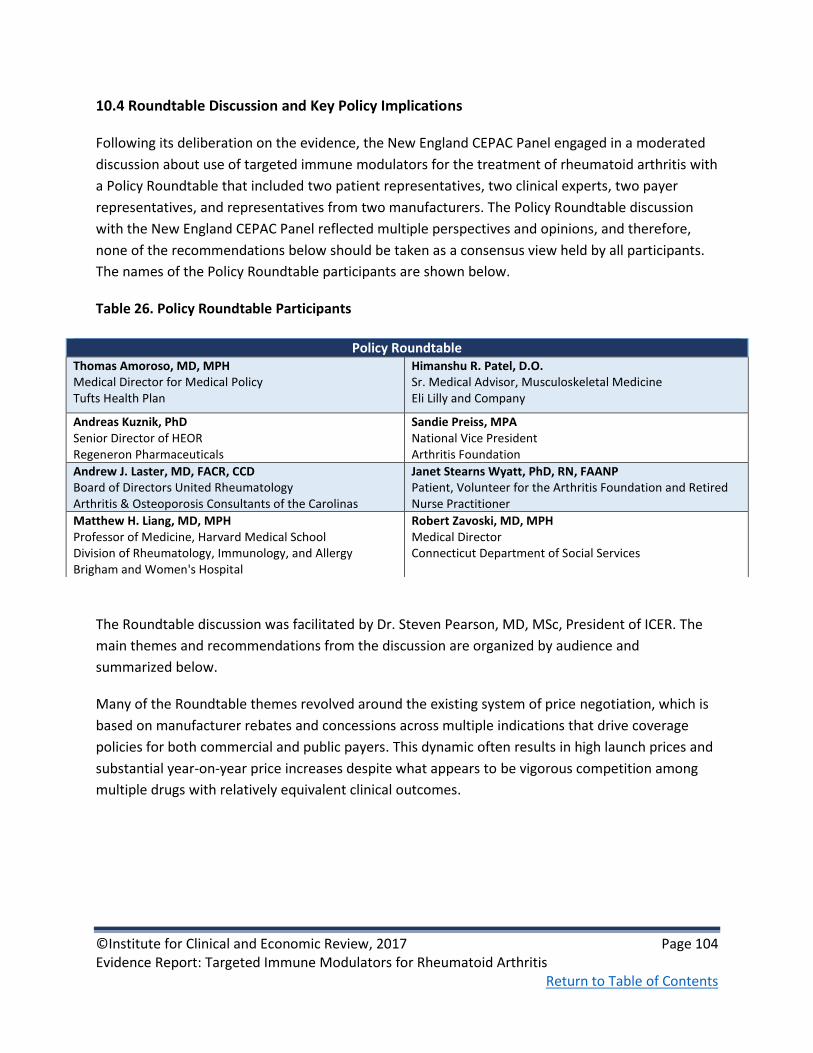
©Institute for Clinical and Economic Review, 2017 Page 104 Evidence Report: Targeted Immune Modulators for Rheumatoid Arthritis Return to Table of Contents
10.4 Roundtable Discussion and Key Policy Implications
Following its deliberation on the evidence, the New England CEPAC Panel engaged in a moderated
discussion about use of targeted immune modulators for the treatment of rheumatoid arthritis with
a Policy Roundtable that included two patient representatives, two clinical experts, two payer
representatives, and representatives from two manufacturers. The Policy Roundtable discussion
with the New England CEPAC Panel reflected multiple perspectives and opinions, and therefore,
none of the recommendations below should be taken as a consensus view held by all participants.
The names of the Policy Roundtable participants are shown below.
Table 26. Policy Roundtable Participants
The Roundtable discussion was facilitated by Dr. Steven Pearson, MD, MSc, President of ICER. The
main themes and recommendations from the discussion are organized by audience and
summarized below.
Many of the Roundtable themes revolved around the existing system of price negotiation, which is
based on manufacturer rebates and concessions across multiple indications that drive coverage
policies for both commercial and public payers. This dynamic often results in high launch prices and
substantial year-on-year price increases despite what appears to be vigorous competition among
multiple drugs with relatively equivalent clinical outcomes.
Policy Roundtable Thomas Amoroso, MD, MPH Medical Director for Medical Policy Tufts Health Plan
Himanshu R. Patel, D.O. Sr. Medical Advisor, Musculoskeletal Medicine Eli Lilly and Company
Andreas Kuznik, PhD Senior Director of HEOR Regeneron Pharmaceuticals
Sandie Preiss, MPA National Vice President Arthritis Foundation
Andrew J. Laster, MD, FACR, CCD Board of Directors United Rheumatology Arthritis & Osteoporosis Consultants of the Carolinas
Janet Stearns Wyatt, PhD, RN, FAANP Patient, Volunteer for the Arthritis Foundation and Retired Nurse Practitioner
Matthew H. Liang, MD, MPH Professor of Medicine, Harvard Medical School Division of Rheumatology, Immunology, and Allergy Brigham and Women's Hospital
Robert Zavoski, MD, MPH Medical Director Connecticut Department of Social Services

©Institute for Clinical and Economic Review, 2017 Page 105 Evidence Report: Targeted Immune Modulators for Rheumatoid Arthritis Return to Table of Contents
Payers and Pharmacy Benefit Managers
1. Consider including in prior authorization processes the requirement that conventional
DMARD therapy dosing be optimized before initiating TIM therapy.
Clinicians on the Roundtable commented that patients often receive sub-optimal doses of
conventional DMARDs such as methotrexate, and may therefore switch to TIM therapy
before clinically necessary. Optimization strategies can include periodic testing for
methotrexate polyglutamate levels to ensure therapeutic dosing, and should be employed
in prior authorization processes as feasible.
2. If step therapy protocols require patients to fail one or two TNFα inhibitors before
switching to another TIM, develop a quick and transparent exception process for specific
situations.
Patient testimony and clinicians on the Roundtable and CEPAC panel described onerous
processes for getting exceptions to standard step-therapy protocols in RA, which typically
involve a trial of adalimumab and/or etanercept before another TIM can be used. These
processes, which may involve multiple phone calls at different points during the protocol,
should be streamlined to allow for rapid exceptions in specific situations, such as clear
contraindications, specific comorbidities, and issues of both geographic (e.g., infusion clinic)
and financial (e.g., patient costs for infusion vs. self-administration) barriers in patient
access.
3. Payers should reach out to providers to learn from their experience with prior
authorization in order to streamline and improve the process.
Payers on the Roundtable felt that their prior authorization processes are already
reasonably streamlined, but providers disagreed. The ensuing discussion made it clear that
there is no current vehicle for a collaborative effort to improve the process. Payers should
therefore engage provider groups with a goal of developing an approach to prior
authorization that both sides are comfortable with.
4. Allow patients who are stable on effective treatment to remain on therapy when they
change insurers.
New health plan enrollees with RA are sometimes required to start at the beginning of a
step-therapy protocol even if they are on a stable later-line treatment that is working for
them. This practice should be stopped, so that new patients can continue treatment
without interruption.
5. Reconsider step therapy if pricing becomes better aligned with clinical value.

©Institute for Clinical and Economic Review, 2017 Page 106 Evidence Report: Targeted Immune Modulators for Rheumatoid Arthritis Return to Table of Contents
At current prices, our analysis indicates that all of the TIMs under review exceed common
cost-effectiveness thresholds but have comparable levels of effectiveness. Step therapy is
not an unreasonable approach in this case, as the focus can be on the less expensive (or
most heavily discounted) TIMs. However, if pricing were to become better aligned with
clinical value for these therapies, payers should reconsider whether step therapy remains a
viable option.
6. Negotiate better rebates and share savings with patients.
The number of TIMs indicated for RA (nine, with two more nearing FDA approval) suggests
that payers and PBMs with significant market leverage should be able to negotiate even
more favorable discounts and rebates than they already receive. Additional leverage might
be gained as an increasing number of biosimilars to the TNFα inhibitors enter the market,
since these will also carry multiple indications and evidence accumulated to date suggests
that they are clinically equivalent to the originator products. Savings from more aggressive
negotiations should be shared with patients, who are struggling to keep up with year-over-
year price increases.
7. Increase transparency around the role of discounting and rebate practice in formulary
design.
Patients and providers expressed concerns around a lack of transparency regarding the
connection between discounting/rebate practice and formulary design, as the terms are
typically confidential and current designs do not always lead to cost-effective choices. For
example, many of the TIMs in our review were more effective than adalimumab in head-to-
head study and also less expensive, but are disadvantaged in most formulary designs.
Transparency is an important first step in educating the general public on the role of rebates
in formulary design as well as how the savings are shared between patients, PBMs, and
health plans.
8. Design innovative risk-sharing payment agreements, including pay-for-performance
contracts with manufacturers, value-based contracting with accountable care
organizations, and indication-specific pricing.
The Roundtable discussion mentioned other efforts that might yield cost savings beyond
price reductions and rebate negotiations. Pay-for-performance agreements have increased
in popularity; as a relevant example, payers might receive an additional rebate for patients
who do not achieve clinical remission during TIM therapy. Payers could also develop
contracts with ACOs that share both financial risk and savings for optimized use and
sequencing of TIM therapies. Finally, if TIMs with multiple indications beyond RA (e.g.,
Crohn’s disease, psoriasis) show markedly different clinical performance and costs,
indication-specific formularies should be developed to recognize these differences.

©Institute for Clinical and Economic Review, 2017 Page 107 Evidence Report: Targeted Immune Modulators for Rheumatoid Arthritis Return to Table of Contents
Providers, Clinical Societies, and Payers
9. Develop clinical guidelines and coverage policies that closely align with the evidence
on outcomes of patients stratified by prognostic factors, allowing for earlier use of
TIM therapy in patients with poor prognostic factors.
Patients with RA need to be brought under control quickly. Better risk stratification can
help to identify those patients who are unlikely to achieve rapid control. Major guideline
statements already recognize the need for aggressive treatment in patients with poor
prognostic factors such as high levels of inflammatory markers or early joint erosions;
coverage policies and provider practice should follow suit.
Clinical Societies and Manufacturers
10. Establish standardized assessments to allow for rigorous direct and indirect
comparisons of evidence across studies and therapeutic alternatives.
The field of rheumatology should be applauded for its work in developing core sets of
clinical and patient-reported outcome measures with strong internal and external validity in
RA clinical studies. However, these measures have proliferated, with variations on the same
theme (e.g., multiple disease activity and radiographic progression measures) making cross-
study comparisons problematic. Clinical societies and manufacturers should collaborate to
develop a standardized and limited “must have” list of clinical outcome measures for clinical
trials and post marketing studies.
Public Policy Decision Makers
11. In a dysfunctional market system, in order to protect patients today and improve their
future access to innovative therapies, policy makers may need to consider some form
of regulatory intervention to ensure that drug prices and price increases do not
continue their current upward trajectory, taking them further from reasonable
alignment with the added benefits to patients.
Discussion highlighted that the current “marketplace” for RA drugs is not working to align
prices with value in a way that would reward new innovative drugs while also reaping the
benefits of competition to keep drugs affordable. One result is that patients and clinicians
face heavy access restrictions from insurers who lack other effective methods to control
unsustainable cost increases. In addition, innovative companies cannot compete on price
for RA-specific products in the face of rebate-driven agreements that cover multiple
indications beyond RA. If some or all of the measures described above cannot be

©Institute for Clinical and Economic Review, 2017 Page 108 Evidence Report: Targeted Immune Modulators for Rheumatoid Arthritis Return to Table of Contents
implemented or are not effective, policymakers should consider some form of regulatory
intervention to address rebate structures and price increases in order to increase true
competition and better protect patients.

©Institute for Clinical and Economic Review, 2017 Page 109 Evidence Report: Targeted Immune Modulators for Rheumatoid Arthritis Return to Table of Contents
References
1. Helmick CG, Felson DT, Lawrence RC, et al. Estimates of the prevalence of arthritis and other rheumatic conditions in the United States. Part I. Arthritis Rheum. 2008;58(1):15-25.
2. Crane MM, Juneja M, Allen J, et al. Epidemiology and Treatment of New-Onset and Established Rheumatoid Arthritis in an Insured US Population. Arthritis Care Res (Hoboken). 2015;67(12):1646-1655.
3. Huizinga TW, Pincus T. In the clinic. Rheumatoid arthritis. Ann Intern Med. 2010;153(1):ITC1-1-ITC1-15; quiz ITC11-16.
4. Aletaha D, Neogi T, Silman AJ, et al. 2010 rheumatoid arthritis classification criteria: an American College of Rheumatology/European League Against Rheumatism collaborative initiative. Ann Rheum Dis. 2010;69(9):1580-1588.
5. van Nies JA, de Jong Z, van der Helm-van Mil AH, Knevel R, Le Cessie S, Huizinga TW. Improved treatment strategies reduce the increased mortality risk in early RA patients. Rheumatology (Oxford). 2010;49(11):2210-2216.
6. Dennis G, Jr., Holweg CT, Kummerfeld SK, et al. Synovial phenotypes in rheumatoid arthritis correlate with response to biologic therapeutics. Arthritis research & therapy. 2014;16(2):R90.
7. Anderson J, Caplan L, Yazdany J, et al. Rheumatoid arthritis disease activity measures: American College of Rheumatology recommendations for use in clinical practice. Arthritis Care Res (Hoboken). 2012;64(5):640-647.
8. Singh JA, Saag KG, Bridges SL, Jr., et al. 2015 American College of Rheumatology Guideline for the Treatment of Rheumatoid Arthritis. Arthritis & rheumatology (Hoboken, N.J.). 2016;68(1):1-26.
9. Smolen JS, Aletaha D, Bijlsma JW, et al. Treating rheumatoid arthritis to target: recommendations of an international task force. Ann Rheum Dis. 2010;69(4):631-637.
10. American College of Rheumatology, Academy for Academic Leadership. Workforce Study of Rheumatology Specialists in the United States. 2015; http://www.rheumatology.org/portals/0/files/ACR-Workforce-Study-2015.pdf. Accessed December 22, 2016.
11. International Foundation for Autoimmune Arthritis. Early Symptoms of Autoimmune Arthritis. Investigation into patient-reported symptoms of early disease and onset experiences. 2015; http://nebula.wsimg.com/f6d485aef25c35f9cb2abc87fdcc03e6?AccessKeyId=9BD8916C246CAC51B04E&disposition=0&alloworigin=1. Accessed December 21, 2016.
12. Nair SC, Bijlsma JW, van der Werf JH, et al. Do radiographic joint damage and disease activity influence functional disability through different mechanisms? Direct and indirect effects of disease activity in established rheumatoid arthritis. J Rheumatol. 2013;40(9):1505-1512.
13. Baecklund E, Iliadou A, Askling J, et al. Association of chronic inflammation, not its treatment, with increased lymphoma risk in rheumatoid arthritis. Arthritis Rheum. 2006;54(3):692-701.
14. Wolfe F, Michaud K. The effect of methotrexate and anti-tumor necrosis factor therapy on the risk of lymphoma in rheumatoid arthritis in 19,562 patients during 89,710 person-years of observation. Arthritis Rheum. 2007;56(5):1433-1439.
15. Rubenfire A. Rheumatoid arthritis drug prices on the rise. Modern Healthcare. April 1, 2016; http://www.modernhealthcare.com/article/20160401/NEWS/160409993. Accessed December 22, 2016.

©Institute for Clinical and Economic Review, 2017 Page 110 Evidence Report: Targeted Immune Modulators for Rheumatoid Arthritis Return to Table of Contents
16. Langreth R, Keller M, Cannon CP. Decoding Big Pharma's Secret Drug Pricing Practices. Bloomberg. June 29, 2016; https://www.bloomberg.com/graphics/2016-drug-prices/. Accessed December 22, 2016.
17. PharmaCompass. Top drugs by sales revenue in 2015: Who sold the biggest blockbuster drugs? March 10, 2016; http://www.pharmacompass.com/radio-compass-blog/top-drugs-by-sales-revenue-in-2015-who-sold-the-biggest-blockbuster-drugs. Accessed December 22, 2016.
18. Burmester GR, Lin Y, Patel R, et al. Efficacy and safety of sarilumab monotherapy versus adalimumab monotherapy for the treatment of patients with active rheumatoid arthritis (MONARCH): a randomised, double-blind, parallel-group phase III trial. Ann Rheum Dis. 2016.
19. Gabay C, Emery P, van Vollenhoven R, et al. Tocilizumab monotherapy versus adalimumab monotherapy for treatment of rheumatoid arthritis (ADACTA): a randomised, double-blind, controlled phase 4 trial. Lancet (London, England). 2013;381(9877):1541-1550.
20. Jobanputra P, Maggs F, Deeming A, et al. A randomised efficacy and discontinuation study of etanercept versus adalimumab (RED SEA) for rheumatoid arthritis: A pragmatic, unblinded, non-inferiority study of first TNF inhibitor use: Outcomes over 2 years. BMJ Open. 2012;2(6).
21. Taylor P, Keystone E, Van Der Heijde D, et al. Baricitinib versus placebo or adalimumab in patients with active rheumatoid arthritis (RA) and an inadequate response to background methotrexate therapy: Results of a phase 3 study. Arthritis and Rheumatology. 2015;67(no pagination).
22. Schiff M, Weinblatt ME, Valente R, et al. Head-to-head comparison of subcutaneous abatacept versus adalimumab for rheumatoid arthritis: two-year efficacy and safety findings from AMPLE trial. Ann Rheum Dis. 2014;73(1):86-94.
23. Schiff M, Keiserman M, Codding C, et al. Efficacy and safety of abatacept or infliximab vs placebo in ATTEST: a phase III, multi-centre, randomised, double-blind, placebo-controlled study in patients with rheumatoid arthritis and an inadequate response to methotrexate. Ann Rheum Dis. 2008;67(8):1096-1103.
24. Singh J, Hossain A, Tanjong Ghogomu E, et al. Biologics or tofacitinib for rheumatoid arthritis in incomplete responders to methotrexate or other traditional disease-modifying anti-rheumatic drugs: a systematic review and network meta-analysis. Cochrane Database Syst Rev. 2016(5).
25. Stevenson M, Archer R, Tosh J, et al. Adalimumab, etanercept, infliximab, certolizumab pegol, golimumab, tocilizumab and abatacept for the treatment of rheumatoid arthritis not previously treated with disease-modifying antirheumatic drugs and after the failure of conventional disease-modifying antirheumatic drugs only: systematic review and economic evaluation. Health Technol Assess. 2016;20(35):1-610.
26. National Institute for Health and Care Excellence. NICE DSU Technical Support Document 3. Heterogeneity: Subgroups, Meta-Regression, Bias and Bias-Adjustment. 2011; http://www.nicedsu.org.uk/TSD3%20Heterogeneity.final%20report.08.05.12.pdf. Accessed August 23, 2016.
27. Gottenberg JE, Brocq O, Perdriger A, et al. Non-TNF-Targeted Biologic vs a Second Anti-TNF Drug to Treat Rheumatoid Arthritis in Patients With Insufficient Response to a First Anti-TNF Drug: A Randomized Clinical Trial. Jama. 2016;316(11):1172-1180.
28. Favalli EG, Biggioggero M, Marchesoni A, Meroni PL. Survival on treatment with second-line biologic therapy: a cohort study comparing cycling and swap strategies. Rheumatology (Oxford). 2014;53(9):1664-1668.
29. Kim HL, Lee MY, Park SY, et al. Comparative effectiveness of cycling of tumor necrosis factor-alpha (TNF-alpha) inhibitors versus switching to non-TNF biologics in rheumatoid arthritis

©Institute for Clinical and Economic Review, 2017 Page 111 Evidence Report: Targeted Immune Modulators for Rheumatoid Arthritis Return to Table of Contents
patients with inadequate response to TNF-alpha inhibitor using a Bayesian approach. Archives of pharmacal research. 2014;37(5):662-670.
30. Lloyd S, Bujkiewicz S, Wailoo AJ, Sutton AJ, Scott D. The effectiveness of anti-TNF-alpha therapies when used sequentially in rheumatoid arthritis patients: a systematic review and meta-analysis. Rheumatology (Oxford). 2010;49(12):2313-2321.
31. Athanasakis K, Tarantilis F, Tsalapati K, Konstantopoulou T, Vritzali E, Kyriopoulos J. Cost-utility analysis of tocilizumab monotherapy in first line versus standard of care for the treatment of rheumatoid arthritis in Greece. Rheumatol Int. 2015;35(9):1489-1495.
32. Lawrence RC, Felson DT, Helmick CG, et al. Estimates of the prevalence of arthritis and other rheumatic conditions in the United States: Part II. Arthritis Rheum. 2008;58(1):26-35.
33. Moher D, Liberati A, Tetzlaff J, Altman DG. Preferred reporting items for systematic reviews and meta-analyses: the PRISMA statement. International journal of surgery (London, England). 2010;8(5):336-341.
34. Warn DE, Thompson SG, Spiegelhalter DJ. Bayesian random effects meta-analysis of trials with binary outcomes: methods for the absolute risk difference and relative risk scales. Statistics in medicine. 2002;21(11):1601-1623.
35. Weiss JE, Ilowite NT. Juvenile idiopathic arthritis. Rheumatic diseases clinics of North America. 2007;33(3):441-470, vi.
36. Mian AN, Ibrahim F, Scott IC, et al. Changing clinical patterns in rheumatoid arthritis management over two decades: sequential observational studies. BMC Musculoskelet Disord. 2016;17:44.
37. David G. Rheumatoid Arthritis and Joint Replacement: Impact of Biologics. American journal of pharmacy benefits. 2014;6(6):9.
38. Bartels CM, Bell CL, Shinki K, Rosenthal A, Bridges AJ. Changing trends in serious extra-articular manifestations of rheumatoid arthritis among United State veterans over 20 years. Rheumatology (Oxford). 2010;49(9):1670-1675.
39. Widdifield J, Bernatsky S, Paterson JM, et al. Trends in Excess Mortality Among Patients With Rheumatoid Arthritis in Ontario, Canada. Arthritis Care Res (Hoboken). 2015;67(8):1047-1053.
40. Zhang Y, Lu N, Peloquin C, et al. Improved survival in rheumatoid arthritis: a general population-based cohort study. Ann Rheum Dis. 2016.
41. Ortiz EC, Shinada S. Evolution of classification criteria for rheumatoid arthritis: how do the 2010 criteria perform? Rheumatic diseases clinics of North America. 2012;38(2):345-353.
42. Smolen JS, Landewe R, Breedveld FC, et al. EULAR recommendations for the management of rheumatoid arthritis with synthetic and biological disease-modifying antirheumatic drugs: 2013 update. Ann Rheum Dis. 2014;73(3):492-509.
43. Seo JH. Overview of immunosuppressive and conventional (non-biologic) disease-modifying drugs in the rheumatic diseases. Furst DE, ed. 2016; UpToDate. Waltham, MA. Accessed January 5, 2017.
44. Curtis JR, Zhang J, Xie F, et al. Use of oral and subcutaneous methotrexate in rheumatoid arthritis patients in the United States. Arthritis Care Res (Hoboken). 2014;66(11):1604-1611.
45. Braun J, Kastner P, Flaxenberg P, et al. Comparison of the clinical efficacy and safety of subcutaneous versus oral administration of methotrexate in patients with active rheumatoid arthritis: results of a six-month, multicenter, randomized, double-blind, controlled, phase IV trial. Arthritis Rheum. 2008;58(1):73-81.

©Institute for Clinical and Economic Review, 2017 Page 112 Evidence Report: Targeted Immune Modulators for Rheumatoid Arthritis Return to Table of Contents
46. Hoekstra M, Haagsma C, Neef C, Proost J, Knuif A, van de Laar M. Bioavailability of higher dose methotrexate comparing oral and subcutaneous administration in patients with rheumatoid arthritis. J Rheumatol. 2004;31(4):645-648.
47. Schiff MH, Jaffe JS, Freundlich B. Head-to-head, randomised, crossover study of oral versus subcutaneous methotrexate in patients with rheumatoid arthritis: drug-exposure limitations of oral methotrexate at doses >/=15 mg may be overcome with subcutaneous administration. Ann Rheum Dis. 2014;73(8):1549-1551.
48. Hazlewood GS, Thorne JC, Pope JE, et al. The comparative effectiveness of oral versus subcutaneous methotrexate for the treatment of early rheumatoid arthritis. Ann Rheum Dis. 2016;75(6):1003-1008.
49. Manara M, Bianchi G, Bruschi E, et al. Adherence to current recommendations on the use of methotrexate in rheumatoid arthritis in Italy: results from the MARI study. Clin Exp Rheumatol. 2016;34(3):473-479.
50. Visser K, Katchamart W, Loza E, et al. Multinational evidence-based recommendations for the use of methotrexate in rheumatic disorders with a focus on rheumatoid arthritis: integrating systematic literature research and expert opinion of a broad international panel of rheumatologists in the 3E Initiative. Ann Rheum Dis. 2009;68(7):1086-1093.
51. Hernandez-Baldizon S. [How to effectively use methotrexate in rheumatoid arthritis?]. Reumatologia clinica. 2012;8(1):42-45.
52. Furst DE. Overview of biologic agents and kinase inhibitors in the rheumatic diseases. Schur PH, ed. 2016; UpToDate. Waltham, MA. Accessed January 5, 2017.
53. Sanofi Genzyme. Sanofi and Regeneron Receive Complete Response Letter from FDA for Sarilumab, an Investigational Treatment for Rheumatoid Arthritis. Press Release. October 28, 2016; http://news.genzyme.com/press-release/sanofi-and-regeneron-receive-complete-response-letter-fda-sarilumab-investigational-tr. Accessed December 20, 2016.
54. U.S. FDA Extends Review Period for Baricitinib, an Investigational Rheumatoid Arthritis Treatment [press release]. https://investor.lilly.com/releasedetail.cfm?ReleaseID=1007957, Jan 13, 2017 2017.
55. van Herwaarden N, den Broeder AA, Jacobs W, et al. Down-titration and discontinuation strategies of tumor necrosis factor-blocking agents for rheumatoid arthritis in patients with low disease activity. Cochrane Database Syst Rev. 2014(9).
56. U.S. Centers for Medicare and Medicaid Services. 2015 Medicare Drug Spending Dashboard. 2016; https://www.cms.gov/Research-Statistics-Data-and-Systems/Statistics-Trends-and-Reports/Information-on-Prescription-Drugs/2015Medicare.html. Accessed December 22, 2016.
57. Arthritis Foundation. Medication Cost Survey Results. Unpublished raw data, Atlanta, GA. Cited with permission. August 2016.
58. Red Book Online. Greenwood Village, CO: Truven Health Analytics. Inflectra. 2016; http://www.micromedexsolutions.com/. Accessed January 18, 2017.
59. Chingcuanco F, Segal JB, Kim SC, Alexander GC. Bioequivalence of Biosimilar Tumor Necrosis Factor-alpha Inhibitors Compared With Their Reference Biologics: A Systematic Review. Ann Intern Med. 2016;165(8):565-574.
60. Stettin G. Inflammatory Conditions Care Value Program Makes America's Costliest Medication Class More Affordable. Express Scripts. September 8, 2016; https://lab.express-scripts.com/lab/insights/drug-options/inflammatory-conditions-care-value-program-makes-americas-costliest-medication-class-more-affordable. Accessed December 22, 2016.

©Institute for Clinical and Economic Review, 2017 Page 113 Evidence Report: Targeted Immune Modulators for Rheumatoid Arthritis Return to Table of Contents
61. Arthritis Foundation. Step Therapy Utilization Survey. Unpublished raw data. Atlanta, GA. Cited with permission. November 2016.
62. Arthritis Foundation. Impact of innovative therapyies on rheumatoid arthritis patients. Unpublished raw data, Atlanta, GA. Cited with permission. December 2016.
63. Bartlett SJ, Orbai AM, Duncan T, et al. Reliability and Validity of Selected PROMIS Measures in People with Rheumatoid Arthritis. PLoS ONE. 2015;10(9):e0138543.
64. Chambers JD, Wilkinson CL, Anderson JE, Chenoweth MD. Variation in Private Payer Coverage of Rheumatoid Arthritis Drugs. J Manag Care Spec Pharm. 2016;22(10):1176-1181.
65. National Institute for Health and Care Excellence. Rheumatoid arthritis in adults: management. [Government Site]. 2015; https://www.nice.org.uk/guidance/cg79. Accessed December, 2016.
66. Smolen JS, Burmester GR, Combe B, et al. Head-to-head comparison of certolizumab pegol versus adalimumab in rheumatoid arthritis: 2-year efficacy and safety results from the randomised EXXELERATE study. Lancet. 2016;388(10061):2763-2774.
67. Fraenkel L, Miller AS, Clayton K, et al. When Patients Write the Guidelines: Patient Panel Recommendations for the Treatment of Rheumatoid Arthritis. Arthritis care & research. 2016;68(1):26-35.
68. Cook DJ, Mulrow CD, Haynes RB. Systematic reviews: synthesis of best evidence for clinical decisions. Ann Intern Med. 1997;126(5):376-380.
69. Donahue K, Jonas D, Hansen R, et al. Drug Therapy for Rheumatoid Arthritis in Adults: An Update. Comparative Effectiveness Review No. 55. (Prepared by RTI-UNC Evidence-based Practice Center under Contract No. 290-02-0016-I.) Rockville, MD: Agency for Healthcare Research and Quality. April 2012. www.effectivehealthcare.ahrq.gov/reports/final.cfm.
70. Dias S, Sutton AJ, Welton NJ, Ades AE. NICE DSU Technical Support Document 3: Heterogeneity: subgroups, meta-regression, bias and bias-adjustment. 2011; last updated April 2012; available from http://www.nicedsu.org.uk.
71. Ollendorf DA, Pearson SD. An integrated evidence rating to frame comparative effectiveness assessments for decision makers. Med Care. 2010;48(6 Suppl):S145-152.
72. U.S. Preventive Services Task Force. Procedure Manual. Agency for Healthcare Research and Quality. 2008.
73. van Tuyl LH, Vlad SC, Felson DT, Wells G, Boers M. Defining remission in rheumatoid arthritis: results of an initial American College of Rheumatology/European League Against Rheumatism consensus conference. Arthritis Rheum. 2009;61(5):704-710.
74. van der Heijde D. How to read radiographs according to the Sharp/van der Heijde method. J Rheumatol. 2000;27(1):261-263.
75. van der Heijde D, Simon L, Smolen J, et al. How to report radiographic data in randomized clinical trials in rheumatoid arthritis: guidelines from a roundtable discussion. Arthritis Rheum. 2002;47(2):215-218.
76. Genant HK, Jiang Y, Peterfy C, Lu Y, Redei J, Countryman PJ. Assessment of rheumatoid arthritis using a modified scoring method on digitized and original radiographs. Arthritis Rheum. 1998;41(9):1583-1590.
77. O'Dell JR, Mikuls TR, Taylor TH, et al. Therapies for active rheumatoid arthritis after methotrexate failure. The New England journal of medicine. 2013;369(4):307-318.
78. van der Heijde D, Tanaka Y, Fleischmann R, et al. Tofacitinib (CP-690,550) in patients with rheumatoid arthritis receiving methotrexate: twelve-month data from a twenty-four-month phase III randomized radiographic study. Arthritis and rheumatism. 2013;65(3):559-570.

©Institute for Clinical and Economic Review, 2017 Page 114 Evidence Report: Targeted Immune Modulators for Rheumatoid Arthritis Return to Table of Contents
79. Kosinski M, Zhao SZ, Dedhiya S, Osterhaus JT, Ware JE, Jr. Determining minimally important changes in generic and disease-specific health-related quality of life questionnaires in clinical trials of rheumatoid arthritis. Arthritis Rheum. 2000;43(7):1478-1487.
80. Ward MM, Guthrie LC, Alba MI. Clinically important changes in individual and composite measures of rheumatoid arthritis activity: thresholds applicable in clinical trials. Ann Rheum Dis. 2015;74(9):1691-1696.
81. Takeuchi T, Miyasaka N, Zang C, et al. A phase 3 randomized, double-blind, multicenter comparative study evaluating the effect of etanercept versus methotrexate on radiographic outcomes, disease activity, and safety in Japanese subjects with active rheumatoid arthritis. Modern rheumatology / the Japan Rheumatism Association. 2013;23(4):623-633.
82. Combe B, Codreanu C, Fiocco U, et al. Etanercept and sulfasalazine, alone and combined, in patients with active rheumatoid arthritis despite receiving sulfasalazine: a double-blind comparison. Ann Rheum Dis. 2006;65(10):1357-1362.
83. Klareskog L, van der Heijde D, de Jager JP, et al. Therapeutic effect of the combination of etanercept and methotrexate compared with each treatment alone in patients with rheumatoid arthritis: double-blind randomised controlled trial. Lancet. 2004;363(9410):675-681.
84. Nishimoto N, Hashimoto J, Miyasaka N, et al. Study of active controlled monotherapy used for rheumatoid arthritis, an IL-6 inhibitor (SAMURAI): evidence of clinical and radiographic benefit from an x ray reader-blinded randomised controlled trial of tocilizumab. Ann Rheum Dis. 2007;66(9):1162-1167.
85. Nishimoto N, Miyasaka N, Yamamoto K, et al. Study of active controlled tocilizumab monotherapy for rheumatoid arthritis patients with an inadequate response to methotrexate (SATORI): significant reduction in disease activity and serum vascular endothelial growth factor by IL-6 receptor inhibition therapy. Mod Rheumatol. 2009;19(1):12-19.
86. van der Heijde D, Klareskog L, Rodriguez-Valverde V, et al. Comparison of etanercept and methotrexate, alone and combined, in the treatment of rheumatoid arthritis: two-year clinical and radiographic results from the TEMPO study, a double-blind, randomized trial. Arthritis Rheum. 2006;54(4):1063-1074.
87. Keystone E, Genovese MC, Klareskog L, et al. Golimumab in patients with active rheumatoid arthritis despite methotrexate therapy: 52-week results of the GO-FORWARD study. Ann Rheum Dis. 2010;69(6):1129-1135.
88. Fleischmann R, Castelar-Pinheiro G, Brzezicki J, et al. Efficacy and safety of sarilumab in combination with csdmards in patients with active rheumatoid arthritis who were inadequate responders or intolerant of anti-TNF-+/- therapy: Results from a phase 3 study. Arthritis and Rheumatology. 2015;67(no pagination).
89. Fleischmann R, Decktor DL, Fan C, Van Hoogstraten H, Genovese MC. Comparable efficacy with sarilumab plus methotrexate in biologic-experienced and biologic-naïve patients with moderate-to-severe rheumatoid arthritis from a phase 3, randomized, double-blind, placebo-controlled, international study. Arthritis and Rheumatology. 2014;66:S1232-S1233.
90. Genovese MC, Kremer J, Zamani O, et al. Baricitinib in Patients with Refractory Rheumatoid Arthritis. The New England journal of medicine. 2016;374(13):1243-1252.
91. Genovese MC, Becker JC, Schiff M, et al. Abatacept for rheumatoid arthritis refractory to tumor necrosis factor alpha inhibition. N Engl J Med. 2005;353(11):1114-1123.
92. Strand V, Burmester GR, Ogale S, Devenport J, John A, Emery P. Improvements in health-related quality of life after treatment with tocilizumab in patients with rheumatoid arthritis refractory to

©Institute for Clinical and Economic Review, 2017 Page 115 Evidence Report: Targeted Immune Modulators for Rheumatoid Arthritis Return to Table of Contents
tumour necrosis factor inhibitors: results from the 24-week randomized controlled RADIATE study. Rheumatology (Oxford). 2012;51(10):1860-1869.
93. Cohen SB, Emery P, Greenwald MW, et al. Rituximab for rheumatoid arthritis refractory to anti-tumor necrosis factor therapy: Results of a multicenter, randomized, double-blind, placebo-controlled, phase III trial evaluating primary efficacy and safety at twenty-four weeks. Arthritis Rheum. 2006;54(9):2793-2806.
94. Weinblatt ME, Schiff M, Valente R, et al. Head-to-head comparison of subcutaneous abatacept versus adalimumab for rheumatoid arthritis: findings of a phase IIIb, multinational, prospective, randomized study. Arthritis and rheumatism. 2013;65(1):28-38.
95. van Vollenhoven RF, Fleischmann R, Cohen S, et al. Tofacitinib or adalimumab versus placebo in rheumatoid arthritis. The New England journal of medicine. 2012;367(6):508-519.
96. Strand V, van Vollenhoven RF, Lee EB, et al. Tofacitinib or adalimumab versus placebo: patient-reported outcomes from a phase 3 study of active rheumatoid arthritis. Rheumatology (Oxford). 2016;55(6):1031-1041.
97. Taylor PC, Keystone EC, van der Heijde D, et al. Baricitinib versus Placebo or Adalimumab in Rheumatoid Arthritis. N Engl J Med. 2017;376(7):652-662.
98. Keystone E, Taylor P, Tanaka Y, et al. Patient-Reported Outcomes from A Phase 3 Study of Baricitinib versus Placebo or Adalimumab in Patients with Active Rheumatoid Arthritis and An Inadequate Response To Background Methotrexate Therapy. Ann Rheum Dis. 2016(75):412-413.
99. Greenberg JD, Reed G, Decktor D, et al. A comparative effectiveness study of adalimumab, etanercept and infliximab in biologically naive and switched rheumatoid arthritis patients: results from the US CORRONA registry. Ann Rheum Dis. 2012;71(7):1134-1142.
100. Hetland ML, Christensen IJ, Tarp U, et al. Direct comparison of treatment responses, remission rates, and drug adherence in patients with rheumatoid arthritis treated with adalimumab, etanercept, or infliximab: results from eight years of surveillance of clinical practice in the nationwide Danish DANBIO registry. Arthritis and rheumatism. 2010;62(1):22-32.
101. Flouri I, Markatseli TE, Voulgari PV, et al. Comparative effectiveness and survival of infliximab, adalimumab, and etanercept for rheumatoid arthritis patients in the Hellenic Registry of Biologics: Low rates of remission and 5-year drug survival. Seminars in arthritis and rheumatism. 2014;43(4):447-457.
102. van Dartel SA, Fransen J, Kievit W, et al. Difference in the risk of serious infections in patients with rheumatoid arthritis treated with adalimumab, infliximab and etanercept: results from the Dutch Rheumatoid Arthritis Monitoring (DREAM) registry. Ann Rheum Dis. 2013;72(6):895-900.
103. Schiff M, Keiserman M, Codding C, et al. Clinical response and tolerability to abatacept in patients with rheumatoid arthritis previously treated with infliximab or abatacept: open-label extension of the ATTEST Study. Ann Rheum Dis. 2011;70(11):2003-2007.
104. Kremer JM, Blanco R, Halland A-M, et al. Clinical efficacy and safety maintained up to 5 years in patients with rheumatoid arthritis treated with tocilizumab in a randomised trial. Clinical and experimental rheumatology. 2016;34(4):625-633.
105. Machado DA, Guzman R, Xavier RM, et al. Two-Year Safety and Efficacy Experience in Patients with Methotrexate-Resistant Active Rheumatoid Arthritis Treated with Etanercept and Conventional Disease-Modifying Anti-rheumatic Drugs in the Latin American Region. The open rheumatology journal. 2016;10:13-25.
106. Keystone EC, Genovese MC, Hall S, et al. Golimumab in patients with active rheumatoid arthritis despite methotrexate therapy: results through 2 years of the GO-FORWARD study extension. The Journal of rheumatology. 2013;40(7):1097-1103.
©Institute for Clinical and Economic Review, 2017 Page 116 Evidence Report: Targeted Immune Modulators for Rheumatoid Arthritis Return to Table of Contents
107. Wailoo AJ, Bansback N, Brennan A, Michaud K, Nixon RM, Wolfe F. Biologic drugs for rheumatoid arthritis in the Medicare program: a cost-effectiveness analysis. Arthritis Rheum. 2008;58(4):939-946.
108. National Institute for Health and Care Excellence. Tocilizumab for the treatment of rheumatoid arthritis. 2012; nice.org.uk/guidance/ta247.
109. Stephens S, Botteman MF, Cifaldi MA, van Hout BA. Modelling the cost-effectiveness of combination therapy for early, rapidly progressing rheumatoid arthritis by simulating the reversible and irreversible effects of the disease. BMJ Open. 2015;5(6):e006560.
110. Carlson JJ, Ogale S, Dejonckheere F, Sullivan SD. Economic evaluation of tocilizumab monotherapy compared to adalimumab monotherapy in the treatment of severe active rheumatoid arthritis. Value Health. 2015;18(2):173-179.
111. Gabay C, Emery P, van Vollenhoven R, et al. Tocilizumab monotherapy versus adalimumab monotherapy for treatment of rheumatoid arthritis (ADACTA): a randomised, double-blind, controlled phase 4 trial. The Lancet.381(9877):1541-1550.
112. National Institute for Health and Care Excellence Decision Support Unit. Progression of Disease in People with Rheumatoid ARthritis Treated with Non-Biologic Therapies. http://www.nicedsu.org.uk/RA%20HAQ%20progression%20FINAL%20sent%20to%20NICE%2006.02.15%20updated%2012.02.15.pdf. 2015.
113. Breedveld FC, Weisman MH, Kavanaugh AF, et al. The PREMIER study: A multicenter, randomized, double-blind clinical trial of combination therapy with adalimumab plus methotrexate versus methotrexate alone or adalimumab alone in patients with early, aggressive rheumatoid arthritis who had not had previous methotrexate treatment. Arthritis Rheum. 2006;54(1):26-37.
114. Sanders GD, Neumann PJ, Basu A, et al. Recommendations for Conduct, Methodological Practices, and Reporting of Cost-effectiveness Analyses: Second Panel on Cost-Effectiveness in Health and Medicine. Jama. 2016;316(10):1093-1103.
115. Gibson L, Alava MH, Wailoo A. Progression of disease in people with rheumatoid arthritis treated with non biologic therapies. 2015.
116. Curtis JR, Jain A, Askling J, et al. A comparison of patient characteristics and outcomes in selected European and U.S. rheumatoid arthritis registries. Semin Arthritis Rheum. 2010;40(1):2-14.e11.
117. Frayer CD, Gu Q, Ogden CL. Anthropometric reference data for children and adults: United States, 2007-2010. National Center for Health Statistics. Vital Health Stat. 2012;11(252).
118. Lillegraven S, Prince FH, Shadick NA, et al. Remission and radiographic outcome in rheumatoid arthritis: application of the 2011 ACR/EULAR remission criteria in an observational cohort. Ann Rheum Dis. 2012;71(5):681-686.
119. U.S. Food and drug Administration. Orencia (R) [package insert]. Bristol Myers Squibb. 2014;2016(Princeton, NJ).
120. U.S. Food and drug Administration. Rituxan (R) [package insert]. Genentech, Inc. 2014;2016(San Francisco, CA).
121. U.S. Food and drug Administration. Xeljanz (R) [package insert]. Pfizer Inc. 2015;2016(New York, NY ).
122. U.S. Food and drug Administration. Cimzia (R) [package insert]. UCB. 2015(Smyrna, Georgia). 123. U.S. Food and drug Administration. Simponi(R) [package insert]. Janssen Biotech Inc.
2016(Horsham, PA).

©Institute for Clinical and Economic Review, 2017 Page 117 Evidence Report: Targeted Immune Modulators for Rheumatoid Arthritis Return to Table of Contents
124. U.S. Food and Drug Administration. Simponi Aria (R) [package insert]. Janssen Biotech Inc. 2016(Horsham, PA).
125. U.S. Food and Drug Administration. Actemra(R) [package insert]. Genentech, Inc. 2014(San Francisco, CA).
126. U.S. Food and drug Administration. Enbrel (R) [package insert]. Amgen. 2015(Thousand Oaks, CA).
127. U.S. Food and drug Administration. Remicade (R) [package insert]. Janssen Biotech Inc. 2015(Horsham, PA).
128. U.S. Food and drug Administration. Humira (R) [package insert]. AbbVie Inc. 2016(North Chicago, IL).
129. Karlsson JA, Kristensen LE, Kapetanovic MC, Gulfe A, Saxne T, Geborek P. Treatment response to a second or third TNF-inhibitor in RA: results from the South Swedish Arthritis Treatment Group Register. Rheumatology (Oxford). 2008;47(4):507-513.
130. SSRHealth. US Brand Rx Net Price. Access-restricted document.2016. 131. RED BOOK - Truven Health Analytics. 132. Kaiser Family Foundation. Kaiser State Health Facts. 2016; http://kff.org/other/state-
indicator/expenses-per-inpatient-day-by-ownership/#notes. Accessed June 21, 2016. 133. Physicians’ Fee & Coding Guide 2016. Atlanta, GA: InGauge Health Solutions. 134. Medicare Provider Utilization and Payment Data. Baltimore, MD: Centers for Medicare and
Medicaid Services; 2014. 135. Bureau of Labor Statistics. Labor Force Statistics from the Current Population Survey. 2016;
http://www.bls.gov/cps/cpsaat03.htm. 136. Wolfe F, Michaud K, Gefeller O, Choi HK. Predicting mortality in patients with rheumatoid
arthritis. Arthritis Rheum. 2003;48(6):1530-1542. 137. Shaw JW, Johnson JA, Coons SJ. US valuation of the EQ-5D health states: development and
testing of the D1 valuation model. Med Care. 2005;43(3):203-220. 138. Alava MH, Wailoo A, Wolfe F, Michaud K. The relationship between EQ-5D, HAQ and pain in
patients with rheumatoid arthritis. Rheumatology (Oxford, England). 2013;52(5):944-950. 139. National Institute for Health and Care Excellence. Adalimumab, etanercept, inflfliximab,
certolizumab pegol, golimumab, tocilizumab and abatacept for rheumatoid arthritis not previously treated with DMARDs or after conventional DMARDs only have failed. 2016.
140. Centers for Disease Control and Prevention. Treatment for TB Disease. http://www.cdc.gov/tb/topic/treatment/tbdisease.htm. Accessed November 22, 2016.
141. Claxton L, Jenks M, Taylor M, et al. An economic evaluation of tofacitinib treatment in rheumatoid arthritis: Modeling the cost of treatment strategies in the United States. Journal of Managed Care and Specialty Pharmacy. 2016;22(9):1088-1102.
142. Vera-Llonch M, Massarotti E, Wolfe F, et al. Cost-effectiveness of abatacept in patients with moderately to severely active rheumatoid arthritis and inadequate response to methotrexate. Rheumatology (Oxford). 2008;47(4):535-541.
143. Jalal H, O'Dell JR, Bridges SL, et al. Cost-Effectiveness of Triple Therapy Versus Etanercept Plus Methotrexate in Early Aggressive Rheumatoid Arthritis. Arthritis Care and Research. 2016;68(12):1751-1757.
144. Doan QV, Chiou CF, Dubois RW. Review of eight pharmacoeconomic studies of the value of biologic DMARDs (adalimumab, etanercept, and infliximab) in the management of rheumatoid arthritis. J Manag Care Pharm. 2006;12(7):555-569.

©Institute for Clinical and Economic Review, 2017 Page 118 Evidence Report: Targeted Immune Modulators for Rheumatoid Arthritis Return to Table of Contents
145. Yuan Y, Trivedi D, Maclean R, Rosenblatt L. Indirect cost-effectiveness analyses of abatacept and rituximab in patients with moderate-to-severe rheumatoid arthritis in the United States. J Med Econ. 2010;13(1):33-41.
146. Lassere L. Pooled Metaanalysis of Radiographic Progression: Comparison of Sharp and Larsen Methods. The Journal of Rheumatology. 2000;27(1):269-276.
147. National Institute for Health and Care Excellence. NICE DSU Technical Support Document 2: A general linear modelling framework for pairwise and network meta-analysis of randomised controlled trials 2016.
148. Cipriani A, Zhou X, Del Giovane C, et al. Comparative efficacy and tolerability of antidepressants for major depressive disorder in children and adolescents: a network meta-analysis. Lancet. 2016;388(10047):881-890.
149. Emery P, Deodhar A, Rigby WF, et al. Efficacy and safety of different doses and retreatment of rituximab: a randomised, placebo-controlled trial in patients who are biological naive with active rheumatoid arthritis and an inadequate response to methotrexate (Study Evaluating Rituximab's Efficacy in MTX iNadequate rEsponders (SERENE)). Ann Rheum Dis. 2010;69(9):1629-1635.
150. Yazici Y, Curtis JR, Ince A, et al. Efficacy of tocilizumab in patients with moderate to severe active rheumatoid arthritis and a previous inadequate response to disease-modifying antirheumatic drugs: the ROSE study. Ann Rheum Dis. 2012;71(2):198-205.
151. Halland AM. Tocilizumab inhibits structural joint damage in rheumatoid arthritis patients with inadequate responses to methotrexate at one year - The LITHE study. European Musculoskeletal Review. 2012;7(2):108-111.
152. Genovese MC, McKay JD, Nasonov EL, et al. Interleukin-6 receptor inhibition with tocilizumab reduces disease activity in rheumatoid arthritis with inadequate response to disease-modifying antirheumatic drugs: the tocilizumab in combination with traditional disease-modifying antirheumatic drug therapy study. Arthritis Rheum. 2008;58(10):2968-2980.
153. Kivitz A, Olech E, Borofsky M, et al. Subcutaneous tocilizumab versus placebo in combination with disease-modifying antirheumatic drugs in patients with rheumatoid arthritis. Arthritis care & research. 2014;66(11):1653-1661.
154. Kremer J, Li Z-G, Hall S, et al. Tofacitinib in combination with nonbiologic disease-modifying antirheumatic drugs in patients with active rheumatoid arthritis: a randomized trial. Ann Intern Med. 2013;159(4):253-261.
155. Dougados M, Van Der Heijde D, Chen YC, et al. Baricitinib, an oral janus kinase (jak)1/jak2 inhibitor, in patients with active rheumatoid arthritis (RA) and an inadequate response to cDMARD therapy: Results of the phase 3 Ra-build study. Ann Rheum Dis. 2015;74:79-80.
156. Yamamoto K, Takeuchi T, Yamanaka H, et al. Efficacy and safety of certolizumab pegol plus methotrexate in Japanese rheumatoid arthritis patients with an inadequate response to methotrexate: the J-RAPID randomized, placebo-controlled trial. Modern rheumatology / the Japan Rheumatism Association. 2014;24(5):715-724.
157. Smolen JS, Emery P, Ferraccioli GF, et al. Certolizumab pegol in rheumatoid arthritis patients with low to moderate activity: the CERTAIN double-blind, randomised, placebo-controlled trial. Ann Rheum Dis. 2015;74(5):843-850.
158. Machado DA, Guzman RM, Xavier RM, et al. Open-label observation of addition of etanercept versus a conventional disease-modifying antirheumatic drug in subjects with active rheumatoid arthritis despite methotrexate therapy in the Latin American region. Journal of clinical rheumatology : practical reports on rheumatic & musculoskeletal diseases. 2014;20(1):25-33.

©Institute for Clinical and Economic Review, 2017 Page 119 Evidence Report: Targeted Immune Modulators for Rheumatoid Arthritis Return to Table of Contents
159. Bingham CO, 3rd, Weinblatt M, Mendelsohn A, et al. Predictors of significant disease activity score-28 (using c-reactive protein) remission achieved with intravenous golimumab in patients with active rheumatoid arthritis despite methotrexate therapy: Results of the phase 3, multicenter, double-blind, placebo-controlled trial [abstract]. Arthritis & rheumatology (Hoboken, N.J.). 2012;64(10 supplement):S558. Abstract 1301.
160. Tanaka Y, Harigai M, Takeuchi T, et al. Golimumab in combination with methotrexate in Japanese patients with active rheumatoid arthritis: results of the GO-FORTH study. Ann Rheum Dis. 2012;71(6):817-824.
161. Keystone EC, Genovese MC, Klareskog L, et al. Golimumab, a human antibody to tumour necrosis factor alpha given by monthly subcutaneous injections, in active rheumatoid arthritis despite methotrexate therapy: the GO-FORWARD Study. Ann Rheum Dis. 2009;68(6):789-796.
162. Genovese MC, Fleischmann R, Kivitz AJ, et al. Sarilumab Plus Methotrexate in Patients With Active Rheumatoid Arthritis and Inadequate Response to Methotrexate: Results of a Phase III Study. Arthritis & rheumatology (Hoboken, N.J.). 2015;67(6):1424-1437.
163. Fleischmann R, van Adelsberg J, Lin Y, et al. Sarilumab and Non-Biologic Disease-Modifying Antirheumatic Drugs in Patients With Active RA and Inadequate Response or Intolerance to TNF Inhibitors. Arthritis & rheumatology (Hoboken, N.J.). 2016.
164. Yoo D-H, Park W, Suh CH, et al. Efficacy and safety of rituximab biosimilar candidate (CT-P10) and innovator rituximab in patients with rheumatoid arthritis: Results from phase I randomized controlled trial over 72 weeks. Arthritis and Rheumatology. 2015;67(no pagination).
165. Yoo DH, Suh CH, Shim SC, et al. A multicentre randomised controlled trial to compare the pharmacokinetics, efficacy and safety of CT-P10 and innovator rituximab in patients with rheumatoid arthritis. Ann Rheum Dis. 2016.
166. Williams JH, Hutmacher MM, Zierhut ML, et al. Comparative assessment of clinical response in patients with rheumatoid arthritis between PF-05280586, a proposed rituximab biosimilar, and rituximab. British Journal of Clinical Pharmacology. 2016;82(6):1568-1579.
167. Bae SC, Kim J, Choe JY, et al. A phase III, multicentre, randomised, double-blind, active-controlled, parallel-group trial comparing safety and efficacy of HD203, with innovator etanercept, in combination with methotrexate, in patients with rheumatoid arthritis: The HERA study. Ann Rheum Dis. 2016.
168. Choe J, Prodanovic N, Niebrzydowski J, et al. A randomised, double-blind, phase III study comparing sb2, an infliximab biosimilar, to the infliximab reference product (remicade) in patients with moderate to severe rheumatoid arthritis despite methotrexate therapy. Ann Rheum Dis. 2017;76(1):58-64.
169. Takeuchi T, Yamanaka H, Tanaka Y, et al. Evaluation of the pharmacokinetic equivalence and 54-week efficacy and safety of CT-P13 and innovator infliximab in Japanese patients with rheumatoid arthritis. Modern Rheumatology. 2015;25(6):817-824.
170. Yoo DH, Hrycaj P, Miranda P, et al. A randomised, double-blind, parallel-group study to demonstrate equivalence in efficacy and safety of CT-P13 compared with innovator infliximab when coadministered with methotrexate in patients with active rheumatoid arthritis: the PLANETRA study. Ann Rheum Dis. 2013;72(10):1613-1620.
171. Peterfy C, Emery P, Tak PP, et al. MRI assessment of suppression of structural damage in patients with rheumatoid arthritis receiving rituximab: Results from the randomised, placebo-controlled, double-blind RA-SCORE study. Ann Rheum Dis. 2016;75(1):170-177.

©Institute for Clinical and Economic Review, 2017 Page 120 Evidence Report: Targeted Immune Modulators for Rheumatoid Arthritis Return to Table of Contents
172. Takeuchi T, Matsubara T, Nitobe T, et al. Phase II dose-response study of abatacept in Japanese patients with active rheumatoid arthritis with an inadequate response to methotrexate. Modern rheumatology / the Japan Rheumatism Association. 2013;23(2):226-235.
173. Kremer JM, Genant HK, Moreland LW, et al. Effects of abatacept in patients with methotrexate-resistant active rheumatoid arthritis: a randomized trial. Ann Intern Med. 2006;144(12):865-876.
174. Kremer JM, Westhovens R, Leon M, et al. Treatment of rheumatoid arthritis by selective inhibition of T-cell activation with fusion protein CTLA4Ig. N Engl J Med. 2003;349(20):1907-1915.
175. Dougados M, van der Heijde D, Chen YC, et al. Baricitinib in patients with inadequate response or intolerance to conventional synthetic DMARDs: results from the RA-BUILD study. Ann Rheum Dis. 2016.
176. Weinblatt ME, Keystone EC, Furst DE, et al. Adalimumab, a fully human anti-tumor necrosis factor alpha monoclonal antibody, for the treatment of rheumatoid arthritis in patients taking concomitant methotrexate: the ARMADA trial. Arthritis Rheum. 2003;48(1):35-45.
177. Kim H-Y, Lee S-K, Song. Y ea. A randomized, double-blind, placebo-controlled, phase III study of the human anti-necrosis factor antibody adalimumab administered as subcutaneous injections in Korean rheumatoid arthritis patients treated with methotrexate. APLAR Journal of Rheumatology. 2007;10(1):9-16.
178. Furst DE, Schiff MH, Fleischmann RM, et al. Adalimumab, a fully human anti tumor necrosis factor-alpha monoclonal antibody, and concomitant standard antirheumatic therapy for the treatment of rheumatoid arthritis: results of STAR (Safety Trial of Adalimumab in Rheumatoid Arthritis). J Rheumatol. 2003;30(12):2563-2571.
179. Keystone EC, Kavanaugh AF, Sharp JT, et al. Radiographic, clinical, and functional outcomes of treatment with adalimumab (a human anti-tumor necrosis factor monoclonal antibody) in patients with active rheumatoid arthritis receiving concomitant methotrexate therapy: a randomized, placebo-controlled, 52-week trial. Arthritis Rheum. 2004;50(5):1400-1411.
180. Smolen J, Landewe RB, Mease P, et al. Efficacy and safety of certolizumab pegol plus methotrexate in active rheumatoid arthritis: the RAPID 2 study. A randomised controlled trial. Ann Rheum Dis. 2009;68(6):797-804.
181. Keystone E, van der Heijde D, Mason D, Jr., et al. Certolizumab pegol plus methotrexate is significantly more effective than placebo plus methotrexate in active rheumatoid arthritis: findings of a fifty-two-week, phase III, multicenter, randomized, double-blind, placebo-controlled, parallel-group study. Arthritis Rheum. 2008;58(11):3319-3329.
182. Choy E, McKenna F, Vencovsky J, et al. Certolizumab pegol plus MTX administered every 4 weeks is effective in patients with RA who are partial responders to MTX. Rheumatology (Oxford, England). 2012;51(7):1226-1234.
183. Combe B, Codreanu C, Fiocco U, et al. Efficacy, safety and patient-reported outcomes of combination etanercept and sulfasalazine versus etanercept alone in patients with rheumatoid arthritis: a double-blind randomised 2-year study. Ann Rheum Dis. 2009;68(7):1146-1152.
184. Weinblatt ME, Bingham CO, 3rd, Mendelsohn AM, et al. Intravenous golimumab is effective in patients with active rheumatoid arthritis despite methotrexate therapy with responses as early as week 2: results of the phase 3, randomised, multicentre, double-blind, placebo-controlled GO-FURTHER trial. Ann Rheum Dis. 2013;72(3):381-389.
185. Li Z, Zhang F, Kay J, et al. Efficacy and safety results from a Phase 3, randomized, placebo-controlled trial of subcutaneous golimumab in Chinese patients with active rheumatoid arthritis despite methotrexate therapy. International Journal of Rheumatic Diseases. 2015.

©Institute for Clinical and Economic Review, 2017 Page 121 Evidence Report: Targeted Immune Modulators for Rheumatoid Arthritis Return to Table of Contents
186. Kim J, Ryu H, Yoo D-H, et al. A clinical trial and extension study of infliximab in Korean patients with active rheumatoid arthritis despite methotrexate treatment. Journal of Korean medical science. 2013;28(12):1716-1722.
187. Maini R, St Clair EW, Breedveld F, et al. Infliximab (chimeric anti-tumour necrosis factor alpha monoclonal antibody) versus placebo in rheumatoid arthritis patients receiving concomitant methotrexate: a randomised phase III trial. ATTRACT Study Group. Lancet. 1999;354(9194):1932-1939.
188. Westhovens R, Yocum D, Han J, et al. The safety of infliximab, combined with background treatments, among patients with rheumatoid arthritis and various comorbidities: a large, randomized, placebo-controlled trial. Arthritis Rheum. 2006;54(4):1075-1086.
189. Emery P, Keystone E, Tony HP, et al. IL-6 receptor inhibition with tocilizumab improves treatment outcomes in patients with rheumatoid arthritis refractory to anti-tumour necrosis factor biologicals: results from a 24-week multicentre randomised placebo-controlled trial. Ann Rheum Dis. 2008;67(11):1516-1523.
190. Genovese MC, Kremer J, Zamani O, et al. Baricitinib, an oral janus kinase (jak)1/jak2 inhibitor, in patients with active rheumatoid arthritis (RA) and an inadequate response to TNF inhibitors: Results of the phase 3 Ra-beacon study. Ann Rheum Dis. 2015;74:75-76.
191. Yoo D-H, Park W, Jeka S, et al. A randomized, controlled, multicenter, 2-arm, parallel-group, double-blind study to demonstrate the equivalence of CT-P10 to innovator rituximab with respect to pharmacokinetic profile in patients with rheumatoid arthritis. Arthritis and rheumatism. 2013;65:S736.
192. Jani RH, Gupta R, Bhatia G, et al. A prospective, randomized, double-blind, multicentre, parallel-group, active controlled study to compare efficacy and safety of biosimilar adalimumab (Exemptia; ZRC-3197) and adalimumab (Humira) in patients with rheumatoid arthritis. Int J Rheum Dis. 2015.
193. Cohen SB, Genovese MC, Choy EH, et al. Randomized, double-blind, phase 3 study of efficacy and safety of ABP 501 compared with adalimumab in subjects with moderate to severe rheumatoid arthritis. Arthritis and Rheumatology. 2015;67(no pagination).
194. Weinblatt M, Baranauskaite A, Niebrzydowski J, et al. A phase III, randomized, double-blind clinical study comparing SB5, an adalimumab biosimilar, with adalimumab reference product (humira) in patients with moderate to severe rheumatoid arthritis despite methotrexate therapy (24-week results). Arthritis and Rheumatology. 2015;67(no pagination).
195. Emery P, Vencovskỳ J, Sylwestrzak A, et al. A phase III randomised, double-blind, parallel-group study comparing SB4 with etanercept reference product in patients with active rheumatoid arthritis despite methotrexate therapy. Ann Rheum Dis. 2015.
196. Kay J, Chopra A, Chandrashekara S, et al. A phase 3, randomized, double-blind, active comparator study of the efficacy and safety of BOW015, a biosimilar infliximab, in patients with active rheumatoid arthritis on stable methotrexate doses. Ann Rheum Dis. 2014;73.
197. U.S. Food and drug Administration. Actemra (tocilizumab) Prescribing Information. 2016; http://www.accessdata.fda.gov/drugsatfda_docs/label/2016/125276s107_125472s018lbl.pdf. Accessed October 17, 2016.
198. Emery P, Fleischmann R, van der Heijde D, et al. The effects of golimumab on radiographic progression in rheumatoid arthritis: results of randomized controlled studies of golimumab before methotrexate therapy and golimumab after methotrexate therapy. Arthritis and rheumatism. 2011;63(5):1200-1210.

©Institute for Clinical and Economic Review, 2017 Page 122 Evidence Report: Targeted Immune Modulators for Rheumatoid Arthritis Return to Table of Contents
199. van Vollenhoven RF, Geborek P, Forslind K, et al. Conventional combination treatment versus biological treatment in methotrexate-refractory early rheumatoid arthritis: 2 year follow-up of the randomised, non-blinded, parallel-group Swefot trial. The Lancet. 2012;379(9827):1712-1720.
200. Lipsky PE, van der Heijde DM, St Clair EW, et al. Infliximab and methotrexate in the treatment of rheumatoid arthritis. Anti-Tumor Necrosis Factor Trial in Rheumatoid Arthritis with Concomitant Therapy Study Group. N Engl J Med. 2000;343(22):1594-1602.
201. Cohen SB, Keystone E, Genovese MC, et al. Continued inhibition of structural damage over 2 years in patients with rheumatoid arthritis treated with rituximab in combination with methotrexate. Ann Rheum Dis. 2010;69(6):1158-1161.
202. Keystone E, Emery P, Peterfy CG, et al. Rituximab inhibits structural joint damage in patients with rheumatoid arthritis with an inadequate response to tumour necrosis factor inhibitor therapies. Ann Rheum Dis. 2009;68(2):216-221.
203. Van Der Heijde D, Genovese MC, Fan C, Fiore S, Decktor DL, Fleischmann R. Clinical and radiographic efficacy of sarilumab plus methotrexate in biologic-experienced and biologic-naïve patients with rheumatoid arthritis in a phase 3, randomized, double-blind, placebo-controlled international study. Ann Rheum Dis. 2015;74:722.
204. Vencovsky J, Sylwestrzak A, Leszczynski P, et al. A phase III, randomized, double-blind clinical study comparing SB4, an etanercept biosimilar, with etanercept reference product (Enbrel) in patients with moderate to severe rheumatoid arthritis despite methotrexate therapy (52-week results). Arthritis and Rheumatology. 2015;67(no pagination).
205. Choe J-Y, Prodanovic N, Niebrzydowski J, et al. A randomized, double-blind, phase III study comparing SB2, an infliximab biosimilar, to the infliximab reference product (Remicade) in patients with moderate to severe rheumatoid arthritis despite methotrexate therapy: 54-week results. Arthritis and Rheumatology. 2015;67(no pagination).
206. Yoo DH, Racewicz A, Brzezicki J, et al. A phase III randomized study to evaluate the efficacy and safety of CT-P13 compared with reference infliximab in patients with active rheumatoid arthritis: 54-week results from the PLANETRA study. Arthritis research & therapy. 2016;18(82):1-12.
207. Emery P, Fleischmann R, Filipowicz-Sosnowska A, et al. The efficacy and safety of rituximab in patients with active rheumatoid arthritis despite methotrexate treatment: results of a phase IIB randomized, double-blind, placebo-controlled, dose-ranging trial. Arthritis Rheum. 2006;54(5):1390-1400.
208. Keystone E, Burmester GR, Furie R, et al. Improvement in patient-reported outcomes in a rituximab trial in patients with severe rheumatoid arthritis refractory to anti-tumor necrosis factor therapy. Arthritis Rheum. 2008;59(6):785-793.
209. Genovese MC, Decktor DL, Parrino J, Boddy A, Graham N. Effect of increased sarilumab dose on efficacy and safety outcomes in poorly responding rheumatoid arthritis (RA) patients: The mobility study. Ann Rheum Dis. 2015;74:727.
210. Genovese MC, Keystone E, Taylor P, et al. 24-Week results of a blinded phase 2b dose-ranging study of baricitinib, an oral janus kinase 1/januse kinase 2 inhibitor, in combination with traditional disease modifying antirheumatic drugs in patients with rheumatoid arthritis. Arthritis and Rheumatism. 2012;64:S1049-S1050.
211. Keystone EC, Taylor PC, Drescher E, et al. Safety and efficacy of baricitinib at 24 weeks in patients with rheumatoid arthritis who have had an inadequate response to methotrexate. Ann Rheum Dis. 2015;74(2):333-340.

©Institute for Clinical and Economic Review, 2017 Page 123 Evidence Report: Targeted Immune Modulators for Rheumatoid Arthritis Return to Table of Contents
212. Kremer JM, Cohen S, Wilkinson BE, et al. A phase IIb dose-ranging study of the oral JAK inhibitor tofacitinib (CP-690,550) versus placebo in combination with background methotrexate in patients with active rheumatoid arthritis and an inadequate response to methotrexate alone. Arthritis and rheumatism. 2012;64(4):970-981.
213. Smolen JS, Beaulieu A, Rubbert-Roth A, et al. Effect of interleukin-6 receptor inhibition with tocilizumab in patients with rheumatoid arthritis (OPTION study): a double-blind, placebo-controlled, randomised trial. Lancet. 2008;371(9617):987-997.
214. Weinblatt ME, Westhovens R, Mendelsohn AM, et al. Radiographic benefit and maintenance of clinical benefit with intravenous golimumab therapy in patients with active rheumatoid arthritis despite methotrexate therapy: results up to 1 year of the phase 3, randomised, multicentre, double blind, placebo controlled GO-FURTHER trial. Ann Rheum Dis. 2014;73(12):2152-2159.
215. Strand V, Burmester GR, Zerbini CA, et al. Tofacitinib with methotrexate in third-line treatment of patients with active rheumatoid arthritis: patient-reported outcomes from a phase III trial. Arthritis Care Res (Hoboken). 2015;67(4):475-483.
216. Bingham CO, 3rd, Weinblatt M, Han C, et al. The effect of intravenous golimumab on health-related quality of life in rheumatoid arthritis: 24-week results of the phase III GO-FURTHER trial. J Rheumatol. 2014;41(6):1067-1076.
217. Emery P, Gaich C, DeLozier A, et al. Patient-Reported Outcomes from a Phase 3 Study of Baricitinib in Patients with Rheumatoid Arthritis with Inadequate Response to Conventional Synthetic Disease-Modifying Antirheumatic Drugs [Abstract. Arthritis & rheumatology (Hoboken, N.J.). 2015;67(suppl 10).
218. Smolen JS, Kremer JM, Gaich CL, et al. Patient-reported outcomes from a randomised phase III study of baricitinib in patients with rheumatoid arthritis and an inadequate response to biological agents (RA-BEACON). Ann Rheum Dis. 2016.
219. Emery P, Decktor DL, Nguyen D, Fan C, Kavanaugh A. Clinical and radiographic efficacy of sarilumab in rheumatoid arthritis patients with varied disease duration. Ann Rheum Dis. 2015;74:730.
220. Keystone E, Taylor P, Genovese M, et al. Safety and efficacy of baricitinib through 128 weeks in an open-label, long-term extension study in patients with rheumatoid arthritis. Journal of Rheumatology. 2015;42(7):1292.
221. Bingham CO, 3rd, Mendelsohn AM, Kim L, et al. Maintenance of Clinical and Radiographic Benefit With Intravenous Golimumab Therapy in Patients With Active Rheumatoid Arthritis Despite Methotrexate Therapy: Week-112 Efficacy and Safety Results of the Open-Label Long-Term Extension of a Phase III, Double-Blind, Randomized, Placebo-Controlled Trial. Arthritis care & research. 2015;67(12):1627-1636.
222. Genovese MC, Han C, Keystone EC, et al. Effect of golimumab on patient-reported outcomes in rheumatoid arthritis: results from the GO-FORWARD study. J Rheumatol. 2012;39(6):1185-1191.
223. Russell AS, Wallenstein GV, Li T, et al. Abatacept improves both the physical and mental health of patients with rheumatoid arthritis who have inadequate response to methotrexate treatment. Ann Rheum Dis. 2007;66(2):189-194.
224. Westhovens R, Cole JC, Li T, et al. Improved health-related quality of life for rheumatoid arthritis patients treated with abatacept who have inadequate response to anti-TNF therapy in a double-blind, placebo-controlled, multicentre randomized clinical trial. Rheumatology (Oxford). 2006;45(10):1238-1246.
225. Reilly MC, Zbrozek AS, Dukes EM. The validity and reproducibility of a work productivity and activity impairment instrument. PharmacoEconomics. 1993;4(5):353-365.

©Institute for Clinical and Economic Review, 2017 Page 124 Evidence Report: Targeted Immune Modulators for Rheumatoid Arthritis Return to Table of Contents
226. Fleischmann R, Weinblatt ME, Schiff M, et al. Patient-Reported Outcomes From a Two-Year Head-to-Head Comparison of Subcutaneous Abatacept and Adalimumab for Rheumatoid Arthritis. Arthritis Care Res (Hoboken). 2016;68(7):907-913.
227. Smolen J, DeLozier AM, De Bono S, Yang L, Arora V, Gaich C. Work Productivity and Daily Activity in Patients with Rheumatoid Arthritis in Four Phase III Randomized Clinical Trials of Baracitinib. Ann Rheum Dis. 2016;75:416.
228. Eriksson JK, Neovius M, Bratt J, et al. Biological vs. conventional combination treatment and work loss in early rheumatoid arthritis: a randomized trial. JAMA Intern Med. 2013;173(15):1407-1414.
229. Eriksson JK, Wallman JK, Miller H, et al. Infliximab Versus Conventional Combination Treatment and Seven-Year Work Loss in Early Rheumatoid Arthritis: Results of a Randomized Swedish Trial. Arthritis Care and Research. 2016;68(12):1758-1766.
230. Li T, Wells G, Westhovens R, Tugwell P. Validation of a simple activity participation measure for rheumatoid arthritis clinical trials. Rheumatology (Oxford). 2009;48(2):170-175.
231. Li T, Wells G, Westhovens R, Emery P, Becker JC, Tugwell P. Improvements in participation in usual daily activities in patients with rheumatoid arthritis treated with abatacept. Value Health. 2011;14(2):361-370.
232. Asai S, Kojima T, Oguchi T, et al. Effects of Concomitant Methotrexate on Large Joint Replacement in Patients With Rheumatoid Arthritis Treated With Tumor Necrosis Factor Inhibitors: A Multicenter Retrospective Cohort Study in Japan. Arthritis Care Res (Hoboken). 2015;67(10):1363-1370.
233. Ferriols-Lisart R, Ferriols-Lisart F. Dose modifications of anti-TNF drugs in rheumatoid arthritis patients under real-world settings: a systematic review. Rheumatology international. 2015;35(7):1193-1210.
234. Pappas DA, John A, Curtis JR, et al. Dosing of Intravenous Tocilizumab in a Real-World Setting of Rheumatoid Arthritis: Analyses from the Corrona Registry. Rheumatology and therapy. 2016;3(1):103-115.
235. Darkow T, Chastek B, Rosenblatt L, et al. Dose Escalation Among Rheumatoid Arthritis Patients Treated with Infliximab or Abatacept: Comparison in Claims Data [Abstract]. Arthritis Rheum. 2011;63(Suppl 10).
236. Fowler R, McMorrow D, Smith D, Nadkarni A. FRI0364 Real-World Incidence of Biologic Dose Escalation and Impact on Biologic Costs Among Patients with Rheumatoid Arthritis Treated with Intravenous Agents Abatacept, Infliximab or Tocilizumab [Abstract]. Ann Rheum Dis. 2015;74:558.
237. Canadian Agency for Drugs and Technologies in Health (CADTH). Biologics Dose Escalation for the Treatment of Rheumatoid Arthritis: A Review of the Clinical and Cost-Effectiveness. Rapid Response Report. 2015; https://www.cadth.ca/sites/default/files/pdf/htis/sep-2015/RC0710%20Biologics%20Dose%20Escalation%20for%20the%20Treatment%20of%20Rheumatoid%20Arthritis%20Clinical%20and%20Cost-Effectiveness%20Final.pdf. Accessed December 23, 2017.
238. Emery P, Hammoudeh M, FitzGerald O, et al. Sustained remission with etanercept tapering in early rheumatoid arthritis. N Engl J Med. 2014;371(19):1781-1792.
239. Smolen JS, Nash P, Durez P, et al. Maintenance, reduction, or withdrawal of etanercept after treatment with etanercept and methotrexate in patients with moderate rheumatoid arthritis (PRESERVE): a randomised controlled trial. Lancet. 2013;381(9870):918-929.

©Institute for Clinical and Economic Review, 2017 Page 125 Evidence Report: Targeted Immune Modulators for Rheumatoid Arthritis Return to Table of Contents
240. Huizinga TW, Conaghan PG, Martin-Mola E, et al. Clinical and radiographic outcomes at 2 years and the effect of tocilizumab discontinuation following sustained remission in the second and third year of the ACT-RAY study. Ann Rheum Dis. 2015;74(1):35-43.
241. Yoo DH, Prodanovic N, Jaworski J, et al. Efficacy and safety of CT-P13 (biosimilar infliximab) in patients with rheumatoid arthritis: Comparison between switching from reference infliximab to CT-P13 and continuing CT-P13 in the PLANETRA extension study. Ann Rheum Dis. 2016.
242. Furst DE, Shaikh SA, Greenwald M, et al. Two dosing regimens of certolizumab pegol in patients with active rheumatoid arthritis. Arthritis Care and Research. 2015;67(2):151-160.
243. Physician and Other Supplier Data CY 2014. Baltimore, MD: Centers for Medicare and Medicaid Services; 2014.
244. Symmons DP, Silman AJ. The Norfolk Arthritis Register (NOAR). Clin Exp Rheumatol. 2003;21(5 Suppl 31):S94-99.
245. Kavanaugh A, Smolen JS, Emery P, et al. Effect of certolizumab pegol with methotrexate on home and work place productivity and social activities in patients with active rheumatoid arthritis. Arthritis Rheum. 2009;61(11):1592-1600.
246. Osterhaus JT, Purcaru O. Discriminant validity, responsiveness and reliability of the arthritis-specific Work Productivity Survey assessing workplace and household productivity within and outside the home in patients with axial spondyloarthritis, including nonradiographic axial spondyloarthritis and ankylosing spondylitis. Arthritis Res Ther. 2014;16(4):R164.
247. Han C, Li N, Peterson S. Minimal important difference in HAQ: A validation from health economic perspectives in patient with rheumatoid arthritis using real-world data. . Paper presented at: American College of Rheumatology/Association of Rheumatology Health Professionals Annual Scientific Meeting, ACR/ARHP 20152015; San Francisco, CA.
248. Barnabe C, Hazlewood G, Barr S, Martin L. Comparison of radiographic scoring methods in a cohort of RA patients treated with anti-TNF therapy. Rheumatology. 2012:ker418.
249. Strand V, Ahadieh S, French J, et al. Systematic review and meta-analysis of serious infections with tofacitinib and biologic disease-modifying antirheumatic drug treatment in rheumatoid arthritis clinical trials [Supplement]. Arthritis research & therapy. 2015;17:362.
250. Smolen J, Genovese M, Takeuchi T, et al. Safety Profile of Baricitinib in Patients with Active Rheumatoid Arthritis: An Integrated Analysis. 2016.
251. van Vollenhoven RF, Emery P, Bingham CO, 3rd, et al. Long-term safety of rituximab in rheumatoid arthritis: 9.5-year follow-up of the global clinical trial programme with a focus on adverse events of interest in RA patients. Ann Rheum Dis. 2013;72(9):1496-1502.
252. Alten R, Kaine J, Keystone E, Nash P, Delaet I, Genovese MC. Long-term safety of subcutaneous abatacept in rheumatoid arthritis: integrated analysis of clinical trial data representing more than four years of treatment. Arthritis & rheumatology (Hoboken, N.J.). 2014;66(8):1987-1997.
253. Fleischmann RM, Halland AM, Brzosko M, et al. Tocilizumab inhibits structural joint damage and improves physical function in patients with rheumatoid arthritis and inadequate responses to methotrexate: LITHE study 2-year results. J Rheumatol. 2013;40(2):113-126.
254. Ai JW, Zhang S, Ruan QL, et al. The Risk of Tuberculosis in Patients with Rheumatoid Arthritis Treated with Tumor Necrosis Factor-alpha Antagonist: A Metaanalysis of Both Randomized Controlled Trials and Registry/Cohort Studies. J Rheumatol. 2015;42(12):2229-2237.
255. Singh JA, Hossain A, Tanjong Ghogomu E, Mudano AS, Tugwell P, Wells GA. Biologic or tofacitinib monotherapy for rheumatoid arthritis in people with traditional disease-modifying anti-rheumatic drug (DMARD) failure: a Cochrane Systematic Review and networkmeta-analysis (NMA) (Review). Cochrane Database Syst Rev. 2016(issue 11).

©Institute for Clinical and Economic Review, 2017 Page 126 Evidence Report: Targeted Immune Modulators for Rheumatoid Arthritis Return to Table of Contents
256. Blumenauer B, Judd M, Wells G, et al. Infliximab for the treatment of rheumatoid arthritis (Review). Cochrane Database Syst Rev. 2002(Issue 3).
257. Lethaby A, Lopez-Olivo MA, Maxwell L, Burls A, Tugwell P, Wells G. Etanercept for the treatment of rheumatoid arthritis (Review). Cochrane Database Syst Rev. 2013(Issue 5).
258. Lopez-Olivo MA, Amezaga U, McGahan L, Pollono EN, Suarez-Almazor ME. Rituximab for rheumatoid arthritis (Review). Cochrane Database Syst Rev. 2015(Issue 1).
259. Lopez-Olivo MA, Bavineni M, Suarez-Almazor ME. Tofacitinib for rheumatoid arthritis (Protocol). Cochrane Database Syst Rev. 2013(Issue 4).
260. Maxwell L, Singh A. Abatacept for rheumatoid arthritis (Review). Cochrane Database Syst Rev. 2010(issue 1).
261. Navarro-Sarabia F, Ariza-Ariza R, Hernandez-Cruz B, Villanueva I. Adalimumab for treating rheumatoid arthritis (Review). Cochrane Database Syst Rev. 2005(Issue 3).
262. Ruiz Garcia G, Jobanputra P, Burls A, et al. Certolizumab pegol (CDP870) for rheumatoid arthritis in adults (Review). Cochrane Database Syst Rev. 2014(Issue 9).
263. Singh JA, Beg S, Lopez-Olivo MA. Tocilizumab for rheumatoid arthritis (Review). Cochrane Database Syst Rev. 2010(Issue 7).
264. Singh JA, Christensen R, Wells GA, et al. Biologics for rheumatoid arthritis: an overview of Cochrane reviews (Review). Cochrane Database Syst Rev. 2009(issue 4).
265. (CADTH) CAfDaTiH. Biological Response Modifier Agents for Adults with Rheumatoid Arthritis. 2010.
266. Baddley JW, Winthrop KL, Chen L, et al. Non-viral opportunistic infections in new users of tumour necrosis factor inhibitor therapy: results of the SAfety Assessment of Biologic ThERapy (SABER) study. Ann Rheum Dis. 2014;73(11):1942-1948.
267. Chen JS, Makovey J, Lassere M, Buchbinder R, March LM. Comparative effectiveness of anti-tumor necrosis factor drugs on health-related quality of life among patients with inflammatory arthritis. Arthritis Care Res (Hoboken). 2014;66(3):464-472.
268. Chiu YM, Lang HC, Lin HY, et al. Risk of tuberculosis, serious infection and lymphoma with disease-modifying biologic drugs in rheumatoid arthritis patients in Taiwan. Int J Rheum Dis. 2014;17 Suppl 3:9-19.
269. Curtis JR, Xie F, Yun H, Bernatsky S, Winthrop KL. Real-world comparative risks of herpes virus infections in tofacitinib and biologic-treated patients with rheumatoid arthritis. Ann Rheum Dis. 2016;75(10):1843-1847.
270. Curtis JR, Yang S, Patkar NM, et al. Risk of hospitalized bacterial infections associated with biologic treatment among US veterans with rheumatoid arthritis. Arthritis Care Res (Hoboken). 2014;66(7):990-997.
271. Curtis JR, Sarsour K, Napalkov P, Costa LA, Schulman KL. Incidence and complications of interstitial lung disease in users of tocilizumab, rituximab, abatacept and anti-tumor necrosis factor alpha agents, a retrospective cohort study. Arthritis research & therapy. 2015;17:319.
272. Galloway JB, Hyrich KL, Mercer LK, et al. Risk of septic arthritis in patients with rheumatoid arthritis and the effect of anti-TNF therapy: results from the British Society for Rheumatology Biologics Register. Ann Rheum Dis. 2011;70(10):1810-1814.
273. Gomez-Reino JJ, Maneiro JR, Ruiz J, et al. Comparative effectiveness of switching to alternative tumour necrosis factor (TNF) antagonists versus switching to rituximab in patients with rheumatoid arthritis who failed previous TNF antagonists: the MIRAR Study. Ann Rheum Dis. 2012;71(11):1861-1864.

©Institute for Clinical and Economic Review, 2017 Page 127 Evidence Report: Targeted Immune Modulators for Rheumatoid Arthritis Return to Table of Contents
274. Grijalva CG, Chen L, Delzell E, et al. Initiation of tumor necrosis factor-alpha antagonists and the risk of hospitalization for infection in patients with autoimmune diseases. Jama. 2011;306(21):2331-2339.
275. Harigai M, Nanki T, Koike R, et al. Risk for malignancy in rheumatoid arthritis patients treated with biological disease-modifying antirheumatic drugs compared to the general population: A nationwide cohort study in Japan. Modern Rheumatology. 2016;26(5):642-650.
276. Johnston SS, Turpcu A, Shi N, Fowler R, Chu BC, Alexander K. Risk of infections in rheumatoid arthritis patients switching from anti-TNF agents to rituximab, abatacept, or another anti-TNF agent, a retrospective administrative claims analysis. Semin Arthritis Rheum. 2013;43(1):39-47.
277. Fleischmann R, Connolly SE, Maldonado MA, Schiff M. Brief Report: Estimating Disease Activity Using Multi-Biomarker Disease Activity Scores in Rheumatoid Arthritis Patients Treated With Abatacept or Adalimumab. Arthritis & rheumatology (Hoboken, N.J.). 2016;68(9):2083-2089.
278. Yun H, Xie F, Delzell E, et al. Comparative Risk of Hospitalized Infection Associated With Biologic Agents in Rheumatoid Arthritis Patients Enrolled in Medicare. Arthritis & rheumatology (Hoboken, N.J.). 2016;68(1):56-66.
279. Smolen J, J-Y C, Prodanovic N, et al. Comparable Safety and Immunogenicity and Sustained Efficacy after Transition to SB2 (An Infliximab Biosimilar) Vs Ongoing Reference Infliximab (Remicade®) in Patients with Rheumatoid Arthritis: Results of Phase III Transition Study [abstract]. Arthritis & rheumatology (Hoboken, N.J.). 2016;68(suppl 10).
280. Matsumoto A, Pavelka K, Rizzo W, et al. Secondary efficacy endpoints: Results from a phase 3 study comparing ABP 501 with adalimumab in subjects with moderate to severe rheumatoid arthritises. Arthritis and Rheumatology. 2015;67(no pagination).
281. Kay J, Chopra A, Chandrashekara S, et al. Secondary efficacy outcomes from a phase 3 study support clinical equivalence between BOW015 and infliximab in patients with active rheumatoid arthritis on stable methotrexate doses. Ann Rheum Dis. 2015;74:1034.
282. Yoo D, Miranda P, Piotrowski M, et al. A randomized, double-blind, phase 3 study demonstrates clinical equivalence of CT-P13 to infliximab when co-administered with methotrexate in patients with active rheumatoid arthritis. Annals of the Rheumatic Disease. 2013;71.
283. Kremer JM, Dougados M, Emery P, et al. Treatment of rheumatoid arthritis with the selective costimulation modulator abatacept: twelve-month results of a phase iib, double-blind, randomized, placebo-controlled trial. Arthritis Rheum. 2005;52(8):2263-2271.
284. Emery P, Kosinski M, Li T, et al. Treatment of rheumatoid arthritis patients with abatacept and methotrexate significantly improved health-related quality of life. J Rheumatol. 2006;33(4):681-689.
285. Kremer JM, Blanco R, Brzosko M, et al. Tocilizumab inhibits structural joint damage in rheumatoid arthritis patients with inadequate responses to methotrexate: results from the double-blind treatment phase of a randomized placebo-controlled trial of tocilizumab safety and prevention of structural joint damage at one year. Arthritis and rheumatism. 2011;63(3):609-621.
286. Strand V, Kosinski M, Chen CI, et al. Sarilumab plus methotrexate improves patient-reported outcomes in patients with active rheumatoid arthritis and inadequate responses to methotrexate: results of a phase III trial. Arthritis research & therapy. 2016;18:198.
287. Kavanaugh A, Decktor DL, Fan C, Van Adelsberg J, Martincova R, Genovese MC. A profile of the efficacy of sarilumab plus methotrexate in rheumatoid arthritis patients: Results of a 52-week, phase 3, randomized, double-blind, placebo-controlled, international study. Arthritis and Rheumatology. 2014;66:S1233-S1234.

©Institute for Clinical and Economic Review, 2017 Page 128 Evidence Report: Targeted Immune Modulators for Rheumatoid Arthritis Return to Table of Contents
288. Burmester GR, Blanco R, Charles-Schoeman C, et al. Tofacitinib (CP-690,550) in combination with methotrexate in patients with active rheumatoid arthritis with an inadequate response to tumour necrosis factor inhibitors: a randomised phase 3 trial. Lancet (London, England). 2013;381(9865):451-460.
289. Strand V, Smolen JS, van Vollenhoven RF, et al. Certolizumab pegol plus methotrexate provides broad relief from the burden of rheumatoid arthritis: analysis of patient-reported outcomes from the RAPID 2 trial. Ann Rheum Dis. 2011;70(6):996-1002.
290. van der Heijde D, Klareskog L, Landewe R, et al. Disease remission and sustained halting of radiographic progression with combination etanercept and methotrexate in patients with rheumatoid arthritis. Arthritis Rheum. 2007;56(12):3928-3939.
291. Morgan CL, Emery P, Porter D, et al. Treatment of rheumatoid arthritis with etanercept with reference to disease-modifying anti-rheumatic drugs: long-term safety and survival using prospective, observational data. Rheumatology (Oxford). 2014;53(1):186-194.
292. Tanaka Y, Harigai M, Takeuchi T, et al. Clinical efficacy, radiographic progression, and safety through 156 weeks of therapy with subcutaneous golimumab in combination with methotrexate in Japanese patients with active rheumatoid arthritis despite prior methotrexate therapy: final results of the randomized GO-FORTH trial. Modern Rheumatology. 2016;26(4):481-490.
293. Karlsson JA, Neovius M, Nilsson JA, et al. Addition of infliximab compared with addition of sulfasalazine and hydroxychloroquine to methotrexate in early rheumatoid arthritis: 2-year quality-of-life results of the randomised, controlled, SWEFOT trial. Ann Rheum Dis. 2013;72(12):1927-1933.

©Institute for Clinical and Economic Review, 2017 Page 129 Evidence Report: Targeted Immune Modulators for Rheumatoid Arthritis Return to Table of Contents
APPENDICES

©Institute for Clinical and Economic Review, 2017 Page 130 Evidence Report: Targeted Immune Modulators for Rheumatoid Arthritis Return to Table of Contents
Appendix A. Search Strategies and Results
Table A1. PRISMA 2009 Checklist
# Checklist item
TITLE
Title 1 Identify the report as a systematic review, meta-analysis, or both.
ABSTRACT
Structured summary
2 Provide a structured summary including, as applicable: background; objectives; data sources; study eligibility criteria, participants, and interventions; study appraisal and synthesis methods; results; limitations; conclusions and implications of key findings; systematic review registration number.
INTRODUCTION
Rationale 3 Describe the rationale for the review in the context of what is already known.
Objectives 4 Provide an explicit statement of questions being addressed with reference to participants, interventions, comparisons, outcomes, and study design (PICOS).
METHODS
Protocol and registration
5 Indicate if a review protocol exists, if and where it can be accessed (e.g., Web address), and, if available, provide registration information including registration number.
Eligibility criteria 6 Specify study characteristics (e.g., PICOS, length of follow-up) and report characteristics (e.g., years considered, language, publication status) used as criteria for eligibility, giving rationale.
Information sources
7 Describe all information sources (e.g., databases with dates of coverage, contact with study authors to identify additional studies) in the search and date last searched.
Search 8 Present full electronic search strategy for at least one database, including any limits used, such that it could be repeated.
Study selection 9 State the process for selecting studies (i.e., screening, eligibility, included in systematic review, and, if applicable, included in the meta-analysis).
Data collection process
10 Describe method of data extraction from reports (e.g., piloted forms, independently, in duplicate) and any processes for obtaining and confirming data from investigators.
Data items 11 List and define all variables for which data were sought (e.g., PICOS, funding sources) and any assumptions and simplifications made.
Risk of bias in individual studies
12 Describe methods used for assessing risk of bias of individual studies (including specification of whether this was done at the study or outcome level), and how this information is to be used in any data synthesis.
Summary measures 13 State the principal summary measures (e.g., risk ratio, difference in means).
Synthesis of results 14 Describe the methods of handling data and combining results of studies, if done, including measures of consistency (e.g., I2
) for each meta-analysis.
Risk of bias across studies
15 Specify any assessment of risk of bias that may affect the cumulative evidence (e.g., publication bias, selective reporting within studies).

©Institute for Clinical and Economic Review, 2017 Page 131 Evidence Report: Targeted Immune Modulators for Rheumatoid Arthritis Return to Table of Contents
Additional analyses 16 Describe methods of additional analyses (e.g., sensitivity or subgroup analyses, meta-regression), if done, indicating which were pre-specified.
# Checklist item
RESULTS
Study selection 17 Give numbers of studies screened, assessed for eligibility, and included in the review, with reasons for exclusions at each stage, ideally with a flow diagram.
Study characteristics
18 For each study, present characteristics for which data were extracted (e.g., study size, PICOS, follow-up period) and provide the citations.
Risk of bias within studies
19 Present data on risk of bias of each study and, if available, any outcome level assessment (see item 12).
Results of individual studies
20 For all outcomes considered (benefits or harms), present, for each study: (a) simple summary data for each intervention group (b) effect estimates and confidence intervals, ideally with a forest plot.
Synthesis of results 21 Present results of each meta-analysis done, including confidence intervals and measures of consistency.
Risk of bias across studies
22 Present results of any assessment of risk of bias across studies (see Item 15).
Additional analysis 23 Give results of additional analyses, if done (e.g., sensitivity or subgroup analyses, meta-regression [see Item 16]).
DISCUSSION
Summary of evidence
24 Summarize the main findings including the strength of evidence for each main outcome; consider their relevance to key groups (e.g., healthcare providers, users, and policy makers).
Limitations 25 Discuss limitations at study and outcome level (e.g., risk of bias), and at review-level (e.g., incomplete retrieval of identified research, reporting bias).
Conclusions 26 Provide a general interpretation of the results in the context of other evidence, and implications for future research.
FUNDING
Funding 27 Describe sources of funding for the systematic review and other support (e.g., supply of data); role of funders for the systematic review.
From: Moher D, Liberati A, Tetzlaff J, Altman DG. The PRISMA Group (2009). Preferred Reporting Items for Systematic Reviews and Meta-Analyses: The PRISMA Statement. PLoS Med 6(6): e1000097. doi:10.1371/journal.pmed1000097

©Institute for Clinical and Economic Review, 2017 Page 132 Evidence Report: Targeted Immune Modulators for Rheumatoid Arthritis Return to Table of Contents
Table A2. Search Strategies of Medline 1996 to Present with Daily Update and Cochrane Central
Register of Controlled trials on September 2, 2016; updated February 13, 2017
1 exp Arthritis, Rheumatoid/
2 ((rheumatoid or rheumatic or rheumat$) adj3 (arthrit$ or diseas$ or condition$)).ti,ab.
3 1 or 2
4 exp abatacept/
5 (abatacept or orencia).ti,ab.
6 exp rituximab/
7 (rituximab or rituxan or mabthera).ti,ab.
8 (tocilizumab or atlizumab or actemra or roactemra).ti,ab.
9 exp infliximab/
10 (infliximab or remicade).ti,ab.
11 exp etanercept/
12 (etanercept or enbrel).ti,ab.
13 exp adalimumab/
14 (adalimumab or humira).ti,ab.
15 exp certolizumab pegol/
16 (certolizumab pegol or cimzia).ti,ab.
17 (golimumab or simponi).ti,ab.
18 4 or 5 or 6 or 7 or 8 or 9 or 10 or 11 or 12 or 13 or 14 or 15 or 16 or 17
19 3 and 18
20 limit 19 to yr="2010 -Current"
21 (tofacitinib or tasocitinib or tofacitinib citrate or Xeljanz).ti,ab.
22 (sarilumab or REGN88).ti,ab.
23 (baricitinib or LY3009104 or INCB028050).ti,ab.
24 21 or 22 or 23

©Institute for Clinical and Economic Review, 2017 Page 133 Evidence Report: Targeted Immune Modulators for Rheumatoid Arthritis Return to Table of Contents
25 24 and 3
26 25 or 20
27 (animals not (humans and animals)).sh.
28 26 not 27
29 limit 28 to english language
30 (abstract or addresses or autobiography or bibliography or biography or clinical trial, phase I or case report or comment or congresses or consensus development conference or duplicate publication or editorial or guideline or in vitro or interview or lecture or legal cases or legislation or letter or news or newspaper article or patient education handout or periodical index or personal narratives or portraits or practice guideline or review or video-audio media).pt.
31 cohort studies/ or longitudinal studies/ or prospective studies/ or retrospective studies/ or comparative study.pt
32 control Groups/ or (control* adj2 (clinical or group* or trial* or study or studies or design* or arm*)).ti,ab. or ("clinical trial" or "clinical trial, phase ii" or clinical trial, phase iii or clinical trial, phase iv or controlled clinical trial or "multicenter study" or "randomized controlled trial").pt. or (randomi?ed adj6 (study or trial* or (clinical adj2 trial*))).ti,ab. or ((single or doubl*) adj2 blind*).ti,ab.
33 31 or 32
34 29 not 30
35 34 and 33
36 Remove duplicates from 35
Table A3. Search Strategies of EMBASE on September 2, 2016; updated February 13, 2017
#1 'rheumatoid arthritis'/exp
#2 ((rheumatoid OR rheumatic OR rheumat*) NEAR/3 (arthrit* OR diseas* OR condition*)):ab,ti
#3 #1 OR #2
#4 ‘abatacept’/exp OR abatacept:ab,ti OR orencia:ab,ti
#5 ‘rituximab’/exp OR rituximab:ab,ti OR rituxan:ab,ti OR mabthera:ab,ti
#6 'tocilizumab'/exp OR tocilizumab:ab,ti OR atlizumab:ab,ti OR actemra:ab,ti OR roactemra:ab,ti
#7 ‘infliximab’/exp OR infliximab:ab,ti OR remicade:ab,ti
#8 'etanercept'/exp OR etanercept:ab,ti OR enbrel:ab,ti

©Institute for Clinical and Economic Review, 2017 Page 134 Evidence Report: Targeted Immune Modulators for Rheumatoid Arthritis Return to Table of Contents
#9 'adalimumab'/exp OR adalimumab:ab,ti OR humira:ab,ti
#10 'certolizumab pegol'/exp OR 'certolizumab pegol':ab,ti OR cimzia:ab,ti
#11 'golimumab'/exp OR golimumab:ab,ti OR simponi:ab,ti
#12 #4 OR #5 OR #6 OR #7 OR #8 OR #9 OR #10 OR #11
#13 #3 AND #12
#14 #13 AND [2010-2016]/py
#15 #14 AND ('chapter'/it OR 'conference abstract'/it OR 'conference paper'/it OR 'conference review'/it OR 'editorial'/it OR 'letter'/it OR 'note'/it OR 'review'/it OR 'short survey'/it)
#16 #14 NOT #15
#17 'tofacitinib'/exp OR tofacitinib:ab,ti OR tasocitinib:ab,ti OR 'tofacitinib citrate':ab,ti OR xeljanz:ab,ti
#18 'baricitinib'/exp OR baricitinib:ab,ti
#19 'sarilumab'/exp OR sarilumab:ab,ti
#20 #17 OR #18 OR #19
#21 #3 AND #20
#22 #21 AND ('chapter'/it OR 'conference review'/it OR 'editorial'/it OR 'letter'/it OR 'note'/it OR 'review'/it OR 'short survey'/it)
#23 #21 NOT #22
#24 #16 OR #23
#25 'animal'/exp OR 'nonhuman'/exp OR 'animal experiment'/exp
#26 'human'/exp
#27 #25 AND #26
#28 #25 NOT #27
#29 #24 NOT #28
#30 #29 AND [english]/lim
#31 #30 AND [medline]/lim
#32 #30 NOT #31

©Institute for Clinical and Economic Review, 2017 Page 135 Evidence Report: Targeted Immune Modulators for Rheumatoid Arthritis Return to Table of Contents
Figure A1. PRISMA flow chart showing results of literature search for rheumatoid arthritis
31 publications (published
prior to 2010) identified
from previous systematic
reviews
4,042 potentially relevant
references screened
3,264 citations excluded
Population: 792
Intervention: 186
Comparator: 276
Outcomes: 334
Study design: 1,314
Duplicates: 362
778 references for full text
review
660 citations excluded (posthoc
analyses, placebo-controlled trials,
sample size limitations, conference
abstract duplicated peer-reviewed
publication)
149 TOTAL
• 67 RCTs
o 110 publications
o publications
o 22 conference
abstracts/posters
• 17 observational studies

©Institute for Clinical and Economic Review, 2017 Page 136 Evidence Report: Targeted Immune Modulators for Rheumatoid Arthritis Return to Table of Contents
Appendix B. Public and Representative Private Insurer Coverage
Policies
Table B1: Coverage Policies for New England Commercial Payers
Connecticut Maine Massachusetts New Hampshire Rhode Island Vermont
Anthem (Wellpoint Inc Group)
Connecticare
Anthem
(Wellpoint Inc
Group)
HPHC Maine
BCBS of
MA
Neighborhood Health Plan
Tufts Health
Plan
Anthem (Wellpoint Inc Group)
HPHC New Hampshire
BCBS of RI
Neighborho
od Health Plan of RI
BCBS of VT
TNFα inhibitors
etanercept (Tradename: Enbrel; Manufacturer: Amgen)
How many cDMARDs 1 1 1 1 1 1 1 1 1 1 1 2
How many TNFs 0 0 0 0 0 0 0 0 0 0 0 0
etanercept AND adalimumab? No No No No No No No No No No No No
Preferred Agent Yes No Yes Yes Yes Yes Yes Yes Yes Yes Yes Yes
infliximab (Tradename: Remicade; Manufacturer: Janssen)
How many cDMARDs 1 1 1 NL 1 1 1 1 1 1 1 2
How many TNFs 0 2 2 NL 2 0 0 0 2 0 0 2
etanercept AND adalimumab? No No No NL No No No No Yes No No Yes
Preferred Agent Yes No Yes NL No Yes Yes Yes No Yes Yes No
adalimumab (Tradename: Humira; Manufacturer: AbbVie)
How many cDMARDs 1 1 1 1 1 1 1 1 1 1 1 2
How many TNFs 0 0 0 0 0 0 0 0 1 0 0 0

©Institute for Clinical and Economic Review, 2017 Page 137 Evidence Report: Targeted Immune Modulators for Rheumatoid Arthritis Return to Table of Contents
Connecticut Maine Massachusetts New Hampshire Rhode Island Vermont
Anthem (Wellpoint Inc Group)
Connecticare
Anthem
(Wellpoint Inc
Group)
HPHC Maine
BCBS of
MA
Neighborhood Health Plan
Tufts Health
Plan
Anthem (Wellpoint Inc Group)
HPHC New Hampshire
BCBS of RI
Neighborho
od Health Plan of RI
BCBS of VT
etanercept AND adalimumab? No No No No No No No No No No No No
Preferred Agent Yes Yes Yes Yes Yes Yes Yes Yes Yes Yes Yes Yes
certolizumab pegol (Tradename: Cimzia; Manufacturer: UCB)
How many cDMARDs 1 1 1 1 1 1 1 1 1 1 1 2
How many TNFs 2 2 2 1 2 0 0 2 1 2 0 2
etanercept AND adalimumab? No No No No Yes No No No No Yes No Yes
Preferred Agent No Yes No No No Yes Yes Yes No No Yes No
golimumab (Tradename: Simponi; Manufacturer: Janssen)
How many cDMARDs 1 1 1 1 1 1 1 1 1 1 1 2
How many TNFs 0 2 2 1 2 0 0 0 1 2 0 2
etanercept AND adalimumab? No No No No Yes No No No No Yes No Yes
Preferred Agent Yes Yes Yes No No Yes Yes Yes No No Yes No
CD20- directed cytolytic antibodies
rituximab (Tradename: Rituxan; Manufacturer: Genentech)
How many cDMARDs 1 1 0 NL 1 NL 1 1 1 1 NL 2
How many TNFs 1 2 1 NL 2 NL 1 1 2 2 NL 2
etanercept AND adalimumab? No No No NL Yes NL No No No No NL Yes
Preferred Agent No Yes No NL No NL No No No No NL No
Tcell inhibitors
abatacept (Tradename: Orencia; Manufacturer: Bristol Myers Squibb)

©Institute for Clinical and Economic Review, 2017 Page 138 Evidence Report: Targeted Immune Modulators for Rheumatoid Arthritis Return to Table of Contents
Connecticut Maine Massachusetts New Hampshire Rhode Island Vermont
Anthem (Wellpoint Inc Group)
Connecticare
Anthem
(Wellpoint Inc
Group)
HPHC Maine
BCBS of
MA
Neighborhood Health Plan
Tufts Health
Plan
Anthem (Wellpoint Inc Group)
HPHC New Hampshire
BCBS of RI
Neighborho
od Health Plan of RI
BCBS of VT
How many cDMARDs 1 1 1 1 1 1 1 1 1 1 1 2
How many TNFs 2 2 2 1 2 1 1 2 2 2 1 2
etanercept AND adalimumab? No No No No Yes 0 0 No No No 0 Yes
Preferred Agent No No No No No No No No No No No No
IL-6 inhibitors
tocilizumab (Tradename: Actemra; Manufacturer: Genentech)
How many cDMARDs NF 1 1 1 1 1 1 1 1 1 1 2
How many TNFs NF 2 2 1 2 0 2 2 1 2 0 2
etanercept AND adalimumab? NF No No No Yes No Yes No No No No Yes
Preferred Agent NF No No No No Yes No No No No Yes No
JAK inhibitors
tofacitinib (Tradename: Xeljanz; Manufacturer: Pfizer)
How many cDMARDs 1 1 1 1 1 1 1 NL NL 1 1 2
How many TNFs 2 2 2 0 2 0 0 NL NL 2 0 2
etanercept AND adalimumab? No No No No Yes No No NL NL No No Yes
Preferred Agent No No No Yes No Yes Yes NL NL No No No

©Institute for Clinical and Economic Review, 2017 Page 139 Evidence Report: Targeted Immune Modulators for Rheumatoid Arthritis Return to Table of Contents
Table B2. Coverage Policies for New England Medicaid Programs
New England Medicaid Programs
Connecticut Maine Massachusetts New Hampshire Rhode Island Vermont
TNFα inhibitors
adalimumab (Tradename: Humira; Manufacturer: AbbVie)
Step Therapy Yes Yes NL Yes NL NL
PA Yes No Yes Yes No Yes
Preferred Agent Yes Yes No Yes Yes Yes
certolizumab pegol (Tradename: Cimzia; Manufacturer: UCB)
Step Therapy Yes Yes NL Yes NL NL
PA Yes Yes Yes Yes Yes Yes
Preferred Agent No No No No No No
etanercept (Tradename: Enbrel; Manufacturer: Amgen)
Step Therapy Yes Yes NL Yes NL NL
PA Yes No Yes Yes No Yes
Preferred Agent Yes Yes No Yes Yes Yes
golimumab (Tradename: Simponi; Manufacturer: Janssen)
Step Therapy Yes Yes NL Yes NL NL
PA Yes Yes Yes Yes Yes Yes
Preferred Agent No No No No No No
infliximab (Tradename: Remicade; Manufacturer: Janssen)
Step Therapy Yes Yes NL Yes NL NL
PA Yes No Yes Yes Yes Yes
Preferred Agent No No No No No No
CD20- directed cytolytic antibodies
rituximab (Tradename: Rituxan; Manufacturer: Genentech)
Step Therapy NL NL Yes NL NL NL
PA Yes NL Yes NL NL NL
Preferred Agent NL NL No NL NL NL
Tcell inhibitors
abatacept (Tradename: Orencia; Manufacturer: Bristol Myers Squibb)
Step Therapy Yes Yes NL Yes NL NL
PA Yes Yes Yes Yes Yes Yes
Preferred Agent No No No No No No
IL-6 inhibitors
tocilizumab (Tradename: Actemra; Manufacturer: Genentech)
Step Therapy Yes Yes NL Yes NL NL
PA Yes Yes Yes Yes Yes Yes
Preferred Agent No No No No No No
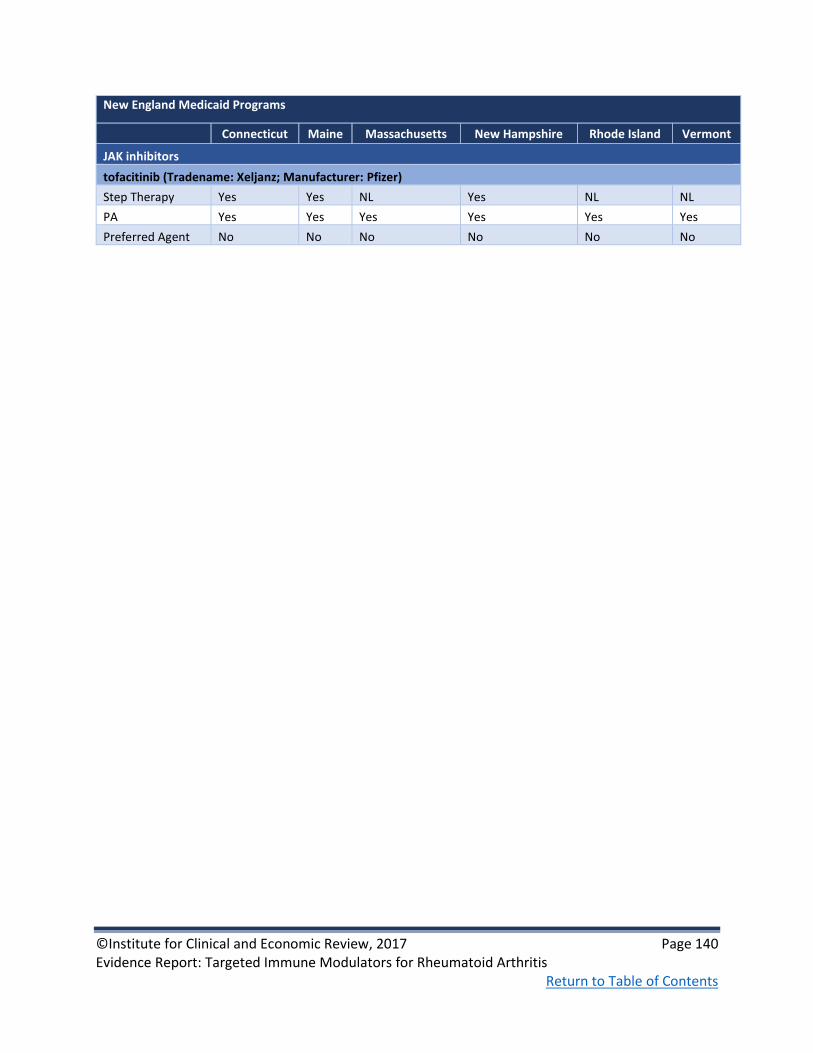
©Institute for Clinical and Economic Review, 2017 Page 140 Evidence Report: Targeted Immune Modulators for Rheumatoid Arthritis Return to Table of Contents
New England Medicaid Programs
Connecticut Maine Massachusetts New Hampshire Rhode Island Vermont
JAK inhibitors
tofacitinib (Tradename: Xeljanz; Manufacturer: Pfizer)
Step Therapy Yes Yes NL Yes NL NL
PA Yes Yes Yes Yes Yes Yes
Preferred Agent No No No No No No

©Institute for Clinical and Economic Review, 2017 Page 141 Evidence Report: Targeted Immune Modulators for Rheumatoid Arthritis Return to Table of Contents
Appendix C. Comparative Clinical Effectiveness
Supplemental Information
Methods: Supplemental Information
We performed screening at both the abstract and full-text level. A single investigator screened all
abstracts identified through electronic searches according to the inclusion and exclusion criteria
described earlier. We did not exclude any study at abstract-level screening due to insufficient
information. For example, an abstract that did not report an outcome of interest would be accepted
for further review in full text. We retrieved the citations that were accepted during abstract-level
screening for full text appraisal. One investigator reviewed full papers and provided justification for
exclusion of each excluded study.
We used criteria published by the US Preventive Services Task Force (USPSTF) to assess the quality
of RCTs and comparative cohort studies, using the categories “good,” “fair,” or “poor” (see
Appendix Table F)72 Guidance for quality ratings using these criteria is presented below, as is a
description of any modifications we made to these ratings specific to the purposes of this review.
Good: Meets all criteria: Comparable groups are assembled initially and maintained throughout the
study; reliable and valid measurement instruments are used and applied equally to the groups;
interventions are spelled out clearly; all important outcomes are considered; and appropriate
attention is paid to confounders in analysis. In addition, intention to treat analysis is used for RCTs.
Fair: Studies were graded "fair" if any or all of the following problems occur, without the fatal flaws
noted in the "poor" category below: Generally comparable groups are assembled initially but some
question remains whether some (although not major) differences occurred with follow-up;
measurement instruments are acceptable (although not the best) and generally applied equally;
some but not all important outcomes are considered; and some but not all potential confounders
are addressed. Intention to treat analysis is done for RCTs.
Poor: Studies were graded "poor" if any of the following fatal flaws exists: Groups assembled
initially are not close to being comparable or maintained throughout the study; unreliable or invalid
measurement instruments are used or not applied equally among groups (including not masking
outcome assessment); and key confounders are given little or no attention. For RCTs, intention to
treat analysis is lacking.

©Institute for Clinical and Economic Review, 2017 Page 142 Evidence Report: Targeted Immune Modulators for Rheumatoid Arthritis Return to Table of Contents
Methods of Network Meta-Analysis
Network meta-analyses were conducted to determine comparative effectiveness using measures of
treatment response (ACR 20/50/70) and radiographic progression of joint damage (modified total
Sharp score).
Selection of trials
Trials included in the NMA were selected from the evidence base according to additional inclusion
criteria listed below.
1) RCTs reporting ACR20, ACR50, or ACR70 at approximately 24 weeks and RCTs reporting
Sharp score at approximately 52 weeks. The selection of these timepoints is in line with
previous health technology assessments and is considered appropriate by clinical experts to
assess the treatment effects on these clinical measures.25
2) RCTs were limited to those involving patients who have failed conventional DMARDs
including methotrexate.
3) RCTs were not excluded on the basis of geographical location.
4) ACR estimates were obtained from pre-crossover follow-up timepoints in all trials.
Crossover did occur in several trials prior to Sharp score calculation, but data were typically
imputed in trials to account for this.
A number of assumptions were made:
1) All conventional DMARDs (e.g., methotrexate, sulfasalazine) have equivalent efficacy so a
single estimate of conventional DMARD performance could be estimated.
2) Different types of administration of the same agents (i.e., iv vs. sc) may have differential
performance, and so were evaluated separately in the NMA.
3) Incremental treatment effect is the same regardless of the ACR cut-off (i.e., 20 vs. 50 vs. 70),
allowing us to use the data more efficiently and reduce variation.
4) Despite different scaling properties, modified Sharp scores measured the same underlying
construct of radiographic damage so that they can be converted to a common metric using
standardized mean difference (SMD).
Our primary analysis included RCTs based on populations who were TIM-naïve as well as mixed
populations with a minority (approximately 20% or less) of TIM-experienced patients. Sensitivity
analyses were undertaken to evaluate trials that focused exclusively on TIM-naïve patients.
Statistical models
ACR outcomes are ordered categorical data with four distinct groups: i.e. ACR<20/No response,
ACR20, ACR50, and ACR70, representing an improvement in symptoms of less than 20%, at least

©Institute for Clinical and Economic Review, 2017 Page 143 Evidence Report: Targeted Immune Modulators for Rheumatoid Arthritis Return to Table of Contents
20%, at least 50%, and at least 70%, respectively. These categories can be treated as mutually
exclusive, meaning patients cannot be in more than one category. Therefore, a multinomial
likelihood model with a probit link was used. Model functions have been previously published.26
While the primary analysis did not adjust for any covariables, an additional model was explored to
adjust for ACR response rate in the conventional DMARD arm of each trial.
The modified total Sharp score is a continuous measure that is calculated on different scales
depending on its modification (e.g., Van der Heijde, Genant, or other modified score). In order to
aggregate and synthesize the data into a common metric representing the difference between
treatment and control, a standardized mean difference (SMD) method was used, as suggested by
Lassere et al.146 SMD was calculated as the difference in mean change from baseline divided by the
pooled standard deviation (SD). When data on the pooled SD were missing, it was imputed based
on available p-values or 95% confidence intervals, assuming SDs of treatment arms were the same.
In order to support comparative value analyses, SMD data were also retransformed to estimates of
absolute Sharp score change relative to conventional DMARDs using the equation: (SMD from the
NMA) × (pooled SD on the Van der Heijde scale from trials).
All statistical analyses were run within a Bayesian framework with WinBUGS 1.4.3. Review of the
deviance information criterion (DIC) statistics as well as comparison of the residual deviance
(resdev) to the number of unconstrained data points was used to assess the best model fit under
multiple alternative assumptions.147 Given the expectation of at least some degree of heterogeneity
in patient populations and/or study design, there is a general preference for a random-effects
approach. But fixed-effect approaches are generally taken when an inadequate evidence base
results in large numbers of single connections in the network. A total of 50,000 iterations each
were employed for both “burn-in” (for model convergence) and model (for model results)
simulations. Relative risks and probabilities of patients having a given ACR response state and SMD
compared to cDMARDs on Sharp score were generated. We modified WinBUGS code from a
technology assessment published by the National Institute for Health and Care Excellence 26 for ACR
outcomes; for the Sharp score analysis, we adapted code from a published NMA of antidepressants
for major depressive disorder.148 All codes are provided in Appendix C.

©Institute for Clinical and Economic Review, 2017 Page 144 Evidence Report: Targeted Immune Modulators for Rheumatoid Arthritis Return to Table of Contents
Additional Comparative Clinical Effectiveness Results
Table C1: DAS28-ESR measure and Number Needed Treated (NNT) in trials of TIMs versus
conventional DMARDs
Intervention
DAS28-ESR remission rate
P value
NNT
Number of trials
(Total N)
TIM Conventional
DMARD
TIMs plus conventional DMARD vs. conventional DMARD
TIM Naïve and Mixed Population
Rituximab149 9 2 <0.01 14 1
Abatacept iv23 11 3 NR NC 1
Tocilizumab iv150-152 30-38 2-3 <0.001 3-4 3
Tocilizumab sc153 32 4 <0.001 4 1
Tofacitinib95,154 6-9 1-3 <0.05 17-20 2
Baricitinib21,155 16-25 1-5 <0.05 4-8 2
Adalimumab21,95 7-18 1-5 <0.05 8-18 2
Certolizumab Pegol156,157 17-26 0-6 <0.0001 5-6 2
Etanercept77,158 22-25 4-14 <0.03 5-11 2
Golimumab iv159 18 5 <0.001 8 1
Golimumab sc 160,161 20-35 6-7 <0.001 4-7 2
Infliximab23 13 3 NR NC 1
TIMs plus conventional DMARD vs. conventional
TIM Experienced
Sarilumab†162,163 29-34 7-14 <0.0001 4-5 2
Baricitinib90 9 3 <0.05 17 1
TIMs monotherapy vs. conventional
Tocilizumab84,85 43-59 1.6-3 <0.001 2 2
Etanercept81 34 19 <0.01 7 1
* Time point was approximately 6 months for all drugs, except for etanercept monotherapy which was reported only at 52 weeks; †DAS28-CRP was reported for sarilumab because DAS28-ESR was not used in any of studies reviewed

©Institute for Clinical and Economic Review, 2017 Page 145 Evidence Report: Targeted Immune Modulators for Rheumatoid Arthritis Return to Table of Contents
Table C2: Disease activity outcomes in biosimilar studies after 24-30 weeks of follow-up
Treatment N DAS28-ESR or CRP DAS28 mean
change from
baseline
% achieving
DAS28 remission
% achieving
CDAI
remission
% achieving
SDAI
remission
Yoo 2015 trial at 24 weeks164,165
Rituximab-bio + MTX 103 DAS28-ESR & CRP ESR-2.1; CRP-2.0 12.5† NR NR
Rituximab-ref + MTX 51 DAS28-ESR & CRP ESR-2.2; CRP-2.1 3.9 NR NR
Williams 2016 trial at 24 weeks166
Rituximab-bio + MTX 71 DAS28-CRP -1.9 NR NR NR
Rituximab-ref (EU) + MTX 72 DAS28-CRP -2 NR NR NR
Rituximab-ref (US) + MTX 71 DAS28-CRP -2.2 NR NR NR
HERA trial at 24 weeks167
Etanercept-bio + MTX 115 DAS28 -2.56 34 NR NR
Etanercept-ref + MTX 118 DAS28 -2.54 31 NR NR
Choe 2017 trial at 30 weeks168
Infliximab-bio + MTX 290 DAS28-ESR -2.3 14.6 8.7 9.5
Infliximab-ref + MTX 293 DAS28-ESR -2.3 15.9 11.7 10.9
Takeuchi 2015 trial at 30 weeks169
Infliximab-bio 50 DAS28-ESR & CRP ESR-2.2; CRP-2.1 NR NR NR
Infliximab-ref 51 DAS28-ESR & CRP ESR-2; CRP-2 NR NR NR
PLANETRA trial at 30 weeks170
Infliximab-bio + MTX 302 DAS28-ESR & CRP NR ESR 36; CRP 61 NR NR
Infliximab-ref + MTX 304 DAS28-ESR & CRP NR ESR 27; CRP 56 NR NR
†statistical significance not reported; ***p <0.001; **p<0.01; *p<0.05
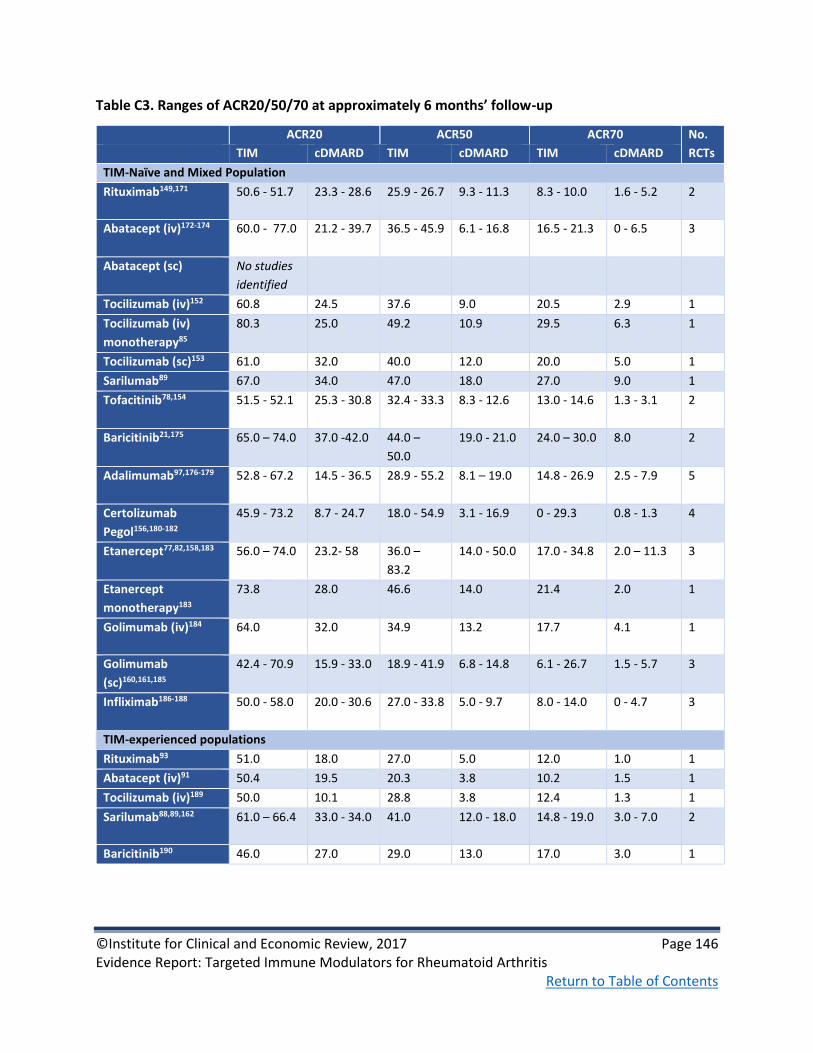
©Institute for Clinical and Economic Review, 2017 Page 146 Evidence Report: Targeted Immune Modulators for Rheumatoid Arthritis Return to Table of Contents
Table C3. Ranges of ACR20/50/70 at approximately 6 months’ follow-up
ACR20 ACR50 ACR70 No.
RCTs TIM cDMARD TIM cDMARD TIM cDMARD
TIM-Naïve and Mixed Population
Rituximab149,171 50.6 - 51.7 23.3 - 28.6 25.9 - 26.7 9.3 - 11.3 8.3 - 10.0 1.6 - 5.2 2
Abatacept (iv)172-174 60.0 - 77.0 21.2 - 39.7 36.5 - 45.9 6.1 - 16.8 16.5 - 21.3 0 - 6.5 3
Abatacept (sc) No studies
identified
Tocilizumab (iv)152 60.8 24.5 37.6 9.0 20.5 2.9 1
Tocilizumab (iv)
monotherapy85
80.3 25.0 49.2 10.9 29.5 6.3 1
Tocilizumab (sc)153 61.0 32.0 40.0 12.0 20.0 5.0 1
Sarilumab89 67.0 34.0 47.0 18.0 27.0 9.0 1
Tofacitinib78,154 51.5 - 52.1 25.3 - 30.8 32.4 - 33.3 8.3 - 12.6 13.0 - 14.6 1.3 - 3.1 2
Baricitinib21,175 65.0 – 74.0 37.0 -42.0 44.0 –
50.0
19.0 - 21.0 24.0 – 30.0 8.0 2
Adalimumab97,176-179 52.8 - 67.2 14.5 - 36.5 28.9 - 55.2 8.1 – 19.0 14.8 - 26.9 2.5 - 7.9 5
Certolizumab
Pegol156,180-182
45.9 - 73.2 8.7 - 24.7 18.0 - 54.9 3.1 - 16.9 0 - 29.3 0.8 - 1.3 4
Etanercept77,82,158,183 56.0 – 74.0 23.2- 58 36.0 –
83.2
14.0 - 50.0 17.0 - 34.8 2.0 – 11.3 3
Etanercept
monotherapy183
73.8 28.0 46.6 14.0 21.4 2.0 1
Golimumab (iv)184 64.0 32.0 34.9 13.2 17.7 4.1 1
Golimumab
(sc)160,161,185
42.4 - 70.9 15.9 - 33.0 18.9 - 41.9 6.8 - 14.8 6.1 - 26.7 1.5 - 5.7 3
Infliximab186-188 50.0 - 58.0 20.0 - 30.6 27.0 - 33.8 5.0 - 9.7 8.0 - 14.0 0 - 4.7 3
TIM-experienced populations
Rituximab93 51.0 18.0 27.0 5.0 12.0 1.0 1
Abatacept (iv)91 50.4 19.5 20.3 3.8 10.2 1.5 1
Tocilizumab (iv)189 50.0 10.1 28.8 3.8 12.4 1.3 1
Sarilumab88,89,162 61.0 – 66.4 33.0 - 34.0 41.0 12.0 - 18.0 14.8 - 19.0 3.0 - 7.0 2
Baricitinib190 46.0 27.0 29.0 13.0 17.0 3.0 1

©Institute for Clinical and Economic Review, 2017 Page 147 Evidence Report: Targeted Immune Modulators for Rheumatoid Arthritis Return to Table of Contents
Table C4. Ranges of ACR20/50/70 in biosimilar studies at 24-30 weeks of follow-up
Biosimilar studies Study arm ACR20, % ACR50, % ACR70, %
Yoo 2013165,191
Week 24
RTX-bio+MTX (n=103) 63.0 37.0 16.0
RTX-ref+MTX (n=51) 66.7 31.3 14.6
Williams 2016166
RTX-bio + MTX (n=71) 58 23 19
RTX-ref (EU) + MTX (n=72) 60 38 18
RTX-ref (US) + MTX (n=71) 78 33 20
Jani 2015192
Week 12
ADA-bio+MTX (n=60) 78.3 43.3 13.3
ADA-ref+MTX (n=60) 79.7 44.1 15.3
Cohen 2015193
Week 24
ADA-bio+MTX (n=264) 74.6 49.2 26.0
ADA-ref+MTX (n=262) 72.4 52.0 22.9
Weinblatt 2015194
Week 24
ADA-bio (n=271) 75.2 38.3 19.2
ADA-ref (n=273) 72.0 39.8 20.3
HERA167
Week 24
ETN-bio+MTX (n=115) 79.1 59.0 28.4
ETN-ref+MTX (n=118) 75.6 46.7 28.2
Emery 2015195
Week 24
ETN-bio+MTX (n=299) 73.8 43.0 23.2
ETN-ref+MTX (n=297) 71.7 39.1 19.9
Kay 2014196
Week 16
IFX-bio (n=127) 85.0 NR NR
IFX-ref (n=62) 85.5 NR NR
Choe 2017168
Week 30
IFX-bio+MTX (n=290) 55.5 30.7 15.5
IFX-ref+MTX (n=293) 59.0 33.8 17.1
PLANETRA170
Week 30
IFX-bio+MTX (n=302) 60.9 35.1 16.6
IFX-ref+MTX (n=304) 58.6 34.2 15.5
Takeuchi 2015169
Week 30
IFX-bio (n=50) 78.0 54.0 32.0
IFX-ref (n=51) 64.7 47.1 27.5

©Institute for Clinical and Economic Review, 2017 Page 148 Evidence Report: Targeted Immune Modulators for Rheumatoid Arthritis Return to Table of Contents
Table C5. Radiographic progression in trials of TIMs versus conventional DMARDs with
approximately one year of follow-up
Study arm
Mean change in
mTSS from
baseline (SD)Ω
Time of
evaluation
(weeks)
Significance
Biologic-naïve and mixed populations
RA-SCORE171β MTX (n=63) 1.4 (SD NR)
52 p=0.002 RTX+MTX (n=60) 0.3 (SD NR)
AIM173β MTX (n=195) 2.32 (NR)
52 p<0.01 ABTiv+MTX (n=391) 1.21 (NR)
SAMURAI84* cDMARD (n=143) 6.1 (4.2, 8.0)
52 p<0.01 TCZ (n=157) 2.3 (1.5, 3.2)
LITHE197β
MTX (n=294) 1.2 (3.1)
52
Adjusted mean difference (95% CI)
4mg: -0.8 (-1.1, -0.5)
8mg: -0.9 (-1.2, -0.6)
4mg TCZ+MTX (n=343) 0.3 (1.3)
8mg TCZ+MTX (n=353) 0.3 (1.0)
MOBILITY162 MTX (n=398) 2.8 (7.7)
52 p<0.0001 SAR+MTX (n=398) 0.3 (4.6)
ORAL-Scan78 MTX (n=160) 0.9 (NR) 52
p=0.0558
TOF+MTX (n=321) 0.3 (NR)
RA-BEAM97
MTX (n=452) 1.80 (NR)
52 BAR+MTX vs. MTX: p≤0.001
ADA+MTX vs. MTX: p≤0.001 BAR+MTX (n=473) 0.71 (NR)
ADA+MTX (n=312) 0.60 (NR)
DE019179α MTX (n=172) 2.7 (6.8)
52 p≤0.001 ADA+MTX (n=183) 0.1 (4.8)
RAPID1181 MTX (n=199) 2.8 (NR)
52 p<0.001 CTZ+MTX (n=393) 0.4 (NR)
TEMPO86*
MTX (n=206/206) 1.5 (0.42, 2.58)/
3.3 (1.18, 5.50)
52/104
Weeks 52 and 104
ETN mono vs. MTX: p<0.05
ETN+MTX vs. MTX: p<0.05
ETN mono (n=202/203) 0.3 (-0.18, 0.84)/
1.1 (0.13, 2.07)
ETN+MTX (n=212/213) -0.8 (-1.16, 0.44)/
-0.6 (-1.05, -0.06)
Takeuchi
201381
MTX (n=171) 9.8 (15.2) 52 p<0.0001
ETN (n=181) 3.3 (9.8)
O’Dell 201377 Triple cDMARD (n=151) 0.5 (1.9)
48 p=NS ETN+MTX (n=153) 0.3 (3.3)
GO-
FORWARD106,198
MTX (n=122) 1.1 (4.7)/1.2 (4.4) 52/104 p=NS/p=NR
GOLsc+MTX (n=86) 0.9 (4.9)/0.5 (3.3)
Swefot199 Triple cDMARD (n=104/109)
5.0 (10.6)/7.2
(12.7) 52/104
Mean difference (95% CI)
Wk 52: 2.1 (-0.30, 4.48)
Wk 104: 3.2 (0.14, 6.3); p=0.009) IFX+MTX (n=102/106) 3.0 (6.1)/4.0 (10.1)
ATTRACT200 MTX (n=64) 7 (10.3) 54 vs. MTX

©Institute for Clinical and Economic Review, 2017 Page 149 Evidence Report: Targeted Immune Modulators for Rheumatoid Arthritis Return to Table of Contents
Study arm
Mean change in
mTSS from
baseline (SD)Ω
Time of
evaluation
(weeks)
Significance
3mg/kg IFX+MTX (n=71) 1.3 (6.0) 3 mg/kg: p<0.001
10 mg/kg: p<0.001
10mg/kg IFX+MTX (n=77) 0.2 (3.6)
Biologic-experienced populations
REFLEXβ201,202 MTX (n=184/187) 2.3/2.8 (SD NR)
56/104 p=0.005/p<0.0001 RTX+MTX (n=273/281) 1.0/1.1 (SD NR)
MOBILITY203∞
MTX (n=82) 2.2
52 p<0.05 SAR+MTX (n=78) 0.2
Ω Van der Heijde modified Sharp score unless otherwise noted; α modified total sharp score (scale 0-398); *95%
confidence interval; β Genant modified total sharp score; ∞subpopulation of MOBILITY trial (patients included in entry
for mixed population)
Table C6. Radiographic progression in biosimilar trials
Study arm
Mean change
in mTSS from
baseline (SD)*
Time of
evaluation
(weeks)
Significance
% Non-
progression
at Year 1α
Vencovsky 2015204 ETN-bio+MTX (n=299) 0.45 (NR)
52 NR NR ETN-ref+MTX (n=297) 0.74 (NR)
Choe 2017205 IFX-bio+MTX (n=291) 0.38 (NR) 54
NR NR IFX-ref+MTX (n=293) 0.37 (NR) 54
PLANETRA206 IFX-bio+MTX (n=302) 1.3 (9.3)
54 NS 51.7
IFX-ref+MTX (n=304) 0.7 (7.0) 51.4
*Van der Heijde method reported in PLANETRA, other studies did not specify Sharp method; α ≤0 units of change from
baseline; NR=not reported; NS=not significant

©Institute for Clinical and Economic Review, 2017 Page 150 Evidence Report: Targeted Immune Modulators for Rheumatoid Arthritis Return to Table of Contents
Table C7. Ranges HAQ-DI outcome in trials of TIMs versus conventional DMARDs at
approximately 6 months
TIMs HAQ-DI mean change from baseline % of patients with change ≥ predefined MCID threshold‡
Absolute difference Number of trials
Absolute difference Number of trials
TIMs plus conventional DMARD vs. conventional DMARD
Rituximab149,171,207,208 -0.25 to -0.37*** 3 11*** 1
Abatacept iv23,91,172,174 -0.34 to -0.4*** 2 21-37 4
Abatacept sc No studies identified No studies identified
Tocilizumab iv152,189 -0.21 to -0.34*** 3 10 to 26*** 2
Tocilizumab sc No studies identified No studies identified
Sarilumab209 -0.2*** 1 18*** 1
Tofacitinib78,154 -0.28 to -0.31*** 2 NR --
Baricitinib90,98,175,190,210,211 -0.24 to -0.4*** 4 18 to 28*** 4
Adalimumab21,176,179 -0.25*** 2 19*** 1
Certolizumab Pegol156,180,182 -0.23 to -0.37 3 NR --
Etanercept83,158 -0.3 to -0.8*** 2 NR --
Golimumab iv 184 -0.50 1 22*** 1
Golimumab sc 160,161,185 -0.11 to -0.38*** 3 24 to 29*** 2
Infliximab23,187 0.4** 1 18* 1
TIMs monotherapy vs. conventional DMARD
Tocilizumab mono84,85 NR -- 28 to 33*** 2
Etanercept mono81 -0.3† 1 29*** 1
†statistical significance not reported; ***p <0.001; **p<0.01; *p<0.05; ‡ Most studies used MCID threshold of 0.22 or 0.3; ¥ N was estimated from trial arms of interest i.e. approved (

©Institute for Clinical and Economic Review, 2017 Page 151 Evidence Report: Targeted Immune Modulators for Rheumatoid Arthritis Return to Table of Contents
Table C8. HAQ-DI in biosimilar trials after 24-30 weeks of follow-up
Treatment N HAQ-DI mean change from baseline:
% change ≥ predefined threshold
HERA trial at 24 weeks167
Etanercept-bio + MTX 115 -0.49 NR
Etanercept-ref + MTX 118 -0.55 NR
Choe 2017 trial at 30 weeks168
Infliximab-bio + MTX 290 -0.5 NR
Infliximab-ref + MTX 293 -0.5 NR
Takeuchi 2015 trial at 30 weeks169
Infliximab-bio 50 -0.6 NR
Infliximab-ref 51 -0.5 NR
PLANETRA trial at 30 weeks170
Infliximab-bio + MTX 302 -0.55 NR
Infliximab-ref + MTX 304 -0.49 NR

©Institute for Clinical and Economic Review, 2017 Page 152 Evidence Report: Targeted Immune Modulators for Rheumatoid Arthritis Return to Table of Contents
Network Meta-Analysis Results
For the ACR response network meta-analysis, a comparison of residual deviance (resdev) and
deviance information criterion (DIC) between the unadjusted model and the model adjusted for
conventional DMARD response rate showed no material differences (resdev: 497.1 vs. 497.2 for
unadjusted vs. adjusted; DIC: 1765.4 vs. 1766.2 respectively), indicating no effect
modification. Further, the response-adjusted model produced universally lower estimates of
treatment effect than might be expected from examination of individual trial results. We
therefore opted to retain the unadjusted model as our primary analysis.
Figure C1. Network Diagram for Analysis of ACR (Mixed Population, combination therapy)
4
cDMARD
ADA + cDMARD
ABT (iv) +
cDMARD
IFX + cDMARD
ETN + cDMARD
GOL (iv) +
cDMARD
SAR + cDMARD
TCZ (iv) + cDMARD
TOF + cDMARD
RTX + cDMARD
CTZ + cDMARD
BAR + cDMARD 6
2
1
1
3
3
4
1
2
1
4
1
GOL (sc) +
cDMARD
3
TCZ (sc) + cDMARD
1
3
ABT (sc) +
cDMARD 1
Int + cDMARD
2

©Institute for Clinical and Economic Review, 2017 Page 153 Evidence Report: Targeted Immune Modulators for Rheumatoid Arthritis Return to Table of Contents
Table C9. ACR Data used in NMA (Mixed population, combination therapy)
Interventions Mean disease
duration Intervention 1 Intervention 2
Trial Name
1 2 3 Weeks
No
respons
e
ACR20 ACR50 ACR70 n No
response ACR20 ACR50 ACR70 n
AIM173 cDMARD ABTiv +
cDMARD
449 132 50 23 14 219 139 121 87 86 433
AMPLE94 ADA +
cDMARD
ABTsc +
cDMARD
94 117 72 65 74 328 108 65 68 77 318
ARMADA176 cDMARD ADA +
cDMARD
607 53 4 2 3 62 22 8 19 18 67
ATTEST23
cDMARD ABTiv +
cDMARD
IFX +
cDMA
RD
405 64 24 12 10 110 52 41 31 32 156
ATTRACT187 cDMARD IFX +
cDMARD
67 13 4 0 84 82 38 26 22 168
DE019179 cDMARD ADA +
cDMARD
569 141 40 14 5 200 76 50 38 43 207
ETN309183 cDMARD ETN +
cDMARD
ETN 341 36 7 6 1 50 27 22 27 25 101
GO-FORTH160 cDMARD GOLsc +
cDMARD
455 59 16 8 5 88 25 25 13 23 86
GO-
FORWARD87
cDMARD GOLsc +
cDMARD
421 96 19 11 7 133 36 20 15 18 89
Kim2007177 cDMARD ADA +
cDMARD
356 40 14 4 5 63 25 12 14 14 65
LARA158 Int
cDMARD
ETN +
cDMARD
430 71 38 17 16 142 47 59 76 97 279

©Institute for Clinical and Economic Review, 2017 Page 154 Evidence Report: Targeted Immune Modulators for Rheumatoid Arthritis Return to Table of Contents
Interventions Mean disease
duration Intervention 1 Intervention 2
O'Dell77 Int
cDMARD
ETN +
cDMARD
271 70 48 33 8 159 73 32 32 26 163
STAR178 cDMARD ADA +
cDMARD
541 207 75 25 11 318 150 76 45 47 318
START188 cDMARD IFX +
cDMARD
390 276 54 17 16 363 317 175 127 102 721
TOWARD152 cDMARD TCZ +
cDMARD
510 312 64 25 12 413 315 186 137 165 803
RA-BUILD175 cDMARD BAR +
cDMARD
390 132 47 31 18 228 79 48 45 55 227
MOBILITY162 cDMARD SAR +
cDMARD
460 265 67 37 29 398 134 83 83 99 399
ORAL Scan78 cDMARD TOF +
cDMARD
463 120 27 11 2 160 156 61 57 47 321
Kremer
2012212
cDMARD TOF +
cDMARD
473 45 7 11 6 69 37 10 10 14 71
LITHE125 cDMARD TCZ +
cDMARD
476 287 67 31 8 393 371 199 131 96 797
OPTION213 cDMARD TCZ +
cDMARD
398 151 31 18 4 204 195 66 86 71 418
RAPID1181 cDMARD CTZ +
cDMARD
319 171 12 9 6 199 162 85 62 84 393
RAPID2180 cDMARD CTZ +
cDMARD
308 116 7 3 1 127 105 61 41 39 246
Choy 2012182 cDMARD CTZ +
cDMARD
502 92 20 5 2 119 67 35 22 0 124
SERENE149 cDMARD RTX +
cDMARD
366 132 24 7 9 172 84 42 27 17 170

©Institute for Clinical and Economic Review, 2017 Page 155 Evidence Report: Targeted Immune Modulators for Rheumatoid Arthritis Return to Table of Contents
Interventions Mean disease
duration Intervention 1 Intervention 2
BREVACTA153 cDMARD TCZsc +
cDMARD
577 149 44 15 11 219 170 92 88 87 437
Kremer 2003 174
cDMARD ABTiv +
cDMARD
77 28 12 2 119 46 27 23 19 115
ORAL
Standard95
cDMARD TOF +
cDMARD
ADA +
cDMA
RD
408 41 2 5 8 56 95 30 32 39 196
GO-
FURTHER184
cDMARD GOLiv +
cDMARD
359 136 35 18 8 197 134 123 68 70 395
ORAL Sync154 cDMARD TOF +
cDMARD
462 110 29 15 5 159 151 59 64 41 315
Li 2015185 cDMARD GOLsc +
cDMARD
406 111 12 7 2 132 76 31 17 8 132
RA-SCORE171 cDMARD RTX +
cDMARD
242 45 11 6 1 63 29 15 11 5 60
Takeuchi
2013172
cDMARD ABTiv +
cDMARD
382 52 10 4 0 66 14 19 15 13 61
J-RAPID156 cDMARD CTZ +
cDMARD
296 58 6 12 1 77 22 15 21 24 82
RA-BEAM cDMARD ADA +
cDMARD
BAR +
cDMA
RD
na 307 88 54 39 488 112 66 79 73 330
Interventions Mean disease
duration Intervention 3
ATTEST23 cDMARD ABTiv +
cDMARD
IFX +
cDMA
RD
405 67 37 21 40 165

©Institute for Clinical and Economic Review, 2017 Page 156 Evidence Report: Targeted Immune Modulators for Rheumatoid Arthritis Return to Table of Contents
Interventions Mean disease
duration Intervention 1 Intervention 2
ORAL
Standard95
cDMARD TOF +
cDMARD
ADA +
cDMA
RD
408 105 36 38 20 199
RA-BEAM21 cDMARD ADA +
cDMARD
BAR +
cDMA
RD
na 127 117 97 146 487
DIC=1455.0; resdev=369.1

©Institute for Clinical and Economic Review, 2017 Page 157 Evidence Report: Targeted Immune Modulators for Rheumatoid Arthritis Return to Table of Contents
Figure C2. League table, base case combination therapy NMA results, ACR20
*To zoom in on numbers, hold the Ctrl key and scroll with mouse or trackpad
Figure C3. League table, base case combination therapy NMA results, ACR50
*To zoom in on numbers, hold the Ctrl key and scroll with mouse or trackpad

©Institute for Clinical and Economic Review, 2017 Page 158 Evidence Report: Targeted Immune Modulators for Rheumatoid Arthritis Return to Table of Contents
Figure C4. League table, base case combination therapy NMA results, ACR70
*To zoom in on numbers, hold the Ctrl key and scroll with mouse or trackpad

©Institute for Clinical and Economic Review, 2017 Page 159 Evidence Report: Targeted Immune Modulators for Rheumatoid Arthritis Return to Table of Contents
Figure C5. Network Diagram for Analysis of ACR (Mixed Population, monotherapy)
SAR
1
ADA cDMARD TCZ (iv) ETN
3
1 2 1

©Institute for Clinical and Economic Review, 2017 Page 160 Evidence Report: Targeted Immune Modulators for Rheumatoid Arthritis Return to Table of Contents
Table C10: ACR Data used in NMA (Mixed population, monotherapy)
Mean
disease
duration
Intervention 1 Intervention 2
Trial Name 1 2 Weeks No
response ACR20 ACR50 ACR70 n
No
response ACR20 ACR50 ACR70 n
ADACTA19 ADA TCZ 354 82 35 16 29 162 57 29 24 53 163
ETN309183 cDMARD ETN 341 36 7 6 1 50 27 28 26 22 103
SAMURAI84 cDMARD TCZ 119 89 30 16 10 145 28 39 37 53 157
SATORI85 cDMARD TCZ 447 48 9 3 4 64 12 18 12 19 61
MONARCH18 ADA SAR 77 53 33 22 185 52 48 41 43 184
DIC=188.5; resdev=41.8
Figure C6. League table, base case monotherapy NMA results, ACR20
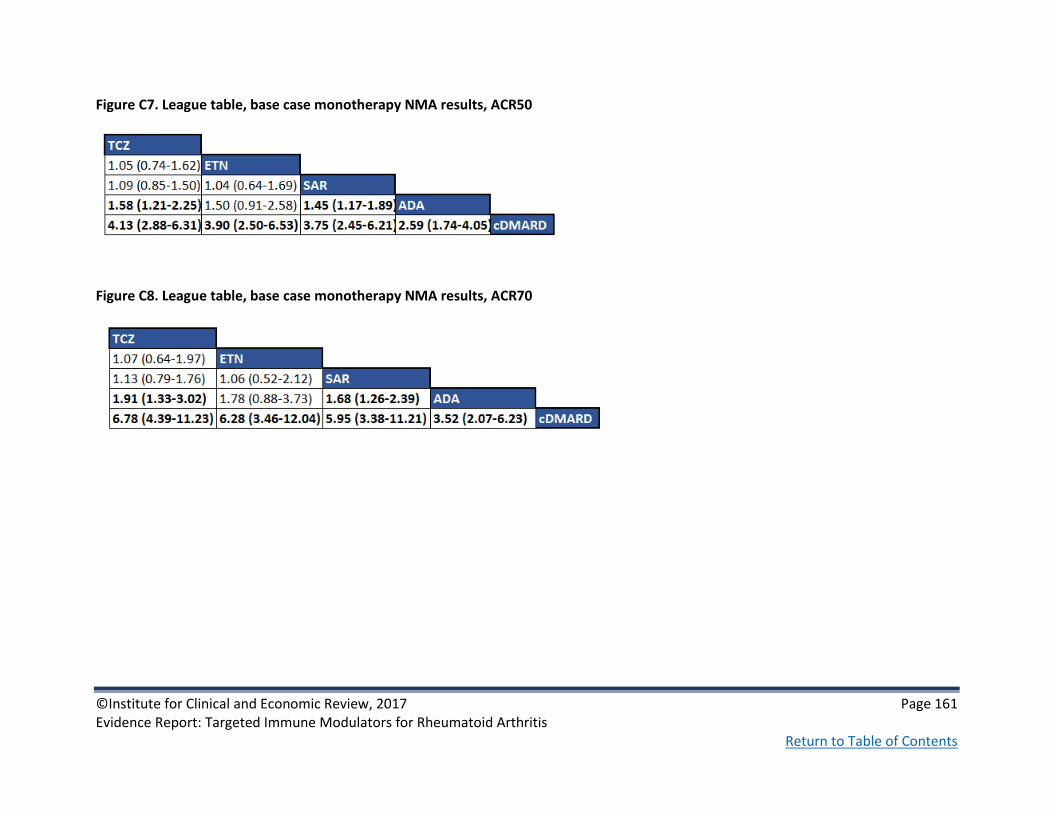
©Institute for Clinical and Economic Review, 2017 Page 161 Evidence Report: Targeted Immune Modulators for Rheumatoid Arthritis Return to Table of Contents
Figure C7. League table, base case monotherapy NMA results, ACR50
Figure C8. League table, base case monotherapy NMA results, ACR70
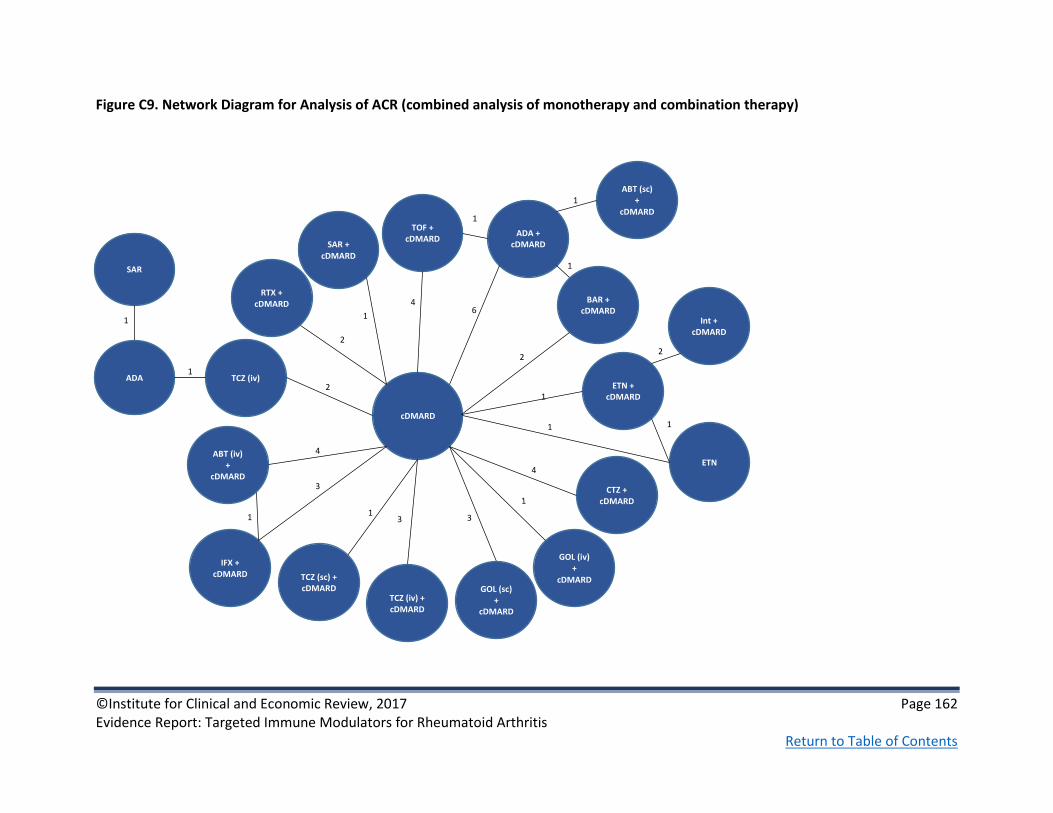
©Institute for Clinical and Economic Review, 2017 Page 162 Evidence Report: Targeted Immune Modulators for Rheumatoid Arthritis Return to Table of Contents
Figure C9. Network Diagram for Analysis of ACR (combined analysis of monotherapy and combination therapy)
SAR
1
4
ADA
cDMARD
ADA + cDMARD
TCZ (iv)
ABT (iv) +
cDMARD
IFX + cDMARD
ETN + cDMARD
GOL (iv) +
cDMARD
ETN
SAR + cDMARD
TCZ (iv) + cDMARD
TOF + cDMARD
RTX + cDMARD
CTZ + cDMARD
BAR + cDMARD 6
2
1
1
3
3
4
1
2
1
4
1
1
1
GOL (sc) +
cDMARD
3
TCZ (sc) + cDMARD
1
3
ABT (sc) +
cDMARD 1
2
Int + cDMARD
2
1

©Institute for Clinical and Economic Review, 2017 Page 163 Evidence Report: Targeted Immune Modulators for Rheumatoid Arthritis Return to Table of Contents
Table C11: ACR Data used in NMA (combined analysis of monotherapy and combination therapy)
Interventions
Mean
disease
duration
Intervention 1 Intervention 2
Trial Name
1 2 3 Weeks No
response ACR20 ACR50 ACR70 n
No
response ACR20 ACR50 ACR70 n
ADACTA19 ADA TCZ 354 82 35 16 29 162 57 29 24 53 163
AIM173 cDMARD ABTiv +
cDMARD
449 132 50 23 14 219 139 121 87 86 433
AMPLE94 ADA +
cDMARD
ABTsc +
cDMARD
94 117 72 65 74 328 108 65 68 77 318
ARMADA176 cDMARD ADA +
cDMARD
607 53 4 2 3 62 22 8 19 18 67
ATTEST23
cDMARD ABTiv +
cDMARD
IFX +
cDMARD
405 64 24 12 10 110 52 41 31 32 156
ATTRACT187 cDMARD IFX +
cDMARD
67 13 4 0 84 82 38 26 22 168
DE019179 cDMARD ADA +
cDMARD
569 141 40 14 5 200 76 50 38 43 207
ETN309183 cDMARD ETN +
cDMARD
ETN 341 36 7 6 1 50 27 22 27 25 101
GO-FORTH160 cDMARD GOLsc +
cDMARD
455 59 16 8 5 88 25 25 13 23 86
GO-
FORWARD87
cDMARD GOLsc +
cDMARD
421 96 19 11 7 133 36 20 15 18 89
Kim2007177 cDMARD ADA +
cDMARD
356 40 14 4 5 63 25 12 14 14 65
LARA158 Int
cDMARD
ETN +
cDMARD
430 71 38 17 16 142 47 59 76 97 279

©Institute for Clinical and Economic Review, 2017 Page 164 Evidence Report: Targeted Immune Modulators for Rheumatoid Arthritis Return to Table of Contents
Interventions
Mean
disease
duration
Intervention 1 Intervention 2
O'Dell77 Int
cDMARD
ETN +
cDMARD
271 70 48 33 8 159 73 32 32 26 163
SAMURAI84 cDMARD TCZ 119 89 30 16 10 145 28 39 37 53 157
SATORI85 cDMARD TCZ 447 48 9 3 4 64 12 18 12 19 61
STAR178 cDMARD ADA +
cDMARD
541 207 75 25 11 318 150 76 45 47 318
START188 cDMARD IFX +
cDMARD
390 276 54 17 16 363 317 175 127 102 721
TOWARD152 cDMARD TCZ +
cDMARD
510 312 64 25 12 413 315 186 137 165 803
RA-BUILD175 cDMARD BAR +
cDMARD
390 132 47 31 18 228 79 48 45 55 227
MOBILITY162 cDMARD SAR +
cDMARD
460 265 67 37 29 398 134 83 83 99 399
ORAL Scan78 cDMARD TOF +
cDMARD
463 120 27 11 2 160 156 61 57 47 321
Kremer
2012212
cDMARD TOF +
cDMARD
473 45 7 11 6 69 37 10 10 14 71
LITHE125 cDMARD TCZ +
cDMARD
476 287 67 31 8 393 371 199 131 96 797
OPTION213 cDMARD TCZ +
cDMARD
398 151 31 18 4 204 195 66 86 71 418
RAPID1181 cDMARD CTZ +
cDMARD
319 171 12 9 6 199 162 85 62 84 393
RAPID2180 cDMARD CTZ +
cDMARD
308 116 7 3 1 127 105 61 41 39 246
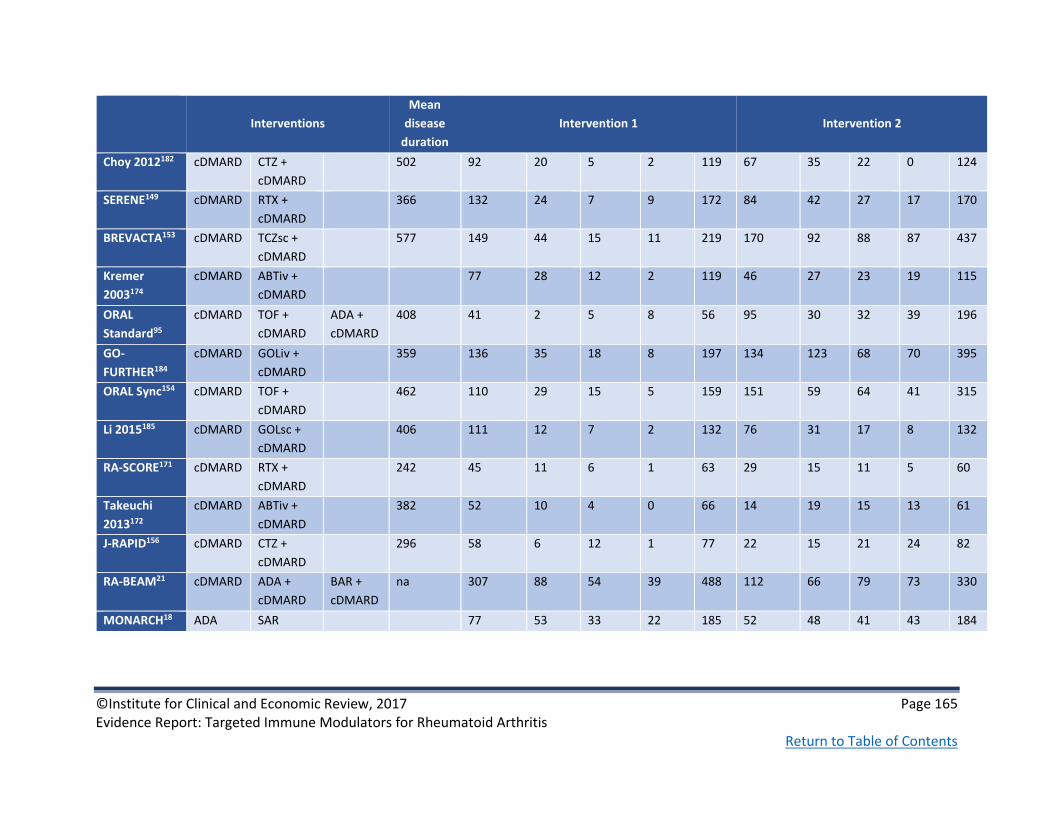
©Institute for Clinical and Economic Review, 2017 Page 165 Evidence Report: Targeted Immune Modulators for Rheumatoid Arthritis Return to Table of Contents
Interventions
Mean
disease
duration
Intervention 1 Intervention 2
Choy 2012182 cDMARD CTZ +
cDMARD
502 92 20 5 2 119 67 35 22 0 124
SERENE149 cDMARD RTX +
cDMARD
366 132 24 7 9 172 84 42 27 17 170
BREVACTA153 cDMARD TCZsc +
cDMARD
577 149 44 15 11 219 170 92 88 87 437
Kremer
2003174
cDMARD ABTiv +
cDMARD
77 28 12 2 119 46 27 23 19 115
ORAL
Standard95
cDMARD TOF +
cDMARD
ADA +
cDMARD
408 41 2 5 8 56 95 30 32 39 196
GO-
FURTHER184
cDMARD GOLiv +
cDMARD
359 136 35 18 8 197 134 123 68 70 395
ORAL Sync154 cDMARD TOF +
cDMARD
462 110 29 15 5 159 151 59 64 41 315
Li 2015185 cDMARD GOLsc +
cDMARD
406 111 12 7 2 132 76 31 17 8 132
RA-SCORE171 cDMARD RTX +
cDMARD
242 45 11 6 1 63 29 15 11 5 60
Takeuchi
2013172
cDMARD ABTiv +
cDMARD
382 52 10 4 0 66 14 19 15 13 61
J-RAPID156 cDMARD CTZ +
cDMARD
296 58 6 12 1 77 22 15 21 24 82
RA-BEAM21 cDMARD ADA +
cDMARD
BAR +
cDMARD
na 307 88 54 39 488 112 66 79 73 330
MONARCH18 ADA SAR 77 53 33 22 185 52 48 41 43 184

©Institute for Clinical and Economic Review, 2017 Page 166 Evidence Report: Targeted Immune Modulators for Rheumatoid Arthritis Return to Table of Contents
Table C11 (continued): ACR Data used in NMA (combined analysis of monotherapy and combination therapy)
Interventions Mean disease
duration Intervention 3
Trial Name 1 2 3 Weeks No response ACR20 ACR50 ACR70 n
ATTEST23 cDMARD ABTiv +
cDMARD
IFX + cDMARD 405 67 37 21 40 165
ETN309183 cDMARD ETN + cDMARD ETN 341 27 28 26 22 103
ORAL Standard95 cDMARD TOF + cDMARD ADA +
cDMARD
408 105 36 38 20 199
RA-BEAM21 cDMARD ADA + cDMARD BAR +
cDMARD
na 127 117 97 146 487
DIC=1765.4; resdev=497.1
Figure C10. League table, NMA results of combined analysis (monotherapy and combination therapy), ACR20
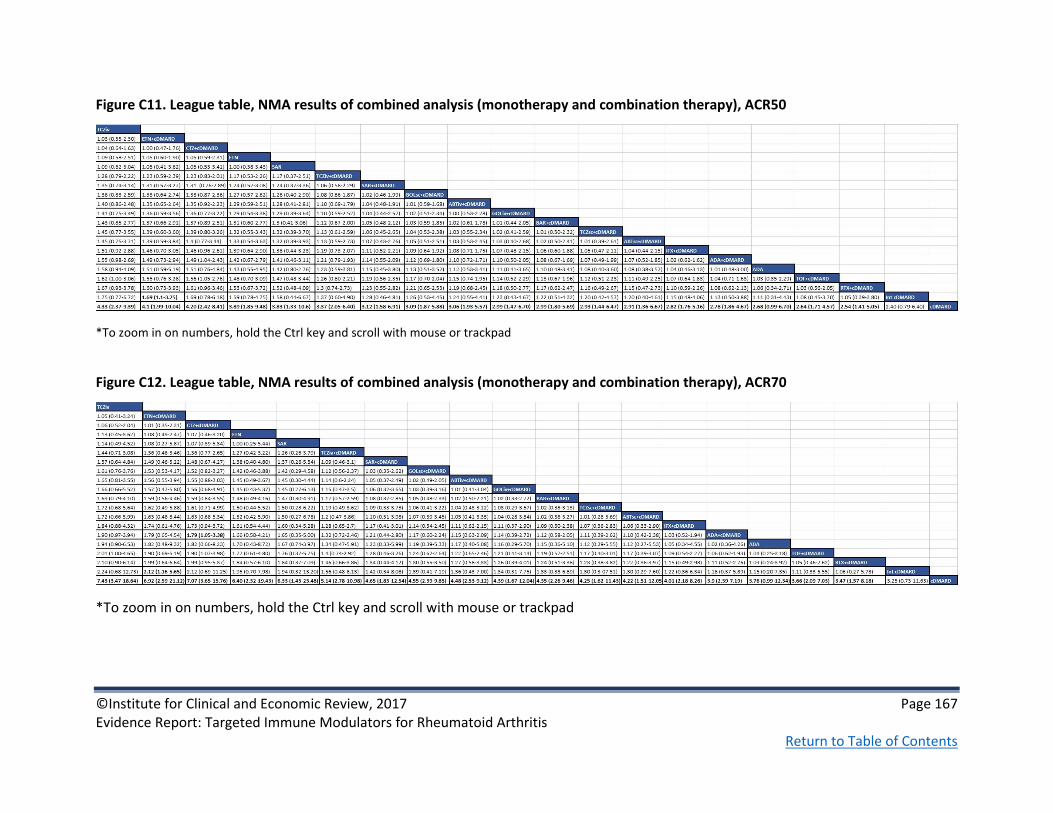
©Institute for Clinical and Economic Review, 2017 Page 167 Evidence Report: Targeted Immune Modulators for Rheumatoid Arthritis Return to Table of Contents
Figure C11. League table, NMA results of combined analysis (monotherapy and combination therapy), ACR50
*To zoom in on numbers, hold the Ctrl key and scroll with mouse or trackpad
Figure C12. League table, NMA results of combined analysis (monotherapy and combination therapy), ACR70
*To zoom in on numbers, hold the Ctrl key and scroll with mouse or trackpad

©Institute for Clinical and Economic Review, 2017 Page 168 Evidence Report: Targeted Immune Modulators for Rheumatoid Arthritis Return to Table of Contents
Figure C13. Network Diagram for Analysis of ACR (TIM-Experienced Population)
cDMARD
ABT (iv) +
cDMARD
SAR + cDMARD
TCZ (iv) + cDMARD
RTX + cDMARD
BAR + cDMARD
1
3
1
1 2
1

©Institute for Clinical and Economic Review, 2017 Page 169 Evidence Report: Targeted Immune Modulators for Rheumatoid Arthritis Return to Table of Contents
Table C12. ACR Data used in NMA (TIM-experienced population)
Interventions
Mean
disease
duration
Intervention 1 Intervention 2
Trial Name
1 2 Weeks No
response ACR20 ACR50 ACR70 n
No
response ACR20 ACR50 ACR70 n
RA-BEACON90 cDMARD BAR +
cDMARD
728 128 25 17 6 176 95 30 22 30 177
REFLEX93 cDMARD RTX +
cDMARD
621 165 26 8 2 201 146 72 44 36 298
RADIATE189 cDMARD TCZ +
cDMARD
625 142 10 4 2 158 197 58 47 29 331
ATTAIN91 cDMARD ABTiv +
cDMARD
620 107 21 3 2 133 127 77 26 26 256
TARGET88 cDMARD SAR +
cDMARD
119 29 20 13 181 72 37 46 29 184
MOBILITY89 cDMARD SAR +
cDMARD
460 73 23 9 4 109 40 25 24 21 110
DIC=226.7; resdev=49.9

©Institute for Clinical and Economic Review, 2017 Page 170 Evidence Report: Targeted Immune Modulators for Rheumatoid Arthritis Return to Table of Contents
Figure C14. League table, NMA results TIM-experienced population, ACR20
TCZiv+cDMARD
1.06 (0.83-1.40) RTX+cDMARD
1.14 (0.88-1.61) 1.08 (0.84-1.47) ABTiv+ cDMARD
1.26 (1.00-1.77) 1.19 (0.96-1.60) 1.10 (0.85-1.49) SAR+cDMARD
1.38 (1.05-2.11) 1.30 (1.01-1.93) 1.21 (0.90-1.76) 1.09 (0.84-1.51) BAR+cDMARD
2.70 (1.76-4.76) 2.55 (1.72-4.28) 2.34 (1.62-3.88) 2.12 (1.55-3.21) 1.92 (1.42-2.94) cDMARD
Figure C15. League table, NMA results TIM-experienced population, ACR50
TCZiv+cDMARD
1.09 (0.74-1.67) RTX+cDMARD
1.24 (0.82-2.03) 1.13 (0.76-1.77) ABTiv+ cDMARD
1.45 (1.00-2.31) 1.32 (0.95-2.00) 1.17 (0.78-1.80) SAR+cDMARD
1.65 (1.07-2.94) 1.51 (1.01-2.57) 1.33 (0.85-2.26) 1.14 (0.77-1.81) BAR+cDMARD
4.25 (2.50-8.42) 3.89 (2.39-7.19) 3.41 (2.13-6.30) 2.93 (1.98-4.79) 2.54 (1.68-4.29) cDMARD
Figure C16. League table, NMA results TIM-experienced population, ACR70
TCZiv+cDMARD
1.14 (0.66-2.03) RTX+cDMARD
1.35 (0.75-2.64) 1.19 (0.68-2.17) ABTiv+ cDMARD
1.68 (1.00-3.10) 1.48 (0.92-2.53) 1.24 (0.71-2.20) SAR+cDMARD
2.02 (1.11-4.22) 1.77 (1.01-3.51) 1.49 (0.80-2.96) 1.20 (0.70-2.20) BAR+cDMARD 6.92 (3.66-15.29) 6.09 (3.41-12.30) 5.07 (2.85-10.41) 4.10 (2.58-7.23) 3.39 (2.02-6.36) cDMARD

©Institute for Clinical and Economic Review, 2017 Page 171 Evidence Report: Targeted Immune Modulators for Rheumatoid Arthritis Return to Table of Contents
Table C13. Relative Risk (Likelihood) of Patients Achieving ACR20 or Better, TIM-Experienced Population
Treatment
TCZiv + cDMARD 2.7 (1.76,4.76)
RTX + cDMARD 2.55 (1.72,4.28)
ABTiv + cDMARD 2.34 (1.62,3.88)
SAR + cDMARD 2.12 (1.55,3.21)
BAR + cDMARD 1.92 (1.42,2.94)
0 1 2 3 4 5
Relative Risk (CrI)

©Institute for Clinical and Economic Review, 2017 Page 172 Evidence Report: Targeted Immune Modulators for Rheumatoid Arthritis Return to Table of Contents
Figure C17. Network Diagram for Analysis of Radiographic Progression (Mixed Population)
GOL (iv) +
cDMARD
1
1
TOF + cDMARD
1
cDMARD
ADA + cDMARD
TCZ (iv)
IFX + cDMARD
ETN + cDMARD
ETN
SAR + cDMARD
TCZ (iv) + cDMARD
RTX + cDMARD
CTZ + cDMARD
BAR + cDMARD
1
1
1
1 3
1
1
1
GOL (sc) +
cDMARD
1
1
ABT (sc) +
cDMARD
1
1
2
1
ABT (iv) +
cDMARD

©Institute for Clinical and Economic Review, 2017 Page 173 Evidence Report: Targeted Immune Modulators for Rheumatoid Arthritis Return to Table of Contents
Table C14. Radiographic Progression Data used in NMA (Mixed population Sharp Score)
Trial Intervention 1 Intervention2 Intervention 3 N
(1) N
(2) N
(3) Mean
(1) SD (1)
Mean (2)
SD (2)
Mean (3)
SD (3)
ATTRACT200 cDMARD IFX + cDMARD 64 173
7.00 10.30 0.73 4.93
TEMPO83 cDMARD ETN ETN + cDMARD 212 212 218 2.80 12.70 0.52 4.64 -0.54 3.50
RA-SCORE171 cDMARD RTX + cDMARD 63 60
1.37 NR 0.29 NR
MOBILITY162 cDMARD SAR + cDMARD 398 399
2.78 7.70 0.25 4.61
Takeuchi 201381 cDMARD ETN
171 181
9.82 15.20 3.33 9.82
LITHE125 cDMARD TCZiv + cDMARD 294 696
1.17 3.14 0.29 1.15
SAMURAI84 cDMARD TCZiv
143 157
6.10 11.60 2.30 5.43
ORAL-Scan78 cDMARD TOF + cDMARD 160 321
0.92 NR 0.29 NR
AMPLE94 ADA + cDMARD ABTsc + cDMARD 289 290
0.38 5.00 0.58 3.22
AIM173 cDMARD ABTiv + cDMARD 195 391 2.32 NR 1.21 NR
DE019179 cDMARD ADA + cDMARD 200 207
2.70 6.80 0.10 4.80
GO-FORWARD198 cDMARD GOLsc + cDMARD 122 86
1.10 4.70 0.93 4.86
GO-FURTHER214 cDMARD GOLiv + cDMARD 193 391 1.22 3.98 0.13 3.11
RAPID1181 cDMARD CTZ + cDMARD 199 393
2.80 NR 0.4 NR
RA-BEAM97 cDMARD BAR + cDMARD ADA+cDMARD 452 473 312 1.8 3.83 0.71 4.02 0.6 10.6
DIC=53.3; resdev=32.3

©Institute for Clinical and Economic Review, 2017 Page 174 Evidence Report: Targeted Immune Modulators for Rheumatoid Arthritis Return to Table of Contents
Figure C18: League table, NMA results Mixed population, Sharp Score
*To zoom in on numbers, hold the Ctrl key and scroll with mouse or trackpad

©Institute for Clinical and Economic Review, 2017 Page 175 Evidence Report: Targeted Immune Modulators for Rheumatoid Arthritis Return to Table of Contents
Figure C19. Network Diagram for Sensitivity Analysis of ACR (TIM-Naïve Population)
SAR
1
1
ADA
cDMARD
ADA + cDMARD
TCZ (iv)
ABT (iv) +
cDMARD
IFX + cDMARD
ETN + cDMARD
GOL (iv) +
cDMARD
ETN
SAR + cDMARD
TCZ (iv) + cDMARD
RTX + cDMARD
CTZ + cDMARD
BAR + cDMARD 5
2
1
1
3 3
2
1
2
1
1
1
GOL (sc) +
cDMARD
3
3
ABT (sc) +
cDMARD
1
2
Int + cDMARD
2
1
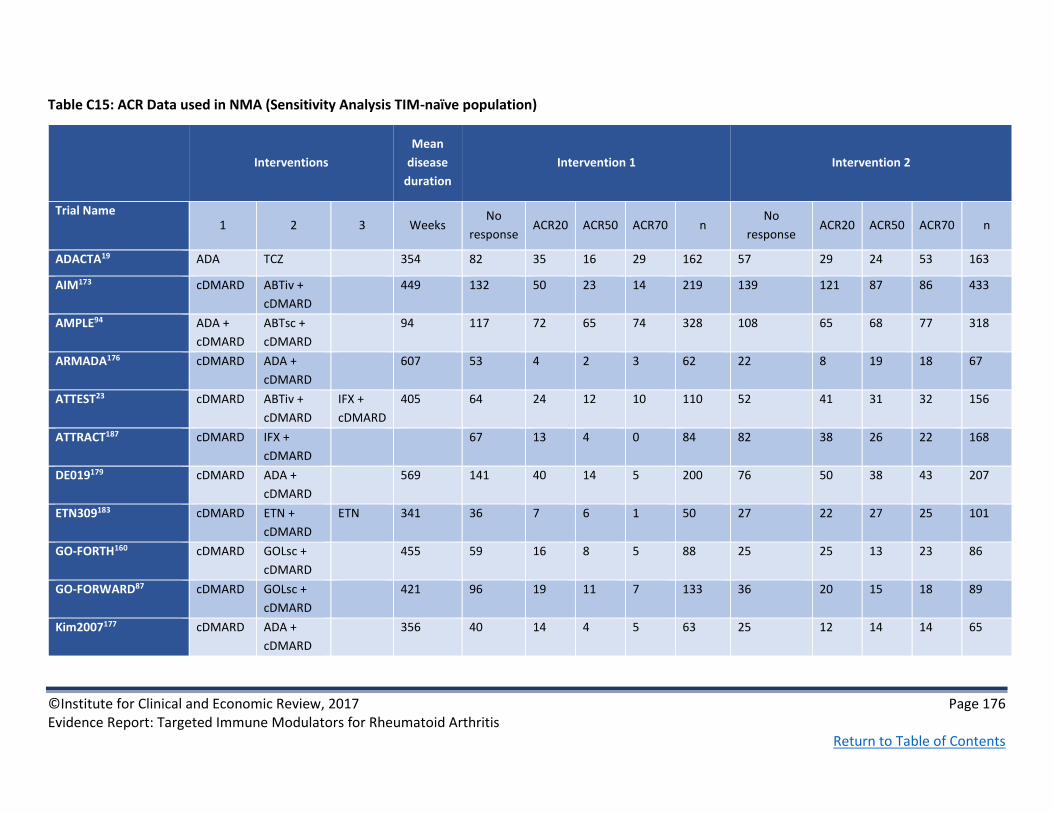
©Institute for Clinical and Economic Review, 2017 Page 176 Evidence Report: Targeted Immune Modulators for Rheumatoid Arthritis Return to Table of Contents
Table C15: ACR Data used in NMA (Sensitivity Analysis TIM-naïve population)
Interventions
Mean
disease
duration
Intervention 1 Intervention 2
Trial Name 1 2 3 Weeks
No
response ACR20 ACR50 ACR70 n
No
response ACR20 ACR50 ACR70 n
ADACTA19 ADA TCZ 354 82 35 16 29 162 57 29 24 53 163
AIM173 cDMARD ABTiv +
cDMARD
449 132 50 23 14 219 139 121 87 86 433
AMPLE94 ADA +
cDMARD
ABTsc +
cDMARD
94 117 72 65 74 328 108 65 68 77 318
ARMADA176 cDMARD ADA +
cDMARD
607 53 4 2 3 62 22 8 19 18 67
ATTEST23 cDMARD ABTiv +
cDMARD
IFX +
cDMARD
405 64 24 12 10 110 52 41 31 32 156
ATTRACT187 cDMARD IFX +
cDMARD
67 13 4 0 84 82 38 26 22 168
DE019179 cDMARD ADA +
cDMARD
569 141 40 14 5 200 76 50 38 43 207
ETN309183 cDMARD ETN +
cDMARD
ETN 341 36 7 6 1 50 27 22 27 25 101
GO-FORTH160 cDMARD GOLsc +
cDMARD
455 59 16 8 5 88 25 25 13 23 86
GO-FORWARD87 cDMARD GOLsc +
cDMARD
421 96 19 11 7 133 36 20 15 18 89
Kim2007177 cDMARD ADA +
cDMARD
356 40 14 4 5 63 25 12 14 14 65

©Institute for Clinical and Economic Review, 2017 Page 177 Evidence Report: Targeted Immune Modulators for Rheumatoid Arthritis Return to Table of Contents
Interventions
Mean
disease
duration
Intervention 1 Intervention 2
LARA158 Int
cDMARD
ETN +
cDMARD
430 71 38 17 16 142 47 59 76 97 279
O'Dell77 Int
cDMARD
ETN +
cDMARD
271 70 48 33 8 159 73 32 32 26 163
SAMURAI84 cDMARD TCZ 119 89 30 16 10 145 28 39 37 53 157
SATORI85 cDMARD TCZ 447 48 9 3 4 64 12 18 12 19 61
STAR178 cDMARD ADA +
cDMARD
541 207 75 25 11 318 150 76 45 47 318
START188 cDMARD IFX +
cDMARD
390 276 54 17 16 363 317 175 127 102 721
TOWARD152 cDMARD TCZ +
cDMARD
510 312 64 25 12 413 315 186 137 165 803
RA-BUILD175 cDMARD BAR +
cDMARD
390 132 47 31 18 228 79 48 45 55 227
MOBILITY162 cDMARD SAR +
cDMARD
460 191 46 26 26 289 95 58 58 78 289
Choy 2012182 cDMARD CTZ +
cDMARD
502 92 20 5 2 119 67 35 22 0 124
SERENE149 cDMARD RTX +
cDMARD
366 132 24 7 9 172 84 42 27 17 170
GO-FURTHER184 cDMARD GOLiv +
cDMARD
359 136 35 18 8 197 134 123 68 70 395
Li 2015185 cDMARD GOLsc +
cDMARD
406 111 12 7 2 132 76 31 17 8 132
RA-SCORE171 cDMARD RTX +
cDMARD
242 45 11 6 1 63 29 15 11 5 60

©Institute for Clinical and Economic Review, 2017 Page 178 Evidence Report: Targeted Immune Modulators for Rheumatoid Arthritis Return to Table of Contents
Interventions
Mean
disease
duration
Intervention 1 Intervention 2
MONARCH18 ADA SAR 77 53 33 22 185 52 48 41 43 184
RA-BEAM97 cDMARD ADA +
cDMARD
BAR +
cDMARD
na 307 88 54 39 488 112 66 79 73 330
Interventions
Mean
disease
duration
Intervention 3
Trial Name 1 2 3 Weeks
No
response ACR20 ACR50 ACR70 n
ATTEST23 cDMARD ABTiv +
cDMARD
IFX +
cDMARD
405 67 37 21 40 165
ETN309183 cDMARD ETN +
cDMARD
ETN 341 27 28 26 22 103
RA-BEAM97 cDMARD ADA +
cDMARD
BAR +
cDMARD
na 127 117 97 146 487
DIC=1096.7; resdev=236.5
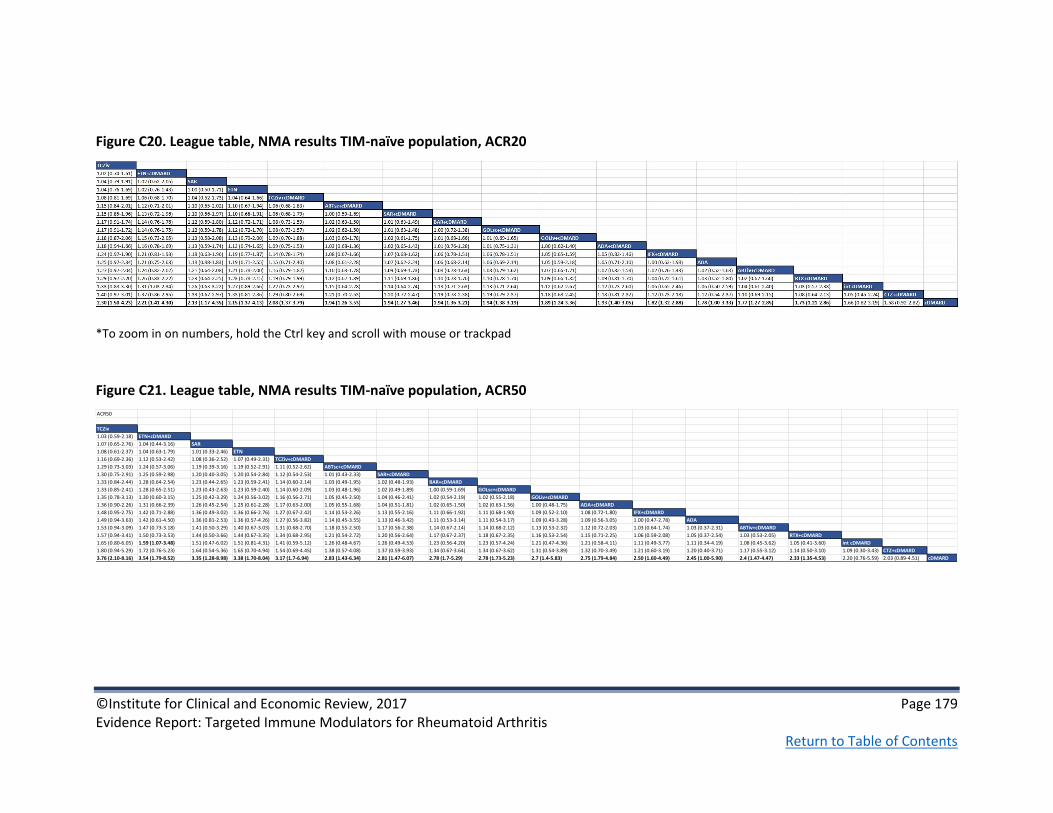
©Institute for Clinical and Economic Review, 2017 Page 179 Evidence Report: Targeted Immune Modulators for Rheumatoid Arthritis Return to Table of Contents
Figure C20. League table, NMA results TIM-naïve population, ACR20
*To zoom in on numbers, hold the Ctrl key and scroll with mouse or trackpad
Figure C21. League table, NMA results TIM-naïve population, ACR50
ACR50
TCZiv
1.03 (0.59-2.18) ETN+cDMARD
1.07 (0.65-2.76) 1.04 (0.44-3.16) SAR
1.08 (0.61-2.37) 1.04 (0.63-1.79) 1.01 (0.33-2.46) ETN
1.16 (0.69-2.36) 1.12 (0.53-2.42) 1.08 (0.36-2.52) 1.07 (0.49-2.31) TCZiv+cDMARD
1.29 (0.73-3.03) 1.24 (0.57-3.06) 1.19 (0.39-3.16) 1.19 (0.52-2.91) 1.11 (0.52-2.62) ABTsc+cDMARD
1.30 (0.75-2.91) 1.25 (0.59-2.98) 1.20 (0.40-3.05) 1.20 (0.54-2.84) 1.12 (0.54-2.53) 1.01 (0.43-2.33) SAR+cDMARD
1.33 (0.84-2.44) 1.28 (0.64-2.54) 1.23 (0.44-2.65) 1.23 (0.59-2.41) 1.14 (0.60-2.14) 1.03 (0.49-1.95) 1.02 (0.48-1.93) BAR+cDMARD
1.33 (0.85-2.41) 1.28 (0.65-2.51) 1.23 (0.43-2.63) 1.23 (0.59-2.40) 1.14 (0.60-2.09) 1.03 (0.48-1.96) 1.02 (0.49-1.89) 1.00 (0.59-1.69) GOLsc+cDMARD
1.35 (0.78-3.13) 1.30 (0.60-3.15) 1.25 (0.42-3.29) 1.24 (0.56-3.02) 1.16 (0.56-2.71) 1.05 (0.45-2.50) 1.04 (0.46-2.41) 1.02 (0.54-2.19) 1.02 (0.55-2.18) GOLiv+cDMARD
1.36 (0.90-2.26) 1.31 (0.66-2.39) 1.26 (0.45-2.54) 1.25 (0.61-2.28) 1.17 (0.63-2.00) 1.05 (0.55-1.68) 1.04 (0.51-1.81) 1.02 (0.65-1.50) 1.02 (0.63-1.56) 1.00 (0.48-1.75) ADA+cDMARD
1.48 (0.95-2.75) 1.42 (0.71-2.88) 1.36 (0.49-3.02) 1.36 (0.66-2.76) 1.27 (0.67-2.42) 1.14 (0.53-2.26) 1.13 (0.55-2.16) 1.11 (0.66-1.92) 1.11 (0.68-1.90) 1.09 (0.52-2.10) 1.08 (0.72-1.80) IFX+cDMARD
1.49 (0.94-3.63) 1.42 (0.61-4.50) 1.36 (0.81-2.53) 1.36 (0.57-4.26) 1.27 (0.56-3.82) 1.14 (0.45-3.55) 1.13 (0.46-3.42) 1.11 (0.53-3.14) 1.11 (0.54-3.17) 1.09 (0.43-3.28) 1.09 (0.56-3.05) 1.00 (0.47-2.78) ADA
1.53 (0.94-3.09) 1.47 (0.73-3.18) 1.41 (0.50-3.29) 1.40 (0.67-3.03) 1.31 (0.68-2.70) 1.18 (0.55-2.50) 1.17 (0.56-2.38) 1.14 (0.67-2.14) 1.14 (0.68-2.12) 1.13 (0.53-2.32) 1.12 (0.72-2.03) 1.03 (0.64-1.74) 1.03 (0.37-2.31) ABTiv+cDMARD
1.57 (0.94-3.41) 1.50 (0.73-3.53) 1.44 (0.50-3.66) 1.44 (0.67-3.35) 1.34 (0.68-2.95) 1.21 (0.54-2.72) 1.20 (0.56-2.64) 1.17 (0.67-2.37) 1.18 (0.67-2.35) 1.16 (0.53-2.54) 1.15 (0.71-2.25) 1.06 (0.59-2.08) 1.05 (0.37-2.54) 1.03 (0.53-2.05) RTX+cDMARD
1.65 (0.80-6.05) 1.59 (1.07-3.48) 1.51 (0.47-6.02) 1.51 (0.81-4.31) 1.41 (0.59-5.12) 1.26 (0.48-4.67) 1.26 (0.49-4.53) 1.23 (0.56-4.20) 1.23 (0.57-4.24) 1.21 (0.47-4.36) 1.21 (0.58-4.11) 1.11 (0.49-3.77) 1.11 (0.34-4.19) 1.08 (0.45-3.62) 1.05 (0.41-3.60) int cDMARD
1.80 (0.94-5.29) 1.72 (0.76-5.23) 1.64 (0.54-5.36) 1.65 (0.70-4.94) 1.54 (0.69-4.45) 1.38 (0.57-4.08) 1.37 (0.59-3.93) 1.34 (0.67-3.64) 1.34 (0.67-3.62) 1.31 (0.54-3.89) 1.32 (0.70-3.49) 1.21 (0.60-3.19) 1.20 (0.40-3.71) 1.17 (0.55-3.12) 1.14 (0.50-3.10) 1.09 (0.30-3.43) CTZ+cDMARD
3.76 (2.10-8.16) 3.54 (1.79-8.52) 3.35 (1.28-8.98) 3.38 (1.70-8.04) 3.17 (1.7-6.94) 2.83 (1.43-6.34) 2.81 (1.47-6.07) 2.78 (1.7-5.29) 2.78 (1.73-5.23) 2.7 (1.4-5.83) 2.75 (1.79-4.84) 2.50 (1.60-4.49) 2.45 (1.00-5.90) 2.4 (1.47-4.47) 2.33 (1.35-4.53) 2.20 (0.76-5.59) 2.03 (0.89-4.51) cDMARD

©Institute for Clinical and Economic Review, 2017 Page 180 Evidence Report: Targeted Immune Modulators for Rheumatoid Arthritis Return to Table of Contents
Figure C22. League table, NMA results TIM-naïve population, ACR70
*To zoom in on numbers, hold the Ctrl key and scroll with mouse or trackpad
TCZiv
1.06 (0.45-3.05) ETN+cDMARD
1.12 (0.52-4.03) 1.06 (0.30-5.02) SAR
1.13 (0.48-3.39) 1.07 (0.51-2.30) 1.01 (0.21-3.75) ETN
1.26 (0.58-3.39) 1.19 (0.40-3.56) 1.13 (0.24-3.85) 1.11 (0.36-3.34) TCZiv+cDMARD
1.47 (0.62-4.67) 1.39 (0.44-4.82) 1.31 (0.27-5.17) 1.30 (0.40-4.49) 1.17 (0.40-3.80) ABTsc+cDMARD
1.49 (0.65-4.45) 1.41 (0.47-4.65) 1.33 (0.29-4.93) 1.32 (0.41-4.36) 1.18 (0.41-3.67) 1.01 (0.31-3.28) SAR+cDMARD
1.54 (0.78-3.53) 1.45 (0.53-3.79) 1.37 (0.32-4.13) 1.36 (0.48-3.55) 1.22 (0.48-2.95) 1.05 (0.37-2.60) 1.04 (0.37-2.55) BAR+cDMARD
1.54 (0.79-3.44) 1.45 (0.54-3.72) 1.37 (0.32-4.07) 1.36 (0.48-3.50) 1.22 (0.49-2.86) 1.05 (0.36-2.63) 1.03 (0.37-2.47) 1.00 (0.48-2.08) GOLsc+cDMARD
1.58 (0.68-4.91) 1.49 (0.48-5.02) 1.40 (0.30-5.46) 1.39 (0.44-4.72) 1.25 (0.44-4.01) 1.07 (0.33-3.58) 1.06 (0.34-3.42) 1.02 (0.41-2.95) 1.02 (0.42-2.92) GOLiv+cDMARD
1.59 (0.85-3.18) 1.50 (0.56-3.51) 1.42 (0.33-3.91) 1.40 (0.51-3.29) 1.26 (0.52-2.68) 1.08 (0.44-2.11) 1.07 (0.39-2.33) 1.03 (0.55-1.77) 1.03 (0.53-1.87) 1.01 (0.36-2.23) ADA+cDMARD
1.79 (0.92-4.11) 1.69 (0.62-4.47) 1.59 (0.38-4.90) 1.58 (0.57-4.19) 1.41 (0.57-3.44) 1.21 (0.42-3.17) 1.20 (0.44-2.95) 1.16 (0.56-2.47) 1.16 (0.58-2.43) 1.13 (0.40-2.82) 1.13 (0.63-2.24) IFX+cDMARD
1.80 (0.90-5.71) 1.69 (0.49-7.91) 1.58 (0.74-3.56) 1.58 (0.44-7.33) 1.43 (0.43-6.23) 1.22 (0.33-5.65) 1.20 (0.34-5.35) 1.16 (0.40-4.67) 1.16 (0.41-4.72) 1.14 (0.31-5.02) 1.13 (0.43-4.46) 1.00 (0.35-3.92) ADA
1.88 (0.92-4.77) 1.77 (0.64-5.11) 1.67 (0.39-5.52) 1.65 (0.58-4.76) 1.48 (0.59-3.99) 1.27 (0.44-3.63) 1.26 (0.45-3.34) 1.21 (0.57-2.86) 1.22 (0.58-2.81) 1.19 (0.41-3.23) 1.18 (0.63-2.64) 1.05 (0.54-2.13) 1.05 (0.26-3.25) ABTiv+cDMARD
1.96 (0.91-5.44) 1.83 (0.65-5.81) 1.73 (0.39-6.28) 1.72 (0.57-5.42) 1.54 (0.58-4.44) 1.32 (0.43-4.02) 1.31 (0.45-3.82) 1.26 (0.56-3.24) 1.27 (0.58-3.21) 1.23 (0.41-3.63) 1.23 (0.61-3.00) 1.09 (0.48-2.73) 1.08 (0.26-3.66) 1.04 (0.42-2.67) RTX+cDMARD
2.09 (0.71-11.36) 1.98 (1.13-5.18) 1.84 (0.35-11.68) 1.83 (0.73-7.10) 1.65 (0.46-9.00) 1.41 (0.36-7.96) 1.39 (0.36-7.56) 1.35 (0.43-6.82) 1.35 (0.44-6.85) 1.31 (0.34-7.19) 1.32 (0.46-6.53) 1.16 (0.36-5.79) 1.16 (0.23-6.97) 1.11 (0.33-5.52) 1.07 (0.29-5.48) int cDMARD
2.36 (0.91-9.45) 2.21 (0.67-9.59) 2.07 (0.42-10.19) 2.07 (0.60-8.85) 1.86 (0.59-7.56) 1.58 (0.46-6.74) 1.57 (0.47-6.34) 1.52 (0.56-5.62) 1.53 (0.57-5.60) 1.48 (0.43-6.23) 1.48 (0.60-5.30) 1.32 (0.49-4.68) 1.30 (0.28-5.98) 1.25 (0.43-4.58) 1.21 (0.38-4.55) 1.13 (0.20-5.35) CTZ+cDMARD
6.29 (3.03-15.85) 5.82 (2.29-17.46)5.41 (1.39-19.31) 5.44 (2.10-16.03) 4.91 (2.12-12.87) 4.17 (1.62-11.58) 4.13 (1.69-10.88) 4.03 (2.13-8.77) 4.03 (2.20-8.63) 3.89 (1.57-10.31) 3.95 (2.35-7.71) 3.47 (1.94-7.03) 3.40 (1.00-10.65) 3.29 (1.70-7.07) 3.15 (1.49-7.22) 2.93 (0.70-9.94) 2.60 (0.86-7.33) cDMARD

©Institute for Clinical and Economic Review, 2017 Page 181 Evidence Report: Targeted Immune Modulators for Rheumatoid Arthritis Return to Table of Contents
Figure C23. Network Diagram for Sensitivity Analysis of ACR (by Class, Mixed Population)
cDMARD
Other biologic
JAK inhibitor
TNFα inhibitor
IL-6
7
18 6
2
2
6
2
Int cDMARD
2

©Institute for Clinical and Economic Review, 2017 Page 182 Evidence Report: Targeted Immune Modulators for Rheumatoid Arthritis Return to Table of Contents
Table C16: ACR Data used in (Sensitivity analysis by class, Mixed population)
Interventions
Mean
disease
duration
Intervention 1 Intervention 2
Trial Name 1 2 3 Weeks
No
response ACR20 ACR50 ACR70 n
No
response ACR20 ACR50 ACR70 n
ADACTA19 TNFi IL-6 354 82 35 16 29 162 57 29 24 53 163
AIM173 cDMARD Other
biologic
449 132 50 23 14 219 139 121 87 86 433
AMPLE94 TNFi Other
biologic
94 117 72 65 74 328 108 65 68 77 318
ARMADA176 cDMARD TNFi 607 53 4 2 3 62 22 8 19 18 67
ATTEST23 cDMARD Other
biologic
TNFi 405 64 24 12 10 110 52 41 31 32 156
ATTRACT187 cDMARD TNFi 67 13 4 0 84 82 38 26 22 168
DE019179 cDMARD TNFi 569 141 40 14 5 200 76 50 38 43 207
ETN309183 cDMARD TNFi TNFi 341 36 7 6 1 50 27 22 27 25 101
GO-
FORTH160
cDMARD TNFi 455 59 16 8 5 88 25 25 13 23 86
GO-
FORWARD87
cDMARD TNFi 421 96 19 11 7 133 36 20 15 18 89
Kim2007177 cDMARD TNFi 356 40 14 4 5 63 25 12 14 14 65
LARA158 Int
cDMARD
TNFi 430 71 38 17 16 142 47 59 76 97 279
O'Dell77 Int
cDMARD
TNFi 271 70 48 33 8 159 73 32 32 26 163
SAMURAI84 cDMARD IL-6 119 89 30 16 10 145 28 39 37 53 157
SATORI85 cDMARD IL-6 447 48 9 3 4 64 12 18 12 19 61
STAR178 cDMARD TNFi 541 207 75 25 11 318 150 76 45 47 318

©Institute for Clinical and Economic Review, 2017 Page 183 Evidence Report: Targeted Immune Modulators for Rheumatoid Arthritis Return to Table of Contents
Interventions
Mean
disease
duration
Intervention 1 Intervention 2
Trial Name 1 2 3 Weeks
No
response ACR20 ACR50 ACR70 n
No
response ACR20 ACR50 ACR70 n
START188 cDMARD TNFi 390 276 54 17 16 363 317 175 127 102 721
TOWARD152 cDMARD IL-6 510 312 64 25 12 413 315 186 137 165 803
RA-BUILD175 cDMARD JAKi 390 132 47 31 18 228 79 48 45 55 227
MOBILITY162 cDMARD IL-6 460 265 67 37 29 398 134 83 83 99 399
ORAL Scan78 cDMARD JAKi 463 120 27 11 2 160 156 61 57 47 321
Kremer
2012212
cDMARD JAKi 473 45 7 11 6 69 37 10 10 14 71
LITHE125 cDMARD IL-6 476 287 67 31 8 393 371 199 131 96 797
OPTION213 cDMARD IL-6 398 151 31 18 4 204 195 66 86 71 418
RAPID1181 cDMARD TNFi 319 171 12 9 6 199 162 85 62 84 393
RAPID2180 cDMARD TNFi 308 116 7 3 1 127 105 61 41 39 246
Choy 2012182 cDMARD TNFi 502 92 20 5 2 119 67 35 22 0 124
SERENE149 cDMARD Other
biologic
366 132 24 7 9 172 84 42 27 17 170
BREVACTA153 cDMARD IL-6 577 149 44 15 11 219 170 92 88 87 437
Kremer
2003174
cDMARD Other
biologic
77 28 12 2 119 46 27 23 19 115
ORAL
Standard95
cDMARD JAKi TNFi 408 41 2 5 8 56 95 30 32 39 196
GO-
FURTHER184
cDMARD TNFi 359 136 35 18 8 197 134 123 68 70 395
ORAL Sync154 cDMARD JAKi 462 110 29 15 5 159 151 59 64 41 315
Li 2015185 cDMARD TNFi 406 111 12 7 2 132 76 31 17 8 132
RA-SCORE171 cDMARD Other
biologic
242 45 11 6 1 63 29 15 11 5 60

©Institute for Clinical and Economic Review, 2017 Page 184 Evidence Report: Targeted Immune Modulators for Rheumatoid Arthritis Return to Table of Contents
Interventions
Mean
disease
duration
Intervention 1 Intervention 2
Trial Name 1 2 3 Weeks
No
response ACR20 ACR50 ACR70 n
No
response ACR20 ACR50 ACR70 n
Takeuchi
2013172
cDMARD Other
biologic
382 52 10 4 0 66 14 19 15 13 61
J-RAPID156 cDMARD TNFi 296 58 6 12 1 77 22 15 21 24 82
RA-BEAM97 cDMARD TNFi JAKi na 307 88 54 39 488 112 66 79 73 330
MONARCH18 TNFi IL-6 77 53 33 22 185 52 48 41 43 184
Interventions
Mean disease
duration Intervention 3
Trial Name 1 2 3 Weeks
No response
ACR20 ACR50 ACR70 n
ATTEST23 cDMARD Other biologic
TNFi 405 67 37 21 40 165
ETN309183 cDMARD TNFi TNFi 341 27 28 26 22 103
ORAL Standard95
cDMARD JAKi TNFi 408 105 36 38 20 199
RA-BEAM97 cDMARD TNFi JAKi nr 127 117 97 146 487
DIC=1626.3; resdev=410.6

©Institute for Clinical and Economic Review, 2017 Page 185 Evidence Report: Targeted Immune Modulators for Rheumatoid Arthritis Return to Table of Contents
Figure C24. League table, NMA results by Class, ACR20
IL-6
1.12 (1.00-1.34) TNFi
1.14 (0.97-1.46) 1.02 (0.87-1.22) Other Biologic
1.17 (1.00-1.54) 1.05 (0.90-1.28) 1.03 (0.83-1.31) JAKi
1.75 (1.19-3.36) 1.55 (1.10-2.77) 1.52 (1.05-2.80) 1.48 (1.02-2.68) Int cDMARD
2.44 (1.65-4.06) 2.16 (1.55-3.28) 2.11 (1.52-3.29) 2.05 (1.49-3.14) 1.36 (0.87-2.16) cDMARD
Figure C25. League table, NMA results by Class, ACR50
IL-6
1.21 (1.00-1.56) TNFi
1.24 (0.95-1.76) 1.03 (0.81-1.35) Other Biologic
1.30 (1.00-1.90) 1.07 (0.84-1.45) 1.05 (0.75-1.49) JAKi
2.37 (1.34-5.49) 1.95 (1.18-4.14) 1.89 (1.09-4.22) 1.81 (1.02-3.97) Int cDMARD
3.77 (2.33-6.81) 3.11 (2.08-5.01) 3.00 (1.98-5.09) 2.86 (1.91-4.75) 1.56 (0.83-2.92) cDMARD

©Institute for Clinical and Economic Review, 2017 Page 186 Evidence Report: Targeted Immune Modulators for Rheumatoid Arthritis Return to Table of Contents
Figure C26. League table, NMA results by Class, ACR70
IL-6
1.32 (1.00-1.84) TNFi
1.36 (0.94-2.16) 1.04 (0.74-1.50) Other Biologic
1.46 (0.99-2.39) 1.11 (0.79-1.66) 1.07 (0.68-1.74) JAKi
3.30 (1.53-9.27) 2.5 (1.26-6.29) 2.40 (1.12-6.51) 2.25 (1.03-6.01) Int cDMARD 6.01 (3.45-11.66) 4.55 (2.89-7.75) 4.34 (2.66-7.98) 4.06 (2.5-7.34) 1.79 (0.79-3.98) cDMARD

©Institute for Clinical and Economic Review, 2017 Page 187 Evidence Report: Targeted Immune Modulators for Rheumatoid Arthritis Return to Table of Contents
WinBUGS Code for Network Meta-Analyses
ACR BASE CASE (UNADJUSTED), Random Effects
# Binomial likelihood, probit link (different categories) # Random effects model for multi-arm trials model # *** PROGRAM STARTS for(i in 1:ns) # LOOP THROUGH STUDIES w[i,1] <- 0 # adjustment for multi-arm trials is zero for control arm delta[i,1] <- 0 # treatment effect is zero for control arm mu[i] ~ dnorm(0,.0001) # vague priors for all trial baselines for (k in 1:na[i]) # LOOP THROUGH ARMS p[i,k,1] <- 1 # Pr(PASI >0) for (j in 1:nc[i]-1) # LOOP THROUGH CATEGORIES r[i,k,j] ~ dbin(q[i,k,j],n[i,k,j]) # binomial likelihood q[i,k,j] <- 1-(p[i,k,C[i,j+1]]/p[i,k,C[i,j]]) # conditional probabilities theta[i,k,j] <- mu[i] + delta[i,k] + z[j] # linear predictor rhat[i,k,j] <- q[i,k,j] * n[i,k,j] # predicted number events dv[i,k,j] <- 2 * (r[i,k,j]*(log(r[i,k,j])-log(rhat[i,k,j])) #Deviance contribution of each category +(n[i,k,j]-r[i,k,j])*(log(n[i,k,j]-r[i,k,j]) - log(n[i,k,j]-rhat[i,k,j]))) dev[i,k] <- sum(dv[i,k,1:nc[i]-1]) # deviance contribution of each arm for (j in 2:nc[i]) # LOOP THROUGH CATEGORIES p[i,k,C[i,j]] <- 1 - phi.adj[i,k,j] # link function # adjust link function phi(x) for extreme values that can give numerical errors # when x< -5, phi(x)=0, when x> 5, phi(x)=1 phi.adj[i,k,j] <- step(5+theta[i,k,j-1]) * (step(theta[i,k,j-1]-5) + step(5-theta[i,k,j-1])*phi(theta[i,k,j-1]) ) for (k in 2:na[i]) # LOOP THROUGH ARMS delta[i,k] ~ dnorm(md[i,k],taud[i,k]) md[i,k] <- d[t[i,k]] - d[t[i,1]] + sw[i,k] # mean of LHR distributions, with multi-arm trial correction taud[i,k] <- tau *2*(k-1)/k # precision of LHR distributions (with multi-arm trial correction) w[i,k] <- (delta[i,k] - d[t[i,k]] + d[t[i,1]]) # adjustment, multi-arm RCTs sw[i,k] <- sum(w[i,1:k-1])/(k-1) # cumulative adjustment for multi-arm trials resdev[i] <- sum(dev[i,1:na[i]]) # summed residual deviance contribution for this trial z[1] <- 0 # set z50=0 for (j in 2:Cmax-1) # Set priors for z, for any number of categories

©Institute for Clinical and Economic Review, 2017 Page 188 Evidence Report: Targeted Immune Modulators for Rheumatoid Arthritis Return to Table of Contents
z.aux[j] ~ dunif(0,5) # priors z[j] <- z[j-1] + z.aux[j] # ensures z[j]~Uniform(z[j-1], z[j-1]+5) totresdev <- sum(resdev[]) #Total Residual Deviance d[1] <- 0 # treatment effect is zero for reference treatment for (k in 2:nt) d[k] ~ dnorm(0,.0001) # vague priors for treatment effects sd ~ dunif(0,5) # vague prior for between-trial SD tau <- pow(sd,-2) # between-trial precision = (1/between-trial variance) A~dnorm(meanA, precA) # calculate prob of achieving ACR 20/50/70 on treat k for (k in 1:nt) for (j in 1: Cmax-1) pacr[k,j] <- 1 - phi(A+d[k] + z[j]) for (k in 1:nt-1) for (kk in k+1:nt) RR20[k,kk] <- ppasi[k,1]/ppasi[kk,1] RR20[kk,k]<- 1/RR20[k,kk] for (k in 1:nt-1) for (kk in k+1:nt) RR50[k,kk] <- ppasi[k,2]/ppasi[kk,2] RR50[kk,k]<- 1/RR50[k,kk] for (k in 1:nt-1) for (kk in k+1:nt) RR70[k,kk] <- ppasi[k,3]/ppasi[kk,3] RR70[kk,k]<-1/RR70[k,kk] # *** PROGRAM ENDS ACR UNADJUSTED, Fixed Effects

©Institute for Clinical and Economic Review, 2017 Page 189 Evidence Report: Targeted Immune Modulators for Rheumatoid Arthritis Return to Table of Contents
# Binomial likelihood, probit link (different categories) # Random effects model for multi-arm trials model # *** PROGRAM STARTS for(i in 1:ns) # LOOP THROUGH STUDIES mu[i] ~ dnorm(0,.001) # vague priors for all trial baselines for (k in 1:na[i]) # LOOP THROUGH ARMS p[i,k,1] <- 1 # Pr(PASI >0) for (j in 1:nc[i]-1) # LOOP THROUGH CATEGORIES r[i,k,j] ~ dbin(q[i,k,j],n[i,k,j]) # binomial likelihood q[i,k,j] <- 1-(p[i,k,C[i,j+1]]/p[i,k,C[i,j]]) # conditional probabilities theta[i,k,j] <- mu[i] + d[t[i,k]]-d[t[i,1]] + z[j] rhat[i,k,j] <- q[i,k,j] * n[i,k,j] # predicted number events dv[i,k,j] <- 2 * (r[i,k,j]*(log(r[i,k,j])-log(rhat[i,k,j])) #Deviance contribution of each category +(n[i,k,j]-r[i,k,j])*(log(n[i,k,j]-r[i,k,j]) - log(n[i,k,j]-rhat[i,k,j]))) dev[i,k] <- sum(dv[i,k,1:nc[i]-1]) # deviance contribution of each arm for (j in 2:nc[i]) # LOOP THROUGH CATEGORIES p[i,k,C[i,j]] <- 1 - phi.adj[i,k,j] # link function # adjust link function phi(x) for extreme values that can give numerical errors # when x< -5, phi(x)=0, when x> 5, phi(x)=1 phi.adj[i,k,j] <- step(5+theta[i,k,j-1]) * (step(theta[i,k,j-1]-5) + step(5-theta[i,k,j-1])*phi(theta[i,k,j-1]) ) resdev[i] <- sum(dev[i,1:na[i]]) # summed residual deviance contribution for this trial z[1] <- 0 # set z50=0 for (j in 2:Cmax-1) # Set priors for z, for any number of categories z.aux[j] ~ dunif(0,5) # priors z[j] <- z[j-1] + z.aux[j] # ensures z[j]~Uniform(z[j-1], z[j-1]+5) totresdev <- sum(resdev[]) #Total Residual Deviance d[1] <- 0 # treatment effect is zero for reference treatment for (k in 2:nt) d[k] ~ dnorm(0,.0001)

©Institute for Clinical and Economic Review, 2017 Page 190 Evidence Report: Targeted Immune Modulators for Rheumatoid Arthritis Return to Table of Contents
# vague priors for treatment effects A ~ dnorm(meanA,precA) # calculate prob of achieving ACR 20/50/70 on treat k for (k in 1:nt) for (j in 1: Cmax-1) pacr[k,j] <- 1 - phi(A+d[k] + z[j]) for (k in 1:nt-1) for (kk in k+1:nt) RR20[k,kk] <- ppasi[k,1]/ppasi[kk,1] RR20[kk,k] <- ppasi[kk,1]/ppasi[k,1] for (k in 1:nt-1) for (kk in k+1:nt) RR50[k,kk] <- ppasi[k,2]/ppasi[kk,2] RR50[kk,k] <- ppasi[kk,2]/ppasi[k,2] for (k in 1:nt-1) for (kk in k+1:nt) RR70[k,kk] <- ppasi[k,3]/ppasi[kk,3] RR70[kk,k] <- ppasi[kk,3]/ppasi[k,3] # *** PROGRAM ENDS ACR ADJUSTED, Random Effects # Binomial likelihood, probit link (different categories) # Random effects model for multi-arm trials model # *** PROGRAM STARTS for(i in 1:ns) # LOOP THROUGH STUDIES w[i,1] <- 0 # adjustment for multi-arm trials is zero for control arm delta[i,1] <- 0 # treatment effect is zero for control arm mu[i] ~ dnorm(0,.001) # vague priors for all trial baselines

©Institute for Clinical and Economic Review, 2017 Page 191 Evidence Report: Targeted Immune Modulators for Rheumatoid Arthritis Return to Table of Contents
for (k in 1:na[i]) # LOOP THROUGH ARMS p[i,k,1] <- 1 # Pr(PASI >0) for (j in 1:nc[i]-1) # LOOP THROUGH CATEGORIES r[i,k,j] ~ dbin(q[i,k,j],n[i,k,j]) # binomial likelihood q[i,k,j] <- 1-(p[i,k,C[i,j+1]]/p[i,k,C[i,j]]) # conditional probabilities theta[i,k,j] <- mu[i] + delta[i,k] + z[j]+(beta[t[i,k]]-beta[t[i,1]])*(mu[i]-mx) # linear predictor rhat[i,k,j] <- q[i,k,j] * n[i,k,j] # predicted number events dv[i,k,j] <- 2 * (r[i,k,j]*(log(r[i,k,j])-log(rhat[i,k,j])) #Deviance contribution of each category +(n[i,k,j]-r[i,k,j])*(log(n[i,k,j]-r[i,k,j]) - log(n[i,k,j]-rhat[i,k,j]))) dev[i,k] <- sum(dv[i,k,1:nc[i]-1]) # deviance contribution of each arm for (j in 2:nc[i]) # LOOP THROUGH CATEGORIES p[i,k,C[i,j]] <- 1 - phi.adj[i,k,j] # link function # adjust link function phi(x) for extreme values that can give numerical errors # when x< -5, phi(x)=0, when x> 5, phi(x)=1 phi.adj[i,k,j] <- step(5+theta[i,k,j-1]) * (step(theta[i,k,j-1]-5) + step(5-theta[i,k,j-1])*phi(theta[i,k,j-1]) ) for (k in 2:na[i]) # LOOP THROUGH ARMS delta[i,k] ~ dnorm(md[i,k],taud[i,k]) md[i,k] <- d[t[i,k]] - d[t[i,1]] + sw[i,k] # mean of LHR distributions, with multi-arm trial correction taud[i,k] <- tau *2*(k-1)/k # precision of LHR distributions (with multi-arm trial correction) w[i,k] <- (delta[i,k] - d[t[i,k]] + d[t[i,1]]) # adjustment, multi-arm RCTs sw[i,k] <- sum(w[i,1:k-1])/(k-1) # cumulative adjustment for multi-arm trials resdev[i] <- sum(dev[i,1:na[i]]) # summed residual deviance contribution for this trial z[1] <- 0 # set z50=0 for (j in 2:Cmax-1) # Set priors for z, for any number of categories z.aux[j] ~ dunif(0,5) # priors z[j] <- z[j-1] + z.aux[j] # ensures z[j]~Uniform(z[j-1], z[j-1]+5) totresdev <- sum(resdev[]) #Total Residual Deviance d[1] <- 0 # treatment effect is zero for reference treatment beta[1]<-0 for (k in 2:nt)

©Institute for Clinical and Economic Review, 2017 Page 192 Evidence Report: Targeted Immune Modulators for Rheumatoid Arthritis Return to Table of Contents
d[k] ~ dnorm(0,.0001) beta[k]<-B #common covariate effect # vague priors for treatment effects sd ~ dunif(0,5) # vague prior for between-trial SD tau <- pow(sd,-2) # between-trial precision = (1/between-trial variance) A ~ dnorm(meanA,precA) B ~ dnorm(0,.0001) #vague prior for covariate effect # calculate prob of achieving ACR 20/50/70 on treat k for (k in 1:nt) for (j in 1: Cmax-1) pACR[k,j] <- 1 - phi(A+d[k] + z[j]) for (k in 1:nt-1) for (kk in k+1:nt) RR20[k,kk] <- ppasi[k,1]/ppasi[kk,1] RR20[kk,k]<- 1/RR20[k,kk] for (k in 1:nt-1) for (kk in k+1:nt) RR50[k,kk] <- ppasi[k,2]/ppasi[kk,2] RR50[kk,k]<- 1/RR50[k,kk] for (k in 1:nt-1) for (kk in k+1:nt) RR70[k,kk] <- ppasi[k,3]/ppasi[kk,3] RR70[kk,k]<-1/RR70[k,kk] # *** PROGRAM ENDS SHARP BASECASE, Fixed Effects # Normal likelihood, identity link # Random effects model for multi-arm trials model # *** PROGRAM STARTS

©Institute for Clinical and Economic Review, 2017 Page 193 Evidence Report: Targeted Immune Modulators for Rheumatoid Arthritis Return to Table of Contents
for(i in 1:ns) # LOOP THROUGH STUDIES w[i,1] <- 0 # adjustment for multi-arm trials is zero for control arm delta[i,1] <- 0 # treatment effect is zero for control arm mu[i] ~ dnorm(0,.0001) # vague priors for all trial baselines for (k in 1:na[i]) # LOOP THROUGH ARMS se[i,k]<-sdd[i,k]/sqrt(n[i,k]) var[i,k] <- pow(se[i,k],2) # calculate variances prec[i,k] <- 1/var[i,k] # set precisions y[i,k] ~ dnorm(theta[i,k],prec[i,k]) # normal likelihood theta[i,k] <- (mu[i] + delta[i,k])*psd[i] # model for linear predictor dev[i,k] <- (y[i,k]-theta[i,k])*(y[i,k]-theta[i,k])*prec[i,k] #Deviance contribution #calculate the pooled nom1[i,k]<-n[i,k]*sdd[i,k]*sdd[i,k] #nominator for the pooled sd resdev[i] <- sum(dev[i,1:na[i]]) # summed residual deviance contribution for this trial ss[i]<-sum(n[i,1:na[i]])-nt+na[i] #total sample size in a study nom[i]<-sum(nom1[i,1:na[i]]) #nominator for the pooled sd psd[i]<-sqrt(nom[i]/(ss[i]-na[i])) #pooled sd for (k in 2:na[i]) # LOOP THROUGH ARMS delta[i,k] ~ dnorm(md[i,k],taud[i,k]) # trial-specific LOR distributions md[i,k] <- d[t[i,k]] - d[t[i,1]] + sw[i,k] # mean of treat effects distributions (with multi-arm trial correction) taud[i,k] <- tau *2*(k-1)/k # precision of treat effects distributions (with multi-arm trial correction) w[i,k] <- (delta[i,k] - d[t[i,k]] + d[t[i,1]]) # adjustment for multi-arm RCTs sw[i,k] <- sum(w[i,1:k-1])/(k-1) # cumulative adjustment for multi-arm trials totresdev <- sum(resdev[]) #Total Residual Deviance d[1]<-0 # treatment effect is zero for reference treatment for (k in 2:nt) d[k] ~ dnorm(0,.0001) # vague priors for treatment effects sd ~ dunif(0,5) # vague prior for between-trial SD. tau <- pow(sd,-2) # between-trial precision = (1/between-trial variance) # Collection of results# # pairwise SMDs # for all comparisons for (c in 1:(nt-1)) for (k in (c+1):nt)
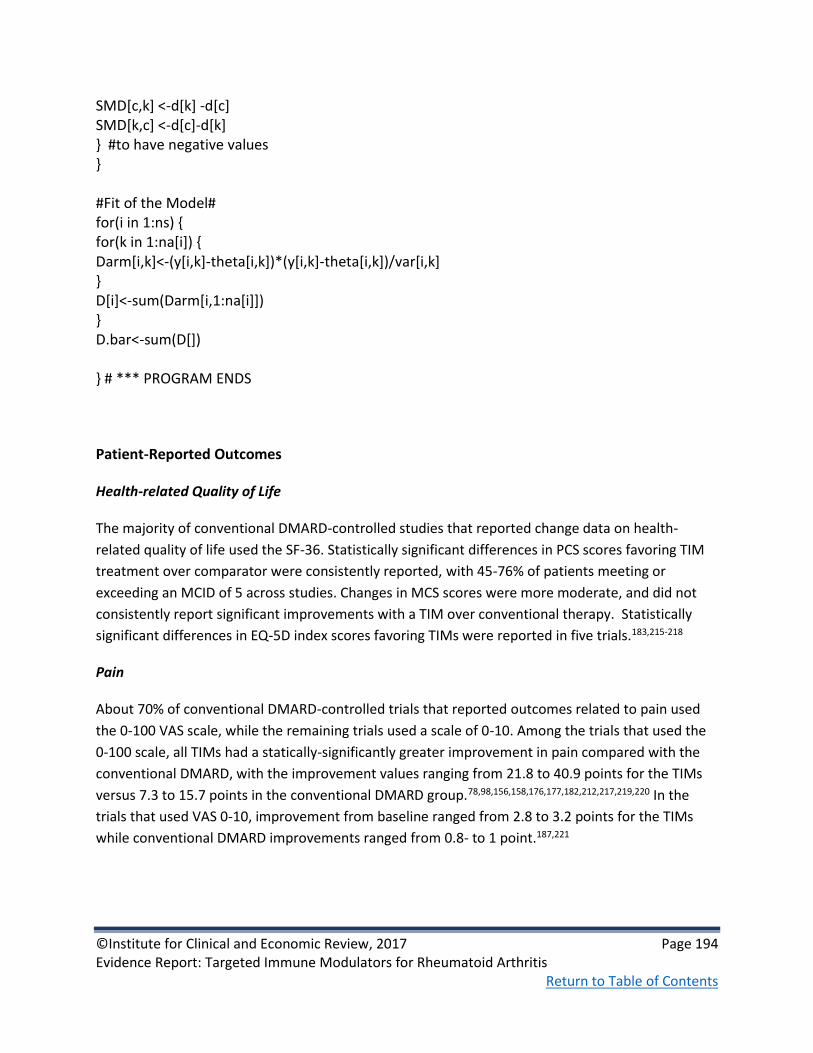
©Institute for Clinical and Economic Review, 2017 Page 194 Evidence Report: Targeted Immune Modulators for Rheumatoid Arthritis Return to Table of Contents
SMD[c,k] <-d[k] -d[c] SMD[k,c] <-d[c]-d[k] #to have negative values #Fit of the Model# for(i in 1:ns) for(k in 1:na[i]) Darm[i,k]<-(y[i,k]-theta[i,k])*(y[i,k]-theta[i,k])/var[i,k] D[i]<-sum(Darm[i,1:na[i]]) D.bar<-sum(D[]) # *** PROGRAM ENDS
Patient-Reported Outcomes
Health-related Quality of Life
The majority of conventional DMARD-controlled studies that reported change data on health-
related quality of life used the SF-36. Statistically significant differences in PCS scores favoring TIM
treatment over comparator were consistently reported, with 45-76% of patients meeting or
exceeding an MCID of 5 across studies. Changes in MCS scores were more moderate, and did not
consistently report significant improvements with a TIM over conventional therapy. Statistically
significant differences in EQ-5D index scores favoring TIMs were reported in five trials.183,215-218
Pain
About 70% of conventional DMARD-controlled trials that reported outcomes related to pain used
the 0-100 VAS scale, while the remaining trials used a scale of 0-10. Among the trials that used the
0-100 scale, all TIMs had a statically-significantly greater improvement in pain compared with the
conventional DMARD, with the improvement values ranging from 21.8 to 40.9 points for the TIMs
versus 7.3 to 15.7 points in the conventional DMARD group.78,98,156,158,176,177,182,212,217,219,220 In the
trials that used VAS 0-10, improvement from baseline ranged from 2.8 to 3.2 points for the TIMs
while conventional DMARD improvements ranged from 0.8- to 1 point.187,221

©Institute for Clinical and Economic Review, 2017 Page 195 Evidence Report: Targeted Immune Modulators for Rheumatoid Arthritis Return to Table of Contents
Fatigue
Statistically significant differences favoring treatment with a TIM over conventional DMARD were
observed in all trials that reported on the FACIT-F. Across studies, scores improved 6.5-10.1 points
with a TIM, while conventional DMARD-treated patients showed much more variation: scores
ranged from a 2.2-point worsening to a 7.9-point improvement. In addition, the majority of trials
that reported on clinically-important differences in the FACIT-F showed a significantly greater
proportion of patients who met or exceeded the MCID with a TIM versus conventional
DMARD.92,208,215-218,222 When evaluated with a VAS, fatigue scores declined from baseline (indicating
improvement) significantly more with a TIM than with conventional DMARD therapy.105,223,224
Figure C27. Improvement in FACIT-F between baseline and Month 6 in head-to-head trials
Work Productivity
Few studies reported on work productivity. In one head-to-head trial of subcutaneous abatacept
plus methotrexate versus adalimumab plus methotrexate, both treatment arms experienced
similar improvements in absenteeism, reduced on-the-job effectiveness, work productivity loss,
and activity impairment over two years of follow-up. Evidence from trials that compared TIMs to
conventional DMARDs was inconsistent.
0
2
4
6
8
10
12
SAR ADA TCZ ADA ADA+MTX TOF+MTX BAR+MTX ADA+MTX
MONARCH ADACTA ORAL Standard RA-BEAM

©Institute for Clinical and Economic Review, 2017 Page 196 Evidence Report: Targeted Immune Modulators for Rheumatoid Arthritis Return to Table of Contents
Several available studies used the Work Productivity and Activity Impairment Questionnaire-
Rheumatoid Arthritis (WPAI-RA) scale to measure overall work productivity and impairment of
regular activities on a weekly basis. WPAI-RA scores are calculated as impairment percentages, with
higher percentages indicating greater impairment and less productivity.225 An MCID for WPAI-RA
has been defined as a 7% absolute change score, although the proportion meeting or exceeding the
MCID was only reported in one of our included studies.226 In the head-to-head AMPLE trial of
subcutaneous abatacept plus MTX versus adalimumab plus MTX, both treatment arms experienced
similar improvements in absenteeism, reduced on-the-job effectiveness, work productivity loss, and
activity impairment over two years of follow-up; improvements in on-the-job effectiveness, work
productivity loss, activity gained, and ability to perform daily activities reached an MCID at all
assessment timepoints (month 6, year 1, and year 2).226 Similarly, in the RA-BEAM trial of
adalimumab and baricitinib combination therapy, 52-week improvements in daily activity and work
productivity were similar for both regimens.227
Conventional DMARD-controlled trials showed overall improvement in productivity and ability to
perform daily activities, although TIMs were not consistently superior to conventional DMARDs. In
the RA-BEACON and RA-BUILD trials of baricitinib versus placebo (with or without concomitant
therapy with conventional DMARDs), for example, patients treated with baricitinib reported a
significant reduction in daily activity impairment compared with the placebo arm (RA-BEACON:
adjusted mean change -26.3 vs. -15.2; p≤0.001), but differences in other elements of the WPAI were
not consistently maintained.218,227 Similarly, Machado and colleagues report that patients treated
with etanercept plus methotrexate experienced a greater improvement in the percentage of overall
impairment caused by RA in the past seven days relative to conventional DMARD therapy (adjusted
mean change -33.4 vs. -21.5; p=0.0188); however, the proportion of patients who experienced
overall work impairment was comparable between groups after 128 weeks of follow-up.105,158
Analyses from the Swefot trial of triple therapy with conventional DMARDs versus infliximab plus
methotrexate did not demonstrate greater improvement in work loss outcomes with TIM therapy:
patients in both groups experienced similar reductions in the number of days per month on sick
leave and disability pension at 12 months and at 7 years.228,229
Activity participation was also evaluated in two conventional DMARD-controlled studies that used
the Activity Participation Questionnaire (APaQ). The APaQ measures the degree to which patients
are limited in participating in self-defined daily activities, such as employment, household chores,
and child rearing over the past 30 days.230 In both the AIM (abatacept versus methotrexate in TIM
naïve patients) and ATTAIN (abatacept versus conventional DMARD in TIM-experienced patients)
trials of combination therapy, activity completion scores showed significantly greater improvements
with abatacept relative to methotrexate or conventional DMARDs during months 3 through 12 of
follow-up. Abatacept-treated patients gained 8.4 and 7.3 days in activity participation, in the AIM

©Institute for Clinical and Economic Review, 2017 Page 197 Evidence Report: Targeted Immune Modulators for Rheumatoid Arthritis Return to Table of Contents
and ATTAIN trials, respectively, compared with 4.5 and 1.4 days in the conventional DMARD groups
(p<0.005 in both trials).231
Use of Healthcare Resources
Healthcare resource use was not commonly reported in clinical trials. One study of etanercept
plus MTX versus conventional DMARD therapy showed comparable proportions of patients
visiting the emergency department or a rheumatologist over 128 weeks of follow-up;
requirements for caregiver assistance declined more with etanercept combination therapy.
Healthcare resource use was measured in only a single RCT that met our inclusion criteria. In this
RCT, patients treated with etanercept plus methotrexate reported a statistically greater but small
reduction in the mean number of emergency department visits over six months than with
conventional DMARD therapy (-0.5 vs. -0.4; p=0.0039); however, after 128 weeks of follow-up, a
similar percentage of patients in both treatment arms reported visiting the emergency department
(0.9% vs. 0.9%).105,158 The percentage of patients who had visited a rheumatologist in the past six
months fluctuated over the course of the study, falling from 11.5% at baseline to 7.7% at week 24 in
the etanercept group and from 13.5% to 9.5% in the conventional DMARD group; by week 128, the
proportion of patients who reported visiting a rheumatologist increased again in both groups and
approached baseline levels.
The same study was the only trial in our set that reported on caregiver burden. Meaningful
reductions in the proportion of patients requiring caregiver assistance in the past month were
observed in both groups between baseline and week 128, although the reduction was slightly
greater among etanercept-treated patients (from 58% to 11.9% with etanercept and 55.6% to
18.2% with conventional DMARDs); statistical significance was not reported.105
We did not identify any RCTs or observational studies that met our inclusion criteria and reported
on requirements for joint replacement or other major surgery. Although it did not meet our
inclusion criteria, a multicenter retrospective cohort study (n=803; median age 59; 83% female;
median DAS28-ESR 5.3; 22% biologic experienced) from Asai and colleagues used propensity score
matching to evaluate the incidence of large joint replacement in RA patients treated with either
adalimumab or etanercept.232 The overall cumulative incidence of large joint replacement was
approximately 10% five years after initiation of treatment, with a lower incidence in patients who
received concomitant MTX (p=0.032). Treatment with adalimumab versus etanercept was not a
significant predictor of joint replacement (HR 0.90; 95% CI 0.46 to 1.72).232

©Institute for Clinical and Economic Review, 2017 Page 198 Evidence Report: Targeted Immune Modulators for Rheumatoid Arthritis Return to Table of Contents
Dose Escalation
Among FDA-approved products in our scope, increases in dose during the maintenance phase of
TIM therapy have been most frequently studied among the TNF-α inhibitors, in a variety of
observational settings (e.g., health care claims data, registries, medical record review). A recent
systematic review of observational data on the five TNF-α inhibitors of interest for this review
comprised information on over 50,000 patients from 34 studies worldwide. 233 The pooled mean
percentages of patients experiencing at least one dose escalation were 4.5% for etanercept, 10.5%
for adalimumab, and 46.3% for infliximab (p=.01 for adalimumab and infliximab vs. etanercept).
Note that adalimumab and infliximab allow for dose escalation via reductions in dosing intervals
and/or increase in amount of drug administered as part of their product labels. No observational
evidence was obtained for certolizumab pegol and golimumab, but we note that labeled total
dosing is fixed for these products.
The IL-6 inhibitor tocilizumab also has a flexible dosing schedule in its label; patients initiating on
the 4 mg/kg dose can escalate to 8 mg/kg if response is inadequate. A recent report of data from
the CORRONA registry indicates that such increases are relatively frequent, as 52% of patients were
found to have escalated their dose within three months of treatment initiation. 234
Observational data on rituximab dosing is limited; information available indicates that, rather than
increases in dose from the labeled two 1,000 mg infusions every six months, a lower-dose regimen
of two 500 mg infusions every six months has been studied. We found no published studies of dose
escalation with abatacept; however, data from conference proceedings suggests that this is a
relatively infrequent event.235,236 Finally, we found no published or presented observational
evidence of dose escalation with tofacitinib.
While observational studies have focused attention primarily on the frequency of dose escalation as
an event, clinical interest lies in whether dose escalation provides a benefit in patients without a
response to standard dosing. A recent review conducted by the Canadian Agency for Drugs and
Technologies in Health (CADTH) identified four such studies, one RCT and three observational
studies.237 The RCT compared rituximab treatment strategies involving a lower dose, the standard
labeled dose, and escalation from lower to higher dose in 314 patients who had inadequate
response to methotrexate and were followed for 48 weeks; no statistical differences were observed
between arms in disease activity, remission, or ACR20/EULAR response. Two additional prospective
cohort studies, one an open label extension of certolizumab in 508 patients that evaluated
escalation from 200 mg every other week to 400 mg every other week, and the other of infliximab
in 198 patients receiving initial dosing of 3 mg/kg or escalated doses of 5 or 7 mg/kg, showed no
effect of dose escalation on measures of disease activity or treatment response. The final study
was a retrospective assessment of dose-escalation strategies for golimumab in 74 patients;

©Institute for Clinical and Economic Review, 2017 Page 199 Evidence Report: Targeted Immune Modulators for Rheumatoid Arthritis Return to Table of Contents
treatment groups were unbalanced and statistical significance of group differences was not
reported. In addition, no discernible pattern between dose escalation and treatment benefit was
observed.
Dose Tapering Strategies
Evidence is beginning to emerge on the clinical effects of reducing the dose or withdrawing
treatment in RA patients with a stable remission. Early findings appear to support dose reductions
over complete cessation of TIM therapy, although results vary; this is at least in part a reflection on
the heterogeneity of disease course following remission.
The PRIZE study was an RCT of 306 patients who received one year of treatment with etanercept
and methotrexate at standard dosing; 193 of these met criteria for remission at that time and were
randomized to reduced-dose etanercept with methotrexate, methotrexate alone, or placebo. 238 At
the end of a 39-week double blind phase, patients in the combination therapy group were
statistically-significantly more likely to achieve remission (63% vs. 40% for MTX alone and 23% for
placebo, p≤.009). All treatment was withdrawn for another 26 weeks. Rates of remission dropped
in all groups; remission levels remained numerically higher for combination therapy (44% vs. 29%
for MTX alone and 23% for placebo), but statistically significant only in the placebo comparison.
In addition, the PRESERVE study of standard-dose (50 mg weekly) or reduced-dose (25 mg weekly)
etanercept as well as placebo in combination with methotrexate assessed the effectiveness of both
dose reduction and drug cessation strategies in 604 patients over one year of follow-up after a 9-
month induction period of standard-dose etanercept-methotrexate treatment.239 Similar
percentages of patients in the standard- and reduced-dose groups (83% and 79% respectively)
achieved low disease activity or remission during follow-up, both of which were statistically-
significantly higher than placebo patients discontinuing etanercept (43%, p=.0001 for both
comparisons).
In contrast, discontinuation of tocilizumab in 556 patients initially randomized to combination
therapy with methotrexate or monotherapy was assessed over three years of follow-up in the ACT-
RAY trial.240 Approximately 50% of patients discontinued tocilizumab after 12 weeks of sustained
remission, although only 6% were able to discontinue all RA drug therapy. Over the next year of
follow-up, the majority of patients (84%) experienced a flare in symptoms after a median of 113
tocilizumab-free days and required reintroduction of therapy, although improvement in disease
activity measures was rapid following reintroduction.
These findings are supported by a 2014 Cochrane review of dose-tapering strategies involving
etanercept or adalimumab.55 A total of seven clinical trials were summarized (N=1,428). Dose
reductions (etanercept only) resulted in clinical outcomes that were similar to those for dose-

©Institute for Clinical and Economic Review, 2017 Page 200 Evidence Report: Targeted Immune Modulators for Rheumatoid Arthritis Return to Table of Contents
continuation strategies, while drug discontinuation during remission was associated with higher
levels of disease activity, a reduced likelihood of maintaining low disease activity or remission, and
worsening of radiographic and functional outcomes.

©Institute for Clinical and Economic Review, 2017 Page 201 Evidence Report: Targeted Immune Modulators for Rheumatoid Arthritis Return to Table of Contents
Adverse events
Table C17: Adverse events in comparative trials * Data presented are percentages of patients with each event
Trial Intervention
Follow up
(weeks)
Any
AE
Serious
AEs
D/C
due to
AEs
Any
infection
Serious
infection TB Malignancy Death
MONARCH18 ADA 24 63.6 6.5 7.1 27.7 1.1 NR 3.3 0
SAR 24 64.1 4.9 6 28.8 1.1 NR 7.6 0.5
ADACTA19 ADA 24 83 10 NR 42 3 NR 1 0
TCZ 24 82 12 NR 48 3 NR 1 2
RED SEA20 ADA 52 NR 10 NR NR NR NR 1.7 2.2
ETN 52 NR 11.6 NR NR NR NR 1.7 0
AMPLE94 ADA 104 91.5 16.5 9.5 61.3 2.7 NR 2.1 0
ABT 104 92.8 13.8 3.8 63.2 2.2 NR 2.2 0.3
ATTEST23 IFX 52 93.3 18.2 7.3 NR 8.5 NR 1.2 NR
ABT 52 89.1 9.6 3.2 NR 1.9 NR 0.6 NR
RA-BEAM21 ADA 24 67 1.8 NR 33.3 0.6 0.3 0 0
BAR 24 70.8 4.5 NR 35.7 1 0 0.4 0.4
ORAL Standard95 ADA 12 51.5 2.5 4.9 NR 0 NR NR NR
TOF 12 52 5.9 6.9 NR 1.5 NR NR NR
BIOSIMILAR trials
Yoo 2015164
RTX-bio 24 71.6 13.7 5.9 38.2 NR NR 0 NR
RTX-ref 24 84.3 13.7 7.8 41.2 NR NR 2 NR
HERA 167 ETN-bio 48 NR 12.9 6.8 37.4 NR NR NR 0
ETN-ref 48 NR 12.3 7.5 41.1 NR NR NR 1.4
Choe 2017205 IFX-bio 30 57.6 9 7.2 29.3 3.1 0.3 0.7 0
IFX-ref 30 58 8.9 3.4 37.5 2 0.3 0 0.3
Vencovsky 2015204 ETN-bio 52 NR 6 5 NR 0.3 0 NR 0.7
ETN-ref 52 NR 5.1 6.4 NR 1.7 0 NR 0
Takeuchi 2015169 IFX-bio 54 88.2 15.7 17.6 NR NR NR NR NR
IFX-ref 54 86.8 15.1 11.3 NR NR NR NR NR
PLANETRA241 IFX-bio 54 70.5 13.9 10.9 NR NR 1 NR 0
IFX-ref 54 70.3 10.3 15.7 NR NR 0 NR 1
Cohen 2015193 ADA-bio 26 50 3.8 1.9 NR 0.8 NR NR NR
ADA-ref 26 54.6 5 0.8 NR 1.1 NR NR NR

©Institute for Clinical and Economic Review, 2017 Page 202 Draft Evidence Report: Targeted Immune Modulators for Rheumatoid Arthritis Return to Table of Contents
Appendix D. Comparative Value Supplemental Information
Table D1. Dose, Frequency of Administration, and Annual Monitoring and Administration Utilization
Intervention Route Dose Frequency of
Administration
Annual
Monitoring
Utilization
Administration
Utilization
rituximab iv Two 1000mg
bags
Every 24 weeks 4 Blood labs 2.5-hour infusion
per
administration
abatacept iv 750mg (for
weight between
60-100kg)
Weeks: 0, 2, then
every 4 weeks
1 office visit
1 TB test
4 Liver labs
4 Blood labs
30-minute
infusion per
administration
abatacept sc 125mg Weekly 1 office visit
1 TB test
4 Liver labs
4 Blood labs
1 annual office
visit, 1
subcutaneous
injection
tocilizumab* iv 25% received 4
mg/kg; 75%
received 8
mg/kg
Every 4 weeks 1 office visit
1 TB test
4 Liver labs
4 Blood labs
1-hour infusion
per
administration
tocilizumab sc 162mg 83% every other
week; 17% every
week
1 office visit
1 TB test
4 Liver labs
4 Blood labs
1 annual office
visit, 1
subcutaneous
injection
sarilumab sc 150-200mg Every 2 weeks 1 office visit
1 TB test
4 Liver labs
4 Blood labs
1 annual office
visit, 1
subcutaneous
injection

©Institute for Clinical and Economic Review, 2017 Page 203 Draft Evidence Report: Targeted Immune Modulators for Rheumatoid Arthritis Return to Table of Contents
Intervention Route Dose Frequency of
Administration
Annual
Monitoring
Utilization
Administration
Utilization
tofacitinib ORAL 5mg 2x per day 4 Liver labs
4 Blood labs
none
baricitinib ORAL 4mg 1x per day 4 Liver labs
4 Blood labs
none
adalimumab sc 40mg Every 2 weeks 1 office visit
1 TB test
4 Liver labs
4 Blood labs
1 annual office
visit, 1
subcutaneous
injection
certolizumab
pegol
sc 200mg (after
first 3
doses=400mg)
Every 2 weeks 1 office visit
1 TB test
4 Liver labs
4 Blood labs
1 annual office
visit, 1
subcutaneous
injection
etanercept sc 50mg weekly 1 office visit
1 TB test
4 Liver labs
4 Blood labs
1 annual office
visit, 1
subcutaneous
injection
golimumab sc 50mg monthly 1 office visit
1 TB test
4 Liver labs
4 Blood labs
1 annual office
visit, 1
subcutaneous
injection
golimumab iv 2mg/kg Weeks: 0, 4,
every 8 weeks
1 office visit
1 TB test
4 Liver labs
4 Blood labs
30-minute
infusion per
administration

©Institute for Clinical and Economic Review, 2017 Page 204 Draft Evidence Report: Targeted Immune Modulators for Rheumatoid Arthritis Return to Table of Contents
Intervention Route Dose Frequency of
Administration
Annual
Monitoring
Utilization
Administration
Utilization
infliximab iv 58% received 3
mg/kg; 42%
received 10
mg/kg
every 7.5 weeks 1 office visit
1 TB test
4 Liver labs
4 Blood labs
2-hour infusion
per
administration
cDMARD ORAL 2.5mg 8 per week (20mg
weekly)
1 office visit
1 TB test
4 Liver labs
4 Blood labs
none
* tocilizumab iv was assumed to 8mg/kg for the monotherapy evaluation.
Table D2. Administration Cost Inputs
Input Value Source
Cost of iv treatment administration
(first hour)
$136.41 Physicians’ Fee and Coding
Guide, 2016242 133
Cost of iv treatment administration
(each additional hour)
$28.64/hour Physicians’ Fee and Coding
Guide, 2016242 133
Cost of subcutaneous treatment
administration
$25.42 Physicians’ Fee and Coding
Guide, 2016242 133
Cost per office visit $73.40 Physicians’ Fee and Coding
Guide, 2016242 133
Table D3. Drug Monitoring Unit Cost Inputs
Input Value Source
Drug monitoring cost: TB Test $84.96 Physician and Other Supplier
Data243 (HCPCS code 86480)
Drug monitoring cost: Liver Test $7.63 Physician and Other Supplier
Data243 (HCPCS code 80076)
Drug monitoring cost: Complete
Blood Count
$10.67 Physician and Other Supplier
Data243 (HCPCS code 85025)

©Institute for Clinical and Economic Review, 2017 Page 205 Draft Evidence Report: Targeted Immune Modulators for Rheumatoid Arthritis Return to Table of Contents
Table D4. Adverse Event Cost and Utility Inputs
Input Value Source
Cost of Serious Infection
$13,747 Medicare Provider
Utilization and Payment
Data134
Weighted by 2/3rd for
pneumonia and 1/3rd
by cellulitis
Cost of Tuberculosis Infection $12,220 Medicare Provider
Utilization and Payment
Data134
Serious Infection Disutility -0.156 National Institute for
Health and Care
Excellence139
Disutility applied for
one-month139
Tuberculosis Infection
Disutility
-0.156 National Institute for
Health and Care
Excellence139
Disutility applied for
two-months140
Table D5. Discontinuation due to Adverse Events Inputs
TIM Risk ratio
95% CI
LL UL
Etanercept 0.85 0.57 1.31
Adalimumab 1.43 0.91 2.22
Infliximab 1.80 1.13 2.78
Abatacept (IV) 0.97 0.53 1.59
Rituximab 1.32 0.52 3.70
Certolizumab Pegol 1.36 0.76 2.34
Golimumab (SC) 1.21 0.48 3.11
Tofacitinib 1.81 1.02 2.90
Abatacept (SC) 0.54 0.27 1.05
Tocilizumab 1.04 0.37 2.77
Baricitinib 1.01 0.98 1.05
Sarilumab 1.11 1.06 1.16
Reference: Methotrexate 4.11% All regimens are in combination with methotrexate; all agents except baricitinib and sarilumab were taken from Singh JA, Christensen R, Wells GA, et al. Biologics for rheumatoid arthritis: an overview of Cochrane reviews (Review). Cochrane Database Syst Rev. 2009(issue 4). Pooled trial data were used for baricitinib and sarilumab

©Institute for Clinical and Economic Review, 2017 Page 206 Draft Evidence Report: Targeted Immune Modulators for Rheumatoid Arthritis Return to Table of Contents
Table D6. Model-Wide Clinical Inputs and Functions
Input Value Source
HAQ Score relationship
with ACR score/categories
ACR70HAQ score drop of 1.07
ACR50HAQ score drop of 0.76
ACR20HAQ score drop of 0.44
Sub-ACR20HAQ score drop of 0.11
Carlson et al., 2015110
Gabay et al., 2013111
HAQ Score relationship
with Total Sharp Score
E(HAQ) on treatment=
exp(-1.73+0.0081*(baseline TSS+TSS mean difference(T))) /
1 + exp(-1.73+0.0081*(baseline TSS+TSS mean
difference(T)))*3
E(HAQ) at baseline=
exp(-1.73+0.0081*baseline TSS) / 1+exp(-
1.73+0.0081*baseline TSS)*3
Change in HAQ=E(HAQ) on treatment – E(HAQ) at baseline
The TSS mean difference is assumed to be a function of
time on TIM where TSS mean difference at T = TSS mean
difference * T, where T = time in years on TIM
Stephens et al.,
2015109
Breedveld et al.,
2006113
Note: the 0.0081
coefficient is a
weighted average
assumed to be 29.6%
in remission
(coefficient=0.02) and
the remaining with
coefficient = 0.0031.
The average TIM had
29.6% achieve ACR70
for those ACR20 or
greater.
Mortality rate relationship
with HAQ score
US RA-severity specific mortality rate = Mortality from life
table*1.33HAQ
Carlson et al., 2015110
Wolfe et al., 2003136
Utility score relationship
with HAQ score
EQ-5D score = 1 – 1/( 1+ exp(2.0734 + 0.0058*age +
0.0023*disease duration – 0.2004*baseline HAQ –
0.2914*male + 0.0249*previous DMARDs – 0.8647*current
HAQ))
Wailoo et al., 2008107
Hospital days relationship
with HAQ score (per model
cycle = 6 months)
Expected value of hospital days =
0.38 days * HAQ
Estimated as linear relationship between HAQ values of 0.6
and 1.6.
Carlson et al. 2015110
Symmons et al.
2003244
Baseline missed worked
days per month due to RA
4 days Kavanaugh et al.,
2009245
Days missed from work
relationship with HAQ score
ACR Responders: 1.93 fewer missed work days per month
ACR non-responders: 0.71 more missed work days per
month
Osterhaus et al.,
2009246
Unemployment
relationship with HAQ score
A 0.25 increase in HAQ is associated with a 30% increased
likelihood for unemployed status (OR=1.30, 95% CI=1.22,
1.39).
Baseline unemployment = 3.8% for all ages ≥ 55 years old.
Han et al., 2015247
US Bureau of Labor
and Statistics135

©Institute for Clinical and Economic Review, 2017 Page 207 Draft Evidence Report: Targeted Immune Modulators for Rheumatoid Arthritis Return to Table of Contents
Input Value Source
Efficacy of non-primary
TIMs and cDMARD after
insufficient response to
previous treatment
HR: 0.84 (applied to HAQ decrements estimated from ACR
and from mTSS).
Carlson et al., 2015110
Karlsson et al., 2008129
HAQ degradation for time
on cDMARD
For each year on cDMARD, we applied an increase in HAQ
of 0.0269 up to 15 years. After 15 years on cDMARD, the
HAQ increase was fixed at the 15 year value of 15*0.0269 =
0.4035.
National Institute for
Health and Care
Excellence Decision
Support Unit112

©Institute for Clinical and Economic Review, 2017 Page 208 Draft Evidence Report: Targeted Immune Modulators for Rheumatoid Arthritis Return to Table of Contents
Table D7. Contributions of ACR and mTSS to HAQ, for TIMs Added on to cDMARD
Treatment 1 Average Proportion of HAQ
Contribution from ACR
Average Proportion of HAQ
Contribution from mTSS
rituximab 92.1% 7.9%
abatacept (iv) 94.5% 5.5%
abatacept (sc) 92.4% 7.6%
tocilizumab (iv) 91.1% 8.9%
tocilizumab (sc) 91.4% 8.6%
sarilumab 92.1% 7.9%
tofacitinib 95.7% 4.3%
baricitinib 93.4% 6.6%
adalimumab 93.4% 6.6%
certolizumab pegol 94.6% 5.4%
etanercept 88.9% 11.1%
golimumab (sc) 96.7% 3.3%
golimumab (iv) 93.2% 6.8%
infliximab 89.8% 10.2%
Table D8. Model Cohort Characteristics for TIM Experienced Population
Value Primary Source
Mean age 57 years Pappas et al, 2014
Female 79.90% Pappas et al, 2014
Caucasian 83.90% Pappas et al, 2014
Mean weight 170 lbs National Health and Nutrition
Examination Survey
Baseline HAQ
prior to cDMARD
treatment
benefit
1.79 Calculation (weighted average
from biologic-experienced trials)
Baseline TSS 93 Barnabe et al, 2012248
HAQ=Health Assessment Questionnaire for Rheumatoid Arthritis Disability Index; TSS=Total Sharp Score

©Institute for Clinical and Economic Review, 2017 Page 209 Draft Evidence Report: Targeted Immune Modulators for Rheumatoid Arthritis Return to Table of Contents
Figure D1. Cost-Effectiveness Frontier for TIMs Added on to cDMARD
Drugs that are farther to the right provide the greatest clinical benefit and drugs higher on the y-
axis are more expensive. Etanercept as the initial treatment is the most expensive therapy, but is
also associated with the highest QALY gains. Conversely, cDMARD therapy is the least expensive
therapy, but is associated with the lowest QALY gains. The line on the graph depicts the cost-
effectiveness efficiency frontier. Those therapies that lie to the left of the frontier are dominated by
therapies that lie on the frontier. Thus, therapies to the left of the frontier, using only the
deterministic findings, are considered to not be as cost-effective as those therapies on the frontier.
The line starts (left to right) from cDMARD therapy to tocilizumab sc because tocilizumab sc has the
smallest ICER. The frontier then extends to etanercept because etanercept is the only therapy that
produces more QALYs gained, but also at a higher cost. It is important to note that all TIMs look
relatively tightly clustered in Figure D1, as well as that this figure does not include estimates of
uncertainty.
$-
$100,000
$200,000
$300,000
$400,000
$500,000
$600,000
$700,000
10.00 10.50 11.00 11.50 12.00 12.50 13.00 13.50 14.00
QALYs
adalimumab
certolizumab pegol
etanercept
golimumab (sc)
golimumab (iv)
infliximab
rituximab
abatacept (sc)
tocilizumab (iv)
tocilizumab (sc)
abatacept (iv)
tofacitinib
cDMARD

©Institute for Clinical and Economic Review, 2017 Page 210 Draft Evidence Report: Targeted Immune Modulators for Rheumatoid Arthritis Return to Table of Contents
Figure D2. Comparisons to the TIM Market Leader; all TIMs added on to cDMARD
Figure D2 graphs the TIM market leader, adalimumab, as the reference case and plots all other TIMs
on the cost-effectiveness plane relative to adalimumab’s estimated cost and QALYs gained.
Therapies in the upper right quadrant are more costly, but also more effective. Therapies in the
upper left quadrant are more costly and less effective (and therefore dominated). Therapies in the
lower left quadrant are less costly, but also less effective. Finally, therapies in the lower right
quadrant are considered dominant, meaning they are less costly and more effective than
adalimumab.

©Institute for Clinical and Economic Review, 2017 Page 211 Draft Evidence Report: Targeted Immune Modulators for Rheumatoid Arthritis Return to Table of Contents
Figure D3. Tornado Diagrams (TIM+cDMARD vs. cDMARD)
Rituximab vs. cDMARD
Abatacept (iv) vs. cDMARD
Abatacept (subcutaneous) vs. cDMARD

©Institute for Clinical and Economic Review, 2017 Page 212 Draft Evidence Report: Targeted Immune Modulators for Rheumatoid Arthritis Return to Table of Contents
Tocilizumab (iv) vs. cDMARD
Tocilizumab (subcutaneous) vs. cDMARD
Tofacitinib vs. cDMARD

©Institute for Clinical and Economic Review, 2017 Page 213 Draft Evidence Report: Targeted Immune Modulators for Rheumatoid Arthritis Return to Table of Contents
Adalimumab vs. cDMARD
Certolizumab pegol vs. cDMARD
Etanercept vs. cDMARD

©Institute for Clinical and Economic Review, 2017 Page 214 Draft Evidence Report: Targeted Immune Modulators for Rheumatoid Arthritis Return to Table of Contents
Golimumab (subcutaneous) vs. cDMARD
Golimumab (iv) vs. cDMARD
Infliximab vs. cDMARD

©Institute for Clinical and Economic Review, 2017 Page 215 Draft Evidence Report: Targeted Immune Modulators for Rheumatoid Arthritis Return to Table of Contents

©Institute for Clinical and Economic Review, 2017 Page 216 Draft Evidence Report: Targeted Immune Modulators for Rheumatoid Arthritis Return to Table of Contents
Table D9. Probabilistic Sensitivity Analysis Results: TIMs vs. conventional DMARD therapy
Cost-Effective
at $50,000 per
QALY
Cost-Effective
at $100,000 per
QALY
Cost-Effective
at $150,000 per
QALY
Cost-Effective
at $200,000 per
QALY
Cost-Effective
at $250,000 per
QALY
rituximab 0% 0% 4% 53% 90%
abatacept (iv) 0% 0% 4% 58% 93%
abatacept (sc) 0% 0% 0% 21% 71%
tocilizumab (iv) 0% 0% 10% 69% 96%
tocilizumab (sc) 0% 0% 27% 83% 98%
tofacitinib 0% 0% 0% 1% 30%
adalimumab 0% 0% 0% 17% 64%
certolizumab pegol 0% 0% 1% 37% 84%
etanercept 0% 0% 1% 34% 84%
golimumab (sc) 0% 0% 0% 25% 73%
golimumab (iv) 0% 0% 1% 46% 88%
infliximab 0% 0% 2% 46% 87%
Table D10. Probabilistic Sensitivity Analysis Results: TIMs vs. adalimumab
Cost-Effective
at $50,000 per
QALY
Cost-Effective
at $100,000 per
QALY
Cost-Effective
at $150,000 per
QALY
Cost-Effective
at $200,000 per
QALY
Cost-Effective
at $250,000 per
QALY
rituximab 100% 100% 100% 100% 100%
abatacept (iv) 100% 100% 100% 100% 100%
abatacept (sc) 2% 6% 34% 75% 91%
tocilizumab (iv) 100% 100% 100% 100% 100%
tocilizumab (sc) 100% 100% 100% 100% 100%
tofacitinib 0% 0% 0% 0% 0%
certolizumab pegol 98% 100% 100% 100% 100%
etanercept 0% 20% 86% 99% 100%
golimumab (sc) 94% 98% 96% 94% 88%
golimumab (iv) 100% 100% 100% 100% 100%
infliximab 100% 100% 100% 100% 100%

©Institute for Clinical and Economic Review, 2017 Page 217 Draft Evidence Report: Targeted Immune Modulators for Rheumatoid Arthritis Return to Table of Contents
Figure D4. Probabilistic Sensitivity Analysis Results: Cost-Effectiveness Clouds

©Institute for Clinical and Economic Review, 2017 Page 218 Draft Evidence Report: Targeted Immune Modulators for Rheumatoid Arthritis Return to Table of Contents
This panel presents three cost-effectiveness clouds from the probabilistic sensitivity analysis. Panel
A plots the cost-effectiveness clouds for the TIM with the smallest ICER (tocilizumab sc) and the TIM
market leader, adalimumab. There is very little overlap between the two clouds. Panel B presents
the cost-effectiveness clouds for the TIM with the highest ICER (tofacitinib) and the TIM market
leader, adalimumab. There is more overlap between the two clouds as compared to Panel A. Panel
C plots the TIM with the smallest ICER (tocilizumab sc) and the TIM with the highest ICER
(tofacitinib). There is clear separation in the cost domain between these two TIMs that had the
highest and lowest ICER when accounting for uncertainty. There remains sufficient overlap in
lifetime discounted QALYs.
Table D11. Scenario Analysis Results: Treatment 4 as a Market Basket of all TIMs
Treatment 1 ICER (cost per QALY gained)
Comparator: cDMARD
ICER (cost per QALY gained)
Comparator: adalimumab
rituximab $209,345 Less costly, More effective
abatacept (iv) $202,701 Less costly, More effective
abatacept (sc) $230,026 Less costly, More effective
tocilizumab (iv) $196,568 Less costly, More effective
tocilizumab (sc) $185,677 Less costly, More effective
tofacitinib $264,109 More costly, Less effective
adalimumab $234,764 Reference
certolizumab pegol $216,163 Less costly, More effective
etanercept $217,940 $74,709
golimumab (sc) $226,611 Less costly, Less effective
golimumab (iv) $213,272 Less costly, More effective
infliximab $213,782 Less costly, More effective

©Institute for Clinical and Economic Review, 2017 Page 219 Draft Evidence Report: Targeted Immune Modulators for Rheumatoid Arthritis Return to Table of Contents
Table D12. Scenario Analysis Results: Treatment 2 as a Market Basket of all TIMs
Treatment 1 ICER (cost per QALY gained) Comparator: cDMARD
ICER (cost per QALY gained) Comparator: adalimumab
rituximab $231,965 Less costly, More effective
abatacept (iv) $220,523 Less costly, More effective
abatacept (sc) $247,869 $185,946
tocilizumab (iv) $213,221 Less costly, More effective
tocilizumab (sc) $201,552 Less costly, More effective
tofacitinib $262,703 More costly, Less effective
adalimumab $252,082 Reference
certolizumab pegol $228,159 Less costly, More effective
etanercept $227,889 $66,005
golimumab (sc) $240,901 Less costly, More effective
golimumab (iv) $226,136 Less costly, More effective
infliximab $229,134 Less costly, More effective
Table D13. Scenario Analysis Results: Societal Perspective
Treatment 1 ICER (cost per QALY gained)
Comparator: cDMARD
ICER (cost per QALY gained)
Comparator: adalimumab
rituximab $159,880 Less Costly, More Effective
abatacept (iv) $152,784 Less Costly, More Effective
abatacept (sc) $188,200 $137,017
tocilizumab (iv) $145,555 Less Costly, More Effective
tocilizumab (sc) $130,522 Less Costly, More Effective
tofacitinib $232,738 More Costly, Less Effective
adalimumab $193,763 Reference
certolizumab pegol $169,724 Less Costly, More effective
etanercept $173,345 $81,481
golimumab (sc) $183,025 Less Costly, More Effective
golimumab (iv) $165,380 Less Costly, More Effective
infliximab $164,194 Less Costly, More Effective
Table D14. Scenario Analysis Results: TIM Experienced Population versus Mixed Population*
ICER (biologic
experienced population)
ICER (mixed
population)
rituximab $196,634 $231,965
abatacept (iv) $193,664 $220,523
tocilizumab (iv) $189,370 $213,221
*Mixed population assumed to be the same as the “Treatment 2 as a Market Basket of all TIMs” scenario since in
the TIM Experienced scenario, we assumed that the second treatment was a market basket of all remaining TIMs.

©Institute for Clinical and Economic Review, 2017 Page 220 Draft Evidence Report: Targeted Immune Modulators for Rheumatoid Arthritis Return to Table of Contents
Table D15. Cost per QALY Gained and Cost per Additional Responder for TIM vs. cDMARD, with a
One-Year Time Horizon
Intervention Payer
Cost
Percent on
initial TIM
(responder)
QALYs ICER (cost per
additional QALY)
ICER (cost per additional
responder)
rituximab $33,766 51.18% 0.7348 $570,715 $119,161
abatacept (iv) $32,564 57.74% 0.7413 $487,761 $90,713
abatacept (sc) $42,121 56.45% 0.7403 $660,794 $125,978
tocilizumab (iv) $32,703 61.34% 0.7455 $457,453 $81,857
tocilizumab (sc) $27,323 56.52% 0.7402 $406,376 $77,134
sarilumab - 58.93% 0.7427 - -
tofacitinib $46,793 52.42% 0.7350 $816,193 $162,974
baricitinib - 57.01% 0.7394 - -
adalimumab $42,287 54.07% 0.7385 $684,816 $137,276
certolizumab pegol $38,008 69.91% 0.7560 $463,939 $77,957
etanercept $42,623 70.15% 0.7574 $517,109 $87,996
golimumab (sc) $38,232 58.09% 0.7422 $575,149 $107,415
golimumab (iv) $35,017 57.35% 0.7419 $523,746 $99,674
infliximab $34,684 54.81% 0.7400 $534,962 $107,320
cDMARD $3,813 26.04% 0.6823
Table D16. Cost per QALY Gained and Cost per Additional Responder for TIM vs. cDMARD, with a
Three-Year Time Horizon
Intervention Payer Cost Percent on
initial TIM
(responder)
QALYs ICER (cost per
additional QALY)
ICER (cost per additional
responder)
rituximab $95,461 45.11% 2.1762 $409,189 $390,628
abatacept (iv) $93,061 52.40% 2.1884 $375,268 $283,597
abatacept (sc) $114,914 53.10% 2.1884 $475,424 $350,840
tocilizumab (iv) $93,475 55.35% 2.1982 $360,993 $258,632
tocilizumab (sc) $81,287 51.00% 2.1873 $322,931 $255,210
sarilumab - 52.87% 2.1920 - -
tofacitinib $126,798 44.32% 2.1729 $570,359 $556,102
baricitinib - 51.57% 2.1831 - -
adalimumab $115,074 47.22% 2.1824 $489,537 $438,610

©Institute for Clinical and Economic Review, 2017 Page 221 Draft Evidence Report: Targeted Immune Modulators for Rheumatoid Arthritis Return to Table of Contents
certolizumab pegol $107,040 61.43% 2.2175 $387,627 $252,952
etanercept $118,508 64.33% 2.2250 $421,268 $263,077
golimumab (sc) $106,604 51.67% 2.1885 $437,177 $339,076
golimumab (iv) $99,319 51.02% 2.1896 $401,791 $320,652
infliximab $98,662 46.39% 2.1873 $403,031 $382,674
cDMARD $11,180 23.53% 1.9702

©Institute for Clinical and Economic Review, 2017 Page 222 Draft Evidence Report: Targeted Immune Modulators for Rheumatoid Arthritis Return to Table of Contents
Figure D5. Consequences of treatment throughout model time horizon

©Institute for Clinical and Economic Review, 2017 Page 223 Draft Evidence Report: Targeted Immune Modulators for Rheumatoid Arthritis Return to Table of Contents
Table D17. Rates of Serious Infection
Intervention Events Patient-years follow up Event per 1,000 PY
Rituximab249 17 664 25.6
Abatacept249 19 1422 13.4
Tocilizumab249 83 1468 56.5
Sarilumab162 28 734 38.2
Tofacitinib249 19 2845 6.7
Baricitinib250 16 421 38
TNFα inhibitors249 106 3279 32.3
MTX249 95 6332 15
Table D18. Rates of Tuberculosis Infection
Intervention Events Patient-years follow up Event per 1,000 PY
Rituximab251 2 11962 0.17
Abatacept252 4 4215 0.95
Tocilizumab253 -- 1842 0
Sarilumab162 -- 734 0
Tofacitinib154 2 647 3.09
Baricitinib21,175,190,220 1 884 1.13
TNFα inhibitors254 36 10495 3.43
MTX254 57 241119 0.24

©Institute for Clinical and Economic Review, 2017 Page 224 Draft Evidence Report: Targeted Immune Modulators for Rheumatoid Arthritis Return to Table of Contents
Appendix E. Previous Systematic Reviews and
Technology Assessments
We examined five systematic reviews comparing the effectiveness of targeted immune modulators
in patients 18 years or older with moderately-to-severely active rheumatoid arthritis and
inadequate response to or intolerance of conventional DMARDs.
NICE Technology Assessment Report25
https://www.nice.org.uk/guidance/TA375/chapter/1-Recommendations
https://www.nice.org.uk/guidance/indevelopment/gid-tag438
The National Institute for Health and Care Excellence (NICE) recommends adalimumab, etanercept,
infliximab, certolizumab pegol, golimumab, tocilizumab, and abatacept, all in combination with
methotrexate, for treating rheumatoid arthritis if the disease is severe, has not responded to
intensive therapy with a combination of conventional disease‑modifying antirheumatic drugs
(DMARDs), and the manufacturers provide certolizumab pegol, golimumab, abatacept and
tocilizumab as agreed in their patient access schemes. Adalimumab, etanercept, certolizumab
pegol or tocilizumab can be used as monotherapy for individuals who have contraindications or
intolerance to methotrexate when the criteria above is met. NICE further recommends that patients
continue treatment only if there is a moderate response, measured using European League Against
Rheumatism (EULAR) criteria, six months after starting therapy; if a moderate EULAR response is
not maintained, treatment should be withdrawn. Patients should start treatment with the least
expensive drug, which may necessarily vary by individual due to different modes of administration
and treatment schedules. NICE’s recommendations also apply to biosimilar products of the
technologies that have a marketing authorization allowing the use of the biosimilar for the same
indication.
NICE is currently developing guidance on tofacitinib for the treatment of RA after failure of
conventional DMARDs, with expected publication in January 2018; an appraisal of rituximab was
suspended in 2011 after the manufacturer decided to terminate its license application in this
indication.

©Institute for Clinical and Economic Review, 2017 Page 225 Draft Evidence Report: Targeted Immune Modulators for Rheumatoid Arthritis Return to Table of Contents
AHRQ comparative effectiveness review69
https://effectivehealthcare.ahrq.gov/ehc/products/203/1044/CER55_DrugTherapiesforRheumatoid
Arthritis_FinalReport_20120618.pdf
In this systematic review and network meta-analysis, benefits and harms of biologic DMARDs and
oral (conventional) DMARDS in adults with rheumatoid arthritis were evaluated. Findings from the
network meta-analysis using Bayesian methods for ACR suggested a higher odd of reaching ACR 50
response for etanercept compared with abatacept, adalimumab, anakinra, infliximab, rituximab,
and tocilizumab (ACR 50 OR range for etanercept 2.39-5.20). The differences showed statistically
significant improvements in disease activity with etanercept than with abatacept, adalimumab,
anakinra, infliximab, rituximab, or tocilizumab, but no statistically significant differences between
etanercept and golimumab. Similarly, indirect analyses from randomized trials indicate that patients
taking certolizumab or etanercept are less likely to withdraw treatment than patients taking other
biologic DMARDs. The authors concluded that there was limited head-to-head comparative
evidence to support one therapy over another in adults with rheumatoid arthritis, and that the
strength of evidence from the NMA results which suggested some differences was low.
Cochrane review24
This systematic review and meta-analysis examined the use of biologics and conventional DMARDs
(or placebo) in people with RA in whom treatment with conventional DMARDs including
methotrexate had failed. Efficacy outcomes, including ACR, function, remission, radiographic
progression, and safety outcomes were analyzed using standard meta-analysis for calculating direct
estimates and Bayesian mixed treatment comparison for NMA estimates. Findings suggest that the
use of biologics + MTX was associated with a clinically important improvement in function, higher
ACR50 and remission rates, and increased risk of serious adverse events than the comparator (MTX
and other conventional DMARD). On radiographic progression, biologic + MTX was also associated
with significantly less progression versus conventional DMARD, with a mean difference of -2.61
(95% CI -4.08 to -1.14) sharp score units; however, the clinical significance of this result was less
clear since the absolute reduction was small. In addition, results were inconclusive for whether
biologics + MTX are associated with an increased risk of cancer or withdrawals due to adverse
events.
Cochrane255
This systematic review and meta-analysis evaluated the benefits and harms of biologic
monotherapy in people with RA in whom treatment with conventional DMARDs including
methotrexate had failed. Based on direct evidence, the use of biologic monotherapy was
associated with a clinically meaningful and statistically significant improvement in ACR50 and HAQ
scores compared with MTX or other conventional DMARDs with a RR of 1.54 (95% CI, 1.14 to 2.08)

©Institute for Clinical and Economic Review, 2017 Page 226 Draft Evidence Report: Targeted Immune Modulators for Rheumatoid Arthritis Return to Table of Contents
and mean difference in HAQ of -0.27 (95% CI, -0.40 to -0.14), but there was no statistically
significant or clinically meaningful difference for direct estimates of biologic monotherapy versus
conventional DMARDs for clinical remission. NMA findings were consistent with these results
except in the case of clinical remission, where NMA results showed a statistically significant and
clinically meaningful difference versus conventional DMARD for TNF monotherapy (absolute
improvement 7% (95% CI, 2% to 14%)) and non-TNF biologic monotherapy (absolute improvement
19% (95% CrI, 7% to 36%). On radiographic progression, biologic monotherapy was also associated
with significantly less progression versus conventional DMARD, though the clinical significance of
this result was less clear since the absolute reduction was small (-0.97% (95% CI -1.69% to -0.25%).
There were 10 other Cochrane reviews that examined the use of specific targeted immune
modulators in rheumatoid arthritis.256-264
CADTH265
https://www.cadth.ca/drugs-management-rheumatoid-arthritis
https://www.cadth.ca/drugs-management-rheumatoid-arthritis
This review from the Canadian Agency for Drugs and Technologies in Health (CADTH) focused on
assessing the comparative efficacy and harms of biological agents (especially TNF-alpha inhibitors)
in the treatment of adults with rheumatoid arthritis. NMA results showed that there were no
statistically significant differences between adalimumab, etanercept, golimumab, infliximab,
abatacept, anakinra, and rituximab on estimates of ACR50 response. Similar trends were observed
for ACR70, except that the absolute proportion of patients achieving a response was lower for
ACR70 compared with ACR50. The proportion of patients reporting serious adverse events was
similar for all biologic agents based on a meta-analysis of placebo-controlled trials. An economic
evaluation was also conducted to examine the relative cost-effectiveness of biologic agents
(abatacept, adalimumab, etanercept, infliximab, and golimumab) in patients who had failed prior
treatment with conventional DMARDs. Based on the model, the most effective first-line biologic
agent, in terms of time with an ACR50 response, was adalimumab. Abatacept, infliximab, and
golimumab were all less expensive than adalimumab, but they were also less effective.
CADTH is currently updating its 2010 review to include newer agents approved since 2010 (e.g.,
tofacitinib), drugs in development (e.g., baricitinib), and biosimilars. The report will evaluate
conventional DMARDs, biologic DMARDs, and small molecule DMARDs in adults with moderate to
severe RA who have previously been treated; it is scheduled for publication on March 10, 2016.

©Institute for Clinical and Economic Review, 2017 Page 227 Draft Evidence Report: Targeted Immune Modulators for Rheumatoid Arthritis Return to Table of Contents
Appendix F. Evidence Tables
Table F1. Head-to-Head Trials: Study Characteristics
Author & Year of
Publication
(Trial Name)
Quality rating
Study sponsor Study Design and
Duration of Follow-
up
Geographic
location of study
Interventions (n) &
Dosing Schedule
Inclusion and Exclusion
Criteria
Baseline patient Characteristics
Baddley J Annals of the rheumatic diseases 2014266 SABER Fair
FDA, US DHHS and
AHRQ grant
Retrospective
cohort of four large
US data system.
The median (IQR)
follow-up time in
the TNFi and
cDMARD was 170
(299) and 104 (166)
days, respectively
USA 1) TNFi (n=24, 384)
1a) ADA (n=5,888)
1b) ETN (n=10,283)
1c) IFX (n=8,212)
2) cDMARD
(leflunomide,
sulfasalazine or
hydroxychloroquine)
(n=11,828)
Both TNFi and
cDMARD regimens
allowed the
concurrent use
(continuation or
addition) of MTX
≥16 with RA with
availability of a baseline
period of 365 days with
continuous enrollment
in the respective data
system preceding the
first qualifying new drug
prescription fill or
infusion. Patients
initiating TNFi,
leflunomide,
sulfasalazine,
hydroxychloroquine
after MTX failures
Mean age (SD)
1) 57.73 (14.53)
2) 58.47 (14.27)
Female, n (%)
1) 20, 955 (85.9)
2) 10, 205 (86.3)

©Institute for Clinical and Economic Review, 2017 Page 228 Draft Evidence Report: Targeted Immune Modulators for Rheumatoid Arthritis Return to Table of Contents
Author & Year of
Publication
(Trial Name)
Quality rating
Study sponsor Study Design and
Duration of Follow-
up
Geographic
location of study
Interventions (n) &
Dosing Schedule
Inclusion and Exclusion
Criteria
Baseline patient Characteristics
Burmester G Ann
Rheum Dis 201618
MONARCH
Good
Sanofi RCT, active
controlled, double-
blind, double-
dummy, phase III
24 weeks
86 centers in
Europe, Israel,
Russia, South
Africa, South
Korea, and the
USA
1) ADA (n=185)
2) SAR (n=184)
Patients were
randomized to q2w
200mg SAR + PBO or
q2W 40mg ADA +
PBO for sc
administration. After
week 16, dose
escalation to
weekly ADA or
matching PBO in
the SAR group was
permitted for
patients who did not
achieve ≥20%
improvement in TJC
& SJC
≥18 years with active RA
(i.e. ≥6 SJC & ≥8 TJC;
CRP≥8mg/L or
ESR≥28mm/hr; DAS28-
ESR>5.1); RA duration ≥
3month; intolerant or
inadequately responded
to adequate MTX dose
for ≥12 weeks.
Exclusion: Patients with
prior bDMARD were
excluded.
Mean age (SD)
1) 53.6 (11.9)
2) 50.9 (12.6)
Female, n (%)
1) 150 (81.1)
2) 157 (85.3)
Mean duration of RA, yrs (SD)
1) 6.6 (7.8)
2) 8.1 (8.1)
Mean HAQ-DI (SD)
1) 1.6 (0.6)
2) 1.6 (0.6)
Mean DAS28-ESR (SD)
1) 6.8 (0.8)
2) 6.8 (0.8)
Mean DAS28-CRP (SD)
1) 6 (0.9)
2) 6 (0.9)

©Institute for Clinical and Economic Review, 2017 Page 229 Draft Evidence Report: Targeted Immune Modulators for Rheumatoid Arthritis Return to Table of Contents
Author & Year of
Publication
(Trial Name)
Quality rating
Study sponsor Study Design and
Duration of Follow-
up
Geographic
location of study
Interventions (n) &
Dosing Schedule
Inclusion and Exclusion
Criteria
Baseline patient Characteristics
Chen J Arthritis care &
research 2014267
Poor
Supported by an
Australian
National Health
and Medical
Research Council
Enabling Grant
Retrospective
database study
Australia 1) ETN (n=1,243)
2) ADA (n=863)
3) IFX (n=159)
Patients with diagnosed
RA, AS, and PsA in the
Australian
Rheumatology
Association Database
between 2001–2011 and
taking an anti-TNF
Grouped by disease
Mean age (SD)
55.6
Female, n (%)
74
Mean duration of RA, yrs (SD)
14.8
Mean DAS28-CRP (SD)
NR
Mean HAQ-DI (SD)
NR
Mean mTSS [0-448] (SD)
NR

©Institute for Clinical and Economic Review, 2017 Page 230 Draft Evidence Report: Targeted Immune Modulators for Rheumatoid Arthritis Return to Table of Contents
Author & Year of
Publication
(Trial Name)
Quality rating
Study sponsor Study Design and
Duration of Follow-
up
Geographic
location of study
Interventions (n) &
Dosing Schedule
Inclusion and Exclusion
Criteria
Baseline patient Characteristics
Chiu YM International
journal of rheumatic
diseases 2014268
Poor
Pfizer Inc
Retrospective
longitudinal
database study
Participants were
matched using
propensity scoring
Total follow-up
time for ETN
ranged from 3, 028-
3,132 patient years
for ETN and for
ADA ranged from
685-697 patient
years
Taiwan 1) ETN (n=1,492)
2) ADA (n=746)
*cDMARD was not
compared with
individual drug
≥18 years with RA
diagnosis; must have
been prescribed
a cDMARD or bDMARD
at least once during
the study period. [BHNI
treatment provisions
allow a patient to
receive bDMARD
treatment for RA only
after having failed at
least two cDMARDs with
a 6-month interval for
each therapy]
Mean age
1) 56.5
2) 56
Female, n (%)
1) 1, 225 (82.1)
2) 605 (81.1)
Mean duration of RA, yrs
1) 7
2) 6.9

©Institute for Clinical and Economic Review, 2017 Page 231 Draft Evidence Report: Targeted Immune Modulators for Rheumatoid Arthritis Return to Table of Contents
Author & Year of
Publication
(Trial Name)
Quality rating
Study sponsor Study Design and
Duration of Follow-
up
Geographic
location of study
Interventions (n) &
Dosing Schedule
Inclusion and Exclusion
Criteria
Baseline patient Characteristics
Curtis J Annals of the
Rheumatic Diseases
2016269
Fair
Investigator
initiated
Retrospective
cohort
Total follow-up for
ABT, RTX, TNFi,
TOC, and TOF are
8,960, 4,115,
27,122, 4,632, and
982 respectively.
USA 1) ABT (n=12,305)
2) RTX (n=5,078)
3) TNFi (n=42,850)
3a) ADA
3b) CTZ
3c) ETN
3d) GOL
3e) IFX
4) TCZ (n=6,967)
5) TOF (n=2,526)
≥18 years and to have
two or more physician
billing diagnoses
for RA, with at least one
from a rheumatologist.
≥12 months of medical
and pharmacy
coverage prior to follow-
up which began at first
use of TOF or RA
biologics
Mean age (SD)
1) 61.2 (13.4)
2) 61.2 (13)
3) 57.7 (13.5)
4) 60.1 (13.5)
5) 55.4 (11.8)
Female, %
1) 83.2
2) 80.8
3) 79.6
4) 82.2
5) 83.2
Curtis J Arthritis care
& research 2014270
Fair
AHRQ grant Retrospective
cohort of US
veterans
The median
duration of follow-
up time was slightly
more than one year
in all groups.
USA 1) ABT (n=451)
2) RTX (n=596)
3) ADA (n=1,885)
4) ETN (n=844)
5) IFX (n=382)
RA diagnosis ≥2
rheumatologists on
separate days or a single
RA diagnosis plus
pharmacy dispensing
bDMARD or cDMARD.
TNFi exposure was
limited to patients who
had prior exposure to a
different anti-TNF
Mean age (SD)
1) 60.3 (10.6)
2) 60.8 (10.6)
3) 60.1 (10.8)
4) 59.9 (10.7)
5) 57.9 (10.5)
Male, %
1) 83.6
2) 87.6
3) 88
4) 88.5
5) 84.8

©Institute for Clinical and Economic Review, 2017 Page 232 Draft Evidence Report: Targeted Immune Modulators for Rheumatoid Arthritis Return to Table of Contents
Author & Year of
Publication
(Trial Name)
Quality rating
Study sponsor Study Design and
Duration of Follow-
up
Geographic
location of study
Interventions (n) &
Dosing Schedule
Inclusion and Exclusion
Criteria
Baseline patient Characteristics
Curtis J Arthritis
research & therapy
2015271
Fair
NR Retrospective
cohort
Mean follow up:
0.7 years
USA 1) TNFi (n=7,951)
1a) ETN
1b) ADA
1c) IFX
1d) CTZ
1e) GOL
2) TCZ (n=1,528)
3) RTX (n=1,134)
4) ABT (n=2,683)
≥18 years with RA
diagnosis; prescription
or administration of new
bDMARD between Jan 1,
2010 and June 30, 2012;
past discontinuation of a
different biologic.
Mean age (SD)
1) 51.7 (12.5)
2) 53.8 (12)
3) 53.8 (12.1)
4) 53.9 (12.6)
Female, %
1) 81.3
2) 82.9
3) 82.1
4) 83
Mean no of prior bDMARD use
1) 1.4
2) 2.1
3) 1.9
4) 1.6

©Institute for Clinical and Economic Review, 2017 Page 233 Draft Evidence Report: Targeted Immune Modulators for Rheumatoid Arthritis Return to Table of Contents
Author & Year of
Publication
(Trial Name)
Quality rating
Study sponsor Study Design and
Duration of Follow-
up
Geographic
location of study
Interventions (n) &
Dosing Schedule
Inclusion and Exclusion
Criteria
Baseline patient Characteristics
Dartel SAA Annals of
Rheumatic Diseases
2013102
DREAM registry
Fair
Pfizer, Abbott,
Schering-Plough,
Roche, UCB
Pharma, Bristol-
Meyers Squibb
Prospective cohort
observational study
Follow-up time: 5
years
Netherlands 1) ETN (n=959)
2) ADA (n=776)
3) IFX (n=621)
Dutch Rheumatoid
Arthritis Monitoring
(DREAM) registry since
2003 and preceding
biological registry from
Radboud University
Nijmegen Medical
Centre (RUNMC) before
2003 (same inclusion
criteria: diagnosis of RA
per the 1987 ACR
criteria, who have
DAS28 >3.2; prior
treatment with at least 2
DMARDs including MTX,
weekly dose up to 25
mg; no contraindication
for TNF-inhibiting
therapy
Mean age, yrs (SD)
1) 55 (13)
2) 53 (13)
3) 55 (13)
Female, %
1) 66
2) 70
3) 71

©Institute for Clinical and Economic Review, 2017 Page 234 Draft Evidence Report: Targeted Immune Modulators for Rheumatoid Arthritis Return to Table of Contents
Author & Year of
Publication
(Trial Name)
Quality rating
Study sponsor Study Design and
Duration of Follow-
up
Geographic
location of study
Interventions (n) &
Dosing Schedule
Inclusion and Exclusion
Criteria
Baseline patient Characteristics
Flouri I Seminars in
arthritis and
rheumatism 2014101
Good
Hellenic
Rheumatology
Society
Prospective cohort
Median follow up:
2.9 years
Greece 1) IFX (n=560)
2) ADA (n=435)
3) ETN (n=302)
Inclusion:
RA patients with active
disease (i.e. DAS28>5.1
or >3.2 plus 2 of the
following: RF or anti-CCP
positivity; bone erosion
in hand and feet
radiography; HAQ
score>1; large joint
involvement; extra-
articular manifestation);
and have failed DMARD.
No specific exclusion
criteria
Age, median (IQR)
1) 58 (17)
2) 59 (18)
3) 57 (19)
Female, %
1) 74
2) 81
3) 80
Median duration of RA, yrs (IQR)
1) 8.5 (12.7)
2) 7.8 (12.8)
3) 7.4 (10.6)
Median HAQ (0-3) (IQR)
1) 1 (0.9)
2) 1 (0.9)
3) 1 (0.9)
Mean DAS28(0-9.35)
1) 5.4 (1.5)
2) 5.6 (1.6)
3) 5.7 (1.6)

©Institute for Clinical and Economic Review, 2017 Page 235 Draft Evidence Report: Targeted Immune Modulators for Rheumatoid Arthritis Return to Table of Contents
Author & Year of
Publication
(Trial Name)
Quality rating
Study sponsor Study Design and
Duration of Follow-
up
Geographic
location of study
Interventions (n) &
Dosing Schedule
Inclusion and Exclusion
Criteria
Baseline patient Characteristics
Gabay C Lancet 201319
ADACTA
Good
Hoffmann-La
Roche
RCT
double-blind, active
comparator,
parallel-group
phase iv
24 weeks
76 centers in 15
countries in
North and South
America,
Australia, and
Europe
1) ADA (n=163)
2) TCZ (n=162)
All patients were
randomized 1:1 to
8mg/kg iv TCZ every
4 weeks + PBO sc
every 2 weeks or
ADA 40mg sc every 2
weeks + PBO iv every
4 weeks.
≥18 years with RA for >6
months; currently on
MTX or cannot tolerate
MTX. All DMARD are
stopped before start of
study
Exclusion:
Patients previously
treated with biologics
Mean age (SD)
1) 53.3 (12.4)
2) 54.4 (13)
Female, n (%)
1) 133 (82)
2) 129 (79)
Mean duration of RA, yrs (SD)
1) 6.3 (6.9)
2) 7.3 (8.1)
Mean DAS (SD)
1) 6.8 (0.9)
2) 6.7 (0.9)
Mean HAQ score (SD)
1) 1.7 (0.6)
2) 1.6 (0.6)
Galloway J Annals of
the rheumatic
diseases 2011272
Fair
Investigator
initiated
Prospective
observational study
3 years
UK 1) cDMARD (n=3,673)
2) ETN (n=3,475)
3) IFX (n=3,475)
4) ADA (n=4,267)
RA patients using TNFi
and a comparison cohort
of patients with active
RA receiving cDMARD
and are biologically
naïve.
Mean age (SD)
1) 60 (12)
2) 56 (12)
3) 56 (12)
4) 57 (12)

©Institute for Clinical and Economic Review, 2017 Page 236 Draft Evidence Report: Targeted Immune Modulators for Rheumatoid Arthritis Return to Table of Contents
Author & Year of
Publication
(Trial Name)
Quality rating
Study sponsor Study Design and
Duration of Follow-
up
Geographic
location of study
Interventions (n) &
Dosing Schedule
Inclusion and Exclusion
Criteria
Baseline patient Characteristics
Gomez-Reino JJ
Annals of the
rheumatic diseases
2012273
MIRAR
Fair
Roche Prospective
multicenter
observational
12 months
100 centers in
Spain
1) RTX (n=575)
2) TNFis (n=513)
2a) ETN
2b) ADA/IFX
2c) Other TNTis
Patients with RA who
received either RTX or an
alternative TNF
antagonist after failing
treatment with ≥1 TNFi
in routine clinical
practice
Mean age (SD)
1) 55.3 (12.8)
2) 54.5 (13.5)
Female, n (%)
1) 472 (82)
2) 413 (80.5)
RA duration >5yrs, n (%)
1) 430 (79.3)
2) 327 (67.4)
Prior TNFs>1, n (%)
1) 208 (37)
2) 58 (11.4)
Mean DAS28 (SD)
1) 5.5 (1.2)
2) 5 (1.3)
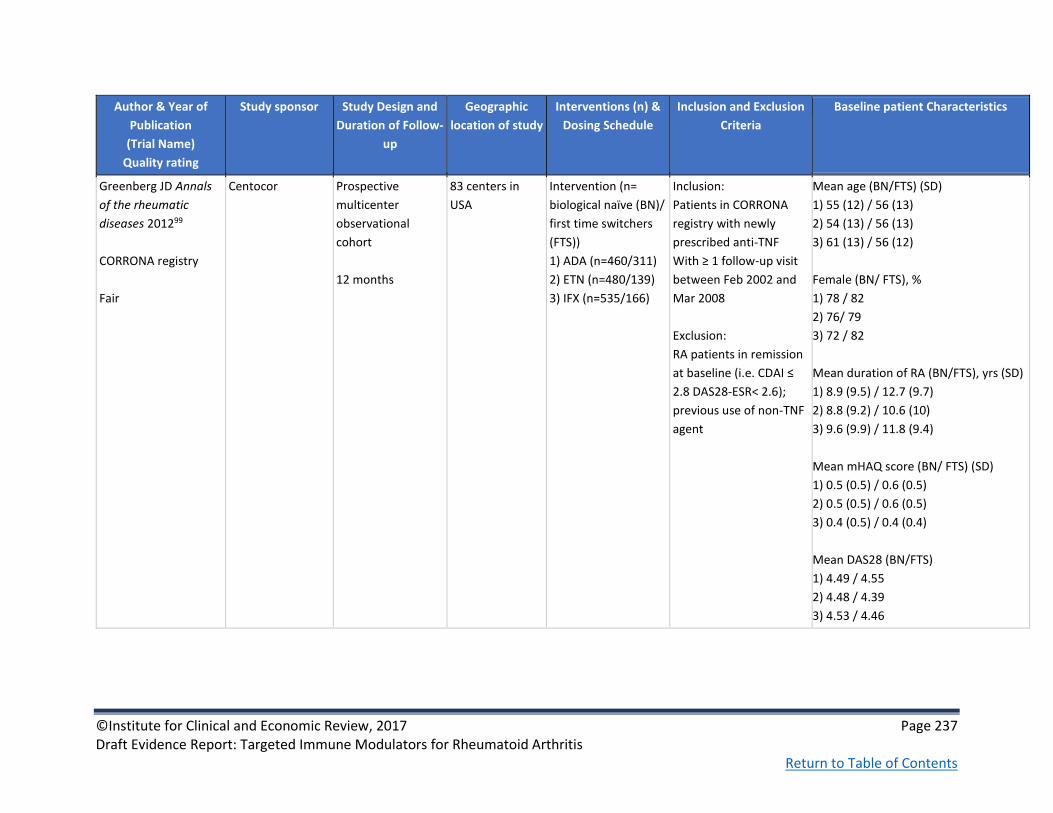
©Institute for Clinical and Economic Review, 2017 Page 237 Draft Evidence Report: Targeted Immune Modulators for Rheumatoid Arthritis Return to Table of Contents
Author & Year of
Publication
(Trial Name)
Quality rating
Study sponsor Study Design and
Duration of Follow-
up
Geographic
location of study
Interventions (n) &
Dosing Schedule
Inclusion and Exclusion
Criteria
Baseline patient Characteristics
Greenberg JD Annals
of the rheumatic
diseases 201299
CORRONA registry
Fair
Centocor Prospective
multicenter
observational
cohort
12 months
83 centers in
USA
Intervention (n=
biological naïve (BN)/
first time switchers
(FTS))
1) ADA (n=460/311)
2) ETN (n=480/139)
3) IFX (n=535/166)
Inclusion:
Patients in CORRONA
registry with newly
prescribed anti-TNF
With ≥ 1 follow-up visit
between Feb 2002 and
Mar 2008
Exclusion:
RA patients in remission
at baseline (i.e. CDAI ≤
2.8 DAS28-ESR< 2.6);
previous use of non-TNF
agent
Mean age (BN/FTS) (SD)
1) 55 (12) / 56 (13)
2) 54 (13) / 56 (13)
3) 61 (13) / 56 (12)
Female (BN/ FTS), %
1) 78 / 82
2) 76/ 79
3) 72 / 82
Mean duration of RA (BN/FTS), yrs (SD)
1) 8.9 (9.5) / 12.7 (9.7)
2) 8.8 (9.2) / 10.6 (10)
3) 9.6 (9.9) / 11.8 (9.4)
Mean mHAQ score (BN/ FTS) (SD)
1) 0.5 (0.5) / 0.6 (0.5)
2) 0.5 (0.5) / 0.6 (0.5)
3) 0.4 (0.5) / 0.4 (0.4)
Mean DAS28 (BN/FTS)
1) 4.49 / 4.55
2) 4.48 / 4.39
3) 4.53 / 4.46

©Institute for Clinical and Economic Review, 2017 Page 238 Draft Evidence Report: Targeted Immune Modulators for Rheumatoid Arthritis Return to Table of Contents
Author & Year of
Publication
(Trial Name)
Quality rating
Study sponsor Study Design and
Duration of Follow-
up
Geographic
location of study
Interventions (n) &
Dosing Schedule
Inclusion and Exclusion
Criteria
Baseline patient Characteristics
Grijalva CG JAMA
2011 274
Fair
FDA, US DHHS,
and AHRQ grant
Retrospective
database cohort
study
365 days
USA 1) TNFi (n=10,242)
1a) ETN (42.9%)
1b) IFX (37.3%)
1c) ADA (19.8%)
2) cDMARD
(leflunomide,
sulfasalazine or
hydroxychloroquine)
(n=10,082)
Patient with study
defined autoimmune
disease (RA and other
disease exclusive
categories) who
subsequently filled a
prescription or
received an infusion for
a TNF-antagonist
or comparator
medication (after MTX
failure) with a baseline
period of 365 days with
continuous enrollment
preceding the first
infusion or prescription
fill in the respective
databases
Exclusion: Patients
with diagnoses for more
than 1 autoimmune
disease
Mean age, (SD)
1) 58.1 (14.1)
2) 58.4 (14.4)
Female, n (%)
1) 9,069 (86.5)
2) 9,077 (86.6)
70% of TNFi patients used MTX at
baseline

©Institute for Clinical and Economic Review, 2017 Page 239 Draft Evidence Report: Targeted Immune Modulators for Rheumatoid Arthritis Return to Table of Contents
Author & Year of
Publication
(Trial Name)
Quality rating
Study sponsor Study Design and
Duration of Follow-
up
Geographic
location of study
Interventions (n) &
Dosing Schedule
Inclusion and Exclusion
Criteria
Baseline patient Characteristics
Harigai, M Mod
Rheumatol 2016275
Poor
Japan College of
Rheumatology;
database
administered by
Department of
Pharmacovigilance
of Tokyo Medical
and Dental
University
Retrospective
database cohort
study
Patients retrieved
from SECURE
database March 31,
2013; mean
observation period
41.1 months
Japan N=14,440
1. ETN (n=7,698)
2. IFX (n=6,620)
3. TCZ (n=2,952)
4. ADA (n=2,277)
5. ABA (n=928)
6. GOL (n=200)
Inclusion: Patients in
SECURE cohort: nation-
wide cohort of Japanese
RA patients ever treated
with biologics. Patients
must have clinical
diagnosis RA; treatment
with biologics approved
in Japan for RA; ≥20 y.o.
Mean age, yrs: 57.0
Female, %: 81.0
Number of biologics used, 1/2/3/4/5
biologics, %:
67.6/23.7/6.9/1.4/0.3

©Institute for Clinical and Economic Review, 2017 Page 240 Draft Evidence Report: Targeted Immune Modulators for Rheumatoid Arthritis Return to Table of Contents
Author & Year of
Publication
(Trial Name)
Quality rating
Study sponsor Study Design and
Duration of Follow-
up
Geographic
location of study
Interventions (n) &
Dosing Schedule
Inclusion and Exclusion
Criteria
Baseline patient Characteristics
Hetland ML Arthritis
and rheumatism
2010100
DANBIO registry
Fair
Abbott,
Wyeth, and
Schering-Plough,
Bristol-Myers
Squibb, Roche,
and UCB-Nordic
Prospective
observational
cohort
12 months
Denmark 1) ADA (n=544)
2) ETN (n=425)
3) IFX (n=908)
The treatment
regimens reflected
routine care:
standard doses plus
concomitant MTX (or
other DMARD) and
prednisolone were
administered per the
decision of the
treating
rheumatologist
Patients with RA treated
with ≥1 cDMARD and
failed treatment; ETN,
ADA or IFX initiated as
first bDMARD
Mean age (range )
1) 56 (15-85)
2) 58 (19-89)
3) 57 (17-85)
Male, %
1) 25
2) 28
3) 27
Mean duration of RA, yrs (range)
1) 9 (0-51)
2) 8 (0-47)
3) 9 (0-68)
Mean DAS28 (range)
1) 5.3 (3.3-8.3)
2) 5.4 (3.3-8.4)
3) 5.4 (3.3-8.3)

©Institute for Clinical and Economic Review, 2017 Page 241 Draft Evidence Report: Targeted Immune Modulators for Rheumatoid Arthritis Return to Table of Contents
Author & Year of
Publication
(Trial Name)
Quality rating
Study sponsor Study Design and
Duration of Follow-
up
Geographic
location of study
Interventions (n) &
Dosing Schedule
Inclusion and Exclusion
Criteria
Baseline patient Characteristics
Jobanputra P BMJ
Open 201220
RED SEA
Fair
University
Hospital
Birmingham NHS
Foundation Trust
RCT, parallel group,
non-blinded, non-
inferiority
52 weeks
4 centers in
England
1) ADA + cDMARD
(n=60)
2) ETN + cDMARD
(n=60)
Patients were
randomized to
subcutaneous ADA
40 mg every other
week or ETN 50 mg
weekly. Clinician
could modify drug
doses
Patients with active RA
despite prior or current
use of 2 DMARDs
including MTX
Exclusion: prior use of
biological TNFi
Mean age (SD)
1) 55 (12.5)
2) 53.2 (13.4)
Female, n (%)
1) 45
2) 42
Mean duration of RA, yrs (range)
1) 7 (3.3 -13)
2) 5.5 (2-14.5)
Mean DAS28-CRP (SD)
1) 5.6 (0.9)
2) 5.8 (0.9)

©Institute for Clinical and Economic Review, 2017 Page 242 Draft Evidence Report: Targeted Immune Modulators for Rheumatoid Arthritis Return to Table of Contents
Author & Year of
Publication
(Trial Name)
Quality rating
Study sponsor Study Design and
Duration of Follow-
up
Geographic
location of study
Interventions (n) &
Dosing Schedule
Inclusion and Exclusion
Criteria
Baseline patient Characteristics
Johnston S Semin
Arthritis Rheum
2013276
Fair
Truven Health
Analytics was paid
by Genentech, Inc.
to conduct study;
Genentech, Inc.
had no role in the
decision to submit
the manuscript for
publication.
Retrospective
analysis of large
U.S. claims
database
Median follow-up
time in days and
total person-years
of follow-up
(regardless of the
occurrence of
infection and
severe infection)
for each group: 1)
ABT 330 days and
1004 yrs
2) ADA 365 days
and 1772 yrs
3) ETN 379 days
and 1392 yrs
4) IFX 348 days and
789 yrs
5) RTX 335 days
and 463 yrs
USA 1) ABT (n=870)
2) ADA (n=1378)
3) ETN (n=1026)
4) IFX (n=649)
5) RTX (n=409)
Dosing not controlled
for; results are
“reflective of the
spectrum of doses
that are typically
administered in ‘real
world’ clinical
practice”
Diagnosis of RA (ICD-9-
CM 714.0x) on a non-
diagnostic claim during
1/1/2003–3/31/2010;
age ≥18 yrs as of the
first-line anti-TNF index;
≥12 prior mos of
continuous enrollment
in health insurance at
start of each treatment
episode, during which
baseline characteristics
were measured
Excluded if ≥1 inpatient
or outpatient non-
diagnostic claim for
alternative indication for
biologic treatment or a
condition that may have
complicated analysis of
infection during baseline
Mean age (SD)
1) 57.0 (12.6)
2) 54.3 (12.0)
3) 54.6 (12.7)
4) 54.3 (12.8)
5) 56.4 (12.0)
Female, %
1) 83.1
2) 80.3
3) 77.2
4) 77.8
5) 77.5
Second-line episode trial, %
1) 64.9
2) 86.9
3) 80.6
4) 69.8
5) 57.2

©Institute for Clinical and Economic Review, 2017 Page 243 Draft Evidence Report: Targeted Immune Modulators for Rheumatoid Arthritis Return to Table of Contents
Author & Year of
Publication
(Trial Name)
Quality rating
Study sponsor Study Design and
Duration of Follow-
up
Geographic
location of study
Interventions (n) &
Dosing Schedule
Inclusion and Exclusion
Criteria
Baseline patient Characteristics
Weinblatt ME Arthritis
and rheumatism
201394
AMPLE
Good
See also Schiff M
Annals of the
rheumatic diseases
201422, Fleischmann R
Arthritis and
Rheumatology 2016277
Bristol-Myers
Squibb
RCT
multicenter
single-blind
Phase IIIB
12 months
120 sites in
United States,
Argentina,
Canada, Chile,
Peru
1) ABTsc+MTX
(n=318)
2) ADAsc+MTX
(n=328)
125 mg ABT sc once
per wk (without
intravenous loading
dose), or 40 mg ADA
sc every other wk,
both given in
combination with
MTX (≥15 and ≤25
mg/wk); patients
could receive either
sulfasalazine or
hydroxychloroquine
ACR 1987 criteria for RA;
age ≥18; diagnosis for ≤5
years; inadequate
response to MTX; no
previous bDMARD
therapy; active disease
(DAS28-
CRP≥3.2defined);
seropositivity for anti–
cyclic citrullinated
peptide antibodies or
rheumatoid factor,
and/or ESR or CRP level
Mean age (SD)
1) 51.4 (12.6)
2) 51.0 (12.8)
Female (%)
1) 81.4
2) 82.3
Mean duration of RA, yrs (SD)
1) 1.9 (1.4)
2) 1.7 (1.4)
Mean HAQ-DI (SD)
1) 1.5 (0.7)
2) 1.5 (0.7)
DAS28-CRP (SD)
1) 5.5 (1.1)
2) 5.5 (1.1)
Mean mTSS [0-448] (SD)
1) 24.8 (37.1)
2) 24.2 (32.9)

©Institute for Clinical and Economic Review, 2017 Page 244 Draft Evidence Report: Targeted Immune Modulators for Rheumatoid Arthritis Return to Table of Contents
Author & Year of
Publication
(Trial Name)
Quality rating
Study sponsor Study Design and
Duration of Follow-
up
Geographic
location of study
Interventions (n) &
Dosing Schedule
Inclusion and Exclusion
Criteria
Baseline patient Characteristics
Schiff M Annals of the
rheumatic diseases
200823
ATTEST
Good
See also Schiff M
Annals of the
rheumatic diseases
2011103
Bristol-Myers
Squibb
RCT
multicenter
double-blind
Phase III
12 months
86 sites in the US
(20 sites),
Europe (18 sites
(5 in Poland, 4 in
Spain, 4 in
Sweden, 2 in
Russia, 2 in
Denmark and 1
in Switzerland)),
Canada (11
sites), Australia
(6 sites), Mexico
(10 sites),
Argentina (5
sites), Brazil (8
sites), Peru (5
sites) and South
Africa (3 sites)
1) ABTiv+MTX
(n=156)
2) PBO+MTX (n=110)
3) IFX+MTX (n=156)
ABT dosed according
to weight: <60 kg, 60-
100 kg, >100 kg
received 500 mg, 750
mg, or 1000 mg of
ABT, respectively.
ABT administered by
iv infusion on days 1,
15 and 29, and every
28 days thereafter,
up to and including
day 337
IFX dosed at 3 mg/kg
for all patients. IFX
administered on days
1, 15, 43 and 85, and
every 56 days
thereafter PBO
patients reallocated
to ABT on day 198
(with blinding
maintained
Met ACR criteria for RA;
age ≥18 yrs; RA diagnosis
for ≥1 yr; inadequate
response to MTX (at
randomization >10
swollen joints, >12
tender joints, and CRP
>1 mg/dL); received MTX
>15 mg/wk for >3
months prior to
randomization and
washed out all DMARDs
(>28 days prior) except
MTX; no prior ABT or
anti-TNFs
Mean age (SD)
1) 49.0 (12.5)
2) 49.4 (11.5)
3) 49.1 (12.0)
Female (%)
1) 83.3
2) 87.3
3) 82.4
Mean duration of RA, yrs (SD)
1) 7.9 (8.5)
2) 8.4 (8.6)
3) 7.3 (6.2)
Mean HAQ-DI (SD)
1) 1.8 (0.6)
2) 1.8 (0.7)
3) 1.7 (0.7)
Mean DAS28-ESR (SD)
1) 6.9 (1.0)
2) 6.8 (1.0)
3) 6.8 (0.9)

©Institute for Clinical and Economic Review, 2017 Page 245 Draft Evidence Report: Targeted Immune Modulators for Rheumatoid Arthritis Return to Table of Contents
Author & Year of
Publication
(Trial Name)
Quality rating
Study sponsor Study Design and
Duration of Follow-
up
Geographic
location of study
Interventions (n) &
Dosing Schedule
Inclusion and Exclusion
Criteria
Baseline patient Characteristics
Smolen JS The Lancet
201666
EXXELERATE
Fair
UCB Pharma RCT, single-blind
(double-blind until
wk12 and
investigator blind
after), parallel-
group
Phase iv
104 wk (2 yr)
151 centers in
North America,
Europe, Australia
1) CTZ + MTX (n=454)
2) ADA + MTX
(n=454)
CTZ administered
400 mg at wks 0, 2,
and 4 (loading dose),
then 200 mg once
every 2 wks plus MTX
ADA administered 40
mg once every 2 wks
plus MTX
At wk 12, patients
achieving DAS28-ESR
≤3.2 or a reduction
from baseline of ≥1.2
randomized to CTZ
switched to receive
ADA regimen while
those randomized to
ADA switched to
receive CTZ (start at
loading dose).
Age ≥18yrs; RA diagnosis
by 2010 ACR/EULAR
criteria; positive
rheumatoid factor or
ACPA result or both;
DAS28-ESR > 3.2; ≥4
swollen joints; hsCRP
≥10 mg/L or ESR
≥28mm/h or both;
bDMARD-naïve; ≥ 12-
week course of MTX
therapy, ≥28 days of
stable dose MTX (15–
25mg/wk) pre-baseline.
Exclusion: serious
infections within 12
months prior to
baseline; TB; history of
congestive heart failure,
demyelinating disorders;
active malignancy or a
history of cancer.
Mean age, yrs (SD)
1) 53.5 (12.3)
2) 52.9 (12.8)
Female, n (%)
1) 360 (79%)
2) 362 (79%)
Mean duration of RA, yrs (SD)
1) 6.0 (6.9)
2) 5.8 (6.9)
Mean CRP mg/L (SD)
1) 15.8 (21.8)
2) 15.4 (21.0)
Mean DAS28-ESR (SD)
6.5 (0.9) both groups
Mean HAQ-DI (SD)
1.5 (0.6) both groups

©Institute for Clinical and Economic Review, 2017 Page 246 Draft Evidence Report: Targeted Immune Modulators for Rheumatoid Arthritis Return to Table of Contents
Author & Year of
Publication
(Trial Name)
Quality rating
Study sponsor Study Design and
Duration of Follow-
up
Geographic
location of study
Interventions (n) &
Dosing Schedule
Inclusion and Exclusion
Criteria
Baseline patient Characteristics
Taylor PC N Engl J Med
201797
RA-BEAM
Good
See also Taylor P
Arthritis and
Rheumatology 201521,
Smolen JS Ann Rheum
Dis 2016 POSTER227,
Keystone E Ann
Rheum Dis 2016
POSTER98
Eli Lilly and
Company
Phase III RCT
double-blind
placebo- and
active-controlled
parallel-group
52 weeks
Non-responders
were rescued from
Wk 16. At Wk 24,
pts on PBO
switched to BAR
281 centers in 26
countries
1) PBO + cDMARD
(n=488)
2) BAR + cDMARD
(n=487)
3) ADA + cDMARD
(n=330)
4 mg of BAR once
daily, or 40 mg of sc
ADA every other
week, in addition to
existing background
therapy (including
methotrexate).
Concomitant stable
doses of cDMARDs,
nonsteroidal anti-
inflammatory drugs,
analgesics,
or glucocorticoids
(≤10 mg of
prednisone or the
equivalent per day)
were permitted.
Age ≥18; active RA;
≥6 tender joints and ≥6
swollen joints; CRP
≥6mg/L; inadequate
response to MTX; ≥12
wks of MTX before trial
entry at stable doses for
≥8 wks; ≥3 joint erosions
or ≥1 joint erosions plus
seropositivity for
rheumatoid factor or
anti-citrullinated peptide
antibodies.
Exclusion: previous
biologic; laboratory
abnormalities; recent
clinically serious
infection
Mean age (SD)
1) 53 (2)
2) 54 (2)
3) 53 (12)
Female (%)
1) 78
2) 77
3) 76
Mean duration of RA, yrs (SD)
1) 10 (9)
2) 10 (9)
3) 10 (9)
Mean HAQ-DI (SD
1) 1.55 (0.67)
2) 1.57 (0.68)
3) 1.59 (0.70)
Mean DAS28-CRP/ESR
1) 5.7 (1.0) / 6.4 (1.0)
2) 5.8 (0.9) / 6.5 (0.9)
3) 5.8 0.9) / 6.4 (1.0)

©Institute for Clinical and Economic Review, 2017 Page 247 Draft Evidence Report: Targeted Immune Modulators for Rheumatoid Arthritis Return to Table of Contents
Author & Year of
Publication
(Trial Name)
Quality rating
Study sponsor Study Design and
Duration of Follow-
up
Geographic
location of study
Interventions (n) &
Dosing Schedule
Inclusion and Exclusion
Criteria
Baseline patient Characteristics
van Vollenhoven RF
The New England
journal of medicine
201295
ORAL Standard
Good
See also Strand V
Rheumatology 201696
Pfizer RCT
multicenter
double-blind
Phase III
12 months
115 centers
worldwide
United States,
Australia, Bosnia
and
Herzegovina,
Bulgaria,
Canada, Chile,
Costa Rica,
Croatia, Czech
Republic,
Denmark,
Dominican
Republic,
Finland,
Germany, Korea,
Mexico,
Philippines,
Poland, Slovakia,
Spain, Thailand,
United Kingdom
1) PBO+MTX TOF
5mg (n=56) or 10mg
(n=52)
2) TOF 5mg +MTX
(n=204)
3) ADA+MTX (n=204)
4) TOF 10mg +MTX
(n=201)
5-10 mg TOF twice
daily, 40 mg sc ADA
once every 2 wks; all
patients took
background MTX.
PBO patients without
20% reduction in no.
swollen and tender
joints after 3 months
randomly assigned to
5 or 10mg TOF; after
6 months, all PBO
patients blindly
switched to 5 mg or
10 mg TOF
*TOF 10 mg & PBO
TOF 10mg excluded
from table
Age ≥18; active RA;
≥6 tender or painful
joints and ≥6 swollen
joints; either ESR>28
mm/hr or CRP>7 mg/L;
receiving 7.5- 25 mg
MTX weekly and had an
incomplete response
Key exclusion criteria
were current
treatment with other
antirheumatic agents,
including biologic
agents; prior ADA; lack
of response to prior anti-
TNF; and current
infection or evidence of
active or inadequately
treated infection with
Mycobacterium
tuberculosis.
Mean age (SD)
1) 55.5 (13.7)
2) 53.0 (11.9)
3) 52.5 (11.7)
Female (%)
1) 76.8
2) 85.3
3) 79.4
Mean duration of RA, yrs
1) 6.9
2) 7.6
3) 8.1
Mean HAQ-DI
1) 1.5
2) 1.5
3) 1.5
Mean DAS28-CRP/ESR
1) 5.6/6.6
2) 5.4/6.6
3) 5.3/6.4
Prior anti-TNF: 5.9-9.6%

©Institute for Clinical and Economic Review, 2017 Page 248 Draft Evidence Report: Targeted Immune Modulators for Rheumatoid Arthritis Return to Table of Contents
Author & Year of
Publication
(Trial Name)
Quality rating
Study sponsor Study Design and
Duration of Follow-
up
Geographic
location of study
Interventions (n) &
Dosing Schedule
Inclusion and Exclusion
Criteria
Baseline patient Characteristics
Yun H Arthritis &
Rheumatology 2016 278
Good
Agency for
Healthcare
Research and
Quality
Observational
Retrospective
cohort study
5 year follow-up
United States 1) ADA (n=4,845)
2) CTZ (n=1,866)
3) ETN (n=3,814)
4) GOL (n=1,394)
5) IFX (n=3,944)
6) RTX (n=4,718)
7) TCZ (n=2,016)
8) ABT (n=9,204)
Data found using 2006-
2011 Medicare claims
data for all RA patient
beneficiaries from
Centers for Medicare
and Medicaid Services
(CMS) Chronic Condition
Data Warehouse.
Patients had prior
treatment with different
biologic agent; patients
had to have continuous
“full coverage”
(traditional Medicare
fee-for-service coverage
with Part D Medicare
coverage).
Exclusions: Medicare
claim with diagnosis of
PsA, psoriasis, AS, IBD
Group Mean age % women
1 61.8 (13.5) 83.9
2 64.1 (13.3) 86.3
3 61.8 (13.3) 85.6
4 60.4 (13.5) 88.7
5 65.3 (12.5) 84.9
6 65.0 (12.2) 85.0
7 66.4 (11.9) 85.3
8 66.8 (12.1) 85.5
No. biologic agents used prior to index
date, %
Number of agents
Group 1 2 ≥3
1 83.9 13.0 3.1
2 49.7 30.7 19.6
3 79.4 16.6 4.0
4 47.1 35.2 17.5
5 75.8 20.2 4.0
6 60.3 31.4 8.3
7 32.7 40.0 27.3
8 76.5 20.1 3.4

©Institute for Clinical and Economic Review, 2017 Page 249 Draft Evidence Report: Targeted Immune Modulators for Rheumatoid Arthritis Return to Table of Contents
Author & Year of
Publication
(Trial Name)
Quality rating
Study sponsor Study Design and
Duration of Follow-
up
Geographic
location of study
Interventions (n) &
Dosing Schedule
Inclusion and Exclusion
Criteria
Baseline patient Characteristics
Biosimilar studies
Bae S-C Ann Rheum
Dis 2016167
HERA
Good
Hanwha Chemical Multicenter
Double-blind
Active-controlled
Parallel-group
RCT
Phase III
48 weeks
37 study sties in
the Republic of
Korea
1) ETN-bio+MTX
(n=115)
2) ETN-ref+MTX
(n=118)
25 mg administered
subcutaneously twice
weekly with stable
dose of
oral/intramuscular or
sc MTX (7.5-25
mg/wk) for 48 weeks
Age ≥20 yrs; RA
diagnosis according to
the 1987 ACR criteria;
active disease defined as
≥6 swollen joints, ≥6
tender joints, CRP ≥1.0
mg/dL or ESR ≥28 mm/h;
ACR functional class I to
III; positive for RF or
anti-CCP antibody or
bone erosions in the
hands and/or feet on X-
ray; insufficient clinical
response to MTX during
≥6 mos of treatment
prior to screening.
Mean age (SD)
1) 51.0 (12.0)
2) 51.3 (12.4)
Female n, (%)
1) 101 (87.8)
2) 101 (85.6)
Mean duration of RA, yrs (SD)
1) 7.19 (7.39)
2) 8.05 (7.43)
Mean DAS28 (SD)
1) 6.15 (0.85)
2) 6.16 (0.86)
Mean HAQ-DI (SD)
1) 1.1 (0.7)
2) 1.1 (0.7)

©Institute for Clinical and Economic Review, 2017 Page 250 Draft Evidence Report: Targeted Immune Modulators for Rheumatoid Arthritis Return to Table of Contents
Author & Year of
Publication
(Trial Name)
Quality rating
Study sponsor Study Design and
Duration of Follow-
up
Geographic
location of study
Interventions (n) &
Dosing Schedule
Inclusion and Exclusion
Criteria
Baseline patient Characteristics
Choe J-Y Ann Rheum
Dis 2015168
Good
See also Choe J-Y
Arthritis
Rheumatology
2015205, Smolen J
Arthritis Rheumatol
2016279
Samsung Bioepis
Co., Ltd.
Multicenter
Double-blind
Parallel group
RCT
Phase III
54-week main
study + 24-week
switching study;
this publication
reports results up
to week 30
73 centers in 11
countries from
Europe and Asia
1) IFX-bio+MTX
(n=291)
2) IFX-ref+MTX
(n=293)
Infusion of 3 mg/kg
intravenous IFX over
2 hrs at week 0, 2, 6,
14, 22, 30, 38, and
46. Dose increases
could occur from
week 30 by 1.5
mg/kg per visit, up to
a total of 7.5 mg/kg.
corticosteroids,
antihistamines or
paracetamol allowed
at investigator
discretion. Oral or
parenteral MTX 10-
25 mg/wk with 5-10
mg/wk folic acid
Age 18-75 yrs; RA
classified by 1987 ACR
criteria; RA diagnosis ≥6
mos; ≥6 tender and ≥6
swollen joints; ESR ≥28
mm/h or CRP ≥1.0
mg/dL; MTX for ≥6 mos
and under stable dose
for ≥4 wks prior to
randomization
Mean age (SD)
1) 51.6 (11.9)
2) 52.6 (11.7)
Female (%)
1) 79.7
2) 80.5
Mean duration of RA, yrs (SD)
1) 6.3 (5.9)
2) 6.6 (6.0)
Mean HAQ-DI (SD)
1) 1.5 (0.6)
2) 1.5 (0.6)
Mean DAS28-ESR (SD)
1) 6.5 (0.8)
2) 6.5 (0.8)

©Institute for Clinical and Economic Review, 2017 Page 251 Draft Evidence Report: Targeted Immune Modulators for Rheumatoid Arthritis Return to Table of Contents
Author & Year of
Publication
(Trial Name)
Quality rating
Study sponsor Study Design and
Duration of Follow-
up
Geographic
location of study
Interventions (n) &
Dosing Schedule
Inclusion and Exclusion
Criteria
Baseline patient Characteristics
Cohen SB Arthritis
Rheumatology 2015193
Abstract
See also Matsumoto
AK Arthritis
Rheumatology 2015280
Amgen Double-blind
Active-controlled
Equivalence study
RCT
Phase III
26 weeks
NR 1) ADA-bio+MTX
(n=264)
2) ADA-ref+MTX
(n=262)
40 mg ADA
administered
subcutaneously
every 2 weeks until
week 22; 7.5-25
mg/wk MTX
Age ≥18 and ≤80 yrs;
diagnosed with RA ≥3
mos before baseline;
active RA defined as ≥6
swollen joints and ≥6
tender joints at
screening and baseline;
taking MTX for ≥12
consecutive weeks and
on stable dose of 7.5-25
mg/wk for >8 wks prior
to receiving study drug;
no known history of
active TB
Exclusion criteria: class iv
RA, Felty’s syndrome or
history of prosthetic or
native joint infection;
major chronic
inflammatory disease
other than RA; prior use
of ≥2 biologics for RA;
prior ADA
Baseline characteristics well balanced
between groups; further detail NR

©Institute for Clinical and Economic Review, 2017 Page 252 Draft Evidence Report: Targeted Immune Modulators for Rheumatoid Arthritis Return to Table of Contents
Author & Year of
Publication
(Trial Name)
Quality rating
Study sponsor Study Design and
Duration of Follow-
up
Geographic
location of study
Interventions (n) &
Dosing Schedule
Inclusion and Exclusion
Criteria
Baseline patient Characteristics
Emery P Ann Rheum
Dis 2015195
Good
See also Vencovsky J
Arthritis
Rheumatology 2015204
Samsung Bioepis
Co., Ltd.
Multicenter
Double-bind
Parallel-group
RCT
Phase III
52-week study;
publication reports
results from 24
weeks
73 centers
across 10
countries in
Europe, Latin
America, and
Asia
1) ETN-bio+MTX
(n=299)
2) ETN-ref (n=297)
Self-administered 50
mg ETN once weekly
for up to 52 wks via
subcutaneous
injection; 10-25
mg/wk MTX; 5-10
mg/wk folic acid
Age 18-75 yrs; RA
diagnosis according to
1987 ACR criteria for ≥6
months and ≤15 yrs prior
to screening; active
disease defined as ≥6
swollen and ≥6 tender
joints and either ESR ≥28
mm/h or CRP ≥1.0 mg/dL
despite MTX for ≥6 mos
(stable dose of 10-25
mg/wk for ≥4 wks prior
to screening)
Exclusion criteria: prior
treatment with biologics;
history of
lymphoproliferative
disease; CHF;
demyelinating disorders;
TB; pregnancy/
breastfeeding
Mean age (SD)
1) 52.1 (11.72)
2) 51.6 (11.63)
Female, n (%)
1) 249 (83.3)
2) 253 (85.2)
Mean RA duration, yrs (SD)
1) 6.0 (4.20)
2) 6.2 (4.41)
Mean DAS28-ESR (SD)
1) 6.5 (0.91)
2) 6.5 (0.88)
Mean HAQ-DI (SD)
1) 1.49 (0.553)
2) 1.50 (0.560)

©Institute for Clinical and Economic Review, 2017 Page 253 Draft Evidence Report: Targeted Immune Modulators for Rheumatoid Arthritis Return to Table of Contents
Author & Year of
Publication
(Trial Name)
Quality rating
Study sponsor Study Design and
Duration of Follow-
up
Geographic
location of study
Interventions (n) &
Dosing Schedule
Inclusion and Exclusion
Criteria
Baseline patient Characteristics
Jani RH Int J Rheum
Dis 2015192
Good
Cadila Healthcare
Limited, the Zydus
Group Company,
India
Multicenter
Double-blind
Active controlled,
parallel arm RCT
12 weeks
11
investigational
sites across India
1) ADA-bio+MTX
(n=60)
2) ADA-ref+MTX
(n=60)
40 mg scADA
administered every
other week for 12
wks
Age ≥18 and ≤65yrs;
history of RA for ≥6 mos;
moderate to severe
active seropositive
disease; history of
treatment with MTX 10-
25 mg/week for ≥12 wks
with stable dose in last 4
wks before screening;
negative pregnancy test
Exclusion criteria:
significant systemic
manifestations of RA;
breastfeeding female;
rheumatic autoimmune
disease other than RA;
ACR functional class iv;
history of DMARD use
other than MTX; prior
anti-TNF; vaccine within
4 wks of enrollment;
uncontrolled
concomitant disease
Mean age (SD)
1) 45 (11.06)
2) 45 (10.92)
Female, n (%)
1) 51 (85.0)
2) 48 (80.0)
Mean RA duration, yrs (SD)
1) 3.3 (4.19)
2) 4.0 (4.98)
Mean DAS28-CRP (SD)
1) 5.9 (0.94)
2) 6.0 (0.78)
Mean DAS28-ESR (SD)
1) 6.9 (0.74)
2) 6.9 (0.72)
Mean HAQ-DI (SD)
1) 1.7 (0.61)
2) 1.6 (0.58)
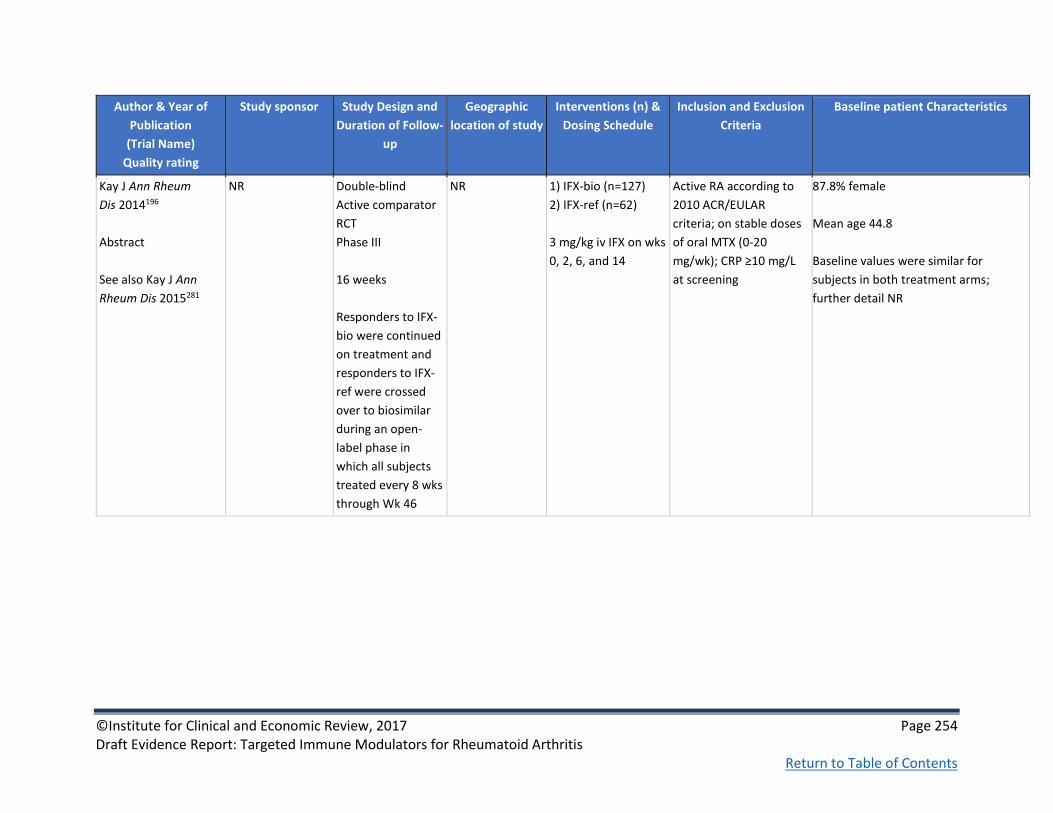
©Institute for Clinical and Economic Review, 2017 Page 254 Draft Evidence Report: Targeted Immune Modulators for Rheumatoid Arthritis Return to Table of Contents
Author & Year of
Publication
(Trial Name)
Quality rating
Study sponsor Study Design and
Duration of Follow-
up
Geographic
location of study
Interventions (n) &
Dosing Schedule
Inclusion and Exclusion
Criteria
Baseline patient Characteristics
Kay J Ann Rheum
Dis 2014196
Abstract
See also Kay J Ann
Rheum Dis 2015281
NR Double-blind
Active comparator
RCT
Phase III
16 weeks
Responders to IFX-
bio were continued
on treatment and
responders to IFX-
ref were crossed
over to biosimilar
during an open-
label phase in
which all subjects
treated every 8 wks
through Wk 46
NR 1) IFX-bio (n=127)
2) IFX-ref (n=62)
3 mg/kg iv IFX on wks
0, 2, 6, and 14
Active RA according to
2010 ACR/EULAR
criteria; on stable doses
of oral MTX (0-20
mg/wk); CRP ≥10 mg/L
at screening
87.8% female
Mean age 44.8
Baseline values were similar for
subjects in both treatment arms;
further detail NR

©Institute for Clinical and Economic Review, 2017 Page 255 Draft Evidence Report: Targeted Immune Modulators for Rheumatoid Arthritis Return to Table of Contents
Author & Year of
Publication
(Trial Name)
Quality rating
Study sponsor Study Design and
Duration of Follow-
up
Geographic
location of study
Interventions (n) &
Dosing Schedule
Inclusion and Exclusion
Criteria
Baseline patient Characteristics
Smolen J Arthritis
Rheumatol 2016279
See also Choe J-Y Ann
Rheum Dis 2015168
See Choe J-Y Ann
Rheum Dis 2015168
above
See Choe J-Y Ann
Rheum Dis 2015168
above
See Choe J-Y Ann
Rheum Dis
2015168 above
At re-randomization,
weeks 54-78:
1) IFX/SB2 [IFX-bio]
(n=94)
2) IFX/IFX (n=101)
3) SB2/SB2 (n=201)
See Choe J-Y Ann Rheum
Dis 2015168 above
Disease activity at re-randomization,
week 54
HAQ-DI, mean (SD)
1) 0.99 (0.624)
2) 0.95 (0.648)
3) 0.98 (0.668)
DAS28-ESR, mean (SD)
1) 3.88 (1.274)
2) 4.08 (1.452)
3) 3.97 (1.434)

©Institute for Clinical and Economic Review, 2017 Page 256 Draft Evidence Report: Targeted Immune Modulators for Rheumatoid Arthritis Return to Table of Contents
Author & Year of
Publication
(Trial Name)
Quality rating
Study sponsor Study Design and
Duration of Follow-
up
Geographic
location of study
Interventions (n) &
Dosing Schedule
Inclusion and Exclusion
Criteria
Baseline patient Characteristics
Takeuchi T Modern
Rheumatology 2015169
Nippon Kayaku
Co., Ltd., Celltrion,
Group
RCT
multicenter
double-blind
Phase III
54 weeks
20 sites in Japan 1) IFX-bio (n=50)
2) IFX-ref (n=51)
Patient received a 2-
hour iv infusion of 3
mg/kg IFX-bio or IFX-
ref at weeks 0, 2, and
6, and each 8 weeks
afterward up to week
54. MTX and folic
acid were co-
administered.
≥20yrs and ≤75yrs with
active RA for ≥1yr with
inadequate response to
MTX; within 6 weeks
prior to study, patients
should have ≥6 TJC &SJC
and at least 2 0f the
following: morning
stiffness ≥45mins,
ESR≥28mm/h, and
CRP≥2mg/dl.
Mean age (SD)
1) 54.5 (13)
2) 53.8 (13.4)
Female, n (%)
1) 40 (80)
2) 41 (80.4)
Mean duration of RA, yrs (SD)
1) 7.1 (7.3)
2) 8 (7.3)
Mean HAQ-DI (SD)
1) 1.03 (0.67)
2) 1.12 (0.65)
Mean DAS28-ESR (SD)
1) 5.929 (1.005)
2) 6.104 (0.841)
Mean DAS28-CRP (SD)
1) 5.19 (1.012)
2) 5.301 (0.9)

©Institute for Clinical and Economic Review, 2017 Page 257 Draft Evidence Report: Targeted Immune Modulators for Rheumatoid Arthritis Return to Table of Contents
Author & Year of
Publication
(Trial Name)
Quality rating
Study sponsor Study Design and
Duration of Follow-
up
Geographic
location of study
Interventions (n) &
Dosing Schedule
Inclusion and Exclusion
Criteria
Baseline patient Characteristics
Weinblatt ME Arthritis
Rheumatology 2015194
Abstract
Samsung Bioepis
Co., Ltd.
Double-blind
Parallel-assignment
RCT
Phase III
52-week study;
conference
abstract reports 24-
wk results
NR 1) ADA-bio (n=271)
2) ADA-ref (n=273)
Patients randomly
assigned to
receive 40 mg of
either ADA-bio or
ADA-ref
administered
subcutaneously
every other wk for 24
wks. At wk 24,
patients in ADA-ref
group were
randomized again to
receive 40 mg of
either ADA-bio or
ADA-ref for
additional 28 wks.
Patients in ADA-bio
group continued to
receive ADA-bio.
Age 18-75 yrs; diagnosis
of RA according to 1987
ACR criteria for ≥6 mos
and ≤15 yrs; moderate
to severe active disease,
defined as ≥6 swollen
and ≥6 tender joints,
either ESR ≥28 mm/h or
CRP ≥1.0 mg/dL; treated
with MTX for ≥6 mos
prior to randomization;
stable rte. of
administration and dose
(10-25 mg/wk) for ≥4
wks prior to screening
Exclusion criteria:
treated previously with
biologic
Baseline demographic and disease
characteristic were comparable
between two
treatment groups; further detail NR

©Institute for Clinical and Economic Review, 2017 Page 258 Draft Evidence Report: Targeted Immune Modulators for Rheumatoid Arthritis Return to Table of Contents
Author & Year of
Publication
(Trial Name)
Quality rating
Study sponsor Study Design and
Duration of Follow-
up
Geographic
location of study
Interventions (n) &
Dosing Schedule
Inclusion and Exclusion
Criteria
Baseline patient Characteristics
Williams J Br J Clin
Pharmacol 2016166
Good
Pfizer RCT
Double-blind
Multi-center
Phase I/II
United States,
Australia,
Canada,
Colombia,
Germany, Israel,
Mexico, Russian
Federation,
South Africa,
United Kingdom
1. PF-05280586 [RTX-
bio] (n=71)
2. RTX-EU (n=72)
3. RTX-US (n=71)
Inclusion: Age ≥18 yrs;
Confirmed diagnosis of
RA; Class I, II, or III or
ACR 1991 Revised
Criteria; RA
seropositivity, stable
dose MTX; inadequate
response to TNF
inhibitors; ≥6 swollen
joints; DAS28-CR >3.2 at
screening
Exclusion: Any prior
treatment with
lymphocyte depleting
therapies; history of
active TB infection;
known or screen test
positive for specific
viruses or indicators of
viral infection
Mean age, yrs
1. 54.8
2. 55.7
3. 53.8
Male, %
1. 18.3
2. 22.2
3. 26.8
Mean DAS28-CRP
1. 5.64
2. 5.80
3. 6.2
HAQ-DI
1. 1.67
2. 1.61
3. 1.74
CRP, mg/dL
1. 12.4
2. 14.7
3. 18.2

©Institute for Clinical and Economic Review, 2017 Page 259 Draft Evidence Report: Targeted Immune Modulators for Rheumatoid Arthritis Return to Table of Contents
Author & Year of
Publication
(Trial Name)
Quality rating
Study sponsor Study Design and
Duration of Follow-
up
Geographic
location of study
Interventions (n) &
Dosing Schedule
Inclusion and Exclusion
Criteria
Baseline patient Characteristics
Yoo DH Ann Rheum
Dis 2013170
PLANETRA
Good
See also Yoo D-H
Arthritis Res Ther
2016,206Yoo D-H Ann
Rheum Dis 2016,241,
Yoo D-H Ann Rheum
Dis 2013282
CELLTRION Inc,
Incheon, Republic
of Korea
RCT
multicenter
double-blind
Phase III
30 weeks
100 centers
across 19
countries in
Europe, Asia,
Latin America
and Middle East
1) IFX-bio+MTX
(n=302)
2) IFX-ref+MTX
(n=304)
intravenous infusion
of either 3 mg/kg of
CT-P13 or IFX at
weeks 0, 2, 6, and
then q8 weeks up to
week 30.
Premedication with
antihistamine
(chlorpheniramine 2–
4 mg or dose of
equivalent
antihistamine) 30–60
min prior to the start
of infusion at
investigator’s
discretion. Weekly
MTX (12.5–25
mg/week, oral or
parenteral dose) and
folic acid (≥5
mg/week, oral dose)
Active RA according to
1987 ACR criteria for ≥1
year prior to screening;
≥6 swollen and ≥6
tender joints; at least
two of the following:
morning stiffness lasting
≥45 min; serum CRP
concentration >2.0
mg/dl and ESR >28
mm/h despite MTX
therapy for ≥3 months
(stable dose of 12.5–25
mg/week for ≥4 weeks
prior to screening).
Median age (range)
1) 50 (18–75)
2) 50 (21–74)
Female, n (%)
1) 245 (81.1)
2) 256 (84.2)
Mean DAS28-CRP (SD)
1) 5.9 (0.8)
2) 5.8 (0.9)
Mean HAQ (SD)
1) 1.6 (0.6)
2) 1.6 (0.6)

©Institute for Clinical and Economic Review, 2017 Page 260 Draft Evidence Report: Targeted Immune Modulators for Rheumatoid Arthritis Return to Table of Contents
Author & Year of
Publication
(Trial Name)
Quality rating
Study sponsor Study Design and
Duration of Follow-
up
Geographic
location of study
Interventions (n) &
Dosing Schedule
Inclusion and Exclusion
Criteria
Baseline patient Characteristics
Yoo D-H Annals of the
Rheumatic Diseases
2016241
PLANETRA
Good
See also Yoo DH Ann
Rheum Dis 2013,170
Yoo D-H Arthritis Res
Ther 2016,206, Yoo D-H
Ann Rheum Dis
2013282
CELLTRION Inc,
Incheon, Republic
of Korea
Open-label single-
arm extension
study following a
52 RCT
1 year
69 centers in 16
countries in
Europe, Asia,
Latin America
and the Middle
East
1) IFX-bio-
maintenance group
(n=158)
2) IFX-bio-switch
group (n=144)
During the whole
study period, IFX-bio
was administered
via 2 hr iv infusion at
a fixed dose of 3
mg/kg
18-75 years old with
active RA for ≥1year;
inadequate response to
≥3months use of MTX
and received stable dose
of MTX for ≥4 weeks
before study.
Mean age (range)
1) 50 (18-73)
2) 49 (23-74)
Female, n (%)
1) 125 (79.1)
2) 122 (84.7)
Other baseline characteristics:
See Yoo DH Ann Rheum Dis 2013170
Week 54 mean DAS28-CRP (range)
1) 3.3 (1.1-7)
2) 3.3 (1.5-7.4)
Week 54 mean DAS28-ESR (range)
1) 4 (1.1-8)
2) 4 (1.5-7.4)

©Institute for Clinical and Economic Review, 2017 Page 261 Draft Evidence Report: Targeted Immune Modulators for Rheumatoid Arthritis Return to Table of Contents
Author & Year of
Publication
(Trial Name)
Quality rating
Study sponsor Study Design and
Duration of Follow-
up
Geographic
location of study
Interventions (n) &
Dosing Schedule
Inclusion and Exclusion
Criteria
Baseline patient Characteristics
Yoo D-H Arthritis
Rheum 2013191
Abstract & Publication
Good
See also Yoo D-H
Arthritis Rheum 2015 164 and Yoo D-H Ann
Rheum Dis 2016165
Celltrion Multicenter
Parallel-group
Double-blind
RCT
Phase I
24 weeks
The second course
of treatment was
initiated between
weeks 24 ~ 48
based on disease
activity and
predefined safety
criteria
Republic of
Korea
1) RTX-bio+MTX
(n=102)
2) RTX-ref+MTX
(n=51)
2 infusions (1000 mg,
iv each) of RTX
(n=51) with a 2-week
interval between
infusions, both co-
administered with
weekly MTX and folic
acid.
Diagnosis of RA
according to 1987 ACR
criteria for ≥6 mons prior
to randomization; active
disease as defined by the
presence of ≥6 swollen
joints and ≥6 tender
joints and either CRP
≥1.5 mg/dL or ESR≥28
mm/hr
Exclusion criteria:
Unresponsive or
intolerable to ≥2 biologic
agents; allergies or
hypersensitivity to
murine, chimeric,
human, or humanized
proteins; chronic
infection with hepatitis
B, hepatitis C, or HIV
Age, yrs
1) 49.8
2) 51.3
Female, %
1) 86.3
2) 90.2
White, %
1) 67.6
2) 68.6
Mean DAS28-CRP/ESR (SD)
1) 6.0 (0.9)/ 6.8 (0.8)
2) 6.0 (0.8)/ 6.7 (0.8)
Prior TNF-antagonists used, %
Group 1 Group 2
ADA 36.3 35.3
CTZ 2.9 3.9
ETN 29.4 37.3
GOL 11.8 5.9
IFX 31.4 37.3
Other* 2.9 2.0
*Investigational drug

©Institute for Clinical and Economic Review, 2017 Page 262 Draft Evidence Report: Targeted Immune Modulators for Rheumatoid Arthritis Return to Table of Contents
Table F2. Head-to-Head Trials Key Clinical Outcomes
Author & Year of
Publication
(Trial Name)
Interventions Treatment Response Disease Activity Structural Damage Function Laboratory
indices
Burmester G Ann
Rheum Dis 201618
MONARCH
1) ADA (n=185)
2) SAR (n=184)
Week 24 ACR20, n (%)
1) 108 (58.4)
2) 132 (71.7)
p=0.0074
Week 24 ACR50, n (%)
1) 55 (29.7)
2) 84 (45.7)
p=0.0017
Week 24 ACR70, n (%)
1) 22 (11.9)
2) 43 (23.4)
p=0.0036
Week 24 Mean change
from baseline (SD)
1) -2.2 (0.106)
2) -3.28 (0.105)
p<0.0001
Week 24 DAS28-ESR
<2.6 remission, n (%)
1) 13 (7)
2) 49 (26.6)
p<0.0001
Week 24 CDAI ≤2.8
remission, n (%)
1) 5 (2.7)
2) 13 (7.1)
p<0.05
NR Week 24 mean
change in HAQ-DI
(SD)
1) -0.43 (0.05)
2) -0.61 (0.05)
P=0.0037
NR

©Institute for Clinical and Economic Review, 2017 Page 263 Draft Evidence Report: Targeted Immune Modulators for Rheumatoid Arthritis Return to Table of Contents
Author & Year of
Publication
(Trial Name)
Interventions Treatment Response Disease Activity Structural Damage Function Laboratory
indices
Flouri I Seminars in
arthritis and
rheumatism 2014101
1) IFX (n=560)
2) ADA (n=435)
3) ETN (n=302)
Month 6 good EULAR
response, %
1) 20
2) 24
3) 19
Year 1 good EULAR
response, %
1) 26
2) 30
3) 24
Week 24/ Year 1
remission
DAS28, %
1) 13/15
2) 16/23
3) 16/19
P=0.587/0.098
CDAI, %
1) 5.7/7.8
2) 11/15
3) 9.8/6.6
P=0.061/0.022
SDAI, %
1) 5.6/7.6
2) 12/17
3) 11/8.3
P=0.024/0.009
NR NR NR
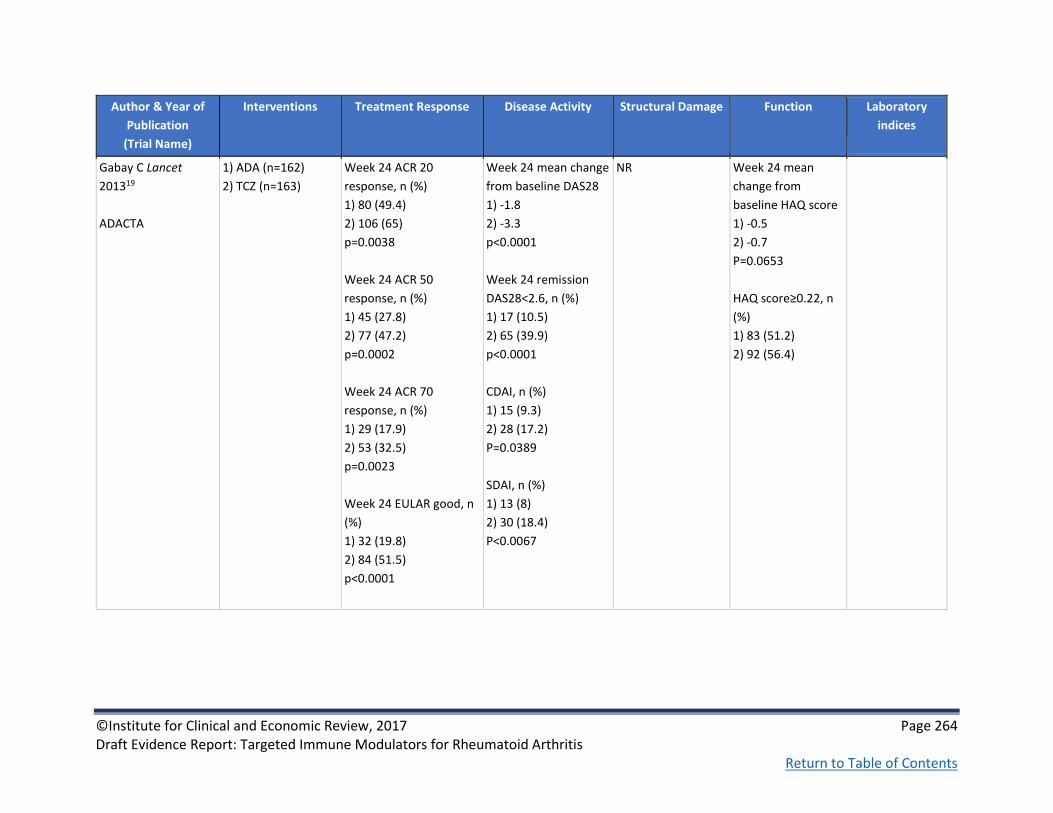
©Institute for Clinical and Economic Review, 2017 Page 264 Draft Evidence Report: Targeted Immune Modulators for Rheumatoid Arthritis Return to Table of Contents
Author & Year of
Publication
(Trial Name)
Interventions Treatment Response Disease Activity Structural Damage Function Laboratory
indices
Gabay C Lancet
201319
ADACTA
1) ADA (n=162)
2) TCZ (n=163)
Week 24 ACR 20
response, n (%)
1) 80 (49.4)
2) 106 (65)
p=0.0038
Week 24 ACR 50
response, n (%)
1) 45 (27.8)
2) 77 (47.2)
p=0.0002
Week 24 ACR 70
response, n (%)
1) 29 (17.9)
2) 53 (32.5)
p=0.0023
Week 24 EULAR good, n
(%)
1) 32 (19.8)
2) 84 (51.5)
p<0.0001
Week 24 mean change
from baseline DAS28
1) -1.8
2) -3.3
p<0.0001
Week 24 remission
DAS28<2.6, n (%)
1) 17 (10.5)
2) 65 (39.9)
p<0.0001
CDAI, n (%)
1) 15 (9.3)
2) 28 (17.2)
P=0.0389
SDAI, n (%)
1) 13 (8)
2) 30 (18.4)
P<0.0067
NR Week 24 mean
change from
baseline HAQ score
1) -0.5
2) -0.7
P=0.0653
HAQ score≥0.22, n
(%)
1) 83 (51.2)
2) 92 (56.4)
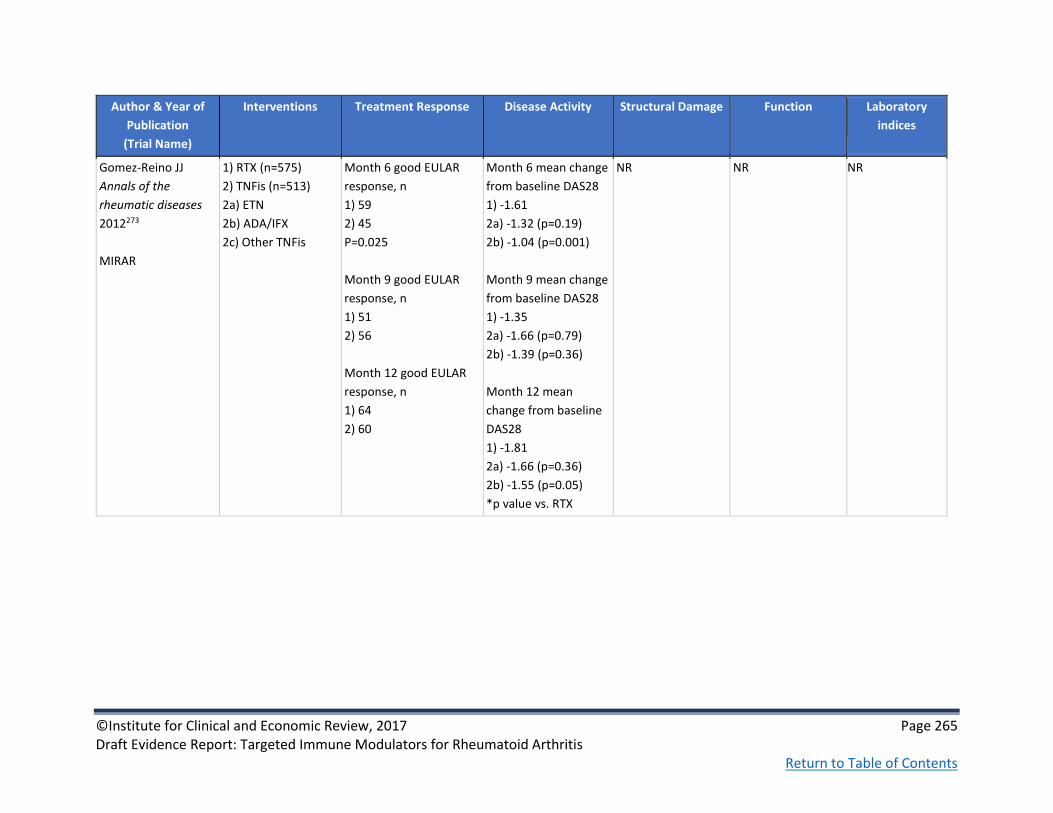
©Institute for Clinical and Economic Review, 2017 Page 265 Draft Evidence Report: Targeted Immune Modulators for Rheumatoid Arthritis Return to Table of Contents
Author & Year of
Publication
(Trial Name)
Interventions Treatment Response Disease Activity Structural Damage Function Laboratory
indices
Gomez-Reino JJ
Annals of the
rheumatic diseases
2012273
MIRAR
1) RTX (n=575)
2) TNFis (n=513)
2a) ETN
2b) ADA/IFX
2c) Other TNFis
Month 6 good EULAR
response, n
1) 59
2) 45
P=0.025
Month 9 good EULAR
response, n
1) 51
2) 56
Month 12 good EULAR
response, n
1) 64
2) 60
Month 6 mean change
from baseline DAS28
1) -1.61
2a) -1.32 (p=0.19)
2b) -1.04 (p=0.001)
Month 9 mean change
from baseline DAS28
1) -1.35
2a) -1.66 (p=0.79)
2b) -1.39 (p=0.36)
Month 12 mean
change from baseline
DAS28
1) -1.81
2a) -1.66 (p=0.36)
2b) -1.55 (p=0.05)
*p value vs. RTX
NR NR
NR

©Institute for Clinical and Economic Review, 2017 Page 266 Draft Evidence Report: Targeted Immune Modulators for Rheumatoid Arthritis Return to Table of Contents
Author & Year of
Publication
(Trial Name)
Interventions Treatment Response Disease Activity Structural Damage Function Laboratory
indices
Greenberg JD Annals
of the rheumatic
diseases 201299
CORRONA registry
Intervention (n=
biological naïve (BN)/
first time switchers
(FTS))
1) ADA (n=460/ 311)
2) ETN (n=480/139)
3) IFX (n=535/166)
Month 12 ACR20
responders (BN/FTS), %
1) 26.8/11.4
2) 31.5/22.6
3) 26.9/18.2
Month 12 ACR50
responders (BN/FTS), %
1) 17.4/ 8.3
2) 20.8/13.2
3) 20.3/10.6
Month 12 ACR70
responders (BN/FTS), %
1) 12.1/0.8
2) 11.8/5.7
3) 12.1/7.6
*All difference not
significant between
drugs
Month 12 DAS28-ESR
remission (BN/FTS), %
1) 33.3/10.5
2) 37.5/26.3
3) 33.8/25
*Difference was not
significant between
drugs
Month 12 CDAI
remission (BN/FTS), %
1) 12.9/4.4
2) 18.5/9.1
3) 17.1/15.3
*Differences not
significant between
drugs
NR NR NR

©Institute for Clinical and Economic Review, 2017 Page 267 Draft Evidence Report: Targeted Immune Modulators for Rheumatoid Arthritis Return to Table of Contents
Author & Year of
Publication
(Trial Name)
Interventions Treatment Response Disease Activity Structural Damage Function Laboratory
indices
Hetland ML Arthritis
and rheumatism
2010100
DANBIO registry
1) ADA (n=544)
2) ETN (n=425)
3) IFX (n=908)
ACR 50, %
Month 6
1) 45
2) 40
3) 31
Month 12
1) 53
2) 45
3) 38
P<0.0001
ACR 70, %
Month 6
1) 24
2) 21
3) 14
Month 12
1) 30
2) 27
3) 17
P<0.0001
Good EULAR response,
% Month 6/ month 12
1) 52/57
2) 42/49
3) 34/40
P<0.0001
DAS28 remission, %
Month 6
1) 32
2) 26
3)21
P<0.0001
Month 12
1) 39
2) 33
3) 27
P<0.0001
CDAI remission
Month 6
1) 18
2)13
3) 10
P=0.0001
Month 12
1) 25
2) 18
3) 16
P=0.0003
NR NR NR

©Institute for Clinical and Economic Review, 2017 Page 268 Draft Evidence Report: Targeted Immune Modulators for Rheumatoid Arthritis Return to Table of Contents
Author & Year of
Publication
(Trial Name)
Interventions Treatment Response Disease Activity Structural Damage Function Laboratory
indices
Jobanputra P BMJ
Open 201220
RED SEA
1) ADA + cDMARD
(n=60)
2) ETN + cDMARD
(n=60)
NR Month 12 DAS28,
median (IQR)
1) 3.5 (2.7-4.2)
2) 3.6 (3-4.4)
NR NR Month 12 CRP,
median (IQR)
1) 5 (3-12)
2) 7 (3-13)
Weinblatt ME
Arthritis and
rheumatism 201394
AMPLE
1) ABTsc+MTX
(n=318)
2) ADAsc+MTX
(n=328)
1 yr, % (95% CI)
ACR20
1) 64.8 (59.5 to 70.0)
2) 63.4 (58.2 to 68.6)
ACR50
1) 46.2 (40.7 to 51.7)
2) 46.0 (40.6 to 51.4)
ACR70
1) 29.2 (24.2 to 34.2)
2) 26.2 (21.5 to 31.0)
1 yr
Mean DAS28-CRP
(SEM)
1) -2.30 (0.08)
2) -2.27 (0.08)
% (95% CI)
DAS28-CRP≤3.2
1) 59.3 (53.5 to 65.1)
2) 61.4 (55.6 to 67.3)
Remission
DAS28-CRP<2.6
1) 43.3 (37.4 to 49.1)
2) 41.9 (36.0 to 47.9)
CDAI, % (95% CI)
1) 23.5 (18.5 to28.5)
2) 24.0 (18.8 to 29.1)
SDAI, % (95% CI)
1) 23.3 (18.3 to 28.3)
2) 24.8 (19.6 to 30)
1 yr mean change
from baseline mTSS
(Van der Heijde)
(SD)
1) 0.58 (3.22)
2) 0.38 (5)
1 yr mean change
from baseline
HAQ-DI (SEM)
1) -0.60 (0.04)
2) -0.59 (0.03)
Mean change
from baseline
(SD)
CRP
1) 0.80 (1.13)
2) 0.65 (1.21)
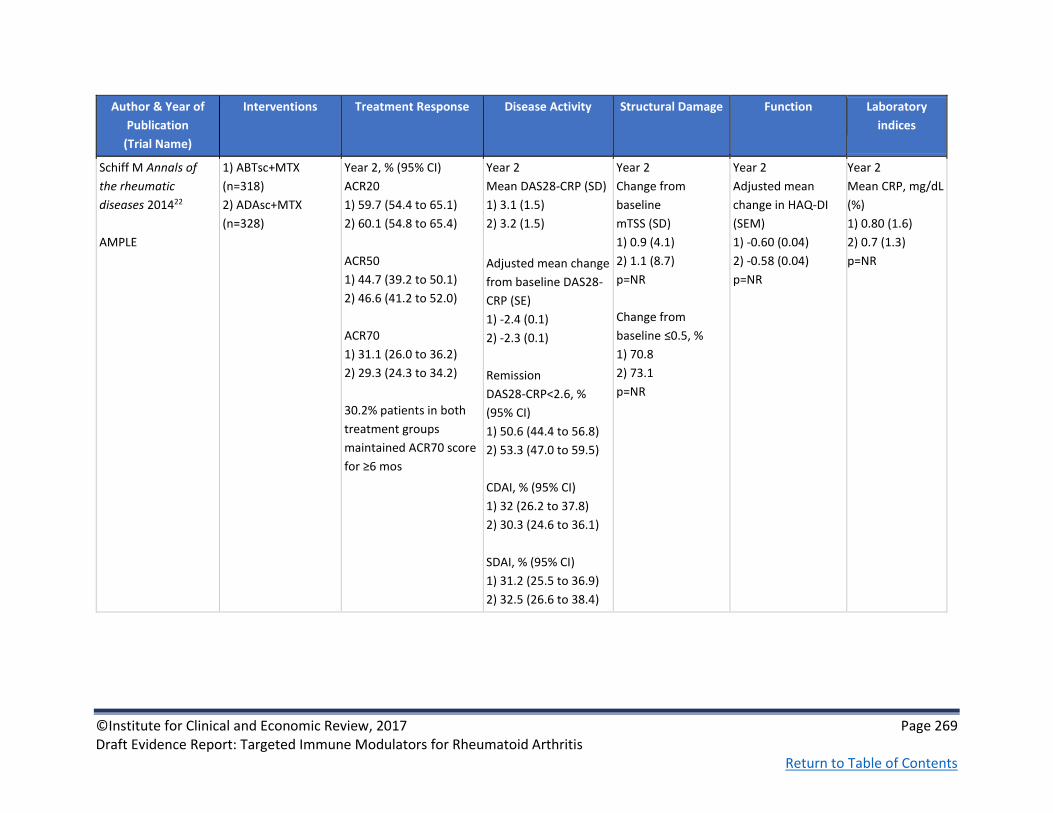
©Institute for Clinical and Economic Review, 2017 Page 269 Draft Evidence Report: Targeted Immune Modulators for Rheumatoid Arthritis Return to Table of Contents
Author & Year of
Publication
(Trial Name)
Interventions Treatment Response Disease Activity Structural Damage Function Laboratory
indices
Schiff M Annals of
the rheumatic
diseases 201422
AMPLE
1) ABTsc+MTX
(n=318)
2) ADAsc+MTX
(n=328)
Year 2, % (95% CI)
ACR20
1) 59.7 (54.4 to 65.1)
2) 60.1 (54.8 to 65.4)
ACR50
1) 44.7 (39.2 to 50.1)
2) 46.6 (41.2 to 52.0)
ACR70
1) 31.1 (26.0 to 36.2)
2) 29.3 (24.3 to 34.2)
30.2% patients in both
treatment groups
maintained ACR70 score
for ≥6 mos
Year 2
Mean DAS28-CRP (SD)
1) 3.1 (1.5)
2) 3.2 (1.5)
Adjusted mean change
from baseline DAS28-
CRP (SE)
1) -2.4 (0.1)
2) -2.3 (0.1)
Remission
DAS28-CRP<2.6, %
(95% CI)
1) 50.6 (44.4 to 56.8)
2) 53.3 (47.0 to 59.5)
CDAI, % (95% CI)
1) 32 (26.2 to 37.8)
2) 30.3 (24.6 to 36.1)
SDAI, % (95% CI)
1) 31.2 (25.5 to 36.9)
2) 32.5 (26.6 to 38.4)
Year 2
Change from
baseline
mTSS (SD)
1) 0.9 (4.1)
2) 1.1 (8.7)
p=NR
Change from
baseline ≤0.5, %
1) 70.8
2) 73.1
p=NR
Year 2
Adjusted mean
change in HAQ-DI
(SEM)
1) -0.60 (0.04)
2) -0.58 (0.04)
p=NR
Year 2
Mean CRP, mg/dL
(%)
1) 0.80 (1.6)
2) 0.7 (1.3)
p=NR

©Institute for Clinical and Economic Review, 2017 Page 270 Draft Evidence Report: Targeted Immune Modulators for Rheumatoid Arthritis Return to Table of Contents
Author & Year of
Publication
(Trial Name)
Interventions Treatment Response Disease Activity Structural Damage Function Laboratory
indices
Fleischmann R
Arthritis
Rheumatology
2016277
AMPLE
1) ABTsc+MTX
(n=318)
2) ADAsc+MTX
(n=328)
NR Year 2 remission
DAS28-CRP <2.6, n (%)
1) 70 (53)
2) 66 (52)
CDAI remission, n (%),
1) 48 (36.4)
2) 43 (34.1)
SDAI remission, n (%);
1) 47 (35.6)
2) 45 (35.7)
RAPID-3 remission, n
(%)
1) 46 (35.1)
2) 30 (24.6)
NR NR NR

©Institute for Clinical and Economic Review, 2017 Page 271 Draft Evidence Report: Targeted Immune Modulators for Rheumatoid Arthritis Return to Table of Contents
Author & Year of
Publication
(Trial Name)
Interventions Treatment Response Disease Activity Structural Damage Function Laboratory
indices
Schiff M Annals of
the rheumatic
diseases 200823
ATTEST
1) ABTiv+MTX
(n=156)
2) PBO+MTX (n=110)
3) IFX+MTX (n=165)*
*Group 3 switched to
ABT at Day 365
Day 197
ACR20, %
1) 66.7 (vs. 2: p<0.001)
2) 41.8
3) 59.4 (vs. 2: p=0.006)
ACR50, %
1) 40.4 (vs. 2: p<0.001)
2) 20.0
3) 37.0 (vs. 2: p=0.004)
ACR70, %
1) 20.5 (vs. 2 p=0.019)
2) 9.1
3) 24.2 (vs. 2: p=0.002)
Day 365
ACR20/50/70
1) 72.4/45.5/26.3
3) 55.8/36.4 /20.6
Diff. ACR20 16.7
95% CI (5.5 to 27.8)
Diff. ACR50 9.1
95% CI (-2.2 to 20.5)
Diff ACR70 5.7
95% CI (-4.2 to 15.6)
Adjusted mean change
from baseline DAS28-
ESR
Day 197
1) -2.53 (vs. 2:
p<0.001)
2) -1.48
3) -2.25 (vs. 2:
p<0.001)
Day 365
1) -2.88
3) -2.25
Est. of difference -0.62
95% CI (-0.96 to -0.29)
Remission DAS28-
ESR<2.6, %
Day 197
1) 11.3
2) 2.9
3) 12.8
Day 365
1) 18.7
3) 21.2
NR % with clinically
meaningful
improvement in
HAQ-DI
Month 6
1) 61.5 (vs. 2:
p=0.001)
2) 40.9
3) 58.8 (vs. 2:
p=0.005)
Day 365
1) 57.7
3) 52.7
Diff. 5.0
95% CI (-6.5 to 16.5)
NR

©Institute for Clinical and Economic Review, 2017 Page 272 Draft Evidence Report: Targeted Immune Modulators for Rheumatoid Arthritis Return to Table of Contents
Author & Year of
Publication
(Trial Name)
Interventions Treatment Response Disease Activity Structural Damage Function Laboratory
indices
Schiff M Annals of
the rheumatic
diseases 2011103
ATTEST
1) ABTiv+MTX
(n=156)
2) PBO+MTX (n=110)
3) IFX+MTX (n=165)*
*Group 3 switched to
ABT at Day 365
Year 2 responders
ACR20, %
1) 86.6
3) 84.3
ACR50, %
1) 60.7
3) 70.9
ACR70, %
1) 40.8
3) 44.9
Year 2
Mean DAS28-ESR
1) 3.5
3) 3.5
Remission
DAS28-ESR<2.6, %
(95% CI)
1) 26.1 (18.1 to 34.1)
3) 28.6 (20.7 to 36.5)
SDAI, % (95% CI)
1) 21.7 (14.2 to 29.3)
3) 24.6 (17.1 to 32.1)
NR
Year 2 mean change
from baseline
HAQ-DI
1) -0.83
3) -0.84
NR

©Institute for Clinical and Economic Review, 2017 Page 273 Draft Evidence Report: Targeted Immune Modulators for Rheumatoid Arthritis Return to Table of Contents
Author & Year of
Publication
(Trial Name)
Interventions Treatment Response Disease Activity Structural Damage Function Laboratory
indices
Smolen JS The Lancet
201666
EXXELERATE
1) CTZ + MTX
(n=454)
2) ADA + MTX
(n=454)
Week 12
ACR20, n (%)
1) 314 (69)
2) 324 (71)
Week 104, primary
responder population
ACR20, %
1) 64.9
2) 66.8
ACR50, %
1) 53.3
2) 56.8
ACR70, %
1) 39.7
2) 41.3
DAS28-ESR ≤3.2, n (%)
Week 24
1) 184 (41)
2) 166 (37)
Week 52
1) 189 (42)
2) 174 (38)
Week 104
1) 161 (35)
2) 152 (33)
P=0.532
NR Week 104
HAQ-DI mean
change from
baseline
1) -0.62
2) -0.72
NR

©Institute for Clinical and Economic Review, 2017 Page 274 Draft Evidence Report: Targeted Immune Modulators for Rheumatoid Arthritis Return to Table of Contents
Author & Year of
Publication
(Trial Name)
Interventions Treatment Response Disease Activity Structural Damage Function Laboratory
indices
Taylor PC N Engl J
Med 201797
See also Taylor P Arthritis and Rheumatology 201521
RA-BEAM
1) PBO + cDMARD
(n=488)
2) BAR + cDMARD
(n=487)
3) ADA + cDMARD
(n=330)
Week 24/52
ACR20, %
1) 37/NA
2) 74*ⱡ/71+
3) 66*/62
ACR50, %
1) 19/NA
2) 50*/56ⱡ
3) 46*/47
ACR70, %
1) 8/NA
2) 30*ⱡ/37
3) 22*/31
*p≤0.001 vs. PBO
+p≤0.01 vs. ADA
ⱡp≤0.05 vs. ADA
Week 24/52 remission
DAS28-CRP <2.6
1) 8/NA
2) 34*/40
3) 32*/39
DAS28-ESR <2.6
1) 5/NA
2) 18*/23
3) 18*/22
CDAI ≤2.8
1) 4/NA
2) 16*/22
3) 12*18
SDAI ≤3.3
1) 3/NA
2) 16*/23
3) 14*18
*p≤0.001 vs. PBO
ⱡp≤0.05 vs. ADA
Week 24 Change
from baseline
mTSS
1) 0.83
2) 0.38*
4) 0.31*
Week 52 Change
from baseline
mTSS
1) 1.80
2) 0.71*
3) 0.60*
p≤0.001 vs. PBO
24 weeks
HAQ-DI MCID ≥0.22
1) 45
2) 73*ⱡ
3) 64*
*p≤0.001 vs. PBO
ⱡp≤0.05 vs. ADA
52 weeks
HAQ-DI MCID ≥0.22
1) NA
2) 68
3) 58
p≤0.01
Week 24/52
Change from
baseline
CRP, mg/L
1) -2.94/NA
2) -15.13/-13.93
3) -11.69/-10.68
ESR, mm/h
1) -6.6/NA
2) -20.0/-19.6
3) -18.2/-17.3

©Institute for Clinical and Economic Review, 2017 Page 275 Draft Evidence Report: Targeted Immune Modulators for Rheumatoid Arthritis Return to Table of Contents
Author & Year of
Publication
(Trial Name)
Interventions Treatment Response Disease Activity Structural Damage Function Laboratory
indices
van Vollenhoven RF
The New England
journal of medicine
201295
ORAL Standard
1) PBO+MTX (n=108)
2) 5mg TOF+MTX
(n=204)
3) 40 ADA+MTX
(n=204)
Month 6
ACR20, n (%)
1) 30 (28.3)
2) 101 (51.5)
3) 94 (47.2)
Month 6
Remission
DAS28-ESR<2.6, n (%)
1) 1 (1.1)
2) 11 (6.2)
3) 12 (6.7)
NR Month 3 mean
change from
baseline
HAQ-DI
1) -0.24
2) -0.55
3) -0.49
NR
Biosimilar studies
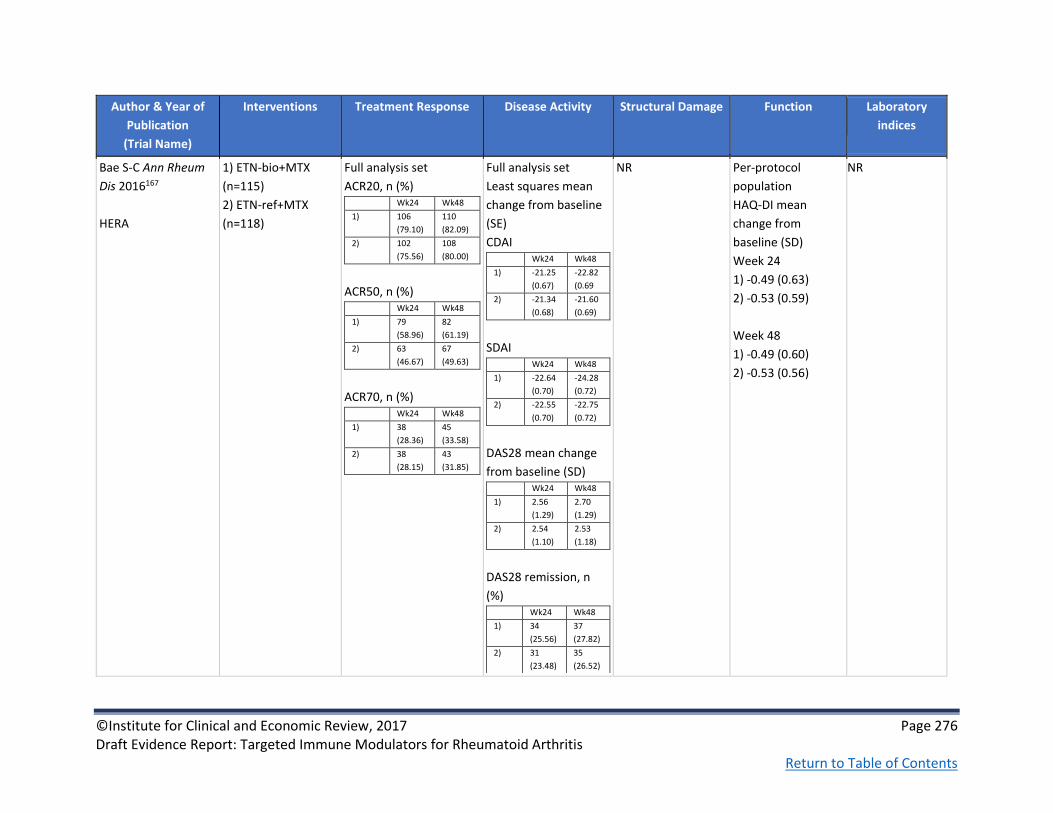
©Institute for Clinical and Economic Review, 2017 Page 276 Draft Evidence Report: Targeted Immune Modulators for Rheumatoid Arthritis Return to Table of Contents
Author & Year of
Publication
(Trial Name)
Interventions Treatment Response Disease Activity Structural Damage Function Laboratory
indices
Bae S-C Ann Rheum
Dis 2016167
HERA
1) ETN-bio+MTX
(n=115)
2) ETN-ref+MTX
(n=118)
Full analysis set
ACR20, n (%) Wk24 Wk48
1) 106
(79.10)
110
(82.09)
2) 102
(75.56)
108
(80.00)
ACR50, n (%) Wk24 Wk48
1) 79
(58.96)
82
(61.19)
2) 63
(46.67)
67
(49.63)
ACR70, n (%) Wk24 Wk48
1) 38
(28.36)
45
(33.58)
2) 38
(28.15)
43
(31.85)
Full analysis set
Least squares mean
change from baseline
(SE)
CDAI Wk24 Wk48
1) -21.25
(0.67)
-22.82
(0.69
2) -21.34
(0.68)
-21.60
(0.69)
SDAI Wk24 Wk48
1) -22.64
(0.70)
-24.28
(0.72)
2) -22.55
(0.70)
-22.75
(0.72)
DAS28 mean change
from baseline (SD) Wk24 Wk48
1) 2.56
(1.29)
2.70
(1.29)
2) 2.54
(1.10)
2.53
(1.18)
DAS28 remission, n
(%) Wk24 Wk48
1) 34
(25.56)
37
(27.82)
2) 31
(23.48)
35
(26.52)
NR Per-protocol
population
HAQ-DI mean
change from
baseline (SD)
Week 24
1) -0.49 (0.63)
2) -0.53 (0.59)
Week 48
1) -0.49 (0.60)
2) -0.53 (0.56)
NR

©Institute for Clinical and Economic Review, 2017 Page 277 Draft Evidence Report: Targeted Immune Modulators for Rheumatoid Arthritis Return to Table of Contents
Author & Year of
Publication
(Trial Name)
Interventions Treatment Response Disease Activity Structural Damage Function Laboratory
indices
Choe J-Y Ann Rheum
Dis 2015168
1) IFX-bio+MTX
(n=290)
2) IFX-ref+MTX
(n=293)
Week 30, full analysis
set
ACR20, n (%)
1) 161 (55.5)
2) 173 (59.0)
Treatment difference=
-2.95% (95% CI -10.88 to
4.97%)
ACR50, n (%)
1) 89 (30.7)
2) 99 (33.8)
Treatment difference= -
2.53% (95% CI -10.07%
to 5.00%)
ACR70, n (%)
1) 45 (15.5)
2) 50 (17.1)
Treatment difference =
-1.08% (95% CI -7.06% to
4.91%)
Week 30
Mean change from
baseline (SD)
DAS28-ESR
1) -2.3 (1.4)
2) -2.3 (1.5)
SDAI
1) -23.5 (14.1)
2) -23.6 (14.5)
CDAI
1) -23.3 (13.7)
2) -23.1 (14.2)
Remission DAS28-ESR,
%
1) 14.6
2) 15.9
Remission SDAI, %
1) 9.5
2) 10.9
NR
Week 30
Mean change from
baseline (SD)
HAQ-DI
1) -0.5 (0.6)
2) -0.5 (0.6)
Week 30
Mean change
from baseline
(SD)
CRP
1) -3.7 (21.6)
2) -5.2 (19.9)
ESR
1) -15.4 (19.8)
2) -15.5 (22.7)

©Institute for Clinical and Economic Review, 2017 Page 278 Draft Evidence Report: Targeted Immune Modulators for Rheumatoid Arthritis Return to Table of Contents
Author & Year of
Publication
(Trial Name)
Interventions Treatment Response Disease Activity Structural Damage Function Laboratory
indices
Choe J-Y Arthritis
Rheumatology
2015205
54-week results of
Choe J-Y Ann Rheum
Dis 2015168
1) IFX-bio+MTX
(n=290)
2) IFX-ref+MTX
(n=293)
Week 54
Full analysis set
ACR20, %
1) 50.7
2) 52.6
ACR50, %
1) 32.1
2) 29.7
ACR70, %
1) 18.3
2) 17.7
NR 54 week mean
change mTSS
1) 0.38
2) 0.37
NR NR
Cohen SB Arthritis
Rheumatology
2015193
1) ADA-bio+MTX
(n=264)
2) ADA-ref+MTX
(n=262)
Week 24
ACR20, n (%)
1) 194 (74.6)
2) 189 (72.4)
RR 1.039
90% CI (0.954-1.133)
ACR50, n (%)
1) 120 (49.2)
2) 131 (52.0)
ACR70, n (%)
1) 64 (26.0)
2) 58 (22.9)
NR NR NR NR

©Institute for Clinical and Economic Review, 2017 Page 279 Draft Evidence Report: Targeted Immune Modulators for Rheumatoid Arthritis Return to Table of Contents
Author & Year of
Publication
(Trial Name)
Interventions Treatment Response Disease Activity Structural Damage Function Laboratory
indices
Emery P Ann Rheum
Dis 2015195
1) ETN-bio+MTX
(n=299)
2) ETN-ref (n=297)
Full analysis set
Week 24
ACR20, n (%)
1) 220 (73.8)
2) 213 (71.7)
ACR50, n (%)
1) 128 (43.0)
2) 116 (39.1)
ACR70, n (%)
1) 69 (23.2)
2) 59 (19.9)
Full analysis set
Week 24
Mean change from
baseline DAS28-ESR
1) 2.6
2) 2.5
Remission DAS28-ESR
≤2.6, n (%)
1) 16.7
2) 16.2
NR NR NR
Matsumoto AK
Arthritis
Rheumatology
2015280
Secondary endpoints
from Cohen SB
Arthritis
Rheumatology
2015193
1) ADA-bio+MTX
(n=264)
2) ADA-ref+MTX
(n=262)
See Matsumoto AK
Arthritis Rheumatol
2015280
Week 24
ACR50 RR: 0.95
90% CI (0.819 to 1.097)
ACR70 RR: 1.13
90% CI (0.872 to 1.464)
Week 24
Difference in mean
change from baseline
in DAS28-CRP: -0.01
90% CI (-0.18 to 0.17)
NR NR NR

©Institute for Clinical and Economic Review, 2017 Page 280 Draft Evidence Report: Targeted Immune Modulators for Rheumatoid Arthritis Return to Table of Contents
Author & Year of
Publication
(Trial Name)
Interventions Treatment Response Disease Activity Structural Damage Function Laboratory
indices
Smolen J Arthritis
Rheumatol 2016279
At re-randomization,
weeks 54-78:
1) IFX/SB2 [IFX-bio]
(n=94)
2) IFX/IFX (n=101)
3) SB2/SB2 (n=201)
Week 78
ACR20, n/N (%)
1) 54/85 (63.5)
2) 64/93 (68.8)
3) 123/180 (68.3)
ACR50, n/N (%)
1) 32/85 (37.6)
2) 44/93 (47.3)
3) 73/180 (40.6)
ACR70, n/N (%)
1) 19/85 (22.4)
2) 29/93 (31.2)
3) 46/180 (25.6)
EULAR Good response,
%
1) 32.9
2) 34.4
3) 35.6
EULAR Moderate
response, %
1) 51.8
2) 50.5
3) 51.7
Week 78
DAS28-ESR change
from 54 week re-
randomization, mean
(SD)
1) -0.12 (1.36)
2) 0.12 (0.92)
3) 0.13 (0.96)
DAS28-ESR change
from Week 0 baseline,
mean (SD)
1) 2.52 (1.52)
2) 2.58 (1.56)
3) 2.62 (1.42)
NR NR NR
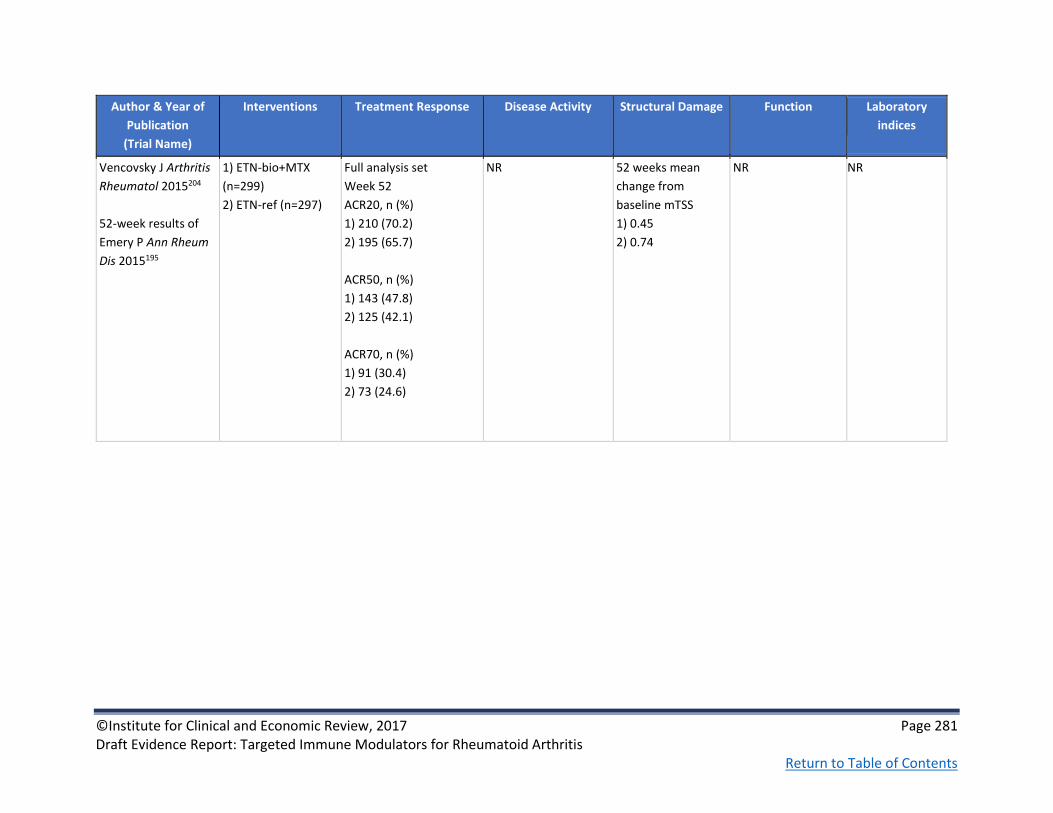
©Institute for Clinical and Economic Review, 2017 Page 281 Draft Evidence Report: Targeted Immune Modulators for Rheumatoid Arthritis Return to Table of Contents
Author & Year of
Publication
(Trial Name)
Interventions Treatment Response Disease Activity Structural Damage Function Laboratory
indices
Vencovsky J Arthritis
Rheumatol 2015204
52-week results of
Emery P Ann Rheum
Dis 2015195
1) ETN-bio+MTX
(n=299)
2) ETN-ref (n=297)
Full analysis set
Week 52
ACR20, n (%)
1) 210 (70.2)
2) 195 (65.7)
ACR50, n (%)
1) 143 (47.8)
2) 125 (42.1)
ACR70, n (%)
1) 91 (30.4)
2) 73 (24.6)
NR 52 weeks mean
change from
baseline mTSS
1) 0.45
2) 0.74
NR NR

©Institute for Clinical and Economic Review, 2017 Page 282 Draft Evidence Report: Targeted Immune Modulators for Rheumatoid Arthritis Return to Table of Contents
Author & Year of
Publication
(Trial Name)
Interventions Treatment Response Disease Activity Structural Damage Function Laboratory
indices
Jani RH Int J Rheum
Dis 2015192
1) ADA-bio+MTX
(n=60)
2) ADA-ref+MTX
(n=60)
Week 12
ACR20, n (%)
1) 47 (78.33)
2) 47 (79.66)
p=NS
ACR50, n (%)
1) 26 (43.33)
2) 26 (44.07)
p=NS
ACR70, n (%)
1) 8 (13.33)
2) 9 (15.25)
p=NS
Change from baseline
at week 12 (SD)
DAS28-CRP
1) -2.1 (1.05)
2) -2.1 (1.17)
DAS28-ESR
1) -2.0 (1.04)
2) -2.1 (1.11)
NR Change from
baseline at week 12
(SD)
HAQ-DI
1) -0.8 (0.61)
2) -0.8 (0.59)
Change from
baseline at week
12 (SD)
CRP
1) -5.8 (12.45)
2) 0.4 (26.38)
ESR
1) -9.0 (19.88)
2) 6.1 (16.98)
Kay J Ann Rheum
Dis 2014196
1) IFX-bio (n=127)
2) IFX-ref (n=62)
Week 16, ITT
ACR20 (%)
1) 85.0
2) 85.5
95% CI for difference
(-11.2% to 10.3%)
NR NR NR NR

©Institute for Clinical and Economic Review, 2017 Page 283 Draft Evidence Report: Targeted Immune Modulators for Rheumatoid Arthritis Return to Table of Contents
Author & Year of
Publication
(Trial Name)
Interventions Treatment Response Disease Activity Structural Damage Function Laboratory
indices
Kay J Ann Rheum Dis
2015281
1) IFX-bio (n=127)
2) IFX-ref (n=62)
No significant difference
in the proportion of
subjects achieving
ACR20, 50, or 70
responses between
treatment groups; these
remained stable
throughout the open
label phase
NR NR NR Wk 16 mean
change from
baseline
CRP, mg/L
1) -13.4
2) -16.48
ESR, mm/h
1) -26.5
2) -23.7
Open label phase,
mean change
from baseline to
wk 54
CRP: -13.9 mg/L
ESR: -24.1

©Institute for Clinical and Economic Review, 2017 Page 284 Draft Evidence Report: Targeted Immune Modulators for Rheumatoid Arthritis Return to Table of Contents
Author & Year of
Publication
(Trial Name)
Interventions Treatment Response Disease Activity Structural Damage Function Laboratory
indices
Takeuchi T Modern
Rheumatology
2015169
1) IFX-bio(n=50)
2) IFX-ref (n=51)
Week 30/week 54
ACR20, %
1) 78/64
2) 64.7/49
p=NS
Week 30/week 54
ACR50, %
1) 54/50
2)47.1/31.4
p=NS
Week 30/week 54
ACR70, %
1) 32/42
2) 27.5/13.7
Week 30 p=NS
Week 54 p=0.002
Week 30/week 54
Mean change from
baseline, DAS28-ESR
1) -2.142/-2.097
2) -1.961/-1.537
P=NS
Week 30/week 54
Mean change from
baseline, DAS28-CRP
1) -2.080/-2.077
2) -1.955/-1.431
Week 30 p =NS
Week 54 p=0.033
Week 30/week 54
Mean change from
baseline, CDAI
1) -17.55/-17.39
2) -17.08/-13.66
p =NS
NR Week 30
Mean change from
baseline, HAQ-DI
1) -0.47
2) -0.36
P=NS
Week 54
Mean change from
baseline, HAQ-DI
1) -0.54
2) -0.25
P=0.007

©Institute for Clinical and Economic Review, 2017 Page 285 Draft Evidence Report: Targeted Immune Modulators for Rheumatoid Arthritis Return to Table of Contents
Author & Year of
Publication
(Trial Name)
Interventions Treatment Response Disease Activity Structural Damage Function Laboratory
indices
Weinblatt ME
Arthritis Rheumatol
2015194
1) ADA-bio (n=271)
2) ADA-ref (n=273)
Per-protocol population
Week 24
ACR20, n (%)
1) 174 (75.2)
2) 170 (72.0)
ACR50, %
1) 38.3
2) 39.8
ACR70, %
1) 19.2
2) 20.3
NR NR NR NR

©Institute for Clinical and Economic Review, 2017 Page 286 Draft Evidence Report: Targeted Immune Modulators for Rheumatoid Arthritis Return to Table of Contents
Author & Year of
Publication
(Trial Name)
Interventions Treatment Response Disease Activity Structural Damage Function Laboratory
indices
Williams J Br J Clin
Pharmacol 2016166
1. PF-05280586
[RTX-bio] (n=71)
2. RTX-EU (n=72)
3. RTX-US (n=71)
24 weeks
ACR20, % (estimated
from graph):
1. 58
2. 60
3. 78
ACR50, % (estimate):
1. 23
2. 38
3. 33
ACR70, % (estimate):
1. 19
2. 18
3. 20
24 weeks
DAS-28 change from
baseline (estimated
from graph):
1. -1.9
2. -2
3. -2.2

©Institute for Clinical and Economic Review, 2017 Page 287 Draft Evidence Report: Targeted Immune Modulators for Rheumatoid Arthritis Return to Table of Contents
Author & Year of
Publication
(Trial Name)
Interventions Treatment Response Disease Activity Structural Damage Function Laboratory
indices
Yoo DH Ann Rheum
Dis 2013170
PLANETRA
1) IFX-bio+MTX
(n=302)
2) IFX-ref+MTX
(n=304)
Week 30
ACR20, n (%)
1) 184 (60.9)
2) 178 (58.6)
Treatment difference=
2% (95% CI: -6%-10%)
ACR50, n (%)
1) 106 (35.1)
2) 104 (34.2)
ACR70, n (%)
1) 50 (16.6)
2) 47 (15.5)
Week 30
Mean change from
baseline (SD)
CDAI
1) -25.2 (13.3)
2) -23.6 (13.0)
p=NS
SDAI
1) -25.8 (14.0)
2) -24.4 (13.6)
p=NS
DAS28-ESR Remission,
n (%)
1) 36 (15)
2) 27 (11)
DAS28-CRP Remission,
n (%)
1) 61 (25)
2) 56 (22)
NR Week 30 Mean
change from
baseline (SD)
HAQ
1) -0.6 (0.6)
2) -0.5 (0.6)
p=NS
Week 30 Mean
change from
baseline (SD)
CRP
1) -0.6 (2.0)
2) -0.8 (1.9)
p=NS

©Institute for Clinical and Economic Review, 2017 Page 288 Draft Evidence Report: Targeted Immune Modulators for Rheumatoid Arthritis Return to Table of Contents
Author & Year of
Publication
(Trial Name)
Interventions Treatment Response Disease Activity Structural Damage Function Laboratory
indices
Yoo D-H Arthritis Res
Ther 2016241
PLANETRA
54-week results
1) IFX-bio+MTX
(n=302)
2) IFX-ref+MTX
(n=304)
Week 54
ITT population
ACR20, %
1) 57.0
2) 52.0
ACR50, %
1) 33.1
2) 31.6
ACR70, %
1) 16.2
2) 15.2
Week 54
ITT population
Mean DAS28-ESR (SD)
1) 4.2
2) 4.2
DAS28-CRP (SD)
1) 3.6
2) 3.6
Mean SDAI (SD)
1) 15.7
2) 16.5
Mean CDAI (SD)
1) 14.8
2) 15.2
Week 54
Mean change from
baseline mTSS (SD)
1) 1.3 (9.3)
2) 0.7 (7.0)
p=NS
No radiographic
progression in
mTSS, n (%)
1) 153 (51.7)
2) 151 (51.4)
p=NS
Week 54 Mean
change from
baseline (SD)
HAQ estimate of
physical ability
1) -0.60 (0.61)
2) -0.52 (0.59)
NR
Yoo D-H Ann Rheum
Dis 2013282
PLANETRA
Additional 54-week
results
1) IFX-bio+MTX
(n=302)
2) IFX-ref+MTX
(n=304)
See Yoo D-H Arthritis Res
Ther 2016241
Week 54 DAS28-CRP
Remission, %
1) 26.4
2) 27.8
See Yoo D-H
Arthritis Res Ther
2016241
See Yoo D-H
Arthritis Res Ther
2016241
NR

©Institute for Clinical and Economic Review, 2017 Page 289 Draft Evidence Report: Targeted Immune Modulators for Rheumatoid Arthritis Return to Table of Contents
Author & Year of
Publication
(Trial Name)
Interventions Treatment Response Disease Activity Structural Damage Function Laboratory
indices
Yoo D Annals of the
Rheumatic Diseases
2016241
PLANETRA
1) IFX-bio-
maintenance group
(n=158)
2) IFX-bio-switch
group (n=144)
Week 102 ACR20, %
1) 71.7
2) 71.8
CI of differences (-10,10)
Week 102 ACR50, %
1) 48
2) 51.4
CI of differences (-15, 8)
Week 102 ACR70, %
1) 24.3
2) 26.1
CI of differences (-12, 8)
Week 102 mean
change from 52wks
DAS28-ESR
1) -2.60
2) -2.69
p=NS
Week 102 mean
change from 52wks
DAS28-CRP
1) -2.40
2) -2.48
p=NS
Week 102 DAS28
remission, % ESR/CRP
1) 13.8/27
2) 12.7/31.7
p=NS
CDAI remission
1) 11.8
2) 16.9
P=NS
NR Week 102 mean
change from
baseline HAQ-DI
1) -0.64
2) -0.63
p=NS

©Institute for Clinical and Economic Review, 2017 Page 290 Draft Evidence Report: Targeted Immune Modulators for Rheumatoid Arthritis Return to Table of Contents
Author & Year of
Publication
(Trial Name)
Interventions Treatment Response Disease Activity Structural Damage Function Laboratory
indices
Yoo D-H Arthritis
Rheum 2013191
1) RTX-bio+MTX
(n=103)
2) RTX-ref+MTX
(n=51)
Week 24
ACR20 (%)
1) 63.0
2) 66.7
ACR50 (%)
1) 37.0
2) 31.3
ACR70 (%)
1) 16.0
2) 14.6
NR NR NR NR

©Institute for Clinical and Economic Review, 2017 Page 291 Draft Evidence Report: Targeted Immune Modulators for Rheumatoid Arthritis Return to Table of Contents
Author & Year of
Publication
(Trial Name)
Interventions Treatment Response Disease Activity Structural Damage Function Laboratory
indices
Yoo D-H Arthritis
Rheum 2015164
1) RTX-bio+MTX
(n=103)
2) RTX-ref+MTX
(n=51)
NR Changes at Week 24
after 1st course
DAS28-CRP (SD)
1) -1.9 (1.2)
2) -2.0 (1.5)
DAS28-ESR (SD)
1) -2.1 (1.2)
2) -2.1 (1.5)
Changes at Week 24
after 2nd course
DAS28-CRP (SD)
1) -2.4 (1.3)
2) -2.0 (1.2)
DAS28-ESR (SD)
1) -2.5 (1.3)
2) -2.0 (1.2)
NR NR

©Institute for Clinical and Economic Review, 2017 Page 292 Draft Evidence Report: Targeted Immune Modulators for Rheumatoid Arthritis Return to Table of Contents
Author & Year of
Publication
(Trial Name)
Interventions Treatment Response Disease Activity Structural Damage Function Laboratory
indices
Yoo D-H Ann Rheum
Dis 2016165
ADDITIONAL 24
WEEK RESULTS
1) RTX-bio+MTX
(n=102)
2) RTX-ref+MTX
(n=51)
Week 24
Good or moderate
EULAR-ESR, %
1) 73.0
2) 70.9
Good or moderate
EULAR-CRP, %
1) 78.0
2) 75.0
Week 24
DAS28-ESR change
from baseline
1) -2.09
2) -2.21
DAS28-CRP change
from baseline
1) -1.98
2) -2.09
CDAI change from
baseline
1) -23.45
2) -23.23
SDAI change from
baseline
1) -24.29
2) -24.46
NR NR Week 24
Change in CRP
(mg/dL)
1) -0.8
2) -1.1

©Institute for Clinical and Economic Review, 2017 Page 293 Draft Evidence Report: Targeted Immune Modulators for Rheumatoid Arthritis Return to Table of Contents
Table F3. Head-to-Head Trials: Harms
Author & Year of Publication
(Trial Name)
Interventions Malignancies Infections Other Adverse
Events
Discontinuation, Serious AE
rate, Deaths
Baddley J Annals of the
rheumatic diseases 2014266
SABER
1) TNFi (n=24, 384)
1a) ADA (n=5,888)
1b) ETN (n=10,283)
1c) IFX (n=8,212)
2) cDMARD
(leflunomide,
sulfasalazine or
hydroxychloroquine)
(n=11,828)
Both TNFi and
cDMARD regimens
allowed the
concurrent use
(continuation or
addition) of MTX
NR Adjusted hazard of non-
viral opportunistic
infection, (95% CI) vs.
ETN
1a) 2.5 (0.9-7.3)
1b) ref
1c) 1.6 (0.8-3.1)
Adjusted hazard of non-
viral opportunistic
infection, (95% CI) vs.
cDMARD
1a) 2.8 (0.8-9.9)
1b) 1.7 (0.7-4.1)
1c) 1.7 (0.9-3.4)
*HR corrected for
baseline glucocorticoid
use.
NR NR

©Institute for Clinical and Economic Review, 2017 Page 294 Draft Evidence Report: Targeted Immune Modulators for Rheumatoid Arthritis Return to Table of Contents
Author & Year of Publication
(Trial Name)
Interventions Malignancies Infections Other Adverse
Events
Discontinuation, Serious AE
rate, Deaths
Burmester G Ann Rheum Dis
201618
MONARCH
1) ADA (n=185)
2) SAR (n=184)
Serious infection, n (%)
1) 2 (1.1)
2) 2 (1.1)
Serious AEs, n (%)
1) 12 (6.5)
2) 9 (4.9)
Discontinuation due to AEs, n
(%)
1) 13 (7.1)
2) 11 (6)
Death, n (%)
1) 0
2) 1 (0.5)
Chiu YM International journal
of rheumatic diseases
2014268
1) ETN (n=1,492)
2) ADA (n=746)
Incident rate ratio of
Lymphoma vs. ETN
1) ref
2) 1.49 (0.03-18.66)
Incident rate ratio of TB
cases vs. ETN
1) ref
2) 2.35 (1.29 -4.15)
Incident rate ratio of
serious bacterial
infection vs. ETN
1) ref
2) 1.83 (1.19-2.77)
NR NR

©Institute for Clinical and Economic Review, 2017 Page 295 Draft Evidence Report: Targeted Immune Modulators for Rheumatoid Arthritis Return to Table of Contents
Author & Year of Publication
(Trial Name)
Interventions Malignancies Infections Other Adverse
Events
Discontinuation, Serious AE
rate, Deaths
Curtis J Annals of the
Rheumatic Diseases 2016269
1) ABT (n=12,305)
2) RTX (n=5,078)
3) TNFi (n=42,850)
3a) ADA
3b) CTZ
3c) ETN
3d) GOL
3e) IFX
4) TOC (n=6,967)
5) TOF (n=2,526)
NR Adjusted hazard ratio of
Herpes zoster and
herpes simplex, (95%
CI) vs. ABT
1) ref
2) 0.98 (0.83-1.15)
3a) 0.89 (0.77-1.03)
3b) 1 (0.83-1.19)
3c) 0.86 (0.74-1)
3d) 1.01 (0.8-1.27)
3e) 1.06 (0.93-1.21)
4) 1.15 (0.99-1.34)
5) 1.4 (1.09-1.81)
NR NR
Curtis J Arthritis care &
research 2014270
1) ABT (n=451)
2) RTX (n=596)
3) ADA (n=1,885)
4) ETN (n=844)
5) IFX (n=382)
NR Adjusted hazard ratio of
hospitalized bacterial
infection, (95% CI) vs.
ETN
1) 1.1 (0.6-2.1)
2) 1.4 (0.8-2.6)
3) 1.4 (0.9-2.2)
4) ref
5) 2.3 (1.3-4)
NR NR
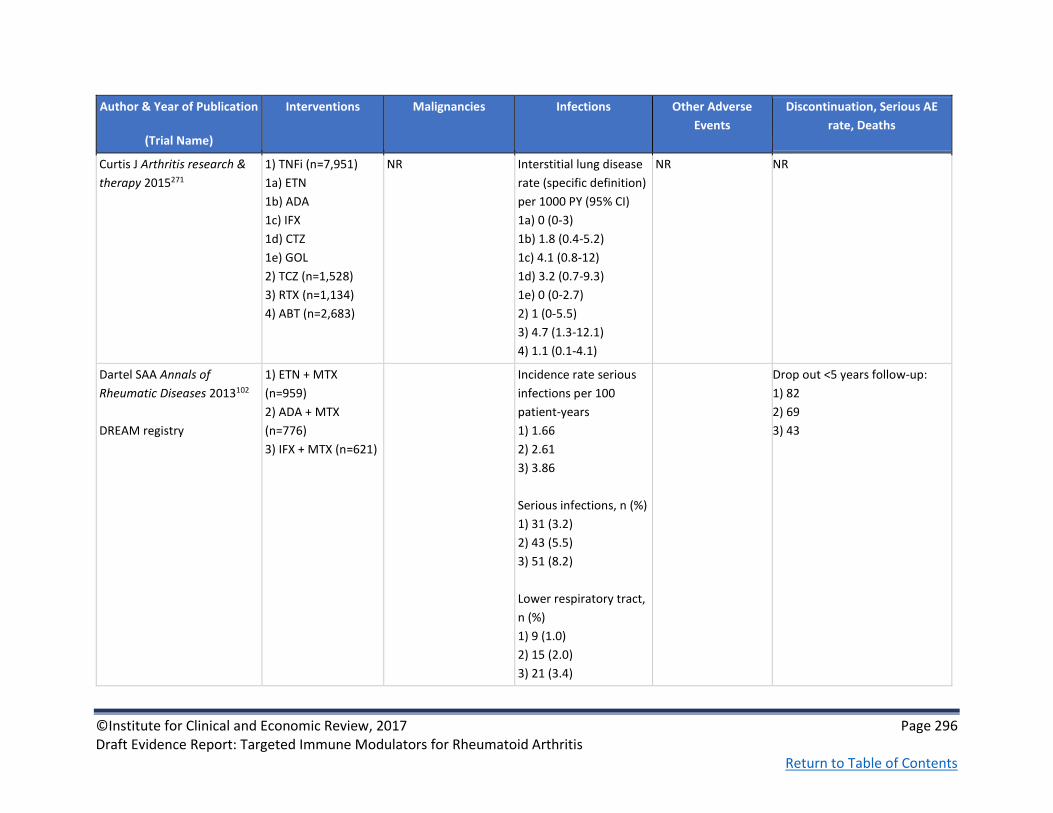
©Institute for Clinical and Economic Review, 2017 Page 296 Draft Evidence Report: Targeted Immune Modulators for Rheumatoid Arthritis Return to Table of Contents
Author & Year of Publication
(Trial Name)
Interventions Malignancies Infections Other Adverse
Events
Discontinuation, Serious AE
rate, Deaths
Curtis J Arthritis research &
therapy 2015271
1) TNFi (n=7,951)
1a) ETN
1b) ADA
1c) IFX
1d) CTZ
1e) GOL
2) TCZ (n=1,528)
3) RTX (n=1,134)
4) ABT (n=2,683)
NR Interstitial lung disease
rate (specific definition)
per 1000 PY (95% CI)
1a) 0 (0-3)
1b) 1.8 (0.4-5.2)
1c) 4.1 (0.8-12)
1d) 3.2 (0.7-9.3)
1e) 0 (0-2.7)
2) 1 (0-5.5)
3) 4.7 (1.3-12.1)
4) 1.1 (0.1-4.1)
NR NR
Dartel SAA Annals of
Rheumatic Diseases 2013102
DREAM registry
1) ETN + MTX
(n=959)
2) ADA + MTX
(n=776)
3) IFX + MTX (n=621)
Incidence rate serious
infections per 100
patient-years
1) 1.66
2) 2.61
3) 3.86
Serious infections, n (%)
1) 31 (3.2)
2) 43 (5.5)
3) 51 (8.2)
Lower respiratory tract,
n (%)
1) 9 (1.0)
2) 15 (2.0)
3) 21 (3.4)
Drop out <5 years follow-up:
1) 82
2) 69
3) 43

©Institute for Clinical and Economic Review, 2017 Page 297 Draft Evidence Report: Targeted Immune Modulators for Rheumatoid Arthritis Return to Table of Contents
Author & Year of Publication
(Trial Name)
Interventions Malignancies Infections Other Adverse
Events
Discontinuation, Serious AE
rate, Deaths
Gabay C Lancet 201319
ADACTA
1) ADA (n=163)
2) TCZ (n=162)
Malignancies, n (%)
1) 1 (1)
2) 0
Serious infection, n (%)
1) 5 (3)
2) 5 (3)
Stroke, n (%)
1) 1 (1)
2) 1 (1)
Myocardial
infarction, n (%)
1) 2 (1)
2) 2 (1)
Serious AE, n (%)
1) 16 (10)
2) 19 (12)
Death, n (%)
1) 0
2) 2 (1)
Galloway J Annals of the
rheumatic diseases 2011272
1) cDMARD
(n=3,673)
2) ETN (n=3,475)
3) IFX (n=3,475)
4) ADA (n=4,267)
NR Adjusted hazard ratio of
septic arthritis, (95%CI)
vs. cDMARD
1) ref
2) 2.5 (1.3-4.9)
3) 2.4 (1-5.8)
4) 1.9 (0.9-4)
NR NR

©Institute for Clinical and Economic Review, 2017 Page 298 Draft Evidence Report: Targeted Immune Modulators for Rheumatoid Arthritis Return to Table of Contents
Author & Year of Publication
(Trial Name)
Interventions Malignancies Infections Other Adverse
Events
Discontinuation, Serious AE
rate, Deaths
Grijalva CG JAMA 2011 274
1) TNFi (n=10,242)
1a) ETN (42.9%)
1b) IFX (37.3%)
1c) ADA (19.8%)
2) cDMARD
(leflunomide,
sulfasalazine or
hydroxychloroquine)
(n=10,082)
NR Adjusted hazard ratio of
serious infection,
(95%CI)
Vs Non-biologic DMARD
1a) 0.91 (0.76-1.08)
1b) 1.25 (1.07-1.48)
1c) 1.05 (0.85-1.3)
Adjusted hazard ratio of
serious infection,
(95%CI)
vs. ETN
1b) 1.26 (1.07-1.47)
1c) 1.05 (0.87-1.25)
IFX vs. ADA
1b) 1.23 (1.02-1.48)
NR NR

©Institute for Clinical and Economic Review, 2017 Page 299 Draft Evidence Report: Targeted Immune Modulators for Rheumatoid Arthritis Return to Table of Contents
Author & Year of Publication
(Trial Name)
Interventions Malignancies Infections Other Adverse
Events
Discontinuation, Serious AE
rate, Deaths
Harigai M Mod Rheumatol
2016275
1) ETN (n=7,698)
2) IFX (n=6,620)
3) TCZ (n=2,952)
4) ADA (n=2,277)
5) ABA (n=928)
6) GOL (n=200)
Non-hematopoietic
malignancies (NHM),
n=245
Malignant lymphoma
(ML), n=72
NHM/ML while taking
drug, n
1) 116/14
2) 64/37
3) 25/4
4) 18/3
NHM/ML if ever
exposed to drug, n
1) 152/26
2) 123/54
3) 32/9
4) 29/3
Prior use of biologics
at malignancy
diagnosis, ML/NHM, %
1) 19.4/46.5
2) 51.4/25.3
3) 5.6/9.4
4) 4.2/6.9
5) 4.2/0
6) 0/0.4
None: 15.3/11.4
NR NR NR

©Institute for Clinical and Economic Review, 2017 Page 300 Draft Evidence Report: Targeted Immune Modulators for Rheumatoid Arthritis Return to Table of Contents
Author & Year of Publication
(Trial Name)
Interventions Malignancies Infections Other Adverse
Events
Discontinuation, Serious AE
rate, Deaths
Jobanputra P BMJ Open
201220
RED SEA
1) ADA + cDMARD
(n=60)
2) ETN + cDMARD
(n=60)
Malignancy
1) 1
2) 1
Injection site
reactions
1) 9
2) 19
Serious AEs, n
1) 6
2) 7
Death, n
1) 2
2) 0
Johnston S Semin Arthritis
Rheum 2013276
1) ABT (n=870)
2) ADA (n=1378)
3) ETN (n=1026)
4) IFX (n=649)
5) RTX (n=409)
NR Adjusted hazard of
infection, (95% CI) vs.
RTX
1) 1.18 (0.98-1.41)
p=NS
2) 1.31 (1.10-1.56)
p<0.001
3) 1.44 (1.20-1.72)
p<0.05
4) 1.30 (1.07-1.57)
p<0.001
Adjusted hazard of
severe infection, (95%
CI) vs. RTX
1) 1.21 (0.78-NR)
2) 1.10 (0.72-1.68)
3) 1.27 (0.83-1.95)
4) 1.62 (1.03-2.55)
IFX vs. RTX p<0.05
p=NS for other
comparisons
NR NR

©Institute for Clinical and Economic Review, 2017 Page 301 Draft Evidence Report: Targeted Immune Modulators for Rheumatoid Arthritis Return to Table of Contents
Author & Year of Publication
(Trial Name)
Interventions Malignancies Infections Other Adverse
Events
Discontinuation, Serious AE
rate, Deaths
Schiff M Annals of the
rheumatic diseases 201422
AMPLE
1) ABTsc+MTX
(n=318)
2) ADAsc+MTX
(n=328)
Year 2
Malignancies, n (%)
1) 7 (2.2)
2) 7 (2.1)
1) (2 squamous cell
carcinomas of the skin,
1 diffuse large B cell
lymphoma, 1 acute
myeloid leukemia, 1
squamous cell
carcinoma of lung, 1
prostate cancer and 1
uterine cancer
2) 2 basal cell
carcinomas, 2
transitional cell
carcinomas, 1 breast
cancer, 1 malignant
melanoma and 1 small
cell lung cancer
Year 2
Infections and
infestations, n (%)
1) 12 (3.8)
2) 19 (5.8)
Serious infections, n (%)
1) 12 (3.8)
2) 19 (5.8)
Pneumonia, n (%)
1) 3 (0.9)
2) 4 (1.2)
Year 2
Local injection site
reactions, n (%)
1) 13 (4.1)
2) 34 (10.4)
Year 2
Discontinuation due to AEs, n
(%)
1) 12 (3.8)
2) 31 (9.5)
Serious AEs, n (%)
1) 44 (13.8)
2) 54 (16.5)
Deaths, n (%)
1) 1 (0.3)
2) 1 (0.3)

©Institute for Clinical and Economic Review, 2017 Page 302 Draft Evidence Report: Targeted Immune Modulators for Rheumatoid Arthritis Return to Table of Contents
Author & Year of Publication
(Trial Name)
Interventions Malignancies Infections Other Adverse
Events
Discontinuation, Serious AE
rate, Deaths
Schiff M Annals of the
rheumatic diseases 200823
ATTEST
1) ABTiv+MTX
(n=156)
2) PBO+MTX (n=110)
3) IFX+MTX (n=165)*
*Group 3 switched to
ABT at Day 365
PBO results from
days 1-197 only
Days 1-365
Malignant neoplasms,
n (%)
1) 1 (0.6)
3) 2 (1.2)
Days 1-365
Serious infections, n (%)
1) 3 (1.9)
3) 14 (8.5)
Days 1-365
Hypotension, n (%)
1) 0
3) 8 (4.8)
Days 1-365
Discontinuation due to AEs, n
(%)
1) 5 (3.2)
2) 0
3) 12 (7.3)
Serious Adverse events, n (%)
1) 15 (9.6)
2) 13 (11.8)
3) 30 (18.2)
Deaths, n (%)
1) 1 (0.6)
2) 0
3) 2 (1.2)

©Institute for Clinical and Economic Review, 2017 Page 303 Draft Evidence Report: Targeted Immune Modulators for Rheumatoid Arthritis Return to Table of Contents
Author & Year of Publication
(Trial Name)
Interventions Malignancies Infections Other Adverse
Events
Discontinuation, Serious AE
rate, Deaths
Schiff M Annals of the
rheumatic diseases 2011103
ATTEST
1) ABTiv+MTX
(n=156)
2) PBO+MTX (n=110)
3) IFX+MTX (n=156)*
*Group 3 switched to
ABT at Day 365
Cumulative 2-yr
study period (ABT,
n=399)
Two malignancies
(including basal cell
carcinoma in a patient
originally randomly
assigned to ABT, which
was possibly related to
treatment)
Incidence rate (95% CI)
Neoplasms: 2.7 (1.5 to
4.5)
Malignant neoplasms:
0.4 (0.0 to 1.3)
The most common
infections (≥10% of
patients) were
nasopharyngitis, urinary
tract infection, upper
respiratory tract
infection, influenza and
pharyngitis; and for
serious infections were
pneumonia and urinary
tract infection (three
patients each)
Cumulative 2-yr study period
(ABT, n=399)
Discontinuation due to AEs
during Yr 2, n: 7
Incidence rate (95% CI)
Serious AEs: 15.2 (12.0 to 19.0)
Deaths: 0.7 (0.2 to 1.8)

©Institute for Clinical and Economic Review, 2017 Page 304 Draft Evidence Report: Targeted Immune Modulators for Rheumatoid Arthritis Return to Table of Contents
Author & Year of Publication
(Trial Name)
Interventions Malignancies Infections Other Adverse
Events
Discontinuation, Serious AE
rate, Deaths
Smolen JS The Lancet 201666
EXXELERATE
1) CTZ + MTX
(n=454)
2) ADA + MTX
(n=454)
Week 104
All malignancies, n
1) 8
2) 7
Week 104
Infections and
infestations, incidence
rate:
1) 59.9
2) 59.1
Serious infections and
infestations, n (%)
1) 17 (3)
2) 16 (3)
Opportunistic infections
(excluding TB):
3 for each treatment
group
1 case of TB in ADA
group
Week 104
Serious treatment-emergent
AEs, n (%)
1) 67 (13)
2) 58 (11)
P=0.391
Discontinuation due to
treatment-emergent adverse
events, n (%)
1) 65 (13)
2) 63 (12)
Deaths: 3 in each treatment
group

©Institute for Clinical and Economic Review, 2017 Page 305 Draft Evidence Report: Targeted Immune Modulators for Rheumatoid Arthritis Return to Table of Contents
Author & Year of Publication
(Trial Name)
Interventions Malignancies Infections Other Adverse
Events
Discontinuation, Serious AE
rate, Deaths
Taylor PC N Engl J Med
201797
See also Taylor P Arthritis and Rheumatology 201521
RA-BEAM
1) PBO + cDMARD
(n=488)
2) BAR + cDMARD
(n=487)
3) ADA + cDMARD
(n=330)
Week 52, n (%)
1) 3 (<1)
2) 3 (<1) (Breast
cancer, squamous-cell
cancer, clear-cell renal
carcinoma)
3) 0
Week 52, n (%)
Any infection
1) 134 (27)*
2) 233 (48)
3) 145 (44)
Serious infection
1) 7 (1)*
2) 10 (2)
3) 5 (2)
Herpes zoster
1) 2 (<1)*
2) 11 (2)
3) 5 (2)
Tuberculosis
1) 0*
2) 0
3) 1 (<1)
*PBO arm reports 24
week data
Week 24
TEAEs (%)
1) 60
2) 70.8
3) 67.0
Week 0-24/0-52, n (%)
SAEs
1) 22 (5)/NA
2) 23 (5)/38 (8)
3) 6 (2)/13 (4)
Discontinuation due to AEs
1) 117 (3)/NA
2) 24 (5)/36 (7)
3) 7 (2)/13 (4)
Deaths, n
1) 1
2) 2
3) 1
1 additional death in a PBO
patient who received rescue
treatment with BAR

©Institute for Clinical and Economic Review, 2017 Page 306 Draft Evidence Report: Targeted Immune Modulators for Rheumatoid Arthritis Return to Table of Contents
Author & Year of Publication
(Trial Name)
Interventions Malignancies Infections Other Adverse
Events
Discontinuation, Serious AE
rate, Deaths
van Vollenhoven RF The New
England journal of medicine
201295
ORAL Standard
1) PBO+MTX (n=106)
2) TOF 5mg +MTX
(n=204)
3) ADA 40 +MTX
(n=204)
Neoplasm benign,
malignant, and
unspecified, including
cysts and polyps
1) 0
2) Salivary-gland
neoplasm, hair follicle
tumor benign,
metastatic renal-cell
carcinoma, non–small-
cell lung cancer
3) Non–small-cell lung
cancer
Serious infections, n (%)
Months 0-3, 3-6
1) 1 (0.9), 0
2) 3 (1.5), 2 (1.0)
3) 0, 2 (1.)
Months 6-12
1) 0 [PBOTOF 5]
2) 2 (1.0)
3) 1 (0.5)
0 cases of pulmonary
or extrapulmonary
tuberculosis or other
major opportunistic
infections
Discontinuation due to AEs, n
(%)
1) 3 (2.8)
2) 25 (12.3)
3) 23 (11.3)
1 (3.6) discontinuation PBO
TOF 5 mg
Serious AEs, n (%)
Months 0-3, 3-6
1) 2 (1.9), 2 (3.4)
2) 12 (5.9), 10 (4.9)
3) 5 (2.5), 6 (2.9)
Months 6-12
1) 1 (1.8) [PBOTOF 5]
2) 10 (4.9)
3) 7 (3.4)
Deaths, n
1) 0
2) 1
3) 1

©Institute for Clinical and Economic Review, 2017 Page 307 Draft Evidence Report: Targeted Immune Modulators for Rheumatoid Arthritis Return to Table of Contents
Author & Year of Publication
(Trial Name)
Interventions Malignancies Infections Other Adverse
Events
Discontinuation, Serious AE
rate, Deaths
Weinblatt ME Arthritis and
rheumatism 201394
AMPLE
1) ABTsc+MTX
(n=318)
2) ADAsc+MTX
(n=328)
Year 1
Malignancies, n (%)
1) 5 (1.6)
2) 4 (1.2)
Year 1
Infection, %
1) 63.2
2) 61.3
Serious infections, n (%)
1) 7 (2.2)
2) 9 (2.7
Year 1
Local injection site
reactions, n (%)
1) 12 (3.8)
2) 30 (9.1)
Year 1
Discontinuation due to AEs, n
(%)
1) 11 (3.5)
2) 20 (6.1)
Serious AEs, n (%)
1) 32 (10.1)
2) 30 (9.1)
Deaths, n
1) 1
2) 0

©Institute for Clinical and Economic Review, 2017 Page 308 Draft Evidence Report: Targeted Immune Modulators for Rheumatoid Arthritis Return to Table of Contents
Author & Year of Publication
(Trial Name)
Interventions Malignancies Infections Other Adverse
Events
Discontinuation, Serious AE
rate, Deaths
Yun H Arthritis &
Rheumatology 2016278
1) ADA (n=4,845)
2) CTZ (n=1,866)
3) ETN (n=3,814)
4) GOL (n=1,394)
5) IFX (n=3,944)
6) RTX (n=4,718)
7) TCZ (n=2,016)
8) ABT (n=9,204)
Overall incidence rate
hospitalized infections:
15.3/100 person-years
Total infections, n (%)
1) 397 (8.2)
2) 116 (6.2)
3) 336 (8.8)
4) 99 (7.1)
5) 472 (12.0)
6) 643 (13.6)
7) 134 (6.6)
8) 926 (10.1)
Upper respiratory tract
infection (URTI),
genitourinary tract
infection (GTI), %
Grp URTI GTI
1 31.7 26.5
2 30.2 29.3
3 31.3 26.2
4 32.3 35.4
5 35.2 24.4
6 35.9 21.8
7 32.1 22.4
8 29.9 28.8
Mortality during or within 30
days after hospitalization, %
1) 5.3
2) 7.8
3) 4.5
4) 4.0
5) 5.1
6) 4.5
7) 5.9
8) 5.7
Biosimilar studies

©Institute for Clinical and Economic Review, 2017 Page 309 Draft Evidence Report: Targeted Immune Modulators for Rheumatoid Arthritis Return to Table of Contents
Author & Year of Publication
(Trial Name)
Interventions Malignancies Infections Other Adverse
Events
Discontinuation, Serious AE
rate, Deaths
Bae S-C Ann Rheum Dis
2016167
HERA
1) ETN-bio+MTX
(n=115)
2) ETN-ref+MTX
(n=118)
NR Week 48
Infection, %
1) 37.4
2) 41.1
Latent tuberculosis, n
(%)
1) 14 (9.5)
2) 8 (5.5)
Week 48
Injection-site
reaction, n (%)
1) 3 (2.0)
2) 8 (5.5)
Upper abdominal
pain, n (%)
1) 9 (6.1)
2) 5 (3.4)
Nasopharyngitis, n
(%)
1) 22 (15.0)
2) 34 (23.3)
Week 48
Discontinuation due to AEs, n
(%)
1) 10 (6.8)
2) 11 (7.5)
Serious AEs, n (%)
1) 19 (12.9)
2) 18 (12.3)
Deaths, n (%)
1) 0
2) 2 (1.4) (cerebral hemorrhage
and acute renal failure/sepsis)
Choe J-Y Ann Rheum Dis
2015168
1) IFX-bio+MTX
(n=290)
2) IFX-ref+MTX
(n=293)
Week 30
Malignancy
1) 2 (prostate cancer
and breast cancer)
2) 0
Week 30
Serious infection or TB,
n (%)
1) 9 (3.1)
2) 6 (2.0)
4.1 cases/100 PY vs. 2.7
cases/100 PY
Active TB, n
1) 1
2) 1
Opportunistic
infections: 0
Week 30
TEAEs related to
study drug, %
1) 21.4
2) 20.1
Infusion related
reactions, n (%)
1) 15 (5.2)
2) 13 (4.4)
Week 30
Discontinuation due to AEs, n
(%)
1) 21 (7.2)
2) 10 (3.4)
Serious TEAEs, n (%)
1) 26 (9.0)
2) 26 (8.9)
Deaths, n
1) 0
2) 1 (heart failure)

©Institute for Clinical and Economic Review, 2017 Page 310 Draft Evidence Report: Targeted Immune Modulators for Rheumatoid Arthritis Return to Table of Contents
Author & Year of Publication
(Trial Name)
Interventions Malignancies Infections Other Adverse
Events
Discontinuation, Serious AE
rate, Deaths
Choe J-Y Arthritis Rheumatol
2015205
54-week results of Choe J-Y
Ann Rheum Dis 2015168
1) IFX-bio+MTX
(n=290)
2) IFX-ref+MTX
(n=293)
Week 54
Malignancy, n (%)
1) 2 (0.7)
2) 0
Week 54
Total infections, n (%)
1) 85 (29.3)
2) 110 (37.5)
Serious infections, n (%)
1) 9 (3.1)
2) 6 (2.0)
Tuberculosis, n (%)
1) 1 (0.3)
2) 1 (0.3)
Week 54
Infusion-related
reaction, n (%)
1) 17 (5.9)
2) 15 (5.1)
Week 54
Serious AEs, n (%)
1) 29 (10.0)
2) 31 (10.6)
Death, n (%)
1) 0
2) 1 (0.3)
Cohen SB Arthritis
Rheumatol 2015193
1) ADA-bio+MTX
(n=264)
2) ADA-ref+MTX
(n=262)
NR Week 26
Serious infections, %
1) 0.8
2) 1.1
Upper respiratory tract
infection, %
1) 1.5
2) 3.8
Week 26
Nasopharyngitis, %
1) 6.4
2) 7.3
Headache, %
1) 4.5
2) 4.2
Arthralgia, %
1) 3.0
2) 3.4
Week 26
Discontinuation due to AEs, %
1) 1.9
2) 0.8
Serious TEAEs, %
1) 3.8
2) 5.0

©Institute for Clinical and Economic Review, 2017 Page 311 Draft Evidence Report: Targeted Immune Modulators for Rheumatoid Arthritis Return to Table of Contents
Author & Year of Publication
(Trial Name)
Interventions Malignancies Infections Other Adverse
Events
Discontinuation, Serious AE
rate, Deaths
Emery P Ann Rheum Dis
2015195
1) ETN-bio+MTX
(n=299)
2) ETN-ref (n=297)
Week 24
Malignancies, n (%)
1) 3 (1.0) (basal cell
carcinoma, breast
cancer, lung cancer
metastatic)
2) 1 (0.3) (invasive
ductal breast
carcinoma)
Week 24
Serious infections, n (%)
1) 1 (0.3)
2) 4 (1.3)
Upper respiratory tract
infection, n (%)
1) 21 (7.0)
2) 15 (5.1)
Viral infection, n (%)
1) 7 (2.3)
2) 5 (1.7)
Week 24
TEAEs related to
study drug, n (%)
1) 83 (27.8)
2) 106 (35.7)
Injection site
erythema, n (%)
1) 6 (2.0)
2) 33 (11.1)
Injection site rash, n
(%)
1) 2 (0.7)
2) 6 (2.0)
Injection site
reaction, n (%)
1) 1 (0.3)
2) 7 (2.4)
Week 24
Discontinuation due to TEAEs, n
(%)
1) 15 (5.0)
2) 19 (6.4)
Serious TEAEs, n (%)
1) 13
2) 13
Deaths, n
1) 1 (cardiorespiratory failure)
2) 0
Vencovsky J Arthritis
Rheumatol 2015204
52-week results of Emery P
Ann Rheum Dis 2015195
1) ETN-bio+MTX
(n=299)
2) ETN-ref (n=297)
Malignancy, n (%)
1) 4 (1.3)
2) 1 (0.3)
Serious infections, n (%)
1) 1 (0.3)
2) 5 (1.7)
Tuberculosis: 0
Injection site
reactions, n (%)
1) 11 (3.7)
2) 52 (17.5)
Serious AEs, n (%)
1) 18 (6.0)
2) 15 (5.1)
Death, n (%)
1) 2 (0.7)
2) 0

©Institute for Clinical and Economic Review, 2017 Page 312 Draft Evidence Report: Targeted Immune Modulators for Rheumatoid Arthritis Return to Table of Contents
Author & Year of Publication
(Trial Name)
Interventions Malignancies Infections Other Adverse
Events
Discontinuation, Serious AE
rate, Deaths
Jani RH Int J Rheum Dis
2015192
1) ADA-bio+MTX
(n=60)
2) ADA-ref+MTX
(n=60)
NR NR Week 12
Pyrexia, headache
and cough were
commonly
reported in both
treatment groups
Week 12
Discontinuation due to AEs, n
1) 2
2) 0
Serious AEs, n
1) 2
2) 1
Kay J Ann Rheum Dis 2014196 1) IFX-bio (n=127)
2) IFX-ref (n=62)
NR Week 16
Infectious AEs, %
1) 15.8
2) 9.7
p=NS
Week 16
TEAEs, %
1) 43.3
2) 50.0
Takeuchi T Modern
Rheumatology 2015169
1) IFX-bio (n=50)
2) IFX-ref (n=51)
Week 54
Serious infection, n
1) 5
2) 3
Week 54
Infusion reaction
1) 2
2) 2
Week 54
Serious AEs, n (%)
1) 8 (15.7)
2) 8 (15.1)
Discontinuation due to AEs, n
(%)
1) 9 (17.6)
2) 6 (11.3)

©Institute for Clinical and Economic Review, 2017 Page 313 Draft Evidence Report: Targeted Immune Modulators for Rheumatoid Arthritis Return to Table of Contents
Author & Year of Publication
(Trial Name)
Interventions Malignancies Infections Other Adverse
Events
Discontinuation, Serious AE
rate, Deaths
Weinblatt ME Arthritis
Rheumatol 2015194
1) ADA-bio (n=271)
2) ADA-ref (n=273)
Week 24
Malignancy, n (%)
1) 0
2) 2 (0.7)
Week 24
Serious infection, n (%)
1) 1 (0.3)
2) 2 (0.7)
Tuberculosis: 0
Week 24
Injection site
reactions, n (%)
1) 8 (3.0)
2) 8 (2.9)
Week 24
Serious TEAEs, n (%)
1) 3 (1.1)
2) 7 (2.6)
Death, n (%)
1) 0
2) 2 (0.7)
Yoo D-H Ann Rheum Dis 2013 170
PLANETRA
1) IFX-bio+MTX
(n=302)
2) IFX-ref+MTX
(n=304)
Week 30
2 patients in IFX-ref
group withdrawn due
to malignancy (breast
cancer, cervix
carcinoma)
Week 30
Latent TB related to
study treatment, n
1) 13
2) 14
Urinary tract infection
1) 4 91.3)
2) 7 (2.3)
Week 30
Increased ALT, n
1) 12
2) 11
Increased AST, n
1) 8
2) 8
Infusion-related
reactions, n (%)
1) 20 (6.6)
2) 25 (8.3)
Week 30
Discontinuation due to AEs, n
(%)
1) 28 (9)
2) 26 (9)
Serious TEAEs, n (%)
1) 30 (10)
2) 21 (7)
Deaths: 0

©Institute for Clinical and Economic Review, 2017 Page 314 Draft Evidence Report: Targeted Immune Modulators for Rheumatoid Arthritis Return to Table of Contents
Author & Year of Publication
(Trial Name)
Interventions Malignancies Infections Other Adverse
Events
Discontinuation, Serious AE
rate, Deaths
Yoo D-H Arthritis Res Ther
2016241
PLANETRA
54-week results
1) IFX-bio+MTX
(n=302)
2) IFX-ref+MTX
(n=304)
Malignancies
1) 2 (Breast cancer,
ovarian cancer)
2) 1 (renal neoplasm)
Upper respiratory tract
infection, n (%)
1) 23 (7.6)
2) 14 (4.7)
Urinary tract infection,
n (%)
1) 9 (3.0)
2) 11 (3.7)
Latent TB, n (%)
1) 22 (7.3)
2) 20 (6.7)
Active TB, n (%)
1) 3 (1)
2) 0
TEAEs related to
study drug, n (%)
1) 132 (43.7)
2) 135 (45.0)
Infusion-related
reaction, n (%)
1) 30 (9.9)
2) 43 (14.3)
Abnormal liver
function test, n (%)
1) 22 (7.3)
2) 14 (4.7)
Discontinuation due to AEs, n
(%)
1) 33 (10.9)
2) 47 (15.7)
Serious TEAEs, n (%)
1) 42 (13.9)
2) 31 (10.3)
Deaths, n
1) 0
2) 1
Yoo D-H Annals of the
Rheumatic Diseases 2016241
PLANETRA
1) IFX-bio-
maintenance group
(n=158)
2) IFX-bio-switch
group (n=144)
No TB cases during
extension study.
Latent TB, n (%)
1) 9 (5.7)
2) 4 (2.8)
Infusion-related
reaction, n (%)
1) 11 (6.9)
2) 4 (2.8)
Serious AEs, n (%)
1) 12 (7.5)
2) 13 (9.1)
Discontinuation due to AEs, n
(%)
1) 16 (10.1)
2) 8 (5.6)
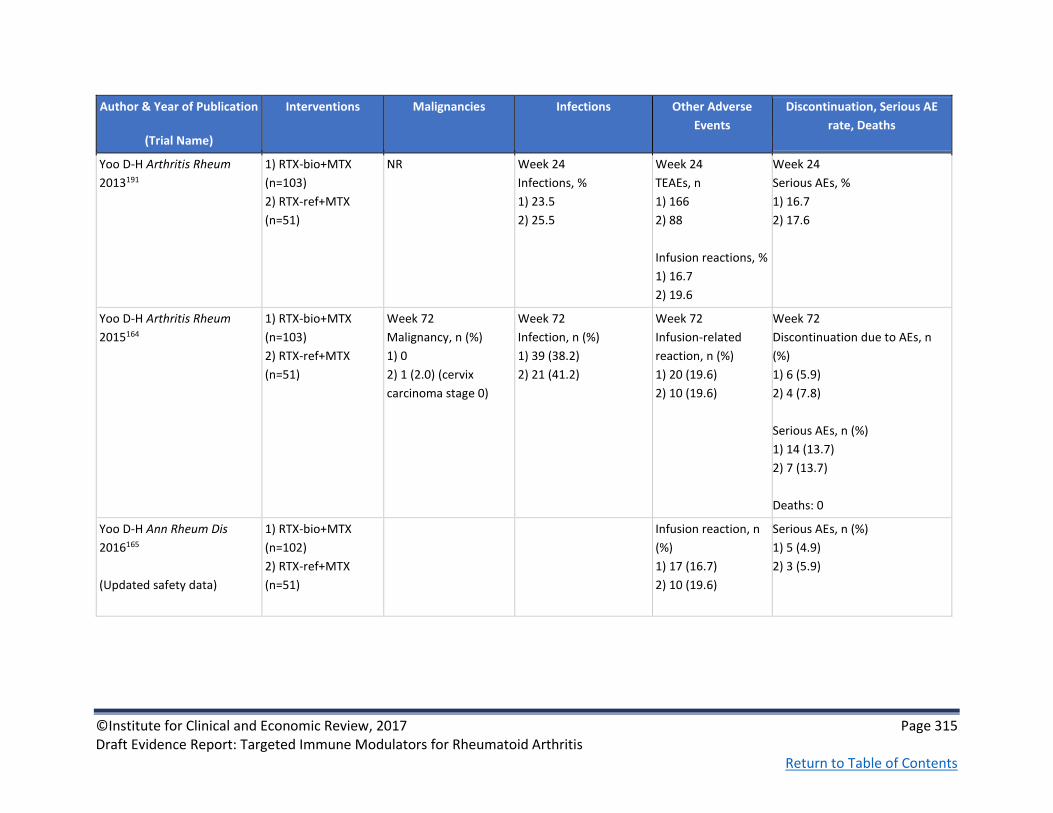
©Institute for Clinical and Economic Review, 2017 Page 315 Draft Evidence Report: Targeted Immune Modulators for Rheumatoid Arthritis Return to Table of Contents
Author & Year of Publication
(Trial Name)
Interventions Malignancies Infections Other Adverse
Events
Discontinuation, Serious AE
rate, Deaths
Yoo D-H Arthritis Rheum
2013191
1) RTX-bio+MTX
(n=103)
2) RTX-ref+MTX
(n=51)
NR Week 24
Infections, %
1) 23.5
2) 25.5
Week 24
TEAEs, n
1) 166
2) 88
Infusion reactions, %
1) 16.7
2) 19.6
Week 24
Serious AEs, %
1) 16.7
2) 17.6
Yoo D-H Arthritis Rheum
2015164
1) RTX-bio+MTX
(n=103)
2) RTX-ref+MTX
(n=51)
Week 72
Malignancy, n (%)
1) 0
2) 1 (2.0) (cervix
carcinoma stage 0)
Week 72
Infection, n (%)
1) 39 (38.2)
2) 21 (41.2)
Week 72
Infusion-related
reaction, n (%)
1) 20 (19.6)
2) 10 (19.6)
Week 72
Discontinuation due to AEs, n
(%)
1) 6 (5.9)
2) 4 (7.8)
Serious AEs, n (%)
1) 14 (13.7)
2) 7 (13.7)
Deaths: 0
Yoo D-H Ann Rheum Dis
2016165
(Updated safety data)
1) RTX-bio+MTX
(n=102)
2) RTX-ref+MTX
(n=51)
Infusion reaction, n
(%)
1) 17 (16.7)
2) 10 (19.6)
Serious AEs, n (%)
1) 5 (4.9)
2) 3 (5.9)

©Institute for Clinical and Economic Review, 2017 Page 316 Draft Evidence Report: Targeted Immune Modulators for Rheumatoid Arthritis Return to Table of Contents
Table F4. Head-to-Head Trials: Patient-reported Outcomes
Author & Year of
Publication
(Trial Name)
Interventions Health-related quality of
life
Pain Fatigue & other PROs
Burmester G Ann Rheum
Dis 201618
MONARCH
1) ADA (n=185)
2) SAR (n=184)
Week 24 mean change
from baseline SF-36 (SD)
PCS
1) 6.1 (0.6)
2) 8.7 (0.6)
P=0.0006
Week 24 mean change
from baseline SF-36 (SD)
MCS
1) 6.8 (0.8)
2) 7.9 (0.8)
P=NS
NR Week 24 mean change from baseline FACIT-
Fatigue
1) 8.4 (0.7)
2) 10.2 (0.7)
p=NS

©Institute for Clinical and Economic Review, 2017 Page 317 Draft Evidence Report: Targeted Immune Modulators for Rheumatoid Arthritis Return to Table of Contents
Author & Year of
Publication
(Trial Name)
Interventions Health-related quality of
life
Pain Fatigue & other PROs
Chen J Arthritis care &
research 2014267
1) ETN (n=1,243)
2) ADA (n=863)
3) IFX (n=159)
Linear regression
modeling used to
evaluate outcomes
After adjusting for some
baseline characteristics
and using etanercept as
reference group
SF-36 PCS
2) 0.15, p=NS
3) 0.69
SF-36 MCS
2) -1.17, p=0.001
3) -0.78, p=NS
AQoL
2) -0.012, p=NS
3) -0.012, p=NS
HAQ-DI
2) 0.028, p=NS
3) 0.069, p=NS
NR Subsequent vs. first time use, coefficient
SF-36 PCS
1) -1.84, p=0.007
2) -1.47, p=0.02
3) -2.51, p=NS
SF-36 MCS
1) 0.34, p=NS
2) -0.05, p=NS
3) 0.81, p=NS
AQoL
1) -0.026, p=NS
2) -0.035, p=0.02
3)-0.036, p=0.32
HAQ-DI
1) 0.013, p=NS
2) 0.121, p=0.006
3) 0.241, p=0.03

©Institute for Clinical and Economic Review, 2017 Page 318 Draft Evidence Report: Targeted Immune Modulators for Rheumatoid Arthritis Return to Table of Contents
Author & Year of
Publication
(Trial Name)
Interventions Health-related quality of
life
Pain Fatigue & other PROs
Schiff M Annals of the
rheumatic diseases 200823
ATTEST
1) ABTiv+MTX (n=156)
2) PBO+MTX (n=110)
3) IFX+MTX (n=165)*
*Group 3 switched to
ABT at Day 365
PBO results from days
1-197 only
Day 365
Change from baseline SF-
36
PCS
1) ~9
3) ~7
Imputed from chart
Diff. 1.93
95% CI (0.02 to 3.84)
MCS
1) ~6
2) ~4
Diff. 1.92
95% CI (-0.30 to 4.15)
all eight
subscales numerically
higher with ABT vs
IFX
NR NR

©Institute for Clinical and Economic Review, 2017 Page 319 Draft Evidence Report: Targeted Immune Modulators for Rheumatoid Arthritis Return to Table of Contents
Author & Year of
Publication
(Trial Name)
Interventions Health-related quality of
life
Pain Fatigue & other PROs
Jobanputra P BMJ Open
201220
RED SEA
1) ADA + cDMARD
(n=60)
2) ETN + cDMARD
(n=60)
EQ5D utility score
1) 0.69 (0.59-0.76)
2) 0.64 (0.52-0.8)
NR Month 12 patient global assessment (0-100)
1) 25 (15-50)
2) 34 (20-50)
Treatment satisfaction score
a) Global
1) 92
2) 92
b) Effectiveness
1) 83
2) 83
c) Side effects
1) 100
2) 100
d) Convenience
1) 83
2) 89
Weinblatt ME Arthritis
and rheumatism 201394
AMPLE
1) ABTsc+MTX
(n=318)
2) ADAsc+MTX
(n=328)
1-yr mean change from
baseline
RAPID-3, (95% CI)
1) -2.87 (-3.10 to -2.63)
2) -2.74 (-2.98 to -2.51)
1-yr mean change from baseline
100-mm VAS patient assessment of fatigue
severity
1) -23.2
2) -21.4

©Institute for Clinical and Economic Review, 2017 Page 320 Draft Evidence Report: Targeted Immune Modulators for Rheumatoid Arthritis Return to Table of Contents
Author & Year of
Publication
(Trial Name)
Interventions Health-related quality of
life
Pain Fatigue & other PROs
Schiff M Annals of the
rheumatic diseases 201422
AMPLE
1) ABTsc+MTX
(n=318)
2) ADAsc+MTX (n=328
Year 2
Adjusted mean
improvement in
patient pain (SEM)
1) 53.5 (6.2)
2) 38.5 (6.1)
Adjusted difference
15.2 (-1.2, 31.6)
Strand V Rheumatology
2016 96
ORAL standard
1) PBO+MTX TOF
5mg (n=56) or 10mg
(n=52)
2) TOF 5mg +MTX
(n=204)
3) ADA+MTX (n=204)
4) TOF 10mg +MTX
(n=201)
Month 3
LSM (SE) change from
baseline
PCS change (SE)
1) 3.17 (0.70)
2) 6.98 (0.52)
3) 7.81 (0.52)
p<0.0001 for 2-3
4) 6.26 (0.52) p<0.001 for
4
MCS change (SE)
1) 1.77 (0.88)
2) 3.16 (0.66)
3) 6.09 (0.66) p<0.0001
for 3
4) 3.38 (0.65)
Month 3
LSM (SE) pain change
from baseline
1) -9.50 (2.19)
2) -26.74 (1.63)
3) -27.82 (1.64)
4) -22.49 (1.62)
p<0.0001 for 2-4
Month 3
LSM (SE) FACIT-F change from baseline
1) 1.57 (0.79)
2) 5.85 (0.59)
3) 6.88 (0.59)
p<0.0001 for 2-3
4) 5.04 (0.58)
p<0.001 for 4

©Institute for Clinical and Economic Review, 2017 Page 321 Draft Evidence Report: Targeted Immune Modulators for Rheumatoid Arthritis Return to Table of Contents
Author & Year of
Publication
(Trial Name)
Interventions Health-related quality of
life
Pain Fatigue & other PROs
Fleischmann R Arthritis
care & research 2016226
AMPLE
See Schiff M Annals of the
rheumatic diseases 2014
1) ABTsc+MTX
(n=318)
2) ADAsc+MTX
(n=328)
@ year 2
VAS, 0-100mm
1) -23.4
2) -21.6
p=NR
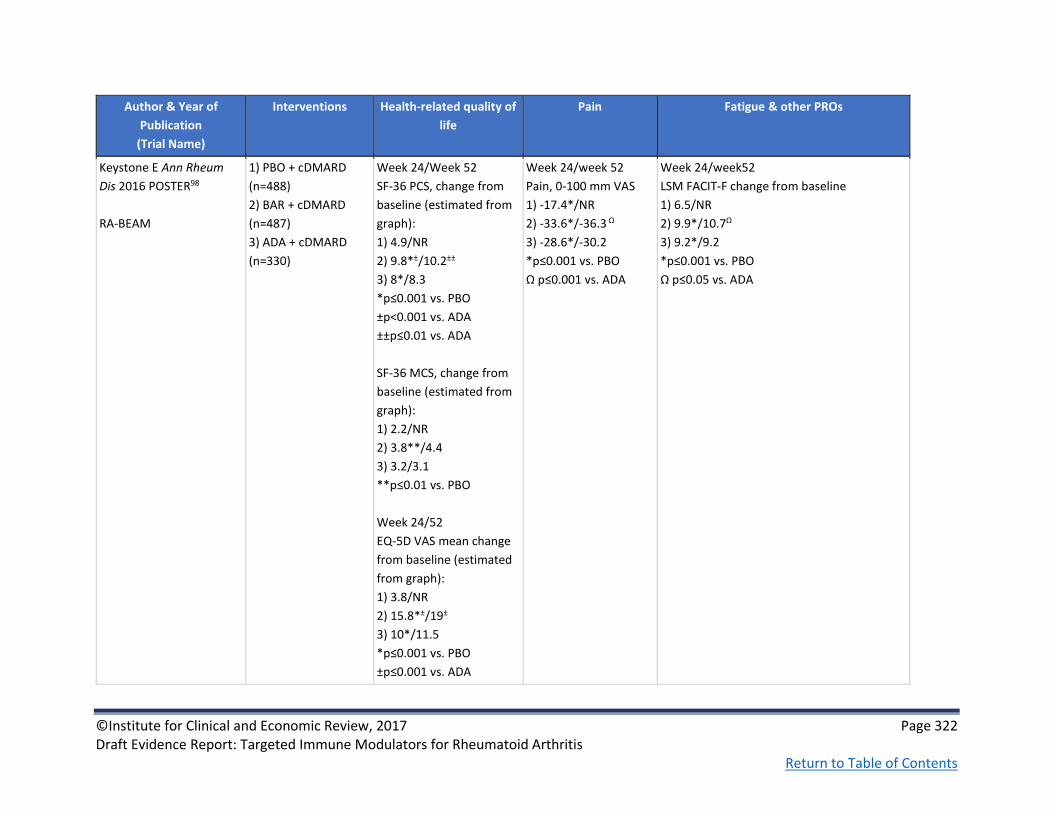
©Institute for Clinical and Economic Review, 2017 Page 322 Draft Evidence Report: Targeted Immune Modulators for Rheumatoid Arthritis Return to Table of Contents
Author & Year of
Publication
(Trial Name)
Interventions Health-related quality of
life
Pain Fatigue & other PROs
Keystone E Ann Rheum
Dis 2016 POSTER98
RA-BEAM
1) PBO + cDMARD
(n=488)
2) BAR + cDMARD
(n=487)
3) ADA + cDMARD
(n=330)
Week 24/Week 52
SF-36 PCS, change from
baseline (estimated from
graph):
1) 4.9/NR
2) 9.8*±/10.2±±
3) 8*/8.3
*p≤0.001 vs. PBO
±p<0.001 vs. ADA
±±p≤0.01 vs. ADA
SF-36 MCS, change from
baseline (estimated from
graph):
1) 2.2/NR
2) 3.8**/4.4
3) 3.2/3.1
**p≤0.01 vs. PBO
Week 24/52
EQ-5D VAS mean change
from baseline (estimated
from graph):
1) 3.8/NR
2) 15.8*±/19±
3) 10*/11.5
*p≤0.001 vs. PBO
±p≤0.001 vs. ADA
Week 24/week 52
Pain, 0-100 mm VAS
1) -17.4*/NR
2) -33.6*/-36.3 Ω
3) -28.6*/-30.2
*p≤0.001 vs. PBO
Ω p≤0.001 vs. ADA
Week 24/week52
LSM FACIT-F change from baseline
1) 6.5/NR
2) 9.9*/10.7Ω
3) 9.2*/9.2
*p≤0.001 vs. PBO
Ω p≤0.05 vs. ADA

©Institute for Clinical and Economic Review, 2017 Page 323 Draft Evidence Report: Targeted Immune Modulators for Rheumatoid Arthritis Return to Table of Contents
Author & Year of
Publication
(Trial Name)
Interventions Health-related quality of
life
Pain Fatigue & other PROs
Taylor PC N Engl J Med
201797
See also Taylor P Arthritis and Rheumatology 201521, Keystone E Ann Rheum Dis 2016 POSTER98
RA-BEAM
1) PBO + cDMARD
(n=488)
2) BAR + cDMARD
(n=487)
3) ADA + cDMARD
(n=330)
NR Week 24/52
Pain, 0-100 mm
1) -17.5/NA
2) -33.6/-36.1
3) -28.8
Week 12
Worst joint pain, least
means squared from
baseline
1) 4.6
2) 3.4*ⱡ
3) 4.0*
*p≤.001 vs. PBO
ⱡp≤0.001 vs. ADA
Week 12
Worst tiredness, least means squared from
baseline
1) 4.3
2) 3.6*ⱡ
3) 3.9*
*p≤.001 vs. PBO
ⱡp≤0.05 vs. ADA
Week 24/52
Patient’s global assessment, 0-100 mm VAS
1) -17.0/NA
2) -33.1/-36.3
3) -29.1/-30.3
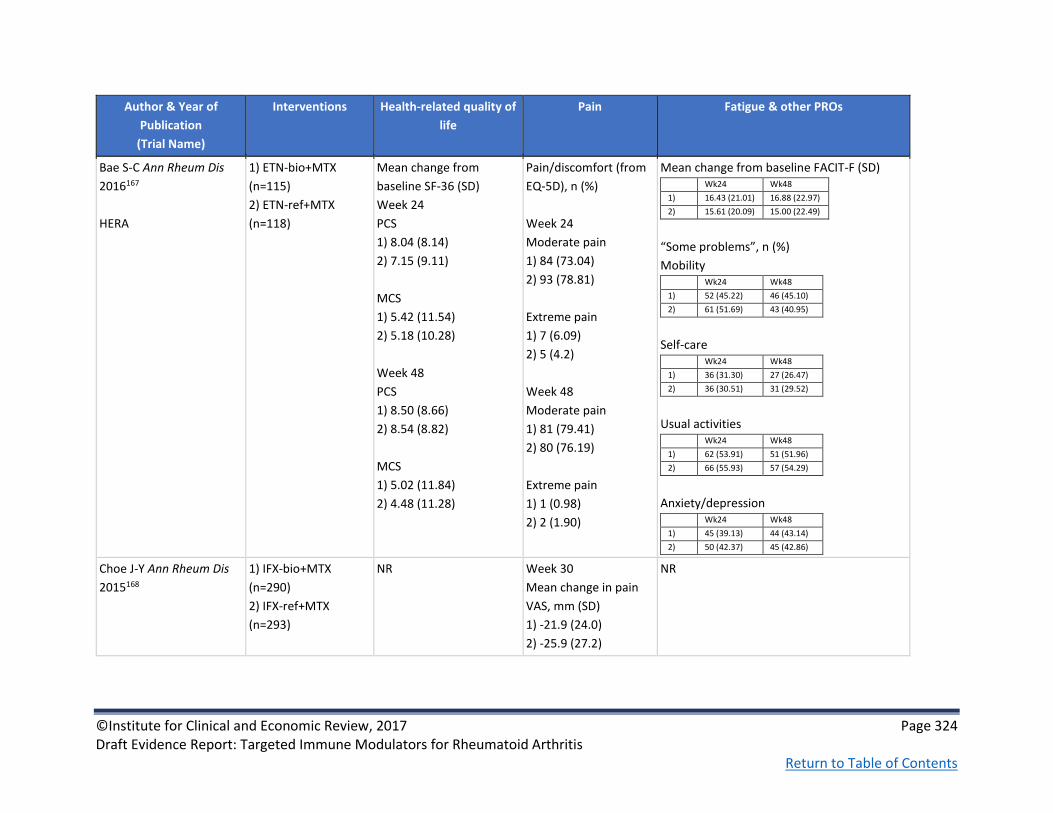
©Institute for Clinical and Economic Review, 2017 Page 324 Draft Evidence Report: Targeted Immune Modulators for Rheumatoid Arthritis Return to Table of Contents
Author & Year of
Publication
(Trial Name)
Interventions Health-related quality of
life
Pain Fatigue & other PROs
Bae S-C Ann Rheum Dis
2016167
HERA
1) ETN-bio+MTX
(n=115)
2) ETN-ref+MTX
(n=118)
Mean change from
baseline SF-36 (SD)
Week 24
PCS
1) 8.04 (8.14)
2) 7.15 (9.11)
MCS
1) 5.42 (11.54)
2) 5.18 (10.28)
Week 48
PCS
1) 8.50 (8.66)
2) 8.54 (8.82)
MCS
1) 5.02 (11.84)
2) 4.48 (11.28)
Pain/discomfort (from
EQ-5D), n (%)
Week 24
Moderate pain
1) 84 (73.04)
2) 93 (78.81)
Extreme pain
1) 7 (6.09)
2) 5 (4.2)
Week 48
Moderate pain
1) 81 (79.41)
2) 80 (76.19)
Extreme pain
1) 1 (0.98)
2) 2 (1.90)
Mean change from baseline FACIT-F (SD) Wk24 Wk48
1) 16.43 (21.01) 16.88 (22.97)
2) 15.61 (20.09) 15.00 (22.49)
“Some problems”, n (%)
Mobility Wk24 Wk48
1) 52 (45.22) 46 (45.10)
2) 61 (51.69) 43 (40.95)
Self-care Wk24 Wk48
1) 36 (31.30) 27 (26.47)
2) 36 (30.51) 31 (29.52)
Usual activities Wk24 Wk48
1) 62 (53.91) 51 (51.96)
2) 66 (55.93) 57 (54.29)
Anxiety/depression Wk24 Wk48
1) 45 (39.13) 44 (43.14)
2) 50 (42.37) 45 (42.86)
Choe J-Y Ann Rheum Dis
2015168
1) IFX-bio+MTX
(n=290)
2) IFX-ref+MTX
(n=293)
NR Week 30
Mean change in pain
VAS, mm (SD)
1) -21.9 (24.0)
2) -25.9 (27.2)
NR

©Institute for Clinical and Economic Review, 2017 Page 325 Draft Evidence Report: Targeted Immune Modulators for Rheumatoid Arthritis Return to Table of Contents
Author & Year of
Publication
(Trial Name)
Interventions Health-related quality of
life
Pain Fatigue & other PROs
Jani RH Int J Rheum Dis
2015192
1) ADA-bio+MTX
(n=60)
2) ADA-ref+MTX
(n=60)
NR Mean change from
baseline, week 12
Patient assessment of
pain
1) -30.1 (17.52)
2) -29.1 (17.10)
NR
Kay J Ann Rheum Dis
2015196
1) IFX-bio (n=127)
2) IFX-ref (n=62)
NR Mean change from
baseline, wk 16
Subject Pain
assessment (VAS), cm
1) -3.4
2) -3.2
Open-label phase:
mean change from
baseline to wk 54 in
subject pain: -4 cm
NR
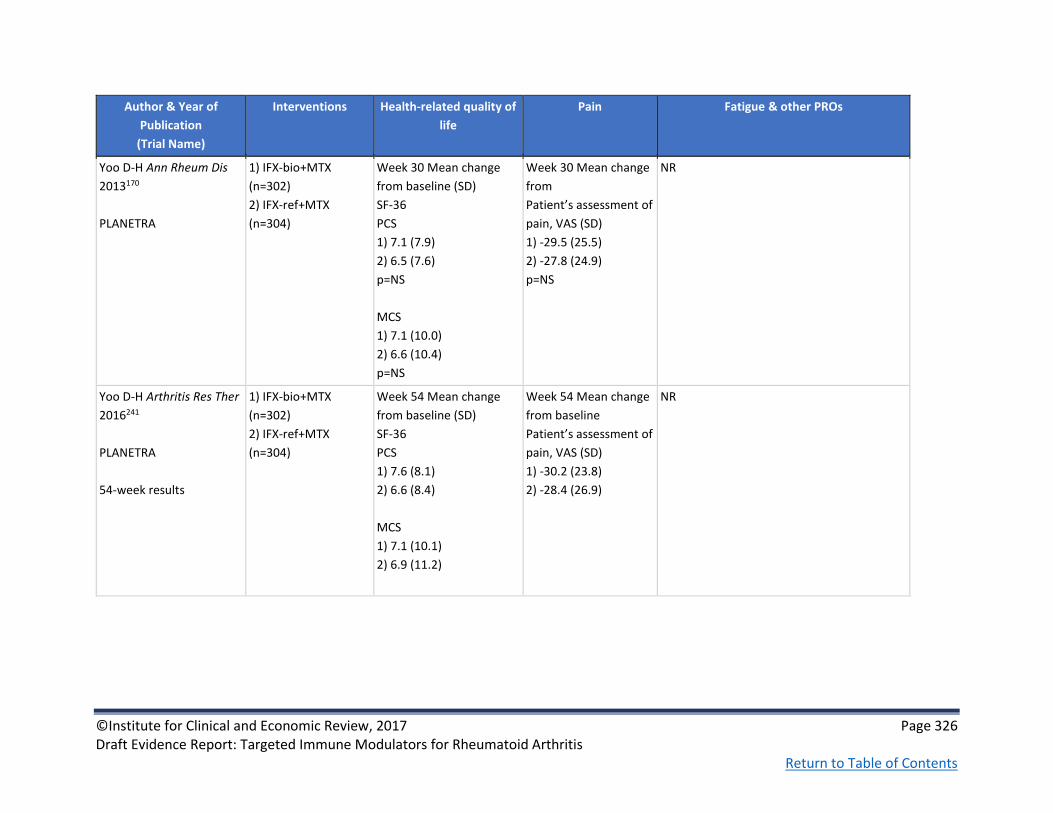
©Institute for Clinical and Economic Review, 2017 Page 326 Draft Evidence Report: Targeted Immune Modulators for Rheumatoid Arthritis Return to Table of Contents
Author & Year of
Publication
(Trial Name)
Interventions Health-related quality of
life
Pain Fatigue & other PROs
Yoo D-H Ann Rheum Dis
2013170
PLANETRA
1) IFX-bio+MTX
(n=302)
2) IFX-ref+MTX
(n=304)
Week 30 Mean change
from baseline (SD)
SF-36
PCS
1) 7.1 (7.9)
2) 6.5 (7.6)
p=NS
MCS
1) 7.1 (10.0)
2) 6.6 (10.4)
p=NS
Week 30 Mean change
from
Patient’s assessment of
pain, VAS (SD)
1) -29.5 (25.5)
2) -27.8 (24.9)
p=NS
NR
Yoo D-H Arthritis Res Ther
2016241
PLANETRA
54-week results
1) IFX-bio+MTX
(n=302)
2) IFX-ref+MTX
(n=304)
Week 54 Mean change
from baseline (SD)
SF-36
PCS
1) 7.6 (8.1)
2) 6.6 (8.4)
MCS
1) 7.1 (10.1)
2) 6.9 (11.2)
Week 54 Mean change
from baseline
Patient’s assessment of
pain, VAS (SD)
1) -30.2 (23.8)
2) -28.4 (26.9)
NR

©Institute for Clinical and Economic Review, 2017 Page 327 Draft Evidence Report: Targeted Immune Modulators for Rheumatoid Arthritis Return to Table of Contents
Author & Year of
Publication
(Trial Name)
Interventions Health-related quality of
life
Pain Fatigue & other PROs
Yoo D Annals of the
Rheumatic Diseases
2016241
PLANETRA
1) IFX-bio-
maintenance group
(n=158)
2) IFX-bio-switch
group (n=144)
NR Week 102 mean
change from 52week
Patient’s assessment of
pain, 100 mm VAS
1) -31.8
2) -34
p=NS
NR
Table F5. Head-to-Head Trials: Non-healthcare Outcomes
Author & Year of
Publication
(Trial Name)
Interventions Requirements for
surgical intervention
Hospitalization,
Rehabilitation,
Assisted living
Productivity Loss Caregiver Burden Other outcomes
Fleischmann R
Arthritis care &
research 2016226
AMPLE
See Schiff M Annals
of the rheumatic
diseases 201422
1) ABTsc+MTX
(n=318)
2) ADAsc+MTX
(n=328)
NR NR @ year 2
WPAI:RA, % mean
improvement
Work time gained
1) 7.4
2) 5.9
Reduced impairment
while working
1) 23.6
2) 19.0
Overall reduced
work impairment
1) 25.4
NR NR

©Institute for Clinical and Economic Review, 2017 Page 328 Draft Evidence Report: Targeted Immune Modulators for Rheumatoid Arthritis Return to Table of Contents
Author & Year of
Publication
(Trial Name)
Interventions Requirements for
surgical intervention
Hospitalization,
Rehabilitation,
Assisted living
Productivity Loss Caregiver Burden Other outcomes
2) 20.5
Activity gained
1) 29.3
2) 23.0
Statistical measures
NR

©Institute for Clinical and Economic Review, 2017 Page 329 Draft Evidence Report: Targeted Immune Modulators for Rheumatoid Arthritis Return to Table of Contents
Table F6. Rituximab versus conventional DMARD: Study Characteristics
Author & Year of
Publication
(Trial Name)
Quality rating
Study sponsor Study Design and
Duration of Follow-
up
Geographic
location of study
Interventions (n) &
Dosing Schedule
Inclusion and Exclusion
Criteria
Baseline patient Characteristics
Cohen SB Arthritis
Rheum. 2006 93
REFLEX
Good
See also Cohen SB
Annals of the
rheumatic diseases
2010201, Keystone E
Arthritis Rheum 2008 208, Keystone E Ann
Rheum Dis 2009 202
Hoffman-La
Roche, Biogen
Idec, Inc;
Genentech, Inc.
and partly
supported by
NIH grant from
the National
Center for
Research
Resources
RCT, Multicenter,
Double-Blind,
Placebo-Controlled,
Phase III trial
Two periods of 24
weeks followed by
a check every 2
months for 18
months resulting in
a 24-month study
duration
114
rheumatology
centers in the
US, Europe,
Canada, and
Israel
1) PBO+MTX (n=209)
2) RTX+MTX (n=308)
iv RTX administered
on days 1 and 15. All
patients received iv
methylprednisolone
100 mg before each
infusion & oral
prednisone during
the 2-week
treatment period.
From weeks 16-24,
patients who failed
to respond to
treatment could
receive rescue
therapy i.e. PBO pts
→RTX & RTX pts →
standard care
RA for≥6 months per
ACR 1987 revised
criteria; taking MTX (10-
25 mg/week for ≥12
weeks with last 4 weeks
at stable dosage
Excluded if: 1) history of
a RAD other than RA 2)
significant systemic
involvement secondary
to RA 3) ACR functional
class iv disease
Mean age, yrs (SD)
1) 52.8 (12.6)
2) 52.2 (12.2)
Female, n (%)
1) 169 (81)
2) 251 (81)
Mean RA duration, yrs (SD)
1) 11.7 (7.7)
2) 12.1 (8.3)
Mean HAQ-DI (SD)
1) 1.9 (0.5)
2) 1.9 (0.6)
Mean DAS-28 (SD)
1) 6.8 (1.0)
2) 6.9 (1.0)
Mean mTSS (SD)
1) 47.9 (36.0)
2) 48.3 (34.9)
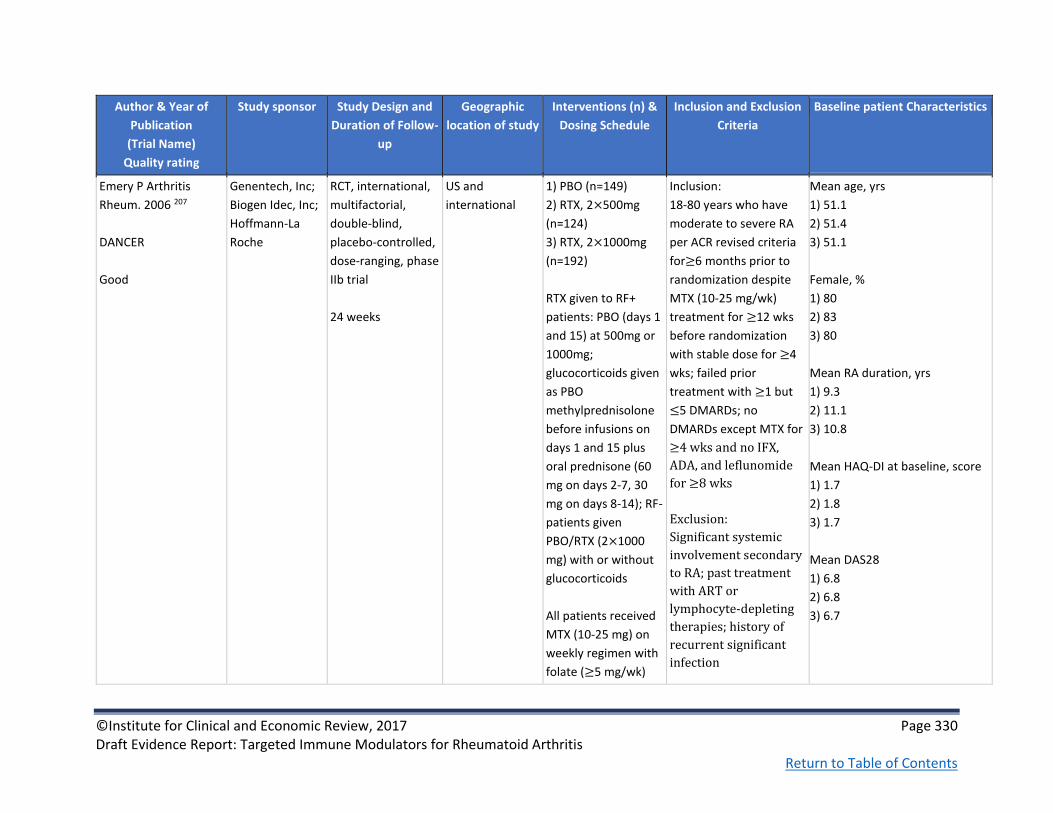
©Institute for Clinical and Economic Review, 2017 Page 330 Draft Evidence Report: Targeted Immune Modulators for Rheumatoid Arthritis Return to Table of Contents
Author & Year of
Publication
(Trial Name)
Quality rating
Study sponsor Study Design and
Duration of Follow-
up
Geographic
location of study
Interventions (n) &
Dosing Schedule
Inclusion and Exclusion
Criteria
Baseline patient Characteristics
Emery P Arthritis
Rheum. 2006 207
DANCER
Good
Genentech, Inc;
Biogen Idec, Inc;
Hoffmann-La
Roche
RCT, international,
multifactorial,
double-blind,
placebo-controlled,
dose-ranging, phase
IIb trial
24 weeks
US and
international
1) PBO (n=149)
2) RTX, 2×500mg
(n=124)
3) RTX, 2×1000mg
(n=192)
RTX given to RF+
patients: PBO (days 1
and 15) at 500mg or
1000mg;
glucocorticoids given
as PBO
methylprednisolone
before infusions on
days 1 and 15 plus
oral prednisone (60
mg on days 2-7, 30
mg on days 8-14); RF-
patients given
PBO/RTX (2×1000
mg) with or without
glucocorticoids
All patients received
MTX (10-25 mg) on
weekly regimen with
folate (≥5 mg/wk)
Inclusion:
18-80 years who have
moderate to severe RA
per ACR revised criteria
for≥6 months prior to
randomization despite
MTX (10-25 mg/wk)
treatment for ≥12 wks
before randomization
with stable dose for ≥4
wks; failed prior
treatment with ≥1 but
≤5 DMARDs; no
DMARDs except MTX for
≥4 wks and no IFX,
ADA, and leflunomide
for ≥8 wks
Exclusion:
Significant systemic
involvement secondary
to RA; past treatment
with ART or
lymphocyte-depleting
therapies; history of
recurrent significant
infection
Mean age, yrs
1) 51.1
2) 51.4
3) 51.1
Female, %
1) 80
2) 83
3) 80
Mean RA duration, yrs
1) 9.3
2) 11.1
3) 10.8
Mean HAQ-DI at baseline, score
1) 1.7
2) 1.8
3) 1.7
Mean DAS28
1) 6.8
2) 6.8
3) 6.7

©Institute for Clinical and Economic Review, 2017 Page 331 Draft Evidence Report: Targeted Immune Modulators for Rheumatoid Arthritis Return to Table of Contents
Author & Year of
Publication
(Trial Name)
Quality rating
Study sponsor Study Design and
Duration of Follow-
up
Geographic
location of study
Interventions (n) &
Dosing Schedule
Inclusion and Exclusion
Criteria
Baseline patient Characteristics
Emery P Annals of the
rheumatic diseases
2010149
SERENE
Good
Genentech, Inc. RCT, double-blind,
placebo controlled,
phase III study
48 weeks
102 centers in 11
countries
1) PBO+MTX (n=172)
2) (2×500mg)
RTX+MTX (n=168)
3) (2 ×1000mg)
RTX+MTX (n=172)
Randomized to
RTX 2×500 mg, RTX
2×1000 mg, or PBO
administered by iv
infusion on days 1
and 15. All infusions
(including PBO) were
pre-medicated with
100mg iv
methylprednisolone.
Between week 16
and week 23,
patients with <20%
improvement
in TJC and SJC versus
baseline were
allowed rescue
treatment
with one non-
biological DMARD.
Inclusion:
18–80 years with RA for
≥6 months which was
active despite 10-12mg/
week MTX for at least 12
weeks. Active RA defined
as ≥8 SJC and TJC, and
either CRP≥0.6mg/dl or
ESR≥28mm/h; No
previous biologic
treatment for RA
Mean age, yrs (SD)
1) 52.2 (12.4)
2) 51.9 (12.9)
3) 51.3 (12.6)
Female, n (%)
1) 147 (85.5)
2) 133 (79.6)
3) 138 (81.2)
Mean RA duration, yrs (SD)
1) 7.5 (7.6)
2) 7.1 (7)
3) 6.6 (7.3)
Mean DAS28-ESR (SD)
1) 6.54 (1.02)
2) 6.4 (0.95)
2) 6.49 (1.06)
Mean DAS28-CRP (SD)
1) 5.95 (0.97)
2) 5.81 (0.91)
3) 5.86 (0.97)

©Institute for Clinical and Economic Review, 2017 Page 332 Draft Evidence Report: Targeted Immune Modulators for Rheumatoid Arthritis Return to Table of Contents
Author & Year of
Publication
(Trial Name)
Quality rating
Study sponsor Study Design and
Duration of Follow-
up
Geographic
location of study
Interventions (n) &
Dosing Schedule
Inclusion and Exclusion
Criteria
Baseline patient Characteristics
Peterfy C Annals of the
Rheumatic Diseases
2016171
RA-SCORE
Good
Hoffmann-La
Roche
RCT
multicenter
double-blind
Phase IIIb
52 weeks
Argentina, Brazil,
Canada, Czech
Republic,
Denmark,
Estonia, France,
Germany,
Greece, Latvia,
Lithuania,
Netherlands,
Norway,
Romania,
Russian
Federation,
Serbia, Spain,
Switzerland,
Turkey
RTX 500mg+MTX
excluded from
table
1) PBO+MTX (n=63)
2) 1000mg RTX+MTX
(n=60)
3) 500mg RTX+MTX
(n=62)
Two infusions of PBO
or RTX 1000 mg
intravenously on
days 1 and 15.
Analgesics,
antihistamines and
methylprednisolone
100 mg before RTX
infusions; stable MTX
and folic acid/folate
(≥5 mg/week). Oral
glucocorticoids (≤10
mg/day) allowed.
Rescue therapy at wk
16 if <20%
improvement in
tender & swollen
joints. RTX
retreatment after wk
24 if DAS28-CRP ≥2.6
and no
contraindications
Met ACR criteria for RA;
disease duration of ≥3
months and ≤10 years;
active RA
(DAS28-CRP ≥3.2);
incomplete response
to 12.5–25 mg/wk MTX
for ≥12 weeks; biologic
naïve; positive for
anticyclic citrullinated
protein (≥20 U) or RF
(≥20 IU/mL); erosion
and/or synovitis in a
single joint
Key exclusion criteria:
history of rheumatic
autoimmune disease
other than RA or
significant systemic
involvement secondary
to RA
Mean age, yrs (SD)
1) 50.3 (11.9)
2) 50.7 (11.7)
Female, n (%)
1) 48 (76.2)
2) 50 (83.3)
Mean RA duration, yrs (SD)
1) 4.4 (3.1)
2) 4.9 (2.9)
Mean HAQ-DI (SD)
1) 1.5 (0.8)
2) 1.3 (0.7)
Mean DAS28-CRP (SD)
1) 5.6 (1.1)
2) 5.3 (1.0)
Mean DAS28-ESR (SD)
1) 6.3 (1.1)
2) 6.0 (1.1)
Mean mTSS (SD)
1) 20.2 (18.9)
2) 19.8 (18.8)

©Institute for Clinical and Economic Review, 2017 Page 333 Draft Evidence Report: Targeted Immune Modulators for Rheumatoid Arthritis Return to Table of Contents
Table F7. Rituximab versus conventional DMARD: Key Clinical Outcomes
Author & Year of
Publication
(Trial Name)
Interventions Treatment Response Disease Activity Structural
Damage
Function Laboratory indices
Cohen SB Arthritis
Rheum. 2006 93
REFLEX
1) PBO+MTX (n=209)
2) RTX+MTX (n=308)
Week 24
ACR20, %
1) 18
2) 51 (p<0.0001)
ACR50, %
1) 5
2) 27 (p<0.0001)
ACR70, %
1) 1
2) 12 (p<0.0001)
Week 24
Achieved remission, %
(DAS28<2.8)
1) 0
2) 9
Week 24
Mean (SD) total
Genant-modified
SHARP
radiographic
score
1) 1.2 (3.3)
2) 0.6 (1.9)
p= 0.169 for 1-2
Week 24 (amongst ITT
population)
HAQ-DI level of 0, n (%)
1) 0.5 (0)
2) 18 (6)
Week 24 (amongst ITT
population)
From elevated to normal
range CRP levels, n (%)
1) 18 (10)
2) 80 (281)
Mean ESR reduction levels
1) 4.1 mm/hour
2) 18.5 mm/hour

©Institute for Clinical and Economic Review, 2017 Page 334 Draft Evidence Report: Targeted Immune Modulators for Rheumatoid Arthritis Return to Table of Contents
Author & Year of
Publication
(Trial Name)
Interventions Treatment Response Disease Activity Structural
Damage
Function Laboratory indices
Cohen SB Annals of
the rheumatic
diseases 2010201
REFLEX
1) PBO+MTX (n=187)
2) RTX+MTX (n=281)
NR NR Week 104 mean
change from
baseline mTSS
1) 2.81
2) 1.14 p<0.0001 Year 2 mean change from baseline mTSS 1) 1.78 2) 0.66 p<0.005 Year 2 % with no change in mTSS from baseline 1)39 2) 57 p<0.0001
NR NR
Keystone E Arthritis
Rheum 2008 208
REFLEX
1) PBO+MTX (n=201)
2) RTX+MTX (n=298),
(1000mg ×2)
NR NR NR Week 24 mean changed
from baseline HAQ-DI
(SD)
1) -0.07 (0.45)
2) -0.44 (0.60)
p< 0.0001 for 1-2
NR

©Institute for Clinical and Economic Review, 2017 Page 335 Draft Evidence Report: Targeted Immune Modulators for Rheumatoid Arthritis Return to Table of Contents
Author & Year of
Publication
(Trial Name)
Interventions Treatment Response Disease Activity Structural
Damage
Function Laboratory indices
Keystone E Ann
Rheum Dis. 2009 202
REFLEX
1) PBO+MTX (n=186)
2) RTX+MTX (n=277)
NR First quartile (lowest)
DAS28, quartile range
From 3-6
Change in TSG
1) 2.02
2) 0.41
Second quartile (highest)
DAS28, quartile range
From 8-9
Change in TSG
1) 4.17
2) 2.4
Week 56
Mean TSG
change
1) 2.31
2) 1.00
p=0.005 for 1-2
First quartile (lowest)
HAQ-DI, quartile range
From 0-2
Change in TSG
1) 1.35
2) 1.08
Second quartile (highest)
HAQ-DI, quartile range
From 2-3
Change in TSG
1) 1.66
2) 1.02
First quartile (lowest)
CRP, quartile range
From 0-1
Change in TSG
1) 0.91
2) 0.46
Second quartile (highest)
CRP, quartile range
From 5-24
Change in TSG
1) 4.86
2) 2.23

©Institute for Clinical and Economic Review, 2017 Page 336 Draft Evidence Report: Targeted Immune Modulators for Rheumatoid Arthritis Return to Table of Contents
Author & Year of
Publication
(Trial Name)
Interventions Treatment Response Disease Activity Structural
Damage
Function Laboratory indices
Emery P Arthritis
Rheum. 2006 207
DANCER
1) PBO (n=149)
2) RTX, 2×500mg
(n=124)
3) RTX, 2×1000mg
(n=192)
Week 24
ACR20, %
1) 28
2) 55
3) 54
p≤0.001 for 2-3
ACR50, %
1) 13
2) 33
3) 34
p≤0.001 for 2-3
ACR70, %
1) 5
1) 13 (p=0.029)
2) 20 (p≤0.001)
Week 24
Mean DAS change from
baseline
1) -0.67 (p<0.0001)
2) -1.79
3) -2.05
NR Week 24
Mean HAQ-DI change
from baseline
1) -0.16
2) -0.43
3) -0.49
Week 24
Mean CRP change from
baseline
1) -0.1
2) -1.7
3) -1.7

©Institute for Clinical and Economic Review, 2017 Page 337 Draft Evidence Report: Targeted Immune Modulators for Rheumatoid Arthritis Return to Table of Contents
Author & Year of
Publication
(Trial Name)
Interventions Treatment Response Disease Activity Structural
Damage
Function Laboratory indices
Emery P Annals of
the rheumatic
diseases 2010149
SERENE
1) PBO+MTX (n=172)
2) (2×500mg)
RTX+MTX (n=167)
3) (2 ×1000mg)
RTX+MTX (n=170)
Week 24 % ACR20
1) 23.3
2) 54.5 (p<0.0001)
3) 50.6 (p<0.0001)
Week 24 % ACR50
1) 9.3
2) 26.3 (p<0.0001)
3) 25.9 (p<0.0001)
Week 24 % ACR70
1) 5.2
2) 9
3) 10
Good EULAR response, n
(%)
1) 8 (4.7)
2) 29 (17.5)
3) 20 (11.8)
(p<0.0001)
Week 24 mean change
from baseline DAS28-ESR
1) -0.75
2) -1.76 (p<0.0001)
3) -1.69 (p<0.0001)
Week 24 remission
DAS28-ESR <2.6, % (p
value vs PBO)
1) 2.3
2) 9.6 (p<0.01)
3) 9.4 (p<0.01)
NR Week 24 mean change
from baseline HAQ-DI
1) 82 (47.7)
2) 109 (66.1) p<0.001
3) 99 (58.2) p<0.001
Week 24 mean change
from baseline SF-36
mental component
1) 1.66
2) 3.31
3) 4.58 (p<0.001)
SF-36 physical
component
1) 2.49
2) 5.91 (p<0.0001)
3) 5.7 (p<0.0001)
NR

©Institute for Clinical and Economic Review, 2017 Page 338 Draft Evidence Report: Targeted Immune Modulators for Rheumatoid Arthritis Return to Table of Contents
Author & Year of
Publication
(Trial Name)
Interventions Treatment Response Disease Activity Structural
Damage
Function Laboratory indices
Peterfy C Annals of
the Rheumatic
Diseases 2016171
RA-SCORE
1) PBO+MTX (n=63)
2) 1000mg RTX+MTX
(n=60)
Week 24
ACR20, %
1) 28.6
2) 51.7 (p=0.006)
ACR50, %
1) 11.1
2) 26.7 (p=0.013)
ACR70, %
1) 1.6
2) 8.3 (p=0.085)
Week 52
ACR20, %
1) 28.6
2) 68.3 (p<0.001)
ACR50, %
1) 14.3
2) 35.0 (p=0.005)
ACR70, %
1) 6.3
2) 16.7 (p=0.049)
Mean change from
baseline DAS28-ESR
Week 24
1) -0.85
2) -1.64 (p=NS)
Week 52
1) -0.81
2) -1.90 (p=NS)
Mean change
from baseline
Genant mTSS
Week 24
1) 0.76
2) 0.30 (p=NS)
Week 52
1) 1.37
2) 0.29 (p=0.002)
Mean change from
baseline HAQ-DI
Week 24
1) -0.19
2) -0.44 (p=NS)
Week 52
1) -0.18
2) -0.42 (p=NS)
NR

©Institute for Clinical and Economic Review, 2017 Page 339 Draft Evidence Report: Targeted Immune Modulators for Rheumatoid Arthritis Return to Table of Contents
Table F8. Rituximab versus conventional DMARD: Harms
Author & Year of
Publication
(Trial Name)
Interventions Malignancies Infections Other Adverse Events Discontinuation, Serious AE rate,
Deaths
Cohen SB Arthritis Rheum.
2006 93
REFLEX
1) PBO+MTX
(n=209)
2) RTX+MTX (n=308)
NR Rate of serious
infections per 100
patient-years, rate (n)
1) 3.7 (3)
2) 5.2 (7)
Acute infusion reactions, n
(%)
First infusion
1) 38 (18)
2) 72 (23)
Second infusion
1) 24 (11)
2) 26 (8)
NR

©Institute for Clinical and Economic Review, 2017 Page 340 Draft Evidence Report: Targeted Immune Modulators for Rheumatoid Arthritis Return to Table of Contents
Author & Year of
Publication
(Trial Name)
Interventions Malignancies Infections Other Adverse Events Discontinuation, Serious AE rate,
Deaths
Emery P Arthritis Rheum.
2006 207
DANCER
1) PBO (n=149)
2) RTX, 2×500mg
(n=124)
3) RTX, 2×1000mg
(n=192)
NR Serious infections, n (%)
1) 2 (1)
2) 0
3) 4 (2)
Adverse events classified as
infections and infestations,
%
1) 28
2) 35
3) 35
1st Infusion-associated
events, %
1) 18
2) 31
3) 38
1st Acute-infusion
reactions, %
1) 17
2) 23
3) 32
Serious noninfection AE
events, n (%)
1) 2(1)
2) 9 (7)
3) 4 (2)
Week 24
Serious AE events, n (%)
1) 4 (3)
2) 9 (7)
3) 13 (7)
Discontinuation due to AEs, n (%)
1) 0
2) 3 (2)
3) 6 (3)
AE events, n (%)
1) 105 (70)
2) 100 (81)
3) 164 (85)

©Institute for Clinical and Economic Review, 2017 Page 341 Draft Evidence Report: Targeted Immune Modulators for Rheumatoid Arthritis Return to Table of Contents
Author & Year of
Publication
(Trial Name)
Interventions Malignancies Infections Other Adverse Events Discontinuation, Serious AE rate,
Deaths
Emery P Annals of the
rheumatic diseases 2010149
SERENE
1) PBO+MTX
(n=172)
2) (2×500mg)
RTX+MTX (n=167)
3) (2 ×1000mg)
RTX+MTX (n=170)
Malignancy, n (%)
1) 1 (<1)
2) 1 (<1)
3) 2 (1)
Serious infection, n (%)
1) 4 (2)
2) 3 (2)
3) 3 (2)
NR Serious AEs, n (%)
1) 15 (9)
2) 13 (8)
3) 17 (10)
Discontinuation due to AE, n (%)
1) 2 (1)
2) 3 (2)
3) 7 (4)
Deaths, n (%)
1) 0
2) 2 (10
3) 0

©Institute for Clinical and Economic Review, 2017 Page 342 Draft Evidence Report: Targeted Immune Modulators for Rheumatoid Arthritis Return to Table of Contents
Author & Year of
Publication
(Trial Name)
Interventions Malignancies Infections Other Adverse Events Discontinuation, Serious AE rate,
Deaths
Peterfy C Annals of the
Rheumatic Diseases 2016171
RA-SCORE
1) PBO+MTX (n=63)
2) 1000mg
RTX+MTX (n=60)
Neoplasms benign,
malignant, and
unspecified
(including cysts
and polyps), n (%)
1) 0
2) 1 (1.7)
(Papillary serous
endometrial
carcinoma)
Any infection, n (%)
1) 16 (25.4)
2) 27 (45.0)
Serious infections
(events/100 PY)
1) 0.0
2) 3.4
Bronchitis, n (%)
1) 2 (3.2)
2) 6 (10.0)
Viral infection, n (%)
1) 2 (3.2)
2) 3 (5.0)
2 serious infections in
1000mg RTX+MTX:
bronchitis and
omphalitis due to
Escherichia coli
Treatment-related TEAEs, n
(%)
1) 14 (22.2)
2) 9 (15.0)
Infusion-related reactions,
% first/second course
1) 0/0
2) 15.0/5.0
Discontinuation due to AEs, n (%)
1) 2 (3.2)
2) 0
Serious TEAEs, n (%)
1) 0
2) 3 (5.0)
Serious TEAEs (Events/100 PY)
1) 0.0
2) 3.4
Deaths: 0

©Institute for Clinical and Economic Review, 2017 Page 343 Draft Evidence Report: Targeted Immune Modulators for Rheumatoid Arthritis Return to Table of Contents
Table F9. Rituximab versus conventional DMARD: Patient-reported Outcomes
Author & Year of Publication
(Trial Name)
Interventions Health-related
quality of life
Pain Fatigue & other PROs
Cohen SB Arthritis Rheum.
2006 93
REFLEX
1) PBO+MTX (n=209)
2) RTX+MTX (n=308)
Week 24
PCS score increase,
n
1) 0.9
2) 5.8
p= 0.0002 for 1-2
MCS score
increase, n
1) 1.3
2) 4.7
p= 0.0002 for 1-2
Week 24
VAS scale, n (SD)
1) -2.5 (23.3)
2) -23.4 (29.4)
p= 0.0045 for 1-2
Week 24
Mean point reduction
in FACIT-F scale, n
1) 0.5
2) 9.1
Keystone E Arthritis Rheum
2008 208
REFLEX
1) PBO+MTX (n=201)
2) RTX+MTX (n=298),
(1000mg ×2)
Week 24
Mean PCS (SD)
1) 1.48 (7.32)
2) 6.64 (8.74)
p< 0.0001 for 1-2
Mean MCS (SD)
1) 2.25 (12.33)
2) 5.32 (12.41)
p<0.0001 for 1-2
Week 24
Mean change from
baseline VAS-pain
(SD)
1) -2.50 (23.30)
2) -23.37 (29.35)
Week 24
Mean change from
baseline FACIT-F (SD)
1) -0.54 (9.84)
2) -9.14 (11.31)

©Institute for Clinical and Economic Review, 2017 Page 344 Draft Evidence Report: Targeted Immune Modulators for Rheumatoid Arthritis Return to Table of Contents
Author & Year of Publication
(Trial Name)
Interventions Health-related
quality of life
Pain Fatigue & other PROs
Emery P Arthritis Rheum.
2006 207
DANCER
1) PBO (n=149)
2) RTX, 2×500mg
(n=124)
3) RTX, 2×1000mg
(n=192)
NR NR Week 24
FACIT-F percentage
improvement, %
1) 4
2) 20
3) 28
Emery P Annals of the
rheumatic diseases 2010149
SERENE
1) PBO+MTX (n=172)
2) (2×500mg)
RTX+MTX (n=167)
3) (2 ×1000mg)
RTX+MTX (n=170)
NR NR Week 24 mean change
from baseline
1) 2.12
2) 5.51 (p<0.001)
3) 6.53 (p<0.0001)

©Institute for Clinical and Economic Review, 2017 Page 345 Draft Evidence Report: Targeted Immune Modulators for Rheumatoid Arthritis Return to Table of Contents
Table F10. Abatacept versus conventional DMARD: Study Characteristics
Author & Year of
Publication
(Trial Name)
Quality rating
Study sponsor Study Design and
Duration of
Follow-up
Geographic
location of
study
Interventions (n) &
Dosing Schedule
Inclusion and Exclusion
Criteria
Baseline patient Characteristics
Takeuchi T Modern
rheumatology
2013172
Takeuchi 2013
Good
Bristol-Myers
Squibb
RCT
multicenter
double-blind
Phase II
dose-response
24 weeks
42 sites in Japan 1) 10mg ABTiv+MTX
(n=61)
2) PBO+MTX (n=66)
3) 2mg ABTiv+MTX
(n=67)
Continued MTX (6–8
mg/wk);
Intravenous ABT
was infused in a
fixed volume of 100
mL saline or 5 %
glucose over 30 min
on weeks 0, 2, 4, 8,
12, 16 and 20 of the
study at a dose of
10mg/kg
ABTiv 2mg+MTX
excluded from table
Japanese; age ≥20 yrs;
diagnosis of RA;
functional status of
Class I, II, or III; previous
treatment with MTX at
6-8mg weekly ≥12 wks,
with a stable dose for at
≥4 wks before
registration; ≥10/66
swollen joints or ≥12/68
tender joints or CRP
≥1.0 mg/dL
Exclusion criteria:
Vasculitis of major
organ system; hepatic,
hematologic,
gastrointestinal,
pulmonary, cardiac,
neurologic or cerebral
disease; HIV, hepatitis B
or C; opportunistic or
serious infections;
active TB; severe
asthma, cancer
Mean age, yrs (SD)
1) 53.4 (11.3)
2) 53.4 (12.0)
Female, n (%)
1) 49 (80.3)
2) 52 (78.8)
Mean RA duration, yrs (SD)
1) 7.4 (5.7)
2) 7.3 (6.2)
Mean HAQ-DI (SD)
1) 1.33 (0.59)
2) 1.50 (0.73)
DAS28-CRP (SD)
1) 6.0 (0.7)
2) 6.0 (0.7)
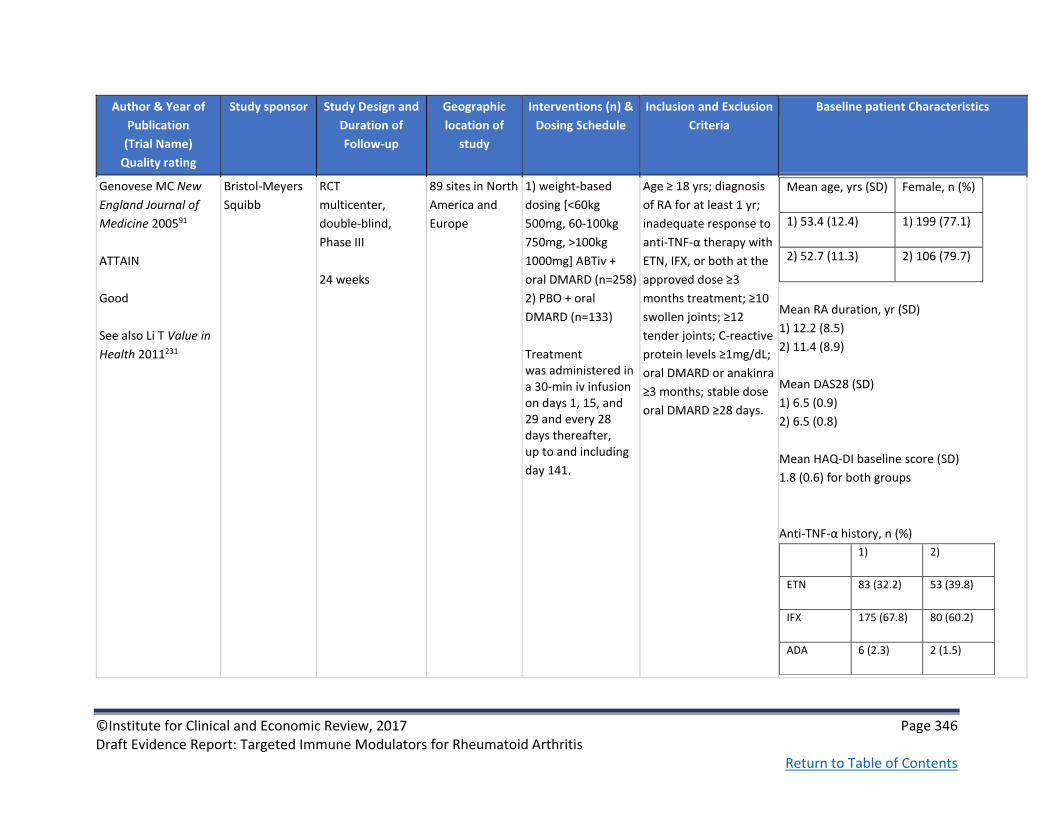
©Institute for Clinical and Economic Review, 2017 Page 346 Draft Evidence Report: Targeted Immune Modulators for Rheumatoid Arthritis Return to Table of Contents
Author & Year of
Publication
(Trial Name)
Quality rating
Study sponsor Study Design and
Duration of
Follow-up
Geographic
location of
study
Interventions (n) &
Dosing Schedule
Inclusion and Exclusion
Criteria
Baseline patient Characteristics
Genovese MC New
England Journal of
Medicine 200591
ATTAIN
Good
See also Li T Value in
Health 2011231
Bristol-Meyers
Squibb
RCT
multicenter,
double-blind,
Phase III
24 weeks
89 sites in North
America and
Europe
1) weight-based
dosing [<60kg
500mg, 60-100kg
750mg, >100kg
1000mg] ABTiv +
oral DMARD (n=258)
2) PBO + oral
DMARD (n=133)
Treatment was administered in a 30-min iv infusion on days 1, 15, and 29 and every 28 days thereafter, up to and including
day 141.
Age ≥ 18 yrs; diagnosis
of RA for at least 1 yr;
inadequate response to
anti-TNF-α therapy with
ETN, IFX, or both at the
approved dose ≥3
months treatment; ≥10
swollen joints; ≥12
tender joints; C-reactive
protein levels ≥1mg/dL;
oral DMARD or anakinra
≥3 months; stable dose
oral DMARD ≥28 days.
Mean age, yrs (SD) Female, n (%)
1) 53.4 (12.4) 1) 199 (77.1)
2) 52.7 (11.3) 2) 106 (79.7)
Mean RA duration, yr (SD)
1) 12.2 (8.5)
2) 11.4 (8.9)
Mean DAS28 (SD)
1) 6.5 (0.9)
2) 6.5 (0.8)
Mean HAQ-DI baseline score (SD)
1.8 (0.6) for both groups
Anti-TNF-α history, n (%)
1) 2)
ETN 83 (32.2) 53 (39.8)
IFX 175 (67.8) 80 (60.2)
ADA 6 (2.3) 2 (1.5)

©Institute for Clinical and Economic Review, 2017 Page 347 Draft Evidence Report: Targeted Immune Modulators for Rheumatoid Arthritis Return to Table of Contents
Author & Year of
Publication
(Trial Name)
Quality rating
Study sponsor Study Design and
Duration of
Follow-up
Geographic
location of
study
Interventions (n) &
Dosing Schedule
Inclusion and Exclusion
Criteria
Baseline patient Characteristics
Kremer JM New
England Journal of
Medicine 2003174
Kremer 2003
Good
See also Kremer JM
Arthritis and
Rheumatism 2005 283,
Emery P Journal of
Rheumatology 2006 284
Bristol-Meyers
Squibb
RCT
Multicenter,
double-blind,
1 year
1) 10mg/kg ABTiv +
MTX (n=115)
2) 2mg/kg ABTiv +
MTX (n=105)
3) PBO + MTX
(n=119)
ABT (2 mg/kg or 10 mg/kg) or PBO was infused intravenously over a 30-minute period on days 1, 15, and 30 and every 30 days thereafter.
American Rheumatism
Association criteria for
RA at ACR functional
class I, II, or III; >10
swollen, >12 tender
joints, C-reactive
protein level >1mg/dl
signifying active disease;
treated with MTX
≥6months and stable
dose 28 days prior to
enrollment; washed-out
of all DMARD other
than MTX for at least 28
days prior to treatment
Exclusions:
pregnant/breastfeeding
Mean age, yrs (range)
1) 55.8 (17-83)
2) 54.4 (23-80)
3) 54.7 (23-80)
Female, %
1) 74.8
2) 62.9
3) 66.4
Mean RA duration, yrs (SD)
1) 9.7 (9.8)
2) 9.7 (8.1)
3) 8.9 (8.3)

©Institute for Clinical and Economic Review, 2017 Page 348 Draft Evidence Report: Targeted Immune Modulators for Rheumatoid Arthritis Return to Table of Contents
Author & Year of
Publication
(Trial Name)
Quality rating
Study sponsor Study Design and
Duration of
Follow-up
Geographic
location of
study
Interventions (n) &
Dosing Schedule
Inclusion and Exclusion
Criteria
Baseline patient Characteristics
Kremer JM Annals of
Internal Medicine
2006173
AIM
Good
See also Russell AS
Annals of Rheumatic
Diseases 2007223, Li T
Value in Health
2011231
Bristol-Meyers
Squibb
RCT
Multicenter,
double-blind
1 year
116 centers
worldwide (21%
N. America, 41%
S. America, 32%
Europe, 6%
other)
1) 10mg/kg ABTiv +
MTX (n=433)
2) PBO + MTX
(n=219)
Study treatment was administered by 30-minute intravenous infusion on days 1, 15, and 29 and then every 28 days up to and including day 337. All patients
were to receive
methotrexate, 15 mg or more per week, although methotrexate at 10 mg per week was acceptable if the patient had a history of toxicity.
Age ≥ 18 years;
rheumatoid arthritis ≥1
year diagnosis;
American Rheumatism
Association criteria for
RA; MTX treatment of
≥15 mg/wk for 3
months or longer, with
stable dose for 28 days
before enrollment;
wash-out of disease
modifying anti-rheum
drugs at least 28 days
pre-randomization; ≥10
swollen joints, ≥12
tender joints; C-reactive
protein levels
≥10.0mg/L; tuberculin
skin testing pre-
randomization
Exclusion: TB positive
test results
Mean age, yrs (SD)
1) 51.5 (12.9)
2) 50.4 (12.4)
Female, %
1) 77.8
2) 81.7
Mean disease duration, yrs (SD)
1) 8.5 (7.3)
2) 8.9 (7.1)
Mean HAQ-DI baseline score (SD)
1) 1.7 (0.7)
2) 1.7 (0.6)
Mean DAS28 baseline score (SD)
1) 6.4 (0.08)
2) 6.4 (0.11)
Mean APaQ, Days of limited activity baseline
(SD)
1) 14.2 (11)
2) 14.4 (12)

©Institute for Clinical and Economic Review, 2017 Page 349 Draft Evidence Report: Targeted Immune Modulators for Rheumatoid Arthritis Return to Table of Contents
Table F11. Abatacept versus conventional DMARD: Key Clinical Outcomes
Author & Year of
Publication
(Trial Name)
Interventions Treatment Response Disease Activity Structural Damage Function Laboratory
indices
Takeuchi T Modern
rheumatology
2013172
Takeuchi 2013
1) 10mg ABTiv+MTX
(n=61)
2) PBO+MTX (n=66)
Week 24, %
ACR20
1) 77.0
2) 21.2
p<0.001
ACR50
1) 45.9
2) 6.1
p<0.001
ACR70
1) 21.3
2) 0
p<0.001
Week 24
DAS28-CRP score (SD)
1) 3.5 (1.3)
2) 5.3 (1.2)
p=NR
DAS28-CRP<2.6 (%)
1) 24.6
2) 1.5
p=NR
NR Week 24
HAQ, score (SD)
1) 0.8 (0.6)
2) 1.4 (0.7)
reduction in HAQ
score ≥0.3, %
1) 60.7
2) 24.2
Week 24
CRP, mg/dL (SD)
1) 0.9 (1.5)
2) 3.4 (2.7)

©Institute for Clinical and Economic Review, 2017 Page 350 Draft Evidence Report: Targeted Immune Modulators for Rheumatoid Arthritis Return to Table of Contents
Author & Year of
Publication
(Trial Name)
Interventions Treatment Response Disease Activity Structural Damage Function Laboratory
indices
Genovese MC New
England Journal of
Medicine 2005 91
ATTAIN
1) 10mg/kg ABTiv +
oral DMARD (n=258)
2) PBO + oral
DMARD (n=133)
Week 24, %
ACR20
1) 50.4
2) 19.5
P<0.001
ACR50
1) 20.3
2) 3.8
P<0.001
ACR70
1) 10.2
2) 1.5
P=0.003
Week 24, %
DAS28≤ 3.2
1) 17.1
2) 3.1
P<0.001
DAS28< 2.6
1) 10.0
2) 0.8
P<0.001
NR
Week 24
Reduction in
HAQ≥0.3, %
1) 47.3
2) 23.3
P<0.001
HAQ, mean score
reduction
1) 0.45
2) 0.11
P<0.001
NR

©Institute for Clinical and Economic Review, 2017 Page 351 Draft Evidence Report: Targeted Immune Modulators for Rheumatoid Arthritis Return to Table of Contents
Author & Year of
Publication
(Trial Name)
Interventions Treatment Response Disease Activity Structural Damage Function Laboratory
indices
Kremer JM Arthritis
and Rheumatism
2005 283
Kremer 2005
See also Kremer JM
New England Journal
of Medicine 2003174
And Emery P Journal
of Rheumatology
2006 284
1) 10mg/kg ABTiv +
MTX (n=115)
2) 2mg/kg ABTiv +
MTX (n=105)
3) PBO + MTX
(n=119)
1 year, %
ACR20
1) 62.6
3) 36.1
P<0.001
ACR50
1) 41.7
3) 20.2
P<0.001
ACR70
1) 20.9
3) 7.6
P=0.003
24 weeks, %
DAS28 <2.6
1) 26.1
3) 9.2
P<0.001
DAS28 <3.2
1) 40.0
3) 19.3
P<0.05 1 year, % DAS28 <2.6 1) 34.8 3) 10.1 P<0.001 DAS28 <3.2 1) 49.6 3) 21.9 P<0.001
NR 1 year
HAQ mean
improvement, %
1) 42.3
3) 10.3
P<0.001
Clinically important HAQ improvements, % 1) 49.6 3) 27.7 P<0.001 HAQ score of 0, % 1) 15.7 3) 7.6 P=0.05 24 weeks Clinically important HAQ improvements, % 1) 58.3 3) 33.6 P<0.001 HAQ score of 0, % 1) 20.0 3) 7.6 P<0.01
1 year
CRP level, mg/dl
Mean
improvement, %
1) 27.6
3) -31.3
P<0.001

©Institute for Clinical and Economic Review, 2017 Page 352 Draft Evidence Report: Targeted Immune Modulators for Rheumatoid Arthritis Return to Table of Contents
Author & Year of
Publication
(Trial Name)
Interventions Treatment Response Disease Activity Structural Damage Function Laboratory
indices
Kremer JM New
England Journal of
Medicine 2003174
Kremer 2003
See also Kremer JM
Arthritis and
Rheumatism 2005 283
And Emery P Journal
of Rheumatology
2006 284
1) 10mg/kg ABTiv +
MTX (n=115)
2) 2mg/kg ABTiv +
MTX (n=105)
3) PBO + MTX
(n=119)
24 weeks, %
ACR20
1) 60.0
3) 35.3
P<0.001
ACR50
1) 36.5
3) 11.8
P<0.001
ACR70
1) 16.5
3) 1.7
P<0.001
NR NR HAQ
24 weeks, mean
change from
baseline
1) 41.5
3) 14.1
P<0.05
24 weeks, mean
change from
baseline
CRP level
1) 31.5
3) -23.6
P<0.05

©Institute for Clinical and Economic Review, 2017 Page 353 Draft Evidence Report: Targeted Immune Modulators for Rheumatoid Arthritis Return to Table of Contents
Author & Year of
Publication
(Trial Name)
Interventions Treatment Response Disease Activity Structural Damage Function Laboratory
indices
Kremer JM Annals of
Internal Medicine
2006173
AIM
1) 10mg/kg ABTiv +
MTX (n=433)
2) PBO + MTX
(n=219)
24 weeks, %
ACR20
1) 67.9
2) 39.7
ACR50
1) 39.9
2) 16.8
ACR70
1) 19.8
2) 6.5
All P values <0.001
1 year, %
ACR20
1) 73.1
2) 39.7
ACR50
1) 48.3
2) 18.2
ACR70
1) 28.8
2) 6.1
All P values <0.001
24 weeks
DAS28≤3.2, %
1) 30.1
2) 10.0
P<0.001
DAS28<2.6, %
1) 14.8
2) 2.8
P<0.001
1 year
DAS28≤3.2, %
1) 42.5
2) 9.9
DAS28<2.6, %
1) 23.8
2) 1.9
P<0.001
1 year
Sharp total score,
change from
baseline
1) 1.21
2) 2.32
1 year, %
HAQ-DI
improvement from
baseline
1) 63.7
2) 39.3
P<0.001
NR

©Institute for Clinical and Economic Review, 2017 Page 354 Draft Evidence Report: Targeted Immune Modulators for Rheumatoid Arthritis Return to Table of Contents
Table F12. Abatacept versus conventional DMARD: Harms
Author & Year of Publication
(Trial Name)
Interventions Malignancies Infections Other Adverse
Events
Discontinuation,
Serious AE rate,
Deaths
Takeuchi T Modern
rheumatology 2013172
Takeuchi 2013
1) 10mg ABTiv+MTX
(n=61)
2) PBO+MTX (n=66)
NR Infections and
infestations, n (%)
1) 20 (32.8)
2) 16 (24.2)
Nasopharyngitis, n
(%)
1) 13 (21.3)
2) 8 (12.1)
Gastrointestinal
disorders, n (%)
1) 15 (24.6)
2) 13 (19.7)
Upper respiratory
tract
inflammation, n
(%)
1) 5 (8.2)
2) 3 (4.5)
Constipation, n (%)
1) 1 (1.6)
2) 4 (6.1)
Discontinuation due
to AEs, n (%)
1) 0
2) 2 (3.0)
Serious AEs, n (%)
1) 5 (8.2)
2) 6 (9.1)
Treatment-
emergent SAEs, n
(%)
1) 2 (3.3)
2) 1 (1.5)
Deaths: 0
Genovese MC New England
Journal of Medicine 200591
ATTAIN
1) 10mg/kg ABTiv +
oral DMARD (n=258)
2) PBO + oral
DMARD (n=133)
NR Serious infections,
n (%)
1) 6 (2.3)
2) 3 (2.3)
P=0.97
Nasopharyngitis, n
(%)
1) 20 (7.8)
2) 8 (6.0)
Headache, n (%)
1) 32 (12.4)
2) 7 (5.3)
Discontinuation due
to AEs, n (%)
1) 9 (3.5)
2) 5 (3.8)
P=0.89
Serious AEs, n (%)
1) 7 (2.7)
2) 2 (1.5)
Deaths: 0

©Institute for Clinical and Economic Review, 2017 Page 355 Draft Evidence Report: Targeted Immune Modulators for Rheumatoid Arthritis Return to Table of Contents
Author & Year of Publication
(Trial Name)
Interventions Malignancies Infections Other Adverse
Events
Discontinuation,
Serious AE rate,
Deaths
Kremer JM Arthritis and
Rheumatism 2005 283
Kremer 2005
See also Kremer JM New
England Journal of Medicine
2003174
And Emery P Journal of
Rheumatology 2006 284
1) 10mg/kg ABTiv +
MTX (n=115)
2) 2mg/kg ABTiv +
MTX (n=105)
3) PBO + MTX
(n=119)
Malignancies*, n
1) 4
3) 3
*Considered by
investigator to be
unrelated to study
treatment
Upper respiratory
tract infections, n
(%)
1) 13 (11.3)
3) 9 (7.6)
Nasopharyngitis, n
(%)
1) 17 (14.8)
3) 11 (9.2)
AEs related to
study treatment:
Upper respiratory
tract infections, n
(%)
1) 5 (4.3)
3) 1 (0.8)
Nasopharyngitis, n
(%)
1) 7 (6.1)
3) 4 (3.4)
NR Discontinuation due
to AEs, n (%)
1) 6 (5.2)
3) 11 (9.2)
Serious AEs, n (%)
1) 14 (12.2)
3) 19 (16.0)
Serious AEs related
to study treatment,
n (%)
1) 2 (1.7)
3) 2 (1.7)
Deaths, n
1) 0
2) 1*
3) 0
*Investigator
reported death as
unrelated to the
investigational drug

©Institute for Clinical and Economic Review, 2017 Page 356 Draft Evidence Report: Targeted Immune Modulators for Rheumatoid Arthritis Return to Table of Contents
Author & Year of Publication
(Trial Name)
Interventions Malignancies Infections Other Adverse
Events
Discontinuation,
Serious AE rate,
Deaths
Kremer JM New England
Journal of Medicine 2003174
Kremer 2003
See also Kremer JM Arthritis
and Rheumatism 2005 283
And Emery P Journal of
Rheumatology 2006 284
1) 10mg/kg ABTiv +
MTX (n=115)
2) 2mg/kg ABTiv +
MTX (n=105)
3) PBO + MTX
(n=119)
0 at 24 weeks 24 weeks
Upper respiratory
tract infection, n
(%)
1) 15 (13.0)
3) 12 (10.1)
Pharyngitis, n (%)
1) 12 (10.4)
3) 7 (5.9)
24 weeks
Fatigue, n (%)
1) 6 (5.2)
3) 13 (10.9)
Musculoskeletal
pain, n (%)
1) 8 (7.0)
3) 15 (12.6)
24 weeks
Discontinuation due
to AEs, n (%)
1) 2 (1.7)
3) 7 (5.8)
Serious AEs, n (%)
1) 3 (2.6)
3) 12 (10.1)
P=0.03
Serious AEs related
to study treatment,
n (%)
1) 0
3) 1 (0.8)
Deaths: 0

©Institute for Clinical and Economic Review, 2017 Page 357 Draft Evidence Report: Targeted Immune Modulators for Rheumatoid Arthritis Return to Table of Contents
Author & Year of Publication
(Trial Name)
Interventions Malignancies Infections Other Adverse
Events
Discontinuation,
Serious AE rate,
Deaths
Kremer JM Annals of Internal
Medicine 2006173
Kremer 2006
AIM
1) 10mg/kg ABTiv +
MTX (n=433)
2) PBO + MTX
(n=219)
Malignancies:
1) 1 large B-cell
lymphoma, thyroid
2) 1 endometrial
carcinoma
Infections, n (%)
1) 17 (3.9)
2) 5 (2.3)
Serious infections,
n (%)
1) 11 (2.5)
2) 2 (0.9)
Tuberculosis:
1 case each group,
neither confirmed
bacteriologically
Headache, n (%)
1) 76 (17.6)
2) 26 (11.9)
Discontinuations
due to adverse
events, n (%)
1) 18 (4.2)
2) 4 (1.8)
Serious adverse AEs,
n (%)
1) 65 (15.0)
2) 26 (11.9)
Death, n (%)
1) 1 (0.2)
2) 1 (0.5)
Table F13. Abatacept versus conventional DMARD: Patient-reported Outcomes
Author & Year of
Publication
(Trial Name)
Interventions Health-related
quality of life
Pain Fatigue & other
PROs
Genovese MC New England
Journal of Medicine 2005 91
ATTAIN
1) 10mg/kg ABTiv +
oral DMARD (n=258)
2) PBO + oral
DMARD (n=133)
Week 24
SF-36, PCS:
P<0.001
SF-36, MCS:
P<0.01
NR NR
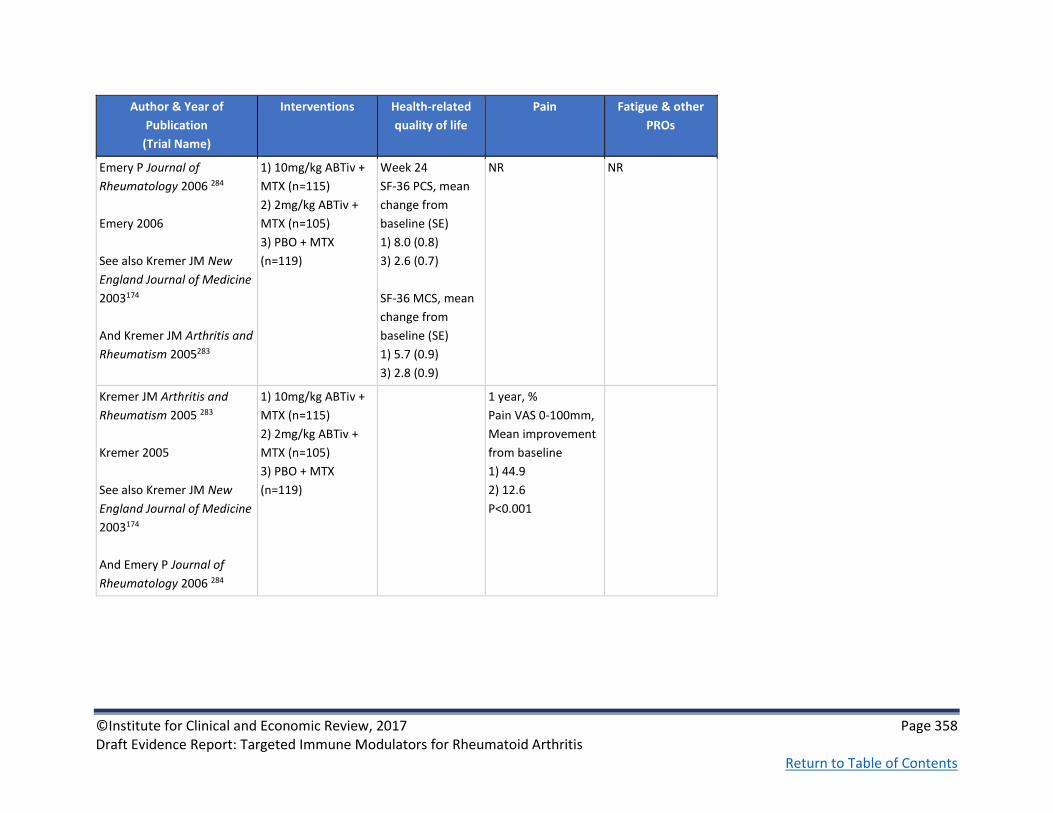
©Institute for Clinical and Economic Review, 2017 Page 358 Draft Evidence Report: Targeted Immune Modulators for Rheumatoid Arthritis Return to Table of Contents
Author & Year of
Publication
(Trial Name)
Interventions Health-related
quality of life
Pain Fatigue & other
PROs
Emery P Journal of
Rheumatology 2006 284
Emery 2006
See also Kremer JM New
England Journal of Medicine
2003174
And Kremer JM Arthritis and
Rheumatism 2005283
1) 10mg/kg ABTiv +
MTX (n=115)
2) 2mg/kg ABTiv +
MTX (n=105)
3) PBO + MTX
(n=119)
Week 24
SF-36 PCS, mean
change from
baseline (SE)
1) 8.0 (0.8)
3) 2.6 (0.7)
SF-36 MCS, mean
change from
baseline (SE)
1) 5.7 (0.9)
3) 2.8 (0.9)
NR NR
Kremer JM Arthritis and
Rheumatism 2005 283
Kremer 2005
See also Kremer JM New
England Journal of Medicine
2003174
And Emery P Journal of
Rheumatology 2006 284
1) 10mg/kg ABTiv +
MTX (n=115)
2) 2mg/kg ABTiv +
MTX (n=105)
3) PBO + MTX
(n=119)
1 year, %
Pain VAS 0-100mm,
Mean improvement
from baseline
1) 44.9
2) 12.6
P<0.001

©Institute for Clinical and Economic Review, 2017 Page 359 Draft Evidence Report: Targeted Immune Modulators for Rheumatoid Arthritis Return to Table of Contents
Author & Year of
Publication
(Trial Name)
Interventions Health-related
quality of life
Pain Fatigue & other
PROs
Kremer JM New England
Journal of Medicine 2003 174
Kremer 2003
See also Kremer JM Arthritis
and Rheumatism 2005 283
And Emery P Journal of
Rheumatology 2006 284
1) 10mg/kg ABTiv +
MTX (n=115)
2) 2mg/kg ABTiv +
MTX (n=105)
3) PBO + MTX
(n=119)
24 weeks
Mean improvement
from baseline
1) 46.4
3) 8.4
P<0.05
Kremer JM Annals of
Internal Medicine 2006 173
AIM
1) 10mg/kg ABTiv +
MTX (n=433)
2) PBO + MTX
(n=219)
24 weeks
SF-36 PCS
P<0.001
SF-36 MCS
P=0.009
1 year
SF-36 PCS
P<0.001
SF-36 MCS
P=0.038
NR NR

©Institute for Clinical and Economic Review, 2017 Page 360 Draft Evidence Report: Targeted Immune Modulators for Rheumatoid Arthritis Return to Table of Contents
Author & Year of
Publication
(Trial Name)
Interventions Health-related
quality of life
Pain Fatigue & other
PROs
Russell AS Annals of
Rheumatic Diseases 2007223
Russell 2007
AIM
1) 10mg/kg ABTiv +
MTX (n=433)
2) PBO + MTX
(n=219)
1 year
Fatigue VAS
P<0.001
Table F14. Abatacept versus conventional DMARD: Non-healthcare Outcomes
Author & Year of
Publication
(Trial Name)
Interventions Requirements for
surgical intervention
Hospitalization,
Rehabilitation,
Assisted living
Productivity Loss Caregiver Burden Other outcomes
Li T Value in Health
2011231
ATTAIN & AIM
AIM
1a) 10mg/kg ABTiv +
MTX (n=433)
2a) PBO + MTX
(n=219)
ATTAIN
1b) 10mg/kg ABTiv +
oral DMARD (n=258)
2b) PBO + oral
DMARD (n=133)
NR NR Differences in gains
in days of activity
participation
Month 6/12 gains
(days per month)
AIM
1a) 7.7/8.4
2a) 3.9/4.5
p<0.0001
ATTAIN Month 6
gains
2a) 7.3 (57.5)
2b) 1.4 (9.9)
P=0.0002
NR Over the 12-month
AIM study, ABT-
treated patients
gained a cumulative
100.1 days of activity
participation vs. 58.2
days in the MTX
group
in the 6-month
ATTAIN study patients
treated with ABT
gained a cumulative
38.1 days vs. 12.8
days for patients
treated with MTX

©Institute for Clinical and Economic Review, 2017 Page 361 Draft Evidence Report: Targeted Immune Modulators for Rheumatoid Arthritis Return to Table of Contents
Table F15. Tocilizumab versus conventional DMARD: Study Characteristics
Author & Year of
Publication
(Trial Name)
Quality rating
Study sponsor Study Design and
Duration of Follow-
up
Geographic
location of study
Interventions (n) &
Dosing Schedule
Inclusion and Exclusion
Criteria
Baseline patient Characteristics
Yazici Y Annals of the
rheumatic diseases
2012150
ROSE
Fair
Roche; third-
party writing
assistance
provided by
Embryon & F
Hoffmann-La
Roche
RCT
multicenter
double-blind
Phase IIIb
24 weeks
United States 1) TCZ+cDMARD
(n=412)
2) PBO+cDMARD
(n=207)
1) 8 mg/kg
intravenously every 4
weeks + stable
antirheumatic
therapy including
DMARD
2) intravenous
placebo every 4
weeks + CDMARD at
stable dose
Adults with active RA for
≥6 months who
had inadequate
response to DMARD;
≥6 swollen joints and ≥6
tender joints at
screening and baseline;
CRP ≥95.24
nmol/l or ESR ≥28 mm/h
at screening
Mean age, yrs (SD)
1) 55.2 (12.06)
2) 55.8 (12.42)
Female, n (%)
1) 325 (79.5)
2) 172 (83.9)
Mean RA duration, yrs (SD)
1) 8.62 y (8.93)
2) 8.52 y (9.05)
Mean DAS28 (SD)
1) 6.53 (1.03)
2) 6.55 (1.01)
Prior anti-TNF, n (%)
1) 155 (37.9)
2) 78 (38)

©Institute for Clinical and Economic Review, 2017 Page 362 Draft Evidence Report: Targeted Immune Modulators for Rheumatoid Arthritis Return to Table of Contents
Author & Year of
Publication
(Trial Name)
Quality rating
Study sponsor Study Design and
Duration of Follow-
up
Geographic
location of study
Interventions (n) &
Dosing Schedule
Inclusion and Exclusion
Criteria
Baseline patient Characteristics
Kremer JM Arthritis
and rheumatism
2011285
LITHE
Good
See also Halland AM
European
Musculoskeletal
Review 2012151
Hoffmann-La
Roche
RCT placebo-
controlled, parallel-
group
Phase III
1 year
Additional 1 year of
open-label therapy.
152 study
locations in 16
countries: USA,
Australia, Brazil,
china, Denmark,
Finland, France,
Greece, Italy,
Mexico, Norway,
Poland, Puerto
Rico, South
Africa, Spain,
Switzerland
1) PBO+MTX (n=393)
2) 4mg/kg TCZ+MTX
(n=399)
3) 8mg/kg TCZ+MTX
(n=398)
Patients were
randomized 1:1:1 to
PBO or either 4mg/kg
or 8mg/kg of TCZ
every 4 weeks + 10 to
25mg MTX every
week. Patients with
<20% improvement
from baseline in SJC
and TJC were eligible
for rescue therapy.
≥18 years with severe to
moderate RA who are
inadequate responders
to ≥ 12 weeks MTX (all
other DMARDS
withdrawn before
study); previous TNFi
discontinuation for
reasons other than
inefficacy; SJC ≥ 6 and
TJC≥8: elevated acute
phase reactants: ≥1 joint
RA erosion on radiology.
Mean age, yrs (SD)
1) 51.3 (12.4)
2) 51.4 (12.6)
3) 53.4 (11.7)
Female, %
1) 83
2) 84
3) 82
Mean RA duration, yrs
1) 9
2) 9.4
3) 9.3
Mean HAQ-DI (SD)
1) 1.5 (0.6)
2) & 3) 1.5 (0.6)
Mean DAS28 (SD)
1) 6.6 (1)
2) 6.5 (0.9)
3) 6.5 (1)
Mean mTSS
1) 28.8
2) 28.7
3) 28.5

©Institute for Clinical and Economic Review, 2017 Page 363 Draft Evidence Report: Targeted Immune Modulators for Rheumatoid Arthritis Return to Table of Contents
Author & Year of
Publication
(Trial Name)
Quality rating
Study sponsor Study Design and
Duration of Follow-
up
Geographic
location of study
Interventions (n) &
Dosing Schedule
Inclusion and Exclusion
Criteria
Baseline patient Characteristics
Kivitz A Arthritis care
& research 2014153
BREVACTA
Good
Roche RCT double-blind,
placebo-controlled,
parallel group, 2-
arm phase III (24
weeks) followed
open label (72
weeks)
141 centers in 22
countries in
Europe, North
America, South
America,
Australia, Africa
and, Asia
1) PBO+MTX (n=219)
2) TCZsc+MTX
(n=437)
Patients were
randomized 2:1 to
receive sc TCZ 162
mg every other
week or sc PBO every
other week for 24
weeks. From
week 12, patients
initially randomized
to receive TCZ
or PBO every other
week could receive
escape therapy
with TCZ 162 mg
weekly at the
investigators’
discretion if there
was <20%
improvement in SJC
and TJC from
baseline.
≥18 years of age with RA
for ≥6 months with ≥SJS
and ≥8 TJC,
radiographical evidence
of ≥1 erosion and
CRP≥10mg/L and/or
ESR≥28 mm/h and
inadequate response to
≥cDMARDs
Mean age, yrs (SD)
1) 52 (11.71)
2) 52.1 (11.45)
Female, n (%)
1) 181 (82.6)
2) 375 (85.8)
Mean RA duration, yrs (SD)
1) 11.1 (8.24)
2) 11.1 (8.39)
Mean HAQ-DI (SD)
1) 1.6 (0.62)
2) 1.6 (0.62)
Mean DAS28 (SD)
1) 6.7 (0.92)
2) 6.6 (0.94)
Mean mTSS (SD)
1) 59.01 (65.9)
2) 60.38 (66.47)

©Institute for Clinical and Economic Review, 2017 Page 364 Draft Evidence Report: Targeted Immune Modulators for Rheumatoid Arthritis Return to Table of Contents
Author & Year of
Publication
(Trial Name)
Quality rating
Study sponsor Study Design and
Duration of Follow-
up
Geographic
location of study
Interventions (n) &
Dosing Schedule
Inclusion and Exclusion
Criteria
Baseline patient Characteristics
Emery P Annals of the
rheumatic diseases
2008189
RADIATE
Good
See also Strand V
Rheumatology 201292
Hoffmann-La
Roche
RCT double-blind,
placebo-controlled,
parallel-group
Phase III
24 weeks
North
America and
western Europe
1) PBO+MTX (n=158)
2) 4mg/kg TCZ+MTX
(n=161)
3) 8mg/kg TCZ+MTX
(n=170)
Patients were
randomly
assigned to 8 mg/kg
or 4 mg/kg of iv TCZ
every 4 weeks or iv
PBO every 4 weeks.
All patients received
stable MTX (10-25mg
weekly). Rescue
therapy (8mg/kg TCZ)
was offered at week
16 in all cases of
treatment failure
(<20% improvement
in both SJC and TJC).
≥18 years of age with
moderate to severe RA
and failure to respond or
intolerance to ≥1 TNFi in
the past year. Patients
had active RA for
≥6months with ≥6 SJC,
≥8 TJC, CRP > 1mg/dl or
ESR >28mm/h
Mean age, yrs (SD)
1) 53.4 (13.3)
3) 53.9 (12.7)
Female, %
1) 79
3) 84
Mean RA duration, yrs (SD)
1) 11.4 (9.2)
3) 12.6 (9.3)
Mean HAQ-DI (SD)
1) 1.7 (0.6)
3) 1.7 (0.6)
Mean DAS28 score (SD)
1) 6.80 (1.06)
3) 6.79 (0.93)

©Institute for Clinical and Economic Review, 2017 Page 365 Draft Evidence Report: Targeted Immune Modulators for Rheumatoid Arthritis Return to Table of Contents
Author & Year of
Publication
(Trial Name)
Quality rating
Study sponsor Study Design and
Duration of Follow-
up
Geographic
location of study
Interventions (n) &
Dosing Schedule
Inclusion and Exclusion
Criteria
Baseline patient Characteristics
Genovese M Arthritis
and rheumatism
2008152
TOWARD
Good
Hoffmann-La
Roche
RCT double-blind,
placebo-controlled,
parallel-group
Phase III
24 weeks
146 locations in
18 countries:
United States,
Argentina,
Australia, Brazil,
Canada, China,
Costa Rica, Czech
Republic,
Finland, France,
Germany,
Mexico, Panama,
Russia, South
Africa, Spain,
Sweden,
Thailand
1) PBO+MTX (n=413)
2) 8mg/kg TCZ+MTX
(n=803)
Patients were
randomly
assigned to 8 mg/kg
of iv TCZ or iv PBO
every 4 weeks
≥18 years of age
diagnosed with
moderate to severe RA
of ≥6months duration
with ≥6 SJC, ≥8 TJC, CRP
≥ 1mg/dl or ESR
≥28mm/h. Patients must
have received stable
dose of conventional
DMARD for ≥8 weeks
prior to study
Exclusion: Patients who
were unsuccessfully
treated with TNFi or
were previously treated
with any cell-depleting
therapy were excluded
Mean age, yrs (SD)
1) 54 (13)
2) 53 (13)
Female, %
1) 84
2) 81
Mean RA duration, yrs (SD)
1) 9.8 (9.1)
2) 9.8 (8.8)
Mean HAQ-DI (SD)
1) 1.5 (0.6)
2) 1.5 (0.6)
Mean DAS28 (SD)
1) 6.6 (1)
2) 6.7 (1)

©Institute for Clinical and Economic Review, 2017 Page 366 Draft Evidence Report: Targeted Immune Modulators for Rheumatoid Arthritis Return to Table of Contents
Author & Year of
Publication
(Trial Name)
Quality rating
Study sponsor Study Design and
Duration of Follow-
up
Geographic
location of study
Interventions (n) &
Dosing Schedule
Inclusion and Exclusion
Criteria
Baseline patient Characteristics
Nishimoto N Annals of
the rheumatic diseases
200784
SAMARAI
Good
Chugai
Pharmaceutical
RCT, parallel-group,
open-label
52 weeks
28 locations in
Japan
1) cDMARD (n=145)
2) 8mg/kg TCZ
(n=157)
Patients were
randomly
assigned to 8 mg/kg
of iv TCZ or
conventional DMARD
therapy
85% of cDMARD
patients were on
MTX (29% on MTX
monotherapy and
56% on MTX plus
other cDMARD) and
15% received other
cDMARD an/ or
immunosuppressant
other than
corticosteroids
>20 years with RA for
≥6months and < 5years,
with ≥6 TJC, ≥6 SJC, ESR
≥30mm/h and CRP
≥20mg/l and inadequate
response to ≥1 DMARD.
Use of TNFi and
leflunomide were not
allowed within 3 months
prior to first dose
Mean age, yrs (SD)
1) 53.1 (12.5)
2) 52.9 (11.6)
Female, n
1) 119
2) 125
Mean RA duration, yrs (SD)
1) 2.4 (1.3)
2) 2.2 (1.4)
Mean DAS28 (SD)
1) 6.4 (0.9)
2) 6.5 (0.8)
Mean mTSS (SD)
1) 30.6 (42)
2) 28.3 (43.9)

©Institute for Clinical and Economic Review, 2017 Page 367 Draft Evidence Report: Targeted Immune Modulators for Rheumatoid Arthritis Return to Table of Contents
Author & Year of
Publication
(Trial Name)
Quality rating
Study sponsor Study Design and
Duration of Follow-
up
Geographic
location of study
Interventions (n) &
Dosing Schedule
Inclusion and Exclusion
Criteria
Baseline patient Characteristics
Nishimoto N Modern
Rheumatology 200985
SATORI
Good
Chugai
Pharmaceutical
RCT double-blind,
parallel-group
Phase III
24 weeks
25 locations in
Japan
1) MTX (n=64)
2) 8mg/kg TCZ (n=61)
Patients were
randomly assigned to
TCZ 8 mg/kg every 4
weeks plus MTX
placebo (TCZ
group) or TCZ
placebo plus MTX 8
mg/week (MTX
group) for 24 weeks
Patients between 20 and
75 years old, with RA
duration >6months, with
≥6 TJC, ≥6 SJC, ESR
≥30mm/h or CRP
≥10mg/l and inadequate
response to MTX.
Patients were not
allowed to have
received prior TNFi or
leflunomide (within
12 weeks prior to the
first dose
Mean age, yrs (SD)
1) 50.8 (12.2)
2) 52.6 (10.6)
Female, n
1) 48
2) 55
Mean RA duration, yrs (SD)
1) 8.7 (7.1)
2) 8.5 (8.4)
Mean DAS28 (SD)
1) 6.2 (0.9)
2) 6.1 (0.9)

©Institute for Clinical and Economic Review, 2017 Page 368 Draft Evidence Report: Targeted Immune Modulators for Rheumatoid Arthritis Return to Table of Contents
Author & Year of
Publication
(Trial Name)
Quality rating
Study sponsor Study Design and
Duration of Follow-
up
Geographic
location of study
Interventions (n) &
Dosing Schedule
Inclusion and Exclusion
Criteria
Baseline patient Characteristics
Smolen J Lancet
2008213
OPTION
Good
Hoffmann-La
Roche
RCT double-blind,
placebo-controlled,
parallel-group
Phase III
24 weeks
73 centers in 17
countries:
Argentina,
Australia,
Austria, Brazil,
Bulgaria, Canada,
China, France,
Germany,
Hungary, Israel,
Italy, Mexico,
Singapore,
Slovakia,
Switzerland &
Thailand
1) PBO+MTX (n=204)
2) 4mg/kg TCZ+MTX
(n=213)
3) 8mg/kg TCZ+MTX
(n=205)
Patients were
randomly assigned to
receive PBO
TCZ 4 mg/kg, or TCZ 8
mg/kg intravenously
every 4 weeks for
24 weeks with
weekly stable dose of
MTX (10–25 mg)
Patients who had not
achieved ≥20%
improvement in both
SJC & TJC by week 16
were eligible for
rescue therapy
with TCZ 8 mg/kg
and, if necessary,
intra-articular
steroids
Adult patients with
moderate to severe
active rheumatoid
Arthritis for >6months
with inadequate
response to MTX. Active
RA was defined as ≥6
SJC, ≥8 TJC, CRP >
10mg/dl or ESR
≥28mm/h. Patients were
to receive MTX for 12
weeks or more before
start of study
Mean age, yrs (SD)
1) 50.6 (12.1)
2) 51.4 (12.8)
3) 50.8 (11.8)
Female, %
1) 78
2) 82
3) 85
Mean RA duration, yrs (SD)
1) 7.8 (7.2)
2) 7.4 (7.4)
3) 7.5 (7.3)
Mean HAQ-DI (SD)
1) 1.5 (0.6)
2) 1.6 (0.6)
3) 1.6 (0.6)
Mean DAS28 (SD)
1) 6.8 (0.9)
2) 6.8 (0.9)
3) 6.8 (0.9)

©Institute for Clinical and Economic Review, 2017 Page 369 Draft Evidence Report: Targeted Immune Modulators for Rheumatoid Arthritis Return to Table of Contents
Table F16. Tocilizumab versus conventional DMARD: Key Clinical Outcomes
Author & Year of
Publication
(Trial Name)
Interventions Treatment Response Disease Activity Structural Damage Function Laboratory
indices
Yazici Y Annals of the
rheumatic diseases
2012150
ROSE
1) TCZ+cDMARD
(n=412)
2) PBO+cDMARD
(n=207)
Week 24, %
ACR20
1) 46.1
2) 26.7
p<0.0001
ACR50
1) 30.1
2) 11.2
p<0.0001
ACR70
1) 16
2) 2.1
p<0.0001
Good EULAR response
1) 32.5
2) 5.9
p<0.0001
Week 24
Remission
(DAS28[ESR]<2.6), %
1) 38.4
2) 2
p<0.0001
DAS28 (ESR)
1) 3.24
2) 5.18
p<0.0001
NR NR NR
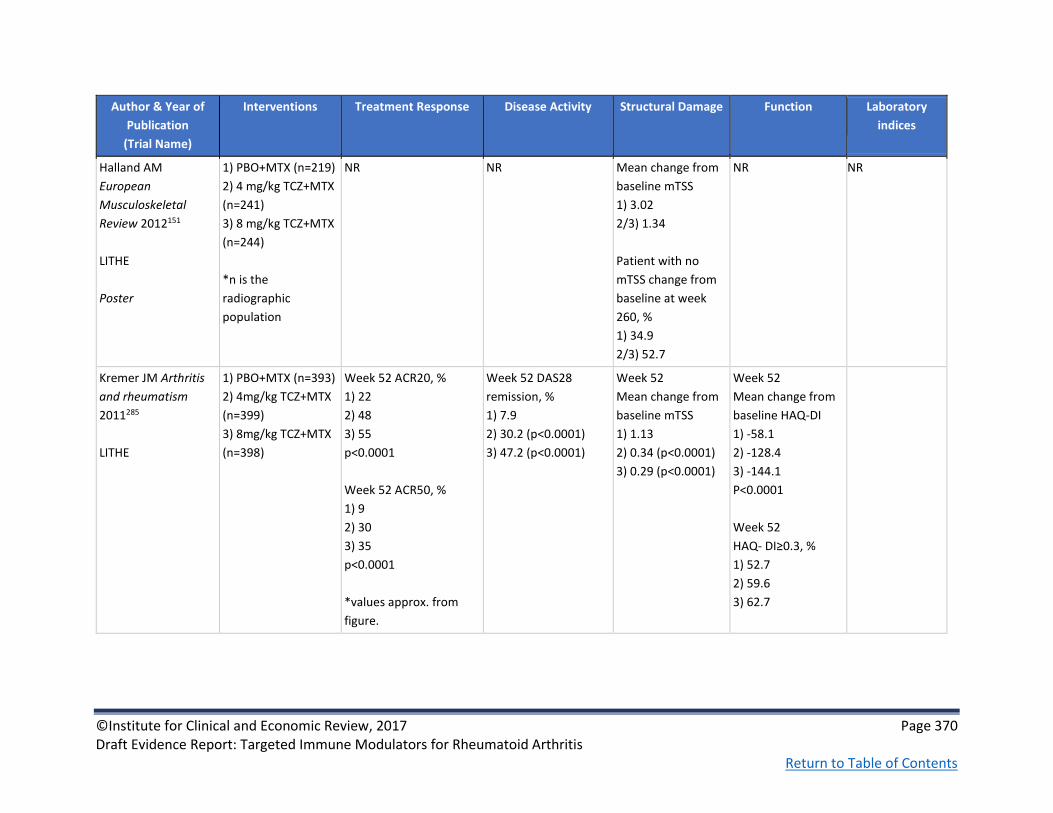
©Institute for Clinical and Economic Review, 2017 Page 370 Draft Evidence Report: Targeted Immune Modulators for Rheumatoid Arthritis Return to Table of Contents
Author & Year of
Publication
(Trial Name)
Interventions Treatment Response Disease Activity Structural Damage Function Laboratory
indices
Halland AM
European
Musculoskeletal
Review 2012151
LITHE
Poster
1) PBO+MTX (n=219)
2) 4 mg/kg TCZ+MTX
(n=241)
3) 8 mg/kg TCZ+MTX
(n=244)
*n is the
radiographic
population
NR
NR Mean change from
baseline mTSS
1) 3.02
2/3) 1.34
Patient with no
mTSS change from
baseline at week
260, %
1) 34.9
2/3) 52.7
NR NR
Kremer JM Arthritis
and rheumatism
2011285
LITHE
1) PBO+MTX (n=393)
2) 4mg/kg TCZ+MTX
(n=399)
3) 8mg/kg TCZ+MTX
(n=398)
Week 52 ACR20, %
1) 22
2) 48
3) 55
p<0.0001
Week 52 ACR50, %
1) 9
2) 30
3) 35
p<0.0001
*values approx. from
figure.
Week 52 DAS28
remission, %
1) 7.9
2) 30.2 (p<0.0001)
3) 47.2 (p<0.0001)
Week 52
Mean change from
baseline mTSS
1) 1.13
2) 0.34 (p<0.0001)
3) 0.29 (p<0.0001)
Week 52
Mean change from
baseline HAQ-DI
1) -58.1
2) -128.4
3) -144.1
P<0.0001
Week 52
HAQ- DI≥0.3, %
1) 52.7
2) 59.6
3) 62.7

©Institute for Clinical and Economic Review, 2017 Page 371 Draft Evidence Report: Targeted Immune Modulators for Rheumatoid Arthritis Return to Table of Contents
Author & Year of
Publication
(Trial Name)
Interventions Treatment Response Disease Activity Structural Damage Function Laboratory
indices
Kivitz A Arthritis care
& research 2014153
BREVACTA
1) PBO+MTX (n=219)
2) 162 mg
TCZsc+MTX (n=437)
Week 24 ACR20, %
1) 32
2) 61
p<0.0001
Week 24 ACR50, %
1) 12
2) 40
p<0.0001
Week 24 ACR70, %
1) 5
2) 20
p<0.0001
Week 24 DAS28-ESR
remission, %
1) 4
2) 32
p<0.0001
Week 24 mean
change from
baseline mTSS
1) 1.23
2) 0.62
p=0.0149
Emery P Annals of
the rheumatic
diseases 2008189
RADIATE
1) PBO+MTX (n=158)
2) 4mg/kg TCZ+MTX
(n=161)
3) 8mg/kg TCZ+MTX
(n=170)
Week 24 ACR20, %
1) 10.1
3) 50
P<0.001
Week 24 ACR50, %
1) 28.8
3) 3.8
P<0.001
Week 24 ACR70, %
1) 12.4
3) 1.3
P=0.001
Week 24 DAS28
remission, %
1) 1.6
3) 30.1
P=0.001
NR Week 24 mean
change from
baseline HAQ-DI
1) -0.05
3) -0.39
P<0.001
Week 24 mean
CRP
1) NR
3) <0.3mg/dl
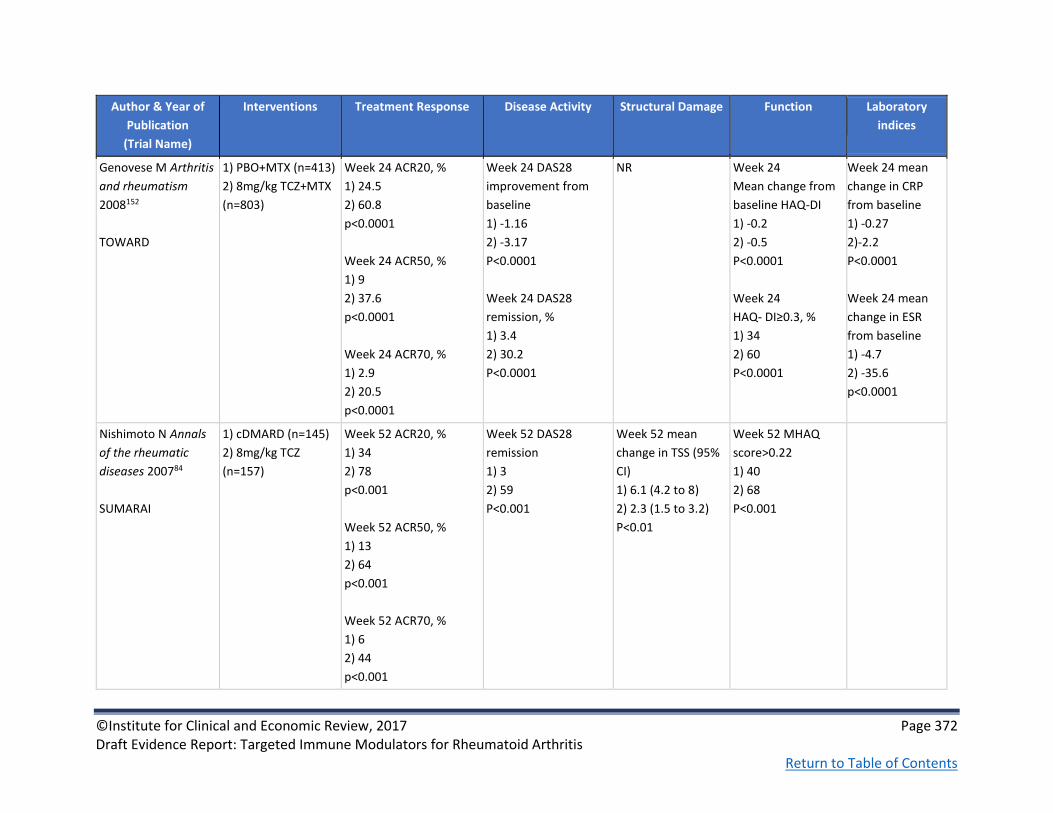
©Institute for Clinical and Economic Review, 2017 Page 372 Draft Evidence Report: Targeted Immune Modulators for Rheumatoid Arthritis Return to Table of Contents
Author & Year of
Publication
(Trial Name)
Interventions Treatment Response Disease Activity Structural Damage Function Laboratory
indices
Genovese M Arthritis
and rheumatism
2008152
TOWARD
1) PBO+MTX (n=413)
2) 8mg/kg TCZ+MTX
(n=803)
Week 24 ACR20, %
1) 24.5
2) 60.8
p<0.0001
Week 24 ACR50, %
1) 9
2) 37.6
p<0.0001
Week 24 ACR70, %
1) 2.9
2) 20.5
p<0.0001
Week 24 DAS28
improvement from
baseline
1) -1.16
2) -3.17
P<0.0001
Week 24 DAS28
remission, %
1) 3.4
2) 30.2
P<0.0001
NR Week 24
Mean change from
baseline HAQ-DI
1) -0.2
2) -0.5
P<0.0001
Week 24
HAQ- DI≥0.3, %
1) 34
2) 60
P<0.0001
Week 24 mean
change in CRP
from baseline
1) -0.27
2)-2.2
P<0.0001
Week 24 mean
change in ESR
from baseline
1) -4.7
2) -35.6
p<0.0001
Nishimoto N Annals
of the rheumatic
diseases 200784
SUMARAI
1) cDMARD (n=145)
2) 8mg/kg TCZ
(n=157)
Week 52 ACR20, %
1) 34
2) 78
p<0.001
Week 52 ACR50, %
1) 13
2) 64
p<0.001
Week 52 ACR70, %
1) 6
2) 44
p<0.001
Week 52 DAS28
remission
1) 3
2) 59
P<0.001
Week 52 mean
change in TSS (95%
CI)
1) 6.1 (4.2 to 8)
2) 2.3 (1.5 to 3.2)
P<0.01
Week 52 MHAQ
score>0.22
1) 40
2) 68
P<0.001

©Institute for Clinical and Economic Review, 2017 Page 373 Draft Evidence Report: Targeted Immune Modulators for Rheumatoid Arthritis Return to Table of Contents
Author & Year of
Publication
(Trial Name)
Interventions Treatment Response Disease Activity Structural Damage Function Laboratory
indices
Nishimoto N Modern
Rheumatology
200985
SATORI
1) MTX (n=64)
2) 8mg/kg TCZ
(n=61)
Week 24 ACR20, %
1) 25
2) 80.3
p<0.001
Week 24 ACR50, %
1) 10.9
2) 49.2
p<0.001
Week 24 ACR70, %
1) 6.3
2) 29.5
p<0.001
Week 24 DAS28
remission, %
1) 1.6
2) 43.1
P<0.001
NR Week 24 MHAQ
score>0.22
1) 34
2) 67
P<0.001
NR
Smolen J Lancet
2008213
OPTION
1) PBO+MTX (n=204)
2) 4mg/kg TCZ+MTX
(n=213)
3) 8mg/kg TCZ+MTX
(n=205)
Week 24 ACR20, %
1) 26
3) 59
p<0.0001
Week 24 ACR50, %
1) 11
3) 44
p<0.0001
Week 24 ACR70, %
1) 2
3) 22
p<0.0001
Week 24 DAS28
remission, %
1) 0.8
3) 27
P<0.0001
NR Week 24
Mean change from
baseline HAQ-DI
1) -0.34
3) -0.55
P=0.0082
Week 24 HAQ-DI
score≥0.3
1) 46
3) 59
P<0.001
Week 24
Mean change
from baseline CRP
1) -3.5
3) -25.1
P<0.0001
Week 24
Mean change
from baseline ESR
1) -7.1
3) -39.5
P<0.0001
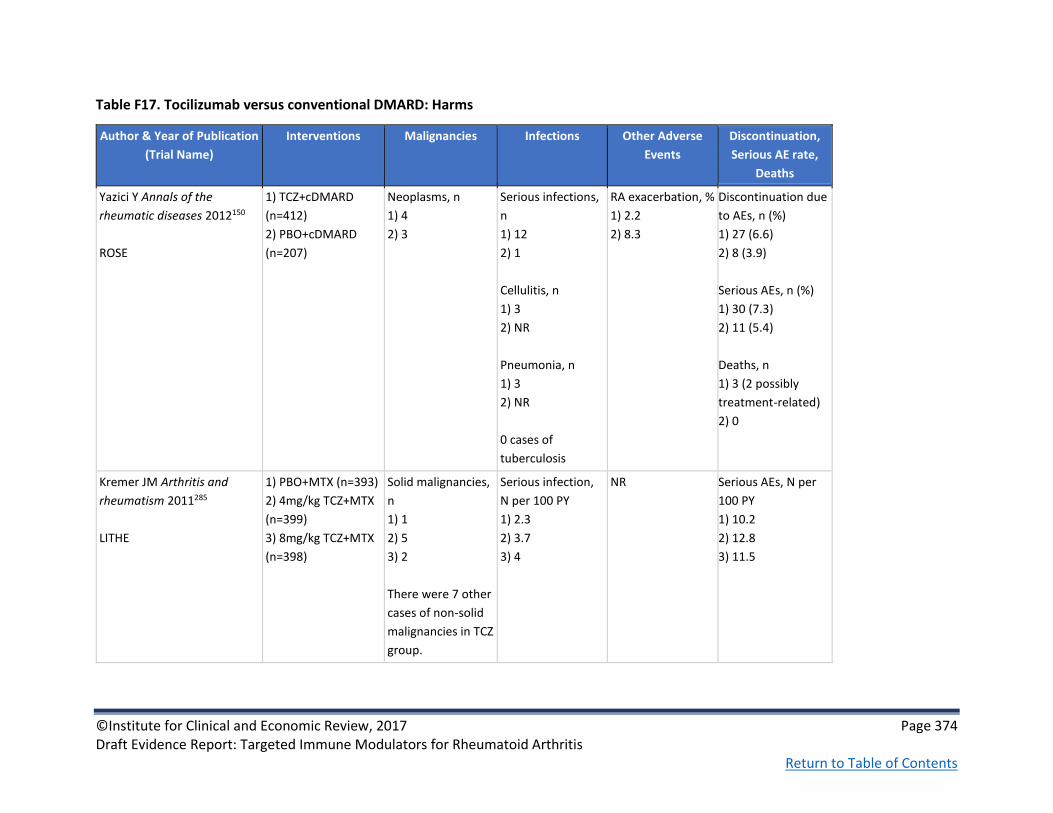
©Institute for Clinical and Economic Review, 2017 Page 374 Draft Evidence Report: Targeted Immune Modulators for Rheumatoid Arthritis Return to Table of Contents
Table F17. Tocilizumab versus conventional DMARD: Harms
Author & Year of Publication
(Trial Name)
Interventions Malignancies Infections Other Adverse
Events
Discontinuation,
Serious AE rate,
Deaths
Yazici Y Annals of the
rheumatic diseases 2012150
ROSE
1) TCZ+cDMARD
(n=412)
2) PBO+cDMARD
(n=207)
Neoplasms, n
1) 4
2) 3
Serious infections,
n
1) 12
2) 1
Cellulitis, n
1) 3
2) NR
Pneumonia, n
1) 3
2) NR
0 cases of
tuberculosis
RA exacerbation, %
1) 2.2
2) 8.3
Discontinuation due
to AEs, n (%)
1) 27 (6.6)
2) 8 (3.9)
Serious AEs, n (%)
1) 30 (7.3)
2) 11 (5.4)
Deaths, n
1) 3 (2 possibly
treatment-related)
2) 0
Kremer JM Arthritis and
rheumatism 2011285
LITHE
1) PBO+MTX (n=393)
2) 4mg/kg TCZ+MTX
(n=399)
3) 8mg/kg TCZ+MTX
(n=398)
Solid malignancies,
n
1) 1
2) 5
3) 2
There were 7 other
cases of non-solid
malignancies in TCZ
group.
Serious infection,
N per 100 PY
1) 2.3
2) 3.7
3) 4
NR Serious AEs, N per
100 PY
1) 10.2
2) 12.8
3) 11.5

©Institute for Clinical and Economic Review, 2017 Page 375 Draft Evidence Report: Targeted Immune Modulators for Rheumatoid Arthritis Return to Table of Contents
Author & Year of Publication
(Trial Name)
Interventions Malignancies Infections Other Adverse
Events
Discontinuation,
Serious AE rate,
Deaths
Kivitz A Arthritis care &
research 2014153
BREVACTA
1) PBO+MTX (n=219)
2) 162 mg
TCZsc+MTX (n=437)
NR Serious infection, n
(%)
1) 4 (1.8)
2) 9 (2.1)
NR Discontinuation due
to AEs, n (%)
1) 3 (1)
2) 9 (2)
Serious AEs, n (%)
1) 8 (3.7)
2) 20 (4.6)
Death
1) 0
2) 3 (<1)
Emery P Annals of the
rheumatic diseases 2008189
RADIATE
1) PBO+MTX (n=158)
2) 4mg/kg TCZ+MTX
(n=161)
3) 8mg/kg TCZ+MTX
(n=170)
NR Serious infection, n
(%)
1) 5 (3.1)
3) 8 (4.6)
Infusion reaction,
%
1) 6.3
3) 9.1
Discontinuation due
to AEs, n (%)
1) 8 (5)
3) 10 (5.7)
Serious AEs, n (%)
1) 18 (11.3)
3) 11 (6.3)
0 deaths in all
groups

©Institute for Clinical and Economic Review, 2017 Page 376 Draft Evidence Report: Targeted Immune Modulators for Rheumatoid Arthritis Return to Table of Contents
Author & Year of Publication
(Trial Name)
Interventions Malignancies Infections Other Adverse
Events
Discontinuation,
Serious AE rate,
Deaths
Genovese M Arthritis and
rheumatism 2008152
TOWARD
1) PBO+MTX (n=413)
2) 8mg/kg TCZ+MTX
(n=803)
NR Serious infection, n
(%)
1) 8 (1.9)
2) 22 (2.7)
Rates of serious
infection (per 100
patient-years)
1) 4.7
2) 5.9
NR Any AE, n (%)
1) 253 (61.1)
2) 584 (72.8)
Serious AE, n (%)
1) 18 (4.3)
2) 54 (6.7)
Discontinuation due
to AE, n (%)
1) 8 (1.9)
2) 31 (3.9)
Death, n (%)
1) 2 (<1)
2) 2 (<1)
Nishimoto N Annals of the
rheumatic diseases 200784
SUMARAI
1) cDMARD (n=145)
2) 8mg/kg TCZ
(n=157)
Malignancies, n
1) 0
2) 3
Serious infection, n
1) 8
2) 12
There was no TB
case
Infusion reaction,
n (%)
1) NA
2) 11 (7)
Serious AE, %
1) 13
2) 18
Nishimoto N Modern
Rheumatology 200985
SATORI
1) MTX (n=64)
2) 8mg/kg TCZ (n=61)
NR There was no TB
case
Infusion reaction,
n (%)
1) NA
2) 7 (11.5)
Serious AE, %
1) 4.7
2) 6.6

©Institute for Clinical and Economic Review, 2017 Page 377 Draft Evidence Report: Targeted Immune Modulators for Rheumatoid Arthritis Return to Table of Contents
Author & Year of Publication
(Trial Name)
Interventions Malignancies Infections Other Adverse
Events
Discontinuation,
Serious AE rate,
Deaths
Smolen J Lancet 2008213
OPTION
1) PBO+MTX (n=204)
2) 4mg/kg TCZ+MTX
(n=213)
3) 8mg/kg TCZ+MTX
(n=205)
NR Serious infection:
NR
Any infection, n
(%)
1) 56 (27)
3) 66 (32)
NR NR

©Institute for Clinical and Economic Review, 2017 Page 378 Draft Evidence Report: Targeted Immune Modulators for Rheumatoid Arthritis Return to Table of Contents
Table F18. Tocilizumab versus conventional DMARD: Patient-reported Outcomes
Author & Year of Publication
(Trial Name)
Interventions Health-related
quality of life
Pain Fatigue & other
PROs
Yazici Y Annals of the
rheumatic diseases 2012150
ROSE
1) TCZ+cDMARD
(n=412)
2) PBO+cDMARD
(n=207)
Week 24 mean
change from
baseline
RAPID3
1) -2.33
2) -1.29
p<0.0001
NR Week 24 mean
change from
baseline
FACIT-F
1) 8.43
2) 5.89
Difference in
adjusted mean
change from
baseline: 2.73
(95% CI 0.45 to
5.00)
p=0.0188
Genovese M Arthritis and
rheumatism 2008152
TOWARD
1) PBO+MTX (n=413)
2) 8mg/kg TCZ+MTX
(n=803)
Week 24 mean
change from
baseline
SF-36
Physical
1) 4.1
2) 8.9
Mental
1) 2.3
3) 5.3
p<0.0001
NR Week 24 mean
change from
baseline
FACIT-F
1) 3.6
2) 8
p<0.0001

©Institute for Clinical and Economic Review, 2017 Page 379 Draft Evidence Report: Targeted Immune Modulators for Rheumatoid Arthritis Return to Table of Contents
Author & Year of Publication
(Trial Name)
Interventions Health-related
quality of life
Pain Fatigue & other
PROs
Smolen J Lancet 2008213
OPTION
1) PBO+MTX (n=204)
2) 4mg/kg TCZ+MTX
(n=213)
3) 8mg/kg TCZ+MTX
(n=205)
Week 24 mean
change from
baseline
SF-36
Physical
1) 5
3) 9.5
p<0.0001
Mental
1) 2.7
3) 7.3
p=0.0012
NR Week 24 mean
change from
baseline
FACIT-F
1) 4
3) 8.6
p<0.0001
Strand V Rheumatology
201292
RADIATE
1) PBO+MTX (n=158)
2) 4mg/kg TCZ+MTX
(n=161)
3) 8mg/kg TCZ+MTX
(n=170)
Week 24 mean
change from
baseline
SF-36 PCS
1) 2.22
3) 8.02
p=0.0003
SF-36 MCS
1) 4.07
3) 4.06
Pain VAS, Mean
change from
baseline
1) -8.6
3) -32.5
p<0.0001
Week 24 mean
change from
baseline
FACIT-F
1) 4.22
3) 8.83
p=0.015

©Institute for Clinical and Economic Review, 2017 Page 380 Draft Evidence Report: Targeted Immune Modulators for Rheumatoid Arthritis Return to Table of Contents
Table F19. Sarilumab versus conventional DMARD: Study Characteristics
Author & Year of
Publication
(Trial Name)
Quality rating
Study sponsor Study Design and
Duration of Follow-
up
Geographic
location of study
Interventions (n) &
Dosing Schedule
Inclusion and Exclusion
Criteria
Baseline patient Characteristics
Fleischmann R
Arthritis and
Rheumatology 2016 163
TARGET
Fair
See also Fleischmann
R Arthritis and
Rheumatology 201588
Sanofi and
Regeneron
Pharmaceuticals,
Inc.
RCT, 3-arm,
multicentered,
double-blind,
placebo-controlled,
phase 3 clinical trial
Duration was 34
weeks including 4
weeks of screening,
24 weeks of
treatment, and 6
weeks of
posttreatment
follow up
155 study
centers across 27
countries
1) PBO+csDMARDs
(n=181)
2) 150mg
SAR+csDMARDs
(n=181)
3) 200mg
SAR+csDMARDs
(n=184)
Interventions were
given every 2 weeks
for 24 weeks; after
12, patients with
<20% improvement
from baseline in SJC
or TJC for 2 joint
assessments ≥4 wks
apart were offered
rescue therapy with
open-label SAR
200mg q2w
Inclusion:
≥18 years old with s had
active RA (≥6 SJC, ≥8
TJC, and ≥8 mg/L hs-
CRP) RA duration of ≥6
months and inadequate
response to or
intolerance of ≥1 anti-
TNF therapies; required
continuous treatment
with standard dose of 1
or a combo of
background cDMARDs
Exclusion:
Uncontrolled
concomitant diseases,
significant extra-articular
manifestations of RA,
functional class iv RA,
current/recurrent
infections, other
inflammatory diseases,
receiving prednisone
(>10 mg/day or
equivalent)
Mean age, yrs (SD)
1) 51.9 (12.4)
2) 54.0 (11.7)
3) 52.9 (12.9)
Female, n (%)
1) 154 (85.1)
2) 142 (78.5)
3) 151 (82.1)
Mean RA duration, yrs (SD)
1) 12.0 (10.0)
2) 11.6 (8.6)
3) 12.7 (9.6)
Mean DAS28-CRP (SD)
1) 6.2 (0.9)
2) 6.1 (0.9)
3) 6.3 (1.0)
Mean HAQ-DI score (SD)
1) 1.8 (0.6)
2) 1.7 (0.6)
3) 1.8 (0.6)

©Institute for Clinical and Economic Review, 2017 Page 381 Draft Evidence Report: Targeted Immune Modulators for Rheumatoid Arthritis Return to Table of Contents
Author & Year of
Publication
(Trial Name)
Quality rating
Study sponsor Study Design and
Duration of Follow-
up
Geographic
location of study
Interventions (n) &
Dosing Schedule
Inclusion and Exclusion
Criteria
Baseline patient Characteristics
Genovese MC Arthritis
& rheumatology
2015162
MOBILITY
Good
See also Strand V
Arthritis Rheumatol
2015 286, Kavanaugh A
Arthritis and
Rheumatology
2014287, Fleischmann R
Arthritis and
Rheumatology 201489,
Van Der Heijde D
Annals of the
Rheumatic Diseases.
2015203, Emery P
Annals of the
Rheumatic Diseases
2015219
Sanofi RCT, double-blind,
placebo controlled
phase II and III
52 weeks
262 centers in 31
countries in
North and South
America,
Australia, Asia,
Africa and
Europe
1) PBO+MTX (n=398)
2) 150mg SAR+MTX
(n=400)
3) 200mg SAR+MTX
(n=399)
Patients were
randomized to every
2 weeks SAR or
placebo plus weekly
MTX. From week 16,
patients who did not
achieve ≥20%
improvement from
baseline in the
SJC or TJC at 2
consecutive
assessments were
offered rescue
therapy with open-
label SAR 200 mg
every 2 weeks
18-75 year olds with
active RA (i.e. ≥6 SJC, ≥8
TJC and
hsCRP≥0.6mg/dl); with
RA duration ≥3 months
despite treatment with
MTX for a minimum of
12 weeks; At least
documented bone
erosion or positive anti-
CCP or RF
Exclusion:
Prior nonresponse to
bDMARD; other
uncontrolled diseases;
significant extraarticular
manifestation; current/
recurrent infection;
functional class iv RA
Mean age, yrs (SD)
1) 50.9 (11.2)
2) 50.1 (11.9)
3) 50.8 (11.8)
Female, %
1) 81
2) 80
3) 85
Mean RA duration, yrs (range)
1) 9.1 (0.3-44)
2) 9.5 (0.3-44.7)
3) 8.6 (0.3-34.2)
Mean DAS28-CRP(SD)
1) 5.9 (0.9)
2) & 3) 6 (0.9)
Mean mTSS (SD)
1) 48 (65.2)
2) 54.7 (63.4)
3) 46.3 (57.4)
Mean HAQ
1) 1.6 (0.7)
2) 1.6 (0.6)
3) 1.7 (0.6)

©Institute for Clinical and Economic Review, 2017 Page 382 Draft Evidence Report: Targeted Immune Modulators for Rheumatoid Arthritis Return to Table of Contents
Table F20. Sarilumab versus conventional DMARD: Key Clinical Outcomes
Author & Year of
Publication
(Trial Name)
Interventions Treatment Response Disease Activity Structural Damage Function Laboratory
indices
Fleischmann R
Arthritis and
Rheumatology
201588
TARGET
Abstract
1) PBO+cDMARD
(n=181)
2) 150mg
SAR+cDMARD
(n=181)
3) 200mg
SAR+cDMARD
(n=184)
Week 24 % ACR20
1) 34
2) 56 p<0.0001)
3) 61 (p<0.0001)
Week 24 % ACR50
1) 18
2) 37 (p<0.0001)
3) 41 (p<0.0001)
Week 24 % ACR70
1) 7
2) 20 (p<0.025)
3) 16 (p<0.025)
NR NR Week 12 mean
change from
baseline HAQ-DI
(SD)
1) -0.29 (0.54)
2) -0.5 (0.64)
p=0.0007
3) -0.49 (0.56)
p=0.0004
NR

©Institute for Clinical and Economic Review, 2017 Page 383 Draft Evidence Report: Targeted Immune Modulators for Rheumatoid Arthritis Return to Table of Contents
Author & Year of
Publication
(Trial Name)
Interventions Treatment Response Disease Activity Structural Damage Function Laboratory
indices
Fleischmann R
Arthritis and
Rheumatology 2016 163
TARGET
1) PBO+csDMARDs
(n=181)
2) 150mg
SAR+csDMARDs
(n=181)
3) 200mg
SAR+csDMARDs
(n=184)
Week 24
ACR20, n (%)
1) 61 (33.7)
2) 101 (55.8)
3) 112 (60.9)
p<0.0001 for 2-3
ACR50, n (%)
1) 33 (18.2)
2) 67 (37.0)
3) 75 (40.8)
p<0.0001 for 2-3
ACR70, n (%)
1) 13 (7.2)
2) 36 (19.9) p<0.001
3) 30 (16.3) p<0.01
Week 24
Mean DAS28-CRP
change from baseline
(SE)
1) -1.4 (0.12)
2) -2.4 (0.11)
3) -2.8 (0.11)
NR Week 12
Mean HAQ-DI
change from
baseline (SE)
1) -0.26 (0.04)
2) -0.46 (0.04)
3) -0.47 (0.04)
Week 24
CRP, mg/L (SD)
1) -3.6 (1.56)
2) -15.2 (1.46)
3) -23.3 (1.42)
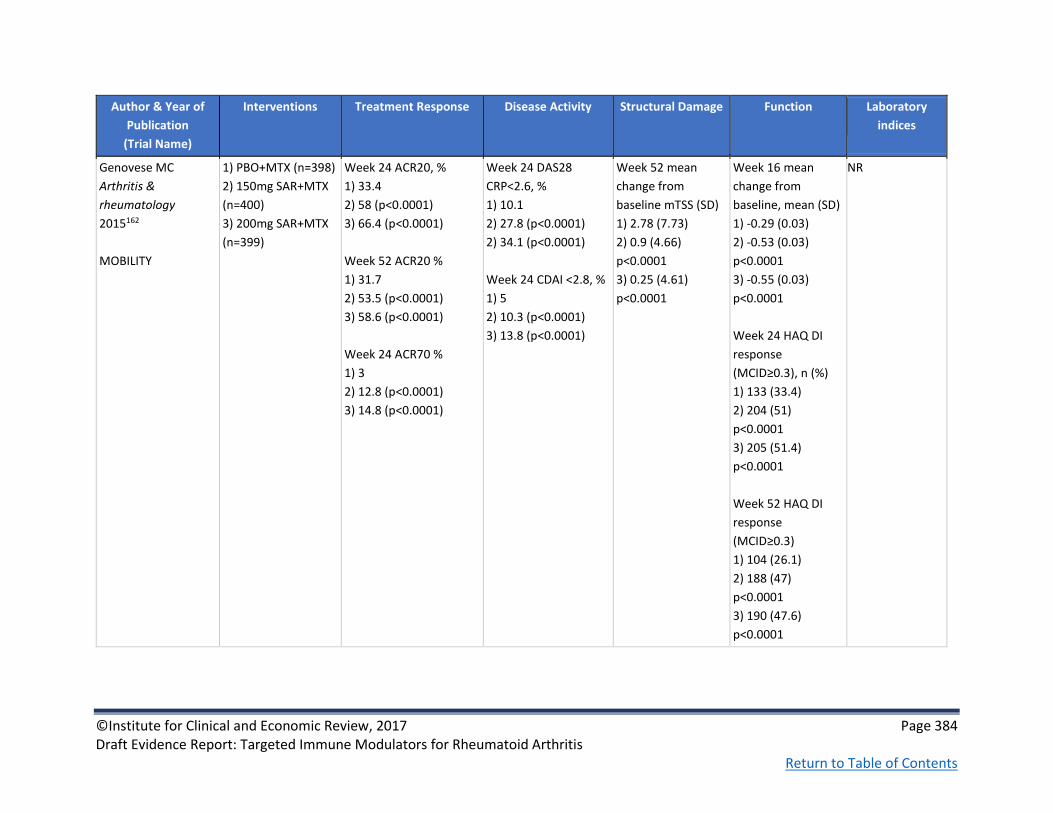
©Institute for Clinical and Economic Review, 2017 Page 384 Draft Evidence Report: Targeted Immune Modulators for Rheumatoid Arthritis Return to Table of Contents
Author & Year of
Publication
(Trial Name)
Interventions Treatment Response Disease Activity Structural Damage Function Laboratory
indices
Genovese MC
Arthritis &
rheumatology
2015162
MOBILITY
1) PBO+MTX (n=398)
2) 150mg SAR+MTX
(n=400)
3) 200mg SAR+MTX
(n=399)
Week 24 ACR20, %
1) 33.4
2) 58 (p<0.0001)
3) 66.4 (p<0.0001)
Week 52 ACR20 %
1) 31.7
2) 53.5 (p<0.0001)
3) 58.6 (p<0.0001)
Week 24 ACR70 %
1) 3
2) 12.8 (p<0.0001)
3) 14.8 (p<0.0001)
Week 24 DAS28
CRP<2.6, %
1) 10.1
2) 27.8 (p<0.0001)
2) 34.1 (p<0.0001)
Week 24 CDAI <2.8, %
1) 5
2) 10.3 (p<0.0001)
3) 13.8 (p<0.0001)
Week 52 mean
change from
baseline mTSS (SD)
1) 2.78 (7.73)
2) 0.9 (4.66)
p<0.0001
3) 0.25 (4.61)
p<0.0001
Week 16 mean
change from
baseline, mean (SD)
1) -0.29 (0.03)
2) -0.53 (0.03)
p<0.0001
3) -0.55 (0.03)
p<0.0001
Week 24 HAQ DI
response
(MCID≥0.3), n (%)
1) 133 (33.4)
2) 204 (51)
p<0.0001
3) 205 (51.4)
p<0.0001
Week 52 HAQ DI
response
(MCID≥0.3)
1) 104 (26.1)
2) 188 (47)
p<0.0001
3) 190 (47.6)
p<0.0001
NR

©Institute for Clinical and Economic Review, 2017 Page 385 Draft Evidence Report: Targeted Immune Modulators for Rheumatoid Arthritis Return to Table of Contents
Author & Year of
Publication
(Trial Name)
Interventions Treatment Response Disease Activity Structural Damage Function Laboratory
indices
Kavanaugh A Arthritis
and Rheumatology
2014287
MOBILITY
1) PBO+MTX (n=398)
2) 150mg SAR+MTX
(n=400)
3) 200mg SAR+MTX
(n=399)
See Genovese MC.
Arthritis & rheumatology
(Hoboken, N.J.). 2015162
Week 52 mean change
from baseline DAS28
1) -1.36
2) -2.78 (p<0.0001)
3) -2.95 (p<0.0001)
Week 52 remission
DAS28 CRP<2.6, %
1) 8.5
2) 31 (p<0.0001)
3) 34.1 (p<0.0001)
Week 52 mean change
from baseline CDAI
1) -17.5
2) -26.96 (p<0.0001)
3) -27.26 (p<0.0001)
Week 52 remission
CDAI <2.8, %
1) 4.8
2) 14.8 (p<0.0001)
3) 18 (p<0.0001)
Week 52 No
radiographic
progression, n (%)
1) 154 (38.7)
2) 191 (47.8)
3) 222 (55.6)
Week 24 mean
change from
baseline, mean (SD)
1) -0.4
2) -0.6 (p<0.0001)
3) -0.6 (p<0.0001)
Week 52 mean
change from
baseline, mean (SD)
1) -0.5
2) -0.7 (p<0.0001)
3) -0.8 (p<0.0001)
NR

©Institute for Clinical and Economic Review, 2017 Page 386 Draft Evidence Report: Targeted Immune Modulators for Rheumatoid Arthritis Return to Table of Contents
Author & Year of
Publication
(Trial Name)
Interventions Treatment Response Disease Activity Structural Damage Function Laboratory
indices
Fleischmann R
Arthritis and
Rheumatology
201489
MOBILITY
Abstract
Prior biologic
1) PBO+MTX (n=109)
2) 150mg SAR+MTX
(n=108)
3) 200mg SAR+MTX
(n=110)
Biologic naive
1) PBO+MTX (n=289)
2) 150mg SAR+MTX
(n=292)
3) 200mg SAR+MTX
(n=289)
Wk 24 ACR20, %
Prior biologic
1) 33
2) 59 (p<0.0001)
3) 64 (p<0.0001)
Biologic naïve
1) 34
2) 58 (p<0.0001)
3) 67 (p<0.0001)
Wk 24 ACR50, %
Prior biologic
1) 12
2) 36 (p<0.0001)
3) 41 (p<0.0001)
Biologic naïve
1) 18
2) 37 (p<0.0001)
3) 47 (p<0.0001)
Wk 24 ACR70, %
Prior biologic
1) 4
2) 20 (p<0.0001)
3) 19 (p=0.0003)
Biologic naïve
1) 9
2) 20 (p=0.0002)
3) 27 (p<0.0001)
Week 52 mean change
from baseline DAS28-
CRP
Prior biologic
1) -1.85
2) -2.8
3) -3.15
Biologic naïve
1) -1.93
2) -3.24
3) -3.29
Week 52 mean change
from baseline CDAI
Prior biologic
1) -23.23
2) -28.45 (p<0.01)
3) -28.81
Biologic naïve
1) -24.52
2) -31.35
3) -30.33
All p<0.001
NR NR NR

©Institute for Clinical and Economic Review, 2017 Page 387 Draft Evidence Report: Targeted Immune Modulators for Rheumatoid Arthritis Return to Table of Contents
Author & Year of
Publication
(Trial Name)
Interventions Treatment Response Disease Activity Structural Damage Function Laboratory
indices
Van Der Heijde D
Annals of the
Rheumatic Diseases.
2015203
MOBILITY
Abstract
Biologic naive
1) PBO+MTX (n=316)
2) 150mg SAR+MTX
(n=318)
3) 200mg SAR+MTX
(n=321)
Prior biologic
1) PBO+MTX (n=82)
2) 150mg SAR+MTX
(n=82)
3) 200mg SAR+MTX
(n=78)
Prior Anti-TNF
1) PBO+MTX (n=51)
2) 150mg SAR+MTX
(n=44)
3) 200mg SAR+MTX
(n=58)
*Statistical
significance difficult
to read from
available table
@ week 52
ACR20 (%)
Biologic naive
1) 33.5
2) 57.9
3) 88.7
Prior biologic
1) 32.9
2) 58.5
3) 65.4
Prior Anti-TNF
1) 31.4
2) 54.5
3) 62.1
Week 52 mean change
from baseline
DAS28
Biologic naive
1) -1.34
2) -2.82
3) -2.92
Prior biologic
1) -1.33
2) -2.57
3) -2.98
Prior Anti-TNF
1) -0.92
2) -2.32
3) -2.71
CDAI
Biologic naive
1) -17.39
2) -27.14
3) -28.83
Prior biologic
1) -16.08
2) -24.02
3) -27.20
Prior Anti-TNF
1) -12.02
2) -24.48
3) -24.44
@ week 52
mTSS, mean change
Biologic naive
1) 2.93
2) 1.03
3) 0.27
Prior biologic
1) 2.23
2) 0.41
3) 0.16
Prior Anti-TNF
1) 2.15
2) 0.64
3) 0.81
mTSS, no
progression (%)
Biologic naive
1) 39.5
2) 45.3
3) 56.1
Prior biologic
1) 36.6
2) 57.3
3) 53.8
Prior Anti-TNF
1) 37.3
2) 59.1
3) 53.4
NR NR

©Institute for Clinical and Economic Review, 2017 Page 388 Draft Evidence Report: Targeted Immune Modulators for Rheumatoid Arthritis Return to Table of Contents
Author & Year of
Publication
(Trial Name)
Interventions Treatment Response Disease Activity Structural Damage Function Laboratory
indices
Emery P Annals of
the Rheumatic
Diseases 2015219
MOBILITY
Abstract
RA duration ≤ 3 years
1) PBO+MTX (n=103)
2) 150mg SAR+MTX
(n=107)
3) 200mg SAR+MTX
(n=98)
RA duration >3 years
1) PBO+MTX (n=295)
2) 150mg SAR+MTX
(n=293)
3) 200mg SAR+MTX
(n=301)
Week 24 ACR20, %
RA≤3yrs/ RA>3yrs
1) 37.9/31.9
2) 56.1/ 58.7
3) 71.4/64.8
Week 24 ACR50, %
RA≤3yrs/ RA>3yrs
1) 25.2/13.6
2) 36.4/37.2
3)58.2/41.6
Week 24 ACR70, %
RA≤3yrs/ RA>3yrs
1) 16.5/4.1
2) 21.4/19.1
3) 39.8/19.9
NR Week 52
Mean change from
baseline mTSS
RA≤3yrs/ RA>3yrs
1) 2.89/2.74
2) 0.84/0.92
3) 0.17/0.28
Week 16
Mean change from
baseline HAQ_DI LS
RA≤3yrs/ RA>3yrs
1) -0.31/-0.28
2) -0.58/-0.5
3) -0.62/-0.53
NR

©Institute for Clinical and Economic Review, 2017 Page 389 Draft Evidence Report: Targeted Immune Modulators for Rheumatoid Arthritis Return to Table of Contents
Table F21. Sarilumab versus conventional DMARD: Harms
Author & Year of Publication
(Trial Name)
Interventions Malignancies Infections Other Adverse
Events
Discontinuation,
Serious AE rate,
Deaths
Fleischmann R Arthritis and
Rheumatology 201588
TARGET
Abstract
1) PBO+cDMARD
(n=181)
2) 150mg
SAR+cDMARD
(n=181)
3) 200mg
SAR+cDMARD
(n=184)
NR NR NR Serious AEs, %
1) 3.3
2) 5.4
3) 3.3
Death, n
1) 1
2) 0
3) 0
Fleischmann R Arthritis and
Rheumatology 2016 163
TARGET
1) PBO+csDMARDs
(n=181)
2) 150mg
SAR+csDMARDs
(n=181)
3) 200mg
SAR+csDMARDs
(n=184)
NR Serious infections,
%
1) 1.1
2) 0.6
3) 1.1
NR Serious AEs, n (%)
1) 6 (3.3)
2) 6 (3.3)
3) 10 (5.4)
Discontinuation due
to AEs, n (%)
1) 8 (4.4)
2) 14 (7.7)
3) 17 (9.2)
Deaths, n
1) 1
2) 0
3) 0

©Institute for Clinical and Economic Review, 2017 Page 390 Draft Evidence Report: Targeted Immune Modulators for Rheumatoid Arthritis Return to Table of Contents
Author & Year of Publication
(Trial Name)
Interventions Malignancies Infections Other Adverse
Events
Discontinuation,
Serious AE rate,
Deaths
Genovese MC Arthritis &
rheumatology 2015162
MOBILITY
1) PBO+MTX (n=398)
2) 150mg SAR+MTX
(n=400)
3) 200mg SAR+MTX
(n=399)
Malignancies, n
1) 1
2) 4
3) 3
Serious infections,
%
1) 2.3
2) 2.6
3) 4
0 cases of TB
NR Serious AEs, n (%)
1) 23 (5.4)
2) 38 (8.8)
3) 48 (11.3)
Discontinuation due
to AEs, n (%)
1) 20 (4.7)
2) 54 (12.5)
3) 59 (13.9)
Death due to AEs, n
(%)
1) 2 (0.5)
2) 2 (0.5)
3) 1 (0.2)

©Institute for Clinical and Economic Review, 2017 Page 391 Draft Evidence Report: Targeted Immune Modulators for Rheumatoid Arthritis Return to Table of Contents
Table F22. Sarilumab versus conventional DMARD: Patient-reported Outcomes
Author & Year of Publication
(Trial Name)
Interventions Health-related
quality of life
Pain Fatigue & other
PROs
Fleischmann R Arthritis and
Rheumatology 2016 163
TARGET
1) PBO+csDMARDs
(n=181)
2) 150mg
SAR+csDMARDs
(n=181)
3) 200mg
SAR+csDMARDs
(n=184)
NR Week 24
Mean patient’s
assessment of pain
change from
baseline (VAS, 0-
100 mm) (SD)
1) -21.3 (2.25)
2) -31.9 (2.09)
3) -33.7 (2.04)
NR

©Institute for Clinical and Economic Review, 2017 Page 392 Draft Evidence Report: Targeted Immune Modulators for Rheumatoid Arthritis Return to Table of Contents
Author & Year of Publication
(Trial Name)
Interventions Health-related
quality of life
Pain Fatigue & other
PROs
Strand V Arthritis Rheumatol.
2015 286
MOBILITY
1) PBO+MTX (n=398)
2) 150mg SAR+MTX
(n=400)
3) 200mg SAR+MTX
(n=399)
Week 24
LSM (SE) PCS
change
1) 5.2 (0.5)
2) 8.0 (0.5)
3) 8.4 (0.5)
p<0.0001 for 2-3
LSM (SE) MCS
change
1) 3.9 (0.6)
2) 5.7 (0.6) p<0.5
3) 8.2 (0.6)
p<0.0001
Week 52
LSM (SE) PCS
change
1) 5.6 (0.6)
2) 9.2 (0.5)
3) 9.1 (0.5)
p<0.0001 for 2-3
LSM (SE) MCS
change
1) 5.5 (0.7)
2) 7.1 (0.6)
3) 8.4 (0.6)
p<0.001
Week 24
LSM (SE) pain VAS
change
1) -15.4 (1.4)
2) -28.5 (1.4)
3) -31.8 (2.3)
p<0.0001 for 2-3
Week 52
LSM (SE) pain VAS
change
1) -19.3 (1.6)
2) -32.7 (1.4)
3) -33.1 (1.4)
p<0.0001 for 2-3
Week 24
LSM (SE) FACIT-F
change
1) 5.8 (0.5)
2) 8.6 (0.5)
3) 9.2 (0.5)
p<0.0001 for 2-3
Week 52
LSM (SE) FACIT-F
change
1) 6.1 (0.5)
2) 9.1 (0.5)
3) 9.2 (0.5)
p<0.0001 for 2-3

©Institute for Clinical and Economic Review, 2017 Page 393 Draft Evidence Report: Targeted Immune Modulators for Rheumatoid Arthritis Return to Table of Contents
Table F23. Tofacitinib versus conventional DMARD: Study Characteristics
Author & Year of
Publication
(Trial Name)
Quality rating
Study sponsor Study Design and
Duration of Follow-
up
Geographic
location of study
Interventions (n) &
Dosing Schedule
Inclusion and Exclusion
Criteria
Baseline patient
Characteristics
Burmester GR Lancet
2013288
ORAL Step
Good See also Strand V Arthritis Care Res (Hoboken) 2015 215
Pfizer RCT
multicenter
double-blind
Phase III
6 months
82 centers in
North America,
Europe, and
Latin America
1) PBO+MTX (n=132)
2) 5mg TOF+MTX
(n=133)
3) 10mg TOF+MTX
(n=134)
Patients were
randomly assigned in
a 2:2:1:1 ratio to
tofacitinib 5 mg twice
a day; tofacitinib 10
mg twice a day;
placebo for 3 months
then advanced to 5
mg tofacitinib
twice a day; or
placebo for 3 months
then advanced to
10 mg tofacitinib
twice a day.
Inclusion:
≥18 years with active
moderate-to severe RA
i.e. ≥6 swollen joints and
≥6 tender joints with ESR
> 28mm/h or CRP
>66.67mmol/L;
inadequate response or
intolerance to ≥ 1 TNFi;
and must be on MTX for
≥4 months
Exclusion:
Hb < 90g/L, Hct <30%,
WBC C1.2 ×109 /L or PLT
< 100 × 109 /L; GFR
<40mL/min; total
bilirubin, AST or ALT >
1.5 times ULN; chronic
or recurrent infection; or
malignancy
Female, n (%)
1) 106 (80.3)
2) 113 (85)
Mean age, yrs (SD)
1) 54.4 (11.3)
2) 55.4 (11.5)
Mean RA duration, yrs
1) 11.3
2) 13
Mean HAQ-DI (SD)
1) & 2) 1.6 (0.7)
Mean DAS28 (SD) DAS28-
ESR
DAS28-
CRP
1) 6.4 (1.1) 5.4 (1)
2) 6.5 (1.1) 5.4 (1)

©Institute for Clinical and Economic Review, 2017 Page 394 Draft Evidence Report: Targeted Immune Modulators for Rheumatoid Arthritis Return to Table of Contents
Author & Year of
Publication
(Trial Name)
Quality rating
Study sponsor Study Design and
Duration of Follow-
up
Geographic
location of study
Interventions (n) &
Dosing Schedule
Inclusion and Exclusion
Criteria
Baseline patient
Characteristics
Kremer J Annals of internal medicine 2013154 ORAL Sync Good
Pfizer RCT double-blind,
placebo-controlled
1 year
114 centers in
North America,
Latin America,
Europe, China,
Australia,
Thailand,
Malaysia
1) PBO group 1/ PBO
group 2 +cDMARD(s)
(n=159)
2) 5mg
TOF+cDMARD(s)
(n=315)
3) 10mg
TOF+cDMARD(s)
(n=318)
Patients were
randomly assigned
4:4:1:1 at baseline to
1 of 4 twice-daily
treatment
sequences: 5 mg
TOF; 10 mg TOF; PBO
group 1 advanced to
5mg TOF (at month
6) and PBO group 2
advanced to 10 mg
TOF (at month 6). AT
month 3, PBO who
achieved ≤20%
reduction from
baseline were blindly
advanced to 5mg or
10mg TOF
≥18 years with RA
diagnosis with active RA
(i.e. ≥4 TJC&SJC,
ESR>28mm/h or CRP
>66.7nmol/L). Patients
were required to have
inadequate response to
≥1 bDMARD or cDMARD
before study and
continue 1 cDMARD
before study.
Mean age, yrs
1) 50.8/53.3
2) 52.7
3) 51.9
Female, %
1) 79.7/75
2) 83.8
3) 81.1
Mean duration of RA, yrs
1) 9.5/ 10.2
2) 8.1
3) 9.2
Mean HAQ-DI
1) 1.45/ 1.24
2) 1.44
3) 1.43
Mean DAS28-ESR
1) 6.44/6.14
2) 6.27
3) 6.36

©Institute for Clinical and Economic Review, 2017 Page 395 Draft Evidence Report: Targeted Immune Modulators for Rheumatoid Arthritis Return to Table of Contents
Author & Year of
Publication
(Trial Name)
Quality rating
Study sponsor Study Design and
Duration of Follow-
up
Geographic
location of study
Interventions (n) &
Dosing Schedule
Inclusion and Exclusion
Criteria
Baseline patient
Characteristics
Kremer JM Arthritis
and rheumatism
2012212
Good
Pfizer RCT double-blind,
phase IIB
24 weeks
72 centers in US,
Europe, and
Latin America
1) PBO+MTX (n=69)
2) 5mg TOF+MTX
(n=71)
TOF doses+MTX:
3) 1mg bid (n=70)
4) 3mg bid (n=68)
5) 10mg bid (n=74)
6) 15mg bid (n=75)
7) 20mg/day (n=80)
Patients receiving
1mg bid, 3mg bid,
and 20 mg/day TOF
& PBO with <20%
reduction from
baseline in SJC % TJC
at week 12 were
reassigned 5 mg bid
TOF for the
remaining 12 weeks
of study (blinding
maintained).
3), 4), 5), 6), and 7)
excluded from table
≥18 years with ≥6 month
RA diagnosis; Active RA
(i.e. SJC ≥ 6 and TJC≥8:
elevated acute phase
reactants); MTX for ≥ 4
months and continues
stable MTX during study.
Discontinue all other
bDMARD and cDMARD.
Mean age, yrs
1) 53
2) 52
Female, %
1) 81
2) 80
Mean RA duration, yrs
1) 9.2
2) 9
Mean HAQ-DI
1) 1.2
2) 1.4
4-variable Mean DAS28-
ESR
1) 6.1
2) 6.1
3-variable Mean DAS28-
CRP
1) 5.3
2) 5.1

©Institute for Clinical and Economic Review, 2017 Page 396 Draft Evidence Report: Targeted Immune Modulators for Rheumatoid Arthritis Return to Table of Contents
Author & Year of
Publication
(Trial Name)
Quality rating
Study sponsor Study Design and
Duration of Follow-
up
Geographic
location of study
Interventions (n) &
Dosing Schedule
Inclusion and Exclusion
Criteria
Baseline patient
Characteristics
van der Heijde D
Arthritis and
rheumatism 201378
ORAL Scan
Good
Pfizer RCT
multicenter
double-blind
Phase III
12-month data
from a 24-month
study
111 centers in
North America,
South America,
Europe, Asia, and
Australia
*TOF 10 mg and
PBOTOF 10mg
excluded from
table
1) PBO+MTX TOF
5mg (n=81) &
PBOTOF 10mg
(n=79)
2) TOF 5mg +MTX
(n=321)
3) TOF 10mg +MTX
(n=316)
TOF 5mg twice daily
or PBO twice daily;
15-25 mg MTX
weekly
PBO patients who did
not achieve ≥20%
improvement in
swollen and tender
joint counts after 3
months blindly
randomized to TOF 5
or 10mg; all
remaining PBO
patients advanced
in a blinded manner
to TOF after 6
months
age ≥18 years; diagnosis
of active RA; ≥6
tender/painful joints and
≥6swollen joints; ESR
>28 mm/hr or CRP >7
mg/L; ≥3 distinct joint
erosions on
posteroanterior hand
and wrist radiographs or
anteroposterior foot
radiographs or IgM RF
positivity or anti-CCP;
stable doses of MTX (15-
25 mg weekly for ≥6
wks); prior use of
biologic or nonbiologic
DMARDs permitted
Key exclusion criteria:
abnormal lab values;
current/past/chronic
infection (hepatitis B or
C or HIV, Mycobacterium
tuberculosis),
lymphoproliferative
disorder, malignancy
Mean age, yrs (SD)
1) 53.2 (11.5)
2) 53.7 (11.6)
Female, n (%)
1) 65 (80.2)
2) 269 (83.8)
Mean RA duration, yrs
1) 8.8
2) 8.9
Mean HAQ-DI
1) 1.40
2) 1.41
Mean DAS28-CRP/ESR
1) 5.14/6.25
2) 5.22/6.34
Mean mTSS
1) 35.0
2) 31.1
Prior anti-TNF: 8.9-19.3%

©Institute for Clinical and Economic Review, 2017 Page 397 Draft Evidence Report: Targeted Immune Modulators for Rheumatoid Arthritis Return to Table of Contents
Table F24. Tofacitinib versus conventional DMARD: Key Clinical Outcomes
Author & Year of
Publication
(Trial Name)
Interventions Treatment Response Disease Activity Structural Damage Function Laboratory
indices
Burmester GR Lancet
2013288
ORAL Step
1) PBO+MTX (n=132)
2) 5mg TOF+MTX
(n=133)
3) 10mg TOF+MTX
(n=134)
Month 3, % (p value vs.
PBO)
ACR20
1) 24.4
2) 41.7 (p=0.0024)
3) 28.1 (p<0.0001)
ACR50
1) 8.4
2) 26.5 (p<0.0001)
3) 27.8 (p<0.0001)
ACR70
1) 1.5%
2) 13.6 (p<0.0001)
3) 10.5 (p=0.0017)
Month 3, % (p value
vs. PBO)
DAS28<2.6
1) 1.7
2) 6.7 (p=0.0496)
3) 8.8 (p=0.0105)
DAS28-4(ESR)≤3.2
1) 5
2) 14.3 (p=0.0138)
3) 20.8 (p=0.0001)
SDAI≤3.3
1) 0
2) 6.1 (p=0.0035)
3) 8.3 (p=0.0005)
NR Month 3 HAQ-DI
improvement from
baseline
1)-0.18
2)-0.43 (p<0.0001)
3)-0.46 (p<0.0001)
Month 3 ESR
mean change
from baseline
(SD)
1) 0.97 (25)
2) -14.04 (22)
3) -15.39 (21.7)
Month 3 CPR
mean change
from baseline
(SD)
1) 29.71 (186.58)
2) -124.57
(245.24)
3) -101.81
(187.05)

©Institute for Clinical and Economic Review, 2017 Page 398 Draft Evidence Report: Targeted Immune Modulators for Rheumatoid Arthritis Return to Table of Contents
Author & Year of
Publication
(Trial Name)
Interventions Treatment Response Disease Activity Structural Damage Function Laboratory
indices
Kremer J Annals of
internal medicine
2013154
1) PBO group 1/ PBO
group 2+cDMARD(s)
(n=159)
2) 5mg
TOF+cDMARD(s)
(n=315)
3) 10mg
TOF+cDMARD(s)
(n=318)
Month 6
ACR20, n (%)
1) 49 (30.8)
2) 164 (52.1) (p<0.001)
3) 180 (56.6) (p<0.001)
ACR50, n (%)
1) 20 (12.6)
2) 105 (33.3)
3) 113 (35.6)
p=NR
ACR70, n (%)
1) 5 (3.1)
2) 41 (13.0)
3) 50 (15.7)
p=NR
Month 6
DAS28-ESR <2.6, %
1) 2.6
2) 8.5 (p=0.005)
3) 12.5 (p<0.001)
NR Month 6
Mean change from
baseline LSM HAQ-
DI
1) -0.16
2) -0.44 (p<0.001)
3) -0.53 (p<0.001)
NR
Kremer JM Arthritis
and rheumatism
2012212
1) PBO+MTX (n=69)
2) 5mg TOF+MTX
(n=71)
Week 12 ACR20 %
1) 33.3
2) 50.7
p<0.05
ACR20 response rate
and significance
sustained at 24 weeks.
Week 12
Mean change from
baseline DAS28-CRP
1) -0.84
2) -1.69
p<0.0001
DAS 28 mean change
from baseline and
significance sustained
at 24 weeks.
NR Week 12
Mean change from
baseline HAQ-DI
1) -0.16
2) -0.49
p<0.001
Week 12
Mean change
from baseline CRP
1) 3.04
2) -10.11
p<0.0001

©Institute for Clinical and Economic Review, 2017 Page 399 Draft Evidence Report: Targeted Immune Modulators for Rheumatoid Arthritis Return to Table of Contents
Author & Year of
Publication
(Trial Name)
Interventions Treatment Response Disease Activity Structural Damage Function Laboratory
indices
van der Heijde D
Arthritis and
rheumatism 201378
ORAL Scan
1) PBO+MTX TOF
5mg (n=81)
2) 5mg TOF+MTX
(n=321)
Month 6/month 12
ACR20, %
1) 25.3/NR
2) 51.5/48.5
ACR50, %
1) 8.3/NR
2) 32.4/32.7
ACR70, %
1) 1.3/NR
2) 14.6/18.8
p<0.0001 for all
Month 6/Month 12
DAS28-ESR<2.6, %
1) 1.6/NR
2) 7.2/10.6
p=NR/NR
LSM change from
baseline DAS28-ESR
1) -1.3/NR
2) -2.1/-2.3
p<0.0001/NR
Month 6
Mean change from
baseline mTSS (Van
der Heijde 0-448)
1) 0.47
2) 0.12
p=0.0792
Month 12
Mean change from
baseline mTSS
1) 0.92
2) 0.29
p=0.0558
No radiographic
progression, %
1) 77.7/74.1
2) 88.8/86.0
p<0.01 for mo 6 &
12
Month 6
LSM change in HAQ-
DI, (SE)
1) -0.17 (0.05)
2) -0.48 (0.03)
p<0.0001
Month 6
LSM change from
baseline
CRP, mg/L (SE)
1) 0.82 (1.61)
2) -9.52 (0.92)
p<0.0001

©Institute for Clinical and Economic Review, 2017 Page 400 Draft Evidence Report: Targeted Immune Modulators for Rheumatoid Arthritis Return to Table of Contents
Table F25. Tofacitinib versus conventional DMARD: Harms
Author & Year of Publication
(Trial Name)
Interventions Malignancies Infections Other Adverse
Events
Discontinuation,
Serious AE rate,
Deaths
Burmester GR Lancet 2013288
ORAL Step
1) PBO+MTX (n=132)
2) 5mg TOF+MTX
(n=133)
3) 10mg TOF+MTX
(n=134)
0 cases of
malignant disease
Serious infection, n
(%)
1) 0
2) 2 (1.5)
3) 2 (1.5)
1 (1.5) serious
infection PBO
TOF 5 mg
NR Serious AE, n (%)
1) 6 (4.5)
2) 7 (5.3)
3) 8 (5.9)
3 (4.5) serious AE
PBO TOF 5 mg
and 2 (3) PBO TOF
10 mg
Discontinuation due
to AE, n (%)
1) 7 (5.3)
2) 12 (9)
3) 13 (9.7)
1 (1.5)
discontinuation
PBO TOF 5 mg
and 2 (3)
discontinuations
PBO TOF 10 mg
Death, n (%)
1(1.5) death PBO
TOF 10 mg.
No other case of
death

©Institute for Clinical and Economic Review, 2017 Page 401 Draft Evidence Report: Targeted Immune Modulators for Rheumatoid Arthritis Return to Table of Contents
Author & Year of Publication
(Trial Name)
Interventions Malignancies Infections Other Adverse
Events
Discontinuation,
Serious AE rate,
Deaths
Kremer J Annals of internal
medicine 2013 154
1) PBO group 1/ PBO
group 2 +cDMARD(s)
(n=159)
2) 5mg TOF (n=315)
3) 10mg TOF (n=318)
NR 7 cases of serious
infection in TOF
group
2 cases of TB in the
TOF group
NR Serious AEs,
1) 6
2) 22
3) 23
Discontinuation due
to AEs,
1) 3
2) 20
3) 31
Death, n
1) 0
2) 2
3) 2
Kremer JM Arthritis and
rheumatism 2012212
1) PBO+MTX (n=69)
2) 5mg TOF+MTX
(n=71)
NR Serious infectious
were reported by 5
patients receiving
tofacitinib
NR Discontinuation due
to AEs, %
1) 5.9
2) 6.1
3) 3.6
4) 4.2
5) 6.8
6) 13.3
7) 9
1 patient receiving
TOF died

©Institute for Clinical and Economic Review, 2017 Page 402 Draft Evidence Report: Targeted Immune Modulators for Rheumatoid Arthritis Return to Table of Contents
Author & Year of Publication
(Trial Name)
Interventions Malignancies Infections Other Adverse
Events
Discontinuation,
Serious AE rate,
Deaths
van der Heijde D Arthritis and
rheumatism 201378
ORAL Scan
1) PBO+MTX TOF
5mg (n=81)
2) 5mg TOF+MTX
(n=321)
Carcinoma, n
1) 0
2) 5 (3 basal cell, 1
stomach
adenocarcinoma, 1
bone squamous
cell carcinoma)
Serious infection
Months 0-3
1) 0
2) 2 (0.6)
Months 3-6
1) 1 (1.2)
[PBOTOF 5]
2) 8 (2.5)
Months 6-12
1) 0 [PBOTOF 5]
2) 1 (0.3)
NR Discontinuation due
to AEs, n (%)
1) 5 (3.1) [mos 0-3]
2) 40 (12.5)
PBOTOF
2 (4.8) [mos 3-6]
2 (2.5) [mos 6-12]
Deaths, n
1) 1
2) 4
Serious AEs, n (%)
Months 0-3
1) 5 (3.1)
2) 12 (3.7)
Months 3-6
1) 1 (2.4) [PBOTOF
5]
2) 17 (5.3)
Months 6-12
1) 1 (1.2) [PBOTOF
5]
2) 13 (4.0)

©Institute for Clinical and Economic Review, 2017 Page 403 Draft Evidence Report: Targeted Immune Modulators for Rheumatoid Arthritis Return to Table of Contents
Table F26. Tofacitinib versus conventional DMARD: Patient-reported Outcomes
Author & Year of Publication
(Trial Name)
Interventions Health-related
quality of life
Pain Fatigue & other
PROs
Burmester GR Lancet 2013288
ORAL Step
1) PBO+MTX (n=132)
2) 5mg TOF+MTX
(n=133)
3) 10mg TOF+MTX
(n=134)
NR Month 3 mean change in pain from baseline 1) -8.3 2) -27.2 (p<0.0001) 3) -25 (p<0.0001)
Improvement in
FACIT-F at month 3
1) 1.1
2) 6.3 (p<0.0001)
3) 4.6 (p=0.0043)
Kremer JM Arthritis and
rheumatism 2012212
1) PBO+MTX (n=69)
2) 5mg TOF+MTX
(n=71)
NR Week 12
Mean change of
patient’s
assessment of pain,
0-100 mm VAS
1) -13.03
2) -27.37
p<0.001
Week 12
Mean change of
patient’s global
assessment of
disease activity, 0-
100 mm VAS
1) -22.75
2) -33.84
p<0.001

©Institute for Clinical and Economic Review, 2017 Page 404 Draft Evidence Report: Targeted Immune Modulators for Rheumatoid Arthritis Return to Table of Contents
Author & Year of Publication
(Trial Name)
Interventions Health-related
quality of life
Pain Fatigue & other
PROs
Strand V Arthritis Care Res
(Hoboken) 2015215
ORAL Step
1) PBO+MTX (n=132)
2) 5mg TOF+MTX
(n=133)
3) 10mg TOF+MTX
(n=134)
Month 3
LSM (SE) PCS
change
1) 2.03 (0.69)
2) 5.65 (0.68)
3) 6.57 (0.69)
p<0.0001 for 2-3
LSM (SE) MCS
change
1) 0.37 (0.94)
2) 3.52 (0.92)
3) 3.96 (0.93)
p<0.05 for 2-3
Month 3
LSM (SE) Pain (VAS)
change
1) -8.26 (2.41)
2) -27.16 (2.43)
3) -24.95 (2.48)
p<0.0001 for 2-3
Month 3
LSM (SE) FACIT-F
change
1) 1.11 (1.04)
2) 6.27 (1.01)
p<0.0001
3) 4.57 (1.03)
p<0.05
van der Heijde D Arthritis
and rheumatism 201378
ORAL Scan
1) PBO+MTX TOF
5mg (n=81)
2) 5mg TOF+MTX
(n=321)
NR Month 6
LS mean change
from baseline
Patient’s
assessment of pain,
0-100 mm VAS
1) -15.70 (2.44)
2) -26.4 (1.42)
p<0.01
Month 6
LS mean change
from baseline
FACIT-F
1) 2.1
2) 5.6
p<0.001

©Institute for Clinical and Economic Review, 2017 Page 405 Draft Evidence Report: Targeted Immune Modulators for Rheumatoid Arthritis Return to Table of Contents
Table F27. Baricitinib versus conventional DMARD: Study Characteristics
Author & Year of
Publication
(Trial Name)
Quality rating
Study sponsor Study Design and
Duration of Follow-
up
Geographic
location of study
Interventions (n) &
Dosing Schedule
Inclusion and Exclusion
Criteria
Baseline patient Characteristics
Dougados M Ann
Rheum Dis 2016175
RA-BUILD
Good See also Smolen JS Ann Rheum Dis 2016 POSTER227, Emery P Arthritis Rheumatol 2015 POSTER217
Eli Lilly and
Company and
Incyte
Corporation
RCT, double-blind,
placebo controlled,
parallel-group
phase III study
24 weeks
182 centers in 22
countries
1) PBO+/-cDMARD(s)
(n=228)
2) 2mg BAR+/-
cDMARD(s) (n=229)
3) 4mg BAR+/-
cDMARD(s) (n=227)
Patients were
randomized 1:1:1 to
once daily doses of
PBO or BAR 2 or 4 mg
+ any stable
background cDMARD
therapies. Rescue
treatment (BAR 4
mg) was assigned at
week 16 for patients
whose tender and
swollen joint counts
improved from
baseline by <20% at
both week 14 and
week 16
Inclusion:
≥18 years old with active
RA (≥6/68
TJC and ≥6/66 SJC;
(CRP) ≥3.6 mg/L) and an
insufficient
response (despite prior
therapy) or intolerance
to ≥1 cDMARDs
Exclusion:
prior biologic use,
selected lab
abnormalities; current or
recent clinically
significant comorbidity
Mean age, yrs (SD)
1) 51 (13)
3) 52 (12)
Female, n (%)
1) 189 (83)
3) 187 (82)
Mean RA duration, yrs (SD)
1) 7 (8)
3) 8 (8)
Mean HAQ-DI(SD)
1) 1.5 (0.6)
3) 1.55 (0.6)
Mean DAS28-ESR (SD)
1) 6.2 (1)
3) 6.2 (0.9)
Mean mTSS unit (SD)
1) 19 (31)
3) 24 (40)

©Institute for Clinical and Economic Review, 2017 Page 406 Draft Evidence Report: Targeted Immune Modulators for Rheumatoid Arthritis Return to Table of Contents
Author & Year of
Publication
(Trial Name)
Quality rating
Study sponsor Study Design and
Duration of Follow-
up
Geographic
location of study
Interventions (n) &
Dosing Schedule
Inclusion and Exclusion
Criteria
Baseline patient Characteristics
Genovese MC The
New England journal
of medicine 2016 90
RA-BEACON
Good
See also Smolen JS
Ann Rheum Dis.
2016218, Genovese MC
Annals of the
Rheumatic Diseases
2015190, Smolen JS
Ann Rheum Dis 2016
POSTER227
Eli Lilly and
Company
RCT double-blind,
placebo-controlled
24 weeks
178 centers in 24
countries
1) PBO + cDMARD
(n=176)
2) 2mg BAR +
cDMARD (n=174)
3) 4mg BAR +
cDMARD (n=177)
Patients were
randomized 1:1:1 to
placebo (PBO) or BAR
(2 or 4
mg) QD for 24 wks in
addition to the
therapies they were
receiving at
enrollment.
≥ 18 years old with
active moderate to
severe RA (i.e. TJC & SJC
≥6, hsCRP ≥3mg/L) on
conventional
DMARDs. Must have
received ≥1 TNF and
discontinued because of
insufficient response. All
bDMARDs were
discontinued ≥28d prior
to treatment
Mean age, yrs (SD)
1) 56 (11)
2) 55 (11)
3) 56 (11)
Female, n (%)
1) 145 (82)
2) 137 (79)
3) 149 (84)
Mean RA duration, yrs (SD)
1) 14 (10)
2) 14 (8)
3) 14 (9)
Mean HAQ-DI (0-3 score) (SD)
1) 1.78 (0.57)
2) 1.71 (0.55)
3) 1.74 (0.59)
Mean DAS28-CRP/ ESR (SD)
1) 5.9 (0.9) / 6.6 (0.9)
2) 6 (0.9)/ 6.7 (1)
3) 5.9 (1)/ 6.6 (1.1)

©Institute for Clinical and Economic Review, 2017 Page 407 Draft Evidence Report: Targeted Immune Modulators for Rheumatoid Arthritis Return to Table of Contents
Author & Year of
Publication
(Trial Name)
Quality rating
Study sponsor Study Design and
Duration of Follow-
up
Geographic
location of study
Interventions (n) &
Dosing Schedule
Inclusion and Exclusion
Criteria
Baseline patient Characteristics
Keystone EC Annals of
the Rheumatic
Diseases 2015211
I4V-MC-JADA
Good
Eli Lilly and
Company
RCT, double-blind,
placebo-controlled
phase IIb
24 weeks
69 centers in 9
countries: USA,
Mexico, India,
Poland, Ukraine,
the Czech
Republic,
Hungary,
Romania and,
Croatia
1) PBO + cDMARD
(n=98)
2) 1mg BAR +
cDMARD (n=49)
3) 2mg BAR +
cDMARD (n=52)
4) 4mg BAR +
cDMARD (n=52)
5) 8mg BAR
+cDMARD (n=50)
Patients were
randomized 2:1:1:1:1
to receive PBO or 1of
4 once-daily BAR
doses (1, 2, 4, or 8
mg) for 12 wks. Pts
assigned to 2 mg, 4
mg or 8 mg
continued blinded
treatment for an
additional 12 weeks
18-75 years with adult
onset RA for ≥6months
and <15 years; moderate
to severe RA (i.e. ≥8 SJC
& TJC and either
CRP>1.2× ULN or ESr
>28mm/h. Regular use
of MTX is required.
Concurrent use with
stable doses of other
cDMARDS were allowed.
Mean age, yrs (SD)
1) 49 (12)
4) 53 (10)
Female, %
1) 87
4) 71
Mean RA duration, yrs(SD)
1) 5.4 (4.3)
4) 5.3 (4.5)
Mean HAQ-DI (SD)
1) 1.2 (0.7)
4) 1 (0.6)
Mean DAS28-ESR
1) 6.3 (0.8)
4) 6 (0.9)

©Institute for Clinical and Economic Review, 2017 Page 408 Draft Evidence Report: Targeted Immune Modulators for Rheumatoid Arthritis Return to Table of Contents
Table F28. Baricitinib versus conventional DMARD: Key Clinical Outcomes
Author & Year of
Publication
(Trial Name)
Interventions Treatment Response Disease Activity Structural Damage Function Laboratory
indices
Dougados M Ann
Rheum Dis 2016175
RA-BUILD
1) PBO+/-cDMARD(s)
(n=228)
2) 2mg BAR+/-
cDMARD(s) (n=229)
3) 4mg BAR+/-
cDMARD(s) (n=227)
Week 12
% ACR20
1) 39
3) 62 (p<0.001)
%ACR50
1) 13
3) 33
%ACR70
1) ~4
3) ~18
Week 24
% ACR20
1) 42
3) 65
%ACR 50
1) 21
3) 44
%ACR70
1) ~8
3) ~24
Week 24 remission, %
DAS28-CRP≤2.6
1) 11
3) 33
DAS28-ESR≤2.6
1) 4
3) 16
CDAI
1) 4
3) 15
SDAI
1) 4
3) 15
All p value vs. PBO
<0.001
Week 24 mean
change from
baseline
mTSS
1) 0.7
3) 0.15 (p<0.001)
Week 24 mean
change from
baseline, HAQ-DI
1) -0.38
3) -0.62 (p<0.001)
Week 24, HAQ-DI
(% achieving
MCID)217
1) -21.9
3) -40.3 (p<0.001)
NR

©Institute for Clinical and Economic Review, 2017 Page 409 Draft Evidence Report: Targeted Immune Modulators for Rheumatoid Arthritis Return to Table of Contents
Author & Year of
Publication
(Trial Name)
Interventions Treatment Response Disease Activity Structural Damage Function Laboratory
indices
Emery P Arthritis
Rheumatol 2015
POSTER217
RA-BUILD
1) PBO+/-cDMARD(s)
(n=228)
2) 2mg BAR+/-
cDMARD(s) (n=229)
3) 4mg BAR+/-
cDMARD(s) (n=227)
Week 24
% patients achieved
HAQ-DI MCID ≥0.22
1) 42
2) 64*
3) 60*
*p≤0.001
% patients achieved
HAQ-DI MCID ≥0.3
1) 37
2) 58*
3) 55*

©Institute for Clinical and Economic Review, 2017 Page 410 Draft Evidence Report: Targeted Immune Modulators for Rheumatoid Arthritis Return to Table of Contents
Author & Year of
Publication
(Trial Name)
Interventions Treatment Response Disease Activity Structural Damage Function Laboratory
indices
Genovese MC Annals
of the Rheumatic
Diseases 2015190
RA-BEACON
1) PBO + cDMARD
(n=176)
2) 2mg BAR +
cDMARD (n=174)
3) 4mg BAR +
cDMARD (n=177)
%ACR20
Wk 12 Wk 24
1 27 27
3 55* 46*
%ACR 50
Wk 12 Wk 24
1 8 13
3 28* 29*
%ACR 70
Wk 12 Wk 24
1 2 3
3 11* 17*
*p≤0.05 vs. PBO.
DAS28-ESR <2.6
Wk 12 Wk 24
1 1 3
3 6* 9*
DAS28-hsCRP<2.6
Wk 12 Wk 24
1 4 6
3 16* 22*
CDAI ≤2.8
Wk 12 Wk 24
1 2 3
3 6 9*
*p≤0.05 vs. PBO.
Week 12 HAQ-
DI≥0.22
1) 43
3) 67*
Week 24 HAQ-DI
≥0.22
1) 30
3) 53*
*p≤0.05 vs. PBO.

©Institute for Clinical and Economic Review, 2017 Page 411 Draft Evidence Report: Targeted Immune Modulators for Rheumatoid Arthritis Return to Table of Contents
Author & Year of
Publication
(Trial Name)
Interventions Treatment Response Disease Activity Structural Damage Function Laboratory
indices
Genovese MC The
New England journal
of medicine 2016 90
RA-BEACON
1) PBO + cDMARD
(n=176)
2) 2mg BAR +
cDMARD (n=174)
3) 4mg BAR +
cDMARD (n=177)
Week 20 % ACR20
1) 27
3) 55 (p≤0.001)
Week 24 mean change
from baseline DAS28-
CRP
1) -0.8
3) -1.8 (p≤0.001)
Remission, % (p value
vs. PBO)
DAS28-CRP<2.6
1) 6
3) 22 (p<0.001)
DAS28-ESR<2.6
1) 3
3) 9 (p<0.05)
CDAI≤2.8
1) 3
3) 9 (p≤0.01)
SDAI≤3.3, %
1) 2
3) 9 (p≤0.01)
Week 24 mean
change from
baseline HAQ-DI
(approx. from
figure)
1) -0.18
3) -0.42 (p≤0.001)

©Institute for Clinical and Economic Review, 2017 Page 412 Draft Evidence Report: Targeted Immune Modulators for Rheumatoid Arthritis Return to Table of Contents
Author & Year of
Publication
(Trial Name)
Interventions Treatment Response Disease Activity Structural Damage Function Laboratory
indices
Keystone EC Annals
of the Rheumatic
Diseases 2015211
I4V-MC-JADA
1) PBO+cDMARD
(n=98)
2) 1mg
BAR+cDMARD (n=49)
3) 2mg BAR
+cDMARD (n=52)
4) 4mg
BAR+cDMARD (n=52)
5) 8mg
BAR+cDMARD (n=50)
2) and 5) excluded
from table
%ACR 20
Wk 12 Wk 24
1 41 --
4 75* 78
% ACR 50
Wk 12 Wk 24
1 10 --
4 35* 48
%ACR 70
Wk 12 Wk 24
1 2 --
3 8 10
4 23* 28
*p<0.05 vs. PBO
% DAS28CRP<2.6
Wk 12 Wk 24
1 4 --
4 37* 34
% DAS28ESR<2.6
Wk 12 Wk 24
1 1 --
4 25* 25
% CDAI<2.8
Wk 12 Wk 24
1 1 --
4 21* 23
% SDAI<3.3
Wk 12 Wk 24
1 1 --
4 17* 23
*p<0.05 vs. PBO
NR Week 12 mean
change from
baseline, HAQ-DI
1) -0.1
4) -0.33 (p<0.001 vs.
PBO)
Week 24 mean
change from
baseline, HAQ-DI
1) -0.18
4) -0.44
Week 12 mean
change from
baseline, ESR
1) -5.5
4) -9 (p<0.01 vs.
PBO)
Week 24 mean
change from
baseline, ESR
1) -6
3) -11
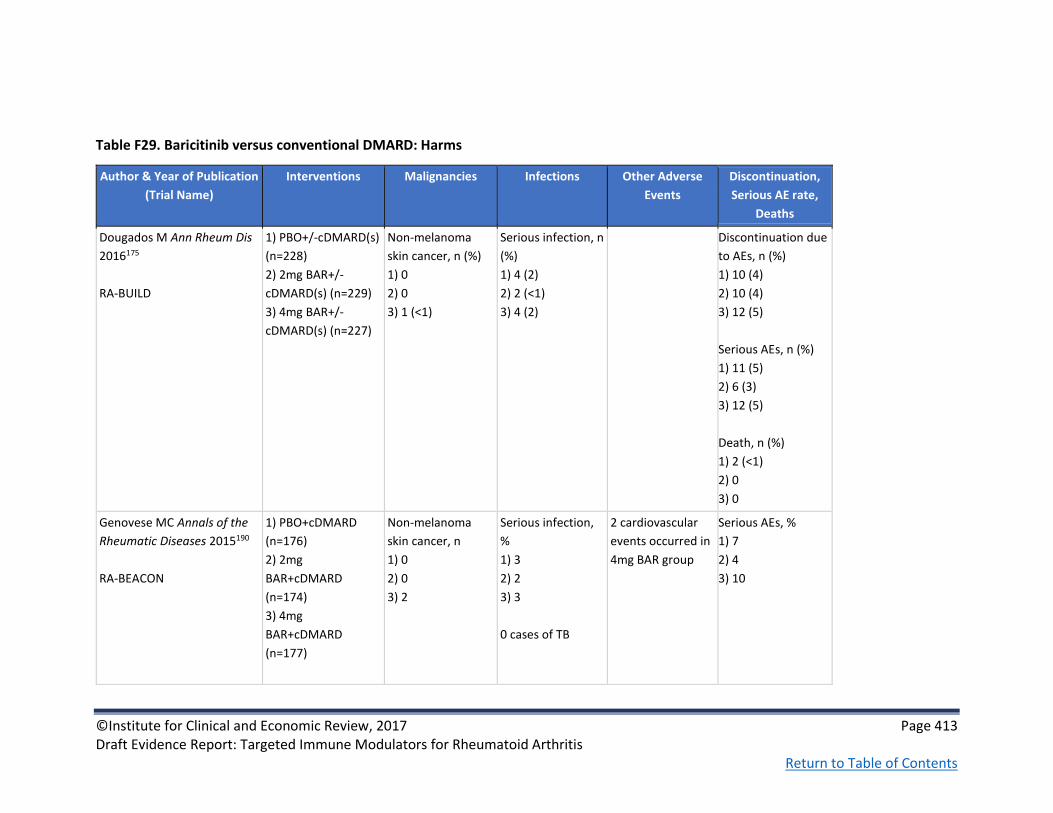
©Institute for Clinical and Economic Review, 2017 Page 413 Draft Evidence Report: Targeted Immune Modulators for Rheumatoid Arthritis Return to Table of Contents
Table F29. Baricitinib versus conventional DMARD: Harms
Author & Year of Publication
(Trial Name)
Interventions Malignancies Infections Other Adverse
Events
Discontinuation,
Serious AE rate,
Deaths
Dougados M Ann Rheum Dis
2016175
RA-BUILD
1) PBO+/-cDMARD(s)
(n=228)
2) 2mg BAR+/-
cDMARD(s) (n=229)
3) 4mg BAR+/-
cDMARD(s) (n=227)
Non-melanoma
skin cancer, n (%)
1) 0
2) 0
3) 1 (<1)
Serious infection, n
(%)
1) 4 (2)
2) 2 (<1)
3) 4 (2)
Discontinuation due
to AEs, n (%)
1) 10 (4)
2) 10 (4)
3) 12 (5)
Serious AEs, n (%)
1) 11 (5)
2) 6 (3)
3) 12 (5)
Death, n (%)
1) 2 (<1)
2) 0
3) 0
Genovese MC Annals of the
Rheumatic Diseases 2015190
RA-BEACON
1) PBO+cDMARD
(n=176)
2) 2mg
BAR+cDMARD
(n=174)
3) 4mg
BAR+cDMARD
(n=177)
Non-melanoma
skin cancer, n
1) 0
2) 0
3) 2
Serious infection,
%
1) 3
2) 2
3) 3
0 cases of TB
2 cardiovascular
events occurred in
4mg BAR group
Serious AEs, %
1) 7
2) 4
3) 10

©Institute for Clinical and Economic Review, 2017 Page 414 Draft Evidence Report: Targeted Immune Modulators for Rheumatoid Arthritis Return to Table of Contents
Author & Year of Publication
(Trial Name)
Interventions Malignancies Infections Other Adverse
Events
Discontinuation,
Serious AE rate,
Deaths
Genovese MC The New
England journal of medicine
2016 90
RA-BEACON
1) PBO + cDMARD
(n=176)
2) 2mg BAR +
cDMARD (n=174)
3) 4mg BAR +
cDMARD (n=177)
Malignancies, n (%)
1) 0
2) 0
3) 2 (1)
Serious infection, n
(%)
1) 5 (3)
2) 4 (2)
3) 6 (3)
Week 24
Serious AEs, n (%)
1) 13 (7)
2) 7 (4)
3) 18 (10)
Discontinuation due
to AEs, n (%)
1) 7 (4)
2) 7 (4)
3) 11 (6)
Keystone EC Annals of the
Rheumatic Diseases 2015211
I4V-MC-JADA
1) PBO + cDMARD
(n=98)
2) 1mg BAR +
cDMARD (n=49)
3) 2mg BAR +
cDMARD (n=52)
4) 4mg BAR +
cDMARD (n=52)
5) 8mg BAR
+cDMARD (n=50)
NR Week 12 serious
infection, n (%)
1) 0
2) 0
3) 2 (4)
4) 0
5) 0
Week 24 serious
infection, n (%)
3) 2 (4)
4) 0
5) 1(2)
0 cases of TB
Week 12 serious
AEs, n (%)
1) 3 (3)
2) 0
3) 3 (6)
4) 0
5) 1(2)
Week 24 serious
AEs, n (%)
1) 3 (6)
2) 0
3) 4(8)

©Institute for Clinical and Economic Review, 2017 Page 415 Draft Evidence Report: Targeted Immune Modulators for Rheumatoid Arthritis Return to Table of Contents
Table F30. Baricitinib versus conventional DMARD: Patient-reported Outcomes
Author & Year of
Publication
(Trial Name)
Interventions Health-related
quality of life
Pain Fatigue & other PROs
Emery P Arthritis and
Rheumatology
2015217
RA-BUILD
See Dougados M Ann
Rheum Dis 2016175
1) PBO+/-cDMARD(s)
(n=228)
2) 2mg BAR+/-
cDMARD(s) (n=229)
3) 4mg BAR+/-
cDMARD(s) (n=227)
@ 24 weeks
SF-36 PCS score
1) 5.3
3) 9.1*
SF-36 PCS MCID (≥5)
(%)
1) 33.8
3) 55.9*
SF-36 MCS score
1) 2.6
3) 3.4
SF-36 MCS MCID (≥5)
(%)
1) 28.1
3) 32.6
EQ-5D (Health State
Index Score, US
algorithm)
1) 0.062
3) 0.131*
*p≤0.001 vs. PBO
@ 24 weeks
VAS
1) 7.9
3) 11.0
Patient Assessment of Pain, VAS % least mean
change from baseline
1) -23.2
3) -38.3
*p≤0.001 vs. placebo
@ 24 weeks
FACIT-F
1) 42.5
3) 59.9*
*p≤0.001 vs. placebo
Patients’ Global Assessment
of Disease Activity
1) -15.6
3) -15.0
p=NR

©Institute for Clinical and Economic Review, 2017 Page 416 Draft Evidence Report: Targeted Immune Modulators for Rheumatoid Arthritis Return to Table of Contents
Author & Year of
Publication
(Trial Name)
Interventions Health-related
quality of life
Pain Fatigue & other PROs
Emery P Arthritis
Rheumatol 2015217
RA-BUILD
1) PBO+/-cDMARD(s)
(n=228)
2) 2mg BAR+/-
cDMARD(s) (n=229)
3) 4mg BAR+/-
cDMARD(s) (n=227)
Week 24
SF-36 PCS MCID ≥5, %
1) 34.0
2) 56*
3) 56*
SF-36 MCS MCID ≥5,
%
1) 28
2) 31
3) 33
EQ-5D VAS, mean
change from baseline
1) 7.9
2) 13.9**
3) 11
*p≤0.001, **p≤0.01
Week 24
Patient’s assessment
of pain (0-100mm
VAS) mean change
from baseline
(estimated from
graph):
1) -22
2) -27.9*
3) -28*
*p≤0.001
Week 24
FACIT-F % of patients with
MCID
1) 43
2) 59*
3) 60*
Patient’s Global Assessment
of Disease Activity (0-
100mm VAS), mean change
from baseline (estimated
from graph):
1) -19
2) -28*
3) -29.5*
*p≤0.001

©Institute for Clinical and Economic Review, 2017 Page 417 Draft Evidence Report: Targeted Immune Modulators for Rheumatoid Arthritis Return to Table of Contents
Author & Year of
Publication
(Trial Name)
Interventions Health-related
quality of life
Pain Fatigue & other PROs
Keystone EC Annals
of the Rheumatic
Diseases. 2015211
I4V-MC-JADA
1) PBO + cDMARD
(n=98)
2) 1mg BAR + cDMARD
(n=49)
3) 2mg BAR + cDMARD
(n=52)
4) 4mg BAR + cDMARD
(n=52)
5) 8mg BAR +cDMARD
(n=50)
Week 12 mean change in pain (0-100) from
baseline
1) -8.8
4) -25 (p<0.001)
5) -25.3 (p<0.001)
Week 24 mean change in pain (0-100) from
baseline
3) -14.7
4) -27.3
5) -26.9
Week 12 mean change in
baseline patient global
assessment of disease
activity
1) -10.3
4) -25.4 (p<0.001)
5) 29.8 (p<0.001)
Week 24 mean change in
baseline patient global
assessment of disease
activity
3) -16.9
4) -30.2
5) -30
Smolen JS Ann
Rheum Dis. 2016 218
RA-BEACON
1) PBO + cDMARD
(n=176)
2) 2mg BAR + cDMARD
(n=174)
3) 4mg BAR + cDMARD
(n=177)
Week 24
LSM PCS change
1) 1.9
3) 7.1
p≤0.001 for 2-3
LSM MCS change
1) 1.9
3) 2.7
Week 12
LSM pain VAS change
1) -8.8
3) -23.0
p≤0.001 for 2-3
Week 24
LSM pain VAS change
1) -8.8
3) -24.8
p≤0.001 for 2-3
Week 12
LSM FACIT-F change
1) 5.2
3) 8.1
p≤0.01 for 2-3
Week 24
LSM FACIT-F change
1) 5.7
3) 9.2 (p≤0.01)

©Institute for Clinical and Economic Review, 2017 Page 418 Draft Evidence Report: Targeted Immune Modulators for Rheumatoid Arthritis Return to Table of Contents
Table F31. Baricitinib versus conventional DMARD: Non-Healthcare Outcomes
Author & Year of Publication
(Trial Name)
Interventions Productivity Loss
Smolen JS Ann Rheum Dis 2016227
POSTER
1. RA-BEGIN trial
MTX (n=210)/BAR 4mg (n=159)/BAR 4mg +
MTX (n=215)
2. RA-BEAM trial
PBO (n=488)/BAR 4mg (n=487)/ADA (n=330)
3. RA-BUILD trial
PBO (n=228)/BAR 2mg (n=229)/BAR 4mg
(n=227)
4. RA-BEACON trial
PBO (n=176)/BAR 2mg (n=174)/BAR 4mg
(n=177)
WPAI-RA Questionnaire results:
Week 24
Impairment in Regular Daily Activities, n
1. 184/145***/192***
2. 333/430αα/272Δ
3. 141/187/187
4. 91/119α/125αα
Absenteeism, n
1. 76/56*/90*
2. 118/139/102
3. 44/62/56
4. 22/37/38
Presenteeism, n
1. 70/51*/86**
2. 110/134αα/99ΔΔ
3. 44/61/53
4. 22/37/38
Overall Work Productivity Impairment, n
1. 70/51*/86**
2. 110/134/99ΔΔ
3. 44/61/53
4. 91/119/125
***p≤0.001 for bari 4 vs. MTX; **p≤0.01 for bari 4 vs. MTX; *p≤0.05 for bari 4 vs.
MTX; αp≤0.05 for bari vs. PBO; ααp≤0.001 for bari vs. PBO; Δp≤0.001 for ADA vs.
PBO; ΔΔp≤0.01 for ADA vs. PBO

©Institute for Clinical and Economic Review, 2017 Page 419 Draft Evidence Report: Targeted Immune Modulators for Rheumatoid Arthritis Return to Table of Contents
Table F32. Adalimumab versus conventional DMARD: Study Characteristics
Author & Year of
Publication
(Trial Name)
Quality rating
Study sponsor Study Design and
Duration of
Follow-up
Geographic
location of
study
Interventions (n) &
Dosing Schedule
Inclusion and
Exclusion Criteria
Baseline patient Characteristics
Furst DE J Rheumatol. 2003 178 STAR Good
Abbott
Laboratories
RCT, double-blind,
placebo-
controlled
69 study sites in
United States
and Canada
1) ADA+cDMARD,
40mg (n=318)
2) PBO+cDMARD
(n=318)
Patients were given
ADA every other
week until the 24th
week; continued to
receive baseline SAT
doses which
includes DMARD
but only if stable
doses for ≥28 days
Patients that failed
to meet or maintain
≥ACR20 response
at week 12 allowed
a single increase in
dosage of DMARD
and/or
corticosteroid
therapy
Inclusion:
≥18 years with active
RA (defined by ≥6
swollen joints and ≥9
tender joins and met
1987 ACR criteria) for
≥3 months
Exclusion:
1) those in other trials
of other biologic
DMARD in RA 2)
treated with anti-CD4
therapy or biologic
DMARD 3) history of
an active
inflammatory
arthritide other than
RA 4) history of major
infections
Mean age, yrs (SD)
1) 55.0 (12.8)
2) 55.8 (12.4)
Female, n (%)
1) 253 (79.6)
2) 252 (79.2)
Mean RA duration, yrs (SD)
1) 9.3 (8.8)
2) 11.5 (9.7)
Mean HAQ-DI (0-3), n (SD)
1) 1.37 (0.62)
2) 1.43 (0.60)
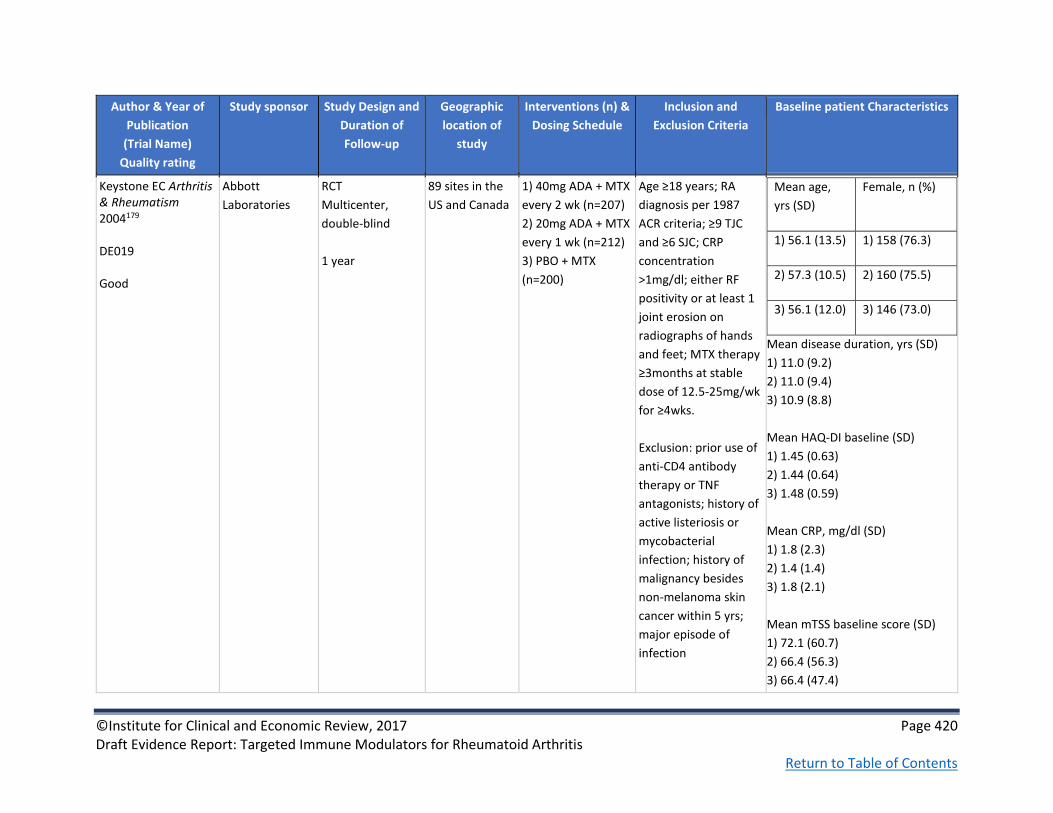
©Institute for Clinical and Economic Review, 2017 Page 420 Draft Evidence Report: Targeted Immune Modulators for Rheumatoid Arthritis Return to Table of Contents
Author & Year of
Publication
(Trial Name)
Quality rating
Study sponsor Study Design and
Duration of
Follow-up
Geographic
location of
study
Interventions (n) &
Dosing Schedule
Inclusion and
Exclusion Criteria
Baseline patient Characteristics
Keystone EC Arthritis & Rheumatism 2004179 DE019 Good
Abbott
Laboratories
RCT
Multicenter,
double-blind
1 year
89 sites in the
US and Canada
1) 40mg ADA + MTX
every 2 wk (n=207)
2) 20mg ADA + MTX
every 1 wk (n=212)
3) PBO + MTX
(n=200)
Age ≥18 years; RA
diagnosis per 1987
ACR criteria; ≥9 TJC
and ≥6 SJC; CRP
concentration
>1mg/dl; either RF
positivity or at least 1
joint erosion on
radiographs of hands
and feet; MTX therapy
≥3months at stable
dose of 12.5-25mg/wk
for ≥4wks.
Exclusion: prior use of
anti-CD4 antibody
therapy or TNF
antagonists; history of
active listeriosis or
mycobacterial
infection; history of
malignancy besides
non-melanoma skin
cancer within 5 yrs;
major episode of
infection
Mean age,
yrs (SD)
Female, n (%)
1) 56.1 (13.5) 1) 158 (76.3)
2) 57.3 (10.5) 2) 160 (75.5)
3) 56.1 (12.0) 3) 146 (73.0)
Mean disease duration, yrs (SD)
1) 11.0 (9.2)
2) 11.0 (9.4)
3) 10.9 (8.8)
Mean HAQ-DI baseline (SD)
1) 1.45 (0.63)
2) 1.44 (0.64)
3) 1.48 (0.59)
Mean CRP, mg/dl (SD)
1) 1.8 (2.3)
2) 1.4 (1.4)
3) 1.8 (2.1)
Mean mTSS baseline score (SD)
1) 72.1 (60.7)
2) 66.4 (56.3)
3) 66.4 (47.4)

©Institute for Clinical and Economic Review, 2017 Page 421 Draft Evidence Report: Targeted Immune Modulators for Rheumatoid Arthritis Return to Table of Contents
Author & Year of
Publication
(Trial Name)
Quality rating
Study sponsor Study Design and
Duration of
Follow-up
Geographic
location of
study
Interventions (n) &
Dosing Schedule
Inclusion and
Exclusion Criteria
Baseline patient Characteristics
Kim APLAR 2007 177 Kim 2007 Good
Abbott
Laboratories
RCT, double-blind,
placebo-
controlled, phase
III trial
Washout period
of 6 weeks
followed by a
placebo-
controlled period
of up to 24 weeks
6 sites in Korea 1) PBO (n=63)
2) ADA (n=65), 40
mg
Received either PBO
or ADA eow by sc
injection for up to
24 weeks; at week
18, patients with no
response (<20%
reduction in tender
and swollen joint
count compared to
baseline) could
switch to rescue
therapy with open-
label ADA 40 mg sc
eow
Inclusion:
≥18 years with active
RA per ACR criteria
and had ≥6 swollen
joints and ≥9 tender
joints; received ≥1
prior DMARD other
than MTX and treated
with MTX for ≥6
months with ≥4
weeks of stable
dosage
Exclusion:
Acute inflammatory
joint diseases other
than RA; active Listeria
or TB infection;
positive serology for
HIV antibody, Hep B
surface antigen, or
Hep C antibody;
calcified granuloma
and/or pleural scarring
on chest radiograph
Mean age, yrs (SD)
1) 49.8 (10.5)
2) 48.5 (10.2)
Female, n (%)
1) 54 (85.7)
2) 62 (95.4)
Mean RA duration, yrs (SD)
1) 6.9 (4.5)
2) 6.8 (4.2)
Patient’s assessment of Pain, mm
VAS (SD)
1) 59.4 (18.6)
2) 57.6 (18.2)
Mean KHAQ-DI (SD)
1) 1.3 (0.6)
2) 1.4 (0.6)
Mean CRP, mg/L (SD)
1) 2.7 (2.6)
2) 2.2 (2.2)

©Institute for Clinical and Economic Review, 2017 Page 422 Draft Evidence Report: Targeted Immune Modulators for Rheumatoid Arthritis Return to Table of Contents
Author & Year of
Publication
(Trial Name)
Quality rating
Study sponsor Study Design and
Duration of
Follow-up
Geographic
location of
study
Interventions (n) &
Dosing Schedule
Inclusion and
Exclusion Criteria
Baseline patient Characteristics
Weinblatt ME Arthritis & Rheumatism 2003176 ARMADA Good
Abbott
Laboratories and
Knoll
Pharmaceuticals
RCT
Double-blind
Multicenter
24 week
35 sites in the
US and Canada
1) 20mg ADA + MTX
(n=69)
2) 40mg ADA + MTX
(n=67)
3) 80mg ADA + MTX
(n=73)
4) PBO + MTX
(n=62)
Study treatment administered subcutaneously every other week as 2 injections of 1.6 ml per injection. Patients
were instructed in
self-injection
techniques.
Age ≥18yrs; RA
diagnosis according to
1987 ACR criteria; ≥9
tender joints and ≥6
swollen joints; MTX
treatment ≥6months
with stable dose 12.5-
25mg/week for at
least 4 wks prior to
study; failure with
treatment ≥1 DMARD
besides MTX but <4
DMARDs.
Exclusion: treatment
with anti-CD4 therapy
or TNFα antagonists;
history of listeriosis or
mycobacterial
infection; major
episode of infection
requiring
hospitalization or iv
antibiotics within 30
days or oral antibiotics
within 14 days prior to
screening
Mean age, yrs (SD)
2) 57.2 (11.4)
4) 56.0 (10.8)
Female, %
2) 74.6
4) 82.3
Mean disease duration, yrs (SD)
2) 12.2 (11.1)
4) 11.1 (8.0)
Pain VAS baseline, 0-100mm (SD)
2) 53.0 (22.0)
4) 57.2 (21.0)
Mean HAQ-DI baseline (SD)
2) 1.55 (0.61)
4) 1.64 (0.63)
Mean CRP baseline, mg/dl (SD)
2) 2.1 (1.8)
4) 3.1 (3.9)

©Institute for Clinical and Economic Review, 2017 Page 423 Draft Evidence Report: Targeted Immune Modulators for Rheumatoid Arthritis Return to Table of Contents
Table F33. Adalimumab versus conventional DMARD: Key Clinical Outcomes
Author & Year of
Publication
(Trial Name)
Interventions Treatment Response Disease Activity Structural Damage Function Laboratory
indices
Furst DE J
Rheumatol. 2003 178
STAR
1) ADA+cDMARD,
40mg (n=318)
2) PBO+cDMARD
(n=318)
Week 24
ACR20, %
1) 52.8
2) 34.9
ACR50, %
1) 28.9
2) 11.3
ACR70, %
1) 14.8
2) 3.5
p≤0.001
NR NR NR NR

©Institute for Clinical and Economic Review, 2017 Page 424 Draft Evidence Report: Targeted Immune Modulators for Rheumatoid Arthritis Return to Table of Contents
Author & Year of
Publication
(Trial Name)
Interventions Treatment Response Disease Activity Structural Damage Function Laboratory
indices
Keystone EC Arthritis
& Rheumatism
2004179
DE019
1) 40mg ADA + MTX
every 2 wk (n=207)
2) 20mg ADA + MTX
every 1 wk (n=212)
3) PBO + MTX
(n=200)
Week 24, n (%)
ACR20
1) 131 (63.3)*
3) 59 (29.5)
ACR50
1) 81 (39.1)*
3) 19 (9.5)
ACR70
1) 43 (20.8)*
3) 5 (2.5)
*1 year, n (%)
ACR20
1) 122 (58.9)*
3) 48 (24.0)
ACR50
1) 86 (41.5)*
3) 19 (9.5)
ACR70
1) 48 (23.2)*
3) 9 (4.5)
*P≤0.001
1 year
mTSS mean change
from baseline (SD)
1) 0.1 (4.8)
2) 0.8 (4.9)
3) 2.7 (6.8)
P≤0.001
Week 24
HAQ-DI absolute
change from
baseline, mean (SD)
1) -0.56 (0.52)
2) -0.60 (0.53)
3) -0.24 (0.52)
P≤0.001
1 year
HAQ-DI absolute
change from
baseline, mean (SD)
1) -0.59 (0.57)
2) -0.61 (0.55)
3) -0.25 (0.56)
P≤0.001
Week 24
CRP absolute
change from
baseline, mg/dl
(SD)
1) -1.0 (2.9)
2) -0.8 (1.3)
3) -0.2 (1.9)
P≤0.001
1 year
CRP absolute
change from
baseline, mg/dl
(SD)
1) -0.7 (1.4)
2) -0.7 (1.4)
3) -0.1 (1.9)
P≤0.001

©Institute for Clinical and Economic Review, 2017 Page 425 Draft Evidence Report: Targeted Immune Modulators for Rheumatoid Arthritis Return to Table of Contents
Author & Year of
Publication
(Trial Name)
Interventions Treatment Response Disease Activity Structural Damage Function Laboratory
indices
Kim APLAR 2007 177
Kim 2007
1) PBO (n=63)
2) ADA (n=65), 40 mg
Week 24
ACR20, n (%)
1) 23 (36.5)
2) 40 (61.5)
p<0.01 for 1-2
ACR50, %
1) 14.3
2) 43.1
p<0.001 for 1-2
ACR70, %
1) 7.9
2) 21.5
p<0.05
NR NR Week 24
Mean change in
KHAQ-DI (SD)
1) -0.2 (0.5)
2) -0.5 (0.55)
p=0.002 for 1-2
Week 24
Mean change in
CRP, mg/L (SD)
1) -0.4 (1.94)
2) -1.4 (3.23)
p=0.001

©Institute for Clinical and Economic Review, 2017 Page 426 Draft Evidence Report: Targeted Immune Modulators for Rheumatoid Arthritis Return to Table of Contents
Author & Year of
Publication
(Trial Name)
Interventions Treatment Response Disease Activity Structural Damage Function Laboratory
indices
Weinblatt ME
Arthritis &
Rheumatism 2003176
ARMADA
1) 20mg ADA + MTX
(n=69)
2) 40mg ADA + MTX
(n=67)
3) 80mg ADA + MTX
(n=73)
4) PBO + MTX (n=62)
Week 24, n (%)
ACR20
2) 45 (67.2)
4) 9 (14.5)
ACR50
2) 37 (55.2)
4) 5 (8.1)
ACR70
2) 18 (26.9)
4) 3 (4.8)
P<0.001
NR NR Week 24
HAQ-DI absolute
change from
baseline, mean (SD)
2) -0.62 (0.63)
4) -0.27 (0.57)
P<0.001
Week 24
CRP absolute
change from
baseline, mg/dl
(SD)
2) -1.6 (1.6)
4) 0.1 (2.4)
P<0.001

©Institute for Clinical and Economic Review, 2017 Page 427 Draft Evidence Report: Targeted Immune Modulators for Rheumatoid Arthritis Return to Table of Contents
Table F34. Adalimumab versus conventional DMARD: Harms
Author & Year of Publication
(Trial Name)
Interventions Malignancies Infections Other Adverse
Events
Discontinuation,
Serious AE rate,
Deaths
Furst DE J Rheumatol. 2003 178
STAR
1) ADA+cDMARD,
40mg (n=318)
2) PBO+cDMARD
(n=318)
1 case of peripheral
T cell lymphoma in
the ADA group
Infections, n (%)
1) 166 (52.2)
2) 157 (49.4)
Serious Infections,
n (%)
1) 4 (1.3)
2) 6 (1.9)
Adverse events, n
(%)
1) 275 (86.5)
2) 263 (82.7)
Discontinuation due
to AEs, n
1) 9
2) 8
Serious AE events, n
(%)
1) 17 (5.3)
2) 22 (6.9)

©Institute for Clinical and Economic Review, 2017 Page 428 Draft Evidence Report: Targeted Immune Modulators for Rheumatoid Arthritis Return to Table of Contents
Author & Year of Publication
(Trial Name)
Interventions Malignancies Infections Other Adverse
Events
Discontinuation,
Serious AE rate,
Deaths
Keystone EC Arthritis &
Rheumatism 2004179
DE019
1) 40mg ADA + MTX
every 2 wk (n=207)
2) 20mg ADA + MTX
every 1 wk (n=212)
3) PBO + MTX
(n=200)
4 patients
developed non-skin
cancers: non-
Hodgkin’s
lymphoma,
adenocarcinoma,
testicular
seminoma, breast
cancer
Serious infections,
n (%)
1) 11 (5.3)*
2) 5 (2.4)
3) 1 (0.5)
*P≤0.01
Infection, n (%)
1) 15 (7.2)
2) 33 (15.6)
3) 9 (4.5)
Upper respiratory
tract infection, n
(%)
1) 41 (19.8)
2) 41 (19.3)
3) 27 (13.5)
1 ADA-treated
patient developed
TB
Headache, n (%)
1) 26 (12.6)
2) 29 (13.7)
3) 12 (6.0)
Diarrhea, n (%)
1) 19 (9.2)
2) 24 (11.3)
3) 30 (15.0)
Arthralgia, n (%)
1) 14 (6.8)
2) 29 (13.7)
3) 24 (12.0)
Joint disorder, n
(%)
1) 13 (6.3)
2) 14 (6.6)
3) 23 (11.5)
Clinical-flare
reaction, n (%)
1) 12 (5.8)
2) 8 (3.8)
3) 29 (14.5)
Serious AEs, n (%)
Adalimumab-
treated: 60 (14.3)
AEs, n (%)
Adalimumab-
treated: 391 (93.3)
Placebo-treated:
181 (90.5)
Withdrawal due to
AEs, n (%)
1) 26 (12.6)
2) 16 (7.5)
3) 13 (6.5)
Deaths:
1) 2 (1 multiple
fractures and 1
urosepsis)
2) 1 (chemotherapy
complications)
3) 0

©Institute for Clinical and Economic Review, 2017 Page 429 Draft Evidence Report: Targeted Immune Modulators for Rheumatoid Arthritis Return to Table of Contents
Author & Year of Publication
(Trial Name)
Interventions Malignancies Infections Other Adverse
Events
Discontinuation,
Serious AE rate,
Deaths
Kim APLAR 2007 177
Kim 2007
1) PBO (n=63)
2) ADA (n=65), 40 mg
NR Incidence of
infectious AEs, %
1) 34.9
2) 36.9
1 case of TB
observed in the
ADA group
NR Serious AE rate, %
1) 0
2) 4.6
Discontinuations
due to AEs, n (%)
1) 4 (6.3)
2) 4 (6.2)
Deaths, n
1) 0
2) 1 (pneumonia)

©Institute for Clinical and Economic Review, 2017 Page 430 Draft Evidence Report: Targeted Immune Modulators for Rheumatoid Arthritis Return to Table of Contents
Table F35. Adalimumab versus conventional DMARD: Patient-reported Outcomes
Author & Year of Publication
(Trial Name)
Interventions Health-related
quality of life
Pain Fatigue & other
PROs
Keystone EC Arthritis &
Rheumatism 2004179
DE019
1) 40mg ADA + MTX
every 2 wk (n=207)
2) 20mg ADA + MTX
every 1 wk (n=212)
3) PBO + MTX
(n=200)
Pain VAS 0-100mm absolute change from baseline, mean (SD) Week 24 1) -28.2 (25.8) 2) -27.9 (27.0) 3) -12.6 (26.1) 1 Year 1) -29.4 (26.4) 2) -27.4 (28.5) 3) -11.2 (27.7) P≤0.001
Kim APLAR 2007 177
Kim 2007
1) PBO (n=63)
2) ADA (n=65), 40 mg
NR Week 24 Mean patient pain VAS change (SD) 1) -10.7 (24.85) 2) -23.7 (26.54) p=0.004 for 1-2
NR
Weinblatt ME Arthritis &
Rheumatism 2003176
ARMADA
1) 20mg ADA + MTX
(n=69)
2) 40mg ADA + MTX
(n=67)
3) 80mg ADA + MTX
(n=73)
4) PBO + MTX (n=62)
Pain VAS 0-100mm absolute change from baseline, mean (SD) 2) 53.0 (22.0) 4) 57.2 (21.0) P<0.001
24 weeks
Mean increase over
baseline, FACIT
fatigue scale
2) 8.5
4) 3.0
P=0.001

©Institute for Clinical and Economic Review, 2017 Page 431 Draft Evidence Report: Targeted Immune Modulators for Rheumatoid Arthritis Return to Table of Contents
Table F36. Certolizumab Pegol versus conventional DMARDs: Study Characteristics
Author & Year of
Publication
(Trial Name)
Quality rating
Study sponsor Study Design and
Duration of
Follow-up
Geographic
location of
study
Interventions (n) &
Dosing Schedule
Inclusion and Exclusion
Criteria
Baseline patient Characteristics
Choy E
Rheumatology
2012182
Good
UCB Pharma RCT
double-blind
placebo controlled
and parallel-group
study
24 weeks
43 centers in 7
countries -
Austria,
Belgium, Czech
Republic,
Germany,
Ireland,
USA and the UK
1) PBO + MTX (n=121)
2) CTZ + MTX (n=126)
Patients were
randomized
on a 1:1
to sc CTZ
400mg or PBO every
4 weeks from
baseline to week 20
in combination with
MTX 15-25 mg/week
Inclusion:
18 - 75 years with adult-
onset RA of ≥ 6 months;
active RA i.e. ≥ 9 tender
joints, ≥ 9 swollen
joints; 1 or more of the
following criteria: ≥45
min of morning
stiffness, ESR ≥28 mm/h
or CRP >10 mg/l; and
must be on MTX ≥ 6
months
Exclusion:
Inflammatory arthritis
other than RA; history
of chronic, serious or
life-threatening
infection, current
infection,
history or chest X-ray of
TB, or positive
PPD skin test
Mean age, yrs (SD)
1) 55.6 (11.7)
2) 53 (12.3)
Female, n (%)
1) 80 (66.1)
2) 91 (72.2)
Mean RA duration, yrs (SD)
1) 9.9 (7.8)
2) 9.4 (7.5)
Mean HAQ-DI (SD)
1) 1.5 (0.7)
2) 1.4 (0.6)
Mean DAS28-3 (SD)
1) 6.3 (0.99)
2) 6.2 (0.98)

©Institute for Clinical and Economic Review, 2017 Page 432 Draft Evidence Report: Targeted Immune Modulators for Rheumatoid Arthritis Return to Table of Contents
Author & Year of
Publication
(Trial Name)
Quality rating
Study sponsor Study Design and
Duration of
Follow-up
Geographic
location of
study
Interventions (n) &
Dosing Schedule
Inclusion and Exclusion
Criteria
Baseline patient Characteristics
Furst DE Arthritis
Care and Research
2015242
DOSEFLEX
Good
UCB Pharma Phase IIIb
with an open-label
run-in period,
followed by a
double-blind,
placebo-controlled
RCT period
34 weeks
US, France,
Canada
1) CTZ 200mg → PBO
+MTX (n=69)
2) CTZ 200mg →
CTZ200mg +MTX
(n=70)
3) CTZ 200mg →
CTZ400mg +MTX
(n=70)
All patients received
a CTZ loading
dose followed by 200
mg CTZ every 2
weeks up to
week 16 during open
label run in. At week
18 ACR20 non-
responders were
withdrawn and
responders were
randomized 1:1:1 to
either
200 mg CTZ every 2
weeks, 400 mg CTZ
every 4 weeks, or
PBO during the
double-blind phase
Inclusion:
18 years with RA for 6
months – 15 yrs with
moderate to severe
active disease (i.e. ≥6
TJC and ≥4 SJC, and
either CRP≥10mg/dl or
ESR≥28mm/hr; RF or
anti-CCP positivity);
Insufficient control by
MTX; must have taken
DMARD for ≥3 months
Mean age, yrs (SD)
1) 51.5 (13.2)
2) 55.6 (10.7)
30 53.1 (13.8)
Female, %
1) 81.2
2) 70
3) 82.9
Mean RA duration, yrs (SD)
1) 6.5 (4.6)
2) 5.9 (4.2)
3) 6.4 (4.7)
Mean HAQ DI (SD)
1) 1.42 (0.55)
2) 1.57 (0.65)
3) 1.41 (0.61)
Mean DAS28-ESR (SD)
1) 6.4 (1)
2) 6.4 (0.8)
3) 6.2 (1)
Prior anti-TNF use overall, n (%): 111
(53.1)

©Institute for Clinical and Economic Review, 2017 Page 433 Draft Evidence Report: Targeted Immune Modulators for Rheumatoid Arthritis Return to Table of Contents
Author & Year of
Publication
(Trial Name)
Quality rating
Study sponsor Study Design and
Duration of
Follow-up
Geographic
location of
study
Interventions (n) &
Dosing Schedule
Inclusion and Exclusion
Criteria
Baseline patient Characteristics
Yamamoto K Modern rheumatology 2014156 J-RAPID Good
Otsuka
Pharmaceutical
Co., Ltd.
RCT
multicenter
double-blind
Phase II/III
24 weeks
67 centers in
Japan
1) PBO+MTX
(n=77)
2) CTZ 200 mg +MTX
(n=82)
3) CTZ 100 mg +MTX
(n=72) *
4) CTZ 400 mg +MTX
(n=85)*
Subcutaneous CTZ or
saline placebo plus
MTX every 2 weeks;
patients randomized
to CTZ +MTX received
induction doses of
200 mg (100 mg
group) or 400 mg
(200 and 400 mg
groups) at Weeks 0, 2
and 4; PBO group
received an
equivalent injection
regimen of saline
solution to maintain
blinding.
*Not abstracted
age 20 – 74; RA
diagnosis for 0.5 – 15
years; active RA with ≥9
tender and ≥9 swollen
joints at screening and
baseline; ESR ≥30
mm/hour or
CRP ≥1.5 mg/dL;
≥6 months MTX before
study drug
administration,
with the MTX dose fixed
≥ 2 months
Mean age, yrs (SD)
1) 51.9 (11.1)
2) 50.6 (11.4)
Female, n (%)
1) 66 (85.7)
2) 69 (84.1)
Mean RA duration, yrs (SD)
1) 5.8 y (4.1)
2) 5.6 y (4.2)
Mean DAS28-ESR (SD)
1) 6.5 (0.9)
2) 6.2 (0.8)
Prior anti-TNF, n (%)
1) 15 (19.5)
2) 11 (13.4)
Mean HAQ-DI (SD)
1) 1.2 (0.7)
2) 1.1 (0.7)

©Institute for Clinical and Economic Review, 2017 Page 434 Draft Evidence Report: Targeted Immune Modulators for Rheumatoid Arthritis Return to Table of Contents
Author & Year of
Publication
(Trial Name)
Quality rating
Study sponsor Study Design and
Duration of
Follow-up
Geographic
location of
study
Interventions (n) &
Dosing Schedule
Inclusion and Exclusion
Criteria
Baseline patient Characteristics
Keystone E Arthritis & Rheumatism 2008181 RAPID1
UCB Pharma RCT
multicenter,
double-blind,
parallel-group
Phase III
1 year
147 centers
worldwide (47%
North America,
9% South
America, 27%
Europe, 18%
other)
1) 200mg CTZ + MTX (n=393) 2) 400mg CTZ + MTX (n=390) 3) PBO + MTX (n=199) CTZ: 400 mg at wks 0, 2, and 4, followed by 200 mg or 400 mg every 2 wks thereafter, administered sc as a reconstituted, preservative-free injection
<20% improvement (ACR20) (12) at wks 12 and 14 were withdrawn from the study at wk 16. Patients who withdrew at wk 16 or who completed the trial could enroll in an open-label extension study of CTZ 400 mg every 2 wks
Age ≥18 yrs; active RA
≥6months but for <15
yrs; ≥9 TJC and ≥9 SJC;
ESR ≥30mm/hr or
CRP>15mg/L; MTX
treatment ≥6months,
with dosage of
≥10mg/wk for
≥2months prior to
baseline.
Exclusions: receiving
any biologic therapy
within 6 months (or
etanercept and/or
anakinra within
3months) of baseline
and/or any previous
biologic therapy that
resulted in severe
hypersensitivity or
anaphylactic reaction;
previous failure to
respond to treatment
with an anti-TNF
Mean age, yrs (SD)
1) 51.4 (11.6)
2) 52.4 (11.7)
3) 52.2 (11.2)
Female, %
1) 82.4
2) 83.6
3) 83.9
Mean RA duration, yrs (SD)
1) 6.1 (4.2)
2) 6.2 (4.4)
3) 6.2 (4.4)
Mean HAQ-DI (SD)
1) 1.7 (0.6)
2) 1.7 (0.6)
3) 1.7 (0.6)

©Institute for Clinical and Economic Review, 2017 Page 435 Draft Evidence Report: Targeted Immune Modulators for Rheumatoid Arthritis Return to Table of Contents
Author & Year of
Publication
(Trial Name)
Quality rating
Study sponsor Study Design and
Duration of
Follow-up
Geographic
location of
study
Interventions (n) &
Dosing Schedule
Inclusion and Exclusion
Criteria
Baseline patient Characteristics
Smolen J Annals of Rheumatic Diseases 2009180 RAPID2 See also Strand V Annals of Rheumatic Diseases 2011 289
UCB Pharma RCT
Multicenter,
double-blind
Phase III
24 weeks
76 sites in US,
Bulgaria, Chile,
Croatia, Czech
Republic,
Estonia, Israel,
Latvia,
Lithuania,
Mexico, Poland,
Russian
Federation,
Serbia, Slovakia,
Ukraine
1) 200mg CTZ + MTX (n=246) 2) 400mg CTZ + MTX (n=246) 3) PBO + MTX (n=127) Groups 1 and 2 were treated with 400 mg at weeks 0, 2 and 4, followed by 200 or 400 mg every 2 weeks
Age ≥18 yrs; diagnosis
of RA defined by ACR
1987 criteria; diagnosis
≥6months but <15
years; active disease at
screening and baseline;
prior MTX for
≥6months, stable dose
≥10mg/wk for
≥2months before
baseline
Exclusion: treatment
with RA biologic agent
within 6months prior
(3month anakira or
etanercept); previous
treatment with a
biologic resulting in a
severe hypersensitivity
or anaphylactic
reaction; no response
to previous anti-TNF
therapy;
history/positive test TB;
positive PPD skin test
unless BCG vaccine
related
Mean age, yrs (SD)
Female, n (%)
1) 52.2 (11.1) 1) 206 (83.7)
3) 51.5 (11.8) 3) 107 (84.3)
Mean RA
duration, yrs (SD)
Mean HAQ-DI
baseline (SD)
1) 6.1 (4.1) 1.6 (0.6), all
groups 3) 5.6 (3.9)
Mean mTSS
baseline (SD)
Mean DAS28-
ESR baseline
(SD)
1) 39.6 (50.1) 1) 6.85 (0.84)
3) 46.5 (58.6) 3) 6.83 (0.87)
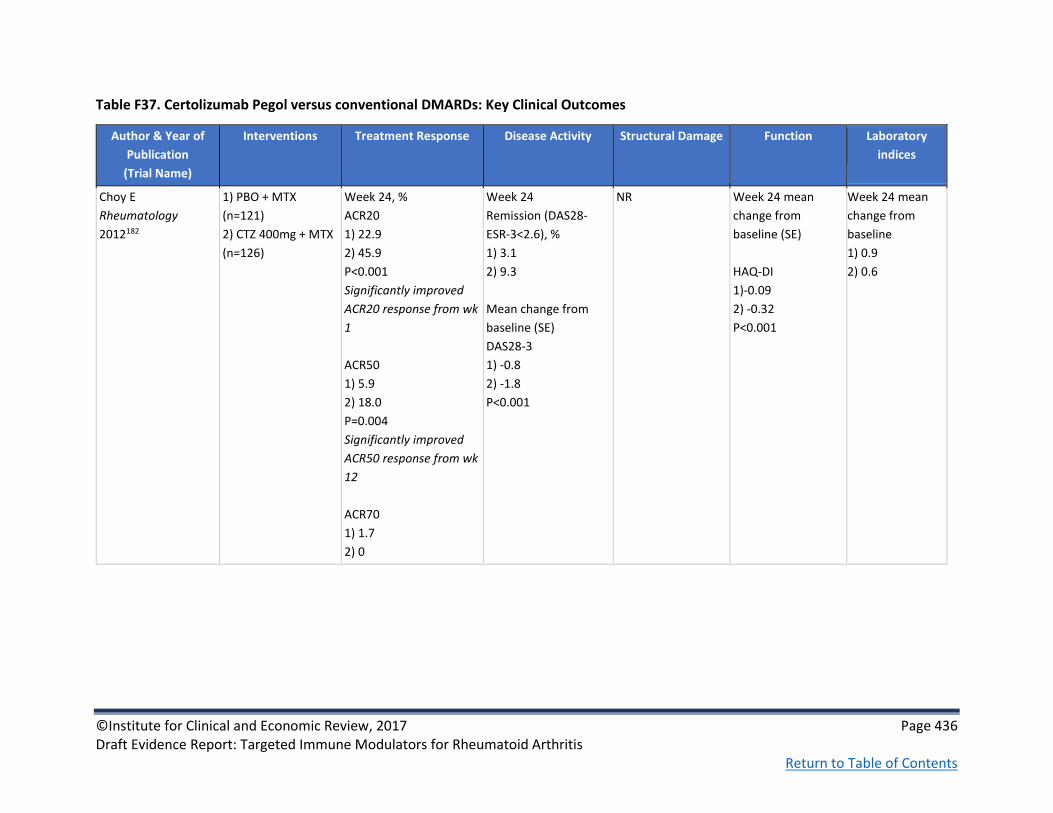
©Institute for Clinical and Economic Review, 2017 Page 436 Draft Evidence Report: Targeted Immune Modulators for Rheumatoid Arthritis Return to Table of Contents
Table F37. Certolizumab Pegol versus conventional DMARDs: Key Clinical Outcomes
Author & Year of
Publication
(Trial Name)
Interventions Treatment Response Disease Activity Structural Damage Function Laboratory
indices
Choy E
Rheumatology
2012182
1) PBO + MTX
(n=121)
2) CTZ 400mg + MTX
(n=126)
Week 24, %
ACR20
1) 22.9
2) 45.9
P<0.001
Significantly improved
ACR20 response from wk
1
ACR50
1) 5.9
2) 18.0
P=0.004
Significantly improved
ACR50 response from wk
12
ACR70
1) 1.7
2) 0
Week 24
Remission (DAS28-
ESR-3<2.6), %
1) 3.1
2) 9.3
Mean change from
baseline (SE)
DAS28-3
1) -0.8
2) -1.8
P<0.001
NR Week 24 mean
change from
baseline (SE)
HAQ-DI
1)-0.09
2) -0.32
P<0.001
Week 24 mean
change from
baseline
1) 0.9
2) 0.6

©Institute for Clinical and Economic Review, 2017 Page 437 Draft Evidence Report: Targeted Immune Modulators for Rheumatoid Arthritis Return to Table of Contents
Author & Year of
Publication
(Trial Name)
Interventions Treatment Response Disease Activity Structural Damage Function Laboratory
indices
Furst DE Arthritis
Care and Research
2015242
DOSEFLEX
1) CTZ 200mg → PBO
+MTX (n=69)
2) CTZ 200mg →
CTZ200mg +MTX
(n=70)
3) CTZ 200mg →
CTZ400mg +MTX
(n=70)
Week 34, % ACR20
1) 44.9
2) 67.1 (p<0.01)
3) 65.2
Week 34, % ACR50
1) 30.4
2) 50 (p<0.05)
3) 52.2 (p<0.05)
Week 34, % ACR70
1) 15.9
2) 30
3) 37.7 (p<0.01)
Week 34 Remission
(DAS 28-ESR < 2.6), %
1) 5.8
2) 24.3
3) 36.2
Week 34 Remission
(CDAI ≤2.8)
1) 17.4
2) 27.1
3) 31.9
Week 34 Remission
(SDAI ≤3.3)
1) 13
2) 22.9
3) 36.2
NR Week 34 mean
change from
baseline (SD)
1) 1.05 (0.68)
2) 0.81 (0.6)
3) 0.79 (0.64)
NR

©Institute for Clinical and Economic Review, 2017 Page 438 Draft Evidence Report: Targeted Immune Modulators for Rheumatoid Arthritis Return to Table of Contents
Author & Year of
Publication
(Trial Name)
Interventions Treatment Response Disease Activity Structural Damage Function Laboratory
indices
Yamamoto K Modern
rheumatology
2014156
J-RAPID
1) PBO+MTX
(n=77)
2) CTZ 200 mg +MTX
(n=82)
Week 24, %
ACR20
1) 24.7
2) 73.2
p<0.0001
Significantly improved
ACR20 response from wk
1
ACR50
1) 16.9
2) 54.9
p<0.0001
ACR70
1) 1.3
2) 29.3
p<0.001
Moderate/good EULAR
response
1) 29.9
2) 85.4%
Week 24
Remission
(DAS28[ESR]<2.6), %
1) 0
2) 17.1
Mean change from
baseline (SE)
DAS28 (ESR)
1) -0.63 (0.15)
2) -2.46 (0.15)
P<0.0001
Week 24 mean
change from
baseline mTSS
1) 2.8
2) 0.2
p<0.001
Week 24 mean
change from
baseline (SE)
HAQ-DI
1) -0.18 (0.06)
2) -0.55 (0.05)
p<0.0001
Week 24 mean
ratio to baseline
CRP
1) 0.76
2) 0.28
ESR
1) 0.8
2) 0.4

©Institute for Clinical and Economic Review, 2017 Page 439 Draft Evidence Report: Targeted Immune Modulators for Rheumatoid Arthritis Return to Table of Contents
Author & Year of
Publication
(Trial Name)
Interventions Treatment Response Disease Activity Structural Damage Function Laboratory
indices
Keystone E Arthritis
& Rheumatism
2008181
RAPID1
1) 200mg CZP + MTX (n=393) 2) 400mg CZP + MTX (n=390) 3) PBO + MTX (n=199)
Week 24, %
ACR20
1) 58.8
3) 13.6
P<0.001
ACR50
P<0.001
ACR70
P<0.001
Mean change from
baseline (SD)
DAS28-ESR
1) -3.3 (1.3)
3) -2.4 (1.3)
P<0.001
24 weeks, mTSS
P<0.001
1 year, mTSS
Mean change from
baseline
1) 0.4
3) 2.8
P<0.001
1 year, HAQ-DI
change from
baseline
P<0.001
NR
Smolen J Annals of
Rheumatic Diseases
2009180
RAPID2
1) 200mg CTZ + MTX (n=246) 2) 400mg CTZ + MTX (n=246) 3) PBO + MTX (n=127)
Week 24, %
ACR20
1) 57.3
3) 8.7
P≤0.001
ACR50
1) 32.5
3) 3.1
P<0.001
ACR70
1) 15.9
3) 0.8
P≤0.01
Week 24
Mean change from
baseline (SD)
DAS28-ESR
1) -2.27 (1.38)
3) -0.50 (1.05)
P<0.001
DAS28-ESR <2.6, %
1) 9.4
3) 0.8
P≤0.05
Week 24
Mean change from
baseline, mTSS
1) 0.2
3) 1.2
P≤0.01
Week 24
HAQ-DI, adjusted
mean change from
baseline (SE)
1) -0.50 (0.03)
3) -0.14 (0.04)
Week 24 CRP, adjusted geometric mean (95% CI) – ratio to baseline
1) 0.42 (0.35 –
0.49)
3) 0.92 (0.74 –
1.14)

©Institute for Clinical and Economic Review, 2017 Page 440 Draft Evidence Report: Targeted Immune Modulators for Rheumatoid Arthritis Return to Table of Contents
Table F38. Certolizumab Pegol versus conventional DMARDs: Harms
Author & Year of Publication
(Trial Name)
Interventions Malignancies Infections Other Adverse
Events
Discontinuation, Serious
AE rate, Deaths
Choy E Rheumatology 2012182 1) PBO + MTX (n=121)
2) CTZ + MTX (n=126)
0 cases of
malignant disease
Serious infection, n (%)
1) 2 (1.7)
2) 3 (2.4)
0 cases of tuberculosis
Discontinuation due to
AEs, n (%)
1) 6 (5)
2) 7 (5.6)
Serious AEs, n (%)
1) 12 (10.1)
2) 16 (12.9)
0 deaths
Furst DE Arthritis Care and
Research 2015242
DOSEFLEX
1) CTZ 200mg → PBO
+MTX (n=69)
2) CTZ 200mg → PBO
+MTX (n=70)
3) CTZ 200mg → PBO
+MTX (n=70)
0 cases of
malignant disease
Serious infection, n (%)
1) 0
2) 3 (4.3)
3) 0
Discontinuation due to
AEs, n (%)
1) 0
2) 4 (5.7)
3) 1 (1.4)
Serious AEs, n (%)
1) 0
2) 5 (7.1)
3) 2 (2.9)
0 deaths

©Institute for Clinical and Economic Review, 2017 Page 441 Draft Evidence Report: Targeted Immune Modulators for Rheumatoid Arthritis Return to Table of Contents
Author & Year of Publication
(Trial Name)
Interventions Malignancies Infections Other Adverse
Events
Discontinuation, Serious
AE rate, Deaths
Yamamoto K Modern
rheumatology 2014156
J-RAPID
1) PBO+MTX
(n=77)
2) CTZ 200 mg +MTX
(n=82)
0 cases of
malignant disease
0 cases of tuberculosis
RA exacerbation,
n (%)
1) 9 (11.7)
2) 4 (4.9)
Discontinuation due to
AEs, n (%)
1) 2 (2.6)
2) 3 (3.7)
Serious AEs, n (%)
1) 1 (1.3)
2) 4 (4.9)
0 deaths
Furst DE Arthritis Care Res
(Hoboken). 2015 242
DOSEFLEX
Serious infection, n (%)
1) 0
2) 3 (4.3)
3) 0
Serious AEs, n (%)
1) 0
2) 5 (7.1)
3) 2 (2.9)
AE leading to withdrawal,
n (%)
1) 8 (11.6)
2) 12 (17.1)
3) 6 (8.7)
0 deaths

©Institute for Clinical and Economic Review, 2017 Page 442 Draft Evidence Report: Targeted Immune Modulators for Rheumatoid Arthritis Return to Table of Contents
Author & Year of Publication
(Trial Name)
Interventions Malignancies Infections Other Adverse
Events
Discontinuation, Serious
AE rate, Deaths
Keystone E Arthritis &
Rheumatism 2008181
RAPID1
1) 200mg CZP + MTX (n=393) 2) 400mg CZP + MTX (n=390) 3) PBO + MTX (n=199)
Malignant
neoplasms, n
1) 7
2) 4
3) 1
Rate per 100 patient-yrs:
Serious infections and
infestations
1) 5.3
2) 7.3
3) 2.2
Infections and infestations
1) 56.4
2) 58.4
3) 56.9
Urinary tract infections
1) 7.6
2) 10.5
3) 14.2
Nasopharyngitis
1) 6.9
2) 9.5
3) 3.3
Upper respiratory tract
infections
1) 7.9
2) 6.7
3) 5.5
Headache,
incidence rate per
100 patient-yrs
1) 7.3
2) 5.7
3) 12.0
Hypertension,
incidence rate per
100 patient-yrs
1) 8.2
2) 10.2
3) 2.2
Back pain,
incidence rate per
100 patient-yrs
1) 5.6
2) 6.4
3) 2.2
Serious adverse events, n
(%)
1) 45 (11.5)
2) 48 (12.3)
3) 11 (5.5)
AE leading to withdrawal,
n (%)
1) 17 (4.3)
2) 22 (5.6)
3) 3 (1.5)
Deaths, n
1) 2
2) 4
3) 1

©Institute for Clinical and Economic Review, 2017 Page 443 Draft Evidence Report: Targeted Immune Modulators for Rheumatoid Arthritis Return to Table of Contents
Author & Year of Publication
(Trial Name)
Interventions Malignancies Infections Other Adverse
Events
Discontinuation, Serious
AE rate, Deaths
Smolen J Annals of Rheumatic
Diseases 2009180
RAPID2
1) 200mg CTZ + MTX (n=246) 2) 400mg CTZ + MTX (n=246) 3) PBO + MTX (n=127)
1 malignant
neoplasm in each
treatment group;
3 total
Any infections, n (%)
1) 69 (27.8)
2) 53 (21.5)
3) 26 (20.8)
Serious Infections, n (%)
1) 8 (3.2)
2) 6 (2.4)
3) 0
Tuberculosis, n
1) 3
2) 2
SAEs, n (%)
1) 18 (7.3)
2) 18 (7.3)
3) 4 (3.2)
AE leading to withdrawal,
n (%)
1) 12 (4.8)
2) 7 (2.8)
3) 2 (1.6)
AEs leading to death, n (%)
1) 1 (0.4)
2) 1 (0.4)
3) 0
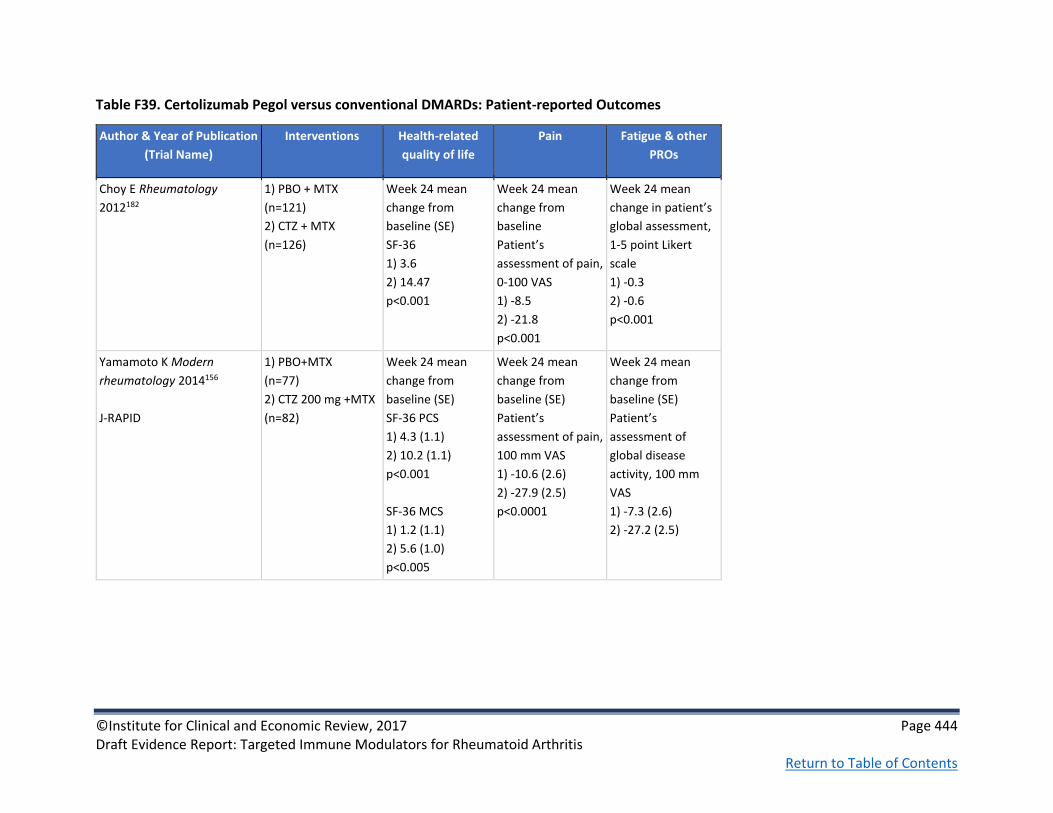
©Institute for Clinical and Economic Review, 2017 Page 444 Draft Evidence Report: Targeted Immune Modulators for Rheumatoid Arthritis Return to Table of Contents
Table F39. Certolizumab Pegol versus conventional DMARDs: Patient-reported Outcomes
Author & Year of Publication
(Trial Name)
Interventions Health-related
quality of life
Pain Fatigue & other
PROs
Choy E Rheumatology
2012182
1) PBO + MTX
(n=121)
2) CTZ + MTX
(n=126)
Week 24 mean
change from
baseline (SE)
SF-36
1) 3.6
2) 14.47
p<0.001
Week 24 mean
change from
baseline
Patient’s
assessment of pain,
0-100 VAS
1) -8.5
2) -21.8
p<0.001
Week 24 mean
change in patient’s
global assessment,
1-5 point Likert
scale
1) -0.3
2) -0.6
p<0.001
Yamamoto K Modern
rheumatology 2014156
J-RAPID
1) PBO+MTX
(n=77)
2) CTZ 200 mg +MTX
(n=82)
Week 24 mean
change from
baseline (SE)
SF-36 PCS
1) 4.3 (1.1)
2) 10.2 (1.1)
p<0.001
SF-36 MCS
1) 1.2 (1.1)
2) 5.6 (1.0)
p<0.005
Week 24 mean
change from
baseline (SE)
Patient’s
assessment of pain,
100 mm VAS
1) -10.6 (2.6)
2) -27.9 (2.5)
p<0.0001
Week 24 mean
change from
baseline (SE)
Patient’s
assessment of
global disease
activity, 100 mm
VAS
1) -7.3 (2.6)
2) -27.2 (2.5)

©Institute for Clinical and Economic Review, 2017 Page 445 Draft Evidence Report: Targeted Immune Modulators for Rheumatoid Arthritis Return to Table of Contents
Author & Year of Publication
(Trial Name)
Interventions Health-related
quality of life
Pain Fatigue & other
PROs
Keystone E Arthritis &
Rheumatism 2008181
RAPID1
1) 200mg CZP + MTX (n=393) 2) 400mg CZP + MTX (n=390) 3) PBO + MTX
(n=199)
Week 12
Patient’s
assessment of
arthritis pain, mean
% change from
baseline
1) -38.2
3) -4.8
P<0.001
Smolen J Annals of
Rheumatic Diseases 2009180
RAPID2
1) 200mg CTZ + MTX (n=246) 2) 400mg CTZ + MTX (n=246) 3) PBO + MTX (n=127)
Week 24
Adjusted mean
change from
baseline
SF-36, PCS
1) 5.2
3) 0.9
P<0.001
SF-36, MCS
p<0.001
Strand V Annals of
Rheumatic Diseases 2011 289
RAPID2
1) 200mg CTZ + MTX (n=246) 2) 400mg CTZ + MTX (n=246) 3) PBO + MTX (n=127)
Week 24
Patient’s
assessment of pain
VAS, mean change
from baseline
1) -23.7
3) -4.7
p<0.001
Week 24
Mean change from
baseline
FAS (range 0-10)
1) -2.0
3) -0.5
p<0.001

©Institute for Clinical and Economic Review, 2017 Page 446 Draft Evidence Report: Targeted Immune Modulators for Rheumatoid Arthritis Return to Table of Contents
Table F40. Etanercept versus conventional DMARDs: Study Characteristics
Author & Year of
Publication
(Trial Name)
Quality rating
Study sponsor Study Design and
Duration of Follow-
up
Geographic
location of study
Interventions (n) &
Dosing Schedule
Inclusion and Exclusion
Criteria
Baseline patient Characteristics
Combe B Ann Rheum
Dis 200682
ETN309
Fair
See also Combe B Ann
Rheum Dis 2009183
Wyeth Research Multicenter
Parallel
Double-blind
RCT
Two years; results
from 24-week
timepoint
Europe and
Australia
1) Sulfasalazine
(n=50)
2) ETN mono (n=103)
3) ETN+sulfasalazine
(n=101)
ETN (25 mg
subcutaneous
injections twice
weekly and oral PBO
once daily);
sulfasalazine tablets
(2, 2.5 or 3 g daily
and sc PBO twice
weekly); or ETN and
sulfasalazine (sc ETN
25 mg twice weekly
and sulfasalazine 2,
2.5 or 3 g once daily).
Stable doses of oral
corticosteroids, 1
NSAID, analgesics
with no anti-
inflammatory action
or daily aspirin
allowed
Age ≥18 years; adult-
onset RA despite
treatment with
sulfasalazine (2-3 g daily
for ≥4 mos before
screening); disease
duration ≤20 years; ≥6
swollen and ≥10 painful
joints and ESR ≥28
mm/hr or CRP ≥20 mg/L
or morning stiffness ≥45
min
Exclusion criteria: prior
ETN or other TNF
antagonists; received a
DMARD other than
sulfasalazine within 3
months before baseline
Mean age, yrs (SD)
1) 53.3 (12.8)
2) 51.3 (13.5)
3) 50.6 (12.3)
Female, n (%)
1) 41.0 (82.0)
2) 81.0 (78.6)
3) 81.0 (80.2)
Mean RA duration, yrs (SD)
1) 5.6 (4.4)
2) 7.1 (5.2)
3) 6.5 (5.1)
Mean DAS (SD)
1) 5.0 (1.1)
2) 5.1 (1.1)
3) 5.2 (1.2)
Median HAQ (SD)
1) 1.6 (0.5)
2) 1.7 (0.6)
3) 1.6 (0.6)

©Institute for Clinical and Economic Review, 2017 Page 447 Draft Evidence Report: Targeted Immune Modulators for Rheumatoid Arthritis Return to Table of Contents
Author & Year of
Publication
(Trial Name)
Quality rating
Study sponsor Study Design and
Duration of Follow-
up
Geographic
location of study
Interventions (n) &
Dosing Schedule
Inclusion and Exclusion
Criteria
Baseline patient Characteristics
Klareskog L Lancet
200483
TEMPO
Good
See also Van der
Heijde D Arthritis
Rheum 200686 and Van
der Heijde D Arthritis
Rheum 2007290
Wyeth research Double-blind
Parallel group
Phase III
RCT
3-year study;
results from 52
weeks
Australia,
Austria, Czech
Republic,
Denmark,
Finland, France,
Germany,
Greece, Israel,
Italy,
Netherlands,
Norway, Poland,
Portugal,
Romania, Spain,
Sweden, United
Kingdom
1) MTX (n=228)
2) ETN mono (n=223)
3) ETN+MTX (n=231)
25 mg ETN
administered
subcutaneously twice
a week; oral MTX (7.5
mg escalated to 20
mg) once a week; 5
mg folic acid
supplement twice a
week
Age ≥18; disease
duration 6 mos to 20 yrs;
active, adult-onset RA;
≥10 swollen and ≥12
painful joints and at least
one of the following: ESR
≥28 mm/h, plasma
CRP ≥20 mg/L, or
morning stiffness for ≥45
min; less than
satisfactory response at
the discretion of the
investigator to at
least one DMARD other
than MTX;
Exclusion criteria:
previous TNFi;
immunosuppressive
drugs within 6 mos of
screening; biologic
within 3 mos of
screening presence of
relevant comorbidity,
including active infection
Mean age, yrs (SD)
1) 53.0 (12.8)
2) 53.2 (13.8)
3) 52.5 (12.4)
Female, n (%)
1) 180 (79)
2) 171 (77)
3) 171 (74)
Mean RA duration, yrs (SD)
1) 6.8 (5.5)
2) 6.3 (5.1)
3) 6.8 (5.4)
Mean DAS (SD)
1) 5.5 (1.2)
2) 5.7 (1.1)
3) 5.5 (1.2)
Median mTSS (SD)
1) 26.8 (5.5-70.5)
2) 21.8 (7.5-58.6)
3) 21.8 (5.5-61.6)
Mean number of previous DMARDs: 2.3

©Institute for Clinical and Economic Review, 2017 Page 448 Draft Evidence Report: Targeted Immune Modulators for Rheumatoid Arthritis Return to Table of Contents
Author & Year of
Publication
(Trial Name)
Quality rating
Study sponsor Study Design and
Duration of Follow-
up
Geographic
location of study
Interventions (n) &
Dosing Schedule
Inclusion and Exclusion
Criteria
Baseline patient Characteristics
Machado DA Journal
of clinical
rheumatology:
practical reports on
rheumatic &
musculoskeletal
diseases 2014158
LARA
Good
See also Machado DA
The open
rheumatology journal
2016105
Funded by
Wyeth, which
was acquired by
Pfizer in October
2009. Medical
writing support
was provided by
Donna McGuire,
CMPP, of Engage
Scientific
Solutions and
was funded by
Pfizer
24-week open-label
RCT
**Primary and
secondary
outcomes based on
mITT (LOCF)**
5 countries in
Latin America
(Argentina, Chile,
Colombia,
Mexico, and
Panama)
N=429
1) ETN+MTX (n=284)
2) cDMARD
(hydroxychloroquine,
or sulfasalazine) +
MTX (n=145)
Age ≥18 years; active
disease (≥8 tender/≥6
swollen joints and ESR
≥28 mm/h) despite
treatment with MTX (7.5
to 25 mg/week) for at
least 3 months
Mean age, yrs (SD)
1) 48.4 (12.0)
2) 48.6 (11.3)
Female, n (%)
1) 248, 88.3
2) 128, 90.1
Mean RA duration, yrs (SD)
1) 7.9 (7.0)
2) 9.0 (7.5)
Mean HAQ-DI (SD)
1) 1.6 (0.7)
2) 1.6 (0.7)
Mean DAS28 (SD)
1) 6.6 (0.7)
2) 6.7 (0.7)
Mean mTSS (SD)
NR

©Institute for Clinical and Economic Review, 2017 Page 449 Draft Evidence Report: Targeted Immune Modulators for Rheumatoid Arthritis Return to Table of Contents
Author & Year of
Publication
(Trial Name)
Quality rating
Study sponsor Study Design and
Duration of Follow-
up
Geographic
location of study
Interventions (n) &
Dosing Schedule
Inclusion and Exclusion
Criteria
Baseline patient Characteristics
Morgan CLI
Rheumatology
(Oxford). 2014 291
BSR Biologics Register
Fair
Pfizer Maximum 10.1 year
follow up, open-
label study
England 1) cDMARDs
(n=2864)
2) ETN (n=3529)
Inclusion:
Active RA (DAS28>5.1),
treated with an anti-TNF
agent, physician
diagnosis of RA,
minimum of one
consultant follow-up
after baseline
registration
Exclusion:
Patients registered >90
after treatment initiation
Mean age, yrs (SD)
1) 59.8 (12.4)
2) 55.3 (12.1)
Female, n (%)
1) 2135 (74.5)
2) 2727 (77.3)
Mean RA duration, yrs (SD)
1) 9.6 (10.4)
2) 13.5 (9.4)
Mean DAS28 (SD)
1) 5.6 (0.9)
2) 6.6 (1.0)
Mean HAQ (SD)
1) 1.6 (0.7)
2) 2.1 (0.6)

©Institute for Clinical and Economic Review, 2017 Page 450 Draft Evidence Report: Targeted Immune Modulators for Rheumatoid Arthritis Return to Table of Contents
Author & Year of
Publication
(Trial Name)
Quality rating
Study sponsor Study Design and
Duration of Follow-
up
Geographic
location of study
Interventions (n) &
Dosing Schedule
Inclusion and Exclusion
Criteria
Baseline patient Characteristics
O'Dell JR The New
England journal of
medicine 201377
Good
Cooperative
Studies Program,
Department of
Veterans Affairs
Office of
Research and
Development,
and others
Amgen donated
the placebo
etanercept but
had no role in
the design of
the study, the
collection or
analysis of the
data, the writing
of the
manuscript, or
the decision to
submit the
manuscript for
publication.
RCT
Double-blind
48 weeks
Patients who did
not have an
improvement at 24
weeks per a
prespecified
threshold were
switched to the
other treatment
group in a blinded
fashion
16 Veteran
Affairs hospitals,
12 Rheumatoid
Arthritis
Investigational
Network sites,
and 8 Canadian
medical centers
N=353
1) cDMARD triple
combination therapy
(methotrexate+
sulfasalazine+
hydroxychloroquine)
(n=178)
2) ETN + MTX
(n=175)
Participants who
were assigned to the
triple-therapy group
received
sulfasalazine at a
dose of 1 g daily for
the first 6 weeks,
with the dose
increased thereafter
to 2g daily, and also
received
hydroxychloroquine,
at a dose of 400 mg
daily, and an
injection
of placebo ETN
weekly.
Age ≥18 years; active
disease despite
treatment with MTX
(stable doses of 15 to 25
mg weekly for at least 12
weeks); DAS28 ≥4.4
Mean age, yrs (SD)
1) 57.8 (13.0)
2) 56.0 (13.2)
Female, n (%)
1) 77, 43.3
2) 85, 48.6
Mean RA duration, yrs (SD)
1) 5.5 (9.3)
2) 4.9 (8.0)
Mean HAQ-DI (SD)
1) 1.4 (0.8)
2) 1.5 (0.8)
Mean DAS28 (SD)
1) 5.8 (0.9)
2) 5.9 (0.9)
Mean mTSS (SD)
1) 20.4
2) 16.3

©Institute for Clinical and Economic Review, 2017 Page 451 Draft Evidence Report: Targeted Immune Modulators for Rheumatoid Arthritis Return to Table of Contents
Author & Year of
Publication
(Trial Name)
Quality rating
Study sponsor Study Design and
Duration of Follow-
up
Geographic
location of study
Interventions (n) &
Dosing Schedule
Inclusion and Exclusion
Criteria
Baseline patient Characteristics
Takeuchi T Modern
rheumatology 201381
Takeuchi Mod Rheum
2013
Good
Pfizer RCT
multicenter
double-blind
Phase III
52 weeks
40 sites in Japan 1) ETN 25mg (n=182)
2) MTX (n=176)
3) ETN 10mg (n=192)
Monotherapy ETN
25mg BIW
administered
subcutaneously, or
oral MTX (up to 8.0
mg) once weekly
(QW)
ETN 10mg excluded
from table
Japanese ancestry; age
20-75 yrs; living in Japan;
diagnosis of RA with ≥6
swollen joints, ≥6
tender/painful joints,
and either ESR ≥28
mm/h or CRP ≥2.0 mg/dL
or morning stiffness
duration ≥45 mins;
diagnosis ≤10 yrs from
screening; unsatisfactory
response to at least one
DMARD; no prior anti-
TNF
Mean age, yrs (SD)
1) 51.8 (11.1)
2) 50.4 (11.9)
Female, n (%)
1) 145 (79.7)
2) 140 (79.6)
Mean RA duration, yrs (SD)
1) 3.0 (2.6)
2) 3.0 (2.7)
Mean HAQ-DI (SD)
1) 1.1 (0.7)
2) 1.0 (0.7)
DAS28-ESR (SD)
1) 5.8 (1.0)
2) 5.8 (1.1)
Mean mTSS (SD)
1) 41.98 (41.51)
2) 43.01 (46.78)

©Institute for Clinical and Economic Review, 2017 Page 452 Draft Evidence Report: Targeted Immune Modulators for Rheumatoid Arthritis Return to Table of Contents
Table F41. Etanercept versus conventional DMARDs: Key Clinical Outcomes
Author & Year of
Publication
(Trial Name)
Interventions Treatment Response Disease Activity Structural Damage Function Laboratory
indices
Combe B Ann Rheum
Dis 200682
ETN309
1) Sulfasalazine
(n=50)
2) ETN mono (n=103)
3) ETN+sulfasalazine
(n=101)
Week 24
ACR20, %
1) 28.0
2) 73.8
3) 74.0
p<0.01
ACR50, %
1) 14.0
2) 46.6
3) 52.0
p<0.01
ACR70, %
1) 2.0
2) 21.4
3) 25.0
p<0.01
Response rates were not
significantly different
between the 2 grps
receiving ETN
Week 24
% improvement in
DAS
1) 19.6
2) 48.2
3) 49.7
p<0.01
NR Improvements in
physical function, as
measured by mean
HAQ scores, started
at week 2 and were
sustained to week
24 (p<0.01)
Week 24 Mean HAQ
1) 1.5
2) 1.1
3) 1.0
The improvement
in CRP and ESR, in
both the groups
receiving ETN,
was significantly
greater than that
in the group
receiving
sulfasalazine
(from week 2
onwards;
p<0.01)

©Institute for Clinical and Economic Review, 2017 Page 453 Draft Evidence Report: Targeted Immune Modulators for Rheumatoid Arthritis Return to Table of Contents
Author & Year of
Publication
(Trial Name)
Interventions Treatment Response Disease Activity Structural Damage Function Laboratory
indices
Combe B Ann Rheum
Dis 2009183
ETN309
1) Sulfasalazine
(n=50)
2) ETN mono (n=103)
3) ETN+sulfasalazine
(n=101)
Week 104
(approximated from
chart)
ACR20, %
1) ~35
2) ~68
3) ~78
ACR50, %
1) ~10
2) ~46
3) ~59
ACR70, %
1) ~3
2) ~25
3) ~28
Significantly lower
mean DAS values were
observed during wks
68–104 for group (3)
vs. (2) (p<0.05)
Week 104 DAS
1) 4.5
2) 2.8
3) 2.5
DAS<2.4, %
1) 4.0
2) 45.6
3) 57.0
NR Significantly more
patients in groups
(2) and (3) attained
the threshold of
HAQ improvement
≥0.22 by week 104
vs. those receiving
sulfasalazine
(p<0.01 compared
with sulfasalazine
alone)

©Institute for Clinical and Economic Review, 2017 Page 454 Draft Evidence Report: Targeted Immune Modulators for Rheumatoid Arthritis Return to Table of Contents
Author & Year of
Publication
(Trial Name)
Interventions Treatment Response Disease Activity Structural Damage Function Laboratory
indices
Klareskog L Lancet
200483
TEMPO
1) MTX (n=228)
2) ETN mono (n=223)
3) ETN+MTX (n=231)
Week 52
ACR20, % (95% CI)
1) 75 (69-80)
2) 76 (70-81)
3) 85 (80-89)
p=0.0091 ETN+MTX vs.
MTX
p=0.0151 ETN+MTX vs.
ETN mono
ACR50, % (95% CI)
1) 43 (36-49)
2) 48 (42-55)
3) 69 (63-75)
p<0·0001 for ETN+MTX
vs. MTX and vs. ETN
mono
ACR70, % (95% CI)
1) 19 (14-25)
2) 24 (19-30)
3) 43 (36-50)
p<0·0001 for ETN+MTX
vs. MTX and vs. ETN
mono
Week 52
Mean DAS, (95% CI)
1) 3.0 (2.8-3.2)
3) 3.0 (2.8-3.1)
3) 2.3 (2.1-2.5)
p<0·0001 for
ETN+MTX vs. MTX and
vs. ETN mono
Remission (DAS<1.6),
% (95% CI)
1) 13 (9-18)
2) 16 (11-21)
3) 35 (29-41)
p<0·0001 for
ETN+MTX vs. MTX and
vs. ETN mono
p=NS ETN mono vs.
MTX
Week 52
Mean change from
baseline mTSS (95%
CI)
1) 2.80 (1.08 to
4.51)
2) 0.52 (-0.10 to
1.15)
3) -0.54 (-1.0 to -
0.07)
p=0·0469 ETN mono
vs MTX
p<0·0001 ETN+MTX
vs MTX
p=0·0006 ETN+MTX
vs ETN mono
% with no
progression (mTSS
≤0.5), (95% CI)
1) 57 (50-64)
2) 68 61-74)
3) 80 (74-85)
p<0·0001 for
ETN+MTX vs. MTX;
p=0.0043 ETN+MTX
vs. ETN mono;
p=0.00213 ETN
mono vs. MTX
Week 52 mean
change from
baseline HAQ-DI,
(95% CI)
1) 1.1 (1.0-1.1)
2) 1.0 (1.0-1.1)
3) 0.8 (0.7-0.9)
p<0·0001 for
ETN+MTX vs. MTX
and vs. ETN mono
p=NS ETN mono vs.
MTX
NR

©Institute for Clinical and Economic Review, 2017 Page 455 Draft Evidence Report: Targeted Immune Modulators for Rheumatoid Arthritis Return to Table of Contents
Author & Year of
Publication
(Trial Name)
Interventions Treatment Response Disease Activity Structural Damage Function Laboratory
indices
Van der Heijde D
Arthritis Rheum
200686
TEMPO
1) MTX (n=228)
2) ETN mono (n=223)
3) ETN+MTX (n=231)
Week 100
ACR20, %
1) 71
2) 75
3) 86
p<0.01 ETN+MTX vs. ETN
mono or MTX
ACR50, %
1) 42
2) 54
3) 71
p<0.01 ETN+MTX vs. ETN
mono or MTX
ACR70, %
1) 21
2) 27
3) 49
p<0.01 ETN+MTX vs. ETN
mono or MTX
Week 100
Mean DAS
1) 3.0
2) 2.9
3) 2.2
p<0.01 ETN+MTX vs.
ETN mono or MTX
Remission (DAS<1.6),
%
1) 15.8
2) 23.3
3) 40.7
p<0.01 ETN+MTX vs.
ETN mono or MTX
Year 2 Mean change
from baseline mTSS
(95% CI)
1) 3.34 (1.18-5.50)
2) 1.10 (0.13-2.07)
3) -0.56 (-1.05 to -
0.06)
p<0.05 ETN mono
vs. MTX
p<0.05 ETN+MTX vs.
MTX or ETN mono
% with no
progression (mTSS
≤0.5)
1) 60
2) 68
3) 78
p<0.05
Year 2
Mean HAQ (%
improvement from
baseline)
1) 1.1 (35.8)
2) 1.0 (38.8)
3) 0.7 (55.8)
p<0.01 ETN+MTX vs.
MTX; p<0.05
ETN+MTX vs. ETN
Year 2
Mean CRP, mg/L
(% improvement
from baseline)
1) 14.2 (49.2)
2) 14.6 (54.2)
3) 7.7 (75.3)

©Institute for Clinical and Economic Review, 2017 Page 456 Draft Evidence Report: Targeted Immune Modulators for Rheumatoid Arthritis Return to Table of Contents
Author & Year of
Publication
(Trial Name)
Interventions Treatment Response Disease Activity Structural Damage Function Laboratory
indices
Van der Heijde D
Arthritis Rheum
2007290
TEMPO
1) MTX (n=228)
2) ETN mono (n=223)
3) ETN+MTX (n=231)
Year 3
ACR20, %
1) 70.2
2) 70.9
3) 85.3
p<0.01 ETN+MTX vs. ETN
mono or MTX
ACR50, %
1) 43.9
2) 45.7
3) 67.1
p<0.01 ETN+MTX vs. ETN
mono or MTX
ACR70, %
1) 21.1
2) 26.0
3) 47.2
p<0.01 ETN+MTX vs. ETN
mono or MTX
Year 3
Remission (DAS<1.6),
%
1) 17.5
2) 21.5
3) 40.7
Year 1/2/3
Remission
(DAS28<2.6), %
1) 17.1/18.9/18.9
2) 17.5/22.4/20.6
3) 38.1/42.4/40.3
ETN+MTX vs. MTX
p<0.01 for all
measures
ETN+MTX vs. ETN
mono
p<0.01 for all
measures
Year 3
Mean change from
baseline mTSS (95%
CI)
1) 5.95 (2.96, 8.94)
2) 1.61 (0.41, 2.81)
3) -0.14 (-1.07, 0.78)
p<0.01
Year 3
% improvement
from baseline HAQ
1) 33.3
2) 37.0
3) 55.0
p<0.01 ETN+MTX vs.
ETN mono or MTX
% with no disability
(HAQ=0)
1) 32.9
2) 35.4
3) 48.1
p<0.01 ETN+MTX vs.
ETN mono or MTX
NR

©Institute for Clinical and Economic Review, 2017 Page 457 Draft Evidence Report: Targeted Immune Modulators for Rheumatoid Arthritis Return to Table of Contents
Author & Year of
Publication
(Trial Name)
Interventions Treatment Response Disease Activity Structural Damage Function Laboratory
indices
Machado DA Journal
of clinical
rheumatology
2014158
LARA
1) ETN+MTX (n=284)
2) cDMARD
(hydroxychloroquine,
or sulfasalazine) +
MTX (n=145)
@ week 24
ACR20 (%)
1) 62.0
2) 23.2
ACR50 (%)
1) 83.2
2) 50.0
ACR70 (%)
1) 34.8
2) 11.3
p<0.0001 all outcomes
@ week 24
DAS28 LDA (%)
1) 47.0
2) 12.0
DAS28-ESR remission
(%)
1) 25.1
2) 3.5
DAS28 (mean score)
1) -3.2
2) -1.7
p<0.0001 all outcomes
mTSS (mean
change)
1) 0.4
2) 1.4
mTSS ≤0 (%)
1) 75.3
2) 68.1
p=NS both
outcomes
HAQ-DI score (mean
change)
1) -0.9
2) -0.1
p<0.0001
NR

©Institute for Clinical and Economic Review, 2017 Page 458 Draft Evidence Report: Targeted Immune Modulators for Rheumatoid Arthritis Return to Table of Contents
Author & Year of
Publication
(Trial Name)
Interventions Treatment Response Disease Activity Structural Damage Function Laboratory
indices
Machado DA The
open rheumatology
journal 2016105
LARA
1) ETN+MTX (n=260)
2) cDMARD
(hydroxychloroquine,
or sulfasalazine) +
MTX (n=126)
@ week 128
ACR20 (%)
1) 89.2
2) 89.2
ACR50 (%)
1) 70.5
2) 65.0
ACR70 (%)
1) 49.0
2) 40.0
EULAR moderate or
good response (%)
1) 91.8
2) 64.8
P<0.0001
EULAR good response
(%)
1) 47.0
2) 12.0
P<0.0001
@ week 128
DAS28<3.2 LDA (%)
1) 57.7
2) 55.0
DAS28<2.6 remission
(%)
1) 39.8
2) 33.3
DAS28 (mean score)
1) -4.8
2) -4.8
NR HAQ-DI score (%
normal score)
1) 51.5
2) 40.8
HAQ-DI score (mean
change)
1) -0.8
2) -0.9
NR

©Institute for Clinical and Economic Review, 2017 Page 459 Draft Evidence Report: Targeted Immune Modulators for Rheumatoid Arthritis Return to Table of Contents
Author & Year of
Publication
(Trial Name)
Interventions Treatment Response Disease Activity Structural Damage Function Laboratory
indices
O'Dell JR The New
England journal of
medicine 201377
RACAT
1) cDMARD triple
combination therapy
(MTX+ sulfasalazine+
hydroxychloroquine)
(n=178)
2) ETN+MTX (n=175)
@ week 24
ACR20 (%)
1) 58
2) 56
P=NS
ACR50 (%)
1) 27
2) 36
P=NS
ACR70 (%)
1) 5
2) 17
P=0.001
@ week 24
DAS28≤3.2 (%)
1) 24.8
2) 34.8
P=0.05
DAS28≤2.6 (%)
1) 12.7
2) 21.7
P=0.03
DAS (mean change)
1) -1.79
2) -2.06
P=NS
CDAI (mean change)
1) -17.8
2) -18.72
P=NS
mTSS (mean
change)
1) 0.42
2) 0.003
P=NS
HAQ II score (mean
change)
1) -0.44
2) -0.51
P=NS
Erythrocyte
Sedimentation
Rate (0-200
mm/h) (mean
change)
1) -7.01
2) -10.79
P=NS

©Institute for Clinical and Economic Review, 2017 Page 460 Draft Evidence Report: Targeted Immune Modulators for Rheumatoid Arthritis Return to Table of Contents
Author & Year of
Publication
(Trial Name)
Interventions Treatment Response Disease Activity Structural Damage Function Laboratory
indices
Takeuchi T Modern
rheumatology 201381
Takeuchi Mod
Rheum 2013
1) ETN 25mg (n=182)
2) MTX (n=176)
Week 52, n (%)
ACR20
1) 143 (78.6)
2) 110 (62.5)
p<0.001
ACR50
1) 113 (62.1)
2) 65 (36.9)
p<0.0001
ACR70
1) 66 (36.3)
2) 28 (15.9)
p<0.0001
Week 52
Mean score
DAS28-ESR (%
improvement from
baseline)
1) 3.3 (42.9)
2) 4.1 (29.1)
p<0.0001
Remission DAS28-ESR
<2.6, n (%)
1) 62 (34.1)
2) 34 (19.3)
p<0.01
Week 52
Change from
baseline mTSS-van
der Heijde (SE)
1) 3.33 (0.73)
2) 9.82 (1.16)
p<0.0001
mTSS change ≤0, n
(%)
1) 79 (43.6)
2) 39 (22.8)
p<0.001
Week 24 change
from baseline mTSS-
van der Heijde (SE)
1) 1.74 (0.45)
2) 5.11 (0.58)
p<0.0001
Week 52
Mean score
HAQ-DI (%
improvement from
baseline)
1) 0.5 (58.1)
2) 0.7 (29.2)
p<0.0001
Week 52
Mean score
CRP, mg/L (%
improvement
from baseline)
1) 7.0 (83.3)
2) 15.9 (50.0)
p<0.0001
ESR, mm/h (%
improvement
from baseline)
1) 24.8 (38.9)
2) 32.3 (11.0)
p<0.0001

©Institute for Clinical and Economic Review, 2017 Page 461 Draft Evidence Report: Targeted Immune Modulators for Rheumatoid Arthritis Return to Table of Contents
Table F42. Etanercept versus conventional DMARDs: Harms
Author & Year of Publication
(Trial Name)
Interventions Malignancies Infections Other Adverse
Events
Discontinuation,
Serious AE rate,
Deaths
Combe B Ann Rheum Dis
200682
ETN309
1) Sulfasalazine
(n=50)
2) ETN mono (n=103)
3) ETN+sulfasalazine
(n=101)
2 patients treated
with ETN mono
were diagnosed
with a malignancy:
1 actinic squamous
cell carcinoma and
1 myelodysplastic
syndrome
Total infections, n
(%)
1) 13 (26.0)
2) 47 (45.6)
3) 31 (30.7)
3 serious
infections
(sinusitis,
pharyngitis and
septic arthritis)
occurred in 2
patients receiving
ETN
Pharyngitis or
laryngitis, n (%)
1) 3 (6.0)
2) 12 (11.7)
3) 5 (5.0)
Upper respiratory
tract infection, n
(%)
1) 5 (10.0)
2) 10 (9.7)
3) 11 (10.9)
Injection site
reaction, n (%)
1) 1 (2.0)
2) 33 (32.0)
3) 16 (15.8)
Headache, n (%)
1) 4 (8.0)
2) 5 (4.9)
3) 15 (14.9)
Nausea, n (%)
1) 3 (6.0)
2) 3 (2.9)
3) 12 (11.9)
Asthenia, n (%)
1) 1 (2.0)
2) 3 (2.9)
3) 10 (9.9)
Discontinuation due
to AEs, n
1) 1
2) 1
3) 1
Serious, non-
infectious AEs, n (%)
1) 1 (2.0)
2) 3 (2.9)
3) 5 (5.0)
Deaths: 0

©Institute for Clinical and Economic Review, 2017 Page 462 Draft Evidence Report: Targeted Immune Modulators for Rheumatoid Arthritis Return to Table of Contents
Author & Year of Publication
(Trial Name)
Interventions Malignancies Infections Other Adverse
Events
Discontinuation,
Serious AE rate,
Deaths
Klareskog L Lancet 200483
TEMPO
1) MTX (n=228)
2) ETN mono (n=223)
3) ETN+MTX (n=231)
Malignant diseases,
n
1) 1 (basal-cell
carcinoma of skin)
2) 4 (1 basal-cell
carcinoma of skin,
1 breast cancer, 1
rectal cancer, 1
melanoma)
3) 1 (basal-cell
carcinoma of skin)
National Cancer
Institute grade 3 or
4 abnormalities of
hepatic enzymes, n
1) 5
2) 2
3) 2
Any infection, n
(%)
1) 147 (64)
2) 131 (59)
3) 154 (67)
Serious infections,
n (%)
1) 10 (4)
2) 10 (4)
3) 10 (4)
No cases of
tuberculosis or
opportunistic
infections
Injection site
reaction, n (%)
1) 4 (2)
2) 46 (21)
3) 23 (10)
Nausea, n (%)
1) 73 (32)
2) 22 (10)
3) 55 (24)
Vomiting n (%)
1) 26 (11)
2) 7 (3)
3) 12 (5)
Discontinuation due
to AEs, n
1) 32
2) 25
3) 24
Serious AEs other
than infection, n (%)
1) 27 (12)
2) 25 (11)
3) 19 (8)
Deaths, n
1) 1 (pulmonary
embolism/suspected
sepsis)
2) 1 (heart
failure/suspected
sepsis)
3) 1
(stroke/pneumonia)
Morgan CLI Rheumatology
(Oxford). 2014 291
BSR Biologics Register
1) cDMARDs
(n=2864)
2) ETN (n=3529)
Cancer, n (%)
1) 254 (23.9)
2) 241 (14.7)
Serious infections,
n (%)
1) 375 (36.2)
2) 538 (35.1)
Tuberculosis, n
1) 1
2) 5
Other serious AEs, n
(%)
1) 310 (29.6)
2) 327 (20.3)
Deaths, n
1) 223
2) 203

©Institute for Clinical and Economic Review, 2017 Page 463 Draft Evidence Report: Targeted Immune Modulators for Rheumatoid Arthritis Return to Table of Contents
Author & Year of Publication
(Trial Name)
Interventions Malignancies Infections Other Adverse
Events
Discontinuation,
Serious AE rate,
Deaths
Van der Heijde D Arthritis
Rheum 200686
TEMPO
1) MTX (n=228)
2) ETN mono (n=223)
3) ETN+MTX (n=231)
Year 2
Malignancies
1) 2
2) 5
3) 5
Malignancies that
occurred between
Year 1 & 2
1) 1 (breast
Cancer)
2) 1 (basal cell skin
carcinoma)
3) 3 (2
gastrointestinal
cancers, 1 lung
cancer)
risk of malignancies
was comparable
with that in the
general US
population
Year 2
Any infection, n
(%)
1) 172 (75)
2) 159 (71)
3) 175 (76)
Serious infection, n
(%)
1) 15 (7)
2) 14 (6)
13 (6)
no cases of
tuberculosis and 1
case of
bronchopulmonary
aspergillosis
(ETN+MTX group)
Year 2
Nausea, n (%)
1) 90 (39)
2) 28 (13)
3) 66 (29)
Injection-site
reaction, n (%)
1) 5 (2)
2) 46 (21)
3) 25 (11)
Vomiting, n (%)
1) 32 (14)
2) 10 (4)
3) 20 (9)
Back pain, n (%)
1) 28 (12)
2) 38 (17)
3) 36 (16)
Hypertension, n
(%)
1) 12 (5)
2) 29 (13)
3) 21 (9)
Year 2
Discontinuation due
to AEs (between yrs
1 & 2), n
1) 15
2) 9
3) 13
No significant
differences
in incidence of
serious AEs
No additional deaths
reported in Year 2

©Institute for Clinical and Economic Review, 2017 Page 464 Draft Evidence Report: Targeted Immune Modulators for Rheumatoid Arthritis Return to Table of Contents
Author & Year of Publication
(Trial Name)
Interventions Malignancies Infections Other Adverse
Events
Discontinuation,
Serious AE rate,
Deaths
Van der Heijde D Arthritis
Rheum 2007290
TEMPO
1) MTX (n=228)
2) ETN mono (n=223)
3) ETN+MTX (n=231)
NR Serious infections,
n (%)
1) 19 (8.3)
2) 15 (6.7)
3) 17 (7.4)
Pneumonia, n (%)
1) 4 (1.8)
2) 4 (1.8)
3) 6 (2.6)
reactivation of
tuberculosis
developed in no
patients with
history of TB; TB
was diagnosed in 1
patient in grp 3)
NR Noninfectious
serious AEs, %
1) 18.9
2) 22.9
3) 23.4
During year 3, 1
patient receiving
ETN mono died from
acute pulmonary
edema, and 1
patient receiving
ETN+MTX died from
cardiac arrest

©Institute for Clinical and Economic Review, 2017 Page 465 Draft Evidence Report: Targeted Immune Modulators for Rheumatoid Arthritis Return to Table of Contents
Author & Year of Publication
(Trial Name)
Interventions Malignancies Infections Other Adverse
Events
Discontinuation,
Serious AE rate,
Deaths
Machado DA Journal of
clinical rheumatology 2014158
LARA
1) ETN+MTX (n=284)
2) cDMARD
(hydroxychloroquine,
or sulfasalazine) +
MTX (n=145)
NR Treatment-
emergent
infections ≥1 (% of
patients)
1) 38.1
2) 21.8
p=NS
Any TEAEs (% of
patients)
1) 68.7
2) 68.3
p=NS
Most common AE
was bronchitis (%
of patients)
1) 5.7
2) 2.1
p=NS
SAEs (1% of
patients)
1) 3.6
2) 1.4
Discontinuation rate
NR
Machado DA The open
rheumatology journal.
2016105
LARA
1) ETN+MTX (n=260)
2) cDMARD
(hydroxychloroquine,
or sulfasalazine) +
MTX (n=126)
Only reported for
patients exposed to
etanercept
Only reported for
patients exposed
to etanercept
Only reported for
patients exposed
to etanercept
Only reported for
patients exposed to
etanercept

©Institute for Clinical and Economic Review, 2017 Page 466 Draft Evidence Report: Targeted Immune Modulators for Rheumatoid Arthritis Return to Table of Contents
Author & Year of Publication
(Trial Name)
Interventions Malignancies Infections Other Adverse
Events
Discontinuation,
Serious AE rate,
Deaths
O'Dell JR The New England
journal of medicine 201377
RACAT
1) cDMARD triple
combination therapy
(methotrexate+
sulfasalazine+
hydroxychloroquine)
(n=178)
2) ETN+MTX (n=175)
NR AEs in ≥5% of
patients
Infections and
infestations (% of
patients)
1) 25.2
2) 37.4
p=0.006
Any AEs (% of
patients)
1) 76.6
2) 75.3
Gastrointestinal
disorders occurred
more frequently
with triple therapy
(5 vs. 4), whereas
infections and skin
and subcutaneous
disorders occurred
more frequently
with ETN-MTX
therapy (12 vs. 4)
SAEs in ≥1% of
patients
Serious infections
and infestations (%
of patients)
1) 1.8
2) 4.1
Discontinuation due
to any AE (% of
patients)
1) 5.4
2) 2.3

©Institute for Clinical and Economic Review, 2017 Page 467 Draft Evidence Report: Targeted Immune Modulators for Rheumatoid Arthritis Return to Table of Contents
Author & Year of Publication
(Trial Name)
Interventions Malignancies Infections Other Adverse
Events
Discontinuation,
Serious AE rate,
Deaths
Takeuchi T Modern
rheumatology 201381
Takeuchi Mod Rheum 2013
1) ETN 25mg (n=182)
2) MTX (n=176)
52 week
Malignancy, n (%)
1) 2 (1.1) (2 breast
cancer)
2) 2 (1.1) (1 breast
cancer, 1 prostate
cancer)
52 week
Serious infections,
n (%)
1) 0
2) 1 (0.6)
(appendicitis)
most common
treatment
emergent
infections were
nasopharyngitis,
upper respiratory
tract infection, and
pharyngitis
52 week
Most common
TEAEs were
increased liver
enzymes, rash,
eczema, and
constipation
Increased alanine
aminotransferase,
n (%)
1) 10 (5.5)
2) 22 (12.5)
Increased
aspartate
aminotransferase,
n (%)
1) 10 (5.5)
2) 22 (12.5)
52 week
Discontinuation due
to AEs, n (%)
1) 19 (10.4)
2) 9 (5.1)
Serious AEs, n (%)*
1) 11 (6.0)
2) 10 (5.7)
*excludes serious
infections
Deaths: 0

©Institute for Clinical and Economic Review, 2017 Page 468 Draft Evidence Report: Targeted Immune Modulators for Rheumatoid Arthritis Return to Table of Contents
Table F43. Etanercept versus conventional DMARDs: Patient-reported Outcomes
Author & Year of Publication
(Trial Name)
Interventions Health-related
quality of life
Pain Fatigue & other
PROs
Combe B Ann Rheum Dis
2006 82
ETN309
1) Sulfasalazine
(n=50)
2) ETN mono (n=103)
3) ETN+sulfasalazine
(n=101)
At all visits, the
improvements in
both the groups
receiving
etanercept were
not different from
each other
EuroQOL was
significantly
improved in
groups 2) and 3)
compared with
group 1) (p<0.01)
At all visits, the
improvements in
both the groups
receiving
etanercept were
not different from
each other
Pain VAS was
significantly
improved in groups
2) and 3) compared
with group 1)
(p<0.01)
NR
Van der Heijde D Arthritis
Rheum 200686
TEMPO
1) MTX (n=228)
2) ETN mono (n=223)
3) ETN+MTX (n=231)
NR Year 2
Pain, 0–100 VAS (%
improvement from
baseline)
1) 36.4 (43.0)
2) 33.9 (47.1)
3) 24.8 (61.4)
p<0.01 ETN+MTX
vs. MTX; p<0.05
ETN+MTX vs. ETN
Year 2
Patient’s global
assessment, 0-10
scale (%
improvement from
baseline)
1) 4.0 (40.9)
2) 3.8 (44.5)
3) 2.8 (59.8)
p<0.01 ETN+MTX
vs. MTX; p<0.05
ETN+MTX vs. ETN

©Institute for Clinical and Economic Review, 2017 Page 469 Draft Evidence Report: Targeted Immune Modulators for Rheumatoid Arthritis Return to Table of Contents
Author & Year of Publication
(Trial Name)
Interventions Health-related
quality of life
Pain Fatigue & other
PROs
Machado DA Journal of
clinical rheumatology 2014158
LARA
1) ETN + MTX
(n=284)
2) cDMARD
(hydroxychloroquine,
or sulfasalazine) +
Methotrexate
(n=145)
week 24 (adjusted
mean changes)
SF-36 MCS
1) 7.3
2) 3.3
p=0.0002
SF-36 PCS
1) 12.4
2) 7.4
p<0.0001
SF-36 Vitality
1) 3.8
2) 2.4
p=0.0003
week 24 (adjusted
mean changes)
VAS, pain
1) -40.9
2) -24.0
p<0.0001
week 24 (adjusted
mean changes)
VAS, fatigue
1) -29.6
2) -17.3
p<0.0001
VAS, general health
1) -33.7
2) -19.3
p<0.0001
Improvements in
subject satisfaction,
physician
satisfaction, and
subject’s
willingness
to retake
medications were
in favor of ETN +
MTX (p<0.0001 for
all)

©Institute for Clinical and Economic Review, 2017 Page 470 Draft Evidence Report: Targeted Immune Modulators for Rheumatoid Arthritis Return to Table of Contents
Author & Year of Publication
(Trial Name)
Interventions Health-related
quality of life
Pain Fatigue & other
PROs
Machado DA The open
rheumatology journal.
2016105
LARA
1) ETN+MTX (n=260)
2) cDMARD
(hydroxychloroquine,
or sulfasalazine) +
MTX (n=126)
@ week 128
SF-36 MCS
1) +8
2) +8
SF-36 PCS
1) +11
2) +11
SF-36 Vitality
1) +4
2) +4
@ week 128
VAS, pain
1) -42.0
2) -40.6
@ week 128
VAS, fatigue
1) -30.5
2) -30.4
VAS, general health
1) -4.3
2) -3.2
PGA, mean change
1) -5.2
2) -5.2
Subject global
assessment, mean
change
1) -4.3
2) -3.8

©Institute for Clinical and Economic Review, 2017 Page 471 Draft Evidence Report: Targeted Immune Modulators for Rheumatoid Arthritis Return to Table of Contents
Author & Year of Publication
(Trial Name)
Interventions Health-related
quality of life
Pain Fatigue & other
PROs
O'Dell JR The New England
journal of medicine 201377
RACAT
1) cDMARD triple
combination therapy
(MTX+sulfasalazine+
hydroxychloroquine)
(n=178)
2) ETN+MTX (n=175)
NR @ week 24
Pain, VAS (mean
change)
1) -1.00
2) -2.32
p=NS
(data in
supplement)
Switching (% of
patients):
1) 27.0
2) 26.7
Outcomes for those
who switched vs.
those who
continued
treatment were not
different between
groups
PGA, mean change
1) -24.44
2) -25.71
Patient Global
Assessment, mean
change
1) -1.92
2) 2.45

©Institute for Clinical and Economic Review, 2017 Page 472 Draft Evidence Report: Targeted Immune Modulators for Rheumatoid Arthritis Return to Table of Contents
Author & Year of Publication
(Trial Name)
Interventions Health-related
quality of life
Pain Fatigue & other
PROs
Takeuchi T Modern
rheumatology 201381
Takeuchi Mod Rheum 2013
1) ETN 25mg (n=182)
2) MTX (n=176)
Week 52 mean
score (%
improvement from
baseline)
Pain, VAS (0-100
mm)
1) 24.3 (51.4)
2) 34.9 (28.7)
p<0.0001
Week 52 mean
score (%
improvement from
baseline)
Patient general
health, VAS (0-100
mm)
1) 24.6 (46.5)
2) 35.0 (31.4)
p<0.0001

©Institute for Clinical and Economic Review, 2017 Page 473 Draft Evidence Report: Targeted Immune Modulators for Rheumatoid Arthritis Return to Table of Contents
Table F44. Etanercept versus conventional DMARDs: Non-healthcare Outcomes
Author & Year of
Publication
(Trial Name)
Interventions Requirements for
surgical intervention
Hospitalization,
Rehabilitation,
Assisted living
Productivity Loss Caregiver Burden Other outcomes
Machado DA Journal
of clinical
rheumatology
2014158
LARA
1) ETN+MTX (n=260)
2) cDMARD
(hydroxychloroquine,
or sulfasalazine) +
MTX (n=126)
NR @ week 24
ED Visits for RA in
the past 6 months
(adjusted mean
change with
ANCOVA)
1) -0.5
2) -0.4
p=0.0039
@ week 24
Overall work
impairment due to
RA in the past 7 days
(adjusted mean
change with
ANCOVA)
1) -33.4
2) -21.5
p=0.0188
NR NR
Machado DA The
open rheumatology
journal. 2016105
LARA
1) ETN+MTX (n=260)
2) cDMARD
(hydroxychloroquine,
or sulfasalazine) +
MTX (n=126)
NR @ week 128
ED Visits for RA in
the past 6 months
1) 0.9
2) 0.9
@ wk 128
WPAI:RA
Work time missed
due to RA in the past
7 days (%)
1) 8.6
2) 2.3
Overall work
impairment due to
RA in the past 7 days
(%)
1) 26.0; 2) 25.4
Currently Employed
(%)
1) 33.6; 2) 25.8
@ week 128
Required caregiver
assistance in past 6
months (%)
1) 11.9
2) 18.2
@ week 128
Rheumatologist visits
in last 6 months
1) 12.9
2) 13.8

©Institute for Clinical and Economic Review, 2017 Page 474 Draft Evidence Report: Targeted Immune Modulators for Rheumatoid Arthritis Return to Table of Contents
Table F45. Golimumab versus conventional DMARDs: Study Characteristics
Author & Year of
Publication
(Trial Name)
Quality rating
Study sponsor Study Design and
Duration of Follow-
up
Geographic
location of study
Interventions (n) &
Dosing Schedule
Inclusion and Exclusion
Criteria
Baseline patient Characteristics
Tanaka Y Annals of the
rheumatic diseases
2012160
GO-FORTH
Good
See also Tanaka Y
Modern Rheumatology
2016292
Janssen
Pharmaceutical
K.K. and
Mitsubishi
Tanabe Pharma
Corporation
RCT
multicenter
double-blind
Phase II/III
24-week data from
a 3-yr study
89
investigational
sites in Japan
1) PBO+MTX (n=88)
2) 50mg GOLsc+MTX
(n=86)
3) 100mg
GOLsc+MTX (n=87)
PBO injection + oral
MTX (Group 1) or sc
GOL 50 mg injection
+ oral MTX (Group 2)
at wk 0 and every 4
wks to wk 24
At wk 16, <20%
improvement
in TJC and SJC
entered DB early
escape: PBO added
GOL 50mg & GOL
50mg increased to
GOL 100mg; at wk 24
all PBO patients
received GOL 50mg;
Age 20-75 years; RA
diagnosis for ≥3 months;
received ≥6mg/wk oral
MTX for ≥3 mos before
study agent initiation;
stable MTX dose (6-8
mg/wk) for ≥4 weeks
before start of study;
active RA (≥4/66 SJC and
≥4/68 TJC at
screening/baseline); at
least 2 of the following:
1) CRP>1.5 mg/dl or
ESR>28 mm/hr; 2)
morning stiffness lasting
≥30 min; 3) radiographic
evidence of erosion; 4)
anti-CCP or RF-positive;
no prior anti-TNFs
GOLsc 100mg +MTX
excluded from table
Mean age, yrs (SD)
1) 51.1 (11.6)
2) 50.4 (9.9)
Female, n (%)
1) 73 (83.0)
2) 73 (84.9)
Mean RA duration, yrs (SD)
1) 8.7 (8.2)
2) 8.8 (8.8)
Mean HAQ-DI (SD)
1) 1.0 (0.68)
2) 1.0 (0.61)
Mean DAS28-ESR (SD)
1) 5.6 (0.99)
2) 5.5 (1.18)
Mean mTSS (SD)
1) 54.2 (62.9)
2) 58.0 (62.4)

©Institute for Clinical and Economic Review, 2017 Page 475 Draft Evidence Report: Targeted Immune Modulators for Rheumatoid Arthritis Return to Table of Contents
Author & Year of
Publication
(Trial Name)
Quality rating
Study sponsor Study Design and
Duration of Follow-
up
Geographic
location of study
Interventions (n) &
Dosing Schedule
Inclusion and Exclusion
Criteria
Baseline patient Characteristics
Keystone E Annals of
the rheumatic diseases
2009161
GO-FORWARD
Good
See also Keystone E
Annals of the
rheumatic diseases
201087, Keystone EC
The Journal of
rheumatology 2013106,
Emery P Arthritis and
rheumatism 2011198,
Genovese MC The
Journal of
Rheumatology 2012222
Centocor, Inc. RCT, double-blind,
placebo-controlled
phase III
52 weeks
52 centers in 11
countries: USA,
Argentina,
Australia, Chile,
Germany,
Hungary, Korea,
Mexico, New
Zealand, Poland,
Taiwan
1) PBO+MTX (n=133)
2) 100mg GOL+PBO
(n=133)
3) 50mg GOL+MTX
(n=89)
4) 100mg GOL+MTX
(n=89)
At wk 16, patients
with <20%
improvement
in TJC and SJC
entered a double-
blind early escape
phase i.e. group 1
→GOL 50 mg +MTX,
group 2 →GOL 100
mg + MTX, group 3
→GOL 100 mg +
MTX. At wk 24, PBO
patients initiated
blinded 50mg GOL
inj. After 52 weeks,
blind broken. GOL
dose could increase
to 100 mg and MTX
doses adjusted
Inclusion: ≥18 years with
active RA (i.e. ≥4 SJC &
TJC or at least 2 of the
following: 1)
CRP≥1.5mg/dl or
ESR>28mm/hr; 2) 30 min
stiffness 3) bone erosion
4) RF positivity) despite
stable MTX dose for ≥4
weeks
Exclusion:
hypersensitivity to GOL
or human
immunoglobulin,
previous use of TNFi,
RTX, natalizumab,
cytotoxic agents, or any
DMARD except MTX; or
iv/IM/IA corticosteroids
within 4 weeks of study
Mean age, yrs
1 2 3 4
52 51 52 50
Female, %
1 2 3 4
82 78.9 80.9 80.9
Mean RA duration, yrs
1 2 3 4
6.5 5.9 4.5 6.7
Mean HAQ-DI
1 2 3 4
1.25 1.375 1.375 1.375
Mean DAS28-ESR
1 2 3 4
6.111 6.013 6.105 5.905

©Institute for Clinical and Economic Review, 2017 Page 476 Draft Evidence Report: Targeted Immune Modulators for Rheumatoid Arthritis Return to Table of Contents
Author & Year of
Publication
(Trial Name)
Quality rating
Study sponsor Study Design and
Duration of Follow-
up
Geographic
location of study
Interventions (n) &
Dosing Schedule
Inclusion and Exclusion
Criteria
Baseline patient Characteristics
Weinblatt ME Annals
of the rheumatic
diseases 2013184
GO-FURTHER
Good See also Bingham CO J
Rheumatol 2014 216,
Weinblatt ME Annals
of the rheumatic
diseases 2014214,
Bingham CO 3rd
Arthritis care &
research 2015221
Centocor, Inc.
and Schering-
Plough
RCT
multicenter
double-blind
Phase III
Average follow-up:
43.5 weeks
92 sites in 3 Latin
American (n=119
patients), 5
European
(n=355), 1 North
American (n=61)
and 4 Asia Pacific
(n=57) countries
1) PBO+MTX (n=197)
2) GOLiv+MTX
(n=395)
Intravenous GOL 2
mg/kg or placebo
infusions at wk 0, 4,
and then q8w up to
wk 100; all patients
received stable
regimen of 15-25
mg/wk MTX
PBO patients who did
not EE crossed over
to GOL at wk24 and
wk28 and then q8w.
Patients assigned to
GOL also received
PBO infusions at
wk16 and wk24 to
maintain blinding
Adults with active RA
despite ≥3 months MTX;
≥6 swollen joints and ≥6
tender
joints at screening and
baseline; CRP ≥1.0
mg/dL; positive for
rheumatoid factor
and/or anticyclic
citrullinated protein at
screening; anti-TNF
naïve
Mean age, yrs (SD)
1) 51.4 (11.26)
2) 51.9 (12.55)
Female, n (%)
1) 157 (79.7)
2) 326 (82.5)
Mean RA duration, yrs (SD)
1) 7.0 (7.24)
2) 6.9 (7.00)
Mean DAS28-CRP (SD)
1) 5.9 (0.93)
2) 6.0 (0.82)
Mean HAQ-DI (SD)
1) 1.6 (0.62)
2) 1.6 (0.67)
Mean mTSS [0-448] (SD)
1) 50.3 (59.85)
2) 47.6 (54.63)

©Institute for Clinical and Economic Review, 2017 Page 477 Draft Evidence Report: Targeted Immune Modulators for Rheumatoid Arthritis Return to Table of Contents
Author & Year of
Publication
(Trial Name)
Quality rating
Study sponsor Study Design and
Duration of Follow-
up
Geographic
location of study
Interventions (n) &
Dosing Schedule
Inclusion and Exclusion
Criteria
Baseline patient Characteristics
Li Z International
Journal of Rheumatic
Diseases 2015185
Good
Centocor, Inc. Phase III RCT
Double-blind
Multicenter
52 weeks
15 sites in China
China
1) PBO+MTX (n=132),
sc injections w/
crossover to 50mg
GOL+MTX at wk 24
2) 50mg GOL+MTX
(n=132) every 4 wks
Group 1 could enter blinded early escape to 50mg GOL at week
16 if they had <20%
improvement from
baseline in TJC & SJC.
At week 24, all group
1 cross over to 50mg
GOL
≥18 years with RA
diagnosis for ≥6 months;
Received stable MTX for
≥4 weeks before study:
≥4 SJC & TJC despite
MTX use: CRP≥15mg/L
or ESR ≥28mm/h: and
anti CCP or RF positive.
Mean age, yrs (SD)
1) 46.7 (12.2)
2) 47.7 (11.5)
Female, n (%)
1) 104 (78.8)
2) 110 (83.3)
Mean RA duration, yrs (SD)
1) 8 (7.3)
2) 7.6 (7.1)
Mean HAQ-DI (SD)
1) 1.2 (0.7)
2) 1.3 (0.7)
Mean DAS28-CRP (0-10 score) (SD)
1) 5.5 (1.1)
2) 5.4 (1.1)

©Institute for Clinical and Economic Review, 2017 Page 478 Draft Evidence Report: Targeted Immune Modulators for Rheumatoid Arthritis Return to Table of Contents
Table F46. Golimumab versus conventional DMARDs: Key Clinical Outcomes
Author & Year of
Publication
(Trial Name)
Interventions Treatment Response Disease Activity Structural Damage Function Laboratory
indices
Tanaka Y Annals of
the rheumatic
diseases 2012160
GO-FORTH
1) PBO+MTX (n=88)
2) 50mg GOL+MTX
(n=86)
Month 6, n (%)
ACR20
1) 29 (33.0)
2) 61 (70.9)
p<0.0001
ACR50
1) 13 (14.8)
2) 36 (41.9)
p<0.0001
ACR70
1) 5 (5.7)
2) 23 (26.7)
p<0.0002
Month 6
Change from
baseline
DAS28-ESR (SD)
1) -0.60 (1.38)
2) -2.05 (1.2)
p<0.0001
DAS28-ESR
remission, n (%)
1) 6 (6.8)
2) 30 (34.9)
p<0.0001
Month 6
Change from
baseline mTSS (Van
der Heijde) (SD)
1) 2.51 (5.52)
2) 1.05 (3.71)
p=0.0203
Change in mTSS<0, n
(%)
1) 44 (50.0)
2) 51 (59.3)
p=0.2179
Month 6
Change from baseline
HAQ-DI (SD)
1) 0.03 (0.58)
2) 0.33 (0.42)
p<0.0001

©Institute for Clinical and Economic Review, 2017 Page 479 Draft Evidence Report: Targeted Immune Modulators for Rheumatoid Arthritis Return to Table of Contents
Author & Year of
Publication
(Trial Name)
Interventions Treatment Response Disease Activity Structural Damage Function Laboratory
indices
Tanaka Y Modern
Rheumatology
2016292
GO-FORTH
1) PBO+MTXGOL
50mg+MTX (n=88)
2) 50 mg GOL+MTX
(n=86)
ACR20, n (%)
wk 1) 2)
52 55
(67.9)
62
(86.10
104 61
(87.1)
63 (94.0)
156 33
(97.1)
32 (94.1)
ACR50, n (%)
wk 1) 2)
52 41
(50.6)
48 (66.7)
104 52
(74.3)
49 (73.1)
156 27
(79.4)
30 (88.2)
ACR70, n (%)
wk 1) 2)
52 25 (30.9) 26 (36.1)
104 31 (44.3) 33 (49.3)
156 21 (61.8) 23 (67.6)
Change from
baseline in DAS28-
ESR (SD)
wk 1) 2)
52 -2.2
(1.3)
-2.5
(1.1)
10
4
-2.7
(1.2)
-2.7
(1.1)
15
6
-3.1
(1.1)
-3.0
(1.0)
DAS28-ESR
remission (<2.6), n
(%)
wk 1) 2)
52 28
(34.
6)
32
(44.
4)
10
4
31
(44.
3)
33
(49.
3)
15
6
19
(55.
9)
21
(61.
8)
Comprehensive
remission*, n (%)
wk 1) 2)
52 16
(19.
8)
18
(25.
0)
10
4
14
(20.
0)
19
(28.
4)
15
6
8
(23.
5)
12
(35.
3)
*DAS28-ESR<2.6, HAQ-
DI<0.5, and change in van
der Heijde-mTSS≤0
Change from baseline
in mTSS (SD)
wk 1) 2)
52 2.0
(8.7)
1.6
(7.4)
10
4
1.5
(12.
0)
2.3
(10.0)
15
6
-0.2
(8.1)
4.1
(13.4)
Change from baseline
in HAQ-DI (SD)
wk 1) 2)
52 0.37
(0.5
4)
0.45
(0.46
)
10
4
0.46
(0.5
7)
0.54
(0.51
)
15
6
0.54
(0.5
6)
0.75
(0.53
)

©Institute for Clinical and Economic Review, 2017 Page 480 Draft Evidence Report: Targeted Immune Modulators for Rheumatoid Arthritis Return to Table of Contents
Author & Year of
Publication
(Trial Name)
Interventions Treatment Response Disease Activity Structural Damage Function Laboratory
indices
Keystone E Annals of
the rheumatic
diseases 2009161
GO-FORWARD
1) PBO+MTX (n=133)
2) 100mg GOL+PBO
(n=133)
3) 50mg GOL+MTX
(n=89)
4) 100mg GOL+MTX
(n=89)
Week 24
ACR20, % (p vs. 1)
1) 27.8
2) 35.3 (p=NS)
3) 59.6 (p<0.001)
4) 59.6 (p<0.001)
ACR50, % (p vs. 1)
1) 13.5
2) 19.5 (p=NS)
3) 37.1 (p<0.001)
4) 32.6 (p<0.001)
ACR70, % (p vs. 1)
1) 5.3
2) 11.3 (p=NS)
3) 20.2 (p<0.001)
4) 14.6 (p=0.017)
ACR90, % (p vs. 1)
1) 0.8
2) 2.3 (p=NS)
3) 5.6 (p=0.028)
4) 2.2 (p=NS)
Week 24 remission
DAS28-ESR, %
1) 6
2) 12 (p=NS)
3) 20.2 (p=0.001)
4) 22.5 (p<0.001)
NR
See Emery P Arthritis
and rheumatism
2011198
Week 24 mean
improvement from
baseline HAQ-DI
1) -0.13 (-0.38 to
0.13)
2) -0.13 (-0.63 to
0.25)
3) -0.38* (-0.75 to -
0.13)
4) -0.5* (-0.75 to -
0.13)
*p<0.001
NR

©Institute for Clinical and Economic Review, 2017 Page 481 Draft Evidence Report: Targeted Immune Modulators for Rheumatoid Arthritis Return to Table of Contents
Author & Year of
Publication
(Trial Name)
Interventions Treatment Response Disease Activity Structural Damage Function Laboratory
indices
Keystone E Annals of
the rheumatic
diseases 201087
GO-FORWARD
Good (Note:
patients in the
PBO+MTX group who
discontinued the
study before
receiving any
GOL doses were not
included in the Week
52 analysis)
1) PBO+MTX (n=133)
2) 100mg GOL+PBO
(n=133)
3) 50mg GOL+MTX
(n=89)
4) 100mg GOL+MTX
(n=89)
Week 52 ACR20, %
1) 43.6
2) 45.1
3) 64
4) 58.4
Week 52 ACR50, %
1) 27.8
2) 28.6
3) 43.8
4) 44.9
Week 52 ACR70, %
1) 15
2) 17.3
3) 24.7
4) 33.7
Week 52 Sustained
DAS28-CRP
remission, %
1) 10.1
2) 14.4
3) 21.1
4) 25
NR
See Emery P Arthritis
and rheumatism
2011198
See Genovese, MC.
The Journal of
rheumatology.
2012222
NR
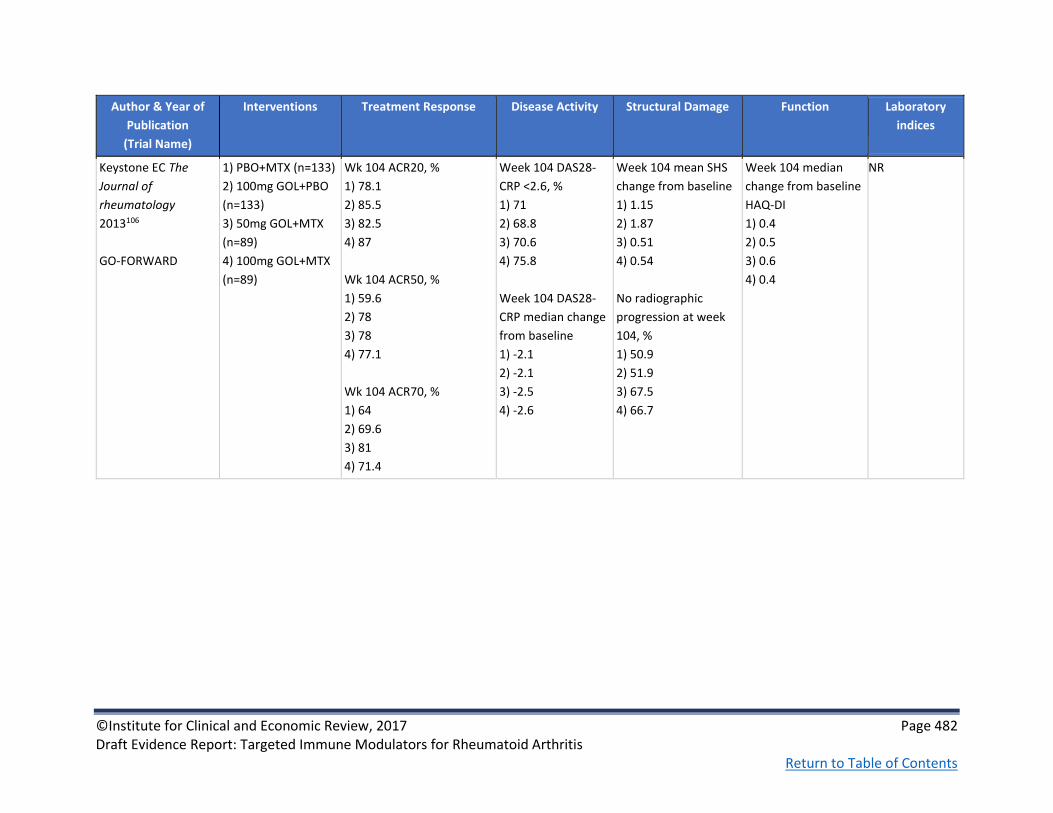
©Institute for Clinical and Economic Review, 2017 Page 482 Draft Evidence Report: Targeted Immune Modulators for Rheumatoid Arthritis Return to Table of Contents
Author & Year of
Publication
(Trial Name)
Interventions Treatment Response Disease Activity Structural Damage Function Laboratory
indices
Keystone EC The
Journal of
rheumatology
2013106
GO-FORWARD
1) PBO+MTX (n=133)
2) 100mg GOL+PBO
(n=133)
3) 50mg GOL+MTX
(n=89)
4) 100mg GOL+MTX
(n=89)
Wk 104 ACR20, %
1) 78.1
2) 85.5
3) 82.5
4) 87
Wk 104 ACR50, %
1) 59.6
2) 78
3) 78
4) 77.1
Wk 104 ACR70, %
1) 64
2) 69.6
3) 81
4) 71.4
Week 104 DAS28-
CRP <2.6, %
1) 71
2) 68.8
3) 70.6
4) 75.8
Week 104 DAS28-
CRP median change
from baseline
1) -2.1
2) -2.1
3) -2.5
4) -2.6
Week 104 mean SHS
change from baseline
1) 1.15
2) 1.87
3) 0.51
4) 0.54
No radiographic
progression at week
104, %
1) 50.9
2) 51.9
3) 67.5
4) 66.7
Week 104 median
change from baseline
HAQ-DI
1) 0.4
2) 0.5
3) 0.6
4) 0.4
NR

©Institute for Clinical and Economic Review, 2017 Page 483 Draft Evidence Report: Targeted Immune Modulators for Rheumatoid Arthritis Return to Table of Contents
Author & Year of
Publication
(Trial Name)
Interventions Treatment Response Disease Activity Structural Damage Function Laboratory
indices
Emery P Arthritis and
rheumatism 2011198
GO-FORWARD & GO-BEFORE *GO-BEFORE patients were MTX naïve therefore not abstracted*
1) PBO+MTX (n=133)
2) 100mg GOL+PBO
(n=133)
3) 50mg GOL+MTX
(n=89)
4) 100mg GOL+MTX
(n=89)
NR NR
Week 24 mean
change from baseline
mTSS, (SD)
1) 0.55 (2.35)
2) 0.27 (1.6)
3) 0.6 (2.74)
4) 0.23 (1.34)
Week 52 mean
change from baseline
mTSS, (SD)
1) 1.1 (4.68)
2) 0.89 (3.37)
3) 0.93 (4.86)
4) 0.15 (1.64)
Week 24 Change in
mTSS<0, n/n
evaluated
1) 81/122
2) 85/ 124
3) 57/86
4) 58/84
All p=NS
NR NR
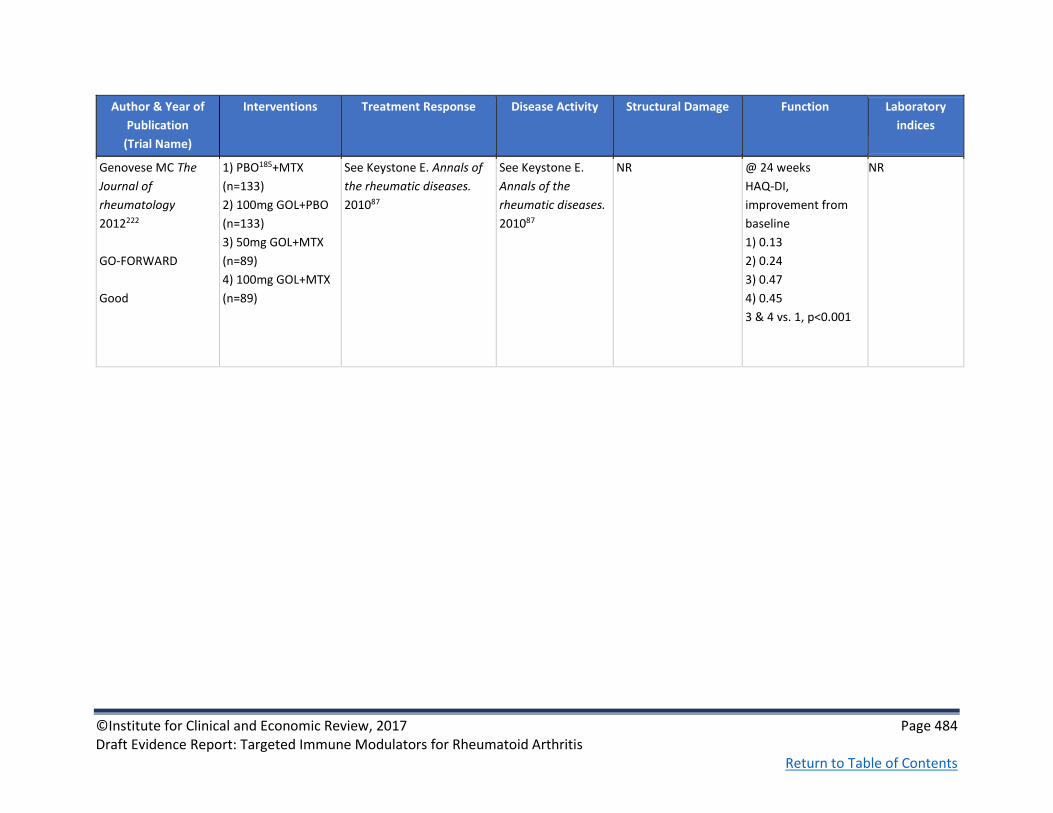
©Institute for Clinical and Economic Review, 2017 Page 484 Draft Evidence Report: Targeted Immune Modulators for Rheumatoid Arthritis Return to Table of Contents
Author & Year of
Publication
(Trial Name)
Interventions Treatment Response Disease Activity Structural Damage Function Laboratory
indices
Genovese MC The
Journal of
rheumatology
2012222
GO-FORWARD
Good
1) PBO185+MTX
(n=133)
2) 100mg GOL+PBO
(n=133)
3) 50mg GOL+MTX
(n=89)
4) 100mg GOL+MTX
(n=89)
See Keystone E. Annals of
the rheumatic diseases.
201087
See Keystone E.
Annals of the
rheumatic diseases.
201087
NR
@ 24 weeks
HAQ-DI,
improvement from
baseline
1) 0.13
2) 0.24
3) 0.47
4) 0.45
3 & 4 vs. 1, p<0.001
NR

©Institute for Clinical and Economic Review, 2017 Page 485 Draft Evidence Report: Targeted Immune Modulators for Rheumatoid Arthritis Return to Table of Contents
Author & Year of
Publication
(Trial Name)
Interventions Treatment Response Disease Activity Structural Damage Function Laboratory
indices
Weinblatt ME Annals
of the rheumatic
diseases 2013184
GO-FURTHER
1) PBO+MTX (n=197)
2) GOLiv+MTX
(n=395)
Week 14 ACR20, n (%)
1) 49 (24.9)
2) 231 (58.5)
p<0.001
Week 24, %
ACR20 (approx. from fig)
1) 65
2) 32
ACR50
1) 13.2
2) 34.9
p<0.001
ACR70
1) 4.1
2) 17.7
p<0.001
Week 52 ACR50, n (%)
1) 26 (13.2)
2) 138 (34.9)
p<0.001
Week 24 mean
change from
baseline (SD)
DAS28-CRP
1) -0.8 (1.43)
2) -2.0 (1.40)
CDAI
1) 8.1 (17.63)
2) 19.2 (12.8)
SDAI
1) 8.6 (18)
2) 22.1 (15.33)
Week 24 remission,
%
CDAI
1) 2.5
2) 6.3
SDAI
1) 2
2) 7.3
P<0.01 for all
See Weinblatt ME
Annals of the
rheumatic diseases
2014214
Week 14 mean
change from baseline
in HAQ, n (%)
1) 0.19 (0.56)
2) 0.50 (0.58)
p<0.001
Improvement in HAQ
≥0.25 units from
baseline, n (%)
Week 14
1) 85 (43.1)
2) 270 (68.4)
p<0.001
Week 24
1) 89 (45.2)
2) 266 (67.3)
p<0.001

©Institute for Clinical and Economic Review, 2017 Page 486 Draft Evidence Report: Targeted Immune Modulators for Rheumatoid Arthritis Return to Table of Contents
Author & Year of
Publication
(Trial Name)
Interventions Treatment Response Disease Activity Structural Damage Function Laboratory
indices
Weinblatt ME Annals
of the rheumatic
diseases 2014214
GO-FURTHER
1) PBO+MTX (n=197)
2) GOLiv+MTX
(n=395)
Week 52, n (%)
ACR20
1) 121 (61.4)
2) 260 (65.8)
ACR50
1) 62 (31.5)
2) 153 (38.7)
ACR70
1) 29 (14.7)
2) 72 (18.2)
Week 52 DAS28–
CRP moderate/good
response, n (%)
1) 149 (75.6)
2) 321 (81.3)
Week 52 remission,
%
CDAI
1) 7.6
2) 8.4
SDAI
1) 8.1
2) 9.1
Week 24 mean
change from baseline
mTSS, SD
1) 1.09 (3.19)
2) 0.03 (1.90)
p<0.001
Change in mTSS ≤0, %
1) 57.4
2) 70.6
p=0.001
Week 52 mean
change from baseline
mTSS, SD
1) 1.22
2) 0.13
p=0.001
Week 52 HAQ-DI
improvement ≥0.25
units, n (%)
1) 123 (62.4)
2) 253 (64.1)

©Institute for Clinical and Economic Review, 2017 Page 487 Draft Evidence Report: Targeted Immune Modulators for Rheumatoid Arthritis Return to Table of Contents
Author & Year of
Publication
(Trial Name)
Interventions Treatment Response Disease Activity Structural Damage Function Laboratory
indices
Bingham CO 3rd
Arthritis care &
research 2015221
GO-FURTHER
1) PBO+MTX (n=197)
2) GOLiv+MTX
(n=395)
Week 100, n (%)
ACR20
1) 130 (66)
2) 273 (69.1)
ACR50
1) 81 (41.1)
2) 178 (45.1)
ACR70
1) 47 (23.9)
2) 92 (23.3)
Baseline to week
100 Mean DAS28-
CRP (SD)
1) 2.2 (1.5)
2) 2.4 (1.5)
Mean CDAI (SD)
1) 23.2 (15.2)
2) 23.6 (14.6)
Week 100 DAS28–
CRP moderate/good
response, n (%)
1) 153 (77.7)
2) 332 (84.1)
Baseline to week 100
mean total SHS
change (SD)
1) 2.1 (7.42)
2) 0.74 (6.32)
P=0.0005
Baseline to week 100
total SHS <0, n (%)
1) 108 (54.8)
2) 244 (61.8)
Week 100 mean
change from baseline
in HAQ, n (%)
1) 0.47 (0.62)
2) 0.53 (0.66)
Week 100 HAQ-DI
improvement ≥0.25
units, n (%)
1) 131 (66.5)
2) 266 (67.3)
Li Z International
Journal of Rheumatic
Diseases 2015185
1) PBO+MTX
(n=132), sc injections
w/ crossover to
50mg GOL+MTX at
wk 24
2) 50mg GOL+MTX
(n=132) every 4 wks
Week 24 ACR20, %
1) 15.9
2) 42.4 (p<0.0001)
Week 24 ACR50, %
1) 6.8
2) 18.9 (p <0.01)
Week 24 ACR70, %
1) 1.5
2) 6.1 (p<0.05)
Week 24 DAS 28-
CRP remission, %
1) 7.6
2) 18.9 (p<0.01)
Week 24 DAS 28-
ESR remission, %
1) 3
2) 7.6 (p<0.01)
Week 24 HAQ-
DI≥0.25, %
1) 29.5
2) 49.2 (p<0.001)
Week 24
Median % change
from baseline HAQ-DI
1) 0
2) 14.3 (p<0.0001)
Week 24
Median %
change from
baseline CRP
1) -4.5
2)
570.8(p<0.0001)

©Institute for Clinical and Economic Review, 2017 Page 488 Draft Evidence Report: Targeted Immune Modulators for Rheumatoid Arthritis Return to Table of Contents
Table F47. Golimumab versus conventional DMARDs: Harms
Author & Year of Publication
(Trial Name)
Interventions Malignancies Infections Other Adverse
Events
Discontinuation,
Serious AE rate,
Deaths
Tanaka Y Annals of the
rheumatic diseases 2012160
GO-FORTH
1) PBO+MTX (n=88)
2) 50mg GOL+MTX
(n=86)
0 events of
neoplasia or
malignancy at wk
16; 2 events of
neoplasia at wk 24
in group 2
0 serious
infections at wk 16
and wk 24
Week 24
Discontinuation due
to AEs, n (%)
1) 1 (1.1)
2) 4 (4.7)
Serious AEs, n (%)
1) 1 (1.1)
2) 2 (2.3)
Deaths: 0
Tanaka Y Modern
Rheumatology 2016292
GO-FORTH
1) PBO+MTXGOL
50mg+MTX (n=88)
2) 50 mg GOL+MTX
(n=170)
PBO+MTX results
from wks 0-24;
GOL+MTX results
from 156 wks
Malignancies, n (%)
1) 0
2) 5 (2.9)
Serious infections,
n (%)
1) 0
2) 12 (7.1)
0 events of
tuberculosis
Pneumonia, 0 (%)
1) 1 (1.1)
2) 3 (1.8)
n (%)
Nasopharyngitis
1) 22 (25.0)
2) 82 (48.2)
Pharyngitis
1) 3 (3.4)
2) 26 (15.3)
Bronchitis
1) 2 (2.3)
2) 16 (9.4)
Discontinuation due
to AEs, n (%)
1) 1 (1.1)
2) 25 (14.7)
Serious AEs, n (%)
1) 2 (2.3)
2) 36 (21.2)
Deaths: 0
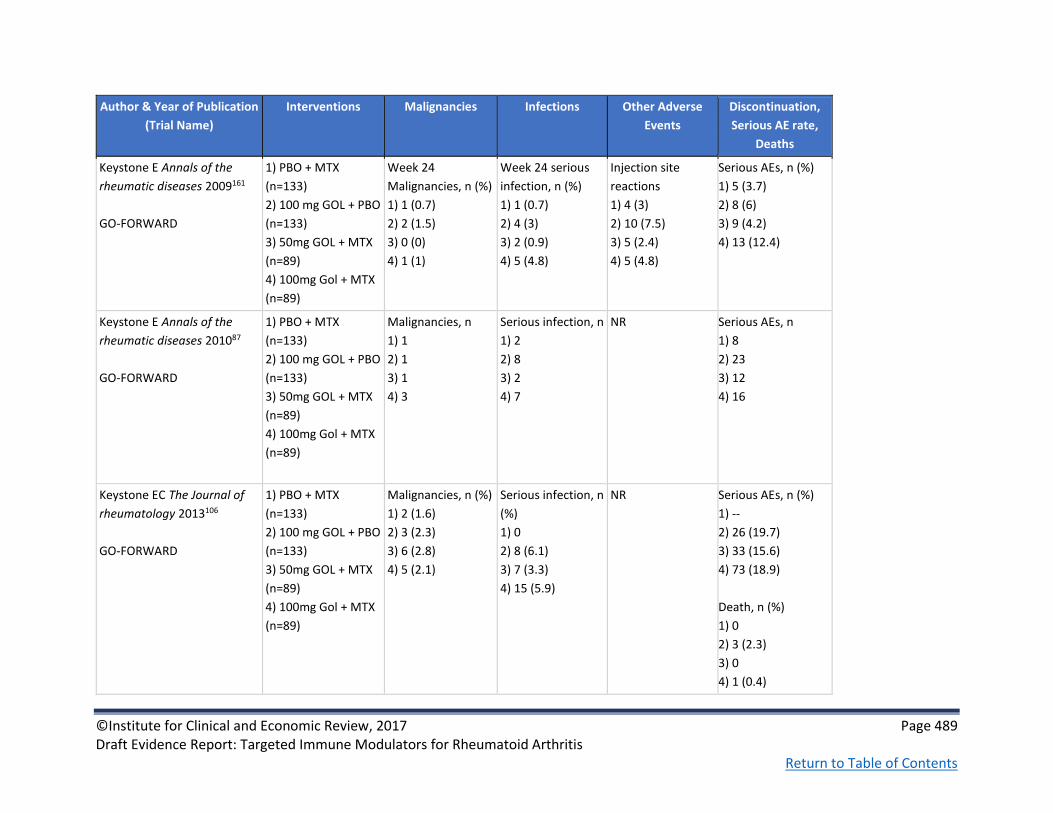
©Institute for Clinical and Economic Review, 2017 Page 489 Draft Evidence Report: Targeted Immune Modulators for Rheumatoid Arthritis Return to Table of Contents
Author & Year of Publication
(Trial Name)
Interventions Malignancies Infections Other Adverse
Events
Discontinuation,
Serious AE rate,
Deaths
Keystone E Annals of the
rheumatic diseases 2009161
GO-FORWARD
1) PBO + MTX
(n=133)
2) 100 mg GOL + PBO
(n=133)
3) 50mg GOL + MTX
(n=89)
4) 100mg Gol + MTX
(n=89)
Week 24
Malignancies, n (%)
1) 1 (0.7)
2) 2 (1.5)
3) 0 (0)
4) 1 (1)
Week 24 serious
infection, n (%)
1) 1 (0.7)
2) 4 (3)
3) 2 (0.9)
4) 5 (4.8)
Injection site
reactions
1) 4 (3)
2) 10 (7.5)
3) 5 (2.4)
4) 5 (4.8)
Serious AEs, n (%)
1) 5 (3.7)
2) 8 (6)
3) 9 (4.2)
4) 13 (12.4)
Keystone E Annals of the
rheumatic diseases 201087
GO-FORWARD
1) PBO + MTX
(n=133)
2) 100 mg GOL + PBO
(n=133)
3) 50mg GOL + MTX
(n=89)
4) 100mg Gol + MTX
(n=89)
Malignancies, n
1) 1
2) 1
3) 1
4) 3
Serious infection, n
1) 2
2) 8
3) 2
4) 7
NR Serious AEs, n
1) 8
2) 23
3) 12
4) 16
Keystone EC The Journal of
rheumatology 2013106
GO-FORWARD
1) PBO + MTX
(n=133)
2) 100 mg GOL + PBO
(n=133)
3) 50mg GOL + MTX
(n=89)
4) 100mg Gol + MTX
(n=89)
Malignancies, n (%)
1) 2 (1.6)
2) 3 (2.3)
3) 6 (2.8)
4) 5 (2.1)
Serious infection, n
(%)
1) 0
2) 8 (6.1)
3) 7 (3.3)
4) 15 (5.9)
NR Serious AEs, n (%)
1) --
2) 26 (19.7)
3) 33 (15.6)
4) 73 (18.9)
Death, n (%)
1) 0
2) 3 (2.3)
3) 0
4) 1 (0.4)

©Institute for Clinical and Economic Review, 2017 Page 490 Draft Evidence Report: Targeted Immune Modulators for Rheumatoid Arthritis Return to Table of Contents
Author & Year of Publication
(Trial Name)
Interventions Malignancies Infections Other Adverse
Events
Discontinuation,
Serious AE rate,
Deaths
Weinblatt ME Annals of the
rheumatic diseases 2013184
GO-FURTHER
1) PBO+MTX (n=197)
2) GOLiv+MTX
(n=395)
Treatment-
emergent
malignancy, n
1) 0
2) 1
Non-treatment-
emergent
malignancy, n
1) 1
2) 0
Infections, n (%)
1) 0
2) 4 (0.9)
NR Discontinuation due
to AEs, n (%)
1) 2 (1.0)
2) 9 (2.3)
Serious AEs, n (%)
1) 2.0
2) 4.1
Deaths, n
1) 1
2) 0
Weinblatt ME Annals of the
rheumatic diseases 2014214
GO-FURTHER
1) PBO+MTX (n=197)
2) GOLiv+MTX
(n=395)
Malignancies
among GOL+MTX
treated patients: 3
(a previously
reported case
of breast cancer
prior to wk24,6 one
case of cervical
carcinoma
stage 0 and a basal
cell carcinoma
between wk24 and
wk52)
Serious infections
occurred in 1.9%
of all GOL+MTX
treated patients
No serious
opportunistic
infections were
documented up to
wk52
Serious
cardiovascular
events between
wk24 and wk 52:
1) 1
2) 2
Discontinuation due
to AEs through wk
52, n (%)
1) 4 (2.0)
2) 14 (3.5)
Serious AEs among
all GOL+MTX treated
patients increased
from wk24 (4.1%) to
wk52 (8.6%)
Deaths between
wk24 and 52
1) 1
2) 1

©Institute for Clinical and Economic Review, 2017 Page 491 Draft Evidence Report: Targeted Immune Modulators for Rheumatoid Arthritis Return to Table of Contents
Author & Year of Publication
(Trial Name)
Interventions Malignancies Infections Other Adverse
Events
Discontinuation,
Serious AE rate,
Deaths
Bingham CO 3rd Arthritis care
& research 2015221
GO-FURTHER
1) PBO+MTX (n=197)
2) GOLiv+MTX
(n=395)
Malignancies, n
1) 1
2) 6
Serious infections
occurred in 6.2%
of all GOL+MTX
treated patients
TB occurred in 3
GOL +MTX treated
patients
NR Serious AEs
occurred in 18.2% of
all GOL + MTX
treated patients
through wk 112
Death through week
112, n (%)
1) 1 (0.5)
2) 3 (0.8)
Li Z International Journal of
Rheumatic Diseases 2015185
1) PBO+MTX
(n=132), sc injections
w/ crossover to
50mg GOL+MTX at
wk 24
2) 50mg GOL+MTX
(n=132) every 4 wks
NR Week 24 Serious
infection, n (%)
1) 0
2) 2 (1.5)
1 TB case at week
48
NR Week 24
Discontinued due to
AEs, n (%)
1) 0
2) 5 (3.8)
Serious AEs, n (%)
1) 1 (0.8)
2) 5 (3.8)
1 death in group 2 t
week 28

©Institute for Clinical and Economic Review, 2017 Page 492 Draft Evidence Report: Targeted Immune Modulators for Rheumatoid Arthritis Return to Table of Contents
Table F48. Golimumab versus conventional DMARDs: Patient-reported Outcomes
Author & Year of Publication
(Trial Name)
Interventions Health-related quality of
life
Pain Fatigue & other
PROs
Genovese MC The Journal of
rheumatology 2012222
GO-FORWARD
1) PBO + MTX
(n=133)
2) 100 mg GOL + PBO
(n=133)
3) 50mg GOL + MTX
(n=89)
4) 100mg Gol + MTX
(n=89)
Week 24 improvement
from baseline
SF-36 PCS (p vs.1)
1) 2.54
2) 4.74 (p=NS)
3) 8.28 (p<0.001)
4) 7.01 (p<0.001)
SF-36 MCS
1) 0.75
2) 3.37 (p=NS)
3) 1.83 (p=NS)
4) 4.33 (p=0.014)
% with ≥5-point
improvement
SF-36 PCS MCID
1) 30.6
2) 36.1 (p=NS)
3) 64.0 (p<0.001)
4) 57.3 (p<0.001)
SF-36 MCS MCID
1) 29.0
2) 36.8
3) 37.1 (p=NS)
4) 44.9 (p<0.001)
NR @week 24,
FACIT-Fatigue,
improvement from
baseline
1) 2.16
2) 5.55
3) 7.30
4) 7.16
3 & 4 vs. 1, p<0.001
FACIT-Fatigue,
MCID (% ≥4-point
improvement)
1) 44.1
2) 60.0
3) 62.5
4) 63.2
3) & 4) vs. 1),
p<0.01

©Institute for Clinical and Economic Review, 2017 Page 493 Draft Evidence Report: Targeted Immune Modulators for Rheumatoid Arthritis Return to Table of Contents
Author & Year of Publication
(Trial Name)
Interventions Health-related quality of
life
Pain Fatigue & other
PROs
Bingham CO J Rheumatol.
2014 216
GO-FURTHER
PBO+MTX (n=197)
2) GOLiv+MTX
(n=395)
Week 16 (p<0.001 for 1-2)
Mean PCS
score (SD)
Mean
MCS score
(SD)
1) 3.77
(7.51)
1) 1.33
(9.70)
2) 7.42
(8.11)
2) 7.23
(10.25)
Week 24 (p<0.001 for 1-2)
Mean PCS
score (SD)
Mean
MCS score
(SD)
1) 3.82
(7.30)
1) 1.21
(10.07)
2) 8.28
(8.32)
2) 6.94
(10.28)
Week 12
Mean EQ-5D VAS
score (SD)
1) 2.53 (27.26)
2) 11.43 (28.87)
p<0.001 for 1-2
Week 16
Mean EQ-5D VAS
score (SD)
1) 3.53 (25.34)
2) 17.69 (28.08)
p<0.001 for 1-2
Week 24
Mean EQ-5D VAS
score (SD)
1) 8.25 (24.62)
19.12 (29.87)
p<0.001 for 1-2
Week 12
Mean FACIT-F score
(SD)
1) 2.05 (9.04)
2) 5.38 (10.32)
p<0.001 for 1-2
Week 16
Mean FACIT-F score
(SD)
1) 2.16 (9.70)
2) 7.54 (10.55)
p<0.001 for 1-2
Week 24
Mean FACIT-F score
(SD)
1) 2.54 (10.22)
2) 7.96 (10.79)
p<0.001 for 1-2
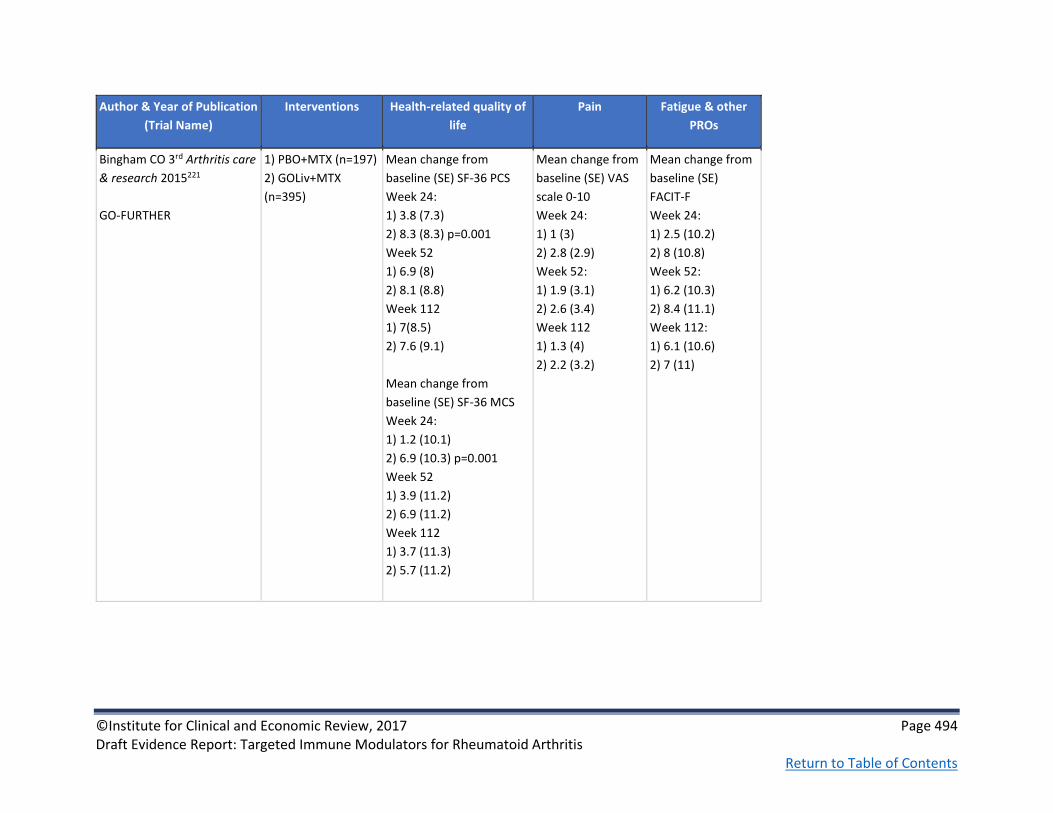
©Institute for Clinical and Economic Review, 2017 Page 494 Draft Evidence Report: Targeted Immune Modulators for Rheumatoid Arthritis Return to Table of Contents
Author & Year of Publication
(Trial Name)
Interventions Health-related quality of
life
Pain Fatigue & other
PROs
Bingham CO 3rd Arthritis care
& research 2015221
GO-FURTHER
1) PBO+MTX (n=197)
2) GOLiv+MTX
(n=395)
Mean change from
baseline (SE) SF-36 PCS
Week 24:
1) 3.8 (7.3)
2) 8.3 (8.3) p=0.001
Week 52
1) 6.9 (8)
2) 8.1 (8.8)
Week 112
1) 7(8.5)
2) 7.6 (9.1)
Mean change from
baseline (SE) SF-36 MCS
Week 24:
1) 1.2 (10.1)
2) 6.9 (10.3) p=0.001
Week 52
1) 3.9 (11.2)
2) 6.9 (11.2)
Week 112
1) 3.7 (11.3)
2) 5.7 (11.2)
Mean change from
baseline (SE) VAS
scale 0-10
Week 24:
1) 1 (3)
2) 2.8 (2.9)
Week 52:
1) 1.9 (3.1)
2) 2.6 (3.4)
Week 112
1) 1.3 (4)
2) 2.2 (3.2)
Mean change from
baseline (SE)
FACIT-F
Week 24:
1) 2.5 (10.2)
2) 8 (10.8)
Week 52:
1) 6.2 (10.3)
2) 8.4 (11.1)
Week 112:
1) 6.1 (10.6)
2) 7 (11)

©Institute for Clinical and Economic Review, 2017 Page 495 Draft Evidence Report: Targeted Immune Modulators for Rheumatoid Arthritis Return to Table of Contents
Author & Year of Publication
(Trial Name)
Interventions Health-related quality of
life
Pain Fatigue & other
PROs
Li Z International Journal of
Rheumatic Diseases 2015185
1) PBO+MTX
(n=132), sc injections
w/ crossover to
50mg GOL+MTX at
wk 24
2) 50mg GOL+MTX
(n=132) every 4 wks
Week 24 Mean change
from baseline SF-36 PCS
1) -0.9
2) 4.3 (p<0.001)
Week 24 Mean change
from baseline SF-36 MCS
1) -2.7
2) 2.2 (p<0.001)
Week 24
Patient’s
assessment of pain
(Percent
improvement from
baseline)
1) -3.2
2) 18.5 (p<0.0001)
Week 24 Mean
change from
baseline FACIT-
Fatigue
1) -2.2
2) 3.4 (p<0.001)
Week 14
Mean change from
baseline patient’s
assessment of
disease activity
1) -1.5
2) 20.5 (p<0.001)

©Institute for Clinical and Economic Review, 2017 Page 496 Draft Evidence Report: Targeted Immune Modulators for Rheumatoid Arthritis Return to Table of Contents
Table F49. Infliximab versus conventional DMARDs: Study Characteristics
Author & Year of
Publication
(Trial Name)
Quality rating
Study sponsor Study Design and
Duration of Follow-
up
Geographic
location of study
Interventions (n) &
Dosing Schedule
Inclusion and Exclusion
Criteria
Baseline patient Characteristics
Kim J Journal of
Korean medical
science 2013186
Fair
Merck Sharp &
Dohme Corp
RCT double-blind,
placebo-controlled
followed by
extension
30 weeks for RCT
Korea 1) PBO+MTX (n=72)
2) IFX+MTX (n=71)
3 mg/kg IFX or PBO
intravenous infusions
at weeks 0, 2, and 6
and every 8 weeks
thereafter through
22 weeks. Patients
continued their
baseline dose of
methotrexate or
corticosteroids
during the trial.
Patients with active RA
(i.e. ≥4 SJC & TJC or at
least 2 of the following:
1) CRP≥2mg/dl or
ESR>28mm/h 2) 30 min
stiffness 3) bone erosion
4) RF positivity) despite
stable MTX for ≥4 weeks.
Mean age, yrs (SD)
1) 49.3 (10.1)
2) 51.4 (11.4)
Female, n (%)
1) 64 (90.1)
2) 64 (88.9)
Median RA duration, yrs (range)
1) 7.4 (0.6-35.7)
2) 9.8 (0.7-45.7)
Mean KHAQ* (SD)
1) 1.4 (0.7)
2) 1.4 (0.7)
*Korean Health Assessment
Questionnaire

©Institute for Clinical and Economic Review, 2017 Page 497 Draft Evidence Report: Targeted Immune Modulators for Rheumatoid Arthritis Return to Table of Contents
Author & Year of
Publication
(Trial Name)
Quality rating
Study sponsor Study Design and
Duration of Follow-
up
Geographic
location of study
Interventions (n) &
Dosing Schedule
Inclusion and Exclusion
Criteria
Baseline patient Characteristics
Maini R Lancet 1999187
ATTRACT
Good
See also Lipsky PE N
Engl J Med 2000200
Centocor Inc. International,
double-blind,
placebo controlled,
phase III
Every 4 weeks for
30 weeks
34 sites in North
America and
Europe
1) PBO (n=88)
2) IFX, 3mg/kg every
8 wk (n=86)
3) IFX, 3mg/kg every
4 wk (n=86)
4) IFX, 10mg/kg every
8 wk (n=87)
5) IFX, 10mg/kg every
4 wk (n=81)
Additional infusion of
same dose given
every 4 or 8 wks with
steady dose of
methotrexate
(median 15 mg/wk
for ≥6 months)
Patients with active RA
and had received
continuous MTX for ≥ 3
months and constant
dose for ≥ 4 wks; if
patient was using oral
corticosteroids or
NSAIDs 1) must have
been stable dose for ≥4
wks 2) if not using those
drugs, could not have
received either for ≥4
wks
Patients were excluded
if: 1) prior DMARD other
than MTX,
corticosteroids in 4 wks
prior to screening 2)
prior TNF or alkylating
agents 3) serious and/or
opportunistic infections
Mean age, yrs (range)
1) 51 (19.0-75.0)
2) 56 (25.0-74.0)
3) 51 (19.0-78.0)
4) 55 (19.0-80.0)
5) 52 (23.0-74.0)
Female, n (%)
1) 70 (80)
2) 70 (81)
3) 66 (77)
4) 67 (77)
5) 59 (73)
Median RA duration, yrs (range)
1) 8.9 (0.8-35.0)
2) 8.4 (0.7-45.0)
3) 7.2 (0.5-33.8)
4) 9.0 (0.5-49.9)
5) 8.7 (0.6-47.0)

©Institute for Clinical and Economic Review, 2017 Page 498 Draft Evidence Report: Targeted Immune Modulators for Rheumatoid Arthritis Return to Table of Contents
Author & Year of
Publication
(Trial Name)
Quality rating
Study sponsor Study Design and
Duration of Follow-
up
Geographic
location of study
Interventions (n) &
Dosing Schedule
Inclusion and Exclusion
Criteria
Baseline patient Characteristics
van Vollenhoven RF
The Lancet 2012199
SWEFOT
Good See also Eriksson JK
JAMA Internal
Medicine 2013228,
Karlsson JA Ann
Rheum Dis. 2013 293,
Eriksson J Arthritis
Care and Research
2016229
Karolinska
Institutet
RCT
multicenter
open label
2-year follow-up
15 rheumatology
units in Sweden
1)MTX +
sulfasalazine+
hydroxychloroquine
(n=130)
2) IFX+MTX (n=128)
all patients given one
dose of MTX 20 mg
every week. Patients
whose DAS28 after 3-
4 mos was >3.2
randomly allocated
to group 1) or 2)
sulfasalazine, 1000
mg twice a day;
hydroxychloroquine,
400 mg once a day;
and IFX 3 mg/kg body
weight, rounded up
to the nearest 100
mg increment and
given intravenously
at weeks 0, 2, and 6,
and every 8 weeks
thereafter; MTX
continued
Age ≥18; diagnosis of RA
with symptom duration
<1 yr; no previous
DMARD treatment; no
oral glucocorticoid
treatment or stable
glucocorticoid treatment
for at least 4 wks of at
most 10mg daily
prednisolone (or
equivalent); DAS28≥3.2
Mean age, yrs (SD)
1) 52.9 (13.9)
2) 51.1 (13.3)
Female, n (%)
1) 101 (78)
2) 79 (76)
Mean RA duration, mo (SD)
1) 6.3 (3.6)
2) 6.2 (3.5)
Mean HAQ-DI (SD) at baseline
1) 1.32 (0.60)
2) 1.27 (0.60)
Mean DAS28-(unspecified) at
randomization (SD)
1) 4.79 (1.05)
2) 4.91 (0.98)

©Institute for Clinical and Economic Review, 2017 Page 499 Draft Evidence Report: Targeted Immune Modulators for Rheumatoid Arthritis Return to Table of Contents
Author & Year of
Publication
(Trial Name)
Quality rating
Study sponsor Study Design and
Duration of Follow-
up
Geographic
location of study
Interventions (n) &
Dosing Schedule
Inclusion and Exclusion
Criteria
Baseline patient Characteristics
Westhovens R Arthritis
Rheum. 2006 188
START
Good
Centocor
Research and
Development,
Inc.
Randomized,
double-blind,
placebo controlled
54 weeks
International and
United States of
America
1) PBO + MTX
(n=363)
2) IFX + MTX, 3mg/kg
(n=360)
3) IFX + MTX,
10mg/kg (n=361)
Given at weeks 0, 2,
6, and 14
At week 22, patients
in PBO group began
receiving 3 mg/kg IFX
and patients in group
3 continued their
dose. Patients in
group 2 who didn’t
meet predefined
response criteria
received increasing
doses of IFX in 1.5
mg/kg increments
Active RA per ACR
criteria despite MTX
treatment for ≥3
months and stable dose
for ≥4 weeks; could
have been treated with
other concomitant
DMARDs
Chest radiography must
show no evidence of
malignancy, infection,
fibrosis, or active TB;
excluded if: 1)
opportunistic/serious
infections during the 2
months prior to
screening 2) HIV; active
or history of TB 3)
congestive heart failure
4) had been treated with
an investigational drug
within 3 months or 5
half-lives from time of
screening
Median age, yrs (range)
1) 52.0 (44-61)
2) 53.0 (45-61)
3) 52.0 (43-60)
Female, n (%)
1) 302 (83.2)
2) 288 (80.0)
3) 281 (77.8)
Median RA duration, yrs (range)
1) 8.4 (4-15)
2) 7.8 (3-15)
3) 6.3 (3-14)
Median HAQ-DI (range) at baseline,
scale 0-3
1) 1.5 (1-2
2) 1.5 (1-2)
3) 1.5 (1-2)

©Institute for Clinical and Economic Review, 2017 Page 500 Draft Evidence Report: Targeted Immune Modulators for Rheumatoid Arthritis Return to Table of Contents
Table F50. Infliximab versus conventional DMARDs: Key Clinical Outcomes
Author & Year of
Publication
(Trial Name)
Interventions Treatment Response Disease Activity Structural Damage Function Laboratory
indices
Kim J Journal of
Korean medical
science 2013186
1)PBO+MTX (n=72)
2) IFX+MTX (n=71)
Week 30
ACR20, %
1) 30.6
2) 50.7
p=0.014
ACR50, %
1) NR
2) 33.8
NR NR Week 30 mean
change from
baseline KHAQ
1) -10.8
2) -35.5
p=0.00
Week 30 rate of
change of CRP, %
1) 11.5
2) 77.6
Week 30 rate of
change of ESR, %
1) 20.5
2) 34

©Institute for Clinical and Economic Review, 2017 Page 501 Draft Evidence Report: Targeted Immune Modulators for Rheumatoid Arthritis Return to Table of Contents
Author & Year of
Publication
(Trial Name)
Interventions Treatment Response Disease Activity Structural Damage Function Laboratory
indices
Maini R Lancet
1999187
ATTRACT
1) PBO (n=88)
2) IFX, 3mg/kg every
8 wk (n=86)
3) IFX, 3mg/kg every
4 wk (n=86)
4) IFX, 10mg/kg
every 8 wk (n=87)
5) IFX, 10mg/kg
every 4 wk (n=81)
Week 30
ACR20, % (estimated
from graphic)
1) 20
2) 50
3) 53
4) 51
5) 56
ACR50, n (%)
1) 4 (5)
p=NR
2) 22 (27)
3) 25 (29)
4) 26 (31)
5) 21 (26)
p<0.001 for all above
ACR70, n (%)
1) 0 (0)
p=NR
2) 7 (8)
p=0.007
3) 9 (11)
p=0.002
4) 15 (18)
p<0.001
5) 9 (11)
p=0.002
NR NR NR NR

©Institute for Clinical and Economic Review, 2017 Page 502 Draft Evidence Report: Targeted Immune Modulators for Rheumatoid Arthritis Return to Table of Contents
Author & Year of
Publication
(Trial Name)
Interventions Treatment Response Disease Activity Structural Damage Function Laboratory
indices
Lipsky PE N Engl J
Med 2000200
ATTRACT
1) MTX + PBO (n=88)
2) IFX + MTX (3mg
every 8 wks, n=86)
3) IFX + MTX (3mg
every 4 wks, n=86)
4) IFX + MTX (10mg
every 8 wks, n=87)
5) IFX + MTX (10mg
every 4 wks, n=81)
54 Weeks
ACR20, (%)
1) 17
2) 42
3) 48
4) 59
5) 59
p<0.001 for 2-5
ACR50, (%)
1) 8
2) 21
p=0.027
3) 34
4) 39
5) 38
p<0.001 for 3-5
ACR70, (%)
1) 2
2) 10
p=0.04
3) 17
p=0.001
4) 25
5) 19
p<0.001 for 4-5
NR Total radiographic
score (SD)
1) 82 (77)
2) 79 (73)
3) 71 (73)
4) 67 (61)
5) 76 (72)
Mean HAQ-DI (SD)
at baseline
1) 1.7 (0.6)
2) 1.8 (0.6)
3) 1.7 (0.6)
4) 1.7 (0.6)
5) 1.7 (0.6)
NR

©Institute for Clinical and Economic Review, 2017 Page 503 Draft Evidence Report: Targeted Immune Modulators for Rheumatoid Arthritis Return to Table of Contents
Author & Year of
Publication
(Trial Name)
Interventions Treatment Response Disease Activity Structural Damage Function Laboratory
indices
van Vollenhoven RF
The Lancet 2012199
SWEFOT
1) MTX+sulfasalazine
+hydroxychloroquine
(n=130)
2) IFX+MTX (n=128)
12 months
ACR20, n (%)
1) 37 (28)
2) 54 (42)
ACR50, n (%)
1) 19 (15)
2) 32 (25)
ACR70, n (%)
1) 9 (7)
2) 15 (12)
24 months
ACR20, n (%)
1) 43 (33)
2) 51 (40)
ACR 50, n, (%)
1) 28 (22)
2) 38 (30)
ACR70, n (%)
1) 18 (14)
2) 21 (16)
NR
Month 12 mean
change from
baseline mTSS (Van
der Heijde), (SD)
1) 5.04 (10.64)
2) 2.95 (6.07)
Month 24 mean
change from
baseline mTSS (Van
der Heijde), (SD)
1) 7.23 (12.72)
2) 4.00 (10.05)
NR NR

©Institute for Clinical and Economic Review, 2017 Page 504 Draft Evidence Report: Targeted Immune Modulators for Rheumatoid Arthritis Return to Table of Contents
Author & Year of
Publication
(Trial Name)
Interventions Treatment Response Disease Activity Structural Damage Function Laboratory
indices
Westhovens R
Arthritis Rheum.
2006 188
START
1) PBO + MTX
(n=363)
2) IFX + MTX, 3mg/kg
(n=360)
3) IFX + MTX,
10mg/kg (n=361)
22 Weeks
ACR20, n (%)
1) 87 (25.5)
2) 199 (58.0)
3) 205 (61.0)
p<0.001 for 2-3
ACR50, n (%)
1) 33 (9.7)
2) 110 (32.1)
3) 119 (35.4)
p<0.001 for 2-3
ACR70, n (%)
1) 16 (4.7)
2) 48 (14.0)
3) 54 (16.1)
p<0.001 for 2-3
Mean DAS28 response
(SD)
1) 4.4 (1.4
2) 3.5 (1.4)
3) 3.3 (1.3)
p<0.001 for 2-2
Remission (DAS28 <
2.6), n (%)
1) 48 (14)
2) 106 (31)
3) 110 (32)
p<0.001 for 2-3
High disease activity
(DAS28 > 5.1), n (%)
1) 110 (33)
2) 41 (12)
3) 35 (10)
p<0.001 for 2-3
Good or moderate
response, n (%)
1) 146 (44)
2) 250 (75)
3) 263 (79)
p<0.001 for 2-3
NR NR CRP, mg/dl at
baseline (range)
1) 1.2 (1-3)
2) 1.6 (1-3)
3) 1.6 (1-3)

©Institute for Clinical and Economic Review, 2017 Page 505 Draft Evidence Report: Targeted Immune Modulators for Rheumatoid Arthritis Return to Table of Contents
Table F51. Infliximab versus conventional DMARDs: Harms
Author & Year of Publication
(Trial Name)
Interventions Malignancies Infections Other Adverse
Events
Discontinuation,
Serious AE rate,
Deaths
Kim J Journal of Korean
medical science 2013186
1)PBO+MTX (n=72)
2) IFX+MTX (n=71)
Malignancies, n
1) 1
2) 0
No TB reported NR NR
Maini R Lancet 1999187
ATTRACT
1) PBO (n=88)
2) IFX, 3mg/kg every
8 wk (n=86)
3) IFX, 3mg/kg every
4 wk (n=86)
4) IFX, 10mg/kg
every 8 wk (n=87)
5) IFX, 10mg/kg
every 4 wk (n=81)
4 cancers in 3 IFX
treated patients in
359 patients
through years of
follow up (2
epithelial cell
cancer and 1
lymphoma)
1 instance of TB in
patient treated
with IFX
1 instance of
coccidiomycosis
Discontinuation due
to AEs, n (%)
PBO – 7 (8)
IFX – 6 (7)
Serious AEs, n (%)
1) 14 (16)
2) 8 (9)
3) 11 (13)
4) 8 (9)
5) 10 (13)
Deaths, n (%)
PBO – 3 (3)
IFX – 2 (0.6)

©Institute for Clinical and Economic Review, 2017 Page 506 Draft Evidence Report: Targeted Immune Modulators for Rheumatoid Arthritis Return to Table of Contents
Author & Year of Publication
(Trial Name)
Interventions Malignancies Infections Other Adverse
Events
Discontinuation,
Serious AE rate,
Deaths
Lipsky PE N Engl J Med
2000200
ATTRACT
1) MTX + PBO (n=88)
2) IFX + MTX (3mg
every 8 wks, n=86)
3) IFX + MTX (3mg
every 4 wks, n=86)
4) IFX + MTX (10mg
every 8 wks, n=87)
5) IFX + MTX (10mg
every 4 wks, n=81)
5 cases of cancer in
IFX + MTX
treatment (2 were
recurrences and 3
were new cases)
Serious infections,
n (%)
1) 7 (8)
2) 2 (2)
3) 6 (7)
4) 7 (8)
5) 6 (7)
NR Serious adverse
events, n (%)
1) 18 (21)
2) 10 (11)
3) 14 (16)
4) 17 (20)
5) 16 (20)
Discontinuation due
to AEs, n
1) 7
2) 5
3) 9
4) 4
5) 8
Deaths, n (%)
MTX + PBO – 3 (3)
IFX + MTX – 5 (1)

©Institute for Clinical and Economic Review, 2017 Page 507 Draft Evidence Report: Targeted Immune Modulators for Rheumatoid Arthritis Return to Table of Contents
Author & Year of Publication
(Trial Name)
Interventions Malignancies Infections Other Adverse
Events
Discontinuation,
Serious AE rate,
Deaths
Westhovens R Arthritis
Rheum. 2006 188
START
1) PBO + MTX
(n=363)
2) IFX + MTX, 3mg/kg
(n=360)
3) IFX + MTX,
10mg/kg (n=361)
26 patients
reported
development of 30
tumors during the
trial
19 of the 30
malignancies were
nonmelanoma skin
cancers, benign
neoplasms, or
carcinoma in situ
1) 0 (5 receiving 3
mg/kg IFX)
2) 9
3) 5
Through 22 weeks
Serious infections,
n (%)
1) 6 (1.7)
2) 6 (1.7)
3) 18 (5)
Common serious
infections in IFX +
MTX, n
Pneumonia (7)
TB (4)
Cellulitis (2)
UTI (2)
In PBO + MTX, n
Bronchitis (2)
Latent TB (1)
Before Week 22
Discontinuation due
to AEs, n (%)
1) 8 (2.2)
2) 18 (5)
3) 20 (5.5)
After Week 22
Discontinuation due
to AEs, n (%)
1) 18 (5)
2) 14 (3.9)
3) 17 (4.7)
Before Week 22
Incidence of AEs, %
1) 7.5
2) 7.8
3)7.8
After Week 22
Incidence of AEs, %
1) 11.8
2) 9.9
3) 10.3

©Institute for Clinical and Economic Review, 2017 Page 508 Draft Evidence Report: Targeted Immune Modulators for Rheumatoid Arthritis Return to Table of Contents
Author & Year of Publication
(Trial Name)
Interventions Malignancies Infections Other Adverse
Events
Discontinuation,
Serious AE rate,
Deaths
van Vollenhoven RF The
Lancet 2012199
SWEFOT
1) MTX+sulfasalazine
+hydroxychloroquine
(n=130)
2) IFX+MTX (n=128)
1 acute myeloid
leukemia in a
patient treated
with IFX+MTX
Infectious AEs, n
(%)
1) 1 (1)
2) 8 (6)
Gastrointestinal
AEs, n (%)
1) 18 (14)
2) 3 (2)
Discontinuation due
to AEs, n (%)
1) 22 (17)
2) 19 (15)
Serious AEs, n
1) 1
2) 2
Deaths, n
1) 0
2) 1

©Institute for Clinical and Economic Review, 2017 Page 509 Draft Evidence Report: Targeted Immune Modulators for Rheumatoid Arthritis Return to Table of Contents
Table F52. Infliximab versus conventional DMARDs: Patient-reported Outcomes
Author & Year of Publication
(Trial Name)
Interventions Health-related
quality of life
Pain Fatigue & other
PROs
Karlsson JA Ann Rheum Dis.
2013 293
SWEFOT
1) MTX +
sulfasalazine+
hydroxychloroquine
(n=130)
2) IFX+MTX (n=128)
Month 21
Mean EQ-5D (SD)
score
1) 0.73 (0.24)
2) 0.68 (0.26)
NR NR
Kim J Journal of Korean
medical science 2013186
1) PBO+MTX (n=72)
2) IFX+MTX (n=71)
Week 30 mean
change from
baseline SF-36
PCS
1) 1.2
2) 6.1
p<0.001
NR NR
Maini R Lancet 1999187
ATTRACT
1) PBO (n=88)
2) IFX, 3mg/kg every
8 wk (n=86)
3) IFX, 3mg/kg every
4 wk (n=86)
4) IFX, 10mg/kg
every 8 wk (n=87)
5) IFX, 10mg/kg
every 4 wk (n=81)
NR Pain score range
(VAS 0 – 10 cm),
(30 weeks)
1) 6.7 (5.9)
2) 7.0 (3.8)
3) 6.9 (3.5)
4) 6.7 (3.1)
5) 6.6 (3.7)
NR
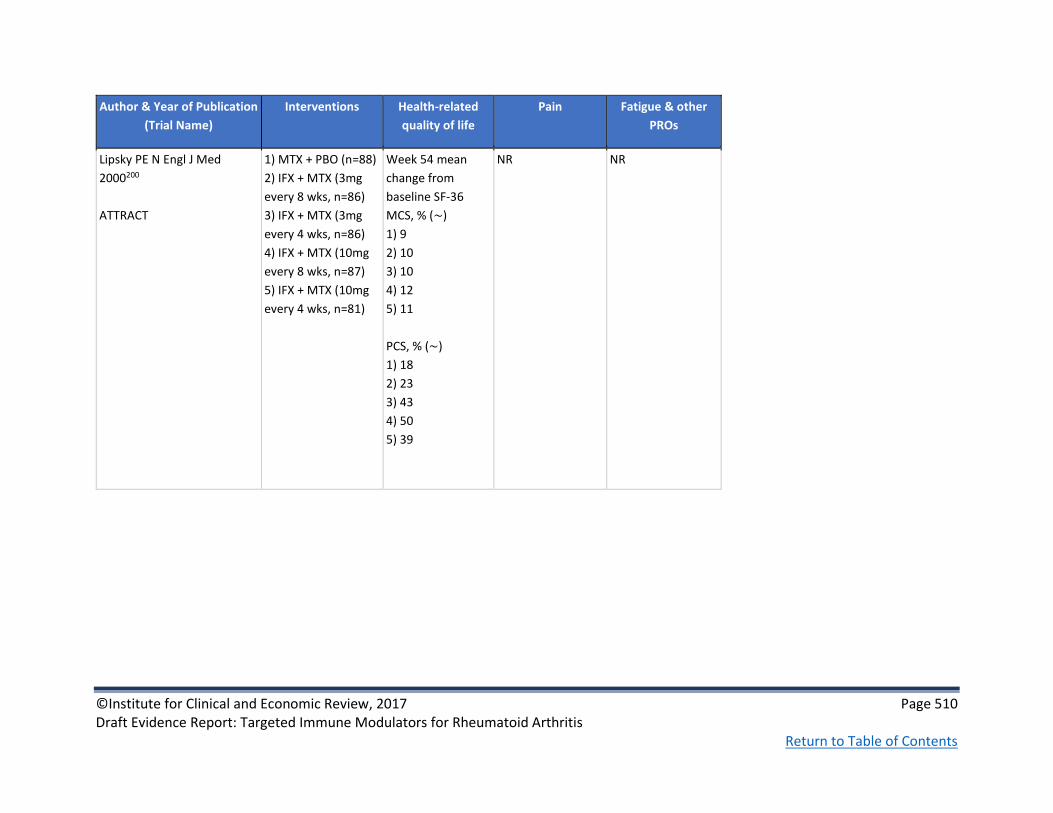
©Institute for Clinical and Economic Review, 2017 Page 510 Draft Evidence Report: Targeted Immune Modulators for Rheumatoid Arthritis Return to Table of Contents
Author & Year of Publication
(Trial Name)
Interventions Health-related
quality of life
Pain Fatigue & other
PROs
Lipsky PE N Engl J Med
2000200
ATTRACT
1) MTX + PBO (n=88)
2) IFX + MTX (3mg
every 8 wks, n=86)
3) IFX + MTX (3mg
every 4 wks, n=86)
4) IFX + MTX (10mg
every 8 wks, n=87)
5) IFX + MTX (10mg
every 4 wks, n=81)
Week 54 mean
change from
baseline SF-36
MCS, % (~)
1) 9
2) 10
3) 10
4) 12
5) 11
PCS, % (~)
1) 18
2) 23
3) 43
4) 50
5) 39
NR NR

©Institute for Clinical and Economic Review, 2017 Page 511 Draft Evidence Report: Targeted Immune Modulators for Rheumatoid Arthritis Return to Table of Contents
Table F53. Infliximab versus conventional DMARDs: Non-healthcare Outcomes

©Institute for Clinical and Economic Review, 2017 Page 512 Draft Evidence Report: Targeted Immune Modulators for Rheumatoid Arthritis Return to Table of Contents
Author & Year of
Publication
(Trial Name)
Interventions Requirements for
surgical intervention
Hospitalization,
Rehabilitation,
Assisted living
Productivity Loss Caregiver Burden Other outcomes
Eriksson JK JAMA
Internal Medicine
2013228
SWEFOT
The current analysis of
the Swefot trial
population included
only patients with
early RA of working
age (<63 years) at
randomization
1) MTX+sulfasalazine+
hydroxychloroquine
(n=105)
2) IFX+MTX (n=99)
3) Controls from
general population
without RA (n=1020)
Controls were
identified from the
Swedish Register of
the Total Population
by sampling 5 sex-,
age-, education-, and
county-matched
controls per patient
with RA
NR NR Change vs. baseline in
days on sick leave and
disability pension,
d/mo (SE)
@12 months/21
months
1) -4.1 (1.2)/ -4.9 (1.2)
2) -4.0 (1.1)/ -6.2 (1.0)
Work loss, mean d/mo
(SD)
@12 months/21
months
1) 13 (13)/ 12 (13)
2) 13 (13)/ 10 (12)
NR NR

©Institute for Clinical and Economic Review, 2017 Page 513 Draft Evidence Report: Targeted Immune Modulators for Rheumatoid Arthritis Return to Table of Contents
Eriksson, J Arthritis
Care and Research
2016229
SWEFOT
1) MTX+sulfasalazine+
hydroxychloroquine
(n=101)
2) IFX+MTX (n=109)
3) MTX responders
(n=91)
4) Controls from
general population
without RA (n=455)
Controls were
identified from the
Swedish Register of
the Total Population
by sampling 5 sex-,
age-, education-, and
county-matched
controls per patient
with RA
NR NR Change vs. baseline in
annual days on sick
leave and disability
pension, days
(SD)
@ 7 years
1) -26 (12)
2) -25 (13)
NR NR

©Institute for Clinical and Economic Review, 2017 Page 514 Draft Evidence Report: Targeted Immune Modulators for Rheumatoid Arthritis Return to Table of Contents
Appendix G. Ongoing Studies
Title, Trial Sponsor,
ClinicalTrials.gov Identifier
Study Design Treatment Arms Patient Population Primary Outcomes Estimated Completion
Date
Clinical Trial Evaluating
Methotrexate + Biologic Versus
Methotrexate, Salazopyrine and
Hydroxychloroquine in Patients
With Rheumatoid Arthritis and
Insufficient Response to
Methotrexate
University Hospital, Strasbourg,
France
NCT02714634
Phase 4
Open label
RCT
1) MTX+biologic
(chosen by
investigator)
2) Triple therapy
(MTX, salazopyrine,
hydroxychloroquine)
Inclusion criteria
• RA
• DAS28-CRP>3.2
• Insufficient response to MTX after ≥3 months
• Radiographic erosions and/or serum RF associated to anti-CCP
• Age ≥18 h)
i) Exclusion criteria
• Prior biologic
• Prior triple therapy
• Absence of TB screening
• Corticosteroids at dose >15 mg/d of equivalent prednisone ≥4 weeks prior to inclusion
Primary
• Participant with low disease activity (DAS28-CRP<3.2) and a daily dose ≤ 7.5 mg/day of equivalent prednisone at 12 months
Secondary
• SAE rate
• CDAI
• DAS28-CRP
• ACR20/50/70, Boolean remission
• Vdh-mTSS
• Costs
• Treatment compliance
February 2020

©Institute for Clinical and Economic Review, 2017 Page 515 Draft Evidence Report: Targeted Immune Modulators for Rheumatoid Arthritis Return to Table of Contents
Title, Trial Sponsor,
ClinicalTrials.gov Identifier
Study Design Treatment Arms Patient Population Primary Outcomes Estimated Completion
Date
Comparative and Pragmatic Study
of Golimumab Intravenous (iv)
(Simponi Aria) Versus Infliximab
(Remicade) in Rheumatoid
Arthritis (AWARE)
Janssen Scientific Affairs, LLC
NCT02728934
Prospective,
observational
(patient
registry)
cohort
1) GOLiv
2) IFX
Inclusion criteria
• Age ≥18
• Confirmed diagnosis of RA
• May or may not have had prior biologic, including GOLsc
j)
k) Exclusion criteria
• Received investigational drug, vaccine, or device within 28 days
• Prior GOLiv or IFX
Primary
• % with infusion reaction at week 52 l) Secondary
• Severe/Serious infusion reaction
• Discontinuation due to infusion reaction
• CDAI
• Discontinuation due to lack of effectiveness
• Adherence
• AEs and SAEs
• Cost effectiveness (medical resource utilization and healthcare economics)
February 2021

©Institute for Clinical and Economic Review, 2017 Page 516 Draft Evidence Report: Targeted Immune Modulators for Rheumatoid Arthritis Return to Table of Contents
Title, Trial Sponsor,
ClinicalTrials.gov Identifier
Study Design Treatment Arms Patient Population Primary Outcomes Estimated Completion
Date
An Efficacy and Safety Study
Evaluating Tofacitinib With and
Without Methotrexate Compared
to Adalimumab with
Methotrexate (ORAL STRATEGY)
Pfizer
NCT02187055
Phase 4
Double blind
RCT
1) TOF (5mg, twice
daily) + MTX
2) TOF (5 mg, twice
daily) monotherapy
3) ADA (40 mg every
other wk) + MTX
Inclusion criteria
• Age ≥18
• Moderate to severe RA
• On MTX but inadequately controlled
• No active TB or inadequately treated TB infection
m) Exclusion criteria
• Previous ADA or TOF
• Current or prior malignancy
• Lab abnormalities
• Infections
Primary
• ACR50 at month 6
Secondary
• SDAI change
• CDAI change
• DAS28-CRP change
• DAS28-ESR change
• ACR20/70
• HAQ-DI change
• SF-36
• WPAI
• EQ-5D
• FACIT-F
• Remission
• LDA
• AEs
December 2016

©Institute for Clinical and Economic Review, 2017 Page 517 Draft Evidence Report: Targeted Immune Modulators for Rheumatoid Arthritis Return to Table of Contents
Title, Trial Sponsor,
ClinicalTrials.gov Identifier
Study Design Treatment Arms Patient Population Primary Outcomes Estimated Completion
Date
A Study of Baricitinib (LY3009104)
in Participants with Rheumatoid
Arthritis
Eli Lilly and Company
NCT02265705
Phase 3
Double blind
RCT
1) BAR (4 mg) + MTX
2) PBO + MTX
Inclusion criteria
• Adult-onset RA diagnosis
• Moderately to severely active RA
• CRP ≥6 mg/L
• Regular MTX for at least 12 weeks prior to study
n) Exclusion criteria
• Corticosteroids at doses >10 mg of prednisone/day
• Recent NSAIDs
• Receiving concomitant treatment with MTX or other cDMARDs within 8 weeks of study entry
• Physiotherapy for RA in 2 weeks prior to study entry
• Prior biologic or JAKi
Primary
• ACR20 at week 12
Secondary
• HAQ-DI change
• DAS28-CRP change
• SDAI≤3.3
• Duration/severity of morning joint stiffness
• Worst tiredness
• Worst pain
June 2017
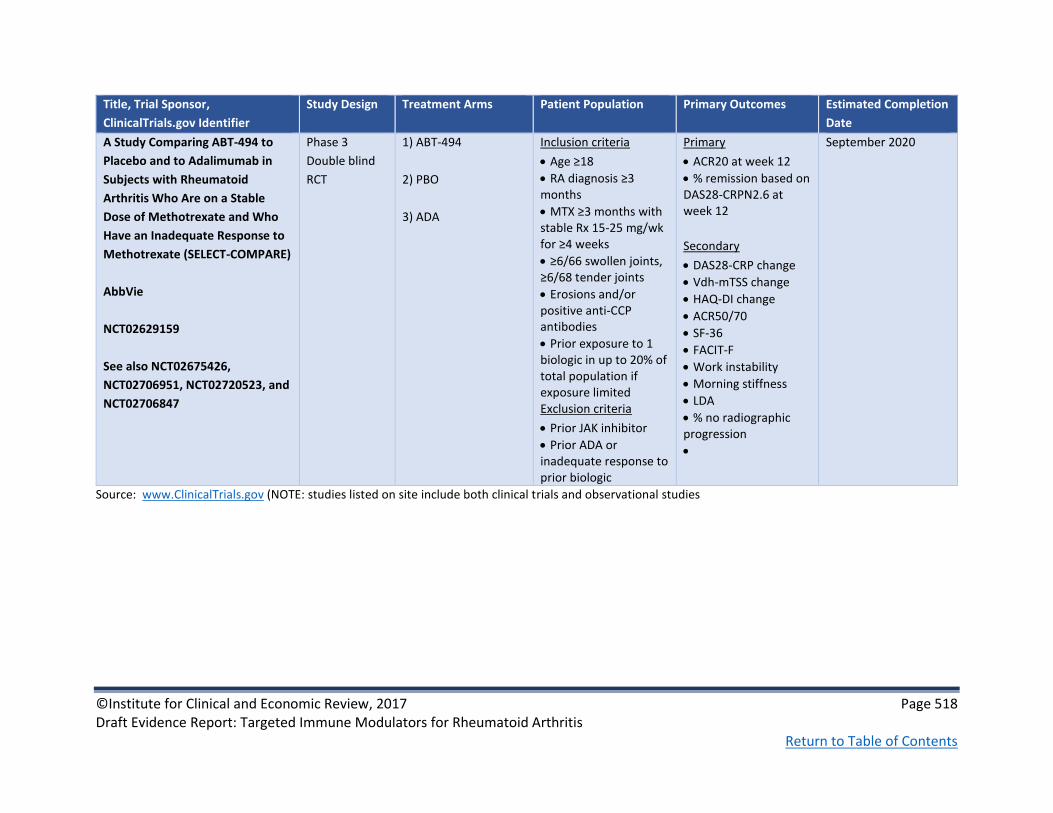
©Institute for Clinical and Economic Review, 2017 Page 518 Draft Evidence Report: Targeted Immune Modulators for Rheumatoid Arthritis Return to Table of Contents
Title, Trial Sponsor,
ClinicalTrials.gov Identifier
Study Design Treatment Arms Patient Population Primary Outcomes Estimated Completion
Date
A Study Comparing ABT-494 to
Placebo and to Adalimumab in
Subjects with Rheumatoid
Arthritis Who Are on a Stable
Dose of Methotrexate and Who
Have an Inadequate Response to
Methotrexate (SELECT-COMPARE)
AbbVie
NCT02629159
See also NCT02675426,
NCT02706951, NCT02720523, and
NCT02706847
Phase 3
Double blind
RCT
1) ABT-494
2) PBO
3) ADA
Inclusion criteria
• Age ≥18
• RA diagnosis ≥3 months
• MTX ≥3 months with stable Rx 15-25 mg/wk for ≥4 weeks
• ≥6/66 swollen joints, ≥6/68 tender joints
• Erosions and/or positive anti-CCP antibodies
• Prior exposure to 1 biologic in up to 20% of total population if exposure limited
o) Exclusion criteria
• Prior JAK inhibitor
• Prior ADA or inadequate response to prior biologic
Primary
• ACR20 at week 12
• % remission based on DAS28-CRPN2.6 at week 12
Secondary
• DAS28-CRP change
• Vdh-mTSS change
• HAQ-DI change
• ACR50/70
• SF-36
• FACIT-F
• Work instability
• Morning stiffness
• LDA
• % no radiographic progression
•
September 2020
Source: www.ClinicalTrials.gov (NOTE: studies listed on site include both clinical trials and observational studies
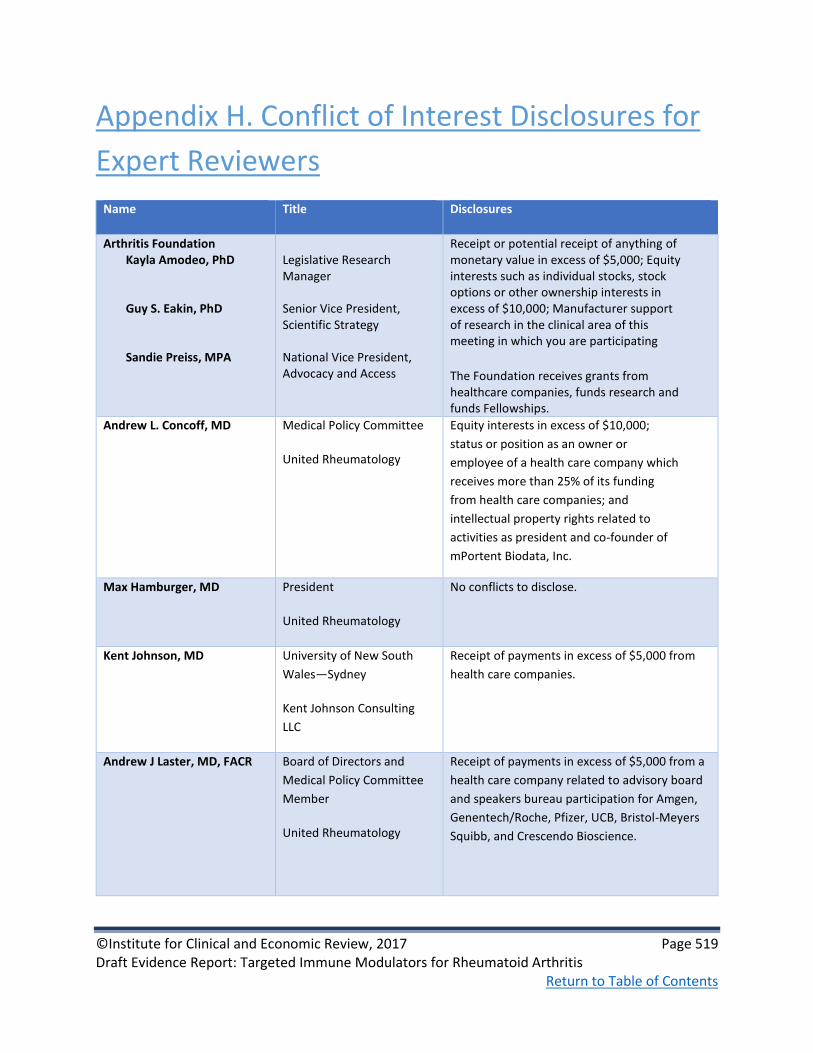
©Institute for Clinical and Economic Review, 2017 Page 519 Draft Evidence Report: Targeted Immune Modulators for Rheumatoid Arthritis Return to Table of Contents
Appendix H. Conflict of Interest Disclosures for
Expert Reviewers
Name Title Disclosures
Arthritis Foundation Kayla Amodeo, PhD Guy S. Eakin, PhD Sandie Preiss, MPA
Legislative Research Manager Senior Vice President, Scientific Strategy National Vice President, Advocacy and Access
Receipt or potential receipt of anything of monetary value in excess of $5,000; Equity interests such as individual stocks, stock options or other ownership interests in excess of $10,000; Manufacturer support of research in the clinical area of this meeting in which you are participating
The Foundation receives grants from healthcare companies, funds research and funds Fellowships.
Andrew L. Concoff, MD Medical Policy Committee
United Rheumatology
Equity interests in excess of $10,000;
status or position as an owner or
employee of a health care company which
receives more than 25% of its funding
from health care companies; and
intellectual property rights related to
activities as president and co-founder of
mPortent Biodata, Inc.
Max Hamburger, MD President
United Rheumatology
No conflicts to disclose.
Kent Johnson, MD University of New South
Wales—Sydney
Kent Johnson Consulting
LLC
Receipt of payments in excess of $5,000 from
health care companies.
Andrew J Laster, MD, FACR Board of Directors and
Medical Policy Committee
Member
United Rheumatology
Receipt of payments in excess of $5,000 from a
health care company related to advisory board
and speakers bureau participation for Amgen,
Genentech/Roche, Pfizer, UCB, Bristol-Meyers
Squibb, and Crescendo Bioscience.

©Institute for Clinical and Economic Review, 2017 Page 520 Draft Evidence Report: Targeted Immune Modulators for Rheumatoid Arthritis Return to Table of Contents
Name Title Disclosures
Matthew H. Liang, MD, MPH Division of Rheumatology,
Immunology, and Allergy,
Brigham and Women's
Hospital
Awaiting response
Elizabeth Tindall, MD, FACR Rheumatology Consultants
of Oregon, LLC
No conflicts to disclose.
Jan Wyatt, PhD, RN, FAANP Patient Advocate No conflicts to disclose.

©Institute for Clinical and Economic Review, 2017 Page 521 Draft Evidence Report: Targeted Immune Modulators for Rheumatoid Arthritis Return to Table of Contents
Appendix I. Public Comments
This section includes summaries of the public comments prepared for the New England CEPAC Public
Meeting on March 24, 2017 in Boston, MA. These summaries were prepared by those who delivered
the public comments at the meeting and are presented in order of delivery.
A video recording of these comments can be found on our site here at minute 2:20:29. Conflict of
interest disclosures are included at the bottom of each statement.
Margaret Michalska, MD, Medical Director for Immunology; Medical Affairs, Genentech
Genentech is committed to advancing research and innovating therapies in RA. We support well-
conducted frameworks that enable meaningful discussions on value and believe that treatment
decisions should be made by the physician and patient.
Treatment recommendations are not generalizable to all populations and depend on a
variety of factors. Selecting the right medicine for the right patient poses a significant
challenge due to market dynamics unique to RA. Access to therapies targeting various
mechanisms of action is important to allow for individualized treatment of patients who
continue to have active disease despite prior treatment(s).
Actemra and Rituxan offer long-term efficacy and safety experience in diverse patient
populations with RA. In patients who respond to Actemra and Rituxan treatment,
clinically meaningful improvements in RA signs, symptoms, and patient-reported
outcomes have been demonstrated.
We recommend the following to improve ICER’s evaluation:
• Consider evidence-based guidelines and real-world clinical practice in the sequential treatment algorithm to support better access to appropriate TIMs for patients who have failed first-line TIM or methotrexate therapy.
• Account for Actemra and Rituxan data derived from clinical trials and post-marketing settings. These data reflect real-world treatment patterns and dosing, and long-term efficacy and safety from over a decade, which are important to audiences that ICER seeks to inform.
• Increase transparency by providing economic models for manufacturer feedback.
• Revise ICER’s Evidence Report as new data becomes available (ex. Investigational drug approval).

©Institute for Clinical and Economic Review, 2017 Page 522 Draft Evidence Report: Targeted Immune Modulators for Rheumatoid Arthritis Return to Table of Contents
Brad Stolshek, Pharm.D., Director, Global Health Economics – Inflammation; Amgen
The forgotten memories of joint deterioration, severe chronic pain, walking difficulties and job loss
seen with inadequately treated moderate to severe rheumatoid arthritis (RA) before the
introduction of TIMs can lead to a complacency enabling the crippling and disabling nature of the
disease quickly becoming a reality again. The current ICER RA model is a symptom of that
complacency and has fundamental shortcomings:
• ICER’s use of cDMARDs as a comparator in patients who already had an inadequate
response to cDMARDs is inappropriate and contrary to clinical practice. Maintaining
patients on cDMARDs risks accelerated progression to joint destruction and disability and
should create a larger decrement in effect for these patients continuing on cDMARD
treatments.
• The full impact of disability is not included for the cDMARD patients who experience
significant disability and surgeries found in long-term observational data. Amgen modeled
the real world TIMs utilization following consensus recommendations, and addressing ICER
failures on clinical approach, disability, productivity and individual patient variation. This
peer-reviewed publication shows the TIMs are cost effective below $150K/QALY.
We must avoid stepping backwards, shortchanging patients who have failed cDMARDs by forcing
them to remain on cDMARDs as ICER does. We must preserve patient choice for RA treatments
based on specific disease characteristics, clinical expertise and individual patient need.
If ICER had included the right comparator and long-term disability data, the TIMS would provide
substantial value in their model. ICER should update their model to recognize the full value of TIMs
in RA.
Tammy Curtice, PharmD, MS; Director, Health Economics & Outcomes Research; Bristol-
Myers Squibb
Bristol-Myers Squibb (BMS) asked that ICER consider 2 key areas:
1. Treatment based on clinical presentation and biomarker status
• ICER acknowledged “There are multiple phenotypic and genotypic variations in the
pathogenesis of the disease that affect both the course of RA and the outcome of therapy“.
• ACR and EULAR guidelines present criteria to consider in the treatment of RA and
recommend risk stratification to guide treatment selection based on clinical presentation;
biomarker data, such as ACPA and C-reactive protein; and radiographic findings.

©Institute for Clinical and Economic Review, 2017 Page 523 Draft Evidence Report: Targeted Immune Modulators for Rheumatoid Arthritis Return to Table of Contents
• However, no attempt was made to run the cost-effectiveness model for scenarios to show
the variance in value across treatment strategies and the potential value of targeting based
on prognostic biomarkers.
• We recommend additional analyses with scenarios for particular subgroups (for example,
prognostic biomarkers).
2. Real World/Registry Data (RWD)
• While modeling is needed to fill data gaps, it is still important to consider available RWD to
inform the model versus assumptions.
• For example, the use of utility data derived from HAQ scores―derived from changes in ACR
scores and modified Total Sharp Score―may dilute effects in over-translation across sets of
outcomes, which may cause underestimation of treatment effects.
• We recommend using RWD to supplement models when available.
In closing, I would like to emphasize that BMS supports a comprehensive and current approach to
value that incorporates key elements: a real-world approach, patient priorities (including
consideration of patient access and unmet medical needs), and total societal value over specific
timelines or budgets, multi-stakeholder input, along with the most up-to-date clinical science.
BMS recommends that ICER:
• Avoid biopharmaceutical budget caps that unduly delay patient access to innovation and
can potentially disadvantage RA patients
• Incorporate clinical benefits & harms in a manner that recognizes the heterogeneity of
treatment effect rather that the average response.
Andrew Koenig D.O., F.A.C.R., Inflammation & Immunology Group Lead; Pfizer
On behalf of my colleagues who work in inflammation on ICER’s draft evidence report that seeks to
examine the clinical and economic value of targeted immune modulators for rheumatoid arthritis
we have identified the following areas for improvement:
1. Address or adjust for significant changes in RA treatments over time.
2. Address treatment discontinuation and switching that limits switching from an initial
therapy to another treatment in the same class.
3. Address ACR classification - not been validated and does not reflect real-world practice.
4. Address Sharp analysis - critical methodological challenges that significantly limits both the
validity of its findings and relevance to clinical practice.
©Institute for Clinical and Economic Review, 2017 Page 524 Draft Evidence Report: Targeted Immune Modulators for Rheumatoid Arthritis Return to Table of Contents
5. Use reported HAQ scores instead of estimating from a post study calculation since there is
consistent measurement in clinical trials.
6. Use product, not class-specific price discounts
7. Fully engage and leverage insights from stakeholders- especially patient stakeholders to
inform the report’s methodology and findings.
We agree that a collaborative effort to objectively examine clinical and economic evidence to help
enable the most efficient use of the healthcare resources in the treatment of RA is a positive goal.
We hope that ICER will seek to better recognize and acknowledge the limitations in its final report
and will use this analysis to begin a broader dialogue about how we can utilize current and evolving
treatments to best meet the needs of RA patients and their caregivers.
Andreas Kuznik, Ph.D., Senior Director, Health Economics and Outcomes Research; Regeneron
Pharmaceuticals
Sanofi-Genzyme and Regeneron would like to reiterate concerns with the final cost-effectiveness
model.
• We recognize that the cost-effectiveness model now accounts for HAQ degradation among
palliative care patients using a rate of 0.0269 per year for a period of 15 years. However, we
believe that this revision does not fully represent the disease progression in the absence of
biologic therapies. In the ICER model, cDMARD patients would merely progress to a HAQ of
2.1 over lifetime, which appears inconsistent with the substantial disease burden in the pre-
biologic era described in multiple patient testimonies at the ICER public meeting on
3/24/2017. We reiterate our recommendation to use a previously reported rate in the NDB
of 0.032 per year and to extend this HAQ progression over the entire model follow-up. In
addition, we recommend that higher rates of HAQ progression, such as 0.045 per year
reported in multiple NICE appraisals, are explored in sensitivity analyses.
• We continue to disagree with the use of a modified Wailoo equation for the utility function
and performing sensitivity analyses using the confidence interval from the original equation.
We strongly encourage exploring the impact of alternative utility equations in sensitivity or
scenario analyses (Hurst et al. 1997, Bansback et al. 2005)
• Pricing assumptions for the individual therapies should not be extracted from the treatment
sequence in the threshold analysis. Instead, we suggest proportionately reducing the cost of
the entire sequence of therapies until the cost effectiveness thresholds are met.
References:

©Institute for Clinical and Economic Review, 2017 Page 525 Draft Evidence Report: Targeted Immune Modulators for Rheumatoid Arthritis Return to Table of Contents
Hurst et al. in Chen, Y.F., Jobanputra, P., Barton, P., Jowett, S., Bryan, S., Clark, W. et al. A systematic
review of the effectiveness of adalimumab, etanercept and infliximab for the treatment of
rheumatoid arthritis in adults and an economic evaluation of their cost-effectiveness. Health
Technology Assessment (Winchester, England) 2006; 10(42):iii-iiv
Bansback NJ, Brennan A, Ghatnekar O. Cost effectiveness of adalimumab in the treatment of
patients with moderate to severe rheumatoid arthritis in Sweden. Ann Rheum Dis 2005;64:995-
1002.
Dr Jeff Stark, Head of Medical Affairs, Rheumatology; UCB
UCB will describe the positive attributes of certolizumab pegol (Cimzia®) that were omitted, as well
as comment on the ICER approach.
• Cimzia has the lowest WAC price for all anti-TNFs. This is contrary to ICER’s review. ICER
failed to convert the WAC per unit prices to reflect dosage variation for agents with weight-
based dosing. Additionally, ICER did not take into account the high rates of dose escalation
that frequently occur with other products, or the administration cost difference for
intravenous products. These omissions lead to inaccurate comparisons of costs across all
agents.
• Cimzia has additional clinical benefits unrecognized by ICER:
• EXXELERATE demonstrates that Cimzia combination therapy is equivalent to
adalimumab combination therapy. Again, contrary to the conclusion drawn by ICER,
this is significant because it demonstrates that access to a second anti-TNF with a
unique molecular structure for primary non-responders has strong therapeutic
value.
• Cimzia has significant efficacy as monotherapy, demonstrated in the FAST4WRD trial
and recognized with a formal monotherapy indication.
• Demonstrated efficacy across many patient subtypes (MTX-naïve, DMARD-IR, TNF-
experienced, etc.).
• Stable, non-weight-based dosing provides lower and more predictable costs for
patients.
• Ability to make a clinical decision based on 12-week response
• CRIB and CRADLE examine Cimzia safety in women who are pregnant or nursing.
UCB questions ICER’s decision to compare products to conventional DMARDs which do not
optimally prevent disease progression and are not the current standard of care. Not using
adalimumab for the ultimate assessment of cost-effectiveness distorted the final result.
©Institute for Clinical and Economic Review, 2017 Page 526 Draft Evidence Report: Targeted Immune Modulators for Rheumatoid Arthritis Return to Table of Contents
Dr. Christopher Phillips, American College of Rheumatology
The American College of Rheumatology supports comparative effectiveness research (CER) that
informs treatment decisions and helps us understand the strengths and weaknesses of one
treatment versus another, with respect to safety, effectiveness and cost. However, we are unsure
this document accomplishes that goal.
Multiple assumptions in this report build off each other and may not reflect reality. HAQ and sharp
scores are translated into QALYs based on various different models. Drug costs are estimated but
may vary widely between WACs, ASPs, and discounts negotiated between PBMs and pharma. With
each link in this path, the confidence interval regarding comparative cost effectiveness widens. ACR
agrees high costs for TIMs is of concern and supports efforts which would allow the healthcare
economy to better bear the costs of effective RA therapy. We are not able to comment on factors
that go into TIM pricing; however, drug pricing and medical appropriateness are separate issues
that should not be conflated. We should not pretend that an analysis based on drug prices in the
current healthcare environment says anything about medical appropriateness.
ACR feels that a report such as this should not become proscriptive towards drug coverage. We are
concerned this document will raise barriers preventing the appropriate use of biologic drugs by
increasing non biological treatments required before allowing biologics, by narrowing the scope of
which biologics will be covered through step edits, or claiming that biologics won't be covered.
ACR believes CER should be used to inform, not constrain, decisions made by a provider and
patient. The ACR will continue to support quality CER that informs patients and their providers and
assists decision making but we will resist attempts couched in CER to inappropriately constrain
them.
Conflict of Interest Disclosure. AbbVie - speaker bureau; AbbVie - clinical research
Dr. Liana Fraenkel, Professor of Medicine, Yale
The ACR appreciates the effort that went into the creation of the report. While the cost-
effectiveness analysis methods used are sound, there are several issues that merit discussion prior
to dissemination.
While several sensitivity analyses were performed, the base model does not reflect clinical practice.
Current standards based on strong evidence require that rheumatologists recommend treatment in

©Institute for Clinical and Economic Review, 2017 Page 527 Draft Evidence Report: Targeted Immune Modulators for Rheumatoid Arthritis Return to Table of Contents
order to minimize inflammation– as fast as possible and to the greatest degree possible. This
strategy is based on data demonstrating accumulation of irreversible damage as early as after 3
months of untreated disease. A related body of evidence now also supports a treat-to-target
strategy which also requires access to TIMs. The comparator strategy is not consistent with
evidence based guidelines (both ACR and EULAR) or what patients and doctors would consider
standard of care for rheumatoid arthritis in 2017. In addition, best practices generally recommend
that cost is considered from the societal (not the payer) perspective.
Beyond the underlying strategies in the model is the question of whether a cost-effectiveness
model is an appropriate metric by which to judge the value of TIMs. While we appreciate that cost
effectiveness models are a key tool to be able to compare strategies, using this metric to compare
treatment options whose costs cannot be measured on the same scale is not informative. It is clear,
given the current costs (regardless of whether or not patients are insured and which type of
coverage they have), that TIMs cannot be shown to be cost effective when compared to
conventional DMARDs from the payer perspective. Comparing an effective class of much more
costly medications to baseline treatment that is MUCH cheaper will never meet benchmarks set in
an era before the development of biologics and small molecules. This is true for RA as well as other
chronic potentially debilitating diseases.
The ACR acknowledges the importance of providing high-value care. The output from this significant
body of work should not imply that TIMs are not sufficiently effective, but should highlight their
cost and call for efforts to maximize value in caring for RA.
Conflict of Interest Disclosure. None to disclose
Chantelle Marcial, Global Healthy Living Foundation—Member
I would like to thank you for allowing us patient advocates the time to speak before you all. As I
mentioned, GHLF has a great level of transparency listing all donors and sponsors. After a bit of a
search I found the funding page on the ICER site. To me, it looks like there is a heavy insurance
presence and that makes me, as a patient, feel that the study was probably weighted toward
cheaper, older DMARD therapies strictly because of the cost savings and not based on actual
patient success with biologics.
The ICER arthritis report uses short-term clinical trial data and ignores the nearly two-decades-old
benefits of substituting legs for wheelchairs. Calculating the economic benefits to society derived
from sustained worker productivity and quality-of-life that results from the use of biologics is
imperative.

©Institute for Clinical and Economic Review, 2017 Page 528 Draft Evidence Report: Targeted Immune Modulators for Rheumatoid Arthritis Return to Table of Contents
CreakyJoints, through a multi-year PCORI contract, has built and is populating a patient-reported-
outcomes registry of people with arthritis. It is called ArthritisPower. We are using many
components of the ICER RA model as instructive of what NOT to do, such as reliance on short-term
clinical trials data, lack of observational research, dismissing co-morbidities, not clearly defining the
benefits of infusion vs. injected, not accepting my patient data as well as population data, and
relying on a small universe of HAQ scores. Instead, we are focused on long-term patient data which
can be combined with clinical and payer data. The objective is to reduce healthcare costs by
incorporating societal as well as short- and long-term health benefits with the patient, not the
payer, driving the conclusions.
Conflict of Interest Disclosure. Global Healthy Living Foundation corporate sponsors include UCB,
Takeda, Pfizer, Janssen, Horizon Pharma, Genentech, Endo, Crescendo, Bristol Myers Squibb,
AstraZeneca, Amgen, AbbVie
Jen Melanson, Arthritis Foundation Advocate & Arthritis Patient
RA attacked me quite suddenly, literally threatening my life. On March 6, 2012, I woke up feeling as
if I might have the flu. But just five days later, I was very seriously ill. Isn fact, I was in heart failure.
While it took a year to finally get a definitive diagnosis of RA, my doctor treated me early and
aggressively, based on my symptoms. I was started first on DMARDs and methotrexate within
weeks of onset, and moved very quickly to biologics when those weren’t enough. The first biologic
didn’t work, so within 6 months my doctor switched me to another. Still, this was almost two full
years after my onset. For those two years, I endured horribly painful, swollen joints. I missed
countless hours of work, ultimately having to give up my job in favor of a position that was less
physically-demanding. I missed hockey games and band concerts and birthday parties and family
gatherings. I became very depressed, even seriously considered taking my own life. But I am one of
the “lucky” ones, having found a biologic that works for me, allowing me to resume a “normal” life.
Still, I worry about my medication regime someday failing, as often happens for RA patients. This is
why it is crucial that patients be allowed access to as many treatment options as possible. RA is not
a one-size-fits-all disease. And for me, access to effective treatment was not just life-changing, it is
life-sustaining.
©Institute for Clinical and Economic Review, 2017 Page 529 Draft Evidence Report: Targeted Immune Modulators for Rheumatoid Arthritis Return to Table of Contents
Renay Houlem, Arthritis Foundation Advocate & Arthritis Patient
[No summary testimony was submitted. A video of public comments can be found here,
beginning at 2:20:29]
Anna Legassie, Arthritis Foundation Advocate & Arthritis Patient [No summary testimony was submitted. A video of public comments can be found here,
beginning at 2:20:29]
Conflict of Interest Disclosure. Arthritis Foundation corporate sponsors include AbbVie, Aleve,
Arthro-7, Instaflex, Iroko Pharmaceuticals, Janssen, Move Free: Total Joint Health, Amgen, Advil,
Ferring Pharmaceuticals, Eli Lilly, Novartis, Pfizer, Boehringer Ingelheim, Bristol-Myers Squibb,
Celgene, Genentech, Gilead, GlaxoSmithKline, Horizon, Mallinckrodt, Merck, Samumed, Sanofi-
Regeneron, Takeda, UCB