Therapies for Active Rheumatoid Arthritis after Methotrexate ...
Upload
independentCategory
view
0download
0
Available online http://arthritis-research.com/content/10/4/R101
Open AccessVol 10 No 4Research articleUpregulated miR-146a expression in peripheral blood mononuclear cells from rheumatoid arthritis patientsKaleb M Pauley1, Minoru Satoh2,3, Annie L Chan2, Michael R Bubb2, Westley H Reeves2,3 and Edward KL Chan1
1Department of Oral Biology, University of Florida, SW Archer Road, Gainesville, Florida 32610, USA2Division of Rheumatology and Clinical Immunology, Department of Medicine, University of Florida, SW Archer Road, Gainesville, Florida 32610, USA3Department of Pathology, Immunology, and Laboratory Medicine, University of Florida, Gainesville, SW Archer Road, Florida 32610, USA
Corresponding author: Edward KL Chan, [email protected]
Received: 29 May 2008 Revisions requested: 26 Jun 2008 Revisions received: 8 Aug 2008 Accepted: 29 Aug 2008 Published: 29 Aug 2008
Arthritis Research & Therapy 2008, 10:R101 (doi:10.1186/ar2493)This article is online at: http://arthritis-research.com/content/10/4/R101© 2008 Pauley et al.; licensee BioMed Central Ltd. This is an open access article distributed under the terms of the Creative Commons Attribution License (http://creativecommons.org/licenses/by/2.0), which permits unrestricted use, distribution, and reproduction in any medium, provided the original work is properly cited.
Abstract
Introduction MicroRNAs are small noncoding RNA moleculesthat negatively regulate gene expression via degradation ortranslational repression of their targeted mRNAs. It is known thataberrant microRNA expression can play important roles incancer, but the role of microRNAs in autoimmune diseases isonly beginning to emerge. In this study, the expression ofselected microRNAs is examined in rheumatoid arthritis.
Methods Total RNA was isolated from peripheral bloodmononuclear cells obtained from patients with rheumatoidarthritis, and healthy and disease control individuals, and theexpression of miR-146a, miR-155, miR-132, miR-16, andmicroRNA let-7a was analyzed using quantitative real-time PCR.
Results Rheumatoid arthritis peripheral blood mononuclearcells exhibited between 1.8-fold and 2.6-fold increases in miR-146a, miR-155, miR-132, and miR-16 expression, whereas let-7a expression was not significantly different compared withhealthy control individuals. In addition, two targets of miR-146a,namely tumor necrosis factor receptor-associated factor 6(TRAF6) and IL-1 receptor-associated kinase 1 (IRAK-1), weresimilarly expressed between rheumatoid arthritis patients andcontrol individuals, despite increased expression of miR-146a in
patients with rheumatoid arthritis. Repression of TRAF6 and/orIRAK-1 in THP-1 cells resulted in up to an 86% reduction intumor necrosis factor-α production, implicating that normal miR-146a function is critical for the regulation of tumor necrosisfactor-α production.
Conclusions Recent studies have shown that synovial tissueand synovial fibroblasts from patients with rheumatoid arthritisexhibit increased expression of certain microRNAs. Our datathus demonstrate that microRNA expression in rheumatoidarthritis peripheral blood mononuclear cells mimics that ofsynovial tissue/fibroblasts. The increased microRNA expressionin rheumatoid arthritis patients is potentially useful as a markerfor disease diagnosis, progression, or treatment efficacy, butthis will require confirmation using a large and well definedcohort. Our data also suggest a possible mechanismcontributing to rheumatoid arthritis pathogenesis, whereby miR-146a expression is increased but unable to properly function,leading to prolonged tumor necrosis factor-α production inpatients with rheumatoid arthritis.
IntroductionRheumatoid arthritis (RA) is a systemic autoimmune disorderthat is characterized by chronic inflammation of synovial tissue,which results in irreversible joint damage [1]. Inflammatory
cytokines, including tumor necrosis factor (TNF)-α and IL-1β,play an important role in RA pathogenesis, and inhibition ofthese cytokines can ameliorate disease in some patients [2,3].
Page 1 of 10(page number not for citation purposes)
CRP: C-reactive protein; ESR: erythrocyte sedimentation rate; GWP: GW or P bodies; IL: interleukin; IFN: interferon; IIF: indirect immunofluores-cence; IRAK: IL-1 receptor-associated kinase; LPS: lipopolysaccharide; MCP: monocyte chemoattractant protein; M-CSF: macrophage colony-stim-ulating factor; miRNA: microRNA; PBMC: peripheral blood mononuclear cell; qRT-PCR: quantitative real-time RT-PCR; RA: rheumatoid arthritis; RISC: RNA-induced silencing complex; RT-PCR: reverse transcription polymerase chain reaction; siRNA: small interfering RNA; TNF: tumor necrosis factor; TRAF: tumor necrosis factor receptor-associated factor.

Arthritis Research & Therapy Vol 10 No 4 Pauley et al.
MicroRNAs (miRNAs) are small noncoding RNA moleculesthat negatively regulate gene expression at the post-transcrip-tional level [4,5]. It is predicted that as much as one-third of allmRNAs are targeted for miRNA-mediated regulation [6], andthe importance of miRNA regulation is becoming increasinglyclear as new roles in critical cellular processes such as apop-tosis, differentiation, and the cell cycle are discovered.
The biogenesis and maturation of miRNAs are dependent ontwo RNase III enzymes, namely Drosha and Dicer. First, miR-NAs are transcribed by RNA polymerase II into a long primarymiRNA (pri-miRNA) transcript [7,8]. The pri-miRNA is thencleaved by Drosha and its partner protein DGCR8 into anapproximately 70-nucleotide precursor miRNA (pre-miRNA)molecule [9-13]. The pre-miRNA is then exported into thecytoplasm via Exportin 5, where it is cleaved into an approxi-mately 21-nucleotide miRNA duplex, similar in structure tosmall interfering RNA (siRNA) [14,15]. One strand of themiRNA duplex is then loaded into the RNA-induced silencingcomplex (RISC), where it binds the 3'-untranslated region ofits target mRNA, causing the degradation or translationalrepression of that mRNA [15].
The key components of RISC are the argonaute proteins 1–4(Ago1–4). Ago2 is known to be the catalytic enzyme of RNAinterference and is critical for both miRNA and siRNA function[16,17]. In addition to Ago2, many other proteins are criticalfor miRNA function, including GW182 and Rck/p54. Theseproteins, as well as miRNA and siRNA, localize to cytoplasmicfoci known as GW or P bodies (here referred to as GWB). Ourrecent studies have established GWB to be useful biomarkersfor siRNA and miRNA activity in cells [18,19]. Our latest study(Pauley KM and coworkers, unpublished data) demonstratedthat the number and size of GWB significantly increases con-currently with increased miRNA expression in lipopolysaccha-ride (LPS)-treated THP-1 cells, implying that GWB can bemonitored as biomarkers for miRNA activity.
TNF-α stimulation has been shown to induce the expression ofcertain miRNAs, including miR-146a and miR-155, in mono-cytes and macrophages [20,21]. Based on these data and thefact that TNF-α plays an important role in RA pathogenesis, assupported by the development of successful anti-TNF-α ther-apies, we set out to compare miRNA expression between RApatients and healthy control individuals.
In this study, we obtained peripheral blood mononuclear cells(PBMCs) from RA patients and control individuals and exam-ined the expression of miR-146a, miR-155, miR-132, miR-16,and miRNA let-7a. Most of these miRNAs were chosen forexamination based on previous reports linking them to immunestimulation by LPS or TNF-α; miR-16 was selected for its abil-ity to target the 3'-untranslated region of TNF-α [20-22].miRNA let-7a was chosen as a control. This study is significantbecause it demonstrates that miRNA expression in RA
PBMCs may mimic conditions in synovial tissue and thus ena-ble us to bypass the need for synovial tissue samples, allowingthe analysis of larger patient populations.
Materials and methodsPatients and control individualsSixteen patients (including two samples from a single patient)who fulfilled the American College of Rheumatology classifica-tion criteria for RA were included in the study. Their demo-graphic, clinical, and laboratory characteristics aresummarized in Table 1. Four disease control individuals,including one with systemic lupus erythematosus, two withSjögren's syndrome, and one with systemic sclerosis, wereincluded. Nine healthy donors with no history of autoimmunedisease were included as control individuals. This study wasapproved by the University of Florida Institutional ReviewBoard, and written permission was obtained from all who par-ticipated in the study.
PBMC collection and quantitative real-time RT-PCRBlood samples were collected in EDTA-treated tubes andPBMCs were isolated by standard Ficoll density-gradient cen-trifugation. PBMCs were washed once in sterile phosphate-buffered saline (PBS) before culture or RNA isolation. TotalRNA was isolated from freshly obtained PBMCs using the mir-Vana miRNA Isolation kit (Ambion, Austin, TX, USA), inaccordance with the manufacturer's protocol. RNA concentra-tions were determined and 10 ng of each RNA sample wereused for quantitative real-time RT-PCR (qRT-PCR). miRNAqRT-PCR was performed using the TaqMan MicroRNAReverse Transcription Kit, TaqMan Universal PCR Master Mix,and TaqMan MicroRNA Assay primers for human miR-146a,miR-155, miR-132, miR-16, and miRNA let-7a (Applied Bio-systems, Foster City, CA, USA). mRNA qRT-PCR was per-formed using the TaqMan High-Capacity cDNA ReverseTranscription Kit, TaqMan Fast PCR Master Mix, and TaqManmRNA assay primers (Applied Biosystems). All reactions wereanalyzed using StepOne Real-Time PCR System (AppliedBiosystems). The levels of miRNA were normalized to U44controls, whereas mRNA levels were normalized to 18S RNA.The cycle threshold (Ct) values, corresponding to the PCRcycle number at which fluorescence emission reaches athreshold above baseline emission, were determined and therelative miRNA or mRNA expression was calculated using the2-ΔΔCt method [23].
Cell culture and cytokine treatmentTHP-1 human monocytes obtained from American Type Cul-ture Collection (Manassas, VA, USA) were cultured in RPMI1640 medium with 2 mmol/l L-glutamine, 4.5 g/l glucose, 10mmol/l HEPES, 1.0 mmol/l sodium pyruvate, 0.05 mmol/l 2-mercaptoethanol, and 10% fetal bovine serum. THP-1 cellswere seeded at 5 × 10⁵ cells per well in a six-well plate andtreated with 10 ng/ml TNF-α, IFN-γ, IL-12p70, IL-4, IL-10 (BDBiosciences, San Jose, CA, USA), IFN-α, IFN-β (PBL Inter-
Page 2 of 10(page number not for citation purposes)

Available online http://arthritis-research.com/content/10/4/R101
feron Source, New Brunswick, NJ, USA), or macrophage col-ony-stimulating factor (M-CSF; US Biological, Swampscott,MA, USA). Cells were also treated with 25 ng/ml monocytechemoattractant protein (MCP)-1 (Sigma) in serum-freemedia. After the designated treatment time had elapsed, cellswere harvested and washed once in PBS before analysis.
Indirect immunofluorescenceTHP-1 cells were cytospun onto glass slides at 1,000 rpm for5 minutes. PBMCs were cultured on glass slides at 37°C for1 hour. Cells were fixed in 3% paraformaldehyde for 10 min-utes and permeabilized in 0.5% Triton X-100 for 5 minutes.GWB were detected in THP-1 cells with a human prototypeanti-GWB serum [24] used at 1:6,000 dilution, and in PBMCswith rabbit anti-Rck/p54 antibodies used at 1:500 dilution.TNF receptor-associated factor (TRAF)6 and IL-1 receptor-associated kinase (IRAK)-1 were detected using rabbit anti-
TRAF6 (1:50; Santa Cruz Biotechnology, Santa Cruz, CA,USA) and rabbit anti-IRAK-1 (1:50; Santa Cruz Biotechnol-ogy). Secondary antibodies used were Alexa Fluor 488 goatanti-human IgG or goat anti-rabbit IgG (1:400) from MolecularProbes (Carlsbad, CA, USA). Slides were mounted usingVectashield Mounting Medium with 4',6-diamidino-2-phenylin-dole (DAPI; VECTOR Laboratories, Burlingame, CA, USA).Fluorescence images were taken with Zeiss Axiovert 200 Mmicroscope and a Zeiss AxioCam MRm camera using the 20×or 40 × 0.75 NA objectives. Color images were assessedusing Adobe Photoshop version 7 (Adobe Systems Inc., SanJose, CA, USA). GWB were counted using Cell-Profiler imageanalysis software [25].
siRNA transfectionsiRNAs targeting TRAF6 and IRAK-1 were transfected intoTHP-1 cells using Lipofectamine 2000 (Invitrogen, Carlsbad,
Table 1
Demographic, clinical, and laboratory information of patients
Subject Sex Age (years) Medications CRP (mg/l) ESR (mm/hour)
RA Patients
RA-1aa Male 65 None 4.14b 9
RA-1b Male 65 MTX 11.8 18
RA-2 Female 33 Etanercept, naproxen 25.7 18
RA-3 Female 43 Etanercept No data No data
RA-4 Female 45 None 98.4 84
RA-5 Female 55 MTX 4.8 26
RA-6 Female 73 None 2.1 30
RA-7 Female 51 Hydroxychloroquine, MTX, prednisone No data 15
RA-8 Male 61 Prednisone, MTX, hydroxychloroquine, sulfasalazine No data 1
RA-9 Male 46 Methylprednisolone, MTX, etanercept 2 9
RA-10 Female 32 Leflunomide 94.2 63
RA-11 Female 50 Etanercept, MTX No data No data
RA-12 Male 67 MTX, celecoxib, prednisone 0.6 11
RA-13 Female 55 MTX No data 17
RA-14 Female 33 Hydroxychloroquine, ibuprofen 2.8 7
RA-15 Female 55 None 168.2 88
RA-16 Female 56 Prednisone, minocycline No data No data
Disease control individuals
SLE1 Female 36 Hydroxychloroquine, prednisone, mycophenolate mofetil
SjS1 Female 30 Hydroxychloroquine, mycophenolate mofetil
SjS2 Male 21 Hydroxychloroquine
SSc1 Female 57 Cyclosporine, hydroxychloroquine, prednisone, mycophenolate mofetil
aSample collected from RA-1 before and after MTX treatment. bNormal value less than 0.8. The normal CRP is <4.9 mg/l, and the normal ESR is <20 mm/hour for females and <10 mm/hour for males. CRP, C-reactive protein; ESR, erythrocyte sedimentation rate; MTX, methotrexate; RA, rheumatoid arthritis; SLE, systemic lupus erythematosus; SjS, Sjögren's syndrome; SSc, scleroderma.
Page 3 of 10(page number not for citation purposes)

Arthritis Research & Therapy Vol 10 No 4 Pauley et al.
CA, USA), in accordance with the manufacturer's instructions.To monitor the transfection efficiency, Cy3-labeled siRNA tar-geting lamin A/C was transfected into cells in parallel in alltransfections, and at least 80% transfection efficiency wasachieved. The siRNAs used in this study were all purchasedfrom Applied Biosystems. The sense and antisense strandsequences were as follows: IRAK-1: 5'-GGUUUCGUCAC-CCAAACAUtt-3' and 5'-AUGUUUGGGUGACGAAACCtg-3'; TRAF6: 5'-GGUUGUUUGCACAAGAUGGtt-3' and 5'-CCAUCUUGUGCAAACAACCtt-3'.
Multiplex analysis of cytokinesTHP-1 cells were transfected as described above and thentreated with 1 μg/ml LPS (Salmonella enterica serotype min-nesota; Sigma, St. Louis, MO, USA) for 24 hours in culturemedium. The culture supernatant was then harvested and fro-zen at -80°C for storage before multiplex analysis. The humancytokine/chemokine LINCOplex premixed kit (LINCOResearch, St. Charles, MO, USA) was used in accordancewith the manufacturer's protocol in order to detect humanMCP-1 and TNF-α quantitatively.
Results and discussionSpecific cytokines/chemokines induce GWB in THP-1 cells and human PBMCsSince our previous work demonstrated that GWB can be usedas biomarkers for miRNA activity (Pauley KM, unpublisheddata), we began to examine a variety of cytokines and chemok-ines for their ability to stimulate miRNA activity in human mono-cytic THP-1 cells. THP-1 cells were treated with 10 ng/mlTNF-α, IFN-α, IFN-β, IFN-γ, IL-12p70, M-CSF, IL-4, IL-10, or25 ng/ml MCP-1 for 4 hours. Indirect immunofluorescence(IIF) was performed using a human anti-GWB serum to detectGWB in the cells. As shown in Figure 1, the proinflammatorycytokines/chemokines TNF-α, IFN-α, IFN-β, IFN-γ, and MCP-1resulted in a significant increase in the number of GWB percell compared with untreated cells cultured in parallel (P <0.0001, as determined using one-way analysis of variance).However, IL-12p70, M-CSF, IL-4, and IL-10 had no significanteffect on the number of GWB. TNF-α elicited the strongestresponse in THP-1 cells, with fourfold increase in the averagenumber of GWB per cell (Figure 1a,c). These experimentswere repeated at least three times, with reproducible resultseach time.
Next, we decided to examine the effect of TNF-α stimulationon human PBMC GWB. GWB staining using human PBMCsfrom a healthy donor, after 4 hours stimulation with TNF-α (1ng/ml), is shown. Similar to THP-1 cells, the number of GWBper cell increased 3.5-fold after TNF-α stimulation of PBMCs(Figure 1b,c; P < 0.0001, as determined by Mann Whitneytest). These data indicated that THP-1 cells may be suitablesubstitutes for human PBMCs in some of the subsequentexperiments.
RA patient PBMCs exhibit increased expression of miR-146a, miR-155, miR-132, and miR-16In Figure 1 we showed that TNF-α is a potent inducer of GWBand therefore miRNA activity. Our preliminary studies andwork from other investigators have confirmed that TNF-α stim-ulation induces the expression of certain miRNAs, including
Figure 1
TNF-α treatment results in increased number of GWB in THP-1 and human PBMCsTNF-α treatment results in increased number of GWB in THP-1 and human PBMCs. (a) THP-1 cells were treated with 10 ng/ml TNF-α, IFN-α, IFN-β, IFN-γ, IL-12p70, M-CSF, IL-4, IL-10, or 25 ng/ml MCP-1 for 4 hours. IIF was performed using a human anti-GWB serum to detect GWB, and the number of GWB were counted using CellProfiler image analysis software. Average number of GWB per cell and SEM is shown. *P < 0.0001, as determined by one-way analysis of variance. (b) Human PBMCs were obtained from a healthy donor and isolated using Ficoll density-gradient centrifugation. The cells were then cul-tured for 4 hours in the presence of 1 ng/ml TNF-α. GWB were detected by IIF using rabbit anti-Rck/p54 antibodies. Average number of GWB and SEM is shown. *P < 0.0001, as determined by Mann-Whitney test. (c) IIF image of THP-1 and PBMCs treated with 10 ng/ml or 1 ng/ml TNF-α for 4 hours, respectively. GWB are shown in green, and nuclei are counterstained with 4',6-diamidino-2-phenylindole (DAPI; blue). Bar = 10 μm. GWP, GW or P bodies; IL, interleukin; IFN, interferon; IIF, indirect immunofluorescence; MCP, macrophage chem-oattractant protein; M-CSF, macrophage colony-stimulating factor; PBMC, peripheral blood mononuclear cell; SEM, standard error of the mean; TNF, tumor necrosis factor.
Page 4 of 10(page number not for citation purposes)

Available online http://arthritis-research.com/content/10/4/R101
miR-146a and miR-155 [20,21]. Based on these data and theimportant role played by TNF-α in RA pathogenesis and ther-apies, we began to investigate the expression levels of miRNAin RA patients as compared with those in healthy and diseasecontrol individuals. PBMCs were obtained from patients (n =17 RA patients and n = 4 disease control individuals) andhealthy donors (n = 9) and isolated by Ficoll density-gradientcentrifugation. Initially, RA PBMCs were monitored by IIF forGWB; however, we did not observe an increased number ofGWB in RA compared with healthy control individuals (notshown). This discrepancy could be due to limited sensitivity inthe quantitation of GWB.
As shown in Figure 2a, the average relative expression levelsof miR-146a, miR-155, miR-132, and miR-16 were 2.6-, 1.8-,2.0-, and 1.9-fold, respectively, higher for RA patients than forhealthy control individuals (P < 0.01 for miR-146a and P <0.05 for miR-155, miR-132, and miR-16, as determined byone-way analysis of variance). The expression of miRNA let-7awas not significantly different between RA patients andhealthy control individuals (Figure 2a). Disease control miRNAexpression resembled that in healthy control individuals.
To examine the relationship between RA disease activity andmiRNA expression levels, patients were classified into inac-tive/remission and active patients, based on C-reactive protein(CRP) and erythrocyte sedimentation rate (ESR) values. Threepatients with normal CRP and ESR (Table 1) were classifiedas inactive, whereas eight patients with elevated CRP and/orESR (Table 1) were classified as active (Figure 2b). Thosepatients with incomplete or no available data were omitted(Table 1). miRNA expression levels were compared betweenthe groups. Interestingly, high miR-146a and miR-16 expres-sion levels appeared to correlate with active disease, whereaslow expression level correlated with inactive disease (Figure2b; P < 0.05, as determined by t-test). These data indicatesthat miR-146a and miR-16 expression levels may be a usefulmarker of RA disease activity. Further studies involving a largerpatient cohort are needed to determine fully whether monitor-ing miRNA expression as a marker for disease activity canimprove upon CRP or ESR measurements.
Figure 2c shows the miRNA expression levels in two samplesfrom a single RA patient collected over a 2-month interval, dur-ing which time this patient's CRP and ESR values increaseddespite methotrexate treatment. The miRNA levels of thispatient were largely unchanged over the 2-month interval,remaining elevated compared with those in healthy controlindividuals. This indicates that the elevated miRNA expressionin this patient may reflect the patient's lack of improvement, asindicated by the increased CRP and ESR values. In thispatient, miR-146a, miR-155, and miR-132 expression levelswere stable over this time period, whereas the expression lev-els of miR-16 and miRNA let-7a increased by approximately3.5-fold and 2.4-fold, respectively. A larger patient population
must be examined in order to determine whether miRNAexpression levels may be indicative of treatment efficacy.
To further analyze the increased miRNA expression exhibitedby these RA patients, we compared miR-146a, miR-155, andmiR-132 expression levels with patient clinical and demo-graphic data (Table 1) and found no significant trends or cor-relations between high expression levels and age, race, ormedications. Patients receiving no medications at the time ofmiRNA analysis exhibited the same trend toward elevatedmiRNA expression, indicating that treatment with medicationsis not responsible for the increased miRNA expression in RApatients.
Recently, two reports [26,27] showed increased miR-146 andmiR-155 expression levels in RA synovial tissue and fibrob-lasts. Stanczyk and coworkers [27] reported a fourfoldincrease in miR-146a expression and a twofold increase inmiR-155 expression in RA synovial fibroblasts compared withosteoarthritis synovial fibroblasts. They also demonstrated thatmiR-155 expression can repress the induction of matrix metal-loproteinases 3 and 1, indicating that miR-155 may beinvolved in modulating the destructive properties of RA syno-vial fibroblasts. However, in that report, miR-155 expressionfrom RA PBMCs was not significantly different from that incontrol PBMCs. This discrepancy could be due to differencesin experimental techniques or patient populations. Nakasa andcolleagues [26] also reported an approximately fourfoldincrease in miR-146a expression in RA synovial tissue. Ourdata demonstrate that RA patient PBMCs exhibit elevatedmiRNA expression in a similar manner to RA synovial tissue,with a 2.6-fold increase in miR-146a expression and a 1.8-foldincrease in miR-155 expression. Because of the invasivenessinvolved in collecting samples, monitoring miRNA expressionin RA synovial tissue is, in most cases, limited to extremelysevere disease in patients undergoing joint surgery or replace-ment. Because blood collection is not invasive, this allows foreasy sample collection over time, which is a distinct advantagewhen monitoring disease activity and treatment efficacy.
Monocyte/macrophage population of RA PBMCs exhibits increased miRNA expressionBecause PBMCs are composed of a mixed cell population,the two main components of which are monocytes/macro-phages and lymphocytes, we wished to determine which cellpopulation in RA patients exhibits increased miRNA expres-sion. PBMCs were isolated from RA patients (n = 2) and incu-bated in tissue culture dishes at 37°C for 1 hour. Themonocyte/macrophage population adhered to the dish,whereas lymphocytes remained in suspension. The adherentcells were washed five times with sterile PBS, and the nonad-herent cells were collected and washed with sterile PBS. Thepurity of the adherent population was approximately 80%, asdetermined by microscopy. RNA was isolated from the cells,miRNA expression was analyzed by qRT-PCR, and the data
Page 5 of 10(page number not for citation purposes)

Arthritis Research & Therapy Vol 10 No 4 Pauley et al.
Figure 2
RA patients exhibit aberrant expression of miR-146a, miR-155, miR-132 and miR-16 versus healthy controlsRA patients exhibit aberrant expression of miR-146a, miR-155, miR-132 and miR-16 versus healthy controls. (a) RNA was isolated from healthy con-trol individuals (n = 9), disease control individuals (n = 4), and RA patient (n = 17). PBMCs and relative expression levels of miR-146a, miR-155, miR-132, miR-16, and miRNA let-7a were analyzed by qRT-PCR using U44 RNA as an internal control. Average is indicated by bars. *P < 0.05, **P < 0.01, as determined by one-way analysis of variance. For RA patients, closed circles indicate patients undergoing anti-TNF-α therapy at time of sample collection, squares indicate MTX treatment, and open circles indicate other or no treatment. (b) Disease activity was determined for patients using CRP and ESR values and correlated with miRNA expression. Normal CRP and ESR values were classified as inactive disease (n = 3; patients 9, 12, and 14 in Table 1), and higher than normal CRP or ESR values were classified as active disease (n = 8; patients 1a, 1b, 2, 4, 5, 6, 10, and 15 in Table 1). Those patients with no or incomplete data for CRP/ESR values were omitted. *P < 0.05, as determined by t-test. (c) PBMCs were col-lected from patient RA-1 before (November 2007) and after (January 2008) MTX treatment and miRNA expression was examined using qRT-PCR. miRNA expression is largely consistent over time, with the exception of increased miR-16 expression. CRP, C-reactive protein; ESR, erythrocyte sedimentation rate; miRNA, microRNA; MTX, methotrexate; PBMC, peripheral blood mononuclear cell; qRT-PCR, quantitative real-time RT-PCR; RA, rheumatoid arthritis; RT-PCR, reverse transcription polymerase chain reaction; TNF, tumor necrosis factor.
Page 6 of 10(page number not for citation purposes)

Available online http://arthritis-research.com/content/10/4/R101
were normalized within the total group of patient and controlsamples.
The expression levels of miR-146a, miR-155, miR-132, andmiR-16 were 2.8-, 1.6-, 4.2-, and 3.4-fold higher, respectively,in monocytes than in lymphocytes (Figure 3a). Let-7a expres-sion was similar between monocytes and lymphocytes (notshown). Figure 3b shows the average expression (miR-146a,miR-155, miR-132, and miR-16 combined) for the monocyteand lymphocyte populations of two RA patients (P < 0.02, asdetermined by Mann-Whitney test). These findings suggestthat monocytes/macrophages contribute to the increasedmiRNA expression observed in RA patients more than lym-phocytes, but further studies must be performed to confirmthis observation.
TRAF6 and IRAK-1 expression is similar between RA patients and control individualsBecause most of the RA patients exhibited increased expres-sion of miR-146a compared with healthy and disease controlindividuals, we decided to examine the expression of two con-firmed targets of miR-146a, namely TRAF6 and IRAK-1 [21].TRAF6 and IRAK-1 mRNA expression levels were analyzed byqRT-PCR (Figure 4a,b). RA patients exhibited increased miR-146a production compared with control individuals, and wetherefore expected to observe decreased TRAF6 and/orIRAK-1 expression in RA patients as compared with controlindividuals. However, TRAF6 and IRAK-1 mRNA expressionlevels were very similar between RA patients and control indi-
viduals, and overall the mRNA levels of TRAF6 and IRAK-1 didnot exhibit the same degree of variability between patients thatwe observed with miRNA expression. This may indicate thatTRAF6 and IRAK-1 transcripts are under other levels of con-trol. To confirm this discrepancy, we analyzed TRAF6 andIRAK-1 protein levels by IIF in one healthy control individual
Figure 3
Monocyte/macrophage fraction of PBMCs exhibit increased miRNA expression compared with lymphocyte fractionMonocyte/macrophage fraction of PBMCs exhibit increased miRNA expression compared with lymphocyte fraction. PBMCs were collected from RA patients and separated into monocyte/macrophage and lym-phocyte populations by allowing the monocytes/macrophages to adhere to a tissue culture dish. (a) miRNA expression was examined using qRT-PCR. SEM is shown (n = 2 patients). (b) Average expres-sion levels of miR-146a, miR-155, miR-132, and miR-16 are shown for monocyte and lymphocyte populations for two RA patients. *P < 0.02, as determined by Mann-Whitney test. SEM is shown. PBMC, peripheral blood mononuclear cell; qRT-PCR, quantitative real-time RT-PCR; RA, rheumatoid arthritis; RT-PCR, reverse transcription polymerase chain reaction; SEM, standard error of the mean.
Figure 4
TRAF6 and IRAK-1 expression levels are similar between RA patients, healthy controls, and disease controlsTRAF6 and IRAK-1 expression levels are similar between RA patients, healthy controls, and disease controls. RNA was isolated from PBMCs from healthy control individuals (n = 9), disease control individuals (n = 4) and RA patients (n = 14), and mRNA expression levels of (a) TRAF6 and (b) IRAK-1 were analyzed using qRT-PCR. (c) PBMCs isolated from a healthy control individual and RA patient were incubated on glass slides for 1 hour at 37°C. The adhered cells were fixed and per-meabilized in 3% paraformaldehyde and 0.5% Triton X-100, respec-tively. Protein levels of TRAF6 and IRAK-1 were analyzed by immunofluorescence using rabbit anti-TRAF6 and anti-IRAK-1 antibod-ies, and relative fluorescence was determined using Image J analysis software. SEM is shown; n > 20 cells. IRAK, IL-1 receptor-associated kinase; PBMC, peripheral blood mononuclear cell; qRT-PCR, quantita-tive real-time RT-PCR; RA, rheumatoid arthritis; RT-PCR, reverse tran-scription polymerase chain reaction; SEM, standard error of the mean; TRAF, tumor necrosis factor receptor-associated factor.
Page 7 of 10(page number not for citation purposes)
Arthritis Research & Therapy Vol 10 No 4 Pauley et al.
and one RA patient whose miR-146a level was increased (Fig-ure 2a). PBMCs were processed for IIF as previouslydescribed and were stained for TRAF6 and IRAK-1. Image Jsoftware was used to quantify the relative level of fluorescencefor at least 20 cells. As shown in Figure 4c, there was no sig-nificant difference in TRAF6 or IRAK-1 protein levels betweenthe RA patient and healthy control individual, which is consist-ent with the mRNA analysis.
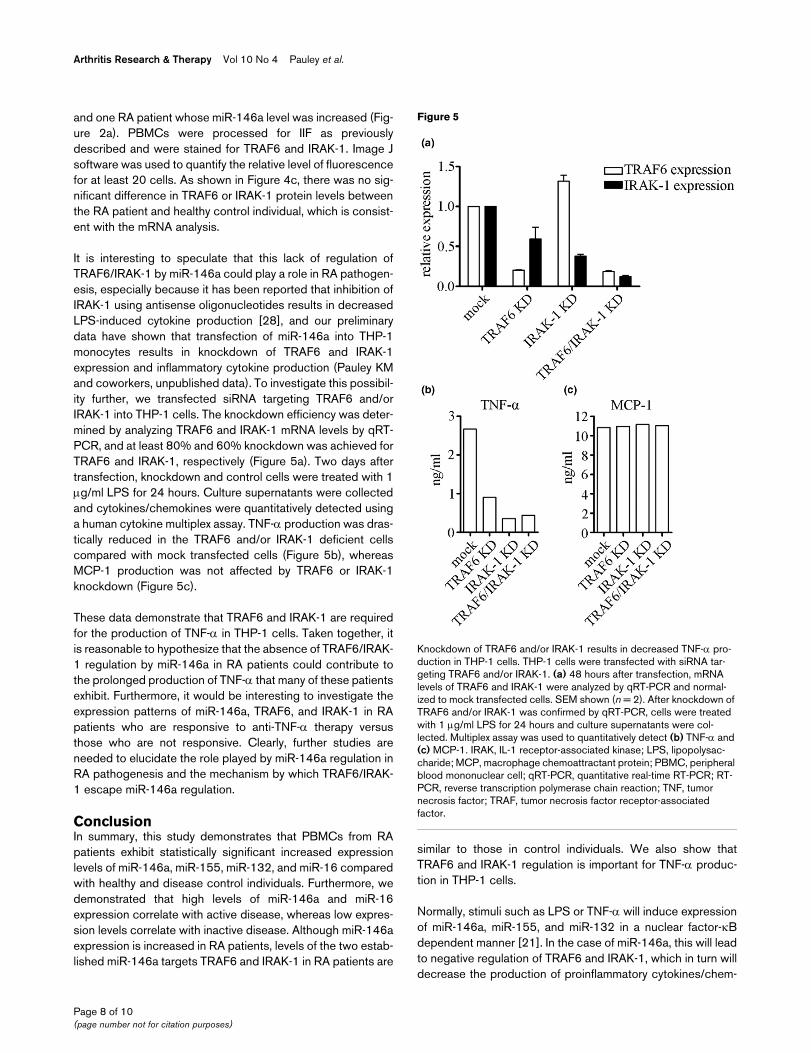
It is interesting to speculate that this lack of regulation ofTRAF6/IRAK-1 by miR-146a could play a role in RA pathogen-esis, especially because it has been reported that inhibition ofIRAK-1 using antisense oligonucleotides results in decreasedLPS-induced cytokine production [28], and our preliminarydata have shown that transfection of miR-146a into THP-1monocytes results in knockdown of TRAF6 and IRAK-1expression and inflammatory cytokine production (Pauley KMand coworkers, unpublished data). To investigate this possibil-ity further, we transfected siRNA targeting TRAF6 and/orIRAK-1 into THP-1 cells. The knockdown efficiency was deter-mined by analyzing TRAF6 and IRAK-1 mRNA levels by qRT-PCR, and at least 80% and 60% knockdown was achieved forTRAF6 and IRAK-1, respectively (Figure 5a). Two days aftertransfection, knockdown and control cells were treated with 1μg/ml LPS for 24 hours. Culture supernatants were collectedand cytokines/chemokines were quantitatively detected usinga human cytokine multiplex assay. TNF-α production was dras-tically reduced in the TRAF6 and/or IRAK-1 deficient cellscompared with mock transfected cells (Figure 5b), whereasMCP-1 production was not affected by TRAF6 or IRAK-1knockdown (Figure 5c).
These data demonstrate that TRAF6 and IRAK-1 are requiredfor the production of TNF-α in THP-1 cells. Taken together, itis reasonable to hypothesize that the absence of TRAF6/IRAK-1 regulation by miR-146a in RA patients could contribute tothe prolonged production of TNF-α that many of these patientsexhibit. Furthermore, it would be interesting to investigate theexpression patterns of miR-146a, TRAF6, and IRAK-1 in RApatients who are responsive to anti-TNF-α therapy versusthose who are not responsive. Clearly, further studies areneeded to elucidate the role played by miR-146a regulation inRA pathogenesis and the mechanism by which TRAF6/IRAK-1 escape miR-146a regulation.
ConclusionIn summary, this study demonstrates that PBMCs from RApatients exhibit statistically significant increased expressionlevels of miR-146a, miR-155, miR-132, and miR-16 comparedwith healthy and disease control individuals. Furthermore, wedemonstrated that high levels of miR-146a and miR-16expression correlate with active disease, whereas low expres-sion levels correlate with inactive disease. Although miR-146aexpression is increased in RA patients, levels of the two estab-lished miR-146a targets TRAF6 and IRAK-1 in RA patients are
similar to those in control individuals. We also show thatTRAF6 and IRAK-1 regulation is important for TNF-α produc-tion in THP-1 cells.
Normally, stimuli such as LPS or TNF-α will induce expressionof miR-146a, miR-155, and miR-132 in a nuclear factor-κBdependent manner [21]. In the case of miR-146a, this will leadto negative regulation of TRAF6 and IRAK-1, which in turn willdecrease the production of proinflammatory cytokines/chem-
Figure 5
Knockdown of TRAF6 and/or IRAK-1 results in decreased TNF-α pro-duction in THP-1 cellsKnockdown of TRAF6 and/or IRAK-1 results in decreased TNF-α pro-duction in THP-1 cells. THP-1 cells were transfected with siRNA tar-geting TRAF6 and/or IRAK-1. (a) 48 hours after transfection, mRNA levels of TRAF6 and IRAK-1 were analyzed by qRT-PCR and normal-ized to mock transfected cells. SEM shown (n = 2). After knockdown of TRAF6 and/or IRAK-1 was confirmed by qRT-PCR, cells were treated with 1 μg/ml LPS for 24 hours and culture supernatants were col-lected. Multiplex assay was used to quantitatively detect (b) TNF-α and (c) MCP-1. IRAK, IL-1 receptor-associated kinase; LPS, lipopolysac-charide; MCP, macrophage chemoattractant protein; PBMC, peripheral blood mononuclear cell; qRT-PCR, quantitative real-time RT-PCR; RT-PCR, reverse transcription polymerase chain reaction; TNF, tumor necrosis factor; TRAF, tumor necrosis factor receptor-associated factor.
Page 8 of 10(page number not for citation purposes)

Available online http://arthritis-research.com/content/10/4/R101
okines, including TNF-α. Thus, the function of miR-146a, atleast in part, is to control the extent of the stimulation, such thatthe production of some of these proinflammatory cytokines/chemokines will not continue for an extended period of time.However, it is interesting to speculate that defective negativeregulation of TRAF6 or IRAK-1 by the increased miR-146a inRA patients is the cause of prolonged TNF-α production.
Although it is very exciting that two independent studies haveshown increased miRNA expression in RA synovial tissue,analyzing miRNA expression in patient PBMCs presents a dis-tinct advantage over analyzing synovial tissue samples. Collec-tion of PBMCs is noninvasive, and samples can be collectedfrom patients ranging in disease severity from early onset tomore severe, whereas synovial tissue collection is biasedtoward patients with severe degenerative disease. With fur-ther validations and studies conducted in larger patient popu-lations, monitoring of selected miRNAs could prove to be avaluable addition to RA diagnostics, or monitoring diseaseprogression or treatment efficacy. The underlying mechanismsresulting in increased miRNA expression and inability of miR-146a to regulate its targets need to be elucidated, and thesemechanisms may be potential targets for the development ofnew RA therapies.
Competing interestsThe authors declare that they have no competing interests.
Authors' contributionsKMP designed and conducted all experiments and drafted themanuscript. MS assisted with statistical evaluations, providedclinical insights, and edited the manuscript. ALC collectedpatient samples. MRB and WHR recruited study subjects, andprovided clinical insights and advice. EKLC conceived of thestudy, assisted in designing the study, and edited the manu-script. All authors read and approved the final manuscript.
AcknowledgementsThis work was supported in part by NIH Grants AI47859, AR051766 and M01R00082. KMP is supported by NIDCR oral biology training grant T32 DE007200.
References1. Smolen JS, Aletaha D, Koeller M, Weisman MH, Emery P: New
therapies for treatment of rheumatoid arthritis. Lancet 2007,370:1861-1874.
2. Bresnihan B, varo-Gracia JM, Cobby M, Doherty M, Domljan Z,Emery P, Nuki G, Pavelka K, Rau R, Rozman B, Watt I, Williams B,Aitchison R, McCabe D, Musikic P: Treatment of rheumatoidarthritis with recombinant human interleukin-1 receptorantagonist. Arthritis Rheum 1998, 41:2196-2204.
3. Lipsky PE, Heijde DM van der, St Clair EW, Furst DE, BreedveldFC, Kalden JR, Smolen JS, Weisman M, Emery P, Feldmann M,Harriman GR, Maini RN: Infliximab and methotrexate in thetreatment of rheumatoid arthritis. Anti-Tumor Necrosis FactorTrial in Rheumatoid Arthritis with Concomitant Therapy StudyGroup. N Engl J Med 2000, 343:1594-1602.
4. Fabbri M, Croce CM, Calin GA: MicroRNAs. Cancer J 2008,14:1-6.
5. Lodish HF, Zhou B, Liu G, Chen CZ: Micromanagement of theimmune system by microRNAs. Nat Rev Immunol 2008,8:120-130.
6. Lewis BP, Burge CB, Bartel DP: Conserved seed pairing, oftenflanked by adenosines, indicates that thousands of humangenes are microRNA targets. Cell 2005, 120:15-20.
7. Cai X, Hagedorn CH, Cullen BR: Human microRNAs are proc-essed from capped, polyadenylated transcripts that can alsofunction as mRNAs. RNA 2004, 10:1957-1966.
8. Lee Y, Kim M, Han J, Yeom KH, Lee S, Baek SH, Kim VN: Micro-RNA genes are transcribed by RNA polymerase II. EMBO J2004, 23:4051-4060.
9. Denli AM, Tops BB, Plasterk RH, Ketting RF, Hannon GJ:Processing of primary microRNAs by the Microprocessorcomplex. Nature 2004, 432:231-235.
10. Gregory RI, Yan KP, Amuthan G, Chendrimada T, Doratotaj B,Cooch N, Shiekhattar R: The Microprocessor complex mediatesthe genesis of microRNAs. Nature 2004, 432:235-240.
11. Han J, Lee Y, Yeom KH, Kim YK, Jin H, Kim VN: The Drosha-DGCR8 complex in primary microRNA processing. Genes Dev2004, 18:3016-3027.
12. Landthaler M, Yalcin A, Tuschl T: The human DiGeorge syn-drome critical region gene 8 and its D. melanogaster homologare required for miRNA biogenesis. 2004, 14:2162-2167.
13. Lee Y, Ahn C, Han J, Choi H, Kim J, Yim J, Lee J, Provost P, Rad-mark O, Kim S, Kim VN: The nuclear RNase III Drosha initiatesmicroRNA processing. Nature 2003, 425:415-419.
14. Du T, Zamore PD: microPrimer: the biogenesis and function ofmicroRNA. Development 2005, 132:4645-4652.
15. Filipowicz W, Bhattacharyya SN, Sonenberg N: Mechanisms ofpost-transcriptional regulation by microRNAs: are the answersin sight? Nat Rev Genet 2008, 9:102-114.
16. Liu J, Carmell MA, Rivas FV, Marsden CG, Thomson JM, Song JJ,Hammond SM, Joshua-Tor L, Hannon GJ: Argonaute2 is the cat-alytic engine of mammalian RNAi. Science 2004,305:1437-1441.
17. Meister G, Landthaler M, Patkaniowska A, Dorsett Y, Teng G,Tuschl T: Human Argonaute2 mediates RNA cleavage targetedby miRNAs and siRNAs. Mol Cell 2004, 15:185-197.
18. Lian S, Fritzler MJ, Katz J, Hamazaki T, Terada N, Satoh M, ChanEKL: Small interfering RNA-mediated silencing induces target-dependent assembly of GW/P bodies. Mol Biol Cell 2007,18:3375-3387.
19. Pauley KM, Eystathioy T, Jakymiw A, Hamel JC, Fritzler MJ, ChanEKL: Formation of GW bodies is a consequence of miRNAgenesis. EMBO Rep 2006, 7:904-910.
20. O'Connell RM, Taganov KD, Boldin MP, Cheng G, Baltimore D:MicroRNA-155 is induced during the macrophage inflamma-tory response. Proc Natl Acad Sci USA 2007, 104:1604-1609.
21. Taganov KD, Boldin MP, Chang KJ, Baltimore D: NF-B-depend-ent induction of microRNA miR-146, an inhibitor targeted tosignaling proteins of innate immune responses. Proc NatlAcad Sci USA 2006, 103:12481-12486.
22. Jing Q, Huang S, Guth S, Zarubin T, Motoyama A, Chen J, Di PF,Lin SC, Gram H, Han J: Involvement of microRNA in AU-rich ele-ment-mediated mRNA instability. Cell 2005, 120:623-634.
23. Livak KJ, Schmittgen TD: Analysis of relative gene expressiondata using real-time quantitative PCR and the 2-ΔΔCt method.Methods 2001, 25:402-408.
24. Eystathioy T, Chan EKL, Tenenbaum SA, Keene JD, Griffith K, Frit-zler MJ: A phosphorylated cytoplasmic autoantigen, GW182,associates with a unique population of human mRNAs withinnovel cytoplasmic speckles. Mol Biol Cell 2002,13:1338-1351.
25. Carpenter AE, Jones TR, Lamprecht MR, Clarke C, Kang IH,Friman O, Guertin DA, Chang JH, Lindquist RA, Moffat J, GollandP, Sabatini DM: CellProfiler: image analysis software for iden-tifying and quantifying cell phenotypes. Genome Biol 2006,7:R100.
26. Nakasa T, Miyaki S, Okubo A, Hashimoto M, Nishida K, Ochi M,Asahara H: Expression of microRNA-146 in rheumatoid arthri-tis synovial tissue. Arthritis Rheum 2008, 58:1284-1292.
27. Stanczyk J, Pedrioli DM, Brentano F, Sanchez-Pernaute O, KollingC, Gay RE, Detmar M, Gay S, Kyburz D: Altered expression ofMicroRNA in synovial fibroblasts and synovial tissue in rheu-matoid arthritis. Arthritis Rheum 2008, 58:1001-1009.
Page 9 of 10(page number not for citation purposes)

Arthritis Research & Therapy Vol 10 No 4 Pauley et al.
28. Cuschieri J, Bulmus V, Gourlay D, Garcia I, Hoffman A, Stayton P,Maier RV: Modulation of macrophage responsiveness tolipopolysaccharide by IRAK-1 manipulation. Shock 2004,21:182-188.
Page 10 of 10(page number not for citation purposes)
Copyright © 2022 FDOKUMEN