Artificial Intelligence to Extract, Analyze and Generate ...
253
HAL Id: tel-03084380 https://hal.inria.fr/tel-03084380 Submitted on 21 Dec 2020 HAL is a multi-disciplinary open access archive for the deposit and dissemination of sci- entific research documents, whether they are pub- lished or not. The documents may come from teaching and research institutions in France or abroad, or from public or private research centers. L’archive ouverte pluridisciplinaire HAL, est destinée au dépôt et à la diffusion de documents scientifiques de niveau recherche, publiés ou non, émanant des établissements d’enseignement et de recherche français ou étrangers, des laboratoires publics ou privés. Artificial Intelligence to Extract, Analyze and Generate Knowledge and Arguments from Texts to Support Informed Interaction and Decision Making Elena Cabrio To cite this version: Elena Cabrio. Artificial Intelligence to Extract, Analyze and Generate Knowledge and Arguments from Texts to Support Informed Interaction and Decision Making. Artificial Intelligence [cs.AI]. Université Côte d’Azur, 2020. tel-03084380
-
Upload
khangminh22 -
Category
Documents
-
view
4 -
download
0
Transcript of Artificial Intelligence to Extract, Analyze and Generate ...

HAL Id: tel-03084380https://hal.inria.fr/tel-03084380
Submitted on 21 Dec 2020
HAL is a multi-disciplinary open accessarchive for the deposit and dissemination of sci-entific research documents, whether they are pub-lished or not. The documents may come fromteaching and research institutions in France orabroad, or from public or private research centers.
L’archive ouverte pluridisciplinaire HAL, estdestinée au dépôt et à la diffusion de documentsscientifiques de niveau recherche, publiés ou non,émanant des établissements d’enseignement et derecherche français ou étrangers, des laboratoirespublics ou privés.
Artificial Intelligence to Extract, Analyze and GenerateKnowledge and Arguments from Texts to Support
Informed Interaction and Decision MakingElena Cabrio
To cite this version:Elena Cabrio. Artificial Intelligence to Extract, Analyze and Generate Knowledge and Arguments fromTexts to Support Informed Interaction and Decision Making. Artificial Intelligence [cs.AI]. UniversitéCôte d’Azur, 2020. �tel-03084380�

1
Universite Cote d’Azur
HABILITATION THESISHabilitation a Diriger des Recherches (HDR)
Major: Computer Science
Elena CABRIO
Artificial Intelligence to Extract, Analyze and Generate Knowledge andArguments from Texts to Support Informed Interaction and Decision
Making
Jury:Fabien Gandon, Research Director, INRIA (France) - President
Pietro Baroni, Full Professor, Universita’ di Brescia (Italy) - RapporteurMarie-Francine Moens, Full Professor, KU Leuven (Belgium) - RapporteurAnne Vilnat, Full Professor, Universite Paris-Sud (France) - RapporteurChris Reed, Full Professor, University of Dundee (UK) - Examinateur
October 22, 2020

2

Contents
1 Introduction 71.1 Information Extraction to generate structured knowledge . . . . . . . . . . . . . 81.2 Natural language interaction with the Web of Data . . . . . . . . . . . . . . . . 101.3 Mining argumentative structures from texts . . . . . . . . . . . . . . . . . . . . 111.4 Cyberbullying and abusive language detection . . . . . . . . . . . . . . . . . . . 131.5 Structure of this report . . . . . . . . . . . . . . . . . . . . . . . . . . . . . . . . 14
2 IE to generate structured knowledge 152.1 Towards Lifelong Object Learning . . . . . . . . . . . . . . . . . . . . . . . . . . 172.2 Mining semantic knowledge from the Web . . . . . . . . . . . . . . . . . . . . . 302.3 Natural Language Processing of Song Lyrics . . . . . . . . . . . . . . . . . . . . 492.4 Lyrics Segmentation via bimodal text-audio representation . . . . . . . . . . . . 502.5 Song lyrics summarization inspired by audio thumbnailing . . . . . . . . . . . . 652.6 Enriching the WASABI Song Corpus with lyrics annotations . . . . . . . . . . . 722.7 Events extraction from social media posts . . . . . . . . . . . . . . . . . . . . . 852.8 Building events timelines from microblog posts . . . . . . . . . . . . . . . . . . . 932.9 Conclusions . . . . . . . . . . . . . . . . . . . . . . . . . . . . . . . . . . . . . . 102
3 Natural language interaction with the Web of Data 1053.1 QAKiS . . . . . . . . . . . . . . . . . . . . . . . . . . . . . . . . . . . . . . . . . 1073.2 RADAR 2.0: a framework for information reconciliation . . . . . . . . . . . . . . 1113.3 Multimedia answer visualization in QAKiS . . . . . . . . . . . . . . . . . . . . . 1253.4 Related Work . . . . . . . . . . . . . . . . . . . . . . . . . . . . . . . . . . . . . 1273.5 Conclusions . . . . . . . . . . . . . . . . . . . . . . . . . . . . . . . . . . . . . . 129
4 Mining argumentative structures from texts 1314.1 A natural language bipolar argumentation approach . . . . . . . . . . . . . . . . 1344.2 Argument Mining on Twitter: arguments, facts and sources . . . . . . . . . . . 1504.3 Argumentation analysis for political speeches . . . . . . . . . . . . . . . . . . . . 1554.4 Mining arguments in 50 years of US presidential campaign debates . . . . . . . . 1634.5 Argument Mining for Healthcare applications . . . . . . . . . . . . . . . . . . . 1674.6 Related work . . . . . . . . . . . . . . . . . . . . . . . . . . . . . . . . . . . . . 1784.7 Conclusions . . . . . . . . . . . . . . . . . . . . . . . . . . . . . . . . . . . . . . 180
5 Cyberbullying and abusive language detection 1835.1 Introduction . . . . . . . . . . . . . . . . . . . . . . . . . . . . . . . . . . . . . . 1835.2 A Multilingual evaluation for online hate speech detection . . . . . . . . . . . . 1855.3 Cross-platform evaluation for Italian hate speech detection . . . . . . . . . . . . 1995.4 A system to monitor cyberbullying . . . . . . . . . . . . . . . . . . . . . . . . . 2035.5 Related Work . . . . . . . . . . . . . . . . . . . . . . . . . . . . . . . . . . . . . 2075.6 Conclusions . . . . . . . . . . . . . . . . . . . . . . . . . . . . . . . . . . . . . . 209
3

4 CONTENTS
6 Conclusions and Perspectives 211

Acknowledgements
I would like to thank the main authors of the publications that are summarized here for theirkind agreement to let these works contribute to this thesis.
5

6 CONTENTS

Chapter 1
Introduction
This document relates and synthesizes my research and research management experience sinceI joined the EDELWEISS team led by Olivier Corby in 2011 for a postdoctoral position at InriaSophia Antipolis (2 years funded by the Inria CORDIS postdoctoral program, followed by 1year funded by the Labex UCN@SOPHIA and 1 year funded by the SMILK LabCom project).In 2011, the Inria EDELWEISS team and the I3S KEWI team merged to become WIMMICS(Web Instrumented Man-Machine Interactions, Communities and Semantics)1, a joint teambetween Inria, University of Nice Sophia Antipolis and CNRS, led by Fabien Gandon. InOctober 2015, I got an Assistant Professor Position (Maitre de Conference) at the Universityof Nice Sophia Antipolis, now part of the Universite Cote d’Azur. WIMMICS is a sub-group ofthe SPARKS2 team (Scalable and Pervasive softwARe and Knowledge Systems) in I3S whichhas been structured into three themes in 2015. My research activity mainly contributes to theFORUM theme (FORmalising and Reasoning with Users and Models). Throughout this 9-yearperiod, I was involved in several research projects and my role has progressively evolved fromjunior researcher to scientific leader. I initiated several research projects on my own, and Isupervised several PhD thesis. In the meantime, I was also involved in the scientific animationof my research community.
My research area is Natural Language Processing, and the majority of my works are inthe sub-areas of Argument(ation) Mining and Information Extraction. Long-term goal of myresearch (and of works in such research area) is to make computers/machines as intelligentas human beings in understanding and generating language, being thus able: to speak, tomake deduction, to ground on common knowledge, to answer, to debate, to support humans indecision making, to explain, to persuade. Natural language understanding can come in manyforms. In my research career so far I put efforts in investigating some of these forms, stronglyconnected to the actions I would like intelligent artificial systems to be able to perform.
In this direction, my first research topic was the study of semantic inferences in natural lan-guage texts, that I investigated in the context of my PhD in Information and CommunicationTechnologies (International Doctoral School in Trento, Italy), supervised by Bernardo Magniniat the Fondazione Bruno Kessler, Human Language Technology research group (Trento, Italy).During my PhD, I focused on better understanding the semantic inference needs across NLPapplications, and in particular on the Textual Entailment (TE) framework. Textual Entail-ment has been proposed as a generic framework to model language variability and capturemajor semantic inference needs across applications in Natural Language Processing. In theTE recognition (RTE) task systems are asked to automatically judge whether the meaningof a portion of text (T), entails the meaning of another text (Hypothesis, H). TE comes atvarious levels of complexity and involves almost all linguistic phenomena of natural languages.
1https://team.inria.fr/wimmics/2https://sparks.i3s.unice.fr/
7
8 CHAPTER 1. INTRODUCTION
Although several approaches have been experimented, TE systems performances are still farfrom being optimal. My work started from the belief that crucial progress may derive from afocus on decomposing the complexity of the TE task into basic phenomena and on their com-bination. More specifically, I analyzed how the common intuition of decomposing TE allows abetter comprehension of the problem from both a linguistic and a computational viewpoint. Iproposed a framework for component-based TE, where each component is in itself a completeTE system, able to address a TE task on a specific phenomenon in isolation. I investigated thefollowing dimensions: i) the definition and implementation of a component-based TE architec-ture; ii) the linguistic analysis of the phenomena; iii) the automatic acquisition of knowledgeto support entailment judgments; iv) the development of evaluation methodologies to assessTE systems capabilities. During my PhD, I have also spent 6 months at the Xerox ResearchCenter Europe in Grenoble (now NAVER Labs Europe), in the Parsing and Semantics researchlab, where I continued my research on my PhD topic.
Following the long-term goal mentioned above and after defending my PhD, my researchtopics gradually evolved from the study of semantic inferences between textual snippets to theinvestigation of methods to extract structured information from unstructured natural languagetext, to populate knowledge bases in different application scenarios, with the goal of makingintelligent system ground on common knowledge. To enhance users interactions with suchstructured data, I then addressed the challenge of mapping natural language expressions (e.g.,user queries) with concepts and relations in structured knowledge bases, implementing a ques-tion answering system. The following step was to focus on mining and analyzing argumentativestructures (from heterogeneous sources, but mainly from the Web), as well as connecting themwith datasets on the Web of Data for their interlinking and semantic enrichment. I am one ofthe very first initiators of the research topic, very popular nowadays, called Argument Mining.The rationale behind my research work (as one of the core topics of the WIMMICS team) is tosupport structured argument exchange, informed decision making and improved fact-checking,also considering the role of emotions and persuasion. For this reason, argumentative structuresand relevant factual information should be mined, understood and interlinked, and the Webrepresents both an invaluable information source, and the ideal place to publish the minedresults, producing new types of links in the global vision of weaving a richer and denser Web.
To preserve an open, safe and accessible Web, another aspect of increasing importance inthis scenario is the development of robust systems to detect abuse in online user generatedcontent. In this context, we addressed the task of multilingual abusive language detection,taking advantage of both the network analysis and the content of the short-text messages ononline platforms to detect cyberbullying phenomena.
This chapter is organized as follows: Sections 1.1, 1.2, 1.3 and 1.4 provide an overview ofthe four main research areas my research contributions deal with. More specifically, in eachsection, I provide: a survey of the research area and a description of the projects in which I amor was involved, presented by application domains. The scientific contributions themselves aredetailed in the next chapters.
1.1 Information Extraction to generate structured knowl-
edge
Information extraction (IE) is the process of extracting specific (pre-specified) informationfrom textual sources. Gathering detailed structured data from texts (where there is a regularand predictable organization of entities and relationships), information extraction enables theautomation of tasks such as smart content classification, integrated search, management anddelivery, and data-driven activities such as mining for patterns and trends, uncovering hidden

1.1. INFORMATION EXTRACTION TO GENERATE STRUCTURED KNOWLEDGE 9
relationships, and so on. Broadly speaking, the goal of IE is to allow computation to be doneon the previously unstructured data. Typically, for structured information to be extractedfrom unstructured texts, the following main subtasks are involved: (i) pre-processing of thetext, (ii) finding and classifying concepts (e.g., mentions of people, things, locations, eventsand other pre-specified types of concepts detected and classified), (iii) connecting the concepts(i.e. identifying relationships between the extracted concepts), (iv) eliminating duplicate data,and (v) enriching a knowledge base for further use.
Natural language remains the most natural means of interaction and externalization ofinformation for humans. Manually managing and effectively making use of the growing amountof information available in unstructured form (e.g., news, articles, social media) is tedious,boring and labor intensive. Information Extraction systems take natural language text asinput and produce structured information specified by certain criteria, that is relevant to aparticular application.
I have been conceived and applied Information Extraction methods in different applicationscenarios, and in the context of several projects.
I was the French project leader of the ALOOF project “Autonomous learning of the mean-ing of objects” (funded by CHIST-ERA3, 2015-2018), whose goal was to enable robots andautonomous systems working with and for humans to exploit the vast amount of knowledge onthe Web in order to learn about previously unseen objects involved in human activities, andto use this knowledge when acting in the real world. In particular, the goal of our researchwas to mine relevant knowledge from the Web on domestic settings (including objects’ names;class properties; appearance and shape; storage locations; and typical usages/functions). Wepresented a framework for extracting such knowledge in the form of (binary) relations. It re-lied on a ranking measure that, given an object, ranks all entities that potentially stand inthe relation in question to the given object. More precisely, we relied on a representationalapproach that exploits distributional spaces to embed entities into low-dimensional spaces inwhich the ranking measure can be evaluated. In the context of this project I supervised thework of Valerio Basile and Roque Lopez Condori, research engineers.
I was also involved in the WASABI project, funded by ANR4, 2016-2019, whose goal isthe creation of a 2 million song knowledge base that combines metadata collected from musicdatabases on the Web, metadata resulting from the analysis of song lyrics, and metadataresulting from the audio analysis, and the development of semantic applications with high addedvalue to exploit this semantic database. In the context of such project, I was co-supervising thePh.D. thesis of Michael Fell on Natural Language Processing of song lyrics. Given that lyricsencode an important part of the semantics of a song, our research activity in this context focusedon extracting relevant information from the lyrics, such as their structure segmentation, theirtopics, the explicitness of the lyrics content, the salient passages of a song and the emotionsconveyed. Together with researchers at IRCAM (Paris), partners of the WASABI project, wehave investigated the coupling of text and audio to improve system performances for MusicInformation Retrieval.
The purpose of the LabCom SMILK “Social Media Intelligence and Linked Knowledge”(common laboratory between WIMMICS and the company ViseoGroup in Grenoble5, 2014-2017) was to develop research and technologies in order to retrieve, analyze, and reason ontextual data coming from Web sources, and to make use of Linked Open Data, social networksstructures and interaction in order to improve the analysis and understanding of textual re-sources. In the context of this project I supervised the work of Farhad Nooralahzadeh, researchengineer (now PhD at the University of Oslo), on semantically enriching raw data by linking
3https://project.inria.fr/aloof/2015/09/22/the-aloof-project/4http://wasabihome.i3s.unice.fr/5project.inria.fr/smilk/

10 CHAPTER 1. INTRODUCTION
the mentions of named entities in the text to the corresponding known entities in knowledgebases. In the context of the same project, we experimented brand-related information retrievalin the field of cosmetics. We created the ProVoc ontology to describe products and brands, weautomatically populated a knowledge base mainly based on ProVoc from heterogeneous textualresources, and we developed a browser plugin providing additional knowledge to users browsingthe web relying on such ontology.
In the Topic Detection and Tracking (TDT) community, the task of analyzing textual docu-ments for detecting events is called Event Detection (ED). ED is generally defined as a discoveryproblem, i.e., mining a set of documents for new patterns recognition [487]. It mainly consistsin discovering new or tracking previously identified events. ED from texts were mainly focusedon finding and following events using conventional media sources such as a stream of broadcastnews stories. In the latest years, NLP researchers have shown growing interest in mining knowl-edge from social media data, specially Twitter, to detect and extract structured representationsand summarize newsworthy events. In this context, I have supervised the PhD thesis of AmosseEdouard on studying methods for detecting, classifying and tracking events on Twitter.
1.2 Natural language interaction with the Web of Data
While more and more structured data is published on the web, the question of how typicalweb users can access this body of knowledge keeps on being of crucial importance. Over thepast years, there has been a growing amount of research on interaction paradigms that allowend users to profit from the expressive power of Semantic Web standards while at the sametime hiding their complexity behind an intuitive and easy-to-use interface. Especially naturallanguage interfaces have received wide attention, as they allow users to express arbitrarily com-plex information needs in an intuitive fashion and, at least in principle, in their own language.Multilingualism is, in fact, an issue of major interest for the Semantic Web community, as boththe number of actors creating and publishing data all in languages other than English, as wellas the amount of users that access this data and speak native languages other than English isgrowing substantially.
The key challenge is to translate the users’ information needs into a form such that they canbe evaluated using standard Semantic Web query processing and inferencing techniques. Overthe past years, a range of approaches have been developed to address this challenge, showingsignificant advances towards answering natural language questions with respect to large, het-erogeneous sets of structured data [449]. However, only few systems yet address the fact thatthe structured data available nowadays is distributed among a large collection of interconnecteddatasets, and that answers to questions can often only be provided if information from severalsources are combined. In addition, a lot of information is still available only in textual form,both on the web and in the form of labels and abstracts in linked data sources. Thereforeapproaches are needed that can not only deal with the specific character of structured data butalso with finding information in several sources, processing both structured and unstructuredinformation, and combining such gathered information into one answer [402, 451].
In this context, I have addressed the problem of enhancing interactions between non-expertusers and data available on the Web of data, focusing in particular on the automatic extrac-tion of structured data from unstructured documents to populate RDF triple stores, and in aQuestion Answering (QA) setting, on the mapping of natural language expressions (e.g., userqueries) with concepts and relations in a structured knowledge base. In particular, I havedesigned and implemented the models and algorithms of a Question Answering system overLinked Data (QAKiS) based on DBpedia as the RDF data set to be queried using a naturallanguage interface. To reconcile information obtained by language specific DBpedia chapters,I have integrated an argumentation-based module into the system to reason over inconsistent

1.3. MINING ARGUMENTATIVE STRUCTURES FROM TEXTS 11
information sets, so as to provide a unique and justified answer to the user.
1.3 Mining argumentative structures from texts
In the last years, the growing of the Web and the daily increasing number of textual datapublished there with different purposes have highlighted the need to process such data in orderto identify, structure and summarize this huge amount of information. Online newspapers,blogs, online debate platforms and social networks, but also normative and technical docu-ments provide an heterogeneous flow of information where natural language arguments can beidentified, and analyzed. The availability of such data, together with the advances in NaturalLanguage Processing and Machine Learning, supported the rise of a new research area calledArgument(ation) Mining (AM). AM is a young and emerging research area within compu-tational linguistics. At its heart, AM involves the automatic identification of argumentativestructures in free text, such as the conclusions, premises, and inference schemes of argumentsas well as their interrelations and counter-considerations [92].
Two main stages have to be considered in the typical argument mining pipeline, from theunstructured natural language documents towards structured (possibly machine-readable) data:
Arguments’ extraction: The first stage of the pipeline is to detect arguments within theinput natural language texts. Referring to standard argument graphs, the retrieved argumentswill thus represent the nodes in the final argument graph returned by the system. This stepmay be further split in two different stages such as the extraction of arguments and the furtherdetection of their boundaries.
Relations’ extraction: The second stage of the pipeline consists in constructing the argumentgraph to be returned as output of the system. The goal is to predict what are the relationsholding between the arguments identified in the first stage. This is an extremely complex task,as it involves high-level knowledge representation and reasoning issues. The relations betweenthe arguments may be of heterogeneous nature, like attack, support or entailment [24]. Thisstage is also in charge of predicting, in structured argumentation, the internal relations of theargument’s components, such as the connection between the premises and the claim [11, 77].Being it an extremely challenging task, existing approaches assume simplifying hypotheses, likethe fact that evidence is always associated with a claim [1].
To date, researchers have investigated AM on genres such as legal documents [330, 18], productreviews [456, 481], news articles [178, 5], online debates [89, 461], user-generated web discourse[364, 204, 154], Wikipedia articles [274, 396], academic literature [265], bioscience literature[202], persuasive essays [425], and dialogues [74, 6]. Recently, also argument quality assessmentcame into focus [205, 162]. AM is also inherently tied to stance and sentiment analysis [25], sinceevery argument carries a stance towards its topic, often expressed with sentiment. Argumentmining gives rise to various practical applications of great importance. In particular, it providesmethods that can find and visualize the main pro and con arguments in a text corpus – or even inan argument search on the web – towards a topic or query of interest [396, 423]. In instructionalcontexts, written and diagrammed arguments represent educational data that can be mined forconveying and assessing students’ command of course material [352].
In this context, together with Serena Villata (CNRS), I proposed a combined frameworkof natural language processing and argumentation theory to support human users in their in-teractions. The framework combines a natural language processing module which exploits theTextual Entailment (TE) approach (previously investigated during my PhD thesis) and detectsthe arguments in natural language debates and the relationships among them, and an argu-

12 CHAPTER 1. INTRODUCTION
mentation module which represents the debates as graphs and detects the accepted arguments.The argumentation module is grounded on bipolar argumentation. Moreover, I studied the re-lation among the notion of support in bipolar argumentation, and the notion of TE in NaturalLanguage Processing (NLP). This research line about natural models of argumentation resultedin the NoDE Benchmark6, a benchmark of natural arguments extracted from different kindsof textual sources. It is composed of three datasets of natural language arguments, released intwo machine-readable formats, i.e., the standard XML format, and XML/RDF format adopt-ing the SIOC-Argumentation vocabulary (extended). Arguments are connected by two kindsof relations: a positive (i.e., support) relation, and a negative (i.e., attack) relation, leadingto the definition of bipolar argumentation graphs. I started also to investigate the mappingbetween argumentation schemes in argumentation theory, and discourse in Natural LanguageProcessing, together with Serena Villata (CNRS) and Sara Tonelli (FBK Trento).
This research line continued by applying argument mining to political speeches. I also co-supervise (official supervisors are Serena Villata and Leendert van der Torre), the PhD thesisof Shohreh Haddadan (University of Luxembourg – 2017-2020) about “Argument Mining onPolitical debates”. Given that political debates offer a rare opportunity for citizens to comparethe candidates’ positions on the most controversial topics of the campaign, we carried outan empirical investigation of the typology of argument components in political debates byannotating a set of political debates from the last 50 years of US presidential campaigns,creating a new corpus of 29k argument components, labeled as premises and claims.
In the same line, I co-supervise also (official supervisors are Serena Villata and Celine Pou-dat), the PhD thesis of Tobias Mayer on “Argument Mining on medical data” (in particular,so far we focused on extracting argumentative structures and their relations from RandomizedClinical Trials). Evidence-based decision making in the health-care domain targets at support-ing clinicians in their deliberation process to establish the best course of action for the caseunder evaluation. We proposed a complete argument mining pipeline for RCTs, classifying ar-gument components as evidence and claims, and predicting the relation, i.e., attack or support,holding between those argument components on a newly created dataset of RCTs. We exper-iment with deep bidirectional transformers in combination with different neural architecturesand outperformed current state-of-the-art end-to-end argument mining systems. These set ofworks are carried out in the context of the IADB project (Integration et Analyse de DonneesBiomedicales, 2017-2020) funded by IDEX UCA Jedi7. The goal of the project is to define themethods to access, process and extract information from a huge quantity of biomedical datafrom heterogeneous source and of different nature (e.g., texts, images).
Another scenario to which I have contributed with argument mining methods concerned theextraction of argumentative text from social media short messages in the context of the InriaCARNOT Project “Natural Language Argumentation on Twitter” (2014-2015) with the start-up Vigiglobe, based in Sophia Antipolis. Understanding and interpreting the flow of messagesexchanged in real time on social platforms, like Twitter, raises several important issues. Thebig amount of information exchanged on these platforms represents a significant value for whois able to read and enrich this multitude of information. Users directly provide this information,and it is interesting to analyze such data both from the quantitative and from the qualitativepoint of view, especially for what concerns reputation and marketing issues (regarding brands,institutions or public actors). Moreover, the automated treatment of this type of data and theconstraints it presents (e.g., limited number of characters, tweets with a particular writing style,amount of data, real-time communication) offer a new and rich context for a challenging useof existing tools for argument mining. In the context of this project, I supervised the activityof Tom Bosc, a research engineer, now doing a PhD in Canada. Always in the context of this
6http://www-sop.inria.fr/NoDE/7http://www.i3s.unice.fr/~riveill/IADB/

1.4. CYBERBULLYING AND ABUSIVE LANGUAGE DETECTION 13
project, I supervised the 3-month internship of Mihai Dusmanu (Ecole Normale Superieure,Paris) about Argument Detection on Twitter.
Still on argument mining, I am currently involved in the DGA RAPID CONFIRMA project“COntre argumeNtation contre les Fausses InfoRMAtions”. Counter-argumentation is a pro-cess aiming to put forward counter-arguments in order to provide evidences against a certainargument previously proposed. In the case of fake news, in order to convince a person that the(fake) information is true, the author of the fake news uses different methods of persuasion viaarguments. Thus, goal of our research is to propose performing methods to identifying thesearguments and attacking them by proposing carefully constructed arguments from safe sources,as a way to fight this phenomenon and its spread along the social network. In the context ofthis project, I am co-supervising the postdoc of Jerome Delobelle.
My research activity dealing with emotions in argumentation started with the SEEMPAD“Social Exchanges and Emotions in Mediated Polemics - Analysis and Data Associate”8 project(Joint Research Team with Heron Lab, 2014-2016). The goal of this project was to study thedifferent dimensions of exchanges arising on online discussion platforms. More precisely, weconcentrated on the study and analysis of the impact of emotions and mental states on theargumentation in online debates, with a particular attention to the application of argumentativepersuasion strategies.
Recently, the ANSWER Inria-Qwant research project9 was launched, whose goal is to de-velop the new version of the Qwant search engine by introducing radical innovations in terms ofsearch criteria as well as indexed content and users’ privacy. In this context, I am co-supervisingthe PhD thesis of Vorakit Vorakitphan (2018-2021) on extracting effective and scalable indica-tors of sentiment, emotions, and argumentative relations in order to offer the users additionalmeans to filter the results selected by the search engine.
1.4 Cyberbullying and abusive language detection
The use of social media platforms such as Twitter, Facebook and Instagram has enormouslyincreased the number of online social interactions, connecting billions of users, favouring theexchange of opinions and giving visibility to ideas that would otherwise be ignored by traditionalmedia. However, this has led also to an increase of attacks targeting specific groups of usersbased on their religion, ethnicity or social status, and individuals often struggle to deal withthe consequences of such offenses.
This problem affects not only the victims of online abuse, but also stakeholders such as gov-ernments and social media platforms. For example, Facebook, Twitter, YouTube and Microsofthave recently signed a code of conduct10, proposed by the European Union, pledging to reviewthe majority of valid notifications for removal of illegal hate speech in less than 24 hours.
Within the Natural Language Processing (NLP) community, there have been several effortsto deal with the problem of online abusive detection, since the computational analysis of lan-guage can be used to quickly identify offenses and ease the removal of abusive messages. Severalworkshops [471, 182] and evaluation campaigns [179, 70, 477, 38, 493] have been recently organ-ised to discuss existing approaches to hate speech detection, propose shared tasks and foster thedevelopment of benchmarks for system evaluation. These have led to the creation of a numberof datasets for hate speech detection in different languages, that have been shared within theNLP research community. Recent advances in deep learning approaches to text classificationhave then been applied also to deal with this task, achieving for some languages state-of-the-art
8https://project.inria.fr/seempad/9https://project.inria.fr/answer/
10http://ec.europa.eu/justice/fundamental-rights/files/hate_speech_code_of_conduct_en.pdf

14 CHAPTER 1. INTRODUCTION
results [116, 185, 190]. These systems are usually tailored to deal with social media texts byapplying pre-processing, using domain-specific embeddings, adding textual features, etc.
Related to this context, I am the French leader of the EIT CREEP (Cyberbulling EffectPrevention, 2017-2019) project (funded by EIT Digital11). The purpose of CREEP is to providea set of tools to support the detection and prevention of psychological/behavioral problems ofcyberbullying teenage victims. The objective is achieved combining social media monitoringand motivational technologies (virtual coaches integrating chatbots). From February 2018to October 2019, I have supervised the activity of two research engineers, Pinar Arslan andMichele Corazza, working on a multilingual platform to monitor cyberbullying based on messageclassification and social network analysis.
Together with them and Sara Tonelli (FBK, Trento, partner of the CREEP project) weproposed a deep learning architecture for abusive detection that is rather stable and well-performing across different languages to evaluate the endowments of several components thatare usually employed in the task, namely the type of embeddings, the use of additional features(text-based or emotion-based), the role of hashtag normalisation and that of emojis. We per-formed our comparative evaluation on English, Italian and German, focusing on freely availableTwitter datasets for hate speech detection. Our goal is to identify a set of recommendations todevelop hate speech detection systems, possibly going beyond language-specific differences.
Moreover, we performed a comparative evaluation on freely available datasets for hate speechdetection in Italian, extracted from four different social media platform, i.e. Facebook, Twitter,Instagram and Whatsapp, to understand if it would it be advisable to combine such platform-dependent datasets to take advantage of training data developed for other platforms in low-resource scenarios. We have integrated the proposed classifiers for hate speech detection as partof the CREEP Social Media Analytics System for cyberbullying prevention. Cyberbullyingis “an aggressive, intentional act carried out by a group or an individual, using electronicforms of contact, repeatedly and over time against a victim who cannot easily defend him orherself”. In online social media, each episode of online activity aimed at offending, menacing,harassing or stalking another person can be classified as a cyberbullying phenomenon. This isconnected even with concrete public health issues, since recent studies show that victims aremore likely to suffer from psycho-social difficulties and affective disorders. Given its societalimpact, the implementation of cyberbullying detection systems, combining abusive languagedetection and social network analysis, has attracted a lot of attention in the last years. Inthis context, together with the colleagues of Inria Rennes (partners of the CREEP project), weare investigating the potential of coupling text and images in the cyberbullying detection task,to consider also cases when the bullying phenomenon starts from a picture posted on a socialmedia platform, or when an image is used to insult someone.
1.5 Structure of this report
This report is structured to describe my research contributions in each of the above-mentionedresearch areas. More precisely, in the following: Chapter 2 describes my research in informationextraction to generate formal knowledge, according to different application scenarios; Chapter 3presents my contribution in the conception and implementation of a Question Answering systemover Linked Data; Chapter 4 provides my contribution in the area of Argument Mining; and,last but not least, Chapter 5 presents my contribution in the area of cyberbullying and abusivelanguage detection. Conclusions summarize my research work, and discuss future perspectives.
11http://creep-project.eu/en/

Chapter 2
Information extraction to generatestructured knowledge
This chapter summarizes my contributions related to the extraction of information and theacquisition of knowledge from text in different application scenarios (mainly robotics, musicinformation retrieval and events extraction) to generate structured knowledge in a machine-readable and machine-interpretable format. The goal is to enable the automation of tasks suchas smart content classification, integrated search, reasoning, and data-driven activities such asmining for patterns and trends, uncovering hidden relations and so on. These contributions fitthe areas of Natural Language Processing and Semantic Web.
My research contributions on this topic have been published in several journal and venues.I provide below a list of the main publications on the topic, divided by application scenarios.
Mining common sense knowledge from the Web for robotics:
• Soufian Jebbara, Valerio Basile, Elena Cabrio, Philipp Cimiano (2019). Extracting com-mon sense knowledge via triple ranking using supervised and unsupervised distributionalmodels. Semantic Web 10(1): 139-158 [241]
• Jay Young, Lars Kunze, Valerio Basile, Elena Cabrio, Nick Hawes, Barbara Caputo(2017). Semantic web-mining and deep vision for lifelong object discovery. Proceed-ings of the International Conference on Robotics and Automation (ICRA-17): 2774-2779[491])
• Jay Young, Valerio Basile, Lars Kunze, Elena Cabrio, Nick Hawes (2016). TowardsLifelong Object Learning by Integrating Situated Robot Perception and Semantic WebMining. ECAI 2016: 1458-1466[489]
• Valerio Basile, Soufian Jebbara, Elena Cabrio, Philipp Cimiano (2016) Populating aKnowledge Base with Object-Location Relations Using Distributional Semantics. Pro-ceedings of the International Conference on Knowledge Engineering and Knowledge Man-agement (EKAW-16): 34-50 [39]
Processing song lyrics:
• Michael Fell, Yaroslav Nachaev, Gabriel Meseguer Brocal, Elena Cabrio, Fabien Gandon,Geoffroy Peeters (2020). Lyrics Segmentation via Bimodal Text-audio Representation.To appear in Journal of Natural Language Engineering [174]
15

16 CHAPTER 2. IE TO GENERATE STRUCTURED KNOWLEDGE
• Michael Fell, Elena Cabrio, Elmahdi Korfed, Michel Buffa, Fabien Gandon (2020). LoveMe, Love Me, Say (and Write!) that You Love Me: Enriching the WASABI Song Cor-pus with Lyrics Annotations. Proceedings of the Language Resources and EvaluationConference (LREC-2020): 2138-2147 [173]
• Michael Fell, Elena Cabrio, Fabien Gandon, Alain Giboin (2019). Song Lyrics Summa-rization Inspired by Audio Thumbnailing. Proceedings of the Recent Advances in NaturalLanguage Processing conference (RANLP-19), 328-337 [172]
• Michael Fell, Elena Cabrio, Michele Corazza, Fabien Gandon (2019). Comparing Auto-mated Methods to Detect Explicit Content in Song Lyrics. Proceedings of the RecentAdvances in Natural Language Processing conference (RANLP-19), 338-344[171]
• Michael Fell, Yaroslav Nechaev, Elena Cabrio, Fabien Gandon (2018) Lyrics Segmenta-tion: Textual Macrostructure Detection using Convolutions. Proceeding of the Interna-tional Conference on Comuputational Linguistics (COLING 2018), 2044-2054[175]
Events Extraction from social media:.
• Amosse Edouard, Elena Cabrio, Sara Tonelli, Nhan Le Thanh (2017). Graph-basedEvent Extraction from Twitter. Proceedings of the Recent Advances in Natural LanguageProcessing conference (RANLP-17) 222-230 [157]
• Amosse Edouard, Elena Cabrio, Sara Tonelli, Nhan Le Thanh (2017). You’ll Never TweetAlone: Building Sports Match Timelines from Microblog Posts. Proceedings of the RecentAdvances in Natural Language Processing conference (RANLP-17), 214-221 [159]
• Amosse Edouard, Elena Cabrio, Sara Tonelli and Nhan Le Thanh (2017). SemanticLinking for Event-Based Classification of Tweet. Proceedings of the 18th InternationalConference on Computational Linguistics and Intelligent Text Processing (CICLing-17)[158]
The contributions reported in this chapter are the results of several collaborations in thecontexts of the CHIST-ERA ALOOF project (for robotics), the ANR-WASABI project andPhD of Michael Fell (for Music Information Retrieval), and the Ph.D. thesis of Amosse Edouard(for events extraction).
The justification underlying the first line of work in the robotics scenario is given by thefact that autonomous robots that are to assist humans in their daily lives are required, amongother things, to recognize and understand the meaning of task-related objects. However, givenan open-ended set of tasks, the set of everyday objects that robots will encounter duringtheir lifetime is not foreseeable. That is, robots have to learn and extend their knowledgeabout previously unknown objects on-the-job. We therefore propose multiple approaches toautomatically acquire parts of this knowledge (e.g., the class of an object, its typical location andmanipulation-relevant knowledge that can support robots’ action planning) in form of rankedhypotheses from the Semantic Web using contextual information extracted from observationsand experiences made by robots. Thus, by integrating situated robot perception and SemanticWeb mining, robots can continuously extend their object knowledge beyond perceptual modelswhich allows them to reason about task-related objects, e.g., when searching for them, robotscan infer the most likely object locations or their typical use. The RDF publishing of theextracted knowledge base was also key to support (instantaneous) knowledge-sharing amongdifferent robots and even beyond. The Semantic Web and linked data approach was chosen tomake the extracted/learned knowledge available to more than just one robot.

2.1. TOWARDS LIFELONG OBJECT LEARNING 17
Goal of the second line of work is to understand how the automatic processing of songlyrics can be exploited to enhance applications such as music recommendation systems andmusic information retrieval. While most of the existing work in this area focus on audio andmetadata, our work demonstrates that the information contained in song lyrics is anotherimportant factor that should be taken into account when designing these applications. As aresult, we present the WASABI Song Corpus, a large corpus of songs enriched with metadataextracted from music databases on the Web, and resulting from the processing of song lyricsand from audio analysis. Given that lyrics encode an important part of the semantics of asong, we present multiple methods to extract relevant information from the lyrics, such as theirstructure segmentation, their topics, the explicitness of the lyrics content, the salient passagesof a song and the emotions conveyed. The corpus contains 1.73M songs with lyrics (1.41Munique lyrics) annotated at different levels with the output of the above mentioned methods.Such corpus labels and the provided methods can be exploited by music search engines andmusic professionals (e.g., journalists, radio presenters) to better handle large collections oflyrics, allowing an intelligent browsing, categorization and segmentation recommendation ofsongs.
The third line of work arise from the observation that the capability to understand andanalyze the stream of messages exchanged on social media (e.g., Twitter) is an effective wayto monitor what people think, which trending topics are emerging, and which main events areaffecting people’s lives. This is crucial for companies interested in social media monitoring, aswell as for public administrations and policy makers, that monitor tweets in order to report orconfirm recent events. In this direction, in our work we address the task of analyzing tweetsto discover new or track previously identified events. First, to classify event-related tweets, weexplore the impact of entity linking and of the NEs generalization, and we apply a supervisedclassifier to separate event-related from non event-related tweets, as well as to associate to event-related tweets the event categories defined by the Topic Detection and Tracking community.Second, we address the task of detecting which tweets describe a specific event and cluster them.We propose a novel approach that exploits NE mentions in tweets and their local context tocreate a temporal event graph. Then, we process the event graphs to detect clusters of tweetsdescribing the same event. Third, we propose an approach to build a timeline with actions ina sports game based on tweets, combining information provided by external knowledge basesto enrich the content of the tweets, and apply graph theory to model relations between actionsand participants in a game.
This chapter is organized as follows: Sections 2.1 and 2.2 describe the work carried out toequip a robot with a database of object knowledge. Then, Sections 2.4, 2.5 and 2.6 present themethods we proposed to annotate relevant information in the song lyrics to enrich the WASABISong corpus with lyrics metadata. Sections 2.7 and 2.8 explain the events extraction methodsto classify and cluster events, and to create timelines. Conclusions end the chapter.
2.1 Towards lifelong object learning by integrating stu-
ated robot perception and Semantic Web mining
It is crucial for autonomous robots working in human environments such as homes, offices orfactories to have the ability to represent, reason about, and learn new information about theobjects in their environment. Current robot perception systems must be provided with modelsof the objects in advance, and their extensibility is typically poor. This includes both perceptualmodels (used to recognize the object in the environment) and semantic models (describing whatthe object is, what it is used for etc.). Equipping a robot a priori with a (necessarily closed)database of object knowledge is problematic because the system designer must predict which

18 CHAPTER 2. IE TO GENERATE STRUCTURED KNOWLEDGE
subset of all the different domain objects is required, and then build all of these models (atime-consuming task). If a new object appears in the environment, or an unmodelled objectbecomes important to a task, the robot will be unable to perceive, or reason about, it. Thesolution to this problem is for the robot to learn on-line about previously unknown objects. Thisallows robots to autonomously extend their knowledge of the environment, training new modelsfrom their own experiences and observations.
The online learning of perceptual and semantic object models is a major challenge forthe integration of robotics and AI. In this section we address one problem from this largerchallenge: given an observation of a scene containing an unknown object, can an autonomoussystem predict the semantic description of this object. This is an important problem becauseonline-learnt object models [167] must be integrated into the robot’s existing knowledge base,and a structured, semantic description of the object is crucial to this. Our solution combinessemantic descriptions of perceived scenes containing unknown objects, with a distributionalsemantic approach which allows us to fill gaps in the scene descriptions by mining knowledgefrom the Semantic Web. Our approach assumes that the knowledge onboard the robot is asubset of some larger knowledge base, i.e. that the object is not unknown beyond the robot’spre-configured knowledge. To determine which concepts from this larger knowledge base mightapply to the unknown object, our approach exploits the spatio-temporal context in whichobjects appear, e.g., a teacup is often found next to a teapot and sugar bowl. These spatio-temporal co-occurrences provide contextual clues to the properties and identity of otherwiseunknown objects.
This section makes the following contributions:
• a novel distributional semantics-based approach for predicting both the semantic identityof an unknown, everyday object based on its spatial context and its most likely locationbased on semantic relatedness;
• an extension to an existing semantic perception architecture to provide this spatial con-text; and
• an evaluation of these techniques on real-world scenes gathered from a long-term au-tonomous robot deployment.
In the following, in Section 2.1.1, we first state the problem of acquiring semantic de-scriptions for unknown objects and give an overview of our approach. In Subsection 2.1.2,we describe the underlying robot perception system and explain how it is integrated with aSemantic Web mining component. Subsection 2.1.3 describes how the component generatesanswers/hypotheses to web-queries from the perception module. In Subsection 2.1.4, we de-scribe the experimental setup and present the results, while in Subsection 2.1.4 we provide adetailed discussion about our approach.1
2.1.1 Problem statement and methodology
Problem Statement. The problem we consider in this section can be summarized as follows:Given the context of a perceived scene and the experience from previous observations, predictthe class of an ’unknown’ identified object. The context of a scene can include informationabout the types and locations of recognized small objects, furniture, and the type of the roomwhere the observation has been made.
In this section we use the following running example (Figure 2.1) to illustrate the problemand our approach:
1We also make available our data set and software source code at: http://github.com/aloof-project/

2.1. TOWARDS LIFELONG OBJECT LEARNING 19
Room kitchenSurface counter-top
Furniture refrigerator, kitchen cabinet, sinkSmall Objects bowl, teabox, instant coffee, water boiler, mug
Figure 2.1: Perceived and interpreted kitchen scene, with various objects.
While operating 24/7 in an office environment, a robot routinely visits the kitchenand scans all surfaces for objects. On a kitchen counter it finds several householdobjects: a bowl, a teabox, a box of instant coffee, and a water boiler. However, oneof the segmented objects, a mug, cannot be identified as one of the known objectclasses. The robot’s task is to identify the unknown object solely based on thecontext of the perceived scene and scenes that have been previously perceived andin which the respective object was identified.
The problem of predicting the class of an object purely based on the context can also beseen as top-down reasoning or top-down processing of information. This stands in contrastto data-driven bottom-up processing where, for example, a robot tries to recognize an objectbased on its sensor data. In top-down processing, an agent, or the robot, has some expectationsof what it will perceive based on commonsense knowledge and its experiences. For example, ifa robot sees a fork and a knife close to each other, and a flat unknown object with a squarebounding-box next to them, it might deduce that the unknown object is probably a plate.In the following, we refer to this kind of processing which combines top-down reasoning andbottom-up perception as knowledge-enabled perception.
Systems such as the one described in this section are key components of integrated, situatedAI systems intended for life-long learning and extensibility. We currently develop the systemwith two main use-cases in mind, both stemming from the system’s capability to suggest in-formation about unknown objects based on the spatial context in which they appear. Thefirst use case is as part of a crowd-sourcing platform, allowing humans that inhabit the robot’senvironment to help it label unknown objects. Here, the prediction system is used to narrowdown the list of candidate labels and categories to be shown to users to select from alongsideimages of unknown objects the robot has encountered. Our second use case will be to help formmore informative queries for larger machine learning systems, in our case an image classification

20 CHAPTER 2. IE TO GENERATE STRUCTURED KNOWLEDGE
Figure 2.2: System overview. The robot perception component identifies all object candidateswithin a scene. All object candidates that can be recognized are labeled according to theirclass, all remaining objects are labeled as ’unknown’. Furthermore, the component computesthe spatial relations between all objects in the scene. Together with context information froma semantic environment map, the robot generates a query to a web service which is processedby the Semantic Web mining component. Based on the semantic relatedness of objects thecomponent provides a ranked list of the potential classes for all unknown objects.
system trained on extensive, though categorized, image data from websites like Amazon. Here,having some hints as to an object’s identity, such as a distribution over a set of possible labelsor categories it might belong to or be related to, could produce a significant speed boost byletting the classification system know what objects it does not have to test against. In thiscase, we aim to use the system to help a robot make smarter, more informed queries whenasking external systems questions about the world.
Our approach. We address the problem of predicting information about the class of anobject based on the perceived scene context by mining the Semantic Web. The extracted scenecontext includes a list of recognized objects and their spatial relations among each other, plusadditional information from a semantic environment map. This information is then used tomine potential object classes based on the semantic relatedness of concepts in the Web. Inparticular, we use DBpedia as a resource for object knowledge, and will later on use WordNetto investigate object taxonomies. The result of the web mining component is a ranked listof potential objects classes, expressed as DBpedia entries, which allows us access to furtherinformation beyond just the class of an object, such as categorical knowledge. An overview ofthe entire developed system is given in Figure 2.2.
Overall, we see our context-based class prediction approach as a means to restrict thenumber of applicable classes for an object. The aim of our knowledge-enabled perceptionsystem is not to replace a bottom-up perception system but rather to complement it as anadditional expert. For example, in the context of a crowdsourcing-based labeling platform oursystem could generate label suggestions for users. Thereby labeling tasks can be performed inless time and object labels would be more consistent across users. Hence, we believe that our

2.1. TOWARDS LIFELONG OBJECT LEARNING 21
system provides an essential functionality in the context of lifelong object learning.In the following, we briefly discuss various resources of object knowledge.
Resources for object knowledge. To provide a common format for object knowledge, andto access the wide variety of structured knowledge available on the Web, we link the obser-vations made by the robot to DBpedia concepts. DBpedia [54] is a crowd-sourced commu-nity effort started by the Semantic Web community to extract structured information fromWikipedia and make this information available on the Web. DBpedia has a broad scopeof entities covering different domains of human knowledge: it contains more than 4 millionthings classified in a consistent ontology and denoted by a URI-based reference of the formhttp://dbpedia.org/page/Teapot for the Teapot concept. DBpedia supports sophisticatedqueries (using an SQL-like query language for RDF called SPARQL) to mine relationshipsand properties associated with Wikipedia resources. We link the objects that the robot canencounter in natural environments to DBpedia concepts, thus exploiting this structured, onto-logical knowledge.
BabelNet [341] is both a multilingual encyclopedic dictionary and a semantic network whichconnects concepts and named entities in a very large network of semantic relations (about 14million entries). BabelNet covers and is obtained from the automatic integration of severalresources, such as WordNet [177], Wiktionary and Wikipedia. Each concept contained inBabelNet is represented as a vector in a high-dimensional geometric space in the NASARIresource, that we use to compute the semantic relatedness among objects.
2.1.2 Situated robot perception
The RoboSherlock framework. To be able to detect both known and unknown objects inits environment a robot must have perceptual capabilities. Our perception pipeline is basedon the RoboSherlock framework [43], an open-source framework for implementing perceptionsystems for robots, geared towards interaction with objects in human environments. The useof RoboSherlock provides us with a suite of vision and perception algorithms. Following theparadigm of Unstructured Information Management (as used by the IBM Watson project),RoboSherlock approaches perception as a problem of content analysis, whereby sensor datais processed by a set of specialized information extraction and processing algorithms calledannotators. The RoboSherlock perception pipeline is a sequence of annotators which includeplane segmentation, RGB-D object segmentation, and object detection algorithms. The outputof the pipeline includes 3D point clusters, bounding-boxes of segmented objects (as seen inFigure 2.2), and feature vectors (color, 3D shape and texture) describing each object. Thesefeature vectors are important as they allow the robot to track unknown objects as it takesmultiple views of the same scene. Though in this section we work with a collected and annotateddataset, we do not require the segmentation or 3D object recognition steps RoboSherlockcan provide via LINE-MOD-3D [223], though this component is used in our full Robot andSimulated system where a range of perception algorithms are connected and used instead ofdataset input. We make use of all other RoboSherlock capabilities the pipeline to processthe data and provide a general architecture for our representation and extraction of historicalspatial context, web query generation and the application of Qualitative Spatial Relations,which we will discuss in a following section.
Scene perception. We assume here that the robot is tasked with observing objects in naturalenvironments. Whilst this is not a service robot task in itself, it is a precursor to manyother task-driven capabilities such as object search, manipulation, human-robot interactionetc. Similar to prior work (e.g., [407]) we assume that the robot already has a semantic map

22 CHAPTER 2. IE TO GENERATE STRUCTURED KNOWLEDGE
of its environment which provides it with at least annotations of supporting surfaces (desks,worktops, shelves etc.), plus the semantic category of the area in which the surface is located(office, kitchen, meeting room etc.). Surfaces and locations are linked to DBpedia entries justas object labels are, typically as entities under the categories Furniture and Room respectively.
From here, we have access to object, surface and furniture labels described by the data,along with 3D bounding-boxes via 3D point data. In the kitchen scene the robot may observevarious objects typical of the room, such as a refrigerator, a cabinet, mugs, sugar bowls orcoffee tins. Their positions in space relative to a global map frame are recorded and we canthen record the distance between objects, estimate their size (volume) and record informationabout their co-occurrences, and the surfaces upon which they were observed, by updatinghistograms attached to each object.
In the following we assume that each scene only contains a single unknown object, but theapproach generalizes to multiple unknown objects treated independently. Joint inference overmultiple unknown objects is future work.
Spatial and semantic context extraction. In order to provide additional information tohelp subsequent components predict the unknown object, we augment the scene descriptionwith additional spatial and semantic context information, describing the relationships betweenthe unknown object and the surrounding known objects and furniture. This context startsfrom the knowledge we already have in the semantic map: labels for the room and surface theobject is supported by.
We make use of Qualitative Spatial Relations (QSRs) to represent information about ob-jects [187]. QSRs discretise continuous spatial measurements, particularly relational informa-tion such as the distance and orientation between points, yielding symbolic representationsof ranges of possible continuous values. In this work, we make use of a qualitative distancemeasure, often called a Ring calculus. When observing an object, we categorize its distance rela-tionship with any other objects in a scene with the following set of symbols: near0, near1, near2,where near0 is the closest. This is accomplished by placing sets of thresholds on the distancefunction between objects, taken from the centroid of the 3D cluster. For example, this al-lows us to represent that the mug is closer to the spoon than the kettle (near0(mug, spoon)near2(mug, kettle)) without using floating-point distance values based on noisy and unreli-able readings from the robot’s sensors. The RoboSherlock framework provides a measure of thequalitative size of objects by thresholding the values associated with the volume of 3D bounding-boxes around objects as they are observed. We categorize objects as small,medium, large inthis way, allowing the robot to represent and compare object sizes. Whilst our symbolic abstrac-tions are currently based on manual thresholds, approaches exist for learning parametrisationsof QSRs through experience (e.g., [490]) and we will try this in the future. For now, we chooseparameters for our qualitative calculi tuned by our own knowledge of objects in the world,and how they might relate. We use near0 for distances in cluster space lower than 0.5, near1
for distances between than 0.5 and 1.0, near2 for distances between 1.0 and 3.5 and near3 fordistances greater than 3.5.
As the robot makes subsequent observations, it may re-identify the same unknown objectin additional scenes. When this happens we store all the scene descriptions together, providingadditional context descriptions for the same object. In Figure 2.3 we show part of the datastructure describing the objects that co-occurred with a plate in a kitchen, and their mostcommon qualitative spatial relations.

2.1. TOWARDS LIFELONG OBJECT LEARNING 23
1 "co_occurrences": [
2 ["Coffee", 0.5, "near_0" ],
3 ["Kitchen_side", 1.0,"near_0" ],
4 ["Kitchen_cabinet", 1.0,"near_1" ],
5 ["Fridge", 0.625,"near_1" ],
6 ["Teabox", 0.625,"near_0" ],
7 ["Waste_container", 0.375,"near_2" ],
8 ["Utensil_rack", 0.625, "near_1" ],
9 ["Sugar_bowl_(dishware)", 0.625,"near_0" ],
10 ["Electric_water_boiler", 0.875,"near_1" ],
11 ["Sink", 0.625, "near_1" ] ],
12 "context_history": [
13 ["Kitchen", 1.0, "Kitchen_counter",1 ],
14 [ "Office", 0.0,"Desk", 0 ]],
15 "context_room_label": "Kitchen",
16 "context_surface_label": "Kitchen_counter",
Figure 2.3: An example data fragment taken from a series of observations of a Plate in a seriesof kitchen scenes, showing object, furniture, room and surface co-occurrence
2.1.3 Semantic Web mining
For an unknown object, our aim is to be able to provide a list of likely DBpedia concepts todescribe it, and we will later consider and compare the merits and difficulties associated withproviding object labels and object categories. As this knowledge is not available on the robot(the object is locally unknown), it must query an external data source to fill this knowledgegap. We therefore use the scene descriptions and spatial contexts for an unknown object togenerate a query to a Web service. In return this service provides a list of the possible DBpediaconcepts which may describe the unknown object. We expect the robot to use this list in thefuture to either automatically label a new object model, or to use the list of possible conceptsto guide a human through a restricted (rather than open-ended) learning interaction.
The Web service provides access to object- and scene-relevant knowledge extracted fromWeb sources. It is queried using a JSON structure sent via an HTTP request (shown inFigure 2.2). This structure aggregates the spatial contexts collected over multiple observationsof the unknown object. In our current work we focus on the co-occurrence structure. Eachentry in this structure describes an object that was observed with the unknown object, the ratioof observations this object was in, and the spatial relation that most frequently held betweenthe two. The room and surface fields describe where the observations were made.
Upon receiving a query, the service computes the semantic relatedness between each objectincluded in the co-occurrence structure and every object in a large set of candidate objectsfrom which possible concepts are drawn from (we discuss the nature of this set later on).
This semantic relatedness is computed by leveraging the vectorial representation of theDBpedia concepts provided by the NASARI resource [96]. In NASARI each concept containedin the multilingual resource BabelNet [341] is represented as a vector in a high-dimensionalgeometric space. The vector components are computed with the word2vec [320] tool, basedon the co-occurrence of the mentions of each concept, in this case using Wikipedia as sourcecorpus.
Since the vectors are based on distributional semantic knowledge (based on the distribu-tional hypothesis : words that occur together often are likely semantically related), vectors thatrepresent related entities end up close in the vector space. We are able to measure such re-

24 CHAPTER 2. IE TO GENERATE STRUCTURED KNOWLEDGE
latedness by computing the inverse of the cosine distance between two vectors. For instance,the NASARI vectors for Pointing device and Mouse (computing) have relatedness 0.98 (ona continuous scale from 0 to 1), while Mousepad and Teabox are 0.26 related.
The system computes the aggregate of the relatedness of a candidate object to each of thescene objects contained in the query. Using relatedness to score the likely descriptions of anunknown object follows from the intuition that related objects are more likely than unrelatedobjects to appear in a scene, e.g., to identify a Teapot is more useful to know that there is aTeacup at the scene rather than a Desk.
Formally, given n observed objects in the query q1, ..., qn, and m candidate objects in theuniverse under consideration o1, ..., om ∈ O, each oi is given a score that indicates its likelihoodof being the unknown object by aggregating its relatedness across all observed objects. Theaggregation function can be as simple as the arithmetic mean of the relatedness scores, or amore complex function. For instance, if the aggregation function is the product, the likelihoodof an object oi is given by:
likelihood(oi) =n∏j=1
relatedness(oi, qj)
For the sake of this work, we experimented with the product as aggregating function. Thisway of aggregating similarity scores gives higher weight to highly related pairs, as opposed tothe arithmetic mean, where each query object contributes equally to the final score. The ideabehind this choice is that if an object is highly related to the target it should be regarded asmore informative.
The information carried by each query is richer than just a bare set of object labels. Onepiece of knowledge that can be exploited to obtain a more accurate prediction is the relativeposition of the observed objects with respect to the target unknown object. Since this infor-mation is represented as a discrete level or proximity (from near 0 to near 3), we can usethis as a threshold to determine whether or not an object should be included in relatednesscalculation. In this work we discard any object related by near 3, based on the intuition thatthe further away an object is spatially, the less related it is. The Results section includesan empirical investigation into approach. For clarity, here we present an example of execu-tion of the algorithm described above on the query corresponding to the kitchen example seenthroughout the section. The input to the Web module is a query containing a list of pairs (ob-ject, distance): (Refrigerator, 3), (Kitchen cabinet, 3), (Sink, 3), (Kitchen cabinet, 3),(Sugar bowl (dishware), 1), (Teabox, 1), (Instant coffee, 2), (Electric water boiler, 3).For the sake of readability, let us assume a set of candidate objects made only of three ele-ments: Tea cosy, Pitcher (container) and Mug. Table 2.1 show the full matrix of pairwisesimilarities.
Among the three candidates, the one with highest aggregated score is Tea cosy, followedby Mug and Pitcher (container). For reference, the ground truth in the example query isMug, that ended up second in the final ranking returned by the algorithm.
We can also alter the performance of the system using the frequency of the objects returnedby the query. The notion of frequency, taken from [133], is a measure based on the number ofincoming links in the Wikipedia page of an entity. Using this measure we can choose to filteruncommon objects from the results of the query, by thresholding with a given frequency value.In the example above, the frequency counts of Tea cosy, Pitcher (container) and Mug arerespectively 25, 161 and 108. Setting a threshold anywhere between 25 and 100 would filterTea cosy out of the result, moving up the ground truth to rank 1. Similarly, we can filterout objects that are too far from the target by imposing a limit on their observed distance.A threshold of 2 (inclusive) for the distance of the objects in the example would excludeRefrigerator, Kitchen cabinet, Sink and Electric water boiler from the computation.

2.1. TOWARDS LIFELONG OBJECT LEARNING 25
Tea cosy Pitcher (container) MugRefrigerator 0.473 0.544 0.522Sink 0.565 0.693 0.621Sugar bowl (dishware) 0.555 0.600 0.627Teabox 0.781 0.466 0.602Instant coffee 0.821 0.575 0.796Electric water boiler 0.503 0.559 0.488product 0.048 0.034 0.047
Table 2.1: Object similarity of the three candidates Tea cosy, Pitcher (container) and Mug
to the objects observed at the example kitchen scene. The last line shows the similarity scoresaggregated by product.
Other useful information available from the spatial context includes the label of the room,surface or furniture where the unknown was observed. Unfortunately, in order to leverage suchinformation, one needs a complete knowledge base containing these kind of relations, and such acollection is unavailable at the moment. However, the room and the surface labels are includedin the relatedness calculations along with the observed objects.
2.1.4 Experiments
In order to evaluate the effectiveness of the method we propose in predicting unknown objects’labels, we perform some experimental tests. In this section we report on the experimental setupand the results we obtained, before discussing them in further detail.
Experimental Set-up. Our experimental evaluation is an experiment based on a collection ofpanoramic RGB-D scans taken from an autonomous mobile service robot deployed in a workingoffice for a month. It took these scans at fixed locations according to a flexible schedule. Afterthe deployment we annotated the objects and furniture items in these sweeps, providing eachone with a DBpedia concept. This gives us 1329 real world scenes (384 kitchen, 945 office) onwhich we can test our approach. From this data, our evaluation treats each labeled object inturn as an unknown object in a leave-one-out experiment, querying the Web service with thehistorical spatial context data for the unknown object similar to that shown in Figure 2.3.
Figure 2.4: An example office scene as an RGB image from our real-world deployment. Ourdata contains 945 office scenes, and 384 kitchen scenes.

26 CHAPTER 2. IE TO GENERATE STRUCTURED KNOWLEDGE
Figure 2.5: WUP similarity measure between WordNet synsets of ground truth and top-rankedresult, with t = 50, p = 2 using the prod method. Ranks closer to 1 are better. Values closerto 1 indicate similarity, and values closer to 0 indicate dissimilarity.
In all of the experiments we compare the ground truth (known label in the data) to theDBpedia concepts predicted by our system. We measure performance based on two metrics.The first WUP similarity measures the semantic similarity between the ground truth and theconcept predicted as most likely for the unknown object. The second measure is the rankingof the ground truth in the list of suggested concepts.
For the experiments, the set of candidate objects (O in Section 2.1.3) was created by addingall concepts from the DBpedia ontology connected to the room types in our data by up to adepth of 3. For example, starting from office leads us to office equipment, computers, stationaryetc. This resulted in a set of 1248 possible concepts. We set the frequency threshold to 20,meaning we ignored any suggest concept which had a frequency value lower than this. Thismeans uncommon concepts such as Chafing dish (frequency=13) would always be ignored ifsuggested, but more common ones such as Mouse (computing) (frequency=1106) would bekept.
Results. Figure 2.5 shows the result of calculating the WUP similarity [479] between theWordNet synsets of the ground truth and the top-ranked result from our semantic web-miningsystem. WUP measures semantic relatedness by considering the depth of two synsets in additionto the depth of their Lowest Common Subsumer (LCS). This means that large leaps betweenconcepts will reduce the eventual similarity score more than small hops might. To do this weused ready available mappings to link DBpedia concepts in our system to WordNet synsets,which are themselves organized as a hierarchy of is-a relations. This is in contrast to DBpedia,which is organized as a directed acyclic graph, and while that still means that we could applythe WUP measure to DBpedia nodes directly, WordNet offers a more structured taxonomy ofconcepts that is more well-suited to this kind of work. This serves to highlight the importanceof a multi-modal approach to the use of such ontologies. In the results, the system predictedLightpen when the ground truth was Mouse producing a WUP score of 0.73, with the LCSbeing the Device concept, with Mouse and Lightpen having depth 10 and 11 respectively,and Device having depth 8 measured from the root node of Entity. In this case, the systemsuggested an object that fell within 3 concepts of the ground truth, and this is true for themajority of the results in Figure 2.5. However, in the case of refrigerator as the ground truth,

2.1. TOWARDS LIFELONG OBJECT LEARNING 27
Figure 2.6: Rank in result by object category, matching the highest ranked object with acategory shared with the ground truth in the result set, with varying values of the parametert, with p = 2 and the prod method. Ranks closer to 1 are better. Ranking is determined bythe position in the result of the first object with an immediate category in common with theground truth. 56% (9/16) achieve <= 10.
Figure 2.7: Rank in result by object label, matching the label of the ground truth in the resultset, with varying values of the parameter t, with p = 2 and the prod method. Increasing valuesof T can cause some objects to be excluded from the result set entirely, such as the Teaware orMonitor at T=50

28 CHAPTER 2. IE TO GENERATE STRUCTURED KNOWLEDGE
Mean Median Std. Dev Variance Range
WUP 0.69 0.70 0.12 0.01 0.43
Category Rank 17.00 9.50 20.17 407.20 73.00
Object Rank 50.93 36.5 50.18 2518.32 141
Figure 2.8: Statistics on WUP and Rank-in-result data, both for t = 50, p = 2 using prod
the system suggests keypad as the highest ranked result, producing a WUP score of 0.52. Here,the LCS is at depth 6 with the concept Artifact, the ground truth refrigerator is at depth13 and the prediction keypad is at depth 10. While in this case the node distance between theLCS and the prediction is 4, where in the previous example it was 3, the WUP score is muchworse here (0.73 vs 0.52) as there are more large leaps across conceptual space. Our best resultin this experiment is for Printer as the ground truth, for which the system suggests keypadagain, however the LCS here is the peripheral node at depth 10, where printer is at depth 11and keypad is at depth 12.
The system suggests a range of objects that are closely related to the unknown object,inferred only from its spatial context and knowledge of the objects and environment around it.From here this allows us to generate a list of candidate concepts which we can use in a secondstage of refinement, such as by presentation to a human-in-loop.
Figure 2.6 shows how frequency thresholding effects the performance of the system. In thisexperiment we consider the position in the ranked result of the first object with an immediateparent DBpedia category in common with the ground truth. Doing so essentially maps thelarger set of object labels to a smaller set of object categories. This is in contrast to consideringthe position in the result of the specific ground truth label, as shown in Figure 2.7, and allowsus to generate a ranking over categories of objects. To ensure categories remain relevant tothe situated objects we are interested in, we prune a number DBpedia categories such as thoselisting objects invented in certain years, or in certain countries. We regard these as beingoverly broad, and provide a more abstract degree of semantic knowledge about objects thanwe are interested in. As such, we retrieve the rank-in-result of the first object that shares animmediate DBpedia category with the ground truth, which in the case of Electric water boilerturns out to be Samovar, a kind of Russian water boiler, as both share the immediate ancestorcategory Boilers (cookware). The Samovar, and thus the boiler category, appears at rank12, whereas the specific label Electric water boiler appears near the end of the result set of1248 objects, which covers 641 unique DBpedia categories. In our results, categories associatedwith 9 of the 16 objects (56%) appear within the result’s top 10 entries. Here as we filter outuncommon words by increasing the filter threshold T we improve the position of the conceptin the list. Whilst this allows us to definitely remove very unlikely answers that appear relateddue to some quirk of the data, the more we also start to reduce the ability of the robot to learnabout certain objects. This is discussed further in the Discussion paragraph below.
Unlike WordNet synsets and concepts, DBpedia categories are more loosely defined andstructured, being generated from Wikipedia, but this means they are typically richer in the kindof semantic detail and broad knowledge representation that may be more suitable for presenta-tion to humans, or more easily mapped to human-authored domains. While WordNet affordsus access to a well-defined hierarchy of concepts, categories like device and container are fairlybroad, whereas DBpedia categories such as V ideo game control methods or Kitchenware de-scribe a smaller set of potential objects, but may be more semantically meaningful when pre-sented to humans.

2.1. TOWARDS LIFELONG OBJECT LEARNING 29
Discussion. Overall, whilst the results of our object category prediction system show that itis possible for this novel system to generate some good predictions, the performance is variableacross objects. There are a number of factors that influence performance, and lead to thisvariability. The first issue is that the current system does not rule out suggestions of thingsit already knows. For example if the unknown object is a keyboard, the spatial context andrelatedness may result in a top suggestion of a mouse, but as the system already knows aboutthat, it is probably a less useful suggestion. However, it is possible that the unknown objectcould be a mouse, but has not been recognized correctly. Perhaps the most fundamental issue inthe challenge of predicting objects concepts from limited information is how the limit the scopeof suggestions. In our system we restricted ourselves to 1248 possible concepts, automaticallyselected from DBpedia by ontological connectivity. This is clearly a tiny fraction of all the pos-sible objects in existence. On one hand this means that our autonomous robot will potentiallybe quite limited in what it can learn about. On the other hand, a large number of this restrictedset of objects still make for highly unlikely suggestions. One reason for this is the corpus-basedautomatically-extracted nature of DBpedia, which means that it includes interesting objectswhich may never be observed by a robot (e.g., Mangle (machine)). More interestingly thoughis the effect that the structure of the ontology has on the nature of suggestions. In this workwe have been using hierarchical knowledge to unpin our space of hypotheses (i.e. the widerworld our robot is placed within), but have not addressed this within our system. This leads toa mismatch between our expectations and the performance of the system with respect to arbi-trary precision. For example, if the robot sees a joystick as an unknown object, an appropriateDBpedia concept would seem (to us) to be Controller (computing) or Joystick. However,much more specific concepts such as Thrustmaster and Logitech Thunderpad Digital arealso available to the system in its current form. When learning about an object for the firsttime, it seems much more useful for the robot to receive a suggestion of the former kind (al-lowing it to later refine its knowledge to locally observable instances) than the latter (whichunlikely to match the environment of the robot). Instead, returning the category of the rankedobjects our system suggests allows us to go some way towards this as shown in Figure 2.6,but still provides us a range of possible candidate categories – though narrowed down from641 possible categories, to in some cases less than 5. As such, from here we can switch to asecondary level of labeling: that of a human-in-loop. We will next integrate the suggestionsystem with a crowd-sourcing platform, allowing humans that inhabit the robot’s environmentto help it label unknown objects, as shown in the next Section. The suggestion system willbe used to narrow down the list of candidate categories that will be shown to users as theyprovide labels for images of objects the robot has seen and learned, but has not yet labeled.While further work is necessary to refine the current 56% of objects that have a category inthe top-10 ranked result, we expect that the current results will be sufficient enough to allowa human to pick a good label when provided a brief list of candidates and shown images ofthe unknown objects. Such systems are crucial for life-long situated learning for mobile robotplatforms, and will allow robot systems to extend their world models over time, and learn newobjects and patterns.
The issue of how to select which set of possible objects to draw suggestions from is at theheart of the challenge of this work: make the set too large and it is hard to get good, accuratesuggestions, but make it too small and you risk ruling out objects that your robot may needto know about. Whilst the use of frequency-based filtering improved our results by removinglow-frequency outliers, more semantically-aware approaches may be necessary to improve thingsfurther. Further improvements can be made, for instance we largely do not use current instanceobservations about the object, but prefer its historical context when forming queries. This maybe the wrong thing to do in some cases, in fact it may be preferable to weight observationsof object context based on their recentness. The difference between historical context and the

30 CHAPTER 2. IE TO GENERATE STRUCTURED KNOWLEDGE
context of an object in a particular instance may provide important contextual clues, and allowus to perform other tasks such as anomaly detection or boost the speed of object search tasks.
One issue we believe our work highlights is the need to integrate a multi-modal approach tothe use of differing corpora and ontologies. For instance, the more formal WordNet hierarchywas used to calculate the semantic relatedness of our experiment results, rather than the lessformal DBpedia ontology. However we hold that the DBpedia category relationships are moreuseful in the human-facing component of our system. There exist other ontologies such asYAGO which integrates both WordNet and DBpedia, along with its own category system,that will certainly be of interest to us in the future as we seek to improve the performanceof our system. One of our primary goals is to better exploit the hierarchical nature of theseontologies to provide a way of retrieving richer categorical information about objects. Whilereliably predicting the specific object label from spatial context alone is difficult, we can providehigher-level ancestor categories that could be used to spur further learning or improve previousresults. As such, we view the prediction process as one of matching the characteristics of a seriesof increasingly more specific categories to the characteristics of an unknown object, rather thanimmediately attempting to match the specific lowest-level characteristics and produce the directobject label. This requires an ontology both formally-defined enough to express a meaningfulhierarchy of categories for each item, and broad enough to provide us mapping to a large setof common-sense categories and objects. It is not clear yet which combination of existing toolswill provide the best route to accomplishing this.
2.2 Mining semantic knowledge from the Web
As discussed before, embodied intelligent systems such as robots require world knowledge toreason on top of their perception of the world in order to decide which actions to take. Considernow another example, i.e. that of a robot having the task to tidy up an apartment by storingall objects in their appropriate place. In order to perform this task, a robot would need tounderstand where the “correct” or at least the “prototypical” location for each object is inorder to come up with an overall plan on which actions to perform to reach the goal of havingeach object stored in its corresponding location.
In general, in manipulating objects, robots might have questions such as the following:
• Where should a certain object typically be stored?
• What is this object typically used for?
• Do I need to manipulate a certain object with care?
The answers to these questions require common sense knowledge about objects, in partic-ular prototypical knowledge about objects that, in absence of abnormal situations or specificcontextual conditions or preferences, can be assumed to hold.
In this article, we are concerned with extracting such common sense knowledge from acombination of unstructured and semi-structured data. We are in particular interested inextracting default knowledge, that is prototypical knowledge comprising relations that typicallyhold in ‘normal’ conditions [306]. For example, given no other knowledge, in a normal situation,we could assume that milk is typically stored in the kitchen, or more specifically in the fridge.However, if a person is currently having breakfast and eating cornflakes at the table in theliving room, then the milk might also be temporarily located in the living room. In this sense,inferences about the location of an object are to be regarded as non-monotonic inferences thatcan be retracted given some additional knowledge about the particular situation. We modelsuch default, or prototypical, knowledge through a degree of prototypicality, that is, we do not
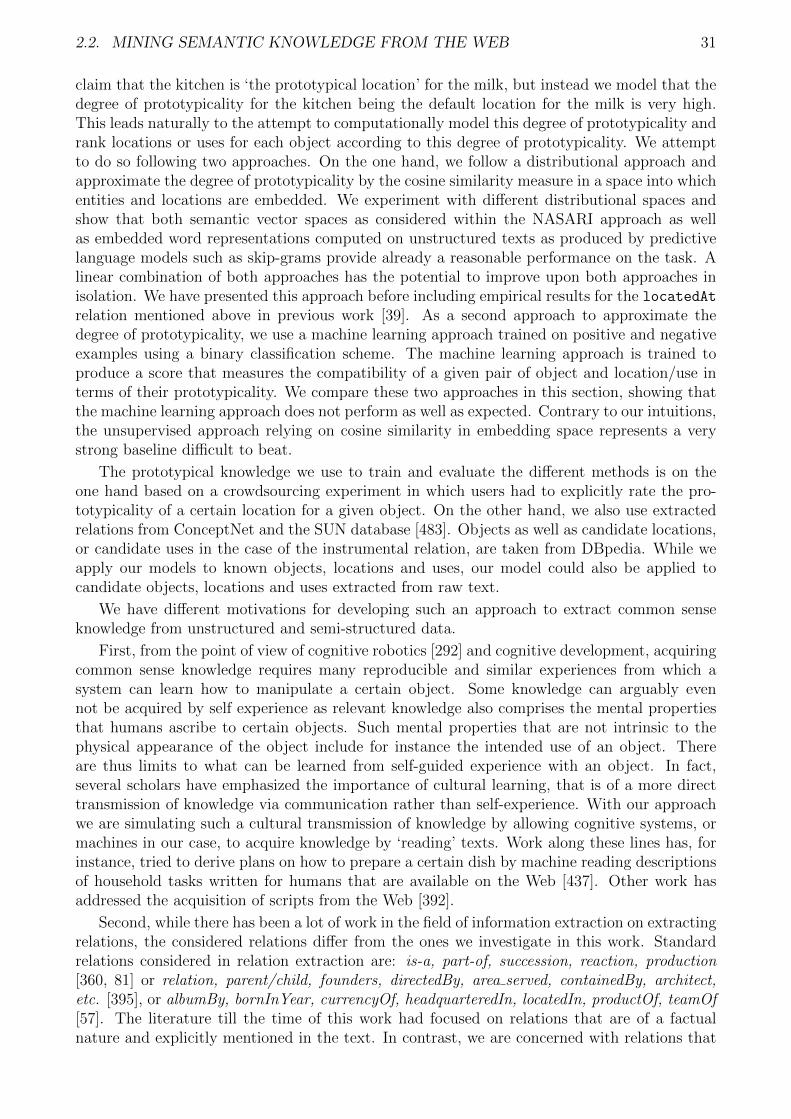
2.2. MINING SEMANTIC KNOWLEDGE FROM THE WEB 31
claim that the kitchen is ‘the prototypical location’ for the milk, but instead we model that thedegree of prototypicality for the kitchen being the default location for the milk is very high.This leads naturally to the attempt to computationally model this degree of prototypicality andrank locations or uses for each object according to this degree of prototypicality. We attemptto do so following two approaches. On the one hand, we follow a distributional approach andapproximate the degree of prototypicality by the cosine similarity measure in a space into whichentities and locations are embedded. We experiment with different distributional spaces andshow that both semantic vector spaces as considered within the NASARI approach as wellas embedded word representations computed on unstructured texts as produced by predictivelanguage models such as skip-grams provide already a reasonable performance on the task. Alinear combination of both approaches has the potential to improve upon both approaches inisolation. We have presented this approach before including empirical results for the locatedAtrelation mentioned above in previous work [39]. As a second approach to approximate thedegree of prototypicality, we use a machine learning approach trained on positive and negativeexamples using a binary classification scheme. The machine learning approach is trained toproduce a score that measures the compatibility of a given pair of object and location/use interms of their prototypicality. We compare these two approaches in this section, showing thatthe machine learning approach does not perform as well as expected. Contrary to our intuitions,the unsupervised approach relying on cosine similarity in embedding space represents a verystrong baseline difficult to beat.
The prototypical knowledge we use to train and evaluate the different methods is on theone hand based on a crowdsourcing experiment in which users had to explicitly rate the pro-totypicality of a certain location for a given object. On the other hand, we also use extractedrelations from ConceptNet and the SUN database [483]. Objects as well as candidate locations,or candidate uses in the case of the instrumental relation, are taken from DBpedia. While weapply our models to known objects, locations and uses, our model could also be applied tocandidate objects, locations and uses extracted from raw text.
We have different motivations for developing such an approach to extract common senseknowledge from unstructured and semi-structured data.
First, from the point of view of cognitive robotics [292] and cognitive development, acquiringcommon sense knowledge requires many reproducible and similar experiences from which asystem can learn how to manipulate a certain object. Some knowledge can arguably evennot be acquired by self experience as relevant knowledge also comprises the mental propertiesthat humans ascribe to certain objects. Such mental properties that are not intrinsic to thephysical appearance of the object include for instance the intended use of an object. Thereare thus limits to what can be learned from self-guided experience with an object. In fact,several scholars have emphasized the importance of cultural learning, that is of a more directtransmission of knowledge via communication rather than self-experience. With our approachwe are simulating such a cultural transmission of knowledge by allowing cognitive systems, ormachines in our case, to acquire knowledge by ‘reading’ texts. Work along these lines has, forinstance, tried to derive plans on how to prepare a certain dish by machine reading descriptionsof household tasks written for humans that are available on the Web [437]. Other work hasaddressed the acquisition of scripts from the Web [392].
Second, while there has been a lot of work in the field of information extraction on extractingrelations, the considered relations differ from the ones we investigate in this work. Standardrelations considered in relation extraction are: is-a, part-of, succession, reaction, production[360, 81] or relation, parent/child, founders, directedBy, area served, containedBy, architect,etc. [395], or albumBy, bornInYear, currencyOf, headquarteredIn, locatedIn, productOf, teamOf[57]. The literature till the time of this work had focused on relations that are of a factualnature and explicitly mentioned in the text. In contrast, we are concerned with relations that

32 CHAPTER 2. IE TO GENERATE STRUCTURED KNOWLEDGE
are i) typically not mentioned explicitly in text, and ii) they are not of a factual nature, butrather represent default or prototypical knowledge. These are thus quite different tasks.
We present and compare different approaches to collect manipulation-relevant knowledgeby leveraging textual corpora and semi-automatically extracted entity pairs. The extractedknowledge is of symbolic form and represented as a set of (Subject, Relation, Object)
triples. While this knowledge is not physically grounded [213], this model can still help robotsor other intelligent systems to decide on how to act, support planning and select the appropriateactions to manipulate a certain object.
2.2.1 Extraction of relations by a ranking approach based on distri-butional representations
This section presents our framework to extract relations between pairs of entities for the pop-ulation of a knowledge base of manipulation-relevant data. We frame the task of relationextraction between entities as a ranking problem as it gives us great flexibility in generating aknowledge base that balances between coverage and confidence. Given a set of triples (s, r, o),where s is the subject entity, r the relation (or predicate) and o the object entity2, we want toobtain a ranking of these triples. The produced ranking of triples should reflect the degree ofprototypicality of the objects with respect to the respective subjects and relations.
Our general approach to produce these rankings is to design a scoring function f(s, r, o) thatassigns a score to each triple, depending on s, r, and o. The scoring function is designed in such away that prototypical triples are assigned a higher score than less prototypical triples. Sortingall triples by their respective scores produces the desired ranking. With a properly chosenfunction f(s, r, o), it is possible to extract relations between entities to populate a knowledgebase. This is achieved by scoring candidate triples and inserting or rejecting them based ontheir respective scores, e.g., if the score is above a certain threshold.
In this work, we present different scoring functions and evaluate them in the context ofbuilding a knowledge base of common sense triples. All of our proposed approaches rely ondistributional representations of entities (and words). We investigate different vector represen-tations and scoring functions, all with different strengths and weaknesses.
Word space models (or distributional space models, or word vector spaces) are abstractrepresentations of the meaning of words, encoded as vectors in a high-dimensional space. Tra-ditionally, a word vector space is constructed by counting co-occurrences of pairs of words ina text corpus, building a large square n-by-n matrix where n is the size of the vocabulary andthe cell i, j contains the number of times the word i has been observed in co-occurrence withthe word j. The i-th row in a co-occurrence matrix is an n-dimensional vector that acts as adistributional representation of the i-th word in the vocabulary. The similarity between twowords is geometrically measurable with a metric such as the cosine similarity, defined as thecosine of the angle between two vectors:
similarity(~x, ~y)cos =~x · ~y
‖ ~x ‖‖ ~y ‖
This is the key point to linking the vector representation to the idea of semantic relatedness,as the distributional hypothesis states that “words that occur in the same contexts tend to havesimilar meaning” [216]. Several techniques can be applied to reduce the dimensionality ofthe co-occurrence matrix. Latent Semantic Analysis [262], for instance, uses Singular ValueDecomposition to prune the less informative elements while preserving most of the topology ofthe vector space, and reducing the number of dimensions to 100-500.
2Here we use the terminology subject and object from the Semantic Web literature instead of the termi-nology head and tail that is typically found in relation extraction literature.

2.2. MINING SEMANTIC KNOWLEDGE FROM THE WEB 33
Recently, neural network based models have received increasing attention for their abilityto compute dense, low-dimensional representations of words. To compute such representation,called word embeddings, several models rely on huge amounts of natural language texts fromwhich a vector representation for each word is learned by a neural network. Their representa-tions of the words are therefore based on prediction as opposed to counting [30].
Vector spaces created on word distributional representations have been successfully provento encode word similarity and relatedness relations [388, 394, 117], and word embeddings haveproven to be a useful feature in many natural language processing tasks [121, 266, 149] in thatthey often encode semantically meaningful information of a word.
We argue that it is possible to extract interaction-relevant relations between entities, e.g.(Object, locatedAt, Location), using appropriate entity vectors and the cosine similaritysince the domain and range of the considered relations are sufficiently narrow. In these cases,the semantic relatedness might be a good indicator for a relation.
Ranking by cosine similarity and word embeddings. In the beginning of this section,we motivated the use of distributional representations for the extraction of relations in order topopulate a database of common sense knowledge. As outlined, we frame the relation extractiontask as a ranking problem of triples (s, r, o) and score them based on a corresponding set ofvector representations V for subject and object entities.
In this section, we propose a neural network-based word embedding model to obtain dis-tributional representations of entities. By using the relation-agnostic cosine similarity3 as ourscoring function f(s, r, o) = similaritycos(~vs, ~vo), with ~vs, ~vo ∈ V , we can interpret the vectorsimilarity as a measure of semantic relatedness and thus as an indicator for a relation betweenthe two entities.
Many word embedding methods encode useful semantic and syntactic properties [251, 326,322] that we leverage for the extraction of prototypical knowledge. In this work, we restrictour experiments to the skip-gram method [320]. The objective of the skip-gram method isto learn word representations that are useful for predicting context words. As a result, thelearned embeddings often display a desirable linear structure [326, 322]. In particular, wordrepresentations of the skip-gram model often produce meaningful results using simple vectoraddition [322]. For this work, we trained the skip-gram model on a corpus of roughly 83 millionAmazon reviews [305].
Motivated by the compositionality of word vectors, we derive vector representations forthe entities as follows: considering a DBpedia entity4 such as Public_toilet, we obtain thecorresponding label and clean it by removing parts in parenthesis, if any, convert it to lowercase, and split it into its individual words. We retrieve the respective word vectors fromour pretrained word embeddings and sum them to obtain a single vector, namely, the vectorrepresentation of the entity: ~vPublic toilet = ~vpublic + ~vtoilet. The generation of entity vectors istrivial for “single-word” entities, such as Cutlery or Kitchen, that are already contained inour word vector vocabulary. In this case, the entity vector is simply the corresponding wordvector. By following this procedure for every entity in our dataset, we obtain a set of entityvectors Vsg, derived from the original skip-gram word embeddings. With this derived set ofentity vector representations, we can compute a score between pairs of entities based on thechosen scoring function, the cosine vector similarity5. Using the example of locatedAt-pairs,
3We also experimented with APSyn [404] as an alternative similarity measure which, unfortunately, did notwork well in our scenario.
4For simplicity, we only use the local parts of the entity URI, neglecting the namespacehttp://dbpedia.org/resource/
5For any entity vector that can not be derived from the word embeddings due to missing vocabulary, weassume a similarity of -1 to every other entity.
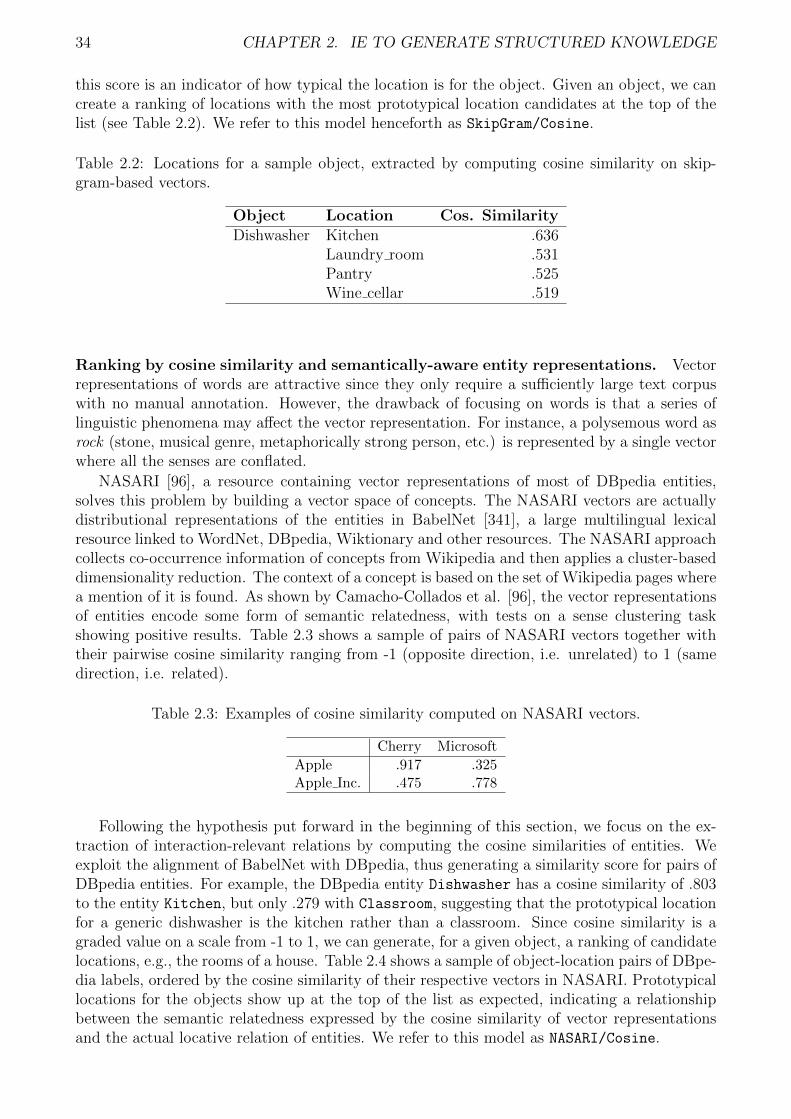
34 CHAPTER 2. IE TO GENERATE STRUCTURED KNOWLEDGE
this score is an indicator of how typical the location is for the object. Given an object, we cancreate a ranking of locations with the most prototypical location candidates at the top of thelist (see Table 2.2). We refer to this model henceforth as SkipGram/Cosine.
Table 2.2: Locations for a sample object, extracted by computing cosine similarity on skip-gram-based vectors.
Object Location Cos. SimilarityDishwasher Kitchen .636
Laundry room .531Pantry .525Wine cellar .519
Ranking by cosine similarity and semantically-aware entity representations. Vectorrepresentations of words are attractive since they only require a sufficiently large text corpuswith no manual annotation. However, the drawback of focusing on words is that a series oflinguistic phenomena may affect the vector representation. For instance, a polysemous word asrock (stone, musical genre, metaphorically strong person, etc.) is represented by a single vectorwhere all the senses are conflated.
NASARI [96], a resource containing vector representations of most of DBpedia entities,solves this problem by building a vector space of concepts. The NASARI vectors are actuallydistributional representations of the entities in BabelNet [341], a large multilingual lexicalresource linked to WordNet, DBpedia, Wiktionary and other resources. The NASARI approachcollects co-occurrence information of concepts from Wikipedia and then applies a cluster-baseddimensionality reduction. The context of a concept is based on the set of Wikipedia pages wherea mention of it is found. As shown by Camacho-Collados et al. [96], the vector representationsof entities encode some form of semantic relatedness, with tests on a sense clustering taskshowing positive results. Table 2.3 shows a sample of pairs of NASARI vectors together withtheir pairwise cosine similarity ranging from -1 (opposite direction, i.e. unrelated) to 1 (samedirection, i.e. related).
Table 2.3: Examples of cosine similarity computed on NASARI vectors.
Cherry Microsoft
Apple .917 .325Apple Inc. .475 .778
Following the hypothesis put forward in the beginning of this section, we focus on the ex-traction of interaction-relevant relations by computing the cosine similarities of entities. Weexploit the alignment of BabelNet with DBpedia, thus generating a similarity score for pairs ofDBpedia entities. For example, the DBpedia entity Dishwasher has a cosine similarity of .803to the entity Kitchen, but only .279 with Classroom, suggesting that the prototypical locationfor a generic dishwasher is the kitchen rather than a classroom. Since cosine similarity is agraded value on a scale from -1 to 1, we can generate, for a given object, a ranking of candidatelocations, e.g., the rooms of a house. Table 2.4 shows a sample of object-location pairs of DBpe-dia labels, ordered by the cosine similarity of their respective vectors in NASARI. Prototypicallocations for the objects show up at the top of the list as expected, indicating a relationshipbetween the semantic relatedness expressed by the cosine similarity of vector representationsand the actual locative relation of entities. We refer to this model as NASARI/Cosine.

2.2. MINING SEMANTIC KNOWLEDGE FROM THE WEB 35
Table 2.4: Locations for a sample object, extracted by computing cosine similarity on NASARIvectors.
Object Location Cos. SimilarityDishwasher Kitchen .803
Air shower (room) .788Utility room .763Bathroom .758Furnace room .749
Paper towel Air shower (room) .671Public toilet .634Bathroom .632Mizuya .597Kitchen .589
Sump pump Furnace room .699Air shower (room) .683Basement .680Mechanical room .676
Ranking by a trained scoring function. In the previous sections, we presented models ofsemantic relatedness for the extraction of relations. The employed cosine similarity function ofthese models is relation-agnostic, that is, it only measures whether there is a relation betweentwo entities but not which relation in particular. The question that naturally arises is: Insteadof using a single model that is agnostic to the relation, can we train a separate model for eachrelation in order to improve the extraction performance? We try to answer this question byintroducing a new model, based on supervised learning.
To extend the proposed approach to any kind of relation we modify the first model we pre-sented (i.e., ranking by cosine similarity and Word Embeddings) by introducing a parameterizedscoring function. This scoring function replaces the cosine similarity which was previously em-ployed to score pairs of entities (e.g., Object-Location). By tuning the parameters of this newscoring function in a data-driven way, we are able to predict scores with respect to arbitraryrelations.
We define the new scoring function f(s, r, o) as a bilinear form:
f(s, r, o) = tanh(~v>s Mr~vo + br) (2.1)
where ~vs, ~vo ∈ V ⊆ Rd are the corresponding embedding vectors for the subject and objectentities s and o, respectively, br is a bias term, and Mr ∈ Rd×d is the scoring matrix corre-sponding to the relation r. Our scoring function is closely related to the ones proposed byJenatton et al. [242] as well as Yang et al. [485], however, we make use of the tanh activationfunction to map the scores to the interval (−1, 1). In part, this relates to the Neural TensorNetwork proposed by Socher et al. [417]. By initializing Mr as the identity matrix and br with0, the inner term of the scoring function corresponds initially to the dot product of ~vs and ~vowhich is closely related to the originally employed cosine similarity.
In order to learn the parameters Mr and br of the scoring function, we follow a procedurerelated to Noise Contrastive Estimation [329] and Negative Sampling [322] which is also used inthe training of the skip-gram embeddings. This method uses “positive” and “negative” triples,T +train and T −train, to iteratively adapt the parameters. The positive triples T +
train are triples thattruly express the respective relation. In our case, these triples are obtained by crowdsourcingand leveraging other resources (see Section 2.2.2). Given these positive triples, the set ofcorrupted negative triples T −train is generated in the following way: we generate negative triples
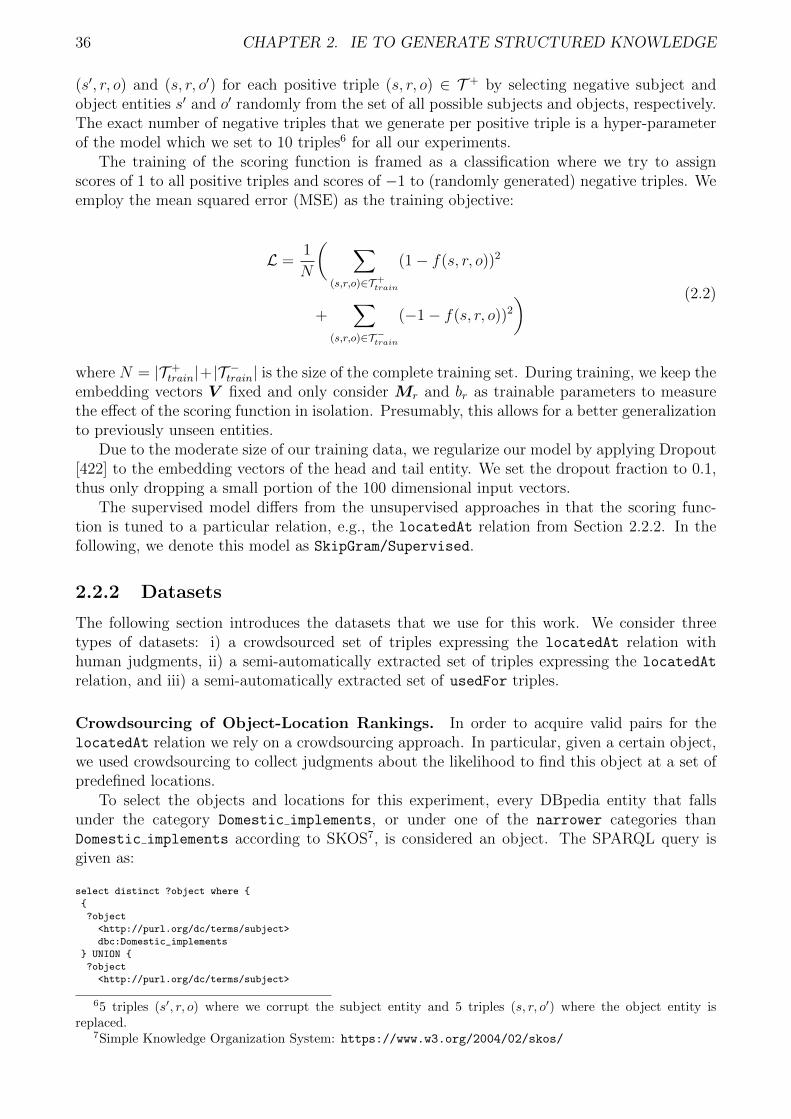
36 CHAPTER 2. IE TO GENERATE STRUCTURED KNOWLEDGE
(s′, r, o) and (s, r, o′) for each positive triple (s, r, o) ∈ T + by selecting negative subject andobject entities s′ and o′ randomly from the set of all possible subjects and objects, respectively.The exact number of negative triples that we generate per positive triple is a hyper-parameterof the model which we set to 10 triples6 for all our experiments.
The training of the scoring function is framed as a classification where we try to assignscores of 1 to all positive triples and scores of −1 to (randomly generated) negative triples. Weemploy the mean squared error (MSE) as the training objective:
L =1
N
( ∑(s,r,o)∈T +
train
(1− f(s, r, o))2
+∑
(s,r,o)∈T −train
(−1− f(s, r, o))2
) (2.2)
where N = |T +train|+|T −train| is the size of the complete training set. During training, we keep the
embedding vectors V fixed and only consider Mr and br as trainable parameters to measurethe effect of the scoring function in isolation. Presumably, this allows for a better generalizationto previously unseen entities.
Due to the moderate size of our training data, we regularize our model by applying Dropout[422] to the embedding vectors of the head and tail entity. We set the dropout fraction to 0.1,thus only dropping a small portion of the 100 dimensional input vectors.
The supervised model differs from the unsupervised approaches in that the scoring func-tion is tuned to a particular relation, e.g., the locatedAt relation from Section 2.2.2. In thefollowing, we denote this model as SkipGram/Supervised.
2.2.2 Datasets
The following section introduces the datasets that we use for this work. We consider threetypes of datasets: i) a crowdsourced set of triples expressing the locatedAt relation withhuman judgments, ii) a semi-automatically extracted set of triples expressing the locatedAt
relation, and iii) a semi-automatically extracted set of usedFor triples.
Crowdsourcing of Object-Location Rankings. In order to acquire valid pairs for thelocatedAt relation we rely on a crowdsourcing approach. In particular, given a certain object,we used crowdsourcing to collect judgments about the likelihood to find this object at a set ofpredefined locations.
To select the objects and locations for this experiment, every DBpedia entity that fallsunder the category Domestic implements, or under one of the narrower categories thanDomestic implements according to SKOS7, is considered an object. The SPARQL query isgiven as:
select distinct ?object where {
{
?object
<http://purl.org/dc/terms/subject>
dbc:Domestic_implements
} UNION {
?object
<http://purl.org/dc/terms/subject>
65 triples (s′, r, o) where we corrupt the subject entity and 5 triples (s, r, o′) where the object entity isreplaced.
7Simple Knowledge Organization System: https://www.w3.org/2004/02/skos/

2.2. MINING SEMANTIC KNOWLEDGE FROM THE WEB 37
?category .
?category
<http://www.w3.org/2004/02/skos/core#broader>
dbc:Domestic_implements .
}
}
Every DBpedia entity that falls under the category Rooms is considered a location. Therespective query is:
select distinct ?room where {
?room
<http://purl.org/dc/terms/subject>
dbc:Rooms
}
These steps result in 336 objects and 199 locations (as of September 2016). To selectsuitable pairs expressing the locatedAt relation for the creation of the gold standard, we filterout odd or uncommon examples of objects or locations like Ghodiyu or Fainting room. Wedo this by ordering the objects by the number of incoming links to their respective Wikipediapage8 in descending order and select the 100 top ranking objects for our gold standard. Weproceed analogously for the locations, selecting 20 common locations and thus obtain 2,000object-location pairs in total.
In order to collect the judgments, we set up a crowdsourcing experiment on the CrowdFlowerplatform9. For each of the 2,000 object-location pairs, contributors were asked to rate thelikelihood of the object to be in that location on a four-point scale:
• -2 (unexpected): finding the object in the room would cause surprise, e.g., it is unex-pected to find a bathtub in a cafeteria.
• -1 (unusual): finding the object in the room would be odd, the object feels out of place,e.g., it is unusual to find a mug in a garage.
• 1 (plausible): finding the object in the room would not cause any surprise, it is seen asa normal occurrence, e.g., it is plausible to find a funnel in a dining room.
• 2 (usual): the room is the place where the object is typically found, e.g, the kitchen isthe usual place to find a spoon.
Contributors were shown ten examples per page, instructions, a short description of theentities (the first sentence from the Wikipedia abstract), a picture (from Wikimedia Commons,when available10), and the list of possible answers as labeled radio buttons.
After running the crowdsourcing experiment for a few hours, we collected 12,767 validjudgments, whereas 455 judgments were deemed “untrusted” by CrowdFlower’s quality filteringsystem. The quality control was based on 57 test questions that we provided and a requiredminimum accuracy of 60% on these questions for a contributor to be considered trustworthy.In total, 440 contributors participated in the experiment.
The pairs received on average 8.59 judgments. Most of the pairs received at least 5 separatejudgments, with some outliers collecting more than one hundred judgments each. The averageagreement, i.e. the percentage of contributors that answered the most common answer for agiven question, is 64.74%. The judgments are skewed towards the negative end of the spectrum,as expected, with 37% pairs rated unexpected, 30% unusual, 24% plausible and 9% usual. Thecost of the experiment was 86 USD.
8We use the URI counts extracted from the parsing of Wikipedia with the DBpedia Spotlight tool for entitylinking [133].
9http://www.crowdflower.com/10Pictures were available for 94 out of 100 objects.
38 CHAPTER 2. IE TO GENERATE STRUCTURED KNOWLEDGE
To use this manually labeled data in later experiments, we normalize, filter and rearrangethe scored pairs and obtain three gold standard datasets:
For the first gold standard dataset, we reduce multiple human judgments for each Object-Location pair to a single score by assigning the average of the numeric values. For instance,if the pair (Wallet, Ballroom) has been rated -2 (unexpected) six times, -1 (unusual) threetimes, and never 1 (plausible) or 2 (usual), its score will be about -1.6, indicating that a Wallet
is not very likely to be found in a Ballroom. For each object, we then produce a ranking ofall 20 locations by ordering them by their averaged score for the given object. We refer to thisdataset of human-labeled rankings as locatedAt-Human-rankings .
The second and third gold standard datasets are produced as follows: The contributors’answers are aggregated using relative majority, that is, each object-location pair has exactly onejudgment assigned to it, corresponding to the most popular judgment among all the contributorsthat answered that question. We extract two sets of relations from this dataset to be usedas a gold standard for experimental tests: one list of the 156 pairs rated 2 (usual) by themajority of contributors, and a larger list of the 496 pairs rated either 1 (plausible) or 2(usual). The aggregated judgments in the gold standard have a confidence score assigned tothem by CrowdFlower, based on a measure of inter-rater agreement. Pairs that score low onthis confidence measure (6 0.5) were filtered out, leaving 118 and 496 pairs, respectively. Werefer to these two gold standard sets as locatedAt-usual and locatedAt-usual/plausible.
Semi-supervised extraction of object-location triples. The SUN database [483] is alarge-scale resource for computer vision and object recognition in images. It comprises 131,067single images, each of them annotated with a label for the type of scene, and labels for eachobject identified in the scene. The images are annotated with 908 categories based on thetype of scene (bedroom, garden, airway, ...). Moreover, 313,884 objects were recognized andannotated with one out of 4,479 category labels.
Despite its original goal of providing high-quality data for training computer vision models,the SUN project generated a wealth of semantic knowledge that is independent from the visiontasks. In particular, the labels are effectively semantic categories of entities such as objects andlocations (scenes, using the lexical conventions of the SUN database).
Objects are observed at particular scenes, and this relational information is retained in thedatabase. In total, we extracted 31,407 object-scene pairs from SUN, together with the numberof occurrences of each pair. The twenty most occurring pairs are shown in Table 2.5.
According to its documentation, the labels of the SUN database are lemmas from WordNet.However, they are not disambiguated and thus they could refer to any meaning of the lemma.Most importantly for our goals, the labels in their current state are not directly linked to anyLOD resource. Faced with the problem of mapping the SUN database completely to a resourcelike DBpedia, we adopted a safe strategy for the sake of the gold standard creation. We took allthe object and scene labels from the SUN pairs for which a resource in DBpedia with matchinglabel exists. In order to limit the noise and obtain a dataset of “typical” location relations,we also removed those pairs that only occur once in the SUN database. This process resultedin 2,961 pairs of entities. We manually checked them and corrected 118 object labels and44 location labels. In some cases the correct label was already present, so we eliminated theduplicates resulting in a new dataset of 2,935 object-location pairs11. The collected triples areused as training data. We refer to this dataset as locatedAt-Extracted-triples .
Semi-supervised extraction of object-action triples. While the methods we propose forrelation extractions are by design independent of the particular relations they are applied to, we
11Of all extracted triples, 24 objects and 12 locations were also among the objects and locations of thecrowdsourced dataset.

2.2. MINING SEMANTIC KNOWLEDGE FROM THE WEB 39
Table 2.5: Most frequent pairs of object-scene in the SUN database.
Frequency Object Scene1041 wall b/bedroom1011 bed b/bedroom949 floor b/bedroom663 desk lamp b/bedroom650 night table b/bedroom575 ceiling b/bedroom566 window b/bedroom473 pillow b/bedroom463 wall b/bathroom460 curtain b/bedroom406 painting b/bedroom396 floor b/bathroom393 cushion b/bedroom380 wall k/kitchen370 wall d/dining room364 chair d/dining room355 table d/dining room351 floor d/dining room349 cabinet k/kitchen344 sky s/skyscraper
have focused most of our experimental effort towards one kind of relation between objects andlocations, namely the typical location where given objects are found. As a first step to assessthe generalizability of our approaches to other kinds of relations, we created an alternativedataset revolving around a relation with the same domain as the location relation, i.e., objects,but a very different range, that is, actions. The relation under consideration will be referred toin the rest of the article as usedFor, for example the predicate usedFor(soap, bath) statesthat the soap is used for (or, during, in the process of) taking a bath.
We built a dataset of object-action pairs in a usedFor relation starting from ConceptNet5 [282], a large semantic network of automatically collected commonsense facts (see also Sec-tion 2.2.5). From the entire ConceptNet, we extracted 46,522 links labeled usedFor. AlthoughConceptNet is partly linked to LOD resources, we found the coverage of such linking to bequite low, especially with respect to non-named entities such as objects. Therefore, we deviseda strategy to link as many of the labels involved in usedFor relations to DBpedia, without risk-ing to compromise the accuracy of such linking. The strategy is quite simple and it starts fromthe observation of the data: for the first argument of the relation, we search DBpedia for an en-tity whose label matches the ConceptNet labels. For the second argument, we search DBpediafor an entity label that matches the gerund form of the ConceptNet label, e.g., Bath→Bathing.We perform this step because we noticed how actions are usually referred to with nouns inConceptNet, but with verbs in the gerund form in DBpedia. We used the morphology genera-tion tool for English morphg [323] to generate the correct gerund forms also for irregular verbs.The application of this linking strategy resulted in a dataset of 1,674 pairs of DBpedia entities.Table 2.6 shows a few examples of pairs in the dataset.
To use this data as training and test data for the proposed models, we randomly dividethe complete set of positive (Object, usedFor, Action) triples in a training portion (527triples) and a test portion (58 triples). We combine each object entity in the test portion with

40 CHAPTER 2. IE TO GENERATE STRUCTURED KNOWLEDGE
Table 2.6: Examples of DBpedia entities in a usedFor relation, according to ConceptNet andour DBpedia linking strategy.
Object ActionMachine Drying
Dictionary Looking
Ban Saving
Cake Jumping
Moon Lighting
Tourniquet Saving
Dollar Saving
Rainbow Finding
Fast food restaurant Meeting
Clipboard Keeping
each action entity to generate a complete test set, comprised of positive and negative triples12.To account for variations in the performance due to this random partitioning, we repeat eachexperiment 100 times and report the averaged results in the experimental section. The averagesize of the test set is ≈ 2059. We refer to this dataset as usedFor-Extracted-triples .
2.2.3 Evaluation
This section presents the evaluation of the proposed framework for relation extraction. We applyour models to the data described in Section 2.2.2, consisting of sets of (Object, locatedAt,Location) and (Object, usedFor, Action) triples. These experiments verify the feasibility ofour approach for the population of a knowledge base of manipulation relevant data.
We start our experiments by evaluating how well the produced rankings of (Object, locatedAt,Location) triples match the ground truth rankings obtained from human judgments. For this,we i) present the evaluations for the unsupervised methods SkipGram/Cosine and NASARI/-Cosine, ii) show the performance of combinations thereof, and iii) evaluate the newly proposedSkipGram/Supervised method.
The second part of our experiments evaluates how well each proposed method performs inextracting a knowledge base. The evaluation is performed for (Object, locatedAt, Location)and (Object, usedFor, Action) triples.
Ranking evaluation. With the proposed methods from previous sections, we are able toproduce a ranking of e.g., locations for a given object that expresses how prototypical the lo-cation is for that object. To test the validity of our methods, we compare their output againstthe gold standard rankings locatedAt-Human-rankings that we obtained from the crowdsourcedpairs. As a first evaluation, we investigate how well the unsupervised baseline methods per-form in creating object-location rankings. Secondly, we show how to improve these results bycombining different approaches. Thirdly, we evaluate the supervised model in comparison toour baselines.
Unsupervised object-location ranking evaluation. Apart from the NASARI-based methodand the skip-gram-based method we employ two simple baselines for comparison: For the loca-tion frequency baseline, the object-location pairs are ranked according to the frequency of the
12We filter out all generated triples that are falsely labeled as negative in this process.

2.2. MINING SEMANTIC KNOWLEDGE FROM THE WEB 41
Table 2.7: Average Precision@k for k = 1 and k = 3 and average NDCG of the producedrankings against the gold standard rankings.
Method NDCG P@1 P@3Location frequency baseline .851 .000 .008Link frequency baseline .875 .280 .260NASARI/Cosine .903 .390 .380SkipGram/Cosine .912 .350 .400
location. The ranking is thus the same for each object, since the score of a pair is only com-puted based on the location. This method makes sense in absence of any further informationon the object: e.g., a robot tasked to find an unknown object should inspect “common” roomssuch as a kitchen or a studio first, rather than “uncommon” rooms such as a pantry.
The second baseline, the link frequency, is based on counting how often every object appearson the Wikipedia page of every location and vice versa. A ranking is produced based on thesecounts. An issue with this baseline is that the collected counts could be sparse, i.e., mostobject-location pairs have a count of 0, thus sometimes producing no value for the ranking foran object. This is the case for rather “unusual” objects and locations.
For each object in the dataset, we compare the location ranking produced by our algo-rithms to the crowdsourced gold standard ranking and compute two metrics: the NormalizedDiscounted Cumulative Gain (NDCG) and the Precision at k (Precision@k or P@k).
The NDCG is a measure of rank correlation used in information retrieval that gives moreweight to the results at the top of the list than at its bottom. It is defined as follows:
NDCG(R) =DCG(R)
DCG(R∗)
DCG(R) = R1 +
|R|∑i=2
Ri
log2(i+ 1)
where R is the produced ranking, Ri is the true relevance of the element at position i and R∗
is the ideal ranking of the elements in R. R∗ can be obtained by sorting the elements by theirtrue relevance scores. This choice of evaluation metric follows from the idea that it is moreimportant to accurately predict which locations are likely for a given object than to decidewhich are unlikely candidates.
While the NDCG measure gives a complete account of the quality of the produced rankings,it is not easy to interpret apart from comparisons of different outputs. To gain a better insightinto our results, we provide an alternative evaluation, the Precision@k. The Precision@k mea-sures the number of locations among the first k positions of the produced rankings that are alsoamong the top-k locations in the gold standard ranking. It follows that, with k = 1, precisionat 1 is 1 if the top returned location is the top location in the gold standard, and 0 otherwise.We compute the average of Precision@k for k = 1 and k = 3 across all the objects.
Table 2.7 shows the average NDCG and Precision@k across all objects: methods NASAR-I/Cosine and SkipGram/Cosine, plus the two baselines introduced above.
Both our methods that are based on semantic relatedness outperform the simple baselineswith respect to the gold standard rankings. The location frequency baseline performs verypoorly, due to an idiosyncrasy in the frequency data, that is, the most “frequent” locationin the dataset is Aisle. This behavior reflects the difficulty in evaluating this task using onlyautomatic metrics, since automatically extracted scores and rankings may not correspond tocommon sense judgment.
The NASARI-based similarities outperform the skip-gram-based method when it comes

42 CHAPTER 2. IE TO GENERATE STRUCTURED KNOWLEDGE
Table 2.8: Rank correlation and precision at k for the method based on fallback strategy.
Method NDCG P@1 P@3Fallback strategy (threshold=.4) .907 .410 .393Fallback strategy (threshold=.5) .906 .400 .393Fallback strategy (threshold=.6) .908 .410 .406Fallback strategy (threshold=.7) .909 .370 .396Fallback strategy (threshold=.8) .911 .360 .403Linear combination (α=.0) .912 .350 .400Linear combination (α=.2) .911 .380 .407Linear combination (α=.4) .913 .400 .423Linear combination (α=.6) .911 .390 .417Linear combination (α=.8) .910 .390 .410Linear combination (α=1.0) .903 .390 .380
to guessing the most likely location for an object (Precision@1), as opposed to the betterperformance of SkipGram/Cosine in terms of Precision@3 and rank correlation.
We explored the results and found that for 19 objects out of 100, NASARI/Cosine correctlyguesses the top ranking location where SkipGram/Cosine fails, while the opposite happens 15out of 100 times. We also found that the NASARI-based method has a lower coverage thanthe skip-gram method, due to the coverage of the original resource (NASARI), where not everyentity in DBpedia is assigned a vector13. The skip-gram-based method also suffers from thisproblem, however, only for very rare or uncommon objects and locations (as Triclinium orJamonera). These findings suggest that the two methods could have different strengths andweaknesses. In the following section we show two strategies to combine them.
Hybrid methods: fallback pipeline and linear combination. The results from the pre-vious sections highlight that the performance of our two main methods may differ qualitatively.In an effort to overcome the coverage issue of NASARI/Cosine, and at the same time experimentwith hybrid methods to extract location relations, we devised two simple ways of combining theSkipGram/Cosine and NASARI/Cosine methods. The first method is based on a fallback strat-egy: given an object, we consider the pair similarity of the object to the top ranking locationaccording to NASARI/Cosine as a measure of confidence. If the top ranked location among theNASARI/Cosine ranking is exceeding a certain threshold, we consider the ranking returned byNASARI/Cosine as reliable. Otherwise, if the similarity is below the threshold, we deem theresult unreliable and we adopt the ranking returned by SkipGram/Cosine instead. The secondmethod produces object-location similarity scores by linear combination of the NASARI andskip-gram similarities. The similarity score for the generic pair s, o is thus given by:
simα(s, o) = α · simNASARI(s, o) + (1− α) · simSkipGram(s, o), (2.3)
where parameter α controls the weight of one method with respect to the other.Table 2.8 shows the obtained results, with varying values of the parameters threshold and
α. While the NDCG is only moderately affected, both Precision@1 and Precision@3 show anincrease in performance with Precision@3 showing the highest score of all investigated methods.
Supervised object-location ranking. In the previous experiments, we investigated howwell our (unsupervised) baseline methods perform when extracting the locatedAt relation. Inthe following, we compare the earlier results to the performance of a scoring function trained in
13Objects like Backpack and Comb, and locations like Loft are all missing.

2.2. MINING SEMANTIC KNOWLEDGE FROM THE WEB 43
Table 2.9: Average precision at k for k = 1 and k = 3 and average NDCG of the producedrankings against the crowdsourced gold standard rankings. SkipGram/Supervised denotes thesupervised model based on skip-gram embeddings trained for the locatedAt relation.
Method NDCG P@1 P@3Location frequency baseline .851 .000 .008Link frequency baseline .875 .280 .260NASARI/Cosine .903 .390 .380SkipGram/Cosine .912 .350 .400Linear combination (α=.4) .913 .400 .423SkipGram/Supervised .908 .454 .387
a supervised fashion. For this experiment we train the scoring function in Eq. (2.1) to extractthe locatedAt relation between objects and locations. The underlying embeddings V on whichthe scoring function computes its scores are fixed to the skip-gram embeddings Vsg. We trainthe supervised method on the semi-automatically extracted triples locatedAt-Extracted-triplespreviously described. These triples act as the positive triples T +
train in the training procedure,from which we also generate the negative examples T −train following the procedure in Section2.2.1. We train the model by generating 10 negative triples per positive triple and minimizingthe mean squared error from Eq. (2.2). We initialize Mr with the identity matrix, br with 0,and train the model parameter using stochastic gradient descent (SGD) using a learning rate of0.001. SGD is performed in mini batches of size 100 with 300 epochs of training. The trainingprocedure is realized with Keras [112].
As before, we test the model on the human-rated set of objects and locations locatedAt-Human-rankings described in Section 2.2.2 and produce a ranking of locations for each object.Table 2.9 shows the performance of the extended model (SkipGram/Supervised) in comparisonto the previous approaches.
Overall, we can observe mixed results. All of our proposed models (supervised and unsu-pervised) improve upon the baseline methods with respect to all evaluation metrics. Comparedto the SkipGram/Cosine model, the SkipGram/Supervised model decreases slightly in per-formance with respect to the NDCG and more so for the Precision@3 score. Most striking,however, is the increase in Precision@1 of SkipGram/Supervised, showing a relative improve-ment of 30% to the SkipGram/Cosine model and constituting the highest overall Precision@1score by a large margin. However, the linear combination (α=.4) still scores higher with respectto Precision@3 and NDCG.
While the presented results do not point to a clear preference for one particular model,in the next section we will investigate the above methods more closely in the context of thegeneration of a knowledge base.
Retrieval evaluation. In the previous section, we tested how the proposed methods performin determining a ranking of locations given an object. For the purpose of evaluation, the testshave been conducted on a closed set of entities. In this section we return to the originalmotivation of this work, that is, to collect manipulation-relevant information about objects inan automated fashion in the form of a knowledge base.
All the methods introduced in this work are based on some scoring function of triplesexpressed as a real number in the range [-1,1] and thus interpretable as a sort of confidencescore relative to the target relation. Therefore, by imposing a threshold on the similarity scoresand selecting only the object-location pairs that score above said threshold, we can extract ahigh-confidence set of object-location relations to build a new knowledge base from scratch.Moreover, by using different values for the threshold, we are able to control the quality and the

44 CHAPTER 2. IE TO GENERATE STRUCTURED KNOWLEDGE
0 200 400 600 800 1000k
0.0
0.2
0.4
0.6
0.8
1.0Pre
cisi
on
SkipGram/Cosine
avrg. SkipGram/Supervised
linear combination
NASARI/Cosine
(a) Precision
0 200 400 600 800 1000k
0.0
0.2
0.4
0.6
0.8
1.0
Reca
ll
SkipGram/Cosine
avrg. SkipGram/Supervised
linear combination
NASARI/Cosine
(b) Recall
0 200 400 600 800 1000k
0.0
0.2
0.4
0.6
0.8
1.0
F-sc
ore
SkipGram/Cosine
avrg. SkipGram/Supervised
linear combination
NASARI/Cosine
(c) F-score
Figure 2.9: Evaluation on automatically created knowledge bases (“usual” locations).
0 200 400 600 800 1000k
0.0
0.2
0.4
0.6
0.8
1.0
Pre
cisi
on
SkipGram/Cosine
avrg. SkipGram/Supervised
linear combination
NASARI/Cosine
(a) Precision
0 200 400 600 800 1000k
0.0
0.2
0.4
0.6
0.8
1.0R
eca
llSkipGram/Cosine
avrg. SkipGram/Supervised
linear combination
NASARI/Cosine
(b) Recall
0 200 400 600 800 1000k
0.0
0.2
0.4
0.6
0.8
1.0
F-sc
ore
SkipGram/Cosine
avrg. SkipGram/Supervised
linear combination
NASARI/Cosine
(c) F-score
Figure 2.10: Evaluation on automatically created knowledge bases (“plausible” and “usual”locations).
coverage of the produced relations. We test this approach on:
• the locatedAt-usual and locatedAt-usual/plausible datasets for the locatedAt relationbetween objects and locations, and
• the usedFor-Extracted-triples dataset for the usedFor relation between objects and ac-tions.
We introduce the usedFor relation in order to assess the generalizability of our supervisedscoring function.
In general, we extract a knowledge base of triples by scoring each possible candidate triple,thus producing an overall ranking. We then select the top k triples from the ranking, with kbeing a parameter. This gives us the triples that are considered the most prototypical. Weevaluate the retrieved set in terms of Precision, Recall and F-score against the gold standardsets with varying values of k. Here, the precision is the fraction of correctly retrieved triples inthe set of all retrieved triples, while the recall is the fraction of retrieved triples that also occurin the gold standard set. The F-score is the harmonic mean of precision and recall:
Precision =|G ∩ Rk||Rk|
Recall =|G ∩ Rk||G|
F1 =2 · Precision ·RecallPrecision+Recall
with G denoting the set of gold standard triples and Rk the set of retrieved triples up to rankk.

2.2. MINING SEMANTIC KNOWLEDGE FROM THE WEB 45
0 200 400 600 800 1000k
0.0
0.2
0.4
0.6
0.8
1.0
Sco
re
avrg. F-score
avrg. Precision
avrg. Recall
Figure 2.11: Evaluation of knowledge base generation for the usedFor relation between objectsand actions. Precision, Recall and F-score are given with respect to extracting the to k scoredtriples.
For the locatedAt relation, we also add to the comparison the results of the hybrid, linearcombination method, with the best performing parameters in terms of Precision@1, namely thelinear combination with α = 0.4.
Figures 2.9 and 2.10 show the evaluation of the four methods evaluated against the two ag-gregated gold standard datasets for the locatedAt relation described above. Figures 2.9c and2.10c, in particular, show F-score plots for a direct comparison of the performance. The Skip-Gram/Supervised model achieves the highest F-score on the locatedAt-usual dataset, peakingat k = 132 with an F-score of 0.415. The SkipGram/Cosine model and the linear combina-tion outperform both the NASARI/Cosine and the SkipGram/Supervised in terms of recall,especially for higher k. This also holds for the locatedAt-usual/plausible dataset. Here, theSkipGram/Supervised model stands out by achieving high precision values for small values ofk. Overall, SkipGram/Supervised performs better for small k (50 – 400) whereas SkipGram/-Cosine and the linear combination obtain better results with increasing k. This seems to bein line with the results from previous experiments in Table 2.9 that show a high Precision@1for the SkipGram/Supervised model but higher scores for SkipGram/Cosine and the linearcombination in terms of Precision@3.
Evaluation of object-action pairs extraction. One of the reasons to introduce a noveltechnique for relation extraction based on a supervised statistical method, as stated previously,is to be able to scale the extraction across different types of relations. To test the validityof this statement, we apply the same evaluation procedure introduced in the previous part ofthis section to the usedFor relation. For the training and evaluation sets we use the datasetusedFor-Extracted-triples comprising of semi-automatically extracted triples from ConceptNet.
Figure 2.11 displays precision, recall and F-score for retrieving the top k results. The resultsare averaged scores over 100 experiments to account for variations in performance due to therandom partitioning in training and evaluation triples and the generation of negative samples.The standard deviation for precision, recall and F-score for all k is visualized along the meanscores.
The supervised model achieves on average a maximum F-score of about 0.465 when ex-tracting 70 triples. This is comparable to the achieved F-scores when training the scoringfunction for the locatedAt relation. To give an insight into the produced false positives, Table2.10 shows the top 30 extracted triples for the usedFor relation of one trained instance of thesupervised model.

46 CHAPTER 2. IE TO GENERATE STRUCTURED KNOWLEDGE
Table 2.10: A list of the top 30 extracted triples for the usedFor relation. The gray highlightedrows mark the entity pairs that are part of the gold standard dataset (Section 2.2.2).
Score Object Action1.00000 Snack Snacking0.99896 Snack Eating0.99831 Curry Seasoning0.99773 Drink Drinking0.98675 Garlic Seasoning0.98165 Oatmeal Snacking0.98120 Food Eating0.96440 Pistol Shooting0.95218 Drink Snacking0.94988 Bagel Snacking0.94926 Wheat Snacking0.93778 Laser Printing0.92760 Food Snacking0.91946 Typewriter Typing0.91932 Oatmeal Eating0.91310 Wok Cooking0.89493 Camera Shooting0.85415 Coconut Seasoning0.85091 Stove Frying0.85039 Oatmeal Seasoning0.84038 Bagel Eating0.83405 Cash Gambling0.81985 Oatmeal Baking0.80975 Lantern Lighting0.80129 Calculator Typing0.78279 Laser Shooting0.77411 Camera Recording0.75712 Book Writing0.72924 Stove Cooking0.72280 Coconut Snacking
2.2.4 Building a Knowledge Base of object locations
Given these results, we can aim for a high-confidence knowledge base by selecting the thresholdon object-location similarity scores that produces a reasonably high precision knowledge basein the evaluation. For instance, the knowledge base made by the top 50 object-location pairsextracted with the linear combination method (α = 0.4) has 0.52 precision and 0.22 recall onthe locatedAt-usual gold standard (0.70 and 0.07 respectively on the locatedAt-usual/plausibleset, see Figures 2.9a and 2.10a). The similarity scores in this knowledge base range from 0.570to 0.866. Following the same methodology that we used to construct the gold standard setof objects and locations (Section 2.2.2), we extract all the 336 Domestic implements and 199Rooms from DBpedia, for a total of 66,864 object-location pairs. Selecting only the pairs whosesimilarity score is higher than 0.570, according to the linear combination method, yields 931high confidence location relations. Of these, only 52 were in the gold standard set of pairs (45were rated “usual” or “plausible” locations), while the remaining 879 are new, such as (Trivet,Kitchen), (Flight bag, Airport lounge) or (Soap dispenser, Unisex public toilet). The

2.2. MINING SEMANTIC KNOWLEDGE FROM THE WEB 47
distribution of objects across locations has an arithmetic mean of 8.9 objects per location andstandard deviation 11.0. Kitchen is the most represented location with 89 relations, while 15out of 107 locations are associated with one single object.14
The knowledge base created with this method is the result of one among many possibleconfigurations of a number of methods and parameters. In particular, the creator of a knowledgebase involving the extraction of relations is given the choice to prefer precision over recall, orvice-versa. This is done, in our method, by adjusting the threshold on the similarity scores.Employing different algorithms for the computation of the actual similarities (word embeddingsvs. entity vectors, supervised vs. unsupervised models) is also expected to result in differentknowledge bases. A qualitative assessment of such impact is left for future work.
2.2.5 Related work on mining semantic knowledge from the Webfor robotics
To obtain information about unknown objects from the Web, a robot can use perceptual orknowledge-based queries. Future systems will inevitably need to use both. In the previoussections we have focused on the knowledge-based approach, but this can be seen as comple-mentary to systems which use image-based queries to search databases of labeled images forsimilarity, e.g., [378]. Although the online learning of new visual object models is currently aniche area in robotics, some approaches do exist [167, 181]. These approaches are capable ofsegmenting previously unknown objects in a scene and building models to support their futurere-recognition. However, this work focuses purely on visual models (what objects look like),and does not address how the learnt objects are described semantically (what objects are).
The RoboSherlock framework [43] (which we build upon) is one of the most prominentprojects to add semantic descriptions to objects for everyday environments, but the frameworkmust largely be configured a priori with knowledge of the objects in its environment. It doessupport more open ended performance, e.g., through the use of Google Goggles, but does not usespatial or semantic context for its Web queries, only vision. The same research group pioneeredWeb and cloud robotics, where tools such as KnowRob [436] (also used in RoboSherlock) bothformalized robot knowledge and capabilities, and used this formal structure to exploit the Webfor remote data sources and knowledge sharing. In a more supervised setting, many approacheshave used humans to train mobile robots about new objects in their environment [191, 419] androbots have also used Web knowledge sources to improve their performance in closed worlds,e.g., the use of object-room co-occurrence data for room categorization in [211].
The spatial organization of a robot’s environment has also been previously exploited toimprove task performance. For example, [439, 259] present a system in which the previous ex-perience of spatial arrangements of desktop objects is used to refine the results of a noisy objectcategorization system. This demonstrates the predictive power of spatial arrangements, whichis something we also exploit in our work. However this prior work matched between scenes inthe same environment and input modality. In our work we connect spatial arrangements in therobot’s situated experience to structured knowledge on the Web. Our predictions for unknownobjects rely on determining the semantic relatedness of terms. This is an important topic inseveral areas, including data mining, information retrieval and web recommendation. [407] ap-plies ontology-based similarity measures in the robotics domain. Background knowledge aboutall the objects the robot could encounter, is stored in an extended version of the KnowRobontology. Then, WUP similarity [479] is applied to calculate relatedness of the concept typesby considering the depth of the concepts and the depth of their lowest common super-conceptin the ontology. [267] presents an approach for computing the semantic relatedness of terms
14The full automatically created knowledge base and used resources are available at https://project.inria.fr/aloof/data/.

48 CHAPTER 2. IE TO GENERATE STRUCTURED KNOWLEDGE
using ontological information extracted from DBpedia for a given domain, using the results formusic recommendations. Contrary to these approaches, we compute the semantic relatednessbetween objects by leveraging the vectorial representation of the DBpedia concepts providedby the NASARI resource [96]. This method links back to earlier distributional semantics work(e.g., Latent Semantic Analysis [262]) with the difference that here concepts are represented asvectors, rather than words.
The work described in Section 2.2 relates to the four research lines discussed below, namely:i) machine reading, ii) supervised relation extraction, iii) encoding common sense knowledgein domain-independent ontologies and knowledge bases, and iv) grounding of knowledge fromthe perspective of cognitive linguistics.
The machine reading paradigm. In the field of knowledge acquisition from the Web, therehas been substantial work on extracting taxonomic (e.g., hypernym), part-of relations [194] andcomplete qualia structures describing an object [115]. Quite recently, there has been a focuson the development of systems that can extract knowledge from any text on any domain (theopen information extraction paradigm [166]). The DARPA Machine Reading Program [29]aimed at endowing machines with capabilities for lifelong learning by automatically readingand understanding texts (e.g., [165]). While such approaches are able to quite robustly acquireknowledge from texts, these models are not sufficient to meet our objectives since: i) they lackvisual and sensorimotor grounding, ii) they do not contain extensive object knowledge. Whilethe knowledge extracted by our approach presented here is also not sensorimotorically grounded,we hope that it can support planning of tasks involving object manipulation. Thus, we needto develop additional approaches that can harvest the Web to learn about usages, appearanceand functionality of common objects. While there has been some work on grounding symbolicknowledge in language [336], so far there has been no serious effort to compile a large andgrounded object knowledge base that can support cognitive systems in understanding objects.
Supervised Relation Extraction. While machine reading attempts to acquire generalknowledge by reading texts, other works attempt to extract specific relations using classifierstrained in a supervised approach using labeled data. A training corpus in which the relationof interest is annotated is typically assumed (e.g., [81]). Another possibility is to rely on theso called distant supervision approach and use an existing knowledge base to bootstrap theprocess by relying on triples or facts in the knowledge base to label examples in a corpus(e.g., [225, 226, 225, 432]). Some researchers have modeled relation extraction as a matrixdecomposition problem [395]. Other researchers have attempted to train relation extractionapproaches in a bootstrapping fashion, relying on knowledge available on the Web, e.g., [58].
Recently, scholars have tried to build models that can learn to extract generic relations fromthe data, rather than a set of pre-defined relations (see [277] and [63]). Related to these modelsare techniques to predict triples in knowledge graphs by relying on the embedding of entities(as vectors) and relations (as matrices) in the same distributional space (e.g., TransE [65] andTransH [469]). Similar ideas were tested in computational linguistics in the past years, whererelations and modifiers are represented as tensors in the distributional space [31, 138].
Ontologies and KB of common sense knowledge. DBpedia15 [270] is a large-scale knowl-edge base automatically extracted from the infoboxes of Wikipedia. Besides its sheer size, it isattractive for the purpose of collecting general knowledge given the one-to-one mapping withWikipedia (allowing us to exploit the textual and structural information contained in there)and its position as the central hub of the Linked Open Data cloud.
15http://dbpedia.org

2.3. NATURAL LANGUAGE PROCESSING OF SONG LYRICS 49
YAGO [431] is an ontology automatically extracted from WordNet and Wikipedia. YAGOextracts facts from the category system and the infoboxes of Wikipedia, and combines thesefacts with taxonomic relations derived from WordNet. Despite its high coverage, for our goals,YAGO suffers from the same drawbacks as DBpedia, i.e., a lack of knowledge about commonobjects, that is, about their purpose, functionality, shape, prototypical location, etc.
ConceptNet16 [282] is a semantic network containing lots of things computers should knowabout the world. However, we cannot integrate ConceptNet directly in our pipeline becauseof the low coverage of the mapping with DBpedia— of the 120 DBpedia entities in our goldstandard (see Section 2.2.2) only 23 have a correspondent node in ConceptNet.
NELL (Never Ending Language Learning) is the product of a continuously-refined processof knowledge extraction from text [327]. Although NELL is a large-scale and quite fine-grainedresource, there are some drawbacks that prevent it to be effectively used as a commonsenseknowledge base. The inventory of predicates and relations is very sparse, and categories (in-cluding many objects) have no predicates.
OpenCyC17 [271] attempts to assemble a comprehensive ontology and knowledge base ofeveryday common sense knowledge, with the goal of enabling AI applications to perform human-like reasoning.
Several projects worldwide have attempted to develop knowledge bases for robots throughwhich knowledge, e.g., about how to manipulate certain objects, can be shared among manyrobots. Examples of such platforms are the RoboEarth project [462], RoboBrain [405] orKnowRob [435], discussed before.
While the above resources are without doubt very useful, we are interested in develop-ing an approach that can extract new knowledge leveraging text corpora, complementing theknowledge contained in ontologies and knowledge bases such as the ones described above.
Grounded Knowledge and Cognitive Linguistics Many scholars have argued that, froma cognitive perspective, knowledge needs to be grounded [213] as well as modality-specificto support simulation, a mental activity that is regarded as ubiquitous in cognitive intelli-gent systems [34]. Other seminal work has argued that cognition is categorical [214, 215] andthat perceptual and cognitive reasoning rely on schematic knowledge. In particular, there hasbeen substantial work on describing the schemas by which we perceive and understand spa-tial knowledge [434]. The knowledge we have gathered is neither grounded nor schematic, normodality-specific in the above senses, but rather amodal and symbolic. This type of knowl-edge is arguably useful in high-level planning but clearly is not sufficient to support simulationor event action execution. Developing models by which natural language can be grounded inaction has been the concern of other authors, e.g., Misra et al. [325] as well as Bollini et al.[64]. Some work has considered extracting spatial relations in natural language input [253].Differently from the above mentioned works, we are neither interested in interpreting naturallanguage with respect to grounded action representations nor in extracting spatial relationsfrom a given sentence. Rather, our goal is to extract prototypical common sense backgroundknowledge from large corpora.
2.3 Natural Language Processing of Song Lyrics
Given that lyrics encode an important part of the semantics of a song, this Section is dedicatedto the description of my research activity on extracting relevant information from the lyrics,such as their structure segmentation, their topics, the explicitness of the lyrics content, the
16http://conceptnet5.media.mit.edu/17http://www.opencyc.org/ as RDF representations: http://sw.opencyc.org/

50 CHAPTER 2. IE TO GENERATE STRUCTURED KNOWLEDGE
salient passages of a song and the emotions conveyed. This research was done in the contextof the WASABI project.
Understanding the structure of song lyrics (e.g., intro, verse, chorus) is an important taskfor music content analysis since it allows to split a song into semantically meaningful segmentsenabling a description of each section rather than a global description of the whole song.Carrying out this task by means of an automated system is a challenging but useful task,that would allow to enrich song lyrics with improved structural clues that can be used forinstance by search engines handling real-word large song collections.
2.4 Lyrics Segmentation via bimodal text-audio repre-
sentation
Understanding the structure of song lyrics (e.g., intro, verse, chorus) is an important task formusic content analysis [106, 473] since it allows to split a song into semantically meaningfulsegments enabling a description of each section rather than a global description of the wholesong. The importance of this task arises also in Music Information Retrieval, where musicstructure detection is a research area aiming at automatically estimating the temporal structureof a music track by analyzing the characteristics of its audio signal over time. Given that lyricscontain rich information about the semantic structure of a song, relying on textual featurescould help in overcoming the existing difficulties associated with large acoustic variation inmusic. However, so far only a few works have addressed the task lyrics-wise [175, 296, 473, 27].Carrying out structure detection by means of an automated system is therefore a challengingbut useful task, that would allow to enrich song lyrics with improved structural clues that canbe used for instance by search engines handling real-word large song collections. A step forward,a complete music search engine should support search criteria exploiting both the audio andthe textual dimensions of a song.
Structure detection consists of two steps: a text segmentation stage that divides lyrics intosegments, and a semantic labelling stage that labels each segment with a structure type (e.g.,intro, verse, chorus). Given the variability in the set of structure types provided in the literatureaccording to different genres [433, 71], rare attempts have been made to achieve the second step,i.e. semantic labelling. While addressing the first step is the core contribution of this section,we leave the task of semantic labelling for future work.
In [175] we proposed a first neural approach for lyrics segmentation that was relying onpurely textual features. However, with this approach we fail to capture the structure of thesong in case there is no clear structure in the lyrics - when sentences are never repeated or in theopposite case when they are always repeated. In such cases however, the structure may arisefrom the acoustic/audio content of the song, often from the melody representation. This sectionaims at extending the approach proposed in [175] by complementing the textual analysis withacoustic aspects. We perform lyrics segmentation on a synchronized text-audio representationof a song to benefit from both textual and audio features.
In this direction, this work focuses on the following research question: given the text andaudio of a song, can we learn to detect the lines delimiting segments in the song text? Thisquestion is broken down into two sub questions: 1) given solely the song text, can we learn todetect the lines delimiting segments in the song? and 2) do audio features - in addition to thetext - boost the model performance on the lyrics segmentation task?
To address these questions, this article contains the following contributions:
1. We introduce a convolutional neural network-based model that i) efficiently exploits theSelf-Similarity Matrix representations (SSM) used in the state-of-the-art [473], and ii)
2.4. LYRICS SEGMENTATION VIA BIMODAL TEXT-AUDIO REPRESENTATION 51
can utilize traditional features alongside the SSMs.
2. We experiment with novel features that aim at revealing different properties of a songtext, such as its phonetics and syntax. We evaluate this unimodal (purely text-based)approach on two standard datasets of English lyrics, the Music Lyrics Database andthe WASABI corpus. We show that our proposed method can effectively detect theboundaries of music segments outperforming the state of the art, and is portable acrosscollections of song lyrics of heterogeneous musical genre.
3. We experiment with a bimodal lyrics representation that incorporates audio featuresinto our model. For this, we use a novel bimodal corpus (DALI) in which each songtext is time-aligned to its associated audio. Our bimodal lyrics segmentation performssignificantly better than the unimodal approach. We investigate which text and audiofeatures are the most relevant to detect lyrics segments and show that the text and audiomodalities complement each other. We perform an ablation test to find out to what extentour method relies on the alignment quality of the lyrics-audio segment representations.
To better understand the rational underlying the proposed approach, consider the segmen-tation of the Pop song depicted in Figure 2.12. The left side shows the lyrics and its segmenta-tion into its structural parts: the horizontal green lines indicate the segment borders betweenthe different lyrics segments. We can summarize the segmentation as follows: Verse1-Verse2-Bridge1-Chorus1-Verse3-Bridge2-Chorus2-Chorus3-Chorus4-Outro. The middle of Figure 2.12shows the repetitive structure of the lyrics. The exact nature of this structure representation isintroduced later and is not needed to understand this introductory example. The crucial pointis that the segment borders in the song text (green lines) coincide with highlighted rectanglesin the chorus (the Ci) of the lyrics structure (middle). We find that in the verses (the Vi) andbridges (the Bi) highlighted rectangles are only found in the melody structure (right). Thereason is that these verses have different lyrics, but share the same melody (analogous for thebridges). While the repetitive structure of the lyrics is an effective representation for lyricssegmentation, we believe that an enriched segment representation that also takes into accountthe audio of a song can improve segmentation models. While previous approaches relied onpurely textual features for lyrics segmentation, showing the discussed limitations, we proposeto perform lyrics segmentation on a synchronized text-audio representation of a song to benefitfrom both textual and audio features.
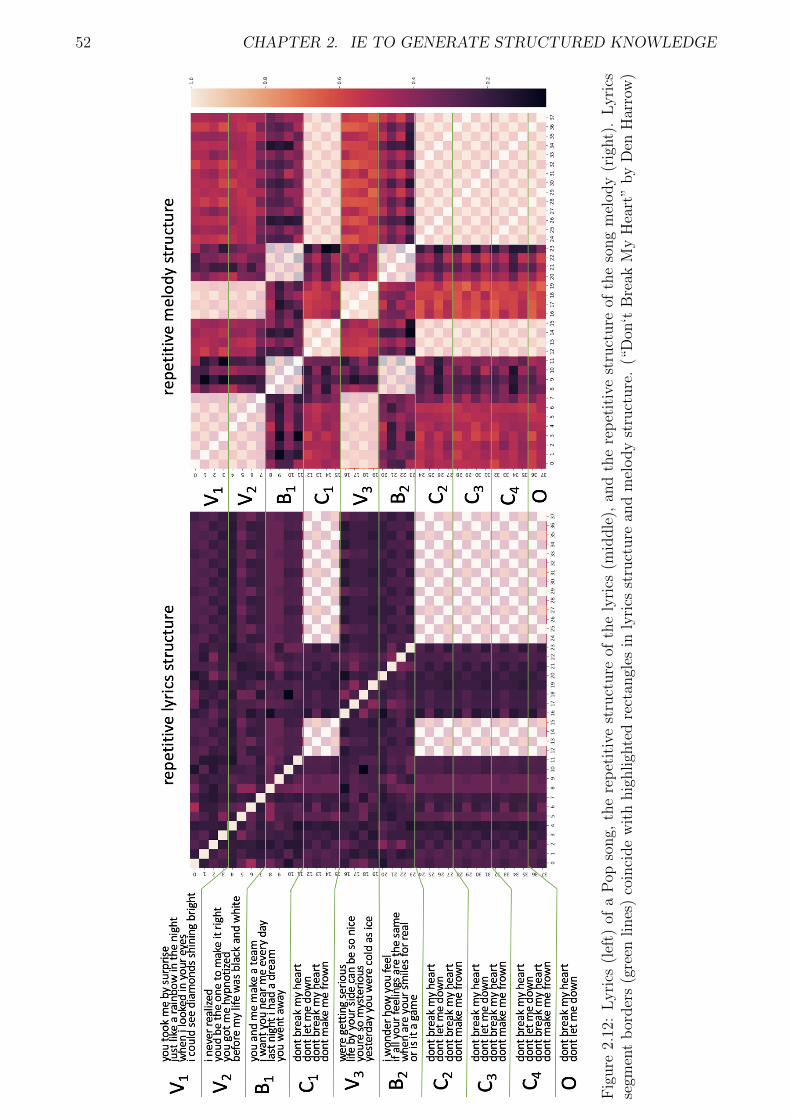
52 CHAPTER 2. IE TO GENERATE STRUCTURED KNOWLEDGE
Fig
ure
2.12
:L
yri
cs(l
eft)
ofa
Pop
song,
the
rep
etit
ive
stru
cture
ofth
ely
rics
(mid
dle
),an
dth
ere
pet
itiv
est
ruct
ure
ofth
eso
ng
mel
ody
(rig
ht)
.L
yri
csse
gmen
tb
order
s(g
reen
lines
)co
inci
de
wit
hhig
hligh
ted
rect
angl
esin
lyri
csst
ruct
ure
and
mel
ody
stru
cture
.(“
Don
‘tB
reak
My
Hea
rt”
by
Den
Har
row
)

2.4. LYRICS SEGMENTATION VIA BIMODAL TEXT-AUDIO REPRESENTATION 53
2.4.1 Modelling segments in song lyrics
Detecting the structure of a song text is a non-trivial task that requires diverse knowledge andconsists of two steps: text segmentation followed by segment labelling. In this work we focuson the task of segmenting the lyrics. This first step is fundamental to segment labelling whensegment borders are not known. Even when segment borders are “indicated” by line breaksin lyrics available online, those line breaks have usually been annotated by users and neitherare they necessarily identical to those intended by the songwriter, nor do users in general agreeon where to put them. Thus, a method to automatically segment unsegmented song textsis needed to automate that first step. Many heuristics can be imagined to find the segmentborders. In our example, separating the lyrics into segments of a constant length of four lines(Figure 2.12) gives the correct segmentation. However, in another example, the segments canbe of different length. This is to say that enumerating heuristic rules is an open-ended task.
We follow [473] by casting the lyrics segmentation task as binary classification. Let L ={a1, a2, ..., an} be the lyrics of a song composed of n lyrics lines and seg ⊆ (L,B) be a functionthat returns for each line ai ∈ L if it is the end of a segment. The task is to learn a classifierthat approximates seg. At the learning stage, the ground truth segment borders are observedfrom segmented text as double line breaks. At the testing stage the classifier has to predict thenow hidden segment borders.
Note that lyrics lines do not exist in isolation, as lyrics are texts that accompany music.Therefore, each lyrics line is naturally associated to a segment of audio. We define a bimodallyrics line ai = (li, si) as a pair containing both the i-th text line li, and its associated audiosegment si. In the case we only use the textual information, we model this as unimodal lyricslines, i.e. ai = (li).
18
In order to infer the lyrics structure, we rely on our Convolutional Neural Network-basedmodel that we introduced in [175]. Our model architecture is detailed later in this section. Itdetects segment boundaries by leveraging the repeated patterns in a song text that are conveyedby the Self-Similarity Matrices.
Self-Similarity Matrices. We produce Self-Similarity Matrices (SSMs) based on bimodallyrics lines ai = (li, si) in order to capture repeated patterns in the text line li as well asits associated audio segment si. SSMs have been previously used in the literature to esti-mate the structure of music [183, 118] and lyrics [473, 175]. Given a song consisting of bi-modal lines {a1, a2, ..., an}, a Self-Similarity Matrix SSMM ∈ Rn×n is constructed, where eachelement is set by computing a similarity measure between the two corresponding elements(SSMM)ij = simM(xi, xj). We choose xi, xj to be elements from the same modality, i.e. theyare either both lyrics lines (li) or both audio segments (si) associated to lyrics lines. simM
is a similarity measures that compares two elements of the same modality to each other. Inour experiments, this is either a text-based or an audio-based similarity. As a result, SSMsconstructed from a text-based similarity highlight distinct patterns of the text, revealing theunderlying structure (see Figure 2.12, middle). Analogously, SSMs constructed from an audio-based similarity highlight distinct patterns of the audio (see Figure 2.12, right). In the unimodalcase, we compute SSMs from only one modality: either text lines li or audio segments si.
There are two common patterns that were investigated in the literature: diagonals andrectangles. Diagonals parallel to the main diagonal indicate sequences that repeat and aretypically found in a chorus. Rectangles, on the other hand, indicate sequences in which all thelines are highly similar to one another. Both of these patterns were found to be indicators ofsegment borders.
18This definition can be straightforwardly extended to more modalities, ai then becomes a tuple containingtime-synchronized information.

54 CHAPTER 2. IE TO GENERATE STRUCTURED KNOWLEDGE
Figure 2.13: Convolutional Neural Network-based model inferring lyrics segmentation.
Convolutional Neural Network-based Model. Lyrics segments manifest themselves inthe form of distinct patterns in the SSM. In order to detect these patterns efficiently, we intro-duce the Convolutional Neural Network (CNN) architecture which is illustrated in Figure 2.13.The model predicts for each lyrics line if it is segment ending. For each of the n lines of a songtext the model receives patches (see Figure 2.13, step A) extracted from SSMs ∈ Rn×n andcentered around the line: inputi = {P 1
i , P2i , ..., P
ci } ∈ R2w×n×c, where c is the number of SSMs
or number of channels and w is the window size. To ensure the model captures the segment-indicating patterns regardless of their location and relative size, the input patches go throughtwo convolutional layers (see Figure 2.13, step B) [195], using filter sizes of (w + 1) × (w + 1)and 1×w, respectively. By applying max pooling after both convolutions each feature is down-sampled to a scalar. After the convolutions, the resulting feature vector is concatenated withthe line-based features (see Figure 2.13, step C) and goes through a series of densely connectedlayers. Finally, the softmax is applied to produce probabilities for each class (border/notborder) (see Figure 2.13, step D). The model is trained with supervision using binary cross-entropy loss between predicted and ground truth segment border labels (see Figure 2.13, stepE). Note that while the patch extraction is a local process, the SSM representation capturesglobal relationships, namely the similarity of a line to all other lines in the lyrics.
Bimodal Lyrics Lines. To perform lyrics segmentation on a bimodal text-audio represen-tation of a song to benefit from both textual and audio features, we use a corpus where theannotated lyrics ground truth (segment borders) is synchronized with the audio. This bimodaldataset is described in the following subsection. We focus solely on the audio extracts that havesinging voice, as only they are associated to the lyrics. For that let ti be the time interval ofthe (singing event of) text line li in our synchronized text-audio corpus. Then, a bimodal lyricsline ai = (li, si) consists of both a text line li (the text line during ti) and its associated audiosegment si (the audio segment during ti). As a result, we have the same number of text linesand audio segments. While the textual information li can be used directly to produce SSMs,the complexity of the raw audio signal prevents it from being used as direct input of our system.Instead, it is common to extract features from the audio that highlight some aspects of thesignal that are correlated with the different musical dimensions. Therefore, we describe eachaudio segment si as set of different time vectors. Each frame of a vector contains informationof a precise and small time interval. The size of each audio frame depends on the configurationof each audio feature. We call an audio segment si featurized by a feature f if f is applied toall frames of si. For our bimodal segment representation we featurize each si with one of thefollowing features:

2.4. LYRICS SEGMENTATION VIA BIMODAL TEXT-AUDIO REPRESENTATION 55
• Mel-frequency cepstral coefficients (mfcc ∈ R14): these coefficients [137] emphasizeparts of the signal that are related with our understanding of the musical timbre. Theyhave proven to be very efficient in a large range of audio applications.
• Chroma feature (chr ∈ R12): this feature [188] describes the harmonic information ofeach frame by computing the “presence” of the twelve different notes.
2.4.2 Datasets
Song texts are available widely across the Web in the form of user-generated content. Unfortu-nately for research purposes, there is no comprehensive publicly available online resource thatwould allow a more standardized evaluation of research results. This is mostly attributableto copyright limitations and has been criticized before in [301]. Research therefore is usuallyundertaken on corpora that were created using standard web-crawling techniques by the respec-tive researchers. Due to the user-generated nature of song texts on the Web, such crawled datais potentially noisy and heterogeneous, e.g., the way in which line repetitions are annotatedcan range from verbatim duplication to something like Chorus (4x) to indicate repeating thechorus four times.
In the following we describe the lyrics corpora we used in our experiments. First, MLDBand WASABI are purely textual corpora. Complementarily, DALI is a corpus that containsbimodal lyrics representations in which text and audio are synchronized.
MLDB and WASABI. The Music Lyrics Database (MLDB) V.1.2.719 is a proprietary lyricscorpus of popular songs of diverse genres. We use this corpus in the same configuration as usedbefore by the state of the art in order to facilitate a comparison with their work. Consequently,we only consider English song texts that have five or more segments and we use the sametraining, development and test indices, which is a 60%-20%-20% split. In total we have 103ksong texts with at least 5 segments. 92% of the remaining song texts count between 6 and 12segments.
The WASABI corpus20 [317], is a larger corpus of song texts, consisting of 744k Englishsong texts with at least 5 segments, and for each song it provides the following information: itslyrics21, the synchronized lyrics when available22, DBpedia abstracts and categories the songbelongs to, genre, label, writer, release date, awards, producers, artist and/or band members,the stereo audio track from Deezer, when available, the unmixed audio tracks of the song, itsISRC, bpm, and duration.
DALI. The DALI corpus23 [316] contains synchronized lyrics-audio representations on dif-ferent levels of granularity: syllables, words, lines and segments / paragraphs. It was createdby joining two datasets: (1) a corpus for karaoke singing (AMX) which contains alignmentsbetween lyrics and audio on the syllable level and (2) a subset of WASABI lyrics that belong tothe same songs than the lyrics in AMX. Note that corresponding lyrics in WASABI can differfrom those in AMX to some extent. Also, in AMX there is no annotation of segments. DALIprovides estimated segments for AMX lyrics, projected from the ground truth segments fromWASABI. For example, Figure 2.14 shows on the left side the lyrics lines as given in AMX. Theright side shows the lyrics lines given in WASABI as well as the ground truth lyrics segments.
19http://www.odditysoftware.com/page-datasales1.htm20https://wasabi.i3s.unice.fr/21Extracted from http://lyrics.wikia.com/22From http://usdb.animux.de23https://github.com/gabolsgabs/DALI

56 CHAPTER 2. IE TO GENERATE STRUCTURED KNOWLEDGE
Corpus name Alignment quality Song countQ+ high (90-100%) 1048Q0 med (52-90%) 1868Q− low (0-52%) 1868
full dataset - 4784
Table 2.11: The DALI dataset partitioned by alignment quality
The left side shows the estimated lyrics segments in AMX. Note how the lyrics in WASABIhave one segment more, as the segment W3 has no counter part in AMX.
Based on the requirements for our task, we derive a measure to assess how well the estimatedAMX segments correspond / align to the groundtruth WASABI segments. Since we will usethe WASABI segments as ground truth labels for supervised learning, we need to make sure,the AMX lines (and hence audio information) actually belongs to the aligned segment. As onlyfor the AMX lyrics segments we have aligned audio features and we want to consistently useaudio features in our segment representations, we make sure that every AMX segment has acounterpart WASABI segment (see Figure 2.14, A0 ∼ W0, A1 ∼ W1, A2 ∼ W2, A3 ∼ W4).On the other hand, we allow WASABI segments to have no corresponding AMX segments (seeFigure 2.14, W3). We further do not impose constraints on the order of appearance of segmentsin AMX segmentations vs. WASABI segmentations, to allow for possible rearrangements inthe order of corresponding segments. With these considerations, we formulate a measure ofalignment quality that is tailored to our task of bimodal lyrics segmentation. Let A,W besegmentations, where A = A0A1...Ax and the Ai are AMX segments and W = W0W1...Wy withWASABI lyrics segments Wi. Then the alignment quality between the segmentations A,W iscomposed from the similarities of the best-matching segments. Using string similarity simstr asdefined in the following subsection, we define the alignment quality Qual as follows:
Qual(A,W ) = Qual(A0A1...Ax, W0W1...Wy)
= min0≤i≤x
{ max0≤j≤y
{ simstr(Ai,Wj) } }
In order to test the impact of Qual on the performance of our lyrics segmentation algorithm, wepartition the DALI corpus into parts with different Qual. Initially, DALI consists of 5358 lyricsthat are synchronized to their audio track. Like in previous publications [473, 175], we ensurethat all song texts contain at least 5 segments. This constraint reduces the number of tracksused by us to 4784. We partition the 4784 tracks based on their Qual into high (Q+), med(Q0), and low (Q−) alignment quality datasets. Table 5.1 gives an overview over the resultingdataset partitions. The Q+ dataset consists of 50842 lines and 7985 segment borders and hasthe following language distribution: 72% English, 11% German, 4% French, 3% Spanish, 3%Dutch, 7% other languages.
2.4.3 Experimental setting
The central input features used by our Convolutional Neural Network-based model are thedifferent SSMs. Therefore, the choice of similarities used to produce the SSMs is essential tothe approach. We experiment with both text-based and audio-based similarities, described inthe following paragraph. We then detail the model configurations and hyperparameters. Wedescribe separately the settings for the experiments using unimodal lyrics lines (text only) orbimodal lyrics lines (text and audio), respectively.

2.4. LYRICS SEGMENTATION VIA BIMODAL TEXT-AUDIO REPRESENTATION 57
Figure 2.14: Lyrics lines and estimated lyrics segments in AMX (left). Lyrics lines and groundtruth lyrics segments in WASABI (right) for the song (“Don‘t Break My Heart” by Den Harrow)
Similarity Measures. We produce SSMs based on three line-based text similarity measures.We further add audio-based similarities - the crucial ingredient that makes our approach multi-modal. In the following, we define the text-based and audio-based similarities used to computethe SSMs.
Text similarities: given the text lines of the lyrics, we compute different similarity measures,based on either their characters, their phonetics or their syntax.
• String similarity (simstr): a normalized Levenshtein string edit similarity between thecharacters of two lines of text [272]. This has been widely used - e.g., [473, 175].
• Phonetic similarity (simphon): a simplified phonetic representation of the lines com-puted using the “Double Metaphone Search Algorithm” [379]. When applied to “i loveyou very much” and “i’l off you vary match” it returns the same result: “ALFFRMX”.This algorithm was developed to capture the similarity of similar sounding words evenwith possibly very dissimilar orthography. We translate the text lines into this “phoneticlanguage” and then compute simstr between them.
• Lexico-syntactical similarity (simlsyn): this measure, initially proposed in [170],combines lexical with syntactical similarity. simlex captures the similarity between textlines such as “Look into my eyes” and “I look into your eyes”: these are partially similaron a lexical level and partially similar on a syntactical level. Given two lines x, y lexico-

58 CHAPTER 2. IE TO GENERATE STRUCTURED KNOWLEDGE
syntactical similarity is defined as: simlsyn(x, y) = sim2lex(x, y)+(1−simsyn)·simsyn(x, y),
where simlex is the overlap of the bigrams of words in x and y, and simsyn is the overlapof the bigrams of pos tags in x, y, the remaining tokens that did not overlap on a wordlevel.
Audio similarities: There are several alternatives to measure the similarity between twoaudio sequences (e.g., mfcc sequences) of possibly different lengths, among which DynamicTime Warping Td is the most popular one in the Music Information Retrieval community.Given bimodal lyrics lines au, av (as previously defined), we compare two audio segments suand sv that are featurized by a particular audio feature (mfcc, chr) using Td:
Td(i, j) = d(su(i), sv(j)) + min
Td(i− 1, j),Td(i− 1, j − 1),Td(i, j − 1)
Td must be parametrized by an inner distance d to measure the distance between the frame iof su and the frame j of sv. Depending on the particular audio feature su and sv are featurizedwith, we employ a different inner distance as defined below. Let m be the length of the vectorsu and n be the length of sv. Then, we compute the minimal distance between the two audiosequences as Td(m,n) and normalize this by the length r of the shortest alignment path betweensu and sv to obtain values in [0,1] that are comparable to each other. We finally apply λx.(1−x)to turn the distance Td into a similarity measure Sd:
Sd(su, sv) = 1− Td(m,n) · r−1
Given bimodal lyrics lines ai, we now define similarity measures between audio segments sithat are featurized by a particular audio feature presented previously (mfcc, chr) based on oursimilarity measure Sd:
• MFCC similarity (simmfcc): Sd between two audio segments featurized by the mfccfeature. As inner distance we use the cosine distance: d(x, y) = x · y · (‖x‖ · ‖y‖)−1
• Chroma similarity (simchr): Sd between two audio segments featurized by the chromafeature; using cosine distance as inner distance
Models and configurations. In our first experiment we represent song texts via unimodallyrics lines and experiment on the MLDB and WASABI datasets. We compare to thestate of the art [473] and successfully reproduce their best features to validate their approach.Two groups of features are used in the replication: repeated pattern features (RPF) extractedfrom SSMs and n-grams extracted from text lines. The RPF basically act as hand-craftedimage filters that aim to detect the edges and the insides of diagonals and rectangles in theSSM.
Then, our own models are neural networks, that use as features SSMs and two line-basedfeatures: the line length and n-grams. For the line length, we extracted the character count fromeach line, a simple proxy of the orthographic shape of the song text. Intuitively, segments thatbelong together tend to have similar shapes. Similarly to [473]’s term features we extractedthose n-grams from each line that are most indicative for segment borders: using the tf-idfweighting scheme, we extracted n-grams that are typically found left or right from the segmentborder, varied n-gram lengths and also included indicative part-of-speech tag n-grams. Thisresulted in 240 term features in total. The most indicative words at the start of a segment were:{ok, lately, okay, yo, excuse, dear, well, hey}. As segment-initial phrases we found: {Been along, I’ve been, There’s a, Won’t you, Na na na, Hey, hey}. Typical words ending a segment

2.4. LYRICS SEGMENTATION VIA BIMODAL TEXT-AUDIO REPRESENTATION 59
were: {..., .., !, ., yeah, ohh, woah. c’mon, wonderland}. And as segment-final phrases we foundas most indicative: {yeah!, come on!, love you., !!!, to you., with you., check it out, at all., let’sgo, ...}
In this experiment we consider only SSMs made from text-based similarities; we note thisin the model name as CNNtext. We further name a CNN model by the set of SSMs that it usesas features. For example, the model CNNtext{str} uses as only feature the SSM made fromstring similarity simstr, while the model CNNtext{str, phon, lsyn} uses three SSMs in parallel(as different input channels), one from each similarity.
For convolutional layers we empirically set wsize = 2 and the amount of features extractedafter each convolution to 128. Dense layers have 512 hidden units. We have also tuned thelearning rate (negative degrees of 10), the dropout probability with increments of 0.1. Thebatch size was selected from the beginning to be 256 to better saturate our GPU. The CNNmodels were implemented using Tensorflow.
For comparison, we implement two baselines. The random baseline guesses for each lineindependently if it is a segment border (with a probability of 50%) or not. The line lengthbaseline uses as only feature the line length in characters and is trained using a logistic regressionclassifier.
For comparison with the state of the art, we use as a first dataset the same they used, theMLDB (see Section 2.4.2). To test the system portability to bigger and more heterogeneousdata sources, we further experimented our method on the WASABI corpus (see Section 2.4.2).In order to test the influence of genre on classification performance, we aligned MLDB toWASABI as the latter provides genre information. Song texts that had the exact same titleand artist names (ignoring case) in both data sets were aligned. This rather strict filter resultedin an amount of 58567 (57%) song texts with genre information in MLDB. Table 2.13 showsthe distribution of the genres in MLDB song texts. We then tested our method on each genreseparately, to test our hypothesis that classification is harder for some genres in which almostno repeated patterns can be detected (as Rap songs). To the best of our knowledge, previouswork did not report on genre-specific results.
In this work we did not normalize the lyrics in order to rigorously compare our results to[473]. We estimate the proportion of lyrics containing tags such as Chorus to be marginal(0.1-0.5%) in the MLDB corpus. When applying our methods for lyrics segmentation to lyricsfound online, an appropriate normalization method should be applied as a pre-processing step.For details on such a normalization procedure we refer the reader to [170], Section 2.1.
Evaluation metrics are Precision (P), Recall (R), and f-score (F1). Significance is testedwith a permutation test [351], and the p-value is reported.
Then, in the second experiment, the song texts are represented via bimodal lyrics linesand experimentation is performed on the DALI corpus. In order to test our hypotheses whichtext and audio features are most relevant to detect segment boundaries, and whether the textand audio modalities complement each other, we compare different types of models: baselines,text-based models, audio-based models, and finally bimodal models that use both text andaudio features. We provide the following baselines: the random baseline guesses for each lineindependently if it is a segment border (with a probability of 50%) or not. The line lengthbaselines use as feature only the line length in characters (text-based model) or milliseconds(audio-based model) or both, respectively. These baselines are trained using a logistic regressionclassifier. All other models are CNNs using the architecture described previously and use asfeatures SSMs made from different textual or audio similarities as previously described. TheCNN-based models that use purely textual features (str) are named CNNtext, while the CNN-based models using purely audio features (mfcc, chr) are named CNNaudio. Lastly, the CNNmult
models are multimodal in the sense that they use combinations of textual and audio features.

60 CHAPTER 2. IE TO GENERATE STRUCTURED KNOWLEDGE
We name a CNN model by its modality (text, audio, mult) as well as by the set of SSMs that ituses as features. For example, the model CNNmult{str, mfcc} uses as textual feature the SSMmade from string similarity simstr and as audio feature the SSM made from mfcc similaritysimmfcc.
As dataset we use the Q+ part of the DALI dataset. We split the data randomly into trainingand test sets using the following scheme: considering that the DALI dataset is relatively small,we average over two different 5-fold cross-validations. We prefer this sampling strategy for oursmall dataset over a more common 10-fold cross-validation as it avoids the test set becomingtoo small.
2.4.4 Results and discussion
Table 2.12 shows the results of our experiments with unimodal lyrics lines on theMLDB dataset. We start by measuring the performance of our replication of [473]’s approach.This reimplementation exhibits 56.3% F1, similar to the results reported in the original paper(57.7%). The divergence could be attributed to a different choice of hyperparameters andfeature extraction code. Much weaker baselines were explored as well. The random baselineresulted in 18.6% F1, while the usage of simple line-based features, such as the line length(character count), improves this to 25.4%.
The best CNN-based model, CNNtext{str, phon, lsyn}+ n-grams, outperforms all our base-lines reaching 67.4% F1, 8.2pp better than the results reported in [473]. We perform a permuta-tion test [351] of this model against all other models. In every case, the performance differenceis statistically significant (p < .05).
Subsequent feature analysis revealed that the model CNNtext{str} is by far the most effec-tive. The CNNtext{lsyn} model exhibits much lower performance, despite using a much morecomplex feature. We believe the lexico-syntactical similarity is much noisier as it relies onn-grams and PoS tags, and thus propagates error from the tokenizers and PoS taggers. TheCNNtext{phon} exhibits a small but measurable performance decrease from CNNtext{str}, pos-sibly due to phonetic features capturing similar regularities, while also depending on the qualityof preprocessing tools and the rule-based phonetic algorithm being relevant for our song-baseddataset. The CNNtext{str, phon, lsyn} model that combines the different textual SSMs yieldsa performance comparable to CNNtext{str}.
In addition, we test the performance of several line-based features on our dataset. Mostnotably, the n-grams feature provides a significant performance improvement producing thebest model. Note that adding the line length feature to any CNNtext model does not increaseperformance.
To show the portability of our method to bigger and more heterogeneous datasets, we ranthe CNN model on the WASABI dataset, obtaining results that are very close to the onesobtained for the MLDB dataset: precision: 67.4% for precision, 67.3% recall, and 67.4% f-scoreusing the CNNtext{str} model.
Results differ significantly based on genre. We split the MLDB dataset with genre anno-tations into training and test, trained on all genres, and tested on each genre separately. InTable 2.13 we report the performances of the CNNtext{str} on lyrics of different genres. Songsbelonging to genres such as Country, Rock or Pop, contain recurrent structures with repeatingpatterns, which are more easily detectable by the CNNtext algorithm. Therefore, they showsignificantly better performance. On the other hand, the performance on genres such as HipHop or Rap, is much worse.
The results of our experiments with multimodal lyrics lines on the DALI datasetare depicted in Table 2.14. The random baseline and the different line length baselines reach a

2.4. LYRICS SEGMENTATION VIA BIMODAL TEXT-AUDIO REPRESENTATION 61
Model Features P R F1
Random baseline n/a 18.6 18.6 18.6Line length baseline text line length 16.7 52.8 25.4
Handcrafted filtersRPF (our replication) 48.2 67.8 56.3RPF [473] 56.1 59.4 57.7RPF + n-grams 57.4 61.2 59.2
CNNtext
{str} 70.4 63.0 66.5{phon} 75.9 55.6 64.2{lsyn} 74.8 50.0 59.9{str, phon, lsyn} 74.1 60.5 66.6{str, phon, lsyn} + n-grams 72.1 63.3 67.4
Table 2.12: Results with unimodal lyrics lines on MLDB dataset in terms of Precision (P),Recall (R) and F1 in %.
Genre Lyrics[#] P R F1
Rock 6011 73.8 57.7 64.8Hip Hop 5493 71.7 43.6 54.2Pop 4764 73.1 61.5 66.6RnB 4565 71.8 60.3 65.6Alternative Rock 4325 76.8 60.9 67.9Country 3780 74.5 66.4 70.2Hard Rock 2286 76.2 61.4 67.7Pop Rock 2150 73.3 59.6 65.8Indie Rock 1568 80.6 55.5 65.6Heavy Metal 1364 79.1 52.1 63.0Southern Hip Hop 940 73.6 34.8 47.0Punk Rock 939 80.7 63.2 70.9Alternative Metal 872 77.3 61.3 68.5Pop Punk 739 77.3 68.7 72.7Soul 603 70.9 57.0 63.0Gangsta Rap 435 73.6 35.2 47.7
Table 2.13: Results with unimodal lyrics lines. CNNtext{str} model performances across musi-cal genres in the MLDB dataset in terms of Precision (P), Recall (R) and F1 in %. Underlinedare the performances on genres with less repetitive text. Genres with highly repetitive structureare in bold.

62 CHAPTER 2. IE TO GENERATE STRUCTURED KNOWLEDGE
performance of 15.5%-33.5% F1. Interestingly, the audio-based line length (33.5% F1) is moreindicative of the lyrics segmentation than the text-based line length (25.0% F1).24
The model CNNtext{str} performs with 70.8% F1 similarly to the CNNtext{str} model fromthe first experiment (66.5% F1). The models use the exact same SSMstr feature and hyperpa-rameters, but another lyrics corpus (DALI instead of MLDB). We believe that as DALI wasassembled from karaoke singing instances, it likely contains more repetitive song texts that areeasier to segment using the employed method. Note that the DALI dataset is too small to allowa genre-wise comparison as we did in the previous experiment using the MLDB dataset.
The CNNaudio models perform similarly well than the CNNtext models. CNNaudio{mfcc}reaches 65.3% F1, while CNNaudio{chr} results in 63.9% F1. The model CNNaudio{mfcc, chr}performs with 70.4% F1 significantly (p < .001) better than the models that use only one of thefeatures. As the mfcc feature models timbre and instrumentation, whilst the chroma featuremodels melody and harmony, they provide complementary information to the CNNaudio modelwhich increases its performance.
Most importantly, the CNNmult models combining text- with audio-based features constantlyoutperform the CNNtext and CNNaudio models. CNNmult{str, mfcc} and CNNmult{str, chr}achieve a performance of 73.8% F1 and 74.5% F1, respectively - this is significantly (p < .001)higher compared to the 70.8% (70.4%) F1 of the best CNNtext (CNNaudio) model. Finally,the overall best performing model is a combination of the best CNNtext and CNNaudio modelsand delivers 75.3% F1. CNNmult{str, mfcc, chr} is the only model to significantly (p < .05)outperform all other models in all three evaluation metrics: precision, recall, and F1. Note,that all CNNmult models outperform all CNNtext and CNNaudio models significantly (p < .001)in recall.
We perform an ablation test on the alignment quality. For this, we train CNN-based modelswith those feature sets that performed best on the Q+ part of DALI. For each modality (text,audio, mult), i.e. CNNtext{str}, CNNaudio{mfcc, chr}, and CNNmult{str, mfcc, chr}, we train amodel for each feature set on each partition of DALI (Q+, Q0, Q−). We always test our modelson the same alignment quality they were trained on. The alignment quality ablation results aredepicted in Table 2.15. We find that independent of the modality (text, audio, mult.), all modelsperform significantly (p < .001) better with higher alignment quality. The effect of modality onsegmentation performance (F1) is as follows: on all datasets we find CNNmult{str, mfcc, chr}to significantly (p < .001) outperform both CNNtext{str} and CNNaudio{mfcc, chr}. Further,CNNtext{str} significantly (p < .001) outperforms CNNaudio{mfcc, chr} on the Q0 and Q−
dataset, whereas this does not hold on the Q+ dataset (p ≥ .05).
2.4.5 Error analysis
An SSM for a Rap song is depicted in Figure 2.15. As texts in this genre are less repetitive, theSSM-based features are less reliable to determine a song’s structure. Moreover, when returningto the introductory example in Figure 2.12, we observe that verses (the Vi) and bridges (theBi) are not detectable when looking at the text representation only (see Figure 2.12, middle).The reason is that these verses have different lyrics. However, as these parts share the samemelody, highlighted rectangles are visible in the melody structure.
Indeed, we found our bimodal segmentation model to produce significantly (p < .001)better segmentations (75.3% F1) compared to the purely text-based (70.8% F1) and audio-basedmodels (70.4% F1). The increase in F1 stems from both increased precision and recall. Themodel increase in precision is observed as CNNmult often produces less false positive segmentborders, i.e. the model delivers less noisy results. We observe an increase in recall in twoways: first, CNNmult sometimes detects a combination of the borders detected by CNNtext and
24Note that adding line length features to any CNN-based model does not increase performance.

2.4. LYRICS SEGMENTATION VIA BIMODAL TEXT-AUDIO REPRESENTATION 63
Model Features P R F1
Random baseline n/a 15.7 15.7 15.7
Line length baselinestext length 16.6 51.8 25.0audio length 22.7 63.8 33.5text length + audio length 22.6 63.0 33.2
CNNtext {str} 78.7 64.2 70.8
CNNaudio
{mfcc} 79.3 55.9 65.3{chr} 76.8 54.7 63.9{mfcc, chr} 79.2 63.8 70.4
CNNmult
{str, mfcc} 80.6 69.0 73.8{str, chr} 82.5 69.0 74.5{str, mfcc, chr} 82.7 70.3 75.3
Table 2.14: Results with multimodal lyrics lines on the Q+ dataset in terms of Precision (P),Recall (R) and F1 in %. Note that the CNNtext{str} model is the same configuration as inTable 2, but trained on different dataset.
Dataset Model Features P R F1
Q+
CNNtext {str} 78.7 64.2 70.8CNNaudio {mfcc, chr} 79.2 63.8 70.4CNNmult. {str, mfcc, chr} 82.7 70.3 75.3
Q0
CNNtext {str} 73.6 54.5 62.8CNNaudio {mfcc, chr} 74.9 48.9 59.5CNNmult. {str, mfcc, chr} 75.8 59.4 66.5
Q−CNNtext {str} 67.5 30.9 41.9CNNaudio {mfcc, chr} 66.1 24.7 36.1CNNmult. {str, mfcc, chr} 68.0 35.8 46.7
Table 2.15: Results with multimodal lyrics lines for the alignment quality ablation test on thedatasets Q+, Q0, Q− in terms of Precision (P), Recall (R) and F1 in %.

64 CHAPTER 2. IE TO GENERATE STRUCTURED KNOWLEDGE
Figure 2.15: Example SSM computed from textual similarity simstr. As common for Rap songtexts, there is no chorus (diagonal stripe parallel to main diagonal). However, there is a highlyrepetitive musical state from line 18 to 21 indicated by the corresponding rectangle in theSSM spanning from (18,18) to (21,21). (“Meet Your Fate” by Southpark Mexican, MLDB-ID:125521)
CNNaudio. Secondly, there are cases where CNNmult detects borders that are not recalled ineither of CNNtext or CNNaudio.
Segmentation algorithms that are based on exploiting patterns in an SSM, share a commonlimitation: non-repeated segments are hard to detect as they do not show up in the SSM.Note, that such segments are still occasionally detected indirectly when they are surroundedby repeated segments. Furthermore, a consecutively repeated pattern such as C2-C3-C4 inFigure 2.12 is not easily segmentable as it could potentially also form one (C2C3C4) or two(C2-C3C4 or C2C3-C4) segments. Another problem is that of inconsistent classification insideof a song: sometimes, patterns in the SSM that look the same to the human eye are classifieddifferently. Note, however that on the pixel level there is a difference, as the inference in theused CNN is deterministic. This is a phenomenon similar to adversarial examples in imageclassification (same intension, but different extension).
We now analyze the predictions of our different models for the example song given inFigure 2.12. We compare the predictions of the following three different models: the text-based model CNNtext{str} (visualized in Figure 2.12 as the left SSM called “repetitive lyricsstructure”), the audio-based model CNNaudio{chr} (visualized in Figure 2.12 as the right SSMcalled “repetitive melody structure”), and the bimodal model CNNmult{str, mfcc, chr}. Startingwith the first chorus, C1, we find it to be segmented correctly by both CNNtext{str} andCNNaudio{chr}. As previously discussed, consecutively repeated patterns are hard to segmentand our text-based model indeed fails to correctly segment the repeated chorus (C2-C3-C4). Theaudio-based model CNNaudio{chr} overcomes this limitation and segments the repeated choruscorrectly. Finally, we find that in this example both the text-based and the audio-based modelsfail to segment the verses (the Vi) and bridges (the Bi) correctly. The CNNmult{str, mfcc, chr}model manages to detect the bridges and verses in our example.
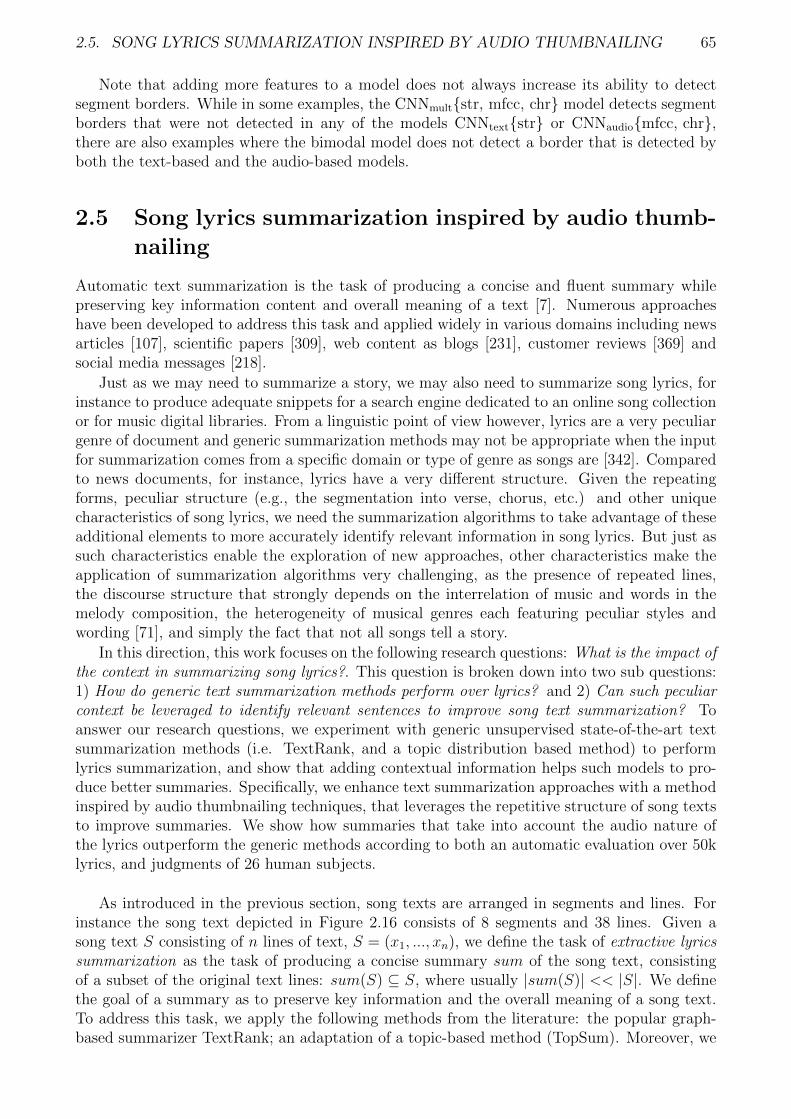
2.5. SONG LYRICS SUMMARIZATION INSPIRED BY AUDIO THUMBNAILING 65
Note that adding more features to a model does not always increase its ability to detectsegment borders. While in some examples, the CNNmult{str, mfcc, chr} model detects segmentborders that were not detected in any of the models CNNtext{str} or CNNaudio{mfcc, chr},there are also examples where the bimodal model does not detect a border that is detected byboth the text-based and the audio-based models.
2.5 Song lyrics summarization inspired by audio thumb-
nailing
Automatic text summarization is the task of producing a concise and fluent summary whilepreserving key information content and overall meaning of a text [7]. Numerous approacheshave been developed to address this task and applied widely in various domains including newsarticles [107], scientific papers [309], web content as blogs [231], customer reviews [369] andsocial media messages [218].
Just as we may need to summarize a story, we may also need to summarize song lyrics, forinstance to produce adequate snippets for a search engine dedicated to an online song collectionor for music digital libraries. From a linguistic point of view however, lyrics are a very peculiargenre of document and generic summarization methods may not be appropriate when the inputfor summarization comes from a specific domain or type of genre as songs are [342]. Comparedto news documents, for instance, lyrics have a very different structure. Given the repeatingforms, peculiar structure (e.g., the segmentation into verse, chorus, etc.) and other uniquecharacteristics of song lyrics, we need the summarization algorithms to take advantage of theseadditional elements to more accurately identify relevant information in song lyrics. But just assuch characteristics enable the exploration of new approaches, other characteristics make theapplication of summarization algorithms very challenging, as the presence of repeated lines,the discourse structure that strongly depends on the interrelation of music and words in themelody composition, the heterogeneity of musical genres each featuring peculiar styles andwording [71], and simply the fact that not all songs tell a story.
In this direction, this work focuses on the following research questions: What is the impact ofthe context in summarizing song lyrics?. This question is broken down into two sub questions:1) How do generic text summarization methods perform over lyrics? and 2) Can such peculiarcontext be leveraged to identify relevant sentences to improve song text summarization? Toanswer our research questions, we experiment with generic unsupervised state-of-the-art textsummarization methods (i.e. TextRank, and a topic distribution based method) to performlyrics summarization, and show that adding contextual information helps such models to pro-duce better summaries. Specifically, we enhance text summarization approaches with a methodinspired by audio thumbnailing techniques, that leverages the repetitive structure of song textsto improve summaries. We show how summaries that take into account the audio nature ofthe lyrics outperform the generic methods according to both an automatic evaluation over 50klyrics, and judgments of 26 human subjects.
As introduced in the previous section, song texts are arranged in segments and lines. Forinstance the song text depicted in Figure 2.16 consists of 8 segments and 38 lines. Given asong text S consisting of n lines of text, S = (x1, ..., xn), we define the task of extractive lyricssummarization as the task of producing a concise summary sum of the song text, consistingof a subset of the original text lines: sum(S) ⊆ S, where usually |sum(S)| << |S|. We definethe goal of a summary as to preserve key information and the overall meaning of a song text.To address this task, we apply the following methods from the literature: the popular graph-based summarizer TextRank; an adaptation of a topic-based method (TopSum). Moreover, we

66 CHAPTER 2. IE TO GENERATE STRUCTURED KNOWLEDGE
Figure 2.16: Song text of “Let’s start a band” by Amy MacDonald along with two examplesummaries.
introduce a method inspired by audio thumbnailing (which we dub Lyrics Thumbnail) whichaims at creating a summary from the most representative parts of the original song text. Whilefor TextRank we rely on the off-the-shelf implementation of [33], in the following we describethe other two methods.
2.5.1 TopSum
We implement a simple topic-based summarization model that aims to construct a summarywhose topic distribution is as similar as possible to that of the original text. Following [249], wetrain a topic model by factorizing a tf-idf-weighted term-document matrix of a song text corpususing non-negative matrix factorization into a term-topic and a topic-document matrix. Giventhe learnt term-topic matrix, we compute a topic vector t for each new document (song text).In order to treat t as a (pseudo-) probability distribution over latent topics ti, we normalize tby applying λt.t/
∑ti∈t ti to it. Given the distributions over latent topics for each song text, we
then incrementally construct a summary by greedily adding one line from the original text ata time (same mechanism as in KLSum algorithm in [210]); that line x∗ of the original text thatminimizes the distance between the topic distribution tS of the original text S and the topicdistribution of the incremental summary sum(S):
x∗ = argminx∈(S\sum(S))
{W (tS, tsum(S)+x)}
W is the Wasserstein distance [457] and is used to measure the distance between two probabilitydistributions (an alternative to Jensen-Shannon divergence [291]).
2.5.2 Lyrics Thumbnail
Inspired by [243], we transfer their fitness measure for audio segments to compute the fitnessof lyrics segments. Analog to an audio thumbnail, we define a Lyrics Thumbnail as the mostrepresentative and repetitive part of the song text. Consequently, it usually consists of (a partof) the chorus. In our corpus the segments are annotated (as double line breaks in the lyrics),so unlike in audio thumbnailing, we do not have to induce segments, but rather measure theirfitness. In the following, we describe the fitness measure for lyrics segments and how we usethis to produce a summary of the lyrics.

2.5. SONG LYRICS SUMMARIZATION INSPIRED BY AUDIO THUMBNAILING 67
Lyrics Fitness Given a segmented song text S = (S1, ..., Sm) consisting of text segments Si,where each Si consists of |Si| text lines, we cluster the Si into partitions of similar segments.For instance, the lyrics in Figure 2.16 consists of 8 segments and 38 lines and the cluster ofchorus consists of {S5, S6, S7}. The fitness Fit of the segment cluster C ⊆ S is defined throughthe precision pr of the cluster and the coverage co of the cluster. pr describes how similar thesegments in C are to each other while co is the relative amount of lyrics lines covered by C:
pr(C) = (∑
Si,Sj∈Ci<j
1)−1 ·∑
Si,Sj∈Ci<j
sim(Si, Sj)
co(C) = (∑Si∈S
|Si|)−1 ·∑Si∈C
|Si|
where sim is a normalized similarity measure between text segments. Fit is the harmonic meanbetween pr and co. The fitness of a segment Si is defined as the fitness of the cluster to whichSi belongs:
∀Si ∈ C : Fit(Si) = Fit(C) = 2pr(C) · co(C)
pr(C) + co(C)
For lyrics segments without repetition the fitness is defined as zero. Based on the fitnessFit for segments, we define a fitness measure for a text line x. This allows us to compute thefitness of arbitrary summaries (with no or unknown segmentation). If the text line x occursfi(x) times in text segment Si, then its line fitness fit is defined as:
fit(x) = (∑Si∈S
fi(x))−1 ·∑Si∈S
fi(x) · Fit(Si)
Fitness-Based Summary Analog to [243]’s audio thumbnails, we create fitness-based sum-maries for a song text. A Lyrics Double Thumbnail consists of two segments: one from thefittest segment cluster (usually the chorus), and one from the second fittest segment cluster(usually the bridge).25 If the second fittest cluster has a fitness of 0, we generate a Lyrics SingleThumbnail solely from the fittest cluster (usually the chorus). If the thumbnail generated hasa length of k lines and we want to produce a summary of p < k lines, we select the p lines inthe middle of the thumbnail following [103]’s “Section-transition Strategy” that they find tocapture the “hook” of the music more likely.26
2.5.3 Experimental setting
Dataset. From the WASABI corpus [317] we select a subset of 190k unique song texts withavailable genre information. As the corpus has spurious genres (416 different ones), we focuson the 10 most frequent ones in order to evaluate our methods dependent on the genre. Weadd 2 additional genres from the underrepresented Rap field (Southern Hip Hop and GangstaRap). The dataset contains 95k song lyrics.
To define the length of sum(S), we rely on [35] that recommend to create audio thumbnailsof the median length of the chorus on the whole corpus. We therefore estimate the medianchorus length on our corpus by computing a Lyrics Single Thumbnail on each text, and wefind the median chorus length to be 4 lines. Hence, we decide to generate summaries of suchlength for all lyrics and all summarization models to exclude the length bias in the methods
25We pick the first occurring representative of the segment cluster. Which segment to pick from the clusteris a potential question for future work.
26They also experiment with other methods to create a thumbnail, such as section initial or section ending.

68 CHAPTER 2. IE TO GENERATE STRUCTURED KNOWLEDGE
comparison27. As the length of the lyrics thumbnail is lower-bounded by the length of thechorus in the song text, we keep only those lyrics with an estimated chorus length of at least 4.The final corpus of 12 genres consists of 50k lyrics with the following genre distribution: Rock:8.4k, Country: 8.3k, Alternative Rock: 6.6k, Pop: 6.9k, R&B: 5.2k, Indie Rock: 4.4k, Hip Hop:4.2k, Hard Rock: 2.4k, Punk Rock: 2k, Folk: 1.7k, Southern Hip Hop: 281, Gangsta Rap: 185.
Models and Configurations. We create summaries using the three summarization methodspreviously described, i.e. a graph-based (TextRank), a topic-based (TopSum), and fitness-based(Lyrics Thumbnail) method, plus two additional combined models (described below). Whilethe Lyrics Thumbnail is generated from the full segment structure of the lyrics including itsduplicate lines, all other models are fed with unique text lines as input (i.e. redundant lines aredeleted). This is done to produce less redundant summaries, given that for instance, TextRankscores each duplicate line the same, hence it may create summaries with all identical lines.TopSum can suffer from a similar shortcoming: if there is a duplicate line close to the idealtopic distribution, adding that line again will let the incremental summary under constructionstay close to the ideal topic distribution. All models were instructed to produce summariesof 4 lines, as this is the estimated median chorus length in our corpus. The summary lineswere arranged in the same order they appear in the original text.28 We use the TextRankimplementation29 of [33] without removing stop words (lyrics lines in input can be quite short,therefore we avoid losing all content of the line if removing stop words). The topic model forTopSum is built using non-negative matrix factorization with scikit-learn30 [370] for 30 topicson the full corpus of 190k lyrics.31 For the topical distance, we only consider the distancebetween the 3 most relevant topics in the original text, following the intuition that one songtext usually covers only a small amount of topics. The Lyrics Thumbnail is computed usingString-based distance between text segments to facilitate clustering. This similarity has beenshown in [473] to indicate segment borders successfully. In our implementation, segments areclustered using the DBSCAN [164] algorithm.32 We also produce two summaries by combiningTextRank + TopSum and TextRank + TopSum + Lyrics Thumbnail, to test if summaries canbenefit from the complementary perspectives the three different summarization methods take.
Model Combination. For any lyrics line, we can obtain a score from each of the appliedmethods. TextRank provides a score for each line, TopSum provides a distance between thetopic distributions of an incremental summary and the original text, and fit provides the fitnessof each line. We treat our summarization methods as blackboxes and use a simple method tocombine the scores the different methods provide for each line. Given the original text separatedinto lines S = (x1, ..., xn), a summary is constructed by greedily adding one line x∗ at a timeto the incremental summary sum(S) ⊆ S such that the sum of normalized ranks of all scoresis minimal:
x∗ = argmin⋃x
{∑A
RA(x)}
Here x ∈ (S \ sum(S)) and A ∈ {TextRank,TopSum, fit}. The normalized rank RA(x) of thescore that method A assigns to line x is computed as follows: first, the highest scores33 areassigned rank 0, the second highest scores get rank 1, and so forth. Then the ranks are linearlyscaled to the [0,1] interval, so each sum of ranks
∑A RA(x) is in [0,3].
27We leave the study of other measures to estimate the summary length to future work.28In case of repeated parts, the first position of each line was used as original position.29https://github.com/summanlp/textrank30https://scikit-learn.org31loss=’kullback-leibler’32eps=0.3, min samples=233In the case of topical distance, a “higher score” means a lower value.

2.5. SONG LYRICS SUMMARIZATION INSPIRED BY AUDIO THUMBNAILING 69
Model Nomenclature For abbreviation, we call the TextRank model henceforth Mr, theTopSum model Ms, the fitness-based summarizer Mf , model combinations Mrs and Mrsf ,respectively.
2.5.4 Evaluation
We evaluate the quality of the produced lyrics summary both soliciting human judgments onthe goodness and utility of a given summary, and through an automatic evaluation of thesummarization methods to provide a comprehensive evaluation.
Human Evaluation. We performed human evaluation of the different summarization meth-ods introduced before by asking participants to rate the different summaries presented to themby specifying their agreement / disagreement according to the following standard criteria [366]:
Informativeness : The summary contains the main points of the original song text.
Non-redundancy : The summary does not contain duplicate or redundant information.
Coherence: The summary is fluent to read and grammatically correct.
Plus one additional criterion coming from our definition of the lyrics summarization task:
Meaning : The summary preserves the meaning of the original song text.
An experimental psychologist expert in Human Computer Interaction advised us in definingthe questionnaire and setting up the experiment. 26 participants - 12 nationalities, 18 men, 8women, aged from 21 to 59 - were taking a questionnaire (Google Forms), consisting of rating 30items with respect to the criteria defined before on a Likert scale from 1 (low) to 5 (high). Eachparticipant was presented with 5 different summaries - each produced by one of the previouslydescribed summarization models - for 6 different song texts. Participants were given exampleratings for the different criteria in order to familiarize them with the procedure. Then, foreach song text, the original song text along with its 5 summaries were presented in randomorder and had to be rated according to the above criteria. For the criterion of Meaning, weasked participants to give a short explanation in free text for their score. The selected 6 songtexts34 have a minimum and a median chorus length of 4 lines and are from different genres,i.e. Pop/Rock (4), Folk (1) and Rap (1), similar to our corpus genre distribution. Song textswere selected from different lengths (18-63 lines), genders of singer (3 male, 3 female), topics(family, life, drugs, relationship, depression), and mood (depressive, angry, hopeful, optimistic,energetic). The artist name and song title were not shown to the participants.
Figure 2.17 shows the ratings obtained for each criterion. We examine the significant differ-ences between the models performances by performing a paired two-tailed t-test. The signifi-cance levels are: 0.05∗, 0.01∗∗, 0.001∗∗∗, and n.s. First, Informativeness and Meaning are ratedhigher∗∗ for the combined model Mrs compared to the single models Mr and Ms. Combining allthree models improves the summaries further: both for Informativeness and Meaning the modelMrsf is rated higher∗∗∗ than Mrs. Further, summaries created by Mrsf are rated higher∗∗∗ inCoherence than summaries from any other model - except from Mf (n.s. difference). Sum-maries are rated on the same level (n.s. differences) for Non-redundancy in all but the Mr andMf summaries, which are perceived as lower∗∗∗ in Non-redundancy than all others. Note, howthe model Mrsf is more stable than all others by exhibiting lower standard deviations in all cri-teria except Non-redundancy. The criteria Informativeness and Meaning are highly correlated(Pearson correlation coefficient 0.84). Correlations between other criteria range between 0.29and 0.51.
34“Pills N Potions” by Nicki Minaj, “Hurt” by Nine Inch Nails, “Real to me” by Brian McFadden, “SomebodyThat I Used To Know” by Gotye, “Receive” by Alanis Morissette, “Let’s Start A Band” by Amy MacDonald
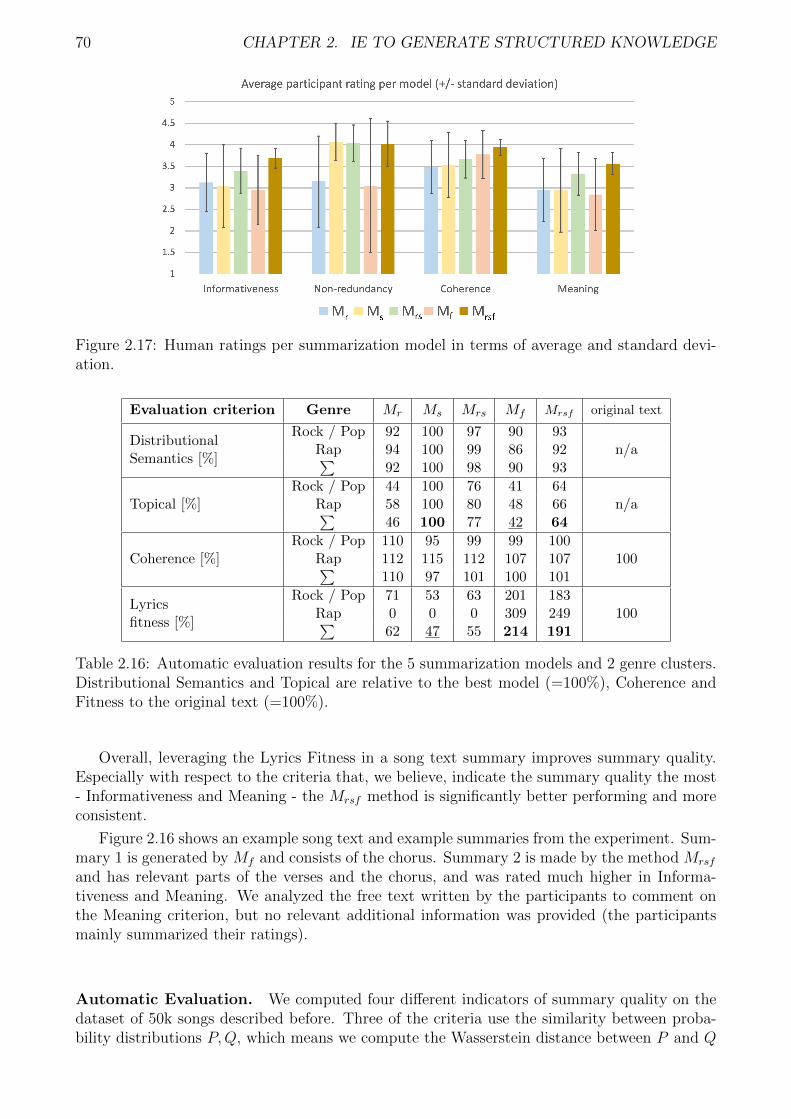
70 CHAPTER 2. IE TO GENERATE STRUCTURED KNOWLEDGE
Figure 2.17: Human ratings per summarization model in terms of average and standard devi-ation.
Evaluation criterion Genre Mr Ms Mrs Mf Mrsf original text
DistributionalSemantics [%]
Rock / Pop 92 100 97 90 93Rap 94 100 99 86 92 n/a∑
92 100 98 90 93
Topical [%]Rock / Pop 44 100 76 41 64
Rap 58 100 80 48 66 n/a∑46 100 77 42 64
Coherence [%]Rock / Pop 110 95 99 99 100
Rap 112 115 112 107 107 100∑110 97 101 100 101
Lyricsfitness [%]
Rock / Pop 71 53 63 201 183Rap 0 0 0 309 249 100∑
62 47 55 214 191
Table 2.16: Automatic evaluation results for the 5 summarization models and 2 genre clusters.Distributional Semantics and Topical are relative to the best model (=100%), Coherence andFitness to the original text (=100%).
Overall, leveraging the Lyrics Fitness in a song text summary improves summary quality.Especially with respect to the criteria that, we believe, indicate the summary quality the most- Informativeness and Meaning - the Mrsf method is significantly better performing and moreconsistent.
Figure 2.16 shows an example song text and example summaries from the experiment. Sum-mary 1 is generated by Mf and consists of the chorus. Summary 2 is made by the method Mrsf
and has relevant parts of the verses and the chorus, and was rated much higher in Informa-tiveness and Meaning. We analyzed the free text written by the participants to comment onthe Meaning criterion, but no relevant additional information was provided (the participantsmainly summarized their ratings).
Automatic Evaluation. We computed four different indicators of summary quality on thedataset of 50k songs described before. Three of the criteria use the similarity between proba-bility distributions P,Q, which means we compute the Wasserstein distance between P and Q

2.5. SONG LYRICS SUMMARIZATION INSPIRED BY AUDIO THUMBNAILING 71
(cf. Subsection 2.5.1) and apply λx. x−1 to it.35 The criteria are:
Distributional Semantics : similarity between the word distributions of original and summary,cf. [291]. We give results relative to the similarity of the best performing model (=100%).
Topical : similarity between the topic distributions of original and summary. Restricted to the3 most relevant topics of the original song text. We give results relative to the similarity of thebest performing model (=100%).
Coherence: average similarity between word distributions in consecutive sentences of the sum-mary, cf. [409]. We give results relative to the coherence of the original song text (=100%).
Lyrics fitness : average line-based fitness fit of the lines in the summary. We give resultsrelative to the Lyrics fitness of the original song text (=100%).
When evaluating each of the 12 genres, we found two clusters of genres to behave verysimilarly. Therefore, we report the results for these two groups: the Rap genre cluster containsHip Hop, Southern Hip Hop, and Gangsta Rap. The Rock / Pop cluster contains the 9 othergenres. Results of the different automatic evaluation metrics are shown in Table 2.16. Distri-butional Semantics metrics have previously been shown [291, 409] to highly correlate with userresponsiveness judgments. We would expect correlations of this metric with Informativenessor Meaning criteria therefore, as those criteria are closest to responsiveness, but we have foundno large differences between the different models for this criterion. The summaries of the Ms
model have the highest similarity to the original text and the Mf have the lowest similarity of90%. The difference between the highest and lowest values are low.
For the Topical similarity, the results are mostly in the same order as the DistributionalSemantics ones, but with much larger differences. While the Ms model reaches the highestsimilarity, this is a self-fulfilling prophecy, as summaries of Ms were generated with the objectiveof maximizing topical similarity. The other two models that incorporate Ms (Mrs and Mrsf ),show a much higher topical similarity to the original text than Mr and Mf .
Coherence is rated best in Mr with 110%. All other models show a coherence close tothat of the original text - between 97% and 101%. We believe that the increased coherenceof Mr is not linguistically founded, but merely algorithmic. Mr produces summaries of themost central sentences in a text. The centrality is using the concept of sentence similarity.Therefore, Mr implicitly optimizes for the automatic evaluation metric of coherence, based onsimilar consecutive sentences. Sentence similarity seems to be insufficient to predict humanjudgments of coherence in this case.
As might be expected, methods explicitly incorporating the Lyrics fitness produce sum-maries with a fitness much higher than the original text - 214% for the Mf and 191% for theMrsf model. The methods not incorporating fitness produce summaries with much lower fitnessthan the original - Mr 62%, Ms 47%, and Mrs 55%. In the Rap genre this fitness is even zero,i.e. summaries (in median) contain no part of the chorus.
Overall, no single automatic evaluation criterion was able to explain the judgments of ourhuman participants. However, considering Topical similarity and fitness together gives us ahint. The model Mf has high fitness (214%), but low Topical similarity (42%). The Ms modelhas the highest Topical similarity (100%), but low fitness (47%). Mrsf might be preferred byhumans as it strikes a balance between Topical similarity (64%) and fitness (191%). Hence,Mrsf succeeds in capturing lines from the most relevant parts of the lyrics, such as the chorus,while jointly representing the important topics of the song text.
35This works as we always deal with distances > 0.
72 CHAPTER 2. IE TO GENERATE STRUCTURED KNOWLEDGE
2.6 Enriching the WASABI Song Corpus with lyrics an-
notations
Let’s imagine the following scenario: following David Bowie’s death, a journalist plans to pre-pare a radio show about the artist’s musical career to acknowledge his qualities. To discuss thetopic from different angles, she needs to have at her disposal the artist biographical informa-tion to know the history of his career, the song lyrics to know what he was singing about, hismusical style, the emotions his songs were conveying, live recordings and interviews. Similarly,streaming professionals such as Deezer, Spotify, Pandora or Apple Music aim at enriching musiclistening with artists’ information, to offer suggestions for listening to other songs/albums fromthe same or similar artists, or automatically determining the emotion felt when listening to atrack to propose coherent playlists to the user. To support such scenarios, the need for richand accurate musical knowledge bases and tools to explore and exploit this knowledge becomesevident.
For this reason, we integrate the results of all the methods for lyrics processing we developedinto the WASABI Song Corpus, a large corpus of songs (2.10M songs, 1.73M with lyrics)enriched with metadata extracted from music databases on the Web, and resulting from theprocessing of song lyrics and from audio analysis. The corpus contains songs in 36 differentlanguages, even if the vast majority are in English. As for the songs genres, the most commonones are Rock, Pop, Country and Hip Hop.
More specifically, while an overview of the goals of the WASABI project supporting thedataset creation and the description of a preliminary version of the dataset can be found in[317], in this section we focus on the description of the methods we proposed to annotate relevantinformation in the song lyrics. Given that lyrics encode an important part of the semantics ofa song, we propose to label the WASABI dataset lyrics with their structure segmentation, theexplicitness of the lyrics content, the salient passages of a song, the addressed topics and theemotions conveyed.
An analysis of the correlations among the above mentioned annotation layers reveals in-teresting insights about the song corpus. For instance, we demonstrate the change in corpusannotations diachronically: we show that certain topics become more important over time andothers are diminished. We also analyze such changes in explicit lyrics content and expressedemotion.
2.6.1 The WASABI Song Corpus
In the context of the WASABI research project36 that started in 2017, a two million songdatabase has been built, with metadata on 77k artists, 208k albums, and 2.10M songs [317].The metadata has been i) aggregated, merged and curated from different data sources on theWeb, and ii) enriched by pre-computed or on-demand analyses of the lyrics and audio data.
We have performed various levels of analysis, and interactive Web Audio applications havebeen built on top of the output. For example, the TimeSide analysis and annotation frameworkhave been linked [180] to make on-demand audio analysis possible. In connection with theFAST project37, an offline chord analysis of 442k songs has been performed, and both anonline enhanced audio player [367] and chord search engine [368] have been built around it.A rich set of Web Audio applications and plugins has been proposed [76, 77, 78], that allow,for example, songs to be played along with sounds similar to those used by artists. All thesemetadata, computational analyses and Web Audio applications have now been gathered in one
36http://wasabihome.i3s.unice.fr/37http://www.semanticaudio.ac.uk

2.6. ENRICHING THE WASABI SONG CORPUS WITH LYRICS ANNOTATIONS 73
Figure 2.18: The WASABI Interactive Navigator.
easy-to-use web interface, the WASABI Interactive Navigator38, illustrated39 in Figure 2.18.We have started building the WASABI Song Corpus by collecting for each artist the complete
discography, band members with their instruments, time line, equipment they use, and so on.For each song we collected its lyrics from LyricWiki40, the synchronized lyrics when available41,the DBpedia abstracts and the categories the song belongs to, e.g., genre, label, writer, releasedate, awards, producers, artist and band members, the stereo audio track from Deezer, theunmixed audio tracks of the song, its ISRC, bpm and duration.
We matched the song ids from the WASABI Song Corpus with the ids from MusicBrainz,iTunes, Discogs, Spotify, Amazon, AllMusic, GoHear, YouTube. Figure 2.19 illustrates42 allthe data sources we have used to create the WASABI Song Corpus. We have also aligned theWASABI Song Corpus with the publicly available LastFM dataset43, resulting in 327k tracksin our corpus having a LastFM id.
As of today, the corpus contains 1.73M songs with lyrics (1.41M unique lyrics). 73k songshave at least an abstract on DBpedia, and 11k have been identified as “classic songs” (theyhave been number one, or got a Grammy award, or have lots of cover versions). About 2k songshave a multi-track audio version, and on-demand source separation using open-unmix [430] orSpleeter [220] is provided as a TimeSide plugin.
Several Natural Language Processing methods have been applied to the lyrics of the songsincluded in the WASABI Song Corpus, as well as various analyses of the extracted informationhave been carried out. After providing some statistics on the WASABI corpus, the rest of the
38http://wasabi.i3s.unice.fr/39Illustration taken from [79].40http://lyrics.wikia.com/41from http://usdb.animux.de/42Illustration taken from [80].43http://millionsongdataset.com/lastfm/

74 CHAPTER 2. IE TO GENERATE STRUCTURED KNOWLEDGE
Figure 2.19: The datasources connected to the WASABI.
section describes the different annotations we added to the lyrics of the songs in the dataset.Based on the research we have conducted, the following lyrics annotations are added: lyricalstructure (Section 2.6.2), summarization (Section 2.6.3), explicit lyrics (Section 2.6.4), emotionin lyrics (Section 2.6.5) and topics in lyrics (Section 2.6.6).
Statistics on the WASABI Song Corpus. This section summarizes key statistics on thecorpus, such as the language and genre distributions, the songs coverage in terms of publicationyears, and then gives the technical details on its accessibility.
Language Distribution Figure 2.20a shows the distribution of the ten most frequent lan-guages in our corpus.44 In total, the corpus contains songs of 36 different languages. The vastmajority (76.1%) is English, followed by Spanish (6.3%) and by four languages in the 2-3%range (German, French, Italian, Portugese). On the bottom end, Swahili and Latin amount to0.1% (around 2k songs) each.
Genre distribution In Figure 2.20b we depict the distribution of the ten most frequentgenres in the corpus.45 In total, 1.06M of the titles are tagged with a genre. It should be notedthat the genres are very sparse with a total of 528 different ones. This high number is partiallydue to many subgenres such as Alternative Rock, Indie Rock, Pop Rock, etc. which we omittedin Figure 2.20b for clarity. The most common genres are Rock (9.7%), Pop (8.6%), Country(5.2%), Hip Hop (4.5%) and Folk (2.7%).
Publication year Figure 2.20c shows the number of songs published in our corpus, bydecade.46 We find that over 50% of all songs in the WASABI Song Corpus are from the2000s or later and only around 10% are from the seventies or earlier.
44Based on language detection performed on the lyrics.45We take the genre of the album as ground truth since song-wise genres are much rarer.46We take the album publication date as proxy since song-wise labels are too sparse.

2.6. ENRICHING THE WASABI SONG CORPUS WITH LYRICS ANNOTATIONS 75
(a) Language distribution (100% = 1.73M) (b) Genre distribution (100% = 1.06M)
(c) Decade of publication dis-tribution (100% = 1.70M)
Figure 2.20: Statistics on the WASABI Song Corpus
Accessibility of the WASABI Song Corpus The WASABI Interactive Navigator relies onmultiple database engines: it runs on a MongoDB server altogether with an indexation by Elas-ticsearch and also on a Virtuoso triple store as a RDF graph database. It comes with a RESTAPI47 and an upcoming SPARQL endpoint. All the database metadata is publicly available48
under a CC licence through the WASABI Interactive Navigator as well as programmaticallythrough the WASABI REST API.
We provide the files of the current version of the WASABI Song Corpus, the models wehave built on it as well as updates here: https://github.com/micbuffa/WasabiDataset.
Table 2.17 summarizes the most relevant annotations in our corpus.
2.6.2 Lyrics structure annotations
In Section 2.4 we presented a method to segment lyrics based on their repetitive structure inthe form of a self-similarity matrix (SSM) [175].
In the WASABI Interactive Navigator, the line-based SSM of a song text can be visualized.It is toggled by clicking on the violet-blue square on top of the song text. For a subset of songsthe color opacity indicates how repetitive and representative a segment is, based on the fitnessmetric that we proposed in Section 2.5 [172]. Note how in Figure 2.21, the segments 2, 4 and7 are shaded more darkly than the surrounding ones. As highly fit (opaque) segments oftencoincide with a chorus, this is a first approximation of chorus detection. Given the variabilityin the set of structure types provided in the literature according to different genres [433, 71],rare attempts have been made in the literature to achieve a more complete semantic labelling,
47https://wasabi.i3s.unice.fr/apidoc/48There is no public access to copyrighted data such as lyrics and full length audio files. Instructions on how
to obtain lyrics are nevertheless provided and audio extracts of 30s length are available for nearly all songs.

76 CHAPTER 2. IE TO GENERATE STRUCTURED KNOWLEDGE
Annotation Labels DescriptionLyrics 1.73M segments of lines of textLanguages 1.73M 36 different onesGenre 1.06M 528 different onesLast FM id 326k UIDStructure 1.73M SSM ∈ Rn×n (n: length)Social tags 276k S = {rock, joyful, 90s, ...}Emotion tags 87k E ⊂ S = {joyful, tragic, ...}Explicitness 715k True (52k), False (663k)Explicitness ¨ 455k True (85k), False (370k)Summary¨ 50k four lines of song textEmotion 16k (valence, arousal) ∈ R2
Emotion¨ 1.73M (valence, arousal) ∈ R2
Topics¨ 1.05M Prob. distrib. ∈ R60
Total tracks 2.10M diverse metadata
Table 2.17: Most relevant song-wise annotations in the WASABI Song Corpus. Annotationswith ¨ are predictions of our models.
labelling the lyrics segments as Intro, Verse, Bridge, Chorus etc.For each song text we provide an SSM based on a normalized character-based edit dis-
tance49 on two levels of granularity to enable other researchers to work with these structuralrepresentations: line-wise similarity and segment-wise similarity.
2.6.3 Lyrics summary
Given the repeating forms, peculiar structure and other unique characteristics of song lyrics, inSection 2.5 we introduced a method for extractive summarization of lyrics that takes advantageof these additional elements to more accurately identify relevant information in song lyrics.Figure 2.22 shows another example summary of four lines length obtained with our proposedcombined method. It is toggled in the WASABI Interactive Navigator by clicking on the greensquare on top of the song text.
The four-line summaries of 50k English used in our experiments are freely available withinthe WASABI Song Corpus; the Python code of the applied summarization methods is alsoavailable50.
2.6.4 Explicit language in lyrics
On audio recordings, the Parental Advisory Label is placed in recognition of profanity andto warn parents of material potentially unsuitable for children. Nowadays, such labelling iscarried out mainly manually on voluntary basis, with the drawbacks of being time consumingand therefore costly, error prone and partly a subjective task. In [171] we have tackled thetask of automated explicit lyrics detection, based on the songs carrying such a label. Wecompared automated methods ranging from dictionary-based lookup to state-of-the-art deepneural networks to automatically detect explicit contents in English lyrics. More specifically, thedictionary-based methods rely on a swear word dictionary Dn which is automatically createdfrom example explicit and clean lyrics. Then, we use Dn to predict the class of an unseen
49In our segmentation experiments we found this simple metric to outperform more complex metrics thattake into account the phonetics or the syntax.
50https://github.com/TuringTrain/lyrics\_thumbnailing

2.6. ENRICHING THE WASABI SONG CORPUS WITH LYRICS ANNOTATIONS 77
Figure 2.21: Structure of the lyrics of “Everytime” by Britney Spears as displayed in theWASABI Interactive Navigator.
Figure 2.22: Summary of the lyrics of “Everytime” by Britney Spears as displayed in theWASABI Interactive Navigator.
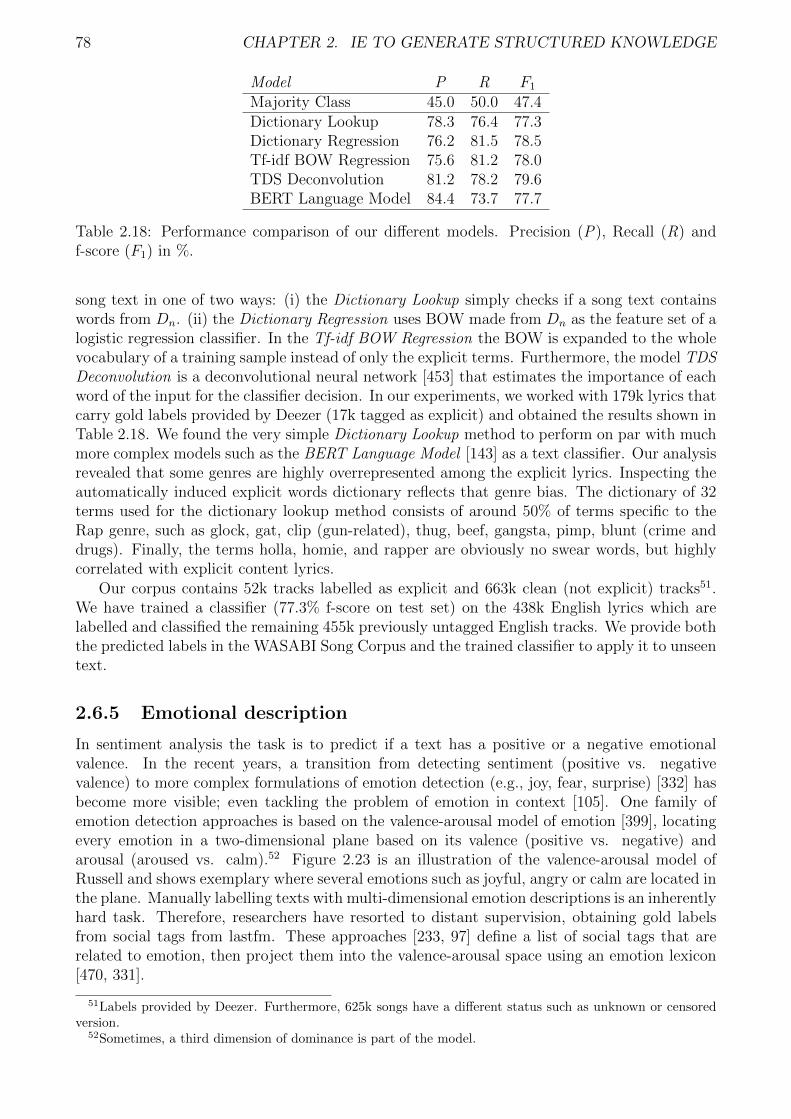
78 CHAPTER 2. IE TO GENERATE STRUCTURED KNOWLEDGE
Model P R F1
Majority Class 45.0 50.0 47.4Dictionary Lookup 78.3 76.4 77.3Dictionary Regression 76.2 81.5 78.5Tf-idf BOW Regression 75.6 81.2 78.0TDS Deconvolution 81.2 78.2 79.6BERT Language Model 84.4 73.7 77.7
Table 2.18: Performance comparison of our different models. Precision (P), Recall (R) andf-score (F1) in %.
song text in one of two ways: (i) the Dictionary Lookup simply checks if a song text containswords from Dn. (ii) the Dictionary Regression uses BOW made from Dn as the feature set of alogistic regression classifier. In the Tf-idf BOW Regression the BOW is expanded to the wholevocabulary of a training sample instead of only the explicit terms. Furthermore, the model TDSDeconvolution is a deconvolutional neural network [453] that estimates the importance of eachword of the input for the classifier decision. In our experiments, we worked with 179k lyrics thatcarry gold labels provided by Deezer (17k tagged as explicit) and obtained the results shown inTable 2.18. We found the very simple Dictionary Lookup method to perform on par with muchmore complex models such as the BERT Language Model [143] as a text classifier. Our analysisrevealed that some genres are highly overrepresented among the explicit lyrics. Inspecting theautomatically induced explicit words dictionary reflects that genre bias. The dictionary of 32terms used for the dictionary lookup method consists of around 50% of terms specific to theRap genre, such as glock, gat, clip (gun-related), thug, beef, gangsta, pimp, blunt (crime anddrugs). Finally, the terms holla, homie, and rapper are obviously no swear words, but highlycorrelated with explicit content lyrics.
Our corpus contains 52k tracks labelled as explicit and 663k clean (not explicit) tracks51.We have trained a classifier (77.3% f-score on test set) on the 438k English lyrics which arelabelled and classified the remaining 455k previously untagged English tracks. We provide boththe predicted labels in the WASABI Song Corpus and the trained classifier to apply it to unseentext.
2.6.5 Emotional description
In sentiment analysis the task is to predict if a text has a positive or a negative emotionalvalence. In the recent years, a transition from detecting sentiment (positive vs. negativevalence) to more complex formulations of emotion detection (e.g., joy, fear, surprise) [332] hasbecome more visible; even tackling the problem of emotion in context [105]. One family ofemotion detection approaches is based on the valence-arousal model of emotion [399], locatingevery emotion in a two-dimensional plane based on its valence (positive vs. negative) andarousal (aroused vs. calm).52 Figure 2.23 is an illustration of the valence-arousal model ofRussell and shows exemplary where several emotions such as joyful, angry or calm are located inthe plane. Manually labelling texts with multi-dimensional emotion descriptions is an inherentlyhard task. Therefore, researchers have resorted to distant supervision, obtaining gold labelsfrom social tags from lastfm. These approaches [233, 97] define a list of social tags that arerelated to emotion, then project them into the valence-arousal space using an emotion lexicon[470, 331].
51Labels provided by Deezer. Furthermore, 625k songs have a different status such as unknown or censoredversion.
52Sometimes, a third dimension of dominance is part of the model.

2.6. ENRICHING THE WASABI SONG CORPUS WITH LYRICS ANNOTATIONS 79
Figure 2.23: Emotion distribution in the corpus in the valence-arousal plane.
Recently, Deezer made valence-arousal annotations for 18,000 English tracks available53 theyhave derived by the aforementioned method [139]. We aligned the valence-arousal annotationsof Deezer to our songs. In Figure 2.23 the green dots visualize the emotion distribution of thesesongs.54 Based on their annotations, we train an emotion regression model using BERT, withan evaluated 0.44/0.43 Pearson correlation/Spearman correlation for valence and 0.33/0.31 forarousal on the test set.
We integrated Deezer’s labels into our corpus and also provide the valence-arousal predic-tions for the 1.73M tracks with lyrics. We also provide the last.fm social tags (276k) andemotion tags (87k entries) to facilitate researchers to build variants of emotion recognitionmodels.
2.6.6 Topic Modelling
We built a topic model on the lyrics of our corpus using Latent Dirichlet Allocation (LDA)[56]. We determined the hyperparameters α, η and the topic count such that the coherencewas maximized on a subset of 200k lyrics. We then trained a topic model of 60 topics on theunique English lyrics (1.05M).
We have manually labelled a number of more recognizable topics. Figures 2.25-2.29 illustratethese topics with word clouds55 of the most characteristic words per topic. For instance, thetopic Money contains words of both the field of earning money (job, work, boss, sweat) as wellas spending it (pay, buy). The topic Family is both about the people of the family (mother,daughter, wife) and the land (sea, valley, tree). We provide the topic distribution of our LDAtopic model for each song and make available the trained topic model to enable its applicationto unseen lyrics.
2.6.7 Diachronic corpus analysis
We examine the changes in the annotations over the course of time by grouping the corpus intodecades of songs according to the distribution shown in Figure 2.20c.
53https://github.com/deezer/deezer\_mood\_detection\_dataset54Depiction without scatterplot taken from [362]55made with https://www.wortwolken.com/

80 CHAPTER 2. IE TO GENERATE STRUCTURED KNOWLEDGE
Figure 2.24: Topic WarFigure 2.25: Topic Death
Figure 2.26: Topic Love Figure 2.27: Topic Family
Figure 2.28: Topic MoneyFigure 2.29: Topic Religion

2.6. ENRICHING THE WASABI SONG CORPUS WITH LYRICS ANNOTATIONS 81
Changes in Topics The importance of certain topics has changed over the decades, asdepicted in Figure 2.30a. Some topics have become more important, others have declined, orstayed relatively the same. We define the importance of a topic for a decade of songs as follows:first, the LDA topic model trained on the full corpus gives the probability of the topic for eachsong separately. We then average these song-wise probabilities over all songs of the decade. Foreach of the cases of growing, diminishing and constant importance, we display two topics. Thetopics War and Death have appreciated in importance over time. This is partially caused bythe rise of Heavy Metal in the beginning of the 1970s, as the vocabulary of the Death topic isvery typical for the genre (see for instance the “Metal top 100 words” in [176]). We measure adecline in the importance of the topics Love and Family. The topics Money and Religion seemto be evergreens as their importance stayed rather constant over time.
Changes in Explicitness We find that newer songs are more likely being tagged as havingexplicit content lyrics. Figure 2.30b shows our estimates of explicitness per decade, the ratioof songs in the decade tagged as explicit to all songs of the decade. Note that the ParentalAdvisory Label was first distributed in 1985 and many older songs may not have been labelledretroactively. The depicted evolution of explicitness may therefore overestimate the “true ex-plicitness” of newer music and underestimate it for music before 1985.
Changes in Emotion We estimate the emotion of songs in a decade as the average valenceand arousal of songs of that decade. We find songs to decrease both in valence and arousalover time. This decrease in positivity (valence) is in line with the diminishment of positivelyconnotated topics such as Love and Family and the appreciation of topics with a more negativeconnotation such as War and Death.
2.6.8 Related Work on lyrics processing
Detection of lyrics structure. Besides the work of [473] that we have discussed in detail inSection 2.4, only a few papers in the literature have focused on the automated detection of thestructure of lyrics. [296] report experiments on the use of standard NLP tools for the analysisof music lyrics. Among the tasks they address, for structure extraction they focus on lyricshaving a clearly recognizable structure (which is not always the case) divided into segments.Such segments are weighted following the results given by descriptors used (as full length text,relative position of a segment in the song, segment similarity), and then tagged with a labeldescribing them (e.g., chorus, verses). They test the segmentation algorithm on a small datasetof 30 lyrics, 6 for each language (English, French, German, Spanish and Italian), which hadpreviously been manually segmented.
More recently, [27] describe a semantics-driven approach to the automatic segmentation ofsong lyrics, and mainly focus on pop/rock music. Their goal is not to label a set of lines in agiven way (e.g., verse, chorus), but rather identifying recurrent as well as non-recurrent groupsof lines. They propose a rule-based method to estimate such structure labels of segmentedlyrics, while in our approach we apply machine learning methods to unsegmented lyrics.
[106] propose a new method for enhancing the accuracy of audio segmentation. They derivethe semantic structure of songs by lyrics processing to improve the structure labeling of theestimated audio segments. With the goal of identifying repeated musical parts in music audiosignals to estimate music structure boundaries (lyrics are not considered), [118] propose to feedConvolutional Neural Networks with the square-sub-matrices centered on the main diagonals ofseveral SSMs, each one representing a different audio descriptor, building their work on [183].
For a different task than ours, [318] use a corpus of 100 lyrics synchronized to an audiorepresentation with information on musical key and note progression to detect emotion. Their

82 CHAPTER 2. IE TO GENERATE STRUCTURED KNOWLEDGE
(a) Evolution of topic importance (b) Evolution of explicit content lyrics
(c) Evolution of emotion
Figure 2.30: Evolution of different annotations during the decades
classification results using both modalities, textual and audio features, are significantly im-proved compared to a single modality.
As an alternative to our CNN-based approach, Recurrent Neural Networks can also beapplied to lyrics segmentation, e.g., in the form of a sequence labeller [293] or a generic textsegmentation model [275].
Text summarization. In the literature, there are two different families of approaches for au-tomatic text summarization: extraction and abstraction [7]. Extractive summarization methodsidentify important elements of the text and generate them verbatim (they depend only on ex-traction of sentences or words from the original text). In contrast, abstractive summarizationmethods interpret and examine the text to generate a new shorter text that conveys the mostcritical information from the original text. Even though summaries created by humans areusually not extractive, most of the summarization research has focused on extractive methods.Purely extractive summaries often give better results [339], due to the fact that latter methodscope with more complex problems such as semantic representation, inference and natural lan-guage generation. Existing abstractive summarizers often rely on an extractive pre-processingcomponent to produce the abstract of the text [49, 250]. Consequently, in this work we focuson extractive summarization methods, also given the fact that lyrics i) strongly use figurativelanguage which makes abstractive summarization even more challenging; and ii) the choice ofthe words by the composer may also have an importance for capturing the style of the song.
In the following, we focus on unsupervised methods for text summarization, the ones tar-geted in our study (no available gold-standard of human-produced summaries of song texts
2.6. ENRICHING THE WASABI SONG CORPUS WITH LYRICS ANNOTATIONS 83
exists). Most methods have in common the process for summary generation: given a text,the importance of each sentence of that text is determined. Then, the sentences with highestimportance are selected to form a summary. The ways different summarizers determine theimportance of each sentence may differ: Statistics-based summarizers extract indicator featuresfrom each sentence, e.g., [169] use among others the sentence position and length and namedentities as features. Topic-based summarizers aim to represent each sentence by its underlyingtopics. For instance, [221] apply Probabilistic Latent Semantic Analysis, while Latent DirichletAllocation is used in [16] to model each sentence’s distribution over latent topics. Another typeof summarization methods is graph-based summarizers. Three of the most popular graph-basedsummarizers are TextRank [319], LexRank [163], and [365]. These methods work by construct-ing a graph whose nodes are sentences and whose graph edge weights are sentence similarities.Then, the sentences that are central to the graph are found by computing the PageRank [358].Contrarily to all previously described methods, systems using supervised machine learning formanother type of summarizers. For instance, [168] treats extractive summarization as a binaryclassification task, where they extract indicator features from sentences of gold summaries andlearn to detect the sentences that should be included in a summary.
If specific knowledge about the application scenario or the domain of the summarized text isavailable, generic summarization methods can be adapted to take into account the prior infor-mation. In query-based summarization [355, 467], the user’s query is taken into account whengenerating a summary. Summarization of a scientific paper can be improved by considering thecitations of it, as in [140]. However, to the best of our knowledge no summarization methodshave been proposed for the domain of song texts. In this work we present a summarizationmethod that uses prior knowledge about the text it summarizes to help generic summarizersgenerate better summaries.
Summaries should i) contain the most important information from input documents, ii) notcontain redundant information, iii) be readable, hence they should be grammatical and coherent[366]. While a multitude of methods to identify important sentences has been described above,several approaches aim to make summaries less redundant and more coherent. The simplestway to evaluate summaries is to let humans assess the quality, but this is extremely expensive.The factors that humans must consider when giving scores to each candidate summary aregrammaticality, non redundancy, integration of most important pieces of information, structureand coherence [400]. The more common way is to let humans generate possibly multiplesummaries for a text and then automatically assess how close a machine-made summary is tothe human gold summaries computing ROUGE scores [276], which boils down to measuring n-gram overlaps between gold summaries and automatic summary. More recently there have beenattempts to rate summaries automatically without the need for gold summaries [342]. The keyidea is that a summary should be similar to the original text in regard to characteristic criteriaas the word distribution. [294] find that topic words are a suitable metric to automaticallyevaluate micro blog summaries.
Audio summarization. Lyrics are texts that accompany music. Therefore, it is worthwhileto see if methods in audio summarization can be transferred to lyrics summarization. In audiosummarization the goal is to find the most representative parts in a song, in Pop songs thoseare usually the chorus and the bridge, in instrumental music the main theme. The task ofcreating short audio summaries is also known as audio thumbnailing [35, 103, 273], as the goalis to produce a short representation of the music that fits onto a thumbnail, but still covers themost representative parts of it. In a recent approach of audio thumbnailing [243], the authorsgenerate a Double Thumbnail from a musical piece by finding the two most representativeparts in it. For this, they search for candidate musical segments in an a priori unsegmentedsong. Candidate musical segments are defined as sequences of music that more or less exactly

84 CHAPTER 2. IE TO GENERATE STRUCTURED KNOWLEDGE
repeat themselves. The representativeness of each candidate segment to the whole piece is thenestimated by their fitness metric. They define the fitness of a segment as a trade-off betweenhow exactly a part is repeated and how much of the whole piece is covered by all repetitions ofthat segment. Then, the audio segments along with their fitness allow them to create an audiodouble thumbnail consisting of the two fittest audio segments.
Songs and lyrics databases. The Million Song Dataset (MSD) project56 [51] is a collectionof audio features and metadata for a million contemporary popular music tracks. Such datasetshares some similarities with WASABI with respect to metadata extracted from Web resources(as artist names, tags, years) and audio features, even if at a smaller scale. Given that it mainlyfocuses on audio data, a complementary dataset providing lyrics of the Million Song dataset wasreleased, called musiXmatch dataset57. It consists in a collection of song lyrics in bag-of-words(plus stemmed words), associated with MSD tracks. However, no other processing of the lyricsis done, as is the case in our work.
MusicWeb and its successor MusicLynx [8] link music artists within a Web-based applicationfor discovering connections between them and provides a browsing experience using extra-musical relations. The project shares some ideas with WASABI, but works on the artist level,and does not perform analyses on the audio and lyrics content itself. It reuses, for example,MIR metadata from AcousticBrainz.
The WASABI project has been built on a broader scope than these projects and mixes awider set of metadata, including ones from audio and natural language processing of lyrics. Inaddition, as presented in this work, it comes with a large set of Web Audio enhanced applications(multitrack player, online virtual instruments and effect, on-demand audio processing, audioplayer based on extracted, synchronized chords, etc.)
Companies such as Spotify, GraceNote, Pandora, or Apple Music have sophisticated privateknowledge bases of songs and lyrics to feed their search and recommendation algorithms, butsuch data are not available (and mainly rely on audio features).
Explicit content detection. [50] consider a dataset of English lyrics to which they applyclassical machine learning algorithms. The explicit labels are obtained from Soundtrack YourBrand 58. They also experiment with adding lyrics metadata to the feature set, such as theartist name, the release year, the music energy level, and the valence/positiveness of a song.[110] apply explicit lyrics detection to Korean song texts. They also use tf-idf weighted BOW aslyrics representation and aggregate multiple decision trees via boosting and bagging to classifythe lyrics for explicit content. More recently, [248] proposed a neural network method to createexplicit words dictionaries automatically by weighting a vocabulary according to all words’frequencies in the explicit class vs. the clean class, accordingly. They work with a corpus ofKorean lyrics.
Emotion recognition Recently, [139] address the task of multimodal music mood predictionbased on the audio signal and the lyrics of a track. They propose a new model based ondeep learning outperforming traditional feature engineering based approaches. Performancesare evaluated on their published dataset with associated valence and arousal values which weintroduced in Section 2.6.5
[482] model song texts in a low-dimensional vector space as bags of concepts, the “emotionalunits”; those are combinations of emotions, modifiers and negations. [486] leverage the music’semotion annotations from Allmusic which they map to a lower dimensional psychological model
56http://millionsongdataset.com57http://millionsongdataset.com/musixmatch/58https://www.soundtrackyourbrand.com

2.7. EVENTS EXTRACTION FROM SOCIAL MEDIA POSTS 85
of emotion. They train a lyrics emotion classifier and show by qualitative interpretation of anablated model (decision tree) that the deciding features leading to the classes are intuitivelyplausible. [234] aim to detect emotions in song texts based on Russell’s model of mood; ren-dering emotions continuously in the two dimensions of arousal and valence (positive/negative).They analyze each sentence as bag of “emotional units”; they reweight sentences’ emotionsby both adverbial modifiers and tense and even consider progressing and adversarial valencein consecutive sentences. Additionally, singing speed is taken into account. With the fullyweighted sentences, they perform clustering in the 2D plane of valence and arousal. Althoughthe method is unsupervised at runtime, there are many parameters tuned manually by theauthors in this work.
[318] render emotion detection as a multi-label classification problem, songs express inten-sities of six different basic emotions: anger, disgust, fear, joy, sadness, surprise. Their corpus(100 song texts) has time-aligned lyrics with information on musical key and note progression.Using Mechanical Turk they each line of song text is annotated with the six emotions. Foremotion classification, they use bags of words and concepts, as musical features key and notes.Their classification results using both modalities, textual and audio features, are significantlyimproved compared to a single modality.
Topic Modelling Among the works addressing this task for song lyrics, [296] define five adhoc topics (Love, Violent, Antiwar, Christian, Drugs) into which they classify their corpus of 500song texts using supervision. Related, [176] also use supervision to find bags of genre-specificn-grams. Employing the view from the literature that BOWs define topics, the genre-specificterms can be seen as mixtures of genre-specific topics.
[287] apply the unsupervised topic model Probabilistic LSA to their ca. 40k song texts.They learn latent topics for both the lyrics corpus as well as a NYT newspaper corpus (forcontrol) and show that the domain-specific topics slightly improve the performance in theirMIR task. While their MIR task performs highly better when using acoustic features, theydiscover that both methods err differently. [249] apply Non-negative Matrix Factorization(NMF) to ca. 60k song texts and cluster them into 60 topics. They show the so discoveredtopics to be intrinsically meaningful.
[429] have worked on topic modelling of a large-scale lyrics corpus of 1M songs. They buildmodels using Latent Dirichlet allocation with topic counts between 60 and 240 and show thatthe 60 topics model gives a good trade-off between topic coverage and topic redundancy. Sincepopular topic models such as LDA represent topics as weighted bags of words, these topics arenot immediately interpretable. This gives rise to the need of an automatic labelling of topicswith smaller labels. A recent approach [53] relates the topical BOWs with titles of Wikipediaarticles in a two step procedure: first, candidates are generated, then ranked.
2.7 Events extraction from social media posts
Twitter has become a valuable source of timely information covering topics from every corner ofthe world. For this reason, NLP researchers have shown growing interest in mining knowledgefrom Twitter data. As a result, several approaches have been proposed to build applications overtweets, e.g., to extract structured representations/summary of newsworthy events [307, 246], orto carry out sentiment analysis to study users reactions [2, 254]. However, as we will see alsoin other chapters of this manuscript, processing tweets is a challenging task, since informationin Twitter stream is continuously changing in real-time, while at the same time there might bea high volume of redundant messages referring to the same issue or event.
In this section, we focus on event extraction from Twitter, consisting in the automatedclustering of tweets related to the same event based on relevant information such as time and

86 CHAPTER 2. IE TO GENERATE STRUCTURED KNOWLEDGE
participants. Although there is no consensus in the NLP community on what an event is [421],our approach relies on the event definition by [150], i.e. “an occurrence causing change in thevolume of text data that discusses the associated topic at a specific time. This occurrence ischaracterized by topic and time, and often associated with entities such as people and location”.
At the time of this study, existing approaches to the task create clusters of tweets aroundevent-related keywords [361], or NEs [307]. However, such approaches fail i) to capture eventsthat do not generate spikes in the volume of tweets; and ii) to distinguish between events thatinvolve the same NEs and keywords. Other approaches model the relationships between termscontained in the tweets relying on a graph representation [247], and retain the nodes with thehighest number of edges as event candidates. However, the main drawbacks of these approachesare that i) they generate highly dense graphs, and ii) trending terms not related to events maybe considered as event candidates.
To address such limitations, in this work we propose an unsupervised approach to detectopen-domain events on Twitter, where the stream of tweets is represented through temporalevent graphs, modeling the relations between NEs and the terms that surround their mentionsin the tweets.
2.7.1 Approach description
In this section, we describe our approach for detecting open-domain events on tweets. Thepipeline consists of the following components: Tweet pre-processing, Named Entity recognitionand linking, graph creation, graph partitioning, event detection and event merging. Each stepis described in the following paragraphs.
Tweet Preprocessing. The workflow starts by collecting tweets published during a fixedtime window, which can be set as input parameter (e.g., 1 hour). Then, we apply common textpreprocessing routines to clean the input tweets. We use TweetMotifs [350], a specific tokenizerfor tweets, which treats hashtags, user mentions and emoticons as single tokens. Then, weremove the retweets, URLs, non ASCII characters and emoticons. It is worth mentioning thatat this stage we do not perform stop word removal since stop words can be part of NEs (e.g.,United States of America). As for hashtags, we define a set of hand-crafted rules to segmentthem into terms, is possible. We also try to correct misspelled terms using SymSpell59, whichmatches misspelled tokens with Wordnet synsets [177].
Named Entity Recognition and Linking. We use NERD-ML [452], a Twitter specificNamed Entity Recognizer (NER) tool, to extract NE mentions in the tweets, since [141] showedthat it is one of the best performing tools for NER on Twitter data. Besides, NERD-ML notonly recognizes the most common entity types (i.e. Person, Organization and Location), buttries also to link any term listed in external knowledge bases such as DBpedia60 or Wikipedia.These are then associated with semantic classes in the NERD ontology.
Graph Generation. Previous works using graph-based methods to model relations betweenterms in text considered all terms in the input document as nodes and used their positionin text to set edges [12, 484]. Such approaches may generate a dense graph, which generallyrequires high computational costs to be processed.
In this work, we assume that the terms surrounding the mention of a NE in a tweet defineits context [349]. Thus, we rely on the NE context to create event graphs, built as follows:
59https://github.com/wolfgarbe/symspell60http://dbpedia.com/

2.7. EVENTS EXTRACTION FROM SOCIAL MEDIA POSTS 87
• Nodes: We consider NE and k terms that precede and follow their mention in a tweet asnodes, where k > 1 is the number of terms surrounding a NE to consider while buildingthe NE context.
• Edges: Nodes in the graph are connected by an edge if they co-occur in the context of aNE.
• Weight: The weight of the edges is the number of co-occurrences between terms in theNE context. In addition, each edge maintains as a property the list of tweets from whichthe relationship is observed.
Formally, let G(V , E) be a directed graph (or digraph) with a set of vertices V and edges E ,such that E ⊂ V V . For any Vi ∈ V , let In(Vi) be the set of vertices that point to Vi (i.e.predecessors), and Out(Vi) be the set of vertices that Vi points to (i.e. successors).
Let Ei = (Vj,Vk) be an edge that connects node Vj to Vk, we define ωij as the weight ofEi, which is represented by the number of times relationships between Vj and Vk is observed intweets published during a time window. An example of the graph created on 2011-07-07 withtweets related to the famine in Somalia and space shuttle to Mars is shown in Figure 2.31.
1
1
1
155
2
2
1
2
2
1
1
1
1
7
1
2
2
1
2
2
2
1
1
2
3
6
11
2
11
12
1
2
11
2
die
worst
declare
southern
touch
safely
south
space_shuttle
bbc_world_news
united_nations
programme
mark
here
kenya
florida
goodbye
stop
nasa
somalia
hornofafrica
sayfear
claim
year
back
thousand
land
cause
four
famine
Figure 2.31: Graph generated on day “2011-07-07” from a sample of tweets related to the eventsabout the famine in Somalia and the space shuttle to Mars.
Graph Partitioning. At this stage, an event graph is generated to model relationshipsbetween terms in the NE contexts. We apply graph theory to partition the graph into sub-graphs, which will be considered as event candidates. Tweets related to the same events usuallyshare a few common keywords [307]. In the event graphs, this phenomenon is expressed bystronger links between nodes related to the same event. In other words, the weight of edgesthat connect terms from tweets related to similar events are higher than edges between nodesthat connect terms from tweets related to different events. The graph partitioning purpose isto identify such edges that, if removed, will split the large graph G into sub-graphs.
Let E = {(V1,W1), (V2,W2), ..., (Vn,Wn)} be a set of pair of vertices in a strongly connectedgraph G. We define λ as the least number of edges whose deletion from G would split G intoconnected sub-graphs. Similarly, we define the edge-connectivity λ(G) of G of an edge set S ⊂ E
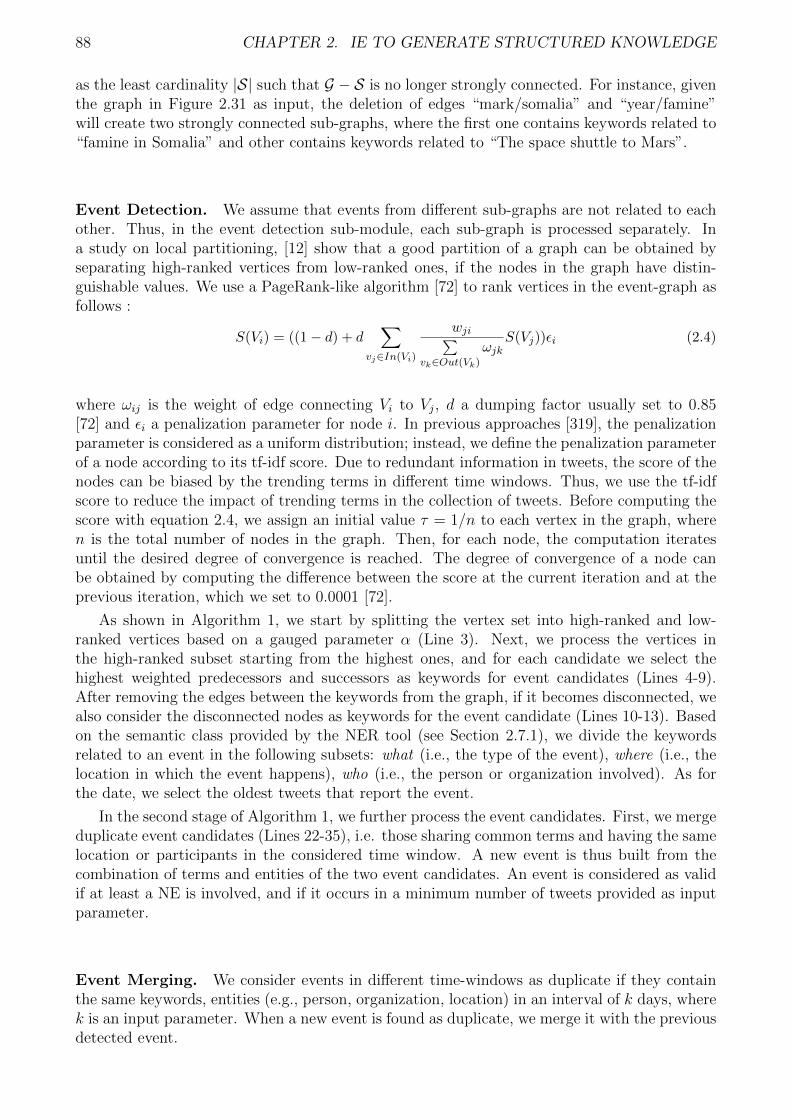
88 CHAPTER 2. IE TO GENERATE STRUCTURED KNOWLEDGE
as the least cardinality |S| such that G − S is no longer strongly connected. For instance, giventhe graph in Figure 2.31 as input, the deletion of edges “mark/somalia” and “year/famine”will create two strongly connected sub-graphs, where the first one contains keywords related to“famine in Somalia” and other contains keywords related to “The space shuttle to Mars”.
Event Detection. We assume that events from different sub-graphs are not related to eachother. Thus, in the event detection sub-module, each sub-graph is processed separately. Ina study on local partitioning, [12] show that a good partition of a graph can be obtained byseparating high-ranked vertices from low-ranked ones, if the nodes in the graph have distin-guishable values. We use a PageRank-like algorithm [72] to rank vertices in the event-graph asfollows :
S(Vi) = ((1− d) + d∑
vj∈In(Vi)
wji∑vk∈Out(Vk)
ωjkS(Vj))εi (2.4)
where ωij is the weight of edge connecting Vi to Vj, d a dumping factor usually set to 0.85[72] and εi a penalization parameter for node i. In previous approaches [319], the penalizationparameter is considered as a uniform distribution; instead, we define the penalization parameterof a node according to its tf-idf score. Due to redundant information in tweets, the score of thenodes can be biased by the trending terms in different time windows. Thus, we use the tf-idfscore to reduce the impact of trending terms in the collection of tweets. Before computing thescore with equation 2.4, we assign an initial value τ = 1/n to each vertex in the graph, wheren is the total number of nodes in the graph. Then, for each node, the computation iteratesuntil the desired degree of convergence is reached. The degree of convergence of a node canbe obtained by computing the difference between the score at the current iteration and at theprevious iteration, which we set to 0.0001 [72].
As shown in Algorithm 1, we start by splitting the vertex set into high-ranked and low-ranked vertices based on a gauged parameter α (Line 3). Next, we process the vertices inthe high-ranked subset starting from the highest ones, and for each candidate we select thehighest weighted predecessors and successors as keywords for event candidates (Lines 4-9).After removing the edges between the keywords from the graph, if it becomes disconnected, wealso consider the disconnected nodes as keywords for the event candidate (Lines 10-13). Basedon the semantic class provided by the NER tool (see Section 2.7.1), we divide the keywordsrelated to an event in the following subsets: what (i.e., the type of the event), where (i.e., thelocation in which the event happens), who (i.e., the person or organization involved). As forthe date, we select the oldest tweets that report the event.
In the second stage of Algorithm 1, we further process the event candidates. First, we mergeduplicate event candidates (Lines 22-35), i.e. those sharing common terms and having the samelocation or participants in the considered time window. A new event is thus built from thecombination of terms and entities of the two event candidates. An event is considered as validif at least a NE is involved, and if it occurs in a minimum number of tweets provided as inputparameter.
Event Merging. We consider events in different time-windows as duplicate if they containthe same keywords, entities (e.g., person, organization, location) in an interval of k days, wherek is an input parameter. When a new event is found as duplicate, we merge it with the previousdetected event.

2.7. EVENTS EXTRACTION FROM SOCIAL MEDIA POSTS 89
Algorithm 1 Algorithm to process a given event-graph to retrieve important sub-events.1: function Graph Processing(G,α)2: E = ∅3: H = {vi ∈ vertex(G)ifscore(vi) >= α} . Equation 2.44: while H 6= ∅ do5: G′ = G.copy()6: vi = H.pop()7: p = max(Wj ∈ In(vi)8: s = max(Wj ∈ Out(vi)9: keywords = set(p, vi, s)10: G′.removeedges((p, vi), (vi, s))11: if notG′.connected() then12: append(keywords, disc vertices(G′))13: end if14: who = person||organization ∈ keywords15: where = location ∈ keywords16: what = keywords− who− where17: tweets = tweet from(keywords)18: when = oldest(tweets, date)19: event =< what, who,where, when >20: append(E, event)21: end while22: for e ∈ E do23: for e′inE do24: if what(e) ∩ what(e′) then25: if who(e) ∩ who(e′) then26: merge(e, e′)27: end if28: if where(e) ∩ where(e′) then29: merge(e, e′)30: end if31: end if32: end for33: if notwho(e)ornotwhere(e) then34: discard(E, e)35: end if36: end for
return E37: end function
2.7.2 Experiments
Given a set of tweets, our goal is to cluster such tweets so that each cluster corresponds to a fine-grained event such as “Death of Amy Winehouse” or “Presidential debate between Obama andRomney during the US presidential election”. We first describe the datasets, then we presentthe experimental setting. This section ends with a comparison of the obtained experimentalresults with state-of-the-art approaches.
Dataset. We test our approach on two gold standard corpora: the First Story Detection(FSD) corpus [377] and the EVENT2012 corpus [308].
FSD. The corpus was collected from the Twitter streaming API61 between 7th July and 12thSeptember 2011. Human annotators annotated 3,035 tweets as related to 27 major eventsoccurred in that period. After removing tweets that are no more available, we are left with2,342 tweets related to one out of the 27 events. To reproduce the same dataset used by otherstate-of-the-art approaches, we consider only those events mentioned in more than 15 tweets.Thus, the final dataset contains 2,295 tweets describing 20 events.
EVENT2012. A corpus of 120 million tweets collected from October to November 2012 fromthe Twitter streaming API, of which 159,952 tweets were labeled as event-related. 506 eventtypes were gathered from the Wikipedia Current Event Portal, and Amazon Mechanical Turkwas used to annotate each tweet with one of such event types. After removing tweets that
61dev.twitter.com/streaming/overview

90 CHAPTER 2. IE TO GENERATE STRUCTURED KNOWLEDGE
are no longer available, our final dataset contains ∼43 million tweets from which 152,758 arerelated to events.
Experimental Setting. For each dataset, we compare our approach with state-of-the-artapproaches. For the FSD dataset, we compare with LEM Bayesian model [496] and DPEMMBayesian model enriched with word embeddings [497]. For the EVENT2012 dataset, we com-pare our results with Named Entity-Based Event Detection approach (NEED) [307] and EventDetection Onset (EDO) [247].
In order to simulate a real scenario where tweets are continuously added to a stream, wesimulate the Twitter stream with a client-server architecture which pushes tweets according totheir creation date. We evaluate our approach in two different scenarios: in the first scenario,we consider tweets from the FSD dataset that are related to events and we classify them intofine-grained event clusters. In the second scenario, we adopt a more realistic approach in thatwe consider all the tweets from the EVENT2012 dataset (i.e., event-related and not event-related ones), and we classify them into event clusters, discarding those that are not related toevents. Our approach requires a few parameters to be provided as input. In the experimentsreported here, we process the input stream with fixed time-window w = 1 hour. The minimumnumber of tweets for event candidates is set to n = 5. Finally, we empirically choose t = 3 daysas the interval of validity for the detected events.
Results. Performance is evaluated both in terms of P/R/F1 and cluster purity.Results on the FSD dataset: In this scenario, we consider an event as correctly classified ifall the tweets in that cluster belong to the same event in the gold standard, otherwise the eventis considered as misclassified. Due to the low number of tweets, we set the gauged parameterα = 0.5 as the minimum score for nodes in the graph to be considered as useful for events. Table2.19 shows the experimental results yielded by our approach in comparison to state-of-the-artapproaches. Our approach outperforms the others, improving the F-score by 0.07 points w.r.t.DPEMM and by 0.13 w.r.t. LEM.
Approach Precision Recall F-measureLEM 0.792 0.850 0.820
DPEMM 0.862 0.900 0.880Our Approach 0.950 0.950 0.950
Table 2.19: Evaluation results on the FSD dataset.
Furthermore, we evaluate the quality of the events, i.e. the clusters, in terms of purity, wherethe purity of an event is based on the number of tweets correctly classified in the cluster andthe number of misclassified tweets. More specifically, purity is computed as: Pe = ne
n, where ne
is the number of tweets correctly classified and n the total number of tweets classified in thatcluster. Figure 2.32 reports the purity of our approach compared to LEM and DPEMM, whereeach point (x, y) denotes the percentage of events having purity less than x. It can be observedthat 5% of the events detected as well as DPEMM have purity less than 0.65 compared to 25%for LEM, while 95% of the events detected have purity higher than 0.95 compared to 75% forDPEMM and 55% for LEM.Results on the EVENT2012 dataset: We also evaluate our approach on the EVENT2012dataset using a more realistic scenario in which all the tweets (i.e., events related and non-eventrelated tweets) are considered. Compared to the FSD dataset, the EVENT2012 dataset hasmore events and tweets and thus a larger vocabulary. We set the cutting parameter α = 0.75 asthe minimum score of nodes in the graph to be considered as important for events. We further

2.7. EVENTS EXTRACTION FROM SOCIAL MEDIA POSTS 91
Figure 2.32: Purity of the events detected by our approach, LEM and DPEMM on the FSDdataset. The y-axis denotes the percentage of events and the x-axis the purity of the events.
detail the importance of the parameters α later in this section. Also, since we include bothevent-related and not event-related tweets, we consider an event as correct if 80% of the tweetsbelong to the same event in the ground truth. Table 2.20 reports on the experimental resultscompared to the NEED and EDO approaches. In general, our approach improves the f-scoreby 0.07 points w.r.t. EDO and 0.23 points w.r.t. NEED. After a manual check of the output,we noticed that some issues with precision may depend on the quality of the dataset, sincesome tweets related to events were not annotated as such in the gold standard. For example,we found that 9,010 tweets related to “BET hip hop award” were not annotated. The samewas found for tweets concerning large events such as “the Presidential debate between Obamaand Romney” or the “shooting of Malala Yousafzai, the 14-year old activist for human rightsin Pakistan”.
We also evaluate the purity of the events detected by our approach (Figure 2.33). We canobserve that the quality of the detected events is lower than for the events detected on the FSDdataset. For instance, more than 20% of the detected events have purity lower than 0.7. Asexpected, event purity is mainly affected by the inclusion in the clusters of non event-relatedtweets.
Approach Precision Recall F-measureNEED 0.636 0.383 0.478EDO 0.754 0.512 0.638
Our Approach 0,750 0.668 0.710
Table 2.20: Evaluation results on the EVENT2012 dataset.
Effect of the Cutting Parameter. We further experiment on the impact of the danglingparameter on the output of our model. The dangling parameter α is used to separate the nodesof the event graph into high-ranked and low-ranked nodes, where the high-ranked nodes areused to extract keywords related to event candidates. We experiment different values for “α”and we evaluate their impact on the performance of our approach on both datasets.
In Figure 2.34a we show the performance of our model for 0 < α ≤ 4 on the FSD dataset. Weobserve that higher value of α gives higher precision while lowering the recall. More specifically,

92 CHAPTER 2. IE TO GENERATE STRUCTURED KNOWLEDGE
Figure 2.33: Purity of the events detected by our approach on the event 2012 dataset. They-axis denotes the percentage of events and the x-axis the purity of the events.
(a) Effect on FSD (b) Effect on EVENT2012
Figure 2.34: Effect of the cutting parameter (α) on the performance of our approach.

2.8. BUILDING EVENTS TIMELINES FROM MICROBLOG POSTS 93
for α ≥ 3 we obtain 100% precision and recall lower than 50%. On the other hand, the bestperformance is obtained for α ≤ 0.5. Since the FSD dataset contains ∼ 6, 000 unique words,at each time window the generated graph is strongly connected, thus the average minimumscore of the nodes is higher than 0.5. For values higher than 0.5, important terms referringto events are ignored, mainly when they are related to events that do not generate a highvolume of tweets. In our experiments, we also observe that higher values of α mostly affect therecognition of events with low number of tweets.
Figure 2.34b shows the performance of our model for different values of α on the EVENT2012dataset. We observe that for different values of α, both precision and recall are affected. Morespecifically, the recall of the model tends to decrease for lower values of α. Without edge cutting(i.e. α = 0), the recall of our model is similar to EDO. Overall, the impact of α is bigger onthe EVENT2012 dataset than on FSD dataset. The variation of precision and recall curves issmaller for consecutive values of α w.r.t. FSD. There are two main reasons for that: i) theEVENT2012 dataset has a richer vocabulary, and ii) many events in the EVENT2012 datasetare similar to each other.
2.8 Building events timelines from microblog posts
In the following we present another work on events extraction, to build events timelines frommicroblog posts. We focus in particular on sport events timelines. Historically, sports fans havewatched matches either at the stadium or on TV, or have listened to them on the radio. Inthe latest years, however, social media platforms have become a new communication channelalso to share information and comment on sports events, thus creating online communities ofsports fans. Microblogs are particularly suitable, thanks to their coverage and speed, makingthem a successful channel to follow and comment on events in real time. Also sports teamsand medias have benefited from these platforms to extend their contact networks, increasetheir popularity and exchange information with fans [193, 356]. The need to monitor andorganize such information is particularly relevant during big events like the Olympic Gamesor FIFA World Cup: several matches take place in a limited time span, sometimes in parallel,and summaries are manually made by journalists. A few approaches have recently tried toautomatize this task by recognizing actions in multimedia data [212, 416, 415].
In this work, we investigate whether the same task can be performed relying only on user-generated content from microblogs. In fact, opinions shared by fans during sports matches areusually reactions to what is happening in the game, implicitly conveying information on theongoing events. Existing works aimed at building complete summaries of sports games fromtweets [343, 484] rely on the observation of peaks in the tweets’ volume. Even though suchapproaches effectively detect the most salient actions in games (e.g., goals), they fail to captureactions that are not reported by many users (e.g., shoots). Moreover, they focus only on specificinformation: for example, [286] and [9] are respectively interested in detecting in soccer gamesgoals, yellow and red cards, and in detecting time and keywords, ignoring the players involvedin the actions.
In this work we perform a more complex task: we create a fine-grained, real-time summaryof the sub-events occurring in sports games using tweets. We define a sub-event in a match asan action that involves one or many participants (e.g., a player, a team) at a given time, asproposed by [150]. More specifically, we want to address the following research questions: i) Isit possible to build detailed sports games summaries in a unsupervised fashion, relying only on acontrolled vocabulary?, and ii) To what extent can Twitter be used to build a complete timelineof a game? Is information retrieved via Twitter reliable and sufficient?

94 CHAPTER 2. IE TO GENERATE STRUCTURED KNOWLEDGE
2.8.1 Proposed approach
Although the approach we propose to detect sub-events in sports games and to build a timeline(Figure 2.35) is general-purpose, we take as an example soccer games, so that we can use aconsistent terminology. The pipeline can be applied to any sports as long as it is representedin the Sports Markup Language [128].
First, a module for information extraction identifies actions (e.g., goals, penalties) andparticipants (e.g., player’s names, teams) mentioned in tweets, setting relations between them(see examples in Table 2.21). Then, participants, actions and relations are modeled togetherin a temporal event-graph, taking into account also the time of the tweet. This leads to thecreation of a timeline where actions and participants are connected and temporally ordered.The modules of this pipeline are described in detail in the following sections.
Figure 2.35: Sub-events extraction pipeline.
Tweets Action Particip.
kick off.... #engwal #euro2016 D1P england#teamengland wales
how has ramsey not got a yellow CJA ramseycard yet every attempt to tackle has walesbeen a foul.
goaaaaaaaaaaal from bale woah BUT bale#eng 0-1 #wal wales
Table 2.21: Detected actions and participants in tweets (England-Wales, June 16, 2016. D1P:First period begins, CJA: Yellow card, BUT: Goal).
2.8.2 Information Extraction
The first module retrieves participants and sub-events (or actions)62 from tweets, and setsrelations between them. In the case of soccer, actions are defined by FIFA, e.g., goals, penalties,yellow/red cards, etc. Participants are the actors who induce the actions. For soccer games,they are players and teams. To extract information we use GATE [130], because it includes ahighly flexible NEs Recognition (NER) tool that allows the integration of custom gazetteers.To detect actions, we update its gazetteer based on the Sports Markup Language, a controlledvocabulary used to describe sports events. SportsML core schema provides concepts allowingthe description of events for 11 major sports including Soccer, American football, Basketballand Tennis. For soccer games, we extract actions such as goals, substitutions, yellow/red
62In this work we use interchangeably the terms actions and sub-events to refer to actions in a sports game.

2.8. BUILDING EVENTS TIMELINES FROM MICROBLOG POSTS 95
cards and penalties. Furthermore, we enrich the list of actions with synonyms extracted fromWordnet [177].
As for participants, we update the gazetteer using the football-data API63 that, given asoccer game in input, returns the name of the teams and their players. We also apply someheuristics so as to associate different spelling variations to players’ and teams’ names. This isdone by considering separately or by combining the different parts of the players’ names (i.e.first name and last-name). For instance, “giroud”, “oliviergiroud” or “olivier giroud” are allassociated with “Olivier Giroud”, a player in the French national team.
We first pre-process the data using GATE in-built tweet normalizer, tokenizer and PoS-tagger. Then, we use the NER module integrating the two custom gazetteers we created. Wealso set links representing relations between actions and participants by means of JAPE (JavaAnnotation Pattern Engine) rules, a GATE-specific format to define regular expressions neededfor pattern matching. Since relations detected through JAPE rules tend to be very accurate,we assign a weight = 2 to edges extracted from such rules. If an action and a participant appearin the same tweet but are not matched through a JAPE rule, we set a link with weight = 1, toaccount for a lower precision.
2.8.3 Timeline creation
Modeling sub-events. The output of the information extraction module (Figure 2.35) isa list of tuples 〈a, p, t, ω〉, where a is a sports action, t the timestamp of the tweet and p theparticipant involved and ω is the weight of the edge connecting a and p. These tuples areused to build a temporal event graph (see Figure 2.36). To retain temporal information on thesub-events, we split the game in fixed time windows, and create an event-graph that models therelationships between actions and participants for each time window. We refer to such graphsas temporal graphs [454] and we build them as follows:
• Nodes : Actions and participants are represented by nodes in the event-graph. First, weretrieve the nodes of the actions, and then we add the connected participants’ nodes;
• Edges : Nodes are connected by an edge if a relation can be set in the tweets publishedduring the time-window. The occurrence of this relation is used to increase the weight ofthe edges. Relationships between participants are created for actions involving 2 or moreparticipants (e.g., a substitution).
Fig. 2.36 shows a temporal graph at time-window 22 of the game between England andWales (Game #16 on June 16, 2016): we observe edges linking participants, e.g., connecting thenode “Sterling” and “Vardy”, retrieved from tweets requesting the substitution of “Sterling”by “Vardy”. Both are linked also to the node “England”, i.e. their team.
Processing the event-graphs. At this stage, the weighted relations between actions andparticipants are considered as sub-event candidates. We cannot automatically include them inthe timeline because they could represent opinions or wishes of the fans, as: “how has ramseynot got a yellow card yet every attempt to tackle has been a foul”. In general, we may assumethat real sub-events in a game are reported by many users, while an action reported by a fewusers only is more likely to be a subjective post reflecting an opinion.
Most of the existing work set an empirical threshold to measure the importance of theactions [9, 299]. However, we observe that the number of tweets generated for a given actionis highly dependent on the game and the team or players involved. Thus, we find it useful to
63http://api.football-data.org

96 CHAPTER 2. IE TO GENERATE STRUCTURED KNOWLEDGE
shoot
goal
cgt
1:0
bale
sterling wales
vardy
england 3
1
6
245
10
2
1
120
39
2 2
Figure 2.36: Event-graph for England-Wales.
tune the thresholds by taking into account both the type of the action and the popularity ofthe teams involved in the game.
For each action belonging to a certain sport, we manually define an empirical thresholdaccording to the importance of the action. For soccer, we can assume that a goal will triggera higher number of tweets than a shoot. These empirical values can be defined by domainexperts for each category of the sports we want to track. Based on the predefined thresholds,the interest of the games for people and the popularity of the opponent teams, we adjust theempirical thresholds using Kreyszig standard score formula [256] as follows :
ϕa,t = εa ∗ηg,t − ηgσg
(2.5)
where ϕa,t is the threshold for action a at time t of the game, εa the empirical threshold fora, ηg,t the count of tweets related to the game at time t, ηg the mean count, σg the standarddeviation of tweets related to the game in the past time windows.
Ranking Sports Actions. Let A = 〈a, p, t, ω〉 be a quadruplet modeling an action a at timet, involving participants p and weighted by ω (i.e. the number of edges connecting a and p inthe event graph). For each participant, we compute a standard score as follows:
za,p,t =ηωi− ηωi
σωi
(2.6)
where ηω is the weight of the edge in graph G that connects nodes a and p, ηω is the meancount of all the actions of type a induced by p, and σω is the standard deviation of relationshipbetween a and p over all past time windows. Thus, we evaluate the action by taking theratio between the standard score for each participant and the total standard scores for all theparticipants as follows :
za,t =za,pi,t∑
pi∈Pza,pi,t
(2.7)
At a given time t an action is added to the timeline iff there exists at least a participant p suchthat za,t ≥ ϕa,t.
As shown in Algorithm 2, we first merge the current event graph and the graph from theprevious time window (Line 1). Then, from the merged graph, we collect all vertices of typefoot action and for each we retrieve all connected nodes as participants of the action (Lines 4-6). We compute the adaptive threshold for each action and a standard score for each participant

2.8. BUILDING EVENTS TIMELINES FROM MICROBLOG POSTS 97
using equation 2.5 and 2.6, respectively (Lines 7-9). Finally, sub-event candidates are createdwith participants that have a score higher than the threshold of the action (Lines 10-16). Forsome actions, participants may not be required (e.g., beginning/end of periods in soccer), forsuch actions we consider both teams as participants in order to comply with equations (2.6and 2.7). We remove from the event graph actions and participants involved in sub-events.Besides, nodes that were not related to sub-events are kept to be processed in the next time-window. However, if a node cannot be confirmed as related to sub-events in two consecutivetime windows, we consider it as noise and simply discard it.
Before putting sub-events on a timeline, we perform a final check to see whether they havenot been validated in the previous time window. If yes, it means that an action overlapstwo time-windows, and the timestamp of the event must be updated, matching the time ofthe first occurrence. We consider two events identical if: i) they mention the same action andparticipants; ii) the number of tweets reporting the more recent action is lower than the numberof tweets on the old one.
Algorithm 2 Algorithm to process a given event-graph to retrieve important sub-events.1: function Graph Processing(Gt, Gt−1, t) . Gt - Event graph at time t, Gt−1 - Event graph at t-1, t - current time2: G = merge (Gt, Gt−1)3: E = ∅4: for vertex ∈ G.vertices() do5: if vertexisfoot action then6: P = G.neighbors(node)7: a = node.action8: ϕa,t = compute (a, t) . equation 2.59: za,t = compute (a, P, t) . equation 2.710: for z ∈ za,t do11: if z ≥ ϕa,t then12: event = (a, p, t)13: E append (a, p, t)14: G delete (a, p)15: end if16: end for17: end if18: end for19: end function
2.8.4 Experiments
Dataset. We experiment our framework on the Hackatal 2016 dataset64, collected duringthe EURO 2016 Championship. A set of keywords were manually defined, including hashtags(#euro, #euro2016, #football) and the names of the teams involved in the competition (e.g.,France) as well as their short names (e.g., #FRA) and hashtags related to current games (e.g.,#FRAROM for the game between France and Romania). For each game, tweets were collectedfor a two-hour time span, starting at the beginning of the game. For comparisons and to limitthe complexity of the processing pipeline, we limit our analysis to tweets in English.
The dataset also contains the summary of the salient sub-events in each game, retrievedfrom journalistic reports (e.g., LeFigaro65). We consider these summaries as the ground truthwhile evaluating our approach. These summaries are defined as a set of triples 〈time, action,
participant〉 where “time” is the time the sub-event occurs, the “action” is the type of the sub-event and “participants” are players or teams involved in the action. The sub-events include:the beginning of the periods (F1P, D1P), end of the periods (F1P, D2P), Shoot (TIR), Goal(BUT), Substitution (CGT), Red card (CRO) and Yellow card (CJA) (see Table 2.22).
64http://hackatal.github.io/2016/.65http://sport24.lefigaro.fr

98 CHAPTER 2. IE TO GENERATE STRUCTURED KNOWLEDGE
Time Action Participants
15:02 D1P –
15:09 TIR Sterling
. . . . . . . . .
15:44 BUT Bale
15:48 F1P –
16:04 CGT Sterling;Vardy
16:18 BUT Vardy
Table 2.22: A few examples of the sub-events that occurred in the game between England andWales.
Loose Partial Complete
actions Prec Rec F1 Prec Rec F1 Prec Rec F1
goal 0.745 0.512 0.549 0.670 0.456 0.493 0.623 0.405 0.444card 0.758 0.560 0.622 0.693 0.506 0.568 0.600 0.433 0.516subt 0.859 0.629 0.693 0.627 0.460 0.510 0.501 0.374 0.438shoot 0.643 0.203 0.292 0.571 0.185 0.264 0.548 0.167 0.243period 0.814 0.656 0.706 0.655 0.517 0.562 0.585 0.462 0.523
Table 2.23: Experimental results of our approach for 24 games in the first stage of the Euro2016 dataset
Experimental setting. We simulate the Twitter stream by grouping the tweets related toa game in intervals of two minutes, which we refer to as time-windows. Thus, we collect allthe tweets published in a time-window in a single document which we give in input to ouralgorithm. In the preprocessing phase, we remove re-tweets if the original tweet is already inthe collection, and we consider one tweet per user in a time window. The input tweets arethen analyzed with GATE. We use the JGraph library [340] to create the event-graph. At eachtime-window, we create a new graph to model the relation between actions and participantsdetected in tweets. We process the event-graph with Algorithm 2 to detect real sub-eventsfound in tweets.
Evaluation strategies. We report on two different evaluation strategies. In the first one,we compare the output of our framework against the state of the art approach [9]. There,sub-events are detected by identifying spikes in the Twitter stream. Since they do not detectparticipants, in this first comparison we also limit our evaluation to the action timeline, lettingout additional information. We also compare the results with the gold standard timeline frommanually created summaries by sports journalists. We show the results for three sample matchesin Figures 2.38, 2.39 and 2.40.
In the second evaluation strategy, we evaluate our approach against the gold standard datadescribed above. This time we include also the sub-event type, the time and participantsinformation. Also, we consider three evaluation settings, namely complete matching, partialmatching and loose matching. In the complete matching mode, we evaluate each sub-eventdetected by our system by taking into account the type of the sub-event, the participants andthe time. A sub-event is considered correct if all three elements are correctly identified. In thepartial mode, we consider the time and the type of the sub-events; and in the loose mode, weonly consider the type. We set the error margin to 2 minutes while comparing the time, sincethis is the duration of the time-windows used to build the temporal graphs. Table 2.23 reportsP/R/F1 for the same sample matches described above, as well as an average of the scores for24 matches in the first stage of the competition.

2.8. BUILDING EVENTS TIMELINES FROM MICROBLOG POSTS 99
Figure 2.37: Precision Recall chart of the performances of our approach. X-axis is the averageprecision and Y-axis the average recall. Blue dots represent the loose matching, orange dotsthe partial matching and green dots the complete matching.
2.8.5 Results and discussion
The overall evaluation concerning the first 24 games in the EURO 2016 Championship (Table2.23) shows that the approach is very accurate in some cases, while it suffers from low per-formance, especially recall, in other settings. If we compare the different actions (left-mostcolumns in the table), we observe that the best performance is obtained when recognizing thestart and the end of the match (last line in the table). For other actions, the performancevaries across the three evaluation modes. For example, when considering participants to shootactions, the approach fails to identify the correct player, probably because other players arelikely to be mentioned in the same tweet. Figure 2.37 provides an overview of the obtainedperformances with the different evaluation strategies.
We further focus on three sample matches: we plot in Figures 2.38, 2.39 and 2.40 thesub-events detected by [9], those detected by our approach, as well as the gold standard ones.We report in Tables 2.24, 2.25 and 2.26 P/R/F1 measures for the loose, partial and completeevaluation strategy.
The first game, England - Wales gained particular attention on Twitter. Figure 2.38 showsthe distribution of tweets during the game (in gray), distinguishing between tweets explicitlymentioning England (red line) and Wales (green). The blue dots correspond to the sub-eventsidentified by [9]’s approach, while those detected by our approach and the ground truth arerepresented with yellow and green dots, respectively. The graphical representation shows thatthere is a significant correspondence between the sub-events detected by our approach and thegold standard ones. We can also observe that [9] fail to detect sub-events that do not producespikes in the volume of tweets. Table 2.24 shows for the same match the average performanceof our approach. In this case, our performance is affected by problems in detecting actions oftype substitution and shoots.
Methods Prec Rec F-score
loose 0.852 0.958 0.902partial 0.630 0.708 0.667complete 0.444 0.500 0.470
Table 2.24: Performance on England- Wales.
A second example is the match France - Romania (see Figure 2.39). Although the game

100 CHAPTER 2. IE TO GENERATE STRUCTURED KNOWLEDGE
Figure 2.38: Sub-events in England-Wales.
was quite debated on Twitter, a few spikes were detected in the stream. In fact, during thefirst period the teams were barely mentioned, as indicated by the red and green curves on thegraph. Instead, other teams were mentioned, which were not directly involved in the game.The second period seemed to be more interesting in terms of sub-events. Table 2.25 showsour performances. We obtain a 91.3% precision in the loose mode, since we detect 23 out of34 sub-events in the game compared to 9 identified by [9], and 21 of the detected sub-eventswere associated to the correct actions. However, the latency between the sub-events detectedby our approach compared to the ground truth contributes in decreasing the performance ofour approach in both intermediate and complete matching. For example, there is a huge peakat time 22:24 when Stancu equalizes for Romania, but we detect this action four minutes latersince most of the tweets in that time span discuss the penalty issue rather than the goal.
Figure 2.39: Sub-events in France-Romania.
Methods Prec Rec F-score
loose 0.913 0.656 0.763partial 0.696 0.500 0.582complete 0.609 0.438 0.510
Table 2.25: Performance on France- Romania.

2.8. BUILDING EVENTS TIMELINES FROM MICROBLOG POSTS 101
As a third example, we consider Belgium - Italy, that was less popular in terms of tweetsthan the previous ones. A few peaks are detected in the game (Figure 2.40). This affectsnegatively the number of sub-events found by [9], while our approach proves to have a bettercoverage, even if recall is on average lower than for the other matches. In most cases, we detectmentions of the actions, but we fail to detect the participants. Table 2.26 shows the overallperformance of our approach. In the ground truth there were only a few tweets related to thisgame, and ∼ 50% of them were shoots. Our approach failed to identify them, impacting onthe recall. On the other hand, all the events detected were correct.
Methods Prec Rec F-score
loose 1.000 0.448 0.619partial 0.923 0.414 0.572complete 0.846 0.379 0.523
Table 2.26: Performance on Belgium- Italy.
Figure 2.40: Sub-events in Belgium- Italy.
2.8.6 Related Work on events extraction
Existing approaches to extract events from tweets can be divided into two main categories,namely closed-domain and open-domain event detection systems [19]. In the closed-domain,approaches are mainly focused on extracting a particular type of event, as for instance naturaldisasters [359]. Works in the closed-domain scenario are usually cast as supervised classificationtasks that rely on keywords to extract event-related messages from Twitter [468], to recognizeevent patterns [383] or to define labels for training a classifier [11, 401].
The open-domain scenario is more challenging, since it is not limited to a specific typeof event and usually relies on unsupervised models. Among the works applying an unsuper-vised approach to event detection on Twitter, [307] create event clusters from tweets usingNE mentions as central terms driving the clusters. Thus, tweets mentioning the same entitiesare grouped together in a single cluster. Experiments on a public dataset of tweets show thatthis strategy outperforms other approaches such as Latent Sensitive Hashing [376]. Similarly,[217] create clusters based on cosine similarity among tweets. Both works do not consider thetemporal aspect of events and fail to capture terms or entities involved in different events atdifferent time periods.

102 CHAPTER 2. IE TO GENERATE STRUCTURED KNOWLEDGE
Very recently, [497] use a non-parametric Bayesian Mixture Model leveraged with wordembeddings to create event clusters from tweets. In this approach, events are modeled as a4-tuple 〈y, l, k, d〉 modeling non-location NEs, location NEs, event keywords and date. Thework was focused on detecting events given a set of event-related tweets, which is however notapplicable to a real scenario, where the stream of tweets can also contain messages that are notevent-related. This scenario is simulated in the second experiment presented in this section.
Most of the works that analyze the content of tweets for tracking sport events are based onspike detection on the stream of messages, to detect sub-events. To summarize event streams,[343] propose a method that identifies spikes in Twitter feed and selects tweets from a sub-eventby scoring each of them based on phrase graph [410]. This method may produce unexpectedsummary if most of the tweets published during the spike are not related to the sub-event.[258] generate live sports summary by prioritizing tweets published by good reporters. First,they identify spikes in the stream of an event as indicators of sub-events, and then the systemtries to generate a summary by measuring the explanatory of the tweet by the presence ofplayer’s names, team names and terms related to the event. Similarly, when a spike is detected,[9] analyze the tweets published during the period to identify the most frequent terms whichthey use to describe spikes in a tweets’ histograms (spikes are considered as sub-events). Tosummarize tweets on football, [239] create event clusters with similar documents, that are thenautomatically classified as relevant to football actions.
In the case of sports games, spikes do not necessarily characterize a sub-event. For example,when the crowd disagrees with the referees or a player, emotional tweets to express disagreementare published. On the other hand, actions with low importance (e.g., a shoot) or actionsproduced by non-popular teams or players (e.g., Albania) may not produce peaks in the volumeof tweets. Thus, approaches solely based on spikes detection are unable to capture those actions.In our approach, we rely on Named Entities (NEs) to identify whether or not a tweet is relatedto a sports event. Besides, we rely on an adaptive threshold tuned according to the actions andthe team (or player) of interest to evaluate whether or not the actions should be added to thetimeline.
2.9 Conclusions
In this section, we have described the research contributions related to extract information fromtext to generate structured knowledge in different application scenarios.
In the first part of this chapter, we focused on the mining of semantic knowledge fromthe Web for the robotics domain, to integrate such knowledge with situated robot vision andperception, to allow robots to continuously extend their object knowledge beyond perceptualmodels. First, we presented an integrated system to suggest concept labels for unknown objectsobserved by a mobile robot. Our system stores the spatial contexts in which objects are observedand uses these to query a Web-based suggestion system to receive a list of possible conceptsthat could apply to the unknown object. These suggestions are based on the relatedness ofthe objects observed with the unknown object, and can be improved by filtering the resultsbased on both frequency and spatial proximity. We evaluated our system data from real officeobservations and demonstrated how various filter parameters changed the match of the resultsto ground truth data.
Moreover, we have presented a framework for extracting manipulation-relevant knowledgeabout objects in the form of (binary) relations. The framework relies on a ranking measurethat, given an object, ranks all entities that potentially stand in the relation in question tothe given object. We rely on a representational approach that exploits distributional spacesto embed entities into low-dimensional spaces in which the ranking measure can be evaluated.We have presented results on two relations: the relation between an object and its prototypical
2.9. CONCLUSIONS 103
location (locatedAt) as well as the relation between an object and one of its intended uses(usedFor). As main contribution, we have presented a supervised approach based on a neuralnetwork that, instead of using the cosine similarity as measure of semantic relatedness, usespositive and negative examples to train a scoring function in a supervised fashion. As an avenuefor future work, the generalizability of the proposed methods to a wider set of relations canbe considered. In the context of manipulation-relevant knowledge for a robotic system, otherinteresting properties of an object include its prototypical size, weight, texture, and fragility.
In the second part of this chapter, we have addressed the task of lyrics processing. First,we addressed the segmentation on synchronized text-audio representations of songs. For thesongs in the corpus DALI where the lyrics are aligned to the audio, we have derived a mea-sure of alignment quality specific to our task of lyrics segmentation. Then, we have shownthat exploiting both textual and audio-based features lead the employed Convolutional NeuralNetwork-based model to significantly outperform the state-of-the-art system for lyrics segmen-tation that relies on purely text-based features. Moreover, we have shown that the advantage ofa bimodal segment representation pertains even in the case where the alignment is noisy. Thisindicates that a lyrics segmentation model can be improved in most situations by enriching thesegment representation by another modality (such as audio).
Second, we have defined and addressed the task of lyrics summarization. We have appliedboth generic unsupervised text summarization methods (TextRank and a topic-based methodwe called TopSum), and a method inspired by audio thumbnailing on 50k lyrics from theWASABI corpus. We have carried out an automatic evaluation on the produced summariescomputing standard metrics in text summarization, and a human evaluation with 26 partici-pants, showing that using a fitness measure transferred from the musicology literature, we canamend generic text summarization algorithms and produce better summaries. In future work,we plan to address the challenging task of abstractive summarization over song lyrics, with thegoal of creating a summary of song texts in prose-style - more similar to what humans woulddo, using their own words.
Finally, we have described the WASABI dataset of songs, focusing in particular on the lyricsannotations resulting from the applications of the methods we proposed to extract relevantinformation from the lyrics. So far, lyrics annotations concern their structure segmentation,their topic, the explicitness of the lyrics content, the summary of a song and the emotionsconveyed. Some of those annotation layers are provided for all the 1.73M songs included in theWASABI corpus, while some others apply to subsets of the corpus, due to various constraintspreviously described. In [20] the authors have studied how song writers influence each other.We aim to learn a model that detects the border between heavy influence and plagiarism.
In the last part of this chapter, we focused on events extraction from Twitter messages, andwe described a model for detecting open-domain events from tweets by modeling relationshipsbetween NE mentions and terms in a directed graph. The proposed approach is unsupervisedand can automatically detect fine-grained events without prior knowledge of the number or typeof events. Our experiments on two gold-standard datasets show that the approach yields state-of-the-art results. In the future, we plan to investigate whether linking terms to ontologies (e.g.,DBpedia, YAGO) can help in detecting different mentions of the same entity, as preliminarilyshown in [158]. This can be used to reduce the density of the event graph. Another possibleimprovement would be to enrich the content of the tweets with information from external webpages resolving the URLs in the tweets.
As a second study on events extraction, we have described a framework to generate timelinesof salient sub-events in sports games exploiting information contained in tweets. Experimentson a set of tweets collected during EURO 2016 proved that our approach accurately detectssub-events in sports games when compared to news on the same events reported by sportsmedia. While previous approaches focused only on detecting the type of the most important

104 CHAPTER 2. IE TO GENERATE STRUCTURED KNOWLEDGE
sub-events, we extract and model a richer set of information, including almost every type ofsub-event and participants involved in the actions. Possible improvements for future workinclude the extension of our approach to other sports (e.g., American football).
Chapter 3
Natural language interaction with theWeb of Data
This Chapter is dedicated to my contributions addressing the challenge of enhancing users’interactions with the web of data by mapping natural language expressions (e.g. user queries)with concepts and relations in a structured knowledge base. These research contributions fit theareas of Natural Language Processing and Semantic Web, and have been published in severalvenues:
• Elena Cabrio, Serena Villata, Alessio Palmero Aprosio (2017). A RADAR for informationreconciliation in Question Answering systems over Linked Data. Semantic Web 8(4): 601-617 [93].
• Elena Cabrio, Serena Villata, Julien Cojan, Fabien Gandon (2014). Classifying Inconsis-tencies in DBpedia Multilingual Chapters, in Proceedings of the Language Resources andEvaluation Conference (LREC-2014), pp. 1443-1450 [95].
• Elena Cabrio, Julien Cojan, Fabien Gandon (2014). Mind the cultural gap: bridginglanguage specific DBpedia chapters for Question Answering, in Philipp Cimiano, PaulBuitelaar (eds.) Towards the Multilingual Semantic Web, pp. 137-154, Springer Verlag[84].
• Elena Cabrio, Vivek Sachidananda, Raphael Troncy (2014) Boosting QAKiS with mul-timedia answer visualization, Proceedings of the Extended Semantic Web Conference(ESWC 2014) - Demo/poster paper [88].
• Elena Cabrio, Alessio Palmero Aprosio, Serena Villata (2014). Reconciling Informationin DBpedia through a Question Answering System, Proceedings of the 13th InternationalSemantic Web Conference (ISWC 2014). Demo paper [87].
• Elena Cabrio, Julien Cojan, Fabien Gandon, and Amine Hallili (2013). Querying mul-tilingual DBpedia with QAKiS, in The Semantic Web: ESWC 2013 Satellite Events,Lecture Notes in Computer Science, Volume 7955, pp. 194-198 [85].
• Julien Cojan, Elena Cabrio, Fabien Gandon (2013). Filling the Gaps Among DBpediaMultilingual Chapters for Question Answering. Proceedings of the 5th Annual ACM WebScience Conference, pp. 33-42 [119].
• Elena Cabrio, Julien Cojan, Alessio Palmero Aprosio, Fabien Gandon (2012). NaturalLanguage Interaction with the Web of Data by Mining its Textual Side, IntelligenzaArtificiale. 6 (2012), pp. 121-133. Special Issue on Natural Language Processing in theWeb Era. IOS Press [82].
105

106 CHAPTER 3. NATURAL LANGUAGE INTERACTION WITH THE WEB OF DATA
• Elena Cabrio, Julien Cojan, Alessio Palmero Aprosio, Bernardo Magnini, Alberto Lavelli,Fabien Gandon (2012). QAKiS: an Open Domain QA System based on Relational Pat-terns, Proceedings of the 11th International Semantic Web Conference (ISWC 2012).Demo paper [83].
To enhance users’ interactions with the web of data, query interfaces providing a flexi-ble mapping between natural language expressions, and concepts and relations in structuredknowledge bases (KB) are particularly relevant. In this direction, I have mainly focused on theautomatic extraction of structured data from unstructured documents to populate RDF triplestores, and in a Question Answering (QA) setting, on the mapping of natural language expres-sions (e.g. user queries) with concepts and relations in a structured KB. More specifically, Ihave proposed and implemented i) the WikiFramework, i.e. a methodology to collect relationalpatterns in several languages, and ii) QAKiS, a system for open domain QA over linked data[83]. QAKiS (Question Answering wiKiframework-based System), allows end users to submita query to an RDF triple store in English and obtain the answer in the same language, hidingthe complexity of the non-intuitive formal query languages involved in the resolution process,but exploiting the expressiveness of these standards to scale to the huge amounts of availablesemantic data. QAKiS addresses the task of QA over structured KBs (e.g. language specificDBpedia chapters) where the relevant information is expressed also in unstructured form (e.g.Wikipedia pages). A crucial issue is the interpretation of the question to convert it into a cor-responding formal query. Differently from the approaches developed at the time of this work,QAKiS implements a relation-based match, where fragments of the question are matched torelational textual patterns automatically collected from Wikipedia (i.e. the WikiFrameworkrepository). Such relation-based matching provides more precision with respect to matchingon single tokens.
To evaluate QAKiS on a comparable setting, we took part into QALD-2 and 3 evaluationcampaigns in 2012 and 2013. The challenge (that was run until 2018) is aimed at any kindof QA system that mediates between a user, expressing his or her information need in naturallanguage, and semantic data. A training and a test set of 100 natural language questions eachare provided by the organizers. The version of QAKiS that took part into such challengestargets only questions containing a Named Entity related to the answer through one propertyof the ontology. However, QAKiS performances are in line with the results obtained by theother participating systems.
As introduced before, QAKiS is based on Wikipedia for patterns extraction. English, Frenchand German DBpedia chapters are the RDF data sets to be queried using a natural languageinterface [85]. While querying at the same time different heterogeneous interlinked datasets, thesystem may receive different results for the same query. The returned results can be related by awide range of heterogenous relations, e.g., one can be the specification of the other, an acronymof the other, etc. In other cases, such results can contain an inconsistent set of informationabout the same topic. A well-known example of such heterogenous interlinked datasets arelanguage-specific DBpedia chapters, where the same information may be reported in differentlanguages. Given the growing importance of multilingualism in the Semantic Web community,and in Question Answering over Linked Data in particular, we choose to apply informationreconciliation to this scenario. We have therefore addressed the issue of reconciling informationobtained by querying the SPARQL endpoints of language-specific DBpedia chapters integratingthe proposed framework into QAKiS.
Moreover, in [88] we extended QAKiS to exploit the structured data and metadata describingmultimedia content on the linked data to provide a richer and more complete answer to theuser, combining textual information with other media content. A first step in this directionconsisted in determining the best sources and media (image, audio, video, or a hybrid) toanswer a query. Then, we have extended QAKiS output to include i) pictures from Wikipedia

3.1. QAKIS 107
Infoboxes, for instance to visualize images of people or places, ii) OpenStreetMap, to visualizemaps and iii) YouTube, to visualize videos related to the answer.
This chapter is organized as follows: Section 3.1 describes the Question Answering systemQAKiS, then Section 3.2 explains the method proposed to reconcile inconsistent informationthat can be collected from multilingual data sources. Section 3.3 describes QAKiS multimediavisualization, while Section 4.6 summarizes related work. Conclusions end the chapter.
3.1 QAKiS
To enhance users’ interactions with the web of data, query interfaces providing a flexible map-ping between natural language expressions, and concepts and relations in structured knowledgebases are becoming particularly relevant. In this section, we present QAKiS (Question An-swering wiKiframework-based System), that allows end users to submit a query to an RDFtriple store in English and obtain the answer in the same language, hiding the complexity ofthe non-intuitive formal query languages involved in the resolution process. At the same time,the expressiveness of these standards is exploited to scale to the huge amounts of availablesemantic data. In its current implementation, QAKiS addresses the task of QA over structuredKnowledge Bases (KBs) (e.g. DBpedia) where the relevant information is expressed also in un-structured form (e.g. Wikipedia pages). Its major novelty with respect to the systems availableat the time of this work, is to implement a relation-based match for question interpretation,to convert the user question into a query language (e.g. SPARQL). Most of the approachesup to then (for an overview, see [290]) based this conversion on some form of flexible match-ing between words of the question and concepts and relations of a triple store, disregardingthe relevant context around a word, without which the match might be wrong. QAKiS triesinstead first to establish a matching between fragments of the question and relational textualpatterns automatically collected from Wikipedia. The underlying intuition is that a relation-based matching would provide more precision with respect to matching on single tokens, asdone by competitors systems.
QAKiS demo is based on Wikipedia for patterns extraction. DBpedia is the RDF data setto be queried using a natural language interface.
Figure 3.1: QAKiS demo interface (v1). The user can either write a question (or select amonga list of examples) and click on Get Answers!. QAKiS outputs: i) the user question (therecognized Named Entity (NE) is linked to its DBpedia page), ii) the generated typed question(see Section 3.1.1), iii) the pattern matched, iv) the SPARQL query sent to the DBpediaSPARQL endpoint, and v) the answer (below the green rectangle results).
QAKiS makes use of relational patterns (automatically extracted from Wikipedia and col-lected in the WikiFramework repository [297]), that capture different ways to express a certainrelation in a given language. For instance, the relation crosses(Bridge,River) can be ex-pressed in English, among the others, by the following relational patterns: [Bridge crosses theRiver] and [Bridge spans over the River]. Assuming that there is a high probability that the
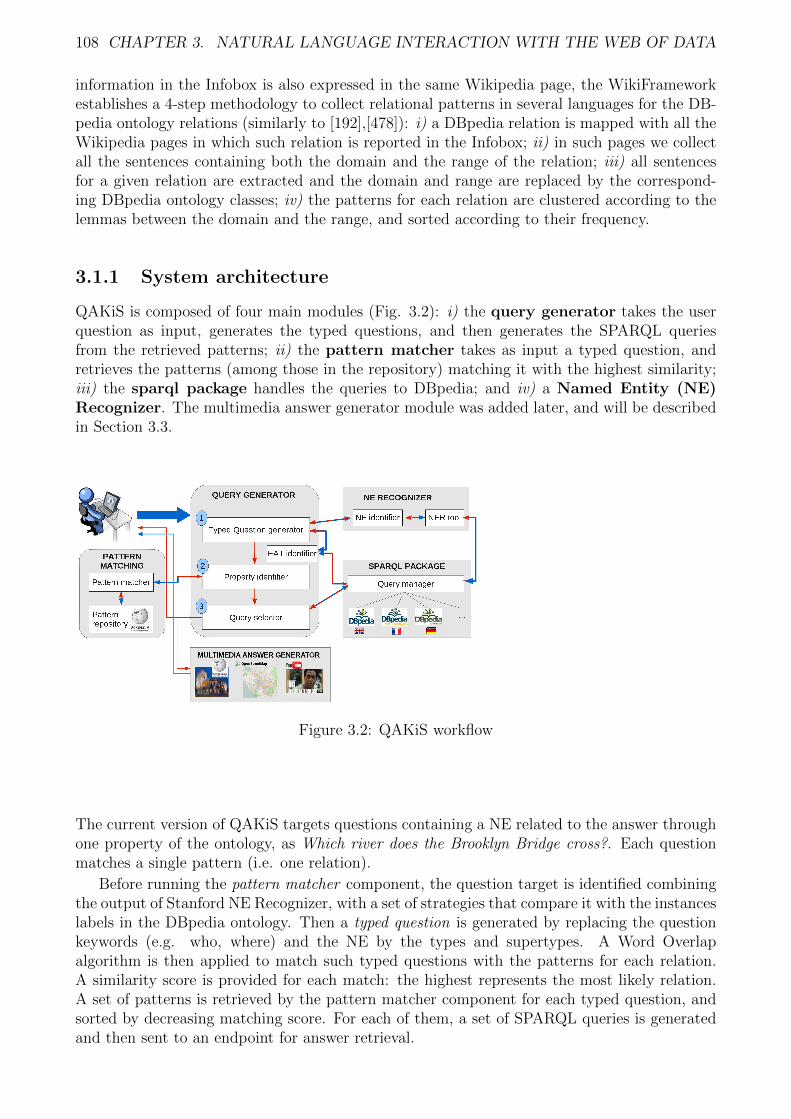
108 CHAPTER 3. NATURAL LANGUAGE INTERACTION WITH THE WEB OF DATA
information in the Infobox is also expressed in the same Wikipedia page, the WikiFrameworkestablishes a 4-step methodology to collect relational patterns in several languages for the DB-pedia ontology relations (similarly to [192],[478]): i) a DBpedia relation is mapped with all theWikipedia pages in which such relation is reported in the Infobox; ii) in such pages we collectall the sentences containing both the domain and the range of the relation; iii) all sentencesfor a given relation are extracted and the domain and range are replaced by the correspond-ing DBpedia ontology classes; iv) the patterns for each relation are clustered according to thelemmas between the domain and the range, and sorted according to their frequency.
3.1.1 System architecture
QAKiS is composed of four main modules (Fig. 3.2): i) the query generator takes the userquestion as input, generates the typed questions, and then generates the SPARQL queriesfrom the retrieved patterns; ii) the pattern matcher takes as input a typed question, andretrieves the patterns (among those in the repository) matching it with the highest similarity;iii) the sparql package handles the queries to DBpedia; and iv) a Named Entity (NE)Recognizer. The multimedia answer generator module was added later, and will be describedin Section 3.3.
Figure 3.2: QAKiS workflow
The current version of QAKiS targets questions containing a NE related to the answer throughone property of the ontology, as Which river does the Brooklyn Bridge cross?. Each questionmatches a single pattern (i.e. one relation).
Before running the pattern matcher component, the question target is identified combiningthe output of Stanford NE Recognizer, with a set of strategies that compare it with the instanceslabels in the DBpedia ontology. Then a typed question is generated by replacing the questionkeywords (e.g. who, where) and the NE by the types and supertypes. A Word Overlapalgorithm is then applied to match such typed questions with the patterns for each relation.A similarity score is provided for each match: the highest represents the most likely relation.A set of patterns is retrieved by the pattern matcher component for each typed question, andsorted by decreasing matching score. For each of them, a set of SPARQL queries is generatedand then sent to an endpoint for answer retrieval.

3.1. QAKIS 109
Multilingual DBpedia alignment. Multilingual DBpedia chapters1 have been created fol-lowing Wikipedia structure: each chapter contains therefore data extracted from Wikipediain the corresponding language, and so reflects local specificity. Data from different DBpediachapters are connected by several alignments: i) instances are aligned according to the inter-language links, that are created by Wikipedia editors to relate articles about the same topic indifferent languages; ii) properties that mostly come from template attributes, i.e. structuredelements that can be included in Wikipedia pages so as to display structured information.These properties are aligned through mappings manually edited by the DBpedia community.Since QAKiS allows to query English, French and German DBpedia chapters, Figure 3.3 showsthe additional information coverage provided by the mentioned DBpedia chapters. Areas FRonly, DE only and DE+FR only correspond to aligned data made available by French andGerman DBpedia chapters.
EN+FRonly
DBpedia EN
DBpedia DE
DBpedia FR
Pairs (subject, property) withvalues in DBpedia chapters
Number
EN+FR+DE 110 685
EN+DE only 48 804
EN+FR only 408 125
DE+FR only 231 585
EN only 1 790 972
DE only 1 036 953
FR only 411 782
DEonly
FRonly
ENonly
EN+DEonly
DE+FRonly
EN+DE+FR
Figure 3.3: Relative coverage of English, German and French DBpedia chapters (in 2013).
QAKiS extension to query DBpedia multilingual chapters. QAKiS extension to querythe ontology properties of multilingual DBpedia is integrated at the SPARQL package level.Instead of sending the query to English DBpedia only, the Query manager reformulates thequeries and sends them to multiple DBpedia chapters. As only the English chapter containslabels in English, this change has no impact on the NE Recognition. The main difference isin the query selection step. As in the monolingual setting, patterns are taken iteratively bydecreasing matching score, the generated query is then evaluated and if no results are found thenext pattern is considered, and so on. However, as queries are evaluated on several DBpediachapters, it is more likely to get results, terminating query selection with a higher matchingscore. Currently, the results of a SPARQL query are aggregated by the set union. Otherstrategies could be considered, as using a voting mechanism to select the most frequent answer,or enforcing a priority according to data provenance (e.g. English chapter could be consideredas more reliable for questions related to English culture).
3.1.2 Experimental evaluation
QALD-2 dataset. Table 1 reports QAKiS’s results on the QALD-2 data sets2 (DBpediatrack). For the demo, we focused on code optimization reducing QAKiS average processingtime per question from 15 to 2 sec., w.r.t. the version used for the challenge.
Most of QAKiS’ mistakes concern wrong relation assignment (i.e. wrong pattern matching).Another issue concerns questions ambiguity, i.e. the same surface forms can in fact refer todifferent relations in the DBpedia ontology. We plan to cluster relations with several patternsin common, to allow QAKiS to search among all the relations in the cluster.
1http://wiki.dbpedia.org/Internationalization/Chapters2http://greententacle.techfak.uni-bielefeld.de/~cunger/qald/

110 CHAPTER 3. NATURAL LANGUAGE INTERACTION WITH THE WEB OF DATA
Precision Recall F-measure # answered # right answ. # partially righttrain 0.476 0.479 0.477 40/100 17/40 4/40test 0.39 0.37 0.38 35/100 11/35 4/35
Table 3.1: QAKiS performances on DBpedia data sets (participation to QALD-2)
The partially correct answers concern questions involving more than one relation: the actualversion of the algorithm detects indeed only one of them, therefore we would need to improvethe system to address questions with multiple (often nested) relations.
QALD-2 dataset reduced. Since QAKiS currently targets only questions containing a NErelated to the answer through one property of the ontology (e.g. In which military conflictsdid Lawrence of Arabia participate? ), we extracted from QALD-2 test set10 the set of questionscorresponding to such criterion (i.e. 32 questions). The discarded questions require either someforms of reasoning (e.g. counting or ordering) on data, aggregation (from datasets differentfrom DBpedia), involve n-relations, or they are boolean questions. We run both QAKiSEN (i.e.the system taking part into the challenge) and QAKiSEN+FR and QAKiSEN+DE (the versionsenriched with the French and German DBpedia, respectively) on the reduced set of questions.Since the answer to QALD-2 questions can be retrieved in English DBpedia, we do not expectmultilingual QAKiS to improve its performances. On the contrary, we want to verify thatQAKiS performances do not decrease (due to the choice of the wrong relation triggered by adifferent pattern that finds an answer in multilingual DBpedia). Even if often extended QAKiSselects different patterns with respect to the original system, the selected relation is the same(except than in one case), meaning that generally performances are not worsen by the additionof multilingual DBpedia chapters.
Multilingual DBpedia. Since that at the time of this work no reference list of questionswhose answers can be found in French or German DBpedia only existed, we created our listto evaluate the improvement in QAKiS’s coverage as follows: i) we take the sample of 32QALD-2 questions described before; ii) we extract the list of triples present in French andGerman DBpedia only; in each question we substitute the NE with another entity for whichthe asked relation can be found respectively in the French or German chapters only. Forinstance, for the QALD-2 question How tall is Michael Jordan?, we substitute the NE MichaelJordan with the entity Margaret Simpson, for which we know that the relation height ismissing in English DBpedia, but is present in the French chapter. As a result, we obtainthe question How tall is Margaret Simpson?, that we submit to QAKiSEN+FR. Following thesame procedure for German, in Who developed Skype? we substituted the NE Skype with theentity IronPython, obtaining the question Who developed IronPython?. The same procedureis applied for German.3 For some properties (e.g. Governor, Battle), no additional links areprovided by the multilingual chapters, so we discarded the questions asking for those relations.QAKiS precision on the new set of questions over French and German DBpedia is in linewith QAKiSEN on English DBpedia (∼ 50%). This evaluation did not have the goal to showimproved performances of the extended version of QAKiS with respect to its precision, but toshow that the integration of multilingual DBpedia chapters in the system is easily achievable,and that the expected improvements on its coverage are really promising and worth exploring(see Figure 3.3). To double-check, we run the same set of questions on QAKiSEN , and in nocases it was able to detect the correct answer, as expected.
3The obtained set of transformed questions is available online at http://dbpedia.inria.fr/qakis/.

3.2. RADAR 2.0: A FRAMEWORK FOR INFORMATION RECONCILIATION 111
3.2 RADAR 2.0: a framework for information reconcil-
iation
In the Web of Data, it is possible to retrieve heterogeneous information items concerning asingle real-world object coming from different data sources, e.g., the results of a single SPARQLquery on different endpoints. It is not always the case that these results are identical, it mayhappen that they conflict with each other, or they may be linked by some other relationlike a specification. The automated detection of the kind of relationship holding betweendifferent instances of a single object with the goal of reconciling them is an open problem forconsuming information in the Web of Data. In particular, this problem arises while querying thelanguage-specific chapters of DBpedia [310]. Such chapters, well connected through Wikipediainstance interlinking, can in fact contain different information with respect to the Englishversion. Assuming we wish to query a set of language-specific DBpedia SPARQL endpoints withthe same query, the answers we collect can be either identical, or in some kind of specificationrelation, or they can be contradictory. Consider for instance the following example: we query aset of language-specific DBpedia chapters about How tall is the soccer player Stefano Tacconi?,receiving the following information: 1.88 from the Italian chapter and the German one, 1.93from the French chapter, and 1.90 from the English one. How can I know what is the “correct”(or better, the more reliable) information, knowing that the height of a person is unique?Addressing such kind of issues is the goal of the present section. More precisely, in this section,we answer the research question:
• How to reconcile information provided by the language-specific chapters of DBpedia?
This open issue is particularly relevant to Question Answering (QA) systems over DB-pedia [290], where the user expects a unique (ideally correct) answer to her factual naturallanguage question. A QA system querying different data sources needs to weight them in anappropriate way to evaluate the information items they provide accordingly. In this scenario,another open problem is how to explain and justify the answer the system provides to the userin such a way that the overall QA system appears transparent and, as a consequence, morereliable. Thus, our research question breaks down into the following subquestions: i) How toautomatically detect the relationships holding between information items returned by differentlanguage-specific chapters of DBpedia? ii) How to compute the reliability degree of such infor-mation items to provide a unique answer? iii) How to justify and explain the answer the QAsystem returns to the user?
First, we need to classify the relations connecting each piece of information to the othersreturned by the different data sources, i.e., the SPARQL endpoints of the language-specific DB-pedia chapters. To this purpose, we propose a categorization of the relations existing betweendifferent information items retrieved with a unique SPARQL query [95] (described later on inthis section). At the time of this work, such categorization was the only one considering linguis-tic, fine-grained relations among the information items returned by language-specific DBpediachapters, given a certain query. This categorization considers ten positive relations amongheterogeneous information items (referring to widely accepted linguistic categories in the liter-ature), and three negative relations meaning inconsistency. Starting from this categorization,we propose the RADAR (ReconciliAtion of Dbpedia through ARgumentation) framework, thatadopts a classification method to return the relation holding between two information items.This first step results in a graph-based representation of the result set where each informationitem is a node, and edges represent the identified relations.
Second, we adopt argumentation theory [151], a suitable technique for reasoning aboutconflicting information, to assess the acceptability degree of the information items, dependingon the relation holding between them and the trustworthiness of their information source [131].

112 CHAPTER 3. NATURAL LANGUAGE INTERACTION WITH THE WEB OF DATA
Roughly, an abstract argumentation framework is a directed labeled graph whose nodes arethe arguments and the edges represent a conflict relation. Since positive relations among thearguments may hold as well, we rely on bipolar argumentation [102] that considers also apositive support relation.
Third, the graph of the result set obtained after the classification step, together with theacceptability degree of each information item obtained after the argumentation step, is used tojustify and explain the resulting information ranking (i.e., the order in which the answers arereturned to the user).
We evaluate our approach as standalone (i.e., over a set of heterogeneous values extractedfrom a set of language-specific DBpedia chapters), and through its integration in the QA systemQAKiS, described in Section 3.1. The reconciliation module is embedded to provide a (possiblyunique) answer whose acceptability degree is over a given threshold, and the graph structurelinking the different answers highlights the underlying justification. Moreover, RADAR isapplied to over 300 DBpedia properties in 15 languages, and the obtained resource of reconciledDBpedia language-specific chapters is released.
Even if information reconciliation is a way to enhance Linked Data quality, we do notaddress the issue of Linked Data quality assessment and fusion [311, 73], nor ontology alignment.Finally, argumentation theory in this work is not exploited to find agreements over ontologyalignments [148]. Note that our approach is intended to reconcile and explain the answer ofthe system to the user. Ontology alignment cannot be exploited to generate such a kind ofexplanations. This is why we decided to rely on argumentation theory that is a way to exchangeand explain viewpoints. In this work, we have addressed the open problem of reconcilingand explaining a result set from language-specific DBpedia chapters using well-known conflictdetection and explanation techniques, i.e., argumentation theory.
3.2.1 Framework description
The RADAR 2.0 (ReconciliAtion of Dbpedia through ARgumentation) framework for infor-mation reconciliation is composed by three main modules (see Figure 3.4). It takes as inputa collection of results from one SPARQL query raised against the SPARQL endpoints of thelanguage-specific DBpedia chapters. Given such result set, RADAR retrieves two kinds ofinformation: (i) the sources proposing each particular element of the result set, and (ii) theelements of the result set themselves. The first module of RADAR (module A, Figure 3.4) takeseach information source, and following two different heuristics, assigns a confidence degree tothe source. Such confidence degree will affect the reconciliation in particular with respect tothe possible inconsistencies: information proposed by the more reliable source will obtain ahigher acceptability degree. The second module of RADAR (module B, Figure 3.4) insteadstarts from the result set, and it matches every element with all the other returned elements,detecting the kind of relation holding between these two elements. The result of such module isa graph composed by the elements of the result set connected with each other by the relationsof our categorization. Both the sources associated with a confidence score and the result setin the form of a graph are then provided to the third module of RADAR, the argumentationone (module C, Figure 3.4). The aim of such module is to reconcile the result set. The mod-ule considers all positive relations as a support relation and all negative relations as an attackrelation, building a bipolar argumentation graph where each element of the result set is seenas an argument. Finally, adopting a bipolar fuzzy labeling algorithm relying on the confidenceof the sources to decide the acceptability of the information, the module returns the accept-ability degree of each argument, i.e., element of the result set. The output of the RADARframework is twofold. First, it returns the acceptable elements (a threshold is adopted), andsecond the graph of the result set is provided, where each element is connected to the others

3.2. RADAR 2.0: A FRAMEWORK FOR INFORMATION RECONCILIATION 113
Figure 3.4: RADAR 2.0 framework architecture.
by the identified relations (i.e., the explanation about the choice of the acceptable argumentsreturned).
Assigning a confidence score to the source
Language-specific DBpedia chapters can contain different information on particular topics, e.g.providing more or more specific information. Moreover, the knowledge of certain instances andthe conceptualization of certain relations can be culturally biased. For instance, we expectto have more precise (and possibly more reliable) information on the Italian actor AntonioAlbanese on the Italian DBpedia, than on the English or on the French ones.
To trust and reward the data sources, we need to calculate the reliability of the source withrespect to the contained information items. In [86], an a priori confidence score is assigned tothe endpoints according to their dimensions and solidity in terms of maintenance (the Englishchapter is assumed to be more reliable than the others on all values, but this is not alwaysthe case). RADAR 2.0 assigns, instead, a confidence score to the DBpedia language-specificchapter depending on the queried entity, according to the following two criteria:
• Wikipedia page length. The chapter of the longest language-specific Wikipedia page de-scribing the queried entity is considered as fully trustworthy (i.e., it is assigned with ascore of 1) while the others are considered less trustworthy (i.e., they are associated witha score < 1). In choosing such heuristic, we followed [60] that demonstrates that thearticle length is a very good predictor of its precision. The length is calculated on theWikipedia dump of the considered language (# of characters in the text, ignoring imagetags and tables). Thus, the longest page is assigned a score equal to 1, and a proportionalscore is assigned to the other chapters.
• Entity geo-localization. The chapter of the language spoken in the places linked to thepage of the entity is considered as fully trustworthy (i.e., it is assigned with a score of1) while the others are considered less trustworthy (i.e., they are associated with a score< 1). We assume that if an entity belongs to a certain place or is frequently referredto it, it is more likely that the DBpedia chapter of such country contains updated andreliable information. All Wikipedia page hyperlinks are considered, and their presencein GeoNames4 is checked. If existing, the prevalent language in the place (following theGeoNames matching country-language5) is extracted, and to the corresponding chapter a
4http://www.geonames.org/5Such table connecting a country with its language can be found here: http://download.geonames.org/
export/dump/countryInfo.txt.
114 CHAPTER 3. NATURAL LANGUAGE INTERACTION WITH THE WEB OF DATA
score equal to 1 is assigned. As for page length, a proportional score is then assigned tothe other chapters (i.e. if an entity has e.g. 10 links to places in Italy and 2 to places inGermany, the score assigned to the Italian DBpedia chapter is 1, while for the Germanchapter is 0.2).
Such metrics (the appropriateness of which for our purposes has been tested on the developmentset) are then summed and normalized with a score ranging from 0 to 1, where 0 is the leastreliable chapter for a certain entity and 1 is the most reliable one. The obtained scores are thenconsidered by the argumentation module for information reconciliation.
Relations classification
We propose a classification of the semantic relations holding among the different instances ob-tained by querying a set of language-specific DBpedia chapters with a certain query. Moreprecisely, such categories correspond to the lexical and discourse relations holding among het-erogeneous instances obtained querying two DBpedia chapters at a time, given a subject andan ontological property. In the following, we list the positive relations between values resultingfrom the data-driven study we carried out and described in [95]. Then, in parallel, we describehow RADAR 2.0 addresses the automatic classification of such relations.
Identity i.e., same value but in different languages (missing owl:sameAs link in DBpedia).E.g., Dairy product vs Produits laitiers
Acronym i.e., initial components in a phrase or a word. E.g., PSDB vs Partito della Social
Democrazia Brasiliana
Disambiguated entity i.e., a value contains in the name the class of the entity. E.g., MichaelLewis (Author) vs Michael Lewis
Coreference i.e., an expression referring to another expression describing the same thing(in particular, non normalized expressions). E.g., William Burroughs vs William S.
Burroughs
Given the high similarity among the relations belonging to these categories, we cluster theminto a unique category called surface variants of the same entity. Given two entities, RADARautomatically detects the surface variants relation among them, if one of the following strategiesis applicable: cross-lingual links6, text identity (i.e. string matching), Wiki redirection anddisambiguation pages.
Geo-specification i.e., ontological geographical knowledge. E.g., Queensland vs Australia
Renaming i.e., reformulation of the same entity name in time. E.g., Edo, old name of Tokyo
In [95], we defined renaming as referring only to geographical renaming. For this reason, wemerge it to the category geo-specification. RADAR classifies a relation among two entities asfalling inside this category when in the GeoNames one entity is contained in the other one (geo-specification is a directional relation between two entities). We also consider the alternative
6Based on WikiData, a free knowledge base that can be read and edited by humans and machines alike,http://www.wikidata.org/, where data entered in any language is immediately available in all other languages.In WikiData, each entity has the same ID in all languages for which a Wikipedia page exists, allowing us toovercome the problem of missing owl:sameAs links in DBpedia (that was an issue in DBpedia versions prior to3.9). Moreover, WikiData is constantly updated (we use April 2014 release).

3.2. RADAR 2.0: A FRAMEWORK FOR INFORMATION RECONCILIATION 115
names gazette included in GeoNames, and geographical information extracted from a set ofEnglish Wikipedia infoboxes, such as Infobox former country7 or Infobox settlement.
Meronymy i.e., a constituent part of, or a member of something. E.g., Justicialist Party
is a part of Front for Victory
Hyponymy i.e., relation between a specific and a general word when the latter is implied bythe former. E.g., alluminio vs metal
Metonymy i.e., a name of a thing/concept for that of the thing/concept meant. E.g., JosephHanna vs Hanna-Barbera
Identity:stage name i.e., pen/stage names pointing to the same entity. E.g., Lemony Snicket
vs Daniel Handler
We cluster such semantic relations into a category called inclusion.8 To detect this category ofrelations, RADAR exploits a set of features extracted from:
MusicBrainz9 to detect when a musician plays in a band, and when a label is owned by abigger label.
BNCF (Biblioteca Nazionale Centrale di Firenze) Thesaurus10 for the broader termrelation between common names.
DBpedia, in particular the datasets connecting Wikipedia, GeoNames and MusicBrainztrough the owl:sameAs relation.
WikiData for the part of, subclass of and instance of relations. It contains links to GeoN-ames, BNCF and MusicBrainz, integrating DBpedia owl:sameAs.
Wikipedia contains hierarchical information in: infoboxes (e.g. property parent for compa-nies, product for goods, alter ego for biographies), categories (e.g., Gibson guitars),“see also” sections and links in the first sentence (e.g., Skype was acquired by [UnitedStates]-based [Microsoft Corporation]).
Inclusion is a directional relation between two entities (the rules we apply to detect meronymy,hyponymy and stage name allow us to track the direction of the relation, i.e. if a → b, or b →a).
Moreover, in the classification proposed in [95], the following negative relations (i.e., valuesmismatches) among possibly inconsistent data are identified:
Text mismatch i.e. unrelated entity. E.g., Palermo vs Modene
Date mismatch i.e. different date for the same event. E.g., 1215-04-25 vs 1214- 04-25
7For instance, we extract the property “today” connecting historical entity names with the current ones(reconcilable with GeoNames). We used Wikipedia dumps.
8Royo [397] defines both relations of meronymy and hyponymy as relations of inclusion, although they differin the kind of inclusion defined (hyponymy is a relation of the kind “B is a type of A”, while meronymy relatesa whole with its different parts or members). Slightly extending Royo’s definition, we joined to this categoryalso the relation of metonymy, a figure of speech scarcely detectable by automatic systems due to its complexity(and stage name, that can be considered as a particular case of metonymy, i.e., the name of the character forthe person herself).
9http://musicbrainz.org/10http://thes.bncf.firenze.sbn.it/

116 CHAPTER 3. NATURAL LANGUAGE INTERACTION WITH THE WEB OF DATA
d
a bc
(a) (b)
a
b
c
1.88
1.93
1.90
1.88
(c)
Figure 3.5: Example of (a) an AF , (b) a bipolar AF , and (c) example provided in the introduc-tion modeled as a bipolar AF , where single lines represent attacks and double lines representsupport.
Numerical mismatch i.e. different numerical values. E.g., 1.91 vs 1.8
RADAR labels a relation between instances (i.e., URIs) as negative, if every attempt to findone of the positive relations described above fails (i.e., negation as a failure). For numericalvalues, a numerical mismatch identifies different values.11
The reader may argue that a machine learning approach could have been applied to thistask, but a supervised approach would have required an annotated dataset to learn the features.Unfortunately, at the moment there is no such training set available to the research community.Moreover, given the fact that our goal is to produce a resource as precise as possible forfuture reuse, the implementation of a rule-based approach allows us to tune RADAR to rewardprecision in our experiments, in order to accomplish our purpose.
Argumentation-based information reconciliation
This subsection begins with a brief overview of abstract argumentation theory, and then wedetail the RADAR 2.0 argumentation module.
An abstract argumentation framework (AF) [151] aims at representing conflicts among ele-ments called arguments, whose role is determined only by their relation with other arguments.An AF encodes, through the conflict (i.e., attack) relation, the existing conflicts within a setof arguments. It is then interesting to identify the conflict outcomes, which, roughly speak-ing, means determining which arguments should be accepted, and which arguments should berejected, according to some reasonable criterion.
The set of accepted arguments of an argumentation framework consists of a set of argumentsthat does not contain an argument conflicting with another argument in the set. Dung [151]presents several acceptability semantics that produce zero, one, or several consistent sets ofaccepted arguments. Roughly, an argument is accepted (i.e., labelled in) if all the argumentsattacking it are rejected, and it is rejected (i.e., labelled out) if it has at least an argumentattacking it which is accepted. Figure 3.5.a shows an example of an AF. The arguments arevisualized as nodes of the argumentation graph, and the attack relation is visualized as edges.Gray arguments are the accepted ones. Using Dung’s admissibility-based semantics [151], theset of accepted arguments is {b, c}. For more details about acceptability semantics, we referthe reader to Baroni at al. [32].
However, associating a crisp label, i.e., in or out, to the arguments is limiting in a number ofreal life situations where a numerical value expressing the acceptability degree of each argumentis required [153, 131, 236]. In particular, da Costa Pereira et al. [131] have proposed a fuzzylabeling algorithm to account for the fact that arguments may originate from sources that aretrusted only to a certain degree. They define a fuzzy labeling for argument A as α(A) =min{A(A), 1 −maxB:B→A α(B)} where A(A) is given by the trust degree of the most reliable
11At the moment no tolerance is admitted, if e.g. the height of a person differs of few millimeters in twoDBpedia chapters, the relation is labeled as numerical mismatch. We plan to add such tolerance for informationreconciliation as future work.

3.2. RADAR 2.0: A FRAMEWORK FOR INFORMATION RECONCILIATION 117
source that offers argument A, and argument B is an argument attacking A. We say thatα(A) is the fuzzy label of argument A. Consider the example in Figure 3.5.a, if we haveA(a) = A(b) = A(c) = 0.8, then the algorithm returns the following labeling: α(a) = 0.2 andα(c) = α(b) = 0.8.
Since we want to take into account the confidence associated with the information sources tocompute the acceptability degree of arguments, we rely on the computation of fuzzy confidence-based degrees of acceptability. As the fuzzy labeling algorithm [131] exploits a scenario wherethe arguments are connected by an attack relation only, in Cabrio et al. [86] we have proposeda bipolar version of this algorithm, to consider also a positive, i.e., support, relation among thearguments (bipolar AFs) for the computation of the fuzzy labels of the arguments.
Let A be a fuzzy set of trustful arguments, and A(A) be the membership degree of argumentA in A, we have that A(A) is given by the trust degree of the most reliable (i.e., trusted) sourcethat offers argument A12, and it is defined as follows: A(A) = maxs∈src(A) τs where τs is thedegree to which source s ∈ src(A) is evaluated as reliable. The starting confidence degreeassociated with the sources is provided by RADAR’s first module. The bipolar fuzzy labelingalgorithm [86] assumes that the following two constraints hold: (i) an argument cannot attackand support another argument at the same time, and (ii) an argument cannot support anargument attacking it, and vice versa. These constraints underlie the construction of thebipolar AF itself. In the following, the attack relation is represented with →, and the supportrelation with ⇒.
Definition 1 Let 〈A,→,⇒〉 be an abstract bipolar argumentation framework where A is afuzzy set of (trustful) arguments, →⊆ A × A and ⇒⊆ A × A are two binary relations calledattack and support, respectively. A bipolar fuzzy labeling is a total function α : A → [0, 1].
Such an α may also be regarded as (the membership function of) the fuzzy set of acceptablearguments where the label α(A) = 0 means that the argument is outright unacceptable, andα(A) = 1 means the argument is fully acceptable. All cases in between provide the degree ofthe acceptability of the arguments which may be considered accepted in the end, if they exceeda certain threshold.
A bipolar fuzzy labeling is defined as follows13, where argument B is an argument attackingA and C is an argument supporting A:
Definition 2 (Bipolar Fuzzy Labeling) A total function α : A → [0, 1] is a bipolar fuzzy labelingiff, for all arguments A, α(A) = avg{min{A(A), 1−maxB:B→A α(B)}; maxC:C⇒A α(C)}.
When the argumentation module receives the elements of the result set linked by the appro-priate relation and the confidence degree associated to each source, the bipolar fuzzy labelingalgorithm is applied to the argumentation framework to obtain the acceptability degree of eachargument. In case of cyclic graphs, the algorithm starts with the assignment of the trustwor-thiness degree of the source to the node, and then the value converges in a finite number ofsteps to the final label. Note that when the argumentation framework is composed by a cycleonly, then all labels become equal to 0.5.
Consider the example in Figure 3.5.b, if we have A(a) = A(d) = 1, A(b) = 0.4 andA(c) = 0.2, then the fuzzy labeling algorithm returns the following labels: α(a) = α(b) = 0.4,α(c) = 0.6, and α(d) = 1. The step by step computation of the labels is shown in Table 3.2.Figure 3.5.c shows how the example provided in the introduction is modeled as a bipolarargumentation framework, where we expect the Italian DBpedia chapter to be the most reliable
12We follow da Costa Pereira et al. [131] choosing the max operator (“optimistic” assignment of the labels),but the min operator may be preferred for a pessimistic assignment.
13For more details about the bipolar fuzzy labeling algorithm, see Cabrio et al. [86].

118 CHAPTER 3. NATURAL LANGUAGE INTERACTION WITH THE WEB OF DATA
Table 3.2: BAF : a→ b, b→ c, c→ a, d⇒ c
t αt(a) αt(b) αt(c) αt(d)0 1 0.4 0.2 11 0.9 0.2 0.6 ↓2 0.65 0.15 ↓3 0.52 0.254 0.46 0.365 0.43 0.46 0.41 ↓7 0.48 ↓
one, given that Stefano Tacconi is an Italian soccer player. The result returned by the bipolarargumentation framework is that the trusted answer is 1.88. A more precise instantiation ofthis example in the QA system is shown in the next section.
The fact that an argumentation framework can be used to provide an explanation andjustify positions is witnessed by a number of applications in different contexts [45], like forinstance practical reasoning [464], legal reasoning [46, 52], medical diagnosis [237]. This isthe reason why we choose this formalism to reconcile information, compute the set of reliableinformation items, and finally justify this result. Other possible solutions would be (weighted)voting mechanisms, where the preferences of some voters, i.e., the most reliable informationsources, carry more weight than the preferences of other voters. However, voting mechanismsdo not consider the presence of (positive and negative) relations among the items within thelist, and no justification beyond the basic trustworthiness of the sources is provided to motivatethe ranking of the information items.
Notice that argumentation is needed in our use case because we have to take into account thetrustworthiness of the information sources, and it provides an explanation of the ranking, whichis not possible with simple majority voting. Argumentation theory, used as a conflict detectiontechnique, allows us to detect inconsistencies and consider the trustworthiness evaluation ofthe information sources, as well as proposing a single answer to the users. As far as we know,RADAR integrated in QAKiS is the first example of QA over Linked Data system coping withthis problem and providing a solution. Simpler methods would not allow to cover both aspectsmentioned above. We use bipolar argumentation instead of non-bipolar argumentation becausewe have not only the negative conflict relation but also the positive support relation among theelements of the result set.
3.2.2 Experimental setting and evaluation
In the following, we describe the dataset on which we evaluate the RADAR framework, andwe discuss the obtained results. Moreover, we describe the resource of reconciled DBpediainformation we create and release.
Dataset
To evaluate the RADAR framework, we created an annotated dataset of possibly inconsistentinformation in DBpedia language-specific chapters to our knowledge [95]. It is composed of400 annotated pairs of values (extracted from English, French and Italian DBpedia chapters), asample that is assumed to be representative of the linguistic relations holding between values inDBpedia chapters. Note that the size of the DBpedia chapter does not bias the type of relations

3.2. RADAR 2.0: A FRAMEWORK FOR INFORMATION RECONCILIATION 119
identified among the values, nor their distribution, meaning that given a specific property,each DBpedia chapter deals with that property in the same way. We randomly divided suchdataset into a development (to tune RADAR) and a test set, keeping the proportion among thedistribution of categories.14 Table 3.3 reports on the dataset statistics, and shows how manyannotated relations belong to each of the categories described before in this section.
Table 3.3: Statistics on the dataset used for RADAR 2.0 evaluation
Dataset # triples # annotated positive relations # annotated negative relationsSurface-form Geo-specific. Inclusion Text mismatch Date mismatch Numerical mismatch
Dev set 104 28 18 20 13 13 12Test set 295 84 48 55 36 37 35Total 399 112 66 75 49 50 47
3.2.3 Results and discussion
Table 3.4 shows the results obtained by RADAR on the relation classification task on the testset. As baseline, we apply an algorithm exploiting only cross-lingual links (using WikiData),and exact string matching. Since we want to produce a resource as precise as possible for futurereuse, RADAR has been tuned to reward precision (i.e., so that it does not generate false posi-tives for a category), at the expense of recall (errors follow from the generation of false negativesfor positive classes). As expected, the highest recall is obtained on the surface form category(our baseline performs even better than RADAR on such category). The geo-specification cat-egory has the lowest recall, either due to missing alignments between DBpedia and GeoNames(e.g. Ixelles and Bruxelles are not connected in GeoNames), or to the values complexity in therenaming subcategory (e.g., Paris vs First French Empire, or Harburg (quarter) vs Hambourg).In general, the results obtained are quite satisfying, fostering future work in this direction.
Table 3.4: Results of the system on relation classification
System Relation category Precision Recall F1
RADAR 2.0
surface form 0.91 0.83 0.87geo-specification 0.94 0.60 0.73inclusion 0.86 0.69 0.77overall positive 1.00 0.74 0.85text mismatch 0.45 1 0.62
baseline
surface form 1.00 0.44 0.61geo-specification 0.00 0.00 0.00inclusion 0.00 0.00 0.00overall positive 1.00 0.21 0.35text mismatch 0.21 1 0.35
Since we consider text mismatch as a negative class (Section 3.2.1), it includes the cases inwhich RADAR fails to correctly classify a pair of values into one of the positive classes. Fordate and numerical mismatches, F1 = 1 (detecting them is actually a trivial task, and thereforethey are not included in Table 3.4. See footnote 11). Overall positive means that RADARcorrectly understands the fact that the different answers to a certain query are all correct and
14The dataset is available at http://www.airpedia.org/radar-1.0.nt.bz2. The original work is based onDBpedia 3.9, but we updated it to DBpedia 2014. Thus, we deleted one pair, since the DBpedia page of one ofthe annotated entities does not exist anymore.

120 CHAPTER 3. NATURAL LANGUAGE INTERACTION WITH THE WEB OF DATA
not conflicting. RADAR precision in this case is 1, and it is important to underline this aspectin the evaluation, since this confirms the reliability of the released reconciled DBpedia in thisrespect. The overall positive result is higher than the partial results because in the precisionof partial values we include the fact that if e.g., a surface form relation is wrongly labeled asgeo-specification, we consider this mistake both as a false negative for surface form, and as afalse positive for geo-specification. This means that RADAR is very precise in assigning positiverelations, but it could provide a less precise classification into finer-grained categories.
Reconciled DBpedia resource
We applied RADAR 2.0 on 300 DBpedia properties - the most frequent in terms of chaptersmapping such properties, corresponding to 47.8% of all properties in DBpedia. We considered∼5M Wikipedia entities. The outcoming resource, a sort of universal DBpedia, counts ∼50Mof reconciled triples from 15 DBpedia chapters: Bulgarian, Catalan, Czech, German, English,Spanish, French, Hungarian, Indonesian, Italian, Dutch, Polish, Portuguese, Slovenian, Turkish.Notice that we did not consider the endpoint availability as a requirement to choose the DBpediachapters: data are directly extracted from the resource.
For functional properties, the RADAR framework is applied as previously described. Incontrast, the strategy to reconcile the values of non-functional properties is slightly different:when a list of values is admitted (e.g. for properties child or instruments), RADAR mergesthe list of the elements provided by the DBpedia chapters, and ranks them with respect to theconfidence assigned to their source, after reconciling positive relations only (there is no way forlists to understand if an element is incorrect or just missing, e.g. in the list of the instrumentsplayed by John Lennon). But since the distinction between functional/non-functional propertiesis not precise in DBpedia, we manually annotated the 300 properties with respect to thisclassification, to allow RADAR to apply the correct reconciliation strategy, and to produce areliable resource. In total, we reconciled 3.2 million functional property values, with an averageaccuracy computed from the precision and recall reported in Table 3.4.
Moreover, we carried out a merge and a light-weight reconciliation of DBpedia classes ap-plying the strategy called “DBpedia CL” in [14] where “CL” stands for cross-language (e.g.,Michael Jackson is classified as a Person in the Italian and German DBpedia chapters, anArtist in the English DBpedia and a MusicalArtist in the Spanish DBpedia. As Person,Artist and MusicalArtist lie on the same path from the root of the DBpedia ontology, all ofthem are kept and used to classify Michael Jackson.
3.2.4 Integrating RADAR in a QA system
We integrate RADAR into a QA system over language-specific DBpedia chapters, given theimportance that information reconciliation has in this context. Indeed, a user expects a unique(and preferably correct) answer to her factual natural language question, and would not trusta system providing her with different and possibly inconsistent answers coming out of a blackbox. A QA system querying different data sources needs therefore to weight in an appropriateway such sources in order to evaluate the information items they provide accordingly.
As QA system we selected QAKiS, described in Section 3.1. As explained before, in QAKiSthe SPARQL query created after the question interpretation phase is sent to the SPARQLendpoints of the language-specific DBpedia chapters (i.e., English, French, German and Italian)for answer retrieval. The set of retrieved answers from each endpoint is then sent to RADAR2.0 for answer reconciliation.
To test RADAR integration into QAKiS, the user can select the DBpedia chapter she wantsto query besides English (that must be selected as it is needed for NE recognition), i.e., French,German or Italian DBpedia. Then the user can either write a question or select among a list of

3.2. RADAR 2.0: A FRAMEWORK FOR INFORMATION RECONCILIATION 121
Figure 3.6: QAKiS + RADAR demo (functional properties)
Figure 3.7: QAKiS + RADAR demo (non-functional properties)

122 CHAPTER 3. NATURAL LANGUAGE INTERACTION WITH THE WEB OF DATA
Figure 3.8: Example about the question Who developed Skype?
examples. Clicking on the tab Reconciliation, a graph with the answers provided by the differentendpoints and the relations among them is shown to the user (as shown in Figures 3.6 and 3.7for the questions How tall is Stefano Tacconi?, and List the children of Margaret Thatcher,respectively). Each node has an associated confidence score, resulting from the fuzzy labelingalgorithm. Moreover, each node is related to the others by a relation of support or attack,and a further specification of such relations according to the categories previously described isprovided to the user as answer justification of why the information items have been reconciledand ranked in this way.
Looking at these examples, the reader may argue that the former question can be answeredby a simple majority voting (Figure 3.6), and the latter can be answered by a grouping based onsurface forms (Figure 3.7), without the need to introduce the complexity of the argumentationmachinery. However, if we consider the following example from our dataset, the advantage ofusing argumentation theory becomes clear. Let us consider the question Who developed Skype? :in this case, we retrieve three different answers, namely Microsoft (from FR DBpedia), MicrosoftSkype Division (from FR DBpedia), and Skype Limited (EN DBpedia). The relations assignedby RADAR are visualized in Figure 3.8. The answer, with the associated weights, returns firstMicrosoft (FR) with a confidence score of 0.74, and second, Skype Limited (EN, FR) with aconfidence score of 0.61. Note that this result cannot be achieved with simple majority votingnor with grouping based on surface forms.
QA experimental setting
To provide a quantitative evaluation of RADAR integration into QAKiS on a standard datasetof natural language questions, we consider the questions provided by the organizers of QALD-5for the DBpedia track (the most recent edition of the challenge at the time of this work).15
More specifically, we collect the questions sets of QALD-2 (i.e. 100 questions of the trainingand 100 questions of the test sets), the test set of QALD-4 (i.e. 50 questions), and the questionssets of QALD-5 (50 additional training questions with respect to the previous years training
15http://www.sc.cit-ec.uni-bielefeld.de/qald/

3.2. RADAR 2.0: A FRAMEWORK FOR INFORMATION RECONCILIATION 123
set, and 59 questions in the test sets). These 359 questions correspond to all the questionsreleased in the five years of the QALD challenge (given the fact that the questions of QALD-1are included into the question set of QALD-2, and the question set of QALD-3 is the sameas QALD-2, but translated into 6 languages, and the training sets of QALD-4 and 5 includeall the questions of QALD-2). QALD-3 also provides natural language questions for SpanishDBpedia, but given that the current version of QAKiS cannot query the Spanish DBpedia, wecould not use this question set.
We extract from this reference dataset of 359 questions, the questions that the currentversion of QAKiS is built to address (i.e. questions containing a NE related to the answerthrough one property of the ontology), corresponding to 26 questions in QALD-2 trainingset, 32 questions in QALD-2 test sets, 12 in QALD-4 test set, 18 in QALD-5 training set,and 11 in QALD-5 test set. The discarded questions require either some form of aggregation(e.g., counting or ordering), information from datasets different than DBpedia, involve n-aryrelations, or are boolean questions. We consider these 99 questions as the QALD referencedataset for our experiments.
Results on QALD answers reconciliation
We run the questions contained into our QALD reference dataset on the English, German,French and Italian chapters of DBpedia. Since the questions of QALD were created to query theEnglish chapter of DBpedia only, it turned out that only in 43/99 cases at least two endpointsprovide an answer (in all the other cases the answer is provided by the English chapter only, notuseful for our purposes). For instance, given the question Who developed Skype? the EnglishDBpedia provides Skype Limited as the answer, while the French one outputs Microsoft andMicrosoft Skype Division. Or given the question How many employees does IBM have?, theEnglish and the German DBpedia chapters provide 426751 as answer, while the French DBpedia433362. Table 3.6 lists these 43 QALD questions, specifying which DBpedia chapters (amongthe English, German, French and Italian ones) contain at least one value for the queried relation.This list of question is the reference question set for our evaluation.
We evaluated the ability of RADAR 2.0 to correctly classify the relations among the in-formation items provided by the different language-specific SPARQL endpoints as answer tothe same query, w.r.t. a manually annotated gold standard, built following the methodologyin Cabrio et al. [95]. More specifically, we evaluate RADAR with two sets of experiments: inthe first case, we start from the answers provided by the different DBpedia endpoints to the 43QALD questions, and we run RADAR on it. In the second case, we add QAKiS in the loop,meaning that the data we use as input for the argumentation module are directly produced bythe system. In this second case, the input are the 43 natural language questions.
Table 3.5 reports on the results we obtained for the two experiments. As already noticedbefore, the QALD dataset was created to query the English chapter of DBpedia only, andtherefore this small dataset does not capture the variability of possibly inconsistent answersthat can be found among DBpedia language-specific chapters. Only three categories of relationsare present in this data – surface forms, geo-specification, and inclusion – and for this reasonRADAR has outstanding performances on it when applied on the correct mapping betweenNL questions and the SPARQL queries. When QAKiS is added into the loop, its mistakes ininterpreting the NL question and translating it into the correct SPARQL query are propagatedin RADAR (that receives in those cases a wrong input), decreasing the total performances.
Notice that in some cases the question interpretation can be tricky, and can somehow biasthe evaluation of the answers provided by the system. For instance, for the question Whichpope succeeded John Paul II?, the English DBpedia provides Benedict XVI as the answer, whilethe Italian DBpedia provides also other names of people that were successors of John Paul II in

124 CHAPTER 3. NATURAL LANGUAGE INTERACTION WITH THE WEB OF DATA
other roles, as for instance in being the Archbishop of Krakow. But since in the gold standardthis question is interpreted as being the successor of John Paul II in the role of Pope, only theentity Benedict XVI is accepted as correct answer.
When integrated into QAKiS, RADAR 2.0 outperforms the results obtained by a preliminaryversion of the argumentation module, i.e. RADAR 1.0 [86], for the positive relation classification(the results of the argumentation module only cannot be strictly compared with the resultsobtained by RADAR 2.0, since i) in its previous version the relation categories are differentand less fine-grained, and ii) in [86] only questions from QALD-2 were used in the evaluation),showing an increased precision and robustness of our framework. Note that this evaluation isnot meant to show that QAKiS performance is improved by RADAR. Actually, RADAR doesnot affect the capacity of QAKiS to answer questions: RADAR is used to disambiguate amongmultiple answers retrieved by QAKiS in order to provide to the user the most reliable (andhopefully correct) one.
One of the reasons why RADAR is implemented as a framework that can be integrated ontop of an existing QA system architecture (and is therefore system-independent), is becausewe would like it to be tested and exploited by potentially all QA systems querying more thanone DBpedia chapter (at the time of this study, QAKiS was the only one, but given thepotential increase in the coverage of a QA system querying multiple DBpedia language-specificchapters [84], we expected other systems to take advantage of these interconnected resources).
Table 3.5: Results on QALD relation classification
System Relation category Precision Recall F1
RADAR 2.0 (only)
surface form 1.00 0.98 0.99geo-specification 0.88 0.80 0.84inclusion 0.80 1.00 0.88overall positive 1.00 0.98 0.99
baseline
surface form 1.00 0.97 0.98geo-specification 0.00 0.00 0.00inclusion 0.00 0.00 0.00overall positive 1.00 0.86 0.92
QAKiS + RADAR 2.0
surface form 1.00 0.59 0.74geo-specification 0.88 0.80 0.84inclusion 0.80 1.00 0.88overall positive 1.00 0.63 0.77
QAKiS + baseline
surface form 1.00 0.58 0.74geo-specification 0.00 0.00 0.00inclusion 0.00 0.00 0.00overall positive 1.00 0.52 0.68
QAKiS + RADAR 1.0 [86]overall positive 0.54 0.56 0.55
(on QALD-2 questions only)

3.3. MULTIMEDIA ANSWER VISUALIZATION IN QAKIS 125
Table 3.6: QALD questions used in the evaluation (in bold the ones correctly answered byQAKiS; x means that the corresponding language specific DBpedia chapter (EN, FR, DE, IT)contains at least one value for the queried relation; dbo means DBpedia ontology)
ID, question set Question DBpedia relation EN FR DE IT84, QALD-2 train Give me all movies with Tom Cruise. starring x x x10, QALD-2 train In which country does the Nile start? sourceCountry x x63, QALD-2 train Give me all actors starring in Batman Begins. starring x x x x43, QALD-2 train Who is the mayor of New York City? leaderName x x x54, QALD-2 train Who was the wife of U.S. president Lincoln? spouse x x6, QALD-2 train Where did Abraham Lincoln die? deathPlace x x x31, QALD-2 train What is the currency of the Czech Republic? currency x x x x73, QALD-2 train Who owns Aldi? keyPerson x x x20, QALD-2 train How many employees does IBM have? numberOfEmployees x x x x33, QALD-2 train What is the area code of Berlin? areaCode x2, QALD-2 test Who was the successor of John F. Kennedy? successor x x4, QALD-2 test How many students does the Free University numberOfStudents x x x
in Amsterdam have?14, QALD-2 test Give me all members of Prodigy. bandMember x x20, QALD-2 test How tall is Michael Jordan? height x x x21, QALD-2 test What is the capital of Canada? capital x x x x35, QALD-2 test Who developed Skype? product x x38, QALD-2 test How many inhabitants does Maribor have? populationTotal x x41, QALD-2 test Who founded Intel? foundedBy x x x65, QALD-2 test Which instruments did John Lennon play? instrument x x68, QALD-2 test How many employees does Google have? numberOfEmployees x x x74, QALD-2 test When did Michael Jackson die? deathDate x x x76, QALD-2 test List the children of Margaret Thatcher. child x x83, QALD-2 test How high is the Mount Everest? elevation x x x86, QALD-2 test What is the largest city in Australia? largestCity x x87, QALD-2 test Who composed the music for Harold and Maude? musicComposer x x x34, QALD-4 test Who was the first to climb Mount Everest? firstAscentPerson x x21, QALD-4 test Where was Bach born? birthPlace x x x x32, QALD-4 test In which countries can you pay using the West currency x x
African CFA franc?12, QALD-4 test How many pages does War and Peace have? numberOfPages x x36, QALD-4 test Which pope succeeded John Paul II? successor x x30, QALD-4 test When is Halloween? date x x259, QALD-5 train Who wrote The Hunger Games? author x x280, QALD-5 train What is the total population of Melbourne, Florida? populationTotal x x x282, QALD-5 train In which year was Rachel Stevens born? birthYear x x x x283, QALD-5 train Where was JFK assassinated? deathPlace x x x x291, QALD-5 train Who was influenced by Socrates? influencedBy x x295, QALD-5 train Who was married to president Chirac? spouse x x298, QALD-5 train Where did Hillel Slovak die? deathPlace x x x x7, QALD-5 test Which programming languages were influenced by Perl? influencedBy x x x x18, QALD-5 test Who is the manager of Real Madrid? manager x x19, QALD-5 test Give me the currency of China. country x x32, QALD-5 test What does the abbreviation FIFA stand for? name x x x47, QALD-5 test Who were the parents of Queen Victoria? parent x x x
3.3 Multimedia answer visualization in QAKiS
Given that an increasingly huge amount of multimedia content is now available on the web onalmost any topic, we judged it to be extremely interesting to consider them in the QA scenario,in which the best answers may be a combination of text and other media answers [227]. Forthis reason, we proposed an additional extension of QAKiS that allows to exploit the structureddata and metadata describing multimedia content on the linked data to provide a richer andmore complete answer to the user, combining textual information with other media content.A first step in this direction consists in determining the best sources and media (image, audio,video, or a hybrid) to answer a query. For this reason, we have carried out an analysis of thequestions provided by the QALD challenge, and we have categorized them according to thepossible improved multimedia answer visualization. Then, we have extended QAKiS output to

126 CHAPTER 3. NATURAL LANGUAGE INTERACTION WITH THE WEB OF DATA
Multimedia Example question
Picture Give me all female Russian astronauts.Picture + video Give me all movies directed by Francis Ford Coppola.Picture + map In which country does the Nile start?Map + barchart Give me all world heritage sites designated within the past 5 years.Statcharts What is the total amount of men and women serving in the FDNY?Timelines When was Alberta admitted as province?
Table 3.7: QALD-3 questions improved answer visualization
include i) pictures from Wikipedia Infoboxes, for instance to visualize images of people or places(for questions as Who is the President of the United States? ); ii) OpenStreetMap, to visualizemaps for questions asking about a place (e.g. What is the largest city in Australia? ) and iii)YouTube, to visualize videos related to the answer (e.g. a trailer of a movie, for questions likeWhich films starring Clint Eastwood did he direct himself? ).
While providing the textual answer to the user, the multimedia answer generator module(see Figure 3.2) queries again DBpedia to retrieve additional information about the entity con-tained in the answer. To display the images, it extracts the properties foaf:depiction anddbpedia-owl:thumbnail, and their value (i.e. the image) is shown as output. To displaythe maps (e.g. when the answer is a place), it retrieves the GPS co-ordinates from DBpe-dia (properties geo:geometry, geo:lat and geo:long), and it injects them dynamically intoOpenStreetMap16 to display the map. Given the fact that DBpedia data can be inconsistentor incomplete, we define a set of heuristics to extract the co-ordinates: in case there are severalvalues for the latitude and longitude, i) we give priorities to negative values (indicating thesouthern hemisphere17), and ii) we take the value with the highest number of decimal values,assuming it is the most precise. Finally, to embed YouTube18 videos, first the Freebase19 ID ofthe entity is retrieved through the DBpedia property owl:sameAs. Then, such ID is used viaYouTube search API (v3) (i.e. it is included in the embed code style <iframe>, that allowsusers to view the embedded video in either Flash or HTML5 players, depending on their viewingenvironment and preferences). Moreover, since we want to have pertinent videos (i.e. showingcontent related to the answer in the context of the question only), we remove stopwords fromthe input question, and we send the remaining words as search parameters. For instance, forthe question Give me the actors starring in Batman Begins, the words “actors”, “starring”,“Batman Begins” are concatenated and used as search parameters, so that the videos extractedfor such actors are connected to the topic of the question (i.e. the actors in their respectiveroles in Batman Begins).
Figure 3.9 shows QAKiS the above described extension in demo interface. The user canselect the DBpedia chapter she wants to query besides English, i.e. French or German DBpedia.Then the user can either write a question or select among a list of examples, and click on GetAnswers!. As output, in the tab Results QAKiS provides: i) the textual answer (linked to itsDBpedia page), ii) the DBpedia source, iii) the associate image in Wikipedia Infobox, iv) amore details button. Clicking on that button, both the entity abstract in Wikipedia, the mapand the retrieved videos (if pertinent) are shown.
In order to determine the best sources and media (image, audio, video, or a hybrid) to answera query, we have carried out an analysis on a subset of the questions provided by the QALD-3
16www.openstreetmap.org17We verified that when both a positive and a negative value are proposed, the negative is the correct one
(the letter S, i.e. South, is not correctly processed.)18www.youtube.com/19www.freebase.com

3.4. RELATED WORK 127
Figure 3.9: QAKiS with multimedia visualization
challenge.20 The goal was to categorize them according to the possible improved multimediaanswer visualization, and to extract some heuristics to be exploited by QAKiS to provide themost complete answer to a certain question. In this analysis, we discarded the questions forwhich no additional multimedia content would be pertinent, e.g. questions whose answer is anumber (e.g. How many students does the Free University in Amsterdam have? ), or booleanquestions (e.g. Did Tesla win a nobel prize in physics? ). In future work we could providemultimedia content on the entity in the question, but in the current work we are focusing onboosting the answer visualization only. Table 3.7 shows the categories of multimedia contentfor answer visualization on which we are focusing, together with an example of question forwhich such kind of multimedia content would be appropriate.
3.4 Related Work
QA systems over Linked Data. The most recent survey on the field of Question Answeringat the time of the works presented in this chapter is provided by [290], with a focus on ontology-based QA. Moreover, they examine the potential of open user-friendly interfaces for the SWto support end users in reusing and querying SW content. State of the art QA systems overLinked Data generally address the issue of question interpretation mapping a natural languagequestion to a triple-based representation. For instance, Freya [134] uses syntactic parsingin combination with ontology-based lookup for question interpretation, partly relying on theuser’s help in selecting the entity that is most appropriate as match for some natural languageexpressions. One of the problems of that approach is that often end-users are unable to help, incase they are not informed about the modeling and vocabulary of the data. PowerAqua [289]accepts user queries expressed in NL and retrieves answers from multiple semantic sources onthe SW. It follows a pipeline architecture, according to which the question is i) transformedby the linguistic component into a triple based intermediate format, ii) passed to a set ofcomponents to identify potentially suitable semantic entities in various ontologies, and then iii)the various interpretations produced in different ontologies are merged and ranked for answerretrieval. PowerAqua’s main limitation is in its linguistic coverage. Pythia [446] relies on a deeplinguistic analysis to compositionally construct meaning representations using a vocabularyaligned to the vocabulary of a given ontology. Pythia’s major drawback is that it requires alexicon, which has to be manually created. Later, an approach based on Pythia [446] but more
20http://doi.org/10.4119/unibi/citec.2013.6

128 CHAPTER 3. NATURAL LANGUAGE INTERACTION WITH THE WEB OF DATA
similar to the one adopted in QAKiS is presented [445]. It relies on a linguistic parse of thequestion to produce a SPARQL template that directly mirrors the internal structure of thequestion (i.e. SPARQL templates with slots to be filled with URIs). This template is theninstantiated using statistical entity identification and predicate detection.
Information reconciliation State-of-the-art QA systems over Linked Data generally ad-dress the issue of question interpretation mapping a natural language question to a triple-basedrepresentation (see [290] for an overview). Moreover, they examine the potential of open user-friendly interfaces for the Semantic Web to support end users in reusing and querying theSemantic Web content. None of these systems considers language-specific DBpedia chapters,and they do not provide a mechanism to reconcile the different answers returned by heteroge-neous endpoints. Finally, none of them provides explanations about the answer returned to theuser.
Several works address alignment agreement based on argumentation theory. More pre-cisely, Laera et al. [261] address alignment agreement relying on argumentation to deal withthe arguments which attack or support the candidate correspondences among ontologies. Do-ran et al. [147] propose a methodology to identify subparts of ontologies which are evaluatedas sufficient for reaching an agreement, before the argumentation step takes place, and dosSantos and Euzenat [148] present a model for detecting inconsistencies in the selected setsof correspondences relating ontologies. In particular, the model detects logical and argumen-tation inconsistency to avoid inconsistencies in the agreed alignment. We share with theseapproaches the use of argumentation to detect inconsistencies, but RADAR goes beyond them:we identify in an automated way relations among information items that are more complexthan owl:sameAs links (as in ontology alignment). Moreover, these approaches do not considertrust-based acceptance degrees of the arguments, lacking to take into account a fundamentalcomponent in the arguments’ evaluation, namely their sources.
We mentioned these works applying argumentation theory to address ontology alignmentagreements as examples of applications of this theory to open problems in the Semantic Webdomain. Actually, the two performances cannot be compared to show the superiority of one ofthe two approaches, as the task is different.
QALD competitions I was involved in the organization of four editions of the Question An-swering over Linked Data challenge (i.e. QALD-3,4,5 and 6), a series of evaluation campaignson question answering over linked data with a strong emphasis on multilingualism, hybridapproaches using information from both structured and unstructured data, and question an-swering over RDF data cubes. It is aimed at all kinds of systems that mediate between auser, expressing his or her information need in natural language, and semantic data. The mainobjective of QALD is to provide up-to-date, demanding benchmarks that establish a standardagainst which question answering systems over structured data can be evaluated and com-pared. It has been organized as an ESWC workshop and an ISWC workshop as well as a partof the Question Answering lab at CLEF. Over the past years, a range of approaches have beendeveloped to address this challenge, showing significant advances towards answering naturallanguage questions with respect to large, heterogeneous sets of structured (and unstructureddata). In [114, 447, 448, 450] we described the computational tasks of the different editions ofthe competition, the technical setup, and presented the participants. Furthermore, we reportedon the obtained results and provided some analysis and interpretation.

3.5. CONCLUSIONS 129
3.5 Conclusions
The work presented in this chapter is interdisciplinary with respect to the research fields of Nat-ural Language Processing and the Semantic Web, to enhance interactions between non-expertusers and the huge and heterogeneous amount of data available on the Web. In particular, wehave presented QAKiS, a QA system over DBpedia that allows end users to submit a queryto an RDF triple store in English and obtain the answer in the same language, hiding thecomplexity of the non-intuitive formal query languages involved in the resolution process. Toshow the interesting potential for NLP applications resulting from the properties alignment inmultilingual DBpedia, we have extended the QAKiS system so that it could query the ontologyproperties of the French, German and Italian DBpedia chapters. We show that this integrationextends the system coverage (i.e. the recall), without having a negative impact on its precision.With this respect, possible extensions of the proposed framework are envisaged, to improvemainly: i) the system coverage, addressing boolean and n-relation questions; ii) port QAKiSto multiple languages, i.e. allowing input questions in languages different from English.
We have also presented another extension of QAKiS, that allows to complement textualanswers with multimedia content from the linked data, to provide a richer and more completeanswer to the user.
Finally, a major contribution of this chapter is the introduction and evaluation of theRADAR 2.0 framework for information reconciliation over language-specific DBpedia chap-ters. The framework is composed of three main modules: a module computing the confidencescore of the sources depending either on the length of the related Wikipedia page or on thegeographical characterization of the queried entity, a module retrieving the relations holdingamong the elements of the result set, and finally a module computing the reliability degreeof such elements depending on the confidence assigned to the sources and the relations amongthem. This third module is based on bipolar argumentation theory, and a bipolar fuzzy labelingalgorithm is exploited to return the acceptability degrees. The resulting graph of the resultset, together with the acceptability degrees assigned to each information item, justifies to theuser the returned answer and it is the result of the reconciliation process. The evaluation ofthe framework shows the feasibility of the proposed approach. Moreover, the framework hasbeen integrated in QAKiS, allowing to reconcile and justify the answers obtained from fourlanguage-specific DBpedia chapters (i.e. English, French, German and Italian). Finally, theresource generated applying RADAR to 300 properties in 15 DBpedia chapters to reconciletheir values is released. There are several points to be addressed as future work, as the userevaluation, to verify whether our answer justification in QAKiS appropriately suits the needs ofthe data consumers, and to receive feedback on how to improve such visualization. Moreover,the proposed framework is not limited to the case of multilingual chapters of DBpedia. Thegeneral approach RADAR is based on allows to extend it to various cases like inconsistentinformation from multiple English data endpoints. The general framework would be the same,the only part to be defined are the rules to extract the relations among the retrieved results.Investigating how a module of this type can be adopted as a fact-checking module is part ofour future research plan.

130 CHAPTER 3. NATURAL LANGUAGE INTERACTION WITH THE WEB OF DATA

Chapter 4
Mining argumentative structures fromtexts
This section is dedicated to my research about argument mining, a research area I contributedto raise together with Serena Villata [92]. My research in this area mainly deals with thedetection of arguments and the prediction of their relations in different textual resources, aspolitical debates, medical texts, and social media content.
My research contributions on this topic have been published in several journal and venues.I provide below a list of the main publications on the topic:
• Shohreh Haddadan, Elena Cabrio and Serena Villata (2019). Yes, we can! Mining Ar-guments in 50 Years of US Presidential Campaign Debates, in Proceedings of the 57thAnnual Meeting of the Association for Computational Linguistics (ACL2019). Short pa-per [209]
• Tobias Mayer, Elena Cabrio, Serena Villata (2020). Transformer-based Argument Miningfor Healthcare Applications, Proceedings of the 24th European Conference on ArtificialIntelligence (ECAI2020) [304]
• Tobias Mayer, Elena Cabrio, Serena Villata (2019). ACTA A Tool for ArgumentativeClinical Trial Analysis. Proceedings of the International Joint Conference in ArtificialIntelligence (IJCAI 2019). Demo paper [303]
• Shohreh Haddadan, Elena Cabrio, Serena Villata (2019) DISPUTool - A tool for the Argu-mentative Analysis of Political Debates. Proceedings of the International Joint Conferencein Artificial Intelligence (IJCAI 2019). Demo paper [208]
• Stefano Menini, Elena Cabrio, Sara Tonelli and Serena Villata (2018). Never retreat,never retract: Argumentation Analysis for Political Speeches, Proceedings of the Thirty-Second AAAI Conference on Artificial Intelligence (AAAI-18) [312]
• Elena Cabrio, Serena Villata (2018), Five Years of Argument Mining: a Data-drivenAnalysis, Proceedings of IJCAI-ECAI 2018 [92]
• Mihai Dusmanu, Elena Cabrio and Serena Villata (2017). Argument Mining on Twit-ter: Arguments, Facts and Sources, in Proceedings of the Empirical Methods in NaturalLanguage Processing conference (EMNLP2017). Short paper [154]
• Sahbi Benlamine, Maher Chaouachi, Serena Villata, Elena Cabrio, Claude Frasson, FabienGandon (2015). Emotions in Argumentation: an Empirical Evaluation, Proceedings ofthe International Joint Conference in Artificial Intelligence (IJCAI 2015) [48]
131

132 CHAPTER 4. MINING ARGUMENTATIVE STRUCTURES FROM TEXTS
• Elena Cabrio, Serena Villata (2013). A natural language bipolar argumentation approachto support users in online debate interactions†. Argument & Computation 4(3): 209-230(2013) [91]
• Elena Cabrio, Serena Villata and Fabien Gandon (2013). A Support Framework forArgumentative Discussions Management in the Web. in The Semantic Web: Semanticsand Big Data, Lecture Notes in Computer Science Volume 7882, pp. 412-426. Bestpaper award [94]
• Elena Cabrio, Serena Villata (2012). Natural Language Arguments: A Combined Ap-proach, in Proceedings of the European Conference on Artificial Intelligence (ECAI 2012)[90]
• Elena Cabrio, Serena Villata (2012). Combining Textual Entailment and Argumenta-tion Theory for Supporting Online Debates Interactions, Proceedings of the 50th annualmeeting of the Association for Computational Linguistics (ACL 2012). Short paper. [89]
AM is “the general task of analyzing discourse on the pragmatics level and applying a certainargumentation theory to model and automatically analyze the data at hand” [206]. Two tasksare crucial in Argument Mining: i) Argument component detection in the input text: this stepmay be further split in the detection of argument components (i.e., claims and premises) andof their textual boundaries. Different methods have been tested in the last years, like SupportVector Machines (SVM) (e.g., [280]), Naıve Bayes classifiers [156], Logistic Regression [274] andNeural Networks [425], and ii) Prediction of the relations holding between the argumentativecomponents (i.e., attacks and supports). Relations can be predicted between arguments [91] orbetween argument components [425].
In this chapter, I summarize my main contributions in the AM research field, from my veryfirst works on bridging semantic inferences methods in NLP with bipolar argumentation toanalyze user-generated content, to my ongoing research on defining and applying AM methodsin the political and in the medical scenarios. The contributions reported in this chapter are theresults of several collaborations with my colleague Serena Villata, in the context of the Ph.D.of Tobias Mayer and Shohreh Haddadan.
Our very first works on user-generated content raised from the observation that with thegrowing use of the Social Web, an increasing number of applications for exchanging opinionswith other people are becoming available online. These applications are widely adopted withthe consequence that the number of opinions about the debated issues increases. In order tocut in on a debate, the participants need first to evaluate the opinions of the other users todetect whether they are in favour or against the debated issue. Bipolar argumentation proposesalgorithms and semantics to evaluate the set of accepted arguments, given the support and theattack relations among them. Two main problems arise. First, an automated framework todetect the relations among the arguments represented by the natural language (NL) formula-tion of the users’ opinions is needed. Together with my colleague Serena Villata, we addressedthis open issue by proposing and evaluating the use of NL techniques to identify the argumentsand their relations. In particular, we adopt the Textual Entailment (TE) approach, a genericframework for applied semantics, where linguistic objects are mapped by means of semanticinferences at a textual level. TE is then coupled together with an abstract bipolar argumenta-tion system which allows to identify the arguments that are accepted in the considered onlinedebate. Second, we address the problem of studying and comparing the different proposals putforward for modelling the support relation. The emerging scenario shows that there is not aunique interpretation of the support relation. In particular, different combinations of additionalattacks among the arguments involved in a support relation are proposed. We provide an NLaccount of the notion of support based on online debates, by discussing and evaluating the
133
support relation among arguments with respect to the more specific notion of TE in the NLprocessing field. Finally, we carry out a comparative evaluation of four proposals of additionalattacks on a sample of NL arguments extracted from Debatepedia. The originality of the pro-posed framework lies in the following point: NL debates are analysed and the relations amongthe arguments are automatically extracted.
In another work on user-generated content, we addressed the problem of understanding thestream of messages exchanged on social media such as Facebook and Twitter, given that is be-coming a major challenge for automated systems. The tremendous amount of data exchangedon these platforms as well as the specific form of language adopted by social media users con-stitute a new challenging context for existing argument mining techniques. We constructed aresource of natural language arguments called DART (Dataset of Arguments and their Rela-tions on Twitter) [68] where the complete argument mining pipeline over Twitter messages isconsidered: (i) we identify which tweets can be considered as arguments and which cannot,and (ii) we identify what is the relation, i.e., support or attack, linking such tweets to eachother. We also worked on the creation of a complete argument mining pipeline over Twittermessages [69], whose final goal is to compute the set of tweets which are widely recognized asaccepted, and the different (possibly conflicting) viewpoints that emerge on a topic, given astream of messages. In addition, new issues emerge when dealing with arguments posted onsuch platforms, such as the need to make a distinction between personal opinions and actualfacts, and to detect the source disseminating information about such facts to allow for prove-nance verification. We applied supervised classification to identify arguments on Twitter, andwe presented two new tasks for argument mining, namely facts recognition and source identi-fication. We studied the feasibility of the approaches proposed to address these tasks on a setof tweets related to the Grexit and Brexit news topics.
One of the main researches we are currently focusing on concern AM on political speeches,with the final goal of addressing fallacies detection. As a first work in this area, we appliedargumentation mining techniques, in particular relation prediction, to study political speechesin monological form, where there is no direct interaction between opponents. We argue thatthis kind of technique can effectively support researchers in history, social and political sciences,which must deal with an increasing amount of data in digital form and need ways to automati-cally extract and analyze argumentation patterns. We tested and discussed our approach basedon the analysis of documents issued by R. Nixon and J.F. Kennedy during 1960 presidentialcampaign. The application of argument mining to such data allows not only to highlight themain points of agreement and disagreement between the candidates’ arguments over the cam-paign issues such as Cuba, disarmament and health-care, but also an in-depth argumentativeanalysis of the respective viewpoints on these topics.
Given that political debates offer a rare opportunity for citizens to compare the candidates’positions on the most controversial topics of the campaign, as a second line of works in this area,we carried out an empirical investigation of the typology of argument components in politicaldebates by annotating 39 political debates from the last 50 years of US presidential campaigns,creating a new corpus of 29k argument components, labeled as premises and claims. Moreover,we evaluated feature-rich SVM learners and Neural Networks methods on such data achievingsatisfactory performances on different oratory styles across time and topics.
As for the medical domain, evidence-based decision making in the health-care domain targetsat supporting clinicians in their deliberation process to establish the best course of action forthe case under evaluation. Although the reasoning stage of this kind of frameworks receivedconsiderable attention, little effort has been devoted to the mining stage. In this researchactivity, we annotated first a dataset of 159 abstracts of Randomized Controlled Trials (RCTs)from the MEDLINE database, comprising 4 different diseases (i.e., glaucoma, hypertension,hepatitis b, diabetes), then a larger dataset of 500 abstracts on the neoplasm disease, leading

134 CHAPTER 4. MINING ARGUMENTATIVE STRUCTURES FROM TEXTS
to a dataset of 4113 argument components and 2601 argument relations. We then proposeda complete argument mining pipeline for RCTs, classifying argument components as evidenceand claims, and predicting the relation, i.e., attack or support, holding between those argumentcomponents. We experiment with deep bidirectional transformers in combination with differentneural architectures (i.e., LSTM, GRU and CRF) and outperformed current state-of-the-artend-to-end argument mining systems.
This chapter is organized as follows: Section 4.1 and 4.2 present the research work carriedout on user-generated content. Section 4.3 and 4.4 report on the work carried out on politicalspeeches and debates, while Section 4.5 describes the recent work on AM on clinical trials. Wereport then related work on AM, and conclusions end the chapter.
4.1 A natural language bipolar argumentation approach
to support users in online debate interactions
In the last years, the Web has changed in the so called Social Web. The Social Web hasseen an increasing number of applications like Twitter1, Debatepedia2, Facebook3 and manyothers, which allow people to express their opinions about different issues. Let us consider forinstance the following debate published on Debatepedia: the issue of the debate is “MakingInternet a right only benefits society”. The participants have proposed various pro and conarguments concerning this issue, e.g., a pro argument claims that the Internet delivers freedomof speech, and a con argument claims that the Internet is not as important as real rights likethe freedom from slavery. These kinds of debates are composed by tens of arguments in favouror against a proposed issue. The main difficulty for newcomers is to understand the currentholding position in the debate, i.e., to understand which are the arguments that are acceptedat a certain moment. This difficulty is twofold: first, the participants have to remember allthe different, possibly long, arguments and understand which are the relations among thesearguments, and second they have to understand, given these relations, which are the acceptedarguments.
In this work, one of our first work on AM, we answer the following research question: howto support the participants in natural language (NL) debates to detect which are the relationsamong the arguments, and which arguments are accepted? Two kinds of relations connect thearguments in such online debate platforms: a positive relation (i.e., a support relation), anda negative relation (i.e., an attack relation). To answer to our research question we need torely on an argumentative framework able to deal with such bipolar relations. [152]’s abstracttheory defines an argumentation framework as a set of abstract arguments interacting witheach others through a so called attack relation. In the last years, several proposals to extendthe original abstract theory with a support relation have been addressed, leading to the birthof bipolar argumentation frameworks (BAF) [100], and the further introduction of a number ofadditional attacks among the arguments [101, 61, 348].
Our research question breaks down into the following subquestions:
1. How to automatically identify the arguments, as well as their relationships, from naturallanguage debates?
2. What is the relation between the notion of support in bipolar argumentation and thenotion of textual entailment in natural language processing?
1http://twitter.com/2http://idebate.org/3http://www.facebook.com/

4.1. A NATURAL LANGUAGE BIPOLAR ARGUMENTATION APPROACH 135
First, we propose to combine natural language techniques and Dung-like abstract argumen-tation to identify and generate the arguments from natural language text, and then to evaluatethis set of arguments to know which are the accepted ones. Starting from the participants’opinions, we detect which ones imply or contradict, even indirectly, the issue of the debateusing the textual entailment approach. Beside formal approaches to semantic inference thatrely on logical representation of meaning, the notion of Textual Entailment (TE) has been pro-posed as an applied framework to capture major semantic inference needs across applicationsin the Computational Linguistics field [132]. The development of the Web has witnessed aparadigm shift, due to the need to process a huge amount of available (but often noisy) data.TE is a generic framework for applied semantics, where linguistic objects are mapped by meansof semantic inferences at a textual level. We use TE to automatically identify, from a naturallanguage text, the arguments. Second, we adopt bipolar argumentation [100] to reason over theset of generated arguments with the aim of deciding which are the accepted ones. Proposals likeargumentation schemes [465], Araucaria [391], Carneades [196], and ArguMed [455] use naturallanguage arguments, but they ask the participants to indicate the semantic relationship amongthe arguments, and the linguistic content remains unanalyzed. As underlined by [390], “thegoal machinery that leads to arguments being automatically generated has been only brieflytouched upon, and yet is clearly fundamental to the endeavor”. Summarizing, we combine thetwo approaches, i.e., textual entailment and abstract bipolar argumentation, in a frameworkwhose aim is to (i) generate the abstract arguments from the online debates through TE, (ii)build the argumentation framework from the arguments and the relationships returned by theTE module, and (iii) return the set of accepted arguments. We evaluate the feasibility of ourcombined approach on a data set extracted from a sample of Debatepedia debates.
Second, we study the relation among the notion of support in bipolar argumentation [100],and the notion of TE in Natural Language Processing (NLP) [132]. In the first study of thecurrent work, we assume the TE relation extracted from NL texts as equivalent to a supportrelation in bipolar argumentation. This is a strong assumption, and in this second part of ourwork we aim at verifying on a sample of real data from Debatepedia whether it is always the casethat support is equivalent to TE. In particular, for addressing this issue we focus both on therelation between support and entailment, and on the relation between attack and contradiction.We show that TE and contradiction are more specific concepts than support and attack, but stillhold in most of the argument pairs. Moreover, starting from the comparative study addressedby [102], we consider four additional attacks proposed in the literature: supported (if argumenta supports argument b and b attacks argument c, then a attacks c) and secondary (if a supportsb and c attacks a, then c attacks b) attacks [101], mediated attacks [61] (if a supports b andc attacks b, then c attacks a), and extended attacks [347, 348] (if a supports b and a attacksc, then b attacks c). We investigate the presence and the distribution of these attacks in NLdebates on a data set extracted from Debatepedia, and we show that all these models areverified in human debates, even if with a different frequency.
The originality of the proposed framework consists in the combination of two techniqueswhich need each other to provide a complete reasoning model: TE has the power to automati-cally identify the arguments in the text and to specify which kind of relation links each coupleof arguments, but it cannot assess which are the winning arguments. This is addressed by ar-gumentation theory which lacks automatic techniques to extract the arguments from free text.The combination of these two approaches leads to the definition of a powerful tool to reasonover online debates. In addition, the benefit of the proposed deeper analysis of the relationamong the two notions of support and TE is twofold. First, it is used to verify, through adata driven evaluation, the “goodness” of the proposed models of bipolar argumentation to beused in real settings, going beyond ad hoc NL examples. Second, it can be used to guide theconstruction of cognitive agents whose major need is to achieve a behavior as close as possible

136 CHAPTER 4. MINING ARGUMENTATIVE STRUCTURES FROM TEXTS
to the human one.
In the following, we first provide an overview on the standard approaches to semantic infer-ence in the natural language processing field as well as an introduction to textual entailment.We then summarize the basic notions of bipolar argumentation, and describe the four kindsof additional attacks we consider in this work. We present our combined framework unifyingtextual entailment and bipolar argumentation towards the automated detection of the argu-ments’ relations and their acceptability, and we address the analysis of the meaning of supportand attack in natural language dialogues, as well as the comparative study on the existingadditional attacks.
4.1.1 NLP approaches to semantic inference
Classical approaches to semantic inference rely on logical representations of meaning that areexternal to the language itself, and are typically independent of the structure of any particularnatural language. Texts are first translated, or interpreted, into some logical form and then newpropositions are inferred from interpreted texts by a logical theorem prover. But, especially af-ter the development of the Web, we have witnessed a paradigm shift, due to the need to processa huge amount of available (but often noisy) data. Addressing the inference task by means oflogical theorem provers in automated applications aimed at natural language understanding hasshown several intrinsic limitations [55]. As highlighted in [335], in formal approaches seman-ticists generally opt for rich (i.e. including at least first order logic) representation formalismsto capture as many relevant aspects of the meaning as possible, but practicable methods forgenerating such representations are very rare. The translation of real-world sentences into logicis difficult because of issues such as ambiguity or vagueness [381]. Moreover, the computa-tional costs of deploying first-order logic theorem prover tools in real world situations may beprohibitive, and huge amounts of additional linguistic and background knowledge are required.Formal approaches address forms of deductive reasoning, and therefore often exhibit a too highlevel of precision and strictness as compared to human judgments, that allow for uncertaintiestypical of inductive reasoning [67]. While it is possible to model elementary inferences on theprecise level allowed by deductive systems, many pragmatic aspects that play a role in every-day inference cannot be accounted for. Inferences that are plausible but not logically stringentcannot be modeled in a straightforward way, but in NLP applications approximate reasoningshould be preferred in some cases to having no answers at all.
Especially in data-driven approaches, like the one sought in this work, where patterns arelearnt from large-scale naturally-occurring data, we can settle for approximate answers pro-vided by efficient and robust systems, even at the price of logic unsoundness or incompleteness.Starting from these considerations, [335] propose to address the inference task directly at thetextual level instead, exploiting currently available NLP techniques. While methods for au-tomated deduction assume that the arguments in input are already expressed in some formalmeaning representation (e.g., first order logic), addressing the inference task at a textual levelopens different and new challenges from those encountered in formal deduction. Indeed, moreemphasis is put on informal reasoning, lexical semantic knowledge, and variability of linguisticexpressions.
The notion of Textual Entailment has been proposed as an applied framework to capturemajor semantic inference needs across applications in NLP [132]. It is defined as a relation be-tween a coherent textual fragment (the Text T ) and a language expression, which is consideredas the Hypothesis (H ). Entailment holds (i.e. T ⇒ H) if the meaning of H can be inferred fromthe meaning of T, as interpreted by a typical language user. The TE relationship is directional,since the meaning of one expression may usually entail the other, while the opposite is muchless certain. Consider the pairs in Example 1 and 2.

4.1. A NATURAL LANGUAGE BIPOLAR ARGUMENTATION APPROACH 137
Example 1
T1: Internet access is essential now; must be a right. The internet is only that wire that deliversfreedom of speech, freedom of assembly, and freedom of the press in a single connection.H: Making Internet a right only benefits society.
Example 2 (Continued)
T2: Internet not as important as real rights. We may think of such trivial things as a fun-damental right, but consider the truly impoverished and what is most important to them. Theright to vote, the right to liberty and freedom from slavery or the right to elementary education.H: Making Internet a right only benefits society.
A system aimed at recognizing TE should detect an inference relation between T1 and H(i.e. the meaning of H can be derived from the meaning of T) in Example 1, while it shouldnot detect an entailment between T2 and H in Example 2. As introduced before, TE defini-tion is based on (and assumes) common human understanding of language, as well as commonbackground knowledge. However, the entailment relation is said to hold only if the statementin the text licenses the statement in the hypothesis, meaning that the content of T and com-mon knowledge together should entail H, and not background knowledge alone. In this appliedframework, inferences are performed directly over lexical-syntactic representations of the texts.Such definition of TE captures quite broadly the reasoning about language variability needed bydifferent applications aimed at NL understanding and processing, e.g., information extraction[398] and text summarization [36]. Differently from the classical semantic definition of entail-ment [109], the notion of TE accounts for some degree of uncertainty allowed in applications(see Example 1).
In 2005, the PASCAL Network of Excellence started an attempt to promote a genericevaluation framework covering semantic-oriented inferences needed for practical applications,launching the Recognizing Textual Entailment challenge [132], with the aim of setting a uni-fying benchmark for the development and evaluation of methods that typically address similarproblems in different, application-oriented, manners. As many of the needs of several NLPapplications can be cast in terms of TE, the goal of the evaluation campaign is to promote thedevelopment of general entailment recognition engines, designed to provide generic modulesacross applications. Since 2005, such initiative has been repeated yearly4, asking the partici-pants to develop a system that, given two text fragments (the text T and the hypothesis H),can determine whether the meaning of one text is entailed, i.e. can be inferred, from the other.For pairs where the entailment relation does not hold between T and H, systems are requiredto make a further distinction between pairs where the entailment does not hold because thecontent of H is contradicted by the content of T (i.e. contradiction, see Example 2), and pairswhere the entailment cannot be determined because the truth of H cannot be verified on thebasis of the content of T (i.e. unknown, see Example 3). [300] provide a definition of contradic-tion for the TE task, claiming that it occurs when two sentences i) are extremely unlikely to betrue simultaneously, and ii) involve the same event. This three-way judgment task (entailmentvs contradiction vs unknown) was introduced since RTE-4, while before a two-way decisiontask (entailment vs no entailment) was asked to participating systems. However, the classictwo-way task is offered as an alternative also in recent editions of the evaluation campaign(contradiction and unknown judgments are collapsed into the judgment no entailment).
In our work, we consider the three way scenario to map TE relation with bipolar argu-mentation, focusing both on the relation between support and entailment, and on the relation
4http://aclweb.org/aclwiki/index.php?title=Recognizing_Textual_Entailment

138 CHAPTER 4. MINING ARGUMENTATIVE STRUCTURES FROM TEXTS
between attack and contradiction. As will be discussed in Section 4.1.5, we consider argumentpairs connected by a relation of support (but where the first argument does not entail the sec-ond one), and argument pairs connected by a relation of attack (but where the first argumentdoes not contradict the second one) as unknown pairs in the TE framework.
Example 3 (Continued)
T3: Internet “right” means denying parents’ ability to set limits. Do you want to make a worldwhere a mother tells her child: “you cannot stay on the internet anymore” that she has taken aright from him? Compare taking the right for a home or for education with taking the “right”to access the internet.H: Internet access is essential now; must be a right. The internet is only that wire that deliversfreedom of speech, freedom of assembly, and freedom of the press in a single connection.
The systems submitted to the RTE challenge are tested against manually annotated datasets, which include typical examples that correspond to success and failure cases of NLP ap-plications. A number of data-driven approaches applied to semantics have been experimentedthroughout the years. In general, the approaches still more used by the submitted systemsinclude Machine Learning (typically SVM), logical inference, cross-pair similarity measuresbetween T and H, and word alignment - for an overview, see [13], and [132].
4.1.2 Bipolar argumentation
This section provides the basic concepts of [152]’s abstract argumentation, and bipolar argu-mentation [100].
Definition 3 (Abstract argumentation framework AF ) An abstract argumentation frameworkis a pair 〈A,→〉 where A is a set of elements called arguments and→⊆ A×A is a binary relationcalled attack. We say that an argument a attacks an argument b if and only if (a, b) ∈→.
[152] presents several acceptability semantics that produce zero, one, or several sets of acceptedarguments. Such semantics are grounded on two main concepts called conflict-freeness anddefence.
Definition 4 (Conflict-free, Defence) Let C ⊆ A. A set C is conflict-free if and only if thereexist no a, b ∈ C such that a → b. A set C defends an argument a if and only if for eachargument b ∈ A if b attacks a then there exists c ∈ C such that c attacks b.
Definition 5 (Acceptability semantics) Let C be a conflict-free set of arguments, and let D :2A 7→ 2A be a function such that D(C) = {a|C defends a}.
• C is admissible if and only if C ⊆ D(C).
• C is a complete extension if and only if C = D(C).
• C is a grounded extension if and only if it is the smallest (w.r.t. set inclusion) completeextension.
• C is a preferred extension if and only if it is a maximal (w.r.t. set inclusion) completeextension.
• C is a stable extension if and only if it is a preferred extension that attacks all argumentsin A \ C.

4.1. A NATURAL LANGUAGE BIPOLAR ARGUMENTATION APPROACH 139
Roughly, an argument is accepted if all its attackers are rejected, and it is rejected if it hasat least an attacker which is accepted.
Bipolar argumentation frameworks, firstly proposed by [100], extend Dung’s frameworktaking into account both the attack relation and the support relation. In particular, an abstractbipolar argumentation framework is a labeled directed graph, with two labels indicating eitherattack or support. In this work, we represent the attack relation by a → b, and the supportrelation by a⇒ b.
Definition 6 (Bipolar argumentation framework) A bipolar argumentation framework (BAF)is a tuple 〈A,→,⇒〉 where A is the set of elements called arguments, and two binary relationsover A are called attack and support, respectively.
[102] address a formal analysis of the models of support in bipolar argumentation to achieve abetter understanding of this notion and its uses. [100, 101] argue about the emergence of newkinds of attacks from the interaction between attacks and supports in BAF. In the rest of thesection, we will adopt their terminology to refer to additional attacks, i.e., complex attacks. Inparticular, they specify two kinds of complex attacks called secondary and supported attacks,respectively.
Definition 7 (Secondary and supported attacks) Let BAF = 〈A,→,⇒〉 where a, b ∈ A. Asupported attack for b by a is a sequence a1R1 . . . Rn−1an, n ≥ 3, with a1 = a, an = b, suchthat ∀i = 1 . . . n − 2, Ri =⇒ and Rn−1 =→. A secondary attack for b by a is a sequencea1R1 . . . Rn−1an, n ≥ 3, with a1 = a, an = b, such that R1 =→ and ∀i = 2 . . . n-1,Ri =⇒.
According to the above definition, these attacks hold in the first two cases depicted inFigure 4.1, where there is a supported attack from a to c, and there is a secondary attack fromc to b. In this work, we represent complex attacks using a dotted arrow.
b ca a bc
b ca a cb
Supported attack Secondary attack(Extended attack 1)
Extended attack 2Mediated attack
Figure 4.1: Additional attacks emerging from the interaction of supports and attacks.
The support relation has been specialized in other approaches where new complex attacksemerging from the combination of existing attacks and supports are proposed. [61] proposea deductive view of support in abstract argumentation where, given the support a ⇒ b theacceptance of a implies the acceptance of b, and the rejection of b implies the rejection of a.They introduce a new kind of complex attacks called mediated attacks (Figure 4.1).
Definition 8 (Mediated attacks) Let BAF = 〈A,→,⇒〉 where a, b ∈ A. A mediated attack onb by a is a sequence a1R1 . . . Rn−2an−1 and anRn−1an−1, n ≥ 3, with a1 = a, an−1 = b, an = c,such that Rn−1 =→ and ∀i = 1 . . . n-2, Ri =⇒.
[347, 348] propose, instead, an account of support called necessary support. In this frame-work, given a ⇒ b then the acceptance of a is necessary to get the acceptance of b, i.e., the

140 CHAPTER 4. MINING ARGUMENTATIVE STRUCTURES FROM TEXTS
acceptance of b implies the acceptance of a. They introduce two new kinds of complex attackscalled extended attacks (Figure 4.1). Note that the first kind of extended attacks is equivalentto the secondary attacks introduced by [100, 101], and that the second case is the dual of sup-ported attacks. See [102] for a formal comparison of the different models of support in bipolarargumentation.
Definition 9 (Extended attacks) Let BAF = 〈A,→,⇒〉 where a, b ∈ A. An extended attackon b by a is a sequence a1R1a2R2 . . . Rnan, n ≥ 3, with a1 = a, an = b, such that R1 =→ and∀i = 2 . . . n, Ri =⇒, or a sequence a1R1 . . . Rnan and a1Rpap, n ≥ 2, with an = a, ap = b, suchthat Rp =→ and ∀i = 1 . . . n, Ri =⇒.
All these models of support in bipolar argumentation address the problem of how to computethe set of extensions from the extended framework providing different kinds of solutions, i.e.,introducing the notion of safety in BAF [100], or computing the extensions in the meta-level[61, 101]. In this work, we are not interested in discussing and evaluating these differentsolutions. Our aim is to evaluate how much these different models of support occur and areeffectively “exploited” in natural language dialogues, towards a better understanding of thenotion of support and attack in bipolar argumentation.
We are aware that the notion of support is controversial in the field of argumentationtheory. In particular, another view of support sees this relation as a relation holding amongthe premises and the conclusion of a structured argument, and not as another relation amongatomic arguments [385]. However, given the amount of attention bipolar argumentation isreceiving in the literature [389], a better account of this kind of frameworks is required.
Another approach to model support has been proposed by [353] and [354], where theydistinguish among prima-facie arguments and standard ones. They show how a set of argumentsdescribed using Dung’s argumentation framework can be mapped from and to an argumentationframework that includes both attack and support relations. The idea is that an argument canbe accepted only if there is an evidence supporting it, i.e., evidence is represented by means ofprima-facie arguments. In this section, we do not intend to take a position in this debate. Wefocus our analysis on the abstract models of bipolar argumentation proposed in the literature[101, 61, 348], and we leave as future work the account of support in structured argumentationand the model proposed by [353] and [354].
4.1.3 Casting bipolar argumentation as a TE problem
The goal of our work is to propose an approach to support the participants in forums ordebates (e.g., Debatepedia, Twitter) to detect which arguments among the ones expressedby the other participants on a certain topic are accepted. As a first step, we need to (i)automatically generate the arguments (i.e. recognize a participant’s opinion on a certain topicas an argument), as well as (ii) detect their relation with respect to the other arguments.We cast the described problem as a TE problem, where the T-H pair is a pair of argumentsexpressed by two different participants in a debate on a certain topic. For instance, giventhe argument “Making Internet a right only benefits society” (that we consider as H as astarting point), participants can be in favor of it (expressing arguments from which H can beinferred, as in Example 1), or can contradict such argument (expressing an opinion against it,as in Example 2). Since in debates one participant’s argument comes after the other, we canextract such arguments and compare them both w.r.t. the main issue, and w.r.t. the otherparticipants’ arguments (when the new argument entails or contradicts one of the argumentspreviously expressed by another participant). For instance, given the same debate as before, anew argument T3 may be expressed by a third participant to contradict T2 (that becomes thenew H (H1) in the pair), as shown in Example 4.

4.1. A NATURAL LANGUAGE BIPOLAR ARGUMENTATION APPROACH 141
Example 4 (Continued)
T3: I’ve seen the growing awareness within the developing world that computers and connec-tivity matter and can be useful. It’s not that computers matter more than water, food, shelterand healthcare, but that the network and PCs can be used to ensure that those other things areavailable. Satellite imagery sent to a local computer can help villages find fresh water, mobilephones can tell farmers the prices at market so they know when to harvest.T2 ≡ H1: Internet not as important as real rights. We may think of such trivial things as afundamental right, but consider the truly impoverished and what is most important to them. Theright to vote, the right to liberty and freedom from slavery or the right to elementary education.
With respect to the goal of our work, TE provides us with the techniques to identify thearguments in a debate, and to detect which kind of relation underlies each couple of arguments.A TE system returns indeed a judgment (entailment or contradiction) on the arguments pairsrelated to a certain topic, that are used as input to build the argumentation framework, as de-scribed in the next section. Example 5 presents how we combine TE with bipolar argumentationto compute at the end the set of accepted arguments.
Example 5 (Continued)
The textual entailment phase returns the following couples for the natural language opinionsdetailed in Examples 1, 2, and 4:
• T1 entails H
• T2 attacks H
• T3 attacks H1 (i.e., T2)
Given this result, the argumentation module of our framework maps each element to its corre-sponding argument: H ≡ A1, T1 ≡ A2, T2 ≡ A3, and T3 ≡ A4. The resulting argumentationframework, visualized in Figure 4.2, shows that the accepted arguments (using admissibility-based semantics) are {A1, A2, A4}. This means that the issue “Making Internet a right onlybenefits society”’ A1 is considered as accepted. Double bordered arguments are the acceptedones.
A1A4 A3
A2
Figure 4.2: The argumentation framework built from the results of the TE module for Exam-ples 1, 2, and 4.
4.1.4 Experimental setting
As a case study to experiment the combination of TE and argumentation theory to supportthe interaction of participants in online debates, we select Debatepedia, an encyclopedia of proand con arguments on critical issues. In the following, we describe the creation of the data setof T-H pairs extracted from a sample of Debatepedia topics, the TE system we use, and wereport on obtained results.

142 CHAPTER 4. MINING ARGUMENTATIVE STRUCTURES FROM TEXTS
Data set. To create the data set of arguments pairs to evaluate our task, we follow thecriteria defined and used by the organizers of RTE (see Section 4.1.1). To test the progressof TE systems in a comparable setting, the participants to RTE are provided with data setscomposed of T-H pairs involving various levels of entailment reasoning (e.g., lexical, syntactic),and TE systems are required to produce a correct judgment on the given pairs (i.e. to say ifthe meaning of one text snippet can be inferred from the other). The data available for theRTE challenges are not suitable for our goal, since the pairs are extracted from news and arenot linked among each others (i.e. they do not report opinions on a certain topic).
For this reason, we created a data set to evaluate our combined approach focusing onDebatepedia. We manually selected a set of topics (Table 4.21 column Topics) of Debatepediadebates, and for each topic we apply the following procedure:
1. the main issue (i.e., the title of the debate in its affirmative form) is considered as thestarting argument;
2. each user opinion is extracted and considered as an argument;
3. since attack and support are binary relations, the arguments are coupled with:
(a) the starting argument, or
(b) other arguments in the same discussion to which the most recent argument refers(i.e., when a user opinion supports or attacks an argument previously expressed byanother user, we couple the former with the latter), following the chronological orderto maintain the dialogue structure;
4. the resulting pairs of arguments are then tagged with the appropriate relation, i.e., attackor support5.
Using Debatepedia as case study provides us with already annotated arguments (pro ⇒entailment6, and con ⇒ contradiction), and casts our task as a yes/no entailment task. Toshow a step-by-step application of the procedure, let us consider the debated issue Can cocabe classified as a narcotic?. At step 1, we transform its title into the affirmative form, and weconsider it as the starting argument (a). Then, at step 2, we extract all the users opinionsconcerning this issue (both pro and con), e.g., (b), (c) and (d):
Example 6(a) Coca can be classified as a narcotic.
(b) In 1992 the World Health Organization’s Expert Committee on Drug Dependence (ECDD)undertook a “prereview” of coca leaf at its 28th meeting. The 28th ECDD report concluded that,“the coca leaf is appropriately scheduled as a narcotic under the Single Convention on NarcoticDrugs, 1961, since cocaine is readily extractable from the leaf.” This ease of extraction makescoca and cocaine inextricably linked. Therefore, because cocaine is defined as a narcotic, cocamust also be defined in this way.
(c) Coca in its natural state is not a narcotic. What is absurd about the 1961 convention isthat it considers the coca leaf in its natural, unaltered state to be a narcotic. The paste orthe concentrate that is extracted from the coca leaf, commonly known as cocaine, is indeed a
5The data set is freely available at http://bit.ly/debatepedia_ds.6Here we consider only arguments implying another argument. Arguments “supporting” another argument,
but not inferring it will be discussed in Section 4.1.5.

4.1. A NATURAL LANGUAGE BIPOLAR ARGUMENTATION APPROACH 143
narcotic, but the plant itself is not.
(d) Coca is not cocaine. Coca is distinct from cocaine. Coca is a natural leaf with very mildeffects when chewed. Cocaine is a highly processed and concentrated drug using derivatives fromcoca, and therefore should not be considered as a narcotic.
At step 3a we couple the arguments (b) and (d) with the starting issue since they are directlylinked with it, and at step 3b we couple argument (c) with argument (b), and argument (d) withargument (c) since they follow one another in the discussion (i.e. user expressing argument (c)answers back to user expressing argument (b), so the arguments are concatenated - the samefor arguments (d) and (c)).At step 4, the resulting pairs of arguments are then tagged with the appropriate relation: (b)supports (a), (d) attacks (a), (c) attacks (b) and (d) supports (c).
We collected 200 T-H pairs (Table 4.21), 100 to train and 100 to test the TE system (eachdata set is composed by 55 entailment and 45 contradiction pairs). The pairs considered forthe test set concern completely new topics, never seen by the system.
Training set
Topic #argum #pairs
TOT. yes no
Violent games boost aggressiveness 16 15 8 7
China one-child policy 11 10 6 4
Consider coca as a narcotic 15 14 7 7
Child beauty contests 12 11 7 4
Arming Libyan rebels 10 9 4 5
Random alcohol breath tests 8 7 4 3
Osama death photo 11 10 5 5
Privatizing social security 11 10 5 5
Internet access as a right 15 14 9 5
TOTAL 109 100 55 45
Test set
Topic #argum #pairs
TOT. yes no
Ground zero mosque 9 8 3 5
Mandatory military service 11 10 3 7
No fly zone over Libya 11 10 6 4
Airport security profiling 9 8 4 4
Solar energy 16 15 11 4
Natural gas vehicles 12 11 5 6
Use of cell phones while driving 11 10 5 5
Marijuana legalization 17 16 10 6
Gay marriage as a right 7 6 4 2
Vegetarianism 7 6 4 2
TOTAL 110 100 55 45
Table 4.1: The Debatepedia data set used in our experiments.
TE system. To detect which kind of relation underlies each couple of arguments, we takeadvantage of the modular architecture of the EDITS system (Edit Distance Textual Entailment

144 CHAPTER 4. MINING ARGUMENTATIVE STRUCTURES FROM TEXTS
Train Test
rel Pr. Rec. Acc. Pr. Rec. Acc.
EDITSyes 0.71 0.73
0.690.69 0.72
0.67no 0.66 0.64 0.64 0.6
WordOverl.yes 0.64 0.65
0.610.64 0.67
0.62no 0.56 0.55 0.58 0.55
Table 4.2: Systems performances on the Debatepedia data set (precision, recall and accuracy)
Suite) version 3.0, an open-source software package for recognizing TE7 [255]. EDITS imple-ments a distance-based framework which assumes that the probability of an entailment relationbetween a given T-H pair is inversely proportional to the distance between T and H (i.e., thehigher the distance, the lower is the probability of entailment).8 Within this framework thesystem implements different approaches to distance computation, i.e., both edit distance algo-rithms (that calculate the T-H distance as the cost of the edit operations, i.e., insertion, deletionand substitution that are necessary to transform T into H), and similarity algorithms. Eachalgorithm returns a normalized distance score. At a training stage, distance scores calculatedover annotated T-H pairs are used to estimate a threshold that best separates positive fromnegative examples. Such threshold is then used at a test stage to assign a judgment and aconfidence score to each test pair.
Evaluation. To evaluate our combined approach, we carry out a two-step evaluation: first, weassess the performances of the TE system to correctly assign the entailment and contradictionrelations to the pairs of arguments in the Debatepedia data set. Then, we evaluate how muchsuch performances impact on the application of the argumentation theory module, i.e. howmuch a wrong assignment of a relation to a pair of arguments is propagated in the argumentationframework.
For the first evaluation, we run EDITS on the Debatepedia training set to learn the model,and we test it on the test set. We tuned EDITS in the following configuration: i) cosinesimilarity as the core distance algorithm, ii) distance calculated on lemmas, and iii) a stopwordlist is defined to set no distance between stopwords. We use the system off-the-shelf, applyingone of its basic configurations. As future work, we plan to fully exploit EDITS features,integrating background and linguistic knowledge in the form of entailment rules, and to calculatethe distance between T and H on their syntactic structure.
Table 4.2 reports on the obtained results both using EDITS and using a baseline that appliesa Word Overlap algorithm on tokenized text. Even using a basic configuration of EDITS, and asmall data set (100 pairs for training) performances on Debatepedia test set are promising, andin line with performances of TE systems on RTE data sets (usually containing about 1000 pairsfor training and 1000 for test). In order to understand if increasing the number of argumentpairs in the training set could bring to an improvement in the system performances, the EDITSlearning curve is visualized in Figure 4.3. Note that augmenting the number of training pairsactually improves EDITS accuracy on the test set, meaning that we should consider extendingthe Debatepedia data set for future work.
As a second step in our evaluation phase, we consider the impact of EDITS performanceson the acceptability of the arguments, i.e. how much a wrong assignment of a relation to a
7http://edits.fbk.eu/8In previous RTE challenges, EDITS always ranked among the 5 best participating systems out of an average
of 25 systems, and is one of the few RTE systems available as open source http://aclweb.org/aclwiki/index.php?title=Textual_Entailment_Resource_Pool

4.1. A NATURAL LANGUAGE BIPOLAR ARGUMENTATION APPROACH 145Sheet2
Page 1
0 10 20 30 40 50 60 70 80 90 1000.3
0.35
0.4
0.45
0.5
0.55
0.6
0.65
0.7
0.480.51
0.65 0.66 0.67
Training set [%]
Acc
ura
cy
Figure 4.3: EDITS learning curve on Debatepedia data set
pair of arguments affects the acceptability of the arguments in the argumentation framework.We use admissibility-based semantics to identify the accepted arguments both on the correctargumentation framework of each Debatepedia topic (where entailment/contradiction relationsare correctly assigned, i.e. the goldstandard), and on the framework generated assigning therelations resulted from the TE system judgments. The precision of the combined approachwe propose in the identification of the accepted arguments is on average 0.74 (i.e. argumentsaccepted by the combined system and by the goldstandard w.r.t. a certain Debatepedia topic),and the recall is 0.76 (i.e. arguments accepted in the goldstandard and retrieved as acceptedby the combined system). Its accuracy (i.e. ability of the combined system to accept somearguments and discard some others) is 0.75, meaning that the TE system mistakes in relationassignment propagate in the argumentation framework, but results are still satisfying.
4.1.5 Extending the analysis on bipolar argumentation beyond TE
In the previous section, we assumed the TE relation extracted from NL texts as equivalent tothe support relation in bipolar argumentation. On closer view, this is a strong assumption.In this second part of our work, we aim at verifying on an extended sample of real data fromDebatepedia whether it is always the case that support is equivalent to TE. In particular, foraddressing this issue, we focus both on the relations between support and entailment, andon the relations between attack and contradiction. We extend the data set presented before,extracting an additional set of arguments from Debatepedia topics. Even if our data set cannotbe exhaustive, the methodology we apply for the arguments extraction aims at preservingthe original structure of the debate, to make it as representative as possible of daily humaninteractions in natural language.
Two different empirical studies are presented in this section. The first one follows theanalysis presented in Section 4.1.3, and explores the relation among the notion of support andattack in bipolar argumentation, and the semantic inferences as defined in NLP. The secondanalysis starts instead from the comparative study of [102] of the four complex attacks proposedin the literature (see Section 4.1.2), and investigates their distribution in NL debates.
Data set. We select the same topics as in Section 4.1.4, since this is the only freely availabledata set of natural language arguments (Table 4.21, column Topics). But Since that dataset was created respecting the assumption that the TE relation and the support relation areequivalent, in all the previously collected pairs both TE and support relations (or contradictionand attack relations) hold.
In this study we want to move a step further, to understand whether it is always the casethat support is equivalent to TE (and contradiction to attack). We therefore apply again theextraction methodology described in Section 4.1.4 to extend our data set. In total, our newdata set contains 310 different arguments and 320 argument pairs (179 expressing the support

146 CHAPTER 4. MINING ARGUMENTATIVE STRUCTURES FROM TEXTS
relation among the involved arguments, and 141 expressing the attack relation, see Table 4.21).We consider the obtained data set as representative of human debates in a non-controlled setting(Debatepedia users position their arguments with respect to the others as PRO or CON, thedata are not biased), and we use it for our empirical studies.
Debatepedia data setTopic #argum #pairsViolent games boost aggressiveness 17 23China one-child policy 11 14Consider coca as a narcotic 17 22Child beauty contests 13 17Arming Libyan rebels 13 15Random alcohol breath tests 11 14Osama death photo 22 24Privatizing social security 12 13Internet access as a right 15 17Ground zero mosque 11 12Mandatory military service 15 17No fly zone over Libya 18 19Airport security profiling 12 13Solar energy 18 19Natural gas vehicles 16 17Use of cell phones while driving 16 16Marijuana legalization 23 25Gay marriage as a right 10 10Vegetarianism 14 13TOTAL 310 320
Table 4.3: Debatepedia data set.
First study: support and TE. Our first empirical study aims at a better understandingof the relation among the notion of support in bipolar argumentation [102], and the definitionof semantic inference in NLP (in particular, the more specific notion of TE) [132].
Basing on the TE definition, an annotator with skills in linguistics has carried out a firstphase of annotation of the Debatepedia data set. The goal of such annotation is to individuallyconsider each pair of support and attack among arguments, and to additionally tag them asentailment, contradiction or null. The null judgment can be assigned in case an argumentis supporting another argument without inferring it, or the argument is attacking anotherargument without contradicting it. As exemplified in Example 6, a correct entailment pair is(b) ⇒ (a), while a contradiction is (d) ; (a). A null judgment is assigned to (d) - (c),since the former argument supports the latter without inferring it. Our data set is an extendedversion of [90]’s one allowing for a deeper investigation.
To assess the validity of the annotation task, we calculate the inter-annotator agreement.Another annotator with skills in linguistics has therefore independently annotated a sampleof 100 pairs of the data set. We calculated the inter-annotator agreement considering theargument pairs tagged as support and attacks by both annotators, and we verify the agreementbetween the pairs tagged as entailment and as null (i.e. no entailment), and as contradictionand as null (i.e. no contradiction), respectively. Applying κ to our data, the agreement for ourtask is κ = 0.74. As a rule of thumb, this is a satisfactory agreement.
Table 4.4 reports the results of the annotation on our Debatepedia data set, as resultingafter a reconciliation phase carried out by the annotators9.
9In this phase, the annotators discuss the results to find an agreement on the annotation to be released.

4.1. A NATURAL LANGUAGE BIPOLAR ARGUMENTATION APPROACH 147
Relations % arguments (# arg.)
support+ entailment 61.6 (111)
- entailment (null) 38.4 (69)
attack+ contradiction 71.4 (100)
- contradiction (null) 28.6 (40)
Table 4.4: Support and TE relations on Debatepedia data set.
On the 320 pairs of the data set, 180 represent a support relation, while 140 are attacks.Considering only the supports, we can see that 111 argument pairs (i.e., 61.6%) are an actualentailment, while in 38.4% of the cases the first argument of the pair supports the second onewithout inferring it (e.g., (d) - (c) in Example 6). With respect to the attacks, we can noticethat 100 argument pairs (i.e., 71.4%) are both attack and contradiction, while only the 28.6%of the argument pairs does not contradict the arguments they are attacking, as in Example 7.
Example 7(e) Coca chewing is bad for human health. The decision to ban coca chewing fifty years agowas based on a 1950 report elaborated by the UN Commission of Inquiry on the Coca Leaf witha mandate from ECOSOC: “We believe that the daily, inveterate use of coca leaves by chewingis thoroughly noxious and therefore detrimental”.(f) Chewing coca offers an energy boost. Coca provides an energy boost for working or forcombating fatigue and cold.
Differently from the relation between support-entailment, the difference between attack andcontradiction is more subtle, and it is not always straightforward to say whether an argumentattacks another argument without contradicting it. In Example 7, we consider that (e) doesnot contradict (f) even if it attacks (f), since chewing coca can offer an energy boost, and stillbe bad for human health. This kind of attacks is less frequent than the attacks-contradictions(see Table 4.4).
Considering the three way scenario to map TE relation with bipolar argumentation, argu-ment pairs connected by a relation of support (but where the first argument does not entailthe second one), and argument pairs connected by a relation of attack (but where the firstargument does not contradict the second one) have to be mapped as unknown pairs in the TEframework. The unknown relation in TE refers to the T-H pairs where the entailment cannotbe determined because the truth of H cannot be verified on the basis of the content of T. Thisis a broad definition, that can apply also to pairs of non related sentences (that are consideredas unrelated arguments in bipolar argumentation).
From an application viewpoint, as highlighted in [390] and [222], argumentation theoryshould be used as a tool in on-line discussions applications to identify the relations amongthe statements, and provide a structure to the dialogue to easily evaluate the user’s opinions.Starting from the methodology proposed in Section 4.1.3 for passing from natural languagearguments to a bipolar argumentation framework, our study demonstrates that applying theTE approach would be productive in the 66% of the Debatepedia data set. Other techniquesshould then be experimented to cover the other cases, for instance measuring the semanticrelatedness of the two propositions using Latent Semantics Analysis techniques [263].
Second study: complex attacks. We carry out now a comparative evaluation of the fouradditional attacks proposed in the literature, and we investigate their meaning and distributionon the sample of NL arguments.

148 CHAPTER 4. MINING ARGUMENTATIVE STRUCTURES FROM TEXTS
Basing on the additional attacks (Section 4.1.2), and the original AF of each topic in ourdata set (Table 4.21), the following procedure is applied: the supported (secondary, mediated,and extended, respectively) attacks are added, and the argument pairs resulting from couplingthe arguments linked by this relation are collected in the data set “supported (secondary,mediated, and extended, respectively) attack”. Collecting the argument pairs generated fromthe different types of complex attacks in separate data sets allows us to independently analyzeeach type, and to perform a more accurate evaluation.10 Figures 4.4a-d show the four AFsresulting from the addition of the complex attacks in the example Can coca be classified as anarcotic?. Note that the AF in Figure 4.4a, where the supported attack is introduced, is thesame of Figure 4.4b where the mediated attack is introduced. Notice that, even if the additionalattack which is introduced coincide, i.e., d attacks b, this is due indeed to different interactionsamong supports and attacks (as highlighted in the figure), i.e., in the case of supported attacksthis is due to the support from d to c and the attack from c to b, while in the case of mediatedattacks this is due to the support from b to a and the attack from d to a.
c a
d
b
c bd
Supported attack
c a
d
b
a db
Mediated attack
c a
d
b
b ac
Secondary attack
c a
d
b
d ca
Extended attack
(a) (d)(c)(b)
Figure 4.4: The bipolar argumentation framework with the introduction of complex attacks.The top figures show which combination of support and attack generates the new additionalattack.
A second annotation phase is then carried out on the data set, to verify if the generatedargument pairs of the four data sets are actually attacks (i.e., if the models of complex attacksproposed in the literature are represented in real data). More specifically, an argument pairresulting from the application of a complex attack can be annotated as: attack (if it is a correctattack) or as unrelated (in case the meanings of the two arguments are not in conflict). Forinstance, the argument pair (g)-(h) (Example 8) resulting from the insertion of a supportedattack, cannot be considered as an attack since the arguments are considering two differentaspects of the issue.
Example 8 (g) Chewing coca offers an energy boost. Coca provides an energy boost for work-ing or for combating fatigue and cold.(h) Coca can be classified as a narcotic.
In the annotation, attacks are then annotated also as contradiction (if the first argumentcontradicts the other) or null (in case the first argument does not contradict the argument itis attacking, as in Example 7). Due to the complexity of the annotation, the same annotationtask has been independently carried out also by a second annotator, so as to compute inter-annotator agreement. It has been calculated on a sample of 80 argument pairs (20 pairsrandomly extracted from each of the “complex attacks” data set), and it has the goal to assessthe validity of the annotation task (counting when the judges agree on the same annotation).
10Data sets freely available for research purposes at http://bit.ly/VZIs6M

4.1. A NATURAL LANGUAGE BIPOLAR ARGUMENTATION APPROACH 149
We calculated the inter-annotator agreement for our annotation task in two steps. We (i)verify the agreement of the two judges on the argument pairs classification attacks/unrelated,and (ii) consider only the argument pairs tagged as attacks by both annotators, and we verifythe agreement between the pairs tagged as contradiction and as null (i.e. no contradiction).Applying κ to our data, the agreement for the first step is κ = 0.77, while for the second stepκ = 0.71. As a rule of thumb, both agreements are satisfactory, although they reflect the highercomplexity of the second annotation (contradiction/null), as pointed out in Section 4.1.5.
The distribution of complex attacks in the Debatepedia data set, as resulting after a rec-onciliation phase carried out by the annotators, is shown in Table 4.5. As can be noticed, themediated attack is the most frequent type of attack, generating 335 new argument pairs in theNL sample we considered (i.e. the conditions that allow the application of this kind of complexattacks appear more frequently in real debates). Together with secondary attacks, they appearin the AFs of all the debated topics. On the contrary, extended attacks are added in 11 out of19 topics, and supported attacks in 17 out of 19 topics. Considering all the topics, on averageonly 6 pairs generated from the additional attacks were already present in the original dataset, meaning that considering also these attacks is a way to hugely enrich our data set of NLdebates.
Proposed models # occ. attacks unrelated
+ contr (null) - contr (null)
Supported attacks 47 23 17 7
Secondary attacks 53 29 18 6
Mediated attacks 335 84 148 103
Extended attacks 28 15 10 3
Table 4.5: Complex attacks distribution in our data set.
Figure 4.5 graphically represents the complex attacks distribution. Considering the firststep of the annotation (i.e. attacks vs unrelated), the figure shows that the latter case is veryinfrequent, and that (except for mediated attacks) on average only 10% of the argument pairsare tagged as unrelated. This observation can be considered as a proof of concept of the fourtheoretical models of complex attacks we analyzed. Due to the fact that the conditions for theapplication of the mediated attacks are verified more often in the data, it has the drawback ofgenerating more unrelated pairs. Still, the number of successful cases is high enough to considerthis kind of attack as representative of human interactions. Considering the second step of theannotation (i.e. attacks as contradiction or null), we can see that results are in line with thosereported in our first study (Table 4.4), meaning that also among complex attacks the samedistribution is maintained.
Sheet1
Page 1
Supported Secondary Mediated Extended0
50
100
150
200
250
300
350
Unrelated- Contradiction+ Contradiction
Figure 4.5: Complex attacks distribution in our data set.

150 CHAPTER 4. MINING ARGUMENTATIVE STRUCTURES FROM TEXTS
4.2 Argument Mining on Twitter: arguments, facts and
sources
Social media platforms like Twitter11 and newspapers blogs allow users to post their ownviewpoints on a certain topic, or to disseminate news read on newspapers. Being these textsshort, without standard spelling and with specific conventions (e.g., hashtags, emoticons), theyrepresent an open challenge for standard argument mining approaches [414]. The nature andpeculiarity of social media data rise also the need of defining new tasks in the argument miningdomain [1, 285].
In this work, we tackle the first standard task in argument mining, addressing the researchquestion: how to mine arguments from Twitter? Going a step further, we address also thefollowing sub-questions that arise in the context of social media: i) how to distinguish factualarguments from opinions? ii) how to automatically detect the source of factual arguments? Toanswer these questions, we extend and annotate a dataset of tweets extracted from the streamsabout the Grexit and the Brexit news. To address the first task of argument detection, weapply supervised classification to separate argument-tweets from non-argumentative ones. Byconsidering only argument-tweets, in the second step we apply again a supervised classifier torecognize tweets reporting factual information from those containing opinions only. Finally, wedetect, for all those arguments recognized as factual in the previous step, what is the sourceof such information (e.g., the CNN), relying on the type of the Named Entities recognized inthe tweets. The last two steps represent new tasks in the argument mining research field, ofparticular importance in social media applications.
In the following, we describe the approaches we have developed to address the followingtasks: i) Argument detection, ii) Factual vs opinion classification, and iii) Source identification,on social media data. Our experimental setting - whose goal is to investigate the tasks’ feasibilityon such peculiar data - considers a dataset of tweets related to the political debates on whetheror not Great Britain and Greece had to leave the European Union (i.e. #Brexit and #Grexitthreads in Twitter).
4.2.1 Experimental setting
Dataset. The only available resource of annotated tweets for argument mining is DART [68].From the highly heterogeneous topics contained in such resource (i.e. the letter to Iran writtenby 47 U.S. senators; the referendum for or against Greece leaving the EU; the release of AppleiWatch; the airing of the 4th episode of the 5th season of the TV series Game of Thrones), andconsidering the fact that tweets discussing a political topic generally have a more developedargumentative structure than tweets commenting on a product release, we decided to select forour experiments the subset of the DART dataset on the thread #Grexit (987 tweets). Then,following the same methodology described in [68], we have extended such dataset collecting900 tweets from the thread on #Brexit. From the original thread, we filtered away retweets,accounts with a bot probability >0.5 [136], and almost identical tweets (Jaccard distance,empirically evaluated threshold). Given that tweets in DART are already annotated for task 1(argument/non-argument, see Section 4.2.1), two annotators carried out the same task on thenewly extracted data. Moreover, the same annotators annotated both datasets (Grexit/Brexit)for the other two tasks of our experiments, i.e. i) given the argument tweets, annotation oftweets as either containing factual information or opinions, and ii) given factual argumenttweets, annotate their source when explicitly cited. Tables 4.6, 4.7 and 4.8 contain statisticalinformation on the datasets.
11www.twitter.com

4.2. ARGUMENT MINING ON TWITTER: ARGUMENTS, FACTS AND SOURCES 151
Inter annotator agreement (IAA) [98] between the two annotators has been calculated forthe three annotation tasks, resulting in κ=0.767 on the first task (calculated on 100 tweets),κ=0.727 on the second task (on 80 tweets), and Dice=0.84 [145]12 on the third task (on thewhole dataset). More specifically, to compute IAA, we sampled the data applying the samestrategy: for the first task, we randomly selected 10% of the tweets of the Grexit dataset (ourtraining set); for task 2, again we randomly selected 10% of the tweets annotated as argumentin the previous annotation step; for task 3, given the small size of the dataset, both annotatorsannotated the whole corpus.
dataset # argument # non-arg total
Brexit 713 187 900
Grexit 746 241 987
total 1459 428 1887
Table 4.6: Dataset for task 1: argument detection
dataset # factual arg. # opinion total
Brexit 138 575 713
Grexit 230 516 746
total 368 1091 1459
Table 4.7: Dataset for task 2: factual arguments vs opinions classification
dataset # arg. with # arg. without total
source cit. source cit.
Brexit 40 98 138
Grexit 79 151 230
total 119 249 368
Table 4.8: Dataset for task 3: source identification
Classification algorithms. We tested Logistic Regression (LR) and Random Forest (RF)classification algorithms, relying on the scikit-learn tool suite13. For the learning methods, wehave used a Grid Search (exhaustive) through a set of predefined hyper-parameters to find thebest performing ones (the goal of our work is not to optimize the classification performance butto provide a preliminary investigation on new tasks in argument mining over Twitter data).We extract argument-level features from the dataset of tweets (following [466]), that we groupinto the following categories:
• Lexical (L): unigram, bigram, WordNet verb synsets;
• Twitter-specific (T): punctuation, emoticons;
12Dice is used instead of κ to account for partial agreement on the set of sources detected in the tweets.13http://scikit-learn.org/

152 CHAPTER 4. MINING ARGUMENTATIVE STRUCTURES FROM TEXTS
• Syntactic/Semantic (S): we have two versions of dependency relations as features, onebeing the original form, the other generalizing a word to its POS tag in turn. We also usethe syntactic tree of the tweets as feature. We apply the Stanford parser [298] to obtainparse trees and dependency relations;
• Sentiment (SE): we extract the sentiment from the tweets with the Alchemy API14, thesentiment analysis feature of IBM’s Semantic Text Analysis API. It returns a polaritylabel (positive, negative or neutral) and a polarity score between -1 (totally negative) and1 (totally positive).
As baselines we consider both LR and RF algorithms with a set of basic features (i.e., lexical).
Task 1: Argument detection. The task consists in classifying a tweet as being an argu-ment or not. We consider as arguments all those text snippets providing a portion of a standardargument structure, i.e., opinions under the form of claims, facts mirroring the data in the Toul-min model of argument [442], or persuasive claims, following the definition of argument tweetprovided in [68, 69]. Our dataset contains 746 argument tweets and 241 non-argument tweetsfor Grexit (that we use as training set), and 713 argument tweets and 187 non-argument tweetsfor Brexit (the test set). Below we report an example of argument tweet (a), and of a non-argument tweet (b).
(a) Junker asks “who does he think I am”. I suspect elected PM Tsipras thinks Junker is anunelected Eurocrat. #justsaying #democracy #grexit(b) #USAvJPN #independenceday #JustinBieberBestIdol Macri #ConEsteFrioYo happy 4thof july #Grefenderum Wireless Festival
We cast the argument detection task as a binary classification task, and we apply thesupervised algorithms described in Section 4.2.1. Table 4.9 reports on the obtained resultswith the different configurations, while Table 4.10 reports on the results obtained by the bestconfiguration, i.e., LR + All features, per each category.
Approach Precision Recall F1
RF+L 0.76 0.69 0.71LR+L 0.76 0.71 0.73
LR+all features 0.80 0.77 0.78
Table 4.9: Results obtained on the test set for the argument detection task (L=lexical features)
Category P R F1 #argumentsper category
non-arg 0.46 0.60 0.52 187
arg 0.89 0.82 0.85 713
avg/total 0.80 0.77 0.78 900
Table 4.10: Results obtained by the best model on each category of the test set for the argumentdetection task
Most of the miss-classified tweets are either ironical, e.g.:
14https://www.ibm.com/watson/alchemy-api.html

4.2. ARGUMENT MINING ON TWITTER: ARGUMENTS, FACTS AND SOURCES 153
If #Greece had a euro for every time someone mentioned #Grexit and #Greferendum theywould probably have enough for a bailout. #GreekCrisis
that was wrongly classified as argument, or contain reported speech, e.g.:
Jeremy Warner: Unintentionally, the Greeks have done themselves a favour. Soon, they willbe out of the euro http: // t. co/ YmqXi36lGj #Grexit
that was wrongly classified as non argument. Our results are comparable to those reported in[69] (they trained a supervised classifier on the tweets of all topics in the DART dataset butthe iWatch, used as test set). Better performances obtained in our setting are most likely dueto a better feature selection, and to the fact that in our case the topics in the training and testsets are more homogeneous.
Task 2: Factual vs opinion classification This task consists in classifying argument-tweetsas containing factual information or being opinion-based [363]. Our interest focuses in particularon factual argument-tweets, as we are interested then in the automated identification of theirsources. This would allow then to rank factual tweet-arguments depending on the reliabilityor expertise of their source for subsequent tasks as fact checking. Given the huge amount ofwork in the literature devoted to opinion extraction, we do not address any further analysis onopinion-based arguments here, referring the interested reader to [281].
An argument is annotated as factual if it contains a piece of information which can beproved to be true (see example (a) below), or if it contains “reported speech” (see example (b)below). All the other argument tweets are considered as “opinion” (see example (c) below).
(a) 72% of people who identified as “English” supported #Brexit (while no majority amongthose identifying as “British”) https: // t. co/ MuUXqncUBe
(b) #Hollande urges #UK to start #Brexit talks as soon as possible. https: // t. co/ d12TV8JqYD .(c) Trump is going to sell us back to England. #Brexit #RNCinCLE
Our dataset contains 230 factual argument tweets and 516 opinion argument tweets for Grexit(training set), and 138 factual argument tweets and 575 opinion argument tweets for Brexit(test set).
To address the task of factual vs opinion arguments classification, we apply the supervisedclassification algorithms previously described. Tweets from Grexit dataset are used as trainingset, and those from Brexit dataset as test set. Table 4.11 reports on the obtained results, whileTable 4.12 reports on the results obtained by the best configuration, i.e. LR + All features,per each category.
Approach Precision Recall F1
RF+L 0.75 0.68 0.71LR+L 0.75 0.75 0.75
LR+all features 0.81 0.79 0.80
Table 4.11: Results obtained on the test set for the factual vs opinion argument classificationtask (L=lexical features)
Most of the miss-classified tweets contain reported opinions/reported speech and are wronglyclassified by the algorithm as opinion - such behaviour could be expected given that sentimentfeatures play a major role in these cases, e.g.,

154 CHAPTER 4. MINING ARGUMENTATIVE STRUCTURES FROM TEXTS
Category P R F1 #argumentsper category
fact 0.49 0.50 0.50 138
opinion 0.88 0.87 0.88 575
avg/total 0.81 0.79 0.80 713
Table 4.12: Results obtained by the best model on each category of the test set for the factualvs opinion argument classification task
Thomas Piketty accuses Germany of forgetting history as it lectures Greece http: // t. co/
B0UqPn0i6T #grexit
Again, the other main reason for miss-classification is sarcasm/irony contained in the tweets,e.g.,
So for Tsipras, no vote means back to the table, for Varoufakis, meant Grexit?
that was wrongly classified as fact.
Task 3: Source identification Since factual arguments (as defined above) are generally re-ported by news agencies and individuals, the third task we address - and that can be of a valuein the context of social media - is the recognition of the information source that disseminatesthe news reported in a tweet (when explicitly mentioned). For instance, in:
The Guardian: Greek crisis: European leaders scramble for response to referendum no vote.http: // t. co/ cUNiyLGfg3
the source of information is The Guardian newspaper. Such annotation is useful to rank factualtweet-arguments depending on the reliability or expertise of their source in news summarizationor fact-checking applications, for example.
Our dataset contains 79 factual argument tweets where the source is explicitly cited forGrexit (training set), and 40 factual argument tweets where the source is explicitly cited forBrexit (test set). Given the small size of the available annotated dataset, to address this taskwe implemented a simple string matching algorithm that relies on a gazetteer containing a setof Twitter usernames and hashtags extracted from the training data, and a list of very commonnews agencies (e.g., BBC, CNN, CNBC). If no matches are found, the algorithm extracts theNEs from the tweets through [346]’s system, and applies the following two heuristics: i) ifa NE is of type dbo:Organisation or dbo:Person, it considers such NE as the source; ii)it searches in the abstract of the DBpedia15 page linked to that NE if the words “news”,“newspaper” or “magazine” appear (if found, such entity is considered as the source). In theexample above, the following NEs have been detected in the tweet: “The Guardian” (linked tothe DBpedia resource http://dbpedia.org/page/The\_Guardian) and “Greek crisis” (linkedto http://dbpedia.org/page/Greek\_government-debt\_crisis). Applying the mentionedheuristics, the first NE is considered as the source. Table 4.13 reports on the obtained results.As baseline, we use a method that considers all the NEs detected in the tweet as sources.
Most of the errors of the algorithm are due to information sources not recognized as NEs(in particular, when the source is a Twitter user), or NEs that are linked to the wrong DBpedia
15http://www.dbpedia.org

4.3. ARGUMENTATION ANALYSIS FOR POLITICAL SPEECHES 155
Approach Precision Recall F1Baseline 0.26 0.48 0.33
Matching+heurist. 0.69 0.64 0.67
Table 4.13: Results obtained on the test set for the source identification task
page. However, in order to draw more interesting conclusions on the most suitable methods toaddress this task, we would need the increase the size of the dataset.
4.3 Argumentation analysis for political speeches
While some of the above mentioned AM approaches have been proposed to detect claims inpolitical debates, e.g., [278, 338], little attention has been devoted to the prediction of relationsbetween arguments, which could help historians, social and political scientists in the analysis ofargumentative dynamics (e.g., supports, attacks) between parties and political opponents. Forexample, this analysis could support the study of past political speeches and of the repercussionsof such claims over time. It could also be used to establish relations with the current way ofdebating in politics. In order to find argumentation patterns in political speeches, typicallycovering a wide range of issues from international politics to environmental challenges, theapplication of computational methods to assist scholars in their qualitative analysis is advisable.In this work, we tackle the following research question: To what extent can we apply argumentmining models to support and ease the analysis and modeling of past political speeches? Thisresearch question breaks down into the following subquestions:
• Given a transcription of speeches from different politicians on a certain topic, how can weautomatically predict the relation holding between two arguments, even if they belong todifferent speeches?
• How can the output of the above-mentioned automated task be used to support historyand political science scholars in the curation, analysis and editing of such corpora?
This issue is investigated by creating and analysing a new annotated corpus for this task,based on the transcription of discourses and official declarations issued by Richard Nixon andJohn F. Kennedy during the 1960 US Presidential campaign. Moreover, we develop a relationclassification system with specific features able to predict support and attack relations betweenarguments [279], distinguishing them from unrelated ones. This argumentation mining pipelineends with the visualization of the resulting graph of the debated topic using the OVA+ tool.16
The main contributions of this article are (1) an annotated corpus consisting of 1,462 pairsof arguments in natural language (around 550,000 tokens) covering 5 topics, (2) a feature-richSupport Vector Machines (SVM) model for relation prediction, and (3) an end-to-end workflowto analyse arguments that, starting from one or more monological corpora in raw text, outputsthe argumentation graph of user-defined topics.
4.3.1 Corpus extraction and annotation
Since no data for this task were available, we collect the transcription of speeches and offi-cial declarations issued by Nixon and Kennedy during 1960 Presidential campaign from TheAmerican Presidency Project.17 The corpus includes 881 documents, released under the NARA
16http://ova.arg-tech.org/17The American Presidency Project (http://www.presidency.ucsb.edu/1960_election.php)

156 CHAPTER 4. MINING ARGUMENTATIVE STRUCTURES FROM TEXTS
public domain license, and more than 1,6 million tokens (around 830,000 tokens for Nixon and815,000 tokens for Kennedy). We select this document collection because of its relevance froma historical perspective: the 1960 electoral campaign has been widely studied by historians andpolitical scientists, being the first campaign broadcast on television. The issues raised duringthe campaign shaped the political scenario of the next decades, for example the rising ColdWar tensions between the United States and the Soviet Union or the relationship with Cuba.
Dataset creation. In order to include relevant topics in the dataset, we asked a historyscholar to list a number of issues that were debated during 1960 campaign, around whichargumentation pairs could emerge. With his help, we selected the following ones: Cuba, disar-mament, healthcare, minimum wage and unemployment (henceforth topics). We then extractedpairs of candidate arguments as follows. For each topic, we manually define a set of keywords(e.g., [medical care, health care]) that lexically express the topic. Then, we extract from thecorpus all sentences containing at least one of these keywords, plus the sentence before andafter them to provide some context: each candidate argument consists then of a snippet oftext containing three consecutive sentences and a date, corresponding to the day in which theoriginal speech was given during the campaign.
In the following step, we combine the extracted snippets into pairs using two differentapproaches. Indeed, we want to analyse two different types of argumentations: those betweencandidates, and those emerging from the speeches uttered by the same candidate over time. Inthe first case, for each topic, we sort all the candidate arguments in chronological order, andthen create pairs by taking one or more snippets by a politician and the one(s) immediatelypreceding it by his opponent. These data are thus shaped as a sort of indirect dialogue, inwhich Nixon and Kennedy talk about the same topics in chronological order. However, thearguments of a speaker are not necessarily the direct answer to the arguments of the other one,making it challenging to label the relation holding between the two.
In the second case, we sort by topic all the candidate arguments in chronological order, asin the previous approach. However, each candidate argument is paired with what the samepolitician said on the same topic in the immediately preceding date. These data provideinformation about how the ideas of Nixon and Kennedy evolve during the electoral campaign,showing, if any, shifts in their opinions. We follow these two approaches also with the goal toobtain a possibly balanced dataset: we expect to have more attack relations holding betweenpairs of arguments from different candidates, while pairs of arguments from the same candidateshould be coherent, mainly supporting each other.
Through this pairing process, we obtain 4,229 pairs for the Cuba topic, 2,508 pairs fordisarmament, 3,945 pairs for health-care, 6,341 pairs for minimum wage, and 2,865 pairs forunemployment, for a total of 19,888 pairs.
Annotation. From the pool of automatically extracted pairs, we manually annotate a subsetof 1,907 pairs randomly selected over the five topics. Annotators were asked to mark if betweentwo given arguments there was a relation of attack (see Example 9 on minimum wage), arelation of support (see Example 10 on disarmament) or if there was no relation (argumentsare neither supporting, nor attacking each other, tackling different issues of the same topic).
Example 9Nixon: And here you get the basic economic principles. If you raise the minimum wage, inmy opinion - and all the experts confirm this that I have talked to in the Government - above$1.15, it would mean unemployment; unemployment, because there are many industries thatcould not pay more than $1.15 without cutting down their work force. $1.15 can be absorbed,and then at a later time we could move to $1.25 as the economy moves up.

4.3. ARGUMENTATION ANALYSIS FOR POLITICAL SPEECHES 157
Kennedy: The fact of the matter is that Mr. Nixon leads a party which has opposed progressfor 25 years, and he is a representative of it. He leads a party which in 1935 voted 90 percentagainst a 25-cent minimum wage. He leads a party which voted 90 percent in 1960 against$1.25 an hour minimum wage.
Example 10Nixon: I want to explain that in terms of examples today because it seems to me there hasbeen a great lack of understanding in recent months, and, for that matter in recent years, as towhy the United States has followed the line that it has diplomatically. People have often spokento me and they have said, Why can’t we be more flexible in our dealings on disarmament? Whycan’t we find a bold new program in this area which will make it possible for the Soviet Unionto agree? The answer is that the reason the Soviet Union has not agreed is that they do notwant apparently to disarm unless we give up the right to inspection.Nixon: People say, Now, why is it we can’t get some imaginative disarmament proposals, orsuspension of nuclear test proposals? Aren’t we being too rigid? And I can only say I have seenthese proposals over the years, and the United States could not have been more tolerant. We havenot only gone an extra mile - we have gone an extra 5 miles - on the tests, on disarmament,but on everything else, but every time we come to a blocking point, the blocking point is noinspection, no inspection.
The annotation guidelines included few basic instructions: if the statements cover morethan one topic, annotators were asked to focus only on the text segments dealing with thechosen topic. Annotation was carried out by strictly relying on the content of the statements,avoiding personal interpretation. Examples of attack are pairs where the candidates proposetwo different approaches to reach the same goal, where they express different considerations onthe current situation with respect to a problem, or where they have a different attitude withrespect to the work done in the past. For example, in order to increase minimum wage, Nixonproposed to set it to 1.10$ per hour, while Kennedy opposed this initiative, claiming that 1.35$should be the minimum wage amount. In this example, the opponents have the same goal,i.e., increase minimum wage, but their statements are annotated as an attack because theirinitiatives are different, clearly expressing their disagreement.
After an initial training following the above guidelines, 3 annotators were asked to judge acommon subset of 100 pairs to evaluate inter-annotator agreement. This was found to be 0.63(Fleiss’ Kappa), which as a rule of thumb is considered a substantial agreement [264]. Afterthat, each annotator judged a different set of argument pairs, with a total of 1,907 judgementscollected. In order to balance the data, we discarded part of the pairs annotated with norelation (randomly picked).
Overall, the final annotated corpus18 is composed of 1,462 pairs: 378 pairs annotated withattack, 353 pairs annotated with support, and 731 pairs where these relations do not hold. Anoverview of the annotated corpus is presented in Table 4.14.
Topic Attack Support No Relation
Cuba 38 40 180Disarmament 76 108 132Medical care 75 72 142Minimum wage 125 80 107Unemployment 64 53 170
Table 4.14: Topic and class distribution in the annotated corpus
18The dataset is available at https://dh.fbk.eu/resources/political-argumentation

158 CHAPTER 4. MINING ARGUMENTATIVE STRUCTURES FROM TEXTS
4.3.2 Experiments on relation prediction
To facilitate the construction of argument graphs and support the argumentative analysis ofpolitical speeches, we propose an approach to automatically label pairs of arguments accordingto the relation existing between them, namely support and attack.
Given the strategy adopted to create the pairs, the paired arguments may happen to bealso unrelated (50% of the pairs are labeled with no relation). Therefore, we first isolate thepairs connected through a relation, and then we classify them as support or attack. Each stepis performed by a binary classifier using specific features, which we describe in the followingsubsection. In this work, we present the results obtained with the feature set that achieved thebest performance on 10-fold cross validation.
Experimental setting. The first step concerns the binary classification of related and unre-lated pairs. In this step the pairs annotated with support and attack have been merged underthe related label. We first pre-process all the pairs using the Stanford CoreNLP suite [298] fortokenization, lemmatization and part-of-speech tagging. Then, for each pair we define threesets of features, representing the lexical overlap between snippets, the position of the topicmention in the snippet, as a proxy for its relevance, and the similarity of snippets with otherrelated / unrelated pairs.
Lexical overlap: the rationale behind this information is that two related arguments aresupposed to be more lexically similar than unrelated ones. Therefore, we compute i) the numberof nouns, verbs and adjectives shared by two snippets in a pair, normalized by their length,and ii) the normalized number of nouns, verbs and adjectives shared by the argument subtreeswhere the topic is mentioned.
Topic position: the rationale behind this information is that, if the same topic is centralin both candidate arguments, then it is likely that these arguments are related. To measurethis, we represent with a set of features how often the topic (expressed by a list of keywords,see previous section on dataset creation) appears at the beginning, in the central part or at theend of each candidate argument.
Similarity with other related / unrelated pairs: the intuition behind this set offeatures is that related pairs should be more similar to other related pairs than to unrelatedones. For each topic, its merged related and unrelated pairs are represented as two vectorsusing a bag-of-words model. Their semantic similarity with the individual pairs in the datasetis computed through cosine similarity and used as a feature.
For classification, we adopt a supervised machine learning approach training Support VectorMachines with radial kernel using LIBSVM [104].
In the second step of the classification pipeline, we take in input the outcome of the firststep and classify all the pairs of related arguments as support or attack. We rely on a set ofsurface, sentiment and semantic features inspired by [315] and [314]. We adopt the Lexicaloverlap set of features used also for the first step, to which we add the features describedbelow. In general, we aim at representing more semantic information compared to the previousstep, in which lexical features were already quite informative.
Negation: this set of features includes the normalized number of words under the scope ofa negation in each argument, and the percentage of overlapping lemmas in the negated phrasesof the two arguments.
Keyword embeddings: we use word2vec [320] to extract from each argument a vectorrepresenting the keywords of a topic. These vectors are extracted using the continuous bag-of-word algorithm, a windows size of 8 and a vector dimensionality of 50.
Argument entailment: these features indicate if the first argument entails the second one,and vice-versa. To detect the presence of entailment we use the Excitement Open Platform

4.3. ARGUMENTATION ANALYSIS FOR POLITICAL SPEECHES 159
[295].Argument sentiment: a set of features based on the sentiment analysis module of the
Stanford CoreNLP suite [418] are used to represent the sentiment of each argument, calculatedas the average sentiment score of the sentences composing it.
Additional features for lexical overlap, entailment and sentiment are obtained also consid-ering only the subtrees containing a topic keyword instead of the full arguments. The featurevectors are then used to train a SVM with radial kernel with LIBSVM, like in the first classi-fication step.
Evaluation. We test the performance of the classification pipeline using the 1,462 manuallyannotated pairs with 10-fold cross-validation. The first classification step separates the argu-ment pairs linked by either an attack or a support relation from the argument pairs with norelation (that will be subsequently discarded). The purpose of this first step is to pass therelated pairs to the second step. Thus, we aim at the highest precision, in order to minimisethe number of errors propagated to the second step. Table 4.15 shows the results of the clas-sification for the first step. We choose a configuration that, despite a low recall (0.23), scoresa precision of 0.88 on the attack/support pairs, providing for the second step a total of 194argument pairs.
Unrelated Attack/Support AveragePrecision 0.56 0.88 0.72Recall 0.97 0.23 0.60F1 0.71 0.36 0.65
Table 4.15: Step 1: classification of related / unrelated pairs
The second step classifies the related pairs assigning an attack or a support label. We providetwo evaluations: we report the classifier performance only on the gold attack and support pairs(Table 4.16), and on the pairs classified as related in the first step (Table 4.17). In this way,we evaluate the classifier also in a real setting, to assess the performance of the end-to-endpipeline.
Attack Support Average
Precision 0.89 0.75 0.82Recall 0.79 0.86 0.83
F1 0.84 0.80 0.82
Table 4.16: Step 2: classification of Attack and Support using only gold data.
Attack Support Average
Precision 0.76 0.67 0.72Recall 0.79 0.86 0.83
F1 0.77 0.75 0.77
Table 4.17: Step 2: classification of Attack and Support using the output of Step 1.
As expected, accuracy using only gold data is 0.82 (against a random baseline of 0.70),while it drops to 0.72 (against a random baseline of 0.51) in the real-world setting.

160 CHAPTER 4. MINING ARGUMENTATIVE STRUCTURES FROM TEXTS
We also test a 3-class classifier, with the same set of features used in the two classificationsteps, obtaining a precision of 0.57. This shows that support/attack and no relation are betterrepresented by using different sets of features, therefore we opt for two binary classifiers incascade.
Notice that a comparison of our results with existing approaches to predict argument rela-tions, namely the approach of [425] on persuasive essays, cannot be fairly addressed due to hugedifferences in the complexity of the used corpus. With their better configuration, [425] obtainan F1 of 0.75 on persuasive essays (that are a very specific kind of texts, human upperbound:macro F1 score of 0.854), and of 0.72 on microtexts [371]. The difference in the task complexityis highlighted also in the inter-annotator agreement. Differently from persuasive essays, wherestudents are requested to put forward arguments in favour and against their viewpoint, in po-litical speeches, candidates often respond to opponents in subtle or implicit ways, avoiding aclear identification of opposing viewpoints.
Error analysis. If we analyse the classifier output at topic level, we observe that overallthe performance is consistent across all topics, with the exception of minimum wage. In thislatter case, the classifier performs much better, with an accuracy of 0.94 in the second step.This is probably due to the fact that Kennedy’s and Nixon’s statements about minimum wageare very different and the discussion revolves around very concrete items (e.g., the amounts ofthe minimum wage, the categories that should benefit from it). In other cases, for exampledisarmament or Cuba, the speakers’ wording is very similar and tends to deal with abstractconcepts such as freedom, war, peace.
Furthermore, we observe that the classifier yields a better performance with argument pairsby the same person rather than those uttered by different speakers: in the first case, accuracyis 0.86, while in the second one it is 0.79 (Step 2).
Looking at misclassified pairs, we notice very challenging cases, where the presence of lin-guistic devices like rhetorical questions and repeated negations cannot be correctly capturedby our features. Example 11 reports on a pair wrongly classified as Support belonging to thehealth care topic:
Example 11
Nixon: Now, some people might say, Mr. Nixon, won’t it be easier just to have the FederalGovernment take this thing over rather than to have a Federal-State program? Won’t it beeasier not to bother with private health insurance programs? Yes; it would be a lot simpler, but,my friends, you would destroy the standard of medical care.
Kennedy: I don’t believe that the American people are going to give their endorsement to theleadership which believes that medical care for our older citizens, financed under social security,is extreme, and I quote Mr. Nixon accurately.
4.3.3 Visualization and analysis of the argumentation graphs
In this section, we describe how the results of our relation prediction system are then used toconstruct the argumentation graphs about the debated topics.
Several tools have been proposed to visualize (and then reason upon) argumentation frame-works in the computational argumentation field, e.g., Carneades19, GRAFIX20, and ConArg221.However, two main problems arise when trying to use such tools for our purposes: first, they
19http://carneades.github.io/20https://www.irit.fr/grafix21http://www.dmi.unipg.it/conarg/

4.3. ARGUMENTATION ANALYSIS FOR POLITICAL SPEECHES 161
are not tailored to long, natural language snippets (the usual names of arguments in compu-tational argumentation are of the form arg1), and second, they do not consider the possibilityto identify specific argumentation schemes over the provided text. For all these reasons, wedecided to rely upon a well-know tool called OVA+ [240], an on-line interface for the manualanalysis of natural language arguments. OVA+ grounds its visualization on the Argument In-terchange Format (AIF) [108], allowing for the representation of arguments and the possibilityto exchange, share and reuse the resulting argument maps. OVA+ handles texts of any typeand any length.
The last step of our argument mining pipeline takes in input the labeled pairs returned bythe relation prediction module and translates this output to comply with the AIF format. Thistranslation is performed through a script converting the CSV input file into json file to be loadon OVA+ through its online interface.22 In this mapping, each argument is extracted in orderto create an information node (I-node) [108], and then, it is possible to create the associatedlocution node (L-node) and to specify the name of the speaker. The locution appears, precededby the name of the participant assigned to it, and edges link the L-node to the I-node via an“Asserting” YA-node, i.e., the illocutionary forces of locutions, as in the Inference AnchoringTheory (IAT) model [75]. Supports or attacks between arguments are represented as follows,always relying upon the standard AIF model. A RA-node (relation of inference) should connecttwo I-nodes. To elicit an attack between two arguments, RA-nodes are changed into CA-nodes, namely schemes of conflict. Nodes representing the support and the attack relationsare the “Default Inference” and the “Default Conflict” nodes, respectively. Figure 4.6 shows(a portion of) the argumentation graph resulting from the relation prediction step about thetopic minimum wage, where three I-nodes (i.e., arguments) are involved in one support andone attack relation. The Asserting nodes connect each argument with its own source (e.g., Kfor Kennedy and N for Nixon).
OVA+ allows users to load an analysis, and to visualize it. Given the loaded argumentationgraph, the user is supported in analyzing the graph by identifying argumentation schemes [465],and adding further illocutionary forces and relations between the arguments. This final stepsubstantially eases the analysis process by historians and social scientists. Moreover, at theend of the analysis, OVA+ permits to save the final argumentation graph on the user’s machine(image or json file).
This graph-based visualization is employed to support political scientists and historians inanalysing and modeling political speeches. This proves the usefulness of applying the argumen-tation mining pipeline over such kind of data: it allows users to automatically identify, amongthe huge amount of assertions put forward by the candidates in their speeches, the main pointson which the candidates disagree (mainly corresponding to the solutions they propose to carryout or their own viewpoints on the previous administrations’ effectiveness) or agree (mainly,general-purpose assertions about the country’s values to promote).
In the following, we analyze the argumentative structure and content of two of the graphsresulting from the discussed topics (i.e., minimun wage and health care), highlighting mainconflicting arguments among candidates, and other argumentative patterns. Note that thisanalysis is carried out on the proposed dataset, that contains a subset of all the speeches of thecandidates, but gives a clear idea of the kind of analysis that could be performed by scholarson the entirety of the speeches. In general (and this is valid for all the analyzed graphs), wenotice that the candidates almost always disagree either on the premises (e.g., who caused theproblem to be faced) or on the proposed solutions (the minor claims).
22The script and the argumentation graphs about the five topics in our corpus (both gold standard andsystem’s output) are available at https://dh.fbk.eu/resources/political-argumentation

162 CHAPTER 4. MINING ARGUMENTATIVE STRUCTURES FROM TEXTS
Figure 4.6: The argumentation graph about the topic minimum wage visualized through theOVA+ tool.
Minimum wage. A widely discussed topic by both candidates was minimum wage, i.e., thebill to set the lowest remuneration that employers may legally pay to workers. It is worthnoticing that the argumentation graph for the minimum wage corpus is rather complicated,and it highlights some main controversial issues. The candidates do not agree about the causesof the low minimum wage in 1960 in the US. More precisely, Kennedy attacks the fact thatthe administration supported an increase in the minimum wage by attacking Nixon’s argument“The misstatement: In the second debate Senator Kennedy said: The Republicans in recentyears, not only in the last 25 years, but in the last 8 years, have opposed minimum wage. Thefacts: [. . . ] The administration supported an increase in the minimum wage in 1955, and in1957 urged legislation to extend minimum wage coverage to some 3 million additional workers,an extension which the Democratic-led Congress failed to approve. In 1960, this administrationsought to extend minimum wage coverage to 3.1 million additional workers and indicated supportof an increase in the minimum wage to $1.15 per hour.”. This argument is attacked fromdifferent perspectives, leading to a disagreement on the actions the administration carried outin the past years to deal with the minimum wage problem. For instance, as shown in Figure4.6, Kennedy states that “In the midthirties, 90 percent of the Republican Party voted againsta 25-cent minimum wage. This summer, as your Congressman can tell you, in the House ofRepresentatives, 90 percent of the Republicans voted against a minimum wage of $1.25 an hour,$50 a week for a 40-hour week, for a business that makes more than a million dollars a year, andMr. Nixon called it extreme. He is frozen in the ice of his own indifference”. While we may saythat this source of disagreement is about the causes of the minimum wage issue, another mainsource of disagreement is represented by the solutions proposed by the two candidates, whichmainly differ regarding the amount of increase of the minimum wage and the coverage of thetwo respective bills. All these issues become evident with ease in the resulting argumentationgraph about the minimum wage topic.

4.4. MINING ARGUMENTS IN 50 YEARS OF US PRESIDENTIAL CAMPAIGN DEBATES163
Medical care. The problem of medical care for the elderly was a main problem in 1960, andthis topic was widely discussed in the campaign. The resulting argumentation graph highlightssome relevant argumentative patterns that are worth analyzing. In general, in the argumenta-tion graphs we are analyzing, the support relation holds between arguments proposed by thesame candidate, ensuring in this way a certain degree of coherence in their own argumentation.Interestingly, in the argumentation graph on the topic medical care, we can observe that asupport relation holds between an argument from Kennedy and one from Nixon, i.e., “Thoseforced to rely on surplus food packages should receive a more balanced, nourishing diet. And tomeet the pressing problem confronting men past working age, and their families, we must putthrough an effective program of medical care for the aged under the social security system. Thepresent medical care program will not send one penny to needy persons without further actionby the Congress and the State legislatures.” supports “N: We stand for programs which willprovide for increased and better medical care for our citizens, and particularly for those whoneed it, who are in the older age brackets - and I will discuss that more a little later. We standfor progress in all of these fields, and certainly, as I stand here before you, I am proud to bea part of that platform and of that program”. These instances of support among candidatesmostly concern general issues, i.e., a program of medical care for the elderly is needed.
In summary, our system allows the detection of such argumentation patterns (i.e., topics onwhich both candidates agree or disagree, topics on which they provide contradictory assertions)and the analysis of how they connect with the other statements asserted in the speeches.
4.4 Mining arguments in 50 years of US presidential
campaign debates
Political debates are public interviews where the candidates of elections are requested to con-front each other on topics such as unemployment, taxes, and foreign policy. During presidentialelections in the US, it is customary for the main candidates of the two largest parties, i.e., theDemocratic and the Republican Parties, to engage in a debate around the most controversialissues of the time. Such debates are considered as a de facto election process, and in some casesthey have nearly decided the outcomes of the elections [120].
Given the importance of these debates and their innate argumentative features, as discussedin the previous section they represent a natural playground for Argument Mining methods. Theability of identifying argumentative components and predicting their relations in such a kindof texts opens the door to cutting-edge tasks like fallacy detection, fact-checking, and counter-argumentation generation.
To be best of our knowledge, none of the few approaches tackling the issue of miningargumentative structures from political debates [278, 312, 155, 459] take on the identificationof argument components (i.e., premises and claims) on a large corpus of political debates.This work fills this gap by (1) performing a large-scale annotation study over 50 years of USpresidential campaigns from 1960 (Nixon vs. Kennedy) to 2016 (Trump vs. Clinton), resultingin 29k annotated argument components, and (2) experimenting with feature-rich SVM learnersand neural architectures outperforming standard baselines in Argument Mining. Finally, toensure full reproducibility of our experiments, we provide all data and source codes under freelicenses.

164 CHAPTER 4. MINING ARGUMENTATIVE STRUCTURES FROM TEXTS
Year Candidates T S W
1960 Kennedy-Nixon 255 2082 48326
1976 Carter-Ford 270 1874 46444
1980 Anderson-Reagan 200 1141 28765
1984 Mondale-Reagan 365 2376 50126
1988 Bush-Dukakis 484 2599 52780
1992 Bush-Clinton-Perot 929 4057 73688
1996 Clinton-Dole 280 2299 32088
2000 Bush-Gore 564 3225 718522000 Cheney-Lieberman 106 835 16395
2004 Bush-Kerry 419 3487 554862004 Cheney-Edwards 169 1069 20486
2008 McCain-Obama 505 2829 56379
2012 Obama-Romney 676 2352 620972012 Biden-Ryan 425 1252 20785
2016 Clinton-Trump 954 2536 40530
TOT. 6601 34013 676227
Table 4.18: Statistics on the debate transcripts: number of speech turns (T), sentences (S) andwords (W).
4.4.1 USElecDeb60To16 dataset creation
The USElecDeb60To16 v.01 dataset was collected from the website of the Commission onPresidential Debates23, which provided transcripts of the debates broadcasted on TV and heldamong the leading candidates for the presidential and vice presidential nominations in theUS. USElecDeb60To16 includes the debates starting from Kennedy and Nixon in 1960 untilthose between Clinton and Trump in 2016. Table 4.18 provides some statistics on the dataset interms of number of turns in the conversations, of sentences and of words in the transcripts. Theunique properties of this dataset are its size (see Table 4.18), its peculiar nature of containingreciprocal discussions (mainly between Democrats and Republicans), and its time line structure.The motivation for creating a new corpus is twofold: i) to the best of our knowledge, no otherbig corpus on political debates annotated at a argument component level for Argument Miningexists, and ii) we ensure the reproducibility of the annotation, writing guidelines, inspiredfrom [396, 278], with precise rules for identifying and segmenting argument components (i.e.,claims and premises) in political debates.24
In the following, we detail the annotation of the argument components through examplesfrom the USElecDeb60To16 dataset.
Claims. Being them the ultimate goal of an argument, in the context of political debates,claims can be a policy advocated by a party or a candidate to be undertaken which needs tobe justified in order to be accepted by the audience. In Example 1,25 Bush is defending thedecisions taken by his administration by claiming that his policy has been effective. Claimsmight also provide judgments about the other candidate or parties (Example 2).
1. Bush-Kerry, September 30, 2004:BUSH: My administration started what’s called the Proliferation Security Initiative. Over 60
23http://www.debates.org24The USElecDeb60To16 v.01 dataset and the annotation guidelines are available here: https://github.
com/ElecDeb60To16/Dataset.25In the examples, claims are marked in bold, premises in Italics and the component boundaries by [square
brackets].

4.4. MINING ARGUMENTS IN 50 YEARS OF US PRESIDENTIAL CAMPAIGN DEBATES165
nations involved with disrupting the trans-shipment of information and/or weapons of massdestruction materials. And [we’ve been effective]. [We busted the A.Q. Khan network. Thiswas a proliferator out of Pakistan that was selling secrets to places like North Korea and Libya].[We convinced Libya to disarm].
2. Kennedy-Nixon, September 26, 1960:NIXON: [I believe the programs that Senator Kennedy advocates will have a ten-dency to stifle those creative energies], [I believe in other words, that his programwould lead to the stagnation of the motive power that we need in this country toget progress].
3. Kennedy-Nixon, October 13, 1960:NIXON: Senator Kennedy’s position and mine completely different on this. [I favor thepresent depletion allowance]. [I favor it not because I want to make a lot of oil men rich],but because [I want to make America rich]. Why do we have a depletion allowance? Because[this is the stimulation, the incentive for companies to go out and explore for oil, to develop it ].
Taking a stance towards a controversial subject, or an opinion towards a specific issue is alsoconsidered as a claim (e.g., “I’ve opposed the death penalty during all of my life”). The presenceof discourse indicators (e.g., “in my opinion”, “I believe”) is generally a useful hint in findingclaims that state opinions and judgments.
Premises. Premises are assertions made by the debaters for supporting their claims (i.e.,reasons or justifications). A type of premise commonly used by candidates is referring to pastexperience: more experienced candidates exploit this technique to assert that their claims aremore relevant than their opponents because of their past experience (Example 4).
4. Carter-Ford, September 23, 1976:CARTER: [Well among my other experiences in the past, I’ve - I’ve been a nuclear engineer,and did graduate work in this field ]. [I think I know the - the uh capabilities andlimitations of atomic power].
Statistics are very commonly used as evidence to justify the claims (Example 6). Moreover,premises may be asserted in the form of examples (in such cases, they may contain discourseindicators to introduce examples and justifications, such as “because”).
5. Nixon-Kennedy, September 26, 1960:NIXON: We often hear gross national product discussed and in that respect may I say that[when we compare the growth in this administration with that of the previous administration thatthen there was a total growth of eleven percent over seven years]; [in this administration therehas been a total growth of nineteen percent over seven years]. [That shows that there’s beenmore growth in this Administration than in its predecessor].
6. Clinton-Dole, October 6, 1996:CLINTON: [We have ten and a half million more jobs, a faster job growth rate than under anyRepublican administration since the 1920s]. [Wages are going up for the first time in a decade].[We have record numbers of new small businesses]. [We have the biggest drop in the number ofpeople in poverty in 27 years]. [All groups of people are growing ]. [We had the biggest drop inincome inequality in 27 years in 1995 ]. [The average family’s income has gone up over $1600just since our economic plan passed ]. So [I think it’s clear that we’re better off than wewere four years ago].

166 CHAPTER 4. MINING ARGUMENTATIVE STRUCTURES FROM TEXTS
Three expert annotators defined the annotation guidelines, then three other annotators car-ried out the annotation task relying on such guidelines. Each transcript has been independentlyannotated by at least two annotators26. 86% of the sentences, which were annotated at leastwith one component, were tagged with only one argument component, while the remaining 14%with more than one component (7% with both claims and premises).27 Only 0.6% of the datasetcontains cross-sentence annotations (i.e., annotations which are not bound in one sentence). 19debates have been independently annotated by three annotators to measure the IAA. The ob-served agreement percentage and IAA at sentence-level (following [424]) are respectively 0.83%and κ = 0.57 (moderate agreement) for argumentative-non argumentative sentences, and 63%and κ = 0.4 (fair agreement) for the argument components. Such annotation tasks are verydifficult with political debates. In many examples, the choice between a premise and a claim ishard to define. In Example 7, the sentence “the way Senator [...]” is used as a premise for theprevious claim, but if observed out of this context, it can be identified as a claim. This justifiesthe IAA on the argument component annotation.
7. McCain-Obama, October 15, 2008:OBAMA: [I disagree with Senator McCain in how to do it], because [the way SenatorMcCain has designed his plan, it could be a giveaway to banks if we’re buying full price formortgages that now are worth a lot less]?.
To release a consistent dataset, in the reconciliation phase we computed the IAA of theannotators with two other expert annotators with background in computational linguistics ona sample of 6 debates. In case of disagreement among the first three annotators, the annotationprovided by the annotator which showed to be consistently in line with the expert annotators(i.e., with a higher IAA) was included in the released dataset.After the reconciliation phase, the USElecDeb60To16 dataset contains the annotation of 29521argument components (i.e., 16087 claims and 13434 premises). Notice that the number ofclaims is higher than the number of premises, because in political speeches the candidatesmake arguments mostly without providing premises for their claims. Moreover, the candidatesuse longer sentences (more words) to express their premises than their claims.
For our experiments, we split the dataset into train (13894 components), validation (6577components) and test (9050 components) sets, keeping the same component distribution as inthe original dataset.
4.4.2 Experimental setting
We address the argument component detection task as two subsequent classification steps, i.e.,the argumentative sentences detection (Task 1), and the argumentative components identifica-tion (Task 2). We address both of these classification tasks at the sentence level (e.g., we labela sentence according to the longest component annotated in the sentence).
Methods. For Task 1, we trained both a linear-kernel SVM with stochastic gradient descentlearning method using bag of words features only, and a SVM classifier with rbf kernel (pythonscikit-learn v0.20.1, penalty parameter=10) using the features listed below to distinguish ar-gumentative sentences (i.e., sentences which contain at least one argument component) fromthe non-argumentative ones. For comparison, we also tested a Neural Network structured withtwo bidirectional LSTM layers [224] using word embeddings from FastText [245, 321] as theweights for the embedding layer. The output layer determines the class Argumentative/Non-Argumentative for the input sentence. A feed-forward Neural Network was also trained using
26We used the Brat annotation tool [428].27A component cannot be both a claim and a premise (see Guidelines).

4.5. ARGUMENT MINING FOR HEALTHCARE APPLICATIONS 167
the same sentence-based features used with the SVM classifier. This network consists of twohidden layers with 64 and 32 neurons for the 1st and 2nd hidden layer, respectively.
As for the component classification step, we applied the same classifiers as for Task 1 (SVMand LSTM). For both tasks, we implemented the majority baseline for argument componentclassification used in [425].
We considered the following features: tf-idf of each word, NGram (bigrams and trigrams),POS of adverbs, adjectives (used by debaters to stress the correctness of their premises), dif-ferent tenses of verbs and modal verbs (they often affect the certainty of the assertions, hencewould be a hint of facts/non-facts in discerning between argument components), syntacticfeatures (constituency parse trees, dept of the parsing tree), discourse connectives (and theirposition), NER (debaters often mention party members, former presidents, organizations anddates or numbers like statistics as examples to strengthen the premises for the claims), semanticfeatures (sentiment polarity of the argument component and of its covering sentence [312]).
Evaluation Tables 4.19 and 4.20 present the results obtained on detecting argumentativesentences (Task 1) and classifying argumentative components (Task 2), respectively. Resultsobtained with linear-kernel SVM significantly outperformed the majority baseline in both tasks.Enriching the feature-set increased the classification performances by 9% on Task 1 using therbf-kernel SVM, while only by 2.2% on Task 2. Running ablation tests for features analysis, wenoticed that the lexical features (tf-idf and NGram features) strongly contribute to performanceincrease in both tasks. NER features – selected on the assumption that they would haveimproved the detection of premises as candidate tend to use NERs to provide examples –showed to be more effective in Task 1 only. Sentiment and discourse indicator features didnot show to be effective in either classification tasks. Results obtained by LSTM with word-embedding as features in both tasks are comparable to that of the SVM using all the features,showing the efficiency of neural classifiers on AM tasks using less dimensionality for the inputdata.
Given the complexity of the task, we computed the human upper bound as the averageF-score of the annotation agreement between annotators and the gold-standard. It resultedin 0.87 and 0.75 on argumentative vs. non-argumentative, and 0.74 and 0.65 on claims andpremises, respectively.
Argumentative sentences are rarely misclassified, which results in high recall on argumen-tative sentence identification. Some patterns can be identified from the misclassified non-argumentative sentences. One of these patterns appears in very short non-argumentative sen-tences which contain an argument indicator such as “so”, for instance the sentence: “So whatshould we do?” is classified as argumentative although in the context it is considered a non-argumentative sentence. Since indicators for claims are more numerous in these debates, thismisclassification mostly occurs when a claim-indicator is uttered by the candidate in a non-argumentative manner.
In other cases, candidates make final remarks phrasing their speech with a structure similarto argumentative sentences, for example: “I think when you make that decision, it might bewell if you would ask yourself, are you better off than you were four years ago?”.
Misclassification between claims and premises, instead, is primarily due to the fact that thecomponent classification is highly dependent on the structure of the argument.
4.5 Argument Mining for Healthcare applications
In the healthcare domain, there is an increasing interest in the development of intelligent sys-tems able to support and ease clinicians’ everyday activities. These systems apply to clinical

168 CHAPTER 4. MINING ARGUMENTATIVE STRUCTURES FROM TEXTS
Classifier Class Precision Recall F-Score
Majoritybaseline
Arg 0.681 1.000 0.810None 0.000 0.000 0.000
Average 0.463 0.681 0.551
SVMLinear Kernel
BOW
Arg 0.758 0.980 0.855None 0.886 0.335 0.486
Average 0.799 0.774 0.737
SVMRbf KernelAll features
Arg 0.855 0.986 0.916None 0.834 0.293 0.433
Average 0.851 0.853 0.823
LSTM networkword-embeddings features
Arg 0.882 0.946 0.913None 0.668 0.463 0.547
Average 0.841 0.854 0.843
Feed Forward NetworkAll features
Arg 0.885 0.859 0.872None 0.471 0.528 0.498
Average 0.805 0.796 0.800
Table 4.19: Classification results on Task 1.
Classifier Class Precision Recall F-Score
Majoritybaseline
Claim 0.51 1.00 0.68Premise 0.00 0.00 0.00Average 0.26 0.51 0.35
SVMLinear Kernel
BOW
Claim 0.625 0.757 0.685Premise 0.682 0.534 0.599Average 0.653 0.647 0.643
SVMRbf KernelAll features
Claim 0.631 0.830 0.717Premise 0.728 0.484 0.581Average 0.678 0.662 0.651
LSTM networkword-embeddings
Claim 0.848 0.810 0.829Premise 0.683 0.739 0.710Average 0.673 0.673 0.673
Feed Forward NetworkAll features
Claim 0.639 0.697 0.667Premise 0.644 0.581 0.611Average 0641 0.641 0.640
Table 4.20: Classification results on Task 2.
trials, clinical guidelines, and electronic health records, and their solutions range from the au-tomated detection of PICO28 elements [244] in health records to evidence-based reasoning fordecision making [237, 129, 288, 387]. These applications highlight the need of clinicians tobe supplied with frameworks able to extract, from the huge quantity of data available for thedifferent diseases and treatments, the exact information they necessitate and to present thisinformation in a structured way, easy to be (possibly semi-automatically) analyzed. Argu-ment(ation) Mining (AM) [371, 279, 92] deals with finding argumentative structures in text.Standard tasks in AM consist in the detection of argument components (i.e., evidence andclaims), and the prediction of the relations (i.e., attack and support) holding among them.Given its aptness to automatically detect in text those argumentative structures that are atthe basis of evidence-based reasoning applications, AM represents a potential valuable contri-
28Patient Problem or Population, Intervention, Comparison or Control, and Outcome.

4.5. ARGUMENT MINING FOR HEALTHCARE APPLICATIONS 169
bution in the healthcare domain.However, despite its natural employment in healthcare applications, only few approaches
have applied AM methods to this kind of text [200, 302, 303], and their contribution is limitedto the detection of argument components, disregarding the more complex phase of predictingthe relations among them. In addition, no huge annotated dataset for AM is available forthe healthcare domain. In this work, we cover this gap, and we answer the following researchquestion: how to define a complete AM pipeline for clinical trials? To answer this question, wepropose a deep bidirectional transformer approach combined with different neural networks toaddress the AM tasks of component detection and relation prediction in Randomized ControlledTrials, and we evaluate this approach on a new huge corpus of 659 abstracts from the MEDLINEdatabase.
More precisely, the contributions of this work are as follows:
1. We build a new dataset from the MEDLINE database, consisting of 4198 argument com-ponents and 2601 argument relations on five different diseases (neoplasm, glaucoma, hep-atitis, diabetes, hypertension)29;
2. We present a complete AM pipeline for clinical trials relying on deep bidirectional trans-formers combined with different neural networks, i.e., Long Short-Term Memory (LSTM)networks, Gated Recurrent Unit (GRU) networks, and Conditional Random Fields (CRFs)30;
3. Our extensive evaluation of various AM architectures (e.g., for persuasive essays) revealsthat current approaches are unable to adequately address the challenges raised by medicaltext and we show that transformer-based approaches outperform these AM pipelines aswell as standard baselines.
In the following, we then describe the corpus we built, the methods we employed and theexperimental setting. Finally, we report the obtained results and we address an error analysis.
4.5.1 Corpus creation
To address AM on clinical data, we rely on and extend our previous dataset [302], the onlyavailable corpus of Randomized Controlled Trial abstracts annotated with the different argu-ment components (evidence, claims and major claims). Such corpus contains the same abstractsused in the corpus of RCT abstracts of [443], that were retrieved directly from PubMed31 bysearching for the disease name and specifying that it has to be a RCT. The first version of thecorpus with coarse labels contained 919 argument components (615 evidence and 304 claims)from 159 abstracts comprising 4 different diseases (i.e., glaucoma, hypertension, hepatitis b,diabetes).
To obtain more training data, we have extracted from PubMed 500 additional abstracts fol-lowing Strategy 1 in [443]. We selected neoplasm32 as a topic, assuming that the abstracts wouldcover experiments over dysfunctions related to different parts of the human body (providingtherefore a good generalization as for training instances).
Annotation was started after a training phase, where amongst others the component bound-aries were topic of discussion. Gold labels were set after a reconciliation phase, during which
29The newly created dataset, called AbstRCT, and the annotation guidelines are available here: https:
//gitlab.com/tomaye/abstrct/30The source code is available here: https://gitlab.com/tomaye/ecai2020-transformer_based_am31PubMed (https://www.ncbi.nlm.nih.gov/pubmed/) is a free search engine accessing primarily the MED-
LINE database on life sciences and biomedical topics.32While neoplasms can either be benign or malignant, the vast majority of articles is about malignant neoplasm
(cancer). We stick with neoplasm as a term, since this was the MeSH term used for the PubMed query.

170 CHAPTER 4. MINING ARGUMENTATIVE STRUCTURES FROM TEXTS
Dataset #Evi #Claim #MajCl #Sup #Att
Neoplasm 2193 993 93 1763 298Glaucoma 404 183 7 334 33Hepatitis 80 27 5 65 1Diabetes 72 36 11 44 8Hypertension 59 26 9 53 2
Total 2808 1265 125 2259 342
Table 4.21: Statistics of the extended dataset. Showing the numbers of evidence, claims, majorclaims, supporting and attacking relations for each disease-based subset, respectively.
the annotators tried to reach an agreement. While the number of annotators vary for the twoannotation phases (component and relation annotation), the inter-annotator agreement (IAA)was always calculated with three annotators based on a shared subset of the data. The thirdannotator was participating in each training and reconciliation phase as well.
In the following, we describe the data annotation process for the argument components inthe neoplasm dataset, and for the argumentative relations in the whole dataset. Table 4.21reports on the statistics of the final dataset.
Annotation of argument components. Following the guidelines for the annotation ofargument components in RCT abstracts provided in [302], two annotators with background incomputational linguistics33 carried out the annotation of the 500 abstracts on neoplasm. IAAamong the annotators has been calculated on 30 abstracts, resulting in a Fleiss’ kappa of 0.72for argumentative components and 0.68 for the more fine-grained distinction between claimsand evidence (meaning substantial agreement for both tasks). Example 1 shows a sampleannotated abstract, where claims are written in bold, major claims are highlighted with adashed underline, and evidence are written in italics.
Claims. In the context of RCT abstracts, a claim is a concluding statement made by theauthor about the outcome of the study. It generally describes the relation of a new treatment(intervention arm) with respect to existing treatments (control arm) and is derived from thedescribed results. Major claims are more a general/concluding claim, which is supported bymore specific claims. The concluding statements do not have to occur at the end of the abstract,and may also occur at the beginning of the text as an introductory claim, as in Example 1.Given the negligible occurrences of major claims in our dataset, we merge them with the claimsfor the classification task.
Evidence. An evidence in RCT abstracts is an observation or measurement in the study,which supports or attacks another argument component, usually a claim. Those observationscomprise side effects and the measured outcome of the intervention and control arm. They areobserved facts, and therefore credible without further justifications, as this is the ground truththe argumentation is based on.
Example 1 Extracellular adenosine 5’-triphosphate (ATP) is involved in the regulation of a va-riety of biologic processes, including neurotransmission, muscle contraction, and liver glucosemetabolism, via purinergic receptors. [In nonrandomized studies involving patients with differenttumor types including non-small-cell lung cancer (NSCLC), ATP infusion appeared to inhibit
33In [201], researchers with different backgrounds (biology, computer science, argumentation pedagogy, andBioNLP) have annotated medical data for an AM task, showing to perform equally well despite their back-grounds.

4.5. ARGUMENT MINING FOR HEALTHCARE APPLICATIONS 171
loss of weight and deterioration of quality of life (QOL) and performance status]. We conducteda randomized clinical trial to evaluate the effects of ATP in patients with advanced NSCLC(stage IIIB or IV). [...] Fifty-eight patients were randomly assigned to receive either 10 intra-venous 30-hour ATP infusions, with the infusions given at 2- to 4-week intervals, or no ATP.Outcome parameters were assessed every 4 weeks until 28 weeks. Between-group differenceswere tested for statistical significance by use of repeated-measures analysis, and reported Pvalues are two-sided. Twenty-eight patients were allocated to receive ATP treatment and 30received no ATP. [Mean weight changes per 4-week period were -1.0 kg (95% confidence inter-val [CI]= 1.5 to -0.5) in the control group and 0.2 kg (95% CI =-0.2 to +0.6) in the ATPgroup (P=.002)]1. [Serum albumin concentration declined by -1.2 g/L (95% CI=-2.0 to -0.4)per 4 weeks in the control group but remained stable (0.0g/L; 95% CI=-0.3 to +0.3) in the ATPgroup (P =.006)]2. [Elbow flexor muscle strength declined by -5.5% (95% CI=-9.6% to -1.4%)per 4 weeks in the control group but remained stable (0.0%; 95% CI=-1.4% to +1.4%) in theATP group (P=.01)]3. [A similar pattern was observed for knee extensor muscles (P =.02)]4.[The effects of ATP on body weight, muscle strength, and albumin concentration were especiallymarked in cachectic patients (P=.0002, P=.0001, and P=. 0001, respectively, for ATP versusno ATP)]5. [...] This randomized trial demonstrates that [ATP has beneficial effects onweight, muscle strength, and QOL in patients with advanced NSCLC]1.
Annotation of argumentative relations. As a next step towards modeling the argumenta-tive structures in the data, it is crucial to annotate the relations, i.e., directed links connectingthe components. Those relations are connecting argument components to form the graph likestructure of an argument. The relation is a directed link from an outgoing node (i.e., the source)to a target node. The nature of the relation can be supporting or attacking, meaning that thesource component is justifying or undermining the target component. Links can occur onlybetween certain components: evidence can be connected to either a claim or another evidence,whereas claims can only point to other claims (including major claims). The polarity of therelation (supporting or attacking) does not limit the possibility to what type of componenta component can be connected. Theoretically, all types of relations are possible between theallowed combination pairs. Practically, some relations occur rather seldom compared to thefrequency of others. The number of outgoing links from a component may exceed one. Further-more, in rare cases, components cannot be connected at all. This can happen for major claimsin the beginning of an abstract, whose function is to point out a related problem, unconnectedto the outcome of the study itself.
Attack. A component is attacking another one, if it is i) contradicting the proposition of thetarget component, or ii) undercutting its implicit assumption of significance, i.e., stating thatthe observed effects are not statistically significant. The latter case is shown in Example 2.Here, evidence 1 is attacked by evidence 2, challenging the generality of the prior observation.
Example 2 [True acupuncture was associated with 0.8 fewer hot flashes per day than sham at 6weeks,]1 [but the difference did not reach statistical significance (95% CI, -0.7 to 2.4; P = .3).]2
The partial-attack is used when the source component is not in full contradiction, but weakeningthe target component by constraining its proposition. Those can be implicit statements aboutthe significance of the study outcome, which usually occur between two claims (see Example3). Attacks and partial-attacks are identified with a unique class for the relation classificationtask.
Example 3 [SLN biopsy is an effective and well-tolerated procedure.]1 [However, its safetyshould be confirmed by the results of larger randomized trials and meta-analyses.]2

172 CHAPTER 4. MINING ARGUMENTATIVE STRUCTURES FROM TEXTS
Figure 4.7: Illustration of the full argument mining pipeline on clinical trials.
Support. All statements or observations justifying the proposition of the target componentare considered as supporting the target (even if they justify only parts of the target component).In Example 1, all the evidence support claim 1.
We carried out the annotation of argumentative relations over the whole dataset of RCT ab-stracts, including both the first version of the dataset [302] and the newly collected abstracts onneoplasm. An expert in the medical domain (a pharmacist) validated the annotation guidelinesbefore starting the annotation process. IAA has been calculated on 30 abstracts annotated inparallel by three annotators (the same two annotators that carried out the argument componentannotation, plus one additional annotator), resulting in a Fleiss’ kappa of 0.62. The annotationof the remaining abstracts was carried out by one of the above mentioned annotators.
4.5.2 The AM pipeline for clinical trials
In this section, we first describe the argument component detection and relation classificationtasks, and then we report about the experimental setting to solve these tasks.
Argument Component Detection The first step of the AM pipeline (visualized in Fig-ure 4.7) is the detection of argumentative components and their boundaries. As describedabove, most of the AM approaches classify the type of component assuming the boundaries ofargument components as given. To merge the component classification and boundary detectioninto one problem, we cast the component detection as sequence tagging task. Following theBIO-tagging scheme, each token should be labeled as either being at the Beginning, Insideor Outside of a component. As we have two component types in AM, this translates into asequence tagging problem with five labels, i.e., B-Claim, I-Claim, B-Evidence, I-Evidence andOutside. To model the temporal dynamics of sequence tagging problems, usually RecurrentNeural Networks (RNN) are used. In our experiments, we evaluate different combinations ofRNNs with various types of pre-trained word representations. Each embedding method is com-bined with uni- or bidirectional LSTMs or GRUs with and without a CRF as a last layer.Furthermore, we are the first to do token level classification on AM by fine-tuning differenttransformer models.
Embeddings. There are two ways to create an input word representation for sequence mod-elling. One way is to look up the representation from pre-trained embeddings. This staticmethod has the advantage that one does not need to train its own embeddings. However,the vocabulary is limited, and the context of the word is not considered. State-of-the-art em-beddings are generated dynamically from the context of the target word based on pre-trained

4.5. ARGUMENT MINING FOR HEALTHCARE APPLICATIONS 173
language models (LM) [4, 144, 375]. In our experiments, we consider both kinds of embeddings.Furthermore, since our data is from the medical domain containing very specific terminologywhich might not be covered in the vocabulary of general word embeddings, we experiment withdifferent approaches to overcome this problem.
As for the static embeddings, we employ GloVe [372] and extvec [252] embeddings, whichare commonly used and are based on aggregated global word-word co-occurence statisticstrained on Wikipedia and the Gigaword 5 corpus. Words are considered to be the smallestunit. Contrary to that, fastText [199] and byte-pair embeddings BPEmb [219] use subwordsegments to increase the capability of their vocabulary and might because of that be a bet-ter choice for a setting with unusual and specific terminology. Moving to the dynamicallygenerated embeddings, Embeddings from Language Models (ELMo) [375] are generating therepresentation of a word by contextualizing it with the whole input sentence. They use a bidi-rectional LSTM to independently train a left-to-right and right-to-left character based LM.We use the ELMo model trained on PubMed to have a model which is trained on the type ofdata we are using. For the same reason, we use the on PubMed trained Contextualized StringEmbeddings (FlairPM) [4], another character-based language model. We compare them di-rectly to embeddings trained on web content, Wikipedia, subtitles and news (FlairMulti).The third type of dynamic embedding are Bidirectional Encoder Representations from Trans-formers (BERT) [144]. The language model considers subwords and the position of the wordin the sentence to give the final representation of a word.
Transformers can be used as features to an RNN, but also have the possibility to fine-tune the pre-trained model on a target dataset, which we make use of. Beside the originalBERT, which is pre-trained on the BooksCorpus and English Wikipedia, there exists multipleother BERT models by now. BioBERT [268] is pre-trained on large-scale biomedical corporaoutperforming the general BERT model in representative biomedical text mining tasks. Theauthors initialize the weights with the original BERT model and train on PubMed abstractsand full articles. Therefore, the vocabulary is the same as for the original BERT. Contraryto that, SciBERT [44] is trained from scratch with an own vocabulary. While SciBERTis trained on full papers from Semantic Scholar it also contains biomedical data, but to asmaller degree than BioBERT. We chose to use the uncased SciBERT model, meaning thatwe ignore the capitalization of words. As it was the case for the original BERT, the uncasedmodel of SciBERT performs slightly better for sentence classification tasks than the casedmodel. Another new model, which outperforms BERT on the General Language UnderstandingEvaluation (GLUE) benchmark, is RoBERTa [284]. There, the BERT pre-training procedureis modified by exchanging static with dynamic masking, using larger byte-pair encoding andbatches size, and increasing the size of the dataset.
Relation Classification. After the argument component detection, the next step is to de-termine which relations hold between the different components (Figure 4.7). We extract validBI tag sequences from the previous step, which are then considered to be the argumenta-tive components of one RCT. Those sequences are phrases and do not necessarily correspondto full sentences. The list of components then serves as input for the relation classification.As explained in Section 4.6, the relation classification task can be tackled with different ap-proaches. We treat it as a sequence classification problem, where the sequence consists of a pairof two components, and the task is to learn the relation between them. For this purpose, weuse self-attending transformers, since these models are dominating the benchmarks for taskswhich involve classifying the status between two sentences [144]. Treating it as a sequenceclassification problem gives us two options to model it: (i) jointly modelling the relations byclassifying all possible argumentative component combinations or (ii) predicting possible link
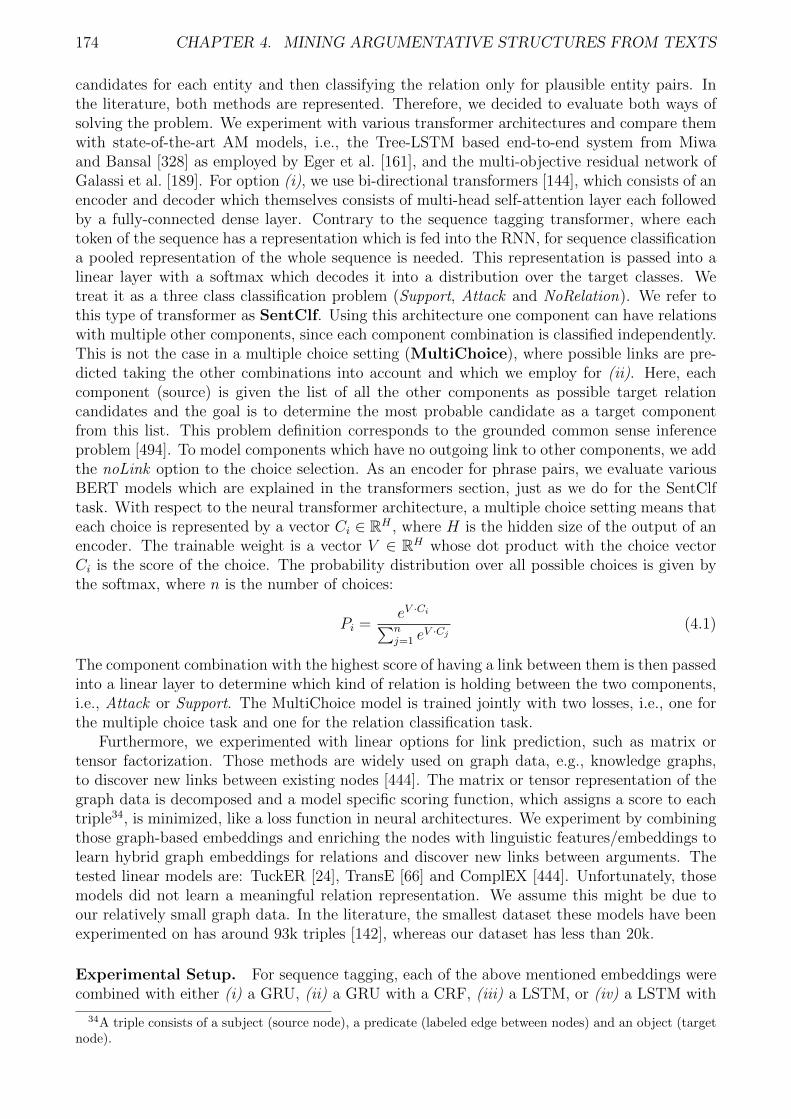
174 CHAPTER 4. MINING ARGUMENTATIVE STRUCTURES FROM TEXTS
candidates for each entity and then classifying the relation only for plausible entity pairs. Inthe literature, both methods are represented. Therefore, we decided to evaluate both ways ofsolving the problem. We experiment with various transformer architectures and compare themwith state-of-the-art AM models, i.e., the Tree-LSTM based end-to-end system from Miwaand Bansal [328] as employed by Eger et al. [161], and the multi-objective residual network ofGalassi et al. [189]. For option (i), we use bi-directional transformers [144], which consists of anencoder and decoder which themselves consists of multi-head self-attention layer each followedby a fully-connected dense layer. Contrary to the sequence tagging transformer, where eachtoken of the sequence has a representation which is fed into the RNN, for sequence classificationa pooled representation of the whole sequence is needed. This representation is passed into alinear layer with a softmax which decodes it into a distribution over the target classes. Wetreat it as a three class classification problem (Support, Attack and NoRelation). We refer tothis type of transformer as SentClf. Using this architecture one component can have relationswith multiple other components, since each component combination is classified independently.This is not the case in a multiple choice setting (MultiChoice), where possible links are pre-dicted taking the other combinations into account and which we employ for (ii). Here, eachcomponent (source) is given the list of all the other components as possible target relationcandidates and the goal is to determine the most probable candidate as a target componentfrom this list. This problem definition corresponds to the grounded common sense inferenceproblem [494]. To model components which have no outgoing link to other components, we addthe noLink option to the choice selection. As an encoder for phrase pairs, we evaluate variousBERT models which are explained in the transformers section, just as we do for the SentClftask. With respect to the neural transformer architecture, a multiple choice setting means thateach choice is represented by a vector Ci ∈ RH , where H is the hidden size of the output of anencoder. The trainable weight is a vector V ∈ RH whose dot product with the choice vectorCi is the score of the choice. The probability distribution over all possible choices is given bythe softmax, where n is the number of choices:
Pi =eV ·Ci∑nj=1 e
V ·Cj(4.1)
The component combination with the highest score of having a link between them is then passedinto a linear layer to determine which kind of relation is holding between the two components,i.e., Attack or Support. The MultiChoice model is trained jointly with two losses, i.e., one forthe multiple choice task and one for the relation classification task.
Furthermore, we experimented with linear options for link prediction, such as matrix ortensor factorization. Those methods are widely used on graph data, e.g., knowledge graphs,to discover new links between existing nodes [444]. The matrix or tensor representation of thegraph data is decomposed and a model specific scoring function, which assigns a score to eachtriple34, is minimized, like a loss function in neural architectures. We experiment by combiningthose graph-based embeddings and enriching the nodes with linguistic features/embeddings tolearn hybrid graph embeddings for relations and discover new links between arguments. Thetested linear models are: TuckER [24], TransE [66] and ComplEX [444]. Unfortunately, thosemodels did not learn a meaningful relation representation. We assume this might be due toour relatively small graph data. In the literature, the smallest dataset these models have beenexperimented on has around 93k triples [142], whereas our dataset has less than 20k.
Experimental Setup. For sequence tagging, each of the above mentioned embeddings werecombined with either (i) a GRU, (ii) a GRU with a CRF, (iii) a LSTM, or (iv) a LSTM with
34A triple consists of a subject (source node), a predicate (labeled edge between nodes) and an object (targetnode).

4.5. ARGUMENT MINING FOR HEALTHCARE APPLICATIONS 175
Neoplasm Glaucoma MixedEmbedding Model f1 F1 C-F1 E-F1 f1 F1 C-F1 E-F1 f1 F1 C-F1 E-F1
GloVe GRU+CRF .61 .58 .50 .66 .60 .52 .36 .68 .55 .50 .36 .64extvec GRU+CRF .67 .65 .58 .72 .68 .64 .57 .72 .67 .64 .57 .71fastText(fT) GRU+CRF .68 .66 .61 .71 .68 .65 .60 .71 .65 .60 .52 .69BPEmb LSTM+CRF .64 .60 .59 .76 .64 .60 .52 .69 .61 .57 .48 .66ELMo LSTM+CRF .70 .68 .59 .76 .74 .72 .67 .77 .72 .70 .67 .74BERT LSTM+CRF .69 .66 .58 .75 .70 .68 .63 .73 .68 .66 .61 .71FlairMulti LSTM+CRF .66 .63 .53 .72 .58 .55 .50 .60 .52 .50 .44 .56FlairPM LSTM+CRF .70 .68 .60 .75 .74 .72 .69 .75 .70 .68 .64 .72
FlairPM + extvec GRU+CRF .68 .65 .54 .74 .74 .72 .67 .77 .68 .66 .60 .72FlairPM + fT GRU+CRF .68 .64 .53 .75 .71 .68 .62 .74 .67 .63 .56 .71FlairPM + BERT LSTM+CRF .70 .69 .61 .76 .71 .70 .67 .73 .68 .67 .62 .72BERT + fT LSTM+CRF .68 .65 .55 .74 .68 .66 .60 .71 .67 .65 .58 .71ELMo + fT LSTM+CRF .71 .68 .59 .77 .74 .72 .69 .77 .72 .70 .65 .75fine-tuning BERT dense layer .82 .60 .69 .83 .77 .55 .63 .80 .80 .57 .65 .83fine-tuning BERT GRU+CRF .89 .85 .78 .90 .89 .86 .76 .89 .90 .88 .81 .91fine-tuning BioBERT GRU+CRF .90 .84 .87 .90 .92 .91 .93 .91 .92 .91 .91 .92fine-tuning SciBERT GRU+CRF .90 .87 .88 .92 .91 .89 .93 .91 .91 .88 .90 .93
Table 4.22: Results of the multi-class sequence tagging task are given in micro F1 (f1) andmacro F1 (F1). The binary F1 for claims are reported as C-F1 and for evidence as E-F1. Bestscores in each column are marked in bold; significance was tested with a two-sided Wilcoxonsigned rank test.
a CRF. Additionally, the best performing static and dynamic embeddings were concatenatedand evaluated as if they were one embedding. The Flair [4] PyTorch NLP framework version0.4.1 was used for implementing the sequence tagging task. For BERT, we use the PyTorchimplementation of huggingface35 version 2.3. Hyper parameter tuning was done with hyperopt36
version 0.1.2. The learning rate was selected from {0.05, 0.1, 0.15, 0.2}, RNN layers {1, 2},hidden size {32, 64, 128, 256}, dropout {0.1, 0.2, 0.5}, and batch size from {8, 16, 32}. TheRNNs were trained over 100 epochs with early stopping and SGD optimizer. For fine-tuningthe BERT model, we used the uncased base model with 12 transformer blocks, a hidden size of768, 12 attention heads, a learning rate of 2e-5 with Adam optimizer for 3 epochs. The sameconfiguration was used for fine-tuning Sci- and BioBERT. For SciBERT, we used the uncasedmodel with the SciBERT vocabulary. For BioBERT, we used version 1.1. For RoBERTa, weincreased the number of epochs for fine-tuning to 10, as it was done in the original paper.The best learning rate was 3e-5 on our task. The number of choices for the multiple choicemodel was 6. Batch size was 8 with a maximum sequence length of 256 subword tokens perinput example. We split our neoplasm corpus such that 350 abstracts are assigned to thetrain, 50 to the development, and 100 to the test set. Additionally, we use the first version ofthe dataset [302] to create two extra test sets, both comprising 100 abstracts. The first oneincludes only glaucoma, whereas the second is a mixed set with 20 abstracts of each disease inthe dataset (neoplasm, glaucoma, hypertension, hepatitis and diabetes), respectively.
4.5.3 Evaluation
This section presents and discusses the empirical results of our AM pipeline for RCTs.
Sequence Tagging. We show the results for the best performing RNN models and the bestperforming embedding combinations in Table 4.22. Results are given on all three test sets inmicro and macro multi-class F1-score and for claim and evidence, respectively. Comparing thestatic word embeddings, fastText with a GRU and a CRF is the best performing combination,
35https://github.com/huggingface/transformers36https://github.com/hyperopt/hyperopt

176 CHAPTER 4. MINING ARGUMENTATIVE STRUCTURES FROM TEXTS
Method Neoplasm Glaucoma Mixed
Tree-LSTM .37 .44 .39Residual network .42 .38 .43
BERT MultiChoice .58 .56 .55BioBERT MultiChoice .61 .58 .57SciBERT MultiChoice .63 .59 .60
BERT SentClf .62 .53 .66BioBERT SentClf .64 .58 .61SciBERT SentClf .68 .62 .69RoBERTa .67 .66 .67
Table 4.23: Results of the relation classification task, given in macro F1-score.
where extvec is only slightly worse and is usually better for evidence classification. For thedynamic embeddings coming from LMs, the ones trained on the medical domain corpus, i.e.,FlairPM and ELMo, show similar performances with a macro F1-score of .68 on the neoplasmtest set. They have the edge over the non-specialized LMs like BERT with .66 or FlairMultiwith .63 macro F1-score. Concatenating static and dynamic embeddings does not bring anotable difference, when taking all test sets into account. Generally, evidence scores are higherthan claim scores, leading to the conclusion that claims are more diverse than evidence. Theexplanation is that, since natural language reports of measurements in clinical trials vary mostlyonly in the measured parameter and its values, claims can be made about almost everything.Another observation is that the performance of the models trained on neoplasm data do notsignificantly decrease for test sets on other disease treatments. This fact supports our choice ofa more general high level disease type like neoplasm for training the models. The performancefor many model combinations even increases on the glaucoma test set. The glaucoma test setcomprises only a handful of different glaucoma treatments and is therefore less diversified thanthe neoplasm or mixed test sets. Looking at the main difference in the results, fine-tuningBERT outperforms all other model combinations, where the version with a GRU and CRF isthe best performing model. Fine-tuning without any kind of sequence modelling on top of itresults in worse performance. Especially with respect to the validity of BIO sequences, wheredisproportionately many invalid sequences are generated. This is not useful when extractingthe components based on BIO-scheme. Comparing the specialized with the general models,Bio- and SciBERT show a better performance than the general BERT model, where the casedBioBERT tends to be more reliable for the out of domain test data. This is in line with thefindings that the cased transformer model works better for tasks like Named Entity Recognition(NER), which is also a sequence tagging task. The difference on our data is marginal: while forNER the casing of a word is relevant, in our task it does not seem to be a sensitive information.
Relation Classification. The results for relation classification are shown in Table 4.23.The numbers are not calculated on gold standard, but show the actual relation classificationperformance when the components come from the sequence tagging module of the pipeline. Weused the best performing sequence tagger, i.e. the fine-tuned SciBERT with a GRU and CRF.We follow previous work on AM [374] and consider the overlap percentage of the componentsto determine the base if a predicted component matches the annotated component in the goldstandard. Since in our data a lot of the components span over 50% or more of a sentence andthe exact boundary detection is not always clear, even for human annotators, we consider apredicted and a gold standard component as matched, when at least 75% of the words overlap.
The Tree-LSTM based end-to-end system performed the worst with a F1-score of .37. Thiscan be explained by the positional encoding in the persuasive essay dataset being more relevantthan in ours. There, components are likely to link to a neighboring component, whereas in our

4.5. ARGUMENT MINING FOR HEALTHCARE APPLICATIONS 177
dataset the position of a component only partially plays a role, and therefore the distance in thedependency tree is not a meaningful feature. Furthermore, the authors specify that their systemdoes not scale with increasing text length [161]. Especially detailed reports of measurementscan make RCT abstracts quite long, such that this system becomes not applicable for this typeof data.
The residual network performed better with a F1-score of .42. The main problem here isthat it learns a multi-objective for link prediction, relation classification and type classificationfor source and target component, where the latter classification step is already covered by thesequence tagger and therefore unnecessary at this step.
Similar to sequence tagging, one can see a notable increase in performance when applyinga BERT model. Comparing the specialized and general BERT model, the Bio- and SciBERTincrease the performance by up to .06 F1-score. Interestingly, RoBERTa delivers comparableresults even though it is a model trained on general data. We speculate that parts of the webcrawl data which was used to train RoBERTa contain PubMed articles, since they are freelyavailable on the web. Independently of that, RoBERTa shows more reliable results when lookingat the performance on the out of domain test sets. While SciBERT as the best performingsystem on the in-domain test set drops .06 points on the glaucoma test set, RoBERTa staysalmost the same and only drops from .67 to .66 F1-score. Looking at the difference betweenthe MultiChoice and SentClf architectures, the SentClf delivers slightly better results, but thedrawback is that this technique tends to link components to multiple components. Since mostof our components have only one outgoing edge, it creates a lot of false positives, i.e., linkswhich do not exist.
While our dataset consists of only study abstracts for practical reasons, the pipeline canbe applied on full text articles as well. Alas, we cannot provide a quantitative analysis onfull articles due to missing annotated data. In preliminary experiments on full articles, wehave observed a notable increase of false positives in the relation classification, which is theexpected consequence of an increased number of components. Furthermore, with the number ofcomponents rising in the double-digit range, the multiple-choice architecture loses its predictivepower. We leave further investigations to determine the exact limit of this architecture appliedon full text articles to future work.
Error Analysis. Common mistakes for the sequence tagger are the invalid BIO sequences.Especially when there are multiple components in one sentence, the tagger tends to mislabelB- tokens as I- tokens. This is due to the natural imbalance between B- and I- tokens. Train-ing the sequence tagging without the BIO scheme using only claim and evidence as labels,poses problems when multiple components are following each other in the text. They wouldbe extracted as one single component instead. This is a common case in concluding sentencesat the end of a study, which strikingly often comprise multiple claims. Further experimentscould go in the direction of weighted loss functions like focal loss to overcome this problem.Notable mistakes arise for determining the exact component boundaries. Especially in the caseof connectives, e.g., however, which have sometimes nothing but a conjunctive function, andin other cases signal a constraint of a previous statement. Another mistake is the misclassifi-cation of the description of the initial state of the participant groups as an observation of thestudy and therefore an evidence, e.g., there were no significant differences in pregnancy-inducedhypertension across supplement groups. In the study abstract these descriptions occur usuallyrelatively close to the actual result description, which means that adding information of theposition in the text will not avoid this error. While only some abstracts are structured, thefull study report does usually have separated sections. This structure can be exploited whenanalysing full reports, and in the simplest case one would analyse only the sections of interest.
Concerning link prediction, general components like the difference was not statistically sig-

178 CHAPTER 4. MINING ARGUMENTATIVE STRUCTURES FROM TEXTS
nificant are problematic, since it could be linked to most of the components/outcomes of thetrial. Here, a positional distance encoding could be beneficial, since those components are usu-ally connected to the previous component. In general, most of the errors in the MultiChoicearchitecture were made in the multiple choice part by predicting a wrong link and not at thestage of classifying the relation type. Interestingly, comparing the two domain adapted models,Bio- and SciBERT, there were no regular errors, which allows any conclusion about the ad-vantages or disadvantages of one model. Looking at the confusion matrices, all tested SentClfmodels show a higher error rate for the NoRelation class. Both transformer approaches have incommon the problem of dealing with negations and limitations or associating the polarity of ameasurement and therefore confusing support and attack.
Example 4 [more research about the exact components of a VR intervention andchoice of outcomes to measure effectiveness is required]source [Conducting apragmatic trial of effectiveness of a VR intervention among cancer survivorsis both feasible and acceptable]target
Example 5 [this did not translate into improved progression-free survival (PFS) oroverall survival]source [The addition of gemcitabine to carboplatin plus pacli-taxel increased treatment burden, reduced PFS time, and did not improve OSin patients with advanced epithelial ovarian cancer]target
Example 4 shows two claims with a limiting/attacking relation, which was wrongly classifiedas supporting. For Example 5, not improving progression-free survival (PFS) corresponds to areduced PFS time, while for other factors reducing the value means it is beneficial and thereforeimproving some study parameter. Here, the inclusion of external expert knowledge is crucial tolearn these fine nuances. The polarity of a measurement cannot be learnt from textual featuresalone. Especially in the medical domain, there are complex interrelationships which are notoften explicitly mentioned and therefore are impossible to capture with a model trained solelyon character-based input. Phrases like increased the blood pressure by X or showed no symptomof Y can connote different messages depending on the context. Future work needs to considerthis challenge of incorporating external expert knowledge. While we do not think this is aproblem limited to a special domain, we consider it greatly important for understanding andrepresenting medical text.
4.6 Related work
One of the latest advances in artificial argumentation [21] is the so-called Argument(ation) Min-ing [371, 279, 92]. Argument mining consists of two standard tasks: (i) the identification ofarguments within the text, that may be further split in the detection of argument components(e.g., claims, evidence) and the identification of their textual boundaries. Different methodshave been used for this task (e.g., Support Vector Machines (SVMs), Naıve Bayes classifiers,and Neural Networks (NNs)); (ii) the prediction of the relations holding between the argumentsidentified in the first stage. They are used to build the argument graphs, in which the relationsconnecting the retrieved argumentative components correspond to the edges. Different meth-ods have been employed to address these tasks, from standard SVMs to NNs. AM methodshave been applied to heterogeneous types of textual documents, e.g., persuasive essays [425],scientific articles [438], Wikipedia articles [26], political speeches and debates [312], and peerreviews [235]. However, only few approaches [492, 200, 302, 303] focused on automaticallydetecting argumentative structures from textual documents in the medical domain, such asclinical trials, clinical guidelines, and Electronic Health Records.

4.6. RELATED WORK 179
Few approaches consider the whole AM pipeline in different application scenarios. In partic-ular, Stab and Gurevych [425] propose a feature-based Integer Linear Programming approachto jointly model argument component types and argumentative relations in persuasive essays.Differently from our data, essays have exactly one major claim each. The authors impose theconstraint such that each claim has no more than one parent, while no constraint holds inour case. In contrast with this approach, Eger et al. [161] present neural end-to-end learningmethods in AM, which do not require the hand-crafting of features or constraints, using thepersuasive essays dataset. They employ TreeLSTM on dependency trees [328] to identify bothcomponents and relations between them. They decouple component classification and relationclassification, but they are jointly learned, using a dependency parser to calculate the features.
Recent approaches for link prediction rely on pointer networks [384] where a sequence-to-sequence model with attention takes as input argument components and returns the linksbetween them. In these approaches, neither the boundary detection task nor the relation classifi-cation one are tackled. Another approach to link prediction relies on structured learning [189].The authors propose a general approach employing structured multi-objective learning withresidual networks, similar to approaches on structured learning on factor graphs [344]. Recently,the argument classification task was addressed with contextualized word embeddings [393].However, differently from our approach, they assume components are given, and boundary de-tection is not considered. In line with their work, we experimented with the BERT [144] basemodel to address parts of the AM pipeline [303] on Randomized Clinical Trials. Contrary tothis preliminary work, we now employ and evaluated various contextualized language modelsand architectures on each task to span the full AM pipeline.
AM on user generated content. The issue of argument detection on Twitter has alreadybeen addressed in the literature. [68, 69] address a binary classification task (argument-tweetvs. non argument), as first step of their pipeline. [197] experiments machine learning techniquesover a dataset in Greek extracted from social media. They first detect argumentative sentences,and second identify premises and claims. However, none of them is neither interested in distin-guishing facts from opinions nor to identify the arguments’ sources. An argumentation-basedapproach is applied to Twitter data to extract opinions in [203], with the aim of detectingconflicting elements in an opinion tree to avoid potentially inconsistent information. Both thegoal and the adopted methodology are different from ours.
AM on political speeches and debates. Few approaches apply part of the argumentmining pipeline to political debates. Among them, [278] address the problem of argumentextraction, and more precisely claim detection, over a corpus based on the 2015 UK politicalelection debates; [160] propose an automatic approach to summarize political debates, startingfrom a political debates corpus [463]; [156] apply argument mining methods to mine ethosarguments from UK parliamentary debates, while in a follow-up work [155] proposed the ethosmining task aiming at detecting ethotic arguments and the relations among the politicians andthe parties in the UK Parliament. [338] show how features based on embedding representationscan improve discovering various frames in argumentative political speeches. [37] studied theuse of semantic frames for modelling argumentation in speakers’ discourse. They investigatedthe impact of argumentation as a influence rank indicator for politicians on the 20 debates forthe Republican primary election. Finally, [459] present a dataset composed of the transcriptsof televised political debates leading up to the 2016 presidential election in the US, with theaddition of the reactions from the social media platform Reddit. The corpus is annotatedbased on the Inference Anchoring Theory, and not with argument components. Contrary topast works, we create a huge annotated dataset including 39 political debates, and we present asuccessful attempt to argument component detection on such a big corpus of political debates.

180 CHAPTER 4. MINING ARGUMENTATIVE STRUCTURES FROM TEXTS
4.7 Conclusions
This chapter focused on my main contributions to the Argument Mining research field. First,two works on AM on user created content (online debates and social media messages) hasbeen presented. In the first work, we have integrated in a combined framework an approachfrom computational linguistics and a technique for non-monotonic reasoning, with the goal ofproviding the participants of online debates and forums with a framework supporting theirinteraction with the application. In particular, the proposed framework helps the participantsto have an overview of the debates, understanding which are the accepted arguments at timebeing. The key contribution of our research is to allow the automatic detection and generation ofthe abstract arguments from natural language texts. First, we adopt a TE approach to inferencebecause of the kind of (noisy) data present on the Web. TE is used to retrieve and identifythe arguments, together with the relation between them: the entailment relation (i.e. inferenceamong two arguments), and the attack relation (i.e. contradiction among two arguments). Thearguments and their relations are then sent to the argumentation module which introduces theadditional attacks. The argumentation module returns the set of acceptable arguments w.r.t.the chosen semantics. Second, we provide a further step towards a better comprehension ofthe support and attack notions in bipolar argumentation by evaluating them against real dataextracted from NL online debates. We point out that the purpose of this work is not to discussthe criticisms advanced against bipolar argumentation [10], nor to support one model over theother. On the contrary, it is intended as a proof of concept of the existing models with respectto real data.
In the second work, we investigated argument mining tasks on Twitter data. The maincontribution is twofold: first, we propose one of the very few approaches of argument miningon Twitter, and second, we propose and evaluate two new tasks for argument mining, i.e.,facts recognition and source identification. These tasks are particularly relevant when appliedto social media data, in line with the open popular challenges of fact-checking and sourceverification to which these results contribute. Being it a work in progress, several open issueshave to be considered as future research. Among them, we are currently extending the datasetof annotated tweets both in terms of annotated tweets per topic, and in terms of addressedtopics (e.g., Brexit after the referendum, Trump), in order to have more instances of facts andsources. On such extended dataset, we plan to run experiments using the three modules of thesystem as a pipeline.
As a second contribution to the AM research field, we have worked on political speechesand debates. In the first work presented in this chapter, an argumentation mining system forrelation prediction has been presented and evaluated over a corpus of political speeches from theNixon-Kennedy U.S. election campaign of 1960. The main advantage of the proposed approachis threefold. First of all, to the best of our knowledge, this is the first approach in argumentmining targeting the relation prediction task in monological speeches, where interlocutors donot directly answer to each other. Our approach enables scholars to put together - and moreimportantly to connect - assertions from the two candidates across the whole political campaign.The output is thus an argumentation graph (one for each topic touched upon in the speeches)summarizing the candidates’ own viewpoint and the respective position. Such graphs areintended to support researchers in history, social and political sciences, which must deal withan increasing amount of data in digital form and need ways to automatically extract andanalyse argumentation patterns. Second, despite the complexity of the task that constituteda challenge in the annotation phase (and that can be observed in the reported examples), theresults we obtained for relation prediction are in line with state-of-the-art systems in argumentmining [425]. A third contribution of our work is a resource of 1,462 pairs of natural languagearguments annotated with the relations of support, attack, and no relation. In the dataset, each

4.7. CONCLUSIONS 181
argument is connected to the source and the date in which the speech was given.
As a follow up work, we investigated the detection of argument components in the USpresidential campaign debates: i) providing a manually annotated resource of 29k argumentcomponents, and ii) evaluating feature-rich SVM learners and Neural Networks on such data(achieving ∼90% w.r.t. human performance). We highlighted the strengths (e.g., satisfac-tory performances on different oratory styles across time and topics) and weaknesses (e.g.,no argument boundaries detection on a clause level, the context of the whole debates is notconsidered).For future work, we plan to i) automatically predict relations between argumentcomponents in the USElecDeb60To16 dataset, and ii) propose a new task, i.e., fallacy detectionso that common fallacies in political argumentation [498] can be automatically identified, inline with the work of [207].
As a third contribution to the AM research field, to support clinicians in decision mak-ing or in (semi)-automatically filling evidence tables for systematic reviews in evidence-basedmedicine, we have proposed a complete argument mining pipeline for the healthcare domain.To this aim, we built a novel corpus of healthcare texts (i.e., RCT abstracts) from the MED-LINE database, which are annotated with argumentative components and relations. Indeed,we show that state-of-the-art argument mining systems are unable to satisfactorily tackle thetwo tasks of argument component detection and relation prediction on this kind of text, givenits peculiar features (e.g., component relations spanning across the whole RCT abstract). Weexpect that our work will have a large impact for clinicians as it is a crucial step towards AIsupported clinical deliberation at a large scale.
We employ a sequence tagging approach combining a domain specific BERT model with aGRU and CRF to identify and classify argument components. We cast the relation classificationtask as a multiple choice problem and compare it with recent transformers for sequence clas-sification. In our extensive evaluation, addressed on a newly AM annotated dataset of RCTs,we investigate the use of different neural transformer architectures and pre-trained models inthis pipeline, showing an improvement of the results in comparison with standard baselinesand state-of-the-art AM systems. For future work, we will annotate relations across differentRCTs to allow reasoning on the resulting argument graphs and clustering of arguments aboutthe same disease. Furthermore, we will investigate different ways to efficiently deal with medi-cal abbreviations and incorporate a distance parameter to overcome the problem that generalcomponents talking about limitations are linked to unrelated components far away in the textof the RCT abstract.
Argumentation, emotions and persuasion. As an additional line of works (in the contextof the SEEMPAD project, in collaboration with the University of Montreal), we have inves-tigated the correlations between argumentation, emotions and persuasion. Argumentation isoften seen as a mechanism to support different forms of reasoning such that decision-making andpersuasion, but all these approaches assume a purely rational behavior of the involved actors.However, humans are proved to be have differently, mixing rational and emotional attitudes toguide their actions, and it has been claimed that there exists a strong connection between theargumentation process and the emotions felt by people involved in such process. In our firstcontributions on this topic [48, 458], we have assessed this claim by means of an experiment:during several debates people’s argumentation in plain English is connected and compared tothe emotions automatically detected from the participants. Our results show a correspondencebetween emotions and argumentation elements, e.g., when in the argumentation two oppositeopinions are conflicting this is reflected in a negative way on the debaters’ emotions.
In follow up works in the same direction, [458, 47] we have explored the role of persuasion,given that in everyday life discussion, people try to persuade each other about the goodness oftheir viewpoint regarding a certain topic. This persuasion process is usually affected by several

182 CHAPTER 4. MINING ARGUMENTATIVE STRUCTURES FROM TEXTS
elements, like the ability of the speaker in formulating logical arguments, her confidence withrespect to the discussed topic, and the emotional solicitation that certain arguments may causein the audience. We have compared the effect of using one of the three well-known persuasionstrategies (Logos, Ethos and Pathos) in the argumentation process. These strategies are usedby a moderator who influences the participants during the debates. We have studied whichpersuasion strategy is the most effective, and how they vary according to two mental metricsextracted from electroencephalograms: Engagement and workload. Results show that the righthemisphere has the highest engagement when Logos arguments are proposed to participantswith Neutral opinion during the debate. We show also that the Logos strategy solicits thehighest mental Workload, and the Pathos strategy is the most effective to use in argumentationand to convince the participants.
So far, we have not applied AM methods on the datasets collected through the above men-tioned experiments with real users, but that would be an interesting future research directionto explore.

Chapter 5
Cyberbullying and abusive languagedetection
5.1 Introduction
This chapter summarizes my contributions related to cyberbullying and abusive language detec-tion. While most social media platforms have established user rules that prohibit hate speech,enforcing these rules requires copious manual labor to review every report. Some platforms,such as Facebook, recently increased the number of content moderators. Addressing the chal-lenge of conceiving and implementing automatic tools and approaches to detect inappropriatelanguage or linguistic behavior could accelerate the reviewing process or allocate the humanresource to the posts that require close human examination. My research contributions on thistopic have been published in several venues:
• Michele Corazza, Stefano Menini, Elena Cabrio, Sara Tonelli, and Serena Villata (2020).A multilingual evaluation for online hate speech detection. ACM journal Transaction inInternet Technology. 20, 2, Article 10 (March 2020), 22 pages [127].
• Pinar Arslan, Michele Corazza, Elena Cabrio, and Serena Villata (2019). Overwhelmedby negative emotions? maybe you are being cyber-bullied! In SAC, pages 1061-1063 [17].
• Stefano Menini, Giovanni Moretti, Michele Corazza, Elena Cabrio, Sara Tonelli, andSerena Villata (2019). A system to monitor cyberbullying based on message classificationand social network analysis. In Proceedings of the Third Workshop on Abusive LanguageOnline, pages 105–110. Association for Computational Linguistics [313].
• Michele Corazza, Stefano Menini, Elena Cabrio, Sara Tonelli, and Serena Villata (2019).Cross-platform evaluation for Italian hate speech detection. In Proceedings of the 6thItalian Conference on Computational Linguistics [125].
• Michele Corazza, Stefano Menini, Elena Cabrio, Sara Tonelli, and Serena Villata (2019).Inriafbk drawing attention to offensive language at germeval2019. In Proceedings of the15th Conference on Natural Language Processing, KONVENS 2019 [126].
• Michele Corazza, Stefano Menini, Pinar Arslan, Rachele Sprugnoli, Elena Cabrio, SaraTonelli, and Serena Villata (2018). Comparing different supervised approaches to hatespeech detection. In Proceedings of the Sixth Evaluation Campaign of Natural LanguageProcessing and Speech Tools for Italian. Final Workshop (EVALITA 2018) co-locatedwith the Fifth Italian Conference on Computational Linguistics (CLiC-it 2018) [122].
183

184 CHAPTER 5. CYBERBULLYING AND ABUSIVE LANGUAGE DETECTION
• Michele Corazza, Stefano Menini, Pinar Arslan, Rachele Sprugnoli, Elena Cabrio, SaraTonelli, and Serena Villata (2018). InriaFBK at Germeval 2018: Identifying OffensiveTweets Using Recurrent Neural Networks. In GermEval 2018 Workshop [123].
The contributions reported in this chapter are the results of several collaborations with theWimmics team members Serena Villata, Michele Corazza and Pinar Arslan, and - within theCREEP project partners -, mainly with Sara Tonelli and Stefano Menini (FBK, Italy).
As introduced before, the use of social media platforms such as Twitter, Facebook andInstagram has enormously increased the number of online social interactions, connecting billionsof users, favouring the exchange of opinions and giving visibility to ideas that would otherwisebe ignored by traditional media. However, this has led also to an increase of attacks targetingspecific groups of users based on their religion, ethnicity or social status, and individuals oftenstruggle to deal with the consequences of such offenses. This problem affects not only the victimsof online abuse, but also stakeholders such as governments and social media platforms. Forexample, Facebook, Twitter, YouTube and Microsoft have recently signed a code of conduct1,proposed by the European Union, pledging to review the majority of valid notifications forremoval of illegal hate speech in less than 24 hours. Despite the number of approaches recentlyproposed in the Natural Language Processing research area for detecting these forms of abusivelanguage, the issue of identifying hate speech at scale is still an unsolved problem. To addressthis issue, we have proposed a robust recurrent neural architecture which is shown to performin a satisfactory way across different languages, namely English, Italian and German. We haveaddressed an extensive analysis of the obtained experimental results over the three languagesto gain a better understanding of the contribution of the different components employed in thesystem, both from the architecture and from the feature selection points of view [127].
With such a system, we took part to two shared tasks for hate speech detection: for Italianat the Evalita 2018 evaluation campaign2[122], and for German at the Germeval 20183 and20194 hate speech detection shared task [123, 126], obtaining competitive results w.r.t. state-of-the-art systems (we classified first on one of Evalita’s task, and among the top systems inthe others).
Moreover, given that most of the available datasets and approaches for hate speech de-tection proposed so far concern the English language, and even more frequently they targeta single social media platform (mainly Twitter), we performed a comparative evaluation onfreely available datasets for hate speech detection in Italian, extracted from four different socialmedia platform, i.e. Facebook, Twitter, Instagram and Whatsapp. The reason behind suchstudy is that in low-resource scenarios as the ones we are targeting in the CREEP project itis common to have smaller datasets for specific platforms, raising research questions such as ifwould it be advisable to combine such platform-dependent datasets to take advantage of train-ing data developed for other platforms. From our study it resulted that the proposed solutionof combining platform-dependent datasets in the training phase is beneficial for all platformsbut Twitter, for which results obtained by training on tweets only outperform those obtainedwith a training on the mixed dataset [125].
In the context of the CREEP project, we have implemented a system for the monitoringof cyberbullying phenomena on social media, that aims at supporting supervising persons(e.g., educators) at identifying potential cases of cyberbullying through an intuitive, easy-to-useinterface. This displays both the outcome of the hate speech detection system described aboveand the network in which the messages are exchanged. Supervising persons can thereforemonitor the escalation of hateful online exchanges and decide whether to intervene or not.
1http://ec.europa.eu/justice/fundamental-rights/files/hate_speech_code_of_conduct_en.pdf2http://www.di.unito.it/~tutreeb/haspeede-evalita18/index.html3https://projects.fzai.h-da.de/iggsa/germeval-2018/4https://projects.fzai.h-da.de/iggsa/

5.2. A MULTILINGUAL EVALUATION FOR ONLINE HATE SPEECH DETECTION 185
We evaluated the NLP classifier on a set of manually annotated data from Instagram, anddetailed the network extraction algorithm starting from high schools in the Manchester area(for English), and in Trentino area (for Italian). However, this is only one possible use case ofthe system, which can be employed over different kinds of data [313].
This chapter is organized as follows: Section 5.2 describes the robust recurrent neuralarchitecture we propose for the task of hate speech detection. Then, Section 5.3 presents themulti-platform comparative evaluation we carried out for Italian. Section 5.4 describes thesystem for the monitoring of cyberbullying phenomena on social media. Section 5.5 discussesrelated work, and conclusions end the chapter.
NOTE : This chapter contains examples of language which may be offensive to somereaders. They do not represent the views of the authors.
5.2 A Multilingual evaluation for online hate speech de-
tection
Within the Natural Language Processing (NLP) community, there have been several effortsto deal with the problem of online hate speech detection, since the computational analysisof language can be used to quickly identify offenses and ease the removal of abusive messages.Several workshops [471, 182] and evaluation campaigns [179, 70, 477, 38, 493] have been recentlyorganised to discuss existing approaches to hate speech detection, propose shared tasks andfoster the development of benchmarks for system evaluation. These have led to the creation of anumber of datasets for hate speech detection in different languages, that have been shared withinthe NLP research community. Recent advances in deep learning approaches to text classificationhave then been applied also to deal with this task, achieving for some languages state-of-the-artresults [116, 185, 190]. These systems are usually tailored to deal with social media texts byapplying pre-processing, using domain-specific embeddings, adding textual features, etc. Giventhe number of configurations and external resources that have been used by systems for hatespeech detection, it is rather difficult to understand what makes a classifier robust for the task,and to identify recommendations on how to pre-process data, what kind of embeddings shouldbe used, etc. To address this issue, after identifying a deep learning architecture that is ratherstable and well-performing across different languages, in this section we propose an evaluationof the endowments of several components that are usually employed in the task, namely thetype of embeddings, the use of additional features (text-based or emotion-based), the role ofhashtag normalisation and that of emojis. We perform our comparative evaluation on English,Italian and German, focusing on freely available Twitter datasets for hate speech detection.Our goal is to identify a set of recommendations to develop hate speech detection systems,possibly going beyond language-specific differences.
5.2.1 Classification framework
Since our goal is to compare the effect of various features, word embeddings and pre-processingtechniques on hate speech detection, we use a modular neural architecture for binary classifi-cation that is able to support both word-level and message-level features. The components arechosen to support the processing of social-media specific language. The neural architecture andthe features are detailed in the following subsections.
Modular Neural Architecture We use a modular neural architecture (see Figure 5.1) inKeras [112]. The architecture that constitutes the base for all the different models uses a single

186 CHAPTER 5. CYBERBULLYING AND ABUSIVE LANGUAGE DETECTION
x1
⊕
xn
⊕. . .
RNNxi
si
si−1
yixe
Figure 5.1: The modular neural architecture
feed-forward hidden layer of 100 neurons, with a ReLu activation and a single output with asigmoid activation. The loss used to train the model is binary cross-entropy. We choose thisparticular architecture because we used it to participate to two shared tasks for hate speechdetection, EVALITA HaSpeeDe 2018 [122] for Italian and Germeval 2018 [124] for German,and it proved to be effective and robust for both languages, also across different social mediaplatforms [125]. In particular, in our original submissions the same architecture was rankedfourth in the Twitter EVALITA subtask (−1.56 F1 compared to the first ranked) and seventhin the Germeval coarse-grained classification task (−2.52 F1 from the top-ranked one).
The architecture is built to support both word-level (i.e. embeddings) and tweet-levelfeatures. In particular, we use a recurrent layer to learn an encoding (xn in Figure 5.1) derivedfrom word embeddings, obtained as the output of the recurrent layer at the last timestep. Thisencoding gets then concatenated with the other selected features, obtaining a vector of tweet-level features. Since the models derived from using different features are different both in termsof number of parameters and in terms of layers, we decided to keep the size of the hidden layerfixed. This allows us to compare different features, as the latent representation learned by thehidden layer that is ultimately used to classify the tweets has the same size regardless of thenumber and kind of features.
More formally, given an input represented as the set of features X = {xj|xj ∈ Xm}, whereXM is the set of all features supported by a model M (see paragraph on features description)and s is the sum of the dimensions of all the features, we compute a function:
M(X) = s(WoH(X) + bo) Wo ∈ R1×100 H(X) ∈ R100 bo ∈ R1
s(X) = (σ(x1), . . . , σ(xn)) x ∈ Rn
σ(x) =1
1 + e−x
where Wo and bo are the learned weights for the output layer and σ(x) is the sigmoid activationfunction (note that in all the models we used n = 1 as we only have one binary output), and:
H(X) = g(WhC(X) + bh) Wh ∈ R100×s C(X) ∈ Rs bh ∈ R100
g(X) = (f(x1), . . . , f(xn)) x ∈ Rn
f(x) = max(0, x) x ∈ R
where H(X) represents the application of a hidden layer of size 100 and learned weights Wh
and bh and g(x) is the ReLU activation function. Additionally:
C(X) =⊕xi∈X
R(xi)
where⊕
denotes the concatenation of all vectors along their axes. For example, if we have aset of vectors X = [x1, x2, x3], then:⊕
xi∈X
xi ∈ Ra+b+c x1 ∈ Ra, x2 ∈ Rb, x3 ∈ Rc
5.2. A MULTILINGUAL EVALUATION FOR ONLINE HATE SPEECH DETECTION 187
Finally:
R(x) =
{x if x is a tweet-level feature
RNN(x) if x is a word-level feature
where RNN is the function returning the output by a recurrent layer at the last timestep.
Features In our experiments, we use the following features, with the goal of evaluating theirimpact on a hate speech detection model:
• Word Embeddings (xe in Figure 5.1): multiple word embeddings from various sourceshave been tested (for a full description of the different embeddings see Section 5.3.1). Weevaluate in particular the contribution of word embeddings extracted from social mediadata, therefore belonging to the specific domain of our classification task, compared withthe performance obtained using generic embedding spaces, like Fasttext [62], which arewidely used across different NLP tasks because of their good coverage.
• Emoji embeddings: emojis are a peculiar element of social media texts. They areoften used to emphasize or reverse the literal meaning of a short message, for example inironic or sarcastic tweets [232]. It is therefore very important for hate speech detection tounderstand which is the best way to represent them and to include them in the embeddingspace. We compare different ways to embed emoji information in our classifier: i) we useembedding spaces created from social media data, where each emoji is also representedthrough a word embedding, or ii) in case of generic embedding spaces, where emojisare not present, we include emoji embeddings through the alignment of different spacesfollowing the approach presented in [413], or iii) in order to cope with the low coverageof emojis, they are replaced by their description in plain text as suggested in [411].
• Ngrams: unigrams (x1 in Figure 5.1) and bigrams derived from the tweets are alsoincluded as features. We first tokenize and lemmatize the tweets by using Spacy [228],then normalize the tweet-level ngram occurrence vector by using tf-idf. Our intuitionis that these features should capture lexical similarities between training and test data,therefore they should be predictive when training and test set deal with the same typeof offenses. Higher-level ngrams are not considered, as we expect them to be very sparseespecially in social media, where tweets do not follow standard writing conventions.
• Social-network specific features: The character limit imposed by some social mediaplatforms like Twitter affects the style in which messages are written: function words tendto be skipped, texts are very concise while punctuation and uppercase words are used toconvey effective messages despite their brevity. Therefore, all these linguistic indicatorscan be used to identify the presence of hateful messages. We consider in particular thenumber of hashtags and mentions, the number of exclamation and question marks, thenumber of emojis, the number of words that are written in uppercase at the tweet-level.These features are then normalized by subtracting their mean and dividing them by theirstandard deviation.
• Emotion lexica: several emotion lexica have been (manually or automatically) createdand used in classification tasks to represent the emotional content of a message [334,333, 41, 426]. While the importance of emotion information to hate speech detection mayseem evident [17], it is also true that an embedding space which is large and representativeenough of the domain may make additional emotion features redundant. We thereforeevaluate the contribution of emotion information using two freely available, multilingual

188 CHAPTER 5. CYBERBULLYING AND ABUSIVE LANGUAGE DETECTION
emotion lexica, namely EmoLex and Hurtlex. Emolex [334, 333] is a large list of Englishwords and their associations with eight basic emotions (anger, fear, anticipation, trust,surprise, sadness, joy, and disgust) and two sentiments (negative and positive), manuallyannotated with Amazon’s Mechanical Turk. The creators of the lexicon have additionallymade available a multilingual version of the resource, that was created by translating eachword with Google translate in 2017. We therefore use the German and Italian translationsas well as the English one. Using EmoLex, we extract two sentiment-related features andeight emotion-related features for each tweet by summing all the sentiment and emotionscores assigned to the words in a tweet and normalizing them by using tf-idf. The secondresource, i.e., Hurtlex [41], is a multilingual lexicon of hate words created starting from theItalian hate lexicon developed by the linguist Tullio De Mauro, organized in 17 categories.It has been expanded through the link to available synset-based computational lexicalresources such as MultiWordNet [380] and Babelnet [? ], and evolved in a multilingualperspective by semi-automatic translation and expert annotation. Since Hurtlex maycontain the same word multiple times with different Part-of-Speech tags, we performed aunion operation over the categories in order to represent all the categories that a word canbelong to, independently of the POS. Using HurtLex, we assign with the same strategya score for negative stereotypes, one for hate words and slurs and one for other insults toeach tweet.
5.2.2 Data and linguistic resources
In the following, we present both the datasets used to train and test our system for English,Italian and German and the word embeddings we have used in our experiments.
English dataset We use the dataset described in [472], containing 16k English tweets manu-ally annotated for hate speech. More precisely, 1,924 are annotated as containing racism, 3,082as containing sexism, while 10,884 tweets are annotated as not containing offensive language.We merge the sexist and racist tweets in a single class, so that 5,006 tweets are considered aspositive instances of hate speech, as in Example 1.
1. Annotation: hateful.Since 1/3 of all #Islam believes that people who leave the religion should be murderedwhere are the moderate Muslim.
Italian dataset We use the Twitter dataset released for the HaSpeeDe (Hate Speech De-tection) shared task organized at Evalita 2018, the evaluation campaign for NLP and speechprocessing tools for Italian5. This dataset includes a total amount of 4,000 tweets [70], com-prising for each tweet the respective annotation, as can be seen in Example 2. The two classesconsidered in the annotation are “hateful post” or “not”.
2. Annotation: hateful.altro che profughi? sono zavorre e tutti uomini (EN: Are they really refugees? they areballast and all men).
German dataset We use the dataset distributed for the shared task on the Identificationof Offensive Language organized at Germeval 2018, a workshop in a series of shared tasks onGerman processing6. The dataset provided for task 1, where offensive comments are to be
5http://www.di.unito.it/~tutreeb/haspeede-evalita186https://www.oeaw.ac.at/ac/konvens2018/workshop/

5.2. A MULTILINGUAL EVALUATION FOR ONLINE HATE SPEECH DETECTION 189
Dataset # hate speech/offensive (%) # other (%) # total
English 5,006 (32%) 10,884 (68%) 16,000Italian 1,296 (32%) 2,704 (68%) 4,000
German 1,688 (34%) 3,321 (66%) 5,009
Table 5.1: Statistics on the datasets
detected from a set of German tweets (binary classification), consists of 5,009 German tweetsmanually annotated at the message level [477] with the labels “offense” (abusive language,insults, and profane statements) and “other” (i.e. not offensive). More specifically, 1,688messages are tagged as “offense” (see Example 3), while 3,321 messages as “other”.
3. Annotation: Offense.@Ralf Stegner Oman Ralle..dich mag ja immer noch keiner. Du willst das die Hetze gegendich aufhort? Geh in Rente und verzichte auf die 1/2deiner Pension (EN: @Ralf StegnerOman Ralle... still, nobody likes you. You want to stop hate against you? Retire andgive up half of your pension).
Table 5.1 summarizes the main statistics on the datasets. The reported values show that,although the datasets have different sizes, the distribution between positive and negative ex-amples is similar. We also manually investigated data samples and the annotation schemesof the English, German and Italian datasets. Although the developers of the English and theItalian corpus focus on hate speech, while the Germeval organisers claim to target offensivelanguage, the kind of messages they annotate as belonging to their respective ‘positive’ classlargely overlap. The targets are different, i.e. the Italian messages focus on immigrants, Muslimand Roma, the English ones on sexist and racial offenses, while the German one has no specifictargets, and includes both offensive messags towards groups and towards individuals. How-ever, the types of offenses, both explicit and implicit, including sarcastic messages, rhetoricalquestions and false claims based on prejudices make them in our view comparable. The onlydifference is the set of messages labeled as ‘Profanity’ and included among the ‘Offensive’ onesin the German dataset, which covers slurs without a specific target. However, they accountonly for 1.4% messages in this training set.
Word Embeddings In our experiments we test several embeddings, with the goal to com-pare generic with social media-specific ones. In order to have a high coverage of emojis, wealso experiment with aligned embedding spaces obtained by aligning the English, Italian andGerman ones. Another element we take into account is the access to the binary Fasttext modelthat originates the embedding space. When using that binary model, it is possible to greatlymitigate the problem of out-of-vocabulary words, since the system is able to provide an embed-ding for unknown words by using subword unit information [321]. The binary model is oftenmade available together with the standard model when pre-trained embeddings are released.When available, we always use this version. The tested embeddings, summarised in Table 5.2,are the following:
• Fasttext embeddings for German and Italian: we use embedding spaces obtaineddirectly from the Fasttext website7 for German and Italian. In particular, we use theItalian and German embeddings trained on Common Crawl and Wikipedia [199] withsize 300. A binary Fasttext model is also available and was therefore used;
7https://fasttext.cc/docs/en/crawl-vectors.html

190 CHAPTER 5. CYBERBULLYING AND ABUSIVE LANGUAGE DETECTION
• English Fasttext Crawl embeddings: English embeddings trained by Fasttext8 onCommon Crawl, with an embedding size of 300. A binary Fasttext model is provided;
• English Fasttext News embeddings: English embeddings trained on Wikipedia 2017using subword information, UMBC web base corpus and statmt.org and released by Fast-text 9, with an embedding size of 300. The available binary Fasttext model was used;
• Italian Twitter embeddings: we trained Fasttext embeddings from a sample of Italiantweets [40], with embedding size of 300. We used the binary version of the model;
• German Twitter embeddings: trained by Spinning Bytes10 from a sample of Germantweets [113]. We used the model with embeddings of size 300. A binary Fasttext modelwas not provided, we therefore used the word-based version;
• English Twitter embeddings: English Fasttext embeddings from Spinning Bytes11,trained on an English Twitter sample [113] with an embedding size of 200. Since a binaryFasttext model was not provided, we used the word-based version;
• Aligned embeddings: since Fasttext embeddings for Italian and German do not containemojis, we extend them by aligning them with an English embedding space containingemojis [28], following the alignment approach presented in [413]. All embeddings and theresulting aligned spaces have a size of 300.
EMBEDDINGS LANGUAGE ALGORITHM SIZEFASTTEXT
BINARY MODEL
Fasttext En CCrawl EN Fasttext 300 YES
Fasttext En News EN Fasttext 300 YES
Twitter English EN Fasttext 200 NO
Fasttext It CCrawl & Wiki IT Fasttext 300 YES
Twitter Italian IT Fasttext 300 YES
Fasttext De CCrawl & Wiki DE Fasttext 300 YES
Twitter German DE Fasttext 300 NO
Aligned EN,IT,DE Fasttext 300 NO
Table 5.2: Overview of the different embeddings used in our experiments
In summary, we were able to use a binary model for all the official Fasttext monolingual datasetsand the Italian Twitter embeddings that we trained. For the remaining embedding spaces, weonly had access to a dictionary-like structure, that contains the embedding for each word inthe vocabulary.
5.2.3 Experiments
In this section, we detail the setup of our experiments, i.e. the pre-processing step, the selectionof hyperparameters and the combination of features and configurations tested for each language.
8https://fasttext.cc/docs/en/english-vectors.html9https://fasttext.cc/docs/en/english-vectors.html
10https://www.spinningbytes.com/resources/wordembeddings/11https://www.spinningbytes.com/resources/wordembeddings/

5.2. A MULTILINGUAL EVALUATION FOR ONLINE HATE SPEECH DETECTION 191
Preprocessing Since hashtags, user mentions, links to external media and emojis are com-mon in social media interactions, it is necessary to carefully preprocess the data, in order tonormalize the text as much as possible while retaining all relevant semantic information. Forthis reason, we first replace URLs with the word “url” and “@” user mentions with “username”by using regular expressions. Since hashtags often provide important semantic content, wewanted to test how splitting them into single words would impact on the performance of theclassifier. To this end, we use the Ekphrasis tool [42] to do hashtag splitting and evaluate theclassifier performance with and without splitting. Since the aforementioned tool only supportsEnglish, it has been adapted to Italian and German by using language-specific Google ngrams.12
Another pre-processing step we evaluate in our experiments is the description of emojis inplain text, that proved to benefit tweet classification [411] but was evaluated so far only on En-glish. In order to map each emoji with a description, we first retrieve an emoji list using the dedi-cated Python library13 and replace each emoji with its English description according to the web-site of the Unicode consortium14. We then translate the descriptions using Google Translate andfix any mistakes by hand. In this way we create a list of emojis with the corresponding transcrip-tion in three languages (available at https://github.com/dhfbk/emoji-transcriptions).
Hyperparameters In order to keep our setting robust across languages, we base our modelon a configuration that performed consistently well on all subtasks of Evalita hate speechdetection [122], both on Facebook and on Twitter data, even if it was not the best performingconfiguration on the single tasks. In particular, our model uses no dropout and no batchnormalization on the outputs of the hidden layer. Instead, a dropout on the recurrent unitsof the recurrent layers is used. We select a batch size of 32 for training and a size of 200 forthe output (and hidden states) of the recurrent layers. We also test the impact of differentrecurrent layers, namely long short-memory (LSTM) [224], gated recurrent unit (GRU) [111]and bidirectional LSTM (BiLSTM) [408].
Settings In our experiments, we perform a series of tests on the aforementioned modularneural model, concerning the following aspects:
• For each language, we test the corresponding embeddings.
• We test all possible combination of features: embeddings, unigrams, bigrams, social fea-tures, EmoLex and Hurtlex.
• We test three possible recurrent layers, namely LSTM, GRU and Bidirectional LSTM.
• We train models with and without hashtag splitting.
• We test models that replace emojis with their description and models that do not. ForItalian and German Fasttext embeddings that do not contain emojis, we also test themodel performance after using emoji embeddings resulting from alignment with an En-glish embedding space.
Overall, we compare 1,800 possible configurations for English, 1,080 for Italian and 1,224for German. The difference is due to the availability of more embedding spaces for English,which increase the amount of possible settings and feature combinations to be tested.
Concerning the dataset splits into training and test instances, for the English dataset - sinceno standardized split is provided - we randomly selected 60% of the dataset for training, 20%
12http://storage.googleapis.com/books/ngrams/books/datasetsv2.html13https://github.com/carpedm20/emoji14https://www.unicode.org/emoji/charts/full-emoji-list.html

192 CHAPTER 5. CYBERBULLYING AND ABUSIVE LANGUAGE DETECTION
for validation and 20% for testing. Since we want our experiments to be reproducible, we usethe train test split function from scikit-learn [370] to shuffle and split the dataset 60%/40%.The remaining 40% was then split in half to obtain the validation and test set, respectively.We use 42 as a seed value for the random number generator used for shuffling.
The German dataset was already randomly split by the GermEval task organizers intotraining and test set, containing 5,009 and 3,532 messages respectively. For our experimentswe keep the same split as proposed in the challenge, but we use 20% of the training set asvalidation set, obtained by invoking train test split from scikit learn with 42 as seed. Similarly,the Italian dataset was randomly split by the HaSpeeDe task organizers into training and testset of 3,000 and 1,000 messages respectively. Again, in our experiments we keep the same splitas proposed in the challenge, but we used 20% of the training set as validation set applying thesame function as for the German dataset.
For each language, the validation test is used to evaluate the classifier performance over 20training epochs and select the best performing model in terms of macro averaged F1 score. Theselected model is then used to evaluate performance on the test set.
5.2.4 Evaluation
In this section, we report a selection of the most relevant results from the pool of settingsdescribed in Section 5.2.3. In particular, the first row of Table 5.3, 5.4 and 5.5 reports the bestrun over all the configurations tested for English, Italian and German respectively, while theother rows show how the best performance changes when modifying one parameter at a time.We also provide an evaluation of the effectiveness of different configurations by comparing thethree languages after downsampling the training sets. As comparison we provide a baselineobtained running a SVM (linear kernel) with a bag of word approach using tf-idf as weight.
Multilingual evaluation on the complete datasets
For English, the best result (0.823 F1) is obtained using an LSTM network and the Fasttextembeddings trained on Common Crawl. Table 5.3 shows how adding or removing single featuresfrom the best configuration affects the result: adding unigram and bigram-based features to theclassifier leads to the largest drop in performance, while changing other features the impact islower. This confirms the findings in [472], in which character n-grams outperform word n-gramsin the classification of racial, sexist and not-offensive tweets. Overall we find that, althoughthe best result is obtained using an LSTM network, replacing LSTM with Bi-LSTM keepingthe same features achieves similar results, with a difference of F1 of 0.1-0.2% F1. This showsthat having both forward and backward information when dealing with tweets is probably notneeded because of the limited length of the messages. The use of hashtag normalization to splitthe hashtags into words improves the system performance in every configuration, increasingthe coverage of the embeddings. Overall, the coverage of Fasttext embeddings trained onCommonCrawl is sufficient to deal with Twitter data, therefore adding specific embeddings orpre-processing them is not necessary. Also, the SVM baseline suffers from lower recall comparedto the best neural configuration, especially when dealing with the hate category, that has lesstraining instances.
For Italian, the best result (0.805 F1) is obtained with a configuration using a LSTMnetwork and the word embeddings we trained on a large corpus of Italian tweets. In Table 5.4we show to what extent the different features affect the performance obtained with the bestconfiguration. On Italian, differently from English and German, the use of unigrams in additionto word embeddings is beneficial to the classifier performance. The best result is obtained usingthe emoji transcription, but their impact is not significant (0.805 F1 using them vs. 0.804 notusing them). The same trend can be found also with different configurations not reported in the

5.2. A MULTILINGUAL EVALUATION FOR ONLINE HATE SPEECH DETECTION 193
EMBED. TEXT FEATS SOCIAL EMOT. EMOJI NETW.HASH.SPLIT
F1 NOHATE
F1HATE
PAVG
RAVG
F1AVG
Fasttext CCrawl emb NO NO NO lstm YES 0.885 0.760 0.820 0.825 0.823
Fasttext CCrawl emb NO NO NO lstm NO 0.879 0.745 0.811 0.814 0.812
Fasttext CCrawl emb NO NO transcr. lstm YES 0.886 0.756 0.821 0.821 0.821
Fasttext CCrawl emb YES NO NO lstm YES 0.883 0.757 0.817 0.823 0.820
Fasttext CCrawl emb YES EMOL NO lstm YES 0.887 0.751 0.823 0.815 0.819
Fasttext CCrawl emb NO EMOL NO lstm YES 0.885 0.751 0.820 0.817 0.818
Fasttext CCrawl emb NO HURTL NO lstm YES 0.884 0.744 0.818 0.810 0.814
Fasttext CCrawl emb YES HURTL NO lstm YES 0.883 0.742 0.816 0.809 0.812
Fasttext CCrawl emb+uni+bi NO NO NO lstm YES 0.881 0.719 0.815 0.790 0.800
Fasttext CCrawl emb+uni NO NO NO lstm YES 0.871 0.711 0.796 0.787 0.791
Fasttext CCrawl emb+bi NO NO NO lstm YES 0.873 0.694 0.800 0.773 0.784
SVM baseline 0.875 0.682 0.808 0.763 0.778
Table 5.3: Best performing configuration on English data (Macro AVG). EMOJI = ‘NO’ meansthat no specific processing of emoji was applied
table. Considering all runs with all configurations, the use of embeddings trained on the samedomain of the dataset (Italian Tweets) always leads to better results compared with the use ofmore generic embeddings as the ones from Fasttext (trained on Common Crawl and Wikipedia).Almost all the best performing configurations take advantage of hashtag splitting. BiLSTMperforms generally worse than LSTM. Like in the English evaluation, the SVM baseline achievesa remarkably lower performance on the hate class, and shows recall issues.
EMBED. TEXT FEATS SOCIAL EMOT. EMOJI NETW.HASH.SPLIT
F1 NOHATE
F1HATE
PAVG
RAVG
F1AVG
Twitter emb+uni NO NO transcription lstm YES 0.867 0.736 0.803 0.806 0.805
Twitter emb+uni YES NO transcription lstm YES 0.872 0.737 0.803 0.806 0.805
Twitter emb+uni NO NO NO lstm YES 0.871 0.736 0.802 0.805 0.804
Twitter emb+uni NO HURTL transcription lstm YES 0.867 0.728 0.795 0.800 0.797
Twitter emb+uni NO NO transcription lstm NO 0.861 0.727 0.789 0.800 0.794
Twitter emb+uni YES HURTL transcription lstm YES 0.863 0.723 0.790 0.796 0.793
Twitter emb+uni YES EMOL transcription lstm YES 0.864 0.718 0.790 0.792 0.791
Twitter emb+uni NO EMOL transcription lstm YES 0.858 0.719 0.784 0.794 0.788
Twitter emb NO NO transcription lstm YES 0.862 0.697 0.785 0.775 0.779
aligned emb+uni NO NO embeddings lstm YES 0.872 0.676 0.809 0.758 0.774
Twitter emb+bi NO NO transcription lstm YES 0.860 0.660 0.783 0.747 0.760
Twitter emb+uni+bi NO NO transcription lstm YES 0.847 0.690 0.766 0.771 0.768
SVM baseline 0.855 0.593 0.781 0.707 0.724
Table 5.4: Best performing configuration on Italian data (Macro AVG).
Table 5.5 reports the results obtained on German data. The best result is achieved witha GRU network, using the standard Fasttext embeddings (trained on Common Crawl andWikipedia). Similar to English, adopting unigrams and bigrams as feature leads to a decreasein performance (0.05 points F1). Considering all the experiments run on German data, theresults confirm that also for this language emoji transcriptions perform better than the emojivectors obtained through multilingual alignment, but for the best configuration no specific emojiprocessing is needed. Hashtag splitting, which is included in the best performing configurationfor English and Italian, is instead not beneficial to German tweet classification. Our intuitionis that, since German is rich in compound words, Ekphrasis hashtag normalization approachbased on Google n-grams tends to split terms also when it is not needed. Although social

194 CHAPTER 5. CYBERBULLYING AND ABUSIVE LANGUAGE DETECTION
and emotion features are not used in the best output, they appear to help in most of theother configurations. Also for this language, the SVM baseline achieves a lower recall and lessaccurate classification on the hate speech class than the neural model.
EMBED. TEXT FEATS SOCIAL EMOT. EMOJI NETW.HASH.SPLIT
F1 NOHATE
F1HATE
PAVG
RAVG
F1AVG
Fasttext emb NO NO NO GRU NO 0.829 0.686 0.754 0.762 0.758
Fasttext emb NO NO NO GRU YES 0.843 0.640 0.765 0.730 0.741
Fasttext emb NO NO transcription GRU NO 0.839 0.644 0.758 0.732 0.741
aligned emb NO NO embeddings GRU NO 0.835 0.652 0.752 0.738 0.744
Fasttext emb YES HURT NO GRU NO 0.834 0.671 0.755 0.751 0.753
Fasttext emb YES NO NO GRU NO 0.836 0.671 0.759 0.751 0.754
Fasttext emb YES EMOL NO GRU NO 0.836 0.657 0.755 0.741 0.747
Fasttext emb NO EMOL NO GRU NO 0.840 0.655 0.760 0.740 0.748
Fasttext emb NO HURTL NO GRU NO 0.843 0.654 0.764 0.739 0.748
Fasttext emb+bi NO NO NO GRU NO 0.806 0.606 0.710 0.703 0.706
Fasttext emb+uni+bi NO NO NO GRU NO 0.821 0.590 0.726 0.697 0.706
Fasttext emb+uni NO NO NO GRU NO 0.819 0.586 0.722 0.694 0.702
SVM baseline 0.807 0.374 0.692 0.597 0.591
Table 5.5: Best performing configuration on German data (Macro AVG).
Beside the aforementioned experiments, we perform an additional evaluation using a character-based RNN. Indeed, character-based representations have been recently used in several NLPtasks including abusive language detection [324] with promising results thanks to their abilityto effectively handle rare and unseen words. We use the best performing systems for the threelanguages, replacing word-based RNN with a character-based one. In order to learn a denserepresentation for characters, we used a learned embedding layer with size 10. The results ofthis set of experiments are reported in Table 5.6, and show that using a character-based RNNthe performance of the system drops significantly in all three languages compared to word-basedRNNs, probably because Fasttext embeddings already account for subword information. Wetherefore decided not to perform further tests with this configuration.
LANG TEXT FEATS SOCIAL EMOTIONS EMOJI NETW.HASH.SPLIT
F1 NOHATE
F1HATE
PAVG
RAVG
F1AVG
EN char NO NO NO lstm YES 0.821 0.489 0.697 0.645 0.655
IT char+uni NO NO transcription lstm YES 0.845 0.540 0.763 0.677 0.692
DE char NO NO NO GRU NO 0.771 0.212 0.555 0.524 0.491
Table 5.6: Results of character based RNN using the best configurations for the three languages.
Contribution of social and emotion information
In order to better understand the contribution of specific features or pre-processing steps onall the system runs, we present a comparative evaluation of the classifier performance with orwithout emoji transcription (in Figure 5.2) and with or without social and emotion features(Figure 5.3). This analysis is done with the goal of focusing not only on the best performingconfiguration, but also on general trends that could not be included in the previous tables. Inparticular, we plot the distribution of runs achieving different macro average F1 scores.
Figure 5.2 shows that transcribing emojis yields the best performance for English but not forthe two other languages. Nevertheless, this distinction is not clear-cut, since no clear trend canbe associated with this feature. More details on the different configurations are shown in Table5.7, confirming the above findings. Figure 5.3 analyses in a similar way the contribution of social

5.2. A MULTILINGUAL EVALUATION FOR ONLINE HATE SPEECH DETECTION 195
(a) English (total: 1800 runs) (b) Italian (total: 1080 runs) (c) German (total: 1224 runs)
Figure 5.2: Results distribution with and without emoji transcription and using aligned emojiembeddings over the three languages.
Language Emoji AVG F1 Max F1 Standard deviation F1 Number of runs
EN NO 0.796 0.823 0.034 612
EN YES 0.797 0.821 0.009 576
EN Transcription 0.796 0.821 0.034 612
IT NO 0.764 0.804 0.021 468
IT YES 0.761 0.798 0.016 144
IT Transcription 0.763 0.805 0.021 468
DE NO 0.684 0.758 0.034 468
DE YES 0.678 0.745 0.028 288
DE Transcription 0.682 0.754 0.034 468
Table 5.7: Mean and Standard deviation of macro averaged F1 scores without any specificprocessing of emojis (‘NO’), using emojis obtained through alignment (‘YES’) and transcribingthem (‘TRANSCRIPTION’)

196 CHAPTER 5. CYBERBULLYING AND ABUSIVE LANGUAGE DETECTION
(a) English (total: 1800 runs) (b) Italian (total: 1080 runs) (c) German (total: 1224 runs)
Figure 5.3: Results distribution with and without social network and emotion features over thethree languages.
Language Social & emotion features Mean F1 Max F1 Standard Deviation F1 Number of Runs
EN NO 0.794 0.823 0.011 300
EN YES 0.797 0.821 0.010 1500
IT NO 0.763 0.805 0.020 180
IT YES 0.763 0.805 0.021 900
DE NO 0.680 0.758 0.035 204
DE YES 0.682 0.754 0.033 1020
Table 5.8: Mean and Standard deviation of macro averaged F1 scores with and without socialand emotion features
network specific features (i.e. tweet length, punctuation marks, uppercase, etc.) and emotionfeatures (i.e. based on EmoLex and Hurtlex). It shows that, while for English and Italian thebest results are obtained without these two groups of features, other runs achieving on averagea slightly lower performance make use of this information. For German, the improvement dueto social and emotion features appears to be more consistent, even if it does not apply to allruns. Also, the averaged results summarised in Table 5.8 confirm that, like for emojis, thedifferences are not clear-cut.
Comparing the results across the three languages, we summarize the main findings from theevaluation as follows:
• Using subword information has a positive impact on our task, since it can deal with thehigh language variability and creativity in the social media domain as well as with typos.
• Creating specific embeddings that cover well the domain of interest is beneficial to thetask performance. If possible, a large amount of Twitter data should be collected tocreate embeddings when dealing with online hate speech classification. If not, pretrainedFasttext embeddings trained on CommonCrawl or similar are recommended, providedthat it is possible to access the binary model
• If the above domain-specific embeddings are available, where emojis are also present,our experiments show that it is not needed to pre-process emojis in specific ways (e.g.,transcribe, add emoji embeddings through alignment)
• Hashtag normalization is useful to classify hate speech in English and Italian, but cur-rent approaches to hashtag splitting may not perform well on languages that are rich incompounds like German, which in turn may affect classification
• Using domain-specific embeddings with a good coverage make emotion lexica redundantin our experiments. The fact that such lexica may be manually or semi-automatically

5.2. A MULTILINGUAL EVALUATION FOR ONLINE HATE SPEECH DETECTION 197
created does not play a major role in classification performance
• Given the limited length of tweets, LSTM yielded better results than BiLSTM
Multilingual evaluation on downsampled datasets
We perform an additional set of experiments to investigate to what extent the size of the datasetaffects the results. Therefore, we downsample both the German and the English datasets tomatch the size of the Italian Twitter dataset, the smallest one. In order to improve our ability tocompare the results, we use the same distribution of labels (hate speech, non hate speech) as theItalian dataset for the two downsampled ones. We then replicate some of the best performingconfigurations presented in the previous tables, and report the results in Table 5.9. As expected,reducing the training data both for English and for German leads to a drop in performance(from 0.823 F1 to 0.782 for English, from 0.758 F1 to 0.713 for German). On all the runs, theclassifier achieves a lower performance on German than on the other two languages, while theresults on Italian and English are comparable. Our experiments suggest that German is morechallenging to classify, partly because of inherent characteristics of the language (for examplethe presence of compound words that makes hashtag splitting ineffective), partly because of theway in which the Germeval dataset was built. Namely, the organisers report that they sampledthe data starting from specific users and avoiding keyword-based queries, so to obtain thehighest possible variability in the offensive language. They also manually checked and enrichedthe data so to cover all the political spectrum in their offenses, and avoid user overlaps betweentraining and test data. This led to the creation of a very challenging dataset, where lexicaloverlap between training and test data is limited (therefore unigram and bigram features donot work well) and where hate speech is not associated with specific topics or keywords.
EMBED. TEXT FEATS SOCIAL EMOT. EMOJI NETW.HASH.SPLIT
LANGF1 NOHATE
F1HATE
PAVG
RAVG
F1AVG
EN 0.847 0.683 0.763 0.769 0.765
Fasttext emb+uni NO NO transcription LSTM YES IT 0.863 0.739 0.794 0.811 0.801
DE 0.822 0.578 0.726 0.690 0.700
EN 0.844 0.696 0.763 0.780 0.770
Fasttext emb+uni NO NO NO LSTM YES IT 0.862 0.723 0.789 0.796 0.793
DE 0.814 0.563 0.712 0.680 0.689
EN 0.846 0.701 0.767 0.783 0.773
Fasttext emb NO NO NO GRU NO IT 0.857 0.708 0.780 0.785 0.783
DE 0.827 0.598 0.736 0.703 0.713
EN 0.857 0.713 0.780 0.792 0.785
Fasttext emb NO NO transcription LSTM YES IT 0.849 0.684 0.767 0.766 0.767
DE 0.824 0.611 0.732 0.710 0.718
EN 0.853 0.711 0.776 0.791 0.782
Fasttext emb NO NO NO LSTM YES IT 0.837 0.683 0.755 0.767 0.760
DE 0.830 0.596 0.741 0.702 0.713
Table 5.9: Performance evaluation on data sets of comparable size in English, Italian andGerman
While our main goal is not to develop a system achieving state-of-the-art results, it is inter-esting to compare our performance with the best systems dealing with hate speech detection.For Italian and German our approach can be easily compared to other existing classifiers usingthe same training and test split, since we relied on the official data released in two shared tasks.These results, however, were obtained in the context of the shared task, therefore the authorscould not use information about the test set performance as we did. The comparison is still

198 CHAPTER 5. CYBERBULLYING AND ABUSIVE LANGUAGE DETECTION
interesting, but it should be noted that we are reporting the best results on the test set, noton the development set.
On Italian, we observe that our best system configuration achieves state-of-the-art results(F1 0.805). The best performing system in the EVALITA shared task [116] reached 0.800F1 on the development set using an SVM-based classifier with rich linguistic features, whilethe best score obtained on the test set (0.799 F1) was yielded by a two-layer BiLSTM in amulti-task learning setting. Similar to our best setting, they also use embeddings extractedfrom social media data, and observe that using sentiment-based lexica does not increase systemperformance.
On German, the best performing system participating in Germeval [477] achieved 0.768 F1[357] and was a stacked ensemble system that combined maximum entropy and random forestclassifiers and relied on five groups of features. However, the system performance in 10-foldcross-validation using only the training set reached 0.817 F1. Our best configuration on thetask test set yields 0.758 F1 with a much simpler architecture, using only Fasttext and no otherfeatures except for word embeddings.
As for English, it is more difficult to draw a similar comparison because the dataset weuse [472] was originally annotated with three classes (i.e. racism, sexism and none), thus mostsystems using the same data perform multiclass classification. Besides, they are run using ten-fold cross-validation like in the original paper [472]. One of the few attempts to distinguishbetween hate and non-hate speech on the same English data is described in [257], where theauthors present a classifier combining word-based CNN and character-based CNN. They report0.734 F1 on the binary task in ten-fold cross-validation. Other works using the same data setfor three-class classification report much higher results (0.783 F1 in [190] using CNN, 0.86 F1 in[257] using a multi-layer perceptron). Interestingly, as shown in [257], multi-class classificationseems generally easier than the binary one on this specific data set, since sexist and racisttweets present lexical-based discriminating features that are easy to capture.
Qualitative evaluation
In our experiments we tested more that 1,000 configurations for each language, and it is thereforedifficult to manually evaluate and compare the results, since each configuration may makespecific mistakes and the distribution of false positives and negatives on the test split wouldchange. In order to gain some insights into the specificity of each language and dataset, however,we focus on the output of the best performing configuration for each language, and we manuallycheck the wrongly classified instances. In most of the cases, it is not possible to assign a categoryto the mistakes done by the classifier, since the false negative tweets are clearly hateful andthe false positive ones are unambiguously non-hateful. These cases are prevalent in all thedatasets, so they are independent from the language and also from the dataset size. The opaquemechanisms with which deep learning classifiers assign labels make it difficult to explain whythese apparently trivial cases were misclassified, but we plan to exploit information conveyedby attention mechanisms to shed light into this issue [126].
Among the broad mistake categories found across the inspected datasets, there are somecases of implicit abuse. Such messages do not contain abusive words but rather convey their of-fensive nature through sarcasm, jokes, the usage of negative stereotypes or supposedly objectivestatements implying some form of offense.
We report few examples of false negatives for the hate speech class below:
4. It’s not about any specific individuals, but about an ideology that will always produceterrorists.

5.3. CROSS-PLATFORM EVALUATION FOR ITALIAN HATE SPEECH DETECTION199
5. Molti ancora non vedono, ma quando attraversano un parco, se popolato da immigrati, sitengono stretta la borsa. (EN: Many do not see it, but when they cross a park populatedwith immigrants they hold their bag close).
6. Schau doch Pornos wenn du mehr Redeanteil von Frauen horen willst (EN: Watch pornif you want to hear more women talk).
We also observe that sentences with a complex syntactic structure, containing for examplemore than one negation, or questions, are frequent both among the false positives and thefalse negatives (see Sentence 7, which was wrongly classified as ‘Not hate’). The same happensfor tweets that contain anaphoric elements that hint at mentions probably present in previousmessages, and for tweets which require some form of world knowledge to be understood. In somecases, a link to external media contributed to the hateful meaning of a tweet, as in Sentence8. However, since we remove urls in the pre-processing step this information was not exploitedfor classification.
7. No. You have proven your ignorance here to anyone who isn’t as dumb as you. It’s therefor all to see but you don’t know it..
8. A quanto pare, il corano si puo usare anche per questo. Ma pare non funzioni moltobene..... http: // t. co/ DcOSHfmfxK (EN: It seems that Quran can be used also forthis. But apparently it does not work very well...http://t.co/DcOSHfmfxK).
Among false positives, the inspected examples confirm the remarks in [476] concerning theEnglish dataset, and we observe a similar behaviour also for Italian tweets: since these datasetswere collected starting from keywords concerning potential hate targets such as women, Romaand Muslims and then extended with not offensive tweets, classifiers tend to associate targetmentions to hate speech, even if such messages are not offensive. This phenomenon is lessevident on the German data, which indeed was created in a different way, starting from a listof users. Two examples of false positive are reported below. In (9) the message is probablyclassified as hateful because of the mention of ‘Jewish’. In (10) it may depend on the mentionof ‘migration’.
9. Fine by me. I had five Jewish friends in college. None ever went to a Synagogue.
10. l’immigrazione e un problema x tutti! Ma servono iniziative non comunicati (EN: Migra-tion is a problem for everybody! But we need initiatives, not press releases).
Finally, we noted few mistakes in the gold standard annotation of the test sets, which werecorrectly classified by our system.
5.3 Cross-platform evaluation for Italian hate speech de-
tection
Most of the available datasets and approaches for hate speech detection proposed so far concernthe English language, and even more frequently they target a single social media platform(mainly Twitter). In low-resource scenarios it is therefore common to have smaller datasetsfor specific platforms, raising research questions such as: would it be advisable to combine suchplatform-dependent datasets to take advantage of training data developed for other platforms?Should such data just be added to the training set or they should be selected in some way? Andwhat happens if training data are available only for one platform and not for the other?
200 CHAPTER 5. CYBERBULLYING AND ABUSIVE LANGUAGE DETECTION
In this section we address all the above questions focusing on hate speech detection for Ital-ian. Relying on the modular neural architecture that we demonstrated to be rather stable andwell-performing across different languages and platforms (in Section 5.2), we perform our com-parative evaluation on freely available datasets for hate speech detection in Italian, extractedfrom four different social media platform, i.e. Facebook, Twitter, Instagram and Whatsapp.In particular, we test the same model while altering only some features and pre-processingaspects. Besides, we use a multi-platform training set but test on data taken from the singleplatforms. We show that the proposed solution of combining platform-dependent datasets inthe training phase is beneficial for all platforms but Twitter, for which results obtained bytraining on tweets only outperform those obtained with a training on the mixed dataset.
5.3.1 Data and linguistic resources
In the following, we present the datasets used to train and test our system and their annotations.Then, we describe the word embeddings we have used in our experiments.
Twitter dataset released for the HaSpeeDe (Hate Speech Detection) shared task organizedat EVALITA 2018 (see dataset description in Section 5.2.2).
Facebook dataset also released for the HaSpeeDe (Hate Speech Detection) shared task. Itconsists of 4,000 Facebook comments collected from 99 posts crawled from web pages (1,941negative, and 2,059 positive instances), comprising for each comment the respective annotation,as can be seen in Example 11. The two classes considered in the annotation are “hateful post”or “not”.
11. Annotation: hateful.Matteo serve un colpo di stato. Qua tra poco dovremo andare in giro tutti armati comein America. (EN: Matteo, we need a coup. Soon we will have to go around armed as inthe U.S.).
Whatsapp dataset collected to study pre-teen cyberbullying [420]. Such dataset has beencollected through a WhatsApp experimentation with Italian lower secondary school studentsand contains 10 chats, subsequently annotated according to different dimensions as the rolesof the participants (e.g., bully, victim) and the presence of cyberbullying expressions in themessage, distinguished between different classes of insults, discrimination, sexual talk and ag-gressive statements. The annotation is carried out at token level. To create additional traininginstances for our model, we join subsequent sentences of the same author (to avoid cases inwhich the user writes one word per message) resulting in 1,640 messages (595 positive in-stances). We consider as positive instances of hate speech the ones in which at least one tokenwas annotated as a cyberbullying expression, as in Example 12).
12. Annotation: Cyberbulling expression.fai schifo, ciccione! (EN: you suck, fat guy).
Instagram dataset includes a total amount of 6,710 messages, which we randomly collectedfrom Instagram focusing on students’ profiles (6,510 negative and 200 positive instances) iden-tified through the monitoring system described in [313]. Since no Instagram datasets in Italianwere available, and we wanted to include this platform to our study, we manually annotatedthem as “hateful post” (as in Example 13) or “not”.
13. Annotation: hateful.Sei una troglodita (EN: you are a caveman).

5.3. CROSS-PLATFORM EVALUATION FOR ITALIAN HATE SPEECH DETECTION201
Platform Training set Embeddings FeaturesEmoji
F1 no hate F1 hate Macro AVGTransc.
InstagramMulti Plat. Twitter Social Yes 0.984 0.432 0.708Single Plat. Twitter Social Yes 0.981 0.424 0.702
FacebookMulti Plat. Twitter Social Yes 0.773 0.871 0.822Single Plat. Twitter Social Yes 0.733 0.892 0.812
WhatsAppMulti Plat. Twitter Social Yes 0.852 0.739 0.796Single Platform Twitter Social Yes 0.814 0.694 0.754
TwitterSingle Plat. Twitter Hurtlex No 0.879 0.717 0.798Filtered Multi Plat. Twitter Hurtlex No 0.858 0.720 0.789Multi Plat. Twitter Hurtlex No 0.851 0.712 0.782
Table 5.10: Classification results
Word Embeddings In our experiments we test two types of embeddings, with the goalto compare generic with social media-specific ones. In both cases, we rely on Faxttext em-beddings [62], since they include both word and subword information, tackling the issue ofout-of-vocabulary words, which are very common in social media data (see Section 5.2.2).
5.3.2 System description
Since our goal is to compare the effect of various features, word embeddings, pre-processingtechniques on hate speech detection applied to different platforms, we use the modular neuralarchitecture for binary classification presented in Section 5.2.1. For preprocessing methods, weused the ones previously described in Section 5.2.3.
As for features, we evaluate the impact of i) word embeddings extracted from social mediadata, compared with the performance obtained using generic embedding spaces; ii) keepingemojis or transcribing them in plain text. To this purpose, we use the official plaintext descrip-tions of the emojis (from the unicode consortium website), translated to Italian with Googletranslate and then manually corrected, as a substitute for emojis; iii) using a lexicon of hurtfulwords [41]; iv) social media specific features, in particular, the number of hashtags and men-tions, the number of exclamation and question marks, the number of emojis, the number ofwords written in uppercase.
5.3.3 Experimental setup
In order to be able to compare the results obtained while experimenting with different trainingdatasets and features, we used fixed hyperparameters, derived from our best submission atEVALITA 2018 for the cross-platform task that involved training on Facebook data and testingon Twitter. In particular, we used a GRU [111] of size 200 as the recurrent layer and we appliedno dropout to the feed-forward layer. Additionally, we used the provided test set for the twoEvalita tasks, using 20% of the development set for validation. For Instagram and WhatsApp,since no standard test set is available, we split the whole dataset using 60% of it for training,while the remaining 40% is split in half and used for validation and testing. For this purpose,we use the train test split function provided by sklearn [370], using 42 as seed for the randomnumber generator. One of our goals was to establish whether merging data from multiple socialmedia platforms can be used to improve performance on single platform test sets. In particular,we used the following datasets for training:
• Multi-platform: we merge all the datasets mentioned in Section 5.2.2 for training.

202 CHAPTER 5. CYBERBULLYING AND ABUSIVE LANGUAGE DETECTION
• Multi-platform filtered by length: we use the same datasets mentioned before, butonly considered instances with a length lower or equal to 280 characters, ignoring URLsand user mentions. This was done to match Twitter length restrictions.
• Same Platform: for each of the datasets, we trained and tested the model on data fromthe same platform.
In addition to the experiments performed on different datasets, we also compare the systemperformance obtained by using different embeddings. In particular, we train the system by usingItalian Fasttext word embeddings trained on CommonCrawl and Wikipedia, and Fasttext wordembeddings trained by us on a sample of Italian tweets [40], with an embedding size of 300. Wealso train our models including either social-media or Hurtlex features. Finally, we compareclassification performance with and without emoji transcription.
5.3.4 Results
For each platform, we report in Table 5.10 the best performing configuration considering em-bedding type, features and emoji transcription. We also report the performance obtained bymerging all training data (Multi-platform), using only platform-specific training data (Sin-gle platform) and filtering training instances > 280 characters (Filtered Multi platform) whentesting on Twitter.
For Instagram, Facebook and Whatsapp, the best performing configuration is identical.They all use emoji transcription, Twitter embeddings and social-specific features. Using multi-platform training data is also helpful, and all the best performing models on the aforementioneddatasets use data obtained from multiple sources. However, the only substantial improvementcan be observed in the WhatsApp dataset, probably because it is the smallest one, and theclassifier benefits from more training data.
The results obtained on the Twitter test set differ from the aforementioned ones in severalways. First of all, the in-domain training set is the best performing one, while the restrictedlength dataset is slightly better than the non restricted one. These results suggest that learn-ing to detect hate speech on the short length interactions that happen on Twitter does notbenefit from using data from other platforms. This effect can be at least partially mitigatedby restricting the length of the social interactions considered and retaining only the traininginstances that are more similar to Twitter ones.
Another remark concerning only Twitter is that Hurtlex is in this case more useful thansocial network specific features. While the precise cause for this would require more investiga-tion, one possible explanation is the fact that Twitter is known for having a relatively lenientapproach to content moderation. This would let more hurtful words slip in, increasing theeffectiveness of Hurtlex as a feature, in addition to word embeddings. Additionally, emoji tran-scription seems to be less useful for Twitter than for other platforms. This might be explainedwith the fact that the Twitter dataset has relatively less emojis when compared to the others.
One final outtake confirmed by the results is the fact that embeddings trained on socialmedia platforms (in this case Twitter) always outperform general-purpose embeddings. Thisshows that the language used on social platforms has peculiarities that might not be presentin generic corpora, and that it is therefore advisable to use domain-specific resources.

5.4. A SYSTEM TO MONITOR CYBERBULLYING 203
5.4 A system to monitor cyberbullying based on mes-
sage classification and social network analysis
As introduced before, the presence on social networks like Twitter, Facebook and Instagram isof main importance for teenagers, but this may also lead to undesirable and harmful situations.We refer to these forms of harassment as cyberbullying, i.e., ‘an aggressive, intentional actcarried out by a group or an individual, using electronic forms of contact, repeatedly and overtime against a victim who cannot easily defend him or herself’ [412]. In online social media, eachepisode of online activity aimed at offending, menacing, harassing or stalking another personcan be classified as a cyberbullying phenomenon. This is connected even with concrete publichealth issues, since recent studies show that victims are more likely to suffer from psycho-socialdifficulties and affective disorders [440].
Given its societal impact, the implementation of cyberbullying detection systems, combin-ing abusive language detection and social network analysis, has attracted a lot of attentionin the last years [441, 229, 386, 146]. However, the adoption of such systems in real life isnot straightforward and their use in a black box scenario is not desirable, given the negativeeffects misleading analyses could have on potential abusers and victims. A more transpar-ent approach should be adopted, in which cyberbullying identification should be mediated byhuman judgment.
In this section, we present a system for the monitoring of cyberbullying phenomena on socialmedia. The system aims at supporting supervising persons (e.g., educators) at identifyingpotential cases of cyberbullying through an intuitive, easy-to-use interface. This displays boththe outcome of a hate speech detection system and the network in which the messages areexchanged. Supervising persons can therefore monitor the escalation of hateful online exchangesand decide whether to intervene or not, similar to the workflow introduced in [386]. We evaluatethe NLP classifier on a set of manually annotated data from Instagram, and detail the networkextraction algorithm starting from 10 Manchester high schools. However, this is only onepossible use case of the system, which can be employed over different kinds of data.
5.4.1 Network extraction
Since cyberbullying is by definition a repeated attack towards a specific victim by one or morebullies, we include in the monitoring system an algorithm to identify local communities in socialnetworks and isolate the messages exchanged only within such communities. In this demo, wefocus on high-schools, but the approach can be extended to other communities of interest. Ourcase study concerns the network of Manchester high-school students, and we choose to focuson Instagram, since it is widely used by teenagers of that age.
Reconstructing local communities on Instagram is a challenging task. Indeed, differentlyfrom how other social networks operate (e.g., Facebook), Instagram does not provide a page forinstitutions such as High Schools, that therefore need to be inferred. To overcome this issue,and to identify local communities of students, we proceed in two steps that can be summarisedas follow:
• Expansion stage. We start from few users that are very likely to be part of the local highschool community, and we use them to identify an increasing number of other possiblemembers expanding our network coverage.
• Pruning stage. We identify, within the large network, smaller communities of users andwe isolate the ones composed by students. For these, we retrieve the exchanged messagesin a given period of time (in our case, the ongoing school year), which will be used toidentify abusive messages.
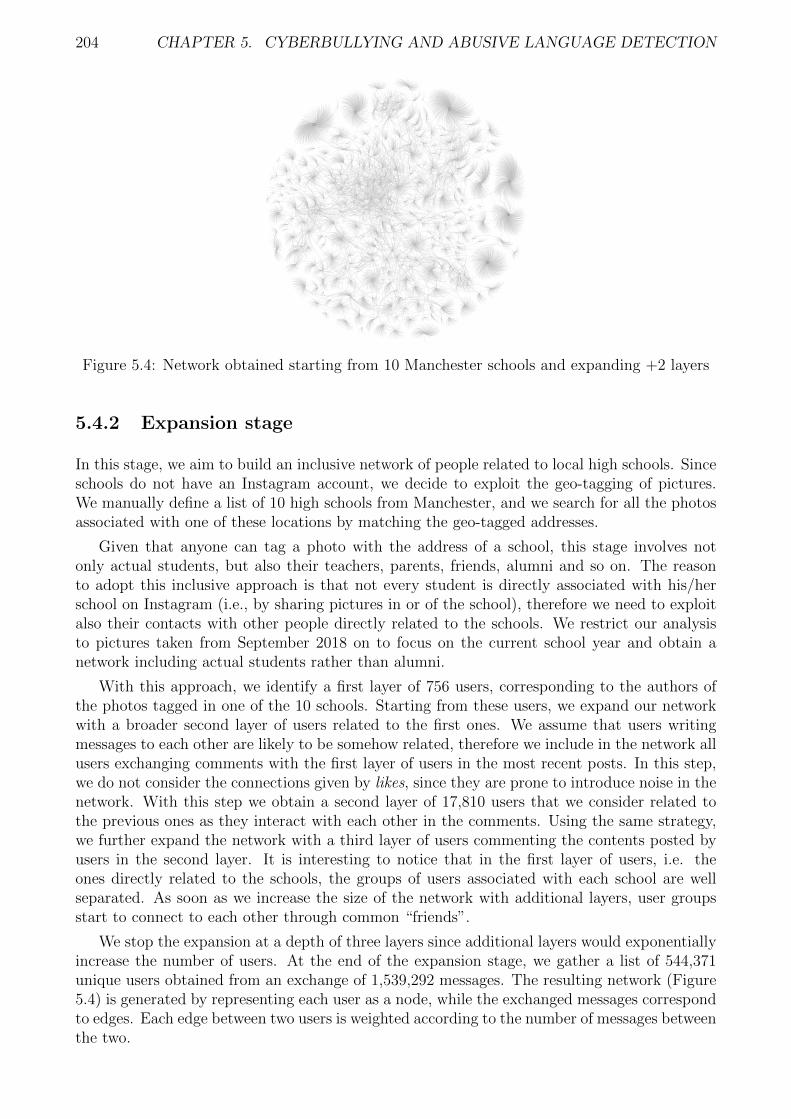
204 CHAPTER 5. CYBERBULLYING AND ABUSIVE LANGUAGE DETECTION
Figure 5.4: Network obtained starting from 10 Manchester schools and expanding +2 layers
5.4.2 Expansion stage
In this stage, we aim to build an inclusive network of people related to local high schools. Sinceschools do not have an Instagram account, we decide to exploit the geo-tagging of pictures.We manually define a list of 10 high schools from Manchester, and we search for all the photosassociated with one of these locations by matching the geo-tagged addresses.
Given that anyone can tag a photo with the address of a school, this stage involves notonly actual students, but also their teachers, parents, friends, alumni and so on. The reasonto adopt this inclusive approach is that not every student is directly associated with his/herschool on Instagram (i.e., by sharing pictures in or of the school), therefore we need to exploitalso their contacts with other people directly related to the schools. We restrict our analysisto pictures taken from September 2018 on to focus on the current school year and obtain anetwork including actual students rather than alumni.
With this approach, we identify a first layer of 756 users, corresponding to the authors ofthe photos tagged in one of the 10 schools. Starting from these users, we expand our networkwith a broader second layer of users related to the first ones. We assume that users writingmessages to each other are likely to be somehow related, therefore we include in the network allusers exchanging comments with the first layer of users in the most recent posts. In this step,we do not consider the connections given by likes, since they are prone to introduce noise in thenetwork. With this step we obtain a second layer of 17,810 users that we consider related tothe previous ones as they interact with each other in the comments. Using the same strategy,we further expand the network with a third layer of users commenting the contents posted byusers in the second layer. It is interesting to notice that in the first layer of users, i.e. theones directly related to the schools, the groups of users associated with each school are wellseparated. As soon as we increase the size of the network with additional layers, user groupsstart to connect to each other through common “friends”.
We stop the expansion at a depth of three layers since additional layers would exponentiallyincrease the number of users. At the end of the expansion stage, we gather a list of 544,371unique users obtained from an exchange of 1,539,292 messages. The resulting network (Figure5.4) is generated by representing each user as a node, while the exchanged messages correspondto edges. Each edge between two users is weighted according to the number of messages betweenthe two.
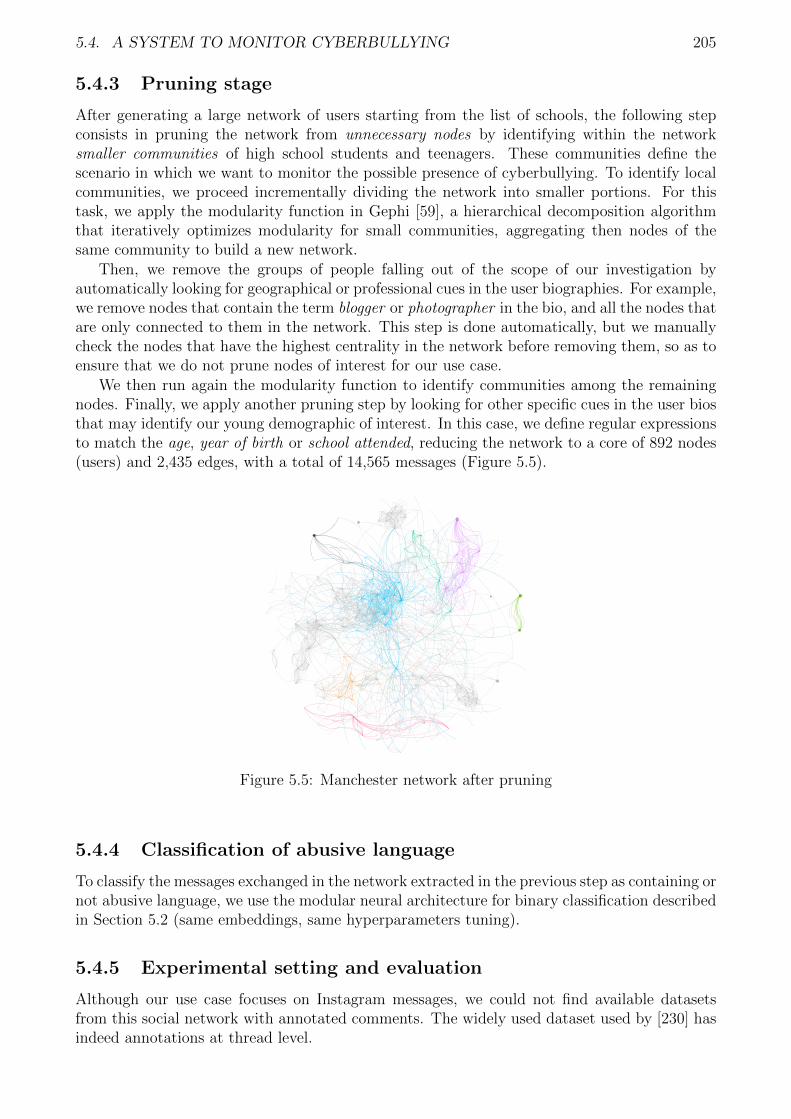
5.4. A SYSTEM TO MONITOR CYBERBULLYING 205
5.4.3 Pruning stage
After generating a large network of users starting from the list of schools, the following stepconsists in pruning the network from unnecessary nodes by identifying within the networksmaller communities of high school students and teenagers. These communities define thescenario in which we want to monitor the possible presence of cyberbullying. To identify localcommunities, we proceed incrementally dividing the network into smaller portions. For thistask, we apply the modularity function in Gephi [59], a hierarchical decomposition algorithmthat iteratively optimizes modularity for small communities, aggregating then nodes of thesame community to build a new network.
Then, we remove the groups of people falling out of the scope of our investigation byautomatically looking for geographical or professional cues in the user biographies. For example,we remove nodes that contain the term blogger or photographer in the bio, and all the nodes thatare only connected to them in the network. This step is done automatically, but we manuallycheck the nodes that have the highest centrality in the network before removing them, so as toensure that we do not prune nodes of interest for our use case.
We then run again the modularity function to identify communities among the remainingnodes. Finally, we apply another pruning step by looking for other specific cues in the user biosthat may identify our young demographic of interest. In this case, we define regular expressionsto match the age, year of birth or school attended, reducing the network to a core of 892 nodes(users) and 2,435 edges, with a total of 14,565 messages (Figure 5.5).
Figure 5.5: Manchester network after pruning
5.4.4 Classification of abusive language
To classify the messages exchanged in the network extracted in the previous step as containing ornot abusive language, we use the modular neural architecture for binary classification describedin Section 5.2 (same embeddings, same hyperparameters tuning).
5.4.5 Experimental setting and evaluation
Although our use case focuses on Instagram messages, we could not find available datasetsfrom this social network with annotated comments. The widely used dataset used by [230] hasindeed annotations at thread level.

206 CHAPTER 5. CYBERBULLYING AND ABUSIVE LANGUAGE DETECTION
Figure 5.6: Interface view for network explo-ration
Figure 5.7: Interface view for hate speech mon-itoring
We therefore train our classification algorithm using the dataset described in [472], contain-ing 16k English tweets manually annotated for hate speech. More precisely, 1,924 are annotatedas containing racism, 3,082 as containing sexism, while 10,884 tweets are annotated as not con-taining offensive language. We merge the sexist and racist tweets in a single class, so that 5,006tweets are considered as positive instances of hate speech. As a test set, we manually annotate900 Instagram comments, randomly extracted from the Manchester network, labeling them ashate speech or not. Overall, the test set contains 787 non-offensive and 113 offensive messages.
We preprocess both data sets, given that hashtags, user mentions, links to external mediaand emojis are common in social media interactions. To normalize the text as much as possiblewhile retaining all relevant semantic information, we first replace URLs with the word “url” and“@” user mentions with “username” by using regular expressions. We also use the Ekphrasistool [42] to split hashtags into sequences of words, when possible.
The system obtained on the test set a micro-averaged F1 of 0.823. We then run the classifieron all messages extracted for the Manchester network, and make the output available throughthe platform interface.
5.4.6 Interface
The system15 relies on a relational database and a tomcat application server. The interface isbased on existing javascript libraries such as C3.js (https://c3js.org) and Sigma.js (http://sigmajs.org).
The platform can be used with two settings: in the first one (Figure 5.6), the Manchesternetwork is displayed, with colors denoting different sub-communities characterised by denseconnections. By clicking on a node, the platform displays the cloud of key-concepts automat-ically extracted from the conversations between the given user and her connections using theKD tool [337]. This view is useful to understand the size and the density of the network and tobrowse through the topics present in the threads. In the second setting (Figure 5.7), which canbe activated by clicking on “Show offensive messages”, the communities are all colored in grey,while the system highlights in red the messages classified as offensive by our system. By clickingon red edges it is possible to view the content of the messages classified as offensive, enablingalso to check the quality of the classifier. This second view is meant to support educators andstakeholders in monitoring cyberbullying without focusing on single users, but rather keeping
15A video of the demo is available at https://dh.fbk.eu/sites/dh.fbk.eu/files/creepdemo_1.m4v

5.5. RELATED WORK 207
an eye on the whole network and zooming in only when hateful exchanges, flagged in red, areescalating.
5.4.7 Discussion
The current system has been designed to support the work of educators in schools, althoughit is not meant to be open to everyone but only to specific personnel. For example, in Italythere must be one responsible teacher to counter cyberbullying in every school, and access tothe system could be given only to that specific person. For the same reason, the system doesnot show the actual usernames but only placeholders, and the possibility to de-anonymise thenetwork of users could be activated only after cyberbullying phenomena have been identified,and only for the users involved in such cases. Indeed, we want to avoid the use of this kindof platforms for the continuous surveillance of students, and prevent a malicious use of themonitoring platform.
The system relies on public user profiles, and does not have access to content that users wantto keep private. This limits the number of cyberbullying cases and hate messages in our usecase, where detected abusive language concerns less than 1% of the messages, while a previousstudy on students’ simulated WhatsApp chats around controversial topics reports that 41% ofthe collected tokens were offensive or abusive [420]. This limitation is particularly relevant whendealing with Instagram, but the workflow presented in this section can be potentially appliedto other social networks and chat applications. Another limitation of working with Instagramis the fact that the monitoring cannot happen in real time. In fact, the steps to extract andprune the network require some processing time and cannot be performed on the fly, especiallyin case of large user networks. We estimate that the time needed to download the data, extractthe network, retrieve and classify the messages and upload them in the visualisation tool wouldbe around one week.
5.5 Related Work
5.5.1 Hate speech detection on English data
Given the well-acknowledged rise in the presence of toxic and abusive speech on social mediaplatforms like Twitter and Facebook, an increasing number of approaches has been proposedto detect such a kind of messages in English. Automated systems for the detection of abusivelanguage range from supervised machine learning models built using a combination of manuallycrafted features such as n-grams [480], syntactic features [345], and linguistic features [488], tomore recent neural networks that take word or character sequences from comments and learnabusive patterns without the need for explicit feature engineering. The recent trend of usingneural network-based approaches has been particularly evident for English, since several train-ing datasets are available for this language, enabling more data-hungry approaches. Indeed,organisers of the 2019 Semeval task on Offensive Language Identification [493] report that 70%of the participants adopt a deep learning approach. However, also simpler classification sys-tems using logistic regression have been successfully applied to the task [472, 135]. Among theneural network-based approaches, different algorithms have been presented, such as Convolu-tional Neural Network using pre-trained word2vec embeddings [495], bi-LSTM with attentionmechanism [3] and bidirectional Gated Recurrent Unit network [269]. More recently, also thecombination of different neural newtorks, capturing both the message content and the Twitteraccount metadata, has been proposed [185]. In a comparative study of various learning modelson the Hate and Abusive Speech on Twitter dataset built by Founta et al. [186], Lee et al. [269]

208 CHAPTER 5. CYBERBULLYING AND ABUSIVE LANGUAGE DETECTION
show that, in the classification of tweets as “normal”, “spam”, “hateful” and “abusive” a bidi-rectional Gated Recurrent Unit network trained on word-level features is the most accuratemodel. Instead, in the binary task of offensive language detection, Liu et al. [283] achieve thebest performance at Semeval 2019 by fine-tuning a bidirectional encoder representation fromtransformer [143].
In this work, we propose a robust neural classifier for the hate speech binary classificationtask which is performing well across different languages (English, Italian and German), and westudy the impact of each feature and component on the results across these languages. Ourrecurrent neural architecture shares some elements with the above approaches, namely the useof a Long Short Term Memory and a Gated Recurrent Unit. Embeddings, textual and socialnetwork specific features are employed. As in [257], we do not use metadata related to the socialmedia accounts. The obtained results are compared in a more detailed way in Section 5.2.4.
5.5.2 Hate speech detection on languages different from English
While most approaches to hate speech detection have been proposed for English, other sys-tems have been developed to deal with the task in German, Italian and Spanish, thanks torecent shared tasks. The 2018 GermEval Shared Task on the Identification of Offensive Lan-guage16 deals with the detection of offensive comments from a set of German tweets. Thetweets have to be classified into the two classes offense and other, where the offense class cov-ers abusive language, insults, as well as profane statements. Different classifiers are used bythe participants, ranging from traditional feature-based supervised learning (i.e., SVMs for thetop performing system TUWienKBS [357]) to the more recent deep learning methods. Mosttop performing systems in both shared tasks employed deep learning (e.g., spMMMP [460],uhhLT [474], SaarOffDe [427], InriaFBK [124]). For example, SaarOffDe employs RecurrentNeural Networks and Convolutional Neural Networks produced top scores, while other sys-tems (e.g., spMMMP, uhhLT) employ transfer learning. The usage of ensemble classificationseems to often improve the classification approaches (e.g., Potsdam [406], RuG [22], SaarOffDe,TUWienKBS, UdSW [475]). Concerning the features, several systems include a combination ofword embeddings, character n-grams and some forms of (task-specific) lexicon. Both the HaUAand the UdSW systems report that high performance scores can be achieved with a classifiersolely relying on a lexicon.
In 2018, the first Hate Speech Detection (HaSpeeDe) task for Italian has been organized atEVALITA-201817. The task consists in automatically annotating messages from Twitter andFacebook, with a boolean value indicating the presence (or not) of hate speech. Similar toGermeval 2018 submissions, also in this case the participating systems adopt a wide range ofapproaches, including bi-LSTM [260], SVM [403], ensemble classifiers [382, 23], RNN [184],CNN and GRU [460]. The authors of the best-performing system, ItaliaNLP [116], experimentwith three different classification models: one based on linear SVM, another one based on a1-layer BiLSTM and a newly-introduced one based on a 2-layer BiLSTM which exploits multi-task learning with additional data from the 2016 SENTIPOLC task18.
Concerning Spanish, the IberEval 2018 edition19 has proposed the Aggressiveness Detec-tion task [99] applied to Mexican Spanish, aiming at providing a classification of aggressive/ non-aggressive tweets. A variety of systems is proposed, exploiting content-based (bag ofwords, word n-grams, term vectors, dictionary words, slang words) and stylistic-based features
16https://www.oeaw.ac.at/fileadmin/subsites/academiaecorpora/PDF/GermEval2018_Proceedings.
pdf17http://www.evalita.it/201818http://www.di.unito.it/~tutreeb/sentipolc-evalita16/index.html19https://sites.google.com/view/ibereval-2018

5.6. CONCLUSIONS 209
(frequencies, punctuation, POS, Twitter specific elements). Most of the systems rely on neuralnetworks (CNN, LSTM and others). The top ranked team was INGEOTEC [198]: the system isbased on MicroT, a text classification approach supported by a lexicon-based model that takesinto account the presence of aggressive and affective words, and a model based on the Fasttextrepresentation of texts. More recently, a task for the detection of hate speech against immi-grants and women on Twitter has been organised at Semeval 2019 [38], providing an Englishand Spanish dataset annotated according to the same guidelines. While for both languages anumber of neural network approaches has been proposed, the best systems for hateful contentdetection still rely on SVM and embedding-based features [238, 373, 15].
Looking at the descriptions of the systems participating in the above tasks, as well as at mostrecent hate speech detection classifiers for English, we observe that deep learning approachesusually share a number of features, such as word embeddings, the use of emotion or sentimentlexica, as well as specific pre-processing steps. Many exploit also other features related to thetweets (e.g., message length, punctuation marks, etc.). Nevertheless, more emphasis is usuallyput on the architecture, and no insight is given into the role played by variants of the abovefeatures and by the selected pre-processing strategy. Also, no attempt to understand differencesacross different languages has been made.
5.6 Conclusions
Targeting the hate speech detection task in social media messages, in the first part of thischapter we have first described a recurrent neural architecture that is rather stable and well-performing across different languages (i.e., English, German and Italian), and then we haveevaluated the contribution of several components that are usually employed in the task, namelythe type of embeddings, the use of additional features (text-based or emotion-based), the roleof hashtag normalisation and that of emojis. Our comparative evaluation has been carried outon English, Italian and German available Twitter datasets for hate speech detection (annotatedas either containing hate speech/offensive language or not). This allowed us to propose a set offindings that could guide researchers in the design of hate speech detection systems, especiallyfor languages different from English.
In the second part of this chapter, we examined the impact of using datasets from multipleplatforms in order to classify hate speech on social media. While the results of our experimentssuccessfully demonstrated that using data from multiple sources helps the performance of ourmodel in most cases, the resulting improvement is not always sizeable enough to be useful.Additionally, when dealing with tweets, using data from other social platforms slightly decreasesperformance, even when we filter the data to contain only short sequences of text. As for futurework, further experiments could be performed, by testing all possible combinations of trainingsources and test sets. This way, we could establish what social platforms share more traitswhen it comes to hate speech, allowing for better detection systems. At the moment, however,the size of the datasets varies too broadly to allow for a fair comparison, and we would need toextend some of the datasets.
In the last part of the chapter, we presented a platform to monitor cyberbullying phenom-ena that relies on two components: an algorithm to automatically detect online communitiesstarting from geo-referenced online pictures, and a hate speech classifier. Both componentshave been combined in a single platform that, through two different views, allows educators tovisualise the network of interest and to detect in which sub-communities hate speech is esca-lating. Although the evaluation has been carried out only on English, the system supports alsoItalian, and will be showcased in both languages.
Always in this context, as an exploratory and ongoing research activity, we are investigatinga zero-shot framework for multilingual hate speech detection. We employed two cross-lingual

210 CHAPTER 5. CYBERBULLYING AND ABUSIVE LANGUAGE DETECTION
language models, i.e., MLM and a new hybrid version of MLM based on emojis (HE–MLM), re-training them to better represent the peculiarity of the language used in social media messages.The second model shows some advantages over the MLM model when used on social media data:first of all, the emojis can be used to convey emotions, that in turn can be correlated with hatespeech or offensive content. Secondly, emojis convey similar meaning in the languages that weconsidered, serving as a common trait between languages during pre-training. Our aim was notto create a system comparable with monolingual state-of-the-art solutions, but to investigatethe possibility to use an unsupervised approach for zero-shot cross lingual hate speech detection.As a first step in this direction, we focused on three European languages, for which similar datawere available. Despite the high variance observed in the models, we can still observe a cleartrend: the HE–MLM models yield better performances than their MLM counterparts, provingthat using emojis for pretraining can be useful when dealing with the classification of hatespeech on social media text (this work is currently under review).

Chapter 6
Conclusions and Perspectives
To summarize, the research contributions on which I have been working on in the last 9 yearshave been published in main international conferences and journals of my research communities.They mainly deal with:
• structured information, relations and events extraction from unstructured natural lan-guage text, to populate knowledge bases in different application scenarios (e.g., robotics,music information retrieval);
• enhancement of users interactions with the web of data, mapping natural language ex-pressions (e.g., user queries) with concepts and relations in a structured knowledge base(focusing in particular on question answering over linked data);
• the detection of argumentative structures and the prediction of their relations in differ-ent textual resources as political debates, medical texts, and social media content (andconsidering the role of emotions and persuasion);
• abusive language detection, in a multilingual scenario. Taking advantage of both thenetwork analysis and the content of the short-text messages on online platforms, we alsoaddressed the challenge of detecting cyberbullying phenomena, considering the dynamicswithin a conversation.
In the continuation of my ongoing research work, and in line with the objectives of the Wim-mics team, I will keep tackling the four general research questions discussed in this document,in line with the recent trends in Natural Language Processing.
There are a variety of language tasks that, while simple and second-nature to humans, arestill very difficult for a machine. New trends in Natural Language Processing systems such asbig data and social network analysis, are rapidly emerging and finding application in variousdomains including - among others - education, travel and tourism (smart cities), and healthcare.Many issues encountered during the development of applications in such domains are addressedas computational tasks, e.g., sentiment analysis, opinion mining, text summarization, dialoguesystems, question answering, emotion recognition, revealing an increasing interest in NaturalLanguage Processing and AI, both from the research community and from industry. The NLPfield is now seeing a major improvement in the form of a semantically rich representation ofwords, an accomplishment enabled by the application of neural networks.
In this context, my current and future work is led by the following research question:How to support the exchange of information and opinions on the Web, helping people andintelligent systems to better understand and evaluate different viewpoints and to promote theirown?Such question breaks down into the following subquestions:
211

212 CHAPTER 6. CONCLUSIONS AND PERSPECTIVES
• How to boost the automated identification of natural language arguments on the Web,and the relations among them?
• How to exploit argumentative information to provide advanced search and explorationfacilities?
• How to select reliable information from the huge amount of heterogeneous resources avail-able on the Web?
• How to generate argumentation-based explanations and counter-arguments to foster anatural interaction with the users?
Among other use case scenarios, I will keep on focusing on healthcare and politics applica-tions, given that argumentation-based decision making is becoming increasingly prominent insuch contexts. In a scenario where doctors debate with each others in order to provide medicaldiagnoses, and the patients interact with eHealth systems to discuss symptoms and shared ex-periences, as a first goal we will improve the supervised (Neural Network-based) algorithms weare currently working on, to automatically detect medical arguments from free textual data ex-changed in forums and in clinical trials to analyze beside their internal discourse structure (i.e.sentences expressing claims about a topic and related evidences), their relation with respect toother arguments on the same topic (contradiction, support), also their coherence. Similarly, inthe automated analysis of political speeches and debates, I plan to automatically predict rela-tions between argument components (intra- and inter-arguments), and propose a new task, i.e.,fallacy detection so that common fallacies in political argumentation [498] can be automaticallyidentified. In this context, our goal is to support the users in making decisions about how toproceed with the discussion, support the patients and citizens in understanding the possibleacceptability of the arguments and their evidences, with regard to their consistency and thesources proposing them, and improve the comprehension of the ongoing discussions.
As a second goal, I will tackle the challenge of exploiting argumentative information toprovide advanced search and exploration facilities. The abundance of information found inonline communities debates is largely left unexploited by current applications, Web services orsearch engines. My goal is therefore to develop applications with advanced forms of search andexploration capabilities, which will allow novel and higher-level methods of navigation, basedon the above described annotations associated with arguments rather than just hyperlinks.
For this task we will extend current state-of-the art question answering system to addressmuch more complex questions, so that arguments will be returned to support the response ofintelligent systems to user information needs expressed through natural language questions.Ranking methods will be applied to return the answers according to user preferences and othercriteria (e.g., topical and contextual relevance), and the results of reasoning (new argumentsgeneration using information from existing ones). To improve the answer quality, the mostrepresentative among the relevant arguments will be identified, i.e., those that exhibit somediversity while covering the user’s information need (considering various aspects, such as con-tent, topic, context, intended audience and relations). Finally, we will study navigation meansfor exploring the structure and interconnections of the returned arguments, leading to otherpotentially interesting arguments and providing an overview of the argumentative graph. Sum-marization techniques will be applied to summarize long debates into smaller ones, whereaselaboration will make an argument more understandable for the specific user and/or querycontext, by adding information extracted from other arguments, or from resources. This anal-ysis will enable the user to get a global, high-level view of the various opinions on a topic,where justified arguments are supported by facts or other arguments, to avoid shortfalls likereproducing common, but unjustified, opinions or biases, or being the victim of informationmanipulation.

213
As a third goal, I will address the challenge of intelligently selecting reliable informationfrom the huge amount of heterogeneous resources available on the Web. The potential ofanswering queries by locating and combining information, which can be massively distributedacross heterogeneous semantic resources, would allow to answer questions concerning e.g., thepolitical trend of French boys and girls in the next elections, mining for instance real-time datafrom a semantic version of Twitter and from the websites of French political campaigns. Giventheir heterogeneity, data sources on the web can be noisy: they can provide information withdifferent granularity and quality, require the integration of both structured and unstructureddata (free text) for answer retrieval, or there can be either gaps in coverage or redundant data.
A step forward (the fourth goal) will concern dealing with the dynamic facet of the web, toallow the users to interact and dialogue with the debating platform interface (as a conversationalagent), so that the system can provide an explanation and a justification for the results itprovides, and the user can become aware of data provenance and trustworthiness. One of themain and complex issues to investigate concern finding strategies to handle the heterogeneousnature of the resources and ontologies, aggregating answers from different linked data resources,and carrying out reasoning on them. Moreover, existing work on (counter-)argument generationis limited to the reformulation of arguments mined from Wikipedia and few newspapers, and it isinsufficient to generate effective and interactive explanatory arguments. Also investigating theautomatic detection of the quality of an argument is an open challenge, to react e.g., in caseof low quality arguments, through contextualized questions, including clarification questions(when the argument is not sufficiently elaborated), and requests for additional elaboration(when the argument lacks supporting evidence). Proactive behaviours should be managedduring the argument-based dialogue (to mirror a crucial ability in human-human dialogues).Existing collaborations and connections with the Human Computer Interaction community willbe strengthen to deal with the problems, desires, and requirements of technology users in theproposed application scenarios.
Such debating technologies will be applied in advanced decision support systems, a new gen-eration of recommendation systems that engage with humans in a more sophisticated manner,and that are relevant for a wide spectrum of domains, including politics and legal (to facilitateactive citizenship, e-governance and e-democracy), healthcare, education (for fact-checking andidentifying of unjustified opinions or prejudices). Related to these aspects, I plan to keep onaddressing research tasks going beyond binary abusive content classification, including identi-fying the target of abuse as well as automatically moderating content (through, for instance,counter-argumentation). Considerable challenges and unaddressed frontiers remain in the cur-rent systems and should be addressed, spanning technical, social and ethical dimensions. Theseissues constrain abusive content detection research, limiting its impact on the development ofreal-world detection systems.
Summary of the available resources created as contributions of my research:
• ALOOF Object and relations, Keyword Linking, Default Knowledge (https://project.inria.fr/aloof/data/)
• WASABI Song Corpus (https://github.com/micbuffa/WasabiDataset)
• AbstRCT - Argument Mining corpus on the health care domain (https://gitlab.com/tomaye/abstrct/
• Argument Mining corpus on the speeches and official declarations issued by Nixon andKennedy (https://dh.fbk.eu/resources/political-argumentation)

214 CHAPTER 6. CONCLUSIONS AND PERSPECTIVES
• USElecDeb60To16 v.01 - Argument Mining corpus on the US Presidential CampaignDebates (https://github.com/ElecDeb60To16/Dataset)
• NoDE - A Benchmark of Natural Argumentation (http://www-sop.inria.fr/NoDE/NoDE-xml.html)
• DART - Dataset of Arguments and their Relations on Twitter (https://www.aclweb.org/anthology/L16-1200.pdf)

Bibliography
[1] Aseel Addawood and Masooda Bashir. ”what is your evidence?” A study of controversialtopics on social media. In Proceedings of the Third Workshop on Argument Mining,hosted by the 54th Annual Meeting of the Association for Computational Linguistics,ArgMining@ACL 2016, August 12, Berlin, Germany, 2016.
[2] Apoorv Agarwal, Boyi Xie, Ilia Vovsha, Owen Rambow, and Rebecca Passonneau. Sen-timent analysis of twitter data. In Proceedings of the workshop on languages in socialmedia, pages 30–38. Association for Computational Linguistics, 2011.
[3] Sweta Agrawal and Amit Awekar. Deep learning for detecting cyberbullying across mul-tiple social media platforms. In ECIR, pages 141–153, 2018.
[4] Alan Akbik, Duncan Blythe, and Roland Vollgraf. Contextual string embeddings forsequence labeling. In Proc. of COLING 2018, pages 1638–1649, 2018.
[5] Khalid Al Khatib, Henning Wachsmuth, Johannes Kiesel, Matthias Hagen, and BennoStein. A news editorial corpus for mining argumentation strategies. In Proceedings ofCOLING 2016, pages 3433–3443, 2016.
[6] Khalid Al Khatib, Henning Wachsmuth, Kevin Lang, Jakob Herpel, Matthias Hagen, andBenno Stein. Modeling deliberative argumentation strategies on wikipedia. In Proceedingsof ACL, pages 2545–2555, 2018.
[7] Mehdi Allahyari, Seyed Amin Pouriyeh, Mehdi Assefi, Saeid Safaei, Elizabeth D. Trippe,Juan B. Gutierrez, and Krys Kochut. Text summarization techniques: A brief survey.CoRR, abs/1707.02268, 2017.
[8] Alo Allik, Florian Thalmann, and Mark Sandler. MusicLynx: Exploring music throughartist similarity graphs. In Companion Proc. (Dev. Track) The Web Conf. (WWW 2018),2018.
[9] Omar Alonso and Kyle Shiells. Timelines as summaries of popular scheduled events. InProceedings of the 22nd International Conference on World Wide Web, pages 1037–1044.ACM, 2013.
[10] Leila Amgoud and Henri Prade. Can AI models capture natural language argumentation?International Journal of Cognitive Informatics and Natural Intelligence, 2013.
[11] Pramod Anantharam, Payam Barnaghi, Krishnaprasad Thirunarayan, and Amit Sheth.Extracting city traffic events from social streams. ACM Transactions on Intelligent Sys-tems and Technology (TIST), 6(4):43, 2015.
[12] Reid Andersen, Fan Chung, and Kevin Lang. Local graph partitioning using pagerankvectors. In Foundations of Computer Science, 2006. FOCS’06. 47th Annual IEEE Sym-posium on, pages 475–486. IEEE, 2006.
215

216 BIBLIOGRAPHY
[13] Ion Androutsopoulos and Prodromos Malakasiotis. A survey of paraphrasing and textualentailment methods. J. Artif. Int. Res., 38(1):135–187, May 2010.
[14] Alessio Palmero Aprosio, Claudio Giuliano, and Alberto Lavelli. Automatic expansionof dbpedia exploiting wikipedia cross-language information. In ESWC, pages 397–411,2013.
[15] Luis Enrique Argota Vega, Jorge Carlos Reyes-Magana, Helena Gomez-Adorno, andGemma Bel-Enguix. MineriaUNAM at SemEval-2019 task 5: Detecting hate speechin twitter using multiple features in a combinatorial framework. In Proceedings of the13th International Workshop on Semantic Evaluation, pages 447–452, Minneapolis, Min-nesota, USA, June 2019. Association for Computational Linguistics.
[16] Rachit Arora and Balaraman Ravindran. Latent dirichlet allocation based multi-document summarization. In Proceedings of the second workshop on Analytics for noisyunstructured text data, pages 91–97. ACM, 2008.
[17] Pinar Arslan, Michele Corazza, Elena Cabrio, and Serena Villata. Overwhelmed byNegative Emotions? Maybe You Are Being Cyber-bullied! In SAC 2019 - The 34thACM/SIGAPP Symposium On Applied Computing, Limassol, Cyprus, 2019.
[18] Kevin D. Ashley and Vern A. Walker. From information retrieval (IR) to argumentretrieval (AR) for legal cases: Report on a baseline study. In Legal Knowledge andInformation Systems - JURIX, pages 29–38, 2013.
[19] Farzindar Atefeh and Wael Khreich. A survey of techniques for event detection in twitter.Computational Intelligence, 31(1):132–164, 2015.
[20] Jack Atherton and Blair Kaneshiro. I said it first: Topological analysis of lyrical influencenetworks. In ISMIR, pages 654–660, 2016.
[21] Katie Atkinson, Pietro Baroni, Massimiliano Giacomin, Anthony Hunter, Henry Prakken,Chris Reed, Guillermo Ricardo Simari, Matthias Thimm, and Serena Villata. Towardsartificial argumentation. AI Magazine, 38(3):25–36, 2017.
[22] Xiaoyu Bai, Flavio Merenda, Claudia Zaghi, Tommaso Caselli, and Malvina Nissim.Overview of the germeval 2018 shared task on the identification of offensive language. InProceedings of GermEval 2018, 14th Conference on Natural Language Processing (KON-VENS 2018), 2018.
[23] Xiaoyu Bai, Flavio Merenda, Claudia Zaghi, Tommaso Caselli, and Malvina Nissim.Rug @ EVALITA 2018: Hate speech detection in italian social media. In Proceedingsof the Sixth Evaluation Campaign of Natural Language Processing and Speech Tools forItalian. Final Workshop (EVALITA 2018) co-located with the Fifth Italian Conference onComputational Linguistics (CLiC-it 2018), Turin, Italy., 2018.
[24] Ivana Balazevic, Carl Allen, and Timothy Hospedales. TuckER: Tensor factorization forknowledge graph completion. In Proc. of EMNLP-IJCNLP 2019, pages 5185–5194, 2019.
[25] Roy Bar-Haim, Indrajit Bhattacharya, Francesco Dinuzzo, Amrita Saha, and NoamSlonim. Stance classification of context-dependent claims. In Proceedings of EACL,pages 251–261, 2017.

BIBLIOGRAPHY 217
[26] Roy Bar-Haim, Indrajit Bhattacharya, Francesco Dinuzzo, Amrita Saha, and NoamSlonim. Stance classification of context-dependent claims. In Proc. of EACL 2017, pages251–261, 2017.
[27] Adriano Barate, Luca A. Ludovico, and Enrica Santucci. A semantics-driven approach tolyrics segmentation. In 2013 8th International Workshop on Semantic and Social MediaAdaptation and Personalization, pages 73–79, Dec 2013.
[28] Francesco Barbieri, Francesco Ronzano, and Horacio Saggion. What does this emojimean? a vector space skip-gram model for twitter emojis. In Language Resources andEvaluation conference, LREC, Portoroz, Slovenia, May 2016.
[29] Ken Barker, Bhalchandra Agashe, Shaw Yi Chaw, James Fan, Noah S. Friedland,Michael Robert Glass, Jerry R. Hobbs, Eduard H. Hovy, David J. Israel, Doo SoonKim, Rutu Mulkar-Mehta, Sourabh Patwardhan, Bruce W. Porter, Dan Tecuci, and Pe-ter Z. Yeh. Learning by reading: A prototype system, performance baseline and lessonslearned. In Proceedings of the Twenty-Second AAAI Conference on Artificial Intelligence,July 22-26, 2007, Vancouver, British Columbia, Canada, pages 280–286, 2007.
[30] Marco Baroni, Georgiana Dinu, and German Kruszewski. Don’t count, predict! A sys-tematic comparison of context-counting vs. context-predicting semantic vectors. In Pro-ceedings of the 52nd Annual Meeting of the Association for Computational Linguistics(ACL), pages 238–247, June 2014. DOI: 10.3115/v1/P14-1023.
[31] Marco Baroni and Roberto Zamparelli. Nouns are vectors, adjectives are matrices: Repre-senting adjective-noun constructions in semantic space. In Proceedings of the 2010 Confer-ence on Empirical Methods in Natural Language Processing (EMNLP), pages 1183–1193,Stroudsburg, PA, USA, 2010. Association for Computational Linguistics.
[32] Pietro Baroni, Martin Caminada, and Massimiliano Giacomin. An introduction to argu-mentation semantics. Knowledge Eng. Review, 26(4):365–410, 2011.
[33] Federico Barrios, Federico Lopez, Luis Argerich, and Rosa Wachenchauzer. Variations ofthe similarity function of textrank for automated summarization. CoRR, abs/1602.03606,2016.
[34] Lawrence W. Barsalou. Simulation, situated conceptualization, and prediction. Philo-sophical Transactions of the Royal Society B: Biological Sciences, 364(1521):1281–1289,2009. DOI: 10.1098/rstb.2008.0319.
[35] Mark A. Bartsch and Gregory H. Wakefield. Audio thumbnailing of popular music usingchroma-based representations. Trans. Multi., 7(1):96–104, February 2005.
[36] Regina Barzilay and Kathleen R. McKeown. Sentence fusion for multidocument newssummarization. Computational Linguistics, 31(3):297–327, 2005.
[37] Amparo Elizabeth Cano Basave and Yulan He. A study of the impact of persuasive argu-mentation in political debates. In NAACL HLT 2016, The 2016 Conference of the NorthAmerican Chapter of the Association for Computational Linguistics: Human LanguageTechnologies, San Diego California, USA, June 12-17, 2016, pages 1405–1413, 2016.
[38] Valerio Basile, Cristina Bosco, Elisabetta Fersini, Debora Nozza, Viviana Patti, Fran-cisco Manuel Rangel Pardo, Paolo Rosso, and Manuela Sanguinetti. SemEval-2019 task5: Multilingual detection of hate speech against immigrants and women in twitter. InProceedings of SEMEVAL 2019, Minneapolis, Minnesota, USA, June 2019.

218 BIBLIOGRAPHY
[39] Valerio Basile, Soufian Jebbara, Elena Cabrio, and Philipp Cimiano. Populating aKnowledge Base with Object-Location Relations Using Distributional Semantics. In20th International Conference on Knowledge Engineering and Knowledge Management(EKAW 2016), pages 34 – 50, Bologna, Italy, November 2016. DOI: 10.1007/
978-3-319-49004-5_3.
[40] Valerio Basile and Malvina Nissim. Sentiment analysis on italian tweets. In Proceedingsof the 4th Workshop on Computational Approaches to Subjectivity, Sentiment and SocialMedia Analysis, pages 100–107, Atlanta, 2013.
[41] Elisa Bassignana, Valerio Basile, and Viviana Patti. Hurtlex: A multilingual lexicon ofwords to hurt. In 5th Italian Conference on Computational Linguistics, CLiC-it 2018,volume 2253, pages 1–6. CEUR-WS, 2018.
[42] Christos Baziotis, Nikos Pelekis, and Christos Doulkeridis. DataStories at SemEval-2017Task 4: Deep LSTM with Attention for Message-level and Topic-based Sentiment Analy-sis. In Proceedings of the 11th International Workshop on Semantic Evaluation (SemEval-2017), pages 747–754, Vancouver, Canada, August 2017. Association for ComputationalLinguistics.
[43] Michael Beetz, Ferenc Balint-Benczedi, Nico Blodow, Daniel Nyga, Thiemo Wiedemeyer,and Zoltan-Csaba Marton. Robosherlock: Unstructured information processing for robotperception. In ICRA, 2015.
[44] Iz Beltagy, Kyle Lo, and Arman Cohan. SciBERT: A pretrained language model forscientific text. In Proc. of EMNLP-IJCNLP 2019, pages 3615–3620, 2019.
[45] Trevor J. M. Bench-Capon, D. Lowes, and A. M. McEnery. Argument-based explanationof logic programs. Knowl.-Based Syst., 4(3):177–183, 1991.
[46] Trevor J. M. Bench-Capon and Giovanni Sartor. Theory based explanation of case lawdomains. In ICAIL, pages 12–21, 2001.
[47] Mohamed S. Benlamine, Serena Villata, Ramla Ghali, Claude Frasson, Fabien L. Gandon,and Elena Cabrio. Persuasive argumentation and emotions: An empirical evaluationwith users. In Human-Computer Interaction. User Interface Design, Development andMultimodality - 19th International Conference, HCI International 2017, Vancouver, BC,Canada, July 9-14, 2017, Proceedings, Part I, pages 659–671, 2017.
[48] Sahbi Benlamine, Maher Chaouachi, Serena Villata, Elena Cabrio, Claude Frasson, andFabien Gandon. Emotions in argumentation: an empirical evaluation. In Qiang Yangand Michael Wooldridge, editors, Proceedings of the Twenty-Fourth International JointConference on Artificial Intelligence, IJCAI 2015, Buenos Aires, Argentina, July 25-31,2015, pages 156–163. AAAI Press, 2015.
[49] Taylor Berg-Kirkpatrick, Dan Gillick, and Dan Klein. Jointly learning to extract andcompress. In Proceedings of the 49th Annual Meeting of the Association for Computa-tional Linguistics: Human Language Technologies - Volume 1, HLT ’11, pages 481–490,Stroudsburg, PA, USA, 2011. Association for Computational Linguistics.
[50] Linn Bergelid. Classification of explicit music content using lyrics and music metadata,2018.

BIBLIOGRAPHY 219
[51] Thierry Bertin-Mahieux, Daniel P.W. Ellis, Brian Whitman, and Paul Lamere. Themillion song dataset. In Proceedings of the 12th International Conference on Music In-formation Retrieval (ISMIR 2011), 2011.
[52] Floris Bex and Douglas Walton. Burdens and standards of proof for inference to the bestexplanation. In Radboud Winkels, editor, Legal Knowledge and Information Systems -JURIX 2010: The Twenty-Third Annual Conference on Legal Knowledge and Informa-tion Systems, Liverpool, UK, 16-17 December 2010, volume 223 of Frontiers in ArtificialIntelligence and Applications, pages 37–46. IOS Press, 2010.
[53] Shraey Bhatia, Jey Han Lau, and Timothy Baldwin. Automatic labelling of topics withneural embeddings. arXiv preprint arXiv:1612.05340, 2016.
[54] Christian Bizer et al. DBpedia - a crystallization point for the web of data. Web Semant.,7(3):154–165, 2009.
[55] P. Blackburn, J. Bos, M. Kohlhase, and H. de Nivelle. Inference and computationalsemantics. Studies in Linguistics and Philosophy, Computing Meaning, 77(2):11–28, 2001.
[56] David M Blei, Andrew Y Ng, and Michael I Jordan. Latent dirichlet allocation. Journalof machine Learning research, 3(Jan):993–1022, 2003.
[57] Sebastian Blohm and Philipp Cimiano. Using the web to reduce data sparseness inpattern-based information extraction. In Knowledge Discovery in Databases: PKDD2007, 11th European Conference on Principles and Practice of Knowledge Discovery inDatabases, Warsaw, Poland, September 17-21, 2007, Proceedings, pages 18–29, 2007.DOI: 10.1007/978-3-540-74976-9_6.
[58] Sebastian Blohm, Philipp Cimiano, and Egon Stemle. Harvesting relations from the web-quantifiying the impact of filtering functions. In Proceedings of the 22nd Conference onArtificial Intelligence (AAAI-07), pages 1316–1323. Association for the Advancement ofArtificial Intelligence (AAAI), Juli 2007.
[59] Vincent D Blondel, Jean-Loup Guillaume, Renaud Lambiotte, and Etienne Lefebvre. Fastunfolding of communities in large networks. Journal of statistical mechanics: theory andexperiment, 2008(10):P10008, 2008.
[60] Joshua E. Blumenstock. Size matters: Word count as a measure of quality on wikipedia.In Proceedings of the 17th International Conference on World Wide Web, WWW ’08,pages 1095–1096, New York, NY, USA, 2008. ACM.
[61] Guido Boella, Dov M. Gabbay, Leendert W. N. van der Torre, and Serena Villata. Supportin abstract argumentation. In Pietro Baroni, Federico Cerutti, Massimiliano Giacomin,and Guillermo Ricardo Simari, editors, COMMA, volume 216 of Frontiers in ArtificialIntelligence and Applications, pages 111–122. IOS Press, 2010.
[62] Piotr Bojanowski, Edouard Grave, Armand Joulin, and Tomas Mikolov. Enriching wordvectors with subword information. Transactions of the Association for ComputationalLinguistics, 5:135–146, 2017.
[63] Kurt Bollacker, Colin Evans, Praveen Paritosh, Tim Sturge, and Jamie Taylor. Free-base: A collaboratively created graph database for structuring human knowledge. InProceedings of the 2008 ACM SIGMOD International Conference on Management ofData, SIGMOD ’08, pages 1247–1250, New York, NY, USA, 2008. ACM. DOI:10.1145/1376616.1376746.

220 BIBLIOGRAPHY
[64] Mario Bollini, Stefanie Tellex, Tyler Thompson, Nicholas Roy, and Daniela Rus. In-terpreting and executing recipes with a cooking robot. In Experimental Robotics - The13th International Symposium on Experimental Robotics, ISER 2012, June 18-21, 2012,Quebec City, Canada, pages 481–495. 2012. DOI: 10.1007/978-3-319-00065-7_33.
[65] Antoine Bordes, Nicolas Usunier, Alberto Garcia-Duran, Jason Weston, and OksanaYakhnenko. Translating embeddings for modeling multi-relational data. In Advancesin Neural Information Processing Systems 26, pages 2787–2795. Curran Associates, Inc.,2013.
[66] Antoine Bordes, Nicolas Usunier, Alberto Garcıa-Duran, Jason Weston, and OksanaYakhnenko. Translating embeddings for modeling multi-relational data. In Proc. ofNIPS 2013, pages 2787–2795, 2013.
[67] Johan Bos and Katja Markert. When logical inference helps determining textual entail-ment (and when it doesn’t). In Proc. of the 2nd PASCAL Workshop on RecognizingTextual Entailment, October 2006.
[68] Tom Bosc, Elena Cabrio, and Serena Villata. DART: a dataset of arguments and theirrelations on twitter. In Proceedings of the Tenth International Conference on LanguageResources and Evaluation LREC 2016, Portoroz, Slovenia, May 23-28, 2016, 2016.
[69] Tom Bosc, Elena Cabrio, and Serena Villata. Tweeties squabbling: Positive and negativeresults in applying argument mining on social media. In Pietro Baroni, Thomas F. Gor-don, Tatjana Scheffler, and Manfred Stede, editors, Computational Models of Argument- Proceedings of COMMA 2016, Potsdam, Germany, 12-16 September, 2016, volume 287of Frontiers in Artificial Intelligence and Applications, pages 21–32. IOS Press, 2016.
[70] Cristina Bosco, Felice Dell’Orletta, Fabio Poletto, Manuela Sanguinetti, and MaurizioTesconi. Overview of the EVALITA 2018 hate speech detection task. In Proceedings ofEVALITA 2018, 2018.
[71] David Brackett. Interpreting Popular Music. Cambridge University Press, 1995.
[72] Sergey Brin and Lawrence Page. The anatomy of a large-scale hypertextual web searchengine. Computer networks and ISDN systems, 30(1):107–117, 1998.
[73] Volha Bryl and Christian Bizer. Learning conflict resolution strategies for cross-languagewikipedia data fusion. In WWW (Companion Volume), pages 1129–1134, 2014.
[74] Katarzyna Budzynska, Mathilde Janier, Juyeon Kang, Chris Reed, Patrick Saint-Dizier,Manfred Stede, and Olena Yaskorska. Towards argument mining from dialogue. InProceedings of COMMA, pages 185–196, 2014.
[75] Katarzyna Budzynska and Chris Reed. Whence inference. Technical report, Universityof Dundee, 2011.
[76] Michel Buffa and Jerome Lebrun. Real time tube guitar amplifier simulation using we-baudio. In Proc. 3rd Web Audio Conference (WAC 2017), 2017.
[77] Michel Buffa and Jerome Lebrun. Web audio guitar tube amplifier vs native simulations.In Proc. 3rd Web Audio Conf. (WAC 2017), 2017.
[78] Michel Buffa, Jerome Lebrun, Jari Kleimola, Stephane Letz, et al. Towards an openweb audio plugin standard. In Companion Proceedings of the The Web Conference 2018,pages 759–766. International World Wide Web Conferences Steering Committee, 2018.

BIBLIOGRAPHY 221
[79] Michel Buffa, Jerome Lebrun, Johan Pauwels, and Guillaume Pellerin. A 2 Million Com-mercial Song Interactive Navigator. In WAC 2019 - 5th WebAudio Conference 2019,Trondheim, Norway, December 2019.
[80] Michel Buffa, Jerome Lebrun, Guillaume Pellerin, and Stephane Letz. Webaudio pluginsin daws and for live performance. In 14th International Symposium on Computer MusicMultidisciplinary Research (CMMR’19), 2019.
[81] Razvan C. Bunescu and Raymond J. Mooney. Subsequence kernels for relation extraction.In Proceedings of the 18th International Conference on Neural Information ProcessingSystems, NIPS’05, pages 171–178, Cambridge, MA, USA, 2005. MIT Press.
[82] Elena Cabrio, Julien Cojan, Alessio Palmero Aprosio, and Fabien Gandon. Natural lan-guage interaction with the web of data by mining its textual side. Intelligenza Artificiale,6(2):121–133, 2012.
[83] Elena Cabrio, Julien Cojan, Alessio Palmero Aprosio, Bernardo Magnini, Alberto Lavelli,and Fabien Gandon. Qakis: an open domain QA system based on relational patterns. InBirte Glimm and David Huynh, editors, Proceedings of the ISWC 2012 Posters & Demon-strations Track, Boston, USA, November 11-15, 2012, volume 914 of CEUR WorkshopProceedings. CEUR-WS.org, 2012.
[84] Elena Cabrio, Julien Cojan, and Fabien Gandon. Mind the Cultural Gap: BridgingLanguage-Specific DBpedia Chapters for Question Answering. In Paul Buitelaar andPhilipp Cimiano, editors, Towards the Multilingual Semantic Web. Springer-Verlag BerlinHeidelberg, 2014.
[85] Elena Cabrio, Julien Cojan, Fabien Gandon, and Amine Hallili. Querying multilingualdbpedia with qakis. In The Semantic Web: ESWC 2013 Satellite Events - ESWC 2013Satellite Events, Montpellier, France, May 26-30, 2013, Revised Selected Papers, pages194–198, 2013.
[86] Elena Cabrio, Julien Cojan, Serena Villata, and Fabien Gandon. Argumentation-based in-consistencies detection for question-answering over dbpedia. In NLP-DBPEDIA@ISWC,2013.
[87] Elena Cabrio, Alessio Palmero Aprosio, and Serena Villata. Reconciling Informationin DBpedia through a Question Answering System. ISWC 2014 : 13th InternationalSemantic Web Conference, October 2014. Poster.
[88] Elena Cabrio, Vivek Sachidananda, and Raphael Troncy. Boosting qakis with multimediaanswer visualization. In The Semantic Web: ESWC 2014 Satellite Events - ESWC 2014Satellite Events, Anissaras, Crete, Greece, May 25-29, 2014, Revised Selected Papers,pages 298–303, 2014.
[89] Elena Cabrio and Serena Villata. Combining textual entailment and argumentation the-ory for supporting online debates interactions. In Proceedings of ACL, pages 208–212,2012.
[90] Elena Cabrio and Serena Villata. Natural language arguments: A combined approach.In ECAI 2012 - 20th European Conference on Artificial Intelligence. Including Presti-gious Applications of Artificial Intelligence (PAIS-2012) System Demonstrations Track,Montpellier, France, August 27-31 , 2012, pages 205–210, 2012.

222 BIBLIOGRAPHY
[91] Elena Cabrio and Serena Villata. A natural language bipolar argumentation approachto support users in online debate interactions†. Argument & Computation, 4(3):209–230,2013.
[92] Elena Cabrio and Serena Villata. Five years of argument mining: a data-driven analysis.In Jerome Lang, editor, Proceedings of IJCAI, pages 5427–5433. ijcai.org, 2018.
[93] Elena Cabrio, Serena Villata, and Alessio Palmero Aprosio. A RADAR for informationreconciliation in question answering systems over linked data. Semantic Web, 8(4):601–617, 2017.
[94] Elena Cabrio, Serena Villata, and Fabien Gandon. A support framework for argumen-tative discussions management in the web. In The Semantic Web: Semantics and BigData, 10th International Conference, ESWC 2013, Montpellier, France, May 26-30, 2013.Proceedings, pages 412–426, 2013.
[95] Elena Cabrio, Serena Villata, and Fabien Gandon. Classifying inconsistencies in dbpe-dia language specific chapters. In Proceedings of the Ninth International Conference onLanguage Resources and Evaluation, LREC 2014, Reykjavik, Iceland, May 26-31, 2014,pages 1443–1450, 2014.
[96] Jose Camacho-Collados, Mohammad Taher Pilehvar, and Roberto Navigli. NASARI: Anovel approach to a semantically-aware representation of items. In Proceedings of the2015 Conference of the North American Chapter of the Association for ComputationalLinguistics: Human Language Technologies, pages 567–577, 2015. DOI: 10.3115/v1/N15-1059.
[97] Erion Cano and Maurizio Morisio. Music mood dataset creation based on last.fm tags. In2017 International Conference on Artificial Intelligence and Applications, Vienna Aus-tria, May 2017.
[98] Jean Carletta. Assessing agreement on classification tasks: the kappa statistic. Compu-tational Linguistics, 22(2):249–254, 1996.
[99] Miguel Angel Alvarez Carmona, Estefanıa Guzman-Falcon, Manuel Montes-y-Gomez,Hugo Jair Escalante, Luis Villasenor Pineda, Veronica Reyes-Meza, and Antonio RicoSulayes. Overview of MEX-A3T at IberEval 2018: Authorship and Aggressiveness Anal-ysis in Mexican Spanish Tweets. In Proceedings of IberEval 2018, pages 74–96, 2018.
[100] Claudette Cayrol and Marie-Christine Lagasquie-Schiex. On the acceptability of argu-ments in bipolar argumentation frameworks. In Proc. of the 8th European Conferenceon Symbolic and Quantitative Approaches to Reasoning with Uncertainty (ECSQARU),LNCS 3571, pages 378–389, July 2005.
[101] Claudette Cayrol and Marie-Christine Lagasquie-Schiex. Coalitions of arguments: A toolfor handling bipolar argumentation frameworks. Int. J. Intell. Syst., 25(1):83–109, 2010.
[102] Claudette Cayrol and Marie-Christine Lagasquie-Schiex. Bipolarity in argumentationgraphs: Towards a better understanding. In Procs of SUM 2011, volume 6929 of LNCS,pages 137–148. Springer, 2011.
[103] Wei Chai and Barry Vercoe. Music thumbnailing via structural analysis. In Proceedingsof the eleventh ACM international conference on Multimedia, pages 223–226, 01 2003.

BIBLIOGRAPHY 223
[104] Chih-Chung Chang and Chih-Jen Lin. Libsvm: a library for support vector machines.ACM Transactions on Intelligent Systems and Technology (TIST), 2(3):27, 2011.
[105] Ankush Chatterjee, Kedhar Nath Narahari, Meghana Joshi, and Puneet Agrawal.Semeval-2019 task 3: Emocontext contextual emotion detection in text. In Proceedingsof the 13th International Workshop on Semantic Evaluation, pages 39–48, 2019.
[106] Heng-Tze Cheng, Yi-Hsuan Yang, Yu-Ching Lin, and Homer H. Chen. Multimodal struc-ture segmentation and analysis of music using audio and textual information. In 2009IEEE International Symposium on Circuits and Systems, pages 1677–1680, May 2009.
[107] Jianpeng Cheng and Mirella Lapata. Neural summarization by extracting sentences andwords. In Proceedings of the 54th Annual Meeting of the Association for ComputationalLinguistics (Volume 1: Long Papers), pages 484–494. Association for ComputationalLinguistics, 2016.
[108] Carlos Ivan Chesnevar, Jarred McGinnis, Sanjay Modgil, Iyad Rahwan, Chris Reed,Guillermo Ricardo Simari, Matthew South, Gerard Vreeswijk, and Steven Willmott. To-wards an argument interchange format. Knowledge Eng. Review, 21(4):293–316, 2006.
[109] Gennaro Chierchia and Sally McConnell-Ginet. Meaning and Grammar: An Introductionto Semantics 2nd ed. Cambridge, MA: MIT Press, 2000.
[110] Hyojin Chin, Jayong Kim, Yoonjong Kim, Jinseop Shin, and Mun Y Yi. Explicit contentdetection in music lyrics using machine learning. In 2018 IEEE International Conferenceon Big Data and Smart Computing (BigComp), pages 517–521. IEEE, 2018.
[111] Kyunghyun Cho, Bart van Merrienboer, Caglar Gulcehre, Dzmitry Bahdanau, FethiBougares, Holger Schwenk, and Yoshua Bengio. Learning phrase representations using rnnencoder–decoder for statistical machine translation. In Proceedings of the 2014 Confer-ence on Empirical Methods in Natural Language Processing (EMNLP), pages 1724–1734.Association for Computational Linguistics, 2014.
[112] Francois Chollet et al. Keras. https://github.com/fchollet/keras, 2015.
[113] Mark Cieliebak, Jan Milan Deriu, Dominic Egger, and Fatih Uzdilli. A twitter corpusand benchmark resources for german sentiment analysis. In 5th International Work-shop on Natural Language Processing for Social Media, Boston, MA, USA, pages 45–51.Association for Computational Linguistics, 2017.
[114] Philipp Cimiano, Vanessa Lopez, Christina Unger, Elena Cabrio, Axel-CyrilleNgonga Ngomo, and Sebastian Walter. Multilingual question answering over linked data(qald-3): Lab overview. In Pamela Forner, Henning Muller, Roberto Paredes, PaoloRosso, and Benno Stein, editors, Information Access Evaluation. Multilinguality, Mul-timodality, and Visualization, pages 321–332, Berlin, Heidelberg, 2013. Springer BerlinHeidelberg.
[115] Philipp Cimiano and Johanna Wenderoth. Automatically Learning Qualia Structuresfrom the Web. In Timothy Baldwin, Anna Korhonen, and Aline Villavicencio, editors,Proceedings of the ACL Workshop on Deep Lexical Acquisition, pages 28–37. Associationfor Computational Linguistics, 2005. DOI: 10.3115/1631850.1631854.
[116] Andrea Cimino, Lorenzo De Mattei, and Felice Dell’Orletta. Multi-task learning in deepneural networks at EVALITA 2018. In EVALITA 2018, 2018.

224 BIBLIOGRAPHY
[117] Alina Maria Ciobanu and Anca Dinu. Alternative measures of word relatedness in distri-butional semantics. In Joint Symposium on Semantic Processing, page 80, 2013.
[118] Alice Cohen-Hadria and Geoffroy Peeters. Music Structure Boundaries Estimation UsingMultiple Self-Similarity Matrices as Input Depth of Convolutional Neural Networks. InAES International Conference Semantic Audio 2017, Erlangen, Germany, June 2017.
[119] Julien Cojan, Elena Cabrio, and Fabien Gandon. Filling the gaps among dbpedia mul-tilingual chapters for question answering. In Web Science 2013 (co-located with ECRC),WebSci ’13, Paris, France, May 2-4, 2013, pages 33–42, 2013.
[120] Stephen Coleman, Jay G. Blumler, Giles Moss, and Matt Homer. The 2015 televisedelection debates; democracy on demand? Leeds University Press, 12 2015.
[121] Ronan Collobert, Jason Weston, Leon Bottou, Michael Karlen, Koray Kavukcuoglu,and Pavel Kuksa. NLP (almost) from scratch. Journal of Machine Learning Research,12:2493–2537, 2011.
[122] Michele Corazza, Stefano Menini, Pinar Arslan, Rachele Sprugnoli, Elena Cabrio, SaraTonelli, and Serena Villata. Comparing different supervised approaches to hate speechdetection. In Proceedings of the Sixth Evaluation Campaign of Natural Language Pro-cessing and Speech Tools for Italian. Final Workshop (EVALITA 2018) co-located withthe Fifth Italian Conference on Computational Linguistics (CLiC-it 2018), Turin, Italy.,2018.
[123] Michele Corazza, Stefano Menini, Pinar Arslan, Rachele Sprugnoli, Elena Cabrio, SaraTonelli, and Serena Villata. InriaFBK at Germeval 2018: Identifying Offensive Tweets Us-ing Recurrent Neural Networks. In GermEval 2018 Workshop, Vienna, Austria, Septem-ber 2018.
[124] Michele Corazza, Stefano Menini, Pinar Arslan, Rachele Sprugnoli, Elena Cabrio, SaraTonelli, and Serena Villata. Inriafbk at germeval 2018: Identifying offensive tweets usingrecurrent neural networks. In GermEval 2018 Workshop, 2018.
[125] Michele Corazza, Stefano Menini, Elena Cabrio, Sara Tonelli, and Serena Villata. Cross-platform evaluation for italian hate speech detection. In Proceedings of the 6th ItalianConference on Computational Linguistics, 2019.
[126] Michele Corazza, Stefano Menini, Elena Cabrio, Sara Tonelli, and Serena Villata. In-riafbk drawing attention to offensive language at germeval2019. In Proceedings of the15th Conference on Natural Language Processing, KONVENS 2019, Erlangen, Germany,October 9-11, 2019, 2019.
[127] Michele Corazza, Stefano Menini, Elena Cabrio, Sara Tonelli, and Serena Villata. Amultilingual evaluation for online hate speech detection. ACM Trans. Internet Techn.,20(2):10:1–10:22, 2020.
[128] International Press Telecommunications Council. SportsML: A solution for sharing sportsdata. https://iptc.org/standards/sportsml-g2/, 2017. [Accessed 03-01-2017].
[129] Robert Craven, Francesca Toni, Cristian Cadar, Adrian Hadad, and Matthew Williams.Efficient argumentation for medical decision-making. In Proc. of KR 2012, pages 598–602,2012.

BIBLIOGRAPHY 225
[130] Hamish Cunningham, Diana Maynard, Kalina Bontcheva, and Valentin Tablan. GATE:A Framework and Graphical Development Environment for Robust NLP Tools and Ap-plications. In Proceedings of the 40th Anniversary Meeting of the Association for Com-putational Linguistics (ACL’02), 2002.
[131] Celia da Costa Pereira, Andrea Tettamanzi, and Serena Villata. Changing one’s mind:Erase or rewind? In Procs of IJCAI 2011, pages 164–171. IJCAI/AAAI, 2011.
[132] I. Dagan, B. Dolan, B. Magnini, and D. Roth. Recognizing textual entailment: Rational,evaluation and approaches. JNLE, 15(04):i–xvii, 2009.
[133] Joachim Daiber, Max Jakob, Chris Hokamp, and Pablo Mendes. Improving efficiencyand accuracy in multilingual entity extraction. In Proceedings of the 9th InternationalConference on Semantic Systems, I-SEMANTICS ’13, pages 121–124, New York, NY,USA, 2013. ACM. DOI: 10.1145/2506182.2506198.
[134] Danica Damljanovic, Milan Agatonovic, and Hamish Cunningham. Freya: an interactiveway of querying linked data using natural language. In Procs of ESWC 2012, pages125–138. Springer, 2012.
[135] Thomas Davidson, Dana Warmsley, Michael W. Macy, and Ingmar Weber. Automatedhate speech detection and the problem of offensive language. In Proceedings of theEleventh International Conference on Web and Social Media, ICWSM 2017, Montreal,Quebec, Canada, May 15-18, 2017., pages 512–515, 2017.
[136] Clayton Allen Davis, Onur Varol, Emilio Ferrara, Alessandro Flammini, and FilippoMenczer. Botornot: A system to evaluate social bots. In Proceedings of the 25th In-ternational Conference Companion on World Wide Web, WWW ’16 Companion, pages273–274, Republic and Canton of Geneva, Switzerland, 2016. International World WideWeb Conferences Steering Committee.
[137] Steven B. Davis and Paul Mermelstein. Comparison of parametric representations formonosyllabic word recognition in continuously spoken sentences. ACOUSTICS, SPEECHAND SIGNAL PROCESSING, IEEE TRANSACTIONS ON, pages 357–366, 1980.
[138] Tim Van de Cruys, Thierry Poibeau, and Anna Korhonen. A tensor-based factorizationmodel of semantic compositionality. In Conference of the North American Chapter of theAssociation for Computational Linguistics : Human Language Technologies (NAACL-HLT 2013), pages 1142–1151, Atlanta, GA, US, 2013. Association for ComputationalLinguistics (ACL).
[139] Remi Delbouys, Romain Hennequin, Francesco Piccoli, Jimena Royo-Letelier, and ManuelMoussallam. Music mood detection based on audio and lyrics with deep neural net. arXivpreprint arXiv:1809.07276, 2018.
[140] Jean Yves Delort, Bernadette Bouchon-Meunier, and Maria Rifqi. Enhanced web docu-ment summarization using hyperlinks. In Proceedings of the Fourteenth ACM Conferenceon Hypertext and Hypermedia, HYPERTEXT ’03, pages 208–215, New York, NY, USA,2003. ACM.
[141] Leon Derczynski, Diana Maynard, Giuseppe Rizzo, Marieke van Erp, Genevieve Gor-rell, Raphael Troncy, Johann Petrak, and Kalina Bontcheva. Analysis of named entityrecognition and linking for tweets. Information Processing & Management, 51(2):32–49,2015.

226 BIBLIOGRAPHY
[142] Tim Dettmers, Minervini Pasquale, Stenetorp Pontus, and Sebastian Riedel. Convo-lutional 2d knowledge graph embeddings. In Proc. of AAAI 2018, pages 1811–1818,February 2018.
[143] Jacob Devlin, Ming-Wei Chang, Kenton Lee, and Kristina Toutanova. BERT: pre-trainingof deep bidirectional transformers for language understanding. In Proceedings of the2019 Conference of the North American Chapter of the Association for ComputationalLinguistics: Human Language Technologies, NAACL-HLT 2019, Minneapolis, MN, USA,June 2-7, 2019, Volume 1 (Long and Short Papers), pages 4171–4186, 2019.
[144] Jacob Devlin, Ming-Wei Chang, Kenton Lee, and Kristina Toutanova. BERT: Pre-training of deep bidirectional transformers for language understanding. In Proc. ofNAACL-HLT 2019, pages 4171–4186, 2019.
[145] Lee R. Dice. Measures of the amount of ecologic association between species. Journal ofEcology, 26:297–302, 1945.
[146] Karthik Dinakar, Birago Jones, Catherine Havasi, Henry Lieberman, and Rosalind W.Picard. Common Sense Reasoning for Detection, Prevention, and Mitigation of Cyber-bullying. TiiS, 2(3):18:1–18:30, 2012.
[147] Paul Doran, Valentina Tamma, Ignazio Palmisano, and Terry Payne. Efficient argu-mentation over ontology correspondences. In Procs of AAMAS 2009, pages 1241–1242,2009.
[148] Cassia Trojahn dos Santos and Jerome Euzenat. Consistency-driven argumentation foralignment agreement. In Procs of OM 2010, CEUR Workshop Proceedings 689, 2010.
[149] Cıcero Nogueira dos Santos and Bianca Zadrozny. Learning character-level representa-tions for part-of-speech tagging. In Proceedings of the 31th International Conference onMachine Learning, ICML 2014, Beijing, China, 21-26 June 2014, pages 1818–1826, 2014.
[150] Wenwen Dou, K Wang, William Ribarsky, and Michelle Zhou. Event detection in so-cial media data. In IEEE VisWeek Workshop on Interactive Visual Text Analytics-TaskDriven Analytics of Social Media Content, pages 971–980, 2012.
[151] Phan M. Dung. On the acceptability of arguments and its fundamental role in non-monotonic reasoning, logic programming and n-person games. Artif. Intell., 77(2):321–358, 1995.
[152] Phan Minh Dung. On the acceptability of arguments and its fundamental role in non-monotonic reasoning, logic programming and n-person games. Artif. Intell., 77(2):321–358, 1995.
[153] Paul E. Dunne, Anthony Hunter, Peter McBurney, Simon Parsons, and MichaelWooldridge. Weighted argument systems: Basic definitions, algorithms, and complex-ity results. Artif. Intell., 175(2):457–486, 2011.
[154] Mihai Dusmanu, Elena Cabrio, and Serena Villata. Argument mining on twitter: Argu-ments, facts and sources. In Proceedings of EMNLP, pages 2317–2322, 2017.
[155] Rory Duthie and Katarzyna Budzynska. A deep modular RNN approach for ethos min-ing. In Proceedings of the Twenty-Seventh International Joint Conference on ArtificialIntelligence, IJCAI 2018, July 13-19, 2018, Stockholm, Sweden., pages 4041–4047, 2018.

BIBLIOGRAPHY 227
[156] Rory Duthie, Katarzyna Budzynska, and Chris Reed. Mining ethos in political debate.In COMMA, pages 299–310, 2016.
[157] Amosse Edouard, Elena Cabrio, Sara Tonelli, and Nhan Le-Thanh. Graph-based eventextraction from twitter. In Proceedings of the International Conference Recent Advancesin Natural Language Processing, RANLP 2017, pages 222–230, Varna, Bulgaria, Septem-ber 2017. INCOMA Ltd.
[158] Amosse Edouard, Elena Cabrio, Sara Tonelli, and Nhan Le Thanh. Semantic Linkingfor Event-Based Classification of Tweets. In Proceedings of the Conference on IntelligentText Processing and Computational Linguistics (CICLing), 2017.
[159] Amosse Edouard, Elena Cabrio, Sara Tonelli, and Nhan Le-Thanh. You’ll never tweetalone: Building sports match timelines from microblog posts. In Proceedings of the In-ternational Conference Recent Advances in Natural Language Processing, RANLP 2017,pages 214–221, Varna, Bulgaria, September 2017. INCOMA Ltd.
[160] Charlie Egan, Advaith Siddharthan, and Adam Z. Wyner. Summarising the points madein online political debates. In Proceedings of the Third Workshop on Argument Mining,2016.
[161] Steffen Eger, Johannes Daxenberger, and Iryna Gurevych. Neural end-to-end learningfor computational argumentation mining. In Proc. of ACL 2017, pages 11–22, 2017.
[162] Roxanne El Baff, Henning Wachsmuth, Khalid Al-Khatib, and Benno Stein. Challenge orempower: Revisiting argumentation quality in a news editorial corpus. In Proceedings ofthe 22nd Conference on Computational Natural Language Learning (CoNLL 2018), pages454–464. Association for Computational Linguistics, 2018.
[163] Gunes Erkan and Dragomir R Radev. Lexrank: Graph-based lexical centrality as saliencein text summarization. Journal of artificial intelligence research, 22:457–479, 2004.
[164] Martin Ester, Hans-Peter Kriegel, Jorg Sander, Xiaowei Xu, et al. A density-basedalgorithm for discovering clusters in large spatial databases with noise. In Kdd, volume 96,pages 226–231, 1996.
[165] Oren Etzioni. Machine reading at web scale. In Proceedings of the 2008 InternationalConference on Web Search and Data Mining, WSDM ’08, pages 2–2. ACM, 2008. DOI:10.1145/1341531.1341533.
[166] Oren Etzioni, Anthony Fader, Janara Christensen, Stephen Soderland, and MausamMausam. Open information extraction: The second generation. In Proceedings ofthe Twenty-Second International Joint Conference on Artificial Intelligence - VolumeOne, IJCAI’11, pages 3–10. AAAI Press, 2011. DOI: 10.5591/978-1-57735-516-8/
IJCAI11-012.
[167] Thomas Faeulhammer, Rares Ambrus, Chris Burbridge, Michael Zillich, John Folkesson,Nick Hawes, Patric Jensfelt, and Markus Vincze. Autonomous learning of object modelson a mobile robot. IEEE RAL, PP(99):1–1, 2016.
[168] Mohamed Abdel Fattah. A hybrid machine learning model for multi-document summa-rization. Applied intelligence, 40(4):592–600, 2014.
[169] Mohamed Abdel Fattah and Fuji Ren. Ga, mr, ffnn, pnn and gmm based models forautomatic text summarization. Comput. Speech Lang., 23(1):126–144, January 2009.
228 BIBLIOGRAPHY
[170] Michael Fell. Lyrics classification. Master’s thesis, Saarland University, Germany, 2014.
[171] Michael Fell, Elena Cabrio, Michele Corazza, and Fabien Gandon. Comparing AutomatedMethods to Detect Explicit Content in Song Lyrics. In Conference on Recent Advancesin Natural Language Processing (RANLP), Varna, Bulgaria, September 2019.
[172] Michael Fell, Elena Cabrio, Fabien Gandon, and Alain Giboin. Song lyrics summarizationinspired by audio thumbnailing. In Proceedings of the Conference on Recent Advances inNatural Language Processing (RANLP), 2019.
[173] Michael Fell, Elena Cabrio, Elmahdi Korfed, Michel Buffa, and Fabien Gandon. Loveme, love me, say (and write!) that you love me: Enriching the WASABI song corpuswith lyrics annotations. In Proceedings of The 12th Language Resources and EvaluationConference, LREC 2020, Marseille, France, May 11-16, 2020, pages 2138–2147, 2020.
[174] Michael Fell, Yaroslav Nechaev, Gabriel Meseguer Brocal, Elena Cabrio, Fabien Gandon,and Geoffroy Peeters. Lyrics segmentation via bimodal text-audio representation. Journalof Natural Language Engineering (to appear), 2020.
[175] Michael Fell, Yaroslav Nechaev, Elena Cabrio, and Fabien Gandon. Lyrics segmentation:Textual macrostructure detection using convolutions. In Emily M. Bender, Leon Der-czynski, and Pierre Isabelle, editors, Proceedings of the 27th International Conference onComputational Linguistics, COLING 2018, pages 2044–2054. Association for Computa-tional Linguistics, 2018.
[176] Michael Fell and Caroline Sporleder. Lyrics-based analysis and classification of music. InJan Hajic and Junichi Tsujii, editors, COLING, pages 620–631. ACL, 2014.
[177] Christiane Fellbaum. WordNet: An Electronic Lexical Database. Bradford Books, 1998.
[178] Vanessa Wei Feng and Graeme Hirst. Classifying arguments by scheme. In Proceedingsof ACL, pages 987–996, 2011.
[179] Elisabetta Fersini, Paolo Rosso, and Maria Anzovino. Overview of the task on automaticmisogyny identification at ibereval 2018. In IberEval@SEPLN, volume 2150 of CEURWorkshop Proceedings, pages 214–228. CEUR-WS.org, 2018.
[180] Thomas Fillon, Josephine Simonnot, Marie-France Mifune, Stephanie Khoury, GuillaumePellerin, and Maxime Le Coz. Telemeta: An open-source web framework for ethnomu-sicological audio archives management and automatic analysis. In Proceedings of the 1stInternational Workshop on Digital Libraries for Musicology, pages 1–8. ACM, 2014.
[181] Ross Finman, Thomas Whelan, Michael Kaess, and John J Leonard. Toward lifelongobject segmentation from change detection in dense rgb-d maps. In ECMR. IEEE, 2013.
[182] Darja Fiser, Ruihong Huang, Vinodkumar Prabhakaran, Rob Voigt, Zeerak Waseem,and Jacqueline Wernimont. Proceedings of the 2nd workshop on abusive language on-line (alw2). In Proceedings of the 2nd Workshop on Abusive Language Online (ALW2).Association for Computational Linguistics, 2018.
[183] Jonathan Foote. Automatic audio segmentation using a measure of audio novelty. In Mul-timedia and Expo, 2000. ICME 2000. 2000 IEEE International Conference on, volume 1,pages 452–455. IEEE, 2000.

BIBLIOGRAPHY 229
[184] Paula Fortuna, Ilaria Bonavita, and Sergio Nunes. Merging datasets for hate speechclassification in italian. In Proceedings of the Sixth Evaluation Campaign of NaturalLanguage Processing and Speech Tools for Italian. Final Workshop (EVALITA 2018) co-located with the Fifth Italian Conference on Computational Linguistics (CLiC-it 2018),Turin, Italy, December 12-13, 2018., 2018.
[185] Antigoni-Maria Founta, Despoina Chatzakou, Nicolas Kourtellis, Jeremy Blackburn,Athena Vakali, and Ilias Leontiadis. A unified deep learning architecture for abuse detec-tion. CoRR, abs/1802.00385, 2018.
[186] Antigoni-Maria Founta, Constantinos Djouvas, Despoina Chatzakou, Ilias Leontiadis,Jeremy Blackburn, Gianluca Stringhini, Athena Vakali, Michael Sirivianos, and NicolasKourtellis. Large scale crowdsourcing and characterization of twitter abusive behavior.In ICWSM, pages 491–500, 2018.
[187] Lutz Frommberger and Diedrich Wolter. Structural knowledge transfer by spatial ab-straction for reinforcement learning agents. Adaptive Behavior, 18(6):507–525, December2010.
[188] Takuya Fujishima. Realtime chord recognition of musical sound: a system using commonlisp music. In ICMC. Michigan Publishing, 1999.
[189] Andrea Galassi, Marco Lippi, and Paolo Torroni. Argumentative link prediction usingresidual networks and multi-objective learning. In Proc. of ArgMining 2018 workshop,pages 1–10, 2018.
[190] Bjorn Gamback and Utpal Kumar Sikdar. Using convolutional neural networks to classifyhate-speech. In Proceedings of the First Workshop on Abusive Language Online, pages85–90. Association for Computational Linguistics, 2017.
[191] Guglielmo Gemignani, Roberto Capobianco, Emanuele Bastianelli, Domenico Bloisi, LucaIocchi, and Daniele Nardi. Living with robots: Interactive environmental knowledgeacquisition. Robotics and Autonomous Systems, 2016.
[192] Daniel Gerber and Axel-Cyrille Ngonga Ngomo. Bootstrapping the linked data web. In1st Workshop on Web Scale Knowledge Extraction @ ISWC 2011, 2011.
[193] Chris Gibbs and Richard Haynes. A phenomenological investigation into how twitter haschanged the nature of sport media relations. International Journal of Sport Communica-tion, 6(4):394–408, 2013.
[194] Roxana Girju, Adriana Badulescu, and Dan Moldovan. Learning semantic constraints forthe automatic discovery of part-whole relations. In Proceedings of the 2003 Conference ofthe North American Chapter of the Association for Computational Linguistics on HumanLanguage Technology - Volume 1, NAACL ’03, pages 1–8, Stroudsburg, PA, USA, 2003.Association for Computational Linguistics. DOI: 10.3115/1073445.1073456.
[195] Ian Goodfellow, Yoshua Bengio, and Aaron Courville. Deep Learning. MIT Press, 2016.http://www.deeplearningbook.org.
[196] Thomas F. Gordon, Henry Prakken, and Douglas Walton. The carneades model of argu-ment and burden of proof. Artif. Intell., 171(10-15):875–896, 2007.
230 BIBLIOGRAPHY
[197] Theodosios Goudas, Christos Louizos, Georgios Petasis, and Vangelis Karkaletsis. Argu-ment extraction from news, blogs, and the social web. International Journal on ArtificialIntelligence Tools, 24(5), 2015.
[198] Mario Graff, Sabino Miranda-Jimenez, Eric Sadit Tellez, Daniela Moctezuma, VladimirSalgado, Jose Ortiz-Bejar, and Claudia N. Sanchez. INGEOTEC at MEX-A3T: authorprofiling and aggressiveness analysis in twitter using µtc and evomsa. In IberEval 2018,pages 128–133, 2018.
[199] Edouard Grave, Piotr Bojanowski, Prakhar Gupta, Armand Joulin, and Tomas Mikolov.Learning word vectors for 157 languages. In Proceedings of the International Conferenceon Language Resources and Evaluation (LREC 2018), 2018.
[200] Nancy Green. Argumentation for scientific claims in a biomedical research article. InProc. of ArgNLP 2014 workshop, 2014.
[201] Nancy Green. Annotating evidence-based argumentation in biomedical text. IEEE BIBM2015, pages 922–929, 2015.
[202] Nancy Green. Towards mining scientific discourse using argumentation schemes. Argu-ment and Computation, 9:121–135, 2018.
[203] Kathrin Grosse, Marıa Paula Gonzalez, Carlos Ivan Chesnevar, and Ana Gabriela Ma-guitman. Integrating argumentation and sentiment analysis for mining opinions fromtwitter. AI Commun., 28(3):387–401, 2015.
[204] Ivan Habernal and Iryna Gurevych. Exploiting debate portals for semi-supervised ar-gumentation mining in user-generated web discourse. In Proceedings of EMNLP, pages2127–2137, 2015.
[205] Ivan Habernal and Iryna Gurevych. Which argument is more convincing? Analyzing andpredicting convincingness of web arguments using bidirectional LSTM. In Proceedingsof the 54th Annual Meeting of the Association for Computational Linguistics (Volume 1:Long Papers), pages 1589–1599. Association for Computational Linguistics, 2016.
[206] Ivan Habernal and Iryna Gurevych. Argumentation mining in user-generated web dis-course. Comput. Linguist., 43(1):125–179, 2017.
[207] Ivan Habernal, Henning Wachsmuth, Iryna Gurevych, and Benno Stein. Before name-calling: Dynamics and triggers of ad hominem fallacies in web argumentation. In Pro-ceedings of the 2018 Conference of the North American Chapter of the Association forComputational Linguistics: Human Language Technologies, NAACL-HLT 2018, New Or-leans, Louisiana, USA, June 1-6, 2018, Volume 1 (Long Papers), pages 386–396, 2018.
[208] Shohreh Haddadan, Elena Cabrio, and Serena Villata. Disputool - A tool for the argu-mentative analysis of political debates. In Proceedings of the Twenty-Eighth InternationalJoint Conference on Artificial Intelligence, IJCAI 2019, Macao, China, August 10-16,2019, pages 6524–6526, 2019.
[209] Shohreh Haddadan, Elena Cabrio, and Serena Villata. Yes, we can! mining argumentsin 50 years of US presidential campaign debates. In Proceedings of the 57th Conferenceof the Association for Computational Linguistics, ACL 2019, Florence, Italy, July 28-August 2, 2019, Volume 1: Long Papers, pages 4684–4690, 2019.

BIBLIOGRAPHY 231
[210] Aria Haghighi and Lucy Vanderwende. Exploring content models for multi-documentsummarization. In Proceedings of Human Language Technologies: The 2009 Annual Con-ference of the North American Chapter of the Association for Computational Linguistics,pages 362–370. Association for Computational Linguistics, 2009.
[211] Marc Hanheide, Charles Gretton, Richard Dearden, Nick Hawes, Jeremy L. Wyatt, An-drzej Pronobis, Alper Aydemir, Moritz Gobelbecker, and Hendrik Zender. Exploitingprobabilistic knowledge under uncertain sensing for efficient robot behaviour. In IJ-CAI’11, Barcelona, Spain, July 2011.
[212] John Hannon, Kevin McCarthy, James Lynch, and Barry Smyth. Personalized and au-tomatic social summarization of events in video. In Proceedings of the 16th internationalconference on Intelligent user interfaces, pages 335–338. ACM, 2011.
[213] Stevan Harnad. The symbol grounding problem. Physica D: Nonlinear Phenomena,42(1):335 – 346, 1990. DOI: 10.1016/0167-2789(90)90087-6.
[214] Stevan Harnad. Categorical perception. In L. Nadel, editor, Encyclopedia of CognitiveScience, pages 67–4. Nature Publishing Group, 2003.
[215] Stevan Harnad. To cognize is to categorize: Cognition is categorization. Handbook ofcategorization in cognitive science, pages 20–45, 2005.
[216] Zellig Harris. Distributional structure. Word, 10(23):146–162, 1954. DOI: 10.1080/
00437956.1954.11659520.
[217] Mahmud Hasan, Mehmet A Orgun, and Rolf Schwitter. Twitternews: real time eventdetection from the twitter data stream. PeerJ PrePrints, 4:e2297v1, 2016.
[218] Ruifang He and Xingyi Duan. Twitter summarization based on social network and sparsereconstruction. In AAAI, 2018.
[219] Benjamin Heinzerling and Michael Strube. Bpemb: Tokenization-free pre-trained subwordembeddings in 275 languages. In Proc. of LREC 2018, pages 2989–2993, 2018.
[220] Romain Hennequin, Anis Khlif, Felix Voituret, and Manuel Moussallam. Spleeter: Afast and state-of-the art music source separation tool with pre-trained models. Late-Breaking/Demo ISMIR 2019, November 2019. Deezer Research.
[221] Leonhard Hennig. Topic-based multi-document summarization with probabilistic latentsemantic analysis. In Proceedings of the International Conference RANLP-2009, pages144–149, 2009.
[222] Stella Heras, Katie Atkinson, Vicente J. Botti, Floriana Grasso, Vicente Julian, and PeterMcBurney. How argumentation can enhance dialogues in social networks. In Computa-tional Model of Arguments (COMMA), pages 267–274, 2010.
[223] Stefan Hinterstoisser, Stefan Holzer, Cedric Cagniart, Slobodan Ilic, Kurt Konolige, Nas-sir Navab, and Vincent Lepetit. Multimodal templates for real-time detection of texture-less objects in heavily cluttered scenes. In IEEE ICCV, 2011.
[224] Sepp Hochreiter and Jurgen Schmidhuber. Long short-term memory. Neural Comput.,9(8):1735–1780, November 1997.

232 BIBLIOGRAPHY
[225] Raphael Hoffmann, Congle Zhang, Xiao Ling, Luke Zettlemoyer, and Daniel S. Weld.Knowledge-based weak supervision for information extraction of overlapping relations. InProceedings of the 49th Annual Meeting of the Association for Computational Linguistics:Human Language Technologies - Volume 1, HLT ’11, pages 541–550. Association forComputational Linguistics, 2011.
[226] Raphael Hoffmann, Congle Zhang, and Daniel S. Weld. Learning 5000 relational extrac-tors. In Proceedings of the 48th Annual Meeting of the Association for ComputationalLinguistics, ACL ’10, pages 286–295, Stroudsburg, PA, USA, 2010. Association for Com-putational Linguistics.
[227] Richang Hong, Meng Wang, Guangda Li, Liqiang Nie, Zheng-Jun Zha, and Tat-SengChua. Multimedia question answering. IEEE MultiMedia, 19(4):72–78, 2012.
[228] Matthew Honnibal and Ines Montani. spacy 2: Natural language understanding withbloom embeddings, convolutional neural networks and incremental parsing. To appear,2017.
[229] Homa Hosseinmardi, Sabrina Arredondo Mattson, Rahat Ibn Rafiq, Richard Han, Qin Lv,and Shivakant Mishra. Analyzing labeled cyberbullying incidents on the instagram socialnetwork. In Social Informatics - 7th International Conference, SocInfo 2015, Beijing,China, December 9-12, 2015, Proceedings, pages 49–66, 2015.
[230] Homa Hosseinmardi, Sabrina Arredondo Mattson, Rahat Ibn Rafiq, Richard O. Han, QinLv, and Shivakant Mishra. Prediction of Cyberbullying Incidents on the Instagram SocialNetwork. CoRR, abs/1503.03909, 2015.
[231] Meishan Hu, Aixin Sun, Ee-Peng Lim, and Ee-Peng Lim. Comments-oriented blog sum-marization by sentence extraction. In Proceedings of the Sixteenth ACM Conference onConference on Information and Knowledge Management, CIKM ’07, pages 901–904, NewYork, NY, USA, 2007. ACM.
[232] Tianran Hu, Han Guo, Hao Sun, Thuy-vy Thi Nguyen, and Jiebo Luo. Spice up yourchat: The intentions and sentiment effects of using emojis. In Proceedings of the EleventhInternational Conference on Web and Social Media, ICWSM 2017, Montreal, Quebec,Canada, pages 102–111, 2017.
[233] Xiao Hu, J Stephen Downie, and Andreas F Ehmann. Lyric text mining in music moodclassification. American music, 183(5,049):2–209, 2009.
[234] Yajie Hu, Xiaoou Chen, and Deshun Yang. Lyric-based song emotion detection withaffective lexicon and fuzzy clustering method. In ISMIR, 2009.
[235] Xinyu Hua, Mitko Nikolov, Nikhil Badugu, and Lu Wang. Argument mining for under-standing peer reviews. In Proc. of NAACL-HLT 2019, page 2131–2137, 2019.
[236] Anthony Hunter. A probabilistic approach to modelling uncertain logical arguments. Int.J. Approx. Reasoning, 54(1):47–81, 2013.
[237] Anthony Hunter and Matthew Williams. Aggregating evidence about the positive andnegative effects of treatments. Artificial Intelligence in Medicine, 56(3):173–190, 2012.

BIBLIOGRAPHY 233
[238] Vijayasaradhi Indurthi, Bakhtiyar Syed, Manish Shrivastava, Nikhil Chakravartula, Man-ish Gupta, and Vasudeva Varma. FERMI at SemEval-2019 task 5: Using sentence em-beddings to identify hate speech against immigrants and women in twitter. In Proceedingsof the 13th International Workshop on Semantic Evaluation, pages 70–74, Minneapolis,Minnesota, USA, June 2019. Association for Computational Linguistics.
[239] Said Jai-Andaloussi, Imane El Mourabit, Nabil Madrane, Samia Benabdellah Chaouni,and Abderrahim Sekkaki. Soccer events summarization by using sentiment analysis. In2015 International Conference on Computational Science and Computational Intelligence(CSCI), pages 398–403. IEEE, 2015.
[240] Mathilde Janier, John Lawrence, and Chris Reed. OVA+: an argument analysis interface.In Computational Models of Argument - Proceedings of COMMA 2014, Atholl PalaceHotel, Scottish Highlands, UK, September 9-12, 2014, pages 463–464, 2014.
[241] Soufian Jebbara, Valerio Basile, Elena Cabrio, and Philipp Cimiano. Extracting com-mon sense knowledge via triple ranking using supervised and unsupervised distributionalmodels. Semantic Web, 10(1):139–158, 2019.
[242] Rodolphe Jenatton, Nicolas L. Roux, Antoine Bordes, and Guillaume R Obozinski. Alatent factor model for highly multi-relational data. In F. Pereira, C. J. C. Burges,L. Bottou, and K. Q. Weinberger, editors, Advances in Neural Information ProcessingSystems 25, pages 3167–3175. Curran Associates, Inc., 2012.
[243] Nanzhu Jiang and Meinard Muller. Estimating double thumbnails for music record-ings. In 2015 IEEE International Conference on Acoustics, Speech and Signal Processing(ICASSP), pages 146–150, April 2015.
[244] Di Jin and Peter Szolovits. PICO element detection in medical text via long short-termmemory neural networks. In Proc. of BioNLP 2018 workshop, pages 67–75, 2018.
[245] Armand Joulin, Edouard Grave, Piotr Bojanowski, Matthijs Douze, Herve Jegou, andTomas Mikolov. Fasttext.zip: Compressing text classification models. arXiv preprintarXiv:1612.03651, 2016.
[246] Satya Katragadda, Ryan Benton, and Vijay Raghavan. Framework for real-time eventdetection using multiple social media sources. In Proceedings of the 50th Hawaii Inter-national Conference on System Sciences, 2017.
[247] Satya Katragadda, Shahid Virani, Ryan Benton, and Vijay Raghavan. Detection of eventonset using twitter. In Neural Networks (IJCNN), 2016 International Joint Conferenceon, pages 1539–1546. IEEE, 2016.
[248] Jayong Kim and Y Yi Mun. A hybrid modeling approach for an automated lyrics-ratingsystem for adolescents. In European Conference on Information Retrieval, pages 779–786.Springer, 2019.
[249] Florian Kleedorfer, Peter Knees, and Tim Pohle. Oh oh oh whoah! towards automatictopic detection in song lyrics. In ISMIR, 2008.
[250] Kevin Knight and Daniel Marcu. Statistics-based summarization - step one: Sentencecompression. In Proceedings of the Seventeenth National Conference on Artificial Intelli-gence and Twelfth Conference on Innovative Applications of Artificial Intelligence, pages703–710. AAAI Press, 2000.

234 BIBLIOGRAPHY
[251] Arne Kohn. What’s in an embedding? Analyzing word embeddings through multilingualevaluation. In Proceedings of the 2015 Conference on Empirical Methods in NaturalLanguage Processing, EMNLP 2015, Lisbon, Portugal, September 17-21, 2015, pages2067–2073, 2015.
[252] Alexandros Komninos and Suresh Manandhar. Dependency based embeddings for sen-tence classification tasks. In Proc. of NAACL-HLT 2016, pages 1490–1500, 2016.
[253] Parisa Kordjamshidi, Martijn Van Otterlo, and Marie-Francine Moens. Spatial role label-ing: Towards extraction of spatial relations from natural language. ACM Transactions onSpeech and Language Processing (TSLP), 8(3):4, 2011. DOI: 10.1145/2050104.2050105.
[254] Efthymios Kouloumpis, Theresa Wilson, and Johanna D Moore. Twitter sentiment anal-ysis: The good the bad and the omg! Icwsm, 11(538-541):164, 2011.
[255] M. Kouylekov and M. Negri. An open-source package for recognizing textual entailment.In ACL System Demonstrations, pages 42–47, 2010.
[256] Erwin Kreyszig. Advanced engineering mathematics. John Wiley & Sons, 2007.
[257] Rohan Kshirsagar, Tyrus Cukuvac, Kathy McKeown, and Susan McGregor. Predictiveembeddings for hate speech detection on twitter. In ALW2, pages 26–32, 2018.
[258] Mitsumasa Kubo, Ryohei Sasano, Hiroya Takamura, and Manabu Okumura. Generat-ing live sports updates from twitter by finding good reporters. In Proceedings of the2013 IEEE/WIC/ACM International Joint Conferences on Web Intelligence (WI) andIntelligent Agent Technologies (IAT)-Volume 01, pages 527–534. IEEE Computer Society,2013.
[259] Lars Kunze, Chris Burbridge, Marina Alberti, Akshaya Tippur, John Folkesson, PatricJensfelt, and Nick Hawes. Combining top-down spatial reasoning and bottom-up objectclass recognition for scene understanding. In IEEE IROS, Chicago, Illinois, US, Septem-ber, 14–18 2014.
[260] Gretel Liz De la Pena Sarracen, Reynaldo Gil Pons, Carlos Enrique Muniz-Cuza, andPaolo Rosso. Hate speech detection using attention-based LSTM. In Proceedings ofthe Sixth Evaluation Campaign of Natural Language Processing and Speech Tools forItalian. Final Workshop (EVALITA 2018) co-located with the Fifth Italian Conference onComputational Linguistics (CLiC-it 2018), Turin, Italy., 2018.
[261] Loredana Laera, Ian Blacoe, Valentina Tamma, Terry Payne, Jerome Euzenat, and TrevorBench-Capon. Argumentation over ontology correspondences in MAS. In Procs of AA-MAS 2007, pages 1–8, 2007.
[262] Thomas K. Landauer and Susan T. Dumais. A solution to plato’s problem: The la-tent semantic analysis theory of acquisition, induction, and representation of knowledge.Psychological Review, 104(2):211–240, 1997. DOI: 10.1037/0033-295X.104.2.211.
[263] Thomas K. Landauer, Darrell Laham, Bob Rehder, and M. E. Schreiner. How well canpassage meaning be derived without using word order? a comparison of latent semanticanalysis and humans. In Proc. of CSS, pages 412–417, December 1997.
[264] J. Richard Landis and Gary G. Koch. The measurement of observer agreement for cate-gorical data. Biometrics, 33(1):159–174, 1977.

BIBLIOGRAPHY 235
[265] John Lawrence, Chris Reed, Colin Allen, Simon McAlister, and Andrew Ravenscroft.Mining arguments from 19th century philosophical texts using topic based modelling. InProceedings of ArgMin, pages 79–87, 2014.
[266] Quoc V. Le and Tomas Mikolov. Distributed representations of sentences and documents.In Proceedings of the 31th International Conference on Machine Learning, ICML 2014,Beijing, China, 21-26 June 2014, pages 1188–1196, 2014.
[267] Jose Paulo Leal, Vania Rodrigues, and Ricardo Queiros. Computing Semantic Relat-edness using DBPedia. In Alberto Simoes, Ricardo Queiros, and Daniela da Cruz, edi-tors, 1st Symposium on Languages, Applications and Technologies, volume 21 of OpenAc-cess Series in Informatics (OASIcs), pages 133–147, Dagstuhl, Germany, 2012. SchlossDagstuhl–Leibniz-Zentrum fuer Informatik.
[268] Jinhyuk Lee, Wonjin Yoon, Sungdong Kim, Donghyeon Kim, Sunkyu Kim, Chan Ho So,and Jaewoo Kang. BioBERT: a pre-trained biomedical language representation modelfor biomedical text mining. Bioinformatics, 2019.
[269] Younghun Lee, Seunghyun Yoon, and Kyomin Jung. Comparative studies of detectingabusive language on twitter. CoRR, abs/1808.10245, 2018.
[270] Jens Lehmann, Robert Isele, Max Jakob, Anja Jentzsch, Dimitris Kontokostas, PabloMendes, Sebastian Hellmann, Mohamed Morsey, Patrick van Kleef, Soren Auer, andChristian Bizer. DBpedia - A large-scale, multilingual knowledge base extracted fromWikipedia. Semantic Web Journal, 6(2):167–195, 2015. DOI: 10.3233/SW-140134.
[271] Douglas B. Lenat. CYC: A large-scale investment in knowledge infrastructure. Commu-nications of the ACM, 38(11):32–38, 1995. DOI: 10.1145/219717.219745.
[272] Vladimir I Levenshtein. Binary codes capable of correcting deletions, insertions, andreversals. In Soviet physics doklady, volume 10, pages 707–710, 1966.
[273] Mark Levy, Mark Sandler, and Michael Casey. Extraction of high-level musical structurefrom audio data and its application to thumbnail generation. In 2006 IEEE InternationalConference on Acoustics Speech and Signal Processing Proceedings, volume 5, pages V–V.IEEE, 2006.
[274] Ran Levy, Yonatan Bilu, Daniel Hershcovich, Ehud Aharoni, and Noam Slonim. Contextdependent claim detection. In COLING, pages 1489–1500, 2014.
[275] Jing Li, Aixin Sun, and Shafiq Joty. Segbot: A generic neural text segmentation modelwith pointer network. In IJCAI, pages 4166–4172, 2018.
[276] Chin-Yew Lin. Rouge: A package for automatic evaluation of summaries. In Text Sum-marization Branches Out, 2004.
[277] Yankai Lin, Zhiyuan Liu, Maosong Sun, Yang Liu, and Xuan Zhu. Learning entity andrelation embeddings for knowledge graph completion. In Proceedings of the Twenty-NinthAAAI Conference on Artificial Intelligence, January 25-30, 2015, Austin, Texas, USA.,pages 2181–2187, 2015. DOI: 10.1016/j.procs.2017.05.045.
[278] Marco Lippi and Paolo Torroni. Argument mining from speech: Detecting claims inpolitical debates. In AAAI, pages 2979–2985, 2016.

236 BIBLIOGRAPHY
[279] Marco Lippi and Paolo Torroni. Argumentation mining: State of the art and emergingtrends. ACM Trans. Internet Techn., 16(2):10, 2016.
[280] Marco Lippi and Paolo Torroni. Margot: A web server for argumentation mining. ExpertSystems with Applications, 65:292–303, 12 2016.
[281] Bing Liu. Sentiment Analysis and Opinion Mining. Synthesis digital library of engineeringand computer science. Morgan & Claypool, 2012.
[282] Hugo Liu and Push Singh. ConceptNet –A practical commonsense reasoning tool-kit. BTTechnology Journal, 22(4):211–226, October 2004. DOI: 10.1023/B:BTTJ.0000047600.45421.6d.
[283] Ping Liu, Wen Li, and Liang Zou. NULI at SemEval-2019 task 6: Transfer learning foroffensive language detection using bidirectional transformers. In Proceedings of the 13thInternational Workshop on Semantic Evaluation, pages 87–91, Minneapolis, Minnesota,USA, June 2019. Association for Computational Linguistics.
[284] Yinhan Liu, Myle Ott, Naman Goyal, Jingfei Du, Mandar Joshi, Danqi Chen, Omer Levy,Mike Lewis, Luke Zettlemoyer, and Veselin Stoyanov. Roberta: A robustly optimizedBERT pretraining approach. CoRR, abs/1907.11692, 2019.
[285] Clare Llewellyn, Claire Grover, Jon Oberlander, and Ewan Klein. Re-using an argumentcorpus to aid in the curation of social media collections. In Proceedings of the NinthInternational Conference on Language Resources and Evaluation, LREC 2014, Reykjavik,Iceland, May 26-31, 2014., pages 462–468, 2014.
[286] Markus Lochtefeld, Christian Jackel, and Antonio Kruger. Twitsoccer: knowledge-basedcrowd-sourcing of live soccer events. In Proceedings of the 14th International Conferenceon Mobile and Ubiquitous Multimedia, pages 148–151. ACM, 2015.
[287] Beth Logan, Andrew Kositsky, and Pedro Moreno. Semantic analysis of song lyrics.In 2004 IEEE International Conference on Multimedia and Expo (ICME) (IEEE Cat.No.04TH8763), volume 2, pages 827–830 Vol.2, June 2004.
[288] Luca Longo and Lucy Hederman. Argumentation theory for decision support in health-care: A comparison with machine learning. In Proc. of BHI 2013, pages 168–180, 2013.
[289] Vanessa Lopez, Victoria S. Uren, Marta Sabou, and Enrico Motta. Cross ontology queryanswering on the semantic web: an initial evaluation. In K-CAP, pages 17–24, 2009.
[290] Vanessa Lopez, Victoria S. Uren, Marta Sabou, and Enrico Motta. Is question answeringfit for the semantic web?: A survey. Semantic Web, 2(2):125–155, 2011.
[291] Annie Louis and Ani Nenkova. Automatically assessing machine summary content with-out a gold standard. Computational Linguistics, 39(2), 2013.
[292] Max Lungarella, Giorgio Metta, Rolf Pfeifer, and Giulio Sandini. Developmen-tal robotics: a survey. Connection Science, 15(4):151–190, 2003. DOI: 10.1080/
09540090310001655110.
[293] Xuezhe Ma and Eduard Hovy. End-to-end sequence labeling via bi-directional lstm-cnns-crf. arXiv preprint arXiv:1603.01354, 2016.

BIBLIOGRAPHY 237
[294] Stuart Mackie, Richard McCreadie, Craig Macdonald, and Iadh Ounis. On choosing aneffective automatic evaluation metric for microblog summarisation. In Proceedings of the5th Information Interaction in Context Symposium, pages 115–124. ACM, 2014.
[295] Bernardo Magnini, Roberto Zanoli, Ido Dagan, Kathrin Eichler, Gunter Neumann, Tae-Gil Noh, Sebastian Pado, Asher Stern, and Omer Levy. The excitement open platform fortextual inferences. In Proceedings of ACL (System Demonstrations), pages 43–48, 2014.
[296] Jose P. G. Mahedero, Alvaro Martınez, Pedro Cano, Markus Koppenberger, and FabienGouyon. Natural language processing of lyrics. In Proceedings of the 13th Annual ACMInternational Conference on Multimedia, MULTIMEDIA ’05, pages 475–478, New York,NY, USA, 2005. ACM.
[297] Rahmad Mahendra, Lilian Wanzare, Bernardo Magnini, Raffaella Bernardi, and AlbertoLavelli. Acquiring relational patterns from wikipedia: A case study. In LTC2011, 112011.
[298] Christopher D. Manning, Mihai Surdeanu, John Bauer, Jenny Finkel, Steven J. Bethard,and David McClosky. The Stanford CoreNLP natural language processing toolkit. InProceedings of ACL (System Demonstrations), pages 55–60, 2014.
[299] Adam Marcus, Michael S Bernstein, Osama Badar, David R Karger, Samuel Madden, andRobert C Miller. Twitinfo: aggregating and visualizing microblogs for event exploration.In Proceedings of the SIGCHI conference on Human factors in computing systems, pages227–236. ACM, 2011.
[300] Marie-Catherine De Marneffe, Anne N. Rafferty, and Christopher D. Manning. Find-ing contradictions in text. In Proc. of the 46th Annual Meeting of the Association forComputational Linguistics (ACL), June 2008.
[301] Rudolf Mayer and Andreas Rauber. Musical genre classification by ensembles of audio andlyrics features. In Proceedings of the 12th International Conference on Music InformationRetrieval, pages 675–680, 2011.
[302] Tobias Mayer, Elena Cabrio, Marco Lippi, Paolo Torroni, and Serena Villata. Argumentmining on clinical trials. In Sanjay Modgil, Katarzyna Budzynska, and John Lawrence,editors, Computational Models of Argument - Proceedings of COMMA 2018, Warsaw,Poland, 12-14 September 2018, volume 305 of Frontiers in Artificial Intelligence andApplications, pages 137–148. IOS Press, 2018.
[303] Tobias Mayer, Elena Cabrio, and Serena Villata. ACTA A tool for argumentative clinicaltrial analysis. In Proceedings of the Twenty-Eighth International Joint Conference onArtificial Intelligence, IJCAI 2019, Macao, China, August 10-16, 2019, pages 6551–6553,2019.
[304] Tobias Mayer, Elena Cabrio, and Serena Villata. Transformer-based argument mining forhealthcare applications. In To appear in Proceedings of the 24th European Conference onArtificial Intelligence (ECAI2020), 2020.
[305] Julian J. McAuley, Rahul Pandey, and Jure Leskovec. Inferring networks of substitutableand complementary products. In Proceedings of the 21th ACM SIGKDD InternationalConference on Knowledge Discovery and Data Mining, Sydney, NSW, Australia, August10-13, 2015, pages 785–794, 2015. DOI: 10.1145/2783258.2783381.

238 BIBLIOGRAPHY
[306] John McCarthy. Circumscription - A form of non-monotonic reasoning. Artificial Intel-ligence, 13(1-2):27–39, 1980. DOI: 10.1016/0004-3702(80)90011-9.
[307] Andrew J McMinn and Joemon M Jose. Real-time entity-based event detection for twit-ter. In International Conference of the Cross-Language Evaluation Forum for EuropeanLanguages, pages 65–77. Springer, 2015.
[308] Andrew J. McMinn, Yashar Moshfeghi, and Joemon M Jose. Building a large-scale corpusfor evaluating event detection on twitter. In Proceedings of CIKM, pages 409–418. ACM,2013.
[309] Qiaozhu Mei and ChengXiang Zhai. Generating impact-based summaries for scientificliterature. In ACL, 2008.
[310] Pablo Mendes, Max Jakob, and Christian Bizer. DBpedia: A multilingual cross-domainknowledge base. In Procs of LREC 2012. ELRA, 2012.
[311] Pablo Mendes, Hannes Muhleisen, and Christian Bizer. Sieve: linked data quality assess-ment and fusion. In Procs of the Joint EDBT/ICDT Workshops, pages 116–123. ACM,2012.
[312] Stefano Menini, Elena Cabrio, Sara Tonelli, and Serena Villata. Never retreat, neverretract: Argumentation analysis for political speeches. In Proceedings of the Thirty-Second AAAI Conference on Artificial Intelligence, (AAAI-18), pages 4889–4896, 2018.
[313] Stefano Menini, Giovanni Moretti, Michele Corazza, Elena Cabrio, Sara Tonelli, and Ser-ena Villata. A system to monitor cyberbullying based on message classification and socialnetwork analysis. In Proceedings of the Third Workshop on Abusive Language Online,pages 105–110, Florence, Italy, August 2019. Association for Computational Linguistics.
[314] Stefano Menini, Federico Nanni, Simone Paolo Ponzetto, and Sara Tonelli. Topic-basedagreement and disagreement in us electoral manifestos. In Proceedings of the 2017 Con-ference on Empirical Methods in Natural Language Processing, pages 2928–2934, Strouds-burg, PA, September 2017. Association for Computational Linguistics.
[315] Stefano Menini and Sara Tonelli. Agreement and disagreement: Comparison of points ofview in the political domain. In Proceedings of COLING, 2016.
[316] Gabriel Meseguer-Brocal, Alice Cohen-Hadria, and Geoffroy Peeters. Dali: a large datasetof synchronized audio, lyrics and notes, automatically created using teacher-student ma-chine learning paradigm. In ISMIR Paris, France, 2018.
[317] Gabriel Meseguer-Brocal, Geoffroy Peeters, Guillaume Pellerin, Michel Buffa, ElenaCabrio, Catherine Faron Zucker, Alain Giboin, Isabelle Mirbel, Romain Hennequin,Manuel Moussallam, Francesco Piccoli, and Thomas Fillon. WASABI: a Two MillionSong Database Project with Audio and Cultural Metadata plus WebAudio enhancedClient Applications. In Web Audio Conference 2017 – Collaborative Audio #WAC2017,London, United Kingdom, August 2017. Queen Mary University of London.
[318] Rada Mihalcea and Carlo Strapparava. Lyrics, music, and emotions. In Proceedingsof the 2012 Joint Conference on Empirical Methods in Natural Language Processing andComputational Natural Language Learning, pages 590–599, Jeju Island, Korea, July 2012.Association for Computational Linguistics.

BIBLIOGRAPHY 239
[319] Rada Mihalcea and Paul Tarau. Textrank: Bringing order into text. In Proceedings ofthe 2004 Conference on Empirical Methods in Natural Language Processing, 2004.
[320] Tomas Mikolov, Kai Chen, Greg Corrado, and Jeffrey Dean. Efficient estimation of wordrepresentations in vector space. arXiv preprint arXiv:1301.3781, 2013.
[321] Tomas Mikolov, Edouard Grave, Piotr Bojanowski, Christian Puhrsch, and ArmandJoulin. Advances in pre-training distributed word representations. In Proceedings of theInternational Conference on Language Resources and Evaluation (LREC 2018), 2018.
[322] Tomas Mikolov, Ilya Sutskever, Kai Chen, Greg S Corrado, and Jeff Dean. Distributedrepresentations of words and phrases and their compositionality. In Advances in NeuralInformation Processing Systems, pages 3111–3119, 2013.
[323] Guido Minnen, John A. Carroll, and Darren Pearce. Applied morphological process-ing of English. Natural Language Engineering, 7(3):207–223, 2001. DOI: 10.1017/
S1351324901002728.
[324] Pushkar Mishra, Helen Yannakoudakis, and Ekaterina Shutova. Neural character-basedcomposition models for abuse detection. In Proceedings of the 2nd Workshop on AbusiveLanguage Online (ALW2), pages 1–10, Brussels, Belgium, October 2018. Association forComputational Linguistics.
[325] Dipendra K. Misra, Jaeyong Sung, Kevin Lee, and Ashutosh Saxena. Tell me dave:Context-sensitive grounding of natural language to manipulation instructions. TheInternational Journal of Robotics Research, 35(1-3):281–300, 2016. DOI: 10.1177/
0278364915602060.
[326] Jeff Mitchell and Mirella Lapata. Vector-based models of semantic composition. InACL 2008, Proceedings of the 46th Annual Meeting of the Association for ComputationalLinguistics, June 15-20, 2008, Columbus, Ohio, USA, pages 236–244, 2008. DOI: 10.1039/9781847558633-00236.
[327] Tom M. Mitchell, William W. Cohen, Estevam R. Hruschka Jr., Partha Pratim Talukdar,Justin Betteridge, Andrew Carlson, Bhavana Dalvi Mishra, Matthew Gardner, BryanKisiel, Jayant Krishnamurthy, Ni Lao, Kathryn Mazaitis, Thahir Mohamed, NdapandulaNakashole, Emmanouil Antonios Platanios, Alan Ritter, Mehdi Samadi, Burr Settles,Richard C. Wang, Derry Tanti Wijaya, Abhinav Gupta, Xinlei Chen, Abulhair Saparov,Malcolm Greaves, and Joel Welling. Never-ending learning. In Proceedings of the Twenty-Ninth AAAI Conference on Artificial Intelligence, January 25-30, 2015, Austin, Texas,USA., pages 2302–2310, 2015.
[328] Makoto Miwa and Mohit Bansal. End-to-end relation extraction using lstms on sequencesand tree structures. In Proc. of ACL 2016, pages 1105–1116, 2016.
[329] Andriy Mnih and Yee Whye Teh. A fast and simple algorithm for training neural proba-bilistic language models. In Proceedings of the 29th International Conference on MachineLearning, ICML 2012, Edinburgh, Scotland, UK, June 26 - July 1, 2012, 2012.
[330] Raquel Mochales and Marie-Francine Moens. Argumentation mining. Artificial Intelli-gence and Law, 19(1):1–22, 2011.
[331] Saif Mohammad. Obtaining reliable human ratings of valence, arousal, and dominancefor 20,000 english words. In Proceedings of the 56th Annual Meeting of the Associationfor Computational Linguistics (Volume 1: Long Papers), pages 174–184, 2018.

240 BIBLIOGRAPHY
[332] Saif Mohammad, Felipe Bravo-Marquez, Mohammad Salameh, and Svetlana Kiritchenko.Semeval-2018 task 1: Affect in tweets. In Proceedings of the 12th international workshopon semantic evaluation, pages 1–17, 2018.
[333] Saif Mohammad and Peter D Turney. Emotions evoked by common words and phrases:Using mechanical turk to create an emotion lexicon. In Proceedings of the NAACL HLT2010 workshop on computational approaches to analysis and generation of emotion intext, pages 26–34. Association for Computational Linguistics, 2010.
[334] Saif Mohammad and Peter D Turney. Crowdsourcing a word–emotion association lexicon.Computational Intelligence, 29(3):436–465, 2013.
[335] Christof Monz and Maarten de Rijke. Light-weight entailment checking for computationalsemantics. In Proc. Inference in Computational Semantics (ICoS-3), pages 59–72, June2001.
[336] Raymond J. Mooney. Learning to connect language and perception. In Proceedingsof the 23rd National Conference on Artificial Intelligence - Volume 3, AAAI’08, pages1598–1601, 2008.
[337] Giovanni Moretti, Rachele Sprugnoli, and Sara Tonelli. Digging in the Dirt: ExtractingKeyphrases from Texts with KD. In Proceedings of the Second Italian Conference onComputational Linguistics, 2015.
[338] Nona Naderi and Graeme Hirst. Argumentation mining in parliamentary discourse. InCMNA, pages 16–25, 2015.
[339] Ramesh Nallapati, Feifei Zhai, and Bowen Zhou. Summarunner: A recurrent neuralnetwork based sequence model for extractive summarization of documents. In AAAI,2016.
[340] Barak Naveh et al. Jgrapht. Internet: http://jgrapht.sourceforge.net, 2008.
[341] Roberto Navigli and Simone Paolo Ponzetto. Babelnet: The automatic construction,evaluation and application of a wide-coverage multilingual semantic network. ArtificialIntelligence, 193:217 – 250, 2012.
[342] Ani Nenkova, Kathleen McKeown, et al. Automatic summarization. Foundations andTrends R© in Information Retrieval, 5(2–3):103–233, 2011.
[343] Jeffrey Nichols, Jalal Mahmud, and Clemens Drews. Summarizing sporting events usingtwitter. In Proceedings of the 2012 ACM international conference on Intelligent UserInterfaces, pages 189–198. ACM, 2012.
[344] Vlad Niculae, Joonsuk Park, and Claire Cardie. Argument mining with structured SVMsand RNNs. In Proc. of ACL 2017, pages 985–995, 2017.
[345] Chikashi Nobata, Joel R. Tetreault, Achint Thomas, Yashar Mehdad, and Yi Chang.Abusive language detection in online user content. In WWW, pages 145–153, 2016.
[346] Farhad Nooralahzadeh, Cedric Lopez, Elena Cabrio, Fabien L. Gandon, and FrederiqueSegond. Adapting semantic spreading activation to entity linking in text. In NaturalLanguage Processing and Information Systems - 21st International Conference on Ap-plications of Natural Language to Information Systems, NLDB 2016, Salford, UK, June22-24, 2016, Proceedings, pages 74–90, 2016.

BIBLIOGRAPHY 241
[347] Farid Nouioua and Vincent Risch. Bipolar argumentation frameworks with specializedsupports. In Proc. of the 22nd IEEE International Conference on Tools with ArtificialIntelligence (ICTAI), pages 215–218. IEEE Computer Society, October 2010.
[348] Farid Nouioua and Vincent Risch. Argumentation frameworks with necessities. In Proc. ofthe 5th International Conference Scalable Uncertainty Management (SUM), LNCS 6929,pages 163–176, October 2011.
[349] Robertus Nugroho, Weiliang Zhao, Jian Yang, Cecile Paris, Surya Nepal, and Yan Mei.Time-sensitive topic derivation in twitter. In International Conference on Web Informa-tion Systems Engineering, pages 138–152. Springer, 2015.
[350] Brendan O’Connor, Michel Krieger, and David Ahn. Tweetmotif: Exploratory searchand topic summarization for twitter. In ICWSM, pages 384–385, 2010.
[351] Markus Ojala and Gemma C. Garriga. Permutation tests for studying classifier perfor-mance. J. Mach. Learn. Res., 11:1833–1863, August 2010.
[352] Nathan Ong, Diane Litman, and Alexandra Brusilovsky. Ontology-based argument min-ing and automatic essay scoring. In Proceedings of the First Workshop on ArgumentationMining, pages 24–28, 2014.
[353] Nir Oren and Timothy J. Norman. Semantics for evidence-based argumentation. InProc. of the International Conference on Computational Models of Argument (COMMA),Frontiers in Artificial Intelligence and Applications 172, pages 276–284, May 2008.
[354] Nir Oren, Chris Reed, and Michael Luck. Moving between argumentation frameworks. InProc. of the International Conference on Computational Models of Argument (COMMA),Frontiers in Artificial Intelligence and Applications 216, pages 379–390, September 2010.
[355] Jahna Otterbacher, Gunes Erkan, and Dragomir R Radev. Using random walks forquestion-focused sentence retrieval. In Proceedings of the conference on Human LanguageTechnology and Empirical Methods in Natural Language Processing, pages 915–922. As-sociation for Computational Linguistics, 2005.
[356] Selami Ozsoy. Use of new media by turkish fans in sport communication: Facebook andtwitter. Journal of Human Kinetics, 28:165–176, 2011.
[357] Joaquin Padilla Montani and Peter Schuller. Tuwienkbs at germeval 2018: Germanabusive tweet detection. In GermEval, 09 2018.
[358] Lawrence Page, Sergey Brin, Rajeev Motwani, and Terry Winograd. The pagerank cita-tion ranking: Bringing order to the web. Technical report, Stanford InfoLab, 1999.
[359] Sandeep Panem, Manish Gupta, and Vasudeva Varma. Structured information extractionfrom natural disaster events on twitter. In Proceedings of the 5th International Workshopon Web-scale Knowledge Representation Retrieval & Reasoning, pages 1–8. ACM, 2014.
[360] Patrick Pantel and Marco Pennacchiotti. Espresso: Leveraging generic patterns for auto-matically harvesting semantic relations. In Nicoletta Calzolari, Claire Cardie, and PierreIsabelle, editors, ACL 2006, 21st International Conference on Computational Linguisticsand 44th Annual Meeting of the Association for Computational Linguistics, Proceedingsof the Conference, Sydney, Australia, 17-21 July 2006. The Association for ComputerLinguistics, 2006. DOI: 10.3115/1220175.1220190.

242 BIBLIOGRAPHY
[361] Ruchi Parikh and Kamalakar Karlapalem. Et: events from tweets. In Proceedings of the22nd International Conference on World Wide Web, pages 613–620. ACM, 2013.
[362] Loreto Parisi, Simone Francia, Silvio Olivastri, and Maria Stella Tavella. Exploiting syn-chronized lyrics and vocal features for music emotion detection. CoRR, abs/1901.04831,2019.
[363] Joonsuk Park, Cheryl Blake, and Claire Cardie. Toward machine-assisted participationin erulemaking: an argumentation model of evaluability. In Proceedings of the 15thInternational Conference on Artificial Intelligence and Law, ICAIL 2015, San Diego,CA, USA, June 8-12, 2015, pages 206–210, 2015.
[364] Joonsuk Park and Claire Cardie. Identifying appropriate support for propositions inonline user comments. In Proceedings of the ArgMin, pages 29–38, 2014.
[365] Daraksha Parveen, Hans-Martin Ramsl, and Michael Strube. Topical coherence for graph-based extractive summarization. In Proceedings of the 2015 Conference on EmpiricalMethods in Natural Language Processing, pages 1949–1954, 2015.
[366] Daraksha Parveen and Michael Strube. Integrating importance, non-redundancy and co-herence in graph-based extractive summarization. In Proceedings of the 24th InternationalConference on Artificial Intelligence, IJCAI’15, pages 1298–1304. AAAI Press, 2015.
[367] J. Pauwels and M. Sandler. A web-based system for suggesting new practice materialto music learners based on chord content. In Joint Proc. 24th ACM IUI Workshops(IUI2019), 2019.
[368] J. Pauwels, A. Xambo, G. Roma, M. Barthet, and G. Fazekas. Exploring real-timevisualisations to support chord learning with a large music collection. In Proc. 4th WebAudio Conf. (WAC 2018), 2018.
[369] Samuel Pecar. Towards opinion summarization of customer reviews. In Proceedingsof ACL 2018, Student Research Workshop, pages 1–8. Association for ComputationalLinguistics, 2018.
[370] Fabian Pedregosa, Gael Varoquaux, Alexandre Gramfort, Vincent Michel, BertrandThirion, Olivier Grisel, Mathieu Blondel, Peter Prettenhofer, Ron Weiss, VincentDubourg, Jake Vanderplas, Alexandre Passos, David Cournapeau, Matthieu Brucher,Matthieu Perrot, and Edouard Duchesnay. Scikit-learn: Machine learning in Python.Journal of Machine Learning Research, 12:2825–2830, 2011.
[371] Andreas Peldszus and Manfred Stede. From argument diagrams to argumentation miningin texts: A survey. Int. J. Cogn. Inform. Nat. Intell., 7(1):1–31, 2013.
[372] Jeffrey Pennington, Richard Socher, and Christopher D. Manning. Glove: Global vectorsfor word representation. In Proc. of EMNLP 2014, pages 1532–1543, 2014.
[373] Juan Manuel Perez and Franco M. Luque. Atalaya at SemEval 2019 task 5: Robustembeddings for tweet classification. In Proceedings of the 13th International Workshop onSemantic Evaluation, pages 64–69, Minneapolis, Minnesota, USA, June 2019. Associationfor Computational Linguistics.
[374] Isaac Persing and Vincent Ng. End-to-end argumentation mining in student essays. InProc. of NAACL-HLT 2016, pages 1384–1394, 2016.
BIBLIOGRAPHY 243
[375] Matthew Peters, Mark Neumann, Mohit Iyyer, Matt Gardner, Christopher Clark, Ken-ton Lee, and Luke Zettlemoyer. Deep contextualized word representations. In Proc. ofNAACL-HLT 2018, pages 2227–2237, 2018.
[376] Sasa Petrovic, Miles Osborne, and Victor Lavrenko. Streaming first story detection withapplication to twitter. In Human Language Technologies: The 2010 Annual Conferenceof the North American Chapter of the Association for Computational Linguistics, pages181–189. Association for Computational Linguistics, 2010.
[377] Sasa Petrovic, Miles Osborne, and Victor Lavrenko. Using paraphrases for improving firststory detection in news and twitter. In Proceedings of the 2012 Conference of the NorthAmerican Chapter of the Association for Computational Linguistics: Human LanguageTechnologies, pages 338–346, 2012.
[378] James Philbin, Ondrej Chum, Michael Isard, Josef Sivic, and Andrew Zisserman. Lostin quantization: Improving particular object retrieval in large scale image databases. InCVPR 2008, pages 1–8, June 2008.
[379] Lawrence Philips. The double metaphone search algorithm. C/C++ Users Journal,18:38–43, 06 2000.
[380] Emanuele Pianta, Luisa Bentivogli, and Christian Girardi. Multiwordnet: developing analigned multilingual database. In Proceedings of the First International Conference onGlobal WordNet, January 2002.
[381] Manfred Pinkal. Logic and lexicon: the semantics of the indefinite. Studies in linguisticsand philosophy, 56, 1995.
[382] Marco Polignano and Pierpaolo Basile. Hansel: Italian hate speech detection throughensemble learning and deep neural networks. In Proceedings of the Sixth EvaluationCampaign of Natural Language Processing and Speech Tools for Italian. Final Workshop(EVALITA 2018) co-located with the Fifth Italian Conference on Computational Linguis-tics (CLiC-it 2018), Turin, Italy., 2018.
[383] Ana-Maria Popescu, Marco Pennacchiotti, and Deepa Paranjpe. Extracting events andevent descriptions from twitter. In Proceedings of the 20th international conference com-panion on World wide web, pages 105–106. ACM, 2011.
[384] Peter Potash, Alexey Romanov, and Anna Rumshisky. Here’s my point: Joint pointerarchitecture for argument mining. In Proc. of EMNLP 2017, pages 1364–1373, 2017.
[385] Henry Prakken. An abstract framework for argumentation with structured arguments.Argument & Computation, 1:93–124, 2010.
[386] Michal Ptaszynski, Fumito Masui, Yasutomo Kimura, Rafal Rzepka, and Kenji Araki.Automatic extraction of harmful sentence patterns with application in cyberbullying de-tection. In Human Language Technology. Challenges for Computer Science and Linguis-tics - 7th Language and Technology Conference, LTC 2015, Poznan, Poland, November27-29, 2015, Revised Selected Papers, pages 349–362, 2015.
[387] Malik Al Qassas, Daniela Fogli, Massimiliano Giacomin, and Giovanni Guida. Analysis ofclinical discussions based on argumentation schemes. Procedia Computer Science, 64:282–289, 2015.

244 BIBLIOGRAPHY
[388] Kira Radinsky, Eugene Agichtein, Evgeniy Gabrilovich, and Shaul Markovitch. A word ata time: computing word relatedness using temporal semantic analysis. In Proceedings ofthe 20th International Conference on World Wide Web, WWW 2011, Hyderabad, India,March 28 - April 1, 2011, pages 337–346, 2011. DOI: 10.1145/1963405.1963455.
[389] Iyad Rahwan and Guillermo Simari, editors. Argumentation in Artificial Intelligence.Springer, 2009.
[390] C. Reed and F. Grasso. Recent advances in computational models of natural argument.Int. J. Intell. Syst., 22(1):1–15, 2007.
[391] Chris Reed and Glen Rowe. Araucaria: Software for argument analysis, diagrammingand representation. Int. Journal on Artificial Intelligence Tools, 13(4):961–980, 2004.
[392] Michaela Regneri, Alexander Koller, and Manfred Pinkal. Learning script knowledge withweb experiments. In ACL 2010, Proceedings of the 48th Annual Meeting of the Associationfor Computational Linguistics, July 11-16, 2010, Uppsala, Sweden, pages 979–988, 2010.
[393] Nils Reimers, Benjamin Schiller, Tilman Beck, Johannes Daxenberger, Christian Stab,and Iryna Gurevych. Classification and clustering of arguments with contextualized wordembeddings. In Proc. of ACL 2019, pages 567–578, 2019.
[394] Joseph Reisinger and Raymond J. Mooney. Multi-prototype vector-space models of wordmeaning. In Human Language Technologies: Conference of the North American Chap-ter of the Association of Computational Linguistics, Proceedings, June 2-4, 2010, LosAngeles, California, USA, pages 109–117, 2010.
[395] Sebastian Riedel, Limin Yao, Andrew McCallum, and Benjamin M. Marlin. Relationextraction with matrix factorization and universal schemas. In Lucy Vanderwende,Hal Daume III, and Katrin Kirchhoff, editors, Human Language Technologies: Confer-ence of the North American Chapter of the Association of Computational Linguistics,Proceedings, June 9-14, 2013, Westin Peachtree Plaza Hotel, Atlanta, Georgia, USA,pages 74–84. The Association for Computational Linguistics, 2013.
[396] Ruty Rinott, Lena Dankin, Carlos Alzate, Mitesh M. Khapra, Ehud Aharoni, and NoamSlonim. Show me your evidence - an automatic method for context dependent evidencedetection. In EMNLP, pages 440–450, 2015.
[397] Ana Rojo. Step by Step: A Course in Contrastive Linguistics and Translation. PeterLang, 2009.
[398] Lorenza Romano, Milen Kouylekov, Idan Szpektor, Ido Dagan, and Alberto Lavelli. In-vestigating a generic paraphrase-based approach for relation extraction. In Proc. of the11st Conference of the European Chapter of the Association for Computational Linguistics(EACL), pages 409–416, April 2006.
[399] James A Russell. A circumplex model of affect. Journal of personality and social psy-chology, 39(6):1161, 1980.
[400] Horacio Saggion and Thierry Poibeau. Automatic Text Summarization: Past, Presentand Future, pages 3–21. Springer, Berlin, Heidelberg, 01 2013.
[401] Takeshi Sakaki, Makoto Okazaki, and Yutaka Matsuo. Earthquake shakes twitter users:real-time event detection by social sensors. In Proceedings of the 19th international con-ference on World wide web, pages 851–860. ACM, 2010.

BIBLIOGRAPHY 245
[402] Muhammad Saleem, Samaneh Nazari Dastjerdi, Ricardo Usbeck, and Axel-Cyrille Ngonga Ngomo. Question answering over linked data: What is difficult to answer?what affects the f scores? In Natural Language Interfaces workshop at ISWC, 2017.
[403] Valentino Santucci, Stefania Spina, Alfredo Milani, Giulio Biondi, and Gabriele Di Bari.Detecting hate speech for italian language in social media. In Proceedings of the SixthEvaluation Campaign of Natural Language Processing and Speech Tools for Italian. FinalWorkshop (EVALITA 2018) co-located with the Fifth Italian Conference on Computa-tional Linguistics (CLiC-it 2018), Turin, Italy., 2018.
[404] Enrico Santus, Emmanuele Chersoni, Alessandro Lenci, Chu-Ren Huang, and PhilippeBlache. Testing apsyn against vector cosine on similarity estimation. In Proceedings ofthe 30th Pacific Asia Conference on Language, Information and Computation, PACLIC30, Seoul, Korea, October 28 - October 30, 2016, pages 229–238, 2016.
[405] Ashutosh Saxena, Ashesh Jain, Ozan Sener, Aditya Jami, Dipendra Kumar Misra, andHema Swetha Koppula. Robobrain: Large-scale knowledge engine for robots. CoRR,abs/1412.0691, 2014.
[406] Tatjana Scheffler, Erik Haegert, Santichai Pornavalaia, and Mino Lee Sasse. Overview ofthe germeval 2018 shared task on the identification of offensive language. In Proceedingsof GermEval 2018, 14th Conference on Natural Language Processing (KONVENS 2018),2018.
[407] Martin J. Schuster, Dominik Jain, Moritz Tenorth, and Michael Beetz. Learning organi-zational principles in human environments. In ICRA, pages 3867–3874, May 2012.
[408] Mike Schuster and Kuldip K. Paliwal. Bidirectional recurrent neural networks. IEEETransactions on Signal Processing, 1997.
[409] Elaheh ShafieiBavani, Mohammad Ebrahimi, Raymond Wong, and Fang Chen. Summa-rization evaluation in the absence of human model summaries using the compositionalityof word embeddings. In Proceedings of the 27th International Conference on Computa-tional Linguistics, pages 905–914. Association for Computational Linguistics, 2018.
[410] Beaux Sharifi, Mark-Anthony Hutton, and Jugal Kalita. Summarizing microblogs auto-matically. In Human Language Technologies: The 2010 Annual Conference of the NorthAmerican Chapter of the Association for Computational Linguistics, pages 685–688. As-sociation for Computational Linguistics, 2010.
[411] Abhishek Singh, Eduardo Blanco, and Wei Jin. Incorporating emoji descriptions improvestweet classification. In Proceedings of the Annual Conference of the North AmericanChapter of the Association for Computational Linguistics (NAACL), 2019.
[412] Peter K. Smith, Jess Mahdavi, Manuel Carvalho, Sonja Fisher, Shanette Russell, andNeil Tippett. Cyberbullying: its nature and impact in secondary school pupils. Journalof Child Psychology and Psychiatry, 49(4):376–385, 2008.
[413] Samuel L. Smith, David H. P. Turban, Steven Hamblin, and Nils Y. Hammerla. Offlinebilingual word vectors, orthogonal transformations and the inverted softmax. In ICLR,2017.
[414] Jan Snajder. Social media argumentation mining: The quest for deliberateness in rau-cousness. CoRR, abs/1701.00168, 2017.

246 BIBLIOGRAPHY
[415] Cees GM Snoek and Marcel Worring. Multimedia event-based video indexing using timeintervals. IEEE Transactions on Multimedia, 7(4):638–647, 2005.
[416] Cees GM Snoek, Marcel Worring, et al. Time interval based modelling and classificationof events in soccer video. In Proceedings of the 9th annual conference of the advancedschool for computing and imaging (ASCI), Heijen. Citeseer, 2003.
[417] Richard Socher, Danqi Chen, Christopher D. Manning, and Andrew Y. Ng. Reasoningwith neural tensor networks for knowledge base completion. In Christopher J. C. Burges,Leon Bottou, Zoubin Ghahramani, and Kilian Q. Weinberger, editors, Advances in Neu-ral Information Processing Systems 26: 27th Annual Conference on Neural InformationProcessing Systems 2013. Proceedings of a meeting held December 5-8, 2013, Lake Tahoe,Nevada, United States., pages 926–934, 2013.
[418] Richard Socher, Alex Perelygin, Jean Y Wu, Jason Chuang, Christopher D Manning, An-drew Y Ng, and Christopher Potts. Recursive deep models for semantic compositionalityover a sentiment treebank. In Proceedings of EMNLP, volume 1631, page 1642, 2013.
[419] Shuran Song, Linguang Zhang, and Jianxiong Xiao. Robot in a room: Toward perfectobject recognition in closed environments. CoRR, abs/1507.02703, 2015.
[420] Rachele Sprugnoli, Stefano Menini, Sara Tonelli, Filippo Oncini, and Enrico Piras. Cre-ating a whatsapp dataset to study pre-teen cyberbullying. In Proceedings of the 2ndWorkshop on Abusive Language Online (ALW2), pages 51–59. Association for Computa-tional Linguistics, 2018.
[421] Rachele Sprugnoli and Sara Tonelli. One, no one and one hundred thousand events:Defining and processing events in an inter-disciplinary perspective. Natural LanguageEngineering, 23(4):485–506, 2017.
[422] Nitish Srivastava, Geoffrey Hinton, Alex Krizhevsky, Ilya Sutskever, and Ruslan Salakhut-dinov. Dropout: A simple way to prevent neural networks from overfitting. Journal ofMachine Learning Research, 15:1929–1958, 2014.
[423] Christian Stab, Johannes Daxenberger, Chris Stahlhut, Tristan Miller, Benjamin Schiller,Christopher Tauchmann, Steffen Eger, and Iryna Gurevych. ArgumenText: Searching forarguments in heterogeneous sources. In Proceedings of NAACL (demo), June 2018.
[424] Christian Stab and Iryna Gurevych. Annotating argument components and relations inpersuasive essays. In COLING, pages 1501–1510, 2014.
[425] Christian Stab and Iryna Gurevych. Parsing argumentation structures in persuasiveessays. Computational Linguistics, 43(3):619–659, 2017.
[426] Jacopo Staiano and Marco Guerini. Depeche mood: a lexicon for emotion analysis fromcrowd annotated news. In Proceedings of the 52nd Annual Meeting of the Association forComputational Linguistics (Volume 2: Short Papers), volume 2, pages 427–433, 2014.
[427] Dominik Stammbach, Azin Zahraei, Polina Stadnikova, and Dietrich Klakow. Overviewof the germeval 2018 shared task on the identification of offensive language. In Proceedingsof GermEval 2018, 14th Conference on Natural Language Processing (KONVENS 2018),2018.

BIBLIOGRAPHY 247
[428] Pontus Stenetorp, Sampo Pyysalo, Goran Topic, Tomoko Ohta, Sophia Ananiadou, andJun’ichi Tsujii. Brat: a web-based tool for nlp-assisted text annotation. In Proceedingsof the Demonstrations at the 13th Conference of the European Chapter of the Associationfor Computational Linguistics, pages 102–107. Association for Computational Linguistics,2012.
[429] Lucas Sterckx. Topic detection in a million songs. PhD thesis, PhD thesis, GhentUniversity, 2014.
[430] Fabian-Robert Stoter, Stefan Uhlich, Antoine Liutkus, and Yuki Mitsufuji. Open-unmix-a reference implementation for music source separation. Journal of Open Source Software,2019.
[431] Fabian M. Suchanek, Gjergji Kasneci, and Gerhard Weikum. Yago: a core of semanticknowledge. In Procs of WWW 2007, pages 697–706. ACM, 2007.
[432] Mihai Surdeanu, Julie Tibshirani, Ramesh Nallapati, and Christopher D. Manning. Multi-instance multi-label learning for relation extraction. In Jun’ichi Tsujii, James Hender-son, and Marius Pasca, editors, Proceedings of the 2012 Joint Conference on EmpiricalMethods in Natural Language Processing and Computational Natural Language Learning,EMNLP-CoNLL 2012, July 12-14, 2012, Jeju Island, Korea, pages 455–465. ACL, 2012.
[433] Philip Tagg. Analysing popular music: theory, method and practice. Popular Music,2:37–67, 1982.
[434] Leonard Talmy. The fundamental system of spatial schemas in language. From per-ception to meaning: Image schemas in cognitive linguistics, 3, 2005. DOI: 10.1515/
9783110197532.3.199.
[435] Moritz Tenorth and Michael Beetz. Knowrob: A knowledge processing infrastructure forcognition-enabled robots. The International Journal of Robotics Research, 32(5):566–590,2013. DOI: 10.1177/0278364913481635.
[436] Moritz Tenorth, Lars Kunze, Dominik Jain, and Michael Beetz. KNOWROB-MAP –knowledge-linked semantic object maps. In IEEE-RAS ICHR, pages 430–435, Nashville,TN, USA, December 6-8 2010.
[437] Moritz Tenorth, Daniel Nyga, and Michael Beetz. Understanding and executing instruc-tions for everyday manipulation tasks from the world wide web. In IEEE InternationalConference on Robotics and Automation, ICRA 2010, Anchorage, Alaska, USA, 3-7 May2010, pages 1486–1491, 2010. DOI: 10.1109/ROBOT.2010.5509955.
[438] Simone Teufel, Advaith Siddharthan, and Colin Batchelor. Towards domain-independentargumentative zoning: Evidence from chemistry and computational linguistics. In Proc.of EMNLP 2009, pages 1493–1502, 2009.
[439] Akshaya Thippur, Chris Burbridge, Lars Kunze, Marina Alberti, John Folkesson, PatricJensfelt, and Nick Hawes. A comparison of qualitative and metric spatial relation modelsfor scene understanding. In AAAI’15, January 2015.
[440] Robert S. Tokunaga. Following you home from school: A critical review and synthesisof research on cyberbullying victimization. Computers in Human Behavior, 26(3):277 –287, 2010.

248 BIBLIOGRAPHY
[441] Sabina Tomkins, Lise Getoor, Yunfei Chen, and Yi Zhang. A socio-linguistic model forcyberbullying detection. In IEEE/ACM 2018 International Conference on Advances inSocial Networks Analysis and Mining, ASONAM 2018, Barcelona, Spain, August 28-31,2018, pages 53–60, 2018.
[442] Stephen Toulmin. The Uses of Argument. Cambridge University Press, 1958.
[443] Antonio Trenta, Anthony Hunter, and Sebastian Riedel. Extraction of evidence tablesfrom abstracts of randomized clinical trials using a maximum entropy classifier and globalconstraints. CoRR, abs/1509.05209, 2015.
[444] Theo Trouillon, Johannes Welbl, Sebastian Riedel, Eric Gaussier, and GuillaumeBouchard. Complex embeddings for simple link prediction. In Proc. of ICML 2016,pages 2071–2080, 2016.
[445] Christina Unger, Lorenz Buhmann, Jens Lehmann, Axel-Cyrille Ngonga Ngomo, DanielGerber, and Philipp Cimiano. Template-based qa over rdf data. In Procs of WWW 2012,pages 639–648, 2012.
[446] Christina Unger and Philipp Cimiano. Pythia: Compositional meaning construction forontology-based question answering on the semantic web. In Procs of NLDB 2011, pages153–160, 2011.
[447] Christina Unger, Corina Forascu, Vanessa Lopez, Axel-Cyrille Ngonga Ngomo, ElenaCabrio, Philipp Cimiano, and Sebastian Walter. Question answering over linked data(QALD-4). In Working Notes for CLEF 2014 Conference, Sheffield, UK, September 15-18, 2014, pages 1172–1180, 2014.
[448] Christina Unger, Corina Forascu, Vanessa Lopez, Axel-Cyrille Ngonga Ngomo, ElenaCabrio, Philipp Cimiano, and Sebastian Walter. Question answering over linked data(QALD-5). In Working Notes of CLEF 2015 - Conference and Labs of the Evaluationforum, Toulouse, France, September 8-11, 2015, 2015.
[449] Christina Unger, Andre Freitas, and Philipp Cimiano. An Introduction to Question An-swering over Linked Data, pages 100–140. Springer International Publishing, Cham,2014.
[450] Christina Unger, Axel-Cyrille Ngonga Ngomo, and Elena Cabrio. 6th open challengeon question answering over linked data (QALD-6). In Semantic Web Challenges - ThirdSemWebEval Challenge at ESWC 2016, Heraklion, Crete, Greece, May 29 - June 2, 2016,Revised Selected Papers, pages 171–177, 2016.
[451] Ricardo Usbeck, Ria Gusmita, Muhammad Saleem, and Axel-Cyrille Ngonga Ngomo. 9thchallenge on question answering over linked data (qald-9). 11 2018.
[452] Marieke Van Erp, Giuseppe Rizzo, and Raphael Troncy. Learning with the web: Spottingnamed entities on the intersection of nerd and machine learning. In # MSM, pages 27–30.Citeseer, 2013.
[453] Laurent Vanni, Melanie Ducoffe, Carlos Aguilar, Frederic Precioso, and Damon Mayaffre.Textual deconvolution saliency (tds): a deep tool box for linguistic analysis. In Proceedingsof the 56th Annual Meeting of the Association for Computational Linguistics (Volume 1:Long Papers), pages 548–557, 2018.
BIBLIOGRAPHY 249
[454] Marc Verhagen, Robert Gaizauskas, Frank Schilder, Mark Hepple, Graham Katz, andJames Pustejovsky. Semeval-2007 task 15: Tempeval temporal relation identification. InProceedings of the 4th International Workshop on Semantic Evaluations, pages 75–80.Association for Computational Linguistics, 2007.
[455] Bart Verheij. Argumed - a template-based argument mediation system for lawyers andlegal knowledge based systems. In Proc. of the 11th International Conference on LegalKnowledge and Information Systems (JURIX), pages 113–130, December 1998.
[456] Maria Paz Garcia Villalba and Patrick Saint-Dizier. Some facets of argument miningfor opinion analysis. In Proceedings of the 2012 Conference on Computational Models ofArgument, pages 23–34, 2012.
[457] Cedric Villani. Optimal transport: old and new, volume 338. Springer Science & BusinessMedia, 2008.
[458] Serena Villata, Elena Cabrio, Imene Jraidi, Sahbi Benlamine, Maher Chaouachi, ClaudeFrasson, and Fabien Gandon. Emotions and personality traits in argumentation: Anempirical evaluation. Argument & Computation, 8(1):61–87, 2017.
[459] Jacky Visser, Barbara Konat, Rory Duthie, Marcin Koszowy, Katarzyna Budzynska, andChris Reed. Argumentation in the 2016 us presidential elections: annotated corpora oftelevision debates and social media reaction. Language Resources and Evaluation, 2019.
[460] Dirk von Grunigen, Ralf Grubenmann, Fernando Benites, Pius Von Daniken, and MarkCieliebak. spmmmp at germeval 2018 shared task: Classification of offensive content intweets using convolutional neural networks and gated recurrent units. In Proceedings ofGermEval 2018, 14th Conference on Natural Language Processing (KONVENS 2018),2018.
[461] Henning Wachsmuth, Shahbaz Syed, and Benno Stein. Retrieval of the best counterar-gument without prior topic knowledge. In Proceedings of ACL, pages 241–251, 2018.
[462] Markus Waibel, Michael Beetz, Raffaello D’Andrea, Rob Janssen, Moritz Tenorth, JavierCivera, Jos Elfring, Dorian Galvez-Lopez, Kai Haussermann, J.M.M. Montiel, AlexanderPerzylo, Bjorn Schießle, Oliver Zweigle, and Rene van de Molengraft. RoboEarth - AWorld Wide Web for Robots. Robotics & Automation Magazine, 18(2):69–82, 2011. DOI:10.1109/MRA.2011.941632.
[463] Marylin Walker, Jean Fox Tree, Pranav Anand, R. Abbott, and Joseph King. A corpusfor research on deliberation and debate. In LREC, pages 812–817, 2012.
[464] Douglas Walton. Explanations and arguments based on practical reasoning. In ThomasRoth-Berghofer, Nava Tintarev, and David B. Leake, editors, Explanation-aware Com-puting, Papers from the 2009 IJCAI Workshop, Pasadena, California , USA, July 11-12,2009, pages 72–83, 2009.
[465] Douglas Walton, Christopher Reed, and Fabrizio Macagno. Argumentation Schemes.Cambridge University Press, 2008.
[466] Lu Wang and Claire Cardie. Improving agreement and disagreement identification inonline discussions with A socially-tuned sentiment lexicon. In Proceedings of the 5thWorkshop on Computational Approaches to Subjectivity, Sentiment and Social MediaAnalysis, WASSA@ACL 2014, June 27, 2014, Baltimore, Maryland, USA, pages 97–106,2014.

250 BIBLIOGRAPHY
[467] Lu Wang, Hema Raghavan, Vittorio Castelli, Radu Florian, and Claire Cardie. A sentencecompression based framework to query-focused multi-document summarization. arXivpreprint arXiv:1606.07548, 2016.
[468] Xiaofeng Wang, Matthew S Gerber, and Donald E Brown. Automatic crime predic-tion using events extracted from twitter posts. In Social Computing, Behavioral-CulturalModeling and Prediction, pages 231–238. Springer, 2012.
[469] Zhen Wang, Jianwen Zhang, Jianlin Feng, and Zheng Chen. Knowledge graph embeddingby translating on hyperplanes. In Proceedings of the Twenty-Eighth AAAI Conference onArtificial Intelligence, July 27 -31, 2014, Quebec City, Quebec, Canada., pages 1112–1119,2014.
[470] Amy Beth Warriner, Victor Kuperman, and Marc Brysbaert. Norms of valence, arousal,and dominance for 13,915 english lemmas. Behavior research methods, 45(4):1191–1207,2013.
[471] Zeerak Waseem, Wendy Hui Kyong Chung, Dirk Hovy, and Joel Tetreault. Proceedingsof the first workshop on abusive language online. In Proceedings of the First Workshopon Abusive Language Online. Association for Computational Linguistics, 2017.
[472] Zeerak Waseem and Dirk Hovy. Hateful symbols or hateful people? predictive featuresfor hate speech detection on twitter. In SRW@HLT-NAACL, 2016.
[473] Kento Watanabe, Yuichiroh Matsubayashi, Naho Orita, Naoaki Okazaki, Kentaro Inui,Satoru Fukayama, Tomoyasu Nakano, Jordan Smith, and Masataka Goto. Modelingdiscourse segments in lyrics using repeated patterns. In Proceedings of COLING 2016,the 26th International Conference on Computational Linguistics: Technical Papers, pages1959–1969, 2016.
[474] Gregor Wiedeman, Eugen Ruppert, Raghav Jindal, and Chris Biemann. Overview ofthe germeval 2018 shared task on the identification of offensive language. In Proceedingsof GermEval 2018, 14th Conference on Natural Language Processing (KONVENS 2018),2018.
[475] Michael Wiegand, Anastasija Amann, Tatiana Anikina, Aikaterini Azoidou, AnastasiaBorisenkov, Kirstin Kolmorgen, Insa Kroger, and Christine Schafer. Overview of thegermeval 2018 shared task on the identification of offensive language. In Proceedings ofGermEval 2018, 14th Conference on Natural Language Processing (KONVENS 2018),2018.
[476] Michael Wiegand, Josef Ruppenhofer, and Thomas Kleinbauer. Detection of AbusiveLanguage: the Problem of Biased Datasets. In Proceedings of the 2019 Conference ofthe North American Chapter of the Association for Computational Linguistics: HumanLanguage Technologies, Volume 1 (Long and Short Papers), pages 602–608, Minneapolis,Minnesota, June 2019. Association for Computational Linguistics.
[477] Michael Wiegand, Melanie Siegel, and Josef Ruppenhofer. Overview of the germeval 2018shared task on the identification of offensive language. In GermEval 2018, 2018.
[478] Fei Wu and Daniel S. Weld. Open information extraction using Wikipedia. In Proceedingsof the 48th Annual Meeting of the Association for Computational Linguistics, pages 118–127, Uppsala, Sweden, July 2010. Association for Computational Linguistics.

BIBLIOGRAPHY 251
[479] Zhibiao Wu and Martha Palmer. Verbs semantics and lexical selection. In ACL, ACL ’94,pages 133–138, Stroudsburg, PA, USA, 1994. Association for Computational Linguistics.
[480] Ellery Wulczyn, Nithum Thain, and Lucas Dixon. Ex machina: Personal attacks seen atscale. In WWW, pages 1391–1399, 2017.
[481] Adam Wyner, Jodi Schneider, Katie Atkinson, and Trevor J. Bench-Capon. Semi-automated argumentative analysis of online product reviews. In Proceedings of the 2012Conference on Computational Models of Argument, pages 43–50, 2012.
[482] Yunqing Xia, Linlin Wang, Kam-Fai Wong, and Mingxing Xu. Sentiment vector spacemodel for lyric-based song sentiment classification. In Proceedings of the 46th AnnualMeeting of the Association for Computational Linguistics on Human Language Tech-nologies: Short Papers, HLT-Short ’08, pages 133–136, Stroudsburg, PA, USA, 2008.Association for Computational Linguistics.
[483] Jianxiong Xiao, James Hays, Krista A. Ehinger, Aude Oliva, and Antonio Torralba. SUNdatabase: Large-scale scene recognition from abbey to zoo. In The Twenty-Third IEEEConference on Computer Vision and Pattern Recognition, CVPR 2010, San Francisco,CA, USA, 13-18 June 2010, pages 3485–3492, 2010. DOI: 10.1109/CVPR.2010.5539970.
[484] Wei Xu, Ralph Grishman, Adam Meyers, and Alan Ritter. A preliminary study of tweetsummarization using information extraction. NAACL 2013, page 20, 2013.
[485] Bishan Yang, Wen-tau Yih, Xiaodong He, Jianfeng Gao, and Li Deng. Embedding Enti-ties and Relations for Learning and Inference in Knowledge Bases. ICLR, 2015.
[486] Dan Yang and Won-Sook Lee. Music emotion identification from lyrics. In 2009 11thIEEE International Symposium on Multimedia, pages 624–629, Dec 2009.
[487] Yiming Yang, Thomas Pierce, and Jaime G. Carbonell. A study of retrospective andon-line event detection. In SIGIR ’98, 1998.
[488] Dawei Yin, Zhenzhen Xue, Liangjie Hong, Brian D. Davison, April Kontostathis, andLynne Edwards. Detection of harassment on web 2.0. In Proceedings of the ContentAnalysis in the Web, pages 1–7, 2009.
[489] Jay Young, Valerio Basile, Lars Kunze, Elena Cabrio, and Nick Hawes. Towards lifelongobject learning by integrating situated robot perception and semantic web mining. InECAI 2016 - 22nd European Conference on Artificial Intelligence, 29 August-2 Septem-ber 2016, The Hague, The Netherlands - Including Prestigious Applications of ArtificialIntelligence (PAIS 2016), pages 1458–1466, 2016.
[490] Jay Young and Nick Hawes. Learning by observation using qualitative spatial relations.In AAMAS 2015, May 2015.
[491] Jay Young, Lars Kunze, Valerio Basile, Elena Cabrio, Nick Hawes, and Barbara Caputo.Semantic web-mining and deep vision for lifelong object discovery. In 2017 IEEE In-ternational Conference on Robotics and Automation, ICRA 2017, Singapore, Singapore,May 29 - June 3, 2017, pages 2774–2779, 2017.
[492] Jure Zabkar, Martin Mozina, Jerneja Videcnik, and Ivan Bratko. Argument based ma-chine learning in a medical domain. In Proc. of COMMA 2006, pages 59–70, 2006.

252 BIBLIOGRAPHY
[493] Marcos Zampieri, Shervin Malmasi, Preslav Nakov, Sara Rosenthal, Noura Farra, andRitesh Kumar. SemEval-2019 task 6: Identifying and categorizing offensive language insocial media (OffensEval). In Proceedings of the 13th International Workshop on Seman-tic Evaluation, pages 75–86, Minneapolis, Minnesota, USA, June 2019. Association forComputational Linguistics.
[494] Rowan Zellers, Yonatan Bisk, Roy Schwartz, and Yejin Choi. SWAG: A large-scaleadversarial dataset for grounded commonsense inference. In Proc. of EMNLP 2018, pages93–104, 2018.
[495] Robinson-D. Zhang, Z. and J. Tepper. Detecting hate speech on twitter using aconvolution-gru based deep neural network. In ESWC, pages 745–760. Springer Verlag,2018.
[496] Deyu Zhou, Liangyu Chen, and Yulan He. A simple bayesian modelling approach toevent extraction from twitter. Atlantis, page 0, 2011.
[497] Deyu Zhou, Xuan Zhang, and Yulan He. Event extraction from Twitter using Non-Parametric Bayesian Mixture Model with Word Embeddings. In Proceedings of the 15thConference of the European Chapter of the Association for Computational Linguistics,pages 808–817, Valencia, Spain, April 2017.
[498] Valentino Zurloni and Luigi Anolli. Fallacies as argumentative devices in political debates.In Multimodal Communication in Political Speech. Shaping Minds and Social Action - In-ternational Workshop, Political Speech 2010, Rome, Italy, November 10-12, 2010, RevisedSelected Papers, pages 245–257, 2010.