Kotak Balanced Advantage Fund
89
June 30, 2022 FUND FACT SHEET Past performance of the Sponsor/AMC/Fund does not indicate the schemes future performance. Risk Factors on page 84. Mutual fund investments are subject to market risks, read all scheme related documents carefully. • Wealth creation over a long period of time • Investment in equity, equity related securities & debt, money market instruments while managing risk through active allocation *Investors should consult their financial advisor if in doubt about whether the product is suitable for them. It is suitable for investors who are seeking*: Kotak Balanced Advantage Fund (An open ended Dynamic Asset Allocation Fund) Investors understand that their principal will be at Very High risk The above riskometer is based on the scheme portfolio as on 30 th June 2022. An addendum may be issued or updated on the website for new riskometer. A fund that gives you freedom from managing equity and debt allocation manually during market ups and downs, giving you a balanced growth. It's Automatic ! It's Automatic ! Kotak Balanced Advantage Fund
-
Upload
khangminh22 -
Category
Documents
-
view
2 -
download
0
Transcript of Kotak Balanced Advantage Fund

June 30, 2022
FUNDFACT SHEET
Past performance of the Sponsor/AMC/Fund does not indicate the schemes future performance. Risk Factors on page 84.Mutual fund investments are subject to market risks, read all scheme related documents carefully.
• Wealth creation over a long period of time • Investment in equity, equity related securities & debt, money market instruments while managing risk through active allocation
*Investors should consult their financial advisor if in doubt about whether the product is suitable for them.
It is suitable for investors who are seeking*:
Kotak Balanced Advantage Fund(An open ended Dynamic Asset Allocation Fund)
Investors understand that their principal will be at Very High risk
The above riskometer is based on the scheme portfolio as on 30th June 2022. An addendum may be issued or updated on the website for new riskometer.
A fund that gives you freedom from managing equity and debt allocation manually during market ups and downs, giving you a balanced growth.
It's Automatic !It's Automatic !
Kotak BalancedAdvantage Fund

INDEX
Contents Page no.
How to read Fact Sheet 4Debt Market Snapshot 3Equity Market Snapshot 2
Kotak Manufacture In India Fund Sectoral/Thematic 16
Market Overview 1
Kotak Flexicap Fund Flexicap Fund 5Kotak Emerging Equity Fund Mid Cap Fund 6
Equity Funds
Kotak Small Cap Fund Small Cap Fund 8
Fund Name/Scheme Name New SEBI scheme category
Kotak Equity Opportunities Fund Large & Mid Cap Fund 7
Kotak Bluechip Fund Large Cap Fund 9Kotak Multicap Fund Multicap Fund 10Kotak Tax Saver Fund ELSS 11Kotak Focused Equity Fund Focused Fund 12Kotak Pioneer Fund Thematic 13Kotak ESG Opportunities Fund Thematic 14Kotak India EQ Contra Fund Contra Fund 15
Hybrid Funds
Kotak Debt Hybrid Fund Conservative Hybrid Fund 24
Debt FundsKotak Overnight Fund Overnight Fund 27
Kotak Multi Asset Allocator Fund of Fund – Dynamic (Erstwhile Known as Asset Allocator Fund) FOF (Domestic) 22
Kotak Liquid Fund Liquid Fund 28Kotak Savings Fund Ultra Short Duration Fund 29
Kotak Infrastructure & Economic Reform Fund Sectoral/Thematic 17
Kotak Money Market Fund Money Market Fund 31
Kotak Equity Hybrid Fund Aggressive Hybrid Fund 19
Kotak India Growth Fund Series 4 18
Kotak Balanced Advantage Fund Balanced Advantage 21
Kotak Equity Arbitrage Fund Arbitrage Fund 26
Kotak Equity Savings Fund Equity Savings 23
Kotak Low Duration Fund Low Duration Fund 32Kotak Corporate Bond Fund Corporate Bond Fund 34Kotak Bond Short Term Fund Short Duration Fund 35
Kotak Dynamic Bond Fund Dynamic Bond 39
Kotak Nifty 50 ETF ETF 59
Kotak Credit Risk Fund Credit Risk Fund 37
Kotak Nifty Midcap 50 ETF ETF 65Kotak Nifty100 Low Volatility 30 ETF ETF 66
Kotak Bond Fund Medium to Long Duration Fund 46
Kotak Global Emerging Market Fund FOF (Overseas) 56Kotak International REIT FOF FOF (Overseas) 55
Kotak Banking & PSU Debt Fund Banking & PSU Fund 43
Kotak NIFTY 50 Index Fund Index 67
Kotak Gilt Fund Gilt Fund 45
Kotak Nifty SDL Apr 2032 Top 12 Equal Weight Index Fund Index 49
Index Funds
Risk Factors 84IDCW History 81
Fund of Funds Scheme
Kotak Gold ETF ETF 58Kotak Nifty Bank ETF ETF 57
About Our Fund Managers 78
Kotak Nifty IT ETF ETF 61
Kotak Medium Term Fund Medium Duration Fund 41Kotak Floating Rate Fund Floater Fund 40
Exposure 50
ETF Funds
Kotak Gold Fund FOF (Domestic) 52Kotak Global Innovation Fund of Fund FOF (Overseas) 53
Kotak Nifty PSU Bank ETF ETF 60
Kotak NIFTY Alpha 50 ETF ETF 62
Kotak Nifty SDL Apr 2027 Top 12 Equal Weight Index Fund Index 48
Kotak NASDAQ 100 Fund of Fund FOF (Overseas) 54
Kotak Nifty 50 Value 20 ETF ETF 63Kotak S&P BSE Sensex ETF ETF 64
Kotak NIFTY Next 50 Index Fund Index 68Scheme Performance 69

1
Market Valuation Indicators
Key Events for the Month of June 2022:
Market Overview
l The S&P 500 and Nasdaq corrected ~8%.
l The CPI inflation rate for May 2022 cooled from the 8 year high in April and came in at 7.04% on the back of the base effect while WPI inflation surged to a record high of 15.88% in May as prices of vegetables and fruits spiked.
l Nifty (-4.8%) corrected sharply, as the markets got worried due to hawkish Fed and recession concerns.
l RBI’s MPC decided to hike the Policy Repo Rate by 50 bps to 4.9% in its June meeting.
l GST revenue collection for June was at Rs 1.44 lakh cr; up 56% year on year.
l FIIs continued being net sellers in the month of June 2022 and were net sellers to the tune of -$6.4bn even as DII buying continued at +$5.9bn.
l Brent Crude was extremely volatile and touched ~$125/ barrel before correcting ~$110/ barrel.
NIFTY P/E (x) - 1 Year Forward
World Market Cap to GDP Ratio is 103%
Market Cap-to-GDP Ratio – Above Long TermAverage But Below Global Average
Source: Bloomberg Consensus estimates Source: Motilal Oswal
Source: Axis Capital Internal Estimates
Stretched
Bubble
Cheap Over Invest80% - 90%
Attractive Neutral +65% - 75%
Fair Neutral50%
Fair ValuePlus
Neutral -35% - 45%
Under Invest15%- 25%
Exit5% - 10%
Market Equity Allocaion
Suggested equity allocation
(Assuming 50% equity
allocation as neutral)
12000
22000
32000
42000
52000
62000
May
-19
Jun-
19
Jul-1
9
Aug
-19
Sep-
19
Oct
-19
Nov
-19
Dec
-19
Jan-
20
Feb-
20
Mar
-20
Apr
-20
May
-20
Jun-
20
Jul-2
0
Aug
-20
Sep-
20
Nov
-20
Dec
-20
Jan-
21
Feb-
21
Mar
-21
Apr
-21
May
-21
Jun-
21
Jul-2
1
Aug
-21
Sep-
21
Oct
-21
Nov
-21
Dec
-21
Jan-
22
Mar
-22
Apr
-22
Cheap 8x - 10x
Attractive 10x - 13x
Fair 13x - 17x
Fair Value Plus 17x - 20x
Stretched 20x - 24x
Strategy for Investments in the Current Scenario
STP/Short Term
STP/Long Term
Strategy for Investments in the Current Scenario
Marginally OW Large cap
Marginally UW Midcap
Marginally UW Smallcap
Neutral Weight Equities
Recommendation: Neutral Weight To Equities
Overall Valuations At Fair Value
17.6
8
13
18
23
28
Jun-
07
Jun-
08
Jun-
09
Jun-
10
Jun-
11
Jun-
12
Jun-
13
Jun-
14
Jun-
15
Jun-
16
Jun-
17
Jun-
18
Jun-
19
Jun-
20
Jun-
21
Jun-
22
Average: 18.4x
52
82 83
103
55
95
88
7164 66
81
69
79 83 80
56
104112
93
FY05
FY06
FY07
FY08
FY09
FY10
FY11
FY12
FY13
FY14
FY15
FY16
FY17
FY18
FY19
FY20
FY21
FY22
FY23
E
Average of 79% for the period
GFC: Peak of 149% in Dec-07
Lowest sincethe GFC
Nominal GDP in FY22/F23E:19.5% / 12%

2
Equity Market Snapshot
High commodity prices may impact economy in near term, even as longer term drivers are intact
India stands out among global asset classes with prospects of strong long term growth given favorable demographics; near-term outflow as India has outperformed other markets significantly
Long runaway of growth in financialization of savings
Higher disinvestment target and repair of leveraged balance sheet to create supply in markets
Expect improved reform momentum
DII Flow
Supply of paper
Policy/Reform Initiative
FII Flow
Economy
Corporate Earnings
Key Variables Short - term Medium - term Remarks
Signifies Growth
Key Variables & their Impact On Equities
High commodity prices to impact margins in near term, while longer term indicators continue to remain healthy
Equity Market Snapshot
Equity and Debt Sailing In Same Boat
GST Collections At A Record High In Apr’22
-11%
-56%
-48%
-40%
-32%
-24%
-16%
-8%
0%
Apr
-76
Apr
-77
Apr
-78
Apr
-79
Apr
-80
Apr
-81
Apr
-82
Apr
-83
Apr
-84
Apr
-85
Apr
-86
Apr
-87
Apr
-88
Apr
-89
Apr
-90
Apr
-91
Apr
-92
Apr
-93
Apr
-94
Apr
-95
Apr
-96
Apr
-97
Apr
-98
Apr
-99
Apr
-00
Apr
-01
Apr
-02
Apr
-03
Apr
-04
Apr
-05
Apr
-06
Apr
-07
Apr
-08
Apr
-09
Apr
-10
Apr
-11
Apr
-12
Apr
-13
Apr
-14
Apr
-15
Apr
-16
Apr
-17
Apr
-18
Apr
-19
Apr
-20
Apr
-21
Apr
-22
S&P 500 Bloomberb Barclays Agg (Bonds)
-13%
Drawdowns in Equity & Bonds Markets
Source: Bloomberg
322
622
909
874
864 95
5
1,05
2
1,05
0 1,15
2
1,19
8
1,13
1 1,23
9
1,41
4
1,02
7
928
1,16
4
1,12
0
1,17
0 1,30
1
1,31
5
1,29
8 1,38
4
1,33
0 1,42
1
1,67
5
300
500
700
900
1100
1300
1500
1700
Apr
-20
May
-20
Jun-
20
Jul-2
0
Aug
-20
Sep-
20
Oct
-20
Nov
-20
Dec
-20
Jan-
21
Feb-
21
Mar
-21
Apr
-21
May
-21
Jun-
21
Jul-2
1
Aug
-21
Sep-
21
Oct
-21
Nov
-21
Dec
-21
Jan-
22
Feb-
22
Mar
-22
Apr
-22
GST (Rs. bn)
Source: MOC,CMIE, Spark Capital Research
Indian Exports Surging Capacity Utilization Closer To Pre-Covid Levels
Source: States, GoI, Spark Capital Research
Rural Spend By Govt. Budgeted To Increase
Source: Bloomberg
India Better Placed Vs. Commodity Producers
Capacity Utilization
Source: Company, PL
Crude Oil @ $100
0
25
50
75
100
125
150
175
Jun-05
Jun-06
Jun-07
Jun-08
Jun-09
Jun-10
Jun-11
Jun-12
Jun-13
Jun-14
Jun-15
Jun-16
Jun-17
Jun-18
Jun-19
Jun-20
Jun-21
Jun-22
Year India’s GDP
2008 33% of (Brazil + Russia)
2011-13 39% of (Brazil + Russia)
2022 ~100% of (Brazil + Russia)

43
Reverse repo 3.35% 3.35% NIL 3.35% NIL
10 Gsec 7.45% 7.42% 3 bps 6.05% 140 bps
Mibor Overnight 4.95% 4.27% 68 bps 3.36% 159 bps
SLR 18.00% 18.00% NIL 18.00% NIL
Repo 4.90% 4.40% 50 bps 4.00% 90 bps
CRR 4.50% 4.50% NIL 4.00% 50 bps
Call ON 5.00% 3.75% 125 bps 3.25% 175 bps
Items Jun-22 May-22 1 Month Change Jun-21 1 yr Change
CBLO 5.00% 4.00% 100 bps 3.50% 150 bps
1 yr TBILL 6.24% 5.94% 30 bps 3.88% 236 bps
5 Year AAA 7.70% 7.46% 24 bps 6.40% 130 bps
USD/INR `78.94 `77.66 `-1.28 `74.35 `-4.59
Source: RBI; Bloomberg.
Key Variables & their Impact On Interest Rates
Denotes fall in interest rates
Key Variables
Inflation
Rupee
Credit Demand
Government Borrowing
RBI Policy
Global Event Risk
Corporate bond Spread
Debt FII flow
Liquidity
Debt Market Snapshot
Inflation is expected to remain elevated and likely to remain above RBI’s tolerance level in the near term
As credit demand picks up and relatively tighter liquidity, it may lead to spread widening
As credit demand picks up, it may lead to spread widening
RBI is front loading rate hikes and the market is expecting further hikes
With uncertainty around, chances of outflows are higher than inflows in near term. However inflows can be seen with index inclusion.
Unexpected hike in CRR by RBI, long term VRRR and economic growth will reduce daily active liquidity in the system, which may lead to flattening of the curve.
Inflation has taken priority over the growth and is guiding the policy worldwide.
Because of the large borrowings, pressure may remain in the short term. However, due to the revenue surprise, pressure may ease on the rates in the medium term.
Emerging markets’ currencies appear to be under pressure in the near term. However, RBI is intervening actively and using strong FX reserves to smoothen out the volatility in the rupee
Medium – term(6months – 2 years)
Short - term(3-6 months) Remarks
43
SLR 18.00% 18.00% NIL 18.00% NIL
CRR 3.00% 3.00% NIL 3.00% NIL
Items Apr-22 Mar-22 1 Month Change Apr-21 1 yr Change
Repo 4.00% 4.00% NIL 4.00% NIL
Reverse repo 3.35% 3.35% NIL 3.35% NIL
1 yr TBILL 4.76% 4.45% 31 bps 3.69% 107 bps
Call ON 3.40% 3.00% 40 bps 3.00% 40 bps
USD/INR `76.42 `75.81 `-0.61 `74.02 `-2.4
10 Gsec 7.14% 6.84% 30 bps 6.03% 111 bps
Mibor Overnight 3.93% 3.90% 3 bps 3.40% 50 bps
CBLO 3.84% 3.10% 74 bps 3.20% 64 bps
5 Year AAA 6.96% 6.76% 20 bps 5.80% 115 bps
Source: RBI; Bloomberg.
Key Variables & their Impact On Interest Rates
Denotes fall in interest rates
Key Variables
Inflation
Rupee
Credit Demand
Government Borrowing
RBI Policy
Global Event Risk
Corporate bond Spread
Debt FII flow
Liquidity
Debt Market Snapshot
RBI Reaffirms The Priority – Inflation Over Growth
Area Of Opportunity In The Current Scenario
This curve represents Indian rupee-denominated overnight index swaps (OIS) – a measure of market expectation of overnight rates.
Inflation is expected to shoot up and likely to remain above RBI’s tolerance level in near term
Because of the large borrowings, pressure may remain in the short term. However, due to the revenue surprise, pressure may ease on the rates in the medium term.
As credit demand picks up, it may lead to spread widening
As credit demand picks up and relatively tighter liquidity, it may lead to spread widening
Despite FII outflows, no threat to the currency in the short to medium term because RBI’s strong FX reserves and strong macros.
RBI is front loading rate hikes and the market is expecting further hikes
Inflation has taken priority over the growth and is guiding the policy worldwide.
With uncertainty around, chances of outflows are higher than inflows in near term. However inflows can be seen with index inclusion.
Unexpected hike in CRR by RBI, long term VRRR and economic growth will reduce daily active liquidity in the system, which may lead to flattening of the curve.
Medium – term(6months – 2 years)
Short - term(3-6 months) Remarks
Source: Bloomberg, RBI, Internal Research
Data as on May 5, 2022 | Source: Bloomberg
OIS Curve
6.95
6.53
0.00
1.00
2.00
3.00
4.00
5.00
6.00
7.00
8.00
Jan-
17
Mar
-17
May
-17
Jul-1
7
Sep-
17
Nov
-17
Jan-
18
Mar
-18
May
-18
Jul-1
8
Sep-
18
Nov
-18
Jan-
19
Mar
-19
May
-19
Jul-1
9
Sep-
19
Nov
-19
Jan-
20
Mar
-20
May
-20
Jul-2
0
Sep-
20
Nov
-20
Jan-
21
Mar
-21
May
-21
Jul-2
1
Sep-
21
Nov
-21
Jan-
22
Mar
-22
CPI Core CPI
CPI Targeted Range = 4(+/-2)%
• Near-term risks are skewed to the upside. The economists are now expecting inflation in FY23 to be in the range of 6.25-6.50%. Higher Commodity Prices/ Elevated supply disruptions/ uncertain geopolitical situation may push the Inflation higher.• There’s upside risk to inflation because of pent up demand for goods, services and vegetable prices.
6.005.86 5.82 5.81 5.78 5.78
5.80
5.73 5.75 5.79 5.86 5.91 5.91
3.85
4.324.60 4.72
5.40
5.74
5.97
6.596.79
6.95 7.05 7.15 7.27
3.0
3.5
4.0
4.5
5.0
5.5
6.0
6.5
7.0
7.5
1D 1M 2M 3M 6M 9M 1Y 2Y 3Y 4Y 5Y 7Y 10Y
01-Jun-19 Current Curve
Opportunity
Yield Curve (5 -May-22) –Repo rate at 4.40% Yield Curve (1 -Jun -19) –
Repo rate at 6%
Source: Bloomberg Economics
The Inflation Challenge – Lower Growth, Higher Inflation
Source: RBI
RBI’s Inflation Projection For FY23
RBI To Reduce Liquidity Over Multi Year Timeframe India’s Real Rates > US Real Rates
CRR: Cash Reserve Ratio. Source: Bloomberg. As on 30th Jun 2022. As on 30-Jun-22. Real rate = 10-year Gilt – Inflation (CPI). Source: Bloomberg.
7.5 7.4
6.25.8
6.7
0.0
2.0
4.0
6.0
8.0
10.0
Q1FY23 Q2FY23 Q3FY23 Q4FY23 FY23
• According to Dr Michael Patra, the objective of Monetary Policy should be totake the repo rate to level which is atleast higher than the inflation projections 4quarters down the line. As per RBI, inflation projection for Q4 FY 23 is 5.80% • Which suggests terminal repo rate could be in band of 5.70-6%
-3000
-1500
0
1500
3000
4500
6000
7500
9000
10500
5.5
6
6.5
7
7.5
8
8.5in INR billionin % Surplus Liquidity - RHS 10-Year Government Bond Yield - LHS
3637.5
Jan-17 Oct-17 Feb-18 Jun-18 Oct-18 Feb-19 Jun-19 Oct-19 Feb-20 Jun-20 Oct-20 Feb-21 Jun-21 Oct-21 Feb-22 Jun-22
• We expect additional 50 bps CRR hike between Aug and Dec 2022
-7.00
-5.00
-3.00
-1.00
1.00
3.00
5.00
7.00
Mar
-12
Jun-
12Se
p-12
Dec
-12
Mar
-13
Jun-
13Se
p-13
Dec
-13
Mar
-14
Jun-
14Se
p-14
Dec
-14
Mar
-15
Jun-
15Se
p-15
Dec
-15
Mar
-16
Jun-
16Se
p-16
Dec
-16
Mar
-17
Jun-
17Se
p-17
Dec
-17
Mar
-18
Jun-
18Se
p-18
Dec
-18
Mar
-19
Jun-
19Se
p-19
Dec
-19
Mar
-20
Jun-
20Se
p-20
Dec
-20
Mar
-21
Jun-
21Se
p-21
Dec
-21
Mar
-22
Jun-
22
Spread = India Real Rate-US Real Rate
Taper Tantrum
Current Scenario
During taper tantrum in 2013, US real rates were higher than India’s real rates.Hence risk of capital outflow was high.
Multiple VRRR windows auctionsresulted into daily liquidity comingdown to ~ INR 1.5 lakh crore

This is the minimum investment amount for a new investor in a mutual fund scheme
SIP
An employee of the asset management company such as mutual fund or life insurer, who manages investments of the scheme. He is usually part of larger team of fund managers and research analysts.
The yield to maturity or the YTM is the rate of return anticipated on a bond if held until maturity. YTM is expressed as an annual rate. The YTM factors in the bond’s current market price, par value, couple interest rate and time to maturity
SIP or systematic investment plan works on the principle of making periodic investments of a fixed sum. It works similar to a recurring bank deposit. For instance, an investor may opt for an SIP that invests Rs 500 every 15th of the month in an equity fund for a period of three years.
Exit load is charged at the time an investor redeems the units of a mutual fund. The exit load is deducted from the prevailing NAV at the time of redemption. For instance, if the NAV is RS 100and an exit load is 1%, the redemption price would be Rs. 99 per unit
This is the minimum investment amount for an existing investor in a mutual fund scheme
Fund Manager
Minimum Additional Amount
Application amount for fresh subscription
Yield to Maturity
BenchmarkA group of securities , usually a market index, whose performance is used as a standard or benchmark to measure investment performance of mutual funds, among other investments. Some typical benchmark include the Nifty, Sensex, BSE 200, BSE 500, 10-year Gsec
Entry Load
Modified duration is the price sensitivity and the percentage change in price for a unit change in yield.
The NAV or net asset value is the total asset value per unit of the mutual fund after deducting all related and permissible expenses. The NAV is calculated at the end of every business day. It is the value at which investors enter or exit the mutual fund
Standard deviation
Exit load
Standard deviation is statistical measure of the range of an investment’s performance. When a mutual fund has a high standard deviation, it means its range of performance is wide, implying greater volatility.
Sharp RatioThe Sharpe Ratio, named after its founder the Noble laureate William Sharpe, is measure of risk-adjusted returns. It is calculated using standard deviation and excess return to determine reward per unit of risk.
Beta
Note: SEBI, vide circular dated June 30, 2009 has abolished entry load and mandated that the upfront commission to distributors will be paid by the investor directly to the distributor, based on his assessment of various factors including the service rendered by the distributor.
Beta is a measure of an investment’s volatility vis-à-vis the market. Beta of less than 1 means that the security will be less volatile than the market. A beta of greater than 1 implies that the security’s price will be more volatile than the market.
A mutual fund may have a sales charge or load at the time of entry and/or exit to compensate the distributor /agent. Entry load is charged at the time an investor purchases the units of a mutual fund. The entry load is added to the prevailing NAV at the time of investment. For instance, if the NAV is Rs 100 and the entry load is 1%, the investor will enter the fund at Rs 101.
NAV
Modified Duration
AUMAUM or assets under management refers to the recent / updated cumulative market value of investments managed by Mutual fund or any investment firm.
Holdings
IDCW stands for ‘Income Distribution cum Capital Withdrawal option’. The amounts can be distributed out of investors’ capital (Equalization Reserve), which is part of the sale price that represents realized gains.
The dividend yield is a financial ratio that shows how much a company pays out in dividends each year relative to its stock price.
Standard deviation is a statistical tool that measures the deviation or dispersion of the data from the mean or average. When seen in mutual funds, it tells you how much the return from your mutual fund portfolio is straying from the expected return, based on the fund's historical performance.
Potential Risk Class (PRC) Matrix
The investment objective and underlying investments determine the nature of the mutual fund scheme. For instance, a mutual fund that aims at generating capital appreciation by investing in stock markets is an equity fund or growth fund. Likewise, a mutual fund that aims at capital preservation by investing in debt markets is a debt fund or income fund. Each of these categories may have sub-categories.
The price-earnings ratio (P/E Ratio) is the relation between a company’s share price and earnings per share (EPS). It denotes what the market is willing to pay for a company’s profits.
Rating Profile
P/BV
A bond's maturity date indicates the specific future date on which an investor gets his principal back i.e. the borrowed amount is repaid in full. Average Maturity is the weighted average of all the current maturities of the debt securities held in the fund.
The holdings or the portfolio is a mutual fund’s latest or updated reported statement of investments/securities. These are usually displayed in terms of percentage to net assets or the rupee value or both. The objective is to give investors an idea of where their money is being invested by the fund manager.
Interest Rate Swap (IRS)
Macaulay DurationMacaulay Duration is a measure of how long it takes for the price of a bond to be repaid by its internal cash flows. Macaulay Duration is used only for an instrument with fixed cash flows. Modified Duration as the name suggests, is a modified version of the Macaulay model that accounts for changing interest rates.
Average Maturity
Mutual funds invest in securities after evaluating their credit worthiness as disclosed by the ratings. A depiction of the mutual fund in various investments based on their rating becomes the rating profile of the fund. Typically, this is a feature of debt funds.
IDCW
P/E Ratio
The price-to-book ratio compares a company's market value to its book value. The market value of a company is its share price multiplied by the number of outstanding shares.
Standard Deviation
Nature of Scheme
IDCW Yield
An interest rate swap is a forward contract in which one stream of future interest payments is exchanged for another based on a specified principal amount. Interest rate swaps usually involve the exchange of a fixed interest rate for a floating rate, or vice versa, to reduce or increase exposure to fluctuations in interest rates.
In reference to SEBI Circular SEBI/HO/IMD/IMD-II DOF3/P/CIR/2021/573 dated June 07, 2021, all debt schemes will be classified in terms of a Potential Risk Class matrix which consists of parameters based on maximum interest rate risk (measured by Macaulay Duration (MD) of the scheme) and maximum credit risk (measured by Credit Risk Value (CRV) of the scheme).
4
How to read Fact Sheet

Flexicap fund - An open-ended dynamic equity scheme investing acrosslarge cap, mid cap, small cap stocks
KOTAK FLEXICAP FUND
Scheme Inception : - September 11, 2009. The returns are calculated by XIRR approach assuming investment of 10,000/- on the 1st working day of every month. XIRR helps in calculating return on investments given an initial and final value and a series of cash inflows and `outflows and taking the time of investment into consideration. Since inception returns are assumed to be starting from the beginning of the subsequent month from the date of inception. # Benchmark ; ̂ Additional Benchmark. TRI – Total Return Index, In terms of SEBI circular dated January 4, 2018, the performance of the scheme is benchmarked to the Total Return variant (TRI) of the Benchmark Index instead of Price Return Variant (PRI).
For last three IDCW, please refer page no 81-83. For scheme performance, please refer page no 69-77.
Kotak Flexicap Fund NAV as on June 30, 2022: ̀ 28.4420 (Reg-Plan-IDCW), ̀ 31.5500 (Dir-Plan-IDCW), ̀ 47.1020 (Growth Option), ̀ 51.6610 (Direct Growth Option)*For Fund Manager experience, please refer page 78-80. ## Risk rate assumed to be 4.95% (FBIL Overnight MIBOR rate as on 30th June 2022).**Total Expense Ratio includes applicable B30 fee and GST.
Alpha is difference of scheme return with benchmark return. *All payouts during the period have been reinvested in the units of the scheme at the then prevailing NAV.Returns >= 1 year:CAGR (Compounded Annualised Growth Rate). N.A stands for data not available. Note: Point to Point (PTP) Returns in INR shows the value of 10,000/- investment made at inception. Source: ICRA MFI Explorer.***As per SEBI Circular dated 27th October 2021 The first tier benchmark is reflective of the category of the scheme and the second tier benchmark is demonstrative of the investment style / strategy of the Fund Manager within the category.
5
Investment style
Value Blend Growth Size
Large
Medium
Small
Benchmark***: Nifty 500 TRI (Tier 1) Nifty 200 TRI (Tier 2)
Fund Manager: Mr. Harsha Upadhyaya
& Mr. Arjun Khanna*
Folio count: 13,58,110
AAUM: `33,549.53 crs
Allotment date: September 11, 2009
( D e d i c a t e d f u n d m a n a g e r f o r investments in foreign securities)
AUM: `33,341.11 crs
SECTOR ALLOCATION (%)
Systematic Investment Plan (SIP) If you had invested `10,000 every month
SYSTEMATIC INVESTMENT PLAN (SIP)
Monthly SIP of Rs 10000
Total Value as on June 30, 2022 (`)
Alpha
Nifty 200 (TRI) Returns (%)
Nifty 50 (TRI) Returns (%)
Total amount invested (`)
Scheme Returns (%)
Nifty 500 (TRI) Returns (%)
Nifty 500 (TRI) (`)#
Alpha
Nifty 200 (TRI) (`)#
Nifty 50 (TRI) (`)^
0.98 0.15 -1.88 -2.79 -4.71 -1.45
35,48,465 23,36,950 13,06,758 8,17,407 4,51,624 1,10,927
12.03 12.52 12.21 12.01 14.52 -13.24
38,04,354 23,55,960 12,21,762 7,62,712 4,22,005 1,09,945
13.21 12.95 10.53 9.55 10.62 -15.25
11.81 12.29 12.44 12.25 14.03 -11.77
Since Inception 10 years 7 years 5 years 3 years 1 year
15,40,000 12,00,000 8,40,000 6,00,000 3,60,000 1,20,000
12.23 12.80 12.42 12.34 15.33 -13.79
34,99,084 23,02,641 12,97,067 8,10,892 4,46,422 1,11,296
1.17 0.43 -1.68 -2.47 -3.90 -2.00
34,44,875 22,74,620 13,07,686 8,15,648 4,43,322 1,12,285
b) If units redeemed or switched out are in excess of the limit within 1 year from the date of allotment: 1%
Trustee’s Discretion
Load Structure
A) B) Direct Plan Regular Plan
IDCW Frequency
Ratios
Available Plans/Options
Minimum Investment Amount
a) For redemption / switch out of upto 10% of the initial investment amount (limit) purchased or switched in within 1 year from the date of allotment: Nil.
c) If units are redeemed or switched out on or after 1 year from the date of allotment: NIL
Total Expense Ratio**
Initial Investment: `5000 and in multiple of `1 for purchase and of ̀ 0.01 for switches
Exit Load:
Options: Payout of IDCW, Reinvestment of IDCW & Growth (applicable for all plans)
Additional Investment: `1000 & in multiples of ̀ 1
The investment objective of the scheme is to generate long-term capital appreciation from a portfolio of equity and equity related securities, generally focused on a few selected sectors. However, there is no assurance that the objective of the scheme will be realized.
Entry Load: Nil. (applicable for all plans)
Investment Objective
Ideal Investments Horizon: 5 years & above
Regular: 1.61%; Direct: 0.68%
Source: $ICRA MFI Explorer.
5.89%
0.94
0.29
21.20%
Portfolio Turnover$Beta $Sharpe## $Standard Deviation
Data as on June 30, 2022
22.31(P/E)
3.19P/BV0.84IDCW Yield
*All payouts during the period have been reinvested in the units of the scheme at the then prevailing NAV. Returns >= 1 year: CAGR (Compounded Annualised Growth Rate). N.A stands for data not available. Note: Point to Point (PTP) Returns in INR shows the value of 10,000/- investmentmade at inception. Source: ICRA MFI Explorer.*Alpha is difference of scheme return with benchmark return.
* Investors should consult their financial advisors if in doubt about whether the product is suitable for them.
This product is suitable for investors who are seeking*:
• Long term capital growth
• Investment in Portfolio of predominantly equity & equity related securities generally focused on a few selected sectors across market capitalisation.
Product Label as on 30th June, 2022
Low High
Low
to
Moder
ate
ModerateModeratelyHigh
High
Very H
ighLo
w
TIER 1: NIFTY 500 TRI
Low High
Low
to
Moder
ate
ModerateModeratelyHigh
High
Very H
ighLo
w
TIER 2: Nifty 200 TRI
Low High
Low
to
Moder
ate
ModerateModeratelyHigh
High
Very H
ighLo
w
Investors understand that their principal will be at very high risk
Investors understand that their principal will be at very high risk Investors understand that their principal will be at very high risk
Fund Benchmark Benchmark
HDFC Bank Ltd. 5.18
Aerospace & Defense 3.51
Electrical Equipment 2.93
Kec International Ltd. 0.96
Petronet LNG Ltd. 1.76
Petroleum Products 7.01
Kotak Mahindra Bank Ltd. 1.15
Reliance Industries Ltd. 7.01
Lupin Ltd. 0.15
Axis Bank Ltd. 3.63
Shree Cement Ltd. 1.03
Larsen And Toubro Ltd. 4.35
Solar Industries India Limited 0.88SRF Ltd. 5.40
State Bank Of India 4.40
Bharat Electronics Ltd. 3.51
Inter Globe Aviation Ltd 1.59
The Ramco Cements Ltd 1.60
Chemicals & Petrochemicals 6.28
Container Corporation of India Ltd. 1.39
Cement & Cement Products 7.42
AU Small Finance Bank Ltd. 2.56
Equity & Equity related
ICICI Bank Ltd. 9.54
IT - Software 11.09
Banks 26.46
Infosys Ltd. 7.02Tata Consultancy Services Ltd. 4.07
Ultratech Cement Ltd. 4.79
Construction 4.35
Transport Services 2.98
Thermax Ltd. 1.97
Gas 2.67
Indraprastha Gas Ltd. 0.91Pharmaceuticals & Biotechnology 2.61Zydus Lifesciences Limited 1.33Cipla Ltd. 1.13
Jindal Steel & Power Ltd. 2.17Ferrous Metals 2.17
Mahindra & Mahindra Ltd. 1.48Hero MotoCorp Ltd. 0.49
Bharti Airtel Ltd 1.97Bharti Airtel Ltd - Partly Paid Shares 0.04Industrial Products 1.81
Telecom - Services 2.01
Maruti Suzuki India Limited 0.38
Automobiles 2.35
Issuer/Instrument Industry/Rating % to Net Assets Issuer/Instrument Industry/Rating % to Net Assets
PORTFOLIO
Bharat Forge Ltd. 1.09AIA Engineering Limited. 0.72
Balkrishna Industries Ltd. 1.68Auto Components 1.78
MRF Limited 0.10Finance 1.47Bajaj Finance Ltd. 1.38SBI Cards & Payment Services Pvt. Ltd. 0.09
Debt Instruments
Britannia Industries Ltd. ( ) CRISIL AAA 0.01
Mutual Fund Units Kotak Liquid Scheme
Corporate Debt/
United Breweries Ltd. 1.01
Equity & Equity
Direct Plan Growth 0.16
Agricultural, Commercial &
related - Total 96.61
Non - Ferrous Metals 0.76
Hindustan Unilever Ltd. 1.14
Max Financial Services Ltd. 0.73
Diversified FMCG 1.14
Bayer Cropscience Ltd. 0.35
Godrej Consumer Products Ltd. 0.57
Coromandel International Ltd. 0.36
Leisure Services 1.00
Bata India Ltd. 0.93
BEML Ltd. 0.36
Futures MRF Limited-JUL2022 0.59
Debentures and Bonds
Beverages 1.01
Consumer Durables 0.93
ICICI Lombard General InsuranceCompany Ltd 0.50
Hindalco Industries Ltd 0.76
Insurance 1.23
Fertilizers & Agrochemicals 0.71
Personal Products 0.57
Construction Vehicles 0.36
Jubilant Foodworks Limited 1.00
Mutual Fund Units - Total 0.16
Financial Institutions
Triparty Repo 3.40Net Current Assets/(Liabilities) -0.18Grand Total 100.00
Corporate Debt/FinancialInstitutions - Total 0.01
Equity Derivative Exposuer is 0.59%
*All payouts during the period have been reinvested in the units of the scheme at the then prevailing NAV. Returns >= 1 year: CAGR (Compounded Annualised Growth Rate). N.A stands for data not available. Note: Point to Point (PTP) Returns in INR shows the value of 10,000/- investmentmade at inception. Source: ICRA MFI Explorer.*Alpha is difference of scheme return with benchmark return.
29.31
29.16
12.52
11.08
11.76
9.67
3.30
8.62
2.15
7.42
2.70
6.99
2.05
4.35
5.64
4.12
1.27
2.98
3.02
2.93
Benchmark
Scheme
Financial Services Information Technology Oil, Gas & Consumable Fuels Capital Goods Construction MaterialsChemicals Construction Automobile and Auto Components Services Metals & Mining

7
6
Mid cap fund - An open-ended equity scheme predominantly investing in mid cap stocks
KOTAK EMERGING EQUITY FUND
Scheme Inception : - March 30, 2007. The returns are calculated by XIRR approach assuming investment of 10,000/- on the 1st working day of every month. XIRR helps in calculating return on investments given an initial and final value and a series of cash inflows and `outflows and taking the time of investment into consideration. Since inception returns are assumed to be starting from the beginning of the subsequent month from the date of inception. # Benchmark ; ̂ Additional Benchmark TRI – Total Return Index, In terms of SEBI circular dated January 4, 2018, the performance of the scheme is benchmarked to the Total Return variant (TRI) of the Benchmark Index instead of Price Return Variant (PRI).Alpha is difference of scheme return with benchmark return. *All payouts during the period have been reinvested in the units of the scheme at the then prevailing NAV. Returns >= 1 year: CAGR (Compounded Annualised Growth Rate). N.A stands for data not available. Note: Point to Point (PTP) Returns in INR shows the value of 10,000/- investment made at inception. Source: ICRA MFI Explorer.
Kotak Emerging Equity Fund NAV as on June 30, 2022: `36.0430 (Reg-Plan-IDCW), `43.7370 (Dir-Plan-IDCW), `65.6250 (Growth Option), `73.4100 (Direct Growth Option) ***As per SEBI Circular dated 27th October 2021 The first tier benchmark is reflective of the category of the scheme and the second tier benchmark is demonstrative of the investment style / strategy of the Fund Manager within the category.
*For Fund Manager experience, please refer page 78-80. ## Risk rate assumed to be 4.95% (FBIL Overnight MIBOR rate as on 30th June 2022).**Total Expense Ratio includes applicable B30 fee and GST. For last three IDCW, please refer page no 81-83. For scheme performance, please refer page no 69-77.
Investment style
Value Blend Growth Size
Large
Medium
Small
( D e d i c a t e d f u n d m a n a g e r f o r investments in foreign securities)
AUM: `18,258.63 crs
Mr. Arjun Khanna*
AAUM: `18,127.11 crs
Allotment date: March 30, 2007
Fund Manager: Mr. Pankaj Tibrewal &
Folio count: 9,05,609
Benchmark***: NIFTY Midcap 150 TRI (Tier 1) Nifty Midcap 100 TRI (Tier 2)
A) Regular Plan B) Direct Plan
a) For redemption / switch out of upto 10% of the initial investment amount (limit) purchased or switched in within 1 year from the date of allotment: Nil.
Source: $ICRA MFI Explorer.
Regular: 1.75%; Direct: 0.49%
Available Plans/Options
c) If units are redeemed or switched out on or after 1 year from the date of allotment: NIL
Trustee’s Discretion
Entry Load: Nil. (applicable for all plans)
Initial Investment: `5000 and in multiple of `1 for purchase and for ̀ 0.01 for switches
Investment ObjectiveThe investment objective of the scheme is to generate long-term capital appreciation from a portfolio of equity and equity related securities, by investing predominantly in mid companies. The scheme may also invest in debt and money market instruments, as per the asset allocation table. There is no assurance that the investment objective of the scheme will be achieved.
Ratios
Options: Payout of IDCW, Reinvestment of IDCW & Growth (applicable for all plans)
Minimum Investment Amount
Additional Investment: `1000 & in multiples of ̀ 1Ideal Investments Horizon: 5 years & above
Load Structure
Exit Load:
IDCW Frequency
Total Expense Ratio**
b) If units redeemed or switched out are in excess of the limit within 1 year from the date of allotment: 1%
3.15%
0.93
0.64
24.54%
Portfolio Turnover$Beta $Sharpe## $Standard Deviation
Data as on June 30, 2022
26.39(P/E)
4.00P/BV0.77IDCW Yield
Systematic Investment Plan (SIP) If you had invested `10,000 every month
SYSTEMATIC INVESTMENT PLAN (SIP)
Nifty Midcap 150 (TRI) Returns (%)
Scheme Returns (%)
Monthly SIP of Rs 10000
Total Value as on June 30, 2022 (`)
Alpha
Nifty Midcap 150 (TRI) (`)#
Nifty Midcap 100 (TRI) Returns (%)
Alpha
Nifty 50 (TRI) Returns (%)
Total amount invested (`)
Nifty Midcap 100 (TRI) (`)#
Nifty 50 (TRI) (`)^
Since Inception 10 years 7 years 5 years 3 years 1 year
73,65,491 30,72,717 14,54,690 9,06,844 4,95,224 1,12,014
15.50 16.32 14.66 15.14 21.19 -15.62
67,97,331 28,22,181 14,15,793 8,75,956 4,90,390 1,09,694
2.43 3.84 2.82 3.04 1.46 4.83
18,40,000 12,00,000 8,40,000 6,00,000 3,60,000 1,20,000
16.40 17.90 15.42 16.56 21.90 -12.17
0.90 1.58 0.76 1.41 0.71 3.44
13.97 14.05 12.60 13.52 20.45 -17.00
59,28,393 24,99,300 13,15,325 8,41,633 4,85,326 1,08,753
11.64 12.29 12.44 12.25 14.03 -11.77
48,28,570 22,74,620 13,07,686 8,15,648 4,43,322 1,12,285
*All payouts during the period have been reinvested in the units of the scheme at the then prevailing NAV. Returns >= 1 year: CAGR (Compounded Annualised Growth Rate). N.A stands for data not available. Note: Point to Point (PTP) Returns in INR shows the value of 10,000/- investmentmade at inception. Source: ICRA MFI Explorer. *Alpha is difference of scheme return with benchmark return.
This product is suitable for investors who are seeking*:
* Investors should consult their financial advisors if in doubt about whether the product is suitable for them.
• Long term capital growth
• Investment in equity & equity related securities predominantly in midcap companies.
Product Label as on 30th June, 2022
Low High
Low
to
Moder
ate
ModerateModeratelyHigh
High
Very H
ighLo
w
TIER 1: Nifty Midcap 150 TRI
Low High
Low
to
Moder
ate
ModerateModeratelyHigh
High
Very H
ighLo
w
TIER 2: Nifty Midcap 100 TRI
Low High
Low
to
Moder
ate
ModerateModeratelyHigh
High
Very H
ighLo
w
Investors understand that their principal will be at very high risk
Investors understand that their principal will be at very high risk Investors understand that their principal will be at very high risk
Fund Benchmark Benchmark
Note: Large Cap, Midcap, Small cap and Debt and Money Market stocks as a % age of Net Assets: 14.41, 65.00, 15.72 & 4.87.
PORTFOLIOIssuer/Instrument Industry/Rating % to Net Assets Issuer/Instrument Industry/Rating % to Net Assets
Whirlpool of India Ltd. 1.75
Kajaria Ceramics Ltd. 2.36Bata India Ltd. 2.22
SKF India Ltd 3.33
Industrial Products 14.33
APL Apollo Tubes Ltd. 1.41
Equity & Equity related
Supreme Industries Limited 3.86
Cummins India Ltd. 3.14Ratnamani Metals & Tubes Ltd. 1.46
Bharat Forge Ltd. 1.13Consumer Durables 14.03Sheela Foam Ltd 2.37
P I Industries Ltd 2.90
Blue Star Ltd. 0.70
MRF Limited 1.06
Auto Components 8.59
Solar Industries India Limited 2.93
Exide Industries Ltd 0.35
Pharmaceuticals & Biotechnology 5.97
International Limited 0.57
Schaeffler India Ltd 4.63
Balkrishna Industries Ltd. 1.02
ZF Commercial Vehicle Control
SRF Ltd. 2.19
ICICI Bank Ltd. 1.62
Hawkins Cooker Ltd 0.49
State Bank Of India 1.36Federal Bank Ltd. 1.28
V-Guard Industries Ltd. 0.77
Zydus Lifesciences Limited 0.76
Chemicals & Petrochemicals 7.60
City Union Bank Ltd. 0.54
Metro Brands Ltd. 0.72
Samvardhana Motherson
India Limited 0.31
Atul Ltd. 2.48
Axis Bank Ltd. 0.82
Fertilizers & Agrochemicals 6.36Coromandel International Ltd. 3.46
Voltas Ltd. 1.53Amber Enterprises India Ltd. 1.12
Amara Raja Batteries Ltd. 0.35
Laurus Labs Ltd. 0.50
Systems India Limited 0.30
AU Small Finance Bank Ltd. 1.70
Eris Lifesciences Ltd. 0.30
Banks 7.32
Motherson Sumi Wiring
Torrent Pharmaceuticals Ltd. 1.84Ipca Laboratories Ltd. 2.01
Alkem Laboratories Ltd. 0.49
The Ramco Cements Ltd 1.51
Electrical Equipment 3.58
Gland Pharma Limited 0.07Cement & Cement Products 3.92JK Cement Ltd. 1.90
Shree Cement Ltd. 0.51
Persistent Systems Limited 3.36Finance 3.02
Mahindra & MahindraFinancial Services Ltd. 0.91
Oberoi Realty Ltd 2.54
Lux Industries Limited 0.71
Thermax Ltd. 3.58
Shriram City Union Finance Ltd. 0.58
Kewal Kiran Clothing Limited. 0.24Aerospace & Defense 2.33Bharat Electronics Ltd. 2.33
Textiles & Apparels 2.39
Insurance 1.64Max Financial Services Ltd. 1.45
IT - Software 3.36
HDFC Ltd. 0.04
Sundaram Finance Ltd. 1.49
Page Industries Ltd 1.44
Realty 2.54
Agricultural Food & other Products 0.88
Petroleum Products 0.76
PNC Infratech Ltd 0.27
Triparty Repo 4.86
FSN E-Commerce Ventures Ltd. 0.16
Jindal Steel & Power Ltd. 1.05
Personal Products 1.33
Gujarat State Petronet Ltd. 0.42
Retailing 1.15
Hindustan Petroleum Corporation Ltd 0.76
Apollo Hospitals Enterprises Ltd. 0.93
Construction 0.60
Godrej Agrovet Ltd. 0.48
Equity & Equity related - Total 95.13
Healthcare Services 0.93
Net Current Assets/(Liabilities) 0.01Grand Total 100.00
Vedant Fashions Ltd 0.99
Gujarat Gas Ltd. 0.41
Ferrous Metals 1.05
Tata Consumer Products Ltd 0.88
Emami Ltd. 1.33
Kalpataru Power Transmission Ltd. 0.33
Financial Technology (Fintech) 0.14
Gas 0.83
PB Fintech Ltd. 0.14
Life Insurance Corporation Of India Ltd. 0.19
Food Products 0.48
SECTOR ALLOCATION (%)
13.89
20.24
6.81
13.95
6.16
13.53
16.48
12.12
7.98
8.59
9.69
6.91 4.88
1.90
3.92
6.44
3.36
2.80
2.69
Benchmark
Scheme
Capital Goods Chemicals Consumer Durables Financial Services Automobile and Auto Components Healthcare ServicesCash & Cash Equivalent Construction Materials Information Technology Fast Moving Consumer Goods

7
Large & mid cap fund - An open-ended equity scheme investing in both large cap and mid cap stocks
KOTAK EQUITY OPPORTUNITIES FUND
***As per SEBI Circular dated 27th October 2021 The first tier benchmark is reflective of the category of the scheme and the second tier benchmark is demonstrative of the investment style / strategy of the Fund Manager within the category.
*For Fund Manager experience, please refer page 78-80. ## Risk rate assumed to be 4.95% (FBIL Overnight MIBOR rate as on 30th June 2022).**Total Expense Ratio includes applicable B30 fee and GST.For last three IDCW, please refer page no 81-83. For scheme performance, please refer page no 69-77.
Scheme Inception : - September 09, 2004. The returns are calculated by XIRR approach assuming investment of ̀ 10,000/- on the 1st working day of every month. XIRR helps in calculating return on investments given an initial and final value and a series of cash inflows and outflows and taking the time of investment into consideration. Since inception returns are assumed to be starting from the beginning of the subsequent month from the date of inception. # Benchmark ; ̂ Additional Benchmark TRI - Total Return Index, In terms of SEBI circular dated January 4, 2018, the performance of the scheme is benchmarked to the Total Return variant (TRI) of the Benchmark Index instead of Price Return Variant (PRI).Alpha is difference of scheme return with benchmark return. *All payouts during the period have been reinvested in the units of the scheme at the then prevailing NAV. Returns >= 1 year: CAGR (Compounded Annualised Growth Rate). N.A stands for data not available. Note: Point to Point (PTP) Returns in INR shows the value of 10,000/- investment made at inception. Source: ICRA MFI Explorer.
Kotak Equity Opportunities Fund NAV as on June 30, 2022: ̀ 31.1710 (Reg-Plan-IDCW), ̀ 34.9660 (Dir-Plan-IDCW), ̀ 178.6680 (Growth Option), ̀ 198.1540 (Direct Growth Option)
7
Investment style
Value Blend Growth Size
Large
Medium
Small
Fund Manager: Mr. Harsha Upadhyaya
Benchmark***: NIFTY Large Midcap 250 TRI (Tier 1) Nifty 200 TRI (Tier 2)
& Mr. Arjun Khanna*
( D e d i c a t e d f u n d m a n a g e r f o r investments in foreign securities)
AAUM: `9,143.84 crs
AUM: `9,222.59 crs
Allotment date: September 9, 2004
Folio count: 3,34,962
IDCW Frequency
Load Structure
Initial Investment: `5000 and in multiple of `1 for purchase and for ̀ 0.01 for switches
b) If units redeemed or switched out are in excess of the limit within 1 year from the date of allotment: 1%c) If units are redeemed or switched out on or after 1 year from the date of allotment: NIL
Trustee’s Discretion
$Source: ICRA MFI Explorer.
Entry Load: Nil. (applicable for all plans)Exit Load:
Minimum Investment Amount
Additional Investment: `1000 & in multiples of ̀ 1Ideal Investments Horizon: 5 years & above
Total Expense Ratio**Regular: 1.83%; Direct: 0.60%
Ratios
a) For redemption / switch out of upto 10% of the initial investment amount (limit) purchased or switched in within 1 year from the date of allotment: Nil.
A) B) Direct Plan Regular Plan
Investment Objective
Available Plans/Options
The investment objective of the scheme is to generate capital appreciation from a diversified portfolio of equity and equity related securities. The scheme will invest predominantly in a mix of large and mid cap stocks from various sectors, which look promising, based on the growth pattern in the economy. There is no assurance that the investment objective of the scheme will be achieved.
Options: Payout of IDCW, Reinvestment of IDCW & Growth (applicable for all plans)
10.82%
0.88
0.50
20.86%
Portfolio Turnover$Beta $Sharpe ## $Standard Deviation
Data as on June 30, 2022
22.08(P/E)
3.36P/BV0.88IDCW Yield
Systematic Investment Plan (SIP) If you had invested `10,000 every month
SYSTEMATIC INVESTMENT PLAN (SIP)
Alpha
Nifty 50 (TRI) (`)^
Total Value as on June 30, 2022 (`)
Scheme Returns (%)
Nifty 50 (TRI) Returns (%)
Monthly SIP of Rs 10000
Nifty Large Midcap 250 (TRI) (`)#
Nifty Large Midcap 250 (TRI) Returns (%)
Nifty 200 (TRI) Returns (%)
Nifty 200 (TRI) (`)#
Alpha
Total amount invested (`)
Since Inception 10 years 7 years 5 years 3 years 1 year
NA -0.59 -0.86 -0.85 -2.42 2.09
21,40,000 12,00,000 8,40,000 6,00,000 3,60,000 1,20,000
86,97,779 24,70,262 13,16,477 8,24,408 4,49,972 1,12,122
NA 14.43 13.48 13.53 17.50 -14.10
14.10 13.84 12.62 12.68 15.08 -12.01
NA 25,49,686 13,57,324 8,41,900 4,65,702 1,10,717
12.26 12.52 12.21 12.01 14.52 -13.24
1.83 1.32 0.42 0.67 0.55 1.23
71,13,162 22,74,620 13,07,686 8,15,648 4,43,322 1,12,285
12.20 12.29 12.44 12.25 14.03 -11.77
71,60,715 23,02,641 12,97,067 8,10,892 4,46,422 1,11,296
• Investment in portfolio of predominantly equity & equity related securities of large & midcap companies.
* Investors should consult their financial advisors if in doubt about whether the product is suitable for them.
This product is suitable for investors who are seeking*:
• Long term capital growth
Product Label as on 30th June, 2022
Low High
Low
to
Moder
ate
ModerateModeratelyHigh
High
Very H
ighLo
w
TIER 1: NIFTY Large Midcap 250 TRI
Low High
Low
to
Moder
ate
ModerateModeratelyHigh
High
Very H
ighLo
w
TIER 2: Nifty 200 TRI
Low High
Low
to
Moder
ate
ModerateModeratelyHigh
High
Very H
ighLo
w
Investors understand that their principal will be at very high risk
Investors understand that their principal will be at very high risk Investors understand that their principal will be at very high risk
Fund Benchmark Benchmark
Note: Large Cap, Midcap, Small cap and Debt and Money Market stocks as a % age of Net Assets: 54.36, 36.26, 3.99 & 5.39.Equity Derivative Exposuer is 0.81%
Banks 17.07
State Bank Of India 4.80ICICI Bank Ltd. 5.33
Axis Bank Ltd. 3.31HDFC Bank Ltd. 2.19AU Small Finance Bank Ltd. 1.44
Equity & Equity related
Supreme Industries Limited 0.72
ABB India Ltd 1.75
AIA Engineering Limited. 1.12
Infosys Ltd. 3.65
Reliance Industries Ltd. 4.78
Finance 2.84
Cholamandalam Financial
Bharat Forge Ltd. 2.01
Chemicals & Petrochemicals 6.77
Petronet LNG Ltd. 0.82
Tata Consultancy Services Ltd. 2.45
Industrial Products 6.74
IT - Software 6.10
Sun Pharmaceuticals Industries Ltd. 2.05
Ipca Laboratories Ltd. 0.88Cipla Ltd. 1.49
SRF Ltd. 3.66
Company Limited 0.52
JK Cement Ltd. 1.21
Cummins India Ltd. 2.17
Gland Pharma Limited 0.65
Cement & Cement Products 4.14
Shree Cement Ltd. 0.43
Thermax Ltd. 1.93
Kalpataru Power Transmission Ltd. 0.62
Gujarat State Petronet Ltd. 1.61
Petroleum Products 4.78
Larsen And Toubro Ltd. 3.21
Indraprastha Gas Ltd. 0.85
Construction 4.35
Polycab India Ltd. 0.72
Aether Industries Ltd. 0.28
Pharmaceuticals & Biotechnology 5.07
Techno Electric & Engineering
Ultratech Cement Ltd. 1.58
The Ramco Cements Ltd 0.73
Dalmia Bharat Limited 0.19
Linde India Ltd. 2.83
Electrical Equipment 3.68
Gas 3.28
Auto Components 3.23Schaeffler India Ltd 1.74Balkrishna Industries Ltd. 1.49
Bajaj Finance Ltd. 2.43
Holdings Ltd. 0.41
Diversified FMCG 2.82
Coromandel International Ltd. 2.53
V-Guard Industries Ltd. 0.62
Bharat Electronics Ltd. 2.41Automobiles 2.13Maruti Suzuki India Limited 1.54
Blue Star Ltd. 1.13
Telecom - Services 1.87Bharti Airtel Ltd 1.82Bharti Airtel Ltd - Partly Paid Shares 0.05Ferrous Metals 1.86
ITC Ltd. 2.82Fertilizers & Agrochemicals 2.53
Hero MotoCorp Ltd. 0.59
Jindal Steel & Power Ltd. 1.86
Bata India Ltd. 0.77
Aerospace & Defense 2.41
Beverages 1.57
Consumer Durables 2.52
Textiles & Apparels 1.09
Leisure Services 0.78
Direct Plan Growth 0.12
Insurance 1.10
Vedant Fashions Ltd 0.82
Mutual Fund Units
Triparty Repo 5.75
Grand Total 100.00
Transport Services 0.71
Futures
Non - Ferrous Metals 0.77
Equity & Equity related - Total 93.80
Honeywell Automation India Ltd. 0.83
DR.Lal Pathlabs Ltd. 0.29
Net Current Assets/(Liabilities) 0.33
Jubilant Foodworks Limited 0.78
United Spirits Ltd. 1.57
Agricultural, Commercial &Construction Vehicles 0.41BEML Ltd. 0.41
JK Cement Ltd.-JUL2022 0.07
Kotak Liquid Scheme
Hindalco Industries Ltd 0.77
DR.Lal Pathlabs Ltd.-JUL2022 0.74
Oberoi Realty Ltd 1.24
Industrial Manufacturing 0.83
Realty 1.24
Mutual Fund Units - Total 0.12
Page Industries Ltd 1.09
Retailing 0.82
Max Financial Services Ltd. 1.10
Container Corporation of India Ltd. 0.71
Healthcare Services 0.29
PORTFOLIOIssuer/Instrument Industry/Rating % to Net Assets Issuer/Instrument Industry/Rating % to Net Assets
SECTOR ALLOCATION (%)
24.65
21.02
7.08
14.06
4.15
9.29
10.75
8.06
6.97
6.09
10.30
6.09 5.42
6.64
5.36
5.89
4.38
1.17
4.34
Benchmark
Scheme
Financial Services Capital Goods Chemicals Oil, Gas & Consumable Fuels Healthcare Services Information TechnologyCash & Cash Equivalent Automobile and Auto Components Fast Moving Consumer Goods Construction

7
Small cap fund - An open-ended equity scheme predominantly investing in small cap stocks
KOTAK SMALL CAP FUND
Note: Point to Point (PTP) Returns in INR shows the value of 10,000/- investment made at inception. Source: ICRA MFI Explorer.
Scheme Inception : - February 24,2005. The returns are calculated by XIRR approach assuming investment of 10,000/- on the 1st working day of every month. XIRR helps in calculating return on investments given an initial and final value and a series of cash inflows and `outflows and taking the time of investment into consideration. Since inception returns are assumed to be starting from the beginning of the subsequent month from the date of inception. # Benchmark ; ̂ Additional Benchmark TRI – Total Return Index, In terms of SEBI circular dated January 4, 2018, the performance of the scheme is benchmarked to the Total Return variant (TRI) of the Benchmark Index instead of Price Return Variant (PRI).Alpha is difference of scheme return with benchmark return. *All payouts during the period have been reinvested in the units of the scheme at the then prevailing NAV. Returns >= 1 year: CAGR (Compounded Annualised Growth Rate). N.A stands for data not available.
*For Fund Manager experience, please refer page 78-80. ## Risk rate assumed to be 4.95% (FBIL Overnight MIBOR rate as on 30th June 2022).**Total Expense Ratio includes applicable B30 fee and GST.For last three IDCW, please refer page no 81-83. For scheme performance, please refer page no 69-77.
***As per SEBI Circular dated 27th October 2021 The first tier benchmark is reflective of the category of the scheme and the second tier benchmark is demonstrative of the investment style / strategy of the Fund Manager within the category.Kotak Small Cap Fund NAV as on June 30, 2022: ̀ 64.3300 (Reg-Plan-IDCW), ̀ 73.2380 (Dir-Plan-IDCW), ̀ 147.4560 (Growth Option), ̀ 166.7410 (Direct Growth Option)
8
Investment style
Value Blend Growth Size
Large
Medium
Small
Fund Manager: Mr. Pankaj Tibrewal & Mr. Arjun Khanna*( D e d i c a t e d f u n d m a n a g e r f o r investments in foreign securities)AAUM: `7,032.59 crs AUM: `7,079.71 crs
Allotment date: February 24, 2005
Benchmark***: NIFTY Smallcap 250 TRI (Tier 1) NIFTY Smallcap 100 TRI (Tier 2)
Folio count: 5,26,976
Source: $ICRA MFI Explorer.
Additional Investment: `1000 & in multiples of ̀ 1Ideal Investments Horizon: 5 years & above
a) For redemption / switch out of upto 10% of the initial investment amount (limit) purchased or switched in within 1 year from the date of allotment: Nil.
Investment Objective
There is no assurance that the investment objective of the Scheme will be achieved
The investment objective of the scheme is to generate capital appreciation from a diversified portfolio of equity and equity related securities by investing predominantly in small cap companies.
A) Regular Plan B) Direct Plan
Options: Payout of IDCW, Reinvestment of IDCW & Growth (applicable for all plans)
IDCW Frequency
Ratios
Entry Load: Nil. (applicable for all plans)
Available Plans/Options
Initial Investment: `5000 and in multiple of `1 for purchase and for ̀ 0.01 for switches
Exit Load:
Trustee’s Discretion
b) If units redeemed or switched out are in excess of the limit within 1 year from the date of allotment: 1%
Minimum Investment Amount
c) If units are redeemed or switched out on or after 1 year from the date of allotment: NIL
Total Expense Ratio**
Load Structure
Regular: 1.96%; Direct: 0.59%
7.07%
0.88
0.85
27.74%
Portfolio Turnover$Beta $Sharpe## $Standard Deviation
Data as on June 30, 2022
28.50(P/E)
4.17P/BV0.68IDCW Yield
Systematic Investment Plan (SIP) If you had invested `10,000 every month
SYSTEMATIC INVESTMENT PLAN (SIP)
Nifty Smallcap 100 (TRI) Returns (%)
Nifty Smallcap 100 (TRI) (`)#
NIFTY Smallcap 250 (TRI) Returns (%)
Alpha
Monthly SIP of Rs 10000
Total amount invested (`)
Total Value as on June 30, 2022 (`)
Scheme Returns (%)
NIFTY Smallcap 250 (TRI) (`)#
Alpha
Nifty 50 (TRI) Returns (%)
Nifty 50 (TRI) (`)^
20,90,000 12,00,000 8,40,000 6,00,000 3,60,000 1,20,000
1,06,40,664 33,47,434 16,65,189 10,51,241 5,71,670 1,11,602
16.61 19.49 19.22 22.64 32.55 -12.79
NA 5.85 7.09 8.68 8.78 9.17 NA 24,44,513 12,93,385 8,50,747 5,08,120 1,05,335
Since Inception 10 years 7 years 5 years 3 years 1 year
NA 13.64 12.13 13.96 23.77 -21.96
9.94 9.96 8.20 8.76 16.27 -32.80
53,50,427 20,09,766 11,24,117 7,47,892 4,57,672 97,612
65,79,719 22,74,620 13,07,686 8,15,648 4,43,322 1,12,285
6.68 9.53 11.02 13.88 16.28 20.01
11.98 12.29 12.44 12.25 14.03 -11.77
• Investment in equity & equity related securities predominantly in small cap Stocks.
This product is suitable for investors who are seeking*:
* Investors should consult their financial advisors if in doubt about whether the product is suitable for them.
• Long term capital growth
Product Label as on 30th June, 2022
Low High
Low
to
Moder
ate
ModerateModeratelyHigh
High
Very H
ighLo
w
TIER 1: NIFTY Smallcap 250 TRI
Low High
Low
to
Moder
ate
ModerateModeratelyHigh
High
Very H
ighLo
w
TIER 2: Nifty Smallcap 100 TRI
Low High
Low
to
Moder
ate
ModerateModeratelyHigh
High
Very H
ighLo
w
Investors understand that their principal will be at very high risk
Investors understand that their principal will be at very high risk Investors understand that their principal will be at very high risk
Fund Benchmark Benchmark
Dixon Technologies India Ltd. 0.90
Century Plyboards (India) Ltd. 4.54
Industrial Products 12.59
Consumer Durables 26.60
Somany Ceramics Ltd. 2.18
Blue Star Ltd. 2.53
VIP Industries Ltd. 1.69Nilkamal Ltd 1.65Hawkins Cooker Ltd 1.30
Orient Electric Ltd. 1.88
Sheela Foam Ltd 3.62
Kajaria Ceramics Ltd. 1.10
Whirlpool of India Ltd. 0.60
Supreme Industries Limited 2.47
WPIL Ltd 0.48
Equity & Equity related
Auto Components 6.16
Amber Enterprises India Ltd. 2.15
V-Guard Industries Ltd. 2.46
Carborundum Universal Ltd. 4.19
Rolex Rings Ltd. 1.52
Apollo Pipes Ltd. 0.84
Ratnamani Metals & Tubes Ltd. 3.21
Sandhar Technologies Ltd. 0.68Samvardhana Motherson
Solar Industries India Limited 2.12
Finolex Cables Ltd. 0.21
Varroc Engineering Ltd. 0.21
Clean Science and Technology Ltd 0.06
Transport Services 3.73Blue Dart Express Ltd. 2.91
Laxmi Organic Industries Limited 1.35
Garware Technical Fibres Ltd. 2.09
Kewal Kiran Clothing Limited. 0.31
Galaxy Surfactants Ltd. 3.46
Schaeffler India Ltd 2.15
Lux Industries Limited 1.20
Retailing 3.49
Great Eastern Shipping Company Ltd 0.82
Atul Ltd. 1.04
Chemicals & Petrochemicals 8.19
Sansera Engineering Ltd. 1.30
International Limited 0.30
Textiles & Apparels 3.60
Aether Industries Ltd. 0.16
APL Apollo Tubes Ltd. 1.19
V-Mart Retail Ltd. 0.90
Torrent Pharmaceuticals Ltd. 0.83
Shoppers Stop Ltd. 1.11
Medplus Health Services Ltd. 0.52
Go Fashion (India) Ltd. 0.96
Alembic Pharmaceuticals Ltd. 2.03Pharmaceuticals & Biotechnology 3.13
Construction Vehicles 2.59
Cyient Ltd. 2.44
Mahindra & Mahindra
AU Small Finance Bank Ltd. 0.89
JK Cement Ltd. 1.38
Ferrous Metals 1.86
JMC Projects (India) Ltd. 0.55
Thermax Ltd. 1.23
Dhanuka Agritech Ltd. 0.71
IT - Services 2.44
Zydus Lifesciences Limited 0.27
V.S.T Tillers Tractors Ltd 1.31
Company Ltd. 0.52
Anand Rathi Wealth Ltd. 0.06UTI Asset Management Company Ltd 0.21
Coromandel International Ltd. 0.88
Fertilizers & Agrochemicals 2.68
Financial Services Ltd. 0.30
Banks 2.65ICICI Bank Ltd. 1.76
Cement & Cement Products 1.86
The Ramco Cements Ltd 0.48
IT - Software 2.47
Shriram City Union Finance Ltd. 0.68
Shyam Metalics and Energy Ltd 1.86Construction 1.85
Aavas Financiers Ltd. 0.98
P I Industries Ltd 1.09
Persistent Systems Limited 2.28Happiest Minds Technologies Limited 0.19
Agricultural, Commercial &
BEML Ltd. 1.28
Finance 1.96
Techno Electric & EngineeringCompany Limited 1.30
Realty 1.53Mahindra Lifespace Developers Ltd 1.53Electrical Equipment 1.23
Food Products 1.07Prataap Snacks Ltd 0.78Heritage Foods Ltd 0.29Oil 0.52Hindustan Oil Exploration
Capital Markets 0.27
Aerospace & Defense 0.22MTAR Technologies Ltd. 0.22Leisure Services 0.18Barbeque Nation Hospitality Ltd. 0.18Agricultural Food & other Products 0.03Ruchi Soya Industries Ltd. 0.03Equity & Equity related - Total 92.90Triparty Repo 7.61Net Current Assets/(Liabilities) -0.51Grand Total 100.00
Note: Large Cap, Midcap, Small cap and Debt and Money Market stocks as a % age of Net Assets: 3.16, 21.36, 68.38 & 7.10.
PORTFOLIOIssuer/Instrument Industry/Rating % to Net Assets Issuer/Instrument Industry/Rating % to Net Assets
SECTOR ALLOCATION (%)
6.08
25.29
13.64
16.16
7.22
10.88 7.10
2.92
6.16
5.43
5.03
8.00
4.91
19.20
4.87
4.48
3.68
2.58
3.60
Benchmark
Scheme
Consumer Durables Capital Goods Chemicals Cash & Cash Equivalent Automobile and Auto ComponentsServices Information Technology Financial Services Consumer Services Textiles

Large cap fund - An open-ended equity scheme predominantly investing in large cap stocks
KOTAK BLUECHIP FUND
9
Investment style
Value Blend Growth Size
Large
Medium
Small
Available Plans/Options
Minimum Investment Amount
Ratios
$Source: ICRA MFI Explorer.
Exit Load: a) For redemption / switch out of upto 10% of the initial investment amount (limit) purchased or switched in within 1 year from the date of allotment: Nil.
Load Structure
To generate capital appreciation from a portfolio of predominantly equity and equity related securities falling under the category of large cap companies. There is no assurance that the investment objective of the scheme will be achieved.
A) Regular Plan B) Direct Plan
IDCW FrequencyTrustee’s Discretion
Options: Payout of IDCW, Reinvestment of IDCW & Growth (applicable for all plans)
Investment Objective
Initial Investment: `1000 and in multiple of `1 for purchase and for ̀ 0.01 for switchesAdditional Investment: ̀ 1000 & in multiples of ̀ 1Ideal Investments Horizon: 5 years & above
Entry Load: Nil. (applicable for all plans)
b) If units redeemed or switched out are in excess of the limit within 1 year from the date of allotment: 1%c) If units are redeemed or switched out on or after 1 year from the date of allotment: NIL
Total Expense Ratio**Regular: 2.00%; Direct: 0.78%
Portfolio Turnover$Beta $Sharpe## $Standard Deviation
8.27%
0.96
0.43
20.94%
Data as on June 30, 2022
26.09(P/E)
3.53P/BV1.07IDCW Yield
Systematic Investment Plan (SIP) If you had invested `10,000 every month
SYSTEMATIC INVESTMENT PLAN (SIP)
Monthly SIP of Rs 10000
Total amount invested ( )`
Total Value as on June 30, 2022 ( )`
Alpha
Nifty 100 (TRI) ( )#`
Scheme Returns (%)
Nifty 100 (TRI) Returns (%)
Nifty 50 (TRI) Returns (%)
Alpha
Nifty 50 (TRI) ( )#`
S&P BSE SENSEX (TRI) ( )^`
S&P BSE SENSEX (TRI) Returns (%)
99,49,436 22,74,620 13,07,686 8,15,648 4,43,322 1,12,285
Since Inception 10 years 7 years 5 years 3 years 1 year
0.44 -0.33 -0.81 -0.24 -0.55 -1.62
14.11 12.04 11.31 11.57 13.23 -14.27
1,09,45,143 22,44,082 12,55,992 8,02,086 4,38,206 1,10,605
23,30,000 12,00,000 8,40,000 6,00,000 3,60,000 1,20,000
1,03,84,991 22,84,358 12,93,040 8,06,809 4,41,668 1,11,694
13.30 12.29 12.44 12.25 14.03 -11.77
1,01,57,046 23,08,058 13,26,066 8,21,031 4,40,519 1,12,643
13.47 12.56 12.83 12.52 13.59 -11.23
13.66 12.37 12.12 11.81 13.77 -12.65
0.81 -0.25 -1.13 -0.68 -0.81 -2.50
*All payouts during the period have been reinvested in the units of the scheme at the then prevailing NAV. Returns >= 1 year: CAGR (Compounded Annualised Growth Rate). N.A stands for data not available. Note: Point to Point (PTP) Returns in INR shows the value of 10,000/- investment made at inception. Source: ICRA MFI Explorer.*Alpha is difference of scheme return with benchmark return.
This product is suitable for investors who are seeking*:
• Long term capital growth
• Investment in portfolio of predominantly equity & equity related securities of large cap companies
* Investors should consult their financial advisors if in doubt about whether the product is suitable for them.
Product Label as on 30th June, 2022
Low High
Low
to
Moder
ate
ModerateModeratelyHigh
High
Very H
ighLo
w
Investors understand that their principal will be at very high risk Low High
Low
to
Moder
ate
ModerateModeratelyHigh
High
Very H
ighLo
w
TIER 1: Nifty 100 TRIInvestors understand that their principal will be at high risk
Low High
Low
to
Moder
ate
ModerateModeratelyHigh
High
Very H
ighLo
w
TIER 2: Nifty 50 TRIInvestors understand that their principal will be at very high risk
Low High
Low
to
Moder
ate
ModerateModeratelyHigh
High
Very H
ighLo
w
TIER 1: Nifty 100 TRIInvestors understand that their principal will be at very high risk
Fund Benchmark Benchmark
Since inception date of Kotak Bluechip Fund - Reg Growth is 04/02/2003 & Since Inception date of Kotak Bluechip Fund- Dividend plan is 29/12/1998. Alpha is difference of scheme return with benchmark return. The returns are calculated by XIRR approach assuming investment of `10,000/- on the 1st working day of every month. XIRR helps in calculating return on investments given an initial and final value and a series of cash inflows and outflows and taking the time of investment into consideration. Since inception returns are assumed to be starting from the beginning of the subsequent month from the date of inception. # Benchmark ; ^ Additional Benchmark. TRI – Total Return Index, In terms of SEBI circular dated January 4, 2018, the performance of the scheme is benchmarked to the Total Return variant (TRI) of the Benchmark Index instead of Price Return Variant (PRI). Alpha is difference of scheme return with benchmark return. *All payouts during the period have been reinvested in the units of the scheme at the then prevailing NAV. Returns >= 1 year: CAGR (Compounded Annualised Growth Rate). N.A stands for data not available. Note: Point to Point (PTP) Returns in INR shows the value of 10,000/- investment made at inception. Source: ICRA MFI Explorer.***As per SEBI Circular dated 27th October 2021 The first tier benchmark is reflective of the category of the scheme and the second tier benchmark is demonstrative of the investment style / strategy of the Fund Manager within the category.Kotak Bluechip Fund NAV as on June 30, 2022: ̀ 43.4540 (Reg-Plan-IDCW), ̀ 49.3680 (Dir-Plan-IDCW), ̀ 336.6350 (Growth Option), ̀ 373.2860 (Direct Growth Option)*For Fund Manager experience, please refer page 78-80. ## Risk rate assumed to be 4.95% (FBIL Overnight MIBOR rate as on 30th June 2022).**Total Expense Ratio includes applicable B30 fee and GST.For last three IDCW, please refer page no 81-83. For scheme performance, please refer page no 69-77.
AAUM: `4,175.48 crs
Fund Manager: Mr. Harish Krishnan &
Mr. Arjun Khanna*
( D e d i c a t e d f u n d m a n a g e r f o r investments in foreign securities)
AUM: `4,217.00 crs
Benchmark***: Nifty 100 TRI (Tier 1) Nifty 50 TRI (Tier 2)
Allotment date: December 29, 1998
Folio count: 2,69,427
Note: Large Cap, Midcap, Small cap and Debt and Money Market stocks as a % age of Net Assets: 80.39, 14.18, 1.83 & 3.60.
Term Deposit as provided above is towards margin for derivatives transactionsEquity Derivative Exposuer is 0.79%
PORTFOLIO
United Breweries Ltd. 1.25
Industrial Products 1.18
Fertilizers & Agrochemicals 1.21
Oberoi Realty Ltd 0.49
Hindalco Industries Ltd 1.02
Jubilant Foodworks Limited 1.25
Of India Ltd. 0.51
ICICI Lombard GeneralInsurance Company Ltd 0.66
Schaeffler India Ltd 1.36
Indraprastha Gas Ltd. 1.11
International Limited 0.69
Bharti Airtel Ltd - Partly Paid Shares 0.06
HDFC Life Insurance Company Ltd. 0.96
Gas 1.90
Gujarat State Petronet Ltd. 0.79
Life Insurance Corporation
Samvardhana Motherson
Telecom - Services 2.17
Godrej Consumer Products Ltd. 1.50Personal Products 1.50
Bharti Airtel Ltd 2.11
Max Financial Services Ltd. 0.46
Motherson Sumi Wiring India Limited 0.33
Auto Components 2.38
Beverages 1.25
Leisure Services 1.25
Coromandel International Ltd. 1.21
Bharat Forge Ltd. 1.18Realty 1.07Mahindra Lifespace Developers Ltd 0.58
Non - Ferrous Metals 1.02
Solar Industries India Limited 0.98
Medplus Health Services Ltd. 0.01Financial Technology (Fintech) 0.01
Triparty Repo 4.34
Chemicals & Petrochemicals 0.98
PB Fintech Ltd. 0.01Equity & Equity related - Total 95.61
FSN E-Commerce Ventures Ltd. 0.90Zomato Ltd. 0.03
Futures
Net Current Assets/(Liabilities) -0.74
CNX BANK INDEX-JUL2022 0.79
Notional Value) - Total 0.79
Retailing 0.94
Grand Total 100.00
Futures (Market value represents
Issuer/Instrument Industry/Rating % to Net Assets Issuer/Instrument Industry/Rating % to Net Assets
Persistent Systems Limited 2.14
ICICI Bank Ltd. 7.09HDFC Bank Ltd. 5.95Axis Bank Ltd. 3.13
AU Small Finance Bank Ltd. 0.45
Banks 20.94Equity & Equity related
IT - Software 13.42Infosys Ltd. 5.89Tata Consultancy Services Ltd. 3.10
Kotak Mahindra Bank Ltd. 2.30State Bank Of India 2.02
Tech Mahindra Ltd. 0.47Petroleum Products 8.90Reliance Industries Ltd. 8.00
Automobiles 6.99Maruti Suzuki India Limited 3.47Mahindra & Mahindra Ltd. 2.53Eicher Motors Ltd. 0.99Finance 5.49HDFC Ltd. 2.57
Bharat Petroleum Corporation Ltd. 0.90
SBI Cards & Payment Services Pvt. Ltd. 1.00Diversified FMCG 4.07
ITC Ltd. 1.95
Wipro Ltd. 0.49
Pharmaceuticals & Biotechnology 3.83Dr Reddys Laboratories Ltd. 1.67Gland Pharma Limited 1.19Zydus Lifesciences Limited 0.97
Bajaj Finance Ltd. 1.92
Construction 3.36Larsen And Toubro Ltd. 3.36
HCL Technologies Ltd. 1.33
Hindustan Unilever Ltd. 2.12
Inter Globe Aviation Ltd 1.47
Bata India Ltd. 1.07
Consumer Durables 3.29
V-Guard Industries Ltd. 0.91Cement & Cement Products 3.01
The Ramco Cements Ltd 0.30
Insurance 2.59
Transport Services 2.86
Shree Cement Ltd. 0.72Ultratech Cement Ltd. 1.99
Container Corporation of India Ltd. 1.39
Titan Company Ltd. 1.31
SECTOR ALLOCATION (%)
32.82
29.04
14.15
13.42
13.38
10.79
5.31
9.36
8.97
6.81
4.26
3.83 3.61
2.34
3.36
3.03
3.29
2.29
3.02
Benchmark
Scheme
Financial Services Information Technology Oil, Gas & Consumable Fuels Automobile and Auto Components Fast Moving Consumer GoodsHealthcare Services Cash & Cash Equivalent Construction Consumer Durables Construction Materials

An open ended equity scheme investing across large cap, mid cap, small cap stocks
Kotak Multicap Fund NAV as on June 30, 2022: ̀ 8.8650 (Reg-Plan-IDCW), ̀ 8.9840 (Dir-Plan-IDCW), ̀ 8.8650 (Growth Option), ̀ 8.9840 (Direct Growth Option)For Fund Manager experience, please refer page 78-80. **Total Expense Ratio includes applicable B30 fee and GST. For scheme performance, please refer page no 69-77.
Fund Manager: Mr. Harsha Upadhyaya, Mr. Devender Singhal, Mr. Abhishek Bisen &
( D e d i c a t e d F u n d m a n a g e r f o r investments in foreign securities)
Allotment date: September 29, 2021
AUM: `3,630.78 crs
Benchmark: Nifty 500 Multicap 50:25:25 TRI
AAUM: `3,610.28 crs
Folio count: 2,11,058
Mr. Arjun Khanna*
KOTAK MULTICAP FUND
• Investment in equity and equity related securities across market capitalisation
This product is suitable for investors who are seeking*:
• Long term capital growth
* Investors should consult their financial advisors if in doubt about whether the product is suitable for them.
Product Label as on 30th June, 2022
Low High
Low
to
Moder
ate
ModerateModeratelyHigh
High
Very H
ighLo
w
Investors understand that their principal will be at very high risk
Low High
Low
to
Moder
ate
ModerateModeratelyHigh
High
Very H
ighLo
w
Investors understand that their principal will be at very high risk
Fund Benchmark
10
IDCW Frequency
Regular: 1.95%; Direct: 0.22%
Load StructureEntry Load: Nil. (applicable for all plans)
Growth and Income Distribution cum capital withdrawal (IDCW) (Payout and Reinvestment) (applicable for all plans)
Investment Objective
However, there is no assurance that the objective of the scheme will be realized.
Ratios
Minimum Investment Amount
Trustee’s Discretion
The investment objective of the scheme is to generate long-term capital appreciation from a portfolio of equity and equity related securities across market capitalization.
Initial Investment: `5000 and in multiple of `1 for purchase and of `0.01 for switches Additional Investment: `1000 & in multiples of ̀ 1
Available Plans/Options
Ideal Investments Horizon5 years & above
Exit Load: a)For redemption / switch out of upto 10% of the initial investment amount (limit) purchased or switched in within 1 year from the date of allotment: Nil. b)If units redeemed or switched out are in excess of the limit within 1 year from the date of allotment: 1%
A) B) Direct Plan Regular Plan
c)If units are redeemed or switched out on or after 1 year from the date of allotment: NIL
Total Expense Ratio**
Data as on June 30, 2022
14.27%Portfolio Turnover
SECTOR ALLOCATION (%)
PORTFOLIOIssuer/Instrument Industry/Rating % to Net Assets Issuer/Instrument Industry/Rating % to Net Assets
Equity & Equity related
ICICI Bank Ltd. 3.60State Bank Of India 3.56
Banks 16.04
Federal Bank Ltd. 2.41Indian Bank 2.27City Union Bank Ltd. 1.80
PNC Infratech Ltd 0.97
Barbeque Nation Hospitality Ltd. 0.38
Greenply Industries Ltd. 1.11
Amber Enterprises India Ltd. 0.40
Automobiles 9.88
Sun Pharmaceuticals Industries Ltd. 1.60
Construction 3.37
Infosys Ltd. 1.61
Axis Bank Ltd. 1.14
Consumer Durables 7.67
Tech Mahindra Ltd. 1.07Tata Consultancy Services Ltd. 0.11Pharmaceuticals & Biotechnology 5.03
Alkem Laboratories Ltd. 1.42
Petroleum Products 3.89
Hindustan Petroleum Corporation Ltd 1.24
Tata Motors Ltd - DVR 1.51
JB Chemicals & Pharmaceuticals Ltd. 0.78
Kalpataru Power Transmission Ltd. 1.34
Beverages 3.33United Breweries Ltd. 1.80
Reliance Industries Ltd. 2.65
United Spirits Ltd. 1.53
Westlife Development Ltd. 0.97
HCL Technologies Ltd. 1.47
IT - Software 7.63
Sapphire Foods India Ltd. 0.88
Mahindra & Mahindra Ltd. 2.29
Century Plyboards (India) Ltd. 2.53Pokarna Ltd. 1.55
Jubilant Foodworks Limited 1.06
Bata India Ltd. 1.06
Bank Of Baroda 1.26
Maruti Suzuki India Limited 6.08
KNR Constructions Ltd. 1.06
Kansai Nerolac Paints Ltd 1.02
Persistent Systems Limited 3.37
Eris Lifesciences Ltd. 1.23
Leisure Services 3.29
ITC Ltd. 3.24
Financial Services Ltd. 1.21Mahindra & Mahindra
Diversified FMCG 3.24
Finance 3.20
Shriram City Union Finance Ltd. 0.93Shriram Transport Finance Co Ltd. 1.06
Auto Components 3.12
Samvardhana Motherson
Subros Ltd. 0.70Motherson Sumi Wiring
Max Healthcare Institute Ltd. 2.02Healthcare Services 3.11
Fortis Healthcare India Ltd 1.09
Rolex Rings Ltd. 0.95
Power 2.68National Thermal PowerCorporation Limited 2.68Telecom - Services 2.32Bharti Airtel Ltd 2.32
India Limited 0.55
Aerospace & Defense 2.27Bharat Electronics Ltd. 2.27
International Limited 0.92
Navneet Education Ltd. 0.80
Ruchi Soya Industries Ltd. 0.11
IT - Services 1.51
Ambuja Cements Ltd. 1.53
Coromandel International Ltd. 0.47Dhanuka Agritech Ltd. 0.22
Net Current Assets/(Liabilities) 0.14
Cement & Cement Products 1.64
Entertainment 1.14
Kotak Liquid Scheme
Mahindra Lifespace Developers Ltd 1.18
Agricultural Food & other Products 0.11
Realty 1.18
Heritage Foods Ltd 0.70
Equity & Equity related - Total 93.39
Direct Plan Growth 1.53
Futures
Tata Chemicals Ltd 1.84
Inox Leisure Ltd. 1.14
Grand Total 100.00
JK Cement Ltd. 0.11
Firstsource Solutions Ltd. 1.51
Carborundum Universal Ltd. 1.04Chemicals & Petrochemicals 1.84
Personal Products 1.47Emami Ltd. 1.47
Printing & Publication 0.80
Industrial Products 2.24
Food Products 0.70
Cummins India Ltd. 1.20
Fertilizers & Agrochemicals 0.69
Mutual Fund Units
Mutual Fund Units - Total 1.53
Reliance Industries Ltd.-JUL2022 2.86
Triparty Repo 4.94ICICI Bank Ltd.-JUL2022 0.81
Equity Derivative Exposuer is 3.67%Note: Large Cap, Midcap, Small cap and Debt and Money Market stocks as a % age of Net Assets: 44.40, 26.43, 26.23, & 2.94.
16.04 9.88 7.63 7.67 5.03 4.943.89
3.673.37
3.33 34.55
Banks Automobiles IT - Software Consumer Durables Pharmaceuticals & Biotechnology TREP & Term Deposits & Rev.Repo
Petroleum Products Derivatives Construction Beverages REST

7
Investment Objective
Available Plans/Options
IDCW Frequency
The investment objective of the scheme is to generate long-term capital appreciation from a diversified portfolio of equity and equity related securities and enable investors to avail the income tax rebate, as permitted from time to time however, there is no assurance that the objective of the scheme will be realized.
A) Regular Plan B) Direct Plan
Options: Growth and IDCW (Payout) (applicable for all plans)
Trustee’s Discretion
Ratios
Minimum Investment AmountInitial Investment: `500 and in multiple of `500
Source: $ICRA MFI Explorer.
Ideal Investments Horizon: 5 years & above
Regular: 2.04%; Direct: 0.75%Total Expense Ratio**
Exit Load: Nil. (applicable for all plans)
Additional Investment: `500 & in multiples of ̀ 500
Entry Load: Nil. (applicable for all plans)Load Structure
24.81%
0.93
0.44
21.19%
Portfolio Turnover$Beta $Sharpe##
$Standard Deviation
An open-ended equity linked saving scheme with a statutory lock in of 3 years and tax benefits
KOTAK TAX SAVER FUND
11
Investment style
Value Blend Growth Size
Large
Medium
Small
Data as on June 30, 2022
21.93(P/E)
3.27P/BV0.94IDCW Yield
* Investors should consult their financial advisors if in doubt about whether the product is suitable for them.
• long term capital growth with a 3 year lock in
This product is suitable for investors who are seeking*:
• Investment in portfolio of predominantly equity & equity related securities.
Product Label as on 30th June, 2022
Low High
Low
to
Moder
ate
ModerateModeratelyHigh
High
Very H
ighLo
w
Investors understand that their principal will be at very high risk
Low High
Low
to
Moder
ate
ModerateModeratelyHigh
High
Very H
ighLo
w
Investors understand that their principal will be at very high risk
Fund Benchmark
Systematic Investment Plan (SIP) If you had invested `10,000 every month
SYSTEMATIC INVESTMENT PLAN (SIP)
0.15 0.70 0.11 0.45 -0.15 1.48
Since Inception 10 years 7 years 5 years 3 years 1 year
57,67,059 22,74,620 13,07,686 8,15,648 4,43,322 1,12,285
59,36,716 23,36,950 13,06,758 8,17,407 4,51,624 1,10,927
60,23,261 24,26,084 13,11,898 8,26,567 4,50,656 1,11,919
20,00,000 12,00,000 8,40,000 6,00,000 3,60,000 1,20,000
12.09 13.50 12.53 12.79 15.18 -12.32
11.94 12.80 12.42 12.34 15.33 -13.79
11.64 12.29 12.44 12.25 14.03 -11.77
Nifty 50 (TRI) ( )^`
Total Value as on June 30, 2022 ( )`
Scheme Returns (%)
Total amount invested ( )`
Nifty 500 (TRI) Returns (%)
Nifty 50 (TRI) Returns (%)
Alpha
Nifty 500 (TRI) ( )#`
Monthly SIP of ( ) 10000`
Scheme Inception : - November 23, 2005. The returns are calculated by XIRR approach assuming investment of 10,000/- on the 1st working day of every month. XIRR helps in calculating return on investments given an initial and final value and a series of `cash inflows and outflows and taking the time of investment into consideration. Since inception returns are assumed to be starting from the beginning of the subsequent month from the date of inception. # Benchmark ; ̂ Additional Benchmark. TRI – Total Return Index, In terms of SEBI circular dated January 4, 2018, the performance of the scheme is benchmarked to the Total Return variant (TRI) of the Benchmark Index instead of Price Return Variant (PRI).
For last three IDCW, please refer page no 81-83. For scheme performance, please refer page no 69-77.For Fund Manager experience, please refer page 78-80. ## Risk rate assumed to be 4.95% (FBIL Overnight MIBOR rate as on 30th June 2022).**Total Expense Ratio includes applicable B30 fee and GST.
Alpha is difference of scheme return with benchmark return. *All payouts during the period have been reinvested in the units of the scheme at the then prevailing NAV. Returns >= 1 year: CAGR (Compounded Annualised Growth Rate). N.A stands for data not available. Note: Point to Point (PTP) Returns in INR shows the value of 10,000/- investment made at inception. Source: ICRA MFI Explorer.Kotak Tax Saver Fund NAV as on June 30, 2022: ̀ 24.3690 (Reg-Plan-IDCW), ̀ 30.7720 (Dir-Plan-IDCW), ̀ 65.1150 (Growth Option) ̀ 73.4610 (Direct Growth Option)
Fund Manager: Mr. Harsha
Upadhyaya*
AAUM: `2,517.82 crs
AUM: `2,528.82 crs
Benchmark: Nifty 500 TRI
Folio count: 3,29,200
Allotment date: November 23, 2005
PORTFOLIO
Equity & Equity related
ICICI Bank Ltd. 7.27
Axis Bank Ltd. 3.27
Banks 20.56
State Bank Of India 5.34
IT - Software 8.85Infosys Ltd. 4.62
Wipro Ltd. 0.99
Chemicals & Petrochemicals 6.81
AU Small Finance Bank Ltd. 1.75
SRF Ltd. 3.30Linde India Ltd. 2.66
Consumer Durables 5.45Whirlpool of India Ltd. 1.05Kansai Nerolac Paints Ltd 1.03Blue Star Ltd. 0.91Sheela Foam Ltd 0.82
Tata Consultancy Services Ltd. 2.86
Solar Industries India Limited 0.85
HCL Technologies Ltd. 0.38
V-Guard Industries Ltd. 0.76
HDFC Bank Ltd. 2.93
Bata India Ltd. 0.49Hawkins Cooker Ltd 0.39Industrial Products 5.18
Cipla Ltd. 1.09
Maruti Suzuki India Limited 2.18
Ashoka Buildcon Limited 0.43
Zydus Lifesciences Limited 0.92
Kalpataru Power Transmission Ltd. 0.78
Mahindra & Mahindra Ltd. 1.95
Sun Pharmaceuticals Industries Ltd. 2.30
Petroleum Products 5.13
Larsen And Toubro Ltd. 3.54
Cummins India Ltd. 1.72
Bharat Forge Ltd. 1.03
Pharmaceuticals & Biotechnology 4.31
Reliance Industries Ltd. 5.13
Carborundum Universal Ltd. 0.99Automobiles 5.16
Bajaj Auto Ltd. 1.03
JMC Projects (India) Ltd. 0.35
Construction 5.10
SKF India Ltd 1.44
Fertilizers & Agrochemicals 2.07
Beverages 2.03
Finance 2.68
Coromandel International Ltd. 2.07
Electrical Equipment 4.25
Dalmia Bharat Limited 0.66
Auto Components 1.09
Agricultural Food &
Gujarat State Petronet Ltd. 0.93
Thermax Ltd. 2.20
Ambuja Cements Ltd. 1.08
The Ramco Cements Ltd 0.63Diversified FMCG 3.35ITC Ltd. 3.35
Cement & Cement Products 3.81
Bajaj Finance Ltd. 2.03Bajaj Finserv Ltd. 0.65
ABB India Ltd 2.05
Ultratech Cement Ltd. 1.44
Blue Dart Express Ltd. 1.23Container Corporation of India Ltd. 0.82
Transport Services 2.05
United Spirits Ltd. 2.03Telecom - Services 1.91Bharti Airtel Ltd 1.87Bharti Airtel Ltd - Partly Paid Shares 0.04Ferrous Metals 1.76Jindal Steel & Power Ltd. 1.76
other Products 1.21Balrampur Chini Mills Ltd. 1.21
Balkrishna Industries Ltd. 1.09Gas 0.93
Non - Ferrous Metals 0.80
Retailing 0.83
Hindalco Industries Ltd 0.80Insurance 0.62Max Financial Services Ltd. 0.62Capital Markets 0.27Prudent Corporate AdvisoryServices Ltd. 0.27Equity & Equity related - Total 96.21
Net Current Assets/(Liabilities) -0.11
FSN E-Commerce Ventures Ltd. 0.83
Grand Total 100.00
Triparty Repo 3.90
Issuer/Instrument Industry/Rating % to Net Assets Issuer/Instrument Industry/Rating % to Net Assets
SECTOR ALLOCATION (%)
29.31
24.14
3.30
9.43
2.70
8.87
12.52
8.86
7.80
6.59
5.64
6.24
11.76
6.06
2.05
5.11
3.73
5.06
5.34
4.30
Benchmark
Scheme
Financial Services Capital Goods Chemicals Information Technology Fast Moving Consumer Goods Automobile and Auto ComponentsOil, Gas & Consumable Fuels Construction Consumer Durables Healthcare Services
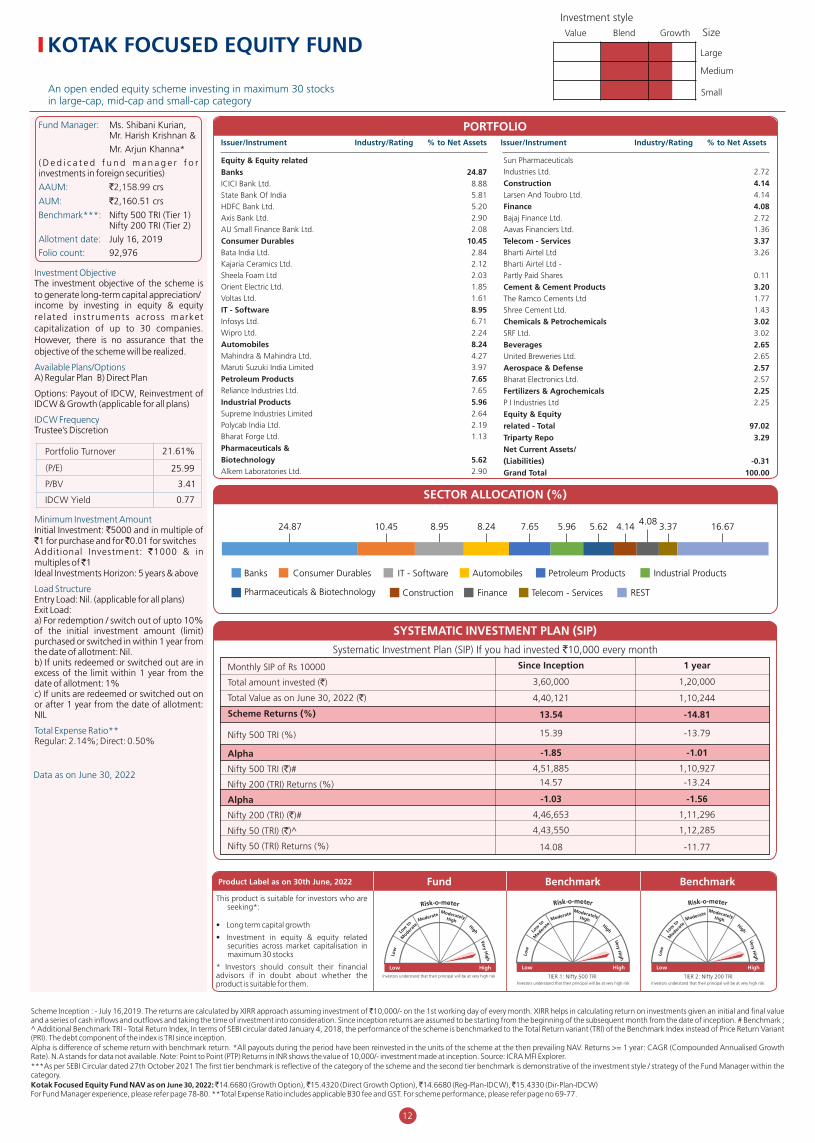
7
An open ended equity scheme investing in maximum 30 stocksin large-cap, mid-cap and small-cap category
12
( D e d i c a t e d f u n d m a n a g e r f o r investments in foreign securities)
Mr. Arjun Khanna*
AUM: `2,160.51 crs
Benchmark***: Nifty 500 TRI (Tier 1) Nifty 200 TRI (Tier 2)
AAUM: ` crs 2,158.99
Allotment date: July 16, 2019
Fund Manager: Ms. Shibani Kurian, Mr. Harish Krishnan &
Folio count: 92,976
Investment style
Value Blend Growth Size
Large
Medium
Small
KOTAK FOCUSED EQUITY FUND
Scheme Inception : - July 16,2019. The returns are calculated by XIRR approach assuming investment of ̀ 10,000/- on the 1st working day of every month. XIRR helps in calculating return on investments given an initial and final value and a series of cash inflows and outflows and taking the time of investment into consideration. Since inception returns are assumed to be starting from the beginning of the subsequent month from the date of inception. # Benchmark ; ^ Additional Benchmark TRI - Total Return Index, In terms of SEBI circular dated January 4, 2018, the performance of the scheme is benchmarked to the Total Return variant (TRI) of the Benchmark Index instead of Price Return Variant (PRI). The debt component of the index is TRI since inception.Alpha is difference of scheme return with benchmark return. *All payouts during the period have been reinvested in the units of the scheme at the then prevailing NAV. Returns >= 1 year: CAGR (Compounded Annualised Growth Rate). N.A stands for data not available. Note: Point to Point (PTP) Returns in INR shows the value of 10,000/- investment made at inception. Source: ICRA MFI Explorer.
Kotak Focused Equity Fund NAV as on June 30, 2022: ̀ 14.6680 (Growth Option), ̀ 15.4320 (Direct Growth Option), ̀ 14.6680 (Reg-Plan-IDCW), ̀ 15.4330 (Dir-Plan-IDCW)For Fund Manager experience, please refer page 78-80. **Total Expense Ratio includes applicable B30 fee and GST. For scheme performance, please refer page no 69-77.
***As per SEBI Circular dated 27th October 2021 The first tier benchmark is reflective of the category of the scheme and the second tier benchmark is demonstrative of the investment style / strategy of the Fund Manager within the category.
IDCW Frequency
Minimum Investment Amount
Load Structure
Exit Load:
Regular: 2.14%; Direct: 0.50%
Available Plans/Options
The investment objective of the scheme is to generate long-term capital appreciation/income by investing in equity & equity re lated instruments across market capitalization of up to 30 companies. However, there is no assurance that the objective of the scheme will be realized.
Ideal Investments Horizon: 5 years & above
Entry Load: Nil. (applicable for all plans)
b) If units redeemed or switched out are in excess of the limit within 1 year from the date of allotment: 1%
Additional Investment: `1000 & in multiples of ̀ 1
Options: Payout of IDCW, Reinvestment of IDCW & Growth (applicable for all plans)
Total Expense Ratio**
Investment Objective
A) Regular Plan B) Direct Plan
Trustee’s Discretion
Initial Investment: `5000 and in multiple of `1 for purchase and for ̀ 0.01 for switches
a) For redemption / switch out of upto 10% of the initial investment amount (limit) purchased or switched in within 1 year from the date of allotment: Nil.
c) If units are redeemed or switched out on or after 1 year from the date of allotment: NIL
21.61%Portfolio Turnover
Data as on June 30, 2022
25.99(P/E)
3.41P/BV
0.77IDCW Yield SECTOR ALLOCATION (%)
Systematic Investment Plan (SIP) If you had invested `10,000 every month
SYSTEMATIC INVESTMENT PLAN (SIP)
Alpha
Monthly SIP of Rs 10000
Total amount invested (`)
Total Value as on June 30, 2022 (`)
Scheme Returns (%)
Nifty 500 TRI (%)
Nifty 500 TRI (`)#
Nifty 200 (TRI) Returns (%)
Alpha
Nifty 200 (TRI) (`)#
Nifty 50 (TRI) (`)^
Nifty 50 (TRI) Returns (%) 14.08 -11.77
4,40,121 1,10,244
4,46,653 1,11,296
4,51,885 1,10,927
3,60,000 1,20,000
13.54 -14.81
15.39 -13.79
Since Inception 1 year
14.57 -13.24
4,43,550 1,12,285
-1.03 -1.56
-1.85 -1.01
• Investment in equity & equity related securities across market capitalisation in maximum 30 stocks
This product is suitable for investors who are seeking*:
• Long term capital growth
* Investors should consult their financial advisors if in doubt about whether the product is suitable for them.
Product Label as on 30th June, 2022
Low High
Low
to
Moder
ate
ModerateModeratelyHigh
High
Very H
ighLo
w
TIER 1: Nifty 500 TRI
Low High
Low
to
Moder
ate
ModerateModeratelyHigh
High
Very H
ighLo
w
TIER 2: Nifty 200 TRI
Low High
Low
to
Moder
ate
ModerateModeratelyHigh
High
Very H
ighLo
w
Investors understand that their principal will be at very high risk
Investors understand that their principal will be at very high risk Investors understand that their principal will be at very high risk
Fund Benchmark Benchmark
Consumer Durables 10.45
Kajaria Ceramics Ltd. 2.12
State Bank Of India 5.81
Axis Bank Ltd. 2.90
Sheela Foam Ltd 2.03
Petroleum Products 7.65
Equity & Equity related
Banks 24.87ICICI Bank Ltd. 8.88
HDFC Bank Ltd. 5.20
AU Small Finance Bank Ltd. 2.08
Bata India Ltd. 2.84
Voltas Ltd. 1.61
IT - Software 8.95Infosys Ltd. 6.71
Orient Electric Ltd. 1.85
Wipro Ltd. 2.24
Automobiles 8.24
Maruti Suzuki India Limited 3.97
Mahindra & Mahindra Ltd. 4.27
Reliance Industries Ltd. 7.65
Industrial Products 5.96Supreme Industries Limited 2.64
Polycab India Ltd. 2.19
Bharat Forge Ltd. 1.13
Pharmaceuticals &
Biotechnology 5.62Alkem Laboratories Ltd. 2.90
Sun Pharmaceuticals
Industries Ltd. 2.72
Construction 4.14
Bharti Airtel Ltd -
Bharat Electronics Ltd. 2.57
The Ramco Cements Ltd 1.77
Chemicals & Petrochemicals 3.02
Larsen And Toubro Ltd. 4.14
Telecom - Services 3.37
United Breweries Ltd. 2.65
Equity & Equity
Aavas Financiers Ltd. 1.36
Fertilizers & Agrochemicals 2.25
related - Total 97.02
Finance 4.08
Beverages 2.65
Triparty Repo 3.29
(Liabilities) -0.31
Grand Total 100.00
Shree Cement Ltd. 1.43
Cement & Cement Products 3.20
Bajaj Finance Ltd. 2.72
SRF Ltd. 3.02
Net Current Assets/
Partly Paid Shares 0.11
Aerospace & Defense 2.57
P I Industries Ltd 2.25
Bharti Airtel Ltd 3.26
PORTFOLIOIssuer/Instrument Industry/Rating % to Net Assets Issuer/Instrument Industry/Rating % to Net Assets
24.87 10.45 8.95 8.24 7.65 5.96 5.62 4.144.08
3.37 16.67
Banks Consumer Durables IT - Software Automobiles Petroleum Products Industrial Products
Pharmaceuticals & Biotechnology Construction Finance Telecom - Services REST

Thematic - An open ended equity scheme investing in pioneering innovations theme.
13
Investment style
Value Blend Growth Size
Large
Medium
Small
Fund Manager: Mr. Harish Krishnan &
AAUM: `1,518.13 crs
Mr. Arjun Khanna*( D e d i c a t e d F u n d m a n a g e r f o r investments in foreign securities)
AUM: `1,508.08 crsBenchmark: 85% IISL Kotak India Pioneering Innovations + 15% MSCI ACWI Information Technology Index TRI.Allotment date: October 31, 2019Folio count: 72,897
KOTAK PIONEER FUND
A) B) Direct Plan Regular PlanOptions: Payout of IDCW, Reinvestment of IDCW & Growth (applicable for all plans)
Total Expense Ratio**
Additional Investment: `1000 & in multiples of ̀ 1
However, there can be no assurance that the investment objective of the Scheme will be realized.
Minimum Investment Amount
IDCW Frequency
The investment objective of the scheme is to generate capital appreciation from a diversified portfolio of equity, equity related instruments and units of global mutual funds which invests into such companies that utilize new forms of production, technology, distribution or processes which are likely to challenge existing markets or value networks, or displace established market leaders, or bring in novel products and/or business models.
Trustee’s Discretion
Load Structure
Ratios
Initial Investment: `5000 and in multiple of `1 for purchase and of ̀ 0.01 for switches
Available Plans/Options
Entry Load: Nil. (applicable for all plans)
a) For redemption / switch out of upto 10% of the initial investment amount (limit) purchased or switched in within 1 year from the date of allotment: Nil.b) If units redeemed or switched out are in excess of the limit within 1 year from the date of allotment: 1%
Exit Load:
Investment Objective
Ideal Investments Horizon: 5 years & above
c) If units are redeemed or switched out on or after 1 year from the date of allotment: NIL
Regular: 2.05%; Direct: 0.47%
Data as on June 30, 2022
13.69%Portfolio Turnover
For Fund Manager experience, please refer page 78-80. **Total Expense Ratio includes applicable B30 fee and GST. For scheme performance, please refer page no 69-77.Kotak Pioneer Fund NAV as on June 30, 2022: ̀ 15.9440 (Reg-Plan-IDCW), ̀ 16.6960 (Dir-Plan-IDCW), ̀ 15.9440 (Growth Option), ̀ 16.6970 (Direct Growth Option)
Scheme Inception : - October 31, 2019. The returns are calculated by XIRR approach assuming investment of ̀ 10,000/- on the 1st working day of every month. XIRR helps in calculating return on investments given an initial and final value and a series of cash inflows and outflows and taking the time of investment into consideration. Since inception returns are assumed to be starting from the beginning of the subsequent month from the date of inception. # Benchmark ; ^ Additional Benchmark TRI - Total Return Index, In terms of SEBI circular dated January 4, 2018, the performance of the scheme is benchmarked to the Total Return variant (TRI) of the Benchmark Index instead of Price Return Variant (PRI). The debt component of the index is TRI since inception. Alpha is difference of scheme return with benchmark return. *All payouts during the period have been reinvested in the units of the scheme at the then prevailing NAV. Returns >= 1 year: CAGR (Compounded Annualised Growth Rate). N.A stands for data not available. Note: Point to Point (PTP) Returns in INR shows the value of 10,000/- investment made at inception. Source: ICRA MFI Explorer.
This product is suitable for investors who are seeking*:
• Long term capital growth
• Investment in equity and equity related securities of companies operating with pioneering innovations theme without any market capitalisation and sector bias.
* Investors should consult their financial advisors if in doubt about whether the product is suitable for them.
Product Label as on 30th June, 2022
Low High
Low
to
Moder
ate
ModerateModeratelyHigh
High
Very H
ighLo
w
Investors understand that their principal will be at very high risk
Low High
Low
to
Moder
ate
ModerateModeratelyHigh
High
Very H
ighLo
w
Investors understand that their principal will be at very high risk
Fund Benchmark
SECTOR ALLOCATION (%)
Systematic Investment Plan (SIP) If you had invested `10,000 every month
SYSTEMATIC INVESTMENT PLAN (SIP)
3,98,819 1,12,285
Since Inception 1 year
14.65 -16.51
16.36 -18.72
4,11,379 1,07,574
4,02,372 1,09,088
1.71 -2.21
3,30,000 1,20,000
13.97 -11.77
85% IISL Kotak India Pioneering Innovations + 15% MSCI ACWI Information Technology Index TRI ( )#`
Nifty 50 (TRI) ( )^`
Alpha
85% IISL Kotak India Pioneering Innovations + 15% MSCI ACWI Information Technology Index TRI (%)
Monthly SIP of ( ) 10000`
Scheme Returns (%)
Total amount invested ( )`
Nifty 50 (TRI) Returns (%)
Total Value as on June 30, 2022 ( )`
For viewing detailed portfolio of CI Global Alpha Innovators Corporate Class on desktop please visit: www.kotakmf.com>> Forms & Downloads>>Portfolios>>CI Global Alpha Innovators Corporate Class.
Mahindra & Mahindra Ltd. 2.90
Sona BLW Precision Forgings Ltd 1.47
Maruti Suzuki India Limited 6.18
Samvardhana Motherson
Igarashi Motors India Ltd. 0.37
Equity & Equity related
Auto Components 7.74
Rolex Rings Ltd. 1.68
Automobiles 9.08
Petroleum Products 8.26
Schaeffler India Ltd 2.43
Motherson Sumi WiringInternational Limited 1.14
India Limited 0.65
Banks 5.84
Fino Payments Bank Ltd 0.48HDFC Bank Ltd. 5.36
Industrial Products 5.80
Reliance Industries Ltd. 8.26
Zydus Lifesciences Limited 1.30
Bajaj Finance Ltd. 2.51
Container Corporation of India Ltd. 2.07
Bharat Forge Ltd. 1.90
Pharmaceuticals & Biotechnology 5.69
SBI Cards & Payment Services Pvt. Ltd. 1.86
AIA Engineering Limited. 1.77
Aavas Financiers Ltd. 0.53
Transport Services 4.04
Thermax Ltd. 1.77
Inter Globe Aviation Ltd 1.97
Titan Company Ltd. 3.22Retailing 2.87
Carborundum Universal Ltd. 0.97
Consumer Durables 3.22
Gland Pharma Limited 1.39Sun Pharmaceuticals Industries Ltd. 1.98
ABB India Ltd 1.75
Persistent Systems Limited 3.95IT - Software 4.84
Divi s Laboratories Ltd. 1.02
Latent View Analytics Ltd 0.89
Ratnamani Metals & Tubes Ltd. 1.16
Finance 4.90
Electrical Equipment 3.52
PORTFOLIO
HDFC Life Insurance Company Ltd. 1.26
Mahindra Lifespace Developers Ltd 1.62
Trent Ltd 1.00CarTrade Tech Ltd 0.64
Fertilizers & Agrochemicals 2.51
Chemicals & Petrochemicals 2.37
Indiamart intermesh ltd. 0.37Zomato Ltd. 0.61
Coromandel International Ltd. 1.58
Solar Industries India Limited 2.37Insurance 2.00
P I Industries Ltd 0.93
Medplus Health Services Ltd. 0.25
ICICI Lombard General InsuranceCompany Ltd 0.74Realty 1.62
Entertainment 0.50Zee Entertainment Enterprises Ltd 0.50
Diversified 1.38
Jubilant Foodworks Limited 1.15
Affle (India) Ltd. 0.28Equity & Equity
3M India Ltd. 1.38Leisure Services 1.15
Gas 0.87
Prudent Corporate Advisory
Mutual Fund Units CI Global Alpha Innovators
Financial Technology (Fintech) 0.50
Capital Markets 0.53
Corp Class I ** Overseas Mutual Fund 11.31
Gujarat State Petronet Ltd. 0.87
Services Ltd. 0.53
PB Fintech Ltd. 0.50
related - Total 79.51
Ishares Nasdaq 100 UCITS ETF USD ** Overseas Mutual Fund 6.95
IT - Services 0.28
Mutual Fund Units - Total 18.26Futures
Net Current Assets/(Liabilities) 0.51
Indiamart intermesh ltd.-JUL2022 0.13
Grand Total 100.00
Triparty Repo 1.72
Issuer/Instrument Industry/Rating % to Net Assets Issuer/Instrument Industry/Rating % to Net Assets
Equity Derivative Exposuer is 0.13%
18.26 9.08 8.26 7.74 5.84 5.80 5.69 4.90 25.554.044.84
Overseas Mutual Fund Automobiles Petroleum Products Auto Components Banks Industrial Products
Pharmaceuticals & Biotechnology Finance IT - Software Transport Services REST

An open-ended Equity Scheme following Environment, Social and Governance (ESG) theme
14
KOTAK ESG OPPORTUNITIES FUND
Investment Objective
Options: Payout of IDCW, Reinvestment of IDCW & Growth (applicable for all plans)
Load Structure
10% of the units allotted shall be redeemed without any Exit Load on or before completion of 1 Year from the date of allotment of units.
Total Expense Ratio**
Available Plans/Options
IDCW FrequencyTrustee’s Discretion
Minimum Investment Amount
The scheme shall seek to generate capital appreciation by investing in a diversified portfolio of companies that follow Environmental, Social and Governance parameters.However, there can be no assurance that the investment objective of the Scheme will be realized.
Exit Load:
Ratios
Ideal Investments Horizon: 5 years & above
A) B) Direct Plan Regular Plan
Initial Investment: `5000 and in multiple of `1 for purchase and of ̀ 0.01 for switchesAdditional Investment: `1000 & in multiples of ̀ 1
Entry Load: Nil. (applicable for all plans)
Any redemption in excess of such limit within 1 Year from the date of allotment shall be subject to the following Exit Load:a) If redeemed or switched out on or before completion of 1 Year from the date of allotment of units-1.00%b) If redeemed or switched out after completion of 1 Year from the date of allotment of units-NIL
Regular: 2.09%; Direct: 0.38%
Data as on June 30, 2022
28.95%Portfolio Turnover
This product is suitable for investors who are seeking*:
• Long term capital growth
• Investment in Portfolio of predominantly equity & equity related securities of companies following environmental, social and governance (ESG) criteria.
* Investors should consult their financial advisors if in doubt about whether the product is suitable for them.
Product Label as on 30th June, 2022
Low High
Low
to
Moder
ate
ModerateModeratelyHigh
High
Very H
ighLo
w
Investors understand that their principal will be at very high risk
Low High
Low
to
Moder
ate
ModerateModeratelyHigh
High
Very H
ighLo
w
Investors understand that their principal will be at very high risk
Fund Benchmark
SECTOR ALLOCATION (%)
Kotak ESG Opportunities Fund NAV as on June 30, 2022: `10.3590 (Reg-Plan-IDCW), `10.6410 (Dir-Plan-IDCW), `10.3590 (Growth Option), `10.6410 (Direct Growth Option)For Fund Manager experience, please refer page 78-80. **Total Expense Ratio includes applicable B30 fee and GST. For scheme performance, please refer page no 69-77.
Folio count: 51,947
& Mr.Arjun Khanna*
AAUM: `1,352.53 crs
Benchmark: Nifty 100 ESG Index TRI
( D e d i c a t e d F u n d m a n a g e r f o r investments in foreign securities)
Fund Manager: Mr. Harsha Upadhyaya
AUM: `1,336.17 crs
Allotment date: December 11, 2020
Ambuja Cements Ltd. 1.51
JK Cement Ltd. 1.28
Ultratech Cement Ltd. 2.94
Sun Pharmaceuticals
Finance 7.49
The Ramco Cements Ltd 0.95
Infosys Ltd. 7.66
Bharat Forge Ltd. 1.46
ICICI Bank Ltd. 6.09
Bajaj Finance Ltd. 4.24
Cement & Cement Products 6.68
Banks 20.20
Pharmaceuticals &
Bajaj Auto Ltd. 2.64
Larsen And Toubro Ltd. 3.79
Biotechnology 5.67
Equity & Equity related
HDFC Bank Ltd. 3.43
Tata Consultancy Services Ltd. 5.87
Mahindra & Mahindra Ltd. 1.64
Coromandel International Ltd. 3.39
HDFC Ltd. 3.25
Dhanuka Agritech Ltd. 0.68
Fertilizers & Agrochemicals 4.07
Wipro Ltd. 2.49
AU Small Finance Bank Ltd. 2.44
Divi s Laboratories Ltd. 1.90
Industries Ltd. 1.24
IT - Software 16.02
State Bank Of India 6.10
Axis Bank Ltd. 2.14
Cipla Ltd. 1.13
Automobiles 4.28
Non - Ferrous Metals 4.05
Abbott India Ltd. 1.40
Hindalco Industries Ltd 4.05
Construction 3.79
Industrial Products 3.78
Supreme Industries Limited 1.63
Ratnamani Metals & Tubes Ltd. 0.69
PORTFOLIO
Chemicals & Petrochemicals 2.99
Linde India Ltd. 2.99
Agricultural Food &
other Products 2.96
Bharti Airtel Ltd -
Reliance Industries Ltd. 2.43
Petroleum Products 2.43
Transport Services 2.31
Inter Globe Aviation Ltd 1.20
Partly Paid Shares 0.08
Container Corporation
of India Ltd. 1.11
Balrampur Chini Mills Ltd. 2.96
Telecom - Services 2.64
Consumer Durables 2.29
Bata India Ltd. 1.25
Bharti Airtel Ltd 2.56
VIP Industries Ltd. 1.04
Direct Plan Growth 0.80
JK Cement Ltd.-JUL2022 0.14
Ferrous Metals 1.23
V-Mart Retail Ltd. 0.34
Kotak Liquid Scheme
Retailing 0.34
Mutual Fund Units
Jindal Steel & Power Ltd. 1.23
related - Total 95.82
Grand Total 100.00
DR.Lal Pathlabs Ltd. 0.09
Equity & Equity
Mutual Fund Units - Total 0.80
Net Current Assets/(Liabilities) -1.41
Hindustan Unilever Ltd. 1.42
Balkrishna Industries Ltd. 1.09
Auto Components 1.09
Healthcare Services 0.09
Diversified FMCG 1.42
Futures
DR.Lal Pathlabs Ltd.-JUL2022 1.47
Triparty Repo 4.79
Issuer/Instrument Industry/Rating % to Net Assets Issuer/Instrument Industry/Rating % to Net Assets
Equity Derivative Exposuer is 1.61%
20.20 16.02 7.49 6.68 5.67 4.79 4.28 4.07 4.05 3.79 22.96
Banks IT - Software Finance Cement & Cement Products Pharmaceuticals & Biotechnology
TREP & Term Deposits & Rev.Repo Automobiles Fertilizers & Agrochemicals Non - Ferrous Metals Construction REST

An open-ended equity scheme following contrarian investment strategy
KOTAK INDIA EQ CONTRA FUND
Folio count: 57,172Allotment date: July 27, 2005
AAUM: `1,188.55 crs AUM: `1,192.39 crs
Fund Manager: Ms. Shibani Kurian*
Benchmark***: Nifty 500 TRI (Tier 1) Nifty 100 TRI (Tier 2)
Investment style
Value Blend Growth Size
Large
Medium
Small
Kotak India EQ Contra Fund NAV as on June 30, 2022: ̀ 25.8920 (Reg-Plan-IDCW), ̀ 30.2590 (Dir-Plan-IDCW), ̀ 75.1150 (Growth Option), ̀ 85.0320 (Direct Growth Option)
Scheme Inception : - July 27,2005. The returns are calculated by XIRR approach assuming investment of 10,000/- on the 1st working day of every month. XIRR helps in calculating return on investments given an initial and final value and a series of cash `inflows and outflows and taking the time of investment into consideration. Since inception returns are assumed to be starting from the beginning of the subsequent month from the date of inception. # Benchmark ; ̂ Additional Benchmark TRI – Total Return Index, In terms of SEBI circular dated January 4, 2018, the performance of the scheme is benchmarked to the Total Return variant (TRI) of the Benchmark Index instead of Price Return Variant (PRI).
For last three IDCW, please refer page no 81-83. For scheme performance, please refer page no 69-77.
***As per SEBI Circular dated 27th October 2021 The first tier benchmark is reflective of the category of the scheme and the second tier benchmark is demonstrative of the investment style / strategy of the Fund Manager within the category.
Alpha is difference of scheme return with benchmark return. *All payouts during the period have been reinvested in the units of the scheme at the then prevailing NAV. Returns >= 1 year: CAGR (Compounded Annualised Growth Rate). N.A stands for data not available. Note: Point to Point (PTP) Returns in INR shows the value of 10,000/- investment made at inception. Source: ICRA MFI Explorer.
For Fund Manager experience, please refer page 78-80. ## Risk rate assumed to be 4.95% (FBIL Overnight MIBOR rate as on 30th June 2022).**Total Expense Ratio includes applicable B30 fee and GST.
Options: Payout of IDCW, Reinvestment of IDCW & Growth (applicable for all plans)
Investment ObjectiveThe investment objective of the scheme is to generate capital appreciation from a diversified portfolio of equity and equity related instruments. The Scheme will invest in stocks of companies, which are fundamentally sound but are undervalued. Undervalued stocks are stocks of those companies whose true long term potentialis not yet recognised by the market. At times, the broad market takes time to appreciate the long-term potential of some fundamentally sound companies.Stocks of such companies are traded at prices below their intrinsic value and are regarded as undervalued stocks.We believe that, over a period of time, the price of a stock reflects the intrinsic value of the underlying company. Thus, the moving up of the price of the undervalued stock towards its intrinsic value will help us generate capital appreciation for investors. However, there can be no assurance that the investment objective of the Scheme will be achieved.
Available Plans/OptionsA) B) Direct Plan Regular Plan
Trustee’s DiscretionRatios
Minimum Investment AmountInitial Investment: `5000 and in multiple of `1 for purchase and for ̀ 0.01 for switchesAdditional Investment: `1000 & in multiples of ̀ 1
Entry Load: Nil. (applicable for all plans)
IDCW Frequency
Exit Load:
Load Structure
a) For redemption / switch out of upto 10% of the initial investment amount (limit) purchased or switched in within 1 year from the date of allotment: Nil.
b) If units redeemed or switched out are in excess of the limit within 1 year from the date of allotment: 1%c) If units are redeemed or switched out on or after 1 year from the date of allotment: NIL
Regular: 2.30%; Direct: 0.90%
Ideal Investments Horizon: 5 years & above
Total Expense Ratio**
$Source: ICRA MFI Explorer.
Portfolio Turnover$Beta $Sharpe## $Standard Deviation
18.50%0.990.41
22.37%
Data as on June 30, 2022
20.51(P/E)2.88P/BV1.29IDCW Yield
Systematic Investment Plan (SIP) If you had invested `10,000 every month
SYSTEMATIC INVESTMENT PLAN (SIP)
Monthly SIP of Rs 10000
Total amount invested ( )`
Nifty 50 (TRI) Returns (%)
Total Value as on June 30, 2022 ( )`
Nifty 100 (TRI) ( )#`
Nifty 100 (TRI) Returns (%)
Nifty 500 (TRI) ( )#`
Alpha
Scheme Returns (%)
Alpha
Nifty 50 (TRI) ( )^`
Nifty 500 (TRI) Returns (%)
62,50,914 23,36,950 13,06,758 8,17,407 4,51,624 1,10,927
63,98,333 23,44,149 13,13,346 8,12,446 4,44,735 1,11,097
12.02 12.80 12.42 12.34 15.33 -13.79
0.23 0.06 0.14 -0.25 -1.08 0.25
12.06 12.37 12.12 11.81 13.77 -12.65
0.19 0.48 0.44 0.28 0.48 -0.89
62,79,983 22,84,358 12,93,040 8,06,809 4,41,668 1,11,694
60,95,050 22,74,620 13,07,686 8,15,648 4,43,322 1,12,285
Since Inception 10 years 7 years 5 years 3 years 1 year
20,40,000 12,00,000 8,40,000 6,00,000 3,60,000 1,20,000
12.25 12.85 12.56 12.09 14.26 -13.54
11.76 12.29 12.44 12.25 14.03 -11.77
* Investors should consult their financial advisors if in doubt about whether the product is suitable for them.
This product is suitable for investors who are seeking*:
• Investment in portfolio of predominantly equity & equity related securities
• Long term capital growth
Product Label as on 30th June, 2022
Low High
Low
to
Moder
ate
ModerateModeratelyHigh
High
Very H
ighLo
w
TIER 1: Nifty 500 TRI
Low High
Low
to
Moder
ate
ModerateModeratelyHigh
High
Very H
ighLo
w
TIER 2: Nifty 100 TRI
Low High
Low
to
Moder
ate
ModerateModeratelyHigh
High
Very H
ighLo
w
Investors understand that their principal will be at very high risk
Investors understand that their principal will be at very high risk Investors understand that their principal will be at very high risk
Fund Benchmark Benchmark
Larsen And Toubro Ltd. 3.21
IndusInd Bank Ltd. 0.86
Equity & Equity related
Federal Bank Ltd. 1.92
IT - Software 10.39
Diversified FMCG 3.81
Hindustan Unilever Ltd. 1.30
Ultratech Cement Ltd. 2.44
Cummins India Ltd. 2.14
Shree Cement Ltd. 1.07
Banks 24.98
HCL Technologies Ltd. 1.02
Reliance Industries Ltd. 7.16Hindustan Petroleum Corporation Ltd 1.21
AU Small Finance Bank Ltd. 1.76
Bharat Petroleum Corporation Ltd. 0.69
HDFC Bank Ltd. 5.05State Bank Of India 4.36Axis Bank Ltd. 2.93
Kotak Mahindra Bank Ltd. 0.43
Tata Consultancy Services Ltd. 2.69
Petroleum Products 9.06
Pharmaceuticals & Biotechnology 6.34Sun Pharmaceuticals Industries Ltd. 2.32
ICICI Bank Ltd. 7.67
Torrent Pharmaceuticals Ltd. 1.18Alkem Laboratories Ltd. 1.11Cipla Ltd. 0.66
Zydus Lifesciences Limited 0.42Industrial Products 5.59
Supreme Industries Limited 1.77
Persistent Systems Limited 1.50
Infosys Ltd. 5.18
Dr Reddys Laboratories Ltd. 0.65
Bharat Forge Ltd. 1.68Automobiles 5.26
Maruti Suzuki India Limited 2.60Mahindra & Mahindra Ltd. 2.66
ITC Ltd. 2.51
Cement & Cement Products 3.80
The Ramco Cements Ltd 0.29Consumer Durables 3.50Voltas Ltd. 1.09Whirlpool of India Ltd. 1.01Kajaria Ceramics Ltd. 0.95Bata India Ltd. 0.45Construction 3.21
Corporation Limited 1.59
Oil 0.33
Fertilizers & Agrochemicals 0.86
SRF Ltd. 1.77
Bharti Airtel Ltd 2.88
Insurance 1.51
Coromandel International Ltd. 0.86
Finance 0.59
Non - Ferrous Metals 0.10
Oberoi Realty Ltd 1.26Ferrous Metals 1.18Jindal Steel & Power Ltd. 1.18
Chemicals & Petrochemicals 1.77
Realty 1.26
Aerospace & Defense 1.64Bharat Electronics Ltd. 1.64
SBI Life Insurance Company Ltd 1.51
Telecom - Services 2.97
Emami Ltd. 0.81
Personal Products 1.97
Auto Components 1.14Samvardhana MothersonInternational Limited 0.81Motherson Sumi Wiring India Limited 0.33
United Breweries Ltd. 1.49
Godrej Consumer Products Ltd. 1.16
Power 1.59
Beverages 1.49
Inter Globe Aviation Ltd 0.95
Gas 0.85Gujarat State Petronet Ltd. 0.85
Aavas Financiers Ltd. 0.59Leisure Services 0.46Jubilant Foodworks Limited 0.46
Oil & Natural Gas Corporation Ltd. 0.33
Bharti Airtel Ltd - Partly Paid Shares 0.09
National Thermal Power
Transport Services 0.95
Medplus Health Services Ltd. 0.22Capital Markets 0.18Prudent Corporate AdvisoryServices Ltd. 0.18
Triparty Repo 3.02
Retailing 0.22
Net Current Assets/(Liabilities) -0.02Grand Total 100.00
Hindalco Industries Ltd 0.10Equity & Equity related - Total 97.00
PORTFOLIOIssuer/Instrument Industry/Rating % to Net Assets Issuer/Instrument Industry/Rating % to Net Assets
SECTOR ALLOCATION (%)
15
29.31
27.27
12.52
10.39
11.76
10.24
7.80
7.27
3.30
7.23
5.64
6.39
5.34
6.34
2.15
3.80
3.73
3.50
2.05
3.21
Benchmark
Scheme
Financial Services Information Technology Oil, Gas & Consumable Fuels Fast Moving Consumer Goods Capital GoodsAutomobile and Auto Components Healthcare Services Construction Materials Consumer Durables Construction

7
An open ended equity scheme following manufacturing theme
KOTAK MANUFACTURE IN INDIA FUND
AUM: `749.06 crs
TRI
Fund Manager: Mr. Harish Krishnan &
AAUM: `734.48 crs
Mr. Abhishek Bisen*
Benchmark***: Nifty India Manufacturing Index
Allotment date: February 22, 2022
Folio count: 38,389
Minimum Investment Amount
Investment Objective
Options: Growth and Income Distribution cum capital withdrawal (IDCW) (Payout and Reinvestment)
Total Expense Ratio**
The scheme shall seek to generate capital appreciation by investing in a diversified portfolio of companies that follow the manufacturing theme. However, there is no assurance that the objective of the Scheme will be realized.
Load Structure
b) If units redeemed or switched out are in excess of the limit within 1 year from the date of allotment: 1%c) If units are redeemed or switched out on or after 1 year from the date of allotment: NILUnits issued on reinvestment of IDCW shall not be subject to entry and exit load.
Ratios
Regular: 2.38%; Direct: 0.67%
A) Regular Plan B) Direct Plan
Trustee’s Discretion
Initial Investment: `5000 and in multiple of `1 for purchase and for ̀ 0.01 for switchesAdditional Investment: `1000 & in .......multiples of `1 for purchase and for `0.01 for switchesIdeal Investments Horizon: 5 years & above
Entry Load: Nil. (applicable for all plans) Exit Load:
Available Plans/Options
IDCW Frequency
a) For redemption / switch out of upto 10% of the initial investment amount (limit) purchased or switched in within 1 year from the date of allotment: Nil.
Kotak Manufacture in India Fund NAV as on June 30, 2022: ̀ 10.0490 (Growth Option), ̀ 10.0490 (Reg-Plan-IDCW), ̀ 10.1120 (Direct Growth Option), ̀ 10.1120 (Dir-Plan-IDCW)For Fund Manager experience, please refer page 78-80. **Total Expense Ratio includes applicable B30 fee and GST.Scheme has not completed 6 months since inception
16
SECTOR ALLOCATION (%)
• Long-term capital growth
• Investment equity and equity related securities across market capitalisation
* Investors should consult their financial advisors if in doubt about whether the product is suitable for them.
This product is suitable for investors who are seeking*:
Product Label as on 28th February, 2022
Low High
Low
to
Moder
ate
ModerateModeratelyHigh
High
Very H
ighLo
w
TIER 1: NIFTY Equity Savings IndexInvestors understand that their principal will be at moderate risk
Low High
Low
to
Moder
ate
ModerateModeratelyHigh
High
Very H
ighLo
w
TIER 2: 75% Nifty 50 Arbitrage Index, 25% Nifty 50 TRIInvestors understand that their principal will be at
low to moderate risk
Fund Benchmark Benchmark
Data as on June 30, 2022
Low High
Low
to
Moder
ate
ModerateModeratelyHigh
High
Very H
ighLo
w
* Investors should consult their financial advisors if in doubt about whether the product is suitable for them.
• Investment equity and equity related securities across market capitalisation
• Long-term capital growth
This product is suitable for investors who are seeking*:
Product Label as on 30th June, 2022
Low High
Low
to
Moder
ate
ModerateModeratelyHigh
High
Very H
ighLo
w
Investors understand that their principal will be at very high risk
Fund Benchmark
Low High
Low
to
Moder
ate
ModerateModeratelyHigh
High
Very H
ighLo
w
Investors understand that their principal will be at very high risk
PORTFOLIOIssuer/Instrument Industry/Rating % to Net Assets Issuer/Instrument Industry/Rating % to Net Assets
Zydus Lifesciences Limited 2.62
Consumer Durables 10.14
Reliance Industries Ltd. 7.10
Eicher Motors Ltd. 1.49
Whirlpool of India Ltd. 1.77
Voltas Ltd. 1.30
Tata Motors Ltd. 1.79
Pharmaceuticals &
V-Guard Industries Ltd. 1.73
Cipla Ltd. 2.88
Maruti Suzuki India Limited 6.50
Biotechnology 16.15
Dixon Technologies India Ltd. 1.19
Equity & Equity related
Dr Reddys Laboratories Ltd. 4.69
Mahindra & Mahindra Ltd. 5.66
Gland Pharma Limited 1.80
Sun Pharmaceuticals Industries Ltd. 4.16
Automobiles 15.44
Bata India Ltd. 1.95
Kajaria Ceramics Ltd. 1.45
Amber Enterprises India Ltd. 0.75
Petroleum Products 8.75
Industrial Products 8.58Carborundum Universal Ltd. 2.17
AIA Engineering Limited. 1.93
Cummins India Ltd. 1.50
Bharat Forge Ltd. 1.74
Auto Components 6.13
Supreme Industries Limited 1.24
Schaeffler India Ltd 2.22
Samvardhana Motherson
International Limited 1.77
Bharat Petroleum Corporation Ltd. 1.65
Balkrishna Industries Ltd. 1.43
Bosch Ltd. 0.71
Electrical Equipment 4.12
Thermax Ltd. 1.82
Fertilizers & Agrochemicals 3.81Coromandel International Ltd. 2.10P I Industries Ltd 1.71
Non - Ferrous Metals 3.33Hindalco Industries Ltd 3.33
ABB India Ltd 2.30
Beverages 1.55
Construction Vehicles 1.97
(Liabilities) -0.02
Personal Products 1.67
3M India Ltd. 1.46
Agricultural, Commercial &
Ferrous Metals 2.49
Ultratech Cement Ltd. 2.43Cement & Cement Products 2.43
Aerospace & Defense 1.84
Textiles & Apparels 1.36
Bharat Electronics Ltd. 1.84
related - Total 96.95
Chemicals & Petrochemicals 2.92
Larsen And Toubro Ltd. 2.81
Net Current Assets/
Construction 2.81
Ashok Leyland Ltd. 1.97
Godrej Consumer Products Ltd. 1.67
SRF Ltd. 1.73
Diversified 1.46United Breweries Ltd. 1.55
Tata Steel Ltd. 2.49
Garware Technical Fibres Ltd. 1.36
Solar Industries India Limited 1.19
Equity & Equity
Triparty Repo 3.07
Grand Total 100.00
0.10%Portfolio Turnover
16.15 15.44 10.14 8.75 8.58 6.13 4.12 3.813.33
3.07 20.48
Pharmaceuticals & Biotechnology Automobiles Consumer Durables Petroleum Products Industrial Products Auto Components
Electrical Equipment Fertilizers & Agrochemicals Non - Ferrous Metals TREP & Term Deposits & Rev.Repo REST

An open ended equity scheme following infrastructure & Economic Reform theme
KOTAK INFRASTRUCTURE &ECONOMIC REFORM FUND
17
Investment style
Value Blend Growth Size
Large
Medium
Small
Ideal Investments Horizon: 5 years & above
Exit Load:
c) If units are redeemed or switched out on or after 1 year from the date of allotment: NIL
The investment objective of the scheme is to generate long-term capital appreciation from a diversified portfolio of .........predominantly equity and equity-related securities of companies involved in ........economic development of India as a result of potential investments in infrastructure and unfolding economic reforms. However, there is no assurance that the objective of the scheme will be realized.
Investment Objective
Options: Payout of IDCW, Reinvestment of IDCW & Growth (applicable for all plans)
A) Regular Plan B) Direct Plan
IDCW Frequency
Initial Investment: `5000 and in multiple of `1 for purchase and for ̀ 0.01 for switches
Source: $ICRA MFI Explorer.
Trustee’s Discretion
Additional Investment: `1000 & in ........multiples of ̀ 1
Load Structure
Available Plans/Options
Ratios
Minimum Investment Amount
Entry Load: Nil. (applicable for all plans)
a) For redemption / switch out of upto 10% of the initial investment amount (limit) purchased or switched in within 1 year from the date of allotment: Nil.b) If units redeemed or switched out are in excess of the limit within 1 year from the date of allotment: 1%
Total Expense Ratio**Regular: 2.63%; Direct: 1.16%
12.15%
1.05
0.46
25.75%
Portfolio Turnover$Beta $Sharpe## $Standard Deviation
Data as on June 30, 2022
29.15(P/E)
3.68P/BV0.72IDCW Yield
For last three IDCW, please refer page no 81-83. For scheme performance, please refer page no 69-77.
TRI – Total Return Index, In terms of SEBI circular dated January 4, 2018, the performance of the scheme is benchmarked to the Total Return variant (TRI) of the Benchmark Index instead of Price Return Variant (PRI).
For Fund Manager experience, please refer page 78-80. ## Risk rate assumed to be 4.95% (FBIL Overnight MIBOR rate as on 30th June 2022).**Total Expense Ratio includes applicable B30 fee and GST.
Scheme Inception : - February 25, 2008. The returns are calculated by XIRR approach assuming investment of 10,000/- on the 1st working day of every month. XIRR helps in calculating return on investments given an initial and final value and a series of cash inflows and `outflows and taking the time of investment into consideration. Since inception returns are assumed to be starting from the beginning of the subsequent month from the date of inception. # Benchmark ; ̂ Additional Benchmark
Alpha is difference of scheme return with benchmark return. *All payouts during the period have been reinvested in the units of the scheme at the then prevailing NAV. Returns >= 1 year: CAGR (Compounded Annualised Growth Rate). N.A stands for data not available. Note: Point to Point (PTP) Returns in INR shows the value of 10,000/- investment made at inception. Source: ICRA MFI Explorer.***As per SEBI Circular dated 27th October 2021 The first tier benchmark is reflective of the category of the scheme and the second tier benchmark is demonstrative of the investment style / strategy of the Fund Manager within the category.Kotak Infrastructure & Economic Reform Fund NAV as on June 30, 2022: ̀ 24.9160 (Reg-Plan-IDCW), ̀ 34.8320 (Dir-Plan-IDCW), ̀ 31.1540 (Growth Option), ̀ 35.2350 (Direct Growth Option)
Systematic Investment Plan (SIP) If you had invested `10,000 every month
SYSTEMATIC INVESTMENT PLAN (SIP)
Total Value as on June 30, 2022 ( )`
India Infrastructure Index Returns (%)
Nifty 50 (TRI) ( )^`
Alpha
Total amount invested ( )`
Monthly SIP of Rs 10000
Scheme Returns (%)
Nifty Infrastructure (TRI) Returns (%)
Alpha
Nifty Infrastructure (TRI) ( )#`
Nifty 50 (TRI) Returns (%)
India Infrastructure Index ( )#`
6.98 9.73 11.41 13.01 17.67 -8.47
17,30,000 12,00,000 8,40,000 6,00,000 3,60,000 1,20,000
Since Inception 10 years 7 years 5 years 3 years 1 year
46,78,018 24,93,211 13,36,448 8,77,553 5,12,249 1,18,668
12.79 14.01 13.05 15.22 24.36 -2.07
29,33,694 19,85,147 12,60,798 8,31,078 4,66,829 1,14,480
5.81 4.28 1.63 2.21 6.69 6.40
6.78 6.66 5.04 5.88 8.95 8.01
27,20,171 17,51,084 11,16,451 7,58,800 4,52,168 1,13,416
6.01 7.34 8.00 9.34 15.42 -10.07
43,77,876 22,74,620 13,07,686 8,15,648 4,43,322 1,12,285
11.98 12.29 12.44 12.25 14.03 -11.77
* Investors should consult their financial advisors if in doubt about whether the product is suitable for them.
This product is suitable for investors who are seeking*:
• Long term capital appreciation by investing in equity and equity related instruments of companies contributing to infrastructure and economic development of India
• Long term capital growth
Product Label as on 30th June, 2022
Low High
Low
to
Moder
ate
ModerateModeratelyHigh
High
Very H
ighLo
w
TIER 1: Nifty Infrastructure TRI
Low High
Low
to
Moder
ate
ModerateModeratelyHigh
High
Very H
ighLo
w
TIER 2: India Infrastructure Index
Low High
Low
to
Moder
ate
ModerateModeratelyHigh
High
Very H
ighLo
w
Investors understand that their principal will be at very high risk
Investors understand that their principal will be at very high risk Investors understand that their principal will be at very high risk
Fund Benchmark Benchmark
Mr. Arjun Khanna*
Benchmark***: Nifty Infrastructure TRI (Tier 1) India Infrastructure Index (Customised Index by IISL) (Tier 2)
Allotment date: February 25, 2008
( D e d i c a t e d F u n d m a n a g e r f o r investments in foreign securities)
Folio count: 21,767
Fund Manager: Mr. Harish Krishnan &
AUM: `533.29 crs
AAUM: `530.20 crs
Transmission Ltd. 1.00
The Ramco Cements Ltd 1.25
Thermax Ltd. 4.72
Construction 13.78APL Apollo Tubes Ltd. 0.36
Larsen And Toubro Ltd. 4.68PNC Infratech Ltd 2.27
Schaeffler India Ltd 6.44Rolex Rings Ltd. 3.15
JMC Projects (India) Ltd. 1.43
Cummins India Ltd. 2.88
Kalpataru Power
Bosch Ltd. 0.57
Transport Services 6.30
Ratnamani Metals & Tubes Ltd. 2.33
Techno Electric & Engineering
Motherson Sumi Wiring
Equity & Equity related Industrial Products 16.08
WPIL Ltd 1.21
Cement & Cement Products 7.86
H G Infra Engineering Ltd. 2.05
Company Limited 0.53Auto Components 11.12
SKF India Ltd 1.71
Carborundum Universal Ltd. 1.41
Rail Vikas Nigam Limited. 1.07
International Limited 0.83
Supreme Industries Limited 1.66
G R Infraprojects Limited 0.75
Samvardhana Motherson
Ultratech Cement Ltd. 3.94
AIA Engineering Limited. 4.52
India Limited 0.13
Shree Cement Ltd. 2.67
Electrical Equipment 6.66
ABB India Ltd 1.94
of India Ltd. 4.04Container Corporation
Partly Paid Shares 0.15
Inter Globe Aviation Ltd 2.26
Petroleum Products 5.35
Telecom - Services 5.29
Chemicals & Petrochemicals 5.28
Consumer Durables 4.18
Gas 5.69
Kajaria Ceramics Ltd. 2.49V-Guard Industries Ltd. 1.69Realty 3.06
Gujarat Gas Ltd. 1.77Indraprastha Gas Ltd. 3.92
Reliance Industries Ltd. 5.35
Bharti Airtel Ltd 5.14Bharti Airtel Ltd -
Mahindra LifespaceDevelopers Ltd 3.06Power 2.28National Thermal PowerCorporation Limited 2.28
Solar Industries India Limited 5.28
Oil 2.10Hindustan Oil ExplorationCompany Ltd. 2.10
Tega Industries Ltd. 1.29Agricultural, Commercial &
Equity & Equity
(Liabilities) -0.35
Triparty Repo 3.56
Grand Total 100.00
Industrial Manufacturing 1.29
BEML Ltd. 0.47
Net Current Assets/
Construction Vehicles 0.47
related - Total 96.79
PORTFOLIOIssuer/Instrument Industry/Rating % to Net Assets Issuer/Instrument Industry/Rating % to Net Assets
SECTOR ALLOCATION (%)
2.93
23.28
12.94
13.77
33.26
13.14
2.21
11.13
12.66
7.87
5.50
6.30
12.61
5.29 5.28 4.18 3.22
Benchmark
Scheme
Capital Goods Construction Oil, Gas & Consumable Fuels Automobile and Auto Components Construction MaterialsServices Telecom Chemicals Consumer Durables Cash & Cash Equivalent

There is no assurance or guarantee that the investment objective of the scheme will be achieved.
IDCW Frequency
Investment Objective
Exit Load: Nil. (applicable for all plans)
Ratios
Total Expense Ratio**
Trustee’s Discretion
A)Regular Plan B) Direct Plan
Regular:1.28%; Direct: 0.34%
The scheme is a close ended scheme. The units of the scheme can be traded on the stock exchange.
Minimum Investment Amount
Load Structure
The investment objective of the scheme is to generate capital appreciation from a diversified portfolio of equity & equity related instruments across market ........capitalisation and sectors.
Available Plans/Options
Options: Payout of IDCW & Growth .(applicable for all plans)
Source: $ICRA MFI Explorer.
Entry Load: Nil. (applicable for all plans)
27.88%Portfolio Turnover
Multicap fund - A 36 months close ended equity scheme investing across large cap,midcap and small cap stocks
KOTAK INDIA GROWTH FUND SERIES 4
Kotak India Growth Fund Series 4 NAV as on June 30, 2022: ̀ 17.7730 (Reg-Plan-IDCW), ̀ 18.4960 (Dir-Plan-IDCW), ̀ 17.7720 (Growth Option), ̀ 18.6240 (Direct Growth Option)For Fund Manager experience, please refer page 78-80. **Total Expense Ratio includes applicable B30 fee and GST. For scheme performance, please refer page no 69-77.
Investment style
Value Blend Growth Size
Large
Medium
Small
Benchmark: Nifty 200 TRI
Fund Manager: Mr. Devender Singhal*
Allotment date: February 20, 2018
AAUM: `82.86 crs
AUM: `83.05 crs
Folio count: 1,737
Data as on June 30, 2022
18
This product is suitable for investors who are seeking*:
• Investment in equity and equity related securities without any market capitalisation and sector bias.
* Investors should consult their financial advisors if in doubt about whether the product is suitable for them.
• Long term capital growth
Product Label as on 30th June, 2022
Low High
Low
to
Moder
ate
ModerateModeratelyHigh
High
Very H
ighLo
w
Investors understand that their principal will be at very high risk
Low High
Low
to
Moder
ate
ModerateModeratelyHigh
High
Very H
ighLo
w
Investors understand that their principal will be at very high risk
Fund Benchmark
Bata India Ltd. 1.07
ITC Ltd. 4.69
Subros Ltd. 1.90
Partly Paid Shares 0.12
Persistent Systems Limited 6.05
Telecom - Services 3.03
Bank Of Baroda 2.35
Petroleum Products 9.23
Infosys Ltd. 1.67
State Bank Of India 5.40ICICI Bank Ltd. 8.69
Axis Bank Ltd. 2.86
Pokarna Ltd. 3.11
HDFC Bank Ltd. 3.25
Corporation Limited 3.44
Construction 2.91
Kotak Mahindra Bank Ltd. 1.60
Bharti Airtel Ltd 2.91Bharti Airtel Ltd -
Greenply Industries Ltd. 0.99
Mahindra & Mahindra Ltd. 3.83
Auto Components 3.09
Automobiles 9.90
Consumer Durables 7.82
Hindustan Petroleum
IT - Software 8.56
Banks 24.15
Maruti Suzuki India Limited 6.07
Equity & Equity related
Reliance Industries Ltd. 8.71
Corporation Ltd 0.52
Tech Mahindra Ltd. 0.84
Century Plyboards (India) Ltd. 2.65
Diversified FMCG 4.69
Power 3.44National Thermal Power
Varroc Engineering Ltd. 1.19
Larsen And Toubro Ltd. 2.25
Pharmaceuticals &
(Liabilities) 2.20
IT - Services 1.20
Zydus Lifesciences Limited 0.60
Bharat Electronics Ltd. 1.41
Cummins India Ltd. 1.23
Finance 0.53Mahindra & Mahindra
Triparty Repo 1.57
Industrial Products 1.23
Financial Services Ltd. 0.53
Grand Total 100.00
related - Total 92.09
JK Cement Ltd. 1.04
Put Option - December 2023 4.14CNX NIFTY - 14500.000 -
Net Current Assets/
Firstsource Solutions Ltd. 1.20
Healthcare Services 0.87
Biotechnology 0.60
Equity & Equity
Option
Options - Total 4.14
Aerospace & Defense 1.41
Cement & Cement Products 1.04
Fortis Healthcare India Ltd 0.87
Barbeque Nation Hospitality Ltd. 1.96
PNC Infratech Ltd 0.66Leisure Services 2.89
Jubilant Foodworks Limited 0.93Entertainment 2.02
Inox Leisure Ltd. 0.73Personal Products 1.92Emami Ltd. 1.92Beverages 1.56
Zee Entertainment Enterprises Ltd 1.29
United Spirits Ltd. 1.56
PORTFOLIO
Term Deposit as provided above is towards margin for derivatives transactionsEquity Derivative Exposuer is 4.14%
Issuer/Instrument Industry/Rating % to Net Assets Issuer/Instrument Industry/Rating % to Net Assets
SECTOR ALLOCATION (%)
30.83
24.67
5.40
12.99
13.25
9.77
12.99
9.24
8.17
8.16
3.39
7.814.14
3.79
3.52
3.44
2.16
3.03
Benchmark
Scheme
Financial Services Automobile and Auto Components Information Technology Oil, Gas & Consumable Fuels
Fast Moving Consumer Goods Consumer Durables Others Cash & Cash Equivalent Power Telecom

7
An open-ended hybrid scheme investing predominantly in equityand equity related instruments
KOTAK EQUITY HYBRID FUND
19
Folio count: 76,239
Fund Manager: Mr. Pankaj Tibrewal, Mr. Abhishek Bisen &
AUM: `2,539.24 crs
Composite Debt
Mr. Arjun Khanna*
AAUM: `2,513.75 crs
Benchmark: NIFTY 50 Hybrid
( D e d i c a t e d F u n d m a n a g e r f o r investments in foreign securities)
65:35 Index
Allotment date: November 25, 1999
Investment style
Value Blend Growth Size
Large
Medium
Small
Maturity
Short Medium Long Volatility
Low
Medium
High
Investment ObjectiveInvestment objective of the scheme is to achieve growth by investing in equity and equity related instruments, balanced with income generation by investing in debt and money market instruments. However, there is no assurance that the objective of the scheme will be realized.
Available Plans/Options
Half Yearly (25th of Mar/Sep)
Ratios
Options: Payout of IDCW, Reinvestment of IDCW & Growth (applicable for all plans)
A) Regular Plan B) Direct Plan
IDCW Frequency
Minimum Investment Amount
Exit Load:
Initial Investment: `5000 and in multiple of `1 for purchase and for ̀ 0.01 for switches
b) If units redeemed or switched out are in excess of the limit within 1 year from the date of allotment: 1%
Total Expense Ratio**Regular: 2.08%; Direct: 0.64%
a) For redemption / switch out of upto 8% of the initial investment amount (limit) purchased or switched in within 1 year from the date of allotment: Nil.
$Source: ICRA MFI Explorer.
Entry Load: Nil. (applicable for all plans)
Additional Investment: `1000 & in multiples of ̀ 1
Load Structure
c) If units are redeemed or switched out on or after 1 year from the date of allotment: NIL
Ideal Investments Horizon: 5 years & above
Data as on June 30, 2022
5.85%
5.46 yrs
0.27 yrs
Portfolio Turnover
Portfolio Average Maturity
IRS Average Maturity*
2.44 yrs
5.74 yrs
0.25 yrs
2.69 yrs
2.53 yrs
0.26 yrs
2.78 yrs
6.81%
1.22
0.53
18.24%
Portfolio Modified Duration
Net Average Maturity
IRS Modified Duration*
Net Modified Duration
Portfolio Macaulay Duration
IRS Macaulay Duration*
Net Macaulay Duration
YTM
$Beta
$Sharpe##
$Standard Deviation
Term Deposit as provided above is towards margin for derivatives transactions
Issuer/Instrument Industry/Rating % to Net Assets
Issuer/Instrument Industry/Rating % to Net Assets
PORTFOLIO
Equity & Equity related
Banks 16.58
ICICI Bank Ltd. 4.92
State Bank Of India 3.34
Kotak Mahindra Bank Ltd. 2.04
Axis Bank Ltd. 1.97
Tata Consultancy Services Ltd. 1.71
Oracle Financial Services
Software Ltd 0.78
Biotechnology 4.87
IT - Software 7.67
Industries Ltd. 1.40
AU Small Finance Bank Ltd. 0.59
Tech Mahindra Ltd. 1.04
Dr Reddys Laboratories Ltd. 1.15
Torrent Pharmaceuticals Ltd. 0.95
Cipla Ltd. 0.89
Zydus Lifesciences Limited 0.48
Infosys Ltd. 4.14
Sun Pharmaceuticals
Pharmaceuticals &
HDFC Bank Ltd. 3.72
Techno Electric & Engineering
Solar Industries India Limited 1.82
Automobiles 2.30
Company Limited 0.89
Electrical Equipment 2.30
Galaxy Surfactants Ltd. 0.87
Auto Components 2.12
JK Cement Ltd. 1.13
International Limited 0.76
United Spirits Ltd. 1.81
Fertilizers & Agrochemicals 1.40
Insurance 1.34
Whirlpool of India Ltd. 0.63
Oberoi Realty Ltd 0.61
Realty 2.27
Indian Oil Corporation Ltd 0.61
Mahindra Lifespace
Diversified FMCG 2.20
Hindustan Unilever Ltd. 0.59
Consumer Durables 4.77
Kajaria Ceramics Ltd. 0.55
Bharat Petroleum
Century Plyboards (India) Ltd. 2.05
Corporation Ltd. 0.66
Industrial Products 4.25
Cummins India Ltd. 1.19
Cement & Cement Products 2.98
Construction 2.88
Petroleum Products 4.03
Shree Cement Ltd. 1.12
Chemicals & Petrochemicals 2.69
Larsen And Toubro Ltd. 1.69
Supreme Industries Limited 1.26
Reliance Industries Ltd. 2.76
Sheela Foam Ltd 1.54
Carborundum Universal Ltd. 0.59
Bharat Forge Ltd. 1.21
The Ramco Cements Ltd 0.73
JMC Projects (India) Ltd. 0.30
Developers Ltd 1.66
Maruti Suzuki India Limited 1.26
Mahindra & Mahindra Ltd. 1.04
Thermax Ltd. 2.30
ITC Ltd. 1.61
Schaeffler India Ltd 1.36
Samvardhana Motherson
Beverages 1.81
Coromandel International Ltd. 0.88
P I Industries Ltd 0.52
ICICI Lombard General
HDFC Life Insurance Company Ltd. 0.28
Insurance Company Ltd 0.78
Of India Ltd. 0.28
Life Insurance Corporation
Finance 1.31
HDFC Ltd. 1.31
Power 1.10
National Thermal Power
Gas 0.90
Petronet LNG Ltd. 0.56
Gujarat Gas Ltd. 0.34
Corporation Limited 1.10
Transport Services 0.71
Blue Dart Express Ltd. 0.71
U P Power Corporation Ltd ( Guaranteed
Government Dated Securities
Hindalco Industries Ltd 0.39
Personal Products 0.60
V.S.T Tillers Tractors Ltd 0.54
Emami Ltd. 0.60
Agricultural, Commercial &
Ferrous Metals 0.36
Debt Instruments
Equity & Equity
Public Sector Undertakings
GS CG 17 Jun 2027 - (STRIPS) SOV 0.19
GS CG 22 Aug 2036 - (STRIPS) SOV 0.04
7.1% Central Government SOV 4.47
7.38% Central Government SOV 1.40
GS CG 22 Aug 2032 - (STRIPS) SOV 0.02
Services Ltd. 0.35
GS CG 22 Aug 2043 - (STRIPS) SOV 0.01
GS CG 22 Feb 2036 - (STRIPS) SOV 0.04
5.53% Central Government(^) SOV 4.97
6.42% Central Government SOV 0.97
related - Total 72.72
Corporate Debt/
Corporate Debt/Financial
Non - Ferrous Metals 0.39
Construction Vehicles 0.54
Debentures and Bonds
Mutual Fund Units - Total 0.28
Financial Institutions
Shyam Metalics and Energy Ltd 0.36
Capital Markets 0.35
By UP State Government ) CRISIL A+(CE) 0.61
LIC Housing Finance Ltd. CRISIL AAA 0.02
Brookfield India Real Estate Trust Realty 0.28
Mutual Fund Units
THDC India Ltd. (THDCIL) ( ) ICRA AA 0.38
Prudent Corporate Advisory
Institutions - Total 0.02
Public Sector Undertakings - Total 0.99
5.74% Central Government SOV 4.75
4.56% Central Government SOV 2.50
4.93% Central Government SOV 0.60
GS CG 22 Aug 2028 - (STRIPS) SOV 0.49
GS CG 22 Aug 2029 - (STRIPS) SOV 0.09
GS CG 22 Aug 2030 - (STRIPS) SOV 0.09
GS CG 22 Feb 2030 - (STRIPS) SOV 0.09
6.67% Central Government SOV 0.07
GS CG 22 Aug 2022 - (STRIPS) SOV 0.04
GS CG 22 Aug 2026 - (STRIPS) SOV 0.03
GS CG 22 Aug 2027 - (STRIPS) SOV 0.03
GS CG 22 Feb 2028 - (STRIPS) SOV 0.03
GS CG 23/12/2025 - (STRIPS) SOV 0.03
GS CG 22 Aug 2031 - (STRIPS) SOV 0.02
GS CG 22 Feb 2029 - (STRIPS) SOV 0.02
GS CG 22 Feb 2032 - (STRIPS) SOV 0.02
GS CG 22 Feb 2027 - (STRIPS) SOV 0.01
GS CG 22 Feb 2043 - (STRIPS) SOV 0.01
GS CG 22 Feb 2044 - (STRIPS) SOV 0.01
Government Dated
Securities - Total 21.04
Net Current Assets/(Liabilities) 0.54
Grand Total 100.00
Triparty Repo 4.41

7
An open-ended hybrid scheme investing predominantly in equity and equity related instruments
KOTAK EQUITY HYBRID FUND
20
Scheme Inception : - November 03, 2014. The returns are calculated by XIRR approach assuming investment of ̀ 10,000/- on the 1st working day of every month. XIRR helps in calculating return on investments given an initial and final value and a series of cash inflows and outflows and taking the time of investment into consideration. Since inception returns are assumed to be starting from the beginning of the subsequent month from the date of inception. # Benchmark ; ̂ Additional Benchmark TRI - Total Return Index, In terms of SEBI circular dated January 4, 2018, the performance of the scheme is benchmarked to the Total Return variant (TRI) of the Benchmark Index instead of Price Return Variant (PRI).
(^) Fully or Party blocked against Interest Rate Swap (IRS) Hedging Position through Interest Rate Swaps as on 30 Jun 2022 is 3.95% of the net assets.
For Fund Manager experience, please refer page 78-80. ## Risk rate assumed to be 4.95% (FBIL Overnight MIBOR rate as on 30th June 2022).**Total Expense Ratio includes applicable B30 fee and GST.For last three IDCW, please refer page no 81-83. For scheme performance, please refer page no 69-77.
Alpha is difference of scheme return with benchmark return. *All payouts during the period have been reinvested in the units of the scheme at the then prevailing NAV. Returns >= 1 year: CAGR (Compounded Annualised Growth Rate). N.A stands for data not available. Note: Point to Point (PTP) Returns in INR shows the value of 10,000/- investment made at inception. Source: ICRA MFI Explorer.
Kotak Equity Hybrid Fund NAV as on June 30, 2022: ̀ 21.9770 (Reg-Plan-IDCW), ̀ 25.8320 (Dir-Plan-IDCW), ̀ 37.3950 (Growth Option) ̀ 42.1400 (Direct Growth Option)
* Investors should consult their financial advisors if in doubt about whether the product is suitable for them.
This product is suitable for investors who are seeking*:
• Investment in equity & equity related securities balanced with income generation by investing in debt & money.
• Long term capital growth
Product Label as on 30th June, 2022
Low High
Low
to
Moder
ate
ModerateModeratelyHigh
High
Very H
ighLo
w
Investors understand that their principal will be at high risk
Low High
Low
to
Moder
ate
ModerateModeratelyHigh
High
Very H
ighLo
w
Investors understand that their principal will be at very high risk
Fund Benchmark
SECTOR ALLOCATION (%)
Systematic Investment Plan (SIP) If you had invested `10,000 every month
SYSTEMATIC INVESTMENT PLAN (SIP)
NIFTY 50 Hybrid Composite Debt 65:35 Index Returns (%)
NIFTY 50 Hybrid Composite Debt 65:35 Index ( )#`
Nifty 50 (TRI) ( )^ `
Total amount invested ( )`
Total Value as on June 30, 2022 ( )`
Scheme Returns (%)
Nifty 50 (TRI) Returns (%)
Alpha
Monthly SIP of ( ) 10000`
9,20,000 8,40,000 6,00,000 3,60,000 1,20,000
11.58 11.96 12.90 15.63 -7.25
10.64 10.90 10.63 10.77 -7.96
14,47,979 12,85,840 8,28,885 4,53,519 1,15,287
0.94 1.06 2.27 4.86 0.72
13,95,157 12,37,940 7,83,618 4,22,899 1,14,813
Since Inception 7 years 5 years 3 year 1 year
11.97 12.44 12.25 14.03 -11.77
14,70,209 13,07,686 8,15,648 4,43,322 1,12,285
21.04 16.58 7.67 4.87 4.77 4.41 4.25 4.032.98
2.88 26.52
Government Dated Securities Banks IT - Software Pharmaceuticals & Biotechnology Consumer Durables
TREP & Term Deposits & Rev.Repo Industrial Products Petroleum Products Cement & Cement Products
Construction REST

For detailed portfolio log on to
https://www.kotakmf.com/Products/funds/hybrid-funds/Kotak-Balanced-Advantage-Fund/Dir-G
Also you can scan the QR code for detailed portfolio.
7
An open ended dynamic asset allocation fund
KOTAK BALANCEDADVANTAGE FUND
Fund Manager: Mr. Harish Krishnan,
50:50 Index
Folio count: 2,33,001
Benchmark: Nifty 50 Hybrid
Mr. Arjun Khanna*
( D e d i c a t e d F u n d m a n a g e r f o r investments in foreign securities)
AUM: `13,493.74 crs
Composite Debt
AAUM: `13,454.85 crs
Mr. Abhishek Bisen &
Mr. Hiten Shah,
Allotment date: August 3, 2018
Investment style
Value Blend Growth Size
Large
Medium
Small
Maturity
Short Medium Long Volatility
Low
Medium
High
Derivatives Issuer/Instrument Industry/Rating % to Net Assets % to Net Assets
Top 10 Holdings
Kotak Balanced Advantage Fund – Asset Allocation
Source: Internal Analysis. As on 30th June 2022. Automatic: A fund that gives you freedom from managing equity and debtallocation manually during the market ups and down, giving you a balanced growth.Mutual fund investment are subject to market risk, read all scheme related documents carefully
21
Scheme Inception : - August 03,2018. The returns are calculated by XIRR approach assuming investment of Rs. 10,000/- on the 1st working day of every month. XIRR helps in calculating return on investments given an initial and final value and a series of cash inflows and outflows and taking the time of investment into consideration. Since inception returns are assumed to be starting from the beginning of the subsequent month from the date of inception. # Benchmark ; ̂ Additional Benchmark TRI - Total Return Index, In terms of SEBI circular dated January 4, 2018, the performance of the scheme is benchmarked to the Total Return variant (TRI) of the Benchmark Index instead of Price Return Variant (PRI). The debt component of the index is TRI since inception. *All payouts during the period have been reinvested in the units of the scheme at the then prevailing NAV. Returns >= 1 year: CAGR (Compounded Annualised Growth Rate). N.A stands for data not available. Note: Point to Point (PTP) Returns in INR shows the value of 10,000/- investment made at inception. Source: ICRA MFI Explorer. # Name of Scheme Benchmark. ## Name of Additional Benchmark. Alpha is difference of scheme return with benchmark return. (^) Fully or Party blocked against Interest Rate Swap (IRS) Hedging Position through Interest Rate Swaps as on 30 Jun 2022 is 3.71% of the net assets.
For Fund Manager experience, please refer page 78-80. Mr. Hiten Shah has been managing the fund since 03/10/2019. **Total Expense Ratio includes applicable B30 fee and GST. For last three IDCW, please refer page no 81-83. For scheme performance, please refer page no 69-77. @@ Risk rate assumed to be 4.95% (FBIL Overnight MIBOR rate as on 30th June 2022).**Total Expense Ratio includes applicable B30 fee and GST.
Kotak Balanced Advantage Fund NAV as on ̀ 13.8170 ( ), ̀ 14.4700 ( ), ̀ 13.8160 (Growth Option) ̀ 14.4700 (Direct Growth Option)June 30, 2022: Reg-Plan-IDCW Dir-Plan-IDCW
* Investors should consult their financial advisors if in doubt about whether the product is suitable for them.
• Investment in equity, equity related securities & debt, money market instruments while managing risk through active allocation.
This product is suitable for investors who are seeking*:
• Wealth creation over a long period of time.
Product Label as on 30th June, 2022
Low High
Low
to
Moder
ate
ModerateModeratelyHigh
High
Very H
ighLo
w
Investors understand that their principal will be at moderately high risk
Fund Benchmark
Investors understand that their principal will be at high risk
Low High
Low
to
Moder
ate
ModerateModeratelyHigh
High
Very H
ighLo
w
Investment Objective
A) Regular Plan B) Direct Plan
The investment objective of the scheme is to generate capital appreciation by investing in a dynamically balanced portfolio of equity & equity related securities and debt & money market securities. There is no assurance or guarantee that the investment objective of the scheme will be achieved.
Options: Payout of IDCW, Reinvestment of IDCW & Growth (applicable for all plans)
IDCW Frequency
Available Plans/Options
Trustee's DiscretionRatios
Source: $ICRA MFI Explorer.
Minimum Investment AmountInitial Investment: `1000 and in multiple of `1 for purchase and of ̀ 0.01 for switchesAdditional Investment: ̀ 1000 & in multiples of `1
Load StructureEntry Load: Nil. (applicable for all plans)
a) For redemption / switch out of upto 8% of the initial investment amount (limit) purchased or switched in within 1 year from the date of allotment: Nil.
Ideal Investments Horizon: 5 years & above
c) If units are redeemed or switched out on or after 1 year from the date of allotment: NIL
Exit Load:
Total Expense Ratio**Regular: 1.72%; Direct: 0.49%
b) If units redeemed or switched out are in excess of the limit within 1 year from the date of allotment: 1%
26.33%
6.09 yrs
0.23 yrs
Portfolio Turnover
Portfolio Average Maturity
IRS Average Maturity*
2.57 yrs
6.31 yrs
0.21 yrs
2.78 yrs
2.66 yrs
0.22 yrs
2.87 yrs
6.83%
13.21%
1.12
0.73
Portfolio Modified Duration
Net Average Maturity
IRS Modified Duration*
Net Modified Duration
Portfolio Macaulay Duration
IRS Macaulay Duration*
Net Macaulay Duration
YTM$Beta $
@@Sharpe $Standard Deviation
Data as on June 30, 2022
SECTOR ALLOCATION (%)
Systematic Investment Plan (SIP) If you had invested `10,000 every month
SYSTEMATIC INVESTMENT PLAN (SIP)
-0.98 -0.93 0.76
6,05,216 4,43,322 1,12,285
Since Inception 3 years 1 year 4,70,000 3,60,000 1,20,000 5,58,440 4,08,141 1,16,382 8.78 8.34 -5.58 9.76 9.27 -6.34
5,69,089 4,13,740 1,15,884
12.97 14.03 -11.77
Monthly SIP of ( ) 10000`
Total Value as on June 30, 2022 ( )`
NIFTY 50 Hybrid Composite Debt 50:50 Index ( )#`
Alpha
Nifty 50 (TRI) ( )^`
Total amount invested ( )`
Scheme Returns (%)NIFTY 50 Hybrid Composite Debt 50:50 Index Returns (%)
Nifty 50 (TRI) Returns (%)
10977.55 11596.90
7610.25
14690.7
14631
15763.05
17132.2
17618.15
17671.65
16983
17354.05
24.529.9
79.0
33.53
36.4736.58
34.06
34.54
35.57
33.2
31.14
34
38.14
20.0
30.0
40.0
50.0
60.0
70.0
80.0
90.0
7000.008000.009000.00
10000.0011000.0012000.0013000.0014000.0015000.0016000.0017000.0018000.0019000.00
Au
g-18
Sep-1
8O
ct-18
No
v-18
Dec-1
8Jan
-19
Feb-1
9M
ar-19
Ap
r-19
May-1
9Ju
n-1
9Ju
l-19
Au
g-19
Sep-1
9O
ct-19
No
v-19
Dec-1
9Jan
-20
Feb-2
0M
ar-20
Ap
r-20
May-2
0Ju
n-2
0Ju
l-20
Au
g-20
Sep-2
0O
ct-20
No
v-20
Dec-2
0Jan
-21
Feb-2
1M
ar-21
Ap
r-21
May-2
1Ju
n-2
1Ju
l-21
Au
g-21
Sep-2
1O
ct-21
No
v-21
Dec-2
1
Nifty 50 KBAF Net Equity
Nifty 50 Index Value (LHS)
K-BAF Net Equity (RHS)
Adani Enterprises Ltd. Metals & Minerals Trading 1.66 -1.67
Treasury Bills 2.85
Debt Instruments
Reliance Industries Ltd. Petroleum Products 3.80
Maruti Suzuki India Limited Automobiles 1.87
Equity & Equity related
HDFC Bank Ltd. Banks 2.82
Axis Bank Ltd. Banks 1.63 Larsen And Toubro Ltd. Construction 1.61
Infosys Ltd. IT - Software 2.67
Bajaj Finance Ltd. Finance 1.33 Others 42.49 -10.55Equity & Equity related - Total 66.07 -15.37
ICICI Bank Ltd. Banks 3.03 Adani Port and Special Economic Zone Ltd. Transport Infrastructure 3.16 -3.15
Mutual Fund Units 2.70
Debentures and Bonds 1.29 Government Dated Securities 21.63
Triparty Repo 4.84 Net Current Assets/(Liabilities) 0.62 Grand Total 100.00
Equity Derivative Exposuer is 15.37%Mutual Fund Units as provided above is towards margin for derivatives transactions.
Low High
Low
to
Moder
ate
ModerateModeratelyHigh
High
Very H
ighLo
w
Investors understand that their principal will be at very high risk
21.63 11.51 6.86 4.84 4.753.53
3.513.20
3.162.88
34.13
Government Dated Securities Banks IT - Software TREP & Term Deposits & Rev.Repo Petroleum Products Automobiles
Finance Pharmaceuticals & Biotechnology Transport Infrastructure Ferrous Metals REST
3138
76
3131
51.1
1158812170
7610
15175
17899
15780
0
2000
4000
6000
8000
10000
12000
14000
16000
18000
20000
0
10
20
30
40
50
60
70
80
90
K-BAF Net Equity Nifty 50
K-BAF NET Equity (LHS)
Nifty 50 Index Value (RHS)

Kotak Mutual Fund -
Economic Reform FundDirect Growth Mutual Fund 6.52
Equity & Equity related
Kotak Mutual Fund -Kotak NIFTY ETF ETF Units 10.85
Kotak Infrastructure &Kotak Gold ETF ETF Units 9.26
Kotak Emerging EquityKotak Bluechip Fund Mutual Fund 24.11Mutual Fund Units
Scheme Direct Growth Mutual Fund 21.60Kotak Bond DirectPlan Growth Mutual Fund 15.32
Kotak Equity Opportunities
Ishares Nasdaq 100
Kotak Small Cap FundDirect Growth Mutual Fund 2.95
Fund Direct Growth 0.72
(Liabilities) -0.06
UCITS ETF USD Overseas Mutual Fund 5.15
Mutual FundUnits - Total 96.48Triparty Repo 3.58Net Current Assets/
Grand Total 100.00
An open ended fund of fund scheme investing in units of Kotak Mahindra Mutual Fund schemes & ETFs / Index schemes (Domestic & Offshore Funds including Gold ETFs schemes).
(Erstwhile known as Kotak Asset Allocator Fund)
KOTAK MULTI ASSET ALLOCATOR FUND OF FUND - DYNAMIC
Investment style For Equity:
Value Blend Growth Size
Large
Medium
Small
Maturity For Debt:
Short Medium Long Volatility
Low
Medium
High
PORTFOLIO
Folio count: 22,500
& Mr. Arjun Khanna*(Ded i ca t ed fund manage r fo r investments in foreign securities)AAUM: `586.04 crsAUM: `586.94 crs
Physical Gold +5 %
Benchmark: 90% Nifty 50 Hybrid
MSCI World Index
Index + 5% price of
Fund Manager: Mr. Devender Singhal, Mr. Abhishek Bisen
Composite Debt 50:50
Allotment date: August 9, 2004
Kotak Multi Asset Allocator Fund of Fund - Dynamic (Erstwhile known as Kotak Asset Allocator Fund) NAV as on June 30, 2022: ̀ 124.7220 (Reg-Plan-IDCW), ̀ 132.4150 (Dir-Plan-IDCW), ̀ 128.1300 (Growth Option), ̀ 134.8410 (Direct Growth Option)*For Fund Manager experience, please refer page 78-80. **Total Expense Ratio includes applicable B30 fee and GST. For scheme performance, please refer page no 69-77. For last three IDCW, please refer page no 81-83.
* Investors should consult their financial advisors if in doubt about whether the product is suitable for them.
This product is suitable for investors who are seeking*:
• Long term capital growth
• Investment in Kotak Mahindra Mutual Fund schemes & ETFs/Index schemes (Domestic & Offshore Funds including Gold ETFs)
Product Label as on 30th June, 2022 Fund Benchmark
Low High
Low
to
Moder
ate
ModerateModeratelyHigh
High
Very H
ighLo
w
Investors understand that their principal will be at high risk
Issuer/Instrument Industry/Rating % to Net Assets Issuer/Instrument Industry/Rating % to Net Assets
SECTOR ALLOCATION (%)However, there is no assurance that the investment objective of the Scheme will be realized.
Investment Objective
Ideal Investment Horizon: 5 years & above
Entry Load: Nil. (applicable for all plans)
8% of the units allotted shall be redeemed without any Exit Load on or before completion of 1 Year from the date of allotment of units.
To generate long term capital appreciation from a portfolio created by investing in units of Kotak Mahindra Mutual Fund schemes & ETFs / Index schemes (Domestic & Offshore Funds including Gold ETFs scheme)
A) Regular Plan B) Direct Plan
Options: Payout of IDCW, Reinvestment of IDCW & Growth (applicable for all plans)
Trustee’s Discretion
Ratios
Available Plans/Options
IDCW Frequency
Minimum Investment AmountInitial Investment: `5000 and in multiple of `1 for purchase and for ̀ 0.01 for switchesAdditional Investment: ̀ 1000 & in multiples of ̀ 1
Load Structure
Exit Load:
Any redemption in excess of such limit within 1 Year from the date of allotment shall be subject to the following Exit Load:a) If redeemed or switched out on or before completion of 1 Year from the date of allotment of units-1.00%
Total Expense Ratio**Regular:0.94%; Direct: 0.13%
b) If redeemed or switched out after completion of 1 Year from the date of allotment of units-NIL
Data as on June 30, 2022
$Beta $Sharpe## $Standard Deviation
1.22
0.79
13.90%
Low High
Low
to
Moder
ate
ModerateModeratelyHigh
High
Very H
ighLo
w
Investors understand that their principal will be at very high risk
22
20.11 71.22 5.15 3.58-0.06
ETF Units Mutual Fund Overseas Mutual Fund TREP & Term Deposits & Rev.Repo Net Current Assets

For detailed portfolio log on to
https://www.kotakmf.com/Products/funds/hybrid-funds/Kotak-Equity-Savings-Fund/Dir-G
Also you can scan the QR code for detailed portfolio.
7
An open-ended scheme investing in equity, arbitrage and debt
KOTAK EQUITY SAVINGS FUND
Investment style
Value Blend Growth Size
Large
Medium
Small
Maturity
Short Medium Long Volatility
Low
Medium
High
Fund Manager: Mr. Devender Singhal,
Mr. Abhishek Bisen,
Mr. Arjun Khanna*
AAUM: `1,886.72 crs
AUM: `1,908.19 crs
Mr. Hiten Shah &
( D e d i c a t e d F u n d m a n a g e r f o r investments in foreign securities)
Benchmark***: NIFTY Equity Savings (Tier 1) 75% NIFTY 50 ARBITRAGE, 25% Nifty 50 TRI (Tier 2)
Allotment date: October 13, 2014
Folio count: 18,622
Issuer/Instrument Industry/Rating % to Net Assets % to Net Assets Derivatives
Top 10 Holdings
***As per SEBI Circular dated 27th October 2021 The first tier benchmark is reflective of the category of the scheme and the second tier benchmark is demonstrative of the investment style / strategy of the Fund Manager within the category.
For Fund Manager experience, please refer page 78-80, Effective April 01, 2021 Kotak Equity Savings Fund will be managed by Mr. Devender Singhal, Mr. Abhishek Bisen and Mr. Hiten Shah.
TRI – Total Return Index, In terms of SEBI circular dated January 4, 2018, the performance of the scheme is benchmarked to the Total Return variant (TRI) of the Benchmark Index instead of Price Return Variant (PRI).
Scheme Inception : - October 13, 2014. The returns are calculated by XIRR approach assuming investment of 10,000/- on the 1st working day of every month. XIRR helps in calculating return on investments given an initial and final value and a series `of cash inflows and outflows and taking the time of investment into consideration. Since inception returns are assumed to be starting from the beginning of the subsequent month from the date of inception. # Benchmark ; ̂ Additional Benchmark
Alpha is difference of scheme return with benchmark return. *All payouts during the period have been reinvested in the units of the scheme at the then prevailing NAV. Returns >= 1 year: CAGR (Compounded Annualised Growth Rate). N.A stands for data not available. Note: Point to Point (PTP) Returns in INR shows the value of 10,000/- investment made at inception. Source: ICRA MFI Explorer.
Kotak Equity Savings Fund NAV as on June 30, 2022: ̀ 18.3207 (Growth Option), ̀ 13.5128 (Monthly-Reg-Plan-IDCW), ̀ 19.4707 (Direct Growth Option), ̀ 14.0997 (Monthly-Dir-Plan-IDCW)
## Risk rate assumed to be 4.95% (FBIL Overnight MIBOR rate as on 30th June 2022).**Total Expense Ratio includes applicable B30 fee and GST.For last three IDCW, please refer page no 81-83. For scheme performance, please refer page no 69-77.
23
SECTOR ALLOCATION (%)
Systematic Investment Plan (SIP) If you had invested `10,000 every month
SYSTEMATIC INVESTMENT PLAN (SIP)
Alpha
Monthly SIP of Rs 10000
CRISIL 10 Year Gilt Index (%)
Total amount invested (`)
Scheme Returns (%)
Total Value as on June 30, 2022 (`)
Nifty Equity Savings Index (%)
Nifty Equity Savings Index (`)#
75% NIFTY 50 ARBITRAGE + 25% Nifty 50 TRI Returns (%)
Alpha
75% NIFTY 50 ARBITRAGE + 25% Nifty 50 (`)#
CRISIL 10 Year Gilt Index (`)^
8.30 8.38 8.11 7.91 -2.32
Since Inception 7 years 5 years 3 years 1 years
9,30,000 8,40,000 6,00,000 3,60,000 1,20,000
-0.17 -0.20 0.05 0.95 3.92
12,09,271 10,64,628 7,06,194 3,96,499 1,20,004
4.75 4.41 3.57 0.44 -4.60
1.46 1.51 1.70 2.47 1.59
12,81,693 11,23,670 7,36,854 4,11,243 1,21,026
12,90,581 11,31,511 7,35,937 4,05,544 1,18,502
8.12 8.19 8.16 8.86 1.60
11,21,320 9,82,424 6,56,749 3,62,453 1,17,022
6.66 6.67 6.46 6.39 0.01
This product is suitable for investors who are seeking*:
• Income from arbitrage opportunities in the equity market & long term capital growth
* Investors should consult their financial advisors if in doubt about whether the product is suitable for them.
• Investment predominantly in arbitrage opportunities in the cash & derivatives segment of the equity market and equity & equity related securities
Product Label as on 30th June, 2022
Low High
Low
to
Moder
ate
ModerateModeratelyHigh
High
Very H
ighLo
w
TIER 1: NIFTY Equity Savings IndexInvestors understand that their principal will be atmoderate risk Investors understand that their principal will be at moderate risk
Low High
Low
to
Moder
ate
ModerateModeratelyHigh
High
Very H
ighLo
w
TIER 2: 75% Nifty 50 Arbitrage Index, 25% Nifty 50 TRIInvestors understand that their principal will be at
low to moderate risk
Fund Benchmark Benchmark
The investment objective of the scheme is to generate capital appreciation and income by predominantly investing in arbitrage opportunities in the cash and derivatives segment of the equity market, and enhance returns with a moderate exposure in equity & equity related instruments. There is no assurance or guarantee that the investment objective of the scheme will be achieved.
IDCW Frequency
Investment Objective
Available Plans/OptionsA) Regular Plan B) Direct Plan
Options: Payout of IDCW, Reinvestment of IDCW & Growth (applicable for all plans)
Monthly (12th of every month)
Ratios
Entry Load: Nil.Load Structure
a) For redemption / switch out of upto 8% of the initial investment amount (limit) purchased or switched in within 90 days from the date of allotment: Nil.
Additional Investment: `1000 & in .......multiples of `1 for purchase and for `0.01 for switches
Source: $ICRA MFI Explorer.
Total Expense Ratio**
b) If units redeemed or switched out are in excess of the limit within 90 days from the date of allotment: 1%c) If units are redeemed or switched out after 90 days from the date of allotment: NIL
Initial Investment: `5000 and in multiple of `1 for purchase and for ̀ 0.01 for switches
Regular: 2.13%; Direct: 1.12%
Ideal Investments Horizon: 3 years & above
Exit Load:
Minimum Investment Amount
40.69%Portfolio Turnover
0.64
8.30%
$Sharpe##
$Standard Deviation
1.04$Beta
Data as on June 30, 2022
ICICI Bank Ltd. Banks 2.09
ICICI Bank Ltd. Banks 2.78 -2.78
CNX NIFTY-JUL2022 -2.23
Equity & Equity related
Chennai Super Kings Cricket Ltd. Leisure Services 1.99
Equity & Equity related - Total 65.59 -34.08
Grand Total 100.00
Adani Port and Special Economic Zone Ltd. Transport Infrastructure 4.53 -4.51
Canara Bank Banks 2.32 -2.32
Others 39.00 -19.32
Reliance Industries Ltd. Petroleum Products 4.09 ITC Ltd. Diversified FMCG 3.02 Adani Enterprises Ltd. Metals & Minerals Trading 2.92 -2.92Maruti Suzuki India Limited Automobiles 2.85
Mutual Fund Units 13.63 Government Dated Securities 6.14 Triparty Repo 11.95 Net Current Assets/(Liabilities) 2.69
Mutual Fund Units as provided above is towards margin for derivatives transactionsEquity Derivative Exposuer is 34.08%
Low High
Low
to
Moder
ate
ModerateModeratelyHigh
High
Very H
ighLo
w
33.63%
2.77 yrs
-
Portfolio Turnover
Portfolio Average Maturity
IRS Average Maturity*
0.07 yrs2.77 yrs
-
0.07 yrs
0.07 yrs
-
0.07 yrs
5.38%
1.03
0.42
8.39%
Portfolio Modified Duration Net Average Maturity
IRS Modified Duration*
Net Modified Duration
Portfolio Macaulay Duration
IRS Macaulay Duration*
Net Macaulay Duration
YTM$Beta$Sharpe##$Standard Deviation
13.63 13.06 11.95 6.48 6.14 5.73 5.66 4.533.85
3.18 25.79
Mutual Fund Banks TREP & Term Deposits & Rev.Repo Automobiles Government Dated Securities Petroleum Products
IT - Software Transport Infrastructure Ferrous Metals Diversified FMCG REST

Mr. Abhishek Bisen &
Mr. Vihag Mishra*
Fund Manager: Mr. Devender Singhal,
AAUM: `1,453.81 crs
AUM: `1,468.39 crs
Benchmark: CRISIL Hybrid 85+15 -
Conservative Index
Folio count: 25,265
(Dedicated fund manager for investments in foreign securities)
Allotment date: December 02, 2003
An open-ended hybrid scheme investing predominantly indebt instruments
KOTAK DEBT HYBRID FUND
24
Investment style
Value Blend Growth Size
Large
Medium
Small
Maturity
Short Medium Long Volatility
Low
Medium
High
Investment Objective
Available Plans/Options
Options: Payout of IDCW, Reinvestment of IDCW & Growth (applicable for all plans)
$Source: ICRAMFI Explorer.Standard Deviation is calculated on Annualised basis using 3 years history of monthly returns.
The investment objective of the scheme is to enhance returns over a portfolio of debt instruments with a moderate exposure in equity and equity related instruments. By investing in debt securities, the scheme will aim at generating regular returns, while enhancement of return is intended through investing in equity and equity related securities. The scheme may also use various derivative and hedging products from time to time, in the manner permitted by SEBI. There is no assurance that the investment objective of the schemes will be realised.
Monthly (12th of every Month)Ratios
IDCW Frequency
Minimum Investment Amount
A) Regular Plan B) Direct Plan
b) If units redeemed or switched out are in excess of the limit within 6 months from the date of allotment: 1%
a) For redemption / switch out of upto 8% of the initial investment amount (limit) purchased or switched in within 6 months from the date of allotment: Nil.
Regular: 1.83%; Direct:0.45%
Ideal Investments Horizon - 3 year & above
Total Expense Ratio**
Load Structure
c) If units are redeemed or switched out after 6 months from the date of allotment: NIL
Initial Investment: (i) Reinvestment of IDCW & Growth and Payout of IDCW (Quarterly) - `5000 & above (ii) Payout of IDCW (Monthly) - `50,000 & above Additional Investment: ̀ 1000 & in multiples of ̀ 1
Exit Load: Entry Load: Nil. (applicable for all plans)
Data as on June 30, 2022
6.03 yrs 0.34 yrs
2.31 yrs 0.32 yrs
4.59% 7.01%
6.37 yrs
2.63 yrs 2.40 yrs 0.33 yrs 2.72 yrs
IRS Modified Duration*
$Standard Deviation
Portfolio Average MaturityIRS Average Maturity* Net Average Maturity
Net Modified Duration
Portfolio Modified Duration
Portfolio Macaulay DurationIRS Macaulay Duration*Net Macaulay DurationYTM
*Interest Rate Swap
Issuer/Instrument Industry/Rating % to Net Assets
Issuer/Instrument Industry/Rating % to Net Assets
PORTFOLIO
Equity & Equity related Banks 5.10ICICI Bank Ltd. 1.78State Bank Of India 1.34HDFC Bank Ltd. 0.64Kotak Mahindra Bank Ltd. 0.51Bank Of Baroda 0.46
Consumer Durables 1.20
Greenply Industries Ltd. 0.15
Corporation Limited 0.89
Pokarna Ltd. 0.43
IT - Software 1.34
Leisure Services 1.27
Automobiles 2.48
Mahindra & Mahindra Ltd. 0.55
Sapphire Foods India Ltd. 0.75
Auto Components 0.54
Biotechnology 0.47
Cummins India Ltd. 0.56
Gland Pharma Limited 0.12
Bharat Petroleum Corporation Ltd. 0.05
Barbeque Nation Hospitality Ltd. 0.26
Petroleum Products 2.46
Bata India Ltd. 0.23
Industrial Products 0.81
Chemicals & Petrochemicals 0.69
Axis Bank Ltd. 0.37
Infosys Ltd. 0.21
Persistent Systems Limited 0.91
Bharti Airtel Ltd -Partly Paid Shares 0.03
Tata Consultancy Services Ltd. 0.22
Varroc Engineering Ltd. 0.12
Indian Oil Corporation Ltd 0.23
Pharmaceuticals &
Maruti Suzuki India Limited 1.72
National Thermal Power
Reliance Industries Ltd. 2.13
Hindustan Petroleum
Tata Motors Ltd - DVR 0.13
Corporation Ltd 0.05
Tata Motors Ltd. 0.08
Diversified FMCG 2.04ITC Ltd. 2.04
Jubilant Foodworks Limited 0.26
Century Plyboards (India) Ltd. 0.39
Power 0.89
Ksb Ltd 0.25
Aether Industries Ltd. 0.69
Telecom - Services 0.67Bharti Airtel Ltd 0.64
Beverages 0.55United Spirits Ltd. 0.30United Breweries Ltd. 0.25
Subros Ltd. 0.42
Ami Organics Ltd 0.15Eris Lifesciences Ltd. 0.15
Emami Ltd. 0.43
Cement & Cement Products 0.41The Ramco Cements Ltd 0.24Ultratech Cement Ltd. 0.11
Consumer Non Durables 0.38JK Cement Ltd. 0.06
Zydus Lifesciences Limited 0.05
PNC Infratech Ltd 0.17
Kansai Nerolac Paints Ltd 0.38
KNR Constructions Ltd. 0.14Larsen And Toubro Ltd. 0.06
Construction 0.37
Personal Products 0.43
Realty 0.33
Developers Ltd 0.33
Healthcare Services 0.32
Capital Markets 0.28Fortis Healthcare India Ltd 0.32
Mahindra Lifespace
Services Ltd. 0.28
Food Products 0.27Prataap Snacks Ltd 0.27
Prudent Corporate Advisory
6.42% Central Government SOV 3.03
7.95% Central Government SOV 0.69
Govt-Rajasthan SOV 0.35
Aerospace & Defense 0.16
Entertainment 0.26
Shriram City Union Finance Ltd. 0.17
Equity & Equityrelated - Total 24.34
5.74% Central Government SOV 11.67
IT - Services 0.20
Services Ltd. 0.05Mahindra & Mahindra Financial
GS CG 22 Feb 2036 - (STRIPS) SOV 0.08
GS CG 17 Jun 2027 - (STRIPS) SOV 0.41
Firstsource Solutions Ltd. 0.20
Insurance 0.20
4.56% Central Government SOV 6.98
Finance 0.22
Government Dated Securities
7.10% Central Government SOV 10.41
Bharat Electronics Ltd. 0.16
Zee Entertainment Enterprises Ltd 0.26
7.38% Central Government SOV 3.80
Debt Instruments
Of India Ltd. 0.20
Debentures and Bonds
5.53% Central Government(^) SOV 16.50
Life Insurance Corporation
4.93% Central Government SOV 3.91
GS CG 22 Aug 2028 - (STRIPS) SOV 1.07
8.27% Rajasthan State
7.76% Madhya Pradesh StateGovt-Madhya Pradesh SOV 0.348.42% Tamil Nadu State
GS CG 22 Aug 2029 - (STRIPS) SOV 0.19GS CG 22 Feb 2030 - (STRIPS) SOV 0.18GS CG 22 Aug 2030 - (STRIPS) SOV 0.17GS CG 22 Aug 2022 - (STRIPS) SOV 0.11
Govt-Tamil Nadu SOV 0.24
8.13% Central Government SOV 0.116.84% Gujarat State Govt-Gujarat SOV 0.10GS CG 22 Aug 2026 - (STRIPS) SOV 0.09
8.86% Punjab State Govt-Punjab SOV 0.03
Securities - Total 61.19
Indian Railway Finance Corporation Ltd. CRISIL AAA 0.28
GS CG 22 Aug 2032 - (STRIPS) SOV 0.05
THDC India Ltd. (THDCIL) ICRA AA 1.63
Grand Total 100.00
Power Finance Corporation Ltd. CRISIL AAA 1.50
Corporate Debt/
Hindalco Industries Ltd. CRISIL AA+ 0.05
Net Current Assets/(Liabilities) 1.06
GS CG 22 Feb 2028 - (STRIPS) SOV 0.08
Public Sector Undertakings
8.85% Maharashtra State
GS CG 22 Aug 2027 - (STRIPS) SOV 0.08
8.90% Maharashtra State
By UP State Government ) CRISIL A+(CE) 1.17
GS CG 22 Aug 2031 - (STRIPS) SOV 0.06
GS CG 22 Aug 2036 - (STRIPS) SOV 0.07
GS CG 22 Feb 2027 - (STRIPS) SOV 0.05
GS CG 22 Feb 2043 - (STRIPS) SOV 0.02
Financial Institutions Embassy Office Parks Reit CRISIL AAA 1.65
Public Sector Undertakings - Total 4.90
GS CG 22 Feb 2032 - (STRIPS) SOV 0.06
Govt-Maharashtra SOV 0.03
8.92% Kerala State Govt-Kerala SOV 0.02
Govt-Maharashtra SOV 0.02
GS CG 22 Feb 2029 - (STRIPS) SOV 0.07
GS CG 23/12/2025 - (STRIPS) SOV 0.05
Government Dated
U P Power Corporation Ltd ( Guaranteed
GS CG 22 Feb 2044 - (STRIPS) SOV 0.02
8.92% Punjab State Govt-Punjab SOV 0.03
GS CG 22 Aug 2043 - (STRIPS) SOV 0.02
Power Finance Corporation Ltd. CRISIL AAA 0.32
Corporate Debt/FinancialInstitutions - Total 1.70Triparty Repo 6.81

An open-ended hybrid scheme investing predominantly in debt instruments
KOTAK DEBT HYBRID FUND
25
Scheme Inception : - December 02, 2003. The returns are calculated by XIRR approach assuming investment of ̀ 10,000/- on the 1st working day of every month. XIRR helps in calculating return on investments given an initial and final value and a series of cash inflows and outflows and taking the time of investment into consideration. Since inception returns are assumed to be starting from the beginning of the subsequent month from the date of inception. # Benchmark ; ̂ Additional Benchmark.
For Fund Manager experience, please refer page 78-80. ##Risk rate assumed to be 4.95% (FBIL Overnight MIBOR rate as on 30th June 2022).**Total Expense Ratio includes applicable B30 fee and GST. For last three IDCW, please refer page no 81-83. For scheme performance, please refer page no 69-77.
Kotak Debt Hybrid Fund NAV as on June 30, 2022: ̀ 41.7399 (Growth Option), ̀ 46.3593 (Direct Growth Option), ̀ 12.0648 (Monthly-Reg-Plan-IDCW), ̀ 12.8674 (Monthly-Dir-Plan-IDCW)Alpha is difference of scheme return with benchmark return. (^) Fully or Party blocked against Interest Rate Swap (IRS) Hedging Position through Interest Rate Swaps as on 30 Jun 2022 is 13.64% of the net assets.
This product is suitable for investors who are seeking*:
* Investors should consult their financial advisors if in doubt about whether the product is suitable for them.
• Investment in a portfolio of debt instruments with a moderate exposure in equity & equity related instruments
• Income & capital growth over a long term horizon
Product Label as on 30th June, 2022
Low High
Low
to
Moder
ate
ModerateModeratelyHigh
High
Very H
ighLo
w
Investors understand that their principal will be at moderately high risk Investors understand that their principal will be at moderately high risk
Low High
Low
to
Moder
ate
ModerateModeratelyHigh
High
Very H
ighLo
w
Fund Benchmark
RATING PROFILE (%)
SECTOR ALLOCATION (%)
Systematic Investment Plan (SIP) If you had invested `10,000 every month
SYSTEMATIC INVESTMENT PLAN (SIP)
Total Value as on June 30, 2022 ( )`
Monthly SIP of ( ) 10000`
Total amount invested ( )`
CRISIL Hybrid 85+15 - Conservative Index Returns (%)
Alpha
CRISIL Hybrid 85+15 - Conservative Index ( )#`
CRISIL 10 Year Gilt Index (`)^
CRISIL 10 Year Gilt Index Returns (%)
Scheme Returns (%)
51,86,556 19,08,114 11,39,009 7,46,929 4,10,116 1,18,583
22,30,000 12,00,000 8,40,000 6,00,000 3,60,000 1,20,000
8.42 8.37 7.64 7.09 5.34 -2.97
Since Inception 10 years 7 years 5 years 3 years 1 year
8.39 8.98 8.57 8.71 8.68 -2.20
-0.02 0.60 0.93 1.62 3.34 0.77
52,00,099 18,48,376 11,01,946 7,17,329 3,90,306 1,18,082
39,93,166 15,89,093 9,82,401 6,56,782 3,62,592 1,17,070
5.91 5.48 4.41 3.58 0.47 -4.53
Alpha is difference of scheme return with benchmark return. ((^) Fully or Party blocked against Interest Rate Swap (IRS) Hedging Position through Interest Rate Swaps as on 31 Mar 2022 is 7.00% of the net assets.
For Fund Manager experience, please refer page 75-77. ##Risk rate assumed to be 3.90% (FBIL Overnight MIBOR rate as on 31st March 2022).**Total Expense Ratio includes applicable B30 fee and GST. For last three IDCW, please refer page no 78-80. For scheme performance, please refer page no 67-74.
Scheme Inception : - December 02, 2003. The returns are calculated by XIRR approach assuming investment of ̀ 10,000/- on the 1st working day of every month. XIRR helps in calculating return on investments given an initial and final value and a series of cash inflows and outflows and taking the time of investment into consideration. Since inception returns are assumed to be starting from the beginning of the subsequent month from the date of inception. # Benchmark ; ̂ Additional Benchmark.
Kotak Debt Hybrid Fund NAV as on March 31, 2022: ̀ 42.9908 (Growth Option), ̀ 47.5824 (Direct Growth Option), ̀ 12.7439 (Monthly-Reg-Plan-IDCW), ̀ 13.5611 (Monthly-Dir-Plan-IDCW), ̀ 15.1778 (Quarterly-Reg-Plan-IDCW), ̀ 16.2318 (Quarterly-Dir-Plan-IDCW)
61.19 24.34 6.81 6.60 1.06
Government Dated Securities Equities TREP & Term Deposits & Rev.Repo Debentures and Bonds Net Current Assets
64.94 24.34 6.81
1.68
1.17
1.06
AAA, SOV Equities TREP & Term Deposits & Rev.Repo AA+, AA A+(CE) Net Current Assets

Also you can scan the QR code for detailed portfolio.
https://www.kotakmf.com/Products/funds/hybrid-funds/Kotak-Equity-Arbitrage-Fund/Dir-G
For detailed portfolio log on to
Maturity
Short Medium Long Volatility
Low
Medium
High
7
An open-ended scheme investing in arbitrage opportunities
KOTAK EQUITY ARBITRAGE FUND
AAUM: `26,041.70 crs
Fund Manager: Mr. Hiten Shah*
AUM: `25,788.79 crs
Allotment date: September 29, 2005
Folio count: 49,367
Benchmark: Nifty 50 Arbitrage Index
For Fund Manager experience, please refer page 75-77. ## Risk rate assumed to be 3.90% (FBIL Overnight MIBOR rate as on 31st March 2022).**Total Expense Ratio includes applicable B30 fee and GST.For last three IDCW, please refer page no 78-80. For scheme performance, please refer page no 67-74.
D erivatives Issuer/Instrument Industry/Rating % to Net Assets % to Net Assets
Investment Objective
A) Regular Plan B) Direct Plan
IDCW Frequency
Ratios
Options: Payout of IDCW, Reinvestment of IDCW & Growth (applicable for all plans)
Additional Investment: `1000 & in multiples of ̀ 1
Ideal Investments Horizon: 3 months & above
Source: $ICRA MFI Explorer.
Entry Load: Nil. (applicable for all plans)
Total Expense Ratio**
Available Plans/Options
Monthly (Monday preceding the last Thursday of the month)
The investment objective of the scheme is to generate capital appreciation and income by predominantly investing in arbitrage opportunities in the cash and derivatives segment of the equity market, and by investing the balance in debt and money market instruments.
Load Structure
Initial Investment: `5000 and in multiple of `1 for purchase and for ̀ 0.01 for switches
Regular: 1.02%; Direct: 0.44%
Minimum Investment Amount
Exit Load:
a) For redemptions/switch outs (including SIP/STP) within 30 days from the date of allotment of units: 0.25%
b) For redemptions/switch outs (including SIP/STP) after 30 days from the date of allotment of units: Nil
475.43%
0.65
0.65
0.76%
Portfolio Turnover
$Beta
$Sharpe##
$Standard Deviation
Top 10 Holdings
Kotak Equity Arbitrage Fund NAV as on June 30, 2022: `10.7228 (Monthly-Reg-Plan-IDCW), `11.2051 (Monthly-Dir-Plan-IDCW), `30.5583 (Growth Option), `32.0814 (Direct Growth Option)For Fund Manager experience, please refer page 78-80. ## Risk rate assumed to be 4.95% (FBIL Overnight MIBOR rate as on 30th June 2022).**Total Expense Ratio includes applicable B30 fee and GST.For last three IDCW, please refer page no 81-83. For scheme performance, please refer page no 69-77.
26
This product is suitable for investors who are seeking*:
• Investment in arbitrage opportunities in the cash & derivatives segment of the equity market.
* Investors should consult their financial advisors if in doubt about whether the product is suitable for them.
• Income from arbitrage opportunities in the equity market
Product Label as on 30th June, 2022
Low High
Low
to
Moder
ate
ModerateModeratelyHigh
High
Very H
ighLo
w
Investors understand that their principal will be at low risk
Low High
Low
to
Moder
ate
ModerateModeratelyHigh
High
Very H
ighLo
w
Investors understand that their principal will be at low risk
Fund Benchmark
SECTOR ALLOCATION (%)
Asian Paints Ltd. Consumer Durables 1.61 -1.61
Mutual Fund Units 22.75
Axis Bank Ltd. Banks 1.63 -1.63
JSW Steel Ltd. Ferrous Metals 1.78 -1.73
Treasury Bills 3.84
Triparty Repo 3.93
Adani Port and Special Economic Zone Ltd. Transport Infrastructure 1.68 -1.67
Tech Mahindra Ltd. IT - Software 1.83 -1.77
Net Current Assets/(Liabilities) 2.18
Grand Total 100.00
Equity & Equity related - Total 67.30 -67.12
Others 46.67 -46.64
Adani Enterprises Ltd. Metals & Minerals Trading 1.60 -1.60
Equity & Equity related
HDFC Bank Ltd. Banks 3.33 -3.32
HDFC Ltd. Finance 3.08 -3.08
Maruti Suzuki India Limited Automobiles 2.03 -2.02
Reliance Industries Ltd. Petroleum Products 2.06 -2.05
Mutual Fund Units as provided above is towards margin for derivatives transactionsEquity Derivative Exposuer is 67.12%
Kotak Equity Arbitrage Fund NAV as on March 31, 2022: `10.7151 (Monthly-Reg-Plan-IDCW), `11.1969 (Monthly-Dir-Plan-IDCW), `30.2097 (Growth Option), `31.6690 (Direct Growth Option), ̀ 20.0515 (Bimonthly-Reg-Plan-IDCW), ̀ 20.2577 (Bimonthly-Dir-Plan-IDCW), ̀ 23.0261 (Fortnightly-Reg-Plan-IDCW), ̀ 23.5093
( Fortnightly-Dir-Plan-IDCW)
497.25%
0.13 yrs
-
Portfolio Turnover
Portfolio Average Maturity
IRS Average Maturity*
0.13 yrs0.13 yrs
-
0.13 yrs
0.13 yrs
-
0.13 yrs
4.93%
0.61
-0.85
0.73%
Portfolio Modified Duration Net Average Maturity
IRS Modified Duration*
Net Modified Duration
Portfolio Macaulay Duration
IRS Macaulay Duration*
Net Macaulay Duration
YTM$Beta$Sharpe##$Standard Deviation
Data as on June 30, 2022
22.75 8.51 7.74 7.61 3.93 3.843.82 3.10
3.15 3.09 32.46
Mutual Fund Banks Finance IT - Software TREP & Term Deposits & Rev.Repo Treasury Bills Consumer Durables
Cement & Cement Products Pharmaceuticals & Biotechnology Automobiles REST

KOTAK OVERNIGHT FUND
An open ended debt scheme investing in overnight securities.A relatively low interest rate risk and relatively low credit risk.
Fund Manager: Mr. Deepak Agrawal
& Mr. Vihag Mishra*
( D e d i c a t e d f u n d m a n a g e r f o r investments in foreign securities)
AAUM: `14,770.70 crs
AUM: `11,690.36 crs
Benchmark: NIFTY 1D Rate index
Folio count: 4,688
Allotment date: January 15, 2019
PORTFOLIO
Kotak Overnight Fund NAV as on June 30, 2022: ̀ 1,141.8439 (Growth Option), ̀ 1,145.1748 (Direct Growth Option), ̀ 1,004.7568 (Daily-Reg-Plan-IDCW), ̀ 1,003.6055 (Daily-Dir-Plan-IDCW)*For Fund Manager experience, please refer page 78-80. **Total Expense Ratio includes applicable B30 fee and GST. For scheme performance, please refer page no 69-77.
MaturityShort Medium Long Volatility
Low
Medium
High
Issuer/Instrument Industry/Rating % to Net Assets
27
Initial Investment: ̀ 5000 and in multiple of `1 for purchase and for ̀ 0.01 for switches
A)Regular Plan B)Direct Plan
Total Expense Ratio**
Daily
Investment ObjectiveThe primary objective of the Scheme is to generate income through investment in debt & money market instruments having maturity of one business day (including CBLO (Tri-Party Repo), Reverse Repo and equivalent). However, there is no assurance or guarantee that the investment objective of the scheme will be achieved.
Ratios
Available Plans/Options
IDCW Frequency
Minimum Investment Amount
Additional Investment: `1000 & in multiples of `1 for purchase and for 0.01 for switchesIdeal Investment Horizon: 1 days
Load StructureEntry Load: Nil. (applicable for all plans)Exit Load: Nil. (applicable for all plans)
Regular: 0.20%; Direct:0.08%
Data as on June 30, 2022
-
-
-
0.13%
4.66%
-
-
-
-
-
-
Portfolio Average Maturity
Portfolio Modified Duration
Net Average Maturity
IRS Modified Duration*
Net Modified Duration
IRS Average Maturity*
$Standard Deviation
Net Macaulay Duration
YTM
IRS Macaulay Duration*
Portfolio Macaulay Duration
*Interest Rate Swap
• Income over a short term investment horizon
• Investment in debt & money market securities having maturity of one business day.
* Investors should consult their financial advisors if in doubt about whether the product is suitable for them.
This product is suitable for investors who are seeking*:
Product Label as on 30th June, 2022
Investors understand that their principal will be at low risk
LowLow HighHigh
Low
to
Moder
ate
Low
to
Moder
ate
ModerateModerate
ModeratelyHigh
ModeratelyHighHighHigh
Very H
igh
Very H
ighLo
wLo
w
Investors understand that their principal will be at low risk
LowLow HighHigh
Low
to
Moder
ate
Low
to
Moder
ate
ModerateModerate
ModeratelyHigh
ModeratelyHighHighHigh
Very H
igh
Very H
ighLo
wLo
w
Fund Benchmark
Potential Risk Class
Credit Risk
(Class A) (Class B) (Class C)
Relatively Low
Relatively Low
Relatively High
Moderate
ModerateRelatively
HighInterest Rate Risk
PRC Matrix
A-I
Treasury Bills
182 Days Treasury Bill 14/07/2022 SOV 1.07
91 Days Treasury Bill 07/07/2022 SOV 0.85
182 Days Treasury Bill 07/07/2022 SOV 0.51
Treasury Bills - Total 2.43
Triparty Repo 97.71
Grand Total 100.00
*For Fund Manager experience, please refer page 75-77. **Total Expense Ratio includes applicable B30 fee and GST. For scheme performance, please refer page no 67-74.
Kotak Overnight Fund NAV as on March 31, 2022: ̀ 1,130.8405 (Growth Option), ̀ 1,133.7997 (Direct Growth Option), ̀ 1,004.7568 (Daily-Reg-Plan-IDCW), ̀ 1,003.6055 (Daily-Dir-Plan-IDCW), ̀ 1,066.8438 (Weekly-Reg-Plan-IDCW)
ALLOCATION (%)
RATING PROFILE (%)
97.71 2.43
TREP & Term Deposits & Rev.Repo Treasury Bills Net Current Assets
-0.14
97.71 2.43-0.14
TREP & Term Deposits & Rev.Repo SOV Net Current Assets

Options: Payout of IDCW, Reinvestment of IDCW & Growth (applicable for all plans)
The investment objective of the Scheme is to provide reasonable returns and high level of liquidity by investing in debt instruments such as bonds, debentures & Government Securities; and money market instruments such as treasury bills, commercial paper, certificate of deposit, including repos in permitted securities of different maturities, so as to spread the risk across different kinds of issuers in the debt markets. The Scheme may invest in call money/term money market in terms of RBI guidelines in this respect. Subject to the maximum amount permitted from time to time, the Scheme may invest in offshore securities in the manner allowed by SEBI / RBI, provided such investments are in conformity with the investment objective of the Scheme and the prevailing guidelines and Regulations. To reduce the risk of the portfolio, the Scheme may also use various derivative and hedging products from time to time, in the manner permitted by SEBI. There is no assurance that the investment objective of the Schemes will be realised.
Available Plans/OptionsA) Regular Plan B) Direct Plan
IDCW FrequencyDaily
Investment Objective
Ratios
$Source: ICRAMFI Explorer. Standard Deviation is calculated on Annualised basis using 3 years history of monthly returns.
Minimum Investment Amount
Ideal Investment Horizon: 7 days to month
Initial Investment: `500 and in multiple of `1 for purchases and of ̀ 0.01 for switches
Total Expense Ratio**Regular: 0.32%; Direct: 0.20%
Additional Investment: `500 and in multiples of `1 for purchases and of ̀ 0.01 for switches
Debentures and Bonds Debt Instruments
National Bank for Agriculture &
Aditya Birla Finance Ltd. ICRA A1+ 1.51
Financial Institutions
IDFC First Bank Limited CRISIL A1+ 1.10
Corporate Debt/Financial
Corporation Ltd. CRISIL AAA 1.73
Finance Company Ltd. CRISIL A1+ 1.38
Commercial Paper(CP)/Certificate
Corporate Debt/
Small Industries Development
HDB Financial Services Ltd. CRISIL AAA 0.45
Financial Institutions
Public Sector Undertakings
Kotak Mahindra Prime Ltd. CRISIL AAA 0.41
Public SectorUndertakings - Total 3.05
8.92% Punjab State Govt-Punjab SOV 0.21
Power Finance Corporation Ltd. CRISIL AAA 0.82
Bajaj Finance Ltd. CRISIL AAA 0.57
HDFC Ltd. CRISIL AAA 0.22
Rural Development CRISIL AAA 0.28
Bank Of India CARE AAA 0.22
8.08% Central Government SOV 1.04
LIC Housing Finance Ltd. CRISIL AAA 0.62
Rural Electrification
Securities - Total 1.25Money Market Instruments
of Deposits(CD)
Government Dated Securities
Government Dated
Corporate Debt/
Reliance Jio Infocomm Ltd. CRISIL A1+ 5.60Bharti Airtel Ltd. CRISIL A1+ 4.14HDFC Ltd. CRISIL A1+ 3.97AXIS Bank Ltd. CRISIL A1+ 3.30
Institutions - Total 2.27
Reliance Retail Ventures Ltd CRISIL A1+ 3.01Tata Steel Ltd. ICRA A1+ 2.07Sikka Ports & Terminals Ltd. CRISIL A1+ 1.91
Cholamandalam Investment and
HDFC Securities Limited CRISIL A1+ 1.10
HDFC Bank Ltd. CARE A1+ 0.77
ICICI Securities Limited CRISIL A1+ 0.68
Julius Baer Capital (India) Pvt. Ltd CRISIL A1+ 0.63
Bajaj Housing Finance Ltd. CRISIL A1+ 1.04
Birla Group Holding Private Limited CRISIL A1+ 0.75
TVS Credit Services limited CRISIL A1+ 0.68
Coromandel International Limited FITCH A1+(IND) 0.55
Dalmia Cement (Bharat) Ltd CRISIL A1+ 0.55
Tata Power Renewable Energy Ltd. CRISIL A1+ 0.55Motilal Oswal FinancialServices Limited ICRA A1+ 0.54Panatone Finvest Ltd. CRISIL A1+ 0.34Tata Cleantech Capital Limited CRISIL A1+ 0.34Bajaj Finance Ltd. CRISIL A1+ 0.28Sharekhan Limited ICRA A1+ 0.28Tata Capital Housing Finance Ltd. CRISIL A1+ 0.28
Corporation Ltd CRISIL A1+ 0.27
Services Limited CRISIL A1+ 0.27
Larsen and Toubro Ltd. CRISIL A1+ 0.55
Tata Capital Financial
Godrej Industries Ltd CRISIL A1+ 0.21Aditya Birla Money Ltd CRISIL A1+ 0.14
Pilani Investment and Industries
Institutions - Total 38.93
Hindustan Petroleum
91 Days Treasury Bill 21/07/2022 SOV 3.45
Public Sector Undertakings
Punjab National Bank CARE A1+ 5.49
National Thermal Power
Net Current Assets/
Chambal Fertilisers & Chemicals Ltd. CRISIL A1+ 0.14
91 Days Treasury Bill 15/09/2022 SOV 1.37
182 Days Treasury Bill 22/09/2022 SOV 0.27
91 Days Treasury Bill 04/08/2022 SOV 1.75
Treasury Bills - Total 23.46
Corporate Debt/Financial
Undertakings - Total 27.52
Grand Total 100.00
Corporation Ltd. ICRA A1+ 2.66
91 Days Treasury Bill 08/09/2022 SOV 8.54
91 Days Treasury Bill 01/09/2022 SOV 1.41
Rural Development CRISIL A1+ 4.54Indian Oil Corporation Ltd. ICRA A1+ 3.58
91 Days Treasury Bill 22/09/2022 SOV 4.28
Public Sector
National Bank for Agriculture &
Indian Bank CRISIL A1+ 8.98
Corporation Ltd. CRISIL A1+ 0.76
91 Days Treasury Bill 18/08/2022 SOV 1.10182 Days Treasury Bill 04/08/2022 SOV 0.55182 Days Treasury Bill 08/09/2022 SOV 0.47
(Liabilities) -2.40
Canara Bank CRISIL A1+ 1.23
Treasury Bills
BOB Financial Solutions Limited CRISIL A1+ 0.28
182 Days Treasury Bill 18/08/2022 SOV 0.27
Triparty Repo 5.92
KOTAK LIQUID FUNDMaturityShort Medium Long Volatility
Low
Medium
High
Issuer/Instrument Industry/Rating % to Net Assets
Issuer/Instrument Industry/Rating % to Net Assets
PORTFOLIO
Existing benchmark will be Second Tier benchmark for aforementioned scheme.
Kotak Liquid Fund NAV as on June 30, 2022: ̀ 4,320.5696 (Growth Option), ̀ 4,346.2158 (Direct Growth Option), ̀ 1,222.8100 (Daily-Reg-Plan-IDCW), ̀ 1,222.8100 (Daily-Dir-Plan-IDCW)*For Fund Manager experience, please refer page 78-80. **Total Expense Ratio includes applicable B30 fee and GST. For scheme performance, please refer page no 69-77.***As per SEBI circular no. SEBI/HO/IMD/IMD-11 DF3/P/CIR/2021 /652 dated October 27, 2021; AMFI letter no. 35P/MEM-COR/70/2021-22 dated November 25, 2021 and AMFI letter no. 35P/ MEM-COR/ 131 / 2021-22 dated March 31, 2022 with effect from April 01, 2022 ("Effective date"), the first tier benchmark index of the scheme.
An open ended liquid scheme. A relatively low interest rate risk and moderate credit risk
Data as on June 30, 2022
28
Load StructureEntry Load: Nil. (applicable for all plans)
Exit Load Structure
4. Applicability of revised exit load on redemption /switch-out of units would be done on First in First out Basis (’FIFO’).
3. The revised load structure will be applicable for Insta Redemption facility as per the applicable circular.
1. Exit load shall applicable be as per the graded basis asspecified below:
Any exit load charged (net off Goods and Services tax, if any) shall be credited back to the Scheme. Units issued on reinvestment of IDCW shall not be subject to entry and exit load.2. The revised exit load shall be effective for all fresh investments
Investor exit uponsubscription
Exit load as a % ofredemption proceeds
Day 7 onwards 0.0000%
Fund Manager: Mr. Deepak Agrawal &
Mr. Vihag Mishra* (Dedicated fund manager
for investments in foreign securities)
Benchmark***: Nifty Liquid Index B-I (Tier 1), Nifty Liquid Index (Tier 2)
November 4, 2003Allotment date:
AAUM: `37,419.06 crs
AUM: `33,834.11 crs
Folio count: 52,200
Day 1 0.0070%Day 2 0.0065%Day 3 0.0060%Day 4 0.0055%Day 5 0.0050%Day 6 0.0045%
0.12 yrs
-
0.12 yrs
0.14% 5.08%
0.12 yrs
- 0.12 yrs
0.12 yrs
-
0.12 yrs
Net Average Maturity
Portfolio Average Maturity
IRS Average Maturity*
Portfolio Modified Duration
IRS Macaulay Duration*
Net Macaulay Duration
Net Modified Duration
$Standard Deviation
IRS Modified Duration*
YTM
Portfolio Macaulay Duration
*Interest Rate Swap
This product is suitable for investors who are seeking*:
• Income over a short term investment horizon
• Investment in debt & money market securities
* Investors should consult their financial advisors if in doubt about whether the product is suitable for them.
Product Label as on 30th June, 2022
Low High
Low
to
Moder
ate
ModerateModeratelyHigh
High
Very H
ighLo
w
Investors understand that their principal will be at low to moderate riskLow High
Low
to
Moder
ate
ModerateModeratelyHigh
High
Very H
ighLo
w
Investors understand that their principal will be at moderately high risk
Fund Benchmark
Potential Risk Class
Credit Risk
(Class A) (Class B) (Class C)
Relatively Low
Relatively Low
Relatively High
Moderate
ModerateRelatively
HighInterest Rate Risk
PRC Matrix
B-I
Low High
Low
to
Moder
ate
ModerateModeratelyHigh
High
Very H
ighLo
w
Investors understand that their principal will be at moderate risk
Kotak Liquid Fund NAV as on March 31, 2022: ̀ 4,278.9895 (Growth Option), ̀ 4,303.0834 (Direct Growth Option), ̀ 1,000.2472 (Weekly-Reg-Plan-IDCW), ̀ 1,005.2114 (Weekly-Dir-Plan-IDCW), ̀ 1,222.8100 (Daily-Reg-Plan-IDCW), ̀ 1,222.8100 (Daily-Dir-Plan-IDCW)*For Fund Manager experience, please refer page 75-77. **Total Expense Ratio includes applicable B30 fee and GST. For scheme performance, please refer page no 67-74.
ALLOCATION (%)
RATING PROFILE (%)
Benchmark
Low High
Low
to
Moder
ate
ModerateModeratelyHigh
High
Very H
ighLo
w
Investors understand that their principal will be at moderate risk
TIER 1: NIFTY Liquid Index B-I TIER 2: Nifty Liquid Index
66.45 23.46 5.925.32
1.25-2.4
Commercial Paper (CP)/Certificate of Deposits (CD) Treasury Bills TREP & Term Deposits & Rev.Repo Debentures and Bonds
Government Dated Securities Net Current Assets
96.48 5.92-2.4
A1+, A1+(IND), AAA, SOV TREP & Term Deposits & Rev.Repo Net Current Assets

Finance Company Ltd.(^) ICRA AA+ 1.19
Rural Development CRISIL AAA 0.66
LIC Housing Finance Ltd. CRISIL AAA 2.00
National Bank for Agriculture &
Shriram City Union Finance Ltd. CRISIL AA 1.92
Aditya Birla Finance Ltd. ICRA AAA 0.89
Cholamandalam Investment and
Sundaram Finance Ltd. CRISIL AAA 0.44
Bank Of India CARE AAA 0.13
Bajaj Finance Ltd. CRISIL AAA 3.12
Undertakings - Total 8.25
Muthoot Finance Ltd. CRISIL AA+ 2.54
Shriram Transport
Rural Electrification
Finance Co Ltd. FITCH IND AA+ 2.22
Bharti Telecom Ltd. CRISIL AA+ 1.31
Corporation Ltd.(^) CRISIL AAA 2.66
Small Industries Development
Public Sector
HDFC Ltd.(^) CRISIL AAA 1.11
Finance Company Ltd. FITCH AA+(IND) 0.88
HDB Financial Services Ltd. CRISIL AAA 0.44
Corporate Debt/Financial
Corporate Debt/
Corporation Ltd. (^) CRISIL AAA 1.42
Bajaj Housing Finance Ltd. CRISIL AAA 1.06
Reliance Industries Ltd. CRISIL AAA 0.89
Cholamandalam Investment and
Financial Institutions
Kotak Mahindra Prime Ltd. CRISIL AAA 0.22
Institutions - Total 20.23
Money Market Instruments
GS CG 16 Dec 2022 - (STRIPS) SOV 0.35
GS CG 22 Feb 2023 - (STRIPS) SOV 0.17
8.37% Odisha State
8.39% Rajasthan State
Govt-Orissa SOV 0.13
Government Dated
Public Sector
Undertakings
Power Finance Corporation Ltd. CRISIL AAA 3.38
Securities - Total 2.33
Rural Electrification
Debt Instruments
Government Dated Securities
8.44% Uttar Pradesh State
Govt-Uttar Pradesh SOV 0.45
Govt-Karnataka SOV 0.78
Debentures and Bonds
8.31% Karnataka State
Govt-Rajasthan SOV 0.45
Commercial Paper(CP)/
182 Days Treasury Bill
182 Days Treasury Bill
182 Days Treasury Bill
22/12/2022 SOV 4.31
Certificate of Deposits(CD)
Treasury Bills
01/12/2022(^) SOV 3.67
15/12/2022 SOV 2.16
Public Sector
Small Industries Development
Canara Bank CRISIL A1+ 1.74
Undertakings - Total 12.40
182 Days Treasury Bill
Bank Of India CARE A1+ 3.64
29/12/2022 SOV 0.86
08/09/2022 SOV 1.75
Treasury Bills - Total 17.32
Rural Development CRISIL A1+ 5.53
Public Sector
Bank Of India CRISIL A1+ 1.49
Corporate Debt/
Financial Institutions
Undertakings
182 Days Treasury Bill
08/12/2022 SOV 2.59
National Bank for Agriculture &
182 Days Treasury Bill
364 Days Treasury Bill
Small Industries Development
AXIS Bank Ltd. CRISIL A1+ 11.72
05/01/2023 SOV 1.98
HDFC Bank Ltd. CRISIL A1+ 1.74
Corporate Debt/Financial
Vedanta Ltd. CRISIL A1+ 1.69
HDFC Securities Limited CRISIL A1+ 0.44
Panatone Finvest Ltd. CRISIL A1+ 3.01
HDFC Bank Ltd. CARE A1+ 8.66
Reliance Retail Ventures Ltd CRISIL A1+ 0.88
LIC Housing Finance Ltd. CRISIL A1+ 3.26
Hero FinCorp Ltd. CRISIL A1+ 0.88
Crompton Greaves Consumer
IndusInd Bank Ltd. CRISIL A1+ 0.44
Institutions - Total 39.03
Triparty Repo 0.13
Electricals Limited CRISIL A1+ 0.68
Deutsche Bank CRISIL A1+ 1.29
(Liabilities) 0.31
Net Current Assets/
HDFC Ltd. CRISIL A1+ 4.34
Grand Total 100.00
29
KOTAK SAVINGS FUNDMaturityShort Medium Long Volatility
Low
Medium
HighAn open ended ultra-short term debt scheme investing ininstruments such that the Macaulay duration of the portfolio is between 3 months and 6 months.A moderate interest rate risk and moderate credit risk.
( D e d i c a t e d F u n d m a n a g e r f o r investments in foreign securities)
& Mr. Vihag Mishra*
AAUM: `13,237.43 crs
Duration Debt Index
AUM: `9,999.97 crs
Nifty Ultra Short
Allotment date: August 13, 2004
Fund Manager: Mr. Deepak Agrawal
Folio count: 43,638
B-I (Tier 1)
(Tier 2) Duration Debt Index
Benchmark***: Nifty Ultra Short
PORTFOLIO
Investment Objective
Additional Investment: ̀ 1000 & in multiples of ̀ 1
Monthly (12th of every Month)IDCW Frequency
A) Regular Plan B) Direct Plan
The investment objective of the Scheme is to generate returns through investments in debt and money market instruments with a view to reduce the interest rate risk. However, there is no assurance or guarantee that the investment objective of the scheme will be achieved.
Options: Payout of IDCW, Reinvestment of IDCW & Growth (applicable for all plans)
Ratios
Available Plans/Options
$Source: ICRAMFI Explorer. Standard Deviation is calculated on Annualised basis using 3 years history of monthly returns.
Minimum Investment AmountInitial Investment: (I) Reinvestment of IDCW & Growth- `5000 & above (ii) Payout of IDCW (Weekly) - ̀ 1,00,00,000 & above
Load Structure
Total Expense Ratio**
Exit Load: Nil (applicable for all plans)
Ideal Investment Horizon: 3-6 months
Regular: 0.80%; Direct: 0.36%
Entry Load: Nil. (applicable for all plans)
Data as on June 30, 2022
0.48 yrs
0.01 yrs
0.40 yrs
0.31%
6.02%
0.50 yrs
0.01 yrs
0.42 yrs 0.41 yrs
0.01 yrs
0.42 yrs
YTM
IRS Macaulay Duration*
Net Modified Duration
Portfolio Modified Duration
$Standard Deviation
IRS Modified Duration*
Portfolio Macaulay Duration
Net Macaulay Duration
Portfolio Average Maturity
IRS Average Maturity*
Net Average Maturity
*Interest Rate Swap
Issuer/Instrument Industry/Rating % to Net Assets Issuer/Instrument Industry/Rating % to Net Assets
Potential Risk Class
Credit Risk
(Class A) (Class B) (Class C)
Relatively Low
Relatively Low
Relatively High
Moderate
ModerateRelatively
HighInterest Rate Risk
PRC Matrix
B-II

30
KOTAK SAVINGS FUND
Kotak Savings Fund NAV as on June 30, 2022: ̀ 35.1454 (Growth Option), ̀ 10.7367 (Monthly-Reg-Plan-IDCW), ̀ 15.9750 (Monthly-Dir-Plan-IDCW), ̀ 36.3313 (Growth - Direct Option)
***As per SEBI circular no. SEBI/HO/IMD/IMD-11 DF3/P/CIR/2021 /652 dated October 27, 2021; AMFI letter no. 35P/MEM-COR/70/2021-22 dated November 25, 2021 and AMFI letter no. 35P/ MEM-COR/ 131 / 2021-22 dated March 31, 2022 with effect from April 01, 2022 ("Effective date"), the first tier benchmark index of the scheme. Existing benchmark will be Second Tier benchmark for aforementioned scheme.
Scheme Inception : - August 13, 2004. The returns are calculated by XIRR approach assuming investment of ̀ 10,000/- on the 1st working day of every month. XIRR helps in calculating return on investments given an initial and final value and a series of cash inflows and outflows and taking the time of investment into consideration. Since inception returns are assumed to be starting from the beginning of the subsequent month from the date of inception. # Benchmark ; ̂ Additional Benchmark. Alpha is difference of scheme return with benchmark return.(^) Fully or Party blocked against Interest Rate Swap (IRS) Hedging Position through Interest Rate Swaps as on 30 Jun 2022 is 6.62% of the net assets.
*For Fund Manager experience, please refer page 78-80. **Total Expense Ratio includes applicable B30 fee and GST. For scheme performance, please refer page no 69-77. For last three IDCW, please refer page no 81-83.
* Investors should consult their financial advisors if in doubt about whether the product is suitable for them.
This product is suitable for investors who are seeking*:
• Income over a short term investment horizon
• Investment in debt & money market securities with portfolio Macaulay duration between 3 months & 6 months
Product Label as on 30th June, 2022
Investors understand that their principal will be at moderate risk
An open ended ultra-short term debt scheme investing ininstruments such that the Macaulay duration of the portfolio is between 3 months and 6 months.A moderate interest rate risk and moderate credit risk.
Systematic Investment Plan (SIP) If you had invested `10,000 every month
SYSTEMATIC INVESTMENT PLAN (SIP)
Alpha is difference of scheme return with benchmark return.
*For Fund Manager experience, please refer page 75-77. **Total Expense Ratio includes applicable B30 fee and GST. For scheme performance, please refer page no 67-74. For last three IDCW, please refer page no 78-80.
Kotak Savings Fund NAV as on March 31, 2022: ̀ 10.0798 (Daily-Reg-Plan-IDCW), ̀ 10.8025 (Daily-Dir-Plan-IDCW), ̀ 34.8900 (Growth Option), ̀ 10.7438 (Monthly-Reg-Plan-IDCW), ̀ 10.5871 (Weekly-Reg-Plan-IDCW), ̀ 15.9847 (Monthly-Dir-Plan-IDCW), ̀ 15.9555 (Weekly-Dir-Plan-IDCW), ̀ 36.0302 (Growth - Direct Option)
(^) Fully or Party blocked against Interest Rate Swap (IRS) Hedging Position through Interest Rate Swaps as on 31 Mar 2022 is 20.34% of the net assets.
Scheme Inception : - August 13, 2004. The returns are calculated by XIRR approach assuming investment of ̀ 10,000/- on the 1st working day of every month. XIRR helps in calculating return on investments given an initial and final value and a series of cash inflows and outflows and taking the time of investment into consideration. Since inception returns are assumed to be starting from the beginning of the subsequent month from the date of inception. # Benchmark ; ̂ Additional Benchmark.
ALLOCATION (%)
RATING PROFILE (%)
Total amount invested ( )`
Monthly SIP of ( ) 10000`
Nifty Ultra Short Duration Debt Index B-I Returns (%)
CRISIL 1 Year T-Bill Index Returns (%)
Nifty Ultra Short Duration Debt Index B-I ( )#`
Nifty Ultra Short Duration Debt Index Returns (%)
CRISIL 1 Year T-Bill Index ( )^`
Nifty Ultra Short Duration Debt Index ( )#`
Alpha
Total Value as on June 30, 2022 ( )`
Alpha
Scheme Returns (%)
6.11 5.90 5.32 4.82 3.67 2.44
7.54 6.61 5.91 5.37 4.40 4.11
44,32,565 16,85,047 10,36,170 6,87,130 3,84,898 1,22,621
44,71,287 16,95,164 10,39,990 6,88,955 3,85,497 1,22,572
38,39,985 16,24,049 10,14,422 6,77,678 3,80,663 1,21,564
-0.35 -0.25 -0.31 -0.36 -0.48 -0.75
Since Inception 10 years 7 years 5 years 3 years 1 year
21,50,000 12,00,000 8,40,000 6,00,000 3,60,000 1,20,000
42,77,563 16,63,584 10,24,960 6,80,933 3,82,150 1,22,145
7.18 6.36 5.61 5.01 3.93 3.36
-0.44 -0.36 -0.41 -0.47 -0.58 -0.67
7.62 6.72 6.01 5.48 4.51 4.03
Low High
Low
to
Moder
ate
ModerateModeratelyHigh
High
Very H
ighLo
w
Investors understand that their principal will be at low to moderate risk
Fund Benchmark
Low High
Low
to
Moder
ate
ModerateModeratelyHigh
High
Very H
ighLo
w
Investors understand that their principal will be at moderate risk
Benchmark
Low High
Low
to
Moder
ate
ModerateModeratelyHigh
High
Very H
ighLo
w
TIER 1: NIFTY Ultra Short Duration Debt Index B-I TIER 2: NIFTY Ultra Short Duration Debt Index
Low High
Low
to
Moder
ate
ModerateModeratelyHigh
High
Very H
ighLo
w
Low High
Low
to
Moder
ate
ModerateModeratelyHigh
High
Very H
ighLo
w
51.43 28.48 17.32 2.33
0.31
0.13
Commercial Paper (CP)/Certificate of Deposits (CD) Debentures and Bonds Treasury Bills Government Dated Securities
Net Current Assets TREP & Term Deposits & Rev.Repo
89.50 10.06 0.310.13
A1+, AAA, SOV AA+, AA+(IND), IND AA+, AA Net Current Assets TREP & Term Deposits & Rev.Repo

8.08% Central Government SOV 0.07
Government Dated Securities 8.31% Karnataka StateGovt-Karnataka SOV 0.628.91% Punjab StateGovt-Punjab SOV 0.36
Govt-Rajasthan SOV 0.188.39% Rajasthan State
Securities - Total 1.23
Commercial Paper(CP)/
Government Dated
Money Market Instruments
Certificate of Deposits(CD) Corporate Debt/Financial Institutions HDFC Ltd. CRISIL A1+ 11.55AXIS Bank Ltd. CRISIL A1+ 10.01HDFC Bank Ltd. CARE A1+ 6.68Tata Motors Finance Ltd. ICRA A1+ 3.09Piramal Enterprises Ltd. CRISIL A1+ 3.05
Edelweiss Finance &
IndusInd Bank Ltd. CRISIL A1+ 1.05Deutsche Bank CRISIL A1+ 1.03
Hero FinCorp Ltd. CRISIL A1+ 0.70
Sikka Ports & Terminals Ltd. CRISIL A1+ 0.70AU Small Finance Bank Ltd. FITCH IND A1+ 0.68
JM Financial Products Limited CRISIL A1+ 0.70
LIC Housing Finance Ltd. CRISIL A1+ 1.43
Bajaj Financial Securities Limited CRISIL A1+ 0.67
AU Small Finance Bank Ltd. FITCH A1+(IND) 0.70
Reliance Retail Ventures Ltd CRISIL A1+ 2.10
Can Fin Homes Ltd. CRISIL A1+ 0.70Daimler Financial Services India CRISIL A1+ 0.70
Vedanta Ltd. CRISIL A1+ 1.84
SBICAP Securities Limited CRISIL A1+ 0.70
Investments Limited CRISIL A1+ 1.05
L & T Finance Ltd. CRISIL A1+ 0.70
Panatone Finvest Ltd. CRISIL A1+ 2.23
Bank Of India CARE A1+ 6.69
Services Pvt. Ltd. CRISIL A1+ 1.04
Bajaj Housing Finance Ltd. CRISIL A1+ 0.35Edelweiss Broking Ltd CRISIL A1+ 0.35HDFC Bank Ltd. CRISIL A1+ 0.35Kec International Ltd. CRISIL A1+ 0.35
Fed Bank Financial Services Limited CRISIL A1+ 0.34
Standard Chartered Capital Ltd. CRISIL A1+ 0.17
Institutions - Total 55.39
HDFC Bank Ltd. FITCH IND A1+ 0.34Arka Fincap Ltd CRISIL A1+ 0.17
Electricals Limited CRISIL A1+ 0.56
Corporate Debt/Financial
Small Industries Development
Northern Arc Capital Limited ICRA A1+ 0.35
National Bank for Agriculture &Public Sector Undertakings
Canara Bank CRISIL A1+ 2.08
Crompton Greaves Consumer
Rural Development CRISIL A1+ 7.13
SBI Cards & Payment
Public SectorUndertakings - Total 17.62
182 Days Treasury Bill 15/09/2022 SOV 9.36
182 Days Treasury Bill 08/09/2022 SOV 2.65
Treasury Bills - Total 25.44Triparty Repo 3.52
182 Days Treasury Bill 01/12/2022 SOV 3.61182 Days Treasury Bill 22/12/2022 SOV 3.43
Treasury Bills
182 Days Treasury Bill 15/12/2022 SOV 2.40364 Days Treasury Bill 05/01/2023 SOV 1.57
182 Days Treasury Bill 08/12/2022 SOV 0.69
Net Current Assets/(Liabilities) -3.20Grand Total 100.00
182 Days Treasury Bill 29/12/2022 SOV 0.69
Bank Of Baroda FITCH A1+(IND) 0.68
182 Days Treasury Bill 22/09/2022 SOV 1.04
31
Fund Manager: Mr. Deepak Agrawal
Benchmark***: Nifty Money Market Index B-I (Tier 1)
( D e d i c a t e d f u n d m a n a g e r f o r investments in foreign securities)AAUM: `14,258.21 crs
Index (Tier 2)
Folio count: 11,843
AUM: `11,232.01 crs
& Mr. Vihag Mishra*
Allotment date: July 14, 2003
Nifty Money Market
KOTAK MONEY MARKET FUNDMaturityShort Medium Long Volatility
Low
Medium
HighAn open ended debt scheme investing in money market instruments. A relatively low interest rate risk and moderate credit risk
Issuer/Instrument Industry/Rating % to Net Assets Issuer/Instrument Industry/Rating % to Net Assets
PORTFOLIO
# Benchmark ; ̂ Additional Benchmark. Alpha is difference of scheme return with benchmark return.
Scheme Inception : - July 14, 2003. The returns are calculated by XIRR approach assuming investment of ̀ 10,000/- on the 1st working day of every month. XIRR helps in calculating return on investments given an initial and final value and a series of cash inflows and outflows and taking the time of investment into consideration. Since inception returns are assumed to be starting from the beginning of the subsequent month from the date of inception.
Kotak Money Market Fund NAV as on June 30, 2022: ̀ 3,631.0989 (Growth Option), ̀ 3,652.1548 (Direct Growth Option), ̀ 1,053.1249 (Monthly-Reg-Plan-IDCW), ̀ 1,052.2448 (Monthly-Dir-Plan-IDCW)
***As per SEBI circular no. SEBI/HO/IMD/IMD-11 DF3/P/CIR/2021 /652 dated October 27, 2021; AMFI letter no. 35P/MEM-COR/70/2021-22 dated November 25, 2021 and AMFI letter no. 35P/ MEM-COR/ 131 / 2021-22 dated March 31, 2022 with effect from April 01, 2022 ("Effective date"), the first tier benchmark index of the scheme. Existing benchmark will be Second Tier benchmark for aforementioned scheme.
*For Fund Manager experience, please refer page 78-80. **Total Expense Ratio includes applicable B30 fee and GST. For scheme performance, please refer page no 69-77. For last three IDCW, please refer page no 81-83.
$Source: ICRAMFI Explorer. Standard Deviation is calculated on Annualised basis using 3 years history of monthly returns.
Exit Load: Nil (applicable for all plans)
Additional Investment: ̀ 1000 & in multiples of ̀ 1
Regular: 0.36%; Direct: 0.26%
Load Structure
Minimum Investment Amount
Ideal Investment Horizon: 3-6 Months
Entry Load: Nil. (applicable for all plans)
Total Expense Ratio**
Initial Investment: `5000 Under growth, weekly IDCW and monthly IDCW option & `1,00,000 under Daily Reinvestment of IDCW option,
A) Regular Plan B) Direct Plan
Monthly (12th of every Month)IDCW Frequency
The investment objective of the Scheme is to generate returns by investing in money market instruments having maturity upto 1 year. There is no assurance that the investment objective of the Scheme will be realised.
Available Plans/Options
Ratios
Investment Objective
Options: Payout of IDCW (w.e.f May 15, 2017, Under Monthly IDCW option only), Re inves tment of IDCW & Growth (applicable for all plans
Data as on June 30, 2022
0.38 yrs
0.38 yrs
0.30%
5.86%
0.38 yrs
-
0.38 yrs
0.38 yrs
-
0.38 yrs
Portfolio Average Maturity
IRS Average Maturity*
Net Average Maturity
Portfolio Modified Duration
IRS Modified Duration*
Net Modified Duration
Portfolio Macaulay Duration
IRS Macaulay Duration*
Net Macaulay Duration
$Standard Deviation
YTM
*Interest Rate Swap
-
This product is suitable for investors who are seeking*:
• Investment in money market securities
* Investors should consult their financial advisors if in doubt about whether the product is suitable for them.
• Income over a short term investment horizon
Product Label as on 30th June, 2022
Low High
Low
to
Moder
ate
ModerateModeratelyHigh
High
Very H
ighLo
wInvestors understand that their principal will be at moderately high risk
Potential Risk Class
Credit Risk
(Class A) (Class B) (Class C)
Relatively Low
Relatively Low
Relatively High
Moderate
ModerateRelatively
HighInterest Rate Risk
PRC Matrix
B-I
Systematic Investment Plan (SIP) If you had invested `10,000 every month
SYSTEMATIC INVESTMENT PLAN (SIP)
Low High
Low
to
Moder
ate
ModerateModeratelyHigh
High
Very H
ighLo
w
Investors understand that their principal will be at low to moderate risk
*For Fund Manager experience, please refer page 75-77. **Total Expense Ratio includes applicable B30 fee and GST. For scheme performance, please refer page no 67-74. For last three IDCW, please refer page no 78-80.
# Benchmark ; ̂ Additional Benchmark. Alpha is difference of scheme return with benchmark return.
Scheme Inception : - July 14, 2003. The returns are calculated by XIRR approach assuming investment of ̀ 10,000/- on the 1st working day of every month. XIRR helps in calculating return on investments given an initial and final value and a series of cash inflows and outflows and taking the time of investment into consideration. Since inception returns are assumed to be starting from the beginning of the subsequent month from the date of inception.
Kotak Money Market Fund NAV as on March 31, 2022: ̀ 3,600.4965 (Growth Option), ̀ 3,620.7122 (Direct Growth Option), ̀ 1,030.3533 (Weekly-Reg-Plan-IDCW), ̀ 1,021.7188 (Weekly-Dir-Plan-IDCW), ̀ 1,053.5498 (Monthly-Reg-Plan-IDCW), ̀ 1,043.1724 (Monthly-Dir-Plan-IDCW), ̀ 1,041.7307 (Daily-Reg-Plan-IDCW), ̀ 1,060.1979 (Daily-Dir-Plan-IDCW)
Low High
Low
to
Moder
ate
ModerateModeratelyHigh
High
Very H
ighLo
w
Investors understand that their principal will be at moderately high risk
ALLOCATION (%)
RATING PROFILE (%)
Monthly SIP of ( ) 10000`
Total amount invested ( )`
Total Value as on June 30, 2022 ( )`
Scheme Returns (%)
Nifty Money Market Index B-I ( )#`
Nifty Money Market Index B-I Returns (%)
Nifty Money Market Index Returns (%)
Alpha
Nifty Money Market Index ( )#`
CRISIL 1 Year T-Bill Index ( )^`
CRISIL 1 Year T-Bill Index Returns (%)
Alpha -0.05 0.28 0.39 0.43 0.31 0.22
-0.05 0.25 0.32 0.35 0.22 0.16
42,13,106 16,24,188 10,14,422 6,77,678 3,80,663 1,21,564
Since Inception 10 years 7 years 5 years 3 years 1 year
22,80,000 12,00,000 8,40,000 6,00,000 3,60,000 1,20,000
47,17,273 16,71,861 10,31,611 6,85,238 3,83,868 1,22,429
7.18 6.17 5.40 4.83 3.91 3.59
7.12 6.46 5.79 5.26 4.23 3.80
47,45,078 16,47,323 10,17,439 6,77,837 3,82,060 1,22,291
7.17 6.21 5.46 4.91 4.01 3.65
47,40,900 16,50,620 10,19,766 6,79,238 3,82,600 1,22,330
6.07 5.90 5.32 4.82 3.67 2.44
Low High
Low
to
Moder
ate
ModerateModeratelyHigh
High
Very H
ighLo
w
Investors understand that their principal will be at low to moderate risk
Fund Benchmark
Low High
Low
to
Moder
ate
ModerateModeratelyHigh
High
Very H
ighLo
w
Investors understand that their principal will be at moderate risk
Benchmark
Low High
Low
to
Moder
ate
ModerateModeratelyHigh
High
Very H
ighLo
w
Investors understand that their principal will be at moderate risk
TIER 1: NIFTY Money Market Index B-I TIER 2: Nifty Money Market Index
Low High
Low
to
Moder
ate
ModerateModeratelyHigh
High
Very H
ighLo
w
Investors understand that their principal will be at low to moderate risk
73.01 25.443.52
1.23
Commercial Paper (CP)/Certificate of Deposits (CD) Treasury Bills TREP & Term Deposits & Rev.Repo
Government Dated Securities Net Current Assets
-3.20
99.68 3.52-3.2
A1+, A1+(IND), IND A1+, SOV TREP & Term Deposits & Rev.Repo Net Current Assets

Debt Instruments
Debentures and Bonds
Shriram Transport
Finance Co Ltd. FITCH IND AA+ 1.62
Industries Ltd. ICRA AA 1.75
L & T Finance Ltd. CRISIL AAA 1.45
Parks REIT CRISIL AAA 1.42
Embassy Office Parks Reit CRISIL AAA 2.83
Govt-Rajasthan SOV 5.73
Government
Securities - Total 25.65
4.93% Central Government SOV 1.89
Rural Electrification
Corporation Ltd. (^) CRISIL AAA 2.31
Power Finance
Public Sector
Public Sector
4.41% Central Government(^) SOV 7.37
Corporate Debt/
Financial Institutions
Undertakings - Total 5.43
Finance Co Ltd. CRISIL AA+ 4.34
HDB Financial
Kirloskar Ferrous
Mindspace Business
Government Dated
Corporation Ltd. (^) CRISIL AAA 2.09
Undertakings
Dated Securities
7.84% Tamil Nadu State
State Bank Of India.
Govt-Tamil Nadu SOV 0.03
5.53% Central Government SOV 9.49
8.00% Rajasthan State
6.56% Rajasthan State
Govt-Rajasthan SOV 0.07
6.42% Central Government(^) SOV 1.07
(Basel III TIER II Bonds) CRISIL AAA 1.03
HDFC Ltd.(^) CRISIL AAA 4.31
Services Ltd.(^) CRISIL AAA 3.45
Shriram Transport
Bahadur Chand Investments
Private Limited ICRA AA 1.43
Aditya Birla Finance Ltd. ICRA AAA 1.43
Bajaj Housing Finance Ltd. (^) CRISIL AAA 1.40
Tata Projects Ltd. FITCH IND AA 1.37
Muthoot Finance Ltd. CRISIL AA+ 1.40
Finance Ltd. CRISIL AAA 1.08
Tata Capital Financial
Services Limited ICRA AAA 1.08
Tata Projects Ltd. (^) FITCH IND AA 1.04
India Grid Trust (^) CRISIL AAA 1.02
Phoenix ARC Pvt Ltd CRISIL AA 0.70
DLF Cyber City Developers Ltd CRISIL AA 0.69
Kotak Mahindra Prime Ltd. CRISIL AAA 0.64
Tata Capital Housing
Godrej Industries Ltd CRISIL AA 0.49
Nabha Power Ltd. ( backed by
Company Limited CRISIL AAA 0.36
Hindustan Zinc Ltd. CRISIL AAA 1.13
unconditional and irrevocable
Tata Power Company Ltd.
guarantee by Larsen & Toubro Ltd ) ICRA AAA(CE) 0.36
ICICI Home Finance
( Guarenteed by TATA
Power Co. Ltd ) CARE AA(CE) 0.29
Financial Institutions
Vedanta Ltd. CRISIL A1+ 6.17
Treasury Bills
Certificate of Deposits(CD)
Institutions - Total 37.08
Institutions - Total 20.52
AXIS Bank Ltd. CRISIL A1+ 6.66
HDFC Bank Ltd. CARE A1+ 1.41
Term Deposits
Corporate Debt/Financial
182 Days Treasury Bill 15/09/2022 SOV 2.53
Term Deposits - Total 0.36
Money Market Instruments
Commercial Paper(CP)/
Piramal Enterprises Ltd. CRISIL A1+ 2.07
HDFC Ltd. CRISIL A1+ 2.11
Triparty Repo 2.70
182 Days Treasury Bill 08/09/2022 SOV 2.99
Sikka Ports & Terminals Ltd. CRISIL A1+ 0.71
Union Bank of India 0.36
Deutsche Bank(^) CRISIL A1+ 1.39
Net Current Assets/
(Liabilities) 1.34
Grand Total 100.00
Treasury Bills - Total 6.92
Corporate Debt/Financial
Corporate Debt/
182 Days Treasury Bill 29/12/2022 SOV 1.40
32
MaturityShort Medium Long Volatility
Low
Medium
High
KOTAK LOW DURATION FUND
& Mr.Vihag Mishra*
Fund Manager: Mr. Deepak Agrawal
( D e d i c a t e d f u n d m a n a g e r f o r investments in foreign securities)
AAUM: `7,283.33 crs
AUM: `6,965.49 crs
Benchmark***: Nifty Low Duration
Nifty Low Duration
Debt Index (Tier 2)
Allotment date: March 6, 2008
Folio count: 94,175
Debt Index B-I (Tier 1)
An open ended low duration debt scheme investing in instruments such that the Macaulay duration of the portfolio is between 6 months and 12 months.A relatively high interest rate risk and moderate credit risk.
PORTFOLIO
Total Expense Ratio**
Additional Investment: ̀ 1000 & in multiples of `1 for purchase and for `0.01 for switches.
The primary objective of the Scheme is to generate income through investment primarily in low duration debt & money market securities. There is no assurance or guarantee that the investment objective of the scheme will be achieved.
IDCW Frequency
Initial Investment: `5000 and in multiple of `1 for purchase and for ̀ 0.01 for switches
Load Structure
At discretion of trustees
Options: Payout of IDCW, Reinvestment of IDCW & Growth (payout of IDCW is available under monthly IDCW only) (applicable for all plans)
Investment Objective
Available Plans/Options
$Source: ICRAMFI Explorer. Standard Deviation is calculated on Annualised basis using 3 years history of monthly returns.
Ratios
Minimum Investment Amount
Ideal Investment Horizon: 6-9 months
Entry Load: Nil. Exit Load: Nil.Any exit load charged (net off Service Tax, if any) shall be credited back to the Scheme;
A) Regular B) Direct Plan
Regular: 1.18%; Direct: 0.42%
Data as on June 30, 2022
2.29 yrs0.15 yrs
0.61 yrs
0.66%
6.73%
2.44 yrs
0.14 yrs
0.75 yrs
0.64 yrs
0.14 yrs 0.78 yrs
IRS Modified Duration*
IRS Average Maturity*
Net Average Maturity
Portfolio Modified Duration
Net Modified Duration
YTM$Standard Deviation
Portfolio Average Maturity
Net Macaulay Duration
Portfolio Macaulay Duration
IRS Macaulay Duration*
*Interest Rate Swap
Issuer/Instrument Industry/Rating % to Net Assets Issuer/Instrument Industry/Rating % to Net Assets
Potential Risk Class
Credit Risk
(Class A) (Class B) (Class C)
Relatively Low
Relatively Low
Relatively High
Moderate
ModerateRelatively
HighInterest Rate Risk
PRC Matrix
B-III
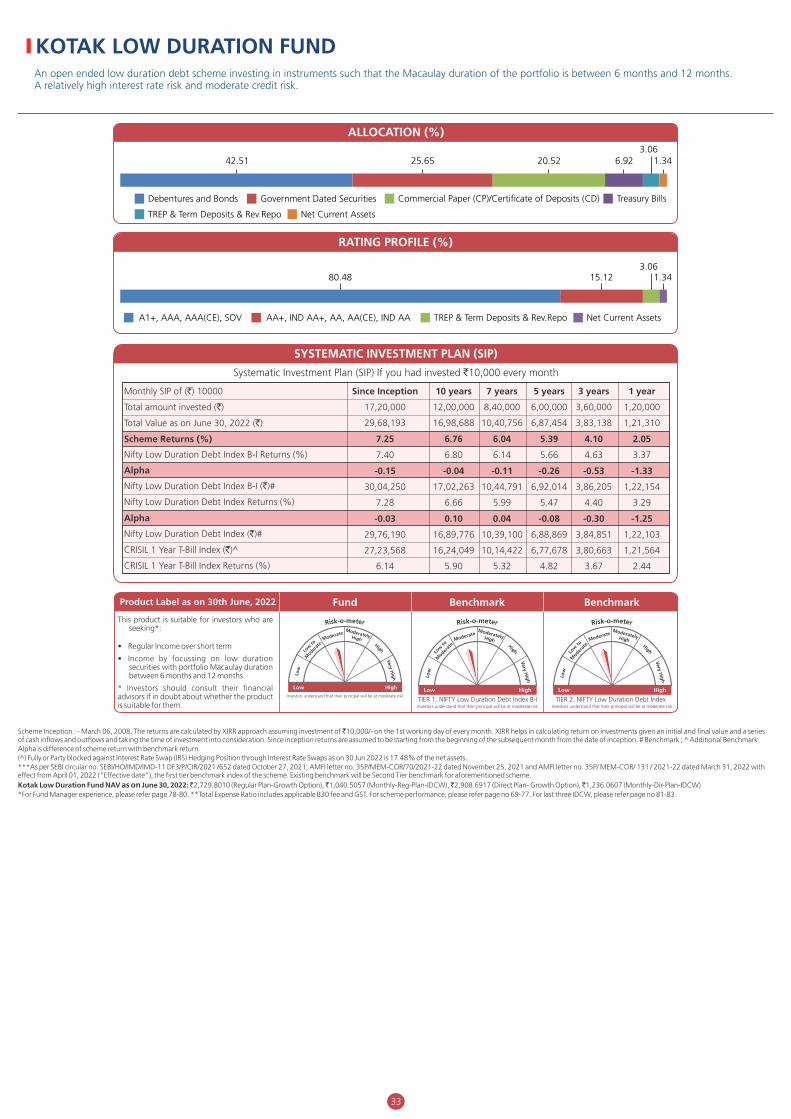
KOTAK LOW DURATION FUND
(^) Fully or Party blocked against Interest Rate Swap (IRS) Hedging Position through Interest Rate Swaps as on 30 Jun 2022 is 17.48% of the net assets.
Scheme Inception : - March 06, 2008. The returns are calculated by XIRR approach assuming investment of ̀ 10,000/- on the 1st working day of every month. XIRR helps in calculating return on investments given an initial and final value and a series of cash inflows and outflows and taking the time of investment into consideration. Since inception returns are assumed to be starting from the beginning of the subsequent month from the date of inception. # Benchmark ; ̂ Additional Benchmark.Alpha is difference of scheme return with benchmark return.
Kotak Low Duration Fund NAV as on June 30, 2022: ̀ 2,729.8010 (Regular Plan-Growth Option), ̀ 1,040.5057 (Monthly-Reg-Plan-IDCW), ̀ 2,908.6917 (Direct Plan- Growth Option), ̀ 1,236.0607 (Monthly-Dir-Plan-IDCW)
***As per SEBI circular no. SEBI/HO/IMD/IMD-11 DF3/P/CIR/2021 /652 dated October 27, 2021; AMFI letter no. 35P/MEM-COR/70/2021-22 dated November 25, 2021 and AMFI letter no. 35P/ MEM-COR/ 131 / 2021-22 dated March 31, 2022 with effect from April 01, 2022 ("Effective date"), the first tier benchmark index of the scheme. Existing benchmark will be Second Tier benchmark for aforementioned scheme.
*For Fund Manager experience, please refer page 78-80. **Total Expense Ratio includes applicable B30 fee and GST. For scheme performance, please refer page no 69-77. For last three IDCW, please refer page no 81-83.
33
This product is suitable for investors who are seeking*:
• Regular Income over short term
* Investors should consult their financial advisors if in doubt about whether the product is suitable for them.
• Income by focussing on low duration securities with portfolio Macaulay duration between 6 months and 12 months
Product Label as on 30th June, 2022
Low High
Low
to
Moder
ate
ModerateModeratelyHigh
High
Very H
ighLo
w
Investors understand that their principal will be at moderate risk
An open ended low duration debt scheme investing in instruments such that the Macaulay duration of the portfolio is between 6 months and 12 months.A relatively high interest rate risk and moderate credit risk.
Systematic Investment Plan (SIP) If you had invested `10,000 every month
SYSTEMATIC INVESTMENT PLAN (SIP)
Alpha is difference of scheme return with benchmark return.
Scheme Inception : - March 06, 2008. The returns are calculated by XIRR approach assuming investment of ̀ 10,000/- on the 1st working day of every month. XIRR helps in calculating return on investments given an initial and final value and a series of cash inflows and outflows and taking the time of investment into consideration. Since inception returns are assumed to be starting from the beginning of the subsequent month from the date of inception. # Benchmark ; ̂ Additional Benchmark.
(^) Fully or Party blocked against Interest Rate Swap (IRS) Hedging Position through Interest Rate Swaps as on 31 Mar 2022 is 9.90% of the net assets.Kotak Low Duration Fund NAV as on March 31, 2022: `2,728.2836 (Regular Plan-Growth Option), `1,014.6942 (Weekly-Reg-Plan-IDCW), `1,039.9293 (Monthly-Reg-Plan-IDCW), `2,901.6171 (Direct Plan- Growth Option), `1,199.1786 (Weekly-Dir-Plan-IDCW), ̀ 1,233.0543 (Monthly-Dir-Plan-IDCW)*For Fund Manager experience, please refer page 75-77. **Total Expense Ratio includes applicable B30 fee and GST. For scheme performance, please refer page no 67-74. For last three IDCW, please refer page no 78-80.
ALLOCATION (%)
RATING PROFILE (%)
Nifty Low Duration Debt Index B-I Returns (%)
Nifty Low Duration Debt Index Returns (%)
Alpha
CRISIL 1 Year T-Bill Index ( )^`
Nifty Low Duration Debt Index B-I ( )#`
CRISIL 1 Year T-Bill Index Returns (%)
Alpha
Nifty Low Duration Debt Index ( )#`
Monthly SIP of ( ) 10000`
Total amount invested ( )`
Total Value as on June 30, 2022 ( )`
Scheme Returns (%)
Since Inception 10 years 7 years 5 years 3 years 1 year
17,20,000 12,00,000 8,40,000 6,00,000 3,60,000 1,20,000
29,68,193 16,98,688 10,40,756 6,87,454 3,83,138 1,21,310
7.25 6.76 6.04 5.39 4.10 2.05
7.40 6.80 6.14 5.66 4.63 3.37
-0.15 -0.04 -0.11 -0.26 -0.53 -1.33
30,04,250 17,02,263 10,44,791 6,92,014 3,86,205 1,22,154
7.28 6.66 5.99 5.47 4.40 3.29
-0.03 0.10 0.04 -0.08 -0.30 -1.25
29,76,190 16,89,776 10,39,100 6,88,869 3,84,851 1,22,103
27,23,568 16,24,049 10,14,422 6,77,678 3,80,663 1,21,564
6.14 5.90 5.32 4.82 3.67 2.44
Fund Benchmark
Low High
Low
to
Moder
ate
ModerateModeratelyHigh
High
Very H
ighLo
w
Investors understand that their principal will be at moderate risk
Benchmark
TIER 1: NIFTY Low Duration Debt Index B-I TIER 2: NIFTY Low Duration Debt Index
Low High
Low
to
Moder
ate
ModerateModeratelyHigh
High
Very H
ighLo
w
Investors understand that their principal will be at moderate riskLow High
Low
to
Moder
ate
ModerateModeratelyHigh
High
Very H
ighLo
w
Investors understand that their principal will be at moderate risk
42.51 25.65 20.52 6.923.06
1.34
Debentures and Bonds Government Dated Securities Commercial Paper (CP)/Certificate of Deposits (CD) Treasury Bills
TREP & Term Deposits & Rev.Repo Net Current Assets
80.48 15.123.06
1.34
A1+, AAA, AAA(CE), SOV AA+, IND AA+, AA, AA(CE), IND AA TREP & Term Deposits & Rev.Repo Net Current Assets

N/A: Field not applicable to the scheme owing to its investment theme. Risk Factor: Mutual Fund investments are subject to market risks, read all scheme related documents carefully. Continuous offer of units of all schemes available at NAV based prices.
DEBT + CASH
LARGECAP
SMALLCAP
MIDCAP
Details provided are as on June 30th, 2022. Ratio Source: ICRA MFI Explorer. Risk free rate assumed to be 4.95% . Alpha = Difference between Scheme returns & Benchmark Index TRI of the scheme. In terms of SEBI circular dated January 4, 2018, the performance of the scheme is benchmarked to the Total Return variant (TRI) of the Benchmark Index instead of Price Return Variant (PRI). * The given market cap data is on the basis of new AMFI guidelines wherein Stocks are categorised as per given AMFI list "For Tax Saver Fund : Minimum Initial Investment: 500. Additional Investment: 500 & inmultiples of 500. For all other Equity Schemes : Minimum Initial Investment: 5000. Additional Investment: 1000 & inmultiples of 1" ^Total Expense Ratio is of Regular Plan
Equity Funds Ready ReckonerKey FeaturesInvestment
Theme
a. Identifies ""flow related"" companies - These benefit from spending from government, private and household (in terms of properties). They are not asset owners.b. Focus on high quality companies exhibiting superior ROE, positive cash flow, low leverage in an otherwise challenging environment
Fund Manager
Mr. Abhishek
Bisen,Mr. HarishKrishnan
&Mr.Hiten
Shah
Scheme Name
AUM
(Rs. Crs)as on 30th June 2022
BenchmarkMcap (%) /
Asset Allocation(%)
Underweight*Overweight* Standard Deviation
(%)
18,258.63
55.1835.71
3.695.42
25.75
27.74Kotak Small Cap Fund
3.1521.5368.22
7.10
Mr. Harish Krishnan
533.29
27.4342.5926.76
3.22
1. Capital Goods2. Automobile and Auto Components3. Chemicals
1. Oil, Gas & Consumable Fuels2. Power3. Telecom
Product Positioning
Kotak Equity Opportunities Fund
Large and Midcap
Identifies investment opportunities across market capitalisation and sectors Mr. Harsha Upadhyaya 9,222.59
Spotting the hidden gems
Kotak Flexicap Fund(Erstwhile Known As Kotak Standard Multicap Fund)
Flexicap
a. Invests in a few sectors as the various sectors of the economy tend to perform differently at different points of timeb. Flexibility to move across market caps depending on their attractiveness during the economic phase
Mr. Harsha Upadhyaya 33,341.11
Focus on few selected sectors
Kotak Tax SaverFund
ELSSa. Portfolio is diversified across sectors and market capitalization segments b. Offers dual benefits of growth and tax savings
Mr. Harsha Upadhyaya Nifty 500 TRI 2,528.82
Tax advantage with potential equity growth
KotakInfrastructure & Economic Reform Fund
Thematic: Infrastructure
True to label
Balanced Advantage
Conservative portfolio with a blend of:a. A fund that gives you freedom from managing equity and debt allocation manually during market ups and downs, giving you a balanced growth.b. Emphasis on back tested P/E* based model d. Better volatility managemente. Better tax efficiency by leveraging arbitrage opportunitiesf. Immunity from market timing to ensure disciplined investing
Takes care of Asset Allocation
7,079.71Small Cap
a. Identifies the hidden growth potential of small cap sized companiesb. Portfolio exhibits higher volatility than large caps and Midcaps however tends to have a higher return potential in the long runc. Buy and hold strategy
Mr. Pankaj Tibrewal
Spot them young, watch them grow
a. Stands for winning investment ideas across the mid & small cap range offering decent growth trajectory over the medium to long term horizonb. Buy and hold strategyc. Riskier than a large cap fund but offers faster growth rate since it has a smaller based. 0%-35% allocation to large cap or small cap opportunities as tactical plays
Mr. Pankaj Tibrewal
15.7264.0115.40
4.88
63.2223.40
9.593.79
74.9120.95
1.322.81
1. Consumer Durables2. Chemicals3. Automobile and Auto Components
1. Financial Services2. Fast Moving Consumer Goods3. Healthcare Services
1.96
2.63
EquitySavings
Conservative portfolio with a blend of:a. Income generation - through arbitrage opportunities & debt investment.b. Growth potential - through moderate participation in equity marketsc. Tax efficiency - through equity orientation
1,908.20 N/A
N/A
N/A
N/A
8.39 2.13
1,508.08
2,160.51
Nifty 50 Hybrid
Composite Debt 50:50
Index
13,493.74 13.21 1.72
Kotak Equity Hybrid Fund
Kotak Equity Arbitrage Fund
Aggresive Hybrid
EquityArbitrage
a. Equity portion: Multi cap strategy to identify outstanding companies having well managed and durable businesses with predictable earnings powerb. Debt portion: Actively managed with medium to long term maturityc. Lower volatility than a pure equity or debt fund
a. Discovers arbitrage opportunities by simultaneously entering transactions of long position in cash and exactly off-setting short position in futuresb. Equity position is completely hedged
Mr. Pankaj Tibrewal
& Mr. Abhishek
Bisen
Mr.Hiten ShahNifty 50
Arbitrage Index
2,539.24
25,788.79 N/A N/A N/A
18.24
0.73
Best of both worlds: equity
& debt
MIP with equity tax efficiency
Arbitrageopportunities
Nifty 50 Hybrid
Composite Debt
65:35 Index
2.08
1.02
Total Expense Ratio
(TER %)^
Kotak BluechipFund
80.7314.16
1.493.62
a. Favours industry leaders in cost, innovation, brand, competence, etc. with a proven execution track record across cyclesb. High conviction and long term calls taken
Large cap Mr. Harish Krishnan
NIFTY 100 TRI(Tier 1)
NIFTY 50 TRI(Tier 2)
NIFTY Large Midcap 250 TRI (Tier 1)
NIFTY 200 TRI(Tier 2)
NIFTY 500 TRI (Tier 1)
Nifty 100 TRI(Tier 2)
NIFTY Midcap 150 TRI (Tier 1)
NIFTY Midcap 100 TRI (Tier 2)
NIFTY Equity Savings (Tier 1)75% Nifty 50
Arbitrage Index, 25% Nifty 50 TRI (Tier 2)
NIFTY 500 TRI (Tier 1)
Nifty 200 TRI(Tier 2)
Nifty Infrastructure
TRI (Tier 1)India
Infrastructure Index (Tier 2)
Nifty 500 TRI(Tier 1)
INifty 200 TRI (Tier 2)
NIFTY Smallcap 250 TRI (Tier 1)Nifty Smallcap 100 TRI (Tier 2)
4,217.00Invest with
industry leaders
1. Automobile & Auto Components2. Services3. Construction
1. Financial Services2. Power3. Oil, Gas & Consumable Fuels
20.94 2.00
72.7123.93
0.402.97
Kotak India EQ Contra Fund
Contra/Value Fund
a. Focus on sustainable large cap stories which can withstand market shocksb. These are companies with pricing power for their competitive advantage or entry barriers
Ms. Shibani Kurian 1,192.39
Long term wealth creators
1. Capital Goods 2. Construction Materials3. Construction
1. Information Technology2. Financial Services3. Metals & Mining
22.37 2.30
1. Capital Goods2. Chemicals3. Construction
1. Information Technology2. Financial Services3. Power
20.86 1.83
1. Capital Goods2. Construction Materials3. Chemicals
1. Fast Moving Consumer Goods2. Power3. Consumer Durables
21.20 1.61
1. Chemicals2. Capital Goods3. Construction
1. Oil,Gas & Consumable Fuels2. Financial Services3. Information Technology
21.19 2.04
Kotak Pioneer Fund
Kotak Focused Equity Fund
It's Future Ready
Performance Through Core
Conviction
Sectoral - Thematic
Focused
N/A 2.05
Kotak Emerging Equity Fund Mid Cap Emerging leaders 24.54
1. Consumer Durables2. Chemicals3. Capital Goods
1. Oil, Gas & Consumable Fuels2. Financial Services3. Power
1.75
Kotak Equity Savings Fund
Kotak Balanced Advantage Fund
Mr. Harish Krishnan
Mr. Devender Singhal
Mr. Harish Krishnan
& Ms. Shibani
Kurian
85% IISL Kotak India Pioneering
Innovations +15% MSCI ACWI Information
Technology Index TRI
Sharpe
0.46
0.85
0.42
0.73
0.53
-0.85
0.43
0.41
0.50
0.29
0.44
N/A
0.64
N/A
Beta
1.05
0.88
1.03
1.12
1.22
0.61
0.96
0.99
0.88
0.94
0.93
N/A
0.93
N/A N/A 2.14
57.2121.3112.32
9.17
a. Concentrated Portfolio:25-30 high growth and good quality businesses with sustainable and scalable earnings potential over the long termb. Leveraging On Research CapabilitiesStock picking through the BMV model- ‘Business, Management and Valuation’ c. Suitable For Long Term InvestorsThose looking to benefit from the structural growth opportunity in Indian equitiesd. Bottom Up Approach To Stock Picking : With a top down thematic overlay.
Conservative portfolio with a blend of:a. 80-100% in pioneering innovations theme Upto 20% in other than pioneering innovations theme Focus on growth oriented / High impact companiesb. Upto 35% may be invested in overseas funds/etfs/securities investingin similar theme access to global techs c. The fund is from the Kotak Mahindra Mutual Fund stable and has structured investmentprocesses
Debt & Cash
Arbitrage
Net Equity
16.99
50.83
32.18
Net Equity
Arbitrage
Debt & Cash
31.88
36.64
31.48
1. Consumer Durables2. Capital Goods3. Automobile and Auto Components
1. Capital Goods2. Services3. Information Technology
1. Capital Goods2. Chemicals3. Consumer Durables
1. Fast Moving Consumer Goods2. Oil, Gas & Consumable Fuels3. Information Technology
1. Financial Services2. Healthcare Services3. Consumer Durables
1. Financial Services2. Oil, Gas & Consumable Fuels3. Information Technology
53.7035.1411.16
67.6025.52
3.883.00

The above risk-o-meter is based on the scheme portfolio as on 31st May 2022. An addendum may be issued or website update for new risk-o-meters
• Wealth creation over a long period of time• Investment in equity, equity related securities & debt, money market instruments while managing risk through active allocation
An Open Ended Dynamic Asset Allocationfund
Name of the Scheme Fund Risk-o-meter
BenchmerkRisk-o-meter
This product is suitable for investors who are seeking* Type of Scheme
• Income from arbitrage opportunities in the equity market & long term capital growth • Investment predominantly in arbitrage opportunities in the cash & derivatives segment of the equity market and equity & equity related securities
An open ended scheme investing inequity, arbitrage and debtKotak Equity Savings Fund
Fund
Investors understand that their principal will be at Very high risk
Investors understand that their principal will be at high risk
Investors understand that their principal will be at very high risk
Investors understand that their principal will be at high risk
Kotak Bluechip
Kotak Tax Saver
Kotak Emerging Equity Scheme
Equity Scheme
Kotak Equity Hybrid Fund
Kotak Equity Arbitrage Fund
• Long term capital growth • Investment in portfolio of predominantly equity & equity related securities of large cap companies
• Long term capital growth with a 3 year lock in• Investment in portfolio of predominantly equity & equity related securities
• Long term capital growth• Investment in equity & equity related securities predominantly in mid & small cap companies.
• Long term capital growth• Investment in equity & equity related securities balanced with income generation by investing in debt & money market instruments
• Income from arbitrage opportunities in the equity market
• Investment in arbitrage opportunities in the cash & derivatives segment of the equity market.
Kotak Bluechip Fund
Kotak Small Cap Fund
Kotak Equity Opportunities Fund
Kotak India EQ Contra Fund
Kotak Flexi Cap Fund (Erstwhile Known As Kotak Standard Multicap Fund)
Kotak Emerging Equity Fund
Equity Scheme
Kotak Focused Equity Fund
Kotak Equity Arbitrage Fund
• Long term capital growth• Investment in equity & equity related securities predominantly in small cap stocks
• Long term capital growth • Investment in portfolio of predominantly equity & equity related securities of large & midcap companies
• Long term capital growth • Investment in portfolio of predominantly equity & equity related securities
• Long term capital growth• Investment in portfolio of predominantly equity & equity related securities generally focused on a few selected sectors across market capitalisation
• Long term capital growth• Investment in equity & equity related securities predominantly in midcap companies.
• Long term capital growth• Investment in equity & equity related securities across market capitalisation in maximum 30 stocks
• Income from arbitrage opportunities in the equity market
• Investment in arbitrage opportunities in the cash &
derivatives segment of the equity market.
• Long term capital growth• Long term capital appreciation by investing in equity and equity related instruments of companies contributing to infrastructure and economic development of India
Kotak Infrastructure & Economic Reform Fund
An open ended scheme investing in arbitrage opportunities
Large Cap Fund- An open ended equity schemepredominantly investing in large cap stocks
Small Cap Fund- An open ended equity schemepredominantly investing in small cap stocks
Large & Mid Cap Fund- An open ended equity scheme investing in both large cap and mid cap stocks
An open ended equity scheme following contrarian investment strategy
Kotak Tax Saver Fund• Long term capital growth with a 3 year lock in• Investment in portfolio of predominantly equity & equity related securities
An Open-Ended Equity Linked Saving Scheme with a statutory lock in of 3 years and tax benefits
Mid Cap Fund - An open ended equity schemepredominantly investing in mid cap stocks
Flexicap Fund - An open ended dynamicequity scheme investing across large cap,mid cap, small cap stock
An open ended equity scheme investingin maximum 30 stocks in large-cap,mid-cap and small-cap category
• Long term capital growth• Investment in equity and equity related Securities of companies operating with Pioneering innovations theme Without any market Capitalisation and Sector bias
Kotak Pioneer Fund Thematic - An open ended equity schemeinvesting in pioneering innovations theme
An open ended equity scheme followingInfrastructure & Economic Reform theme
Fund TIER 1 Benchmark
TIER 2 Benchmark
Investors understand that their principal will be at low risk
Investors understand that their principal will be at low risk
Kotak Balanced Advantage Fund
Investors understand that their principal will be at very high risk
Investors understand that their principal will be at very high risk
Investors understand that their principal will be at very high risk
Investors understand that their principal will be at very high risk
Investors understand that their principal will be at very high risk
Kotak Equity Hybrid Fund
• Long term capital growth• Investment in equity & equity related securities balanced with income generation by investing in debt & money instruments
An open ended hybrid scheme investingpredominantly in equity and equity related instruments
TIER 1 Benchmark TIER 2 Benchmark
Investors understand that their principal will be at low to moderate risk
Investors understand that their principal will be at moderate risk
Investors understand that their principal will be at moderate risk
Deta
ils p
rovid
ed
are
as o
n J
un
e 3
0th
, 2022. F
or
deta
ils o
f sw
ap
po
sit
ion
s k
ind
ly r
efe
r re
sp
ecti
ve p
rod
uct
pag
e in
facts
heet
No
te:
**A
AA
als
o in
clu
des A
1+
,A1+
(SO
), A
AA
(SO
), IN
D A
AA
, N
et
cu
rren
t A
ssets
, C
BL
O, Term
Dep
osit
an
d R
ev r
ep
o. F
or
Ko
tak G
ilt
Fu
nd
: C
ash
an
d C
ash
E
qu
ivale
nt
is in
clu
ded
un
der
Gilt.
F
or
Liq
uid
sch
em
es (
Ko
tak L
iqu
id S
ch
em
e a
nd
Ko
tak M
on
ey M
ark
et
) an
d L
iqu
id p
lus s
ch
em
es (
Ko
tak S
avin
gs a
nd
Ko
tak L
ow
Du
rati
on
) T-b
ill is
in
clu
ded
in
AA
A.
* T
he r
evis
ed
exit
lo
ad
sh
all b
e e
ffecti
ve f
or
all f
resh
in
vestm
en
ts (
i.e. u
nit
s a
llo
tted
on
pu
rch
ases o
r sw
itch
-in
s (
inclu
din
g t
hro
ug
h s
yste
mati
c in
vestm
en
ts u
nd
er
exis
tin
g e
nro
lmen
ts/r
eg
istr
ati
on
s)
on
or
aft
er
Octo
ber
20, 2019.
^ T
ota
l E
xp
en
se R
ati
o is o
f R
eg
ula
r P
lan
** R
evis
ed
lo
ad
str
uctu
re is e
ffecti
ve f
rom
May 1
3, 2020
Sc
he
me
Na
me
Cu
rre
nt
Sc
he
me
P
os
itio
nin
g
3
3,8
34.1
17
da
ys
1 t
o M
on
thK
ota
k L
iqu
id F
un
d 1
00
% A
AA
L
iqu
id
11
,23
2.0
13
mo
nth
s –
6 m
on
ths
Ko
tak
Mo
ne
y M
ark
et
Fu
nd
Mo
ne
y M
ark
et
89
.95
% A
AA
,8
.13
% A
A+
1.9
2%
Be
low
AA
+
1
1,3
03
.21
3 m
on
ths
– 6
mo
nth
sK
ota
k S
avin
gs F
un
dU
ltra
Sh
ort
Du
rati
on
84
.88
% A
AA
7.3
6%
AA
+7
.76
% B
elo
w A
A+
6,9
65
.48
6 m
on
ths
– 1
ye
ar
Ko
tak
Lo
w D
ura
tio
n
Fu
nd
Lo
w D
ura
tio
n
61
.55
% A
AA
28
.00
% G
ilt
10
.46
% A
A+
61
.36
% A
AA
38
.64
% G
ilt
7,0
13
.60
2-3
ye
ars
K
ota
k B
an
kin
g &
P
SU
De
bt
Fu
nd
63
.65
% A
AA
26
.64
% G
ilt
7.7
1%
AA
+2
.00
% B
elo
w A
A+
Ba
nk
ing
an
d P
SU
13
,11
3.5
31
– 3
y
ea
rs
Ko
tak
Bo
nd
Sh
ort
Te
rm F
un
dS
ho
rt D
ura
tio
n
1
,57
7.6
73
Ye
ars
an
d a
bo
ve
Ko
tak
Cre
dit
Ris
k F
un
d
30
.03
% A
AA
10
.48
% G
ilt
2.1
0%
AA
+5
7.3
9%
Be
low
AA
+
Cre
dit
Ris
k
1,9
15.2
12
Ye
ars
an
d a
bo
ve
Ko
tak
Me
diu
m
Te
rm F
un
d
48
.95
% A
AA
24
.34
% G
ilt
14
.63
% A
A+
12
.07
% B
elo
w A
A+
Me
diu
m T
erm
(A
cc
rua
l S
tra
teg
y)
2,0
65
.00
2-3
ye
ars
Ko
tak
Dy
na
mic
Bo
nd
F
un
d
41
.22
% A
AA
52
.98
% G
ilt
5.7
9%
AA
+D
yn
am
ic
11
,69
0.3
61
da
yK
ota
k O
ve
rnig
ht
Fu
nd
10
0%
Gil
tO
ve
rnig
ht
Cu
rre
nt
Po
rtfo
lio
Q
ua
lity
**Id
ea
l In
ve
stm
en
t H
ori
zon
AU
M (
Rs
cro
res)
as
on
30th
Ju
ne
22
6,0
19
.81
1 –
2 y
ea
rsK
ota
k F
loa
tin
g R
ate
F
un
dF
loa
tin
g R
ate
1,5
50.7
82
-3 y
ea
rs
Ko
tak
Bo
nd
Fu
nd
7
.50
% A
AA
92
.50
% G
ilt
Me
diu
m t
o L
on
g
Du
rati
on
0.3
2
0.3
6
0.8
0
1.1
8
0.7
9
1.1
6
1.7
1
1.5
6
1.2
1
0.2
0
0.6
2
1.8
0
1.4
5
1
,67
2.3
62
-3 y
ea
rs
Ko
tak
Gil
t F
un
d 1
00
% G
ilt
Gil
t
Macau
lay
Du
rati
on
(ye
ars
)
5.0
80
.12
Ma
turi
ty <
91
da
ys
0.1
20.1
2
Nil
5.8
60
.38
Ma
turi
ty <
1 y
ea
r0
.38
0.3
8
6.0
20
.50
Ma
ca
ula
y d
ura
tio
n3
-6 m
on
ths
Nil
0.4
20
.42
Nil
6.7
32
.44
Ma
ca
ula
y d
ura
tio
n6
-12
mo
nth
s0
.75
0.7
8
8,9
02
.49
9 m
on
ths
– 1
ye
ar
Ko
tak
Co
rpo
rate
Bo
nd
Fu
nd
8
1.1
9%
AA
A1
8.8
1%
Gil
tC
orp
ora
te B
on
d0
.65
6.6
62.8
51.2
88
0-1
00
% c
orp
ora
te b
on
de
xp
os
ure
in
AA
+ &
a
bo
ve
as
se
tsN
il1
.34
6.7
44
.95
Pre
do
min
an
tly
Hig
h q
ua
lity
Ba
nk
ing
& P
SU
as
se
tsN
il2
.20
2.3
4
6.7
93
.30
Ma
ca
ula
y d
ura
tio
n 1
-3 y
ea
rsN
il1
.56
1.6
4
7.4
62
.77
Min
imu
m 6
5%
in
be
low
AA
+ i
ns
tru
me
nts
Wit
hd
raw
al
up
to
6%
of
inv
es
tme
nt
am
t w
ith
in 1
yr:
Nil
, >
ab
ov
e l
imit
of
wit
hd
raw
al
wit
hin
1 y
ea
r :
1%
, A
fte
r 1
ye
ar
: N
il.*
*1
.55
1.6
5
7.7
0
7.0
9
5.5
8
7.2
6
Ma
ca
ula
y d
ura
tio
n 3
-4 y
ea
rs(1
-4 y
ea
rs w
he
n d
efe
ns
ive
)2
.67
2.8
2
2.8
3
2.9
5D
yn
am
ic s
tra
teg
y -
inv
es
tme
nt
ac
ros
s d
ura
tio
nN
il
Nil
Nil
4.6
60.0
0O
ne
Da
y M
atu
rity
N
il0
.00
0.0
0
YT
M %
Av
era
ge
M
atu
rity
(y
ea
rs)
Ke
y D
iffe
ren
tia
tor
Mo
dif
ied
Du
rati
on
(ye
ars
)
7.3
2N
il4
.67
Av
era
ge
Ma
turi
ty –
Wit
hin
3
-4 y
ea
rs1
.73
1.8
4
7.2
57
.43
Ma
ca
ula
y d
ura
tio
n 4
-7 y
ea
rs(1
-7 y
ea
rs w
he
n d
efe
ns
ive
)3
.19
3.3
0
7.2
38
.72
Gil
t F
un
d w
ith
Dy
na
mic
str
ate
gy,
no
ca
p o
n d
ura
tio
nN
il2
.58
2.6
7
Investo
r E
xit
Up
on
su
bscri
pti
on
*E
xit
Lo
ad
as
a %
of
red
em
pti
on
Pro
ce
ed
Day 5
Day 2
Day 1
Day 3
Day 4
Day 6
Day 7
on
ward
s0.0
045%
0.0
070%
0.0
065%
0.0
060%
0.0
055%
0.0
050%
0.0
000%
Deb
t F
un
ds R
ead
y R
ecko
ner
Ex
it L
oa
d
To
tal
Ex
pe
ns
eR
ati
o
(TE
R %
)^
10
0%
AA
A
Mutual Fund investments are subject to market risks, read all scheme related documents carefully. The above risk-o-meter is based on the scheme portfolio as on 30th June 2022. An addendum may be issued or website update for new risk-o-meters
Name of the Scheme This product is suitable for investors who are seeking*
• Income over a medium term investment horizon• Investment in debt & money market securities across duration
Kotak Dynamic Bond Fund
Type of Scheme
• Income over a short to medium term investment horizon• Investment in debt & money market securities of PSUs, Banks, Public Financial Institutions, Government Securities & Municipal Bonds
An open ended debt scheme predominantly investing in Debt instruments of banks, Public Sector Undertakings, Public Financial Institutions and Municipal Bonds. A relatively high interest rate risk and moderate credit risk.
An open ended dynamic debt scheme investing across duration. A relatively high interest rate risk and moderate credit risk.
• Income over a long investment horizon• Investment in sovereign securities issued by the Central and/or State Government(s) and / or reverse repos in such securities.
Kotak Gilt Fund An open ended debt scheme investing in government securities across maturity. A relatively high interest rate risk and relatively low credit risk.
Kotak Banking andPSU Debt Fund
Kotak Bond Fund
• Income over a long term investment horizon• Investment in debt & money market securities with a portfolio Macaulay duration between 4 years and 7 years
An open ended medium term debt scheme investing ininstruments such that the Macaulay duration of the portfolio isbetween 4 years and 7 years. A relatively high interest rate risk and moderate credit risk.
Kotak Money Market Fund
• Income over a short term investment horizon• Investment in money market securities
An open ended debt scheme investing in money market instruments. A relatively low interest rate risk and moderate credit risk.
Kotak Low Duration Fund
• Regular Income over short term• Income by focusing on low duration securities with portfolio Macaulay duration between 6 months and 12 months
An open ended low duration debt scheme investing in instruments such that the Macaulay duration of the portfolio is between 6 months and 12 months. A relatively high interest rate risk and moderate credit risk.
Kotak CorporateBond Fund
• Regular Income over short term• Income by investing in fixed income securities of varying maturities and predominantly investing in AA+ and above rated corporate bonds
An open ended debt scheme predominantly investing in AA+ and above rated corporate bonds. A relatively high interest rate risk and moderate credit risk.
Kotak Bond Short Term• Income over a medium term investment horizon• Investment in debt & money market securities with portfolio Macaulay duration between 1 year and 3 years
An open ended short term debt scheme investing in instruments such that the Macaulay duration of the portfolio is between 1 year and 3 years. A relatively high interest rate risk and moderate credit risk.
• Income over a short term investment horizon.• Investment in floating & fixed rate debt instruments swapped for floating rate returns and money market instruments.
Kotak Floating Rate Fund
An open ended debt scheme predominantly investing infloating rate instruments. A relatively high interest rate risk and moderate credit risk.
• Income over a short term investment horizon• Investment in debt & money market securitiesKotak Liquid Fund
An open ended liquid scheme. A relatively low interest rate risk and moderate credit risk
• Income over a medium term investment horizon• Investment in debt, government securities & money market instruments with portfolio Macaulay duration between 3 years and 4 years
Kotak Medium Term Fund
An open ended medium term debt scheme investing in instruments such that the Macaulay duration of the portfolio is between 3 years and 4 years. A relatively high interest rate risk and relatively high credit risk.
• Income over a medium term investment horizon• Investment predominantly in AA and below rated corporate bonds (Excluding AA+ rated corporate bonds)
Kotak Credit Risk Fund
An open ended debt scheme predominantly investing in AA and below rated corporate bonds (Excluding AA+ rated corporate bonds). A relatively high interest rate risk and relatively high credit risk.
• Income over a short term investment horizon.• Investment in debt & money market securities having maturity of one business day.
Kotak Overnight Fund An open ended debt scheme investing in overnight securities.A relatively low interest rate risk and relatively low credit risk.
Benchmark RiskometerFund Riskometer
Investors understand that their principal will be at moderate risk
Investors understand that their principal will be at moderate risk
Investors understand that their principal will be at moderately high risk
Investors understand that their principal will be at moderate risk
Investors understand that their principal will be at moderate risk
Investors understand that their principal will be at moderate risk
Investors understand that their principal will be at moderate risk
Investors understand that their principal will be at moderate risk
Investors understand that their principal will be at low to moderate risk
Investors understand that their principal will be at moderately high risk
Investors understand that their principal will be at moderate risk
Investors understand that their principal will be at low to moderate risk
Investors understand that their principal will be at Moderately high risk
Investors understand that their principal will be at high risk
Investors understand that their principal will be at high risk
Investors understand that their principal will be at moderate risk
Investors understand that their principal will be at moderate risk
Investors understand that their principal will be at high risk
Investors understand that their principal will be at low risk
Investors understand that their principal will be at low risk
• Income over a short term investment horizon• Investment in debt & money market securities with portfolio Macaulay duration between 3 months and 6 months
Kotak Savings Fund
Potential Risk Class
An open ended ultra-short term debt scheme investingin instruments such that the Macaulay duration of theportfolio is between 3 months and 6 monthsA moderate interest rate risk and moderate credit risk.
Fund Benchmark (Tier-1) Benchmark (Tier-2)
Fund Benchmark (Tier-1) Benchmark (Tier-2)
Investors understand that their principal will be at moderate risk
Investors understand that their principal will be at moderate risk
Investors understand that their principal will be at moderate risk
Fund Benchmark (Tier-1) Benchmark (Tier-2)
Fund Benchmark (Tier-1) Benchmark (Tier-2)
Fund Benchmark (Tier-1) Benchmark (Tier-2)
Fund Benchmark (Tier-1) Benchmark (Tier-2)
Fund Benchmark (Tier-1)
Fund Benchmark (Tier-1) Benchmark (Tier-2)
Investors understand that their principal will be at moderate risk
Investors understand that their principal will be at low to moderate risk
Fund Benchmark (Tier-1)
Investors understand that their principal will be at moderate risk
Investors understand that their principal will be at moderate risk
Fund Benchmark (Tier-1)

Debt Instruments
Government Dated Securities
6.56% Rajasthan StateGovt-Rajasthan SOV 1.127.89% Gujarat State Govt-Gujarat SOV 0.63
4.93% Central Government(^) SOV 1.86
8.03% Gujarat State Govt-Gujarat SOV 0.528.15% Central Government SOV 0.34
5.53% Central Government(^) SOV 7.116.42% Central Government(^) SOV 2.22
6.97% Karnataka State
Debentures and Bonds
Mangalore Refinery and
HDB Financial Services Ltd.(^) CRISIL AAA 3.10
Govt-Tamil Nadu SOV 0.03
Rural Development ICRA AAA 4.64
Corporation Ltd. CRISIL AAA 0.28
LIC Housing Finance Ltd. CRISIL AAA 4.29
Undertakings - Total 19.71
Securities - Total 14.11
( Mukesh Ambani Group ) CRISIL AAA 3.00
Public Sector
Government Dated
Hindustan Petroleum
Public Sector Undertakings Power Finance Corporation Ltd. (^) CRISIL AAA 5.36
Govt-Karnataka SOV 0.27
State Bank Of India.
National Bank for Agriculture &
Corporate Debt/Financial Institutions
Nabha Power Ltd. ( backed by
by Larsen & Toubro Ltd ) ICRA AAA(CE) 4.49
Bajaj Finance Ltd. (^) CRISIL AAA 3.06
Rural Development CRISIL AAA 0.56Rural Electrification Corporation Ltd. CRISIL AAA 0.32
Sikka Ports & Terminals Ltd.
Corporation Ltd. (^) CRISIL AAA 2.93
HDFC Ltd.(^) CRISIL AAA 5.25
7.84% Tamil Nadu State
Bajaj Housing Finance Ltd. CRISIL AAA 3.33
Power Finance Corporation Ltd. CRISIL AAA 2.93
Jamnagar Utilities & Power
(Basel III TIER II Bonds) CRISIL AAA 1.88
Petrochemicals Ltd. FITCH AAA(IND) 0.81
8.45% Punjab State Govt-Punjab SOV 0.01
Rural Electrification
National Bank for Agriculture &
unconditional and irrevocable guarantee
Private Limited ( Mukesh Ambani Group ) CRISIL AAA 2.99
Tata Capital Financial
Mahindra & Mahindra
HDB Financial Services Ltd. CRISIL AAA 2.54Grasim Industries Ltd. CRISIL AAA 2.18
Services Limited ICRA AAA 1.65
Financial Services Ltd. (^) FITCH AAA(IND) 1.41
Mahindra & Mahindra Ltd. FITCH AAA(IND) 1.12
Embassy Office Parks Reit CRISIL AAA 1.09
Mahindra & Mahindra FinancialServices Ltd.(^) FITCH IND AAA 0.95
Mindspace Business Parks REIT CRISIL AAA 1.11
Reliance Industries Ltd. CRISIL AAA 0.85John Deere Financial
Embassy Office Parks Reit CRISIL AAA 1.12
India Private Limited CRISIL AAA 0.80Sundaram Finance Ltd. ICRA AAA 0.56
Kotak Mahindra Prime Ltd. CRISIL AAA 1.11
LIC Housing Finance Ltd. CRISIL AAA 0.56
India Grid Trust CRISIL AAA 1.04
Aditya Birla Finance Ltd. ICRA AAA 0.56
ICICI Bank Ltd.(Basel III TIER II Bonds) ICRA AAA 0.56Aditya Birla Finance Ltd. ICRA AAA 0.56LIC Housing Finance Ltd. CARE AAA 0.33Corporate Debt/Financial
Tata Capital FinancialServices Limited ICRA AAA 1.13
Financial Institutions Corporate Debt/
Institutions - Total 50.74
Net Current Assets/(Liabilities) 2.22
Public Sector
Small Industries Development
182 Days Treasury Bill 15/12/2022 SOV 0.82Treasury Bills - Total 4.69
Undertakings - Total 1.10
of Deposits(CD)
Grand Total 100.00
Money Market Instruments
Treasury Bills
Institutions - Total 6.27Triparty Repo 1.16
182 Days Treasury Bill 22/12/2022 SOV 1.09
HDFC Bank Ltd. CARE A1+ 1.10
Commercial Paper(CP)/Certificate
182 Days Treasury Bill 15/09/2022 SOV 2.78
Bank Of India CARE A1+ 1.10
AXIS Bank Ltd.(^) CRISIL A1+ 5.17
Corporate Debt/Financial
Public Sector Undertakings
34
MaturityShort Medium Long Volatility
Low
Medium
HighAn open ended debt scheme predominantly investing in AA+ and above rated corporate bonds. A relatively high interest rate risk and moderate credit risk.
KOTAK CORPORATE BOND FUND
Allotment date: September 21, 2007
& Mr. Vihag Mishra*
AUM: `8,902.49 crs
( D e d i c a t e d f u n d m a n a g e r f o r investments in foreign securities)
Fund Manager: Mr. Deepak Agrawal
Benchmark***: CRISIL Corporate Bond Fund B-II Index (Tier 1) CRISIL Corporate Bond Composite Index (Tier 2)
AAUM: 9,093.07 crs`
Folio count: 35,450
PORTFOLIO
Scheme Inception : - September 21, 2007. The returns are calculated by XIRR approach assuming investment of ̀ 10,000/- on the 1st working day of every month. XIRR helps in calculating return on investments given an initial and final value and a series of cash inflows and outflows and taking the time of investment into consideration. Since inception returns are assumed to be starting from the beginning of the subsequent month from the date of inception. # Benchmark ; ̂ Additional Benchmark.
***As per SEBI circular no. SEBI/HO/IMD/IMD-11 DF3/P/CIR/2021 /652 dated October 27, 2021; AMFI letter no. 35P/MEM-COR/70/2021-22 dated November 25, 2021 and AMFI letter no. 35P/ MEM-COR/ 131 / 2021-22 dated March 31, 2022 with effect from April 01, 2022 ("Effective date"), the first tier benchmark index of the scheme. Existing benchmark will be Second Tier benchmark for aforementioned scheme.
*For Fund Manager experience, please refer page 78-80.**Total Expense Ratio includes applicable B30 fee and GST. For scheme performance, please refer page no 69-77. For last three IDCW, please refer page no 81-83.
Alpha is difference of scheme return with benchmark return. (^) Fully or Party blocked against Interest Rate Swap (IRS) Hedging Position through Interest Rate Swaps as on 30 Jun 2022 is 23.38% of the net assets.
Kotak Corporate Bond Fund NAV as on June 30, 2022: ̀ 3,023.6451 (Regular Plan-Growth Option), ̀ 1,039.1852 (Monthly-Reg-Plan-IDCW), ̀ 3,125.1934 (Direct Plan- Growth Option), ̀ 1,076.4799 (Monthly-Dir-Plan-IDCW)
Investment ObjectiveThe investment objective of the scheme is to generate income by investing in debt /and money market securities across the yield curve and predominantly in AA+ and above rated corporate securities. The scheme would also seek to maintain reasonable liquidity within the fund. There is no assurance or guarantee that the investment objective of the scheme will be achieved.
A) Regular Plan B) Direct Plan
Options: Payout of IDCW, Reinvestment of IDCW & Growth (applicable for all plans)
IDCW FrequencyMonthly (12th of every Month)
Ratios
Available Plans/Options
Ideal Investment Horizon: 1-1.5 year
$Source: ICRAMFI Explorer. Standard Deviation is calculated on Annualised basis using 3 years history of monthly returns.
Additional Investment: ̀ 1000 & in multiples of `1for purchase and for `0.01 for switches.
Entry Load: Nil. (applicable for all plans)
Minimum Investment Amount
Regular: 0.65%; Direct: 0.30%
Total Expense Ratio**
Initial Investment: `5000 and in multiple of `1 for purchase and for ̀ 0.01 for switches
Load Structure
Exit Load: Nil. (applicable for all plans)
Data as on June 30, 2022
2.47 yrs0.38 yrs
0.93 yrs
1.00%
6.66%
2.85 yrs
0.35 yrs
1.28 yrs
0.98 yrs
0.36 yrs
1.34 yrs
Net Modified Duration
IRS Macaulay Duration*
YTM
Net Average Maturity
IRS Average Maturity*
Portfolio Average Maturity
Portfolio Modified Duration
IRS Modified Duration*
Portfolio Macaulay Duration
Net Macaulay Duration
$Standard Deviation
*Interest Rate Swap
Issuer/Instrument Industry/Rating % to Net Assets Issuer/Instrument Industry/Rating % to Net Assets
This product is suitable for investors who are seeking*:
• Regular Income over short term
• Income by investing in fixed income securities of varying maturities and predominantly investing in AA+ and above rated corporate bonds.
* Investors should consult their financial advisors if in doubt about whether the product is suitable for them.
Product Label as on 30th June, 2022
Low High
Low
to
Moder
ate
ModerateModeratelyHigh
High
Very H
ighLo
w
Investors understand that their principal will be at low to moderate risk
Potential Risk Class
Credit Risk
(Class A) (Class B) (Class C)
Relatively Low
Relatively Low
Relatively High
Moderate
ModerateRelatively
HighInterest Rate Risk
PRC Matrix
B-III
Systematic Investment Plan (SIP) If you had invested `10,000 every month
SYSTEMATIC INVESTMENT PLAN (SIP)
ALLOCATION (%)
RATING PROFILE (%)
Total amount invested ( )`
Monthly SIP of ( ) 10000`
Total Value as on June 30, 2022 ( )`
Scheme Returns (%)
CRISIL Corporate Bond Fund B-II Index Returns (%)
Alpha
Alpha
CRISIL 10 Year Gilt Index ( )^`
CRISIL Corporate Bond Fund B-II Index ( )#`
CRISIL 10 Year Gilt Index (%)
CRISIL Corporate Bond Composite Index Returns (%)
CRISIL Corporate Bond Composite Index ( )#`
Since Inception 10 years 7 years 5 years 3 years 1 year
8.31 7.71 6.94 6.40 4.68 -0.23
34,21,147 17,84,721 10,74,897 7,05,132 3,86,488 1,19,849
17,80,000 12,00,000 8,40,000 6,00,000 3,60,000 1,20,000
32,27,210 17,43,251 10,61,281 6,98,108 3,85,281 1,21,025
7.60 7.26 6.58 6.00 4.47 1.60
8.22 7.85 7.29 6.83 5.48 2.58
-0.62 -0.59 -0.71 -0.83 -1.01 -0.98
33,94,151 17,98,211 10,88,359 7,12,754 3,91,140 1,21,652
-0.71 -0.45 -0.36 -0.40 -0.21 1.83
28,02,062 15,89,033 9,82,401 6,56,782 3,62,592 1,17,070
5.85 5.48 4.41 3.58 0.47 -4.53
Fund Benchmark Benchmark
Low High
Low
to
Moder
ate
ModerateModeratelyHigh
High
Very H
ighLo
w
Investors understand that their principal will be at moderate risk
TIER 1: CRISIL Corporate Bond Fund BII Index TIER 2: CRISIL Corporate Bond Composite Index
Low High
Low
to
Moder
ate
ModerateModeratelyHigh
High
Very H
ighLo
w
Investors understand that their principal will be at moderate risk
70.45 14.11 7.37 4.692.22
1.16
Debentures and Bonds Government Dated Securities Commercial Paper (CP)/Certificate of Deposits (CD) Treasury Bills
Net Current Assets TREP & Term Deposits & Rev.Repo
96.62 2.22 1.16
A1+, AAA, AAA(CE), AAA(IND), IND AAA, SOV Net Current Assets TREP & Term Deposits & Rev.Repo

MaturityShort Medium Long Volatility
Low
Medium
HighAn open ended short term debt scheme investing in instruments such that the Macaulay duration of the portfolio is between 1 year and 3 yearsA relatively high interest rate risk and moderate credit risk.
KOTAK BOND SHORT TERM FUND
PORTFOLIO
35
Available Plans/Options
A) Regular Plan B) Direct Plan
Ideal Investment Horizon: 1 years & above
Ratios
Options: Payout of IDCW, Reinvestment of IDCW & Growth (applicable for all plans)
IDCW Frequency
Investment Objective
The investment objective of the Scheme is to provide reasonable returns and .............reasonably high levels of liquidity by investing in debt instruments such as bonds, debentures and Government securities; and money market instruments such as treasury bills, commercial papers, certificates of deposit, including repos in permitted securities of different maturities, so as to spread the risk across different kinds of issuers in the debt markets. There is no assurance that the investment objective of the Scheme will be realised.
At discretion of trustees
$Source: ICRAMFI Explorer. Standard Deviation is calculated on Annualised basis using 3 years history of monthly returns.
Minimum Investment Amount
Initial Investment: (i) Reinvestment of IDCW & Growth - `5000 & above (ii) Payout of IDCW (Monthly IDCW) - ̀ 50,000 & above
Additional Investment: ̀ 1000 & in multiples of ̀ 1
Load Structure
Exit Load: Nil.
Total Expense Ratio**
Entry Load: Nil. (applicable for all plans)
Regular: 1.16%; Direct: 0.34%
Data as on June 30, 2022
Issuer/Instrument Industry/Rating % to Net Assets Issuer/Instrument Industry/Rating % to Net Assets
Potential Risk Class
Credit Risk
(Class A) (Class B) (Class C)
Relatively Low
Relatively Low
Relatively High
Moderate
ModerateRelatively
HighInterest Rate Risk
PRC Matrix
B-III
Fund Manager: Mr. Deepak Agrawal
& Mr. Vihag Mishra*
Nifty Short Duration
Benchmark***: Nifty Short Duration
Debt Index B-II (Tier 1)
Folio count: 27,309
Allotment date: May 2, 2002
AAUM: `13,165.68 crs
Debt Index (Tier 2)
(Dedicated fund manager for investments in foreign securities)
AUM: `13,113.54 crs
(Basel III TIER II Bonds) CRISIL AAA 1.64
6.97% Karnataka State
8.25% Madhya Pradesh State
Govt-Rajasthan SOV 0.15
Govt-Karnataka SOV 0.19
8.27% Rajasthan State
7.59% Central Government SOV 0.66
GS CG 22 Aug 2026 - (STRIPS) SOV 0.11
5.28% Bihar State Govt-Bihar SOV 0.01
Power Finance Corporation Ltd. CRISIL AAA 0.07
GS CG 22 Feb 2028 - (STRIPS) SOV 0.10
Export-Import Bank of India CRISIL AAA 0.74
Rural Electrification
5.74% Central Government SOV 2.89
Govt-Madhya Pradesh SOV 0.38
6.53% Tamil Nadu State
Government Dated
Securities - Total 25.39
8.00% Rajasthan State
1.44% Central Government SOV 0.10
8.25% Maharashtra State
Govt-Kerala SOV 2.46
Govt-Madhya Pradesh SOV 0.55
GS CG 22 Feb 2029 - (STRIPS) SOV 0.09
Public Sector Undertakings
State Bank Of India.
Govt-Maharashtra SOV 0.59
6.90% Central Government SOV 0.41
8.45% Bihar State Govt-Bihar SOV 0.08
GS CG 22 Aug 2025 - (STRIPS) SOV 0.12
8.24% Kerala State
Govt-Tamil Nadu SOV 0.01
4.41% Central Government(^) SOV 2.26
Govt-Rajasthan SOV 0.74
National Bank for Agriculture &
Rural Development ICRA AAA 1.66
Corporation Ltd. (^) CRISIL AAA 1.88
6.69% Madhya Pradesh State
Power Finance
Corporation Ltd. (^) CRISIL AAA 1.11
Bank Of Baroda
(Basel III TIER II Bonds) FITCH IND AAA 0.77
Canara Bank (Basel III TIER II Bonds) FITCH IND AAA 0.75
National Bank for Agriculture &
Rural Development CRISIL AAA 0.73
Rural Electrification Corporation Ltd. CRISIL AAA 0.32
ONGC Petro Additions Ltd. ICRA AAA(CE) 0.21
National Thermal Power
Undertakings - Total 9.92
Corporate Debt/
Bajaj Finance Ltd. CRISIL AAA 7.28
Power Private Limited
( Mukesh Ambani Group ) CRISIL AAA 2.90
Jamnagar Utilities &
Sikka Ports & Terminals Ltd.
( Mukesh Ambani Group ) CRISIL AAA 2.21
Public Sector
Corporation Ltd. CRISIL AAA 0.04
HDFC Ltd.(^) CRISIL AAA 4.81
Financial Institutions
LIC Housing Finance Ltd.(^) CRISIL AAA 2.91
Debt Instruments
Debentures and Bonds
Government Dated Securities
5.53% Central Government(^) SOV 6.26
6.42% Central Government(^) SOV 4.14
4.93% Central Government(^) SOV 3.09
Nabha Power Ltd. ( backed by
unconditional and irrevocable
guarantee by Larsen & Toubro Ltd ) ICRA AAA(CE) 1.88
Power Private Limited
Certificate of Deposits(CD)
Financial Services Ltd. (^) FITCH AAA(IND) 1.53
PTC First Business Receivables Trust
Money Market Instruments
182 Days Treasury Bill 01/12/2022 SOV 0.74
Treasury Bills - Total 13.25
Hindustan Zinc Ltd. CRISIL AAA 0.90
HDB Financial Services Ltd.(^) CRISIL AAA 0.77
( Mukesh Ambani Group) CRISIL AAA 0.19
AXIS Finance Ltd. CRISIL AAA 0.90
Bajaj Finance Ltd. CRISIL AAA 1.14
Mahindra & Mahindra
Grasim Industries Ltd. CRISIL AAA 1.22
HDB Financial Services Ltd. CRISIL AAA 0.74
Tata Capital Financial
Institutions - Total 39.53
Receivables Trust) CRISIL AAA(SO) 0.82
Commercial Paper(CP)/
(Series 23) 01/10/2025(First Business
Aditya Birla Housing Finance(^) ICRA AAA 0.76
Bajaj Housing Finance Ltd. CRISIL AAA 0.74
India Grid Trust CRISIL AAA 0.73
Services Limited ICRA AAA 0.37
HDB Financial Services Ltd. CARE AAA 0.37
Services Limited(^) ICRA AAA 0.57
First Business Receivables Trust
Kotak Mahindra Prime Ltd. CRISIL AAA 1.52
John Deere Financial India
Private Limited CRISIL AAA 0.55
Tata Capital Financial
ICICI Home Finance
( Originator Reliance Industries Ltd ) CRISIL AAA(SO) 1.26
Services Limited CRISIL AAA 0.77
Company Limited CRISIL AAA 0.19
Kotak Mahindra Prime Ltd. CRISIL AAA 1.50
Tata Capital Financial
Jamnagar Utilities &
Corporate Debt/Financial
Treasury Bills
182 Days Treasury Bill 22/12/2022 SOV 5.94
182 Days Treasury Bill 15/09/2022 SOV 5.12
182 Days Treasury Bill 15/12/2022 SOV 1.30
91 Days Treasury Bill 18/08/2022 SOV 0.15
Bank Of Baroda FITCH A1+(IND) 0.73
Public Sector Undertakings
Public Sector
Undertakings - Total 1.10
Financial Institutions
AXIS Bank Ltd. CRISIL A1+ 6.30
Panatone Finvest Ltd. CRISIL A1+ 1.47
HDFC Bank Ltd. CARE A1+ 1.11
Corporate Debt/Financial
(Liabilities) 0.13
Grand Total 100.00
National Bank for Agriculture &
Standard Chartered Capital Ltd. CRISIL A1+ 0.19
Institutions - Total 9.07
Corporate Debt/
Rural Development CRISIL A1+ 0.37
Triparty Repo 1.61
Net Current Assets/
0.46 yrs
1.14 yrs
1.20%
6.79%
3.30 yrs
0.42 yrs
1.56 yrs
1.20 yrs
0.44 yrs
1.64 yrs
Portfolio Average Maturity
Net Average Maturity
IRS Macaulay Duration*
IRS Average Maturity*
IRS Modified Duration*
Net Macaulay Duration
YTM
Portfolio Modified Duration
Net Modified Duration
Portfolio Macaulay Duration
$Standard Deviation
*Interest Rate Swap
2.85 yrs

Scheme Inception : - May 02,2002. The returns are calculated by XIRR approach assuming investment of ̀ 10,000/- on the 1st working day of every month. XIRR helps in calculating return on investments given an initial and final value and a series of cash inflows and outflows and taking the time of investment into consideration. Since inception returns are assumed to be starting from the beginning of the subsequent month from the date of inception. # Benchmark ; ̂ Additional Benchmark. Alpha is difference of scheme return with benchmark return.
Kotak Bond Short Term Fund NAV as on June 30, 2022: ̀ 42.2750 (Growth Option), ̀ 45.4535 (Direct Growth Option), 10.0104 Reg-Plan-IDCW , ̀ 12.8612 Direct-Plan-IDCW ` ( ) ( l)*For Fund Manager experience, please refer page 78-80. **Total Expense Ratio includes applicable B30 fee and GST. For scheme performance, please refer page no 69-77. For last three IDCW, please refer page no 81-83.
(^) Fully or Party blocked against Interest Rate Swap (IRS) Hedging Position through Interest Rate Swaps as on 30 Jun 2022 is 24.77% of the net assets.***As per SEBI circular no. SEBI/HO/IMD/IMD-11 DF3/P/CIR/2021 /652 dated October 27, 2021; AMFI letter no. 35P/MEM-COR/70/2021-22 dated November 25, 2021 and AMFI letter no. 35P/ MEM-COR/ 131 / 2021-22 dated March 31, 2022 with effect from April 01, 2022 ("Effective date"), the first tier benchmark index of the scheme. Existing benchmark will be Second Tier benchmark for aforementioned scheme.
KOTAK BOND SHORT TERM FUND
36
• Investment in debt & money market securities with portfolio Macaulay duration between 1 year & 3 years
This product is suitable for investors who are seeking*:
• Income over a medium term investment horizon
* Investors should consult their financial advisors if in doubt about whether the product is suitable for them.
Product Label as on 30th June, 2022
Low High
Low
to
Moder
ate
ModerateModeratelyHigh
High
Very H
ighLo
w
Investors understand that their principal will be at low to moderate risk
An open ended short term debt scheme investing in instruments such that the Macaulay duration of the portfolio is between 1 year and 3 yearsA relatively high interest rate risk and moderate credit risk.
Systematic Investment Plan (SIP) If you had invested `10,000 every month
SYSTEMATIC INVESTMENT PLAN (SIP)
Scheme Inception : - May 02,2002. The returns are calculated by XIRR approach assuming investment of ̀ 10,000/- on the 1st working day of every month. XIRR helps in calculating return on investments given an initial and final value and a series of cash inflows and outflows and taking the time of investment into consideration. Since inception returns are assumed to be starting from the beginning of the subsequent month from the date of inception.
(^) Fully or Party blocked against Interest Rate Swap (IRS) Hedging Position through Interest Rate Swaps as on 31 Mar 2022 is 12.78% of the net assets.# Benchmark ; ̂ Additional Benchmark. Alpha is difference of scheme return with benchmark return.
*For Fund Manager experience, please refer page 75-77. **Total Expense Ratio includes applicable B30 fee and GST. For scheme performance, please refer page no 67-74. For last three IDCW, please refer page no 78-80.
Kotak Bond Short Term Fund NAV as on March 31, 2022: `42.5874 (Growth Option), `45.6958 (Direct Growth Option), `10.0540 (Monthly-Reg-Plan-IDCW), `12.8818 (Monthly-Dir-Plan-IDCW), `15.0428 (Half Yearly-Reg-Plan-IDCW), `15.8412 (Half Yearly-Dir-Plan-IDCW), 10.0843 Reg-Plan-IDCW , ̀ 12.9297 Direct-Plan-IDCW ` ( ) ( l)
ALLOCATION (%)
RATING PROFILE (%)
CRISIL 10 Year Gilt Index (%)
Nifty Short Duration Debt Index B-II Returns (%)
Total Value as on June 30, 2022 ( )`
Nifty Short Duration Debt Index Returns (%)
CRISIL 10 Year Gilt Index ( )^`
Alpha
Nifty Short Duration Debt Index ( )#`
Monthly SIP of ( ) 10000`
Alpha
Total amount invested ( )`
Scheme Returns (%)
Nifty Short Duration Debt Index B-II ( )#`
Since Inception 10 years 7 years 5 years 3 years 1 year
54,36,454 16,96,954 10,42,957 6,90,750 3,82,165 1,20,416
-0.31 -0.44 -0.49 -0.59 -1.05 -1.40
56,37,181 17,36,260 10,61,463 7,01,007 3,88,254 1,21,311
7.67 7.14 6.53 6.06 4.63 1.47
7.41 6.74 6.09 5.58 3.93 0.65
56,02,026 17,32,858 10,59,178 6,99,061 3,86,186 1,20,942
24,20,000 12,00,000 8,40,000 6,00,000 3,60,000 1,20,000
7.72 7.18 6.59 6.17 4.98 2.05
-0.26 -0.40 -0.43 -0.48 -0.70 -0.82
5.89 5.48 4.41 3.58 0.47 -4.53
45,61,641 15,89,033 9,82,401 6,56,782 3,62,592 1,17,070
Low High
Low
to
Moder
ate
ModerateModeratelyHigh
High
Very H
ighLo
w
Investors understand that their principal will be at low to moderate risk
Fund Benchmark
Low High
Low
to
Moder
ate
ModerateModeratelyHigh
High
Very H
ighLo
w
Investors understand that their principal will be at moderate risk
Benchmark
TIER 1: NIFTY Short Duration Debt Index B-II TIER 2: Nifty Short Duration Debt Index
Low High
Low
to
Moder
ate
ModerateModeratelyHigh
High
Very H
ighLo
w
Investors understand that their principal will be at moderate risk
49.45 25.39 13.25 10.171.61
0.13
Debentures and Bonds Government Dated Securities Treasury Bills Commercial Paper (CP)/Certificate of Deposits (CD)
TREP & Term Deposits & Rev.Repo Net Current Assets
98.261.61
0.13
A1+, A1+(IND), AAA, AAA(CE), AAA(IND), AAA(SO), IND AAA, SOV TREP & Term Deposits & Rev.Repo Net Current Assets

37
KOTAK CREDIT RISK FUND
An open ended debt scheme predominantly investing in AA and below rated corporate bonds (Excluding AA+ rated corporate bonds).A relatively high interest rate risk and relatively high credit risk.
Index (Tier 2)
& Mr. Vihag Mishra*
Index C-III (Tier 1)
( D e d i c a t e d f u n d m a n a g e r f o r investments in foreign securities)
AAUM: `1,627.85 crs
AUM: `1,577.67 crs
Benchmark***: Nifty Credit Risk Bond
Nifty Credit Risk Bond
Allotment date: May 11, 2010Folio count: 13,816
Fund Manager: Mr. Deepak Agrawal
Embassy Office Parks REIT Realty 2.34
National Bank for Agriculture & Rural Development ICRA AAA 1.55
Punjab National Bank(Basel III TIER II Bonds) CRISIL AA+ 0.32
Tata Motors Finance Solutions Ltd. CARE AA- 3.50
Prestige Projects Pvt. Ltd ICRA A+(CE) 4.30
Tata Projects Ltd. FITCH IND AA 1.52
THDC India Ltd. (THDCIL) CARE AA 1.58
Brookfield India Real Estate Trust Realty 1.28
Debentures and Bonds
Public Sector Undertakings
Mutual Fund Units
5.53% Central Government(^) SOV 7.41
Government Dated Securities
Government Dated Securities - Total 8.90
Power Finance Corporation Ltd. CRISIL AAA 4.07
U P Power Corporation Ltd ( Guaranteed By UP State Government ) CRISIL A+(CE) 3.75
Public Sector Undertakings - Total 14.35
Corporate Debt/Financial Institutions
Mindspace Business Parks REIT Realty 0.44
6.12% Karnataka State Govt-Karnataka SOV 1.49
Tata Power Company Ltd. ( Guarenteed by TATA Power Co. Ltd ) CARE AA(CE) 6.83
Godrej Properties Limited ICRA AA 6.35
Aadhar Housing Finance Limited CARE AA 6.19
Export-Import Bank of India CRISIL AAA 3.08
DLF Cyber City Developers Ltd CRISIL AA 6.10
Manappuram Finance Ltd. CRISIL AA 5.08
Mutual Fund Units - Total 4.06
Debt Instruments
Bahadur Chand Investments Private Limited ICRA AA 4.74
Bajaj Housing Finance Ltd. CRISIL AAA 4.62
Godrej Industries Ltd CRISIL AA 3.72
Godrej Industries Ltd CRISIL AA 1.85
Century Textiles & Industries Ltd. CRISIL AA 1.56
Muthoot Finance Ltd. CRISIL AA+ 0.95
Muthoot Finance Ltd. CRISIL AA+ 0.84
Corporate Debt/Financial Institutions - Total 59.16
Tata Projects Ltd. FITCH IND AA 0.32
Money Market Instruments
Commercial Paper(CP)/Certificate of Deposits(CD)
Treasury Bills
182 Days Treasury Bill 04/08/2022 SOV 1.58
Treasury Bills - Total 1.58
Public Sector Undertakings
Vedanta Ltd. CRISIL A1+ 3.00
Corporate Debt/Financial Institutions - Total 3.00
Triparty Repo 1.53
Small Industries Development Bank Of India CARE A1+ 3.11
LIC Housing Finance Ltd. CRISIL AAA 0.05
Public Sector Undertakings - Total 3.11
Corporate Debt/Financial Institutions
Jamnagar Utilities & Power Private Limited ( Mukesh Ambani Group ) CRISIL AAA 0.64
Net Current Assets/(Liabilities) 4.31
Grand Total 100.00
Issuer/Instrument Industry/Rating % to Net Assets
PORTFOLIO
MaturityShort Medium Long Volatility
Low
Medium
High
Options: Payout of IDCW, Reinvestment of IDCW & Growth (applicable for all plans)
Investment Objective
The investment objective of the scheme is to generate income by investing in debt /and money market securities across the yield curve and predominantly in AA rated and below corporate securities. The scheme would also seek to maintain reasonable liquidity within the fund. There is no assurance that the investment objective of the Schemes will be realised.
Available Plans/Options
A) Regular Plan B) Direct Plan
At discretion of trustees
$Source: ICRAMFI Explorer. Standard Deviation is calculated on Annualised basis using 3 years history of monthly returns.
Minimum Investment Amount
Ratios
Additional Investment: ̀ 1000 & in multiples of ̀ 1
Ideal Investments Horizon: 3 year & above
Load Structure
Entry Load: Nil. (applicable for all plans)
Exit Load: a) For redemption / switch out of upto 6% of the initial investment amount (limit) purchased or switched in within 1 year from the date of allotment: Nil.
b) If units redeemed or switched out are in excess of the limit within 1 year from the date of allotment: 1%
IDCW Frequency
Initial Investment: `5000 and in multiple of `1 for purchase and for ̀ 0.01 for switches
c) If units are redeemed or switched out on or after 1 year from the date of allotment: NIL
Total Expense Ratio**
Regular: 1.71%; Direct: 0.74%
Data as on June 30, 2022
*Interest Rate Swap
Potential Risk Class
Credit Risk
(Class A) (Class B) (Class C)
Relatively Low
Relatively Low
Relatively High
Moderate
ModerateRelatively
HighInterest Rate Risk
PRC Matrix
C-III
2.59 yrs0.18 yrs
1.39 yrs
2.75%
7.46%
2.77 yrs
0.16 yrs
1.55 yrs
1.49 yrs
0.16 yrs
1.65 yrs
Portfolio Average Maturity
Net Average Maturity
Portfolio Modified Duration
IRS Average Maturity*
Net Macaulay Duration
IRS Macaulay Duration*
$Standard Deviation
IRS Modified Duration*
YTM
Portfolio Macaulay Duration
Net Modified Duration

KOTAK CREDIT RISK FUND
Scheme Inception : - May 11, 2010. The returns are calculated by XIRR approach assuming investment of ̀ 10,000/- on the 1st working day of every month. XIRR helps in calculating return on investments given an initial and final value and a series of cash inflows and outflows and taking the time of investment into consideration. Since inception returns are assumed to be starting from the beginning of the subsequent month from the date of inception.
(^) Fully or Party blocked against Interest Rate Swap (IRS) Hedging Position through Interest Rate Swaps as on 30 Jun 2022 is 6.32% of the net assets.***As per SEBI circular no. SEBI/HO/IMD/IMD-11 DF3/P/CIR/2021 /652 dated October 27, 2021; AMFI letter no. 35P/MEM-COR/70/2021-22 dated November 25, 2021 and AMFI letter no. 35P/ MEM-COR/ 131 / 2021-22 dated March 31, 2022 with effect from April 01, 2022 ("Effective date"), the first tier benchmark index of the scheme. Existing benchmark will be Second Tier benchmark for aforementioned scheme.Kotak Credit Risk Fund NAV as on ̀ 23.9751 (Growth Option), ̀ 26.2121 (Direct Growth Option), ̀ 10.4264 (Annual-Reg-Plan-IDCW), ̀ 19.6878 (Annual-Dir-Plan-IDCW).June 30, 2022:*For Fund Manager experience, please refer page 78-80. **Total Expense Ratio includes applicable B30 fee and GST. For scheme performance, please refer page no 69-77. For last three IDCW, please refer page no 81-83.
# Benchmark ; ̂ Additional Benchmark. Alpha is difference of scheme return with benchmark return.
ISIN Name of the Security
INE528G0839409.00% Yes Bank Ltd. (Basel III Tier I)
Perpetual Call-18/10/2022 (L)
^^Includes Securities Below Investment grade or DefaultValue Recognised in
NAV(Rs. In Lacs)% to
Net AssetsTotal Security Value
(Rs. In Lacs)
0.00 0.00 9040.89
Total 1,464.90 0.94 16,135.07-
INE695A08063 8.70% Future Lifestyle Fashions Ltd. 1,464.90 0.94 7094.18
• Income over a medium term investment horizon
* Investors should consult their financial advisors if in doubt about whether the product is suitable for them.
This product is suitable for investors who are seeking*:
• Investment predominantly in AA and below rated corporate bonds (Excluding AA+ rated corporate bonds)
Product Label as on 30th June, 2022
Low High
Low
to
Moder
ate
ModerateModeratelyHigh
High
Very H
ighLo
w
Investors understand that their principal will be at Moderately high riskLow High
Low
to
Moder
ate
ModerateModeratelyHigh
High
Very H
ighLo
w
Investors understand that their principal will be at high risk
An open ended debt scheme predominantly investing in AA and below rated corporate bonds (Excluding AA+ rated corporate bonds).A relatively high interest rate risk and relatively high credit risk.
Systematic Investment Plan (SIP) If you had invested `10,000 every month
SYSTEMATIC INVESTMENT PLAN (SIP)
38
*For Fund Manager experience, please refer page 75-77. **Total Expense Ratio includes applicable B30 fee and GST. For scheme performance, please refer page no 67-74. For last three IDCW, please refer page no 78-80.
# Benchmark ; ̂ Additional Benchmark. Alpha is difference of scheme return with benchmark return.
Scheme Inception : - May 11, 2010. The returns are calculated by XIRR approach assuming investment of ̀ 10,000/- on the 1st working day of every month. XIRR helps in calculating return on investments given an initial and final value and a series of cash inflows and outflows and taking the time of investment into consideration. Since inception returns are assumed to be starting from the beginning of the subsequent month from the date of inception.
Kotak Credit Risk Fund NAV as on `24.6786 (Growth Option), `26.9159 (Direct Growth Option), `10.0846 (Weekly-Reg-Plan-IDCW), `10.4393 (Weekly-Dir-Plan-IDCW), `10.9007 (Monthly-Reg-Plan-IDCW), `10.6242 March 31, 2022:(Monthly-Dir-Plan-IDCW), ̀ 11.5359 (Quarterly-Reg-Plan-IDCW), ̀ 10.5550 (Quarterly Dir-Plan-IDCW), ̀ 10.7324 (Annual-Reg-Plan-IDCW), ̀ 20.2164 (Annual-Dir-Plan-IDCW).
(^) Fully or Party blocked against Interest Rate Swap (IRS) Hedging Position through Interest Rate Swaps as on 31 Mar 2022 is 17.17% of the net assets.
ALLOCATION (%)
RATING PROFILE (%)
Total amount invested ( )`
Total Value as on June 30, 2022 ( )`
Monthly SIP of ( ) 10000`
Scheme Returns (%)
NIFTY Credit Risk Bond Index C-III Returns (%)
NIFTY Credit Risk Bond Index C-III ( )#`
NIFTY Credit Risk Bond Index Returns (%)
Alpha
NIFTY Credit Risk Bond Index ( )#`
CRISIL 10 Year Gilt Index ( )^`
Alpha
CRISIL 10 Year Gilt Index (%)
Since Inception 10 years 7 years 5 years 3 years 1 year
22,59,687 16,73,643 10,21,015 6,75,770 3,77,700 1,18,683
6.91 6.48 5.50 4.71 3.15 -2.04
-2.14 -2.35 -2.82 -3.39 -4.27 -6.18
25,99,486 18,93,416 11,28,941 7,35,630 4,02,590 1,22,637
-1.87 -2.07 -2.60 -3.21 -4.07 -5.73
21,00,258 15,89,033 9,82,401 6,56,782 3,62,592 1,17,070
14,60,000 12,00,000 8,40,000 6,00,000 3,60,000 1,20,000
9.06 8.83 8.32 8.10 7.42 4.13
8.78 8.55 8.10 7.91 7.22 3.69
5.78 5.48 4.41 3.58 0.47 -4.53
25,52,871 18,65,646 11,20,109 7,32,285 4,01,383 1,22,355
Fund Benchmark Benchmark
TIER 2: NIFTY Credit Risk Bond Index
Low High
Low
to
Moder
ate
ModerateModeratelyHigh
High
Very H
ighLo
w
Investors understand that their principal will be at high risk
TIER 1: NIFTY Credit Risk Bond Index C-III
Low High
Low
to
Moder
ate
ModerateModeratelyHigh
High
Very H
ighLo
w
Investors understand that their principal will be at high risk
73.51 8.9 6.11 4.31 4.061.58
1.53
Debentures and Bonds Government Dated Securities Commercial Paper (CP)/Certificate of Deposits (CD) Net Current Assets
Realty Treasury Bills TREP & Term Deposits & Rev.Repo
51.45 30.6 8.05 4.314.06
1.53
AA+, AA, AA(CE), IND AA, AA- A1+, AAA, SOV A+(CE) Net Current Assets Realty TREP & Term Deposits & Rev.Repo

39
4.93% Central Government(^) SOV 0.30
Debentures and Bonds
5.53% Central Government(^) SOV 27.75
Govt-Gujarat SOV 9.14
8.25% Maharashtra StateGovt-Maharashtra SOV 2.49
6.54% Central Government SOV 9.10
8.03% Gujarat State
Brookfield India Real Estate Trust Realty 0.67
Government Dated Securities
7.16% Central Government SOV 0.17
6.52% Karnataka State
Public Sector Undertakings
Mutual Fund Units
Embassy Office Parks REIT Realty 3.61
6.42% Central Government(^) SOV 2.51
Mindspace Business Parks REIT Realty 0.32
6.67% Central Government SOV 0.35
6.53% Tamil Nadu State5.85% Central Government SOV 0.14
Debt Instruments
1.44% Central Government SOV 0.97
Mutual Fund Units - Total 4.60
Govt-Karnataka SOV 0.026.62% Uttar Pradesh State
Government DatedSecurities - Total 52.99
Govt-Tamil Nadu SOV 0.04
National Bank for Agriculture &
Govt-Uttar Pradesh SOV 0.01
Rural Development CRISIL AAA 4.62Bank Of Baroda(Basel III TIER I Bonds) CRISIL AA+ 2.91
Public Sector
Sikka Ports & Terminals Ltd.
Rural ElectrificationCorporation Ltd. CRISIL AAA 1.07Power Finance Corporation Ltd. CRISIL AAA 0.25
Undertakings - Total 8.85Corporate Debt/Financial Institutions
( Mukesh Ambani Group ) CRISIL AAA 5.18Muthoot Finance Ltd. CRISIL AA+ 2.89LIC Housing Finance Ltd. CRISIL AAA 2.52
(First Business Receivables Trust) CRISIL AAA(SO) 2.47
Institutions - Total 15.35
Grand Total 100.00
Institutions - Total 14.20
Trust (Series 23) 01/10/2025
( Mukesh Ambani Group ) CRISIL AAA 2.29
Financial Institutions
PTC First Business Receivables
Jamnagar Utilities &Power Private Limited
Commercial Paper(CP)/
Net Current Assets/
Corporate Debt/Financial
Money Market Instruments
Triparty Repo 2.54
Corporate Debt/
AXIS Bank Ltd. CRISIL A1+ 9.43HDFC Bank Ltd. CARE A1+ 4.77
Certificate of Deposits(CD)
Corporate Debt/Financial
(Liabilities) 1.47
KOTAK DYNAMIC BOND FUNDMaturityShort Medium Long Volatility
Low
Medium
HighAn open ended dynamic debt scheme investing across duration. A relatively high interest rate risk and moderate credit risk.
Index B-III (Tier 1)
AAUM: `2,096.86 crs
Index (Tier 2)
Benchmark***: Nifty Composite Debt
& Mr. Vihag Mishra*
Folio count: 24,862
Allotment date: May 26, 2008
AUM: `2,065.01 crs
( D e d i c a t e d f u n d m a n a g e r f o r investments in foreign securities)
Nifty Composite Debt
Fund Manager: Mr. Deepak Agrawal PORTFOLIO
Scheme Inception : - May 26, 2008. The returns are calculated by XIRR approach assuming investment of ̀ 10,000/- on the 1st working day of every month. XIRR helps in calculating return on investments given an initial and final value and a series of cash inflows and outflows and taking the time of investment into consideration. Since inception returns are assumed to be starting from the beginning of the subsequent month from the date of inception. # Benchmark ; ̂ Additional Benchmark.Alpha is difference of scheme return with benchmark return.(^) Fully or Party blocked against Interest Rate Swap (IRS) Hedging Position through Interest Rate Swaps as on 30 Jun 2022 is 28.47% of the net assets.***As per SEBI circular no. SEBI/HO/IMD/IMD-11 DF3/P/CIR/2021 /652 dated October 27, 2021; AMFI letter no. 35P/MEM-COR/70/2021-22 dated November 25, 2021 and AMFI letter no. 35P/ MEM-COR/ 131 / 2021-22 dated March 31, 2022 with effect from April 01, 2022 ("Effective date"), the first tier benchmark index of the scheme. Existing benchmark will be Second Tier benchmark for aforementioned scheme.Kotak Dynamic Bond Fund NAV as on ̀ 29.8535 (Growth Option), ̀ 31.7508 (Direct Growth Option), ̀ 11.2472 (Quarterly-Reg-Plan-IDCW), ̀ 11.1436 (Quarterly-Dir-Plan-IDCW)June 30, 2022: *For Fund Manager experience, please refer page 78-80. **Total Expense Ratio includes applicable B30 fee and GST. For scheme performance, please refer page no 69-77. For last three IDCW, please refer page no 81-83.
Available Plans/Options
(applicable for all plans)
Ratios
Options: Payout of IDCW, Reinvestment of IDCW & Growth
Minimum Investment AmountInitial Investment: ̀ 5000 and in multiple of `1 for purchase and for ̀ 0.01 for switches
Investment ObjectiveThe investment objective of the Scheme is to maximise returns through an active management of a portfolio of debt and money market securities. There is no assurance or guarantee that the investment objective of the scheme will be achieved.
Ideal Investment Horizon: 2-3 years
A)Regular Plan B)Direct Plan
IDCW FrequencyAt discretion of trustees
$Source: ICRAMFI Explorer. Standard Deviation is calculated on Annualised basis using 3 years history of monthly returns.
Additional Investment: `1000 & in multiples of ̀ 1
Load StructureEntry Load: Nil. (applicable for all plans)Exit Load: Nil
Total Expense Ratio**Regular: 1.21%; Direct: 0.28%
Data as on June 30, 2022
6.34 yrs0.92 yrs
2.01 yrs
1.89%
7.09%
7.26 yrs
0.80 yrs
2.82 yrs
2.12 yrs
0.83 yrs
2.95 yrs
Portfolio Average Maturity
IRS Average Maturity*
IRS Modified Duration*
Net Modified Duration
Portfolio Macaulay Duration
IRS Macaulay Duration*
Net Macaulay Duration
YTM
Net Average Maturity
Portfolio Modified Duration
$Standard Deviation
*Interest Rate Swap
Issuer/Instrument Industry/Rating % to Net Assets Issuer/Instrument Industry/Rating % to Net Assets
• Income over a medium term investment horizon
* Investors should consult their financial advisors if in doubt about whether the product is suitable for them.
• Investment in debt & money market securities across durations.
This product is suitable for investors who are seeking*:
Product Label as on 30th June, 2022
Low High
Low
to
Moder
ate
ModerateModeratelyHigh
High
Very H
ighLo
w
Investors understand that their principal will be at moderate risk
Potential Risk Class
Credit Risk
(Class A) (Class B) (Class C)
Relatively Low
Relatively Low
Relatively High
Moderate
ModerateRelatively
HighInterest Rate Risk
PRC Matrix
B-III
Systematic Investment Plan (SIP) If you had invested `10,000 every month
SYSTEMATIC INVESTMENT PLAN (SIP)
Scheme Inception : - May 26, 2008. The returns are calculated by XIRR approach assuming investment of ̀ 10,000/- on the 1st working day of every month. XIRR helps in calculating return on investments given an initial and final value and a series of cash inflows and outflows and taking the time of investment into consideration. Since inception returns are assumed to be starting from the beginning of the subsequent month from the date of inception. # Benchmark ; ̂ Additional Benchmark.Alpha is difference of scheme return with benchmark return.(^) Fully or Party blocked against Interest Rate Swap (IRS) Hedging Position through Interest Rate Swaps as on 31 Mar 2022 is 17.46% of the net assets.Kotak Dynamic Bond Fund NAV as on ̀ 30.3464 (Growth Option), ̀ 32.1963 (Direct Growth Option), ̀ 11.4328 (Quarterly-Reg-Plan-IDCW), ̀ 11.3000 (Quarterly-Dir-Plan-IDCW), ̀ 21.9200 (Monthly-Reg-Plan-IDCW), ̀ 22.5602 (Monthly-Dir-Plan-IDCW) March 31, 2022:*For Fund Manager experience, please refer page 75-77. **Total Expense Ratio includes applicable B30 fee and GST. For scheme performance, please refer page no 67-74. For last three IDCW, please refer page no 78-80.
ALLOCATION (%)
RATING PROFILE (%)
Nifty Composite Debt Index B-III ( )#`
Alpha
Total Value as on June 30, 2022 ( )`
Nifty Composite Debt Index Returns (%)
Nifty Composite Debt Index ( )#`
Monthly SIP of ( ) 10000`
CRISIL 10 Year Gilt Index ( )^`
Scheme Returns (%)
Nifty Composite Debt Index B-III Returns (%)
Total amount invested ( )`
CRISIL 10 Year Gilt Index (%)
Alpha
Since Inception 10 years 7 years 5 years 3 years 1 year
17,00,000 12,00,000 8,40,000 6,00,000 3,60,000 1,20,000
7.90 7.49 6.71 5.92 3.64 -0.94
0.08 -0.01 -0.15 -0.59 -1.42 -1.05
7.63 7.32 6.61 6.12 3.96 -0.92
30,66,226 17,64,102 10,65,891 6,96,690 3,80,497 1,19,398
7.83 7.49 6.85 6.51 5.06 0.11
30,47,737 17,64,619 10,71,443 7,07,028 3,88,675 1,20,071
0.27 0.17 0.10 -0.20 -0.32 -0.01
30,02,502 17,48,406 10,62,205 7,00,143 3,82,314 1,19,406
26,12,236 15,89,033 9,82,401 6,56,782 3,62,592 1,17,070
5.82 5.48 4.41 3.58 0.47 -4.53
Investors understand that their principal will be at moderate risk
Low High
Low
to
Moder
ate
ModerateModeratelyHigh
High
Very H
ighLo
w
Fund Benchmark Benchmark
Low High
Low
to
Moder
ate
ModerateModeratelyHigh
High
Very H
ighLo
w
Investors understand that their principal will be at moderately high risk
TIER 1: NIFTY Composite Debt Index B-IIIInvestors understand that their principal will be at moderate risk
Low High
Low
to
Moder
ate
ModerateModeratelyHigh
High
Very H
ighLo
w
TIER 2: NIFTY Composite Debt Index
52.99 24.20 14.20 4.602.54
1.47
Government Dated Securities Debentures and Bonds Commercial Paper (CP)/Certificate of Deposits (CD) Realty
TREP & Term Deposits & Rev.Repo Net Current Assets
85.59 5.80 4.602.54
1.47
A1+, AAA, AAA(SO), SOV AA+ Realty TREP & Term Deposits & Rev.Repo Net Current Assets

Govt-Telangana SOV 0.24
GS CG 02/01/2025 - (STRIPS) SOV 0.37
8.24% Kerala State
State Bank Of India.
ONGC Petro Additions Ltd.(^) ICRA AAA(CE) 2.45
Government Dated Securities
Corporation Ltd. CRISIL AAA 3.49
Govt-Kerala SOV 1.36
GS CG 22 Feb 2024 - (STRIPS) SOV 0.30
Corporation Ltd.(^) CRISIL AAA 3.85
Debt Instruments
Canara Bank(Basel III TIER II Bonds) FITCH IND AAA 2.43
(Basel III TIER I Bonds)(^) CRISIL AA+ 1.98
Govt-Rajasthan SOV 1.79
Govt-Rajasthan SOV 0.04
Rural Electrification
(Basel III TIER II Bonds)(^) FITCH IND AA+ 2.40Indian Bank
Debentures and Bonds
5.53% Central Government SOV 14.24
8.20% Gujarat State
GS CG 22 Feb 2025 - (STRIPS) SOV 0.28
8.50% Punjab State
Government Dated
8.39% Rajasthan State
8.20% Rajasthan State
Public Sector Undertakings Power Finance
Securities - Total 22.97
Govt-Punjab SOV 0.51
6.42% Central Government SOV 1.34
6.17% Telangana State
Govt-Gujarat SOV 1.02
4.93% Central Government SOV 1.48
Corporation Ltd. (^) CRISIL AAA 8.15Rural Electrification
Power Finance Corporation Ltd.(^) CRISIL AAA 2.52
State Bank Of India.(Basel III TIER II Bonds)(^) CRISIL AAA 1.59
ICICI Bank Ltd.
PTC First Business Receivables Trust
Grand Total 100.00
HDB Financial Services Ltd. CRISIL AAA 1.67
(Series 22) 01/07/2025
(Liabilities) 5.07
Bharti Telecom Ltd.(^) CRISIL AA+ 2.42
Kotak Mahindra Prime Ltd. (^) CRISIL AAA 1.61Muthoot Finance Ltd. (^) CRISIL AA+ 1.62
PTC First Business Receivables Trust
(First Business Receivables Trust) CRISIL AAA(SO) 1.69
AXIS Bank Ltd. CRISIL AAA 1.31
unconditional and irrevocable
(First Business Receivables Trust) CRISIL AAA(SO) 1.69
Embassy Office Parks Reit CRISIL AAA 1.61
(Series 21) 01/04/2025
Nabha Power Ltd. ( backed by
guarantee by Larsen & Toubro Ltd ) ICRA AAA(CE) 1.25
Tata Capital Housing
Corporate Debt/FinancialAXIS Finance Ltd. CRISIL AAA 0.40
(Basel III TIER I Bonds)(^) CRISIL AA+ 2.03
Bajaj Finance Ltd. CRISIL AAA 0.40
LIC Housing Finance Ltd. (^) CRISIL AAA 1.69
Net Current Assets/
Bajaj Housing Finance Ltd. CRISIL AAA 2.01
Institutions - Total 41.66
Finance Ltd.(^) CRISIL AAA 1.60
Power Private Limited( Mukesh Ambani Group ) CRISIL AAA 3.35Citicorp Finance (India) Ltd. (^) ICRA AAA 2.48
(Basel III TIER II Bonds) FITCH AAA(IND) 1.44Public SectorUndertakings - Total 30.30Corporate Debt/Financial Institutions HDFC Ltd. CRISIL AAA 8.33
Bank Of Baroda
LIC Housing Finance Ltd.(^) CRISIL AAA 4.50Jamnagar Utilities &
40
MaturityShort Medium Long Volatility
Low
Medium
High
KOTAK FLOATING RATE FUND
AUM: `6,019.81 crs
Fund Manager: Mr. Deepak Agrawal &
Mr. Vihag Mishra*
Benchmark: Nifty Short Duration Debt Index
Folio count: 7,231
AAUM: `6,148.74 crs
(Dedicated fund manager for investments in foreign securities)
Allotment date: May 14, 2019
An open ended debt scheme predominantly investing in floating rate instruments. A relatively high interest rate risk and moderate credit risk.
PORTFOLIO
Scheme Inception : - May 14, 2019. The returns are calculated by XIRR approach assuming investment of ̀ 10,000/- on the 1st working day of every month. XIRR helps in calculating return on investments given an initial and final value and a series of cash inflows and outflows and taking the time of investment into consideration. Since inception returns are assumed to be starting from the beginning of the subsequent month from the date of inception. # Benchmark ; ̂ Additional Benchmark. Alpha is difference of scheme return with benchmark return.
Kotak Floating Rate Fund NAV as on `1,207.0036 (Growth Option), ̀ 1,074.2210 (Reg-Plan-IDCW), ̀ 1,220.6503 (Direct Growth Option), ̀ 1,063.3717 (Dir-Plan-IDCW)June 30, 2022: *For Fund Manager experience, please refer page 78-80. **Total Expense Ratio includes applicable B30 fee and GST. For scheme performance, please refer page no 69-77. For last three IDCW, please refer page no 81-83.
(^) Fully or Party blocked against Interest Rate Swap (IRS) Hedging Position through Interest Rate Swaps as on 30 Jun 2022 is 24.92% of the net assets.
Total Expense Ratio**
A) Regular B) Direct Plan
Ratios
The primary objective of the Scheme is to generate income through investment primarily in floating rate debt instruments, fixed rate debt instruments swapped for floating rate returns and money market instruments. However, there is no assurance or guarantee that the investment objective of the scheme will be achieved
Minimum Investment Amount
Available Plans/Options
Investment Objective
Load Structure
Exit Load: Nil (Applicable for All Plans)
Initial Purchase: ̀ 5000 and in multiple of ̀ 1 for purchase and for ̀ 0.01 for switches
$Source: KMIS & ICRAMFI Explorer. Standard Deviation is calculated on Annualised basis using 3 years history of monthly returns.
Additional Purchase: `1000 & in multiples of `1 for purchase and for `0.01 for switches.Ideal Investment Horizon: 2 year & above
Options: Growth, Payout of IDCW and Reinvestment of IDCW.
At discretion of trustees IDCW Frequency
Entry Load: Nil (Applicable for All Plans)
Regular: 0.62%; Direct: 0.22%
Data as on June 30, 2022
-0.01 yrs
1.74 yrs
1.40%
7.32%
4.67 yrs
-0.01 yrs 1.73 yrs
1.86 yrs
-0.01 yrs
1.84 yrs
Net Average Maturity
Portfolio Macaulay Duration
IRS Macaulay Duration*
Net Macaulay Duration
Portfolio Average Maturity
YTM$Standard Deviation
IRS Average Maturity*
Portfolio Modified Duration
IRS Modified Duration*
Net Modified Duration
*Interest Rate Swap
Issuer/Instrument Industry/Rating % to Net Assets Issuer/Instrument Industry/Rating % to Net Assets
This product is suitable for investors who are seeking*:
• Income over a short term investment horizon
• Investment in debt & money market securities having maturity of one business day
* Investors should consult their financial advisors if in doubt about whether the product is suitable for them.
Product Label as on 30th June, 2022 Fund
Low High
Low
to
Moder
ate
ModerateModeratelyHigh
High
Very H
ighLo
w
Investors understand that their principal will be at low to moderate risk
Benchmark
Investors understand that their principal will be at Moderate risk
Low High
Low
to
Moder
ate
ModerateModeratelyHigh
High
Very H
ighLo
w
Potential Risk Class
Credit Risk
(Class A) (Class B) (Class C)
Relatively Low
Relatively Low
Relatively High
Moderate
ModerateRelatively
HighInterest Rate Risk
PRC Matrix
B-III
Systematic Investment Plan (SIP) If you had invested `10,000 every month
SYSTEMATIC INVESTMENT PLAN (SIP)
Monthly SIP of ( ) 10000`
Total Value as on June 30, 2022 ( )`
Total amount invested ( )`
CRISIL 10 Year Gilt Index (%)
CRISIL 10 Year Gilt Index ( )^`
Scheme Returns (%)
Alpha
Nifty Short Duration Debt Index ( )#`
Nifty Short Duration Debt Index Returns (%)
Since Inception 3 years 1 year
4,11,025 3,86,950 1,20,698
4.91 4.76 1.09
4.83 4.63 1.47
0.08 0.13 -0.38
4,10,493 3,86,186 1,20,942
3,85,505 3,62,592 1,17,070
0.89 0.47 -4.53
3,80,000 3,60,000 1,20,000
Scheme Inception : - May 14, 2019. The returns are calculated by XIRR approach assuming investment of ̀ 10,000/- on the 1st working day of every month. XIRR helps in calculating return on investments given an initial and final value and a series of cash inflows and outflows and taking the time of investment into consideration. Since inception returns are assumed to be starting from the beginning of the subsequent month from the date of inception. # Benchmark ; ̂ Additional Benchmark. Alpha is difference of scheme return with benchmark return.(^) Fully or Party blocked against Interest Rate Swap (IRS) Hedging Position through Interest Rate Swaps as on 31 Mar 2022 is 30.52% of the net assets.Kotak Floating Rate Fund NAV as on `1,214.8169 (Growth Option), ̀ 1,108.5689 (Weekly-Reg-Plan-IDCW), ̀ 1,081.1746 (Reg-Plan-IDCW), ̀ 1,227.3269 (Direct Growth Option), ̀ 1,069.1880 (Dir-Plan-IDCW)March 31, 2022: *For Fund Manager experience, please refer page 75-77. **Total Expense Ratio includes applicable B30 fee and GST. For scheme performance, please refer page no 67-74. For last three IDCW, please refer page no 78-80.
ALLOCATION (%)
RATING PROFILE (%)
4.68 yrs
Investors understand that their principal will be at Moderate risk
Low High
Low
to
Moder
ate
ModerateModeratelyHigh
High
Very H
ighLo
w
71.96 22.97 5.07
Debentures and Bonds Government Dated Securities Net Current Assets
84.48 10.45 5.07
AAA, AAA(CE), AAA(IND), AAA(SO), IND AAA, SOV AA+, IND AA+ Net Current Assets

41
MaturityShort Medium Long Volatility
Low
Medium
HighAn open ended medium term debt scheme investing in instruments such that the Macaulay duration of the portfolio is between 3 years and 4 yearsA relatively high interest rate risk and relatively high credit risk.
KOTAK MEDIUM TERM FUND
AAUM: crs`2,061.54
AUM: `1,915.21 crsBenchmark***: Nifty Medium Duration Debt Index
Nifty Medium
(Tier 2)Allotment date: March 21, 2014Folio count: 11,513
C-III (Tier 1)
Fund Manager: Mr. Deepak Agrawal & Mr. Vihag Mishra*( D e d i c a t e d f u n d m a n a g e r f o r investments in foreign securities)
Duration Debt Index
Issuer/Instrument Industry/Rating % to Net Assets
PORTFOLIO
Debt Instruments
Government Dated Securities
8.14% Tamil Nadu State Govt-Tamil Nadu SOV 2.67
Mutual Fund Units
Mutual Fund Units - Total 4.82
Embassy Office Parks REIT Realty 2.94
Brookfield India Real Estate Trust Realty 1.55
Mindspace Business Parks REIT Realty 0.33
Debentures and Bonds
5.53% Central Government(^) SOV 11.56
6.42% Central Government(^) SOV 5.16
6.54% Central Government SOV 2.45
1.44% Central Government SOV 1.05
6.53% Tamil Nadu State Govt-Tamil Nadu SOV 0.14
6.67% Central Government SOV 0.04
Government Dated Securities - Total 24.34
Public Sector Undertakings
Power Finance Corporation Ltd. CRISIL AAA 5.78
Punjab National Bank(Basel III TIER I Bonds) CARE AA 3.64
U P Power Corporation Ltd ( Guaranteed By UP State Government ) CRISIL A+(CE) 3.16
Punjab National Bank(Basel III TIER II Bonds) CRISIL AA+ 1.27
4.93% Central Government(^) SOV 1.27
ONGC Petro Additions Ltd. ICRA AAA(CE) 1.25
State Bank Of India.(Basel III TIER II Bonds) CRISIL AAA 2.50
Rural Electrification Corporation Ltd. CRISIL AAA 0.58
Canara Bank (Basel III TIER I Bonds) CRISIL AA+ 0.53
National Bank for Agriculture & Rural Development ICRA AAA 0.18
Steel Authority of India Ltd. CARE AA 0.04
Public Sector Undertakings - Total 18.93
Corporate Debt/Financial Institutions
LIC Housing Finance Ltd. CRISIL AAA 10.18
Prestige Projects Pvt. Ltd ICRA A+(CE) 2.71
EMBASSY OFFICE PARKS REIT CRISIL AAA 7.64
Corporate Debt/Financial Institutions - Total 48.17
Muthoot Finance Ltd. CRISIL AA+ 3.22
Muthoot Finance Ltd. CRISIL AA+ 0.03
Corporate Debt/Financial Institutions
Corporate Debt/Financial Institutions - Total 1.24
Net Current Assets/(Liabilities) 1.49
India Grid Trust CRISIL AAA 2.51
Money Market Instruments
IOT Utkal Energy Services Ltd. CRISIL AAA 0.01
Grand Total 100.00
Tata Projects Ltd. FITCH IND AA 2.51
(First Business Receivables Trust) CRISIL AAA(SO) 2.66
Bharti Telecom Ltd. CRISIL AA+ 5.05
PTC First Business Receivables Trust (Series 23) 01/10/2025
Commercial Paper(CP)/Certificate of Deposits(CD)
Vedanta Ltd. CRISIL A1+ 1.24
Sikka Ports & Terminals Ltd. ( Mukesh Ambani Group ) CRISIL AAA 6.08
Shriram Transport Finance Co Ltd. FITCH IND AA+ 4.54
Triparty Repo 1.01
Kotak Mahindra Prime Ltd. CRISIL AAA 1.03
Investment Objective
IDCW Frequency
Available Plans/Options
Total Expense Ratio**
At discretion of trustees
$Source: ICRAMFI Explorer. Standard Deviation is calculated on Annualised basis using 3 years history of monthly returns.
Exit Load: Nil.
The investment objective of the scheme is to generate regular income and capital appreciation by investing in a portfolio of medium term debt and money market instruments. There is no assurance or ...guarantee that the investment objective of the scheme will be achieved.
Ideal Investment Horizon: 2.5 years & above
A) Regular Plan B) Direct Plan
Minimum Investment AmountInitial Purchase: ̀ 5,000/- and in multiples of 1 for purchases and for ̀ 0.01 for switches.
Options: Payout of IDCW, Reinvestment of IDCW & Growth (applicable for all plans)
Additional Purchase: `1000 & in multiples of `1.for purchases and for `0.01 for switches.
Load StructureEntry Load: Nil. (applicable for all plans)
Ratios
Regular: 1.56%; Direct: 0.46%
Data as on June 30, 2022
5.13 yrs0.45 yrs
2.27 yrs
1.61%
7.70%
5.58 yrs
0.40 yrs
2.67 yrs
2.41 yrs
0.42 yrs
2.83 yrs
Portfolio Average Maturity
IRS Average Maturity*
Net Modified Duration
Portfolio Macaulay Duration
Net Macaulay Duration
Net Average Maturity
YTM
Portfolio Modified Duration
$Standard Deviation
IRS Macaulay Duration*
IRS Modified Duration*
*Interest Rate Swap
Potential Risk Class
Credit Risk
(Class A) (Class B) (Class C)
Relatively Low
Relatively Low
Relatively High
Moderate
ModerateRelatively
HighInterest Rate Risk
PRC Matrix
C-III

42
KOTAK MEDIUM TERM FUND
Scheme Inception : - March 21, 2014. The returns are calculated by XIRR approach assuming investment of ̀ 10,000/- on the 1st working day of every month. XIRR helps in calculating return on investments given an initial and final value and a series of cash inflows and outflows and taking the time of investment into consideration. Since inception returns are assumed to be starting from the beginning of the subsequent month from the date of inception. # Benchmark ; ̂ Additional Benchmark.Alpha is difference of scheme return with benchmark return.(^) Fully or Party blocked against Interest Rate Swap (IRS) Hedging Position through Interest Rate Swaps as on 30 Jun 2022 is 18.00% of the net assets.***As per SEBI circular no. SEBI/HO/IMD/IMD-11 DF3/P/CIR/2021 /652 dated October 27, 2021; AMFI letter no. 35P/MEM-COR/70/2021-22 dated November 25, 2021 and AMFI letter no. 35P/ MEM-COR/ 131 / 2021-22 dated March 31, 2022 with effect from April 01, 2022 ("Effective date"), the first tier benchmark index of the scheme. Existing benchmark will be Second Tier benchmark for aforementioned scheme.
*For Fund Manager experience, please refer page 78-80. **Total Expense Ratio includes applicable B30 fee and GST. For scheme performance, please refer page no 69-77. For last three IDCW, please refer page no 81-83.Kotak Medium Term Fund NAV as on June 30, 2022: ̀ 18.1824 (Growth Option), ̀ 19.6243 (Direct Growth Option), ̀ 11.1601 (Reg-Plan-IDCW), ̀ 19.6259 (Dir-Plan-IDCW).
ISIN Name of the Security Value Recognised inNAV (Rs. In Lacs)
% toNet Assets
Total Security Value(Rs. In Lacs)
INE528G0839409.00% Yes Bank Ltd. (Basel III Tier I)
Perpetual Call-18/10/2022 (L) 0.00 0.00 4427.34
^^Includes Securities Below Investment grade or Default
Total - 0.00 0.00 4,427.34
• Investment in debt, government securities & money market instruments with portfolio Macaulay duration between 3 years & 4 years
This product is suitable for investors who are seeking*:
• Income over a medium term investment horizon
* Investors should consult their financial advisors if in doubt about whether the product is suitable for them.
Product Label as on 30th June, 2022
Low High
Low
to
Moder
ate
ModerateModeratelyHigh
High
Very H
ighLo
w
Investors understand that their principal will be at moderately high risk
Investors understand that their principal will be at moderate risk
Low High
Low
to
Moder
ate
ModerateModeratelyHigh
High
Very H
ighLo
w
An open ended medium term debt scheme investing in instruments such that the Macaulay duration of the portfolio is between 3 years and 4 yearsA relatively high interest rate risk and relatively high credit risk.
Systematic Investment Plan (SIP) If you had invested `10,000 every month
SYSTEMATIC INVESTMENT PLAN (SIP)
70.00 14.39 8.132.91
2.70
Scheme
Alpha is difference of scheme return with benchmark return.
Scheme Inception : - March 21, 2014. The returns are calculated by XIRR approach assuming investment of ̀ 10,000/- on the 1st working day of every month. XIRR helps in calculating return on investments given an initial and final value and a series of cash inflows and outflows and taking the time of investment into consideration. Since inception returns are assumed to be starting from the beginning of the subsequent month from the date of inception. # Benchmark ; ̂ Additional Benchmark.
*For Fund Manager experience, please refer page 75-77. **Total Expense Ratio includes applicable B30 fee and GST. For scheme performance, please refer page no 67-74. For last three IDCW, please refer page no 78-80.
(^) Fully or Party blocked against Interest Rate Swap (IRS) Hedging Position through Interest Rate Swaps as on 31 Mar 2022 is 6.73% of the net assets.Kotak Medium Term Fund NAV as on March 31, 2022: ̀ 18.3846 (Growth Option), ̀ 19.7879 (Direct Growth Option), ̀ 10.7114 (Quarterly-Reg-Plan-IDCW), ̀ 10.9385 (Quarterly-Dir-Plan-IDCW), ̀ 11.1852 (Annual-Reg-Plan-IDCW), ̀ 19.5786 (Annual-Dir-Plan-IDCW).
ALLOCATION (%)
RATING PROFILE (%)
CRISIL 10 Year Gilt Index ( )^`
Nifty Medium Duration Debt Index ( )#`
CRISIL 10 Year Gilt Index Returns (%)
Monthly SIP of ( ) 10000`
Total amount invested ( )`
Total Value as on June 30, 2022 ( )`
Scheme Returns (%)
Alpha
Nifty Medium Duration Debt Index C-III ( )#`
Nifty Medium Duration Debt Index C-III Returns (%)
Nifty Medium Duration Debt Index Returns (%)
Alpha
7.73 7.44 7.24 6.50 2.36
13,89,414 10,94,260 7,19,993 3,97,149 1,21,512
-0.85 -0.95 -1.00 0.10 1.61
Since Inception 7 years 5 years 3 years 1 year
10,00,000 8,40,000 6,00,000 3,60,000 1,20,000
6.27 5.83 5.29 4.49 0.69
13,05,380 10,33,136 6,85,733 3,85,368 1,20,445
-1.45 -1.61 -1.95 -2.02 -1.67
7.12 6.77 6.29 4.39 -0.91
12,40,010 9,82,401 6,56,782 3,62,592 1,17,070
5.07 4.41 3.58 0.47 -4.53
13,53,598 10,68,516 7,03,201 3,84,813 1,19,414
Fund Benchmark Benchmark
Low High
Low
to
Moder
ate
ModerateModeratelyHigh
High
Very H
ighLo
w
Investors understand that their principal will be at high risk
TIER 1: NIFTY Medium Duration Debt Index C-IIIInvestors understand that their principal will be at moderate risk
Low High
Low
to
Moder
ate
ModerateModeratelyHigh
High
Very H
ighLo
w
TIER 2: NIFTY Medium Duration Debt Index
67.10 24.34 4.82
1.491.24
1.01
Debentures and Bonds Government Dated Securities Realty Net Current Assets
Commercial Paper (CP)/Certificate of Deposits (CD) TREP & Term Deposits & Rev.Repo
65.98 20.83 5.87 4.821.49
1.01
A1+, AAA, AAA(CE), AAA(SO), SOV AA+, IND AA+, AA, IND AA A+(CE) Realty Net Current Assets
TREP & Term Deposits & Rev.Repo

5.53% Central Government(^) SOV 11.40
Government Dated Securities
State Bank Of India.
Govt-Gujarat SOV 0.07
6.42% Central Government(^) SOV 2.68
Govt-Tamil Nadu SOV 0.03
Government Dated
Debentures and Bonds
Debt Instruments
4.41% Central Government(^) SOV 1.41
7.89% Gujarat State
8.90% Tamil Nadu State
6.46% Gujarat State
4.93% Central Government(^) SOV 1.13
5.74% Central Government SOV 2.70
Govt-Gujarat SOV 0.01
8.20% Central Government SOV 0.37
Securities - Total 19.80
Public Sector Undertakings
Rural Development CRISIL AAA 6.20
Rural Electrification
(Basel III TIER II Bonds) CRISIL AAA 7.91
Corporation Ltd. CRISIL AAA 3.09
Corporation Ltd. (^) CRISIL AAA 2.71
National Bank for Agriculture &
Indian Bank
(Basel III TIER II Bonds) FITCH IND AA+ 2.43
Bank Of Baroda
Rural Electrification
Hindustan Petroleum
Corporation Ltd. CRISIL AAA 2.14
Union Bank of India
(Basel III TIER II Bonds) FITCH IND AAA 2.22
(Basel III TIER I Bonds) CARE AA 2.00
Petrochemicals Ltd. FITCH AAA(IND) 0.69
(Basel III TIER I Bonds) CRISIL AA+ 1.43
National Bank for Agriculture &
(Basel III TIER I Bonds) CRISIL AA+ 0.94
Punjab National Bank
Power Finance Corporation Ltd. CRISIL AAA 0.99
(Basel III TIER II Bonds) CRISIL AA+ 1.74
Rural Development ICRA AAA 1.38
Mangalore Refinery and
Canara Bank
Bank Of Baroda
(Basel III TIER II Bonds) FITCH IND AAA 1.39
Canara Bank
Power Finance Corporation Ltd. (^) CRISIL AAA 1.36
Bank Of Baroda
Money Market Instruments
Certificate of Deposits(CD)
ICICI Bank Ltd.
Corporate Debt/
Institutions - Total 1.01
Commercial Paper(CP)/
Public Sector
(Basel III TIER II Bonds) CRISIL AA+ 0.21
ICICI Bank Ltd.
AXIS Bank Ltd. CRISIL A1+ 9.29
Public Sector
Financial Institutions
(Basel III TIER I Bonds) CRISIL AA+ 0.16
182 Days Treasury Bill 22/12/2022 SOV 4.16
(Basel III TIER II Bonds) FITCH AAA(IND) 0.19
182 Days Treasury Bill 15/12/2022 SOV 1.04
182 Days Treasury Bill 08/09/2022 SOV 0.71
Public Sector
(Basel III TIER I Bonds) ICRA AA+ 0.51
AXIS Bank Ltd. CRISIL AAA 0.34
Corporate Debt/Financial
Bank Of Baroda
(Basel III TIER I Bonds) CRISIL AA+ 0.29
Punjab National Ban
Undertakings - Total 39.31
Treasury Bills
182 Days Treasury Bill 15/09/2022 SOV 0.94
Treasury Bills - Total 6.85
Undertakings
Small Industries Development
Bank Of Baroda FITCH A1+(IND) 1.72
National Bank for Agriculture &
Bank Of India CARE A1+ 9.32
Rural Development CRISIL A1+ 0.69
Undertakings - Total 11.73
Corporate Debt/
Financial Institutions
Deutsche Bank CRISIL A1+ 1.38
Triparty Repo 1.78
HDFC Bank Ltd. CARE A1+ 4.86
Net Current Assets/
(Liabilities) 1.88
HDFC Bank Ltd. CRISIL A1+ 2.11
Corporate Debt/Financial
Institutions - Total 17.64
Grand Total 100.00
43
MaturityShort Medium Long Volatility
Low
Medium
High
KOTAK BANKING AND PSU DEBT FUND
Folio count: 20,437
( D e d i c a t e d f u n d m a n a g e r f o r investments in foreign securities)
Benchmark: CRISIL Banking and
AUM: `7,013.60 crs
PSU Debt Index
Fund Manager: Mr. Deepak Agrawal
& Mr. Vihag Mishra*
AAUM: `7,165.37 crs
Allotment date: December 29,1998
An open ended debt scheme predominantly investing in Debtinstruments of banks, Public Sector Undertakings, Public Financial Institutions and Municipal Bonds. A relatively high interest rate risk and moderate credit risk.
PORTFOLIO
Investment ObjectiveTo generate income by predominantly investing in debt & money market securities issued by Banks, Public Sector Undertaking (PSUs), Public Financial Institutions (PFI), Municipal Bonds and Reverse repos in such securities, sovereign securities issued by the Central Government & State Governments, and / or any security unconditionally .........guaranteed by the Govt. of India. There is no assurance that or guarantee that the investment objective of the scheme will be achieved.
Available Plans/Options
Ratios
IDCW Frequency
Options: Payout of IDCW, Reinvestment of IDCW & Growth (applicable for all plans)
Monthly (12th of every Month)
$Source: ICRAMFI Explorer. Standard Deviation is calculated on Annualised basis using 3 years history of monthly returns.
A) Regular Plan B) Direct Plan
Load Structure
Minimum Investment Amount
Additional Investment: ̀ 1000 & in multiples of ̀ 1.
Regular: 0.79%; Direct: 0.36%
Ideal Investment Horizon: 2-3 years
Entry Load: Nil. (applicable for all plans)
Initial Investment: Payout of IDCW, Reinvestment of IDCW & Growth `5000 & above.
Total Expense Ratio**
Exit Load: Nil (applicable for all plans)
Data as on June 30, 2022
0.37 yrs
1.86 yrs
1.13%
6.74%
4.95 yrs
0.34 yrs
2.20 yrs
1.99 yrs
0.35 yrs
2.34 yrs
Net Average Maturity
IRS Modified Duration*
Portfolio Macaulay Duration
IRS Macaulay Duration*
Net Macaulay Duration
Portfolio Modified Duration
Portfolio Average Maturity
IRS Average Maturity*
Net Modified Duration
YTM$Standard Deviation
*Interest Rate Swap
Issuer/Instrument Industry/Rating % to Net Assets Issuer/Instrument Industry/Rating % to Net Assets
Potential Risk Class
Credit Risk
(Class A) (Class B) (Class C)
Relatively Low
Relatively Low
Relatively High
Moderate
ModerateRelatively
HighInterest Rate Risk
PRC Matrix
B-III
4.58 yrs

KOTAK BANKING AND PSU DEBT FUND
(^) Fully or Party blocked against Interest Rate Swap (IRS) Hedging Position through Interest Rate Swaps as on 30 Jun 2022 is 20.03% of the net assets.
Scheme Inception : - December 29, 1998. The returns are calculated by XIRR approach assuming investment of ̀ 10,000/- on the 1st working day of every month. XIRR helps in calculating return on investments given an initial and final value and a series of cash inflows and outflows and taking the time of investment into consideration. Since inception returns are assumed to be starting from the beginning of the subsequent month from the date of inception. # Benchmark ; ^ Additional Benchmark. Alpha is difference of scheme return with benchmark return.
Kotak Banking And PSU Debt Fund NAV as on June 30, 2022: ̀ 52.4922 (Growth Option), ̀ 54.0255 (Direct Growth Option), ̀ 10.3817 (Monthly-Reg-Plan-IDCW), ̀ 10.2750 (Monthly-Dir-Plan-IDCW) *For Fund Manager experience, please refer page 78-80. **Total Expense Ratio includes applicable B30 fee and GST. For scheme performance, please refer page no 69-77. For last three IDCW, please refer page no 81-83.
44
This product is suitable for investors who are seeking*:
• Investment in debt & money market securities of PSUs, Banks, Public Financial Institutions , government securities, and Municipal Bonds.
* Investors should consult their financial advisors if in doubt about whether the product is suitable for them.
• Income over a short to medium term investment horizon.
Product Label as on 30th June, 2022 Fund Benchmark
Low High
Low
to
Moder
ate
ModerateModeratelyHigh
High
Very H
ighLo
w
Investors understand that their principal will be at moderate risk
Low High
Low
to
Moder
ate
ModerateModeratelyHigh
High
Very H
ighLo
w
Investors understand that their principal will be at moderate risk
An open ended debt scheme predominantly investing in Debtinstruments of banks, Public Sector Undertakings, Public Financial Institutions and Municipal Bonds. A relatively high interest rate risk and moderate credit risk.
Systematic Investment Plan (SIP) If you had invested `10,000 every month
SYSTEMATIC INVESTMENT PLAN (SIP)
CRISIL Banking and PSU Debt Index ( )#`
Monthly SIP of ( ) 10000`
Scheme Returns (%)
CRISIL Banking and PSU Debt Index Returns (%)
Alpha
CRISIL 10 Year Gilt Index ( )^`
Total Value as on June 30, 2022 ( )`
CRISIL 10 Year Gilt Index (%)
Total amount invested ( )`
NA -0.02 0.17 0.30 0.41 1.08
NA 7.38 6.59 5.95 4.09 0.18
NA 15,89,033 9,82,401 6,56,782 3,62,592 1,17,070
71,09,266 17,52,862 10,68,259 7,02,500 3,85,463 1,20,805
NA 5.48 4.41 3.58 0.47 -4.53
7.12 7.36 6.77 6.25 4.50 1.26
Since Inception 10 years 7 years 5 years 3 years 1 year
NA 17,54,777 10,61,625 6,97,177 3,83,082 1,20,115
28,30,000 12,00,000 8,40,000 6,00,000 3,60,000 1,20,000
ALLOCATION (%)
RATING PROFILE (%)
40.32 29.37 19.80 6.85
1.881.78
Debentures and Bonds Commercial Paper (CP)/Certificate of Deposits (CD) Government Dated Securities Treasury Bills
Net Current Assets TREP & Term Deposits & Rev.Repo
86.63 9.71 1.88 1.78
A1+, A1+(IND), AAA, AAA(IND), IND AAA, SOV AA+, IND AA+, AA Net Current Assets TREP & Term Deposits & Rev.Repo

5.53% Central Government(^) SOV 46.26
4.93% Central Government SOV 4.29
GS CG 22 Aug 2029 - (STRIPS) SOV 2.24
GS CG 22 Feb 2029 - (STRIPS) SOV 2.15
GS CG 22 Aug 2027 - (STRIPS) SOV 1.38
7.80% Jharkhand State
7.95% Central Government SOV 0.71
GS CG 17 Jun 2027 - (STRIPS) SOV 0.42
GS CG 17/12/2027 - (STRIPS) SOV 0.40
GS CG 17/06/2028 - (STRIPS) SOV 0.39
GS CG 17/12/2028 - (STRIPS) SOV 0.37
6.42% Central Government SOV 4.43
Government Dated Securities
GS CG 17/06/2029 - (STRIPS) SOV 0.36
7.10% Central Government SOV 13.56
GS CG 22 Feb 2028 - (STRIPS) SOV 2.33
7.38% Central Government SOV 1.87
5.74% Central Government SOV 11.51
GS CG 22 Aug 2028 - (STRIPS) SOV 1.47
Govt-Jharkhand SOV 0.91
GS CG 22 Aug 2030 - (STRIPS) SOV 0.27
GS CG 22 Feb 2030 - (STRIPS) SOV 0.29
8.43% Tamil Nadu State
Govt-Tamil Nadu SOV 0.22
GS CG 22 Aug 2031 - (STRIPS) SOV 0.10
(Liabilities) 1.33
Net Current Assets/
GS CG 22 Aug 2022 - (STRIPS) SOV 0.20
GS CG 22 Aug 2026 - (STRIPS) SOV 0.15
Govt-Haryana SOV 0.09
Govt-Andhra Pradesh SOV 0.14
GS CG 22 Feb 2032 - (STRIPS) SOV 0.10
6.57% Andhra Pradesh State
GS CG 22 Aug 2032 - (STRIPS) SOV 0.10
6.68% Haryana State
GS CG 22 Feb 2043 - (STRIPS) SOV 0.04
Triparty Repo 1.26
GS CG 22 Feb 2044 - (STRIPS) SOV 0.04
GS CG 22 Feb 2036 - (STRIPS) SOV 0.12
GS CG 23/12/2025 - (STRIPS) SOV 0.14
Securities - Total 97.41
Government Dated
Grand Total 100.00
6.78% Karnataka State
GS CG 22/02/2026 - (STRIPS) SOV 0.16
GS CG 22 Aug 2043 - (STRIPS) SOV 0.04
Govt-Karnataka SOV 0.05
GS CG 22 Aug 2036 - (STRIPS) SOV 0.11
MaturityShort Medium Long Volatility
Low
Medium
HighAn open ended debt scheme investing in government securities across maturity. A relatively high interest rate risk and relatively low credit risk.
KOTAK GILT FUND
Benchmark: Nifty All Duration
Allotment date: Regular Plan - December 29, 1998;
G-Sec Index
PF & Trust Plan -
( D e d i c a t e d f u n d m a n a g e r f o r investments in foreign securities)
AAUM: crs`1,665.62
November 11, 2003
Folio count: 5,122
AUM: `1,672.36 crs
Fund Manager: Mr. Abhishek Bisen &
Mr. Vihag Mishra*PORTFOLIO
45
The objective of the Plan is to generate risk-free returns through investments in sovereign securities issued by the Central Government ...and/or State Government(s) and/or any security unconditionally guaranteed by the Government of India, and/or reverse repos in such securities as and when permitted by RBI. A portion of the fund may be invested in Reverse repo, CBLO and/or other similar instruments as may be notified to meet the day-to-day liquidity requirements of the Plan. To ensure total safety of Unit holders' funds, the Plan does not invest in any other securities such as shares, debentures or bonds issued by any other entity. The Fund will seek to underwrite issuance of Government Securities if and to the extent permitted by SEBI/RBI and subject to the prevailing rules and regulations specified in this respect and may also participate in their auction from time to time. Subject to the maximum amount permitted from time to time, the Plan may invest in securities abroad, in the manner allowed by SEBI/RBI in conformity with the guidelines, rules and regulations in this respect. There is no assurance that the investment objective of the Plan will be achieved. It is however emphasized, that ...........investments under the Plan are made in Government Securities, where there is no risk of default of payment in principal or interest amount.
Quarterly (20th of Mar/Jun/Sep/Dec)
Investment Objective
Available Plans/OptionsA) Regular Non Direct Plan, B) PF & Trust Non Direct Plan, C) Regular Direct Plan,D) PF & Trust Direct Plan.Options: Payout of IDCW, Reinvestment of IDCW & Growth (applicable for all plans)IDCW Frequency
Ratios
Ideal Investments Horizon: 2-3 yearsLoad Structure
Initial Investment: `5000 and in multiple of `1 for purchase and for ̀ 0.01 for switches
Total Expense Ratio**
$Source: ICRAMFI Explorer. Standard Deviation is calculated on Annualised basis using 3 years history of monthly returns.
Additional Investment: `1000 & in multiples of `1
Entry Load: (a) Regular Plan - Entry: Nil. (b) PF & Trust Plan - Entry: Nil. (applicable for all plans)
Minimum Investment Amount
Exit Load: (a) Regular Plan - Exit: Nil. (b) PF&Trust Plan-Exit: Nil. (applicable for all plans)
Regular: 1.45%; Direct: 0.39%
Data as on June 30, 2022
8.38 yrs
2.26%
7.23%
8.72 yrs
2.58 yrs
2.67 yrs
0.34 yrs
0.31 yrs
2.35 yrs
Portfolio Average Maturity
Portfolio Macaulay Duration
IRS Modified Duration*
Net Modified Duration
Portfolio Modified Duration
Net Average Maturity
YTM
(A) Reg. Plan (B) PF Trust Plan
$Standard Deviation
IRS Average Maturity*
IRS Macaulay Duration*
Net Macaulay Duration
*Interest Rate Swap
2.27 yrs
0.32 yrs
*For Fund Manager experience, please refer page 78-80. **Total Expense Ratio includes applicable B30 fee and GST. For scheme performance, please refer page no 69-77. For last three IDCW, please refer page no 81-83.
Kotak Gilt Fund NAV as on `77.0930 (Regular-Growth), `84.8020 (Regular-Growth-Direct), `15.0641 (Quarterly-Reg-Plan-IDCW), `19.1520 (Quarterly-Dir-Plan-June 30, 2022:IDCW), ̀ 78.8709 (PF & Trust-Growth), ̀ 86.8393 (PF & Trust-Growth Direct), ̀ 11.5808 (PF & Trust-Quarterly-Reg-Plan-IDCW )
(^) Fully or Party blocked against Interest Rate Swap (IRS) Hedging Position through Interest Rate Swaps as on 30 Jun 2022 is 17.97% of the net assets.
Issuer/Instrument Industry/Rating % to Net Assets Issuer/Instrument Industry/Rating % to Net Assets
* Investors should consult their financial advisors if in doubt about whether the product is suitable for them.
This product is suitable for investors who are seeking*:
• Income over a long investment horizon
• Investment in sovereign securities issued by theCentral and/or State Government(s) and/or reverse repos in such securities
Product Label as on 30th June, 2022 Fund Benchmark
Low High
Low
to
Moder
ate
ModerateModeratelyHigh
High
Very H
ighLo
w
Investors understand that their principal will be at low to moderate risk
Low High
Low
to
Moder
ate
ModerateModeratelyHigh
High
Very H
ighLo
w
Investors understand that their principal will be at moderate risk
Potential Risk Class
Credit Risk
(Class A) (Class B) (Class C)
Relatively Low
Relatively Low
Relatively High
Moderate
ModerateRelatively
HighInterest Rate Risk
PRC Matrix
A-III (^) Fully or Party blocked against Interest Rate Swap (IRS) Hedging Position through Interest Rate Swaps as on 31 Mar 2022 is 16.04% of the net assets.
Kotak Gilt Fund NAV as on `78.4908 (Regular-Growth), `86.1112 (Regular-Growth-Direct), `15.3372 (Quarterly-Reg-Plan-IDCW), `19.4477 (Quarterly-Dir-Plan-IDCW), `80.3009 (PF & Trust-Growth), `88.1800 (PF & Trust-March 31, 2022:Growth Direct), ̀ 11.7908 (PF & Trust-Quarterly-Reg-Plan-IDCW )*For Fund Manager experience, please refer page 75-77. **Total Expense Ratio includes applicable B30 fee and GST. For scheme performance, please refer page no 67-74. For last three IDCW, please refer page no 78-80.
ALLOCATION (%)
RATING PROFILE (%)
97.41 1.33 1.26
Government Dated Securities Net Current Assets TREP & Term Deposits & Rev.Repo
97.41 1.33 1.26
SOV Net Current Assets TREP & Term Deposits & Rev.Repo

6.42% Central Government SOV 2.23
Government Dated Securities
6.99% Telangana State
GS CG 22 Aug 2028 - (STRIPS) SOV 1.53
Debentures and Bonds
GS CG 22/02/2026 - (STRIPS) SOV 0.35
6.58% Gujarat State
GS CG 22 Feb 2028 - (STRIPS) SOV 2.46
GS CG 22 Feb 2029 - (STRIPS) SOV 2.28
7.10% Central Government SOV 24.16
5.74% Central Government SOV 16.91
5.53% Central Government(^) SOV 22.62
Debt Instruments
4.93% Central Government SOV 10.34
GS CG 22 Aug 2029 - (STRIPS) SOV 2.19
7.38% Central Government SOV 2.03
Govt-Telangana SOV 1.56
GS CG 22 Aug 2027 - (STRIPS) SOV 1.41
1.44% Central Government SOV 0.86
GS CG 23/12/2025 - (STRIPS) SOV 0.40
6.48% Rajasthan State
Govt-Rajasthan SOV 0.31
Govt-Gujarat SOV 0.14
7.78% West Bengal State
Govt-West Bengal SOV 0.13
Undertakings
Net Current Assets/
Corporation Ltd. CRISIL AAA 4.17
Triparty Repo 2.02
Grand Total 100.00
Public Sector
Undertakings - Total 4.17
Power Finance
(Liabilities) 1.32
GS CG 22 Feb 2030 - (STRIPS) SOV 0.06
GS CG 22 Aug 2030 - (STRIPS) SOV 0.06
GS CG 22 Aug 2032 - (STRIPS) SOV 0.05
GS CG 22 Feb 2036 - (STRIPS) SOV 0.03
GS CG 22 Aug 2031 - (STRIPS) SOV 0.06
GS CG 22 Aug 2043 - (STRIPS) SOV 0.02
GS CG 22 Feb 2043 - (STRIPS) SOV 0.02
GS CG 22 Feb 2044 - (STRIPS) SOV 0.02
Government Dated
Securities - Total 92.49
Public Sector
GS CG 22 Aug 2026 - (STRIPS) SOV 0.08
GS CG 22 Feb 2032 - (STRIPS) SOV 0.05
GS CG 22 Aug 2036 - (STRIPS) SOV 0.02
GS CG 22 Aug 2022 - (STRIPS) SOV 0.11
46
MaturityShort Medium Long Volatility
Low
Medium
HighAn open ended medium term debt scheme investing in instruments such that the Macaulay duration of the portfolio is between 4 years and 7 years.A relatively high interest rate risk and moderate credit risk.
KOTAK BOND FUND
(Tier 2)
AAUM: crs`1,555.18
Folio count: 5,072
Duration Debt Index
Mr. Vihag Mishra*( D e d i c a t e d f u n d m a n a g e r f o r investments in foreign securities)
AUM: `1,550.79 crs
Duration Debt Index
Fund Manager: Mr. Abhishek Bisen &
Benchmark***: Nifty Medium to Long
Allotment date: November 25, 1999
B-III (Tier 1) Nifty Medium to Long
PORTFOLIO
Ratios
Options: Payout of IDCW, Reinvestment of IDCW & Growth (applicable for all plans)
Ideal Investments Horizon: 2-3 years
Investment Objective
IDCW Frequency
Minimum Investment Amount
The investment objective of the Scheme is to create a portfolio of debt instruments such as bonds, debentures, Government Securities and money market instruments, including repos in permitted securities of different maturities, so as to spread the risk across different kinds of issuers in the debt markets. There is no assurance that the investment objective of the Scheme will be achieved.
A) Regular Plan B) Direct Plan
Available Plans/Options
At discretion of trustees
$Source: ICRAMFI Explorer. Standard Deviation is calculated on Annualised basis using 3 years history of monthly returns.
Initial Investment: `5000 and in multiple of `1 for purchase and for ̀ 0.01 for switches
Additional Investment: ̀ 1000 & in multiples of ̀ 1
Load Structure
Entry Load: Nil. (applicable for all plans)
Exit Load: Nil. (applicable for all plans)
Note: The aforesaid revised exit load structure will be applicable only on a prospective basis for Units purchased /SIP/STP registered on or after April 20, 2021.
Total Expense Ratio**
Regular: 1.80%; Direct: 0.63%
Data as on June 30, 2022
Issuer/Instrument Industry/Rating % to Net Assets Issuer/Instrument Industry/Rating % to Net Assets
Potential Risk Class
Credit Risk
(Class A) (Class B) (Class C)
Relatively Low
Relatively Low
Relatively High
Moderate
ModerateRelatively
HighInterest Rate Risk
PRC Matrix
B-III
ALLOCATION (%)
RATING PROFILE (%)
7.06 yrs0.37 yrs
2.85 yrs
2.49%
7.25%
7.43 yrs
0.34 yrs
3.19 yrs
2.95 yrs
0.35 yrs
3.30 yrs
IRS Average Maturity*
Portfolio Modified Duration
Portfolio Average Maturity
Net Average Maturity
Net Modified Duration
Net Macaulay Duration
$Standard Deviation
IRS Modified Duration*
YTM
Portfolio Macaulay Duration
IRS Macaulay Duration*
*Interest Rate Swap
92.49 4.17 2.02 1.32
Government Dated Securities Debentures and Bonds TREP & Term Deposits & Rev.Repo Net Current Assets
96.66 2.02 1.32
AAA, SOV TREP & Term Deposits & Rev.Repo Net Current Assets

KOTAK BOND FUND
47
(^) Fully or Party blocked against Interest Rate Swap (IRS) Hedging Position through Interest Rate Swaps as on 30 Jun 2022 is 19.37% of the net assets.
*For Fund Manager experience, please refer page 78-80. **Total Expense Ratio includes applicable B30 fee and GST. For scheme performance, please refer page no 69-77. For last three IDCW, please refer page no 81-83.
***As per SEBI circular no. SEBI/HO/IMD/IMD-11 DF3/P/CIR/2021 /652 dated October 27, 2021; AMFI letter no. 35P/MEM-COR/70/2021-22 dated November 25, 2021 and AMFI letter no. 35P/ MEM-COR/ 131 / 2021-22 dated March 31, 2022 with effect from April 01, 2022 ("Effective date"), the first tier benchmark index of the scheme. Existing benchmark will be Second Tier benchmark for aforementioned scheme.
Scheme Inception : - November 25,1999. The returns are calculated by XIRR approach assuming investment of ̀ 10,000/- on the 1st working day of every month. XIRR helps in calculating return on investments given an initial and final value and a series of cash inflows and outflows and taking the time of investment into consideration. Since inception returns are assumed to be starting from the beginning of the subsequent month from the date of inception. # Benchmark ; ̂ Additional Benchmark. Alpha is difference of scheme return with benchmark return.
Kotak Bond Fund NAV as on ̀ 61.6466 (Growth Option), ̀ 67.0426 (Direct Growth Option), ̀ 37.7688 (Reg-Plan-IDCW), ̀ 22.3139 ( Dir-Plan-IDCW)June 30, 2022:
• Income over a long investment horizon
• Investment in debt & money market securities with a portfolio Macaulay duration between 4 years & 7 years.
This product is suitable for investors who are seeking*:
* Investors should consult their financial advisors if in doubt about whether the product is suitable for them.
Product Label as on 30th June, 2022
Low High
Low
to
Moder
ate
ModerateModeratelyHigh
High
Very H
ighLo
w
Investors understand that their principal will be at moderate risk
An open ended medium term debt scheme investing in instruments such that the Macaulay duration of the portfolio is between 4 years and 7 years.A relatively high interest rate risk and moderate credit risk.
Systematic Investment Plan (SIP) If you had invested `10,000 every month
SYSTEMATIC INVESTMENT PLAN (SIP)
Kotak Bond Fund NAV as on `62.9112 (Growth Option), `68.2148 (Direct Growth Option), `13.1762 (Quarterly-Reg-Plan-IDCW), `18.1254 (Quarterly-Dir-Plan-IDCW), `38.3360 (Annual-Reg-Plan-March 31, 2022:IDCW), ̀ 22.5398 ( Annual-Dir-Plan-IDCW)*For Fund Manager experience, please refer page 75-77. **Total Expense Ratio includes applicable B30 fee and GST. For scheme performance, please refer page no 67-74. For last three IDCW, please refer page no 78-80.
Scheme Inception : - November 25,1999. The returns are calculated by XIRR approach assuming investment of ̀ 10,000/- on the 1st working day of every month. XIRR helps in calculating return on investments given an initial and final value and a series of cash inflows and outflows and taking the time of investment into consideration. Since inception returns are assumed to be starting from the beginning of the subsequent month from the date of inception. # Benchmark ; ̂ Additional Benchmark. Alpha is difference of scheme return with benchmark return.(^) Fully or Party blocked against Interest Rate Swap (IRS) Hedging Position through Interest Rate Swaps as on 31 Mar 2022 is 15.98% of the net assets.
Monthly SIP of ( ) 10000`
Scheme Returns (%)
Total Value as on June 30, 2022 ( )`
Nifty Medium to Long Duration Debt Index B-III Returns (%)
Alpha
Nifty Medium to Long Duration Debt Index B-III ( )#`
Nifty Medium to Long Duration Debt Index Returns (%)
Alpha
Total amount invested ( )`
Nifty Medium to Long Duration Debt Index ( )#`
CRISIL 10 Year Gilt Index ( )^`
CRISIL 10 Year Gilt Index Returns (%)
Since Inception 10 years 7 years 5 years 3 years 1 year
69,52,014 16,57,174 10,23,937 6,83,103 3,76,536 1,18,837
27,20,000 12,00,000 8,40,000 6,00,000 3,60,000 1,20,000
NA 7.63 7.07 7.00 6.29 1.31
NA 17,77,208 10,79,924 7,15,733 3,95,925 1,20,839
NA 7.22 6.49 6.01 3.79 -1.58
NA -0.93 -0.92 -0.88 -0.85 -0.23
NA 17,39,349 10,57,893 6,98,283 3,81,382 1,18,986
NA 15,89,033 9,82,401 6,56,782 3,62,592 1,17,070
NA 5.48 4.41 3.58 0.47 -4.53
7.55 6.29 5.58 5.14 2.95 -1.81
NA -1.34 -1.49 -1.86 -3.35 -3.12
Investors understand that their principal will be at moderate risk
Low High
Low
to
Moder
ate
ModerateModeratelyHigh
High
Very H
ighLo
w
Fund Benchmark Benchmark
Low High
Low
to
Moder
ate
ModerateModeratelyHigh
High
Very H
ighLo
w
Investors understand that their principal will be at moderately high risk
TIER 1: NIFTY Medium to Long Duration Debt Index B-IIIInvestors understand that their principal will be at moderate risk
Low High
Low
to
Moder
ate
ModerateModeratelyHigh
High
Very H
ighLo
w
TIER 2: NIFTY Medium to Long Duration Debt Index

Minimum Investment Amount
Investment ObjectiveThe investment objective of the scheme is to track the Nifty SDL Apr 2027 Top 12 Equal Weight Index by investing in SDLs, maturing on or before Apr 2027, subject to tracking errors
Ratios
Available Plans/Options
However, there is no assurance or guarantee that the investment objective of the scheme will be achieved.
Load Structure
Regular & Direct Plan
Ideal Investments Horizon: 1 year and Above
Entry Load: Nil. (applicable for all plans)
Exit Load: For redemption / switch-out of units on or before 30 days from the date of allotment: 0.15% of applicable NAV. For redemption / switch-out of units after 30 days from the date of allotment – Nil. Any exit load charged (net off Goods and Services tax, if any) shall be credited back to the Scheme. Units issued on reinvestment of IDCW shall not be subject to entry and exit load.
Initial Investment: `5000 and in multiples of `1 for purchases and of ̀ 0.01 for switches
Total Expense Ratio**
Additional Purchase: `1000 and in multiples of ̀ 1 for purchases and of ̀ 0.01 for switches
Regular: 0.30%; Direct: 0.14%
Government Dated Securities 7.59% Karnataka StateGovt-Karnataka SOV 7.637.87% Uttar Pradesh StateGovt-Uttar Pradesh SOV 6.757.78% West Bengal StateGovt-West Bengal SOV 5.878.31% Rajasthan State
7.86% Karnataka State
7.74% Tamil Nadu State
7.64% West Bengal State
Govt-Tamil Nadu SOV 2.05
7.73% Rajasthan State
5.74% Central Government SOV 2.767.85% Tamil Nadu State
Govt-Madhya Pradesh SOV 2.06
7.16% Tamil Nadu State
Govt-Andhra Pradesh SOV 2.21
7.08% Karnataka State
Govt-Tamil Nadu SOV 1.80
7.59% Gujarat State
7.59% Bihar State Govt-Bihar SOV 2.92
6.72% Kerala State Govt-Kerala SOV 3.96
Govt-Rajasthan SOV 5.417.64% Haryana State
7.71% Gujarat StateGovt-Gujarat SOV 5.00
Govt-Andhra Pradesh SOV 2.93
Govt-Tamil Nadu SOV 2.37
Govt-Haryana SOV 2.06
Govt-West Bengal SOV 3.75
Govt-Tamil Nadu SOV 4.31
Govt-Gujarat SOV 3.81
7.14% Andhra Pradesh State
7.62% Andhra Pradesh State
7.80% Haryana State
7.61% Tamil Nadu State
Govt-Karnataka SOV 2.01
7.76% Madhya Pradesh State
Govt-Haryana SOV 5.32
Govt-Karnataka SOV 1.85
Govt-Rajasthan SOV 1.77
Govt-West Bengal SOV 1.487.92% West Bengal State
6.48% Rajasthan State
7.64% Uttar Pradesh State
7.15% Kerala State Govt-Kerala SOV 1.666.54% Maharashtra State
7.15% Karnataka StateGovt-Karnataka SOV 1.76
Govt-Maharashtra SOV 1.63
7.59% Haryana State Govt-Haryana SOV 1.467.20% Tamil Nadu StateGovt-Tamil Nadu SOV 1.23
Govt-Rajasthan SOV 1.12
Govt-Uttar Pradesh SOV 0.88
7.15% Rajasthan StateGovt-Rajasthan SOV 0.86
7.85% Rajasthan StateGovt-Rajasthan SOV 0.59
6.90% Andhra Pradesh State
7.80% Kerala State Govt-Kerala SOV 0.59
Govt-Andhra Pradesh SOV 0.57
7.78% Bihar State Govt-Bihar SOV 0.82
7.85% Bihar State Govt-Bihar SOV 0.59
7.14% Gujarat State Govt-Gujarat SOV 0.86
7.62% Uttar Pradesh StateGovt-Uttar Pradesh SOV 0.59
7.64% Kerala State Govt-Kerala SOV 0.417.77% Kerala State Govt-Kerala SOV 0.297.62% Tamil Nadu StateGovt-Tamil Nadu SOV 0.29
Grand Total 100.00
7.12% Bihar State Govt-Bihar SOV 0.29
Government Dated
Net Current Assets/(Liabilities) 2.27
7.2% Uttar Pradesh StateGovt-Uttar Pradesh SOV 0.29
7.25% Maharashtra State
7.61% Rajasthan State Govt-Rajasthan SOV 0.297.75% Karnataka State Govt-Karnataka SOV 0.29
Securities - Total 97.73
Govt-Maharashtra SOV 0.29
An open-ended Target Maturity Index Fund investing in constituents of Nifty SDL Apr 2027 Top 12Equal Weight Index. A relatively high interest rate risk and relatively low credit risk
KOTAK NIFTY SDL APR 2027 TOP 12 EQUAL WEIGHT INDEX FUND
AUM: `1,715.70 crs
Fund Manager: Mr. Abhishek Bisen*
AAUM: 1,376.18 crs`
Top 12 Equal Weight
Allotment date: February 11, 2022
Index
Benchmark: Nifty SDL Apr 2027
Folio count: 734
PORTFOLIO
Kotak Nifty SDL Apr 2027 Top 12 Equal Weight Index Fund NAV as on ̀ 9.7950 (Regular-Growth), ̀ 9.8010 (Regular-Growth-Direct), ̀ 9.7955 (Regular Plan-IDCW ), June 30, 2022:`9.8011 (Direct Plan-IDCW ).*For Fund Manager experience, please refer page 78-80. **Total Expense Ratio includes applicable B30 fee and GST.
Scheme has not completed 6 months since inception
Issuer/Instrument Industry/Rating % to Net Assets Issuer/Instrument Industry/Rating % to Net Assets
This product is suitable for investors who are seeking*:
• Income over Target Maturity Periods
* Investors should consult their financial advisors if in doubt about whether the product is suitable for them.
• Target Maturity Index Fund tracking Nifty SDL Apr 2027 Top 12 Equal weight Index
Product Label as on 30th June, 2022 Fund Benchmark
Low High
Low
to
Moder
ate
ModerateModeratelyHigh
High
Very H
ighLo
w
Investors understand that their principal will be at moderate risk
Low High
Low
to
Moder
ate
ModerateModeratelyHigh
High
Very H
ighLo
w
Investors understand that their principal will be at moderate risk
Data as on June 30, 2022
Potential Risk Class
Credit Risk
(Class A) (Class B) (Class C)
Relatively Low
Relatively Low
Relatively High
Moderate
ModerateRelatively
HighInterest Rate Risk
PRC Matrix
A-III
ALLOCATION (%)
RATING PROFILE (%)
48
4.55 yrs
-
3.69 yrs
7.54%
4.55 yrs
-
3.69 yrs
3.83 yrs
-
3.83 yrs
IRS Modified Duration*
Portfolio Average Maturity
Net Average Maturity
IRS Average Maturity*
Portfolio Modified Duration
IRS Macaulay Duration*
Net Macaulay Duration
Portfolio Macaulay Duration
Net Modified Duration
YTM
*Interest Rate Swap
97.73 2.27
Government Dated Securities Net Current Assets
97.73 2.27
SOV Net Current Assets

Minimum Investment Amount
Ideal Investments Horizon: 1 year and Above
Ratios
Entry Load: Nil. (applicable for all plans)
Exit Load: For redemption / switch-out of units on or before 30 days from the date of allotment: 0.15% of applicable NAV. For redemption / switch-out of units after 30 days from the date of allotment – Nil. Any exit load charged (net off Goods and Services tax, if any) shall be credited back to the Scheme. Units issued on reinvestment of IDCW shall not be subject to entry and exit load.
Investment ObjectiveThe investment objective of the scheme is to track the Nifty SDL Apr 2032 Top 12 Equal Weight Index by investing in SDLs, maturing on or before Apr 2032, subject to tracking errors
Initial Investment: `5000 and in multiples of `1 for purchases and of ̀ 0.01 for switches
Total Expense Ratio**
Available Plans/Options
However, there is no assurance or guarantee that the investment objective of the scheme will be achieved.
Regular & Direct Plan
Additional Purchase: `1000 and in multiples of ̀ 1 for purchases and of ̀ 0.01 for switches
Load Structure
Regular: 0.30%; Direct: 0.14%
6.87% Rajasthan State
7.93% Karnataka State
Govt-Madhya Pradesh SOV 7.06
Government Dated Securities
Govt-Tamil Nadu SOV 6.386.67% Maharashtra State
6.85% Madhya Pradesh State
7.30% Karnataka State
Govt-Maharashtra SOV 6.32
7.03% Madhya Pradesh State
7.80% Andhra Pradesh State6.84% Gujarat State Govt-Gujarat SOV 5.45
Govt-Madhya Pradesh SOV 4.47
6.83% Tamil Nadu State
7.17% Kerala State Govt-Kerala SOV 6.507.09% Rajasthan StateGovt-Rajasthan SOV 6.47
Govt-Karnataka SOV 6.57
Govt-Andhra Pradesh SOV 4.59
Govt-Rajasthan SOV 3.83
Govt-Uttar Pradesh SOV 3.27
Govt-West Bengal SOV 3.387.17% West Bengal StateGovt-Karnataka SOV 3.43
7.28% Uttar Pradesh State
6.95% Tamil Nadu State
7.06% Gujarat State Govt-Gujarat SOV 3.236.93% Gujarat State Govt-Gujarat SOV 3.226.94% Uttar Pradesh State
7.14% Punjab State Govt-Punjab SOV 2.656.62% Uttar Pradesh StateGovt-Uttar Pradesh SOV 2.477.24% Uttar Pradesh State
6.89% Uttar Pradesh StateGovt-Uttar Pradesh SOV 1.34
7.14% Haryana State Govt-Haryana SOV 3.26
Govt-Uttar Pradesh SOV 3.21
7.08% Gujarat State Govt-Gujarat SOV 1.307.13% Haryana State Govt-Haryana SOV 1.118.39% Andhra Pradesh StateGovt-Andhra Pradesh SOV 0.63
Govt-Uttar Pradesh SOV 2.03
Govt-Tamil Nadu SOV 3.23
Government Dated
(Liabilities) 4.02
Govt-Karnataka SOV 0.58
Securities - Total 95.98Net Current Assets/
Grand Total 100.00
6.97% Karnataka State
An open-ended Target Maturity Index Fund investing in constituents of Nifty SDL Apr 2032 Top 12Equal Weight Index. A relatively high interest rate risk and relatively low credit risk
KOTAK NIFTY SDL APR 2032 TOP 12 EQUAL WEIGHT INDEX FUND
AAUM: crs`139.42
Fund Manager: Mr. Abhishek Bisen*
Folio count: 232
Allotment date: February 11, 2022
AUM: `147.20 crs
Top 12 Equal Weight Index
Benchmark: Nifty SDL Apr 2032
PORTFOLIO
Data as on June 30, 2022 *For Fund Manager experience, please refer page 78-80. **Total Expense Ratio includes applicable B30 fee and GST.
Scheme has not completed 6 months since inception
Kotak Nifty SDL Apr 20 Top 12 Equal Weight Index Fund NAV as on ̀ 9.8164 (Regular Plan-Growth), ̀ 9.8250 (Direct Plan- Growth), ̀ 9.8194 (Regular Plan-IDCW ), 32 June 30, 2022:`9.8251 (Direct Plan-IDCW ).
Issuer/Instrument Industry/Rating % to Net Assets Issuer/Instrument Industry/Rating % to Net Assets
This product is suitable for investors who are seeking*:
* Investors should consult their financial advisors if in doubt about whether the product is suitable for them.
• Income over Target Maturity Periods
• Target Maturity Index Fund tracking Nifty SDL Apr 2032 Top 12 Equal weight Index
Product Label as on 30th June, 2022 Fund Benchmark
Low High
Low
to
Moder
ate
ModerateModeratelyHigh
High
Very H
ighLo
w
Investors understand that their principal will be at moderate risk
Low High
Low
to
Moder
ate
ModerateModeratelyHigh
High
Very H
ighLo
w
Investors understand that their principal will be at moderate risk
Potential Risk Class
Credit Risk
(Class A) (Class B) (Class C)
Relatively Low
Relatively Low
Relatively High
Moderate
ModerateRelatively
HighInterest Rate Risk
PRC Matrix
A-III
ALLOCATION (%)
RATING PROFILE (%)
49
8.85 yrs
-
6.20 yrs
7.80%
8.85 yrs
-
6.20 yrs
6.44 yrs
-
6.44 yrs
IRS Average Maturity*
Portfolio Modified Duration
Portfolio Macaulay Duration
Net Modified Duration
Portfolio Average Maturity
Net Average Maturity
YTM
Net Macaulay Duration
IRS Modified Duration*
IRS Macaulay Duration*
*Interest Rate Swap
95.98 4.02
Government Dated Securities Net Current Assets
95.98 4.02
SOV Net Current Assets

AXIS Finance Ltd. 0.11
Aditya Birla Finance Ltd. 0.64
Aditya Birla Housing Finance Ltd. 0.08
Andhra Pradesh State Govt #
Bahadur Chand Investments Private Limited 0.13
Bajaj Finance Ltd. 1.57
Bajaj Financial Securities Limited 0.07Bajaj Housing Finance Ltd. 0.95
Bank Of Baroda 0.62
Aadhar Housing Finance Limited 0.07
BOB Financial Solutions Limited 0.08
AXIS Bank Ltd. 5.06
Arka Fincap Ltd 0.02
Bharti Airtel Ltd. 1.14
AU Small Finance Bank Ltd. 0.15
Aditya Birla Money Ltd 0.04
Bharti Telecom Ltd. 0.30
Britannia Industries Ltd. #
Citicorp Finance (India) Ltd. 0.11
Hindalco Industries Ltd. #
Dalmia Cement (Bharat) Ltd 0.15
First Business Receivables Trust ( Originator Reliance Industries Ltd ) 0.44
Export-Import Bank of India 0.11
Indian Oil Corporation Ltd. 0.99
IndusInd Bank Ltd. 0.15
Central Government 26.36
Indian Bank 2.72
FedBank Financial Services Limited 0.04
Godrej Properties Limited 0.08Grasim Industries Ltd. 0.27
Chambal Fertilisers & Chemicals Ltd. 0.04
Edelweiss Broking Ltd 0.04
ICICI Securities Limited 0.19
HDFC Securities Limited 0.34
ICICI Bank Ltd. 0.17
Hindustan Petroleum Corporation Ltd. 0.34
IDFC First Bank Limited 0.30
Deutsche Bank 0.37
Bihar State Govt 0.01
Century Textiles & Industries Ltd. 0.02
Daimler Financial Services India 0.08
Embassy Office Parks REIT - NCDs/ZCBs 0.52
Can Fin Homes Ltd. 0.08
Godrej Industries Ltd 0.14
Coromandel International Limited 0.15
Cholamandalam Investment and Finance Company Ltd. 0.56
DLF Cyber City Developers Ltd 0.11
Gujarat State Govt 0.31
Edelweiss Finance & Investments Limited 0.11
Birla Group Holding Private Limited 0.21
Canara Bank 1.07
HDB Financial Services Ltd. 0.99HDFC Bank Ltd. 2.61HDFC Ltd. 4.43
Haryana State Govt 0.04Hero FinCorp Ltd. 0.15
Crompton Greaves Consumer Electricals Limited 0.12
Hindustan Zinc Ltd. 0.15
ICICI Home Finance Company Limited 0.04
IOT Utkal Energy Services Ltd. #
India Grid Trust - NCDs 0.23
Indian Railway Finance Corporation Ltd. #
JM Financial Products Limited 0.08
John Deere Financial India Private Limited 0.11
Julius Baer Capital (India) Pvt. Ltd 0.19Karnataka State Govt 0.19
Kirloskar Ferrous Industries Ltd. 0.09Kotak Mahindra Prime Ltd. 0.63
L & T Finance Ltd. 0.15LIC Housing Finance Ltd. 1.93
Jamnagar Utilities & Power Private Limited ( Mukesh Ambani Group ) 0.71
Larsen and Toubro Ltd. 0.15
Madhya Pradesh State Govt 0.10
Kerala State Govt 0.32
Jharkhand State Govt 0.01
Kec International Ltd. 0.04
50
Details of exposure across all Debt Funds of Kotak Mahindra Mutual Fund as on June 30, 2022
Issuer Name %age of Exposure to Debt AUM

Issuer Name
Industry / Sector %age of Exposure to Debt AUM $BANK 16.02
CASH (TREP/REVERSE REPO) 12.24
GOI/TBILLS 28.60
FINANCIAL SERVICES 19.62
NBFC 9.73
Total 100.00
CORPORATES 13.79
51
%age of Exposure to Debt AUM
Maharashtra State Govt 0.10Mahindra & Mahindra Financial Services Ltd. 0.31
Mahindra & Mahindra Ltd. 0.08
Manappuram Finance Ltd. 0.06Mangalore Refinery and Petrochemicals Ltd. 0.09
Rural Electrification Corporation Ltd. 2.10
ONGC Petro Additions Ltd. 0.15
Motilal Oswal Financial Services Limited 0.15
Sundaram Finance Ltd. 0.10
Tamil Nadu State Govt 0.12
Phoenix ARC Pvt Ltd 0.04
Punjab State Govt 0.12
Tata Motors Finance Ltd. 0.33
Standard Chartered Capital Ltd. 0.04
Meghalaya State Govt 0.03
Tata Projects Ltd. 0.19
Reliance Retail Ventures Ltd 1.13
U P Power Corporation Ltd ( Guaranteed By UP State Government ) 0.21
Mindspace Business Parks REIT - NCDs 0.15
Piramal Enterprises Ltd. 0.44
Prestige Projects Pvt. Ltd (Guarantee by Prestige Estate Projects Ltd) 0.09
National Thermal Power Corporation Ltd. 0.74
Northern Arc Capital Limited 0.04
Rajasthan State Govt 0.62Reliance Industries Ltd. 0.13
SBI Cards & Payment Services Pvt. Ltd. 0.11
Shriram Transport Finance Co Ltd. 0.57
THDC India Ltd. (THDCIL) 0.05
Nabha Power Ltd. ( Guaranteed by Larsen & Toubro Ltd ) 0.57National Bank for Agriculture & Rural Development 3.81
Punjab National Bank 1.69
TREP/REVERSE REPO 12.24
Power Grid Corporation of India Ltd. #
Sharekhan Limited 0.08
Muthoot Finance Ltd. 0.48
Sikka Ports & Terminals Ltd. (Mukesh Ambani Group) 1.24
Panatone Finvest Ltd. (Sub. of Tata Sons) 0.74
Pilani Investment and Industries Corporation Ltd 0.08
Power Finance Corporation Ltd. 2.13
Reliance Jio Infocomm Ltd. 1.55
SBICAP Securities Limited 0.08
Shriram City Union Finance Ltd. 0.17
Odisha State Govt 0.01
Small Industries Development Bank Of India 1.85
Steel Authority of India Ltd. #
State Bank Of India. 0.97
TVS Credit Services limited 0.19
Tata Capital Financial Services Limited 0.49Tata Capital Housing Finance Ltd. 0.21
Tata Cleantech Capital Limited 0.09
Tata Motors Finance Solutions Ltd. 0.04
Tata Power Company Ltd. 0.10Tata Power Renewable Energy Ltd. 0.15
Tata Steel Ltd. 0.57Telangana State Govt 0.04
Union Bank of India 0.13Uttar Pradesh State Govt 0.22
YES Bank Ltd. 0.00
Vedanta Ltd. 0.72
Total 100.00
West Bengal State Govt #
For viewing this on the desktop please visit: Kotak MF website>> Market & Funds >> Fund Updates >> Key Credit Brief. Also you can scan the QR code for Key Credit Brief.
Key Credit Brief provides the Key Highlights for select counterparties in our portfolio.Please for the updated Key Credit Brief.click here
# Indicates Less than Rs. 0.005%

Investment ObjectiveThe investment objective of the scheme is to generate returns by investing in units of Kotak Gold Exchange Traded Fund. However, there is no assurance or guarantee that the investment objective of the scheme will be achieved.
Available Plans/OptionsA) Regular Plan B) Direct Plan
Options: Payout of IDCW, Reinvestment of IDCW & Growth (applicable for all plans)
IDCW Frequency
a) If redeemed or switched out on or before completion of 1 Year from the date of allotment of units-1.00%
6% of the units allotted shall be redeemed without any Exit Load on or before completion of 1 Year from the date of allotment of units.
Exit Load:
Any redemption in excess of such limit within 1 Year from the date of allotment shall be subject to the following Exit Load:
Regular:0.54%; Direct: 0.18%
Initial Investment: `5000 and in multiple of `1 for purchase and for ̀ 0.01 for switchesAdditional Investment: ̀ 1000 & in multiples of ̀ 1Ideal Investment Horizon: 3 years & above
Total Expense Ratio**
Trustee’s DiscretionMinimum Investment Amount
Load StructureEntry Load: Nil. (applicable for all plans)
b) If redeemed or switched out after completion of 1 Year from the date of allotment of units-NIL
Equity & Equity related
Mutual Fund Units
Mutual Fund Units - Total 98.32
Kotak Gold ETF Mutual Fund 98.32
Kotak Mutual Fund -
Net Current Assets/
(Liabilities) -0.12
Triparty Repo 1.80
Grand Total 100.00
An open ended fund of fund scheme investing in units ofKotak Gold Exchange Traded Fund
KOTAK GOLD FUND
PORTFOLIO
Benchmark: Price of Gold
Folio count: 75,978
Fund Manager: Mr. Abhishek Bisen*
AAUM: `1,303.63 crs
AUM: `1,308.21 crs
Allotment date: March 25, 2011
Kotak Gold Fund NAV as on June 30, 2022: ̀ 20.5445 (Reg-Plan-IDCW), ̀ 21.4167 (Dir-Plan-IDCW), ̀ 20.5445 (Growth Option), ̀ 21.4169 (Direct Growth Option)*For Fund Manager experience, please refer page 78-80. **Total Expense Ratio includes applicable B30 fee and GST. For scheme performance, please refer page no 69-77.
Data as on June 30, 2022
52
This product is suitable for investors who are seeking*:
* Investors should consult their financial advisors if in doubt about whether the product is suitable for them.
• Investment in physical gold
• Returns in line with physical gold over medium to long term, subject to tracking error
Product Label as on 30th June, 2022 Fund Benchmark
Low High
Low
to
Moder
ate
ModerateModeratelyHigh
High
Very H
ighLo
w
Investors understand that their principal will be at high risk
Issuer/Instrument Industry/Rating % to Net Assets Issuer/Instrument Industry/Rating % to Net Assets
SECTOR ALLOCATION (%)
Low High
Low
to
Moder
ate
ModerateModeratelyHigh
High
Very H
ighLo
w
Investors understand that their principal will be at high risk
98.32 1.80-0.12
Mutual Fund TREP & Term Deposits & Rev.Repo Net Current Assets

Initial Investment: `1000 and in multiple of `1 for purchase and of ̀ 0.01 for switches
Entry Load: Nil. (applicable for all plans)Exit Load:
However, there is no assurance that the objective of the scheme will be realised.
Minimum Investment Amount (Existing)
Additional Investment: `1000 & in multiples of `1 for purchase and of `0.01 for switches
Options: Payout of IDCW, Reinvestment of IDCW & Growth (applicable for all plans)
The primary investment objective of the scheme is to provide long-term capital appreciation by investing in units of Wellington Global Innovation Fund or any other similar overseas mutual fund schemes/ETFs.
Available Plans/Options
Ideal Investments Horizon: 5 years & above
Investment Objective
A) B) Direct Plan Regular Plan
Load Structure
a) For redemptions or switched out within 1 year from the date of allotment of units, irrespective of the amount of investment-1.00%
Regular: 1.63%; Direct: 0.35%Total Expense Ratio**
b) For redemptions or switched out after 1 year from the date of allotment of units, irrespective of the amount of investment-NIL
Equity & Equity related
Mutual Fund Units
Wellington Global Innovation S
USD ACC Overseas Mutual Fund 99.14
Units - Total 99.14
Mutual Fund
An open ended fund of fund investing in units of Wellington Global Innovation Fundor any other similar overseas mutual fund schemes/ETFs
PORTFOLIO
Kotak Global Innovation Fund of Fund NAV as on June 30, 2022: ̀ 6.4200 (Reg-Plan-IDCW), ̀ 6.4965 (Dir-Plan-IDCW), ̀ 6.4200 (Growth Option), ̀ 6.4965 (Direct Growth Option)*For Fund Manager experience, please refer page 78-80. **Total Expense Ratio includes applicable B30 fee and GST. For scheme performance, please refer page no 69-77.
53
Fund Manager: Mr. Arjun Khanna*
AAUM: `1,101.11 crs
Folio count: 70,608
AUM: `1,084.95 crs
Benchmark: MSCI All Country World Index TRI
Allotment date: July 29, 2021
Data as on June 30, 2022
Triparty Repo 1.43
(Liabilities) -0.57
Grand Total 100.00
Net Current Assets/
KOTAK GLOBAL INNOVATION FUND OF FUND
• Investment in units of Wellington Global Innovation Fund or any other similar overseas mutual fund schemes/ETFs.
* Investors should consult their financial advisors if in doubt about whether the product is suitable for them.
This product is suitable for investors who are seeking*:
• Long term capital growth
Product Label as on 30th June, 2022
Low High
Low
to
Moder
ate
ModerateModeratelyHigh
High
Very H
ighLo
w
Investors understand that their principal will be at very high risk
Low High
Low
to
Moder
ate
ModerateModeratelyHigh
High
Very H
ighLo
w
Investors understand that their principal will be at very high risk
Fund Benchmark
Issuer/Instrument Industry/Rating % to Net Assets Issuer/Instrument Industry/Rating % to Net Assets
https://www.kotakmf.com/Information/forms-and-downloads
SECTOR ALLOCATION (%)
99.14 1.43-0.57
Overseas Mutual Fund TREP & Term Deposits & Rev.Repo Net Current Assets

Initial Investment: `5000 and in multiple of `1 for purchase and of ̀ 0.01 for switches
Regular: 0.67%; Direct: 0.27%
Options: Growth
Load Structure
The investment objective of the scheme is to provide long-term capital appreciation by investing in units of overseas ETF’s and/ or Index Fund based on NASDAQ 100 Index. However, there can be no assurance that the investment objective of the Scheme will be realized.
Entry Load: Nil. (applicable for all plans)
Additional Investment: `1000 & in multiples of ̀ 1
A) B) Direct Plan Regular Plan
Minimum Investment Amount
Ideal Investments Horizon: 5 years & above
Investment Objective
Exit Load: Nil
Available Plans/Options
Total Expense Ratio**
UCITS ETF USD Overseas Mutual Fund 99.52
Units - Total 99.52
Equity & Equity related Mutual Fund Units Ishares Nasdaq 100
Mutual Fund
An open ended fund of fund investing in units of overseas ETF's and/or Index Fund based on NASDAQ 100 Index
PORTFOLIO
Kotak NASDAQ 100 FUND OF FUND NAV as on June 30, 2022: ̀ 9.1842 (Growth Option), ̀ 9.2370 (Direct Growth Option)*For Fund Manager experience, please refer page 78-80. **Total Expense Ratio includes applicable B30 fee and GST. For scheme performance, please refer page no 69-77.
54
Fund Manager: Mr. Arjun Khanna &
AAUM: `1,064.19 crs
AUM: `1,112.52 crs
Benchmark: NASDAQ 100 TRI
Allotment date: February 2, 2021
Mr. Abhishek Bisen*
Folio count: 51,090
Data as on June 30, 2022
(Liabilities) -0.71
Triparty Repo 1.19Net Current Assets/
Grand Total 100.00
KOTAK NASDAQ 100 FUND OF FUND
For viewing detailed portfolio of Ishares NASDAQ 100 UCITS ETF USD on desktop please visit: https://www.ishares.com/uk/individual/en/products/253741/ishares-nasdaq-100-ucits-etf
This product is suitable for investors who are seeking*:
• Long term capital growth
• Return that corresponds generally to the performance of the NASDAQ-100 Index, subject to tracking error.
* Investors should consult their financial advisors if in doubt about whether the product is suitable for them.
Product Label as on 30th June, 2022
Low High
Low
to
Moder
ate
ModerateModeratelyHigh
High
Very H
ighLo
w
Investors understand that their principal will be at very high risk
Low High
Low
to
Moder
ate
ModerateModeratelyHigh
High
Very H
ighLo
w
Investors understand that their principal will be at very high risk
Fund Benchmark
Issuer/Instrument Industry/Rating % to Net Assets Issuer/Instrument Industry/Rating % to Net Assets
SECTOR ALLOCATION (%)
99.52 1.19-0.71
Overseas Mutual Fund TREP & Term Deposits & Rev.Repo Net Current Assets

55
The investment objective of the scheme is to provide long-term capital appreciation and income by investing in units of SMAM ASIA REIT Sub Trust fund and/or other similar overseas REIT funds. However, there can be no assurance that the investment objective of the Scheme will be realized.
Investment Objective
Available Plans/Options
IDCW Frequency
Options: Payout of IDCW, Reinvestment of IDCW & Growth (applicable for all plans)
Trustee’s Discretion
Minimum Investment Amount
A) B) Direct Plan Regular Plan
Initial Investment: `5000 and in multiple of `1 for purchase and of ̀ 0.01 for switchesAdditional Investment: `1000 & in multiples of ̀ 1Ideal Investments Horizon: 5 years & above
Total Expense Ratio**
Any redemption in excess of such limit within 1 Year from the date of allotment shall be subject to the following Exit Load:
8% of the units allotted shall be redeemed without any Exit Load on or before completion of 1 Year from the date of allotment of units.
a) If redeemed or switched out on or before completion of 1 Year from the date of allotment of units-1.00%
Load Structure
b) If redeemed or switched out after completion of 1 Year from the date of allotment of units-NIL
Entry Load: Nil. (applicable for all plans)
Regular: 1.38%; Direct: 0.49%
Exit Load:
Equity & Equity related
SMAM ASIA REIT Sub Trust Overseas Mutual Fund 99.19
Mutual Fund Units - Total 99.19
Mutual Fund Units
An open-ended fund of fund scheme investing in units of SMAM ASIA REIT Sub Trust Fundand/or other similar overseas REIT funds.
PORTFOLIO
Kotak International REIT FOF NAV as on June 30, 2022: ̀ 9.2949 (Reg-Plan-IDCW), ̀ 9.4286 (Dir-Plan-IDCW), ̀ 9.2950 (Growth Option), ̀ 9.4287 (Direct Growth Option)*For Fund Manager experience, please refer page 78-80. **Total Expense Ratio includes applicable B30 fee and GST. For scheme performance, please refer page no 69-77.
AUM: `159.33 crs
Benchmark: S&P Asia Pacific ex Japan REIT Total Return Index.
Allotment date: December 29, 2020
Folio count: 9,269
Fund Manager: Mr. Arjun Khanna*
AAUM: `165.69 crs
Data as on June 30, 2022
Triparty Repo 1.26
(Liabilities) -0.45
Net Current Assets/
Grand Total 100.00
KOTAK INTERNATIONAL REIT FOF
TOP 10 HOLDING OF SMAM ASIA REIT SUB FUND
NAME WEIGHTCOUNTRY
GOODMAN GROUP NPV (STAPLED UNITS) Australia 8.66%
DIGITAL CORE REIT NPV (REIT) Singapore 5.55%
CAPITALAND INT COM NPV (REIT) Singapore 9.47%
LINK R/EST INVEST NPV Hong Kong 9.29%
MAPLETREE LOGISTIC NPV Singapore 6.06%
SCENTRE GROUP LTD STAPLED SECURITIES Australia 3.84%
KEPPEL DC REIT NPV Singapore 3.87%
ASCENDAS REAL ESTA UNITS NPV (REIT) Singapore 4.37%
FRASERS LOG & COM NPV UNITS (REIT) Singapore 4.39%
MAPLETREE IND TST NPV (REIT) Singapore 4.20%
Data as on 30th June, 2022
* Investors should consult their financial advisors if in doubt about whether the product is suitable for them.
• Long term capital appreciation and income by investing in units of SMAM ASIA REIT Sub Trust Fund and/or other similar overseas REIT funds.
This product is suitable for investors who are seeking*:
• Long term capital growth
Product Label as on 30th June, 2022
Low High
Low
to
Moder
ate
ModerateModeratelyHigh
High
Very H
ighLo
w
Investors understand that their principal will be at very high risk
Low High
Low
to
Moder
ate
ModerateModeratelyHigh
High
Very H
ighLo
w
Investors understand that their principal will be at very high risk
Fund Benchmark
Issuer/Instrument Industry/Rating % to Net Assets Issuer/Instrument Industry/Rating % to Net Assets
SECTOR ALLOCATION (%)
99.19 1.26-0.45
Overseas Mutual Fund TREP & Term Deposits & Rev.Repo Net Current Assets

Investment Objective
Trustee’s Discretion
Exit Load: Entry Load: Nil. (applicable for all plans)
Minimum Investment Amount
Available Plans/Options
Ideal Investment Horizon: 5 years & above
Regular: 1.69%; Direct: 1.20%
The investment objective of the scheme is to provide long-term capital appreciation by investing in an overseas mutual fund scheme that invests in a diversified portfolio of securities as prescribed by SEBI from time to time in global emerging markets. However, there is no assurance or guarantee that the investment objective of the scheme will be achieved.
a) If redeemed or switched out on or before completion of 1 Year from the date of allotment of units-1.00%b) If redeemed or switched out after completion of 1 Year from the date of allotment of units-NIL
IDCW Frequency
Initial Investment: `5000 and in multiple of `1 for purchase and for ̀ 0.01 for switches
A) Regular Plan B) Direct Plan
Additional Investment: ̀ 1000 & in multiples of ̀ 1
Options: Payout of IDCW, Reinvestment of IDCW & Growth (applicable for all plans)
10% of the units allotted shall be redeemed without any Exit Load on or before completion of 1 Year from the date of allotment of units.Any redemption in excess of such limit within 1 Year from the date of allotment shall be subject to the following Exit Load:
Load Structure
Total Expense Ratio**
Equity & Equity related
Mutual Fund Units
CI Emerging Markets
Fund I - 974 Overseas Mutual Fund 97.58
Mutual Fund Units - Total 97.58
Net Current Assets/
(Liabilities) -0.61
Grand Total 100.00
Triparty Repo 3.03
An open ended fund of fund scheme investing in overseas mutual fundschemes investing in global emerging markets.
KOTAK GLOBAL EMERGING MARKET FUNDInvestment style
Value Blend Growth Size
Large
Medium
Small
PORTFOLIO
Kotak Global Emerging Market Fund NAV as on June 30, 2022: ̀ 19.1190 (Reg-Plan-IDCW), ̀ 20.5110 (Dir-Plan-IDCW), ̀ 19.1180 (Growth Option), ̀ 20.4250 (Direct Growth Option)*For Fund Manager experience, please refer page 78-80. **Total Expense Ratio includes applicable B30 fee and GST. For scheme performance, please refer page no 69-77.
Benchmark: MSCI Emerging Market index
Fund Manager: Mr. Arjun Khanna*
AAUM: `130.81 crs
AUM: `128.82 crs
Allotment date: September 26, 2007
Folio count: 20,149
Data as on June 30, 2022
56
For viewing detailed portfolio of CI Emerging Markets Fund on desktop please visit: www.kotakmf.com>> Forms & Downloads>>Portfolios>>CI Emerging Markets Fund
This product is suitable for investors who are seeking*:
• Long term capital growth
• Investment in overseas mutual fund schemes that invest in a diversified portfolio of securities in global emerging markets
* Investors should consult their financial advisors if in doubt about whether the product is suitable for them.
Product Label as on 30th June, 2022
Low High
Low
to
Moder
ate
ModerateModeratelyHigh
High
Very H
ighLo
w
Investors understand that their principal will be at very high risk
Low High
Low
to
Moder
ate
ModerateModeratelyHigh
High
Very H
ighLo
w
Investors understand that their principal will be at very high risk
Fund Benchmark
Issuer/Instrument Industry/Rating % to Net AssetsIssuer/Instrument Industry/Rating % to Net Assets Issuer/Instrument Industry/Rating % to Net Assets
SECTOR ALLOCATION (%)
97.58 3.03-0.61
Overseas Mutual Fund TREP & Term Deposits & Rev.Repo Net Current Assets

Total Expense Ratio**
Regular Plan
Investment Objective
Option - Payout of IDCW
Minimum Investment Amount
Through AMC: 15000 Units,
Load Structure
Exit Load: Nil (applicable for all plans)
Available Plan/Options
Regular: 0.18%
The investment objective of the scheme is to provide returns before expenses that closely correspond to the total returns of stocks as represented by the Nifty Bank Index subject to tracking errors. There is no assurance or guarantee that the investment objective of the scheme will be achieved.
Entry Load: Nil. (applicable for all plans)
Ideal Investment Horizon: 5 years and .......above
Ratios
Through Exchange:1 Unit,
7
Equity & Equity related
HDFC Bank Ltd. Banks 27.49
AU Small Finance Bank Ltd. Banks 2.53
IndusInd Bank Ltd. Banks 5.01
State Bank Of India Banks 11.67
Kotak Mahindra Bank Ltd. Banks 11.34
ICICI Bank Ltd. Banks 22.87
Bandhan Bank Ltd. Banks 1.77
Bank Of Baroda Banks 1.76
Axis Bank Ltd. Banks 11.56 Related - Total 99.54
Triparty Repo 0.31
IDFC First Bank Limited Banks 0.95
Federal Bank Ltd. Banks 1.75
Net Current Assets/
(Liabilities) 0.15
Grand Total 100.00
Punjab National Bank Banks 0.84
Equity & Equity
Portfolio Turnover:
Tracking Error:
44.09%
0.31%
KOTAK NIFTY BANK ETF
An open-ended scheme replicating/ tracking nifty bank indexNSE Symbol - KOTAKBKETFBSE Scrip Code - 590136
PORTFOLIO
Kotak Nifty Bank ETF NAV as on June 30, 2022: ̀ 338.9540*For Fund Manager experience, please refer page 78-80. **Total Expense Ratio includes applicable B30 fee and GST. For scheme performance, please refer page no 69-77.
Data as on June 30, 2022
57
AAUM: `6,313.52 crs
Allotment date: December 04, 2014
Fund Manager: Mr. Devender Singhal &
Mr. Satish Dondapati*
AUM: `6,024.29 crs
Benchmark: Nifty Bank Index TRI
Folio count: 30,516
Issuer/Instrument Industry/Rating % to Net Assets Issuer/Instrument Industry/Rating % to Net Assets
* Investors should consult their financial advisors if in doubt about whether the product is suitable for them.
• Investment in stocks comprising the underlying index and endeavours to track the benchmark index
• Long term capital growth
This product is suitable for investors who are seeking*:
Product Label as on 30th June, 2022
Low High
Low
to
Moder
ate
ModerateModeratelyHigh
High
Very H
ighLo
w
Investors understand that their principal will be at very high risk
Low High
Low
to
Moder
ate
ModerateModeratelyHigh
High
Very H
ighLo
w
Investors understand that their principal will be at very high risk
Fund Benchmark
SECTOR ALLOCATION (%)
99.54 0.310.15
Banks TREP & Term Deposits & Rev.Repo Net Current Assets

Kotak Gold ETF NAV as on June 30, 2022: `43.9675*For Fund Manager experience, please refer page 78-80. **Total Expense Ratio includes applicable B30 fee and GST. For scheme performance, please refer page no 69-77.
The investment objective of the scheme is to generate returns that are in line with the returns on investment in physical gold, subject to tracking errors. However, there is no assurance that the investment objective of the Scheme will be achieved.
Available Plan
Investment Objective
Ratios
Regular Plan
Ideal Investment Horizon: 5 years and....... above
Entry Load: Nil. (applicable for all plans)
Minimum Investment AmountThrough Exchange:1 Unit,Through AMC: 100000 Units,
Load Structure
Exit Load: Nil (applicable for all plans)
Total Expense Ratio**Regular: 0.55%
7
Equity & Equity Related - Total 97.77
Gold
Gold 1 Kg Fineness 0.995 ** 97.77
Equity & Equity related Net Current Assets/
(Liabilities) 2.23
Grand Total 100.00
KOTAK GOLD ETF
An open-ended scheme replicating/ tracking physical gold pricesNSE Symbol - KOTAKGOLDBSE Scrip Code - 590097
PORTFOLIO
Tracking Error: 0.11%
AUM: `2,391.49 crs
Fund Manager: Mr. Abhishek Bisen &
Folio count: 4,24,234
Benchmark: Price of Gold
Mr. Jeetu Valechha Sonar*
AAUM: `2,380.00 crs
Allotment date: July 27, 2007
Data as on June 30, 2022
58
Issuer/Instrument Industry/Rating % to Net Assets Issuer/Instrument Industry/Rating % to Net Assets
This product is suitable for investors who are seeking*:
• Returns in line with physical gold over medium to long term, subject to tracking error
• Investment in physical gold
* Investors should consult their financial advisors if in doubt about whether the product is suitable for them.
Product Label as on 30th June, 2022 Fund Benchmark
Low High
Low
to
Moder
ate
ModerateModeratelyHigh
High
Very H
ighLo
w
Investors understand that their principal will be at high risk
SECTOR ALLOCATION (%)
Tracking Error: 0.12%
Period Kotak Gold ETF Price of Gold
Last 1 Year 17.04% 18.11%
Last 3 Years 17.12% 17.91%
Last 5 Years 11.48% 12.40%
Sourec: Kotak MF
Since Inception 11.74% 12.84%
Last 10 Years 5.12% 6.13%
Low High
Low
to
Moder
ate
ModerateModeratelyHigh
High
Very H
ighLo
w
Investors understand that their principal will be at high risk
97.77 2.23
Gold Net Current Assets
Period Kotak Gold ETF Physical Gold Difference
1 Year 11.01% 11.90% -0.90%
3 Year 17.12% 17.92% -0.81%
5 Year 11.38% 12.29% -0.91%
Sourec: KotakMF
10 Year 4.86% 5.87% -1.01%
1 Year Tracking Erroras on 31st May 2022
0.2371
Performance & Difference as of 31st May 2022
Period Kotak Gold ETF Price of Gold Difference
SinceInception
6.77% 8.25% -1.48%
Sourec: KotakMF
1 Year 3.19% 5.08% -1.89%
3 Year 16.02% 16.83% -0.81%
5 Year 11.26% 11.80% -0.54%
7 Year 8.39% 9.39% -1.00%
10 Year 4.41% 5.54% -1.13%

The investment objective of the scheme is to provide returns before expenses that closely correspond to the total returns of the Nifty 50 subject to tracking errors. However, there is no assurance or guarantee that the investment objective of the scheme will be achieved.
Through AMC: 50000 Units,
Ratios
Regular Plan
Exit Load: Nil (applicable for all plans)
Load Structure
Through Exchange:1 Unit,
Entry Load: Nil. (applicable for all plans)
Available Plan
Ideal Investment Horizon: 5 years and above
Investment Objective
Minimum Investment Amount
Regular: 0.12%Total Expense Ratio**
7
Portfolio Turnover:
Tracking Error:
21.39%
0.09%
Reliance Industries Ltd. Petroleum Products 12.89
HDFC Bank Ltd. Banks 8.51
Infosys Ltd. IT - Software 7.70
ICICI Bank Ltd. Banks 7.08
HDFC Ltd. Finance 5.66
Tata Consultancy Services Ltd. IT - Software 4.87
Equity & Equity related
Kotak Mahindra Bank Ltd. Banks 3.51
Of India Ltd. Power 1.04
Mahindra & Mahindra Ltd. Automobiles 1.51
Power Grid Corporation
Industries Ltd. Pharmaceuticals &
HCL Technologies Ltd. IT - Software 1.48
Sun Pharmaceuticals
Axis Bank Ltd. Banks 2.42
Biotechnology 1.29
National Thermal Power
Ultratech Cement Ltd. Cement & Cement Products 0.93
Bajaj Finance Ltd. Finance 2.07
ITC Ltd. Diversified FMCG 3.44
Asian Paints Ltd. Consumer Durables 1.75
Titan Company Ltd. Consumer Durables 1.17
Tata Motors Ltd. Automobiles 1.06
Bajaj Finserv Ltd. Finance 0.95
Larsen And Toubro Ltd. Construction 2.71
Tata Steel Ltd. Ferrous Metals 1.01
Nestle India Ltd. Food Products 0.90
Bharti Airtel Ltd Telecom - Services 2.38
Hindustan Unilever Ltd. Diversified FMCG 2.87
Corporation Limited Power 0.98
State Bank Of India Banks 2.57
Tech Mahindra Ltd. IT - Software 0.91
Maruti Suzuki India Limited Automobiles 1.62
Wipro Ltd. IT - Software 0.89
Biotechnology 0.77
Dr Reddys Laboratories Ltd. Pharmaceuticals &
Hero MotoCorp Ltd. Automobiles 0.51
Economic Zone Ltd. Transport Infrastructure 0.69
Bajaj Auto Ltd. Automobiles 0.69
Apollo Hospitals Enterprises Ltd. Healthcare Services 0.54
Biotechnology 0.71
JSW Steel Ltd. Ferrous Metals 0.79
Corporation Ltd. Oil 0.85
IndusInd Bank Ltd. Banks 0.74
Cipla Ltd. Pharmaceuticals &
Hindalco Industries Ltd Non - Ferrous Metals 0.71
Oil & Natural Gas
Grasim Industries Ltd. Cement & Cement Products 0.71
Adani Port and Special
Divi s Laboratories Ltd. Pharmaceuticals &
Biotechnology 0.67
HDFC Life Insurance Company Ltd. Insurance 0.74
Tata Consumer Products Ltd Agricultural Food &
other Products 0.61
SBI Life Insurance Company Ltd Insurance 0.70
Britannia Industries Ltd. Food Products 0.59
Coal India Ltd. Consumable Fuels 0.56
Eicher Motors Ltd. Automobiles 0.56
Bharat Petroleum
UPL Ltd Fertilizers & Agrochemicals 0.49
Corporation Ltd. Petroleum Products 0.42
Shree Cement Ltd. Cement & Cement Products 0.37
Net Current Assets/
(Liabilities) 0.36
Equity & Equity
Related - Total 99.59
Grand Total 100.00
Triparty Repo 0.05
KOTAK NIFTY 50 ETF
An open-ended scheme replicating/ tracking nifty 50 indexNSE Symbol - KOTAKNIFTY
PORTFOLIO Mr. Satish Dondapati*
Allotment date: February 2, 2010
AUM: `1,693.65 crs
Benchmark: Nifty 50 TRI
Fund Manager: Mr. Devender Singhal &
Folio count: 17,430
AAUM: `1,678.35 crs
Kotak Nifty 50 ETF NAV as on June 30, 2022: ̀ 167.5396*For Fund Manager experience, please refer page 78-80. **Total Expense Ratio includes applicable B30 fee and GST. For scheme performance, please refer page no 69-77. For last three IDCW, please refer page no 81-83.
Data as on June 30, 2022
59
This product is suitable for investors who are seeking*:
• Investment in stocks comprising the underlying index and endeavours to track the benchmark index
* Investors should consult their financial advisors if in doubt about whether the product is suitable for them.
• Long term capital growth
Product Label as on 30th June, 2022
Low High
Low
to
Moder
ate
ModerateModeratelyHigh
High
Very H
ighLo
w
Investors understand that their principal will be at very high risk
Low High
Low
to
Moder
ate
ModerateModeratelyHigh
High
Very H
ighLo
w
Investors understand that their principal will be at very high risk
Fund Benchmark
Issuer/Instrument Industry/Rating % to Net AssetsIssuer/Instrument Industry/Rating % to Net Assets Issuer/Instrument Industry/Rating % to Net Assets
SECTOR ALLOCATION (%)
24.83 15.85 13.31 8.68 6.315.95
3.442.92
2.712.38
13.62
Banks IT - Software Petroleum Products Finance Diversified FMCG Automobiles Pharmaceuticals & Biotechnology
Consumer Durables Construction Telecom - Services REST
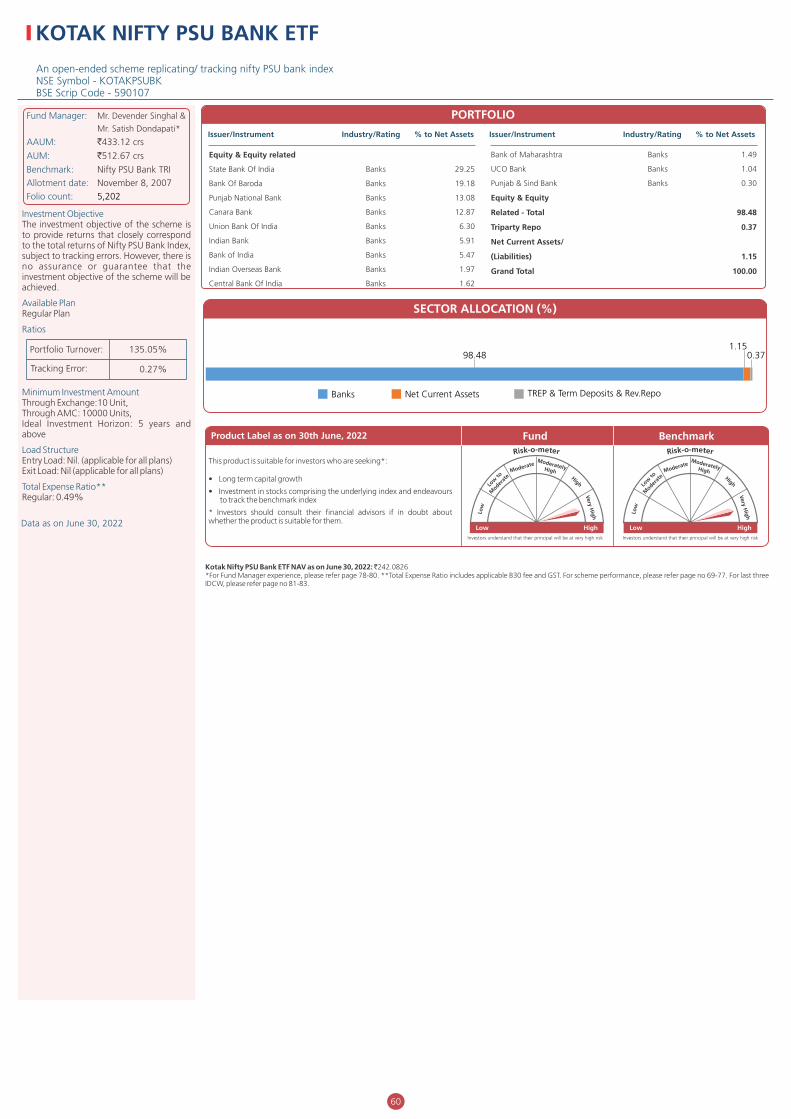
Available Plan
Minimum Investment Amount
Entry Load: Nil. (applicable for all plans)
Investment ObjectiveThe investment objective of the scheme is to provide returns that closely correspond to the total returns of Nifty PSU Bank Index, subject to tracking errors. However, there is no assurance or guarantee that the investment objective of the scheme will be achieved.
Ratios
Ideal Investment Horizon: 5 years and above
Through AMC: 10000 Units,
Load Structure
Exit Load: Nil (applicable for all plans)
Total Expense Ratio**
Regular Plan
Through Exchange:10 Unit,
Regular: 0.49%
7
Portfolio Turnover:
Tracking Error:
135.05%
0.27%
Equity & Equity related
State Bank Of India Banks 29.25
Bank Of Baroda Banks 19.18
Punjab National Bank Banks 13.08
Canara Bank Banks 12.87
Union Bank Of India Banks 6.30
Indian Overseas Bank Banks 1.97
Bank of India Banks 5.47
Indian Bank Banks 5.91
Central Bank Of India Banks 1.62
Bank of Maharashtra Banks 1.49
Equity & Equity
(Liabilities) 1.15
Grand Total 100.00
Related - Total 98.48
Triparty Repo 0.37
UCO Bank Banks 1.04
Punjab & Sind Bank Banks 0.30
Net Current Assets/
KOTAK NIFTY PSU BANK ETF
An open-ended scheme replicating/ tracking nifty PSU bank indexNSE Symbol - KOTAKPSUBKBSE Scrip Code - 590107
Benchmark: Nifty PSU Bank TRI
Fund Manager: Mr. Devender Singhal &
Mr. Satish Dondapati*
AAUM: `433.12 crs
AUM: `512.67 crs
Allotment date: November 8, 2007
Folio count: 5,202
PORTFOLIO
Kotak Nifty PSU Bank ETF NAV as on June 30, 2022: ̀ 242.0826*For Fund Manager experience, please refer page 78-80. **Total Expense Ratio includes applicable B30 fee and GST. For scheme performance, please refer page no 69-77. For last three IDCW, please refer page no 81-83.
Data as on June 30, 2022
60
Issuer/Instrument Industry/Rating % to Net Assets Issuer/Instrument Industry/Rating % to Net Assets
This product is suitable for investors who are seeking*:
• Investment in stocks comprising the underlying index and endeavours to track the benchmark index
* Investors should consult their financial advisors if in doubt about whether the product is suitable for them.
• Long term capital growth
Product Label as on 30th June, 2022
Low High
Low
to
Moder
ate
ModerateModeratelyHigh
High
Very H
ighLo
w
Investors understand that their principal will be at very high risk
Low High
Low
to
Moder
ate
ModerateModeratelyHigh
High
Very H
ighLo
w
Investors understand that their principal will be at very high risk
Fund Benchmark
SECTOR ALLOCATION (%)
98.481.15
0.37
Banks Net Current Assets TREP & Term Deposits & Rev.Repo

Ratios
Available Plan
Exit Load: Nil (applicable for all plans)
The investment objective of the scheme is to replicate the composition of the NIFTY IT Index and to generate returns that are commensurate with the performance of the NIFTY IT Index, subject to tracking errors.However, there is no assurance or guarantee that the investment objective of the scheme will be achieved.
Investment Objective
Regular Plan
Through AMC: 100000 Units,Ideal Investments Horizon: 5 years & above
Load StructureEntry Load: Nil. (applicable for all plans)
Total Expense Ratio**
Minimum Investment Amount
Through Exchange:1 Unit,
Regular: 0.22%
7
Portfolio Turnover: 149.30%
KOTAK NIFTY IT ETF FUND
An open ended scheme replicating/ tracking NIFTY IT IndexNSE Symbol - KOTAKIT
Fund Manager: Mr. Devender Singhal &
Allotment date: March 2, 2021
Folio count: 10,058
Mr. Satish Dondapati*
AAUM: `135.16 crs
AUM: `133.19 crs
Benchmark: NIFTY IT Index TRI
PORTFOLIO
*For Fund Manager experience, please refer page 78-80. **Total Expense Ratio includes applicable B30 fee and GST. For scheme performance, please refer page no 69-77. Kotak Nifty IT ETF IDCW NAV as on June 30, 2022: ̀ 28.4214Data as on June 30, 2022
61
Equity & Equity related
IT - Software 97.87
Infosys Ltd. 26.64
HCL Technologies Ltd. 9.16
Tata Consultancy Services Ltd. 26.48
Wipro Ltd. 9.14
MindTree Ltd. 4.65
Tech Mahindra Ltd. 9.27
Mphasis Ltd 4.75
Larsen & Toubro Infotech Ltd 4.54
IT - Services 2.08
Net Current Assets/
Equity & Equity
Grand Total 100.00
Related - Total 99.95
(Liabilities) 0.05
L&T Technology Services Ltd 2.08
Coforge Limited 3.24
Issuer/Instrument Industry/Rating % to Net Assets Issuer/Instrument Industry/Rating % to Net Assets
• Long term capital growth
* Investors should consult their financial advisors if in doubt about whether the product is suitable for them.
This product is suitable for investors who are seeking*:
• Investment in stocks comprising the underlying index and endeavours to track the benchmark index.
Product Label as on 30th June, 2022
Low High
Low
to
Moder
ate
ModerateModeratelyHigh
High
Very H
ighLo
w
Investors understand that their principal will be at very high risk
Low High
Low
to
Moder
ate
ModerateModeratelyHigh
High
Very H
ighLo
w
Investors understand that their principal will be at very high risk
Fund Benchmark
SECTOR ALLOCATION (%)
Portfolio Turnover:
Tracking Error:
166.84%
0.12% Tracking Error: 0.12%
97.872.08
0.05
IT - Software IT - Services Net Current Assets

A) Regular Plan
Exit Load: Nil (applicable for all plans)
Regular: 0.40%
Through Exchange:1 Unit,
Ideal Investment Horizon: 5 years and....... above
Minimum Investment Amount
Available Plans/Options
Ratios
Through AMC: 100000 Units,
Load Structure
Investment ObjectiveThe investment objective of the scheme is to replicate the composition of the NIFTY Alpha 50 Index and to generate returns that are commensurate with the performance of the NIFTY Alpha 50 Index, subject to tracking errors. However, there is no assurance or guarantee that the investment objective of the scheme will be achieved.
Entry Load: Nil. (applicable for all plans)
Total Expense Ratio**
7
Portfolio Turnover: 126.67%
KOTAK NIFTY ALPHA 50 ETF
An open ended scheme replicating/tracking NIFTY Alpha 50 IndexNSE Symbol - KOTAKALPHA
Fund Manager: Mr. Devender Singhal
Mr. Satish Dondapati
Mr. Abhishek Bisen*
AAUM: `57.49 crs
AUM: `57.65 crs
Benchmark: NIFTY Alpha 50 Index
(Total Return Index)
Allotment date: December 22, 2021
Folio count: 9,131
PORTFOLIO
*For Fund Manager experience, please refer page 78-80. **Total Expense Ratio includes applicable B30 fee and GST. Scheme has not completed 6 months since inception
Kotak NIFTY Alpha 50 ETF NAV as on June 30, 2022: ̀ 25.5913 (Reg-Plan-IDCW),
Data as on June 30, 2022
62
The Indian Hotels Company Ltd. 2.40
Poonawalla Fincorp Ltd. 2.72
Tourism Corporation Ltd. 2.46
Hindustan Aeronautics Ltd. 2.55
Indian Railway Catering And
Finance 4.21
Bharat Electronics Ltd. 2.07
Aerospace & Defense 4.62
Tata Teleservices Ltd 9.61
KPIT Technologies Ltd. 3.68
Persistent Systems Limited 1.61
Mphasis Ltd 1.09
Birlasoft Ltd. 0.40
Happiest Minds
Equity & Equity related
Technologies Limited 0.01
Telecom - Services 10.83
Tata Elxsi Ltd. 3.98
MindTree Ltd. 0.80
Tanla Solutions Limited 1.49
Coforge Limited 0.17
IT - Software 13.23
Capital Markets 9.51
Angel One Limited 2.85
Himachal Futuristic Comm Ltd 1.22
Central Depository Services
(India) Ltd. 0.88
Chemicals & Petrochemicals 8.30
Linde India Ltd. 3.00
Gujarat Narmada Valley
Deepak Nitrite Ltd. 0.17
Textiles & Apparels 7.10
Trident Ltd 5.28
Page Industries Ltd 1.65
Vardhman Textiles Ltd. 0.17
Power 6.80
Tata Power Co. Ltd. 3.49
Indian Energy Exchange Ltd 1.91
Adani Green Energy Ltd. 1.72
SRF Ltd. 2.77
Fertilisers Co Ltd. 2.36
Adani Transmission Ltd 1.57
JSW Energy Ltd. 0.02
Leisure Services 4.86
BSE Ltd. 3.87
Minda Industries Ltd. 1.77
National Aluminium Company Ltd 0.93
Bajaj Holdings and Investment Ltd. 1.49
Apollo Hospitals Enterprises Ltd. 0.82
KEI Industries Ltd. 0.01
Adani Total Gas Ltd. 2.70
Healthcare Services 3.23
Macrotech Developers Ltd 1.78
Realty 3.64
Gas 2.70
Diversified Metals 0.43
Grand Total 100.00
Radico Khaitan Ltd. 1.15
Prestige Estates Projects Limited 1.86
ABB India Ltd 1.67
Fortis Healthcare India Ltd 0.01
Oil India Limited 2.97
Suzlon Energy Ltd. 1.65
Industrial Products 3.11
Max Healthcare Institute Ltd. 2.40
Polycab India Ltd. 1.57
Metals & Minerals Trading 2.11
Adani Enterprises Ltd. 2.11
Oil 2.97
Auto Components 1.77
Consumer Durables 1.25
Titan Company Ltd. 1.25
Beverages 3.18
Electrical Equipment 3.32
Varun Beverages Ltd 2.03
APL Apollo Tubes Ltd. 1.53
Non - Ferrous Metals 0.93
IT - Services 0.92
Fertilizers & Agrochemicals 0.79
Chemicals Ltd. 0.79
Vedanta Ltd. 0.43
Pharmaceuticals & Biotechnology 0.12
Laurus Labs Ltd. 0.12
Equity & Equity
Brightcom Group Ltd. 0.02
L&T Technology Services Ltd 0.90
Related - Total 99.93
Net Current Assets/
Chambal Fertilisers &
(Liabilities) 0.07
Issuer/Instrument Industry/Rating % to Net Assets Issuer/Instrument Industry/Rating % to Net Assets
• Investment in stocks Comprising the underlying index and endeavours to track the benchmark index
* Investors should consult their financial advisors if in doubt about whether the product is suitable for them.
• Long term capital growth
This product is suitable for investors who are seeking*:
Product Label as on 30th June, 2022
Low High
Low
to
Moder
ate
ModerateModeratelyHigh
High
Very H
ighLo
w
Investors understand that their principal will be at very high risk
Low High
Low
to
Moder
ate
ModerateModeratelyHigh
High
Very H
ighLo
w
Investors understand that their principal will be at very high risk
Fund Benchmark
SECTOR ALLOCATION (%)
Portfolio Turnover:
Tracking Error:
83.39%
1.80%
13.23 10.83 9.51 8.30 7.10 6.80 4.864.62
4.213.64
26.90
IT - Software Telecom - Services Capital Markets Chemicals & Petrochemicals Textiles & Apparels Power
Leisure Services Aerospace & Defense Finance Realty REST

Investment Objective
Ratios
Available PlanRegular Plan
Minimum Investment AmountThrough Exchange:1 Unit,Through AMC: 10000 Units,
The investment objective of the scheme is to provide returns before expenses that closely correspond to the total returns of stocks as represented by the Nifty 50 Value 20 Index, subject to tracking errors.
Total Expense Ratio**
Load StructureEntry Load: Nil. (applicable for all plans)
Ideal Investment Horizon: 5 years and above
Exit Load: Nil (applicable for all plans)
Regular: 0.14%
7
Portfolio Turnover:
Tracking Error:
28.17%
0.90%
KOTAK NIFTY 50 VALUE 20 ETF
An open-ended scheme replicating/ tracking nifty 50 Value 20 indexNSE Symbol - KOTAKNV20
Fund Manager: Mr. Devender Singhal &
AAUM: `33.21 crs
Allotment date: December 2, 2015
AUM: `33.62 crs
Mr. Satish Dondapati*
Benchmark: Nifty50 Value 20 TRI
Folio count: 10,669
PORTFOLIO
Kotak Nifty 50 Value 20 ETF IDCW NAV as on June 30, 2022: ̀ 88.9149*For Fund Manager experience, please refer page 78-80. **Total Expense Ratio includes applicable B30 fee and GST. For scheme performance, please refer page no 69-77.
Data as on June 30, 2022
63
ITC Ltd. Diversified FMCG 11.64
Equity & Equity related
Power Grid Corporation
Infosys Ltd. IT - Software 14.87
Services Ltd. IT - Software 14.79
Tech Mahindra Ltd. IT - Software 3.08
Wipro Ltd. IT - Software 3.00
Hindustan Unilever Ltd. Diversified FMCG 9.69
National Thermal Power
Larsen And Toubro Ltd. Construction 9.16
HCL Technologies Ltd. IT - Software 5.01
Of India Ltd. Power 3.52
Corporation Limited Power 3.30
Corporation Ltd. Oil 2.88
Oil & Natural Gas
Tata Consultancy
JSW Steel Ltd. Ferrous Metals 2.66
Grasim Industries Ltd. Cement &
Cement Products 2.41
Hindalco Industries Ltd Non - Ferrous Metals 2.41
Bajaj Auto Ltd. Automobiles 2.35
Corporation Ltd. Petroleum Products 1.43
UPL Ltd Fertilizers & Agrochemicals 1.66
Grand Total 100.00
Hero MotoCorp Ltd. Automobiles 1.72
Britannia Industries Ltd. Food Products 1.99
Coal India Ltd. Consumable Fuels 1.89
Bharat Petroleum
(Liabilities) 0.54
Related - Total 99.46
Equity & Equity
Net Current Assets/
• Long term capital growth
• Investment in stocks comprising the underlying index and endeavours to track the benchmark index.
This product is suitable for investors who are seeking*:
* Investors should consult their financial advisors if in doubt about whether the product is suitable for them.
Product Label as on 30th June, 2022
Low High
Low
to
Moder
ate
ModerateModeratelyHigh
High
Very H
ighLo
w
Investors understand that their principal will be at very high risk
Low High
Low
to
Moder
ate
ModerateModeratelyHigh
High
Very H
ighLo
w
Investors understand that their principal will be at very high risk
Fund Benchmark
Issuer/Instrument Industry/Rating % to Net Assets Issuer/Instrument Industry/Rating % to Net Assets
SECTOR ALLOCATION (%)
40.75 21.33 9.16 6.82 4.072.88
2.662.41
2.411.99
5.52
IT - Software Diversified FMCG Construction Power Automobiles Oil Ferrous Metals
Cement & Cement Products Non - Ferrous Metals Food Products REST

7
Regular: 0.28%
Investment Objective
Through Exchange:1 Unit,
The investment objective of the scheme is to provide returns before expenses that closely correspond to the total returns of the BSE SENSEX subject to tracking errors. H o w e v e r, t h e re i s n o a s s u r a n c e or guarantee that the investment objective .of the scheme will be achieved.
Regular Plan Available Plan
Load Structure
Exit Load: Nil (applicable for all plans)
Ratios
Minimum Investment Amount
Through AMC: 10000 Units,
Entry Load: Nil. (applicable for all plans)
Ideal Investment Horizon: 5 years and above
Total Expense Ratio**
Portfolio Turnover:
Tracking Error:
12.84%
0.10%
Bank Ltd. Banks 3.62
Reliance Industries Ltd. Petroleum Products 14.88
Equity & Equity related
HDFC Bank Ltd. Banks 9.83
Infosys Ltd. IT - Software 8.89
ICICI Bank Ltd. Banks 8.17
HDFC Ltd. Finance 6.52
Tata Consultancy
Services Ltd. IT - Software 5.56
ITC Ltd. Diversified FMCG 3.98
Kotak Mahindra
Hindustan Unilever Ltd. Diversified FMCG 3.31
Larsen And Toubro Ltd. Construction 3.13
State Bank Of India Banks 2.97
Axis Bank Ltd. Banks 2.89
Maruti Suzuki India Limited Automobiles 1.87
Bharti Airtel Ltd Telecom - Services 2.75
Asian Paints Ltd. Consumer Durables 2.02
Bajaj Finance Ltd. Finance 2.39
Mahindra & Mahindra Ltd. Automobiles 1.74
HCL Technologies Ltd. IT - Software 1.76
Biotechnology 1.49
Nestle India Ltd. Food Products 1.04
Biotechnology 0.89
Related - Total 99.55
Wipro Ltd. IT - Software 1.02
Power Grid Corporation
Sun Pharmaceuticals
Of India Ltd. Power 1.20
Corporation Limited Power 1.13
Ultratech Cement Ltd. Cement & Cement Products 1.08
Tech Mahindra Ltd. IT - Software 1.03
Tata Steel Ltd. Ferrous Metals 1.14
Titan Company Ltd. Consumer Durables 1.35
Dr Reddys Laboratories Ltd. Pharmaceuticals &
IndusInd Bank Ltd. Banks 0.80
National Thermal Power
Grand Total 100.00
Net Current Assets/(Liabilities) 0.45
Equity & Equity
Bajaj Finserv Ltd. Finance 1.10
Industries Ltd. Pharmaceuticals &
KOTAK S&P BSE SENSEX ETF
An open-ended scheme replicating/ tracking S&P BSE sensex indexNSE Symbol - KTKSENSEXBSE Scrip Code - 532985
PORTFOLIO
AUM: `19.68 crs
Fund Manager: Mr. Devender Singhal &
Benchmark: S&P BSE SENSEX TRI
Mr. Satish Dondapati*
AAUM: `19.84 crs
Allotment date: June 6, 2008
Folio count: 1,389
Kotak S&P BSE Sensex ETF NAV as on June 30, 2022: ̀ 558.8566*For Fund Manager experience, please refer page 78-80. **Total Expense Ratio includes applicable B30 fee and GST. For scheme performance, please refer page no 69-77. For last three IDCW, please refer page no 81-83.
Data as on June 30, 2022
64
Issuer/Instrument Industry/Rating % to Net Assets Issuer/Instrument Industry/Rating % to Net Assets
This product is suitable for investors who are seeking*:
* Investors should consult their financial advisors if in doubt about whether the product is suitable for them.
• Investment in stocks comprising the underlying index and endeavours to track the benchmark index
• Long term capital growth
Product Label as on 30th June, 2022
Low High
Low
to
Moder
ate
ModerateModeratelyHigh
High
Very H
ighLo
w
Investors understand that their principal will be at very high risk
Low High
Low
to
Moder
ate
ModerateModeratelyHigh
High
Very H
ighLo
w
Investors understand that their principal will be at very high risk
Fund Benchmark
SECTOR ALLOCATION (%)
28.28 18.26 14.88 10.01 7.29
3.61
3.37
3.13
2.75
2.38
6.04
Banks IT - Software Petroleum Products Finance Diversified FMCG Automobiles Consumer Durables
Construction Telecom - Services Pharmaceuticals & Biotechnology REST

65
Scheme has not completed 6 months since inception *For Fund Manager experience, please refer page 78-80. **Total Expense Ratio includes applicable B30 fee and GST. Kotak Nifty Midcap 50 ETF NAV as on June 30, 2022: ̀ 73.3530 (Reg-Plan-IDCW),
Available Plans/Options
The investment objective of the scheme is to replicate the composition of the NIFTY Midcap 50 Index and to generate returns tha t a re commensura te w i th the performance of the NIFTY Midcap 50 Index, subject to tracking errors. However, there is no assurance or guarantee that the investment objective of the scheme will be achieved.
Investment Objective
Regular Plan
Ratios
Minimum Investment Amount
Load Structure
Exit Load: Nil (applicable for all plans)
Through Exchange:1 Unit,
Total Expense Ratio**Regular: 0.15%
Data as on June 30, 2022
Through AMC: 35000 Units and multiple thereof, Ideal Investment Horizon: 5 years and....... above
Entry Load: Nil. (applicable for all plans)
KOTAK NIFTY MIDCAP 50 ETF
An open ended scheme replicating/tracking NIFTY Midcap 50 IndexNSE Symbol - KOTAKMID50
AUM: `4.30 crs
Fund Manager: Mr. Devender Singhal
AAUM: `4.32 crs
Folio count: 1,753
Mr. Satish Dondapati
Benchmark: Nifty Midcap 50
Allotment date: January 28, 2022
Mr. Abhishek Bisen*
(Total Return Index)
PORTFOLIO
Issuer/Instrument Industry/Rating % to Net Assets Issuer/Instrument Industry/Rating % to Net Assets
• Investment in stocks Comprising the underlying index and endeavours to track the benchmark index
This product is suitable for investors who are seeking*:
• Long term capital appreciation.
* Investors should consult their financial advisors if in doubt about whether the product is suitable for them.
Product Label as on 30th June, 2022
Low High
Low
to
Moder
ate
ModerateModeratelyHigh
High
Very H
ighLo
w
Investors understand that their principal will be at very high risk
Low High
Low
to
Moder
ate
ModerateModeratelyHigh
High
Very H
ighLo
w
Investors understand that their principal will be at very high risk
Fund Benchmark
SECTOR ALLOCATION (%)
Power Finance Corporation Ltd. 1.68
Equity & Equity related
Banks 9.17
Federal Bank Ltd. 2.50
Finance 10.34
Shriram Transport Finance Co Ltd. 3.56
Rural Electrification
Corporation Ltd 1.59
Mahindra & Mahindra
Financial Services Ltd. 1.44
LIC Housing Finance Ltd. 1.37
L&T Finance Holdings Ltd 0.70
AU Small Finance Bank Ltd. 3.62
IDFC First Bank Limited 1.36
Industrial Products 6.28
Astral Ltd. 2.03
Cummins India Ltd. 1.93
Aerospace & Defense 5.93
Hindustan Aeronautics Ltd. 2.05
Power 5.80
Tata Power Co. Ltd. 4.75
Canara Bank 1.69
Bharat Forge Ltd. 2.32
Torrent Power Ltd 1.05
Pharmaceuticals &
Biotechnology 5.44
Alkem Laboratories Ltd. 2.04
Bharat Electronics Ltd. 3.88
Aurobindo Pharma Ltd. 2
Abbott India Ltd. 1.40
IT - Software 5.42
Construction Vehicles 4.38
Coforge Limited 1.79
Auto Components 4.40
MRF Limited 1.98
Mphasis Ltd 2.63
Software Ltd 1
Bata India Ltd. 1.40
Agricultural, Commercial &
Escorts Ltd. 1.43
Ashok Leyland Ltd. 2.95
Voltas Ltd. 3.12
Balkrishna Industries Ltd. 2.42
Consumer Durables 4.52
Oracle Financial Services
Retailing 3.34
Vodafone Idea Ltd 0.94
Tata Communications Ltd. 1.48
Godrej Properties Limited 1.92
Telecom - Services 2.42
United Breweries Ltd. 1.44
Hindustan Petroleum
Related - Total 99.66
Bharat Heavy Electricals Ltd. 0.80
of India Ltd. 2.26
Indian Railway Catering And
Insurance 2.36
Corporation Ltd 1.92
Petroleum Products 1.92
Realty 1.92
Net Current Assets/
Max Financial Services Ltd. 2.36
IT - Services 1.16
Honeywell Automation India Ltd. 1.02
Grand Total 100.00
Industrial Manufacturing 1.02
Ferrous Metals 1.86
Cement & Cement Products 1.13
L&T Technology Services Ltd 1.16
Transport Services 2.26
Jindal Steel & Power Ltd. 1.86
Beverages 1.44
Equity & Equity
Container Corporation
The Ramco Cements Ltd 1.13
Tourism Corporation Ltd. 2.11
Leisure Services 2.11
(Liabilities) 0.34
Gas 3.26
Entertainment 3.30
Gujarat Gas Ltd. 1.00
TVS Motors Company Ltd 2.72
Electrical Equipment 2.49
ABB India Ltd 1.69
Page Industries Ltd 3.27
Trent Ltd 3.34
Zee Entertainment Enterprises Ltd 2.74
Sun TV Network Ltd. 0.56
Textiles & Apparels 3.27
Petronet LNG Ltd. 2.26
Automobiles 2.72
Portfolio Turnover: 241.96%
Tracking Error: 0.32%
Portfolio Turnover: 216.39%
10.34 9.17 6.28 5.93 5.80 5.44 5.42 4.52 4.40 4.38 38.32
Finance Banks Industrial Products Aerospace & Defense Power Pharmaceuticals & Biotechnology
IT - Software Consumer Durables Auto Components Equities REST

66
*For Fund Manager experience, please refer page 78-80. **Total Expense Ratio includes applicable B30 fee and GST. Kotak Nifty100 Low Volatility 30 ETF Fund NAV as on June 30, 2022: ̀ 12.0867 (Reg-Plan-IDCW),
Scheme has not completed 6 months since inception
Ideal Investments Horizon: 5 years & above
Available Plans/Options
Trustee’s Discretion
Ratios
Investment Objective
Minimum Investment Amount
Through AMC: 2,00,000 Units
A) Regular Plan
The investment objective of the scheme is to replicate the composition of the NIFTY 100 Low Volatility 30 Index and to generate returns that are commensurate with the performance of the NIFTY 100 Low Volatility 30 Index, subject to tracking errors. However, there is no assurance that the objective of the scheme will be realized.
IDCW Frequency
Through Exchange: 1 Unit,
Exit Load: Nil (applicable for all plans)
Load StructureEntry Load: Nil. (applicable for all plans)
Regular: 0.30%
Data as on June 30, 2022
Total Expense Ratio**
KOTAK NIFTY 100 LOW VOLATILITY 30 ETF
An open ended scheme replicating/tracking NIFTY 100 Low Volatility 30 Index FundNSE Symbol - KOTAKLOVOL
Folio count: 1,255
Mr. Satish Dondapati*
AAUM: `1.31 crs
AUM: `1.70 crs
Benchmark: NIFTY 100 Low
Volatility 30 Index
(Total Return Index)
Allotment date: March 23, 2022
Fund Manager: Mr. Devender Singhal PORTFOLIO
Issuer/Instrument Industry/Rating % to Net Assets Issuer/Instrument Industry/Rating % to Net Assets
* Investors should consult their financial advisors if in doubt about whether the product is suitable for them.
• Long term capital appreciation.
• Investment in stocks Comprising the underlying index and endeavours to track the benchmark index
This product is suitable for investors who are seeking*:
Product Label as on 30th June, 2022
Low High
Low
to
Moder
ate
ModerateModeratelyHigh
High
Very H
ighLo
w
Investors understand that their principal will be at very high risk
Low High
Low
to
Moder
ate
ModerateModeratelyHigh
High
Very H
ighLo
w
Investors understand that their principal will be at very high risk
Fund Benchmark
SECTOR ALLOCATION (%)
Pharmaceuticals &
Dr Reddys Laboratories Ltd. 3.43
Reliance Industries Ltd. 3.35
Personal Products 8.81
Equity & Equity related
Bajaj Auto Ltd. 3.57
Marico Ltd. 2.97
Biotechnology 6.95
Food Products 8.62
Infosys Ltd. 3.39
ITC Ltd. 3.43
Hero MotoCorp Ltd. 3.24
Tech Mahindra Ltd. 2.65
IT - Software 15.99
HCL Technologies Ltd. 3.12
Wipro Ltd. 3.01
Petroleum Products 6.82
Diversified FMCG 7.10
Colgate Palmolive (India ) Ltd. 2.95
Tata Consultancy Services Ltd. 3.82
Dabur India Ltd. 2.89
Nestle India Ltd. 4.51
Britannia Industries Ltd. 4.11
Hindustan Unilever Ltd. 3.67
Cipla Ltd. 3.52
Indian Oil Corporation Ltd 3.47
Automobiles 6.81
Banks 6.52
Ultratech Cement Ltd. 3.36
Of India Ltd. 3.12
Asian Paints Ltd. 3.01
National Thermal Power
Corporation Limited 3.15
HDFC Bank Ltd. 3.41
HDFC Life Insurance Company Ltd. 3.14
Insurance 6.50
Kotak Mahindra Bank Ltd. 3.11
ACC Ltd. 3.09
Cement & Cement Products 6.45
SBI Life Insurance Company Ltd 3.36
Power 6.27
Power Grid Corporation
Consumer Durables 5.85
Berger Paints (I) Ltd. 2.84
Construction 3.46
Larsen And Toubro Ltd. 3.46
Pidilite Industries Ltd. 3.35
Equity & Equity
Related - Total 99.50
Net Current Assets/
(Liabilities) -5.37
Grand Total 100.00
Chemicals & Petrochemicals 3.35
Triparty Repo 5.87
Portfolio Turnover: 537.53%
15.99 8.81 8.62 7.10 6.95 6.82 6.81 6.52 6.50 6.45 19.43
IT - Software Personal Products Food Products Diversified FMCG Pharmaceuticals & Biotechnology
Petroleum Products Automobiles Banks Insurance Cement & Cement Products REST

Available Plans/Options
The investment objective of the scheme is to replicate the composition of the Nifty 50 and to generate returns that are commensurate with the performance of the NIFTY 50 Index, subject to tracking errors.
Minimum Investment Amount
Load Structure
Ideal Investments Horizon: 5 years & above
Ratios
Initial Purchase: `100 and in multiple of `1 for purchase and of ̀ 0.01 for switches
Total Expense Ratio**
Exit Load: Nil (applicable for all plans)Entry Load: Nil. (applicable for all plans)
However, there is no assurance that the objective of the scheme will be realised.
IDCW & Growth (applicable for all plans)
Investment Objective
Regular: 0.51%; Direct: 0.18%
Options: Payout of IDCW, Reinvestment of
A) Regular Plan B) Direct Plan
Additional Investment: `100 & in multiples of ̀ 1for purchases and ̀ 0.01 for switches
7
Portfolio Turnover: 16.05%
KOTAK NIFTY 50 INDEX FUND
An open ended scheme replicating/tracking the NIFTY 50 Index
Mr. Satish Dondapati
Mr. Abhishek Bisen*
AAUM: `196.14 crs
AUM: `204.37 crs
Benchmark: Nifty 50 Index TRI
Fund Manager: Mr. Devender Singhal
(Total Return Index)
Allotment date: June 21, 2021
Folio count: 50,555
PORTFOLIO
Kotak Nifty 50 Index Fund NAV as on June 30, 2022: ̀ 10.0850 (Reg-Plan-IDCW), ̀ 10.1190 (Dir-Plan-IDCW), ̀ 10.0850 (Growth Option), ̀ 10.1190 (Direct Growth Option)*For Fund Manager experience, please refer page 78-80. **Total Expense Ratio includes applicable B30 fee and GST. For scheme performance, please refer page no 69-77.
Data as on June 30, 2022
67
Kotak Mahindra Bank Ltd. Banks 3.50
Infosys Ltd. IT - Software 7.66
ICICI Bank Ltd. Banks 7.05
HDFC Ltd. Finance 5.63
Reliance Industries Ltd. Petroleum Products 12.83
Equity & Equity related
HDFC Bank Ltd. Banks 8.47
Tata Consultancy Services Ltd. IT - Software 4.85
ITC Ltd. Diversified FMCG 3.43
Hindustan Unilever Ltd. Diversified FMCG 2.85
Equity & Equity
Related - Total 99.24
Triparty Repo 0.69
Net Current Assets/
Grand Total 100.00
Rest 40.27
(Liabilities) 0.07
Larsen And Toubro Ltd. Construction 2.70
Issuer/Instrument Industry/Rating % to Net Assets Issuer/Instrument Industry/Rating % to Net Assets
• Long term capital growth
* Investors should consult their financial advisors if in doubt about whether the product is suitable for them.
This product is suitable for investors who are seeking*:
• Returns that are commensurate with the performance of NIFTY 50 Index, subject to tracking error.
Product Label as on 30th June, 2022
Low High
Low
to
Moder
ate
ModerateModeratelyHigh
High
Very H
ighLo
w
Investors understand that their principal will be at very high risk
Low High
Low
to
Moder
ate
ModerateModeratelyHigh
High
Very H
ighLo
w
Investors understand that their principal will be at very high risk
Fund Benchmark
SECTOR ALLOCATION (%)
24.75 15.78 13.25 8.64 6.28
5.93
3.41
2.90
2.70
2.42
13.94
Banks IT - Software Petroleum Products Finance Diversified FMCG Automobiles Pharmaceuticals & Biotechnology
Consumer Durables Construction Telecom - Services REST
Tracking Error: 0.55%
For detailed portfolio log on to: https://www.kotakmf.com/Products/funds/index-funds/Kotak-Nifty-50-Index-Fund/Reg-G

Exit Load: Nil (applicable for all plans)
Regular: 0.83%; Direct: 0.31%
Investment Objective
Ratios
A) Regular Plan B) Direct Plan
Additional Investment: `1000 & in multiples of `1for purchases and `0.01 for switches
IDCW & Growth (applicable for all plans)
Ideal Investments Horizon: 5 years & above
The investment objective of the scheme is to replicate the composition of the Nifty Next 50 and to generate returns that are commensurate with the performance of the NIFTY Next 50 Index, subject to tracking errors.However, there is no assurance that the objective of the scheme will be realized.
Initial Investment: `5000 and in multiple of `1 for purchase and of ̀ 0.01 for switches
Load Structure
Available Plans/Options
Options: Payout of IDCW, Reinvestment of
Entry Load: Nil. (applicable for all plans)
Minimum Investment Amount
Total Expense Ratio**
7
Portfolio Turnover: 56.74%
KOTAK NIFTY NEXT 50 INDEX FUND
An open ended scheme replicating/tracking the NIFTY Next 50 Index
Fund Manager: Mr. Devender Singhal &
AAUM: `91.79 crs
Allotment date: March 10, 2021
Mr. Satish Dondapati*
AUM: `92.10 crs
Index TRI
Benchmark: Nifty Next 50
Folio count: 9,644
PORTFOLIO
Kotak Nifty Next 50 Index Fund NAV as on June 30, 2022: ̀ 10.3893 (Reg-Plan-IDCW), ̀ 10.4616 (Dir-Plan-IDCW), ̀ 10.3891 (Growth Option), ̀ 10.4617 (Direct Growth Option)*For Fund Manager experience, please refer page 78-80. **Total Expense Ratio includes applicable B30 fee and GST. For scheme performance, please refer page no 69-77.
Data as on June 30, 2022
68
Trading 5.84
Equity & Equity related
Petrochemicals 3.19
Adani Green Energy Ltd. Power 4.01
SRF Ltd. Chemicals &
Info Edge (India) Ltd. Retailing 2.83
Pidilite Industries Ltd. Chemicals &
Adani Transmission Ltd Power 4.11
Avenue Supermarts Ltd. Retailing 3.03
Adani Enterprises Ltd. Metals & Minerals
Petrochemicals 3.10
Grand Total 100.00
Godrej Consumer Products Ltd. Personal Products 2.79
ICICI Lombard General
Insurance Company Ltd Insurance 2.79
Equity & Equity
Triparty Repo 0.87
Net Current Assets/
Rest 64.67
(Liabilities) -0.05
Related - Total 99.18
Dabur India Ltd. Personal Products 2.82
Issuer/Instrument Industry/Rating % to Net Assets Issuer/Instrument Industry/Rating % to Net Assets
* Investors should consult their financial advisors if in doubt about whether the product is suitable for them.
• Returns that are commensurate with the performance of NIFTY Next 50 Index, subject to tracking error.
• Long term capital growth
This product is suitable for investors who are seeking*:
Product Label as on 30th June, 2022
Low High
Low
to
Moder
ate
ModerateModeratelyHigh
High
Very H
ighLo
w
Investors understand that their principal will be at very high risk
Low High
Low
to
Moder
ate
ModerateModeratelyHigh
High
Very H
ighLo
w
Investors understand that their principal will be at very high risk
Fund Benchmark
SECTOR ALLOCATION (%)
Portfolio Turnover: 66.30%
Tracking Error: 0.75% Tracking Error: 0.71%
10.70 8.82 8.12 6.80 6.29 5.91 5.84 4.64 4.35 4.35 34.18
Personal Products Finance Power Retailing Chemicals & Petrochemicals Pharmaceuticals & Biotechnology
Metals & Minerals Trading Insurance Banks Cement & Cement Products REST
For detailed portfolio log on to: https://www.kotakmf.com/Products/funds/index-funds/Kotak-Nifty-Next-50-Index-Fund/Reg-G

4569
Scheme Performances as on June 30, 2022
Past performance may or may not be sustained in future. All payouts during the period have been reinvested in the units of the scheme at the then prevailing NAV. Returns >= 1 year: CAGR (Compounded Annualised Growth Rate). N.A stands for data not available. Note: Point to Point (PTP) Returns in INR shows the value of 10,000/- investment made at inception. Source: ICRA MFI Explorer. # Name of Scheme Benchmark. ## Name of Additional Benchmark.
Scheme Inception date is 09/09/2004. Mr. Harsha Upadhyaya has been managing the fund since 04/08/2012.
TRI - Total Return Index, In terms of SEBI circular dated January 4, 2018, the performance of the scheme is benchmarked to the Total Return variant (TRI) of the Benchmark Index instead of Price Return Variant (PRI). Alpha is difference of scheme return with benchmark return.
Different plans have different expense structure. The performance details provided herein are of regular plan
Kotak Equity Opportunities Fund - Growth
Different plans have different expense structure. The performance details provided herein are of regular plan
TRI - Total Return Index, In terms of SEBI circular dated January 4, 2018, the performance of the scheme is benchmarked to the Total Return variant (TRI) of the Benchmark Index instead of Price Return Variant (PRI). Alpha is difference of scheme return with benchmark return.
Scheme Inception date is 11/09/2009. Mr. Harsha Upadhyaya has been managing the fund since 04/08/2012.
Past performance may or may not be sustained in future. All payouts during the period have been reinvested in the units of the scheme at the then prevailing NAV. Returns >= 1 year: CAGR (Compounded Annualised Growth Rate). N.A stands for data not available. Note: Point to Point (PTP) Returns in INR shows the value of 10,000/- investment made at inception. Source: ICRA MFI Explorer. # Name of Scheme Benchmark. ## Name of Additional Benchmark.
Kotak Flexicap Fund - Growth
Kotak Flexicap Fund - Growth
Kotak Flexicap Fund - Growth
Nifty 500 TRI # (Tier 1)
Nifty 200 TRI # (Tier 2)
Nifty 500 TRI # (Tier 1)
Nifty 50 TRI##
9.03% 12.77% -3.73% 12.06% -3.02% 11.55% 12,971 14,353 14,084 13,891
9.26% 11.23% -1.98% 11.32% -2.06% 12.03% 15,572 17,034 17,096 17,653
12.86% 11.33% 1.54% 11.20% 1.66% 11.02% 47,102 39,518 38,941 38,141
-2.93% 0.56% -3.49% 0.82% -3.75% 1.66% 9,707 10,056 10,082 10,166
Since Inception
Last 1 Year
Last 5 Years
Last 3 Years
ALPHA(Tier 1)
Past performance may or may not be sustained in future. All payouts during the period have been reinvested in the units of the scheme at the then prevailing NAV. Returns >= 1 year: CAGR (Compounded Annualised Growth Rate). N.A stands for data not available. Note: Point to Point (PTP) Returns in INR shows the value of 10,000/- investment made at inception. Source: ICRA MFI Explorer. # Name of Scheme Benchmark. ## Name of Additional Benchmark. TRI - Total Return Index, In terms of SEBI circular dated January 4, 2018, the performance of the scheme is benchmarked to the Total Return variant (TRI) of the Benchmark Index instead of Price Return Variant (PRI). Alpha is difference of scheme return with benchmark return.
Different plans have different expense structure. The performance details provided herein are of regular plan Scheme Inception date is 30/03/2007. Mr. Pankaj Tibrewal has been managing the fund since 27/05/2010.
Kotak Emerging Equity Fund - Growth
ALPHA(Tier 2)
Nifty 50 TRI ##
Nifty 200 TRI # (Tier 2)
Kotak Emerging Equity Fund -
Growth
Kotak Emerging Equity Fund -
Growth NIFTY Midcap
150 TRI # (Tier 1) Nifty Midcap
100 TRI # (Tier 2) NIFTY Midcap
150 TRI # (Tier 1) Nifty 50
TRI##ALPHA(Tier 1)
ALPHA(Tier 2)
Nifty 50 TRI ##
Nifty Midcap 100 TRI # (Tier 2)
Kotak Equity Opportunities Fund - Growth
Kotak Equity Opportunities Fund - Growth
NIFTY Large Midcap 250
TRI # (Tier 1) Nifty 200
TRI # (Tier 2)
NIFTY Large Midcap 250 TRI # (Tier 1)
Nifty 50 TRI##
ALPHA(Tier 1)
ALPHA(Tier 2)
Nifty 50 TRI ##
Nifty 200 TRI # (Tier 2)
13.12% 13.83% -0.72% 13.13% -0.01% 11.06% 65,625 72,259 65,749 49,565
0.94% -0.38% 1.32% -0.84% 1.78% 1.66% 10,094 9,962 9,916 10,166
18.83% 17.64% 1.20% 15.59% 3.25% 11.55% 16,804 16,300 15,460 13,891
12.60% 11.99% 0.61% 9.42% 3.18% 12.03% 18,105 17,622 15,686 17,653
17.56% NA NA 14.82% 2.75% 14.95% 1,78,668 NA 1,17,210 1,19,682
0.06% 0.41% -0.35% 0.82% -0.76% 1.66% 10,006 10,041 10,082 10,166
13.86% 14.67% -0.80% 12.06% 1.81% 11.55% 14,778 15,094 14,084 13,891
10.84% 11.84% -1.00% 11.32% -0.48% 12.03% 16,733 17,502 17,096 17,653
Since Inception
Last 5 Years
Last 1 Year
Last 3 Years
Since Inception
Last 1 Year
Last 5 Years
Last 3 Years
Kotak Small Cap Fund - Growth
Different plans have different expense structure. The performance details provided herein are of regular plan Scheme Inception date is 24/02/2005. Mr. Pankaj Tibrewal has been managing the fund since 21/01/2010.
Past performance may or may not be sustained in future. All payouts during the period have been reinvested in the units of the scheme at the then prevailing NAV. Returns >= 1 year: CAGR (Compounded Annualised Growth Rate). N.A stands for data not available. Note: Point to Point (PTP) Returns in INR shows the value of 10,000/- investment made at inception. Source: ICRA MFI Explorer. # Name of Scheme Benchmark. ## Name of Additional Benchmark. TRI - Total Return Index, In terms of SEBI circular dated January 4, 2018, the performance of the scheme is benchmarked to the Total Return variant (TRI) of the Benchmark Index instead of Price Return Variant (PRI). Alpha is difference of scheme return with benchmark return.
Kotak Smallcap Fund - Growth
Kotak Smallcap Fund - Growth
NIFTY Smallcap 250 TRI # (Tier 1)
NIFTY Smallcap 100 TRI # (Tier 2)
NIFTY Smallcap 250 TRI # (Tier 1)
Nifty 50 TRI ##
ALPHA(Tier 1)
ALPHA(Tier 2)
Nifty 50 TRI ##
NIFTY Smallcap 100 TRI # (Tier 2)
5.08% -3.36% 8.43% -12.37% 17.44% 1.66% 10,508 9,664 8,763 10,166
15.30% 7.27% 8.04% 3.99% 11.32% 12.03% 20,387 14,204 12,160 17,653
16.77% NA NA 12.08% 4.69% 13.88% 1,47,456 NA 72,409 95,440
27.27% 17.52% 9.75% 12.03% 15.24% 11.55% 20,657 16,253 14,073 13,891
Last 1 Year
Last 5 Years
Last 3 Years
Since Inception
Kotak Bluechip Fund - Growth
Since Inception date of Kotak Bluechip Fund- Dividend plan is 29/12/1998. Alpha is difference of scheme return with benchmark return.
Since inception date of Kotak Bluechip Fund - Reg Growth is 04/02/2003. Mr. Harish Krishnan has been managing the fund since 01/01/2014 Different plans have different expense structure. The performance details provided herein are of regular plan Past performance may or may not be sustained in future. All payouts during the period have been reinvested in the units of the scheme at the then prevailing NAV. Returns >= 1 year: CAGR (Compounded Annualised Growth Rate). N.A stands for data not available. Note: Point to Point (PTP) Returns in INR shows the value of 10,000/- investment made at inception. Source: ICRA MFI Explorer. # Name of Scheme Benchmark. ## Name of Additional Benchmark. TRI - Total Return Index, In terms of SEBI circular dated January 4, 2018, the performance of the scheme is benchmarked to the Total Return variant (TRI) of the Benchmark Index instead of Price Return Variant (PRI).
Kotak Bluechip Fund - Growth
Kotak Bluechip Fund - Growth
Nifty 100 TRI # (Tier 1)
Nifty 50 TRI # (Tier 2)
Nifty 100 TRI # (Tier 1)
S&P BSE SENSEX TRI ##
ALPHA(Tier 1)
ALPHA(Tier 2)
S&P BSE SENSEX TRI ##
Nifty 50 TRI # (Tier 2)
12.29% 11.57% 0.72% 11.55% 0.74% 11.69% 14,171 13,899 13,891 13,944
10.38% 11.48% -1.10% 12.03% -1.65% 12.71% 16,393 17,224 17,653 18,194
18.72% 17.16% 1.56% 16.54% 2.18% 17.13% 2,79,760 2,16,264 1,95,253 2,15,178
-1.38% 1.08% -2.46% 1.66% -3.04% 2.22% 9,862 10,108 10,166 10,222
Last 5 Years
Since Inception
Last 1 Year
Last 3 Years

70
Kotak Tax Saver Fund - GrowthKotak Tax SaverFund - Growth
Nifty 500 TRI# Nifty 50 TRI## Nifty 500 TRI# Nifty 50 TRI##
Scheme Inception date is 23/11/2005. Mr. Harsha Upadhyaya has been managing the fund since 25/08/2015. Different plans have different expense structure. The performance details provided herein are of regular plan Past performance may or may not be sustained in future. All payouts during the period have been reinvested in the units of the scheme at the then prevailing NAV. Returns >= 1 year: CAGR (Compounded Annualised Growth Rate). N.A stands for data not available. Note: Point to Point (PTP) Returns in INR shows the value of 10,000/- investment made at inception. Source: ICRA MFI Explorer. # Name of Scheme Benchmark. ## Name of Additional Benchmark. TRI - Total Return Index, In terms of SEBI circular dated January 4, 2018, the performance of the scheme is benchmarked to the Total Return variant (TRI) of the Benchmark Index instead of Price Return Variant (PRI). Alpha is difference of scheme return with benchmark return.
ALPHA Kotak Tax SaverFund - Growth
11.94% 12.66% -0.72% 12.82% 65,115 72,464 74,213
0.18% 0.56% -0.38% 1.66% 10,018 10,056 10,166
12.50% 12.77% -0.27% 11.55% 14,252 14,353 13,891
10.94% 11.23% -0.29% 12.03% 16,812 17,034 17,653
Last 3 Years
Last 5 Years
Since Inception
Last 1 Year
Different plans have different expense structure. The performance details provided herein are of regular plan Past performance may or may not be sustained in future. All payouts during the period have been reinvested in the units of the scheme at the then prevailing NAV. Returns >= 1 year: CAGR (Compounded Annualised Growth Rate). N.A stands for data not available. Note: Point to Point (PTP) Returns in INR shows the value of 10,000/- investment made at inception. Source: ICRA MFI Explorer. # Name of Scheme Benchmark. ## Name of Additional Benchmark. TRI - Total Return Index, In terms of SEBI circular dated January 4, 2018, the performance of the scheme is benchmarked to the Total Return variant (TRI) of the Benchmark Index instead of Price Return Variant (PRI). Alpha is difference of scheme return with benchmark return.
Scheme Inception date is 27/07/2005. Ms. Shibani Kurian has been managing the fund since 09/05/2019.
Kotak India EQ Contra Fund - GrowthKotak India EQ
Contra Fund - Growth
Kotak India EQ Contra Fund
- Growth Nifty 500
TRI # (Tier 1) Nifty 100
TRI # (Tier 2) Nifty 500
TRI # (Tier 1) Nifty 50
TRI##ALPHA(Tier 1)
ALPHA(Tier 2)
Nifty 50 TRI ##
Nifty 100 TRI # (Tier 2)
-0.77% 0.56% -1.33% 1.08% -1.85% 1.66% 9,923 10,056 10,108 10,166
12.15% 12.77% -0.62% 11.57% 0.58% 11.55% 14,119 14,353 13,899 13,891
12.34% 11.23% 1.10% 11.48% 0.86% 12.03% 17,897 17,034 17,224 17,653
12.64% 13.12% -0.48% 13.56% -0.92% 13.39% 75,115 80,745 86,232 83,956
Last 1 Year
Last 5 Years
Since Inception
Last 3 Years
Kotak Multicap Fund - Growth
Kotak Multicap Fund -Growth
Nifty 50 TRI ## Nifty 50 TRI ##
Scheme Inception date is 29/09/2021. Mr. Harsha Upadhyaya, Mr. Devender Singhal & Mr. Abhishek Bisen has been managing the fund since 29/09/2021.
Alpha is difference of scheme return with benchmark return.
Different plans have different expense structure. The performance details provided herein are of regular plan Past performance may or may not be sustained in future. All payouts during the period have been reinvested in the units of the scheme at the then prevailing NAV. Simple annualized returns have been provided as per the extant guidelines since the scheme has completed 6 months but not 1 year. N.A stands for data not available. Note: Point to Point (PTP) Returns in INR shows the value of 10,000/- investment made at inception. Source: ICRA MFI Explorer. # Name of Scheme Benchmark. ## Name of Additional Benchmark. TRI - Total Return Index, In terms of SEBI circular dated January 4, 2018, the performance of the scheme is benchmarked to the Total Return variant (TRI) of the Benchmark Index instead of Price Return Variant (PRI).
Kotak Multicap Fund -Growth
ALPHANifty 500 Multicap50:25:25 TRI #
Nifty 500 Multicap50:25:25 TRI #
-15.12% -14.39% -0.73% -13.33% 8,842 8,899 8,981
-17.45% -24.14% 6.69% -16.84% 9,093 8,719 9,126
Since Inception
Last 6 Months
Kotak Focused Equity Fund - Growth
Different plans have different expense structure. The performance details provided herein are of regular plan Scheme Inception date is 16/07/2019. Mr. Harish Krishnan & Ms. Shibani Kurian has been managing the fund since 16/07/2019.
Past performance may or may not be sustained in future. All payouts during the period have been reinvested in the units of the scheme at the then prevailing NAV. Returns >= 1 year: CAGR (Compounded Annualised Growth Rate). N.A stands for data not available. Note: Point to Point (PTP) Returns in INR shows the value of 10,000/- investment made at inception. Source: ICRA MFI Explorer. # Name of Scheme Benchmark. ## Name of Additional Benchmark. TRI - Total Return Index, In terms of SEBI circular dated January 4, 2018, the performance of the scheme is benchmarked to the Total Return variant (TRI) of the Benchmark Index instead of Price Return Variant (PRI). Alpha is difference of scheme return with benchmark return.
Kotak Focused Equity Fund
- Growth
Kotak Focused Equity Fund
- Growth Nifty 500
TRI # (Tier 1) Nifty 200
TRI # (Tier 2) Nifty 500
TRI # (Tier 1) Nifty 50
TRI##ALPHA(Tier 1)
ALPHA(Tier 2)
Nifty 50 TRI ##
Nifty 200 TRI # (Tier 2)
13.82% 13.47% 0.36% 12.67% 1.15% 12.12% 14,668 14,533 14,233 14,030
-0.01% 0.56% -0.57% 0.82% -0.84% 1.66% 9,999 10,056 10,082 10,166
Since Inception
Last 1 Year
Kotak Pioneer Fund - Growth
Kotak Pioneer FundGrowth
Nifty 50 TRI ## Nifty 50 TRI ##
Scheme Inception date is 31/10/2019. Mr. Harish Krishnan & Mr. Arjun Khanna has been managing the fund since 31/10/2019. Different plans have different expense structure. The performance details provided herein are of regular plan Past performance may or may not be sustained in future. All payouts during the period have been reinvested in the units of the scheme at the then prevailing NAV. Returns >= 1 year: CAGR (Compounded Annualised Growth Rate). N.A stands for data not available. Note: Point to Point (PTP) Returns in INR shows the value of 10,000/- investment made at inception. Source: ICRA MFI Explorer. # Name of Scheme Benchmark. ## Name of Additional Benchmark. TRI - Total Return Index, In terms of SEBI circular dated January 4, 2018, the performance of the scheme is benchmarked to the Total Return variant (TRI) of the Benchmark Index instead of Price Return Variant (PRI). Alpha is difference of scheme return with benchmark return.
Kotak Pioneer FundGrowth
ALPHA85% IISL Kotak India PioneeringInnovations + 15% MSCI ACWI
Information Technology Index TRI #
85% IISL Kotak India PioneeringInnovations + 15% MSCI ACWI
Information Technology Index TRI #
19.12% 15.48% 3.65% 12.53% 15,944 14,676 13,697
-5.58% -0.79% -4.79% 1.66% 9,442 9,921 10,166Last 1 Year
Since Inception
Different plans have different expense structure. The performance details provided herein are of regular plan Scheme Inception date is 11/12/2020. Mr. Harsha Upadhyaya has been managing the fund since 11/12/2020
Past performance may or may not be sustained in future. All payouts during the period have been reinvested in the units of the scheme at the then prevailing NAV. Returns >= 1 year: CAGR (Compounded Annualised Growth Rate). N.A stands for data not available. Note: Point to Point (PTP) Returns in INR shows the value of 10,000/- investment made at inception. Source: ICRA MFI Explorer. # Name of Scheme Benchmark. ## Name of Additional Benchmark. TRI - Total Return Index, In terms of SEBI circular dated January 4, 2018, the performance of the scheme is benchmarked to the Total Return variant (TRI) of the Benchmark Index instead of Price Return Variant (PRI). Alpha is difference of scheme return with benchmark return.
Kotak ESG Opportunities Fund - Growth
Kotak ESGOpportunities Fund -
Growth
Nifty 100ESG Index TRI #
Nifty 50 TRI ## Kotak ESGOpportunities Fund -
Growth
Nifty 100ESG Index TRI #
Nifty 50 TRI ##ALPHA
2.30% 11.71% -9.41% 11.94% 10,359 11,874 11,912
-9.21% -1.77% -7.44% 1.66% 9,079 9,823 10,166Last 1 Year
Since Inception

71
Kotak Balanced Advantage Fund - Growth
Kotak BalancedAdvantage Fund - Growth
Nifty 50 TRI## Nifty 50 TRI##ALPHANIFTY 50 Hybrid
Composite Debt 50:50 Index#Kotak Balanced
Advantage Fund - GrowthNIFTY 50 Hybrid
Composite Debt 50:50 Index#
Past performance may or may not be sustained in future. All payouts during the period have been reinvested in the units of the scheme at the then prevailing NAV. Returns >= 1 year: CAGR (Compounded Annualised Growth Rate). N.A stands for data not available. Note: Point to Point (PTP) Returns in INR shows the value of 10,000/- investment made at inception. Source: ICRA MFI Explorer. # Name of Scheme Benchmark. ## Name of Additional Benchmark. Alpha is difference of scheme return with benchmark return.
Different plans have different expense structure. The performance details provided herein are of regular plan Scheme Inception date is 03/08/2018. Mr. Harish Krishnan and Mr. Abhishek Bisen have been managing the fund since 03/08/2018. Mr. Hiten Shah has been managing the fund since 03/10/2019.
9.15% 9.90% -0.75% 11.55% 13,012 13,284 13,891
8.62% 9.59% -0.97% 10.08% 13,816 14,305 14,559
0.58% 1.71% -1.13% 1.66% 10,058 10,171 10,166
Since Inception
Last 1 Year
Last 3 Years
Kotak Infrastructure and Economic Reform Fund - Growth
Past performance may or may not be sustained in future. All payouts during the period have been reinvested in the units of the scheme at the then prevailing NAV. Returns >= 1 year: CAGR (Compounded Annualised Growth Rate). N.A stands for data not available. Note: Point to Point (PTP) Returns in INR shows the value of 10,000/- investment made at inception. Source: ICRA MFI Explorer. # Name of Scheme Benchmark. ## Name of Additional Benchmark. TRI - Total Return Index, In terms of SEBI circular dated January 4, 2018, the performance of the scheme is benchmarked to the Total Return variant (TRI) of the Benchmark Index instead of Price Return Variant (PRI). Alpha is difference of scheme return with benchmark return
Scheme Inception date is 25/02/2008. Mr. Harish Krishnan has been managing the fund since 01/02/2015. Different plans have different expense structure. The performance details provided herein are of regular plan
Kotak Infrastructure and Economic Reform
Fund - Growth
Kotak Infrastructure and Economic Reform
Fund - Growth
Nifty Infrastructure TRI # (Tier 1)
India Infrastructure Index (Customised
Index by IISL) # (Tier 2)
Nifty Infrastructure TRI # (Tier 1)
Nifty 50 TRI##
ALPHA(Tier 1)
ALPHA(Tier 2)
Nifty 50 TRI ##
India Infrastructure Index (Customised
Index by IISL) # (Tier 2) 8.24% 1.13% 7.11% 3.57% 4.67% 9.35% 31,154 11,746 16,542 36,070
11.77% 8.07% 3.70% 6.61% 5.16% 1.66% 11,177 10,807 10,661 10,166
14.07% 12.97% 1.09% 10.09% 3.98% 11.55% 14,857 14,433 13,353 13,891
9.35% 9.51% -0.17% 7.22% 2.13% 12.03% 15,636 15,757 14,173 17,653Last 5 Years
Last 1 Year
Since Inception
Last 3 Years
Kotak India Growth Fund - Series 4 - Growth
Kotak India Growth Fund- Series 4 - Growth
Nifty 200 TRI# Nifty 50 TRI## Nifty 50 TRI##
Past performance may or may not be sustained in future. All payouts during the period have been reinvested in the units of the scheme at the then prevailing NAV. Returns >= 1 year: CAGR (Compounded Annualised Growth Rate). N.A stands for data not available. Note: Point to Point (PTP) Returns in INR shows the value of 10,000/- investment made at inception. Source: ICRA MFI Explorer. # Name of Scheme Benchmark. ## Name of Additional Benchmark.
Scheme Inception date is 20/02/2018. Mr. Devender Singhal has been managing the fund since 09/05/2019.
Alpha is difference of scheme return with benchmark return.
Different plans have different expense structure. The performance details provided herein are of regular plan
Kotak India Growth Fund- Series 4 - Growth
Nifty 200 TRI#ALPHA
23.43% 12.06% 11.38% 11.55% 18,838 14,084 13,891
14.10% 10.62% 3.48% 11.56% 17,772 15,526 16,111
6.84% 0.82% 6.02% 1.66% 10,684 10,082 10,166
Since Inception
Last 1 Year
Last 3 Years
Kotak Equity Hybrid Fund - Growth
Kotak Equity HybridFund - Growth
NIFTY 50 Hybrid CompositeDebt 65:35 Index# Nifty 50 TRI##
Kotak Equity HybridFund - Growth Nifty 50 TRI##
NIFTY 50 Hybrid CompositeDebt 65:35 Index#
TRI - Total Return Index, In terms of SEBI circular dated January 4, 2018, the performance of the scheme is benchmarked to the Total Return variant (TRI) of the Benchmark Index instead of Price Return Variant (PRI).
Scheme Inception date is 25/11/1999 and Kotak Equity Hybrid Fund - Regular plan scheme inception date is 3rd November 2014. Mr. Abhishek Bisen has been managing the fund since 15/04/2008. Mr. Pankaj Tibrewal has been managing the fund since 25/08/2015.
Past performance may or may not be sustained in future. All payouts during the period have been reinvested in the units of the scheme at the then prevailing NAV. Returns >= 1 year: CAGR (Compounded Annualised Growth Rate). N.A stands for data not available. Note: Point to Point (PTP) Returns in INR shows the value of 10,000/- investment made at inception. Source: ICRA MFI Explorer. # Name of Scheme Benchmark. ## Name of Additional Benchmark.
Different plans have different expense structure. The performance details provided herein are of regular plan
The equity component of the index is TRI since inception. Alpha is difference of scheme return with benchmark return.
ALPHA
13.60% 10.59% 3.01% 11.55% 14,676 13,535 13,891
10.26% 9.63% 0.63% 10.04% 21,126 20,219 20,803
10.16% 10.62% -0.46% 12.03% 16,226 16,571 17,653
2.45% 1.74% 0.71% 1.66% 10,245 10,174 10,166
Since Inception
Last 3 Years
Last 1 Year
Last 5 Years
The equity component of the index is TRI since inception. Alpha is difference of scheme return with benchmark return.
Past performance may or may not be sustained in future. All payouts during the period have been reinvested in the units of the scheme at the then prevailing NAV. Returns >= 1 year: CAGR (Compounded Annualised Growth Rate). N.A stands for data not available. Note: Point to Point (PTP) Returns in INR shows the value of 10,000/- investment made at inception. Source: ICRA MFI Explorer. # Name of Scheme Benchmark. ## Name of Additional Benchmark.
Scheme Inception date is 09/08/2004. Mr. Devender Singhal & Mr. Arjun Khanna has been managing the fund since 09/05/2019. Mr. Abhishek Bisen has been managing the fund since 15/11/2021. Different plans have different expense structure. The performance details provided herein are of regular plan
TRI - Total Return Index, In terms of SEBI circular dated January 4, 2018, the performance of the scheme is benchmarked to the Total Return variant (TRI) of the Benchmark Index instead of Price Return Variant (PRI).
Kotak Multi Asset Allocator Fund of Fund - Dynamic - Growth
Kotak Multi Asset Allocator Fund of
Fund - Dynamic-Growth
Kotak Multi Asset Allocator Fund of
Fund - Dynamic-Growth
90% Nifty 50 Hybrid Composite Debt 50:50 Index + 5% price of Physical Gold
+5 % MSCI World Index#
90% Nifty 50 Hybrid Composite Debt 50:50 Index + 5% price of Physical Gold
+5 % MSCI World Index#
Nifty 50 TRI ## Nifty 50 TRI ##ALPHA
15.31% 10.89% 4.42% 14.93% 1,28,130 63,659 1,20,755
2.87% 1.60% 1.27% 1.66% 10,287 10,160 10,166
11.69% 10.18% 1.50% 12.03% 17,383 16,244 17,653
15.99% 10.37% 5.62% 11.55% 15,623 13,454 13,891
Last 1 Year
Last 3 Years
Since Inception
Last 5 Years

72
Kotak Savings Fund - Growth
Kotak SavingsFund - Growth
NIFTY UltraShort Duration
Debt Index B-I # (Tier 1)
CRISIL 1 YearTBill##
Scheme Inception date is 13/08/2004. Mr. Deepak Agrawal has been managing the fund since 01/04/2008.
Past performance may or may not be sustained in future. All payouts during the period have been reinvested in the units of the scheme at the then prevailing NAV. Returns >= 1 year: CAGR (Compounded Annualised Growth Rate). N.A stands for data not available. Note: Point to Point (PTP) Returns in INR shows the value of 10,000/- investment made at inception. Source: ICRA MFI Explorer. # Name of Scheme Benchmark. ## Name of Additional Benchmark.
Different plans have different expense structure. The performance details provided herein are of regular plan
The performance of the scheme is benchmarked to the Total Return variant (TRI) of the Benchmark. Alpha is difference of scheme return with benchmark return.
ALPHA(Tier 1)
3.38% 4.06% -0.68% 4.06% -0.68% 2.97% 10,338 10,406 10,406 10,297
4.83% 5.25% -0.42% 5.09% -0.26% 4.74% 11,525 11,664 11,612 11,493
7.28% 7.73% -0.45% 7.67% -0.39% 5.93% 35,145 37,858 37,525 28,018
5.80% 6.21% -0.41% 6.14% -0.34% 5.58% 13,259 13,518 13,475 13,122
Last 1 Year
Since Inception
Last 3 Years
Last 5 Years
NIFTY UltraShort Duration
Debt Index # (Tier 2)
ALPHA(Tier 2)
CRISIL 1 YearTBill##
Kotak SavingsFund - Growth
NIFTY UltraShort Duration
Debt Index B-I # (Tier 1)
NIFTY UltraShort Duration
Debt Index # (Tier 2)
Kotak Equity Arbitrage Fund - Growth
Kotak Equity ArbitrageFund - Growth
Nifty 50 ArbitrageIndex#
CRISIL 1 YearTbill ##
CRISIL 1 YearTbill ##
Kotak Equity ArbitrageFund - Growth
Nifty 50 ArbitrageIndex#
Past performance may or may not be sustained in future. All payouts during the period have been reinvested in the units of the scheme at the then prevailing NAV. Returns >= 1 year: CAGR (Compounded Annualised Growth Rate). N.A stands for data not available. Note: Point to Point (PTP) Returns in INR shows the value of 10,000/- investment made at inception. Source: ICRA MFI Explorer. # Name of Scheme Benchmark. ## Name of Additional Benchmark. TRI - Total Return Index, In terms of SEBI circular dated January 4, 2018, the performance of the scheme is benchmarked to the Total Return variant (TRI) of the Benchmark Index instead of Price Return Variant (PRI). Alpha is difference of scheme return with benchmark return.
Scheme Inception date is 29/09/2005. Mr. Hiten Shah has been managing the fund since 03/10/2019. Different plans have different expense structure. The performance details provided herein are of regular plan
ALPHA
6.89% NA NA 6.03% 30,558 NA 26,670
3.89% 3.61% 0.27% 2.97% 10,389 10,361 10,297
4.41% 3.81% 0.60% 4.74% 11,385 11,191 11,493
5.15% 4.38% 0.77% 5.58% 12,856 12,394 13,122Last 5 Years
Last 1 Year
Last 3 Years
Since Inception
Kotak Equity Savings Fund - Growth
TRI - Total Return Index, In terms of SEBI circular dated January 4, 2018, the performance of the scheme is benchmarked to the Total Return variant (TRI) of the Benchmark Index instead of Price Return Variant (PRI). Alpha is difference of scheme return with benchmark return.
Past performance may or may not be sustained in future. All payouts during the period have been reinvested in the units of the scheme at the then prevailing NAV. Returns >= 1 year: CAGR (Compounded Annualised Growth Rate). N.A stands for data not available. Note: Point to Point (PTP) Returns in INR shows the value of 10,000/- investment made at inception. Source: ICRA MFI Explorer. # Name of Scheme Benchmark. ## Name of Additional Benchmark.
Different plans have different expense structure. The performance details provided herein are of regular plan
Scheme Inception date is 13/10/2014. Mr. Devender Singhal has been managing the fund since 01/04/2021. Mr. Abhishek Bisen has been managing the fund since 17/09/2014. Mr. Hiten Shah has been managing the fund since 03/10/2019.
Kotak Equity Savings Fund - Growth
Kotak Equity Savings Fund - Growth
NIFTY Equity Savings #
(Tier 1)
75% NIFTY 50 ARBITRAGE, 25%
Nifty 50 TRI # (Tier 2)
NIFTY Equity Savings #
(Tier 1)
CRISIL 10 Year Gilt ##
ALPHA(Tier 1)
ALPHA(Tier 2)
CRISIL 10 Year Gilt ##
75% NIFTY 50 ARBITRAGE, 25%
Nifty 50 TRI # (Tier 2)
8.42% 8.14% 0.28% 6.22% 2.20% 3.70% 12,753 12,653 11,989 11,154
7.91% 8.32% -0.40% 6.62% 1.30% 4.13% 14,638 14,912 13,779 12,244
5.65% 2.99% 2.66% 3.41% 2.24% -3.64% 10,565 10,299 10,341 9,636
8.16% 8.27% -0.11% 6.86% 1.30% 6.53% 18,321 18,470 16,690 16,294
Last 3 Years
Last 1 Year
Since Inception
Last 5 Years
Kotak Liquid Fund - GrowthKotak Liquid
Fund - GrowthNIFTY Liquid Index
B-I # (Tier 1)NIFTY Liquid
Index # (Tier 2)Kotak Liquid
Fund - GrowthCRISIL 1
Year TBill##
Different plans have different expense structure. The performance details provided herein are of regular plan Past performance may or may not be sustained in future. All payouts during the period have been reinvested in the units of the scheme at the then prevailing NAV. Returns >= 1 year: CAGR (Compounded Annualised Growth Rate). N.A stands for data not available. Note: Point to Point (PTP) Returns in INR shows the value of 10,000/- investment made at inception. Source: ICRA MFI Explorer. # Name of Scheme Benchmark. ## Name of Additional Benchmark. The performance of the scheme is benchmarked to the Total Return variant (TRI) of the Benchmark. Alpha is difference of scheme return with benchmark return.
Scheme Inception date is 04/11/2003. Mr. Deepak Agrawal has been managing the fund since 01/05/2007.
ALPHA(Tier 1)
4.03% 4.24% -0.21% 4.22% -0.20% 4.73% 11,258 11,327 11,323 11,490
5.26% 5.36% -0.10% 5.35% -0.09% 5.58% 12,921 12,984 12,977 13,122
3.53% 3.74% -0.22% 3.80% -0.28% 2.97% 10,353 10,374 10,380 10,297
6.88% 7.03% -0.15% 6.92% -0.04% 5.85% 34,624 35,537 34,897 28,895
Last 3 Years
Since Inception
Last 5 Years
Last 1 Year
ALPHA(Tier 2)
CRISIL 1Year TBill##
NIFTY Liquid IndexB-I # (Tier 1)
NIFTY LiquidIndex # (Tier 2)
Kotak Debt Hybrid Fund - Growth
Different plans have different expense structure. The performance details provided herein are of regular plan
TRI - Total Return Index, In terms of SEBI circular dated January 4, 2018, the performance of the scheme is benchmarked to the Total Return variant (TRI) of the Benchmark Index instead of Price Return Variant (PRI). The equity component of the index is TRI since inception. Alpha is difference of scheme return with benchmark return.
The performance of the scheme is benchmarked to the Total Return variant (TRI) of the Benchmark. Alpha is difference of scheme return with benchmark return.
Past performance may or may not be sustained in future. All payouts during the period have been reinvested in the units of the scheme at the then prevailing NAV. Returns >= 1 year: CAGR (Compounded Annualised Growth Rate). N.A stands for data not available. Note: Point to Point (PTP) Returns in INR shows the value of 10,000/- investment made at inception. Source: ICRA MFI Explorer. # Name of Scheme Benchmark. ## Name of Additional Benchmark.
Scheme Inception date is 02/12/2003. Mr. Abhishek Bisen has been managing the fund since 01/04/2008. Mr. Devender Singhal has been managing the fund since 25/08/2015.
Kotak Debt HybridFund - Growth
CRISIL Hybrid 85 +15 - Conservative Index#
CRISIL 10 YearGilt##
CRISIL 10 YearGilt##
CRISIL Hybrid 85 +15 - Conservative Index#
Kotak Debt HybridFund - GrowthALPHA
3.65% 1.13% 2.52% -3.64% 10,365 10,113 9,636
7.61% 7.39% 0.22% 4.13% 14,431 14,284 12,244
7.99% 8.20% -0.21% 5.36% 41,740 43,266 26,415
9.86% 7.62% 2.24% 3.70% 13,270 12,471 11,154
Last 1 Year
Last 3 Years
Since Inception
Last 5 Years
Kotak Overnight Fund - Growth
Kotak OvernightFund - Growth
NIFTY 1D RateIndex #
CRISIL 1 YearTbill ##
CRISIL 1 YearTbill ##
Scheme Inception date is 15/01/2019. Mr. Deepak Agrawal has been managing the fund since 15/01/2019. Different plans have different expense structure. The performance details provided herein are of regular plan Past performance may or may not be sustained in future. All payouts during the period have been reinvested in the units of the scheme at the then prevailing NAV. Returns >= 1 year: CAGR (Compounded Annualised Growth Rate). N.A stands for data not available. Note: Point to Point (PTP) Returns in INR shows the value of 10,000/- investment made at inception. Source: ICRA MFI Explorer. # Name of Scheme Benchmark. ## Name of Additional Benchmark. Alpha is difference of scheme return with benchmark return.
Kotak OvernightFund - Growth
NIFTY 1D RateIndex #ALPHA
3.91% 4.07% -0.16% 5.13% 11,418 11,478 11,888
3.38% 3.57% -0.19% 2.97% 10,338 10,357 10,297
3.58% 3.74% -0.16% 4.73% 11,114 11,166 11,490
Since Inception
Last 1 Year
Last 3 Years

73
Past performance may or may not be sustained in future. All payouts during the period have been reinvested in the units of the scheme at the then prevailing NAV. Returns >= 1 year: CAGR (Compounded Annualised Growth Rate). N.A stands for data not available. Note: Point to Point (PTP) Returns in INR shows the value of 10,000/- investment made at inception. Source: ICRA MFI Explorer. # Name of Scheme Benchmark. ## Name of Additional Benchmark.
Different plans have different expense structure. The performance details provided herein are of regular plan
The performance of the scheme is benchmarked to the Total Return variant (TRI) of the Benchmark. Alpha is difference of scheme return with benchmark return.
Scheme Inception date is 11/05/2010. Mr. Deepak Agrawal has been managing the fund since 12/04/2010.
Kotak Credit Risk Fund - Growth
Kotak Credit RiskFund - Growth
NIFTY Credit RiskBond Index
C-III # (Tier 1)
CRISIL 10 YearGilt ##
CRISIL 10 YearGilt ##
ALPHA(Tier 1)
0.86% 5.73% -4.87% 5.15% -4.29% -3.64% 10,086 10,573 10,515 9,636
5.06% 8.57% -3.51% 8.47% -3.41% 3.70% 11,600 12,806 12,770 11,154
7.47% 9.18% -1.71% 8.99% -1.53% 6.02% 23,975 29,046 28,456 20,337
5.58% 8.16% -2.57% 7.94% -2.36% 4.13% 13,123 14,804 14,655 12,244
Last 3 Years
Last 5 Years
Since Inception
Last 1 Year
NIFTY Credit RiskBond Index #
(Tier 2)
ALPHA(Tier 2)
Kotak Credit RiskFund - Growth
NIFTY Credit RiskBond Index
C-III # (Tier 1)
NIFTY Credit RiskBond Index #
(Tier 2)
Kotak Corporate Bond Fund - Growth
Past performance may or may not be sustained in future. All payouts during the period have been reinvested in the units of the scheme at the then prevailing NAV. Returns >= 1 year: CAGR (Compounded Annualised Growth Rate). N.A stands for data not available. Note: Point to Point (PTP) Returns in INR shows the value of 10,000/- investment made at inception. Source: ICRA MFI Explorer. # Name of Scheme Benchmark. ## Name of Additional Benchmark.
Scheme Inception date is 21/09/2007. Mr. Deepak Agrawal has been managing the fund since 31/01/2015. Different plans have different expense structure. The performance details provided herein are of regular plan
The performance of the scheme is benchmarked to the Total Return variant (TRI) of the Benchmark. Alpha is difference of scheme return with benchmark retur
Kotak Corporate BondFund - Growth
CRISIL CorporateBond Fund BIIIndex # (Tier 1)
CRISIL 10 YearGilt ##
CRISIL 10 YearGilt ##
Kotak Corporate BondFund - Growth
ALPHA(Tier 1)
6.26% 7.29% -1.03% 7.22% -0.96% 3.70% 12,004 12,356 12,333 11,154
2.91% 3.64% -0.73% 2.02% 0.89% -3.64% 10,291 10,364 10,202 9,636
7.77% 8.52% -0.75% 8.88% -1.11% 6.19% 30,236 33,487 35,192 24,285
6.78% 7.35% -0.57% 6.76% 0.02% 4.13% 13,887 14,260 13,874 12,244Last 5 Years
Since Inception
Last 1 Year
Last 3 Years
CRISIL CorporateBond CompositeIndex # (Tier 2)
ALPHA(Tier 2)
CRISIL CorporateBond Fund BIIIndex # (Tier 1)
CRISIL CorporateBond CompositeIndex # (Tier 2)
Different plans have different expense structure. The performance details provided herein are of regular plan Scheme Inception date is 06/03/2008. Mr. Deepak Agrawal has been managing the fund since 01/02/2015.
The performance of the scheme is benchmarked to the Total Return variant (TRI) of the Benchmark. Alpha is difference of scheme return with benchmark return.
Past performance may or may not be sustained in future. All payouts during the period have been reinvested in the units of the scheme at the then prevailing NAV. Returns >= 1 year: CAGR (Compounded Annualised Growth Rate). N.A stands for data not available. Note: Point to Point (PTP) Returns in INR shows the value of 10,000/- investment made at inception. Source: ICRA MFI Explorer. # Name of Scheme Benchmark. ## Name of Additional Benchmark.
Kotak Low Duration Fund - Growth
Kotak Low DurationFund - Growth
NIFTY LowDuration Debt
Index B-I # (Tier 1)
CRISIL 1 YearTBill##
ALPHA(Tier 1)
7.26% 7.95% -0.69% 7.84% -0.58% 6.17% 27,298 29,919 29,500 23,566
2.77% 3.76% -0.99% 3.60% -0.83% 2.97% 10,277 10,376 10,360 10,297
5.61% 5.64% -0.03% 5.41% 0.20% 4.74% 11,784 11,795 11,717 11,493
6.21% 6.29% -0.07% 6.18% 0.03% 5.58% 13,520 13,567 13,499 13,122
Last 3 Years
Since Inception
Last 5 Years
Last 1 Year
NIFTY LowDuration DebtIndex # (Tier 2)
ALPHA(Tier 2)
CRISIL 1 YearTBill##
Kotak Low DurationFund - Growth
NIFTY LowDuration Debt
Index B-I # (Tier 1)
NIFTY LowDuration DebtIndex # (Tier 2)
Scheme Inception date is 02/05/2002. Mr. Deepak Agrawal has been managing the fund since 11/07/2007. Different plans have different expense structure. The performance details provided herein are of regular plan Past performance may or may not be sustained in future. All payouts during the period have been reinvested in the units of the scheme at the then prevailing NAV. Returns >= 1 year: CAGR (Compounded Annualised Growth Rate). N.A stands for data not available. Note: Point to Point (PTP) Returns in INR shows the value of 10,000/- investment made at inception. Source: ICRA MFI Explorer. # Name of Scheme Benchmark. ## Name of Additional Benchmark. The performance of the scheme is benchmarked to the Total Return variant (TRI) of the Benchmark. Alpha is difference of scheme return with benchmark return.
Kotak Bond Short Term Fund - GrowthKotak Bond
Short Term Fund -Growth
NIFTY ShortDuration Debt Index
B-II # (Tier 1)
NIFTY ShortDuration DebtIndex # (Tier 2)
CRISIL 10 YearGilt ##
ALPHA(Tier 1)
6.20% 6.65% -0.45% 6.64% -0.43% 4.13% 13,513 13,800 13,792 12,244
2.17% 3.22% -1.05% 2.80% -0.63% -3.64% 10,217 10,322 10,280 9,636
7.41% 7.69% -0.29% 7.65% -0.24% 6.21% 42,275 44,609 44,226 33,751
5.96% 6.46% -0.49% 6.44% -0.48% 3.70% 11,903 12,071 12,066 11,154
Since Inception
Last 3 Years
Last 5 Years
Last 1 Year
ALPHA(Tier 2)
CRISIL 10 YearGilt ##
Kotak BondShort Term Fund -
Growth
NIFTY ShortDuration Debt Index
B-II # (Tier 1)
NIFTY ShortDuration DebtIndex # (Tier 2)
Kotak Dynamic Bond Fund - Growth
Kotak Dynamic BondFund - Growth
NIFTY CompositeDebt Index
B-III # (Tier 1)
NIFTY CompositeDebt Index #
(Tier 2)
CRISIL 10 YearGilt ##
ALPHA(Tier 1)
Scheme Inception date is 26/05/2008. Mr. Deepak Agrawal has been managing the fund since 25/11/2012. Different plans have different expense structure. The performance details provided herein are of regular plan Past performance may or may not be sustained in future. All payouts during the period have been reinvested in the units of the scheme at the then prevailing NAV. Returns >= 1 year: CAGR (Compounded Annualised Growth Rate). N.A stands for data not available. Note: Point to Point (PTP) Returns in INR shows the value of 10,000/- investment made at inception. Source: ICRA MFI Explorer. # Name of Scheme Benchmark. ## Name of Additional Benchmark. The performance of the scheme is benchmarked to the Total Return variant (TRI) of the Benchmark. Alpha is difference of scheme return with benchmark return.
6.73% 6.57% 0.16% 6.46% 0.27% 4.13% 13,855 13,750 13,680 12,244
8.06% 8.20% -0.13% 7.95% 0.11% 6.20% 29,854 30,375 29,420 23,356
1.50% 2.22% -0.73% 1.35% 0.15% -3.64% 10,150 10,222 10,135 9,636
6.05% 7.22% -1.18% 6.57% -0.52% 3.70% 11,933 12,335 12,111 11,154Last 3 Years
Last 1 Year
Last 5 Years
Since Inception
ALPHA(Tier 2)
CRISIL 10 YearGilt ##
Kotak Dynamic BondFund - Growth
NIFTY CompositeDebt Index
B-III # (Tier 1)
NIFTY CompositeDebt Index #
(Tier 2)
The performance of the scheme is benchmarked to the Total Return variant (TRI) of the Benchmark. Alpha is difference of scheme return with benchmark return.
Different plans have different expense structure. The performance details provided herein are of regular plan Scheme Inception date is 14/07/2003. Mr. Deepak Agrawal has been managing the fund since 01/11/2006.
Past performance may or may not be sustained in future. All payouts during the period have been reinvested in the units of the scheme at the then prevailing NAV. Returns >= 1 year: CAGR (Compounded Annualised Growth Rate). N.A stands for data not available. Note: Point to Point (PTP) Returns in INR shows the value of 10,000/- investment made at inception. Source: ICRA MFI Explorer. # Name of Scheme Benchmark. ## Name of Additional Benchmark.
Kotak Money Market Fund - Growth
Kotak Money MarketFund - Growth
NIFTY Money MarketIndex B-I # (Tier 1)
NIFTY Money MarketIndex # (Tier 2)
Kotak Money MarketFund - Growth
ALPHA(Tier 1)
6.05% 5.60% 0.44% 5.67% 0.38% 5.58% 13,413 13,136 13,177 13,122
7.03% 7.18% -0.14% 7.16% -0.12% 5.84% 36,311 37,248 37,115 29,360
3.82% 3.60% 0.22% 3.67% 0.15% 2.97% 10,382 10,360 10,367 10,297
5.02% 4.55% 0.47% 4.64% 0.38% 4.74% 11,587 11,431 11,462 11,493
Since Inception
Last 1 Year
Last 3 Years
Last 5 Years
ALPHA(Tier 2)
CRISIL 1 YearTBill##
NIFTY Money MarketIndex B-I # (Tier 1)
NIFTY Money MarketIndex # (Tier 2)
CRISIL 1 YearTBill##

74
Different plans have different expense structure. The performance details provided herein are of regular plan Past performance may or may not be sustained in future. All payouts during the period have been reinvested in the units of the scheme at the then prevailing NAV. Returns >= 1 year: CAGR (Compounded Annualised Growth Rate). N.A stands for data not available. Note: Point to Point (PTP) Returns in INR shows the value of 10,000/- investment made at inception. Source: ICRA MFI Explorer. # Name of Scheme Benchmark. ## Name of Additional Benchmark. The performance of the scheme is benchmarked to the Total Return variant (TRI) of the Benchmark. Alpha is difference of scheme return with benchmark return.
Scheme Inception date is 29/12/1998. Mr. Abhishek Bisen has been managing the fund since 15/04/2008.
Kotak Gilt Fund - GrowthKotak Gilt Fund
- GrowthNIFTY All Duration
G-Sec Index#CRISIL 10 Year
Gilt##CRISIL 10 Year
Gilt##Kotak Gilt Fund
- GrowthNIFTY All Duration
G-Sec Index#ALPHA
9.07% NA NA NA 77,093 NA NA
5.53% 5.97% -0.45% 4.13% 13,087 13,368 12,244
0.76% 0.18% 0.58% -3.64% 10,076 10,018 9,636
5.64% 5.39% 0.25% 3.70% 11,794 11,711 11,154
Last 5 Years
Since Inception
Last 3 Years
Last 1 Year
Kotak Gilt Fund - PF and Trust - Growth
Kotak Gilt Fund - PF andTrust - Growth
CRISIL 10 YearGilt##
CRISIL 10 YearGilt##
Kotak Gilt Fund - PF andTrust - Growth
NIFTY All DurationG-Sec Index#
NIFTY All DurationG-Sec Index#ALPHA
Scheme Inception date is 11/11/2003. Mr. Abhishek Bisen has been managing the fund since 15/04/2008.
Past performance may or may not be sustained in future. All payouts during the period have been reinvested in the units of the scheme at the then prevailing NAV. Returns >= 1 year: CAGR (Compounded Annualised Growth Rate). N.A stands for data not available. Note: Point to Point (PTP) Returns in INR shows the value of 10,000/- investment made at inception. Source: ICRA MFI Explorer. # Name of Scheme Benchmark. ## Name of Additional Benchmark. The performance of the scheme is benchmarked to the Total Return variant (TRI) of the Benchmark. Alpha is difference of scheme return with benchmark return.
Different plans have different expense structure. The performance details provided herein are of regular plan
7.18% 5.81% 1.38% 5.31% 36,464 28,658 26,230
0.76% 0.18% 0.57% -3.64% 10,076 10,018 9,636
5.53% 5.97% -0.45% 4.13% 13,087 13,368 12,244
5.64% 5.39% 0.25% 3.70% 11,794 11,711 11,154Last 3 Years
Last 5 Years
Since Inception
Last 1 Year
Kotak Floating Rate Fund - Growth
Kotak Floating RateFund - Growth
NIFTY Short DurationDebt Index#
CRISIL 10 YearGilt ##
CRISIL 10 YearGilt ##
Different plans have different expense structure. The performance details provided herein are of regular plan Scheme Inception date is 14/05/2019. Mr. Deepak Agrawal has been managing the fund since 14/05/2019.
Past performance may or may not be sustained in future. All payouts during the period have been reinvested in the units of the scheme at the then prevailing NAV. Returns >= 1 year: CAGR (Compounded Annualised Growth Rate). N.A stands for data not available. Note: Point to Point (PTP) Returns in INR shows the value of 10,000/- investment made at inception. Source: ICRA MFI Explorer. # Name of Scheme Benchmark. ## Name of Additional Benchmark. Alpha is difference of scheme return with benchmark return.
Kotak Floating RateFund - Growth
NIFTY Short DurationDebt Index#
ALPHA
6.19% 6.59% -0.40% 4.94% 12,070 12,213 11,630
2.89% 2.80% 0.08% -3.64% 10,289 10,280 9,636
6.15% 6.44% -0.29% 3.70% 11,966 12,066 11,154Last 3 Years
Last 1 Year
Since Inception
Different plans have different expense structure. The performance details provided herein are of regular plan
The performance of the scheme is benchmarked to the Total Return variant (TRI) of the Benchmark. Alpha is difference of scheme return with benchmark return.
Past performance may or may not be sustained in future. All payouts during the period have been reinvested in the units of the scheme at the then prevailing NAV. Returns >= 1 year: CAGR (Compounded Annualised Growth Rate). N.A stands for data not available. Note: Point to Point (PTP) Returns in INR shows the value of 10,000/- investment made at inception. Source: ICRA MFI Explorer. # Name of Scheme Benchmark. ## Name of Additional Benchmark.
Scheme Inception date is 21/03/2014. Mr. Deepak Agrawal has been managing the fund since 22/06/2015.
Kotak Medium Term Fund - GrowthKotak Medium Term
Fund - Growth
NIFTY Medium DurationDebt Index
C-III # (Tier 1)
CRISIL 10 YearGilt##
CRISIL 10 YearGilt##
ALPHA(Tier 1)
6.07% 7.73% -1.66% 7.09% -1.02% 3.70% 11,939 12,511 12,289 11,154
2.93% 4.45% -1.52% 1.71% 1.23% -3.64% 10,293 10,445 10,171 9,636
7.49% 8.60% -1.11% 8.09% -0.60% 6.82% 18,182 19,801 19,042 17,270
5.66% 7.10% -1.44% 6.74% -1.08% 4.13% 13,169 14,095 13,860 12,244
Since Inception
Last 1 Year
Last 3 Years
Last 5 Years
NIFTY MediumDuration DebtIndex # (Tier 2)
ALPHA(Tier 2)
Kotak Medium TermFund - Growth
NIFTY Medium DurationDebt Index
C-III # (Tier 1)
NIFTY MediumDuration DebtIndex # (Tier 2)
Scheme Inception date is 25/11/1999. Mr. Abhishek Bisen has been managing the fund since 01/04/2008.
Past performance may or may not be sustained in future. All payouts during the period have been reinvested in the units of the scheme at the then prevailing NAV. Returns >= 1 year: CAGR (Compounded Annualised Growth Rate). N.A stands for data not available. Note: Point to Point (PTP) Returns in INR shows the value of 10,000/- investment made at inception. Source: ICRA MFI Explorer. # Name of Scheme Benchmark. ## Name of Additional Benchmark. The performance of the scheme is benchmarked to the Total Return variant (TRI) of the Benchmark. Alpha is difference of scheme return with benchmark return.
Different plans have different expense structure. The performance details provided herein are of regular plan
Kotak Bond Fund - Growth
Kotak Bond Fund- Growth
NIFTY Medium toLong Duration DebtIndex B-III # (Tier 1)
CRISIL 10 YearGilt##
Kotak Bond Fund- Growth
CRISIL 10 YearGilt##
ALPHA(Tier 1)
5.20% 6.47% -1.26% 6.29% -1.09% 4.13% 12,888 13,682 13,569 12,244
5.60% 8.07% -2.47% 6.63% -1.04% 3.70% 11,780 12,630 12,131 11,154
0.73% 3.24% -2.52% 0.98% -0.25% -3.64% 10,073 10,324 10,098 9,636
8.38% NA NA NA NA NA 61,647 NA NA NA
Last 1 Year
Last 3 Years
Last 5 Years
Since Inception
NIFTY Medium toLong Duration Debt
Index # (Tier 2)
ALPHA(Tier 2)
NIFTY Medium toLong Duration DebtIndex B-III # (Tier 1)
NIFTY Medium toLong Duration Debt
Index # (Tier 2)
Kotak Banking and PSU Debt Fund - Growth
Kotak Banking and PSU DebtFund - Growth
CRISIL Banking andPSU Debt Index#
CRISIL 10 YearGilt ##
CRISIL Banking andPSU Debt Index#
CRISIL 10 YearGilt ##
Kotak Banking and PSU DebtFund - Growth
The performance of the scheme is benchmarked to the Total Return variant (TRI) of the Benchmark. Alpha is difference of scheme return with benchmark return.
Scheme Inception date is 29/12/1998. Mr. Deepak Agrawal has been managing the fund since 01/08/2008. Different plans have different expense structure. The performance details provided herein are of regular plan Past performance may or may not be sustained in future. All payouts during the period have been reinvested in the units of the scheme at the then prevailing NAV. Returns >= 1 year: CAGR (Compounded Annualised Growth Rate). N.A stands for data not available. Note: Point to Point (PTP) Returns in INR shows the value of 10,000/- investment made at inception. Source: ICRA MFI Explorer. # Name of Scheme Benchmark. ## Name of Additional Benchmark.
ALPHA
6.87% 6.73% 0.14% 4.13% 13,944 13,851 12,244
7.30% NA NA NA 52,492 NA NA
2.76% 2.25% 0.51% -3.64% 10,276 10,225 9,636
6.58% 6.30% 0.28% 3.70% 12,115 12,018 11,154
Since Inception
Last 5 Years
Last 1 Year
Last 3 Years

75
Kotak Global Emerging Market Fund - Growth
Kotak Global EmergingMarket Fund - Growth
MSCI Emerging Marketindex#
Nifty 50 TRI## Nifty 50 TRI##Kotak Global EmergingMarket Fund - Growth
MSCI Emerging Marketindex#
ALPHA
Scheme Inception date is 26/09/2007. Mr. Arjun Khanna has been managing the fund since 09/05/2019. Different plans have different expense structure. The performance details provided herein are of regular plan Past performance may or may not be sustained in future. All payouts during the period have been reinvested in the units of the scheme at the then prevailing NAV. Returns >= 1 year: CAGR (Compounded Annualised Growth Rate). N.A stands for data not available. Note: Point to Point (PTP) Returns in INR shows the value of 10,000/- investment made at inception. Source: ICRA MFI Explorer. # Name of Scheme Benchmark. ## Name of Additional Benchmark. TRI - Total Return Index, In terms of SEBI circular dated January 4, 2018, the performance of the scheme is benchmarked to the Total Return variant (TRI) of the Benchmark Index instead of Price Return Variant (PRI). Alpha is difference of scheme return with benchmark return.
4.49% 6.42% -1.94% 9.47% 19,118 25,085 38,074
-20.96% -20.37% -0.58% 1.66% 7,904 7,963 10,166
6.76% 5.57% 1.19% 11.55% 12,176 11,772 13,891
6.40% 6.73% -0.33% 12.03% 13,642 13,855 17,653
Since Inception
Last 5 Years
Last 1 Year
Last 3 Years
Kotak Gold Fund - GrowthKotak Gold
Fund - Growth Price of Gold# A.B: N.A Price of Gold# A.B: N.AKotak Gold
Fund - GrowthALPHA
Different plans have different expense structure. The performance details provided herein are of regular plan Scheme Inception date is 25/03/2011. Mr. Abhishek Bisen has been managing the fund since 04/03/2011.
Past performance may or may not be sustained in future. All payouts during the period have been reinvested in the units of the scheme at the then prevailing NAV. Returns >= 1 year: CAGR (Compounded Annualised Growth Rate). N.A stands for data not available. Note: Point to Point (PTP) Returns in INR shows the value of 10,000/- investment made at inception. Source: ICRA MFI Explorer. # Name of Scheme Benchmark. Alpha is difference of scheme return with benchmark return.
13.35% 13.73% -0.39% NA 14,577 14,727 NA
6.59% 8.12% -1.53% NA 20,545 24,118 NA
6.77% 8.77% -2.01% NA 10,677 10,877 NA
11.04% 11.94% -0.90% NA 16,887 17,585 NALast 5 Years
Last 1 Year
Last 3 Years
Since Inception
Kotak International REIT FOF - Growth
Kotak InternationalREIT FOF - Growth
S&P Asia Pacific exJapan REIT TRI # A.B: N.A A.B: N.A
Scheme Inception date is 29/12/2020. Mr. Arjun Khanna has been managing the fund since 29/12/2020.
Past performance may or may not be sustained in future. All payouts during the period have been reinvested in the units of the scheme at the then prevailing NAV. Returns >= 1 year: CAGR (Compounded Annualised Growth Rate). N.A stands for data not available. Note: Point to Point (PTP) Returns in INR shows the value of 10,000/- investment made at inception. Source: ICRA MFI Explorer. # Name of Scheme Benchmark. TRI - Total Return Index, In terms of SEBI circular dated January 4, 2018, the performance of the scheme is benchmarked to the Total Return variant (TRI) of the Benchmark Index instead of Price Return Variant (PRI).
Different plans have different expense structure. The performance details provided herein are of regular plan
Alpha is difference of scheme return with benchmark return.
Kotak InternationalREIT FOF - Growth
S&P Asia Pacific exJapan REIT TRI #ALPHA
-4.75% -1.71% -3.05% NA 9,295 9,745 NA
-9.08% -8.58% -0.50% NA 9,092 9,142 NA
Since Inception
Last 1 Year
Kotak NASDAQ 100 FUND OF FUND - Growth
Kotak NASDAQ 100Fund of Fund - Growth
NASDAQ 100TRI #
Nifty 50 TRI ## Nifty 50 TRI
TRI - Total Return Index, In terms of SEBI circular dated January 4, 2018, the performance of the scheme is benchmarked to the Total Return variant (TRI) of the Benchmark Index instead of Price Return Variant (PRI).
Different plans have different expense structure. The performance details provided herein are of regular plan Scheme Inception date is 02/02/2021. Mr. Arjun Khanna & Mr. Abhishek Bisen has been managing the fund since 02/02/2021
Alpha is difference of scheme return with benchmark return.
Past performance may or may not be sustained in future. All payouts during the period have been reinvested in the units of the scheme at the then prevailing NAV. Returns >= 1 year: CAGR (Compounded Annualised Growth Rate). N.A stands for data not available. Note: Point to Point (PTP) Returns in INR shows the value of 10,000/- investment made at inception. Source: ICRA MFI Explorer. # Name of Scheme Benchmark. ## Name of Additional Benchmark.
Kotak NASDAQ 100Fund of Fund - Growth
NASDAQ 100TRI #
ALPHA
-5.88% -4.69% -1.19% 6.91% 9,184 9,348 10,984
-15.97% -15.47% -0.50% 1.66% 8,403 8,453 10,166
Since Inception
Last 1 Year
Kotak Global Innovation Fund of Fund - Growth
Kotak Global InnovationFund of Fund - Growth
Nifty 50 TRI ## Nifty 50 TRI ##
Scheme Inception date is 29/07/2021. Mr. Arjun Khanna has been managing the fund since 29/07/2021.
Past performance may or may not be sustained in future. All payouts during the period have been reinvested in the units of the scheme at the then prevailing NAV. Simple annualized returns have been provided as per the extant guidelines since the scheme has completed 6 months but not 1 year. N.A stands for data not available. Note: Point to Point (PTP) Returns in INR shows the value of 10,000/- investment made at inception. Source: ICRA MFI Explorer. # Name of Scheme Benchmark. ## Name of Additional Benchmark.
Alpha is difference of scheme return with benchmark return.
Different plans have different expense structure. The performance details provided herein are of regular plan
TRI - Total Return Index, In terms of SEBI circular dated January 4, 2018, the performance of the scheme is benchmarked to the Total Return variant (TRI) of the Benchmark Index instead of Price Return Variant (PRI).
Kotak Global InnovationFund of Fund - Growth
ALPHAMSCI All CountryWorld Index TRI #
MSCI All CountryWorld Index TRI #
-66.00% -31.83% -34.17% -15.14% 5,840 8,261 9,214
-38.89% -12.09% -26.80% 1.22% 6,355 8,881 10,112
Last 6 Months
Since Inception
Kotak Nifty Bank ETF
Kotak Nifty Bank ETF Nifty Bank Index TRI# Nifty 50 TRI## Kotak Nifty Bank ETF Nifty Bank Index TRI# Nifty 50 TRI##ALPHA
Different plans have different expense structure. The performance details provided herein are of regular plan Past performance may or may not be sustained in future. All payouts during the period have been reinvested in the units of the scheme at the then prevailing NAV. Returns >= 1 year: CAGR (Compounded Annualised Growth Rate). N.A stands for data not available. Note: Point to Point (PTP) Returns in INR shows the value of 10,000/- investment made at inception. Source: ICRA MFI Explorer. # Name of Scheme Benchmark. ## Name of Additional Benchmark. TRI - Total Return Index, In terms of SEBI circular dated January 4, 2018, the performance of the scheme is benchmarked to the Total Return variant (TRI) of the Benchmark Index instead of Price Return Variant (PRI). Alpha is difference of scheme return with benchmark return.
Scheme Inception date is 10/12/2014. Mr. Devender Singhal & Mr. Satish Dondapati has been managing the fund since 09/05/2019.
8.36% 8.77% -0.41% 10.14% 18,350 18,883 20,758
-3.44% -3.22% -0.23% 1.66% 9,656 9,678 10,166
2.11% 2.81% -0.70% 11.55% 10,649 10,869 13,891
7.44% 7.98% -0.54% 12.03% 14,319 14,680 17,653Last 5 Years
Last 3 Years
Last 1 Year
Since Inception

76
Kotak Nifty 50 ETF
Kotak Nifty 50 ETF Nifty 50 TRI# S&P BSE SENSEX TRI## Kotak Nifty 50 ETF Nifty 50 TRI# S&P BSE SENSEX TRI##ALPHA
Scheme Inception date is 02/02/2010. Mr. Devender Singhal & Mr. Satish Dondapati has been managing the fund since 09/05/2019.
Alpha is difference of scheme return with benchmark return.
Past performance may or may not be sustained in future. All payouts during the period have been reinvested in the units of the scheme at the then prevailing NAV. Returns >= 1 year: CAGR (Compounded Annualised Growth Rate). N.A stands for data not available. Note: Point to Point (PTP) Returns in INR shows the value of 10,000/- investment made at inception. Source: ICRA MFI Explorer. # Name of Scheme Benchmark. ## Name of Additional Benchmark. TRI - Total Return Index, In terms of SEBI circular dated January 4, 2018, the performance of the scheme is benchmarked to the Total Return variant (TRI) of the Benchmark Index instead of Price Return Variant (PRI).
Different plans have different expense structure. The performance details provided herein are of regular plan
10.14% 11.37% -1.23% 11.58% 33,164 38,064 38,953
1.54% 1.66% -0.12% 2.22% 10,154 10,166 10,222
11.28% 11.55% -0.26% 11.69% 13,793 13,891 13,944
11.81% 12.03% -0.22% 12.71% 17,477 17,653 18,194
Last 3 Years
Last 5 Years
Last 1 Year
Since Inception
Kotak S&P BSE Sensex ETF
Kotak S&P BSESensex ETF
S&P BSE SENSEX TRI# Nifty 50 TRI## Kotak S&P BSESensex ETF
S&P BSE SENSEX TRI# Nifty 50 TRI##ALPHA
Scheme Inception date is 06/06/2008. Mr. Devender Singhal & Mr. Satish Dondapati has been managing the fund since 09/05/2019. Different plans have different expense structure. The performance details provided herein are of regular plan Past performance may or may not be sustained in future. All payouts during the period have been reinvested in the units of the scheme at the then prevailing NAV. Returns >= 1 year: CAGR (Compounded Annualised Growth Rate). N.A stands for data not available. Note: Point to Point (PTP) Returns in INR shows the value of 10,000/- investment made at inception. Source: ICRA MFI Explorer. # Name of Scheme Benchmark. ## Name of Additional Benchmark. TRI - Total Return Index, In terms of SEBI circular dated January 4, 2018, the performance of the scheme is benchmarked to the Total Return variant (TRI) of the Benchmark Index instead of Price Return Variant (PRI). Alpha is difference of scheme return with benchmark return.
12.39% 12.71% -0.32% 12.03% 17,936 18,194 17,653
1.96% 2.22% -0.27% 1.66% 10,196 10,222 10,166
11.34% 11.69% -0.34% 11.55% 13,816 13,944 13,891
9.54% 10.61% -1.07% 10.44% 36,037 41,336 40,459
Last 1 Year
Since Inception
Last 3 Years
Last 5 Years
Kotak Nifty PSU Bank ETFKotak Nifty PSU
Bank ETFNifty PSU Bank TRI# Nifty 50 TRI## Nifty 50 TRI##Kotak Nifty PSU
Bank ETFNifty PSU Bank TRI#ALPHA
Scheme Inception date is 08/11/2007. Mr. Devender Singhal & Mr. Satish Dondapati has been managing the fund since 09/05/2019.
TRI - Total Return Index, In terms of SEBI circular dated January 4, 2018, the performance of the scheme is benchmarked to the Total Return variant (TRI) of the Benchmark Index instead of Price Return Variant (PRI). Alpha is difference of scheme return with benchmark return.
Past performance may or may not be sustained in future. All payouts during the period have been reinvested in the units of the scheme at the then prevailing NAV. Returns >= 1 year: CAGR (Compounded Annualised Growth Rate). N.A stands for data not available. Note: Point to Point (PTP) Returns in INR shows the value of 10,000/- investment made at inception. Source: ICRA MFI Explorer. # Name of Scheme Benchmark. ## Name of Additional Benchmark.
Different plans have different expense structure. The performance details provided herein are of regular plan
-1.26% 0.16% -1.42% 8.49% 8,300 10,237 32,991
-8.65% -8.01% -0.64% 11.55% 7,617 7,779 13,891
-6.12% -5.46% -0.66% 12.03% 7,292 7,552 17,653
-1.89% -1.26% -0.63% 1.66% 9,811 9,874 10,166
Last 5 Years
Last 1 Year
Since Inception
Last 3 Years
Kotak Nifty 50 Value 20 ETFKotak Nifty 50 Value
20 ETFNifty 50 Value
20 TRI #Nifty 50 TRI## Nifty 50 TRI##Kotak Nifty 50 Value
20 ETFNifty 50 Value
20 TRI #ALPHA
TRI - Total Return Index, In terms of SEBI circular dated January 4, 2018, the performance of the scheme is benchmarked to the Total Return variant (TRI) of the Benchmark Index instead of Price Return Variant (PRI).
Scheme Inception date is 01/12/2015. Mr. Devender Singhal & Mr. Satish Dondapati has been managing the fund since 09/05/2019.
Past performance may or may not be sustained in future. All payouts during the period have been reinvested in the units of the scheme at the then prevailing NAV. Returns >= 1 year: CAGR (Compounded Annualised Growth Rate). N.A stands for data not available. Note: Point to Point (PTP) Returns in INR shows the value of 10,000/- investment made at inception. Source: ICRA MFI Explorer. # Name of Scheme Benchmark. ## Name of Additional Benchmark.
Alpha is difference of scheme return with benchmark return.
Different plans have different expense structure. The performance details provided herein are of regular plan
2.66% 2.83% -0.17% 1.66% 10,266 10,283 10,166
16.47% 17.45% -0.98% 12.03% 21,441 22,355 17,653
15.42% 16.76% -1.35% 11.55% 15,393 15,939 13,891
15.72% 15.59% 0.13% 12.38% 26,151 25,954 21,563Since Inception
Last 3 Years
Last 5 Years
Last 1 Year
Kotak Gold ETF
Kotak Gold ETF Price of Gold# CRISIL 10 Year Gilt## Price of Gold# CRISIL 10 Year Gilt##Kotak Gold ETFALPHA
TRI - Total Return Index, In terms of SEBI circular dated January 4, 2018, the performance of the scheme is benchmarked to the Total Return variant (TRI) of the Benchmark Index instead of Price Return Variant (PRI).
Scheme Inception date is 27/07/2007. Mr. Abhishek Bisen has been managing the fund since 15/04/2008 & Mr. Jeetu Valechha Sonar has been managing the fund since 28/02/2022. Different plans have different expense structure. The performance details provided herein are of regular plan
Alpha is difference of scheme return with benchmark return.
Past performance may or may not be sustained in future. All payouts during the period have been reinvested in the units of the scheme at the then prevailing NAV. Returns >= 1 year: CAGR (Compounded Annualised Growth Rate). N.A stands for data not available. Note: Point to Point (PTP) Returns in INR shows the value of 10,000/- investment made at inception. Source: ICRA MFI Explorer. # Name of Scheme Benchmark.
12.98% 13.73% -0.76% NA 14,434 14,727 NA
11.36% 12.44% -1.08% NA 49,884 57,646 NA
7.97% 8.77% -0.80% NA 10,797 10,877 NA
11.08% 11.94% -0.87% NA 16,913 17,585 NA
Last 1 Year
Since Inception
Last 3 Years
Last 5 Years
Kotak Nifty IT ETFKotak Nifty IT ETF Nifty 50 TRI ## Nifty 50 TRI ##
Past performance may or may not be sustained in future. All payouts during the period have been reinvested in the units of the scheme at the then prevailing NAV. Returns >= 1 year: CAGR (Compounded Annualised Growth Rate). N.A stands for data not available. Note: Point to Point (PTP) Returns in INR shows the value of 10,000/- investment made at inception. Source: ICRA MFI Explorer. # Name of Scheme Benchmark. ## Name of Additional Benchmark. TRI - Total Return Index, In terms of SEBI circular dated January 4, 2018, the performance of the scheme is benchmarked to the Total Return variant (TRI) of the Benchmark Index instead of Price Return Variant (PRI). Alpha is difference of scheme return with benchmark return.
Scheme Inception date is 02/03/2021. Mr. Devender Singhal & Mr. Satish Dondapati has been managing the fund since 02/03/2021. Different plans have different expense structure. The performance details provided herein are of regular plan
Kotak Nifty IT ETFALPHANifty IT Index TRI # Nifty IT Index TRI #
-2.87% -2.67% -0.20% 1.66% 9,713 9,733 10,166
9.14% 9.52% -0.38% 5.73% 11,232 11,284 10,769
Last 1 Year
Since Inception

77
Kotak Nifty Next 50 Index Fund - Growth
Kotak Nifty Next 50 Index Fund - Growth
Nifty Next 50 TRI # Nifty 50 TRI ## Nifty 50 TRI ##
Past performance may or may not be sustained in future. All payouts during the period have been reinvested in the units of the scheme at the then prevailing NAV. Returns >= 1 year: CAGR (Compounded Annualised Growth Rate). N.A stands for data not available. Note: Point to Point (PTP) Returns in INR shows the value of 10,000/- investment made at inception. Source: ICRA MFI Explorer. # Name of Scheme Benchmark. ## Name of Additional Benchmark. TRI - Total Return Index, In terms of SEBI circular dated January 4, 2018, the performance of the scheme is benchmarked to the Total Return variant (TRI) of the Benchmark Index instead of Price Return Variant (PRI).
Scheme Inception date is 10/03/2021. Mr. Devender Singhal & Mr. Satish Dondapati has been managing the fund since 10/03/2021. Different plans have different expense structure. The performance details provided herein are of regular plan
Alpha is difference of scheme return with benchmark return.
Kotak Nifty Next 50 Index Fund - Growth
Nifty Next 50 TRI #ALPHA
2.96% 4.03% -1.06% 4.45% 10,389 10,530 10,586
-4.68% -4.06% -0.62% 1.66% 9,532 9,594 10,166Last 1 Year
Since Inception
Kotak NIFTY 50 Index Fund - Growth
Kotak NIFTY 50Index Fund - Growth
Nifty 50 TRI # S&P BSE SENSEX TRI ## S&P BSE SENSEX TRI ##
Past performance may or may not be sustained in future. All payouts during the period have been reinvested in the units of the scheme at the then prevailing NAV. Returns >= 1 year: CAGR (Compounded Annualised Growth Rate). N.A stands for data not available. Note: Point to Point (PTP) Returns in INR shows the value of 10,000/- investment made at inception. Source: ICRA MFI Explorer. # Name of Scheme Benchmark. ## Name of Additional Benchmark.
Scheme Inception date is 21/06/2021. Mr. Devender Singhal, Mr. Satish Dondapati & Mr. Abhishek Bisen has been managing the fund since 21/06/2021. Different plans have different expense structure. The performance details provided herein are of regular plan
TRI - Total Return Index, In terms of SEBI circular dated January 4, 2018, the performance of the scheme is benchmarked to the Total Return variant (TRI) of the Benchmark Index instead of Price Return Variant (PRI). Alpha is difference of scheme return with benchmark return.
Kotak NIFTY 50Index Fund - Growth
Nifty 50 TRI #ALPHA
0.83% 1.51% -0.68% 2.04% 10,085 10,155 10,209
1.03% 1.66% -0.63% 2.22% 10,103 10,166 10,222Last 1 Year
Since Inception
Kotak Nifty Alpha 50 ETF
Kotak Nifty Alpha 50 ETF Nifty Alpha 50 TRI # Nifty 50 TRI ## Nifty 50 TRI ##
Scheme Inception date is 22/12/2021. Mr. Devender Singhal, Mr. Satish Dondapati & Mr. Abhishek Bisen has been managing the fund since 22/12/2021.Different plans have different expense structure. The performance details provided herein are of regular plan Past performance may or may not be sustained in future. All payouts during the period have been reinvested in the units of the scheme at the then prevailing NAV. Simple annualized returns have been provided as per the extant guidelines since the scheme has completed 6 months but not 1 year. N.A stands for data not available. Note: Point to Point (PTP) Returns in INR shows the value of 10,000/- investment made at inception. Source: ICRA MFI Explorer. # Name of Scheme Benchmark. ## Name of Additional Benchmark.TRI - Total Return Index, In terms of SEBI circular dated January 4, 2018, the performance of the scheme is benchmarked to the Total Return variant (TRI) of the Benchmark Index instead of Price Return Variant (PRI). Alpha is difference of scheme return with benchmark return.
Kotak Nifty Alpha 50 ETF Nifty Alpha 50 TRI #ALPHA
-43.58% -38.90% -4.68% -11.90% 7,424 7,738 9,362
-52.08% -48.16% -3.91% -16.84% 6,944 7,219 9,126
Since Inception
Last 6 Months

ABOUT OUR FUND MANAGERS
Kotak Tax Saver Fund (Nov. 23,'05), Kotak Equity Opportunities Fund (Sep 9, ‘04), Kotak Flexicap Fund (Sep 11, ‘09), Kotak ESG Opportunities Fund (Dec. 11,'20) & Kotak Multicap Fund (Sep. 29'21).Business ExperienceMr. Harsha has more than two decades of rich experience spread over Equity Research and Fund Management. His prior stints have been with companies such as DSP BlackRock, UTI Asset Management, Reliance Group and SG Asia Securities. Mr. Harsha is a Bachelor of Engineering (Mechanical) from National Institute of Technology, Suratkal, a Post Graduate in Management (Finance) from Indian Institute of Management, Lucknow and Chartered Financial Analyst from the CFA Institute.
Name: Mr. Harsha UpadhyayaMr. Harsha Upadhyaya manages 5 funds of Kotak Mahindra Mutual Fund. Different plans shall have a different expense structure. The performance details provided herein are of regular plan.
78
Kotak Infrastructure and Economic Reform Fund - Growth, *Name of the Benchmark - (Tier 1): Nifty Infrastructure TRI / (Tier 2): India Infrastructure TR Index (Customised Index by IISL), Scheme Inception date is 25/02/2008. Mr. Harish Krishnan has been managing the fund since 31/01/2015.
Kotak Bluechip Fund - Growth, *Name of the Benchmark - (Tier 1): Nifty 100 TRI / (Tier 2): Nifty 50 TRI, Since inception date of Kotak Bluechip Fund - Reg Growth is 04/02/2003. Mr. Harish Krishnan has been managing the fund since 15/11/2013.
Kotak Focused Equity Fund - Growth, *Name of the Benchmark - (Tier 1): Nifty 500 TRI / (Tier 2): Nifty 200 TRI, Scheme Inception date is 16/07/2019. Mr. Harish Krishnan & Ms. Shibani Kurian has been managing the fund since 16/07/2019.
Kotak Balanced Advantage Fund - Growth, *Name of the Benchmark - NIFTY 50 Hybrid Composite Debt 50:50 Index . Scheme Inception date is 03/08/2018. Mr. Abhishek Bisen & Mr. Harish Krishnan has been managing the fund since 03/08/2018. Mr. Hiten Shah has been managing the fund since 03/10/2019.
Kotak Pioneer Fund - Growth, *Name of the Benchmark - 85% IISL Kotak India Pioneering Innovations + 15% MSCI ACWI Information Technology Index TRI, Scheme Inception date is 31/10/2019. Mr. Harish Krishnan & Mr. Arjun Khanna has been managing the fund since 31/10/2019.
Name: Mr. Abhishek Bisen
Business Experience
(Oct. 13, '14), Kotak Gold Fund (Mar. 25, ’11), Kotak Multi Asset Allocator Fund of Fund – Dynamic (Aug. 09, ’04), Kotak Gold ETF (Jul. 27, ’07), Kotak Balanced Advantage Fund (Aug. 03' 18), Kotak NASDAQ 100 FUND OF FUND (Feb. 02' 21), Kotak Multicap Fund (Sep. 29'21), Kotak NIFTY Alpha 50 ETF (Dec. 22'21), Kotak NIFTY 50 Index Fund (Jun. 21'21), Kotak Nifty Midcap 50 ETF (Jan. 28'22), KOTAK NIFTY SDL APR 2027 TOP 12 EQUAL WEIGHT INDEX FUND (Feb. 11'22), KOTAK NIFTY SDL APR 2032 TOP 12 EQUAL WEIGHT INDEX FUND (Feb. 11'22) & Kotak Manufacture in India Fund (Feb. 22'22).
Kotak Equity Hybrid Fund (Nov. 25, ‘99), Kotak Debt Hybrid Fund (Dec. 02, ‘03), Kotak Bond Fund (Regular Plan) (Nov. 25, ’99), Kotak Gilt Fund (Regular & PF-Trust) (Dec. 29, ’98), Kotak Equity Savings Fund
Mr. Abhishek has been associated with the company since October 2006 and his key responsibilities include fund management of debt schemes. Prior to joining Kotak AMC, Abhishek was working with Securities Trading Corporation Of India Ltd where he was looking at Sales & Trading of Fixed Income Products apart from doing Portfolio Advisory. He has been awarded twice as one of the Highly Commended Investors in Indian Rupees Bonds from the Asset magazine Hong Kong. His educational background is B.A (Management) and MBA (Finance).
Mr. Abhishek Bisen manages 18 funds of Kotak Mahindra Mutual Fund. Different plans shall have a different expense structure. The performance details provided herein are of regular plan.
Scheme Names
Kotak NASDAQ 100 Fund of Fund - Growth
Kotak Bond Fund - Growth
Kotak Gilt Fund - Growth
1 YEAR 3 YEARS 5 YEARS Since Inception
SchemeReturns(%)^
BenchmarkReturns (%)^*
SchemeReturns(%)^
BenchmarkReturns (%)^*
SchemeReturns(%)^
BenchmarkReturns (%)^*
SchemeReturns(%)^
BenchmarkReturns (%)^*
Top 3
Bottom 3
9.88 4.65 17.56 11.56 12.51 10.78 15.62 11.10
-0.44 -0.29 NA NA NA NA 0.20 0.71
1.19 2.89 6.01 8.25 5.62 6.66 8.41 NA
7.65 5.13 8.76 8.63 8.23 8.69 8.39 8.58
1.12 -0.31 6.39 5.82 6.09 6.12 9.12 NA
7.87 5.65 14.64 11.66 10.81 11.30 10.85 10.18Kotak Equity Hybrid - Growth
Kotak Multi Asset Allocator Fund of Fund - Dynamic - Growth
Kotak Equity Savings Fund - Growth
Mr. Pankaj is a graduate in Commerce from St. Xavier's College, Kolkata and holds a Master's degree in Finance from Manchester University. He has been associated with the mutual fund industry since 2003 where he has managed several debt and equity schemes. He has been a part of the organization since January 2010. Mr. Pankaj's earlier stint was with Principal Mutual Fund.
Mr. Pankaj Tibrewal manages 3 funds of Kotak Mahindra Mutual Fund. Different plans shall have a different expense structure. The performance details provided herein are of regular plan.
Business ExperienceKotak Small Cap Fund (Feb. 24,‘05), Kotak Emerging Equity Fund (Mar 30,'07) & Kotak Equity Hybrid Fund (Nov. 25,'99).
Name: Mr. Pankaj Tibrewal
Kotak Emerging Equity Fund - Growth, *Name of the Benchmark - (Tier 1): NIFTY Midcap 150 TRI / (Tier 2): NIFTY Midcap 100 TRI , Scheme Inception date is 30/03/2007. Mr. Pankaj Tibrewal has been managing the fund since 27/05/2010.
Kotak Equity Hybrid Fund - Growth, *Name of the Benchmark - NIFTY 50 Hybrid Composite Debt 65:35 Index, Scheme Inception date is 25/11/1999 and Kotak Equity Hybrid Fund - Regular plan scheme inception date is 3rd November 2014. Mr. Pankaj Tibrewal has been managing the fund since 25/08/2015. Mr. Abhishek Bisen has been managing the fund since 15/04/2008.
Kotak Smallcap Fund - Growth, *Name of the Benchmark - (Tier 1): NIFTY Smallcap 250 TRI / (Tier 2): NIFTY Smallcap 100 TRI, Scheme Inception date is 24/02/2005. Mr. Pankaj Tibrewal has been managing the fund since 21/01/2010.
Scheme Names
Kotak Small Cap Fund - Growth
Kotak Equity Hybrid Fund - Growth
Kotak Emerging Equity Fund - Growth
1 YEAR 3 YEARS 5 YEARS Since Inception
SchemeReturns(%)^
BenchmarkReturns (%)^*
SchemeReturns(%)^
BenchmarkReturns (%)^*
SchemeReturns(%)^
BenchmarkReturns (%)^*
SchemeReturns(%)^
BenchmarkReturns (%)^*
7.87 5.65 14.64 11.66 10.81 11.30 10.85 10.18
11.73 10.28 20.52 19.23 13.75 13.65 13.53 14.32
15.04 9.34 28.50 18.23 16.27 9.05 17.15 NA
Mr. Harish Krishnan manages 6 funds of Kotak Mahindra Mutual Fund. Different plans shall have a different expense structure. The performance details provided herein are of regular plan.
Business Experience
Kotak Infrastructure & Economic Reform Fund (Feb 25, '08), Kotak Focused Equity fund (Jul 16, '19), Kotak Pioneer Fund (Oct 31, '19), Kotak Bluechip Fund (Dec 29, ’98), Kotak Balanced Advantage Fund (Aug. 03,’18) & Kotak Manufacture in India Fund (Feb. 22'22).
Mr. Harish has more than a decade of experience spread over Equity Research and Fund Management. Prior to joining Kotak Mahindra Mutual Fund, he was based out of Singapore and Dubai, managing Kotak's offshore funds. Mr. Harish has also worked at Infosys Technologies Ltd in his earlier stint. He is a Bachelor of Technology (Electronics & Communications) from Government Engineering College, Trichur, a post Graduate in Management from Indian Institute of Management, Kozhikode and a Chartered Financial Analyst from the CFA Institute.
Name: Mr. Harish Krishnan
Scheme Names
Kotak Infrastructure and EconomicReform Fund - Growth
Kotak Bluechip Fund - Growth
1 YEAR 3 YEARS 5 YEARS Since Inception
SchemeReturns(%)^
BenchmarkReturns (%)^*
SchemeReturns(%)^
BenchmarkReturns (%)^*
SchemeReturns(%)^
BenchmarkReturns (%)^*
SchemeReturns(%)^
BenchmarkReturns (%)^*
4.55 4.65 9.98 10.80 NA NA 9.53 10.45
6.14 7.56 13.68 13.08 11.33 12.50 19.10 17.54
3.98 9.76 NA NA NA NA 22.16 18.71
8.49 8.08 NA NA NA NA 16.10 15.95
21.82 14.50 14.98 15.42 9.92 10.63 8.55 1.52
Kotak Focused Equity Fund - Growth
Kotak Balanced Advantage Fund - Growth
Kotak Pioneer Fund - Growth
Kotak Flexi Cap Fund - Growth, *Name of the Benchmark - (Tier 1): Nifty 500 TRI / (Tier 2): Nifty 200 TRI , Scheme Inception date is 11/09/2009. Mr. Harsha Upadhyaya has been managing the fund since 04/08/2012.
Kotak Equity Opportunities Fund - Growth, *Name of the Benchmark - (Tier 1): Nifty Large Midcap 250 TRI / (Tier 2): Nifty 200 TRI , Scheme Inception date is 09/09/2004. Mr. Harsha Upadhyaya has been managing the fund since 04/08/2012.
Kotak ESG Opportunities Fund - Growth, *Name of the Benchmark - Nifty 100 ESG TRI, Scheme Inception date is 11/12/2020. Mr. Harsha Upadhyaya has been managing the fund since 11/12/2020.
Kotak Tax Saver Fund - Growth, *Name of the Benchmark - Nifty 500 TRI, Scheme Inception date is 23/11/2005. Mr. Harsha Upadhyaya has been managing the fund since 25/08/2015.
8.33
8.25 4.40
-1.69
8.99 8.08
8.08
6.35
7.97
7.97
14.85
NA
10.47
14.10
14.25 13.63 NA
14.25 16.22 13.63
Scheme Names
1 YEAR 3 YEARS 5 YEARS Since Inception
SchemeReturns(%)^
BenchmarkReturns (%)^*
SchemeReturns(%)^
BenchmarkReturns (%)^*
SchemeReturns(%)^
BenchmarkReturns (%)^*
SchemeReturns(%)^
BenchmarkReturns (%)^*
0.18 0.56 12.50 12.77 10.94 11.23 11.94 12.66
Kotak Equity Opportunities Fund - Growth
Kotak Flexi Cap Fund - Growth
Kotak Tax Saver Fund - Growth
Kotak ESG Opportunities Fund - Growth
Kotak Multicap Fund - Growth Kotak Multicap Fund has not yet completed 1 year from Inception, the performance of the scheme is not disclosed.
-9.21 -1.77 NA NA NA NA 2.30 11.71
0.06
-2.93
0.41 0.82 0.56 0.82
12.77
14.67 12.06
12.06
13.86
9.03 9.26
10.84 11.84 11.32 11.23 11.32 12.86
17.56 NA
11.33 14.82
11.20
(Tier 1): Nifty Large Midcap 250 TRI (Tier 2): Nifty 200 TRI
Nifty 500 TRI
Nifty 100 ESG TRI
(Tier 1): Nifty 500 TRI (Tier 2): Nifty 200 TRI
Nifty 500 Multicap 50:25:25 TRI
Benchmark
Scheme Names
1 YEAR 3 YEARS 5 YEARS Since Inception
SchemeReturns(%)^
BenchmarkReturns (%)^*
SchemeReturns(%)^
BenchmarkReturns (%)^*
SchemeReturns(%)^
BenchmarkReturns (%)^*
SchemeReturns(%)^
BenchmarkReturns (%)^*
Kotak Focused Equity Fund - Growth
Kotak Infrastructure and EconomicReform Fund - Growth
Kotak Pioneer Fund - Growth
(Tier 2): India Infrastructure TRI Index(Customised Index by IISL)
(Tier 1): Nifty Infrastructure TRI
Kotak Bluechip Fund - Growth
Kotak Balanced Advantage Fund - Growth (Tier 1): Nifty 500 TRI
(Tier 2): Nifty 50 TRI
(Tier 2): Nifty 200 TRI(Tier 1): Nifty 100 TRI
85% IISL Kotak India Pioneering Innovations + 15%MSCI ACWI Information Technology Index TRI
Benchmark
Nifty 50 Hybrid Composite Debt 50:50 Index
-0.01
-5.58
0.58
11.77
-1.38
6.61
0.56
1.08
8.07
1.71
0.82
1.66
-0.79
12.29
14.07
NA
9.15
NA
12.97
NA
10.09
9.90
11.55
11.57
NA
NA
9.35
NA
10.38
NA
NA
NA
9.51
NA
11.48 12.03
NA
7.22
NA
8.62
8.24
19.12
18.72
13.8217.16
15.48
16.54
12.67
3.57
13.47
9.59
1.13
Scheme Names
1 YEAR 3 YEARS 5 YEARS Since Inception
SchemeReturns(%)^
BenchmarkReturns (%)^*
SchemeReturns(%)^
BenchmarkReturns (%)^*
SchemeReturns(%)^
BenchmarkReturns (%)^*
SchemeReturns(%)^
BenchmarkReturns (%)^*
Kotak Emerging Equity Fund - Growth
Kotak Small Cap Fund - Growth(Tier 2): NIFTY Smallcap 100 TRI
(Tier 1): NIFTY Smallcap 250 TRI
Kotak Equity Hybrid Fund - Growth(Tier 1): NIFTY Midcap 150 TRI (Tier 2): NIFTY Midcap 100 TRI
NIFTY 50 Hybrid Composite Debt 65:35 Index
Benchmark
5.08
2.45
0.94
27.27
13.60
18.83
15.30
12.60
10.16 10.26
13.12
16.77 NA
9.63 13.83 13.13
12.08
1 YEAR 3 YEARS 5 YEARS Since Inception
SchemeReturns(%)^
BenchmarkReturns (%)^*
SchemeReturns(%)^
BenchmarkReturns (%)^*
SchemeReturns(%)^
BenchmarkReturns (%)^*
SchemeReturns(%)^
BenchmarkReturns (%)^*Scheme Names
Kotak Gold Fund - Growth
Kotak Equity Savings Fund -Growth
Kotak Gold ETF
Kotak Bond Fund - Growth
Kotak Balanced Advantage Fund - Growth
0.73
5.65
7.97
0.58
-15.97
6.77 Price of Gold
(Tier 1): NIFTY Equity Savings Index
(Tier 2): NIFTY Medium to Long DurationDebt Index
(Tier 2): 75% NIFTY 50 ARBITRAGE + 25%Nifty 50 TRI(Tier 1): NIFTY Medium to Long DurationDebt Index B-III
Nifty 50 Hybrid Composite Debt 50:50 Index
Benchmark
Top 3
Bottom 3
Kotak NASDAQ 100 Fund of Fund - Growth NASDAQ 100 TRI
2.99
3.41
1.71
0.98
-15.47
8.77
3.24
8.77
-0.38 -0.84
1.74
-3.36-12.37
17.52
12.0310.59 17.64 15.59
7.27
3.99
11.99
10.62
9.42
Price of Gold 12.98
9.15
13.35
8.42
5.60
NA
5.20
11.04
7.91
NA
11.08
NA
8.38
11.36
6.59
8.16
8.62
-5.88
9.90
13.73 8.14
8.07
13.73
6.63
6.22
NA
11.94
8.32
6.29
11.94
6.62
6.47
NA NA
NA
8.27
12.44
6.86
9.59
8.12
NA
-4.69

Kotak Bond Short Term Fund (May. 02, ’02), Kotak Dynamic Bond Fund (May. 26, ‘08), Kotak Money Market Fund (Jul. 14, ‘03), Kotak Liquid Fund (Nov. 04, ‘03), Kotak Banking and PSU Debt Fund (Dec. 29, ’98), Kotak Savings Fund (Aug. 13, ’04), Kotak Credit Risk Fund (May 11, '10), Kotak Medium Term Fund (Mar. 21, ’14), Kotak Low Duration Fund (Mar. 06, ’08), Kotak Corporate Bond Fund (Sep. 21, ’07), Kotak Overnight Fund (Jan. 15, 19), All Fixed Maturity Plans, Kotak Floating Rate Fund (May. 14, 19).
Mr. Deepak's career has started from Kotak AMC when he joined the organization in December 2002 where he was initially in Research, Dealing and then moved into Fund Management from November 2006. Mr. Deepak is a Post Graduate in Commerce, Chartered Account and Company Secretary.
Business Experience
Name: Mr. Deepak AgrawalMr. Deepak Agrawal manages 12 funds & All FMPs of Kotak Mahindra Mutual Fund. Different plans shall have a different expense structure. The performance details provided herein are of regular plan.
Kotak Money Market Fund - Growth, *Name of the Benchmark - (Tier 1): NIFTY Money Market Index B-I / (Tier 2): NIFTY Money Market Index, Scheme Inception date is 14/07/2003. Mr. Deepak Agrawal has been managing the
fund since 01/11/2006.
Kotak Overnight Fund - Growth, *Name of the Benchmark - NIFTY 1D Rate Index, Scheme Inception date is 15/01/2019. Mr. Deepak Agrawal has been managing the fund since 15/01/2019.
Kotak Dynamic Bond Fund - Growth, *Name of the Benchmark - (Tier 1): NIFTY Composite Debt Index B-III / (Tier 2): NIFTY Composite Debt Index, Scheme Inception date is 26/05/2008. Mr. Deepak Agrawal has been
managing the fund since 25/11/2012.
Kotak Credit Risk Fund - Growth, *Name of the Benchmark - (Tier 1): NIFTY Credit Risk Bond Index C-III / (Tier 2): NIFTY Credit Risk Bond Index , Scheme Inception date is 11/05/2010. Mr. Deepak Agrawal has been managing
the fund since 12/04/2010.
Kotak Liquid Fund - Growth, *Name of the Benchmark - (Tier 1): NIFTY Liquid Index B-I / (Tier 2): NIFTY Liquid Index, Scheme Inception date is 04/11/2003. Mr. Deepak Agrawal has been managing the fund since 01/05/2007.
Kotak Bond Short Term Fund - Growth, *Name of the Benchmark - (Tier 1): NIFTY Short Duration Debt Index B-II / (Tier 2): NIFTY Short Duration Debt Index, Scheme Inception date is 02/05/2002. Mr. Deepak Agrawal has been
managing the fund since 11/07/2007.
55
Kotak India Growth Fund - Series 4 - Growth, *Name of the Benchmark - Nifty 200 TRI, Scheme Inception date is 14/02/2018. Mr. Devender Singhal has been managing the fund since 24/01/2019.
Kotak Nifty Bank ETF, *Name of the Benchmark - Nifty Bank TRI, Scheme Inception date is 10/12/2014. Mr. Devender Singhal & Mr. Satish Dondapati has been managing the fund since 09/05/2019. Kotak Nifty Next 50 Index Fund - Growth, *Name of the Benchmark - Nifty Next 50 TRI, Scheme Inception date is 10/03/2021. Mr. Devender Singhal & Mr. Satish Dondapati has been managing the fund since 10/03/2021.
Kotak Debt Hybrid Fund - Growth, *Name of the Benchmark - CRISIL Hybrid 85+15 - Conservative Index, Scheme Inception date is 02/12/2003. Mr. Abhishek Bisen has been managing the fund since 01/04/2008. Mr. Devender Singhal has been managing the fund since 25/08/2015. Kotak Nifty IT ETF, *Name of the Benchmark - Nifty IT TRI, Scheme Inception date is 02/03/2021. Mr. Devender Singhal & Mr. Satish Dondapati has been managing the fund since 02/03/2021.
Kotak Equity Savings Fund - Growth, *Name of the Benchmark - (Tier 1): NIFTY Equity Savings Index / (Tier 2): 75% NIFTY 50 ARBITRAGE + 25% Nifty 50 TRI , Scheme Inception date is 13/10/2014. Mr. Devender Singhal has been managing the fund since 01/04/2021. Mr. Abhishek Bisen has been managing the fund since 17/09/2014. Mr. Hiten Shah has been managing the fund since 03/10/2019.
Name: Mr. Devender SinghalMr. Devender Singhal manages 16 funds of Kotak Mahindra Mutual Fund. Different plans shall have a different expense structure. The performance details provided herein are of regular plan.Kotak Debt Hybrid Fund - Growth (Dec. 02, ’03), Kotak India Growth Fund Series-4 (Feb. 20, '18), Kotak Nifty 50 Value 20 ETF (Dec. 02, '15), Kotak Nifty Bank ETF (Dec. 04, '14), Kotak S&P BSE Sensex ETF (Jun. 06, '08), Kotak Multi Asset Allocator Fund of Fund – Dynamic (Aug,. 09, '04), Kotak Nifty PSU Bank ETF (Nov. 08, 07), Kotak Nifty 50 ETF (Feb. 02, '10), Kotak Nifty IT ETF (Mar. 02, '21), Kotak NIFTY 50 Index Fund (Jun. 21, '21), Kotak NIFTY Next 50 Index (Mar. 10, '21), Kotak Equity Savings Fund (Oct. 13' 14), Kotak Multicap Fund (Sep. 29'21), Kotak NIFTY Alpha 50 ETF (Dec. 22'21), Kotak Nifty Midcap 50 ETF (Jan. 28'22) & Kotak Nifty 100 Low Volatility 30 ETF Fund (Mar. 23'22)Business ExperienceMr. Devender has been associated with the Kotak Group since July 2007. He is responsible for the research coverage of FMCG, Automobiles and Media sectors at Kotak AMC since Feb 2009. Devender has an overall working experience of 19 years in equity research and fund management. Prior to joining Kotak AMC, Devender worked with the PMS divisions of Kotak, Religare, Karvy and P N Vijay Financial Services.
79
Kotak Equity Savings Fund - Growth, *Name of the Benchmark - (Tier 1): NIFTY Equity Savings Index / (Tier 2): 75% NIFTY 50 ARBITRAGE + 25% Nifty 50 TRI , Scheme Inception date is 13/10/2014. Mr. Devender Singhal has been managing the fund since 01/04/2021. Mr. Abhishek Bisen has been managing the fund since 17/09/2014. Mr. Hiten Shah has been managing the fund since 03/10/2019.
Kotak Gold Fund - Growth, *Name of the Benchmark - Price of Gold . Scheme Inception date is 25/03/2011. Mr. Abhishek Bisen has been managing the fund since 04/03/2011.
Kotak NASDAQ 100 Fund of Fund - Growth, *Name of the Benchmark - NASDAQ 100 TRI, Scheme Inception date is 02/02/2021. Mr. Arjun Khanna & Mr. Abhishek Bisen has been managing the fund since 02/02/2021
Kotak Gold ETF, *Name of the Benchmark - Price of Gold . Scheme Inception date is 03/08/2018. Scheme Inception date is 27/07/2007. Mr. Abhishek Bisen has been managing the fund since 15/04/2008 & Mr. Jeetu Valechha Sonar has been managing the fund since 28/02/2022.
Kotak Bond Fund - Growth, *Name of the Benchmark - (Tier 1): NIFTY Medium to Long Duration Debt Index B-III / (Tier 2): NIFTY Medium to Long Duration Debt Index, Scheme Inception date is 25/11/1999. Mr. Abhishek Bisen has been managing the fund since 01/04/2008. Kotak Balanced Advantage Fund - Growth, *Name of the Benchmark - NIFTY 50 Hybrid Composite Debt 50:50 Index . Scheme Inception date is 03/08/2018. Mr. Abhishek Bisen & Mr. Harish Krishnan has been managing the fund since 03/08/2018. Mr. Hiten Shah has been managing the fund since 03/10/2019.
Scheme Names
Kotak Debt Hybrid Fund - Growth
Kotak Nifty Next 50 Index Fund -Growth
1 YEAR 3 YEARS 5 YEARS Since Inception
SchemeReturns(%)^
BenchmarkReturns (%)^*
SchemeReturns(%)^
BenchmarkReturns (%)^*
SchemeReturns(%)^
BenchmarkReturns (%)^*
SchemeReturns(%)^
BenchmarkReturns (%)^*
Kotak IT ETF
Kotak NV20 ETF
Top 3
Bottom 3
Kotak Banking ETF
11.94 12.18 16.91 18.29 17.21 18.18 16.84 16.71
11.23 11.57 NA NA NA NA 15.46 15.93
5.09 1.82 10.34 8.08 8.04 7.74 8.07 8.26
0.48 0.74 3.91 4.64 8.60 9.14 9.32 9.74
3.83 4.47 NA NA NA NA 8.74 9.92
11.04 7.97 24.16 13.63 NA NA 14.98 12.19Kotak India Growth Fund - Series 4 - Growth
Scheme Names
Kotak Money Market Fund - Growth
Kotak Medium Term Fund - Growth
1 YEAR 3 YEARS 5 YEARS Since Inception
SchemeReturns(%)^
BenchmarkReturns (%)^*
SchemeReturns(%)^
BenchmarkReturns (%)^*
SchemeReturns(%)^
BenchmarkReturns (%)^*
SchemeReturns(%)^
BenchmarkReturns (%)^*
Kotak Dynamic Bond Fund - Growth
Kotak Bond Short Term Fund - Growth
Kotak Credit Risk Fund - Growth
Top 3
Bottom 3
3.41 3.63 4.08 4.28 5.29 5.38 6.89 7.04
2.10 2.14 6.53 7.42 7.06 6.77 8.14 8.21
2.26 3.20 6.09 6.49 6.34 6.75 7.43 7.70
3.68 3.47 5.06 4.59 6.07 5.63 7.04 7.19
3.42 4.14 5.53 7.73 5.85 7.20 7.59 8.59
1.32 5.77 5.18 8.53 5.73 8.22 7.53 9.19
Kotak Liquid Fund - Growth
Kotak Focused Equity Fund - Growth, *Name of the Benchmark - (Tier 1): Nifty 500 TRI / (Tier 2): Nifty 200 TRI, Scheme Inception date is 16/07/2019. Mr. Harish Krishnan & Ms. Shibani Kurian has been managing the fund since 16/07/2019.Kotak India EQ Contra Fund - Growth, *Name of the Benchmark - (Tier 1): Nifty 500 TRI / (Tier 2): Nifty 100 TRI, Scheme Inception date is 27/07/2005. Ms. Shibani Kurian has been managing the fund since 09/05/2019.
Ms. Shibani Sircar Kurian has a total experience of 20 years in the Indian equity markets of which almost more than 11 years have been with Kotak Mahindra Asset Management Company Limited. Her primary responsibilities include equity fund management and heading the equity research team.
Ms. Shibhani Kurian manages 2 funds of Kotak Mahindra Mutual Fund. Different plans shall have a different expense structure. The performance details provided herein are of regular plan.Name: Ms. Shibani Kurian
Kotak Focused Equity Fund (Jul 16, '19) & Kotak India EQ Contra Fund - Growth (July. 27, '05).Business Experience
Prior to joining Kotak Mahindra Asset Management Company Limited, she worked for almost 6 years with UTI Asset Management Company Limited. and for 1 and half years with Dawnay Day AV Financial Services.She holds a PGDM (with a specialization in Finance) from T.A. Pai Management Institute, Manipal and a BSc (Hons) in Economics from St. Xavier’s College, Kolkata.
Scheme Names
Kotak Focused Equity Fund - Growth
1 YEAR 3 YEARS 5 YEARS Since Inception
SchemeReturns(%)^
BenchmarkReturns (%)^*
SchemeReturns(%)^
BenchmarkReturns (%)^*
SchemeReturns(%)^
BenchmarkReturns (%)^*
SchemeReturns(%)^
BenchmarkReturns (%)^*
8.49 8.08 NA NA NA NA 16.10 15.95
6.92 8.08 13.47 14.25 13.09 12.40 13.01 13.54Kotak India EQ Contra Fund - Growth
1 YEAR 3 YEARS 5 YEARS Since Inception
SchemeReturns(%)^
BenchmarkReturns (%)^*
SchemeReturns(%)^
BenchmarkReturns (%)^*
SchemeReturns(%)^
BenchmarkReturns (%)^*
SchemeReturns(%)^
BenchmarkReturns (%)^*Scheme Names
Kotak Overnight Fund - Growth
Kotak Liquid Fund - Growth
Kotak Money Market Fund -Growth
Kotak Bond Short Term Fund -Growth
Kotak Dynamic Bond Fund -Growth
3.82 3.53
3.38
2.17
1.50
0.86
(Tier 1): NIFTY Money Market Index B-I
(Tier 2): NIFTY Money Market Index(Tier 1): NIFTY Liquid Index B-I
(Tier 2): NIFTY Liquid Index
NIFTY 1D Rate Index
(Tier 1): NIFTY Short Duration Debt Index B-II
Benchmark
Top 3
Bottom 3
Kotak Credit Risk Fund - Growth
(Tier 2): NIFTY Short Duration Debt Index
5.73
3.80
3.67
2.80
1.35
3.60
3.57
3.74
3.22
2.22
5.15
(Tier 1): NIFTY Composite Debt Index B-III (Tier 2): NIFTY Composite Debt Index (Tier 1): NIFTY Credit Risk Bond Index C-III (Tier 2): NIFTY Credit Risk Bond Index
5.02
6.05
3.58
5.96
4.03
5.06
NA
6.05
5.58
5.26
6.20
6.73
7.03
7.41
7.47
3.91
6.88
8.06
1 YEAR 3 YEARS 5 YEARS Since Inception
SchemeReturns(%)^
BenchmarkReturns (%)^*
SchemeReturns(%)^
BenchmarkReturns (%)^*
SchemeReturns(%)^
BenchmarkReturns (%)^*
SchemeReturns(%)^
BenchmarkReturns (%)^*Scheme Names
Kotak Equity Savings Fund - Growth
Kotak India Growth Fund - Series 4 - Growth
Kotak Debt Hybrid Fund - Growth
Kotak Nifty Next 50 Index Fund -Growth
6.84 0.82 23.43 12.06 NA NA 14.10 10.62Nifty 200 TRI
(Tier 1): NIFTY Equity Savings Index(Tier 2): 75% NIFTY 50 ARBITRAGE + 25% Nifty 50 TRI
CRISIL Hybrid 85+15 - Conservative Index
Benchmark
Top 3
Bottom 3Kotak Nifty Bank ETF
Nifty Next 50 TRI
Nifty Bank TRI
Scheme Names
1 YEAR 3 YEARS 5 YEARS Since Inception
SchemeReturns(%)^
BenchmarkReturns (%)^*
SchemeReturns(%)^
BenchmarkReturns (%)^*
SchemeReturns(%)^
BenchmarkReturns (%)^*
SchemeReturns(%)^
BenchmarkReturns (%)^*
Kotak India EQ Contra Fund - Growth
Kotak Focused Equity Fund - Growth(Tier 2): Nifty 200 TRI
(Tier 1): Nifty 500 TRI
(Tier 1): Nifty 500 TRI (Tier 2): Nifty 100 TRI
Benchmark
-0.01
-0.77 0.56
0.56 0.82
1.08
NA
12.15 12.77 NA
11.57
NA
12.34
NA NA NA 11.23 11.48
13.82
12.64 13.12 12.67 13.47
13.56
4.64 4.55
4.24 4.22
7.22
6.57
8.57
8.47
3.74
6.44
6.46 6.64
6.46
NA
5.60
5.36 5.35
5.67
6.65
6.57
7.94
8.16
7.16 7.03 6.92
4.07
7.69 7.65
7.18
8.20
9.18 8.99
7.95
Kotak Nifty IT ETF Nifty IT TRI
3.65 1.13 9.86 7.62 7.61 7.39 7.99 8.20
-3.44 -3.22 2.11 2.81 7.44 7.98 8.36 8.77
-2.87 -2.67 NA NA NA NA 9.14 9.52
-4.68 -4.06 NA NA NA NA 2.96 4.03
5.65 2.99 3.41
8.42 6.22 8.14
7.91 6.62 8.32
8.16 8.27 6.86

80
Name: Mr. Arjun Khanna
Kotak International REIT FOF Dec 29 20 , Kotak Global Emerging Market Fund - Growth (Sep. 26, '07), Kotak NASDAQ 100 FUND OF FUND Feb 2 21 Kotak Global Innovation - Growth ( . , ‘ ) ( . 0 ' ), Fund of Fund (Jul. 29, ’21) & Kotak Pioneer Fund (Oct. 31, '19).Business Experience
Mr. Arjun Khanna manages 5 funds of Kotak Mahindra Mutual Fund. Different plans shall have a different expense structure. The performance details provided herein are of regular plan.
Mr. Arjun Khanna has over 13 years of experience in banking and financial companies. Prior to joining Kotak Asset Management Company Limited, he worked in equity research in Principal PNB AMC. He has also worked at Citigroup NA in his earlier stint. He is a Bachelor of Engineering (Electronics) from Mumbai University and a post Graduate in Masters of Management Studies (Finance) from Jamnalal Bajaj Institute of Management Studies. He is a holder of the right to use the Chartered Financial Analyst® designation and is a Financial Risk Manager - Certified by the Global Association of Risk Professionals.
Kotak NASDAQ 100 Fund of Fund - Growth, *Name of the Benchmark - NASDAQ 100 TRI, Scheme Inception date is 02/02/2021. Mr. Arjun Khanna & Mr. Abhishek Bisen has been managing the fund since 02/02/2021
Kotak Pioneer Fund - Growth, *Name of the Benchmark - 85% IISL Kotak India Pioneering Innovations + 15% MSCI ACWI Information Technology Index TRI, Scheme Inception date is 31/10/2019. Mr. Harish Krishnan & Mr. Arjun Khanna has been managing the fund since 31/10/2019.Kotak International REIT FOF - Growth, *Name of the Benchmark - S&P Asia Pacific ex Japan REIT TRI, Scheme Inception date is 29/12/2020. Mr. Arjun Khanna has been managing the fund since 29/12/2020.
Kotak Global Emerging Market Fund - Growth, *Name of the Benchmark - MSCI Emerging Market index, Scheme Inception date is 26/09/2007. Mr. Arjun Khanna has been managing the fund since 09/05/2019.
Name: Mr. Satish DondapatiMr. Satish Dondapati manages 11 funds of Kotak Mahindra Mutual Fund. Different plans shall have a different expense structure. The performance details provided herein are of regular plan.
Business Experience
Kotak Nifty 50 Value 20 ETF (Dec. 2, '15), Kotak Nifty Bank ETF (Dec. 04, '14), Kotak S&P BSE Sensex ETF (Jun. 06, '08), Kotak Nifty 50 ETF (Feb. 02, '10), Kotak Nifty PSU Bank ETF (Nov. 08, '07), Kotak Nifty IT ETF (Mar. 02, '21), Kotak NIFTY 50 Index Fund (Jun. 21, '21), Kotak NIFTY Next 50 Index Fund (Mar. 10, '21), Kotak NIFTY Alpha 50 ETF (Dec. 22'21), Kotak Nifty Midcap 50 ETF (Jan. 28'22) & Kotak Nifty 100 Low Volatility 30 ETF Fund (Mar. 23'22)
Mr. Satish Dondapati has been associated with the company since March 2008. He has over 16 years of experience in MF Product Development and Sales. Prior to joining Kotak Asset Management Company Limited, he was the part of MF Product Team of Centurion Bank Of Punjab.
Kotak Nifty 50 Value 20 ETF - *Name of the Benchmark Nifty 50 Value 20 TRI, Scheme Inception date is 01/12/2015. Mr. Devender Singhal & Mr. Satish Dondapati has been managing the fund since 09/05/2019.
Kotak Nifty 50 ETF, *Name of the Benchmark - Nifty 50 TRI, Scheme Inception date is 02/02/2010. Mr. Devender Singhal & Mr. Satish Dondapati has been managing the fund since 09/05/2019.
Kotak Nifty Bank ETF, *Name of the Benchmark - Nifty Bank TRI, Scheme Inception date is 10/12/2014. Mr. Devender Singhal & Mr. Satish Dondapati has been managing the fund since 09/05/2019.
Kotak S&P BSE Sensex ETF, *Name of the Benchmark - S&P BSE SENSEX TRI, Scheme Inception date is 06/06/2008. Mr. Devender Singhal & Mr. Satish Dondapati has been managing the fund since 09/05/2019.
Kotak Nifty IT ETF, *Name of the Benchmark - Nifty IT TRI, Scheme Inception date is 02/03/2021. Mr. Devender Singhal & Mr. Satish Dondapati has been managing the fund since 02/03/2021.
Kotak Nifty Next 50 Index Fund - Growth, *Name of the Benchmark - Nifty Next 50 TRI, Scheme Inception date is 10/03/2021. Mr. Devender Singhal & Mr. Satish Dondapati has been managing the fund since 10/03/2021.
Mr. Hiten Shah, is a MMS in Finance with over 12 years of work experience. Prior to joining Kotak Mahindra Mutual Fund, he was associated with Edelweiss Asset Management for more than 8 years as a Co-Fund manager and Chief dealer in equities segment. Mr Hiten Shah was also associated with Edelweiss securities Ltd. as low risk arbitrage trader for more than 3 years.
Kotak Balanced Advantage Fund (Aug. 03, ’18), Kotak Equity Savings Fund (Oct. 13, ‘2014) & Kotak Equity Arbitrage Fund (Sep. 29, ‘05).Mr. Hiten Shah manages 3 fund of Kotak Mahindra Mutual Fund Different plans shall have a different expense structure. The performance details provided herein are of regular plan.Name: Mr. Hiten Shah
Business Experience
Name: Mr. Jeetu Valechha Sonar
Business ExperienceMr. Jeetu Valechha Sonar has completed his P.G.D.M in Finance Management from Welingkar Institute of Management Development and Research and has more than 11 years of experience in Commodity and Equity dealing and advisory. Prior to joining Kotak AMC Limited, he has worked as institutional dealer with Kotak Securities Ltd. and is part of Kotak Group since 2014.
Mr. Jeetu Valechha Sonar manages 1 fund of Kotak Mahindra Mutual Fund Different plans shall have a different expense structure. The performance details provided herein are of regular plan. Kotak Gold ETF (Jul. 27, ’07).
Kotak Equity Arbitrage Fund - Growth, *Name of the Benchmark - Nifty 50 Arbitrage Index, Scheme Inception date is 29/09/2005. Mr. Hiten Shah has been managing the fund since 03/10/2019.Kotak Balanced Advantage Fund - Growth, *Name of the Benchmark - NIFTY 50 Hybrid Composite Debt 50:50 Index . Scheme Inception date is 03/08/2018. Mr. Abhishek Bisen & Mr. Harish Krishnan has been managing the fund since 03/08/2018. Mr. Hiten Shah has been managing the fund since 03/10/2019.
Kotak Equity Savings Fund - Growth, *Name of the Benchmark - (Tier 1): NIFTY Equity Savings Index / (Tier 2): 75% NIFTY 50 ARBITRAGE + 25% Nifty 50 TRI , Scheme Inception date is 13/10/2014. Mr. Devender Singhal has been managing the fund since 01/04/2021. Mr. Abhishek Bisen has been managing the fund since 17/09/2014. Mr. Hiten Shah has been managing the fund since 03/10/2019.
Kotak Gold ETF, *Name of the Benchmark - Price of Gold, Scheme Inception date is 27/07/2007. Mr. Abhishek Bisen has been managing the fund since 15/04/2008. & Mr. Jeetu Valechha Sonar has been managing the fund since 28/02/2022.
Scheme Names
Kotak Equity Savings Fund - Growth
1 YEAR 3 YEARS 5 YEARS Since Inception
SchemeReturns(%)^
BenchmarkReturns (%)^*
SchemeReturns(%)^
BenchmarkReturns (%)^*
SchemeReturns(%)^
BenchmarkReturns (%)^*
SchemeReturns(%)^
BenchmarkReturns (%)^*
Kotak Equity Arbitrage Fund - Growth
Kotak Balanced Advantage Fund - Growth 4.55 4.65 9.98 10.80 NA NA 9.53 10.45
3.96 3.73 4.38 3.87 5.20 4.46 6.90 NA
7.65 5.13 8.76 8.63 8.23 8.69 8.39 8.58
Scheme Names
Kotak Gold ETF
1 YEAR 3 YEARS 5 YEARS Since Inception
SchemeReturns(%)^
BenchmarkReturns (%)^*
SchemeReturns(%)^
BenchmarkReturns (%)^*
SchemeReturns(%)^
BenchmarkReturns (%)^*
SchemeReturns(%)^
BenchmarkReturns (%)^*
4.38 5.08 16.04 16.83 10.91 11.80 11.48 12.57
Scheme Names
Kotak Pioneer Fund - Growth
Kotak Global Innovation FOF - Growth
1 YEAR 3 YEARS 5 YEARS Since Inception
SchemeReturns(%)^
BenchmarkReturns (%)^*
SchemeReturns(%)^
BenchmarkReturns (%)^*
SchemeReturns(%)^
BenchmarkReturns (%)^*
SchemeReturns(%)^
BenchmarkReturns (%)^*
3.98 9.76 NA NA NA NA 22.16 18.71
-14.73 -13.89 10.23 9.26 7.75 8.10 4.87 6.83
-0.44 -0.29 NA NA NA NA 0.20 0.71
2.07 4.21 NA NA NA NA 0.08 4.28Kotak International REIT FOF - Growth
Kotak Global Emerging Market Fund - Growth
Kotak NASDAQ 100 FOF - Growth
Kotak Global Innovation Fund of Fund has not yet completed 1 year from Inception,the performance of the scheme is not disclosed.
Scheme Names
Kotak PSU Bank ETF
Kotak NV20 ETF
Kotak Nifty Next 50 Index Fund- Growth
Kotak Sensex ETF
Kotak Banking ETF
Kotak IT ETF
1 YEAR 3 YEARS 5 YEARS Since Inception
SchemeReturns(%)^
BenchmarkReturns (%)^*
SchemeReturns(%)^
BenchmarkReturns (%)^*
SchemeReturns(%)^
BenchmarkReturns (%)^*
SchemeReturns(%)^
BenchmarkReturns (%)^*
0.48 0.74 3.91 4.64 8.60 9.14 9.32 9.74
6.31 6.97 -7.85 -7.19 -6.51 -5.86 -1.00 0.44
11.94 12.18 16.91 18.29 17.21 18.18 16.84 16.71
3.83 4.47 NA NA NA NA 8.74 9.92
8.07 8.39 12.87 13.22 13.36 13.69 9.95 11.04
11.23 11.57 NA NA NA NA 15.46 15.93Top 3
Bottom 3
Scheme Names
1 YEAR 3 YEARS 5 YEARS Since Inception
SchemeReturns(%)^
BenchmarkReturns (%)^*
SchemeReturns(%)^
BenchmarkReturns (%)^*
SchemeReturns(%)^
BenchmarkReturns (%)^*
SchemeReturns(%)^
BenchmarkReturns (%)^*
Kotak International REIT FOF - Growth
Kotak Pioneer Fund - Growth 85% IISL Kotak India Pioneering Innovations + 15%MSCI ACWI Information Technology Index TRI
S&P Asia Pacific ex Japan REIT TRINASDAQ 100 TRI
Benchmark
-9.08 -8.58 NA NA NA NA -4.75 -1.71
-5.58 -0.79 NA NA NA NA 19.12 15.48
-15.97 -15.47 NA NA NA NA -5.88 -4.69
-20.96 -20.37 6.76 5.57 6.40 6.73 4.49 6.42
Kotak NASDAQ 100 FOF - GrowthKotak Global Emerging Market Fund -Growth
Kotak Global Innovation FOF - Growth
MSCI Emerging Market Index
MSCI All Country World Index TRI Kotak Global Innovation Fund of Fund has not yet completed 1 year from Inception,the performance of the scheme is not disclosed.
Scheme Names
1 YEAR 3 YEARS 5 YEARS Since Inception
SchemeReturns(%)^
BenchmarkReturns (%)^*
SchemeReturns(%)^
BenchmarkReturns (%)^*
SchemeReturns(%)^
BenchmarkReturns (%)^*
SchemeReturns(%)^
BenchmarkReturns (%)^*
Kotak Nifty IT ETF
Kotak Nifty 50 Value 20 ETF Nifty 50 Value 20 TRI
Nifty 50 TRI
S&P BSE Sensex TRI
Benchmark
-3.44 -3.22 2.11 2.81 7.44 7.98 8.36 8.77
1.96 2.22 11.34 11.69 12.39 12.71 9.54 10.61
-2.87 -2.67 NA NA NA NA 9.14 9.52
2.66 2.83 15.42 16.76 16.47 17.45 15.72 15.59
-4.68 -4.06 NA NA NA NA 2.96 4.03
1.54 1.66 11.28 11.55 11.81 12.03 10.14 11.37
Kotak S&P BSE Sensex ETF
Kotak Nifty 50 ETF
Kotak Nifty Next 50 Index Fund
Nifty IT TRI
Nifty Bank TRIKotak Nifty Bank ETF
Top 3
Nifty Next 50 TRIBottom 3
Scheme Names
1 YEAR 3 YEARS 5 YEARS Since Inception
SchemeReturns(%)^
BenchmarkReturns (%)^*
SchemeReturns(%)^
BenchmarkReturns (%)^*
SchemeReturns(%)^
BenchmarkReturns (%)^*
SchemeReturns(%)^
BenchmarkReturns (%)^*
Kotak Balanced Advantage Fund - Growth
Kotak Equity Savings Fund - Growth(Tier 1): NIFTY Equity Savings Index(Tier 2): 75% NIFTY 50 ARBITRAGE +25% Nifty 50 TRI
Nifty 50 Hybrid Composite Debt 50:50 Index
Benchmark
3.89
5.65
0.58
Kotak Equity Arbitrage Fund - Growth Nifty 50 Arbitrage Index
1.71
3.41
2.99
3.61 4.41
8.42
9.15
9.90
3.81
8.14
6.22
5.15
7.91
NA
6.62
4.38
NA
8.32
6.89
8.16
8.62
6.86
NA
9.59
8.27
Scheme Names
1 YEAR 3 YEARS 5 YEARS Since Inception
SchemeReturns(%)^
BenchmarkReturns (%)^*
SchemeReturns(%)^
BenchmarkReturns (%)^*
SchemeReturns(%)^
BenchmarkReturns (%)^*
SchemeReturns(%)^
BenchmarkReturns (%)^*
Kotak Gold ETF Price of Gold
Benchmark
7.97 8.77 12.98 13.73 11.08 11.94 11.36 12.44

IDCW HISTORY
Equity Schemes
Record Date Cum IDCW NAV `/Unit
Jan-24-22 10.7417 0.0185Feb-21-22 10.7590 0.0542
Jun-27-22 10.7391 0.0371
Mar-28-22 10.7235 0.0158
May-23-22 10.7579 0.0463Apr-25-22 10.7592 0.032
Kotak Equity Arbitrage Fund - Monthly IDCW Option
81
Jul-26-21 23.0392 0.0441
Jun-28-21 23.0429 0.0478
Sep-06-21 23.0028 0.0077Aug-23-21 23.0325 0.0374Aug-9-21 23.0227 0.0276
Jul-12-21 23.0415 0.0464
Kotak Equity Arbitrage Fund - Fortnightly IDCW Option
Record Date Cum IDCW NAV `/Unit
Kotak Equity Arbitrage Fund - Bimonthly IDCW
Sep-21-20 20.0553 0.0964
Jan-25-21 20.0406 0.1071
Nov-23-20 20.0743 0.1481
Mar-22-21 20.0433 0.0851
May-24-21 20.1136 0.1649
Jul-26-21 20.1339 0.1659
Record Date Cum IDCW NAV `/Unit
Dec-28-17 39.2181 1.52
Dec-27-18 32.943 0.8677
Jun-28-17 39.0457 1.5
Dec-23-19 37.059 2.5606Dec-23-20 38.489 1.523
Mar-23-18 35.3566 3.604
Kotak Bluechip Fund - IDCW
Record Date Cum IDCW NAV `/Unit
Kotak India EQ Contra Fund
Jul-25-19 20.628 1.8797Jul-20-20 18.519 1.086
Mar-23-18 23.714 4.778Jul-28-17 23.4326 0.7
Nov-20-15 18.54 0.5Jul-15-16 19.6923 0.5
Record Date Cum IDCW NAV `/Unit
Feb-23-21 28.46 0.575Nov-23-20 25.459 0.488Aug-24-20 23.396 0.457May-26-20 19.263 0.387Feb-26-20 25.006 0.4533Nov-26-19 24.65 0.4498
Kotak Equity Opportunities Fund
Record Date Cum IDCW NAV `/Unit
Kotak Small Cap Fund
Feb-20-19 33.152 0.8942Feb-28-18 45.3733 1.265Feb-27-17 36.4033 1.45Feb-23-16 26.77 1
Feb-24-21 52.435 2.586Feb-27-20 38.797 2.8244
Record Date Cum IDCW NAV `/Unit
Kotak Multi Asset Allocator Fund of Fund – Dynamic(Erstwhile Known as Asset Allocator Fund)
Aug-30-10 37.774 Individual/ HUF: 0.8784 Others: 0.8186
Record Date Cum IDCW NAV `/Unit
Kotak Emerging Equity Fund
Apr-28-15 21.499 2.1
May-24-19 23.623 1.6123
May-26-17 26.01 1.59
May-20-20 17.646 0.536
May-27-16 21.1956 1.3
Mar-23-18 26.1532 2.674
Record Date Cum IDCW NAV `/Unit
Record Date Cum IDCW NAV `/Unit
Kotak Flexicap Fund
Sep-24-19 24.035 1.2024
Oct-12-15 19.739 1.00
Sep-24-20 20.984 0.883
Sep-24-18 23.504 1.3281
Sep-30-16 21.3488 1.25Sep-27-17 23.5921 1.5
Record Date Cum IDCW NAV `/Unit
Kotak Equity Saving Fund - Monthly IDCW Option
Jul-13-20 11.2263 0.043
Nov-12-20 11.8299 0.0381Dec-14-20 12.0606 0.0404
Oct-12-20 11.6235 0.0395Sep-14-20 11.4749 0.0405Aug-12-20 11.4015 0.0423
Record Date Cum IDCW NAV `/Unit
Kotak Equity Saving Fund - Quarterly IDCW
Sep-20-19 11.0934 0.1354
Mar-20-19 11.2372 0.1553
Sep-21-20 11.3791 0.1253
Jun-20-19 11.2538 0.1576
Dec-20-19 11.3744 0.0329Jun-22-20 11.1034 0.221
Record Date Cum IDCW NAV `/Unit
Kotak Infrastructure and Economic Reform Fund
Feb-21-19 16.252 0.4356
Feb-23-17 17.5644 0.5
Feb-28-18 20.5821 0.625
Jun-23-15 15.2601 0.5
Record Date Cum IDCW NAV `/Unit
Hybrid Schemes
Dec-23-20 17.878 0.089
Jun-12-20 13.671 0.068
Jun-25-19 15.572 0.1398
Sep-25-20 15.192 0.077
Dec-26-19 15.994 0.139Sep-25-19 15.339 0.1301
Kotak Equity Hybrid Fund
Kotak Tax Saver Fund
Mar-26-20 13.818 0.2878
Dec-23-20 20.119 0.399Sep-28-20 17.455 0.349
Dec-24-19 19.111 0.3346
Jun-12-20 15.531 0.155
Sep-26-19 18.653 0.3108
Record Date Cum IDCW NAV `/Unit

Kotak Bond Short Term Fund - Half Yearly IDCW
Record Date Cum IDCW NAV `/Unit
82
Kotak Nifty PSU Bank ETF
Feb-21-13 358.8668 19.00Mar-10-17 334.3964 0.2
ETF Schemes
Record Date Cum IDCW NAV `/Unit
Kotak Nifty 50 ETF
Mar-10-17 904.9522 10.00
May-06-13 613.1266 11.00May-06-16 785.7880 11.00
Record Date Cum IDCW NAV `/Unit
Record Date Cum IDCW NAV `/Unit
Others: 0.1035
Jun-13-22 12.0939 Individual/ HUF: 0.1065 Others: 0.1065
Others: 0.0995
May-12-22 12.2491 Individual/ HUF: 0.1035
Apr-12-22 12.6882 Individual/ HUF: 0.0995
Kotak Debt Hybrid Fund - Monthly IDCW
Kotak Debt Hybrid Fund - Quarterly IDCW
Mar-22-21 14.6143 Individual/ HUF: 0.2468 Others: 0.2942
Dec-22-20 14.3163 Individual/ HUF: 0.1881 Others: 0.2468
Jun-21-21 15.0172 Individual/ HUF: 0.2942
Others: 0.1881
Record Date Cum IDCW NAV `/Unit
Kotak Bond Fund Regular Plan - Annual IDCW
Mar-20-13 22.5941 Individual/ HUF: 1.4008
Mar-20-14 21.2977 Individual/ HUF: 0.2158 Others: 0.2067
Others: 1.2006
Record Date Cum IDCW NAV `/Unit
Kotak Bond Short Term Fund - Monthly IDCW
Aug-12-21 10.1062 Individual/ HUF: 0.0621
Sep-13-21 10.1208 Individual/ HUF: 0.0767 Others: 0.0767
Others: 0.0621Jun-14-21 10.1114 Individual/ HUF: 0.0599 Others: 0.0599
Record Date Cum IDCW NAV `/Unit
Kotak Bond Fund Regular Plan - Quarterly IDCW Option
Others: 0.041
Dec-22-20 13.01 Individual/ HUF: 0.0557 Others: 0.0557Sep-21-20 12.6259 Individual/ HUF: 0.041
Dec-20-19 12.139 Individual/ HUF: 0.3879 Others: 0.3592
Record Date Cum IDCW NAV `/Unit
Debt Schemes
Kotak S&P BSE Sensex ETF
Mar-11-17 297.6072 7.50
Jun-18-13 201.3164 7.00Mar-10-17 297.6072 7.50
Record Date Cum IDCW NAV `/Unit
Kotak Credit Risk Fund - Annual IDCW
Others: 0.6507
Others: 0.6454
Others: 0.4203
Mar-12-21 10.7312 Individual/ HUF: 0.6454
Mar-12-20 11.0635 Individual/ HUF: 0.7027
Mar-12-19 10.8959 Individual/ HUF: 0.4539
Record Date Cum IDCW NAV `/Unit
Kotak Credit Risk Fund - Monthly IDCW
Record Date Cum IDCW NAV `/Unit
Others: 0.0217
Oct-12-20 10.4296 Individual/ HUF: 0.0664 Others: 0.0664
Sep-14-20 Individual/ HUF: 0.084210.4173 Others: 0.0842
Mar-12-21 Individual/ HUF: 0.021710.5102
Kotak Dynamic Bond Fund - Quarterly IDCW
Others: 0.1959
Jun-21-21 11.2294 Individual/ HUF: 0.1356
Dec-22-20 11.4483 Individual/ HUF: 0.3302 Others: 0.3302Sep-21-20 11.3106 Individual/ HUF: 0.1959
Others: 0.1356
Record Date Cum IDCW NAV `/Unit
Kotak Savings Fund - Monthly IDCW
Record Date Cum IDCW NAV `/Unit
Jun-13-22 10.7562 Individual/ HUF: 0.0435
Others: 0.0026
Others: 0.0393Apr-12-22 10.752 Individual/ HUF: 0.0393
May-12-22 10.7153 Individual/ HUF: 0.0026 Others: 0.0435
Kotak Dynamic Bond Fund - Monthly IDCW
Record Date Cum IDCW NAV `/Unit
Aug-12-21 21.8108 Individual/ HUF: 0.0602
Jun-14-21 21.9491 Individual/ HUF: 0.1787 Others: 0.1787
Sep-13-21 22.0315 Individual/ HUF: 0.2809 Others: 0.2809
Others: 0.0602
Kotak Credit Risk Fund - Quarterly IDCW
Others: 0.1018Jun-21-21 11.4909 Individual/ HUF: 0.1018
Sep-21-20 11.1727 Individual/ HUF: 0.2223 Others: 0.2223
Others: 0.1109Jun-22-20 10.9416 Individual/ HUF: 0.1109
Record Date Cum IDCW NAV `/Unit
Mar-22-21 14.8013 Individual/ HUF: 0.2087 Others: 0.2087
Mar-20-19 12.6446 Individual/ HUF: 0.0039 Others: 0.0036
Sep-21-20 14.5527 Individual/ HUF: 0.0102 Others: 0.0102
Kotak Bond Short Term-Standard IDCW Option
Record Date Cum IDCW NAV `/UnitDec-23-21 10.0456 Individual/ HUF: 0.0456 Others: 0.0456

Kotak Medium Term Fund - Annual IDCW
Record Date Cum IDCW NAV `/Unit
83
Kotak Gilt Fund PF and Trust Plan - Quarterly IDCW
Jun-21-21 11.9893 Individual/ HUF: 0.0899 Others: 0.0369
Others: 0.0899
Dec-20-21 11.9635 Individual/ HUF: 0.0369
Mar-21-22 11.881 Individual/ HUF: 0.1372 Others: 0.1372
Record Date Cum IDCW NAV `/Unit
Kotak Gilt Fund Regular Plan - Quarterly IDCW
Dec-22-20 15.0693 Individual/ HUF: 0.1522
Jun-22-20 15.4225 Individual/ HUF: 0.8284 Others: 0.0417
Others: 0.8284
Others: 0.1522Sep-21-20 14.6362 Individual/ HUF: 0.0417
Record Date Cum IDCW NAV `/Unit
Kotak Money Market Fund - Monthly IDCW
Record Date Cum IDCW NAV `/Unit
Jun-13-22 1054.978 Individual/ HUF: 4.4335
Others: 0.8623Apr-12-22 1054.583 Individual/ HUF: 4.0384
May-12-22 1051.407 Individual/ HUF: 0.8623 Others: 4.4335
Others: 4.0384
Kotak Banking and PSU Debt Fund - Monthly IDCW
Others: 0.0012Apr-12-22 10.4182 Individual/ HUF: 0.0082
Feb-14-22 10.4740 Individual/ HUF: 0.0581
Jun-13-22 10.2474 Individual/ HUF: 0.0012
Others: 0.0082
Others: 0.0581
Record Date Cum IDCW NAV `/Unit
Debt Schemes
Kotak Banking and PSU Debt Fund - Annual IDCW
Mar-20-15 16.7914 Individual/ HUF: 0.9986
Mar-14-16 16.6687 Individual/ HUF: 0.884
Others: 0.9261
Mar-15-17 16.8762 Individual/ HUF: 1.0169
Others: 0.819
Others: 0.9421
Record Date Cum IDCW NAV `/Unit
Kotak Corporate Bond Fund - Regular Plan Monthly IDCW
Record Date Cum IDCW NAV `/UnitJun-13-22 1036.909 Individual/ HUF: 0.7868 Others: 0.7868Apr-12-22 1044.616 Individual/ HUF: 2.9575
Mar-14-22 1044.87 Individual/ HUF: 3.211 Others: 3.211
Others: 2.9575
Record Date Cum IDCW NAV `/Unit
Kotak Corporate Bond Fund - Regular Quarterly IDCW
Mar-20-17 1062.9423 Individual/ HUF: 11.1398
Dec-20-16 1070.3117 Individual/ HUF: 17.6919
Jun-20-17 1070.4266 Individual/ HUF: 15.966 Others: 14.7922
Others: 10.3208
Others: 16.3912
Kotak Low Duration Fund - Regular Plan Monthly IDCW
Record Date Cum IDCW NAV `/Unit
Sep-13-21 1028.3051 Individual/ HUF: 5.0225
Aug-12-21 1027.8012 Individual/ HUF: 4.5186 Others: 4.5186
Others: 5.0225
Jul-12-21 1024.987 Individual/ HUF: 1.7043 Others: 1.7043
Kotak Medium Term Fund - Quarterly IDCW
Record Date Cum IDCW NAV `/Unit
Jun-21-21 10.7898 Individual/ HUF: 0.243 Others: 0.243Dec-22-20 10.9108 Individual/ HUF: 0.3469 Others: 0.3469Sep-21-20 10.8378 Individual/ HUF: 0.2771 Others: 0.2771
There is no assurance or guarantee to Unit holders as to rate/quantum of IDCW distribution nor that the IDCW will be paid regularly. After payment of the IDCW, the per Unit NAV falls to the extent of the payout and statutory levy, if any.IDCW frequency is as per Trustee's discretion.
Kotak Floating Rate Fund
Sep-13-21 1073.4860 Individual/ HUF: 9.3500 Others: 9.3500Aug-12-21 1074.3688 Individual/ HUF: 10.2328 Others: 10.2328Jul-12-21 1066.187 Individual/ HUF: 2.0511 Others: 2.0511
Record Date Cum IDCW NAV `/Unit
Others: 0.4142
Others: 0.588
Others: 0.4043Mar-12-21 10.9688 Individual/ HUF: 0.4043
Mar-12-20 11.2021 Individual/ HUF: 0.635
Mar-12-19 11.1171 Individual/ HUF: 0.4473

Mutual Fund investments are subject to market risks, read all scheme related documents carefully.*The rating indicates highest degree of safety regarding timely receipt of payments from the investments that the Scheme has made. The ratings
should, however, not be construed as an indication of expected returns, prospective performance of the Mutual Fund Scheme, NAV or of volatility in its
returns.Disclaimer on market outlooks:The outlook provided is only a subjective understanding of an uncertain market phenomena, which may or may not occur, and may also not have any
effect on the performance of the scheme, clement or otherwise. This outlook should not be construed as a reason for investment into the scheme based
on prospect of future performance, which may not accrue as anticipated by the statement.
RISK FACTORS
KOTAK MAHINDRA ASSET MANAGEMENT COMPANY LIMITED: 6th Floor, Kotak Infiniti, Building No. 21, Infinity Park, Off Western Express Highway, Gen. A. K.
Vaidya Marg, Malad (East), Mumbai – 400 097. Tel.: / 91-18003091490 Fax: 91-22-6708 2213 E-mail: 91-8048893330 [email protected]: www.kotakamc.com.
Corporate Office of Asset Management Company: 2nd Floor, 12-BKC, Plot No C-12, G Block, BKC, Bandra (East), Mumbai - 400 051
For details contact us at:
CONTACT DETAILS
Bhuj: 02832-221572
Ajmer: 0145-2628881
Aligarh: 0571 2742764
Amritsar: 9988637366
Allahabad: 9918333350
Aurangabad: 9158016627
Ambala: 0171-2631572/4003033
Bangalore: 080 – 61874600/01/02/03
Agra: 562 – 2520492/4009647
Bareilly: 0581-2510521
Anand: 02692-249259
Belgaum: 8050001089
Bhavnagar: 0278-3003130/2519544
Bhilai: 0788-2289385
Bhopal: 0755-2551449
Bhubaneswar: 8114392770
Ahmedabad: 079-48999926/ 27/ 28/ 26779888
Calicut: 0495 2701031
Chandigarh: 0172-4671885/0172-5049476
Coimbatore: 7094877333
Dehradun: 0135-2742900
Goa: 0832-6650490/6653185
Durgapur: 9073670769
Dhanbad: 9334235493
Cuttack: 8114392771/0671-2411590
Chennai: 044-28221333/ 28220500
Gorakhpur: 0551-2204127
Cochin: 0484-4851170/9745005122
Gurgaon: 0124-4165425/27
Guwahati: 0361-2454784
Gwalior: 0751-2347815
Hubli: 0836-2353540
Jaipur: 0141-2373879/2373887
Indore: 0731-4971967
Hyderabad: 040-23314029/52/53
Jalgaon: 0257-2237131/ 32
Jalandhar: 0181-2233481/82
Jammu: 0191-2470779
Jamnagar: 0288-2555589
Jamshedpur: 0657-2317041
Jabalpur : 0761-2450711
Jodhpur: 0291-2630625
Madurai: 0452-4202138
Lucknow: 0522 - 4021168/69
Mangalore: 0824-4112006
Kota: 0744-2504038
Meerut: 0121-2658105
Kottayam: 0481-2577077
Ludhiana: 0161-4646602/04
Kanpur: 9919448821 /8176054641
Moradabad: 8048893330
Kolkata: 033-46021037
"Mumbai
Mumbai (Borivali): 8879234246/8879236194
Mumbai [Goregaon]: 022-66056825
Kolkata - Dalhousie Square: 9830913413
(Registered Office): 022-61660001"
Mumbai [12Bkc]: (022) 662185210
Mumbai [Nariman Point]: 022-665963333
Kolhapur: 0231-6610390/91
Mysore: 0821-4267788
Nagpur: 0712-2425052/2428577
Nasik: 0253 - 2311543
New Delhi: 011-41100860-65
Panipat: 180-4022062/2632062
Rourkela: 8114392772/0661-2500981
Trivandrum: 0471-2722299
Vishakhapatnam: 0891-2552145
Pune: 020-25648111/112/113
Trichy: 9693410167
Patna: 9709015898
Surat: 0261-4896767/ 2474596
Salem: 0427-4960766
Rohtak: 0180-4022062/01262256062
Udaipur: 0294-2420005
Siliguri: 0353-2522012
Patiala: 0175-5205268
Shimla: 0177-2807911
Thrissur: 9072402033
Ranchi: 9693410167
Rajkot: 0281-6620735
Vapi: (0260)2400587
Vadodara: 0265-2334012 / 2354012
Raipur: 0771- 2887699
Saharanpur: 0132-2724757
Vijayawada: 0866-2484895
Varanasi: 0542-2220727
Thane [Mumbai]: 022-25348353/54
Pondicherry: 0413-4206083
84


![[Kotak] India Daily, July 25, 2017 - Kotak Securities](https://static.fdokumen.com/doc/165x107/63161b1a15106505030be7d5/kotak-india-daily-july-25-2017-kotak-securities.jpg)


![[Kotak] India Daily, October 26, 2016 - Kotak Securities](https://static.fdokumen.com/doc/165x107/631c83236c6907d3680156e0/kotak-india-daily-october-26-2016-kotak-securities.jpg)