
20November 2020_India_Daily - Kotak Securities
98
For Private Circulation Only. FOR IMPORTANT INFORMATION ABOUT KOTAK SECURITIES’ RATING SYSTEM AND OTHER DISCLOSURES. REFER TO THE END OF THIS MATERIAL. Contents Special Reports Initiating Coverage Divis Laboratories: New world order Strategy Strategy: A weaker week, but expected Daily Alerts Results Bharat Electronics: Excellent performance Sector alerts Automobiles & Components: State-wise demand trends in 2QFY21 Construction Materials: Cement prices stable, demand remains robust INDIA DAILY November 20, 2020 India 19-Nov 1-day 1-mo 3-mo Sensex 43,600 (1.3) 7.5 14.1 Nifty 12,772 (1.3) 7.4 12.9 Global/Regional indices Dow Jones 29,483 0.2 4.1 6.3 Nasdaq Composite 11,905 0.9 3.4 5.7 FTSE 6,334 (0.8) 7.6 5.3 Nikkei 25,515 (0.4) 8.3 11.5 Hang Seng 26,357 (0.7) 7.3 6.3 KOSPI 2,546 (0.0) 8.0 12.0 Value traded – India Cash (NSE+BSE) 811 637 609 Derivatives (NSE) 65,723 16,436 15,97 3 Deri. open interest 6,828 4,361 4,056 Forex/money market Change, basis points 19-Nov 1-day 1-mo 3-mo Rs/US$ 74.3 10 85 (74) 10yr govt bond, % 6.2 - (2) (8) Net investment (US$ mn) 18-Nov MTD CYTD FIIs 727 5,869 12,415 MFs (12) (2,148 ) (1,420) Top movers Change, % Best performers 19-Nov 1-day 1-mo 3-mo TTMT/A IN Equity 72 (5.1) 30.5 65.3 IIB IN Equity 818 (1.2) 30.8 59.3 AXSB IN Equity 612 (3.9) 23.8 40.6 TTMT IN Equity 168 (3.2) 29.5 38.0 KMB IN Equity 1,826 (0.2) 33.4 36.5 Worst performers BHEL IN Equity 29 2.5 1.7 (24.3) EDEL IN Equity 61 0.7 6.9 (19.6) UPLL IN Equity 417 (2.3) (8.7) (15.3) PNB IN Equity 30 (2.8) 9.7 (14.5) IHFL IN Equity 177 (2.8) 15.9 (13.3) [email protected] Contact: +91 22 6218 6427
-
Upload
khangminh22 -
Category
Documents
-
view
5 -
download
0
Transcript of 20November 2020_India_Daily - Kotak Securities

For Private Circulation Only. FOR IMPORTANT INFORMATION ABOUT KOTAK SECURITIES’ RATING SYSTEM AND OTHER DISCLOSURES. REFER TO THE END OF THIS MATERIAL.
Contents
Special Reports
Initiating Coverage
Divis Laboratories: New world order
Strategy
Strategy: A weaker week, but expected
Daily Alerts
Results
Bharat Electronics: Excellent performance
Sector alerts
Automobiles & Components: State-wise demand trends in 2QFY21
Construction Materials: Cement prices stable, demand remains robust
INDIA DAILY November 20, 2020 India 19-Nov 1-day 1-mo 3-mo
Sensex 43,600 (1.3) 7.5 14.1
Nifty 12,772 (1.3) 7.4 12.9
Global/Regional indices
Dow Jones 29,483 0.2 4.1 6.3
Nasdaq Composite 11,905 0.9 3.4 5.7
FTSE 6,334 (0.8) 7.6 5.3
Nikkei 25,515 (0.4) 8.3 11.5
Hang Seng 26,357 (0.7) 7.3 6.3
KOSPI 2,546 (0.0) 8.0 12.0
Value traded – India
Cash (NSE+BSE) 811 637 609
Derivatives (NSE) 65,723 16,436 15,97
3
Deri. open interest 6,828 4,361 4,056
Forex/money market
Change, basis points
19-Nov 1-day 1-mo 3-mo
Rs/US$ 74.3 10 85 (74)
10yr govt bond, % 6.2 - (2) (8)
Net investment (US$ mn)
18-Nov MTD CYTD
FIIs 727 5,869 12,415
MFs (12) (2,148
) (1,420)
Top movers
Change, %
Best performers 19-Nov 1-day 1-mo 3-mo
TTMT/A IN Equity 72 (5.1) 30.5 65.3
IIB IN Equity 818 (1.2) 30.8 59.3
AXSB IN Equity 612 (3.9) 23.8 40.6
TTMT IN Equity 168 (3.2) 29.5 38.0
KMB IN Equity 1,826 (0.2) 33.4 36.5
Worst performers
BHEL IN Equity 29 2.5 1.7 (24.3)
EDEL IN Equity 61 0.7 6.9 (19.6)
UPLL IN Equity 417 (2.3) (8.7) (15.3)
PNB IN Equity 30 (2.8) 9.7 (14.5)
IHFL IN Equity 177 (2.8) 15.9 (13.3)
[email protected]: +91 22 6218 6427

Company Report
For Private Circulation Only. In the US, this document may only be distributed to QIBs (qualified institutional buyers) as defined under rule 144A of the Securities Act of 1933. This document is not for public distribution
and has been furnished to you solely for your information and may not be reproduced or redistributed to any other person. The manner of circulation and distribution of this document may be restricted by law or regulation in certain countries, including the United States. Persons into whose possession this document may come are required to inform themselves of, and to observe, such restrictions.
Divis Laboratories (DIVI)
Pharmaceuticals
New world order. Divi’s has built a global leadership across its API portfolio, and we
expect it to benefit from a shift in global supply chains, driving 20% CAGR over
FY2020-23E. However, for the synthesis segment, our analysis of over >350 NCEs
suggests a steep and continued decline in peak tonnage requirements over time, with
the opportunity from new product introductions over CY2016-18 to be only US$450
mn, across 60 launches. At ~35X FY2023E EPS, we believe the stock fully captures
the generics growth, while ignoring the emerging headwinds to the higher valued
synthesis business. We initiate with REDUCE rating, and Fair Value of Rs3,000/share.
Best-in-class synthesis business, though headwinds emerging
Over the years, DIVI’s has emerged as a partner of choice for several of its key Big Pharma
customers for synthesis projects, with expertise in scaling up high tonnage products. Despite a
near-term benefit from fast-track development of certain customer projects, largely for Covid-
19 treatments, in our view, we see risks of a significant slowdown in growth over the longer
term. Our deep dive, bottom-up analysis of >350 NCEs launched post CY2000 indicates a
continued and steep decline in tonnage requirements, with the trend in particular accelerating
post CY2015. For example, CY2016-18 NCE launches are only likely to have a peak global API
requirement of 113 tons (average: 2 tons), a sharp decline compared to 5,192 tons for
CY2001-10 launches, thereby bringing down the addressable opportunity from new product
introductions to US$450 mn, with no product in the >US$25 mn opportunity bucket. Even as
we expect the segment to grow 15% CAGR over FY2020-23E, we expect the growth rate to
moderate to high-single digits from FY2023E, and expect contribution to decline to 38% of
revenues by FY2023E from 41% in FY2020, and down from peak of 51% in FY2016.
Generics API segment has significant runway for growth
Divi’s has emerged as a dominant, independent API provider globally, with leading market
shares globally for 11 APIs, and dominant market share in several high-volume products such
as naproxen, which now accounts for ~18% of consolidated revenues. We expect Divi’s to
benefit from a structural shift in global supply chains, which are likely to favor Indian API
companies, with significant scope for market share gains across products. We believe Divi’s
recent capacity additions will enable market share gains across its existing portfolio, with
potential for incremental Rs12-15 bn revenues from existing products, and further Rs5-6 bn
from new product introductions by FY2024-25, driving 20% revenue CAGR over FY2020-23E.
Expect 23% EPS CAGR over FY2020-23E; initiate with REDUCE
We initiate coverage on Divi’s with a REDUCE rating and Fair Value of Rs3,000/share, based on
32X Dec 2020 EPS, a ~50% premium to frontline peers, and at a ~30% discount to global
CDMOs. While Divi’s has an industry-leading API business that can further scale, we expect
synthesis to moderate over the medium term, given global industry shifts. Divi’s superior
business model is reflected in 22% RoACE at the peak of its capex cycle. However, at 25X
FY2023E EV/EBITDA, and 35X FY2023E P/E, valuations fully capture the superior growth in
generics APIs, while ignoring the increasing risks to the synthesis segment.
Company data and valuation summary
Company data Stock data High Low Price performance 1M 3M 12M
Rating: REDUCE 52-week range 3,499 1,626 Absolute (%) 11.0 8.7 98.2
Priced at close of: Rel. to BSE-30 (%) 3.0 (3.7) 84.0
Current price (Rs) Capitalisation Forecasts/valuation 2021 2022E 2023E
3,435 Market cap (Rs bn) 911 EPS (Rs) 70.9 85.8 97.0
Net debt/(cash) (Rs bn) (10.9) P/E (X) 48.4 40.0 35.4
Free float (%) 48.0 RoAE (%) 23.8 24.6 23.7
Shares outstanding (mn) 265 EV/EBITDA (X) 33.5 27.8 24.7
Source: Company, Kotak Institutional Equities estimates
19-Nov-20
REDUCE
November 19, 2020
INITIATING COVERAGE
Sector view: Attractive
CMP (`): 3,435
Fair Value (`): 3,000
BSE-30: 43,600
Chirag Talati, CFA
Kumar Gaurav
[email protected]: +91 22 6218 6427
KOTAK INSTITUTIONAL EQUITIES RESEARCH 3
Divis Laboratories Pharmaceuticals
FINANCIAL SNAPSHOT
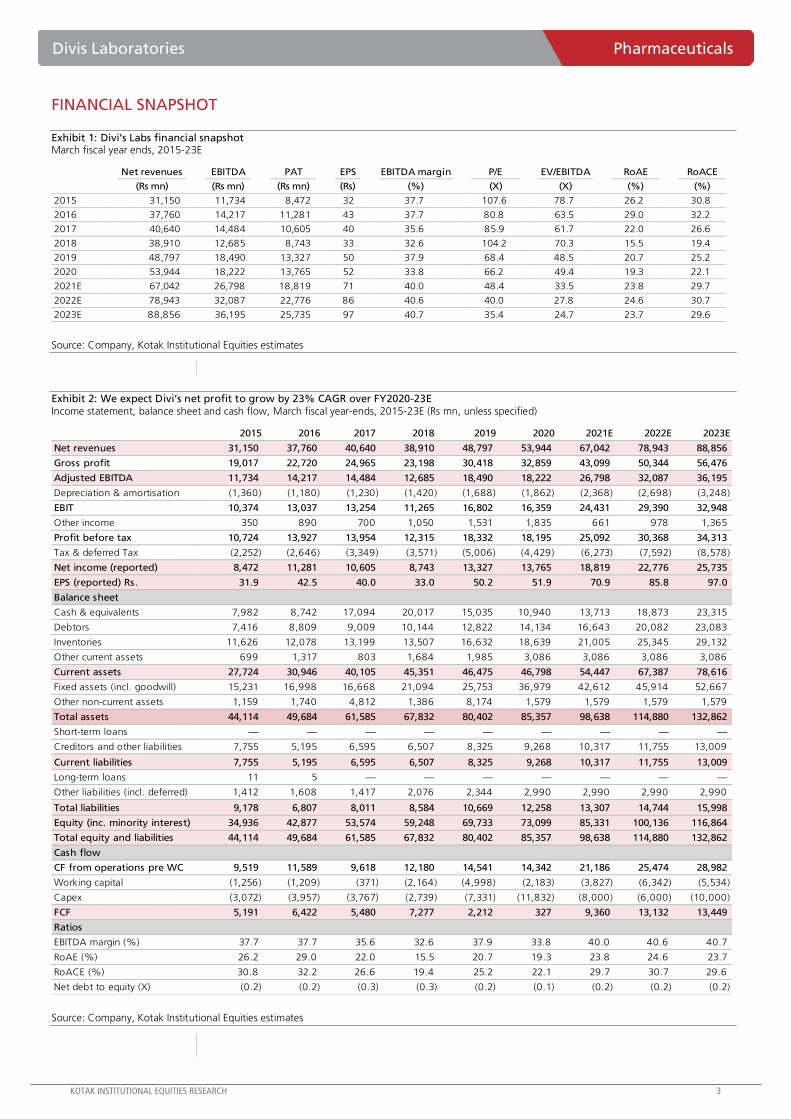
Exhibit 1: Divi’s Labs financial snapshot March fiscal year ends, 2015-23E
Net revenues EBITDA PAT EPS EBITDA margin P/E EV/EBITDA RoAE RoACE
(Rs mn) (Rs mn) (Rs mn) (Rs) (%) (X) (X) (%) (%)
2015 31,150 11,734 8,472 32 37.7 107.6 78.7 26.2 30.8
2016 37,760 14,217 11,281 43 37.7 80.8 63.5 29.0 32.2
2017 40,640 14,484 10,605 40 35.6 85.9 61.7 22.0 26.6
2018 38,910 12,685 8,743 33 32.6 104.2 70.3 15.5 19.4
2019 48,797 18,490 13,327 50 37.9 68.4 48.5 20.7 25.2
2020 53,944 18,222 13,765 52 33.8 66.2 49.4 19.3 22.1
2021E 67,042 26,798 18,819 71 40.0 48.4 33.5 23.8 29.7
2022E 78,943 32,087 22,776 86 40.6 40.0 27.8 24.6 30.7
2023E 88,856 36,195 25,735 97 40.7 35.4 24.7 23.7 29.6
Source: Company, Kotak Institutional Equities estimates
Exhibit 2: We expect Divi’s net profit to grow by 23% CAGR over FY2020-23E Income statement, balance sheet and cash flow, March fiscal year-ends, 2015-23E (Rs mn, unless specified)
2015 2016 2017 2018 2019 2020 2021E 2022E 2023E
Net revenues 31,150 37,760 40,640 38,910 48,797 53,944 67,042 78,943 88,856
Gross profit 19,017 22,720 24,965 23,198 30,418 32,859 43,099 50,344 56,476
Adjusted EBITDA 11,734 14,217 14,484 12,685 18,490 18,222 26,798 32,087 36,195
Depreciation & amortisation (1,360) (1,180) (1,230) (1,420) (1,688) (1,862) (2,368) (2,698) (3,248)
EBIT 10,374 13,037 13,254 11,265 16,802 16,359 24,431 29,390 32,948
Other income 350 890 700 1,050 1,531 1,835 661 978 1,365
Profit before tax 10,724 13,927 13,954 12,315 18,332 18,195 25,092 30,368 34,313
Tax & deferred Tax (2,252) (2,646) (3,349) (3,571) (5,006) (4,429) (6,273) (7,592) (8,578)
Net income (reported) 8,472 11,281 10,605 8,743 13,327 13,765 18,819 22,776 25,735
EPS (reported) Rs. 31.9 42.5 40.0 33.0 50.2 51.9 70.9 85.8 97.0
Balance sheet
Cash & equivalents 7,982 8,742 17,094 20,017 15,035 10,940 13,713 18,873 23,315
Debtors 7,416 8,809 9,009 10,144 12,822 14,134 16,643 20,082 23,083
Inventories 11,626 12,078 13,199 13,507 16,632 18,639 21,005 25,345 29,132
Other current assets 699 1,317 803 1,684 1,985 3,086 3,086 3,086 3,086
Current assets 27,724 30,946 40,105 45,351 46,475 46,798 54,447 67,387 78,616
Fixed assets (incl. goodwill) 15,231 16,998 16,668 21,094 25,753 36,979 42,612 45,914 52,667
Other non-current assets 1,159 1,740 4,812 1,386 8,174 1,579 1,579 1,579 1,579
Total assets 44,114 49,684 61,585 67,832 80,402 85,357 98,638 114,880 132,862
Short-term loans — — — — — — — — —
Creditors and other liabilities 7,755 5,195 6,595 6,507 8,325 9,268 10,317 11,755 13,009
Current liabilities 7,755 5,195 6,595 6,507 8,325 9,268 10,317 11,755 13,009
Long-term loans 11 5 — — — — — — —
Other liabilities (incl. deferred) 1,412 1,608 1,417 2,076 2,344 2,990 2,990 2,990 2,990
Total liabilities 9,178 6,807 8,011 8,584 10,669 12,258 13,307 14,744 15,998
Equity (inc. minority interest) 34,936 42,877 53,574 59,248 69,733 73,099 85,331 100,136 116,864
Total equity and liabilities 44,114 49,684 61,585 67,832 80,402 85,357 98,638 114,880 132,862
Cash flow
CF from operations pre WC 9,519 11,589 9,618 12,180 14,541 14,342 21,186 25,474 28,982
Working capital (1,256) (1,209) (371) (2,164) (4,998) (2,183) (3,827) (6,342) (5,534)
Capex (3,072) (3,957) (3,767) (2,739) (7,331) (11,832) (8,000) (6,000) (10,000)
FCF 5,191 6,422 5,480 7,277 2,212 327 9,360 13,132 13,449
Ratios
EBITDA margin (%) 37.7 37.7 35.6 32.6 37.9 33.8 40.0 40.6 40.7
RoAE (%) 26.2 29.0 22.0 15.5 20.7 19.3 23.8 24.6 23.7
RoACE (%) 30.8 32.2 26.6 19.4 25.2 22.1 29.7 30.7 29.6
Net debt to equity (X) (0.2) (0.2) (0.3) (0.3) (0.2) (0.1) (0.2) (0.2) (0.2)
Source: Company, Kotak Institutional Equities estimates

4 KOTAK INSTITUTIONAL EQUITIES RESEARCH
Pharmaceuticals Divis Laboratories
VALUATION: INITIATE COVERAGE WITH A REDUCE RATING
We initiate coverage on Divi’s with a REDUCE rating and Fair Value of Rs3,000/share, based on 32X Dec 2022
EPS, a ~50% premium to frontline peers, and at a ~30% discount to global CDMOs such as Wuxi and Samsung.
Even as Divi’s has an industry-leading API business that can further scale given its capacity expansion, as well
as emerging opportunities from dislocations in global supply chains, we expect synthesis to moderate over
the medium term, given global industry shifts. Divi’s superior business model is reflected in 22% RoACE at the
peak of its capex cycle. However, at 25X FY2023E EV/EBITDA, and 35X FY2023E P/E, valuations fully capture
the potential superior growth in generics APIs, while ignoring the medium-to-longer-term risks challenges to
the synthesis segment.
We initiate coverage with a REDUCE rating; Fair Value of Rs3,000
We initiate coverage on Divi’s with a REDUCE rating and a fair value of Rs3,000/share, based
on 32X Dec 2022 EPS, a 50% premium to frontline Indian generics peers, 25% premium to
its long-term average, and a discount to CDMO peers such as Wuxi and Samsung, though
these operate on in much different and higher barrier to entry markets for outsourcing,
warranting a discount. At current valuations of 25X FY2023E EV/EBITDA, and 35X FY2023E
EPS (premium to take-out multiples for Cambrex), valuations fully capture the potential
superior growth in generics APIs, and ignore the increasing capital intensity resulting from
declining synthesis contribution to the mix.
We believe the generics API business is a best-in-class business that is well-poised to
capitalize on global dislocations in the supply chain, given its dominance in its core API
portfolio. We expect Divi’s to gain share across its key API products, and expect new API
introductions over the medium term, providing visibility on its ability to generate mid-teens
revenue growth for the segment over FY2021-24E, on a high base, after taking into account
the superlative growth in FY2021.
Our argument for a discount is also underpinned by our analysis of the synthesis market
opportunity, where we believe reducing peak tonnage requirements means that growth
rates on a sustainable basis will likely decline to high single digits from FY2023E, once the
full benefit of recently announced capex (which we believe is partly for Covid-19 projects
being fast-tracked by partners) is fully in the base. We also see limited utility in extrapolating
the multiples of CDMOs like WuXi and Lonza, given their presence across the spectrum of
technologies, including small molecules (across tonnage, as well as formulations and API, as
well as cytotoxic and non-cytotoxic), biologics (substance and fill/finish), vaccines, as well as
newer technology platforms such as gene therapy and CAR-T.

KOTAK INSTITUTIONAL EQUITIES RESEARCH 5
Divis Laboratories Pharmaceuticals
Exhibit 3: Divi’s trading at 43X one-year forward P/E 1-year forward P/E multiple (X)
10
15
20
25
30
35
40
45
50
Jan
-08
Jan
-09
Jan
-10
Jan
-11
Jan
-12
Jan
-13
Jan
-14
Jan
-15
Jan
-16
Jan
-17
Jan
-18
Jan
-19
Jan
-20
Source: Bloomberg
Exhibit 4: Divi’s trading at 30X one-year forward EV/EBITDA 1-year forward EV/EBIDTA multiple (X)
0
5
10
15
20
25
30
35
Jan
-08
Jan
-09
Jan
-10
Jan
-11
Jan
-12
Jan
-13
Jan
-14
Jan
-15
Jan
-16
Jan
-17
Jan
-18
Jan
-19
Jan
-20
Source: Bloomberg
Exhibit 5: Divi’s trades at a premium to Indian peers Valuation summary, KIE coverage universe, March fiscal year ends, 2019-23E
Company Rating (Rs mn) (US$ mn) 2020 2021E 2022E 2023E 2020 2021E 2022E 2023E 2020 2021E 2022E 2023E 2020 2021E 2022E 2023E
Aurobindo Pharma 830 REDUCE 486,417 7,260 46.7 59.3 59.8 63.3 17.8 14.0 13.9 13.1 11.1 8.4 7.9 7.1 1.9 1.9 2.0 2.0
Biocon 423 SELL 507,300 7,572 6.1 7.8 9.9 11.3 69.7 54.2 42.6 37.3 36.3 25.0 19.7 17.1 9.2 6.5 5.5 5.0
Cipla 742 BUY 598,464 8,932 19.2 29.7 33.4 45.8 38.7 25.0 22.2 16.2 18.9 13.7 12.4 9.0 3.4 3.1 3.1 2.9
Dr. Reddy's 4,708 SELL 782,775 11,683 107.5 157.4 203.3 267.2 43.8 29.9 23.2 17.6 19.3 17.0 13.0 10.1 4.6 4.1 3.7 3.5
Laurus 269 REDUCE 143,915 2,148 23.9 17.3 18.6 22.5 11.2 15.6 14.5 11.9 27.4 11.0 9.7 7.5 4.7 2.9 2.7 2.3
Lupin 884 ADD 400,878 5,983 21.7 27.1 42.4 51.1 40.7 32.7 20.9 17.3 15.7 14.0 9.8 8.0 2.8 2.8 2.5 2.4
Sun Pharma 507 ADD 1,217,273 18,168 19.1 21.2 23.7 27.8 26.6 23.9 21.4 18.3 15.1 13.7 11.7 10.0 4.0 4.0 3.7 3.6
Torrent 2,635 REDUCE 445,832 6,654 54.9 72.0 89.0 104.7 48.0 36.6 29.6 25.2 21.5 18.6 15.8 13.9 5.3 5.0 4.7 4.4
Pharma 4,582,853 68,401 33.8 25.6 22.0 18.2 17.5 14.2 12.0 9.9 3.7 3.3 2.9 2.6
EV/EBITDA (X) EV/Sales (X)
Price (Rs)
Market cap. EPS (Rs) PER (X)
Source: Company, Kotak Institutional Equities estimates
Exhibit 6: Global CRAMS/CRO comparative valuation Valuation summary, calendar year ends, 2019-21E
Market cap.
Company (US$ mn) 2020 2021E 2022E 2023E 2020 2021E 2022E 2023E 2020 2021E 2022E 2023E 2020 2021E 2022E 2023E
Divi's 12,153 66.2 48.4 40.0 35.4 49.4 33.5 27.8 24.7 16.7 13.4 11.3 10.0 19.3 23.8 24.6 23.7
Catalent 17,150 89.8 41.5 35.9 29.5 29.7 21.5 19.2 16.9 6.4 5.3 4.9 4.4 10.6 12.9 13.2 14.7
Celltrion 34,896 122.2 66.7 55.3 49.1 71.8 42.2 35.4 31.0 34.2 21.2 17.4 14.9 17.1 18.6 19.2 18.1
Lonza 48,773 68.5 43.7 38.3 33.4 31.5 28.1 25.1 22.0 8.1 7.7 7.2 6.6 13.0 14.0 14.2 14.7
Samsung Biologics 46,282 228.5 210.6 136.9 103.5 346.5 124.1 95.7 77.6 95.1 48.4 39.4 33.3 5.5 5.8 9.0 10.9
Syngene 3,099 55.6 58.0 46.8 36.0 37.2 32.6 26.3 21.4 11.2 10.0 8.4 7.0 19.9 15.9 17.0 18.7
Wuxi Biologics 42,547 295.6 185.7 133.0 92.4 252.2 145.5 96.2 68.5 82.4 51.8 35.4 24.8 11.7 10.2 12.2 14.9
Average 132.3 93.5 69.5 54.2 116.9 61.1 46.5 37.4 36.3 22.5 17.7 14.4 13.9 14.4 15.6 16.5
Notes:
(1) March fiscal year-ends 2020-23 for Divi's, Syngene. Calendar year-ends 2019-22 for other companies
P/E ratio EV/EBITDA (X) EV/Sales (X) RoAE (%)
Source: Bloomberg

6 KOTAK INSTITUTIONAL EQUITIES RESEARCH
Pharmaceuticals Divis Laboratories
SYNTHESIS MARKET SET FOR A MAJOR DISRUPTION
Over the years, DIVI’s has emerged as a partner of choice for several of its key Big Pharma customers for
synthesis projects, with expertise in scaling up high tonnage products. Despite a near-term benefit from fast-
track development of certain customer projects, we see risks of a significant slowdown in growth over the
longer term, as our deep-dive analysis into all NCEs launched post CY2000 indicates a continued and steep
decline in tonnage requirements, with the trend accelerating post CY2015. We expect CY2016-18 NCE
launches to have a peak global API requirement of only 113 tons (average: 2 tons), a sharp decline compared
to 5,192 tons for CY2001-10 launches. While we expect the segment to grow at 15% CAGR over FY2020-23E,
we expect the growth rate to moderate to high-single digits from FY2023E.
Divi’s is a global leader in custom synthesis
We expect a stable near and medium-term outlook for the synthesis business, with
expectations of strong 15% CAGR over FY2020-2E, given its existing pipeline, with some
benefits of capacity debottlenecking, as well as near-term benefits from Rs4 bn dedicated
capex for a few unspecified Phase III projects that are getting fast-tracked by customers. We
suspect the capex is related to key intermediate manufacturing for molnupiravir, Merck’s
oral Covid-19 anti-viral project in development, which is currently in Phase III development,
with an EUA (emergency use authorization) filing expected in Dec 2020. In contrast to the
generic API segment, which will benefit from changing market dynamics, we discuss major
trends that will likely disrupt the custom synthesis market over the longer term.
Exhibit 7: Custom synthesis segment likely to see steady growth
until FY2023E Mach fiscal year-ends, 2015-23E (Rs bn)
15
19 21 20
24
27
31
35 35
-
5
10
15
20
25
30
35
40
20
15
20
16
20
17
20
18
20
19
20
20
20
21
E
20
22
E
20
23
E
Source: Industry data, Kotak Institutional Equities estimates
Exhibit 8: Synthesis contribution has declined to ~41% of
revenues Mach fiscal year-ends, 2015-23E (% of revenues)
51 51
45 44 44 41
39 39 38
-
10
20
30
40
50
60
20
15
20
16
20
17
20
18
20
19
20
20
20
21
E
20
22
E
20
23
E
Source: Industry data, Kotak Institutional Equities estimates
Divi’s strict adherence to IPR norms, proven delivery capability through the development
cycle, commercial supply track-record, and strong relationship with pharma majors marked
its transformation from an API player to a global leader in custom synthesis, and particularly,
in the US$16-20 bn CMO market for innovator APIs, with the segment contributing nearly
half of Divi’s revenues, with significantly superior profitability than API’s and neutraceuticals
segments. Divi’s has four R&D centres and two pilot plants, and through these, it has strong
presence in all stages of product development, starting from process development in labs to
all stages of pre-clinical and clinical trials, and more importantly, reliable commercial supplies
for the intermediate or API through the life cycle.
Recurring commercial
revenue streams
contribute >75% of
synthesis revenues
KOTAK INSTITUTIONAL EQUITIES RESEARCH 7
Divis Laboratories Pharmaceuticals
Within the spectrum of opportunities, DIVI’s core competence lies in (1) chiral chemistry,
which has been the backbone of several successful NCE introductions (more than half of the
drugs currently in use are chiral compounds), and (2) difficult to scale high tonnage APIs,
where innovators need a reliable provider to scale the manufacturing over the development
and commercial stage, without material disruptions. We believe commercial supplies of such
large volume APIs contribute >75% of Divi’s custom synthesis revenues, making it critical for
Divi’s to have a steady stream of high-tonnage API launches to drive recurring business over
the longer term. DIVI’s historic track-record has helped it win repeat business from most of
its key Big Pharma customers, with customers spanning 6 of the top 10 global companies,
and preferred supplier relationship with several large pharma companies such as Merck
(losartan, sitagliptin intermediates), GSK (anti-virals including valacyclovir and dolutegravir),
Astra Zeneca (UCB (levetiracetam)), etc.
Global R&D pipelines remain strong on improving R&D productivity
Synthesis market growth is dependent on two factors – (1) global R&D spend on small
molecules and consequently the number of products in R&D pipeline, and (2) the
commercial supply opportunity, which is contingent on the complexity of chemistry of
pipelines, and more importantly, tonnage of the products getting commercialized. A
combination of increasing R&D spend and increasing productivity given the improvements in
R&D process (higher number of targets, better hits through technology use, and early go/no-
go decisions through better algorithms) has resulted in an accelerated pace of pipeline
progress, with small molecule research also experiencing a step-changed despite the continued
move towards biologics, and increasing shift towards gene therapies and T-cell approach.
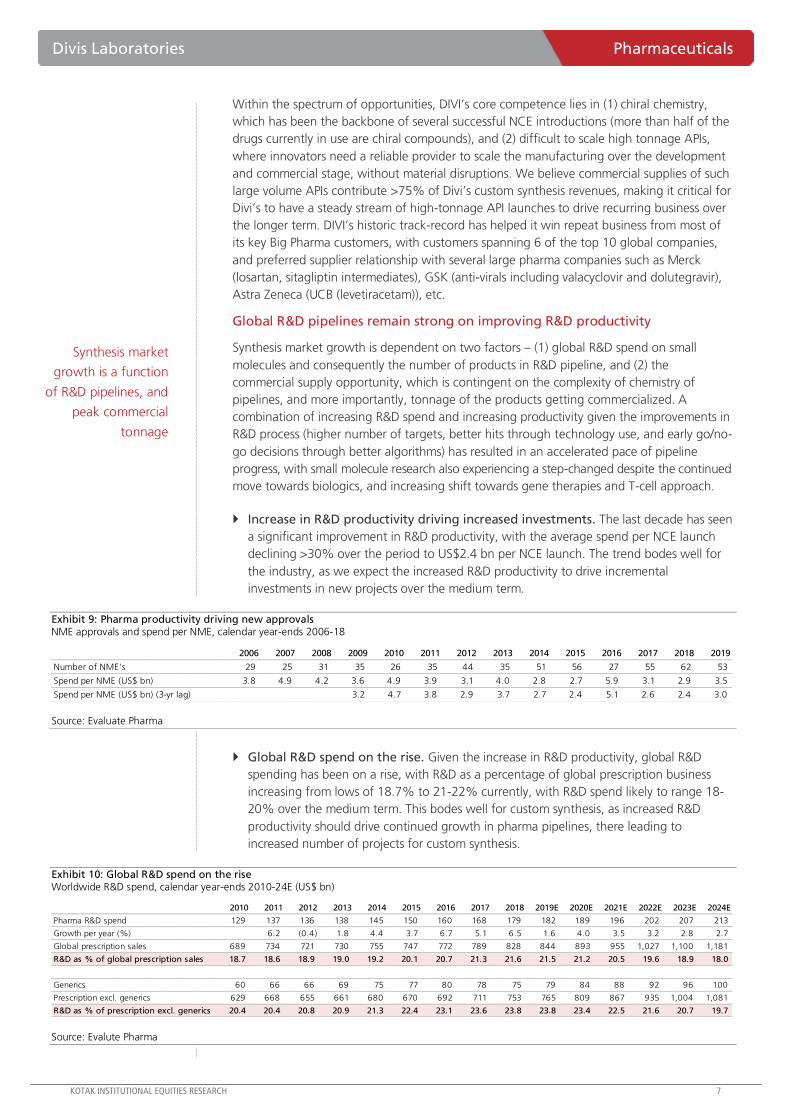
Increase in R&D productivity driving increased investments. The last decade has seen
a significant improvement in R&D productivity, with the average spend per NCE launch
declining >30% over the period to US$2.4 bn per NCE launch. The trend bodes well for
the industry, as we expect the increased R&D productivity to drive incremental
investments in new projects over the medium term.
Exhibit 9: Pharma productivity driving new approvals NME approvals and spend per NME, calendar year-ends 2006-18
2006 2007 2008 2009 2010 2011 2012 2013 2014 2015 2016 2017 2018 2019
Number of NME's 29 25 31 35 26 35 44 35 51 56 27 55 62 53
Spend per NME (US$ bn) 3.8 4.9 4.2 3.6 4.9 3.9 3.1 4.0 2.8 2.7 5.9 3.1 2.9 3.5
Spend per NME (US$ bn) (3-yr lag) 3.2 4.7 3.8 2.9 3.7 2.7 2.4 5.1 2.6 2.4 3.0
Source: Evaluate Pharma
Global R&D spend on the rise. Given the increase in R&D productivity, global R&D
spending has been on a rise, with R&D as a percentage of global prescription business
increasing from lows of 18.7% to 21-22% currently, with R&D spend likely to range 18-
20% over the medium term. This bodes well for custom synthesis, as increased R&D
productivity should drive continued growth in pharma pipelines, there leading to
increased number of projects for custom synthesis.
Exhibit 10: Global R&D spend on the rise Worldwide R&D spend, calendar year-ends 2010-24E (US$ bn)
2010 2011 2012 2013 2014 2015 2016 2017 2018 2019E 2020E 2021E 2022E 2023E 2024E
Pharma R&D spend 129 137 136 138 145 150 160 168 179 182 189 196 202 207 213
Growth per year (%) 6.2 (0.4) 1.8 4.4 3.7 6.7 5.1 6.5 1.6 4.0 3.5 3.2 2.8 2.7
Global prescription sales 689 734 721 730 755 747 772 789 828 844 893 955 1,027 1,100 1,181
R&D as % of global prescription sales 18.7 18.6 18.9 19.0 19.2 20.1 20.7 21.3 21.6 21.5 21.2 20.5 19.6 18.9 18.0
Generics 60 66 66 69 75 77 80 78 75 79 84 88 92 96 100
Prescription excl. generics 629 668 655 661 680 670 692 711 753 765 809 867 935 1,004 1,081
R&D as % of prescription excl. generics 20.4 20.4 20.8 20.9 21.3 22.4 23.1 23.6 23.8 23.8 23.4 22.5 21.6 20.7 19.7
Source: Evalute Pharma
Synthesis market
growth is a function
of R&D pipelines, and
peak commercial
tonnage

8 KOTAK INSTITUTIONAL EQUITIES RESEARCH
Pharmaceuticals Divis Laboratories
Increased productivity driving more products through the funnel. Given the
improvements in R&D productivity, and continued increase in R&D investments, the
number of R&D projects at every stage is exhibiting a steady increase from CY2010-17.
This, in turn, should drive a steady number of new approvals over the medium term.
Increasing projects in the pipeline should help drive early fee for service revenues for the
synthesis providers, and the development to approval lifecycle typically offer US$5-10 mn
revenue per product, though these are non-recurring revenues, and hence, the recurring
revenues from commercial supplies are critical to drive sustainable growth for the industry.
Exhibit 11: Research pipeline for NCEs remains robust Calendar year-ends, 1995-2017
Phase 1995 2005 2010 2011 2012 2013 2014 2015 2016 2017
Pre-clinical 1,446 2,054 2,195 2,178 2,461 2,467 2,369 2,834 2,953 3,077
Phase I 231 435 682 643 659 651 677 750 774 799
Phase II 383 481 749 746 754 735 762 825 830 835
Phase III 202 163 186 196 201 199 208 227 229 232
Pre-reg 78 46 26 34 30 38 41 40 42 44
Reg 33 10 7 10 8 14 19 15 16 18
Launched 959 1,249 1,377 1,387 1,423 1,450 1,478 1,523 1,539 1,579
Source: Evaluate Pharma
Small molecules likely to continue to dominate global pharma sales. Contrary to
expectations and despite a continued increase in number of biotechnology-led approvals,
small molecules have continued to dominate the market, and given the sharp increase in
small molecule-led approvals from CY2010-19, we expect small molecules to continue to
dominate the global market accounting for >2/3rd of global pharma market by CY2024.
Exhibit 12: Conventional chemical based drugs likely to account for substantial portion of the market % of world-wide drug sales from biotechnology vs conventional products, calendar year-ends, 2010-24E
2010 2011 2012 2013 2014 2015 2016 2017 2018 2019 2020E 2021E 2022E 2023E 2024E
Biotechnology 18 18 20 21 22 23 25 26 28 29 30 31 32 33 34
Conventional 82 82 80 79 78 77 75 74 72 71 70 69 68 67 66
Source: Evaluate Pharma
KOTAK INSTITUTIONAL EQUITIES RESEARCH 9
Divis Laboratories Pharmaceuticals
Disruption on the cards for existing business model
The R&D productivity-led growth in pipelines, and consequently for the custom synthesis
market is a well understood argument, and one that we concur with as well. However, the
synthesis market is heavily dependent on the commercial opportunities for R&D projects,
and particularly, on the peak tonnage requirements of the newly introduced molecules in
the market. We believe a segment of the market is incorrectly extrapolating the commercial
potential for innovator products into opportunity size for CDMOs (contract development and
manufacturing organization) as well. Smaller tonnage molecules, while highly lucrative for
CDMOs translate into smaller opportunity (US$1-10 mn bucket) size, which makes it difficult
to scale beyond a point for CDMOs like DIVI’s, which needs introductions in the US$25-50
mn and >US$50 mn bucket, in order to sustain the current pace of growth over the medium
to longer term.
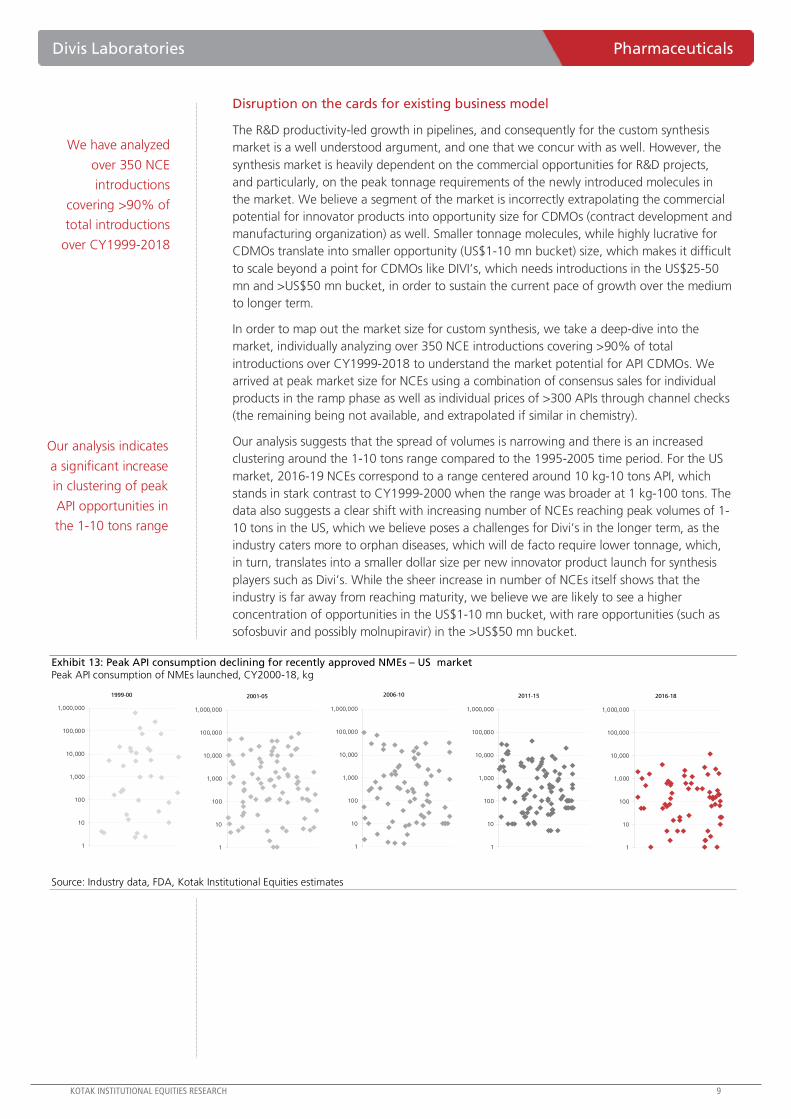
In order to map out the market size for custom synthesis, we take a deep-dive into the
market, individually analyzing over 350 NCE introductions covering >90% of total
introductions over CY1999-2018 to understand the market potential for API CDMOs. We
arrived at peak market size for NCEs using a combination of consensus sales for individual
products in the ramp phase as well as individual prices of >300 APIs through channel checks
(the remaining being not available, and extrapolated if similar in chemistry).
Our analysis suggests that the spread of volumes is narrowing and there is an increased
clustering around the 1-10 tons range compared to the 1995-2005 time period. For the US
market, 2016-19 NCEs correspond to a range centered around 10 kg-10 tons API, which
stands in stark contrast to CY1999-2000 when the range was broader at 1 kg-100 tons. The
data also suggests a clear shift with increasing number of NCEs reaching peak volumes of 1-
10 tons in the US, which we believe poses a challenges for Divi’s in the longer term, as the
industry caters more to orphan diseases, which will de facto require lower tonnage, which,
in turn, translates into a smaller dollar size per new innovator product launch for synthesis
players such as Divi’s. While the sheer increase in number of NCEs itself shows that the
industry is far away from reaching maturity, we believe we are likely to see a higher
concentration of opportunities in the US$1-10 mn bucket, with rare opportunities (such as
sofosbuvir and possibly molnupiravir) in the >US$50 mn bucket.
Exhibit 13: Peak API consumption declining for recently approved NMEs – US market Peak API consumption of NMEs launched, CY2000-18, kg
1
10
100
1,000
10,000
100,000
1,000,000
1
10
100
1,000
10,000
100,000
1,000,000
1
10
100
1,000
10,000
100,000
1,000,000
1
10
100
1,000
10,000
100,000
1,000,000
2001-051999-00 2006-10 2011-15
1
10
100
1,000
10,000
100,000
1,000,000
2016-18
Source: Industry data, FDA, Kotak Institutional Equities estimates
We have analyzed
over 350 NCE
introductions
covering >90% of
total introductions
over CY1999-2018
Our analysis indicates
a significant increase
in clustering of peak
API opportunities in
the 1-10 tons range

10 KOTAK INSTITUTIONAL EQUITIES RESEARCH
Pharmaceuticals Divis Laboratories
US opportunity likely to decline steeper than anticipated
Our analysis shows a consistent decline in the opportunity size in terms of the peak tonnage
requirements of NCEs launched from CY1999-2018, with the trend particularly accelerating
post CY2015, with peak tonnage for launches from CY2016-18 at only 42 tons in the US.
To put this in perspective, the largest launch in CY1999 has an expected peak tonnage
requirement in the US of >700 tons. From CY1999-2015, the decline in tonnage
requirements was getting offset by higher pricing for newly launched APIs, with our analysis
indicating that average pricing increased from ~US$265/kg for products launched in
CY1999-2000 to an average or ~US$5,100/kg for products launched from CY2011-15. This
led to the market size for custom synthesis increasing from US$332 mn for products
launched in CY1999-2000 to US$1.4 bn for products launched from CY2011-15, though,
partially benefitting from sofosbuvir global launch, which we believe had a peak market size
of >US$300 mn. Excluding sofosbuvir, the CY2011-15 bucket saw a doubling in market size,
driven by a large number of new launches in the small molecule category.
In contrast, new product introductions post CY2015 are expected to see a steep decline in
the market opportunity given stable pricing with average pricing likely to grow only to
~US$5,500/kg, while the peak tonnage is likely to drop 80% from CY2011-15 levels,
resulting in a sharp contraction in the peak new product opportunity for CDMOs. We expect
this trend to continue as our analysis of pipeline indicates similar low tonnage launches from
CY2019-22 timeframe, with products such as molnupiravir being an exception. We expect
this trend to result in further drop in the new product opportunity, which we expect will
further bring down the medium to longer term growth for custom synthesis market, even as
the near-term outlook remains robust given that bulk of the peak opportunities for the
CY2006-10 and CY2011-15 buckets fall in the CY2018-24E timeframe.
Exhibit 14: Total peak API consumption for all NCE launches
from 1999-2018 – US market Calendar year-ends 1999-2018 (tons)
1,257
597
444
272
42
0
200
400
600
800
1,000
1,200
1,400
1999-00 2001-05 2006-10 2011-15 2016-18
Source: Industry data, Kotak Institutional Equities estimates
Exhibit 15: Opportunity bucket declining post surge in CY2011-
15 time frame – US market Peak market opportunity, calendar year-ends, 1999-2018 (US$ mn)
332409
521
1,361
239
0
200
400
600
800
1,000
1,200
1,400
1,600
1999-00 2001-05 2006-10 2011-15 2016-18
Source: Industry data, Kotak Institutional Equities estimates
Ex-US likely to be critical given the higher patient volumes
We see this trend as universal, impacting both US as well as ex-US opportunities, though we
do see increased contribution from ex-US opportunities given our expectations of a decline
in the premium of API prices for the US over ex-US, particularly, as US sales are increasingly
more driven by formulation prices. This, in turn, should drive increased contribution from ex-
US, due to higher number of treated patients over time.
We see the trend of
declining peak
tonnage
requirements
accelerating post
CY2015
Combined peak
tonnage for launches
from CY2016-18 in
the US stands at only
42 tons
KOTAK INSTITUTIONAL EQUITIES RESEARCH 11
Divis Laboratories Pharmaceuticals
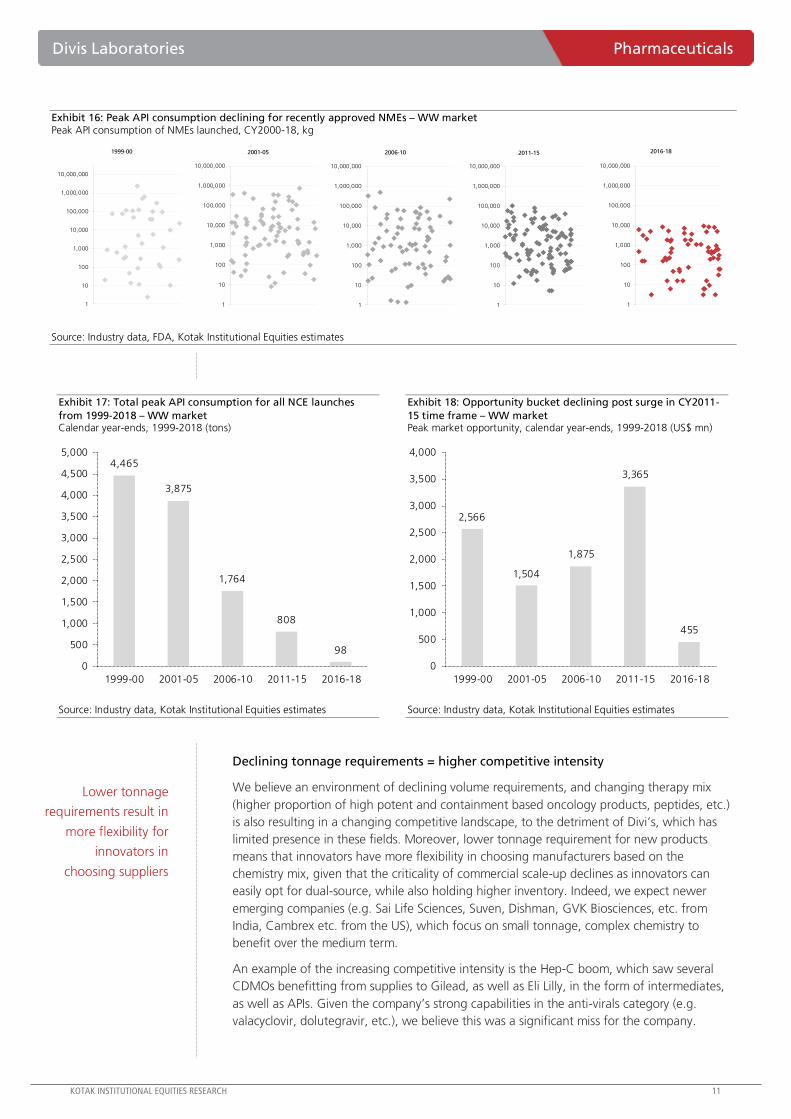
Exhibit 16: Peak API consumption declining for recently approved NMEs – WW market Peak API consumption of NMEs launched, CY2000-18, kg
1
10
100
1,000
10,000
100,000
1,000,000
10,000,000
1
10
100
1,000
10,000
100,000
1,000,000
10,000,000
1
10
100
1,000
10,000
100,000
1,000,000
10,000,000
1
10
100
1,000
10,000
100,000
1,000,000
10,000,000
2001-051999-00 2006-10 2011-15
1
10
100
1,000
10,000
100,000
1,000,000
10,000,000
2016-18
Source: Industry data, FDA, Kotak Institutional Equities estimates
Exhibit 17: Total peak API consumption for all NCE launches
from 1999-2018 – WW market Calendar year-ends, 1999-2018 (tons)
4,465
3,875
1,764
808
98
0
500
1,000
1,500
2,000
2,500
3,000
3,500
4,000
4,500
5,000
1999-00 2001-05 2006-10 2011-15 2016-18
Source: Industry data, Kotak Institutional Equities estimates
Exhibit 18: Opportunity bucket declining post surge in CY2011-
15 time frame – WW market Peak market opportunity, calendar year-ends, 1999-2018 (US$ mn)
2,566
1,504
1,875
3,365
455
0
500
1,000
1,500
2,000
2,500
3,000
3,500
4,000
1999-00 2001-05 2006-10 2011-15 2016-18
Source: Industry data, Kotak Institutional Equities estimates
Declining tonnage requirements = higher competitive intensity
We believe an environment of declining volume requirements, and changing therapy mix
(higher proportion of high potent and containment based oncology products, peptides, etc.)
is also resulting in a changing competitive landscape, to the detriment of Divi’s, which has
limited presence in these fields. Moreover, lower tonnage requirement for new products
means that innovators have more flexibility in choosing manufacturers based on the
chemistry mix, given that the criticality of commercial scale-up declines as innovators can
easily opt for dual-source, while also holding higher inventory. Indeed, we expect newer
emerging companies (e.g. Sai Life Sciences, Suven, Dishman, GVK Biosciences, etc. from
India, Cambrex etc. from the US), which focus on small tonnage, complex chemistry to
benefit over the medium term.
An example of the increasing competitive intensity is the Hep-C boom, which saw several
CDMOs benefitting from supplies to Gilead, as well as Eli Lilly, in the form of intermediates,
as well as APIs. Given the company’s strong capabilities in the anti-virals category (e.g.
valacyclovir, dolutegravir, etc.), we believe this was a significant miss for the company.
Lower tonnage
requirements result in
more flexibility for
innovators in
choosing suppliers

12 KOTAK INSTITUTIONAL EQUITIES RESEARCH
Pharmaceuticals Divis Laboratories
DIVI’S COULD EMERGE AS BENEFICIARY OF AN EMERGING WORLD ORDER IN API’S
Divi’s has emerged as a dominant, independent API provider globally, with leading market shares globally for
11 APIs, with dominant market share in several high volume products such as naproxen, which now accounts
for ~18% of consolidated revenues. We expect Divi’s to benefit from a structural shift in global supply chains,
which are likely to favor Indian API companies, with significant scope for market share gains across products.
We believe Divi’s recent capacity additions will enable it to add significant market share across its top-11
products, with potential for incremental Rs12-15 bn revenues from existing products, and further Rs5-6 bn
from new product introductions by FY2024-25, driving 20% revenue CAGR over FY2020-23E.
Process improvement-led strategy for high tonnage APIs
Divi’s journey in the API segment from its inception to reaching ~Rs27 bn revenues started
with a focus on organic chemistry driven products, particularly, for chiral APIs, such as
naproxen, where Divi’s improved the process by eliminating solvent use, and thereby
creating a process that was not only low-cost, but could be scaled to thousands of tons.
Over time, Divi’s replicated the strategy to a number of products, with its strengths in chiral
chemistry and creating organic processes, by targeting high tonnage products, where it
created process that could be replicated on batch size in excess of 1 tons typically, which has
enabled it to emerge as one of the lowest cost producers for all of its key high tonnage APIs.
Smart product selection further enabled the company to significantly scale its existing
business, with its six of its key API products also falling in top-20 APIs by volumes globally.
This is meaningful, as we believe at least half of the remaining 14 products within the top-
20 products are largely commodity products with limited process advantage for any player
globally. More importantly, Divi’s product portfolio also consists of volume growth products,
with underlying volume for its top-10 products growing at ~7% CAGR from CY2013-19. A
combination of smart product selection, and process led large-batch size manufacturing
strategy has enabled Divi’s to emerge as the world leader in 18 of 26 APIs in its portfolio.
Exhibit 19: Volumes of top-10 products have grown at ~7%
CAGR from CY2013-19 Global market size, calendar year-ends, 2013-19
9,4
68
10
,28
7
11,3
66
12,4
05
13,0
69
13,5
06
13,9
44
7.0
8.7
10.5
9.1
5.4
3.3 3.2
0
2
4
6
8
10
12
-
2,000
4,000
6,000
8,000
10,000
12,000
14,000
16,000
2013 2014 2015 2016 2017 2018 2019
Top-10 API's WW market (tons, LHS) Growth (%, RHS)
Source: Industry, Kotak Institutional Equities estimates
Exhibit 20: Naproxen sales doubled from FY2014-19 March fiscal year-ends, 2014-20
2,6
50
3,1
50
3,3
50
2,9
00
2,7
50
3,3
55
3,4
00
4,764
5,607
6,797 6,502 5,837
8,783
9,605
-
2,000
4,000
6,000
8,000
10,000
12,000
-
500
1,000
1,500
2,000
2,500
3,000
3,500
4,000
2014 2015 2016 2017 2018 2019 2020
Volumes (tons, LHS) Revenues (Rs mn, RHS)
Source: Company, Kotak Institutional Equities estimates
Six of Divi’s key API
products fall in top-
20 APIs by volumes
globally

KOTAK INSTITUTIONAL EQUITIES RESEARCH 13
Divis Laboratories Pharmaceuticals
Exhibit 21: Divi’s API portfolio focuses on high-tonnage chiral API’s Global market size, calendar year-end, 2019
3,964
2,612 2,371 2,101
1,184 733 605 140 120
116
8.5
2.5
12.5
4.8
1.3
12.4
8.1
-4.5
8.1
-7.8
(10)
(5)
-
5
10
15
-
900
1,800
2,700
3,600
4,500
Gab
apen
tin
Napro
xen
Leve
tira
ceta
m
Iop
amid
ol
Vals
art
an
Pre
gabalin
Vala
cycl
ovi
r
Dext
rom
eth
orp
han
Phenyl
eph
rine
Nabum
etone
Market size (tons) [LHS] CY2015-19 volume CAGR (%) [RHS]
Source: Industry, Kotak Institutional Equities estimates
Exhibit 22: Divi’s has globally leading market shares for its top APIs Global market size, calendar year-end, 2019
60 5855 55
49
2016 14 13
84
0
10
20
30
40
50
60
70
Napro
xen
Nabum
etone
Gab
apen
tin
Dext
rom
eth
orp
han
Carb
idop
a
Pre
gabalin
Phenyl
eph
rine
Vala
cycl
ovi
r
Leve
tira
ceta
m
Vals
art
an
Iop
amid
ol
Source: Industry, Kotak Institutional Equities estimates
Divi’s is a global
market leader in 18
of 26 APIs in its
portfolio

14 KOTAK INSTITUTIONAL EQUITIES RESEARCH
Pharmaceuticals Divis Laboratories
Focus on quality and economies of scale to help drive volumes
Divi’s currently has one facility in Hyderabad, and post the commissioning of Unit-3, two
facilities in Vizag. The two key facilities, Unit-1 and 2, are approved by most regulatory
authorities globally, including the US FDA and the EU GMP, etc. Unit-1 and 2 have
aggregate reactor volume of 9,659 KL, which is slated to increased to 15,580 KL with the
completion of debottlenecking and capacity enhancement projects, and should be sufficient
to manufacture between 7-10 K tons of API/intermediates.
Divi’s has historically had a stellar track record in regulatory audits, barring the unfortunate
incident in Dec 2017, that escalated into an import alert, though, there are few instances of
companies getting out of import alert within a year, which is a big testament to Divi’s focus
on cGMP, and more importantly, record keeping and data integrity, as we believe the
company was able to provide all the documentation, including retrospective analysis of all
the batches of naproxen, spanning five years, with a new testing method, in less than six
months. Moreover, we believe Divi’s focus on custom synthesis segments, and its ability to
win repeat, high-tonnage business is a testament to its quality focus. It is worth noting that
we have not come across of any material recalls for any of the finished dosage forms due to
impurity concerns for innovator companies or generic manufacturers that rely on Divi’s
intermediates or APIs. Post the US FDA issues, Divi’s has also expanded its quality focus by
employing 3-40 subject matter experts to further adopt best practices in key areas, and
strengthen its quality framework.
Exhibit 23: Existing and upcoming facilities for Divi’s
Unit Location
Land area
(acres)
# of
reactors
Existing
capacity (tons)
Post-expansion
(tons) Description Regulatory status
Unit I
Chotuppal
Mandan near
Hyderabad
500 362 2,670 6,350
Spread across 500 acres with production
blocks for API and intermediates. Additional 7
blocks capacity enhancement, with brownfield
expansion through SEZ unit. (DC-SEZ).
Last inspected in June'19 with
zero 483 observations.
Unit II
Chippada
Village near
Vizag
490 1,018 10,740 14,400
Spread across 490 acres with an EOU (8
blocks), an SEZ unit (Unit 9) and a DSN SEZ
(block 6), with capacity enhancement
through 7 new blocks at DCV-SEZ.
Last inspected in Nov'19 with
zero 483 observations.
Unit III Kakinada 500 Likely to require Rs6-8 bn capex.
Commissioning likely in FY2025
Unit IV Nellore 200 Likely to require Rs4-6 bn capex.
Commissioning likely in FY2025
N/A
N/A
Source: Company, Kotak Institutional Equities
Putting numbers to the capex plan
From FY2017-20, Divi’s has spent Rs14-15 bn in debottlenecking and capacity
enhancements at Units-1 and 2, as well as for setting up Unit-3, with the company
indicating further Rs10-15 bn capex over FY2021-24E for its Kakinada and Nellore projects.
This is the first major capacity expansion by Divi’s in over a decade, with the project leading
to excitement for the Street given Divi’s track record of efficiently deploying capital, which
has seen it earn superior return ratios compared to peers. We believe the capex plan will
help add significant capacities, and position Divi’s to gain share from competitors,
particularly, given the ongoing shifts away from China, owing to large-scale price
fluctuations, ranging from key starting materials to APIs, as mentioned earlier. We believe
the recent capex has potential to add Rs18-22 bn incremental generic API revenues for Divi’s
by FY2025 (11-13% CAGR from FY2021-25E).
Divi’s can likely add
Rs12-15 bn in
incremental revenues
from existing APIs
post recent capex

KOTAK INSTITUTIONAL EQUITIES RESEARCH 15
Divis Laboratories Pharmaceuticals
Incremental Rs12-15 bn potential from existing APIs. We believe a large part of the
capex expansion is towards adding capacities for existing products and enhancing vertical
integration given that Divi’s has seen increase in demand for its core APIs from its existing
customers, as well as new inquiries, though, it has been unable to satisfy the demand due
to capacity constraints. We believe the incremental capacities will help add significant
revenues from products such as valsartan, where API remains in short supplies, with most
API producers using the API for captive consumption, and limited capacities available from
independent API proviers such as Divi’s. Over the past year, Divi’s customers have
launched the generic in the US, but more meaningfully from RoW markets, which are
sticky in nature. Given the underlying volume growth in other flagship products, such as
naproxen, gabapentin, iopamidol, dextromethorphan and pregabalin, we believe Divi’s
will be able to utilize the new capex over coming 3-4 years, with the volume and pricing
dynamics suggesting peak potential of Rs12-15 bn revenues (incremental 9-11% CAGR
over FY2021-24E), as depicted in Exhibits 23-24.
Exhibit 24: Capacity expansion at Vizag to add meaningful
capacities for existing products Existing and incremental capacities (tons)
2,700
1,250
300 270 150 90
810
375
300 200 150 270
-
1,000
2,000
3,000
4,000
Napro
xen
Gab
apen
tin
Leve
tira
ceta
m
Dext
rom
eth
orp
han
Pre
gabalin
Vals
art
an
Source: Company, Kotak Institutional Equities estimates
Exhibit 25: Capacity expansion will help DIVI target Rs10 bn
incremental revenues through market share gains Peak potential revenues from capacity expansion (Rs mn)
4,995
3,848
2,637
1,998
1,110
555 -
1,000
2,000
3,000
4,000
5,000
Vals
art
an
Dext
rom
eth
orp
han
Napro
xen
Leve
tira
ceta
m
Gab
apen
tin
Pre
gabalin
Source: Company, Kotak Institutional Equities estimates
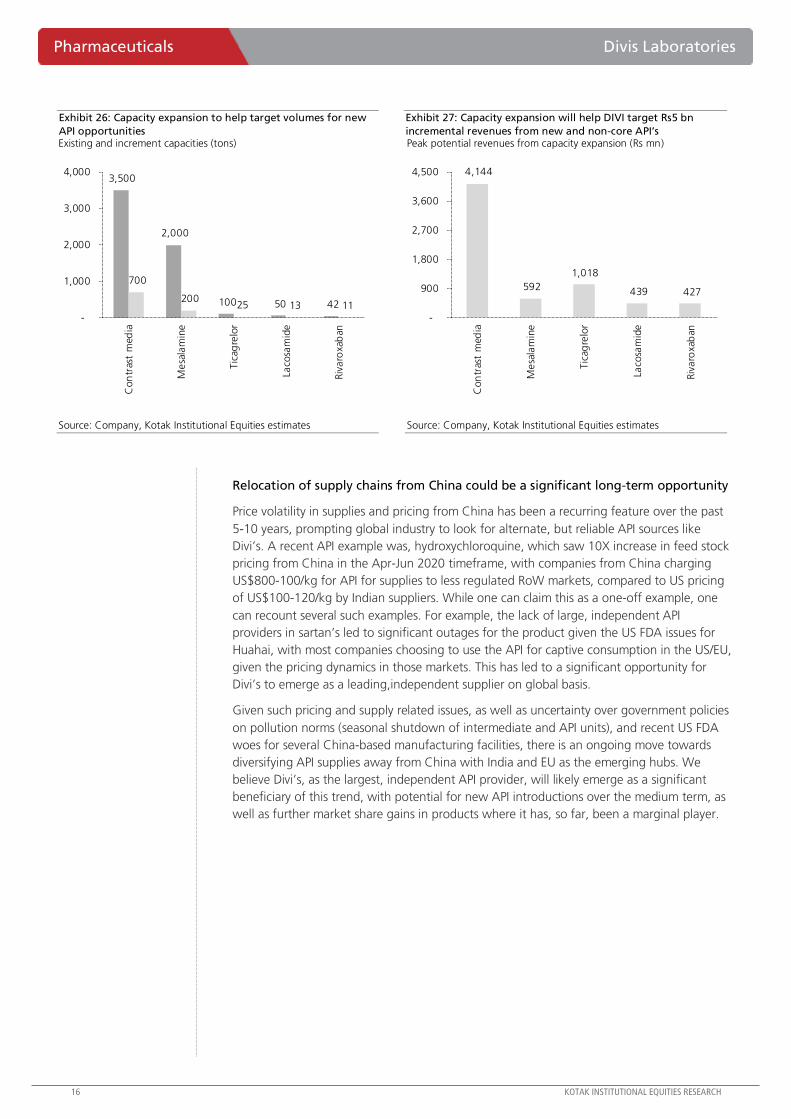
Rs5-6 bn revenue potential from new APIs post capacity enhancements. A critique
of the Divi’s API model is its inability to add new products in the pipeline on a consistent
basis, in contrast to an emerging API business model by companies like MSN, which rely
on aggressive new launches (15-20 API scale-ups annually as compared to DIVI’s portfolio
of ~35 APIs) and targeting a mix of very low tonnage products to high tonnage new
product expirations. We believe Divi’s focus on high tonnage means that it has to be
selective in its APIs in order to create a global leadership. We believe the capacity
bottlenecks also played a role in its inability to introduce new products to the market over
the past 2-3 years, though, we believe, based on the capacity expansion plans, Divi’s can
easily add Rs5-6 bn in revenues from new product introductions (incremental 3-5%
CAGR over FY2021-24E), based on its recent new product offerings, as detailed in
Exhibits 25-26.
New launches can help
add Rs5 bn
incremental revenues
post recent capex
16 KOTAK INSTITUTIONAL EQUITIES RESEARCH
Pharmaceuticals Divis Laboratories
Exhibit 26: Capacity expansion to help target volumes for new
API opportunities Existing and increment capacities (tons)
3,500
2,000
100 50 42
700
200 25 13 11
-
1,000
2,000
3,000
4,000
Con
tras
t m
edia
Mesa
lam
ine
Tic
agre
lor
Laco
sam
ide
Riv
aro
xab
an
Source: Company, Kotak Institutional Equities estimates
Exhibit 27: Capacity expansion will help DIVI target Rs5 bn
incremental revenues from new and non-core API’s Peak potential revenues from capacity expansion (Rs mn)
4,144
592
1,018
439 427
-
900
1,800
2,700
3,600
4,500
Con
tras
t m
edia
Mesa
lam
ine
Tic
agre
lor
Laco
sam
ide
Riv
aro
xab
an
Source: Company, Kotak Institutional Equities estimates
Relocation of supply chains from China could be a significant long-term opportunity
Price volatility in supplies and pricing from China has been a recurring feature over the past
5-10 years, prompting global industry to look for alternate, but reliable API sources like
Divi’s. A recent API example was, hydroxychloroquine, which saw 10X increase in feed stock
pricing from China in the Apr-Jun 2020 timeframe, with companies from China charging
US$800-100/kg for API for supplies to less regulated RoW markets, compared to US pricing
of US$100-120/kg by Indian suppliers. While one can claim this as a one-off example, one
can recount several such examples. For example, the lack of large, independent API
providers in sartan’s led to significant outages for the product given the US FDA issues for
Huahai, with most companies choosing to use the API for captive consumption in the US/EU,
given the pricing dynamics in those markets. This has led to a significant opportunity for
Divi’s to emerge as a leading,independent supplier on global basis.
Given such pricing and supply related issues, as well as uncertainty over government policies
on pollution norms (seasonal shutdown of intermediate and API units), and recent US FDA
woes for several China-based manufacturing facilities, there is an ongoing move towards
diversifying API supplies away from China with India and EU as the emerging hubs. We
believe Divi’s, as the largest, independent API provider, will likely emerge as a significant
beneficiary of this trend, with potential for new API introductions over the medium term, as
well as further market share gains in products where it has, so far, been a marginal player.

KOTAK INSTITUTIONAL EQUITIES RESEARCH 17
Divis Laboratories Pharmaceuticals
NEUTRACEUTICALS CONTRIBUTION UNLIKELY TO GO UP MATERIALLY
We see the neutraceutials business offering steady growth and expect 16% revenue CAGR from FY2020-23E,
benefitting from a post Covid-19 surge in the use of neutraceuticals, though, given the competitive landscape,
we believe, the segment is likely to remain a relatively smaller contributor for Divi’s, with existing players
such as BASF and DSM likely to continue to dominate the segment.
Divi’s also manufactures specialty ingredients for use in nutraceutical products. This segment
mainly consists of β-carotenoids and luteins (low end products), lycopene and analogue
compounds (high end products), as well as Vitamin-D derivatives. Carotenoids is a US$1.8
bn market and falls into Divi’s core strengths given (1) large volume requirements of ~1,800
tons, (2) well diversified geographic spread with the EU accounting for roughly half of the
global market, and the US accounting for only a quarter of the market, and (3) consistent 3-
4% volume growth. However, despite entering this segment in late mid-2000’s, DIVI has
had limited success in the segment, with sales still below the US$50 mn mark, and <5%
market share of global market, that has seen companies such as BASF and DSM continuing
to dominate. We expect the segment to remain a steady growth driver, delivering 16%
CAGR from CY2020-23E, though, we do not expect the segment to create a meaningful
impact on overall growth for Divi’s.
Exhibit 28: Neutraceuticals segment to post steady growth March fiscal year-ends, 2015-23E (Rs mn)
1.4 1.5 1.9
2.4 2.5
3.8
4.6
5.5
6.4 51
12
21
29
5
52
21 20
15
-
10
20
30
40
50
60
0
1
2
3
4
5
6
7
20
15
20
16
20
17
20
18
20
19
20
20
20
21
E
20
22
E
20
23
E
Neutraceuticals (Rs mn) [LHS] % growth [RHS]
Source: Company, Kotak Institutional Equities estimates
Exhibit 29: Neutraceuticals likely to remain a small segment March fiscal year-ends, 2015-23E (% of sales)
4 4
5
6
5
7 7 7 7
-
1
2
3
4
5
6
7
8
20
15
20
16
20
17
20
18
20
19
20
20
20
21
E
20
22
E
20
23
E
Source: Company, Kotak Institutional Equities estimates
Exhibit 30: Competitive benchmarking of key neutraceuticals competitors globally
DSM BASF Allied Divi's ZMC
Product portfolioComprehensive
portfolioSimilar to DSM Similar to DSM Inferior to DSM
More active in animal
feed
Backward
integration levels
Backward integrated to
crystal production
Backward integrated to
crystal production
Backward integrated to
crystal production
Backward integrated to
crystal production
Backward integrated to
crystal production
Focus
Focus across human
nutrition (~$40% of the
market), animal feed
(~45% of the market),
as well as dietary
supplements (~15% of
the market), and
cosmetics.
Higher focus on animal
feed (~45% of the
market), though, has
seen increased focus on
human nutrion over the
past few years
High focus on human
nutrition (~40% of the
market)
High focus on human
nutrition (~40% of the
market)
More active in animal
feed (~45% of the
market)
Source: Industry data, Kotak Institutional Equities

18 KOTAK INSTITUTIONAL EQUITIES RESEARCH
Pharmaceuticals Divis Laboratories
KEY RISKS
High reliance on naproxen sales, and potential market shifts such as ongoing shifts to pregabalin, gabapentin
enacarbil and brivaracetam, high customer concentration, sharper decline in custom synthesis opportunities,
regulatory risks on manufacturing and inability to scale up newly commissioned facilities are some of the key
risks for Divi’s.
Divi’s has high product concentration from top-5 products. We have discussed Divi’s
core strengths in products such as naproxen and the top-5 generic products in earlier
sections. While we do not anticipate any disruption to Divi’s generics business, particularly,
naproxen, given the economies of scale that Divi’s operates on, as well as its cost
advantages, any disruptions from new therapies, particularly for products such as
levetiracetam (from brivaracetam) and gabapentin (from gapabentin enacarbil) can impact
overall volumes and revenues of the generics segment over the longer term.
Inability to add meaningful new projects to custom synthesis segment. Divi’s has
maintained its preferred supplier relationship with 6 of top-10 Big Pharma companies
over the past decade or even longer. However, we also see a few gaps over the past few
years, such as its inability to participate in the Hep-C opportunity, which was a one of its
kind opportunity for custom synthesis (and even generics). This, along, with our analysis
on emerging therapies and declining tonnage requirements (detailed in synthesis segment)
mean that it is now critical for Divi’s to significantly broaden its basket of customers, as
well as its product basket to encompass more low tonnage products.
Exhibit 31: Product and customer concentration is a risk March fiscal year-ends, 2015-23E (% of revenues)
2015 2016 2017 2018 2019 2020 2021E 2022E 2023E
Top product 18 18 16 15 18 18 17 16 16
Top-5 products 44 43 43 46 47 47 46 46 46
Top-5 customers 43 38 41 42 37 36 — — —
Source: Kotak Institutional Equities estimates
Any issues with the US FDA or other regulatory agencies could hurt growth. Divi’s
has historically had a stellar track record in regulatory audits, barring the unfortunate
incident in Dec 2017, that escalated into an import alert, though, there are few instances
of companies getting out of import alert within a year, which is a big testament to Divi’s
focus on cGMP, and more importantly, record keeping and data integrity, as we believe
the company was able to provide all the documentation, including retrospective analysis
of over 2,000 batches of naproxen, spanning five years, with a new testing method, in
less than six months. Moreover, we believe Divi’s focus on custom synthesis segments,
and its ability to win repeat, high-tonnage business is a testament to its quality focus. It is
worth noting that we have not come across of any recalls for any of the finished dosage
forms for innovator companies that rely on Divi’s intermediates or APIs.
Recent case against the CFO for insider trading is a risk. The SEBI, in an order passed
in July 2020, had issued a penalty of Rs9.7 mn against L. Kishore Babu, the CFO of the
company, and his family members, as well as associates, in an insider trading case dating
back to CY2017, pertaining to the lifting of import alert for Unit-II. Following, the SEBI
order, Mr Kishore Babu went on a three-month leave. We understand he has now settled
the case with SEBI, and is back as the CFO of the company.

KOTAK INSTITUTIONAL EQUITIES RESEARCH 19
Divis Laboratories Pharmaceuticals
Top-heavy organization has been a strength, but could also pose a risk. Divi’s has a
well laid-out succession plan, as the second generation promoters, are now taking over
the mantle, with Kiran Divi now appointed as the CEO, and in-charge of the operations
of the company. He is supported by his sister, Nilima Motaparti, as well as Prakash Divi
(cousin), who looks after business development, and is now in charge of key client
relations. The second generation has stepped up well, and Mr Kiran Divi’s role was
particularly noteworthy during the import alert issue at Unit-II, which happened just when
he was taking up the operational roles (earlier he was looking after business development
as well).
Exhibit 32: Key management personnel and compensation March fiscal year-ends, 2015-20 (Rs mn)
Name Designation 2015 2016 2017 2018 2019 2020
Murali Divi Chairman & MD 354 450 465 402 588 524
NV Ramana Executive Director 182 230 242 206 299 269
Kiran Divi CEO 124 156 162 140 202 184
Kishore Babu L CFO 16 17 36 21 23 24
Nilima Motaparti Whole time Director — — — 5 7 50
Madhusudan Rao Divi Whole time Director 10 10 19 10 10 10
PV Lakshmi Rajani Company Secretary 2 3 3 2 3
Devendar Rao General Manager 13 14 29 17 18 20
Hemanth Kumar General Manager 13 14 29 17 18 20
Madhu Babu D Vice President — — — 10 11 13
Prasad YTS General Manager 13 14 29 17 18 20
Ramakrishna S General Manager 13 14 29 17 18 20
Ramana LV General Manager 8 10 21 12 14 15
Ramesh Babu L VP, Procurement 12 13 17 15 17 18
Ramesh Babu M General Manager 13 14 29 17 18
Satya Prakash Divi VP (Sales & Marketing) 16 17 19 21 23 24
Srinivasa Rao P General Manager 13 14 29 17 18 20
Subba Rao K Deputy General Manager — 6 13 — — 11
Sudhakar P Deputy General Manager — 6 13 — — —
Veeraiah Chowdary G Deputy General Manager — 6 13 — — —
Balaji Siripurapu Deputy General Manager — — 10 — — —
MNA Rao General Manager R&D — 10 11 — — —
Naga Sekhar Deputy General Manager — 6 13 — — —
Punna Rao AML Deputy General Manager — 6 11 — — —
Ramaiah Chowdary P General Manager 5 8 17 — — —
Salaries of key employees 805 1,039 1,256 947 1,307 1,238
Source: Company, Kotak Institutional Equities
20 KOTAK INSTITUTIONAL EQUITIES RESEARCH
Pharmaceuticals Divis Laboratories
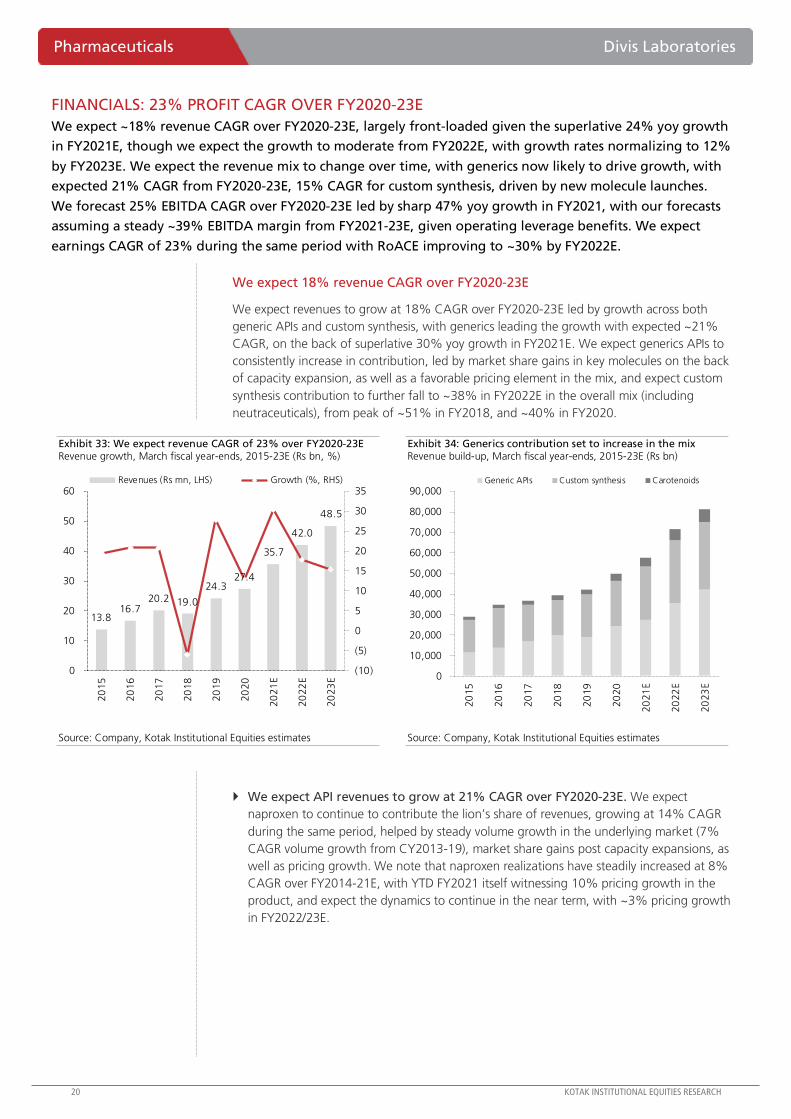
FINANCIALS: 23% PROFIT CAGR OVER FY2020-23E
We expect ~18% revenue CAGR over FY2020-23E, largely front-loaded given the superlative 24% yoy growth
in FY2021E, though we expect the growth to moderate from FY2022E, with growth rates normalizing to 12%
by FY2023E. We expect the revenue mix to change over time, with generics now likely to drive growth, with
expected 21% CAGR from FY2020-23E, 15% CAGR for custom synthesis, driven by new molecule launches.
We forecast 25% EBITDA CAGR over FY2020-23E led by sharp 47% yoy growth in FY2021, with our forecasts
assuming a steady ~39% EBITDA margin from FY2021-23E, given operating leverage benefits. We expect
earnings CAGR of 23% during the same period with RoACE improving to ~30% by FY2022E.
We expect 18% revenue CAGR over FY2020-23E
We expect revenues to grow at 18% CAGR over FY2020-23E led by growth across both
generic APIs and custom synthesis, with generics leading the growth with expected ~21%
CAGR, on the back of superlative 30% yoy growth in FY2021E. We expect generics APIs to
consistently increase in contribution, led by market share gains in key molecules on the back
of capacity expansion, as well as a favorable pricing element in the mix, and expect custom
synthesis contribution to further fall to ~38% in FY2022E in the overall mix (including
neutraceuticals), from peak of ~51% in FY2018, and ~40% in FY2020.
Exhibit 33: We expect revenue CAGR of 23% over FY2020-23E Revenue growth, March fiscal year-ends, 2015-23E (Rs bn, %)
13.816.7
20.2 19.0
24.327.4
35.7
42.0
48.5
(10)
(5)
0
5
10
15
20
25
30
35
0
10
20
30
40
50
60
20
15
20
16
20
17
20
18
20
19
20
20
20
21
E
20
22
E
20
23
E
Revenues (Rs mn, LHS) Growth (%, RHS)
Source: Company, Kotak Institutional Equities estimates
Exhibit 34: Generics contribution set to increase in the mix Revenue build-up, March fiscal year-ends, 2015-23E (Rs bn)
0
10,000
20,000
30,000
40,000
50,000
60,000
70,000
80,000
90,000
20
15
20
16
20
17
20
18
20
19
20
20
20
21
E
20
22
E
20
23
E
Generic APIs Custom synthesis Carotenoids
Source: Company, Kotak Institutional Equities estimates
We expect API revenues to grow at 21% CAGR over FY2020-23E. We expect
naproxen to continue to contribute the lion’s share of revenues, growing at 14% CAGR
during the same period, helped by steady volume growth in the underlying market (7%
CAGR volume growth from CY2013-19), market share gains post capacity expansions, as
well as pricing growth. We note that naproxen realizations have steadily increased at 8%
CAGR over FY2014-21E, with YTD FY2021 itself witnessing 10% pricing growth in the
product, and expect the dynamics to continue in the near term, with ~3% pricing growth
in FY2022/23E.

KOTAK INSTITUTIONAL EQUITIES RESEARCH 21
Divis Laboratories Pharmaceuticals
We expect other existing APIs such as levetiracetam, gabapentin and pregabalin to
benefit from capacity additions and increasing levels of backward integration. We expect
losartan sales to continue growing on the back of market share gains for the innovator in
RoW markets, with the API likely to emerge as a top-3 product behind naproxen and
dextromethorphan, with top-3 APIs likely to cross US$100 mn sales each by FY2023E. We
also expect a meaningful increase in valsartan sales over the period with the product likely
to emerge as a top-5 largest product in Divi’s generics portfolio, behind naproxen,
dextromethorphan and gabapentin moving to >US$50 mn bucket by FY2022E. We also
expect Divi’s to partly retain (around a third) benefits of INR depreciation for products
where it has a dominant market leadership position.
Custom synthesis. We expect synthesis business to grow at ~15% CAGR from FY2020-
23E, helped by steady growth for the key underlying molecules, and benefitting from the
recently announced Rs4 bn capex, which, we suspect is largely towards a dedicated
capacity for Covid-19 anti-virals, possibly, Merck’s molnupiravir, where Phase III data is
likely in Dec 2020, followed by an emergency use authorization (EUA) in the same month.
Neutraceuticals. We expect neutraceuticals portfolio to grow at steady 16% CAGR from
FY2020-23E, though it is likely to remain a sub-10% revenue contributor to revenues.
Exhibit 35: We expect growth across both custom synthesis and generics Revenue break-up, March fiscal year-ends, 2015-23E
2015 2016 2017 2018 2019 2020 2021E 2022E 2023E
Revenues (Rs mn)
Generics 13,825 16,713 20,180 18,978 24,255 27,352 35,661 42,027 48,475
Custom synthesis 15,788 19,190 18,088 16,884 20,731 21,976 25,842 30,546 33,055
Neutraceuticals 1,370 1,536 1,857 2,390 2,510 3,810 4,616 5,540 6,371
Total 30,984 37,439 40,125 38,252 47,497 53,138 66,119 78,113 87,900
Revenue Mix (%)
Generics 45 45 50 50 51 51 54 54 55
Custom synthesis 51 51 45 44 44 41 39 39 38
Neutraceuticals 4 4 5 6 5 7 7 7 7
Total 100 100 100 100 100 100 100 100 100
Growth (%)
Generics 19 21 21 (6) 28 13 30 18 15
Custom synthesis 30 22 (6) (7) 23 6 18 18 8
Neutraceuticals 51 12 21 29 5 52 21 20 15
Total 26 21 7 (5) 24 12 24 18 13
Concentration data (% of sales)
Top product 18 18 16 15 18 18 17 16 16
Top-5 products 44 43 43 46 47 47 46 46 46
Top-5 customers 43 38 41 42 37 36 — — —
Source: Company, Kotak Institutional Equities estimates
22 KOTAK INSTITUTIONAL EQUITIES RESEARCH
Pharmaceuticals Divis Laboratories
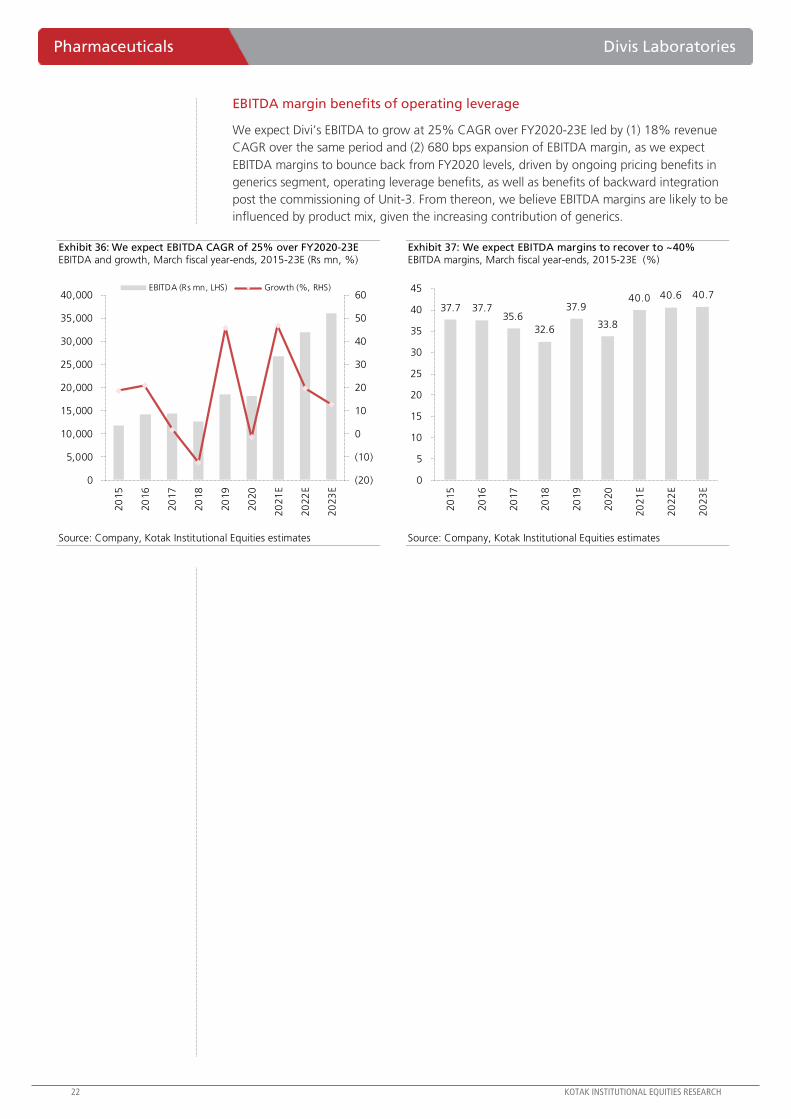
EBITDA margin benefits of operating leverage
We expect Divi’s EBITDA to grow at 25% CAGR over FY2020-23E led by (1) 18% revenue
CAGR over the same period and (2) 680 bps expansion of EBITDA margin, as we expect
EBITDA margins to bounce back from FY2020 levels, driven by ongoing pricing benefits in
generics segment, operating leverage benefits, as well as benefits of backward integration
post the commissioning of Unit-3. From thereon, we believe EBITDA margins are likely to be
influenced by product mix, given the increasing contribution of generics.
Exhibit 36: We expect EBITDA CAGR of 25% over FY2020-23E EBITDA and growth, March fiscal year-ends, 2015-23E (Rs mn, %)
(20)
(10)
0
10
20
30
40
50
60
0
5,000
10,000
15,000
20,000
25,000
30,000
35,000
40,000
20
15
20
16
20
17
20
18
20
19
20
20
20
21
E
20
22
E
20
23
E
EBITDA (Rs mn, LHS) Growth (%, RHS)
Source: Company, Kotak Institutional Equities estimates
Exhibit 37: We expect EBITDA margins to recover to ~40% EBITDA margins, March fiscal year-ends, 2015-23E (%)
37.7 37.735.6
32.6
37.9
33.8
40.0 40.6 40.7
0
5
10
15
20
25
30
35
40
45
20
15
20
16
20
17
20
18
20
19
20
20
20
21
E
20
22
E
20
23
E
Source: Company, Kotak Institutional Equities estimates

KOTAK INSTITUTIONAL EQUITIES RESEARCH 23
Divis Laboratories Pharmaceuticals
Increasing profitabality to drive returns from FY2021/22E
Divi’s has a strong balance sheet and the company has remained debt free despite the capex
cycle over the past two years. While the incremental capex has resulted in a dilution in
return ratios in FY2019-20, we expect RoACE to jump sharply from FY2021 post the
commissioning of the new facility, and full benefits of capacity enhancements, with
FY2023E RoCE likely to move up back to ~30%, though, we expect the longer-trajectory to
trends downwards, given the increasing contribution of generics segment, which will cap
the asset turn to 1.6-1.8X over the medium term, with the company already indicating two
more rounds of capacity enhancements at Kakinada (Rs8-10 bn capex) and Nellore (Rs6-8 bn
capex).
Exhibit 38: We expect capex requirements to increase given
increasing generics contribution March fiscal year-ends, 2014-23E (Rs mn)
3,072 3,957 3,767
2,739
7,331
11,832
8,000
6,000
10,000
0
2,000
4,000
6,000
8,000
10,000
12,000
14,000
20
15
20
16
20
17
20
18
20
19
20
20
20
21
E
20
22
E
20
23
E
Source: Company, Kotak Institutional Equities estimates
Exhibit 39: We expect sharp improvement in FCF from FY2021E March fiscal year-ends, 2014-23E (Rs mn)
5,191
6,422 5,480
7,277
2,212
327
9,360
13,132 13,449
0
2,000
4,000
6,000
8,000
10,000
12,000
14,000
16,000
20
15
20
16
20
17
20
18
20
19
20
20
20
21
E
20
22
E
20
23
E
Source: Company, Kotak Institutional Equities estimates
Exhibit 40: Return ratios to improve gradually as formulation business starts contributing Return ratios, March fiscal year-ends, 2012-23E (%)
27.1 26.0
27.4 26.2
29.0
22.0
15.5
20.7 19.3
23.8 24.6 23.7
30.2 30.131.4 30.8
32.2
26.6
19.4
25.2
22.1
29.730.7
29.6
0
5
10
15
20
25
30
35
2012 2013 2014 2015 2016 2017 2018 2019 2020 2021E 2022E 2023E
RoAE RoACE
Source: Company, Kotak Institutional Equities estimates

24 KOTAK INSTITUTIONAL EQUITIES RESEARCH
Pharmaceuticals Divis Laboratories
Working capital to remain stable
Divi’s has historically had a longer cash conversion cycle due to high inventories, particularly,
for its generics API business, which is a function of its “make to stock” business model. The
company typically holds inventory of key APIs available throughout the year for partners,
thereby giving them flexibility to plan manufacturing batches, as typically, other API
companies have a lead time of 45-60 days of delivery for API. The strategy also enables Divi’s
to plan production seamlessly by minimizing capacity bottlenecks. We believe this strategy
played a significant part in enabling the company to drive its realizations upwards for its key
generic molecules.
Exhibit 41: Divi’s working capital cycle is longer for its “make to stock” business model Cash conversion cycles, March fiscal year-ends, 2015-23E (days)
2015 2016 2017 2018 2019 2020 2021E 2022E 2023E
Receivables 95 92 83 92 105 99 99 99 99
Inventories 149 126 121 122 137 131 125 125 125
Creditors 29 24 41 37 40 41 41 41 41
Working capital cycle 215 194 163 177 202 188 183 183 183
Source: Company, Kotak Institutional Equities estimates
Exhibit 42: We expect 23% EPS CAGR over FY2020-23E Divi’s Labs consolidated profit and loss statement; March fiscal year-ends, 2015-23E (Rs mn)
2015 2016 2017 2018 2019 2020 2021E 2022E 2023E
Net revenues 31,150 37,760 40,640 38,910 48,797 53,944 67,042 78,943 88,856
Gross profit 19,017 22,720 24,965 23,198 30,418 32,859 43,099 50,344 56,476
Staff costs (2,903) (3,610) (4,999) (4,560) (5,307) (6,211) (7,453) (8,347) (9,182)
R&D and SG&A (4,380) (4,894) (5,482) (5,953) (6,622) (8,427) (8,848) (9,910) (11,099)
Adjusted EBITDA 11,734 14,217 14,484 12,685 18,490 18,222 26,798 32,087 36,195
Depreciation & amortisation (1,360) (1,180) (1,230) (1,420) (1,688) (1,862) (2,368) (2,698) (3,248)
EBIT 10,374 13,037 13,254 11,265 16,802 16,359 24,431 29,390 32,948
Other income 350 890 700 1,050 1,531 1,835 661 978 1,365
Profit before tax 10,724 13,927 13,954 12,315 18,332 18,195 25,092 30,368 34,313
Tax & deferred Tax (2,252) (2,646) (3,349) (3,571) (5,006) (4,429) (6,273) (7,592) (8,578)
Net income (reported) 8,472 11,281 10,605 8,743 13,327 13,765 18,819 22,776 25,735
EPS (reported) Rs. 31.9 42.5 40.0 33.0 50.2 51.9 70.9 85.8 97.0
Margins (%)
Gross margin 61.1 60.2 61.4 59.6 62.3 60.9 64.3 63.8 63.6
EBITDA margin 37.7 37.7 35.6 32.6 37.9 33.8 40.0 40.6 40.7
EBIT margin 33.3 34.5 32.6 29.0 34.4 30.3 36.4 37.2 37.1
Net margin 27.2 29.9 26.1 22.5 27.3 25.5 28.1 28.9 29.0
Growth (%)
Revenues 24.2 21.2 7.6 (4.3) 25.4 10.5 24.3 17.8 12.6
EBITDA 18.6 21.2 1.9 (12.4) 45.8 (1.4) 47.1 19.7 12.8
Net income 13.2 33.1 (6.0) (17.6) 52.4 3.3 36.7 21.0 13.0
Source: Company, Kotak Institutional Equities estimates

KOTAK INSTITUTIONAL EQUITIES RESEARCH 25
Divis Laboratories Pharmaceuticals
Exhibit 43: Balance sheet quality set to improve steadily Divi’s Labs balance sheet, March fiscal year-ends, 2015-23E (Rs mn)
2015 2016 2017 2018 2019 2020 2021E 2022E 2023E
Balance sheet
Cash & equivalents 652 717 787 1,125 1,052 1,226 3,999 9,159 13,601
Debtors 7,416 8,809 9,009 10,144 12,822 14,134 16,643 20,082 23,083
Inventories 11,626 12,078 13,199 13,507 16,632 18,639 21,005 25,345 29,132
Other Current Assets 699 1,317 803 1,684 1,985 3,086 3,086 3,086 3,086
Current investments 7,330 8,025 16,307 18,893 13,983 9,714 9,714 9,714 9,714
Current Assets 27,724 30,946 40,105 45,351 46,475 46,798 54,447 67,387 78,616
PPE at cost (GBV) 19,485 21,909 17,871 23,610 26,235 35,046 43,046 49,046 59,046
Acc. Depreciation (6,435) (7,551) (5,639) (3,713) (5,401) (7,264) (9,631) (12,329) (15,576)
CWIP 2,182 2,639 4,436 1,198 4,919 9,197 9,197 9,197 9,197
PPE 15,231 16,998 16,668 21,094 25,753 36,979 42,612 45,914 52,667
Other assets 1,159 1,740 4,812 1,386 8,174 1,579 1,579 1,579 1,579
Fixed Assets 16,390 18,738 21,480 22,480 33,927 38,559 44,191 47,494 54,246
Total Assets 44,114 49,684 61,585 67,832 80,402 85,357 98,638 114,880 132,862
Creditors 2,269 2,327 4,458 4,112 4,833 5,907 6,956 8,394 9,648
Provisions 3,201 48 13 9 11 25 25 25 25
Other Current Liabilities 2,285 2,820 2,124 2,386 3,481 3,337 3,337 3,337 3,337
Current Liabilities 7,755 5,195 6,595 6,507 8,325 9,268 10,317 11,755 13,009
Long Term Debt 11 5 — — — — — — —
Other LT liabilities 1,412 1,608 1,417 2,076 2,344 2,990 2,990 2,990 2,990
Long Term Liabilities 1,423 1,612 1,417 2,076 2,344 2,990 2,990 2,990 2,990
Total Liabilities 9,178 6,807 8,011 8,584 10,669 12,258 13,307 14,744 15,998
Net assets (34,936) (42,877) (53,574) (59,248) (69,733) (73,099) (85,331) (100,136) (116,864)
Shareholders' Equity 34,936 42,877 53,574 59,248 69,733 73,099 85,331 100,136 116,864
Total Liabilities & Sh. Eq. 44,114 49,684 61,585 67,832 80,402 85,357 98,638 114,880 132,862
Source: Company, Kotak Institutional Equities estimates
Exhibit 44: Capex to increase from FY2020 onwards Divi’s Labs cash flow statement, March fiscal year-ends, 2015-23E (Rs mn)
2015 2016 2017 2018 2019 2020 2021E 2022E 2023E
Cash flow
PBT 10,721 13,781 13,953 12,313 18,551 18,195 25,092 30,368 34,313
Depreciation & amortization 1,360 1,182 1,233 1,425 1,689 1,862 2,368 2,698 3,248
Working capital (1,256) (1,209) (371) (2,164) (4,998) (2,183) (3,827) (6,342) (5,534)
Tax (2,114) (2,940) (3,017) (2,713) (4,844) (4,452) (6,273) (7,592) (8,578)
Others (448) (434) (2,552) 1,154 (854) (1,262) — — —
CF from operations 8,263 10,379 9,247 10,016 9,543 12,159 17,360 19,132 23,449
Capex (3,072) (3,957) (3,767) (2,739) (7,331) (11,832) (8,000) (6,000) (10,000)
FCF 5,191 6,422 5,480 7,277 2,212 327 9,360 13,132 13,449
CF from investing (5,208) (4,135) (11,396) (4,783) (6,854) (835) (8,000) (6,000) (10,000)
Change in net debt 82 158 46 64 776 (612) — — —
Dividends (3,106) (6,390) — (3,192) (3,200) (10,241) (6,587) (7,972) (9,007)
CF from financing (3,030) (6,241) 24 (3,142) (2,459) (10,914) (6,587) (7,972) (9,007)
Inc./dec. in cash & equivalents 25 3 (2,125) 2,091 230 411 2,773 5,160 4,442
Source: Company, Kotak Institutional Equities estimates

26 KOTAK INSTITUTIONAL EQUITIES RESEARCH
Pharmaceuticals Divis Laboratories
COMPANY PROFILE
Divi’s was established in 1990, initially with a focus on helping generic companies develop cost efficient
processes for APIs, and later shifted to manufacturing APIs and intermediates, and later expanded to
providing custom synthesis and manufacturing services to innovator companies. Divi’s currently manufactures
35 high tonnage generic APIs, along with a portfolio of neutraceutical ingredients. Divi’s also has a portfolio
of early stage to commercial APIs and intermediates for global innovator companies. The company has three
R&D centers and four multipurpose manufacturing facilities at two sites (Unit 1 near Hyderabad and Unit 2
near Vizag), and is currently in the process of expanding its manufacturing facility.
Divi’s Labs was founded in 1990 by Dr Murali Divi, a first generation entrepreneur, who had
split from Dr. Reddy’s, where he was the Managing Director of Cheminor, and played an
instrumental role in turning around the business. Post his exit from Dr. Reddy’s, Dr Divi
started Divi’s as a company offering process development services to manufacturers of
generic APIs and intermediates, and started manufacturing generic APIs in mid-1990’s. The
first generic API developed and manufactured by Divi’s was naproxen, where it replaced
existing catalyst based reactions with enzymatic, “green chemistry” based process that
enabled it to create a highly scalable and cost effective process, thereby enabling to capture
~50% of the global naproxen market over time, a position, it has since held. Post the
implementation of TRIPS in 1995, Divi’s also decided to enter the custom synthesis and
manufacturing segment for innovators, initially, with a US$2 mn contract for commercial
supplies from GSK, which, as per industry sources, became a steadfast supporter and key
innovator customer for Divi’s.
Exhibit 45: History and chronological events of the company
Timeline Development
1990 Inception of Divi’s as Divi’s Research Centre (DRC)
1995 Commissioned manufacturing facility (Unit-1) near Hyderabad
2000 First USFDA Inspection
2002 Commenced new manufacturing facility (Unit 2) near Vishakhapatnam
2007 Set up Nutraceuticals facility at Unit 2
2008 First MFDS(Korea) inspection
2010 Established new research centre at Hyderabad
2011 First EU GMP and Japan PMDA Inspection
2012 First TGA Inspection
2013 First Slovenian Medicines Agency inspection for Unit-II
2014 First COFEPRIS inspection
2015 New Pilot block with 160 Reactors and Kilo Lab
2016 First Anvisa (Brazil) inspection
2017 Unit-II receives US FDA import alert in March, with the US FDA lifting the import alert in November
2018 10 new production blocks commissioned
2019 Additional investment of $250M towards expansion of production blocks in Unit -I and Unit- II
2020 Eighth USFDA inspection in Unit 2
2020 Commissioning new production blocks in DC SEZ at Unit-I and DCV SEZ at Unit-II
2020 Setting up Manufacturing plant at Kakinada
Source: Company, Kotak Institutional Equities

For Private Circulation Only. FOR IMPORTANT INFORMATION ABOUT KOTAK SECURITIES’ RATING SYSTEM AND OTHER DISCLOSURES, REFER TO THE END OF THIS MATERIAL.
Lower activity compared to previous weeks
Electricity consumption was 3% lower over the seven-day period ending November 18
(Exhibit 38), when compared to a similar period in the previous year. November MTD daily
average electricity consumption is 2% lower than the daily average electricity consumption in
November 2018 and 4% higher than the daily average electricity consumption in November
2019 (Exhibit 37).
Import duty collection continues to remain strong and is up 17% yoy and 8% mom in
November (Exhibit 23).
Daily average e-waybills generated were lower over the past week, when compared to the
week before and October 2020 daily average (Exhibit 7). However, it was still higher than the
FY2019 daily average.
Daily average cars, goods carriers and two-wheeler registrations were up in October, when
compared to the daily average in September. We also compare the car and two-wheeler
registrations over the festive period of 2020 with those registrations over the 2019 festive
period. We show that car registrations were higher during 2020, but two-wheeler
registrations were lower (Exhibit 14 – 18).
Mobility levels, as per Google mobility reports, were lower this week on account of holidays
(Exhibits 24-32). Relative to a group of select countries, recovery in India’s mobility levels
remains slower.
Domestic aviation continues to recover. The number of daily domestic departures over the
past week was close to 1,850, and the daily average number of passengers was higher than
~210,000 (Exhibit 6).
Lower testing means lower cases, with no change in positive rate
Various holidays and festivals over the past week meant that testing was much lower than
recent average (~1 million tests per day versus ~1.1 million tests per day). This, coupled with a
stable positive rate of ~4%, meant that the number of new cases declined slightly over the past
week (275k new cases versus 320k new cases). However, once the testing picks up again, we
expect to see a similar number of cases as before (Exhibits 50-55). We show that the proportion
of new cases in North India started to rise with the onset of cooler weather mid-late October
and is now at an all-time high (Exhibit 63). Correspondingly, we have a higher growth rate in
Delhi, Haryana, Himachal Pradesh and Rajasthan than the national growth rate (Exhibit 59). The
case fatality rate has remained at 1.5% for close to six weeks now (Exhibit 72).
Strategy KIE Covid-19 Tracker
A weaker week, but expected. Most economic indicators were weaker over the past
week, as expected due to multiple holidays. Electricity consumption was down 3%,
daily average of e-waybills generated was lower than the first week and activity levels,
as per Google mobility report, were down in general. We compare cars and two-
wheeler registrations over the festive period of 2019 and 2020 and show that while car
registrations were higher this festive period, two-wheeler registrations were lower.
INDIA
NOVEMBER 19, 2020
UPDATE
BSE-30: 43,600
QUICK NUMBERS
Electricity
consumption 3%
lower than similar
period previous
year
Daily average e-
waybills generated
lower (1.8 mn vs.
2.0 mn previous
week)
Import duty
collection up 8%
mom and 17% yoy
Anurag Singh
[email protected]: +91 22 6218 6427

India Strategy
28 KOTAK INSTITUTIONAL EQUITIES RESEARCH
ACTIVITY SLOWER OVER THE PAST WEEK DUE TO HOLIDAYS
KIE’s Covid-19 Tracker assesses the economic recovery through certain high-frequency indicators. We find that
(1) electricity consumption over the past seven days was 3% lower when compared to a similar period in the
previous year; (2) daily average e-waybills generated over this week were lower than the previous week’s
daily average, (3) traffic congestion eased in most cities, and (4) activity levels, per Google mobility report,
were slightly down. However, the past week was not directly comparable with the week before it because of
multiple holidays over the past week.
Steady improvement in most indicators
We track a set of indicators as a proxy for economic activity.
Road traffic. Road traffic remains lower than 2019 levels. This data is available for four
Indian cities – Mumbai, New Delhi, Bengaluru and Pune (Exhibits 2-5). The week-on-week
change in congestion level was negative for most cities. The lower congestion can be
attributed to the holidays and festive season. We also track the number of e-waybills
generated (Exhibit 7). This is available on a weekly basis and is a proxy for the movement
of goods across the country. The daily average of number of e-waybills generated in
October was the highest recorded. Daily average in the second week of November was
lower than the October daily average.
Civil aviation data. We track the number of domestic departures and the passengers
carried (Exhibit 6). The number of daily domestic departures has increased to over 1,850
now. For comparison, the pre-Covid daily average was close to 3,000. The pace of
improvement has quickened over the past two weeks. The number of passengers on
flights was routinely over ~200,000, as against pre-Covid figure of 400,000. This
compares with close to 500 daily departures and 40,000 passengers per day at the restart
of domestic aviation at the end of May.
Electricity consumption. Covid-19 forced a prolonged lockdown and temporary
shutting down of factories. This, in turn, led to lower electricity consumption. We show
the daily electricity consumption of major states (Exhibits 37-49) in India and compare this
with consumption in the same week of CY2019. Electricity consumption in India, over the
seven day period ending November 11, was 3% lower than the electricity consumption in
the similar period in 2019. We would like to note that the electricity consumption in
November 2019 was much lower than that in November 2018. Only one out of ten states
we track saw higher electricity consumption in the past week compared to a similar
period previous year. We do note however that the state-level electricity consumption
gaps are quite volatile and may change dramatically from one week to the next.
Payment data. We use payment data released by RBI and National Payment Corporation
of India (NPCI). Specifically, we track UPI, IMPS and NETC FASTag transaction values. Daily
average UPI and IMPS transaction values recorded an all-time high in September and
continued their strong performance in October. NETC transactions are above pre-Covid
levels (Exhibits 33-34). Also, we note that some of the UPI/IMPS transactions may be in
lieu of cash payments (as people avoid handling cash used by others) and may not reflect
more total spending by consumers. NETC FASTag transactions have continued to increase
week-on-week.

Strategy India
KOTAK INSTITUTIONAL EQUITIES RESEARCH 29
Real estate and vehicle purchases. We track the number of property sales registered in
Maharashtra and the daily number of vehicles registered in Regional Transport Offices
under the Vahan4 umbrella (Exhibits 14-18). The daily average of property registrations in
Maharashtra in November continues to be much higher than the daily average of
FY2020. Daily average cars, goods carriers and two-wheeler registrations were up in
October, when compared to the daily average in September. We also compare the car
and two-wheeler registrations over the festive period of 2020 with those registrations
over the 2019 festive period. We show that car registrations were higher during 2020,
but two-wheeler registrations were lower.
Railway/Ports data. We show daily average metric tons of freight carried by Indian
railways as a proxy of goods movement in India. We also show the year-on-year
change in the freight load for major commodities (Exhibits 8-9). Railway freight
volume is slightly down sequentially in November so far. On yoy basis, the railway
freight volume is higher in November. We also show the volume of traffic at
major ports and the change in volume for major commodities (Exhibits 10-13).
Container volume increased on a month-on-month basis at JNPT; and is close to
the pre-Covid level. The volume at Paradip port increased with substantial
increases in coal and iron ore volumes. Many major ports saw an improvement of
yoy volume change during October.
Employment and business sentiment. Covid-19 has led to hiring freezes as well as
involuntary attrition in certain industries. We show the change in the number of new job
postings since February 2020, and the change in new job postings in the most recent
month, on Naukri.com (Exhibits 19 and 20). The hospitality industry continues to remain
the worst affected industry as of October. Most industries saw an increase in the number
of new job postings in October, when compared to September. We also show estimated
nation-wide unemployment level based on CMIE survey (Exhibit 21). The unemployment
level estimated by CMIE is close to 7%. Finally, we show the number of new companies
registered with Ministry of Corporate Affairs each month (Exhibit 22). The number of new
companies registered in October was similar to the number of companies registered in
September.
Movement of people. We use Google mobility reports to track the change in the time
spent by people at their residences and the number of visits to workplaces,
retail/recreational places and grocery/pharma stores compared against the pre-Covid
baseline (Exhibits 24-32). The week-on-week change in mobility trends was slightly
negative but this was on account of multiple holidays over the past week. The recovery in
metro cities continues to lag the broader recovery for excess time spent at residential
areas and excess visits to workplaces. We also compare recovery in mobility in India to the
same in a select set of countries. With the new set of lockdowns in Europe, India’s
recovery towards normalcy is now relatively better.
Import duty collection. We also monitor external trade by comparing the import duty
collected in the current period against the import duty collected during the same period
in FY2020 (Exhibit 23). Daily average import duty collected has been extremely strong so
far in November.
Petroleum product consumption. Petroleum consumption is another proxy of
economic activity. We track this using data released by Petroleum Planning and Analysis
Cell (PPAC). Monthly data (Exhibits 35-36) shows that consumption of motor spirit
(petroleum) in June was already back to March 2020 consumption level. Petrol and diesel
consumption increased month-on-month in October. The yoy change in both petrol and
diesel consumption was positive in October.

India Strategy
30 KOTAK INSTITUTIONAL EQUITIES RESEARCH
Most of the indicators above show that economic activity is still below the pre-Covid period
(Exhibit 1). As evidence from other countries suggests, the road to recovery will not be a
straight line, especially as long as the daily case count continues to increase.
Exhibit 1: Most economic indicators improving Economic indicators tracked by KIE
Source: Kotak Institutional Equities
Exhibits 2 to 5 show vehicular congestion data for four major cities – Mumbai, New Delhi,
Bengaluru and Pune. Current congestion data is compared to day-of-week adjusted
historical average.
Exhibit 2: Mumbai road congestion dipped slightly over the past week Daily traffic congestion data (Mumbai), relative to historical average (%) as estimated on Nov 19
Source: TomTom.com, Kotak Institutional Equities
Indicator Direction Comments
MovementSlightly low,
but improving
Road traffic was flat on a week-on-week basis, except in
Mumbai. Railway freight data is down sequentially but up yoy in
November. Google mobility report showed higher mobility on a
week-on-week basis. Daily average e-waybills continue to
increase.
New vehicle
registration
Low, but
improving
Cars and two-wheeler registrations were up sequentially in
October, with car registrations close to October 2019 level.
Electricity
consumptionNormal
Electricity consumption gap negative, meaning India consumed
more electricity in past week, compared to a similar period in
2019.
Property sales Normal
Property sale registrations in Maharashtra were much higher in
November as compared to April 2020. They are also higher than
March 2020 daily average.
New job postingsLow, but
improving
Most industries saw an increase in the number of new job
postings in October, when compared to September. The Naukri
JobSpeak index was relatively flat mom in October, but is still
down 27% since the start of the pandemic.
Import duty
collectionNormal
Daily import duty collection increased in October, and has been
very strong in November MTD.
Petrochem
consumptionNormal
Petrol and diesel consumption increased in October. Petrol and
diesel consumption was up yoy.

Strategy India
KOTAK INSTITUTIONAL EQUITIES RESEARCH 31
Exhibit 3: Congestion levels were flat in New Delhi Daily traffic congestion data (New Delhi), relative to historical average (%) as estimated on Nov 19
Source: TomTom.com, Kotak Institutional Equities
Exhibit 4: Road congestion decreased in Bengaluru Daily traffic congestion data (Bengaluru), relative to historical average (%) as estimated on Nov 19
Source: TomTom.com, Kotak Institutional Equities

India Strategy
32 KOTAK INSTITUTIONAL EQUITIES RESEARCH
Exhibit 5: Congestion levels was down marginally in Pune Daily traffic congestion data (Pune), relative to historical average (%) as estimated on Nov 19
Source: TomTom.com, Kotak Institutional Equities
Exhibit 6 shows the number of domestic flights and the passengers carried. This compares
with a daily average of ~3,000 domestic flights per day and ~400,000 daily domestic
passengers in pre-Covid period.
Exhibit 6: The number of daily passengers was routinely above 200,000 over the past week Daily domestic departures (#) and passengers carried (#)
Source: Ministry of Civil Aviation, Kotak Institutional Equities
Exhibit 7 shows the daily average e-waybills generated. E-waybills are needed to transport
goods of value over Rs50,000. For the months prior to June 2020, we divide the number of
monthly e-waybills generated by 30 to estimate the average daily number of e-waybills
generated. From June 2020, we divide the weekly data by 7 to get the average daily e-
waybills generated for the week.
The number of average daily e-waybills generated fell slightly in March 2020, and sharply in
April 2020 demonstrating the effect of lockdown. With the relaxations in lockdown effective
from May 4, we see that the average daily e-waybills generated have been rising on a week-
on-week basis.
0
500
1,000
1,500
2,000
2,500
0
50,000
100,000
150,000
200,000
250,000
25
-May
8-J
un
22
-Ju
n
6-J
ul
20
-Ju
l
3-A
ug
17
-Au
g
31
-Au
g
14
-Sep
28
-Sep
12
-Oct
26
-Oct
9-N
ov
Passengers Departures (rhs)

Strategy India
KOTAK INSTITUTIONAL EQUITIES RESEARCH 33
Exhibit 7: Small decrease in the number of e-waybills generated over the past week Daily average e-waybills generated (mn)
Source: GST Network, Kotak Institutional Equities
Similarly, railway freight data (Exhibits 8 and 9) shows that there was a sharp decline in
railway freight movement in March and April.
Exhibit 8: Railway freight volume is up sequentially and yoy in November Daily average freight traffic (mn tons)
Source: Indian Railways, Kotak Institutional Equities
0.9
1.2
1.6 1.5
1.6 1.6
1.8
1.5
1.7 1.7 1.7
1.8 1.8 1.8
1.7 1.7 1.7 1.7 1.8 1.8
1.8 1.9 1.9
1.4
0.3
0.8
1.4 1.6 1.6
1.9 2.1 2.0
1.8
0.0
0.5
1.0
1.5
2.0
2.5
Ap
r-1
8
May-
18
Jun
-18
Jul-
18
Au
g-1
8
Sep
-18
Oct
-18
No
v-1
8
Dec-
18
Jan
-19
Feb
-19
Mar-
19
Ap
r-1
9
May-
19
Jun
-19
Jul-
19
Au
g-1
9
Sep
-19
Oct
-19
No
v-1
9
Dec-
19
Jan
-20
Feb
-20
Mar-
20
Ap
r-2
0
May-
20
Jun
-20
Jul-
20
Au
g-2
0
Sep
-20
Oct
-20
No
v 1
- N
ov
8
No
v 9
- N
ov
15
3.7
3.3
2.2
2.7
3.1 3.1 3.0
3.4 3.5 3.6
0.0
0.5
1.0
1.5
2.0
2.5
3.0
3.5
4.0
4.5
Ap
r-1
8
May-
18
Jun
-18
Jul-
18
Au
g-1
8
Sep
-18
Oct
-18
No
v-1
8
Dec-
18
Jan
-19
Feb
-19
Mar-
19
Ap
r-1
9
May-
19
Jun
-19
Jul-
19
Au
g-1
9
Sep
-19
Oct
-19
No
v-1
9
Dec-
19
Jan
-20
Feb
-20
Mar-
20
Ap
r-2
0
May-
20
Jun
-20
Jul-
20
Au
g-2
0
Sep
-20
Oct
-20
No
v-2
0

India Strategy
34 KOTAK INSTITUTIONAL EQUITIES RESEARCH
Exhibit 9: Railway freight volume up yoy for most categories in November Yoy change (%) for different freight categories
Source: Indian Railways, Kotak Institutional Equities
Apart from rail and road, we also show the impact of Covid-19 and lockdown on port
volumes. Exhibit 10 shows that all major ports saw a yoy drop in volume, when compared to
April and May 2019. The commodities which were most affected were coal and containers
(Exhibit 11). Jawaharlal Nehru Port Trust (JNPT) which handles a significant amount of India’s
container volumes saw a large decline in container volume in April and May (Exhibit 12).
Similarly, Paradip port trust, which handles a significant portion of India’s coal and iron ore
volumes, saw decline in April and May, with the largest drop in volume coming in coal
volumes (Exhibit 13).
Exhibit 10: October yoy change was better than past few months for some ports Yoy change (%) in total volume handled
Source: Indian Ports Association, Kotak Institutional Equities
3%
13%
6%
10%
(40%)
(30%)
(20%)
(10%)
0%
10%
20%
Coal/coke Container Petroleum/gases Total
Feb-20 Mar-20 Apr-20 May-20 Jun-20 Jul-20 Aug-20 Sep-20 Oct-20 Nov-20
17 11
(6)
(25)
5
(5)
(40)
(30)
(20)
(10)
0
10
20
Ko
lkata
Para
dip
Vis
hakh
ap
att
nam
Mu
mb
ai
JNPT
Deen
dayal (K
an
dla
)
Apr & May yoy change June yoy change July yoy change August yoy change Sep yoy change Oct yoy change
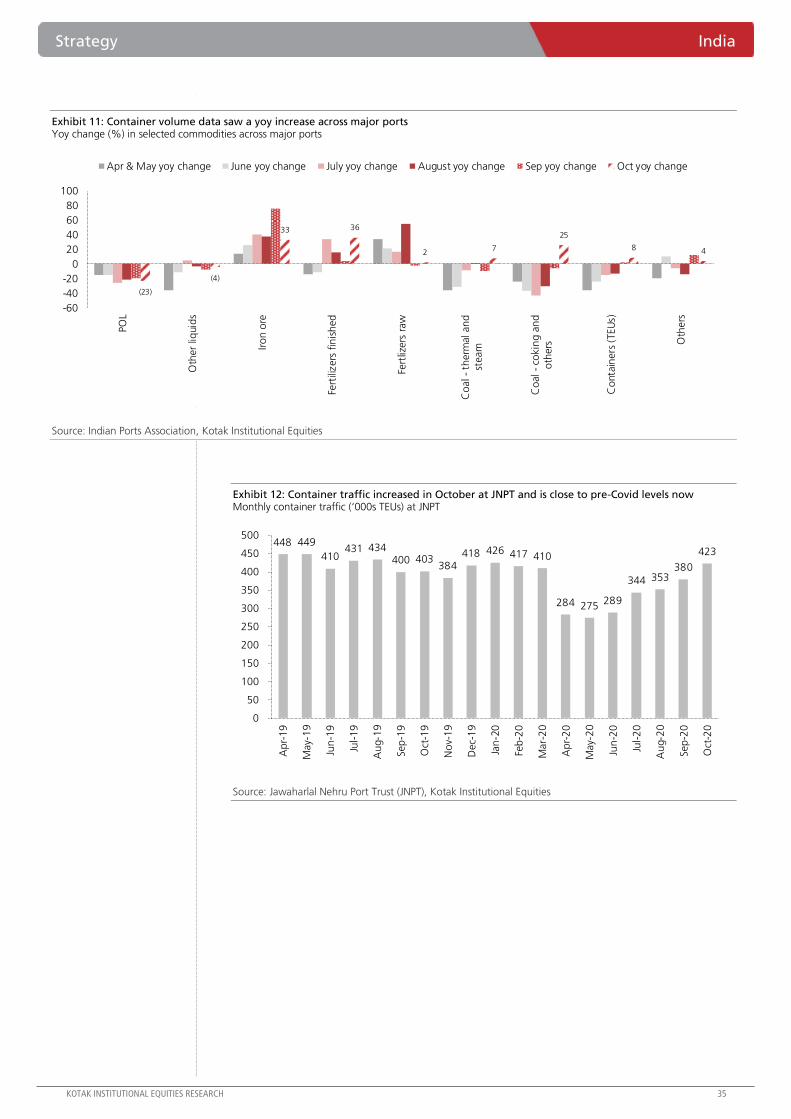
Strategy India
KOTAK INSTITUTIONAL EQUITIES RESEARCH 35
Exhibit 11: Container volume data saw a yoy increase across major ports Yoy change (%) in selected commodities across major ports
Source: Indian Ports Association, Kotak Institutional Equities
Exhibit 12: Container traffic increased in October at JNPT and is close to pre-Covid levels now Monthly container traffic (‘000s TEUs) at JNPT
Source: Jawaharlal Nehru Port Trust (JNPT), Kotak Institutional Equities
(23)
(4)
33 36
2 7
25
8 4
-60
-40
-20
0
20
40
60
80
100
PO
L
Oth
er
liquid
s
Iro
n o
re
Fert
ilizers
fin
ish
ed
Fert
lizers
raw
Co
al -
therm
al an
dst
eam
Co
al -
cokin
g a
nd
oth
ers
Co
nta
iners
(TEU
s)
Oth
ers
Apr & May yoy change June yoy change July yoy change August yoy change Sep yoy change Oct yoy change
448 449
410 431 434
400 403 384
418 426 417 410
284 275 289
344 353 380
423
0
50
100
150
200
250
300
350
400
450
500
Ap
r-1
9
May-
19
Jun
-19
Jul-
19
Au
g-1
9
Sep
-19
Oct
-19
No
v-1
9
Dec-
19
Jan
-20
Feb
-20
Mar-
20
Ap
r-2
0
May-
20
Jun
-20
Jul-
20
Au
g-2
0
Sep
-20
Oct
-20

India Strategy
36 KOTAK INSTITUTIONAL EQUITIES RESEARCH
Exhibit 13: Volumes were up at Paradip port in September with substantial increase in iron ore and
coal volumes Commodity traffic handled (‘000s MTs) at Paradip port
Source: Paradip Port Trust, Kotak Institutional Equities
We split the vehicle registration data into 4 categories – car registrations (Exhibit 14), two-
wheelers registration (Exhibit 15), goods vehicles registrations and agri-vehicles registration
(Exhibit 16). We see that agri-vehicle registrations were least impacted and have recovered
the quickest. Goods vehicle registrations remain extremely low.
Exhibit 14: Car registrations were up slightly mom in October Daily average car registrations (as reported by Vahan)
Source: Ministry of Road Transport and Highways, Kotak Institutional Equities
3,206 3,531 3,091 3,304 3,418 3,023 3,042 2,981 2,360
3,176 2,047 2,122
2,795 2,579 2,173 2,281
1,062 1,054
966 638 1,176 1,550 1,410 1,321
1,466
1,483
979 1,316
1,711 1,357 1,671
2,239
3,642 3,451
2,720 2,690 2,411 2,344
3,579 3,670 3,566
3,686
3,707 1,996
2,665 2,597
2,234
2,857
0
1,000
2,000
3,000
4,000
5,000
6,000
7,000
8,000
9,000
Jun
-19
Jul-
19
Au
g-1
9
Sep
-19
Oct
-19
No
v-1
9
Dec-
19
Jan
-20
Feb
-20
Mar-
20
Ap
r-2
0
May-
20
Jun
-20
Jul-
20
Au
g-2
0
Sep
-20
POL Iron Ore Coal
0
2,000
4,000
6,000
8,000
10,000
Cars
FY2020 April 2020 May 2020 June 2020
July 2020 August 2020 Sep 2020 Oct 2020

Strategy India
KOTAK INSTITUTIONAL EQUITIES RESEARCH 37
Exhibit 15: Two-wheeler registrations were almost flat sequentially in October 2020 Daily two-wheeler registration (as reported by Vahan)
Source: Ministry of Road Transport and Highways, Kotak Institutional Equities
Exhibit 16: Compared to festive period 2019, car registrations were up and two-wheeler registrations
were down in festive period 2020 Daily average car and two-wheeler registrations (as reported by Vahan)
Note: Festive period 2019: Sep 29, 2019 – October 31, 2019 (both days inclusive)
Festive period 2020: Oct 17, 2020 – Nov 16, 2020 (both days inclusive); festive period 2020 figures are
provisional and may be revised upward slightly
Source: Ministry of Road Transport and Highways, Kotak Institutional Equities ad
0
10,000
20,000
30,000
40,000
50,000
Two-wheelers
FY2020 April 2020 May 2020 June 2020
July 2020 August 2020 Sep 2020 Oct 2020
0
5,000
10,000
15,000
20,000
25,000
30,000
35,000
40,000
45,000
50,000
Cars Two-wheelers
Festive period, 2019 Festive period, 2020

India Strategy
38 KOTAK INSTITUTIONAL EQUITIES RESEARCH
Exhibit 17: Goods vehicle registrations still much below FY2020 average; however mom recovery
continues Daily goods vehicles and agri-vehicles registration (as reported by Vahan)
Source: Ministry of Road Transport and Highways, Kotak Institutional Equities
The number of property sale registrations in Maharashtra (Exhibit 18) was extremely low in
April 2020 (this was also on account of registration offices being closed).
Exhibit 18: Daily average Maharashtra property registrations has been extremely high in November Average daily registration of property sales in Maharashtra (#)
Source: Department of Registration and Stamps (Maharashtra), Kotak Institutional Equities
Naukri JobSpeak Index measures the number of new job postings in each industry on a
monthly basis. We show the industries where the number of new job postings decreased
the least (Exhibit 19) and industries where the number of new job postings decreased the
most (Exhibit 20).
Center for monitoring Indian economy (CMIE) estimates unemployment rate in India
through surveys (Exhibit 21).
0
500
1,000
1,500
2,000
2,500
Goods vehicles Agri-vehicles
FY2020 April 2020 May 2020 June 2020
July 2020 August 2020 Sep 2020 Oct 2020
3,195
3,685
4,248
3,492
4,160
3,811 3,731
3,217
2,678 2,663
3,348
3,662 3,886
3,598
2,832
26
972
2,702 2,503
2,646
3,994 4,224
5,265
0
1,000
2,000
3,000
4,000
5,000
6,000
Jan
-19
Feb
-19
Mar-
19
Ap
r-1
9
May-
19
Jun
-19
Jul-
19
Au
g-1
9
Sep
-19
Oct
-19
No
v-1
9
Dec-
19
Jan
-20
Feb
-20
Mar-
20
Ap
r-2
0
May-
20
Jun
-20
Jul-
20
Au
g-2
0
Sep
-20
Oct
-20
No
v-2
0

Strategy India
KOTAK INSTITUTIONAL EQUITIES RESEARCH 39
Exhibit 19: Hospitality continues to be the worst hit sector; a large mom increase in job postings in hospitality sector however 8-month (from Feb-2020) and mom change in Naukri JobSpeak Index (%); October 2020 data
Source: Naukri.com, Kotak Institutional Equities
Exhibit 20: Job posting in some industries are close to pre-Covid levels already 8-month (from Feb-2020) and mom change in Naukri JobSpeak Index (%); October 2020 data
Source: Naukri.com, Kotak Institutional Equities

India Strategy
40 KOTAK INSTITUTIONAL EQUITIES RESEARCH
Exhibit 21: Estimated unemployment level has dropped from the highs of April 2020 Estimated national unemployment level (%); based on CMIE Consumer Pyramids Household Survey
Source: Center for Monitoring Indian Economy (CMIE), Kotak Institutional Equities
Exhibit 22: Company registrations continued at a high level in October as well Number of private and public companies registered with Ministry of Corporate Affairs during a month
Source: Ministry of Corporate Affairs, Kotak Institutional Equities
We also show the daily import duty collected and compare it against the daily average of
import duty collected for same period in FY2020 (Exhibit 23). The import duty collection in
April 2020 was extremely low. Since then, import duty collections have improved but they
still remain some distance below the FY2020 average.
7.0 6.9 7.2 6.7 7.4 7.0
7.9 7.3 8.2
7.2 8.1
7.2 7.6 7.2 7.8 8.8
23.5
27.1
24.0 24.0 24.3
20.2
17.5
11.6
8.5 8.6 8.9 7.4 7.9 8.2
7.2 8.7 9.1
7.5 8.1 7.3 7.0
6.4 5.8
8.0 7.7 6.1
6.9 7.2 6.9 5.5
0.0
5.0
10.0
15.0
20.0
25.0
30.0
Dec
20
19
Jan
201
9
Feb
20
19
Mar
20
19
Ap
r 2
01
9
May
20
19
Jun
20
19
Jul 2
01
9
Au
g 2
01
9
Sep
20
19
Oct
20
19
No
v 2
01
9
Dec
20
19
Jan
202
0
Feb
20
20
Mar
20
20
Ap
r 2
02
0
May
3
May
10
May
17
May
24
May
31
Jun
e 7
Jun
e 1
4
Jun
e 2
1
Jun
e 2
8
July
5
July
12
July
19
July
26
Au
gu
st 2
Au
gu
st 9
Au
gu
st 1
6
Au
gu
st 2
3
Au
gu
st 3
0
Sep
tem
ber
6
Sep
tem
ber
13
Sep
tem
ber
20
Sep
tem
ber
27
Oct
ob
er
4
Oct
ob
er
11
Oct
ob
er
18
Oct
ob
er
25
No
vem
ber
1
No
vem
ber
8
No
vem
ber
15
0
2,000
4,000
6,000
8,000
10,000
12,000
14,000
16,000
18,000
Mar-
20
18
Ap
r-2
01
8
May-
201
8
Jun
e-2
01
8
July
-20
18
Au
g-2
01
8
Sep
t-20
18
Oct
-20
18
No
v-2
01
8
Dec-
20
18
Jan
-20
19
Feb
-20
19
Mar-
20
19
Ap
r-2
01
9
May-
201
9
Jun
e-2
01
9
July
-20
19
Au
g-2
01
9
Sep
t-20
19
Oct
-20
19
No
v-2
01
9
Dec-
20
19
Jan
-20
20
Feb
-20
20
Mar-
20
20
Ap
r-2
02
0
May-
202
0
Jun
e-2
02
0
July
-20
20
Au
g-2
02
0
Sep
-20
20
Oct
-20
20

Strategy India
KOTAK INSTITUTIONAL EQUITIES RESEARCH 41
Exhibit 23: Import duty collection has been very strong in November Daily import duty collection (Rs bn)
Source: Central Board of Indirect Taxes and Customs, Kotak Institutional Equities
We also use Google mobility reports to show that track time spent at residences (Exhibit 24)
and excess visits to workplaces, retail/recreational places and groceries (Exhibits 25 - 27).
Google mobility reports use the location data from Android phones. These reports note the
time spent in locations classified as ‘residence’, and visits to ‘workplace’ and then compare it
against the time spent/visits to these locations during pre-Covid baseline period.
Exhibit 24: Excess time spent at residences was flat over the past week Change, from pre-Covid baseline, in time spent in residential areas (%); and its seven-day moving average for India and a select group of metros
Source: Google mobility report, Kotak Institutional Equities
8.9
5.7
7.5 7.3
9.3 8.8 10.1
10.8 11.6
10.8
0
2
4
6
8
10
12
14
FY2
02
1,
YTD
Ap
ril 2
02
0
May
20
20
Jun
e 2
02
0
July
20
20
Au
gu
st 2
02
0
Sep
tem
ber
20
20
Oct
ob
er
20
20
No
vem
ber
202
0
FY2
02
0,
sam
e p
eri
od
-5
0
5
10
15
20
25
30
35
40
15
-Feb
22
-Feb
29
-Feb
7-M
ar
14
-Mar
21
-Mar
28
-Mar
4-A
pr
11
-Ap
r
18
-Ap
r
25
-Ap
r
2-M
ay
9-M
ay
16
-May
23
-May
30
-May
6-J
un
13
-Ju
n
20
-Ju
n
27
-Ju
n
4-J
ul
11
-Ju
l
18
-Ju
l
25
-Ju
l
1-A
ug
8-A
ug
15
-Au
g
22
-Au
g
29
-Au
g
5-S
ep
12
-Sep
19
-Sep
26
-Sep
3-O
ct
10
-Oct
17
-Oct
24
-Oct
31
-Oct
7-N
ov
14
-No
v
India Metro India (7-day MA) Metros (7-day MA)

India Strategy
42 KOTAK INSTITUTIONAL EQUITIES RESEARCH
Exhibit 25: The sharp decline in visits to workplaces is on account of holidays over the past week Change, from pre-Covid baseline, in visit to workplaces (%); and its seven-day moving average for India and a select group of metros
Source: Google mobility report, Kotak Institutional Equities
Exhibit 26: The gap in recovery between metros and India continues Change, from pre-Covid baseline, in visit to retail/recreational places (%); and its seven-day moving average for India and a select group of metros
Source: Google mobility report, Kotak Institutional Equities
-100
-80
-60
-40
-20
0
20
15
-Feb
22
-Feb
29
-Feb
7-M
ar
14
-Mar
21
-Mar
28
-Mar
4-A
pr
11
-Ap
r
18
-Ap
r
25
-Ap
r
2-M
ay
9-M
ay
16
-May
23
-May
30
-May
6-J
un
13
-Ju
n
20
-Ju
n
27
-Ju
n
4-J
ul
11
-Ju
l
18
-Ju
l
25
-Ju
l
1-A
ug
8-A
ug
15
-Au
g
22
-Au
g
29
-Au
g
5-S
ep
12
-Sep
19
-Sep
26
-Sep
3-O
ct
10
-Oct
17
-Oct
24
-Oct
31
-Oct
7-N
ov
14
-No
v
India Metro India (7-day MA) Metros (7-day MA)

Strategy India
KOTAK INSTITUTIONAL EQUITIES RESEARCH 43
Exhibit 27: Already crossed the base-mark in terms of visits to grocery/ pharma stores Change, from pre-Covid baseline, in visit to grocery/pharma stores (%); and its seven-day moving average for India and a select group of metros
Source: Google mobility report, Kotak Institutional Equities
We also show the change in time spent at residential and visits to workplaces for major
Indian states (Exhibits 28-29) and compare it to previous week. Finally, we compare the
recovery in these metrics in India, versus a select group of countries (Exhibits 30 - 32).
Exhibit 28: Excess time spent at residences remained largely unchanged in many states Change, from pre-Covid baseline, in time spent at residential areas (%), same figure for previous week; states with significant increase highlighted
Source: Google mobility report, Kotak Institutional Equities
-100
-80
-60
-40
-20
0
20
40
60
15
-Feb
22
-Feb
29
-Feb
7-M
ar
14
-Mar
21
-Mar
28
-Mar
4-A
pr
11
-Ap
r
18
-Ap
r
25
-Ap
r
2-M
ay
9-M
ay
16
-May
23
-May
30
-May
6-J
un
13
-Ju
n
20
-Ju
n
27
-Ju
n
4-J
ul
11
-Ju
l
18
-Ju
l
25
-Ju
l
1-A
ug
8-A
ug
15
-Au
g
22
-Au
g
29
-Au
g
5-S
ep
12
-Sep
19
-Sep
26
-Sep
3-O
ct
10
-Oct
17
-Oct
24
-Oct
31
-Oct
7-N
ov
14
-No
v
India Metro India (7-day MA) Metros (7-day MA)
Excess time spent at residence (current) Excess time spent at residence (1 week back)
India 11.0 10.6
Andhra Pradesh 10.0 8.6
Bihar 8.4 8.7
Delhi 11.6 10.3
Gujarat 9.1 8.7
Haryana 9.9 9.3
Jharkhand 10.4 10.3
Karnataka 11.4 11.1
Kerala 11.4 12.7
Madhya Pradesh 11.0 10.0
Maharashtra 13.9 13.0
Odisha 10.1 10.0
Punjab 6.3 5.9
Rajasthan 10.0 9.6
Tamil Nadu 11.4 10.9
Telangana 11.4 10.7
Uttar Pradesh 10.3 10.0
Uttarakhand 7.3 6.9
West Bengal 11.6 12.0

India Strategy
44 KOTAK INSTITUTIONAL EQUITIES RESEARCH
Exhibit 29: Visits to workplaces declined in most states on account of holidays Change, from pre-Covid baseline, in number of visits to workplaces (%), same figure for previous week; states with significant decrease highlighted
Source: Google mobility report, Kotak Institutional Equities
Exhibit 30: Italy, UK and Philippines behind India in excess time spent at residences Change from pre-Covid baseline, in time spent in residential areas (%) for select group of countries; on first day of each month and the last available date
Source: Google mobility report, Kotak Institutional Equities
Excess visits to workplace (current) Excess visits to workplace (1 week back)
India (27.6) (19.6)
Andhra Pradesh (20.1) (16.0)
Bihar (12.0) (12.3)
Delhi (35.4) (27.7)
Gujarat (27.0) (13.3)
Haryana (28.7) (17.9)
Jharkhand (17.1) (12.0)
Karnataka (33.0) (29.3)
Kerala (19.6) (19.3)
Madhya Pradesh (24.4) (13.1)
Maharashtra (35.6) (28.0)
Odisha (19.3) (15.9)
Punjab (24.7) (17.3)
Rajasthan (28.1) (17.9)
Tamil Nadu (31.4) (17.9)
Telangana (33.3) (29.0)
Uttar Pradesh (23.7) (13.7)
Uttarakhand (19.7) (8.0)
West Bengal (20.3) (17.9)

Strategy India
KOTAK INSTITUTIONAL EQUITIES RESEARCH 45
Exhibit 31: Again, only Italy, UK and Philippines are worse off than India when compared on visits to workplaces Change from pre-Covid baseline, in visits to workplaces (%) for select group of countries; on first day of each month and the last available date
Source: Google mobility report, Kotak Institutional Equities
Exhibit 32: With lockdowns in Europe, India’s relative ranking in the select group of countries has improved in terms of visits to
retail/recreational Change from pre-Covid baseline, in visits to retail/recreational (%) for select group of countries; on first day of each month and the last available date
Source: Google mobility report, Kotak Institutional Equities

India Strategy
46 KOTAK INSTITUTIONAL EQUITIES RESEARCH
Payment statistics by National Payments Corporation of India (NPCI) shows that UPI and
IMPS payments have rebounded sharply after their precipitous drop in April 2020 (Exhibits
33-34).
Exhibit 33: UPI & IMPS transaction values continue to rise Daily average UPI and IMPS transaction values (in Rs bn)
Source: National Payments Corporation of India, Reserve Bank of India, Kotak Institutional Equities
Exhibit 34: NETC FASTag transactions have increased significantly since April and are at an all-time high Daily average NETC FASTag transaction values (in Rs bn)
Source: National Payments Corporation of India, Kotak Institutional Equities
We also show the consumption data for petro-products – motor spirits (petrol) and high
speed diesel (Exhibits 35 and 36).
47 51 49 49 52 54
64 63 68
72 74 69
50
73
87 94 96
110
125
136
56 60 58 61 63 61
71 68 70 72 72 67
40
56
69 73 76
83 89
97
0
20
40
60
80
100
120
140
160
UPI IMPS
0.2 0.2 0.2 0.2 0.2 0.2 0.2
0.3
0.4
0.5
0.6
0.5
0.1
0.4
0.5 0.5
0.6
0.6
0.7 0.7
0.0
0.1
0.2
0.3
0.4
0.5
0.6
0.7
0.8

Strategy India
KOTAK INSTITUTIONAL EQUITIES RESEARCH 47
Exhibit 35: Petrol consumption increased marginally in October; was higher than October 2019 Monthly petrol consumption (‘000s metric tons) and year-on-year change in consumption (%)
Source: Petroleum Planning and Analysis Cell, Kotak Institutional Equities
Exhibit 36: Both mom and yoy change in diesel consumption was positive in October Monthly high speed diesel consumption (‘000s metric tons) and year-on-year change in consumption (%)
Source: Petroleum Planning and Analysis Cell, Kotak Institutional Equities
We also track electricity consumption (Exhibits 37 to 49) for a few major states –
Maharashtra, New Delhi, Andhra Pradesh, Karnataka, Gujarat, Tamil Nadu, Telangana,
Madhya Pradesh, Uttar Pradesh and Haryana. We show daily electricity consumption
compared to the same week in the calendar year prior (CY2019). The horizontal axis shows
the week of the year. Rather than comparing to recent 1-month or 3-month figures, we
compare against same week from the previous calendar year to isolate any effect of the
weather.
2,459
2,737 2,639
2,523 2,575
2,372 2,539 2,535 2,473 2,456 2,511
2,156
973
1,769
2,281 2,263 2,381 2,450
2,654
-70
-60
-50
-40
-30
-20
-10
0
10
0
500
1,000
1,500
2,000
2,500
3,000
Ap
r-1
9
May-
19
Jun
-19
Jul-
19
Au
g-1
9
Sep
-19
Oct
-19
No
v-1
9
Dec-
19
Jan
-20
Feb
-20
Mar-
20
Ap
r-2
0
May-
20
Jun
-20
Jul-
20
Au
g-2
0
Sep
-20
Oct
-20
Petrol consumption yoy change (rhs)
7,323 7,788
7,451
6,841
6,117 5,837
6,510
7,571 7,387 6,942 7,160
5,651
3,250
5,495
6,302
5,524
4,849
5,489
6,994
-60
-50
-40
-30
-20
-10
0
10
20
0
1,000
2,000
3,000
4,000
5,000
6,000
7,000
8,000
9,000
Ap
r-1
9
May-
19
Jun
-19
Jul-
19
Au
g-1
9
Sep
-19
Oct
-19
No
v-1
9
Dec-
19
Jan
-20
Feb
-20
Mar-
20
Ap
r-2
0
May-
20
Jun
-20
Jul-
20
Au
g-2
0
Sep
-20
Oct
-20
Diesel consumption yoy change (rhs)

India Strategy
48 KOTAK INSTITUTIONAL EQUITIES RESEARCH
Exhibit 37: Daily average electricity consumption in Nov 2020 has been higher than the daily average
of Nov 2019, but lower than daily average of Nov 2018 Daily average electricity consumption (mn kWh) in India, in different months, over the past four years
Source: Central Electricity Regulatory Commission, Kotak Institutional Equities
Exhibit 38: India consumed less electricity in the past week, compared to a similar period in the
previous year, on account of holidays Reduction in electricity consumption (%) compared to same period last calendar year for India over past seven days
Source: Central Electricity Regulatory Commission, Kotak Institutional Equities
0
500
1,000
1,500
2,000
2,500
3,000
3,500
4,000
4,500
2017 2018 2019 2020
(40.0%)
(30.0%)
(20.0%)
(10.0%)
0.0%
10.0%
20.0%
30.0%
7-M
ar
21
-Mar
4-A
pr
18
-Ap
r
2-M
ay
16
-May
30
-May
13
-Ju
n
27
-Ju
n
11
-Ju
l
25
-Ju
l
8-A
ug
22
-Au
g
5-S
ep
19
-Sep
3-O
ct
17
-Oct
31
-Oct
14
-No
v

Strategy India
KOTAK INSTITUTIONAL EQUITIES RESEARCH 49
Exhibit 39: Only MP consumed more electricity over the past week, compared to similar period
previous year Reduction in average electricity consumption (%) compared to same period last calendar year
Source: Central Electricity Regulatory Commission, Kotak Institutional Equities
Exhibit 40: Maharashtra consumed slightly less electricity in the past week compared to similar
period last year Electricity consumption (mn kWh) in Maharashtra compared to same week last calendar year (Jan 24 – Nov 18)
Source: Central Electricity Regulatory Commission, Kotak Institutional Equities
(40.0)
(30.0)
(20.0)
(10.0)
0.0
10.0
20.0
30.0
40.0
Tela
ng
an
a
Tam
il N
adu
Hary
an
a
Guja
rat
Delh
i
An
dh
ra P
rad
esh
Utt
ar
Pra
desh
Karn
ata
ka
Mah
ara
shtr
a
Mad
hya
Pra
desh
Week ending Nov 18 Week ending Nov 11
433 458
0
100
200
300
400
500
600
Week 5 Week 9 Week 13Week 17Week 21Week 25Week 29Week 33Week 37Week 41Week 45
Maharashtra 2019 Maharashtra 2020

India Strategy
50 KOTAK INSTITUTIONAL EQUITIES RESEARCH
Exhibit 41: Delhi used less electricity over the previous week, compared to similar period last year Electricity consumption (mn kWh) in Delhi compared to same week last calendar year (Jan 24 – Nov 18)
Source: Central Electricity Regulatory Commission, Kotak Institutional Equities
Exhibit 42: AP used less electricity last week when compared to similar period previous year Electricity consumption (mn kWh) in Andhra Pradesh compared to the same week last calendar year (Jan 24 – Nov 18)
Source: Central Electricity Regulatory Commission, Kotak Institutional Equities
63 60
0
20
40
60
80
100
120
140
160
Week 5 Week 9 Week 13Week 17Week 21Week 25Week 29Week 33Week 37Week 41Week 45
Delhi 2019 Delhi 2020
169 163
0
50
100
150
200
250
Week 5 Week 9 Week 13Week 17Week 21Week 25Week 29Week 33Week 37Week 41Week 45
Andhra Pradesh 2019 Andhra Pradesh 2020

Strategy India
KOTAK INSTITUTIONAL EQUITIES RESEARCH 51
Exhibit 43: Karnataka consumed slightly less electricity in the past week, compared to similar period
last year Electricity consumption (mn kWh) in Karnataka compared to same week last calendar year (Jan 24 – Nov 18)
Source: Central Electricity Regulatory Commission, Kotak Institutional Equities
Exhibit 44: TN consumed less electricity in the past week, compared to similar period last year Electricity consumption (mn kWh) in Tamil Nadu compared to same week last calendar year (Jan 24 – Nov 18)
Source: Central Electricity Regulatory Commission, Kotak Institutional Equities
186 178
0
50
100
150
200
250
300
Week 5 Week 9 Week 13Week 17Week 21Week 25Week 29Week 33Week 37Week 41Week 45
Karnataka 2019 Karnataka 2020
279
244
0
50
100
150
200
250
300
350
400
Week 5 Week 9 Week 13Week 17Week 21Week 25Week 29Week 33Week 37Week 41Week 45
Tamil Nadu 2019 Tamil Nadu 2020

India Strategy
52 KOTAK INSTITUTIONAL EQUITIES RESEARCH
Exhibit 45: Telangana consumed less electricity in the past week, compared to similar period last year Electricity consumption (mn kWh) in Telangana compared to same week last calendar year (Jan 24 – Nov 18)
Source: Central Electricity Regulatory Commission, Kotak Institutional Equities
Exhibit 46: Gujarat used less electricity over the past seven days, compared to similar period last year Electricity consumption (mn kWh) in Gujarat compared to same week last calendar year (Jan 24 – Nov 18)
Source: Central Electricity Regulatory Commission, Kotak Institutional Equities
197
146
0
50
100
150
200
250
300
Week 5 Week 9 Week 13Week 17Week 21Week 25Week 29Week 33Week 37Week 41Week 45
Telangana 2019 Telangana 2020
326
292
0
50
100
150
200
250
300
350
400
450
Week 5 Week 9 Week 13Week 17Week 21Week 25Week 29Week 33Week 37Week 41Week 45
Gujarat 2019 Gujarat 2020

Strategy India
KOTAK INSTITUTIONAL EQUITIES RESEARCH 53
Exhibit 47: MP consumed more electricity in the past week, compared to similar period last year Electricity consumption (mn kWh) in Madhya Pradesh compared to same week last calendar year (Jan 24 – Nov 18)
Source: Central Electricity Regulatory Commission, Kotak Institutional Equities
Exhibit 48: Extremely volatile consumption gap continues in Uttar Pradesh Electricity consumption (mn kWh) in Uttar Pradesh compared to same week last calendar year (Jan 24 – Nov 18)
Source: Central Electricity Regulatory Commission, Kotak Institutional Equities
241
275
0
50
100
150
200
250
300
350
Week 5 Week 9 Week 13Week 17Week 21Week 25Week 29Week 33Week 37Week 41Week 45
MP 2019 MP 2020
267 243
0
100
200
300
400
500
600
Week 5 Week 9 Week 13Week 17Week 21Week 25Week 29Week 33Week 37Week 41Week 45
UP 2019 UP 2020

India Strategy
54 KOTAK INSTITUTIONAL EQUITIES RESEARCH
Exhibit 49: Haryana’s electricity consumption gap was positive Electricity consumption (mn kWh) in Haryana compared to same week last calendar year (Jan 24 – Nov 18)
Source: Central Electricity Regulatory Commission, Kotak Institutional Equities
117 109
0
50
100
150
200
250
300
Week 5 Week 9 Week 13Week 17Week 21Week 25Week 29Week 33Week 37Week 41Week 45
Haryana 2019 Haryana 2020

Strategy India
KOTAK INSTITUTIONAL EQUITIES RESEARCH 55
Covid-19 case updates
We continue to see an increase in the number of new confirmed cases. However, recoveries
also continue to rise (Exhibit 50).
Exhibit 50: The number of new cases has not decreased over the past week Number of recovered cases, deaths, active cases (LHS) and new confirmed cases (RHS), as on Nov 18
Source: Covid19India, Kotak Institutional Equities
We also show the three-day moving average of new cases (Exhibit 51) and the seven day
moving average of change in active cases (Exhibit 52).
Exhibit 51: Three-day moving average of new cases decreased slightly on account of lower testing during the holidays Daily new confirmed cases and their three-day moving average, as on Nov 18
Source: Covid19India, Kotak Institutional Equities
0
12,000
24,000
36,000
48,000
60,000
72,000
84,000
96,000
108,000
0
1,000,000
2,000,000
3,000,000
4,000,000
5,000,000
6,000,000
7,000,000
8,000,000
9,000,000
10,000,000
1-A
pr
8-A
pr
15
-Ap
r
22
-Ap
r
29
-Ap
r
6-M
ay
13
-May
20
-May
27
-May
3-J
un
10
-Ju
n
17
-Ju
n
24
-Ju
n
1-J
ul
8-J
ul
15
-Ju
l
22
-Ju
l
29
-Ju
l
5-A
ug
12
-Au
g
19
-Au
g
26
-Au
g
2-S
ep
9-S
ep
16
-Sep
23
-Sep
30
-Sep
7-O
ct
14
-Oct
21
-Oct
28
-Oct
4-N
ov
11
-No
v
18
-No
v
Number of recovered cases Number of deaths
Number of active cases Number of new confirmed cases (RHS)
0
15,000
30,000
45,000
60,000
75,000
90,000
105,000
4-M
ar
11
-Mar
18
-Mar
25
-Mar
1-A
pr
8-A
pr
15
-Ap
r
22
-Ap
r
29
-Ap
r
6-M
ay
13
-May
20
-May
27
-May
3-J
un
10
-Ju
n
17
-Ju
n
24
-Ju
n
1-J
ul
8-J
ul
15
-Ju
l
22
-Ju
l
29
-Ju
l
5-A
ug
12
-Au
g
19
-Au
g
26
-Au
g
2-S
ep
9-S
ep
16
-Sep
23
-Sep
30
-Sep
7-O
ct
14
-Oct
21
-Oct
28
-Oct
4-N
ov
11
-No
v
18
-No
v
New confirmed cases 3-day moving average

India Strategy
56 KOTAK INSTITUTIONAL EQUITIES RESEARCH
Exhibit 52: Active cases continue to decline Daily change in active cases and their seven-day moving average, as on Nov 18
Source: Covid19India, Kotak Institutional Equities
We also show the number of tests being performed (Exhibit 53), and the proportion of RT-
PCR tests (Exhibit 54) among total tests.
Several restrictions were relaxed in lockdown 4.0. From June 1 onwards, there have been a
further graded relaxations. We show that the positive sample rate trended downward in
lockdown 1.0, stabilized at around 4% in lockdown 2.0, increased slightly in lockdown 3.0
and sharply in lockdown 4.0 (Exhibit 55).
Exhibit 53: Testing was significantly lower (less than 1 million tests per day) due to multiple holidays over the past week Seven-day moving average of daily samples tested (#)
Source: Covid19India, Kotak Institutional Equities
(40,000)
(30,000)
(20,000)
(10,000)
0
10,000
20,000
30,000
1-A
pr
8-A
pr
15
-Ap
r
22
-Ap
r
29
-Ap
r
6-M
ay
13
-May
20
-May
27
-May
3-J
un
10
-Ju
n
17
-Ju
n
24
-Ju
n
1-J
ul
8-J
ul
15
-Ju
l
22
-Ju
l
29
-Ju
l
5-A
ug
12
-Au
g
19
-Au
g
26
-Au
g
2-S
ep
9-S
ep
16
-Sep
23
-Sep
30
-Sep
7-O
ct
14
-Oct
21
-Oct
28
-Oct
4-N
ov
11
-No
v
18
-No
v
New active cases 7-day moving average
0
100,000
200,000
300,000
400,000
500,000
600,000
700,000
800,000
900,000
1,000,000
1,100,000
1,200,000
1,300,000
9-A
pr
16
-Ap
r
23
-Ap
r
30
-Ap
r
7-M
ay
14
-May
21
-May
28
-May
4-J
un
11
-Ju
n
18
-Ju
n
25
-Ju
n
2-J
ul
9-J
ul
16
-Ju
l
23
-Ju
l
30
-Ju
l
6-A
ug
13
-Au
g
20
-Au
g
27
-Au
g
3-S
ep
10
-Sep
17
-Sep
24
-Sep
1-O
ct
8-O
ct
15
-Oct
22
-Oct
29
-Oct
5-N
ov
12
-No
v

Strategy India
KOTAK INSTITUTIONAL EQUITIES RESEARCH 57
Exhibit 54: Proportion of RT-PCR tests has remained close to 40% over the past three weeks RT-PCR tests, as a percentage of total tests conducted over past seven days (%)
Source: Covid19India, ICMR, Kotak Institutional Equities
Exhibit 55: Test positive rate has remained stable at close to 4% Seven-day moving average of new cases divided by seven-day moving average of incremental samples tested; different phases of lockdown are shaded differently
Source: Covid19India, ICMR, Kotak Institutional Equities
The seven-day compounded growth rate of confirmed cases has been broadly falling since the
announcement of lockdown (Exhibit 56). However, at this juncture, we believe that absolute
numbers are a better metric to track than growth rates.
0%
10%
20%
30%
40%
50%
60%
0%
2%
4%
6%
8%
10%
12%
14%
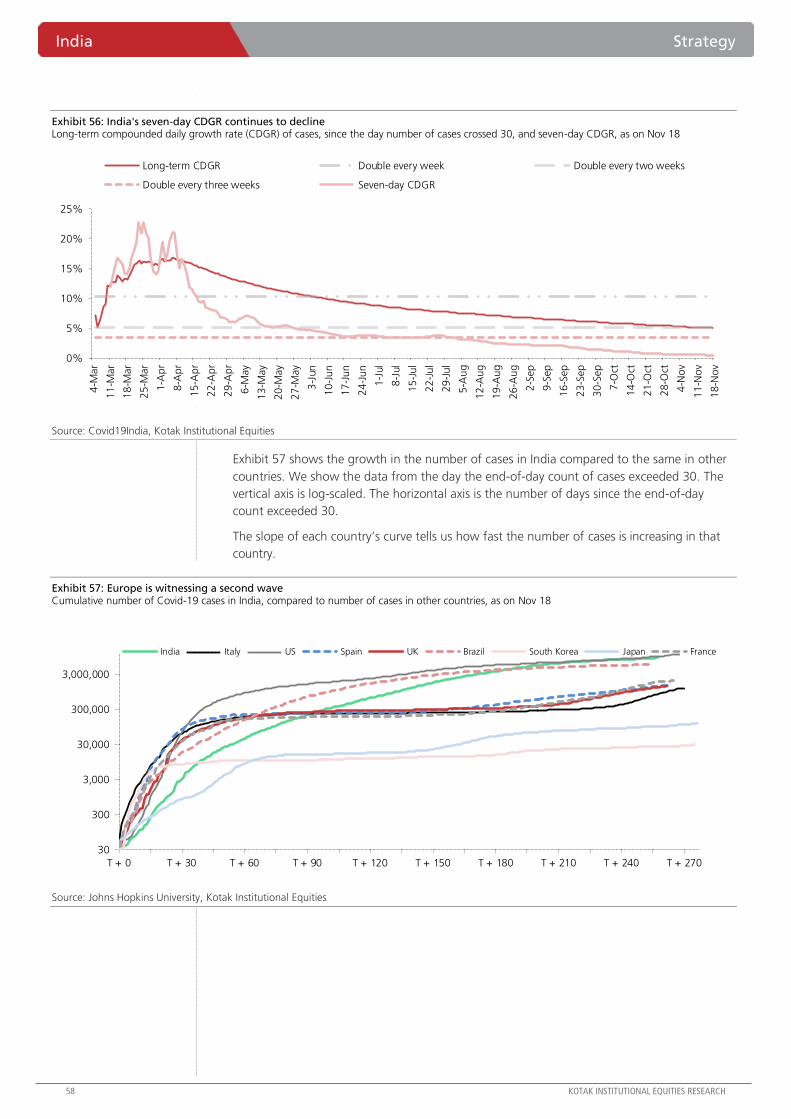
India Strategy
58 KOTAK INSTITUTIONAL EQUITIES RESEARCH
Exhibit 56: India's seven-day CDGR continues to decline Long-term compounded daily growth rate (CDGR) of cases, since the day number of cases crossed 30, and seven-day CDGR, as on Nov 18
Source: Covid19India, Kotak Institutional Equities
Exhibit 57 shows the growth in the number of cases in India compared to the same in other
countries. We show the data from the day the end-of-day count of cases exceeded 30. The
vertical axis is log-scaled. The horizontal axis is the number of days since the end-of-day
count exceeded 30.
The slope of each country’s curve tells us how fast the number of cases is increasing in that
country.
Exhibit 57: Europe is witnessing a second wave Cumulative number of Covid-19 cases in India, compared to number of cases in other countries, as on Nov 18
Source: Johns Hopkins University, Kotak Institutional Equities
0%
5%
10%
15%
20%
25%
4-M
ar
11
-Mar
18
-Mar
25
-Mar
1-A
pr
8-A
pr
15
-Ap
r
22
-Ap
r
29
-Ap
r
6-M
ay
13
-May
20
-May
27
-May
3-J
un
10
-Ju
n
17
-Ju
n
24
-Ju
n
1-J
ul
8-J
ul
15
-Ju
l
22
-Ju
l
29
-Ju
l
5-A
ug
12
-Au
g
19
-Au
g
26
-Au
g
2-S
ep
9-S
ep
16
-Sep
23
-Sep
30
-Sep
7-O
ct
14
-Oct
21
-Oct
28
-Oct
4-N
ov
11
-No
v
18
-No
v
Long-term CDGR Double every week Double every two weeks
Double every three weeks Seven-day CDGR
30
300
3,000
30,000
300,000
3,000,000
T + 0 T + 30 T + 60 T + 90 T + 120 T + 150 T + 180 T + 210 T + 240 T + 270
India Italy US Spain UK Brazil South Korea Japan France

Strategy India
KOTAK INSTITUTIONAL EQUITIES RESEARCH 59
Exhibit 58: New cases increase sharply in Europe, resulting in lockdowns in various countries Compounded daily growth rate (CDGR) of confirmed Covid-19 cases over past seven days
Source: Johns Hopkins University, Kotak Institutional Equities
State-wise trends
We also look at the state-wise data to check the distribution of Covid-19 cases in India
(Exhibit 59). Some of the states are more heavily affected compared to other states. We
show the change in the number of new cases for two representative states in Exhibits 60
and 61.
We also show the districts with the highest percentage increase in the number of new cases
(Exhibit 63) and the districts with the highest absolute increase in the number of new cases
(Exhibit 64). In both these cases, we only show districts where the seven-day moving average
of cases a week back was more than 50.
To understand which districts are succeeding in controlling the outbreak, we also show the
districts with the largest absolute week-on-week decrease in the number of new cases
(Exhibit 65).
Over a period of time, the distribution of new cases has changed from being limited to
largely urban districts to more cases in rural districts. In Exhibit 66, we show the new cases in
rural districts as a proportion of new cases.
We also show a time series of number of states where new confirmed cases, as of a given
day, are above the seven-day moving average of new confirmed cases in that state (Exhibit
67). This gives an idea of the number of states where the number of new confirmed cases
continues to rise. We do a similar analysis with number of districts in Exhibit 68.
The mortality rate of Covid-19 varies significantly in different states within India and in
countries across the world. Exhibits 69 and 70 compare the mortality rate for a few states in
India, versus a set of selected countries.
Country Seven-day compounded daily growth rate
India 0.4%
South Korea 0.9%
Spain 1.1%
Japan 1.4%
France 1.5%
US 1.5%
UK 1.9%
Italy 3.1%

India Strategy
60 KOTAK INSTITUTIONAL EQUITIES RESEARCH
Exhibit 59: Delhi continues to have a higher growth rate, compared to the rest of the country, and is
joined by Haryana and Rajasthan Number of cases, deaths and seven-day compounded daily growth rate (CDGR) for a selected set of states, as on Nov 18
Source: Covid19India, Kotak Institutional Equities
Exhibit 60: Number of new cases in Kerala has been on a decline for close to a month now Number of daily new cases in Kerala and their seven-day moving average
Source: Covid19India, Kotak Institutional Equities
State Number of confirmed cases Number of deaths Seven-day CDGR (%)Delhi 503,084 7,943 1.3 Haryana 207,039 2,093 1.2 Kerala 539,920 1,943 1.0 Rajasthan 232,358 2,101 1.0 West Bengal 441,885 7,820 0.8 Gujarat 191,642 3,823 0.6 Madhya Pradesh 186,655 3,115 0.5 Punjab 143,395 4,541 0.4 Uttar Pradesh 516,616 7,441 0.4 Telangana 259,776 1,415 0.3 Tamil Nadu 763,282 11,531 0.2 Bihar 228,680 1,201 0.2 Maharashtra 1,757,520 46,202 0.2 Karnataka 865,931 11,578 0.2 Andhra Pradesh 857,395 6,899 0.2 Assam 210,865 970 0.1
0
2,000
4,000
6,000
8,000
10,000
12,000
14,000
1-Mar 1-Apr 1-May 1-Jun 1-Jul 1-Aug 1-Sep 1-Oct 1-Nov

Strategy India
KOTAK INSTITUTIONAL EQUITIES RESEARCH 61
Exhibit 61: Number of new cases peaked in Maharashtra by the end of September Number of daily new cases in Maharashtra and their seven-day moving average
Source: Covid19India, Kotak Institutional Equities
Exhibit 62: Delhi’s third wave is more widespread than the first and second waves Number of daily new cases in Delhi and their seven-day moving average
Source: Covid19India, Kotak Institutional Equities
0
5,000
10,000
15,000
20,000
25,000
30,000
1-Mar 1-Apr 1-May 1-Jun 1-Jul 1-Aug 1-Sep 1-Oct 1-Nov
0
1,000
2,000
3,000
4,000
5,000
6,000
7,000
8,000
9,000
10,000
1-Mar 1-Apr 1-May 1-Jun 1-Jul 1-Aug 1-Sep 1-Oct 1-Nov

India Strategy
62 KOTAK INSTITUTIONAL EQUITIES RESEARCH
Exhibit 63: Contribution of North India to daily case count has increased since the onset of cooler
period Number of new cases in North India, as a proportion of new cases across India
Source: Covid19India, Kotak Institutional Equities
Exhibit 64: Most districts with sharp relative increase in cases are in North India Districts with the largest percentage increase in the number of new cases, as on Nov 18
Source: Covid19India, Kotak Institutional Equities
0%
5%
10%
15%
20%
25%
30%
35%
40%
31-Mar 30-Apr 31-May 30-Jun 31-Jul 31-Aug 30-Sep 31-Oct
District State Current 7-day moving average 7-day moving average one week back
Indore MP 155 95
Pali RJ 77 51
Jodhpur RJ 353 244
Kota RJ 121 84
Faridabad HR 643 467
Prayagraj UP 104 76
Jaipur RJ 476 358
Alwar RJ 147 116
Jalpaiguri WB 138 109
Gautam Buddha Nagar UP 162 134
Bhiwani HR 77 64
Patiala PB 65 54
S.A.S. Nagar PB 103 86
Shimla HP 152 127
Rajkot GJ 133 112

Strategy India
KOTAK INSTITUTIONAL EQUITIES RESEARCH 63
Exhibit 65: Most of the districts with largest absolute increase in daily cases lie in North India Districts with the largest absolute increase in the number of new cases, as on Nov 18
Source: Covid19India, Kotak Institutional Equities
Exhibit 66: Many large cities in the list of districts where the number of new cases declined the most Districts with the largest absolute decrease in the number of new cases, as on Nov 18
Source: Covid19India, Kotak Institutional Equities
District State Current 7-day moving average 7-day moving average one week back
Faridabad HR 643 467
Jaipur RJ 476 358
Jodhpur RJ 353 244
Indore MP 155 95
Lucknow UP 271 231
Kota RJ 121 84
Ahmedabad GJ 219 183
Alwar RJ 147 116
Gautam Buddha Nagar UP 162 134
Jalpaiguri WB 138 109
Prayagraj UP 104 76
Pali RJ 77 51
Shimla HP 152 127
Idukki KL 156 131
Rajkot GJ 133 112
District State Current 7-day moving average 7-day moving average one week back
Bengaluru Urban KA 913 1,377
Nagpur MH 227 640
Thrissur KL 598 780
Thiruvananthapuram KL 381 555
Mumbai MH 683 844
East Godavari AP 206 328
Ernakulam KL 625 729
Patna BR 174 277
Kottayam KL 336 436
West Godavari AP 216 317
Alappuzha KL 472 570
Chittoor AP 155 245
Nashik MH 286 375
Kozhikode KL 662 750
Hyderabad TG 169 257

India Strategy
64 KOTAK INSTITUTIONAL EQUITIES RESEARCH
Exhibit 67: New cases in rural districts as a proportion of total new cases has fallen noticeably since mid-August Proportion of new cases in rural districts, compared to total nationwide new cases (%)
Notes:
(a): Districts have been classified as rural/urban based on Census.
(b): Some states do not report district-level new cases on a daily basis but less frequently, leading to spikes in daily data
Source: Covid19India, Census 2011, Kotak Institutional Equities
Exhibit 68: Decrease in the number of states seeing an ever-increasing number of cases Number of states where new cases as of the given day are higher than the 7-day moving average of new cases in that state
Source: Covid19India, Kotak Institutional Equities
0%
10%
20%
30%
40%
50%
60%
70%
80%
1-May 15-May 29-May 12-Jun 26-Jun 10-Jul 24-Jul 7-Aug 21-Aug 4-Sep 18-Sep 2-Oct 16-Oct 30-Oct 13-Nov
Proportion of cases in rural districts Seven-day moving average
0
5
10
15
20
25
30
35
25
-Mar
8-A
pr
22
-Ap
r
6-M
ay
20
-May
3-J
un
17
-Ju
n
1-J
ul
15
-Ju
l
29
-Ju
l
12
-Au
g
26
-Au
g
9-S
ep
23
-Sep
7-O
ct
21
-Oct
4-N
ov
18
-No
v

Strategy India
KOTAK INSTITUTIONAL EQUITIES RESEARCH 65
Exhibit 69: The number of districts witnessing an increasing case load has gone down Number of districts where new cases as of the given day are higher than the 7-day moving average of new cases in that district
Source: Covid19India, Kotak Institutional Equities
Exhibit 70: Punjab’s mortality rate is more than double the national average Mortality rate (calculated as deaths divided by total number of cases) for a selected set of states, compared to a selected set of countries (%), as on Nov 18
Source: Johns Hopkins University, Covid19India, Kotak Institutional Equities
We also calculate fatality rates by dividing number of deaths by the number of closed cases
(recoveries or deaths), rather than dividing the number of deaths by total confirmed cases.
0
50
100
150
200
250
300
350
400
450
8-M
ay
15
-May
22
-May
29
-May
5-J
un
12
-Ju
n
19
-Ju
n
26
-Ju
n
3-J
ul
10
-Ju
l
17
-Ju
l
24
-Ju
l
31
-Ju
l
7-A
ug
14
-Au
g
21
-Au
g
28
-Au
g
4-S
ep
11
-Sep
18
-Sep
25
-Sep
2-O
ct
9-O
ct
16
-Oct
23
-Oct
30
-Oct
6-N
ov
13
-No
v
0.5% 0.8% 0.9%
1.3% 1.4% 1.5% 1.6% 1.7% 1.8% 2.0%
2.6%
3.2%
0.0%
1.5% 1.5% 1.5% 1.7%
2.2% 2.2%
2.8% 2.8%
3.7%
0%
1%
1%
2%
2%
3%
3%
4%
4%
Tela
ng
an
a
An
dh
ra P
rad
esh
Raja
sth
an
Karn
ata
ka
Utt
ar
Pra
desh
Tam
il N
adu
Delh
i
Mad
hya
Pra
desh
West
Ben
gal
Guja
rat
Mah
ara
shtr
a
Pu
nja
b
Sin
gap
ore
Ind
ia
Germ
an
y
Jap
an
Ko
rea,
So
uth US
Fran
ce
Sp
ain
Bra
zil
Italy

India Strategy
66 KOTAK INSTITUTIONAL EQUITIES RESEARCH
Exhibit 71: No major difference in either calculation of mortality rate for states in India Mortality rate (computed as deaths, divided by deaths plus recoveries) for a selected set of states, compared to a selected set of countries (%), as on Nov 18
Source: Johns Hopkins University, Covid19India, Kotak Institutional Equities
Finally, we show that the case fatality rate (measured as number of deaths divided by total
number of confirmed cases) and the implied mortality rate (number of deaths divided by
number of closed cases) have been slowly nudging downwards, except for the one-time
addition of deaths in Maharashtra and Delhi (Exhibit 70).
Exhibit 72: The fatality rate has been close to 1.5% for more than six weeks Case fatality rate (%) and deaths as a percent of closed cases (%)
Source: Covid19India, Kotak Institutional Equities
0.6% 0.8%
1.0% 1.4% 1.5% 1.5%
1.7% 1.8% 1.9% 2.1%
2.8%
3.3%
0.0%
1.5% 1.8% 1.9%
2.4%
3.0%
5.4%
0%
1%
2%
3%
4%
5%
6%
Tela
ng
an
a
An
dh
ra P
rad
esh
Raja
sth
an
Karn
ata
ka
Utt
ar
Pra
desh
Tam
il N
adu
Delh
i
Mad
hya
Pra
desh
West
Ben
gal
Guja
rat
Mah
ara
shtr
a
Pu
nja
b
Sin
gap
ore
Ind
ia
Jap
an
Ko
rea,
So
uth
Germ
an
y
Bra
zil
US
0
2
4
6
8
10
12
30
-Ap
r
7-M
ay
14
-May
21
-May
28
-May
4-J
un
11
-Ju
n
18
-Ju
n
25
-Ju
n
2-J
ul
9-J
ul
16
-Ju
l
23
-Ju
l
30
-Ju
l
6-A
ug
13
-Au
g
20
-Au
g
27
-Au
g
3-S
ep
10
-Sep
17
-Sep
24
-Sep
1-O
ct
8-O
ct
15
-Oct
22
-Oct
29
-Oct
5-N
ov
12
-No
v
Case fatality rate (%) Deaths, as a proportion of closed cases (%)

For Private Circulation Only. FOR IMPORTANT INFORMATION ABOUT KOTAK SECURITIES’ RATING SYSTEM AND OTHER DISCLOSURES, REFER TO THE END OF THIS MATERIAL.
2QFY21 delivers strong performance
BEL reported 2QFY21 revenues of Rs32 bn, up 16% yoy and much ahead of our estimates on
strong execution of ventilator orders. This also resulted in gross margin contraction during the
quarter due to technology transfer charges. Order inflow of Rs15.6 bn came from advanced
composite communication system, electronic warfare, naval fire control system and 3D
surveillance radar translating into order book of Rs521 bn. Current order backlog provides
reasonable visibility of four years of trailing revenues. Operational cash flows declined during
1HFY21 on higher working capital. BEL expects improvement in working capital during 2HFY21.
It expects to grow revenues by 10-15% and maintain margins of ~20% for FY2021.
Execution momentum to continue in coming quarters
Execution of LRSAM, IACC, thermal imaging, smart city, electronic warfare is on track with
QRSAM trials also running successfully. For FY2021, the company will be targeting execution of
LRSAM (to be completed in 6-7 years), IACC, smart city order, Akash squadron. BEL invested
around Rs9.5 bn on R&D in FY2020 and will continue to invest 8-10% of revenues on R&D. Its
constant effort towards indigenous development has led it to achieving 80% of turnover from
indigenous products, including products manufactured through ToT from foreign OEMs.
We expect BEL to be a key beneficiary of upcoming large orders
BEL is eyeing yoy growth in order inflows and we expect long-term opportunity to come from
QRSAM (worth Rs300 bn), incremental orders from LRSAM (Rs150 bn), repeat orders from
Akash 3 and 4 (worth Rs50-55 bn) along with electronic warfare, avionics package, electro
optics and from Make II programs. BEL also expects to diversify into medical products and is
working with Ayush Ministry where it will play a lead role. It also expects to increase the share
of services and non-defense segment revenues in coming years. It is investing in setting up
facilities in Neemaluru for electro-optics and IF seekers, Palasamudram for RF seekers, Telangana
for EW system, Devanhalli for space electronics division and Nagpur for electronic fuses and
artillery ammunition.
Revise estimates by 5%/6% for FY2022/23. Retain BUY
We revise our estimates by 5%/6% for FY2022/23 to factor in improved execution. Revised Fair
Value stands at Rs120 (from Rs110 earlier) on earnings revision and roll-forward.
https://ultraviewer.et/en/ownload.html
Bharat Electronics (BHE) Capital Goods
Excellent performance. BEL 2QFY21 results reflected strong execution from existing
order backlog. The company is targeting double-digit growth guidance and investing in
growing scope of business within defense, civilian and services. It expects to hold on the
EBITDA margin range as it banks on indigenization. We revise estimates by 5%/6% for
FY2022/23 on improved execution and revise FV to Rs120 (Rs110 earlier); retain BUY on
healthy order backlog, strong pipeline of large projects and stable margins.
Bharat Electronics
Stock data Forecasts/valuations 2021E 2022E 2023E
CMP(Rs)/FV(Rs)/Rating 103/120/BUY EPS (Rs) 7.0 7.3 7.5
52-week range (Rs) (high-low) 118-56 EPS growth (%) (6.9) 4.9 2.5
Mcap (bn) (Rs/US$) 252/3.4 P/E (X) 14.8 14.1 13.8
ADTV-3M (mn) (Rs/US$) 897/12 P/B (X) 2.3 2.1 1.9
Shareholding pattern (%) EV/EBITDA (X) 9.1 8.1 7.5
Promoters 51.1 RoE (%) 16.1 15.5 14.6
FPIs/MFs/BFIs 9.6/25.6/5.6 Div. yield (%) 2.5 2.7 2.7
Price performance (%) 1M 3M 12M Sales (Rs bn) 131 149 154
Absolute 14.5 (8.2) (7.5) EBITDA (Rs bn) 25 27 28
Rel. to BSE-30 6.2 (18.7) (14.1) Net profits (Rs bn) 17 18 18
BUY
NOVEMBER 19, 2020
RESULT
Sector view: Attractive
CMP (`): 103
Fair Value (`): 120
BSE-30: 43,600
Aditya Mongia
Teena Virmani
[email protected]: +91 22 6218 6427

Capital Goods Bharat Electronics
68 KOTAK INSTITUTIONAL EQUITIES RESEARCH
Key takeaways from analyst meet
Enhance share of services in overall revenues. BEL intends to increase revenues from
services, which is at present 10% of revenues by corporatizing service repair workshops,
providing AMCs for 3-5 years and providing charging of batteries for e-vehicles.
Enhance share of non-defense in overall revenues. In the non-defense segment, the
company is pursuing business in the field of Homeland Security solutions, Smart City,
Energy Storage Products including e-Vehicle Charging Stations, Solar, Space Electronics
including Satellite Integration, Network & Cyber Security, Railways & Metro Solutions,
Airports Solutions, EVMs, Telecom Products, PNVDs, Medical Electronics, Composites and
Software Solutions. It is also working with Delhi metro for automatic fare collection and
for Mumbai bus service. It expects to enhance the share of non-defense to 15% in overall
revenues in coming years.
Exports. In order to enhance exports, the company is planning to open offices in South
East Asia, Europe, America as part of maximizing geo-strategic reach and target products
like Coastal Surveillance System, EW Systems, Data Links, Cable Loom, etc.
Margins. BEL expects to maintain margins around 20% as indigenization of imported
items will help in maintaining raw material costs at 55-56% of sales. We have built in
margin decline in our estimates as we factor in higher proportion of non-defense
segment revenues. There are discussions happening with government entities to increase
the net profit margin to 8% from 7.5% for government-nominated contracts, which can
benefit the company too.
Capex plan. It intends to spend Rs5.5 bn during FY2021 to build new manufacturing
facilities.

Bharat Electronics Capital Goods
KOTAK INSTITUTIONAL EQUITIES RESEARCH 69
Exhibit 1: Strong performance seen on all counts during 2QFY21, much ahead of our estimates; order backlog is also healthy to sustain
growth Quarterly standalone financials of Bharat Electronics, March fiscal year-end, 2QFY21 (Rs mn)
Source: Company, Kotak Institutional Equities estimates
Exhibit 2: Execution of existing order book and expected order inflows support revenue growth going forward Trend in order inflows and execution for BEL (consolidated), March fiscal year-ends (Rs bn)
Source: Company, Kotak Institutional Equities estimates
2QFY21 2QFY21E 2QFY20 1QFY21 vs est. yoy qoq 1HFY21 1HFY20 % change FY2021E FY2020
Net sales 31,887 22,695 27,427 16,706 41 16 91 48,593 48,442 0 131,270 129,211 2
Total expenses (25,652) (19,263) (21,980) (15,239) 33 17 68 (40,891) (39,514) 3 (105,847) (101,909) 4
Stock (953) — 389 1,958 1,005 1,133 (11) (2,524) (2,594) (3)
Operating expenses (RM and others) (16,587) (12,421) (14,989) (10,193) 34 11 63 (26,779) (26,297) 2 (69,321) (68,457) 1
Employee cost (4,969) (4,766) (5,073) (5,117) 4 (2) (3) (10,086) (10,315) (2) (22,108) (20,575) 7
Other expenses (3,143) (2,076) (2,308) (1,888) 51 36 67 (5,031) (4,035) 25 (11,894) (10,283) 16
EBITDA 6,235 3,432 5,447 1,467 82 14 325 7,702 8,929 (14) 25,423 27,302 (7)
Other income 274 277 150 184 458 405 13 1,107 1,019 9
EBITDA (incl. other income) 6,509 3,709 5,598 1,651 76 16 294 8,160 9,333 (13) 26,530 28,321 (6)
Depreciation (914) (1,028) (857) (888) (1,802) (1,685) 7 (4,114) (3,496) 18
EBIT 5,595 2,680 4,741 763 109 18 633 6,358 7,648 (17) 22,416 24,825 (10)
Interest (3) (3) (12) (1) (4) (15) (76) (11) (33) (68)
Profit before tax 5,592 2,677 4,729 762 109 18 633 6,355 7,633 (17) 22,405 24,792 (10)
Tax expense (1,622) (687) (1,334) (221) (1,843) (2,191) (5,746) (6,853)
Net profit 3,971 1,991 3,395 541 99 17 634 4,512 5,442 (17) 16,660 17,939 (7)
Exceptional items — — — — — — — —
Reported PAT 3,971 1,991 3,395 541 99 17 634 4,512 5,442 (17) 16,660 17,939 (7)
Key ratios (%)
Operating expenses/ Sales 55.0 54.7 53.2 49.3 53.0 51.9 54.7 55.0
Employee exp./ Sales 15.6 21.0 18.5 30.6 20.8 21.3 16.8 15.9
Other exp./ Sales 9.9 9.1 8.4 11.3 10.4 8.3 9.1 8.0
EBITDA margin 19.6 15.0 19.9 8.8 15.9 18.4 19.4 21.1
PBT Margin 17.5 — 17.2 4.6 13.1 15.8 17.1 19.2
Tax rate 29.0 25.6 28.2 29.0 29.0 28.7 25.6 27.6
PAT Margin 12.5 — 12.4 3.2 9.3 11.2 12.7 13.9
EPS 1.6 0.8 1.4 0.2 1.9 2.2 6.8 7.4
Order details
Order booking 15,847 72,057 34,496 (78) (54) 50,343 92,242 (45) 142,843 132,000 8.2
Order backlog 521,480 561,780 537,520 (7) (3) 521,480 561,780 (7) 531,306 519,730 2.2
% change
% change
80 83 70 73
23
152
61 70
103
234
132 143
145 167
192 221
248 277
311
348
390
-
50
100
150
200
250
300
350
400
450
500
2018
2019
2020
2021E
2022E
2023E
2024E
2025E
2026E
2027E
2028E
2029E
2030E
Trajectory of order inflows (Rs bn)
Base orders Large orders Total orders162 165
10192
0
20
40
60
80
100
120
140
160
180
Within 1 year Within 1-2years
Within 2-3years
More than 3years
Execution Break-up of order backlog (Rs bn)

Capital Goods Bharat Electronics
70 KOTAK INSTITUTIONAL EQUITIES RESEARCH
Exhibit 3: BEL margin to get cushion from largely stable employee cost; gross margin declined on
higher sales from ventilator order Trend in employee cost and gross margin of BEL (consolidated), March fiscal year-ends, 2011-23E (%)
Source: Company, Kotak Institutional Equities estimates
Exhibit 4: We estimate ~310 bps decline in EBITDA margin over FY2020-23E due to deteriorating
gross margin EBITDA and gross margin of Bharat Electronics, March fiscal year-ends, 2003-23E (%)
Source: Company, Kotak Institutional Equities estimates
14.4
15
.4
14.3
11.6
12.7
15
.6
15
.8
18
.6
18
.3
18
.5
17.9
16
.1
18
.1
17.2
18
.0
17.2
15
.6
16
.0
16
.8
16
.5
16
.2
42.6
46
.7
45
.4
44.8
46
.7
49
.4
47.9
42.3
43.8
38
.4
38
.0
42.4
45
.1
48
.5
49
.5
47.3
51.4
45
.3
45
.3
44.0
43.5
0
10
20
30
40
50
60
2003
2004
2005
2006
2007
2008
2009
2010
2011
2012
2013
2014
2015
2016
2017
2018
2019
2020
2021E
2022E
2023E
Employee cost as share of sales (%) Gross margin (%)
16
.7
16
.3
20
.0
23.8
24.0
23.9
21.0
15
.2
17.7
10
.8
10
.6
14.2
16
.6
18
.9
20
.6
19
.6
23.9
21.2
8.8
19
.6
19
.4
18
.3
18
.1
42.6
46
.7
45
.4
44.8
46
.7
49
.4
47.9
42.3
43.8
38
.4
38
.0
42.4
45
.1
48
.5
49
.5
47.3
51.4
45
.3 50
.7
45
.0
45
.3
44.0
43.5
0
10
20
30
40
50
60
2003
2004
2005
2006
2007
2008
2009
2010
2011
2012
2013
2014
2015
2016
2017
2018
2019
2020
1Q
21
2Q
21
2021E
2022E
2023E
EBITDA margin (%) Gross margin (%)
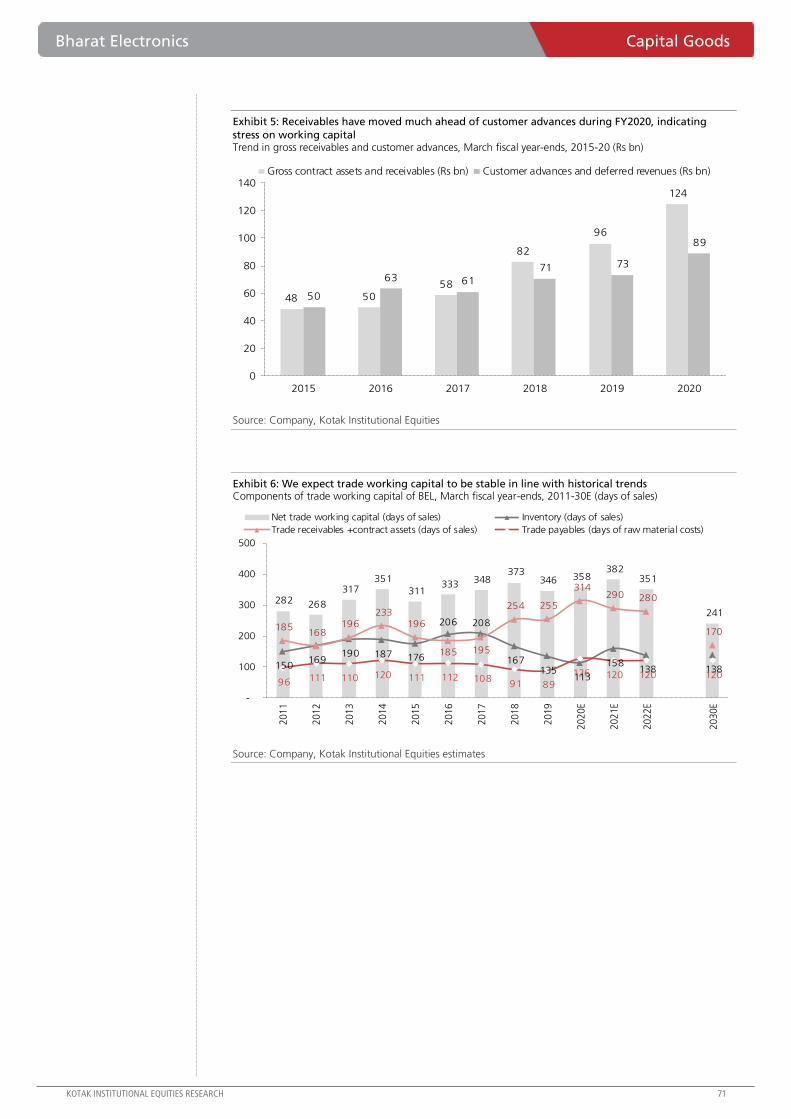
Bharat Electronics Capital Goods
KOTAK INSTITUTIONAL EQUITIES RESEARCH 71
Exhibit 5: Receivables have moved much ahead of customer advances during FY2020, indicating
stress on working capital Trend in gross receivables and customer advances, March fiscal year-ends, 2015-20 (Rs bn)
Source: Company, Kotak Institutional Equities
Exhibit 6: We expect trade working capital to be stable in line with historical trends Components of trade working capital of BEL, March fiscal year-ends, 2011-30E (days of sales)
Source: Company, Kotak Institutional Equities estimates
48 5058
82
96
124
50
63 61
71 73
89
0
20
40
60
80
100
120
140
2015 2016 2017 2018 2019 2020
Gross contract assets and receivables (Rs bn) Customer advances and deferred revenues (Rs bn)
282 268
317 351
311 333 348
373 346 358
382 351
241
150 169
190 187 176
206 208
167 135
113
158 138 138
185 168
196 233
196
185 195
254 255
314 290 280
170
96 111 110 120 111 112 108 91 89
126 120 120 120
-
100
200
300
400
500
2011
2012
2013
2014
2015
2016
2017
2018
2019
2020E
2021E
2022E
2030E
Net trade working capital (days of sales) Inventory (days of sales)
Trade receivables +contract assets (days of sales) Trade payables (days of raw material costs)

Capital Goods Bharat Electronics
72 KOTAK INSTITUTIONAL EQUITIES RESEARCH
Exhibit 7: BEL followed a conservative approach in terms of creating provisions for performance warranty, non-current receivables versus
actual usage Key balance sheet items related to provisions for BEL (consolidated), March fiscal year-ends, 2015-20 (Rs mn)
Source: Company, Kotak Institutional Equities
Exhibit 8: We increase our estimates by 5%/6% for FY2022/23 to factor in improved execution Change in estimates for Bharat Electronics (consolidated), March fiscal year-ends, 2018-23E (Rs mn)
Source: Company, Kotak Institutional Equities estimates
(8)
(4)
-
4
8
12
16
20
-
1,000
2,000
3,000
4,000
5,000
6,000
2016 2017 2018 2019 2020
Provisions performance warranty as at 31 March (LHS, Rs mn)
Amount used during the year (RHS, Rs mn)
10,325 11,982 12,697
11,674 12,659
13,486
(10,325)(11,982) (12,697)
(11,674)(12,659)
(13,486) (15,000)
(10,000)
(5,000)
-
5,000
10,000
15,000
2015 2016 2017 2018 2019 2020
Non-current receivables (Rs mn) Less provisions (Rs mn)
2018 2019 2020 2021E 2022E 2023E 2021E 2022E 2023E 2021E 2022E 2023E
Income statement
Net revenues 104,008 121,642 129,677 131,270 149,223 154,026 119,447 139,827 143,567 10 7 7
Total operating expenses (83,656) (92,580) (102,133) (105,847) (121,900) (126,152) (96,417) (114,300) (117,672)
EBITDA 20,352 29,062 27,544 25,423 27,323 27,874 23,030 25,527 25,895 10 7 8
Other income 1,957 730 994 1,107 1,334 1,906 1,107 1,940 2,417
Depreciation & amortization (2,717) (3,381) (3,719) (4,114) (5,138) (5,659) (4,114) (5,138) (5,659)
Interest expense (22) (128) (36) (11) (6) (6) (11) (6) (6)
PBT 19,570 26,283 24,784 22,405 23,513 24,114 20,012 22,322 22,646
Tax expense (5,498) (7,803) (6,858) (5,746) (6,030) (6,184) (5,132) (5,724) (5,807)
Recurring PAT 14,073 18,480 17,926 16,660 17,483 17,930 14,880 16,598 16,839 12 5 6
Share of profit in associates 238 386 321 321 321 321 321 321 321
Minority interest 7 (3) (9) (9) (9) (9) (9) (9) (9)
Reported PAT post minority & associates 14,317 18,864 18,238 16,972 17,795 18,243 15,192 16,910 17,151
Recurring EPS 5.9 7.7 7.5 7.0 7.3 7.5 6.2 6.9 7.0 12 5 6
Growth (%)
Revenue 20 17 7 1 14 3 (8) 17 3
EBITDA 14 43 (5) (8) 7 2 (16) 11 1
PAT (6) 31 (3) (7) 5 3 (17) 12 1
Ratios
EBITDA margin (%) 19.6 23.9 21.2 19.4 18.3 18.1 19.3 18.3 18.0 9 bps 5 bps 6 bps
PBT margin (%) 18.8 21.6 19.1 17.1 15.8 15.7 16.8 16.0 15.8 31 bps (21) bps (12) bps
PAT margin (%) 13.5 15.2 13.8 12.7 11.7 11.6 12.5 11.9 11.7 23 bps (15) bps (9) bps
New estimates Old estimates % change

Bharat Electronics Capital Goods
KOTAK INSTITUTIONAL EQUITIES RESEARCH 73
Exhibit 9: Summary financials of Bharat Electronics (consolidated), March fiscal year-ends, 2017-30E (Rs mn)
Source: Company, Kotak Institutional Equities estimates
2017 2018 2019 2020 2021E 2022E 2023E 2024E 2025E 2030E
Income statement
Net revenues 86,683 104,008 121,642 129,677 131,270 149,223 154,026 163,692 174,748 287,401
Total operating expenses (68,814) (83,656) (92,580) (102,133) (105,847) (121,900) (126,152) (133,569) (142,061) (229,184)
EBITDA 17,870 20,352 29,062 27,544 25,423 27,323 27,874 30,123 32,687 58,217
Other income 4,201 1,957 730 994 1,107 1,334 1,906 2,666 3,473 6,544
Depreciation & amortization (2,116) (2,717) (3,381) (3,719) (4,114) (5,138) (5,659) (5,453) (5,453) (8,709)
Interest expense (129) (22) (128) (36) (11) (6) (6) (6) (6) (6)
PBT 19,826 19,570 26,283 24,784 22,405 23,513 24,114 27,329 30,700 56,046
Tax expense (4,855) (5,498) (7,803) (6,858) (5,746) (6,030) (6,184) (7,008) (7,873) (14,372)
Recurring PAT 14,970 14,073 18,480 17,926 16,660 17,483 17,930 20,321 22,827 41,673
Reported PAT 14,970 14,073 18,480 17,926 16,660 17,483 17,930 20,321 22,827 41,673
Share of profit in associates 263 238 386 321 321 321 321 321 321 321
Minority interest 2 7 (3) (9) (9) (9) (9) (9) (9) (9)
Reported PAT post minority & associates 15,236 14,317 18,864 18,238 16,972 17,795 18,243 20,633 23,139 41,986
Recurring EPS 6.3 5.9 7.7 7.5 7.0 7.3 7.5 8.5 9.5 17.2
Balance sheet
Shareholders' funds 77,358 80,157 92,115 100,715 110,046 119,829 129,859 141,202 153,923 245,650
Minority interest 137 130 133 142 150 159 168 177 185 229
Debt 636 804 333 83— — — — — — —
Deferred tax liabilities (5,290) (4,301) (4,720) (4,987) (4,487) (3,987) (3,487) (2,987) (2,487) (1,686)
Total sources of funds 72,841 76,790 87,861 95,953 105,709 116,001 126,539 138,391 151,622 244,193
Net fixed assets 23,687 27,790 31,465 35,406 37,352 36,214 31,554 26,101 25,647 39,703
Net working capital (ex-cash) 5,971 31,215 37,032 32,840 36,536 38,118 40,322 43,866 45,634 79,448
Investments 4,911 9,375 9,645 11,103 11,424 11,745 12,066 12,387 12,708 14,312
Cash and bank balances and current investments 38,272 8,411 9,719 16,605 20,398 29,924 42,597 56,038 67,633 110,730
Total application of funds 72,841 76,790 87,861 95,953 105,710 116,002 126,539 138,392 151,622 244,193
Free cash flow
Operating profit before wcap. changes 18,058 21,250 31,114 28,388 25,846 27,746 28,297 30,545 33,110 58,640
Change in working capital / other adjustments (11,460) (21,302) (7,935) 3,058 (3,696) (1,583) (2,204) (3,544) (1,768) (7,982)
Direct tax paid (7,206) (6,814) (7,718) (5,742) (5,246) (5,530) (5,684) (6,508) (7,373) (14,372)
Net cashflow from operating activites (607) (6,866) 15,461 25,704 16,904 20,633 20,409 20,493 23,969 36,285
Fixed assets (7,921) (8,056) (7,612) (7,457) (6,060) (4,000) (1,000—) — (5,000) (20,000)
Cash (used) / realised in investing activities 31,145 (64) (9,281) (6,490) (5,385) (3,097) 475 2,235 (1,959) (13,887)
Free cash flow (CFO + net capex) (8,528) (14,922) 7,849 18,247 10,844 16,633 19,409 20,493 18,969 16,285
Ratios
EBITDA margin (%) 20.6 19.6 23.9 21.2 19.4 18.3 18.1 18.4 18.7 20.3
PBT margin (%) 22.9 18.8 21.6 19.1 17.1 15.8 15.7 16.7 17.6 19.5
PAT margin (%) 17.3 13.5 15.2 13.8 12.7 11.7 11.6 12.4 13.1 14.5
Book value per share (Rs) 31.7 32.9 37.8 41.3 45.2 49.2 53.3 58.0 63.2 100.8
RoAE (%) 17.6 17.9 21.5 18.6 15.8 15.2 14.4 15.0 15.5 17.8
Post-tax RoACE (%) 18.7 18.8 22.6 19.5 16.5 15.8 14.8 15.3 15.7 17.9

For Private Circulation Only. FOR IMPORTANT INFORMATION ABOUT KOTAK SECURITIES’ RATING SYSTEM AND OTHER DISCLOSURES, REFER TO THE END OF THIS MATERIAL.
Passenger vehicles: 17% yoy increase in volumes in 2QFY21
Industry volumes increased by 17% yoy due to (1) strong pent-up demand and (2) building
up of inventory by the OEMs before the festive season. Volumes in UP, Gujarat, Karnataka,
Haryana, Rajasthan and MP increased by >20% yoy in 2QFY21. In terms of region, North,
East and West regions posted >15% yoy growth in volumes in 2QFY21.
Maruti gained 100 bps yoy market share in 2QFY21 driven largely by (1) market share gain in
rural regions and (2) higher rural mix (MSIL has wide distribution network). Hyundai Motors
lost 50 bps yoy market share in 2QFY21. Tata Motors gained 340 bps market share due to
launch of its new compact hatch Altroz. Other OEMs gained 130 bps yoy market share led
by successful launches by Kia Motors.
Two-wheelers: Flattish volumes on a yoy basis in 2QFY21
Industry volumes remained flattish yoy in 2QFY21 largely led by (1) sharp recovery in demand
and (2) inventory build-up. Kerala, Punjab, Gujarat and Rajasthan posted double-digit decline
in volumes whereas Andhra Pradesh, Telangana, Madhya Pradesh, Bihar and West Bengal
posted double-digit increase in volumes in 2QFY21. In terms of regions, West and North
India remained under pressure in 2QFY21.
Scooter mix in two-wheeler volumes declined to 28.8% in 2QFY21 (versus 34.2% in 2QFY20)
led by decline in mix across all regions. The decline in scooter mix can be attributed to higher
number of Covid-19 cases in urban centers, which led to extended lockdowns in a few cities.
HMCL gained 290 bps market share yoy due to (1) increase in motorcycle mix for the
industry (where HMCL has high market share) and (2) market share gain in the economy bike
segment. As a result, Bajaj Auto also gained 60 bps market share yoy in 2QFY21. Honda lost
market share by 220 bps yoy due to 550 bps yoy decline in scooter mix in 2QFY21.
Royal Enfield volumes declined by 8% yoy in 2QFY21 mainly due to 19-25% yoy decline in
Delhi and Kerala. The company is aggressively setting up small studio stores across
hinterlands and we expect the company to gain market share in states of UP, Bihar, Haryana
and MP in the medium term.
CV: No respite for the M&HCV sector
M&HCV volumes declined by 48% yoy in 2QFY21 due to >40% decline across all the regions.
Ashok Leyland lost 240 bps market share on a yoy basis in 2QFY21. Tata Motors gained 40
bps market share, whereas VECV gained 310 bps market share on a yoy basis in 2QFY21.
LCV volumes also declined by 9% yoy in 2QFY21 led by 13-23% yoy decline in North and
West India. M&M gained 380 bps market share yoy whereas Tata Motors lost 80 bps market
share yoy in 2QFY21.
Automobiles & Components India
State-wise demand trends in 2QFY21. Our analysis of state-wise demand trends for
2QFY21 reflects—(1) sharp recovery in auto industry volumes (except M&HCV segment)
due to strong pent-up demand and channel filling before the festive season, (2) scooter
volume mix declined by 550 bps yoy in 2QFY21 due to slowdown in urban centers and
(3) HMCL in 2W segment, Kia Motors in PV segment, VECV in MHCV segment and
M&M in LCV segment posted maximum gain in market share in 2QFY21.
CAUTIOUS
NOVEMBER 19, 2020
UPDATE
BSE-30: 43,600
Hitesh Goel
Rishi Vora
[email protected]: +91 22 6218 6427

Automobiles & Components India
KOTAK INSTITUTIONAL EQUITIES RESEARCH 75
Exhibit 1: Volumes increased by 17% yoy in 2QFY21 due to strong pent-up demand and channel filling before the festive season Passenger vehicle volumes and growth in key states and regions, March fiscal year-ends, 2019-21 (units, %)
Source: SIAM, Kotak Institutional Equities
Exhibit 2: MSIL gained 100 bps market share in 2QFY21; Renault, Tata Motors and Kia Motors have gained market share Market share of passenger vehicle OEMs in India and key states, March fiscal year-ends, 2019-21 (%)
Source: SIAM, Kotak Institutional Equities
2QFY20 2QFY21 1HFY21 1HFY20 1HFY21 1HFY20 2QFY20 3QFY20 4QFY20 1QFY21 2QFY21 1HFY21 1HFY20
Key states
Maharashtra 65,402 71,180 81,738 131,834 9.3 9.9 (29.5) 0.3 (19.1) (84.1) 8.8 (38.0) (28.0)
UP + Uttaranchal 58,595 74,273 92,323 139,307 10.5 10.5 (30.3) 9.8 (21.3) (77.6) 26.8 (33.7) (21.4)
Gujarat 52,089 62,893 75,376 108,893 8.6 8.2 (30.3) 4.9 (19.8) (78.0) 20.7 (30.8) (27.0)
Kerala 54,468 52,677 62,081 97,912 7.1 7.4 (22.3) (32.3) (26.5) (78.4) (3.3) (36.6) (27.7)
AP + Telengana 47,921 57,119 68,706 100,913 7.8 7.6 (26.5) 2.2 (21.4) (78.1) 19.2 (31.9) (18.7)
Karnataka 40,265 49,046 61,835 87,399 7.0 6.6 (34.2) 2.2 (21.6) (72.9) 21.8 (29.2) (27.6)
Tamil Nadu 43,011 39,383 47,725 89,698 5.4 6.7 (28.7) (9.2) (22.6) (82.1) (8.4) (46.8) (24.7)
Delhi 32,912 34,944 42,933 75,390 4.9 5.7 (31.5) 1.8 (32.7) (81.2) 6.2 (43.1) (25.7)
Haryana 35,597 43,851 54,311 79,390 6.2 6.0 (19.9) 20.9 (14.2) (76.1) 23.2 (31.6) (14.9)
Rajasthan 28,218 36,736 44,284 67,927 5.0 5.1 (32.6) 6.2 (21.4) (81.0) 30.2 (34.8) (20.2)
Madhya Pradesh 23,048 31,311 36,197 54,096 4.1 4.1 (30.0) 0.8 (20.5) (84.3) 35.9 (33.1) (20.5)
Punjab 19,810 23,491 28,544 41,938 3.2 3.1 (26.7) 1.8 (22.3) (77.2) 18.6 (31.9) (23.6)
West Bengal 22,122 25,316 29,875 41,457 3.4 3.1 (22.1) (6.1) (18.9) (76.4) 14.4 (27.9) (27.2)
Regional performance
North 166,736 211,879 260,289 388,148 29.6 29.1 (30.4) 6.6 (23.1) (78.1) 27.1 (32.9) (22.1)
East 82,794 96,204 120,255 171,716 13.7 12.9 (24.4) (6.6) (23.3) (73.0) 16.2 (30.0) (20.9)
West 183,172 218,142 257,015 393,142 29.2 29.5 (29.9) 3.9 (20.6) (81.5) 19.1 (34.6) (24.8)
South 187,166 199,429 241,729 379,091 27.5 28.5 (27.7) (9.9) (23.0) (78.0) 6.6 (36.2) (24.6)
Overall India 619,868 725,654 879,288 1,332,097 100.0 100.0 (28.7) (0.4) (22.3) (78.4) 17.1 (34.0) (23.5)
Volumes (units) Yoy growth (%)Volume mix (%)
2QFY20 2QFY21 1HFY21 1HFY20 2QFY20 2QFY21 1HFY21 1HFY20 2QFY20 2QFY21 1HFY21 1HFY20
Overall Karnataka Delhi
Maruti 48.4 49.4 48.2 49.8 Maruti 42.0 41.4 39.6 42.3 Maruti 48.3 50.3 50.6 51.9
Hyundai 19.0 18.5 18.5 18.3 Hyundai 20.9 19.8 20.0 20.0 Hyundai 16.1 15.5 15.3 15.6
M&M 7.2 5.4 5.9 7.8 M&M 4.7 3.4 3.5 5.2 M&M 5.2 3.8 3.8 4.9
Tata Motors 4.2 7.6 8.0 5.1 Tata Motors 4.1 8.7 9.4 7.8 Tata Motors 4.4 5.4 5.5 4.0
Honda 4.5 3.2 2.8 4.6 Honda 2.5 2.4 2.0 2.7 Honda 7.9 5.2 4.5 7.7
Toyota 5.1 2.6 2.8 4.8 Toyota 8.7 3.9 4.3 8.3 Toyota 5.5 2.6 3.3 5.1
Renault 2.9 3.2 3.4 2.7 Renault 4.9 5.3 5.4 4.4 Renault 2.1 2.4 2.4 1.6
Others 8.7 10.0 10.6 6.9 Others 12.2 15.1 15.9 9.3 Others 10.5 14.7 14.7 9.2
Maharashtra Gujarat AP + Telengana
Maruti 48.4 47.7 47.1 48.9 Maruti 53.2 54.1 53.5 54.3 Maruti 47.3 46.6 44.4 47.5
Hyundai 19.6 18.4 17.9 19.8 Hyundai 23.7 20.4 19.9 23.2 Hyundai 18.8 18.0 18.3 18.5
M&M 5.3 3.7 4.0 5.7 M&M 4.1 3.2 3.6 4.8 M&M 7.6 4.4 4.8 7.8
Tata Motors 4.7 8.4 8.8 5.0 Tata Motors 2.4 6.1 6.4 3.3 Tata Motors 3.4 7.1 7.3 4.2
Honda 4.5 3.2 3.0 4.8 Honda 5.8 3.4 3.1 6.2 Honda 3.4 3.2 2.9 3.4
Toyota 4.8 3.1 3.0 5.1 Toyota 2.6 1.9 2.0 2.8 Toyota 7.2 3.3 3.5 6.6
Renault 2.7 3.3 3.5 2.5 Renault 2.3 1.8 1.9 1.9 Renault 2.2 2.9 3.1 3.9
Others 10.1 12.0 12.7 8.2 Others 5.8 9.1 9.7 3.5 Others 10.1 14.6 15.7 8.0
UP + Uttaranchal Tamil Nadu Kerala
Maruti 47.2 48.1 46.9 50.8 Maruti 41.9 42.9 44.9 51.8 Maruti 53.5 53.3 49.5 52.4
Hyundai 18.5 19.2 19.0 16.8 Hyundai 16.9 16.6 18.2 18.6 Hyundai 12.6 10.1 11.1 13.1
M&M 10.9 8.7 9.4 11.8 M&M 5.5 4.5 5.2 6.1 M&M 2.9 1.6 1.9 3.4
Tata Motors 5.2 7.7 8.1 6.5 Tata Motors 3.4 6.2 7.2 4.1 Tata Motors 7.5 16.0 17.2 6.9
Honda 4.2 3.1 2.7 4.3 Honda 6.0 5.2 5.0 6.9 Honda 5.5 4.1 3.7 6.0
Toyota 3.5 1.6 1.7 3.3 Toyota 8.3 5.2 5.6 8.2 Toyota 6.9 3.2 3.6 7.0
Renault 3.1 3.5 3.8 1.7 Renault 5.3 6.5 7.4 3.4 Renault 2.8 2.7 3.0 2.8
Others 7.3 8.1 8.5 4.9 Others 12.6 12.9 6.5 0.7 Others 8.4 8.9 10.1 8.5

India Automobiles & Components
76 KOTAK INSTITUTIONAL EQUITIES RESEARCH
Exhibit 3: Volume remained flattish yoy in 2QFY21 led by weakness in Northern and Western regions Two-wheeler volumes yoy growth, March fiscal year-ends, 2019-21 (units, %)
Source: SIAM, Kotak Institutional Equities
Exhibit 4: Scooter mix deteriorated by 550 bps yoy in 2QFY21 due to slowdown in urban centers Scooter mix in key states and regions, March fiscal year-ends, 2018-21 (%)
Source: SIAM, Kotak Institutional Equities
2QFY20 2QFY21 1HFY21 1HFY20 1HFY21 1HFY20 2QFY20 3QFY20 4QFY20 1QFY21 2QFY21 1HFY21 1HFY20
Key states
UP + Uttaranchal 562,304 613,087 838,965 1,478,539 14.0 15.3 (26.2) (8.4) (29.6) (75.3) 9.0 (43.3) (14.5)
Maharashtra 422,756 390,061 436,376 787,259 7.3 8.1 (25.9) (13.4) (10.1) (87.3) (7.7) (44.6) (22.6)
AP + Telengana 416,030 500,123 657,570 865,877 11.0 8.9 (26.9) (9.9) (18.9) (65.0) 20.2 (24.1) (18.0)
Tamil Nadu 390,750 404,303 506,604 785,075 8.4 8.1 (23.4) (21.1) (28.2) (74.1) 3.5 (35.5) (19.3)
Gujarat 319,277 223,786 266,382 565,222 4.4 5.8 (23.4) (2.7) (13.0) (82.7) (29.9) (52.9) (26.9)
Madhya Pradesh 303,320 335,142 427,857 631,489 7.1 6.5 (15.8) (23.1) (25.5) (71.7) 10.5 (32.2) (9.2)
Karnataka 284,072 272,881 366,963 589,691 6.1 6.1 (25.9) (14.4) (21.3) (69.2) (3.9) (37.8) (17.4)
Rajasthan 298,568 247,855 313,442 563,839 5.2 5.8 (15.5) (10.2) (26.4) (75.3) (17.0) (44.4) (11.0)
Bihar 216,266 251,087 341,662 560,270 5.7 5.8 (11.6) (11.8) (24.8) (73.7) 16.1 (39.0) (0.4)
West Bengal 266,725 339,740 425,907 520,673 7.1 5.4 33.8 (27.5) (12.1) (66.1) 27.4 (18.2) (0.7)
Kerala 167,315 144,136 190,992 331,649 3.2 3.4 (20.4) (28.7) (33.4) (71.5) (13.9) (42.4) (19.9)
Punjab 174,356 126,532 157,849 295,467 2.6 3.0 (22.8) (13.4) (34.5) (74.1) (27.4) (46.6) (26.2)
Regional performance
North 1,038,966 1,015,784 1,354,299 2,347,397 22.6 24.2 (24.3) (10.6) (31.3) (74.1) (2.2) (42.3) (17.4)
East 870,397 1,014,850 1,309,387 1,906,149 21.8 19.7 (7.8) (20.5) (23.0) (71.6) 16.6 (31.3) (9.0)
West 1,502,288 1,327,205 1,602,293 2,842,168 26.7 29.3 (19.6) (12.7) (20.2) (79.5) (11.7) (43.6) (16.9)
South 1,268,530 1,329,497 1,732,309 2,591,952 28.9 26.8 (24.6) (16.8) (24.2) (69.6) 4.8 (33.2) (18.3)
Overall India 4,680,181 4,687,336 5,998,288 9,687,666 100.0 100.0 (20.2) (14.7) (24.6) (73.8) 0.2 (38.1) (16.0)
Volumes (units) Volume mix (%) Yoy growth (%)
1QFY18 2QFY18 3QFY18 4QFY18 1QFY19 2QFY19 3QFY19 4QFY19 1QFY20 2QFY20 3QFY20 4QFY20 1QFY21 2QFY21 1HFY21 1HFY20
Key states
UP + Uttaranchal 16.8 22.2 20.2 16.2 15.3 20.0 20.2 12.2 12.4 23.2 16.2 13.0 10.1 15.4 14.0 16.5
Maharashtra 45.1 43.4 41.6 40.4 44.6 42.9 42.9 43.7 46.7 43.7 44.4 41.3 26.3 34.0 33.2 45.1
AP + Telengana 34.7 34.2 33.2 32.6 35.9 32.3 32.7 31.0 35.9 34.1 40.6 34.9 33.5 31.9 32.2 35.0
Tamil Nadu 44.4 41.5 43.0 44.8 44.5 44.9 46.7 45.8 45.3 47.5 49.9 45.0 45.0 45.4 45.3 46.4
Gujarat 47.1 43.7 40.7 39.4 45.7 41.4 38.1 37.2 42.7 40.4 37.7 41.4 28.5 33.8 32.9 41.4
Madhya Pradesh 22.1 23.8 23.4 18.7 18.9 21.1 17.7 15.8 15.2 19.9 19.9 18.8 9.3 13.6 12.6 17.5
Karnataka 45.5 43.9 45.0 42.9 46.3 43.5 48.5 46.7 49.8 50.6 49.6 45.8 39.6 39.9 39.8 50.2
Rajasthan 23.0 23.0 21.6 23.3 22.9 21.8 18.3 17.0 19.3 19.4 18.1 16.6 11.0 16.0 14.9 19.4
Bihar 7.7 9.7 10.4 7.8 6.7 9.8 10.3 5.8 5.8 8.6 7.9 6.7 10.5 8.1 8.8 6.9
West Bengal 28.1 25.1 25.6 29.7 26.1 20.8 25.7 25.4 26.7 26.0 28.0 29.3 30.4 26.2 27.1 26.3
Kerala 66.6 63.4 64.1 63.4 64.4 63.9 64.4 63.7 65.2 63.0 64.0 64.1 64.3 66.2 65.7 64.1
Punjab 50.5 42.9 43.1 43.0 48.4 39.3 33.6 36.7 48.3 41.1 34.6 46.2 39.1 38.9 39.0 44.1
Regional performance
North 27.0 30.6 27.9 24.2 24.4 27.8 25.7 19.3 21.3 30.8 22.8 21.1 18.3 23.7 22.4 25.5
East 23.0 25.1 24.8 23.5 22.5 22.8 25.3 20.2 21.5 25.7 24.3 22.3 25.5 23.1 23.7 23.4
West 36.0 34.9 33.6 32.5 34.1 33.0 30.2 29.4 30.6 31.8 31.5 32.1 16.7 24.2 22.9 31.2
South 44.6 42.8 43.3 42.9 44.8 42.7 44.8 43.4 45.6 45.9 48.1 43.8 41.5 41.4 41.5 45.7
Overall India 33.5 34.4 33.0 32.0 32.1 32.9 31.7 29.6 30.2 34.2 31.9 31.5 26.7 28.8 28.3 32.2
Scooter mix (%)

Automobiles & Components India
KOTAK INSTITUTIONAL EQUITIES RESEARCH 77
Exhibit 5: HMCL gained 290 bps market share yoy in 2QFY21; Bajaj Auto also gained 60 bps share yoy in 2QFY21 Market share of two-wheeler OEMs in Indian and key states, March fiscal year-ends, 2019-21 (%)
Source: SIAM, Kotak Institutional Equities
2QFY20 2QFY21 1HFY21 1HFY20 2QFY20 2QFY21 1HFY21 1HFY20 2QFY20 2QFY21 1HFY21 1HFY20
Overall Maharashtra Gujarat
Hero 34.9 37.8 38.5 35.5 Hero 24.4 30.1 29.9 21.6 Hero 35.6 35.9 36.0 32.2
Honda 28.6 26.4 24.9 27.7 Honda 38.5 37.8 37.0 39.8 Honda 39.3 37.8 37.2 40.9
TVS 14.3 13.9 13.9 14.3 TVS 14.3 11.0 11.2 14.5 TVS 6.8 6.8 6.9 7.5
Bajaj 11.1 11.7 12.3 11.7 Bajaj 8.2 9.1 9.7 8.8 Bajaj 8.3 8.1 8.4 8.6
Royal Enfield 3.3 3.0 3.2 3.4 Royal Enfield 2.7 2.5 2.8 2.9 Royal Enfield 1.9 2.5 2.8 2.0
Yamaha 3.3 3.7 3.9 3.3 Yamaha 2.4 2.9 3.1 2.5 Yamaha 1.6 2.9 3.0 1.8
UP + Uttaranchal AP + Telengana West Bengal
Hero 49.9 55.6 56.9 53.6 Hero 28.3 27.0 27.9 26.5 Hero 34.7 35.0 35.9 33.0
Honda 20.7 14.5 12.6 16.2 Honda 34.2 33.9 32.8 34.6 Honda 24.9 25.0 23.5 24.6
TVS 15.7 13.7 13.4 13.9 TVS 13.1 13.7 13.6 13.4 TVS 17.1 16.0 15.9 18.4
Bajaj 8.8 11.8 12.5 11.5 Bajaj 13.1 14.0 14.7 14.0 Bajaj 10.4 11.3 11.5 10.3
Royal Enfield 3.0 2.7 3.0 3.3 Royal Enfield 2.7 2.8 2.9 2.7 Royal Enfield 2.8 2.2 2.3 2.7
Yamaha 0.9 1.0 1.0 0.7 Yamaha 3.1 3.3 3.3 3.2 Yamaha 7.4 8.3 8.8 8.3
Tamil Nadu Karnataka Rajasthan
Hero 19.3 21.6 21.4 18.2 Hero 18.2 25.8 26.0 17.6 Hero 54.5 57.6 59.4 53.8
Honda 28.0 26.3 24.8 28.9 Honda 34.3 33.7 32.5 35.5 Honda 20.0 17.5 16.2 20.1
TVS 21.1 24.0 24.4 21.4 TVS 20.1 16.7 16.9 19.2 TVS 10.9 9.9 9.7 10.8
Bajaj 14.0 11.0 11.6 14.1 Bajaj 11.1 10.0 10.8 11.6 Bajaj 10.9 11.6 11.3 11.7
Royal Enfield 3.4 3.5 3.8 3.4 Royal Enfield 3.3 3.3 3.5 3.4 Royal Enfield 1.7 1.8 1.8 1.9
Yamaha 8.8 9.2 9.8 8.9 Yamaha 3.4 3.0 3.4 3.5 Yamaha 0.7 0.8 0.9 0.7

India Automobiles & Components
78 KOTAK INSTITUTIONAL EQUITIES RESEARCH
Exhibit 6: Royal Enfield volumes have declined by 8% yoy in 2QFY21 partly due to supply chain constraints
Volumes and market share of Royal Enfield across major states, March fiscal year-ends, 2019-21 (units, %)
Source: SIAM, Kotak Institutional Equities
1QFY19 2QFY19 3QFY19 4QFY19 1QFY20 2QFY20 3QFY20 4QFY20 1QFY21 2QFY21 1HFY21 1HFY20
Volumes (units)
Kerala 23,855 21,735 17,957 18,042 17,416 17,601 16,315 13,763 5,858 13,223 19,081 35,017
Tamil Nadu 21,131 21,249 10,013 17,762 13,501 13,157 8,638 15,461 4,990 14,202 19,192 26,658
Uttar Pradesh 26,000 20,054 21,354 28,790 29,039 14,328 22,888 20,585 7,358 14,316 21,674 43,367
Maharashtra 15,318 14,931 16,733 12,853 11,523 11,324 15,033 13,474 2,405 9,941 12,346 22,847
Delhi 15,040 13,352 13,837 7,756 6,678 8,437 12,768 9,581 2,955 6,831 9,786 15,115
Karnataka 12,786 12,562 10,257 10,140 10,491 9,359 7,994 8,303 3,728 9,044 12,772 19,850
Punjab 10,987 11,493 12,652 12,747 8,700 9,025 12,975 8,754 3,274 7,642 10,916 17,725
Bihar 9,736 9,321 8,842 8,765 9,437 6,244 8,381 6,239 2,617 5,249 7,866 15,681
Telangana 8,709 8,441 7,368 7,127 6,309 6,023 5,878 5,925 2,510 5,967 8,477 12,332
Gujarat 9,053 7,251 7,239 5,298 5,093 6,019 7,409 5,092 1,928 5,491 7,419 11,112
West Bengal 7,928 6,937 8,252 6,841 6,638 7,386 8,006 6,718 2,092 7,628 9,720 14,024
Andhra Pradesh 7,391 7,682 5,727 6,097 5,978 5,022 4,852 6,722 2,436 7,896 10,332 11,000
Rajasthan 6,595 6,400 7,769 6,154 5,303 5,223 6,309 4,410 1,243 4,471 5,714 10,526
Madhya Pradesh 6,379 6,129 7,361 6,838 6,122 5,223 6,586 5,482 1,688 5,117 6,805 11,345
Haryana 6,320 6,432 5,945 8,657 6,804 7,065 5,252 3,698 1,827 3,443 5,270 13,869
Orissa 6,250 5,514 6,099 5,780 5,534 4,432 5,488 5,063 1,653 4,122 5,775 9,966
Others 25,596 25,476 23,515 19,721 19,139 16,617 19,363 14,887 5,597 16,113 21,710 35,756
Total 219,074 204,959 190,920 189,368 173,705 152,485 174,135 154,157 54,159 140,696 194,855 326,190
Yoy (%)
Kerala 24.8 (10.4) (23.7) (24.5) (27.0) (19.0) (9.1) (23.7) (66.4) (24.9) (45.5) (23.2)
Tamil Nadu 11.0 1.0 (37.4) (22.7) (36.1) (38.1) (13.7) (13.0) (63.0) 7.9 (28.0) (37.1)
Uttar Pradesh 64.1 9.0 7.9 26.1 11.7 (28.6) 7.2 (28.5) (74.7) (0.1) (50.0) (5.8)
Maharashtra (14.7) (11.3) (14.6) (36.7) (24.8) (24.2) (10.2) 4.8 (79.1) (12.2) (46.0) (24.5)
Delhi 18.4 3.6 2.8 (50.6) (55.6) (36.8) (7.7) 23.5 (55.8) (19.0) (35.3) (46.8)
Karnataka (11.5) (7.8) (9.3) (22.3) (17.9) (25.5) (22.1) (18.1) (64.5) (3.4) (35.7) (21.7)
Punjab 5.4 5.9 14.6 (5.7) (20.8) (21.5) 2.6 (31.3) (62.4) (15.3) (38.4) (21.2)
Bihar 74.0 46.3 13.4 10.1 (3.1) (33.0) (5.2) (28.8) (72.3) (15.9) (49.8) (17.7)
Telangana 30.2 10.7 1.8 (11.6) (27.6) (28.6) (20.2) (16.9) (60.2) (0.9) (31.3) (28.1)
Gujarat 6.1 (23.5) (24.6) (43.8) (43.7) (17.0) 2.3 (3.9) (62.1) (8.8) (33.2) (31.8)
West Bengal 36.9 0.5 13.5 (4.3) (16.3) 6.5 (3.0) (1.8) (68.5) 3.3 (30.7) (5.7)
Andhra Pradesh 25.0 14.4 (11.4) (18.5) (19.1) (34.6) (15.3) 10.3 (59.3) 57.2 (6.1) (27.0)
Rajasthan 40.0 6.4 16.0 (6.7) (19.6) (18.4) (18.8) (28.3) (76.6) (14.4) (45.7) (19.0)
Madhya Pradesh 50.7 21.5 26.7 7.8 (4.0) (14.8) (10.5) (19.8) (72.4) (2.0) (40.0) (9.3)
Haryana 23.6 23.6 0.4 19.7 7.7 9.8 (11.7) (57.3) (73.1) (51.3) (62.0) 8.8
Orissa 69.4 35.2 14.6 0.6 (11.5) (19.6) (10.0) (12.4) (70.1) (7.0) (42.1) (15.3)
Others 34.8 8.5 (1.4) (14.0) (25.2) (34.8) (17.7) (24.5) (70.8) (3.0) (39.3) (30.0)
Total 22.5 3.1 (4.9) (14.4) (20.7) (25.6) (8.8) (18.6) (68.8) (7.7) (40.3) (23.1)

Automobiles & Components India
KOTAK INSTITUTIONAL EQUITIES RESEARCH 79
Exhibit 7: M&HCVs volume declined by 48% yoy in 2QFY21 led by >40% decline in most of the key states M&HCV volumes and growth in key states and regions, March fiscal year-ends, 2019-21 (units, %)
Source: SIAM, Kotak Institutional Equities
Exhibit 8: Ashok Leyland lost 240 bps market share yoy in 2QFY21; VECV gained 310 bps market share yoy in 2QFY21 Market share of MHCV OEMs in India and key states, March fiscal year-ends, 2019-21 (%)
Source: SIAM, Kotak Institutional Equities
2QFY20 2QFY21 1HFY21 1HFY20 1HFY21 1HFY20 2QFY20 3QFY20 4QFY20 1QFY21 2QFY21 1HFY21 1HFY20
Key states
Maharashtra 6,941 2,610 2,933 15,525 10.1 12.7 (49.2) (18.4) (47.2) (96.2) (62.4) (81.1) (31.9)
Uttar Pradesh 3,516 1,668 1,994 8,714 6.9 7.2 (60.6) (50.0) (66.7) (93.7) (52.6) (77.1) (49.7)
Gujarat 5,009 1,736 1,970 11,084 6.8 9.1 (39.3) (17.0) (49.0) (96.1) (65.3) (82.2) (26.1)
Tamil Nadu 3,848 2,423 2,670 11,825 9.2 9.7 (48.2) (33.2) (60.2) (96.9) (37.0) (77.4) (21.5)
Rajasthan 2,830 1,288 1,582 6,999 5.4 5.7 (64.8) (45.0) (53.0) (92.9) (54.5) (77.4) (51.5)
Haryana 3,773 2,194 2,437 9,609 8.4 7.9 (43.0) (22.6) (66.7) (95.8) (41.8) (74.6) (32.7)
West Bengal 2,585 1,288 1,474 7,338 5.1 6.0 (57.2) (43.3) (65.6) (96.1) (50.2) (79.9) (39.1)
Andhra Pradesh 1,296 572 685 4,959 2.4 4.1 (77.4) (79.3) (79.4) (96.9) (55.9) (86.2) (52.0)
Orissa 2,848 1,401 1,657 6,212 5.7 5.1 (35.3) (44.5) (43.3) (92.4) (50.8) (73.3) (22.5)
Madhya Pradesh 1,230 690 805 3,495 2.8 2.9 (64.0) (46.6) (76.2) (94.9) (43.9) (77.0) (39.0)
Karnataka 2,324 1,249 1,560 7,046 5.4 5.8 (58.2) (19.9) (47.6) (93.4) (46.3) (77.9) (29.1)
Delhi 1,395 1,862 2,232 3,427 7.7 2.8 (50.4) (16.2) (56.9) (81.8) 33.5 (34.9) (29.7)
Regional performance
North 11,476 7,450 8,784 29,121 30.3 23.9 (49.7) (33.5) (59.6) (92.4) (35.1) (69.8) (37.2)
East 8,794 4,772 5,841 22,542 20.1 18.5 (52.5) (48.7) (57.4) (92.2) (45.7) (74.1) (36.4)
West 17,736 6,916 7,975 41,163 27.5 33.8 (52.7) (31.5) (53.3) (95.5) (61.0) (80.6) (37.6)
South 9,684 5,574 6,433 29,026 22.2 23.8 (56.6) (38.4) (59.6) (95.6) (42.4) (77.8) (31.0)
Overall India 47,690 24,712 29,033 121,852 100.0 100.0 (52.9) (36.8) (57.1) (94.2) (48.2) (76.2) (35.8)
Volumes (units) Volume mix (%) Yoy growth (%)
2QFY20 2QFY21 1HFY21 1HFY20 2QFY20 2QFY21 1HFY21 1HFY20 2QFY20 2QFY21 1HFY21 1HFY20
Overall Rajasthan West Bengal
Tata Motors 50.0 50.4 51.8 49.5 Tata Motors 61.6 60.1 61.7 61.2 Tata Motors 66.4 55.6 56.8 66.2
Ashok Leyland 30.7 28.3 26.5 32.8 Ashok Leyland 30.2 27.3 25.2 29.8 Ashok Leyland 24.4 31.4 29.5 24.8
Eicher 14.3 17.4 17.7 12.2 Eicher 6.5 10.4 10.2 5.9 Eicher 6.4 10.9 11.7 5.6
Mahindra 3.3 2.0 2.1 3.2 Mahindra 0.7 1.7 2.4 1.9 Mahindra 2.3 1.3 1.2 2.8
SML Isuzu 1.6 1.8 1.9 2.1 SML Isuzu 0.9 0.5 0.5 1.1 SML Isuzu 0.4 0.8 0.7 0.7
Maharashtra Haryana Andhra Pradesh
Tata Motors 42.9 48.9 49.1 42.6 Tata Motors 51.7 53.7 54.8 52.4 Tata Motors 21.6 28.1 29.9 24.6
Ashok Leyland 33.1 28.9 28.2 36.7 Ashok Leyland 27.0 14.3 13.4 26.8 Ashok Leyland 48.7 36.0 33.9 53.2
Eicher 18.7 18.7 19.1 16.6 Eicher 16.7 27.3 27.0 15.8 Eicher 20.8 27.6 28.3 12.9
Mahindra 4.6 2.9 2.7 3.5 Mahindra 3.3 2.9 3.2 3.3 Mahindra 6.5 7.2 6.7 6.4
SML Isuzu 0.7 0.7 1.0 0.6 SML Isuzu 1.4 1.8 1.6 1.7 SML Isuzu 2.4 1.0 1.2 2.9
Tamil Nadu Gujarat Uttar Pradesh
Tata Motors 25.1 25.3 25.7 23.4 Tata Motors 51.0 54.5 53.7 49.3 Tata Motors 58.9 55.9 58.2 61.6
Ashok Leyland 56.1 51.9 49.7 59.7 Ashok Leyland 30.8 26.0 25.0 31.5 Ashok Leyland 18.0 14.7 13.8 18.3
Eicher 14.3 18.6 20.5 11.8 Eicher 12.9 17.5 18.9 13.6 Eicher 18.8 26.8 25.2 15.3
Mahindra 2.1 0.9 1.0 2.3 Mahindra 4.6 1.5 1.8 4.7 Mahindra 1.8 1.6 1.7 1.7
SML Isuzu 2.4 3.3 3.1 2.8 SML Isuzu 0.7 0.6 0.7 0.9 SML Isuzu 2.5 1.0 1.1 3.1

India Automobiles & Components
80 KOTAK INSTITUTIONAL EQUITIES RESEARCH
Exhibit 9: LCVs volume declined by 9% yoy in 2QFY21 led by 13-23% yoy decline in North and West India LCV volumes and growth in key states and regions, March fiscal year-ends, 2019-21 (units, %)
Source: SIAM, Kotak Institutional Equities
Exhibit 10: M&M gained 380 bps market share yoy in 2QFY21; Tata Motors has lost 80 bps market share yoy in 2QFY21 Market share of LCV OEMs in India and key states, March fiscal year-ends, 2019-21 (%)
Source: SIAM, Kotak Institutional Equities
2QFY20 2QFY21 1HFY21 1HFY20 1HFY21 1HFY20 2QFY20 3QFY20 4QFY20 1QFY21 2QFY21 1HFY21 1HFY20
Key states
Maharashtra 15,565 12,685 14,954 30,381 11.0 12.0 (22.3) 5.8 (35.2) (84.7) (18.5) (50.8) (11.6)
Uttar Pradesh 12,134 10,236 13,158 26,826 9.7 10.6 (17.1) (12.2) (46.0) (80.1) (15.6) (51.0) (7.6)
Tamil Nadu 9,782 10,425 12,981 22,273 9.6 8.8 (32.6) (19.2) (52.7) (79.5) 6.6 (41.7) (18.1)
Gujarat 8,778 6,109 7,604 18,059 5.6 7.1 (25.3) (10.1) (38.0) (83.9) (30.4) (57.9) (17.0)
Karnataka 7,865 7,874 10,080 17,314 7.4 6.9 (34.0) (5.2) (41.2) (76.7) 0.1 (41.8) (23.2)
Andhra Pradesh 5,347 5,124 6,578 12,910 4.8 5.1 (35.4) (30.4) (50.4) (80.8) (4.2) (49.0) (21.9)
West Bengal 5,831 6,523 7,995 12,315 5.9 4.9 (22.5) (3.9) (44.3) (77.3) 11.9 (35.1) (14.0)
Rajasthan 6,025 4,884 6,450 13,358 4.8 5.3 (7.7) 9.1 (30.4) (78.6) (18.9) (51.7) 3.6
Assam 5,468 5,289 6,550 11,648 4.8 4.6 (13.5) 0.6 (49.5) (79.6) (3.3) (43.8) (12.3)
Kerala 5,288 4,548 5,740 10,362 4.2 4.1 (7.3) (28.6) (62.1) (76.5) (14.0) (44.6) (14.5)
Madhya Pradesh 5,677 4,462 5,582 11,158 4.1 4.4 (8.1) (4.4) (51.2) (79.6) (21.4) (50.0) 5.2
Haryana 4,424 4,280 5,417 9,955 4.0 3.9 (20.1) (14.3) (48.5) (79.4) (3.3) (45.6) (9.8)
Regional performance
North 27,169 23,699 29,702 59,978 21.9 23.7 (19.0) (12.1) (46.3) (81.7) (12.8) (50.5) (9.0)
East 20,193 22,476 28,155 42,844 20.7 17.0 (20.6) 3.5 (36.2) (74.9) 11.3 (34.3) (13.2)
West 39,316 30,324 37,533 79,792 27.7 31.6 (19.3) (0.0) (38.1) (82.2) (22.9) (53.0) (8.9)
South 32,251 31,991 40,333 70,060 29.7 27.7 (31.9) (14.9) (48.5) (77.9) (0.8) (42.4) (20.4)
Overall India 118,929 108,490 135,723 252,674 100.0 100.0 (23.3) (6.3) (42.8) (79.6) (8.8) (46.3) (13.1)
Volumes (units) Yoy growth (%)Volume mix (%)
2QFY20 2QFY21 1HFY21 1HFY20 2QFY20 2QFY21 1HFY21 1HFY20 2QFY20 2QFY21 1HFY21 1HFY20
Overall Tamil Nadu Gujarat
M&M 42.2 46.0 48.7 40.4 M&M 28.4 24.0 27.1 25.0 M&M 46.9 57.6 60.4 45.5
Tata Motors 39.0 38.2 35.7 40.6 Tata Motors 38.5 40.6 38.4 42.1 Tata Motors 38.0 29.4 27.1 40.5
Ashok Leyland 10.2 10.8 10.7 10.1 Ashok Leyland 23.8 25.3 25.3 22.3 Ashok Leyland 6.3 8.1 7.5 6.2
Eicher 2.7 2.5 2.5 3.0 Eicher 4.2 3.6 3.5 4.5 Eicher 2.1 2.9 2.9 2.9
Force Motors 4.2 2.2 2.2 4.0 Force Motors 3.2 6.1 5.2 3.5 Force Motors 2.8 1.8 1.9 2.6
Maharashtra Karnataka Rajasthan
M&M 44.1 43.6 44.6 42.8 M&M 33.4 38.5 39.6 31.5 M&M 58.2 60.4 64.1 55.4
Tata Motors 37.2 39.2 38.4 36.9 Tata Motors 37.1 35.8 33.9 37.7 Tata Motors 30.9 34.4 30.9 32.8
Ashok Leyland 9.6 12.5 12.1 10.2 Ashok Leyland 20.6 20.7 21.3 20.5 Ashok Leyland 2.1 2.2 2.2 2.6
Eicher 3.8 2.7 2.5 3.7 Eicher 3.2 1.7 2.0 3.6 Eicher 1.7 1.0 1.0 1.8
Force Motors 4.3 1.9 2.1 5.1 Force Motors 3.7 3.0 2.8 3.7 Force Motors 6.2 1.7 1.6 5.6
Uttar Pradesh Andhra Pradesh West Bengal
M&M 36.2 47.1 50.6 36.3 M&M 62.1 66.6 67.9 51.7 M&M 42.3 43.7 47.1 38.5
Tata Motors 50.6 44.9 41.2 50.1 Tata Motors 17.2 15.9 15.3 17.4 Tata Motors 51.8 50.3 47.1 55.9
Ashok Leyland 5.7 5.5 5.7 5.6 Ashok Leyland 14.2 13.0 12.8 24.0 Ashok Leyland 2.7 4.0 3.9 2.4
Eicher 2.5 1.7 1.7 2.8 Eicher 1.7 2.1 1.9 1.8 Eicher 0.6 1.2 1.2 0.9
Force Motors 4.2 0.5 0.6 3.7 Force Motors 2.9 2.4 2.0 2.5 Force Motors 2.0 0.7 0.6 2.0
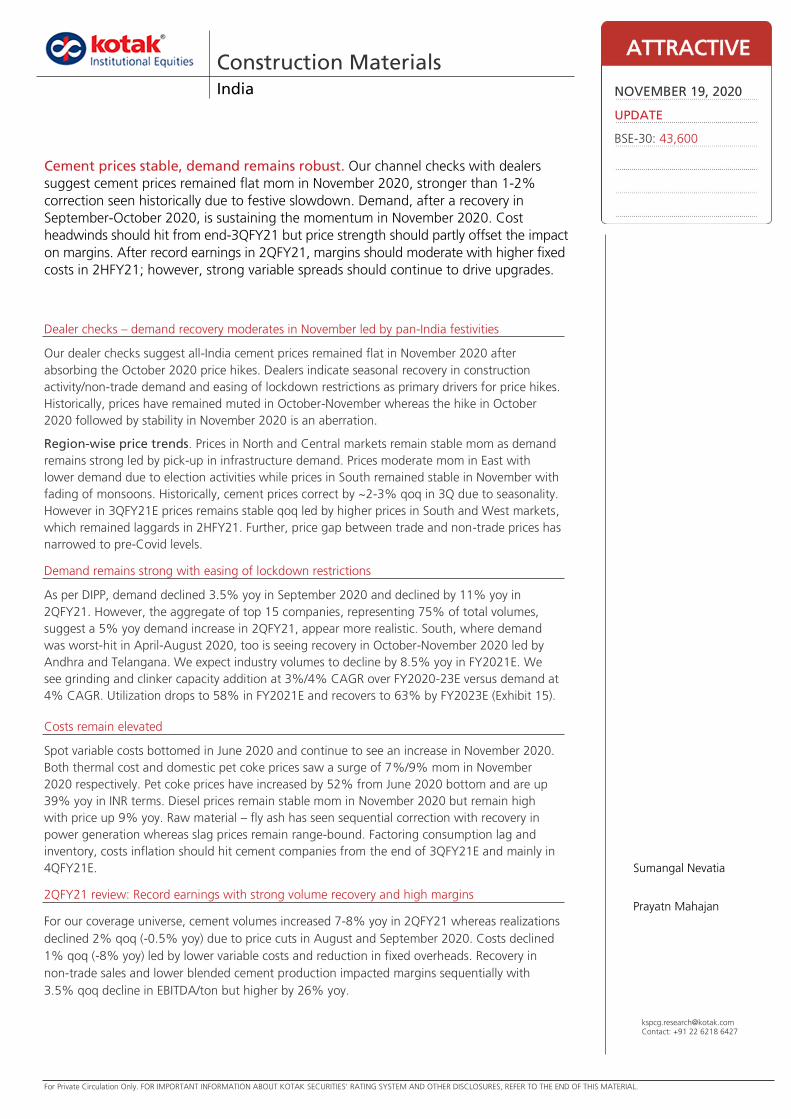
For Private Circulation Only. FOR IMPORTANT INFORMATION ABOUT KOTAK SECURITIES’ RATING SYSTEM AND OTHER DISCLOSURES, REFER TO THE END OF THIS MATERIAL.
Dealer checks – demand recovery moderates in November led by pan-India festivities
Our dealer checks suggest all-India cement prices remained flat in November 2020 after
absorbing the October 2020 price hikes. Dealers indicate seasonal recovery in construction
activity/non-trade demand and easing of lockdown restrictions as primary drivers for price hikes.
Historically, prices have remained muted in October-November whereas the hike in October
2020 followed by stability in November 2020 is an aberration.
Region-wise price trends. Prices in North and Central markets remain stable mom as demand
remains strong led by pick-up in infrastructure demand. Prices moderate mom in East with
lower demand due to election activities while prices in South remained stable in November with
fading of monsoons. Historically, cement prices correct by ~2-3% qoq in 3Q due to seasonality.
However in 3QFY21E prices remains stable qoq led by higher prices in South and West markets,
which remained laggards in 2HFY21. Further, price gap between trade and non-trade prices has
narrowed to pre-Covid levels.
Demand remains strong with easing of lockdown restrictions
As per DIPP, demand declined 3.5% yoy in September 2020 and declined by 11% yoy in
2QFY21. However, the aggregate of top 15 companies, representing 75% of total volumes,
suggest a 5% yoy demand increase in 2QFY21, appear more realistic. South, where demand
was worst-hit in April-August 2020, too is seeing recovery in October-November 2020 led by
Andhra and Telangana. We expect industry volumes to decline by 8.5% yoy in FY2021E. We
see grinding and clinker capacity addition at 3%/4% CAGR over FY2020-23E versus demand at
4% CAGR. Utilization drops to 58% in FY2021E and recovers to 63% by FY2023E (Exhibit 15).
Costs remain elevated
Spot variable costs bottomed in June 2020 and continue to see an increase in November 2020.
Both thermal cost and domestic pet coke prices saw a surge of 7%/9% mom in November
2020 respectively. Pet coke prices have increased by 52% from June 2020 bottom and are up
39% yoy in INR terms. Diesel prices remain stable mom in November 2020 but remain high
with price up 9% yoy. Raw material – fly ash has seen sequential correction with recovery in
power generation whereas slag prices remain range-bound. Factoring consumption lag and
inventory, costs inflation should hit cement companies from the end of 3QFY21E and mainly in
4QFY21E.
2QFY21 review: Record earnings with strong volume recovery and high margins
For our coverage universe, cement volumes increased 7-8% yoy in 2QFY21 whereas realizations
declined 2% qoq (-0.5% yoy) due to price cuts in August and September 2020. Costs declined
1% qoq (-8% yoy) led by lower variable costs and reduction in fixed overheads. Recovery in
non-trade sales and lower blended cement production impacted margins sequentially with
3.5% qoq decline in EBITDA/ton but higher by 26% yoy.
Construction Materials India
Cement prices stable, demand remains robust. Our channel checks with dealers
suggest cement prices remained flat mom in November 2020, stronger than 1-2%
correction seen historically due to festive slowdown. Demand, after a recovery in
September-October 2020, is sustaining the momentum in November 2020. Cost
headwinds should hit from end-3QFY21 but price strength should partly offset the impact
on margins. After record earnings in 2QFY21, margins should moderate with higher fixed
costs in 2HFY21; however, strong variable spreads should continue to drive upgrades.
ATTRACTIVE
NOVEMBER 19, 2020
UPDATE
BSE-30: 43,600
Sumangal Nevatia
Prayatn Mahajan
[email protected]: +91 22 6218 6427

India Construction Materials
82 KOTAK INSTITUTIONAL EQUITIES RESEARCH
Exhibit 1: All-India prices remained stable in November 2020 Monthly cement prices across regions in India, November 2019–20 (Rs per 50 kg bag)
Source: Industry, Kotak Institutional Equities estimates
Exhibit 2: The current price trends suggest flat realizations qoq in 3QFY21E Quarterly trend in cement prices in India across geographies, 3QFY19 - 3QFY21E (Rs per 50 kg bag)
Source: Industry, Kotak Institutional Equities estimates
Region-wise cement price trends and dealer feedback
North—prices remain stable. Cement prices in the North moderated by Rs1/bag to
Rs370/bag in November 2020 after a sharp 5% mom increase in October—channel
checks indicate strong demand and tight supply as the primary reasons for such stability
in prices. Pre-Diwali demand remained buoyant while demand pick-up post festive season
is expected to be strong. Dealers cite retail demand for small job works and opening up
of government road projects as the primary source of demand. Dealers now operate with
very high inventory levels and are have started working on credit. Regions like Delhi,
Haryana, Punjab and Rajasthan report of Rs2-3/bag price drop while other regions report
stable prices.
Nov-19 Dec-19 Jan-20 Feb-20 Mar-20 Apr-20 May-20 Jun-20 Jul-20 Aug-20 Sep-20 Oct-20 Nov-20
North 347 343 354 359 358 358 375 369 363 353 352 371 370
Central 345 339 350 355 357 357 369 359 362 354 349 362 361
East 337 331 342 344 341 341 352 345 341 338 333 332 331
West 318 308 318 331 331 331 357 353 352 342 334 333 336
South 299 288 287 309 307 391 401 386 388 383 377 379 378
All India average 325 316 324 335 334 362 376 367 366 359 354 360 360
Change per bag (%, mom)
North 0 (1) 3 2 (0) - 5 (2) (2) (3) (0) 5 (0)
Central (2) (2) 3 1 1 - 3 (3) 1 (2) (2) 4 (0)
East (1) (2) 4 0 (1) - 3 (2) (1) (1) (2) (0) (0)
West (0) (3) 3 4 0 - 8 (1) (0) (3) (2) (0) 1
South 2 (4) (0) 7 (1) 28 2 (4) 0 (1) (2) 0 (0)
All India average 0 (3) 2 3 (0) 8 4 (3) (0) (2) (2) 2 (0)
Change per bag (%, yoy)
North 17 20 19 25 31 31 33 3 2 1 2 7 7
Central 11 15 14 19 24 24 25 (2) (1) (1) (2) 3 5
East (2) (4) (2) 0 1 1 2 (6) (5) (3) (3) (2) (2)
West 2 (1) (1) 6 9 9 13 2 5 4 3 4 6
South (11) (13) (14) (10) (6) 11 11 18 24 29 21 29 26
All India average 1 1 0 5 8 14 16 5 8 9 7 11 11
3QFY19 4QFY19 1QFY20 2QFY20 3QFY20 4QFY20 1QFY21 2QFY21 3QFY21
North 301 306 355 350 345 357 367 356 370
Central 329 333 367 358 345 354 362 355 361
East 330 329 365 351 336 343 346 337 331
West 306 311 347 330 315 327 347 343 335
South 329 346 331 307 293 301 393 383 378
All India average 320 328 349 334 322 331 368 360 360
Change per bag (%, qoq)
North (1) 2 16 (1) (1) 3 3 (3) 4
Central (2) 1 10 (2) (4) 3 2 (2) 2
East (3) (0) 11 (4) (4) 2 1 (3) (2)
West (3) 2 12 (5) (4) 4 6 (1) (2)
South (3) 5 (4) (7) (4) 3 31 (3) (1)
All India average (3) 2 6 (4) (4) 3 11 (2) 0
Change per bag (%, yoy)
North (3) (0) 19 15 15 17 4 2 7
Central 4 4 14 7 5 6 (1) (1) 5
East 0 (2) 8 3 2 4 (5) (4) (1)
West 1 2 9 4 3 5 0 4 6
South (2) (0) (5) (10) (11) (13) 19 25 29
All India average (0) 0 6 1 0 1 5 8 12

Construction Materials India
KOTAK INSTITUTIONAL EQUITIES RESEARCH 83
Central—prices remain stable. Cement prices in the Central region moderate by
Rs1/bag in November 2020 absorbing the 4% price hike of October 2020. Dealer checks
indicate strong volumes in October. However, volumes decline in November in lieu of the
festivities. Dealers continue to be optimistic on pick-up in demand post the festivities with
restart of government projects in certain regions like UP and MP. Inventory levels at dealer
levels remain high. There has also been a sharp uptick in non-trade prices resulting in
narrowing of the gap between trade and non-trade prices to Rs20-25/bag from Rs50-
60/bag earlier.
West—prices increase by Rs3/bag. Cement prices increased by Rs3/bag mom in
November. Most regions indicate a lower off-take in November due to festivities. Demand
recovery post festivities is yet to be seen in the region. Volumes remained strong in
October continuing the trend from September. Sequential demand uptick was mostly
from cities like Surat, Ahmedabad, and Nagpur as markets come out of extended
lockdowns. Bigger cities like Mumbai, Pune, Rajkot and Baroda also begin to show
recovery in volumes post easing of lockdown restrictions. Dealers highlight higher than
normal inter-regional movement of cement to Southern India (due to elevated prices in
South) and from East (due to weak prices in East) which is hampering prices. Dealers are
expecting a sharp hike in prices going from December with restart of real estate projects
in the regions.
South—prices remain stable. Most states continue to show an improvement in volumes
on a mom basis. Resumption of state government projects in areas such as schools, roads
and affordable housing projects are giving support to strong rural demand from tier 1
and tier 2 cities. Dealers expect demand to improve going forward with the easing of
monsoons, improved availability of labor and higher infrastructure spends by the
government. Prices in Andhra Pradesh and Karnataka declined by Rs5-10/bag while prices
increase by Rs10/bag in Tamil Nadu. Dealers in some states have resorted to strikes to
revolt against such sharp increases in price and dealers expect prices to correct as volumes
increase.
East—prices remain stable. Cement prices in East declined by Rs1/bag in November
2020. Eastern markets witnessed strong volume growth in October which did however
continue in November 2020 due to the ongoing festivities. Moreover, increasing spread
of Covid-19 in the region has led to more stringent lockdowns hampering construction
activity. Demand remains weak in Bihar on the back of elections, while demand in
Kolkata and Guwahati continues to remain strong led by government projects. Prices
remain stable in West Bengal, Odisha while decline by Rs3-5/bag in Assam, Bihar and
other North Eastern states. Dealers expect trade prices to increase in the coming weeks
post the harvesting season.

India Construction Materials
84 KOTAK INSTITUTIONAL EQUITIES RESEARCH
Exhibit 3: 2QFY21 witnessed lower margins due to lower prices offset by higher volumes Earnings for cement companies for the quarter ended September 2020
Source: Company, Kotak Institutional Equities estimates
Exhibit 4: Prices moderated in South while in North prices remained resilient ; pan-India realization/ton declined 2% qoq Quarterly realizations for cement companies till quarter ended June 2020
Source: Company, Kotak Institutional Equities estimates
Exhibit 5: Volumes for coverage companies increased ~8% yoy on easing of lockdown restrictions Quarterly volumes for cement companies till quarter ended September 2020
Source: Company, Kotak Institutional Equities estimates
Ultratech Cement ACC Ambuja Cements
Sep-20 Jun-20 Sep-19 % (yoy) % (qoq) Sep-20 Jun-20 Sep-19 % (yoy) % (qoq) Sep-20 Jun-20 Sep-19 % (yoy) % (qoq)
Sales, (mn tons) 19.2 13.9 17.8 8 38 6.5 4.8 6.4 1 35 5.7 4.2 5.2 8 35
Realization (Rs/ton) 5,208 5,270 5,196 0 (1) 5,450 5,418 5,478 (0) 1 5,031 5,195 5,021 0 (3)
Operating costs (Rs/ton) 3,825 3,816 4,127 (7) 0 4,417 4,326 4,614 (4) 2 3,831 3,775 4,180 (8) 1
EBITDA (Rs/ton) 1,383 1,453 1,069 29 (5) 1,033 1,093 864 20 (5) 1,200 1,421 841 43 (16)
Shree Cement JK Lakshmi Cement JK Cement
Sep-20 Jun-20 Sep-19 % (yoy) % (qoq) Sep-20 Jun-20 Sep-19 % (yoy) % (qoq) Sep-20 Jun-20 Sep-19 % (yoy) % (qoq)
Sales, (mn tons) 6.5 4.9 5.7 14 32 2.4 1.9 2.1 16 25 2.8 1.8 2.2 26 59
Realization (Rs/ton) 4,628 4,718 4,896 (5) (2) 4,371 4,319 4,541 (4) 1 5,517 5,463 5,600 (1) 1
Operating costs (Rs/ton) 3,115 3,297 3,421 (9) (6) 3,590 3,569 3,820 (6) 1 4,056 4,244 4,466 (9) (4)
EBITDA (Rs/ton) 1,513 1,421 1,475 3 6 781 750 722 8 4 1,461 1,219 1,134 29 20
Orient Cement Dalmia Cement
Sep-20 Jun-20 Sep-19 % (yoy) % (qoq) Sep-20 Jun-20 Sep-19 % (yoy) % (qoq)
Sales, (mn tons) 1.0 0.8 1.2 (18) 25 4.8 3.7 4.5 7 31
Realization (Rs/ton) 4,677 5,004 4,150 13 (7) 5,021 5,393 5,002 0 (7)
Operating costs (Rs/ton) 3,568 3,807 3,718 (4) (6) 3,558 3,716 3,940 (10) (4)
EBITDA (Rs/ton) 1,109 1,198 432 157 (7) 1,463 1,678 1,063 38 (13)
2QFY19 3QFY19 4QFY19 1QFY20 2QFY20 3QFY20 4QFY20 1QFY21 2QFY21 yoy qoq FY2021 FY2020 %YoY
Pan India players
ACC 5,241 5,215 5,253 5,756 5,478 5,232 5,338 5,418 5,450 (0.5) 0.6 5,386 5,419 (1)
Ambuja 4,787 4,671 4,596 5,117 5,021 4,795 4,909 5,195 5,031 0.2 (3.2) 5,007 4,870 3
Ultratech 4,908 4,810 4,866 5,377 5,196 5,000 5,052 5,270 5,208 0.2 (1.2) 5,392 5,392 -
Pan-India 4,959 4,873 4,896 5,414 5,226 5,013 5,084 5,287 5,226 (0.0) (1.2) 5,324 5,305 0
North based players
Shree Cement 4,268 4,315 4,500 5,013 4,896 4,561 4,659 4,718 4,628 (5.5) (1.9) 4,657 4,776 (3)
JK Cement 5,179 5,098 5,182 5,750 5,600 5,489 5,468 5,463 5,517 (1.5) 1.0 5,502 5,709 (4)
JK Lakshmi Cement 4,003 4,058 3,988 4,472 4,541 4,313 4,331 4,319 4,371 (3.7) 1.2 4,029 4,102 (2)
North 4,409 4,442 4,535 5,054 4,981 4,722 4,772 4,782 4,788 (3.9) 0.1 4,718 4,816 (2)
South based players
Dalmia Cement (ex-OCL) 5,225 4,841 5,024 5,576 5,002 4,741 4,803 5,393 5,021 0.4 (6.9) 5,306 5,039 5
Orient Cement 3,815 3,782 4,107 4,552 4,150 3,817 4,156 5,004 4,677 12.7 (6.5) 4,630 4,171 11
South 4,855 4,574 4,797 5,321 4,817 4,533 4,652 5,322 4,960 3.0 (6.8) 4,942 4,837 2
All-India 4,826 4,748 4,803 5,326 5,120 4,890 4,955 5,171 5,089 (0.6) (1.6) 5,130 5,142 (0)
Growth %
1QFY21E
2QFY19 3QFY19 4QFY19 1QFY20 2QFY20 3QFY20 4QFY20 1QFY21 2QFY21 yoy qoq FY2021 FY2020 %YoY
Pan India players
ACC 6.6 7.5 7.5 7.2 6.4 7.8 6.6 4.8 6.5 0.8 35.2 26.0 28.9 (10.0)
Ambuja 5.5 6.1 6.4 5.8 5.2 6.5 5.8 4.2 5.7 8.4 35.3 22.5 24.0 (6.1)
Ultratech 18.1 20.8 24.6 20.5 17.8 20.0 20.5 13.9 19.2 8.1 37.8 80.1 82.3 (2.7)
Pan-India 30.1 34.4 38.4 33.5 29.4 34.3 32.8 22.9 31 6.6 36.8 129 135 (5)
North based players
Shree Cement 5.6 5.9 7.3 6.1 5.7 6.2 6.9 4.9 6.5 14.1 32.5 24.7 23.9 3.1
JK Cement 2.2 2.5 2.9 2.3 2.2 2.6 2.7 1.8 2.8 25.5 59.1 11.3 9.6 17.9
JK Lakshmi Cement 2.1 2.3 2.9 2.3 2.1 2.3 2.5 1.9 2.4 16.0 25.1 10.6 10.6 -
North 9.9 10.7 13.1 10.7 10.0 11.1 12.0 8.6 12 17.1 36.3 47 44 6
South based players
Dalmia Cement (ex-OCL) 4.1 4.5 5.6 4.6 4.5 5.1 5.2 3.7 4.8 7.4 31.1 25.0 19.2 30.0
Orient Cement 1.5 1.5 1.8 1.5 1.2 1.5 1.6 0.8 1.0 (17.7) 24.5 5.0 5.8 (13.0)
South 5.6 6.0 7.4 6.1 5.7 6.6 6.7 4.5 5.8 1.9 29.9 30 25 20
All-India 45.6 51.1 58.9 50.3 45.2 52.0 51.6 36.0 49 8.3 35.8 205 204 0
Growth %

Construction Materials India
KOTAK INSTITUTIONAL EQUITIES RESEARCH 85
Exhibit 6: Cost/ton declined by 1% qoq in 2QFY21 mainly led by lower other expenses Quarterly costs/ton for cement companies till quarter ended September 2020
Source: Company, Kotak Institutional Equities estimates
Exhibit 7: Margins for cement companies moderated sequentially with the decline in prices barring North-based names Quarterly EBITDA/ton for cement companies till quarter ended September 2020
Source: Company, Kotak Institutional Equities estimates
Exhibit 8: As per DIPP, cement volumes declined 3% yoy in September 2020 and 25% YTD FY2021 Monthly cement production volumes in India, FY2016 - 2021 ('000 tons, %)
Source: DIPP, Kotak Institutional Equities estimates
2QFY19 3QFY19 4QFY19 1QFY20 2QFY20 3QFY20 4QFY20 1QFY21 2QFY21 yoy qoq FY20201 FY2020 %YoY
Pan India players
ACC 4,566 4,563 4,542 4,671 4,614 4,536 4,445 4,326 4,417 (4.3) 2.1 4,402 4,585 (4)
Ambuja 4,131 4,012 3,869 3,917 4,180 3,958 3,862 3,775 3,831 (8.4) 1.5 3,837 3,973 (3)
Ultratech 4,132 4,069 3,851 3,965 4,127 3,980 3,892 3,816 3,825 (7.3) 0.2 4,099 4,244 (3)
Pan-India 4,226 4,166 3,988 4,109 4,243 4,101 3,997 3,915 3,948 (6.9) 0.8 4,114 4,265 4
North based players
Shree Cement 3,311 3,215 3,338 3,524 3,421 3,201 3,097 3,297 3,115 (9.0) (5.5) 3,246 3,302 (2)
JK Cement 4,310 4,255 4,212 4,436 4,466 4,404 4,240 4,244 4,056 (9.2) (4.4) 4,220 4,475 (6)
JK Lakshmi Cement 3,572 3,632 3,542 3,743 3,820 3,661 3,507 3,569 3,590 (6.0) 0.6 3,276 3,352 (2)
North 3,585 3,546 3,576 3,768 3,736 3,574 3,434 3,551 3,437 (8.0) (3.2) 3,489 3,568 2
South based players
Dalmia Cement (ex-OCL) 4,283 3,991 3,937 4,112 3,940 3,845 3,820 3,716 3,558 (9.7) (4.2) 3,966 3,942 1
Orient Cement 3,572 3,531 3,271 3,562 3,718 3,445 3,364 3,807 3,568 (4.0) (6.3) 3,610 3,511 3
South 4,096 3,875 3,772 3,975 3,891 3,755 3,714 3,732 3,560 (8.5) (4.6) 3,597 3,842 7
All-India 4,071 4,002 3,869 4,020 4,086 3,945 3,829 3,806 3,779 (7.5) (0.7) 3,897 4,063 4
Growth %
2QFY19 3QFY19 4QFY19 1QFY20 2QFY20 3QFY20 4QFY20 1QFY21 2QFY21 yoy qoq FY2021 FY2020 %YoY
Pan India players
ACC 676 652 712 1,084 864 697 893 1,093 1,033 19.6 (5.4) 984 834 18
Ambuja 656 659 727 1,200 841 837 1,047 1,421 1,200 42.7 (15.5) 1,170 897 30
Ultratech 776 742 1,014 1,413 1,069 1,020 1,160 1,453 1,383 29.4 (4.8) 1,293 1,148 13
Pan-India 733 707 908 1,305 983 912 1,087 1,372 1,278 29.9 (6.9) 1,209 1,040 16
North based players
Shree Cement 956 1,100 1,161 1,489 1,475 1,360 1,562 1,421 1,513 2.5 6.5 1,410 1,474 (4)
JK Cement 869 843 971 1,314 1,134 1,086 1,228 1,219 1,461 28.8 19.9 1,282 1,235 4
JK Lakshmi Cement 431 427 446 729 722 652 825 750 781 8.3 4.1 753 750 0
North 825 896 959 1,286 1,244 1,149 1,338 1,231 1,351 8.6 9.8 1,229 1,248 (2)
South based players
Dalmia Cement (ex-OCL) 942 850 1,087 1,464 1,063 896 983 1,678 1,463 37.6 (12.8) 1,340 1,097 22
Orient Cement 243 251 837 990 432 372 792 1,198 1,109 156.6 (7.4) 1,020 660 55
South 758 699 1,025 1,346 926 778 938 1,590 1,401 51.3 (11.9) 1,345 996 35
All-India 756 746 934 1,306 1,034 946 1,126 1,365 1,310 26.7 (4.0) 1,234 1,080 14
Growth %
-100
-80
-60
-40
-20
0
20
40
-
5
10
15
20
25
30
35
Sep-1
6
Nov-
16
Jan-1
7
Mar-
17
May-
17
Jul-17
Sep-1
7
Nov-
17
Jan-1
8
Mar-
18
May-
18
Jul-18
Sep-1
8
Nov-
18
Jan-1
9
Mar-
19
May-
19
Jul-19
Sep-1
9
Nov-
19
Jan-2
0
Mar-
20
May-
20
Jul-20
Sep-2
0
Demand (mn tons) (LHS) % yoy (RHS) 3 MA % (RHS)

India Construction Materials
86 KOTAK INSTITUTIONAL EQUITIES RESEARCH
Exhibit 9: Top 15 companies (75% of industry) 2QFY21 volumes saw 5% yoy growth versus 11%
decline as per DIPP % yoy change in cement production volumes in India for top 15 players and as per DIPP, 1QFY12-21
Source: DIPP, Kotak Institutional Equities estimates
Exhibit 10: International pet-coke prices increased 3% in November to US$95/ton US pet coke prices (CFR basis), 2017 - 2020 (US$/ton)
Source: Industry, Kotak Institutional Equities estimates
(50.0)
(40.0)
(30.0)
(20.0)
(10.0)
-
10.0
20.0
30.0
40.0
1Q
FY12
3Q
FY12
1Q
FY13
3Q
FY13
1Q
FY14
3Q
FY14
1Q
FY15
3Q
FY15
1Q
FY16
3Q
FY16
1Q
FY17
3Q
FY17
1Q
FY18
3Q
FY18
1Q
FY19
3Q
FY19
1Q
FY20
3Q
FY20
1Q
FY21
% yoy (15 Co's aggregate) % yoy ( DIPP)
-60%
-50%
-40%
-30%
-20%
-10%
0%
10%
20%
30%
40%
40
50
60
70
80
90
100
110
120
130
Nov-
17
Jan-1
8
Mar-
18
May-
18
Jul-18
Sep-1
8
Nov-
18
Jan-1
9
Mar-
19
May-
19
Jul-19
Sep-1
9
Nov-
19
Jan-2
0
Mar-
20
May-
20
Jul-20
Sep-2
0
Nov-
20
Pet Coke Prices (US$/ton) (LHS) mom % (RHS) 3 MA % (RHS)

Construction Materials India
KOTAK INSTITUTIONAL EQUITIES RESEARCH 87
Exhibit 11: Domestic pet-coke prices increased 9% mom in November 2020 to Rs8,596/ton Domestic pet coke prices, 2017-20 (Rs/ton)
Source: Industry, Kotak Institutional Equities estimates
Exhibit 12: Imported coal costs increased 7% mom in November 2020 Coal prices at Richard Bay (US$/ton, %), FY2016-21
Source: Bloomberg, Kotak Institutional Equities estimates
-40%
-20%
0%
20%
40%
60%
80%
100%
0
2,000
4,000
6,000
8,000
10,000
12,000
Nov-
17
Jan-1
8
Mar-
18
May-
18
Jul-18
Sep-1
8
Nov-
18
Jan-1
9
Mar-
19
May-
19
Jul-19
Sep-1
9
Nov-
19
Jan-2
0
Mar-
20
May-
20
Jul-20
Sep-2
0
Nov-
20
Pet Coke Prices (Rs/ton) (LHS) Mom % (RHS) 3 MA % (RHS)
-40%
-30%
-20%
-10%
0%
10%
20%
30%
40%
50%
60%
40
50
60
70
80
90
100
110
120
Nov-
16
Jan-1
7
Mar-
17
May-
17
Jul-17
Sep-1
7
Nov-
17
Jan-1
8
Mar-
18
May-
18
Jul-18
Sep-1
8
Nov-
18
Jan-1
9
Mar-
19
May-
19
Jul-19
Sep-1
9
Nov-
19
Jan-2
0
Mar-
20
May-
20
Jul-20
Sep-2
0
Nov-
20
Richard Bay (US$/ton) (LHS) Mom % (3mma) (RHS)

India Construction Materials
88 KOTAK INSTITUTIONAL EQUITIES RESEARCH
Exhibit 13: Retail diesel prices in India remained stable mom in November 2020 Average retail price of diesel in major cities in India (Rs/litre)
Source: Company, Kotak Institutional Equities estimates
Exhibit 14: Spot spreads in cement moderated on stable prices and higher costs Spreads (cement prices less energy costs) and EBITDA/ton for Indian cement companies, FY2016-20 (Rs/ton)
Note: (1) EBITDA/ton computation is based on average reported by companies under our coverage till 2QFY21
Source: DIPP, Kotak Institutional Equities estimates
50
55
60
65
70
75
80
85
Nov-
16
Jan-1
7
Mar-
17
May-
17
Jul-17
Sep-1
7
Nov-
17
Jan-1
8
Mar-
18
May-
18
Jul-18
Sep-1
8
Nov-
18
Jan-1
9
Mar-
19
May-
19
Jul-19
Sep-1
9
Nov-
19
Jan-2
0
Mar-
20
May-
20
Jul-20
Sep-2
0
Nov-
20
Diesel Prices (Rs/Litre)
500
600
700
800
900
1,000
1,100
1,200
1,300
1,400
1,500
2,500
3,000
3,500
4,000
4,500
Nov-
16
Jan-1
7
Mar-
17
May-
17
Jul-17
Sep-1
7
Nov-
17
Jan-1
8
Mar-
18
May-
18
Jul-18
Sep-1
8
Nov-
18
Jan-1
9
Mar-
19
May-
19
Jul-19
Sep-1
9
Nov-
19
Jan-2
0
Mar-
20
May-
20
Jul-20
Sep-2
0
Nov-
20
Spreads: Cement price (-) energy costs (-) freight costs EBITDA/ton (Rs) (RHS)

Construction Materials India
KOTAK INSTITUTIONAL EQUITIES RESEARCH 89
Exhibit 15: We expect cement demand to decline by 8% in FY2021E due to demand disruption led by
Covid-19 Cement capacity, demand and supply, FY2017-23E (mn tons,%)
Source: Company, Kotak Institutional Equities estimates
Exhibit 16: We estimate EBITDA/ton for cement companies to increase by 14% in FY2021 due to lower costs and higher prices Realization/ton, costs/ton, EBITDA/ton and volumes (Rs/ton, mn tons), FY2017-FY2023E
Source: Companies, Kotak Institutional Equities estimates
Exhibit 17: Valuation summary for coverage companies
Source: Companies, Kotak Institutional Equities estimates
2014 2015 2016 2017 2018 2019 2020 2021E 2022E 2023E CAGR (20-23)
Cement capacity (mtpa) 374 417 438 458 471 483 505 532 550 563 3.7%
Cement production 256 271 283 280 298 337 334 308 344 371 3.6%
Growth yoy (%) 4 6 5 (1) 6 13 (1) (8) 12 8
Capacity utilization (%) 68 65 65 61 63 70 66 58 63 66 0%
Consumption 251 266 279 275 293 333 330 303 339 367 4%
Growth yoy (%) 2.7 5.7 4.8 (1.2) 6.5 13.4 (0.8) (8.1) 11.9 8.1
Exports 5.1 6.3 6.2 6.3 6.0 6.0 6.1 6.1 6.1 6.1 0%
Imports 0.8 1.1 1.4 1.6 1.6 1.6 1.6 1.6 1.6 1.6 1%
FY2017 FY2018 FY2019 FY2020 FY2021E FY2022E FY2023E FY2019 FY2020 FY2021E FY2022E FY2023E
Realisation (Rs/ton)
ACC 4,780 5,069 5,212 5,419 5,386 5,480 5,607 3 4 (1) 2 2
Ambuja 4,392 4,552 4,697 4,870 5,007 5,144 5,299 3 4 3 3 3
Ultratech 4,853 4,557 4,916 5,392 5,392 5,522 5,687 8 10 - 2 3
Shree Cement 3,897 4,172 4,533 4,776 4,657 4,796 4,940 9 5 (3) 3 3
JK Cement 5,689 4,950 5,173 5,709 5,502 5,707 5,871 4 10 (4) 4 3
JK Lakshmi Cement 3,755 3,963 3,933 4,102 4,029 4,209 4,354 (1) 4 (2) 4 3
Dalmia Cement 4,839 5,059 5,077 5,039 5,306 5,172 5,306 0 (1) 5 (3) 3
Orient Cement 3,377 3,858 3,925 4,171 4,630 4,398 4,486 2 6 11 (5) 2
Average 4,448 4,522 4,683 4,935 4,988 5,054 5,194 4 5 1 1 3
Costs (Rs/ton)
ACC (Blended) 4,139 4,340 4,494 4,585 4,402 4,472 4,553 4 2 (4) 2 2
Ambuja 3,595 3,712 3,915 3,973 3,837 3,899 3,983 5 1 (3) 2 2
Ultratech 3,848 3,717 4,046 4,244 4,099 4,169 4,282 9 5 (3) 2 3
Shree Cement 2,752 3,088 3,507 3,302 3,246 3,262 3,351 14 (6) (2) 0 3
JK Cement 4,682 4,130 4,331 4,475 4,220 4,303 4,451 5 3 (6) 2 3
JK Lakshmi Cement 3,280 3,507 3,520 3,352 3,276 3,432 3,558 0 (5) (2) 5 4
Dalmia Cement 3,596 3,858 4,037 3,942 4,031 3,921 4,031 5 (2) 2 (3) 3
Orient Cement 3,057 3,337 3,446 3,515 3,615 3,634 3,709 3 2 3 1 2
Average 3,619 3,711 3,912 3,924 3,841 3,887 3,990 5 0 (2) 1 3
EBITDA (Rs/ton)
ACC 641 728 718 834 984 1,008 1,054 (1) 16 18 2 5
Ambuja 797 840 782 897 1,170 1,245 1,315 (7) 15 30 6 6
Ultratech 1,005 840 870 1,148 1,293 1,353 1,405 4 32 13 5 4
Shree Cement 1,145 1,084 1,026 1,474 1,410 1,534 1,589 (5) 44 (4) 9 4
JK Cement 1,007 820 841 1,235 1,282 1,404 1,420 3 47 4 10 1
JK Lakshmi Cement 475 457 413 750 753 777 795 (9) 81 0 3 2
Dalmia Cement 1,243 1,200 1,040 1,097 1,340 1,251 1,275 (13) 6 22 (7) 2
Orient Cement (196) 377 487 660 1,020 769 782 29 36 55 (25) 2
Average 765 793 772 1,012 1,157 1,168 1,204 (3) 31 14 1 3
Volumes (mn tons)
ACC 23 26 28 29 26 30 33 8 2 (10) 15 10
Ambuja 21 23 24 24 22 26 29 5 (1) (6) 15 13
Ultratech 52 67 86 82 80 91 98 27 (4) (3) 14 7
Shree Cement 20 22 25 24 25 30 33 13 (4) 3 21 10
JK Cement 8 9 10 10 11 13 14 4 (1) 18 15 8
JK Lakshmi Cement 8 9 11 11 11 11 12 16 (3) - 7 7
Dalmia Cement 15 17 19 19 19 22 25 10 3 0 13 15
Orient Cement 6 6 6 6 5 6 6 12 (10) (13) 12 10
Average 19 22 26 26 25 29 31 16 (2) (2) 15 9
yoy growth (%)
Market cap. CMP (Rs) Target price
Company (US$ mn) 19-Nov (Rs) 2020 2021E 2022E 2023E 2020 2021E 2022E 2023E 2020 2021E 2022E 2023E 2020 2021E 2022E 2023E
Large-cap. stocks
ACC 4,266 1,680 1,800 70 76 91 102 24 22 19 16 11.2 10.2 8.5 7.1 109 105 98 87
Ambuja Cements 6,934 259 300 11 12 14 17 24 21 18 15 13.2 11.7 9.5 7.7 100 104 98 90
UltraTech Cement 17,714 4,778 4,900 133 167 218 266 36 29 22 18 16.6 14.4 11.5 9.6 184 171 161 148
Shree Cement 11,127 23,662 17,500 435 382 651 905 54 62 36 26 21.5 23.2 16.2 13.7 264 224 218 215
Mid-cap. stocks
Dalmia Bharat 2,534 978 1,250 14 38 42 63 70 26 23 15 10.3 8.1 7.4 5.7 110 95 72 65
JK Cement 1,793 1,899 2,000 64 81 117 138 30 23 16 14 13.6 10.9 8.1 6.8 152 142 133 122
JK Lakshmi Cement 545 343 350 23 11 30 36 15 32 12 10 7.0 6.7 6.2 5.8 56 55 53 55
Orient Cement 191 69 75 4 9 7 9 16 8 10 8 6.8 4.5 5.1 4.4 44 39 38 36
EV (US$/ton)EV/EBITDA (X)P/E (X)EPS (Rs)
ADD
BUY
ADD
BUY
ADD
Rating
BUY
BUY
SELL

90 KOTAK INSTITUTIONAL EQUITIES RESEARCH
K
OTA
K IN
STIT
UTIO
NA
L EQ
UIT
IES R
ESEA
RC
H
90
Ind
ia D
aily
Su
mm
ary
- No
ve
mb
er 2
0, 2
020
Kotak Institutional Equities: Valuation summary of KIE Universe stocks
Source: Company, Bloomberg, Kotak Institutional Equities estimates
Fair O/S ADVT
Price (Rs) Value Upside Mkt cap. shares EPS (Rs) EPS growth (%) P/E (X) EV/EBITDA (X) 3mo
Company Rating 19-Nov-20 (Rs) (%) (Rs bn) (US$ bn) (mn) 2021E 2022E 2023E 2021E 2022E 2023E 2021E 2022E 2023E 2021E 2022E 2023E 2021E 2022E 2023E 2021E 2022E 2023E 2021E 2022E 2023E (US$ mn)
Automobiles & Components
Amara Raja Batteries REDUCE 838 730 (13) 143 1.9 171 36 46 52 (7.3) 27.5 13.3 23 18.3 16.2 12.7 10.1 8.8 3.5 3.0 2.7 15.8 17.7 17.6 1.1 1.4 1.5 9.6
Apollo Tyres BUY 173 175 1 99 1.3 638 4.7 11.6 16.2 (43.5) 145.7 39.9 36.8 15.0 10.7 7.1 5.5 4.2 1.0 0.9 0.9 2.8 6.4 8.5 0.8 1.6 1.6 15.2
Ashok Leyland BUY 95 95 0 278 3.7 2,936 (0.5) 3.3 6.9 (143.9) 708.8 109.5 NM 28.9 13.8 43.3 13.6 8.0 3.9 3.6 3.0 NM 12.9 24 0.0 1.0 2.2 51
Bajaj Auto BUY 3,034 3,900 29 878 12 289 154 185 216 (12.5) 19.7 17.1 19.7 16.4 14.0 14.4 11.4 9.4 4.0 3.7 3.3 21 23 25 3.0 3.6 4.3 41
Balkrishna Industries SELL 1,596 1,250 (22) 309 4.2 193 52 62 77 4.2 19.5 24.4 30.8 25.8 20.8 18.2 15.1 12.2 5.5 4.9 4.2 18.9 20 22 1.4 1.5 1.7 17.5
Bharat Forge SELL 510 320 (37) 237 3.2 466 (0) 13 19 (102.4) 7,097.2 50.4 NM 40.4 26.9 47.9 20.4 15.4 4.6 4.2 3.7 NM 10.8 14.7 0.0 0.6 0.6 17.4
CEAT ADD 1,134 1,200 6 46 0.6 40 72 92 108 14.4 28.7 17.2 15.8 12.3 10.5 8.6 6.7 5.9 1.5 1.3 1.2 9.6 11.3 12.0 1.1 1.1 1.1 4.4
Eicher Motors SELL 2,551 1,920 (25) 697 9.4 272 57 82 105 (14.8) 43.9 27.5 44.6 31.0 24.3 32.3 23.4 18.0 7.3 6.1 5.0 17.5 21 23 0.5 0.5 0.5 57
Endurance Technologies REDUCE 1,044 1,020 (2) 147 2.0 141 34 49 59 (16.2) 44.7 21.9 31 21.4 17.6 14.3 10.8 8.9 4.3 3.7 3.1 13.9 17.3 17.9 0.5 0.8 1.0 1.5
Escorts BUY 1,406 1,535 9 125 2.6 101 72 85 96 31.7 17.6 13.3 19.5 16.6 14.7 11.3 9.4 7.9 2.8 2.4 2.1 14.2 14.6 14.5 0.8 0.9 1.0 41
Exide Industries REDUCE 170 165 (3) 145 1.9 850 8.0 9.7 10.6 (19.9) 21.1 9.2 21.3 17.6 16.1 11.3 9.6 8.6 2.2 2.0 1.9 10.5 11.8 12.0 2.1 2.1 2.1 8.7
Hero Motocorp SELL 2,989 2,700 (10) 597 8.0 200 136 175 202 (14.7) 29.2 14.9 22.0 17.0 14.8 14.0 10.4 8.8 4.0 3.6 3.3 18.6 22 23 3.0 3.5 4.0 74
Mahindra CIE Automotive SELL 156 110 (30) 59 0.8 378 1.8 8.2 12.1 (80.6) 347.1 48.3 85.4 19.1 12.9 16.7 8.7 6.5 1.3 1.2 1.1 1.5 6.4 8.8 — — — 0.6
Mahindra & Mahindra BUY 704 770 9 875 11.8 1,138 32 44 49 35.1 35.6 12.7 21.9 16.1 14.3 13.2 10.6 9.2 2.2 1.9 1.7 10.2 12.7 12.8 0.5 0.9 1.0 52
Maruti Suzuki SELL 6,963 5,200 (25) 2,103 28.3 302 155 243 300 (16.9) 56.0 23.9 45 29 23 28.4 17.0 13.0 4.1 3.7 3.3 9.4 13.5 15.0 0.8 0.9 1.1 110
Motherson Sumi Systems ADD 137 140 2 432 5.8 3,158 2.9 7.4 9.0 (21.2) 155.0 20.3 46.8 18.4 15.3 10.2 5.4 4.4 3.6 2.9 2.3 7.9 17.5 16.9 0.9 1.2 1.3 23
MRF SELL 76,831 63,325 (18) 326 4.4 4 2,441 3,141 3,896 (27.3) 28.7 24.0 31 24.5 19.7 11.8 9.7 8.0 2.5 2.2 2.0 8.1 9.6 10.8 0.1 0.1 0.1 21
Schaeffler India SELL 3,908 3,500 (10) 122 1.6 31 87 139 166 (26.5) 60.7 19.5 45 28 24 22.2 14.9 12.4 3.8 3.4 3.0 8.8 12.8 13.5 — — — 0.9
SKF REDUCE 1,555 1,450 (7) 77 1.0 49 43 54 67 (26.4) 26.2 22.9 36 29 23 26.2 19.9 16.0 5.2 4.5 3.9 14.4 15.9 16.9 7.0 0.6 0.7 0.7
Tata Motors SELL 168 120 (28) 603 7.5 3,829 (12.7) 12.8 17.5 38.6 200.4 36.5 NM 13.1 9.6 5.3 3.7 3.2 1.0 1.0 0.9 NM 7.6 9.6 — — — 139
Timken SELL 1,161 825 (29) 87 1.2 75 22 35 42 (34.2) 60.6 21.7 54 34 28 31.0 20.4 16.7 6.4 5.5 4.6 11.0 17.6 18.2 0.1 0.1 0.2 0.9
TVS Motor SELL 475 300 (37) 226 3.0 475 7.5 15.5 20.1 (41.9) 106.0 29.4 63 31 24 22.0 14.7 12.1 5.9 5.2 4.5 9.7 18.2 21 0.7 0.8 1.1 18.9
Varroc Engineering BUY 333 380 14 45 0.6 135 (20) 23 35 (10,817.5) 213.9 56.2 NM 14.7 9.4 11.5 5.3 4.2 1.6 1.5 1.3 NM 10.1 13.8 — — — 1.5
Automobiles & Components Cautious 8,657 116.7 (7.6) 118.5 24.7 45.8 21.0 16.8 12.6 8.8 7.3 3.0 2.7 2.4 6.5 12.8 14.2 1.1 1.3 1.5 707
Banks
AU Small Finance Bank SELL 884 620 (30) 271 3.6 304 29.0 23.9 31.4 30.8 (17.6) 31.4 30 37 28 — — — 5.3 4.7 4.0 18.3 12.9 14.8 — — — 7.0
Axis Bank BUY 612 600 (2) 1,871 25.2 2,822 34.4 43 54 496.2 24.5 25.4 18 14.3 11.4 — — — 2.0 1.8 1.6 10.9 12.3 13.9 0.8 1.0 1.3 168
Bandhan Bank ADD 353 340 (4) 568 7.6 1,610 20.1 20.4 24.8 7.3 1.0 22.0 17.5 17.3 14.2 — — — 3.2 2.7 2.3 19.3 16.3 16.9 — — — 53
Bank of Baroda ADD 48 65 36 222 3.0 4,627 8.8 18.3 20 648.3 106.8 9.3 5 2.6 2.4 — — — 0.4 0.4 0.3 6.0 11.6 11.5 3.7 7.6 8.3 19.3
Canara Bank REDUCE 93 85 (9) 136 1.8 1,454 (1.0) 7.0 20.1 95.2 774.8 185.4 NM 13.3 4.6 — — — 0.4 0.4 0.4 NM 1.9 5.3 — — — 12.6
City Union Bank ADD 192 160 (17) 142 1.9 737 6.8 9.4 11.6 4.7 39.3 22.6 28 20.4 16.6 — — — 2.8 2.5 2.2 9.1 11.6 13.0 0.6 0.9 1.1 5.1
DCB Bank BUY 94 150 59 29 0.4 310 9.3 11.6 16.7 (14.2) 23.9 44.4 10.1 8.1 5.6 — — — 0.9 0.8 0.7 8.8 10.0 13.0 1.0 1.2 1.8 3.0
Equitas Holdings BUY 53 100 89 18 0.2 342 7.8 8.3 16.3 30.2 5.3 96.9 6.7 6.4 3.3 — — — 0.6 0.6 0.5 9.2 8.8 15.4 — — — 3.9
Federal Bank BUY 59 80 37 117 1.6 1,993 7.1 7.7 11.7 (8.4) 8.1 52.4 8.3 7.6 5.0 — — — 0.8 0.8 0.7 9.4 9.5 13.2 2.7 2.9 4.4 30
HDFC Bank ADD 1,374 1,300 (5) 7,566 101.8 5,483 53 58 68 10.3 10.4 16.3 26 24 20 — — — 4.0 3.5 3.1 15.9 15.5 16.0 0.7 0.8 1.0 193
ICICI Bank BUY 479 500 4 3,303 44.4 6,893 23.3 27 30 90.0 15.9 11.4 21 17.7 15.9 — — — 2.4 2.2 2.0 12.3 12.3 12.5 1.0 1.1 1.3 188
IndusInd Bank ADD 818 620 (24) 619 8.3 756 26 61 75 (58.8) 132.4 22.9 31 13.4 10.9 — — — 1.7 1.5 1.3 5.5 11.2 12.5 0.5 1.1 1.4 196
Karur Vysya Bank BUY 36 65 82 29 0.4 799 4.7 7 9 60.5 39.0 42.7 8 5.5 3.8 — — — 0.5 0.5 0.4 5.6 7.4 10.0 3.4 4.8 6.8 1.2
Punjab National Bank REDUCE 30 30 - 282 3.8 9,411 1 5 7 2.3 854.1 36.3 59 6.2 4.5 — — — 0.5 0.6 0.5 0.7 5.6 7.1 — — — 14.3
RBL Bank BUY 212 270 27 108 1.5 597 9.5 19 24 (4.8) 96.0 28.5 22 11.4 8.9 — — — 1.1 1.0 0.9 4.9 8.5 10.1 0.7 1.3 1.7 54
State Bank of India BUY 240 340 42 2,140 28.8 8,925 24 30 39 46.6 24.8 30.4 10 8.1 6.2 — — — 1.1 1.0 0.9 8.8 10.0 11.7 0.1 0.1 0.1 169
Ujjivan Financial Services BUY 248 345 39 30 0.4 121 33.6 44 - 24.9 31.6 (100.0) 7 5.6 - — — — 1.2 1.0 — 17.0 19.3 NM 1.7 2.4 0.0 3.6
Ujjivan Small Finance Bank ADD 34 39 15 59 0.8 1,750 2 2 3 (3.1) (4.8) 82.5 19 19.5 10.7 — — — 1.8 1.7 1.5 10.1 8.9 14.1 0.0 0.0 0.0 0.5
Union Bank REDUCE 25 25 (1) 162 2.2 6,407 3 0 4 131.7 (86.2) 1,041.9 9 68.1 6.0 — — — 0.4 0.4 0.4 3.0 0.4 4.6 1.6 0.2 2.5 1.4
YES Bank SELL 14 11 (23) 358 4.8 25,055 (1) (0) 0 95.4 49.9 131.1 NM NM 152.5 — — — 1.3 1.3 1.2 NM NM 0.7 0.0 0.0 0.0 27
Banks Attractive 18,028 242.6 117.7 28.4 25.6 20 15.5 12.3 1.6 1.5 1.4 8.2 9.7 11.0 0.7 0.8 1.0 1,150
P/B (X) RoE (%) Dividend yield (%)

KOTAK INSTITUTIONAL EQUITIES RESEARCH 91
In
dia
Da
ily S
um
ma
ry - N
ove
mb
er 2
0, 2
020
91
K
OTA
K IN
STIT
UTIO
NA
L EQ
UIT
IES R
ESEA
RC
H
Kotak Institutional Equities: Valuation summary of KIE Universe stocks
Source: Company, Bloomberg, Kotak Institutional Equities estimates
Fair O/S ADVT
Price (Rs) Value Upside Mkt cap. shares EPS (Rs) EPS growth (%) P/E (X) EV/EBITDA (X) 3mo
Company Rating 19-Nov-20 (Rs) (%) (Rs bn) (US$ bn) (mn) 2021E 2022E 2023E 2021E 2022E 2023E 2021E 2022E 2023E 2021E 2022E 2023E 2021E 2022E 2023E 2021E 2022E 2023E 2021E 2022E 2023E (US$ mn)
Building Products
Astral Poly Technik SELL 1,450 870 (40) 219 2.9 151 19.2 25 31 16.7 32.0 24.3 76 57 46 43.0 33.5 26.8 12.5 10.6 9.1 17.7 20.0 21 0.2 0.3 0.6 3.5
Building Products Cautious 219 2.9 16.7 32.0 24.3 76 57 46 43.0 33.5 26.8 12.4 10.6 9.1 16.5 18.5 19.7 0.2 0.3 0.6 3.5
Capital goods
ABB SELL 1,045 870 (17) 221 3.0 212 9 20 26 (47.1) 115.3 32.0 113 52 40 74.0 34.4 25.9 6.2 5.8 5.3 5.5 11.4 14.0 0.6 0.7 0.8 2.3
Ashoka Buildcon BUY 74 135 83 21 0.3 281 11.3 11.9 12.9 (18.1) 5.8 7.7 6.5 6.2 5.7 5.0 4.2 3.5 0.7 0.7 0.6 11.6 11.2 11.0 2.4 2.6 2.8 1.2
Bharat Electronics BUY 103 120 16 251 3.4 2,437 7.0 7.3 7.5 (6.9) 4.9 2.5 14.8 14.1 13.8 9.1 8.1 7.5 2.3 2.1 1.9 16.1 15.5 14.6 2.5 2.6 2.7 12.1
BHEL SELL 29 26 (12) 102 1.4 3,482 (3.8) 1.8 2.8 10.4 148.5 52.5 NM 15.8 10.4 (7.1) 5.5 4.3 0.4 0.4 0.3 NM 2.2 3.4 (5.8) 2.5 3.5 17.0
Carborundum Universal ADD 336 310 (8) 64 0.9 189 13.6 16.1 18.3 (5.3) 18.1 14.1 25 21 18.3 14.0 11.7 10.0 3.1 2.9 2.6 13.3 14.3 14.8 1.1 1.3 1.5 1.3
Cochin Shipyard BUY 339 530 56 45 0.6 132 38 46 38 (21.6) 21.8 (16.8) 8.9 7.3 8.8 4.5 4.4 4.7 1.1 1.0 0.9 12.9 14.3 11.0 3.5 3.8 4.1 1.5
Cummins India BUY 511 525 3 142 1.9 277 21 26 29 (16.1) 21.1 10.5 24 19.7 17.8 25.3 20.0 17.6 3.3 3.1 3.0 13.9 16.2 17.1 2.3 2.8 3.1 7.9
Dilip Buildcon BUY 365 515 41 50 0.7 137 25 45 61 (19.0) 83.2 35.2 14.8 8.1 6.0 5.7 4.3 3.7 1.3 1.1 0.9 8.9 14.5 16.7 0.1 0.2 0.3 0.9
IRB Infrastructure BUY 119 145 22 42 0.6 351 13 10 9 (37.8) (20.0) (10.9) 9.3 11.7 13.1 6.6 6.0 4.9 0.6 0.6 0.6 6.6 5.0 4.3 3.2 1.6 2.1 2.4
Kalpataru Power Transmission BUY 303 475 57 47 0.6 153 25 39 43 (2.4) 56.8 11.7 12.2 7.8 7.0 4.7 3.9 3.3 1.2 1.0 0.9 10.4 13.5 12.9 1.1 1.5 1.7 1.7
KEC International BUY 345 380 10 89 1.2 257 24.0 32 35 9.3 31.4 11.3 14.3 10.9 9.8 8.3 6.6 5.9 2.7 2.2 1.8 20 22 20 0.8 1.0 1.1 1.9
L&T BUY 1,134 1,300 15 1,593 21.4 1,403 34 63 76 (46.9) 86.9 21.0 34 18.0 14.9 22.9 16.9 15.5 2.3 2.2 2.0 7.5 12.5 13.9 1.3 1.7 2.1 71
Siemens SELL 1,428 1,000 (30) 508 6.8 356 32 36 43 70.6 11.7 17.5 44 39 34 30.3 27.0 23.0 5.0 4.6 4.2 11.7 12.1 13.0 0.6 0.7 0.8 10.6
Thermax BUY 845 850 1 101 1.4 113 18 29 36 (2.6) 55.2 24.6 46 30 24 31.3 21.3 17.2 31.3 21.3 17.2 6.8 10.3 12.3 1.3 1.8 2.3 0.9
Capital goods Attractive 3,274 44.1 (30.8) 74.5 17.3 32 18.6 15.8 2.1 2.0 1.8 6.5 10.5 11.5 1.1 1.6 1.9 133
Commercial & Professional Services
SIS BUY 387 425 10 57 0.8 149 16 19 24 5.5 17.5 27.5 24 21 16.2 11.7 10.6 9.0 3.6 3.1 2.6 15.8 16.0 17.4 0.2 0.2 0.3 0.6
TeamLease Services ADD 2,382 2,550 7 41 0.5 17 45 67 93 118.9 50.2 38.1 53 35 26 36.6 26.7 20.5 6.3 5.3 4.4 12.5 16.3 18.8 — — — 0.9
Commercial & Professional Services Attractive 97 1.3 20.7 25.5 30.6 31 25 18.9 16.0 13.9 11.4 4.3 3.7 3.1 13.9 14.9 16.4 0.1 0.1 0.2 2
Commodity Chemicals
Asian Paints REDUCE 2,162 2,000 (7) 2,073 27.9 959 27.4 37.2 44.0 0.7 35.8 18.3 79 58 49 47.9 37.7 32.9 18.0 15.5 13.4 24 29 29 0.6 0.8 1.0 69
Berger Paints SELL 637 505 (21) 618 8.3 971 7.0 9.8 11.6 3.2 40.5 18.5 91 65 55 55.3 41.2 35.4 19.7 16.7 14.1 23 28 28 0.3 0.5 0.6 12.2
Kansai Nerolac ADD 540 560 4 291 3.9 539 9.4 13.0 15.3 (5.5) 38.9 17.1 57 41 35 36.9 27.1 23.6 7.1 6.5 5.8 12.8 16.3 17.3 0.6 0.8 1.0 1.7
Tata Chemicals ADD 353 355 1 90 1.2 255 20.0 33.3 36.8 (36.9) 66.5 10.7 17.7 10.6 9.6 5.7 4.3 3.8 0.7 0.7 0.6 3.9 6.3 6.7 2.0 3.3 3.7 13.9
Commodity Chemicals Neutral 3,073 41.3 (6.2) 40.5 17.2 71 51 43 38.5 29.6 26.0 9.6 8.7 7.8 13.5 17.2 18.1 0.6 0.8 1.0 97
Construction Materials
ACC BUY 1,680 1,800 7 315 4.2 188 76.1 90.8 102.1 5.3 19.2 12.4 22 18.5 16.5 10.2 8.4 7.1 2.6 2.4 2.2 12.1 13.5 14.1 2.3 2.7 3.0 27
Ambuja Cements BUY 259 300 16 514 6.9 1,986 12.2 14.4 17.4 15.6 18.0 20.5 21 17.9 14.9 8.2 6.6 5.2 2.2 2.0 1.8 10.3 11.8 12.9 6.6 1.0 1.3 21
Dalmia Bharat BUY 978 1,250 28 183 2.5 187 37.5 42.1 63.1 168.8 12.2 50.0 26 23 15.5 8.1 7.4 5.7 1.7 1.6 1.4 6.6 7.0 9.7 — — — 2.4
Grasim Industries ADD 837 875 5 551 7.4 657 54.2 76.5 100.1 2.9 41.2 30.9 15.5 10.9 8.4 8.2 6.0 4.7 0.9 0.8 0.8 6.1 8.0 9.7 0.2 0.4 0.7 31
J K Cement ADD 1,899 2,000 5 147 2.0 77 81.5 116.9 138.3 26.8 43.4 18.4 23 16.3 13.7 11.5 8.6 7.3 4.1 3.3 2.7 19.1 23 22 0.5 0.5 0.5 2.3
JK Lakshmi Cement BUY 343 350 2 40 0.5 118 22.9 29.6 35.8 (2.6) 29.6 20.7 15.0 11.6 9.6 6.7 6.2 5.8 2.1 1.8 1.5 14.9 16.7 17.3 1.0 1.3 1.6 1.5
Orient Cement ADD 69 75 8 14 0.2 205 8.9 6.7 8.5 109.6 (24.1) 26.9 7.8 10.3 8.1 4.5 5.1 4.4 1.1 1.0 1.0 15.3 10.5 12.3 2.9 2.9 2.9 0.5
Shree Cement SELL 23,662 17,500 (26) 854 11.5 36 543.6 774.9 904.9 24.9 42.6 16.8 44 31 26 23.1 17.4 14.9 5.9 5.1 4.3 14.3 17.8 17.8 0.5 0.5 0.5 20
UltraTech Cement ADD 4,778 4,900 3 1,379 18.6 289 166.4 217.8 266.0 25.2 30.8 22.1 29 22 18.0 14.4 11.5 9.6 3.2 2.8 2.4 11.6 13.5 14.5 0.3 0.4 0.5 38
Construction Materials Attractive 3,996 53.8 18.7 30.6 23.4 25 19.2 15.5 11.3 8.9 7.3 2.3 2.1 1.9 9.3 11.0 12.1 1.3 0.7 0.8 144
P/B (X) RoE (%) Dividend yield (%)

92 KOTAK INSTITUTIONAL EQUITIES RESEARCH
K
OTA
K IN
STIT
UTIO
NA
L EQ
UIT
IES R
ESEA
RC
H
92
Ind
ia D
aily
Su
mm
ary
- No
ve
mb
er 2
0, 2
020
Kotak Institutional Equities: Valuation summary of KIE Universe stocks
Source: Company, Bloomberg, Kotak Institutional Equities estimates
Fair O/S ADVT
Price (Rs) Value Upside Mkt cap. shares EPS (Rs) EPS growth (%) P/E (X) EV/EBITDA (X) 3mo
Company Rating 19-Nov-20 (Rs) (%) (Rs bn) (US$ bn) (mn) 2021E 2022E 2023E 2021E 2022E 2023E 2021E 2022E 2023E 2021E 2022E 2023E 2021E 2022E 2023E 2021E 2022E 2023E 2021E 2022E 2023E (US$ mn)
Consumer Durables & Apparel
Crompton Greaves Consumer SELL 299 255 (15) 187 2.5 627 8.0 9.5 10.6 1.1 18.9 11.7 37 31 28 28 24 21 10.4 8.2 6.7 31 29 26 1.0 0.8 0.8 8.1
Havells India SELL 828 600 (28) 518 7.0 626 14.7 16.2 18.6 24.8 10.3 14.7 56 51 45 38 35 30 10.7 9.5 8.5 20 19.7 20 0.6 0.7 0.8 21
Page Industries REDUCE 21,913 21,000 (4) 244 3.3 11 285 428 499 (7.5) 50.3 16.7 77 51 44 49 35 30 25.7 20.7 17.2 36 45 43 0.7 1.1 1.3 17.8
Polycab ADD 937 970 4 140 1.9 149 44 52 58 (13.7) 18.0 9.9 21 17.9 16.2 14 11 10 3.2 2.8 2.4 16.1 16.5 15.9 0.6 0.8 0.8 3.2
TCNS Clothing Co. REDUCE 402 390 (3) 25 0.3 66 (5) 14 17 (149.5) 358.7 22.9 NM 29 24 41 11 9.0 4.0 3.3 2.8 NM 12.4 12.9 — — — 0.3
Vardhman Textiles ADD 849 720 (15) 49 0.7 57 25 90 104 (70.8) 260.6 16.1 34 9.5 8.1 12.7 6.0 5.2 0.8 0.7 0.7 2.3 8.0 8.7 1.5 2.4 2.9 0.4
Voltas SELL 774 655 (15) 256 3.4 331 14.0 21.3 24.7 (13.6) 51.8 16.1 55 36 31 48 30 26 5.6 5.0 4.5 10.5 14.5 15.2 0.5 0.7 0.8 22
Whirlpool SELL 2,140 1,750 (18) 272 3.7 127 33 49 61 (12.4) 49.1 24.5 65 44 35 44 30 24 9.6 8.7 7.9 15.6 21 24 0.5 0.9 1.4 2.0
Consumer Durables & Apparel Cautious 1,691 22.8 (13.3) 41.6 50 35 31 32 24 20 6.5 5.7 12.9 16.3 16.7 0.6 0.8 75
Consumer Staples
Bajaj Consumer Care ADD 184 230 25 27 0.4 148 15.0 14.8 15.7 19.7 (1.3) 6.1 12.3 12.4 11.7 9.1 9.0 8.1 3.6 3.2 2.8 31 27 26 4.3 4.3 4.9 1.5
Britannia Industries ADD 3,511 4,050 15 846 11.4 240 78 81 93 32.8 2.9 15.8 45 44 38 34 32 28 28.3 20.7 17.3 50 54 50 3.1 1.4 1.6 35
Colgate-Palmolive (India) ADD 1,517 1,600 5 413 5.6 272 33 37 43 18.0 11.8 15.2 45 41 35 29.4 26.4 23.2 25.4 24.2 22.9 56 61 67 2.1 2.3 2.7 14.7
Dabur India REDUCE 507 480 (5) 897 12.1 1,767 9.7 11.1 12.5 12.6 14.0 12.5 52 46 41 43 36 32 12.3 11.2 10.2 25 26 26 1.2 1.4 1.6 24
Godrej Consumer Products ADD 685 750 10 700 9.4 1,022 15.7 18.5 21.2 13.7 18.0 14.5 44 37 32 30 26 22 7.8 7.0 6.3 18.9 19.8 21 1.1 1.4 1.7 13.2
Hindustan Unilever ADD 2,131 2,500 17 5,006 67.4 2,343 35 43 51 11.4 23.3 18.0 61 50 42 43 35 30 11.5 11.0 10.5 32 23 26 1.5 1.8 2.2 67
ITC BUY 188 250 33 2,312 31.1 12,318 10.4 12.4 13.4 (9.8) 18.5 8.3 18.0 15.2 14.0 12.7 10.5 9.5 3.5 3.4 3.3 18.9 22 23 4.8 5.6 6.1 72
Jyothy Laboratories ADD 139 160 15 51 0.7 367 6.0 6.3 7.1 27.2 4.6 13.5 23 22 19.4 16.1 15.3 13.6 3.9 3.6 3.4 17.3 16.9 18.0 2.5 2.9 3.2 0.8
Marico ADD 367 400 9 474 6.4 1,290 8.9 9.9 11.0 10.1 10.6 12.0 41 37 33 29 26 23 14.3 13.2 12.2 36 37 38 1.9 2.1 2.4 15.6
Nestle India REDUCE 16,934 16,000 (6) 1,633 22.0 96 226 265 307 10.5 17.5 15.6 75 64 55 49 43 37 73.3 48.9 35.4 105 92 74 1.2 0.9 1.0 29
Tata Consumer Products ADD 515 530 3 475 6.4 922 10.1 12.3 14.3 26.4 21.7 16.6 51 42 36 28 25 22 3.3 3.1 3.0 6.6 7.6 8.4 0.7 0.8 1.0 32
United Breweries ADD 1,052 1,125 7 278 3.7 264 3.7 19.7 24.9 (77.3) 435.6 26.0 286 53 42 75 27 23 7.9 6.9 6.1 2.8 13.8 15.4 0.1 0.6 0.8 11.0
United Spirits ADD 572 620 8 416 5.6 727 7.0 14.1 17.2 (38.9) 101.5 22.0 82 40 33 40 25 21 9.4 7.6 6.5 12.1 21 21 — — 0.9 16.0
Varun Beverages BUY 769 850 11 222 3.0 289 10.8 25.9 32.6 (33.4) 139.3 26.0 71 30 24 21 13 11 6.0 5.1 4.3 8.9 18.6 19.8 0.2 0.4 0.4 2.9
Consumer Staples Attractive 13,749 185.0 2.5 21.6 13.6 42 35 30 30 24 21 8.4 7.8 7.3 20.0 23 24 2.0 2.2 2.5 335
Diversified Financials
Bajaj Finance REDUCE 4,537 3,000 (34) 2,734 36.8 600 73 135 172 (17) 85 27 62 34 26 — — — 7.5 6.3 5.2 12.8 20 22 0.2 0.3 0.4 253
Bajaj Finserv BUY 7,822 8,000 2 1,245 16.8 159 270 425 528 28 58 24 29 18.4 14.8 — — — 4.0 3.4 2.9 13.7 19.9 21 0.2 0.2 0.2 64
Cholamandalam BUY 332 350 5 272 3.7 820 20.0 26.4 32.7 56 32.0 23.8 16.6 12.6 10.2 — — — 3.0 2.6 2.1 18.4 20 21 0.7 0.9 1.1 23
HDFC ADD 2,325 2,240 (4) 4,181 56.3 1,789 61 68 81 (40.3) 10 20.4 38 34 29 — — — 3.8 3.6 3.3 11.0 10.8 12.0 0.9 1.0 1.2 129
HDFC AMC REDUCE 2,425 1,950 (20) 516 6.9 213 57 68 79 (3.5) 19 15.8 42 36 31 — — — 11.3 9.9 8.6 28 29 30 1.3 1.5 1.8 10.7
IIFL Wealth ADD 1,000 1,100 10 87 1.2 88 34.7 45.1 60.7 46 29.7 34.6 29 22 16.5 — — — 3.0 2.9 2.7 10.4 13.4 17.0 5.0 2.9 3.0 0.7
L&T Finance Holdings ADD 72 90 26 144 1.9 2,005 4 9 13 (55.7) 136 49.6 19.1 8.1 5.4 — — — 0.9 0.9 0.8 5.1 11.2 14.9 2.0 2.3 2.3 12.6
LIC Housing Finance ADD 329 400 22 166 2.2 505 55.3 73.8 85.9 16 33.4 16.5 5.9 4.5 3.8 — — — 1.0 0.8 0.7 14.5 17.0 17.2 2.8 3.8 4.4 24
Mahindra & Mahindra Financial BUY 156 160 3 192 2.6 1,232 8.3 17.2 20.7 (44) 107.0 20.9 18.8 9.1 7.5 — — — 1.4 1.3 1.1 7.7 13.1 14.3 0.8 2.2 2.7 18.8
Muthoot Finance REDUCE 1,170 1,150 (2) 469 6.3 401 83 94 104 11.3 12 11.0 14.0 12.5 11.2 — — — 3.3 2.8 2.3 26 24 22 1.4 1.6 1.8 38
Shriram City Union Finance BUY 985 1,400 42 65 0.9 66 138 179 200 (9.0) 30 11.7 7.1 5.5 4.9 — — — 0.9 0.8 0.7 12.0 13.9 13.8 1.8 2.7 3.1 0.6
Shriram Transport BUY 912 1,100 21 231 3.1 253 74.5 113.9 149.1 (32) 53.0 30.9 12.2 8.0 6.1 — — — 1.1 1.0 0.9 9.6 12.9 15.0 1.2 1.9 2.5 45
Diversified Financials Attractive 10,366 139.5 (16.5) 37.9 20.0 30 22 18.2 3.5 3.1 2.8 11.6 14.2 15.6 0.8 0.9 1.1 623
P/B (X) RoE (%) Dividend yield (%)

KOTAK INSTITUTIONAL EQUITIES RESEARCH 93
In
dia
Da
ily S
um
ma
ry - N
ove
mb
er 2
0, 2
020
93
K
OTA
K IN
STIT
UTIO
NA
L EQ
UIT
IES R
ESEA
RC
H
Kotak Institutional Equities: Valuation summary of KIE Universe stocks
Source: Company, Bloomberg, Kotak Institutional Equities estimates
Fair O/S ADVT
Price (Rs) Value Upside shares 3mo
Company Rating 19-Nov-20 (Rs) (%) (Rs bn) (US$ bn) (mn) 2021E 2022E 2023E 2021E 2022E 2023E 2021E 2022E 2023E 2021E 2022E 2023E 2021E 2022E 2023E 2021E 2022E 2023E 2021E 2022E 2023E (US$ mn)
Electric Utilities
CESC BUY 581 800 38 77 1.0 133 91 105 113 (8) 16.0 7.7 6.4 5.5 5.1 4.8 4.3 3.8 0.6 0.5 0.5 9.3 9.9 9.9 2.2 2.2 2.5 2.5
JSW Energy BUY 60 65 8 99 1.3 1,640 5.2 5.3 6.3 (18) 1 18.9 11.6 11.4 9.6 5.6 4.8 4.4 0.8 0.7 0.7 7.1 6.7 7.4 0.0 — — 2.1
NHPC ADD 21 26 27 206 2.8 10,045 3.0 3.2 3.2 5.8 6 1.0 6.9 6.5 6.5 10.3 9.2 8.7 0.6 0.6 0.6 9.3 9.5 9.2 8.1 8.7 8.7 1.6
NTPC BUY 90 125 39 888 12.0 9,895 12.7 15.0 16.0 14.2 18.2 6.6 7.1 6.0 5.6 7.8 6.0 5.1 0.7 0.7 0.6 10.7 11.7 11.5 3.8 5.0 5.4 44
Power Grid BUY 190 220 16 993 13.4 5,232 21.8 26 28 25 19.1 7.8 8.7 7.3 6.8 6.7 6.0 5.5 1.5 1.3 1.2 17.1 19.0 18.9 6.6 7.8 8.4 25
Tata Power BUY 59 67 13 189 2.5 3,196 4.0 5.3 6.0 (11) 33 14.0 14.9 11.2 9.8 7.7 7.5 7.0 0.9 0.8 0.7 6.3 7.4 7.8 0.0 — — 21
Electric Utilities Attractive 2,453 33.0 13.9 17.4 7.3 8.1 6.9 6.4 0.9 0.8 0.8 11.2 12.2 12.1 4.8 5.8 6.2 95
Fertilizers & Agricultural Chemicals
Bayer Cropscience SELL 4,999 3,900 (22) 225 3.0 45 140.8 156.4 176.5 8.9 11.1 12.8 35 32 28 25 22 19 7.3 6.2 5.3 22 21 20 0.6 0.6 0.7 2.6
Dhanuka Agritech SELL 714 650 (9) 34 0.5 48 37.0 40.8 45.8 24.4 10.4 12.2 19.3 17.5 15.6 14.4 12.6 11.0 4.0 3.5 3.0 23 21 21 1.3 1.7 2.2 1.0
Godrej Agrovet SELL 515 455 (12) 99 1.3 192 15.4 18.0 20.9 33.5 17.1 16 33 29 25 18 15 13 4.0 3.6 3.2 12.7 13.4 13.8 1.0 1.2 1.4 1.0
PI Industries SELL 2,351 1,700 (28) 357 4.8 148 50.9 59.5 70.8 54.2 17 19 46 40 33 33 27 22 10.7 8.9 7.3 26 25 24 0.3 0.4 0.6 9.8
Rallis India ADD 255 290 14 50 0.7 195 11.3 14.5 17.6 25.1 28.2 21.5 22.5 17.6 14.5 15.4 12.1 9.9 3.1 2.8 2.4 14.7 16.7 17.7 1.1 1.2 1.3 3.0
UPL SELL 417 420 1 318 4.3 765 32.4 37.3 41.2 39.6 15.1 10.3 13 11.2 10.1 7.2 6.4 5.8 1.8 1.6 1.4 14.4 14.9 14.7 2.0 2.3 2.6 38
Fertilizers & Agricultural Chemicals Cautious 1,082 14.6 36.0 15.8 13.2 24 20 18.1 12.0 10.6 9.4 3.7 3.2 2.8 15.5 15.8 15.7 1.0 1.2 1.4 56
Gas Utilities
GAIL (India) BUY 94 120 28 422 5.7 4,510 8.0 10.4 11.5 (39.2) 29.4 10.8 11.7 9.0 8.1 8.7 6.7 5.8 0.9 0.9 0.8 8.0 9.9 10.5 4.3 5.3 6.4 17.6
GSPL SELL 194 200 3 109 1.5 564 13.2 11.8 8.0 (23.1) (10.6) (32.2) 14.7 16.4 24.2 5.8 6.0 7.9 1.5 1.4 1.3 10.6 8.7 5.6 1.0 1.2 1.0 2.2
Indraprastha Gas SELL 442 400 (10) 310 4.2 700 16.1 21.6 23.6 (3.2) 33.9 9.3 27.4 20.5 18.7 19.2 14.4 12.9 5.3 4.5 3.9 21 24 22 0.6 1.1 1.4 19.2
Mahanagar Gas ADD 921 1,050 14 91 1.2 99 65.3 81.6 86.8 (12.5) 25.0 6.3 14.1 11.3 10.6 8.9 7.0 6.2 2.7 2.4 2.1 20 22 21 2.7 3.4 4.1 13.6
Petronet LNG BUY 254 300 18 381 5.1 1,500 19.6 21.7 24.1 11.0 11.0 10.8 13.0 11.7 10.5 7.1 6.5 6.0 3.3 3.1 3.0 26 27 29 5.8 6.8 8.1 13.8
Gas Utilities Attractive 1,313 17.7 (20.9) 20.4 7.6 14.5 12.0 11.2 9.1 7.5 6.8 1.8 1.7 1.6 12.2 13.8 14.0 3.5 4.3 5.1 66
Health Care Services
Apollo Hospitals ADD 2,298 2,240 (3) 320 4.3 139 -3.4 40 60 (119) 1,261 50 NM 58.0 38.5 25.2 18.5 16.6 9.7 8.8 7.6 NM 15.9 21 (0.1) 0.7 1.0 41
Dr Lal Pathlabs SELL 2,125 1,400 (34) 177 2.4 83 30.0 39.3 42.7 10.8 31.1 8.6 70.8 54.0 49.7 45.3 33.8 30.9 14.7 12.3 10.5 22 25 23 0.4 0.6 0.6 5.7
HCG BUY 125 150 20 16 0.2 143 (8.7) (2.4) (1.7) 28 73 27 NM NM NM 12.9 7.1 6.1 1.9 1.9 2.0 NM NM NM — — — 0.1
Metropolis Healthcare SELL 2,066 1,450 (30) 105 1.4 51 37.1 41.8 45.5 23.8 12.6 9 55.6 49.4 45.4 36.1 31.2 28.1 16.2 13.4 11.2 32 30 27 0.5 0.6 0.7 3.3
Narayana Hrudayalaya BUY 357 375 5 73 1.0 204 -7.8 7.2 10.7 (233.6) 193 48 NM 49.5 33.4 70.9 15.9 12.7 7.5 6.5 5.4 NM 14.0 17.7 — — — 0.9
Health Care Services Attractive 777 10.5 (70) 475 31 271.1 47.2 35.9 23.6 16.3 14.4 7.4 6.6 5.8 2.7 14.0 16.1 0.1 0.5 0.7 52
Hotels & Restaurants
Jubilant Foodworks ADD 2,510 2,700 8 331 4.5 133 19 43 53 (20) 128.2 25 133.6 58.6 46.9 39.3 25.2 21.1 25.9 19.0 15.0 21 37 36 0.2 0.6 0.8 31
Lemon Tree Hotels BUY 35 35 (0) 28 0.4 790 -1.5 0.0 0.7 (1,168) 99 5,898 NM NM 52.4 58.2 17.9 12.2 4.0 4.2 4.2 NM NM 7.9 — 1.0 1.6 0.6
Hotels & Restaurants Attractive 359 4.8 (57) 343 35 278.7 62.9 46.7 41.1 23.9 19.3 18.0 14.8 12.3 6.5 23 26 0.2 0.6 0.9 32
Insurance
HDFC Life Insurance ADD 646 615 (5) 1,305 17.6 2,010 6.8 7.4 7.8 5.8 8.2 6.3 95 88 82 — — — 17.1 15.7 14.5 18.8 18.7 18.3 0.3 0.3 0.3 30
ICICI Lombard SELL 1,296 980 (24) 589 7.9 454 34.5 33.7 38.3 31 (2) 14 38 38 34 — — — 7.8 6.8 5.9 23 19.6 18.7 0.3 0.6 0.6 9.1
ICICI Prudential Life BUY 441 500 13 633 8.5 1,436 8.5 9.6 9.9 14 13.2 3.4 52 46 44 — — — 7.4 6.6 5.9 15.2 15.2 14.0 0.3 0.4 0.4 11.7
Max Financial Services NR 613 — — 165 2.2 343 9.5 26.7 16.0 (6) 180 (40) 64 23 38 — — — — — — 13.5 38 17.3 — 1.0 0.3 13.6
SBI Life Insurance BUY 847 1,100 30 847 11.4 1,001 17.8 20.8 23.6 25.3 16.9 13.1 48 41 36 — — — 8.9 7.6 6.4 20 20 19.3 — 0.4 0.4 17.5
Insurance Attractive 3,539 47.6 19.5 21.7 2.2 56.5 46.4 45 9.9 8.0 7.5 17.6 17.3 16.5 0.2 0.3 0.3 82
Mkt cap. EPS (Rs) EPS growth (%) P/E (X) EV/EBITDA (X) P/B (X) RoE (%) Dividend yield (%)

94 KOTAK INSTITUTIONAL EQUITIES RESEARCH
K
OTA
K IN
STIT
UTIO
NA
L EQ
UIT
IES R
ESEA
RC
H
94
Ind
ia D
aily
Su
mm
ary
- No
ve
mb
er 2
0, 2
020
Kotak Institutional Equities: Valuation summary of KIE Universe stocks
Source: Company, Bloomberg, Kotak Institutional Equities estimates
Fair O/S ADVT
Price (Rs) Value Upside shares 3mo
Company Rating 19-Nov-20 (Rs) (%) (Rs bn) (US$ bn) (mn) 2021E 2022E 2023E 2021E 2022E 2023E 2021E 2022E 2023E 2021E 2022E 2023E 2021E 2022E 2023E 2021E 2022E 2023E 2021E 2022E 2023E (US$ mn)
Internet Software & Services
Info Edge SELL 3,834 2,910 (24) 493 6.6 128.3 25.8 43.4 53.3 (4.2) 68.6 22.7 148.8 88.2 71.9 139.5 81.1 64.3 10.8 9.9 9.0 9.5 11.7 13.1 0.2 0.3 0.3 27
Just Dial SELL 612 550 (10) 38 0.5 61.8 25.9 29.9 35.5 (38.2) 15.3 18.8 23.6 20.4 17.2 16.0 13.3 11.1 3.1 2.7 2.3 12.7 14.0 14.4 — — — 20
Internet Software & Services Cautious 531 7.1 (18.3) 51.2 21.7 108.1 71.5 58.8 100.3 65.5 53.4 9.2 8.3 7.5 8.5 11.6 12.7 0.2 0.3 0.3 47
IT Services
HCL Technologies ADD 805 945 17 2,183 29.4 2,716 45.3 50.0 55.1 11.1 10.4 10.1 17.8 16.1 14.6 10.7 9.5 8.3 3.7 3.1 2.7 23 21 19.8 1.3 1.7 1.7 112
Infosys BUY 1,097 1,400 28 4,672 62.9 4,250 43.7 48.9 55.4 12.2 12.0 13.2 25.1 22.4 19.8 16.5 14.8 13.0 6.4 5.8 5.2 27 27 28 2.4 2.7 3.2 160
L&T Infotech ADD 2,983 3,350 12 521 7.0 176 101.3 115.3 138.1 17 13.8 19.7 29.4 25.9 21.6 19.4 17.5 14.8 8.1 6.7 5.6 30 28 28 1.1 1.2 1.3 15.0
Mindtree SELL 1,319 1,225 (7) 217 2.9 165 60.9 67.1 73.3 59 10 9 21.7 19.7 18.0 13.5 12.4 11.1 5.7 4.8 4.0 29 26 24 1.4 1.5 1.7 29
Mphasis REDUCE 1,301 1,350 4 243 3.3 187 66.3 74.3 83.3 4 12.0 12.1 19.6 17.5 15.6 12.7 11.1 9.7 3.8 3.4 3.0 20 20 20 2.7 2.7 2.7 7.7
TCS REDUCE 2,637 2,800 6 9,895 133.1 3,750 86.6 99.6 110.7 0 15.0 11.2 30.5 26.5 23.8 21.2 18.8 16.9 11.6 9.8 9.0 38 40 39 1.3 2.3 3.4 170
Tech Mahindra BUY 823 1,020 24 717 9.6 880 47.5 55.4 64.3 3.5 16.8 16.0 17.3 14.9 12.8 9.8 8.3 7.0 3.1 2.8 2.5 18.3 19.6 20 2.7 2.9 3.1 61
Wipro ADD 343 380 11 1,958 26.3 5,649 18.0 20.0 21.9 8.6 10.7 9.6 19.0 17.1 15.6 12.4 11.2 9.9 3.6 3.1 2.7 18.7 19.1 18.2 0.6 1.5 1.5 83
IT Services Attractive 20,405 274.6 6.0 12.0 11.7 25.0 22.3 19.9 16.5 14.7 13.0 6.6 5.7 5.1 26 26 25 1.5 2.2 2.8 638
Media
DB Corp. REDUCE 78 81 4 14 0.2 175 5.3 14.1 14.2 (66.5) 166.7 1.2 14.7 5.5 5.5 4.7 2.3 2.5 0.8 0.8 0.8 5.4 14.3 14.6 2.6 15.4 16.7 0.2
Jagran Prakashan REDUCE 37 37 (1) 11 0.1 281 3.9 7.3 8.4 (43.6) 87 NA 9.5 5.1 NA 2.0 1.2 NA 0.5 0.5 NA 5.7 10.3 11.5 5.3 13.4 13.4 0.2
PVR BUY 1,287 1,500 17 71 1.0 55 -92.9 39.5 59.5 (421) 143 51 NM 32.6 21.6 (22.4) 11.6 9.0 3.4 3.1 2.8 NM 9.9 13.5 (0.7) 0.3 0.5 47
Sun TV Network REDUCE 422 435 3 166 2.2 394 38.9 39.2 41.4 10 0.7 5.6 10.8 10.8 10.2 7.2 7.0 6.6 2.8 2.7 2.6 26 25 26 5.9 6.5 7.1 15.2
Zee Entertainment Enterprises ADD 186 225 21 179 2.4 960 10.9 16.5 17.9 (2.1) 51.4 8.4 17.1 11.3 10.4 10.6 7.0 6.0 1.8 1.6 1.5 10.9 15.3 14.9 1.9 2.1 2.4 104
Media Cautious 440 5.9 (26.5) 67.3 9.6 19.4 11.6 10.6 11.1 6.8 6.0 2.0 1.9 1.8 10.5 16.4 16.7 3.1 4.2 4.6 166
Metals & Mining
Hindalco Industries BUY 214 300 40 481 6.5 2,220 19.2 28.9 31.5 7.7 50.6 9 11.2 7.4 6.8 6.3 5.1 4.5 0.8 0.7 0.6 7.1 9.8 9.7 0.5 0.5 0.5 43
Hindustan Zinc BUY 224 295 32 946 12.7 4,225 17.7 20.3 22.7 9.7 14.7 11.8 12.7 11.1 9.9 7.6 6.4 5.7 3.0 3.0 3.0 21 27 30 9.5 9.0 10.1 4.3
Jindal Steel and Power BUY 234 285 22 238 3.2 1,020 23.8 23.6 23.8 411 (1) 1 9.8 9.9 9.8 5.2 4.8 4.5 0.7 0.7 0.6 7.4 6.9 6.5 — — — 34
JSW Steel ADD 331 340 3 801 10.8 2,402 17.0 26.6 32.2 68.3 57 20.8 19.5 12.4 10.3 9.0 6.6 5.6 2.0 1.7 1.5 10.6 14.8 15.5 0.6 0.6 0.6 37
National Aluminium Co. SELL 37 30 (18) 68 0.9 1,866 2.4 2.0 2.9 228 (16) 42.9 15.1 18.0 12.6 4.3 6.2 5.8 0.7 0.6 0.6 4.4 3.6 5.0 0.0 2.8 4.0 6.0
NMDC REDUCE 96 95 (1) 295 4.0 2,931 14.0 10.3 10.0 (4.3) (26.2) (3) 6.9 9.3 9.6 6.9 15.8 (20.7) 1.0 0.9 0.9 14.5 10.1 9.3 3.6 5.4 5.2 11.5
Tata Steel BUY 524 635 21 599 8.1 1,146 25.0 71.0 88.9 (29) 184 25 20.9 7.4 5.9 7.9 5.8 5.3 0.8 0.8 0.7 4.0 10.8 12.1 2.4 3.0 3.2 99
Vedanta BUY 112 145 29 417 5.6 3,717 15.2 20.3 23.4 133 34 15.0 7.4 5.5 4.8 3.9 3.2 2.8 0.8 0.8 0.8 10.8 14.8 16.3 24.9 13.4 14.9 52
Metals & Mining Attractive 3,845 51.7 33.3 37.4 14.5 12.3 8.9 7.8 6.5 5.4 4.9 1.2 1.1 1.0 9.5 12.1 12.7 5.9 4.8 5.2 286
Mkt cap. EPS (Rs) EPS growth (%) P/E (X) EV/EBITDA (X) P/B (X) RoE (%) Dividend yield (%)

KOTAK INSTITUTIONAL EQUITIES RESEARCH 95
In
dia
Da
ily S
um
ma
ry - N
ove
mb
er 2
0, 2
020
95
K
OTA
K IN
STIT
UTIO
NA
L EQ
UIT
IES R
ESEA
RC
H
Kotak Institutional Equities: Valuation summary of KIE Universe stocks
Source: Company, Bloomberg, Kotak Institutional Equities estimates
Fair O/S ADVT
Price (Rs) Value Upside shares 3mo
Company Rating 19-Nov-20 (Rs) (%) (Rs bn) (US$ bn) (mn) 2021E 2022E 2023E 2021E 2022E 2023E 2021E 2022E 2023E 2021E 2022E 2023E 2021E 2022E 2023E 2021E 2022E 2023E 2021E 2022E 2023E (US$ mn)
Oil, Gas & Consumable Fuels
BPCL BUY 384 425 11 832 11.2 1,967 37 37 39 250.1 0.1 6.1 10.4 10.4 9.8 7.9 8.2 7.4 2.1 1.9 1.7 20.8 18.9 18.3 4.5 4.8 5.1 52.9
Coal India BUY 122 180 47 752 10.1 6,163 17 17 18 (36) 0.4 4.8 7.0 7.0 6.7 7.2 5.9 5.2 2.5 2.6 2.7 34.1 36.1 39.6 16.4 16.4 16.4 23.5
HPCL BUY 213 260 22 325 4.4 1,524 46 33 35 548.6 (27.8) 3.4 4.6 6.4 6.2 6.1 7.4 6.7 1.0 0.9 0.8 22.5 14.4 13.8 6.5 6.3 8.1 21.6
IOCL BUY 85 100 18 797 10.7 9,181 13.8 13.3 14.1 449.2 (3.6) 6.5 6.2 6.4 6.0 5.6 5.6 5.3 0.8 0.7 0.7 13.0 11.7 11.7 7.3 7.1 7.5 21.8
Oil India SELL 92 70 (24) 100 1.3 1,084 4 6 9 (82) 71.3 52.3 25.3 14.8 9.7 8.7 7.0 5.6 0.4 0.4 0.4 1.6 2.7 4.1 0.9 2.7 4.1 1.2
ONGC SELL 72 60 (17) 908 12.2 12,580 5 7 12 (65) 50.5 73.2 15.5 10.3 5.9 4.6 3.9 2.9 0.4 0.4 0.4 2.5 3.7 6.2 2.8 4.0 6.2 21.0
Reliance Industries ADD 1,973 2,150 9 11,695 157.4 6,032 67 90 110 0.5 34.5 22.4 29.4 21.9 17.9 15.7 10.0 9.4 2.4 2.1 2.1 8.5 10.4 12.1 0.4 0.4 0.4 498.7
Oil, Gas & Consumable Fuels Attractive 15,409 207.4 12.6 21.0 21.0 18.3 15.1 12.5 10.2 7.8 7.1 1.6 1.4 1.4 8.8 9.5 11.1 2.0 2.1 2.3 641
Pharmaceuticals
Aurobindo Pharma REDUCE 830 830 (0) 486 6.5 586 59 60 63 21.8 1 6.0 14.0 13.9 13.1 8.4 7.9 7.1 2.2 1.9 1.7 15.7 14.0 13.2 0.9 1.1 1.3 44.1
Biocon SELL 423 240 (43) 507 6.8 1,202 7.8 9.9 11.3 26 27 14.4 54 43 37 24.1 18.6 16.6 6.3 5.6 5.0 11.5 13.2 13.5 0.6 0.8 0.9 29.0
Cipla BUY 742 880 19 598 8.1 806 29.7 33 46 54.9 12 37 25 22.2 16.2 13.7 12.4 9.0 3.3 3.0 2.6 13.3 13.4 16.0 0.8 0.9 1.2 87.5
Divis Laboratories REDUCE 3,435 3,000 (13) 912 12.3 265 71 86 97 37 21 13.0 48 40.0 35.4 33.9 28.1 24.8 10.7 9.1 7.8 22.1 22.7 22.0 (0.7) (0.9) (1.0) #N/A
Dr Reddy's Laboratories SELL 4,708 4,000 (15) 783 10.5 166 157 203 267 21 29 31.5 30 23.2 17.6 17.0 13.0 10.1 4.4 3.8 3.2 14.8 16.4 18.1 0.5 0.7 0.7 168.0
Laurus Labs REDUCE 269 310 15 144 1.9 536 17.3 18.6 23 261.3 8 21 16 14.5 11.9 11.0 9.7 7.5 5.3 3.9 2.9 34.3 27.0 24.7 — — — 26.8
Lupin ADD 884 1,000 13 401 5.4 450 27 42 51 24.5 56 21 33 21 17.3 14.0 9.8 8.0 2.9 2.6 2.3 8.9 12.5 13.4 0.5 0.7 0.9 55.0
Sun Pharmaceuticals ADD 507 525 3 1,217 16.4 2,406 21.2 23.7 28 27.0 11 17 24 21 18.3 13.7 11.7 10.0 2.6 2.4 2.1 10.9 11.6 11.6 0.2 0.9 1.1 71.2
Torrent Pharmaceuticals REDUCE 2,635 2,550 (3) 446 6.0 169 71 88 104 23.6 24 17 37 30 25 18.3 15.9 14.0 7.9 6.8 5.8 21.4 22.7 22.6 0.9 1.2 1.4 24.2
Pharmaceuticals Attractive 5,495 73.9 32.5 17 20 28 24 19.8 15.7 13.3 11.1 3.8 3.4 3.0 13.8 14.3 15.0 0.3 0.6 0.7 506
Real Estate
Brigade Enterprises BUY 218 230 6 45 0.6 204 4.7 13 17 (26) 177 31 45.9 16.6 12.7 15.6 6.3 5.2 1.9 1.8 1.6 4.2 11.1 13.2 1.1 1.1 1.1 0.8
DLF BUY 185 200 8 458 6.2 2,475 4.7 8.1 8.8 297 72 10 39 22.9 20.9 34.0 24.8 24.5 1.3 1.2 1.2 3.3 5.6 5.8 1.1 1.1 1.1 33.5
Embassy Office Parks REIT ADD 344 375 9 265 3.6 772 11.3 13.4 15.4 14 19 15 30 26 22 16.6 14.8 13.6 1.2 1.3 1.4 4.0 4.9 6.0 6.4 7.5 8.7 2.6
Godrej Properties SELL 1,040 700 (33) 262 3.5 252 10.2 13.3 33.1 (5.2) 31 149.0 102 78 31 ##### 125.4 45.0 5.2 4.9 4.2 5.2 6.4 14.4 — — — 19.1
Mindspace REIT ADD 305 330 8 181 2.4 593 14 16 18 69.4 9.5 13 21.1 19.3 17.0 17.3 14.0 12.6 1.1 1.1 1.1 9.1 5.7 6.5 2.7 6.7 7.1 2—
Oberoi Realty ADD 455 450 (1) 166 2.2 364 21 26 31 13.3 22.2 17 21.2 17.3 14.8 16.1 14.4 11.3 1.8 1.6 1.5 8.7 9.8 10.4 0.4 0.4 0.4 3.6
Prestige Estates Projects ADD 277 275 (1) 111 1.5 401 4.0 11.5 20 (57.9) 185 71 69 24 14.1 10.0 7.6 6.3 2.0 1.9 1.7 3.0 8.1 12.6 0.5 0.5 0.5 2.1
Sobha BUY 307 400 30 29 0.4 95 11 33 50 (64) 212.3 51.0 28.9 9.3 6.1 6.0 4.4 3.8 1.2 1.1 0.9 4.1 12.2 16.5 2.3 2.3 2.3 2.0
Sunteck Realty BUY 268 300 12 39 0.5 140 8.8 18.4 16 23.0 109 (13) 30 14.6 16.7 24.7 12.3 13.9 1.2 1.1 1.1 4.1 8.2 6.7 0.4 0.4 0.4 1.9
Real Estate Attractive 1,556 20.9 77.2 49 26 35 24 18.9 20.1 14.8 12.6 1.5 1.5 1.4 4.4 6.3 7.7 1.9 2.5 2.8 68
Retailing
Aditya Birla Fashion and Retail BUY 159 180 13 132 1.8 915 (5.7) 2.0 3.5 (201.1) 134.7 78.9 NM 81 45 34.7 10.3 8.9 6.8 5.8 5.2 NM 7.9 12.1 — — — 7.1
Avenue Supermarts SELL 2,392 1,475 (38) 1,550 20.9 648 15.6 33 42 (25.5) 108.6 27.7 153 73 57 99 49 38 12.8 10.9 9.2 8.7 16.1 17.3 — — — 21.6
Titan Company ADD 1,292 1,325 3 1,147 15.4 888 8.4 20 26 (49.9) 137.3 28.2 153 65 50 80 41 32 16.0 13.7 11.5 10.8 22.8 24.8 0.2 0.5 0.6 45.9
Retailing Attractive 2,829 38.1 (53.3) 227.6 30.3 228 69 53 83 39 31 13.2 11.2 9.5 5.8 16.2 17.8 0.1 0.2 0.3 75
Speciality Chemicals
Castrol India BUY 119 165 39 117 1.6 989 6.3 8.9 9.6 (25.2) 41.5 7.9 18.9 13.4 12.4 12.1 8.7 8.0 7.9 7.4 7.0 43.3 57.1 58.0 4.2 6.8 7.2 2.0
Pidilite Industries REDUCE 1,558 1,550 (1) 792 10.7 508 20.8 30 36 (10.0) 44.9 19.6 75 52 43 50 35 29 15.5 13.1 11.1 22.0 27.4 27.7 0.4 0.6 0.8 19.7
S H Kelkar and Company BUY 126 130 3 18 0.2 141 8.5 8.8 9.9 83.4 3.2 13.2 14.9 14.4 12.7 9.5 8.4 7.4 1.8 1.7 1.5 13.4 12.2 12.6 1.2 1.8 2.4 1.3
SRF ADD 5,054 5,000 (1) 299 4.0 58 177 216 271 28.4 22.1 25.2 28.5 23.4 18.7 16.7 14.0 11.5 4.5 3.8 3.2 17.9 17.8 18.8 0.3 0.4 0.4 17.1
Speciality Chemicals Attractive 1,226 16.5 (1.0) 34.7 18.6 43 32 27.2 27.0 20.5 17.4 8.6 7.4 6.4 19.9 23.1 23.5 0.8 1.2 1.3 40
Mkt cap. EPS (Rs) EPS growth (%) P/E (X) EV/EBITDA (X) P/B (X) RoE (%) Dividend yield (%)

96 KOTAK INSTITUTIONAL EQUITIES RESEARCH
K
OTA
K IN
STIT
UTIO
NA
L EQ
UIT
IES R
ESEA
RC
H
96
Ind
ia D
aily
Su
mm
ary
- No
ve
mb
er 2
0, 2
020
Kotak Institutional Equities: Valuation summary of KIE Universe stocks
Source: Company, Bloomberg, Kotak Institutional Equities estimates
Fair O/S ADVT
Price (Rs) Value Upside shares 3mo
Company Rating 19-Nov-20 (Rs) (%) (Rs bn) (US$ bn) (mn) 2021E 2022E 2023E 2021E 2022E 2023E 2021E 2022E 2023E 2021E 2022E 2023E 2021E 2022E 2023E 2021E 2022E 2023E 2021E 2022E 2023E (US$ mn)
Telecommunication Services
Bharti Airtel BUY 469 710 52 2,556 34.4 5,456 (0.2) 10.2 21.4 NM NM NM NM 46.1 21.9 7.8 6.3 5.1 4.4 4.3 3.8 NM 9.5 18.4 1.3 1.3 1.3 175.9
Bharti Infratel ADD 186 215 16 343 4.6 1,850 16.2 17.4 18.6 (1.8) 7.6 6.5 11.5 10.6 10.0 4.6 4.3 4.0 2.5 2.4 2.4 21.9 23.2 24.2 8.1 8.6 9.2 34.7
Vodafone Idea RS 9 — — 266 3.6 28,735 (8.7) (6.8) (5.0) NM NM NM NM NM NM 10.7 8.5 7.0 (0.7) (0.6) (0.4) 167.0 47.0 26.4 — — — 59
Tata Communications BUY 1,011 1,075 6 288 3.9 285 46.6 52.5 62.5 21.7 12.7 19.2 21.7 19.3 16.2 8.8 7.8 6.8 NM 22.9 10.1 NM 264 86.5 0.4 0.6 0.7 1.5
Telecommunication Services Attractive 3,453 46.5 41.8 55.3 126.6 NM NM 140.2 8.2 6.7 5.6 9.7 12.6 15.2 NM NM 10.8 1.8 1.8 1.9 272
Transportation
Adani Ports and SEZ BUY 382 435 14 776 10.4 2,032 20.3 26.4 28.9 (24.3) 30.0 9.4 18.8 14.5 13.2 13.9 10.6 9.2 2.7 2.3 2.0 15.1 17.2 16.3 0.9 1.0 1.1 30.5
Container Corp. SELL 408 360 (12) 249 3.3 609 9.4 12.5 16.4 (44.6) 33.2 30.6 43 33 25 21.4 17.0 13.6 2.4 2.4 2.3 5.6 7.3 9.3 1.3 1.7 2.2 11.9
Gateway Distriparks BUY 100 135 35 12 0.2 125 3.7 3.6 6.2 (12.3) (4.0) 73.7 27.0 28.1 16.2 7.0 7.0 5.9 0.8 0.8 0.8 3.3 3.0 5.1 3.0 3.0 3.0 0.2
GMR Infrastructure BUY 25 26 4 152 2.0 6,036 (3.7) (1.4) (0.5) (23.1) 63.1 65.4 NM NM NM 84.9 18.6 13.2 (3.6) (3.2) (4.1) 66.3 18.3 7.4 — — — 6.2
Gujarat Pipavav Port BUY 92 120 31 45 0.6 483 4.8 6.3 7.3 (20.5) 31.5 15.1 19.2 14.6 12.7 8.7 7.4 6.5 2.1 2.2 2.2 11.2 14.7 17.0 4.9 6.4 7.3 0.4
InterGlobe Aviation BUY 1,688 1,870 11 650 8.7 383 (164.5) 91.5 120.2 (2,437.7) 155.6 31.4 NM 18 14.0 NM 4.9 3.7 91.8 15.4 3.7 NM 142.7 70.7 — — — 40
Mahindra Logistics REDUCE 389 340 (13) 28 0.4 71 5.6 11.7 15.6 (37.5) 110.9 33.2 70 33 25 21.6 13.5 10.7 4.8 4.3 3.8 7.1 13.8 16.4 — — — 0.5
Transportation Attractive 1,911 25.7 (172.4) 363.9 26.3 NM 21 16.4 24.8 9.5 7.8 4.8 4.0 3.3 NM 19.4 20.1 0.7 0.8 0.9 89
KIE universe 129,773 1746.5 19.0 36.4 20.6 28 20.4 16.9 13.1 10.4 9.1 2.8 2.5 2.3 10.0 12.4 13.8 1.4 1.7 1.9
Notes:
(a) We have used adjusted book values for banking companies.
(b) 2021 means calendar year 2020, similarly for 2022 and 2023 for these particular companies.
(c) Exchange rate (Rs/US$)= 74.31
Mkt cap. EPS (Rs) EPS growth (%) P/E (X) EV/EBITDA (X) P/B (X) RoE (%) Dividend yield (%)

Ind
ia D
aily
Su
mm
ary
-N
ove
mb
er 2
0, 2
020
97 KOTAK INSTITUTIONAL EQUITIES RESEARCH
India
Ratings and other definitions/identifiers
Definitions of ratings
BUY. We expect this stock to deliver more than 15% returns over the next 12 months.
ADD. We expect this stock to deliver 5-15% returns over the next 12 months.
REDUCE. We expect this stock to deliver -5-+5% returns over the next 12 months.
SELL. We expect this stock to deliver <-5% returns over the next 12 months.
Our Fair Value estimates are also on a 12-month horizon basis.
Our Ratings System does not take into account short-term volatility in stock prices related to movements in the market. Hence, a particular Rating may not
strictly be in accordance with the Rating System at all times.
Other definitions
Coverage view. The coverage view represents each analyst’s overall fundamental outlook on the Sector. The coverage view will consist of one of the following
designations: Attractive, Neutral, Cautious.
Other ratings/identifiers
NR = Not Rated. The investment rating and fair value, if any, have been suspended temporarily. Such suspension is in compliance with applicable regulation(s)
and/or Kotak Securities policies in circumstances when Kotak Securities or its affiliates is acting in an advisory capacity in a merger or strategic transaction
involving this company and in certain other circumstances.
CS = Coverage Suspended. Kotak Securities has suspended coverage of this company.
NC = Not Covered. Kotak Securities does not cover this company.
RS = Rating Suspended. Kotak Securities Research has suspended the investment rating and fair value, if any, for this stock, because there is not a sufficient
fundamental basis for determining an investment rating or fair value. The previous investment rating and fair value, if any, are no longer in effect for this stock
and should not be relied upon.
NA = Not Available or Not Applicable. The information is not available for display or is not applicable.
NM = Not Meaningful. The information is not meaningful and is therefore excluded.
Kotak Institutional Equities Research coverage universeDistribution of ratings/investment banking relationships
Source: Kotak Institutional Equities As of September 30, 2020
Percentage of companies covered by Kotak Institutional
Equities, within the specified category.
* The above categories are defined as follows: Buy = We
expect this stock to deliver more than 15% returns over the next
12 months; Add = We expect this stock to deliver 5-15% returns
over the next 12 months; Reduce = We expect this stock to
deliver -5-+5% returns over the next 12 months; Sell = We
expect this stock to deliver less than -5% returns over the next
12 months. Our target prices are also on a 12-month horizon
basis. These ratings are used illustratively to comply with
applicable regulations. As of 30/09/2020 Kotak Institutional
Equities Investment Research had investment ratings on 204
equity securities.
Percentage of companies within each category for which Kotak
Institutional Equities and or its affiliates has provided
investment banking services within the previous 12 months.
39.2%
25.5%
14.2%
21.1%
2.0% 2.5% 1.0%3.4%
0%
10%
20%
30%
40%
50%
60%
70%
BUY ADD REDUCE SELL

Corporate Office Overseas Affiliates
Kotak Securities Ltd.
27 BKC, Plot No. C-27, “G Block”
Bandra Kurla Complex, Bandra (E)
Mumbai 400 051, India
Tel: +91-22-43360000
Kotak Mahindra (UK) Ltd
8th Floor, Portsoken House
155-157 Minories
London EC3N 1LS
Tel: +44-20-7977-6900
Kotak Mahindra Inc
369 Lexington Avenue
28th Floor, New York
NY 10017, USA
Tel:+1 212 600 8856
Copyright 2020 Kotak Institutional Equities (Kotak Securities Limited). All rights reserved. 1. Note that the research analysts contributing to this report may not be registered/qualified as research analysts with FINRA; and
2. Such research analysts may not be associated persons of Kotak Mahindra Inc and therefore, may not be subject to NASD Rule 2711 restrictions on communications with a subject company, public appearances and trading securities held by a research analyst account.
3. Any U.S. recipients of the research who wish to effect transactions in any security covered by the report should do so with or through Kotak Mahindra Inc and (ii) any transactions in the securities covered by the research by U.S. recipients must be effected only through Kotak Mahindra Inc at [email protected].
This report is distributed in Singapore by Kotak Mahindra (UK) Limited (Singapore Branch) to institutional investors, accredited investors or expert investors only as defined under the Securities and Futures Act. Recipients of this analysis / report are to contact Kotak Mahindra (UK) Limited (Singapore Branch) (16 Raffles Quay, #35-02/03, Hong Leong Building, Singapore 048581) in respect of any matters arising from, or in connection with, this analysis / report. Kotak Mahindra (UK) Limited (Singapore Branch) is regulated by the Monetary Authority of Singapore. Kotak Securities Limited and its affiliates are a full-service, integrated investment banking, investment management, brokerage and financing group. We along with our affiliates are leading underwriter of securities and participants in virtually all securities trading markets in India. We and our affiliates have investment banking and other business relationships with a significant percentage of the companies covered by our Investment Research Department. Our research professionals provide important input into our investment banking and other business selection processes. Investors should assume that Kotak Securities Limited and/or its affiliates are seeking or will seek investment banking or other business from the company or companies that are the subject of this material and that the research professionals who were involved in preparing this material may participate in the solicitation of such business. Our research professionals are paid in part based on the profitability of Kotak Securities Limited, which include earnings from investment banking and other business. Kotak Securities Limited generally prohibits its analysts, persons reporting to analysts, and members of their households from maintaining a financial interest in the securities or derivatives of any companies that the analysts cover. Additionally, Kotak Securities Limited generally prohibits its analysts and persons reporting to analysts from serving as an officer, director, or advisory board member of any companies that the analysts cover. Our salespeople, traders, and other professionals may provide oral or written market commentary or trading strategies to our clients that reflect opinions that are contrary to the opinions expressed herein, and our proprietary trading and investing businesses may make investment decisions that are inconsistent with the recommendations expressed herein. In reviewing these materials, you should be aware that any or all of the foregoing, among other things, may give rise to real or potential conflicts of interest. Additionally, other important information regarding our relationships with the company or companies that are the subject of this material is provided herein. This material should not be construed as an offer to sell or the solicitation of an offer to buy any security in any jurisdiction where such an offer or solicitation would be illegal. We are not soliciting any action based on this material. It is for the general information of clients of Kotak Securities Limited. It does not constitute a personal recommendation or take into account the particular investment objectives, financial situations, or needs of individual clients. Before acting on any advice or recommendation in this material, clients should consider whether it is suitable for their particular circumstances and, if necessary, seek professional advice. The price and value of the investments referred to in this material and the income from them may go down as well as up, and investors may realize losses on any investments. Past performance is not a guide for future performance, future returns are not guaranteed and a loss of original capital may occur. Kotak Securities Limited does not provide tax advise to its clients, and all investors are strongly advised to consult with their tax advisers regarding any potential investment. Certain transactions -including those involving futures, options, and other derivatives as well as non-investment-grade securities - give rise to substantial risk and are not suitable for all investors. The material is based on information that we consider reliable, but we do not represent that it is accurate or complete, and it should not be relied on as such. Opinions expressed are our current opinions as of the date appearing on this material only. We endeavor to update on a reasonable basis the information discussed in this material, but regulatory, compliance, or other reasons may prevent us from doing so. We and our affiliates, officers, directors, and employees, including persons involved in the preparation or issuance of this material, may from time to time have "long" or "short" positions in, act as principal in, and buy or sell the securities or derivatives thereof of companies mentioned herein. Kotak Securities Limited and its non US affiliates may, to the extent permissible under applicable laws, have acted on or used this research to the extent that it relates to non US issuers, prior to or immediately following its publication. Foreign currency denominated securities are subject to fluctuations in exchange rates that could have an adverse effect on the value or price of or income derived from the investment. In addition, investors in securities such as ADRs, the value of which are influenced by foreign currencies affectively assume currency risk. In addition options involve risks and are not suitable for all investors. Please ensure that you have read and understood the current derivatives risk disclosure document before entering into any derivative transactions. Kotak Securities Limited established in 1994, is a subsidiary of Kotak Mahindra Bank Limited. Kotak Securities is one of India's largest brokerage and distribution house. Kotak Securities Limited is a corporate trading and clearing member of Bombay Stock Exchange Limited (BSE), National Stock Exchange of India Limited (NSE), Metropolitan Stock Exchange of India Limited (MSE), National Commodity and Derivatives Exchange (NCDEX) and Multi Commodity Exchange(MCX). Our businesses include stock broking, services rendered in connection with distribution of primary market issues and financial products like mutual funds and fixed deposits, depository services and Portfolio Management. Kotak Securities Limited is also a depository participant with National Securities Depository Limited (NSDL) and Central Depository Services (India) Limited (CDSL). Kotak Securities Limited is also registered with Insurance Regulatory and Development Authority as Corporate Agent for Kotak Mahindra Old Mutual Life Insurance Limited and is also a Mutual Fund Advisor registered with Association of Mutual Funds in India (AMFI). Kotak Securities Limited is registered as a Research Analyst under SEBI (Research Analyst) Regulations, 2014. We hereby declare that our activities were neither suspended nor we have defaulted with any stock exchange authority with whom we are registered in last five years. However SEBI, Exchanges and Depositories have conducted the routine inspection and based on their observations have issued advise letters or levied minor penalty on KSL for certain operational deviations. We have not been debarred from doing business by any Stock Exchange / SEBI or any other authorities; nor has our certificate of registration been cancelled by SEBI at any point of time. We offer our research services to primarily institutional investors and their employees, directors, fund managers, advisors who are registered with us Details of Associates are available on website i.e. www.kotak.com Research Analyst has served as an officer, director or employee of subject company(ies): No We or our associates may have received compensation from the subject company(ies) in the past 12 months. We or our associates have managed or co-managed public offering of securities for the subject company(ies) in the past 12 months. YES. Visit our website for more details We or our associates may have received compensation for investment banking or merchant banking or brokerage services from the subject company(ies) in the past 12 months. We or our associates may have received any compensation for products or services other than investment banking or merchant banking or brokerage services from the subject company(ies) in the past 12 months. We or our associates may have received compensation or other benefits from the subject company(ies) or third party in connection with the research report. Our associates may have financial interest in the subject company(ies). Research Analyst or his/her relative's financial interest in the subject company(ies): No Kotak Securities Limited has financial interest in the subject company(ies) at the end of the month immediately preceding the date of publication of Research Report: Bharat Electronics, Divis Laboratories - YES Nature of Financial interest: Holding equity shares or derivatives of the subject company. Our associates may have actual/beneficial ownership of 1% or more securities of the subject company(ies) at the end of the month immediately preceding the date of publication of Research Report. Research Analyst or his/her relatives has actual/beneficial ownership of 1% or more securities of the subject company(ies) at the end of the month immediately preceding the date of publication of Research Report: No Kotak Securities Limited has actual/beneficial ownership of 1% or more securities of the subject company(ies) at the end of the month immediately preceding the date of publication of Research Report: No Subject company(ies) may have been client during twelve months preceding the date of distribution of the research report. A graph of daily closing prices of securities is available at https://www.moneycontrol.com/india/stockpricequote/ and http://economictimes.indiatimes.com/markets/stocks/stock-quotes. (Choose a company from the list on the browser and select the"three years" icon in the price chart).
Kotak Securities Limited. Registered Office: 27 BKC, C 27, G Block, Bandra Kurla Complex, Bandra (E), Mumbai 400051. CIN: U99999MH1994PLC134051, Telephone No.: +22 43360000, Fax No.: +22 67132430. Website: www.kotak.com / www.kotaksecurities.com. Correspondence Address: Infinity IT Park, Bldg. No 21, Opp. Film City Road, A K Vaidya Marg, Malad (East), Mumbai 400097. Telephone No: 42856825. SEBI Registration No. INZ000200137(Member of NSE, BSE, MSE, MCX & NCDEX). Member Id: NSE-08081; BSE-673; MSE-1024; MCX-56285; NCDEX-1262. AMFI ARN 0164, PMS INP000000258 and Research Analyst INH000000586. NSDL/CDSL: IN-DP-NSDL-23-97. Compliance Officer Details: Mr. Manoj Agarwal. Call: 022 - 4285 8484, or Email: [email protected]. Investments in securities market are subject to market risks, read all the related documents carefully before investing. In case you require any clarification or have any concern, kindly write to us at below email ids: Level 1: For Trading related queries, contact our customer service at ‘[email protected]’ and for demat account related queries contact us at [email protected] or call us on: Toll free numbers 18002099191 / 1860 266 9191 Level 2: If you do not receive a satisfactory response at Level 1 within 3 working days, you may write to us at [email protected] or call us on 022-42858445 and if you feel you are still unheard, write to our customer service HOD at [email protected] or call us on 022-42858208. Level 3: If you still have not received a satisfactory response at Level 2 within 3 working days, you may contact our Compliance Officer (Name: Mr. Manoj Agarwal) at [email protected] or call on 91- (022) 4285 8484. Level 4 : If you have not received a satisfactory response at Level 3 within 7 working days, you may also approach Managing Director / CEO (Mr. Jaideep Hansraj) at [email protected] or call on 91-(022) 4285 8301. First Cut notes published on this site are for information purposes only. They represent early notations and responses by analysts to recent events. Data in the notes may not have been verified by us and investors should not act upon any data or views in these notes. Most First Cut notes, but not necessarily all, will be followed by final research reports on the subject. There could be variance between the First cut note and the final research note on any subject, in which case the contents of the final research note would prevail. We accept no liability for the contents of the First Cut Notes.


![[Kotak] India Daily, April 2, 2019 - Kotak Securities](https://static.fdokumen.com/doc/165x107/63265a4f5c2c3bbfa803a474/kotak-india-daily-april-2-2019-kotak-securities.jpg)


![[Kotak] India Daily, October 24, 2016 - Kotak Securities](https://static.fdokumen.com/doc/165x107/633d69d4e674f41574068690/kotak-india-daily-october-24-2016-kotak-securities.jpg)

