India Daily, January 2, 2019 - Kotak Securities
50
For Private Circulation Only. FOR IMPORTANT INFORMATION ABOUT KOTAK SECURITIES’ RATING SYSTEM AND OTHER DISCLOSURES. REFER TO THE END OF THIS MATERIAL. Contents Daily Alerts Company alerts Gateway Distriparks: Delay in payment to lower value realization from Blackstone deal Lack of support from NBFCs leads to GDL missing the revised timeline to pay Blackstone Delay would impact value from transaction for GDL Revise our SoTP to Rs195 to factor in higher cost of funding and share loss to road operators Sector alerts Automobiles & Components: Weak end to CY2018; volumes weak across segments Passenger vehicles: Low single-digit industry volume growth in December 2018 M&M's auto volumes grow by 1% yoy; tractor volumes down 6% yoy in December 2018 MHCV industry volumes remain under pressure in December 2018 Royal Enfield volumes down 13% yoy; other two-wheeler OEMs yet to report numbers Banks: MSME restructuring: an (un)expected move RBI permits one-time restructuring of impaired but yet to recognized as NPLs of MSME loans Share of MSME sector is 25% of overall loans with this segment contributing to ~13% of loans The financial stability report discussed the quality of underwriting rather than rise in NPLs Public banks to benefit but don’t see immediate impact on banks/NBFCs under our coverage Consumer Staples: Month in review - December 2018: price cuts in soaps/detergents Pricing and promotions - price reduction in soaps in view of RM deflation RM trends - mixed for agro-commodities; crude fall provides relief IT Services: December 2018 quarter preview 5-12% yoy growth rate in c/c; no unusual impact of furloughs Expect stable margins despite some cross-currency headwinds Mid-tier companies - expect growth momentum to continue CY2019 demand and risks to margins from onsite cost increase will be the key focus area Economy alerts Economy: Expenditure cuts imminent in 4QFY19 November 2018 GST revenues at Rs947 bn GST shortfall likely to be around Rs1 tn Fiscal math: Expenditure cuts inevitable if budgeted fiscal deficit target is sacrosanct Limited space for immediate direct budgetary support to rural sector INDIA DAILY January 2, 2019 India 1-Jan 1-day 1-mo 3-mo Sensex 36,255 0.5 0.2 (0.7) Nifty 10,910 0.4 0.3 (0.9) Global/Regional indices Dow Jones 23,327 1.1 (8.7) (12.5) Nasdaq Composite 6,635 0.8 (9.5) (17.4) FTSE 6,728 (0.1) (3.6) (10.2) Nikkei 20,015 (0.3) (10.5) (17.0) Hang Seng 25,846 1.3 (2.5) (7.0) KOSPI 2,041 0.6 (2.7) (12.9) Value traded – India Cash (NSE+BSE) 202 319 346 Derivatives (NSE) 4,121 4,392 7,144 Deri. open interest 2,925 2,770 2,899 Forex/money market Change, basis points 1-Jan 1-day 1-mo 3-mo Rs/US$ 69.6 (14) (87) (369) 10yr govt bond, % 7.5 5 (19) (62) Net investment (US$ mn) 31-Dec MTD CYTD FIIs (144) 2,039 (4,557) MFs 91 1,055 17,081 Top movers Change, % Best performers 1-Jan 1-day 1-mo 3-mo POWF IN Equity 107 0.0 24.2 35.1 BOI IN Equity 106 2.2 25.3 34.4 HDIL IN Equity 27 0.8 30.5 31.8 UNBK IN Equity 88 2.8 12.4 27.6 FB IN Equity 93 (0.3) 9.0 27.3 Worst performers SUNP IN Equity 434 0.7 (12.0) (31.7) TTMT IN Equity 173 0.4 0.9 (24.4) TTMT/A IN Equity 93 0.5 (0.7) (23.0) JSTL IN Equity 304 (0.9) (3.3) (20.2) CIPLA IN Equity 523 0.7 (3.3) (20.0)
-
Upload
khangminh22 -
Category
Documents
-
view
0 -
download
0
Transcript of India Daily, January 2, 2019 - Kotak Securities

For Private Circulation Only. FOR IMPORTANT INFORMATION ABOUT KOTAK SECURITIES’ RATING SYSTEM AND OTHER DISCLOSURES. REFER TO THE END OF THIS MATERIAL.
Contents
Daily Alerts
Company alerts
Gateway Distriparks: Delay in payment to lower value realization from Blackstone deal
Lack of support from NBFCs leads to GDL missing the revised timeline to
pay Blackstone
Delay would impact value from transaction for GDL
Revise our SoTP to Rs195 to factor in higher cost of funding and share loss
to road operators
Sector alerts
Automobiles & Components: Weak end to CY2018; volumes weak across segments
Passenger vehicles: Low single-digit industry volume growth in December
2018
M&M's auto volumes grow by 1% yoy; tractor volumes down 6% yoy in
December 2018
MHCV industry volumes remain under pressure in December 2018
Royal Enfield volumes down 13% yoy; other two-wheeler OEMs yet to
report numbers
Banks: MSME restructuring: an (un)expected move
RBI permits one-time restructuring of impaired but yet to recognized as
NPLs of MSME loans
Share of MSME sector is 25% of overall loans with this segment
contributing to ~13% of loans
The financial stability report discussed the quality of underwriting rather
than rise in NPLs
Public banks to benefit but don’t see immediate impact on banks/NBFCs
under our coverage
Consumer Staples: Month in review - December 2018: price cuts in soaps/detergents
Pricing and promotions - price reduction in soaps in view of RM deflation
RM trends - mixed for agro-commodities; crude fall provides relief
IT Services: December 2018 quarter preview
5-12% yoy growth rate in c/c; no unusual impact of furloughs
Expect stable margins despite some cross-currency headwinds
Mid-tier companies - expect growth momentum to continue
CY2019 demand and risks to margins from onsite cost increase will be the
key focus area
Economy alerts
Economy: Expenditure cuts imminent in 4QFY19
November 2018 GST revenues at Rs947 bn
GST shortfall likely to be around Rs1 tn
Fiscal math: Expenditure cuts inevitable if budgeted fiscal deficit target is
sacrosanct
Limited space for immediate direct budgetary support to rural sector
INDIA DAILY January 2, 2019
India 1-Jan 1-day 1-mo 3-mo
Sensex 36,255 0.5 0.2 (0.7)
Nifty 10,910 0.4 0.3 (0.9)
Global/Regional indices
Dow Jones 23,327 1.1 (8.7) (12.5)
Nasdaq Composite 6,635 0.8 (9.5) (17.4)
FTSE 6,728 (0.1) (3.6) (10.2)
Nikkei 20,015 (0.3) (10.5) (17.0)
Hang Seng 25,846 1.3 (2.5) (7.0)
KOSPI 2,041 0.6 (2.7) (12.9)
Value traded – India
Cash (NSE+BSE) 202 319 346
Derivatives (NSE) 4,121 4,392 7,144
Deri. open interest 2,925 2,770 2,899
Forex/money market
Change, basis points
1-Jan 1-day 1-mo 3-mo
Rs/US$ 69.6 (14) (87) (369)
10yr govt bond, % 7.5 5 (19) (62)
Net investment (US$ mn)
31-Dec MTD CYTD
FIIs (144) 2,039 (4,557)
MFs 91 1,055 17,081
Top movers
Change, %
Best performers 1-Jan 1-day 1-mo 3-mo
POWF IN Equity 107 0.0 24.2 35.1
BOI IN Equity 106 2.2 25.3 34.4
HDIL IN Equity 27 0.8 30.5 31.8
UNBK IN Equity 88 2.8 12.4 27.6
FB IN Equity 93 (0.3) 9.0 27.3
Worst performers
SUNP IN Equity 434 0.7 (12.0) (31.7)
TTMT IN Equity 173 0.4 0.9 (24.4)
TTMT/A IN Equity 93 0.5 (0.7) (23.0)
JSTL IN Equity 304 (0.9) (3.3) (20.2)
CIPLA IN Equity 523 0.7 (3.3) (20.0)

For Private Circulation Only. FOR IMPORTANT INFORMATION ABOUT KOTAK SECURITIES’ RATING SYSTEM AND OTHER DISCLOSURES, REFER TO THE END OF THIS MATERIAL.
Lack of support from NBFCs leads to GDL missing the revised timeline to pay Blackstone
Blackstone has given GDL an arbitration notice after the latter missed the revised timeline of
December 28, 2018 for paying the remaining Rs5.6 bn consideration and interest for buying
the CCPS in GRFL of the latter. The management ascribed the delay in payment to scarcity of
funding from NBFCs and has recently received board approval to raise Rs6.2 bn NCD.
Management expects to realize such amount by March 2019 and is aiming to convince
Blackstone of such arrangement. It has the current month to do so else the case would go for
international arbitration (3-6 month process), making the share purchase agreement signed in
June 2018 null and void. Management believes that the transaction would go through as it
banks on (1) lenders showing good interest and on (2) Blackstone being paid a reasonable
quantum for exit and the 15% interest paid on delay in payment.
Delay would impact value from transaction for GDL
With the delay in payment, GDL is likely on the back foot and would need to show intent in
order to save the deal. Lenders to the NCD may leverage such positioning of GDL to possibly
charge a higher interest rate. Note that GDL had earlier approached lenders for a bond issuance
for funding the stake buy (11%+ rate) only to go to NBFCs (10.5% rate offered then). There is
a possibility of Blackstone asking for a higher consideration in lieu of not going for an
international arbitration, though we consider limited gains if any to accrue to Blackstone. The
loss of value from the delay in transaction would essentially depend on the intent from GDL (or
the lack of it) to consolidate its stake in its rail transportation business.
Revise our SoTP to Rs195 to factor in higher cost of funding and share loss to road operators
We reduce our EV/EBITA multiple for the rail business to 11X (from 12X), factoring in a higher
12% cost of funding for the Rs6.2 bn of NCD. We also moderate down our volume/EBITDA
margin estimates for the rail business by 4%/50-150 bps over FY2019-21, leading to a 1-7%
decline in consolidated EBITDA. This is primarily on account of competitive pressure from road
operators that are benefitting from an improved cost structure. We defer the consolidation of
the rail business by six months, with FY2020 being the first full year of operations. CMP factors
in the CFS business at 5X EV/EBTIDA and the rail business being valued at Rs16 bn equity
valuation. Early reversal of the arbitration notice from Blackstone would be key trigger for GDL.
Gateway Distriparks (GDPL) Transportation
Delay in payment to lower value realization from Blackstone deal. The delay in
payment by GDL to Blackstone would unlikely jeopardize the transaction given a willing
seller and assuming a willing buyer. It would alter the terms from lenders to fund the
transaction. We lower the multiple for the rail business and also cut estimates to reflect
loss of share to road operators from rail operators; revise fair value to Rs195 from
Rs230. CMP factors in nil premiums to Rs16 bn deal valuation of the rail business. BUY.
BUY
JANUARY 02, 2019
UPDATE
Coverage view: Attractive
Price (`): 125
Fair Value (`): 195
BSE-30: 36,255
Aditya Mongia
Ajinkya Bhat
Gateway Distriparks
Stock data Forecasts/Valuations 2019E 2020E 2021E
52-week range (Rs) (high,low) EPS (Rs) 6.4 6.0 8.7
Market Cap. (Rs bn) EPS growth (%) (16.0) (5.5) 44.6
Shareholding pattern (%) P/E (X) 19.6 20.7 14.3
Promoters 29.6 Sales (Rs bn) 6.4 14.1 15.7
FIIs 35.9 Net profits (Rs bn) 0.7 0.7 0.9
MFs 14.6 EBITDA (Rs bn) 1.2 2.8 3.1
Price performance (%) 1M 3M 12M EV/EBITDA (X) 13.9 7.9 6.7
Absolute (10.5) (13.2) (47.4) ROE (%) 6.6 7.7 14.3
Rel. to BSE-30 (10.7) (12.5) (51.0) Div. Yield (%) 0.0 2.4 2.4
Co mpan y d a ta an d va lua t io n s ummary
253-122
13.6

Gateway Distriparks Transportation
KOTAK INSTITUTIONAL EQUITIES RESEARCH 3
Exhibit 1: Sharp moderation seen in growth for exim rail container volumes in the past two months Yoy change in container cargo volumes (NTKM) for Indian Railways, Apr-Nov 2018 (%)
Source: Indian Railways, Kotak Institutional Equities
Exhibit 2: There has been a 12% divergence in pricing of rail and road operators since October 2018 Change in pricing of rail container and road operators since October 2018 (%)
Source: Indian Railways, IFTRT, Kotak Institutional Equities
12.4
10.3
6.1
14.9
9.8
11.2
6.1
1.2
0
2
4
6
8
10
12
14
16
Apr-18 May-18 Jun-18 Jul-18 Aug-18 Sep-18 Oct-18 Nov-18
Notes:
(a) We have erduced increase in rail pricing to the extent of 25% discount offered on empty movement
(b) We have combined the 5%/4% reduction in road freight rates over Nov 2018 and 1H Dec 2018
3.1
(8.8)(10)
(8)
(6)
(4)
(2)
0
2
4
Rail operators Road operators
A 12 % divergence in price action has happened over a short period of 60 days

Transportation Gateway Distriparks
4 KOTAK INSTITUTIONAL EQUITIES RESEARCH
Exhibit 3: Key segmental assumptions for GDL (consolidated), March fiscal year-ends, 2016-21E (Rs mn)
Source: Company, Kotak Institutional Equities estimates
Exhibit 4: Sep-2019E based SoTP for GDL (Rs per share)
Source: Company, Kotak Institutional Equities estimates
2018 2019E 2020E 2021E 2019E 2020E 2021E 2019E 2020E 2021E
CFS
Revenues 3,955 4,307 4,805 5,348 4,307 4,805 5,348 — — —
Volumes (000 TEUs) 401 445 482 521 445 482 521 — — —
Yoy growth (%) 5 11 8 8 11 8 8
Realization (Rs) 9,868 9,671 9,961 10,260 9,671 9,961 10,260 — — —
Yoy growth (%) (4) (2) 3 3 (2) 3 3
EBITDA 844 833 977 1,141 833 977 1,141 — — —
EBITDA margin (%) 21.3 19.3 20.3 21.3 19.3 20.3 21.3 0 bps 0 bps 0 bps
Rail logistics
Revenues 7,593 8,389 9,332 10,381 8,711 9,751 10,847 (4) (4) (4)
Volumes (000 TEUs) 230 247 266 288 256 278 300 (4) (4) (4)
Yoy growth (%) 5 7 8 8 11 9 8
Realization (Rs) 33,037 34,028 35,049 36,100 34,028 35,049 36,100 — — —
Yoy growth (%) (5) 3 3 3 3 3 3
EBITDA 1,334 1,558 1,780 1,980 1,618 1,909 2,232 (4) (7) (11)
EBITDA margin (%) 17.6 18.6 19.1 19.1 18.6 19.6 20.6 0 bps (50) bps (150) bps
Consolidated
Sales 3,955 6,405 14,137 15,728 6,485 14,556 16,194 (1) (3) (3)
EBITDA 844 1,222 2,757 3,121 1,237 2,886 3,372 (1) (4) (7)
PAT (post associates and minority) 827 1,335 (4,245) 1,302 (3,918) 1,208 1,544
Recurring PAT 827 695 657 950 584 856 1,192
EPS (Rs) 7.6 6.4 6.0 8.7 5.4 7.9 11.0
Change (%)
Old estimates (pro-forma)
(post Blackstone deal)New estimates
EBITDA Net debt Stake
(Rs mn) (Rs mn) (%) (Rs mn) (Rs/share) Comments
Rail business 1,880 11.0 7,261 100 13,392 123 11X Sep-2020E EV/EBITDA
CFS business 1,059 5.0 (248) 100 5,543 51 5X Sep-2020E EV/EBITDA
Cold-chain business 810 9.0 363 40 2,216 209X Sep-2020E EV/EBITDA less
20% holding company discount
SOTP 195
Multiple Equity valuation
(X)

Gateway Distriparks Transportation
KOTAK INSTITUTIONAL EQUITIES RESEARCH 5
Exhibit 5: Key financials of GDL (consolidated) in scenario of Blackstone exit, March fiscal year-ends, 2011-21E (Rs mn)
Source: Company, Kotak Institutional Equities estimates
2011 2012 2013 2014 2015 2016 2017 2018 2019E 2020E 2021E
Income statement
Income from operations 5,991 8,214 9,540 10,128 11,113 10,508 3,934 3,955 6,405 14,137 15,728
Total operating costs (4,394) (5,730) (7,100) (7,556) (7,845) (8,022) (3,023) (3,111) (5,182) (11,380) (12,607)
EBITDA 1,597 2,484 2,441 2,572 3,268 2,487 911 844 1,222 2,757 3,121
Other income 129 144 155 171 128 197 123 138 186 193 201
Financial charges (182) (135) (164) (279) (240) (184) (53) (108) (238) (1,207) (1,130)
Depreciation (502) (628) (699) (801) (889) (805) (265) (304) (463) (934) (978)
Pre-tax profit 1,041 1,864 1,733 1,663 2,266 1,694 715 569 707 810 1,215
Taxation (44) (508) (373) (190) (441) (671) (150) (139) (305) (210) (314)
Net PAT 997 1,356 1,360 1,473 1,826 1,024 565 430 402 600 900
Minority interest (30) (36) (93) (114) (37) (10) 2 (4) (1) (0) (1)
Associate profit — — — — 89 83 176 402 294 57 50
Recurring PAT 967 1,320 1,267 1,359 1,878 1,097 744 827 695 657 950
Extraordinary/exceptional items — — — — — — — — 640 (4,902) 352
Reported PAT 967 1,320 1,267 1,359 1,878 1,097 744 827 1,335 (4,245) 1,302
Recurring EPS (Rs per share) 8.9 12.1 11.7 12.5 17.3 10.1 6.8 7.6 6.4 6.0 8.7
Balance sheet
Shareholders funds 6,879 7,478 7,887 8,366 9,233 9,413 10,179 10,092 10,836 6,198 7,107
Minority Interest 610 663 806 1,257 259 276 84 89 90 90 91
Preference capital 2,958 2,958 2,958 2,958 2,958 2,958 — — — — —
Loan funds 1,154 1,037 2,093 2,761 1,529 2,222 1,091 1,135 6,129 10,971 10,271
Total liabilities 11,601 12,135 13,744 15,343 13,980 14,868 11,354 11,316 17,054 17,259 17,468
Net fixed assets 9,832 10,171 11,759 12,788 9,946 10,308 2,921 2,992 11,372 11,395 11,364
Goodwill on consolidation — — 511 553 317 317 241 241 241 241 241
Investments 130 — 1 — 1,443 1,492 5,287 5,660 1,492 1,492 1,492
Current investments — — — 340 810 1,531 1,788 1,636 — — —
Cash balances 1,506 1,662 927 1,149 744 303 84 93 2,792 2,852 2,960
Net current assets excluding cash 270 442 634 553 870 1,046 849 507 1,054 1,175 1,307
Total assets 11,601 12,135 13,744 15,343 13,979 14,868 11,354 11,316 17,054 17,259 17,468
Cash flow statement
Cashflow from operating activities 335 2,073 1,933 2,098 2,375 2,050 613 847 1,280 (2,282) 3,227
Cashflow from investing activities (1,602) (860) (1,932) (2,005) (1,957) (1,562) (559) 7 (2,746) (900) (897)
Cashflow from financing activities 1,219 (940) (146) (92) (700) (729) (121) (892) 4,164 3,243 (2,222)
Net Cash Inflow / Outflow (49) 273 (145) 1 (282) (241) (67) (38) 2,698 60 108
Closing Cash & Cash Equivalent 746 1,779 1,517 929 867 503 30 (8) 2,792 2,852 2,960
Growth (%)
Revenue growth 37.1 16.1 6.2 9.7 (5.4) (62.6) 0.5 NM 120.7 11.3
EBITDA growth 55.6 (1.8) 5.4 27.1 (23.9) (63.4) (7.4) NM 125.6 13.2
PAT growth 36.5 (4.1) 7.3 38.2 (41.6) (32.2) 11.2 NM (5.5) 44.6
Key ratios
EBITDA margin (%) 26.7 30.2 25.6 25.4 29.4 23.7 23.2 21.3 19.1 19.5 19.8
PAT margin (%) 16.6 16.5 14.3 14.5 16.4 9.7 14.4 10.9 6.3 4.2 5.7
Effective tax rate (%) 4.3 27.3 21.5 11.4 19.4 39.6 21.0 24.5 43.1 25.9 25.9
Net debt to equity (0.1) (0.1) 0.1 0.2 0.1 0.2 0.1 0.1 0.3 1.3 1.0
RoE (%) 11.3 12.6 12.0 12.2 15.3 8.8 6.5 8.1 12.7 (49.3) 19.3
RoCE (%) 11.2 12.6 11.8 12.0 14.7 9.0 6.1 8.3 6.6 10.9 12.0
De-consolidation of
GRFL under Ind-AS
Reconsolidation after
acquisition of Blackstone's stake
For Private Circulation Only. FOR IMPORTANT INFORMATION ABOUT KOTAK SECURITIES’ RATING SYSTEM AND OTHER DISCLOSURES, REFER TO THE END OF THIS MATERIAL.
Passenger vehicles: Low single-digit industry volume growth in December 2018
As per our calculations, passenger vehicle industry volumes grew only marginally (+2-4% yoy) in
December 2018; subdued festive season, reduction in dealer inventory and weaker consumer
sentiment weighed on industry volumes. Maruti’s overall volumes declined by 1% yoy to
128,338 units in December 2018 led by (1) 2% yoy growth in domestic volumes and (2) 36%
yoy decline in exports. Entry car segment volumes declined by 14% yoy while there was 4% yoy
decline in compact hatchback/sedan segments. Ciaz volumes grew by 99% yoy on a low base,
SUV volumes were up 5% yoy led possibly by launch of new Ertiga and vans segment volumes
grew by 39% yoy. In terms of other OEMs, domestic volumes of Hyundai/Honda reported
5%/4% yoy growth aided by attractive year-end offers and Toyota’s volumes were up 10% yoy.
Tata Motors’ PV volumes grew by 1% yoy led by the success of Nexon.
M&M’s auto volumes grow by 1% yoy; tractor volumes down 6% yoy in December 2018
Mahindra reported 1% yoy volume growth in the automotive segment, which was driven by
20-38% yoy growth in three-wheeler and export volumes. CV segment volumes declined by
4% yoy partly due to high base (volumes up 24% yoy in December 2017) while utility vehicle
volumes declined by 3% yoy—the positive impact of launch of Marazzo was possibly offset by
continued decline in TUV/KUV volumes. M&M’s overall tractor volumes declined by 6% yoy led
by 2% yoy decline in domestic volumes while export volumes were down 45% yoy. Escorts
reported 28% yoy growth in tractor volumes led by strong growth in both domestic and export
volumes, which reflects some market share gains for the company.
MHCV industry volumes remain under pressure in December 2018
Tata Motors reported 11% yoy decline in domestic CV volumes led by 27% yoy decline in
M&HCV truck volumes; this segment was largely impacted by drop in cargo sales due to low
consumer sentiments. However, the tipper segment continued to grow strongly at 14% yoy
and was relatively unaffected on the back of road construction, affordable housing, irrigation
projects and government spending on infrastructure projects. VECV’s volumes were up 3% yoy
led by 1% yoy growth in domestic volumes while exports were up 10% yoy. Ashok Leyland is
yet to report December 2018 volumes.
Royal Enfield volumes down 13% yoy; other two-wheeler OEMs yet to report numbers
Royal Enfield volumes surprised negatively and declined by 13% yoy led by 14% yoy decline in
domestic volumes while exports were up 41% yoy. We have been highlighting that two-
wheeler industry volumes will likely be subdued over the next two years due to increase in
vehicle prices post increase in insurance costs and weaker consumer sentiment. Other two-
wheeler OEMs are yet to report numbers; as per our understanding, retail demand has been
subdued and inventory levels are high, which would weigh on OEM’s wholesale volumes.
Automobiles & Components India
Weak end to CY2018; volumes weak across segments. Weak festive season and
need for reduction in dealer inventory levels impacted OEM’s dispatches in December
2018. As per our checks, demand is still subdued across most segments due to weak
consumer sentiment, which would impact industry volumes over the next few months.
We see downside risks to our FY2019E volume estimates for most companies,
particularly for four-wheeler OEMs (Ashok, M&M and Maruti) and Eicher; we note that
our two-wheeler industry volume estimates are already below Street expectations.
NEUTRAL
JANUARY 01, 2019
UPDATE
BSE-30: 36,255
Hitesh Goel
Nishit Jalan
Rishi Vora

Automobiles & Components India
KOTAK INSTITUTIONAL EQUITIES RESEARCH 7
Exhibit 1: Maruti Suzuki volumes declined by 1% in December 2018; mini segment volumes declined by 14% yoy Maruti Suzuki monthly sales volume, March fiscal year-ends (units)
Source: Company, Kotak Institutional Equities estimates
Exhibit 2: Mahindra & Mahindra: UV/CV volumes declined by 3-4% yoy in December 2018; tractor volumes down 6% yoy Mahindra & Mahindra monthly sales volume, March fiscal year-ends (units)
Source: Company, Kotak Institutional Equities estimates
YTD January-March
Dec-17 Jan-18 Feb-18 Mar-18 Apr-18 May-18 Jun-18 Jul-18 Aug-18 Sep-18 Oct-18 Nov-18 Dec-18 2018 2019
Sales volume (units)
M800, Alto, A-Star, Wagon R 32,146 33,316 33,789 37,511 37,794 37,864 29,381 37,710 35,895 34,971 32,835 29,954 27,661 322,567 304,065
Swift, Baleno, Ritz, Celerio, Dzire 53,336 67,868 65,213 68,885 83,834 77,263 71,570 74,373 71,364 74,011 64,789 72,533 51,334 546,509 641,071
Gypsy, Ertiga, S-Cross, Brezza 19,276 20,693 20,324 22,764 20,804 25,629 19,321 24,505 17,971 21,639 20,764 23,512 20,225 189,978 194,370
Omni and Eeco 11,420 12,250 12,425 13,689 15,886 16,717 12,185 15,791 13,663 14,645 13,668 14,053 15,850 116,773 132,458
Ciaz 2,382 5,062 4,897 4,321 5,116 4,024 1,579 48 7,002 6,246 3,892 3,838 4,734 44,633 36,479
Light commercial vehicle 726 1,411 1,252 1,412 1,544 1,703 1,626 1,723 1,805 2,038 2,152 2,128 1,675 5,958 16,394
Total domestic 119,286 140,600 137,900 148,582 164,978 163,200 135,662 154,150 147,700 153,550 138,100 146,018 121,479 1,226,418 1,324,837
Exports 10,780 10,751 11,924 12,016 8,008 9,312 9,319 10,219 10,489 8,740 8,666 7,521 6,859 91,383 79,133
Total volumes 130,066 151,351 149,824 160,598 172,986 172,512 144,981 164,369 158,189 162,290 146,766 153,539 128,338 1,317,801 1,403,970
Yoy change (%)
M800, Alto, A-Star, Wagonr 2.0 (12.2) 2.1 21.1 (2.8) (3.1) 15.1 (10.9) 1.3 (9.1) 1.1 (21.6) (14.0) (5.7)
Swift, Baleno, Ritz, Celerio, Dzire 16.3 15.4 31.5 11.3 31.8 50.8 76.7 17.8 (3.6) 1.7 3.7 10.8 (3.8) 17.3
Gypsy, Ertiga, S-Cross, Brezza 19.9 26.8 13.8 24.3 0.8 13.4 39.2 (4.9) (16.2) 8.7 (11.2) 1.9 4.9 2.3
Omni and Eeco 23.8 (13.6) (12.5) 17.7 14.0 32.7 32.3 0.5 (1.9) 6.6 7.9 3.6 38.8 13.4
Ciaz (35.8) (22.5) (16.8) (12.1) (27.2) (14.8) (60.0) (99.2) 8.4 11.5 (5.2) (4.3) 98.7 (18.3)
Total domestic 12.1 5.0 14.2 16.1 14.2 24.9 45.5 0.1 (2.8) 1.4 1.5 0.5 1.8 8.0
Exports (6.2) 2.8 24.9 2.1 19.1 48.1 (29.0) (9.9) (10.4) (25.1) (17.0) (19.1) (36.4) (13.4)
Total volumes 10.3 4.8 15.0 14.9 14.4 26.0 36.3 (0.6) (3.4) (0.5) 0.2 (0.7) (1.3) 6.5
YTD
Dec-17 Jan-18 Feb-18 Mar-18 Apr-18 May-18 Jun-18 Jul-18 Aug-18 Sep-18 Oct-18 Nov-18 Dec-18 2018 2019
Sales volume (units)
Passenger UVs (incl. Verito) 15,543 23,686 22,389 26,555 21,927 20,715 18,137 19,781 19,758 21,411 24,066 16,188 15,091 176,941 177,074
Commercial Vehicles 17,542 21,002 20,946 25,496 18,963 18,748 19,229 19,284 20,326 22,917 24,353 19,673 16,906 149,353 180,399
3-wheelers 3,894 4,744 5,138 6,602 4,327 4,355 4,323 5,540 5,289 6,940 6,931 5,703 4,693 38,141 48,101
Exports (Auto sector) 2,221 2,626 2,654 3,424 2,880 3,031 3,466 2,594 2,951 3,754 3,066 3,537 3,065 19,543 28,344
Auto division 39,200 52,058 51,127 62,077 48,097 46,849 45,155 47,199 48,324 55,022 58,416 45,101 39,755 383,978 433,918
Tractors (Dom + Exp) 18,488 21,875 20,483 28,277 30,925 29,330 40,529 22,679 17,785 37,581 47,376 25,949 17,404 247,688 269,558
Total 57,688 73,933 71,610 90,354 79,022 76,179 85,684 69,878 66,109 92,603 105,792 71,050 57,159 631,666 703,476
Yoy change (%)
Passenger UVs (incl. Verito) (6.9) 17.9 8.7 4.7 13.1 2.1 12.2 (5.6) 2.2 (15.5) 0.7 1.0 (2.9) 0.1
Commercial vehicles 23.9 51.2 27.9 11.3 25.9 15.3 27.1 28.4 24.7 19.4 26.3 26.5 (3.6) 20.8
3-wheelers 12.6 55.2 50.0 30.4 25.9 7.3 68.9 46.7 35.4 17.1 13.1 28.0 20.5 26.1
Exports (Auto sector) 8.2 16.1 15.4 26.4 88.5 134.4 86.8 30.8 14.3 17.1 30.9 39.7 38.0 45.0
Auto division 7.8 32.5 19.7 10.8 22.0 11.8 26.4 13.1 14.7 2.5 13.1 16.9 1.4 13.0
Tractors (Dom + Exp) 31.6 37.5 36.5 46.2 18.3 14.6 23.1 20.4 6.9 (17.9) 17.7 12.9 (5.9) 8.8
Total 14.4 33.9 24.1 19.9 20.5 12.9 24.8 15.4 12.5 (6.9) 15.1 15.4 (0.9) 11.4

India Automobiles & Components
8 KOTAK INSTITUTIONAL EQUITIES RESEARCH
Exhibit 3: Tata Motors reported 11% yoy volume decline in December 2018; domestic M&HCV truck volumes down 27% yoy Tata Motors monthly sales volume, March fiscal year-ends (units)
Source: Company, Kotak Institutional Equities estimates
Exhibit 4: VECV reported 3% yoy volume growth in December 2018; domestic MHCV volumes increased by 7% yoy VECV monthly sales volume, March fiscal year-ends (units)
Source: Company, Kotak Institutional Equities estimates
Exhibit 5: Escorts reported 28% yoy volume growth in December 2018; domestic tractor volumes grew by 21% yoy Escorts monthly sales volume, March fiscal year-ends (units)
Source: Company, Kotak Institutional Equities estimates
YTD January-March
Dec-17 Jan-18 Feb-18 Mar-18 Apr-18 May-18 Jun-18 Jul-18 Aug-18 Sep-18 Oct-18 Nov-18 Dec-18 2018 2019
Sales volume (units)
MHCVs 21,851 18,431 20,706 24,321 18,271 17,565 17,456 16,143 19,698 23,292 19,203 16,172
LCVs 24,640 25,855 24,970 31,296 20,915 22,861 26,147 23,535 25,389 28,127 24,610 21,785
Total CVs 46,491 44,286 45,676 55,617 39,186 40,426 43,603 39,678 45,087 51,419 43,813 37,957 39,980 303,860 381,149
UVs 6,177 6,854 6,393 7,908 6,659 6,043 6,044 5,706 6,558 6,351 6,818 5,655
Cars 8,252 13,484 11,692 12,628 10,676 11,525 12,372 11,483 12,112 12,221 11,633 11,462
Total PVs 14,429 20,338 18,085 20,536 17,335 17,568 18,416 17,189 18,670 18,572 18,451 17,117 14,459 130,660 157,777
Total sales 60,920 64,624 63,761 76,153 56,521 57,994 62,019 56,867 63,757 69,991 62,264 55,074 54,439 434,520 538,926
Yoy change (%)
MHCVs 57.6 11.7 19.1 20.1 208.9 70.8 59.4 26.2 31.5 37.0 23.8 (8.2)
LCVs 54.6 55.1 40.6 47.9 72.4 33.4 44.4 28.3 29.7 19.4 16.7 (2.7)
Total CVs 56.0 33.5 30.0 34.3 117.1 47.4 50.1 27.4 30.5 26.8 19.7 (5.1) (14.0) 25.4
UVs 371.5 179.2 174.3 223.3 309.3 447.4 406.6 101.1 127.5 21.7 31.1 (0.4)
Cars (16.0) 25.7 15.8 (5.1) (5.5) 17.1 22.4 (6.2) 4.8 (0.9) 2.0 (2.1)
Total PVs 29.5 54.3 45.5 30.4 34.1 60.5 62.9 14.0 29.3 5.8 11.1 (1.5) 0.2 20.8
Total sales 48.8 39.4 34.0 33.3 82.5 51.2 53.7 23.0 30.1 20.4 17.0 (4.0) (10.6) 24.0
YTD
Dec-17 Jan-18 Feb-18 Mar-18 Apr-18 May-18 Jun-18 Jul-18 Aug-18 Sep-18 Oct-18 Nov-18 Dec-18 2018 2019
Domestic sales
LCV 1,410 1,664 1,499 2,193 1,124 1,864 1,857 1,731 1,423 1,536 1,369 908 1,240
MHCV 3,635 4,346 4,284 5,787 2,265 3,404 3,639 3,427 3,420 4,149 3,752 2,909 3,872
Total 5,045 6,010 5,783 7,980 3,389 5,268 5,496 5,158 4,843 5,685 5,121 3,817 5,112 36,104 43,889
Export sales
LCV 111 154 329 404 168 115 233 223 195 201 169 328 151
MHCV 799 548 684 861 382 491 586 535 910 702 536 457 850
Total 910 702 1,013 1,265 550 606 819 758 1,105 903 705 785 1,001 6,021 7,232
Total sales 5,955 6,712 6,796 9,245 3,939 5,874 6,315 5,916 5,948 6,588 5,826 4,602 6,113 42,125 51,121
Yoy change (%)
LCV 65.1 59.8 9.9 20.1 (8.6) 9.1 56.6 51.3 45.8 22.7 11.5 (10.8) (12.1)
MHCV 50.5 57.7 23.7 26.2 68.0 51.6 65.7 33.1 20.3 8.3 16.0 (4.4) 6.5
Total domestic 54.3 58.3 19.8 24.5 31.5 33.2 62.5 38.7 26.8 11.8 14.7 (6.0) 1.3 21.6
Export sales
LCV 63.2 (29.4) 213.3 101.0 0.0 (19.6) 26.6 (4.7) (21.1) 24.1 1.8 404.6 36.0
MHCV 26.4 26.0 53.4 80.5 15.4 10.8 83.7 45.4 99.6 2.0 (0.2) (23.8) 6.4
Total exports 30.0 7.5 83.8 86.6 10.2 3.4 62.8 25.9 57.2 6.2 0.3 18.0 10.0 20.1
Total sales 50.0 50.9 26.3 30.4 28.0 29.4 62.5 36.9 31.6 11.0 12.8 (2.6) 2.7 21.4
Residual volumes
YTD
Dec-17 Jan-18 Feb-18 Mar-18 Apr-18 May-18 Jun-18 Jul-18 Aug-18 Sep-18 Oct-18 Nov-18 Dec-18 2018 2019
Sales volume (units)
Escorts 3,606 5,316 6,462 11,790 6,186 8,325 9,983 5,626 4,812 10,617 13,140 8,005 4,598 56,849 71,292
Domestic 3,476 5,160 6,295 11,557 6,094 8,087 9,758 5,483 4,674 10,396 12,867 7,641 4,212 55,434 69,212
Exports 130 156 167 233 92 238 225 143 138 221 273 364 386 1,415 2,080
Yoy change (%)
Escorts 13.1 45.6 52.2 66.5 26.3 20.9 72.8 3.6 5.2 2.5 28.8 56.4 27.5 25.4
Domestic 14.2 47.1 53.4 64.8 28.0 19.5 72.1 3.9 6.3 2.5 28.7 54.6 21.2 24.9
Exports (9.7) 7.6 16.8 258.5 (33.8) 105.2 110.3 (7.7) (22.0) 5.7 33.8 104.5 196.9 47.0

Automobiles & Components India
KOTAK INSTITUTIONAL EQUITIES RESEARCH 9
Exhibit 6: Royal Enfield reported 13% yoy volume decline in December 2018 Royal Enfield monthly sales volume, March fiscal year-ends (units)
Source: Company, Kotak Institutional Equities estimates
Exhibit 7: There could be downside risks to our FY2019 volume estimates particularly for Royal Enfield, Maruti and Mahindra Summary table of OEM volumes
Source: Companies, Kotak Institutional Equities estimates
YTD
Dec-17 Jan-18 Feb-18 Mar-18 Apr-18 May-18 Jun-18 Jul-18 Aug-18 Sep-18 Oct-18 Nov-18 Dec-18 2018 2019
Sales volume (units)
Royal Enfield 66,968 77,878 73,077 76,087 76,187 74,697 74,477 69,063 69,377 71,662 70,451 65,744 58,278 594,753 629,936
Domestic 65,367 76,205 71,327 74,209 74,627 72,510 72,588 67,001 68,014 70,065 70,044 65,026 56,026 580,763 615,901
Exports 1,601 1,673 1,750 1,878 1,560 2,187 1,889 2,062 1,363 1,597 407 718 2,252 13,990 14,035
Yoy change (%)
Royal Enfield 16.7 30.5 25.0 26.6 26.7 23.1 17.9 5.0 2.1 1.7 1.4 (6.2) (13.0) 5.9
Domestic 16.1 31.1 25.7 26.7 27.4 23.6 17.7 3.9 1.7 1.0 3.0 (4.1) (14.3) 6.1
Exports 48.0 8.4 2.8 20.1 (1.1) 6.7 26.9 58.4 23.3 53.9 (72.5) (69.4) 40.7 0.3
OEM Dec-18 Yoy chg (%) Mom chg (%) FYTD19 Yoy chg (%)
Residual monthly
volume run rate
Residual volume
run rate (Yoy
growth)
Eicher Motor (RE) 58,278 (13.0) (11.4) 629,936 5.9 82,531 9.9
Eicher Motor (VECV) 6,113 2.7 32.8 51,121 21.4 5,470 (3.8)
Escorts 4,598 27.5 (42.6) 71,292 25.4 8,594 9.4
Maruti Suzuki 128,338 (1.3) (16.4) 1,403,970 6.5 177,001 15.0
Mahindra and Mahindra 57,159 (0.9) (19.6) 703,476 11.4 95,410 21.3
Tata Motors (standalone) 54,439 (10.6) (1.2) 538,926 24.0 70,744 3.6
For Private Circulation Only. FOR IMPORTANT INFORMATION ABOUT KOTAK SECURITIES’ RATING SYSTEM AND OTHER DISCLOSURES, REFER TO THE END OF THIS MATERIAL.
RBI permits one-time restructuring of impaired but yet to recognized as NPLs of MSME loans
RBI has permitted a one-time restructuring of MSME loans (loan exposure up to `250 mn by
both banks and NBFCs). The borrower (GST registered) should have defaulted/days-past-due
(0-90 days) as of January 01, 2019 but is currently to be classified as “standard”. The
restructuring should be completed by March 31, 2020 and lenders would have to make a
provision of 5% on these restructured loans and provide disclosures of the same in the notes to
accounts.
Share of MSME sector is 25% of overall loans with this segment contributing to ~13% of loans
MSME accounts for ~25% of commercial lending in India as of FY2018 (~`23 tn). The segment
has recorded 18% yoy growth in 1QFY19 (Exhibit 1). Of this, the exposure which is up to `250
mn is `13 tn (~13% of total loans) and grew 16% yoy. Growth is skewed towards the lower
end of the spectrum with average ticket size of <`5 mn. With a gradual push towards
formalization and higher availability of income disclosures on account of GST, credit growth has
ramped up in recent quarters. NBFCs and private banks have grown faster than public banks
(Exhibit 3).
The financial stability report discussed the quality of underwriting rather than rise in NPLs
We are quite surprised at the timing of the notification. Lenders usually step back lending when
the early warning indicators suggest rising trends of deterioration. However, the last available
data (1QFY19) suggests that lenders have been quite comfortable and growing this portfolio at
a healthy pace (Exhibit 2). The gross NPLs have been stable in recent quarters (Exhibit 4).
Further, the financial stability report that was released a few days back discussed the relative
differences in the quality of underwriting between different players as public banks have shown
disproportionately higher NPLs (Exhibits 5 and 6) than private banks or NBFCs.
RBI has suggested the need to tighten the credit screens when onboarding these borrowers for
public banks. However, this report did not speak of any alarming trends of NPLs in the near
term which required the RBI to provide a relief for these delinquent borrowers.
Public banks to benefit but don’t see immediate impact on banks/NBFCs under our coverage
Our recent interaction with banks/NBFCs on this topic suggests no meaningful impact on
banks/NBFCs under our coverage. The familiar risks remain: (1) quality of collateral, (2) ability to
monitor cash flows as diversion of funds is high (3) volatile margins of borrowers and (4) rising
NPL trends in the LAP portfolio across players. There is likely to be a fair amount of discussion
when the initial 3QFY19 results are out from private banks. We believe that we are not going to
see any worrying signs unless the recent liquidity tightness has caused a spike in early warning
signs as a few players like NBFCs, have played a critical role in recent quarters. We believe that
the impact of this guideline would be mostly on public banks, especially those that are under
PCA.
Banks India
MSME restructuring: an (un)expected move. RBI has allowed banks/NBFCs to
undertake a one-time restructuring exercise of MSME borrowers who are stressed but
yet to be classified as NPLs. Lenders would have to make 5% provisions on these
accounts. We don’t see material impact on banks/NBFCs under our coverage as the
trends are not showing any signs of further deterioration, but public banks, which have
higher impairments in this portfolio could stand to benefit. The timing is a surprise as
the last available data is not showing rising trends of impairment.
ATTRACTIVE
JANUARY 02, 2019
UPDATE
BSE-30: 36,255
QUICK NUMBERS
Loans to MSME
sector form ~25%
of loans; up to `250
mn has ~13% share
NPLs are at 15% for
public banks, 5%
for NBFCs and 4%
for private banks
Highest NPLs are in
the `100-250 mn
bucket and below
`1 mn bucket
M B Mahesh CFA
Nischint Chawathe
Dipanjan Ghosh
Shrey Singh

Banks India
KOTAK INSTITUTIONAL EQUITIES RESEARCH 11
Exhibit 1: MSME lending book is around `22.9 tn (including MSME loans to individuals) and is
growing at 18% yoy MSME loans outstanding, March fiscal year-ends, 1QFY17-1QFY19 (` tn)
Source: SIDBI, TransUnion CIBIL, Kotak Institutional Equities
Exhibit 2: Smaller segments have delivered better growth rates; MSME loans to individual also witnessed robust growth in 1QFY19 Break-up of segments within MSME lending, March fiscal year-ends, 1QFY17-1QFY19 (Rs bn)
Source: SIDBI, TransUnion CIBIL, Kotak Institutional Equities
Exhibit 3: Private banks and NBFCs have continue to gain share Lender-wise market share, March fiscal year-ends, June 2016-June 2018 (Rs bn)
Source: SIDBI, TransUnion CIBIL
15.3 16.0
16.8 18.1
19.3 19.6 20.8
22.0 22.9
0
5
10
15
20
25
1QFY17 2QFY17 3QFY17 4QFY17 1QFY18 2QFY18 3QFY18 4QFY18 1QFY19
YoY growth
1QFY17 2QFY17 3QFY17 4QFY17 1QFY18 2QFY18 3QFY18 4QFY18 1QFY19 (%)
Very small (<1 mn) 560 580 560 580 640 670 770 810 820 28
Micro 1 (1-5 mn) 1,390 1,460 1,420 1,490 1,570 1,600 1,750 1,890 1,900 21
Micro 2 (5-10mn) 930 970 950 1,010 1,060 1,070 1,160 1,220 1,230 16
SME 1 (10-50 mn) 2,980 3,060 3,060 3,220 3,360 3,380 3,710 3,880 3,950 18
SME 2 (50-100 mn) 1,760 1,790 1,810 1,870 1,930 1,920 2,070 2,130 2,170 12
MSME 3 (100-250 mn) 2,590 2,640 2,670 2,750 2,800 2,800 3,000 3,070 3,120 11
MSME loans to individuals (<250 mn)5,100 5,480 6,300 7,220 7,960 8,150 8,330 9,040 9,670 21
Total 15,310 15,980 16,770 18,140 19,320 19,590 20,790 22,040 22,860 18

India Banks
12 KOTAK INSTITUTIONAL EQUITIES RESEARCH
Exhibit 4: Smallest and largest ticket segments have seen maximum stress; individual loans see low
stress levels NPL ratios for segments within MSME, June 2016-June 2018 (%)
Source: SIDBI, TransUnion CIBIL
Exhibit 5: Smallest and largest ticket segment have seen maximum stress Lender-wise NPL ratios, 1QFY17-1QFY19 (%)
Source: SIDBI, TransUnion CIBIL
Exhibit 6: In the mid ticket size segment, private lender witness superior asset quality compared to
peers Lender-wise NPL ratios for different range of ticket size, March fiscal year-ends, 1QFY19 (%)
Source: SIDBI, TransUnion CIBIL
0.0
3.2
6.4
9.6
12.8
16.0
Jun-16 Sep-16 Dec-16 Mar-17 Jun-17 Sep-17 Dec-17 Mar-18 Jun-18
Very small (<1 mn) Micro 1 (1-5 mn)
Micro 2 (5-10mn) SME 1 (10-50 mn)
SME 2 (50-100 mn) MSME 3 (100-250 mn)
MSME loans to individuals (<250 mn)
1QFY17 2QFY17 3QFY17 4QFY17 1QFY18 2QFY18 3QFY18 4QFY18 1QFY19
NBFC 3.9 4.2 4.4 5.1 5.0 5.4 5.0 5.0 5.0
Private 3.6 3.4 4.2 4.1 4.0 3.9 3.8 3.9 3.9
PSB 13.0 13.4 14.3 14.3 14.5 14.3 14.2 14.4 15.2
PSU Private NBFC
<1 mn 5.0 3.7 2.3
1-5 mn 2.7 1.4 1.6
5-10 mn 2.6 1.3 1.1
10-50 mn 2.2 0.3 1.2
50-100 mn 4.5 0.9 2.1
100-250 mn 5.6 3.4 2.1

Banks India
KOTAK INSTITUTIONAL EQUITIES RESEARCH 13
Exhibit 7: Marginal shift in MSME portfolio towards better quality borrowers Break-up of MSME portfolio across banks, March fiscal year-ends, 1QFY18-1QFY18 (%)
Source: SIDBI, TransUnion CIBIL

For Private Circulation Only. FOR IMPORTANT INFORMATION ABOUT KOTAK SECURITIES’ RATING SYSTEM AND OTHER DISCLOSURES, REFER TO THE END OF THIS MATERIAL.
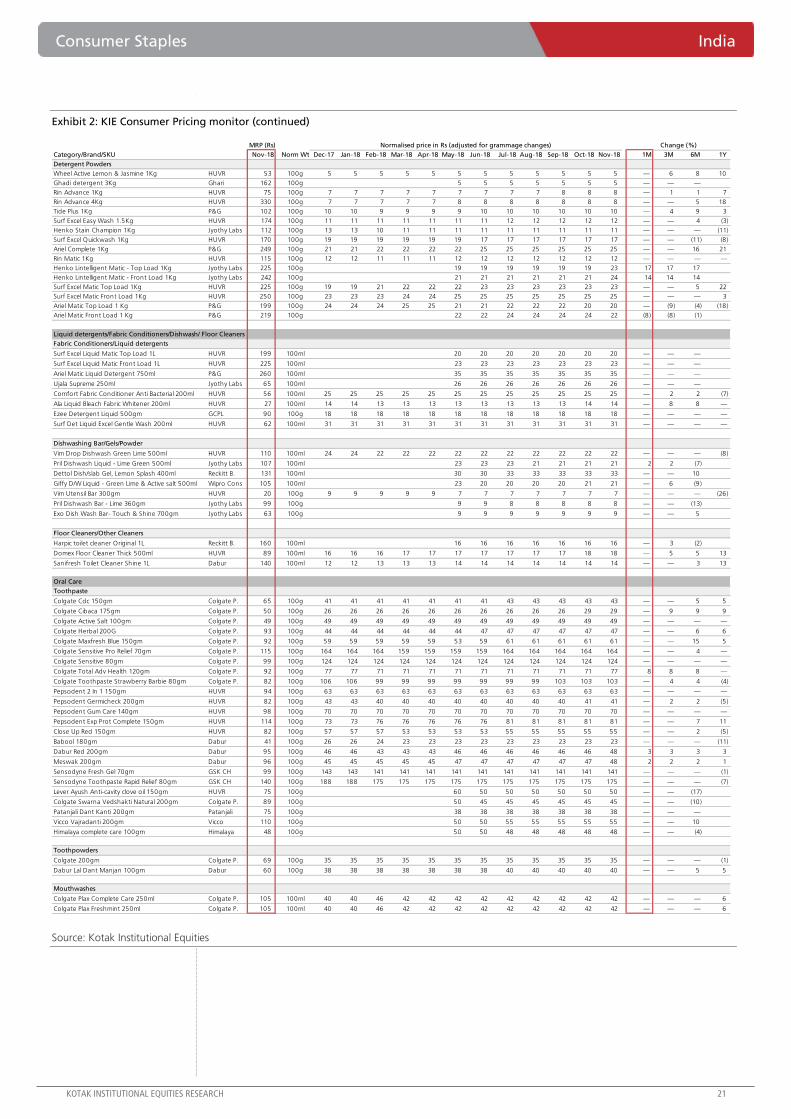
Pricing and promotions—price reduction in soaps in view of RM deflation
Refer to Exhibits 2 and 3 for pricing and promotional activity, respectively.
Soaps/detergents. We witness reduction in soap prices largely in multipacks (pack of 3-5
soaps); GCPL has cut prices of multipacks of Cinthol and Godrej No. 1 soaps by 6-7%.
Companies are passing on the benefit of RM deflation (palm oil prices down 19% over the past
six months) to drive volumes. We believe HUVR has also reduced prices on similar lines and
expect others to follow the suit. Promotional activity in detergents continues—HUVR and P&G
continue extra grammage/price cuts on 1-4 kg SKUs of premium variants of Surf and Ariel
(Exhibit 4). Jyothy has increased price of 1 kg SKUs of matics by 14-17% and introduced 50%
extra grammage. Pricing and promotions in the dish wash category were largely stable.
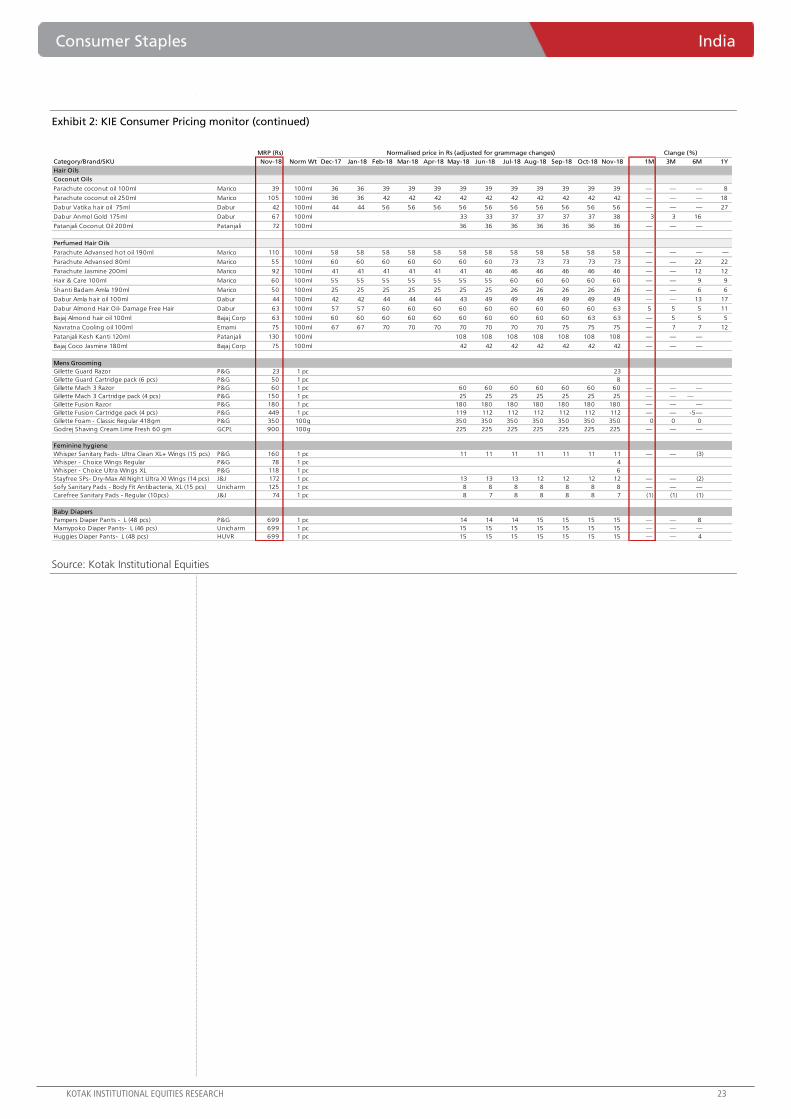
Personal care items. (1) Hair oils—pricing was largely stable across the board (copra prices
were flat mom in Nov 2018, down 23% yoy and cumulative drop of 30% since April) and
promotional activity was negligible. Dabur has increased price of Dabur Almond hair oil and
Dabur Anmol Gold coconut hair oil by 3-5%; we note that Marico, Bajaj Corp and Emami
have also increased prices of value-added hair oil variants/SKUs over the past 2-3 months,
(2) shampoos—we did not notice any incremental price intervention or promotions in
shampoos, and (3) oral care—Colgate has increased price of Colgate Total Advance Health
toothpaste by about 8% and Dabur has increased price of Meswak and Red by 2-3%.
We noticed step-up in in-store marketing in Modern Trade by HUVR— (1) HUVR has
provided lighted shelves highlighting functional aspects of several home care and personal
care products. We believe this initiative targets accelerated premiumization, and (2) we
witnessed LED display with promotional video of Dove hair care products.
Food/beverage items. (1) Biscuits—pricing and promotions were steady. Britannia and ITC
continue to offer extra grammage on several variants of Good Day and Mom’s Magic
biscuits, respectively, and (2) pricing and promotional activity is largely stable in tea/coffee,
edible oils, chocolates, juices, health/protein drinks and dairy products. ITC has reduced
grammage on Yippee mood masala variant of noodle translating into effective price increase
of 8%.
RM trends—mixed for agro-commodities; crude fall provides relief
Refer to Exhibit 4 for detailed RM inflation impact.
Agri-inputs. Agri commodities remained mixed in November. A rise of 6% mom was seen in
liquid milk prices while cocoa prices rose 3% mom. Moderate increase was seen in barley (up
2% mom) and India tea (up 2% mom). Wheat and corn prices stayed broadly flat for the
month. Some easing (down 1-2% mom) was seen in sugar and Robusta coffee.
Oil commodities basket. The highlight of the month was the sharp 19% mom collapse
seen in crude oil price. PFAD prices were down 19% mom, followed by palm oil (down 11%
mom), rice bran oil (down 7% mom) and sunflower oil (down 3% mom). Castor oil prices
were up 15% mom and kardi and groundnut oil were up 6% each; mentha oil was down
4% mom.
Consumer Staples India
Month in review—December 2018: price cuts in soaps/detergents. The KIE
consumer universe marginally outperformed broader markets, up 1% over the last
month. RM trends were mixed for agri-commodities while crude fall was a relief. On the
in-market activity front, we witnessed price reduction in multipacks of soaps, continued
promotions in detergents and modest price increases in hair oil and oral care. We retain
our ‘tread selectively’ stance; top picks: JUBI, CLGT, NEST, MRCO, BRIT and ITC.
CAUTIOUS
JANUARY 01, 2019
UPDATE
BSE-30: 36,255
Rohit Chordia
Jaykumar Doshi
Aniket Sethi

Consumer Staples India
KOTAK INSTITUTIONAL EQUITIES RESEARCH 15
Other commodities. Other commodities generally saw deflationary trends—domestic
styrene and VAM prices were down 9-14% mom, while both caustic soda and soda ash
prices declined 5% mom. Prices for LAB were up 2% mom while HDPE saw a modest 1%
mom correction; crude fall impact would be seen in these with a lag. Prices for most
other commodities were broadly flat.
Who benefits? (1) Lower crude oil prices should benefit HUL, GCPL, JYL, APNT and PIDI,
and (2) fall in caustic soda and soda ash prices should also help HUVR, GCPL and JYL.
Who gets impacted? (1) Increase in liquid milk prices could hurt Nestle, JUBI, BRIT and
GSK-CH, (2) increase in castor oil prices is negative for Marico, Dabur, Bajaj Corp and
APNT, and (3) increase in mentha oil prices hurts Emami, Colgate, HUVR and Dabur.
Sector (KIE consumer universe) outperforms broader markets
Our overall consumer coverage performed ahead of the broader markets over the past
month posting 1% return (flat, ex-ITC).
Key stocks that outperformed were—JYL (14%), UBBL (up 10%), CLGT (up 9%), GCPL (up
8%) and CDEL (up 6%). Key underperformers were Page (down 8%), UNSP (down 8%),
and PIDI (down 5%).
On a 12-month basis, the sector outperformed the broader markets posting 16% absolute
return (17% ex-ITC) versus 7% return for the broader markets. Our preferred picks—JUBI,
CLGT, NEST, MRCO, BRIT and ITC.

India Consumer Staples
16 KOTAK INSTITUTIONAL EQUITIES RESEARCH
New launches/relaunches
ITC launches Sunfeast Wonderz Milk, dairy beverage range in 4 flavours. ITC has
forayed into the ready-to-drink milk-based beverages with the launch of Sunfeast
Wonderz Milk in four variants—Fruit ‘n’ Milk (Mango), Fruit ‘n’ Milk (Mixed Fruit), Shakes
(Classic Vanilla) and NutShakes (Kesar Badam). While the two Fruit ‘n’ Milk variants would
be available in 200 ml bottles priced at `25, the Shakes variant would be available in 200
ml bottles priced at `30, and the Nut Shakes variant would be available in 200 ml bottles
priced at `35. The launch of the new brand will commence first in the states of Tamil
Nadu and Karnataka, which together account for nearly a quarter of the national market.
Dove launches body nourishment cream. Dove has launched a skin nourishment
cream in two variants—one of the variants is a non-greasy one. The product is priced at
`199 for 150 ml.
Tata Coffee launches a new premium coffee. Tata Coffee has launched a premium
Arabica coffee priced at `250 for 150 gm. It is primarily positioned for black coffee
drinkers.
Nivea launches new body lotion. Nivea has launched a new body lotion range
containing (three variants) containing different premium oils. It is being marketed under
the proposition of ‘oil in lotion’. The product is priced at `240 for 200 ml.
Emami launches a new face wash under BoroPlus. Emami has launched a zero oil and
zero pimple face wash under Boroplus. The product contains a unique formulation of
multanni mitti and neem providing relief for pimple problems. It is priced at `85 for a 100
ml tube (includes 20 ml promotional volume).
InnerBeing launches wide range of millet-based breakfast & snack mixes.
InnerBeing Wellness launched its millet-based breakfast and snack mixes, along with a
range of super grains like quinoa, foxtail millet and ragi multi-mix. Headquartered in
Hyderabad, the brand uses millets as main ingredients in their products, apart from other
natural and nourishing ingredients, like plant protein, chia seeds, sesame seeds, pumpkin
seeds, almonds and cashew nuts, among others.
Nestle India introduces Everyday Chai Life in three flavoured variants. Nestle India
has launched Everyday Chai Life in three flavours—Desi Masala, Saffron and Cardamom
and Ginger and Lemongrass. The instant chai will be available both in stores and via e-
commerce platforms in convenient sachet and easy to carry sachet in a cup formats,
priced at `20 and `30, respectively.
Marico unveils 2 variants of Coco Soul cold pressed virgin coconut oil. Marico has
introduced a range of Cold Pressed Virgin Coconut Oils under the brand name Coco Soul.
The USDA-certified range of products includes 100% organic and 100% natural variants.
It is available in 250 ml and 500 ml bottles along with a 500 ml jar.
Lavazza launches premium 100% Arabica blend iTierra! Colombia in India. Italian
coffee brand Lavazza launched iTierra! Colombia, a premium blend of coffee carefully
designed and crafted from 100% Arabica, for the away-from-home segment in India.
Keventer unveils UHT milk. Keventer, one of the fastest-growing food and beverage
companies in eastern India, launched Keventer UHT (ultra-high temperature) milk
prepared using Tetra Pak’s aseptic processing and packaging technology. Keventer Milk is
available in three pack sizes (200 ml, 500 ml and one-liter) in three variants—
standardized (thick and creamy), toned (daily use) and double-toned (low-calorie).
Consumer Staples India
KOTAK INSTITUTIONAL EQUITIES RESEARCH 17
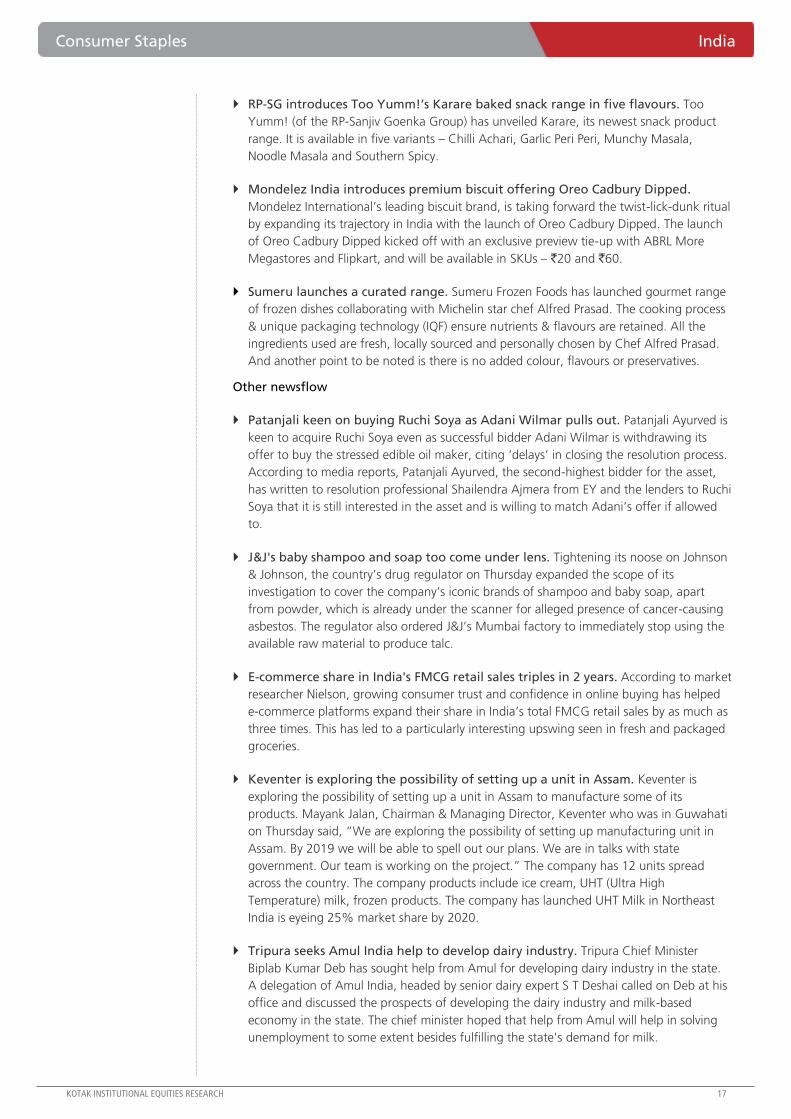
RP-SG introduces Too Yumm!’s Karare baked snack range in five flavours. Too
Yumm! (of the RP-Sanjiv Goenka Group) has unveiled Karare, its newest snack product
range. It is available in five variants – Chilli Achari, Garlic Peri Peri, Munchy Masala,
Noodle Masala and Southern Spicy.
Mondelez India introduces premium biscuit offering Oreo Cadbury Dipped.
Mondelez International’s leading biscuit brand, is taking forward the twist-lick-dunk ritual
by expanding its trajectory in India with the launch of Oreo Cadbury Dipped. The launch
of Oreo Cadbury Dipped kicked off with an exclusive preview tie-up with ABRL More
Megastores and Flipkart, and will be available in SKUs – `20 and `60.
Sumeru launches a curated range. Sumeru Frozen Foods has launched gourmet range
of frozen dishes collaborating with Michelin star chef Alfred Prasad. The cooking process
& unique packaging technology (IQF) ensure nutrients & flavours are retained. All the
ingredients used are fresh, locally sourced and personally chosen by Chef Alfred Prasad.
And another point to be noted is there is no added colour, flavours or preservatives.
Other newsflow
Patanjali keen on buying Ruchi Soya as Adani Wilmar pulls out. Patanjali Ayurved is
keen to acquire Ruchi Soya even as successful bidder Adani Wilmar is withdrawing its
offer to buy the stressed edible oil maker, citing ‘delays’ in closing the resolution process.
According to media reports, Patanjali Ayurved, the second-highest bidder for the asset,
has written to resolution professional Shailendra Ajmera from EY and the lenders to Ruchi
Soya that it is still interested in the asset and is willing to match Adani’s offer if allowed
to.
J&J's baby shampoo and soap too come under lens. Tightening its noose on Johnson
& Johnson, the country’s drug regulator on Thursday expanded the scope of its
investigation to cover the company’s iconic brands of shampoo and baby soap, apart
from powder, which is already under the scanner for alleged presence of cancer-causing
asbestos. The regulator also ordered J&J’s Mumbai factory to immediately stop using the
available raw material to produce talc.
E-commerce share in India's FMCG retail sales triples in 2 years. According to market
researcher Nielson, growing consumer trust and confidence in online buying has helped
e-commerce platforms expand their share in India’s total FMCG retail sales by as much as
three times. This has led to a particularly interesting upswing seen in fresh and packaged
groceries.
Keventer is exploring the possibility of setting up a unit in Assam. Keventer is
exploring the possibility of setting up a unit in Assam to manufacture some of its
products. Mayank Jalan, Chairman & Managing Director, Keventer who was in Guwahati
on Thursday said, “We are exploring the possibility of setting up manufacturing unit in
Assam. By 2019 we will be able to spell out our plans. We are in talks with state
government. Our team is working on the project.” The company has 12 units spread
across the country. The company products include ice cream, UHT (Ultra High
Temperature) milk, frozen products. The company has launched UHT Milk in Northeast
India is eyeing 25% market share by 2020.
Tripura seeks Amul India help to develop dairy industry. Tripura Chief Minister
Biplab Kumar Deb has sought help from Amul for developing dairy industry in the state.
A delegation of Amul India, headed by senior dairy expert S T Deshai called on Deb at his
office and discussed the prospects of developing the dairy industry and milk-based
economy in the state. The chief minister hoped that help from Amul will help in solving
unemployment to some extent besides fulfilling the state's demand for milk.

India Consumer Staples
18 KOTAK INSTITUTIONAL EQUITIES RESEARCH
Barista eyes more than doubling India store count in three years. According to
Barista CEO Puneet Gulati, Barista is looking to more than double its stores in India to
500 and also expand its FMCG reach to 10,000 outlets in the next 2-3 years. Barista,
which at present has over 200 Barista Cafes and Barista Express kiosks across India,
expects its FMCG offerings to account for up to 12% of its profits by FY2020 from about
5% at present.
Mother Dairy forays into organic food business. Mother Dairy has entered into the
`40 bn organic food business as part of its strategy to diversify product portfolio. The
company is targeting revenue of `500 mn in FY2020 and `1 bn in FY2021, Mother Dairy
Fruits and Vegetables Director Saugata Mitra said. To start with, Mother Dairy has
launched its organic range of fresh fruits and vegetables and other kitchen ingredients
under its horticulture brand Safal. The new range of products—labelled as ‘Safal
Organic’—is available in select 100 Safal booths across Delhi-NCR.

Consumer Staples India
KOTAK INSTITUTIONAL EQUITIES RESEARCH 19
Exhibit 1: A snapshot of new launches and key new promotional campaigns
Source: Company, Kotak Institutional Equities

India Consumer Staples
20 KOTAK INSTITUTIONAL EQUITIES RESEARCH
Exhibit 2: KIE Consumer Pricing monitor (continued)
Source: Kotak Institutional Equities
MRP (Rs)
Category/Brand/SKU Company Nov-18 Norm Wt Dec-17 Jan-18 Feb-18 Mar-18 Apr-18 May-18 Jun-18 Jul-18 Aug-18 Sep-18 Oct-18 Nov-18 1M 3M 6M 1Y
Soaps
Dove Moisturising Cream 3*100gm HUVR 172 100g 57 57 57 57 57 57 57 57 57 57 57 57 — — — —
Dove Moisturising Cream 75gm HUVR 49 100g 65 65 65 65 65 65 65 65 65 65 65 65 — — — —
Hamam 150gm HUVR 44 100g 31 31 31 30 30 30 29 29 29 29 29 29 — — (2) (5)
Lifebuoy Total 125gm HUVR 29 100g 22 22 22 22 22 22 22 22 23 23 23 23 — — 4 7
Lifebuoy Total 3*90gm HUVR 65 100g 22 22 24 24 24 24 24 24 24 24 24 24 — — — 11
Lux Creamy White 125gm HUVR 50 100g 40 40 40 40 40 40 40 40 40 40 40 40 — — — —
Pears Pure Gentle 3*125gm HUVR 164 100g 44 44 44 44 44 44 44 44 44 44 44 44 — — — —
Fiama Di Wills Mild Dew 3*115gm ITC 180 100g 39 39 40 40 40 39 39 39 39 52 52 52 — 33 33 29
Cinthol Original 4*100gm GCPL 125 100g 34 34 34 33 33 34 34 34 34 34 34 31 (7) (7) (7) (7)
Cinthol Soap Lime Fresh 4*75gm GCPL 75 100g 24 24 25 25 25 25 25 25 25 25 25 25 (1) (1) (1) 4
Godrej No 1 Lime & Aloevera (3+1) *100gm GCPL 68 100g 18 18 18 18 18 18 18 18 18 18 17 17 — (6) (6) (4)
Godrej No 1 Saffron & Milk Cream (3+1) *150gm GCPL 102 100g 18 18 18 18 18 16 16 16 17 17 17 17 — — 4 (6)
Ayush Purifying Turmeric Soap - 100 g HUVR 30 100g 30 30 30 30 30 30 30 — — —
Dettol soap Original 125 g Reckitt B. 50 100g 41 41 41 42 42 42 40 (6) (6) (2)
Santoor soap Sandal & Turmeric 4*100 g Wipro Cons 108 100g 26 26 26 27 27 27 27 — — 4
Patanjali soap Neem Kanti 75 g Patanjali 15 100g 20 20 20 20 20 20 20 — — —
Margo soap Original neem 2*100 gm Jyothy Labs 56 100g 24 24 28 28 28 28 28 — — 17
Shower Gels/Facewash/Handwash/Bodywash
Facewashes
Pears Pure & Gentle 60gm HUVR 125 100g 200 200 192 192 192 208 208 200 208 208 208 208 — — — 4
Lakme Blush and Glow Strawberry gel 50ml HUVR 99 100ml 198 198 198 198 198 198 198 198 198 198 198 198 — — — —
Lakme Face Clnsr Deep Pore Cleanser 120ml HUVR 230 100ml 158 158 158 158 158 192 192 192 192 192 192 192 — — — 21
Dove Beauty Moisture 50gm HUVR 125 100g 210 210 240 240 240 250 250 270 270 270 270 250 (7) (7) — 19
Ponds Face Wash Daily 100G HUVR 140 100g 119 119 119 119 119 140 140 140 140 140 140 140 — — — 17
Fair & Lovely Fairness 50gm HUVR 60 100g 110 110 110 110 110 110 110 110 110 110 110 120 9 9 9 9
Olay Cleanser Total Effects Anti Ageing 100gm P&G 269 100g 260 260 269 269 269 269 269 269 269 269 269 269 — — — 3
Himalaya Face Wash - Purifying Neem 100 ml Himalaya 120 100ml 117 117 117 117 117 117 120 3 3 3
Clean & Clear Natural Bright 100ml J&J 117 100ml 110 110 117 117 117 117 117 — — 6
Garnier- Power White, Double Action 100ml L'Oreal 180 100ml 180 180 180 180 180 180 180 — — —
Handwash
Lifebuoy Total 10 Pump 190ml HUVR 82 100ml 38 38 36 36 36 36 43 43 43 43 43 43 — — 19 13
Dettol - Germ Protection, Original Pump 200ml Reckitt B. 99 100ml 44 44 44 48 48 48 50 4 4 14
Godrej Protekt Masterblaster Pump 300ml GCPL 89 100ml 30 30 30 30 30 30 30 — — —
Savlon Double Strength Pump 220ml ITC 80 100ml 34 36 36 36 36 36 36 — — 8
Lifebuoy Total 10 Refill 750ml HUVR 175 100ml 23 23 23 23 23 23 23 — — 1
Dettol - Germ Protection, Original Refill 750ml Reckitt B. 109 100ml 13 13 15 15 15 15 15 — — 10
Godrej Protekt Masterblaster Refill 750ml GCPL 99 100ml 15 13 13 13 13 13 13 — — (14)
Savlon Double Strength Pump Refill 750ml ITC 99 100ml 23 23 23 23 23 23 13 (41) (41) (41)
Bodywash/ Shower Gels
Palmolive Absolute Relaxing 250ml Colgate P. 180 100ml 76 76 76 76 76 72 72 60 72 72 72 72 — — — (5)
Fiama Di Wills Lemongrass & Jojoba (Clr Sprng) 250mlITC 199 100ml 80 80 80 80 80 80 80 80 80 80 80 80 — — — (0)
Lux Velvet Touch Moisturising 235ml HUVR 99 100ml 41 41 41 41 41 42 42 42 42 42 42 42 — — — 2
Pears Pure & Gentle 250M HUVR 180 100ml 74 74 74 74 74 72 72 72 72 72 72 72 — — — (3)
Cinthol Play Refreshing 200ml GCPL 150 100ml 60 60 60 75 75 75 75 75 75 75 75 75 — — — 25
Dove Deeply Nourishing 190ml HUVR 140 100ml 52 52 52 74 74 74 74 — — 41
Nivea - Lemon & Oil 250ml Nivea 199 100ml 80 80 80 80 80 80 80 — — —
Detergents
Detergent Bars
Wheel Active 120gm HUVR 5 100g 4 4 4 4 4 4 4 4 4 4 4 4 — — — 8
Rin Advance 75gm HUVR 5 100g 6 6 7 7 7 7 7 7 7 7 7 7 — — — 7
Rin Advance 145gm HUVR 10 100g 6 6 7 7 7 7 7 7 7 7 7 7 — — — 14
Rin Advance 250gm HUVR 17 100g 6 6 6 6 6 6 6 6 6 6 7 7 — 6 6 9
Surf Excel Bar 100gm HUVR 10 100g 10 10 10 10 10 10 10 10 10 10 10 10 — — — 5
Surf Excel 250gm HUVR 27 100g 10 10 10 10 10 10 10 10 11 11 11 11 — — 4 8
Surf Excel Det Bar 400gm HUVR 50 100g 12 12 12 13 13 13 13 13 13 13 13 13 — — — 4
Sunlight 150gm HUVR 20 100g 13 13 14 13 13 13 13 — — —
Change (%)Normalised price in Rs (adjusted for grammage changes)
Consumer Staples India
KOTAK INSTITUTIONAL EQUITIES RESEARCH 21
Exhibit 2: KIE Consumer Pricing monitor (continued)
Source: Kotak Institutional Equities
MRP (Rs)
Category/Brand/SKU Nov-18 Norm Wt Dec-17 Jan-18 Feb-18 Mar-18 Apr-18 May-18 Jun-18 Jul-18 Aug-18 Sep-18 Oct-18 Nov-18 1M 3M 6M 1Y
Detergent Powders
Wheel Active Lemon & Jasmine 1Kg HUVR 53 100g 5 5 5 5 5 5 5 5 5 5 5 5 — 6 8 10
Ghadi detergent 3Kg Ghari 162 100g 5 5 5 5 5 5 5 — — —
Rin Advance 1Kg HUVR 75 100g 7 7 7 7 7 7 7 7 7 8 8 8 — 1 1 7
Rin Advance 4Kg HUVR 330 100g 7 7 7 7 7 8 8 8 8 8 8 8 — — 5 18
Tide Plus 1Kg P&G 102 100g 10 10 9 9 9 9 10 10 10 10 10 10 — 4 9 3
Surf Excel Easy Wash 1.5Kg HUVR 174 100g 11 11 11 11 11 11 11 12 12 12 12 12 — — 4 (3)
Henko Stain Champion 1Kg Jyothy Labs 112 100g 13 13 10 11 11 11 11 11 11 11 11 11 — — — (11)
Surf Excel Quickwash 1Kg HUVR 170 100g 19 19 19 19 19 19 17 17 17 17 17 17 — — (11) (8)
Ariel Complete 1Kg P&G 249 100g 21 21 22 22 22 22 25 25 25 25 25 25 — — 16 21
Rin Matic 1Kg HUVR 115 100g 12 12 11 11 11 12 12 12 12 12 12 12 — — — —
Henko Lintelligent Matic - Top Load 1Kg Jyothy Labs 225 100g 19 19 19 19 19 19 23 17 17 17
Henko Lintelligent Matic - Front Load 1Kg Jyothy Labs 242 100g 21 21 21 21 21 21 24 14 14 14
Surf Excel Matic Top Load 1Kg HUVR 225 100g 19 19 21 22 22 22 23 23 23 23 23 23 — — 5 22
Surf Excel Matic Front Load 1Kg HUVR 250 100g 23 23 23 24 24 25 25 25 25 25 25 25 — — — 3
Ariel Matic Top Load 1 Kg P&G 199 100g 24 24 24 25 25 21 21 22 22 22 20 20 — (9) (4) (18)
Ariel Matic Front Load 1 Kg P&G 219 100g 22 22 24 24 24 24 22 (8) (8) (1)
Liquid detergents/Fabric Conditioners/Dishwash/ Floor Cleaners
Fabric Conditioners/Liquid detergents
Surf Excel Liquid Matic Top Load 1L HUVR 199 100ml 20 20 20 20 20 20 20 — — —
Surf Excel Liquid Matic Front Load 1L HUVR 225 100ml 23 23 23 23 23 23 23 — — —
Ariel Matic Liquid Detergent 750ml P&G 260 100ml 35 35 35 35 35 35 35 — — —
Ujala Supreme 250ml Jyothy Labs 65 100ml 26 26 26 26 26 26 26 — — —
Comfort Fabric Conditioner Anti Bacterial 200ml HUVR 56 100ml 25 25 25 25 25 25 25 25 25 25 25 25 — 2 2 (7)
Ala Liquid Bleach Fabric Whitener 200ml HUVR 27 100ml 14 14 13 13 13 13 13 13 13 13 14 14 — 8 8 —
Ezee Detergent Liquid 500gm GCPL 90 100g 18 18 18 18 18 18 18 18 18 18 18 18 — — — —
Surf Det Liquid Excel Gentle Wash 200ml HUVR 62 100ml 31 31 31 31 31 31 31 31 31 31 31 31 — — — —
Dishwashing Bar/Gels/Powder
Vim Drop Dishwash Green Lime 500ml HUVR 110 100ml 24 24 22 22 22 22 22 22 22 22 22 22 — — — (8)
Pril Dishwash Liquid - Lime Green 500ml Jyothy Labs 107 100ml 23 23 23 21 21 21 21 2 2 (7)
Dettol Dish/slab Gel, Lemon Splash 400ml Reckitt B. 131 100ml 30 30 33 33 33 33 33 — — 10
Giffy D/W Liquid - Green Lime & Active salt 500ml Wipro Cons 105 100ml 23 20 20 20 20 21 21 — 6 (9)
Vim Utensil Bar 300gm HUVR 20 100g 9 9 9 9 9 7 7 7 7 7 7 7 — — — (26)
Pril Dishwash Bar - Lime 360gm Jyothy Labs 99 100g 9 9 8 8 8 8 8 — — (13)
Exo Dish Wash Bar- Touch & Shine 700gm Jyothy Labs 63 100g 9 9 9 9 9 9 9 — — 5
Floor Cleaners/Other Cleaners
Harpic toilet cleaner Original 1L Reckitt B. 160 100ml 16 16 16 16 16 16 16 — 3 (2)
Domex Floor Cleaner Thick 500ml HUVR 89 100ml 16 16 16 17 17 17 17 17 17 17 18 18 — 5 5 13
Sanifresh Toilet Cleaner Shine 1L Dabur 140 100ml 12 12 13 13 13 14 14 14 14 14 14 14 — — 3 13
Oral Care
Toothpaste
Colgate Cdc 150gm Colgate P. 65 100g 41 41 41 41 41 41 41 43 43 43 43 43 — — 5 5
Colgate Cibaca 175gm Colgate P. 50 100g 26 26 26 26 26 26 26 26 26 26 29 29 — 9 9 9
Colgate Active Salt 100gm Colgate P. 49 100g 49 49 49 49 49 49 49 49 49 49 49 49 — — — —
Colgate Herbal 200G Colgate P. 93 100g 44 44 44 44 44 44 47 47 47 47 47 47 — — 6 6
Colgate Maxfresh Blue 150gm Colgate P. 92 100g 59 59 59 59 59 53 59 61 61 61 61 61 — — 15 5
Colgate Sensitive Pro Relief 70gm Colgate P. 115 100g 164 164 164 159 159 159 159 164 164 164 164 164 — — 4 —
Colgate Sensitive 80gm Colgate P. 99 100g 124 124 124 124 124 124 124 124 124 124 124 124 — — — —
Colgate Total Adv Health 120gm Colgate P. 92 100g 77 77 71 71 71 71 71 71 71 71 71 77 8 8 8 —
Colgate Toothpaste Strawberry Barbie 80gm Colgate P. 82 100g 106 106 99 99 99 99 99 99 99 103 103 103 — 4 4 (4)
Pepsodent 2 In 1 150gm HUVR 94 100g 63 63 63 63 63 63 63 63 63 63 63 63 — — — —
Pepsodent Germicheck 200gm HUVR 82 100g 43 43 40 40 40 40 40 40 40 40 41 41 — 2 2 (5)
Pepsodent Gum Care 140gm HUVR 98 100g 70 70 70 70 70 70 70 70 70 70 70 70 — — — —
Pepsodent Exp Prot Complete 150gm HUVR 114 100g 73 73 76 76 76 76 76 81 81 81 81 81 — — 7 11
Close Up Red 150gm HUVR 82 100g 57 57 57 53 53 53 53 55 55 55 55 55 — — 2 (5)
Babool 180gm Dabur 41 100g 26 26 24 23 23 23 23 23 23 23 23 23 — — — (11)
Dabur Red 200gm Dabur 95 100g 46 46 43 43 43 46 46 46 46 46 46 48 3 3 3 3
Meswak 200gm Dabur 96 100g 45 45 45 45 45 47 47 47 47 47 47 48 2 2 2 1
Sensodyne Fresh Gel 70gm GSK CH 99 100g 143 143 141 141 141 141 141 141 141 141 141 141 — — — (1)
Sensodyne Toothpaste Rapid Relief 80gm GSK CH 140 100g 188 188 175 175 175 175 175 175 175 175 175 175 — — — (7)
Lever Ayush Anti-cavity clove oil 150gm HUVR 75 100g 60 50 50 50 50 50 50 — — (17)
Colgate Swarna Vedshakti Natural 200gm Colgate P. 89 100g 50 45 45 45 45 45 45 — — (10)
Patanjali Dant Kanti 200gm Patanjali 75 100g 38 38 38 38 38 38 38 — — —
Vicco Vajradanti 200gm Vicco 110 100g 50 50 55 55 55 55 55 — — 10
Himalaya complete care 100gm Himalaya 48 100g 50 50 48 48 48 48 48 — — (4)
Toothpowders
Colgate 200gm Colgate P. 69 100g 35 35 35 35 35 35 35 35 35 35 35 35 — — — (1)
Dabur Lal Dant Manjan 100gm Dabur 60 100g 38 38 38 38 38 38 38 40 40 40 40 40 — — 5 5
Mouthwashes
Colgate Plax Complete Care 250ml Colgate P. 105 100ml 40 40 46 42 42 42 42 42 42 42 42 42 — — — 6
Colgate Plax Freshmint 250ml Colgate P. 105 100ml 40 40 46 42 42 42 42 42 42 42 42 42 — — — 6
Change (%)Normalised price in Rs (adjusted for grammage changes)

India Consumer Staples
22 KOTAK INSTITUTIONAL EQUITIES RESEARCH
Exhibit 2: KIE Consumer Pricing monitor (continued)
Source: Kotak Institutional Equities
MRP (Rs)
Category/Brand/SKU Nov-18 Norm Wt Dec-17 Jan-18 Feb-18 Mar-18 Apr-18 May-18 Jun-18 Jul-18 Aug-18 Sep-18 Oct-18 Nov-18 1M 3M 6M 1Y
Shampoo bottles
Clear Active Care Anti Dandruff 80ml HUVR 65 100ml 75 75 75 81 81 81 81 81 81 81 81 81 — — — 8
Clinic Plus Anti Dandruff 80ml HUVR 45 100ml 56 56 56 56 56 56 56 56 56 56 56 56 — — — —
Dove Dandruff Care 80ml HUVR 68 100ml 75 75 85 85 85 85 85 85 85 85 85 85 — — — 13
Patanjali Kesh Kanti Anti-Dandruff 200ml Patanjali 110 100ml 55 55 55 55 55 55 55 — — —
Pure Derm Dandruff Protect 80ml HUVR 65 100ml 81 81 81 81 81 81 81 — — —
Tresemme Hair Fall Defense 185ml HUVR 105 100ml 67 67 73 73 73 55 55 55 55 55 55 55 — — — (17)
Head & Shoulders Anti Hair Fall 170ml P&G 145 100ml 97 97 81 81 81 81 81 81 81 81 81 81 — — — (17)
Pantene Hair Fall Control 340ml P&G 220 100ml 67 67 67 64 64 65 65 65 65 65 65 65 — — — (3)
Pure Derm Anti Hairfall 180ml HUVR 135 100ml 75 75 75 75 75 75 75 — — —
Clinic Plus Shmp Strong & Long 80ml HUVR 45 100ml 56 56 50 50 50 50 50 50 50 50 50 50 — — — (11)
Dove Daily Shine 80ml HUVR 62 100ml 78 78 78 78 78 78 78 78 78 78 78 78 — — — —
Sunsilk Black Shine 80ml HUVR 50 100ml 63 63 63 63 63 63 63 63 63 63 63 63 — — — —
Head & Shoulders Smooth & Silky 180ml P&G 145 100ml 97 97 88 81 81 81 81 81 81 81 81 81 — — — (17)
Pantene Long Black 180ml P&G 115 100ml 67 67 67 67 67 67 67 67 67 64 64 64 — (4) (4) (4)
Dabur Shmp Vatika Black Shine Amla 180ml Dabur 108 100ml 62 62 62 62 52 52 52 60 60 60 60 60 — — 16 (4)
Loreal Paris Total Repair 5 175ml L'oreal 135 100ml 77 77 77 77 77 77 77 — — —
Himalaya Protein- Gentle Daily Care 200ml Himalaya 128 100ml 64 64 64 64 64 64 64 — — —
Patanjali Kesh Kanti Natural Cleanser 200ml Patanjali 75 100ml 38 38 38 38 38 38 38 — — —
Skin Creams/Lotions/Talcs
Face Creams/Fairness Creams/Facial Cleanser
Fair & Lovely Advanced Multi Vitamin 50gm HUVR 95 100g 192 192 186 186 186 186 186 190 190 190 190 190 — — 2 (1)
DABUR Gulabari Premium Rose water 120ml Dabur 199 100g 35 35 35 35 35 35 38 38 38 38 38 38 — — 7 7
Nivea Crème 100ml Nivea 45 100ml 135 135 135 135 135 135 129 (4) (4) (4)
Nivea Soft Light Moisturiser 100ml Nivea 129 100ml 150 150 150 150 150 150 150 — — —
Ponds Light Light Moisturiser 150ml HUVR 150 100ml 133 133 133 133 133 133 133 — — —
Fair & Handsome Whitening Cream, Laser 12 15g Emami 50 100g 333 333 333 333 333 333 333 — — —
Anti-Ageing/Special Creams
Ponds Age Miracle Day Cream 50gm HUVR 649 100g 1,150 1,150 1,150 1,150 1,298 1,298 1,298 1,298 1,298 1,298 1,298 1,298 — — — 13
Olay Age Protect Anti Ageing Cream 40gm Olay 329 100g 725 725 823 873 873 873 873 823 823 823 823 823 — — (6) 13
Olay Skin Total Effect Normal Cream 50gm Olay 849 100g 1,598 1,598 1,698 1,698 1,698 1,698 1,698 1,698 1,698 1,698 1,698 1,698 — — — 6
Body Lotions
Lakme Peach Milk Moisture 200ml HUVR 310 100ml 155 155 155 155 155 155 155 155 155 155 155 155 — — — —
Dove Go Fresh Normal Skin 400ml HUVR 430 100ml 93 93 100 100 100 100 100 100 100 108 108 108 — 8 8 16
Ponds Drm Flower 100ml HUVR 81 100ml 81 81 81 81 81 81 81 81 81 81 81 81 — — — —
Vaseline Healthy White 100ml HUVR 115 100ml 95 95 99 99 99 99 99 99 99 99 99 115 16 16 16 21
Talcs
Navratna Cool, Active Deo 100gm Emami 68 100g 68 68 68 68 68 68 68 — — —
AXE Talc Dark Temptation 100gm HUVR 65 100g 65 65 65 63 63 63 63 63 63 63 63 65 3 3 3 —
Ponds Talc Dream Flower Pink 100gm HUVR 78 100g 76 76 76 76 76 76 78 78 78 78 78 78 — — 3 3
Cinthol Talc Original 100gm GCPL 55 100g 55 55 55 55 55 55 55 55 55 55 55 55 — — — —
Deodorants / Air Freshners
Deodorants
Axe Dark Temptation 150ml HUVR 190 100ml 127 127 127 127 127 127 127 127 127 127 127 127 — — — (5)
Axe Deo Pulse 150ml HUVR 190 100ml 133 133 127 127 127 127 127 127 127 127 127 127 — — — (5)
Cinthol Deo Spray Dive 150ml GCPL 195 100ml 130 130 130 130 130 130 130 130 130 130 130 130 — — — —
Set Wet Deospray Rave 150ml Marico 149 100ml 99 99 99 99 99 99 99 99 99 99 99 99 — — — —
Fogg Fresh Spicy Block 150ml Vini 275 100ml 183 183 183 183 183 183 183 — — —
Engage Deo Spray - Urge 150ml ITC 190 100ml 130 127 127 127 127 127 127 — — (3)
Wild Stone Deo Red 150ml McNROE 199 100ml 133 133 133 133 133 133 133 — — —
Air Fresheners
Aer Freshner Car Cool Surf Blue Bx 45ml GCPL 379 100ml 582 582 632 632 632 842 842 842 842 842 842 842 — — — 45
Aer Freshner Cool Surf Blue Cn 300ml GCPL 149 100ml 47 47 50 50 50 50 50 50 50 50 50 50 — — — 6
Godrej aer Pocket Bathroom Fragrance 10gm GCPL 55 50 50 55 55 55 55 55 — — 10
Odonil Zipper Bathroom Air Freshener 10gm Dabur 50 45 45 45 45 45 50 50 — 11 11
Odonil Room Spray Home Freshener 200gm Dabur 140 100g 70 70 75 75 75 75 70 (6) (6) —
Home Insecticides
Coils/Machine/Mats
GK Mosquto Coil Low Smoke 12Hrs - 10 Coils GCPL 33 32 32 33 33 33 33 33 33 33 33 33 33 — — — 3
Goodknight (GK) Machine Activ Combi GCPL 85 99 99 85 85 85 85 85 85 85 85 85 85 — — — (14)
Goodknight (GK) Mat Silver Power 30P GCPL 60 54 54 54 54 54 54 54 54 60 60 60 60 — — 11 11
Mortein PowerGard 12 Hrs 10 Coils Reckitt B. 32 32 32 32 32 32 32 32 — — —
GK Activ + Liquid Ref - Lavender 45 ml (45 nights) GCPL 72 72 72 72 72 72 72 72 — — —
All Out Floral Refill - Power Plus 45 ml (45 nights) SC Johnson 72 72 72 72 72 72 72 72 — — —
Maxo Mosquito Repellent liquid 45 ml (45 nights) Jyothy Labs 67 67 67 67 67 67 67 67 — — —
Sprays/Aerosols
Hit Spray Cockroach Champion 320ml GCPL 160 100ml 43 43 47 47 47 47 48 50 50 50 50 50 — — 7 15
Creams/Lotions
Good Knight Cool Gel 50gm GCPL 45 150 150 150 90 90 90 90 — — (40)
Odomos Mosquito Cream Natural 50gm Dabur 48 100g 94 94 94 94 94 94 94 94 96 96 96 96 — — 2 2
Normalised price in Rs (adjusted for grammage changes) CIange (%)
Consumer Staples India
KOTAK INSTITUTIONAL EQUITIES RESEARCH 23
Exhibit 2: KIE Consumer Pricing monitor (continued)
Source: Kotak Institutional Equities
MRP (Rs)
Category/Brand/SKU Nov-18 Norm Wt Dec-17 Jan-18 Feb-18 Mar-18 Apr-18 May-18 Jun-18 Jul-18 Aug-18 Sep-18 Oct-18 Nov-18 1M 3M 6M 1Y
Hair Oils
Coconut Oils
Parachute coconut oil 100ml Marico 39 100ml 36 36 39 39 39 39 39 39 39 39 39 39 — — — 8
Parachute coconut oil 250ml Marico 105 100ml 36 36 42 42 42 42 42 42 42 42 42 42 — — — 18
Dabur Vatika hair oil 75ml Dabur 42 100ml 44 44 56 56 56 56 56 56 56 56 56 56 — — — 27
Dabur Anmol Gold 175ml Dabur 67 100ml 33 33 37 37 37 37 38 3 3 16
Patanjali Coconut Oil 200ml Patanjali 72 100ml 36 36 36 36 36 36 36 — — —
Perfumed Hair Oils
Parachute Advansed hot oil 190ml Marico 110 100ml 58 58 58 58 58 58 58 58 58 58 58 58 — — — —
Parachute Advansed 80ml Marico 55 100ml 60 60 60 60 60 60 60 73 73 73 73 73 — — 22 22
Parachute Jasmine 200ml Marico 92 100ml 41 41 41 41 41 41 46 46 46 46 46 46 — — 12 12
Hair & Care 100ml Marico 60 100ml 55 55 55 55 55 55 55 60 60 60 60 60 — — 9 9
Shanti Badam Amla 190ml Marico 50 100ml 25 25 25 25 25 25 25 26 26 26 26 26 — — 6 6
Dabur Amla hair oil 100ml Dabur 44 100ml 42 42 44 44 44 43 49 49 49 49 49 49 — — 13 17
Dabur Almond Hair Oil- Damage Free Hair Dabur 63 100ml 57 57 60 60 60 60 60 60 60 60 60 63 5 5 5 11
Bajaj Almond hair oil 100ml Bajaj Corp 63 100ml 60 60 60 60 60 60 60 60 60 60 63 63 — 5 5 5
Navratna Cooling oil 100ml Emami 75 100ml 67 67 70 70 70 70 70 70 70 75 75 75 — 7 7 12
Patanjali Kesh Kanti 120ml Patanjali 130 100ml 108 108 108 108 108 108 108 — — —
Bajaj Coco Jasmine 180ml Bajaj Corp 75 100ml 42 42 42 42 42 42 42 — — —
Mens Grooming
Gillette Guard Razor P&G 23 1 pc 23
Gillette Guard Cartridge pack (6 pcs) P&G 50 1 pc 8
Gillette Mach 3 Razor P&G 60 1 pc 60 60 60 60 60 60 60 — — —
Gillette Mach 3 Cartridge pack (4 pcs) P&G 150 1 pc 25 25 25 25 25 25 25 — — —
Gillette Fusion Razor P&G 180 1 pc 180 180 180 180 180 180 180 — — —
Gillette Fusion Cartridge pack (4 pcs) P&G 449 1 pc 119 112 112 112 112 112 112 — — -5—
Gillette Foam - Classic Regular 418gm P&G 350 100g 350 350 350 350 350 350 350 0 0 0
Godrej Shaving Cream Lime Fresh 60 gm GCPL 900 100g 225 225 225 225 225 225 225 — — —
Feminine hygiene
Whisper Sanitary Pads- Ultra Clean XL+ Wings (15 pcs) P&G 160 1 pc 11 11 11 11 11 11 11 — — (3)
Whisper - Choice Wings Regular P&G 78 1 pc 4
Whisper - Choice Ultra Wings XL P&G 118 1 pc 6
Stayfree SPs- Dry-Max All Night Ultra Xl Wings (14 pcs) J&J 172 1 pc 13 13 13 12 12 12 12 — — (2)
Sofy Sanitary Pads - Body Fit Antibacteria, XL (15 pcs) Unicharm 125 1 pc 8 8 8 8 8 8 8 — — —
Carefree Sanitary Pads - Regular (10pcs) J&J 74 1 pc 8 7 8 8 8 8 7 (1) (1) (1)
Baby Diapers
Pampers Diaper Pants - L (48 pcs) P&G 699 1 pc 14 14 14 15 15 15 15 — — 8
Mamypoko Diaper Pants- L (46 pcs) Unicharm 699 1 pc 15 15 15 15 15 15 15 — — —
Huggies Diaper Pants- L (48 pcs) HUVR 699 1 pc 15 15 15 15 15 15 15 — — 4
Normalised price in Rs (adjusted for grammage changes) CIange (%)

India Consumer Staples
24 KOTAK INSTITUTIONAL EQUITIES RESEARCH
Exhibit 2: KIE Consumer Pricing monitor (continued)
Source: Kotak Institutional Equities
MRP (Rs)
Category/Brand/SKU Nov-18 Norm Wt Dec-17 Jan-18 Feb-18 Mar-18 Apr-18 May-18 Jun-18 Jul-18 Aug-18 Sep-18 Oct-18 Nov-18 1M 3M 6M 1Y
Edible Oils
Saffola Kardi Oil - 1L Marico 200 100ml 20 20 20 20 20 20 20 20 20 20 20 20 — — 3 3
Saffola Tasty Blend - 1L Marico 135 100ml 13 13 13 13 13 13 14 14 14 14 14 14 — — 4 4
Saffola Gold - 1L Marico 159 100ml 15 15 15 15 15 15 16 16 16 16 16 16 — — 6 6
Saffola Active - 1L Marico 135 100ml 13 13 13 13 13 13 13 13 13 14 14 14 — 4 4 4
Sundrop Heart - 1L Marico 210 100ml 21 21 21 21 21 21 21 21 21 21 21 21 — — 2 2
Sundrop Nutrilite - 1L Marico 135 100ml 13 13 13 13 13 13 13 13 14 14 14 14 — — 2 2
Sundrop Superlite Advanced -1L Marico 195 100ml 16 16 16 16 16 16 16 16 16 16 16 16 — — 2 2
Sundrop Goldlite -1L Marico 140 100ml 14 14 14 14 14 14 14 14 14 14 14 14 — — 2 2
Fortune Vivo- 1L Adani Wilmar 150 100ml 15 15 15 15 15 15 15 — — 3
Emami Rice bran oil- 1L Emami 110 100ml 9 9 10 11 11 11 11 — — 20
Tea/ Coffee
Tea
Red Label ctc 1kg HUVR 430 100g 41 41 41 41 41 41 41 41 43 43 43 43 — — 5 5
Society Tea 1kg Amar Tea 415 100g 42 42 42 42 42 42 42 — — —
Red Label Natural Care Box 500gm HUVR 260 100g 48 48 48 48 48 50 50 50 50 50 52 52 4 4 4 8
Tajmahal Ctc Box 250gm HUVR 140 100g 53 53 56 56 56 56 56 56 56 56 56 56 — — — 6
Agni Ctc Leaves 1kg TGBL 220 100g 20 20 20 20 20 20 20 20 22 22 22 22 — — 10 10
Tata Ctc Gold 1kg TGBL 440 100g 42 42 42 42 42 42 42 42 44 44 44 44 — — 5 5
Wagh Bakri Leaf Tea - Premium 1kg Wagh Bakri 425 100g 41 41 41 41 41 41 43 4 4 4
Tea Bags/ Green Tea
Taj Mahal Tea Darjeeling Green Bag 10P HUVR 60 60 60 60 60 60 60 60 60 60 60 60 60 — — — —
Taj Mahal Tea Masala Flavoured Bags 10P HUVR 55 55 55 55 55 55 55 55 55 55 55 55 55 — — — —
Tata Tetly Tea Bag 25P TGBL 50 50 50 50 50 50 50 50 50 50 50 50 50 — — — —
Tata Tetly Tea Bag Grn Regular 10P TGBL 60 60 60 60 60 60 60 60 60 60 60 60 60 — — — —
Tata Tetley Green Tea Bag 30P TGBL 140 160 160 160 140 140 140 140 140 140 140 140 140 — — — (13)
Lipton Tea Bag Clear Green Jasmine 10P HUVR 60 55 55 55 60 60 60 60 60 60 60 60 60 — — — 9
Iced Tea
Lipton Instant Mix Ice Tea Lemon Pp 500gm HUVR 130 100g 52 52 52 52 52 52 52 52 52 52 52 52 — — — —
Nestea Ice Tea Lemon 500gm Nestle 165 100g 28 28 33 33 33 33 33 33 33 33 33 33 — — — 18
Coffee
Bru Gold Jar 100gm HUVR 245 100g 245 245 245 245 245 245 245 245 245 245 245 245 — — — (8)
Bru Instant Jar 100gm HUVR 165 100g 165 165 165 165 165 165 165 165 165 165 165 165 — — — (3)
Nescafe Classic Box 200gm Nestle 440 100g 220 220 220 220 220 220 220 220 220 220 220 220 — — — —
Nescafe Classic 50gm Nestle 130 100g 260 260 260 260 260 260 260 260 260 260 260 260 — — — —
Sunrise Premium Jar 50gm Nestle 80 100g 200 200 200 160 160 160 160 160 160 160 160 160 — — — (20)
Dairy
Milk/Condensed Milk/ Milk Powder
Nestle Condmilk Milkmaid 400gm Nestle 113 100g 28 28 28 28 28 28 28 28 28 28 28 28 — — — (5)
Nestle Milk Slim 1L Nestle 80 100ml 8 8 8 8 8 8 8 8 8 8 8 8 — — — —
Nestle Milk Toned A+ 1L Nestle 75 100ml 8 8 8 8 8 8 8 8 8 8 8 8 — — — —
Britannia Milk 1L Britannia 75 100ml 8 8 8 8 8 8 8 8 8 8 8 8 — — — —
Britannia Milk Slimz 1L Britannia 69 100ml 7 7 7 7 7 7 7 7 7 7 7 7 — — — —
Amul Taaza 1L Amul 60 100ml 6 6 6 6 6 6 6 6 6 6 6 6 — — (3) —
Amul Gold 1L Amul 64 100ml 6 6 7 7 7 7 6 6 6 6 6 6 — — (3) —
Amul Lite 1L Amul 72 100ml 6 6 7 7 7 7 7 7 7 7 7 7 — — — 24
Everyday Milkpow Dairy Whitner Pouch 400gm Nestle 169 100g 45 45 42 42 42 42 42 42 42 42 42 42 — — — (5)
Yoghurt/Dahi
Nestle Dahi Slim 200gm Nestle 35 100g 15 15 18 18 18 18 18 18 18 18 18 18 — — — 17
Britannia Dahi Daily Fresh 150gm Britannia 20 100g 13 13 13 13 13 13 13 13 13 13 13 13 — — — —
Britannia Dahi Low Fat 200gm Britannia 30 100g 15 15 15 15 15 15 15 15 15 15 15 15 — — — —
Butter/Cheese
Britannia Cheese Block 400gm Britannia 250 100g 63 63 63 63 63 63 63 — — —
Britannia Cheese Spread Classic 180gm Britannia 85 100g 45 45 47 47 47 47 47 47 47 47 47 47 — — — 5
Amul Butter 500gm Amul 225 100g 43 43 45 45 45 45 45 45 45 45 45 45 — — — 5
Amul Lite Butter 500gm Amul 145 100g 31 31 29 29 29 29 29 29 29 29 29 29 — — — (6)
Nutrilite Butter 500gm Zydus Cadila 180 100g 32 32 34 34 34 36 36 36 36 36 36 36 — — — 13
Amul cheese slice plain 200 gm Amul 118 59 59 59 59 59 59 59 — — —
Go cheese slice 200 gm Parag milk 125 63 63 63 63 63 63 63 — — —
Britannia cheese slice 200 gm Britannia 120 73 73 73 73 60 60 60 — (17) (17)
Cakes/ Desert Mixes
Britannia Cake Fruity Fun 60gm Britannia 15 100g 19 19 19 20 20 25 25 25 25 25 25 25 — — — 33
Change (%)Normalised price in Rs (adjusted for grammage changes)
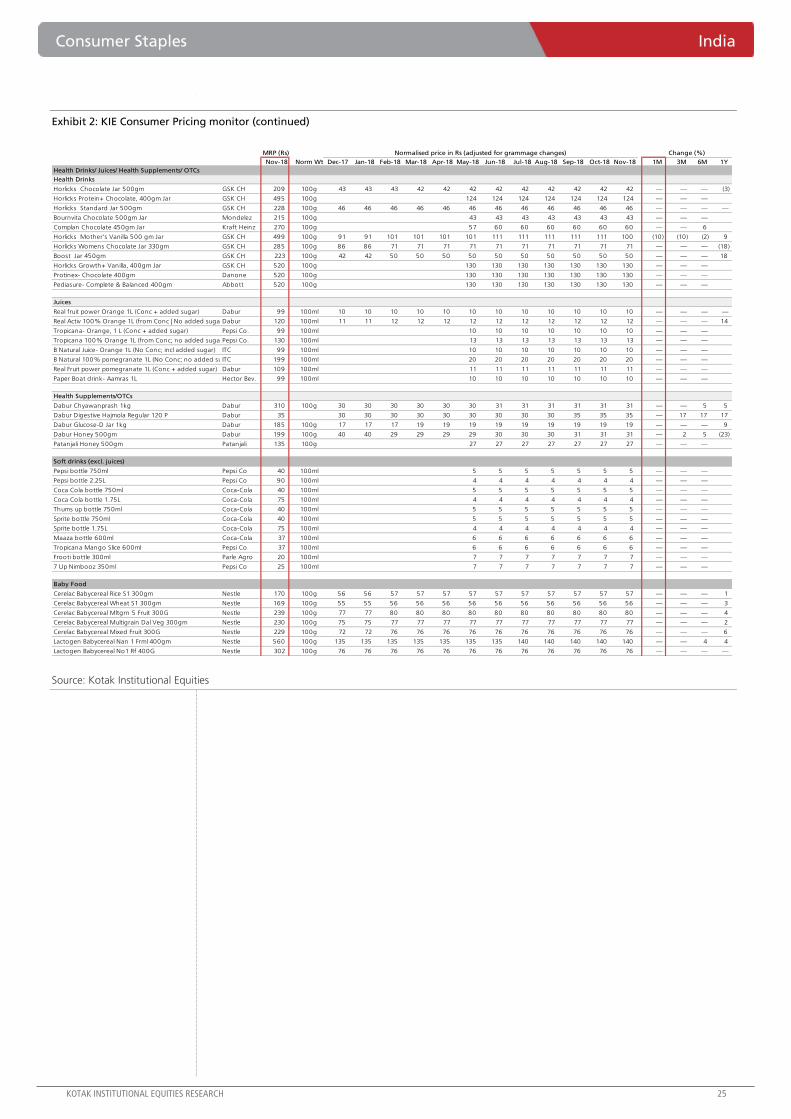
Consumer Staples India
KOTAK INSTITUTIONAL EQUITIES RESEARCH 25
Exhibit 2: KIE Consumer Pricing monitor (continued)
Source: Kotak Institutional Equities
MRP (Rs)
Nov-18 Norm Wt Dec-17 Jan-18 Feb-18 Mar-18 Apr-18 May-18 Jun-18 Jul-18 Aug-18 Sep-18 Oct-18 Nov-18 1M 3M 6M 1Y
Health Drinks/ Juices/ Health Supplements/ OTCs
Health Drinks
Horlicks Chocolate Jar 500gm GSK CH 209 100g 43 43 43 42 42 42 42 42 42 42 42 42 — — — (3)
Horlicks Protein+ Chocolate, 400gm Jar GSK CH 495 100g 124 124 124 124 124 124 124 — — —
Horlicks Standard Jar 500gm GSK CH 228 100g 46 46 46 46 46 46 46 46 46 46 46 46 — — — —
Bournvita Chocolate 500gm Jar Mondelez 215 100g 43 43 43 43 43 43 43 — — —
Complan Chocolate 450gm Jar Kraft Heinz 270 100g 57 60 60 60 60 60 60 — — 6
Horlicks Mother's Vanilla 500 gm Jar GSK CH 499 100g 91 91 101 101 101 101 111 111 111 111 111 100 (10) (10) (2) 9
Horlicks Womens Chocolate Jar 330gm GSK CH 285 100g 86 86 71 71 71 71 71 71 71 71 71 71 — — — (18)
Boost Jar 450gm GSK CH 223 100g 42 42 50 50 50 50 50 50 50 50 50 50 — — — 18
Horlicks Growth+ Vanilla, 400gm Jar GSK CH 520 100g 130 130 130 130 130 130 130 — — —
Protinex- Chocolate 400gm Danone 520 100g 130 130 130 130 130 130 130 — — —
Pediasure- Complete & Balanced 400gm Abbott 520 100g 130 130 130 130 130 130 130 — — —
Juices
Real fruit power Orange 1L (Conc + added sugar) Dabur 99 100ml 10 10 10 10 10 10 10 10 10 10 10 10 — — — —
Real Activ 100% Orange 1L (from Conc | No added sugar)Dabur 120 100ml 11 11 12 12 12 12 12 12 12 12 12 12 — — — 14
Tropicana- Orange, 1 L (Conc + added sugar) Pepsi Co. 99 100ml 10 10 10 10 10 10 10 — — —
Tropicana 100% Orange 1L (from Conc; no added sugar)Pepsi Co. 130 100ml 13 13 13 13 13 13 13 — — —
B Natural Juice- Orange 1L (No Conc; incl added sugar) ITC 99 100ml 10 10 10 10 10 10 10 — — —
B Natural 100% pomegranate 1L (No Conc; no added sugar)ITC 199 100ml 20 20 20 20 20 20 20 — — —
Real Fruit power pomegranate 1L (Conc + added sugar) Dabur 109 100ml 11 11 11 11 11 11 11 — — —
Paper Boat drink- Aamras 1L Hector Bev. 99 100ml 10 10 10 10 10 10 10 — — —
Health Supplements/OTCs
Dabur Chyawanprash 1kg Dabur 310 100g 30 30 30 30 30 30 31 31 31 31 31 31 — — 5 5
Dabur Digestive Hajmola Regular 120 P Dabur 35 30 30 30 30 30 30 30 30 30 35 35 35 — 17 17 17
Dabur Glucose-D Jar 1kg Dabur 185 100g 17 17 17 19 19 19 19 19 19 19 19 19 — — — 9
Dabur Honey 500gm Dabur 199 100g 40 40 29 29 29 29 30 30 30 31 31 31 — 2 5 (23)
Patanjali Honey 500gm Patanjali 135 100g 27 27 27 27 27 27 27 — — —
Soft drinks (excl. juices)
Pepsi bottle 750ml Pepsi Co 40 100ml 5 5 5 5 5 5 5 — — —
Pepsi bottle 2.25L Pepsi Co 90 100ml 4 4 4 4 4 4 4 — — —
Coca Cola bottle 750ml Coca-Cola 40 100ml 5 5 5 5 5 5 5 — — —
Coca Cola bottle 1.75L Coca-Cola 75 100ml 4 4 4 4 4 4 4 — — —
Thums up bottle 750ml Coca-Cola 40 100ml 5 5 5 5 5 5 5 — — —
Sprite bottle 750ml Coca-Cola 40 100ml 5 5 5 5 5 5 5 — — —
Sprite bottle 1.75L Coca-Cola 75 100ml 4 4 4 4 4 4 4 — — —
Maaza bottle 600ml Coca-Cola 37 100ml 6 6 6 6 6 6 6 — — —
Tropicana Mango Slice 600ml Pepsi Co 37 100ml 6 6 6 6 6 6 6 — — —
Frooti bottle 300ml Parle Agro 20 100ml 7 7 7 7 7 7 7 — — —
7 Up Nimbooz 350ml Pepsi Co 25 100ml 7 7 7 7 7 7 7 — — —
Baby Food
Cerelac Babycereal Rice S1 300gm Nestle 170 100g 56 56 57 57 57 57 57 57 57 57 57 57 — — — 1
Cerelac Babycereal Wheat S1 300gm Nestle 169 100g 55 55 56 56 56 56 56 56 56 56 56 56 — — — 3
Cerelac Babycereal Mltgrn 5 Fruit 300G Nestle 239 100g 77 77 80 80 80 80 80 80 80 80 80 80 — — — 4
Cerelac Babycereal Multigrain Dal Veg 300gm Nestle 230 100g 75 75 77 77 77 77 77 77 77 77 77 77 — — — 2
Cerelac Babycereal Mixed Fruit 300G Nestle 229 100g 72 72 76 76 76 76 76 76 76 76 76 76 — — — 6
Lactogen Babycereal Nan 1 Frml 400gm Nestle 560 100g 135 135 135 135 135 135 135 140 140 140 140 140 — — 4 4
Lactogen Babycereal No1 Rf 400G Nestle 302 100g 76 76 76 76 76 76 76 76 76 76 76 76 — — — —
Change (%)Normalised price in Rs (adjusted for grammage changes)

India Consumer Staples
26 KOTAK INSTITUTIONAL EQUITIES RESEARCH
Exhibit 2: KIE Consumer Pricing monitor (continued)
Source: Kotak Institutional Equities
MRP (Rs)
Category/Brand/SKU Nov-18 Norm Wt Dec-17 Jan-18 Feb-18 Mar-18 Apr-18 May-18 Jun-18 Jul-18 Aug-18 Sep-18 Oct-18 Nov-18 1M 3M 6M 1Y
Biscuits/Atta
CreamBiscuits
Sunfeast Dark Fantasy Chocolate 100gm ITC 30 100g 25 25 30 30 30 30 30 40 40 40 40 40 — — 33 60
Britannia Cream Jim Jam 150gm Britannia 30 100g 20 20 20 20 20 20 20 20 20 20 20 20 — — — —
Britannia Cream Pure magic vanilla 150gm Britannia 30 100g 20 20 25 30 30 30 30 30 30 30 30 30 — — — 50
Britannia Cream Treat Bourbon 150gm Britannia 28 100g 19 19 19 19 19 19 19 19 19 19 19 19 — — — 4
Sunfeast Cream Bourbon 150gm ITC 26 100g 17 17 13 17 17 17 17 17 17 17 17 17 — — — 4
Parle Cream Hide & Seek Bourbon 100gm Parle 25 100g 17 17 17 17 17 25 25 25 25 25 25 25 — — — 50
Parle Crm Bis Bourbon Kream 150gm Parle 25 100g 13 13 17 17 17 17 17 17 17 17 17 17 — — —
Oreo Choco Creme Biscuits 120gm Mondelez 29 100g 25 24 24 24 24 24 24 — — (3)
Britannia Tiger Cream Biscuits - Chocolate 43gm Britannia 5 100g 12 12 12 12 12 12 12 — — —
Sunfeast Special-bounce Cream Biscuits 83gm ITC 10 100g 12 12 12 12 12 12 12 — — —
Cookies/Healthy biscuits
Sunfeast Mom's Magic Cookie Butter 150gm ITC 20 100g 10 10 13 13 13 13 13 13 13 13 13 13 — — — 33
Britannia Good Day Butter 150gm Britannia 22 100g 13 13 13 13 13 15 15 15 15 15 15 15 — — — 10
Britannia Cookies Good Day Cashew 100gm Britannia 20 100g 15 15 20 20 20 20 20 20 20 20 20 20 — — — 33
Britannia NutriChoice Digestive 100gm Britannia 25 100g 16 16 19 19 19 20 20 25 25 25 25 25 — — 25 56
Sunfeast Farmlite - Oats & Almonds 75gm ITC 25 100g 33 33 33 33 33 33 33 — — —
Marie/Glucose/Salted/Nice Biscuits
Sunfeast Marie Light 100gm ITC 10 100g 9 9 12 12 12 12 12 12 12 12 12 12 — — — 29
Britannia Vita Marie Gold 150gm Britannia 20 100g 13 13 13 13 13 13 13 13 13 13 13 13 — — — —
Parle Makesmith Marie 100gm Parle 10 100g 10 10 10 11 11 11 11 11 11 11 11 11 — — — 11
Sunfeast Bisccuits Glucose 80gm ITC 5 100g 6 6 6 6 6 6 6 6 6 6 6 6 — — — —
Britannia Tiger 124gm Britannia 10 100g 8 8 8 8 8 8 8 8 8 8 8 8 1 1 — 7
Parle Glucose 130gm Parle 10 100g 7 7 7 7 7 7 7 7 7 7 7 8 8 8 8 8
Sunfeast Snacky Salted 80gm ITC 10 100g 16 16 16 16 16 16 16 16 16 16 16 16 — — — —
Parle Salted Krackjack 80gm Parle 10 100g 13 13 13 13 13 13 13 13 13 13 13 13 — — — 6
Parle Salted Monaco Classic 80gm Parle 10 100g 13 13 13 13 13 13 13 13 13 13 13 13 — — — 6
Britannia 50-50 Maska Chaska 50gm Britannia 10 100g 18 18 20 20 20 20 20 20 20 20 20 20 — — — 10
Sunfeast Plain Nice 150gm ITC 25 100g 13 13 13 13 13 13 13 13 13 17 17 17 — 25 25 25
Britannia Nice Time 150gm Britannia 25 100g 15 15 15 17 17 17 17 17 17 17 17 17 — — — 14
Breakfast snacks
Marico Saffola Oats 1Kg Marico 185 100g 18 18 18 18 18 19 19 19 19 19 19 19 — — — 3
Kelloggs Corn Flakes Original 475gm Kelloggs 175 100g 37 37 37 37 37 37 37 — — —
Bagrrys Muesli - Crunchy 500gm Bagrrys India 290 100g 61 61 61 61 61 61 61 — — —
Quaker Oats 1kg Pepsi Co. 186 100g 19 19 19 19 19 19 19 — — —
Atta
Aashirvaad Atta Multigrain 5kg ITC 285 100g 6 6 6 6 6 6 6 6 6 6 6 6 — — 4 4
Aashirvaad Atta Whole Wheat 5kg ITC 235 100g 5 5 5 5 5 5 5 5 5 5 5 5 — — 4 4
Soups/Sauces/Spreads
Ketchup/Sauces/Spreads
Maggi Ketchup Tomato 1kg Nestle 147 100g 15 15 15 15 15 15 15 15 15 15 15 15 — — — —
Maggi Sauce Tomato 1kg Nestle 142 100g 14 14 14 14 14 14 14 14 14 14 14 14 — — — —
Kissan Ketchup Fresh Tomato Bt 1kg HUVR 130 100g 13 13 13 13 13 13 13 13 13 13 13 13 — — — 4
Kissan Sauce no onion no garlic 1K HUVR 147 100g 13 13 15 15 15 15 15 15 15 15 15 15 — — — 18
Spreads/Jams
Nutella Hazelnut Spread with Cocoa 160gm Jar Ferrero 200 125 125 125 125 125 125 125 — — —
Kissan Jam Mixed Fruit 200gm HUVR 60 100g 30 30 30 30 30 30 30 30 30 30 30 30 — — — —
Sundrop Peanut Butter Creamy 508gm Jar Agro tech 215 40 42 42 42 42 42 42 — — 5
Soups
Knorr Classic Thick Tomato 61gm HUVR 55 100g 100 100 100 90 90 90 90 90 90 90 90 90 — — — (10)
Maggi Sweet Corn Vegetable 45gm Nestle 45 100g 125 125 125 125 125 100 100 100 100 100 100 100 — — — (20)
Chocolate bars
Nestle Kit Kat 76.8gm Nestle 60 100g 78 78 78 78 78 78 78 78 78 78 78 78 — — — —
Nestle Munch Home Pk 72gm Nestle 60 100g 55 55 87 83 83 83 83 83 83 83 83 83 — — — 51
Nestle Milk 19.8gm Nestle 10 100g 56 56 51 51 51 51 51 51 51 51 51 51 — — — (9)
Nestle Bar One 22gm Nestle 10 100g 45 45 45 45 45 45 45 45 45 45 45 45 — — — —
Nestle Munch crunchiest ever 20.1g Nestle 10 100g 58 58 58 58 58 50 50 50 50 50 50 50 — — — (14)
Cadbury Dairy Milk 12gm Mondelez 10 100g 83 76 76 76 76 76 76 — — (9)
Cadbury Dairy Milk Silk 60gm Mondelez 65 100g 108 108 108 108 108 108 108 — — —
Cadbury 5 Star 19.5gm Mondelez 10 100g 51 51 51 51 51 51 51 — — —
Cadbury Perk 28gm Mondelez 10 100g 36 36 36 36 36 36 36 — — —
Kinder Joy 20gm Ferrero 40 100g 185 200 200 200 200 200 200 — — 8
Ferrero Rocher 16pcs 200gm box Ferrero 499 100g 220 238 238 238 238 238 250 5 5 13
Noodles
Noodles
Maggi Masala 70gm Nestle 12 100g 16 16 16 16 16 16 17 17 17 17 17 17 — — 9 9
Maggi Masala 140gm Nestle 23 100g 16 16 16 16 16 16 16 16 16 16 16 16 — — 5 (4)
Maggi Masala 280gm Nestle 44 100g 16 16 16 16 16 16 16 16 16 16 16 16 — — — (2)
Maggi oats noodles 300gm Nestle 95 100g 32 32 32 32 32 32 32 — — —
Maggi Chicken 284gm Nestle 55 100g 19 19 19 19 19 19 19 19 19 19 19 19 — — — (8)
Maggi Cuppa Mania Yo Masala 70gm Nestle 40 100g 64 64 57 57 57 57 57 57 57 57 57 57 — — — (11)
Maggi Atta masala 300gm Nestle 75 100g 24 24 23 23 23 25 25 25 25 25 25 25 — — — 3
Sunfeast Yippee Classic Masala 70gm ITC 10 100g 14 14 14 14 14 14 14 — — —
Sunfeast Yippee Magic Masala 70gm ITC 10 100g 13 13 13 13 13 14 14 14 14 14 14 14 — — — 7
Sunfeast Yippee Mood Masala 65gm ITC 15 100g 21 21 21 21 21 21 23 8 8 8
Knorr Soupy Mast Masala Pp 75gm HUVR 15 100g 21 21 17 17 17 20 20 20 20 20 20 20 — — — (7)
Change (%)Normalised price in Rs (adjusted for grammage changes)

Consumer Staples India
KOTAK INSTITUTIONAL EQUITIES RESEARCH 27
Exhibit 3: Ongoing promotional activity across FMCG categories in Dec 2018
Source: Kotak Institutional Equities
SKU Original Offer Eff change (%) Promotional offer
Soaps
Pears soap 125gm 67 67 (16.7) Free 20% extra
Pears soap 75gm 40 40 (25.0) Free 33% extra
Detergents/Dishwash
Surf Excel matic Top load detergent powder 4Kg 948 948 (33.3) Free 50% extra
Surf Excel matic Front load detergent powder 4Kg 1048 1048 (33.3) Free 50% extra
Ariel Excel matic Top load detergent powder 4Kg 898 898 (33.3) Free 50% extra
Ariel Excel matic Front load detergent powder 4Kg 998 998 (33.3) Free 50% extra
Ariel Excel matic Top load detergent powder 3Kg 747 597 (20.1) Price off Rs150; 20% discount
Ariel Excel matic Front load detergent powder 3Kg 795 645 (18.9) Price off Rs150; 19% discount
Surf Excel matic Top load detergent powder 2Kg 449 449 Free Surf Excel Liquid Detergent - Matic, Top Load 500 ml worth Rs99
Surf Excel matic Front load detergent powder 2Kg 480 480 Free Surf Excel Liquid Detergent - Matic, Front Load 500 ml worth Rs115
Ariel Excel matic Top load detergent powder 1Kg 259 199 (23.2) Price off Rs60; 23% discount
Ariel Excel matic Front load detergent powder 1Kg 279 239 (14.3) Price off Rs40; 15% discount
Ariel Complete detergent powder 2Kg 498 498 (33.3) Free 50% (1Kg) extra
Ariel Complete detergent powder 1Kg 249 249 (33.3) Free 50% (500gm) extra
Ariel Colour detergent powder 500gm 498 498 (28.6) Free 40% (200gm) extra
Henko Lintelligent Matic - Top Load detergent powder 1Kg 225 225 (33.3) Free 50% (500gm) extra
Henko Lintelligent Matic - Front Load detergent powder 1Kg 242 242 (33.3) Free 50% (500gm) extra
Henko Stain Champion 1Kg 138 112 (18.8) Price off Rs26; 18.8% discount
Henko Stain Champion 3Kg 414 414 (25.0) Free 33% extra
Biscuits/Cakes
Britannia Good Day Butter cookies 53gm 10 10 (29.3) Free 41% (22gm) extra
Britannia Good Day Cashew cookies 53gm 10 10 (11.7) Free 13% (7gm) extra
Britannia Good Day Chocochip cookies 44gm 10 10 (21.4) Free 27% (12 gm) extra
Britannia Marie Gold 68gm 10 10 (23.6) Free 30% extra
Britannia Nutrichoice Digestive 150gm 35 35 (25.0) Free 33% extra
Parle Nutrichoice Digestive 100gm 20 20 (16.7) Free 20% (20gm) extra
Sunfeast Mom's Magic Rich butter cookies 60gm 10 10 (20.0) Free 25% extra
Sunfeast Mom's Magic Cashew & Almond cookies 50gm 10 10 (17.8) Free 21% extra
MRP (Rs)

India Consumer Staples
28 KOTAK INSTITUTIONAL EQUITIES RESEARCH
Exhibit 4: Monthly raw material trends for November 2018
Source: Kotak Institutional Equities
Inflationary = +3%
Deflationary = -3%
No Commodity Unit Current MoM 3M 6M YoY MoM 3M 6M YoY Companies impacted
Agri Commodities
1 Tea - India Avg. Rs/Kg 146 2 (1) 6 6 2 (1) 6 6 HUL, TGBL
2 Tea - World Avg. USD/MT 2,700 (1) (3) (11) (15) (4) 0 (5) (6) HUL, TGBL
3 Tea - Mombassa/Kenya USD/Kg 3 (2) (2) (10) (21) (5) 1 (4) (13) HUL, TGBL
4 Coffee Arabica - Intl. US cents/Pound 142 1 11 0 (1) (2) 14 7 9 HUL, Nestle, TGBL
5 Coffee Robusta - Intl. US cents/Pound 87 (2) 4 (6) (9) (4) 7 (0) 1 HUL, Nestle, TGBL
6 Sugar - domestic Rs/Quintal 3,415 (1) (1) 16 (13) (1) (1) 16 (13) HUL, Nestle, GSKCHL, ITC, Dabur, Britannia
7 Wheat Rs/Quintal 2,046 0 4 17 11 0 4 17 11 ITC, Nestle, GSKCHL, Britannia
8 Barley Rs/Quintal 1,905 2 16 28 27 2 16 28 27 GSKCHL
9 Maize (corn) USD/MT 161 0 (1) (10) 8 (2) 2 (5) 19 Colgate, HUL, Dabur (Sorbitol)
10 Liquid Milk - domestic Rs/Ltr 33 6 3 (3) (3) 6 3 (3) (3) Nestle, GSKCHL, Jubilant Foodworks, Britannia
11 Milk Powder - domestic Rs/Kg 242 (1) (2) (4) (3) (1) (2) (4) (3) Nestle, GSKCHL, Britannia
12 Cocoa Bean USD/MT 2,232 3 0 (18) 3 1 3 (13) 13 Nestle
Oil Commodities
13 Crude Oil - Brent USD/Barrel 65 (19) (11) (15) 4 (21) (8) (10) 15 HUL, GCPL, Jyothy Labs, Asian Paints, Pidilite
14 Palm oil Rs/MT 52,889 (11) (12) (19) (7) (11) (12) (19) (7) HUL, GCPL, Jyothy Labs
15 PFAD USD/MT 361 (19) (26) (29) (43) (21) (24) (25) (37) HUL, GCPL, Jyothy Labs
16 Light liquid paraffin (LLP) Rs/Ltr 55 0 15 18 20 0 15 18 20 Marico, Dabur, Bajaj Corp
17 Copra Rs/Quintal 9,600 1 (17) (26) (23) 1 (17) (26) (23) Marico, Dabur
18 Coconut oil Rs/Quintal 13,550 (6) (17) (25) (20) (6) (17) (25) (20) Marico, Dabur
19 Rice Bran oil Rs/10Kg 633 (7) (8) (3) 6 (7) (8) (3) 6 Marico
20 Kardi oil/ Safflower oil Rs/MT 1,350 6 6 2 5 6 6 2 5 Marico
21 Sunflower oil Rs/MT 73,833 (3) (2) 5 12 (3) (2) 5 12 Marico
22 Groundnut oil Rs/MT 97,778 6 4 17 12 6 4 17 12 Marico
23 Linseed oil Rs/MT 89,833 (0) (5) 14 20 (0) (5) 14 20 Marico, Dabur, Bajaj Corp, Asian Paints
24 Castor oil Rs/MT 117,813 15 25 40 26 15 25 40 26 Marico, Dabur, Bajaj Corp, Asian Paints
25 Mentha oil Rs/Kg 2,210 4 7 42 23 4 7 42 23 Emami, Colgate, HUL, Dabur
Chemicals/Paints/Other Commodities
26 Caustic soda Rs/ 50Kg 2,241 (5) 6 (8) (1) (5) 6 (8) (1) HUL, GCPL, Jyothy Labs
27 Soda ash Rs/ 50Kg 1,402 (5) 8 12 19 (5) 8 12 19 HUL, GCPL, Jyothy Labs
28 LAB Rs/Kg 123 2 10 16 23 2 10 16 23 HUL, Jyothy Labs
29 HDPE - domestic Rs/Kg 126 (1) (1) (0) 27 (1) (1) (0) 27 All companies
30 PAN Rs/Kg 80 — — — 14 — — — 14 Asian Paints
31 PENTA Rs/Kg 115 — — — — — — — — Asian Paints
32 Tio2 Anatese Rs/Kg 168 — — (9) (9) — — (9) (9) Asian Paints
33 Tio2 Rutile Rs/Kg 222 — 3 3 6 — 3 3 6 Asian Paints
34 Tio2 Dupont Rs/Kg 277 4 5 8 16 4 5 8 16 Asian Paints
35 Turpentine oil Rs/Ltr 100 — (6) 6 39 — (6) 6 39 Asian Paints
36 Formaldehyde Rs/Kg 29 — 12 12 26 — 12 12 26 Asian Paints
37 Acrylic acid Rs/Kg 125 — — — 18 — — — 18 Asian Paints
38 Vinyl Acetate - Domestic Rs/Kg 77 (9) (16) (28) (16) (9) (16) (28) (16) Asian Paints
39 Vinyl Acetate - China US$/MT 1,167 3 (7) (8) 9 (0) (4) (2) 20 Pidilite, Asian Paints
40 Styrene - domestic Rs/Kg 88 (14) (14) (10) (17) (14) (14) (10) (17) Asian Paints
41 Gold Rs/10gm 31,006 (1) 5 (0) 5 (1) 5 (0) 5 Titan, Jewellery companies
42 Diamond price index USD/Carrat 121 1 1 1 5 (2) 4 8 16 Titan, Jewellery companies
% chg - local currency % chg - currency Adj.
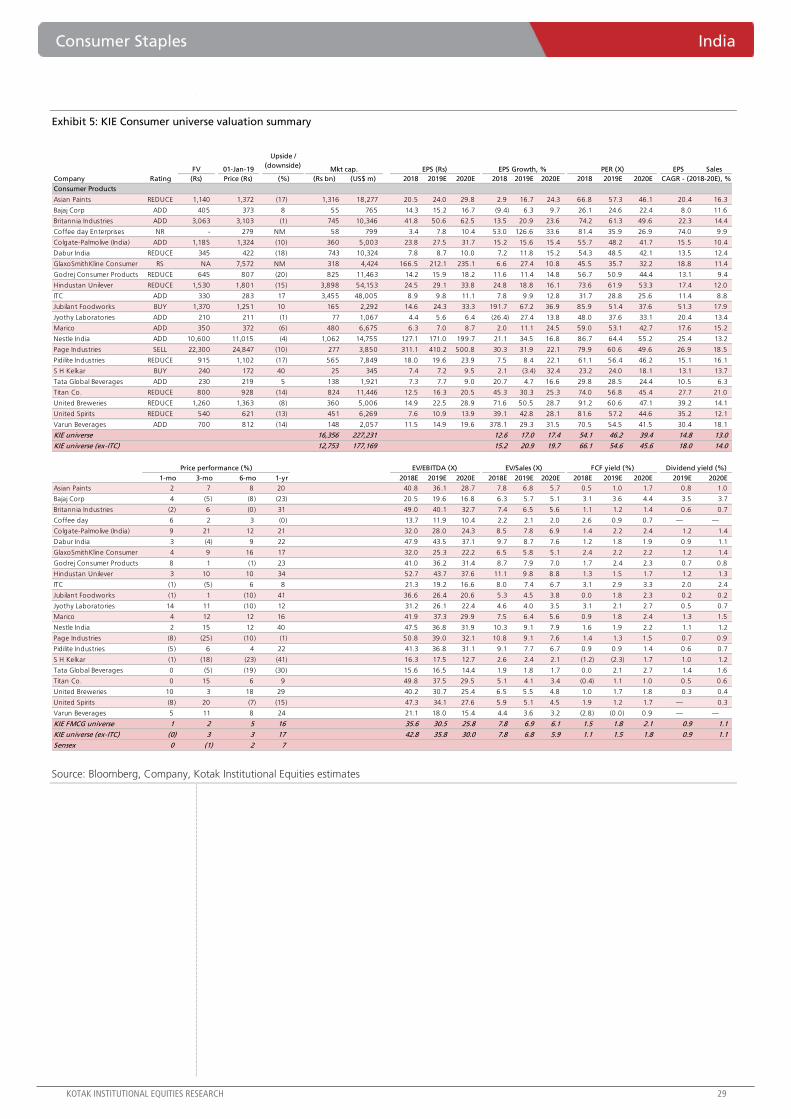
Consumer Staples India
KOTAK INSTITUTIONAL EQUITIES RESEARCH 29
Exhibit 5: KIE Consumer universe valuation summary
Source: Bloomberg, Company, Kotak Institutional Equities estimates
FV 01-Jan-19 EPS Sales
Company Rating (Rs) Price (Rs) (Rs bn) (US$ m) 2018 2019E 2020E 2018 2019E 2020E 2018 2019E 2020E
Consumer Products
Asian Paints REDUCE 1,140 1,372 (17) 1,316 18,277 20.5 24.0 29.8 2.9 16.7 24.3 66.8 57.3 46.1 20.4 16.3
Bajaj Corp ADD 405 373 8 55 765 14.3 15.2 16.7 (9.4) 6.3 9.7 26.1 24.6 22.4 8.0 11.6
Britannia Industries ADD 3,063 3,103 (1) 745 10,346 41.8 50.6 62.5 13.5 20.9 23.6 74.2 61.3 49.6 22.3 14.4
Coffee day Enterprises NR - 279 NM 58 799 3.4 7.8 10.4 53.0 126.6 33.6 81.4 35.9 26.9 74.0 9.9
Colgate-Palmolive (India) ADD 1,185 1,324 (10) 360 5,003 23.8 27.5 31.7 15.2 15.6 15.4 55.7 48.2 41.7 15.5 10.4
Dabur India REDUCE 345 422 (18) 743 10,324 7.8 8.7 10.0 7.2 11.8 15.2 54.3 48.5 42.1 13.5 12.4
GlaxoSmithKline Consumer RS NA 7,572 NM 318 4,424 166.5 212.1 235.1 6.6 27.4 10.8 45.5 35.7 32.2 18.8 11.4
Godrej Consumer Products REDUCE 645 807 (20) 825 11,463 14.2 15.9 18.2 11.6 11.4 14.8 56.7 50.9 44.4 13.1 9.4
Hindustan Unilever REDUCE 1,530 1,801 (15) 3,898 54,153 24.5 29.1 33.8 24.8 18.8 16.1 73.6 61.9 53.3 17.4 12.0
ITC ADD 330 283 17 3,455 48,005 8.9 9.8 11.1 7.8 9.9 12.8 31.7 28.8 25.6 11.4 8.8
Jubilant Foodworks BUY 1,370 1,251 10 165 2,292 14.6 24.3 33.3 191.7 67.2 36.9 85.9 51.4 37.6 51.3 17.9
Jyothy Laboratories ADD 210 211 (1) 77 1,067 4.4 5.6 6.4 (26.4) 27.4 13.8 48.0 37.6 33.1 20.4 13.4
Marico ADD 350 372 (6) 480 6,675 6.3 7.0 8.7 2.0 11.1 24.5 59.0 53.1 42.7 17.6 15.2
Nestle India ADD 10,600 11,015 (4) 1,062 14,755 127.1 171.0 199.7 21.1 34.5 16.8 86.7 64.4 55.2 25.4 13.2
Page Industries SELL 22,300 24,847 (10) 277 3,850 311.1 410.2 500.8 30.3 31.9 22.1 79.9 60.6 49.6 26.9 18.5
Pidilite Industries REDUCE 915 1,102 (17) 565 7,849 18.0 19.6 23.9 7.5 8.4 22.1 61.1 56.4 46.2 15.1 16.1
S H Kelkar BUY 240 172 40 25 345 7.4 7.2 9.5 2.1 (3.4) 32.4 23.2 24.0 18.1 13.1 13.7
Tata Global Beverages ADD 230 219 5 138 1,921 7.3 7.7 9.0 20.7 4.7 16.6 29.8 28.5 24.4 10.5 6.3
Titan Co. REDUCE 800 928 (14) 824 11,446 12.5 16.3 20.5 45.3 30.3 25.3 74.0 56.8 45.4 27.7 21.0
United Breweries REDUCE 1,260 1,363 (8) 360 5,006 14.9 22.5 28.9 71.6 50.5 28.7 91.2 60.6 47.1 39.2 14.1
United Spirits REDUCE 540 621 (13) 451 6,269 7.6 10.9 13.9 39.1 42.8 28.1 81.6 57.2 44.6 35.2 12.1
Varun Beverages ADD 700 812 (14) 148 2,057 11.5 14.9 19.6 378.1 29.3 31.5 70.5 54.5 41.5 30.4 18.1
KIE universe 16,356 227,231 12.6 17.0 17.4 54.1 46.2 39.4 14.8 13.0
KIE universe (ex-ITC) 12,753 177,169 15.2 20.9 19.7 66.1 54.6 45.6 18.0 14.0
1-mo 3-mo 6-mo 1-yr 2018E 2019E 2020E 2018E 2019E 2020E 2018E 2019E 2020E 2019E 2020E
Asian Paints 2 7 8 20 40.8 36.1 28.7 7.8 6.8 5.7 0.5 1.0 1.7 0.8 1.0
Bajaj Corp 4 (5) (8) (23) 20.5 19.6 16.8 6.3 5.7 5.1 3.1 3.6 4.4 3.5 3.7
Britannia Industries (2) 6 (0) 31 49.0 40.1 32.7 7.4 6.5 5.6 1.1 1.2 1.4 0.6 0.7
Coffee day 6 2 3 (0) 13.7 11.9 10.4 2.2 2.1 2.0 2.6 0.9 0.7 — —
Colgate-Palmolive (India) 9 21 12 21 32.0 28.0 24.3 8.5 7.8 6.9 1.4 2.2 2.4 1.2 1.4
Dabur India 3 (4) 9 22 47.9 43.5 37.1 9.7 8.7 7.6 1.2 1.8 1.9 0.9 1.1
GlaxoSmithKline Consumer 4 9 16 17 32.0 25.3 22.2 6.5 5.8 5.1 2.4 2.2 2.2 1.2 1.4
Godrej Consumer Products 8 1 (1) 23 41.0 36.2 31.4 8.7 7.9 7.0 1.7 2.4 2.3 0.7 0.8
Hindustan Unilever 3 10 10 34 52.7 43.7 37.6 11.1 9.8 8.8 1.3 1.5 1.7 1.2 1.3
ITC (1) (5) 6 8 21.3 19.2 16.6 8.0 7.4 6.7 3.1 2.9 3.3 2.0 2.4
Jubilant Foodworks (1) 1 (10) 41 36.6 26.4 20.6 5.3 4.5 3.8 0.0 1.8 2.3 0.2 0.2
Jyothy Laboratories 14 11 (10) 12 31.2 26.1 22.4 4.6 4.0 3.5 3.1 2.1 2.7 0.5 0.7
Marico 4 12 12 16 41.9 37.3 29.9 7.5 6.4 5.6 0.9 1.8 2.4 1.3 1.5
Nestle India 2 15 12 40 47.5 36.8 31.9 10.3 9.1 7.9 1.6 1.9 2.2 1.1 1.2
Page Industries (8) (25) (10) (1) 50.8 39.0 32.1 10.8 9.1 7.6 1.4 1.3 1.5 0.7 0.9
Pidilite Industries (5) 6 4 22 41.3 36.8 31.1 9.1 7.7 6.7 0.9 0.9 1.4 0.6 0.7
S H Kelkar (1) (18) (23) (41) 16.3 17.5 12.7 2.6 2.4 2.1 (1.2) (2.3) 1.7 1.0 1.2
Tata Global Beverages 0 (5) (19) (30) 15.6 16.5 14.4 1.9 1.8 1.7 0.0 2.1 2.7 1.4 1.6
Titan Co. 0 15 6 9 49.8 37.5 29.5 5.1 4.1 3.4 (0.4) 1.1 1.0 0.5 0.6
United Breweries 10 3 18 29 40.2 30.7 25.4 6.5 5.5 4.8 1.0 1.7 1.8 0.3 0.4
United Spirits (8) 20 (7) (15) 47.3 34.1 27.6 5.9 5.1 4.5 1.9 1.2 1.7 — 0.3
Varun Beverages 5 11 8 24 21.1 18.0 15.4 4.4 3.6 3.2 (2.8) (0.0) 0.9 — —
KIE FMCG universe 1 2 5 16 35.6 30.5 25.8 7.8 6.9 6.1 1.5 1.8 2.1 0.9 1.1
KIE universe (ex-ITC) (0) 3 3 17 42.8 35.8 30.0 7.8 6.8 5.9 1.1 1.5 1.8 0.9 1.1
Sensex 0 (1) 2 7
Price performance (%)
Upside /
(downside)
(%)
EPS (Rs)
EV/EBITDA (X) Dividend yield (%)
CAGR - (2018-20E), %
Mkt cap. EPS Growth, % PER (X)
EV/Sales (X) FCF yield (%)

India Consumer Staples
30 KOTAK INSTITUTIONAL EQUITIES RESEARCH
Exhibit 6: P/E multiples are fairly high for the earnings profile One year forward PE (based on consensus estimates)
Source: Bloomberg, Company, Kotak Institutional Equities
Exhibit 7: P/E multiples are fairly high for the earnings profile One year forward PE (based on consensus estimates)
Source: Bloomberg, Company, Kotak Institutional Equities
Exhibit 8: Consumer sector P/E rich at 39X One year forward P/ E based on consensus estimates (X)
Source: Bloomberg, Company, Kotak Institutional Equities
Exhibit 9: Consumer sector (ex-ITC) is trading at 50X One year forward P/E based on consensus estimates (X)
Source: Bloomberg, Company, Kotak Institutional Equities
10
20
30
40
50
60
70
80
Dec
-08
Dec
-09
Dec
-10
Dec
-11
Dec
-12
Dec
-13
Dec
-14
Dec
-15
Dec
-16
Dec
-17
Dec
-18
Nestle Dabur Asian Paints
ITC HUL GCPL
-
10
20
30
40
50
60
70
Dec
-08
Dec
-09
Dec
-10
Dec
-11
Dec
-12
Dec
-13
Dec
-14
Dec
-15
Dec
-16
Dec
-17
Dec
-18
Marico TitanColgate GSK Consumer
5
10
15
20
25
30
35
40
45
Dec
-98
Dec
-00
Dec
-02
Dec
-04
Dec
-06
Dec
-08
Dec
-10
Dec
-12
Dec
-14
Dec
-16
Dec
-18
5
15
25
35
45
55
65
Dec
-98
Dec
-00
Dec
-02
Dec
-04
Dec
-06
Dec
-08
Dec
-10
Dec
-12
Dec
-14
Dec
-16
Dec
-18
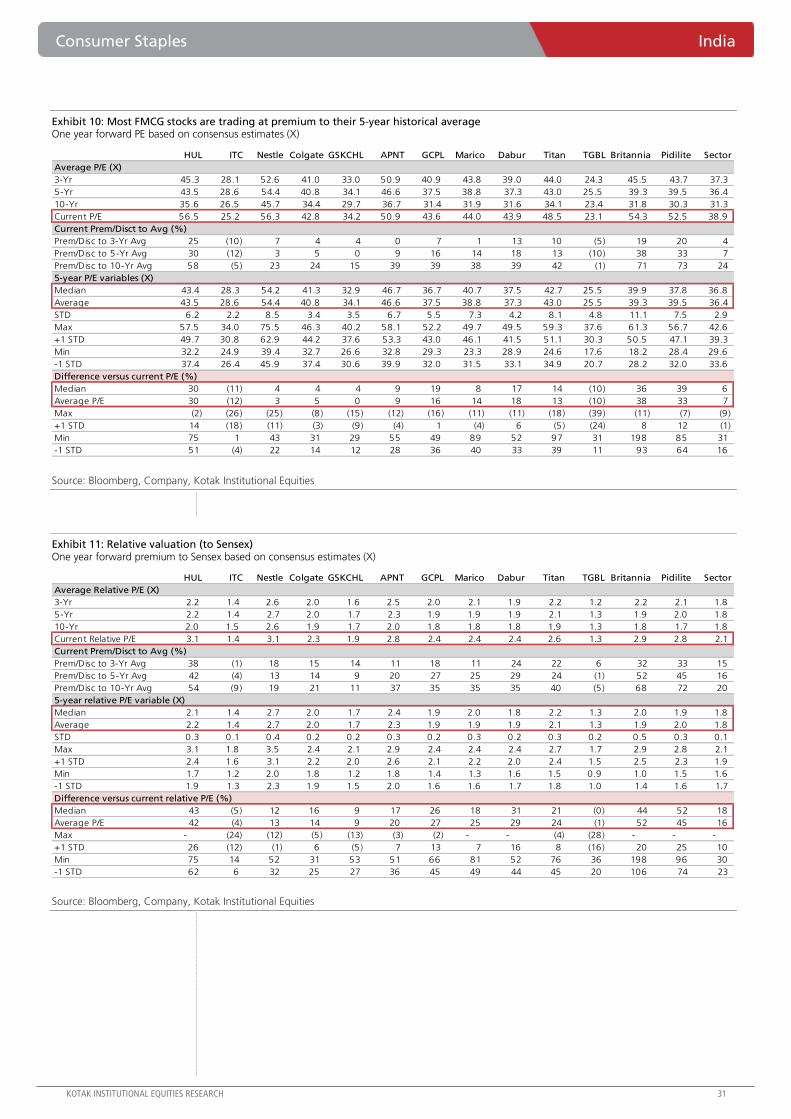
Consumer Staples India
KOTAK INSTITUTIONAL EQUITIES RESEARCH 31
Exhibit 10: Most FMCG stocks are trading at premium to their 5-year historical average One year forward PE based on consensus estimates (X)
Source: Bloomberg, Company, Kotak Institutional Equities
Exhibit 11: Relative valuation (to Sensex) One year forward premium to Sensex based on consensus estimates (X)
Source: Bloomberg, Company, Kotak Institutional Equities
HUL ITC Nestle Colgate GSKCHL APNT GCPL Marico Dabur Titan TGBL Britannia Pidilite Sector
Average P/E (X)
3-Yr 45.3 28.1 52.6 41.0 33.0 50.9 40.9 43.8 39.0 44.0 24.3 45.5 43.7 37.3
5-Yr 43.5 28.6 54.4 40.8 34.1 46.6 37.5 38.8 37.3 43.0 25.5 39.3 39.5 36.4
10-Yr 35.6 26.5 45.7 34.4 29.7 36.7 31.4 31.9 31.6 34.1 23.4 31.8 30.3 31.3
Current P/E 56.5 25.2 56.3 42.8 34.2 50.9 43.6 44.0 43.9 48.5 23.1 54.3 52.5 38.9
Current Prem/Disct to Avg (%)
Prem/Disc to 3-Yr Avg 25 (10) 7 4 4 0 7 1 13 10 (5) 19 20 4
Prem/Disc to 5-Yr Avg 30 (12) 3 5 0 9 16 14 18 13 (10) 38 33 7
Prem/Disc to 10-Yr Avg 58 (5) 23 24 15 39 39 38 39 42 (1) 71 73 24
5-year P/E variables (X)
Median 43.4 28.3 54.2 41.3 32.9 46.7 36.7 40.7 37.5 42.7 25.5 39.9 37.8 36.8
Average 43.5 28.6 54.4 40.8 34.1 46.6 37.5 38.8 37.3 43.0 25.5 39.3 39.5 36.4
STD 6.2 2.2 8.5 3.4 3.5 6.7 5.5 7.3 4.2 8.1 4.8 11.1 7.5 2.9
Max 57.5 34.0 75.5 46.3 40.2 58.1 52.2 49.7 49.5 59.3 37.6 61.3 56.7 42.6
+1 STD 49.7 30.8 62.9 44.2 37.6 53.3 43.0 46.1 41.5 51.1 30.3 50.5 47.1 39.3
Min 32.2 24.9 39.4 32.7 26.6 32.8 29.3 23.3 28.9 24.6 17.6 18.2 28.4 29.6
-1 STD 37.4 26.4 45.9 37.4 30.6 39.9 32.0 31.5 33.1 34.9 20.7 28.2 32.0 33.6
Difference versus current P/E (%)
Median 30 (11) 4 4 4 9 19 8 17 14 (10) 36 39 6
Average P/E 30 (12) 3 5 0 9 16 14 18 13 (10) 38 33 7
Max (2) (26) (25) (8) (15) (12) (16) (11) (11) (18) (39) (11) (7) (9)
+1 STD 14 (18) (11) (3) (9) (4) 1 (4) 6 (5) (24) 8 12 (1)
Min 75 1 43 31 29 55 49 89 52 97 31 198 85 31
-1 STD 51 (4) 22 14 12 28 36 40 33 39 11 93 64 16
HUL ITC Nestle Colgate GSKCHL APNT GCPL Marico Dabur Titan TGBL Britannia Pidilite Sector
Average Relative P/E (X)
3-Yr 2.2 1.4 2.6 2.0 1.6 2.5 2.0 2.1 1.9 2.2 1.2 2.2 2.1 1.8
5-Yr 2.2 1.4 2.7 2.0 1.7 2.3 1.9 1.9 1.9 2.1 1.3 1.9 2.0 1.8
10-Yr 2.0 1.5 2.6 1.9 1.7 2.0 1.8 1.8 1.8 1.9 1.3 1.8 1.7 1.8
Current Relative P/E 3.1 1.4 3.1 2.3 1.9 2.8 2.4 2.4 2.4 2.6 1.3 2.9 2.8 2.1
Current Prem/Disct to Avg (%)
Prem/Disc to 3-Yr Avg 38 (1) 18 15 14 11 18 11 24 22 6 32 33 15
Prem/Disc to 5-Yr Avg 42 (4) 13 14 9 20 27 25 29 24 (1) 52 45 16
Prem/Disc to 10-Yr Avg 54 (9) 19 21 11 37 35 35 35 40 (5) 68 72 20
5-year relative P/E variable (X)
Median 2.1 1.4 2.7 2.0 1.7 2.4 1.9 2.0 1.8 2.2 1.3 2.0 1.9 1.8
Average 2.2 1.4 2.7 2.0 1.7 2.3 1.9 1.9 1.9 2.1 1.3 1.9 2.0 1.8
STD 0.3 0.1 0.4 0.2 0.2 0.3 0.2 0.3 0.2 0.3 0.2 0.5 0.3 0.1
Max 3.1 1.8 3.5 2.4 2.1 2.9 2.4 2.4 2.4 2.7 1.7 2.9 2.8 2.1
+1 STD 2.4 1.6 3.1 2.2 2.0 2.6 2.1 2.2 2.0 2.4 1.5 2.5 2.3 1.9
Min 1.7 1.2 2.0 1.8 1.2 1.8 1.4 1.3 1.6 1.5 0.9 1.0 1.5 1.6
-1 STD 1.9 1.3 2.3 1.9 1.5 2.0 1.6 1.6 1.7 1.8 1.0 1.4 1.6 1.7
Difference versus current relative P/E (%)
Median 43 (5) 12 16 9 17 26 18 31 21 (0) 44 52 18
Average P/E 42 (4) 13 14 9 20 27 25 29 24 (1) 52 45 16
Max - (24) (12) (5) (13) (3) (2) - - (4) (28) - - -
+1 STD 26 (12) (1) 6 (5) 7 13 7 16 8 (16) 20 25 10
Min 75 14 52 31 53 51 66 81 52 76 36 198 96 30
-1 STD 62 6 32 25 27 36 45 49 44 45 20 106 74 23

For Private Circulation Only. FOR IMPORTANT INFORMATION ABOUT KOTAK SECURITIES’ RATING SYSTEM AND OTHER DISCLOSURES, REFER TO THE END OF THIS MATERIAL.
5-12% yoy growth rate in c/c; no unusual impact of furloughs
We expect constant currency (c/c) revenue growth rate of 1.2-4% on a sequential basis and
4.5-11.7% on yoy comparison for Tier-1 IT. We expect furloughs to be in line with the historical
trends and do not expect any unusual impact of the same for the quarter. We expect Infosys
and TCS to report c/c sequential revenue growth of 1.2% and 1.8%, respectively. Wipro will
report c/c growth rate of 2.2% led by the full-quarter benefit from the Alight Solutions deal.
HCLT will report acceleration in sequential revenue growth aided by ramp-up of the Nokia deal
and seasonal strength in the IP business; we forecast 3% organic qoq c/c revenue growth rate
and 3.3% on reported basis. We expect TM to report c/c qoq growth of 2.6% led by ramp-up
in telecom deals. The enterprise segment will be impacted by furloughs.
Expect stable margins despite some cross-currency headwinds
Strength of the USD against other currencies will result in modest cross-currency headwind of
70-80 bps. HCLT and Tech Mahindra will report sequential margin increase led by seasonal
strength in revenues and mix shift. Infosys will report marginal decline in margins due to
reinvestments in business and transition costs in large deals. TCS will likely report 40 bps
increase in margins on a sequential basis and increase of 170 bps on yoy comparison.
Appreciation in the INR against the USD towards the end of the quarter can result in forex
translation losses although it is difficult to quantify the same.
Mid-tier companies—expect growth momentum to continue
Mid-tier companies will report a stronger quarter than Tier-1 IT largely riding on the back of
momentum of the past few quarters. A few factors helped in building the growth momentum,
including uptick in spending, lower legacy drag and greater participation in deals (due to
reduced deal sizes). We expect sequential c/c revenue growth rate of 2.3-4.2% and yoy growth
rate of 12.6-18%. LTI will lead the pack with 4.2% c/c sequential and 17.3% yoy growth rate.
Mindtree had guided for similar growth rates in the December 2018 quarter when compared to
the September 2018 quarter. We expect Hexaware and Mphasis to report sequential revenue
growth of 2.6% and 3.4%, respectively.
CY2019 demand and risks to margins from onsite cost increase will be the key focus area
We expect the focus to shift to two key aspects for CY2019: demand and margin defense.
Tug-of-war between a potential slowdown and increasing deal sizes. The macro
environment is seemingly more volatile with expectations of a slower global GDP growth in
2019. Certain segments of the market such as manufacturing are showing signs of a
slowdown, based on our conversations with companies. On the positive side, (1) increasing
size of digital deals and (2) momentum in large deal closures in the past six months will
contribute to growth. We believe it is still too early to take a call on the direction of growth
for FY2020E although a growth rate similar to FY2019E could be a reasonable outcome. We
further note that none of the Tier-1 IT companies has indicated slowdown in budgeting
process, deal pipeline or decision-making although they typically are never the lead indicators
for demand.
IT Services India
December 2018 quarter preview. We expect a steady quarter for Tier-1 IT with 1.2-
4% sequential revenue growth rate in c/c. The December quarter is usually impacted by
furloughs although the magnitude is no different than earlier years. The focus will shift to
(1) CY2019 demand; positives of increase in deal momentum could be potentially offset
by a weaker macro and (2) margin protection strategies of companies in light of visa-
induced rise in the onsite cost structure. Infosys and Tech Mahindra are our top picks.
CAUTIOUS
JANUARY 01, 2019
UPDATE
BSE-30: 36,255
Kawaljeet Saluja
Sathishkumar S

IT Services India
KOTAK INSTITUTIONAL EQUITIES RESEARCH 33
Likely increase in cost structure in US. Tightening of conditions for visas comes at a
time when the unemployment rates are at a record low. Even as IT companies have
stepped up local hiring, the fact is that talent is not easily available at the mid-level.
This could potentially impact cost structure in the US or even impact demand fulfillment.
Companies have to resort to a mix of subcontracting and offshore/nearshoring to meet
demand. This impacts margins. Companies will have to use to a mix of strategies to offset
the impact, including—(1) smarter pricing of resources. Clients are unlikely to pay up a
higher price for onsite resources due to talent shortage. Companies can try their luck on
pricing through COLA adjustments but need to be successful. Renegotiation of rate card
and MSAs is a long-drawn process that calls for involvement of the procurement team.
A possible workaround is smarter definition of ‘high skill’ or hot skill areas through which
vendors can ask for higher prices and can be decided upon without the involvement of
procurement teams and (2) rupee depreciation. In the normal course, rupee depreciation
benefits do get passed on to clients either through renegotiation of MSAs (gradual) or
adjustment of implied pricing (in short-duration fixed-price projects). It remains to be seen
whether the pricing gets readjusted in the current cycle noting increased onsite costs
resulting from constrained visa availability and select cases of staffing challenges.
These challenges are across all players.
Stocks available at attractive valuations
Acknowledging the external risks, we believe many stocks are available at attractive
valuations. Infosys trades at 15.5X FY2020E earnings and 13.5X on FY2021E basis.
The company is on track to achieve peer-matching revenue growth in FY2020E backed by
credible steps for a turnaround, some of which are visible in large deal momentum and
smart hiring in large deals and consulting. Tech Mahindra trades at 12.5X FY2020E
earnings, attractive when considering pick-up in core telecom growth, steady enterprise
segment, increase in margin profile and optionality of 5G spending.
Comments on individual companies
Infosys. We expect sequential constant currency revenue growth of 1.2% and cross
currency headwind of 70 bps. 3Q is a seasonally weak quarter. We do not model revenue
flow from a large deal signed in the September 2018 quarter. We expect EBIT margin to
decline marginally as measures to curb attrition through retention bonuses and
investments in sales and digital competencies pick pace. We expect Infosys to tighten
constant currency revenue growth guidance to 7-8% from 6-8% band and maintain EBIT
margin band of 22-24%. We expect muted net profit growth on yoy comparison due to
lower treasury income after the company completed buyback of shares in the December
2017 quarter. The company has made solid progress in large deal signings and seems to
be taking steps in turning around the consulting business through high profile hires from
competition. Progress made by Infosys on catching up with competition on digital
competencies will be keenly tracked. We expect investors to focus on (1) TCV of deal
wins that has started looking up, (2) progress in curbing attrition that seems to have
reached worrying levels, (3) progress in service lines where the company trails
competition, viz. BPO and IMS and (4) pricing outlook, especially in light of fears that the
company has focused on a growth-at-any-cost approach.
TCS. We expect sequential constant currency revenue growth of 1.8% and cross currency
headwind of 70 bps. We expect broad-based growth across verticals led by general
demand buoyancy. We expect EBIT margin to expand by 40 bps led by operational
efficiencies. Growth acceleration and tailwinds from currency will result in an impressive
25% yoy growth in net profit. We expect investors to focus on (1) the impact of a volatile
macro on CY2019 demand and budgeting cycle, (2) pipeline of large deals, (3) whether
the company can deliver double-digit growth without the support of mega-deals, and
(4) EBIT margin outlook and reinvestment plans of the recent currency windfall.

India IT Services
34 KOTAK INSTITUTIONAL EQUITIES RESEARCH
Wipro. Adjusting for reorganization of India business (Wipro moved out India PSU &
government business that contributed US$34 mn from IT services segment), we expect
sequential constant currency revenue growth of 2.2% and cross-currency headwind of 70
bps. Revenue growth will be led by US$25 mn in incremental revenues from the Alight
deal. Revenue growth will be led by the financial services vertical while energy, healthcare
and manufacturing verticals will drag. We note that EBIT margin in September 2018
quarter was impacted by one-time settlement with National Grid; adjusting for the same,
EBIT margin was 18%. Also EBIT margin of December 2017 quarter had a one-time
impact of customer insolvency; adjusted margin for this period was 17.2%. We expect 20
bps qoq increase in margin led by full-quarter benefit of cost-rationalization initiatives of
the previous quarter. We expect Wipro to guide to 1-3% revenue growth for the March
2019 quarter, which is a seasonally strong quarter for the company. We expect investors
to focus on (1) sustainability of growth demonstrated in the September 2018 quarter,
(2) sustainability of margin, especially after cost rationalization undertaken at acquired
entities, (3) state of demand from weak utilities, healthcare and communications vertical,
(4) impact of recent oil price correction on E&U demand, and (5) performance of acquired
entities.
HCL Technologies. We expect HCLT to deliver sequential revenue growth of 3.3% in
reported currency. Decomposition of revenue growth is as follows—(1) organic constant
currency revenue growth rate of 3%, (2) contribution from H&D International of US$21
mn or 1%, and (3) cross currency headwind of 70 bps. The growth will be led by—
(1) large deal contribution in IMS business (+3.5% qoq) and (2) seasonal strength in the IP
business. We expect EBIT margin to increase 40 bps sequentially led by revenue uptick
and sharp sequential growth from higher-margin IP business. We expect the company to
maintain 9.5-11.5% constant currency revenue growth guidance. Organic revenue
growth for FY2019E will be higher than the earlier expected 5.25%. We expect investors
to focus on (1) products business strategy in the light of aggressive acquisitions,
(2) synergies in services business from product acquisitions, (3) deal momentum in IMS,
and (4) measures to turn around the underperforming applications business.
Tech Mahindra. We expect constant currency revenue growth of 2.6% and cross
currency headwind of 75 bps. The telecom vertical will report constant currency revenue
growth of 4.5%, while enterprise segment growth will be marginal at 1%, impacted by
furloughs. We expect EBIT margin to increase 20 bps sequentially led largely by
operational tightening. We forecast marginal forex loss as compared to gain of US$7.5
mn in the previous quarter. We expect TCV of deal wins to move back to US$300 mn
range, down from US$500 mn in the previous quarter. We expect investors to focus on
(1) demand outlook, especially for the telecom vertical mainly in light of recently
announced large deals, (2) health of the enterprise business, (3) deal pipeline, (4) 5G
opportunity, and (5) M&A strategy and capital allocation.

IT Services India
KOTAK INSTITUTIONAL EQUITIES RESEARCH 35
Exhibit 1: Currency movement in December 2018 quarter
Source: Bloomberg, Kotak Institutional Equities estimates
Exhibit 2: Cross currency headwinds in 3QFY19E
Notes: (a) As per disclosures for Infosys, TCS, Wipro, HCLT and Tech M; assumed to be in line with geographic mix for other companies.
Source: Company, Bloomberg
Depreciation of currencies against the US Dollar
INR/USD USD/GBP USD/EUR USD/AUD JPY/USD
Sep-18 quarter avg. rate 70.5 1.31 1.17 0.73 111.8
Dec-18 quarter avg. rate 71.3 1.28 1.14 0.71 112.2
Appr/ (Depr) (%) (1.1) (2.6) (2.4) (2.5) (0.3)
Appreciation of the Rupee against other currencies
INR/USD INR/GBP INR/EUR INR/AUD JPY/INR
Sep-18 quarter avg. rate 70.5 92.4 82.2 51.6 1.6
Dec-18 quarter avg. rate 71.3 91.0 81.1 50.8 1.6
Appr/ (Depr) (%) (1.1) 1.5 1.4 1.4 (0.8)
Impact in bps on
US US$ revenue
USD GBP EUR AUD Others growth
TCS 54 14 10 (76)
Infosys 67 5 12 9 7 (67)
Wipro 60 10 9 5 16 (67)
HCL Tech 66 9 18 (77)
Tech M 48 11 11 5 25 (76)
L&T Infotech 67 (49)
Mindtree 74 (51)
Hexaware 77 (52)
Mphasis 80 (34)11 9
17 16
19 8
13 9
Currency-wise revenue mix (a)
Europe Rest of the world
22
7
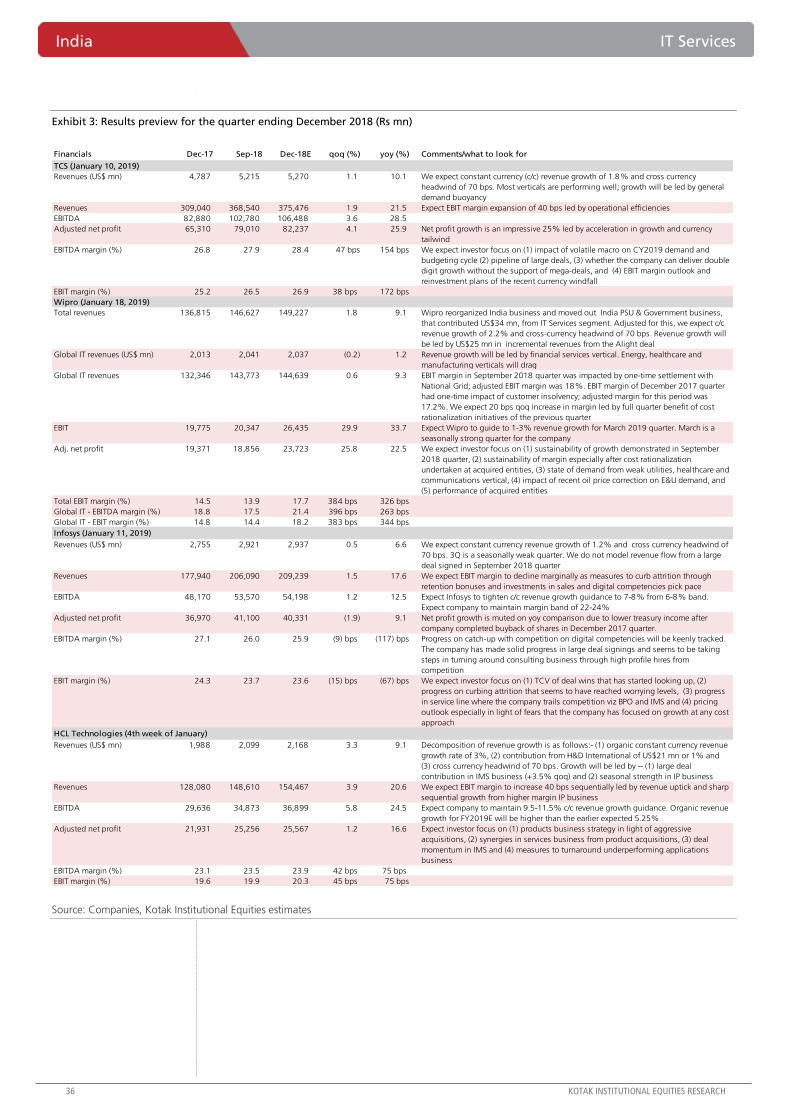
India IT Services
36 KOTAK INSTITUTIONAL EQUITIES RESEARCH
Exhibit 3: Results preview for the quarter ending December 2018 (Rs mn)
Source: Companies, Kotak Institutional Equities estimates
Financials Dec-17 Sep-18 Dec-18E qoq (%) yoy (%) Comments/what to look for
TCS (January 10, 2019)
Revenues (US$ mn) 4,787 5,215 5,270 1.1 10.1 We expect constant currency (c/c) revenue growth of 1.8% and cross currency
headwind of 70 bps. Most verticals are performing well; growth will be led by general
demand buoyancy
Revenues 309,040 368,540 375,476 1.9 21.5 Expect EBIT margin expansion of 40 bps led by operational efficiencies
EBITDA 82,880 102,780 106,488 3.6 28.5
Adjusted net profit 65,310 79,010 82,237 4.1 25.9 Net profit growth is an impressive 25% led by acceleration in growth and currency
tailwind
EBITDA margin (%) 26.8 27.9 28.4 47 bps 154 bps We expect investor focus on (1) impact of volatile macro on CY2019 demand and
budgeting cycle (2) pipeline of large deals, (3) whether the company can deliver double
digit growth without the support of mega-deals, and (4) EBIT margin outlook and
reinvestment plans of the recent currency windfall
EBIT margin (%) 25.2 26.5 26.9 38 bps 172 bps
Wipro (January 18, 2019)
Total revenues 136,815 146,627 149,227 1.8 9.1 Wipro reorganized India business and moved out India PSU & Government business,
that contributed US$34 mn, from IT Services segment. Adjusted for this, we expect c/c
revenue growth of 2.2% and cross-currency headwind of 70 bps. Revenue growth will
be led by US$25 mn in incremental revenues from the Alight deal
Global IT revenues (US$ mn) 2,013 2,041 2,037 (0.2) 1.2 Revenue growth will be led by financial services vertical. Energy, healthcare and
manufacturing verticals will drag
Global IT revenues 132,346 143,773 144,639 0.6 9.3 EBIT margin in September 2018 quarter was impacted by one-time settlement with
National Grid; adjusted EBIT margin was 18%. EBIT margin of December 2017 quarter
had one-time impact of customer insolvency; adjusted margin for this period was
17.2%. We expect 20 bps qoq increase in margin led by full quarter benefit of cost
rationalization initiatives of the previous quarter
EBIT 19,775 20,347 26,435 29.9 33.7 Expect Wipro to guide to 1-3% revenue growth for March 2019 quarter. March is a
seasonally strong quarter for the company
Adj. net profit 19,371 18,856 23,723 25.8 22.5 We expect investor focus on (1) sustainability of growth demonstrated in September
2018 quarter, (2) sustainability of margin especially after cost rationalization
undertaken at acquired entities, (3) state of demand from weak utilities, healthcare and
communications vertical, (4) impact of recent oil price correction on E&U demand, and
(5) performance of acquired entities
Total EBIT margin (%) 14.5 13.9 17.7 384 bps 326 bps
Global IT - EBITDA margin (%) 18.8 17.5 21.4 396 bps 263 bps
Global IT - EBIT margin (%) 14.8 14.4 18.2 383 bps 344 bps
Infosys (January 11, 2019)
Revenues (US$ mn) 2,755 2,921 2,937 0.5 6.6 We expect constant currency revenue growth of 1.2% and cross currency headwind of
70 bps. 3Q is a seasonally weak quarter. We do not model revenue flow from a large
deal signed in September 2018 quarter
Revenues 177,940 206,090 209,239 1.5 17.6 We expect EBIT margin to decline marginally as measures to curb attrition through
retention bonuses and investments in sales and digital competencies pick pace
EBITDA 48,170 53,570 54,198 1.2 12.5 Expect Infosys to tighten c/c revenue growth guidance to 7-8% from 6-8% band.
Expect company to maintain margin band of 22-24%
Adjusted net profit 36,970 41,100 40,331 (1.9) 9.1 Net profit growth is muted on yoy comparison due to lower treasury income after
company completed buyback of shares in December 2017 quarter.
EBITDA margin (%) 27.1 26.0 25.9 (9) bps (117) bps Progress on catch-up with competition on digital competencies will be keenly tracked.
The company has made solid progress in large deal signings and seems to be taking
steps in turning around consulting business through high profile hires from
competition
EBIT margin (%) 24.3 23.7 23.6 (15) bps (67) bps We expect investor focus on (1) TCV of deal wins that has started looking up, (2)
progress on curbing attrition that seems to have reached worrying levels, (3) progress
in service line where the company trails competition viz BPO and IMS and (4) pricing
outlook especially in light of fears that the company has focused on growth at any cost
approach
HCL Technologies (4th week of January)
Revenues (US$ mn) 1,988 2,099 2,168 3.3 9.1 Decomposition of revenue growth is as follows:- (1) organic constant currency revenue
growth rate of 3%, (2) contribution from H&D International of US$21 mn or 1% and
(3) cross currency headwind of 70 bps. Growth will be led by -- (1) large deal
contribution in IMS business (+3.5% qoq) and (2) seasonal strength in IP business
Revenues 128,080 148,610 154,467 3.9 20.6 We expect EBIT margin to increase 40 bps sequentially led by revenue uptick and sharp
sequential growth from higher margin IP business
EBITDA 29,636 34,873 36,899 5.8 24.5 Expect company to maintain 9.5-11.5% c/c revenue growth guidance. Organic revenue
growth for FY2019E will be higher than the earlier expected 5.25%
Adjusted net profit 21,931 25,256 25,567 1.2 16.6 Expect investor focus on (1) products business strategy in light of aggressive
acquisitions, (2) synergies in services business from product acquisitions, (3) deal
momentum in IMS and (4) measures to turnaround underperforming applications
business
EBITDA margin (%) 23.1 23.5 23.9 42 bps 75 bps
EBIT margin (%) 19.6 19.9 20.3 45 bps 75 bps

IT Services India
KOTAK INSTITUTIONAL EQUITIES RESEARCH 37
Exhibit 3: Results preview for the quarter ending December 2018 (Rs mn) (contd)
Source: Companies, Kotak Institutional Equities estimates
Financials Dec-17 Sep-18 Dec-18E qoq (%) yoy (%) Comments/what to look for
Tech Mahindra (February 5, 2019)
Revenues (US$ mn) 1,209 1,218 1,241 1.9 2.7 Expect c/c revenue growth of 2.6% and cross currency headwind of 75 bps.
Telecom vertical will report c/c revenue growth of 4.5%, while enterprise
segment growth will be marginal at 1%, impacted by furloughs
Revenues 77,760 86,299 88,456 2.5 13.8 EBIT margin will increase 20 bps sequentially led largely by operational
tightening
EBITDA 12,647 16,187 16,749 3.5 32.4 We forecast marginal forex loss as compared to gain of US$7.5 mn in the
previous quarter
Adjusted net profit 9,432 10,643 10,886 2.3 15.4 We expect TCV of deal wins to move back to US$300 mn range, down from
US$500 mn in the previous quarter
EBITDA margin (%) 16.3 18.8 18.9 18 bps 267 bps We expect investors to focus on (1) demand outlook especially for telecom
vertical especially in light of recently announced large deals, (2) health of
enterprise business, (3) deal pipeline, (4) 5G opportunity, and (5) M&A strategy
and capital allocation
EBIT margin (%) 12.7 15.3 15.5 17 bps 277 bps
L&T Infotech (January 18, 2019)
Revenues (US$ mn) 294 329 341 3.7 16.1 We expect c/c revenue growth of 4.2% and cross currency headwind of 50
bps. Revenue growth will be led by financial services, CPG and pharma clients
Revenues 18,838 23,312 24,276 4.1 28.9 We expect 70 bps decline in EBIT margin as the company reinvests the currency
gains in localization and competency development
EBITDA (excl forex gains) 3,216 4,790 4,840 1.0 50.5 Translation lossess will offset hedging gains in the quarter. As a result we do
not expect any Fx gains in the quarter. December 2017 and September 2018
quarter had forex gains of Rs772 mn and Rs711 mn respectively
Adjusted net profit 2,827 4,028 3,519 (12.6) 24.5 Expect investor focus on (1) demand outlook, (2) large deal momentum, (3)
capital allocation, (4) M&A strategy and (5) status of the hedge book after the
recent Rupee appreciation
EBITDA margin (%) 17.1 20.5 19.9 (61) bps 286 bps
EBIT margin (%) 14.9 19.0 18.3 (67) bps 336 bps
Mindtree (January 16, 2019)
Revenues (US$ mn) 214.3 246.4 250.4 1.6 16.8 We expect revenue growth of 2.3% in constant currency. Expect cross-currency
headwind of 50 bps. Growth will be impacted by usual year-end furloughs
Revenues 13,777 17,554 17,840 1.6 29.5 We expect EBITDA margin increase of 50 bps sequentially even as the company
has guided for stable margin. Note that previous quarter margin was impacted
by investments in hiring of senior level resources. We do not expect the pace
of this investment to continue
EBITDA 2,074 2,699 2,842 5.3 37.0 We expect deal momentum to conitnue and forecast solid TCVs
Adjusted net profit 1,415 2,063 1,757 (14.8) 24.2 We expect investor focus on (1) deal wins and pipeline, and (2) composition of
growth especially given the heavy reliance on top client for growth
EBITDA margin (%) 15.1 15.4 15.9 56 bps 88 bps
EBIT margin (%) 12.0 13.1 13.5 43 bps 149 bps
Hexaware Technologies (January 30, 2019)
Revenues (US$ mn) 156.1 171.1 174.7 2.1 11.9 We expect c/c revenue growth of 2.6% sequentially. Growth will be led by ramp
up of deal wins that missed execution in the previous quarter.
Revenues 10,048 12,096 12,448 2.9 23.9 We expect 70 bps decline in EBIT margin- 50 bps from wage hike and rest from
large deal transition costs and measures to boost onsite talent supply partially
offset by operational efficiencies
EBITDA 1,599 2,023 2,039 0.8 27.5 We expect the company to guide for 11-13% revenue growth in c/c for
CY2019E
Adjusted net profit 1,211 1,722 1,520 (11.7) 25.5 Expect investor focus on ((1) demand fulfillment challenges onsite. Hexaware
had called out talent supply shortage onsite in the last quarter, (2) ramp up of
large deals that were delayed in the last quarter due to unseasonal furloughs
and talent shortage, (3) momentum in TCVs of net new business and (4)
macro outlook and demand environment for CY2019
EBITDA margin (%) 15.9 16.7 16.4 (35) bps 46 bps
EBIT margin (%) 14.3 15.4 14.7 (71) bps 37 bps
Mphasis (January 24, 2019)
Revenues (US$ mn) 252 276 284 3.0 12.8 We expect c/c revenue growth of 3.4%
Revenues 16,607 19,149 20,226 5.6 21.8 We expect EBIT margin decline of 60-70 bps due to wage hike that is spread
over the next quarter, normalisation of G&A expenses and impact from large
deal transition costs partially offset by operational efficiencies
EBITDA 2,713 3,329 3,378 1.5 24.5 Investor focus will remain on (1) deal wins in direct channel and confidence on
sustenance of growth in direct core and DXC channel, (2) outlook for Digital
Risk, (3) qualitative outlook on deal wins from Blackstone portfolio companies,
(4) commentary on hedges and its impact on margins in FY2019 and (5) macro
outlook
Adjusted net profit 2,121 2,709 2,667 (1.5) 25.8
EBITDA margin (%) 16.3 17.4 16.7 (68) bps 36 bps
EBIT margin (%) 15.3 16.4 15.8 (65) bps 50 bps
Notes:
(a) Result dates are yet to be announced for some companies.

India IT Services
38 KOTAK INSTITUTIONAL EQUITIES RESEARCH
Exhibit 4: Kotak Institutional Equities: valuation summary of key Indian technology companies
Source: Companies, Kotak Institutional Equities estimates
31-Dec-18 EPS (Rs) P/E (X) EV/EBITDA (X) RoE (%)
Company Price (Rs) Rating (Rs m) (US$ m) 2019E 2020E 2021E 2019E 2020E 2021E 2019E 2020E 2021E 2019E 2020E 2021E
HCL Technologies 964 ADD 1,342,978 19,225 73.6 77.7 81.2 13.1 12.4 11.9 8.6 7.7 7.1 25.1 22.1 20.5
Hexaware Technologies 333 REDUCE 98,991 1,417 19.9 22.6 25.4 16.7 14.7 13.1 12.5 9.7 8.5 27.8 27.1 26.3
Infosys 660 ADD 2,882,652 41,265 36.7 41.2 45.5 18.0 16.0 14.5 12.4 10.8 9.6 23.5 24.1 23.9
L&T Infotech 1,731 ADD 300,220 4,298 83.0 94.6 109.7 20.9 18.3 15.8 15.2 12.7 10.7 33.9 31.3 29.6
Mindtree 865 ADD 141,963 2,032 45.0 55.4 63.1 19.2 15.6 13.7 12.2 9.6 8.2 24.8 26.0 25.2
Mphasis 1,018 SELL 196,986 2,820 55.4 62.8 64.5 18.4 16.2 15.8 12.8 11.6 10.7 18.5 19.8 20.1
TCS 1,893 REDUCE 7,103,452 101,685 84.7 94.5 103.0 22.4 20.0 18.4 15.8 14.1 13.1 33.8 33.7 34.8
Tech Mahindra 723 ADD 638,252 9,136 47.7 56.3 64.3 15.2 12.8 11.3 8.9 7.3 6.1 20.8 21.0 20.3
Wipro 331 REDUCE 1,496,936 21,428 18.9 22.9 24.8 17.5 14.4 13.4 11.2 9.4 8.6 16.4 17.7 17.6
Tech Mahindra 638,252 9,136 15.2 12.8 11.3 8.9 7.3 6.1 20.8 21.0 20.3
KIE universe 107,489,195 1,538,486 22.3 17.0 14.7 11.0 9.6 8.5 12.0 14.2 14.9
Target O/S shares EPS CAGR (%) Sales (Rs mn)
Company Price (Rs) (mn) 2019-21E 2019E 2020E 2021E 2019E 2020E 2021E 2019E 2020E 2021E 2019E 2020E 2021E
HCL Technologies 1,100 1,409 9.2 18.1 5.6 4.5 101,360 105,763 110,639 141,687 149,881 155,446 601,744 668,704 713,826
Hexaware Technologies 360 302 15.3 20.3 13.6 12.3 6,010 6,827 7,665 7,341 9,193 10,241 46,385 54,680 61,137
Infosys 780 4,350 12.1 13.5 12.3 10.4 159,525 179,173 197,829 214,343 240,870 264,025 822,279 919,979 1,006,314
L&T Infotech 2,000 175 20.0 30.5 14.0 16.0 14,721 16,855 19,553 18,477 21,606 24,660 93,830 110,076 125,128
Mindtree 1,080 165 22.3 30.2 23.1 14.0 7,389 9,092 10,365 10,759 13,359 14,946 69,993 80,495 90,471
Mphasis 900 193 13.7 26.4 13.4 2.7 10,712 11,684 11,997 13,515 15,459 16,429 78,446 89,976 98,025
TCS 1,950 3,829 15.1 25.6 11.6 8.9 320,497 354,776 386,412 411,614 459,367 494,365 1,473,839 1,648,377 1,784,302
Tech Mahindra 865 891 14.6 11.9 18.0 14.1 42,547 50,667 57,803 63,824 73,966 81,236 350,034 388,542 422,310
Wipro 325 4,507 13.5 11.7 21.2 7.9 85,300 103,391 111,571 112,836 131,011 138,476 590,438 636,200 673,083
Tech Mahindra 42,547 50,667 57,803 63,824 73,966 81,236 350,034 388,542 422,310
KIE universe 17.5 30.9 16.0
Notes:
(a) Hexaware Technologies is December year-ending.
Mkt cap.
EPS growth (%) Net Profit (Rs mn) EBITDA (Rs mn)

For Private Circulation Only.
November 2018 GST revenues at Rs947 bn
Based on the monthly PIB release, total GST collection was at Rs947 bn in November, lower
than Rs976 bn in October (Exhibit 1). This was the second consecutive month of decline as well
from the peak in September. CGST collection amounted to Rs164 bn (October: Rs168 bn),
SGST was at Rs225 bn (Rs231 bn), IGST at Rs479 bn (Rs497 bn), and compensation cess was at
Rs79 bn (Rs80 bn). After allocations from the IGST, CGST for October was at Rs439 bn
(October: Rs351 bn) and SGST was Rs463 bn (October: Rs388 bn). We note that these numbers
are prior to refunds and the final numbers will be released at month-end by the CGA (cash-
accounting basis). The number of returns filed in November was at 7.24 mn against 6.96 mn in
October.
GST shortfall likely to be around Rs1 tn
Accounting for refunds, on a cash accounting basis, November collections would likely be
around Rs870 bn, implying a 9MFY19 run-rate of Rs896 bn (Exhibit 2). For 9MFY19, CGST
would be around Rs3.4 tn, unallocated IGST at Rs128 bn, and SGST around Rs3.8 tn. We note
that the required run-rate for the rest of FY2019 is now around Rs1.5 tn. In a more realistic
(though still optimistic) scenario of (1) 1-5% mom increase in rest of FY2019, (2) higher IGST
allocation to the center and (3) distribution of unallocated compensation cess equally between
center and states, the center’s shortfall would likely be around Rs1 tn.
Fiscal math: Expenditure cuts inevitable if budgeted fiscal deficit target is sacrosanct
We continue to believe that expenditure cuts are inevitable if the government is to stick to its
budgeted GFD/GDP of 3.3% in FY2019. For 8MFY19, the fiscal deficit is already at 114.8% of
its budgeted target. Net tax receipts in 8MFY19 were Rs7.32 tn against a full-year target of
Rs14.8 tn (49.4% of the budgeted target), while total spending stood at Rs16.1 tn against the
full-year target of Rs24.4 tn (66% of budgeted target) (Exhibits 3 and 4). This implies that while
the expenditure remained on course, subdued tax receipts were responsible for pushing up the
deficit. There are limited chances of exceeding the divestment target with the government
garnering Rs338 bn till December 1, 2018; below its target of Rs800 bn. We maintain our
FY2019 GFD/GDP estimate at 3.5% including expenditure cuts in 4QFY19. This will also weigh
on GDP growth in 2HFY19, which is likely to be around 6.6% after 7.6% in 1HFY19.
Limited space for immediate direct budgetary support to rural sector
There have been a fair number of discussions with regards to the rural distress issue; particularly
farm distress stemming from inadequate income/profit generation. While measures such as
farm loan waivers, direct investment supports, tweaks to crop insurance schemes, further
interest subvention for crop loans, etc. remain on the card, the budgetary cost will be high. For
example, based on Agricultural Census, 2011 data (Exhibit 5) assuming Rs2,500/ha/year of
direct investment, the cost to the exchequer will be around Rs270 bn. However, most of these
schemes are usually staggered in their payouts and have a significant lag in their effects and,
hence, may not immediately alleviate the farm distress situation.
Economy Public Finance
Expenditure cuts imminent in 4QFY19. With GST revenues continuing to remain well
below budgeted targets, it will be difficult for the central government to meet its
GFD/GDP target of 3.3% without expenditure cuts. With the monthly GST run rate
remaining at around Rs896 bn for 9MFY19 and a likely shortfall of around Rs1 tn, we
maintain our GFD/GDP estimate at 3.5% including expenditure cuts in 4QFY19.
INDIA
JANUARY 02, 2019
UPDATE
BSE-30: 36,255
QUICK NUMBERS
November GST
collections at Rs947
bn
9MFY19 run-rate at
Rs896 bn; required
rate at Rs1.5 tn for
rest of FY2019
Maintain our
FY2019 GFD/GDP
estimate at 3.5%
Suvodeep Rakshit
Upasna Bhardwaj
Avijit Puri

India Economy
40 KOTAK ECONOMIC RESEARCH
Exhibit 1: November GST revenue at Rs947 bn Breakup of monthly GST collection (Rs bn)
Source: PIB, Kotak Economics Research
Exhibit 2: GST run rate significantly below budgeted run rate Summary of GST collections, March fiscal year-ends (Rs bn)
Source: PIB, CGA, Kotak Economics Research estimates
Total
CGST SGST IGST IGST (imports) Total GST filings (mn)
Jul-17 151 230 481 213 73 936 5.9
Aug-17 148 216 486 238 80 930 5.9
Sep-17 145 219 505 247 82 951 5.7
Oct-17 157 230 448 223 79 913 5.0
Nov-17 136 193 428 218 81 837 5.3
Dec-17 145 205 453 231 86 889 5.6
Jan-18 145 204 447 229 85 880 5.8
Feb-18 157 214 445 232 77 893 6.0
Mar-18 187 257 505 212 86 1,035 6.0
Apr-18 159 217 491 244 73 940 6.2
May-18 160 220 495 245 81 956 6.5
Jun-18 159 223 500 249 84 965 6.6
Jul-18 153 212 499 265 76 940 6.7
Aug-18 153 211 501 253 80 944 6.7
Sep-18 165 228 534 269 80 1,007 6.7
Oct-18 168 231 497 241 80 976 7.0
Nov-18 164 225 479 236 79 947 7.2
Compensation
cess
Mar-18 Apr-18 May-18 Jun-18 Jul-18 Aug-18 Sep-18 Oct-18 Nov-18
Monthly collections (PIB press releases)
Center 325 288 316 579 370 306 490 351 439
Center GST (CGST) 187 159 160 159 153 153 165 168 164
Centre's share of IGST (C-IGST) 138 129 157 420 217 153 325 183 274
States 403 340 367 638 411 350 529 388 463
States' GST (SGST) 257 217 220 223 212 211 228 231 225
States' share of IGST (S-IGST) 146 123 147 415 200 140 301 157 238
Unallocated IGST 222 239 192 (335) 82 209 (92) 158 (33)
Compensation cess 86 73 81 84 76 80 80 80 79
Total 1,035 940 956 965 940 944 1,007 976 947
FYTD collections (post refund adjustments)
Centre 521 971 1,383 1,563 1,975 2,421 2,759 3,193 3,531
- CGST 321 602 911 1,490 1,851 2,149 2,629 2,973 3,403
- Unallocated IGST 200 369 471 72 124 272 130 220 128
State 399 732 1,092 1,730 2,132 2,473 2,993 3,372 3,825
Compensation cess 85 157 237 317 391 469 548 627 704
Total 1,004 1,860 2,712 3,609 4,498 5,364 6,300 7,192 8,061
FY2019BE
Centre 6,539
- Unallocated IGST 500
State 5,078
Compensation cess 900
Total 12,517
Required run rate to meet FY2019BE
Centre 547 557 573 622 652 686 756 836 1,003
- Unallocated IGST 27 13 3 53 54 38 74 70 124
State 425 435 443 418 421 434 417 426 417
Compensation cess 74 74 74 73 73 72 70 68 65
Total 1,047 1,066 1,089 1,113 1,145 1,192 1,243 1,331 1,485
FYTD19 run rate
Centre 521 486 461 391 395 404 394 399 392
- Unallocated IGST 200 185 157 18 25 45 19 28 14
State 399 366 364 432 426 412 428 421 425
Compensation cess 85 79 79 79 78 78 78 78 78
Total 1,004 930 904 902 900 894 900 899 896

Economy India
KOTAK ECONOMIC RESEARCH 41
Exhibit 3: Indirect tax revenues growth significantly low Monthly tax receipts of the Indian government, March fiscal year-ends (Rs bn)
Source: CEIC, CGA, Kotak Economics Research
Exhibit 4: Expenditure growth well ahead of receipts growth Monthly fiscal aggregates of the Indian government, March fiscal year-ends (Rs bn)
Source: CEIC, CGA, Kotak Economics Research
Exhibit 5: Around 110 mn hectares of marginal, small, and semi-medium land holdings Number (mn) and area (mn ha) of farm holdings, 2010-11
Source: Agriculture Census 2010-11, Kotak Economics Research
Chg. (%) FYTD (Apr-Nov) Chg. (%)
Date Nov-18 Nov-17 Oct-18 yoy mom 2019 2018 yoy
Gross tax revenues 1,256 1,139 1,333 10.3 (5.8) 11,647 10,873 7.1
Direct taxes 436 372 615 17.1 (29) 5,512 4,854 13.6
Corporation tax 209 180 266 16.1 (22) 2,913 2,498 16.6
Income tax 213 178 335 20 (36) 2,504 2,152 16.4
Other taxes 14 14 13 (0.8) 4.9 96 203.9 (53)
Indirect taxes 306 270 302 13.1 1.1 6,135 6,019 1.9
Customs duty 109 84 115 29 (5.2) 868 1,028 (15.6)
Excise duty 194 175 181 11.2 7.3 1,381 1,652 (16.4)
Service tax 3 11 7 (77) (61) 56 791 (93)
GST 514 496 416 3.6 24 3,829 2,548 50
CGST+UGST 345 239 481 44 (28) 2,983 855 249
IGST 90 186 (142) (51) (164) 220 1,383 (84)
Compensation cess 79 71 77 11.7 2.7 626 309 103
Net tax revenues 706 658 783 7.3 (9.9) 7,317 6,994 4.6
Non-tax revenues 109 103 187 5.8 (42) 1,386 1,055 31
Non-debt capital receipts 71 233 15 (70) 389 263 618 (58)
Chg. (%) FYTD (Apr-Nov) Chg. (%)
Date Nov-18 Nov-17 Oct-18 yoy mom 2019 2018 yoy
Total receipts 886 994 985 (10.9) (10.1) 8,966 8,667 3.4
Total expenditure 1,566 1,862 1,524 (15.9) 2.8 16,132 14,788 9.1
Revenue expenditure 1,423 1,648 1,379 (13.7) 3.2 14,218 12,947 9.8
Capital expenditure 143 213 145 (33) (1.0) 1,914 1,841 4.0
Fiscal deficit 680 868 539 (22) 26 7,166 6,121 17.1
Revenue deficit 608 888 408 (31) 49 5,515 4,898 12.6
Primary deficit 119 349 172 (66) (31) 3,684 3,023 22
Number (mn) Area (mn ha) Number (mn) Area (mn ha) Number (mn) Area (mn ha)
Marginal (< 1 ha) 92.7 35.9 0.1 0.0 92.8 35.9
Small (1-2 ha) 24.7 35.2 0.0 0.0 24.8 35.2
Semi-medium (2-4 ha) 13.9 37.6 0.0 0.1 13.9 37.7
Medium (4-10 ha) 5.9 33.7 0.0 0.1 5.9 33.8
Large (> 10 ha) 1.0 15.7 0.0 1.2 1.0 16.9
Total 138.1 158.0 0.2 1.5 138.3 159.6
Individual holdings Joint holdings Total

42 KOTAK ECONOMIC RESEARCH
KO
TA
K IN
STIT
UTIO
NA
L EQ
UIT
IES R
ESEA
RC
H
42
Ind
ia D
aily
Su
mm
ary
- Jan
uary
2, 2
019
Kotak Institutional Equities: Valuation summary of KIE Universe stocks
Source: Company, Bloomberg, Kotak Institutional Equities estimates
Fair O/S ADVT
Price (Rs) Value Upside Mkt cap. shares EPS (Rs) EPS growth (%) P/E (X) EV/EBITDA (X) 3mo
Company Rating 1-Jan-19 (Rs) (%) (Rs bn) (US$ bn) (mn) 2019E 2020E 2021E 2019E 2020E 2021E 2019E 2020E 2021E 2019E 2020E 2021E 2019E 2020E 2021E 2019E 2020E 2021E 2019E 2020E 2021E (US$ mn)
Automobiles & Components
Amara Raja Batteries REDUCE 739 780 6 126 1.81 171 32.3 37.5 42.9 17.1 15.9 14.5 22.9 19.7 17.2 12.1 10.4 9.0 3.7 3.2 2.8 17.4 17.5 17.4 0.7 0.8 0.9 5.2
Apollo Tyres BUY 234 315 34 134 1.93 541 16.7 22.2 26.2 25.0 32.8 17.7 14.0 10.5 9.0 8.1 6.7 5.5 1.3 1.2 1.0 9.4 11.5 12.3 1.3 1.3 1.3 10.6
Ashok Leyland BUY 103 170 66 301 4.32 2,926 6.8 9.6 10.1 26.0 41.8 5.1 15.1 10.7 10.1 7.6 5.5 5.3 3.6 2.9 2.5 25.6 30.4 26.6 2.0 2.8 3.0 36.4
Bajaj Auto REDUCE 2,727 2,500 (8) 789 11.34 289 148.7 169.2 177.6 6.0 13.8 5.0 18.3 16.1 15.4 12.6 10.6 9.8 3.7 3.3 3.0 21.3 21.6 20.4 2.2 2.5 2.6 17.7
Balkrishna Industries BUY 929 1,030 11 180 2.58 193 44.1 53.6 60.0 17.9 21.5 12.0 21.1 17.3 15.5 11.2 9.6 8.2 3.7 3.1 2.7 19.1 19.6 18.6 0.6 0.6 0.7 13.5
Bharat Forge SELL 511 600 17 238 3.42 466 22.6 26.6 28.6 39.6 17.7 7.4 22.6 19.2 17.9 13.0 11.1 10.2 4.4 3.7 3.2 20.9 21.0 19.4 1.0 1.1 1.2 12.5
CEAT ADD 1,294 1,280 (1) 52 0.75 40 79.5 97.0 101.2 22.8 22.1 4.3 16.3 13.3 12.8 9.4 8.3 7.5 1.8 1.6 1.5 11.7 12.8 12.0 0.7 0.7 0.8 11.9
Eicher Motors SELL 23,195 20,000 (14) 633 9.09 27 899.3 1,056.6 1,184.1 13.5 17.5 12.1 25.8 22.0 19.6 18.5 15.5 13.2 8.8 6.8 5.4 39.1 35.0 30.6 0.1 0.1 0.0 35.3
Escorts BUY 720 1,050 46 61 1.27 89 56.9 66.7 74.6 46.7 17.2 11.9 12.6 10.8 9.6 7.3 6.2 5.1 2.2 1.9 1.6 17.1 17.2 16.6 1.2 1.4 1.6 18.9
Exide Industries SELL 268 235 (12) 227 3.27 850 10.3 11.4 12.7 25.3 11.0 11.6 26.0 23.4 21.0 14.8 13.2 11.8 3.8 3.5 3.1 15.4 15.5 15.7 1.1 1.3 1.5 6.6
Hero Motocorp SELL 3,128 2,600 (17) 625 8.97 200 173.4 181.5 195.2 (6.4) 4.7 7.5 18.0 17.2 16.0 10.7 10.0 9.1 4.8 4.3 3.9 27.8 26.1 25.4 2.8 2.9 3.1 25.6
Mahindra CIE Automotive ADD 255 280 10 97 1.39 378 13.9 15.5 16.9 44.4 12.1 9.0 18.4 16.4 15.1 9.3 8.3 7.4 2.3 2.0 1.8 13.2 13.0 12.4 — — — 1.3
Mahindra & Mahindra BUY 773 1,050 36 961 13.81 1,138 44.8 53.9 56.9 18.1 20.3 5.5 17.3 14.3 13.6 11.5 9.5 8.7 2.6 2.2 2.0 15.7 16.7 15.6 1.2 1.4 1.5 40.3
Maruti Suzuki BUY 7,477 8,200 10 2,259 32.45 302 280.6 348.9 392.1 9.8 24.4 12.4 26.6 21.4 19.1 14.5 11.3 9.6 4.7 4.1 3.6 19.0 20.5 20.0 0.9 1.2 1.3 97.3
Motherson Sumi Systems SELL 165 150 (9) 522 7.51 3,158 6.6 8.0 9.2 21.2 21.1 15.0 25.1 20.7 18.0 10.3 8.4 7.2 4.6 4.0 3.4 19.7 20.6 20.5 1.0 1.1 1.2 19.3
MRF REDUCE 66,801 62,000 (7) 283 4.07 4 3,048.2 3,702.1 4,088.7 14.2 21.5 10.4 21.9 18.0 16.3 9.7 8.2 7.1 2.6 2.3 2.0 12.5 13.3 13.0 0.1 0.1 0.1 6.7
Schaeffler India BUY 5,646 5,700 1 94 1.35 17 148.4 192.5 236.8 3.6 29.7 23.0 38.1 29.3 23.8 10.9 8.2 6.4 6.4 5.3 4.4 20.9 19.9 20.3 0.2 0.2 0.2 0.7
SKF ADD 1,906 1,900 (0) 98 1.41 51 67.9 81.8 96.6 17.8 20.5 18.1 28.1 23.3 19.7 17.8 14.8 12.2 4.6 4.0 3.4 16.5 17.2 17.5 0.6 0.7 0.9 0.8
Tata Motors BUY 173 300 73 589 7.88 3,396 1.0 21.1 30.9 (94.8) 1,935.5 46.5 167.4 8.2 5.6 3.9 3.0 2.5 0.6 0.6 0.5 0.4 7.2 9.7 — — — 49.7
Timken SELL 611 550 (10) 46 0.66 68 18.8 21.8 25.1 38.6 16.5 15.0 32.6 28.0 24.3 19.5 16.6 14.3 5.0 4.2 3.5 16.6 16.2 15.7 0.2 0.2 0.2 0.2
TVS Motor SELL 565 350 (38) 268 3.85 475 14.8 17.1 19.6 6.2 15.2 14.7 38.1 33.1 28.8 19.1 16.8 14.8 8.1 7.0 6.0 22.7 22.6 22.4 0.8 0.9 1.0 12.6
Varroc Engineering BUY 735 1,050 43 99 1.42 135 36.6 46.0 69.3 9.5 25.6 50.6 20.1 16.0 10.6 10.3 8.1 5.8 3.0 2.5 2.0 14.8 15.7 19.1 — — — 0.0
WABCO India SELL 6,875 6,100 (11) 130 1.87 19 182.6 222.4 230.3 27.0 21.8 3.6 37.6 30.9 29.8 26.1 20.8 19.6 7.1 5.8 4.9 20.5 20.6 17.9 0.2 0.2 0.2 0.4
Automobiles & Components Neutral 8,813 126.414 (4.8) 37.9 15.4 23.4 17.0 14.7 9.6 7.6 6.5 2.9 2.6 2.3 12.3 15.1 15.4 1.0 1.2 1.3 424
Banks
Axis Bank REDUCE 627 635 1 1,612 23.2 2,567 18.0 41.5 46.7 1579.4 130.1 12.5 34.8 15.1 13.4 — — — 2.6 2.2 1.9 7.1 14.6 14.5 0.4 1.0 1.1 100.3
Bank of Baroda ADD 123 130 5 326 4.7 2,652 17.3 25.8 28.7 289.0 48.7 11.2 7.1 4.8 4.3 — — — 1.0 0.8 0.6 10.8 14.2 13.7 — — — 32.5
Canara Bank ADD 282 280 (1) 206 3.0 733 1.3 54.2 68.3 102.3 3946.4 26.1 210.3 5.2 4.1 — — — 1.4 1.0 0.7 0.3 10.6 11.9 — — — 25.9
City Union Bank ADD 194 185 (5) 142 2.0 732 9.4 10.5 12.2 5.5 11.9 16.1 20.6 18.4 15.9 — — — 3.2 2.8 2.5 15.5 15.3 15.7 0.9 1.0 1.1 2.4
DCB Bank BUY 169 185 9 52 0.8 308 10.0 12.3 17.1 25.3 23.4 38.6 17.0 13.7 9.9 — — — 2.0 1.8 1.5 11.4 12.6 15.4 0.6 0.7 0.9 3.6
Equitas Holdings BUY 124 160 29 42 0.6 340 4.4 8.4 11.4 378.1 89.9 35.6 28.0 14.7 10.9 — — — 1.8 1.6 1.4 6.4 11.2 13.4 — — — 8.6
Federal Bank BUY 93 105 13 184 2.7 1,972 6.0 8.0 9.7 35.3 32.4 21.8 15.4 11.6 9.6 — — — 1.5 1.4 1.3 9.4 11.5 12.8 1.5 1.9 2.3 16.7
HDFC Bank ADD 2,148 2,200 2 5,842 83.9 2,595 78.1 96.5 113.4 15.9 23.6 17.5 27.5 22.3 18.9 — — — 4.0 3.6 3.1 16.7 16.7 17.2 0.7 0.9 1.0 99.7
ICICI Bank BUY 364 410 13 2,343 33.7 7,072 8.2 26.6 31.9 (14.1) 223.4 19.7 44.2 13.7 11.4 — — — 2.5 2.1 1.8 4.9 14.8 15.8 0.5 1.5 1.8 112.6
IDFC Bank NR 43 — — 148 2.1 3,404 0.9 2.9 4.2 (63.5) 215.5 45.1 47.1 14.9 10.3 — — — 1.0 0.9 0.9 2.0 6.2 8.5 0.4 1.3 1.9 7.0
IndusInd Bank BUY 1,596 1,750 10 961 13.8 600 46.7 83.9 99.6 (22.3) 79.9 18.6 34.2 19.0 16.0 — — — 3.5 3.1 2.7 12.0 16.9 17.3 0.3 0.6 0.7 60.4
J&K Bank BUY 39 90 133 21 0.3 557 5.4 7.6 16.0 48.7 41.1 109.3 7.1 5.1 2.4 — — — 0.5 0.4 0.4 4.8 6.5 12.6 2.8 4.0 8.3 0.4
Karur Vysya Bank ADD 90 110 22 73 1.0 799 3.2 13.4 14.3 (32.6) 317.8 7.0 28.2 6.7 6.3 — — — 1.3 1.1 1.0 3.7 14.4 13.9 0.9 3.7 4.1 1.7
Punjab National Bank ADD 80 85 7 296 4.3 2,761 (18.3) 12.9 14.0 58.8 170.3 8.8 NM 6.2 5.7 — — — 1.8 1.0 0.8 NM 11.4 11.0 — — — 26.0
RBL Bank SELL 577 500 (13) 246 3.5 420 21.3 28.6 34.3 40.5 34.3 20.0 27.1 20.2 16.8 — — — 3.4 3.0 2.7 12.7 15.1 16.0 0.6 0.7 0.9 14.1
State Bank of India BUY 300 380 27 2,674 38.4 8,925 7.5 39.3 52.3 202.3 424.3 32.8 39.9 7.6 5.7 — — — 1.9 1.4 1.1 3.0 14.5 16.5 0.1 0.1 0.2 94.8
Ujjivan Financial Services BUY 275 350 27 33 0.5 121 16.4 25.3 31.3 2648.5 54.2 23.8 16.7 10.9 8.8 — — — 1.7 1.5 1.3 10.7 14.7 16.0 0.5 0.9 1.3 9.1
Union Bank ADD 88 90 2 103 1.5 1,169 7.9 31.2 43.5 117.6 294.3 39.2 11.2 2.8 2.0 — — — 1.2 0.7 0.4 4.0 14.4 17.5 1.3 5.3 7.4 12.3
YES Bank SELL 184 190 3 426 6.1 2,303 17.8 19.0 23.7 (2.8) 6.5 24.6 10.3 9.7 7.8 — — — 1.5 1.3 1.2 15.0 14.2 15.7 1.6 1.7 2.1 175.9
Banks Attractive 15,731 226.0 790 160 23 33 12.5 10.2 1.9 1.7 1.5 5.9 13.4 14.4 0.5 0.9 1.0 804
P/B (X) RoE (%) Dividend yield (%)

KOTAK ECONOMIC RESEARCH 43
Ind
ia D
aily
Su
mm
ary
- Jan
uary
2, 2
019
43
K
OTA
K IN
STIT
UTIO
NA
L EQ
UIT
IES R
ESEA
RC
H
Kotak Institutional Equities: Valuation summary of KIE Universe stocks
Source: Company, Bloomberg, Kotak Institutional Equities estimates
Fair O/S ADVT
Price (Rs) Value Upside Mkt cap. shares EPS (Rs) EPS growth (%) P/E (X) EV/EBITDA (X) 3mo
Company Rating 1-Jan-19 (Rs) (%) (Rs bn) (US$ bn) (mn) 2019E 2020E 2021E 2019E 2020E 2021E 2019E 2020E 2021E 2019E 2020E 2021E 2019E 2020E 2021E 2019E 2020E 2021E 2019E 2020E 2021E (US$ mn)
Building Products
Astral Poly Technik SELL 1,129 640 (43) 135 1.9 120 17.5 22.0 25.6 19.7 25.2 16.7 64.3 51.4 44.0 33.6 27.9 23.7 10.5 8.8 7.4 18.3 18.7 18.3 0.1 0.1 0.1 1.1
Building Products Cautious 135 1.9 20.4 25.2 16.7 64 51 44 33.6 27.9 23.7 10.5 8.8 7.4 16.4 17.2 16.9 0.1 0.1 0.1 1.1
Capital goods
ABB SELL 1,319 1,040 (21) 280 4.0 212 27.5 31.0 37.7 38.9 12.5 21.6 47.9 42.6 35.0 28.3 25.7 21.6 7.0 6.4 5.6 15.4 15.7 17.0 0.7 0.7 0.7 6.4
Ashoka Buildcon BUY 125 215 72 35 0.5 282 9.7 10.6 10.4 14.8 9.6 (1.6) 12.93 11.80 11.99 8.7 7.7 7.2 1.6 1.4 1.3 13.0 12.5 11.1 1.4 1.1 1.1 0.6
BHEL REDUCE 74 — 4 271 3.9 3,482 3.0 5.0 6.7 27.6 70.0 34.2 25.0 14.69 10.95 12.6 7.5 5.5 0.8 0.8 0.8 3.2 5.6 7.3 2.5 4.2 5.6 14.6
Carborundum Universal SELL 361 315 (13) 68 1.0 189 14.3 17.3 19.8 25.6 20.8 14.5 25.2 20.8 18.20 14.1 11.4 9.8 3.9 3.5 3.1 16.4 17.8 18.2 1.2 1.4 1.6 0.2
CG Power and Industrial BUY 46 67 46 29 0.4 627 3.0 4.8 7.0 272.9 59.2 45.4 15.01 9.43 6.48 6.5 4.6 3.4 1.1 1.0 0.9 7.1 11.1 14.8 — — — 3.9
Cummins India REDUCE 848 700 (17) 235 3.4 277 27.1 32.7 37.4 12.3 20.7 14.2 31.3 25.9 22.7 25.3 21.0 18.0 5.5 5.2 4.8 18.3 20.7 22.0 1.7 2.1 2.4 7.1
Dilip Buildcon BUY 424 855 102 58 0.8 137 51.8 56.6 69.3 11.5 9.2 22.5 8.18 7.49 6.11 4.8 4.2 3.5 1.8 1.5 1.2 25.1 21.7 21.4 0.3 0.3 0.4 2.8
IRB Infrastructure BUY 165 260 58 58 0.8 351 29.7 31.7 20.2 31.6 6.8 (36.3) 5.55 5.20 8.15 6.5 7.0 8.6 0.9 0.8 0.7 17.0 15.7 9.1 1.9 2.3 2.5 4.8
Kalpataru Power Transmission BUY 391 540 38 60 0.9 153 30.1 35.5 42.4 55.0 18.2 19.4 13.02 11.02 9.23 6.9 5.7 4.8 1.9 1.7 1.4 16.0 16.3 16.7 0.4 0.4 0.4 0.5
KEC International BUY 302 380 26 78 1.1 257 20.4 26.1 32.0 13.7 28.0 22.8 14.85 11.60 9.44 8.6 7.1 5.8 3.2 2.6 2.1 23.5 24.4 24.2 0.7 0.9 1.1 1.7
L&T BUY 1,442 1,530 6 2,021 29.0 1,401 68.9 69.3 78.8 33.3 0.6 13.6 20.9 20.8 18.30 17.9 17.4 15.4 3.6 3.3 2.9 18.2 16.5 16.9 1.6 1.6 1.8 47.6
Sadbhav Engineering BUY 211 340 61 36 0.5 172 14.7 18.5 19.0 13.9 26.0 3.1 14.37 11.41 11.07 10.7 8.3 7.2 1.7 1.5 1.3 12.7 14.1 12.8 — — — 0.6
Siemens SELL 1,063 920 (13) 378 5.4 356 28.4 33.2 39.2 13.1 16.9 18.1 37.4 32.0 27.1 22.5 19.0 15.9 4.2 3.9 3.5 11.7 12.6 13.7 0.7 0.9 1.0 11.4
Thermax REDUCE 1,131 970 (14) 135 1.9 113 28.4 37.8 43.0 37.9 33.1 13.6 39.8 29.9 26.3 28.2 21.3 18.7 28.2 21.3 18.7 11.3 13.9 14.3 0.7 0.9 1.0 1.0
Capital goods Neutral 3,742 53.8 29.6 11.2 14.1 22 19.7 17.3 2.8 2.6 2.4 13.0 13.2 13.8 1.4 1.6 1.8 804
Commercial & Professional Services
SIS REDUCE 769 855 11 56 0.8 72.7 28.3 34.3 40.9 26.0 21.4 19.1 27.2 22.4 18.8 16.5 13.4 11.2 4.7 4.0 3.3 18.8 19.2 19.3 0.3 0.4 0.5 0.5
TeamLease Services SELL 2,828 1,925 (32) 48 0.7 17.1 58.9 76.0 98.5 36.6 29.0 29.7 48.0 37.2 28.7 48.7 37.1 28.4 8.9 7.2 5.8 20.5 21.4 22.3 — — — 0.5
Commercial & Professional Services Cautious 105 1.5 31.5 23.9 22.7 33.6 27.1 22.1 23.5 18.8 15.3 6.0 4.9 4.1 17.7 18.2 18.5 0.2 0.2 0.3 1
Commodity Chemicals
Asian Paints REDUCE 1,372 1,140 (17) 1,316 18.9 959.2 24.0 29.8 35.1 16.7 24.3 17.8 57.3 46.1 39.1 36.1 28.7 24.2 13.9 12.2 10.8 26 28 29 0.8 1.0 1.2 29
Tata Chemicals ADD 705 760 8 180 2.6 254.8 42.3 50.3 56.8 (18.9) 19.0 12.9 16.7 14.0 12.4 7.3 6.0 5.1 1.5 1.4 1.3 9.3 10.3 10.9 2.1 2.4 2.4 5.8
Commodity Chemicals Neutral 1,495 21.5 2.3 22.6 16.3 44.3 36.1 31.1 25.3 20.5 17.6 6.9 6.3 5.8 15.6 17.5 18.5 0.9 1.2 1.4 35
Conglomerate
Godrej Industries RS 544 — — 183 2.6 336.0 15.9 19.7 0.0 8.9 24.2 34.2 27.6 28.8 31.4 4.5 3.9 13.9 15.1 0.3 0.3 4.0
Conglomerate Neutral 183 2.6 8.9 24.2 34.3 27.6 28.8 31.4 4.5 3.9 13.1 14.2 0.3 0.3 4
Construction Materials
ACC SELL 1,489 1,250 (16) 280 4.0 188.0 57.9 67.4 77.9 19.0 16.3 15.7 25.7 22.1 19.1 13.5 11.6 9.8 2.8 2.6 2.3 11.2 12.0 12.7 1.1 1.1 1.1 15.6
Ambuja Cements REDUCE 223 195 (13) 443 6.4 1985.7 7.7 9.7 11.3 1.8 26.2 16.7 29.1 23.1 19.8 9.5 7.7 6.5 2.1 2.0 1.9 7.2 8.8 9.7 1.6 1.6 1.6 13.6
Dalmia Bharat ADD - 2,335 - - 0.0 192.1 15.0 35.9 47.7 0.8 140.4 32.6 NM NM NM 1.7 1.4 1.0 — — — 2.7 6.3 7.9 - - - 2.8
Grasim Industries ADD 834 1,030 24 548 7.9 657.0 77.3 84.9 96.0 63.0 9.9 13.1 10.8 9.8 8.7 6.9 6.6 6.0 0.9 0.8 0.8 8.7 8.9 9.3 0.7 0.7 0.7 18.6
India Cements REDUCE 96 102 6 30 0.4 308.2 3.8 7.0 9.1 15.9 85.3 29.2 25.4 13.7 10.6 8.2 6.8 6.2 0.6 0.5 0.5 2.2 4.0 5.0 1.0 1.0 1.0 8.6
J K Cement ADD 719 800 11 50 0.7 69.9 45.0 69.7 69.0 4.1 54.8 -1.0 16.0 10.3 10.4 9.7 8.7 7.1 2.3 1.9 1.6 15.0 20 16.9 1.1 1.1 1.1 0.5
JK Lakshmi Cement ADD 311 320 3 37 0.5 117.7 4.6 22.5 31.2 3.5 386.3 38.6 67.3 13.8 10.0 11.2 7.0 5.6 2.5 2.1 1.8 3.7 16.7 19.6 0.6 0.6 0.6 0.4
Orient Cement ADD 85 110 30 17 0.2 204.8 2.0 7.6 11.7 (7.8) 282.7 53.1 42.5 11.1 7.3 9.9 6.0 4.5 1.7 1.5 1.3 4.0 14.5 19.5 1.8 2.4 2.4 0.1
Shree Cement SELL 16,973 11,750 (31) 591 8.5 34.8 330.8 514.6 645.0 (16.7) 55.6 25.4 51.3 33.0 26.3 21.4 15.1 12.2 6.1 5.3 4.4 12.4 17.1 18.3 0.3 0.3 0.3 6.8
UltraTech Cement SELL 4,009 2,760 (31) 1,101 15.8 274.6 103.2 147.7 187.3 17.1 43.2 26.8 38.9 27.1 21.4 18.0 14.2 11.8 3.9 3.4 3.0 10.4 13.4 14.9 0.2 0.2 0.2 18.7
Construction Materials Cautious 3,097 44.5 23.5 31.6 19.9 24.8 18.9 15.7 10.4 8.8 7.6 2.1 1.9 1.7 8.3 10.0 10.9 0.7 0.7 0.7 86
P/B (X) RoE (%) Dividend yield (%)

44 KOTAK ECONOMIC RESEARCH
K
OTA
K IN
STIT
UTIO
NA
L EQ
UIT
IES R
ESEA
RC
H
44
Ind
ia D
aily
Su
mm
ary
- Jan
uary
2, 2
019
Kotak Institutional Equities: Valuation summary of KIE Universe stocks
Source: Company, Bloomberg, Kotak Institutional Equities estimates
Fair O/S ADVT
Price (Rs) Value Upside Mkt cap. shares EPS (Rs) EPS growth (%) P/E (X) EV/EBITDA (X) 3mo
Company Rating 1-Jan-19 (Rs) (%) (Rs bn) (US$ bn) (mn) 2019E 2020E 2021E 2019E 2020E 2021E 2019E 2020E 2021E 2019E 2020E 2021E 2019E 2020E 2021E 2019E 2020E 2021E 2019E 2020E 2021E (US$ mn)
Consumer Durables & Apparel
Crompton Greaves Consumer SELL 234 190 (19) 147 2.1 627 6.0 7.2 8.5 15.6 21.3 17.0 39.2 32.3 27.6 24.4 20.6 17.5 13.1 10.1 7.8 39.3 35.3 32.0 0.9 1.1 — 2.0
Havells India SELL 695 490 (29) 435 6.2 625 13.3 16.5 19.5 19.7 24.8 17.7 52.4 42.0 35.7 33.7 26.7 22.5 10.3 9.0 7.9 20.9 22.9 23.6 0.7 0.8 1.0 12.8
Page Industries SELL 24,847 22,300 (10) 277 4.0 11 410.2 500.8 599.4 31.9 22.1 19.7 60.6 49.6 41.5 39.0 32.1 26.7 25.3 20.1 16.2 47.1 45.1 43.2 0.7 0.9 1.0 16.3
TCNS Clothing Co. BUY 714 740 4 44 0.6 64 20.1 22.2 26.6 30.9 10.6 19.9 35.6 32.2 26.8 22.1 16.8 13.4 7.8 6.1 4.8 25.4 21.4 20.2 — — — 0.0
Vardhman Textiles ADD 1,105 1,300 18 63 0.9 56 119.4 130.2 141.3 15.9 9.1 8.5 9.26 8.49 7.82 7.0 6.5 5.8 1.1 1.0 0.9 12.9 12.8 12.6 1.8 2.7 2.7 0.3
Voltas SELL 555 490 (12) 184 2.6 331 16.6 18.6 22.3 (3.7) 11.5 20.0 33.4 29.9 24.9 25.4 21.9 18.1 4.2 3.8 3.4 13.4 13.5 14.5 0.6 0.7 0.8 10.8
Whirlpool SELL 1,405 1,220 (13) 178 2.6 127 34.9 41.5 48.7 26.4 18.7 17.4 40.2 33.9 28.9 25.1 20.6 17.2 8.3 7.0 6.0 22.4 22.3 22.4 0.4 0.6 1.0 1.0
Consumer Durables & Apparel Cautious 1,328 19.1 16.7 17.7 38.4 32.6 27.9 24.7 20.7 17.6 7.0 6.1 18.2 18.7 19.0 0.7 0.9 43
Consumer Staples
Bajaj Corp. ADD 373 405 8 55 0.8 148 15.2 16.7 18.3 6.3 9.7 9.7 24.6 22.4 20.4 19.6 16.8 14.6 11.3 11.4 11.3 45.9 50.8 55.6 3.5 3.7 4.0 0.3
Britannia Industries ADD 3,103 3,063 (1) 746 10.7 240 50.6 62.5 74.8 20.9 23.6 19.6 61.3 49.6 41.5 40.2 32.7 27.3 17.5 14.2 11.6 31.7 31.5 30.8 0.6 0.7 0.9 14.6
Colgate-Palmolive (India) ADD 1,324 1,185 (10) 360 5.2 272 27.5 31.7 36.8 15.6 15.4 16.1 48.2 41.7 36.0 28.0 24.3 21.1 21.1 18.3 16.0 46.3 46.9 47.4 1.2 1.4 1.7 9.2
Dabur India REDUCE 422 345 (18) 745 10.7 1,762 8.7 10.0 11.5 11.8 15.2 14.8 48.5 42.1 36.7 40.6 34.7 30.0 13.2 11.5 10.2 27.0 29.2 29.5 0.9 1.1 1.3 20.0
GlaxoSmithKline Consumer RS 7,572 — — 318 4.6 42 212.1 235.1 259.8 27.4 10.8 10.5 35.7 32.2 29.1 25.3 22.2 19.5 8.1 7.3 6.6 24.1 23.8 23.7 1.2 1.4 1.7 4.1
Godrej Consumer Products REDUCE 807 645 (20) 825 11.9 1,022 15.9 18.2 21.0 11.4 14.8 15.4 50.9 44.4 38.4 35.9 31.2 26.7 10.7 9.4 8.2 23.2 22.6 22.8 0.7 0.8 0.9 11.6
Hindustan Unilever REDUCE 1,801 1,530 (15) 3,899 56.0 2,160 29.2 33.8 38.2 18.9 16.0 13.0 61.8 53.2 47.1 43.7 37.6 33.2 48.2 40.4 34.2 83.2 82.6 78.6 1.2 1.3 1.5 40
ITC ADD 283 330 17 3,462 49.7 12,275 9.8 11.1 12.4 9.9 12.8 12.5 28.8 25.6 22.7 18.6 16.2 14.3 6.3 5.9 5.6 20.5 22.4 24.5 2.0 2.4 2.7 43
Jyothy Laboratories ADD 211 210 (1) 78 1.1 364 5.6 6.4 7.4 27.4 13.8 16.2 37.6 33.1 28.5 26.2 22.5 19.1 5.8 5.1 4.5 16.5 16.4 16.7 0.5 0.7 0.9 0.8
Marico ADD 372 350 (6) 481 6.9 1,291 7.0 8.7 10.2 11.8 24.5 17.0 53.1 42.7 36.5 37.3 29.9 25.2 17.7 16.1 14.4 34.4 39.5 41.7 1.3 1.5 1.7 10.4
Nestle India ADD 11,015 10,600 (4) 1,062 15.3 96 171.0 199.7 229.7 34.5 16.8 15.1 64.4 55.2 47.9 37.1 32.0 27.7 28.5 26.1 23.8 46.2 49.4 51.9 1.1 1.2 1.4 12.2
Tata Global Beverages ADD 219 230 5 138 2.0 631 7.7 9.0 10.1 4.7 16.6 13.1 28.5 24.4 21.6 16.5 14.4 12.7 1.9 1.8 1.7 6.8 7.6 8.3 1.4 1.6 1.8 7.0
United Breweries REDUCE 1,363 1,260 (8) 360 5.2 264 22.5 28.9 35.8 50.5 28.7 23.8 60.6 47.1 38.1 30.7 25.4 21.2 11.2 9.3 7.7 20.1 21.6 22.2 0.3 0.4 0.5 12.9
United Spirits REDUCE 621 540 (13) 451 6.5 727 10.9 13.9 17.5 42.8 28.1 25.5 57.2 44.6 35.6 34.1 27.6 23.0 13.1 9.0 6.3 26.5 23.9 20.8 — 0.3 0.4 15.3
Varun Beverages ADD 815 700 (14) 149 2.1 183 14.9 19.6 24.5 29.2 31.5 25.4 54.8 41.7 33.2 18.1 15.5 13.5 7.5 6.5 5.5 14.5 16.7 18.0 0.3 0.1 0.2 0.9
Consumer Staples Cautious 13,129 188.6 15.8 15.8 14.4 44.6 38.5 33.7 29.5 25.3 22.0 11.9 10.7 9.6 27 28 28 1.2 1.5 1.7 203
Diversified Financials
Bajaj Finance REDUCE 2,657 1,950 (27) 1,535 22.1 575 65.9 87.8 113.6 51.9 33.2 29.5 40.3 30.3 23.4 — — — 8.0 6.5 5.2 22 24 25 0.2 0.3 0.4 94
Bajaj Finserv ADD 6,522 5,650 (13) 1,038 14.9 159 239.7 302.7 375.1 36.6 26.3 23.9 27.2 21.5 17.4 — — — 4.3 3.6 3.0 17.4 18.0 18.7 0.2 0.2 0.2 22
Bharat Financial Inclusion NA 1,012 — — 142 2.0 139 53.4 63.3 77.3 63.5 18.5 22.2 19.0 16.0 13.1 — — — 3.7 3.0 2.4 21.8 20.5 20.1 — — — 16.4
Cholamandalam ADD 1,255 1,425 14 196 2.8 156 75.3 91.3 113.9 28.4 21.2 24.8 16.7 13.8 11.0 — — — 3.4 2.8 2.3 21.0 21.2 22.0 0.7 0.9 1.1 6.9
HDFC ADD 2,009 2,150 7 3,454 49.6 1,676 52.9 61.6 73.3 (29.9) 16.6 18.9 38.0 32.6 27.4 — — — 4.6 4.2 3.9 13.1 13.6 14.8 1.0 1.2 1.4 84
IIFL Holdings REDUCE 500 470 (6) 160 2.3 319 29.8 33.7 39.3 4.3 12.9 16.6 16.8 14.9 12.7 — — — 2.4 2.2 1.9 16.8 16.1 16.6 1.3 1.4 1.7 2.0
L&T Finance Holdings ADD 153 145 (5) 306 4.4 1,996 12.0 13.6 15.5 63.3 13.4 13.7 12.8 11.3 9.9 — — — 2.2 1.9 1.7 18.1 18.4 18.0 1.3 1.6 1.6 20
LIC Housing Finance BUY 487 590 21 246 3.5 505 42.1 51.7 65.5 (3.5) 22.7 26.8 11.5 9.4 7.4 — — — 1.6 1.4 1.2 15.0 15.6 17.3 1.3 1.7 2.1 14.1
Magma Fincorp BUY 111 145 31 30 0.4 237 12.2 16.9 20.3 25.1 39.0 19.9 9.1 6.5 5.5 — — — 1.1 1.0 0.8 13.0 15.7 16.4 1.7 2.3 2.7 0.2
Mahindra & Mahindra Financial ADD 472 450 (5) 291 4.2 614 23.8 27.1 32.6 35.7 14.0 20.2 19.9 17.4 14.5 — — — 2.9 2.7 2.4 14.7 14.9 16.0 1.2 1.3 1.6 13.1
Muthoot Finance ADD 513 510 (0) 205 2.9 400 43.1 43.4 47.8 0.3 0.6 10.2 11.9 11.8 10.7 — — — 2.3 2.0 1.8 21 18.0 17.4 1.9 1.9 2.1 9.7
PNB Housing Finance REDUCE 927 975 5 155 2.2 167 57.9 67.7 81.3 16.4 16.9 20.1 16.0 13.7 11.4 — — — 2.2 1.9 1.7 14.2 14.4 15.4 0.4 0.4 0.4 4.9
Shriram City Union Finance ADD 1,591 1,875 18 105 1.5 66 141.8 158.5 188.8 40.8 11.8 19.1 11.2 10.0 8.4 — — — 1.8 1.6 1.4 15.8 15.6 16.2 1.1 1.3 1.5 0.4
Shriram Transport BUY 1,230 1,450 18 279 4.0 227 106.8 124.1 143.4 54.6 16.1 15.6 11.5 9.9 8.6 — — — 1.9 1.7 1.4 16.7 16.8 16.9 1.2 1.4 1.7 24
Diversified Financials Neutral 8,142 117.0 8.2 19.1 20.9 25.5 21.4 17.73 3.8 3.3 2.9 14.8 15.5 16.3 0.8 0.9 1.1 312
P/B (X) RoE (%) Dividend yield (%)

KOTAK ECONOMIC RESEARCH 45
In
dia
Da
ily S
um
ma
ry - Ja
nu
ary
2, 2
019
45
K
OTA
K IN
STIT
UTIO
NA
L EQ
UIT
IES R
ESEA
RC
H
Kotak Institutional Equities: Valuation summary of KIE Universe stocks
Source: Company, Bloomberg, Kotak Institutional Equities estimates
Fair O/S ADVT
Price (Rs) Value Upside shares 3mo
Company Rating 1-Jan-19 (Rs) (%) (Rs bn) (US$ bn) (mn) 2019E 2020E 2021E 2019E 2020E 2021E 2019E 2020E 2021E 2019E 2020E 2021E 2019E 2020E 2021E 2019E 2020E 2021E 2019E 2020E 2021E (US$ mn)
Electric Utilities
CESC BUY 671 790 18 89 1.3 133 88.5 105.6 114.5 1.6 19.3 8.4 7.6 6.4 5.9 6.7 5.9 5.4 0.7 0.7 0.6 8.6 10.7 10.7 1.9 1.9 2.0 9.0
JSW Energy REDUCE 70 66 (5) 114 1.6 1,640 4.8 5.8 6.6 57.8 20.0 13.4 14.4 12.0 10.6 5.9 5.0 4.3 1.0 0.9 0.8 6.9 7.7 8.1 — — — 0.9
NHPC ADD 26 30 16 266 3.8 10,260 2.8 2.9 3.7 15.7 4.3 25.6 9.2 8.8 7.0 7.8 7.6 6.6 0.9 0.8 0.8 9.5 9.6 11.5 6.1 5.8 7.6 1.8
NTPC BUY 149 190 28 1,226 17.6 8,245 14.3 16.0 18.6 14.1 12.1 15.7 10.4 9.3 8.0 9.0 7.9 6.7 1.1 1.0 1.0 11.2 11.6 12.4 2.9 3.2 3.7 20
Power Grid BUY 200 250 25 1,046 15.0 5,232 19.2 22.2 24.7 21.7 15.7 11.0 10.4 9.0 8.1 7.5 6.8 6.3 1.7 1.5 1.4 17.5 18.1 18.0 3.2 3.7 4.1 12.8
Tata Power BUY 77 90 17 207 3.0 2,705 6.3 6.9 9.7 17.0 10.6 39.7 12.3 11.1 7.9 9.8 9.9 9.3 1.2 1.1 1.0 10.5 10.5 13.0 — — — 8.7
Electric Utilities Attractive 2,950 42.4 17.4 13.0 16.0 10.4 9.2 7.9 1.2 1.1 1.0 11.7 12.2 13.0 2.9 3.2 3.8 54
Fertilizers & Agricultural Chemicals
Bayer Cropscience SELL 4,213 3,550 (16) 145 2.1 34 94.0 113.8 135.2 7.4 21.0 18.8 44.8 37.0 31.2 27.3 22.7 18.9 7.1 6.2 5.4 17.0 18.0 18.6 0.4 0.5 0.6 0.5
Dhanuka Agritech ADD 445 500 12 22 0.3 49 25.5 27.8 30.7 (0.9) 9.1 10.5 17.5 16.0 14.5 12.8 10.9 9.5 3.0 2.6 2.3 18.4 17.6 17.1 1.2 1.3 1.5 0.2
Godrej Agrovet ADD 503 580 15 97 1.4 189 13.0 17.5 21.8 12.9 34.7 0.0 38.7 28.7 23.1 21.0 15.8 12.9 5.1 4.4 0.0 13.9 16.3 17.4 0.4 0.5 0.6 0.7
Kaveri Seed SELL 576 515 (11) 38 0.5 66 34.3 34.4 37.2 7.3 0.1 8.3 16.8 16.8 15.5 13.9 13.2 11.8 4.0 3.5 3.0 26 22 21 1.4 1.7 1.7 4.4
PI Industries BUY 864 850 (2) 119 1.7 138 29.6 38.5 45.9 11.5 29.9 19.2 29.2 22.5 18.83 20.8 16.0 13.1 5.3 4.4 3.7 19.6 21 21 0.5 0.7 0.8 1.2
Rallis India ADD 181 220 22 35 0.5 195 10.0 12.1 13.2 16.6 20.0 9.7 18.0 15.0 13.6 11.8 10.0 8.8 2.7 2.4 2.2 15.7 17.1 16.9 2.0 2.2 2.4 0.8
UPL ADD 754 650 (14) 384 5.5 507 47.0 53.9 60.0 9.5 14.7 11.4 16.0 14.0 12.6 10.5 9.0 7.8 3.5 2.9 2.5 23.9 22.9 21.5 1.2 1.5 1.6 22
Fertilizers & Agricultural Chemicals Attractive 839 12.1 9.7 17.3 13.6 21.4 18.2 16.0 13.9 11.7 10.0 4.2 3.5 3.0 19.6 19.5 18.9 0.9 1.1 1.3 30
Gas Utilities
GAIL (India) BUY 362 455 26 817 11.7 2,255 31.6 32.7 35.3 54.9 3.5 8.0 11.5 11.1 10.3 7.2 6.9 6.3 1.8 1.7 1.5 16.8 15.8 15.6 3.0 3.2 3.5 28
GSPL SELL 175 180 3 99 1.4 564 16.5 14.4 13.6 39.4 (12.9) (5.7) 10.6 12.2 12.9 4.6 4.7 4.6 1.7 1.5 1.4 17.1 13.2 11.2 1.4 1.2 1.2 1.0
Indraprastha Gas SELL 272 240 (12) 190 2.7 700 12.0 13.7 15.3 16.4 14.0 11.5 22.6 19.9 17.8 14.2 12.3 10.8 4.7 4.1 3.7 22.2 22.1 21.8 1.0 1.4 1.8 8.0
Mahanagar Gas ADD 912 930 2 90 1.3 99 56.0 60.3 63.6 15.7 7.7 5.4 16.3 15.1 14.3 9.4 8.6 8.0 3.8 3.4 3.1 24.7 23.7 22.6 2.4 3.0 3.5 4.0
Petronet LNG BUY 229 280 22 344 4.9 1,500 16.0 18.3 20.6 15.1 14.3 12.9 14.3 12.5 11.1 9.4 8.1 6.9 3.2 2.9 2.7 23.4 24.4 25.2 3.5 4.0 4.9 9.6
Gas Utilities Attractive 1,539 22.1 38.5 5.4 8.3 13.0 12.3 11.4 8.0 7.5 6.7 2.3 2.1 1.9 17.6 16.8 16.6 2.7 3.0 3.4 51
Health Care Services
Apollo Hospitals ADD 1,266 1,230 (3) 176 2.5 139 24.5 28.6 35.2 190.2 16.7 23.1 51.7 44.3 36.0 20.2 18.1 15.7 5.0 4.7 4.3 10.1 10.9 12.4 0.5 0.6 0.7 11.0
Aster DM Healthcare BUY 162 240 49 82 1.2 505 4.9 8.0 11.9 77.3 63.1 48.8 33.1 20.3 13.6 12.8 9.6 7.5 2.7 2.4 2.1 8.4 12.5 16.3 — — — 0.3
Dr Lal Pathlabs REDUCE 925 910 (2) 77 1.1 83 23.9 28.2 34.3 17.0 17.7 21.9 38.6 32.8 26.9 23.4 19.6 15.9 8.2 6.9 5.7 23.0 22.8 23 0.5 0.6 0.7 1.5
HCG BUY 194 270 39 17 0.2 85 -1.2 1.0 3.7 (178.5) 178.8 280.5 NM 200.9 52.8 16.5 13.4 10.8 3.3 3.2 3.0 NM 1.6 5.9 — — — 0.3
Narayana Hrudayalaya ADD 191 265 39 39 0.6 204 2.7 5.9 8.5 7.1 119.0 44.2 71.0 32.4 22.5 18.5 13.0 10.3 3.6 3.2 2.8 5.2 10.5 13.4 — — — 0.2
Health Care Services Attractive 391 5.6 69.1 39.9 35.7 47.0 33.6 24.7 17.8 14.5 11.9 4.3 3.9 3.4 9.2 11.6 13.9 0.3 0.4 0.5 13.18854
Hotels & Restaurants
Coffee Day Enterprises NR 278 — — 59 0.8 211 7.6 10.1 12.5 126.6 33.6 23.5 36.7 27.5 22.3 12.1 10.5 9.7 2.3 2.1 0.0 6.5 8.1 9.2 — — — 0.6
Jubilant Foodworks BUY 1,251 1,370 10 165 2.4 132 24.3 33.3 43.4 67.2 36.9 30.2 51.4 37.6 28.8 25.6 19.5 15.0 12.4 9.5 7.3 28 29 29 — — — 36
Lemon Tree Hotels ADD 74 80 8 59 0.8 786 0.4 1.2 2.0 147.2 174.7 67.1 166.5 60.6 36.3 36.9 22.5 16.7 6.9 6.2 5.7 4.2 10.7 16.4 — — 1.3 0.0
Hotels & Restaurants Attractive 283 4.1 86.9 45.5 33.3 54.6 37.5 28.2 20.5 16.0 13.1 6.0 5.2 4.5 11.0 13.8 15.9 0.1 0.1 0.4 37
Insurance
HDFC Standard Life Insurance ADD 386 380 (2) 779 11.2 2,007 6.5 8.1 9.8 18.3 23.8 21.0 59.1 47.7 39.4 — — — 14.7 13.1 11.5 26 29 31 0.4 0.5 0.6 6.1
ICICI Lombard SELL 873 650 (26) 397 5.7 454 25.6 31.4 36.5 34.9 22.7 16.4 34.1 27.8 23.9 — — — 7.4 6.2 5.2 23 24 24 0.7 0.8 1.0 6.7
ICICI Prudential Life BUY 326 450 38 468 6.7 1,436 8.9 10.3 12.3 (21.0) 15.6 19.8 36.6 31.6 26.4 — — — 6.2 5.3 4.6 18.1 18.1 18.7 0.5 0.5 0.6 6.0
Max Financial Services BUY 444 510 15 119 1.7 268 6.3 6.4 6.5 36.9 1.8 1.8 70.7 69.4 68.2 — — — 8.3 8.0 7.8 0.5 0.5 0.5 5.0
SBI Life Insurance BUY 599 715 19 599 8.6 1,000 12.7 14.3 16.1 10.8 12.4 12.1 47.0 41.8 37.3 — — — 7.9 6.8 5.9 18.0 17.5 17.0 0.3 0.4 0.4 3.3
Insurance Attractive 2,362 33.9 6.9 18.1 17.1 45.4 38.5 32.9 8.5 7.3 6.4 18.6 19.1 19.4 0.3 0.4 0.4 27
Mkt cap. EPS (Rs) EPS growth (%) P/E (X) EV/EBITDA (X) P/B (X) RoE (%) Dividend yield (%)

46 KOTAK ECONOMIC RESEARCH
K
OTA
K IN
STIT
UTIO
NA
L EQ
UIT
IES R
ESEA
RC
H
46
Ind
ia D
aily
Su
mm
ary
- Jan
uary
2, 2
019
Kotak Institutional Equities: Valuation summary of KIE Universe stocks
Source: Company, Bloomberg, Kotak Institutional Equities estimates
Fair O/S ADVT
Price (Rs) Value Upside shares 3mo
Company Rating 1-Jan-19 (Rs) (%) (Rs bn) (US$ bn) (mn) 2019E 2020E 2021E 2019E 2020E 2021E 2019E 2020E 2021E 2019E 2020E 2021E 2019E 2020E 2021E 2019E 2020E 2021E 2019E 2020E 2021E (US$ mn)
Internet Software & Services
Info Edge ADD 1,439 1,660 15 176 2.5 122 26.2 33.4 40.4 16.3 27.7 20.9 55.0 43.0 35.6 41.5 31.3 25.3 6.6 5.9 5.3 13.4 14.5 15.8 0.6 0.6 0.7 4.1
Just Dial ADD 500 610 22 34 0.5 67 28.3 29.8 32.2 33.2 5.1 8.2 17.7 16.8 15.5 10.2 9.0 7.7 3.5 3.0 2.5 19.3 19.1 17.6 0.6 0.6 0.6 18.4
Internet Software & Services Attractive 209 3.0 20.2 19.5 16.8 41.8 35.0 29.9 30.2 24.5 20.5 5.9 5.2 4.6 14.0 14.9 15.3 0.6 0.6 0.7 23
IT Services
HCL Technologies ADD 960 1,100 15 1,337 19.2 1,409 73.6 77.7 81.2 18.1 5.6 4.5 13.0 12.4 11.8 8.5 7.7 7.0 3.0 2.6 2.3 25.1 22.1 20.5 0.9 3.2 3.4 32
Hexaware Technologies REDUCE 332 360 8 99 1.4 302 19.9 22.6 25.4 20.3 13.6 12.3 16.7 14.7 13.1 12.5 9.7 8.5 4.3 3.7 3.2 27.8 27.1 26.3 2.4 2.4 3.0 8.1
Infosys ADD 665 780 17 2,905 41.7 4,350 36.7 41.2 45.5 13.5 12.3 10.4 18.1 16.1 14.6 12.5 10.9 9.7 4.1 3.7 3.3 23.5 24.1 23.9 3.3 2.9 3.2 86
L&T Infotech ADD 1,713 2,000 17 297 4.3 175 83.0 94.6 109.7 30.5 14.0 16.0 20.7 18.1 15.6 15.1 12.6 10.6 6.3 5.1 4.2 33.9 31.3 29.6 1.4 1.5 1.8 5.8
Mindtree ADD 863 1,080 25 142 2.0 165 45.0 55.4 63.1 30.2 23.1 14.0 19.2 15.6 13.7 12.2 9.5 8.2 4.4 3.7 3.2 24.8 26.0 25.2 1.6 1.9 2.2 18.8
Mphasis SELL 1,006 900 (11) 195 2.8 193 55.4 62.8 64.5 26.4 13.4 2.7 18.1 16.0 15.6 12.6 11.5 10.6 3.2 3.3 3.0 18.5 19.8 20 2.0 2.5 3.0 7.3
TCS REDUCE 1,903 1,950 2 7,140 102.6 3,829 84.7 94.5 103.0 25.6 11.6 8.9 22.5 20.1 18.5 15.9 14.2 13.1 7.0 6.6 6.3 33.8 33.7 34.8 1.8 3.5 3.8 83
Tech Mahindra ADD 719 865 20 635 9.1 891 47.7 56.3 64.3 11.9 18.0 14.1 15.1 12.8 11.2 8.9 7.2 6.1 2.9 2.5 2.1 20.8 21.0 20.3 1.3 1.4 1.6 32
Wipro REDUCE 327 325 (1) 1,478 21.2 4,507 18.9 22.9 24.8 11.7 21.2 7.9 17.3 14.2 13.2 11.0 9.2 8.4 2.6 2.4 2.2 16.4 17.7 17.6 0.5 3.1 3.4 18.8
IT Services Cautious 14,227 204.4 16.8 12.1 9.0 19.0 17.0 15.6 13.0 11.4 10.4 4.6 4.2 3.8 24.0 24.5 24.3 1.8 3.1 3.4 292
Media
DB Corp. ADD 171 210 23 32 0.5 184 16.5 20.4 23.4 (6.4) 23.8 14.9 10.4 8.4 7.3 5.7 4.5 3.9 1.7 1.5 1.4 15.5 19.1 20.4 2.3 5.8 7.3 0.3
DishTV ADD 38 51 34 70 1.0 1,925 1.0 2.4 3.2 329.2 139.8 31.6 37.7 15.7 11.9 3.8 3.1 2.5 13.8 10.3 7.2 40.2 75.0 71.2 — — — 4.5
Jagran Prakashan REDUCE 115 110 (4) 34 0.5 311 10.0 11.1 12.7 3.5 10.8 15.0 11.5 10.4 9.0 5.0 4.5 3.9 1.8 1.8 1.7 15.0 17.2 19.3 4.3 7.8 7.8 0.2
PVR RS 1,595 NA - 75 1.1 47 37.2 51.0 65.1 38.5 37.2 27.6 42.9 31.3 24.5 15.8 12.3 10.4 6.2 5.3 4.5 15.5 18.3 19.8 0.2 0.3 0.4 7.6
Sun TV Network REDUCE 608 670 10 240 3.4 394 35.0 37.4 41.3 21.5 6.8 10.5 17.4 16.2 14.7 11.6 10.7 9.3 4.7 4.4 4.1 28.6 28.1 28.7 3.3 3.7 4.1 15.9
Zee Entertainment Enterprises REDUCE 480 430 (10) 461 6.6 960 16.7 19.6 22.1 11.4 17.1 12.6 28.7 24.5 21.8 16.9 14.9 13.1 5.4 4.7 4.2 19.9 20.6 20.5 0.9 1.1 1.5 27
Media Attractive 911 13.1 21.6 20.5 14.9 23.1 19.2 16.7 10.5 9.2 8.2 4.8 4.3 3.8 20.7 22.4 23.1 1.6 2.1 2.4 55
Metals & Mining
Hindalco Industries BUY 223 330 48 500 7.2 2,229 29.1 32.2 34.4 33.3 10.4 6.8 7.6 6.9 6.5 5.1 4.4 4.0 0.8 0.7 0.7 11.2 11.1 10.7 0.5 0.5 0.5 32
Hindustan Zinc REDUCE 278 265 (5) 1,174 16.9 4,225 20.1 21.0 23.8 -6.5 4.6 13.3 13.8 13.2 11.7 8.3 7.5 6.4 3.4 3.1 2.8 24 25 25 7.2 3.8 4.3 5.4
Jindal Steel and Power REDUCE 163 165 1 158 2.3 968 5.3 7.4 15.2 162.7 38.9 105.8 30.6 22.0 10.7 6.6 6.4 5.5 0.5 0.5 0.5 1.7 2.3 4.7 — — — 29
JSW Steel SELL 304 285 (6) 735 10.6 2,406 30.9 23.1 27.3 14.6 (25.1) 18.2 9.8 13.1 11.1 6.7 8.0 7.1 2.2 2.0 1.7 25 16.0 16.5 1.1 1.1 1.1 26
National Aluminium Co. BUY 66 87 33 127 1.8 1,933 9.7 8.3 8.6 233.2 (14.5) 3.6 6.8 7.9 7.7 3.0 3.6 3.4 1.1 1.1 1.1 17.3 14.3 14.5 9.2 9.2 9.2 8.1
NMDC REDUCE 96 115 20 303 4.4 3,164 12.3 10.1 10.6 5.2 (18.5) 5.1 7.8 9.5 9.1 4.7 5.7 5.4 1.2 1.1 — 15.5 11.9 12.0 5.7 5.7 5.7 4.9
Tata Steel ADD 516 610 18 588 8.4 1,205 90.1 80.9 93.4 33.9 (10.2) 15.4 5.7 6.4 5.5 5.4 6.1 5.8 0.9 0.9 0.8 17.3 14.2 14.9 1.9 1.9 1.9 62
Vedanta BUY 202 330 63 751 10.8 3,717 22.5 33.1 34.4 4.3 47.1 3.9 9.0 6.1 5.9 5.2 4.1 3.7 1.1 1.0 0.9 12.9 17.5 16.5 4.0 4.9 5.1 45
Metals & Mining Attractive 4,335 62.3 19.8 2.6 11.6 9.0 8.8 7.9 5.8 5.6 5.1 1.3 1.2 1.1 14.5 13.7 13.9 3.8 3.1 3.2 28
Mkt cap. EPS (Rs) EPS growth (%) P/E (X) EV/EBITDA (X) P/B (X) RoE (%) Dividend yield (%)
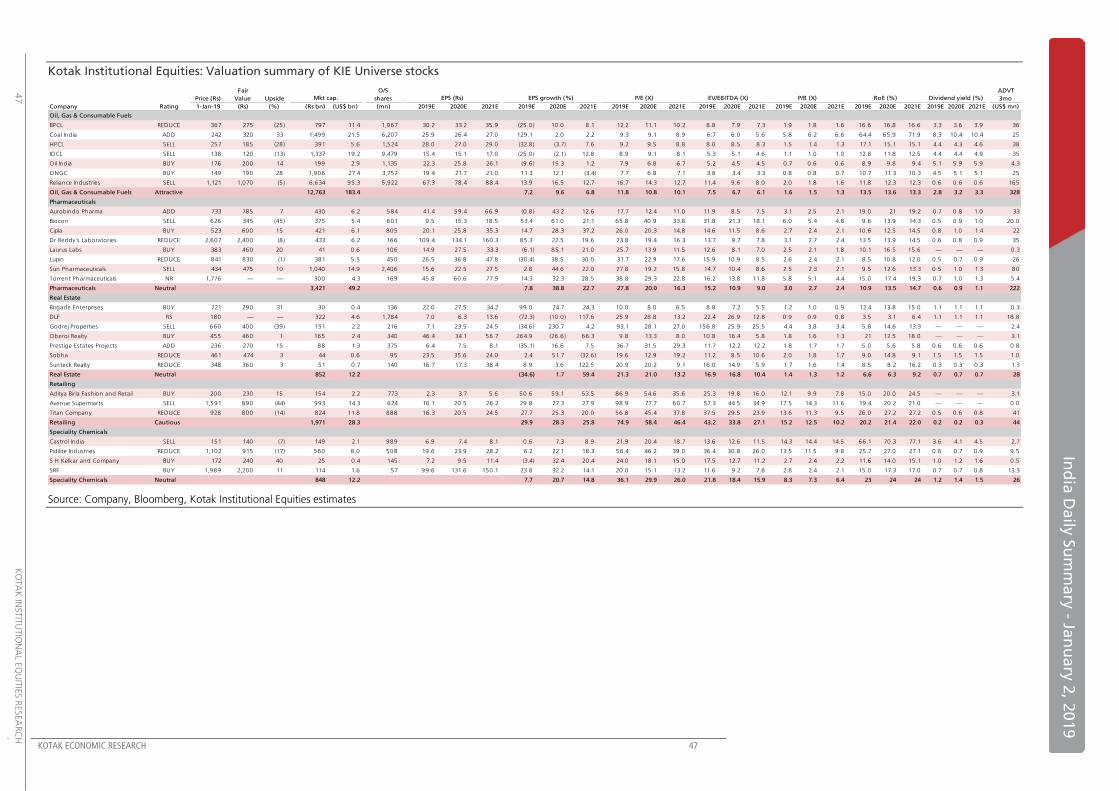
KOTAK ECONOMIC RESEARCH 47
In
dia
Da
ily S
um
ma
ry - Ja
nu
ary
2, 2
019
47
K
OTA
K IN
STIT
UTIO
NA
L EQ
UIT
IES R
ESEA
RC
H
Kotak Institutional Equities: Valuation summary of KIE Universe stocks
Source: Company, Bloomberg, Kotak Institutional Equities estimates
Fair O/S ADVT
Price (Rs) Value Upside shares 3mo
Company Rating 1-Jan-19 (Rs) (%) (Rs bn) (US$ bn) (mn) 2019E 2020E 2021E 2019E 2020E 2021E 2019E 2020E 2021E 2019E 2020E 2021E 2019E 2020E 2021E 2019E 2020E 2021E 2019E 2020E 2021E (US$ mn)
Oil, Gas & Consumable Fuels
BPCL REDUCE 367 275 (25) 797 11.4 1,967 30.2 33.2 35.9 (25.0) 10.0 8.1 12.2 11.1 10.2 8.8 7.9 7.3 1.9 1.8 1.6 16.6 16.8 16.6 3.3 3.6 3.9 36
Coal India ADD 242 320 33 1,499 21.5 6,207 25.9 26.4 27.0 129.1 2.0 2.2 9.3 9.1 8.9 6.7 6.0 5.6 5.8 6.2 6.6 64.4 65.9 71.9 8.3 10.4 10.4 25
HPCL SELL 257 185 (28) 391 5.6 1,524 28.0 27.0 29.0 (32.8) (3.7) 7.6 9.2 9.5 8.8 8.0 8.5 8.3 1.5 1.4 1.3 17.1 15.1 15.1 4.4 4.3 4.6 38
IOCL SELL 138 120 (13) 1,337 19.2 9,479 15.4 15.1 17.0 (25.0) (2.1) 12.8 8.9 9.1 8.1 5.3 5.1 4.6 1.1 1.0 1.0 12.8 11.8 12.5 4.4 4.4 4.9 35
Oil India BUY 176 200 14 199 2.9 1,135 22.3 25.8 26.1 (9.6) 15.3 1.2 7.9 6.8 6.7 5.2 4.5 4.5 0.7 0.6 0.6 8.9 9.8 9.4 5.1 5.9 5.9 4.3
ONGC BUY 149 190 28 1,906 27.4 3,752 19.4 21.7 21.0 11.3 12.1 (3.4) 7.7 6.8 7.1 3.8 3.4 3.3 0.8 0.8 0.7 10.7 11.3 10.3 4.5 5.1 5.1 25
Reliance Industries SELL 1,121 1,070 (5) 6,634 95.3 5,922 67.3 78.4 88.4 13.9 16.5 12.7 16.7 14.3 12.7 11.4 9.6 8.0 2.0 1.8 1.6 11.8 12.3 12.3 0.6 0.6 0.6 165
Oil, Gas & Consumable Fuels Attractive 12,763 183.4 7.2 9.6 6.8 11.8 10.8 10.1 7.5 6.7 6.1 1.6 1.5 1.3 13.5 13.6 13.3 2.8 3.2 3.3 328
Pharmaceuticals
Aurobindo Pharma ADD 733 785 7 430 6.2 584 41.4 59.4 66.9 (0.8) 43.2 12.6 17.7 12.4 11.0 11.9 8.5 7.5 3.1 2.5 2.1 19.0 21 19.2 0.7 0.8 1.0 33
Biocon SELL 626 345 (45) 375 5.4 601 9.5 15.3 18.5 53.4 61.0 21.1 65.8 40.9 33.8 31.8 21.3 18.1 6.0 5.4 4.8 9.6 13.9 14.3 0.5 0.9 1.0 20.0
Cipla BUY 523 600 15 421 6.1 805 20.1 25.8 35.3 14.7 28.3 37.2 26.0 20.3 14.8 14.6 11.5 8.6 2.7 2.4 2.1 10.6 12.5 14.5 0.8 1.0 1.4 22
Dr Reddy's Laboratories REDUCE 2,607 2,400 (8) 433 6.2 166 109.4 134.1 160.3 85.3 22.5 19.6 23.8 19.4 16.3 13.7 9.7 7.8 3.1 2.7 2.4 13.5 13.9 14.5 0.6 0.8 0.9 35
Laurus Labs BUY 383 460 20 41 0.6 106 14.9 27.5 33.3 (6.1) 85.1 21.0 25.7 13.9 11.5 12.6 8.1 7.0 2.5 2.1 1.8 10.1 16.5 15.6 — — — 0.3
Lupin REDUCE 841 830 (1) 381 5.5 450 26.5 36.8 47.8 (30.4) 38.5 30.0 31.7 22.9 17.6 15.9 10.9 8.5 2.6 2.4 2.1 8.5 10.8 12.0 0.5 0.7 0.9 26
Sun Pharmaceuticals SELL 434 475 10 1,040 14.9 2,406 15.6 22.5 27.5 2.8 44.6 22.0 27.8 19.2 15.8 14.7 10.4 8.6 2.5 2.3 2.1 9.5 12.6 13.3 0.5 1.0 1.3 80
Torrent Pharmaceuticals NR 1,776 — — 300 4.3 169 45.8 60.6 77.9 14.3 32.3 28.5 38.8 29.3 22.8 16.2 13.8 11.8 5.8 5.1 4.4 15.0 17.4 19.3 0.7 1.0 1.3 5.4
Pharmaceuticals Neutral 3,421 49.2 7.8 38.8 22.7 27.8 20.0 16.3 15.2 10.9 9.0 3.0 2.7 2.4 10.9 13.5 14.7 0.6 0.9 1.1 222
Real Estate
Brigade Enterprises BUY 221 290 31 30 0.4 136 22.0 27.5 34.2 99.0 24.7 24.3 10.0 8.0 6.5 8.8 7.2 5.5 1.2 1.0 0.9 12.4 13.8 15.0 1.1 1.1 1.1 0.3
DLF RS 180 — — 322 4.6 1,784 7.0 6.3 13.6 (72.3) (10.0) 117.6 25.9 28.8 13.2 22.4 26.9 12.8 0.9 0.9 0.8 3.5 3.1 6.4 1.1 1.1 1.1 18.8
Godrej Properties SELL 660 400 (39) 151 2.2 216 7.1 23.5 24.5 (34.6) 230.7 4.2 93.1 28.1 27.0 156.8 25.9 25.5 4.4 3.8 3.4 5.8 14.6 13.3 — — — 2.4
Oberoi Realty BUY 455 460 1 165 2.4 340 46.4 34.1 56.7 264.9 (26.6) 66.3 9.8 13.3 8.0 10.8 16.4 5.8 1.8 1.6 1.3 21 12.5 18.0 — — — 3.1
Prestige Estates Projects ADD 236 270 15 88 1.3 375 6.4 7.5 8.1 (35.1) 16.6 7.5 36.7 31.5 29.3 11.7 12.2 12.2 1.8 1.7 1.7 5.0 5.6 5.8 0.6 0.6 0.6 0.8
Sobha REDUCE 461 474 3 44 0.6 95 23.5 35.6 24.0 2.4 51.7 (32.6) 19.6 12.9 19.2 11.2 8.5 10.6 2.0 1.8 1.7 9.0 14.8 9.1 1.5 1.5 1.5 1.0
Sunteck Realty REDUCE 348 360 3 51 0.7 140 16.7 17.3 38.4 8.9 3.6 122.5 20.9 20.2 9.1 16.0 14.9 5.9 1.7 1.6 1.4 8.5 8.2 16.2 0.3 0.3 0.3 1.3
Real Estate Neutral 852 12.2 (34.6) 1.7 59.4 21.3 21.0 13.2 16.9 16.8 10.4 1.4 1.3 1.2 6.6 6.3 9.2 0.7 0.7 0.7 28
Retailing
Aditya Birla Fashion and Retail BUY 200 230 15 154 2.2 773 2.3 3.7 5.6 50.6 59.1 53.5 86.9 54.6 35.6 25.3 19.8 16.0 12.1 9.9 7.8 15.0 20.0 24.5 — — — 3.1
Avenue Supermarts SELL 1,591 890 (44) 993 14.3 624 16.1 20.5 26.2 29.8 27.3 27.9 98.9 77.7 60.7 57.3 44.5 34.9 17.5 14.3 11.6 19.4 20.2 21.0 — — — 0.0
Titan Company REDUCE 928 800 (14) 824 11.8 888 16.3 20.5 24.5 27.7 25.3 20.0 56.8 45.4 37.8 37.5 29.5 23.9 13.6 11.3 9.5 26.0 27.2 27.2 0.5 0.6 0.8 41
Retailing Cautious 1,971 28.3 29.9 28.3 25.8 74.9 58.4 46.4 43.2 33.8 27.1 15.2 12.5 10.2 20.2 21.4 22.0 0.2 0.2 0.3 44
Speciality Chemicals
Castrol India SELL 151 140 (7) 149 2.1 989 6.9 7.4 8.1 0.6 7.3 8.9 21.9 20.4 18.7 13.6 12.6 11.5 14.3 14.4 14.5 66.1 70.3 77.1 3.6 4.1 4.5 2.7
Pidilite Industries REDUCE 1,102 915 (17) 560 8.0 508 19.6 23.9 28.2 6.2 22.1 18.3 56.4 46.2 39.0 36.4 30.8 26.0 13.5 11.5 9.8 25.7 27.0 27.1 0.6 0.7 0.9 9.5
S H Kelkar and Company BUY 172 240 40 25 0.4 145 7.2 9.5 11.4 (3.4) 32.4 20.4 24.0 18.1 15.0 17.5 12.7 11.2 2.7 2.4 2.2 11.6 14.0 15.1 1.0 1.2 1.6 0.5
SRF BUY 1,989 2,200 11 114 1.6 57 99.6 131.6 150.1 23.8 32.2 14.1 20.0 15.1 13.2 11.6 9.2 7.8 2.8 2.4 2.1 15.0 17.3 17.0 0.7 0.7 0.8 13.3
Speciality Chemicals Neutral 848 12.2 7.7 20.7 14.8 36.1 29.9 26.0 21.8 18.4 15.9 8.3 7.3 6.4 23 24 24 1.2 1.4 1.5 26
Mkt cap. EPS (Rs) EPS growth (%) P/E (X) EV/EBITDA (X) P/B (X) RoE (%) Dividend yield (%)

48 KOTAK ECONOMIC RESEARCH
K
OTA
K IN
STIT
UTIO
NA
L EQ
UIT
IES R
ESEA
RC
H
48
Ind
ia D
aily
Su
mm
ary
- Jan
uary
2, 2
019
Kotak Institutional Equities: Valuation summary of KIE Universe stocks
Source: Company, Bloomberg, Kotak Institutional Equities estimates
Fair O/S ADVT
Price (Rs) Value Upside shares 3mo
Company Rating 1-Jan-19 (Rs) (%) (Rs bn) (US$ bn) (mn) 2019E 2020E 2021E 2019E 2020E 2021E 2019E 2020E 2021E 2019E 2020E 2021E 2019E 2020E 2021E 2019E 2020E 2021E 2019E 2020E 2021E (US$ mn)
Telecommunication Services
Bharti Airtel ADD 320 360 13 1,277 18.3 3,997 (8.5) (9.2) (4.2) NM NM NM NM NM NM 9.7 8.6 7.3 2.1 2.4 2.7 NM NM NM 1.9 1.9 1.9 36
Bharti Infratel REDUCE 262 270 3 485 7.0 1,850 13.2 12.8 14.3 (4.1) (2.7) 12 19.9 20 18.3 7.5 7.6 6.9 3.0 3.0 2.9 14.7 14.6 16.0 4.1 4.0 4.5 9.2
Vodafone Idea NR 38 - (100) 330 4.7 4,359 (10.7) (2.4) (6.9) NM NM NM NM NM NM 33.6 12.1 10.5 0.5 0.7 0.8 NM NM NM — — — 13.7
Tata Communications ADD 522 580 11 149 2.1 285 (3.8) 2.9 5.0 NM 176.1 73.8 NM 181 104 10.0 9.0 8.4 NM NM 944.4 NM NM NM 1.2 1.4 1.4 2.9
Telecommunication Services Cautious 2,241 32.2 NM 12.1 23.9 NM NM NM 12.2 9.3 8.1 1.6 1.4 1.6 NM NM NM 2.0 1.9 2.0 62
Transportation
Adani Ports and SEZ BUY 389 390 0 806 11.6 2,071 20.2 22.5 28.8 9.3 11.5 27.6 19.2 17.3 13.5 14.1 11.8 10.5 3.4 2.9 2.4 18.6 18.0 19.5 0.3 0.5 0.4 22
Container Corp. SELL 685 590 (14) 334 4.8 487 20.4 24.6 28.6 12.0 20.6 16.4 33.6 27.8 23.9 19.8 16.3 13.8 3.3 3.1 2.9 10.2 11.5 12.5 1.5 1.8 1.7 8.4
Gateway Distriparks BUY 125 195 56 14 0.2 109 6.4 6.0 8.7 (16.0) (5.5) 44.6 19.6 21 14.3 13.9 7.9 6.7 1.3 2.2 1.9 6.6 7.7 14.3 — 2.4 2.4 0.3
Gujarat Pipavav Port BUY 102 140 37 49 0.7 483 5.3 6.5 7.8 28.9 23.7 18.7 19.3 15.6 13.2 10.1 8.2 6.9 2.4 2.4 2.3 12.6 15.3 17.7 4.3 5.3 6.2 0.3
InterGlobe Aviation BUY 1,166 1,220 5 448 6.4 383 (21.3) 36.4 81.6 (136.4) 270.8 124.3 NM 32.0 14.3 NM 19.0 7.5 7.1 5.9 4.3 NM 20.1 34.9 — — 0.7 21
Mahindra Logistics REDUCE 517 510 (1) 37 0.5 71 13.0 18.9 24.5 32.8 45.0 29.6 39.7 27.4 21.1 22.1 15.4 11.7 7.4 6.1 4.9 20.2 24.4 25.7 — — — 0.5
Transportation Attractive 1,688 24.2 (34.6) 62.6 43.0 35.3 21.7 15.2 21.6 13.3 9.9 3.8 3.4 2.9 10.9 15.7 19.0 0.6 0.8 0.9 52
KIE universe 107,730 1547.6 17.5 30.9 16.0 22.3 17.1 14.7 11.0 9.6 8.5 2.7 2.4 2.2 12.0 14.2 14.9 1.4 1.8 1.9
KIE universe (ex-Oil, Gas & Consumable Fuels) 94,967 1364.2 20.9 37.0 18.1 25.4 18.5 15.7 12.2 10.6 9.3 3.0 2.7 2.4 11.7 14.4 15.3 1.2 1.6 1.8
Notes:
(a) We have used adjusted book values for banking companies.
(b) 2019 means calendar year 2018, similarly for 2020 and 2021 for these particular companies.
(c) Exchange rate (Rs/US$)= 69.60
Mkt cap. EPS (Rs) EPS growth (%) P/E (X) EV/EBITDA (X) P/B (X) RoE (%) Dividend yield (%)

Ind
ia D
aily
Su
mm
ary
-Ja
nu
ary
2, 2
019
49 KOTAK INSTITUTIONAL EQUITIES RESEARCH
Economy India
Ratings and other definitions/identifiers
Definitions of ratings
BUY. We expect this stock to deliver more than 15% returns over the next 12 months.
ADD. We expect this stock to deliver 5-15% returns over the next 12 months.
REDUCE. We expect this stock to deliver -5-+5% returns over the next 12 months.
SELL. We expect this stock to deliver <-5% returns over the next 12 months.
Our Fair Value estimates are also on a 12-month horizon basis.
Other definitions
Coverage view. The coverage view represents each analyst’s overall fundamental outlook on the Sector. The coverage view will consist of one of the following
designations: Attractive, Neutral, Cautious.
Other ratings/identifiers
NR = Not Rated. The investment rating and fair value, if any, have been suspended temporarily. Such suspension is in compliance with applicable regulation(s)
and/or Kotak Securities policies in circumstances when Kotak Securities or its affiliates is acting in an advisory capacity in a merger or strategic transaction
involving this company and in certain other circumstances.
CS = Coverage Suspended. Kotak Securities has suspended coverage of this company.
NC = Not Covered. Kotak Securities does not cover this company.
RS = Rating Suspended. Kotak Securities Research has suspended the investment rating and fair value, if any, for this stock, because there is not a sufficient
fundamental basis for determining an investment rating or fair value. The previous investment rating and fair value, if any, are no longer in effect for this stock
and should not be relied upon.
NA = Not Available or Not Applicable. The information is not available for display or is not applicable.
NM = Not Meaningful. The information is not meaningful and is therefore excluded.
Kotak Institutional Equities Research coverage universe
Distribution of ratings/investment banking relationships
Source: Kotak Institutional Equities As of September 30, 2018
Percentage of companies covered by Kotak Institutional
Equities, within the specified category.
* The above categories are defined as follows: Buy = We
expect this stock to deliver more than 15% returns over
the next 12 months; Add = We expect this stock to
deliver 5-15% returns over the next 12 months; Reduce
= We expect this stock to deliver -5-+5% returns over
the next 12 months; Sell = We expect this stock to deliver
less than -5% returns over the next 12 months. Our
target prices are also on a 12-month horizon basis.
These ratings are used illustratively to comply with
applicable regulations. As of 30/06/2018 Kotak
Institutional Equities Investment Research had
investment ratings on 201 equity securities.
Percentage of companies within each category for
which Kotak Institutional Equities and or its affiliates has
provided investment banking services within the
previous 12 months.
27.6%
31.0%
22.2%19.2%
2.5%5.4%
3.4%0.0%
0%
10%
20%
30%
40%
50%
60%
70%
BUY ADD REDUCE SELL

Corporate Office Overseas Affiliates
Kotak Securities Ltd.
27 BKC, Plot No. C-27, “G Block”
Bandra Kurla Complex, Bandra (E)
Mumbai 400 051, India
Tel: +91-22-43360000
Kotak Mahindra (UK) Ltd
8th Floor, Portsoken House
155-157 Minories
London EC3N 1LS
Tel: +44-20-7977-6900
Kotak Mahindra Inc
369 Lexington Avenue
28th Floor, New York
NY 10017, USA
Tel:+1 212 600 8856
Copyright 2018 Kotak Institutional Equities (Kotak Securities Limited). All rights reserved. 1. Note that the research analysts contributing to this report may not be registered/qualified as research analysts with FINRA; and
2. Such research analysts may not be associated persons of Kotak Mahindra Inc and therefore, may not be subject to NASD Rule 2711 restrictions on communications with a subject company, public appearances and trading securities held by a research analyst account.
3. Any U.S. recipients of the research who wish to effect transactions in any security covered by the report should do so with or through Kotak Mahindra Inc and (ii) any transactions in the securities covered by the research by U.S. recipients must be effected only through Kotak Mahindra Inc at [email protected].
This report is distributed in Singapore by Kotak Mahindra (UK) Limited (Singapore Branch) to institutional investors, accredited investors or expert investors only as defined under the Securities and Futures Act. Recipients of this analysis / report are to contact Kotak Mahindra (UK) Limited (Singapore Branch) (16 Raffles Quay, #35-02/03, Hong Leong Building, Singapore 048581) in respect of any matters arising from, or in connection with, this analysis / report. Kotak Mahindra (UK) Limited (Singapore Branch) is regulated by the Monetary Authority of Singapore. Kotak Securities Limited and its affiliates are a full-service, integrated investment banking, investment management, brokerage and financing group. We along with our affiliates are leading underwriter of securities and participants in virtually all securities trading markets in India. We and our affiliates have investment banking and other business relationships with a significant percentage of the companies covered by our Investment Research Department. Our research professionals provide important input into our investment banking and other business selection processes. Investors should assume that Kotak Securities Limited and/or its affiliates are seeking or will seek investment banking or other business from the company or companies that are the subject of this material and that the research professionals who were involved in preparing this material may participate in the solicitation of such business. Our research professionals are paid in part based on the profitability of Kotak Securities Limited, which include earnings from investment banking and other business. Kotak Securities Limited generally prohibits its analysts, persons reporting to analysts, and members of their households from maintaining a financial interest in the securities or derivatives of any companies that the analysts cover. Additionally, Kotak Securities Limited generally prohibits its analysts and persons reporting to analysts from serving as an officer, director, or advisory board member of any companies that the analysts cover. Our salespeople, traders, and other professionals may provide oral or written market commentary or trading strategies to our clients that reflect opinions that are contrary to the opinions expressed herein, and our proprietary trading and investing businesses may make investment decisions that are inconsistent with the recommendations expressed herein. Kotak Securities Limited has two independent equity research groups: Institutional Equities and Private Client Group. This report has been prepared by the Institutional Equities Research Group of Kotak Securities Limited. The views and opinions expressed in this document may or may not match or may be contrary with the views, estimates, rating, target price of the Private Client Group. In reviewing these materials, you should be aware that any or all of the foregoing, among other things, may give rise to real or potential conflicts of interest. Additionally, other important information regarding our relationships with the company or companies that are the subject of this material is provided herein. This material should not be construed as an offer to sell or the solicitation of an offer to buy any security in any jurisdiction where such an offer or solicitation would be illegal. We are not soliciting any action based on this material. It is for the general information of clients of Kotak Securities Limited. It does not constitute a personal recommendation or take into account the particular investment objectives, financial situations, or needs of individual clients. Before acting on any advice or recommendation in this material, clients should consider whether it is suitable for their particular circumstances and, if necessary, seek professional advice. The price and value of the investments referred to in this material and the income from them may go down as well as up, and investors may realize losses on any investments. Past performance is not a guide for future performance, future returns are not guaranteed and a loss of original capital may occur. Kotak Securities Limited does not provide tax advise to its clients, and all investors are strongly advised to consult with their tax advisers regarding any potential investment. Certain transactions -including those involving futures, options, and other derivatives as well as non-investment-grade securities - give rise to substantial risk and are not suitable for all investors. The material is based on information that we consider reliable, but we do not represent that it is accurate or complete, and it should not be relied on as such. Opinions expressed are our current opinions as of the date appearing on this material only. We endeavor to update on a reasonable basis the information discussed in this material, but regulatory, compliance, or other reasons may prevent us from doing so. We and our affiliates, officers, directors, and employees, including persons involved in the preparation or issuance of this material, may from time to time have "long" or "short" positions in, act as principal in, and buy or sell the securities or derivatives thereof of companies mentioned herein. Kotak Securities Limited and its non US affiliates may, to the extent permissible under applicable laws, have acted on or used this research to the extent that it relates to non US issuers, prior to or immediately following its publication. Foreign currency denominated securities are subject to fluctuations in exchange rates that could have an adverse effect on the value or price of or income derived from the investment. In addition, investors in securities such as ADRs, the value of which are influenced by foreign currencies affectively assume currency risk. In addition options involve risks and are not suitable for all investors. Please ensure that you have read and understood the current derivatives risk disclosure document before entering into any derivative transactions. Kotak Securities Limited established in 1994, is a subsidiary of Kotak Mahindra Bank Limited. Kotak Securities is one of India's largest brokerage and distribution house. Kotak Securities Limited is a corporate trading and clearing member of Bombay Stock Exchange Limited (BSE), National Stock Exchange of India Limited (NSE), Metropolitan Stock Exchange of India Limited (MSE), National Commodity and Derivatives Exchange (NCDEX) and Multi Commodity Exchange(MCX). Our businesses include stock broking, services rendered in connection with distribution of primary market issues and financial products like mutual funds and fixed deposits, depository services and Portfolio Management. Kotak Securities Limited is also a depository participant with National Securities Depository Limited (NSDL) and Central Depository Services (India) Limited (CDSL). Kotak Securities Limited is also registered with Insurance Regulatory and Development Authority as Corporate Agent for Kotak Mahindra Old Mutual Life Insurance Limited and is also a Mutual Fund Advisor registered with Association of Mutual Funds in India (AMFI). Kotak Securities Limited is registered as a Research Analyst under SEBI (Research Analyst) Regulations, 2014. We hereby declare that our activities were neither suspended nor we have defaulted with any stock exchange authority with whom we are registered in last five years. However SEBI, Exchanges and Depositories have conducted the routine inspection and based on their observations have issued advise letters or levied minor penalty on KSL for certain operational deviations. We have not been debarred from doing business by any Stock Exchange / SEBI or any other authorities; nor has our certificate of registration been cancelled by SEBI at any point of time. We offer our research services to primarily institutional investors and their employees, directors, fund managers, advisors who are registered with us Details of Associates are available on website i.e. www.kotak.com Research Analyst has served as an officer, director or employee of subject company(ies): No We or our associates may have received compensation from the subject company(ies) in the past 12 months. We or our associates have managed or co-managed public offering of securities for the subject company(ies) in the past 12 months. YES. Visit our website for more details We or our associates may have received compensation for investment banking or merchant banking or brokerage services from the subject company(ies) in the past 12 months. We or our associates may have received any compensation for products or services other than investment banking or merchant banking or brokerage services from the subject company(ies) in the past 12 months. We or our associates may have received compensation or other benefits from the subject company(ies) or third party in connection with the research report. Our associates may have financial interest in the subject company(ies). Research Analyst or his/her relative's financial interest in the subject company(ies): No Kotak Securities Limited has financial interest in the subject company(ies) at the end of the month immediately preceding the date of publication of Research Report: YES Nature of financial interest is investment banking and/or other businesss relationships Our associates may have actual/beneficial ownership of 1% or more securities of the subject company(ies) at the end of the month immediately preceding the date of publication of Research Report. Research Analyst or his/her relatives has actual/beneficial ownership of 1% or more securities of the subject company(ies) at the end of the month immediately preceding the date of publication of Research Report: No Kotak Securities Limited has actual/beneficial ownership of 1% or more securities of the subject company(ies) at the end of the month immediately preceding the date of publication of Research Report: No Subject company(ies) may have been client during twelve months preceding the date of distribution of the research report. A graph of daily closing prices of securities is available at https://www.moneycontrol.com/india/stockpricequote/ and http://economictimes.indiatimes.com/markets/stocks/stock-quotes. (Choose a company from the list on the browser and select the"three years" icon in the price chart). Kotak Securities Limited. Registered Office: 27 BKC, C 27, G Block, Bandra Kurla Complex, Bandra (E), Mumbai 400051. CIN: U99999MH1994PLC134051, Telephone No.: +22 43360000, Fax No.: +22 67132430. Website: www.kotak.com / www.kotaksecurities.com. Correspondence Address: Infinity IT Park, Bldg. No 21, Opp. Film City Road, A K Vaidya Marg, Malad (East), Mumbai 400097. Telephone No: 42856825. SEBI Registration No: INZ000200137(Member of NSE, BSE & MSE) AMFI ARN 0164, PMS INP000000258 and Research Analyst INH000000586. NSDL/CDSL: IN-DP-NSDL-23-97. Compliance Officer Details: Mr. Manoj Agarwal. Call: 022 - 4285 8484, or Email: [email protected]. Investments in securities market are subject to market risks, read all the related documents carefully before investing. In case you require any clarification or have any concern, kindly write to us at below email ids: Level 1: For Trading related queries, contact our customer service at ‘[email protected]’ and for demat account related queries contact us at [email protected] or call us
on: Toll free numbers 18002099191 / 1800222299 and 18002099292 Level 2: If you do not receive a satisfactory response at Level 1 within 3 working days, you may write to us at [email protected] or call us on 022-42858445 and if you feel you
are still unheard, write to our customer service HOD at [email protected] or call us on 022-42858208. Level 3: If you still have not received a satisfactory response at Level 2 within 3 working days, you may contact our Compliance Officer (Name: Mr. Manoj Agarwal) at
[email protected] or call on 91- (022) 4285 8484.
Level 4: If you have not received a satisfactory response at Level 3 within 7 working days, you may also approach CEO (Mr. Kamlesh Rao) at [email protected] or call on 91-(022) 4285 8301.
First Cut notes published on this site are for information purposes only. They represent early notations and responses by analysts to recent events. Data in the notes may not have been verified by us and investors should not act upon any data or views in these notes. Most First Cut notes, but not necessarily all, will be followed by final research reports on the subject. There could be variance between the First cut note and the final research note on any subject, in which case the contents of the final research note would prevail. We accept no liability for the contents of the First Cut Notes.
For further disclosure please view https://kie.kotak.com/kinsite/index.php

![[Kotak] India Daily, October 24, 2016 - Kotak Securities](https://static.fdokumen.com/doc/165x107/633d69d4e674f41574068690/kotak-india-daily-october-24-2016-kotak-securities.jpg)


![[Kotak] India Daily, May 07, 2018 - Kotak Securities](https://static.fdokumen.com/doc/165x107/633c43a3f3eeefb08b0c1dc3/kotak-india-daily-may-07-2018-kotak-securities.jpg)

![[Kotak] India Daily, July 25, 2017 - Kotak Securities](https://static.fdokumen.com/doc/165x107/63161b1a15106505030be7d5/kotak-india-daily-july-25-2017-kotak-securities.jpg)


![[Kotak] India Daily, October 26, 2016 - Kotak Securities](https://static.fdokumen.com/doc/165x107/631c83236c6907d3680156e0/kotak-india-daily-october-26-2016-kotak-securities.jpg)