India Daily, January 9, 2014 - Kotak Securities
72
For Private Circulation Only. FOR IMPORTANT INFORMATION ABOUT KOTAK SECURITIES’ RATING SYSTEM AND OTHER DISCLOSURES. REFER TO THE END OF THIS MATERIAL. INDIA DAILY January 9, 2014 India 8-Jan 1-day1-mo 3-mo Sensex 20,729 0.2 (1.3) 3.7 Nifty 6,175 0.2 (1.4) 4.2 Global/Regional indices Dow Jones 16,463 (0.4) 2.8 11.4 Nasdaq Composite 4,166 0.3 2.5 12.7 FTSE 6,722 (0.5) 2.6 5.6 Nikkei 15,865 (1.6) 1.4 13.0 Hang Seng 22,939 (0.2) (3.7) (0.4) KOSPI 1,957 (0.1) (2.2) (2.3) Value traded – India Cash (NSE+BSE) 144 129 132 Derivatives (NSE) 915 964 994 Deri. open interest 1,283 1,427 1,253 Forex/money market Change, basis points 8-Jan 1-day 1-mo 3-mo Rs/US$ 62.2 7 134 34 10yr govt bond, % 9.1 1 - 17 Net investment (US$mn) 7-Jan MTD CYTD FIIs (86) 4,096 19,986 MFs (11) (766) (3,492) Top movers Change, % Best performers 8-Jan 1-day 1-mo 3-mo WLCO IN Equity 62.4 (1.0) 63.8 92.0 FTECH IN Equity 298.6 10.0 86.8 81.5 SUEL IN Equity 11.8 1.3 21.6 69.8 ADE IN Equity 240.2 (0.7) (13.9) 52.4 EDSL IN Equity 29.8 4.9 17.1 49.9 Worst performers UT IN Equity 14.9 (0.3) (7.2) (17.5) RCOM IN Equity 128.2 (1.2) (8.5) (16.4) UTCEM IN Equity 1700.9 0.6 (11.8) (13.7) IDEA IN Equity 161.5 (0.4) (8.2) (11.4) GNP IN Equity 514.1 (0.0) (3.3) (11.2) Contents Special Reports Initiating Coverage Eicher Motors: Full throttle Daily Alerts Company Larsen & Toubro: Prima facie below-threshold returns from IDPL portfolio Prestige Estates Projects: 3QFY14 - big launch helps maintain sales volume Sector Consumer Products: Month in review - December 2013: Pricing action picks pace Media: 3QFY14 ratings and ad volumes update Metals & Mining: 3QFY14E preview - a good quarter for steel companies
-
Upload
khangminh22 -
Category
Documents
-
view
0 -
download
0
Transcript of India Daily, January 9, 2014 - Kotak Securities
For Private Circulation Only. FOR IMPORTANT INFORMATION ABOUT KOTAK SECURITIES’ RATING SYSTEM AND OTHER DISCLOSURES. REFER TO THE END OF THIS MATERIAL.
INDIA DAILYJanuary 9, 2014 India 8-Jan 1-day1-mo 3-mo
Sensex 20,729 0.2 (1.3) 3.7
Nifty 6,175 0.2 (1.4) 4.2
Global/Regional indices
Dow Jones 16,463 (0.4) 2.8 11.4
Nasdaq Composite 4,166 0.3 2.5 12.7
FTSE 6,722 (0.5) 2.6 5.6
Nikkei 15,865 (1.6) 1.4 13.0
Hang Seng 22,939 (0.2) (3.7) (0.4)
KOSPI 1,957 (0.1) (2.2) (2.3)
Value traded – India
Cash (NSE+BSE) 144 129 132
Derivatives (NSE) 915 964 994
Deri. open interest 1,283 1,427 1,253
Forex/money market
Change, basis points
8-Jan 1-day 1-mo 3-mo
Rs/US$ 62.2 7 134 34
10yr govt bond, % 9.1 1 - 17
Net investment (US$mn)
7-Jan MTD CYTD
FIIs (86) 4,096 19,986
MFs (11) (766) (3,492)
Top movers
Change, %
Best performers 8-Jan 1-day 1-mo 3-mo
WLCO IN Equity 62.4 (1.0) 63.8 92.0
FTECH IN Equity 298.6 10.0 86.8 81.5
SUEL IN Equity 11.8 1.3 21.6 69.8
ADE IN Equity 240.2 (0.7) (13.9) 52.4
EDSL IN Equity 29.8 4.9 17.1 49.9
Worst performers
UT IN Equity 14.9 (0.3) (7.2) (17.5)
RCOM IN Equity 128.2 (1.2) (8.5) (16.4)
UTCEM IN Equity 1700.9 0.6 (11.8) (13.7)
IDEA IN Equity 161.5 (0.4) (8.2) (11.4)
GNP IN Equity 514.1 (0.0) (3.3) (11.2)
Contents
Special Reports
Initiating Coverage
Eicher Motors: Full throttle
Daily Alerts
Company
Larsen & Toubro: Prima facie below-threshold returns from IDPL portfolio
Prestige Estates Projects: 3QFY14 - big launch helps maintain sales volume
Sector
Consumer Products: Month in review - December 2013: Pricing action picks pace
Media: 3QFY14 ratings and ad volumes update
Metals & Mining: 3QFY14E preview - a good quarter for steel companies
For private Circulation Only. FOR IMPORTANT INFORMATION ABOUT KOTAK SECURITIES’ RATING SYSTEM AND OTHER DISCLOSURES, REFER TO THE END OF THIS MATERIAL.
Royal Enfield business—on cruise control
The Royal Enfield business is in a sweet spot with waiting periods of 4-6 months across its product range. We believe volume trajectory will remain strong driven by—(1) expansion of distribution network (it is present only in the top-60 cities), (2) scale-up of the export business with the launch of Continental GT and (3) uptrading of customers to the premium motorcycle segment. We expect Royal Enfield volumes to grow at 29% CAGR over CY2013-15, driven by rising demand for leisure motorcycles, attractive price points, muted competition and an expanded distribution network.
Volvo Eicher Commercial Vehicle business—muddling through tough times
Eicher and Volvo have formed a joint venture (54:46), Volvo Eicher Commercial Vehicle (VECV), which will manufacture commercial vehicles for the Indian market and become a hub for manufacturing Euro 3-6 engines for Volvo’s global operations.
VECV’s business growth will be driven by outsourcing of engines to Volvo and improvement in market share in the truck segment. We expect VECV to post revenue CAGR of 27% over CY2013-15, driven by the addition of engine sourcing revenue to Volvo and recovery in truck volumes through market-share gains. Engine sourcing to Volvo will likely contribute 10-11% of VECV’s revenue, by CY2014-15, but a significant part of incremental revenue growth.
Valuations attractive on strong earnings growth potential; we initiate coverage with an ADD
We expect Eicher Motors’ consolidated earnings to increase by 2.3X over CY2013-15, driven by strong growth in the Royal Enfield business, addition of engine outsourcing revenues in the VECV business and recovery of the commercial-vehicle cycle in CY2015. The stock trades at ~7.7X CY2015E EV/EBITDA and 15.1X CY2015E EPS, which we believe is cheap, given the company’s strong growth prospects.
We initiate coverage on the stock with an ADD rating with target price of `5,500, based on the sum-of-the-parts valuation methodology. We value the Royal Enfield business at 20X March 2015E EPS and the VECV business at 17X March 2015E EPS.
Eicher Motors (EIM)
Automobiles
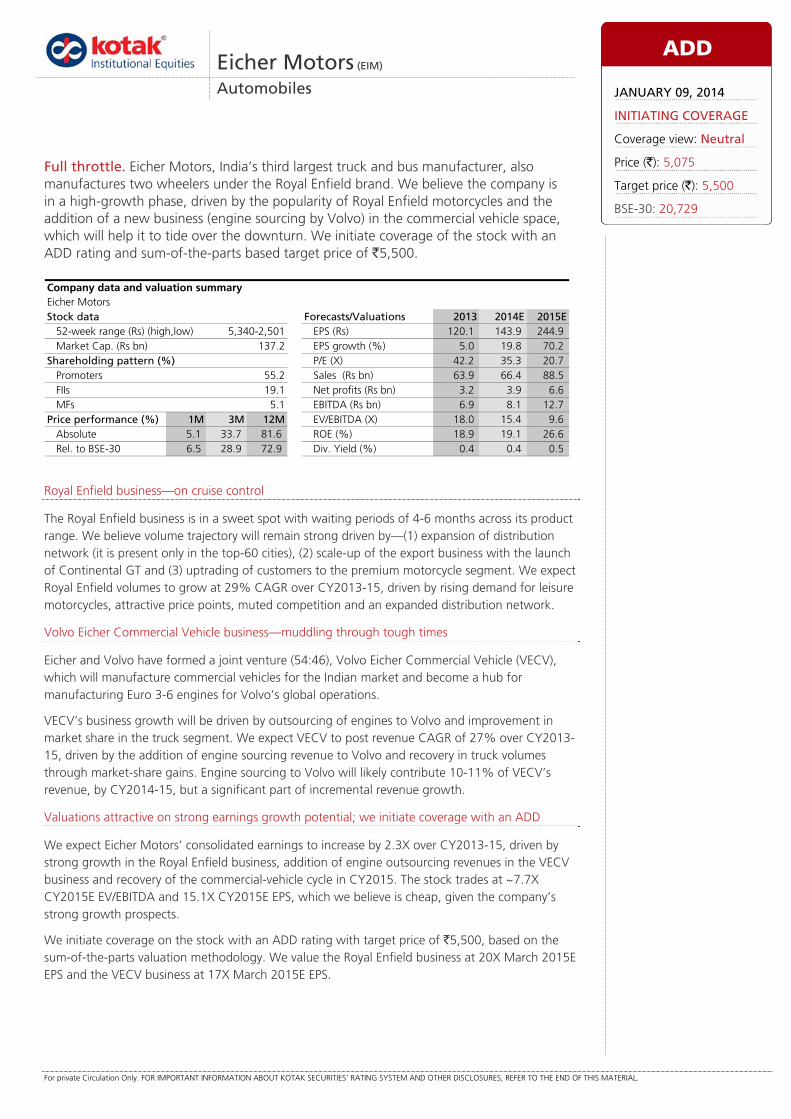
Full throttle. Eicher Motors, India’s third largest truck and bus manufacturer, also manufactures two wheelers under the Royal Enfield brand. We believe the company is in a high-growth phase, driven by the popularity of Royal Enfield motorcycles and the addition of a new business (engine sourcing by Volvo) in the commercial vehicle space, which will help it to tide over the downturn. We initiate coverage of the stock with an ADD rating and sum-of-the-parts based target price of `5,500.
Eicher MotorsStock data Forecasts/Valuations 2013 2014E 2015E
52-week range (Rs) (high,low) EPS (Rs) 120.1 143.9 244.9Market Cap. (Rs bn) 137.2 EPS growth (%) 5.0 19.8 70.2
Shareholding pattern (%) P/E (X) 42.2 35.3 20.7Promoters 55.2 Sales (Rs bn) 63.9 66.4 88.5FIIs 19.1 Net profits (Rs bn) 3.2 3.9 6.6MFs 5.1 EBITDA (Rs bn) 6.9 8.1 12.7
Price performance (%) 1M 3M 12M EV/EBITDA (X) 18.0 15.4 9.6Absolute 5.1 33.7 81.6 ROE (%) 18.9 19.1 26.6Rel. to BSE-30 6.5 28.9 72.9 Div. Yield (%) 0.4 0.4 0.5
Company data and valuation summary
5,340-2,501
ADD
JANUARY 09, 2014
INITIATING COVERAGE
Coverage view: Neutral
Price (`): 5,075
Target price (`): 5,500
BSE-30: 20,729

Eicher Motors Automobiles
KOTAK INSTITUTIONAL EQUITIES RESEARCH 3
FINANCIAL SNAPSHOT
Eicher Motors, consolidated forecasts and valuation, calendar year-ends, 2009-16E
Net sales EBITDA PAT EPS EV/EBITDA P/E RoCE RoE(Rs mn) (Rs mn) (Rs mn) (Rs) (X) (X) (%) (%)
2009 29,386 1,444 834 31 85.6 164.3 6.1 7.7 2010 43,971 3,569 1,889 70 33.9 72.5 17.8 16.1 2011 56,775 5,551 3,088 114 21.7 44.4 18.3 21.9 2012 63,899 5,490 3,243 120 22.4 42.2 12.6 18.9 2013E 66,438 6,153 3,884 144 20.2 35.3 10.1 19.1 2014E 88,487 10,443 6,610 245 11.7 20.7 15.2 26.6 2015E 110,554 14,919 9,068 336 7.7 15.1 19.1 28.5 2016E 132,967 17,076 10,669 395 6.2 12.8 19.5 26.2
Source: Company, Kotak Institutional Equities estimates
We expect earnings to more than double over CY2013-15E Eicher Motors consolidated profit & loss, balance sheet and cash flow statement, calendar year-ends, 2009-16E (` mn)
2009 2010 2011 2012 2013E 2014E 2015E 2016EProfit model (Rs mn)Net sales 29,386 43,971 56,775 63,899 66,438 88,487 110,554 132,967
EBITDA 1,444 3,569 5,551 5,490 6,153 10,443 14,919 17,076 Other income 1,054 1,276 1,768 1,366 1,943 2,284 2,905 3,693 Interest (87) (95) (77) (38) (23) (23) (23) (23)
Depreciaton (539) (573) (640) (822) (1,222) (1,650) (2,002) (2,282)
Profit before tax 1,873 4,177 6,602 5,997 6,850 11,054 15,799 18,464 Extraordinary income/(expenses) — — — — — — — —
Tax (578) (1,108) (1,628) (1,249) (1,882) (2,890) (4,186) (4,871) Minority interest (461) (1,179) (1,886) (1,506) (1,084) (1,553) (2,544) (2,924)
Net profit 834 1,889 3,088 3,243 3,884 6,610 9,068 10,669 Adjusted net profit 834 1,889 3,088 3,243 3,884 6,610 9,068 10,669 Adjusted diluted EPS (Rs) 31 70 114 120 144 245 336 395 Balance sheet (Rs mn)Equity 127 269 270 270 270 270 270 270
Reserves and surplus 10,564 12,052 14,661 17,279 20,468 26,289 34,410 44,131
Deferred tax liability 142 249 645 1,232 1,232 1,232 1,232 1,232 Minority interest 5,747 6,774 8,377 9,485 10,569 12,122 14,666 17,590
Total borrowings 1,264 956 504 389 389 389 389 389 Current liabilities 6,978 9,332 13,343 16,060 16,075 18,615 21,391 24,013
Total liabilities 24,820 29,633 37,799 44,715 49,003 58,917 72,359 87,626 Net fixed assets 3,758 4,513 8,991 14,962 20,439 25,190 27,588 29,505 Investments 2,941 4,586 5,126 6,385 12,385 15,385 21,885 30,385
Cash 11,707 12,457 11,973 8,035 707 269 324 633 Other current assets 6,415 8,043 11,528 15,271 15,410 18,011 22,500 27,040
Miscellaneous expenditure — 35 182 62 62 62 62 62
Total assets 24,820 29,633 37,799 44,715 49,003 58,917 72,359 87,626 Free cash flow (Rs mn)Operating cash flow excl. working capital 1,031 2,986 4,273 4,436 4,270 7,552 10,732 12,205
Working capital changes 2,654 374 (238) 389 (123) (62) (1,712) (1,919) Capital expenditure (701) (1,315) (4,173) (7,820) (6,700) (6,400) (4,400) (4,200)
Free cash flow (ex financing) 2,984 2,045 (138) (2,995) (2,553) 1,090 4,620 6,087 RatiosEBITDA margin (%) 4.9 8.1 9.8 8.6 9.3 11.8 13.5 12.8
Debt/equity (X) 0.1 0.1 0.0 0.0 0.0 0.0 0.0 0.0 Net debt/equity (X) (1.2) (1.3) (1.1) (0.7) (0.6) (0.5) (0.6) (0.7)
Book value (Rs per share) 396 455 546 648 766 982 1,283 1,643 RoAE (%) 7.7 16.1 21.9 18.9 19.1 26.6 28.5 26.2
Source: Company, Kotak Institutional Equities estimates

Automobiles Eicher Motors
4 KOTAK INSTITUTIONAL EQUITIES RESEARCH
VALUATIONS—ATTRACTIVE DUE TO STRONG GROWTH PROSPECTS We initiate coverage on Eicher Motors with an ADD rating. We like the medium-term story with a ramp-up in
Royal Enfield volumes and market-share gains in the truck business. Sourcing of engines by Volvo for its
global operations is also likely to open new growth opportunities for the company. We value the company
through the sum-of-the-parts valuation methodology. We value the Royal Enfield business at
20X March 2015E EPS and the VECV business at 17X March 2015E EPS. Our one-year target price is `5,500.
Eicher Motors has two business verticals—the Royal Enfield (RE) business (two wheelers) and the Volvo Eicher Commercial Vehicle (VECV) business. We have valued the businesses separately as they have different growth profiles and return ratios. The RE business is an asset-light business with a superior margin profile and the VECV business has better long-term growth prospects but is asset heavy and has lower return ratios.
We value the RE business at 20X March 2015E EPS as we believe the business can post 15% CAGR over the next decade as we expect customers to uptrade to the premium segment with a rise in income levels. RE is also likely to convert 55% of its EBITDA into free cash and incremental capital invested is about 60%. We believe there is no direct comparison to the RE business due to its niche positioning but the Harley Davidson business has a similar customer profile and business model.
We expect RE to trade at a premium to Harley Davidson. RE and Harley Davidson operate in the leisure motorcycle segment with Harley Davidson focused mainly on developed markets and RE focused on India. Key reasons for our higher valuation for the RE business than the Harley Davidson business are as follows.
Both businesses have asset-light models but the RE business has superior asset turns (4-5X) compared with Harley Davidson (~2X) and RE’s operating margin profile is also superior as RE builds up scale. RE’s incremental RoIC is about 60% and Harley Davidson’s is ~20%.
RE’s growth prospects are much better than Harley Davidson’s as RE has a strong brand presence in an under-penetrated Indian market and Harley Davidson operates in developed markets (90% of its sales are in North America and Europe) where growth prospects are subdued. Emerging market consumers in India and Indonesia, the main markets that will drive growth in the premium motorcycle segment, prefer vehicles in the 250-650 cc range, which are affordable and more suited to the build of Indian and Indonesian men/women. Harley Davidson does not have a product below 800 cc and will need to invest in a product line in the 350-500 cc range to challenge RE.
RE’s customer profile is changing from a leisure user to a commuter. The management indicated that half its customers in India use the motorcycle for regular commutes and not for leisure. We believe this will help the company to improve volume growth as it can tap the commuter segment, as well.
In India, competition is muted in the premium motorcycle space, in which RE operates (350-500 cc) and given that RE’s price-value proposition is quite attractive, we do not see an immediate threat to the RE brand.
We value the VECV business at 17X March 2015E EPS as we expect VECV to post 15% CAGR over the next decade, higher than our industry forecast of commercial vehicle CAGR of 12%, driven by market-share gains. VECV will benefit from superior Volvo technology, which will be used in heavier tonnage trucks, which will result in class-leading fuel efficiency and low maintenance. The VECV business will also convert 30% of its EBITDA into free cash after capex expansion and generate a healthy 17-20% return on capital employed over a commercial cycle.
Eicher Motors Automobiles
KOTAK INSTITUTIONAL EQUITIES RESEARCH 5
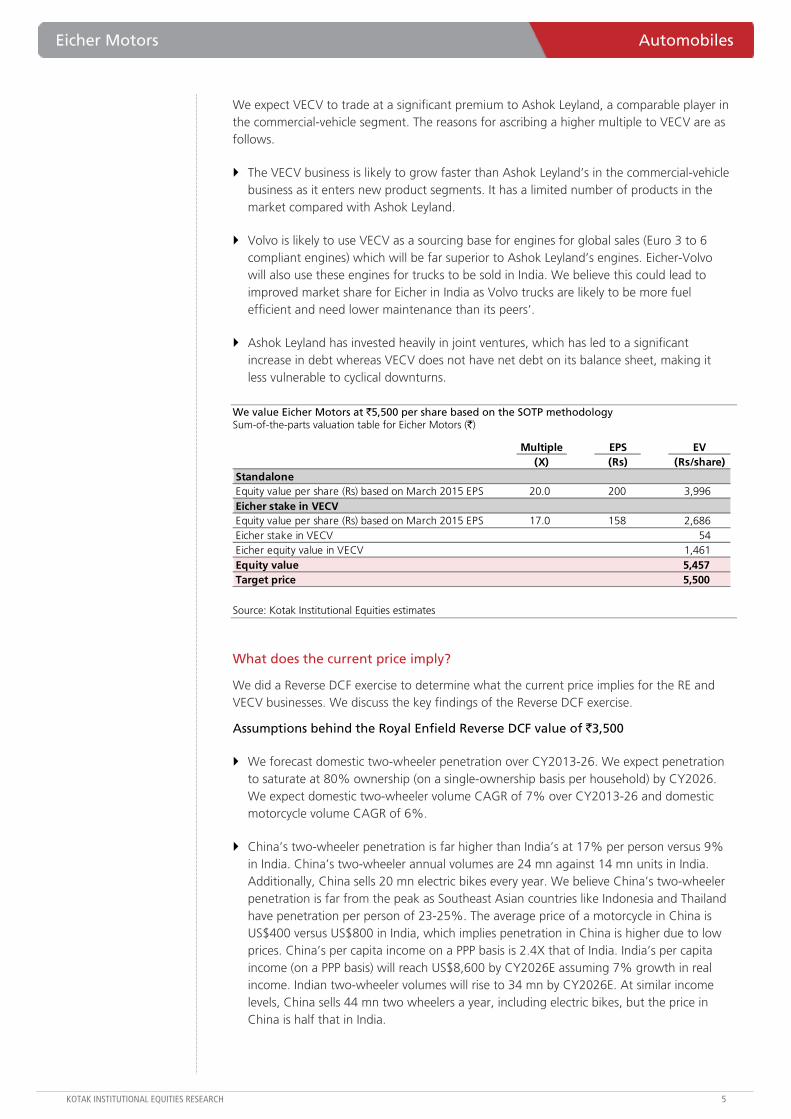
We expect VECV to trade at a significant premium to Ashok Leyland, a comparable player in the commercial-vehicle segment. The reasons for ascribing a higher multiple to VECV are as follows.
The VECV business is likely to grow faster than Ashok Leyland’s in the commercial-vehicle business as it enters new product segments. It has a limited number of products in the market compared with Ashok Leyland.
Volvo is likely to use VECV as a sourcing base for engines for global sales (Euro 3 to 6 compliant engines) which will be far superior to Ashok Leyland’s engines. Eicher-Volvo will also use these engines for trucks to be sold in India. We believe this could lead to improved market share for Eicher in India as Volvo trucks are likely to be more fuel efficient and need lower maintenance than its peers’.
Ashok Leyland has invested heavily in joint ventures, which has led to a significant increase in debt whereas VECV does not have net debt on its balance sheet, making it less vulnerable to cyclical downturns.
We value Eicher Motors at `5,500 per share based on the SOTP methodology Sum-of-the-parts valuation table for Eicher Motors (`)
Multiple EPS EV(X) (Rs) (Rs/share)
StandaloneEquity value per share (Rs) based on March 2015 EPS 20.0 200 3,996 Eicher stake in VECVEquity value per share (Rs) based on March 2015 EPS 17.0 158 2,686 Eicher stake in VECV 54 Eicher equity value in VECV 1,461 Equity value 5,457 Target price 5,500
Source: Kotak Institutional Equities estimates
What does the current price imply?
We did a Reverse DCF exercise to determine what the current price implies for the RE and VECV businesses. We discuss the key findings of the Reverse DCF exercise.
Assumptions behind the Royal Enfield Reverse DCF value of `3,500
We forecast domestic two-wheeler penetration over CY2013-26. We expect penetration to saturate at 80% ownership (on a single-ownership basis per household) by CY2026. We expect domestic two-wheeler volume CAGR of 7% over CY2013-26 and domestic motorcycle volume CAGR of 6%.
China’s two-wheeler penetration is far higher than India’s at 17% per person versus 9% in India. China’s two-wheeler annual volumes are 24 mn against 14 mn units in India. Additionally, China sells 20 mn electric bikes every year. We believe China’s two-wheeler penetration is far from the peak as Southeast Asian countries like Indonesia and Thailand have penetration per person of 23-25%. The average price of a motorcycle in China is US$400 versus US$800 in India, which implies penetration in China is higher due to low prices. China’s per capita income on a PPP basis is 2.4X that of India. India’s per capita income (on a PPP basis) will reach US$8,600 by CY2026E assuming 7% growth in real income. Indian two-wheeler volumes will rise to 34 mn by CY2026E. At similar income levels, China sells 44 mn two wheelers a year, including electric bikes, but the price in China is half that in India.

Automobiles Eicher Motors
6 KOTAK INSTITUTIONAL EQUITIES RESEARCH
Reverse DCF value of `3,500 for RE implies (1) volume CAGR of 11% over CY2013-26E and terminal volume growth of 2%, (2) 2.4% annual increase in ASPs during this period and (3) EBIT margin falling from 21% currently to 17% in CY2026. Harley Davidson operates at 15-16% EBIT margins and 90% of its revenue comes from developed markets. We believe RE’s EBIT margins could decline to these levels as competition intensifies.
For RE to achieve volume CAGR of 11% the following assumptions should play out. (1) The share of premium motorcycles should increase from 17% currently to 24% by CY2026 in the domestic motorcycle industry; (2) the share of the 250-500 cc segment should increase from 14% currently to 25% by CY2026 in the premium motorcycle segment and (3) RE’s market share in the 250-500 cc segment should decline from 95% currently to 68% by CY2026.
Assumptions behind the Reverse DCF value of `1,500 for VECV
The Reverse DCF value of `1,500 (for Eicher’s 54.4% stake) implies (1) volume CAGR of 11% over CY2014-30 and terminal growth of 3%, (2) gross annual average selling price increase of 2% over this period and (3) EBIT margins declining from 8% to 6% by CY2030.
Reverse DCF implies annual sales volume growth of 12% in the medium term and 10% in the long term DCF model for Royal Enfield, calendar year-ends, 2014-26E
2014E 2015E 2016E 2017E 2018E 2019E 2020E 2021E 2022E 2023E 2024E 2025E 2026EVolumes (units) 254,938 293,179 328,361 367,764 411,896 461,323 516,682 568,350 625,185 687,704 756,474 832,121 915,333Gross average price (Rs/vehicle) 105,347 110,614 115,039 117,340 119,687 122,080 124,522 127,012 129,553 132,144 134,786 137,482 140,232Gross vehicle revenues 26,857 32,430 37,774 43,153 49,298 56,318 64,338 72,187 80,994 90,876 101,962 114,402 128,359Spare part revenues 1,278 1,406 1,547 1,732 1,940 2,173 2,434 2,629 2,839 3,066 3,311 3,576 3,862Excise duty 3,376 4,060 4,719 5,178 5,916 6,758 7,721 8,662 9,719 10,905 12,235 13,728 15,403Net revenue 24,759 29,776 34,603 39,707 45,323 51,733 59,052 66,154 74,114 83,037 93,038 104,250 116,818EBIT 5,250 6,468 7,422 8,339 9,518 10,864 12,401 12,569 14,082 15,777 17,677 19,807 19,859EBIT (1-tax) 4,253 5,175 5,864 5,762 6,577 7,507 8,569 8,685 9,730 10,902 12,215 13,687 13,723Depreciation/amortisation 201 215 233 210 225 241 260 280 301 323 347 373 318(Increase)/decrease in working capital (116) (124) (209) 957 337 385 439 (559) 362 406 456 511 574Capital expenditure (200) (200) (300) (269) (307) (351) (401) (392) (440) (445) (499) (560) (419)Free cash flows 4,138 5,066 5,588 6,661 6,831 7,782 8,868 8,014 9,953 11,186 12,518 14,011 14,195Years discounted 1.0 2.0 3.0 4.0 5.0 6.0 7.0 8.0 9.0 10.0 11.0 12.0 13.0 Discount factor 0.9 0.8 0.7 0.6 0.6 0.5 0.5 0.4 0.4 0.3 0.3 0.3 0.2 Discounted cash flow 3,695 4,039 3,977 4,233 3,876 3,943 4,011 3,237 3,589 3,602 3,599 3,596 3,253Core PBT 5,250 6,468 7,422 8,339 9,518 10,864 12,401 12,569 14,082 15,777 17,677 19,807 19,859Tax expense 1,431 1,795 2,123 2,577 2,941 3,357 3,832 3,884 4,351 4,875 5,462 6,121 6,136Core PAT 3,819 4,673 5,298 5,762 6,577 7,507 8,569 8,685 9,730 10,902 12,215 13,687 13,723Core EPS (Rs) 141 173 196 213 244 278 317 322 360 404 452 507 508
Near-term volume growth (CY2017-20) 12.0 NPV CalcLong-term growth (CY2021-26) 10.0 Sum of free cash flow 48,650 WACC used (%) 12.0 Terminal value 33,183 Terminal growth rate (%) 2.0 Enterprise value 81,833 Capitalization rate (%) 10.0 Net cash 12,312 Terminal value calculation Net present value-equity 94,145 Cash flow in terminal year 14,195 Shares o/s (mn) 27 Terminal value 144,794 NPV /share(Rs) 3,487 Discounted value 33,183
Source: Kotak Institutional Equities estimates

Eicher Motors Automobiles
KOTAK INSTITUTIONAL EQUITIES RESEARCH 7
Reverse DCF implies annual sales volume growth of 12% in the medium term and 10% in the long term Key assumptions behind the DCF model for Royal Enfield, calendar year-ends, 2014-26E
2014E 2015E 2016E 2017E 2018E 2019E 2020E 2021E 2022E 2023E 2024E 2025E 2026EKey assumptionsVolume growth (%) 45.0 15.0 12.0 12.0 12.0 12.0 12.0 10.0 10.0 10.0 10.0 10.0 10.0 Gross average price increase (%) 6.0 5.0 4.0 2.0 2.0 2.0 2.0 2.0 2.0 2.0 2.0 2.0 2.0 Spare parts revenue growth (%) 10.0 10.0 10.0 12.0 12.0 12.0 12.0 8.0 8.0 8.0 8.0 8.0 8.0 Two-wheeler penetration Number of households (mn) 254 263 266 271 278 283 287 291 293 295 297 299 301India's population (mn) 1,239 1,254 1,269 1,284 1,298 1,312 1,326 1,335 1,343 1,351 1,360 1,368 1,377 Domestic two-wheeler population (mn units) 105.8 116.1 126.2 135.8 145.5 156.7 168.5 180.5 192.6 204.6 216.6 226.9 240.9 Domestic two-wheeler volumes (mn units) 14.7 16.2 17.8 19.6 21.6 23.3 25.2 26.7 28.3 30.0 31.8 33.7 33.7 Penetration per person for two wheelers (%) 8.5 9.3 9.9 10.6 11.2 11.9 12.7 13.5 14.3 15.1 15.9 16.6 17.5 Penetration per household for two wheelers (%) 41.7 44.1 47.4 50.1 52.3 55.4 58.7 62.0 65.7 69.4 72.9 75.9 80.0 Domestic motorcycle volumes (mn units) 11.1 12.0 13.0 14.0 14.9 15.7 16.7 17.5 18.4 19.3 20.3 21.3 22.4 Premium motorcycle volumes (mn units) 1.9 2.0 2.3 2.5 2.8 3.0 3.3 3.5 3.9 4.1 4.5 4.9 5.4 Premium m/c as % of m/c vols 17.0 17.0 18.0 18.0 19.0 19.0 20.0 20.0 21.0 21.0 22.0 23.0 24.0 Share of 250-500cc segment in premium m/c 14.2 16.0 16.0 17.0 18.0 18.0 20.0 22.0 23.0 24.0 24.0 25.0 25.0 Royal enfield share in 250-500cc segment (%) 95.0 89.7 87.9 85.8 81.1 85.7 77.4 73.7 70.3 70.6 70.6 67.9 68.2 Key ratios (%)EBIT margin (%) 21.2 21.7 21.4 21.0 21.0 21.0 21.0 19.0 19.0 19.0 19.0 19.0 17.0 Effective tax rate (%) 19.0 20.0 21.0 30.9 30.9 30.9 30.9 30.9 30.9 30.9 30.9 30.9 30.9 Excise duty as percentage of domestic revenue 12.6 12.5 12.5 12.0 12.0 12.0 12.0 12.0 12.0 12.0 12.0 12.0 12.0 Capex as % of change in revenues 2.1 3.6 5.6 5.0 5.0 5.0 5.0 5.0 5.0 4.5 4.5 4.5 3.0 Depreciation as a percentage of avg. gross block 5.8 5.9 5.9 5.0 5.0 5.0 5.0 5.0 5.0 5.0 5.0 5.0 4.0 Year-end net WCap excl. cash (days of sales) (23.6) (18.2) (13.6) (20.0) (20.0) (20.0) (20.0) (15.0) (15.0) (15.0) (15.0) (15.0) (15.0) Gross block (incl. CWIP) 3,575 3,775 4,075 4,344 4,651 5,002 5,403 5,796 6,236 6,681 7,180 7,739 8,158 Year-end net WCap (excl. cash) (1,740) (1,616) (1,407) (2,365) (2,701) (3,086) (3,525) (2,967) (3,329) (3,735) (4,190) (4,701) (5,275)
Source: Kotak Institutional Equities estimates
Reverse DCF implies annual sales volume growth of 12% in the medium term and 8% in the long term DCF model for VECV, calendar year-ends, 2014-30E
2014E 2015E 2016E 2017E 2018E 2019E 2020E 2026E 2027E 2028E 2029E 2030EVolumes (units) 47,736 59,289 73,724 82,571 92,480 103,577 116,006 184,088 198,815 214,720 231,897 250,449Gross average price (Rs/vehicle) 1,004,963 1,043,728 1,060,246 1,081,451 1,103,080 1,125,142 1,147,645 1,292,435 1,318,283 1,344,649 1,371,542 1,398,973Gross vehicle revenues 47,973 61,882 78,166 89,297 102,012 116,539 133,134 237,921 262,094 288,723 318,057 350,372Spare part revenues 14,070 14,050 14,234 15,657 17,223 18,945 20,839 33,069 35,715 38,572 41,658 44,991Engine revenues 8,211 13,164 16,379 16,871 17,377 17,898 18,435 22,012 22,673 23,353 24,054 24,775Excise duty 6,526 8,318 10,414 10,716 12,241 13,985 15,976 28,551 31,451 34,647 38,167 42,045Net revenue 63,728 80,778 98,365 111,109 124,370 139,397 156,432 264,452 289,030 316,001 345,602 378,093EBIT 3,543 6,449 7,372 8,889 9,950 11,152 12,515 18,512 20,232 22,120 24,192 22,686EBIT (1-tax) 2,083 4,058 4,624 6,151 6,885 7,717 8,660 12,810 14,001 15,307 16,741 15,698Depreciation/amortisation 1,449 1,787 2,050 2,163 2,327 2,514 2,728 4,047 4,301 4,580 4,888 4,719(Increase)/decrease in working capital 54 (1,588) (1,710) 1,988 (348) (398) (455) (481) (530) (584) (643) 2,172Capital expenditure (6,200) (4,200) (3,900) (2,783) (3,179) (3,632) (4,149) (4,389) (4,835) (5,326) (5,867) (5,170)Free cash flows (2,614) 57 1,065 7,519 5,684 6,201 6,784 11,987 12,937 13,978 15,119 17,419Years discounted 1.0 2.0 3.0 4.0 5.0 6.0 7.0 13.0 14.0 15.0 16.0 17.0 Discount factor 0.9 0.8 0.7 0.6 0.6 0.5 0.5 0.2 0.2 0.2 0.2 0.1 Discounted cash flow (2,334) 45 758 4,778 3,225 3,142 3,069 2,747 2,647 2,554 2,466 2,537 Core PBT 3,543 6,449 7,372 8,889 9,950 11,152 12,515 18,512 20,232 22,120 24,192 22,686 Tax expense 1,460 2,391 2,748 2,738 3,064 3,435 3,854 5,702 6,231 6,813 7,451 6,987 Core PAT 2,083 4,058 4,624 6,151 6,885 7,717 8,660 12,810 14,001 15,307 16,741 15,698 Core EPS (Rs) 77 150 171 228 255 286 321 474 519 567 620 581
Near-term volume growth (CY2017-20) 12.0 NPV CalcLong-term growth (CY2021-30) 8.0 Sum of free cash flow 41,978 WACC used (%) 12.0 Terminal value 29,034 Terminal growth rate (%) 3.0 Enterprise value 71,013 Capitalization rate (%) 9.0 Net cash 3,342 Terminal value calculation Net present value-equity 74,354 Cash flow in terminal year 17,419 Shares o/s (mn) 27 Terminal value 199,350 NPV /share(Rs) 2,754 Discounted value 29,034 Eicher share in VECV 1,498
Source: Kotak Institutional Equities estimates

Automobiles Eicher Motors
8 KOTAK INSTITUTIONAL EQUITIES RESEARCH
Reverse DCF implies annual sales volume growth of 12% in the medium term and 8% in the long term Key assumptions behind the Reverse DCF model for VECV, calendar year-ends, 2014-30E
2014E 2015E 2016E 2017E 2018E 2019E 2020E 2026E 2027E 2028E 2029E 2030EKey assumptionsVolume growth (%) 13.7 24.2 24.3 12.0 12.0 12.0 12.0 8.0 8.0 8.0 8.0 8.0 Gross average price increase (%) 2.7 3.9 1.6 2.0 2.0 2.0 2.0 2.0 2.0 2.0 2.0 2.0 Spare parts revenue growth (%) (1.7) (0.1) 1.3 10.0 10.0 10.0 10.0 8.0 8.0 8.0 8.0 8.0 Key ratios (%)EBIT margin (%) 5.6 8.0 7.5 8.0 8.0 8.0 8.0 7.0 7.0 7.0 7.0 6.0 Effective tax rate (%) 41.2 37.1 37.3 30.8 30.8 30.8 30.8 30.8 30.8 30.8 30.8 30.8 Excise duty as % of domestic revenue 13.6 13.4 13.3 12.0 12.0 12.0 12.0 12.0 12.0 12.0 12.0 12.0 Capex as % of change in revenues 89.8 30.2 23.9 25.0 25.0 25.0 25.0 20.0 20.0 20.0 20.0 16.0 Depreciation as a % of avg. gross block 5.4 5.6 5.7 5.5 5.5 5.5 5.5 5.5 5.5 5.5 5.5 5.0 Year-end net Wcap. excl. cash (days of sales) 8.6 16.1 20.7 10.0 10.0 10.0 10.0 8.0 8.0 8.0 8.0 5.0 Gross block (incl. CWIP) 29,829 34,029 37,929 40,711 43,890 47,522 51,671 75,774 80,609 85,935 91,801 96,972 Year-end net WCap (excl. cash) 1,137 2,725 4,434 2,446 2,795 3,193 3,648 5,215 5,745 6,328 6,971 4,800
Source: Kotak Institutional Equities estimates
We expect Royal Enfield’s strong growth to continue and VECV volumes to recover in CY2014 Eicher Motors sales volumes, calendar year-ends, 2009-16E (units)
2009 2010 2011 2012 2013E 2014E 2015E 2016ESales volumes (units)StandaloneTwo-wheelers 51,955 52,576 74,626 113,432 175,820 254,938 293,179 328,361 VECVDomestic5-14 ton 16,893 26,426 31,381 29,541 25,110 28,876 36,095 45,119 >16 ton 1,424 4,219 7,352 7,699 6,544 7,526 10,160 13,716 Buses 3,282 4,819 6,496 8,521 7,243 7,967 9,162 10,537 ExportsCargo 2,037 2,073 2,652 1,822 1,913 2,104 2,420 2,710 Buses 628 644 456 679 713 784 902 1,010 Volvo trucksVolvo trucks domestic 900 1,094 705 569 455 478 550 632 Total 25,164 39,275 49,042 48,831 41,978 47,736 59,289 73,724 Yoy change (%)StandaloneTwo-wheelers 1.2 41.9 52.0 55.0 45.0 15.0 12.0 VECVDomestic5-14 ton 56.4 18.8 (5.9) (15.0) 15.0 25.0 25.0 >16 ton 196.3 74.3 4.7 (15.0) 15.0 35.0 35.0 Buses 46.8 34.8 31.2 (15.0) 10.0 15.0 15.0 ExportsCargo 1.8 27.9 (31.3) 5.0 10.0 15.0 12.0 Buses 2.5 (29.2) 48.9 5.0 10.0 15.0 12.0 Volvo trucksVolvo trucks domestic 21.6 (35.6) (19.3) (20.0) 5.0 15.0 15.0 Total 56.1 24.9 (0.4) (14.0) 13.7 24.2 24.3
Source: Company, Kotak Institutional Equities estimates

Eicher Motors Automobiles
KOTAK INSTITUTIONAL EQUITIES RESEARCH 9
Royal Enfield will continue to contribute a significant part of total EBITDA Revenue, EBITDA and PBT breakdown, Eicher Motors, calendar year-ends, 2009-16E (` mn, %)
2009 2010 2011 2012 2013E 2014E 2015E 2016ERevenue (Rs mn)Standalone 4,080 4,844 7,378 11,793 18,636 28,135 33,836 39,321 VECV (54.4% stake) 14,711 22,942 29,298 31,638 30,262 38,218 48,468 59,176 Total 18,791 27,786 36,676 43,431 48,898 66,353 82,304 98,497 Revenue mix (%)Standalone 21.7 17.4 20.1 27.2 38.1 42.4 41.1 39.9 VECV (54.4% stake) 78.3 82.6 79.9 72.8 61.9 57.6 58.9 60.1 Total 100 100 100 100 100 100 100 100 EBITDA (Rs mn)Standalone 250 416 765 1,454 2,996 5,451 6,683 7,654 VECV (54.4% stake) 650 1,715 2,603 2,196 1,717 2,715 4,480 5,126 Total 900 2,131 3,368 3,650 4,713 8,166 11,163 12,780 EBITDA mix (%)Standalone 27.8 19.5 22.7 39.8 63.6 66.7 59.9 59.9 VECV (54.4% stake) 72.2 80.5 77.3 60.2 36.4 33.3 40.1 40.1 Total 100 100 100 100 100 100 100 100 PBT (Rs mn)Standalone 466 866 1,418 1,738 3,754 6,503 8,159 9,651 VECV (54.4% stake) 765 1,801 2,820 2,317 1,848 2,647 4,336 4,983 Total 1,232 2,667 4,238 4,055 5,602 9,150 12,495 14,634 PBT mix (%)Standalone 37.9 32.5 33.5 42.9 67.0 71.1 65.3 65.9 VECV (54.4% stake) 62.1 67.5 66.5 57.1 33.0 28.9 34.7 34.1 Total 100 100 100 100 100 100 100 100
Source: Company, Kotak Institutional Equities estimates
Automobiles Eicher Motors
10 KOTAK INSTITUTIONAL EQUITIES RESEARCH
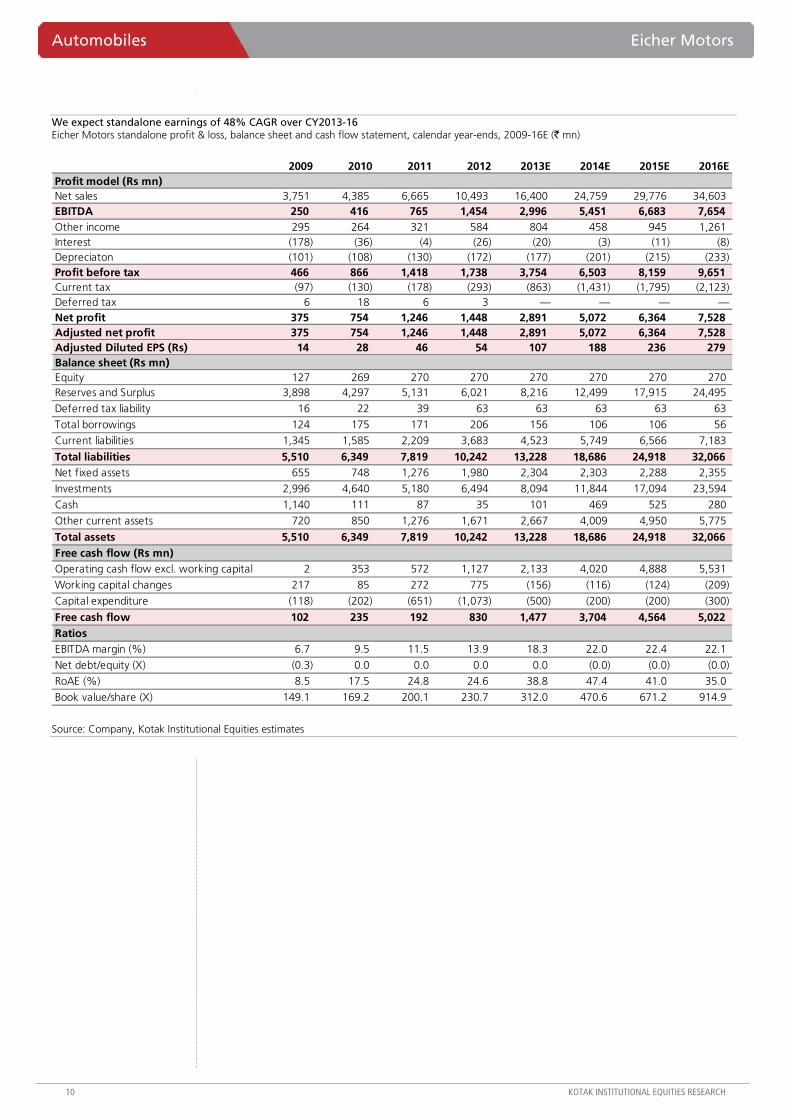
We expect standalone earnings of 48% CAGR over CY2013-16 Eicher Motors standalone profit & loss, balance sheet and cash flow statement, calendar year-ends, 2009-16E (` mn)
2009 2010 2011 2012 2013E 2014E 2015E 2016EProfit model (Rs mn)Net sales 3,751 4,385 6,665 10,493 16,400 24,759 29,776 34,603 EBITDA 250 416 765 1,454 2,996 5,451 6,683 7,654 Other income 295 264 321 584 804 458 945 1,261 Interest (178) (36) (4) (26) (20) (3) (11) (8) Depreciaton (101) (108) (130) (172) (177) (201) (215) (233) Profit before tax 466 866 1,418 1,738 3,754 6,503 8,159 9,651 Current tax (97) (130) (178) (293) (863) (1,431) (1,795) (2,123) Deferred tax 6 18 6 3 — — — —Net profit 375 754 1,246 1,448 2,891 5,072 6,364 7,528 Adjusted net profit 375 754 1,246 1,448 2,891 5,072 6,364 7,528 Adjusted Diluted EPS (Rs) 14 28 46 54 107 188 236 279 Balance sheet (Rs mn)Equity 127 269 270 270 270 270 270 270 Reserves and Surplus 3,898 4,297 5,131 6,021 8,216 12,499 17,915 24,495
Deferred tax liability 16 22 39 63 63 63 63 63
Total borrowings 124 175 171 206 156 106 106 56 Current liabilities 1,345 1,585 2,209 3,683 4,523 5,749 6,566 7,183
Total liabilities 5,510 6,349 7,819 10,242 13,228 18,686 24,918 32,066 Net fixed assets 655 748 1,276 1,980 2,304 2,303 2,288 2,355
Investments 2,996 4,640 5,180 6,494 8,094 11,844 17,094 23,594
Cash 1,140 111 87 35 101 469 525 280
Other current assets 720 850 1,276 1,671 2,667 4,009 4,950 5,775
Total assets 5,510 6,349 7,819 10,242 13,228 18,686 24,918 32,066 Free cash flow (Rs mn)Operating cash flow excl. working capital 2 353 572 1,127 2,133 4,020 4,888 5,531
Working capital changes 217 85 272 775 (156) (116) (124) (209)
Capital expenditure (118) (202) (651) (1,073) (500) (200) (200) (300)
Free cash flow 102 235 192 830 1,477 3,704 4,564 5,022 RatiosEBITDA margin (%) 6.7 9.5 11.5 13.9 18.3 22.0 22.4 22.1
Net debt/equity (X) (0.3) 0.0 0.0 0.0 0.0 (0.0) (0.0) (0.0)
RoAE (%) 8.5 17.5 24.8 24.6 38.8 47.4 41.0 35.0
Book value/share (X) 149.1 169.2 200.1 230.7 312.0 470.6 671.2 914.9
Source: Company, Kotak Institutional Equities estimates

Eicher Motors Automobiles
KOTAK INSTITUTIONAL EQUITIES RESEARCH 11
We expect 53% CAGR in consolidated net profit over CY2013-15 Eicher Motors consolidated profit & loss, balance sheet and cash flow statement, calendar year-ends, 2009-16E (` mn)
2009 2010 2011 2012 2013E 2014E 2015E 2016EProfit model (Rs mn)Net sales 29,386 43,971 56,775 63,899 66,438 88,487 110,554 132,967
EBITDA 1,444 3,569 5,551 5,490 6,153 10,443 14,919 17,076 Other income 1,054 1,276 1,768 1,366 1,943 2,284 2,905 3,693
Interest (87) (95) (77) (38) (23) (23) (23) (23)
Depreciaton (539) (573) (640) (822) (1,222) (1,650) (2,002) (2,282)
Profit before tax 1,873 4,177 6,602 5,997 6,850 11,054 15,799 18,464 Tax (578) (1,108) (1,628) (1,249) (1,882) (2,890) (4,186) (4,871)
Minority Interest (461) (1,179) (1,886) (1,506) (1,084) (1,553) (2,544) (2,924)
Net profit 834 1,889 3,088 3,243 3,884 6,610 9,068 10,669 Adjusted net profit 834 1,889 3,088 3,243 3,884 6,610 9,068 10,669 Adjusted Diluted EPS (Rs) 31 70 114 120 144 245 336 395 Balance sheet (Rs mn)Equity 127 269 270 270 270 270 270 270
Reserves and Surplus 10,564 12,052 14,661 17,279 20,468 26,289 34,410 44,131
Deferred tax liability 142 249 645 1,232 1,232 1,232 1,232 1,232
Minority Interest 5,747 6,774 8,377 9,485 10,569 12,122 14,666 17,590
Total borrowings 1,264 956 504 389 389 389 389 389
Current liabilities 6,978 9,332 13,343 16,060 16,075 18,615 21,391 24,013
Total liabilities 24,820 29,633 37,799 44,715 49,003 58,917 72,359 87,626 Net fixed assets 3,758 4,513 8,991 14,962 20,439 25,190 27,588 29,505
Investments 2,941 4,586 5,126 6,385 12,385 15,385 21,885 30,385
Cash 11,707 12,457 11,973 8,035 707 269 324 633
Other current assets 6,415 8,043 11,528 15,271 15,410 18,011 22,500 27,040
Miscellaneous expenditure - 35 182 62 62 62 62 62
Total assets 24,820 29,633 37,799 44,715 49,003 58,917 72,359 87,626 Free cash flow (Rs mn)Operating cash flow excl. working capital 1,031 2,986 4,273 4,436 4,270 7,552 10,732 12,205
Working capital changes 2,654 374 (238) 389 (123) (62) (1,712) (1,919)
Capital expenditure (701) (1,315) (4,173) (7,820) (6,700) (6,400) (4,400) (4,200)
Free cash flow (ex financing) 2,984 2,045 (138) (2,995) (2,553) 1,090 4,620 6,087 RatiosEBITDA margin (%) 4.9 8.1 9.8 8.6 9.3 11.8 13.5 12.8
Debt/equity (X) 0.1 0.1 0.0 0.0 0.0 0.0 0.0 0.0
Net debt/equity (X) (1.2) (1.3) (1.1) (0.7) (0.6) (0.5) (0.6) (0.7)
Book value (Rs per share) 396 455 546 648 766 982 1,283 1,643
ROAE (%) 7.7 16.1 21.9 18.9 19.1 26.6 28.5 26.2
Source: Company, Kotak Institutional Equities estimates

For private Circulation Only. FOR IMPORTANT INFORMATION ABOUT KOTAK SECURITIES’ RATING SYSTEM AND OTHER DISCLOSURES, REFER TO THE END OF THIS MATERIAL.
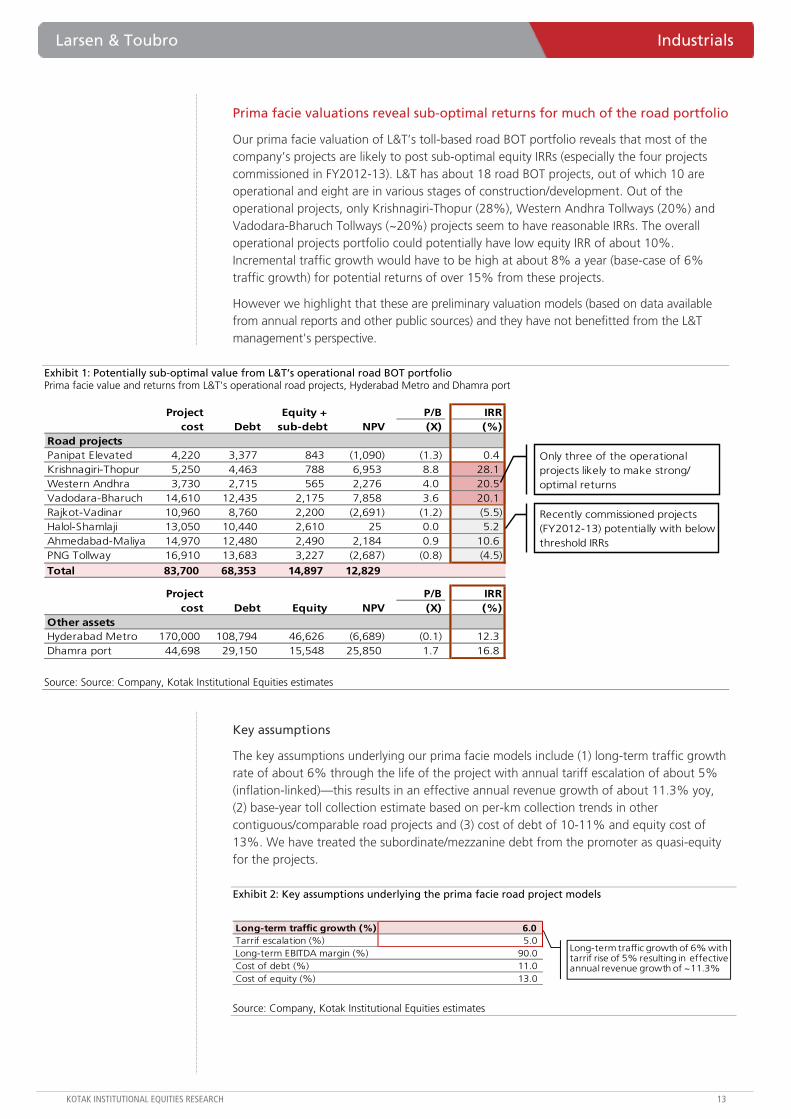
Prima facie valuations reveal below-threshold returns of about 10% for L&T’s road portfolio
Our prima facie valuation reveals that L&T’s operational toll-road portfolio may have sub-optimal equity IRR of 10% (returns especially low for the four recently commissioned projects in FY2012-13). This is due to sharp traffic disappointments (16% below estimates) partly on one-offs such as law & order issues and toll plaza bypass (though we note long-term disappointments in Vadodara-Bharuch, Panipat elevated corridor; four-year toll collection CAGR of only ~8%). Returns may be even lower for the under-construction portfolio as they were won during a period of stiffer competition (FY2011-12). Some limitations the of analysis include (1) done on weak FY2013 base, (2) no specific input for L&T, (3) no provision for project-specific opportunities and constraints.
May add to debt; Hyderabad Metro sub-optimal; Dhamra deal reasonable; execution an issue
The road portfolio may need cash support over the next few years adding to high debt (ex-finance consolidated debt of `355 bn at the end of FY2013, which can rise to `550 bn by the end of FY2015). Even the Hyderabad Metro (25% of development portfolio) may potentially post sub-optimal returns (12%) with large downside to base traffic, real estate monetization, project cost (equity IRR of 5-7% and a large negative NPV of `50-60 bn in a worst-case scenario). Dhamra port sale (`55 bn EV; 1.7X book; 16-17% equity IRR) seems reasonable given its long-term potential. Construction of three road projects (cost ~`60 bn) is yet to start (September 2013 NHAI data).
We retain estimates; reiterate REDUCE with a target price of `970 after sharp performance
Low returns may affect the value realization from monetization/induction of a strategic partner and take the sheen off the stock as a large share of capital (21% ex-finance) is deployed in the assets.
We believe our value of 1XP/B (FY2015E-end estimates book value) for L&T’s asset portfolio is reasonable. We retain REDUCE (TP: `970) on full valuations (post the recent outperformance) with risks related to margin pressure (commodities, competition) and large consolidated debt in a weak environment. We believe overall valuation levels will stay in check on low returns and low growth.
Larsen & Toubro (LT)
Industrials
Prima facie below-threshold returns from IDPL portfolio. Our prima facie analysis of operating road projects of L&T IDPL, shows the blended portfolio IRR of eight operational projects is ~10%. We believe under-construction projects can be even worse as competition was higher over FY2011-12 (large premium payments committed to NHAI). In a recent note we highlighted that Hyderabad Metro may post mediocre returns with large risks, related to traffic, cost and real estate absorption. Such returns can (1) affect the value realization from monetization/induction of a strategic partner and (2) take the sheen off the stock, as debt grows, and projects may need support from the parent.
Larsen & ToubroStock data Forecasts/Valuations 2014 2015E 2016E
52-week range (Rs) (high,low) EPS (Rs) 48.2 58.0 72.1Market Cap. (Rs bn) 924.5 EPS growth (%) (8.1) 20.5 24.3
Shareholding pattern (%) P/E (X) 20.7 17.2 13.8Promoters 0.0 Sales (Rs bn) 854.4 991.1 1,151.7FIIs 18.2 Net profits (Rs bn) 44.5 53.6 66.6MFs 7.5 EBITDA (Rs bn) 108.9 126.1 146.8
Price performance (%) 1M 3M 12M EV/EBITDA (X) 15.1 13.7 12.2Absolute (13.0) 18.1 (3.4) ROE (%) 12.2 13.0 14.2Rel. to BSE-30 (11.8) 13.9 (8.0) Div. Yield (%) 1.3 1.4 1.6
Company data and valuation summary
1,154-677
REDUCE
JANUARY 09, 2014
UPDATE
Coverage view: Cautious
Price (`): 998
Target price (`): 970
BSE-30: 20,729
Larsen & Toubro Industrials
KOTAK INSTITUTIONAL EQUITIES RESEARCH 13
Prima facie valuations reveal sub-optimal returns for much of the road portfolio
Our prima facie valuation of L&T’s toll-based road BOT portfolio reveals that most of the company’s projects are likely to post sub-optimal equity IRRs (especially the four projects commissioned in FY2012-13). L&T has about 18 road BOT projects, out of which 10 are operational and eight are in various stages of construction/development. Out of the operational projects, only Krishnagiri-Thopur (28%), Western Andhra Tollways (20%) and Vadodara-Bharuch Tollways (~20%) projects seem to have reasonable IRRs. The overall operational projects portfolio could potentially have low equity IRR of about 10%. Incremental traffic growth would have to be high at about 8% a year (base-case of 6% traffic growth) for potential returns of over 15% from these projects.
However we highlight that these are preliminary valuation models (based on data available from annual reports and other public sources) and they have not benefitted from the L&T management's perspective.
Exhibit 1: Potentially sub-optimal value from L&T’s operational road BOT portfolio Prima facie value and returns from L&T's operational road projects, Hyderabad Metro and Dhamra port
Project Equity + P/B IRRcost Debt sub-debt NPV (X) (%)
Road projectsPanipat Elevated 4,220 3,377 843 (1,090) (1.3) 0.4 Krishnagiri-Thopur 5,250 4,463 788 6,953 8.8 28.1 Western Andhra 3,730 2,715 565 2,276 4.0 20.5 Vadodara-Bharuch 14,610 12,435 2,175 7,858 3.6 20.1 Rajkot-Vadinar 10,960 8,760 2,200 (2,691) (1.2) (5.5) Halol-Shamlaji 13,050 10,440 2,610 25 0.0 5.2 Ahmedabad-Maliya 14,970 12,480 2,490 2,184 0.9 10.6 PNG Tollway 16,910 13,683 3,227 (2,687) (0.8) (4.5)
Total 83,700 68,353 14,897 12,829
Project P/B IRRcost Debt Equity NPV (X) (%)
Other assetsHyderabad Metro 170,000 108,794 46,626 (6,689) (0.1) 12.3 Dhamra port 44,698 29,150 15,548 25,850 1.7 16.8
Recently commissioned projects (FY2012-13) potentially with below threshold IRRs
Only three of the operational projects likely to make strong/ optimal returns
Source: Source: Company, Kotak Institutional Equities estimates
Key assumptions
The key assumptions underlying our prima facie models include (1) long-term traffic growth rate of about 6% through the life of the project with annual tariff escalation of about 5% (inflation-linked)—this results in an effective annual revenue growth of about 11.3% yoy, (2) base-year toll collection estimate based on per-km collection trends in other contiguous/comparable road projects and (3) cost of debt of 10-11% and equity cost of 13%. We have treated the subordinate/mezzanine debt from the promoter as quasi-equity for the projects.
Exhibit 2: Key assumptions underlying the prima facie road project models
Long-term traffic growth (%) 6.0 Tarrif escalation (%) 5.0 Long-term EBITDA margin (%) 90.0 Cost of debt (%) 11.0 Cost of equity (%) 13.0
Long-term traffic growth of 6% with tarrif rise of 5% resulting in effective annual revenue growth of ~11.3%
Source: Company, Kotak Institutional Equities estimates

Industrials Larsen & Toubro
14 KOTAK INSTITUTIONAL EQUITIES RESEARCH
We have selected eight out of the 10 operational road projects for our analysis—not included (1) Coimbatore bypass project—won a long time ago (1997) and (2) Interstate-Palanpur project (annuity-based project; have restricted the analysis to toll-based projects). Exhibit 3 summarizes the details of the projects.
Exhibit 3: Key details of L&T’s operational BOT road projects (` mn)
Length Project CA(kms) cost Grant/ Premium CoD Period 2013 2014E 2015E 2013 2014E 2015E
Road projectsPanipat Elevated 10 4,220 Rs3.5 bn -ve grant over 10 yrs (post CoD) Jul-08 20 yrs 453 504 561 (372) (367) (565) Krishnagiri-Thopur 86 5,250 Rs3.6 bn -ve grant over 10 yrs (post CoD) Feb-09 20 yrs 1,212 1,348 1,501 (38) 87 251 Western Andhra 56 3,730 Rs450 mn positive grant Mar-09 20 yrs 481 535 596 (112) (95) (25) Vadodara-Bharuch 83 14,610 Rs4.7 bn upfront payment Jun-09 15 yrs 2,268 2,524 2,809 (405) 75 (59) Rajkot-Vadinar 132 10,960 12.95% rev. share increasing by 1% p.a. Feb-12 20 yrs 682 759 845 (1,135) (1,112) (1,064) Halol-Shamlaji 173 13,050 10.2% rev. share increasing by 1% p.a. Apr-12 20 yrs 933 1,131 1,259 (1,251) (1,059) (977) Ahmedabad-Maliya 180 14,970 12.13% rev. share increasing by 1% p.a. Apr-12 22 yrs 885 1,438 1,601 (843) (1,142) (1,041) PNG Tollway 60 16,910 6.2% rev. share increasing by 1% p.a. Oct-12 20 yrs 189 855 952 (376) (1,489) (1,418) Total 780 83,700 7,102 9,095 10,123 (4,531) (5,101) (4,900)
Revenues Net PAT
Source: Source: Company, Kotak Institutional Equities estimates
Exhibit 4: Financial structure (equity, promoter debt, external debt) of L&T’s operational road projects
Projectcost Total Capital Quasi-equity Total External Promoter Comments
Panipat Elevated 4,220 843 843 - 3,377 927 2,450 Rs2.45 bn non-convertible debentures from IDPLKrishnagiri-Thopur 5,250 788 788 - 4,463 4,011 452 Small L&A from Narmada InfraWestern Andhra 3,730 565 565 - 2,715 2,715 - No subordinate-debt from promoterVadodara-Bharuch 14,610 2,175 435 1,740 12,435 12,435 - Rs1.74 bn promoter subordinate-debt (quasi equity)Rajkot-Vadinar 10,960 2,200 1,100 1,100 8,760 8,760 - Rs1.1 bn promoter mezzanine debt (quasi-equity)Halol-Shamlaji 13,050 2,610 1,305 1,305 10,440 10,440 - Rs1.3 bn promoter mezzanine debt (quasi-equity)Ahmedabad-Maliya 14,970 2,490 1,490 1,000 12,480 12,480 - Rs1 bn promoter mezzanine debt (quasi-equity)PNG Tollway 16,910 3,227 1,691 1,536 13,683 13,683 - Rs1.5 bn promoter mezzanine debt (quasi-equity)Total 83,700 14,897 8,217 6,681 68,353 65,451 2,902
DebtEquity
Source: Source: Company, Kotak Institutional Equities estimates
Out of four recently won contracts only the Beawer project has begun construction, leading to execution disappointment
Apart from the operational portfolio, L&T has about eight road projects that are in various stages of construction (likely to be commissioned over the next 1-2 years). Based on the prima facie valuations of the operational projects, we believe the projects under construction could potentially post even lower returns as these projects were won in a relatively high competition environment (2011-12) with large premium commitments to NHAI. Three road projects (project cost of ~`60 bn) have not yet started construction as of September 2013 NHAI data—Deccan Tollways, Amravati Jalgaon and Jalgaon- Maharashtra Border.

Larsen & Toubro Industrials
KOTAK INSTITUTIONAL EQUITIES RESEARCH 15
Exhibit 5: Details of L&T’s under-construction BOT road projects (` mn)
Length Project Concession(kms) Cost Debt Equity Grant/ Premium CoD period
Under construction projectsDevihalli-Hassan 77 4,940 2,238 900 Rs1.8 bn positive grant Nov-13 30 yrsBeawar-Pali-Pindwara 244 24,720 18,540 6,180 Rs2.5 bn annual premium increasing at 5% p.a. Jun-14E 23 yrsSamakhiali-Gandhidham 56 13,000 10,400 2,600 Rs676 mn annual premium increasing at 5% p.a. Mar-14E 24 yrsChennai-Tada 43 8,480 6,784 1,696 17.07% revenue share increasing by 1% p.a. Mar-14E 15 yrsAmravati-Jalgaon 275 27,000 20,250 6,750 Rs1.3 bn annual premium increasing at 5% p.a. Mar-15E 19 yrsJalgaon-Gujarat/Mah border 209 21,000 15,750 5,250 Rs1.45 bn annual premium increasing at 5% p.a. Mar-15E 20 yrsDeccan Tollways 145 12,730 9,548 3,183 Rs810 mn annual premium increasing at 5% p.a. Sep-15E 25 yrs
1,049 111,870 83,510 26,559
Source: Source: Company, Kotak Institutional Equities
Large miss on toll attributed to stabilization phase; gap can increase
Toll collection for L&T’s roads portfolio was 16% below the company’s expectations in FY2013. The company attributed this largely to the initial stabilization phase with specific mention of teething issues in Gujarat projects such as (1) law and order problems, (2) temporary bypasses to evade toll check points and (3) the presence of a parallel road without a toll. L&T is trying to address these issues and hopes to recover the traffic trajectory. This is on top of a general slowdown in traffic seen across its road projects. Slower growth and commissioning of new projects would possibly increase the gap beyond the current 16%, versus projection over the next two years or so. Start of projects won more recently and in general against more aggressive competition could also increase the gap.
Exhibit 6: Large revenue miss in FY2013 at the portfolio level Per day gross toll collection for L&T's portfolio, March fiscal year-ends, 2010-14E (` mn)
13.3
16.8
23.3
32.7
36.8
0
8
16
24
32
40
2010 2011 2012 2013 2014E
(Rs mn per day)16% miss versus internal estimate
Source: Company, Kotak Institutional Equities
However, we note that traffic pick-up over the past four years, after the initial start, has remained low in assets like Vadodara-Bharuch and Panipat elevated corridor. Annual revenues have grown at a CAGR of 8-8.5% for the two projects; adjusted for a potential inflation-linked tariff escalation of 7-8% during this period, this would imply relatively flat/low traffic growth over FY2010-13.

Industrials Larsen & Toubro
16 KOTAK INSTITUTIONAL EQUITIES RESEARCH
Exhibit 7: Toll collections from Vadodara-Bharuch and Panipat Corridor projects, March fiscal year-ends, 2010-13 (` mn)
2010 2011 2012 2013 CAGR (%)Annualized revenuesVadodara-Bharuch 1,794 1,897 2,112 2,268 8.1 Panipat Elevated Corridor 355 387 420 453 8.4
Source: Company, Kotak Institutional Equities
Projects may require support over the next few years; debt may rise
L&T’s road portfolio may need some equity/cash-flow support over the next few years as low/disappointing traffic levels may lead to losses. This may result in potential debt at the parent level, increasing the high consolidated debt burden. We note this would be apart from the incremental equity requirements of under-construction/development projects in the company’s portfolio.
Exhibit 8: Operational projects may need equity support from the parent over the next few years Project-wise free cash flow to equity for L&T's operational road projects, March fiscal year-ends, 2014-20E (` mn)
2014E 2015E 2016E 2017E 2018E 2019E 2020EOperational projectsPanipat Elevated (195) (466) (790) (676) (458) (345) (286) Krishnagiri-Thopur 227 371 263 435 789 1,064 1,057 Western Andhra (132) (62) (108) 174 218 340 255 Vadodara-Bharuch 212 78 186 1,177 1,445 1,987 1,694 Rajkot-Vadinar (733) (685) (537) (1,019) (1,061) (472) (461) Halol-Shamlaji (537) (456) (331) (431) (914) (649) (165) Ahmedabad-Maliya (471) (370) (215) (391) (842) (638) (135) PNG Tollway (747) (677) (550) (465) (652) (1,264) (1,115)
Cumulative FCFE (2,376) (2,268) (2,081) (1,195) (1,476) 22 843
Source: Company, Kotak Institutional Equities estimates
Hyderabad Metro prima facie valuation implies below-threshold IRR
Our prima facie valuation for L&T’s Hyderabad Metro project reflects that the project could potentially have sub-optimal equity IRR of 12% (with a negative NPV of about –`6.7 bn). This is against a potential equity investment of `46 bn.
May have downside as traffic, real estate monetization estimates may disappoint
Key underlying assumptions include (1) base-year (FY2013) traffic of 1.5 mn passengers a day, (2) traffic growth of 4% over FY2013-21E tapering to 1%, (3) 35% EBITDA margin in the first year of operations, scaling up to a steady state of 60% and (4) 18.5 mn sq. ft of real estate monetization over 10 years (starting 2018E). Exhibit 9 summarizes the assumptions built into our prima facie model of the project.

Larsen & Toubro Industrials
KOTAK INSTITUTIONAL EQUITIES RESEARCH 17
Exhibit 9: Key assumptions underlying our prima facie valuation of the Hyderabad Metro project
Financing structureProject cost (Rs mn) 170,000 Equity (Rs mn) 46,626 Debt (Rs mn) 108,794 Grant (Rs mn) 14,580
TimelinesConcession period 60 yrsExpected CoD Mar-17
Key operational assumptionsBase-year traffic (mn pax per day) 1.5 Initial traffic growth (%) 4.0 Tariff escalation (%) 5.0 Cost of debt (%) 11.0 Tax rate (%) 30.0 Cost of equity (%) 13.0
Real estate developmentTotal area to be developed 18.5 mn sq. ftTimeline to monetize entire area 10 yrsAverage rental in FY2013 (per month) Rs40-45 per sq. ft
Assuming small Rs5-6 bn escalation versus estimated project cost of Rs164 bn
Debt: equity of 70:30
Based on timelines shared by the company
Against Delhi Metro current traffic level of 2 mn pax
On lease basis
Based on current rental rates in Hyderabad
Source: Kotak Institutional Equities estimates
Our assumptions for the project are based mainly on the feasibility study/traffic forecast included in the Detailed Project Report (DPR) of the Hyderabad Metro and the established track record by Delhi Metro over the past few years.
We believe our valuation could face some potential downside on the following factors
Favorable base year traffic assumption. Our model builds base-year passenger traffic of about 1.5 mn passengers a day against present traffic levels of 2 mn for Delhi Metro (in FY2013); this is versus a population and metro network size of over 2X in Delhi. Hence our assumption could face some downside risk. We also note very sharp disappointment in the Delhi Metro project in terms of traffic projected versus actual initial ridership (actual ridership was only about a fourth of what was initially estimated).
Exhibit 10: Delhi Metro actual ridership only a fourth of initial projections Actual versus project traffic in the Delhi Metro project
Year Actual Estimated2006 493 2,497 19.7 2007 622 2,760 22.5 2008 768 3,049 25.2 2009 889 3,369 26.4
Actual as % of estimated
Ridership ('000 pax per day)
Source: CDM report on Delhi Metro, UNFCCC website
Real estate monetization of 1.5-2 mn sq. ft a year may not be easy in Hyderabad. Our model builds monetization of the 18.5 mn sq. ft of commercial real estate over 10 years (starting from FY2018)—an average of about 1.85 mn sq. ft a year. This may not be easy to achieve in Hyderabad with current levels of overall annual off-take levels of about 1-1.5 mn sq. ft. However we note that Hyderabad’s rental rates are relatively low (compared with those of Bangalore) and could potentially rise; this would positively impact the valuation, to some extent.

Industrials Larsen & Toubro
18 KOTAK INSTITUTIONAL EQUITIES RESEARCH
Potential project cost escalations. The estimated capex of `170 bn for the project—about `2.4 bn per km of network, seems relatively low compared to costs of other metro projects (Delhi Metro Phase 3, Jaipur Metro, Mumbai Phase 1, Gurgaon Metro).
Exhibit 11: Comparison of capex in Hyderabad Metro and Delhi Metro projects
Hyderabad Jaipur Mumbai GurgaonMetro Phase-II Phase-III Metro Metro Ph 1 Metro
Approved route length (kms) 71 102 103 35 11 6 No. of stations 66 85 67 31 12 6 Estimated capex (Rs mn) 163,750 191,310 352,420 97,320 43,210 18,500 Capex per km (Rs mn) 2,301 1,871 3,420 2,767 3,903 3,136
Delhi Metro
Source: DMRC, JMRC, IL&FS, Industry, Hyderabad Metro website, Kotak Institutional Equities
No additional real estate capex included. We note that we have not assumed additional capex for the 18.5 mn sq. ft of real estate development involved in the project.
Value highly sensitive to traffic growth and base-traffic assumptions
We note that the valuation of the project is highly sensitive to the base-year traffic and growth assumptions. In case the base-year traffic (in FY2013) is assumed at about 1 mn passengers a day (versus our assumption of 1.5 mn) the project could have a large negative NPV of –`24 bn and low 10.9% equity IRR.
Exhibit 12: Sensitivity of NPV of Hyderabad Metro project at base traffic and traffic growth estimates
Base - 1% Base-case Base + 1% Base + 2% Base + 3%1.00 (27,920) (23,626) (18,311) (11,616) (3,012) 1.25 (20,501) (15,151) (8,510) (123) 10,655 1.50 (13,118) (6,689) 1,276 11,315 24,222 1.75 (5,760) 1,703 10,979 22,707 37,782 2.00 1,533 10,071 20,682 34,043 51,230
Traffic growth rate (%)
Base traffic (mn pax per
day)
Source: Kotak Institutional Equities estimates
Worst case—can have very large negative value considering the size of the project
Our worst-case scenario estimates potential negative potential NPV of –`62 bn and equity IRR of 7.7%. This assumes (1) base year traffic of 1 mn passengers a day (versus a base case of 1.5 mn), (2) about 10 mn sq. ft of real estate absorption over 12 years (against 18 mn sq. ft assumed in our base model) and (3) about 10% higher project cost of `187 bn (versus our base case assumption of `170 bn).
Dhamra port sale value seems fair for a reasonably attractive asset
News flows suggest the potential sale of the Dhamra port asset (a JV between L&T and Tata Steel) to Adani Ports & SEZ Ltd (APSEZ) for a likely enterprise value of about `55 bn. Against this, the project has been funded through (1) `29 bn of debt, (2) `6.5 bn of equity invested by L&T and Tata Steel (`3.24 bn each) and (3) `9 bn of subordinate debt/quasi-equity invested by L&T and Tata Steel (at the end of FY2013).
This transaction implies a price-to-book value (adjusted for the loan funds) of about 1.7X for L&T’s and Tata Steel’s historical investment in the port (share capital + quasi-equity). While this valuation may appear expensive on an EV/EBITDA basis currently (implies over 6X FY2013 EBITDA), we believe it may be reasonable given the long-term potential for growth and expansion at the port.

Larsen & Toubro Industrials
KOTAK INSTITUTIONAL EQUITIES RESEARCH 19
Exhibit 13: Sale implies 2X P/B value (on historically invested book) Implied valuation of Dhamra port acquisition by ADSEZ (` mn)
Rs mnTotal capital employed 44,698 Debt 29,150 Total equity 15,548
Share capital 6,480 Subordinate debt/ quasi-equity 9,068
Acquisition EV 55,000 Implied equity value (EV-debt) 25,850 Implied P/B (X) 1.7
Source: Company, Kotak Institutional Equities
Assuming `12.9 bn as positive cash inflow (sales realization of L&T’s stake) in FY2014E and equity investments/subordinate loans given to Dhamra Port over FY2006-13 (adjusting for interest received on subordinate loans), the deal may imply reasonable equity IRR of 16-17%.
Exhibit 14: Implied equity IRR on the sale of the Dhamra port asset, March fiscal year-ends, 2006-14E (` mn)
2006 2007 2008 2009 2010 2011 2012 2013 2014L&T's investment in Dhamra portEquity investmet 533 936 1,236 1,586 2,465 3,240 3,240 3,240 Subordinate loans - - - - - 1,401 3,677 4,534 Total investment 533 936 1,236 1,586 2,465 4,641 6,917 7,774 Change in equity/ L&AEquity investmet (annual) (533) (403) (300) (350) (879) (775) - - 12,925 Subordinate loans - - - - - (1,401) (2,275) (857) Add: Interest received on sub-loans - - - - - 7 270 416 Net cash flow (533) (403) (300) (350) (879) (2,169) (2,005) (441) 12,925 Equity IRR (%) 16.8
Source: Company, Kotak Institutional Equities estimates
Deal finalization closer post recent environment clearance for the second phase
News flows suggested that the Dhamra port asset sale was contingent on the project receiving land allocation and securing environment and coastal zone approvals for its next phase of expansion. In September 2013, the Expert Appraisal Committee (EAC) recommended the environment and coastal zone clearances for the second phase of expansion at Dhamra port. Land acquisition itself was contingent on environmental clearance. Hence we believe the company could be a step closer to finalization of the asset sale deal.
Dhamra port profile—27 mn ton bulk cargo port on the east coast of India
Dhamra Port (DPCL) is a 50:50 joint venture between L&T and Tata Steel. The port (phase 1) consists of two operational berths with a cumulative berth length of 700 mts (350 mts each) with a capacity to handle volumes of about 27 mn tons a year. Berth 1 is an import berth for handling coal and limestone cargo while berth 2 is an export berth for handling iron ore cargo. The port has a deep draft of about 18.5 mts and is capable of accepting capsize vessels. The project also has large scope for expansion with a total waterfront availability of over 4.5 kms and 742 acres of land. The master plan for the port involves eventual expansion to 13-15 berths with capacity to handle over 100 mn tons of cargo.
Recent operations—strong scale-up in Dhamra port volumes
We note a strong scale-up in cargo volumes handled at Dhamra port. The port recorded cargo volumes of 3.1 mn tons in 1QFY14, up 34% yoy (the port handled over 11 mn tons in FY2013E, up about 118% yoy, from 5.06 mn tons in FY2012).

Industrials Larsen & Toubro
20 KOTAK INSTITUTIONAL EQUITIES RESEARCH
Exhibit 15: Strong scale-up in volumes at Dhamra port Quarterly cargo volumes handled at Dhamra port, March fiscal year-ends, 2012-1QFY14
0.5
1.3 1.5
1.8
2.3 2.2
3.3 3.3 3.1
-
0.5
1.0
1.5
2.0
2.5
3.0
3.5
1QFY12 2QFY12 3QFY12 4QFY12 1QFY13 2QFY13 3QFY13 4QFY13 1QFY14
(mn tons) Dhamra cargo volumes
Source: Company, Kotak Institutional Equities
The company expects the port to handle about 16 mn tons of cargo in FY2014 (up 44.5% yoy) and record positive cash profit (about `250 mn) in FY2014 against a cash loss of `1.94 bn reported in FY2013.
Exhibit 16: Operational highlights of Dhamra port, March fiscal year-ends, 2012-14E (` mn)
2012 2013 2014EVolumes (MMT) 5.1 11.1 16.0 Yoy growth (%) 118.8 44.5 Net revenues (incl. other income) 1,970 5,060 7,800 EBITDA (100) 2,070 4,160 EBITDA margin (%) (5.1) 40.9 53.3 Interest to banks (2,920) (3,190) (3,050) Interest payment on promoter loans (280) (820) (860) Cash profit/ (loss) (3,300) (1,940) 250 Depreciation (1,280) (1,460) (1,500) PBT (4,580) (3,400) (1,250) Tax expenses - - - Net PAT (4,580) (3,400) (1,250)
Source: Company, Kotak Institutional Equities estimates
Sub-optimal returns could potentially affect monetization
L&T recently announced it was considering a potential IPO and listing of select road projects in Singapore (as part of its plans to monetize its development assets in IDPL). The low potential value/sub-optimal returns of the underlying assets could slow progress on this envisaged transaction. Even if the company lists only a few select assets, the valuation of cherry-picked assets cannot be extended to the entire development portfolio. The transaction size itself may not make a significant difference given the large equity base of IDPL’s portfolio.
Large equity requirement of about `82 bn for L&T’s development portfolio
L&T envisages about `82 bn of incremental investment requirement (`20 bn in FY2014E) for projects including (1) `62 bn of existing commitments and (2) `20 bn of incremental projects (supported by `10 bn from project-specific partners in incremental projects). This is expected to be funded through (1) strategic investment of `20 bn (we believe 15-22% of stake sale may help to raise this amount, implying a valuation range of `90-130 bn), (2) Dhamra stake sale for `9 bn, (3) specific investor in metro, mezzanine equity of `13 bn and (4) `40 bn from portfolio churn, securitization, bonds and further dilution at IDPL level.

Larsen & Toubro Industrials
KOTAK INSTITUTIONAL EQUITIES RESEARCH 21
Exhibit 17: Incremental equity requirement and funding for IDPL's existing and new projects (` bn)
Total project cost 439Invested capital 42Equity requirement 82
DeploymentExisting projects 62New projects (net) 20Total 82SourcingStrategic investor 20Dhamra sale 9Investor for metro mezzan 13SecuritizationBonds/debtFurther dilutionTotal 82
40
Stake sale to fund new project capex
Source: Company, Kotak Institutional Equities
Potential for further increase in already high consolidated debt
L&T reported large consolidated debt of `620 bn at the end of FY2013 (against `472 bn at the end of FY2012). Adjusted for the finance subsidiaries L&T had consolidated debt of `355 bn at the end of FY2013, about a third of which resides in its infrastructure development subsidiaries.
We believe the consolidated debt of L&T is likely to rise over the next 2-3 years as the company makes progress on its under-construction/development projects in roads, metro and power. Prima facie, we believe L&T could potentially have consolidated ex-finance debt of about `550 bn by end-FY2015. This debt may become an overhang in an environment of lower-than-expected growth (gap versus expectations would continue to widen) and high capital cost
Exhibit 18: Large consolidated debt likely to further increase over the next 2-3 years Break up of L&T's consolidated debt between standalone and key subsidiary groups, March fiscal year-ends, 2012-16E (` mn)
2012 2013 2014E 2015E 2016EConsolidated debt 471,501 619,937 779,542 893,536 990,366 Standalone debt 98,958 88,342 128,342 128,342 118,342 Subsidiary debt 392,195 541,874 651,200 765,194 872,024
Financial Services 208,741 264,882 314,927 365,017 423,865 Developmental Projects 70,242 111,393 152,642 185,996 222,978 Power Development 21,035 38,526 50,400 67,200 67,200 Property Development 21,761 35,882 43,382 50,882 58,382 Ship building 22,174 27,537 33,537 38,537 41,037 Heavy Engineering 11,612 14,692 15,442 16,692 17,692 Power 15,673 23,668 23,668 23,668 23,668 Hydrocarbons 10,516 13,225 13,225 13,225 13,225 Corporate 2,154 1,082 1,082 1,082 1,082 Electrical & Automation 924 595 595 595 595 Infrastructure 3,235 6,781 IT & Technology 2,950 2,608 1,297 1,297 1,297 Machinery & Industrial Products 1,179 1,003 1,003 1,003 1,003
Debt drawn in infrastructure development SPVs
Mainly in L&T Finance & L&T Infrastructure Finance subs
Primarily Nabha Power
In boiler and turbine manufacturing JVs
Primarily in L&T Seawoods, CSJ Infra and L&T Realty
Source: Company, Kotak Institutional Equities estimates
Development projects related debt could increase by `40-45 bn each year over FY2014-16 (assuming no debt repayment in operational projects).

Industrials Larsen & Toubro
22 KOTAK INSTITUTIONAL EQUITIES RESEARCH
Exhibit 19: Development projects-related debt to rise over next 2-3 years Project-wise debt in L&T’s development portfolio, March fiscal year-ends, 2012-16E (` mn)
2012 2013 2014E 2015E 2016EIDPLL&T Infrastructure Development Projects 755 5,100 5,100 5,100 5,100 Road projectsL&T Panipat Elevated Corridor 3,252 3,165 3,165 3,165 3,165 L&T Krishnagiri Thopur Toll Road 7,076 6,592 6,592 6,592 6,592 L&T Western Andhra Tollway 2,642 2,642 2,642 2,642 2,642 L&T Transportation Infrastructure 1,325 1,099 1,099 1,099 1,099 L&T Interstate Road Corridor 4,236 4,158 4,158 4,158 4,158 L&T Vadodara Bharuch Tollway 13,339 12,503 12,503 12,503 12,503 L&T Rajkot-Vadinar Tollway 6,088 9,333 9,333 9,333 9,333 L&T Ahmedabad-Maliya Tollway 8,800 13,766 13,766 13,766 13,766 L&T Halol-Shamlaji Tollway 10,140 11,961 11,961 11,961 11,961 L&T Samakhiali Gandhidham Tollway 1,200 3,805 3,805 3,805 3,805 PNG Tollway 8,397 13,393 13,393 13,393 13,393
L&T Chennai-Tada Tollway 1,621 1,965 4,509 4,509 4,509 L&T Deccan Tollways - - 2,387 4,774 8,115 L&T BPP Tollway - 3,650 8,285 11,993 14,774 L&T Krishnagiri Walajahpet Tollway 357 3,898 7,494 7,494 7,494 L&T Devihalli Hassan Tollway 850 1,999 3,004 3,004 3,004 L&T East-West Tollway Ltd - - 3,038 7,088 13,163 L&T Great Eastern Highway Ltd - - 3,150 6,300 11,025 MetroL&T Metro Rail (Hyderabad) - 12,367 29,560 49,620 69,679 PowerNabha Power 18,535 34,826 50,400 67,200 67,200 Total infra debt 91,276 149,919 203,042 253,196 290,178
Debt drawn in development projects could increase by about Rs40-45 bn each year for the next three years as projects get completed
Source: Company, Kotak Institutional Equities
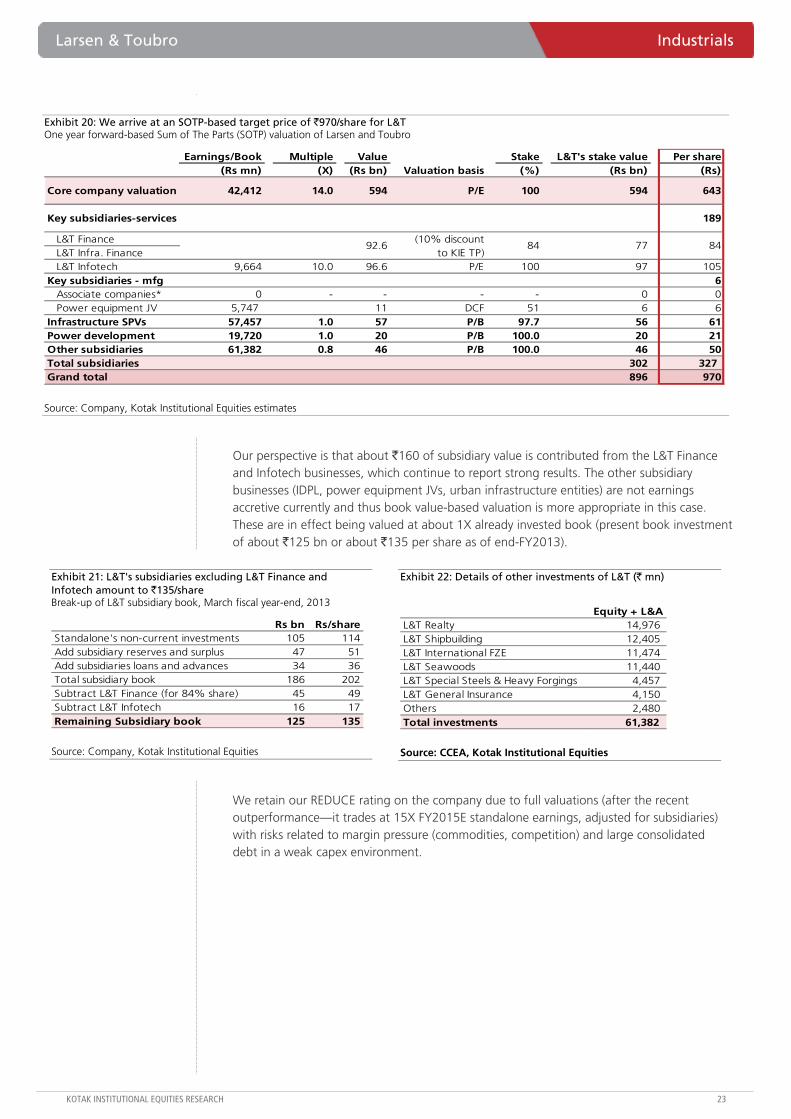
We retain estimates and target price of `970; reiterate REDUCE
We retain our standalone estimates of `51.5 and `54.7 and our consolidated estimates of `48.2 and `58 for FY2014E and FY2015E respectively.
Our SOTP-based target price of `970 comprises (1) `643/share from the core construction business based on 14X one-year forward earnings, (2) `84/share from the financial services subsidiaries (based on KIE target price), (3) `105/share from L&T Infotech (10X forward earnings), (4) `85/share from infrastructure development and power subsidiaries and (5) `50/share from other investments.
Larsen & Toubro Industrials
KOTAK INSTITUTIONAL EQUITIES RESEARCH 23
Exhibit 20: We arrive at an SOTP-based target price of `970/share for L&T One year forward-based Sum of The Parts (SOTP) valuation of Larsen and Toubro
Earnings/Book Multiple Value Stake L&T's stake value Per share (Rs mn) (X) (Rs bn) (%) (Rs bn) (Rs)
Core company valuation 42,412 14.0 594 P/E 100 594 643
Key subsidiaries-services 189
L&T FinanceL&T Infra. FinanceL&T Infotech 9,664 10.0 96.6 P/E 100 97 105
Key subsidiaries - mfg 6 Associate companies* 0 - - - - 0 0 Power equipment JV 5,747 11 DCF 51 6 6
Infrastructure SPVs 57,457 1.0 57 P/B 97.7 56 61 Power development 19,720 1.0 20 P/B 100.0 20 21 Other subsidiaries 61,382 0.8 46 P/B 100.0 46 50 Total subsidiaries 302 327 Grand total 896 970
84
Valuation basis
92.6 (10% discount
to KIE TP) 84 77
Source: Company, Kotak Institutional Equities estimates
Our perspective is that about `160 of subsidiary value is contributed from the L&T Finance and Infotech businesses, which continue to report strong results. The other subsidiary businesses (IDPL, power equipment JVs, urban infrastructure entities) are not earnings accretive currently and thus book value-based valuation is more appropriate in this case. These are in effect being valued at about 1X already invested book (present book investment of about `125 bn or about `135 per share as of end-FY2013).
Exhibit 21: L&T's subsidiaries excluding L&T Finance and Infotech amount to `135/share Break-up of L&T subsidiary book, March fiscal year-end, 2013
Rs bn Rs/shareStandalone's non-current investments 105 114Add subsidiary reserves and surplus 47 51Add subsidiaries loans and advances 34 36Total subsidiary book 186 202Subtract L&T Finance (for 84% share) 45 49Subtract L&T Infotech 16 17Remaining Subsidiary book 125 135
Source: Company, Kotak Institutional Equities
Exhibit 22: Details of other investments of L&T (` mn)
Equity + L&AL&T Realty 14,976 L&T Shipbuilding 12,405 L&T International FZE 11,474 L&T Seawoods 11,440 L&T Special Steels & Heavy Forgings 4,457 L&T General Insurance 4,150 Others 2,480 Total investments 61,382
Source: CCEA, Kotak Institutional Equities
We retain our REDUCE rating on the company due to full valuations (after the recent outperformance—it trades at 15X FY2015E standalone earnings, adjusted for subsidiaries) with risks related to margin pressure (commodities, competition) and large consolidated debt in a weak capex environment.

Industrials Larsen & Toubro
24 KOTAK INSTITUTIONAL EQUITIES RESEARCH
Exhibit 23: Standalone balance sheet and income statement of L&T, March fiscal year-ends, 2009-16E (` mn)
2009 2010 2011 2012 2013 2014E 2015E 2016EIncome statementNet operating revenues 339,385 370,348 439,049 531,705 608,733 679,986 781,209 894,267Cost of goods sold (300,164) (322,592) (382,685) (469,067) (544,798) (612,663) (705,629) (809,046)S, G & A (17,703) (14,627) (19,903) (22,230) (20,911) (24,480) (26,561) (29,511)Salaries & wages (19,745) (23,791) (28,845) (36,635) (44,363) (54,209) (62,871) (71,926)EBIDTA 39,222 47,756 56,364 62,639 63,935 67,323 75,580 85,220EBIDTA margin (%) 11.6 12.9 12.8 11.8 10.5 9.9 9.7 9.5Other income 7,398 9,502 11,811 13,383 18,509 17,852 16,599 16,969Interest (4,156) (5,053) (6,474) (6,661) (9,824) (10,563) (13,476) (12,951)Depreciation (3,073) (4,159) (6,003) (7,005) (8,194) (8,378) (8,865) (9,210)PBT 39,404 48,059 55,708 62,553 64,571 66,234 69,838 80,028Tax (12,312) (16,409) (19,459) (18,538) (18,005) (18,719) (19,383) (22,315)PAT 27,092 31,650 36,250 44,015 46,566 47,515 50,455 57,713Extraordinaries 7,725 12,105 3,329 550 2,541 0 0 0Reported PAT 34,817 43,755 39,579 44,565 49,107 47,515 50,455 57,713EPS (Rs) 30.8 35.0 39.7 47.9 50.4 51.5 54.7 62.5Balance sheetShareholders funds 124,351 182,884 218,241 252,019 291,427 326,283 363,344 405,675 Equity capital 1,171 1,204 1,218 1,225 1,231 1,846 1,846 1,846 Reserves & surplus 123,180 181,679 217,024 250,794 290,196 324,437 361,497 403,829 Total debt 65,560 68,008 71,611 98,958 88,342 128,342 128,342 118,342 Total sources of funds 190,157 251,125 290,074 351,188 379,769 454,626 491,686 524,017 Total fixed assets 50,538 62,231 72,370 82,255 87,101 90,722 96,858 97,648 Intangible assets 1,408 1,427 2,212 1,381 1,919 1,919 1,919 1,919 Investments 82,637 137,053 146,848 158,719 161,034 172,197 178,170 199,731 Net working capital (excl. cash) 48,303 36,869 53,975 91,110 117,191 172,446 189,645 207,052 Cash and bank balances 7,753 14,319 17,304 19,053 14,947 19,762 27,516 20,089 Total application of funds 190,157 251,125 290,074 351,188 379,769 454,626 491,686 524,017 Cash flow statementCash flow from operations (1,600) 47,522 26,996 12,383 29,625 638 42,121 49,515 Cash flow from investing activities (30,695) (69,191) (25,681) (27,120) (14,792) (23,163) (20,972) (31,562) Free cash flow (32,295) (21,668) 1,315 (14,737) 14,834 (22,526) 21,148 17,954 Cash flow from financing activities 31,688 29,330 2,711 17,109 (17,773) 27,341 (13,395) (25,381) Net cash (utilized)/ generated (608) 7,662 4,026 2,372 (2,939) 4,816 7,754 (7,427) Cash balance at start of the year 9,645 7,753 14,319 17,304 19,053 14,947 19,762 27,516 Cash balance at end of the year 7,753 14,319 17,304 19,053 14,947 19,762 27,516 20,089
Source: Company, Kotak Institutional Equities estimates

Larsen & Toubro Industrials
KOTAK INSTITUTIONAL EQUITIES RESEARCH 25
Consolidated financials
Exhibit 24: Consolidated balance sheet and income statement of L&T, March fiscal year-ends, 2009-16E (` mn)
2009 2010 2011 2012 2013 2014E 2015E 2016EIncome statementRevenues 404,799 439,698 520,891 643,131 744,980 854,399 991,130 1,151,737 Expenditure (355,457) (376,001) (443,982) (555,711) (646,894) (745,533) (864,996) (1,004,967) EBITDA 49,342 63,697 76,910 87,420 98,087 108,866 126,134 146,770 EBITDA margin (%) 12.2 14.5 14.8 13.6 13.2 12.7 12.7 12.7 Other income 5,920 7,766 8,532 8,290 10,959 9,183 7,505 7,181 Interest & finance charges 4,620 6,919 8,309 11,019 20,950 27,332 30,954 32,567 Depreciation 7,038 9,273 12,432 15,523 15,865 20,016 20,840 22,176 PBT 43,603 55,271 64,701 69,167 72,231 70,700 81,845 99,209 Tax 14,249 20,374 23,479 22,826 23,855 26,223 28,264 32,611 PAT 29,355 34,897 41,222 46,342 48,375 44,478 53,581 66,598 EPS (Rs) 31.8 37.8 44.7 50.2 52.4 48.2 58.0 72.1 One-time items 8,537 19,611 3,339 568 4,149 - - - Reported PAT 37,891 54,507 44,562 46,910 52,524 44,478 53,581 66,598
Balance SheetShare holder's funds 161,046 231,658 260,766 311,402 365,126 410,073 461,479 524,120 Capital 1,171 1,204 1,218 1,225 1,231 1,846 1,846 1,846 Reserves and surplus 149,289 219,581 249,288 292,643 337,366 381,698 433,104 495,745 Minority interest 10,586 10,873 10,260 17,535 26,529 26,529 26,529 26,529 Loan funds 184,000 226,561 327,983 471,501 619,937 726,746 823,144 912,121 Deferred tax liability 1,308 1,530 3,101 818 1,837 2,349 2,349 2,349 Total sources of funds 346,354 459,749 591,850 783,721 986,900 1,112,640 1,260,444 1,412,062 Net block 155,892 189,789 279,865 343,135 417,400 460,039 506,634 520,990 Cash & bank balances 14,590 33,216 36,446 35,221 36,312 5,019 20,632 47,494 Investments 68,054 99,279 92,158 87,895 87,675 83,205 81,121 90,285 Net current assets 97,231 126,592 183,380 317,470 445,513 564,376 652,056 753,293 Total application of funds 346,354 459,749 591,850 783,721 986,900 1,112,640 1,260,444 1,412,062
Source: Company, Kotak Institutional Equities estimates

For private Circulation Only. FOR IMPORTANT INFORMATION ABOUT KOTAK SECURITIES’ RATING SYSTEM AND OTHER DISCLOSURES, REFER TO THE END OF THIS MATERIAL.
3QFY14 sales performance: Buoyed by new launch in Bangalore
A big launch in Bangalore, ‘Prestige Lakeside Habitat’, helped Prestige garner sales of 1.55 mn sq. ft for `9.4 bn in 3QFY14. We assume around 63% of the sales achieved to be contributed by the new launch. New large-scale project launches have contributed 70-90% of quarterly sales (or in the immediate quarter thereafter), showing strong push of sales at new projects. Excluding the subsequent phases of the 3QFY14 launch, Prestige plans to launch over 18 mn sq. ft between 1QFY15E and 2QFY16E (we expect no new launch in 4QFY14E) across four cities.
Robust collections indicate strong construction progress
Prestige’s collections have been steadily increasing. Collections have increased from an average of `3.3 bn in FY2012 to `6 bn in FY2014, indicating strong construction progress at its residential projects, relegating the constant debtors to do with particular commercial and super-luxury residential sales only (given a separate business model followed for them). With an estimated collections order book of `55 bn at end-3QFY14 and plans to launch more projects in FY2015, we expect the collections run-rate to increase further in FY2015E to an average of `7 bn/quarter.
Prestige is the largest constructor in India; what next from here?
At end-1HFY14, Prestige had over 56 mn sq. ft of built-up area under construction, which we believe is the highest in India. Prestige has scaled up rapidly in Bangalore (the largest residential market in India by volumes) to take advantage of a buoyant market in the past 3 years. Its sales have increased from an average of 1.6 mn sq. ft/year during FY2006-11 to 5.7 mn sq. ft a year during FY2012-14E, a 3X jump. With a high base in Bangalore now, we would expect more launches from Prestige in other markets like Chennai and Hyderabad to see a consolidated volume jump.
What’s in store for 3QFY14E results?
We assume Prestige’s gross collections margin on its residential projects is around 40%, thus supporting a strong business development case. Prestige utilizes debt to fund its office buildings (annuity income projects) given a positive spread. While we expect debt to increase and remain comfortable about it, the quantum of increase depends on its business development expenditure.
Prestige Estates Projects (PEPL)
Real Estate
3QFY14—big launch helps maintain sales volume. Prestige’s 3QFY14 sales stood at 1.6 mn sq. ft for `9.4 bn. Prestige has achieved 80% of the FY2014 guidance of `43 bn of sales and collections of `23 bn. We expect the collections order book from sales to grow to `55 bn at end-3QFY14E, and expect it to increase to `7 bn/quarter in FY2015E. With a high base in Bangalore, we await management plans to further increase volumes through expansions elsewhere; maintain BUY with a target price of `200.
Prestige Estates ProjectsStock data Forecasts/Valuations 2013 2014E 2015E
52-week range (Rs) (high,low) EPS (Rs) 8.2 13.1 17.1Market Cap. (Rs bn) 54.9 EPS growth (%) 224.5 60.9 30.1
Shareholding pattern (%) P/E (X) 19.2 11.9 9.2Promoters 75.0 Sales (Rs bn) 19.5 30.7 36.0FIIs 17.4 Net profits (Rs bn) 2.9 4.6 6.0MFs 6.2 EBITDA (Rs bn) 5.8 9.5 11.4
Price performance (%) 1M 3M 12M EV/EBITDA (X) 12.7 8.1 6.6Absolute 3.0 15.8 (11.1) ROE (%) 11.7 15.6 17.4Rel. to BSE-30 4.3 11.6 (15.3) Div. Yield (%) 0.0 0.0 0.0
Company data and valuation summary
195-105
BUY
JANUARY 09, 2014
UPDATE
Coverage view: Cautious
Price (`): 157
Target price (`): 200
BSE-30: 20,729
QUICK NUMBERS
• In 9MFY14, Prestige has achieved 80% of its FY2014 guidance
• We estimate a strong collections order book, high at `55 bn at end-3QFY14E
• We expect quarterly collections to increase to `7 bn next year

Prestige Estates Projects Real Estate
KOTAK INSTITUTIONAL EQUITIES RESEARCH 27
A strong show in new launches—a regular for Prestige
In 3QFY14, Prestige recorded sales of 1.55 mn sq. ft for `9 bn. As seen in Exhibit 1, Prestige has been able to manage a mix of high-margin low-volume and high-volume low-margin projects as the average realization for the year has increased from `4,300/sq. ft in FY2012 to `5,870/sq. ft in FY2014. We assume around 63% of the sales achieved during the quarter to be from its new launch in Bangalore, ‘Prestige Lakeside Habitat’.
Exhibit 1: Consistently strong sales performance Prestige: Sales performance, March fiscal year-ends, 2012-14
Q1FY12 Q2FY12 Q3FY12 Q4FY12 1QFY13 Q2FY13 Q3FY13 Q4FY13 1QFY14 2QFY14 3QFY14Sales (mn sq. ft) 0.46 2.12 1.01 1.33 2.04 1.62 1.44 0.89 1.77 1.82 1.58 Value (Rs bn) 2.1 7.8 4.7 6.5 10.1 8.2 7.5 5.4 10.2 10.7 9.4 Collections (Rs bn) 2.3 3.3 3.3 4.6 4.2 5.1 5.1 5.3 6.1 6.2 5.9 Realizations (Rs/sq. ft) 4,601 3,682 4,709 4,877 4,953 5,037 5,236 6,085 5,779 5,871 5,966 Avg. realizations (Rs/sq. ft) 4,302 5,212 5,868
Source: Company, Kotak Institutional Equities
We believe Prestige too has strong brand equity in the market in line with its local and national peers. But unlike most other peers, Prestige’s strength (in addition to being the quick constructor) also lies in the strong pre-sales model it follows during the launch of a project. As seen in Exhibit 2, between 70% and 90% of sales for a quarter (or a subsequent quarter if the project is launched towards the last few days of a quarter) are contributed by new launches or large-scale project launches during that quarter.
Exhibit 2: Strong pre-sales at launch is Prestige's strength Prestige: Total sales and sales from new launches, March fiscal year-ends, 2012-14 (mn sq. ft)
1HFY12 2HFY12 1QFY13 2QFY13 3QFY13 4QFY13 1QFY14 2QFY14 3QFY14Total sales 2.6 2.3 1.3 1.6 1.4 0.9 1.8 1.8 1.6 Sales from new launches 1.9 0.8 — 1.5 0.3 0.1 1.3 0.4 1.0 Sales from new launches (%) 75 32 — 93 23 13 71 20 63
Bela Vista Tranquility Lakeside Habitat
Remarks / Project launches Sunrise Park, Augusta Golf Village,
Ivy Terraces Fern Hills + 12 launches
Source: Company, Kotak Institutional Equities
With Prestige achieving 82% of its sales target and about 80% of its collection target for FY2014, we don’t expect major new launches from Prestige in 4QFY14E, other than subsequent area release from certain existing projects. Prestige’s focus will now be on sales of its ongoing projects and an increase in sales of certain premium projects from its ongoing portfolio.
Exhibit 3: Prestige 9MFY14 performance versus FY2014 guidance
Sales (Rs bn) 36 43 30Collections (Rs bn) 18 23 18Launches (mn sq. ft) 13 14 NA
Remark Prestige share of sales value
guidance is Rs37 bn
9MFY14 performance
FY2014 guidance
9MFY14 Prestige's share
Source: Company

Real Estate Prestige Estates Projects
28 KOTAK INSTITUTIONAL EQUITIES RESEARCH
Increase in collections reflects the strong construction focus
Prestige collected `5.9 bn in 3QFY14, totaling to `18.2 bn for 9MFY14. Prestige’s collections have been increasing with its sales, given its strong construction progress (as collections in most cases are construction-linked) (see Exhibit 4). Prestige’s average collection has increased from `3.3 bn/quarter in FY2012 to `6 bn/quarter in FY2014. Increase in collections is due to the strong project portfolio of Prestige (a mix of mid-income and premium projects), which Prestige has launched since FY2012. Prestige’s debtors though have remained over `8 bn from FY2011-13, primarily from the commercial projects and select super-luxury projects. Prestige follows a different sales model (sell first and then lease) for certain commercial projects and hence the final installment (20-30% of sales value) is collected post leasing of the commercial premises already sold.
Exhibit 4: Increase in collections in tandem with increase in sales Prestige: Sales and collections, March fiscal year-ends, 2012-14 (Rs mn)
1QFY12 2QFY12 3QFY12 4QFY12 1QFY13 2QFY13 3QFY13 4QFY13 1QFY14 2QFY14 3QFY14Residential: Mid-income 1,125 6,686 3,145 5,085 5,929 5,707 4,875 3,164 7,298 7,723
Residential: Premium 763 418 779 1,249 2,656 1,023 1,245 1,547 2,809 2,546
Commercial 211 694 820 152 1,520 1,430 1,420 705 122 416
Total sales 2,099 7,798 4,744 6,486 10,105 8,160 7,540 5,416 10,229 10,685 9,402
Collections 2,250 3,268 3,280 4,556 4,241 5,050 5,076 5,328 6,074 6,198 5,923
Avg. yearly collections 3,339 4,924 6,065
9,402
Source: Company, Kotak Institutional Equities

Prestige Estates Projects Real Estate
KOTAK INSTITUTIONAL EQUITIES RESEARCH 29
Exhibit 5: Sales and construction to reflect in strong revenue recognition Prestige: Profit model, balance sheet, cash flow, March fiscal year-ends, 2011-15E (Rs mn)
2011 2012 2013 2014E 2015EProfit modelNet sales 15,431 10,523 16,938 30,748 35,955EBITDA 3,738 2,966 4,691 9,466 11,365Other income 682 342 226 226 226Interest (1,234) (1,193) (1,997) (2,200) (2,149)Depreciation (606) (605) (725) (784) (920)Pre-tax profits 2,580 1,510 2,195 6,708 8,522Tax (838) (583) (735) (2,247) (2,855)Deferred tax (76) (43) — — —Net income 1,667 884 1,460 4,461 5,667Adjusted net income 1,709 826 1,519 4,602 5,986Earnings per share (Rs) 5.2 2.5 4.3 13.1 17.1Balance sheet Total equity 21,142 21,510 26,211 30,355 35,884Minority interests 2,240 2,668 2,668 2,668 2,668Non-current liabilities 7,521 8,697 13,645 16,042 17,512Current liabilities 20,806 26,514 27,389 25,340 23,410Total liabilities and equity 51,709 59,389 69,913 74,406 79,474Non-current assetsNet fixed assets 14,206 20,678 28,123 33,824 39,784Other non-current assets and advances 3,784 5,944 6,444 7,944 6,604Current assets 31,041 31,027 33,606 30,898 31,346Investments 2,679 1,740 1,740 1,740 1,740Total assets 51,709 59,389 69,913 74,406 79,474Free cash flow Operating cash flow, excl. working capital 2,392 1,472 2,244 5,386 6,906Working capital changes (7,667) (191) 32 (1,910) 1,460Capital expenditure (3,488) (6,139) (8,169) (6,485) (6,880)Free cash flow (8,764) (4,858) (5,894) (3,010) 1,486Ratios (%)Debt/equity 71 87 90 81 68 Net debt/equity 56 77 74 75 61 RoAE (%) 11.8 3.9 6.3 16.2 18.0RoACE (%) 8.6 4.3 6.2 11.3 12.3Book value per share (Rs) 64 66 75 87 103
Source: Company, Kotak Institutional Equities estimates
Note: We would remodel our income statement numbers post clarity on phases of certain large projects.

For private Circulation Only. FOR IMPORTANT INFORMATION ABOUT KOTAK SECURITIES’ RATING SYSTEM AND OTHER DISCLOSURES, REFER TO THE END OF THIS MATERIAL.
Pricing action – visible in hair oils, biscuits, tea and select food items
(Refer to Exhibit 2 for complete pricing monitor and Exhibit 3 for ongoing promotional offers) –
Detergents. While HUVR had reversed most offers/price-offs in November itself, it has initiated select promotional offers in Surf and has taken a 5% hike in Wheel Active Gold; P&G remains aggressive – distributing free Tide Bar worth `10 on Tide Plus 1kg SKU priced at `95 (increased from `92 – 3% hike on MRP).
Hair oils. Marico has initiated another round of hikes in Parachute CNO (prices up 5-8%) and has also hiked prices of Shanti Badam Amla by 10%; Dabur has hiked prices of Dabur Vatika Enriched CNO by 18-20% (also offering freebies); within the almond category, both Dabur Almond (price raised 10%) and Bajaj Almond Drops are distributing freebies.
Biscuits. Parle remains aggressive sustaining its promotional extra grammage offer across several of its brands equating to a 10-20% price cut; fresh competitive action is visible in the digestives category with both McVities and Britannia cutting prices in select SKUs and offering 50% free grammage in 100g SKU.
Tea/coffee/milk. HUVR continues to run promotional offers/price cuts in Red Label, Red Label Nature Care and Taj Mahal brands; Amul has raised prices of its milk offerings by 4-8%.
Other food items. (1) Agrotech has hiked prices of select Sundrop variants by 3-4%, (2) Nestle has raised prices across its baby food portfolio by 3-4%, (3) while Nestle has increased its ketchup price of Maggi Ketchup by 5%, HUVR is running 13% price-off on Kissan ketchup, (4) Amul has raised butter prices by 6% and (5) Nestle has upped its Everyday milk powder price by 5%.
Raw material trends – agri commodities remain benign even as oils/select inputs witness inflation
Raw material trends over the last quarter indicate a pick-up in inflationary trend in select inputs –
Agri inputs – while domestic tea, wheat and barley prices remained benign, others like Kenyan tea prices, international coffee prices and sugar are down between 10% and 30% yoy. However, milk, milk powder and cocoa prices have witnessed significant inflation yoy.
Oil commodities basket – copra has witnessed maximum inflation inching up 70% yoy and 40% qoq along with other inflationary commodities like palm oil/PFAD (up ~25-35% yoy), LLP (up ~21% yoy), rice bran oil (up 9% yoy) and crude oil (up 13% yoy – adjusted for currency).
Other commodities – while caustic soda and soda ash are down ~8-10% yoy, others like LAB and HDPE (packaging) are up ~15%+. Paint inputs – Tio2 Rutile remains marginally inflationary (up 3% qoq, down 3% yoy); monomers like acrylic acid, vinyl acetate and styrene remain inflationary (up ~10-30% yoy) and resins like PAN and PENTA are up ~5%+ yoy.
Consumer Products India
Month in review – December 2013: Pricing action picks pace. KIE consumer universe outperformed the broader market by around 2% in Dec 2013 led by Colgate, Nestle, Dabur and TGBL. Weakness in HUVR and ITC sustained. On the business side, we saw increased pricing action as companies look to pass on Rupee depreciation-led RM inflation. Our channel checks continue to suggest decelerating growth momentum. RM trend was mixed but inflationary on an average for most companies.
CAUTIOUS
JANUARY 09, 2014
UPDATE
BSE-30: 20,729

Consumer Products India
KOTAK INSTITUTIONAL EQUITIES RESEARCH 31
Categories to be impacted negatively include dairy/milk, chocolates, detergents, soaps, hair oils and paints while categories witnessing benign RM environment include tea, coffee, malted foods, biscuits, toothpaste, safflower oil and cooling oils. In terms of companies, we expect TGBL (benign tea/coffee prices) and Colgate (lower essential oil prices coupled with decline in Sorbitol prices, derived from maize) to benefit while Marico to be the worst-hit (significant inflation in copra prices coupled with higher rice bran oil prices). Refer to Exhibit 4 for detailed RM inflation impact.
Sector outperforms by a modest 2% in December, select mid-caps rally
December was a relatively muted month for Indian consumer stocks – KIE consumer universe outperformed the index marginally by 2% led by mid-cap names like Colgate Palmolive (up 5% mom), TGBL (up 7% mom), Nestle India (up 6%) and Dabur (up 5%). Key underperformers during the month were (1) Jubilant Foodworks (corrected by 8% mom post sharp run-up last month on news-flow of signing up Burger King franchise), (2) Bajaj Corp (down 5% due to concerns over volume slowdown in hair oils), (3) GSK Consumers (down 7%) and Asian Paints (down 3%). Overall, the KIE consumer universe has underperformed the index by 9% and 11% over the past 3 months and 6 months respectively and outperformed by 3% over the past one year. Sector P/E has corrected from a peak of ~32X to a lower-yet-still-rich P/E of 28X (one-year forward).
We remain Cautious on the sector given (1) slowing volume growth across categories, (2) high competitive intensity, (3) Rupee depreciation impact to pressure GMs in 2HFY14 and (4) weakening rural growth outperformance versus urban markets (media reports and our interactions suggest rural is now growing at par with urban). Key tailwinds in near to medium term include (1) uptick in rural growth driven by good monsoons and election spends and (2) initial signs of pricing element coming back. Our preferred picks include ITC in large-caps and Dabur, Jyothy Labs and Titan (on dips) in mid-caps.
Key industry/stock developments
New launches
Garnier launched Garnier Fair Miracle 2-in-1 fairness cream priced at `49/15g versus Fair & Lovely Advanced available at `45/25g and Olay Natural White at `49/20g.
Dabur launched Fem Fairness Naturals – all-new skin fairness range on the bleach platform with no added ammonia priced in the range of `25-34.
Santoor re-launched its Santoor glycerine soap as Santoor PureGlo priced at `34/75g (currently available at `28 – promotional price-off of `6).
HUVR launched Lakme Eyeconic white eye make-up priced at `250 – also available in four other shades of brown, blue, grey and green.
Gillette launched Gillette Venus – its World’s No1 female shaving brand in India priced at `199.
ITC re-launched its Sunfeast Marie Light range of biscuits with new packaging and brand campaign.
Pizza Hut unveiled a brand new pizza dubbed ’So Cheezy‘, which is reportedly the cheesiest pizza ever – the new pizza has Jalapeno flavored cheese stuffed in the crust, creamy cheese in the middle and lots of mozzarella cheese on top.
HUL launched export rice brand Gold Seal Indus Valley in Indian markets (available in Middle East since 1986) – the brand has been launched in select cities only in the MT channel.

India Consumer Products
32 KOTAK INSTITUTIONAL EQUITIES RESEARCH
Exhibit 1: Key new launches in December
Source: Company, Kotak Institutional Equities
CEO speak –
Paul Polman, Unilever CEO, in an investor conference in London indicated that Unilever plans to cut 800 marketing jobs, slash its product variants (number of SKUs) by 30% and focus predominantly on brands with over Euro1 bn in sales – all in a bid to save costs. Media reports suggest some likely SKU/category rationalization in India as well, and
Varun Berry, COO of Britannia Industries, highlighted that in the near term the company is likely to consolidate its position in bakery, focus on expanding distribution (both breadth and depth) and continue to ramp up in-house manufacturing (while 50% of production is outsourced, Britannia plans to bring this down further through capacity ramp-up).
Other news-flow –
Vinita Bali is set to retire as the MD of Britannia Industries in March 2014, nearly two years before her contract expires, and will be succeeded by Varun Berry, the current COO.
Unauthenticated media reports suggests Nestle SA is looking to hike its stake in Nestle India through an open offer (may invest US$1 bn+ to hike its stake from current 62% to 75%).
Bajaj Corp has incorporated a wholly owned subsidiary Bajaj Corp International (FZE), a limited liability company, to take up trading in skin and hair-care products.

Consumer Products India
KOTAK INSTITUTIONAL EQUITIES RESEARCH 33
Akzo Nobel India announced various changes in its board – Amit Jain has stepped down from the board as MD from Dec 31, 2013 and Himanshu Agarwal, CFO has been nominated as the operating head of the company till the MD position is filled.
Dunkin Donuts India launched a new positioning, targeting the urban youth consumer captioned ’Get your Mojo back‘ – the move is supported with the launch of a slew of new products. We believe that the company continues to be in the ‘positioning discovery’ phase.
Britannia has opened a new production facility in Jhagadia, Gujarat (at cost of `750 mn); it is the fourth plant that Britannia has opened since 2010 and a fifth one is coming up in Tamil Nadu (likely to commence operations in FY2015E). The company intends to leverage the Jhagadia plant to capture higher market share in the Gujarat market; we note that the company’s market share in Gujarat is materially lower than its national market share.

India Consumer Products
34 KOTAK INSTITUTIONAL EQUITIES RESEARCH
Exhibit 2: KIE consumer pricing monitor
MRP (Rs)Category/Brand/SKU Dec-13 Norm Wt Apr-13 May-13 Jun-13 Jul-13 Aug-13 Sep-13 Oct-13 Nov-13 Dec-13 1M 3M 6M 1YSoapsDOVE SOAP MOISTURISING CREAM 3*100g 166 100g 46 46 46 53 53 53 55 55 55 — 5 20 5 DOVE SOAP MOISTURISING CREAM 75g 44 100g 49 49 49 56 56 59 59 59 59 — — 19 5 BREEZE SOAP LEMON SPLASH (3+1)*75g 30 100g 10 10 10 10 10 10 10 10 10 — — - (27) HAMAM SOAP 100g 24 100g 22 22 22 22 22 24 24 24 24 — — 9 9 LIFEBUOY SOAP CLINI CARE 10 COMPLET 125g 47 100g 36 36 36 36 36 38 38 38 38 — — 4 4 LIFEBUOY SOAP TOTAL 125g 22 100g 17 17 17 17 17 18 18 18 18 — — 5 5 LIFEBUOY SOAP TOTAL 3*100g 50 100g 18 18 16 16 17 17 17 17 17 — — 4 (6) LIRIL SOAP 2000 SOFT ALOEVERA LEMON 125g 45 100g 34 36 36 36 36 36 36 36 36 — — — 5 LUX SOAP CREAMY WHITE 125g 42 100g 32 32 32 32 32 34 34 34 34 — — 5 5 LUX SOAP SANDAL & CREAM 150g 35 100g 23 23 23 23 23 23 23 23 23 — — — — PEARS SOAP PURE GENTLE 3*125g 156 100g 33 33 33 33 40 40 42 42 42 — 4 25 4 VIVEL SOAP SATIN SOFT 3*100g 61 100g 23 23 20 20 20 20 20 20 20 — — — (5) VIVEL SOAPS LUXURY OLIVE BUTTER 4*100g 110 100g 28 28 28 28 28 28 28 28 28 — — — 10 FIAMA DI WILLS SOAP CLEAR SPRING 125g 45 100g 38 38 38 38 38 42 42 42 36 (13) (13) (6) (6) FIAMA DI WILLS SOAP SOFT GREEN 3*100g 158 100g 53 53 53 53 53 53 53 53 53 — — — — FIAMA DI WILLS SOAP MILD DEW (3+1)*115g 150 100g 43 43 43 43 43 34 34 34 33 (4) (4) (25) (10) CINTHOL SOAP ORIGINAL 100g 32 100g 32 32 32 32 32 32 32 32 32 — — — — CINTHOL SOAP ORIGINAL 4*100g 128 100g 30 30 30 30 30 30 30 32 32 — 6 6 6 GODREJ SOAP NO 1 LIME & ALOEVERA (3+1) *75g 40 100g 13 13 13 13 13 13 13 13 13 — — — — GODREJ NO 1 SAFFRON & MILK CRM (3+1) *100g 64 100g 15 15 15 15 15 15 15 16 16 — 7 7 7 Shower Gels/Facewash/Handwash/BodywashFacewashesPEARS FACEWASH PURE & GENTLE CLEANSING 60g 70 100g 82 82 82 100 100 100 117 117 117 — 17 43 43 LAKME FACEWASH STRAWBERRY 50ml 80 100ml 150 150 150 150 150 160 160 160 160 — — 7 7 DOVE FACEWASH BEAUTY MOISTURE 50g 90 100g 150 170 170 170 180 180 180 180 180 — — 6 20 PONDS FACEWASH DAILY ACT CLEANSING SYSTEM 50g 55 100g 90 100 100 100 100 100 110 110 110 — 10 10 22 FAIR & LOVELY FACE WASH MULTIVITAMIN 50g 49 100g 98 98 98 98 98 98 98 98 98 — — — — OLAY CLEANSER TOTAL EFFECT FOAMING 100g 245 100g 225 225 225 245 245 245 245 245 245 — — 9 25 FIAMA DI WILLS FACEWASH AQUA PLUSE MEN 100g 150 100g 100 100 100 100 100 100 100 100 100 — — — 7 HandwashLIFEBUOY HANDWASH TOTAL 215ml 60 100ml 28 28 28 28 28 28 28 28 28 — — — 11 LIFEBUOY HANDWASH ACTIVFRESH POUCH 185ml 37 100ml 19 19 19 19 19 20 20 20 20 — — 3 9 LIFEBUOY HANDWASH COLOUR CHANGING PUMP 200ml 75 100ml 38 38 38 38 38 38 38 38 38 — — — — Bodywash/ Shower GelsFIAMA DI WILLS SHOWER GEL CLEAR SPRING 200ml 135 100ml 63 63 63 63 68 68 68 68 68 — — 8 8 LUX BODYWASH SOFT LUXURY STRAWBERRY & CREAM 240ml 125 100ml 48 48 48 48 48 52 52 52 52 — — 9 9 CINTHOL SHOWER GEL ENERGY DEODORIZE 200ml 150 100ml 60 60 60 60 60 60 60 60 60 — — — — DetergentsDetergent BarsWHEEL ACTIVE BLUE BAR 140g 5 100g 4 4 4 4 4 4 4 4 4 — — — — RIN DETERGENT BAR ADVANCE 85g 5 100g 6 6 6 6 6 6 6 6 6 — — — 6 RIN DET BAR ADVANCE 160g 10 100g 6 6 6 6 6 6 6 6 6 — 13 — (3) RIN DETERGENT BAR ADVANCE 250g 16 100g 6 6 6 6 6 6 6 6 6 — — — 2 SURF EXCEL DET BAR 100g 10 100g 10 10 10 10 10 10 10 10 10 — — — — SURF EXCEL DETERGENT BAR 250g 29 100g 11 11 11 11 11 11 11 12 12 — 4 4 7 SURF EXCEL DETERGENT BAR 4*200g 88 100g 11 11 11 11 11 11 11 11 11 — 4 4 7 TIDE DET BAR 140g 10 100g 7 7 7 7 7 7 7 7 7 — — — — TIDE DETERGENT BAR 85g 6 100g 7 7 7 7 7 7 7 7 7 — — — — TIDE DETERGENT BAR 4*250g 69 100g 7 7 7 7 7 7 7 7 7 — — — (0)
Normalised price in Rs (adjusted for grammage changes) Change (%)
Source: Company, Kotak Institutional Equities

Consumer Products India
KOTAK INSTITUTIONAL EQUITIES RESEARCH 35
Exhibit 2: KIE consumer pricing monitor (continued)
MRP (Rs)Category/Brand/SKU Dec-13 Norm Wt Apr-13 May-13 Jun-13 Jul-13 Aug-13 Sep-13 Oct-13 Nov-13 Dec-13 1M 3M 6M 1YDetergent PowdersWHEEL DETERGENT POWDER ACTIVE LEMON & JASMINE 1Kg 44 100g 4 4 4 4 4 4 4 4 4 — 10 10 5 WHEEL DETERGENT POWDER ACT GOLD 1.5Kg 84 100g 5 5 5 5 5 5 5 5 6 5 12 12 12 RIN DETERGENT POWDER ADVANCE 1Kg 76 100g 8 8 8 8 8 8 8 8 8 — (5) — 3 RIN DETERGENT POWDER MATIC 1Kg 115 100g 11 11 11 11 11 12 12 12 12 — — 6 21 SURF DETERGENT POWDER EXCEL EASY WASH 1.5Kg 207 100g 13 13 13 13 13 13 13 14 14 — 5 5 7 SURF DETERGENT POWDER EXCEL MATIC 1Kg 205 100g 20 20 20 20 20 20 20 21 21 — 4 4 4 SURF DETERGENT POWDER EXCEL MATIC FRONT LOAD 1Kg 224 100g 22 22 22 22 22 22 22 22 22 — 4 4 4 SURF DETERGENT POWDER EXCEL QUICKWASH 1Kg 182 100g 18 18 18 18 18 18 18 18 18 — 2 4 4 ARIEL DETERGENT POWDER COMPLETE PP 1Kg 175 100g 18 18 18 18 18 18 18 18 18 — — — — ARIEL DETERGENT POWDER 24HOUR FRESH COMPLETE 1Kg 193 100g 19 19 19 19 19 19 19 19 19 — — — — ARIEL DETERGENT POWDER MATIC COMPLETE BOX 1Kg 185 100g 19 22 22 22 22 22 22 19 19 — (14) (14) — TIDE DETERGENT POWDER NATURAL LEMON & CHANDAN 170g 10 100g 5 5 5 5 5 5 5 6 6 — 12 12 12 TIDE DETERGENT POWDER PLUS 1Kg 95 100g 9 9 9 9 9 9 9 9 10 3 3 3 3 HENKO DETERGENT POWDER 1Kg 135 100g 13 13 14 14 14 14 14 14 14 — — — 9 Fabric Conditioners/ Dishwash/ Floor CleanersFabric Conditioners/LiquidsRIN LIQ FABRIC BLUE PERFECT SHINE 250ml 49 100ml 20 20 20 20 20 20 20 20 20 — — — 4 COMFORT FABRIC CONDITIONER ANTI BACTERIAL 200m 35 100ml 21 21 21 21 21 21 18 18 18 — (17) (17) (17) EZEE DETERGENT LIQUID 500g 85 100g 16 16 16 16 16 17 17 17 17 — — 6 6 Dishwashing Bar/Gels/PowderVIM DROP DISHWASH ACTIVE GEL GREEN LIME 250ml 53 100g 21 21 21 21 22 22 22 21 21 — (2) 2 (5) VIM DROP DW ACTIVE GEL GREEN LIME 500ml 99 100g 20 20 20 20 20 20 20 20 20 — 1 1 1 VIM UTENSIL BAR 140g 10 100g 7 7 7 7 7 7 7 7 7 — — — — VIM UTENSIL BAR 200g 15 100g 7 7 7 7 7 7 7 8 8 — 7 7 7 Floor Cleaners/Other CleanersCIF ALL PUPROSE CLEANER WHITE 120ml 29 100ml 24 24 24 24 24 24 24 24 24 — — — — DOMEX FLOOR CLEANER THICK 500ml 63 100ml 12 12 12 12 12 12 13 13 13 — 3 9 9 SANIFRESH TOILET CLEANER SHINE 1L 94 100ml 9 9 9 9 9 9 9 9 9 — - - 7 Oral CareToothpasteCOLGATE TOOTHPASTE CDC 150g 52 100g 35 35 35 35 35 35 35 35 35 — — — 6 COLGATE TOOTHPASTE CIBACA 175g 40 100g 22 22 22 22 23 23 23 23 23 — — 5 14 COLGATE TOOTHPASTE ACTIVE SALT 100g 44 100g 40 40 42 42 42 44 44 44 44 — — 5 10 COLGATE TOOTHPASTE MAXFRESH BLUE 150g 78 100g 50 50 50 52 52 52 52 52 52 — — 4 11 COLGATE TOOTHPASTE SENSITIVE PRO RELIEF 70g 95 100g 136 136 136 136 136 136 136 136 136 — — — — COLGATE TOOTHPASTE SENST TP 80g 90 100g 106 113 113 113 113 113 113 113 113 — — — 6 COLGATE TOOTHPASTE TOTAL ADV HEALTH 140g 92 100g 58 58 58 66 66 66 66 66 66 — — 13 13 PEPSODENT TOOTHPASTE 2 IN 1 150g 78 100g 47 47 47 52 52 52 52 52 52 — — 11 26 PEPSODENT TOOTHPASTE CENTRE FRESH 150G 82 100g 50 50 50 50 50 55 55 55 55 — — 9 17 PEPSODENT TOOTHPASTE WHITENING 150g 82 100g 50 50 50 50 55 55 55 55 55 — — 9 17 PEPSODENT TOOTHPASTE EXP PROT COMPLETE 150g 95 100g 63 63 63 63 63 63 63 63 63 — — — 6 PEPSODENT TOOTHPASTE EXPERT PROT SENSITIVE 80g 80 100g 100 100 100 100 100 100 100 100 100 — — — — PEPSODENT TOOTPST EXPERT PROT PRO SENSITIVE 80g 99 100g 150 150 124 124 124 124 124 124 124 — — — (18) CLOSE UP TOOTHPASTE FIRE FREEZE 150g 100 100g 57 57 57 57 57 63 63 67 67 — 6 16 23 CLOSE UP TOOTHPASTE RED 150g 80 100g 48 48 48 51 51 51 51 53 53 — 5 11 18 BABOOL TOOTHPASTE 180g 40 100g 19 19 19 19 19 19 19 22 22 — 17 17 17 DABUR TOOTHPASTE RED 200g 75 100g 35 35 35 36 36 38 38 38 38 — — 7 10 MESWAK TOOTHPASTE 200g 78 100g 36 36 36 36 36 38 38 39 39 — 4 8 11 SENSODYNE TOOTHPASTE FRESH GEL 80g 90 100g 113 113 113 113 113 113 113 113 113 — — — 6 ToothpowdersCOLGATE TOOTHPOWDER 200g 59 100g 28 28 28 30 30 30 30 30 30 — — 7 7 DABUR TOOTHPOWDER LAL DANT MANJAN 100g 32 100g 30 30 30 30 30 30 32 32 32 — 7 7 7 MouthwashesCOLGATE PLAX COMPLETE CARE 250ml 115 100ml 46 46 46 46 46 46 46 46 46 — — — — COLGATE PLAX MOUTHWASH FRESHMINT 250ml 85 100ml 38 38 40 40 40 40 34 34 34 — (14) (14) (11)
Normalised price in Rs (adjusted for grammage changes) Change (%)
Source: Company, Kotak Institutional Equities

India Consumer Products
36 KOTAK INSTITUTIONAL EQUITIES RESEARCH
Exhibit 2: KIE consumer pricing monitor (continued)
MRP (Rs)Category/Brand/SKU Dec-13 Norm Wt Apr-13 May-13 Jun-13 Jul-13 Aug-13 Sep-13 Oct-13 Nov-13 Dec-13 1M 3M 6M 1YShampoo bottlesCLEAR SHAMPOO ACTIVE CARE ANTIDANDRUFF 80ml 62 100ml 69 78 78 78 78 78 78 78 78 — — — 18 CLINIC PLUS SHAMPOO ANTI DANDRUFF 80ml 49 100ml 54 61 61 61 61 49 49 49 49 — — (20) (6) DOVE SHAMPOO DANDRUFF CARE 80ml 69 100ml 77 86 86 86 86 86 86 86 86 — — — 13 SUNSILK SHAMPOO ANTI DANDRUFF 80ml 56 100ml 62 70 70 70 70 70 70 70 70 — — — 13 TRESEMME SHAMPOO HAIR FALL DEFENSE 100ml 68 100ml 64 64 64 64 68 68 68 68 68 — — 6 6 HEAD & SHO SHAMPOO ANTI HAIR FALL 170ml 125 100ml 79 79 79 79 85 85 85 74 74 — (14) (7) (7) PANTENE SHAMPOO HAIR FALL CONTROL 180ml 119 100ml 72 72 72 72 77 77 77 66 66 — (14) (8) (5) DOVE SHAMPOO DAILY SHINE 80ml 68 100ml 76 85 85 85 85 85 85 85 85 — — — 20 SUNSILK SHAMPOO BLACK SHINE 80ml 56 100ml 62 70 70 70 70 70 70 70 70 — — — 13 HEAD & SHOULDERS SHAMPOO SMOOTH & SILKY 170ml 125 100ml 79 79 79 79 79 85 85 74 74 — (14) (7) (7) PANTENE SHAMPOO LONG BLACK 180ml 119 100ml 69 69 69 69 69 77 77 66 66 — (14) (5) (5) DABUR SHAMPOO VATIKA BLACK SHINE AMLA 90ml 56 100ml 62 62 62 62 62 62 62 62 62 — — — — Skin Creams/Lotions/TalcsFace Creams/Fairness Creams/Facial CleansersFAIR & LOVELY SKIN CREAM MULTI VITAMIN 50g 85 100g 170 170 170 170 170 170 170 170 170 — — — 4 FAIR AND LOVELY FOREEVER GLOW 25g 59 100g 236 236 236 236 236 236 236 236 236 — — — — PONDS FACE CREAM OIL CONTROL SKN MATTIFYING 100g 130 100g 130 130 130 130 130 130 130 130 130 — — — — OLAY CLEANSER TOTAL EFFECT FOAMING 100g 245 100g 225 225 245 245 245 245 245 245 245 — — — 9 Anti-Ageing/Special CreamsPONDS SKIN CREAM WHITE BEAUTY NATURALS 50g 249 100g 498 498 498 498 498 498 498 498 498 — — — — PONDS SKIN CREAM AGE MIRACLE DAILY 50ml 499 100ml 898 898 898 998 998 998 998 998 998 — — 11 11 OLAY AGE PROTECT ANTI AGEING CREAM 40g 275 100g 648 648 648 688 688 688 688 688 688 — — 6 6 OLAY SKIN CREAM TOTAL EFFECT NORMAL 50g 749 100g 1,398 1,398 1,398 1,398 1,398 1,498 1,498 1,498 1,498 — — 7 7 Body LotionsDOVE BODY LTN GO FRESH NORMAL SKIN 400ml 299 100ml 60 60 65 65 65 75 75 75 75 — — 15 25 PONDS BODY LTN DRM FLOWER 100M 55 100ml 55 55 55 55 55 55 55 55 55 — — — 12 VASELINE BODY LOTION HEALTHY WHITE 100m 75 100ml 69 69 72 75 75 75 75 75 75 — — 4 9 PARACHUTE BODY LOTION NORMAL 100ml 59 100ml 59 59 59 59 59 59 59 59 59 — — — — TalcsPONDS TALC DREAM FLOWER PINK 100G 55 100g 49 49 49 49 49 49 49 55 55 — 12 12 22 CINTHOL TALC ORIGINAL 100g 45 100g 45 45 45 45 45 45 45 45 45 — — — — DeodorantsAXE DEO DARK TEMPTATION 150m 165 100ml 100 100 110 110 110 110 110 110 110 — — — 10 DOVE DEO ORIGINAL ANTI PERSPIRANT 169ml 170 100ml 95 101 101 101 101 101 101 101 101 — — — 6 CINTHOL DEO SPRAY DIVE 150ml 175 100ml 117 117 117 117 117 117 117 117 117 — — — — ZATAK AVENGER DEO 150ml 150 100ml 100 100 100 100 100 100 100 100 100 — — — — SET WET DEOSPRAY RAVE 150ml 165 100ml 100 100 100 110 110 110 110 110 110 — — 10 — Home InsecticidesGOOD KNIGHT MOSQUTO COIL LOW SMOKE 12HR 30 29 29 29 29 29 30 30 30 30 — — 3 11 GOODKNIGHT COIL MAHA JUMBO 10P 30 28 28 28 28 28 30 30 30 30 — — 7 11 GOODKNIGHT MACHINE ACTIV COMBI 72 99 99 99 99 99 72 72 72 72 — — (27) (27) Hair OilsCoconut OilsPARACHUTE COCONUT OIL 100ml 27 100ml 25 25 25 23 23 23 25 25 27 8 17 8 — PARACHUTE COCONUT OIL 250ml 66 100ml 24 24 24 24 24 24 25 25 26 5 10 10 3 DABUR HAIROIL VATIKA 75ml 30 100ml 44 44 40 40 40 40 40 40 40 — — — (9) Perfmued Hair OilsPARACHUTE ADVANSED HOT OIL 190ml 95 100ml 50 50 50 50 50 50 50 50 50 — — — 9 PARACHUTE ADVANSED 80ml 39 100ml 44 44 44 44 44 44 49 49 49 — 11 11 22 PARACHUTE JASMINE 200ml 71 100ml 34 34 34 34 34 34 34 34 36 HAIR & CARE 100ml 48 100ml 45 45 45 45 45 45 48 48 48 — 7 7 9 SHANTI BADAM AMLA 200ml 44 100ml 23 23 23 23 23 23 23 23 25 10 10 10 9 DABUR HAIROIL AMLA 100ml 39 100ml 39 39 39 39 39 39 39 39 39 — — — 3 DABUR HAIR OIL ALMOND DAMAGE FREE 100ml 55 100ml 50 50 50 50 50 50 50 50 55 10 10 10 10 DABUR VATIKA HAIR OIL ENRCHD ALMOND 100ml 55 100ml 50 50 50 50 50 55 55 55 55 — — 10 10 BAJAJ ALMOND HAIR OIL 100ml 55 100ml 55 55 55 55 55 55 55 55 55 — — — 10 NAVRATNA COOLING OIL 100ml 60 100ml 60 60 60 60 60 60 60 60 60 — — — 9
Normalised price in Rs (adjusted for grammage changes) Change (%)
Source: Company, Kotak Institutional Equities

Consumer Products India
KOTAK INSTITUTIONAL EQUITIES RESEARCH 37
Exhibit 2: KIE consumer pricing monitor (continued)
MRP (Rs)Category/Brand/SKU Dec-13 Norm Wt Apr-13 May-13 Jun-13 Jul-13 Aug-13 Sep-13 Oct-13 Nov-13 Dec-13 1M 3M 6M 1YEdible OilsSAFFOLA KARDI OIL - 1L 180 100ml 18 18 18 18 18 18 18 18 18 — — — — SAFFOLA GOLD - 1L 140 100ml 14 14 14 14 14 14 14 14 14 — — — (3) SAFFOLA ACTIVE - 1L 115 100ml 12 12 12 12 12 12 12 12 12 — — — — SUNDROP HEART - 1L 180 100ml 17 17 17 17 17 17 17 17 18 4 9 9 9 SUNDROP NUTRILITE - 1L 135 100ml 14 14 14 14 14 14 14 14 14 — — — 4 SUNDROP SUPERLITE ADV -1L 170 100ml 16 16 16 16 16 16 17 17 17 3 10 10 13 Tea/ CoffeeTeaRED LABEL CTC TEA 1Kg 329 100g 35 37 37 37 37 37 33 33 33 — (11) (11) 12 RED LABEL CTC TEA PP 500g 180 100g 36 38 38 38 38 38 36 36 36 — (5) (5) 2 RED LABEL TEA NATURAL CARE BOX 500g 200 100g 41 44 44 44 44 44 44 44 40 (9) (9) (9) (2) TAAZA CTC TEA 1Kg 275 100g 27 28 28 28 28 28 28 28 28 — — — 8 TAJMAHAL CTC TEA BOX 250g 108 100g 46 46 46 46 46 46 46 43 43 — (6) (6) 3 AGNI CTC TEA LEAVES 1Kg 228 100g 24 24 24 24 24 23 23 23 23 — — (3) — TATA CTC TEA GOLD 1Kg 396 100g 388 388 388 388 388 388 388 388 396 2 2 2 6 CoffeeBRU COFFEE GOLD JAR 100g 179 100g 195 199 199 199 199 199 199 179 179 — (10) (10) (1) BRU COFFEE INSTANT JAR 100g 154 100g 174 174 174 174 174 174 174 154 154 — (11) (11) (11) NESCAFE COFFEE CLASSIC BOX 200g 399 100g 190 190 190 190 190 195 195 195 200 2 2 5 5 NESCAFE COFFEE CLASSIC 50g 106 100g 198 212 212 212 212 230 212 212 212 — (8) — 7 SUNRISE COFFEE PREMIUM JAR 50g 88 100g 172 172 172 172 176 164 164 176 176 — 7 2 6 DairyMilk/Condensed Milk/ Milk PowderNESTLE MILK SLIM TP 1L 69 100ml 6 7 7 7 7 7 7 7 7 — 6 6 11 NESTLE MILK TONED A+ TP 1L 65 100ml 6 6 6 6 6 6 6 7 7 — 5 5 10 BRITANNIA MILK 1L 62 100ml 6 6 6 6 6 6 6 6 6 — — 5 5 BRITANNIA MILK SLIMZ 1L 65 100ml 6 6 6 6 6 7 7 7 7 — — 5 5 AMUL TAAZA 1L 52 100ml 5 5 5 5 5 5 5 5 5 8 8 8 13 AMUL GOLD 1L 54 100ml 5 5 5 5 5 5 5 5 5 4 4 4 10 AMUL LITE 1L 58 100ml 5 5 5 5 5 6 6 6 6 — 5 9 16 EVERYDAY MILKPOW DAIRY WHITNER PP 400g 155 100g 36 36 36 36 36 36 36 37 39 5 7 7 7 Butter/CheeseBRITANNIA CHEESE SPREAD CLASSIC 180g 78 100g 47 47 47 47 47 47 47 47 43 (8) (8) (8) (8) BRITANNIA PROCESSED CREAM CHEESE 180g 150 100g 83 83 83 83 83 83 83 83 83 — — — — AMUL BUTTER 500g 172 100g 30 30 30 30 30 30 32 32 34 6 13 13 13 Health Drinks/ Juices/ Health Supplements/ OTCsHealth DrinksHORLICKS HEALTHDRINK CHOCOLATE JAR 500g 185 100g 34 36 36 36 37 37 37 37 37 — — 3 8 HORLICKS HEALTHDRINK JUNIOR JAR 500g 206 100g 40 40 40 40 40 41 41 41 41 — — 3 3 HORLICKS HEALTHDRINK STANDARD JAR 500g 187 100g 34 36 36 36 36 36 36 37 37 — 3 3 9 HORLICKS HEALTHDRINK LITE MALT JAR 500G 217 100g 43 43 43 43 43 43 43 43 43 — — — 3 HORLICKS WOMENS CHOCOLATE JAR 330g 230 100g 67 67 67 70 70 70 70 70 70 — — 5 28 BOOST HEALTHDRINK JR 500g 186 100g 36 36 36 36 37 37 37 37 37 — — 3 3 ACTILIFE MALT JAR 250g 160 100g 53 53 53 64 64 64 64 64 64 — — 20 20 JuicesREAL JUICE ACTIVE ORANGE 1L 99 100ml 10 10 10 10 10 10 10 10 10 — — — — REAL JUICE ORANGE 1L 90 100ml 9 9 9 9 9 9 9 9 9 — 6 6 6 REAL JUICE APPLE 1L 90 100ml 9 9 9 9 9 9 9 9 9 — 6 6 6 Health Supplements/OTCsDABUR CHYAWANPRASH 1Kg 260 100g 24 24 24 24 24 26 26 26 26 — — 8 11 DABUR DIGESTIVE HAJMOLA REGULAR 120 P 22 20 20 20 20 22 22 22 22 22 — — 10 10 DABUR GLUCOSE-D JAR 1Kg 144 100g 14 14 14 14 14 14 14 14 14 — — — — DABUR HONEY 500G 165 100g 32 32 33 33 33 33 33 33 33 — — — 3
Normalised price in Rs (adjusted for grammage changes) Change (%)
Source: Company, Kotak Institutional Equities

India Consumer Products
38 KOTAK INSTITUTIONAL EQUITIES RESEARCH
Exhibit 2: KIE consumer pricing monitor (continued)
MRP (Rs)Category/Brand/SKU Dec-13 Norm Wt Apr-13 May-13 Jun-13 Jul-13 Aug-13 Sep-13 Oct-13 Nov-13 Dec-13 1M 3M 6M 1YBiscuits/AttaCreamBiscuitsSUNFEAST BISCUITS DARK FANTASY CHOC 100g 25 100g 25 25 25 25 25 25 25 25 25 — — — — BRITANNIA CREAM BISCUITS JIM JAM 150g 25 100g 17 17 17 17 17 17 17 17 17 — — — — BRITANNIA CREAM BISCUITS TREAT BOURBON 150g 25 100g 17 17 17 17 17 17 17 17 17 — — — (7) SUNFEAST CREAM BISCUITS BOURBON 150g 25 100g 17 17 17 17 17 17 17 17 17 — — — — PARLE CREAM BISCUITS HIDE & SEEK BOURBON 150g 20 100g 13 16 16 16 16 13 13 13 13 — — (17) (17) Cookies/Healthy biscuitsSUNFEAST COOKIE BUTTER 100g 10 100g 10 10 10 10 10 10 10 10 10 — — — — BRITANNIA BISCUITS GOODAY BUTTER 150g 20 100g 13 13 13 13 13 13 13 13 13 — — — — BRITANNIA COOKIES GOOD DAY CASHEW 107g 15 100g 15 15 15 15 15 15 15 15 15 — — — — BRITANNIA BISCUITS NUTRICHOICE DIGESTIVE 75g 12 100g 20 20 20 20 20 16 16 16 16 — — (20) (20) BRITANNIA COOKIES NUTRI CHOICE OATS 150g 50 100g 33 33 33 33 33 33 33 33 33 — — — — Marie/Glucose/Salted/Nice BiscuitsSUNFEAST BISCUITS MARIE LIGHT 100g 10 100g 10 10 10 10 10 10 10 10 10 — — — — BRITANNIA BISCUITS VITA MARIE GOLD 150g 18 100g 12 12 12 12 12 12 12 12 12 — — — — PARLE BISCUITS DIGESTIVE MARIE 100g 10 100g 10 10 10 10 10 10 10 10 10 — — — — SUNFEAST BISCCUITS GLUCOSE 80g 5 100g 6 6 6 6 6 6 6 6 6 — — — — BRITANNIA BISCUITS TIGER 133g 10 100g 8 8 8 8 8 8 8 8 8 — — — — PARLE BISCUITS GLUCOSE 144g 10 100g 7 7 7 7 7 7 7 7 7 — — — — HORLICKS BISCUITS 100g 10 100g 10 10 10 10 10 10 10 10 10 — — — — SUNFEAST BISCUITS SNACKY SALTED 80g 10 100g 13 13 13 13 13 13 13 13 13 — — — — PARLE SALTED BISCUITS KRACKJACK 80g 10 100g 13 13 13 13 13 10 10 10 10 — — (21) (21) PARLE SALTED BISCUITS MONACO CLASSIC REG 80g 10 100g 13 13 13 13 13 10 10 13 13 — 20 — — SUNFEAST PLAIN BISCUITS NICE 150G 20 100g 10 10 13 13 13 13 13 13 13 — — — 33 BRITANNIA BISCUITS NICE TIME 150g 22 100g 15 15 15 15 15 15 15 15 15 — — — — AttaAASHIRVAAD ATTA MULTIGRAIN 5Kg 240 100g 5 5 5 5 5 5 5 5 5 — — 7 17 AASHIRVAAD ATTA WHOLE WHEAT 5Kg 210 100g 4 4 4 4 4 4 4 4 4 — — — 35 Soups/Sauces/SpreadsKetchup/SaucesMAGGI KETCHUP TOMATO 1Kg 126 100g 12 12 12 12 11 11 12 12 13 5 17 5 10 KISSAN KETCHUP FRESH TOMATO BT 1Kg 105 100g 11 12 12 12 12 12 12 12 11 (13) (13) (9) (6) Spreads/JamsKISSAN CHEESY GARLIC CREAMY SPREAD 100G 34 100g 34 34 34 34 34 34 34 34 34 — — — — KISSAN JAM MIXED FRUIT 200G 48 100g 24 24 24 24 24 24 24 24 24 — — — 2 SoupsMAGGI SOUP RICH TOMATO 54g 40 100g 72 72 72 74 74 74 74 74 74 — — 3 3 KNORR SOUP CLASSIC THICK TOMATO 55g 34 100g 71 71 71 73 73 62 62 62 62 — — (13) (6) MAGGI SOUP SWEET CORN VEGETABLE 36g 40 100g 108 108 111 111 111 111 111 111 111 — — — 3 KNORR SOUP SWEET CORN VEGETABLE 47g 34 100g 83 83 83 85 85 72 72 72 72 — — (13) (6) Chocolate barsNESTLE CHOCOLATE KIT KAT 108g 60 100g 56 56 56 56 56 56 56 56 56 — — — — NESTLE CHOCOLATE MUNCH HOME PK 69g 35 100g 51 51 51 51 51 51 51 51 51 — — — 17 NESTLE MILK CHOCOLATE 18G 10 100g 56 56 56 56 56 56 56 56 56 — — — — NESTLE CHOCOLATE BAR ONE 26G 10 100g 36 36 36 36 36 36 36 38 38 — 8 8 8 NESTLE CHOCOLATE ALPINO BAR 22g 25 100g — — — — 114 114 114 114 114 — — — — NoodlesMAGGI NOODLES MASALA 70g 10 100g 13 13 13 13 13 13 13 14 14 — 7 7 7 MAGGI NOODLES MASALA 140g 20 100g 13 13 13 13 13 13 13 14 14 — 7 7 7 MAGGI NOODLES MASALA 280g 40 100g 13 13 13 13 13 13 13 14 14 — 7 7 7 MAGGI NDL MASALA 560g 80 100g 13 13 13 13 13 13 13 14 14 — 7 7 7 MAGGI NOODLES CHICKEN 304g 55 100g 18 18 18 18 18 18 18 18 18 — — — — MAGGI NOODLES VEG ATTA 320g 78 100g 24 24 24 24 24 24 24 24 24 — — — 4 SUNFEAST NOODLES YIPPEE MAGIC MASALA 75g 10 100g 13 13 13 13 13 13 13 13 13 — — — — SUNFEAST NOODLES YIPPE CHINESE MASALA PP 75g 15 100g 20 20 20 20 20 20 20 20 20 — — — — KNORR NOODLES SOUPY MAST MASALA PP 70g 12 100g 17 17 17 17 17 17 17 17 17 — — — 3 Baby FoodCERELAC BABYCEREAL RICE S1 300g 142 100g 46 46 46 46 46 46 46 46 47 3 3 3 3 CERELAC BABYCEREAL WHEAT S1 300g 140 100g 46 46 46 46 46 46 46 46 47 1 1 1 1 CERELAC BABYCEREAL MULTIGRAIN DAL VEG 300g 182 100g 58 58 58 58 58 58 58 58 61 4 4 4 4 LACTOGEN BABYCEREAL NAN 1 FRML 400g 390 100g 93 98 98 98 98 98 98 98 98 — — — 5 NESTUM BABYCEREAL RICE DAL S2 300g 105 100g 35 35 35 35 35 35 35 35 35 — — — —
Change (%)Normalised price in Rs (adjusted for grammage changes)
Source: Company, Kotak Institutional Equities

Consumer Products India
KOTAK INSTITUTIONAL EQUITIES RESEARCH 39
Exhibit 3: Ongoing promotional activity across FMCG categories for December 2013
SKU Original Offer Eff change (%) Promotional OfferSoaps/HandwashDOVE MOISTURISING CREAM BAR 75g 44 44 Free Vaseline Total Moisture 9ml sachet #LIFEBUOY COOLFRESH HANDWASH POUCH 900ml 251 145 (42.2) Price off of Rs106CINTHOL ORIGINAL (4*100g) 400g 128 128 Free Cinthol Talc 50g worth Rs25 #FIAMA DI WILLS GEL BAR EXOTIC DREAM 125g 52 45 (13.5) Price off of Rs7 #FIAMA DI WILLS GEL BAR LA FANTASIA 125g 32 27 (15.6) Price off of Rs5FIAMA DI WILLS AQUA PULSE MEN (3*100g) 100g 120 120 Free Fiama Di Wills Men face wash worth Rs85SANTOOR PURE GLO 75g 34 28 (17.6) Price off of Rs6DETTOL RE-ENERGIZE HANDWASH 250ml 75 75 Free Dettol soap 75g worth Rs23 freeDetergentsSURF EXCEL EASY WASH 700g 96 74 (22.9) Price off of Rs22SURF EXCEL QUICK WASH 500g 93 93 Free 3X20ml Comfort sachet worth Rs9SURF EXCEL MATIC TOP LOAD 1Kg 205 205 Free 200ml Comfort conditioner worth Rs44RIN DETERGENT POWDER 500g 40 38 (5.0) Price off of Rs2RIN DETERGENT POWDER 1Kg 80 76 (5.0) Price off of Rs4 #ARIEL MATIC COMPLETE+ 1Kg 216 185 (14.4) Price off of Rs31 #ARIEL COMPLETE 3Kg 525 399 (24.0) Price off of Rs126TIDE PLUS 1Kg 95 95 Free Tide bar worth Rs10TIDE PLUS 4Kg 363 318 (12.4) Price off of Rs45HENKO FRONT & TOP LOAD 1Kg 200 200 Free 400g Pril bar worth Rs25MR. WHITE DETERGENT POWDER 4Kg 328 249 (24.1) Price off of Rs70Fabric conditioners/DishwashGODREJ EZEE LIQUID DETERGENT 500g 110 85 (22.7) Price off of Rs25 # GODREJ EZEE LIQUID DETERGENT 250g 44 40 (9.1) Price off of Rs4 # WIPRO SAFEWASH LIQUID DETERGENT 500g 150 150 Buy 1 get 1 free # COMFORT LILY FRESH FABRIC CONDITIONER 1.5L 285 255 (10.5) Price off of Rs30COMFORT LILY FRESH FABRIC CONDITIONER 800ml 163 148 (9.2) Price off of Rs15VANISH LIQUID FABRIC STAIN REMOVER 900ml 125 99 (20.8) Price off of Rs26 # DETTOL KITCHEN GEL LEMON FRESH 400ml 94 79 (16.0) Price off of Rs15 # VIM KITCHEN GEL NEEM 500ml 103 89 (13.6) Price off of Rs14 # HARPIC POWER PLUS - ALL IN 1 500ml 63 63 Free Dettol soap 75g worth Rs23 # Hair OilsPARACHUTE COCONUT OIL 500ml 136 136 (16.7) Free 100ml extra # PARACHUTE COCONUT OIL 250ml 65 65 (16.7) 20% Extra grammage free # PARACHUTE ADVANSED TENDER COCONUT OIL 100ml 45 45 Free Godrej No1 Soap # DABUR ALMOND HAIR OIL 100ml 50 55 10.0 Free Dabur Red Paste 50g worth Rs17 # DABUR VATIKA ENRICHED ALMOND HAIR OIL 100ml 55 55 Free Vatika shampoo 50ml worth Rs28 # DABUR VATIKA ENRICHED COCONUT HAIR OIL 150ml 55 65 18.2 Free Dabur Gulabari Gulab jal 59ml worth Rs24DABUR VATIKA ENRICHED COCONUT HAIR OIL 300ml 100 120 20.0 Free Dabur Vatika shampoo 90ml worth Rs56BAJAJ BRAHMI AMLA HAIR OIL 200ml 75 75 Free Colgate Total toothpaste worth Rs25 # BAJAJ ALMOND DROPS HAIR OIL 100ml 55 55 Free Garnier Fructis shampoo sachets worth Rs12ToothpasteCOLGATE SENSITIVE ORIGINAL TOOTHPASTE 40g 49 49 (20.0) 25% Extra grammage free # COLGATE TOTAL TOOTHBRUSH 1No 58 58 Free 35g Colgate Total Toothpaste freePEPSODENT GERMICHECK 2 IN 1 150g 78 78 Free Pepsodent Toothpaste 32g # PEPSODENT EXPERT PROT PRO SENSITIVE 80g 80g 99 99 Free gumcare brush worth Rs40 # BABOOL 180g 40 40 Free toothbrush worth Rs15 free #
Notes:(1) # Offer was available in November as well
MRP (Rs)
Source: Company, Kotak Institutional Equities

India Consumer Products
40 KOTAK INSTITUTIONAL EQUITIES RESEARCH
Exhibit 3: Ongoing promotional activity across FMCG categories for December 2013 (continued)
SKU Original Offer Eff change (%) Promotional OfferShampoo bottlesCLINIC PLUS STRONG & LONG SHAMPOO 80ml 49 49 (20.0) 25% Extra grammage free # PANTENE SMOOTH SILKY 180ml 139 119 (14.4) Price off of Rs20 # PANTENE HAIR FALL CONTROL 180ml 139 119 (14.4) Price off of Rs20 # PANTENE ANTI DANDRUFF 2 IN 1 180ml 139 119 (14.4) Price off of Rs20 # PANTENE NT FUSION FUL & LIFE 320ml 229 204 (10.9) Price off of Rs25 # HEAD & SHOULDERS SMOOTH SILKY 375ml 269 244 (9.3) Price off of Rs25 # HEAD & SHOULDERS CLEAN & BALANCED 170ml 145 125 (13.8) Price off of Rs20 # HEAD & SHOULDERS ANTI HAIR FALL 170ml 145 125 (13.8) Price off of Rs20 # Other personal care itemsSANTOOR PERFUMED TALC 150g 105 105 Buy 1 get 1 free # EMAMI GOLDEN BEAUTY TALC 100g 55 55 Buy 1 get 1 free # PARACHUTE ADVANSED BODY LOTION 250ml 125 125 Free Clean & Clear morning energy face wash # GILLETTE VECTOR RAZOR 1No 49 39 (20.4) Price off of Rs10BiscuitsBRITANNIA NUTRICHOICE DIGESTIVE BISCUITS 75g 15 12 (20.0) Price off of Rs3 # BRITANNIA NUTRICHOICE DIGESTIVE BISCUITS 100g 20 20 (33.3) 50% Extra grammage freeBRITANNIA TIGER GLUCOSE 54g 4 4 (6.9) 4g extra grammage free # BRITANNIA TREAT ORANGE 150g 25 25 Free Good Day Choco chip cookies worth Rs10BRITANNIA BOURBON 75g 12 10 (16.7) Price off of Rs2BRITANNIA PURE MAGIC 100g 25 20 (20.0) Price off of Rs5 # PARLE HIDE & SEEK BOURBON 150g 24 20 (16.7) Price off of Rs4 # PARLE KREAMS GOLD 100g 10 10 (14.3) 16% Extra grammage free # PARLE JAM-IN! 75g 12 10 (16.7) Price off of Rs2 # PARLE KRACK JACK 80g 10 10 (20.6) 25% Extra grammage free # MCVITIES DIGESTIVE BISCUITS 100g 20 20 (33.3) 50% Extra grammage freeMCVITIES DIGESTIVE BISCUITS 400g 80 62 (22.5) Price off of Rs18Other Food itemsKISSAN FRESH TOMATO KETCHUP 1L 120 105 (12.5) Price off of Rs15KISSAN MIXED FRUIT JAM 500g 107 99 (7.5) Price off of Rs8DABUR CHYAWANPRASH 1Kg 260 260 Free Honey bottle worth Rs27 # DABUR HONEY 500g 165 165 Free Dabur Chyawanprash mixed fruit flavour 100g worth Rs40 # KNORR SOUPS - SELECT VEG RANGE 40 36 (10.0) Price off of Rs6 # Tea/CoffeeBROOKE BOND RED LABEL 250g 95 95 Free 2 Bru Gold sachets worth Rs5 eachBROOKE BOND RED LABEL 1Kg 369 329 Price off of Rs40 # BROOKE BOND TAJ MAHAL 500g 226 226 Free one Taj Green tea bags 10No pack worth Rs60 # BROOKE BOND TAJ MAHAL 250g 115 108 (6.1) Price off of Rs7 # BROOKE BOND RED LABEL NATURE CARE 250g 112 102 (8.9) Price off of Rs10BROOKE BOND RED LABEL NATURE CARE 500g 220 200 (9.1) Price off of Rs20BRU INSTANT COFFEE 200g 290 260 (10.3) Price off of Rs30 #
Notes:(1) # Offer was available in November as well
MRP (Rs)
Source: Company, Kotak Institutional Equities
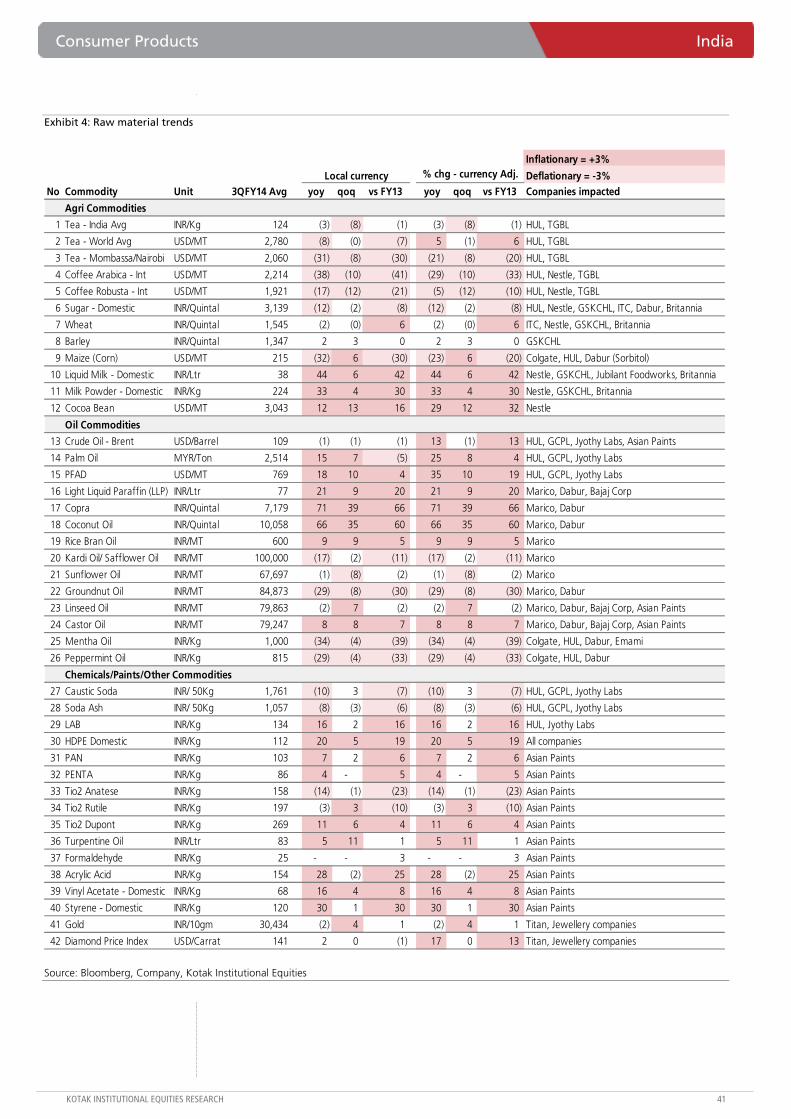
Consumer Products India
KOTAK INSTITUTIONAL EQUITIES RESEARCH 41
Exhibit 4: Raw material trends
Inflationary = +3%
Deflationary = -3%No Commodity Unit 3QFY14 Avg yoy qoq vs FY13 yoy qoq vs FY13 Companies impacted
Agri Commodities
1 Tea - India Avg INR/Kg 124 (3) (8) (1) (3) (8) (1) HUL, TGBL
2 Tea - World Avg USD/MT 2,780 (8) (0) (7) 5 (1) 6 HUL, TGBL
3 Tea - Mombassa/Nairobi USD/MT 2,060 (31) (8) (30) (21) (8) (20) HUL, TGBL
4 Coffee Arabica - Int USD/MT 2,214 (38) (10) (41) (29) (10) (33) HUL, Nestle, TGBL
5 Coffee Robusta - Int USD/MT 1,921 (17) (12) (21) (5) (12) (10) HUL, Nestle, TGBL
6 Sugar - Domestic INR/Quintal 3,139 (12) (2) (8) (12) (2) (8) HUL, Nestle, GSKCHL, ITC, Dabur, Britannia
7 Wheat INR/Quintal 1,545 (2) (0) 6 (2) (0) 6 ITC, Nestle, GSKCHL, Britannia
8 Barley INR/Quintal 1,347 2 3 0 2 3 0 GSKCHL
9 Maize (Corn) USD/MT 215 (32) 6 (30) (23) 6 (20) Colgate, HUL, Dabur (Sorbitol)
10 Liquid Milk - Domestic INR/Ltr 38 44 6 42 44 6 42 Nestle, GSKCHL, Jubilant Foodworks, Britannia
11 Milk Powder - Domestic INR/Kg 224 33 4 30 33 4 30 Nestle, GSKCHL, Britannia
12 Cocoa Bean USD/MT 3,043 12 13 16 29 12 32 Nestle
Oil Commodities
13 Crude Oil - Brent USD/Barrel 109 (1) (1) (1) 13 (1) 13 HUL, GCPL, Jyothy Labs, Asian Paints
14 Palm Oil MYR/Ton 2,514 15 7 (5) 25 8 4 HUL, GCPL, Jyothy Labs
15 PFAD USD/MT 769 18 10 4 35 10 19 HUL, GCPL, Jyothy Labs
16 Light Liquid Paraffin (LLP) INR/Ltr 77 21 9 20 21 9 20 Marico, Dabur, Bajaj Corp
17 Copra INR/Quintal 7,179 71 39 66 71 39 66 Marico, Dabur
18 Coconut Oil INR/Quintal 10,058 66 35 60 66 35 60 Marico, Dabur
19 Rice Bran Oil INR/MT 600 9 9 5 9 9 5 Marico
20 Kardi Oil/ Safflower Oil INR/MT 100,000 (17) (2) (11) (17) (2) (11) Marico
21 Sunflower Oil INR/MT 67,697 (1) (8) (2) (1) (8) (2) Marico
22 Groundnut Oil INR/MT 84,873 (29) (8) (30) (29) (8) (30) Marico, Dabur
23 Linseed Oil INR/MT 79,863 (2) 7 (2) (2) 7 (2) Marico, Dabur, Bajaj Corp, Asian Paints
24 Castor Oil INR/MT 79,247 8 8 7 8 8 7 Marico, Dabur, Bajaj Corp, Asian Paints
25 Mentha Oil INR/Kg 1,000 (34) (4) (39) (34) (4) (39) Colgate, HUL, Dabur, Emami
26 Peppermint Oil INR/Kg 815 (29) (4) (33) (29) (4) (33) Colgate, HUL, Dabur
Chemicals/Paints/Other Commodities
27 Caustic Soda INR/ 50Kg 1,761 (10) 3 (7) (10) 3 (7) HUL, GCPL, Jyothy Labs
28 Soda Ash INR/ 50Kg 1,057 (8) (3) (6) (8) (3) (6) HUL, GCPL, Jyothy Labs
29 LAB INR/Kg 134 16 2 16 16 2 16 HUL, Jyothy Labs
30 HDPE Domestic INR/Kg 112 20 5 19 20 5 19 All companies
31 PAN INR/Kg 103 7 2 6 7 2 6 Asian Paints
32 PENTA INR/Kg 86 4 - 5 4 - 5 Asian Paints
33 Tio2 Anatese INR/Kg 158 (14) (1) (23) (14) (1) (23) Asian Paints
34 Tio2 Rutile INR/Kg 197 (3) 3 (10) (3) 3 (10) Asian Paints
35 Tio2 Dupont INR/Kg 269 11 6 4 11 6 4 Asian Paints
36 Turpentine Oil INR/Ltr 83 5 11 1 5 11 1 Asian Paints
37 Formaldehyde INR/Kg 25 - - 3 - - 3 Asian Paints
38 Acrylic Acid INR/Kg 154 28 (2) 25 28 (2) 25 Asian Paints
39 Vinyl Acetate - Domestic INR/Kg 68 16 4 8 16 4 8 Asian Paints
40 Styrene - Domestic INR/Kg 120 30 1 30 30 1 30 Asian Paints
41 Gold INR/10gm 30,434 (2) 4 1 (2) 4 1 Titan, Jewellery companies
42 Diamond Price Index USD/Carrat 141 2 0 (1) 17 0 13 Titan, Jewellery companies
% chg - currency Adj.Local currency
Source: Bloomberg, Company, Kotak Institutional Equities

India Consumer Products
42 KOTAK INSTITUTIONAL EQUITIES RESEARCH
Exhibit 5: KIE consumer universe valuation summary
TP 7-Jan-14 EPS Sales
Company Rating (Rs) Price (Rs) (Rs m) (US$ m) 2013 2014E 2015E 2013 2014E 2015E 2013 2014E 2015EConsumer ProductsAsian Paints SELL 440 490 (10) 469,960 7,565 11.6 13.1 15.3 12.7 12.9 16.9 42.2 37.4 32.0 14.9 15.0
Bajaj Corp BUY 255 216 18 31,786 512 11.3 12.7 14.9 38.4 12.5 17.9 19.1 17.0 14.4 15.1 18.1
Colgate-Palmolive (India) SELL 1,200 1,341 (11) 182,367 2,935 36.5 35.7 41.9 11.3 (2.2) 17.2 36.7 37.5 32.0 7.1 15.1
Dabur India ADD 190 173 10 300,825 4,842 4.4 5.4 6.4 16.3 16.1 15.1 39.2 31.9 26.9 20.7 15.6
GlaxoSmithKline Consumer SELL 4,100 4,293 (5) 180,553 2,906 103.9 123.0 146.3 23.0 18.4 19.0 41.3 34.9 29.3 18.7 16.8
Godrej Consumer Products REDUCE 800 814 (2) 276,885 4,457 20.3 23.6 29.6 20.4 16.5 25.2 40.1 34.5 27.5 20.8 21.0
Hindustan Unilever REDUCE 560 559 0 1,208,729 19,456 15.4 16.4 18.3 28.1 6.7 11.2 36.3 34.0 30.6 8.9 10.2
ITC ADD 365 317 15 2,508,257 40,373 9.3 10.6 12.1 19.0 13.5 14.4 33.9 29.9 26.1 14.0 12.6
Jubilant Foodworks SELL 925 1,242 (26) 81,995 1,320 19.9 22.5 30.6 21.7 12.9 35.9 62.3 55.2 40.6 23.9 30.2
Jyothy Laboratories ADD 215 193 11 34,992 563 3.9 6.0 9.1 40.5 53.8 52.5 49.8 32.4 21.2 53.2 20.9
Marico REDUCE 215 222 (3) 143,309 2,307 5.6 7.6 8.8 9.2 35.5 15.6 39.5 29.2 25.3 25.1 6.5
Nestle India SELL 4,500 5,382 (16) 518,923 8,353 110.8 117.3 140.2 11.1 5.9 19.5 48.6 45.9 38.4 12.5 12.2
Speciality Restaurants BUY 145 127 14 5,964 96 5.0 4.4 5.2 6.3 (11.6) 17.4 25.5 28.8 24.5 1.9 21.0
Tata Global Beverages ADD 155 157 (1) 96,779 1,558 6.3 6.8 7.7 14.8 9.1 13.5 24.7 23.1 20.4 10.2 5.5
Titan Industries REDUCE 260 226 15 200,684 3,230 8.2 8.8 10.0 19.7 7.2 14.4 27.7 25.8 22.6 10.8 17.1 KIE universe 6,242,009 100,472 19.3 12.9 16.2 36.3 32.2 27.7 14.5 13.2
ADVT-3moCompany 1-mo 3-mo 6-mo 1-year US$ mn 2013 2014E 2015E 2013 2014E 2015E 2013 2014E 2015E 2014E 2015EAsian Paints (3) 7 5 12 9.5 26.8 22.6 19.3 4.2 3.6 3.1 1.2 2.5 2.8 1.1 1.4
Bajaj Corp (5) (18) (16) (10) 0.5 16.4 14.8 12.2 4.6 4.0 3.3 3.7 1.0 7.7 3.4 4.0
Colgate-Palmolive (India) 5 5 (5) (13) 2.5 27.1 27.1 22.4 5.8 5.0 4.3 2.4 2.2 2.7 2.1 2.5
Dabur India 5 1 10 34 4.5 30.2 25.2 21.2 4.9 4.2 3.6 2.1 2.5 3.1 1.2 1.4
GlaxoSmithKline Consumer (7) 1 (20) 11 0.7 29.6 25.1 20.4 5.3 4.4 3.7 2.8 2.7 2.1 1.3 1.7
Godrej Consumer Products (2) (3) 3 12 2.3 30.3 24.2 19.0 4.6 3.7 3.0 (0.4) 1.8 3.1 0.7 0.9
Hindustan Unilever (0) (8) (8) 6 12.3 29.3 26.3 22.8 4.5 4.1 3.7 2.7 3.1 3.1 2.0 2.2
ITC 2 (9) (9) 11 34.6 23.6 20.5 17.5 8.2 7.3 6.4 1.9 2.7 3.1 2.0 2.4
Jubilant Foodworks (8) 5 11 (5) 5.9 33.4 27.5 20.5 5.7 4.4 3.3 0.3 0.3 1.1 0.5 0.8
Jyothy Laboratories (2) 9 3 18 0.5 31.9 20.3 15.3 3.7 2.8 2.2 0.0 4.3 4.8 1.3 1.3
Marico 4 4 6 (4) 1.3 24.1 19.6 16.9 3.2 3.1 2.7 (3.7) 5.6 3.2 0.3 0.3
Nestle India 6 7 5 10 4.9 28.7 25.4 21.8 6.3 5.6 4.9 1.4 2.2 2.8 1.0 1.3
Speciality Restaurants 5 3 (16) (32) 0.3 12.3 12.1 9.6 2.0 1.7 1.4 (3.6) (1.4) (2.1) 1.2 1.6
Tata Global Beverages 7 0 6 (4) 7.4 14.5 13.6 11.8 1.4 1.3 1.2 (0.1) 3.4 5.2 1.6 1.9
Titan Industries (2) (6) (3) (17) 6.6 18.7 18.2 14.8 1.9 1.7 1.5 1.5 (7.0) 2.6 1.2 1.4
United Spirits 30.3 24.2 19.0 4.6 3.7 3.0 1.7 2.4 3.1 0.7 0.9
KIE FMCG universe 1 (5) (5) 8 25.6 22.3 18.9 5.2 4.6 4.0 1.7 2.4 3.1 1.2 1.4 SENSEX (1) 4 6 5
Price performance (%)
CAGR - (2013-15E), %
Upside / (downside)
(%)
EV/EBITDA (X) EV/Sales (X) FCF yield (%) Dividend yield (%)
Mkt cap. EPS (Rs) EPS Growth, % PER (X)
Source: Company, Kotak Institutional Equities estimates
Exhibit 6: Consumer sector P/E has corrected from peak, at 28X One-year forward P/E (based on consensus estimates)
5
10
15
20
25
30
35
Apr
-95
Jun-
96
Aug
-97
Oct
-98
Dec
-99
Feb-
01
Apr
-02
Jun-
03
Aug
-04
Oct
-05
Dec
-06
Feb-
08A
pr-0
9
Jun-
10A
ug-1
1
Oct
-12
Dec
-13
Source: Bloomberg, Company, Kotak Institutional Equities
Exhibit 7: Consumer sector trading @ 90% premium to Sensex One-year forward P/E (based on consensus estimates)
-
0.5
1.0
1.5
2.0
2.5
3.0
Apr
-95
Jun-
96A
ug-9
7O
ct-9
8
Dec
-99
Feb-
01A
pr-0
2
Jun-
03A
ug-0
4O
ct-0
5
Dec
-06
Feb-
08A
pr-0
9
Jun-
10A
ug-1
1O
ct-1
2D
ec-1
3
Source: Bloomberg, Company, Kotak Institutional Equities
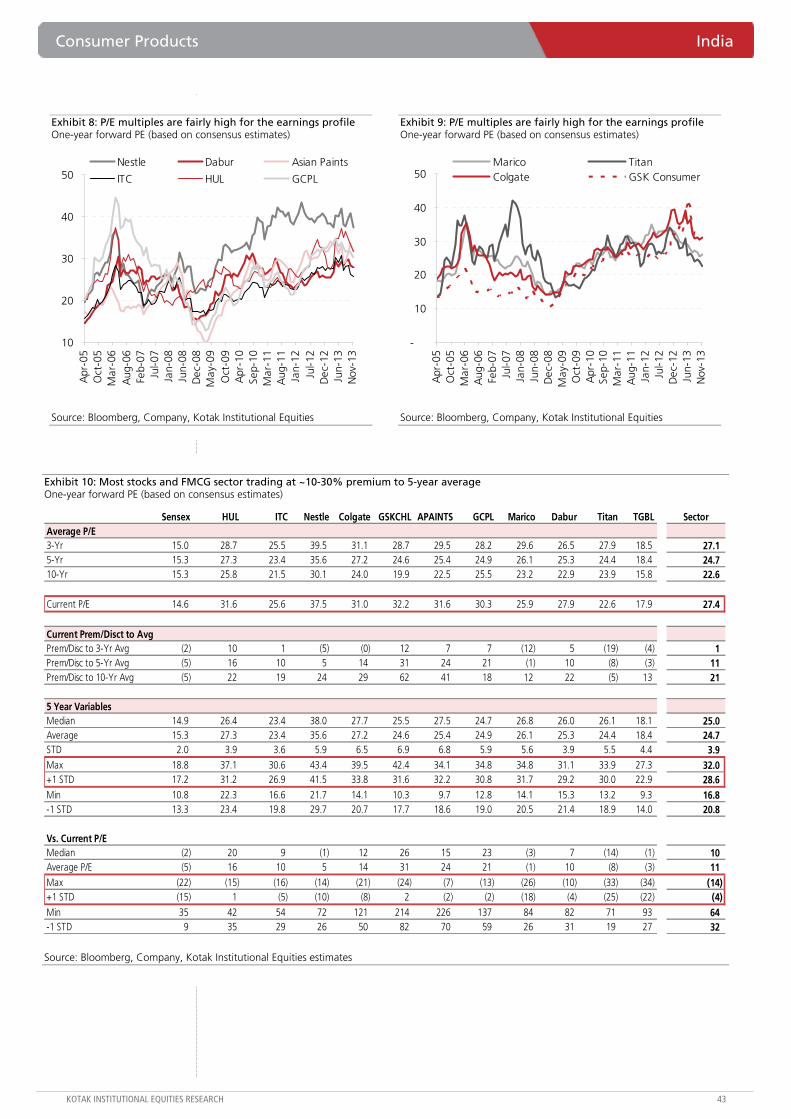
Consumer Products India
KOTAK INSTITUTIONAL EQUITIES RESEARCH 43
Exhibit 8: P/E multiples are fairly high for the earnings profile One-year forward PE (based on consensus estimates)
10
20
30
40
50
Apr
-05
Oct
-05
Mar
-06
Aug
-06
Feb-
07Ju
l-07
Jan-
08Ju
n-08
Dec
-08
May
-09
Oct
-09
Apr
-10
Sep-
10M
ar-1
1A
ug-1
1Ja
n-12
Jul-1
2D
ec-1
2Ju
n-13
Nov
-13
Nestle Dabur Asian Paints
ITC HUL GCPL
Source: Bloomberg, Company, Kotak Institutional Equities
Exhibit 9: P/E multiples are fairly high for the earnings profile One-year forward PE (based on consensus estimates)
-
10
20
30
40
50
Apr
-05
Oct
-05
Mar
-06
Aug
-06
Feb-
07Ju
l-07
Jan-
08Ju
n-08
Dec
-08
May
-09
Oct
-09
Apr
-10
Sep-
10M
ar-1
1A
ug-1
1Ja
n-12
Jul-1
2D
ec-1
2Ju
n-13
Nov
-13
Marico TitanColgate GSK Consumer
Source: Bloomberg, Company, Kotak Institutional Equities
Exhibit 10: Most stocks and FMCG sector trading at ~10-30% premium to 5-year average One-year forward PE (based on consensus estimates)
Sensex HUL ITC Nestle Colgate GSKCHL APAINTS GCPL Marico Dabur Titan TGBL SectorAverage P/E3-Yr 15.0 28.7 25.5 39.5 31.1 28.7 29.5 28.2 29.6 26.5 27.9 18.5 27.1 5-Yr 15.3 27.3 23.4 35.6 27.2 24.6 25.4 24.9 26.1 25.3 24.4 18.4 24.7 10-Yr 15.3 25.8 21.5 30.1 24.0 19.9 22.5 25.5 23.2 22.9 23.9 15.8 22.6
Current P/E 14.6 31.6 25.6 37.5 31.0 32.2 31.6 30.3 25.9 27.9 22.6 17.9 27.4
Current Prem/Disct to AvgPrem/Disc to 3-Yr Avg (2) 10 1 (5) (0) 12 7 7 (12) 5 (19) (4) 1 Prem/Disc to 5-Yr Avg (5) 16 10 5 14 31 24 21 (1) 10 (8) (3) 11 Prem/Disc to 10-Yr Avg (5) 22 19 24 29 62 41 18 12 22 (5) 13 21
5 Year VariablesMedian 14.9 26.4 23.4 38.0 27.7 25.5 27.5 24.7 26.8 26.0 26.1 18.1 25.0 Average 15.3 27.3 23.4 35.6 27.2 24.6 25.4 24.9 26.1 25.3 24.4 18.4 24.7 STD 2.0 3.9 3.6 5.9 6.5 6.9 6.8 5.9 5.6 3.9 5.5 4.4 3.9 Max 18.8 37.1 30.6 43.4 39.5 42.4 34.1 34.8 34.8 31.1 33.9 27.3 32.0 +1 STD 17.2 31.2 26.9 41.5 33.8 31.6 32.2 30.8 31.7 29.2 30.0 22.9 28.6 Min 10.8 22.3 16.6 21.7 14.1 10.3 9.7 12.8 14.1 15.3 13.2 9.3 16.8 -1 STD 13.3 23.4 19.8 29.7 20.7 17.7 18.6 19.0 20.5 21.4 18.9 14.0 20.8
Vs. Current P/EMedian (2) 20 9 (1) 12 26 15 23 (3) 7 (14) (1) 10 Average P/E (5) 16 10 5 14 31 24 21 (1) 10 (8) (3) 11 Max (22) (15) (16) (14) (21) (24) (7) (13) (26) (10) (33) (34) (14) +1 STD (15) 1 (5) (10) (8) 2 (2) (2) (18) (4) (25) (22) (4) Min 35 42 54 72 121 214 226 137 84 82 71 93 64 -1 STD 9 35 29 26 50 82 70 59 26 31 19 27 32
Source: Bloomberg, Company, Kotak Institutional Equities estimates

India Consumer Products
44 KOTAK INSTITUTIONAL EQUITIES RESEARCH
Exhibit 11: Relative valuation (to Sensex) for FMCG - sector/most stocks at 10-30% premium to 5-year average One-year forward premium to Sensex (based on consensus estimates)
HUL ITC Nestle Colgate GSKCHL APAINTS GCPL Marico Dabur Titan TGBL SectorAverage Relative P/E3-Yr 1.9 1.7 2.7 2.1 1.9 2.0 1.9 2.0 1.8 1.9 1.2 1.8 5-Yr 1.8 1.5 2.4 1.8 1.6 1.7 1.6 1.7 1.7 1.6 1.2 1.6 10-Yr 1.7 1.4 2.0 1.6 1.3 1.5 1.7 1.5 1.5 1.5 1.0 1.5
Current Relative P/E 2.2 1.8 2.6 2.1 2.2 2.2 2.1 1.8 1.9 1.5 1.2 1.9
Current Prem/Disct to AvgPrem/Disc to 3-Yr Avg 12 2 (4) 1 15 9 9 (11) 8 (18) (1) 3 Prem/Disc to 5-Yr Avg 20 13 9 18 37 30 26 3 16 (4) 2 15 Prem/Disc to 10-Yr Avg 25 24 29 34 68 47 23 17 28 0 20 26
5 Year VariablesMedian 1.7 1.5 2.5 1.7 1.6 1.7 1.6 1.7 1.7 1.7 1.2 1.6 Average 1.8 1.5 2.4 1.8 1.6 1.7 1.6 1.7 1.7 1.6 1.2 1.6 STD 0.4 0.3 0.4 0.5 0.5 0.5 0.4 0.4 0.2 0.4 0.2 0.3 Max 2.6 2.1 3.0 2.6 3.0 2.3 2.4 2.5 2.1 2.3 1.6 2.2 +1 STD 2.2 1.8 2.8 2.3 2.1 2.2 2.1 2.1 1.9 2.0 1.4 2.0 Min 1.3 1.0 1.5 1.0 0.9 0.8 1.0 1.0 1.1 0.9 0.8 1.1 -1 STD 1.4 1.3 1.9 1.3 1.1 1.2 1.2 1.3 1.4 1.2 1.0 1.3
Vs. Current Relative P/EMedian 24 15 3 25 37 25 33 4 12 (8) (1) 17 Average P/E 20 13 9 18 37 30 26 3 16 (4) 2 15 Max (17) (17) (16) (19) (26) (8) (14) (28) (9) (33) (24) (15) +1 STD (1) (5) (8) (7) 5 1 0 (17) 2 (23) (14) (4) Min 63 68 73 117 147 175 115 76 66 72 61 72 -1 STD 50 41 35 61 97 82 71 36 34 25 25 42
Source: Bloomberg, Company, Kotak Institutional Equities estimates

For private Circulation Only. FOR IMPORTANT INFORMATION ABOUT KOTAK SECURITIES’ RATING SYSTEM AND OTHER DISCLOSURES, REFER TO THE END OF THIS MATERIAL.
Zee Entertainment network—market share gains but first quarter of reduced ad volumes
Zee reported strong 3QFY14 in rating terms with about 100 bps gain in network market share, led by (1) strong performance of Zee TV in a traditionally weak quarter (competing channels with high profile content such as KBC and Bigg Boss have delivered weak-average ratings), (2) strong performance of regional channels (notably Zee Marathi) and (3) first full-quarter of operations of &pictures (7% market share). Zee reduced its ad volumes to 14 minutes/hour (12 minutes of commercials + two minutes of promos) for the first time in 3QFY14, from 16-16.5 minutes/hour. However, the impact would be largely negated by (1) strong network market share, (2) new channel launches (16-17% like-to-like decline in ad volumes moderates to 9-10% when we include &pictures) and (3) rate hikes and continuous rate renegotiations with advertisers (discussed in our note Management meeting takeaways—a straight path on December 20, 2013). We expect Zee to manage the transition to TRAI ad cap regulation without much disruption with 15% ad growth (recent 20% ad growth may be difficult).
Sun TV network—market share losses moderate but reduced ad volumes continue to hurt
Sun reported continued pressure on ratings with around 50 bps decline in network market share, led by (1) weak performance of Gemini TV (flagship Telugu channel), (2) modest decline in Udaya TV and Movies (flagship Kannada channels) and (3) rising competitive intensity in South India across markets (Zee, Star, ETV-TV18). However, we highlight that a qoq decline in network market share has moderated over the past three quarters. The company has also highlighted renewed efforts to improve fiction content in the Telugu and Kannada markets. Sun had reduced its ad volumes to 12 minutes/hour from 17-18 minutes/hour in 2QFY14 and the impact of the large decline will continue in 3QFY14. However, we highlight that the impact may be partially negated by (1) sharp rate hikes in Sun TV (flagship Tamil channel) and (2) claw-back of ad volumes shared with content partners (6-7 minutes/hour in 3QFY14 from eight minutes/hour previously). Sun TV rates were under-priced versus leading channels in other markets; the discount is now bridged.
ADD Sun given compliance with ad cap; REDUCE Zee on rich valuations, aggressive estimates
We retain ADD on Sun (fair value: `430) as we believe the worst is over, assuming 50-100 bps market share declines continue. Sun is in compliance with TRAI’s 12 minutes/hour ad cap implying (1) Sun will benefit from industry-led rate hikes (or complete pass-through of 2QFY14 rate hikes) if the court rules in favor of the ad cap or (2) higher ad volumes (with modest decline in ad rates), if the court does not. Strong DAS-led subs growth in Sun has begun given Phase-I DAS in Chennai is still pending. We retain REDUCE on Zee stock (fair value: `250). Robust revenue growth is likely to continue but a film accounting policy (revenue-cost mismatch) implies aggressive earnings and estimates (the Street’s and ours); valuations are at 26X FY2015E earnings at 25% premium to the historical. Correspondingly, valuations at over 40X FY2015E FCF at 100% premium to the sector.
Media India
3QFY14 ratings and ad volumes update. Zee reported market share gains in 3QFY14 led by (1) strength of Zee TV in a traditionally weak quarter, (2) regional channels (Zee Marathi) and (3) first full-quarter of &pictures. Sun reported continued market share decline yoy largely led by Gemini TV (flagship Telugu channel); however, we note qoq losses have moderated over the past three quarters. Ad volumes will be of larger interest in 3QFY14 as large broadcasters have voluntarily started implementing the ad cap. (1) Zee reduced its ad volumes to 14 minutes/hour from 16-16.5 minutes/hour. Rate hikes and new channels will mitigate the impact. (2) Sun’s sharp decline in ad volumes to 12 minutes/hour from 17-18 minutes/hour will continue to hurt. ADD Sun (REDUCE Zee) given compliance with TRAI’s 12 minutes/hour ad cap and thus no negative surprises.
NEUTRAL
JANUARY 09, 2014
UPDATE
BSE-30: 20,729

India Media
46 KOTAK INSTITUTIONAL EQUITIES RESEARCH
Zee network market share and ad volumes
Exhibit 1: Market share of the Zee network, 2QFY13-3QFY14 (%)
2QFY13 3QFY13 4QFY13 1QFY14 2QFY14 3QFY14 WeightZee TV 19 16 19 17 16 18 8.0 Zee Cinema 22 21 21 20 19 19 2.0 Zee Bengali 30 32 31 31 30 31 1.5 Zee B Cinema 1 7 6 5 4 4 1.0 Zee Marathi 24 29 31 31 34 38 1.0 Zee Talkies 8 10 10 12 12 13 0.5 Zee Telugu 16 16 16 15 17 15 2.0 Zee Kannada 14 14 15 15 12 13 1.0 &pictures - - - - 2 7 1.5 Average 14.9 16.1 16.7 16.3 16.4 17.5 Weighted 17.1 16.6 17.8 16.9 16.7 17.8 Cumulative 316 308 329 314 309 330
Source: TAM Media Research, Kotak Institutional Equities estimates
Exhibit 2: Primetime ad volume of the Zee network, 3QFY10-14 (minutes/hour)
3QFY10 3QFY11 3QFY12 3QFY13 3QFY14 WeightZee TV 17.3 16.9 16.0 16.1 14.0 8.0 Zee Cinema 19.0 19.9 15.6 14.9 13.9 2.0 Zee Telugu 16.9 18.3 17.9 19.0 13.6 2.0 Zee Bangla 15.1 16.7 16.6 17.2 14.0 1.5 Zee Marathi 15.5 16.0 18.0 18.4 14.5 1.0 Zee Kannada 15.8 18.0 16.8 17.7 14.2 1.0 Zee Talkies 17.7 18.9 24.2 21.4 14.4 0.5 Zee Bangla Cinema - - - 12.9 13.0 1.0 &pictures - - - - 13.6 1.5 Average 16.8 17.8 17.9 17.2 13.9 Weighted average 17.1 17.5 16.7 16.6 13.9
Source: TAM Media Research, Kotak Institutional Equities estimates
Exhibit 3: Market share of Zee network, CY2006-13 (%)
2006 2007 2008 2009 2010 2011 2012 2013 WeightZee TV 21 27 22 20 18 16 17 18 8.0 Zee Cinema 32 30 29 30 25 25 23 19 2.0 &pictures - - - - - - - 2 1.5 Zee Bengali 21 38 39 27 23 30 31 30 1.5 Zee B Cinema - - - - - - 2 4 1.0 Zee Marathi 43 45 48 39 36 27 26 36 1.0 Zee Talkies - 4 11 12 10 10 9 12 0.5 Zee Telugu 4 7 13 16 15 15 16 16 2.0 Zee Kannada 3 5 12 12 11 15 16 13 1.0 Average 14 17 19 17 15 15 16 17 Weighted 17.2 21.5 20.6 18.7 16.9 16.0 16.8 17.6 Cumulative 317 397 381 346 312 296 311 325
Source: TAM Media Research, Kotak Institutional Equities estimates

Media India
KOTAK INSTITUTIONAL EQUITIES RESEARCH 47
Sun network market share and ad volumes
Exhibit 4: Market share of the Sun network, 2QFY13-3QFY14 (%)
2QFY13 3QFY13 4QFY13 1QFY14 2QFY14 3QFY14 WeightSun TV 51 53 51 51 52 52 3.0 KTV 15 14 14 15 15 13 2.0 Gemini TV 30 29 28 26 25 24 2.0 Gemini Movies 12 12 12 12 11 11 1.5 Udaya TV 32 30 29 27 28 28 1.0 Udaya Movies 12 11 10 10 8 8 0.5 Surya TV 23 18 20 21 21 20 1.0 Kiran TV 9 9 7 8 12 11 0.5 Average 22.9 22.0 21.4 21.1 21.6 21.0 Weighted 28.3 28.0 27.2 26.8 27.2 26.5 Cumulative 326 321 313 308 313 305
Source: TAM Media Research, Kotak Institutional Equities estimates
Exhibit 5: Primetime ad volume of Sun TV network, 3QFY10-14 (minutes/hour)
3QFY10 3QFY11 3QFY12 3QFY13 3QFY14 WeightSun TV 19.3 20.6 19.4 21.0 11.7 3.0 KTV 11.6 12.5 10.3 16.5 10.3 2.0 Gemini TV 17.2 16.0 16.1 16.5 10.4 2.0 Gemini Movies 14.3 17.1 12.6 21.5 12.6 1.5 Udaya TV 14.5 16.1 15.9 16.7 10.8 1.0 Udaya Movies 16.1 16.3 12.8 21.8 12.6 0.5 Surya TV 9.9 13.0 12.8 12.8 9.5 1.0 Kiran TV 8.1 14.1 11.6 13.7 12.2 0.5 Aditya TV 14.1 12.2 9.6 14.9 13.9 1.5 Average 13.9 15.3 13.5 17.3 11.6 Weighted average 15.0 15.9 14.3 17.8 11.5
Source: TAM Media Research, Kotak Institutional Equities estimates
Exhibit 6: Market share of Sun network, CY2006-13 (%)
2006 2007 2008 2009 2010 2011 2012 2013 WeightSun TV 59 56 52 55 57 57 53 52 2.5 KTV 21 20 18 17 17 15 14 14 2.0 Gemini TV 38 36 32 31 35 33 30 25 2.0 Gemini Movies 22 19 18 16 17 12 12 11 1.5 Udaya TV 44 46 37 33 34 35 33 29 1.0 Udaya Movies 19 20 18 19 16 13 12 9 0.5 Surya TV 38 32 32 27 26 24 23 20 1.0 Kiran TV 7 7 8 9 10 6 9 11 0.5 Average 31 30 27 26 26 24 23 21 Weighted 36 34 31 30 31 30 28 26 Cumulative 395 372 337 332 343 325 304 284
Source: TAM Media Research, Kotak Institutional Equities estimates
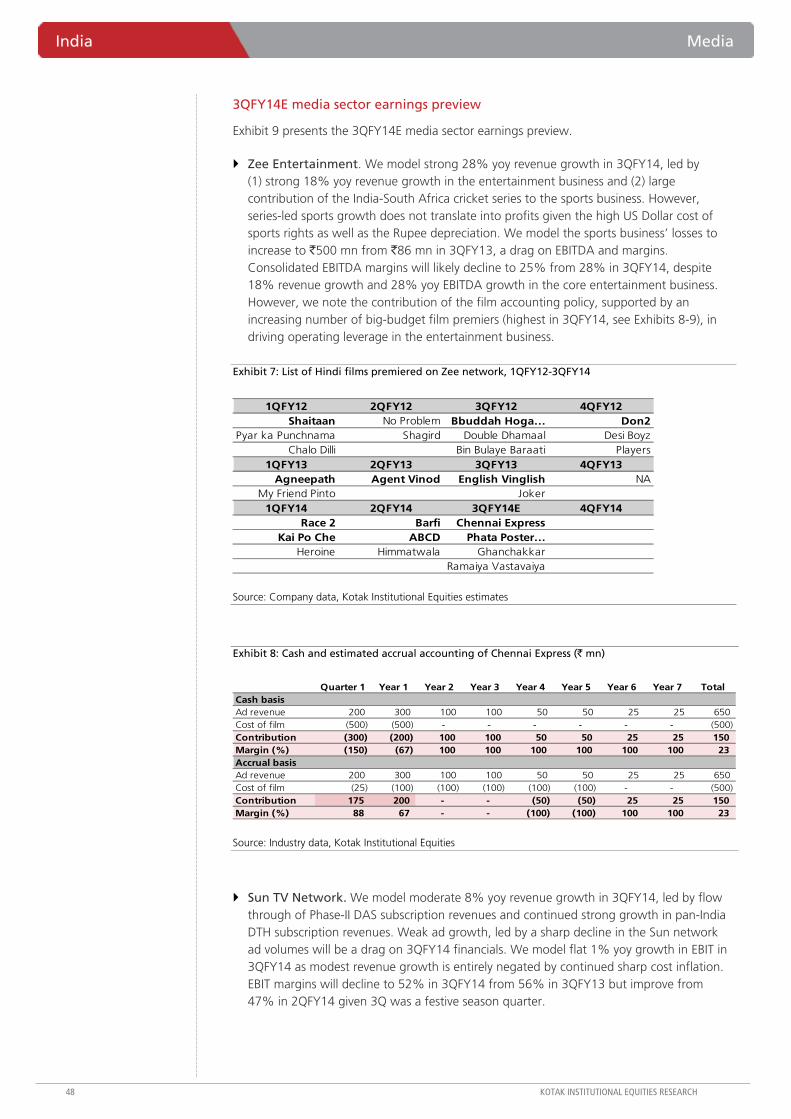
India Media
48 KOTAK INSTITUTIONAL EQUITIES RESEARCH
3QFY14E media sector earnings preview
Exhibit 9 presents the 3QFY14E media sector earnings preview.
Zee Entertainment. We model strong 28% yoy revenue growth in 3QFY14, led by (1) strong 18% yoy revenue growth in the entertainment business and (2) large contribution of the India-South Africa cricket series to the sports business. However, series-led sports growth does not translate into profits given the high US Dollar cost of sports rights as well as the Rupee depreciation. We model the sports business’ losses to increase to `500 mn from `86 mn in 3QFY13, a drag on EBITDA and margins. Consolidated EBITDA margins will likely decline to 25% from 28% in 3QFY14, despite 18% revenue growth and 28% yoy EBITDA growth in the core entertainment business. However, we note the contribution of the film accounting policy, supported by an increasing number of big-budget film premiers (highest in 3QFY14, see Exhibits 8-9), in driving operating leverage in the entertainment business.
Exhibit 7: List of Hindi films premiered on Zee network, 1QFY12-3QFY14
1QFY12 2QFY12 3QFY12 4QFY12Shaitaan No Problem Bbuddah Hoga… Don2
Pyar ka Punchnama Shagird Double Dhamaal Desi BoyzChalo Dilli Bin Bulaye Baraati Players
1QFY13 2QFY13 3QFY13 4QFY13Agneepath Agent Vinod English Vinglish NA
My Friend Pinto Joker1QFY14 2QFY14 3QFY14E 4QFY14
Race 2 Barfi Chennai ExpressKai Po Che ABCD Phata Poster…
Heroine Himmatwala GhanchakkarRamaiya Vastavaiya
Source: Company data, Kotak Institutional Equities estimates
Exhibit 8: Cash and estimated accrual accounting of Chennai Express (` mn)
Quarter 1 Year 1 Year 2 Year 3 Year 4 Year 5 Year 6 Year 7 TotalCash basisAd revenue 200 300 100 100 50 50 25 25 650 Cost of film (500) (500) - - - - - - (500) Contribution (300) (200) 100 100 50 50 25 25 150 Margin (%) (150) (67) 100 100 100 100 100 100 23 Accrual basisAd revenue 200 300 100 100 50 50 25 25 650 Cost of film (25) (100) (100) (100) (100) (100) - - (500) Contribution 175 200 - - (50) (50) 25 25 150 Margin (%) 88 67 - - (100) (100) 100 100 23
Source: Industry data, Kotak Institutional Equities
Sun TV Network. We model moderate 8% yoy revenue growth in 3QFY14, led by flow through of Phase-II DAS subscription revenues and continued strong growth in pan-India DTH subscription revenues. Weak ad growth, led by a sharp decline in the Sun network ad volumes will be a drag on 3QFY14 financials. We model flat 1% yoy growth in EBIT in 3QFY14 as modest revenue growth is entirely negated by continued sharp cost inflation. EBIT margins will decline to 52% in 3QFY14 from 56% in 3QFY13 but improve from 47% in 2QFY14 given 3Q was a festive season quarter.

Media India
KOTAK INSTITUTIONAL EQUITIES RESEARCH 49
DB Corp./Jagran Prakashan. Weak performance in C&S TV companies will provide an opportunity for regional print media to shine. We model 13% yoy revenue growth and 18% yoy EBITDA growth in DB Corp. in 3QFY14. Robust revenue growth in DB Corp. will be on a high base of 3QFY13, partially supported by election ad spends (in key Rajasthan and MPCG markets). The demerger of Nai Dunia with Jagran prevents like-to-like financial comparison. We model 19% yoy revenue growth and 15% yoy EBITDA growth in Jagran in 3QFY14; EBITDA growth is comparable on a yoy basis since Nai Dunia has negligible contribution currently. We highlight the robust financials are despite double-digit yoy inflation in newsprint prices, led by Rupee depreciation.
We model robust 10% yoy growth in Dish TV revenues, led by 12% yoy growth in subs revenues, strong 32% yoy growth in bandwidth and advertising income but for 28% yoy decline in rental income (moderating subs adds). We model 12% yoy growth in EBITDA despite 27% yoy increase in content costs; the impact of MediaPro renegotiation will start to moderate in 3QFY14 (base effect as Dish TV started providing for the same in 3QFY13) but for higher sports content costs (Sachin’s farewell series).
Exhibit 9: 3QFY14E media sector earnings preview
Dec-12 Sep-13 Dec-13E yoy qoq CommentsDB Corp
Net sales 4,389 4,380 4,950 12.8 13.0
EBITDA 1,228 1,125 1,450 18.1 28.9
EBIT 1,077 966 1,275 18.4 32.0
PBT 1,060 934 1,300 22.6 39.2
PAT 706 602 850 20.4 41.3
Extraordinaries - - - - -
PAT-reported 706 602 850 20.4 41.3
DishTV
Net sales 5,578 5,926 6,150 10.3 3.8
EBITDA 1,377 1,479 1,550 12.5 4.8
EBIT (336) (26) 50 114.9 296.1
PBT (449) (160) (100) 77.7 37.5
PAT (449) (160) (100) 77.7 37.5
Extraordinaries - - - - -
PAT-reported (449) (160) (100) 77.7 37.5
Jagran Prakashan
Net sales 3,489 3,854 4,150 18.9 7.7
EBITDA 911 911 1,050 15.3 15.3
EBIT 745 736 875 17.4 18.9
PBT 659 610 850 29.0 39.3
PAT 459 415 575 25.2 38.7
Extraordinaries 200 55 75 (62.4) 36.4
PAT-reported 659 470 650 (1.3) 38.4
Sun TV Network
Net sales 4,859 4,664 5,250 8.1 12.6
EBITDA 3,763 3,377 3,925 4.3 16.2
EBIT 2,720 2,201 2,750 1.1 24.9
PBT 2,808 2,350 2,875 2.4 22.3
PAT 1,899 1,472 1,900 0.1 29.1
Extraordinaries - 220 - - (100.0)
PAT-reported 1,899 1,692 1,900 0.1 12.3
Zee Entertainment Enterprises
Net sales 9,388 11,013 12,000 27.8 9.0
EBITDA 2,611 3,105 2,950 13.0 (5.0)
EBIT 2,521 3,014 2,850 13.0 (5.4)
PBT 2,866 3,409 3,200 11.7 (6.1)
PAT 1,941 2,243 3,200 64.9 42.7
Extraordinaries - 120 - - (100.0)
PAT-reported 1,941 2,363 3,200 64.9 35.4
The demerger of Nai Dunia brand with standalone Jagran financials prevents like-to-like comparison on a yoy basis
We expect robust 13% yoy EBITDA growth led by margin expansion in the entertainment business; increased sports losses will partly negate the strong performance in the entertainment segment
We expect robust 15% yoy EBITDA growth led by (1) robust like-to-like revenue growth partially negated by (2) newsprint inflation
We expect moderate 8% yoy revenue growth led by DAS-led subscription growth, which is partially offset by weak advertising revenues
We expect modest 2% yoy PBT growth led by (1) moderate revenue growth and (2) continued content inflation
We expect strong 28% yoy revenue growth led by (1) strength in entertainment business and (2) contribution from India-South Africa cricket series
We expect robust 13% yoy EBITDA growth led by (1) robust revenue growth and (2) moderating content inflation (MediaPro deal impact in 3QFY13)
Change (%)
We expect robust 12% yoy revenue growth led by (1) robust advertising growth and (2) counter-cyclical circulation growth
We expect robust 14% yoy EBITDA growth led by robust revenue growth but offset sharp qoq increase in newsprint prices
We expect robust 10% yoy revenue growth led by (1) moderate ARPU growth as well as (2) robust subs growth (festival season impact in 3QFY14)
Source: Company data, Kotak Institutional Equities estimates
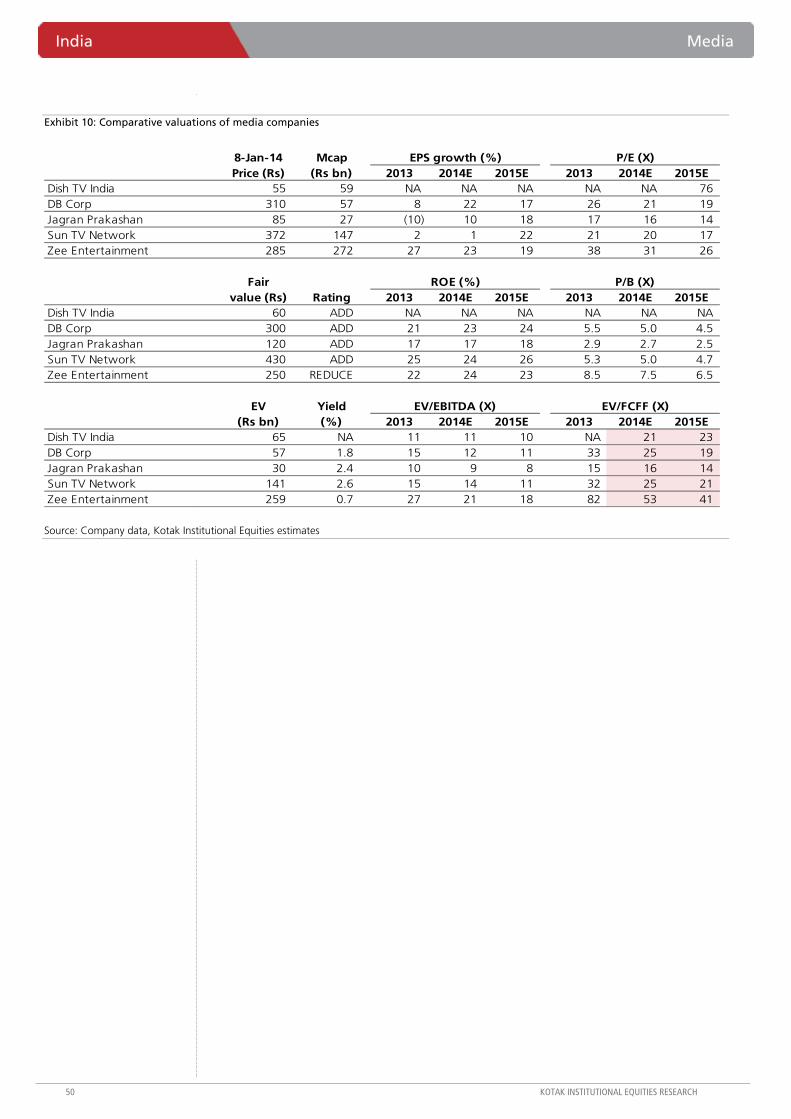
India Media
50 KOTAK INSTITUTIONAL EQUITIES RESEARCH
Exhibit 10: Comparative valuations of media companies
8-Jan-14 Mcap EPS growth (%) P/E (X)Price (Rs) (Rs bn) 2013 2014E 2015E 2013 2014E 2015E
Dish TV India 55 59 NA NA NA NA NA 76 DB Corp 310 57 8 22 17 26 21 19 Jagran Prakashan 85 27 (10) 10 18 17 16 14 Sun TV Network 372 147 2 1 22 21 20 17 Zee Entertainment 285 272 27 23 19 38 31 26
Fair ROE (%) P/B (X)value (Rs) Rating 2013 2014E 2015E 2013 2014E 2015E
Dish TV India 60 ADD NA NA NA NA NA NADB Corp 300 ADD 21 23 24 5.5 5.0 4.5 Jagran Prakashan 120 ADD 17 17 18 2.9 2.7 2.5 Sun TV Network 430 ADD 25 24 26 5.3 5.0 4.7 Zee Entertainment 250 REDUCE 22 24 23 8.5 7.5 6.5
EV Yield EV/EBITDA (X) EV/FCFF (X)(Rs bn) (%) 2013 2014E 2015E 2013 2014E 2015E
Dish TV India 65 NA 11 11 10 NA 21 23 DB Corp 57 1.8 15 12 11 33 25 19 Jagran Prakashan 30 2.4 10 9 8 15 16 14 Sun TV Network 141 2.6 15 14 11 32 25 21 Zee Entertainment 259 0.7 27 21 18 82 53 41
Source: Company data, Kotak Institutional Equities estimates

Media India
KOTAK INSTITUTIONAL EQUITIES RESEARCH 51
Hindi GE channel market share and ad volumes
Exhibit 11: Market share of key Hindi GE channels, 2QFY13-3QFY14 (%)
2QFY13 3QFY13 4QFY13 1QFY14 2QFY14 3QFY14Colors 18 19 18 17 19 19 Life OK 10 11 11 12 12 14 SAB 10 12 12 13 13 13 Sony TV 18 18 14 15 14 12 Star Plus 21 21 23 23 22 22 Zee TV 19 16 19 17 16 18 Others 4 4 4 4 3 3
Source: TAM Media Research, Kotak Institutional Equities estimates
Exhibit 12: Primetime ad volumes of Hindi GE channels, 3QFY10-14 (minutes/hour)
3QFY10 3QFY11 3QFY12 3QFY13 3QFY14Colors 14.3 NA 14.7 15.7 13.4 DD National 11.3 9.5 10.3 11.0 10.5 LikeOK - - - 14.9 13.8 Sahara One 19.5 18.1 16.9 17.2 11.9 SAB TV 17.2 16.0 16.1 15.9 16.0 Sony TV 18.2 17.2 15.5 14.8 15.7 Star Plus 16.6 15.5 16.0 16.7 13.9 Zee TV 17.3 16.9 16.0 16.1 14.0 Average 16.4 15.5 15.1 15.3 13.6
Source: TAM Media Research, Kotak Institutional Equities estimates
Exhibit 13: Market share of key Hindi GE channels, CY2006-13 (%)
2006 2007 2008 2009 2010 2011 2012 2013Colors - - 8 24 22 20 18 19 Imagine TV - - 7 8 7 6 2 - Life OK 7 7 7 5 3 3 9 13 SAB 4 5 3 5 8 11 11 13 Sony TV 13 12 9 10 13 16 18 13 Star Plus 48 39 30 23 26 25 22 22 Zee TV 21 27 22 20 18 16 17 18 Others 8 10 14 7 4 4 4 2 HH-Index 3,030 2,528 1,682 1,681 1,738 1,686 1,613 1,638
Source: TAM Media Research, Kotak Institutional Equities estimates

India Media
52 KOTAK INSTITUTIONAL EQUITIES RESEARCH
Hindi Cinema channel market share and ad volumes
Exhibit 14: Market share of key Hindi movie channels, 2QFY13-3QFY14 (%)
2QFY13 3QFY13 4QFY13 1QFY14 2QFY14 3QFY14&pictures - - - - 2 7 Movies OK 13 11 10 10 10 12 SET MAX (a) 21 22 21 17 19 17 Star Gold 24 21 18 20 17 17 UTV Action 5 6 6 7 6 7 UTV Movies 7 7 7 8 8 9 Zee Cinema 22 21 21 20 19 19 Others 9 13 17 19 18 12
Notes:(a) SET MAX ratings are adjusted for IPL.
Source: TAM Media Research, Kotak Institutional Equities estimates
Exhibit 15: Primetime ad volumes of Hindi Cinema channels, 3QFY10-14 (minutes/hour)
3QFY10 3QFY11 3QFY12 3QFY13 3QFY14&pictures - - - - 13.6 FILMY 26.0 21.3 23.4 17.0 10.4 MoviesOK - - - 18.6 14.0 MAX 17.8 19.0 17.3 13.2 15.5 Star Gold 21.0 20.4 15.0 17.0 14.0 UTV Action - 26.3 18.3 15.7 12.7 UTV Movies 20.5 28.3 19.0 15.7 13.2 Zee Cinema 19.0 19.9 15.6 14.9 13.9 Zee Classic 4.0 4.7 6.4 6.3 13.0 Average 18.1 20.0 16.4 14.8 13.3
Source: TAM Media Research, Kotak Institutional Equities estimates
Exhibit 16: Market share of key Hindi movie channels, CY2006-13 (%)
2006 2007 2008 2009 2010 2011 2012 2013&pictures - - - - - - - 2 FILMY 7 8 7 5 5 4 3 2 Movies OK - - - - - - 8 11 SET MAX (a) 32 34 30 29 26 25 22 18 Star Gold 22 21 20 19 21 26 25 17 UTV Action - 1 3 3 7 5 5 7 UTV Movies - - 5 7 8 7 6 8 Zee Cinema 32 30 29 30 25 25 23 19 Others 7 7 6 7 8 8 7 15 HH-Index 2,568 2,529 2,234 2,190 1,908 2,027 1,798 1,291
Notes:(a) SET MAX ratings are adjusted for IPL.
Source: TAM Media Research, Kotak Institutional Equities estimates

Media India
KOTAK INSTITUTIONAL EQUITIES RESEARCH 53
Tamil channel market share and ad volumes
Exhibit 17: Market share of key Tamil GE channels, 2QFY13-3QFY14 (%)
2QFY13 3QFY13 4QFY13 1QFY14 2QFY14 3QFY14Jaya TV 3 3 3 3 3 3 KTV 15 14 14 15 15 13 Kalaignar TV 6 7 7 5 5 5 Raj TV 3 3 3 3 4 4 Sun TV 51 53 51 51 52 52 Vijay TV 10 9 10 10 9 11 Zee Tamizh 4 4 4 5 5 5 Others 7 7 8 7 7 7
Source: TAM Media Research, Kotak Institutional Equities estimates
Exhibit 18: Primetime ad volumes of Tamil channels, 3QFY10-14 (minutes/hour)
3QFY10 3QFY11 3QFY12 3QFY13 3QFY14Adithya 14.1 12.2 9.6 14.9 13.9 Chutti TV 8.7 14.6 14.4 19.3 11.0 DD Podhigai 3.9 3.1 3.0 3.9 4.6 Jaya TV 13.0 12.7 16.7 13.6 8.7 Kalaignar 11.7 13.6 14.0 11.4 10.2 KTV 11.6 12.5 10.3 16.5 10.3 Sun TV 19.3 20.6 19.4 21.0 11.7 Vijay TV 19.1 21.0 19.2 18.9 13.8 Zee Tamil 7.9 14.7 18.6 18.9 13.7 Average 12.2 13.9 13.9 15.4 10.9
Source: TAM Media Research, Kotak Institutional Equities estimates
Exhibit 19: Market share of key Tamil GE channels, CY2006-13 (%)
2006 2007 2008 2009 2010 2011 2012 2013Jaya TV 7 6 5 4 4 4 3 3 KTV 21 20 18 17 17 15 14 14 Kalaignar TV - 4 12 10 9 7 7 5 Raj TV 4 3 2 2 2 3 3 4 Sun TV 59 56 52 55 57 57 53 52 Vijay TV 6 8 6 6 6 7 10 10 Zee Tamizh - - 0 1 2 3 4 5 Others 3 3 5 4 3 4 6 7 HH-Index 4,058 3,621 3,201 3,448 3,695 3,586 3,169 3,100
Source: TAM Media Research, Kotak Institutional Equities estimates

India Media
54 KOTAK INSTITUTIONAL EQUITIES RESEARCH
Telugu channel market share and ad volumes
Exhibit 20: Market share of key Telugu GE channels, 2QFY13-3QFY14 (%)
2QFY13 3QFY13 4QFY13 1QFY14 2QFY14 3QFY14Eenadu TV 16 16 17 19 20 19 Gemini Movies 12 12 12 12 11 11 Gemini TV 30 29 28 26 25 24 Maa Movies 5 6 6 6 7 7 Maa Telugu 20 20 21 21 21 21 Zee Telugu 16 16 15 17 15 17 Others 1 1 1 1 1 1
Source: TAM Media Research, Kotak Institutional Equities estimates
Exhibit 21: Primetime ad volumes of Telugu channels, 3QFY10-14 (minutes/hour)
3QFY10 3QFY11 3QFY12 3QFY13 3QFY14DD Saptagiri 4.2 4.5 3.5 3.9 3.2 Eenadu TV 15.1 15.9 15.4 16.9 11.5 Gemini TV 17.2 16.0 16.1 16.5 10.4 Gemini Movies 14.3 17.1 12.6 21.5 12.6 Gemini Comedy 4.3 9.1 10.9 13.7 11.0 Maa TV 17.4 18.6 18.4 18.8 11.7 Maa Movies - - 21.6 20.5 11.8 Zee Telugu 16.9 18.3 17.9 19.0 13.6 Average 12.8 14.2 14.6 16.3 10.7
Source: TAM Media Research, Kotak Institutional Equities estimates
Exhibit 22: Market share of key Telugu GE channels, CY2006-13 (%)
2006 2007 2008 2009 2010 2011 2012 2013Eenadu TV 19 18 17 16 16 16 16 20 Gemini Movie 22 19 18 16 17 12 12 11 Gemini TV 38 36 32 31 35 33 30 25 Maa Movies - - - - - 5 6 7 Maa Telugu 10 13 16 17 16 17 20 21 Siti Telugu 5 3 3 2 - - - - Zee Telugu 4 7 13 16 15 15 16 16 Others 2 2 2 1 1 1 1 1 HH-Index 2,454 2,274 2,057 2,057 2,246 2,047 1,958 1,860
Source: TAM Media Research, Kotak Institutional Equities estimates

Media India
KOTAK INSTITUTIONAL EQUITIES RESEARCH 55
Kannada channel market share and ad volumes
Exhibit 23: Market share of key Kannada GE channels, 2QFY13-3QFY14 (%)
2QFY13 3QFY13 4QFY13 1QFY14 2QFY14 3QFY14ETV Kannada 14 13 16 19 16 20 Kasturi 5 5 5 4 3 3 Suvarna 19 20 20 23 25 22 Udaya Movies 12 11 10 10 8 8 Udaya TV 32 30 29 27 28 28 Zee Kannada 14 15 15 12 13 13 Others 5 5 5 6 6 6
Source: TAM Media Research, Kotak Institutional Equities estimates
Exhibit 24: Primetime ad volumes of Kannada channels, 3QFY10-14 (minutes/hour)
3QFY10 3QFY11 3QFY12 3QFY13 3QFY14DD Chandana 6.0 7.0 5.1 6.0 4.8 ETV Kannada 15.4 15.9 15.8 18.6 13.5 Kasturi 16.7 17.6 19.4 16.2 18.2 Suvarna 16.3 18.3 16.4 18.5 13.5 Udaya TV 14.5 16.1 15.9 16.7 10.8 Udaya Movies 16.1 16.3 12.8 21.8 12.6 Z Kannada 15.8 18.0 16.8 17.7 14.2 Average 14.4 15.6 14.6 16.5 12.5
Source: TAM Media Research, Kotak Institutional Equities estimates
Exhibit 25: Market share of key Kannada GE channels, CY2006-13 (%)
2006 2007 2008 2009 2010 2011 2012 2013ETV Kannada 29 22 16 15 14 13 13 19 Kasturi - 2 8 6 7 6 5 3 Suvarna - 3 6 13 17 18 20 24 Udaya Movies 19 20 18 19 16 13 12 9 Udaya TV 44 46 37 33 34 35 33 29 Zee Kannada 3 5 12 12 11 15 16 13 Others 5 3 2 2 2 1 1 2 HH-Index 3,189 3,041 2,197 2,034 2,042 2,121 2,099 2,078
Source: TAM Media Research, Kotak Institutional Equities estimates

India Media
56 KOTAK INSTITUTIONAL EQUITIES RESEARCH
Malayalam channel market share and ad volumes
Exhibit 26: Market share of key Malay GE channels, 2QFY13-3QFY14 (%)
2QFY13 3QFY13 4QFY13 1QFY14 2QFY14 3QFY14Amrita TV 3 3 4 4 3 3 Asianet 41 43 44 43 39 42 Asianet Plus 6 7 6 6 5 5 Kairali 4 4 4 5 5 5 Kiran TV 9 9 7 8 12 11 M Manorama 13 15 13 12 13 13 Surya TV 23 18 20 21 21 20 Others 1 1 1 1 1 1
Source: TAM Media Research, Kotak Institutional Equities estimates
Exhibit 27: Primetime ad volumes of Malayalam channels, 3QFY10-14 (minutes/hour)
3QFY10 3QFY11 3QFY12 3QFY13 3QFY14Amrita 16.4 16.4 12.1 12.0 10.8 Asianet 16.1 15.6 15.9 16.2 12.7 Asianet Plus 17.2 14.5 14.8 13.6 11.0 DD Malayalam 3.2 2.2 3.3 3.8 3.4 Kairali 18.5 17.8 19.5 16.9 10.9 Kiran TV 8.1 14.1 11.6 13.7 12.2 M Manorama - - 8.8 13.2 11.8 Surya TV 9.9 13.0 12.8 12.8 9.5 Average 12.8 13.4 12.4 12.8 10.3
Source: TAM Media Research, Kotak Institutional Equities estimates
Exhibit 28: Market share of key Malay GE channels, CY2006-13 (%)
2006 2007 2008 2009 2010 2011 2012 2013Amrita TV 4 5 4 4 4 6 3 3 Asianet 32 37 38 41 42 44 41 41 Asianet Plus 8 10 9 11 11 10 8 5 Kairali 7 7 7 6 7 7 4 5 Kiran TV 7 7 8 9 10 6 9 11 M Manorama - - - - - 1 11 13 Surya TV 38 32 32 27 26 24 23 20 Others 3 3 3 2 2 2 1 1 HH-Index 2,694 2,596 2,648 2,700 2,653 2,737 2,479 2,438
Source: TAM Media Research, Kotak Institutional Equities estimates

Media India
KOTAK INSTITUTIONAL EQUITIES RESEARCH 57
Bengali channel market share and ad volumes
Exhibit 29: Market share of key Bengali GE channels, 2QFY13-3QFY14 (%)
2QFY13 3QFY13 4QFY13 1QFY14 2QFY14 3QFY14ETV Bangla 10 7 6 6 7 7 Jalsha Movies - 2 10 7 8 8 Rupashi Bangla 3 3 2 1 1 1 Sony Aath 5 4 3 5 5 4 Star Jalsha 39 38 35 40 40 41 Zee Bangla 30 32 31 31 30 31 Zee B Cinema 1 7 6 5 4 4 Others 13 7 5 4 4 5
Source: TAM Media Research, Kotak Institutional Equities estimates
Exhibit 30: Primetime ad volumes of Bengali channels, 3QFY10-14 (minutes/hour)
3QFY10 3QFY11 3QFY12 3QFY13 3QFY14DD Bangla 7.2 5.8 8.0 7.3 6.5 ETV Bangla 15.3 19.1 15.7 16.6 13.3 Jalsha Movies - - - - - Rupashi Bangla 13.0 17.5 14.6 15.4 15.7 Sony Aath 17.1 17.6 18.0 17.8 15.5 Star Jalsha 16.1 15.4 15.4 16.8 13.8 Zee Bangla 15.1 16.7 16.6 17.2 14.0 Zee Bangla Cinema - - - 12.9 13.0 Average 14.0 15.3 14.7 14.9 11.5
Source: TAM Media Research, Kotak Institutional Equities estimates
Exhibit 31: Market share of key Bengali GE channels, CY2006-13 (%)
2006 2007 2008 2009 2010 2011 2012 2013Akash Bangla 16 14 9 8 5 3 2 1 ETV Bangla 58 41 35 22 16 12 9 7 Jalsha Movies - - - - - - 1 8 Rupashi Bangla - - - 2 7 4 4 1 Sony Aath - 0 6 4 6 5 4 4 Star Jalsha - - 5 35 40 36 38 40 Zee Bangla 21 38 39 27 23 30 31 30 Zee B Cinema - - - - - - 2 4 Others 6 6 5 3 4 9 9 3 HH-Index 4,040 3,408 2,951 2,497 2,505 2,454 2,608 2,710
Source: TAM Media Research, Kotak Institutional Equities estimates

India Media
58 KOTAK INSTITUTIONAL EQUITIES RESEARCH
Marathi channel market share and ad volumes
Exhibit 32: Market share of key Marathi GE channels, 2QFY13-3QFY14 (%)
2QFY13 3QFY13 4QFY13 1QFY14 2QFY14 3QFY14DD Marathi 3 3 2 3 2 2 ETV Marathi 24 14 13 15 19 18 Mi Marathi 2 2 2 2 3 4 Star Pravah 36 39 38 34 28 24 Zee Marathi 24 29 31 31 34 38 Zee Talkies 8 10 10 12 12 13 Others 3 4 3 2 2 1
Source: TAM Media Research, Kotak Institutional Equities estimates
Exhibit 33: Primetime ad volumes of Marathi channels, 3QFY10-14 (minutes/hour)
3QFY10 3QFY11 3QFY12 3QFY13 3QFY14DD Sahyadri 10.6 9.0 8.1 9.8 7.8 ETV Marathi 15.0 17.5 18.1 17.0 15.2 Saam TV 9.4 14.1 14.8 15.4 17.8 Star Pravah 14.9 16.4 15.8 16.0 14.1 Zee Marathi 15.5 16.0 18.0 18.4 14.5 Zee Talkies 17.7 18.9 24.2 21.4 14.4 Average 13.8 15.3 16.5 16.3 14.0
Source: TAM Media Research, Kotak Institutional Equities estimates
Exhibit 34: Market share of key Marathi GE channels, CY2006-13 (%)
2006 2007 2008 2009 2010 2011 2012 2013DD Marathi 12 11 8 6 5 3 3 2 ETV Marathi 44 33 25 24 22 27 23 19 Mi Marathi - 6 6 3 6 5 2 3 Star Pravah - - 1 14 18 25 35 26 Zee Marathi 43 45 48 39 36 27 26 36 Zee Talkies - 4 11 12 10 10 9 12 Others - - 1 2 2 2 3 2 HH-Index 3,985 3,331 3,160 2,497 2,325 2,243 2,509 2,484
Source: TAM Media Research, Kotak Institutional Equities estimates

For private Circulation Only. FOR IMPORTANT INFORMATION ABOUT KOTAK SECURITIES’ RATING SYSTEM AND OTHER DISCLOSURES, REFER TO THE END OF THIS MATERIAL.
We expect healthy increase in flat steel and iron ore realizations, modest increase in long products
Domestic prices of flat-steel products increased by 5-8% (`2,000-3,000/ton) sequentially (see Exhibit 5), an alignment with import parity prices, from a discount earlier. Higher steel prices supported domestic iron ore prices as miners hiked prices by 7-15%. However, in the long products segment, domestic prices were volatile in a weak demand scenario. The increase in sponge iron/scrap prices was not fully passed on end users, impacting the spreads of secondary steel makers. On average, we estimate a sequential increase of a mere 1-2% (`500-800/ton) in prices of longs.
Steel demand—weakness persists, imports decline, moderate increase in exports
Domestic steel demand has disappointed so far with April-November 2013 growth being a mere 0.4% yoy in a weak investment cycle. The rise in domestic steel production (+5% yoy) was absorbed mainly through import substitution (imports declined 28% yoy to 3.7 mn tons). Steel exports grew by a moderate 7% yoy to 3.5 mn tons. The increase in export volumes could have been higher (JSW’s aggressive export push with plans for 60% growth to 3 mn tons in FY2014) but for a volume decline at Essar Steel due to production disruptions.
3QFY14 steel results—we expect strong performance in domestic operations, fall in subsidiaries
For steel names, we expect strong performance in Indian operations and we expect international subsidiaries to report a decline. Companies with a high proportion of flats will gain more.
Tata Steel. We estimate consolidated EBITDA of `37.7 bn (+2% qoq, +68% yoy). We expect 29% yoy growth in standalone EBITDA to `32.5 bn, led by a higher realization of `900/ton. Long-product deliveries will decline due to a 60-day partial shutdown. We expect EBITDA from international subsidiaries to decline to `5.1 bn from `7.7 bn in 2QFY14 due to seasonal factors in Europe/political unrest in Thailand. We expect Tata Steel Europe EBITDA of US$20/ton.
JSW Steel. We expect consolidated EBITDA to increase 7.8% qoq to `25.3 bn. We expect blended steel realization to increase by `1,500/ton, driven by (1) JSW Steel’s higher presence in the flats segment (84%) and (2) favorable forex hedge of `65.7/US$ for exports. We expect EBITDA/ton to increase 12% qoq to `8,030/ton. We expect higher iron ore/coking coal costs.
Jindal Steel and Power. We expect EBITDA of `15.3 bn (+3.1% qoq, -15% yoy). Performance will be muted since long-product prices have barely changed sequentially and declined yoy. Higher pellet prices could help.
Strong performance by NMDC; a mixed quarter for non-ferrous names
We expect a strong performance by NMDC on higher volumes /iron ore prices. For non-ferrous names, we expect mixed results mainly due to operational factors. Sequential EBITDA will decline for HZ, remain flat for Sesa Sterlite and increase moderately for Hindalco/Nalco. Novelis will report another weak quarter, mainly due to seasonal factors. We prefer NMDC/Sesa Sterlite.
Metals & Mining India
3QFY14E preview—a good quarter for steel companies. We expect 3QFY14 to be a strong quarter for steel companies, led by a `2,000-3,000/ton increase in flat steel prices. Steel names, particularly those with a high presence in flats, are expected to perform strongly in domestic operations while we expect international operations to report a weak quarter. Among non-ferrous names we expect mixed results, impacted mainly by operational factors. We expect EBITDA to decline for Hindustan Zinc, stay flat for Sesa Sterlite and gains to be marginal for Hindalco. NMDC will gain on strong volumes and realizations. We prefer NMDC/Sesa Sterlite in the sector.
NEUTRAL
JANUARY 09, 2014
UPDATE
BSE-30: 20,729

India Metals & Mining
60 KOTAK INSTITUTIONAL EQUITIES RESEARCH
NMDC will gain on strong volumes and higher iron ore prices
We expect a 36% yoy and 27% qoq increase in EBITDA to `18.9 bn, driven by an increase in volumes to 7.3 mn tons (+37% yoy, +12% qoq) and stronger domestic realizations (+4% qoq, +3% yoy). We expect EBITDA to increase by 13% qoq to `2,590/ton. Higher realizations will be driven by (1) price hikes of `100/200 per ton in October/December 2013 for the Chhattisgarh operations and (2) increase in e-auction prices in Karnataka by 10-15% for iron ore fines and 2-3% for iron ore lumps. We expect NMDC’s PAT to grow 23% yoy and 21% qoq to `15.9 bn.
Non-ferrous—a mixed quarter, driven by operational issues/improvements
LME price movement was sequentially flat on a relatively stable USD-INR rate (quarterly average)—prices in Rupee terms changed by (0.8%) -2.4% (see Exhibit 1). While the impact of prices on the results will be limited, more influential factors will be gains/losses in production volumes and changes in power/fuel costs.
Hindustan Zinc. We expect HZ’s EBITDA to decline 5.6% qoq to `17.8 bn (+19% yoy) and PAT to increase 4.4% qoq to `17.1 bn (+6% yoy). The decline will be led by an expected decline in lead/silver volumes by 10%/6% due to mining/grade constraints. Note that HZ has stopped treatment of external lead concentrate due to thin margins. We also expect power and fuel costs to increase due to higher costs of imported coal. A sequential increase in PAT will be driven by higher other income of `4.1 bn after it declined steeply in 2QFY14 due to interest rate volatility. Other income may still be lower than the quarterly run rate of `5 -5.1 bn due to MTM losses in tax-free bonds.
Sesa Sterlite. We expect consolidated EBITDA of `68.8 bn (-1% qoq from pro-forma numbers) and PAT of `15.2 bn (+9% qoq from pro-forma). The performance of the underlying business will be mixed with sequential improvements in power, oil & gas and a decline in zinc and copper. We expect EBITDA to increase in (1) the power business on higher generation and improved realization (`3.5 bn +126% yoy +23% qoq) and (2) Cairn India (`37.6 bn, +6% qoq, +14% yoy). The copper business will report a decline in EBITDA (`2.8 bn,-30% qoq) after an accident impacted production at its subsidiary Copper Mines of Tasmania. We estimate 13% qoq decline in Zinc International EBITDA to `3.4 bn on a decline in production volumes.
Hindalco. In standalone India operations, we expect EBITDA to increase 19% qoq to `6.4 bn (+10% yoy) and PAT to increase 9% qoq to `3.9 bn (-11% yoy). We forecast aluminum EBIT of `2.2 bn (+5% yoy) and copper EBIT of `2.2 bn (+2% yoy). Decline in power and fuel costs/improved realization will drive 19% qoq increase in EBITDA. Other income will decline sequentially as 2QFY14 numbers included dividend income from subsidiary and non-recurring income of `0.6 bn.
We expect Novelis’ EBITDA to be US$180 mn (-2.7% yoy, -21% qoq). We build rolled shipments of 645,000 tons (flat yoy). We estimate adjusted EBITDA/ton of US$263 (-13% qoq, -3% yoy). We expect yoy EBITDA performance to decline in North America (-2% yoy) and Asia (-9% yoy) and to improve in South America (+10% yoy).

Metals & Mining India
KOTAK INSTITUTIONAL EQUITIES RESEARCH 61
Exhibit 1: Price movement for ferrous and non-ferrous metals in 3QFY14
3QFY13 2QFY14 3QFY14 yoy qoq 3QFY13 2QFY14 3QFY14 yoy qoqUS$/ton US$/ton US$/ton (%) (%) Rs/ton Rs/ton Rs/ton (%) (%)
Non FerrousZinc 1,947 1,860 1,907 (2.1) 2.5 105,461 115,481 118,255 12.1 2.4Aluminium 1,999 1,782 1,769 (11.5) (0.7) 108,253 110,662 109,722 1.4 (0.8)Lead 2,197 2,100 2,114 (3.8) 0.6 118,959 130,425 131,069 10.2 0.5Copper 7,913 7,079 7,163 (9.5) 1.2 428,535 439,581 444,214 3.7 1.1FerrousHard coking coal - contract 170 145 152 (10.6) 4.8 9,206 9,004 9,426 2.4 4.7Global HRC prices - CIS 526 533 529 0.5 (0.7)Domestic Steel HRC - Mumbai** 35,667 36,000 38,900 9.1 8.1Domestic Steel HRC - Mumbai* 35,969 35,671 37,550 4.4 5.3Domestic Steel - Rebar* 35,269 33,408 34,167 (3.1) 2.3
INR/USD (average) 54.2 62.1 62.0 14.5 (0.1)INR/USD (closing) 54.8 62.5 61.9 13.0 (1.1)** As per CRU, * As per Steel mint
Change ChangeImplied Rupee realization
Source: Bloomberg, CRU, Steelmint, Kotak Institutional Equities
Exhibit 2: LME non-ferrous metals price movements (US$/ton)
LME Aluminium (US$/ton)
1,500
1,700
1,900
2,100
2,300
Sep-
12
Dec
-12
Mar
-13
Jun-
13
Sep-
13
Dec
-13
LME Zinc (US$/ton)
1,500
1,700
1,900
2,100
2,300
Sep-
12
Dec
-12
Mar
-13
Jun-
13
Sep-
13
Dec
-13
LME Lead (US$/ton)
1,500
1,900
2,300
2,700
Sep-
12
Dec
-12
Mar
-13
Jun-
13
Sep-
13
Dec
-13
LME Copper (US$/ton)
6,000
6,750
7,500
8,250
Sep-
12
Dec
-12
Mar
-13
Jun-
13
Sep-
13
Dec
-13
Source: Bloomberg, Kotak Institutional Equities

India Metals & Mining
62 KOTAK INSTITUTIONAL EQUITIES RESEARCH
Exhibit 3: Global steel prices were flat, ranging between US$525 and US$530/ton in 3QFY14
450
500
550
600
650
Sep-
12
Oct
-12
Nov
-12
Dec
-12
Jan-
13
Feb-
13
Mar
-13
Apr
-13
May
-13
Jun-
13
Jul-1
3
Aug
-13
Sep-
13
Oct
-13
Nov
-13
Dec
-13
China export HRC FOB (US$/ton)
CIS export HRC FOB (US$/ton)
Source: Bloomberg, Kotak Institutional Equities
Exhibit 4: Contract hard coking coal prices were US$152/ton (+5% qoq) in 3QFY14; average spot prices were flat qoq at US$141/ton
100
160
220
280
Sep-
12
Oct
-12
Nov
-12
Dec
-12
Jan-
13
Feb-
13
Mar
-13
Apr
-13
May
-13
Jun-
13
Jul-1
3
Aug
-13
Sep-
13
Oct
-13
Nov
-13
Dec
-13
Australian quarterly contract (US$/ton)
Australian spot (US$/ton)
Source: Bloomberg, Kotak Institutional Equities
Exhibit 5: Domestic flat prices were strong in 3QFY14, aided by the Rupee depreciation; we estimate flat prices were higher by `2,000-2,500/ton qoq in domestic markets across products
33,000
35,000
37,000
39,000
Sep-
12
Oct
-12
Nov
-12
Dec
-12
Jan-
13
Feb-
13
Mar
-13
Apr
-13
May
-13
Jun-
13
Jul-1
3
Aug
-13
Sep-
13
Oct
-13
Nov
-13
Dec
-13
India HRC prices (Rs/ton)
Source: Steelmint, Kotak Institutional Equities
Exhibit 6: Long product prices were volatile in a weak-demand scenario; we estimate moderate qoq pricing gains
31,000
33,000
35,000
37,000
39,000
Sep-
12O
ct-1
2
Nov
-12
Dec
-12
Jan-
13
Feb-
13M
ar-1
3
Apr
-13
May
-13
Jun-
13Ju
l-13
Aug
-13
Sep-
13
Oct
-13
Nov
-13
Dec
-13
India TMT prices (Rs/ton)
Source: Steelmint, Kotak Institutional Equities

Metals & Mining India
KOTAK INSTITUTIONAL EQUITIES RESEARCH 63
Exhibit 7: The average USD-INR rate was flat qoq at `62.0 and closed 1% higher at `61.9
INR/US$
30
38
46
54
62
70
Sep-
11
Dec
-11
Mar
-12
Jun-
12
Sep-
12
Dec
-12
Mar
-13
Jun-
13
Sep-
13
Dec
-13
`
Source: Bloomberg, Kotak Institutional Equities
Exhibit 8: Domestic steel demand was flat with a mere 0.4% yoy growth over April-November 2013
Apr-November '13 Apr-November '12 Change (%)Finished steel production 53.4 50.7 5.3
Imports 3.7 5.1 (28.3) Exports 3.5 3.3 6.9
Availability 53.5 52.5 1.9 Less: variation in stock (0.8) (0.7) 23.8
Apparent consumption 54.4 53.2 2.2 Less: double counting 6.1 5.1 18.6
Real finished steel consumption 48.3 48.1 0.4
Source: JPC, Kotak Institutional Equities

India Metals & Mining
64 KOTAK INSTITUTIONAL EQUITIES RESEARCH
Exhibit 9: Results preview for ferrous companies (` mn)
3QFY13 2QFY14 3QFY14E yoy qoq
FERROUS
Jindal Steel and Power - Standalone
Net Sales 38,209 36,556 37,477 (1.9) 2.5
EBITDA 12,781 9,833 10,062 (21.3) 2.3
EBIT 10,237 6,797 6,996 (31.7) 2.9
Net profit 5,205 2,567 3,251 (37.5) 26.7
Steel deliveries ('000 tons) 734 740 756 3.0 2.1
Pellet deliveries ('000 tons) 623 639 600 (3.7) (6.1)
Power (mn units) 1,544 1,400 1,450 (6.1) 3.6
Jindal Steel and Power - consolidated
Net Sales 48,016 49,838 50,899 6.0 2.1
EBITDA 17,897 14,778 15,237 (14.9) 3.1
EBIT 14,106 10,230 10,673 (24.3) 4.3
Net profit 8,673 4,521 5,524 (36.3) 22.2
Steel deliveries ('000 tons) 734 740 756 3.0 2.1
Power (mn units) 3,333 3,499 3,469 4.1 (0.9)
JSW Steel - consolidated
Net Sales 88,662 127,963 124,116 40.0 (3.0)
EBITDA 13,310 23,480 25,318 90.2 7.8
EBIT 7,766 15,966 17,560 126.1 10.0
Net profit before extraordinaries (3,447) 5,653 5,723 (266.0) 1.2
Net profit (737) (1,156) 5,723 (876.5) (595.3)
Steel deliveries ('000 tons) 2,170 3,130 3,020 39.2 (3.5)
Tata Steel - Standalone
Net Sales 93,703 99,210 102,091 9.0 2.9
EBITDA 25,262 29,379 32,513 28.7 10.7
EBIT 21,280 27,126 28,404 33.5 4.7
Net profit 10,464 15,587 16,316 55.9 4.7
Steel deliveries ('000 tons) 1,887 2,040 2,081 10.3 2.0
Average realisation/ton (Rs) 45,314 44,698 45,553 0.5 1.9
EBITDA/ton (Rs) 13,366 14,402 15,625 16.9 8.5
Tata Steel - Consolidated
Net Sales 321,071 366,449 361,040 12.4 (1.5)
EBITDA 22,389 37,054 37,672 68.3 1.7
EBIT 7,761 22,614 23,267 199.8 2.9
Net profit (7,630) 9,168 5,992 (178.5) (34.6)
Steel deliveries ('000 tons) 5,830 6,480 6,168 5.8 (4.8)
Average realisation/ton (US$) 1,017 911 944 (7.2) 3.7
EBITDA/ton (US$) 71 92 99 38.9 7.0
NMDC
Net Sales 20,477 24,799 28,862 40.9 16.4
EBITDA 13,913 14,936 18,926 36.0 26.7
EBIT 13,574 14,588 18,571 36.8 27.3
Net profit 12,928 13,184 15,884 22.9 20.5
Saleable ore ('000 dmt) 5,320 6,504 7,300 37.2 12.2
Average realisation/ton (Rs) 3,849 3,813 3,954 2.7 3.7
We expect only moderate increase in longs realization (16% of product mix). We expect JSW to book Rs1.5 bn of hedging cost related to acceptances. Numbers are not comparable on yoy basis
Change (%)
We model steel deliveries at 755K tons and pellet sales at 600K tons. Pellet realization will likely be higher by Rs400-500/ton on sequential comparison
Long product prices have barely changed on sequential basis and declined on yoy comparison. This will contribute to muted standalone performance
We estimate JPL revenues at Rs6.7 bn (+1% qoq, +21% yoy) and PAT at Rs3.2 bn (+6% qoq, + 24% yoy) on PLF of 93%.We expect power realizations to improve 5% qoq to Rs3.7/unit.
Increase in steel prices will drive drive strong EBITDA growth. We expect blended realizatons to increase by Rs1,500/ton aided by stronger realizations in flats in domestic market and exports booked at higher Fx rate of Rs65.70/.
We estimate NMDC's blended realization to increase 5% qoq in Chhattisgarh after prices hikes in Oct/Dec 2013. Our checks indicate Karnataka e-auction prices for fines increased 12% -15% qoq and for lumps by 3%.
Deliveries in Tata Steel Europe will decline due to seasonal factors. We model 3.35 mn tons (-5%qoq). While cost pressures will increase on lower deliveries, we expect improved efficiences will aid performance. We model EBITDA of US$20/ton
Performance in SE Asia will deteriorate due to political unrest in Thailand. We expect EBITDA from subsidiaries to decline to Rs5.1 bn from Rs7.7 bn in 2QFY14.
We model steel deliveries of 2.08 mn tons (+2% qoq). Longs product volumes will be impacted by a 60 days shutdown at caster. However carry over inventories will cushion steep decline in longs deliveries. Flats volume will rise.
We expect strong EBITDA growth driven by (1) estimated iron ore sales of 7.3 mn tons (+12% qoq, +37% yoy) and (2) improved realizations.
We estimate EBITDA/ton of Rs15,600. We estimate blended realziation to increase by Rs900/ton mainly on increase in flat product prices. Company can report higher repairs and maintenance costs due to shutdowns.
Source: Company, Kotak Institutional Equities estimates

Metals & Mining India
KOTAK INSTITUTIONAL EQUITIES RESEARCH 65
Exhibit 10: Result preview for non-ferrous companies (` mn)
Change (%)3QFY13 2QFY14 3QFY14E yoy qoq
NON - FERROUS
Hindalco Industries
Net Sales 68,717 63,049 68,075 (0.9) 8.0
EBITDA 5,821 5,398 6,426 10.4 19.0
EBIT 3,937 3,434 4,455 13.2 29.7
Net profit 4,335 3,571 3,877 (10.6) 8.6
Primary aluminium ('000 tons) 140 132 135 (3.3) 2.3
Copper cathodes ('000 tons) 84 77 85 1.6 10.4
Aluminium EBITDA/ton (US$) 467 390 441 (5.5) 13.2
Novelis
Net Sales (US$ mn) 2,321 2,427 2,171 (6.5) (10.5)
EBITDA (US$ mn) 185 228 180 (2.7) (21.0)
EBIT 53 122 100 130.2 (25.6)
Net profit (US$ mn) 3 23 27 787.4 15.7
Rolled shipments ('000 t) 681 753 685 0.6 (9.0)
Adj. EBITDA/ton (US$) 272 303 263 (3.3) (13.2)
Hindustan Zinc
Net Sales 31,780 35,591 34,669 9.1 (2.6)
EBITDA 14,940 18,834 17,782 19.0 (5.6)
EBIT 18,231 19,638 19,999 9.7 1.8
Net profit 16,125 16,403 17,127 6.2 4.4
Refined Zinc ('000 tons) 171 196 195 14.3 (0.5)
Refined Lead ('000 tons) 30 31 26 (12.1) (14.9)
Silver (kg) 108,560 91,000 85,000 (21.7) (6.6)
National Aluminium Co.
Net Sales 16,928 17,382 17,114 1.1 (1.5)
EBITDA 1,827 2,677 3,068 67.9 14.6
EBIT 1,722 2,619 3,034 76.2 15.8
Net profit 1,189 1,792 2,063 73.5 15.1
Aluminium deliveries ('000 tons) 102 75 75 (26.1) 1.1
Sesa Sterlite*
Net Sales 2,275 180,260 184,205 NM 2.2
EBITDA (1,054) 69,550 68,765 NM (1.1)
EBIT (700) 49,030 47,189 NM (3.8)
Net profit 4,967 14,020 15,253 NM 8.8
Copper cathodes ('000 tons) — 82 85 NM 3.7
Aluminum ('000 tons) — 201 195 NM (2.7)
Power wheeled units (mn units) — 1,910 2,450 NM 28.3
Refined Zinc ('000 tons) — 196 195 NM (0.5)
Refined Lead ('000 tons) — 31 26 NM (14.9)
Silver (kg) — 91,000 85,000 NM (6.6)
We expect EBITDA on sequential basis will increase in (1) power business on higher generation and improved realization (Rs3.5 bn, +23% qoq) and (2) Cairn India (up 14% yoy to Rs37.6 bn)
Copper business will report a decline in EBITDA (Rs 2.8 bn,-30% qoq) after an accident impacted production in copper mines of Tasmania. We estimate 13% qoq decline in Zinc Internatianal EBITDA to Rs3.4 bn on decline in production volumes.
We expect qoq increase in EBITDA driven by (1) decline in power costs and (2) marginal improvement in alumina realizations.
Despite lower EBITDA, we expect PAT to increase aided by higher other incom; it was lower in 2QFY14 due to MTM losses. However, the we expect other income to be still lower than quarterly run rate of Rs5.5 bn due to losses in tax free bonds.
We expect flat rolled shipments of 645K tons (flat yoy)
With the partial shutdown of smelter pot lines (198 pots), we expect aluminum production at 75K tons (flat qoq). Alumina sales will be high - we model 355,000 tons.
Other income will decline qoq as 2QFY14 numbers included dividend income from subsdiary and non recurring income of Rs0.6 bn.
We forecast aluminum EBIT of Rs2.2 bn (+5% yoy) and copper EBIT of Rs2.2 bn (+2% yoy). Decline in power and fuel costs/improved realization will drive 19% qoq increase in EBITDA.
We estimate adjusted EBITDA/ton at at US$263 (-13% qoq, -3% yoy). We expect yoy EBITDA will decline in North America (-2% yoy) and Asia (-9% yoy) while it will improve in South America (+ 10% yoy).
We expect a sequential decline in EBITDA due to (1) lower lead and silver volumes from lower lead mined-in-concentrate. We estimate volumes of 195K tons of zinc, 26K tons of lead and 85 tons of silver, (2) increase in power cost. Note that HZ uses higher proportion of imported coal,, cost of which has inceased.
Notes: (1) 2QFY14 results for Sesa Sterlite are on a pro forma basis and 3QFY13 results pertain to pre-merger Sesa Goa.
Source: Company, Kotak Institutional Equities estimates

KO
TAK INSTITUTIO
NAL EQ
UITIES RESEARCH 66
In
dia D
aily Sum
mary - Jan
uary
Ind
ia Daily Su
mm
ary - Janu
ary 9, 2014
December 2013: Results calendar
Mon Tue Wed Thu Fri Sat Sun6-Jan 7-Jan 8-Jan 9-Jan 10-Jan 11-Jan 12-Jan
Indusind BankInfosys
13-Jan 14-Jan 15-Jan 16-Jan 17-Jan 18-Jan 19-JanExide Inds NIIT Tech Bajaj Finserv Axis Bank HDFC Bank
BAJFINANCE Bajaj Auto Hindustan ZincDCB Bank Bajaj Holdings ITCYes Bank HCL Tech Wipro
LIC Housing FinMindtreeSouth Indian BankRallis IndiaD B CORP
20-Jan 21-Jan 22-Jan 23-Jan 24-Jan 25-Jan 26-JanAsian Paints Ashok Leyland Alembic Pharma Amara Raja Bharat Elect ICRA
Colgate Palmolive Biocon Cairn India Coromandel Intl Persistent SysThermax Dabur India Essar Ports Karnataka BankTorrent Pharma HDFC Mahindra Lifesp
Mahindra & Mah Fin
27-Jan 28-Jan 29-Jan 30-Jan 31-Jan 1-Feb 2-FebShree Cement JSW Steel CHOLAFIN Container Corp Grasim Inds
Maruti Suzuki ICICI Bank IDFCPidilite Inds Magma Fin
3-Feb 4-Feb 5-Feb 6-Feb 7-Feb 8-Feb 9-Feb
Source: BSE, NSE, Kotak Institutional Equities

In
dia D
aily Sum
mary - Jan
uary 9, 2014
67
KOTAK IN
STITUTIO
NAL EQ
UITIES RESEARCH
Kotak Institutional Equities: Valuation summary of KIE Universe stocks
8-Jan-14 Mkt cap.O/S
shares EPS (Rs) EPS growth (%) PER (X) EV/EBITDA (X) RoE (%)Target price Upside
ADVT-3mo
Company Price (Rs) Rating (Rs mn) (US$ mn) (mn) 2013 2014E 2015E 2013 2014E 2015E 2013 2014E 2015E 2013 2014E 2015E 2013 2014E 2015E 2013 2014E 2015E 2013 2014E 2015E (Rs) (%) (US$ mn)Automobiles
Amara Raja Batteries 332 ADD 56,752 913 171 16.8 20.1 22.5 33.3 19.5 12.0 19.8 16.6 14.8 11.9 10.0 8.5 5.4 4.3 3.5 0.8 1.2 1.4 30.4 28.8 26.1 340 2.3 1.5
Apollo Tyres 113 BUY 56,811 914 504 12.2 16.0 17.0 49.5 31.4 6.4 9.3 7.1 6.6 5.4 4.6 3.6 1.5 1.2 1.0 0.4 0.6 0.6 19.7 21.3 18.7 125 10.9 14.3
Ashok Leyland 18 REDUCE 48,557 781 2,661 0.5 (2.1) 0.3 (74.5) (479.9) 116.8 33.7 (8.9) 52.7 10.4 40.6 10.4 1.0 1.1 1.1 3.3 — — 12.6 (16.7) 3.1 15 (17.8) 3.2
Bajaj Auto 1,918 BUY 555,156 8,927 289 105.2 118.9 143.3 1.3 13.0 20.5 18.2 16.1 13.4 13.4 12.4 10.5 6.9 5.6 4.6 2.3 2.5 3.0 43.2 38.5 37.9 2,500 30.3 12.5
Bharat Forge 332 SELL 78,712 1,266 237 11.3 17.3 18.1 (35.2) 53.2 4.8 29.4 19.2 18.3 12.5 9.4 8.9 3.1 2.7 2.4 1.0 0.9 1.1 13.5 12.4 13.7 270 (18.6) 2.3
Exide Industries 118 ADD 100,173 1,611 850 6.2 6.8 8.1 13.4 11.3 18.5 19.2 17.2 14.5 12.7 11.2 9.6 2.9 2.6 2.3 1.4 1.5 1.8 16.1 16.0 16.9 135 14.6 3.5
Hero Motocorp 2,065 REDUCE 412,311 6,630 200 106.1 109.6 143.2 (10.9) 3.4 30.7 19.5 18.8 14.4 15.6 13.2 9.7 7.6 6.0 4.8 2.9 1.6 2.4 44.0 37.4 38.6 2,000 (3.1) 10.8
Mahindra & Mahindra 909 BUY 510,724 8,212 562 63.0 63.2 71.5 22.7 0.2 13.1 14.4 14.4 12.7 10.0 10.1 8.9 3.3 2.9 2.6 1.6 1.9 2.1 24.4 20.6 20.1 1,130 24.4 15.1
Maruti Suzuki 1,838 SELL 555,072 8,926 302 79.2 94.5 105.0 39.9 19.4 11.1 23.2 19.4 17.5 14.1 11.3 9.5 2.9 2.6 2.3 0.4 0.6 0.6 13.9 14.1 13.9 1,475 (19.7) 22.1
Motherson Sumi Systems 198 BUY 174,768 2,810 882 5.0 8.8 13.5 71.2 74.1 54.0 39.3 22.6 14.7 12.2 8.9 5.7 7.6 5.7 4.0 0.7 1.3 2.0 26.8 36.8 32.4 205 3.5 2.2
Tata Motors 370 ADD 1,191,408 19,158 3,218 30.7 37.7 46.5 (31.1) 22.5 23.5 12.0 9.8 8.0 6.2 5.0 4.2 3.0 2.3 1.8 0.5 — — 27.5 26.6 25.0 385 4.0 46.0
Automobiles Neutral 3,740,445 60,146 (10.3) 17.2 17.4 15.7 13.4 11.4 8.9 7.5 6.1 3.6 2.9 2.4 1.3 1.0 1.3 22.7 21.8 21.0 133.3
Banks/Financial Institutions
Axis Bank 1,212 ADD 567,044 9,118 468 110.7 123.7 133.3 7.8 11.7 7.8 10.9 9.8 9.1 — — — 1.7 1.5 1.4 1.5 1.9 2.2 18.5 16.4 15.6 1,375 13.5 55.0
Bajaj Finserv 738 BUY 117,478 1,889 159 103.4 86.1 88.2 9.1 (16.8) 2.5 7.1 8.6 8.4 — — — 1.5 1.3 1.1 1.8 1.8 1.8 25.7 16.3 14.6 825 11.7 0.5
Bank of Baroda 630 REDUCE 266,017 4,278 423 106.0 90.9 112.5 (12.7) (14.3) 23.7 5.9 6.9 5.6 — — — 0.9 0.9 0.8 3.4 2.9 3.6 15.6 11.8 13.3 620 (1.5) 21.6
Bank of India 242 ADD 144,417 2,322 597 46.1 48.4 59.4 (1.1) 5.1 22.6 5.3 5.0 4.1 — — — 0.8 0.7 0.7 4.1 4.3 5.3 12.9 12.1 13.5 220 (9.1) 18.1
Canara Bank 274 REDUCE 125,881 2,024 459 64.8 40.7 62.5 (12.5) (37.2) 53.5 4.2 6.7 4.4 — — — 0.6 0.6 0.6 4.6 4.4 4.4 12.1 7.3 10.4 255 (7.0) 12.0
City Union Bank 51 BUY 27,243 438 539 6.0 6.8 7.0 (13.0) 13.9 2.6 8.5 7.4 7.2 — — — 1.7 1.3 1.2 1.7 2.0 2.0 22.3 19.7 16.9 60 18.7 0.5
Dev Credit Bank 58 BUY 14,531 234 250 4.1 6.1 6.4 78.3 50.3 3.9 14.2 9.5 9.1 — — — 1.6 1.4 1.2 — — — 11.6 15.0 13.5 60 3.3 1.2
Federal Bank 83 BUY 71,075 1,143 855 9.8 7.9 11.7 7.9 (18.9) 47.3 8.5 10.5 7.1 — — — 1.2 1.1 0.9 2.2 1.8 2.6 13.9 10.2 13.7 90 8.3 4.3
HDFC 804 ADD 1,243,729 19,999 1,546 31.4 36.1 41.1 12.3 15.2 13.7 25.7 22.3 19.6 — — — 5.0 4.4 4.0 1.6 1.8 2.0 22.0 21.1 21.4 850 5.7 32.5
HDFC Bank 665 REDUCE 1,581,600 25,432 2,379 28.3 35.7 44.5 28.4 26.3 24.5 23.5 18.6 15.0 — — — 4.4 3.8 3.2 0.8 1.0 1.3 20.3 21.5 22.6 655 (1.5) 33.3
ICICI Bank 1,054 ADD 1,216,279 19,558 1,154 72.2 77.4 80.5 28.7 7.2 4.1 14.6 13.6 13.1 — — — 1.9 1.7 1.6 1.9 2.2 2.3 13.1 12.8 12.3 1,250 18.6 62.6
IDFC 102 BUY 154,790 2,489 1,512 12.1 13.5 15.0 18.1 10.9 11.6 8.4 7.6 6.8 — — — 1.1 1.0 0.9 2.5 2.6 2.8 14.2 14.1 14.1 140 36.8 18.2
India Infoline 64 ADD 19,423 312 304 9.2 9.0 10.0 102.9 (2.8) 11.5 6.9 7.1 6.4 — — — 1.0 0.9 0.8 4.8 2.4 2.7 15.1 14.1 13.9 65 1.8 0.2
IndusInd Bank 422 BUY 220,599 3,547 523 20.3 24.6 28.4 18.3 21.1 15.4 20.8 17.2 14.9 — — — 3.0 2.6 2.3 0.7 0.9 1.0 18.3 17.0 16.3 470 11.4 17.4
ING Vysya Bank 591 ADD 109,184 1,756 185 39.6 36.8 43.9 30.2 (7.1) 19.3 14.9 16.1 13.5 — — — 2.4 1.6 1.4 0.8 0.9 1.0 14.6 11.9 11.2 620 5.0 1.3
J&K Bank 1,440 REDUCE 69,819 1,123 48 217.6 233.0 207.1 31.4 7.1 (11.1) 6.6 6.2 7.0 — — — 1.4 1.3 1.1 3.5 3.7 3.3 23.6 21.4 16.6 1,250 (13.2) 1.5
Karur Vysya Bank 345 ADD 36,988 595 107 51.3 27.8 63.3 9.7 (45.8) 127.3 6.7 12.4 5.5 — — — 1.2 1.2 1.1 4.1 2.0 4.6 19.0 9.4 19.2 380 10.1 1.2
LIC Housing Finance 210 ADD 106,241 1,708 505 20.3 24.7 27.8 11.9 21.9 12.7 10.4 8.5 7.6 — — — 1.7 1.5 1.3 1.9 2.3 2.6 16.8 17.9 17.6 250 18.8 10.9
L&T Finance Holdings 72 SELL 124,063 1,995 1,715 4.3 3.8 5.0 60.3 (10.1) 29.9 17.0 18.9 14.6 — — — 2.3 2.0 1.7 — — — 14.3 11.3 12.7 60 (17.1) 4.5
Magma Fincorp 69 BUY 13,034 210 190 6.5 8.1 11.0 100.6 23.8 36.3 10.5 8.5 6.2 — — — 0.9 0.9 0.8 1.6 1.9 2.5 10.1 10.4 13.0 110 60.3 0.1
Mahindra & Mahindra Financial 294 REDUCE 166,976 2,685 568 15.5 18.6 21.3 28.6 20.0 14.5 18.9 15.8 13.8 — — — 3.8 3.3 2.8 1.2 1.5 1.7 23.8 21.9 21.4 240 (18.3) 3.9
Muthoot Finance 107 NR 42,665 686 397 28.2 29.9 34.9 17.3 6.1 16.7 3.8 3.6 3.1 — — — 1.1 0.8 0.7 3.7 4.2 4.9 31.2 26.2 23.7 — — —
Oriental Bank of Commerce 213 ADD 63,838 1,027 300 45.5 34.7 51.4 16.3 (23.7) 48.1 4.7 6.1 4.1 — — — 0.6 0.6 0.6 4.2 3.3 4.9 10.7 7.9 10.8 240 12.7 7.5
PFC 155 BUY 205,090 3,298 1,319 33.5 35.9 39.3 45.6 7.2 9.3 4.6 4.3 4.0 — — — 0.9 0.8 0.8 4.5 4.8 5.3 19.8 18.3 17.5 185 19.0 6.2
Punjab National Bank 610 REDUCE 220,989 3,554 362 134.3 95.3 134.6 (6.7) (29.1) 41.3 4.5 6.4 4.5 — — — 0.8 0.8 0.7 4.3 3.1 4.4 16.5 10.5 13.4 610 (0.1) 17.8
Reliance Capital 355 ADD 87,461 1,406 246 26.9 18.6 27.4 27.5 (30.8) 47.4 13.2 19.1 12.9 — — — 0.8 0.7 0.7 2.3 1.6 2.3 5.9 3.9 5.6 480 35.1 19.1
Rural Electrification Corp. 209 ADD 206,661 3,323 987 38.7 44.7 47.6 35.3 15.5 6.5 5.4 4.7 4.4 — — — 1.2 1.2 1.0 3.9 3.8 4.5 23.7 23.0 20.6 250 19.4 4.8
Shriram City Union Finance 1,065 NR 62,995 1,013 59 81.2 84.0 104.4 23.4 3.5 24.3 13.1 12.7 10.2 — — — 2.8 2.2 1.9 0.7 1.0 1.3 22.6 19.5 19.9 — — 0.2
Shriram Transport 628 ADD 140,065 2,252 223 61.0 61.8 74.2 8.2 1.4 20.1 10.3 10.2 8.5 — — — 2.0 1.8 1.5 1.1 1.4 1.7 20.6 17.8 18.3 670 6.7 3.5
State Bank of India 1,657 ADD 1,151,337 18,514 695 206.2 162.1 193.2 18.2 (21.4) 19.2 8.0 10.2 8.6 — — — 1.5 1.5 1.3 2.8 2.6 2.7 15.4 10.9 11.8 1,950 17.7 64.0
Union Bank 129 ADD 77,165 1,241 597 36.0 27.5 36.4 11.5 (23.7) 32.7 3.6 4.7 3.5 — — — 0.6 0.5 0.5 6.2 4.7 6.2 15.0 10.0 12.2 140 8.3 11.1
Yes Bank 356 REDUCE 127,813 2,055 359 36.3 33.1 36.4 31.0 (8.7) 10.0 9.8 10.8 9.8 — — — 2.2 1.9 1.6 1.7 1.5 1.7 24.8 20.4 17.9 320 (10.2) 49.6
Banks/Financial Institutions Cautious 8,782,490 141,223 17.8 (1.7) 17.8 10.7 10.9 9.2 — — — 1.8 1.6 1.5 2.0 2.1 2.4 16.7 15.1 15.9 487.8
Cement
ACC 1,083 REDUCE 203,540 3,273 188 73.7 49.5 59.2 29.1 (32.8) 19.4 14.7 21.9 18.3 8.9 11.7 9.0 2.6 2.4 2.3 3.2 2.2 2.2 19.5 12.2 13.5 1,100 1.5 5.4
Ambuja Cements 175 SELL 265,959 4,277 1,522 10.3 7.7 9.5 32.8 (25.5) 23.9 16.9 22.7 18.3 9.4 13.1 11.4 2.8 2.8 2.6 1.6 1.6 2.4 17.8 12.3 14.4 155 (11.3) 4.7
Grasim Industries 2,600 ADD 238,665 3,838 92 272.4 268.9 279.0 (5.6) (1.3) 3.8 9.5 9.7 9.3 7.2 6.4 5.1 1.2 1.1 1.0 0.9 1.3 1.3 13.6 11.9 11.2 3,000 15.4 3.3
India Cements 58 ADD 17,878 287 307 6.8 3.5 5.9 (24.4) (48.9) 70.1 8.6 16.8 9.9 4.4 5.5 4.3 0.4 0.4 0.4 3.7 4.6 4.6 5.2 2.6 4.3 70 20.3 1.8
Shree Cement 4,510 SELL 157,114 2,526 35 307.0 256.7 299.5 92.3 (16.4) 16.7 14.7 17.6 15.1 9.7 10.4 9.2 4.2 3.6 3.0 0.4 0.4 0.4 33.3 21.9 21.6 3,950 (12.4) 1.1
UltraTech Cement 1,701 REDUCE 466,339 7,499 274 101.3 87.6 105.5 13.4 (13.5) 20.4 16.8 19.4 16.1 10.4 10.8 8.6 2.7 2.4 2.1 0.6 0.6 0.6 18.9 14.7 15.5 1,650 (3.0) 4.4
Cement Cautious 1,349,494 21,700 16.2 (16.2) 15.9 14.2 16.9 14.6 8.6 9.3 7.6 2.2 2.0 1.8 1.3 1.2 1.4 15.3 11.7 12.3 20.8
Price/BV (X) Dividend yield (%)
Source: Company, Bloomberg, Kotak Institutional Equities estimates

KO
TAK INSTITUTIO
NAL EQ
UITIES RESEARCH 68
In
dia D
aily Sum
mary - Jan
uary
Ind
ia Daily Su
mm
ary - Janu
ary 9, 2014
Kotak Institutional Equities: Valuation summary of KIE Universe stocks
8-Jan-14 Mkt cap.O/S
shares EPS (Rs) EPS growth (%) PER (X) EV/EBITDA (X) Price/BV (X) RoE (%)Target price Upside
ADVT-3mo
Company Price (Rs) Rating (Rs mn) (US$ mn) (mn) 2013 2014E 2015E 2013 2014E 2015E 2013 2014E 2015E 2013 2014E 2015E 2013 2014E 2015E 2013 2014E 2015E 2013 2014E 2015E (Rs) (%) (US$ mn)Consumer products
Asian Paints 491 SELL 470,488 7,565 959 11.6 13.1 15.3 12.7 12.9 16.9 42.2 37.4 32.0 26.8 22.6 19.3 13.3 11.1 9.4 0.9 1.1 1.4 36.3 34.0 33.6 440 (10.3) 9.4
Bajaj Corp. 215 BUY 31,676 509 148 11.3 12.7 14.9 38.4 12.5 17.9 19.1 17.0 14.4 17.4 15.7 13.0 6.6 5.8 5.1 3.0 3.4 4.0 26.4 32.4 32.2 255 18.7 0.5
Colgate-Palmolive (India) 1,336 SELL 181,741 2,922 136 36.5 35.5 41.5 11.3 (2.7) 16.7 36.6 37.6 32.2 27.0 27.1 22.4 38.9 31.8 29.8 2.1 2.1 2.5 107.4 89.2 92.0 1,200 (10.2) 2.5
Dabur India 174 ADD 303,265 4,876 1,743 4.4 5.4 6.4 19.0 22.6 18.8 39.5 32.2 27.1 31.0 25.9 21.8 14.3 11.4 9.2 0.9 1.1 1.4 40.0 39.4 37.6 190 9.2 4.5
GlaxoSmithKline Consumer 4,329 SELL 182,077 2,928 42 103.9 123.0 146.3 23.0 18.4 19.0 41.7 35.2 29.6 36.0 32.2 26.9 14.0 11.9 10.1 1.0 1.3 1.7 34.9 35.0 35.6 4,100 (5.3) 0.7
Godrej Consumer Products 830 REDUCE 282,551 4,543 340 20.3 23.6 29.6 20.4 16.5 25.2 41.0 35.2 28.1 30.9 24.7 19.4 8.0 6.8 5.7 0.6 0.7 0.8 22.6 22.4 23.7 800 (3.6) 2.2
Hindustan Unilever 559 REDUCE 1,209,162 19,443 2,163 15.4 16.4 18.3 28.1 6.7 11.2 36.3 34.0 30.6 29.8 26.7 23.2 49.0 35.4 28.7 3.3 2.0 2.2 103.1 113.0 98.3 560 0.2 12.2
ITC 317 ADD 2,509,445 40,352 7,920 9.3 10.6 12.1 19.0 13.5 14.4 34.0 29.9 26.1 23.9 20.8 17.7 10.7 9.5 8.6 1.7 2.0 2.4 36.1 35.9 37.1 365 15.2 34.4
Jubilant Foodworks 1,269 SELL 83,734 1,346 66 19.9 22.5 30.6 21.7 13.0 35.9 63.6 56.3 41.4 34.5 28.4 21.2 19.5 15.1 11.8 — 0.3 0.5 36.1 30.3 32.3 925 (27.1) 5.8
Jyothy Laboratories 194 ADD 35,055 564 181 3.9 6.9 11.5 40.5 77.3 67.6 49.9 28.1 16.8 32.0 20.3 15.3 5.4 3.6 3.1 1.2 1.3 1.3 9.9 15.5 20.1 215 11.0 0.5
Marico 220 REDUCE 141,988 2,283 645 5.6 7.6 8.8 8.0 35.8 15.1 39.2 28.8 25.1 24.2 19.8 17.2 7.0 8.4 6.7 0.2 0.7 1.0 18.3 30.2 27.8 215 (2.4) 1.2
Nestle India 5,422 SELL 522,828 8,407 96 110.8 117.3 140.2 11.1 5.9 19.5 49.0 46.2 38.7 28.9 25.6 22.0 26.7 21.2 17.1 0.9 1.0 1.3 71.6 58.1 54.2 4,500 (17.0) 4.9
Page Industries 5,372 ADD 59,914 963 11 100.9 141.5 182.7 25.1 40.3 29.1 53.2 38.0 29.4 34.4 24.8 19.2 27.3 20.0 14.8 0.9 1.1 1.4 59.3 62.3 58.9 5,300 (1.3) 0.4
Speciality Restaurants 129 BUY 6,033 97 47 5.0 4.4 5.2 1.8 (11.6) 17.4 25.8 29.1 24.8 16.2 15.3 12.1 2.1 2.0 1.8 0.8 1.2 1.6 11.6 6.9 7.5 145 12.8 0.3
Tata Global Beverages 157 ADD 97,150 1,562 618 6.3 6.8 7.7 14.8 6.9 13.5 24.8 23.2 20.4 14.6 12.3 10.7 1.7 1.6 1.5 1.4 1.6 1.9 8.4 8.6 9.2 155 (1.3) 7.4
Titan Industries 223 REDUCE 197,754 3,180 888 8.2 8.8 10.0 20.9 7.2 14.4 27.3 25.4 22.2 18.4 17.9 14.6 10.0 8.0 6.5 0.9 1.2 1.4 42.3 35.0 32.2 260 16.7 6.6
United Breweries 788 SELL 208,232 3,348 264 6.5 6.7 11.9 36.2 2.6 77.5 120.6 117.5 66.2 46.0 41.0 27.7 13.8 14.3 12.1 0.1 0.1 0.2 11.8 11.6 19.3 650 (17.5) 6.0
United Spirits 2,706 BUY 393,279 6,324 145 9.1 31.9 65.4 (33.4) 251.7 104.9 298.4 84.8 41.4 36.0 33.3 21.5 8.2 4.9 4.5 0.1 0.1 0.2 2.8 7.3 11.3 2,700 (0.2) 40.1
Consumer products Cautious 6,916,372 111,215 19.2 16.6 19.1 39.6 33.9 28.5 26.9 23.5 19.5 12.2 10.2 8.9 1.5 1.5 1.8 30.7 30.1 31.4 139.9
Constructions
NCC 31 ADD 7,864 126 257 2.4 2.1 2.5 74.2 (14.3) 17.3 12.5 14.6 12.5 6.2 6.9 6.5 0.3 0.3 0.3 1.0 3.3 3.3 2.6 2.2 2.5 40 30.5 1.0
Sadbhav Engineering 92 BUY 15,722 253 171 4.9 5.4 9.2 (47.3) 9.4 71.0 18.7 17.1 10.0 14.3 7.9 5.9 1.8 1.4 1.2 0.6 0.7 0.7 8.6 7.9 12.0 160 74.5 0.2
Construction Cautious 33,910 545 (62.7) 72.2 95.4 31.5 18.3 9.4 6.8 6.2 5.5 0.6 0.5 0.5 0.5 1.2 1.4 1.8 2.8 5.3 1.3
Energy
Aban Offshore 432 RS 18,814 303 44 38.6 77.2 98.5 (43.5) 99.8 27.7 11.2 5.6 4.4 7.8 7.3 6.5 0.6 0.7 0.6 0.8 1.2 1.2 6.4 14.9 15.6 — — 11.4
Bharat Petroleum 318 BUY 229,614 3,692 723 36.6 36.0 34.9 99.2 (1.5) (3.2) 8.7 8.8 9.1 6.4 6.0 6.5 1.3 1.2 1.1 3.5 3.4 3.3 14.5 12.9 11.5 440 38.6 7.3
Cairn india 328 ADD 625,604 10,060 1,910 63.1 62.7 55.3 51.7 (0.7) (11.8) 5.2 5.2 5.9 4.2 3.9 4.0 1.3 1.1 1.0 3.5 3.7 3.7 24.8 22.7 17.2 370 13.0 11.7
Castrol India 299 SELL 147,923 2,379 495 9.0 9.9 10.4 (4.4) 9.0 5.7 33.1 30.3 28.7 22.8 20.6 19.2 25.3 23.9 37.9 2.3 2.7 2.8 79.0 81.1 102.1 230 (23.1) 0.8
GAIL (India) 346 ADD 438,831 7,056 1,268 36.0 34.8 36.5 18.4 (3.5) 5.0 9.6 10.0 9.5 6.5 6.7 5.7 1.7 1.5 1.3 2.8 2.8 3.0 17.5 14.9 13.8 410 18.5 4.8
GSPL 58 ADD 32,581 524 563 9.6 8.7 7.6 2.6 (8.8) (13.1) 6.1 6.6 7.6 3.8 3.9 4.2 1.0 0.9 0.8 1.7 1.7 2.6 17.6 13.7 10.6 75 29.5 0.5
Hindustan Petroleum 217 ADD 73,616 1,184 339 24.8 12.5 21.0 (7.6) (49.6) 68.2 8.8 17.4 10.3 8.2 10.3 7.7 0.4 0.4 0.4 3.9 1.8 3.1 4.7 2.3 3.7 240 10.5 4.1
Indian Oil Corporation 196 ADD 474,664 7,633 2,428 16.8 11.8 26.6 (48.8) (30.0) 125.8 11.6 16.6 7.3 9.3 7.4 4.6 0.8 0.7 0.7 3.2 3.8 6.9 6.2 4.0 8.8 250 27.9 1.8
Oil India 464 BUY 278,959 4,486 601 59.7 57.0 62.8 4.1 (4.6) 10.2 7.8 8.1 7.4 3.2 2.8 2.4 1.4 1.3 1.2 6.5 6.2 6.9 15.9 14.2 14.6 600 29.3 2.5
Oil & Natural Gas Corporation 273 BUY 2,337,368 37,585 8,556 29.4 32.1 36.6 (10.5) 9.2 14.0 9.3 8.5 7.5 3.7 3.3 2.7 1.2 1.1 1.0 3.5 3.7 4.2 13.3 13.2 13.6 340 24.5 13.2
Petronet LNG 122 BUY 91,575 1,473 750 15.3 10.4 12.0 8.7 (32.0) 15.3 8.0 11.7 10.2 5.8 7.4 6.2 1.9 1.6 1.4 2.0 2.0 2.3 25.6 14.4 14.5 165 35.1 2.3
Reliance Industries 849 BUY 2,492,811 40,084 2,936 65.0 69.4 77.9 6.2 6.7 12.3 13.1 12.2 10.9 8.5 8.4 6.8 1.3 1.2 1.1 1.1 1.1 1.2 11.3 11.1 11.3 980 15.4 40.4
Energy Attractive 7,242,359 116,457 0.1 2.1 12.5 9.5 9.3 8.3 5.9 5.4 4.5 1.2 1.1 1.0 2.6 2.7 3.2 13.0 12.1 12.4 100.8
Industrials
ABB 663 SELL 140,538 2,260 212 6.7 9.8 19.7 (23.6) 47.6 100.2 99.7 67.6 33.7 58.3 36.8 20.6 5.4 5.2 4.6 0.5 0.5 0.5 5.5 7.8 14.4 450 (32.1) 2.1
Bharat Electronics 1,019 REDUCE 81,508 1,311 80 113.6 103.6 114.6 6.8 (8.8) 10.6 9.0 9.8 8.9 5.3 4.8 4.6 1.2 1.1 1.0 2.9 2.9 2.9 14.5 12.0 12.2 1,075 5.5 0.4
Bharat Heavy Electricals 163 SELL 398,714 6,411 2,448 27.0 15.0 11.7 (6.0) (44.5) (21.8) 6.0 10.9 13.9 3.9 7.1 8.8 1.3 1.2 1.1 3.3 2.0 1.5 23.7 11.5 8.4 105 (35.5) 15.1
Crompton Greaves 126 ADD 79,627 1,280 630 1.3 5.1 8.8 (77.2) 293.4 70.5 96.8 24.6 14.4 22.5 11.9 8.9 2.2 2.1 1.9 1.0 1.1 1.3 2.3 8.8 13.8 135 6.8 5.0
Cummins India 472 REDUCE 130,728 2,102 277 28.3 21.4 23.0 28.3 (24.5) 7.8 16.7 22.1 20.5 16.3 20.3 18.9 5.5 4.9 4.5 2.8 2.0 2.1 34.5 22.6 21.4 400 (15.2) 2.0
Kalpataru Power Transmission 86 BUY 13,213 212 153 8.8 11.9 16.0 (34.1) 36.1 33.8 9.8 7.2 5.4 6.4 5.7 5.1 0.7 0.6 0.6 1.7 1.7 1.7 6.8 8.4 10.4 120 39.4 0.4
KEC International 56 BUY 14,410 232 257 2.5 5.1 8.6 (63.1) 101.9 68.9 22.1 10.9 6.5 7.8 6.3 4.9 1.2 1.1 1.0 0.9 1.4 2.3 5.5 10.4 15.8 68 21.3 0.4
Larsen & Toubro 998 REDUCE 921,577 14,819 923 52.4 48.2 58.0 4.4 (8.1) 20.5 19.1 20.7 17.2 15.3 15.1 13.7 2.7 2.4 2.1 1.2 1.3 1.4 15.2 12.2 13.0 970 (2.8) 40.7
Siemens 631 SELL 222,130 3,572 352 4.9 17.6 22.3 (64.4) 260.6 27.0 129.4 35.9 28.2 42.6 17.1 14.0 5.7 5.3 4.9 0.4 0.8 0.9 4.4 15.4 18.0 400 (36.6) 4.0
Thermax 692 REDUCE 82,440 1,326 119 25.5 25.2 31.3 (22.5) (1.3) 24.1 27.1 27.5 22.1 18.3 17.5 14.8 4.4 4.0 3.6 1.0 1.0 1.3 17.4 15.2 17.0 540 (22.0) 0.7
Voltas 117 BUY 38,609 621 331 5.9 6.0 8.3 (39.7) 1.2 39.2 19.8 19.6 14.1 14.3 13.2 8.5 2.4 2.2 2.0 1.6 1.5 2.1 12.5 11.6 14.8 110 (5.8) 6.0
Industrials Cautious 2,123,492 34,146 (6.6) (19.4) 9.8 14.9 18.5 16.9 11.6 13.0 12.2 2.4 2.1 1.9 1.7 1.4 1.4 15.8 11.5 11.5 76.7
Dividend yield (%)
Source: Company, Bloomberg, Kotak Institutional Equities estimates

In
dia D
aily Sum
mary - Jan
uary 9, 2014
69
KOTAK IN
STITUTIO
NAL EQ
UITIES RESEARCH
Kotak Institutional Equities: Valuation summary of KIE Universe stocks
8-Jan-14 Mkt cap.O/S
shares EPS (Rs) EPS growth (%) PER (X) EV/EBITDA (X) Price/BV (X) RoE (%)Target price Upside
ADVT-3mo
Company Price (Rs) Rating (Rs mn) (US$ mn) (mn) 2013 2014E 2015E 2013 2014E 2015E 2013 2014E 2015E 2013 2014E 2015E 2013 2014E 2015E 2013 2014E 2015E 2013 2014E 2015E (Rs) (%) (US$ mn)Infrastructure
Adani Port and SEZ 151 ADD 304,131 4,890 2,017 8.0 7.4 11.4 47.3 (7.8) 53.2 18.7 20.3 13.3 17.7 14.0 10.0 4.7 3.6 3.0 0.8 0.8 1.2 28.2 20.1 24.6 150 (0.5) 6.5
Container Corporation 755 BUY 147,229 2,367 195 48.2 51.6 59.4 7.1 7.0 15.2 15.7 14.6 12.7 11.3 10.3 8.5 2.3 2.1 1.9 1.5 1.6 1.8 15.8 15.1 15.6 850 12.6 0.4
GMR Infrastructure 23 RS 88,747 1,427 3,892 (1.8) (3.7) (2.6) (56.2) (108.7) 30.1 (12.9) (6.2) (8.8) 18.4 14.6 8.0 1.0 1.2 1.4 — — — (9.3) (21.9) (18.8) — — 2.7
Gujarat Pipavav Port 63 BUY 30,360 488 483 1.5 3.7 4.9 29.7 145.0 31.6 41.0 16.8 12.7 16.8 11.7 8.9 2.5 2.2 1.9 — — — 7.6 16.6 16.8 75 19.4 0.8
IRB Infrastructure 94 ADD 31,392 505 332 16.7 15.5 14.7 11.1 (7.2) (5.3) 5.6 6.1 6.4 6.4 7.0 6.7 0.9 0.7 0.7 4.2 4.2 4.2 17.4 13.3 10.8 100 5.9 5.0
Infrastructure Cautious 601,859 9,678 19.5 (29.7) 80.1 24.0 34.2 19.0 14.6 12.3 8.5 2.3 2.1 2.0 1.0 1.0 1.3 9.5 6.2 10.3 15.4
Media
DB Corp 310 ADD 56,826 914 183 11.9 14.5 16.7 7.9 22.3 15.1 26.1 21.3 18.5 14.7 12.1 10.6 5.5 5.0 4.5 1.8 2.3 2.9 22.3 24.5 25.5 300 (3.2) 0.3
DishTV 55 ADD 58,670 943 1,065 (1.2) (0.4) 0.7 (22.3) 64.2 259.9 (44.4) (124.0) 77.5 11.8 10.7 9.3 (37.8) (29.0) (46) — — — 106.0 26.4 (46) 60 8.9 3.7
Eros International 182 ADD 16,688 268 92 17.2 19.5 23.2 4.6 13.0 19.1 10.5 9.3 7.8 7.0 6.2 5.1 1.7 1.4 1.2 — — — 17.2 16.4 16.5 180 (1.0) 0.9
Jagran Prakashan 85 ADD 26,850 432 316 5.1 5.5 6.7 (10.4) 8.1 22.5 16.8 15.5 12.7 9.8 8.3 7.0 2.9 2.7 2.5 2.5 3.7 4.2 19.0 18.0 20.5 120 41.3 0.3
Sun TV Network 372 ADD 146,696 2,359 394 18.0 19.1 22.5 2.4 6.0 18.0 20.7 19.5 16.5 13.1 11.8 10.1 5.0 4.7 4.4 2.6 3.2 4.0 26.5 25.8 28.4 430 15.5 4.9
Zee Entertainment Enterprises 285 REDUCE 270,940 4,357 950 7.6 9.3 11.0 25.6 22.5 19.0 37.7 30.8 25.8 26.7 21.0 17.3 5.5 5.1 4.9 0.6 0.8 0.9 15.3 17.5 19.5 250 (12.3) 8.9
Media Neutral 604,202 9,716 8.3 20.1 24.5 29.0 24.2 19.4 14.9 12.7 10.6 4.7 4.4 4.0 1.3 1.7 2.2 16.2 18.0 20.7 19.1
Metals & Mining
Coal India 289 BUY 1,824,166 29,333 6,316 27.5 27.1 30.5 18.1 (1.3) 12.5 10.5 10.6 9.5 6.1 5.4 4.3 3.6 3.2 2.8 4.8 4.8 5.4 37.2 31.5 31.1 360 24.7 12.8
Hindalco Industries 115 REDUCE 237,943 3,826 2,065 15.8 12.7 13.3 (10.9) (19.4) 4.3 7.3 9.1 8.7 9.1 8.9 7.3 0.7 0.6 0.6 1.1 1.2 1.2 9.0 7.1 6.8 110 (4.6) 15.4
Hindustan Zinc 130 ADD 549,250 8,832 4,225 16.4 15.8 16.7 24.2 (3.5) 5.6 7.9 8.2 7.8 5.2 4.2 3.4 1.7 1.5 1.3 2.4 2.4 2.4 23.5 19.2 17.6 160 23.1 2.6
Jindal Steel and Power 258 REDUCE 241,506 3,883 935 31.1 20.5 22.2 (26.6) (34.3) 8.5 8.3 12.6 11.6 7.4 9.3 6.9 1.1 1.1 1.0 0.7 0.7 0.7 14.9 8.7 8.7 240 (7.1) 11.0
JSW Steel 1,026 SELL 248,075 3,989 242 32.9 94.0 106.1 (46.2) 185.9 12.9 31.2 10.9 9.7 7.1 6.4 5.9 1.2 1.1 1.0 0.9 0.9 0.9 4.2 10.5 11.1 710 (30.8) 12.9
National Aluminium Co. 37 REDUCE 95,487 1,535 2,577 2.3 2.5 2.9 (31.2) 7.6 18.5 16.1 15.0 12.6 5.2 5.9 5.1 0.8 0.8 0.8 3.4 3.4 3.4 5.0 5.3 6.1 35 (5.5) 0.3
NMDC 139 ADD 550,697 8,855 3,965 16.4 15.1 15.6 (11.2) (7.8) 2.9 8.5 9.2 8.9 4.5 4.9 5.1 2.0 1.8 1.7 5.0 5.8 5.8 24.4 20.9 19.9 155 11.6 6.5
Sesa Sterlite 192 ADD 567,734 9,129 2,965 25.8 22.5 21.9 (16.8) (12.8) (2.8) 7.4 8.5 8.8 4.6 4.4 4.4 0.8 0.8 0.7 — — — 3.3 0.1 (0.1) 210 9.7 24.3
Tata Steel 392 ADD 381,181 6,129 971 3.4 40.6 40.9 (86.9) 1,087.7 0.6 114.7 9.7 9.6 7.9 6.5 6.2 1.1 1.0 0.9 2.0 2.0 2.0 0.9 11.0 10.2 395 0.7 37.5
Metals & Mining Neutral 4,696,039 75,512 9.9 2.6 6.7 10.1 9.8 9.2 6.1 5.8 5.2 1.6 1.4 1.3 3.1 3.2 3.4 15.4 14.4 14.1 123.3
Pharmaceutical
Apollo Hospitals 908 REDUCE 126,277 2,031 139 21.9 26.7 31.2 38.5 22.0 16.7 41.5 34.0 29.1 21.7 18.6 15.6 4.6 4.2 3.8 0.6 0.7 0.9 11.6 12.9 13.7 850 (6.4) 2.6
Biocon 475 SELL 93,934 1,510 198 15.5 20.1 24.3 (9.2) 29.6 20.5 30.6 23.6 19.6 17.5 13.7 11.5 3.5 3.2 2.9 1.6 1.2 1.5 20.5 14.1 15.4 370 (22.2) 6.8
Cipla 404 ADD 324,541 5,219 803 17.8 19.2 21.2 27.1 8.2 10.3 22.7 21.0 19.0 15.1 15.3 12.6 3.6 3.1 2.7 0.5 0.5 0.5 15.6 14.9 15.2 450 11.3 8.6
Cadila Healthcare 845 ADD 172,951 2,781 205 29.5 33.1 44.1 (7.5) 12.2 33.3 28.7 25.5 19.2 20.6 18.2 13.9 5.9 5.0 4.2 0.9 0.9 1.2 23.7 21.2 24.1 830 (1.7) 1.7
Divi's Laboratories 1,237 ADD 164,143 2,639 133 45.4 57.4 61.3 12.9 26.4 6.9 27.3 21.6 20.2 19.9 16.4 14.0 6.6 5.5 4.7 1.2 1.5 1.6 26.0 27.8 25.2 1,090 (11.9) 4.2
Dr Reddy's Laboratories 2,532 BUY 431,576 6,940 170 96.0 122.1 139.8 14.2 27.3 14.5 26.4 20.7 18.1 17.6 14.1 12.3 5.9 4.8 4.0 0.6 0.7 0.8 24.0 25.6 24.0 2,700 6.6 10.3
GlaxoSmithKline Pharmaceuticals 2,974 RS 252,083 4,053 85 81.4 84.5 97.5 9.7 3.8 15.5 36.5 35.2 30.5 28.6 27.4 22.9 12.6 11.6 10.4 1.7 1.8 2.0 28.5 34.2 36.0 - (100.0) 2.1
Glenmark Pharmaceuticals 514 ADD 139,246 2,239 271 22.7 27.0 33.0 3.7 19.0 22.3 22.7 19.0 15.6 16.4 12.3 10.5 5.0 4.4 3.6 0.4 0.4 0.4 23.8 24.8 25.5 570 10.9 5.8
Lupin 938 ADD 419,442 6,745 447 29.5 36.0 42.9 52.3 21.9 19.1 31.8 26.1 21.9 19.8 16.5 13.5 8.0 6.4 5.2 0.4 0.7 0.8 28.6 27.5 26.4 950 1.2 9.4
Ranbaxy Laboratories 474 REDUCE 200,461 3,223 423 21.8 (16.7) 17.2 217.7 (176.5) 202.8 21.7 (28.4) 27.6 11.7 29.3 17.9 4.9 7.3 5.0 — — — 26.5 (20.7) 21.4 300 (36.7) 19.7
Sun Pharmaceuticals 601 SELL 1,244,551 20,012 2,071 17.6 24.7 25.6 37.5 40.2 3.9 34.1 24.4 23.4 24.1 17.0 15.6 7.5 6.5 5.1 0.4 0.5 0.5 24.3 28.6 24.4 510 (15.1) 17.5
Pharmaceuticals Attractive 3,569,205 57,393 46.4 3.1 29.0 29.5 28.6 22.2 19.6 16.9 14.4 6.2 5.4 4.5 0.6 0.7 0.8 20.8 19.0 20.1 88.8
Real Estate
DLF 162 ADD 288,406 4,638 1,780 4.3 4.2 9.7 (40.5) (2.7) 132.6 37.7 38.8 16.7 19.7 14.3 11.3 1.0 1.0 0.9 1.2 0.6 0.6 2.7 2.6 5.7 210 29.6 21.4
Godrej Properties 166 ADD 33,092 532 199 8.8 6.9 13.6 40.6 (21.3) 95.6 18.8 23.9 12.2 16.9 17.3 8.9 2.3 1.5 1.4 0.9 1.2 1.2 9.6 7.6 11.6 180 8.3 0.5 HDIL 53 NR 22,354 359 419 1.7 11.0 14.3 (91.0) 528.0 30.4 30.5 4.9 3.7 9.0 7.9 6.8 0.2 0.2 0.2 — — — 0.7 4.3 5.4 — — 8.9 Oberoi Realty 224 BUY 73,524 1,182 328 15.4 19.0 21.7 9.0 23.4 14.4 14.6 11.8 10.3 10.3 8.3 6.5 1.8 1.6 1.4 0.9 0.9 0.9 12.8 14.0 14.2 290 29.5 0.7
Prestige Estates Projects 157 BUY 54,898 883 350 8.2 13.1 17.1 224.5 60.9 30.1 19.2 11.9 9.2 12.7 8.1 6.6 2.0 1.7 1.5 — — — 11.7 15.6 17.4 200 27.5 0.6 Sobha Developers 308 BUY 30,243 486 98 22.1 23.2 36.5 5.4 4.7 57.5 13.9 13.3 8.5 7.9 7.9 5.8 1.4 1.3 1.2 2.3 1.6 1.6 10.5 10.2 14.6 475 54.0 0.8 Sunteck Realty 289 BUY 17,324 279 60 0.7 57.7 24.7 29.0 8,502 (57.2) 430.8 5.0 11.7 405.5 4.0 8.5 3.5 2.1 1.8 — 0.7 0.7 0.7 52.7 16.6 470 62.7 0.1
Real Estate Cautious 519,841 8,359 (32.5) 58.2 43.5 26.6 16.8 11.7 15.5 11.0 9.0 1.1 1.0 0.9 1.0 0.7 0.7 4.0 5.7 7.7 33.1
Dividend yield (%)
Source: Company, Bloomberg, Kotak Institutional Equities estimates
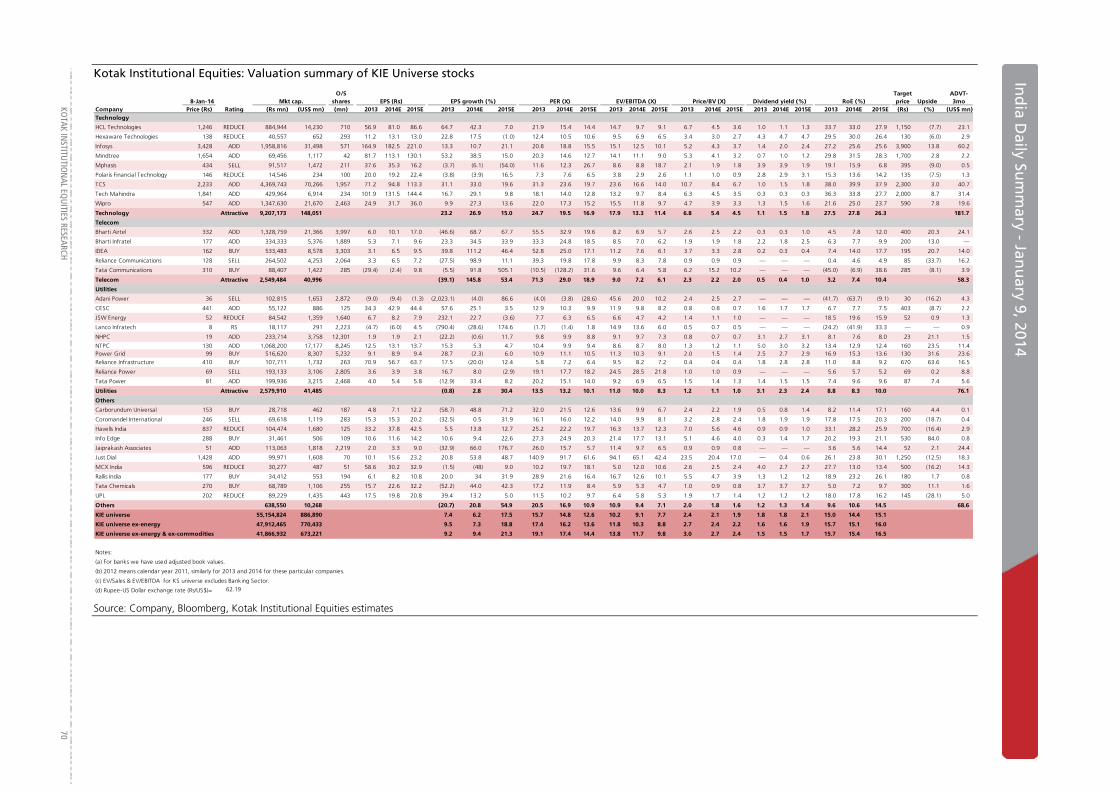
KO
TAK INSTITUTIO
NAL EQ
UITIES RESEARCH 70
In
dia D
aily Sum
mary - Jan
uary
Ind
ia Daily Su
mm
ary - Janu
ary 9, 2014
Kotak Institutional Equities: Valuation summary of KIE Universe stocks
8-Jan-14 Mkt cap.O/S
shares EPS (Rs) EPS growth (%) PER (X) EV/EBITDA (X) Price/BV (X) RoE (%)Target price Upside
ADVT-3mo
Company Price (Rs) Rating (Rs mn) (US$ mn) (mn) 2013 2014E 2015E 2013 2014E 2015E 2013 2014E 2015E 2013 2014E 2015E 2013 2014E 2015E 2013 2014E 2015E 2013 2014E 2015E (Rs) (%) (US$ mn)Technology
HCL Technologies 1,246 REDUCE 884,944 14,230 710 56.9 81.0 86.6 64.7 42.3 7.0 21.9 15.4 14.4 14.7 9.7 9.1 6.7 4.5 3.6 1.0 1.1 1.3 33.7 33.0 27.9 1,150 (7.7) 23.1
Hexaware Technologies 138 REDUCE 40,557 652 293 11.2 13.1 13.0 22.8 17.5 (1.0) 12.4 10.5 10.6 9.5 6.9 6.5 3.4 3.0 2.7 4.3 4.7 4.7 29.5 30.0 26.4 130 (6.0) 2.9
Infosys 3,428 ADD 1,958,816 31,498 571 164.9 182.5 221.0 13.3 10.7 21.1 20.8 18.8 15.5 15.1 12.5 10.1 5.2 4.3 3.7 1.4 2.0 2.4 27.2 25.6 25.6 3,900 13.8 60.2
Mindtree 1,654 ADD 69,456 1,117 42 81.7 113.1 130.1 53.2 38.5 15.0 20.3 14.6 12.7 14.1 11.1 9.0 5.3 4.1 3.2 0.7 1.0 1.2 29.8 31.5 28.3 1,700 2.8 2.2
Mphasis 434 SELL 91,517 1,472 211 37.6 35.3 16.2 (3.7) (6.1) (54.0) 11.6 12.3 26.7 8.6 8.8 18.7 2.1 1.9 1.8 3.9 3.9 1.9 19.1 15.9 6.8 395 (9.0) 0.5
Polaris Financial Technology 146 REDUCE 14,546 234 100 20.0 19.2 22.4 (3.8) (3.9) 16.5 7.3 7.6 6.5 3.8 2.9 2.6 1.1 1.0 0.9 2.8 2.9 3.1 15.3 13.6 14.2 135 (7.5) 1.3
TCS 2,233 ADD 4,369,743 70,266 1,957 71.2 94.8 113.3 31.1 33.0 19.6 31.3 23.6 19.7 23.6 16.6 14.0 10.7 8.4 6.7 1.0 1.5 1.8 38.0 39.9 37.9 2,300 3.0 40.7
Tech Mahindra 1,841 ADD 429,964 6,914 234 101.9 131.5 144.4 16.7 29.1 9.8 18.1 14.0 12.8 13.2 9.7 8.4 6.3 4.5 3.5 0.3 0.3 0.3 36.3 33.8 27.7 2,000 8.7 31.4
Wipro 547 ADD 1,347,630 21,670 2,463 24.9 31.7 36.0 9.9 27.3 13.6 22.0 17.3 15.2 15.5 11.8 9.7 4.7 3.9 3.3 1.3 1.5 1.6 21.6 25.0 23.7 590 7.8 19.6
Technology Attractive 9,207,173 148,051 23.2 26.9 15.0 24.7 19.5 16.9 17.9 13.3 11.4 6.8 5.4 4.5 1.1 1.5 1.8 27.5 27.8 26.3 181.7
Telecom
Bharti Airtel 332 ADD 1,328,759 21,366 3,997 6.0 10.1 17.0 (46.6) 68.7 67.7 55.5 32.9 19.6 8.2 6.9 5.7 2.6 2.5 2.2 0.3 0.3 1.0 4.5 7.8 12.0 400 20.3 24.1
Bharti Infratel 177 ADD 334,333 5,376 1,889 5.3 7.1 9.6 23.3 34.5 33.9 33.3 24.8 18.5 8.5 7.0 6.2 1.9 1.9 1.8 2.2 1.8 2.5 6.3 7.7 9.9 200 13.0 —
IDEA 162 BUY 533,483 8,578 3,303 3.1 6.5 9.5 39.8 111.2 46.4 52.8 25.0 17.1 11.2 7.6 6.1 3.7 3.3 2.8 0.2 0.3 0.4 7.4 14.0 17.7 195 20.7 14.0
Reliance Communications 128 SELL 264,502 4,253 2,064 3.3 6.5 7.2 (27.5) 98.9 11.1 39.3 19.8 17.8 9.9 8.3 7.8 0.9 0.9 0.9 — — — 0.4 4.6 4.9 85 (33.7) 16.2
Tata Communications 310 BUY 88,407 1,422 285 (29.4) (2.4) 9.8 (5.5) 91.8 505.1 (10.5) (128.2) 31.6 9.6 6.4 5.8 6.2 15.2 10.2 — — — (45.0) (6.9) 38.6 285 (8.1) 3.9
Telecom Attractive 2,549,484 40,996 (39.1) 145.8 53.4 71.3 29.0 18.9 9.0 7.2 6.1 2.3 2.2 2.0 0.5 0.4 1.0 3.2 7.4 10.4 58.3
Utilities
Adani Power 36 SELL 102,815 1,653 2,872 (9.0) (9.4) (1.3) (2,023.1) (4.0) 86.6 (4.0) (3.8) (28.6) 45.6 20.0 10.2 2.4 2.5 2.7 — — — (41.7) (63.7) (9.1) 30 (16.2) 4.3
CESC 441 ADD 55,122 886 125 34.3 42.9 44.4 57.6 25.1 3.5 12.9 10.3 9.9 11.9 9.8 8.2 0.8 0.8 0.7 1.6 1.7 1.7 6.7 7.7 7.5 403 (8.7) 2.2
JSW Energy 52 REDUCE 84,542 1,359 1,640 6.7 8.2 7.9 232.1 22.7 (3.6) 7.7 6.3 6.5 6.6 4.7 4.2 1.4 1.1 1.0 — — — 18.5 19.6 15.9 52 0.9 1.3
Lanco Infratech 8 RS 18,117 291 2,223 (4.7) (6.0) 4.5 (790.4) (28.6) 174.6 (1.7) (1.4) 1.8 14.9 13.6 6.0 0.5 0.7 0.5 — — — (24.2) (41.9) 33.3 — — 0.9
NHPC 19 ADD 233,714 3,758 12,301 1.9 1.9 2.1 (22.2) (0.6) 11.7 9.8 9.9 8.8 9.1 9.7 7.3 0.8 0.7 0.7 3.1 2.7 3.1 8.1 7.6 8.0 23 21.1 1.5
NTPC 130 ADD 1,068,200 17,177 8,245 12.5 13.1 13.7 15.3 5.3 4.7 10.4 9.9 9.4 8.6 8.7 8.0 1.3 1.2 1.1 5.0 3.0 3.2 13.4 12.9 12.4 160 23.5 11.4 Power Grid 99 BUY 516,620 8,307 5,232 9.1 8.9 9.4 28.7 (2.3) 6.0 10.9 11.1 10.5 11.3 10.3 9.1 2.0 1.5 1.4 2.5 2.7 2.9 16.9 15.3 13.6 130 31.6 23.6
Reliance Infrastructure 410 BUY 107,711 1,732 263 70.9 56.7 63.7 17.5 (20.0) 12.4 5.8 7.2 6.4 9.5 8.2 7.2 0.4 0.4 0.4 1.8 2.8 2.8 11.0 8.8 9.2 670 63.6 16.5
Reliance Power 69 SELL 193,133 3,106 2,805 3.6 3.9 3.8 16.7 8.0 (2.9) 19.1 17.7 18.2 24.5 28.5 21.8 1.0 1.0 0.9 — — — 5.6 5.7 5.2 69 0.2 8.8
Tata Power 81 ADD 199,936 3,215 2,468 4.0 5.4 5.8 (12.9) 33.4 8.2 20.2 15.1 14.0 9.2 6.9 6.5 1.5 1.4 1.3 1.4 1.5 1.5 7.4 9.6 9.6 87 7.4 5.6
Utilities Attractive 2,579,910 41,485 (0.8) 2.8 30.4 13.5 13.2 10.1 11.0 10.0 8.3 1.2 1.1 1.0 3.1 2.3 2.4 8.8 8.3 10.0 76.1
Others
Carborundum Universal 153 BUY 28,718 462 187 4.8 7.1 12.2 (58.7) 48.8 71.2 32.0 21.5 12.6 13.6 9.9 6.7 2.4 2.2 1.9 0.5 0.8 1.4 8.2 11.4 17.1 160 4.4 0.1
Coromandel International 246 SELL 69,618 1,119 283 15.3 15.3 20.2 (32.5) 0.5 31.9 16.1 16.0 12.2 14.0 9.9 8.1 3.2 2.8 2.4 1.8 1.9 1.9 17.8 17.5 20.3 200 (18.7) 0.4
Havells India 837 REDUCE 104,474 1,680 125 33.2 37.8 42.5 5.5 13.8 12.7 25.2 22.2 19.7 16.3 13.7 12.3 7.0 5.6 4.6 0.9 0.9 1.0 33.1 28.2 25.9 700 (16.4) 2.9
Info Edge 288 BUY 31,461 506 109 10.6 11.6 14.2 10.6 9.4 22.6 27.3 24.9 20.3 21.4 17.7 13.1 5.1 4.6 4.0 0.3 1.4 1.7 20.2 19.3 21.1 530 84.0 0.8
Jaiprakash Associates 51 ADD 113,063 1,818 2,219 2.0 3.3 9.0 (32.9) 66.0 176.7 26.0 15.7 5.7 11.4 9.7 6.5 0.9 0.9 0.8 — — — 3.6 5.6 14.4 52 2.1 24.4
Just Dial 1,428 ADD 99,971 1,608 70 10.1 15.6 23.2 20.8 53.8 48.7 140.9 91.7 61.6 94.1 65.1 42.4 23.5 20.4 17.0 — 0.4 0.6 26.1 23.8 30.1 1,250 (12.5) 18.3
MCX India 596 REDUCE 30,277 487 51 58.6 30.2 32.9 (1.5) (48) 9.0 10.2 19.7 18.1 5.0 12.0 10.6 2.6 2.5 2.4 4.0 2.7 2.7 27.7 13.0 13.4 500 (16.2) 14.3
Rallis India 177 BUY 34,412 553 194 6.1 8.2 10.8 20.0 34 31.9 28.9 21.6 16.4 16.7 12.6 10.1 5.5 4.7 3.9 1.3 1.2 1.2 18.9 23.2 26.1 180 1.7 0.8
Tata Chemicals 270 BUY 68,789 1,106 255 15.7 22.6 32.2 (52.2) 44.0 42.3 17.2 11.9 8.4 5.9 5.3 4.7 1.0 0.9 0.8 3.7 3.7 3.7 5.0 7.2 9.7 300 11.1 1.6
UPL 202 REDUCE 89,229 1,435 443 17.5 19.8 20.8 39.4 13.2 5.0 11.5 10.2 9.7 6.4 5.8 5.3 1.9 1.7 1.4 1.2 1.2 1.2 18.0 17.8 16.2 145 (28.1) 5.0
Others 638,550 10,268 (20.7) 20.8 54.9 20.5 16.9 10.9 10.9 9.4 7.1 2.0 1.8 1.6 1.2 1.3 1.4 9.6 10.6 14.5 68.6
KIE universe 55,154,824 886,890 7.4 6.2 17.5 15.7 14.8 12.6 10.2 9.1 7.7 2.4 2.1 1.9 1.8 1.8 2.1 15.0 14.4 15.1
KIE universe ex-energy 47,912,465 770,433 9.5 7.3 18.8 17.4 16.2 13.6 11.8 10.3 8.8 2.7 2.4 2.2 1.6 1.6 1.9 15.7 15.1 16.0
KIE universe ex-energy & ex-commodities 41,866,932 673,221 9.2 9.4 21.3 19.1 17.4 14.4 13.8 11.7 9.8 3.0 2.7 2.4 1.5 1.5 1.7 15.7 15.4 16.5
Notes:
(a) For banks we have used adjusted book values.
(b) 2012 means calendar year 2011, similarly for 2013 and 2014 for these particular companies.
(c) EV/Sales & EV/EBITDA for KS universe excludes Banking Sector.
(d) Rupee-US Dollar exchange rate (Rs/US$)= 62.19
Dividend yield (%)
Source: Company, Bloomberg, Kotak Institutional Equities estimates

KOTAK INSTITUTIONAL EQUITIES RESEARCH 72
Disclosures
Kotak Institutional Equities Research coverage universeDistribution of ratings/investment banking relationships
Source: Kotak Institutional Equities As of September 30, 2013
Percentage of companies covered by Kotak Institutional Equities, within the specified category.
Percentage of companies within each category for which Kotak Institutional Equities and or its affiliates has provided investment banking services within the previous 12 months.
* The above categories are defined as follows: Buy = We expect this stock to deliver more than 15% returns over the next 12 months; Add = We expect this stock to deliver 5-15% returns over the next 12 months; Reduce = We expect this stock to deliver -5-+5% returns over the next 12 months; Sell = We expect this stock to deliver less than -5% returns over the next 12 months. Our target prices are also on a 12-month horizon basis. These ratings are used illustratively to comply with applicable regulations. As of 30/09/2013 Kotak Institutional Equities Investment Research had investment ratings on 165 equity securities.
13.9%
32.7%34.5%
18.8%
6.1% 5.5%
0.6% 1.8%
0%
10%
20%
30%
40%
50%
60%
70%
BUY ADD REDUCE SELL
Ratings and other definitions/identifiers
Definitions of ratings
BUY. We expect this stock to deliver more than 15% returns over the next 12 months.
ADD. We expect this stock to deliver 5-15% returns over the next 12 months.
REDUCE. We expect this stock to deliver -5-+5% returns over the next 12 months.
SELL. We expect this stock to deliver <-5% returns over the next 12 months.
Our target prices are also on a 12-month horizon basis.
Other definitions
Coverage view. The coverage view represents each analyst’s overall fundamental outlook on the Sector. The coverage view will consist of one of the following designations: Attractive, Neutral, Cautious.
Other ratings/identifiers
NR = Not Rated. The investment rating and target price, if any, have been suspended temporarily. Such suspension is in compliance with applicable regulation(s) and/or Kotak Securities policies in circumstances when Kotak Securities or its affiliates is acting in an advisory capacity in a merger or strategic transaction involving this company and in certain other circumstances.
CS = Coverage Suspended. Kotak Securities has suspended coverage of this company.
NC = Not Covered. Kotak Securities does not cover this company.
RS = Rating Suspended. Kotak Securities Research has suspended the investment rating and price target, if any, for this stock, because there is not a sufficient fundamental basis for determining an investment rating or target. The previous investment rating and price target, if any, are no longer in effect for this stock and should not be relied upon.
NA = Not Available or Not Applicable. The information is not available for display or is not applicable.
NM = Not Meaningful. The information is not meaningful and is therefore excluded.

Corporate Office Overseas Offices
Kotak Securities Ltd.
27 BKC, Plot No. C-27, “G Block”
Bandra Kurla Complex, Bandra (E)
Mumbai 400 051, India
Tel: +91-22-43360000
Kotak Mahindra (UK) Ltd
8th Floor, Portsoken House
155-157 Minories
London EC3N 1LS
Tel: +44-20-7977-6900
Kotak Mahindra Inc
50 Main Street, Ste. 890
Westchester Financial Centre
White Plains, New York 10606
Tel:+1-914-997-6120
Copyright 2014 Kotak Institutional Equities (Kotak Securities Limited). All rights reserved.
1. Note that the research analysts contributing to this report may not be registered/qualified as research analysts with FINRA; and
2. Such research analysts may not be associated persons of Kotak Mahindra Inc and therefore, may not be subject to NASD Rule 2711 restrictions on communications with a subject company, public appearances and trading securities held by a research analyst account.
3. Any U.S. recipients of the research who wish to effect transactions in any security covered by the report should do so with or through Kotak Mahindra Inc and (ii) any transactions in the securities covered by the research by U.S. recipients must be effected only through Kotak Mahindra Inc at [email protected].
Kotak Securities Limited and its affiliates are a full-service, integrated investment banking, investment management, brokerage and financing group. We along with our affiliates are leading underwriter of securities and participants in virtually all securities trading markets in India. We and our affiliates have investment banking and other business relationships with a significant percentage of the companies covered by our Investment Research Department. Our research professionals provide important input into our investment banking and other business selection processes. Investors should assume that Kotak Securities Limited and/or its affiliates are seeking or will seek investment banking or other business from the company or companies that are the subject of this material and that the research professionals who were involved in preparing this material may participate in the solicitation of such business. Our research professionals are paid in part based on the profitability of Kotak Securities Limited, which include earnings from investment banking and other business. Kotak Securities Limited generally prohibits its analysts, persons reporting to analysts, and members of their households from maintaining a financial interest in the securities or derivatives of any companies that the analysts cover. Additionally, Kotak Securities Limited generally prohibits its analysts and persons reporting to analysts from serving as an officer, director, or advisory board member of any companies that the analysts cover. Our salespeople, traders, and other professionals may provide oral or written market commentary or trading strategies to our clients that reflect opinions that are contrary to the opinions expressed herein, and our proprietary trading and investing businesses may make investment decisions that are inconsistent with the recommendations expressed herein. In reviewing these materials, you should be aware that any or all of the foregoing, among other things, may give rise to real or potential conflicts of interest. Additionally, other important information regarding our relationships with the company or companies that are the subject of this material is provided herein.
This material should not be construed as an offer to sell or the solicitation of an offer to buy any security in any jurisdiction where such an offer or solicitation would be illegal. We are not soliciting any action based on this material. It is for the general information of clients of Kotak Securities Limited. It does not constitute a personal recommendation or take into account the particular investment objectives, financial situations, or needs of individual clients. Before acting on any advice or recommendation in this material, clients should consider whether it is suitable for their particular circumstances and, if necessary, seek professional advice. The price and value of the investments referred to in this material and the income from them may go down as well as up, and investors may realize losses on any investments. Past performance is not a guide for future performance, future returns are not guaranteed and a loss of original capital may occur. Kotak Securities Limited does not provide tax advise to its clients, and all investors are strongly advised to consult with their tax advisers regarding any potential investment.
Certain transactions -including those involving futures, options, and other derivatives as well as non-investment-grade securities - give rise to substantial risk and are not suitable for all investors. The material is based on information that we consider reliable, but we do not represent that it is accurate or complete, and it should not be relied on as such. Opinions expressed are our current opinions as of the date appearing on this material only. We endeavor to update on a reasonable basis the information discussed in this material, but regulatory, compliance, or other reasons may prevent us from doing so. We and our affiliates, officers, directors, and employees, including persons involved in the preparation or issuance of this material, may from time to time have “long” or “short” positions in, act as principal in, and buy or sell the securities or derivatives thereof of companies mentioned herein. For the purpose of calculating whether Kotak Securities Limited and its affiliates holds beneficially owns or controls, including the right to vote for directors, 1% of more of the equity shares of the subject issuer of a research report, the holdings does not include accounts managed by Kotak Mahindra Mutual Fund. Kotak Securities Limited and its non US affiliates may, to the extent permissible under applicable laws, have acted on or used this research to the extent that it relates to non US issuers, prior to or immediately following its publication. Foreign currency denominated securities are subject to fluctuations in exchange rates that could have an adverse effect on the value or price of or income derived from the investment. In addition, investors in securities such as ADRs, the value of which are influenced by foreign currencies affectively assume currency risk. In addition options involve risks and are not suitable for all investors. Please ensure that you have read and understood the current derivatives risk disclosure document before entering into any derivative transactions.
This report has not been prepared by Kotak Mahindra Inc. (KMInc). However KMInc has reviewed the report and, in so far as it includes current or historical information, it is believed to be reliable, although its accuracy and completeness cannot be guaranteed. Any reference to Kotak Securities Limited shall also be deemed to mean and include Kotak Mahindra Inc.

![[Kotak] India Daily, May 07, 2018 - Kotak Securities](https://static.fdokumen.com/doc/165x107/633c43a3f3eeefb08b0c1dc3/kotak-india-daily-may-07-2018-kotak-securities.jpg)


![[Kotak] India Daily, July 25, 2017 - Kotak Securities](https://static.fdokumen.com/doc/165x107/63161b1a15106505030be7d5/kotak-india-daily-july-25-2017-kotak-securities.jpg)


![[Kotak] India Daily, April 2, 2019 - Kotak Securities](https://static.fdokumen.com/doc/165x107/63265a4f5c2c3bbfa803a474/kotak-india-daily-april-2-2019-kotak-securities.jpg)
![[Kotak] India Daily, October 26, 2016 - Kotak Securities](https://static.fdokumen.com/doc/165x107/631c83236c6907d3680156e0/kotak-india-daily-october-26-2016-kotak-securities.jpg)