
MARKET STRATEGY - Kotak Securities
21
OCTOBER 2017 MONTHLY MARKET STRATEGY IN THIS ISSUE • Fed’s unwinding of balance sheet, policy recalibration from ECB, Oil prices • India’s fiscal situation, RBI policy and earnings for Q2FY18
-
Upload
khangminh22 -
Category
Documents
-
view
0 -
download
0
Transcript of MARKET STRATEGY - Kotak Securities

OCTOBER 2017
MONTHLYMARKET STRATEGY
IN THIS ISSUE• Fed’s unwinding of balance sheet, policy recalibration from ECB, Oil prices• India’s fiscal situation, RBI policy and earnings for Q2FY18

Kotak Securities – Private Client Research Please see the Disclosure/Disclaimer on the last page For Private Circulation 2
Monthly Market Strategy October 2017
MONTHLY OUTLOOK FOR OCTOBER 2017
Market sentiment during last month was impacted by negative global cues such as tensions surrounding US & North Korea, credit rating downgrade of China/Hong Kong, higher oil prices as well as Fed’s plan to start unwinding its balance sheet from Oct, 2017. Domestically, impact of possible fiscal stimulus on fiscal deficit also weighed on the markets.
Going ahead, market will continue to focus on policy decisions on taxation and infrastructure spending in US along with its balance sheet unwinding. Tensions between US and North Korea will continue to have an adverse impact on markets. OPEC’s move to tighten global supplies may continue to keep oil prices on an uptrend. Domestically, markets are likely to focus on the upcoming RBI policy, government’s plan to revive the growth in economy as well as Q2FY18 results.
Benchmark indices are currently trading at around 17x FY19 consensus estimates. Valuations continue to remain at higher levels for the domestic markets and hence we believe that earnings revival is absolutely critical for such rich valuations to sustain. However, we continue to believe that the long-term India story remains intact, but given the abundant liquidity and ongoing near-term disruptions, one should focus on bottom-up approach, favoring sectors which could be favorably impacted by the implementation of GST (Logistics, Auto, Media, Building Materials, Cement, etc) and Government spending (Roads, Railways & Defense). Key risks to our recommendation would come from geopolitical concerns globally, decline in liquidity from FIIs and domestic mutual funds, sharp currency movements and a spike in oil prices.
Market performance – sector wise (Sep 2017)
Source: Bloomberg
Benchmark indices - India
Source: Bloomberg
4000
6000
8000
10000
12000
16,000
20,500
25,000
29,500
34,000 Sensex (LHS) Nifty (RHS)
-1.1% -1.2% -0.8%
0.6%
-4.1%
0.0%
-1.8%
-4.0%
-2.3%
1.6%
-0.4%
2.5%
0.1%
-6.0%
-4.0%
-2.0%
0.0%
2.0%
4.0%

Kotak Securities – Private Client Research Please see the Disclosure/Disclaimer on the last page For Private Circulation 3
Monthly Market Strategy October 2017
GLOBAL MARKETS
Most of the global markets witnessed selling pressure towards month-end owing to risks surrounding the discussions between North Korea and US that continued to have an adverse impact on the markets. Despite the repeated warnings from the US, North Korea has been pacing up its nuclear weapons and the ballistic missiles program.
Important events to watch out for in global markets:
US – Balance sheet unwinding to start from Oct, 2017 in the face of healthy US economy
Federal Open Market Committee has indicated in its September meeting that it would begin the unwinding of its $4.5 trillion balance sheet, most of which consists of the Treasury and mortgage-backed securities it acquired under a program known as quantitative easing. Fed announced that it will let a small portion of its $4.5 trillion balance sheet mature without being replaced, starting in October with reductions of $10 billion a month and gradually rising over the next year to $50 billion a month.
Central bank didn’t raise its benchmark interest rate from its current 1 percent to 1.25 percent target, however, its updated rate forecast showed that another hike this year is likely. Market expectations for a December Fed rate hike are now at 62.7 percent, according to the CME Group's Fedwatch tool. Latest economic forecasts show policymakers expect three rates hikes in 2018, which would bring the benchmark rate to between 2% and 2.25% by the end of next year. Fed’s rate hikes this year and its decision to begin reducing its bond holdings are signs of a solid economy and job market.
President Donald Trump also unveiled his administration's much awaited tax overhaul plan. The plan proposes to slash the corporate tax rate to 20 percent, from 35 percent; lower the top individual tax rate to 35 percent, from 39.6 percent; repeal the estate tax; double the size of standard deductions for married couples and individuals; and expand child tax credits.
EU – Asset purchasing program may be prolonged in 2018, albeit at a lower pace
In the eurozone, growth has quickened and unemployment has fallen against the backdrop of ultra-low interest rates and other measures by the European Central Bank (ECB) to boost activity. ECB rate-setters are comforted by euro zone wage data, but we believe that ECB will be looking at more indicators such as prices and sentiment, until their Oct. 26 meeting to gauge whether inflation is gradually heading towards the ECB’s target of almost 2 percent.
As per Eurostat, second-quarter GDP was up 2.1% compared with a year earlier, the fastest growth since 2011. In lieu of the healthy growth in the economy, rate might need to rise in the coming months but won’t happen before purchases end. ECB policymakers are likely to meet in October and there are indications that asset purchasing program may be prolonged in 2018, at a pace of 40 or 20 billion euro per month, down from the current 60 billion euros.
China – Concerns remain over the credit growth fuelled by debt
Concerns about China's sustained strong credit growth appear to be increasing, even as first-half economic growth beat expectations. Rating agencies have also downgraded the China’s long-term sovereign credit rating by one notch stating that a prolonged period of strong credit growth led by debt has increased China's economic and financial risks. The Chinese government has been expanding the economy as it pushes to double its size between 2010 and 2020, and has allowed non-financial sector debt to rise rapidly. Total debt has quadrupled since the financial crisis to hit $28tn (£22tn) at the end of last year. We believe that Chinese government may face challenges of containing financial risks stemming from years of credit-fuelled stimulus. The only positive lining comes from the fact that China has little overseas debt, and a high national savings rate. In addition, most of the debt is state owned – state-controlled banks loaned funds to state-controlled firms – giving the government the ability to manage the situation.

Kotak Securities – Private Client Research Please see the Disclosure/Disclaimer on the last page For Private Circulation 4
Monthly Market Strategy October 2017
Oil prices to continue to move up
Recently, Brent crude oil touched US$59.25 a barrel, nearly a six-month high on expectation of production cut agreement led by the Organization of the Petroleum Exporting Countries to further tighten global supplies and decline in US crude oil supply due to hurricane. Hurricane Harvey forced the closure of nearly 25 percent of U.S. refining capacity. Refining margins have also moved up in recent past which are likely to boost crude oil demand from refiners. All these factors coupled with OPEC’s move to tighten global supplies are likely to keep oil prices higher going forward also.
Brent Crude (US$/bl)
Source: Bloomberg
DOMESTIC MARKETS
Valuations is a concern but we recommend a stock specific approach.
Market optimism was impacted by weaker than expected GDP growth for Q1FY18, disruptions related to GST, government’s plans for fiscal stimulus as well as negative global cues. Though the uncertainty pertaining to North Korea-US standoff will continue to weigh on markets negatively but replenishment of inventory post GST has now begun and logistical and procedural issues are likely to be addressed in the coming quarters. Valuations continue to remain at higher levels for the domestic markets and hence we believe that earnings revival is absolutely critical for such rich valuations to sustain.
Important events to watch out for in domestic markets:
Fiscal stimulus likely to come to boost growth in the economy
With faltering GDP growth seen in Q1FY18, the government is planning a special fiscal stimulus package worth $7 bn to revive the economy after growth slipped to a modest rate of 5.7% in the first quarter of the current fiscal compared with 7.9% in the same quarter last year. Though it is aimed at reviving the economy, economists are not very optimistic as it may have an adverse impact on the fiscal deficit scenario which can move up to 3.5-3.7% as against the target range of 3.2% for FY18. The extra money will be spent more on bank recapitalization, rural jobs programme and rural housing to boost growth in the economy.
Government will have to strike a balance between managing fiscal deficit target and increasing spending via fiscal stimulus in order to prevent any deterioration of fiscal deficit target. We believe what the economy needs is deeper and broader structural reforms that will help attain sustainable higher growth in the medium to long run such as resolving issues related to GST implementation, disinvestment, privatization, job creation to boost the economy.
20
45
70
95
120

Kotak Securities – Private Client Research Please see the Disclosure/Disclaimer on the last page For Private Circulation 5
Monthly Market Strategy October 2017
Quarterly results and expected outlook in H2FY18
Results of companies for Q2FY18 and management commentaries going forward will remain in focus in the coming days to ascertain the demand revival post GST implementation. Cost factors will be watched out for closely owing to higher costs of production as compared to last year. Energy companies are also likely to be impacted by higher oil prices
For IT sector, 1QFY18 was the weakest 1Qs, 2QFY18 is likely to be weak as compared to historical 2Qs but better than 1qfy18. Pickup is expected across key demand verticals of insurance, manufacturing and telecom whereas weakness within banking vertical is expected to continue due to slow spending by large banks.
For Oil and gas sector, in Q2FY18, we expect refinery companies to remain in focus on account of meaningful jump in refining margins, potential inventory gains due to higher crude oil price and rupee depreciation against USD. US refiners hit by Hurricane Harvey has affected product/crude oil supply resulting in higher product prices and better crack spreads. Higher crude oil price and weak rupee will be positive for upstream companies like ONGC and Oil India. Further, from 1st October 2017, domestic gas prices are due for revision and is expected to be revised upwards. This will be positive for upstream gas producing companies but negative for city gas distribution companies like IGL and MGL.
For auto sector, in Q2FY18, volumes are likely to remain strong as the companies pushed inventories at dealerships ahead of the festive season. Overall demand in FY18 has been healthy with two wheeler, passenger vehicle and tractor segment reported robust growth. Commercial vehicle demand, which was under pressure in 1QFY18, witnessed recovery in August 2017. With strong volume growth, auto ancillary segment is also expected to benefit.
Capacity curbs led by environmental crackdown and strong China demand to drive the growth in Metals & Mining sector in 2HFY18. We expect ferrous space should gain from increasing spreads and consolidation in the industry. On the non-ferrous space, depleting mines, falling inventories and resilient demand have driven zinc prices; closure of illegal aluminium capacities and expected closures during winter to curb pollution in China have contributed to rise in aluminium prices. Strong season (2HFY18) coupled with higher realisation will keep metal stocks in focus, in our view.
Outlook for Capital Goods companies remains subdued, which has been the case for the past few years. Private sector companies are struggling with debt of Rs 6.5 trn which is impacting their ability to make fresh investments. Almost 40-50 road projects and 20000 MW of power projects are up for sale. Fuel issues have yet not been resolved especially in the gas based power projects segment. In addition to this, GST related disruptions is also expected to weigh on the Q2FY18 numbers. Given this scenario, we remain positive on the select companies in the sector that are providing earnings visibility.
For Cement sector, results for Q2FY18 are likely to be subdued owing to monsoons and sand mining ban (in TN) impacting the volume offtake while realizations are down on YoY basis in northern, southern and eastern region. Cost pressures are likely to remain high owing to higher pet coke prices which were impacted by Hurricane Harvey in US as well as higher diesel prices. Though results are expected to weak for Q2FY18, we expect demand recovery to commence from H2FY18 led by healthy monsoons reviving rural demand growth, onset of construction activity in government projects, affordable housing as well as increased spend on individual housing. Costs are likely to remain high going forward but demand revival is likely to help cement prices sustain at higher levels.
Building material and consumption driven companies are likely to witness volume disruption in Q2FY18 due to GST implementation but going ahead companies are likely to gain the market share of unorganized players. Infrastructure companies are likely to be impacted by monsoons and lower than expected pace of execution of projects.

Kotak Securities – Private Client Research Please see the Disclosure/Disclaimer on the last page For Private Circulation 6
Monthly Market Strategy October 2017
RBI policy
In the last monetary policy meeting, RBI cut the repo rate for the first time this year to 6% in August as inflation continued to come well below the RBI’s expectations. However, CPI inflation accelerated further to 3.4% in August from 2.4% in July, led largely by a surge in food inflation. August WPI inflation surged to a four-month high of 3.24% from 1.9% in July. August CPI reading is likely to be considered by RBI for its next policy meeting on 3rd and 4th Oct, 2017. RBI had indicated in its last meeting that it would be gauging the impact of food inflation, GST on the prices and implementation of HRA hike. The Indian central bank has been extremely sensitive about fiscal discipline and any move by the government on expanding the deficit can complicate policy choices for the Reserve Bank of India (RBI).
We expect RBI to maintain rates in its next policy meet on 3rd and 4th October.
FII and domestic flows
FIIs were net sellers for the month to the tune of Rs 71.5 bn as on 27th Sep, 2017 while mutual
funds were net buyers to the tune of Rs.118.2 bn as on 27th Sep, 2017. Strong domestic inflows
have been covering up for the shortfall in FII inflows from past several months. With financialization of savings and lack of options to invest in productive assets, domestic liquidity has seen a surge post demonetization. Mutual funds have been buyers worth Rs.807bn in CYTD while FIIs bought stocks worth Rs.401 bn in CYTD.
FII & Mutual Fund investment (Rs cr)
Source: Bloomberg
-20,000
-10,000
0
10,000
20,000
30,000
40,000FII MF

Kotak Securities – Private Client Research Please see the Disclosure/Disclaimer on the last page For Private Circulation 7
Monthly Market Strategy October 2017
Recommendation
Valuations continue to remain at higher levels for the domestic markets and hence we believe that earnings revival is absolutely critical for such rich valuations to sustain. However, we continue to believe that the long-term India story remains intact, but given the abundant liquidity and ongoing near-term disruptions, one should focus on bottom-up approach, favoring sectors which could be favorably impacted by the implementation of GST (Logistics, Auto, Media, Building Materials, Cement, etc) and Government spending (Roads, Railways & Defense). Key risks to our recommendation would come from geopolitical concerns globally, decline in liquidity from FIIs and domestic mutual funds, sharp currency movements and a spike in oil prices.
Preferred picks
Domestic Cyclicals / Investment oriented sectors
Sector Stocks
Automobiles Maruti Suzuki, Escorts, FIEM, Hero MotoCorp
Building Material Asian Granito, Century Plyboard, Shankara Building Products
Capital Goods, Engineering Engineers India, Cummins India, Genus Power Infra, Voltamp,
Time Technoplast, L&T
Cement Ultratech Cement, Shree Cement, India Cement
Construction IRB, NCC, KNR Construction
FMCG ITC, Colgate Palmolive
Logistics, Transportation Adani Port, Allcargo Global Logistics, VRL Logistics
Metals & Mining Moil Ltd
Oil & Gas ONGC, MRPL, Oil India, Petronet LNG
Others Mold-tek Packing Ltd, Bodal Chemicals
Paints Kansai Nerolac, VIP Industries
Shipping Shipping Corporation of India
Source: Kotak Securities - Private Client Research
Export oriented / Defensive sectors
Sector Stocks
IT NIIT Ltd
Media DB Corp, TV18 Broadcast
Source: Kotak Securities - Private Client Research

Kotak Securities – Private Client Research Please see the Disclosure/Disclaimer on the last page For Private Circulation 8
Monthly Market Strategy October 2017
Current Market Price (Rs) 52 Week H/L (Rs) Mkt Cap (Rs mn)
471 518 / 175 14171
Source: Bloomberg
Source: Capitaline
Financials (Rs mn) FY17 FY18E FY19E
Net sales 10,660 12,159 14,476
Growth (%) 7% 14% 19%
EBITDA 1,235 1,520 1,954
EBITDA margin (%) 11.6% 12.5% 13.5%
PBT 532 804 1,225
Net profit 391 534 789
EPS (Rs) 13.0 17.8 26.2
Growth (%) 21% 37% 48%
CEPS (Rs) 24.5 30.1 39.5
BV (Rs/share) 133.3 149.5 174.1
DPS(Rs) 1.3 1.3 1.3 Source: Company
ROE (%) 10.2 12.6 16.2
ROCE (%) 11.9 14.3 18.0
Net cash (debt) 3,150 2,955 3,033
NWC (Days) 123.6 123.6 123.6
Valuation Parameters FY17 FY18E FY19E
P/E (x) 36.2 26.5 18.0
P/BV (x) 3.5 3.2 2.7
EV/Sales (x) 1.6 1.4 1.2
EV/EBITDA (x) 14.0 11.3 8.8
Price Performance (%) 1M 3M 6M
8.8 11.0 30.1
Source: Bloomberg, Company, Kotak Securities - Private Client Research Source: Company
Last report at Rs.439 on 31 August 2017
Analyst: [email protected]
Target Price (Rs)
603
Asian Granito India Ltd (AGL) - Buy
Business mix (%)
Potential Upside (%)
28.0%
1 Year Performance
Share Holding Pattern (%)
Revenue mix (Rs mn)
0
4,000
8,000
12,000
16,000
FY15 FY16 FY17 FY18E FY19E
Quartz and marble Tiles
0
450
900
1350
1800
2250Asian Granito India Ltd (AGL) Nifty
Investment Argument
Fourth largest player in tile industry and set to benefit from demand growth: Asian Granito has a capacity of 33 mn sq meter spread across 8
plants in Gujarat.
Continuous innovations to aid margins: AGL is continuously innovating to add new products in the market and has the first mover advantage in
introducing large format tiles with much higher margins
Shift towards B2C going forward: Company would now be focusing more on increasing B2C mix as compared to higher proportion being sold in B2B
category earlier. AGIL is continuously putting efforts to increase the B2C
sales from the current level 35% in FY17 to 50% in next 2-3 years Strong distribution network and international presence: AGL has an
extensive marketing and distribution network comprising of 180+ exclusive
showrooms, 16 display centres and 5500+ touch points Excellent growth in quartz business: Revenues from quartz division are likely
to improve sharply going forward owing to new product addition as well as
higher branding. Lower power cost as compared to other players: The company acquired
Artistique Ceramic Pvt. Ltd with a 70% shareholding in Crystal Ceramics
and the acquired company enjoys a gas supply arrangement with ONGC significantly lower than the prevailing market price.
Risks & Concerns
Slower than expected ramp up in dealer network. Lower than expected volume uptick
Sharp rise in gas prices
Company Background Asian Granito, promoted by Mr Kamlesh Patel and Mr Mukesh Patel in year
2000, is engaged in the manufacture and sale of ceramic wall and floor tiles,
vitrified tiles, digital polished glazed vitrified tiles, digital wall tiles, marble and quartz
Sector Background
Government initiatives such as Swachch Bharat Abhiyan, Affordable housing, Development of smart cities to be positive for organized players
Promoter
32%
FII
5%MFs
5%
Others
58%
0%
25%
50%
75%
100%
FY15 FY16 FY17 Q1FY18
Double charged Ceramics PVT GVT

Kotak Securities – Private Client Research Please see the Disclosure/Disclaimer on the last page For Private Circulation 9
Monthly Market Strategy October 2017
FIEM Industries Ltd (FIEM) - Buy
Current Market Price (Rs) 52 Week H/L (Rs) Mkt Cap (Rs mn)
920 1510 / 821 12141
Source: Bloomberg
Source: Bloomberg
Financials (Rs mn) FY17 FY18E FY19E
Sales 10,174 12,539 14,573
Growth (%) 3.1 23.2 16.2
EBITDA 1,174 1,468 1,799
EBITDA margin (%) 11.5 11.7 12.3
PBT 455 938 1,310
Net profit 471 657 917
Adjusted EPS (Rs) 35.8 49.9 69.7
Growth (%) (25.2) 39.5 39.6
CEPS (Rs) 54.8 81.9 103.4
BV (Rs/share) 321.7 361.9 421.9
Dividend / share (Rs) 8.0 8.0 8.0 Source: Company, Kotak Securities - Private Client Research
ROE (%) 13.5 14.6 17.8
ROCE (%) 14.7 16.6 21.1
Net cash (debt) (2,021) (436) 68
NW Capital (Days) 18.8 16.5 13.5
Valuation Parameters FY17 FY18E FY19E
P/E (x) 25.7 18.4 13.2
P/BV (x) 2.9 2.5 2.2
EV/Sales (x) 1.3 1.0 0.8
EV/EBITDA (x) 11.3 8.6 6.7
Price Performance (%) 1M 3M 6M
2.1 2.4 3.0
Source: Bloomberg, Company, Kotak Securities - Private Client Research Source: Company, Kotak Securities - Private Client Research
Last report at Rs.928 on 6 September 2017
Analyst: [email protected]
Target Price (Rs)
1254
EBITDA margin (%)
Potential Upside (%)
36.3%
1 Year Performance
Share Holding Pattern (%)
Revenues (Rs mn)
Promoter
64.0%
FII15.0%
DII
9.0%
Others12.0%
0
4,000
8,000
12,000
16,000
FY12 FY13 FY14 FY15 FY16 FY17E FY18E FY19E
11.0
11.5
12.0
12.5
13.0
FY12 FY13 FY14 FY15 FY16 FY17E FY18E FY19E
0
100
200
300
400
500
600 FIEM Industries Ltd (FIEM) Nifty
Investment Argument
FIEM generates almost 95% of its automobile business revenues from the 2W segment and hence recovery in this segment will be positive for the
company.
Production at FIEM’s top customers is growing at robust pace and FIEM will be a direct beneficiary of the same. Honda Motorcycle and Scooters
India Limited (HMSI) and TVS Motors (TVSM) are the top clients –
accounting for ~70% of FIEM’s automotive business revenues. LED luminaries segment has been under pressure. FIEM is looking at
various options to improve its performance in this segment but the same
are expected to yield result over the longer run. EBITDA margin performance is expected to improve gradually for the
company
Risks & Concerns
Lower than expected growth in two wheeler demand
High dependence on few clients
Further significant fall in LED prices
Company Background
FIEM is one of the leading manufacturers of automotive lighting and
signaling equipment for the two wheeler segment in India. Apart from
automotive lighting, FIEM’s product portfolio comprises of rear view mirrors, sheet metal parts and plastic components for two /four wheeler
segment. Recently, FIEM ventured into the LED lighting business.
Sector Background
Auto ancillary sector will be the key beneficiary of expected revival in the
domestic automobile demand.
Kotak Securities – Private Client Research Please see the Disclosure/Disclaimer on the last page For Private Circulation 10
Monthly Market Strategy October 2017
Current Market Price (Rs) 52 Week H/L (Rs) Mkt Cap (Rs mn)
419 434 / 268 708149
Source: Bloomberg
Source: KIE
Financials (Rs mn) FY17 FY18E FY19E
Sales 481,489 562,169 642,050
Growth (%) 16.8% 14.2%
EBITDA 65,584 72,573 78,623
EBITDA margin (%) 13.6 12.9 12.2
PBT 56,886 65,134 72,519
Net profit 37,806 43,729 48,556
EPS (Rs) 22.4 25.9 28.7
Growth (%) NA 15.6% 10.8%
Dividend Yield (%) 2.2% 2.2% 2.4%
Dividend per share (Rs) 9.1 9.1 9.9
ROE (%) 9.0 10.1 10.2
ROCE (%) 9.0 9.4 9.8 Source: KIE
Net cash (debt) (37,481) (25,585) (25,013)
Valuation Parameters FY17 FY18E FY19E
P/E (x) 18.7 16.2 14.6
EV/Sales (x) 1.5 1.3 1.1
EV/EBITDA (x) 11.4 10.1 9.3
Price Performance (%) 1M 3M 6M
10.5 15.6 12.1
Source: Bloomberg, Company, Kotak Securities - Private Client Research Source: KIE
Last report at Rs.424 on 23 February 2017
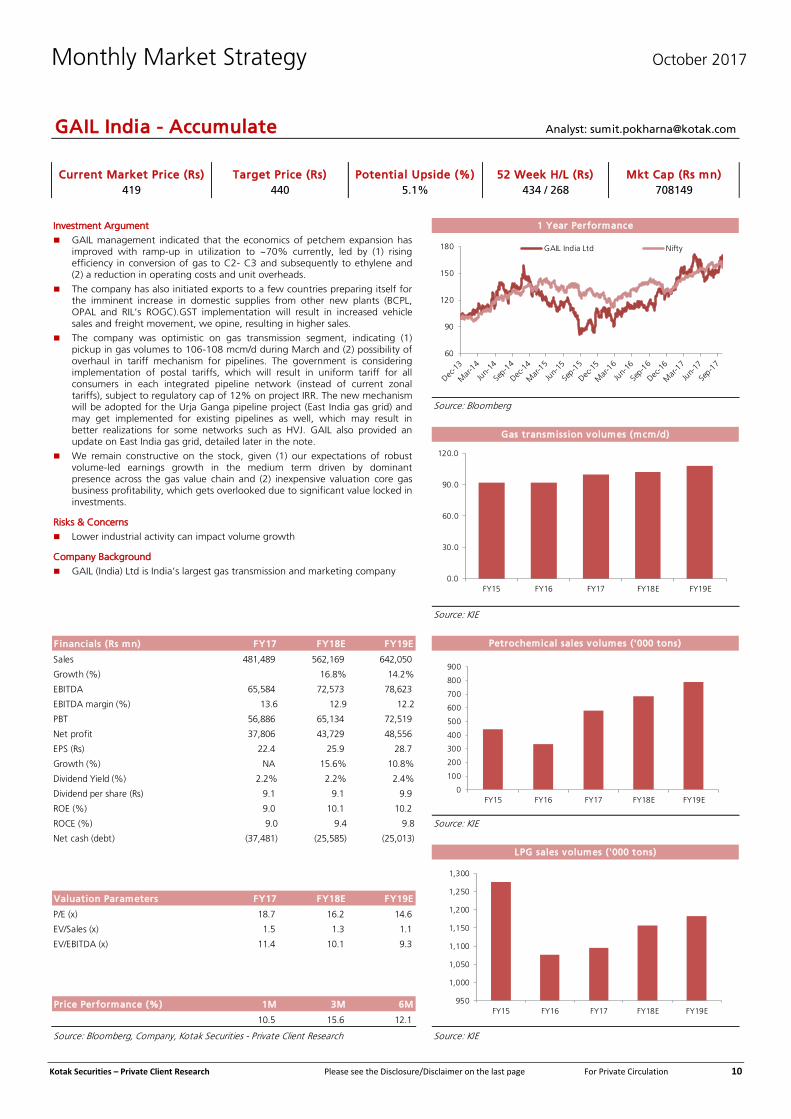
GAIL India - Accumulate Analyst: [email protected]
Target Price (Rs)
440
LPG sales volumes ('000 tons)
Potential Upside (%)
5.1%
1 Year Performance
Gas transmission volumes (mcm/d)
Petrochemical sales volumes ('000 tons)
FY15 FY16 FY17 FY18E FY19E
0.0
30.0
60.0
90.0
120.0
0
100
200
300
400
500
600
700
800
900
FY15 FY16 FY17 FY18E FY19E
950
1,000
1,050
1,100
1,150
1,200
1,250
1,300
FY15 FY16 FY17 FY18E FY19E
60
90
120
150
180 GAIL India Ltd Nifty
Investment Argument
GAIL management indicated that the economics of petchem expansion has improved with ramp-up in utilization to ~70% currently, led by (1) rising efficiency in conversion of gas to C2- C3 and subsequently to ethylene and (2) a reduction in operating costs and unit overheads.
The company has also initiated exports to a few countries preparing itself for the imminent increase in domestic supplies from other new plants (BCPL, OPAL and RIL’s ROGC).GST implementation will result in increased vehicle sales and freight movement, we opine, resulting in higher sales.
The company was optimistic on gas transmission segment, indicating (1) pickup in gas volumes to 106-108 mcm/d during March and (2) possibility of overhaul in tariff mechanism for pipelines. The government is considering implementation of postal tariffs, which will result in uniform tariff for all consumers in each integrated pipeline network (instead of current zonal tariffs), subject to regulatory cap of 12% on project IRR. The new mechanism will be adopted for the Urja Ganga pipeline project (East India gas grid) and may get implemented for existing pipelines as well, which may result in better realizations for some networks such as HVJ. GAIL also provided an update on East India gas grid, detailed later in the note.
We remain constructive on the stock, given (1) our expectations of robust volume-led earnings growth in the medium term driven by dominant presence across the gas value chain and (2) inexpensive valuation core gas business profitability, which gets overlooked due to significant value locked in investments.
Risks & Concerns
Lower industrial activity can impact volume growth
Company Background
GAIL (India) Ltd is India’s largest gas transmission and marketing company

Kotak Securities – Private Client Research Please see the Disclosure/Disclaimer on the last page For Private Circulation 11
Monthly Market Strategy October 2017
Current Market Price (Rs) 52 Week H/L (Rs) Mkt Cap (Rs mn)
57 59 / 33 14701
Source: Bloomberg
Source: Capitaline
Financials (Rs mn) FY17 FY18E FY19E
Net sales 6,424 8,380 9,680
Growth (%) (25.1) 30.5 15.5
EBITDA 866 1,136 1,375
EBITDA margin (%) 13.5 13.6 14.2
PBT 704 996 1,235
Net profit 579 760 914
EPS (Rs) 2.3 3.0 3.6
Growth (%) (23.8) 31.2 20.3
CEPS (Rs) 2.9 3.6 4.3
BV (Rs/share) 26.5 28.9 31.8
DPS(Rs) 0.4 0.5 0.5 Source: Company
ROE (%) 8.5 10.3 11.4
ROCE (%) 11.9 15.2 17.5
Net cash (debt) (2,040) (2,064) (1,999)
NWC (Days) 197.1 177.4 177.3
Valuation Parameters FY17 FY18E FY19E
P/E (x) 25.3 19.3 16.1
P/BV (x) 2.2 2.0 1.8
EV/Sales (x) 2.4 1.8 1.6
EV/EBITDA (x) 17.6 13.4 11.1
Price Performance (%) 1M 3M 6M
2.0 19.1 48.4
Source: Bloomberg, Company, Kotak Securities - Private Client Research Source: Company
Last report at Rs.53 on 29 August 2017
Analyst: [email protected]
Target Price (Rs)
75
Genus Power Infrastructures Ltd - Buy
Meters market (Rs bn)
Potential Upside (%)
31.2%
1 Year Performance
Share Holding Pattern (%)
Meter sales (mn)
0
1
2
3
4
5
6
7
FY12 FY13 FY14 FY15 FY16 FY17
0
5
10
15
20
25
30
35
FY15 FY16 FY17
50
120
190
260
330
400Genus Power Infrastructures Ltd (GPIL) Nifty
Investment Argument The market for electric meters declined from Rs 28-32 bn in FY16 to Rs18-
20 bn in FY17 due to uncertainty related to mode of procurement of meters. This situation is improving and we understand from the company that the volume of tendering has increased by 20%.
India has 200 million legacy meters and there are plans to install up to 130 million smart meters by 2021. Immediate opportunity for smart meters can come from the new power distribution franchisee licenses being allotted in various cities (Bharatpur, Kota). EESL is coming out with a tender of 5 mn smart meters for the states of UP and Haryana.
GPIL plans to ramp-up its exports of meters from the current level of ~ Rs 120 mn in FY17 to Rs 1250 mn by end of FY19.
As of FY17, the company’s net debt to equity stands reduced to 0.15x as compared to 0.64x at the end of FY15. The company scores over its peers like KEC, Kalpataru Transmission and HPL Electric on this count.
Risks & Concerns Execution risk in project business. Increasing working capital requirement Loans and Advances to related parties.
Company Background Genus is the flagship company of the USD 400 million Kailash group. The
company primarily manufactures and distributes Electronic Energy Meters (EEMs) and hybrid microcircuits as well as executes power distribution management projects in India and across the world.
Mr Ishwar Chand Agarwal, aged 66 years, is the founder of Kailash Group and the executive chairperson of the Company.
Sector Background The market for meters in India was estimated to be Rs 32 bn in fiscal 2016 but declined appreciably in FY17 due to uncertainty in the mode of procurement of meters by the utilities. The market is dominated by organised players contributing to over 80% of the total market. There has been a continued and visible shift from demand for traditional meters to demand for metering solutions, which helps in energy management as compared to mere monitoring and billing functionalities.
Promoter
42%
FII
1%MFs
6%
Others
51%

Kotak Securities – Private Client Research Please see the Disclosure/Disclaimer on the last page For Private Circulation 12
Monthly Market Strategy October 2017
KNR Construction Ltd - Buy
Current Market Price (Rs) 52 Week H/L (Rs) Mkt Cap (Rs mn)
207 237 / 114 29027
Source: Bloomberg
Source: Bloomberg
Financials (Rs mn) FY17 FY18E FY19E
Sales 15,411 18,714 22,083
Growth (%) 70.7 21.4 18.0
EBITDA 2,296 2,788 3,315
EBITDA margin (%) 14.9 14.9 15.0
PBT 1,741 1,997 2,415
Net profit 1,790 1,758 1,908
EPS (Rs) 12.0 12.5 13.6
Growth (%) 80.0 4.6 8.5
CEPS (Rs) 15.7 18.2 20.1
Book value (Rs/share) 63.1 74.9 87.8
Dividend per share (Rs) 0.6 0.6 0.7 Source: Industry, Company, Kotak Securities - Private Client Research
ROE (%) 19.5 18.1 16.7
ROCE (%) 18.1 18.1 18.9
Net cash (debt) (998) (853) 573
Net Working Capital (Days) 76.2 85.4 77.6
Valuation Parameters FY17 FY18E FY19E
P/E (x) 17.3 16.5 15.2
P/BV (x) 3.3 2.8 2.4
EV/Sales (x) 1.9 1.6 1.4
EV/EBITDA (x) 13.1 10.8 9.1
Price Performance (%) 1M 3M 6M
(1.2) (0.8) 13.7
Source: Bloomberg, Company, Kotak Securities - Private Client Research Source: Company, Kotak Securities - Private Client Research
Last report at Rs.205 on 19 September 2017
Analyst: [email protected]
Target Price (Rs)
236
Order Book to Bill ratio
Potential Upside (%)
14.2%
1 Year Performance
Share Holding Pattern (%)
NHAI Project Award (Km)
Promoter
58.1%
FII
4.5%
DII
26.9%
Others
10.6%
0
200
400
600
800
1000
1200
1400
1600
Dec-
13
Mar-
14
Jun-1
4
Sep
-14
Dec-
14
Mar-
15
Jun-1
5
Sep
-15
Dec-
15
Mar-
16
Jun-1
6
Sep
-16
Dec-
16
Mar-
17
Jun-1
7
Sep
-17
KNR Construction Nifty
Investment Argument
KNR construction is present in the construction of roads and highways with track record of generating positive operating cash flows, low net debt
equity at 0.1x.
KNR is among the few construction companies which has executed several projects ahead of schedule.
KNR has robust order backlog of Rs 33.4 bn (excluding recent irrigation
order of Rs 8.8 bn bagged in JV). Further, it has strong pipeline of new orders from road sector which gives strong revenue growth visibility for next
2-3 years.
The company has track record of beating its guidance and we expect the trend to continue looking at order book and order pipeline.
Risks & Concerns
Slow down in project awarding in road sector Aggressive bidding of projects
Company Background
KNR construction incorporated in 1995, is Hyderabad based construction company and is promoted by Mr. K. Narasimha Reddy. The company is broadly
present in construction of roads and highways with small presence in irrigation
space. Majority of its order book is located in south India. The company has a track record of executing 5400 lane km of projects across 12 states in India.
Sector Background
Awarding activity in road sector has been strong in the past 3-4 years and is expected to remain firm as government has set target to award 50000 km of
road projects of value Rs 5 trn in the next 2 years. The awarding activity has
slowed down in H1FY18 due to stricter land acquisition criteria. However, the industry players expect the awarding activities to improve for the rest of the
financial year as land acquisition have been fast tracked by the government.
NHAI has awarded more than 55% of the projects under HAM, 35% under EPC and 10% under BOT toll in FY17. Large number of HAM projects are expected
to come for bidding in the coming quarters.
0
1
1
2
2
3
3
4
4
5
0
5
10
15
20
25
30
35
40
45
FY11 FY12 FY13 FY14 FY15 FY16 FY17 FY18E FY19E
Order Book (LHS - Rs bn) Revenue (LHS - Rs bn)
OB/Bill (RHS - x)
HAM
55%
EPC
35%
BOT
10%

Kotak Securities – Private Client Research Please see the Disclosure/Disclaimer on the last page For Private Circulation 13
Monthly Market Strategy October 2017
Current Market Price (Rs) 52 Week H/L (Rs) Mkt Cap (Rs mn)
7984 8200 / 4765 25341216
Source: Bloomberg
Source: Bloomberg
Financials (Rs Mn) FY17 FY18E FY19E
Sales 680,348 814,502 950,911
Growth (%) 17.8 19.7 16.7
EBITDA 103,530 117,332 148,704
EBITDA margin (%) 15.2 14.4 15.6
PBT 99,413 117,404 151,019
Net profit 73,377 85,705 109,489
EPS (Rs) 242.9 283.7 362.4
Growth (%) 60.5 16.8 27.8
CEPS (Rs) 329.0 371.4 455.8
BV (Rs/share) 1,197.4 1,239.9 1,512.0
Dividend / share (Rs) 75.0 75.0 75.0 Source: Company
ROE (%) 23.2 23.3 26.3
ROCE (%) 30.9 31.4 35.9
Net cash (debt) 224,432 285,123 375,583
NW Capital (Days) (21.3) (22.2) (21.8)
Valuation Parameters FY17 FY18E FY19E
P/E (x) 32.9 28.1 22.0
P/BV (x) 6.7 6.4 5.3
EV/Sales (x) 36.8 30.8 26.3
EV/EBITDA (x) 242.1 213.5 167.9
Price Performance (%) 1M 3M 6M
6.1 10.5 34.3
Source: Bloomberg, Company, Kotak Securities - Private Client Research Source: Company
Last report at Rs.8068 on 25 September 2017
Maruti Suzuki India Ltd - Buy Analyst: [email protected]
Target Price (Rs)
9061
Market Share (%)
Potential Upside (%)
13.5%
1 Year Performance
Share Holding Pattern (%)
Sales Volumes (Units)
Promoter56.2%FII
22.1%
DII15.0%
Others6.7%
0
500,000
1,000,000
1,500,000
2,000,000
FY08 FY09 FY10 FY11 FY12 FY13 FY14 FY15 FY16 FY17
45.9 46.5
44.7 45.3
38.4
40.1
42.1
45.0
46.8 47.4
35
40
45
50
FY08 FY09 FY10 FY11 FY12 FY13 FY14 FY15 FY16 FY17
50
150
250
350
450
550 Maruti Suzuki India Ltd Nifty
Investment Argument
We expect MSIL's volumes to grow at a strong pace aided by expected, recovery in rural areas, continued robust demand for recently launched
products (Baleno, Brezza, Ignis), expansion of Nexa network and demand in
favor of petrol run vehicle. Furthermore facelifts, upgrades and variants of existing models will also drive sales for the company.
MSIL’s market share in the domestic passenger car market stands increased
from 47.4% in FY17 to 50.9% in FY18 (April-August). With strong presence in rural areas and dominance in the entry level car
segment, MSIL will be the key beneficiary of rural demand recovery.
In recent years, the company made substantial strides in the premium car segment. MSIL has big opportunity to gain market share in the premium
segment. Focus on premium products and scaling-up of distribution
network will translate into share of premium products in MSIL's product mix increase in a meaningful way
We expect MSIL's EBITDA margin to stay healthy.
Risks & Concerns Lower than anticipated growth will jeopardize our revenue and profit
estimates.
MSIL benefits from yen depreciation. Any unfavorable movement of yen can have significant impact on the company's profitability.
Company Background
MSIL, India's largest passenger car company, is a subsidiary of Suzuki Motor Corporation of Japan. Formed as a government owned company (Maruti
Udyog Limited), it entered into a JV with Suzuki Motor Corporation. Over
the years the company has been one the most successful player in the Indian car market.
Sector Background
India’s passenger vehicle industry sold ~3.4mn vehicles in FY16. While 81% of sales happened in the domestic market, balance 19% were exported.
Top five players account for ~80% of domestic industry sales volumes.

Kotak Securities – Private Client Research Please see the Disclosure/Disclaimer on the last page For Private Circulation 14
Monthly Market Strategy October 2017
Current Market Price (Rs) 52 Week H/L (Rs) Mkt Cap (Rs mn)
168 185 / 106 22377
Source: Bloomberg
Source: Company
Financials (RS mn) FY17 FY18E FY19E
Sales 16,799 17,165 18,622
Growth (%) 8.9 2.2 8.5
EBITDA 2,121 2,243 2,565
EBITDA margin (%) 12.6 13.1 13.8
PBT 1,097 1,262 1,672
Net profit 806 845 1,124
EPS (Rs) 6.1 6.4 8.4
Growth (%) 4.9 4.9 32.9
CEPS (Rs) 9.2 9.8 11.9
Book value (Rs/share) 77.4 82.8 90.0
Dividend per share (Rs) 0.9 1.0 1.2 Source: chemicals.nic.in, Company
ROE (%) 8.3 7.9 9.8
ROCE (%) 9.2 9.6 11.3
Net cash (debt) (7,700) (6,777) (5,730)
Net Working Capital (Days) 195 191 180
Valuation Parameters FY17 FY18E FY19E
P/E (x) 27.8 26.5 19.9
P/BV (x) 2.2 2.0 1.9
EV/Sales (x) 1.8 1.7 1.5
EV/EBITDA (x) 14.2 13.0 11.0
Price Performance (%) 1M 3M 6M
4.1 37.1 24.8
Source: Bloomberg, Company, Kotak Securities - Private Client Research Source: Company, Kotak Securities - Private Client Research
Rise in revenue share of Presetige & above in IMFL
Potential Upside (%)
18.9%
1 Year Performance
Share Holding Pattern (%)
Decline in D/E ratio
Last report at Rs.146 on 10 August 2017
Radico Khaitan Ltd - Buy Analyst: [email protected]
Target Price (Rs)
200
Promoter
40%
FII
18%
DII
14%
Others28%
40
60
80
100
120
140
160 Radico Khaitan Ltd Nifty
Investment Argument
RKL is increasing its focus on premiumization with its volume share of prestige and above segment in IMFL business increased from 10% in FY10 to 26% in FY17. The company is on track to grow this further which will have positive impact on its EBITDA margins in coming years.
RKL is focused growing organically by leveraging its marketing and distribution strength without any major capex. It has established strong manufacturing and distribution setup which can meet next five years of growth with minimum investments.
We believe that most of the negatives in the industry such as highway ban, prohibition, GST, etc are already factored in and expect growth to come back in FY19E.
The stock is presently trading at FY19E PE of 17.3x based on EPS of Rs 8.4 respectively and is available at a steep discount to its peers like USL.
Risks & Concerns
Present in a highly regulated business with low pricing power
GST would negatively impact margins in near term
Company Background
Radico Khaitan Ltd (RKL) is one of the largest players in the Indian spirits industry and owns brands like 8PM whisky, Magic Moments vodka, etc. RKL has evolve from a distillery player to a branded IMFL player in India with presence across products categories and has 4 brands in 1mn cases annual sales category. It operates three distilleries and one JV with total capacity of 157 million litres (30 mn cases of IMFL and 7 mn cases of country liquor) and 33 bottling units spread across the country. It has strong sales network through over 55,000 retail outlets across India. It is presently the market leader in premium vodka category with its brand Magic
Moments.
Sector Background
India is the third largest global spirits market by volume in the world, just behind China and Russia. The consumption of spirits and hard liquor accounts for the majority of alcohol consumption in India. The size of Indian made foreign liquor (IMFL) is 293 mn cases in 2016 which grew by 2.7% in the year. The Indian spirits industry has slowed down in recent years from double digits to low single digit growth in volumes. This is led by increasing duty and prohibition by certain state governments. Alcoholic beverages industry is expected to grow at 2017-21 CAGR of 8.4% in value terms and 4.7% in volume terms and is expected to reach 363 million cases by CY2021.
33% 38% 41% 44% 46% 49%
67% 62% 59% 56% 54% 51%
0%
20%
40%
60%
80%
100%
FY14 FY15 FY16 FY17 FY18E FY19E
Prestige & Above % of total Regular
0.0
0.2
0.4
0.6
0.8
1.0
1.2
1.4
FY14 FY15 FY16 FY17 FY18E FY19E
Kotak Securities – Private Client Research Please see the Disclosure/Disclaimer on the last page For Private Circulation 15
Monthly Market Strategy October 2017
Current Market Price (Rs) 52 Week H/L (Rs) Mkt Cap (Rs mn)
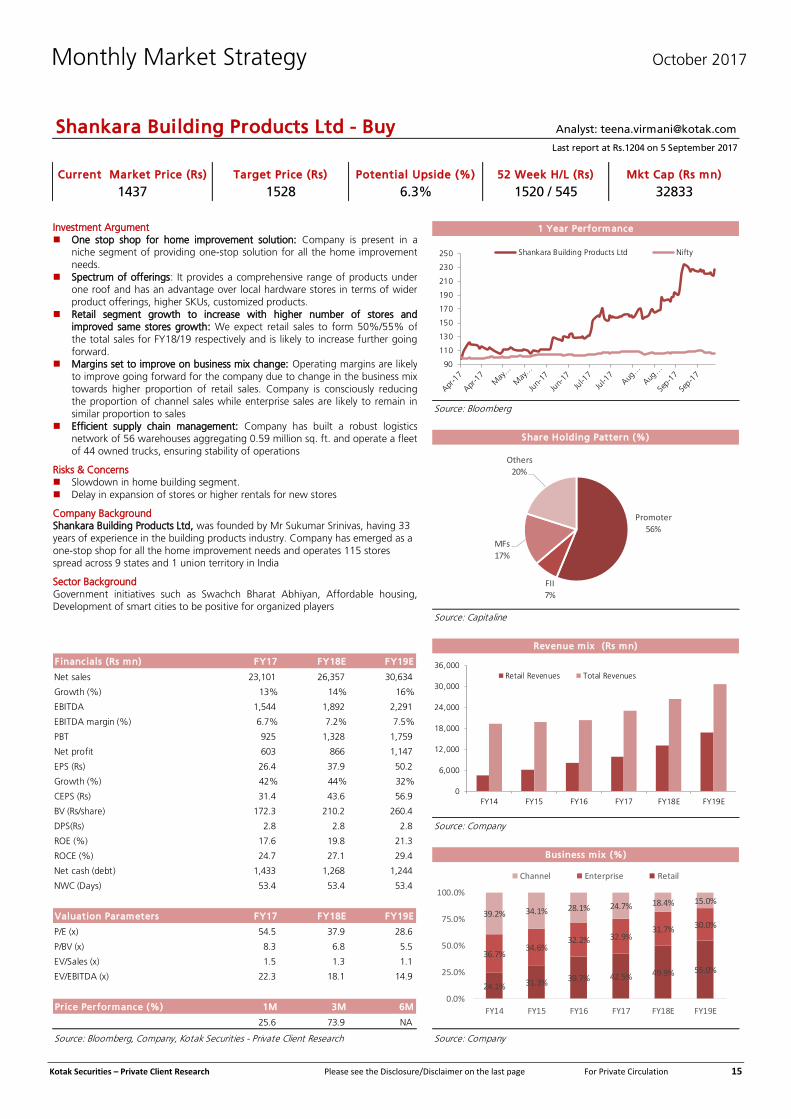
1437 1520 / 545 32833
Source: Bloomberg
Source: Capitaline
Financials (Rs mn) FY17 FY18E FY19E
Net sales 23,101 26,357 30,634
Growth (%) 13% 14% 16%
EBITDA 1,544 1,892 2,291
EBITDA margin (%) 6.7% 7.2% 7.5%
PBT 925 1,328 1,759
Net profit 603 866 1,147
EPS (Rs) 26.4 37.9 50.2
Growth (%) 42% 44% 32%
CEPS (Rs) 31.4 43.6 56.9
BV (Rs/share) 172.3 210.2 260.4
DPS(Rs) 2.8 2.8 2.8 Source: Company
ROE (%) 17.6 19.8 21.3
ROCE (%) 24.7 27.1 29.4
Net cash (debt) 1,433 1,268 1,244
NWC (Days) 53.4 53.4 53.4
Valuation Parameters FY17 FY18E FY19E
P/E (x) 54.5 37.9 28.6
P/BV (x) 8.3 6.8 5.5
EV/Sales (x) 1.5 1.3 1.1
EV/EBITDA (x) 22.3 18.1 14.9
Price Performance (%) 1M 3M 6M
25.6 73.9 NA
Source: Bloomberg, Company, Kotak Securities - Private Client Research Source: Company
Last report at Rs.1204 on 5 September 2017
Analyst: [email protected]
Target Price (Rs)
1528
Shankara Building Products Ltd - Buy
Business mix (%)
Potential Upside (%)
6.3%
1 Year Performance
Share Holding Pattern (%)
Revenue mix (Rs mn)
0
6,000
12,000
18,000
24,000
30,000
36,000
FY14 FY15 FY16 FY17 FY18E FY19E
Retail Revenues Total Revenues
90
110
130
150
170
190
210
230
250 Shankara Building Products Ltd Nifty
Investment Argument
One stop shop for home improvement solution: Company is present in a niche segment of providing one-stop solution for all the home improvement
needs.
Spectrum of offerings: It provides a comprehensive range of products under one roof and has an advantage over local hardware stores in terms of wider
product offerings, higher SKUs, customized products.
Retail segment growth to increase with higher number of stores and improved same stores growth: We expect retail sales to form 50%/55% of
the total sales for FY18/19 respectively and is likely to increase further going
forward. Margins set to improve on business mix change: Operating margins are likely
to improve going forward for the company due to change in the business mix
towards higher proportion of retail sales. Company is consciously reducing the proportion of channel sales while enterprise sales are likely to remain in
similar proportion to sales
Efficient supply chain management: Company has built a robust logistics network of 56 warehouses aggregating 0.59 million sq. ft. and operate a fleet
of 44 owned trucks, ensuring stability of operations
Risks & Concerns Slowdown in home building segment.
Delay in expansion of stores or higher rentals for new stores
Company Background Shankara Building Products Ltd, was founded by Mr Sukumar Srinivas, having 33
years of experience in the building products industry. Company has emerged as a
one-stop shop for all the home improvement needs and operates 115 stores spread across 9 states and 1 union territory in India
Sector Background
Government initiatives such as Swachch Bharat Abhiyan, Affordable housing, Development of smart cities to be positive for organized players
Promoter
56%
FII
7%
MFs
17%
Others
20%
24.1% 31.3% 39.7% 42.5% 49.9% 55.0%
36.7%34.6%
32.2% 32.9%31.7% 30.0%
39.2% 34.1% 28.1% 24.7% 18.4% 15.0%
0.0%
25.0%
50.0%
75.0%
100.0%
FY14 FY15 FY16 FY17 FY18E FY19E
Channel Enterprise Retail

Kotak Securities – Private Client Research Please see the Disclosure/Disclaimer on the last page For Private Circulation 16
Monthly Market Strategy October 2017
Current Market Price (Rs) 52 Week H/L (Rs) Mkt Cap (Rs mn)
3854 4533 / 3050 1056078
Source: Bloomberg
Source: Bloomberg
Financials (Rs mn) FY17 FY18E FY19E
Sales 238,914 294,952 350,536
Growth (%) 0 23 19
EBIT 49,690 61,111 80,181
EBIT margin (%) 20.8% 20.7% 22.9%
PBT 37,760 39,766 54,905
Net profit 26,277 28,631 39,532
EPS (Rs) 95.8 104.3 144.1
Growth (%) 21% 9% 38%
CEPS 142.0 166.0 209.7
Book Value (Rs / Share) 838.7 931.0 1063.0
Dividend per Share (Rs) 10.0 10.0 10.0
ROE (%) 12.0 11.8 14.5 Source: Company
ROCE (%) 15.4 14.3 15.9
Net cash (debt) 8,242 (124,959) (86,240)
Net working capital (Days) 34.4 34.4 34.4
Valuation Parameters FY17 FY18E FY19E
P/E (x) 40.2 36.9 26.8
P/BV (x) 4.6 4.1 3.6
EV/Sales (x) 4.4 4.0 3.3
EV/EBITDA (x) 21.1 19.3 14.2
Price Performance (%) 1M 3M 6M
(2.0) (2.5) (3.6)
Source: Bloomberg, Company, Kotak Securities - Private Client Research Source: Company
Volume growth of Ultratech Cements (MT)
Potential Upside (%)
16.1%
1 Year Performance
Share Holding Pattern (%)
Cement Industry Capacity (MT)
Last report at Rs.4205 on 20 July 2017
Analyst: [email protected]
Target Price (Rs)
4474
Ultratech Cement Ltd - Accumulate
Promoter
12.8%
FII
40.1%
DII
17.8%
Others
29.2%
0
100
200
300
400
500
FY12 FY13 FY14 FY15 FY16
80
110
140
170
200
230
260 Ultratech Cement Nifty
Investment Argument
Ultratech Cements continues to witness dispatch growth better than peers during current fiscal till date.
Cement prices have started recovering in anticipation of rural demand
recovery as well as ongoing demand from infrastructure projects.
Company also finalized the purchase of 21MT of cement assets of Jaiprakash
Associates at an enterprise valuation of Rs 159 bn. Capacity utilization of JP
Assets is currently very low at less than 15% while company plans to increase the capacity utilization to 60% in first 12 months and later take it to 70%
during next 12 months.
We remain positive on the company owing to its leadership position and expect company to benefit from improvement in cement volumes on demand
revival.
Risks & Concerns
Decline in cement prices may put risk to our estimates
Steep increase in costs may put pressure on operating margins
Adverse ruling from CCI can also impact company negatively
Company Background
Ultratech Cement is a leader in cement industry and is likely to take its
capacity to 93MT post its on-going capex plan as well as with consolidation of 21MT of JPAssociates’ cement plants.
Sector Background
Cement demand is likely to recover from H2FY18 led by recovery in rural demand, government infrastructure projects as well as individual housing.
Cement prices have also recovered across regions in line with demand
improvement. Costs are likely to move up but with improved demand, it is likely to be passed on.
0
10
20
30
40
50
60
FY11 FY12 FY13 FY14 FY15 FY16

Kotak Securities – Private Client Research Please see the Disclosure/Disclaimer on the last page For Private Circulation 17
Monthly Market Strategy October 2017
VIP Industries Ltd - Buy
Current Market Price (Rs) 52 Week H/L (Rs) Mkt Cap (Rs mn)
252 269 / 112 35584
Source: Bloomberg
Source: Bloomberg
Financia ls (Rs mn) FY17 FY18E FY19E
Sales 12,752 15,581 17,734
Growth (%) 4.8 22.2 13.8
EBITDA 1,319 1,957 2,264
EBITDA margin (%) 10.3 12.6 12.8
PBT 1,244 1,874 2,177
Net profit 849 1,302 1,512
EPS (Rs) 6.0 9.2 10.7
Growth (%) 25.2 53.3 16.2
CEPS 6.9 10.2 11.7
Book Value (Rs / Share) 28.6 34.2 40.6
Dividend per Share (Rs) 2.2 3.0 3.5
ROE (%) 21.0 26.9 26.3 Source: Company
ROCE (%) 29.3 37.5 36.8
Net cash (debt) 60 128 582
Net working capital (Days) 77.2 71.2 74.4
Valuat ion Parameters FY17 FY18E FY19E
P/E (x) 42.0 27.4 23.6
P/BV (x) 8.8 7.4 6.2
EV/Sales (x) 2.8 2.3 2.0
EV/EBITDA (x) 26.9 18.1 15.5
Price Performance (%) 1M 3M 6M
16.5 36.8 34.3
Source: Bloomberg, Company, Equinomics Research & Advisory Private Ltd Source: Company
Last report at Rs.248 on 21 September 2017
Analyst: [email protected]
Target Price (Rs)
325
Ad spends by VIP (Rs mn)
Potential Upside (%)
29.1%
1 Year Performance
Share Holding Pattern (%)
EBIDTA Margin profile of VIP (%)
Promoter
52.0%
FII
5.0%
DII
17.0%
Others
26.0%
0
70
140
210
280
350
420
490
VIP Industries Ltd Nifty
Investment Argument
We estimate the penetration of luggage to increase within the country with growing income levels and growing leisure and business travel.
Diversified product portfolio enables VIP to cater to consumer of every age
and every income group
VIP has been constantly working on improving its brand visibility and product
reach for the entire range of products across various VIP brands and across
price points.
We estimate volumes for VIP to grow at 12% CAGR over FY17 to FY20E.
We expect the sourcing of soft luggage from China to fall to 50% with share
of Bangladesh increasing to 40%, which would aid margins going forward.
Risks & Concerns
Continued competition from unorganized sector.
Depreciation of rupee
Increase in prices of raw material like polypropylene and polycarbonate
Company Background
VIP Industries is a leading luggage maker in India offering a wide range of products in hard luggage and soft luggage
The company has manufacturing facilities located at Haridwar in Uttarakhand,
Jalgaon, Nagpur and Nashik in Maharashtra
The company has set up a subsidiary in Bangladesh to manufacture and
market luggage and bags
Sector Background
The Indian luggage industry is currently valued at Rs 80 bn and is partially
dominated by the unorganized sector
0.0
2.0
4.0
6.0
8.0
10.0
12.0
14.0
FY15 FY16 FY17 FY18E FY19E FY20E
0
200
400
600
800
1,000
1,200
FY15 FY16 FY17 FY18E FY19E FY20E

SEPTEMBER 1, 2017
PRIVATE CLIENT RESEARCH
SELECTION OF STOCKS – SEPTEMBER 2017
NIFTY: 9918 Stock M Cap Current (Rs mn) Price PE (x) Comment (Rs) FY18 FY19E
ITC 3,390,486 282 30.0 26.6 Reassuring signals from the government, as excise duty hike well below past five years' average
Discount to average FMCG multiples provides protection from downsides
Genus Power 12,760 50 16.6 13.8 Demand for meters is gaining traction
Smart meters offers a good long term opportunity
Shipping Corp of India 46,580 100 19.6 13.9 Shipping markets have become stable which is positive for the stock
Strategic sale by government is expected to improve management of SCI
Stock is trading at attractive valuations
M&M 825,830 1,345 20.7 18.8 Good monsoons is likely to keep tractor demand robust in FY18
Increased share of tractor revenues will be positive for overall EBITDA margins
UPL 422,231 831 18.5 14.7 UPL is coming into the Nifty in end of Sep’17. This should lead to re-rating of the stock
In the Agrochemical space the company is way ahead of its peers in terms of size. It has best in class RoE of 25% on such a high base and earnings CAGR forecast of 22% (for FY17-19E).
Engineers India 105,124 156 25.6 17.3 EIL expected to benefit from recovery in spending by major
hydrocarbon players like HPCL, BPCL and IOC. Company
likely to expand margins in FY18/FY19.
Kansai Nerolac 274,890 510 48.6 44.0 Strong automotive demand is a big positive for the company which is the market leader in automotive paints
Company is also aggressively expanding the decorative segment
Raw material situation to remain benign
Guj. Alkalies & Chem 32239 439 6.8 6.7 Caustic soda prices have risen to US$470/tonne in the last six months. We expect the prices to remain firm for the next one or two years, which would drive the earnings for GACL in FY18E & FY19E
Asian Granito 13,846 461 25.9 17.6 With its continuous innovations for introducing value added products, access to low cost gas, shift towards increasing B2C sales, we expect company’s revenues and PAT to grow at a CAGR of 17%/42% between FY17-19. Stock is trading at attractive valuations
TV18 Broadcast 65,056 38 28.8 17.5 See pick-up in near-term ratings of Hindi GEC channels, valuations reasonable at 17.5x PER FY19E
Finolex Industries 75,577 609 20.5 17.1 GST led disruption is over and demand has recovered from end of July. Good monsoon positive for rural economy and agri pipes demand.
The company is targeting for double digit volume growth in pipes and fitting business in FY18.
Source : Kotak Securities - Private Client research

OCTOBER 3, 2017
PRIVATE CLIENT RESEARCH
SELECTION OF STOCKS – OCTOBER 2017
NIFTY: 9789 Stock M Cap Current (Rs mn) Price PE (x) Comment (Rs) FY18E FY19E
ITC 3,101,934 258 27.4 24.3 Reassuring signals from the government, as excise duty hike well below past five years' average
Discount to average FMCG multiples provides protection from downsides
ONGC 2,194,443 171 8.7 7.8 Higher crude oil price, weak currency, expected higher
domestic gas price and increase in production are
key triggers for the stock
MRPL 224,947 128 12.4 8.0 We expect MRPL’s profitability to improve on account of i). Improved product mix, ii). Better refining margins iii). Economies of scale, iv). Forward integration - Polypropylene plant and v). Various tax benefits
Mahindra & Mahindra 772,412 1,258 19.4 17.6 Good monsoons is likely to keep tractor demand robust in FY18 Increased share of tractor revenues will be positive for overall EBITDA margins
UPL 394,794 777 17.3 13.8 UPL is coming into the Nifty in end of Sep’17. This should lead to re-rating of the stock
In the Agrochemical space the company is way ahead of its peers in terms of size. It has best in class RoE of 25% on such a high base and earnings CAGR forecast of 22% (for FY17-19E).
Venky’s India 28,271 2,005 14.9 11.3 Broiler/ Day-old chick prices rising strongly since mid
August, augurs well for 2QFY18 earnings
Valuations reasonable, at 11X FY19E PER.
MoIL 5,050 192 15.7 13.0 MOIL has increased manganese ore prices by 10-15% in June/July'17 across various grades supported by improved international manganese ore prices, the benefit of the same would accrue from 2QFY18 onwards.
VRL Logistics 33,197 364.0 26.6 21.4 GST Act and Motor Vehicle Act is expected to improve business prospects of the company We estimate improvement in EBIDTA margins and return ratios over FY17 to FY20E VRL has created a niche for itself in the transport industry and has overcome the nuances of the industry through effective practices within the company.
Asian Granito 13,846 473 26.6 18.1 With its continuous innovations for introducing value added products, access to low cost gas, shift towards increasing B2C sales, we expect company’s revenues and PAT to grow at a CAGR of 17%/42% between FY17-19. Stock is trading at attractive valuations
TV18 Broadcast 66,768 39 29.5 18.0 See pick-up in near-term ratings of Hindi GEC channels, valuations reasonable at 18x PER FY19E
KNR Constructions 2,910 207 16.6 15.2 Strong pipeline of Rs 16 bn of orders from Road and irrigation space On track to achieve FY18 revenue and order inflows guidance of Rs 17-18 bn and Rs 20-25 bn respectively
Source : Kotak Securities - Private Client research

Kotak Securities – Private Client Research Please see the Disclosure/Disclaimer on the last page For Private Circulation 18
Monthly Market Strategy October 2017
RATING SCALE Definitions of ratings
BUY – We expect the stock to deliver more than 12% returns over the next 9 months
ACCUMULATE – We expect the stock to deliver 5% - 12% returns over the next 9 months
REDUCE – We expect the stock to deliver 0% - 5% returns over the next 9 months
SELL – We expect the stock to deliver negative returns over the next 9 months
NR – Not Rated. Kotak Securities is not assigning any rating or price target to the stock. The report has been prepared for
information purposes only.
RS – Rating Suspended. Kotak Securities has suspended the investment rating and price target for this stock, either because there
is not a Sufficient fundamental basis for determining, or there are legal, regulatory or policy constraints around publishing,
an investment rating or target. The previous investment rating and price target, if any, are no longer in effect for this stock
and should not be relied upon.
NA – Not Available or Not Applicable. The information is not available for display or is not applicable
NM – Not Meaningful. The information is not meaningful and is therefore excluded.
NOTE – Our target prices are with a 9-month perspective. Returns stated in the rating scale are our internal benchmark.
FUNDAMENTAL RESEARCH TEAM
Sanjeev Zarbade Ruchir Khare Amit Agarwal Nipun Gupta Capital Goods, Engineering Capital Goods, Engineering Logistics, Paints, Transportation Information Technology [email protected] [email protected] [email protected] [email protected] +91 22 6218 6424 +91 22 6218 6431 +91 22 6218 6439 +91 22 6218 6433
Teena Virmani Ritwik Rai Jatin Damania Ashini Shah Construction, Cement FMCG, Media Metals & Mining Midcap [email protected] [email protected] [email protected] [email protected] +91 22 6218 6432 +91 22 6218 6426 +91 22 6218 6440 +91 22 6218 5438
Arun Agarwal Sumit Pokharna Pankaj Kumar K. Kathirvelu Auto & Auto Ancillary Oil and Gas Midcap Production [email protected] [email protected] [email protected] [email protected] +91 22 6218 6443 +91 22 6218 6438 +91 22 6218 6434 +91 22 6218 6427
TECHNICAL RESEARCH TEAM
Shrikant Chouhan Amol Athawale [email protected] [email protected] 91 22 6218 5408 +91 20 6620 3350
DERIVATIVES RESEARCH TEAM
Sahaj Agrawal Malay Gandhi Prashanth Lalu Prasenjit Biswas [email protected] [email protected] [email protected] [email protected] +91 79 6607 2231 +91 22 6218 6420 +91 22 6218 5497 +91 33 6625 9810

Kotak Securities – Private Client Research Please see the Disclosure/Disclaimer on the last page For Private Circulation 19
Monthly Market Strategy October 2017
Disclosure/Disclaimer Kotak Securities Limited established in 1994, is a subsidiary of Kotak Mahindra Bank Limited. Kotak Securities is one of India's largest brokerage and distribution house.
Kotak Securities Limited is a corporate trading and clearing member of Bombay Stock Exchange Limited (BSE), National Stock Exchange of India Limited (NSE), Metropolitan Stock Exchange of India Limited (MSE). Our businesses include stock broking, services rendered in connection with distribution of primary market issues and financial products like mutual funds and fixed deposits, depository services and Portfolio Management.
Kotak Securities Limited is also a depository participant with National Securities Depository Limited (NSDL) and Central Depository Services (India) Limited (CDSL). Kotak Securities Limited is also registered with Insurance Regulatory and Development Authority as Corporate Agent for Kotak Mahindra Old Mutual Life Insurance Limited and is also a Mutual Fund Advisor registered with Association of Mutual Funds in India (AMFI). We are registered as a Research Analyst under SEBI (Research Analyst) Regulations, 2014.
We hereby declare that our activities were neither suspended nor we have defaulted with any stock exchange authority with whom we are registered in last five years. However SEBI, Exchanges and Depositories have conducted the routine inspection and based on their observations have issued advise/warning/deficiency letters/ or levied minor penalty on KSL for certain operational deviations. We have not been debarred from doing business by any Stock Exchange / SEBI or any other authorities; nor has our certificate of registration been cancelled by SEBI at any point of time.
We offer our research services to clients as well as our prospects.
This document is not for public distribution and has been furnished to you solely for your information and must not be reproduced or redistributed to any other person. Persons into whose possession this document may come are required to observe these restrictions.
This material is for the personal information of the authorized recipient, and we are not soliciting any action based upon it. This report is not to be construed as an offer to sell or the solicitation of an offer to buy any security in any jurisdiction where such an offer or solicitation would be illegal. It is for the general information of clients of Kotak Securities Ltd. It does not constitute a personal recommendation or take into account the particular investment objectives, financial situations, or needs of individual clients.
We have reviewed the report, and in so far as it includes current or historical information, it is believed to be reliable though its accuracy or completeness cannot be guaranteed. Neither Kotak Securities Limited, nor any person connected with it, accepts any liability arising from the use of this document. The recipients of this material should rely on their own investigations and take their own professional advice. Price and value of the investments referred to in this material may go up or down. Past performance is not a guide for future performance. Certain transactions -including those involving futures, options and other derivatives as well as non-investment grade securities - involve substantial risk and are not suitable for all investors. Reports based on technical analysis centers on studying charts of a stock's price movement and trading volume, as opposed to focusing on a company's fundamentals and as such, may not match with a report on a company's fundamentals.
Opinions expressed are our current opinions as of the date appearing on this material only. While we endeavor to update on a reasonable basis the information discussed in this material, there may be regulatory, compliance or other reasons that prevent us from doing so. Prospective investors and others are cautioned that any forward-looking statements are not predictions and may be subject to change without notice. Our proprietary trading and investment businesses may make investment decisions that are inconsistent with the recommendations expressed herein.
Kotak Securities Limited has two independent equity research groups: Institutional Equities and Private Client Group. This report has been prepared by the Private Client Group. The views and opinions expressed in this document may or may not match or may be contrary with the views, estimates, rating, target price of the Institutional Equities Research Group of Kotak Securities Limited.
We and our affiliates/associates, officers, directors, and employees, Research Analyst(including relatives) worldwide may: (a) from time to time, have long or short positions in, and buy or sell the securities thereof, of company (ies) mentioned herein or (b) be engaged in any other transaction involving such securities and earn brokerage or other compensation or act as a market maker in the financial instruments of the subject company/company (ies) discussed herein or act as advisor or lender / borrower to such company (ies) or have other potential/material conflict of interest with respect to any recommendation and related information and opinions at the time of publication of Research Report or at the time of public appearance. Kotak Securities Limited (KSL) may have proprietary long/short position in the above mentioned scrip(s) and therefore may be considered as interested. The views provided herein are general in nature and does not consider risk appetite or investment objective of particular investor; readers are requested to take independent professional advice before investing. This should not be construed as invitation or solicitation to do business with KSL. Kotak Securities Limited is also a Portfolio Manager. Portfolio Management Team (PMS) takes its investment decisions independent of the PCG research and accordingly PMS may have positions contrary to the PCG research recommendation. Kotak Securities Limited does not provide any promise or assurance of favourable view for a particular industry or sector or business group in any manner. The investor is requested to take into consideration all the risk factors including their financial condition, suitability to risk return profile and take professional advice before investing.
The analyst for this report certifies that all of the views expressed in this report accurately reflect his or her personal views about the subject company or companies and its or their securities, and no part of his or her compensation was, is or will be, directly or indirectly related to specific recommendations or views expressed in this report.
No part of this material may be duplicated in any form and/or redistributed without Kotak Securities' prior written consent.
Details of Associates are available on our website ie www.kotak.com
Research Analyst has served as an officer, director or employee of subject company(ies): No
We or our associates may have received compensation from the subject company(ies) in the past 12 months.
We or our associates have managed or co-managed public offering of securities for the subject company(ies) in the past 12 months: No
We or our associates may have received compensation for investment banking or merchant banking or brokerage services from the subject company(ies) in the past 12 months. We or our associates may have received any compensation for products or services other than investment banking or merchant banking or brokerage services from the subject company(ies) in the past 12 months. We or our associates may have received compensation or other benefits from the subject company(ies) or third party in connection with the research report. Our associates may have financial interest in the subject company(ies).
Research Analyst or his/her relative's financial interest in the subject company(ies): No
Kotak Securities Limited has financial interest in the subject company(ies) at the end of the month immediately preceding the date of publication of Research Report: Maruti Suzuki, Ultratech Cement, GAIL, VIP Industries, KNR Construction - Yes
Our associates may have actual/beneficial ownership of 1% or more securities of the subject company(ies) at the end of the month immediately preceding the date of publication of Research Report.
Research Analyst or his/her relatives has actual/beneficial ownership of 1% or more securities of the subject company(ies) at the end of the month immediately preceding the date of publication of Research Report: No.
Kotak Securities Limited has actual/beneficial ownership of 1% or more securities of the subject company(ies) at the end of the month immediately preceding the date of publication of Research Report: No
Subject company(ies) may have been client during twelve months preceding the date of distribution of the research report.
"A graph of daily closing prices of securities is available at www.nseindia.com and http://economictimes.indiatimes.com/markets/stocks/stock-quotes. (Choose a company from the list on the browser and select the "three years" icon in the price chart)."
Kotak Securities Limited. Registered Office: 27 BKC, C 27, G Block, Bandra Kurla Complex, Bandra (E), Mumbai 400051. CIN: U99999MH1994PLC134051, Telephone No.: +22 43360000, Fax No.: +22 67132430. Website: www.kotak.com/www.kotaksecurities.com. Correspondence Address: Infinity IT Park, Bldg. No 21, Opp. Film City Road, A K Vaidya Marg, Malad (East), Mumbai 400097. Telephone No: 42856825. SEBI Registration No: NSE INB/INF/INE 230808130, BSE INB 010808153/INF 011133230, MSE INE 260808130/INB 260808135/INF 260808135, AMFI ARN 0164, PMS INP000000258 and Research Analyst INH000000586. NSDL/CDSL: IN-DP-NSDL-23-97. Our research should not be considered as an advertisement or advice, professional or otherwise. The investor is requested to take into consideration all the risk factors including their financial condition, suitability to risk return profile and the like and take professional advice before investing. Investments in securities market are subject to market risks, read all the related documents carefully before investing. Derivatives are a sophisticated investment device. The investor is requested to take into consideration all the risk factors before actually trading in derivative contracts. Compliance Officer Details: Mr. Manoj Agarwal. Call: 022 - 4285 8484, or Email: [email protected].
Level 1: For Trading related queries, contact our customer service at '[email protected]' and for demat account related queries contact us at [email protected] or call us on: Online Customers - 30305757 (by using your city STD code as a prefix) or Toll free numbers 18002099191 / 1800222299, Offline Customers - 18002099292
Level 2: If you do not receive a satisfactory response at Level 1 within 3 working days, you may write to us at [email protected] or call us on 022-42858445 and if you feel you are still unheard, write to our customer service HOD at [email protected] or call us on 022-42858208.
Level 3: If you still have not received a satisfactory response at Level 2 within 3 working days, you may contact our Compliance Officer (Mr. Manoj Agarwal ) at [email protected] or call on 91- (022) 4285 8484.
Level 4: If you have not received a satisfactory response at Level 3 within 7 working days, you may also approach CEO (Mr. Kamlesh Rao) at [email protected] or call on 91-(022) 4285 8301.


![[Kotak] India Daily, October 24, 2016 - Kotak Securities](https://static.fdokumen.com/doc/165x107/633d69d4e674f41574068690/kotak-india-daily-october-24-2016-kotak-securities.jpg)

![[Kotak] India Daily, May 07, 2018 - Kotak Securities](https://static.fdokumen.com/doc/165x107/633c43a3f3eeefb08b0c1dc3/kotak-india-daily-may-07-2018-kotak-securities.jpg)


![[Kotak] India Daily, October 26, 2016 - Kotak Securities](https://static.fdokumen.com/doc/165x107/631c83236c6907d3680156e0/kotak-india-daily-october-26-2016-kotak-securities.jpg)