India Daily, July 19, 2012 - Kotak Securities
36
For Private Circulation Only. FOR IMPORTANT INFORMATION ABOUT KOTAK SECURITIES’ RATING SYSTEM AND OTHER DISCLOSURES. REFER TO THE END OF THIS MATERIAL. INDIA DAILY July 19, 2012 India 18-Jul 1-day1-mo 3-mo Sensex 17,185 0.5 1.9 (1.8) Nifty 5,216 0.5 2.2 (2.2) Global/Regional indices Dow Jones 12,909 0.8 0.6 (0.4) Nasdaq Composite 2,943 1.1 0.4 (2.2) FTSE 5,686 1.0 1.8 (1.0) Nikkie 8,785 0.7 1.5 (8.4) Hang Seng 19,437 1.0 0.1 (7.4) KOSPI 1,819 1.3 (3.8) (9.0) Value traded – India Cash (NSE+BSE) 111 119 117 Derivatives (NSE) 1,145 1,916 1,049 Deri. open interest 1,395 1,218 1,222 Forex/money market Change, basis points 18-Jul 1-day 1-mo 3-mo Rs/US$ 55.4 (5) (56) 317 10yr govt bond, % 8.3 - (6) (15) Net investment (US$mn) 17-Jul MTD CYTD FIIs 103 1,518 10,035 MFs (17) (348) (282) Top movers -3mo basis Change, % Best performers 18-Jul 1-day 1-mo 3-mo DIVI IN Equity 1059.1 (0.1) 12.0 25.0 GNP IN Equity 379.6 (2.2) 1.8 18.6 Z IN Equity 147.6 2.1 9.3 17.6 HPCL IN Equity 344.9 (0.8) 7.7 15.1 IBULL IN Equity 248.6 1.1 11.1 14.0 Worst performers ADE IN Equity 198.7 2.2 (5.0) (33.7) TTMT IN Equity 221.6 (1.9) (6.9) (30.6) RCOM IN Equity 65.0 0.3 2.2 (24.7) SUEL IN Equity 18.2 (0.3) 4.9 (24.4) IVRC IN Equity 47.7 1.7 0.3 (22.6) Contents Daily Alerts Results Bajaj Auto: Operationally weak quarter Exide Industries: Impressive quarter but stock valuations factoring in sharper recovery Company Tata Steel: FY2012 annual report: Subsidiaries a drag on profits Sector Banks/Financial Institutions: Risk on and risk off Strategy Strategy: Educomp Solutions refinances while Moser Baer seeks to restructure
-
Upload
khangminh22 -
Category
Documents
-
view
0 -
download
0
Transcript of India Daily, July 19, 2012 - Kotak Securities

For Private Circulation Only. FOR IMPORTANT INFORMATION ABOUT KOTAK SECURITIES’ RATING SYSTEM AND OTHER DISCLOSURES. REFER TO THE END OF THIS MATERIAL.
INDIA DAILYJuly 19, 2012 India 18-Jul 1-day1-mo 3-mo
Sensex 17,185 0.5 1.9 (1.8)
Nifty 5,216 0.5 2.2 (2.2)
Global/Regional indices
Dow Jones 12,909 0.8 0.6 (0.4)
Nasdaq Composite 2,943 1.1 0.4 (2.2)
FTSE 5,686 1.0 1.8 (1.0)
Nikkie 8,785 0.7 1.5 (8.4)
Hang Seng 19,437 1.0 0.1 (7.4)
KOSPI 1,819 1.3 (3.8) (9.0)
Value traded – India
Cash (NSE+BSE) 111 119 117
Derivatives (NSE) 1,145 1,916 1,049
Deri. open interest 1,395 1,218 1,222
Forex/money market
Change, basis points
18-Jul 1-day 1-mo 3-mo
Rs/US$ 55.4 (5) (56) 317
10yr govt bond, % 8.3 - (6) (15)
Net investment (US$mn)
17-Jul MTD CYTD
FIIs 103 1,518 10,035
MFs (17) (348) (282)
Top movers -3mo basis
Change, %
Best performers 18-Jul 1-day 1-mo 3-mo
DIVI IN Equity 1059.1 (0.1) 12.0 25.0
GNP IN Equity 379.6 (2.2) 1.8 18.6
Z IN Equity 147.6 2.1 9.3 17.6
HPCL IN Equity 344.9 (0.8) 7.7 15.1
IBULL IN Equity 248.6 1.1 11.1 14.0
Worst performers
ADE IN Equity 198.7 2.2 (5.0) (33.7)
TTMT IN Equity 221.6 (1.9) (6.9) (30.6)
RCOM IN Equity 65.0 0.3 2.2 (24.7)
SUEL IN Equity 18.2 (0.3) 4.9 (24.4)
IVRC IN Equity 47.7 1.7 0.3 (22.6)
Contents
Daily Alerts
Results
Bajaj Auto: Operationally weak quarter
Exide Industries: Impressive quarter but stock valuations factoring in sharper recovery
Company
Tata Steel: FY2012 annual report: Subsidiaries a drag on profits
Sector
Banks/Financial Institutions: Risk on and risk off
Strategy
Strategy: Educomp Solutions refinances while Moser Baer seeks to restructure

For private Circulation Only. FOR IMPORTANT INFORMATION ABOUT KOTAK SECURITIES’ RATING SYSTEM AND OTHER DISCLOSURES, REFER TO THE END OF THIS MATERIAL.
Inferior product mix impacts profitability in this quarter
Domestic and export average selling prices declined by 1% and 1.6% qoq respectively due to inferior product mix. Adjusted EBITDA (excluding Rs360 mn loss on hedge contract) of Rs9,077 mn in 1QFY13 was 4% below our estimates. Net sales including operating income of Rs48.7 bn (+3% yoy, +5% qoq) were 2% below our estimates due to lower average selling prices. Net profit of Rs7,184 mn (+1% yoy, -7% qoq) was 3% below our estimates.
EBITDA margin at 18.7% declined by 110 bps qoq driven by lower product mix and discontinuation of 1% additional export incentives which was available till March 2012. We believe adjusted EBITDA margins declined by 110 bps qoq driven by (1) 40 bps decline due to discontinuation of 1% additional export benefits till March 2012 and (2) 70 bps impact due to inferior product mix. The company indicated that price increase of 1.5% in May 2012 offset the negative impact due to rise in commodity costs.
Other income also rose sharply which included Rs330 mn gain related to reversal of time value of hedges while the tax rate came in at 29.5% as income tax benefits on Pantnagar plant has been reduced from 100% to 30% from April 2012.
We retain our ADD rating on the stock due to attractive valuations
We believe Bajaj Auto is attractively valued at 12.7X PE on 12-month forward earnings estimates given (1) 12% earnings CAGR over FY2012-14E which is likely to be back-ended and (2) 5% free cash-flow yield. We expect Bajaj Auto’s volumes to recover from 2HFY12E driven by new model launches and recovery in export volumes. We expect EBITDA margins to improve driven by improvement in product mix and benefit of Rupee depreciation in FY2014E as the company has started taking hedges between Rs55 and Rs64/USD. Our target price remains unchanged at Rs1,675 based on 12-month forward earnings estimates.
Bajaj Auto (BJAUT)
Automobiles
Operationally weak quarter. Bajaj Auto reported an operationally weak quarter due to inferior product mix led by lower three-wheeler exports and lower share of premium domestic motorcycles in the product mix. We believe EBITDA margins are likely to inch up gradually with improvement in premium motorcycle sales and recovery in export volumes. We maintain our ADD rating on the stock due to attractive valuation and gradual improvement in volume growth in 2HFY13E.
Bajaj AutoStock data Forecasts/Valuations 2012 2013E 2014E
52-week range (Rs) (high,low) EPS (Rs) 103.8 109.3 130.2Market Cap. (Rs bn) 440.1 EPS growth (%) 14.9 5.3 19.1
Shareholding pattern (%) P/E (X) 14.7 13.9 11.7Promoters 50.0 Sales (Rs bn) 188.8 208.1 236.7FIIs 16.5 Net profits (Rs bn) 30.0 31.6 37.7MFs 2.5 EBITDA (Rs bn) 40.3 41.6 49.1
Price performance (%) 1M 3M 12M EV/EBITDA (X) 10.6 10.4 8.8Absolute (1.4) (11.4) 7.3 ROE (%) 54.5 45.6 42.9Rel. to BSE-30 (4.1) (10.3) 15.6 Div. Yield (%) 3.0 2.9 3.4
Company data and valuation summary
1,843-1,351
ADD
JULY 18, 2012
RESULT
Coverage view: Cautious
Price (Rs): 1,521
Target price (Rs): 1,675
BSE-30: 17,185

Bajaj Auto Automobiles
KOTAK INSTITUTIONAL EQUITIES RESEARCH 3
Operationally weak quarter; recovery likely to be back-ended
Bajaj Auto reported a profit after tax of Rs7,184 mn (+1% yoy, -7% qoq) which was 3% below our estimates. The company reported a loss of Rs360 mn (Rs170 mn related to 1QFY12 and Rs190 mn related to July 2012) related to hit on unrealized hedge contracts which is reflected in other expenses. We believe this is non-recurring in nature as we expect exports to recover in 2HFY13E.
Adjusted EBITDA (excluding Rs360 mn loss on hedge contract) of Rs9,077 mn was 4% below our estimates. Net sales including operating income of Rs48.7 bn (+3% yoy, +5% qoq) was 2% below our estimates due to lower average selling prices.
EBITDA margin at 18.7% declined by 110 bps qoq driven by lower product mix and discontinuation of 1% additional export benefit which was available till March 2012. We believe adjusted EBITDA margins declined by 110 bps qoq driven by (1) 40 bps decline due to discontinuation of 1% additional export benefits till March 2012 and (2) 70 bps impact due to inferior product mix. The company indicated that price increase of 1.5% in May 2012 offset the negative impact due to rise in commodity costs.
Other key highlights of the result
Average selling prices declined by 1.6% qoq driven by 1% decline in domestic selling prices and 1.6% qoq decline in export selling prices. Inferior product mix impacted both domestic and export segments.
Export volumes declined by 3% yoy primarily driven by 41% yoy decline in three-wheeler exports. Export motorcycle volumes increased by 7% yoy. Three-wheeler exports were impacted by increase in import duties in Sri Lanka and political unrest in Egypt.
The company had cut prices of two-wheelers by 5-14% and by 10% in three-wheelers in July 2012 to improve demand in Sri Lanka. This price cut could impact EBITDA margins by 60-70 bps in our view and could be structural given import duties were hiked sharply.
Export volumes were booked at Rs49.8/USD in 1QFY13 versus Rs 48.6/USD in 4QFY12. Hence, impact of poor product mix on export average selling prices was 4% qoq in our view.
The company has started hedging its export exposure for FY2014E between Rs55 and Rs64/USD. We expect a sharp jump in export average selling prices in FY2014E which could boost EBITDA margins.
Domestic motorcycle volumes were flat yoy in 1QFY13 but premium motorcycle segment share in overall volumes declined by 190 bps qoq which impacted domestic average selling prices.
Staff costs increased by 12% yoy due to salary hikes given to employees.
Other expenses also rose by 26% yoy driven by Rs360 mn hit due to unrealized hedge contracts.
Other income also rose sharply which included Rs330 mn gain related to reversal of time value of hedges.
Tax rate came in at 29.5% as income tax benefits on Pantnagar plant has been reduced from 100% to 30% from April 2012.

Automobiles Bajaj Auto
4 KOTAK INSTITUTIONAL EQUITIES RESEARCH
We believe Bajaj Auto will face near-term headwinds due to subdued domestic volumes and slow pick-up in export volumes in Sri Lanka. However, we expect a gradual recovery in volumes from 3QFY13 driven by recovery in Pulsar volumes and recovery in Sri Lanka export volumes. We believe EBITDA margins will inch up gradually from current levels from 3QFY13E. We maintain our ADD rating in the stock with a target price of Rs1,675 based on 14X multiple on 12-month forward earnings estimates.
Bajaj Auto results were operationally weaker than our estimates due to lower average selling prices Bajaj Auto interim results, March fiscal year-ends (Rs mn)
% change1QFY13 1QFY13E 1QFY12 4QFY12 KIE est yoy qoq
Volumes (units) 1,078,971 1,078,971 1,092,815 1,017,167 — (1.3) 6.1 Net realisations 43,686 44,364 41,502 44,393 (1.5) 5.3 (1.6) Net sales 47,136 47,868 45,354 45,156 (1.5) 3.9 4.4 Operating income 1,520 1,600 1,709 1,359 (5.0) (11.1) 11.9 Net sales (including op income) 48,657 49,468 47,063 46,514 (1.6) 3.4 4.6 Inc/dec in stock 1,156 - 1,148 (1,708) Raw materials 33,925 35,445 33,511 34,834 (1.0) 1.2 5.9 Staff costs 1,604 1,330 1,431 1,196 20.6 12.1 34.2 Other expenses 3,255 3,245 2,575 2,987 0.3 26.4 9.0 Total expenses 39,940 40,020 38,665 37,309 (0.2) 3.3 7.1 EBITDA 8,717 9,447 8,398 9,206 (7.7) 3.8 (5.3) Other income 1,820 1,400 1,441 1,395 30.0 26.3 30.5 Interest expense 0 20 2 18 Depreciation expense 352 445 306 434 (20.8) 15.0 (18.8) Profit before tax before exceptional 10,184 10,382 9,531 10,149 (1.9) 6.9 0.3 Extraordinary income — — — — Valuation loss on hedges — — — (203) Profit before tax 10,184 10,382 9,531 10,352 (1.9) 6.9 (1.6) Tax expense 3,000 3,011 2,420 2,631 (0.4) 24.0 14.0 Profit after tax 7,184 7,371 7,111 7,720 (2.5) 1.0 (6.9) Adj PAT 7,184 7,371 7,111 7,720 (2.5) 1.0 (6.9) Raw material cost as % of net sales 72.1 71.7 73.6 71.2 Staff cost as % of net sales 3.3 2.7 3.0 2.6 Other expenses as % of net sales 6.7 6.6 5.5 6.4 EBITDA margin (%) 17.9 19.1 17.8 19.8 No of shares 289 289 289 289 EPS 24.9 25.5 24.6 26.7 Tax rate (%) 29.5 29.0 25.4 25.9 Volume breakdown (units)Economy 149,492 149,492 111,607 159,866 33.9 (6.5) Executive 298,827 298,827 355,156 277,277 (15.9) 7.8 Premium 169,679 169,679 155,986 179,372 8.8 (5.4) Domestic motorcycle 617,998 617,998 622,749 616,515 (0.8) 0.2 Export motorcycle 364,134 364,134 339,926 280,732 7.1 29.7 Total motorcycle 982,623 982,623 963,051 897,247 2.0 9.5 Domestic 3 wheelers 44,837 44,837 42,276 53,237 6.1 (15.8) Export 3 wh 51,511 51,511 87,488 66,682 (41.1) (22.8) 3 wheelers 96,348 96,348 129,764 119,919 (25.8) (19.7) Total volumes 1,078,971 1,078,971 1,092,815 1,017,166 (1.3) 6.1 Volume mix (%)Economy 13.9 13.9 10.2 15.7 Executive 27.7 27.7 32.5 27.3 Premium 15.7 15.7 14.3 17.6 Domestic motorcycle 57.3 57.3 57.0 60.6 Export motorcycle 33.7 33.7 31.1 27.6 Total motorcycle 91.1 91.1 88.1 88.2 Domestic 3 wheelers 4.2 4.2 3.9 5.2 Export 3 wh 4.8 4.8 8.0 6.6 3 wheelers 8.9 8.9 11.9 11.8 Total volumes 100.0 100.0 100.0 100.0
Source: Company, Kotak Institutional Equities estimates

Bajaj Auto Automobiles
KOTAK INSTITUTIONAL EQUITIES RESEARCH 5
We estimate earnings to increase at 12% CAGR over FY2012-14E Bajaj Auto profit and loss, balance sheet and cash flow statement, March fiscal year-ends, 2010-15E (Rs mn)
2010 2011 2012 2013E 2014E 2015EProfit model (Rs mn)Net sales 115,085 158,968 188,803 208,096 236,745 268,556
EBITDA 26,175 34,138 40,284 41,648 49,135 53,927 Other income 976 3,339 2,997 4,410 5,610 7,210 Interest (60) (17) (222) — — —Depreciation (1,365) (1,228) (1,456) (1,513) (1,671) (1,723)
Profit before tax 25,726 36,232 41,602 44,545 53,075 59,415 Extra-ordinary items (1,624) 7,246 (1,340) — — —Taxes (7,075) (10,080) (10,221) (12,918) (15,392) (17,230)
Net profit 17,027 33,397 30,041 31,627 37,683 42,184 Adjusted net profit 18,171 26,152 30,041 31,627 37,683 42,184 Adjusted earnings per share (Rs) 62.8 90.4 103.8 109.3 130.2 145.8 Balance sheet (Rs mn)Equity 29,283 49,102 60,411 77,237 97,285 119,728 Deferred tax liability 17 297 484 484 484 484 Total borrowings 13,386 4,855 2,546 2,546 2,546 2,546 Current liabilities 28,579 38,222 47,370 49,892 53,155 58,408
Total liabilities 71,265 92,476 110,811 130,159 153,470 181,166 Net fixed assets 15,211 15,483 14,914 15,900 16,730 17,257 Investments 40,215 47,219 48,828 70,702 90,702 110,702 Cash 1,014 2,288 16,538 9,285 9,444 13,897 Other current assets 14,824 27,443 30,211 33,951 36,275 38,989 Miscellaneous expenditure — 43 320 320 320 320 Total assets 71,265 92,476 110,811 130,159 153,470 181,166 Free cash flow (Rs mn)Operating cash flow excl. working capital 18,874 24,352 28,802 23,700 28,601 31,716 Working capital changes 8,498 (8,215) 797 (1,219) 939 2,538 Capital expenditure (1,078) (2,006) (1,090) (2,500) (2,500) (2,250) Free cash flow 26,293 14,131 28,509 19,982 27,040 32,004 RatiosEBITDA margin (%) 21.9 20.5 20.3 19.1 19.9 19.2 PAT margin (%) 15.8 16.5 15.9 15.2 15.9 15.7 Debt/equity (X) 0.5 0.1 0.0 0.0 0.0 0.0 Net debt/equity (X) 0.4 0.1 (0.2) (0.1) (0.1) (0.1) Book Value (Rs/share) 101.2 169.7 208.7 266.9 336.2 413.7 RoAE (%) 70.9 84.9 54.5 45.6 42.9 38.7 RoACE (%) 42.5 63.6 47.5 39.7 37.3 33.2
Source: Company, Kotak Institutional Equities estimates

For private Circulation Only. FOR IMPORTANT INFORMATION ABOUT KOTAK SECURITIES’ RATING SYSTEM AND OTHER DISCLOSURES, REFER TO THE END OF THIS MATERIAL.
Inverter and four-wheeler replacement demand surprises positively
Exide’s 1QFY13 EBITDA of Rs2.34 bn (+5% yoy, +10% qoq) was 13% better than our expectations due to sharp improvement in inverter and four-wheeler automotive replacement volumes. Inverter volumes have grown by >20% yoy in 1QFY13 and four-wheeler replacement volumes grew by ~16-19% yoy in 1QFY13. EBITDA margins rose by 40 bps qoq despite improvement in product mix. The management has not provided segmental margin break-up but we believe industrial margins would have improved due to strong growth in inverter volumes, which could be offset by slight deterioration in profitability in the auto segment as the company had taken a price cut in April 2012 in the four-wheeler replacement battery segment.
Industrial segment is driving the recovery in profitability which may not be sustainable
Inverter battery volumes have grown at a strong pace over the past few quarters driven by increase in power deficit in the country and harsh summer in North India. We believe such high growth in inverter battery volumes may moderate in 2HFY12E due to high base effect and slight improvement in the power deficit situation in the country. Competition in this segment is increasing and if volume growth moderates, we believe margins could come under pressure.
We retain our SELL rating on limited levers for margin expansion
We retain our SELL rating on the stock due to expensive valuations and limited pricing power. We expect EBITDA margins to remain range-bound around 15% levels despite strong revenue growth and stable lead price outlook due to competitive pressures. We have increased our target price to Rs115 (from Rs105 earlier) as we have raised our earnings estimates by 5-6% over FY2013-14E due to improvement in product mix led by higher-than-expected inverter volumes. Our target price is based on the sum-of-the-parts valuation methodology.
Exide Industries (EXID)
Automobiles
Impressive quarter but stock valuations factoring in sharper recovery. Exide reported a >20% yoy growth in inverter volumes and ~16-19% yoy growth in automotive four-wheeler replacement battery volumes in 1QFY13, which is impressive in our view. EBITDA margins remained flattish qoq despite improvement in product mix which is a cause for concern due to higher publicity/marketing spends. We retain our SELL rating on the stock on expensive valuations and limited pricing power.
Exide IndustriesStock data Forecasts/Valuations 2012 2013E 2014E
52-week range (Rs) (high,low) EPS (Rs) 5.4 7.1 8.1Market Cap. (Rs bn) 111.2 EPS growth (%) (27.2) 30.1 15.5
Shareholding pattern (%) P/E (X) 24.1 18.5 16.1Promoters 46.0 Sales (Rs bn) 51.1 59.0 68.3FIIs 18.1 Net profits (Rs bn) 4.6 6.0 6.9MFs 3.3 EBITDA (Rs bn) 6.8 9.0 10.2
Price performance (%) 1M 3M 12M EV/EBITDA (X) 16.2 12.1 10.8Absolute (1.7) (0.9) (22.1) ROE (%) 15.9 18.4 18.6Rel. to BSE-30 (4.4) 0.2 (16.1) Div. Yield (%) 1.1 1.4 1.6
Company data and valuation summary
188-99
SELL
JULY 18, 2012
RESULT
Coverage view: Cautious
Price (Rs): 131
Target price (Rs): 115
BSE-30: 17,185

Exide Industries Automobiles
KOTAK INSTITUTIONAL EQUITIES RESEARCH 7
Pick-up in four-wheeler replacement and inverter volumes drives revenue growth
Exide Industries’ 1QFY13 net sales grew by 25% yoy (6% ahead of our estimates). The revenue growth was boosted by (1) ~16-19% yoy growth in four-wheeler replacement battery volumes and (2) 19% yoy growth in industrial battery volumes (primarily inverter and UPS segment). Four-wheeler OEM battery volume was flat yoy while two-wheeler volumes grew by 28% yoy due to a shift towards self-start bikes from kick-start which is aiding market share gains for organized players in the two-wheeler replacement market.
Gross margins improved by 220 bps qoq driven by improvement in product mix (higher share of four-wheeler replacement and inverter volumes) but other expenses to net sales increased by 160 bps qoq driven by increase in publicity expenses and Rs103 mn forex loss related to imported lead procurement. EBITDA margins were flattish qoq despite sharp improvement in product mix, which is our main concern on pricing power.
The company did not report any smelter income in this quarter as they would require cash for expansion plans of smelters. Net profit of Rs1,534 mn (-6% yoy, +8% qoq) was 13% above our estimates due to higher-than-expected revenues which led to better-than-expected operating margins.
Pick-up in four-wheeler replacement and inverter volumes drives revenue growth Exide Industries 1QFY13 results, March fiscal year-ends (Rs mn)
1QFY13 1QFY13E 1QFY12 4QFY12 kotak est yoy qoqGross sales 17,522 16,532 13,774 16,044 6.0 27.2 9.2 Excise duty and sales tax (2,011) (1,950) (1,341) (1,586) 3.1 50.0 26.8 Other operating income 25 18 49 18 38.9 (48.9) 41.2 Net sales 15,536 14,600 12,482 14,476 6.4 24.5 7.3 Raw materials 10,100 9,900 7,941 9,726 2.0 27.2 3.8 Staff costs 841 760 720 746 10.6 16.8 12.7 Other expenses 2,254 1,874 1,596 1,874 20.3 41.2 20.3 Total expenses 13,194 12,534 10,256 12,346 5.3 28.6 6.9 EBITDA 2,342 2,066 2,225 2,130 13.3 5.2 10.0 Depreciation 276 274 237 273 0.8 16.5 1.3 EBIT 2,066 1,792 1,988 1,857 15.3 3.9 11.2 Other income 147 150 308 147 (1.7) (52.1) 0.5 Interest expense 14 13 14 14 6.2 (2.8) 1.5 Profit before tax 2,199 1,929 2,282 1,990 14.0 (3.6) 10.5 Tax expense 665 565 650 565 17.7 2.4 17.7 Profit after tax 1,534 1,364 1,633 1,425 12.5 (6.0) 7.7 # of shares 850 850 850 850 EPS (Rs/ share) 1.8 1.6 1.9 1.7 Excise duty, sales tax to gross sales 11.5 11.8 9.7 9.9 Tax rate (%) 30.2 29.3 28.5 28.4 As % of net revenuesRaw material 65.0 67.8 63.6 67.2 Staff costs 5.4 5.2 5.8 5.2 Other expenses 14.5 12.8 12.8 12.9 EBITDA margin 15.1 14.2 17.8 14.7 EBIT margin 13.3 12.3 15.9 12.8
change (%)
Source: Company, Kotak Institutional Equities estimates

Automobiles Exide Industries
8 KOTAK INSTITUTIONAL EQUITIES RESEARCH
Recovery in business in past few quarters has been led by industrial segment
The company’s industrial business has recovered sharply driven by (1) increase in power cuts in the country since October 2011 as power demand-supply deficit widened and (2) harsh summer conditions in North India. The company had cut inverter battery prices by 15% in September 2011 which corrected the gap in pricing between Exide and its competitors. Inverter volumes of Exide have grown by ~40%, 22% and 20-25% yoy in 3QFY12, 4QFY12 and 1QFY13 respectively. The company had also increased prices by 3-4% in 4QFY12 to take advantage of higher demand which boosted industrial EBITDA margins from 11% in 3QFY12 to 15% in 4QFY12.
We believe inverter battery demand will moderate in 2HFY12E due to high base effect and slight improvement in the power demand-supply situation. Many State Governments have implemented hikes in electricity prices which could improve power situation with a lag. We also highlight that competition is increasing in the inverter battery space as Amararaja has also launched home UPS/inverter battery brands in the market in 4QFY12 under private-label brands. Hence, we believe EBITDA margins could come under pressure once the inverter battery demand moderates.
The inverter battery segment accounts for 25% of Exide’s revenues and possibly 33% of Exide’s EBITDA in our view. Hence, any moderation in demand in this segment could have a material impact on earnings in our view.
Power deficit situation had started to worsen from October 2011 Power demand-supply deficit, April 2011-June 2012 (%)
Apr-11 May-11 Jun-11 Jul-11 Aug-11 Sep-11 Oct-11 Nov-11 Dec-11 Jan-12 Feb-12 Mar-12 Apr-12 May-12 Jun-12Northern region (4.7) (4.0) (3.9) (2.6) (5.1) (6.6) (11.4) (9.4) (9.1) (7.2) (6.7) (5.8) (5.0) (9.6) (10.5) Western region (11.6) (10.9) (8.1) (8.6) (7.2) (8.2) (13.9) (15.5) (14.9) (12.4) (13.5) (9.1) (4.4) (3.5) (4.0) Southern region (6.9) (4.8) (4.6) (4.3) (2.9) (5.6) (11.0) (11.7) (11.4) (9.3) (13.1) (16.7) (15.5) (10.9) (12.2) Eastern region (4.3) (4.1) (3.9) (3.6) (3.6) (5.2) (4.6) (4.7) (5.9) (6.0) (5.8) (4.3) (6.1) (5.1) (5.7) All India (7.6) (6.5) (5.4) (4.9) (5.0) (6.6) (11.3) (11.6) (11.5) (9.4) (10.6) (10.1) (8.2) (7.6) (8.6)
Source: CEA, Kotak Institutional Equities estimates
Four-wheeler replacement battery volume growth improved in 1QFY13
After a slow growth in four-wheeler replacement battery volumes over 1QFY12-4QFY12 (~low single-digit growth), Exide has delivered a ~16-19% yoy growth in replacement volumes in 1QFY13. Exide management indicated that they have gained market share in 1QFY13. However, we highlight that the company had taken a series of price cuts since September 2011 of around 8% in four-wheeler automotive batteries to gain some of its lost market share. We expect four-wheeler replacement automotive battery demand to remain strong over the next couple of years driven by sharp growth in automobile demand in FY2010-2011, but we believe EBITDA margins are unlikely to improve in this segment as both Exide and Amararaja have ambitions to increase market share.
Our key assumptions
We forecast Exide’s four-wheeler OEM volumes to grow by 7-13% yoy over FY2013-2014E in line with our industry growth forecasts.
We estimate four-wheeler replacement battery volumes to grow between 15% and 25% yoy in FY2013-14E as we expect Exide’s market share to remain stable during this period assuming stable pricing.

Exide Industries Automobiles
KOTAK INSTITUTIONAL EQUITIES RESEARCH 9
We expect strong growth in two-wheeler OEM volumes in FY2013E as Exide gains market share from Amco. However, we expect two-wheeler OEM demand to moderate in FY2014E for Exide as we expect Amararaja to gain share. Amararaja is in the process of tying up with two-wheeler OEMs over the next few quarters. The company is currently not present in the two-wheeler OEM battery segment.
We forecast Exide to gain market share in the two-wheeler OEM battery segment driven by a shift towards self-start bikes which require greater power.
We expect EBITDA margins to improve by 160 bps yoy in FY2013E driven by improvement in replacement/OEM mix and stable pricing. We expect EBITDA margins to decline by 40 bps yoy in FY2014E as we factor in 200 bps yoy decline in inverter EBITDA margins.
We estimate Exide’s industrial segment revenues to grow by 17% yoy in FY2013E and 13% yoy in FY2014E driven by growth in inverter and UPS battery volumes. We expect industrial segment EBITDA margins to decline by 100 bps yoy in FY2014E due to increase in competition.
We expect strong growth in Exide revenues over the next few years Exide Industries revenue breakdown, March fiscal year-ends, 2010-15E (Rs mn)
2010 2011 2012 2013E 2014E 2015E4 wheeler volumes (mn units)4wh - OEM 3.1 3.8 4.0 4.2 4.8 5.4 YoY change (%) 22.6 4.2 6.8 12.7 12.8 4 wh - Replacement 3.5 3.8 3.7 4.3 5.3 6.0 YoY change (%) 7.7 (1.3) 14.5 24.5 13.9 Total 4 wheeler volumes 6.6 7.6 7.7 8.5 10.1 11.4 YoY change (%) 14.7 1.5 10.5 18.6 13.4 Replacement/OEM mix (X) 1.13 0.99 0.94 1.01 1.11 1.12 2 wheeler volumes (mn units)2wh - OEM 5.5 7.2 10.1 12.2 13.1 14.0 YoY change (%) 30.9 39.4 21.8 6.9 6.9 2 wh - Replacement 3.2 3.0 3.7 4.4 5.8 7.0 YoY change (%) (7.3) 23.6 21.1 31.3 20.5 Total 2 wheeler volumes 8.7 10.9 13.7 16.7 18.9 21.0 YoY change (%) 25.3 25.8 21.6 13.4 11.0 Replacement/OEM mix (X) 0.58 0.39 0.36 0.36 0.44 0.50Overall automotive volumes (mn units)Total OEM volumes 8.61 11.01 14.0 16.5 17.9 19.4 Total Replacement volumes 6.7 6.7 7.4 8.7 11.1 13.0 Total auto volumes 15.3 18.5 21.4 25.2 29.0 32.4 YoY change (%) 20.7 15.8 17.6 15.2 11.9 Automotive revenues (Rs mn) 19,558 24,270 26,464 30,261 35,848 40,520 YoY change (%) 24.1 9.0 14.3 18.5 13.0 Automotive ASPs (Rs/unit) 1,278 1,314 1,237 1,203 1,237 1,250 YoY chg (%) 2.8 (5.8) (2.8) 2.9 1.1 Industrial battery volumes (mn units)Industrial battery volumes 6.5 5.3 5.8 6.6 7.5 8.5 YoY change (%) (18.0) 8.0 15.0 14.0 13.0Industrial revenues (Rs mn) 18,284 21,024 24,567 28,708 32,420 36,540 YoY change (%) 15.0 16.9 16.9 12.9 12.7 Industrial ASPs (Rs/unit) 2,813 3,944 4,268 4,337 4,296 4,285 YoY change (%) 40.2 8.2 1.6 (0.9) (0.3) Total volumes (mn units) 21.8 23.8 27.1 31.8 36.5 40.9 YoY change (%) 9.2 14.1 17.1 14.9 12.1 Operational income 97 242 39.8 40.0 40.0 40.0 Net revenues (Rs mn) 37,940 45,536 51,070 58,968 68,268 77,061 YoY change (%) 20.0 12.2 15.5 15.8 12.9
Source: Company, Kotak Institutional Equities estimates

Automobiles Exide Industries
10 KOTAK INSTITUTIONAL EQUITIES RESEARCH
Earnings revision
We have revised our earnings estimates upwards by 5-6% yoy in FY2013-14E primarily driven by increase in our inverter battery volume assumptions and slight increase in our four-wheeler replacement volume assumptions. We have also increased our EBITDA margin assumptions by 40-80 bps over this period to factor in improvement in product mix.
We value the stock using the sum-of-the-parts valuation methodology. We have increased our target price to Rs115 (from Rs105 earlier) based on 12-month forward earnings estimates.
Exide Industries sum-of-the-parts valuation methodology
EPS PE(Rs) (X) Per share value
12m forward EPS 7.4 14 104 ING Vysya (50% stake value) 10 SOTP based value 114 SOTP based value 115
Source: Kotak Institutional Equities estimates
We revise our earnings upwards by 5-6% over FY2013-14E Earnings revision table, March fiscal year-ends, 2013-14E (Rs mn)
2013E 2014E 2013E 2014E 2013E 2014ENet sales 58,968 68,268 58,349 66,708 1.1 2.3 EBITDA 8,823 9,934 8,263 9,444 6.8 5.2 Margin (%) 15.0 14.6 14.2 14.2 5.7 2.8 Net Profit 5,867 6,729 5,523 6,440 6.2 4.5 Standalone EPS 6.9 7.9 6.5 7.6 6.2 4.5
New estimates Old estimates % change
Source: Kotak Institutional Equities estimates

Exide Industries Automobiles
KOTAK INSTITUTIONAL EQUITIES RESEARCH 11
We estimate a 15% CAGR in earnings over FY2013-15E Exide Industries profit and loss, balance sheet and cash flow statement, March fiscal year-ends, 2010-15E (Rs mn)
2010 2011 2012 2013E 2014E 2015EProfit model (Rs mn)Net sales 37,940 45,536 51,070 58,968 68,268 77,061 EBITDA 8,894 8,788 6,839 8,823 9,934 11,240 Other income 121 1,038 668 597 796 1,073 Interest (103) (57) (48) (48) — —Depreciation (807) (835) (1,007) (1,109) (1,252) (1,409) Profit before tax 8,106 8,934 6,452 8,264 9,478 10,904 Tax expense (2,735) (2,740) (1,840) (2,396) (2,749) (3,162) Adjusted net profit 5,371 6,335 4,612 5,867 6,729 7,742 Adjusted earnings per share (Rs) 6.3 7.5 5.4 6.9 7.9 9.1 Balance sheet (Rs mn)Equity 22,198 27,425 30,573 34,680 39,391 44,810 Total Borrowings 900 22 — — — —Deferred Tax Liability 590 675 825 825 825 825 Current liabilities 5,929 7,964 9,546 11,011 12,714 14,458 Total liabilities 29,616 36,085 40,944 46,516 52,930 60,094 Net fixed assets 7,144 9,018 9,932 11,523 13,271 14,362 Investments 13,354 13,780 15,546 16,692 19,892 24,092 Cash 29 148 577 2,225 1,002 407 Other current assets 9,089 13,140 14,889 16,076 18,764 21,232 Total assets 29,616 36,085 40,944 46,516 52,930 60,094 Free cash flow (Rs mn)Operating cash flow 6,355 7,114 5,769 6,976 7,981 9,151 Working capital changes (637) (2,015) (168) 279 (986) (724) Capital expenditure (1,098) (2,708) (1,921) (2,700) (3,000) (2,500) Change in investments (6,672) (426) (1,767) (1,146) (3,200) (4,200) Free cash flow 3,683 1,204 3,680 4,555 3,995 5,927 RatiosEBITDA margin (%) 23.4 19.3 13.4 15.0 14.6 14.6 PAT margin (%) 14.2 13.9 9.0 9.9 9.9 10.0 Net debt/equity (X) 0.0 (0.0) (0.0) (0.1) (0.0) (0.0) Book Value (Rs/share) 26.1 32.3 36.0 40.8 46.3 52.7 RoAE (%) 31.0 25.5 15.9 18.0 18.2 18.4 RoACE (%) 38.1 34.9 23.9 26.5 26.7 27.0
Source: Company, Kotak Institutional Equities estimates

For private Circulation Only. FOR IMPORTANT INFORMATION ABOUT KOTAK SECURITIES’ RATING SYSTEM AND OTHER DISCLOSURES, REFER TO THE END OF THIS MATERIAL.
Subsidiaries a drag on profits of Tata Steel India
Tata Steel’s reported net income declined 40% to Rs54 bn in FY2012. The main reason for the decline in profits was slippage in subsidiaries’ performance; key subsidiaries reported an attributable loss of Rs53.9 bn in FY2012 from profits of Rs18 bn in FY2011. Chief among them were: (1) Tata Steel Europe, which reported a loss of Rs46 bn in FY2012 against profit of Rs16.4 bn in FY2011. Note that FY2011 net income was supported by the sale of TCP; (2) Tata Steel Thailand increased its losses to Rs2.19 bn from Rs944 mn in FY2011 due to disrupted operations due to floods and (3) the South African unit increased losses in the ferrochrome business. A combination of operational improvement, likely non-recurrence of one-off items and alignment of cost to the current operating environment should ensure lower losses from subsidiaries in FY2013.
Forex volatility leads to increase in book value but impacts earnings and debt
The depreciation of the Rupee had an impact at multiple levels in FY2012.
Foreign currency translation reserve contributed Rs52 of the Rs74 increase in book value per share. Book value was Rs443/share at the end of FY2012. Foreign currency translation reserve increases due to the translation impact of overseas subsidiaries’ financials to functional currency (the Rupee). The Rupee depreciation may lead to an increase in reserves and surplus of Tata Steel: We would not be surprised if Rupee depreciation drives up book value further in 1QFY13.
Translation impact of GBP-denominated debt to the local currency may have led to Rs25-30 bn increase in debt. Depreciation of the Rupee since the end of FY2012 will lead to increase in this reported debt (Rs35 bn, in our view). This impacts fair value since the translation benefit of Tata Steel Europe EBITDA is not sufficient to offset the debt restatement impact.
Rupee depreciation led to Rs7.26 bn swing in Tata Steel’s FY2012 EBITDA (forex loss of Rs4.67 bn in FY2012 versus a gain of Rs2.59 bn in FY2011). Earnings impact was due to US$1.7 bn of unhedged foreign-currency debt. We expect forex losses to increase in FY2013.
We highlight that every Re1 depreciation the against US Dollar increases our TP on Tata Steel by Rs20 at the spot steel prices
Tata Steel (TATA)
Metals & Mining
FY2012 annual report: Subsidiaries a drag on profits. Tata Steel’s FY2012 annual report highlights (1) subsidiaries were a drag on profits, contributing Rs58 bn of the earnings swing; (2) book value increased by Rs74/share, contributed by a Rs52/share increase in foreign exchange translation reserves; (3) conversion costs increased by 19% for the India steel business, which is a concern and (4) movement in items of pension fund of TSE requires clarification. This is our preliminary read through; we may follow this up with a detailed update. We maintain our ADD rating.
Tata SteelStock data Forecasts/Valuations 2012 2013E 2014E
52-week range (Rs) (high,low) EPS (Rs) 26.1 54.2 67.8Market Cap. (Rs bn) 399.9 EPS growth (%) (65.4) 108.1 24.9
Shareholding pattern (%) P/E (X) 15.8 7.6 6.1Promoters 31.4 Sales (Rs bn) 1,329.0 1,440.0 1,455.6FIIs 16.2 Net profits (Rs bn) 25.3 52.7 65.8MFs 3.8 EBITDA (Rs bn) 124.2 159.8 183.5
Price performance (%) 1M 3M 12M EV/EBITDA (X) 7.3 5.8 5.1Absolute (1.9) (11.5) (28.0) ROE (%) 6.7 12.7 14.3Rel. to BSE-30 (4.7) (10.4) (22.4) Div. Yield (%) 2.9 2.9 2.9
Company data and valuation summary
596-332
ADD
JULY 18, 2012
UPDATE
Coverage view: Cautious
Price (Rs): 412
Target price (Rs): 480
BSE-30: 17,185

Tata Steel Metals & Mining
KOTAK INSTITUTIONAL EQUITIES RESEARCH 13
TSE pension plan likely to slip into deficit, but cash drain may not be significant
Surplus of Tata Steel Europe (TSE) pension plan declined to Rs12 bn in FY2012 from Rs23 bn in FY2011. Some movements in net fair value of the plan assets are puzzling and we would seek clarification on them: (1) Reduction in expected returns on plan assets has not resulted in a reduction in fair value of the plan assets and (2) liability-related provisions appear aggressive. We believe the underlying surplus of the pension plan could slip into deficit. Tata Steel may have to increase funding to the plan as a result. Note that in FY2012 the total impact to earnings was Rs5.8 bn (earnings impact should have been higher but for the company’s accounting policy to adjust the actuarial gains/losses directly against the reserves. Without this accounting treatment, FY2012 net income would have been lower by 44%).
Reconciliation between change in the fair value and expected return of plan assets. Tata Steel cut expected returns on plan assets to 1-3.5% in FY2012 from 2-9.6% in FY2011. This should have resulted in a decline in fair value of assets. Surprisingly, the company reported an actuarial gain of Rs78.5 bn in FY2012 implying there have been larger gains from elsewhere. This could have been possible through MTM gain on the bond portfolio.
Liability-related assumption appears aggressive. We note that the underlying discount rate has fallen to 2.5-4.8% in FY2012 from 3-5.9% in FY2011. The rate of escalation in salary has declined marginally to 1-4.2% in FY2012 from 1-1.46% in FY2011. Both assumptions are reasonably aggressive as they reduce the present value of liability.
We note the underlying plan is a reasonably mature plan (current service cost is about 20% of interest cost) and aggressive assumptions on discount rates/staff costs may not materially change the outstanding liability but it nevertheless represents a higher risk. The lack of information on a number of members in the plan, expected mortality rates and the benefit provided to retired employees makes it difficult to analyze the change in liabilities.
Capital work in progress up to Rs200 bn, aggressive capex likely to continue
Tata Steel spent Rs121 bn on capex in FY2012. The capex number is likely to stay at Rs120-130 bn over the next 3-4 years, in our view. Consolidated CWIP increased to Rs200 bn in FY2012 from Rs135.5 bn in FY2011. The increase could have been due to
Capex on green-field integrated steel plant in Orissa. The company may have spent US$850 mn by the end of FY2012 on this project. Tata Steel indicates it has all the requisite clearances for the project and placed orders for equipment such as blast furnace, sinter plant, coke oven, steel melting ship and hot strip mills. Major piling work for the blast furnace is complete and ~130K cubic meters of concreting work done.
~US$2 bn on 3 mtpa brown-field expansion at Jamshedpur. Trial production has started. This expansion comprises a 3 mtpa blast furnace, 6mtpa pellet plant, 2X0.7 mtpa coke oven batteries, a new LD shop, thin slab caster and rolling mill of 2.54 mn tonnes per annum to produce hot-rolled coils
Blast Furnace No 4 rebuild at Port Talbot at an estimated cost of GBP185 mn. This will improve campaign life of the BF by 20 years and increase productivity to 2.5 mtpa.
Standalone CWIP increased to Rs 161 bn. Increase in CWIP in FY2012 was higher than the standalone capex. This could have been due to merger of Centennial Steel, a company managing project execution of brown-field expansion at Jamshedpur, with Tata Steel India.
It is surprising that capex on subsidiaries declined to Rs49 bn in FY2012 from Rs56 bn in FY2011, despite an increase in capex at Tata Steel Europe.

Metals & Mining Tata Steel
14 KOTAK INSTITUTIONAL EQUITIES RESEARCH
A weak year for Tata Steel Europe
Tata Steel Europe had a poor year. Performance was impacted by factors such as weak realizations, major mid-term maintenance campaign for better operational performance at Port Talbot and long business products restructuring costs at Scunthorpe UK. Key cost items such as staff costs increased 7.7% to US$192/tonne. Power cost increased 16% to US$31/tonne. Other costs also increased 8.8% to US$247/tonne. The increase could have been higher but for the adjustment of proceeds of US$125 mn from settlement of TCP arbitration in other expenditure in FY2012. The company was also impacted by inventory write-down of US$154 mn, resulting from a sudden dip in steel prices in 3QFY12. Performance of Tata Steel Europe may improve marginally due to lower restructuring costs, better operational management and lower probability of inventory write-down a la FY2012.
Conversion costs increase 19% for India business
Reported India steel business conversion cost increased 19% to Rs21,763/tonne in FY2012. Adjusting for forex gains in FY2011 and loss in FY2012, conversion cost increased to Rs21,058/tonne. The increase was due to a 24% increase in power and fuel costs and 13% increase in employee cost/tonne. Increase in cost of production is a concern but worked into our assumptions of the subsequent years.
Earnings likely to be volatile
Tata Steel’s earnings are likely to be volatile on account of the following factors.
Likely volatile performance of TSE. We forecast loss in FY2013 though lower than Rs42 bn in FY2012. Tata Steel does not create deferred tax in case of a loss at TSE; hence the earnings impact is greater, especially while consolidating it with a full tax paying India entity
High operating and financial leverage.
As a result, a marginal change in EBITDA can lead to a material shift in earnings.
Leverage may appear high but is manageable
Net debt/EBITDA of 4.3X and net debt/equity of 1.2X on FY2012 financials may appear high but are not a concern. Even leverage ratios of FY2013E and FY2014E are not a concern noting strong profitability of the India business, likely strong operational cash generation in the India business and residing CWIP that will deliver strong cash flows.
Maintain ADD rating
Our positive view on Tata Steel is driven by inexpensive valuations and catalysts in the form of brown-field expansion and start of shipments from overseas raw material projects. We have end-FY2013E fair value of Rs480/share.

Tata Steel Metals & Mining
KOTAK INSTITUTIONAL EQUITIES RESEARCH 15
Tata Steel consolidated leverage details, March fiscal year ends (Rs mn), FY2012-14E (X)
2012 2013E 2014EExistingEBITDA 115,592 159,839 183,545 Total equity 430,436 435,311 487,674 Net debt (Rs mn) 498,719 521,826 535,579 Net debt/ EBITDA (X) 4.3 3.3 2.9 Net debt/ Equity (X) 1.2 1.2 1.1
Source: Kotak Institutional Equities estimates
Tata Steel's attributable share of earnings in subsidiaries and associates, March fiscal year ends, FY2010-12 (Rs mn)
Tata Steel's Attributable earnings share
2010 2011 2012Tata Steel Europe (TSE) (75,040) 16,410 (42,420)NatSteel Holdings 1,020 1,520 180Tata Steel Thailand (TSTH) (75) (944) (2,193)Tata Metaliks 145 5 (566)TM International Logistics Limited 189 291 281Tayo Rolls Limited (65) (163) (289)Tata Steel Processing & Distribution Limited 320 430 550The Tinplate Company of India Limited 297 160 104Tata NYK Shipping Pte Ltd (30) 15 (570)TRL Krosaki Refractories Limited 325 341 27Tata Sponge Iron Limited 368 437 329Tata Steel KZN Pte Limited 387 (495) (1,521)Total Proportionate Earnings (72,160) 18,006 (46,089)Tata Steel Standalone Net Profit 50,468 68,657 66,964Tata Steel Consolidated Net Profit (20,092) 89,827 53,898
Note:(a) Consolidated Net Profit adjusted for extraordinary items
Source: Company, Kotak Institutional Equities estimates
Contribution of various reserves to book value of Tata Steel , FY2010-12
Mar-10 Mar-11 Mar-12Reserves and surplus (Rs mn)Actuarial gain/(loss) reserve (31,310) (35,338) (59,060)Foreign currency translation reserve (59,970) (46,588) 3,864Other reserves 310,551 426,196 475,693Total reserves & surplus 219,272 344,270 420,497No. of shares outstanding (mn) 887 959 971Per share contribution (Rs/share)Actuarial gain/(loss) reserve (35) (37) (61)Foreign currency translation reserve (68) (49) 4Other reserves 350 445 490Total reserves & surplus 247 359 433
Source: Company, Kotak Institutional Equities

Metals & Mining Tata Steel
16 KOTAK INSTITUTIONAL EQUITIES RESEARCH
Unhedged foreign currency payables, March fiscal year-ends, 2010-12 (US$ mn)
(% change)Mar-10 Mar-11 Mar-12 Mar-11 Mar-12
Import of goods and services 44 68 120 54.1 77.1 Capital imports 20 36 106 76.1 194.2 Interest and commitment charges payable 17 20 24 15.8 18.7 Loans payable 1,136 1,594 1,544 40.3 (3.1) Total unhedged payable 1,218 1,717 1,793 41.0 4.4
Source: Company, Kotak Institutional Equities

Tata Steel Metals & Mining
KOTAK INSTITUTIONAL EQUITIES RESEARCH 17
Tata Steel Europe pension assets/(obligations), March fiscal year ends, FY2008-12 (Rs bn)
Mar-08 Mar-09 Mar-10 Mar-11 Mar-12Fair value of plan assets 1,176 997 1,090 1,160 1,407 Fair value of plan liabilities 1,063 947 1,075 1,138 1,395 Net assets / (obligations) recognised in balance sheet 113 50 15 23 12
A Reconciliation of opening and closing balances of obligation1 Obligation as at the beginning of the year — 1,063 947 1,075 1,138 2 Current service cost 15 11 10 12 13 3 Interest cost 54 67 60 56 63 4 Obligation of new companies 1,135 — — — —5 Actuarial (gain)/ loss (61) (98) 211 2 101 6 Exchange rate variation (30) (43) (89) 52 139 7 Settlements and curtailments — (0) (1) (3) (1) 8 Benefits paid (57) (58) (69) (61) (63) 9 Employee contribution 6 6 5 4 5 10 Past service cost 0 1 — — —11 Obligation as at the end of the year 1,063 947 1,075 1,138 1,395 B Change in plan assets1 Fair value of plan assets as at the beginning of the year — 1,176 997 1,090 1,160 2 Expected return on plan assets 64 68 57 64 70 3 Actuarial gain/ (loss) (2) (159) 176 (3) 78 4 Assets of new companies 1,172 — — — —5 Employee contribution 6 19 5 4 5 6 Employer contribution 25 — 13 14 15 7 Settlements and curtailments — — (1) — —8 Refund of scheme assets — — — (0) —9 Benefits paid (57) (59) (69) (61) (63) 10 Exchange rate variation (31) (48) (88) 53 141 11 Fair value of plan assets as at the end of the year 1,176 997 1,090 1,160 1,407
D Expense recognised in the period1 Current service cost 15 11 10 12 13 2 Interest cost 54 67 60 56 63 3 Expected return on plan assets (64) (68) (57) (64) (70) 4 Actuarial (gain)/ loss (58) 61 36 6 22 5 Past service cost 0 1 — — —6 Exchange rate variation — — — — —7 Services and curtailments — (0) (0) (3) (1) 8 Expense recognised in the year (53) 71 47 7 28
E Investment details % invested % invested % invested % invested1 Equities 25 23 27 29 27 2 Bonds 62 65 62 60 63 3 Property 7 8 6 7 7 4 Others (including bank balances) 6 4 5 4 3
Total 100 100 100 100 100 E.1 Investment details Rs bn Rs bn Rs bn Rs bn1 Equities 294 229 294 337 380 2 Bonds 729 648 676 696 886 3 Property 82 80 65 81 98 4 Others (including bank balances) 71 40 55 46 42
Total 1,176 997 1,090 1,160 1,407 F Assumptions1 Discount rate p.a. 4.7-6.6% 3.9-7% 2.5-6% 3-5.9% 2.5-4.8%2 Estimated rate of return on plan assets p.a. 3.5-9.1% 3.5-9.1% 2.5-8.7% 2-9.6% 1.0-3.45%3 Rate of escalation in salary p.a. 2.5-4.5% 2-4% 1-4.6% 1-4.6% 1.0-4.2%
G Other disclosures1 Experience adjustment on plan liabilities - Gain / (loss) (9.2) (21.5) (9.9) (1.1) 2.1 2 Experience adjustment on plan assets - Gain / (Loss) (2.2) (159.1) 175.5 3.3 78.5
H Econmic expense of retirement benefits1 Closing difference of net assets 113 50 15 23 12 2 Opening difference of net assets — 113 50 15 23 3 Employees contribution — 13 14 15 4 Economic expense of retirement benefits 113 (63) (47) (6) (26) 5 Reported expense 53 (71) (47) (7) (28) 6 Difference excess / (under) 60 8 0 1 2
Source: Company, Kotak Institutional Equities

Metals & Mining Tata Steel
18 KOTAK INSTITUTIONAL EQUITIES RESEARCH
Tata Steel, conversion cost/tonne adjusted for forex losses/gains, March fiscal year-ends, 2011-2012 (Rs/tonne)
2011 2012 % change Employee cost 4,081 4,594 13 Power and fuel cost 2,188 2,719 24 Freight and handling 2,400 2,569 7 Other expenditure 9,576 11,880 24 Conversion cost (excl. raw material cost) 18,244 21,763 19 Forex Loss/Gain per tonne 404 (704) (274) Conversion cost (adj. for forex loss/gain) 18,648 21,058 13
Source: Company, Kotak Institutional Equities estimates
Tata Steel Europe , conversion cost/tonne, March fiscal year-ends, 2010-2012 (US$/tonne)
2010 2011 2012Employee cost 188 178 192Power cost 29 26 31Freight cost 48 55 57Other costs 239 227 247Conversion cost/tonne 504 487 527
Source: Company, Kotak Institutional Equities estimates
Tata Steel, revenue and EBITDA/tonne, March fiscal year-ends, 2011-2012 (Rs/tonne)
2011 2012 change
(Rs/ tonne) (Rs/ tonne) (%)
Revenue 45,817 51,166 11.7
Raw material cost 10,013 12,400 23.8
Employee cost 4,422 4,595 3.9
Power and fuel cost 2,190 2,720 24.2
Freight and handling 2,402 2,569 7.0
Other expenditure 8,071 10,150 25.8
EBITDA 18,720 18,732 0.1
Source: Company, Kotak Institutional Equities estimates

Tata Steel Metals & Mining
KOTAK INSTITUTIONAL EQUITIES RESEARCH 19
Tata Steel, valuation, March fiscal year-ends, 2013E basis (Rs mn)
EBITDA Multiple Enterprise value EV
(Rs mn) (X) (Rs mn) (Rs/share) Valuation basis
Tata Steel standalone 133,797 6.5 869,677 896 Valued on FY2013E EBITDA
Tata Steel Europe 12,532 5.0 62,662 65
Tata Steel thailand and other businesses 6,104 5.0 30,521 31
Total Enterprise Value 962,861 992
Consolidated group net debt 521,826 FY2013E, adjusted for cash and marketable securities
Total borrowings 521,826 537
Arrived market capitalization 441,034 454 Based on fully diluted equity
Add: Value of investments 25,098 26
Arrived market capitalization 466,132 480
Target price (Rs) 480
Source: Kotak Institutional Equities estimates

Metals & Mining Tata Steel
20 KOTAK INSTITUTIONAL EQUITIES RESEARCH
Tata Steel (consolidated), profit model, balance sheet and cash flow model, March fiscal year-ends, 2008-2014E (Rs mn)
2,008 2,009 2,010 2011E 2012E 2013E 2014EProfit model (Rs mn)Net sales 1,315,336 1,473,293 1,023,931 1,187,531 1,328,997 1,440,016 1,455,611 EBITDA 177,824 181,277 80,427 159,956 115,592 159,839 183,545 Other income 4,759 2,657 11,859 9,810 15,730 4,467 4,497 Interest (40,854) (32,902) (30,221) (27,700) (42,501) (36,051) (36,244) Depreciation (41,370) (42,654) (44,917) (44,148) (45,167) (55,973) (60,140) Profit before tax 100,359 108,378 17,147 97,917 43,654 72,282 91,658 Extraordinaries 63,351 (40,945) (16,837) 23,102 33,619 - - Taxes (40,493) (18,940) (21,518) (32,459) (36,365) (23,853) (30,247) Profit after tax 123,218 48,492 (21,208) 88,561 40,909 48,429 61,411 Minority interest (1,399) 409 (152) 603 1,731 1,558 1,714 Share in profit/(loss) of associates 1,682 607 1,269 664 2,681 2,708 2,708 Reported net income 123,500 49,509 (20,092) 89,827 45,321 52,695 65,833 Adjusted net income 110,441 61,750 (3,255) 72,281 25,321 52,695 65,833 Fully diluted EPS (Rs) 118.4 66.2 (3.5) 75.3 26.1 54.2 67.8
Balance sheet (Rs mn)Equity 287,015 217,700 230,208 355,639 430,436 435,311 487,674 Deferred tax liability 24,545 17,094 16,541 20,126 24,424 20,126 20,126 Total Borrowings 590,973 653,732 531,004 621,843 620,719 594,593 594,593 Current liabilities 339,163 313,109 309,678 346,578 385,297 406,329 409,173 Minority interest 8,327 8,949 8,841 8,889 10,912 5,599 3,885 Total liabilities 1,250,022 1,210,583 1,096,272 1,353,076 1,471,787 1,461,959 1,515,452 Net fixed assets 331,187 364,175 365,252 365,092 421,003 507,353 513,713 Capital work in progress 88,476 88,880 92,706 158,842 200,397 150,092 195,092 Goodwill 180,500 153,649 145,418 152,982 173,546 152,982 152,982 Investments 33,675 64,111 54,178 78,473 40,213 56,895 49,603 Cash 42,319 61,484 68,151 108,926 108,016 46,174 50,743 Other current assets 572,309 477,229 370,566 488,760 528,613 548,463 553,320 Miscellaneous expenditure 1,556 1,055 - - - - - Total assets 1,250,022 1,210,583 1,096,272 1,353,076 1,471,787 1,461,959 1,515,452
Free cash flow (Rs mn)Operating cash flow excl. working cap 117,771 116,077 23,343 105,012 66,314 99,935 117,054 Working capital changes (22,227) 2,254 49,017 (71,749) 11,590 (7,333) (2,012) Capital expenditure (79,967) (83,608) (69,472) (101,636) (119,586) (111,700) (111,500) Free cash flow 15,578 34,723 2,889 (68,373) (41,682) (19,098) 3,542
RatiosEBITDA margin (%) 13.5 12.3 7.9 13.5 8.7 11.1 12.6 EBIT margin (%) 10.4 9.4 3.5 9.8 5.3 7.2 8.5 Debt/equity (X) 2.1 3.0 2.3 1.7 1.4 1.4 1.2 Net debt/equity (X) 1.9 2.6 1.9 1.4 1.2 1.2 1.1 Net debt/EBITDA (X) 3.0 3.1 5.5 3.0 4.3 3.3 2.9 RoAE (%) 51.0 24.5 (1.5) 24.7 6.4 12.7 14.3 RoACE (%) 14.6 9.9 (34.8) 9.3 4.9 7.0 7.7
Source: Company, Kotak Institutional Equities estimates

For private Circulation Only. FOR IMPORTANT INFORMATION ABOUT KOTAK SECURITIES’ RATING SYSTEM AND OTHER DISCLOSURES, REFER TO THE END OF THIS MATERIAL.
Off-balance sheet exposure to loans stable at 1.1-1.2X since FY2009; forex-adjusted exposure at 0.5X
Overall off-balance sheet exposure to loans has remained broadly stable across public and private banks since FY2009. Overall exposure has declined to 1.1-1.2X in recent years as compared to the peak at 2X of loans we witnessed in FY2008. Excluding forward contracts, the overall exposure has declined further to 0.5X loans as compared to 1.2X in FY2008. Most private banks like HDFC Bank (4.4X exposure, 1.5X adjusted exposure), ICICI Bank (3.6X exposure, 2.2X adjusted exposure) and Axis Bank (2.8X exposure, 1.6X adjusted exposure) have a higher exposure compared to public banks at 0.7X loans (0.3X loans).
Risk of guarantee remains in related business but expect some exposure to come off over time
One of the biggest risks in off-balance sheet remains in the guarantee-related business (performance and financial guarantee) underwritten by banks. Overall guarantee exposure declined marginally for both private and public banks in FY2012. However, we believe that the performance-related guarantee business would decline over the next few years as investment cycle has been tapering off. ICICI Bank, Axis Bank, IDBI Bank, Yes Bank and IndusInd Bank are the most aggressive banks in the guarantee business at 0.2X-0.4X of loans. Banks prefer opening these exposures for existing customers and/or with collateral. Risks and capital consumed are similar to funded exposure.
Contingent liability and Basel-3 exposure have different connotations
Contingent liability and non-funded exposure reported by Basel-3 exposure do show reasonable variance in the following areas. (1) Contingent liability includes off-balance sheet notional principal on gross basis as compared to net basis under basel-3. (2) Basel-3 does not include the contingent liability arising out of partly paid investments; claims not yet acknowledged as debt/disputed claims etc. (3) Credit exposure, for certain banks, is reduced by the value of collaterals, primarily fixed deposits, after applying certain discount. (4) Select banks differentiate sanctions (contingent liability) and utilization (Basel-3) and only industry-related exposure. We do note some differences across banks resulting in variance between contingent liability and non-funded exposure.
Infrastructure, banks and engineering/construction are top exposures in the non-funded segment
Infrastructure continues to dominate the overall exposure though in FY2012 most banks kept this exposure stable or a marginal decline except for Axis Bank (21% of non-funded exposure in FY2012 as compared to 13% of non-funded exposure in FY2011). Non-fund exposure to banks was reasonably high but we understand they primarily are in the nature of derivative-type exposure for their client exposures. Most performance guarantee exposures are in the engineering/construction vertical, one of the largest exposures in the non-fund business. Iron and steel segment has been one of the other verticals with significant non-fund exposure.
Banks/Financial Institutions India
Risk on and risk off. Analysis of off-balance sheet exposures (both public and private banks) indicates a fairly stable ratio at 1.1-1.2X since FY2009. Private banks (3.3X loans) dominate as compared to public banks (0.7X loans) despite a lower share in funded business. Significant off-balance sheet exposure is currently towards infrastructure and construction verticals, but we expect these ratios to come down as investment activity in these sectors is slowing down. Risks remain similar to funded exposure though banks focus on existing clients to mitigate the same.
NEUTRAL
JULY 18, 2012
UPDATE
BSE-30: 17,185
QUICK NUMBERS
• Off-balance sheet exposure to loans at 1.2X in FY2012
• Guarantee exposure to loans at 0.24X in FY2012
• Infra, banks, construction and iron/steel are top non-fund exposure
India Banks/Financial Institutions
22 KOTAK INSTITUTIONAL EQUITIES RESEARCH
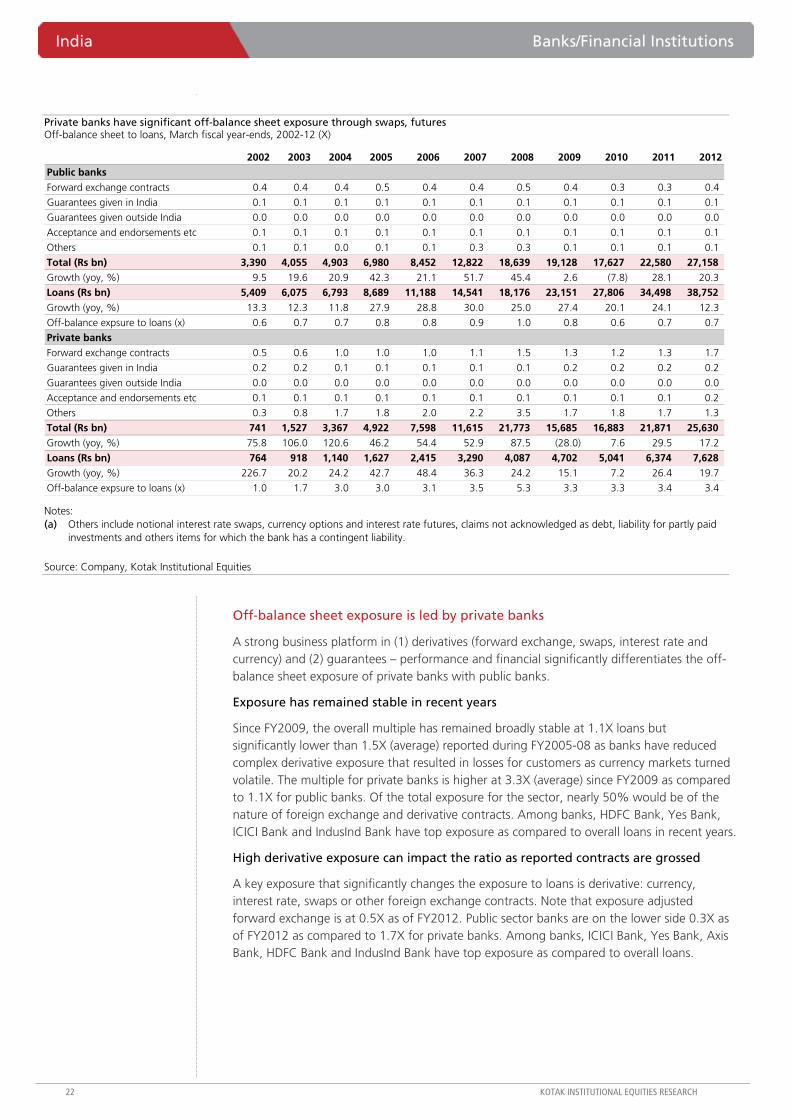
Private banks have significant off-balance sheet exposure through swaps, futures Off-balance sheet to loans, March fiscal year-ends, 2002-12 (X)
2002 2003 2004 2005 2006 2007 2008 2009 2010 2011 2012Public banksForward exchange contracts 0.4 0.4 0.4 0.5 0.4 0.4 0.5 0.4 0.3 0.3 0.4
Guarantees given in India 0.1 0.1 0.1 0.1 0.1 0.1 0.1 0.1 0.1 0.1 0.1
Guarantees given outside India 0.0 0.0 0.0 0.0 0.0 0.0 0.0 0.0 0.0 0.0 0.0
Acceptance and endorsements etc 0.1 0.1 0.1 0.1 0.1 0.1 0.1 0.1 0.1 0.1 0.1
Others 0.1 0.1 0.0 0.1 0.1 0.3 0.3 0.1 0.1 0.1 0.1
Total (Rs bn) 3,390 4,055 4,903 6,980 8,452 12,822 18,639 19,128 17,627 22,580 27,158 Growth (yoy, %) 9.5 19.6 20.9 42.3 21.1 51.7 45.4 2.6 (7.8) 28.1 20.3
Loans (Rs bn) 5,409 6,075 6,793 8,689 11,188 14,541 18,176 23,151 27,806 34,498 38,752 Growth (yoy, %) 13.3 12.3 11.8 27.9 28.8 30.0 25.0 27.4 20.1 24.1 12.3
Off-balance expsure to loans (x) 0.6 0.7 0.7 0.8 0.8 0.9 1.0 0.8 0.6 0.7 0.7
Private banksForward exchange contracts 0.5 0.6 1.0 1.0 1.0 1.1 1.5 1.3 1.2 1.3 1.7
Guarantees given in India 0.2 0.2 0.1 0.1 0.1 0.1 0.1 0.2 0.2 0.2 0.2
Guarantees given outside India 0.0 0.0 0.0 0.0 0.0 0.0 0.0 0.0 0.0 0.0 0.0
Acceptance and endorsements etc 0.1 0.1 0.1 0.1 0.1 0.1 0.1 0.1 0.1 0.1 0.2
Others 0.3 0.8 1.7 1.8 2.0 2.2 3.5 1.7 1.8 1.7 1.3
Total (Rs bn) 741 1,527 3,367 4,922 7,598 11,615 21,773 15,685 16,883 21,871 25,630 Growth (yoy, %) 75.8 106.0 120.6 46.2 54.4 52.9 87.5 (28.0) 7.6 29.5 17.2
Loans (Rs bn) 764 918 1,140 1,627 2,415 3,290 4,087 4,702 5,041 6,374 7,628 Growth (yoy, %) 226.7 20.2 24.2 42.7 48.4 36.3 24.2 15.1 7.2 26.4 19.7
Off-balance expsure to loans (x) 1.0 1.7 3.0 3.0 3.1 3.5 5.3 3.3 3.3 3.4 3.4
Notes: (a) Others include notional interest rate swaps, currency options and interest rate futures, claims not acknowledged as debt, liability for partly paid
investments and others items for which the bank has a contingent liability.
Source: Company, Kotak Institutional Equities
Off-balance sheet exposure is led by private banks
A strong business platform in (1) derivatives (forward exchange, swaps, interest rate and currency) and (2) guarantees – performance and financial significantly differentiates the off-balance sheet exposure of private banks with public banks.
Exposure has remained stable in recent years
Since FY2009, the overall multiple has remained broadly stable at 1.1X loans but significantly lower than 1.5X (average) reported during FY2005-08 as banks have reduced complex derivative exposure that resulted in losses for customers as currency markets turned volatile. The multiple for private banks is higher at 3.3X (average) since FY2009 as compared to 1.1X for public banks. Of the total exposure for the sector, nearly 50% would be of the nature of foreign exchange and derivative contracts. Among banks, HDFC Bank, Yes Bank, ICICI Bank and IndusInd Bank have top exposure as compared to overall loans in recent years.
High derivative exposure can impact the ratio as reported contracts are grossed
A key exposure that significantly changes the exposure to loans is derivative: currency, interest rate, swaps or other foreign exchange contracts. Note that exposure adjusted forward exchange is at 0.5X as of FY2012. Public sector banks are on the lower side 0.3X as of FY2012 as compared to 1.7X for private banks. Among banks, ICICI Bank, Yes Bank, Axis Bank, HDFC Bank and IndusInd Bank have top exposure as compared to overall loans.

Banks/Financial Institutions India
KOTAK INSTITUTIONAL EQUITIES RESEARCH 23
Private banks exposure remains high Off-balance sheet exposure to loans, March fiscal year-ends, 2002-12 (X)
0
1
2
3
4
5
6
2002
2003
2004
2005
2006
2007
2008
2009
2010
2011
2012
Public Private Sector
Notes: (a) FY2012 does not include IDBI.
Source: Company, Capitaline, Kotak Institutional Equities
…though has declined marginally adjusted for forex Off-balance sheet (less forex) exposure to loans, March fiscal year-ends, 2002-12 (X)
0
1
2
3
4
5
2002
2003
2004
2005
2006
2007
2008
2009
2010
2011
2012
Public Private Sector
Notes: (a) FY2012 does not include IDBI.
Source: Company, Capitaline, Kotak Institutional Equities
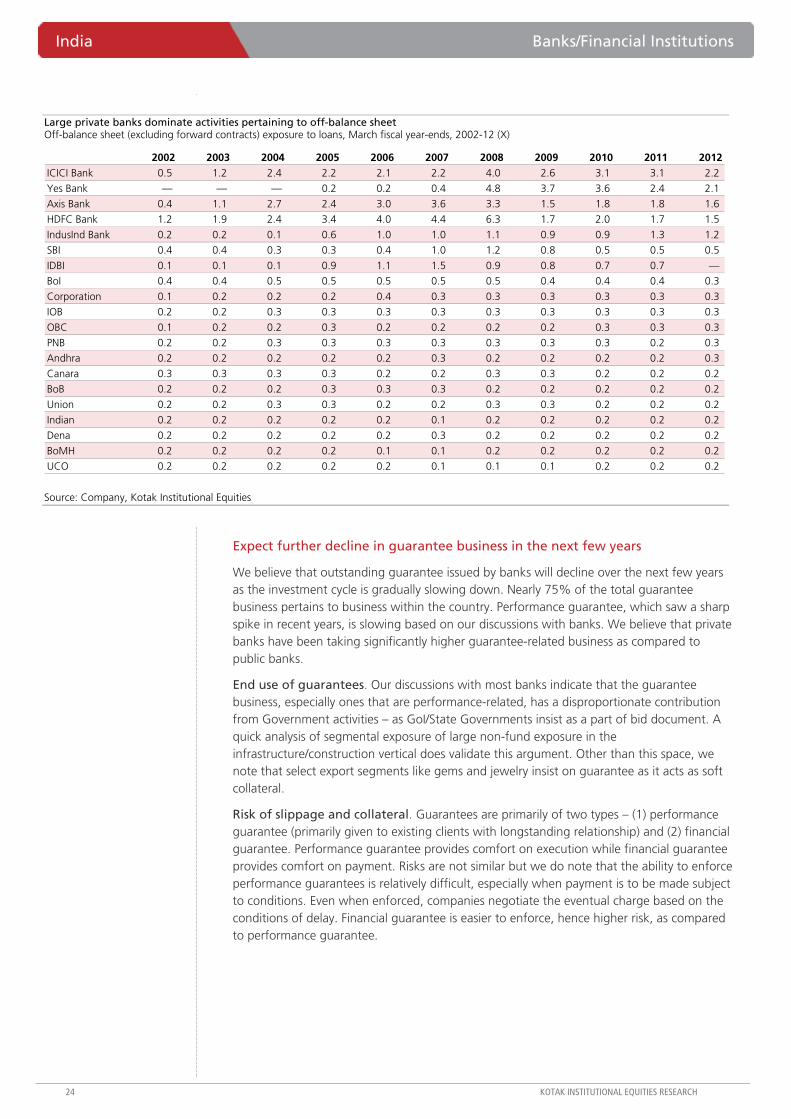
Large private banks dominate activities pertaining to off-balance sheet Off-balance sheet exposure to loans, March fiscal year-ends, 2002-12 (X)
2002 2003 2004 2005 2006 2007 2008 2009 2010 2011 2012HDFC Bank 3.0 3.5 4.6 5.5 6.1 7.0 9.3 4.1 3.8 3.6 4.4
Yes Bank — — — 8.8 7.3 8.3 7.3 5.3 4.8 4.0 4.2
ICICI Bank 0.8 1.7 3.3 2.9 2.7 2.9 5.4 3.8 4.0 4.3 3.6
IndusInd Bank 0.5 0.7 0.7 1.2 1.8 1.9 2.4 2.8 2.3 3.2 2.9
Axis Bank 1.5 1.8 4.0 3.4 4.4 5.0 4.3 2.6 3.1 3.1 2.8
Union 0.4 0.6 0.9 1.0 0.8 0.7 0.8 0.8 0.6 1.1 1.3
SBI 0.8 0.8 0.7 0.8 0.9 1.6 1.9 1.3 0.9 1.0 1.0
Federal 0.6 0.8 1.1 1.4 1.4 0.9 0.7 0.3 0.4 0.7 0.9
Canara 1.1 1.3 1.1 1.0 0.7 0.6 1.0 1.1 0.7 0.6 0.8
BoI 1.3 1.2 1.4 1.4 1.3 1.1 1.3 0.9 0.8 0.8 0.8
IDBI 0.1 0.1 0.1 1.3 1.5 1.7 1.2 1.1 0.9 0.9 -
PNB 0.7 0.6 0.7 0.7 0.7 0.7 0.8 0.7 0.5 0.5 0.7
Dena 0.3 0.4 0.6 0.6 0.5 0.7 0.6 0.4 0.4 0.3 0.7
OBC 0.2 0.2 0.3 0.4 0.3 0.3 0.4 0.4 0.6 0.6 0.6
Allahabad 0.7 0.8 0.8 0.6 0.7 0.5 1.1 0.8 0.7 0.6 0.6
Indian 0.6 0.6 0.4 0.3 0.5 0.2 0.3 0.3 0.3 0.5 0.5
BoB 0.4 0.7 0.9 0.8 0.7 0.7 0.8 0.5 0.5 0.6 0.5
Corporation 0.4 0.5 0.5 0.7 0.8 0.8 0.7 0.9 0.6 0.6 0.5
Andhra 0.2 0.3 0.4 0.9 1.1 0.7 0.6 0.7 0.7 0.5 0.5
Syndicate 0.8 1.4 1.4 1.4 1.0 0.9 0.8 0.9 0.6 0.5 0.4
Source: Company, Kotak Institutional Equities
India Banks/Financial Institutions
24 KOTAK INSTITUTIONAL EQUITIES RESEARCH
Large private banks dominate activities pertaining to off-balance sheet Off-balance sheet (excluding forward contracts) exposure to loans, March fiscal year-ends, 2002-12 (X)
2002 2003 2004 2005 2006 2007 2008 2009 2010 2011 2012ICICI Bank 0.5 1.2 2.4 2.2 2.1 2.2 4.0 2.6 3.1 3.1 2.2
Yes Bank — — — 0.2 0.2 0.4 4.8 3.7 3.6 2.4 2.1
Axis Bank 0.4 1.1 2.7 2.4 3.0 3.6 3.3 1.5 1.8 1.8 1.6
HDFC Bank 1.2 1.9 2.4 3.4 4.0 4.4 6.3 1.7 2.0 1.7 1.5
IndusInd Bank 0.2 0.2 0.1 0.6 1.0 1.0 1.1 0.9 0.9 1.3 1.2
SBI 0.4 0.4 0.3 0.3 0.4 1.0 1.2 0.8 0.5 0.5 0.5
IDBI 0.1 0.1 0.1 0.9 1.1 1.5 0.9 0.8 0.7 0.7 —
BoI 0.4 0.4 0.5 0.5 0.5 0.5 0.5 0.4 0.4 0.4 0.3
Corporation 0.1 0.2 0.2 0.2 0.4 0.3 0.3 0.3 0.3 0.3 0.3
IOB 0.2 0.2 0.3 0.3 0.3 0.3 0.3 0.3 0.3 0.3 0.3
OBC 0.1 0.2 0.2 0.3 0.2 0.2 0.2 0.2 0.3 0.3 0.3
PNB 0.2 0.2 0.3 0.3 0.3 0.3 0.3 0.3 0.3 0.2 0.3
Andhra 0.2 0.2 0.2 0.2 0.2 0.3 0.2 0.2 0.2 0.2 0.3
Canara 0.3 0.3 0.3 0.3 0.2 0.2 0.3 0.3 0.2 0.2 0.2
BoB 0.2 0.2 0.2 0.3 0.3 0.3 0.2 0.2 0.2 0.2 0.2
Union 0.2 0.2 0.3 0.3 0.2 0.2 0.3 0.3 0.2 0.2 0.2
Indian 0.2 0.2 0.2 0.2 0.2 0.1 0.2 0.2 0.2 0.2 0.2
Dena 0.2 0.2 0.2 0.2 0.2 0.3 0.2 0.2 0.2 0.2 0.2
BoMH 0.2 0.2 0.2 0.2 0.1 0.1 0.2 0.2 0.2 0.2 0.2
UCO 0.2 0.2 0.2 0.2 0.2 0.1 0.1 0.1 0.2 0.2 0.2
Source: Company, Kotak Institutional Equities
Expect further decline in guarantee business in the next few years
We believe that outstanding guarantee issued by banks will decline over the next few years as the investment cycle is gradually slowing down. Nearly 75% of the total guarantee business pertains to business within the country. Performance guarantee, which saw a sharp spike in recent years, is slowing based on our discussions with banks. We believe that private banks have been taking significantly higher guarantee-related business as compared to public banks.
End use of guarantees. Our discussions with most banks indicate that the guarantee business, especially ones that are performance-related, has a disproportionate contribution from Government activities – as GoI/State Governments insist as a part of bid document. A quick analysis of segmental exposure of large non-fund exposure in the infrastructure/construction vertical does validate this argument. Other than this space, we note that select export segments like gems and jewelry insist on guarantee as it acts as soft collateral.
Risk of slippage and collateral. Guarantees are primarily of two types – (1) performance guarantee (primarily given to existing clients with longstanding relationship) and (2) financial guarantee. Performance guarantee provides comfort on execution while financial guarantee provides comfort on payment. Risks are not similar but we do note that the ability to enforce performance guarantees is relatively difficult, especially when payment is to be made subject to conditions. Even when enforced, companies negotiate the eventual charge based on the conditions of delay. Financial guarantee is easier to enforce, hence higher risk, as compared to performance guarantee.

Banks/Financial Institutions India
KOTAK INSTITUTIONAL EQUITIES RESEARCH 25
Risk weights and revenue. Risk weights are similar to any funded exposure – capital is allocated based on the underlying credit rating (adjusted for the collateral provided) of the corporate. While banks have not been giving explicit revenue from this business, we do note that Axis Bank did give some broad reference to this stream in FY2010 when it moved its revenue recognition to an ammortisation basis from recognition at origination – total revenues deferred was `1.4 bn and outstanding exposure was `206 bn implying a deferred revenue of about 65-70 bps. Banks do revisit these guarantee charges on an annual basis and we understand that it could be in the range of 1-2% depending on the promoter, underlying nature and duration of the contract.
Private banks have a disproportionate share in the guarantee business Guarantee to total loans, March fiscal year-ends, 2002-12
-
0.06
0.12
0.18
0.24
0.30
2002
2003
2004
2005
2006
2007
2008
2009
2010
2011
2012
Public Private Sector
Source: Company, Capitaline, Kotak Institutional Equities
ICICI Bank has one of the highest exposures to loans at nearly 0.4X Individual exposure of guarantee to total loans, March fiscal year-ends, 2002-12 (X)
2002 2003 2004 2005 2006 2007 2008 2009 2010 2011 2012ICICI Bank 0.20 0.20 0.19 0.17 0.13 0.15 0.18 0.27 0.34 0.38 0.38 Axis Bank 0.16 0.14 0.13 0.09 0.13 0.12 0.20 0.25 0.36 0.38 0.33 IDBI 0.08 0.07 0.09 0.07 0.08 0.13 0.14 0.26 0.27 0.31 — Yes Bank 0.06 0.08 0.18 0.22 0.29 0.20 0.18 0.24 IndusInd Bank 0.10 0.09 0.04 0.04 0.11 0.13 0.14 0.11 0.23 0.35 0.21 SBI 0.12 0.11 0.10 0.09 0.10 0.11 0.12 0.13 0.16 0.19 0.20 PNB 0.09 0.09 0.11 0.11 0.11 0.13 0.12 0.13 0.13 0.14 0.14 OBC 0.09 0.10 0.10 0.12 0.13 0.11 0.12 0.14 0.13 0.14 0.13 Andhra 0.10 0.09 0.11 0.11 0.12 0.11 0.10 0.09 0.13 0.12 0.12 Corporation 0.09 0.11 0.12 0.11 0.11 0.13 0.14 0.13 0.15 0.14 0.12 BoI 0.09 0.09 0.09 0.10 0.12 0.10 0.09 0.11 0.12 0.11 0.11 IOB 0.10 0.10 0.11 0.10 0.09 0.09 0.09 0.11 0.11 0.09 0.11 Indian 0.07 0.08 0.06 0.07 0.07 0.07 0.07 0.09 0.11 0.13 0.10 Canara 0.17 0.18 0.20 0.16 0.14 0.14 0.16 0.17 0.14 0.11 0.10 BoMH 0.14 0.13 0.13 0.11 0.09 0.10 0.09 0.11 0.10 0.10 0.10 Federal 0.06 0.06 0.05 0.06 0.05 0.05 0.06 0.07 0.08 0.12 0.09 Union 0.07 0.07 0.08 0.08 0.08 0.07 0.06 0.09 0.09 0.09 0.08 BoB 0.10 0.10 0.09 0.09 0.08 0.07 0.06 0.07 0.08 0.09 0.08 Vijaya 0.10 0.09 0.09 0.10 0.11 0.08 0.09 0.09 0.07 0.07 0.08 Allahabad 0.06 0.06 0.06 0.06 0.06 0.06 0.06 0.06 0.07 0.05 0.07
Source: Company, Kotak Institutional Equities

India Banks/Financial Institutions
26 KOTAK INSTITUTIONAL EQUITIES RESEARCH
Infra, banks, construction and iron and steel have taken high levels of off-balance sheet exposure
We have primarily concentrated on the top banks to understand the nature of non-fund exposure of banks. As discussed, the top non-fund exposure is infrastructure, primarily power and roads/ports followed by banks, engineering/construction and iron and steel sectors. Barring Axis Bank, the exposure in infrastructure has been fairly stable or declined in most banks. The next largest exposure is in banks but we note that banks have taken derivative-linked exposure to meet the clients/individual requirements. Engineering/construction vertical, one of the next largest segments, is primarily in the form of guarantee (performance).
ICICI Bank off-balance sheet exposure Break-up of off-balance sheet exposure, March fiscal year-ends, 2009-12 (%)
2009 2010 2011 2012Banks 19.5 14.0 13.4 13.7
Construction 4.9 5.8 7.1 7.5
Crude petroleum/refining and petrochemicals 10.6 10.4 8.1 9.9
Electronics & Engineering 13.1 14.8 16.6 17.0
Iron and steel (including metal) 10.1 11.8 12.1 11.5
Power 4.9 5.3 7.3 7.2
Roads, port, telecom and other infra 8.5 10.2 7.1 5.4
Services - finance 3.0 4.5 4.5 5.0
Services- non finance 5.4 6.3 5.2 5.0
Others 20.0 16.9 18.6 17.9 Notes: Exposure in banks are primarily derivative exposure.
Source: Company, Kotak Institutional Equities
Axis Bank off-balance sheet exposure Break-up of off-balance sheet exposure, March fiscal year-ends, 2009-12 (%)
2009 2010 2011 2012Banks 4.0 6.1 7.0 6.5
Chemical/Dyes/Paints 6.1 3.4 2.1 4.2
Edible oil & Vanaspati 2.8 4.2 2.9 3.9
Engineering 3.7 5.8 7.7 9.7
Gems & Jewellery 12.6 18.4 7.2 0.4
Iron and steel (including metal) 9.5 6.8 7.8 6.0
Power 3.7 8.0 13.4 20.8
Roads, port, telecom and other infra 25.7 14.5 13.5 12.2
Others 31.9 32.7 38.4 36.2
Source: Company, Kotak Institutional Equities

Banks/Financial Institutions India
KOTAK INSTITUTIONAL EQUITIES RESEARCH 27
SBI off-balance sheet exposure Break-up of off-balance sheet exposure, March fiscal year-ends, 2009-12 (%)
2009 2010 2011 2012Iron and steel (including metal) 7.6 8.3 7.4 7.1
Chemical/Dyes/Paints 2.1 1.8 6.7 3.0
Construction 2.3 1.2 0.9 0.7
Engineering 7.6 8.4 8.0 10.3
NBFC and trading 5.2 4.8 2.3 2.9
Petroleum 8.9 9.5 7.7 8.3
Power 3.4 5.0 6.3 6.8
Roads, port, telecom and other infra 3.6 3.6 7.6 6.8
Source: Company, Kotak Institutional Equities
Yes Bank off-balance sheet exposure Break-up of off-balance sheet exposure, March fiscal year-ends, 2009-12 (%)
2009 2010 2011 2012Automobiles 0.7 0.6 1.9 3.4
Chemical/Dyes/Paints 4.6 2.6 2.7 4.0
Construction 4.4 5.3 14.3 16.3
Engineering 13.1 10.1 6.1 6.6
Gems & Jewellery 4.6 4.4 4.7 1.6
Iron and steel (including metal) 7.6 3.3 6.0 11.3
Petroleum 0.6 5.3 4.2 6.0
Trading 10.3 7.6 14.3 0.3
Vegetable oils 0.9 1.1 3.3 3.2
Power 6.1 13.2 10.9 9.8
Roads, port, telecom and other infra 19.5 20.7 11.8 8.3
Others 27.6 25.9 20.0 29.2
Source: Company, Kotak Institutional Equities
Exposures are backed by collaterals, especially for select sectors
In addition to having a funded relationship with a client where the overall client exposure (funded and non-funded) could have an underlying collateral, banks could take additional collateral in the form of fixed deposits or others (like mortgage, promoters equity etc.). We note that Yes Bank has nearly 11-25% of its overall non-funded exposure backed in the form of fixed deposits/guarantee. We understand that select banks net these collaterals (after taking a suitable haircut) before reporting the funded exposure.
Yes Bank has a portion of its outstanding non-funded exposure backed by fixed deposits/guarantee Non-funded exposure covered for Yes Bank, March fiscal year-ends, 2010-12 (` bn)
Non funded exposure Backed by FD/ guarantee % of total
2010 105 23 21.9
2011 185 45 24.4
2012 220 26 11.8
Source: Company, Kotak Institutional Equities

India Banks/Financial Institutions
28 KOTAK INSTITUTIONAL EQUITIES RESEARCH
A few reasons result in wide difference between Basel-3 non-fund exposure and contingent liability
There are a few basic reasons that result in a wide difference between Basel-3 non-fund exposure and contingent liability. (1) Contingent liability includes off-balance sheet notional principal on gross basis as compared to net basis under Basel-3. (2) Basel-3 does not include the contingent liability arising out of partly paid investments; claims not yet acknowledged as debt/disputed claims etc. (3) Credit exposure, for certain banks, is reduced by the value of collaterals, primarily fixed deposits, after applying certain discount. (4) Select banks differentiate sanctions (contingent liability) and utilization (Basel-3). (5) Select banks report only exposure to industry as compared to overall non-funded exposure. Barring services (trade), retail and agriculture would have negligible non-fund exposure.
Non-fund exposure explains about 20-25% of the total contingent liability Variation between non-fund exposure and contingent liability, Mach fiscal year-ends, 2009-12 (` bn)
2009 2010 2011 2012ICICI BankContingent liability 8,347 7,271 9,231 9,155
Non-fund exposure 2,088 2,110 2,522 3,020
Variation (%) 25.0 29.0 27.3 33.0 HDFC BankContingent liability 4,060 4,791 5,751 8,653
Non-fund exposure 1,706 2,230 2,674 3,428
Variation (%) 42.0 46.5 46.5 39.6 Axis BankContingent liability 2,093 3,183 4,454 4,802
Non-fund exposure 360 541 809 907
Variation (%) 17.2 17.0 18.2 18.9 Yes BankContingent liability 658 1,058 1,362 1,614
Non-fund exposure 76 105 185 220
Variation (%) 11.5 9.9 13.6 13.6 Notes: (a) Non-fund exposure primarily includes industry exposure.
Source: Company, Kotak Institutional Equities

For private Circulation Only. FOR IMPORTANT INFORMATION ABOUT KOTAK SECURITIES’ RATING SYSTEM AND OTHER DISCLOSURES, REFER TO THE END OF THIS MATERIAL.
FCCB activity – previous and upcoming
The restructuring and refinancing activity in the FCCB landscape continues as Educomp Solutions gets added to the list of issuers who have managed to raise funds to pay off their FCCB obligations. The likes of Financial Technologies, Orchid Chemicals, Reliance Communication, JSW Steel and Rolta India are few of the issuers who have successfully tapped the ECB route during the year. On the restructuring front, Moser Baer seeks to restructure its FCCB obligation (two tranches which were due in June 2012) as it convenes a bondholder meeting in August 2012. Gati, 3i Infotech and Subex are few Indian issuers who have managed to restructure and roll over their FCCBs last year. While Suzlon postponed the maturity date of two tranches from June 12, 2012 to July 27, 2012, Gemini Communications extended its maturity date by three months (to October 18, 2012). In a move to assist the current scenario, the RBI has extended the FCCB buyback window till March 2013 and revised the norms for pricing the buyback.
FCCB universe – Tata Steel and JPA have FCCBs maturing in September 2012
In terms of prominent issuers, Tata Steel and JPA have FCCBs worth US$382 mn and US$354 mn respectively in September 2012. Plethico Pharma, GTL Infrastructure and SUEL’s June 2012 tranche continue to trade at heavy discounts. While Prime Focus is currently trading at a maturity multiple of 1.4X (redemption value/CB price), Shiv-Vani Oil & Gas Exploration is yielding 28% for its FCCB maturing CY2015E.
Strategy.dot
Strategy India convertibles monthly
Educomp Solutions refinances while Moser Baer seeks to restructure. While prominent companies (like JSW Steel and Tata Motors) paid up their FCCB obligations without much ado, restructuring proposals (for Moser Baer) and extension of redemption dates (for Suzlon and Gemini Communication) marred issuers at the other end of the spectrum.
INDIA
JULY 18, 2012
UPDATE
BSE-30: 17,185
QUICK NUMBERS
• Educomp Solutions ties up US$155 mn to pay back FCCB obligations
• Moser Baer seeks to restructure FCCB obligation
• Clarity on SUEL’s June 2012 tranche will emerge by the end of July 2012

KO
TAK INSTITUTIO
NAL EQ
UITIES RESEARCH 30
In
dia D
aily Sum
mary - Ju
ly 1
Ind
ia Daily Su
mm
ary - July 19, 2012
June 2012: Results calendar
Mon Tue Wed Thu Fri Sat16-Jul 17-Jul 18-Jul 19-Jul 20-Jul 21-JulCastrol India Axis Bank Bajaj Auto DB Corp Binani Industries Bank of MaharashtraExide Industries Bajaj Finance Bajaj Holdings DishTV Crompton Greaves Jaiprakash Power VenturesMindtree Bajaj Finserv CRISIL Dr Reddy's Laboratories Hindustan Zinc Oberoi RealtySouth Indian Bank Hero Motorcorp HT Media
HMVL JSW EnergyKotak Mahindra Bank Karnataka BankL&T Finance Holdings Reliance IndustriesNIIT Tech Ultratech CementZee News United Phosphorus
Zee Entertainment23-Jul 24-Jul 25-Jul 26-Jul 27-Jul 28-JulCairn India Ashok Leyland Aventis Pharma ACC Central Bank of India Godrej IndustriesColgate Palmolive Canara Bank Biocon Ambuja Cements CESC Indraprastha GasCoromandel International Container Corp GAIL Bajaj Electricals Grasim Industries Maruti SuzukiDabur India HCL Technologies HCL Technologies BHEL HCCHindustan Unilever Il&FS Investment Managers Jubilant Foodworks Deepak Fertilizers ICICI BankIdea Cellular ING Vysya Bank Madras Cements Gujarat Gas MMFSLIndian Bank Jindal Steel & Power Power Grid ITC Neyveli LigniteL&T LIC Housing Finance Yes Bank JSW Steel NTPCSJVN Lupin Indiabulls Real Estate Sterlite Industries Punjab National BankTata Global Beverages Mahindra Lifespace Developer Tata Communications REC
Mangalore Refinery Thermax Union BankPolaris Technology United SpiritsSesa Goa Nestle IndiaShriram TransportTorrent PowerWipro
30-Jul 31-Jul 1-Aug 2-Aug 3-Aug 4-AugBharat Electronics Hexaware Technologies Adani Ports 3I Infotech Marico Godrej ConsumerOriental Bank of Commerce IPCA Laboratories Adani Power Berger Paints Motherson SumiIndian Overseas Bank Shoppers Stop Century Textiles Cummins India
Titan Industries Engineers IndiaGlaxosmithkline Consumers
6-Aug 7-Aug 8-Aug 9-Aug 10-Aug 11-AugABB Apollo Tyres BPCL Godrej IndustriesMahindra & Mahindra Ranbaxy LaboratoriesPower Finance Corp
13-Aug 14-Aug 15-Aug 16-Aug 17-Aug 18-AugHindalco Industries
Source: BSE, NSE, Kotak Institutional Equities

In
dia D
aily Sum
mary - Ju
ly 19, 2012
31
KOTAK IN
STITUTIO
NAL EQ
UITIES RESEARCH
Kotak Institutional Equities: Valuation summary of KIE Universe stocks
18-Jul-12 Mkt cap.O/S
shares EPS (Rs) EPS growth (%) PER (X) EV/EBITDA (X) RoE (%)Target price Upside ADVT-3mo
Company Price (Rs) Rating (Rs mn) (US$ mn) (mn) 2012 2013E 2014E 2012 2013E 2014E 2012 2013E 2014E 2012 2013E 2014E 2012 2013E 2014E 2012 2013E 2014E 2012 2013E 2014E (Rs) (%) (US$ mn)
Automobiles
Apollo Tyres 83 BUY 41,991 759 504 7.5 10.8 13.0 (13.9) 43.5 20.2 11.1 7.7 6.4 6.1 4.7 3.9 1.4 1.2 1.0 0.5 0.7 0.9 14.6 18.0 18.3 95 14.0 4.8
Ashok Leyland 24 ADD 64,389 1,163 2,661 2.1 2.8 3.5 (10.6) 29.9 27.2 11.4 8.8 6.9 7.1 6.0 4.7 1.4 1.3 1.1 4.1 4.1 4.1 17.5 20.6 23.3 33 36.4 3.6
Bajaj Auto 1,521 ADD 440,148 7,951 289 103.8 109.3 130.2 14.9 5.3 19.1 14.7 13.9 11.7 10.6 10.4 8.8 7.2 5.7 4.5 3.0 2.9 3.4 54.5 45.6 42.9 1,675 10.1 16.0
Bharat Forge 301 REDUCE 71,451 1,291 237 19.7 20.2 24.9 57.0 2.4 23.6 15.3 14.9 12.1 8.5 7.8 6.6 2.9 2.5 2.2 1.3 1.7 2.0 16.2 17.8 17.6 325 7.9 2.2
Exide Industries 131 SELL 111,180 2,008 850 5.4 7.1 8.1 (27.2) 30.1 15.5 24.1 18.5 16.1 16.2 12.1 10.8 3.6 3.2 2.8 1.1 1.4 1.6 15.9 18.4 18.6 115 (12.1) 2.8
Hero Motocorp 2,114 SELL 422,146 7,625 200 119.1 136.2 137.8 19.8 14.4 1.1 17.8 15.5 15.3 13.6 11.5 10.1 7.7 6.1 5.0 2.1 2.6 2.6 62.1 52.6 41.5 1,900 (10.1) 17.9
Mahindra & Mahindra 709 BUY 435,142 7,860 614 45.1 46.8 53.5 8.1 3.7 14.2 15.7 15.1 13.3 12.1 10.6 9.0 3.4 3.0 2.6 1.6 2.0 2.3 24.6 21.9 21.7 850 19.9 17.6
Maruti Suzuki 1,227 NR 370,531 6,693 302 56.6 69.6 95.9 (28.6) 22.9 37.9 21.7 17.6 12.8 16.6 11.3 7.4 2.4 2.1 1.9 0.6 0.6 0.6 11.1 12.8 15.6 — — 17.2
Tata Motors 222 BUY 736,820 13,310 3,325 43.2 40.1 52.0 58.7 (7.0) 29.5 5.1 5.5 4.3 4.3 3.6 3.0 2.2 1.6 1.2 1.7 1.7 2.2 51.7 34.7 31.3 300 35.4 63.5
Automobiles Cautious 2,727,737 49,273 26.4 3.0 21.6 9.6 9.3 7.7 6.9 5.8 4.8 3.0 2.4 1.9 2.1 2.3 2.6 30.9 25.7 25.4
Banks/Financial Institutions
Andhra Bank 112 ADD 62,897 1,136 560 24.0 19.4 23.4 6.1 (19.4) 21.0 4.7 5.8 4.8 — — — 0.9 0.9 0.9 4.9 3.9 4.8 19.2 13.8 15.0 135 20.1 1.4
Axis Bank 1,038 ADD 429,009 7,749 413 102.7 103.2 106.1 24.4 0.5 2.9 10.1 10.1 9.8 — — — 2.0 1.7 1.6 1.5 1.5 1.6 20.3 17.4 15.6 1,200 15.6 51.2
Bajaj Finserv 713 REDUCE 103,186 1,864 145 94.8 71.8 71.1 21.3 (24.3) (1.1) 7.5 9.9 10.0 — — — 2.1 1.7 1.5 2.1 2.1 2.1 32.2 19.0 16.1 680 (4.7) 1.7
Bank of Baroda 716 REDUCE 295,206 5,332 412 121.4 116.3 114.5 12.4 (4.2) (1.5) 5.9 6.2 6.3 — — — 1.2 1.1 1.0 2.4 2.7 2.7 21.7 17.0 14.7 730 2.0 12.2
Bank of India 330 BUY 189,477 3,423 575 46.6 60.7 66.3 2.5 30.2 9.3 7.1 5.4 5.0 — — — 1.1 1.0 0.9 2.1 2.7 3.0 15.0 16.5 15.8 430 30.4 4.2
Canara Bank 406 REDUCE 179,814 3,248 443 74.1 78.4 92.1 (18.5) 5.8 17.5 5.5 5.2 4.4 — — — 1.0 0.9 0.8 2.7 3.0 3.0 15.4 14.4 15.0 450 10.9 5.1
Corporation Bank 417 BUY 61,777 1,116 148 101.7 97.0 120.5 6.6 (4.6) 24.2 4.1 4.3 3.5 — — — 0.8 0.7 0.6 4.9 4.7 5.8 19.5 16.3 17.7 540 29.5 1.0
Federal Bank 432 BUY 73,928 1,335 171 45.4 45.6 49.8 32.3 0.4 9.2 9.5 9.5 8.7 — — — 1.3 1.2 1.1 2.1 2.1 2.3 14.4 13.0 12.8 500 15.7 1.7
HDFC 687 REDUCE 1,052,520 19,012 1,532 27.9 32.3 38.1 15.8 15.8 17.9 24.6 21.3 18.0 — — — 5.5 4.2 3.7 1.5 1.7 2.1 22.7 22.4 21.8 660 (4.0) 29.0
HDFC Bank 587 REDUCE 1,377,506 24,883 2,347 22.0 28.0 35.0 30.4 27.3 24.9 26.7 20.9 16.8 — — — 4.6 4.0 3.4 0.7 0.9 1.2 18.7 20.3 21.5 575 (2.0) 28.3
ICICI Bank 939 BUY 1,082,680 19,557 1,153 56.1 61.2 66.8 25.4 9.2 9.1 16.7 15.3 14.1 — — — 1.8 1.7 1.6 1.8 2.0 2.1 11.2 11.3 11.4 1,100 17.1 67.2
IDFC 137 BUY 206,437 3,729 1,512 10.3 11.7 14.2 16.9 14.2 21.0 13.3 11.7 9.6 — — — 1.7 1.5 1.3 - 1.7 2.0 13.7 13.7 14.8 145 6.2 16.6
India Infoline 57 REDUCE 18,627 336 327 4.5 4.5 5.2 (38.3) (1.0) 15.0 12.5 12.7 11.0 — — — 1.1 0.9 0.9 2.3 1.3 1.6 7.7 7.7 8.0 55 (3.6) 0.5
Indian Bank 185 BUY 79,572 1,437 430 39.6 39.8 43.1 1.2 0.5 8.4 4.7 4.7 4.3 — — — 0.9 0.8 0.8 4.1 4.0 4.3 19.4 16.9 16.2 260 40.4 1.1
Indian Overseas Bank 83 REDUCE 66,031 1,193 797 13.2 19.0 24.1 (24.0) 43.9 27.0 6.3 4.4 3.4 — — — 0.7 0.7 0.6 5.4 6.3 7.6 9.9 12.1 14.0 100 20.7 1.8
IndusInd Bank 336 ADD 156,961 2,835 468 17.2 19.3 22.7 38.5 12.4 17.6 19.6 17.4 14.8 — — — 3.6 3.2 2.7 0.7 0.7 0.9 20.1 18.7 18.5 360 7.3 3.1
J&K Bank 814 ADD 39,471 713 48 165.7 165.1 177.3 30.6 (0.4) 7.4 4.9 4.9 4.6 — — — 1.0 0.8 0.7 4.1 4.0 4.3 21.2 18.2 17.1 950 16.7 0.7
LIC Housing Finance 264 ADD 133,155 2,405 505 18.1 25.4 30.7 (11.8) 40.1 21.1 14.6 10.4 8.6 — — — 2.4 2.1 1.8 1.3 1.9 2.3 18.6 20.7 21.3 290 10.0 7.5
Mahindra & Mahindra Financial 670 BUY 68,643 1,240 102 60.5 76.2 90.1 33.9 26.0 18.2 11.1 8.8 7.4 — — — 2.4 2.0 1.7 2.0 2.5 3.0 22.8 24.1 23.8 825 23.1 2.1
Muthoot Finance 134 BUY 49,847 900 372 24.0 18.8 21.4 52.4 (21.6) 13.8 5.6 7.1 6.3 — — — 1.7 1.4 1.1 3.0 — — 41.9 22.7 21.0 190 41.7 —
Oriental Bank of Commerce 249 BUY 72,780 1,315 292 39.1 58.5 60.1 (24.0) 49.6 2.6 6.4 4.3 4.2 — — — 0.8 0.7 0.6 3.2 4.7 4.9 9.9 13.6 12.7 330 32.3 1.7
PFC 181 BUY 238,799 4,314 1,319 23.0 28.1 31.1 0.9 22.1 10.6 7.9 6.4 5.8 — — — 1.2 1.1 1.1 3.3 4.1 4.5 16.9 16.9 16.6 185 2.2 9.0
Punjab National Bank 832 ADD 282,214 5,098 339 144.0 146.4 165.3 2.9 1.7 12.9 5.8 5.7 5.0 — — — 1.2 1.1 1.0 2.6 2.7 3.0 21.1 17.5 17.1 900 8.2 8.7
Reliance Capital 355 ADD 87,288 1,577 246 21.1 30.1 31.7 126.7 42.5 5.4 16.8 11.8 11.2 — — — 0.8 0.8 0.7 2.4 3.4 3.6 5.8 6.6 6.7 450 26.9 25.1
Rural Electrification Corp. 192 BUY 189,875 3,430 987 28.6 35.1 38.9 10.0 23.0 10.7 6.7 5.5 4.9 — — — 1.4 1.3 1.2 3.9 4.8 5.3 20.5 21.8 20.8 230 19.6 7.8
Shriram City Union Finance 750 BUY 41,501 750 55 65.4 80.5 98.8 34.7 23.0 22.8 11.5 9.3 7.6 — — — 2.4 1.9 1.5 0.8 1.4 1.8 23.3 22.4 22.6 850 13.3 0.1
Shriram Transport 542 BUY 120,853 2,183 223 56.4 63.5 71.7 2.3 12.6 12.9 9.6 8.5 7.6 — — — 2.0 1.8 1.6 2.1 2.3 2.6 23.1 21.7 20.8 650 20.0 2.3
SKS Microfinance 79 RS 5,906 107 75 (89.1) (27.5) (29.0) (667.7) (69.1) 5.4 (0.9) (2.9) (2.7) — — — 0.5 0.6 0.8 — — — (44.7) (19.3) (24.8) — — 2.5
State Bank of India 2,186 BUY 1,466,560 26,491 671 174.5 210.8 229.8 34.0 20.8 9.0 12.5 10.4 9.5 — — — 2.2 1.9 1.7 1.8 1.9 2.0 15.7 15.8 15.3 2,375 8.7 133.8
Union Bank 196 BUY 108,045 1,952 551 32.3 41.1 42.9 (18.2) 27.4 4.3 6.1 4.8 4.6 — — — 1.0 0.9 0.8 4.1 4.1 4.3 14.9 16.4 15.2 280 42.7 3.9
Yes Bank 351 ADD 123,952 2,239 353 27.7 31.3 38.1 32.1 12.9 22.1 12.7 11.2 9.2 — — — 2.7 2.2 1.9 1.1 1.3 1.6 23.1 21.5 21.9 385 9.6 18.9
Banks/Financial Institutions Neutral 8,464,515 152,899 15.7 13.7 11.9 11.6 10.2 9.1 — — — 1.9 1.7 1.6 1.8 2.0 2.3 16.7 17.0 17.0
Cement
ACC 1,267 SELL 238,035 4,300 188 57.1 68.8 78.9 7.8 20.6 14.6 22.2 18.4 16.1 12.6 9.7 7.9 3.1 2.8 2.5 2.6 1.8 1.8 16.9 17.3 17.5 1,060 (16.3) 10.6
Ambuja Cements 170 SELL 258,804 4,675 1,522 7.8 10.3 11.6 (1.2) 32.8 12.4 21.8 16.4 14.6 12.5 9.6 8.5 3.0 2.7 2.5 1.3 1.6 2.3 14.6 17.8 18.0 150 (11.8) 7.9
Grasim Industries 2,628 BUY 241,026 4,354 92 288.6 282.9 309.2 24.4 (2.0) 9.3 9.1 9.3 8.5 5.5 5.3 4.6 1.4 1.3 1.1 1.3 1.3 1.3 16.9 14.4 13.9 2,800 6.6 3.0
India Cements 82 ADD 25,189 455 307 9.0 10.8 13.6 373.8 20.8 26.0 9.2 7.6 6.0 4.5 4.3 3.4 0.6 0.5 0.5 3.9 3.9 3.9 6.9 8.1 9.4 110 34.1 2.3
Shree Cement 2,926 SELL 101,925 1,841 35 75.8 133.5 129.5 32.6 76.1 (3.0) 38.6 21.9 22.6 9.1 7.5 7.6 4.8 4.1 3.7 0.5 0.7 0.7 13.1 20.2 17.3 2,300 (21.4) 0.7
UltraTech Cement 1,566 SELL 429,057 7,750 274 89.3 95.1 109.3 99.0 6.5 14.9 17.5 16.5 14.3 10.7 9.4 7.9 2.9 2.5 2.1 0.6 0.6 0.6 20.8 18.6 18.1 1,260 (19.5) 4.4
Cement Cautious 1,294,035 23,375 35.8 12.4 12.3 16.4 14.6 13.0 8.8 7.7 6.6 2.4 2.1 1.9 1.3 1.2 1.4 14.5 14.5 14.4
Price/BV (X) Dividend yield (%)
Source: Company, Bloomberg, Kotak Institutional Equities estimates

KO
TAK INSTITUTIO
NAL EQ
UITIES RESEARCH 32
In
dia D
aily Sum
mary - Ju
ly 1
Ind
ia Daily Su
mm
ary - July 19, 2012
Kotak Institutional Equities: Valuation summary of KIE Universe stocks
18-Jul-12 Mkt cap.O/S
shares EPS (Rs) EPS growth (%) PER (X) EV/EBITDA (X) Price/BV (X) RoE (%)Target price Upside ADVT-3mo
Company Price (Rs) Rating (Rs mn) (US$ mn) (mn) 2012 2013E 2014E 2012 2013E 2014E 2012 2013E 2014E 2012 2013E 2014E 2012 2013E 2014E 2012 2013E 2014E 2012 2013E 2014E (Rs) (%) (US$ mn)
Consumer products
Asian Paints 3,665 SELL 351,536 6,350 96 99.9 115.6 137.2 23.6 15.7 18.7 36.7 31.7 26.7 26.2 21.5 17.8 13.7 10.0 7.9 1.1 1.0 1.0 42.9 37.4 33.7 3,000 (18.1) 6.7
Colgate-Palmolive (India) 1,161 SELL 157,894 2,852 136 32.8 39.5 45.7 10.9 20.2 15.8 35.4 29.4 25.4 30.2 24.6 21.0 36.3 29.7 25.9 2.2 2.4 3.0 109.0 110.9 108.9 1,100 (5.3) 1.9
Dabur India 116 ADD 201,187 3,634 1,740 3.7 4.4 5.1 13.3 17.7 16.4 31.2 26.5 22.8 23.9 20.5 17.4 12.0 10.0 8.0 1.1 1.3 1.5 43.9 41.9 39.5 120 3.8 2.6
GlaxoSmithkline Consumer 2,643 ADD 111,144 2,008 42 84.5 105.5 122.7 18.5 24.9 16.4 31.3 25.1 21.5 23.6 19.3 15.9 10.1 8.4 7.0 1.3 1.7 1.9 33.8 35.2 34.3 3,000 13.5 1.5
Godrej Consumer Products 579 ADD 187,440 3,386 324 17.7 22.6 26.1 18.7 27.8 15.6 32.8 25.7 22.2 25.0 18.2 15.2 6.7 5.1 4.5 0.6 0.6 0.7 25.2 23.5 24.8 575 (0.7) 5.0
Hindustan Unilever 446 ADD 963,757 17,409 2,159 11.9 14.3 16.7 20.6 20.4 16.6 37.5 31.1 26.7 31.6 23.8 19.6 27.4 23.7 20.5 2.0 2.6 3.1 83.8 81.9 83.2 480 7.6 17.6
ITC 255 ADD 1,958,188 35,372 7,681 8.0 9.2 10.4 25.2 14.6 13.1 31.8 27.7 24.5 22.4 18.8 16.3 10.0 8.8 7.1 1.8 2.0 1.2 35.5 35.2 33.3 265 3.9 26.6
Jubilant Foodworks 1,228 SELL 80,583 1,456 66 16.7 24.2 34.9 49.3 44.5 44.6 73.5 50.9 35.2 42.3 28.6 20.6 26.9 17.6 11.7 — — — 44.7 41.8 40.0 900 (26.7) 16.6
Jyothy Laboratories 126 ADD 9,776 177 78 10.8 11.0 12.6 4.0 2.2 14.3 11.7 11.5 10.0 13.4 9.9 8.6 1.4 1.3 1.2 3.7 4.6 4.6 12.4 11.6 12.3 220 74.6 0.5
Nestle India 4,502 SELL 434,097 7,841 96 104.6 125.3 146.5 20.5 19.8 16.9 43.0 35.9 30.7 28.4 23.4 19.4 34.1 23.8 17.6 1.1 1.3 1.5 94.7 77.9 65.7 4,000 (11.2) 3.2
Tata Global Beverages 119 BUY 73,620 1,330 618 5.4 6.0 7.4 36.3 12.1 22.1 22.1 19.7 16.1 13.1 10.3 8.5 1.3 1.2 1.2 1.5 1.7 2.1 7.8 8.0 9.3 120 0.8 3.6
Titan Industries 223 ADD 197,621 3,570 888 6.7 8.1 9.7 36.5 21.2 19.2 33.2 27.4 23.0 22.6 18.3 14.7 13.7 10.4 7.4 1.0 1.3 0.4 47.9 43.2 37.8 270 21.3 11.2
United Spirits 779 ADD 97,844 1,767 126 16.6 30.3 39.2 (53.0) 82.7 29.3 47.0 25.7 19.9 16.0 12.0 10.5 2.1 2.0 1.8 0.2 0.3 0.4 4.7 7.9 9.4 700 (10.1) 27.3
Consumer products Attractive 4,938,076 89,199 19.7 19.0 16.2 34.3 28.8 24.8 24.4 19.7 16.6 10.5 9.0 7.5 1.5 1.8 1.6 30.6 31.2 30.2
Constructions
IVRCL 48 REDUCE 12,723 230 267 0.9 3.3 6.0 (84.7) 264.1 83.6 52.8 14.5 7.9 9.4 7.3 5.8 0.6 0.6 0.6 0.8 0.8 0.8 1.2 4.3 7.5 50 4.9 9.4
NCC 41 ADD 10,481 189 257 1.4 2.5 3.6 (78.0) 81.5 43.1 29.1 16.0 11.2 8.0 6.9 7.7 0.4 0.4 0.4 1.5 1.5 2.4 12.9 11.3 11.2 55 34.6 2.6
Punj Lloyd 54 REDUCE 18,185 328 340 3.3 3.3 7.0 (322.9) (0.5) 113.7 16.2 16.3 7.6 7.2 6.6 5.6 0.6 0.6 0.5 0.4 0.5 1.2 3.7 3.6 7.3 60 12.0 2.6
Sadbhav Engineering 140 BUY 21,027 380 150 9.3 9.3 12.5 19.3 0.1 34.7 15.1 15.1 11.2 8.4 8.4 6.8 2.7 2.3 1.9 0.4 0.4 0.4 17.7 15.2 17.2 180 28.7 0.4
Construction Cautious 62,416 1,127 (19.5) 29.7 68.5 20.0 15.4 9.2 8.0 7.1 6.2 0.8 0.7 0.7 0.7 0.7 1.1 3.8 4.7 7.4
Energy
Aban Offshore 416 RS 18,123 327 44 68.3 77.1 87.5 (49.1) 12.9 13.5 6.1 5.4 4.8 8.4 6.8 6.4 0.6 0.6 0.5 0.9 1.1 1.2 12.3 13.1 12.3 — — 6.2
Bharat Petroleum 377 ADD 272,420 4,921 723 18.1 19.7 24.6 (6.8) 8.7 24.8 20.8 19.1 15.3 11.1 10.6 10.0 1.7 1.6 1.5 1.5 1.6 2.0 7.9 8.1 9.5 430 14.1 8.5
Cairn india 314 ADD 599,496 10,829 1,907 41.6 55.2 61.1 25.0 32.6 10.6 7.6 5.7 5.1 5.5 3.8 3.1 1.3 1.1 1.0 — 3.5 4.8 17.9 20.7 20.4 350 11.4 27.2
Castrol India 545 SELL 134,867 2,436 247 18.9 20.2 22.0 (4.4) 7.0 8.5 28.8 26.9 24.8 19.7 18.5 16.8 24.6 22.5 20.7 2.8 2.8 3.1 87.9 87.2 86.7 425 (22.1) 1.1
GAIL (India) 355 BUY 450,754 8,142 1,268 30.3 29.5 32.0 7.7 (2.6) 8.2 11.7 12.0 11.1 7.8 7.5 6.7 1.9 1.7 1.5 2.4 2.4 2.7 16.6 14.4 13.9 415 16.8 7.4
GSPL 69 BUY 38,769 700 563 9.3 8.0 7.7 4.2 (13.6) (4.5) 7.4 8.6 9.0 4.8 5.2 5.2 1.4 1.2 1.1 1.5 1.5 1.5 20.6 15.0 12.5 85 23.4 1.3
Hindustan Petroleum 345 SELL 116,908 2,112 339 26.9 23.7 32.8 (34.2) (12.0) 38.4 12.8 14.6 10.5 2.9 3.1 2.9 0.7 0.7 0.7 2.5 2.1 2.9 5.4 4.6 6.1 295 (14.5) 6.3
Indian Oil Corporation 269 ADD 653,726 11,809 2,428 32.7 22.8 27.3 0.8 (30.2) 19.7 8.2 11.8 9.9 5.9 7.8 7.3 1.1 1.0 0.9 1.9 1.1 1.9 12.9 8.5 9.4 295 9.6 2.6
Oil India 483 BUY 290,343 5,245 601 58.6 61.6 62.3 22.0 5.1 1.1 8.2 7.8 7.8 3.1 2.5 2.2 1.5 1.4 1.2 3.9 4.3 4.6 17.6 16.5 15.1 570 18.0 1.2
Oil & Natural Gas Corporation 285 ADD 2,441,745 44,107 8,556 32.8 32.5 34.1 33.1 (0.9) 4.7 8.7 8.8 8.4 3.8 3.4 3.0 1.5 1.3 1.2 3.4 3.5 3.9 17.0 14.9 14.0 305 6.9 12.9
Petronet LNG 147 ADD 109,875 1,985 750 14.1 14.0 13.2 70.7 (0.8) (5.9) 10.4 10.5 11.1 7.2 7.6 6.7 2.8 2.3 1.9 1.7 1.7 1.7 29.7 23.3 17.9 150 2.4 5.6
Reliance Industries 716 REDUCE 2,133,800 38,544 2,981 61.3 58.5 58.9 (1.1) (4.5) 0.6 11.7 12.2 12.2 6.9 7.2 6.4 1.2 1.1 1.0 1.2 1.2 1.2 11.7 10.3 9.5 750 4.8 45.3
Energy Neutral 7,260,825 131,157 13.3 (1.3) 6.2 9.5 9.7 9.1 5.4 5.2 4.6 1.3 1.2 1.1 2.2 2.4 2.8 14.1 12.6 12.2
Industrials
ABB 764 SELL 161,972 2,926 212 8.7 19.9 23.7 192.0 128.7 19.1 87.8 38.4 32.2 56.1 23.6 20.0 6.4 5.6 4.9 0.4 0.4 0.4 7.4 15.6 16.3 500 (34.6) 0.7
BGR Energy Systems 301 REDUCE 21,713 392 72 31.1 28.4 32.3 (30.7) (8.6) 13.7 9.7 10.6 9.3 6.4 6.0 5.6 1.9 1.7 1.5 2.3 1.9 2.2 21.7 17.1 17.1 260 (13.6) 5.3
Bharat Electronics 1,319 REDUCE 105,480 1,905 80 89.3 120.4 131.6 (16.8) 34.9 9.3 14.8 11.0 10.0 7.7 3.6 2.4 1.9 1.7 1.5 1.9 1.9 1.9 13.2 16.0 15.5 1,550 17.6 0.8
Bharat Heavy Electricals 229 SELL 560,990 10,133 2,448 28.8 26.4 23.1 17.1 (8.0) (12.5) 8.0 8.7 9.9 5.4 5.5 6.0 2.2 1.9 1.6 2.7 2.5 2.2 30.9 23.3 17.5 200 (12.7) 22.5
Crompton Greaves 130 ADD 83,203 1,503 642 5.7 8.6 11.0 (60.0) 49.7 28.1 22.6 15.1 11.8 10.0 7.9 6.4 2.3 2.0 1.8 1.1 1.1 1.3 10.6 14.3 16.2 145 11.8 4.7
Cummins India 434 SELL 120,346 2,174 277 22.0 23.1 26.7 (0.9) 4.6 15.8 19.7 18.8 16.3 18.0 15.9 13.5 5.9 5.3 4.7 2.5 2.6 3.0 30.7 28.2 28.8 420 (3.3) 2.3
KEC International 55 BUY 14,230 257 257 6.9 8.5 9.7 (14.1) 23.3 14.5 8.0 6.5 5.7 5.3 5.2 4.6 1.2 1.1 0.9 2.2 2.3 2.6 16.4 17.5 17.3 75 35.5 0.3
Larsen & Toubro 1,402 ADD 853,303 15,414 609 81.2 85.4 94.2 20.0 5.1 10.3 17.3 16.4 14.9 12.1 11.1 10.3 2.7 2.3 2.0 1.0 1.0 1.0 17.1 15.2 14.5 1,375 (1.9) 55.1
Maharashtra Seamless 328 BUY 23,137 418 71 45.0 42.1 47.4 (6.6) (6.5) 12.6 7.3 7.8 6.9 4.4 3.9 3.0 0.8 0.8 0.7 2.7 2.6 2.9 11.8 10.3 10.8 425 29.6 0.1
Siemens 685 SELL 233,187 4,212 340 23.9 28.3 32.0 (6.2) 18.2 13.0 28.6 24.2 21.4 17.6 14.9 12.9 5.2 4.5 3.8 0.7 0.8 1.0 19.4 19.8 19.3 575 (16.1) 2.2
Suzlon Energy 18 REDUCE 32,259 583 1,777 (4.0) (0.3) 0.7 (34.1) (91.7) (322.5) (4.6) (55.0) 24.7 7.9 6.6 5.9 0.6 0.6 0.6 1.1 1.1 1.1 (11.7) (1.1) 2.6 15 (17.4) 8.7
Tecpro Systems 157 ADD 7,907 143 50 24.8 23.1 26.7 (8.3) (6.5) 15.3 6.3 6.8 5.9 4.8 4.6 4.5 1.1 1.0 0.9 — — — 17.9 15.1 15.6 200 27.7 0.1
Thermax 493 REDUCE 58,723 1,061 119 32.9 28.1 32.1 4.0 (14.7) 14.4 15.0 17.5 15.3 9.8 10.8 9.0 3.6 3.2 2.8 1.4 1.7 1.8 26.6 19.2 19.3 440 (10.7) 0.5
Voltas 114 ADD 37,605 679 331 7.9 8.2 8.9 (18.8) 2.9 8.5 14.3 13.9 12.8 10.5 9.4 8.1 2.5 2.3 2.0 1.3 2.2 2.3 18.3 17.1 16.7 125 9.9 4.9
Industrials Cautious 2,314,056 41,800 9.6 7.2 3.9 15.0 14.0 13.5 9.8 9.0 8.6 2.6 2.2 2.0 1.5 1.5 1.5 17.3 16.1 14.8
Infrastructure
Adani Port and SEZ 113 BUY 227,972 4,118 2,017 5.6 7.0 10.8 22.1 26.1 54.3 20.3 16.1 10.4 16.0 12.1 9.2 4.4 3.7 2.8 0.9 1.2 1.6 23.8 24.9 30.5 160 41.6 2.4
Container Corporation 901 ADD 117,073 2,115 130 73.2 75.4 84.5 8.3 3.0 12.1 12.3 11.9 10.7 8.4 7.8 6.5 2.1 1.9 1.6 1.9 1.9 2.2 18.0 16.4 16.3 975 8.2 0.7
GMR Infrastructure 24 RS 93,028 1,680 3,892 (1.1) 0.1 1.1 236.7 (113.0) 645.0 (21.1) 162.3 21.8 19.2 8.2 5.3 1.0 0.8 0.7 — — — (5.8) 0.8 5.5 — — 3.5
GVK Power & Infrastructure 14 RS 22,820 412 1,579 1.0 0.3 2.6 1.6 (73.4) 861.1 14.5 54.5 5.7 15.9 18.8 7.3 0.7 0.7 0.6 2.1 2.4 5.5 4.6 1.2 11.1 — — 4.2
IRB Infrastructure 133 BUY 44,238 799 332 11.9 15.2 11.4 (12.9) 27.9 (24.9) 11.2 8.8 11.7 7.7 6.6 6.4 1.3 1.0 0.9 — — — 13.1 13.0 8.4 180 35.2 14.7
Infrastructure Neutral 528,447 9,546 0.8 38.3 48.7 23.6 17.1 11.5 14.1 9.8 7.1 1.9 1.6 1.4 0.9 1.1 1.4 8.1 9.4 12.2
Dividend yield (%)
Source: Company, Bloomberg, Kotak Institutional Equities estimates

In
dia D
aily Sum
mary - Ju
ly 19, 2012
33
KOTAK IN
STITUTIO
NAL EQ
UITIES RESEARCH
Kotak Institutional Equities: Valuation summary of KIE Universe stocks
18-Jul-12 Mkt cap.O/S
shares EPS (Rs) EPS growth (%) PER (X) EV/EBITDA (X) Price/BV (X) RoE (%)Target price Upside ADVT-3mo
Company Price (Rs) Rating (Rs mn) (US$ mn) (mn) 2012 2013E 2014E 2012 2013E 2014E 2012 2013E 2014E 2012 2013E 2014E 2012 2013E 2014E 2012 2013E 2014E 2012 2013E 2014E (Rs) (%) (US$ mn)
Media
DB Corp 196 BUY 35,960 650 183 11.0 13.3 15.9 (21.9) 20.3 20.3 17.8 14.8 12.3 10.1 8.6 7.1 3.8 3.4 3.2 2.0 3.0 5.1 22.8 24.2 26.6 290 47.8 0.4
DishTV 68 ADD 72,390 1,308 1,063 (1.3) 0.3 1.3 (24.4) (124.3) 306.9 (50.5) 207.9 51.1 16.5 12.9 10.1 (74.9) (117.0) 90.7 — — — 844.9 (43.9) 1,581.0 80 17.5 3.9
Hindustan Media Ventures 122 BUY 8,954 162 73 8.9 10.4 12.5 22.3 16.0 20.6 13.7 11.8 9.8 7.2 5.8 4.5 2.0 1.8 1.6 0.8 1.6 3.3 15.9 16.2 17.3 190 55.7 0.0
HT Media 97 ADD 22,732 411 235 7.0 7.5 10.9 (8.4) 5.8 46.7 13.7 13.0 8.8 5.8 4.8 3.0 1.4 1.3 1.2 0.4 2.1 4.1 11.0 10.6 14.3 130 34.5 0.3
Jagran Prakashan 85 BUY 26,818 484 316 5.6 6.1 7.1 (17.3) 7.5 17.5 15.0 14.0 11.9 8.3 7.7 6.6 3.6 3.3 2.9 4.1 4.1 4.1 24.5 24.5 26.1 130 53.3 0.3
Sun TV Network 294 REDUCE 115,722 2,090 394 17.6 17.9 18.9 (10.0) 2.0 5.6 16.7 16.4 15.5 10.2 9.7 9.1 4.3 4.0 3.7 3.2 3.4 4.1 28.6 26.3 25.6 320 9.0 5.4
Zee Entertainment Enterprises 148 ADD 141,648 2,559 960 6.0 7.0 8.6 (0.5) 16.6 23.2 24.7 21.2 17.2 17.1 14.1 11.2 3.1 3.0 2.8 0.9 1.0 1.2 13.0 14.4 17.0 160 8.4 4.4
Media Attractive 440,238 7,952 (5.0) 20.7 22.2 23.4 19.4 15.9 11.7 10.2 8.4 3.8 3.5 3.2 1.6 1.9 2.4 16.0 17.8 19.9
Metals & Mining
Coal India 360 BUY 2,275,786 41,109 6,316 23.3 26.6 31.9 34.5 14.1 20.0 15.5 13.6 11.3 10.2 8.4 6.5 5.1 4.1 3.4 1.9 2.2 2.7 37.1 33.8 32.8 390 8.2 12.5
Hindalco Industries 120 REDUCE 230,650 4,166 1,915 17.7 16.4 14.8 38.9 (7.8) (9.6) 6.8 7.4 8.1 7.0 6.8 6.3 0.7 0.7 0.6 1.2 1.2 1.2 11.1 9.4 7.9 115 (4.5) 18.6
Hindustan Zinc 118 ADD 498,550 9,006 4,225 13.2 13.0 15.5 13.2 (1.5) 19.5 9.0 9.1 7.6 5.3 4.4 3.1 1.9 1.6 1.4 2.0 2.0 2.0 22.6 18.9 19.4 145 22.9 1.4
Jindal Steel and Power 427 ADD 398,739 7,203 935 42.4 44.7 48.0 5.6 5.4 7.4 10.1 9.5 8.9 8.0 7.6 6.9 2.2 1.8 1.5 0.4 0.4 0.4 24.6 20.7 18.4 480 12.5 17.1
JSW Steel 673 REDUCE 152,132 2,748 226 23.8 62.6 66.7 (69.7) 163.2 6.5 28.3 10.8 10.1 5.3 6.1 6.0 0.9 0.9 0.8 1.1 1.5 1.5 8.2 8.2 8.2 640 (4.9) 28.3
National Aluminium Co. 56 SELL 144,325 2,607 2,577 3.4 3.8 4.0 (18.6) 11.6 5.1 16.6 14.8 14.1 8.4 6.3 5.2 1.2 1.2 1.1 1.8 1.8 1.8 7.6 8.1 8.0 53 (5.4) 0.3
Sesa Goa 191 ADD 165,998 2,999 869 31.0 47.3 38.6 (36.2) 52.6 (18.5) 6.2 4.0 4.9 5.6 6.2 8.7 1.1 0.9 0.8 2.4 2.4 2.4 11.4 9.6 5.9 210 9.9 9.3
Sterlite Industries 103 ADD 347,548 6,278 3,361 15.8 14.4 17.2 3.9 (8.5) 19.1 6.6 7.2 6.0 3.8 3.4 2.9 0.8 0.7 0.6 1.9 1.9 1.9 12.1 10.1 11.0 126 21.9 13.4
Tata Steel 412 ADD 399,881 7,223 971 26.1 54.2 67.8 (65.4) 108.1 24.9 15.8 7.6 6.1 7.3 5.8 5.1 1.0 0.9 0.8 2.9 2.9 2.9 6.7 12.7 14.3 480 16.6 32.7
Metals & Mining Cautious 4,613,609 83,338 (2.2) 14.0 13.1 11.4 10.0 8.8 7.1 6.3 5.4 1.8 1.6 1.4 1.9 2.0 2.2 16.2 16.1 16.0
Pharmaceutical
Apollo Hospitals 626 ADD 86,984 1,571 139 15.8 22.0 28.0 19.3 39.3 27.1 39.7 28.5 22.4 17.0 14.0 11.7 3.5 3.0 2.8 — — — 9.6 11.1 12.7 700 11.8 1.3
Biocon 250 ADD 49,920 902 200 16.9 19.9 21.5 (8.0) 17.7 8.2 14.8 12.5 11.6 7.8 6.4 5.7 2.2 2.0 1.8 — — — 15.7 16.5 16.0 265 6.2 2.2
Cipla 330 REDUCE 264,884 4,785 803 14.3 17.2 18.8 16.1 20.2 9.4 23.1 19.2 17.5 18.5 14.5 12.8 3.5 3.0 2.7 0.6 0.8 0.9 15.8 16.6 15.9 315 (4.5) 7.4
Cadila Healthcare 870 ADD 178,193 3,219 205 31.9 38.5 44.9 (8.2) 20.8 16.7 27.3 22.6 19.4 21.2 16.1 14.0 6.9 5.6 4.7 0.9 1.0 1.1 27.5 27.5 26.4 810 (6.9) 1.5
Dishman Pharma & chemicals 66 REDUCE 5,356 97 81 5.1 8.3 10.2 (48.6) 64.7 22.6 13.0 7.9 6.4 8.0 6.0 5.2 0.6 0.6 0.5 — — — 4.6 7.2 8.4 50 (24.1) 0.6
Divi's Laboratories 1,059 ADD 140,596 2,540 133 40.2 52.2 61.1 24.1 30.0 17.0 26.4 20.3 17.3 19.9 14.6 12.5 6.6 5.5 4.6 — — — 27.1 29.6 28.9 1,085 2.4 3.7
Dr Reddy's Laboratories 1,672 REDUCE 284,614 5,141 170 83.8 96.2 105.1 29.0 14.8 9.3 20.0 17.4 15.9 13.2 11.2 10.2 5.0 4.0 3.3 0.8 1.0 1.1 27.6 25.5 22.8 1,740 4.0 9.0
GlaxoSmithkline Pharmaceuticals 2,067 SELL 175,043 3,162 85 74.3 82.3 92.7 8.8 10.8 12.6 27.8 25.1 22.3 20.0 17.1 14.8 9.0 8.5 7.6 2.2 2.8 2.8 32.4 34.8 36.1 1,930 (6.6) 1.0
Glenmark Pharmaceuticals 380 REDUCE 102,680 1,855 271 21.9 22.1 26.2 29.3 1.0 18.6 17.3 17.2 14.5 20.6 12.9 11.1 4.3 3.5 2.9 — — — 26.7 22.5 22.0 345 (9.1) 4.2
Jubilant Life Sciences 167 REDUCE 26,675 482 159 1.0 31.0 37.4 (93.1) 3,007.3 20.7 167.9 5.4 4.5 7.4 5.7 4.8 1.1 0.9 0.8 1.2 1.8 2.4 16.2 19.4 19.7 185 10.5 0.2
Lupin 569 ADD 255,156 4,609 448 19.4 27.4 31.6 0.6 41.8 15.2 29.4 20.7 18.0 20.2 14.7 12.3 6.2 5.0 4.1 0.6 0.8 1.0 23.8 27.3 25.4 550 (3.4) 6.2
Ranbaxy Laboratories 489 SELL 206,184 3,724 422 19.8 35.5 24.8 (51.2) 79.4 (30.3) 24.7 13.7 19.7 15.5 10.7 15.5 5.1 3.9 3.3 — 0.6 0.6 17.3 32.3 18.3 445 (8.9) 8.3
Sun Pharmaceuticals 627 ADD 649,011 11,723 1,036 25.0 26.1 29.1 42.5 4.6 11.1 25.1 24.0 21.6 18.4 16.0 13.8 4.9 4.1 3.5 0.7 0.8 1.0 23.9 20.4 19.4 650 3.7 7.4
Pharmaceuticals Attractive 2,425,293 43,809 11.0 22.3 5.8 23.3 19.0 18.0 16.1 12.6 12.5 3.6 3.0 3.3 0.7 0.9 0.9 15.4 16.0 18.5
Property
DLF 206 ADD 352,602 6,369 1,715 7.1 12.7 16.9 (22.1) 79.7 33.1 29.1 16.2 12.2 15.1 11.5 8.8 1.3 1.2 1.1 1.2 1.4 1.7 4.5 7.6 9.5 260 26.4 20.5
Housing Development & Infrastructure 85 BUY 35,448 640 419 22.0 28.8 28.8 11.3 30.5 0.2 3.8 2.9 2.9 4.9 4.4 4.0 0.3 0.3 0.3 — 1.8 2.4 8.3 10.8 9.6 105 24.1 30.8 Mahindra Life Space Developer 326 BUY 13,304 240 41 29.4 29.8 34.3 18.0 1.3 15.1 11.1 10.9 9.5 10.8 8.4 8.2 1.2 1.1 1.0 1.4 1.5 1.7 11.2 10.4 11.0 390 19.6 0.0
Oberoi Realty 235 BUY 77,589 1,402 330 14.1 14.3 22.4 (10.5) 1.4 57.3 16.7 16.5 10.5 13.4 10.5 6.6 2.1 1.9 1.7 0.8 1.1 1.3 13.1 12.0 16.9 300 27.5 0.4
Phoenix Mills 187 BUY 27,014 488 145 7.3 10.7 11.5 14.9 46.9 7.9 25.6 17.5 16.2 19.6 13.6 13.0 1.6 1.5 1.4 1.1 1.1 1.1 6.4 8.9 9.0 300 60.9 0.2 Sobha Developers 339 BUY 33,204 600 98 21.4 25.1 37.4 13.8 17.1 49.2 15.8 13.5 9.1 9.6 8.6 6.0 1.7 1.5 1.3 1.5 1.5 1.5 10.9 11.7 15.6 430 27.0 1.1
Unitech 23 RS 60,960 1,101 2,616 0.9 1.8 2.3 (56.1) 84.8 32.7 24.5 13.3 10.0 27.0 14.8 11.4 0.5 0.5 0.5 0.4 0.4 0.4 2.1 3.7 4.7 — — 7.8
Property Cautious 600,120 10,840 (17.4) 52.1 26.7 19.0 12.5 9.8 13.1 10.1 7.9 1.0 1.0 0.9 1.2 1.5 1.7 5.4 7.7 9.0
Dividend yield (%)
Source: Company, Bloomberg, Kotak Institutional Equities estimates

KO
TAK INSTITUTIO
NAL EQ
UITIES RESEARCH 34
In
dia D
aily Sum
mary - Ju
ly 1
Ind
ia Daily Su
mm
ary - July 19, 2012
Kotak Institutional Equities: Valuation summary of KIE Universe stocks
18-Jul-12 Mkt cap.O/S
shares EPS (Rs) EPS growth (%) PER (X) EV/EBITDA (X) Price/BV (X) RoE (%)Target price Upside ADVT-3mo
Company Price (Rs) Rating (Rs mn) (US$ mn) (mn) 2012 2013E 2014E 2012 2013E 2014E 2012 2013E 2014E 2012 2013E 2014E 2012 2013E 2014E 2012 2013E 2014E 2012 2013E 2014E (Rs) (%) (US$ mn)
Technology
HCL Technologies 476 REDUCE 340,519 6,151 715 32.6 38.4 40.7 42.8 17.7 6.0 14.6 12.4 11.7 8.7 7.6 7.0 3.0 2.5 2.2 1.7 1.7 1.7 22.1 21.6 20.2 445 (6.6) 11.5
Hexaware Technologies 114 ADD 33,459 604 294 9.1 12.5 13.5 207.9 37.1 8.4 12.5 9.1 8.4 11.1 6.3 5.4 3.3 2.6 2.2 2.6 2.9 3.1 26.9 32.0 28.2 140 22.8 3.5
Infosys 2,179 REDUCE 1,250,689 22,592 574 144.9 166.0 172.8 21.0 14.6 4.1 15.0 13.1 12.6 9.7 8.1 7.4 4.0 3.3 2.9 2.1 2.4 2.5 29.0 27.7 24.4 2,350 7.9 63.6
Mahindra Satyam 81 BUY 95,138 1,719 1,176 10.2 9.1 9.9 142.3 (10.5) 8.3 8.0 8.9 8.2 6.5 4.4 3.8 3.2 2.3 1.9 — — 2.4 50.4 30.5 25.8 88 8.8 4.1
Mindtree 646 ADD 26,580 480 41 53.1 77.6 74.7 115.1 46.2 (3.8) 12.2 8.3 8.7 9.0 5.3 5.2 2.8 2.2 1.9 0.8 2.4 3.5 25.2 29.6 23.6 710 9.9 2.3
Mphasis 384 SELL 80,917 1,462 211 39.0 37.6 36.9 (24.6) (3.7) (1.8) 9.8 10.2 10.4 8.2 6.9 6.4 2.1 1.8 1.6 1.2 1.3 1.4 22.8 18.7 15.9 355 (7.6) 1.3
Polaris Financial Technology 114 REDUCE 11,386 206 100 20.8 19.3 21.4 7.4 (6.8) 10.4 5.5 5.9 5.3 3.0 2.5 2.1 0.9 0.8 0.7 3.4 3.6 3.8 18.1 14.5 14.4 120 5.1 1.6
TCS 1,195 REDUCE 2,339,441 42,259 1,957 54.4 68.1 70.6 22.0 25.3 3.7 22.0 17.6 16.9 15.5 12.5 11.9 7.2 5.9 5.0 2.1 2.3 2.4 36.8 36.9 31.9 1,125 (5.9) 37.8
Tech Mahindra 709 BUY 90,359 1,632 127 80.2 90.8 88.2 66.9 13.3 (2.9) 8.8 7.8 8.0 11.5 8.1 8.7 2.2 1.9 1.8 0.6 1.4 1.6 28.4 27.4 23.7 750 5.8 2.1
Wipro 364 REDUCE 894,844 16,164 2,456 22.7 27.6 29.1 5.2 21.5 5.3 16.0 13.2 12.5 11.0 8.6 7.9 3.1 2.6 2.3 1.3 1.7 1.8 21.2 21.7 19.5 375 2.9 10.5
Technology Cautious 5,163,332 93,268 20.7 18.7 4.1 16.7 14.0 13.5 11.6 9.4 8.8 4.3 3.5 3.0 1.9 2.1 2.3 25.5 25.2 22.6
Telecom
Bharti Airtel 325 ADD 1,232,701 22,267 3,798 11.2 18.0 22.3 (29.6) 60.7 23.5 28.9 18.0 14.6 8.0 6.5 5.5 2.4 2.2 1.9 — 0.5 0.7 8.6 12.7 14.0 375 15.5 21.5
IDEA 84 ADD 276,982 5,003 3,303 2.2 4.7 7.0 (19.6) 113.7 50.6 38.3 17.9 11.9 8.1 6.1 4.9 2.1 1.9 1.6 — — — 5.7 11.2 14.8 95 13.3 5.2
MTNL 25 RS 15,498 280 630 (9.1) (8.4) (8.3) (11.9) (8.1) (1.7) (2.7) (2.9) (3.0) 0.5 0.6 0.7 0.2 0.2 0.2 — — — (5.7) (5.5) (5.8) — — 0.7
Reliance Communications 65 SELL 134,057 2,422 2,064 4.5 2.3 5.1 (31.1) (48.1) 117.6 14.5 27.8 12.8 7.6 6.6 5.6 0.4 0.4 0.4 — — — 2.6 1.5 3.2 60 (7.6) 13.4
Tata Communications 252 REDUCE 71,763 1,296 285 (28.0) (24.2) (18.3) 12.3 (13.5) (24.4) (9.0) (10.4) (13.8) 10.1 7.9 7.0 2.6 3.3 4.1 — — — (24.9) (27.7) (26.6) 210 (16.6) 1.0
Telecom Attractive 1,731,000 31,268 (34.4) 68.7 41.0 38.2 22.6 16.0 8.2 6.6 5.5 1.6 1.5 1.4 — — 0.5 4.2 6.7 8.6
Utilities
Adani Power 46 SELL 109,848 1,984 2,393 (0.4) 5.5 4.7 (116.4) (1,517.6) (14.9) (118.9) 8.4 9.9 25.7 7.6 5.8 1.7 1.4 1.2 — — — (1.4) 18.1 13.2 48 4.6 3.0
CESC 308 BUY 38,443 694 125 25.9 26.4 37.7 8.0 1.9 42.8 11.9 11.7 8.2 8.8 9.3 5.8 0.6 0.6 0.6 1.5 1.6 1.7 5.5 5.4 7.4 355 15.4 1.0
JSW Energy 53 SELL 86,264 1,558 1,640 2.0 3.2 3.5 (60.6) 57.3 11.5 26.0 16.6 14.8 13.4 7.1 6.2 1.5 1.4 1.3 — — — 5.8 8.7 8.9 50 (4.9) 2.6
Lanco Infratech 15 BUY 32,567 588 2,223 (0.5) 0.7 1.0 (131.8) (229.9) 51.1 (28.0) 21.5 14.2 10.8 7.7 6.6 0.7 0.6 0.6 — — — (2.5) 3.1 4.3 26 77.5 9.4
NHPC 19 BUY 227,564 4,111 12,301 2.4 2.2 2.4 79.5 (9.8) 7.7 7.6 8.5 7.9 7.1 7.0 6.0 0.8 0.7 0.7 3.6 3.3 3.6 10.8 9.1 9.2 26 40.5 1.2
NTPC 157 REDUCE 1,294,950 23,391 8,245 11.2 12.0 15.3 2.4 6.9 27.6 14.0 13.1 10.3 12.4 11.3 8.6 1.7 1.6 1.4 2.1 2.3 2.9 12.8 12.6 14.7 160 1.9 5.8
Power Grid 111 ADD 514,826 9,300 4,630 7.1 8.2 9.2 23.0 16.0 11.6 15.7 13.6 12.2 12.3 10.4 9.3 2.2 2.0 1.8 1.9 2.2 2.5 14.6 15.4 15.5 125 12.4 4.8
Reliance Infrastructure 529 BUY 139,077 2,512 263 60.3 66.7 73.6 4.0 10.6 10.3 8.8 7.9 7.2 10.7 9.3 7.9 0.6 0.5 0.5 1.9 2.1 2.1 8.9 9.8 10.2 890 68.3 25.4
Reliance Power 104 SELL 292,715 5,287 2,805 3.1 3.3 2.7 14.0 8.1 (18.4) 33.8 31.2 38.3 54.2 26.7 17.7 1.7 1.6 1.5 — — — 5.0 5.2 4.0 76 (27.2) 10.2
Tata Power 99 BUY 243,255 4,394 2,468 4.6 7.5 6.7 (40.6) 63.6 (10.7) 21.4 13.1 14.6 11.0 7.7 7.1 1.8 1.6 1.5 1.5 1.7 1.7 8.1 13.2 10.8 115 16.7 6.2
Utilities Attractive 2,979,509 53,821 (0.3) 18.9 14.1 15.3 12.8 11.3 12.4 9.9 8.2 1.5 1.3 1.2 1.8 1.9 2.2 9.5 10.5 11.0
Others
Carborundum Universal 161 REDUCE 30,088 544 187 11.6 11.4 12.7 27.0 (1.9) 11.9 13.9 14.1 12.6 8.4 7.8 6.9 2.9 2.4 2.1 1.6 1.5 1.7 27.8 21.2 20.1 150 (6.8) 0.1
Coromandel International 249 SELL 70,218 1,268 283 22.5 22.7 24.6 (8.5) 0.9 8.5 11.1 11.0 10.1 9.3 7.9 7.3 2.9 2.5 2.2 3.0 3.1 3.3 27.5 23.3 21.9 260 4.6 0.4
Havells India 580 ADD 72,376 1,307 125 31.5 36.5 41.7 61.6 16.0 14.3 18.4 15.9 13.9 11.7 9.4 8.2 7.2 5.3 4.1 1.1 1.2 1.4 45.6 38.4 33.3 600 3.4 2.9
Jaiprakash Associates 77 BUY 162,992 2,944 2,126 2.9 7.1 10.8 (51.5) 142.3 51.9 26.2 10.8 7.1 11.4 8.5 6.5 1.4 1.3 1.1 — — — 5.6 12.5 16.7 88 14.8 23.1
Jet Airways 359 SELL 31,010 560 86 (233.8) (33.8) (29.1) 2,225.0 (86) (13.9) (1.5) (10.6) (12.4) (167.3) 10.9 10.3 (7.4) (4.3) (3.2) — — — — — — 280 (22.0) 12.3
Rallis India 125 BUY 24,274 438 195 5.1 8.2 9.4 (21.6) 61 14.7 24.5 15.2 13.3 12.0 9.4 8.1 4.4 3.6 3.0 1.6 1.6 1.6 21.6 25.1 23.4 145 16.2 1.1
SpiceJet 32 BUY 14,168 256 441 (13.3) (0.5) 2.4 (635.0) (96.3) (584.6) (2.4) (65.0) 13.4 (6.0) 22.5 9.2 (10.0) (8.6) (24.3) — — — (658) 14.2 (95.0) 45 40.2 2.5
Tata Chemicals 318 REDUCE 81,012 1,463 255 32.9 38.8 42.3 25.4 17.9 9.0 9.7 8.2 7.5 5.2 4.4 3.7 1.3 1.2 1.0 3.8 4.7 5.3 18.6 19.5 19.4 365 14.8 1.6
United Phosphorus 125 BUY 57,518 1,039 462 13.0 17.6 21.3 5.4 35.4 20.7 9.6 7.1 5.9 6.5 4.9 4.0 1.4 1.2 1.0 2.0 2.8 3.6 16.2 18.5 — 150 20.4 3.6
Others 543,656 9,820 (77.7) 456.2 30.8 67.7 12.2 9.3 11.9 7.9 6.4 2.1 1.8 1.6 1.5 1.7 1.9 3.1 15.1 17.0
KS universe (b) 46,086,865 832,494 10.0 12.7 12.1 14.0 12.4 11.1 9.0 7.8 6.8 2.1 1.9 1.7 1.7 1.9 2.1 15.4 15.4 15.5
KS universe (b) ex-Energy 38,826,039 701,337 9.0 16.9 13.6 15.3 13.1 11.5 10.6 8.7 7.6 2.4 2.1 1.9 1.6 1.8 1.9 15.8 16.3 16.6
KS universe (d) ex-Energy & ex-Commodities 32,918,395 594,624 10.7 17.7 13.8 16.1 13.6 12.0 11.7 9.4 8.1 2.5 2.2 2.0 1.6 1.8 1.9 15.8 16.4 16.7
Notes:
(a) For banks we have used adjusted book values.
(b) 2012 means calendar year 2011, similarly for 2013 and 2014 for these particular companies.
(c) EV/Sales & EV/EBITDA for KS universe excludes Banking Sector.
(d) Rupee-US Dollar exchange rate (Rs/US$)= 55.36
Dividend yield (%)
Source: Company, Bloomberg, Kotak Institutional Equities estimates

KOTAK INSTITUTIONAL EQUITIES RESEARCH 36
Disclosures
Kotak Institutional Equities Research coverage universeDistribution of ratings/investment banking relationships
Source: Kotak Institutional Equities As of June 30, 2012
Percentage of companies covered by Kotak Institutional Equities, within the specified category.
Percentage of companies within each category for which Kotak Institutional Equities and or its affiliates has provided investment banking services within the previous 12 months.
* The above categories are defined as follows: Buy = We expect this stock to deliver more than 15% returns over the next 12 months; Add = We expect this stock to deliver 5-15% returns over the next 12 months; Reduce = We expect this stock to deliver -5-+5% returns over the next 12 months; Sell = We expect this stock to deliver less than -5% returns over the next 12 months. Our target prices are also on a 12-month horizon basis. These ratings are used illustratively to comply with applicable regulations. As of 30/06/2012 Kotak Institutional Equities Investment Research had investment ratings on 167 equity securities.
18.0%
32.3% 33.5%
16.2%
4.2%0.6% 0.6% 1.2%
0%
10%
20%
30%
40%
50%
60%
70%
BUY ADD REDUCE SELL
Ratings and other definitions/identifiers
Definitions of ratings
Definitions of ratings
BUY. We expect this stock to deliver more than 15% returns over the next 12 months.
ADD. We expect this stock to deliver 5-15% returns over the next 12 months.
REDUCE. We expect this stock to deliver -5-+5% returns over the next 12 months.
SELL. We expect this stock to deliver <-5% returns over the next 12 months.
Our target prices are also on a 12-month horizon basis.
Other definitions
Coverage view. The coverage view represents each analyst’s overall fundamental outlook on the Sector. The coverage view will consist of one of the following designations: Attractive, Neutral, Cautious.
Other ratings/identifiers
NR = Not Rated. The investment rating and target price, if any, have been suspended temporarily. Such suspension is in compliance with applicable regulation(s) and/or Kotak Securities policies in circumstances when Kotak Securities or its affiliates is acting in an advisory capacity in a merger or strategic transaction involving this company and in certain other circumstances.
CS = Coverage Suspended. Kotak Securities has suspended coverage of this company.
NC = Not Covered. Kotak Securities does not cover this company.
RS = Rating Suspended. Kotak Securities Research has suspended the investment rating and price target, if any, for this stock, because there is not a sufficient fundamental basis for determining an investment rating or target. The previous investment rating and price target, if any, are no longer in effect for this stock and should not be relied upon.
NA = Not Available or Not Applicable. The information is not available for display or is not applicable.
NM = Not Meaningful. The information is not meaningful and is therefore excluded.

Corporate Office Overseas Offices
Kotak Securities Ltd.
Bakhtawar, 1st Floor
229, Nariman Point
Mumbai 400 021, India
Tel: +91-22-6634-1100
Kotak Mahindra (UK) Ltd
8th Floor, Portsoken House
155-157 Minories
London EC3N 1LS
Tel: +44-20-7977-6900
Kotak Mahindra Inc
50 Main Street, Ste. 890
Westchester Financial Centre
White Plains, New York 10606
Tel:+1-914-997-6120
Copyright 2012 Kotak Institutional Equities (Kotak Securities Limited). All rights reserved.
1. Note that the research analysts contributing to this report may not be registered/qualified as research analysts with FINRA; and
2. Such research analysts may not be associated persons of Kotak Mahindra Inc and therefore, may not be subject to NASD Rule 2711 restrictions on communications with a subject company, public appearances and trading securities held by a research analyst account.
Kotak Securities Limited and its affiliates are a full-service, integrated investment banking, investment management, brokerage and financing group. We along with our affiliates are leading underwriter of securities and participants in virtually all securities trading markets in India. We and our affiliates have investment banking and other business relationships with a significant percentage of the companies covered by our Investment Research Department. Our research professionals provide important input into our investment banking and other business selection processes. Investors should assume that Kotak Securities Limited and/or its affiliates are seeking or will seek investment banking or other business from the company or companies that are the subject of this material and that the research professionals who were involved in preparing this material may participate in the solicitation of such business. Our research professionals are paid in part based on the profitability of Kotak Securities Limited, which include earnings from investment banking and other business. Kotak Securities Limited generally prohibits its analysts, persons reporting to analysts, and members of their households from maintaining a financial interest in the securities or derivatives of any companies that the analysts cover. Additionally, Kotak Securities Limited generally prohibits its analysts and persons reporting to analysts from serving as an officer, director, or advisory board member of any companies that the analysts cover. Our salespeople, traders, and other professionals may provide oral or written market commentary or trading strategies to our clients that reflect opinions that are contrary to the opinions expressed herein, and our proprietary trading and investing businesses may make investment decisions that are inconsistent with the recommendations expressed herein. In reviewing these materials, you should be aware that any or all of the foregoing, among other things, may give rise to real or potential conflicts of interest. Additionally, other important information regarding our relationships with the company or companies that are the subject of this material is provided herein.
This material should not be construed as an offer to sell or the solicitation of an offer to buy any security in any jurisdiction where such an offer or solicitation would be illegal. We are not soliciting any action based on this material. It is for the general information of clients of Kotak Securities Limited. It does not constitute a personal recommendation or take into account the particular investment objectives, financial situations, or needs of individual clients. Before acting on any advice or recommendation in this material, clients should consider whether it is suitable for their particular circumstances and, if necessary, seek professional advice. The price and value of the investments referred to in this material and the income from them may go down as well as up, and investors may realize losses on any investments. Past performance is not a guide for future performance, future returns are not guaranteed and a loss of original capital may occur. Kotak Securities Limited does not provide tax advise to its clients, and all investors are strongly advised to consult with their tax advisers regarding any potential investment.
Certain transactions -including those involving futures, options, and other derivatives as well as non-investment-grade securities - give rise to substantial risk and are not suitable for all investors. The material is based on information that we consider reliable, but we do not represent that it is accurate or complete, and it should not be relied on as such. Opinions expressed are our current opinions as of the date appearing on this material only. We endeavor to update on a reasonable basis the information discussed in this material, but regulatory, compliance, or other reasons may prevent us from doing so. We and our affiliates, officers, directors, and employees, including persons involved in the preparation or issuance of this material, may from time to time have “long” or “short” positions in, act as principal in, and buy or sell the securities or derivatives thereof of companies mentioned herein. For the purpose of calculating whether Kotak Securities Limited and its affiliates holds beneficially owns or controls, including the right to vote for directors, 1% of more of the equity shares of the subject issuer of a research report, the holdings does not include accounts managed by Kotak Mahindra Mutual Fund. Kotak Securities Limited and its non US affiliates may, to the extent permissible under applicable laws, have acted on or used this research to the extent that it relates to non US issuers, prior to or immediately following its publication. Foreign currency denominated securities are subject to fluctuations in exchange rates that could have an adverse effect on the value or price of or income derived from the investment. In addition, investors in securities such as ADRs, the value of which are influenced by foreign currencies affectively assume currency risk. In addition options involve risks and are not suitable for all investors. Please ensure that you have read and understood the current derivatives risk disclosure document before entering into any derivative transactions.
This report has not been prepared by Kotak Mahindra Inc. (KMInc). However KMInc has reviewed the report and, in so far as it includes current or historical information, it is believed to be reliable, although its accuracy and completeness cannot be guaranteed. Any reference to Kotak Securities Limited shall also be deemed to mean and include Kotak Mahindra Inc.

![[Kotak] India Daily, July 25, 2017 - Kotak Securities](https://static.fdokumen.com/doc/165x107/63161b1a15106505030be7d5/kotak-india-daily-july-25-2017-kotak-securities.jpg)


![[Kotak] India Daily, October 24, 2016 - Kotak Securities](https://static.fdokumen.com/doc/165x107/633d69d4e674f41574068690/kotak-india-daily-october-24-2016-kotak-securities.jpg)


![[Kotak] India Daily, April 2, 2019 - Kotak Securities](https://static.fdokumen.com/doc/165x107/63265a4f5c2c3bbfa803a474/kotak-india-daily-april-2-2019-kotak-securities.jpg)