
15July 2020_India_Daily - Kotak Securities
89
For Private Circulation Only. FOR IMPORTANT INFORMATION ABOUT KOTAK SECURITIES’ RATING SYSTEM AND OTHER DISCLOSURES. REFER TO THE END OF THIS MATERIAL. Contents Special Reports Theme Report Reliance Industries: The virtuous cycle On the forefront of digital ecosystem in India targeting 4Cs of the business model We now ascribe US$62 bn of EV to the offline retail footprint and digital commerce foray Reiterate BUY with revised FV of Rs2,150, noting several catalysts in the medium term Daily Alerts Result Mindtree: A quarter that could have been worse but for top client Revenues from travel, hospitality decline 54.6% qoq, top client concentration increases to 30% Thoughts on top client concentration and future of travel and transportation vertical Marginal cut in revenue estimates with broadly unchanged EPS estimates Results, Change in Reco Wipro: Upgrade to ADD on inexpensive valuations Wipro reports sharp revenue contraction; EBIT margin increase sharply led by cost management Focus of CEO Thierry Delaporte to be on profitable growth Challenges aplenty but all in the price; upside from moderate improvement in performance Change in Reco Shree Cement: Efficient but expensive FY2020 reports record margins, retains leadership in cost efficiency Strong operating performance improves FCF yield and balance sheet strength Growth to sustain, expansions on track and low utilization provide headroom Downgrade to SELL on expensive valuations post the recent rally INDIA DAILY July 15, 2020 India 14-Jul 1-day 1-mo 3-mo Sensex 36,033 (1.8) 8.4 18.6 Nifty 10,607 (1.8) 8.1 18.8 Global/Regional indices Dow Jones 26,643 2.1 3.4 13.4 Nasdaq Composite 10,489 0.9 7.8 25.0 FTSE 6,180 0.1 1.9 10.4 Nikkei 22,902 1.4 6.4 17.1 Hang Seng 25,478 (1.1) 7.2 5.5 KOSPI 2,205 1.0 8.6 18.7 Value traded – India Cash (NSE+BSE) 572 632 598 Derivatives (NSE) 15,160 11,314 6,270 Deri. open interest 3,664 2,930 1,912 Forex/money market Change, basis points 14-Jul 1-day 1-mo 3-mo Rs/US$ 75.3 0 (53) (112) 10yr govt bond, % 6.1 - (17) (81) Net investment (US$ mn) 13-Jul MTD CYTD FIIs (11) (169) (2,610) MFs (107) (377) 4,481 Top movers Change, % Best performers 14-Jul 1-day 1-mo 3-mo IHFL IN Equity 223 (6.3) 45.6 143.5 BHEL IN Equity 39 (8.7) 33.7 81.4 RIL IN Equity 1,917 (0.9) 18.7 68.3 EDEL IN Equity 57 (0.4) 30.3 63.6 ARBP IN Equity 809 (0.0) 5.3 57.2 Worst performers YES IN Equity 21 (5.0) (27.8) (14.5) COAL IN Equity 128 (1.7) (2.9) (12.7) HUVR IN Equity 2,235 (1.3) 7.2 (10.2) DIVI IN Equity 2,218 (0.8) (5.0) (7.4) PIDI IN Equity 1,381 (1.1) (3.6) (6.4) [email protected] Contact: +91 22 6218 6427
-
Upload
khangminh22 -
Category
Documents
-
view
1 -
download
0
Transcript of 15July 2020_India_Daily - Kotak Securities

For Private Circulation Only. FOR IMPORTANT INFORMATION ABOUT KOTAK SECURITIES’ RATING SYSTEM AND OTHER DISCLOSURES. REFER TO THE END OF THIS MATERIAL.
Contents
Special Reports
Theme Report
Reliance Industries: The virtuous cycle
On the forefront of digital ecosystem in India targeting 4Cs of the business
model
We now ascribe US$62 bn of EV to the offline retail footprint and digital
commerce foray
Reiterate BUY with revised FV of Rs2,150, noting several catalysts in the
medium term
Daily Alerts
Result
Mindtree: A quarter that could have been worse but for top client
Revenues from travel, hospitality decline 54.6% qoq, top client
concentration increases to 30%
Thoughts on top client concentration and future of travel and
transportation vertical
Marginal cut in revenue estimates with broadly unchanged EPS estimates
Results, Change in Reco
Wipro: Upgrade to ADD on inexpensive valuations
Wipro reports sharp revenue contraction; EBIT margin increase sharply led
by cost management
Focus of CEO Thierry Delaporte to be on profitable growth
Challenges aplenty but all in the price; upside from moderate improvement
in performance
Change in Reco
Shree Cement: Efficient but expensive
FY2020 reports record margins, retains leadership in cost efficiency
Strong operating performance improves FCF yield and balance sheet
strength
Growth to sustain, expansions on track and low utilization provide
headroom
Downgrade to SELL on expensive valuations post the recent rally
INDIA DAILY July 15, 2020 India 14-Jul 1-day 1-mo 3-mo
Sensex 36,033 (1.8) 8.4 18.6
Nifty 10,607 (1.8) 8.1 18.8
Global/Regional indices
Dow Jones 26,643 2.1 3.4 13.4
Nasdaq Composite 10,489 0.9 7.8 25.0
FTSE 6,180 0.1 1.9 10.4
Nikkei 22,902 1.4 6.4 17.1
Hang Seng 25,478 (1.1) 7.2 5.5
KOSPI 2,205 1.0 8.6 18.7
Value traded – India
Cash (NSE+BSE) 572 632 598
Derivatives (NSE) 15,160 11,314 6,270
Deri. open interest 3,664 2,930 1,912
Forex/money market
Change, basis points
14-Jul 1-day 1-mo 3-mo
Rs/US$ 75.3 0 (53) (112)
10yr govt bond, % 6.1 - (17) (81)
Net investment (US$ mn)
13-Jul MTD CYTD
FIIs (11) (169) (2,610)
MFs (107) (377) 4,481
Top movers
Change, %
Best performers 14-Jul 1-day 1-mo 3-mo
IHFL IN Equity 223 (6.3) 45.6 143.5
BHEL IN Equity 39 (8.7) 33.7 81.4
RIL IN Equity 1,917 (0.9) 18.7 68.3
EDEL IN Equity 57 (0.4) 30.3 63.6
ARBP IN Equity 809 (0.0) 5.3 57.2
Worst performers
YES IN Equity 21 (5.0) (27.8) (14.5)
COAL IN Equity 128 (1.7) (2.9) (12.7)
HUVR IN Equity 2,235 (1.3) 7.2 (10.2)
DIVI IN Equity 2,218 (0.8) (5.0) (7.4)
PIDI IN Equity 1,381 (1.1) (3.6) (6.4)
[email protected]: +91 22 6218 6427

Company Report
For Private Circulation Only. In the US, this document may only be distributed to QIBs (qualified institutional buyers) as defined under rule 144A of the Securities Act of 1933. This document is not for public distribution and has been furnished to you solely for your information and may not be reproduced or redistributed to any other person. The manner of circulation and distribution of this document may be restricted by law or regulation in certain countries, including the United States. Persons into whose possession this document may come are required to inform themselves of, and to observe, such restrictions.
Reliance Industries (RIL)
Oil, Gas & Consumable Fuels
The virtuous cycle. RIL’s leadership in connectivity and retail businesses and recent
strategic partnership with Facebook will enable it to further expand its presence in
India’s digital ecosystem, which can create significant value in the long run. We expect
the foray in digital commerce business to be the next big driver of RIL stock, with the
valuation of legacy O2C and digital services segments broadly established in a
reasonable range for now. We retain BUY rating on the stock, raising our SoTP-based
Fair Value to Rs2,150 and valuing the overall retail business at an EV of US$62 bn.
On the forefront of digital ecosystem in India targeting 4Cs of the business model
RIL’s well-established connectivity business under Jio Platforms, formidable offline retail
footprint under Reliance Retail, proposed foray in the digital commerce segment under JioMart
and recent strategic partnership with Facebook, have propelled it to the forefront of consumer-
facing digital ecosystem opportunity in India. We believe RIL’s ever-expanding portfolio of
products and services to target the 4Cs of the digital ecosystem—connectivity, commerce,
content and currency—will enable it to leverage the sizeable traffic across its consumer-facing
verticals, generate new revenue streams and create significant value in the long run.
We now ascribe US$62 bn of EV to the offline retail footprint and digital commerce foray
Our analysis of the overall retail business opportunity in this report suggests that Reliance
Retail can potentially double its revenues to over US$26 bn from core segments in next four
years, while achieving an incremental GMV of US$12 bn from its foray in India’s e-commerce
market, which is all set to treble to US$100 bn by FY2025. We ascribe US$62 bn of EV to RIL’s
retail business, (1) ascribing 25X EV/EBITDA multiple to core retail segment versus 20X earlier
and (2) factoring incremental contribution of US$17 bn (~Rs1.3 tn) from the digital commerce
business based on probability-weighted scenarios that may evolve for e-commerce in India by
FY2030. (1) RIL’s proven track record of execution, (2) large customer base of Jio and retail
segments, (3) strategic tie-up with WhatsApp, (4) unmatched portfolio of private labels and
exclusive brand tie-ups, (5) India’s domestic-centric policies and (6) possible inorganic ventures,
will enable the company to overcome the head-start achieved by other e-commerce players.
Reiterate BUY with revised FV of Rs2,150, noting several catalysts in the medium term
We reiterate BUY on RIL, while raising our SoTP-based FV to Rs2,150 from Rs1,750 earlier,
ascribing higher value to the retail business and rolling forward to September 2021; our
estimates remain largely unchanged as we incorporate the recent transactions and FY2020 AR.
Progress on digital commerce business, monetization of incremental ecosystem opportunities,
increase in telecom tariffs and recovery in O2C business environment are the key catalysts to
watch out for. Potential closure of transactions related to O2C and fiber-InvIT, and further
strategic partnerships in digital services and retail business can be positive triggers as well.
Company data and valuation summary
BUY
July 15, 2020
THEME
Sector view: Attractive
CMP (`): 1,917
Fair Value (`): 2,150
BSE-30: 36,033
INSIDE
RIL has established
leadership in offline retail
.................. .pg12
Fast growing multi-
category retailer with a
formidable footprint
.................. .pg16
Aspirations to tap India’s
e-commerce
opportunity..pg22
Tarun Lakhotia
Garima Mishra
Hemang Khanna
Shubhangi Nigam
Reliance Industries
Stock data Forecasts/valuations 2020 2021E 2022E
52-week range (Rs) (high,low) EPS (Rs) 66.7 69.8 93.3
Mcap (bn) (Rs/US$) EPS growth (%) 1.2 4.6 33.7
ADTV-3M (mn) (Rs/US$) P/E (X) 28.7 27.5 20.5
Shareholding pattern (%) P/B (X) 2.5 2.3 2.0
Promoters 48.9 EV/EBITDA (X) 16.7 13.9 9.5
FIIs 25.9 RoE (%) 9.4 8.6 10.7
MFs/BFIs Div. yield (%) 0.3 0.4 0.4
Price performance (%) 1M 3M 12M Sales (Rs bn) 5,967 5,093 6,453
Absolute 21 63 51 EBITDA (Rs bn) 831 893 1,204
Rel. to BSE-30 13 39 62 Net profits (Rs bn) 396 414 593
1,948-867
11,363/150.7
5.3/6.2
35,427/470
[email protected]: +91 22 6218 6427
KOTAK INSTITUTIONAL EQUITIES RESEARCH 3
Reliance Industries Oil, Gas & Consumable Fuels
ON THE FOREFRONT OF CONSUMER-FACING DIGITAL ECOSYSTEM IN INDIA
RIL’s well-established connectivity layer under Jio Platforms, formidable offline retail footprint under Reliance
Retail, proposed outlay in the digital commerce business and recent strategic partnership with Facebook,
have propelled it to the forefront of consumer-facing digital ecosystem opportunity in India. We believe RIL’s
ever-expanding offering of products and services amid the backdrop of India’s domestic-centric policies will
enable it to leverage the sizeable traffic across its consumer-facing verticals and generate new revenue
streams in the long run. We reiterate our BUY rating on the stock, while raising our fair value to Rs2,150
factoring in the digital commerce opportunity, which we expect the company to realize in the medium term.
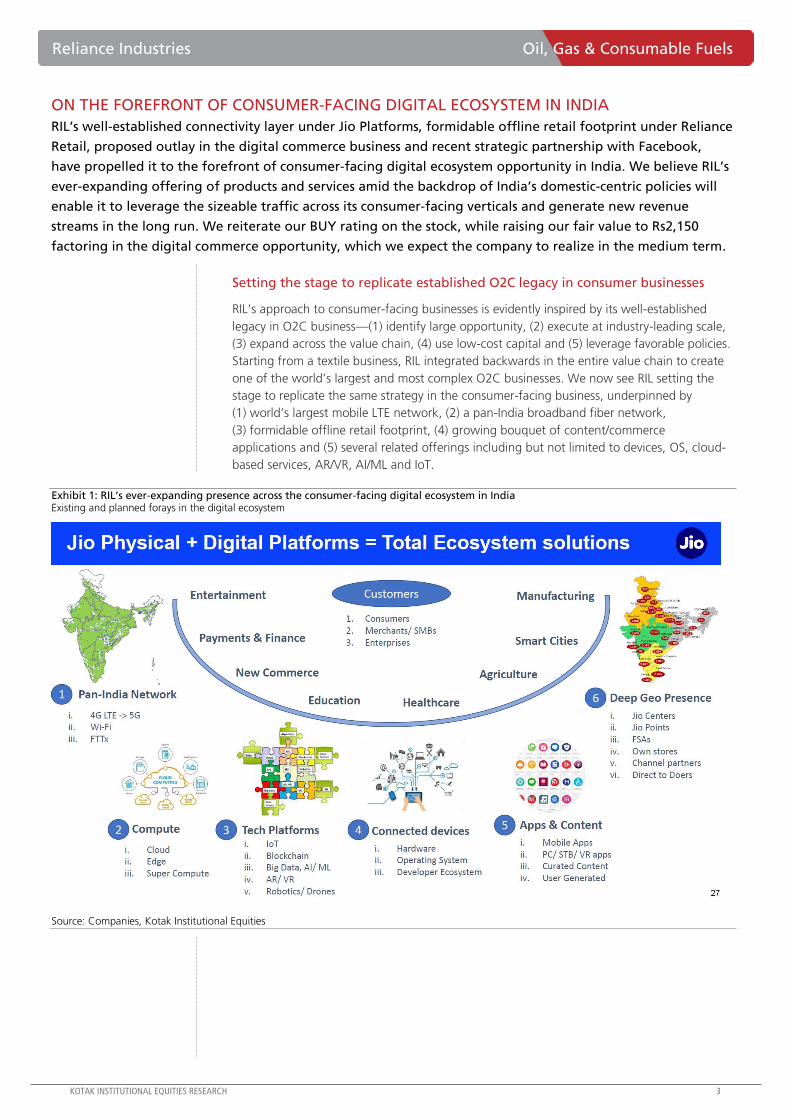
Setting the stage to replicate established O2C legacy in consumer businesses
RIL's approach to consumer-facing businesses is evidently inspired by its well-established
legacy in O2C business—(1) identify large opportunity, (2) execute at industry-leading scale,
(3) expand across the value chain, (4) use low-cost capital and (5) leverage favorable policies.
Starting from a textile business, RIL integrated backwards in the entire value chain to create
one of the world’s largest and most complex O2C businesses. We now see RIL setting the
stage to replicate the same strategy in the consumer-facing business, underpinned by
(1) world’s largest mobile LTE network, (2) a pan-India broadband fiber network,
(3) formidable offline retail footprint, (4) growing bouquet of content/commerce
applications and (5) several related offerings including but not limited to devices, OS, cloud-
based services, AR/VR, AI/ML and IoT.
Exhibit 1: RIL’s ever-expanding presence across the consumer-facing digital ecosystem in India Existing and planned forays in the digital ecosystem
Source: Companies, Kotak Institutional Equities

4 KOTAK INSTITUTIONAL EQUITIES RESEARCH
Oil, Gas & Consumable Fuels Reliance Industries
RIL targeting the 4Cs of the digital ecosystem business model
Well-established digital ecosystem companies across the world have exhibited a few
common traits and strategies—(1) a robust scalable technology backbone connecting a large
base of consumers on a best-in-class digital interface, that acts as a hook, (2) offering of
incremental layers to fulfill the customers’ requirements of products, services or content
within their own ecosystem or through an open marketplace, (3) providing transactional
capability through an integrated payments mechanism and (4) generating revenues and
profits through a combination of advertising, commissions and subscription.
We believe RIL has chartered its path in a similar way to service the entire spectrum of the
digital ecosystem in India—(1) connectivity through mobile/fiber-to-the-home/enterprise
services, (2) commerce through offline retail, online foray and digitizing large unorganized
segment, (3) content through its bouquet of media and entertainment apps and related
business verticals and (4) currency through transaction capabilities. RIL’s recent strategic tie-
up with Facebook/WhatsApp may enable it to enhance its powerful digital ecosystem
offering by connecting to customers through integrated user-friendly interfaces to meet
most, if not all, of their requirements in the digital world.
Exhibit 2: Jio Platforms + Reliance Retail can evolve into large revenue generating companies akin to their Chinese counterparts Comparison of product offerings of Jio Platforms + Reliance Retail with Alibaba and Tencent
Reliance Retail + Jio Platforms Alibaba group Tencent
B2C commerce
(1) Retail own brands: Fresh, Smart, Market, Ajio
etc. (2) Textile own brands (3) In-Store brands:
John Players, Snactac, avaasa (Ethnic
Indianwear), GoodLife (Full range grocery brand)
and LYF smartphones (4G mobile devices)
Taobao is B2C/C2C focused, enabling small
businesses and individuals to open online stores.
Tmall offers a wide selection of branded products
oriented towards China's growing middle class.
Partnered with JD.com in 2014. JD.com features
prominently on WeChat.
B2B commerceReliance Market and JioMart can evolve as a
large B2B national supplier
Alibaba B2B is a trading platform, connecting
manufacturers from countries such as China, India,
US and Thailand with international buyers.
Local commerceJioMart enabled O2O connecting offline
customers with online B2C/B2B platforms
Ele.me (connects local shops to consumers), Didi
Kuaidi (cab aggregator)Didi Kuaidi (cab aggregator)
Payment and fintech JioMoney/JioPayAlipay: online third-party payments platform,
providing transaction and escrow services. Weixin Pay, QQ Wallet, LiCaiTong, WeSure, Weiliadai
Logistics Grab (acquired in 2019)Cainiao Logistics - provides logistics support to all
of Alibaba's operations
Social media and
messagingFB, Instagram, Whatsapp, JioChat, JioCall Influencing and personal content on Taobao QQ IM, Weixin and WeChat (Free service)
Digital content JioMovies, JioTV, JioSaavn, JioNews Relevant digital content on B2C websitesAdvanced Casual Games ACGs, Mobile games,
Massively Multiplayer Online Games MMOGs
MarketingFacebook and Instagram Platforms, JioAds Cross-
device Marketing Technology Platform.
Online advertising. Alimama is an online marketing
platform that provides sellers on Alibaba Group's
marketplaces a range of marketing and advertising
services. Advertisers can choose between pay-for-
performance and display marketing. These ads are
the primary means through which Alibaba makes
money from Taobao.
Online advertising. (1) Media. Includes news, video
and music properties, e.g. Tencent News app;
QQ.com and verticals; regional portals; QQ Music
etc. (2) Social and others. Includes social properties,
app store, browser and ad networks, e.g. Qzone, QQ,
Weixin Official Accounts, Weixin Moments, Mini
Programs, QQ Browser, Mobile Ad Network,
YingYongBao etc.
Online infrastructure
JioCloud Store and Access your files from
anywhere. JioBrowser Fast, Safe & Light weight
browser. JioSecurity Protect phone, secure data
Aliyun Alibaba Cloud. Develops platforms for cloud
computing and data management, ensuring that
Alibaba's e-commerce portals can handle its
massive traffic and transaction volumes.
Utilities & Infrastructure (Cloud services, Browser)
Offline retail
Network of ~12,000 stores with US$12 bn of
core revenues across grocery, consumer
electronics and fashion & lifestyle
Hema Supermarket, Intime Retail, Suning Vipshop
Source: Companies, Kotak Institutional Equities
We look at the growth profile of Tencent, which transformed itself from being the provider
of only a messenger service to offering multiple products in the communications, social
networking, gaming, media, fintech, cloud segments for users and enterprises (refer
Appendix 1 for more details). In the subsequent sections, we evaluate RIL’s existing offline
retail business and online B2C and B2B commerce opportunities and how we expect it to
unfold over the next few years.

KOTAK INSTITUTIONAL EQUITIES RESEARCH 5
Reliance Industries Oil, Gas & Consumable Fuels
We ascribe fair value of US$62 bn for RIL’s retail segment
We compute fair value of US$62 bn for retail business attributable to RIL for its 94.38%
stake, while ascribing (1) US$48 bn to existing offline retail segment at 25X EBITDA of core
retail business and 10X EBITDA on fuel and recharges based on our September 2022
estimates and (2) US$17 bn to digital commerce opportunity based on probability-weighted
scenario analysis of the industry evolution by FY2030, discounted back to September 2021.
We see further potential upside from incremental revenue-generating opportunities as RIL
capitalizes on its leadership in the retail ecosystem.
RIL’s digital commerce business comprises JioMart’s online B2C business and the kirana
digitization program. We believe the digitized kiranas will be key enablers of RR’s online
business and hence, we see limited merit in valuing the B2B distribution business separately.
We acknowledge that valuation of digital commerce businesses remains subjective for now;
that said, we remain confident that the vast under-penetration of organized retail, the huge
user base garnered by Jio, execution capabilities of RIL group and domestic-centric policies in
India can together drive significant scale-up of these new businesses in a quick time.
Valuing existing offline retail at US$48 bn
We value RR’s offline core retail business segment at US$45 bn based on 25X EV/EBITDA
multiple on September 2022 estimates, in line with our DCF-implied target multiple for
Avenue Supermarts. We include incremental value of US$3 bn for fuel and recharges
segment, valuing it at 10X EV/EBITDA multiple on September 2022 estimates.
Exhibit 3: Retail companies command higher valuation multiples given large untapped opportunity Peer valuation of retail companies in India, March fiscal year-ends, 2020-22E
2020 2021E 2022E 2020 2021E 2022E
Food and grocery retailers
Avenue Supermarts Ltd 71.4 71.9 41.7 6.1 5.5 3.9
Future Retail Ltd 8.4 5.9 5.2 0.5 0.4 0.4
Average 39.9 38.9 23.5 3.3 3.0 2.1
Apparel, footwear, jewelry retailers
Aditya Birla Fashion & Retail 9.0 11.7 7.0 1.2 1.4 1.1
Bata 44.8 34.9 22.1 8.8 7.6 4.9
Future Lifestyle Fashions Lt 4.0 4.0 3.0 0.6 0.6 0.4
Shoppers Stop Ltd 7.0 11.0 8.0 1.0 1.2 1.0
TCNS Clothing Co Ltd 13.9 18.7 9.7 2.3 2.6 1.9
Trent Ltd 40.0 55.0 33.0 6.5 7.3 5.0
Titan 36.0 53.0 30.3 4.2 5.1 3.7
Vmart Retail Ltd 16.0 25.0 15.0 2.1 2.1 1.3
Average 21.3 26.7 16.0 3.3 3.5 2.4
EV/EBITDA (X) EV/Revenue (X)
Notes: (a) KIE estimates used for Avenue Supermarts, ABFRL and TCNS Clothing.
Source: Bloomberg, Kotak Institutional Equities estimates
Valuing digital commerce business at equity valuation of US$17 bn
In our attempt to value RR’s e-commerce business, we create three plausible scenarios by
envisaging, (1) duopoly market with top-2 players commanding 80% market share, (2) an
oligopolistic market with three large players including RR commanding 80% market share
and (3) a hyper-competitive and fragmented market with several large players. We assign 40%
probability each to the first two scenarios and 20% probability to the third scenario.
Based on our FY2030 e-commerce industry GMV estimate of US$225 bn and reasonable
assumptions on market share and margins for RR in the respective scenarios, we compute
probability-weighted equity value of US$17 bn, discounted back to September 2021.

6 KOTAK INSTITUTIONAL EQUITIES RESEARCH
Oil, Gas & Consumable Fuels Reliance Industries
Exhibit 4: We compute US$17 bn of equity value based on probability-weighted valuation scenario for RR’s digital commerce segment Valuation scenario for digital commerce business, March fiscal year-end, 2030 (US$ bn)
Scenario A - Duopoly Scenario B - Oligopoly Scenario C - Intense competition
DescriptionTop-2 players command 80% in the e-
commerce market
Top-3 players commanding 80%
market share
All the players continue fighting for
market share
Gross Merchandise Value
(GMV, US$ bn)225 225 225
Market share of RR's e-
commerce segment (%)40 30 20
GMV of RR's e-commerce
segment (US$ bn)90 67 45
Explanation Limited discounting by top-2 players Limited discounting by top-3 playersDiscounting continues to attract new
customers and retain old ones
Operating profit / EBITDA
margin (%)8.0 7.0 (10.0)
EBITDA of RR's e-commerce
segment (US$ bn)7.2 4.7 (4.5)
EV/EBITDA valuation multiple
(X)12.0 12.0 NA
ExplanationStable cash flow generating business
will command a high valuation multiple
Unstable cash flows and hence a low
valuation multiple
Continues to burn cash; accumulated
EBITDA loss included in CAC
EV of RR's e-commerce
segment (US$ bn)86.3 56.6 —
Initial investment in customer
acquisition costs (US$ bn)18.0 20.2 22.5
Equity value of RR's e-
commerce segment (US$ bn)68.3 36.4 (22.5)
Equity value discounted to
Sep-2021 (US$ bn)31.2 16.6 (10.3)
Probability 0.4 0.4 0.2
Probability-weighted equity
value (US$ bn)17.1
Source: Kotak Institutional Equities estimates
With RR having only begun its digital commerce business (JioMart’s online grocery delivery
business and the kirana B2B distribution business), we believe value creation from this
business will happen only over the medium term (next decade or so). Our optimism for this
business segment for RR stems from various factors—(1) initial-phase development of e-
commerce market has already happened in India, (2) Jio has already brought a large
population online (nearly 400 mn subscribers); low buyer penetration implies large growth
opportunity, (3) RR’s large physical store presence and associated infrastructure provides it
with competitive advantage and (4) regulatory advantage of having the ability to store and
sell own inventory as opposed to restrictions on majority foreign-owned competitors
(Amazon and Flipkart). Overall, we think RR is best positioned amongst its peers as it has a
presence across the entire value chain of offline B2C retail, B2B retail and kirana network
which can all feed the online business.
We concede that e-commerce business model in India is marked by high competitive
intensity, which may keep customer acquisition costs elevated for some time. We also
acknowledge that RIL is presently one of the several players in the Indian e-commerce
market and ramp-up of digital commerce foray will not be without challenges. We further
see that while supply-side constraints have been addressed by retailers, demand aggregation
remains a challenge and typically results in high customer acquisition costs. It is here that
RIL’s partnership with WhatsApp may hold it in good stead. In this context, we believe a
probability-weighted model is a reasonable way to value RR’s digital commerce business.

KOTAK INSTITUTIONAL EQUITIES RESEARCH 7
Reliance Industries Oil, Gas & Consumable Fuels
Raise fair value to Rs2,150 factoring in the digital commerce opportunity
We raise our SoTP-based fair value of RIL to Rs2,150 from Rs1,750 earlier, ascribing higher
value to existing core retail business at 25X EV/EBITDA multiple versus 20X earlier,
incrementally factoring in Rs1.3 tn (~US$17 bn) of fair value from the digital commerce
business, which we expect the company to realize in the medium term and rolling forward
to September 2021. We have also updated our model for recent transactions related to Jio
Platform and rights issue and details from subsidiary annual reports; we have not
incorporated digital commerce business in our estimates for retail business for now.
Exhibit 5: Our SoTP valuation of Reliance is Rs2,150 per share Sum-of-the-parts valuation, September 2021E (Rs)
EBITDA EV/EBITDA EV Valuation
(Rs bn) (X) (Rs bn) (US$ bn) (Rs/share)
Energy 4,774 63 752
Petrochemicals 322 7.5 2,419 32 381
Refining and marketing 259 7.5 1,944 26 306
Upstream 46 9.0 412 5 65
Digital services 4,489 59 707
Base case 519 10.0 5,190 69 817
Telecom option value 654 9 103
Minority interest (1,355) (18) (213)
Retail 4,708 62 741
Core retail 137 25.0 3,424 45 539
Fuel and recharges 24 10.0 240 3 38
Digital commerce 1,299 17 205
Minority interest (256) (3) (40)
Total enterprise value 13,971 185 2,201
Real estate projects / others 126 2 20
Outstanding receipts from rights issue 398 5 63
Consolidated net debt 844 11 133
Fair value 13,651 181 2,150
Notes:
(a) We use 6.349 bn shares including rights issue but excluding 412.8 mn treasury shares.
Source: Kotak Institutional Equities estimates
Exhibit 6: We ascribe option value of Rs654 bn (US$9 bn) for telecom business Calculation of option value for Jio in a two-private player market structure (Rs bn)
Incremental revenues assuming Jio garners 50% share of VIL 268
Incremental EBITDA at 60% margins 161
EV/EBITDA (X) 10.0
Incremental EV 1,608
Incremental capex to support higher market share (300)
Net equity value accretion 1,308
Option value assuming 50% probability 654
Source: Kotak Institutional Equities estimates

8 KOTAK INSTITUTIONAL EQUITIES RESEARCH
Oil, Gas & Consumable Fuels Reliance Industries
Exhibit 7: Financial model of Reliance Retail, March fiscal year-ends, 2016-25E (Rs bn)
2016 2017 2018 2019 2020 2021E 2022E 2023E 2024E 2025E
Profit model
Revenues (gross) 209 333 622 1,166 1,465 1,691 2,232 2,628 2,966 3,326
Core retail 189 255 362 735 928 946 1,307 1,559 1,770 2,000
Jio and fuel 22 83 330 570 702 866 1,091 1,256 1,406 1,560
EBITDA 9 12 25 62 97 93 143 179 212 249
Core retail 9 11 22 52 83 75 121 153 183 217
Jio and fuel (0) 1 4 10 14 18 22 26 29 32
EBIT 5 8 21 55 83 74 116 146 175 208
Net income 3 5 13 33 57 54 83 105 128 155
Contribution to RIL's EPS (Rs) 0 1 2 5 9 9 12 16 19 23
Balance sheet
Net-worth 55 69 92 128 184 238 321 426 554 709
Net debt 11 (3) 32 120 28 179 200 183 125 33
Invested capital 67 66 124 248 212 417 522 609 679 743
Operating metrics (%)
Revenue growth 20.0 59.3 86.7 87.4 25.6 15.4 32.0 17.7 12.8 12.2
Core retail 34.9 42.3 102.9 26.2 1.9 38.2 19.3 13.5 13.0
Jio and fuel 277.6 296.9 73.1 23.0 23.4 26.0 15.2 11.9 11.0
EBITDA margins 4.3 3.5 4.1 5.3 6.6 5.5 6.4 6.8 7.1 7.5
Core retail 4.2 6.0 7.0 8.9 7.9 9.2 9.8 10.4 10.9
Jio and fuel 1.3 1.1 1.8 2.0 2.1 2.0 2.0 2.0 2.0
EBIT margins 2.4 2.4 3.3 4.8 5.6 4.4 5.2 5.6 5.9 6.3
RoAE 5.2 8.5 16.5 30.0 36.6 25.5 29.8 28.1 26.1 24.6
RoACE 5.0 7.8 14.2 19.4 26.7 17.4 18.4 19.2 20.2 21.8
Source: Company, Kotak Institutional Equities estimates
Exhibit 8: Financial model of Reliance Jio, March fiscal year-ends, 2018-25E (Rs bn)
2018 2019 2020 2021E 2022E 2023E 2024E 2025E
Assumptions
Wireless subscriber base at end-period (mn) 187 307 388 432 452 471 489 509
Wireless subscriber market share (%) 17 28 34 37 38 38 39 40
Wireless ARPU (Rs/month) 102 131 130 147 165 178 186 195
Broadband subscriber base at end-period (mn) 1 1 4 7 11 15 18
Broadband ARPU (Rs/month) — — 702 720 730 740 747
Overall EBITDA margins (%) 33 39 40 46 49 51 53 55
Profit model
Revenues 202 388 543 739 920 1,063 1,189 1,318
EBITDA 67 151 216 340 452 541 630 723
Net income 7 30 56 158 234 307 387 474
Contribution to RIL's EPS (Rs) 1 5 10 20 28 36 46 56
Balance sheet
Net-worth 1,029 404 1,710 1,868 2,101 2,408 2,795 3,269
Effective net debt 1,400 1,456 495 475 237 (122) (546) (1,045)
Invested capital 2,278 1,760 2,144 2,408 2,544 2,645 2,770 2,914
Cash flow
Operating cash flow (20) 50 99 261 358 433 500 565
Working capital (29) (75) (37) 16 15 12 10 11
Capital expenditure (358) (438) (518) (240) (220) (242) (168) (189)
Free cash flow (407) (464) (455) 37 153 203 342 387
Returns (%)
RoAE 0.8 4.1 5.3 8.8 11.8 13.6 14.9 15.6
RoACE 0.9 2.6 5.2 8.0 11.0 13.7 16.6 19.6
CRoCI 2.5 6.9 8.4 11.6 14.3 16.6 19.0 21.3
Adjusted CRoCI 2.5 6.9 8.8 12.0 15.1 18.7 24.5 33.2
Source: Company, Kotak Institutional Equities estimates

KOTAK INSTITUTIONAL EQUITIES RESEARCH 9
Reliance Industries Oil, Gas & Consumable Fuels
Exhibit 9: We expect consumer-facing businesses to drive robust growth in EBITDA over the next few years Consolidated segment-wise break-up of EBITDA, March fiscal year-ends, 2016-23E (Rs bn)
2016 2017 2018 2019 2020 2021E 2022E 2023E
EBITDA
Petrochemicals 137 165 243 379 309 260 320 325
Refining and marketing 268 286 306 261 245 186 249 269
Oil and gas 69 13 17 16 4 5 30 62
Organized retail 9 12 25 62 97 93 143 179
Digital services — (0) 68 153 225 355 472 566
Others (65) (13) (17) (32) (48) (6) (9) (12)
Total 417 462 642 839 831 893 1,204 1,389
Source: Company, Kotak Institutional Equities estimates
Exhibit 10: RIL's earnings are leveraged to several business drivers Sensitivity of consolidated EBITDA, EPS and SoTP to key assumptions, March fiscal year-end, 2022
Change (Rs bn) (%) (Rs bn) (%) (Rs/share) (%)
Refining margins +US$1/bbl 39 3% 4.6 5% 46 2%
Refining operating cost+US$0.5/bbl (20) -2% (2.3) -2% (23) -1%
Petchem margins +US$25/ton 39 3% 4.6 5% 46 2%
Retail EBITDA margins +50 bps 11 1% 1.3 1% 44 2%
Jio wireless ARPU +Rs10/month 40 3% 4.7 5% 63 3%
Jio wireless subscriber +25 mn 28 2% 3.3 4% 45 2%
Exchange rate Rs1/US$ 11 1% 1.3 1% 13 1%
Base case 1,204 93 2,150
EBITDA EPS SoTP valuation
Source: Kotak Institutional Equities estimates

10 KOTAK INSTITUTIONAL EQUITIES RESEARCH
Oil, Gas & Consumable Fuels Reliance Industries
Exhibit 11: Consolidated profit model, balance sheet and cash flow statement for RIL, March fiscal year-ends, 2016-23E (Rs bn)
2016 2017 2018 2019 2020 2021E 2022E 2023E
Profit model (Rs bn)
Net sales 2,740 3,054 3,917 5,671 5,967 5,093 6,453 6,963
EBITDA 417 462 642 839 831 893 1,204 1,389
Other income 75 94 89 81 140 196 205 224
Finance cost (37) (38) (81) (165) (220) (216) (195) (173)
DD&A expense (116) (116) (167) (209) (222) (272) (332) (387)
Pretax profits 339 401 483 546 528 601 882 1,053
Minority interest/share of associates 2 (0) 1 (1) (4) (43) (64) (83)
Extraordinary items 46 — 11 5 (2) — — —
Effective tax (89) (102) (133) (154) (128) (144) (226) (270)
Net profits 299 299 361 396 394 414 593 699
Adjusted net profits 253 299 350 391 396 414 593 699
Adjusted EPS (Rs) 43 51 59 66 67 70 93 110
Balance sheet (Rs bn)
Total equity 2,316 2,637 2,935 3,871 4,533 5,040 5,993 6,643
Deferred tax liability 205 212 245 451 512 544 592 642
Minority interest 34 29 35 83 80 1,299 1,363 1,446
Total borrowings 1,807 1,966 2,188 2,875 2,914 2,450 1,937 1,930
Other liabilities 1,629 2,224 2,709 2,696 3,590 3,428 3,456 3,327
Total liabilities and equity 5,990 7,068 8,113 9,976 11,630 12,761 13,341 13,988
Cash 110 30 43 75 309 1,119 1,324 1,708
Loans and advances 29 37 50 74 224 224 224 224
Other assets 917 1,032 1,341 1,814 2,014 2,001 2,201 2,320
Total fixed assets 4,094 5,185 5,851 5,658 6,315 6,650 6,824 6,968
Investments 840 784 829 2,355 2,768 2,768 2,768 2,768
Total assets 5,990 7,068 8,113 9,976 11,630 12,761 13,341 13,988
Effective net debt 1,663 2,237 2,349 2,335 2,487 1,023 111 (469)
Free cash flow (Rs bn)
Operating cash flow, excl. working capital 211 212 353 475 504 556 829 995
Working capital 78 155 185 (251) 192 42 21 (58)
Capital expenditure (469) (781) (740) (936) (765) (788) (697) (719)
Other income 37 15 23 16 22 196 205 224
Free cash flow (143) (400) (178) (697) (47) 5 358 441
Ratios (%)
Debt/equity 78.0 74.6 74.5 74.3 64.3 48.6 32.3 29.1
Net debt/equity 71.8 84.8 80.0 60.3 54.9 20.3 1.9 (7.1)
RoAE 11.2 12.1 12.6 11.5 9.4 8.6 10.7 11.1
RoACE 6.8 6.9 7.7 7.8 7.2 7.0 8.1 8.7
Adjusted RoACE 12.3 13.3 12.3 11.8 9.9 8.3 10.7 11.9
CRoCI 6.6 6.2 7.4 7.5 7.3 7.9 9.6 10.5
Adjusted CRoCI 11.8 12.2 10.2 12.4 10.3 11.3 14.2 15.9
Source: Company, Kotak Institutional Equities estimates

KOTAK INSTITUTIONAL EQUITIES RESEARCH 11
Reliance Industries Oil, Gas & Consumable Fuels
SETTING THE STAGE TO COMMAND LEADERSHIP IN THE COMMERCE BUSINESS
RIL’s accelerated expansion in the offline retail business over the past few years followed by its recent foray
into digital commerce via JioMart sets the stage for it to command leadership in the entire retail value chain.
The strategic commercial partnership with Facebook/WhatsApp can enable it to reach out to customers with
user-friendly interfaces to enable online shopping, payments and cross-sell other digital services, while
domestic-centric policies may allow it to overcome the head-start achieved by other e-commerce players.
Long runway of growth for organized retailers in India
India’s retail market is highly unorganized and while penetration of organized retail has been
on the rise, several categories such as food and grocery and apparel offer a long runway of
growth to organized retailers.
Exhibit 12: Food and grocery is the largest category but the least penetrated by organized retail Snapshot of India’s retail market, March fiscal year-ends, 2017-25E (US$ bn)
2020-25E CAGR
2017 2020E 2025E (%)
Nominal GDP 2,464 3,555 6,265 12
Private consumption 1,454 2,062 3,634 12
Private consumption as proportion of GDP (%) 59 58 58
Merchandise retail 710 990 1,708 12
Merchandise retail as proportion of private consumption (%) 49 48 47 (0)
Organized retail 67 119 256 17
Organized retail as proportion of retail (%) 9 12 15 5
Category-wise size of retail
Food and grocery 474 659 1,126 11
Apparel and accessories 56 79 139 12
Jewelry and watches 55 77 136 12
Consumer electronics 42 59 104 12
Home and living 31 44 77 12
Others 23 32 57 12
Pharmacy and wellness 21 30 52 12
Foot apparel 8 10 18 12
Total 710 990 1,708 12
Category-wise contribution to overall retail (%)
Food and grocery 67 67 66
Apparel and accessories 8 8 8
Jewelry and watches 8 8 8
Consumer electronics 6 6 6
Home and living 4 4 4
Others 3 3 3
Pharmacy and wellness 3 3 3
Foot apparel 1 1 1
Total 100 100 100
Penetration of organized retail (%)
Food and grocery 3 4
Apparel and accessories 24 36
Jewelry and watches 28 35
Consumer electronics 27 34
Home and living 11 13
Others 13 15
Pharmacy and wellness 11 20
Foot apparel 27 34
Source: Technopak, Kotak Institutional Equities estimates

12 KOTAK INSTITUTIONAL EQUITIES RESEARCH
Oil, Gas & Consumable Fuels Reliance Industries
RIL has established leadership in India’s offline retail business
Reliance Retail (RR) has gradually metamorphosed from a network of standalone stores into
a behemoth achieving core retail revenues of US$13 bn in FY2020 underpinned by an
offline presence of ~11,800 outlets across 7,000+ cities and towns. It has steadily cemented
its leadership presence in India’s organized retail space by increasing its touch-points at a
pace of 48% over FY2017-20 and adding retail trading area at a CAGR of 28%, which led
to revenues growing at a robust CAGR of 54% in the given period. In India’s largely
fragmented as well as unorganized merchandise retail landscape, RR now commands a
market-share of ~1.4% (excluding recharges and fuel retail), and is the largest retailer in
terms of presence as well as revenues.
Exhibit 13: Multi-category retailer with presence across key consumption baskets RR’s various retail categories with revenue and proportion contribution, March fiscal year-end, 2020
Source: Company, Kotak Institutional Equities
Exhibit 14: RR is a leader in India’s fragmented retail market RR’s estimated market-share in key retail categories, March fiscal year-end, 2020
Reliance Retail Overall India market RR's market-share
(US$ bn) (US$ bn) (%)
Grocery retail 5 659 0.7
Fashion and lifestyle retail 2 166 1.1
Electronics retail 6 59 10.1
Total 12 884 1.4
Source: Company, Kotak Institutional Equities estimates
F&G
F&L
CE
JR
PR
Reliance Retail
Consumer electronics
(US$6 bn, 27%)
Fashion and lifestyle
(US$2 bn, 8%)
Connectivity
(US$7 bn, 34%)
Food and grocery
(US$5 bn, 21%)
Petroleum retail
(US$2 bn, 9%)
Reliance TrendsReliance Fresh
Reliance JewelsReliance Smart
Trends FootwearSmart Point
Project EveReliance Market
AJIO.comJioMart
Reliance Digital
Jio Point
RESQ
Brand Partnerships
Digital commerce portal
Offline store format
Business segmentRelianceDigital

KOTAK INSTITUTIONAL EQUITIES RESEARCH 13
Reliance Industries Oil, Gas & Consumable Fuels
Exhibit 15: Formidable presence across the country Segment-wise presence across the country
Source: Company, Kotak Institutional Equities
Online retail market in India expected to increase to US$225 bn by FY2030
We believe Indian online retail market GMV could treble from US$30 bn (in FY2020) to
reach US$100 bn by FY2025 and increase further to US$225 bn by FY2030, providing a fair
amount of growth runway for RR. This growth in online retail will be driven by rising internet
penetration, improving buyer penetration and higher online spends per shopper as online
merchandise assortment improves and the propensity to shop online (for reasons such as
ease of purchase, return, payment) continues to improve.
Exhibit 16: We expect India to be a US$2.9 tn merchandise retail market by FY2030 Consumption and retail metrics of India, March fiscal year-ends, 2017-30E
2017 2020 2025E 2030E 2020-25E 2025-30E
Nominal GDP 2,464 3,555 6,265 10,557 12 11
Private consumption 1,454 2,062 3,634 6,123 12 11
Private consumption as proportion of GDP (%) 59 58 58 58
Merchandise retail 710 990 1,708 2,878 12 11
Merchandise retail as proportion of private consumption (%) 49 48 47 47
Organized retail 67 119 256 547 17 16
Organized retail as proportion of retail (%) 9 12 15 19
CAGR (%)
Source: Technopak, Kotak Institutional Equities estimates

14 KOTAK INSTITUTIONAL EQUITIES RESEARCH
Oil, Gas & Consumable Fuels Reliance Industries
Exhibit 17: Number of online shoppers significantly lag internet users and can rise substantially Categorization of the Indian online user by use case, December calendar year-end, 2020E
Source: Flipkart, Bain & Company, Kotak Institutional Equities
Exhibit 18: Improving buyer penetration and spends will drive e-commerce market size to US$225 bn by FY2030 Estimated size of e-commerce market, March fiscal year-ends, 2015-30E
2020-25 CAGR 2025-30 CAGR
2015 2016 2017 2018 2019 2020 2021E 2022E 2023E 2024E 2025E 2030E (%) (%)
Population (mn) 1,257 1,269 1,281 1,293 1,305 1,318 1,330 1,343 1,354 1,367 1,380 1,422 0.9 0.6
Internet penetration (%) 24 27 33 38 49 55 60 64 67 70 73 78
Internet population (mn) 302 343 422 494 637 725 798 859 907 957 1,007 1,109 6.8 1.9
Number of online shoppers (mn) 30 40 50 69 96 120 144 168 196 226 258 372 16.5 7.6
Buyer penetration (%) 10 12 12 14 15 17 18 20 22 24 26 34
Online money spent (Rs) 8,015 11,307 12,437 14,303 16,448 18,093 19,903 21,893 24,082 26,490 29,139 45,247 10.0 9.2
Yoy increase in online spend (%) 148 41 10 15 15 10 10 10 10 10 10 9
Total e-commerce market size (Rs bn) 240 452 623 980 1,579 2,173 2,870 3,683 4,713 5,975 7,506 16,846 28 18
Total e-commerce market size (US$ bn) 4 7 9 15 23 31 38 49 63 80 100 225 26.7 17.5
Yoy growth (%) 76 34 64 49 36 25 28 28 27 26
Source: IAMAI, Census 2011, TRAI, Kotak Institutional Equities estimates
The Indian online retail landscape is dominated by online marketplaces such as Flipkart and
Amazon India – both majority foreign-held and hence cannot carry out B2C retail operations.
We believe this will be a key differentiator between RR’s model and the others – being an
Indian entity, RR will have the flexibility to sell its own inventory, private labels and the like,
unlike most extant players who can only be aggregators.
RIL is getting ready to tap O2O and B2B opportunities
Alongside Facebook’s strategic investment in Jio Platforms, Reliance Retail and WhatsApp
have entered into a commercial partnership agreement to further accelerate Reliance Retail’s
digital commerce business through its JioMart platform and to support digital
transformation of small and medium-sized businesses using integration with WhatsApp.
We believe RR’s arrangement with WhatsApp can enable access to a huge untapped
opportunity to play for a bigger share of the pie in India’s huge retail market, ~98% of
which is still offline. This can give RR a higher pool of ‘transacting users’ as opposed to only
‘online users’ enabling superior user monetization in the future.
We reckon RR may look at multiple monetization streams—(1) O2O offering to end-
customers serviced by a combination of local kirana networks and RR’s own offline presence,
(2) commission-based revenues by transforming India’s retail distribution network by
aggregating distribution requirements of large clusters of kirana stores and (3) transactional
revenues by enabling transactions on ‘JioPay’.
625
360
303
180
105
- 100 200 300 400 500 600 700
Internet users
Chatting and social media
Video content
Service transactions
Product transactors
Number of users (mn)

KOTAK INSTITUTIONAL EQUITIES RESEARCH 15
Reliance Industries Oil, Gas & Consumable Fuels
Apart from the offline business, RIL is attempting new models to further boost its presence
in India’s fast growing organized retail space: it is partnering with small kirana stores by
digitizing them through JioPoS offering and attempting to increase its distribution reach,
and has also launched its online grocery portal, JioMart, which already has a presence in
~200 cities.
JioMart provides an interesting play by straddling both offline retail (the large but
unorganized network of kirana stores that it seeks to integrate, as well as RIL’s offline stores)
and online retail (WhatsApp enabled e-commerce which could potentially interlink with
other plays such as AJIO).
In the following sections we focus separately on Reliance Retail’s offline and online
operations, value proposition to the end-customers, new business initiatives and a
framework to value the business in the medium term.

16 KOTAK INSTITUTIONAL EQUITIES RESEARCH
Oil, Gas & Consumable Fuels Reliance Industries
FAST GROWING MULTI-CATEGORY RETAILER WITH A FORMIDABLE FOOTPRINT
RR has posted strong 54% CAGR in revenues of its core retail operations over FY2017-20. This has been driven
by a healthy pace of store additions (48% CAGR) as well as strong SSSG. We believe RR will continue to invest
in its offline network to maintain its dominance as well as to complement its online offering. Leveraging its
relationship with Jio’s other apps as well as WhatsApp, RR can transform into a multi-channel retail
behemoth with a large O2O play.
RR’s existing offline business comprises two broad categories: core retail (comprising food
and grocery, fashion & lifestyle and consumer electronics businesses) and others (comprising
revenues from Jio recharges and fuel retail).
Existing retail revenues to more than double in four years
We model existing offline retail revenues to more than double in FY2020-24 growing by a
robust 19% CAGR over the next four years, assuming similar growth trajectory for core
retail and Jio and fuel segments. We expect margins of core retail business to expand by
~150 bps to 10.4% in FY2024 and that of other segments to remain stable around 2%,
which will cumulatively enhance overall margins to 7.1% in FY2024 from 6.6% in FY2020.
We have assumed weaker numbers for FY2021 factoring in anticipated impact on consumer
discretionary spends amid ongoing lockdowns and bleak economic outlook.
Exhibit 19: We expect offline retail business revenues to double in four years Financial model of Reliance Retail, March fiscal year-ends, 2016-25E (Rs bn)
2016 2017 2018 2019 2020 2021E 2022E 2023E 2024E 2025E
Profit model
Revenues (gross) 209 333 622 1,166 1,465 1,691 2,232 2,628 2,966 3,326
Core retail 189 255 362 735 928 946 1,307 1,559 1,770 2,000
Jio and fuel 22 83 330 570 702 866 1,091 1,256 1,406 1,560
EBITDA 9 12 25 62 97 93 143 179 212 249
Core retail 9 11 22 52 83 75 121 153 183 217
Jio and fuel (0) 1 4 10 14 18 22 26 29 32
EBIT 5 8 21 55 83 74 116 146 175 208
Net income 3 5 13 33 57 54 83 105 128 155
Contribution to RIL's EPS (Rs) 0 1 2 5 9 9 12 16 19 23
Balance sheet
Net-worth 55 69 92 128 184 238 321 426 554 709
Net debt 11 (3) 32 120 28 179 200 183 125 33
Invested capital 67 66 124 248 212 417 522 609 679 743
Operating metrics (%)
Revenue growth 20.0 59.3 86.7 87.4 25.6 15.4 32.0 17.7 12.8 12.2
Core retail 34.9 42.3 102.9 26.2 1.9 38.2 19.3 13.5 13.0
Jio and fuel 277.6 296.9 73.1 23.0 23.4 26.0 15.2 11.9 11.0
EBITDA margins 4.3 3.5 4.1 5.3 6.6 5.5 6.4 6.8 7.1 7.5
Core retail 4.2 6.0 7.0 8.9 7.9 9.2 9.8 10.4 10.9
Jio and fuel 1.3 1.1 1.8 2.0 2.1 2.0 2.0 2.0 2.0
EBIT margins 2.4 2.4 3.3 4.8 5.6 4.4 5.2 5.6 5.9 6.3
RoAE 5.2 8.5 16.5 30.0 36.6 25.5 29.8 28.1 26.1 24.6
RoACE 5.0 7.8 14.2 19.4 26.7 17.4 18.4 19.2 20.2 21.8
Source: Company, Kotak Institutional Equities estimates
Robust growth in offline retail driven by store additions and rising throughput
RR’s core retail revenues (excluding fuel and telecom) have increased at an impressive ~54%
CAGR over FY2017-20. Reported profitability (EBITDA) from the same has also increased at a
CAGR of 74% over the same period. RR is present across key verticals such as food and
grocery, general merchandise, apparel and footwear, jewelry, electronics and toys. Besides,
RR also operates several stores in partnership with several international brands.

KOTAK INSTITUTIONAL EQUITIES RESEARCH 17
Reliance Industries Oil, Gas & Consumable Fuels
Exhibit 20: RR's healthy revenue growth has been driven by increase in store count and throughput Details of RR's category-wise store count and revenues, March fiscal year-ends, 2017-20
2017-20 CAGR
2017 2018 2019 2020 (%)
Store count (#)
Grocery 447 537 605 797 21
Consumer electronics 266 287 357 400 15
Jio Points 1,645 5,381 7,684 8,201 71
Fashion and lifestyle 1,258 1,368 1,769 2,386 24
Total 3,616 7,573 10,415 11,784 48
Total excluding Jio points 1,971 2,192 2,731 3,583 22
Segment-wise revenues (Rs bn)
Grocery 108 140 234 346 47
Consumer electronics 95 152 392 446 67
Fashion and lifestyle 51 71 110 136 39
Total core revenues 254 363 735 928 54
Break-up of core retail revenues (%)
Grocery 43 39 32 37
Consumer electronics 38 42 53 48
Fashion and lifestyle 20 20 15 15
Source: Company, Kotak Institutional Equities
Store addition data reveals that RR has been most aggressive in adding stores in the fashion
and lifestyle formats. RR has consciously developed multiple formats to serve a diverse set of
customers.
Exhibit 21: RR operates multiple formats under its key segments of grocery, apparel and electronics Snapshot of RR’s various store formats
Grocery
Reliance Fresh Neighbourhood store offering fresh produce, grocery and other daily need items
Reliance Smart Supermarket store dealing in fresh foods, staples, home & personal care items, apparel and general merchandise
Reliance Market Cash and carry chain serving B2B customers
Smart PointSmaller version of Reliance Smart serving everyday needs of customers in the grocery and pharmacy categories.
Also offers assisted e-commerce.
Apparel
Trends Flagship chain catering to value focused customer. Large variety of own brands.
Reliance Footprint Offers wide range of products across footwear, luggage, handbags & accessories
Reliance Jewels Retailer of fine and precious jewelry
Project Eve Experiential store catering to women's apparel needs
AjioOnline portal offering curated fashion from over 500 national and international brands. Also retails its own
private label.
Consumer electronics
Reliance Digital Big box electronics retailer stocking 200+ national and international brands
Jio store Smaller stores focused on offering mobility & communication devices and bouquet of Jio services
Reliance Resq Dedicated service arm offering end-to-end product lifecycle support
Source: Company, Kotak Institutional Equities
RR’s core retail revenues also include sales of Jio-related devices such as JioPhone on which
the company possibly earns a small margin. Sale of these devices has driven a large increase
in revenues from electronics retail from FY2019 onwards.
RR has not consistently shared format-wise margins; however recent margin disclosures
reveal that RR’s margins compare favorably with its better performing peers such as Avenue
Supermarts in grocery, Trent in apparel retail and Croma in electronics retail.

18 KOTAK INSTITUTIONAL EQUITIES RESEARCH
Oil, Gas & Consumable Fuels Reliance Industries
Exhibit 22: Margin expansion across formats has driven a strong increase in EBITDA Segment-wise margin profile of Reliance Retail, March fiscal year-ends, 2017-20
2017-20 CAGR
2017 2018 2019 2020 (%)
Segment-wise revenues (Rs bn)
Grocery 108 140 234 346 47
Consumer electronics 95 152 392 446 67
Fashion and lifestyle 51 71 110 136 39
Total core revenues 254 363 735 928 54
Segment-wise EBITDA (Rs bn)
Grocery 11 23
Consumer electronics 19 28
Fashion and lifestyle 22 32
Total EBITDA 11 22 52 83 98
Segment-wise EBITDA margins (%)
Grocery 4.9 6.5
Consumer electronics 4.7 6.2
Fashion and lifestyle 19.9 23.9
Overall 4.2 6.0 7.0 8.9
Source: Company, Kotak Institutional Equities
While certain metrics such as format-wise retail trading area are not available, we try and
benchmark RR’s various formats with relevant peers.
Food and grocery – large growth runway
RIL’s food and grocery business comprise of its Reliance Market, Reliance Smart, and
Reliance Fresh formats. RR had 765 stores altogether under these formats as of March 2020.
Reliance Smart is the large hypermarket format retailing food and grocery, FMCG products
and general merchandise. Reliance Fresh is the smaller fresh food and grocery format.
Margins for different grocers vary on account of store ownership: Dmart, for instance, owns
its stores and hence pays very little rent. RR predominantly operates on a rental model and
hence margins are comparable more with peers such as Future Retail, Star Bazaar (Trent
Hypermarket) and Spencer’s.
The comparison below shows that RIL’s grocery retail business is notching decent margins,
despite the segment being intensely competitive. Management has attributed the margin
expansion in FY2020 to improved SSSG as well as positive impact from Ind-AS 116 adoption.
Exhibit 23: RR is one of the few profitable food and grocery retailers in India Operating metrics of Indian food and grocery retailers, March fiscal year-ends, 2019-20 (Rs mn)
2019 2020 2018 2019 2019 2020 2019 2020 2018 2019
No. of stores (#) 176 214 285 292 605 765 156 160 35 39
Revenues (Rs mn) 200,045 248,702 184,793 201,649 233,713 346,010 21,872 23,733 9,396 10,005
EBITDA (Rs mn) 16,333 21,283 8,371 10,369 11,370 22,530 139 793 (1,035) (802)
EBITDA margin (%) 8% 9% 5% 5% 5% 7% 1% 3% -11% -8%
Trent
Hypermarket Spencer's RetailAvenue Supermarts Future Retail Reliance Retail
Source: Companies, Kotak Institutional Equities
We believe RIL’s offline food and grocery retail network will play a critical role in enabling
the company’s recent online offering JioMart.
Apparel – Reliance Trends rapidly gaining scale
Reliance Trends is RR’s flagship apparel retail format, with 1,400+ stores currently. Besides
Trends, RR has various other retail formats to cater to a wide set of customers.

KOTAK INSTITUTIONAL EQUITIES RESEARCH 19
Reliance Industries Oil, Gas & Consumable Fuels
Exhibit 24: RR has apparel formats spanning all customer segments Various apparel retail formats of RR
Apparel segment Reliance format
Luxury International partner brands, Ajio Gold
Mid-segment Ajio, M&S, Project Eve, Reliance Jewels
Value fashion Trends, Trends Woman, Trends Man, Trends Footwear, Payless, Vision Express
Value Reliance Market, SMART
Source: Company, Kotak Institutional Equities
Indian retailers have been adding the maximum number of stores in the urban mass market
family format stores such as Pantaloons (ABFRL) and Westside/Zudio (Trent). These stores
have registered impressive SSSG in FY2019-20 boosted by improved merchandising, sharper
price-quality proposition as well as focus on private label (60% for Pantaloons and 90% for
Westside). From a store count perspective, Reliance Trends is the largest and fastest growing
chain in the value fashion category.
Exhibit 25: Reliance Trends is one of the fastest growing affordable fashion retail chain Net store additions of Indian apparel retailers, March fiscal year-ends, 2015-20
2015 2016 2017 2018 2019 2020
Store count
ABFRL-Lifestyle brands 1,735 1,877 1,761 1,813 1,980 2,253
ABFRL-Pantaloons 134 163 209 275 308 342
FBB 46 51 54 61 94 95
FLFL 358 369 372 332 339 354
Reliance Trends 271 344 458 670 1,400
Trent-Westside 85 93 111 125 150 173
Vmart 108 123 141 171 214 266
Net store additions
ABFRL-Lifestyle brands 194 142 (116) 52 167 273
ABFRL-Pantaloons 27 29 46 66 33 34
FBB — 5 3 7 33 1
FLFL 31 11 3 (40) 7 15
Reliance Trends — — 73 114 212 730
Trent-Westside 5 8 18 14 25 23
Vmart 19 15 18 30 43 52 Notes: (a) FY2020 results of FLFL and Future Retail are yet to be published and hence store count is as of 9MFY20.
Source: Companies, Kotak Institutional Equities
RR has surprised us with consistently high margin metrics for its fashion and lifestyle
segment (which includes apparel, luxury brands, jewelry businesses). A comparison with
peers also indicates that RR’s segment margins are significantly superior to its peers. This
may be a function of better store economics of Reliance Trends particularly in Tier II/III cities
and higher throughput. The jump in FY2020 EBITDA margin was in part due to Ind-AS 116
implementation.
20 KOTAK INSTITUTIONAL EQUITIES RESEARCH
Oil, Gas & Consumable Fuels Reliance Industries
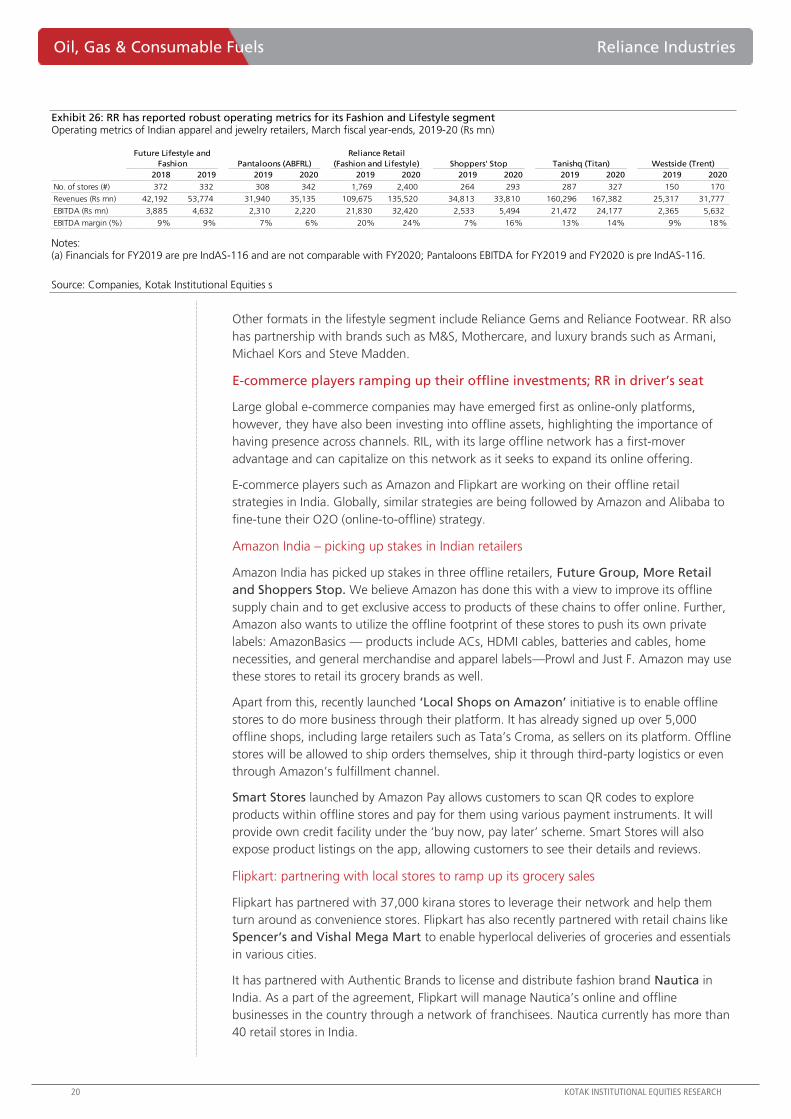
Exhibit 26: RR has reported robust operating metrics for its Fashion and Lifestyle segment Operating metrics of Indian apparel and jewelry retailers, March fiscal year-ends, 2019-20 (Rs mn)
2018 2019 2019 2020 2019 2020 2019 2020 2019 2020 2019 2020
No. of stores (#) 372 332 308 342 1,769 2,400 264 293 287 327 150 170
Revenues (Rs mn) 42,192 53,774 31,940 35,135 109,675 135,520 34,813 33,810 160,296 167,382 25,317 31,777
EBITDA (Rs mn) 3,885 4,632 2,310 2,220 21,830 32,420 2,533 5,494 21,472 24,177 2,365 5,632
EBITDA margin (%) 9% 9% 7% 6% 20% 24% 7% 16% 13% 14% 9% 18%
Tanishq (Titan)Pantaloons (ABFRL) Westside (Trent)
Reliance Retail
(Fashion and Lifestyle) Shoppers' Stop
Future Lifestyle and
Fashion
Notes: (a) Financials for FY2019 are pre IndAS-116 and are not comparable with FY2020; Pantaloons EBITDA for FY2019 and FY2020 is pre IndAS-116.
Source: Companies, Kotak Institutional Equities s
Other formats in the lifestyle segment include Reliance Gems and Reliance Footwear. RR also
has partnership with brands such as M&S, Mothercare, and luxury brands such as Armani,
Michael Kors and Steve Madden.
E-commerce players ramping up their offline investments; RR in driver’s seat
Large global e-commerce companies may have emerged first as online-only platforms,
however, they have also been investing into offline assets, highlighting the importance of
having presence across channels. RIL, with its large offline network has a first-mover
advantage and can capitalize on this network as it seeks to expand its online offering.
E-commerce players such as Amazon and Flipkart are working on their offline retail
strategies in India. Globally, similar strategies are being followed by Amazon and Alibaba to
fine-tune their O2O (online-to-offline) strategy.
Amazon India – picking up stakes in Indian retailers
Amazon India has picked up stakes in three offline retailers, Future Group, More Retail
and Shoppers Stop. We believe Amazon has done this with a view to improve its offline
supply chain and to get exclusive access to products of these chains to offer online. Further,
Amazon also wants to utilize the offline footprint of these stores to push its own private
labels: AmazonBasics — products include ACs, HDMI cables, batteries and cables, home
necessities, and general merchandise and apparel labels—Prowl and Just F. Amazon may use
these stores to retail its grocery brands as well.
Apart from this, recently launched ‘Local Shops on Amazon’ initiative is to enable offline
stores to do more business through their platform. It has already signed up over 5,000
offline shops, including large retailers such as Tata’s Croma, as sellers on its platform. Offline
stores will be allowed to ship orders themselves, ship it through third-party logistics or even
through Amazon’s fulfillment channel.
Smart Stores launched by Amazon Pay allows customers to scan QR codes to explore
products within offline stores and pay for them using various payment instruments. It will
provide own credit facility under the ‘buy now, pay later’ scheme. Smart Stores will also
expose product listings on the app, allowing customers to see their details and reviews.
Flipkart: partnering with local stores to ramp up its grocery sales
Flipkart has partnered with 37,000 kirana stores to leverage their network and help them
turn around as convenience stores. Flipkart has also recently partnered with retail chains like
Spencer’s and Vishal Mega Mart to enable hyperlocal deliveries of groceries and essentials
in various cities.
It has partnered with Authentic Brands to license and distribute fashion brand Nautica in
India. As a part of the agreement, Flipkart will manage Nautica’s online and offline
businesses in the country through a network of franchisees. Nautica currently has more than
40 retail stores in India.

KOTAK INSTITUTIONAL EQUITIES RESEARCH 21
Reliance Industries Oil, Gas & Consumable Fuels
Alibaba: rapidly developing its offline network in China
Alibaba has a majority stake in brick-and-mortar retailer Intime. It has also invested in
Hema, a 150-unit grocery chain in 21 Chinese cities. Hema seamlessly integrates physical
store conveniences with digital tools, Hema has been called ‘the most futuristic retailer’ in
the world. Hema offers free 30-minute deliveries of fresh produces within a radius of 3
kilometers from stores. Hema is the only Chinese supermarket chain operating both online
and offline channels; it virtually dominates Chinese online grocery scene. Its business has
been gaining steam during the Covid-19 crisis, with its sales more than tripling.
Alibaba Group also has acquired 36% of Sun Art Retail Group, which operate nearly 400
hypermarkets under the Auchan and RT-Mart banners. Per the agreement, Alibaba would
share its Digital commerce technology and insights of consumer trends with RT Mart to
expedite its digitization, sync its online and offline operations, improve its in-store layout and
increase efficiencies in the grocer’s inventory management.
As part the digital makeover, RT-Mart gains access to Alibaba’s customer insights, supply-
chain management, retail technologies and electronic payments via Alipay.

22 KOTAK INSTITUTIONAL EQUITIES RESEARCH
Oil, Gas & Consumable Fuels Reliance Industries
ASPIRATIONS TO TAP INDIA’S E-COMMERCE OPPORTUNITY
Reliance Retail is all set to tap India’s burgeoning e-commerce opportunity by leveraging its widespread
offline presence across consumption categories and benefiting from domestic-centric policies, which may
allow it to overcome the headstart by other e-commerce players. The company’s approach to target the
lowest common-denominator for consumer, food and grocery, through its JioMart platform, and its recent
strategic tie-up with WhatsApp, may allow it to expand the universe of online transactors in India. This
coupled with enhancement and expansion of existing online offerings such as AJIO and RelianceDigital may
propel it to the pole position in e-commerce business as well in the medium term.
From grocery to other categories: RIL can amass US$12 bn GMV by FY2025
RIL already has the online apparel property AJIO, which has evolved into a fashion
marketplace retailing Reliance Trend’s private label, RR’s partner luxury brands as well as
third-party brands. With RIL already targeting apparel and grocery, the two large
components of retail (76% of overall retail in FY2020), we believe it can steadily foray into
other categories such as jewelry, home and living, consumer electronics and others. It
already has offline formats offering this merchandise and hence it would be only a matter of
time before it readies its comprehensive online merchandise offering.
A steady foray into digital commerce backed by its own merchandise, partnership with a
variety of brands, pan-India network and widespread customer reach via WhatsApp and
other popular apps, and regulations favoring Indian companies can drive RIL to steadily ramp
up its share in the Indian digital commerce market. We believe it can achieve digital
commerce GMV of US$12 bn by FY2025, implying a 12% share in the e-commerce market.
Exhibit 27: RIL can achieve digital commerce GMV of US$12 bn by FY2025 RIL's estimated online GMV, March fiscal year-ends, 2020-25E (US$ bn)
2020 2021E 2022E 2023E 2024E 2025E
Estimated e-commerce market size (US$ bn) 31 38 49 63 80 100
Incremental annual GMV (US$ bn) 8 11 14 17 20
Base case
RIL's share in incremental GMV (%) 2 8 15 22 28
RIL's cumulative GMV (US$ bn) 0 1 3 7 12
Source: Kotak Institutional Equities estimates
Grocery to be JioMart’s biggest bet; to steadily ramp-up other segments
We believe online commerce provides RIL the opportunity to monetize its Jio customer
better, especially since it already has a large offline presence and a variety of merchandise is
being sold via Reliance Retail’s store network. RR already has e-commerce websites called
AJIO.com for sale of apparel and RelianceDigital.in for sale of electronics products.
The recent large-scale launch of JioMart gives it footprint in grocery as well. Grocery is
particularly attractive as it is currently highly unorganized and RR has the opportunity to
seize a sizeable first-mover advantage. Note that other e-commerce players such as Amazon
and Flipkart have been relatively late entrants to this category and we believe their
operations in the food and grocery category are not very sizeable yet.
RR has been tactical in focusing on the food and grocery segment via JioMart, instead of
traditional large e-commerce categories. We believe this may be deliberate as: (1) large initial
focus on electronics has led to a plateauing of user base of other competitors such as
Amazon and Flipkart and is now forcing them to look towards grocery, and (2) unlike
Amazon and Flipkart, JioMart’s access to 380 mn+ telecom subscribers and its tie-up with
WhatsApp can allow it to sell grocery to a much larger customer base.
As highlighted above, food and grocery is the largest retail category in India, and also the
highest frequency purchase item. It is also highly fragmented and unorganized, and thus
presents an opportunity for large retailers to garner a share in the business. Further, as

KOTAK INSTITUTIONAL EQUITIES RESEARCH 23
Reliance Industries Oil, Gas & Consumable Fuels
incomes increase, spends in this category can continue to increase at least the rate of
growth of real GDP. We believe it is this market size and customer reach that RIL intends to
tap into.
RR may benefit from regulations favoring domestic retailers
Unlike its other foreign owned peers, RIL does not have to contend with restrictions of multi-
brand retail in its B2C business. Regulations have tended to become stricter for foreign-
owned e-commerce players, as local sellers have protested against large, company-owned
sellers being active on marketplaces, effectively accusing marketplaces of buying and selling
products.
A case in point is that of Flipkart, which was recently denied permission by the DPIIT
(Department for Promotion of Industry and Internal Trade) to undertake a food retail
business in India citing violation of marketplace model. Per DPIIT, a foreign-owned
marketplace cannot be a seller on its own platform. However, rival Amazon already operates
in the space through subsidiary Amazon Retail India (ARIPL); this may also be reviewed by
DPIIT.
In April 2020, the government tweaked FDI policy, banning fresh investments from China
through the automatic route. Chinese e-commerce companies such as Alibaba are large
investors in Indian startups like BigBasket. The change in policy makes it mandatory for all
Chinese investors to seek government approval before investing in Indian firms, which may
affect further funding rounds in startups by Chinese investors.
Exhibit 28: Government has restricted foreign investment in inventory led e-commerce and multi-brand retail Details of permitted foreign investment in Indian retail
Foreign
investment cap
(%) Government approval Comments
Sale of products (other than food)
manufactured in India by the manufacturer100 Automatic Retail sale via e-commerce is allowed.
Sale of food products manufactured in
India100 Government approval Retail sale via e-commerce is allowed.
Cash and carry/wholesale trading
including B2B e-commerce100 Automatic
Wholesale/cash and carry trader can also undertake single brand retail trading.
Such traders will be mandated to maintain separate books of accounts for
these two arms of the business and duly audited by the statutory auditors.
Government regulations have to be separately complied with by the respective
business arms.
B2B e-commerce 100 Automatic
Such companies would engage only in B2B e-commerce and not in retail trading,
thus implying that existing restrictions on FDI in domestic trading would be
applicable to ecommerce as well.
Market place model of e-commerce 100 Automatic
Marketplace model of e-commerce means providing of an IT platform by an e-
commerce entity on a digital & electronic network to act as a facilitator between
buyer and seller.
An e-commerce entity will not permit more than 25% of the sales value
generated on its marketplace from one vendor or their group companies.
Inventory model of e-commerce Not allowed Foreign investment is not permitted in inventory-based model of e-commerce.
Single brand product retail trading 100
Automatic up to 49%;
government approval
beyond this
For foreign investment beyond 51%, sourcing of 30% of the value of goods
purchased be done from India preferably from MSMEs, in all sectors. The
quantum of domestic sourcing will be self-certified by the company, to be
subsequently checked by statutory auditors. The procurement requirement is to
be met in the first instance as an average five years total value of goods
purchased beginning April 1 of the year of the commencement of the business.
Thereafter it shall be met on an annual basis.
Multi brand retail trading 51 Government approval Minimum amount to be brought in as foreign investment is US$100 mn.
At least 50% of the total foreign investment brought in the first tranche of
US$100 mn shall be invested in 'back-end infrastructure' within three years.
Source: DPIIT, Kotak Institutional Equities
The presence of a large offline network will give RR an edge that its other competitors such
as BigBasket and Grofers do not have. RR can benefit from an established supply chain
(sourcing, warehousing, store inventory), something which its competitors will take a while
to establish when entering into new cities.

24 KOTAK INSTITUTIONAL EQUITIES RESEARCH
Oil, Gas & Consumable Fuels Reliance Industries
Exhibit 29: BigBasket and Grofers command a small share of the grocery market Standalone financials of BigBasket and Grofers, March fiscal year-ends, 2015-19 (Rs mn)
2014 2015 2016 2017 2018 2019
Revenues
BigBasket 751 1,837 5,275 10,905 15,832 27,526
Grofers — — 80 132 298 701
EBITDA
BigBasket (23) (77) (941) (1,778) (3,070) (5,580)
Grofers — — (2,279) (2,809) (2,661) (4,484)
PBT
BigBasket (23) (76) (1,034) (1,918) (3,103) (5,627)
Grofers — — (2,251) (2,683) (2,583) (4,480)
Notes: (a) Grofers reports gross commission as revenue as it does not own inventory. Its revenue figures are thus notcomparable with those of BigBasket.
Source: Tofler, MCA, Kotak Institutional Equities
Industry discussions reveal that the two specialist grocery delivery companies clocked
~US$1.5-2 bn of GMV in FY2020, implying a minuscule 0.2-0.3% share of online grocery in
the overall food and grocery pie. This is also much lower than higher shares that e-
commerce has managed to achieve in certain other categories such as electronics and
apparel. We believe grocery has been a much tougher nut to crack for most companies
given: (1) inherently low margins in the business, (2) low ATV (average transaction value)
compared to categories such as apparel and electronics, (3) demand for quick turnaround
times and deliveries, (4) high number of SKUs demanded per order, and (5) high competition
from offline channel.
JioMart: B2C model may undergo several iterations
JioMart has commenced its online grocery delivery business on a pan-India basis by
connecting local kirana shops to customers. JioMart’s model involves forming a local
network of kirana stores so as to have their entire inventory online, allocating incoming
orders to stores based on product availability and proximity, and facilitating delivery to the
customer by its own network. The grocery shop shares a certain margin with JioMart for
every order originated by JioMart. Per RIL, JioMart intends to act as a centralized
procurement and delivery platform between manufacturers and merchant partners. JioMart
will enable digitization of merchants through Jio PoS at the backend and JioMart app at the
front-end.
The local store aggregation model has not met with much success in the past as local stores
may not carry very large assortment of products resulting in a mismatch between product
shown on JioMart’s website and actual product delivered to the customer. Control of
customer experience will thus be key for JioMart to succeed in the business. We believe
these can be addressed by: (1) control of the back-end of these stores by JioMart, (2) very
localized inventory view offered by JioMart on its website, and (3) efficient delivery logistics
(either by store or JioMart).
RIL’s opportunity size in this business extends to Indian food and grocery retail market,
estimated at US$660 bn for FY2020. Grocery is a low margin category and hence revenue
opportunity will be smaller at 7-10% of GMV opportunity at US$46-66 bn.
JioMart’s kirana digitization strategy to supplement digital commerce
We believe RR’s JioMart seeks to not only become a meaningful grocery retailer by providing
customers the convenience of shopping online, it also seeks a slice of the large B2B market,
which hitherto has been driven by traditional distributors. While the proportion of modern
trade has been on the rise, we believe RIL would want to integrate its Reliance Market
offering with its network of kirana stores, thereby disintermediating the existing value chain
(company – distributor – wholesaler – stockist – retailer). We believe this business can be an

KOTAK INSTITUTIONAL EQUITIES RESEARCH 25
Reliance Industries Oil, Gas & Consumable Fuels
important feeder to the digital commerce business and can significantly aid supply
aggregation in a fragmented market.
RR’s intent to launch its distribution service on a large scale can help it amass sizeable
revenues. RR will need to establish a virtuous cycle by offering consistently low-priced
products to shops, the widest variety while at the same time negotiating for best prices with
FMCG companies and other large producers. As discussed above, RR has several private
labels in its grocery retail business. It can push these private labels on a large scale through
this channel and ultimately to customers ordering products online. This business is currently
in a trial phase and we expect it to be gradually ramped up, in sync with JioMart online.
JioMart: B2B operations launched but execution will be key
After piloting its operations in parts of Mumbai, RIL commenced operations of JioMart, its
online groceries delivery portal. Besides B2C operations, RR has also sought to build a
network of small stores by offering them a PoS device for refundable deposit of Rs4,000-
5,000, with the idea of: (1) connecting these stores with its own B2B supply chain, (2)
getting these chains to use JioPay on the PoS machine, and (3) garnering precious data on
revenue potential of the shop, SKUs sold, etc. It can offer stores benefits such as cheaper
procurement price of products (vs traditional distributors), lower turnaround times leading to
higher fill rates (aided by enhanced data availability via PoS), and additional customers via
WhatsApp pay.
The social commerce interface combining WhatsApp pay and JioPay can create a vast fintech
space – potentially representing ways for: (1) providing working capital loans to shop owners
with little or no credit history, and (2) potentially earning margins on transactions originating
on JioPay. Note JioPay could be a currency of transaction not only in the Reliance-PoS
enabled kirana shops, but all across the RIL ecosystem and can be used by vendors and
customers alike. Most importantly, these kiranas can act as supply aggregators and delivery
agents for the nascent JioMart online business.
We conducted interviews with shop owners who had been given the Reliance PoS systems.
Some findings: (1) the PoS did not provide massive appeal to shop owners as it mandatorily
required bar-coding of inventory; this is something shop owners find it difficult to comply
with given they don’t have manpower to do this, (2) the benefits of purchasing merchandise
from RR wasn’t clear as too much variety wasn’t available, (3) companies such as HUL had
commenced with their own direct distribution programs and some kiranas were purchasing
directly from the company, and (4) some incremental orders were being received from RIL
and the company was providing some additional discounts – however, the pattern of these
discounts wasn’t consistent .
For now, we reckon RIL will have to make its proposition to shop owners stronger for these
shop owners to switch to an end-to-end RIL powered supply chain.
We note that apart from RIL, there are others also who are trying to modernize the kiranas
and seeking to integrate their supply chain by taking over their B2B needs. We believe Metro
Cash and Carry has evolved a model that has proven beneficial for kirana owners by catering
to their twin needs of modernization as well as back-end supply chain integration with
Metro’s network. Some key highlights of the model include: (1) there is need for back-end
supplies for kiranas to be consolidated, as currently kiranas interact with 150-200 vendors
with limited price transparency, (2) there is need to hand-hold kiranas and make them aware
of new retail practices, especially in the face of competition from large e-commerce players,
and (3) kiranas need to be provided with devices and software that are easy to use and may
ultimately provide with some cost saving. Refer to appendix-1 for more details on takeaways
from a webinar with Arvind Mediratta, MD of Metro Cash and Carry, that we attended.
Our interaction with a few stores who have opted for Metro’s Smart Kirana program reveal
that these shop owners have benefited significantly from the Smart Kirana program. Their
revenues have increased by 20-40% as a result of the remodeling, and the lower priced
goods sourced from Metro have enabled them to have competitive pricing.

26 KOTAK INSTITUTIONAL EQUITIES RESEARCH
Oil, Gas & Consumable Fuels Reliance Industries
We believe RIL would need to come up with some such model in order to gain kirana’s trust
as well as their business. We do believe kiranas are looking to consolidate their supplier base
as well as bring down their cost of procurement; these both are aspects that RIL can take up
in their B2B program.
Regulatory regime may also favor kirana modernization
Media reports have stated that the Commerce Ministry is drafting a new e-commerce policy,
which will incentivize kiranas to integrate their operations with existing e-commerce
platforms. It is not clear as to what these incentives may be, but they may be in the form of
a one-time grant or interest subvention on investments put up by kiranas towards
digitization. Overall, this push by the government may also be beneficial for RR, which
intends to connect millions of such vendors to its own network.
B2C can be extended into O2O, and can play on synergies between RIL’s offline
and online offering
O2O generally refers to ‘online to offline’, implying that online services can be used to
generate in-store revenues. Reverse O2O refers to offline to online, implying that a physical
point-of-sale can generate online revenues. There are several benefits of O2O, important
among these being enabling a customer to research online and purchase offline; or browse
offline and purchase online. Both are important as buy rate in offline retail can be very high
(as high as 30-70% per some estimates), significantly higher than 1-3% on online platforms.
Benefits of O2O to the platform operator can be immense: (1) it can significantly increase a
user’s engagement within the ecosystem: for instance, a grocery buyer on WhatsApp can be
a customer of Reliance Trends, Reliance Jio telecom services, Jio Movies etc., and (2) the
more significantly engaged a user is, the more the platform can understand the user’s
behavior through data analytics.
RIL has acquired stakes in several start-ups over the past few years to strengthen its O2O
platform, offer support of voice assistants to customers, software services to SMEs as well as
logistic network.

KOTAK INSTITUTIONAL EQUITIES RESEARCH 27
Reliance Industries Oil, Gas & Consumable Fuels
Exhibit 30: RIL on a spree of acquisitions in past two years to bolster digital space offerings Details of acquired company
Year Company acquired Comment
2019 NowFloats Nowfloats offers SaaS solutions to small and medium enterprises (SMEs) that enable them to get a digital presence.
2019 Asteria AerospaceRobotics and artificial intelligence company. Asteria develops drone-based solutions to provide intelligence from aerial data
for military and industrial applications.
2019 Fynd
RIL bought the stake for Rs3 bn as it aims to push for online-to-offline (O2O) commerce giving it an 87.6% stake in the
startup. Fynd provides a technology platform and solutions to merchants to manage their inventory and sales across multiple
demand channels for consumers, including e-commerce platforms. It sources products across categories such as clothing,
footwear, jewellery from nearby outlets and brings them online.
2019 Embibe AI based education platform that uses data analytics to deliver personalized learning outcome
2019 GuavasAI-based solution for real-time customer experience analytics. The deployment will help Jio in getting predictive analytics to
automate network troubleshooting.
2019 C-Square
C-Square provides software solutions with specific focus on pharma sector for various stakeholders including C&F,
distributors, retailers, online ecommerce, sales force automation, etc. The aforesaid investment will further enable Reliance
group’s digital commerce initiatives and solutions.
2019 Reverie
Reverie provides a voice suite (called Gopal) in 12 Indian languages like Hindi, Telugu, Tamil, Bengali, Marathi, Gujarati, Indian
English, etc. which can be integrated with both chatbots and Interactive Voice Response (IVR) solutions which companies can
use to engage with non-English speaking customers. Reverie will work towards integration of its Indic language localization
services with RIL’s digital consumer platforms.
2019 TesseractTesseract has launched three hardware and two software products in the MR, AR, and VR spaces. Tesseract has developed the
Jio HoloBoard as a native mixed reality (MR) headset for JioFiber users.
2019 Haptik
Haptik is one of the world's largest conversational AI platforms that lets customers chat with their voice assistants to complete
daily tasks such as online shopping, travel bookings, food delivery among others. It is to compete against Amazon' Alexa and
Google Assistant
2019 SankhyaSutra Labs SankhyaSutra Labs offers high-performance computing software simulation services.
2019 Grab A Grub
Grab offers services ranging from on-demand, reverse deliveries, first mile, and last-mile logistics. The investment will support
Reliance Group’s “digital commerce initiatives and strengthen its logistics services, catering to both B2B and B2C segments.
The deal would help the company boost its e-commerce model to take on its rival Amazon India and Flipkart in the country.
2019 Easygov RIL announced an agreement to acquire shares in data solutions and software company Easygov for up to Rs180 mn.
2018 NetraDyne The US-based AI startup focuses on driver and fleet safety and uses artificial intelligence for the same
2018 Vakt HoldingsWith this acquisition, RIL was looking to accelerate its digital journey through active participation in an emerging and evolving
blockchain-enabled technologies.
Source: Media releases, Kotak Institutional Equities
In China, Tencent’s Wechat has shown that Chinese online consumers can use a single app
for varied uses such as social networking, instant messaging, e-commerce, payments as well
as O2O services. The service has become comprehensive enough to host a wide variety of
sellers and brands online such that a wide variety of choice is offered to the consumer
without diluting experience.
For a retailer to be present everywhere, the offline play becomes critical. This is evident from
the fact that global e-commerce players such as Amazon, Alibaba, etc. are all developing
their offline presence.

28 KOTAK INSTITUTIONAL EQUITIES RESEARCH
Oil, Gas & Consumable Fuels Reliance Industries
Inorganic opportunities could further cement leadership position
Per media reports, RIL is in advanced stages of discussion for acquisition of Kishore Biyani’s
stake in retail and supply chain assets of Future Group. The transaction may first involve a
merger of three Future Group entities (Future Retail (FRL), Future Lifestyle & Fashion (FLFL),
Future Supply Chain (FSC)); RIL will then purchase a stake in the merged entity. FRL operates
store formats such as Big Bazaar (hypermarket), FBB (value fashion), Easyday (local grocery
store) and Foodhall (premium food and grocery). It had a network of ~1,400 stores as of
9MFY20 with a retail trading area of 16.1 mn sq. ft. It has a presence in 414 cities, with its
flagship Big Bazaar stores present in ~140 cities. FRL reported revenues of Rs157 bn in
9MFY20. This compares with RR’s FY2020 core revenues of Rs928 bn. FLFL is an apparel
retailer and operates the Central (premium apparel large format store) and Brand Factory
(apparel discount retailer) formats. Besides, FLFL also has partnerships with foreign brands
and operates certain standalone stores (EBOs) for these brands (some of these brands
include Clarks, Scullers, Urban Yoga, Lee Cooper and Indigo Nation). It had a network of
~355 stores (including EBOs) as of December 2019 and retail trading area of 7.5 mn sq. ft.
FLFL reported revenues of Rs46.2 bn in 9MFY20. JioMart intends to supply grocery online as
well as act as a distributor to retail shops. We believe this would require an integrated supply
chain network to connect RIL Market and warehouses with local kiranas, and kiranas and
local RR outlets with customers. Assets of Future Supply Chain and Future Retail’s Easyday
network can help JioMart’s distribution and hyperlocal retail ambitions. RR’s core revenue
run-rate can increase by ~30%, should this acquisition go through and can further bolster
RR’s leadership position in offline retail
Acquisition of an existing online grocery retailer may also make strategic sense
As discussed above, online grocers such as BigBasket and Grofers amassed US$1.5-2 bn of
GMV in FY2020. These companies have built a decent presence in the 20-30 cities they are
present in and are aspiring to spread even wider. We believe these companies have created
a niche in a difficult category by offering good quality products, large product assortments
and timely delivery to customers. With competitors such as Amazon and Flipkart eyeing the
large grocery space themselves, we believe it would be prudent for RR to acquire one of the
existing online players in order to gain a time advantage over other competitors. It can also
get a headstart and learn softer aspects such as customer experience, complaints redressal,
which are key to running a successful grocery business in India.
Per last valuation rounds, BigBasket was valued at US$1.2 bn and Grofers at US$650 mn;
these companies are not profitable yet and may make reasonable acquisition targets for RR.
Expansion into online will not be without challenges
Existing e-commerce players have made significant investments to acquire users
India’s e-commerce landscape has till now been ruled by primarily foreign-capital backed
start-ups, with Amazon’s Indian entity joining the fray. Pure-play Indian corporate-backed e-
commerce players are very few (the likes of Tata Cliq) and none of these have managed to
make a mark on the digital commerce landscape.
Online retailers in India have invested significantly and incurred large losses to fuel change in
customers’ buying behavior. These losses have been on account of significant customer
acquisition costs in the form of deals and discounts offered to customers as well as other
costs such as free delivery. As shown below, losses incurred by extant Indian e-commerce
players have increased meaningfully in the past few years. Until it gains scale, RIL may also
incur some losses as it seeks to increase its share in the online retail pie.

KOTAK INSTITUTIONAL EQUITIES RESEARCH 29
Reliance Industries Oil, Gas & Consumable Fuels
Exhibit 31: E-commerce players have made significant investments into acquiring customers Details of financial performance of key e-commerce players (including group companies), March fiscal year-ends, 2015-19 (Rs mn)
2015 2016 2017 2018 2019
E-commerce
Flipkart group
Revenues 104,376 157,889 180,000 271,682 404,525
PBT (26,286) (44,770) (42,515) (49,823) (81,137)
Amazon India
Revenues 22,931 74,268 168,608 262,647 306,389
PBT (17,539) (37,306) (50,383) (66,557) (68,231)
Paytm E-commerce
Revenues — — 72 7,442 8,928
PBT — — (136) (18,056) (11,714)
Snapdeal
Revenues 7,664 11,589 9,038 4,361 8,138
PBT (13,192) (29,600) (14,740) (2,566) (1,884)
Shopclues
Revenues 773 1,780 1,800 2,713 2,041
PBT (1,014) (3,830) (3,471) (2,081) (686)
Total
Revenues 135,744 245,525 359,518 548,844 730,021
PBT (58,031) (115,505) (111,246) (139,084) (163,651) Notes: (a) Total revenues of various companies are not comparable given varying proportions of B2B sales.
Source: MCA, Kotak Institutional Equities
The e-commerce companies invest heavily in customer acquisition costs, in the hope that
once acquired the customer would consume a wide array of products and services from the
same portal. For instance, a customer who has purchased a mobile phone from a portal,
would purchase everything from grocery, apparel, books, etc. from the same. In addition,
the customer would also consume other services such as video, flight booking, music, e-
books, etc. from the same portal, thereby eventually helping the portal recover its initial
customer acquisition cost and perhaps make money from the consumer.
We believe RR may benefit significantly from: (1) its partnership with WhatsApp, which
already has 400 mn+ users in India; this user base can be targeted by RR to market its online
offerings, and (2) Jio may bundle some of these apps within its master Jio app to all its 380
mn users, something which none of the other e-commerce players could have done. We
also think that RR can piggyback on the heavy lifting that the larger marketplaces like
Amazon and Flipkart have already done in terms of sensitizing consumers to benefits of
online shopping.
Varied tastes and preferences of customers
Organized retail and the associated shopping experience is far less developed in India than in
western world. Further, user tastes and preferences in India are also extremely diverse,
making it contingent on online platforms to tie-up extensively with local stores, in order to
provide a holistic offering to the consumer.

30 KOTAK INSTITUTIONAL EQUITIES RESEARCH
Oil, Gas & Consumable Fuels Reliance Industries
Lack of clarity on data sharing between RR and Jio Platforms
JioMart can collect consumer data, but given RR and Jio Platforms are separate entities, we
do not know how and to what extent this data will be shared between entities to make
online and offline user experience sharper. Further, given that Facebook is now a partner of
Jio Platforms, it is also not clear what kind of data sharing could take place between FB,
WhatsApp, JioMart/AJIO and other apps of Jio Platforms. RIL would need to come up with
some transparent data sharing mechanism between various entities in order to ensure
maximum utilization of the said data. FB, in partnership with Shopify, has launched its own
commerce services; while these have not launched in India, we are not sure if even these
could compete with RR in the future.

KOTAK INSTITUTIONAL EQUITIES RESEARCH 31
Reliance Industries Oil, Gas & Consumable Fuels
STRONG PRIVATE LABEL PUSH AND BRAND PARTNERSHIPS ARE KEY ASSETS
RR has developed a plethora of private brands in its offline business across grocery, fashion and lifestyle and
electronics. We believe these private labels can help its long-term merchandising strategy, fill in white spaces
that may be there in the offerings of existing third-party brands as well as cultivate loyalty amongst both
customers and B2B kirana partners. RR’s current pricing strategy indicates that it will strive to be a price
leader in the various categories it is present in, in a bid to maximize overall turnover.
Fashion & Lifestyle: steadily ramping up brand portfolio across formats
Reliance Retail has a portfolio of 46 well-known exclusive international partner brands that
span across the entire spectrum of luxury (Armani, Burberry etc.) to high-premium and high-
street lifestyle. RR operates ~682 stores for these international brands. Many international
brands from the portfolio have made India a significant market outside of their home
countries and have the largest store presence in India than in any other country.
It has set up, built and ‘glocalized’ international brands such as Armani, Diesel, Brooks
Brothers, Marks & Spencer, Muji, Mothercare etc. RR’s fashion platform AJIO also offers
1,400+ national and international brands.
Exhibit 32: Plethora of international partner brands in the luxury to premium segments RR’s brand portfolio in fashion retail segment, March fiscal year-ends, 2020
Source: Company, Kotak Institutional Equities
Reliance Trends, the flagship store concept of RR for fashion retail, predominantly sells own
brand products, which constitute over 70% of its sales. Trends has developed a robust
portfolio of over 20 own brands such as Avaasa, DNMX, Netplay etc. to cater to diverse
tastes and preferences of customers. According to RIL’s FY2020 annual report, many of
these brands have an annual turnover of ~Rs5 bn, making them comparable to many
national and international brands operating in the market. Private labels fetch around 70-75%
of RR’s fashion and lifestyle revenues

32 KOTAK INSTITUTIONAL EQUITIES RESEARCH
Oil, Gas & Consumable Fuels Reliance Industries
Private label push in the food & grocery segment also gaining steam
In addition, RR has developed a wide range of own brand products across various categories
such as staples, food FMCG, home & personal care and general merchandise. Best Farms,
Good Life, Masti Oye, Kaffe, Enzo, Mopz, Expelz, among others are some of the brands that
have been well received by consumers.
Private labels fetch around 14% of grocery revenues. E-commerce retailers like Amazon,
Flipkart and grocery firms like BigBasket, Grofers are also increasingly focusing on such in-
house brands as they offer better margins.
Exhibit 33: Multiple private label brands launched by the online and offline retailers List of private label brands of retailers
Dmart BigBasket Easyday Amazon Flipkart Grofers
Premia BB Popular Golden Harvest Solimo Supermart Select G-Mother's Choice
BB Royal Tasty Treat Presto Supermart Home G-Happy Home
Fresho Nilgiris Vedaka Farmlife G-Happy Day
BB Home Karmiq Essentials Billion G-Fresh Milk
BB Royal Organic Desi Atta Basics MarQ O'range
Sunkist Symbol Perfect Homes
Clean Mate Fresh Cara Mia
Kara
Source: Company websites, Kotak Institutional Equities
RR’s food and HPC private labels are placed in the lowest price bucket category mainly to
attract price sensitive customers. These are possibly targeted to garner market share from
the FMCG incumbents, especially in low involvement purchases like home cleaning essentials.
Exhibit 34: RIL’s private label brands spanning across categories in value retail Portfolio of private label brands of RR
Source: Company, Kotak Institutional Equities
During the Covid-related lockdown, when the established online grocery players like
BigBasket, Grofers were struggling with explosive demand and disruptions in supply chain,
the strategic launch of JioMart in 200 cities indicates the sourcing power that RR enjoys
within the ecosystem.
RR has been selling its private label offerings through Reliance SMART, Market and Fresh
stores until now. With JioMart joining the league, the online marketplace will provide better
customer and demand visibility and push the company’s in-house grocery brands. Currently,

KOTAK INSTITUTIONAL EQUITIES RESEARCH 33
Reliance Industries Oil, Gas & Consumable Fuels
JioMart’s product listings largely include its private label brands rather than extensive listing
of known FMCG brands. As the website picks up traction, the catalogue might be extended
to the other product categories that RR operates in such as fashion and electronics.
With this strategy, RR is competing head on with online retailers such as Amazon, Flipkart
and BigBasket, which have their own brands in the e-commerce segment, and also the likes
of FMCG behemoths (HUL, ITC) in the offline segment with RR’s product offerings available
at relatively cheaper price points.
Private labels will be key differentiators across all retail formats
In addition to providing better margins and better inventory control, private labels will
enable RR to better compete with rivals such as Amazon and Flipkart, both of whom have
also introduced heir private labels across various product categories.
Exhibit 35: RR’s private labels are cheaper than competing brands across most foo and HPC categories Price comparison of RR’s products with other brands
Product Quantity RR Brand RR HUL ITC Tata Others Cheapest
Staples
Wheat/Atta 10 kg Good Life 315 330 343 na 375 RR
Chana Dal 500 gm Good Life 47 na na 60 50 RR
Salt 1 kg Good Life 15 16 18 18 20 RR
Mustard Oil 1 L Good Life 116 na na na 125 RR
Soya chunks 1 kg Good Life 105 na na na 143 RR
Snacks
Bourbon 150 gm Snactac 20 na 27 na 30 RR
Instant Noodles 300 gm Snactac 35 na 45 na 46 RR
Oats 1 kg Snactac 95 na na na 150 RR
Aloo Bhujia 150 gm Masti Oye 28 na na na 33 RR
Instant Soup (Tomato) 60 gm Snactac 25 52 na na 55 RR
Ketchup 950 gm Snactac 89 110 na na 89 RR
Tea 250 gm Aarambh 80 62 na 55 50 Others
Coffee 50 gm Kaffe 60 90 na 90 125 RR
HPC
Face Wash 100 ml Get Real 60 100 na na 98 RR
Shower Gel 250 ml Get Real 75 120 64 na 150 ITC
Detergent Powder 1 kg Sudz 65 53 na 55 55 HUL
Dishwash gel 500 ml Scrubz 125 104 na na 100 Others
Floor cleaner 1L Mopz 99 152 93 na 161 ITC
Toilet cleaner 1L Expelz 99 na na na 151 RR
Prices (Rs)
Notes: (a) Prices retrieved on July 10, 2020.
Source: Company, Kotak Institutional Equities
Electronics: building presence across white goods and small electronics
Reliance Reconnect is RR’s brands in the electronics segment. As seen below, its products
are very competitively priced. Further, we also observe that RR is present across large
appliances (AC, refrigerators, TV, washing machines), small appliances (air cooler, kitchen
appliances etc.) as well as other items such as smartphones and accessories.

34 KOTAK INSTITUTIONAL EQUITIES RESEARCH
Oil, Gas & Consumable Fuels Reliance Industries
Exhibit 36: Reliance Reconnect is a price leader across key electronics categories Price comparison of Reliance Reconnect with competing brands in the electronics category
Product Prices (Rs) Product Prices (Rs)
Mobile accessories Home Appliances
Earphones Bluetooth Wireless Split Inverter AC 1T-3 star
-Reliance Reconnect 899 -Reliance Reconnect 19,990
-Boat Rockerz 1,099 -Voltas 29,350
-Philips 1,299 -Blue Star 32,179
-JBL 1,499 -Carrier 32,259
-Skullcandy 1,537 -Samsung 37,790
Power Banks 20,000 mAh HD LED TV 32''
-Reliance Reconnect 1,299 -Reliance Reconnect 7,490
-Ambrane 1,499 -Sanyo 8,999
-Intex 1,597 -Micromax 9,299
-Redmi 1,599 -Samsung 12,490
-SYSKA 1,949 -Mi 12,499
Headsets Wireless Washing Machines 6.5kg/Fully Auto/Top Load
-Reliance Reconnect 1,499 -Reliance Reconnect 13,490
-Philips 1,849 -Whirlpool 13,990
-JBL 1,999 -LG 14,990
-Motorola 2,200 -IFB 16,399
-Sony 4,099 -Samsung 16,799
Screen Guards Steam Iron 2000W
-Reliance Reconnect 499 -Reliance Reconnect 899
-Others 50 -INALSA 1,533
-Usha 1,789
-Bajaj 1,820
-Philips 2,025
Source: Company, Kotak Institutional Equities

KOTAK INSTITUTIONAL EQUITIES RESEARCH 35
Reliance Industries Oil, Gas & Consumable Fuels
APPENDIX 1
Chinese e-commerce companies have amassed large revenues over the past decade. Key drivers for the same
have been an increase in internet penetration led by proliferation of smartphones, increase in consumption
and purchasing power and lack of foreign internet companies. We take a look at how Tencent has evolved
from a messaging company to a multi-product company, which has led to addition of new revenue streams.
Large online user base can be monetized in multiple ways
Tencent is the largest communications and social platform in China with 1.17 bn MAUs on
its Weixin and Wechat platforms and 727 mn MAUs on its QQ messenger as of December
2019. Over a period of time it has evolved from only a messenger service to a provider of
multiple products and services to its vast customer base. As a result, its revenues have
increased steeply at a CAGR of 36% over CY2013-19.
Exhibit 37: Tencent has multiple ways of monetizing users on its platforms Various revenue streams of Tencent
Source: Company, Kotak Institutional Equities
Exhibit 38: Tencent has consistently added new revenue streams to its business by offering new
services to its customer base Service-wise break-up of Tencent's revenues, December calendar year-ends (RMB bn)
Source: Company, Kotak Institutional Equities

36 KOTAK INSTITUTIONAL EQUITIES RESEARCH
Oil, Gas & Consumable Fuels Reliance Industries
APPENDIX 2
We present below a few snapshots related to JioPos, JioMart and a simple integration with WhatsApp at the
current juncture; we believe latter may change perhaps with an embedded offering in future.
Exhibit 39: JioPoS-lite
Source: Company, Kotak Institutional Equities
Exhibit 40: JioPoS device
Source: Company, Kotak Institutional Equities

KOTAK INSTITUTIONAL EQUITIES RESEARCH 37
Reliance Industries Oil, Gas & Consumable Fuels
Exhibit 41: Co-branded kirana store under JioMart
Source: Company, Kotak Institutional Equities
Exhibit 42: JioMart’s existing interface with WhatsApp
Source: Company, Kotak Institutional Equities

38 KOTAK INSTITUTIONAL EQUITIES RESEARCH
Oil, Gas & Consumable Fuels Reliance Industries
APPENDIX 3
We attended a webinar with Arvind Mediratta, MD of Metro Cash and Carry, who elucidated on the
company’s efforts to modernize kiranas and offer them cost-effective product distribution services. We
present key takeaways from the discussion below. We believe RR could emulate Metro’s kirana
modernization strategy in order to increase its value proposition to kiranas.
Metro Cash and Carry: decent kirana partnership model
Metro has a sizeable cash and carry retail business in India, catering to small retailers
primarily in southern India. We attended a webinar by Arvind Mediratta, CEO, Metro Cash
and Carry; key takeaways below:
Supply-side constraints for small shops. Small kiranas have to interact with 150-200+
suppliers to source stocks, and this process is difficult to manage. There is no
transparency in prices and FMCG companies have preferential schemes/discounts for
select few large retailers. The kiranas operate at thin margins of 12-15% so any kind of
cost rationalization makes a big difference.
Demand-side challenges on account of modern trade and e-commerce. E-
commerce companies are resorting to predatory pricing on the back of huge fund raises.
Kiranas can’t compete on such pricing. Customer needs are also continuously changing
with increasing demand for organic and frozen products. Kiranas don’t have the technical
knowhow to analyze customer behavior. Hence, are slow in adapting changing customer
needs. Kiranas also lack preferred digital payment options, which became a hurdle,
especially after demonetization. However, these kirana stores are champions of EDLC
operations and highest delivery speed.
Metro Cash and Carry’s value proposition to kiranas. Metro C&C is a wholesaler,
pure B2B player. It wants to ensure kiranas stay relevant in the current context of
digitization. Metro C&C has shifted gears from being only a goods supplier to a complete
solutions provider. Metro provides better terms than distributors, has a vast product
assortment, and also helps with credit facility, payments modes and cost-effective delivery
solutions. It also wants to help kiranas from a demand perspective, to increase their sales,
profits and better cash flows by helping them manage inventory days (typically 6-7 weeks;
this level can be reduced if online solutions are provided).
Smart mPOS installation. Metro has developed an ordering and assortment app for
kirana owners to see and order products. Pricing is volume linked (tier pricing/slab pricing).
All transactions are routed through this app. It helps in getting meaningful insights on
kirana’s customers like purchase behavior, ATV and frequency. Kiranas can then come out
with customized offers using targeted marketing and data analytics to improve sales and
absolute profits. From the data, we can have an auto replenishment program and top
SKUs can be identified. mPOS installations are ~30-40k with operations in 17 cities only.
The company charges a monthly maintenance rate for mPOS.
Store remodeling. Metro helps in converting kiranas into modern independent
stores/supermarkets, which offers better customer experience. The company indicates
sales increase by 50-60% due to this. Remodeling takes 24 hours in accordance to the
customers in the kirana’s catchment. Metro helps with planograms, assortment and store
layouts. Remodeling cost varies from Rs150k-300k. Payback is six months for store
remodeling and 3-4 months for mPOS device.
Kirana Success Centres. The company has customer consultants/experts to offer free
advisory services to kiranas, starting from assortment, better pricing and customer
analytics.
KOTAK INSTITUTIONAL EQUITIES RESEARCH 39
Reliance Industries Oil, Gas & Consumable Fuels
Technological challenges. Troubleshooting and customer service teams are always
needed on ground as kirana owners aren’t enough tech-savvy. They ensure that kiranas
are using mPOS regularly with ease for real-time data updates.
Government push. Demonetization and GST provided an impetus to kiranas to enter in
organized retail. South-based (AP, Karnataka) kirana owners are relatively more open to
adapt technology in comparison to Gujarat, UP and Punjab, which have shown reluctance
to migrate to GST.

For Private Circulation Only. FOR IMPORTANT INFORMATION ABOUT KOTAK SECURITIES’ RATING SYSTEM AND OTHER DISCLOSURES, REFER TO THE END OF THIS MATERIAL.
Revenues from travel, hospitality decline 54.6% qoq, top client concentration increases to 30%
Mindtree reported sequential revenue decline of 9.1% to US$253 mn, worse than estimate of
7.4% decline. All verticals except communications, media and technology (CMT) declined
sequentially with travel & hospitality (T&H) leading the way at 54.6% qoq. Revenues ex-top client
declined 15.5% qoq and 16.2% yoy to US$177 mn. The top client was the bright spot and grew
at 10.5% qoq and 43.7% yoy to US$76 mn. However, this has resulted in significant increase in
top client concentration to 30% of revenues from 24.8% in 4QFY20 and 20.1% in 1QFY20. EBIT
margin at 18.2% increased 110 bps qoq despite absorbing additional cost of 30 bps from visas
and 60 bps contribution to State Funds for fight against Covid. Two key factors for EBITDA margin
increase were—(1) 80 bps from rupee depreciation and (2) 30.2% qoq and 28.6% yoy absolute
decline in other expenses with decline in travel, subcontracting costs and other miscellaneous
expenses leading the way. Depreciation costs declined due to change in estimates of useful life of
assets. Net profit at Rs 2.13 bn grew 3.3% qoq and 129.3% yoy and was 2.4% higher than our
estimate.
Thoughts on top client concentration and future of travel and transportation vertical
We do not foresee any immediate risks to revenues from the top client since—(1) the sourcing
strategy from the top client is decentralized. As long as Mindtree manages efficient operations,
growth could continue, (2) Mindtree is exposed to high growth cloud platform of the client and
(3) it gets revenues from multiple divisions across the organization. While we do not foresee any
immediate risk to the business, longer-term risks from client concentration cannot be ignored. The
sharp 54.6% revenue decline in TT&H vertical captures the impact of furloughs of clients. The
decline also indicates relative lack of presence in legacy systems; Mindtree presence could be at
the experience layer, which is relatively easier to furlough. TT&H will be under pressure in the near
term. Rebound will be sharp once economic activity starts normalizing.
Marginal cut in revenue estimates with broadly unchanged EPS estimates
We cut our revenue estimates marginally with higher revenue decline modeled in other
businesses offset by higher revenues from the top client. We are surprised with the EBITDA margin
resilience in the face of sharp revenue decline. EBITDA margin has been helped by aggressive cost
rationalization with not much left in the tank on cost takeouts anymore. High client
concentration, risks of business model in transition and high exposure to challenged verticals keep
us cautious. We maintain REDUCE with an unchanged FV of Rs890.
Mindtree (MTCL) IT Services
A quarter that could have been worse but for top client. Mindtree reported sharp
sequential revenue decline of 9% with an even sharper decline of 15.5% excluding
revenues from the top client. EBIT margin was stable helped by 26% qoq decline in
other costs. Growth from the top client is a positive but comes with the concern of
concentration at 30% of revenues. Stock valuations are expensive against the backdrop
of high discretionary spending exposure and client concentration risks. REDUCE stays.
REDUCE
JULY 15, 2020
RESULT
Sector view: Cautious
CMP (`): 978
Fair Value (`): 890
BSE-30: 36,033
Kawaljeet Saluja
Sathishkumar S
Mindtree
Stock data Forecasts/valuations 2020 2021E 2022E
52-week range (Rs) (high,low) EPS (Rs) 38.3 54.9 62.5
Mcap (bn) (Rs/US$) EPS growth (%) (16.4) 43.3 13.8
ADTV-3M (mn) (Rs/US$) P/E (X) 25.5 17.8 15.7
Shareholding pattern (%) P/B (X) 5.1 4.3 3.6
Promoters 74.1 EV/EBITDA (X) 14.0 10.4 9.1
FIIs 11.9 RoE (%) 19.5 26.2 25.1
MFs/BFIs Div. yield (%) 3.1 1.7 1.9
Price performance (%) 1M 3M 12M Sales (Rs bn) 78 79 85
Absolute 7 32 30 EBITDA (Rs bn) 11 14 15
Rel. to BSE-30 0 13 40 Net profits (Rs bn) 6 9 10
1,063-652
161/2.2
3.7/2.1
1,092/14
[email protected]: +91 22 6218 6427
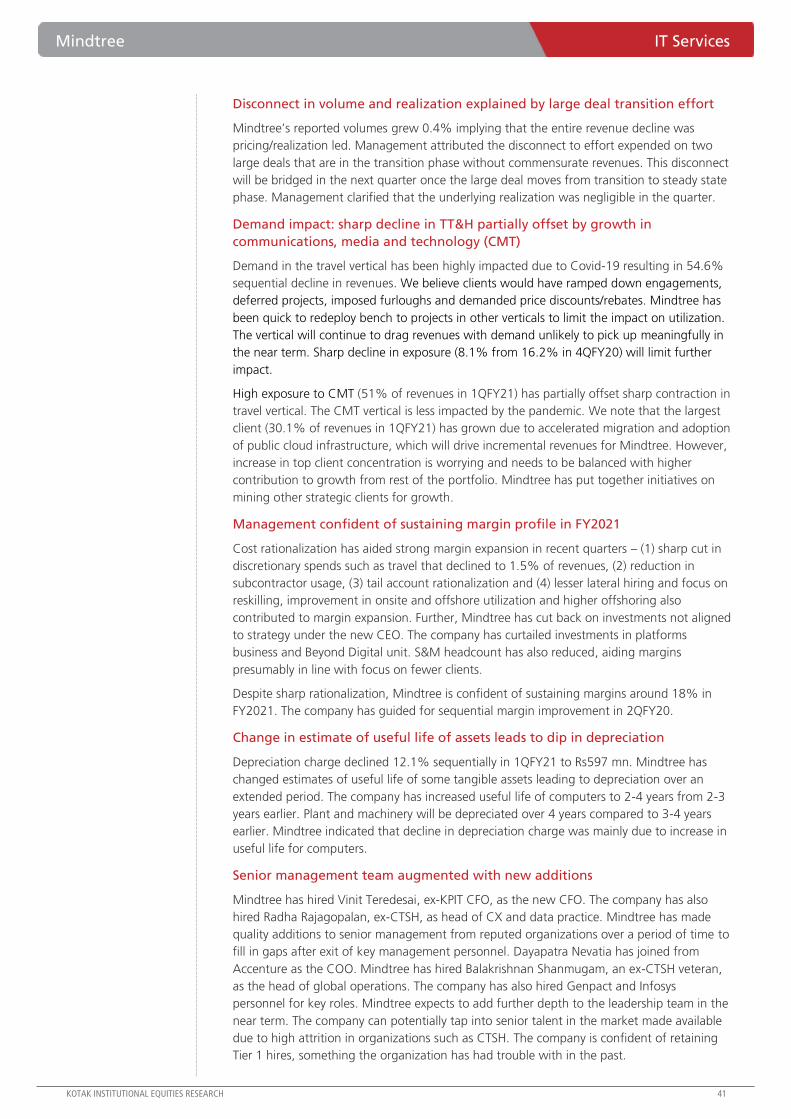
Mindtree IT Services
KOTAK INSTITUTIONAL EQUITIES RESEARCH 41
Disconnect in volume and realization explained by large deal transition effort
Mindtree’s reported volumes grew 0.4% implying that the entire revenue decline was
pricing/realization led. Management attributed the disconnect to effort expended on two
large deals that are in the transition phase without commensurate revenues. This disconnect
will be bridged in the next quarter once the large deal moves from transition to steady state
phase. Management clarified that the underlying realization was negligible in the quarter.
Demand impact: sharp decline in TT&H partially offset by growth in
communications, media and technology (CMT)
Demand in the travel vertical has been highly impacted due to Covid-19 resulting in 54.6%
sequential decline in revenues. We believe clients would have ramped down engagements,
deferred projects, imposed furloughs and demanded price discounts/rebates. Mindtree has
been quick to redeploy bench to projects in other verticals to limit the impact on utilization.
The vertical will continue to drag revenues with demand unlikely to pick up meaningfully in
the near term. Sharp decline in exposure (8.1% from 16.2% in 4QFY20) will limit further
impact.
High exposure to CMT (51% of revenues in 1QFY21) has partially offset sharp contraction in
travel vertical. The CMT vertical is less impacted by the pandemic. We note that the largest
client (30.1% of revenues in 1QFY21) has grown due to accelerated migration and adoption
of public cloud infrastructure, which will drive incremental revenues for Mindtree. However,
increase in top client concentration is worrying and needs to be balanced with higher
contribution to growth from rest of the portfolio. Mindtree has put together initiatives on
mining other strategic clients for growth.
Management confident of sustaining margin profile in FY2021
Cost rationalization has aided strong margin expansion in recent quarters – (1) sharp cut in
discretionary spends such as travel that declined to 1.5% of revenues, (2) reduction in
subcontractor usage, (3) tail account rationalization and (4) lesser lateral hiring and focus on
reskilling, improvement in onsite and offshore utilization and higher offshoring also
contributed to margin expansion. Further, Mindtree has cut back on investments not aligned
to strategy under the new CEO. The company has curtailed investments in platforms
business and Beyond Digital unit. S&M headcount has also reduced, aiding margins
presumably in line with focus on fewer clients.
Despite sharp rationalization, Mindtree is confident of sustaining margins around 18% in
FY2021. The company has guided for sequential margin improvement in 2QFY20.
Change in estimate of useful life of assets leads to dip in depreciation
Depreciation charge declined 12.1% sequentially in 1QFY21 to Rs597 mn. Mindtree has
changed estimates of useful life of some tangible assets leading to depreciation over an
extended period. The company has increased useful life of computers to 2-4 years from 2-3
years earlier. Plant and machinery will be depreciated over 4 years compared to 3-4 years
earlier. Mindtree indicated that decline in depreciation charge was mainly due to increase in
useful life for computers.
Senior management team augmented with new additions
Mindtree has hired Vinit Teredesai, ex-KPIT CFO, as the new CFO. The company has also
hired Radha Rajagopalan, ex-CTSH, as head of CX and data practice. Mindtree has made
quality additions to senior management from reputed organizations over a period of time to
fill in gaps after exit of key management personnel. Dayapatra Nevatia has joined from
Accenture as the COO. Mindtree has hired Balakrishnan Shanmugam, an ex-CTSH veteran,
as the head of global operations. The company has also hired Genpact and Infosys
personnel for key roles. Mindtree expects to add further depth to the leadership team in the
near term. The company can potentially tap into senior talent in the market made available
due to high attrition in organizations such as CTSH. The company is confident of retaining
Tier 1 hires, something the organization has had trouble with in the past.
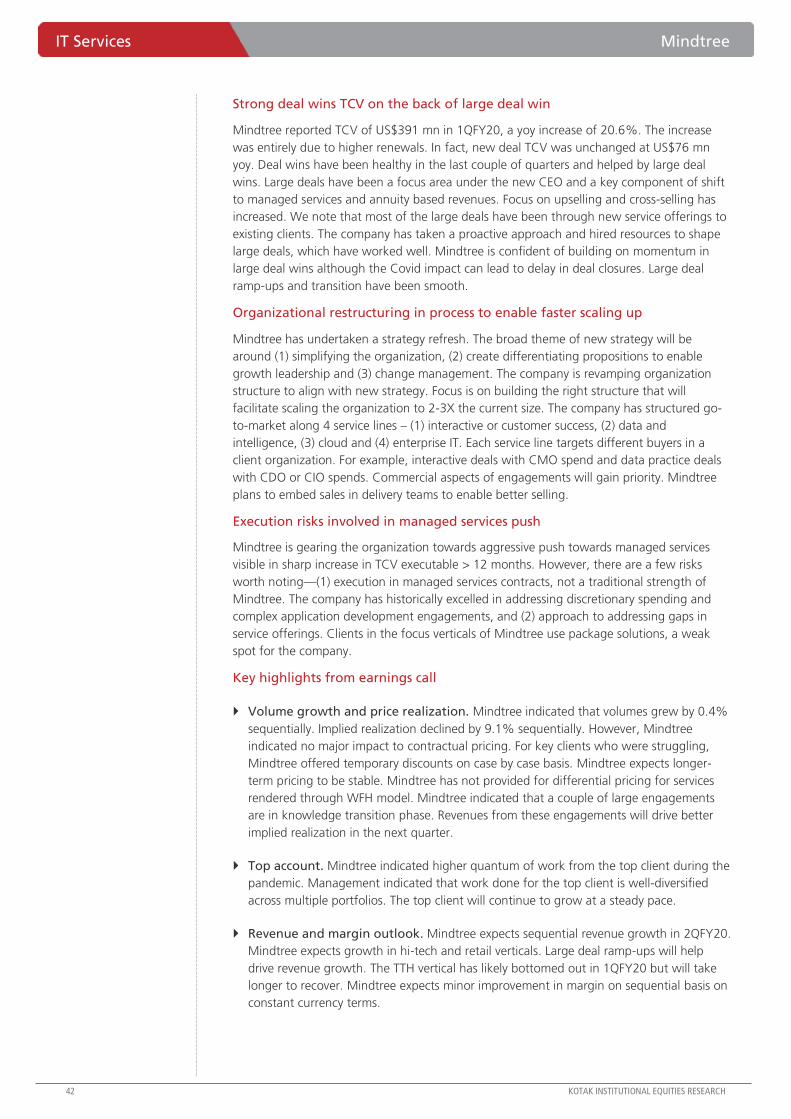
IT Services Mindtree
42 KOTAK INSTITUTIONAL EQUITIES RESEARCH
Strong deal wins TCV on the back of large deal win
Mindtree reported TCV of US$391 mn in 1QFY20, a yoy increase of 20.6%. The increase
was entirely due to higher renewals. In fact, new deal TCV was unchanged at US$76 mn
yoy. Deal wins have been healthy in the last couple of quarters and helped by large deal
wins. Large deals have been a focus area under the new CEO and a key component of shift
to managed services and annuity based revenues. Focus on upselling and cross-selling has
increased. We note that most of the large deals have been through new service offerings to
existing clients. The company has taken a proactive approach and hired resources to shape
large deals, which have worked well. Mindtree is confident of building on momentum in
large deal wins although the Covid impact can lead to delay in deal closures. Large deal
ramp-ups and transition have been smooth.
Organizational restructuring in process to enable faster scaling up
Mindtree has undertaken a strategy refresh. The broad theme of new strategy will be
around (1) simplifying the organization, (2) create differentiating propositions to enable
growth leadership and (3) change management. The company is revamping organization
structure to align with new strategy. Focus is on building the right structure that will
facilitate scaling the organization to 2-3X the current size. The company has structured go-
to-market along 4 service lines – (1) interactive or customer success, (2) data and
intelligence, (3) cloud and (4) enterprise IT. Each service line targets different buyers in a
client organization. For example, interactive deals with CMO spend and data practice deals
with CDO or CIO spends. Commercial aspects of engagements will gain priority. Mindtree
plans to embed sales in delivery teams to enable better selling.
Execution risks involved in managed services push
Mindtree is gearing the organization towards aggressive push towards managed services
visible in sharp increase in TCV executable > 12 months. However, there are a few risks
worth noting—(1) execution in managed services contracts, not a traditional strength of
Mindtree. The company has historically excelled in addressing discretionary spending and
complex application development engagements, and (2) approach to addressing gaps in
service offerings. Clients in the focus verticals of Mindtree use package solutions, a weak
spot for the company.
Key highlights from earnings call
Volume growth and price realization. Mindtree indicated that volumes grew by 0.4%
sequentially. Implied realization declined by 9.1% sequentially. However, Mindtree
indicated no major impact to contractual pricing. For key clients who were struggling,
Mindtree offered temporary discounts on case by case basis. Mindtree expects longer-
term pricing to be stable. Mindtree has not provided for differential pricing for services
rendered through WFH model. Mindtree indicated that a couple of large engagements
are in knowledge transition phase. Revenues from these engagements will drive better
implied realization in the next quarter.
Top account. Mindtree indicated higher quantum of work from the top client during the
pandemic. Management indicated that work done for the top client is well-diversified
across multiple portfolios. The top client will continue to grow at a steady pace.
Revenue and margin outlook. Mindtree expects sequential revenue growth in 2QFY20.
Mindtree expects growth in hi-tech and retail verticals. Large deal ramp-ups will help
drive revenue growth. The TTH vertical has likely bottomed out in 1QFY20 but will take
longer to recover. Mindtree expects minor improvement in margin on sequential basis on
constant currency terms.

Mindtree IT Services
KOTAK INSTITUTIONAL EQUITIES RESEARCH 43
Deal transition. Mindtree indicated that Realogy large deal has successfully completed
transition. Bulk of the revenues will be recognized in 2QFY20 .Mindtree indicated
seamless transition for deals won in the previous and current quarters. Mindtree indicated
that deal closures have been delayed to some extent due to the Covid impact.
Travel vertical. The travel vertical has been the most impacted due to the pandemic.
Mindtree indicated longstanding relationship with marquee logos in the travel vertical.
The travel vertical can rebound provided activity picks up pace for clients. Mindtree
expects weak outlook for the next couple of quarters, although discussions with clients
have started in a few pockets. Mindtree indicated the company has not lost market share
to peers and expects similar ramp down across vendors.
BFSI. Mindtree is fairly strong in insurance and is working on a few deals in banking. The
company is hopeful of reviving growth in the vertical.
Facilities. Mindtree is not planning to set up new facilities. The company indicated that
facilities cost in the near term will not be material change from 1QFY21 levels.
Margin walk-through. Mindtree reported EBITDA margin at 18.2% compared to
17.1% in the previous quarter helped by 30 bps tailwinds from operational efficiencies,
especially in G&A, 80 bps tailwind from rupee depreciation and 100 bps tailwind from
one-time contribution to PM CARES fund, partially offset by 90 bps headwind from visa
cost and contribution to Covid relief. Mindtree will continue to pursue avenues for
operational efficiencies.
Client metrics. Number of US$50 mn clients was flat qoq and yoy at 1. Number of
US$25 mn clients was flat qoq and was up by 1 yoy to 5.
Tail account rationalization. Mindtree will focus more on cross sell and upsell to
strategic clients. Rationalization will not create disruption in revenues and margins in tail
accounts. Management is confident of upsell and cross sell of services across all service
lines to every account, which is strategic.
Wage hikes and promotions. Mindtree is yet to decide on wage hikes. The company
will go ahead with promotions as per usual timeline.
Fixed price projects. Contribution from fixed price projects increased sharply to 67.1%
from 58.8% in the previous quarter. Mindtree indicated that the sharp increase was due
to change in vertical mix of revenues. Management indicated that higher contribution
from fixed price projects can help drive higher operational efficiencies.

IT Services Mindtree
44 KOTAK INSTITUTIONAL EQUITIES RESEARCH
Exhibit 1: Mindtree, 1QFY21 interim results (Ind-AS), March fiscal year-ends (Rs mn)
Source: Company, Kotak Institutional Equities estimates
Exhibit 2: Key changes to estimates, March fiscal year-ends, 2021-23E
Source: Kotak Institutional Equities estimates
1QFY21 1QFY21E 1QFY20 4QFY20 KIE yoy qoq FY2020 FY2019 % chg. FY2021E % chg.
Revenues (US$ mn) 253.2 257.8 264.2 278.4 (1.8) (4.2) (9.1) 1,089 1,001 8.7 1,051 (3.4)
Revenues 19,088 19,538 18,342 20,505 (2.3) 4.1 (6.9) 77,643 70,215 10.6 79,298 2.1
Direct costs (12,776) (12,626) (12,532) (12,933) 1.2 1.9 (1.2) (50,647) (44,212) 14.6 (50,607) (0.1)
Gross profit 6,312 6,912 5,810 7,572 (8.7) 8.6 (16.6) 26,996 26,003 3.8 28,692 6.3
SG&A expenses (2,834) (3,556) (3,969) (4,061) (20.3) (28.6) (30.2) (16,098) (15,358) 4.8 (14,603) (9.3)
EBITDA 3,478 3,356 1,841 3,511 3.6 88.9 (0.9) 10,898 10,645 2.4 14,089 29.3
Depreciation (597) (660) (669) (679) (9.6) (10.8) (12.1) (2,754) (1,641) 67.8 (2,641) (4.1)
EBIT 2,881 2,695 1,172 2,832 6.9 145.8 1.7 8,144 9,004 (9.6) 11,448 40.6
Interest (131) (128) (130) (128) (529) (29) (524)
Other income 148 173 220 (92) (14.3) (32.7) (260.9) 673 893 (24.6) 1,349 100.5
Profit before tax 2,898 2,740 1,262 2,612 5.8 129.6 10.9 8,288 9,868 (16.0) 12,273 48.1
Tax (768) (659) (335) (551) 16.5 129.3 39.4 (1,979) (2,327) (15.0) (3,234) 63.4
Net profit 2,130 2,081 927 2,061 2.4 129.8 3.3 6,309 7,541 (16.3) 9,039 43.3
EPS (Rs/ share) 12.9 12.7 5.6 12.5 2.1 129.3 3.3 38.3 45.8 (16.4) 54.9 43.3
Shares outstanding (mn) 164.7 164.6 164.4 164.6 164.6 164.6 164.6
Margins (%)
Gross margin 33.1 35.4 31.7 36.9 34.8 37.0 36.2
SG&A as % of revenues 14.8 18.2 21.6 19.8 20.7 21.9 18.4
EBITDA margin 18.2 17.2 10.0 17.1 14.0 15.2 17.8
EBIT margin 15.1 13.8 6.4 13.8 10.5 12.8 14.4
Tax rate (%) 26.5 24.1 26.5 21.1 23.9 23.6 26.3
% chg.
2021E 2022E 2023E 2021E 2022E 2023E 2021E 2022E 2023E
Revenues (Rs mn) 79,298 85,403 92,110 79,582 86,628 93,620 (0.4) (1.4) (1.6)
Revenues (US$ mn) 1,051 1,124 1,212 1,054 1,140 1,232 (0.2) (1.4) (1.6)
Growth (%) (3.4) 6.9 7.9 (3.2) 8.2 8.1
Growth (c/c, %) (2.9) 6.9 7.9
Growth (organic c/c, %) (3.4) 6.9 7.9
EBITDA (Rs mn) 14,089 15,418 15,907 13,909 14,953 15,623 1.3 3.1 1.8
Net Profit (Rs mn) 9,039 10,284 11,034 9,037 10,119 11,060 0.0 1.6 (0.2)
Fully diluted EPS (Rs/share) 54.9 62.5 67.0 54.9 61.5 67.2 0.0 1.6 (0.2)
Re/ $ rate 75.4 76.0 76.0 75.5 76.0 76.0 (0.1) — —
EBITDA margin (%) 17.8 18.1 17.3 17.5 17.3 16.7
EBIT margin (%) 14.4 14.9 14.6 14.1 14.1 13.9
New Old Change (%)
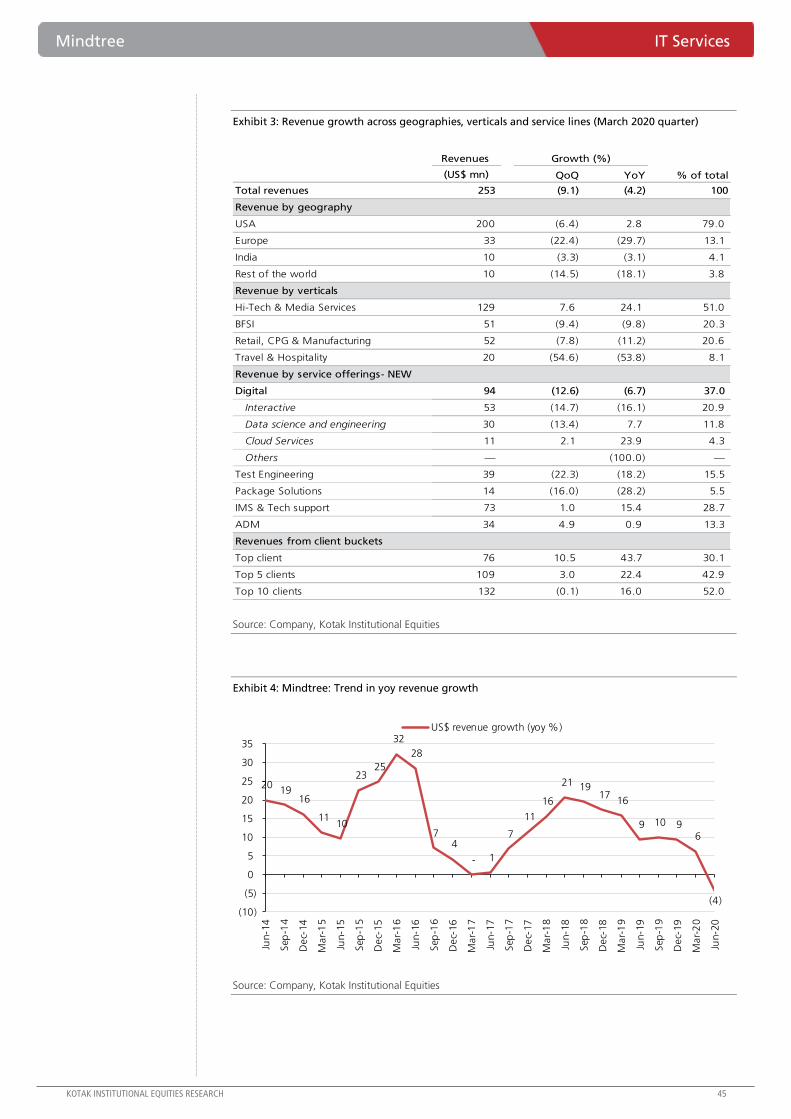
Mindtree IT Services
KOTAK INSTITUTIONAL EQUITIES RESEARCH 45
Exhibit 3: Revenue growth across geographies, verticals and service lines (March 2020 quarter)
Source: Company, Kotak Institutional Equities
Exhibit 4: Mindtree: Trend in yoy revenue growth
Source: Company, Kotak Institutional Equities
Revenues
(US$ mn) QoQ YoY % of total
Total revenues 253 (9.1) (4.2) 100
Revenue by geography
USA 200 (6.4) 2.8 79.0
Europe 33 (22.4) (29.7) 13.1
India 10 (3.3) (3.1) 4.1
Rest of the world 10 (14.5) (18.1) 3.8
Revenue by verticals
Hi-Tech & Media Services 129 7.6 24.1 51.0
BFSI 51 (9.4) (9.8) 20.3
Retail, CPG & Manufacturing 52 (7.8) (11.2) 20.6
Travel & Hospitality 20 (54.6) (53.8) 8.1
Revenue by service offerings- NEW
Digital 94 (12.6) (6.7) 37.0
Interactive 53 (14.7) (16.1) 20.9
Data science and engineering 30 (13.4) 7.7 11.8
Cloud Services 11 2.1 23.9 4.3
Others — (100.0) —
Test Engineering 39 (22.3) (18.2) 15.5
Package Solutions 14 (16.0) (28.2) 5.5
IMS & Tech support 73 1.0 15.4 28.7
ADM 34 4.9 0.9 13.3
Revenues from client buckets
Top client 76 10.5 43.7 30.1
Top 5 clients 109 3.0 22.4 42.9
Top 10 clients 132 (0.1) 16.0 52.0
Growth (%)
20 19
16
11 10
23 25
32
28
7 4
- 1
7
11
16
21 1917
16
9 10 9 6
(4)(10)
(5)
0
5
10
15
20
25
30
35
Jun-1
4
Sep
-14
Dec-
14
Mar-
15
Jun-1
5
Sep
-15
Dec-
15
Mar-
16
Jun-1
6
Sep
-16
Dec-
16
Mar-
17
Jun-1
7
Sep
-17
Dec-
17
Mar-
18
Jun-1
8
Sep
-18
Dec-
18
Mar-
19
Jun-1
9
Sep
-19
Dec-
19
Mar-
20
Jun-2
0
US$ revenue growth (yoy %)

IT Services Mindtree
46 KOTAK INSTITUTIONAL EQUITIES RESEARCH
Exhibit 5: Strong growth in top client is a sharp contrast to sharp decline in non-top 10 accounts
Source: Company, Kotak Institutional Equities
Exhibit 6: Mindtree: TCV of deal wins increases 18.7% on ttm basis helped by large deal wins and strong renewals from top client
Source: Company, Kotak Institutional Equities
Exhibit 7: EBITDA margin increases by 110 bps in the quarter to 18.2%
Source: Company, Kotak Institutional Equities
Jun-17 Sep-17 Dec-17 Mar-18 Jun-18 Sep-18 Dec-18 Mar-19 Jun-19 Sep-19 Dec-19 Mar-20 Jun-20 4 qtr 8 qtr 12 qtr
Revenues (US$ mn)
Top client 30.6 33.2 35.6 40.3 46.9 49.8 50.3 51.8 53.1 55.8 63.6 69.0 76.3 9.5 6.3 7.9
Top-5 clients 60.2 62.1 67.7 72.4 78.0 83.3 85.0 86.9 88.8 90.0 99.3 105.5 108.7 5.2 4.2 5.0
Top-10 clients 83.0 86.4 93.6 98.8 105.1 110.4 110.9 112.5 113.6 116.8 125.5 132.0 131.8 3.8 2.9 3.9
Non Top-10 accounts 117.1 119.8 120.7 127.4 136.4 136.0 140.6 149.5 150.6 154.2 149.7 146.4 121.4 (5.2) (1.4) 0.3
Ex-top client 169.5 173.0 178.7 185.9 194.6 196.6 201.2 210.2 211.1 215.2 211.6 209.4 176.9 (4.3) (1.2) 0.4
Growth (%, qoq)
Top client 9.5 8.4 7.2 13.2 16.4 6.2 1.1 2.9 2.6 5.1 13.9 8.6 10.5
Top-5 clients 0.3 3.0 9.1 6.9 7.8 6.8 2.1 2.2 2.2 1.4 10.4 6.2 3.0
Top-10 clients 1.3 4.0 8.4 5.6 6.3 5.1 0.5 1.4 1.0 2.8 7.4 5.2 (0.1)
Non Top-10 accounts 3.0 2.3 0.7 5.6 7.1 (0.3) 3.4 6.3 0.7 2.4 (2.9) (2.2) (17.1)
Ex-top client 1.1 2.1 3.3 4.0 4.7 1.0 2.3 4.5 0.4 1.9 (1.6) (1.1) (15.5)
CQGR (%)
Mar-18 Jun-18 Sep-18 Dec-18 Mar-19 Jun-19 Sep-19 Dec-19 Mar-20 Jun-20
Renewals 256 255 222 184 158 248 186 128 206 315
New 42 51 49 72 84 76 121 79 187 76
Total TCV (US$ mn) 298 306 271 256 242 324 307 207 393 391
Expiring within 1 year 237 259 198 212 218 271 239 174 286 265
Expiring >1 year 61 47 73 44 23 53 68 33 107 126
Digital 102 139 162 136 126 137 140 127 190 NA
Total TCV (TTM US$ mn) 1,011 1,055 1,119 1,131 1,075 1,093 1,129 1,080 1,231 1,298
18.4
20.8 19.5
21.5
20.0 19.8
20.5 19.5
17.6 18.5
17.7 17.1
14.7
12.5 13.4
14.2
11.1 11.6
15.1 16.1
14.1 15.4
15.9 15.2
10.0
13.0
15.6
17.1 18.2
5
10
15
20
25
Jun-1
3
Sep
-13
Dec-
13
Mar-
14
Jun-1
4
Sep
-14
Dec-
14
Mar-
15
Jun-1
5
Sep
-15
Dec-
15
Mar-
16
Jun-1
6
Sep
-16
Dec-
16
Mar-
17
Jun-1
7
Sep
-17
Dec-
17
Mar-
18
Jun-1
8
Sep
-18
Dec-
18
Mar-
19
Jun-1
9
Sep
-19
Dec-
19
Mar-
20
Jun-2
0
EBITDA margin (%)

Mindtree IT Services
KOTAK INSTITUTIONAL EQUITIES RESEARCH 47
Exhibit 8: Travel vertical reports a loss due to sharp revenue decline
Source: Company, Kotak Institutional Equities
Exhibit 9: BFSI margins have improved to corporate average levels
Source: Company, Kotak Institutional Equities
10.4
5.1
13.0
15.6
10.4 8.8
13.2
17.8
12.0
16.8 14.9
12.8
6.0
10.3 11.6 12.1
(13.2)(15)
(10)
(5)
0
5
10
15
20
Jun-1
6
Sep
-16
Dec-
16
Mar-
17
Jun-1
7
Sep
-17
Dec-
17
Mar-
18
Jun-1
8
Sep
-18
Dec-
18
Mar-
19
Jun-1
9
Sep
-19
Dec-
19
Mar-
20
Jun-2
0
Travel segment EBITDA margins
10.8 9.2
7.1 8.6 9.1
7.1
11.4 9.9
3.3
5.7
2.6
4.6 4.8
11.3
14.9
17.1
20.2
0
5
10
15
20
25
Jun-1
6
Sep
-16
Dec-
16
Mar-
17
Jun-1
7
Sep
-17
Dec-
17
Mar-
18
Jun-1
8
Sep
-18
Dec-
18
Mar-
19
Jun-1
9
Sep
-19
Dec-
19
Mar-
20
Jun-2
0
BFSI segment EBITDA margins

IT Services Mindtree
48 KOTAK INSTITUTIONAL EQUITIES RESEARCH
Exhibit 10: Mindtree: Near-term revenue and margin forecast
Source: Company, Kotak Institutional Equities estimates
Exhibit 11: Mindtree: Trend in digital revenue growth (%)
Source: Company, Kotak Institutional Equities
264
271 275
278
253
260
266 271
10.0
13.0
15.6
17.1 18.2
17.5 17.4 17.9
0
2
4
6
8
10
12
14
16
18
20
240
245
250
255
260
265
270
275
280
285
Jun-19 Sep-19 Dec-19 Mar-20 Jun-20 Sep-20E Dec-20E Mar-21E
Digital revenues (LHS, US$ mn) EBITDA margin (RHS, %)
84 87 93
97 100
103 105 107
94
19.1 18.7
13.6
10.6
(6.7)(10)
(5)
0
5
10
15
20
25
60
65
70
75
80
85
90
95
100
105
110
Jun-18 Sep-18 Dec-18 Mar-19 Jun-19 Sep-19 Dec-19 Mar-20 Jun-20
Digital revenues (LHS, US$ mn) Digital revenue growth (RHS, yoy %)

Mindtree IT Services
KOTAK INSTITUTIONAL EQUITIES RESEARCH 49
Exhibit 12: Mindtree: Trend in Interactive practice growth (%)
Source: Company, Kotak Institutional Equities
Exhibit 13: Top client now accounts for 30.1% of revenues
Source: Company, Kotak Institutional Equities
52 51
56 59
63 64 61 62
53
20.5
26.5
10.4
5.3
(16.1)
(20)
(15)
(10)
(5)
0
5
10
15
20
25
30
30
35
40
45
50
55
60
65
Jun-18 Sep-18 Dec-18 Mar-19 Jun-19 Sep-19 Dec-19 Mar-20 Jun-20
Digital revenues (LHS, US$ mn) Digital revenue growth (RHS, yoy %)
30.1
0
5
10
15
20
25
30
35
Mar-
12
Sep
-12
Mar-
13
Sep
-13
Mar-
14
Sep
-14
Mar-
15
Sep
-15
Mar-
16
Sep
-16
Mar-
17
Sep
-17
Mar-
18
Sep
-18
Mar-
19
Sep
-19
Mar-
20
Revenue contribution from top client (%)

IT Services Mindtree
50 KOTAK INSTITUTIONAL EQUITIES RESEARCH
Exhibit 14: Mindtree: Subcontracting expenses have decline by 110 bps to 6.8% of revenues
Source: Company, Kotak Institutional Equities
Exhibit 15: Travel expenses have declined sharply on absolute basis
Source: Company, Kotak Institutional Equities
5.5
5.9 6.1 6.2
6.0
6.7 6.6
6.1 6.1 6.1
5.5 5.8
6.1 5.9 5.9
7.5 7.3 7.3 7.4
8.0
8.6
7.9 7.6
7.9
6.8
4
5
6
7
8
9
Jun-1
4
Sep
-14
Dec-
14
Mar-
15
Jun-1
5
Sep
-15
Dec-
15
Mar-
16
Jun-1
6
Sep
-16
Dec-
16
Mar-
17
Jun-1
7
Sep
-17
Dec-
17
Mar-
18
Jun-1
8
Sep
-18
Dec-
18
Mar-
19
Jun-1
9
Sep
-19
Dec-
19
Mar-
20
Jun-2
0
Subcontracting charges as a % of revenues
493 518 509
747
540 528 518
695 750
813748
867 837 817744
292
3.8 4.0 3.9
5.8
4.1 3.8
3.5
4.2 4.3 4.5
4.1
4.7 4.4
4.2
3.6
1.5
-
100
200
300
400
500
600
700
800
900
1,000
0
1
2
3
4
5
6
7
Sep
-16
Dec-
16
Mar-
17
Jun-1
7
Sep
-17
Dec-
17
Mar-
18
Jun-1
8
Sep
-18
Dec-
18
Mar-
19
Jun-1
9
Sep
-19
Dec-
19
Mar-
20
Jun-2
0
Travel expense (Rs mn) (RHS) Travel expense as a % of revenues (LHS)
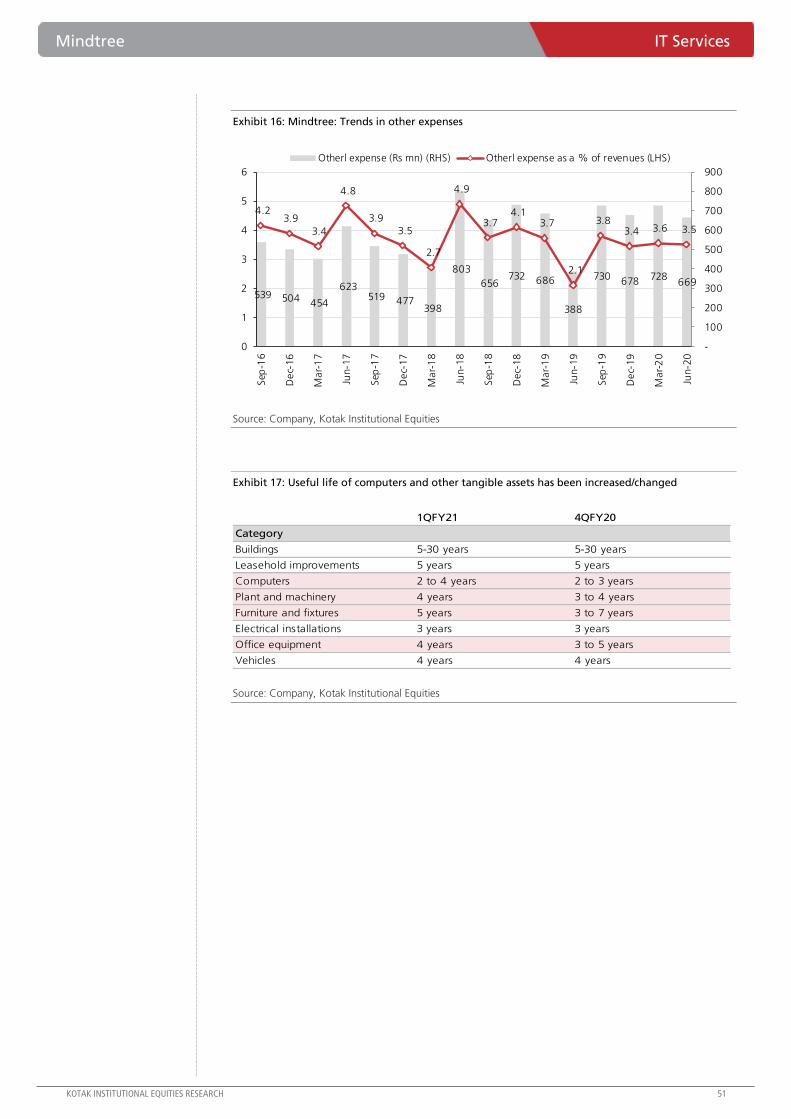
Mindtree IT Services
KOTAK INSTITUTIONAL EQUITIES RESEARCH 51
Exhibit 16: Mindtree: Trends in other expenses
Source: Company, Kotak Institutional Equities
Exhibit 17: Useful life of computers and other tangible assets has been increased/changed
Source: Company, Kotak Institutional Equities
539 504 454
623 519 477
398
803
656 732 686
388
730678 728
669
4.2 3.9
3.4
4.8
3.9
3.5
2.7
4.9
3.7 4.1
3.7
2.1
3.8 3.4 3.6 3.5
-
100
200
300
400
500
600
700
800
900
0
1
2
3
4
5
6
Sep
-16
Dec-
16
Mar-
17
Jun-1
7
Sep
-17
Dec-
17
Mar-
18
Jun-1
8
Sep
-18
Dec-
18
Mar-
19
Jun-1
9
Sep
-19
Dec-
19
Mar-
20
Jun-2
0
Otherl expense (Rs mn) (RHS) Otherl expense as a % of revenues (LHS)
1QFY21 4QFY20
Category
Buildings 5-30 years 5-30 years
Leasehold improvements 5 years 5 years
Computers 2 to 4 years 2 to 3 years
Plant and machinery 4 years 3 to 4 years
Furniture and fixtures 5 years 3 to 7 years
Electrical installations 3 years 3 years
Office equipment 4 years 3 to 5 years
Vehicles 4 years 4 years
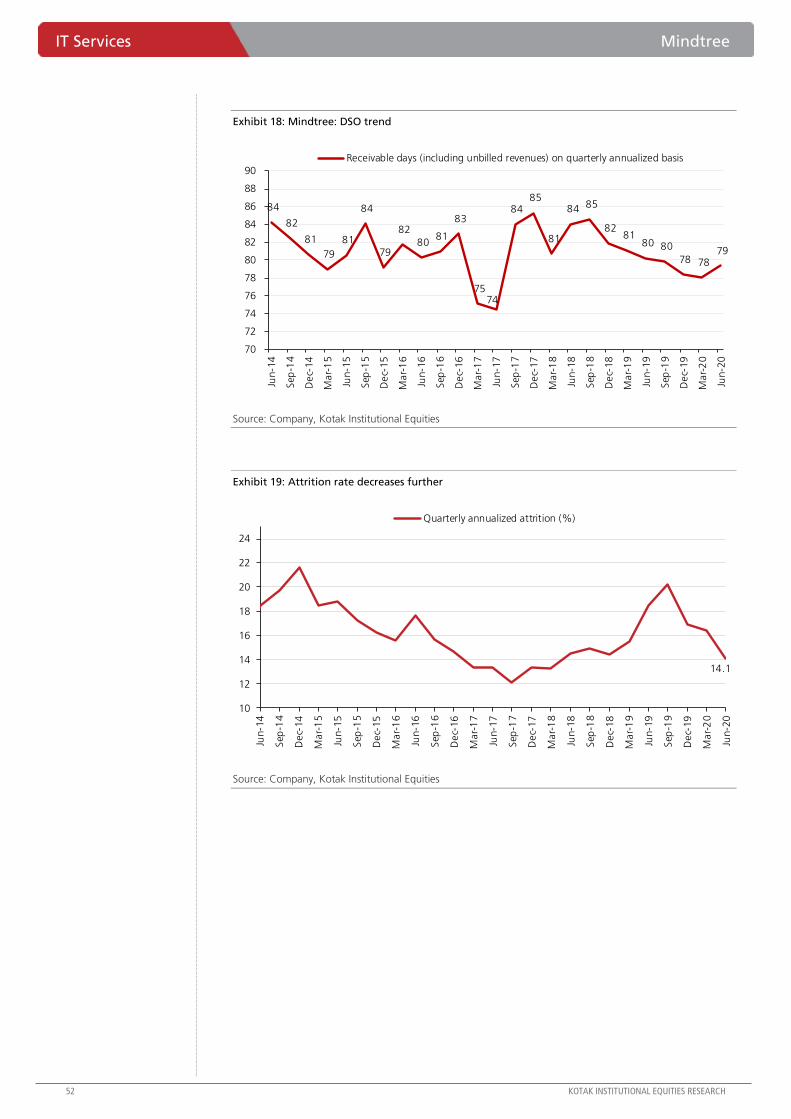
IT Services Mindtree
52 KOTAK INSTITUTIONAL EQUITIES RESEARCH
Exhibit 18: Mindtree: DSO trend
Source: Company, Kotak Institutional Equities
Exhibit 19: Attrition rate decreases further
Source: Company, Kotak Institutional Equities
84
82
81
79
81
84
79
82
80 81
83
75 74
84 85
81
84 85
82 81
80 80
78 78 79
70
72
74
76
78
80
82
84
86
88
90
Jun-1
4
Sep
-14
Dec-
14
Mar-
15
Jun-1
5
Sep
-15
Dec-
15
Mar-
16
Jun-1
6
Sep
-16
Dec-
16
Mar-
17
Jun-1
7
Sep
-17
Dec-
17
Mar-
18
Jun-1
8
Sep
-18
Dec-
18
Mar-
19
Jun-1
9
Sep
-19
Dec-
19
Mar-
20
Jun-2
0
Receivable days (including unbilled revenues) on quarterly annualized basis
14.1
10
12
14
16
18
20
22
24
Jun-1
4
Sep
-14
Dec-
14
Mar-
15
Jun-1
5
Sep
-15
Dec-
15
Mar-
16
Jun-1
6
Sep
-16
Dec-
16
Mar-
17
Jun-1
7
Sep
-17
Dec-
17
Mar-
18
Jun-1
8
Sep
-18
Dec-
18
Mar-
19
Jun-1
9
Sep
-19
Dec-
19
Mar-
20
Jun-2
0
Quarterly annualized attrition (%)
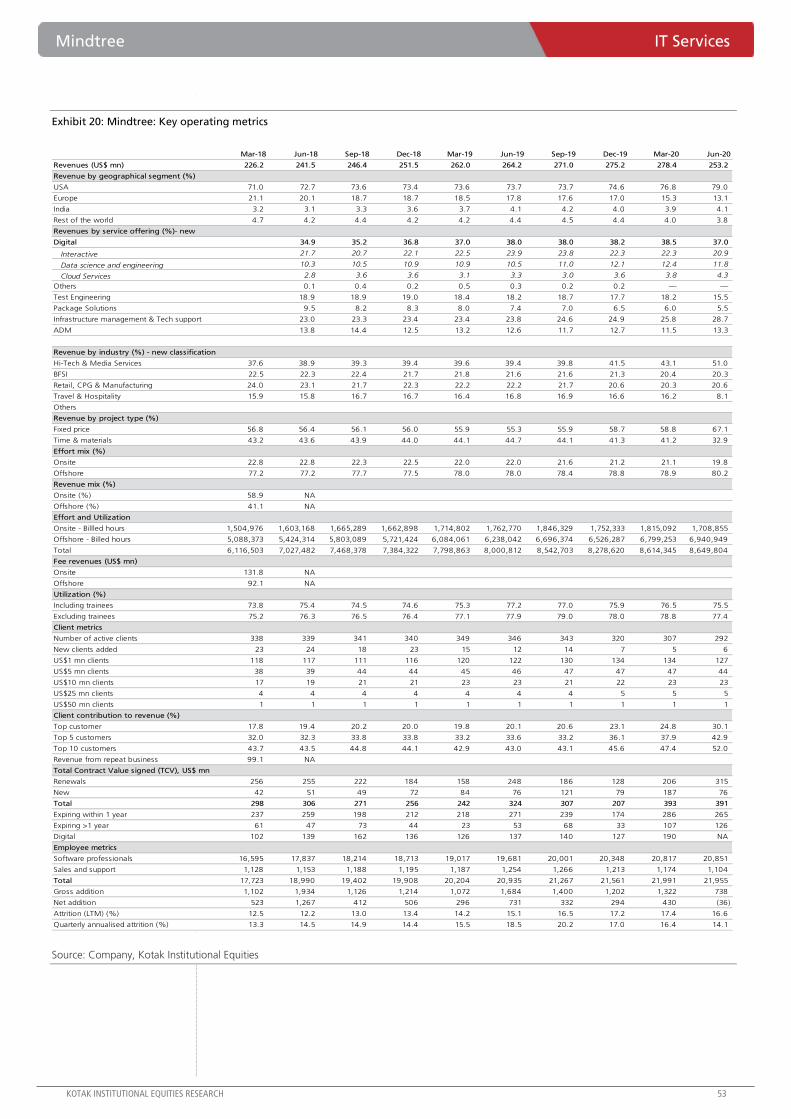
Mindtree IT Services
KOTAK INSTITUTIONAL EQUITIES RESEARCH 53
Exhibit 20: Mindtree: Key operating metrics
Source: Company, Kotak Institutional Equities
Mar-18 Jun-18 Sep-18 Dec-18 Mar-19 Jun-19 Sep-19 Dec-19 Mar-20 Jun-20
Revenues (US$ mn) 226.2 241.5 246.4 251.5 262.0 264.2 271.0 275.2 278.4 253.2
Revenue by geographical segment (%)
USA 71.0 72.7 73.6 73.4 73.6 73.7 73.7 74.6 76.8 79.0
Europe 21.1 20.1 18.7 18.7 18.5 17.8 17.6 17.0 15.3 13.1
India 3.2 3.1 3.3 3.6 3.7 4.1 4.2 4.0 3.9 4.1
Rest of the world 4.7 4.2 4.4 4.2 4.2 4.4 4.5 4.4 4.0 3.8
Revenues by service offering (%)- new
Digital 34.9 35.2 36.8 37.0 38.0 38.0 38.2 38.5 37.0
Interactive 21.7 20.7 22.1 22.5 23.9 23.8 22.3 22.3 20.9
Data science and engineering 10.3 10.5 10.9 10.9 10.5 11.0 12.1 12.4 11.8
Cloud Services 2.8 3.6 3.6 3.1 3.3 3.0 3.6 3.8 4.3
Others 0.1 0.4 0.2 0.5 0.3 0.2 0.2 — —
Test Engineering 18.9 18.9 19.0 18.4 18.2 18.7 17.7 18.2 15.5
Package Solutions 9.5 8.2 8.3 8.0 7.4 7.0 6.5 6.0 5.5
Infrastructure management & Tech support 23.0 23.3 23.4 23.4 23.8 24.6 24.9 25.8 28.7
ADM 13.8 14.4 12.5 13.2 12.6 11.7 12.7 11.5 13.3
Revenue by industry (%) - new classification
Hi-Tech & Media Services 37.6 38.9 39.3 39.4 39.6 39.4 39.8 41.5 43.1 51.0
BFSI 22.5 22.3 22.4 21.7 21.8 21.6 21.6 21.3 20.4 20.3
Retail, CPG & Manufacturing 24.0 23.1 21.7 22.3 22.2 22.2 21.7 20.6 20.3 20.6
Travel & Hospitality 15.9 15.8 16.7 16.7 16.4 16.8 16.9 16.6 16.2 8.1
Others
Revenue by project type (%)
Fixed price 56.8 56.4 56.1 56.0 55.9 55.3 55.9 58.7 58.8 67.1
Time & materials 43.2 43.6 43.9 44.0 44.1 44.7 44.1 41.3 41.2 32.9
Effort mix (%)
Onsite 22.8 22.8 22.3 22.5 22.0 22.0 21.6 21.2 21.1 19.8
Offshore 77.2 77.2 77.7 77.5 78.0 78.0 78.4 78.8 78.9 80.2
Revenue mix (%)
Onsite (%) 58.9 NA
Offshore (%) 41.1 NA
Effort and Utilization
Onsite - Billled hours 1,504,976 1,603,168 1,665,289 1,662,898 1,714,802 1,762,770 1,846,329 1,752,333 1,815,092 1,708,855
Offshore - Billed hours 5,088,373 5,424,314 5,803,089 5,721,424 6,084,061 6,238,042 6,696,374 6,526,287 6,799,253 6,940,949
Total 6,116,503 7,027,482 7,468,378 7,384,322 7,798,863 8,000,812 8,542,703 8,278,620 8,614,345 8,649,804
Fee revenues (US$ mn)
Onsite 131.8 NA
Offshore 92.1 NA
Utilization (%)
Including trainees 73.8 75.4 74.5 74.6 75.3 77.2 77.0 75.9 76.5 75.5
Excluding trainees 75.2 76.3 76.5 76.4 77.1 77.9 79.0 78.0 78.8 77.4
Client metrics
Number of active clients 338 339 341 340 349 346 343 320 307 292
New clients added 23 24 18 23 15 12 14 7 5 6
US$1 mn clients 118 117 111 116 120 122 130 134 134 127
US$5 mn clients 38 39 44 44 45 46 47 47 47 44
US$10 mn clients 17 19 21 21 23 23 21 22 23 23
US$25 mn clients 4 4 4 4 4 4 4 5 5 5
US$50 mn clients 1 1 1 1 1 1 1 1 1 1
Client contribution to revenue (%)
Top customer 17.8 19.4 20.2 20.0 19.8 20.1 20.6 23.1 24.8 30.1
Top 5 customers 32.0 32.3 33.8 33.8 33.2 33.6 33.2 36.1 37.9 42.9
Top 10 customers 43.7 43.5 44.8 44.1 42.9 43.0 43.1 45.6 47.4 52.0
Revenue from repeat business 99.1 NA
Total Contract Value signed (TCV), US$ mn
Renewals 256 255 222 184 158 248 186 128 206 315
New 42 51 49 72 84 76 121 79 187 76
Total 298 306 271 256 242 324 307 207 393 391
Expiring within 1 year 237 259 198 212 218 271 239 174 286 265
Expiring >1 year 61 47 73 44 23 53 68 33 107 126
Digital 102 139 162 136 126 137 140 127 190 NA
Employee metrics
Software professionals 16,595 17,837 18,214 18,713 19,017 19,681 20,001 20,348 20,817 20,851
Sales and support 1,128 1,153 1,188 1,195 1,187 1,254 1,266 1,213 1,174 1,104
Total 17,723 18,990 19,402 19,908 20,204 20,935 21,267 21,561 21,991 21,955
Gross addition 1,102 1,934 1,126 1,214 1,072 1,684 1,400 1,202 1,322 738
Net addition 523 1,267 412 506 296 731 332 294 430 (36)
Attrition (LTM) (%) 12.5 12.2 13.0 13.4 14.2 15.1 16.5 17.2 17.4 16.6
Quarterly annualised attrition (%) 13.3 14.5 14.9 14.4 15.5 18.5 20.2 17.0 16.4 14.1

IT Services Mindtree
54 KOTAK INSTITUTIONAL EQUITIES RESEARCH
Exhibit 21: Condensed consolidated financials for Mindtree, March fiscal year-ends, 2016-23E (Rs mn)
Source: Company, Kotak Institutional Equities estimates
2016 2017 2018 2019 2020 2021E 2022E 2023E
Profit model
Revenues 46,896 52,364 54,628 70,215 77,643 79,298 85,403 92,110
EBIT 6,967 5,323 5,690 9,004 8,144 11,448 12,740 13,424
Interest (expense)/income (4) (191) (169) (29) (529) (524) (524) (524)
Other income 810 445 1,902 893 673 1,349 1,761 2,326
Pretax profits 7,773 5,577 7,423 9,868 8,288 12,273 13,977 15,226
Tax (1,741) (1,363) (1,722) (2,327) (1,979) (3,234) (3,693) (4,192)
Profit after tax 6,032 4,214 5,701 7,541 6,309 9,039 10,284 11,034
Diluted earnings per share (Rs) 35.9 25.1 34.5 45.8 38.3 54.9 62.5 67.0
Balance sheet
Total equity 23,956 25,771 27,414 33,061 31,568 37,326 44,525 52,248
Deferred taxation liability (602) (624) (318) (388) (1,835) (1,835) (1,835) (1,835)
Total borrowings 433 991 3,009 5 5,663 5,139 4,615 4,091
Current liabilities 9,013 7,144 6,942 8,724 14,335 13,949 14,523 15,166
Total liabilities and equity 32,800 33,282 37,047 41,402 49,731 54,579 61,828 69,671
Cash 4,491 8,435 11,304 10,598 13,618 19,356 25,777 32,335
Other current assets 15,846 14,435 16,083 20,838 21,885 22,788 24,648 26,697
Goodwill 7,606 6,411 6,059 5,912 5,491 5,128 4,806 4,806
Tangible fixed assets 4,857 4,001 3,601 4,054 8,737 7,307 6,597 5,833
Total assets 32,800 33,282 37,047 41,402 49,731 54,579 61,828 69,671
Free cash flow
Operating cash flow, excl. WC 8,407 7,181 8,029 10,683 11,177 14,089 15,418 15,907
Tax paid (1,939) (1,771) (1,632) (2,255) (1,640) (3,234) (3,693) (4,192)
Working capital changes (2,243) 1,217 (833) (2,360) 420 (1,289) (1,285) (1,406)
Capital expenditure (1,315) (846) (1,011) (1,708) (1,220) (848) (1,646) (1,719)
Acquisitions (6,659) (467) (164) — — — — —
Free cash flow (3,749) 5,314 4,389 4,360 8,737 8,717 8,794 8,590
Ratios (%)
EBIT margin 14.9 10.2 10.4 12.8 10.5 14.4 14.9 14.6
Net debt/equity (0.2) (0.3) (0.3) (0.3) (0.3) (0.4) (0.5) (0.5)
RoAE 27.4 17.0 21.4 24.9 19.5 26.2 25.1 22.8
RoACE 24.3 15.7 15.3 21.7 17.6 21.2 20.5 18.4

For Private Circulation Only. FOR IMPORTANT INFORMATION ABOUT KOTAK SECURITIES’ RATING SYSTEM AND OTHER DISCLOSURES, REFER TO THE END OF THIS MATERIAL.
Wipro reports sharp revenue contraction; EBIT margin increase sharply led by cost management
Wipro reported 7.5% sequential decline in qoq and 4.4% yoy, in line with our estimates.
Revenue decline was across all verticals with a sharper decline in the communications and
consumer business. Energy & utilities held well with a revenue decline restricted to 5.4% qoq.
Contrary to expectations, EBIT margin increased 140 bps qoq and 60 bps yoy to 19.1%.
Management attributed the increase to (1) 100 bps tailwind from currency, and (2) 100 bps
from operations. This was offset by 50 bps additional provision for doubtful debts. We believe
that the surprise expansion can be explained by a 180 bps qoq reduction in travel costs, overall
cost management and lower variable compensation payout. EPS of Rs4.2 was 8.2% ahead of
our estimate and grew 5.8% yoy and 2.7% qoq. FCF generation was strong.
Focus of CEO Thierry Delaporte to be on profitable growth
A downturn typically affords an organization the opportunity to make substantive changes since
the cost of lost growth is low. Delaporte plans to get Wipro back on the path to industry
growth without losing sight of profitability. He indicated that his key near-term priorities are—
(1) engage with leaders and be active on day to day operations; (2) increase client connects to
understand how they are doing and expectations of Wipro, (3) reinforce employee
engagement, (4) redefine and reinforce strategy and vision for the organization, (5) streamline
processes, focus on top talent, challenge status quo, make the organization more nimble and
efficient. Overall, a good balance between diving into day-to-day operations and working on a
bigger plan for the organization.
Challenges aplenty but all in the price; upside from moderate improvement in performance
We upgrade Wipro to ADD and raise fair value to Rs265 form Rs220, valuing the stock at 14X
June 2022E EPS, up from 12X earlier. Our FY2021-23E EPS increases by 1-4%. Our upgrade is
not based on Wipro’s successful turnaround and aligning to industry matching growth rates.
Instead our upgrade captures inexpensive valuations, helped by—(1) moderate tailwinds in
infrastructure management services resulting from pull-forward of cloud adoption. Security
services are additional drivers. Cloud and IMS is a core area of strength. The company
announced a couple of large deals in the quarter and (2) moderate improvement in large deal
win. Our revenue growth estimates stand at mid-single digits, below peers but marginally
higher than historical levels. Wipro has surprised us consistently with margin defense.
Our EPS estimates are based on EBIT margin of 17.9-18.3% for the next three years.
Wipro (WPRO) IT Services
Upgrade to ADD on inexpensive valuations. We upgrade Wipro to ADD noting
inexpensive valuations. The stock trades at 12X FY2022E earnings, implying negligible
2% growth to perpetuity, which is a tad pessimistic. We value the stock at 14X FY2022
leading to FV of Rs265 (Rs220 earlier). Our upgrade is not predicated on Wipro reaching
industry matching growth but based on modest mid-single digit revenue growth. The
CEO does have a challenging task to turnaround Wipro; however, the cost of lost
growth is low in a downturn, affording a chance to make meaningful changes.
ADD
JULY 15, 2020
RESULT, CHANGE IN RECO.
Sector view: Cautious
CMP (`): 225
Fair Value (`): 265
BSE-30: 36,033
Kawaljeet Saluja
Sathishkumar S
Wipro
Stock data Forecasts/valuations 2020 2021E 2022E
52-week range (Rs) (high,low) EPS (Rs) 16.6 17.0 18.2
Mcap (bn) (Rs/US$) EPS growth (%) 11.1 2.4 7.1
ADTV-3M (mn) (Rs/US$) P/E (X) 13.5 13.2 12.3
Shareholding pattern (%) P/B (X) 2.4 2.0 1.9
Promoters 74.0 EV/EBITDA (X) 8.2 7.4 6.6
FIIs 10.9 RoE (%) 17.3 16.2 15.7
MFs/BFIs Div. yield (%) 0.7 0.9 3.8
Price performance (%) 1M 3M 12M Sales (Rs bn) 615 602 635
Absolute 8 19 (13) EBITDA (Rs bn) 127 129 136
Rel. to BSE-30 1 1 (7) Net profits (Rs bn) 97 97 104
276-159
1,286/17.1
1.5/5.6
1,764/23
[email protected]: +91 22 6218 6427

IT Services Wipro
56 KOTAK INSTITUTIONAL EQUITIES RESEARCH
Outlook—a few verticals have bottomed out, others may take longer
The company expects the September quarter to be one of stabilization. Demand has
bottomed, as per the company, in the consumer, communications and technology verticals.
Together, these verticals account for 34% of Wipro revenues. The demand outlook is not as
clear for other verticals. Wipro did announce a couple of large deals in the quarter E.ON and
John Lewis Partnership.
Leadership changes, large deal and resource allocation—key priorities, in our
view
CEO Delaporte has excellent credentials and has handled various portfolios ranging from
operations, vertical and handled finance function in his earlier stint at CAP Gemini. We
believe the following to be strategic priorities:
Leadership changes. For a well-run, growing organization, changes may be restricted to
a few functions. Infosys’ turnaround effort under Salil Parekh was interesting since it was
accompanied by minimal changes to the leadership team with infusion of external talent
only where internal talent was not up to the industry benchmark. This approach worked
well for Infosys. Wipro’s continued growth challenges may call for sharper assessment of
performance of leaders and a different approach. It is common for a new external CEO
to pick his team in pursuit of long-term growth objectives. Irrespective of the approach, a
remodeled team is often put in place in the first 6-9 months of a new CEO. This approach
is essential for focusing entire energies on clients, delivery and the overall turnaround
effort. Incremental changes over an extended period can drain the company of much
needed momentum, while a spike in attrition in the second or third year can jeopardize a
turnaround effort.
Allocation of resources and quick wins. Quick wins are necessary to energize an
organization. Wipro’s underperformance over the past few years has sapped the
organization of energy and put it in a vicious cycle. Quick wins serve three purposes—
(1) establish credentials of the CEO in a new organization, (2) easier buy-in from
stakeholders about the efficacy of the change and (3) motivate the existing team. We also
believe that allocation of resources to growth areas is critical. A growing organization
inevitably assigns the best resources to growth areas. However, this may not hold true for
Wipro, which has seen high churn in the past (not in the past 12 months though) that
has led to suboptimal alignment of talent. This task may not be easy to execute quickly
for an external CEO.
Digital capabilities and the case of missing mega-deals. Wipro is ranked highly for
digital competencies and for good reason. Acquisitions of Appirio (Salesforce consulting
partner) and DesignIt (digital marketing agency) combined with investments in
automation and strength in cloud migration and security services make Wipro a credible
player. The company has reported strong growth in digital competencies. At the same
time, revenue contraction in legacy offerings has been sharper. We are surprised with this
peculiar divergence. This dynamic can be explained by high deflationary pressure in legacy
services or Wipro’s relatively tardy win rate in core modernization/ digital transformation
programs. Either way, this dynamic is worrying. Interlinked with this peculiar dynamic is
Wipro’s full service suite and good digital competencies, which it has not leveraged for
integrated deals. Large deals provide an important leverage for growth.
Allocation of resources. Wipro is present across multiple verticals, though it lacks
muscle in some, leading to a loss of relevance in these verticals. It is imperative to keep
the existing relationships going, but importantly, allocation of growth funds can be
directed towards core verticals such as financial services, consumer, healthcare,
technology and energy & utilities. The same holds true for geographical diversification.

Wipro IT Services
KOTAK INSTITUTIONAL EQUITIES RESEARCH 57
Key highlights from earnings call
Margin walk-through. EBIT margin increased by 150 bps sequentially to 19.1% in
1QFY21, aided by 100 bps tailwind from Rupee depreciation against USD, 100 bps
tailwind from operational efficiencies, partially offset by 50 bps increase in provisioning
for doubtful debts.
Demand outlook. Wipro indicated strong demand in areas such as cloud, collaboration
and cyber security. Wipro indicated demand uptick in offerings such as VDI, SD-WAN,
BPO and platform offerings. Consumer, technology and communications verticals will be
more stable compared to other verticals.
Utilization. Wipro indicated that high utilization was due to less leave taken by
employees and the induction of freshers into projects. Realization decline appears sharp
but has impact from a volume drop in outcome-based contracts in fixed-price projects.
Wipro has also aggressively reduced subcontractor headcount.
Employee expense. A sharp decline in employee expense on a sequential basis is due to
a high base and some level of variable pay cut in 1QFY21. Wipro had paid out 100%
variable pay to employees (except for the leadership team, which took pay cut) in 4QFY20
leading to high employee expense.
BFSI. Wipro indicated that banks have shored up cash to keep robust balance sheets,
resulting in lower spending. Banks are worried about delinquencies and almost zero
interest rates. Wipro is involved in discussions with clients on deals around run services.
Focus on profitable growth. New CEOs indicated strong focus on driving growth.
Wipro will focus on accounts, offerings and verticals, where the company has a strong
foothold. CEO indicated that growth will not be at the cost of profitability and was
confident of ability to drive profitable growth.
Deal bookings. Wipro indicated a pickup in order book in the latter half of the quarter.
Pipeline continues to be healthy. Decision making is slower compared to pre Covid. Order
book has increased yoy.
Furloughs. Wipro indicated that the company had furloughed some employees in
developed markets, which helped manage costs. These employees can be tapped once
demand recovers instead of hiring afresh.
Acquisition. Wipro has acquired IVIA, an IT services provider in Brazil, for US$22.4 mn.
The acquisition will help Wipro expand its geographical footprint in Brazil and set up local
delivery centers.
Client metrics. The number of US$50 mn clients was flat qoq and up by 1 yoy. The
number of US$100 mn clients declined by 2 qoq and was flat yoy. The number of US$20
mn client declined by 1 qoq and by 2 on a yoy basis.

IT Services Wipro
58 KOTAK INSTITUTIONAL EQUITIES RESEARCH
Exhibit 1: Wipro 1QFY21 results (IFRS) (Rs mn)
Source: Company, Kotak Institutional Equities estimates
Exhibit 2: Wipro: Key changes to FY2021-23E estimates
Source: Kotak Institutional Equities estimates
1QFY21 1QFY21E 1QFY20 4QFY20 KIE yoy qoq FY2020 FY2019 % chg. FY2021E % chg.
IT services revenues (US$ mn) 1,922 1,905 2,039 2,074 0.9 (5.7) (7.3) 8,256 8,120 1.7 7,714 (6.6)
- IT Services 145,956 142,515 143,514 152,960 2.4 1.7 (4.6) 594,041 568,253 4.5 582,885 (1.9)
- India State Run Enterprise 2,117 2,224 2,143 2,341 (4.8) (1.2) (9.6) 8,400 8,544 (1.7) 8,380 (0.2)
- IT Products 2,258 2,457 2,409 2,792 (8.1) (6.3) (19.1) 11,010 12,312 (10.6) 11,031 0.2
- reconciling items 5 — (47) 10 1,094 (49) 5
Total revenues 150,336 147,196 148,019 158,103 2.1 1.6 (4.9) 614,545 589,060 4.3 602,301 (2.0)
Operating Income 26,940 23,625 25,373 26,391 14.0 6.2 2.1 105,730 99,910 5.8 104,094 (1.5)
- IT Services 27,822 23,677 26,521 26,925 17.5 4.9 3.3 106,541 102,503 3.9 105,011 (1.4)
- India State Run Enterprise (100) — (636) (481) — (1,829) —
- IT Products 124 (52) (407) 116 (130.5) 6.9 (2,103) (1,047) 100.9 (9) (99.6)
- reconciling items (906) — (105) (169) 1,292 283 (908)
Other income/ (expense) 3,982 4,525 5,363 3,254 (12.0) (25.8) 22.4 16,753 15,548 7.8 19,475 16.2
Extraordinaries —
PBT 30,922 28,150 30,736 29,645 9.8 0.6 4.3 122,483 115,458 6.1 123,569 0.9
Income taxes (6,838) (5,938) (6,699) (6,206) 15.2 2.1 10.2 (24,799) (25,242) (1.8) (25,959) 4.7
PAT 24,084 22,212 24,037 23,439 8.4 0.2 2.8 97,684 90,216 8.3 97,610 (0.1)
Equity in earnings of affiliates 31 8 (16) 13 — (43) —
Minority interest (211) (136) (147) (191) (495) (142) (545)
Net income 23,904 22,084 23,874 23,261 8.2 0.1 2.8 97,218 90,031 8.0 97,096 (0.1)
EPS (Rs/share) 4.2 3.9 4.0 4.1 8.2 5.8 2.7 16.6 15.0 11.2 17.0 2.4
Operating margin
IT Services 19.1 16.6 18.5 17.6 17.9 18.0 18.0
India State Run Enterprise (0.0) — (0.3) (0.2) — (0.2) —
IT Products 5.5 (2.1) (16.9) 4.2 (19.1) (8.5) (0.1)
Net Income Margin 15.9 15.0 16.1 14.7 14.1 14.7 14.4
Tax rates (%) 22.1 21.1 21.8 20.9 20.2 21.9 21.0
Notes:
(1) Wipro carved out India State Run Enterprises (ISRE) from IT Services segment into a separate segment effective quarter ended December 31, 2018.
Financials have been adjusted for the reclassification
(2) YoY revenue growth is adjusted for divestment of Workday and Cornerstone business
% chg.
Rs mn 2021E 2022E 2023E 2021E 2022E 2023E 2021E 2022E 2023E
IT Services revenues (US$ mn) 7,714 8,095 8,501 7,760 8,199 8,489 (0.6) (1.3) 0.2
Revenue growth (%) (6.6) 4.9 5.0 (6.0) 5.7 3.5
IT services c/c revenue growth (%) (5.6) 4.9 5.0 (5.0) 5.7 3.5
IT services organic c/c revenue growth (%) (6.0) 4.9 5.0 (5.5) 5.7 3.5
Rupee/ US$ rate 75.6 76.0 77.0 75.5 76.0 77.0 0.1 — —
EBITDA margin (%) 22.2 22.0 22.3 20.7 21.0 20.9
EBIT margin (%) 18.0 17.9 18.3 16.8 17.1 17.1
EPS (Rs/share) 17.0 18.2 19.8 16.4 18.0 19.2 3.9 1.1 3.3
New Old Change (%)

Wipro IT Services
KOTAK INSTITUTIONAL EQUITIES RESEARCH 59
Exhibit 3: Growth rates across verticals, geographies and service lines (Jun 2020)
Source: Company, Kotak Institutional Equities
Exhibit 4: Sharp revenue decline in non-top 10 accounts
Source: Company, Kotak Institutional Equities
Contribution to
Jun-20 QoQ YoY revenues (%) QoQ YoY
Revenues (US$ mn) 1,922 (7.3) (5.7) 100.0 (7.5) (4.4)
Service line split of revenues
Cloud and infrastructure services 498 (7.1) (5.0) 25.9 (6.9) (3.1)
Data, Analytics and AI 138 (7.5) (8.5) 7.2 (7.8) (7.3)
Digital operations and Platforms 284 (5.9) (5.0) 14.8 (5.9) (4.6)
Industrial & Engineering services 148 (7.5) (4.3) 7.7 (7.6) (3.5)
Modern application Services 853 (7.9) (6.2) 44.4 (8.3) (4.8)
Vertical split of revenues
Communications 98 (14.7) (18.6) 5.1 (16.2) (16.9)
Consumer 306 (12.3) (3.7) 15.9 (12.4) (2.5)
Energy, Natural Resources & Utilities 254 (4.4) (3.0) 13.2 (5.4) (1.7)
Finance Solutions 590 (6.6) (8.7) 30.7 (6.4) (6.9)
Healthcare, Life Sciences & Services 259 (7.2) (2.9) 13.5 (7.2) (2.1)
Manufacturing 156 (8.0) (3.5) 8.1 (8.1) (2.0)
Technology 259 (2.0) (2.2) 13.5 (2.1) (1.4)
Geographical split of revenues
US 1,134 (7.4) (5.3) 59.0
Europe 455 (8.9) (9.1) 23.7
RoW 332 (4.7) (2.3) 17.3
Customer concentration
Top customer 61 (2.2) (19.9) 3.2
Top 5 customers 236 (8.3) (16.9) 12.3
Top 10 customers 390 (3.0) (7.9) 20.3
Non top 10 1,532 (9.5) (7.3) 79.7
Growth (%) C/C growth (%)
4 qtr CQGR
Jun-17 Sep-17 Dec-17 Mar-18 Jun-18 Sep-18 Dec-18 Mar-19 Jun-19 Sep-19 Dec-19 Mar-20 Jun-20 (%)
Revenue(US$ mn)
Top client 56 63 63 73 74 74 76 77 75 66 63 62 61 (5.0)
Top 5 clients 203 221 227 246 237 245 266 284 281 262 258 253 236 (4.3)
Top 10 clients 344 362 359 380 372 384 403 423 422 406 402 400 390 (1.9)
ex- Top 10 clients 1,589 1,607 1,614 1,640 1,617 1,626 1,643 1,652 1,617 1,643 1,693 1,673 1,532 (1.3)
Growth (qoq %)
Top client (1.1) 12.4 0.2 15.1 1.2 1.0 1.8 1.4 (1.8) (13.1) (4.1) (1.0) (1.2)
Top 5 clients 3.9 8.7 2.9 8.6 (3.9) 3.6 8.5 6.9 (1.1) (6.8) (1.8) (1.8) (6.6)
Top 10 clients 4.2 5.3 (0.9) 5.7 (2.0) 3.2 5.0 5.0 (0.3) (3.9) (0.9) (0.5) (2.5)
ex- Top 10 clients (2.2) 1.1 0.4 1.6 (1.4) 0.5 1.1 0.5 (2.1) 1.6 3.0 (1.1) (8.5)
Client buckets
US$ 100 mn+ 9 9 9 8 8 9 10 10 13 13 14 15 13
US$ 75 mn+ 18 16 17 20 19 19 19 22 23 23 22 22 22
US$ 50 mn+ 36 39 41 39 40 39 41 41 41 41 41 40 39
Notes
(1) IT services segment has been reclassifed and does not include India PSU and India govt. business from Jun-17 quarter

IT Services Wipro
60 KOTAK INSTITUTIONAL EQUITIES RESEARCH
Exhibit 5: Vertical-wise margin performance (Jun 2020)
Source: Companies, Kotak Institutional Equities
Exhibit 6: BFSI revenues decline 6.9% due to lower spending
Source: Company, Kotak Institutional Equities
Contribution
EBIT margin (%) qoq yoy qoq yoy to revenues (%)
Banking Financial Services & Insurance 19.0 156 (156) (6.4) (6.9) 30.7
Communications 12.0 (100) (172) (16.2) (16.9) 5.1
Consumer 19.1 135 339 (12.4) (2.5) 15.9
Energy, Natural Resources & Utilities 18.5 (73) 660 (5.4) (1.7) 13.2
Healthcare, Life Sciences & Services 13.8 116 229 (7.2) (2.1) 13.5
Manufacturing 18.8 14 39 (8.1) (2.0) 8.1
Technology 21.2 (373) (595) (2.1) (1.4) 13.5
Change (%) C/C growth (%)
5.5
2.8 4.3
7.8 8.1
10.8
14.5 14.5 14.4 16.0
17.5 15.9
11.2
5.9
1.0
(1.3)
(6.9)(10)
(5)
0
5
10
15
20
Jun-1
6
Sep
-16
Dec-
16
Mar-
17
Jun-1
7
Sep
-17
Dec-
17
Mar-
18
Jun-1
8
Sep
-18
Dec-
18
Mar-
19
Jun-1
9
Sep
-19
Dec-
19
Mar-
20
Jun-2
0
BFSI c/c yoy growth (%)

Wipro IT Services
KOTAK INSTITUTIONAL EQUITIES RESEARCH 61
Exhibit 7: Revenues decline in Consumer BU but can recover faster
Source: Company, Kotak Institutional Equities
Exhibit 8: Strong FCF generation
Source: Company, Kotak Institutional Equities
6.9
3.7
0.5 1.4
2.9
4.5 5.6
2.2
4.8
7.7
10.0
14.8
7.7
6.1
12.1
6.4
(2.5)(4)
(2)
0
2
4
6
8
10
12
14
16
Jun-1
6
Sep
-16
Dec-
16
Mar-
17
Jun-1
7
Sep
-17
Dec-
17
Mar-
18
Jun-1
8
Sep
-18
Dec-
18
Mar-
19
Jun-1
9
Sep
-19
Dec-
19
Mar-
20
Jun-2
0
Consumer BU c/c yoy growth (%)
55
125
7.8
118.2
68.2
117.5 113.0
98.8
84.0
101.0
37.3
157.5
-
20
40
60
80
100
120
140
160
180
Sep
-17
Dec-
17
Mar-
18
Jun-1
8
Sep
-18
Dec-
18
Mar-
19
Jun-1
9
Sep
-19
Dec-
19
Mar-
20
Jun-2
0
FCF/ net profit (%)

IT Services Wipro
62 KOTAK INSTITUTIONAL EQUITIES RESEARCH
Exhibit 9: Operating cash flows as a % of net income increases to 174.9%
Source: Company, Kotak Institutional Equities
Exhibit 10: EBIT margin improves 150 bps qoq to 19.1%
Source: Company, Kotak Institutional Equities
79.1
154.0
41.6
135.9
98.6
142.0 134.0
120.4 106.8
124.5
60.5
174.9
0
20
40
60
80
100
120
140
160
180
200
Sep
-17
Dec-
17
Mar-
18
Jun-1
8
Sep
-18
Dec-
18
Mar-
19
Jun-1
9
Sep
-19
Dec-
19
Mar-
20
Jun-2
0
OCF/ net profit (%)
19.1
15
17
19
21
23
25
Jun-1
3
Sep
-13
Dec-
13
Mar-
14
Jun-1
4
Sep
-14
Dec-
14
Mar-
15
Jun-1
5
Sep
-15
Dec-
15
Mar-
16
Jun-1
6
Sep
-16
Dec-
16
Mar-
17
Jun-1
7
Sep
-17
Dec-
17
Mar-
18
Jun-1
8
Sep
-18
Dec-
18
Mar-
19
Jun-1
9
Sep
-19
Dec-
19
Mar-
20
Jun-2
0
IT services adjusted EBIT margin (%)

Wipro IT Services
KOTAK INSTITUTIONAL EQUITIES RESEARCH 63
Exhibit 11: Subcontracting costs have been managed well
Source: Company, Kotak Institutional Equities
Exhibit 12: Sharp decline in attrition levels
Source: Company, Kotak Institutional Equities
14.1
8
9
10
11
12
13
14
15
16
17
18
Jun-1
3
Sep
-13
Dec-
13
Mar-
14
Jun-1
4
Sep
-14
Dec-
14
Mar-
15
Jun-1
5
Sep
-15
Dec-
15
Mar-
16
Jun-1
6
Sep
-16
Dec-
16
Mar-
17
Jun-1
7
Sep
-17
Dec-
17
Mar-
18
Jun-1
8
Sep
-18
Dec-
18
Mar-
19
Jun-1
9
Sep
-19
Dec-
19
Mar-
20
Jun-2
0
Subcontracting costs as a % of revenue
10.710
13
16
19
22
25
Sep
-10
Mar-
11
Sep
-11
Mar-
12
Sep
-12
Mar-
13
Sep
-13
Mar-
14
Sep
-14
Mar-
15
Sep
-15
Mar-
16
Sep
-16
Mar-
17
Sep
-17
Mar-
18
Sep
-18
Mar-
19
Sep
-19
Mar-
20

IT Services Wipro
64 KOTAK INSTITUTIONAL EQUITIES RESEARCH
Exhibit 13: Sales and marketing expense as a % of revenues at multi-quarter lows
Note: (1) S&M spends adjusted for impairment of HPS receivables
Source: Company, Kotak Institutional Equities
Exhibit 14: Wipro: Trends in G&A expenses
Note: (1) G&A spends adjusted for write-off of receivables due to client bankruptcies in Dec-17 and Mar-18 andpayment to settle dispute with National Grid in Sep-18
Source: Company, Kotak Institutional Equities
7.8 7.5
8.3 7.9 7.9
7.5 7.0
7.5 7.6 7.2 7.2
6.6 6.6
0
1
2
3
4
5
6
7
8
9
Jun-1
7
Sep
-17
Dec-
17
Mar-
18
Jun-1
8
Sep
-18
Dec-
18
Mar-
19
Jun-1
9
Sep
-19
Dec-
19
Mar-
20
Jun-2
0
S&M as a% of IT services revenues
5.4 5.4 5.4
6.1 6.1 5.8
6.8
4.8
5.5
4.6 5.0 5.0
6.1
0
1
2
3
4
5
6
7
8
Jun-1
7
Sep
-17
Dec-
17
Mar-
18
Jun-1
8
Sep
-18
Dec-
18
Mar-
19
Jun-1
9
Sep
-19
Dec-
19
Mar-
20
Jun-2
0
G&A as a % of IT services revenues
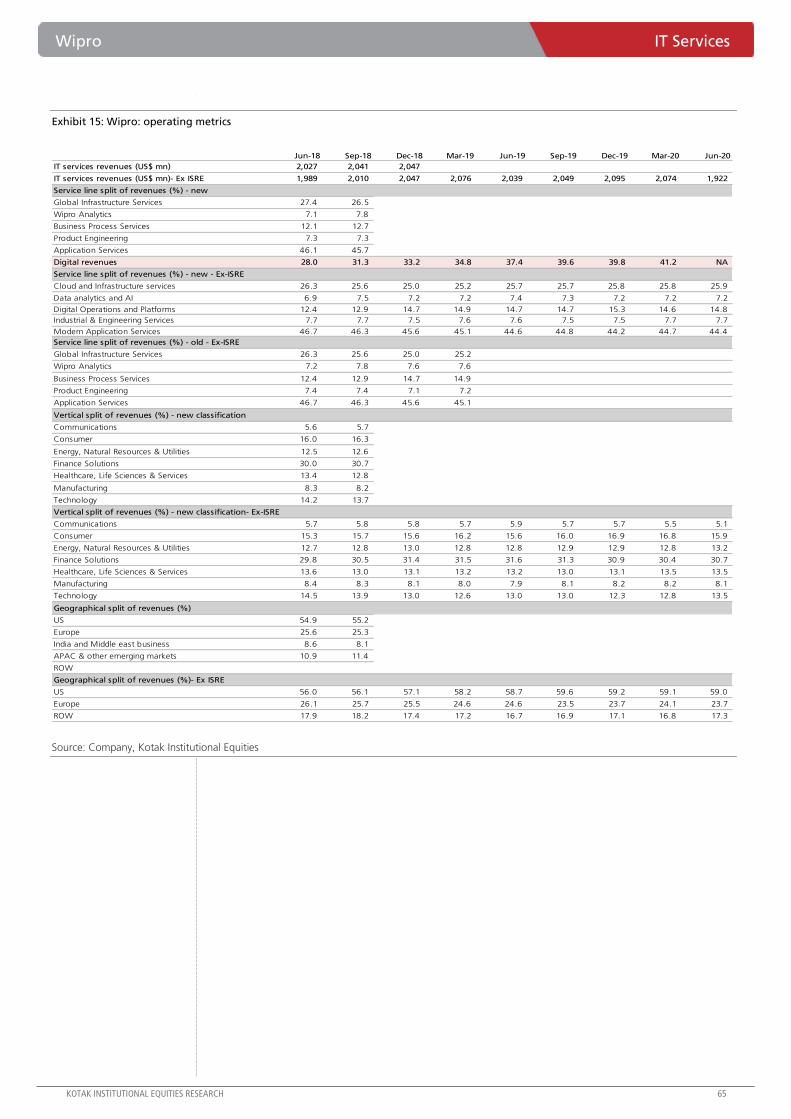
Wipro IT Services
KOTAK INSTITUTIONAL EQUITIES RESEARCH 65
Exhibit 15: Wipro: operating metrics
Source: Company, Kotak Institutional Equities
Jun-18 Sep-18 Dec-18 Mar-19 Jun-19 Sep-19 Dec-19 Mar-20 Jun-20
IT services revenues (US$ mn) 2,027 2,041 2,047
IT services revenues (US$ mn)- Ex ISRE 1,989 2,010 2,047 2,076 2,039 2,049 2,095 2,074 1,922
Service line split of revenues (%) - new
Global Infrastructure Services 27.4 26.5
Wipro Analytics 7.1 7.8
Business Process Services 12.1 12.7
Product Engineering 7.3 7.3
Application Services 46.1 45.7
Digital revenues 28.0 31.3 33.2 34.8 37.4 39.6 39.8 41.2 NA
Service line split of revenues (%) - new - Ex-ISRE
Cloud and Infrastructure services 26.3 25.6 25.0 25.2 25.7 25.7 25.8 25.8 25.9
Data analytics and AI 6.9 7.5 7.2 7.2 7.4 7.3 7.2 7.2 7.2
Digital Operations and Platforms 12.4 12.9 14.7 14.9 14.7 14.7 15.3 14.6 14.8
Industrial & Engineering Services 7.7 7.7 7.5 7.6 7.6 7.5 7.5 7.7 7.7
Modern Application Services 46.7 46.3 45.6 45.1 44.6 44.8 44.2 44.7 44.4
Service line split of revenues (%) - old - Ex-ISRE
Global Infrastructure Services 26.3 25.6 25.0 25.2
Wipro Analytics 7.2 7.8 7.6 7.6
Business Process Services 12.4 12.9 14.7 14.9
Product Engineering 7.4 7.4 7.1 7.2
Application Services 46.7 46.3 45.6 45.1
Vertical split of revenues (%) - new classification
Communications 5.6 5.7
Consumer 16.0 16.3
Energy, Natural Resources & Utilities 12.5 12.6
Finance Solutions 30.0 30.7
Healthcare, Life Sciences & Services 13.4 12.8
Manufacturing 8.3 8.2
Technology 14.2 13.7
Vertical split of revenues (%) - new classification- Ex-ISRE
Communications 5.7 5.8 5.8 5.7 5.9 5.7 5.7 5.5 5.1
Consumer 15.3 15.7 15.6 16.2 15.6 16.0 16.9 16.8 15.9
Energy, Natural Resources & Utilities 12.7 12.8 13.0 12.8 12.8 12.9 12.9 12.8 13.2
Finance Solutions 29.8 30.5 31.4 31.5 31.6 31.3 30.9 30.4 30.7
Healthcare, Life Sciences & Services 13.6 13.0 13.1 13.2 13.2 13.0 13.1 13.5 13.5
Manufacturing 8.4 8.3 8.1 8.0 7.9 8.1 8.2 8.2 8.1
Technology 14.5 13.9 13.0 12.6 13.0 13.0 12.3 12.8 13.5
Geographical split of revenues (%)
US 54.9 55.2
Europe 25.6 25.3
India and Middle east business 8.6 8.1
APAC & other emerging markets 10.9 11.4
ROW
Geographical split of revenues (%)- Ex ISRE
US 56.0 56.1 57.1 58.2 58.7 59.6 59.2 59.1 59.0
Europe 26.1 25.7 25.5 24.6 24.6 23.5 23.7 24.1 23.7
ROW 17.9 18.2 17.4 17.2 16.7 16.9 17.1 16.8 17.3

IT Services Wipro
66 KOTAK INSTITUTIONAL EQUITIES RESEARCH
Exhibit 15: Wipro: Operating metrics …continued
Source: Company, Kotak Institutional Equities
Jun-18 Sep-18 Dec-18 Mar-19 Jun-19 Sep-19 Dec-19 Mar-20 Jun-20
Client metrics
Customer size distribution (TTM)
Million dollar clients of which 624 612
> US$100 mn 8 9
>US$75 mn 19 19
>US$50 mn 40 39
>US$20 mn 91 93
>US$10 mn 173 180
>US$5 mn 278 274
>US$3 mn 368 358
>US$1 mn 624 612
Repeat business (%) 99.5 98.6
New client additions 75 76
Total active customers 1,254 1,193
Customer concentration (%)
Top customer 3.7 3.6
Top 5 customers 11.7 12.1
Top 10 customers 18.3 18.8
Employees (IT services) 179,735 175,346
Client metrics- Ex ISRE
Customer size distribution (TTM)
Million dollar clients of which 595 584 578 571 564 569 572 574 577
> US$100 mn 8 9 10 10 13 13 14 15 13
>US$75 mn 19 19 19 22 23 23 22 22 22
>US$50 mn 40 39 41 41 41 41 41 40 39
>US$20 mn 91 92 99 96 92 92 96 96 97
>US$10 mn 171 177 171 172 166 165 169 166 163
>US$5 mn 268 265 269 262 259 261 260 260 258
>US$3 mn 359 348 339 339 340 341 344 341 348
>US$1 mn 595 584 578 571 564 569 572 574 577
Repeat business (%) 99.5 98.6 97.9 97.6 99.4 98.4 97.6 97.0 99.7
New client additions 75 76 57 63 41 57 77 65 42
Total active customers 1,184 1,131 1,132 1,115 1,060 1,027 1,070 1,074 1,004
Customer concentration (%)- Ex ISRE
Top customer 3.7 3.7 3.7 3.7 3.7 3.2 3.0 3.0 3.2
Top 5 customers 11.9 12.2 13.0 13.7 13.8 12.8 12.3 12.2 12.3
Top 10 customers 18.7 19.1 19.7 20.4 20.7 19.8 19.2 19.3 20.3
Employees (IT services) 160,846 171,451 172,379 171,425 174,850 181,453 187,318 182,886 181,804
Localization rate in US (%) 58.0 60.0 62.6 64.0 65.4 67.8 70.0 NA 69.8
Utilization (%)
Global IT Services excl IFOX-Gross (a) (b) 74.5 74.4 73.4 75.4 73.9 71.4 70.2 73.4 75.0
Global IT Services excl IFOX-Net 83.9 83.2 81.9 84.1 82.8 79.9 78.5 82.4 84.5
Attrition (%)
Global IT Services - Voluntary - Qtrly annualized 17.7 18.3 17.5 16.6 17.9 16.0 12.5 12.6 10.7
Revenues by project type (%)
Fixed price 58.9 58.9 59.8 60.0 61.6 61.9 62.6 63.2 61.7
Time and material 41.1 41.1 40.2 40.0 38.4 38.1 37.4 36.8 38.3
Onsite-offshore revenue split (%)
Onsite 52.9 52.8 52.2 51.5 52.3 53.3 53.2 51.8 51.5
Offshore 47.1 47.2 47.8 48.5 47.7 46.7 46.8 48.2 48.5
Note:
(1) Wipro has carved out India State Run Enterprises (ISRE) from IT Services segment. New IT segment classification excludes India PSU and India govt. business

Wipro IT Services
KOTAK INSTITUTIONAL EQUITIES RESEARCH 67
Exhibit 16: Profit model, balance sheet, cash model of Wipro Limited, March fiscal year-ends, 2016-2023E (Rs mn)
Source: Company, Kotak Institutional Equities estimates
2016 2017 2018 2019 2020 2021E 2022E 2023E
Profit model
Revenues 516,307 558,261 546,359 590,607 614,545 602,301 634,625 674,068
Cost of revenues (including depreciation) (356,723) (391,434) (385,575) (412,853) (436,085) (423,009) (449,205) (477,638)
Gross profit 159,584 166,827 160,784 177,754 178,460 179,292 185,420 196,430
SG&A expenses (including depreciation) (62,561) (72,950) (76,490) (80,641) (72,730) (75,198) (75,089) (76,536)
EBIT 97,023 93,877 84,294 97,113 105,730 104,094 110,331 119,894
Other income 17,698 16,477 18,169 18,346 16,753 19,475 23,077 26,711
Pre-tax profits 114,721 110,354 102,463 115,459 122,483 123,569 133,408 146,605
Provision for tax (25,305) (25,213) (22,390) (25,242) (24,799) (25,959) (28,807) (32,981)
PAT 89,416 85,141 80,073 90,217 97,684 97,610 104,601 113,625
Equity in earnings of affiliates, minority interest (net) (492) (248) 8 (185) (466) (514) (567) (625)
PAT from continuing operations 88,924 84,893 80,081 90,032 97,218 97,096 104,034 112,999
EPS (Rs) 13.5 13.1 12.7 15.0 16.6 17.0 18.2 19.8
Balance Sheet
Shareholders funds 466,078 520,304 482,936 568,116 557,458 640,827 686,523 737,752
Borrowings 17,361 19,611 45,268 28,368 17,478 12,638 12,638 12,638
Minority interest 2,224 2,391 2,410 2,637 1,875 2,420 3,018 3,677
Other liabilities 20,697 21,667 22,731 19,700 23,858 23,858 23,858 23,858
Total liabilities 506,360 563,973 553,345 618,821 600,669 679,743 726,037 777,926
Net fixed assets 64,952 69,794 64,443 70,601 97,868 96,011 95,585 95,132
Goodwill & intangibles 117,832 141,718 135,697 130,742 147,374 143,847 140,320 136,793
Cash and bank balances 306,339 351,843 301,687 386,161 343,436 346,168 403,702 458,067
Net current assets excluding cash (14,402) (31,387) (17,913) (17,556) (24,627) 57,423 49,168 49,493
Other assets 31,639 32,005 69,431 48,873 36,618 36,293 37,263 38,440
Total assets 506,360 563,973 553,345 618,821 600,669 679,743 726,037 777,926
Cashflow statement
Operating profit before working capital changes 111,823 119,261 105,289 116,396 127,829 128,720 135,622 146,366
Tax paid (26,935) (25,476) (28,105) (25,149) (6,384) (25,959) (28,807) (32,981)
Change in working capital/other adjustments (6,151) 4,541 (936) 27,165 (23,855) (8,493) 7,318 (1,469)
Capital expenditure (13,172) (19,646) (20,699) (20,841) (22,227) (19,242) (21,338) (22,493)
Acquisitions (39,373) (29,374) (6,816) 25,838 (2,544) — — —
Other income 17,086 9,843 14,956 15,728 19,603 19,475 23,077 26,711
Free cash flow 43,278 59,149 63,689 139,137 92,422 94,500 115,873 116,135
Margins and ratios
Consolidated gross profit margin (%) 30.9 29.9 29.4 30.1 29.0 29.8 29.2 29.1
Consolidated EBIT margin (%) 18.8 16.8 15.4 16.4 17.2 17.3 17.4 17.8
IT services EBIT margin (%) 20.5 17.4 15.8 17.1 17.9 18.0 17.9 18.3
RoAE (%) 20.3 17.2 16.0 17.1 17.3 16.2 15.7 15.9
RoACE (%) 17.3 14.7 13.1 14.4 15.0 13.7 13.0 13.0

For Private Circulation Only. FOR IMPORTANT INFORMATION ABOUT KOTAK SECURITIES’ RATING SYSTEM AND OTHER DISCLOSURES, REFER TO THE END OF THIS MATERIAL.
FY2020 reports record margins, retains leadership in cost efficiency
SRCM’s operating margins increased to Rs1,474 (+44% yoy) led by (1) 5% yoy higher
realization given sharp price hikes at the start of the year, (2) 6% yoy lower costs on the back of
lower freight and power-fuel costs. SRCM remains the lowest-cost producer in the sector in
FY2020, led mainly by high operational efficiency, low power-fuel consumption and partially by
surplus power capacity. Key incremental data points from the annual report are (1) consumption
of green power (WHRS, AFR) increased to 45% mix from 41% mix in FY2019, (2) clinker ratio
increased to 1.55X from 1.5X in FY2019, and (3) use of alternate raw material consumption
(slag, fly ash, synthetic gypsum etc.) increased by 7.3% yoy to 8.2 mn tons, aiding cost reduction.
Strong operating performance improves FCF yield and balance sheet strength
SRCM’s working capital reduced to 53 days in FY2020 from 58 days in FY2019 led by lower
inventories. Cash conversion ratio improved to 1.1X from 0.8X in FY2019. Higher operating
cash flow and lower capex led to record high FCF of Rs23 bn or 3% yield. Strong internal
accruals and fund raise of Rs24 bn through QIP increased SRCM’s FY2020 cash balance to Rs33
bn (4% of current market cap).
Growth to sustain, expansions on track and low utilization provide headroom
SRCM’s capacity would increase from 40.4 mtpa in FY2020 to 46.4 mtpa in FY2021E. Earlier,
both the grinding units (GU) - 3 mtpa at Odisha and 3 mtpa at Pune were expected to
commission in 1QFY21E, however, Covid-19-led delays will likely push commissioning by 3-6
months (3QFY21E). SRCM has yet not announced expansion plans beyond the existing 46 mtpa
but aims to reach 56 mtpa in the medium term. The company spent Rs2 bn on acquiring land in
FY2020. With utilization of 50% in FY2021E, existing capacity itself provides strong growth
headroom.
Downgrade to SELL on expensive valuations post the recent rally
We increase EBITDA by 5%/2%/2% as we increase volumes by 2% and reduce costs/ton by 2%
for FY2021/22/23E. We revise our fair value to Rs16,000/share (from Rs15,500) as we roll
forward to June 2022E at an unchanged 10X EV/EBITDA. We downgrade to SELL from REDUCE
on expensive valuations—16X EV/EBITDA and US$210 EV FY2022E.
Shree Cement (SRCM) Construction Materials
Efficient but expensive. SRCM’s FY2020 annual report details improvement in FCF
yield, working capital and higher cash balance. Benign commodity costs and higher
realizations led to record high operating margins. Power and fuel consumption
parameters were stable, suggesting little room for further improvement. The increase in
green energy consumption and clinker ratio is encouraging. SRCM retains its sector
leadership in costs and margins. Nonetheless, valuations are expensive. We downgrade
to SELL (from REDUCE) with a revised fair value of Rs16,000/share (from Rs15,500).
SELL
JULY 14, 2020
CHANGE IN RECO.
Sector view: Cautious
CMP (`): 22,086
Fair Value (`): 16,000
BSE-30: 36,033
Sumangal Nevatia
Murtuza Arsiwalla
Prayatn Mahajan
Shree Cement
Stock data Forecasts/valuations 2020 2021E 2022E
52-week range (Rs) (high,low) EPS (Rs) 435.2 382.0 651.5
Mcap (bn) (Rs/US$) EPS growth (%) 34.6 (12.2) 70.5
ADTV-3M (mn) (Rs/US$) P/E (X) 50.7 57.8 33.9
Shareholding pattern (%) P/B (X) 6.2 5.7 5.0
Promoters 62.6 EV/EBITDA (X) 21.7 23.4 16.3
FIIs 11.9 RoE (%) 13.9 10.3 15.8
MFs/BFIs Div. yield (%) 0.5 0.5 0.5
Price performance (%) 1M 3M 12M Sales (Rs bn) 119 111 143
Absolute (1) 28 4 EBITDA (Rs bn) 37 33 46
Rel. to BSE-30 (8) 9 11 Net profits (Rs bn) 16 14 24
25,313-15,410
797/10.6
8.4/1.3
1,358/18
[email protected]: +91 22 6218 6427

Shree Cement Construction Materials
KOTAK INSTITUTIONAL EQUITIES RESEARCH 69
Exhibit 1: SRCM’s volumes declined 4% due to Covid-19 Cement volumes, utilization, FY2017-20, (mn tons, %)
Source: Company, Kotak Institutional Equities estimates
Exhibit 2: SRCM ‘s clinker ratio continues to improve in FY2020 SRCM cement to clinker ratio , FY2016-2020
Source: Company, Kotak Institutional Equities estimates
Exhibit 3: SRCM’ blended realizations grew 5% yoy on sharp
price hikes in key markets SRCM Realizations/ton, FY2017-2020, (Rs/ton, % yoy)
Source: Company, Kotak Institutional Equities estimates
Exhibit 4: Incentive/ton continue to decline in FY2020 SRCM Incentive/ton, FY2018-2020, (Rs/ton)
Source: Company, Kotak Institutional Equities estimates
70
65
68
62
56
58
60
62
64
66
68
70
72
-
5.0
10.0
15.0
20.0
25.0
30.0
2017 2018 2019 2020
Volumes (mn tons) Utilization (%) [RHS]
1.48
1.52
1.51 1.51
1.55
1.44
1.46
1.48
1.50
1.52
1.54
1.56
FY2016 FY2017 FY2018 FY2019 FY2020
Cement/Clinker Ratio
12
7
9
5
0
2
4
6
8
10
12
14
-
1,000
2,000
3,000
4,000
5,000
6,000
2017 2018 2019 2020
Realization (Rs/ton) Growth (%) [RHS]
117
90
75
-
20
40
60
80
100
120
140
2018 2019 2020
Incenitves/Ton (Rs/Ton)

Construction Materials Shree Cement
70 KOTAK INSTITUTIONAL EQUITIES RESEARCH
Exhibit 5: SRCM’s costs declined 6% yoy on lower input costs
Cost/ton for SRCM, FY2017-2020, (Rs/ton, % yoy)
Source: Company, Kotak Institutional Equities estimates
Exhibit 6: SRCM’s profitability hit record highs in FY2020 EBITDA/ton, FY2017-2020, (Rs/ton, % yoy)
Source: Company, Kotak Institutional Equities estimates
Exhibit 7: SRCM’s material costs declined on lower input costs Material cost/ton, FY2017-2020, (Rs/ton, % yoy)
Source: Company, Kotak Institutional Equities estimates
Exhibit 8: SRCM’s material costs declined on lower gypsum costs Gypsum cost/ton, FY2017-2020, (Rs/ton, % yoy)
Source: Company, Kotak Institutional Equities estimates
2
12 14
(6)
-10
-5
0
5
10
15
-
500
1,000
1,500
2,000
2,500
3,000
3,500
4,000
2017 2018 2019 2020
Costs (Rs/ton) Growth % [RHS]
45
(5) (5)
44
-10
0
10
20
30
40
50
-
200
400
600
800
1,000
1,200
1,400
1,600
2017 2018 2019 2020
EBITDA (Rs/ton) Growth % [RHS]
3% 3%
1%
-15%-16%
-14%
-12%
-10%
-8%
-6%
-4%
-2%
0%
2%
4%
6%
270
280
290
300
310
320
330
340
350
FY2017 FY2018 FY2019 FY2020
Material Costs (Rs/Ton) % Change [RHS]
-9%
3%
9%
-4%
-10%
-8%
-6%
-4%
-2%
0%
2%
4%
6%
8%
10%
80
82
84
86
88
90
92
94
96
98
FY2017 FY2018 FY2019 FY2020
Gypsum (Rs/Ton) % Change (yoy) [RHS]

Shree Cement Construction Materials
KOTAK INSTITUTIONAL EQUITIES RESEARCH 71
Exhibit 9: SRCM’s material costs declined on lower fly ash costs Fly-ash cost/ton, FY2017-2020, (Rs/ton, % yoy)
Source: Company, Kotak Institutional Equities estimates
Exhibit 10: SRCM’s power cost declined by 10% yoy on improved
operational metrics and lower fuel cost Power cost/ton, FY2017-20, (Rs/ton, % yoy)
Source: Company, Kotak Institutional Equities estimates
Exhibit 11: Power consumption efficiency remains stable Power consumption (kwh/ton of cement), FY2017-20
Source: Company, Kotak Institutional Equities estimates
Exhibit 12: Fuel consumption/ton of clinker remains stable Fuel consumption ((Kcal/kg of clinker)
Source: Company, Kotak Institutional Equities estimates
3%5%
0%
-14%
-20%
-15%
-10%
-5%
0%
5%
10%
95
100
105
110
115
120
125
130
FY2017 FY2018 FY2019 FY2020
Fly ash (Rs/Ton) % Change (yoy) [RHS]
-8%
48% 50%
-10%
-20%
-10%
0%
10%
20%
30%
40%
50%
60%
400
500
600
700
800
900
1000
1100
FY2017 FY2018 FY2019 FY2020
Power & Fuel Cost (Rs/Ton)
% Change (yoy) [RHS]
70 69 69 70.5
20
30
40
50
60
70
80
FY2017 FY2018 FY2019 FY2020
Energy consumption (kWh/ton of cement)
718
728719 721
600
620
640
660
680
700
720
740
FY2017 FY2018 FY2019 FY2020
Thermal energy consumption (KCal/kg of clinker)

Construction Materials Shree Cement
72 KOTAK INSTITUTIONAL EQUITIES RESEARCH
Exhibit 13: Alternate raw material consumption continues to
increase resulting in lower costs Alternative raw material, FY2017-20, (mn tons)
Source: Company, Kotak Institutional Equities estimates
Exhibit 14: SRCM is increasing its dependence on green energy Green Power %, FY2017-2020, (% of total power)
Source: Company, Kotak Institutional Equities estimates
Exhibit 15: Number of employees declined in FY2020 Number of employees,% change yoy, FY2017-20
Source: Company, Kotak Institutional Equities estimates
Exhibit 16: Cost per employee continued to increase in FY2020 Employee cost, % change yoy, FY2017-2020, (Rs mn/employee)
Source: Company, Kotak Institutional Equities estimates
6.67.1
7.78.2
0.0
1.0
2.0
3.0
4.0
5.0
6.0
7.0
8.0
9.0
FY2017 FY2018 FY2019 FY2020
Alternative Raw Material Consumption (mn tons)
36% 37% 41% 45%
0%
20%
40%
60%
80%
100%
120%
FY2017 FY2018 FY2019 FY2020
Green Energy (%) Conventional Energy (%)
-4%
-14%
12%
-2%
-20%
-15%
-10%
-5%
0%
5%
10%
15%
500
1500
2500
3500
4500
5500
6500
7500
FY2017 FY2018 FY2019 FY2020
Number of employees % Change (yoy) [RHS]
5%
1%
7%
10%
0%
2%
4%
6%
8%
10%
12%
0.85
0.90
0.95
1.00
1.05
1.10
1.15
1.20
FY2017 FY2018 FY2019 FY2020
Cost/employee (Rs mn) % Change (yoy) [RHS]

Shree Cement Construction Materials
KOTAK INSTITUTIONAL EQUITIES RESEARCH 73
Exhibit 17: SRCM’s freight cost declined 6% yoy on lower diesel
prices Freight cost/ton, FY2017-20, (Rs/ton, % yoy)
Source: Company, Kotak Institutional Equities estimates
Exhibit 18: SRCM’s other costs declined 2% yoy on lower cost of
packing materials Other cost/ton, FY2017-20, (Rs/ton, % yoy)
Source: Company, Kotak Institutional Equities estimates
Exhibit 19: SRCM’s KMP remuneration declined in FY2020 as a part of cost reduction measures taken
during pandemic KMP remuneration as a % of PAT, FY2017-20, (Rs mn, %)
Source: Company, Kotak Institutional Equities estimates
14%
23%
-1%
-6%
-10%
-5%
0%
5%
10%
15%
20%
25%
500
600
700
800
900
1,000
1,100
1,200
FY2017 FY2018 FY2019 FY2020
Freight Costs (Rs/Ton) % Change (yoy) [RHS]
-4%
-14%
12%
-2%
-20%
-15%
-10%
-5%
0%
5%
10%
15%
400
450
500
550
600
650
700
750
800
FY2017 FY2018 FY2019 FY2020
Other Costs (Rs/Ton) % Change (yoy) [RHS]
Name 2016 2017 2018 2019 2020
H.M.Bangur (MD) 253 382 426 462 418
Prashant Bangur (Jt MD) 103 153 195 230 208
Total 356 535 621 693 625
% PAT 8% 4% 4% 7% 4%

Construction Materials Shree Cement
74 KOTAK INSTITUTIONAL EQUITIES RESEARCH
Exhibit 20: SRCM’s net cash balance increased in FY2020 as the company raised Rs24 bn through a
QIP during the year SRCM's net cash balance, March fiscal year-ends, FY2016-2020E (Rs bn)
Source: Company, Kotak Institutional Equities estimates
Exhibit 21: SRCM continues to reduce its working capital cycle Debtor days, inventory days, creditor days for Shree Cements, March fiscal year-ends, FY2016-2020
Source: Company, Kotak Institutional Equities estimates
18
31
22
(2)
33
(5)
-
5
10
15
20
25
30
35
2016 2017 2018 2019 2020
Net Cash (Rs bn)
58 55
49
58
53
-
10
20
30
40
50
60
70
2016 2017 2018 2019 2020
Recievable Days Inventory Days
Payable Days Net Working Capital Cycle

Shree Cement Construction Materials
KOTAK INSTITUTIONAL EQUITIES RESEARCH 75
Exhibit 22: SRCM’s CWIP continues to decline on completion of projects under construction CWIP for Shree Cements, March fiscal year-ends, FY2016-2020 (Rs bn)
Source: Company, Kotak Institutional Equities estimates
Exhibit 23: Land purchases continue to remain strong in FY2020 Land purchases, March fiscal year-ends, FY2017-2020 (Rs bn)
Source: Company, Kotak Institutional Equities estimates
0
2
4
6
8
10
12
14
16
2016 2017 2018 2019 2020
Capital Work in Progress (Rs bn)
0.0
0.5
1.0
1.5
2.0
2.5
2017 2018 2019 2020
Land Purchases (Rs bn)

Construction Materials Shree Cement
76 KOTAK INSTITUTIONAL EQUITIES RESEARCH
Exhibit 24: Shree Cement's new capacity additions are in East and West regions, expected to
complete by 3QFY21 SRCM's cement capacity additions at various locations, March fiscal year-ends, FY2014-2021E (Rs mn)
Source: Company, Kotak Institutional Equities estimates
Exhibit 25: Shree Cement will diversify into the East and West markets on completion of its projects SRCM's regional capacity post expansion in FY2021E (%)
Source: Company, Kotak Institutional Equities estimates
Exhibit 26: SRCM’s cash conversion ratio remains high due to
strong operational cash flows and lower working capital SRCM Cash conversion ratio, FY2016-2020
Source: Company, Kotak Institutional Equities estimates
Exhibit 27: SRCM’s FCF yield grew to 3% on lower capex and
working capital release SRCM FCF Yield, FY2016-2020, (%)
Source: Company, Kotak Institutional Equities estimates
Location 2014 2015 2016 2017 2018 2019 2020 2021E
Aurangabad, Bihar 2.0 - - 1.6 2.0 - - -
Cuttack, Odisha - - - - - - - 3.0
Jharkhand - - - - - - 2.5 -
East 2.0 - - 1.6 2.0 - 2.5 3.0
Pune - - - - - - - 3.0
West - - - - - - - 3.0
New Cement capacity (mtpa) 2.0 - - 1.6 2.0 - 2.5 6.0
North
52%
Central
11%
East
24%
West
7%
South
6%
0.79
0.97
1.10
0.81
1.12
-
0.20
0.40
0.60
0.80
1.00
1.20
2016 2017 2018 2019 2020
Cash conversion ratio
0%
1%
0%
0%
3%
-1%
0%
1%
1%
2%
2%
3%
3%
4%
2016 2017 2018 2019 2020
FCF Yield (%)

Shree Cement Construction Materials
KOTAK INSTITUTIONAL EQUITIES RESEARCH 77
Exhibit 28: SRCM’ ROE remains high on higher earnings SRCM ROE, FY2011-2020 (%)
Source: Company, Kotak Institutional Equities estimates
Exhibit 29: SRCM ROCE remains high on higher earnings SRCM FCF Yield, FY2011-2020, (%)
Source: Company, Kotak Institutional Equities estimates
Exhibit 30: Shree Cement, changes in estimates, March fiscal year ends, FY2021-2023E
Source: Company, Kotak Institutional Equities estimates
Exhibit 31: We factor in 12% CAGR volume growth for SRCM over the next three years Key assumptions in the earnings model for SRCM, March fiscal year-ends, FY2017-23E
Source: Company, Kotak Institutional Equities estimates
13.5
26.7
29.9
20.0
9.0 7.0
19.3 16.7
12.2 13.9
-
5.0
10.0
15.0
20.0
25.0
30.0
35.0
20
11
20
12
20
13
20
14
20
15
20
16
20
17
20
18
20
19
20
20
RoAE (%)
10.3
15.8
19.7
14.5
7.1 5.6
14.2
11.2
9.0
11.1
-
5.0
10.0
15.0
20.0
25.0
20
11
20
12
20
13
20
14
20
15
20
16
20
17
20
18
20
19
20
20
RoACE (%)
2021E 2022E 2023E 2021E 2022E 2023E 2021E 2022E 2023E
Volume and realizations (mn tons, Rs/ton)
Cement sales (mn tons) 22.9 28.7 31.5 22.4 28.0 30.8 2 2 2
Realization (Rs/ton) 4,740 4,882 4,955 4,781 4,948 5,022 (1) (1) (1)
Costs (Rs/ton) 3,295 3,270 3,351 3,371 3,325 3,414 (2) (2) (2)
Adjusted EBITDA (Rs/ton) 1,445 1,612 1,604 1,410 1,623 1,608 2 (1) (0)
Earnings estimates (Rs mn)
Revenues 111,160 143,118 159,791 107,243 138,746 154,910 4 3 3
EBITDA 33,134 46,212 50,568 31,629 45,515 49,604 5 2 2
PAT 13,784 23,505 25,989 12,821 22,865 25,135 8 3 3
EPS 382 651 720 355 634 697 8 3 3
Revised estimate Previous estimate Change (%)
2017 2018 2019 2020 2021E 2022E 2023E 2017 2018 2019 2020 2021E 2022E 2023E
Cement segment
Cement Capacity (mn tons) 29.3 34.9 37.9 40.4 46.4 46.4 46.4 14 19 9 7 15 0 0
Utilization (%) 70 65 68 62 49 62 68
Volumes (mn tons) 20.6 22.5 25.9 24.9 22.9 28.7 31.5 45 9 15 (4) (8) 25 10
Realization (Rs/ton) 3,897 4,172 4,533 4,776 4,848 4,993 5,068 12 7 9 5 1 3 1
EBITDA (Rs/ton) 1,145 1,084 1,026 1,474 1,445 1,612 1,604 45 (5) (5) 44 (2) 12 (1)
Costs (Rs/ton) 2,752 3,088 3,507 3,302 3,403 3,381 3,464 2 12 14 (6) 3 (1) 2
Total revenues (Rs bn) 80 94 117 119 111 143 160 61 17 25 2 (7) 29 12
EBITDA (Rs bn) 24 24 27 37 33 46 51 110 4 9 39 (10) 39 9
PAT (Rs bn) 13 14 10 16 14 24 26 194 3 (31) 65 (12) 71 11
EPS (Rs/Share) 384 397 323 435 382 651 720 233 3 (19) 35 (12) 71 11
Growth (%)

Construction Materials Shree Cement
78 KOTAK INSTITUTIONAL EQUITIES RESEARCH
Exhibit 32: Our fair value of Rs16,000/share is based on 10X June 2022E EBITDA Shree Cement, Valuation details, June 2022E financials
Source: Company, Kotak Institutional Equities estimates
Exhibit 33: Shree Cement valuation is highly sensitive to realizations Sensitivity of Shree Cement to Realization, Volume and Costs, June 2022E financials
Source: Company, Kotak Institutional Equities estimates
Cement
Adjusted EBITDA (Rs mn) 47,301
EV/EBITDA (X) 10
EV (Rs mn) 475,659
Net cash (Rs mn) 81,614
Equity value (Rs mn) 557,273
UAE Plant @ book value 20,000
Total (Rs mn) 577,273
No. of shares 36.1
Fair Value (Rs/share) 16,000
3.4
1.6 1.8
6.5
3.1 3.4
1.9
0.9 1.0
-
1.0
2.0
3.0
4.0
5.0
6.0
7.0
1% Realisation 1% Volume -1% Costs
Sensitivity to FY2022E earnings and Fair Value
EBITDA EPS Fair Value

Shree Cement Construction Materials
KOTAK INSTITUTIONAL EQUITIES RESEARCH 79
Exhibit 34: Shree Cement is trading at a premium on mean
EV/EBITDA SRCM EV/EBITDA 1 Year Forward, July 2012-20
Source: Company, Kotak Institutional Equities estimates
Exhibit 35: Shree Cement is trading at a premium on mean
EV/Ton SRCM EV/Ton 1 Year Forward, July FY2012-20
Source: Company, Kotak Institutional Equities estimates
Exhibit 36: Shree Cement, Profit model, balance sheet and cash flow model, March fiscal year-ends, FY2016-23E (Rs mn)
Source: Company, Kotak Institutional Equities estimates
-
5
10
15
20
25
30
35
40
Jul-
12
Nov-
12
Mar-
13
Jul-
13
Nov-
13
Mar-
14
Jul-
14
Nov-
14
Mar-
15
Jul-
15
Nov-
15
Mar-
16
Jul-
16
Nov-
16
Mar-
17
Jul-
17
Nov-
17
Mar-
18
Jul-
18
Nov-
18
Mar-
19
Jul-
19
Nov-
19
Mar-
20
Jul-
20
x EV/EBITDA- 1Y FWD
-1sd 10Y Avg +1sd
-
50
100
150
200
250
300
Jul-
12
Nov-
12
Mar-
13
Jul-
13
Nov-
13
Mar-
14
Jul-
14
Nov-
14
Mar-
15
Jul-
15
Nov-
15
Mar-
16
Jul-
16
Nov-
16
Mar-
17
Jul-
17
Nov-
17
Mar-
18
Jul-
18
Nov-
18
Mar-
19
Jul-
19
Nov-
19
Mar-
20
Jul-
20
x EV/t ($)
-1sd 10Y Avg +1sd
2016 2017 2018 2019 2020 2021E 2022E 2023E
Profit model (Rs mn)
Net sales 55,678 85,943 98,331 117,220 119,040 111,160 143,118 159,791
EBITDA 13,203 25,132 24,728 26,528 36,745 33,134 46,212 50,568
Other Income 1,201 3,616 3,891 2,454 2,716 4,839 5,634 6,507
Interest (751) (1,294) (1,353) (2,470) (2,865) (2,772) (2,368) (2,368)
Depreciaton (9,084) (12,146) (8,994) (13,917) (16,994) (17,971) (20,096) (22,221)
Profit before tax 4,568 15,307 18,272 12,596 19,602 17,230 29,381 32,486
Extra-ordinary items 530 — — (1,754) — — — —
Current tax (1,231) (3,263) (4,466) (2,204) (5,302) (4,308) (7,345) (8,122)
Deferred tax 682 1,346 36 873 1,401 862 1,469 1,624
Net profit 4,549 13,390 13,842 9,510 15,702 13,784 23,505 25,989
Adjusted PAT 4,019 13,390 13,842 11,265 15,702 13,784 23,505 25,989
Earnings per share (Rs) 115.4 384.3 397.3 323.3 435.2 382.0 651.5 720.3
Balance sheet (Rs mn)
Equity 61,802 76,981 88,968 95,974 129,364 139,179 158,715 180,736
Borrowings 8,629 12,926 34,030 27,980 31,755 23,474 23,474 23,474
Current liabilities 17,459 21,753 17,500 14,755 16,008 23,766 30,595 34,158
Other Current Liabilities - - 10,920 13,224 16,251 16,251 16,251 16,251
Total liabilities 87,889 111,661 151,418 151,933 193,379 202,671 229,036 254,620
Fixed assets 33,147 33,096 50,043 55,862 49,214 46,243 41,147 33,926
Goodwill - - 121 106 194 194 194 194
Investments 23,661 42,426 54,343 44,439 89,154 89,154 89,154 89,154
Cash 2,830 1,110 1,209 3,078 1,082 14,780 34,993 61,071
Other current assets 25,617 29,952 32,682 36,512 36,312 34,015 43,794 48,897
Deferred tax asset 2,634 5,077 6,133 7,234 7,438 8,299 9,768 11,393
Other Non Current Assets - - 6,887 4,702 9,986 9,986 9,986 9,986
Total assets 87,889 111,661 151,418 151,933 193,379 202,671 229,036 254,620
Net Debt (17,863) (30,610) (21,523) 2,046 (32,902) (54,881) (75,094) (101,172)
Free cash flow (Rs mn)
Operating cash flow excl. working capital 12,374 25,292 26,350 25,638 30,936 30,894 42,132 46,586
Working capital changes (2,059) (509) (1,131) (5,302) 5,591 10,054 (2,950) (1,539)
Capital expenditure (7,348) (12,947) (25,263) (18,853) (12,941) (15,000) (15,000) (15,000)
Free cash flow 2,968 11,836 (43) 1,484 23,586 25,948 24,182 30,047
Ratios
EV/EBITDA 57 29 30 29 21 22 16 14
P/E 169 57 56 81 51 58 34 31
P/B 12 10 9 8 6 6 5 4
EV/Ton 448 376 332 291 266 220 210 203
Book value (Rs/share) 1,774 2,210 2,554 2,755 3,713 3,995 4,556 5,188
RoAE (%) 7.0 19.3 16.7 12.2 13.9 10.3 15.8 15.3
RoACE (%) 5.6 14.2 11.2 9.0 11.1 7.5 12.1 11.7
CRoCI (%) 13.2 29.8 31.0 26.2 28.6 24.9 31.5 31.0

80 KOTAK INSTITUTIONAL EQUITIES RESEARCH
KO
TA
K IN
STIT
UTIO
NA
L EQ
UIT
IES R
ESEA
RC
H
80
Ind
ia D
aily
Su
mm
ary
- July
15, 2
02
0
June 2020: Results calendar
Source: NSE, Kotak Institutional Equities
Mon Tue Wed Thu Fri Sat Sun
13-Jul 14-Jul 15-Jul 16-Jul 17-Jul 18-Jul 19-Jul
Mindtree Bandhan Bank Bajaj Consumer Care Britannia Industries HDFC Bank
Oberoi Realty Federal Bank L&T Finance Holdings HCL Technologies Mahindra & Mahindra Financial
Wipro Infosys L&T Technology ICICI Lombard
L&T Infotech
20-Jul 21-Jul 22-Jul 23-Jul 24-Jul 25-Jul 26-Jul
ACC Axis Bank Bajaj Auto AU Small Finance Ambuja Cements ICICI Bank
Bajaj Finance Bajaj Holding & Investment Biocon Asian Paints Supreme Industries
Bajaj Finserv Dhanuka Agritech HDFC AMC Crompton Greaves Consumer
HDFC Life Insurance Jindal Steel and Power Mphasis ITC
Hindustan Unilever L&T SKF JSW Steel
Hindustan Zinc Rallis India Schaeffler India
ICICI Prudential Life
Mahindra CIE Automotive
SBI Life Insurance
Syngene International
27-Jul 28-Jul 29-Jul 30-Jul 31-Jul 1-Aug 2-Aug
Bharat Electronics Castrol India Carborundum Universal Cholamandalam
Bharti Infratel IDFC First Bank Dr Reddy's Laboratories Dabur India
Marico Orient Cement GlaxoSmithkline Pharmaceuticals HDFC
TVS Motor Torrent Pharmaceuticals
3-Aug 4-Aug 5-Aug 6-Aug 7-Aug 8-Aug 9-Aug
Kansai Nerolac Godrej Properties Mahanagar Gas
Trent The Ramco Cement
10-Aug 11-Aug 12-Aug 13-Aug 14-Aug 15-Aug 16-Aug
Bosch Endurance Technologies

KOTAK INSTITUTIONAL EQUITIES RESEARCH 81
In
dia
Da
ily S
um
ma
ry - Ju
ly 1
5, 2
02
0
81
K
OTA
K IN
STIT
UTIO
NA
L EQ
UIT
IES R
ESEA
RC
H
Kotak Institutional Equities: Valuation summary of KIE Universe stocks
Source: Company, Bloomberg, Kotak Institutional Equities estimates
Fair O/S ADVT
Price (Rs) Value Upside Mkt cap. shares EPS (Rs) EPS growth (%) P/E (X) EV/EBITDA (X) 3mo
Company Rating 14-Jul-20 (Rs) (%) (Rs bn) (US$ bn) (mn) 2020 2021E 2022E 2020 2021E 2022E 2020 2021E 2022E 2020 2021E 2022E 2020 2021E 2022E 2020 2021E 2022E 2020 2021E 2022E (US$ mn)
Automobiles & Components
Amara Raja Batteries REDUCE 696 620 (11) 119 1.6 171 39 33 41 36.7 (14.8) 25.4 18 21.1 16.8 10.8 11.2 9.1 3.3 2.9 2.6 18.9 14.6 16.3 1.6 1.2 1.5 11.8
Apollo Tyres BUY 110 110 (0) 63 0.8 638 8.3 2.3 8.7 (41.9) (72.0) 273.3 13.3 47.4 12.7 6.3 6.6 4.8 0.6 0.6 0.6 4.8 1.4 4.9 2.7 1.2 2.4 12.8
Ashok Leyland BUY 50 65 29 148 2.0 2,936 1.2 (0.6) 2.2 (82.4) (150.8) 447.8 41.2 NM 23.3 14.1 24.5 9.7 2.0 2.1 2.0 4.6 NM 8.6 6.9 0.0 1.3 30
Bajaj Auto BUY 2,900 3,000 3 839 11 289 176 158 190 15.0 (10.1) 20.0 16.5 18.3 15.3 13.4 14.2 11.2 4.2 3.9 3.5 24 22 24 4.2 3.3 3.9 35
Balkrishna Industries SELL 1,252 1,100 (12) 242 3.2 193 50 50 58 25.2 0.6 16.3 25.2 25.1 21.5 17.1 14.3 12.2 4.8 4.4 3.9 19.9 18.3 19.1 1.6 1.8 1.9 12.0
Bharat Forge SELL 367 285 (22) 171 2.3 466 8 0 11 (66.2) (94.5) 2,559.2 48.9 884.0 33.2 18.3 35.4 16.2 3.3 3.3 3.0 6.6 0.4 9.5 0.5 0.0 0.8 17.3
CEAT BUY 878 940 7 36 0.5 40 63 60 78 1.9 (4.6) 30.7 14.0 14.7 11.2 7.5 7.5 6.6 1.2 1.1 1.1 8.9 8.0 9.8 1.4 1.4 1.4 2.5
Eicher Motors ADD 18,850 17,500 (7) 515 6.8 27 671 563 792 (17.7) (16.1) 40.6 28.1 33.5 23.8 20.6 24.6 17.3 6.2 5.4 4.6 24 17.3 21 0.2 — — 61
Endurance Technologies REDUCE 884 820 (7) 124 1.7 141 40 29 46 11.1 (28.4) 59.2 22 30.7 19.3 10.9 12.5 8.7 4.1 3.7 3.2 18.8 12.1 16.6 0.6 0.5 0.9 2.8
Escorts BUY 1,080 1,300 20 96 1.8 101 55 59 76 0.4 8.5 28.0 19.8 18.2 14.2 13.7 10.9 8.1 2.8 2.2 1.9 14.0 11.9 13.5 0.2 0.8 1.1 39
Exide Industries SELL 153 150 (2) 130 1.7 850 10.0 7.5 9.1 10.3 (24.3) 20.2 15.4 20.3 16.9 9.4 10.9 9.4 2.1 2.0 1.8 13.8 9.9 11.2 2.7 2.3 2.3 7.7
Hero Motocorp REDUCE 2,612 2,600 (0) 522 6.9 200 159 133 174 (6.1) (16.5) 30.8 16.4 19.7 15.0 11.0 12.1 8.9 3.7 3.5 3.2 24 18.2 22 3.7 3.3 4.0 62
Mahindra CIE Automotive BUY 114 100 (12) 43 0.6 378 9.4 5.9 9.6 (34.9) (37.7) 63.3 12.0 19.3 11.8 5.7 7.8 5.4 0.9 0.9 0.8 8.0 4.7 7.2 — — — 0.4
Mahindra & Mahindra BUY 545 650 19 678 9.0 1,138 24 31 43 (50.0) 32.1 35.5 22.9 17.3 12.8 10.5 11.1 8.3 1.8 1.6 1.5 7.8 9.9 12.1 0.4 0.6 1.2 48
Maruti Suzuki SELL 5,772 4,300 (25) 1,744 23.1 302 187 133 226 (24.7) (28.8) 69.8 31 43 26 18.9 21.6 12.7 3.6 3.4 3.1 11.9 8.1 12.7 1.0 0.8 1.0 131
Motherson Sumi Systems ADD 94 110 17 297 3.9 3,158 3.7 1.1 5.1 (27.5) (70.3) 359.1 25.3 85.3 18.6 7.0 8.9 4.6 2.6 2.7 2.3 10.5 3.1 13.2 1.6 1.4 1.8 32
MRF SELL 64,396 55,000 (15) 273 3.6 4 3,355 2,185 2,861 25.8 (34.9) 30.9 19 29.5 22.5 11.2 11.3 9.0 2.2 2.1 1.9 12.3 7.3 8.9 0.2 0.1 0.1 9.2
Schaeffler India SELL 3,578 3,200 (11) 112 1.5 31 118 105 140 (18.3) (10.5) 33.3 30 34 25 16.3 17.2 13.4 3.8 3.4 3.0 13.0 10.6 12.6 — — — 0.5
SKF ADD 1,678 1,550 (8) 83 1.1 49 58 52 65 (10.7) (10.8) 25.6 29 32 26 22.0 24.8 19.1 4.4 5.5 4.7 15.2 16.9 18.2 0.7 6.5 0.6 1.4
Tata Motors SELL 105 90 (14) 378 4.6 3,829 (20.7) (44.6) (5.1) (284.1) (115.3) 88.5 NM NM NM 6.0 12.7 4.7 0.6 0.8 0.8 NM NM NM — — — 98
Timken SELL 1,015 825 (19) 76 1.0 75 33 35 42 65.6 6.2 20.1 31 29 24 19.9 17.3 14.1 4.8 4.2 3.6 16.9 15.3 15.9 0.1 0.1 0.1 0.7
TVS Motor SELL 383 220 (42) 182 2.4 475 13.0 9.0 14.9 (7.9) (31.1) 66.7 29 43 26 14.7 16.5 12.0 5.0 4.7 4.2 17.7 11.4 17.4 0.9 1.0 1.0 16.6
Varroc Engineering BUY 207 360 74 28 0.4 135 0 (22) 17 (99.4) (11,685.4) 180.1 1,114.6 NM 12.0 5.7 8.5 4.2 0.9 1.0 1.0 0.1 NM 8.2 — — — 0.9
Automobiles & Components Neutral 6,898 91.6 (39.2) (74.7) 521.2 33.7 133.6 21.5 10.7 13.9 8.1 2.5 2.5 2.3 7.4 1.9 10.7 1.6 1.2 1.5 633
Banks
AU Small Finance Bank SELL 636 515 (19) 195 2.6 304 22.2 16.3 23.5 69.9 (26.4) 44.0 29 39 27 — — — 4.6 4.2 3.7 17.9 10.7 13.7 — — — 5.9
Axis Bank BUY 418 600 44 1,179 15.6 2,822 5.8 36 42 (68.3) 518.4 16.5 72 11.7 10.1 — — — 1.5 1.4 1.2 2.1 11.3 12.0 0.0 1.3 1.5 237
Bandhan Bank ADD 352 270 (23) 567 7.5 1,610 18.1 18.4 19.3 10.9 1.6 4.7 19.4 19.1 18.3 — — — 3.8 3.2 2.7 22.1 17.8 15.8 — — — 64
Bank of Baroda ADD 49 65 33 226 3.0 4,627 1.2 8.2 18 (27.8) 597.5 119.9 42 6.0 2.7 — — — 0.4 0.4 0.4 0.6 5.6 11.4 0.0 3.4 7.4 27
City Union Bank ADD 125 160 28 92 1.2 737 6.5 5.5 9.8 (30.5) (14.9) 79.0 19 22.7 12.7 — — — 1.9 1.8 1.6 9.4 7.4 12.3 0.9 0.8 1.4 4.0
DCB Bank BUY 80 150 88 25 0.3 310 10.9 10.7 11.6 3.6 (1.9) 9.0 7.3 7.5 6.9 — — — 0.8 0.8 0.7 11.2 10.0 9.9 — 1.3 1.5 3.8
Equitas Holdings BUY 57 100 76 19 0.3 342 6.1 6.0 9.7 (4.3) (1.1) 61.6 9.4 9.5 5.9 — — — 0.7 0.7 0.6 7.8 7.1 10.5 — — — 14.4
Federal Bank BUY 51 80 57 102 1.4 1,993 7.7 6.1 6.9 23.6 (21.1) 13.0 6.6 8.4 7.4 — — — 0.8 0.7 0.7 10.9 8.1 8.6 — 2.7 3.0 23
HDFC Bank ADD 1,059 1,200 13 5,813 77.2 5,483 48 48 53 23.7 0.8 9.5 22 22 20 — — — 3.4 3.1 2.8 16.4 14.6 14.3 — 0.9 1.0 269
ICICI Bank BUY 346 470 36 2,238 29.7 6,474 12.3 25 28 134.9 100.2 15.7 28 14.1 12.2 — — — 2.1 1.9 1.7 7.1 13.0 13.5 — 1.4 1.6 225
IndusInd Bank ADD 511 600 17 354 4.7 694 64 27 73 16.3 (57.1) 167.0 8 18.7 7.0 — — — 1.1 1.0 0.9 14.9 5.4 13.3 — 0.8 2.1 201
Karur Vysya Bank BUY 33 65 99 26 0.3 799 2.9 5 7 11.5 54.8 50.2 11 7.2 4.8 — — — 0.5 0.5 0.4 3.6 5.4 7.8 0.0 3.6 5.4 0.9
Punjab National Bank NR 34 — — 316 4.2 9,652 0 2 6 102.3 212.6 283.8 67 21.5 5.6 — — — 0.6 0.6 0.6 0.7 2.1 6.8 — — — 18.9
RBL Bank BUY 165 270 64 84 1.1 509 9.9 11 20 (51.1) 8.2 84.0 17 15.3 8.3 — — — 0.9 0.8 0.8 5.6 5.1 8.8 — 0.9 1.6 90
State Bank of India BUY 186 340 83 1,660 22.0 8,925 16 25 30 1,580.3 51.6 22.7 11 7.6 6.2 — — — 1.0 0.8 0.7 6.4 9.0 10.1 — 0.1 0.1 181
Ujjivan Financial Services BUY 249 490 97 30 0.4 121 26.9 34 44 117.0 24.9 31.6 9 7.4 5.6 — — — 1.4 1.2 1.0 15.7 17.0 19.3 1.2 1.7 2.4 19.3
Ujjivan Small Finance Bank BUY 35 37 6 60 0.8 1,728 2 2 2 38.5 (5.6) (1.9) 18 19.3 19.7 — — — 2.0 2.0 1.9 14.0 10.0 9.2 1.1 1.0 1.0 0.0
Union Bank RS 30 — — 195 2.6 9,414 (8) (2) 2 49.4 77.9 187.9 NM NM 18.5 — — — 0.5 0.7 0.7 NM NM 2.6 — (0.9) 0.8 2.6
Banks Attractive 13,593 180.4 43.1 97.6 43.7 33 16.5 11.5 1.5 1.3 1.2 4.4 7.7 10.1 0.1 0.8 1.1 1,420
P/B (X) RoE (%) Dividend yield (%)

82 KOTAK INSTITUTIONAL EQUITIES RESEARCH
KO
TA
K IN
STIT
UTIO
NA
L EQ
UIT
IES R
ESEA
RC
H
82
Ind
ia D
aily
Su
mm
ary
- July
15, 2
02
0
Kotak Institutional Equities: Valuation summary of KIE Universe stocks
Source: Company, Bloomberg, Kotak Institutional Equities estimates
Fair O/S ADVT
Price (Rs) Value Upside Mkt cap. shares EPS (Rs) EPS growth (%) P/E (X) EV/EBITDA (X) 3mo
Company Rating 14-Jul-20 (Rs) (%) (Rs bn) (US$ bn) (mn) 2020 2021E 2022E 2020 2021E 2022E 2020 2021E 2022E 2020 2021E 2022E 2020 2021E 2022E 2020 2021E 2022E 2020 2021E 2022E (US$ mn)
Building Products
Astral Poly Technik SELL 914 765 (16) 138 1.8 151 16.4 18 25 25.6 11.7 37.7 56 50 36 31.1 27.4 20.4 9.2 7.9 6.6 17.8 17.0 19.8 0.1 0.2 0.3 2.2
Building Products Cautious 138 1.8 26.6 11.7 37.7 56 50 36 31.1 27.4 20.4 9.2 7.8 6.6 16.5 15.8 18.2 0.1 0.2 0.3 2.2
Capital goods
ABB SELL 908 795 (12) 192 2.6 212 18 14 21 46.3 (19.1) 46.5 52 64 44 33.2 40.8 26.7 5.5 5.3 4.9 9.9 8.4 11.6 0.6 0.7 0.8 2.5
Ashoka Buildcon BUY 61 130 112 17 0.2 281 13.8 8.5 11.5 16.2 (38.0) 34.7 4.5 7.2 5.3 3.0 4.8 3.6 0.7 0.6 0.6 16.1 8.9 11.1 0.0 2.2 3.0 1.3
Bharat Electronics BUY 97 105 8 237 3.1 2,437 7.5 6.1 6.5 (3.3) (18.2) 6.7 13.0 15.9 14.9 8.0 9.5 8.6 2.3 2.2 2.0 18.9 14.2 14.0 2.9 2.4 2.5 21
BHEL REDUCE 39 28 (27) 135 1.8 3,482 -4.2 -1.5 2.5 (221.0) 64.0 263.0 NM NM 15.7 (52.1) (312.9) 6.3 0.5 0.5 0.5 NM NM 3.0 (5.3) (1.7) 2.6 35
Carborundum Universal ADD 244 285 17 46 0.6 189 14.4 13.7 15.9 9.9 (4.7) 16.0 16.9 17.8 15.3 11.0 10.2 8.4 2.5 2.2 2.0 15.2 13.3 13.9 1.1 1.1 1.2 0.5
Cochin Shipyard BUY 325 550 69 43 0.6 132 48 39 47 32.5 (19.7) 19.7 6.7 8.3 7.0 3.1 3.8 3.7 1.1 1.1 1.0 18.1 13.2 14.4 4.6 3.6 3.9 2.4
Cummins India BUY 387 460 19 107 1.4 277 26 16 24 (3.2) (35.4) 48.7 15.2 23 15.8 17.0 28.2 16.1 2.6 2.5 2.4 17.0 10.8 15.5 3.6 2.3 3.5 9.3
Dilip Buildcon BUY 283 495 75 39 0.5 137 30 27 45 (45.3) (10.8) 64.8 9.3 10.4 6.3 4.5 5.0 3.1 1.1 1.0 0.8 12.2 9.8 14.2 0.2 0.2 0.3 1.3
IRB Infrastructure BUY 120 150 25 42 0.6 351 21 15 11 (15.2) (27.9) (22.9) 5.9 8.1 10.5 3.5 6.4 6.1 0.6 0.6 0.6 11.1 7.6 5.6 4.2 3.2 2.1 3.9
Kalpataru Power Transmission BUY 257 470 83 40 0.5 153 25 25 39 (16.4) 0.1 53.3 10.1 10.1 6.6 4.3 4.2 3.6 1.2 1.1 0.9 12.0 11.1 15.2 1.3 1.2 1.7 2.0
KEC International BUY 268 342 27 69 0.9 257 22.0 25 31 16.3 13.4 24.4 12.2 10.8 8.6 7.1 6.5 5.3 2.5 2.1 1.7 22 21 22 1.3 1.0 1.2 1.7
L&T BUY 913 1,180 29 1,281 17.0 1,403 63 40 69 3.3 (37.1) 73.8 14.4 23 13.2 15.6 17.6 12.8 2.2 1.9 1.7 15.8 8.9 13.7 2.0 1.6 2.4 73
Sadbhav Engineering BUY 54 113 110 9 0.1 172 4.2 5.3 11.4 (61.4) 26.0 115.4 12.8 10.2 4.7 6.7 6.4 4.0 0.4 0.4 0.4 3.5 4.2 8.6 — — — 0.3
Siemens SELL 1,131 1,000 (12) 403 5.3 356 26 33 38 (14.9) 28.2 14.7 44 34 30 29.0 22.4 19.7 4.2 3.9 3.5 9.9 11.8 12.5 0.6 0.8 0.9 67
Thermax BUY 772 820 6 92 1.2 113 19 15 31 (48.8) (22.5) 109.8 41 53 25 22.0 34.3 17.8 22.0 34.3 17.8 7.0 5.4 10.7 0.9 0.7 1.2 1.1
Capital goods Neutral 2,753 36.5 (17.1) (21.7) 61.2 18.4 24 14.6 1.9 1.7 1.6 10.4 7.4 11.0 1.4 1.3 2.0 1,420
Commercial & Professional Services
SIS REDUCE 370 405 10 54 0.7 149 15 16 20 5.0 3.8 25.7 24 24 18.7 11.3 11.4 9.9 4.0 3.4 2.9 17.1 15.6 16.8 1.0 0.2 0.3 0.3
TeamLease Services ADD 1,801 1,875 4 31 0.4 17 20 50 68 (64.3) 143.7 36.4 88 36 26 32.2 26.3 20.0 5.4 4.7 4.0 6.3 13.9 16.2 — — — 0.5
Commercial & Professional Services Cautious 85 1.1 (16.7) 22.6 28.6 33 27 21 14.5 14.1 11.9 4.3 3.7 3.2 13.3 14.1 15.4 0.6 0.1 0.2 0.9
Commodity Chemicals
Asian Paints REDUCE 1,688 1,700 1 1,620 21.5 959 27.2 19.1 36.2 20.7 (29.9) 90.0 62 89 47 38.7 50.5 30.0 16.0 14.6 12.6 27 17.2 29 0.7 0.5 1.0 64
Berger Paints SELL 500 410 (18) 486 6.5 971 6.8 5.8 9.2 32.2 (15.1) 60.2 74 87 54 45.9 50.7 34.2 18.3 15.9 13.5 26 19.6 27 0.4 0.3 0.6 10.8
Kansai Nerolac BUY 437 450 3 235 3.1 539 9.9 5.7 12.5 14.6 (42.6) 120.1 44 77 35 29.5 45.9 23.0 6.2 6.0 5.5 14.8 8.0 16.5 0.7 0.7 1.0 1.6
Tata Chemicals ADD 306 320 5 78 1.0 255 31.7 31.0 37.5 (26.2) (2.1) 21.0 9.7 9.9 8.1 4.7 4.6 3.8 0.6 0.6 0.6 6.4 6.0 7.0 3.6 3.6 4.3 8.5
Commodity Chemicals Neutral 2,419 32.1 9.2 (24.4) 72.2 53 69 40 30.4 36.5 23.9 8.2 7.7 7.0 15.6 11.1 17.2 0.8 0.6 1.1 85
Construction Materials
ACC BUY 1,294 1,400 8 243 3.2 188 72.3 52.3 72.7 35.8 (27.7) 39.2 17.9 25 17.8 8.2 10.6 7.9 2.1 2.0 1.9 12.3 8.3 11.1 1.1 2.0 2.8 24
Ambuja Cements BUY 191 190 (0) 378 5.0 1,986 10.6 7.5 10.7 49.1 (29.5) 43.3 18.0 26 17.8 6.2 8.3 5.8 1.6 1.5 1.4 9.0 6.0 8.1 0.8 0.8 0.8 12.5
Dalmia Bharat BUY 699 935 34 131 1.7 192 14.0 2.0 19.2 (12.1) (85.4) 844.0 50 343 36 7.0 7.5 5.5 1.3 1.3 1.2 2.5 0.4 3.4 — — — 2.4
Grasim Industries ADD 597 735 23 393 5.2 657 52.6 40.6 71.6 (21.1) (22.9) 76.5 11.3 14.7 8.3 7.4 8.1 5.2 0.7 0.7 0.6 6.0 4.6 7.6 0.7 0.2 0.5 19.9
J K Cement BUY 1,419 1,450 2 110 1.5 77 64.2 51.8 92.2 83.6 (19.4) 78.1 22 27 15.4 10.8 11.2 7.8 3.6 3.3 2.8 17.3 12.5 19.4 0.5 0.7 0.7 1.5
JK Lakshmi Cement BUY 283 275 (3) 33 0.4 118 23.5 10.7 23.3 478.2 (54.5) 118.0 12.0 26 12.1 5.4 7.2 5.0 2.0 1.9 1.6 17.4 7.2 14.3 0.9 0.6 1.2 1.6
Orient Cement BUY 63 55 (13) 13 0.2 205 4.2 2.5 5.4 82.1 (41.2) 117.3 14.9 25 11.7 6.4 7.4 5.5 1.2 1.1 1.1 8.0 4.5 9.5 1.2 3.2 3.2 0.9
Shree Cement SELL 22,086 16,000 (28) 797 10.6 36 435.2 382.0 651.5 34.6 (12.2) 70.5 51 58 34 21.7 23.4 16.3 6.2 5.7 5.0 13.9 10.3 15.8 0.5 0.5 0.5 18.0
UltraTech Cement BUY 3,771 4,000 6 1,088 14.4 289 132.9 115.8 202.7 45.2 (12.8) 75.0 28 33 18.6 13.5 14.1 9.2 2.8 2.6 2.3 10.5 8.2 13.1 0.3 0.4 0.5 32
Construction Materials Cautious 3,186 42.3 21.1 (22.2) 70.7 24 30 17.8 10.3 11.4 7.7 2.0 1.9 1.7 8.4 6.2 9.7 0.5 0.6 0.7 112
P/B (X) RoE (%) Dividend yield (%)

KOTAK INSTITUTIONAL EQUITIES RESEARCH 83
In
dia
Da
ily S
um
ma
ry - Ju
ly 1
5, 2
02
0
83
K
OTA
K IN
STIT
UTIO
NA
L EQ
UIT
IES R
ESEA
RC
H
Kotak Institutional Equities: Valuation summary of KIE Universe stocks
Source: Company, Bloomberg, Kotak Institutional Equities estimates
Fair O/S ADVT
Price (Rs) Value Upside Mkt cap. shares EPS (Rs) EPS growth (%) P/E (X) EV/EBITDA (X) 3mo
Company Rating 14-Jul-20 (Rs) (%) (Rs bn) (US$ bn) (mn) 2020 2021E 2022E 2020 2021E 2022E 2020 2021E 2022E 2020 2021E 2022E 2020 2021E 2022E 2020 2021E 2022E 2020 2021E 2022E (US$ mn)
Consumer Durables & Apparel
Crompton Greaves Consumer SELL 243 185 (24) 153 2.0 627 7.9 5.7 7.9 33.1 (28.2) 38.5 31 43 31 26 32 24 10.4 8.2 6.9 39 21 24 0.0 0.0 1.0 2.9
Havells India SELL 580 475 (18) 363 4.8 626 11.8 8.7 13.8 (6.6) (26.1) 58.5 49 67 42 34 43 29 8.4 7.8 7.1 17.3 12.2 17.7 1.8 0.5 0.8 19.4
Page Industries REDUCE 19,502 16,000 (18) 218 2.9 11 308 277 397 (12.9) (10.0) 43.5 63 70 49 41 44 33 26.5 23.0 18.7 43 35 42 0.8 0.8 1.2 11.6
Polycab ADD 809 725 (10) 120 1.6 149 52 40 51 53.2 (21.7) 27.0 15.7 20 15.8 11 13 10 3.1 2.8 2.4 23 14.6 16.2 0.6 0.5 0.6 3.5
TCNS Clothing Co. REDUCE 345 380 10 21 0.3 66 11 4 15 (47.7) (64.3) 302.6 32 90 22 12 17 8.6 3.4 3.1 2.6 10.9 3.6 12.8 — — — 0.2
Vardhman Textiles ADD 655 800 22 38 0.5 57 85 65 101 (34.1) (23.4) 54.4 7.7 10.0 6.5 5.9 6.4 4.2 0.6 0.6 0.5 8.3 6.0 8.7 2.7 1.9 3.1 0.2
Voltas SELL 548 440 (20) 181 2.4 331 16.2 10.3 17.8 3.4 (36.5) 73.0 34 53 31 28 51 25 4.2 4.0 3.7 12.8 7.7 12.5 0.7 0.5 0.8 20
Whirlpool SELL 2,175 1,580 (27) 276 3.7 127 38 26 47 17.0 (32.0) 82.8 58 85 47 39 57 33 10.8 10.0 9.0 20 12.2 20 0.2 0.4 0.9 1.8
Consumer Durables & Apparel Cautious 1,370 18.2 2.3 (26.6) 35 48 31 24 31 21 5.7 5.2 16.3 11.0 15.1 0.9 0.5 60
Consumer Staples
Bajaj Consumer Care ADD 156 170 9 23 0.3 148 12.5 12.1 12.7 (16.6) (3.6) 5.0 12.4 12.9 12.3 9.0 9.6 8.9 3.5 3.2 2.9 33 26 25 1.3 5.1 5.1 1.4
Britannia Industries REDUCE 3,735 3,300 (12) 899 11.9 240 59 77 83 22.1 30.3 8.2 63 49 45 49 37 34 20.4 17.1 13.7 32 38 34 0.9 0.7 0.9 43
Colgate-Palmolive (India) ADD 1,430 1,450 1 389 5.2 272 28 30 36 5.9 7.4 19.7 50 47 39 32.0 30.0 25.6 24.4 24.3 23.0 51 52 60 2.0 2.0 2.4 21
Dabur India REDUCE 479 400 (17) 847 11.2 1,767 8.6 9.3 10.6 6.1 7.6 13.9 56 52 45 46 42 35 12.8 11.9 10.9 25 24 25 0.6 1.3 1.5 23
Godrej Consumer Products BUY 695 615 (11) 710 9.4 1,022 13.8 14.8 18.6 (4.8) 7.7 25.2 50 47 37 34 32 26 9.0 8.0 7.2 18.6 18.1 20 0.9 1.1 1.4 16.7
Hindustan Unilever ADD 2,235 2,300 3 5,247 69.7 2,343 31 35 44 10.9 12.8 25.8 72 63 50 54 44 36 60.1 12.1 11.5 86 32 23 1.1 1.4 1.8 224
ITC BUY 196 255 30 2,408 32.0 12,308 11.6 10.7 12.4 14.4 (7.2) 15.5 16.9 18.3 15.8 11.7 12.8 10.9 3.8 3.7 3.5 21 19.4 22 5.2 4.7 5.4 79
Jyothy Laboratories ADD 115 135 18 42 0.6 367 4.7 5.2 5.7 (15.5) 11.0 8.2 24 22 20 17.8 14.7 13.6 3.4 3.3 3.1 13.6 15.3 15.7 2.6 3.1 3.5 0.9
Marico BUY 349 350 0 450 6.0 1,290 8.1 8.2 9.4 12.4 1.5 13.7 43 42 37 30 29 26 14.9 14.1 13.4 35 34 37 1.9 2.0 2.3 16.3
Nestle India REDUCE 16,896 16,000 (5) 1,629 21.6 96 204 241 282 22.6 17.9 17.3 83 70 60 57 47 41 84.3 68.9 57.0 70 108 104 2.0 1.2 1.4 39
Tata Consumer Products ADD 419 385 (8) 384 5.1 922 8.0 8.2 10.9 13.9 2.9 33.2 53 51 38 29 26 22 2.8 2.7 2.6 6.9 5.4 6.9 0.6 0.8 1.0 25
United Breweries ADD 1,005 1,180 17 266 3.5 264 16.2 2.5 21.8 (24.0) (84.4) 760.7 62 397 46 30 65 24 7.5 7.6 6.5 12.8 1.9 15.2 0.2 0.1 0.6 11.1
United Spirits ADD 620 620 0 450 6.0 727 11.5 9.3 14.8 21.7 (19.4) 59.9 54 67 42 31 37 26 11.2 9.6 7.8 23 15.5 21 — — — 39
Varun Beverages BUY 681 800 17 197 2.6 289 16.2 14.4 29.1 51.9 (11.3) 102.1 42 47 23 16 16 11 5.9 5.2 4.3 17.6 11.7 20 0.1 0.2 0.3 3.2
Consumer Staples Cautious 13,940 185.1 13.0 3.2 22.1 44 42 35 31 29 24 11.2 8.4 7.9 26 19.9 23 1.8 1.8 2.2 543
Diversified Financials
Bajaj Finance BUY 3,191 2,700 (15) 1,920 25.5 600 104 66 126 50 (37) 92 31 49 25 — — — 5.9 5.3 4.5 20 11.5 19.3 0.3 0.2 0.4 432
Bajaj Finserv BUY 6,243 7,000 12 994 13.2 159 212 238 392 5 12 65 29 26 15.9 — — — 3.2 2.9 2.5 12.2 11.6 16.9 0.2 0.2 0.2 95
Cholamandalam BUY 199 265 33 163 2.2 820 12.8 12.1 18.7 (15) (5.8) 54.3 15.5 16.5 10.7 — — — 2.1 2.0 1.7 14.7 11.5 15.7 0.9 0.7 1.0 38
IIFL Wealth ADD 947 1,200 27 83 1.1 88 23.8 37.0 53.7 (47) 55.8 45.1 40 26 17.6 — — — 2.8 2.7 2.6 7.0 10.7 15.1 1.1 2.5 3.7 0.2
L&T Finance Holdings ADD 64 85 32 129 1.7 2,005 8 5 9 (24.1) (38) 72.6 7.6 12.2 7.1 — — — 0.9 0.8 0.8 14.7 7.0 11.3 3.0 2.3 2.5 18.9
LIC Housing Finance ADD 264 350 33 133 1.8 505 47.6 36.2 66.6 4 (24.0) 84.1 5.5 7.3 4.0 — — — 0.9 0.9 0.7 13.9 9.6 16.0 3.0 2.3 4.2 26
Muthoot Finance ADD 1,082 1,025 (5) 434 5.8 401 75 69 85 52.3 (7) 22.8 14.4 15.6 12.7 — — — 3.7 3.2 2.7 28 22 23 1.4 1.3 1.6 38
Shriram City Union Finance BUY 669 1,250 87 44 0.6 66 152 84 158 1.2 (44) 87.1 4.4 7.9 4.2 — — — 0.7 0.6 0.5 14.7 7.5 12.8 0.9 1.6 3.5 0.6
Shriram Transport BUY 675 1,050 56 153 2.0 227 110.3 81.7 119.0 (2) (25.9) 45.6 6.1 8.3 5.7 — — — 0.9 0.8 0.7 14.8 9.9 13.0 0.7 1.8 2.6 61
Diversified Financials Neutral 7,314 97.1 32.3 (25.9) 43.9 17.9 24 16.8 2.7 2.7 2.4 15.1 11.1 14.2 0.9 0.9 1.2 912
P/B (X) RoE (%) Dividend yield (%)

84 KOTAK INSTITUTIONAL EQUITIES RESEARCH
KO
TA
K IN
STIT
UTIO
NA
L EQ
UIT
IES R
ESEA
RC
H
84
Ind
ia D
aily
Su
mm
ary
- July
15, 2
02
0
Kotak Institutional Equities: Valuation summary of KIE Universe stocks
Source: Company, Bloomberg, Kotak Institutional Equities estimates
Fair O/S ADVT
Price (Rs) Value Upside shares 3mo
Company Rating 14-Jul-20 (Rs) (%) (Rs bn) (US$ bn) (mn) 2020 2021E 2022E 2020 2021E 2022E 2020 2021E 2022E 2020 2021E 2022E 2020 2021E 2022E 2020 2021E 2022E 2020 2021E 2022E (US$ mn)
Electric Utilities
CESC BUY 631 810 28 84 1.1 133 99 102 114 9 3.3 11.8 6.4 6.2 5.5 5.3 5.0 4.4 0.7 0.6 0.6 10.7 10.4 10.7 2.0 2.0 2.1 5.7
JSW Energy BUY 45 65 46 73 1.0 1,640 6.3 -2.2 -2.4 49 (136) (5.6) 7.0 NM NM 4.6 8.1 7.0 0.6 0.6 0.7 8.9 NM NM — — — 1.7
NHPC ADD 20 26 30 201 2.7 10,045 2.8 3.0 3.2 10.7 6 8.7 7.2 6.8 6.2 7.3 7.9 7.1 0.7 0.6 0.6 9.2 9.3 9.7 7.3 8.7 9.3 1.6
NTPC BUY 88 140 60 867 11.5 9,895 11.1 13.2 15.4 (0.9) 18.7 16.8 7.9 6.6 5.7 9.7 7.6 6.0 0.8 0.7 0.7 10.0 11.1 11.9 3.6 4.5 5.3 22
Power Grid BUY 163 220 35 855 11.3 5,232 20.7 22 25 9 6.3 16.1 7.9 7.4 6.4 6.6 6.3 5.6 1.3 1.2 1.1 17.5 17.0 18.1 6.1 6.5 7.6 28
Tata Power BUY 48 55 14 130 1.7 2,705 4.4 4.9 6.5 110 11 31.8 10.8 9.7 7.4 7.3 6.5 5.9 0.7 0.7 0.6 6.9 7.1 8.7 — — — 21
Electric Utilities Attractive 2,210 29.3 8.2 5.7 16.3 7.8 7.4 6.4 0.9 0.8 0.8 11.2 11.1 11.9 4.5 5.2 5.9 79
Fertilizers & Agricultural Chemicals
Bayer Cropscience SELL 5,584 3,400 (39) 251 3.3 45 129.3 134.2 149.9 64.7 3.8 11.7 43 42 37 33 30 26 9.7 8.2 7.0 24 21 20 0.4 0.5 0.5 2.3
Dhanuka Agritech SELL 756 535 (29) 36 0.5 48 29.7 34.9 38.2 25.7 17.4 9.5 25.4 21.6 19.8 20.3 17.0 15.3 5.1 4.9 4.6 21 23 24 3.2 3.7 4.1 1.2
Godrej Agrovet SELL 441 375 (15) 85 1.1 192 11.5 12.9 17.0 0.8 11.8 32 38 34 26 22 18 14 3.8 3.5 3.2 10.4 10.7 12.9 1.2 1.0 1.3 1.5
Rallis India ADD 293 230 (21) 57 0.8 195 9.0 10.6 14.2 7.4 17.1 33.7 32.3 27.6 20.7 22.1 18.9 14.5 4.0 3.6 3.2 13.1 13.9 16.5 0.9 0.9 1.0 3.3
UPL SELL 438 350 (20) 334 4.4 765 23.2 30.3 35.7 22.7 30.4 17.8 19 14.4 12.3 8.6 7.7 6.7 2.1 1.9 1.7 11.5 13.5 14.3 1.4 1.8 2.1 40
Fertilizers & Agricultural Chemicals Attractive 1,025 13.6 26.7 22.5 18.8 30 25 20.7 13.9 12.2 10.6 4.0 3.5 3.1 13.2 14.4 15.2 0.9 1.1 1.3 53
Gas Utilities
GAIL (India) BUY 99 150 51 447 5.9 4,510 13.2 9.5 11.6 (5.5) (28.2) 22.2 7.5 10.5 8.6 5.8 7.6 6.1 1.0 1.0 0.9 13.5 9.4 10.9 6.5 4.0 5.0 23
GSPL SELL 209 210 0 118 1.6 564 17.2 12.8 11.8 21.9 (25.7) (7.6) 12.2 16.4 17.7 5.5 6.7 6.8 1.8 1.6 1.5 15.5 10.2 8.7 1.0 0.9 1.1 2.3
Indraprastha Gas SELL 415 380 (8) 290 3.9 700 16.7 16.0 20.8 38.6 (4.1) 29.8 24.9 25.9 20.0 17.7 18.3 14.1 5.7 4.9 4.2 25 20 23 0.7 0.7 1.0 26
Mahanagar Gas ADD 990 1,175 19 98 1.3 99 74.6 61.9 82.8 32.8 (17.1) 33.9 13.3 16.0 11.9 9.1 10.5 7.6 3.3 3.0 2.7 28 19.6 24 3.5 3.0 4.5 14.0
Petronet LNG BUY 266 300 13 399 5.3 1,500 17.6 18.7 22.2 17.3 6.2 18.5 15.1 14.2 12.0 8.4 8.0 6.9 3.6 3.4 3.3 25 25 28 4.7 5.3 6.7 11.6
Gas Utilities Attractive 1,352 17.9 6.8 (16.9) 20.5 11.8 14.2 11.8 7.7 8.9 7.4 1.9 1.8 1.7 16.5 12.8 14.3 4.0 3.4 4.3 77
Health Care Services
Apollo Hospitals BUY 1,442 1,700 18 201 2.7 139 18.4 1 44 9 (97) 6,877 78.2 ###### 33.1 14.6 22.3 12.8 6.0 6.0 5.4 7.7 0.3 17.2 0.8 0.0 1.2 19.5
Dr Lal Pathlabs SELL 1,893 1,180 (38) 158 2.1 83 27.1 26.1 37.7 13.4 (3.5) 44.5 70.0 72.5 50.2 43.8 45.2 31.8 15.3 13.3 11.2 23 19.6 24 0.4 0.4 0.6 3.4
HCG BUY 122 140 15 11 0.1 143 (7.7) (6.4) (1.8) (128) 16 72 NM NM NM 9.6 8.2 5.4 2.2 1.8 1.9 NM NM NM — — — 0.7
Metropolis Healthcare SELL 1,556 1,240 (20) 79 1.0 51 29.2 28.9 40.0 22.0 (1.2) 39 53.3 53.9 38.9 32.9 32.0 23.6 14.9 12.7 10.5 31 26 30 0.5 0.6 0.8 7.4
Narayana Hrudayalaya BUY 283 360 27 58 0.8 204 5.8 -3.0 8.3 101.0 (152) 376 48.6 NM 34.1 14.9 31.0 12.2 5.1 5.4 4.6 10.7 NM 14.6 — — — 0.7
Health Care Services Attractive 566 7.5 6 (79) 707 58.0 270.2 33.5 15.6 20.8 12.5 5.8 5.4 4.9 10.0 2.0 14.5 0.5 0.2 0.7 32
Hotels & Restaurants
Jubilant Foodworks ADD 1,652 1,750 6 218 2.9 133 24 9 30 (2) (62.3) 240 70.1 185.9 54.6 24.1 31.4 19.0 19.3 19.0 14.6 26 10.3 30 0.4 0.2 0.6 30
Lemon Tree Hotels BUY 24 38 60 19 0.2 790 -0.1 -0.9 0.6 (118) (655) 161 NM NM 42.9 14.0 28.7 11.1 2.3 2.5 2.4 NM NM 5.7 — 0.0 0.9 1.5
Hotels & Restaurants Attractive 237 3.1 (18) (85) 868 78.2 512.6 52.9 21.9 31.0 17.3 12.1 12.4 10.4 15.5 2.4 19.6 0.3 0.2 0.6 32
Insurance
HDFC Life Insurance ADD 598 560 (6) 1,208 16.0 2,010 6.4 3.7 5.6 1.4 (42.4) 50.5 92.8 161.1 107 — — — 17.2 16.4 15.4 20 10.4 14.8 0.0 0.2 0.2 42
ICICI Lombard SELL 1,260 875 (31) 573 7.6 454 26.3 30.8 35.7 14 17 16 48.0 40.9 35 — — — 9.3 7.7 6.6 21 21 20 0.3 0.2 0.6 18.6
ICICI Prudential Life BUY 422 500 18 606 8.0 1,436 7.4 6.3 7.6 (6) (14.7) 20.7 56.8 66.6 55 — — — 8.0 7.3 6.6 14.8 11.5 12.6 0.2 0.3 0.3 18.4
Max Financial Services ADD 554 575 4 149 2.0 343 10.1 10.3 28.1 452 2 173 54.8 53.6 19.7 — — — — — — 12.7 14.5 40 — 0.2 1.2 12.4
SBI Life Insurance BUY 860 1,050 22 860 11.4 1,001 14.2 14.9 15.6 7.2 4.9 4.5 60.5 57.7 55 — — — 10.8 9.3 8.2 18.4 17.3 15.8 — 0.3 0.3 17.5
Insurance Attractive 3,396 45.1 8.4 (6.5) 32.1 64.7 69.3 52 11.0 9.8 8.1 17.0 14.1 15.4 0.0 0.2 0.2 109
Mkt cap. EPS (Rs) EPS growth (%) P/E (X) EV/EBITDA (X) P/B (X) RoE (%) Dividend yield (%)

KOTAK INSTITUTIONAL EQUITIES RESEARCH 85
In
dia
Da
ily S
um
ma
ry - Ju
ly 1
5, 2
02
0
85
K
OTA
K IN
STIT
UTIO
NA
L EQ
UIT
IES R
ESEA
RC
H
Kotak Institutional Equities: Valuation summary of KIE Universe stocks
Source: Company, Bloomberg, Kotak Institutional Equities estimates
Fair O/S ADVT
Price (Rs) Value Upside shares 3mo
Company Rating 14-Jul-20 (Rs) (%) (Rs bn) (US$ bn) (mn) 2020 2021E 2022E 2020 2021E 2022E 2020 2021E 2022E 2020 2021E 2022E 2020 2021E 2022E 2020 2021E 2022E 2020 2021E 2022E (US$ mn)
Internet Software & Services
Info Edge SELL 2,896 2,185 (25) 355 4.7 122.3 26.9 19.8 36.7 4.2 (26.5) 85.4 107.6 146.4 79.0 84.8 127.4 63.0 14.6 13.5 12.0 13.8 9.6 16.1 0.3 0.2 0.3 17.2
Just Dial BUY 374 420 12 24 0.3 61.8 42.0 24.3 33.0 31.4 (42.2) 35.9 8.9 15.4 11.3 3.3 8.0 4.5 1.9 2.0 1.7 24 12.2 16.1 — — — 18.4
Internet Software & Services Attractive 379 5.0 15.2 (34.9) 66.5 63.0 96.8 58.1 51.9 86.4 47.5 10.2 10.0 8.8 16.2 10.4 15.1 0.3 0.2 0.3 36
IT Services
HCL Technologies ADD 591 625 6 1,605 21.3 2,716 40.8 38.5 43.8 11.4 (5.6) 13.7 14.5 15.4 13.5 9.0 9.0 7.7 3.3 2.7 2.4 24 19.5 19.0 0.9 1.7 2.3 38
Hexaware Technologies REDUCE 354 320 (10) 106 1.4 302 21.2 19.8 22.7 9.9 (6.7) 14.6 16.7 17.9 15.6 12.2 11.5 9.7 3.9 3.4 3.0 25 20 20 2.4 1.7 2.8 4.7
Infosys BUY 783 775 (1) 3,336 44.3 4,259 38.9 37.5 42.2 10.0 (3.6) 12.3 20.1 20.9 18.6 14.1 13.7 12.1 5.1 4.7 4.4 25 24 25 2.2 3.3 3.8 100
L&T Infotech ADD 2,241 2,150 (4) 390 5.2 176 86.6 87.4 107.1 0 0.9 22.6 25.9 25.6 20.9 18.5 16.4 14.1 7.3 6.3 5.3 30 26 28 1.2 1.4 1.6 3.8
Mindtree REDUCE 978 890 (9) 161 2.1 165 38.3 54.9 62.5 (16) 43 14 25.5 17.8 15.7 14.0 10.4 9.1 5.1 4.3 3.6 19.5 26 25 3.1 1.7 1.9 15.1
Mphasis REDUCE 934 870 (7) 174 2.3 187 63.5 60.6 65.6 13 (4.7) 8.2 14.7 15.4 14.2 9.9 9.7 8.8 3.0 2.8 2.5 21 18.6 18.5 3.7 3.7 3.7 3.0
TCS REDUCE 2,172 2,040 (6) 8,150 108.2 3,752 86.2 83.6 94.1 4 (3.0) 12.5 25.2 26.0 23.1 18.3 18.2 16.4 9.5 8.8 8.2 36 35 37 3.1 3.1 3.5 107
Tech Mahindra BUY 598 660 10 521 6.9 880 45.9 34.6 48.7 (3.9) (24.5) 40.6 13.0 17.3 12.3 8.0 8.6 6.4 2.4 2.3 2.0 19.2 13.5 17.5 2.6 2.6 2.9 37
Wipro ADD 225 265 18 1,286 17.1 5,703 16.6 17.0 18.2 11.1 2.4 7.1 13.5 13.2 12.3 8.2 7.4 6.6 2.4 2.0 1.9 17.3 16.2 15.7 0.7 0.9 3.8 24
IT Services Cautious 15,729 208.8 4.3 (3.8) 13.3 20.2 21.0 18.6 14.0 13.7 12.1 5.3 4.8 4.4 26 23 24 2.4 2.7 3.4 332
Media
DB Corp. REDUCE 79 81 2 14 0.2 175 15.7 5.3 14.1 0.4 (66.5) 166.7 5.0 15.0 5.6 2.9 4.8 2.4 0.8 0.8 0.8 15.7 5.4 14.3 15.8 2.5 15.1 0.4
Jagran Prakashan REDUCE 40 35 (12) 11 0.1 281 7.0 3.3 7.0 (20.9) (52) NA 5.7 11.9 NA 1.7 2.2 NA 0.6 0.6 NA 10.3 4.9 9.9 11.3 5.0 12.6 0.4
PVR BUY 1,027 1,625 58 53 0.7 51 29.0 -32.7 59.3 (33) (213) 281 35.5 NM 17.3 10.9 32.4 7.3 2.3 3.0 2.6 8.5 NM 16.2 0.2 (0.3) 0.6 40
Sun TV Network REDUCE 391 435 11 154 2.0 394 35.5 34.9 39.7 (2) (1.6) 13.6 11.0 11.2 9.9 7.5 7.2 6.3 2.7 2.6 2.5 25 24 26 6.4 6.4 7.0 16.1
Zee Entertainment Enterprises REDUCE 166 145 (13) 160 2.1 960 17.9 13.1 16.2 8.6 (27.1) 24.4 9.3 12.7 10.2 6.2 7.8 6.0 1.7 1.6 1.4 18.5 12.6 14.6 2.7 3.3 3.3 59
Media Attractive 392 5.2 (0.4) (29.1) 46.0 10.5 14.8 10.1 6.5 8.1 5.7 1.8 1.8 1.7 17.6 12.3 16.9 4.5 4.1 5.1 115
Metals & Mining
Hindalco Industries BUY 164 225 37 368 4.9 2,220 17.8 10.5 20.0 (28.2) (41.1) 91 9.2 15.7 8.2 5.3 6.6 4.9 0.6 0.6 0.6 6.8 3.9 7.1 0.6 0.6 0.6 35
Hindustan Zinc BUY 192 215 12 810 10.7 4,225 16.1 11.5 15.3 (14.5) (28.4) 32.7 11.9 16.6 12.5 6.7 8.6 6.5 2.0 2.4 2.4 18.4 13.2 19.4 8.6 6.0 8.0 2.9
Jindal Steel and Power BUY 166 200 21 169 2.2 1,020 (7.7) (9.1) 13.8 (343) (19) 251 NM NM 12.0 6.7 7.8 5.2 0.5 0.5 0.5 NM NM 4.4 — — — 34
JSW Steel ADD 194 180 (7) 469 6.2 2,402 10.1 (0.4) 14.8 (68.3) (104) 4,298.7 19.2 NM 13.1 9.0 11.4 6.9 1.3 1.3 1.2 6.8 NM 9.5 1.1 1.1 1.1 31
National Aluminium Co. SELL 34 24 (29) 63 0.8 1,866 0.7 (0.4) 1.4 (91) (154) 461.1 45.9 NM 23.5 8.3 15.1 7.1 0.6 0.6 0.6 1.4 NM 2.7 4.4 0.0 2.1 7.3
NMDC ADD 83 105 27 253 3.4 3,062 14.6 11.9 11.1 (0.7) (18.8) (7) 5.6 6.9 7.5 3.9 4.8 5.2 0.9 0.9 0.8 16.7 12.8 11.2 6.7 7.2 6.7 7.3
Tata Steel BUY 337 400 19 382 5.1 1,146 35.2 (20.8) 63.3 (61) (159) 404 9.6 NM 5.3 8.0 9.8 5.2 0.5 0.6 0.5 5.9 NM 10.4 3.0 2.0 3.4 64
Vedanta BUY 109 120 10 405 5.4 3,717 6.5 5.5 12.3 (57) (16) 125.0 16.7 19.9 8.8 4.6 6.1 4.6 0.7 0.8 0.8 4.2 3.8 8.7 3.6 11.2 7.8 42
Metals & Mining Attractive 2,919 38.7 (45.5) (60.0) 235.2 12.4 31.1 9.3 6.4 8.0 5.4 0.9 0.9 0.9 7.1 2.9 9.3 4.2 4.4 4.6 44
RoE (%) Dividend yield (%)Mkt cap. EPS (Rs) EPS growth (%) P/E (X) EV/EBITDA (X) P/B (X)

86 KOTAK INSTITUTIONAL EQUITIES RESEARCH
KO
TA
K IN
STIT
UTIO
NA
L EQ
UIT
IES R
ESEA
RC
H
86
Ind
ia D
aily
Su
mm
ary
- July
15, 2
02
0
Kotak Institutional Equities: Valuation summary of KIE Universe stocks
Source: Company, Bloomberg, Kotak Institutional Equities estimates
Fair O/S ADVT
Price (Rs) Value Upside shares 3mo
Company Rating 14-Jul-20 (Rs) (%) (Rs bn) (US$ bn) (mn) 2020 2021E 2022E 2020 2021E 2022E 2020 2021E 2022E 2020 2021E 2022E 2020 2021E 2022E 2020 2021E 2022E 2020 2021E 2022E (US$ mn)
Oil, Gas & Consumable Fuels
BPCL BUY 374 440 18 811 10.8 1,967 11 26 33 (71.0) 144.2 28.4 35.5 14.5 11.3 20.3 10.6 8.9 2.2 2.1 1.9 5.9 14.7 17.4 4.4 3.4 4.4 37.4
Coal India BUY 128 215 68 790 10.5 6,163 27 20 20 (4) (24.7) (3.2) 4.7 6.3 6.5 3.6 5.5 5.1 2.5 2.4 2.5 57.0 38.9 37.6 11.7 15.6 15.6 20.6
HPCL BUY 210 260 24 321 4.3 1,524 7 24 27 (82.0) 235.0 10.7 29.5 8.8 7.9 18.2 9.1 8.1 1.1 1.0 1.0 3.8 12.2 12.7 4.6 5.7 6.3 21.4
IOCL BUY 86 130 50 813 10.8 9,181 (3.9) 9.8 13.2 (121.9) 349.6 34.4 NM 8.8 6.5 23.1 5.7 5.2 0.8 0.8 0.8 NM 9.4 11.9 4.9 5.1 6.9 21.5
Oil India SELL 95 70 (26) 103 1.4 1,084 21 3 6 (32) (85.6) 105.7 4.6 31.9 15.5 3.3 8.7 7.5 0.4 0.4 0.4 8.6 1.3 2.7 11.1 1.3 2.6 2.7
ONGC SELL 77 60 (22) 973 12.9 12,580 13 4 7 (43) (71.7) 89.6 5.7 20.3 10.7 2.7 4.5 3.7 0.4 0.4 0.4 7.3 2.1 3.8 6.5 2.5 3.9 27.1
Reliance Industries BUY 1,917 2,150 12 11,362 150.8 5,926 67 70 93 1.2 4.6 33.7 28.7 27.5 20.5 16.7 13.9 9.5 2.5 2.3 2.0 9.4 8.6 10.7 0.3 0.4 0.4 480.5
Oil, Gas & Consumable Fuels Attractive 15,174 201.4 (37.3) 2.5 35.2 20.2 19.8 14.6 10.8 9.9 7.5 1.7 1.6 1.4 8.4 8.0 9.7 1.9 1.8 2.1 611.1
Pharmaceuticals
Aurobindo Pharma REDUCE 809 730 (10) 474 6.3 586 48 51 56 19.3 6 8.8 16.7 15.8 14.5 10.2 9.6 8.4 2.8 2.4 2.1 16.8 15.5 14.8 0.4 0.9 1.1 66.4
Biocon SELL 438 225 (49) 525 7.0 1,202 6.2 8.2 10.0 2 32 21.9 70 54 44 32.7 24.2 19.8 7.1 6.5 5.8 10.6 12.1 13.2 0.1 0.7 0.8 43.0
Cipla BUY 632 650 3 510 6.8 806 19.2 27 32 1.1 39 20 33 23.8 19.7 16.1 13.3 11.1 3.2 2.9 2.6 9.9 12.2 13.2 1.2 0.8 1.0 68.6
Dr Reddy's Laboratories SELL 3,983 3,100 (22) 662 8.8 166 130 147 188 30 13 27.5 31 27.0 21.2 16.1 15.1 11.7 4.3 3.8 3.3 13.9 13.9 15.5 0.6 0.6 0.8 61.1
Laurus Labs ADD 616 560 (9) 66 0.9 107 23.9 34.7 38 117.9 45 10 26 17.8 16.2 13.5 10.8 9.2 3.7 3.1 2.6 15.3 17.3 16.0 (0.6) — — 14.5
Lupin ADD 873 900 3 396 5.3 450 22 32 46 3.6 46 44 40 27 19.1 15.5 12.1 8.8 3.1 2.8 2.5 7.4 10.4 13.3 0.7 0.5 0.8 42.0
Sun Pharmaceuticals ADD 492 480 (2) 1,181 15.7 2,406 16.7 19.2 24 3.8 15 25 29 26 20.5 15.6 13.5 11.0 2.6 2.4 2.2 9.3 9.4 11.2 1.4 0.8 1.0 78.0
Torrent Pharmaceuticals REDUCE 2,421 2,350 (3) 410 5.4 169 57 70 86 22.6 22 22 42 34 28 20.1 17.3 14.8 8.5 7.3 6.2 20.1 21.2 22.2 1.8 1.0 1.2 27.2
Pharmaceuticals Neutral 4,223 56.1 12.5 20 23 31 26 21.2 16.1 13.9 11.4 3.5 3.2 2.8 11.2 12.1 13.3 0.9 0.7 0.9 400.8
Real Estate
Brigade Enterprises BUY 138 235 70 28 0.4 204 6.4 7 15 (46) 6 114 21.6 20.3 9.5 10.3 9.5 4.8 1.2 1.2 1.1 5.9 6.0 12.0 1.8 1.8 1.8 0.7
DLF BUY 140 200 43 346 4.6 2,475 (2.4) 5.0 8.7 (140) 310 74 NM 28.0 16.1 33.6 38.8 22.6 1.0 1.0 0.9 NM 3.6 6.0 — 1.4 1.4 22.3
Embassy Office Parks REIT ADD 335 400 19 259 3.4 772 9.9 12.3 14.1 110 24 15 34 27 24 16.5 15.5 14.3 1.2 1.3 1.3 3.4 4.4 5.4 7.3 7.9 8.9 7.5
Godrej Properties SELL 895 610 (32) 226 3.0 252 10.7 10.9 17.7 (2.7) 2 62.2 83 82 51 69.8 131.3 119.4 4.7 4.4 4.1 7.4 5.6 8.4 — — — 6.3
Oberoi Realty ADD 369 575 56 134 1.8 364 22 34 38 (4.0) 55.5 12 17.1 11.0 9.8 15.9 9.6 8.2 1.5 1.4 1.2 9.4 13.1 13.1 0.5 0.5 0.5 2.3
Prestige Estates Projects ADD 186 275 48 74 1.0 401 10.9 6.6 10 25.1 (39) 54 17 28 18.2 6.4 7.0 5.9 1.3 1.3 1.3 8.7 4.9 7.2 0.8 0.8 0.8 2.2
Sobha BUY 236 415 76 22 0.3 95 30 36 45 (5) 21.5 24.1 7.9 6.5 5.3 4.7 4.2 3.8 0.9 0.8 0.7 12.1 13.4 14.8 3.0 3.0 3.0 1.1
Sunteck Realty BUY 185 320 73 27 0.4 140 12.2 11.3 24 (24.7) (7) 108 15 16.3 7.9 13.2 14.3 5.8 0.9 0.8 0.8 5.9 5.2 10.1 0.5 0.5 0.5 1.6
Real Estate Neutral 1,117 14.8 (41.9) 105.5 42.1 50 24 17.1 16.0 15.0 11.7 1.3 1.3 1.3 2.7 5.4 7.4 1.9 2.5 2.7 44.0
Retailing
Aditya Birla Fashion and Retail BUY 118 150 27 93 1.2 773 (2.1) (4.2) 2.7 (151.4) (96.4) 165.1 NM NM 43 9.7 12.7 7.6 8.4 12.0 9.4 NM NM 24.3 — — — 4.1
Avenue Supermarts SELL 2,155 1,480 (31) 1,396 18.5 648 21.0 20 39 45.1 (4.4) 92.8 103 107 56 64 71 37 12.2 11.3 9.4 15.8 11.1 18.4 — — — 15.4
Titan Company BUY 974 1,215 25 865 11.5 888 16.8 10 21 (0.2) (38.6) 102.8 58 94 46 35 52 30 13.0 11.8 10.0 23.4 13.1 23.3 0.4 0.3 0.6 53.1
Retailing Cautious 2,353 31.2 (2.8) (28.4) 141.8 89 124 51 40 52 29 12.5 11.5 9.6 14.0 9.2 18.7 0.2 0.1 0.2 72.6
Speciality Chemicals
Castrol India BUY 123 165 35 121 1.6 989 8.4 6.0 8.9 16.8 (28.8) 48.8 14.7 20.6 13.8 9.7 13.7 9.3 8.9 8.6 8.2 65.3 42.4 60.8 4.5 4.5 6.7 2.3
Pidilite Industries REDUCE 1,381 1,325 (4) 702 9.3 508 23.1 17 28 30.1 (24.5) 60.9 60 79 49 44 55 35 15.7 14.2 12.2 27.2 18.8 26.6 0.5 0.5 0.7 17.9
S H Kelkar and Company BUY 71 95 35 10 0.1 141 4.6 4.6 6.2 (24.3) (1.0) 35.8 15.2 15.4 11.3 8.1 7.7 6.0 1.2 1.1 1.1 7.8 7.6 9.8 2.8 1.4 2.5 1.5
SRF ADD 3,804 3,800 (0) 219 2.9 57 138 151 197 23.5 9.2 30.9 27.6 25.2 19.3 17.1 14.7 11.7 4.4 3.8 3.2 17.5 16.3 18.2 0.4 0.4 0.5 14.2
Speciality Chemicals Neutral 1,051 14.0 22.1 (15.8) 46.5 37 44 29.9 24.4 27.2 19.3 9.1 8.1 7.1 24.7 18.6 23.6 1.0 0.9 1.4 35.9
Mkt cap. EPS (Rs) EPS growth (%) P/E (X) EV/EBITDA (X) P/B (X) RoE (%) Dividend yield (%)

KOTAK INSTITUTIONAL EQUITIES RESEARCH 87
Ind
ia D
aily
Su
mm
ary
- July
15, 2
02
0
87
K
OTA
K IN
STIT
UTIO
NA
L EQ
UIT
IES R
ESEA
RC
H
Kotak Institutional Equities: Valuation summary of KIE Universe stocks
Source: Company, Bloomberg, Kotak Institutional Equities estimates
Fair O/S ADVT
Price (Rs) Value Upside shares 3mo
Company Rating 14-Jul-20 (Rs) (%) (Rs bn) (US$ bn) (mn) 2020 2021E 2022E 2020 2021E 2022E 2020 2021E 2022E 2020 2021E 2022E 2020 2021E 2022E 2020 2021E 2022E 2020 2021E 2022E (US$ mn)
Telecommunication Services
Bharti Airtel BUY 589 690 17 3,215 42.7 5,456 (6.7) 5.7 14.5 NM NM NM NM 104.1 40.8 11.2 8.8 7.1 4.2 4.2 4.0 NM 4.0 10.0 0.3 1.0 1.0 183.6
Bharti Infratel BUY 209 185 (11) 386 5.1 1,850 16.5 16.5 17.7 25.7 0.2 6.9 12.7 12.6 11.8 5.3 5.1 4.8 2.9 2.8 2.8 21.7 22.5 23.9 5.2 7.7 8.1 30.4
Vodafone Idea RS 9 — — 269 3.6 28,735 (25.7) (3.6) (5.9) NM NM NM NM NM NM 8.2 7.0 5.6 4.5 -6.1 (1.3) NM NM 132 — — — 81
Tata Communications BUY 699 705 1 199 2.6 285 16.0 14.9 21.4 43.8 (6.6) 43.7 43.8 46.9 32.6 9.0 7.9 6.9 NM NM (41.0) NM NM NM 0.6 0.6 0.9 1.0
Telecommunication Services Cautious 4,069 54.0 NM 56.0 66.6 NM NM NM 9.7 7.9 6.5 4.3 4.8 5.6 NM NM NM 0.8 1.6 1.6 295.6
Transportation
Adani Ports and SEZ BUY 320 390 22 651 8.6 2,032 26.9 18.7 21.9 34.7 (30.5) 16.9 11.9 17.1 14.6 11.5 12.4 10.6 2.5 2.3 2.0 21.8 14.0 14.5 4.0 1.0 1.0 18.2
Container Corp. SELL 423 390 (8) 258 3.4 609 17.3 8.0 13.0 5.7 (53.6) 62.2 25 53 33 14.1 24.9 17.2 2.6 2.5 2.5 10.3 4.8 7.6 0.8 1.0 1.7 10.9
Gateway Distriparks BUY 88 135 54 10 0.1 109 4.2 (0.4) 5.1 (37.5) (108.6) 1,491.1 20.7 NM 17.2 7.0 8.5 6.2 0.7 0.7 0.7 3.5 NM 4.1 3.4 3.4 3.4 0.2
GMR Infrastructure BUY 20 26 31 120 1.6 7,147 (3.1) (1.8) (0.8) (25.4) 40.9 55.9 NM NM NM 15.8 18.4 16.6 (4.5) (7.1) (5.5) 106.6 55.8 25.2 — — — 3.1
Gujarat Pipavav Port BUY 81 106 31 39 0.5 483 6.0 4.5 5.8 42.2 (25.1) 28.0 13.4 18.0 14.0 7.4 7.8 6.8 1.9 1.9 1.9 14.2 10.5 13.5 6.9 5.2 6.7 0.8
InterGlobe Aviation SELL 955 925 (3) 368 4.9 383 (6.5) (189.9) 66.4 (258.9) (2,828.8) 135.0 NM NM 14.4 4.2 (8.4) 2.0 6.2 (136.8) 2.0 NM NM 253.3 — — — 42
Mahindra Logistics ADD 311 275 (12) 22 0.3 71 8.9 5.9 10.3 (29.0) (34.2) 75.8 35 53 30 14.4 16.4 11.7 4.1 3.9 3.5 12.2 7.5 12.2 — — — 0.4
Transportation Attractive 1,468 19.5 17.6 (183.9) 288.8 31 NM 19.3 10.4 21.5 8.6 3.4 3.6 3.1 11.2 NM 16.3 2.1 0.8 0.9 76
KIE universe 109,355 1451.8 (14.0) 1.3 51.6 28 27.5 18.1 12.3 12.5 9.5 2.6 2.4 2.2 9.2 8.6 12.0 1.5 1.6 2.0
Notes:
(a) We have used adjusted book values for banking companies.
(b) 2020 means calendar year 2019, similarly for 2021 and 2022 for these particular companies.
(c) Exchange rate (Rs/US$)= 75.33
Mkt cap. EPS (Rs) EPS growth (%) P/E (X) EV/EBITDA (X) P/B (X) RoE (%) Dividend yield (%)
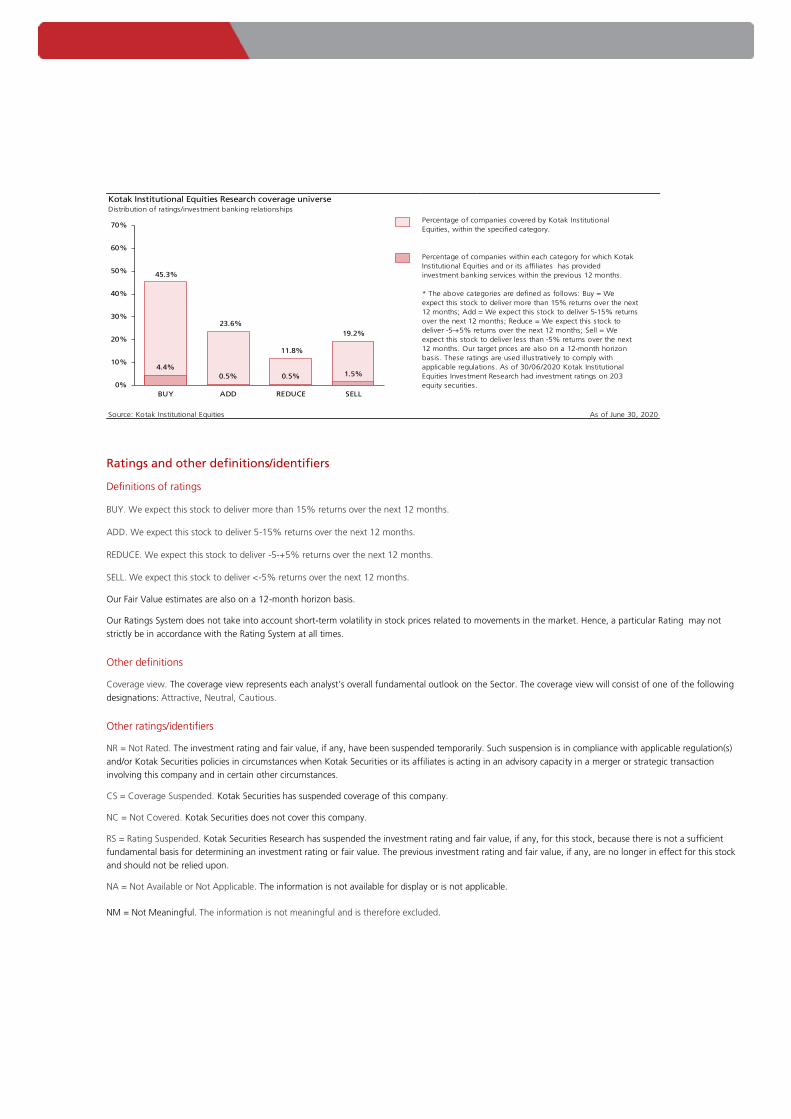
Ind
ia D
aily
Su
mm
ary
-Ju
ly 1
5, 2
02
0
Ratings and other definitions/identifiers
Definitions of ratings
BUY. We expect this stock to deliver more than 15% returns over the next 12 months.
ADD. We expect this stock to deliver 5-15% returns over the next 12 months.
REDUCE. We expect this stock to deliver -5-+5% returns over the next 12 months.
SELL. We expect this stock to deliver <-5% returns over the next 12 months.
Our Fair Value estimates are also on a 12-month horizon basis.
Our Ratings System does not take into account short-term volatility in stock prices related to movements in the market. Hence, a particular Rating may not
strictly be in accordance with the Rating System at all times.
Other definitions
Coverage view. The coverage view represents each analyst’s overall fundamental outlook on the Sector. The coverage view will consist of one of the following
designations: Attractive, Neutral, Cautious.
Other ratings/identifiers
NR = Not Rated. The investment rating and fair value, if any, have been suspended temporarily. Such suspension is in compliance with applicable regulation(s)
and/or Kotak Securities policies in circumstances when Kotak Securities or its affiliates is acting in an advisory capacity in a merger or strategic transaction
involving this company and in certain other circumstances.
CS = Coverage Suspended. Kotak Securities has suspended coverage of this company.
NC = Not Covered. Kotak Securities does not cover this company.
RS = Rating Suspended. Kotak Securities Research has suspended the investment rating and fair value, if any, for this stock, because there is not a sufficient
fundamental basis for determining an investment rating or fair value. The previous investment rating and fair value, if any, are no longer in effect for this stock
and should not be relied upon.
NA = Not Available or Not Applicable. The information is not available for display or is not applicable.
NM = Not Meaningful. The information is not meaningful and is therefore excluded.
Kotak Institutional Equities Research coverage universe
Distribution of ratings/investment banking relationships
Source: Kotak Institutional Equities As of June 30, 2020
Percentage of companies covered by Kotak Institutional
Equities, within the specified category.
* The above categories are defined as follows: Buy = We
expect this stock to deliver more than 15% returns over the next
12 months; Add = We expect this stock to deliver 5-15% returns
over the next 12 months; Reduce = We expect this stock to
deliver -5-+5% returns over the next 12 months; Sell = We
expect this stock to deliver less than -5% returns over the next
12 months. Our target prices are also on a 12-month horizon
basis. These ratings are used illustratively to comply with
applicable regulations. As of 30/06/2020 Kotak Institutional
Equities Investment Research had investment ratings on 203
equity securities.
Percentage of companies within each category for which Kotak
Institutional Equities and or its affiliates has provided
investment banking services within the previous 12 months.45.3%
23.6%
11.8%
19.2%
4.4%
0.5% 0.5% 1.5%
0%
10%
20%
30%
40%
50%
60%
70%
BUY ADD REDUCE SELL

Corporate Office Overseas Affiliates
Kotak Securities Ltd.
27 BKC, Plot No. C-27, “G Block”
Bandra Kurla Complex, Bandra (E)
Mumbai 400 051, India
Tel: +91-22-43360000
Kotak Mahindra (UK) Ltd
8th Floor, Portsoken House
155-157 Minories
London EC3N 1LS
Tel: +44-20-7977-6900
Kotak Mahindra Inc
369 Lexington Avenue
28th Floor, New York
NY 10017, USA
Tel:+1 212 600 8856
Copyright 2020 Kotak Institutional Equities (Kotak Securities Limited). All rights reserved. 1. Note that the research analysts contributing to this report may not be registered/qualified as research analysts with FINRA; and
2. Such research analysts may not be associated persons of Kotak Mahindra Inc and therefore, may not be subject to NASD Rule 2711 restrictions on communications with a subject company, public appearances and trading securities held by a research analyst account.
3. Any U.S. recipients of the research who wish to effect transactions in any security covered by the report should do so with or through Kotak Mahindra Inc and (ii) any transactions in the securities covered by the research by U.S. recipients must be effected only through Kotak Mahindra Inc at [email protected].
This report is distributed in Singapore by Kotak Mahindra (UK) Limited (Singapore Branch) to institutional investors, accredited investors or expert investors only as defined under the Securities and Futures Act. Recipients of this analysis / report are to contact Kotak Mahindra (UK) Limited (Singapore Branch) (16 Raffles Quay, #35-02/03, Hong Leong Building, Singapore 048581) in respect of any matters arising from, or in connection with, this analysis / report. Kotak Mahindra (UK) Limited (Singapore Branch) is regulated by the Monetary Authority of Singapore. Kotak Securities Limited and its affiliates are a full-service, integrated investment banking, investment management, brokerage and financing group. We along with our affiliates are leading underwriter of securities and participants in virtually all securities trading markets in India. We and our affiliates have investment banking and other business relationships with a significant percentage of the companies covered by our Investment Research Department. Our research professionals provide important input into our investment banking and other business selection processes. Investors should assume that Kotak Securities Limited and/or its affiliates are seeking or will seek investment banking or other business from the company or companies that are the subject of this material and that the research professionals who were involved in preparing this material may participate in the solicitation of such business. Our research professionals are paid in part based on the profitability of Kotak Securities Limited, which include earnings from investment banking and other business. Kotak Securities Limited generally prohibits its analysts, persons reporting to analysts, and members of their households from maintaining a financial interest in the securities or derivatives of any companies that the analysts cover. Additionally, Kotak Securities Limited generally prohibits its analysts and persons reporting to analysts from serving as an officer, director, or advisory board member of any companies that the analysts cover. Our salespeople, traders, and other professionals may provide oral or written market commentary or trading strategies to our clients that reflect opinions that are contrary to the opinions expressed herein, and our proprietary trading and investing businesses may make investment decisions that are inconsistent with the recommendations expressed herein. In reviewing these materials, you should be aware that any or all of the foregoing, among other things, may give rise to real or potential conflicts of interest. Additionally, other important information regarding our relationships with the company or companies that are the subject of this material is provided herein. This material should not be construed as an offer to sell or the solicitation of an offer to buy any security in any jurisdiction where such an offer or solicitation would be illegal. We are not soliciting any action based on this material. It is for the general information of clients of Kotak Securities Limited. It does not constitute a personal recommendation or take into account the particular investment objectives, financial situations, or needs of individual clients. Before acting on any advice or recommendation in this material, clients should consider whether it is suitable for their particular circumstances and, if necessary, seek professional advice. The price and value of the investments referred to in this material and the income from them may go down as well as up, and investors may realize losses on any investments. Past performance is not a guide for future performance, future returns are not guaranteed and a loss of original capital may occur. Kotak Securities Limited does not provide tax advise to its clients, and all investors are strongly advised to consult with their tax advisers regarding any potential investment. Certain transactions -including those involving futures, options, and other derivatives as well as non-investment-grade securities - give rise to substantial risk and are not suitable for all investors. The material is based on information that we consider reliable, but we do not represent that it is accurate or complete, and it should not be relied on as such. Opinions expressed are our current opinions as of the date appearing on this material only. We endeavor to update on a reasonable basis the information discussed in this material, but regulatory, compliance, or other reasons may prevent us from doing so. We and our affiliates, officers, directors, and employees, including persons involved in the preparation or issuance of this material, may from time to time have "long" or "short" positions in, act as principal in, and buy or sell the securities or derivatives thereof of companies mentioned herein. Kotak Securities Limited and its non US affiliates may, to the extent permissible under applicable laws, have acted on or used this research to the extent that it relates to non US issuers, prior to or immediately following its publication. Foreign currency denominated securities are subject to fluctuations in exchange rates that could have an adverse effect on the value or price of or income derived from the investment. In addition, investors in securities such as ADRs, the value of which are influenced by foreign currencies affectively assume currency risk. In addition options involve risks and are not suitable for all investors. Please ensure that you have read and understood the current derivatives risk disclosure document before entering into any derivative transactions. Kotak Securities Limited established in 1994, is a subsidiary of Kotak Mahindra Bank Limited. Kotak Securities is one of India's largest brokerage and distribution house. Kotak Securities Limited is a corporate trading and clearing member of Bombay Stock Exchange Limited (BSE), National Stock Exchange of India Limited (NSE), Metropolitan Stock Exchange of India Limited (MSE), National Commodity and Derivatives Exchange (NCDEX) and Multi Commodity Exchange(MCX). Our businesses include stock broking, services rendered in connection with distribution of primary market issues and financial products like mutual funds and fixed deposits, depository services and Portfolio Management. Kotak Securities Limited is also a depository participant with National Securities Depository Limited (NSDL) and Central Depository Services (India) Limited (CDSL). Kotak Securities Limited is also registered with Insurance Regulatory and Development Authority as Corporate Agent for Kotak Mahindra Old Mutual Life Insurance Limited and is also a Mutual Fund Advisor registered with Association of Mutual Funds in India (AMFI). Kotak Securities Limited is registered as a Research Analyst under SEBI (Research Analyst) Regulations, 2014. We hereby declare that our activities were neither suspended nor we have defaulted with any stock exchange authority with whom we are registered in last five years. However SEBI, Exchanges and Depositories have conducted the routine inspection and based on their observations have issued advise letters or levied minor penalty on KSL for certain operational deviations. We have not been debarred from doing business by any Stock Exchange / SEBI or any other authorities; nor has our certificate of registration been cancelled by SEBI at any point of time. We offer our research services to primarily institutional investors and their employees, directors, fund managers, advisors who are registered with us Details of Associates are available on website i.e. www.kotak.com Research Analyst has served as an officer, director or employee of subject company(ies): No We or our associates may have received compensation from the subject company(ies) in the past 12 months. We or our associates have managed or co-managed public offering of securities for the subject company(ies) in the past 12 months. YES. Visit our website for more details We or our associates may have received compensation for investment banking or merchant banking or brokerage services from the subject company(ies) in the past 12 months. We or our associates may have received any compensation for products or services other than investment banking or merchant banking or brokerage services from the subject company(ies) in the past 12 months. We or our associates may have received compensation or other benefits from the subject company(ies) or third party in connection with the research report. Our associates may have financial interest in the subject company(ies). Research Analyst or his/her relative's financial interest in the subject company(ies): No Kotak Securities Limited has financial interest in the subject company(ies) at the end of the month immediately preceding the date of publication of Research Report: Shree Cement, Mindtree, Reliance Industries - YES Nature of Financial interest: Holding equity shares or derivatives of the subject company. Our associates may have actual/beneficial ownership of 1% or more securities of the subject company(ies) at the end of the month immediately preceding the date of publication of Research Report. Research Analyst or his/her relatives has actual/beneficial ownership of 1% or more securities of the subject company(ies) at the end of the month immediately preceding the date of publication of Research Report: No Kotak Securities Limited has actual/beneficial ownership of 1% or more securities of the subject company(ies) at the end of the month immediately preceding the date of publication of Research Report: No Subject company(ies) may have been client during twelve months preceding the date of distribution of the research report. A graph of daily closing prices of securities is available at https://www.moneycontrol.com/india/stockpricequote/ and http://economictimes.indiatimes.com/markets/stocks/stock-quotes. (Choose a company from the list on the browser and select the"three years" icon in the price chart).
Kotak Securities Limited. Registered Office: 27 BKC, C 27, G Block, Bandra Kurla Complex, Bandra (E), Mumbai 400051. CIN: U99999MH1994PLC134051, Telephone No.: +22 43360000, Fax No.: +22 67132430. Website: www.kotak.com / www.kotaksecurities.com. Correspondence Address: Infinity IT Park, Bldg. No 21, Opp. Film City Road, A K Vaidya Marg, Malad (East), Mumbai 400097. Telephone No: 42856825. SEBI Registration No. INZ000200137(Member of NSE, BSE, MSE, MCX & NCDEX). Member Id: NSE-08081; BSE-673; MSE-1024; MCX-56285; NCDEX-1262. AMFI ARN 0164, PMS INP000000258 and Research Analyst INH000000586. NSDL/CDSL: IN-DP-NSDL-23-97. Compliance Officer Details: Mr. Manoj Agarwal. Call: 022 - 4285 8484, or Email: [email protected]. Investments in securities market are subject to market risks, read all the related documents carefully before investing. In case you require any clarification or have any concern, kindly write to us at below email ids: Level 1: For Trading related queries, contact our customer service at ‘[email protected]’ and for demat account related queries contact us at [email protected] or call us on: Toll free numbers 18002099191 / 1860 266 9191 Level 2: If you do not receive a satisfactory response at Level 1 within 3 working days, you may write to us at [email protected] or call us on 022-42858445 and if you feel you are still unheard, write to our customer service HOD at [email protected] or call us on 022-42858208. Level 3: If you still have not received a satisfactory response at Level 2 within 3 working days, you may contact our Compliance Officer (Name: Mr. Manoj Agarwal) at [email protected] or call on 91- (022) 4285 8484. Level 4 : If you have not received a satisfactory response at Level 3 within 7 working days, you may also approach Managing Director / CEO (Mr. Jaideep Hansraj) at [email protected] or call on 91-(022) 4285 8301. First Cut notes published on this site are for information purposes only. They represent early notations and responses by analysts to recent events. Data in the notes may not have been verified by us and investors should not act upon any data or views in these notes. Most First Cut notes, but not necessarily all, will be followed by final research reports on the subject. There could be variance between the First cut note and the final research note on any subject, in which case the contents of the final research note would prevail. We accept no liability for the contents of the First Cut Notes.


![[Kotak] India Daily, October 24, 2016 - Kotak Securities](https://static.fdokumen.com/doc/165x107/633d69d4e674f41574068690/kotak-india-daily-october-24-2016-kotak-securities.jpg)


![[Kotak] India Daily, April 2, 2019 - Kotak Securities](https://static.fdokumen.com/doc/165x107/63265a4f5c2c3bbfa803a474/kotak-india-daily-april-2-2019-kotak-securities.jpg)


![[Kotak] India Daily, May 07, 2018 - Kotak Securities](https://static.fdokumen.com/doc/165x107/633c43a3f3eeefb08b0c1dc3/kotak-india-daily-may-07-2018-kotak-securities.jpg)


