![[Kotak] India Daily, July 25, 2017 - Kotak Securities](https://static.fdokumen.com/doc/165x107/63161b1a15106505030be7d5/kotak-india-daily-july-25-2017-kotak-securities.jpg)
22May 2017_India_Daily - Kotak Securities
153
For Private Circulation Only. FOR IMPORTANT INFORMATION ABOUT KOTAK SECURITIES’ RATING SYSTEM AND OTHER DISCLOSURES. REFER TO THE END OF THIS MATERIAL. Kotak Institutional Equities Research [email protected] . Mumbai: +91-22-4336-0000 Contents Special Reports Strategy Strategy: GST: The finishing line is finally here Daily Alerts Results State Bank of India: Standalone shines; subsidiaries weak Motherson Sumi Systems: Strong performance of SMP business Grasim Industries: In line; high costs affect VSF, but chemicals improve Tata Power: Down, but not out Muthoot Finance: Gets back on track Karur Vysya Bank: A quarter where profits take precedence DB Corp.: Weak print Jyothy Laboratories: Weaker-than-expected performance KEC International: Blockbuster end to a great year Kalpataru Power Transmission: Resilient performance Results, Change in Reco Bajaj Auto: Margins surprised negatively Cummins India: Attractiveness lessens Dhanuka Agritech: Downgrade to REDUCE on rich valuations TeamLease Services: 4QFY17 - staffing segment remains buoyant Company alerts Titan Company: Investor forum takeaways: upbeat revenue growth prognosis Sun TV Network: Multiple tailwinds PVR: GST - modest benefit versus high expectations Sector alerts Automobiles: GST rates to be neutral for the sector Insurance: A solid beginning INDIA DAILY May 22, 2017 India 19-May 1-day 1-mo 3-mo Sensex 30,465 0.1 3.7 5.5 Nifty 9,428 (0.0) 3.4 5.6 Global/Regional indices Dow Jones 20,805 0.7 1.3 0.1 Nasdaq Composite 6,084 0.5 2.9 3.8 FTSE 7,471 0.5 5.0 2.3 Nikkei 19,716 0.6 5.9 1.7 Hang Seng 25,175 0.2 4.7 4.0 KOSPI 2,297 0.4 6.1 9.0 Value traded – India Cash (NSE+BSE) 331 307 331 Derivatives (NSE) 6,464 5,207 5,317 Deri. open interest 3,464 3,327 3,321 Forex/money market Change, basis points 19-May 1-day 1-mo 3-mo Rs/US$ 64.6 (21) 6 (229) 10yr govt bond, % 7.2 - (2) (7) Net investment (US$ mn) 18-May MTD CYTD FIIs 56 386 2,903 MFs 36 1,058 6,955 Top movers Change, % Best performers 19-May 1-day 1-mo 3-mo DLFU IN Equity 207.6 (0.0) 13.2 42.1 BOI IN Equity 178.3 (0.5) 18.5 39.6 HDIL IN Equity 91.4 0.7 (0.5) 38.8 RECL IN Equity 217.0 (0.8) 5.9 37.3 FB IN Equity 112.4 1.1 21.7 33.3 Worst performers GNP IN Equity 659.2 (2.3) (27.0) (30.1) IDEA IN Equity 87.9 1.0 3.0 (21.9) UNSP IN Equity 1920.8 (6.1) 0.9 (19.9) DIVI IN Equity 611.0 (0.2) (3.1) (18.6) TECHM IN Equity 416.2 (1.5) (2.7) (18.1)
-
Upload
khangminh22 -
Category
Documents
-
view
1 -
download
0
Transcript of 22May 2017_India_Daily - Kotak Securities

For Private Circulation Only. FOR IMPORTANT INFORMATION ABOUT KOTAK SECURITIES’ RATING SYSTEM AND OTHER DISCLOSURES. REFER TO THE END OF THIS MATERIAL.
Kotak Institutional Equities Research [email protected] . Mumbai: +91-22-4336-0000
Contents
Special Reports
Strategy
Strategy: GST: The finishing line is finally here
Daily Alerts
Results
State Bank of India: Standalone shines; subsidiaries weak
Motherson Sumi Systems: Strong performance of SMP business
Grasim Industries: In line; high costs affect VSF, but chemicals improve
Tata Power: Down, but not out
Muthoot Finance: Gets back on track
Karur Vysya Bank: A quarter where profits take precedence
DB Corp.: Weak print
Jyothy Laboratories: Weaker-than-expected performance
KEC International: Blockbuster end to a great year
Kalpataru Power Transmission: Resilient performance
Results, Change in Reco
Bajaj Auto: Margins surprised negatively
Cummins India: Attractiveness lessens
Dhanuka Agritech: Downgrade to REDUCE on rich valuations
TeamLease Services: 4QFY17 - staffing segment remains buoyant
Company alerts
Titan Company: Investor forum takeaways: upbeat revenue growth prognosis
Sun TV Network: Multiple tailwinds
PVR: GST - modest benefit versus high expectations
Sector alerts
Automobiles: GST rates to be neutral for the sector
Insurance: A solid beginning
INDIA DAILY May 22, 2017 India 19-May 1-day 1-mo 3-mo
Sensex 30,465 0.1 3.7 5.5
Nifty 9,428 (0.0) 3.4 5.6
Global/Regional indices
Dow Jones 20,805 0.7 1.3 0.1
Nasdaq Composite 6,084 0.5 2.9 3.8
FTSE 7,471 0.5 5.0 2.3
Nikkei 19,716 0.6 5.9 1.7
Hang Seng 25,175 0.2 4.7 4.0
KOSPI 2,297 0.4 6.1 9.0
Value traded – India
Cash (NSE+BSE) 331 307 331
Derivatives (NSE) 6,464 5,207 5,317
Deri. open interest 3,464 3,327 3,321
Forex/money market
Change, basis points
19-May 1-day 1-mo 3-mo
Rs/US$ 64.6 (21) 6 (229)
10yr govt bond, % 7.2 - (2) (7)
Net investment (US$ mn)
18-May MTD CYTD
FIIs 56 386 2,903
MFs 36 1,058 6,955
Top movers
Change, %
Best performers 19-May 1-day 1-mo 3-mo
DLFU IN Equity 207.6 (0.0) 13.2 42.1
BOI IN Equity 178.3 (0.5) 18.5 39.6
HDIL IN Equity 91.4 0.7 (0.5) 38.8
RECL IN Equity 217.0 (0.8) 5.9 37.3
FB IN Equity 112.4 1.1 21.7 33.3
Worst performers
GNP IN Equity 659.2 (2.3) (27.0) (30.1)
IDEA IN Equity 87.9 1.0 3.0 (21.9)
UNSP IN Equity 1920.8 (6.1) 0.9 (19.9)
DIVI IN Equity 611.0 (0.2) (3.1) (18.6)
TECHM IN Equity 416.2 (1.5) (2.7) (18.1)

For Private Circulation Only. FOR IMPORTANT INFORMATION ABOUT KOTAK SECURITIES’ RATING SYSTEM AND OTHER DISCLOSURES, REFER TO THE END OF THIS MATERIAL.
Kotak Institutional Equities Research [email protected] Mumbai: +91-22-4336-0000
GST rate on most services at 18% versus the current 15%
Exhibit 1 gives the GST rates of various services broken down by key sectors and sub-sectors.
As can be seen, the government has put most services in the 18% category. As in the case of
goods, the government has exempt certain mass-consumption items (education, healthcare,
transportation on local and metro trains) from GST or kept the GST rate at 5% (transportation
in general). However, the 18% tax on communication is on the higher side, in our view. Also,
the GST rate of 28% on cinema tickets for multiplexes and 12-40% GST rate on F&B items
(blended 11% currently) will be negative for the listed multiplex stocks versus expectations.
GST rates on most goods in the range of 12-28%
Exhibit 2 shows the GST rates on various goods broken down by key sectors and sub-sectors.
We have already covered this in detail in our May 19 report. The government is yet to decide on
the rates for two important sectors—textiles (apart from branded garments at 18%; the
definition of branded garment is not clear since it can technically include private labels from the
unorganized sector too) and precious metals and jewelry. The government will decide on the
rates for these two categories of goods on June 3.
Limited impact on inflation as GST tax rates on common items are below current rates
We see limited impact on CPI inflation due to the changes to tax rates from July 1 following the
implementation of GST as the government has (1) exempt fresh food items completely from
GST, same as in the current taxation system, (2) kept the rates on edible oils and processed
foods items at 5-12% (with the exception of aerated waters), (3) exempt services such as
education and healthcare completely from GST, same as under the current system and (4) kept
the rate on transportation at 5% in general. The aforementioned goods and services account
for a large share of the CPI basket (see Exhibit 3).
Interesting to see how the government handles tax on gold, precious metals and jewelry
It would be interesting to see how the government handles the vexatious issue of tax on gold
and jewelry since (1) the industry vehemently opposes any changes to the taxation structure and
(2) gold imports have surged of late (see Exhibit 4). In our view, the government should
separate the two ‘roles’ of gold between savings and consumption and tax the ‘roles’ separately
to achieve its objectives of (1) higher disclosures on purchase and sale of gold and (2) higher
household financial savings. Accordingly it can (1) exempt ‘paper’ gold (gold bonds) completely
from tax as is the case for other financial savings products (other than any GST on transaction
fees), (2) tax bullion at a rate of 5% to discourage savings in the form of physical gold and
(3) tax jewelry overall at 12% GST or making charges (service) separately at 18% GST.
Strategy India
GST: The finishing line is finally here. We believe GST is all set to be implemented on
July 1, 2017 with (1) the GST Council finalizing the GST rates on almost all goods and
services and (2) 12 states passing the state GST laws; more will do so over the next few
weeks. The government has followed a multi-pronged approach to prepare for the
implementation of GST. However, we are less sure about the readiness of companies,
especially the smaller ones, to adopt GST in a smooth manner.
INDIA
MAY 22, 2017
UPDATE
BSE-30: 30,465
QUICK NUMBERS
7% of goods
exempt, 14% at 5%,
17% at 12%, 43%
at 18% and 19% at
28% GST rate
Most services to be
taxed at 18% versus
current rate of 15%
40% of CPI basket
exempt from GST
Sanjeev Prasad [email protected]
Mumbai: +91-22-4336-0830
Sunita Baldawa [email protected]
Mumbai: +91-22-4336-0896
Anindya Bhowmik [email protected]
Mumbai: +91-22-4336-0897

Strategy India
KOTAK INSTITUTIONAL EQUITIES RESEARCH 3
Exhibit 1: GST rate on most services at 18% versus the current 15% Current service tax rates and GST rates on various services
Source: Government of India, Kotak Institutional Equities
Services Current rate GST rate Companies impacted
Communication
Broadband services 15 18
DTH& cable services 15 18 Dish TV
Telecom services 15 18 Airtel, Idea
Education
Elementary and secondary Nil Nil
Higher education & PG Nil Nil
Vocational education Nil Nil
Entertainment
Amusement parks 15% + E-tax 28
Gambling 15 28
Live sports 15% + E-tax 28
Movies ~30 blended 28 PVR
Theatre, drama, classical dance 15% + E-tax 18
Healthcare
Diagnostics Nil Nil Dr Lal Pathlabs
Hospitals, clinics Nil Nil Apollo Hospitals
Hospitality
Non-AC/alcohol serving restaurants 15 12
AC, alcohol serving restaurants 15% + VAT 18
Five star restaurants 15% + VAT 28
Hotels & lodging between Rs1,000 & Rs2,500/day 15 12
Hotels & lodging between Rs2,500 & Rs5,000/day 15% + VAT 18
Hotels & lodging above Rs5,000/day 15% + VAT 28
Transportation
Air transportation (economy) ~6 5
Air transportation (other than economy) ~9 12
Rail transportation (local & metro) Nil Nil
Rail transportation (AC & 1st class) ~5 5
Renting of metered cab, auto-rickshaw Nil Nil
Public transport (other than tourism) Nil Nil
Renting of cab, radio taxi ~5 5

India Strategy
4 KOTAK INSTITUTIONAL EQUITIES RESEARCH
Exhibit 2: GST rate on most goods in the range of 12-28% Central excise duty, state VAT and GST rates on goods
Source: Government of India, Kotak Institutional Equities
Central Current
Goods excise duty State VAT effective rate GST rate Companies impacted
Automobiles
Two-wheelers 12.5 12.5-14.5 24.3 28Bajaj Auto, Eicher Motors, Hero
Motocorp and TVS Motors
Three-wheelers 12.5 12.5-14.5 24.3 28
Small petrol cars/Compact SUVs 12.5 12.5-14.5 24.3 29 Maruti Suzuki
Small diesel cars/Compact SUVs 12.5 12.5-14.5 24.3 31 Maruti Suzuki
Mid-sized cars 24 12.5-14.5 32.3 43 Maruti Suzuki
Large cars 30 12.5-14.5 34.1 43 Maruti Suzuki
Large SUVs 27 12.5-14.5 35.9 43 M&M
Commercial vehicles 12.5 12.5-14.5 24.3 28Ashok Leyland, Bharat Forge, Eicher
Motors, Tata Motors and Wabco
Tractors 8.8 4-6 11.9 12 M&M
Cement
Cement
12.5% + Rs125/ton
(Chargeable on 30%
discount to MRP)
12.5-14.5 23-26 28UltraTech, ACC, Ambuja, Shree Cement
and other mid-cap names
Consumer durables
Air-conditioner, microwave oven, refrigerator, washing machines 12.5 12-5-14.5 26-30 28 Havells, Voltas, Whirlpool
Fans, water heaters, mixer juicer grinders 12.5 12-5-14.5 26-30 28 Crompton
Consumer staples
FMCG products (except those stated below) 12.55-12.5 (varies
across states)16-24 28 All FMCG companies
Bakery items
Bread Nil Nil Nil Nil
Pastries and cakes 6 5-12.5 11-18 18 Britannia
Rusks, toasted bread and similar toasted products Nil 5-12.5 5-12.5 5 Britannia
Beverages
Aerated waters containing added sugars 21 15 32-36 28
Fruit pulp or fruit juice-based drinks 6 5 11-12 12 Dabur, Manpasand Beverages
Mineral water 12.5 12.5 26-28 18
Tea and coffee Nil 5 4-6 5
Cigarettes
Cigarettes46 (blended; varies
based on stick's length)
27 (blended - varies
across states)40-70
28% + fixed cess +
ad valorem cessITC, VST, Godfrey Phillips
Dairy products
Butter and others fats (ghee, butter oil etc.) Nil 5-12.5 5-12.5 12 Britannia
Cheese Nil 12.5 12.5 12 Britannia
Fresh milk (ex-UHT), curd, butter milk, paneer Nil Nil Nil Nil
Milk powder/ UHT milk, skimmed milk, cream, yoghurt Nil 5 4-6 5 Nestle, Britannia
SMP, milk food for babies (ex-condensed milk) Nil Nil Nil 5 Nestle
Other food items
Chocolates, chewing gum 12.5 12.5 26-28 28 Nestle
Honey (branded) Nil 5 4-6 5 Dabur
Ice cream 6 12.5 16-20 18 HUVR
Namkeens 12.5 12.5 26-28 12
Pasta 6 12.5 18 18 Nestle, ITC
Sauce, soup and broths 12.5 12.5 26-28 18
Vegetable oils Nil 5 4-6 5 Marico, Agro Tech Foods
Personal care items
Coconut oil Nil 5 4-6 5 Marico, Dabur
Hair oils (excluding coconut oil), toothpaste, soaps 12.5 12.5 26-28 18 Marico, Dabur, Bajaj Corp., Emami
Perfumes, deodorants, shampoos, hair cream, hair dyes 12.5 12.5 26-28 28
Sanitary napkins Nil 5 4-6 12 P&G Hygiene
Building materials
Paints 12.5 12.5 26-28 28 All paint companies
Prepared glues and other prepared adhesives (under 1Kg) 12.5 12.5 26-28 18
Sanitaryware, faucets, tiles 12.5 7-12.5 18-24 28 Cera, HSIL, Kajaraia, Somany
Others
Apparel/garments 2 4-5 6-7 Not decidedArvind, Kewal Kiran, Nandan Denim and
Page Industries
Bullion/Jewelry 1 1 2 Not decided Titan, PC Jeweller
Notes:
(a) Excise duty and state VAT are charged on different ‘bases’ and hence , they are not additive.
(b) Swachh Bharat, Krishi Kalyan and Infrastructure cess to be subsumed in GST within one year of implementation.
(c) Small cars/mini SUVs includes vehicles <4 m in length and engine size less than 1,200 cc/1,500 cc for petrol/diesel vehicles
(d) Mid-sized cars/SUVs includes vehicles >4 m in length and engine size less than 1,500 cc
(e) Large SUVs/Cars includes vehicles with engine size greater than 1,500 cc

Strategy India
KOTAK INSTITUTIONAL EQUITIES RESEARCH 5
Exhibit 3: Gold imports have surged recently Value of gold imports, March fiscal year-ends, 2014-17 (US$ bn)
Source: CEIC, Kotak Institutional Equities
Exhibit 4: GST-exempt items have 40% weight in CPI basket Weight of various food items in CPI basket (%)
Source: MOSPI, Kotak Institutional Equities
1.4 1.3
2.6
1.8 2.2
3.1
1.8 2.1
3.8 4.2
5.6
1.4 1.6
2.0
5.0
3.1
2.4 2.0
3.0
5.0
2.0 1.7
3.5 3.8
2.9
1.4 1.0
1.2 1.5
1.2 1.1 1.1
1.8
3.5
4.4
2.0 2.0
3.5
4.2 3.8
0
1
2
3
4
5
6
7
Jan
-14
Mar-
14
May-
14
Jul-1
4
Sep
-14
Nov-
14
Jan
-15
Mar-
15
May-
15
Jul-1
5
Sep
-15
Nov-
15
Jan
-16
Mar-
16
May-
16
Jul-1
6
Sep
-16
Nov-
16
Jan
-17
Mar-
17
Gold imports
Weight in CPI
Fresh food items 30.0
Edible oils and processed food items 15.2
Education 4.5
Healthcare 5.8
Transportation 2.5
Others 42.0
Total 100.0

For Private Circulation Only. FOR IMPORTANT INFORMATION ABOUT KOTAK SECURITIES’ RATING SYSTEM AND OTHER DISCLOSURES, REFER TO THE END OF THIS MATERIAL.
Kotak Institutional Equities Research [email protected] Mumbai: +91-22-4336-0000
Solid operating profit growth gives headroom to improve coverage
SBI reported a sharp rise in earnings, which was supported by solid growth in operating profits.
Revenue growth of 9% yoy was led by 18% yoy growth in NII despite loan growth being weak
at 8% yoy. NIM improved qoq by ~5 bps as the bank benefitted due to demonetization as well
as one-off interest on tax refunds. CASA ratio was stable qoq. Consolidated performance was
weak as the subsidiaries reported a huge loss ahead of the merger. There were higher
provisions for bad loans as well as retirement-related expenses.
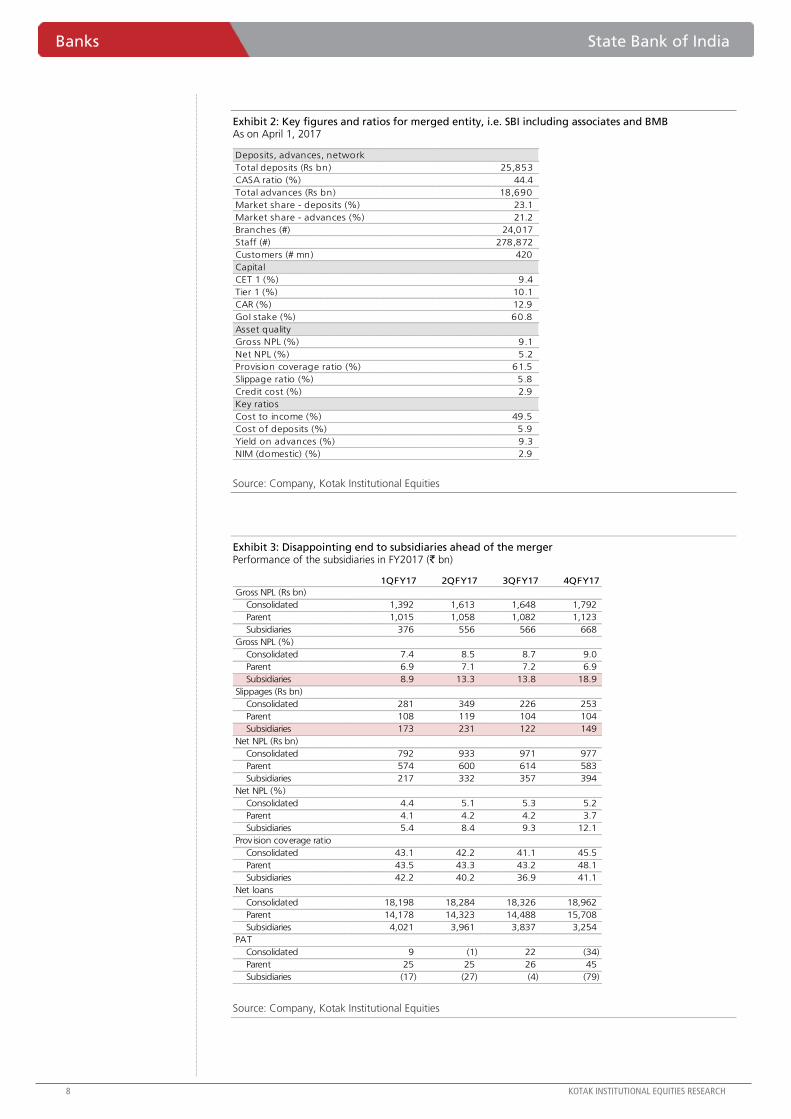
A weak end to subsidiaries; NPLs closer to any other mid-tier public bank
The banking subsidiaries reported a steep loss in 4QFY17 and FY2017 resulting in a big drag in
consolidated performance. The slippages were high at ~15% for the quarter/year resulting in
gross NPLs increasing closer to ~19%, similar to most mid-tier public banks. Net NPLs were at
12% yoy with overall coverage ratio stable yoy but improving qoq. These banks cut back lending,
ahead of the consolidation, resulting in loans declining ~20% yoy. The performance has been
quite disappointing though the management highlighted that such a performance is unlikely to
be repeated as the bank has taken full control over the operations in the past few months.
Maintain BUY: awaiting resolutions while merger-related pain seems to be complete
We maintain BUY rating on SBI with TP of ₹350 (from `360 earlier) with key changes to
estimates on credit costs and impairment outlook. At our TP, we value the bank at 1.5X book
(1X reported) and 10X FY2019E EPS for RoEs in the range of ~10% in the short term. Our
broad thesis on the bank remains unchanged as it remains our preferred idea in public banks.
We have seen one major rerating in the bank over the past year but any incremental return
from here is contingent on (1) pace of resolutions and (2) quantum of haircuts. Outcomes for
many of these large accounts are not quick and require lengthy approval process and consensus
from all banks and stakeholders. While we continue to see a fair amount of work done for
resolving these assets, we have not yet seen the conclusion making it difficult to understand the
full impact of these resolutions. On the other hand, the merger process seems to be going
smoothly and we are unlikely to see any major surprises in 1QFY18 results.
State Bank of India (SBIN) Banks
Standalone shines; subsidiaries weak. SBI reported a sharp improvement in operating
profit growth of 25% yoy giving headroom for higher provisions as slippages were
stable qoq. Revenue growth of 9% yoy was led by NII growth on the back of decline in
funding costs. Slippages declined to 2.6% and net NPL ratios declined qoq. The merger
is now complete and the only negative surprise was the performance of subsidiaries,
which was quite disappointing. We have moved to consolidated performance post-
merger with a broadly unchanged price. Maintain BUY as it remains our preferred idea
in PSU banks; TP ₹ 350 (from ₹ 360).
BUY
MAY 22, 2017
RESULT
Coverage view: Attractive
Price (`): 308
Target price (`): 350
BSE-30: 30,465
QUICK NUMBERS
NII grew 18% yoy;
earnings grew 2.2X
yoy
Gross NPLs at 6.9%;
restructured loans
at 2.3% of loans
Maintain BUY with
TP at ₹350 (from
`360 earlier)
M B Mahesh CFA [email protected]
Mumbai: +91-22-4336-0886
Nischint Chawathe [email protected]
Mumbai: +91-22-4336-0887
Abhijeet Sakhare [email protected]
Mumbai: +91-22-4336-0889
State Bank of India
Stock data Forecasts/Valuations 2017 2018E 2019E
52-week range (Rs) (high,low) EPS (Rs) 13.1 16.1 29.5
Market Cap. (Rs bn) EPS growth (%) 2.6 22.7 82.7
Shareholding pattern (%) P/E (X) 23.4 19.1 10.5
Promoters 60.2 NII (Rs bn) 618.6 815.1 950.0
FIIs 10.9 Net profits (Rs bn) 104.8 130.8 238.9
MFs 8.0 BVPS 131.1 158.4 197.1
Price performance (%) 1M 3M 12M P/B (X) 2.3 1.9 1.6
Absolute 8.4 14.3 78.3 ROE (%) 6.3 6.4 10.3
Rel. to BSE-30 4.4 6.9 48.7 Div. Yield (%) 0.8 0.9 1.0
Company data and valuation summary
315-166
2,497.8

State Bank of India Banks
KOTAK INSTITUTIONAL EQUITIES RESEARCH 7
Exhibit 1: SBI quarterly results March fiscal year-ends, 4QFY16 - 4QFY17 (` mn)
Source: Company, Kotak Institutional Equities estimates
4QFY17 4QFY17E 4QFY16 3QFY17 4QFY17E 4QFY16 3QFY17 2017 2016 (% chg.) 2018E
Income earned 473,926 437,571 428,314 439,256 8 11 8 1,755,183 1,636,853 7 2,353,488
Income on advances 298,612 286,600 292,425 298,313 4 2 0 1,195,100 1,156,660 3 1,608,547
Income on investments 135,070 139,694 110,079 126,087 (3) 23 7 482,053 423,040 14 664,327
Interest on balance w ith RBI 40,244 11,277 25,810 14,857 257 56 171 78,029 57,153 37 80,614
Interest expense 293,219 282,744 275,406 291,741 4 6 1 1,136,580 1,068,039 6 1,538,352
Net interest income (NII) 180,707 154,826 152,908 147,515 17 18 23 618,603 568,815 9 815,136
Non-interest income 103,275 89,765 106,956 96,619 15 (3) 7 354,609 281,584 26 656,190
Fees, commission 60,780 51,417 57,940 40,110 18 5 52 178,030 144,160 23 267,045
Invt. income 17,660 10,170 14,160 39,690 74 25 (56) 107,490 51,688 108 132,490
Forex income 5,890 5,534 4,850 5,910 6 21 (0) 26,760 21,123 27 53,520
Other income excl. treasury 85,615 79,595 92,796 56,929 8 (8) 50 247,119 229,896 7 523,700
Total income 283,982 244,591 259,864 244,135 16 9 16 973,212 850,398 14 1,471,326
Operating expenses 106,688 120,211 117,945 118,702 (11) (10) (10) 464,728 417,824 11 879,448
Staff expenses 45,393 53,637 49,130 54,833 (15) (8) (17) 264,893 251,138 5 368,574
Other retirement contributions 17,030 15,225 20,300 16,540 12 (16) 3
Other operating expenses 61,295 51,349 48,517 47,329 19 26 30 199,835 166,685 20 510,874
Pre-provision operating profit 177,295 124,380 141,919 125,433 43 25 41 508,484 432,575 18 591,879
Provisions and extraordinaries 117,401 79,839 131,741 89,428 47 (11) 31 359,927 294,838 22 407,626
Loan loss provisions 109,929 72,717 121,392 72,446 51 (9) 52 351,152 302,907 16 400,864
Standard assets 2,890 6,820 9,960 13,640 NM (71) NM
Investment depreciation 780 196 (60) 100 299 (1,400) 680 2,080 1,496 39 -
Other provisions 3,802 107 449 3,243 3,463 747 17 6,696 (9,565) (170) 6,762
PBT 59,894 44,541 10,179 36,004 34 488 66 148,557 137,737 8 184,253
Less tax 14,716 14,573 (2,460) 9,904 1 (698) 49 43,711 38,234 14 53,433
Profit after tax 45,178 29,968 12,638 26,100 51 257 73 104,846 99,503 5 130,819
Fees to PBT (%) 101.5 569.2 111.4 119.8 104.7 144.9
Treasury income/PBT (%) 28.2 139.7 110.0 71.0 36.4 71.9
Cost income ratio (%) 37.6 45.4 48.6 47.8 49.1 59.8
Tax rate (%) 24.6 (24.2) 27.5 29.4 27.8 29.0
Key balance sheet data (Rs bn)
Advances gross 16,273 15,095 14,972 8 9
Advances net 15,711 14,637 14,478 7 9
Deposits 20,448 17,307 20,408 18 0
Investments 7,660 4,771 8,339 61 (8)
Yield management ratios (%)
Cost of deposits 5.8 6.2 5.9
Yield on advances 9.4 10.0 9.5
Net interest margin (Reported, Qtly ) 2.8 3.0 2.8
Asset quality details
Gross NPLs (Rs bn) 1,123 982 1,082 14 4
Gross NPLs (%) 6.9 6.5 7.2
Net NPLs (Rs bn) 583 558 614 4 (5)
Net NPLs (%) 3.7 3.8 4.2
Slippages 103.7 303.1 103.6
Provision coverage (%) 48.1 43.2 43.2
Provision coverage (tech w /o, %) 66.0 60.7 62.9
Standard restructured loans (Rs bn) 366 391 346 (6) 6
Standard restructured loans (%) 2.3 2.7 2.4
Capital adequacy details (%)
CAR 13.1 13.1 12.9
Tier I 10.4 9.9 10.0
(% chg.)
Banks State Bank of India
8 KOTAK INSTITUTIONAL EQUITIES RESEARCH
Exhibit 2: Key figures and ratios for merged entity, i.e. SBI including associates and BMB As on April 1, 2017
Source: Company, Kotak Institutional Equities
Exhibit 3: Disappointing end to subsidiaries ahead of the merger Performance of the subsidiaries in FY2017 (` bn)
Source: Company, Kotak Institutional Equities
Deposits, advances, network
Total deposits (Rs bn) 25,853
CASA ratio (%) 44.4
Total advances (Rs bn) 18,690
Market share - deposits (%) 23.1
Market share - advances (%) 21.2
Branches (#) 24,017
Staff (#) 278,872
Customers (# mn) 420
Capital
CET 1 (%) 9.4
Tier 1 (%) 10.1
CAR (%) 12.9
GoI stake (%) 60.8
Asset quality
Gross NPL (%) 9.1
Net NPL (%) 5.2
Provision coverage ratio (%) 61.5
Slippage ratio (%) 5.8
Credit cost (%) 2.9
Key ratios
Cost to income (%) 49.5
Cost of deposits (%) 5.9
Yield on advances (%) 9.3
NIM (domestic) (%) 2.9
1QFY17 2QFY17 3QFY17 4QFY17
Gross NPL (Rs bn)
Consolidated 1,392 1,613 1,648 1,792
Parent 1,015 1,058 1,082 1,123
Subsidiaries 376 556 566 668
Gross NPL (%)
Consolidated 7.4 8.5 8.7 9.0
Parent 6.9 7.1 7.2 6.9
Subsidiaries 8.9 13.3 13.8 18.9
Slippages (Rs bn)
Consolidated 281 349 226 253
Parent 108 119 104 104
Subsidiaries 173 231 122 149
Net NPL (Rs bn)
Consolidated 792 933 971 977
Parent 574 600 614 583
Subsidiaries 217 332 357 394
Net NPL (%)
Consolidated 4.4 5.1 5.3 5.2
Parent 4.1 4.2 4.2 3.7
Subsidiaries 5.4 8.4 9.3 12.1
Provision coverage ratio
Consolidated 43.1 42.2 41.1 45.5
Parent 43.5 43.3 43.2 48.1
Subsidiaries 42.2 40.2 36.9 41.1
Net loans
Consolidated 18,198 18,284 18,326 18,962
Parent 14,178 14,323 14,488 15,708
Subsidiaries 4,021 3,961 3,837 3,254
PAT
Consolidated 9 (1) 22 (34)
Parent 25 25 26 45
Subsidiaries (17) (27) (4) (79)

State Bank of India Banks
KOTAK INSTITUTIONAL EQUITIES RESEARCH 9
Fresh slippages decline; impairments including watchlist declines 70 bps to
~10%
High slippages, credit cost for standalone bank. Slippages remained high at 2.6%
(albeit ~30 bps lower qoq), with nearly 50% of slippages from watchlist accounts (iron &
steel, textiles and ‘others’). Total impaired loans (GNPL and restructured loans) declined
40 bps qoq to 9.2%, comprising 6.9% gross NPL and 2.3% restructured loans. Credit
cost for the quarter was 2.9%, up ~100 bps qoq.
Delayed AQR recognition impacts associates’ asset quality in FY2017. Asset quality
at the group level was much weaker with gross NPL of 9.1% and net NPL of 5.2%.
Slippage for the year was also much higher at 5.8% with credit cost of 2.9%. SBI
highlighted that uniform recognition of stress loans led to higher slippages as AQR-
related slippages identified by RBI were much lower for associate banks – these had to be
recognized in line with parent’s recognition standards.
Power exposure lead to a higher, revised watchlist. SBI has revised the watchlist
loans to `324 bn from `132 bn at the end of the year. `324 bn is spilt as `220 bn
corresponding to SBI while rest is from associate banks. Weak power exposures without
power purchase agreements (PPAs) were included in the watchlist – these were not
included earlier as they were under construction.
7% of power loans under watchlist. SBI has nearly `146 bn loans to power sector of
which 3% is already NPL and 17% is non-investment grade exposure. Of these 10%, SBI
has identified 7% as those exposure needs attention and hence have been included in
the watchlist exposures.
~40% coverage in top-50 NPLs. Top 50 NPL accounts comprise nearly 48% of total
gross NPLs, with coverage ratio of ~40%. As such, there is scope to further improve
coverage levels on these accounts. SBI’s overall standalone coverage ratio improved ~300
bps qoq to 66%, which is one of the highest among PSU banks. Including associate
banks, the coverage ratio was lower at ~62%.
Exhibit 4: Post-merger watchlist exposure is `324 bn Sector-wise watchlist exposure, March 2016-March 2017 (Rs bn)
Source: Company, Kotak Institutional Equities
Exhibit 5: Nearly 45% of FY2017 slippages were from watchlist accounts Break-up of slippages, March fiscal year-ends, 1QFY17-4QFY17 (Rs bn)
Source: Company, Kotak Institutional Equities
Mar-16 Sep-16 Dec-16 Mar-17 Post-merger
Construction, roads & engg. 87 41 19 18 31
Power 47 37 30 28 111
Iron & steel 43 27 19 - 35
Oil & gas 34 34 - - -
Textile 12 9 8 4 8
Telecom 8 8 8 8 32
Others 117 103 96 74 107
Total 348 260 180 132 324
1QFY17 2QFY17 3QFY17 4QFY17 FY2017
Total slippages 108 119 104 104 434
Corporate - watchlist 29 49 73 54 206
Corporate - non-watchlist 7 20 27 24 78
Others (retail, agri, SME) 71 50 3 26 150

Banks State Bank of India
10 KOTAK INSTITUTIONAL EQUITIES RESEARCH
Exhibit 6: 7% of the power sector exposure under watchlist, out of ~17% of non-investment grade
exposure Break-up of power sector exposure (approximate values), March 2017 (%)
Source: Company, Kotak Institutional Equities
Exhibit 7: NPLs increased in key portfolios like mid-corporate segment Sectoral break-up of NPLs, March fiscal year-ends, 2011-17 (%)
Notes: (a) Gross NPL has been calculated based on outstanding NPL in each category to the reported advances. These ratios differ from those reported by the bank (exposures have been reclassified between various segments).
Source: Company, Kotak Institutional Equities
Exhibit 8: Restructured loans as % of loans is one of the lowest among public banks Restructured loans, March fiscal year-ends, 2012-17
Source: Company, Kotak Institutional Equities
PSUs40%
Investment grade40%
Non-investment grade10%
Under watchlist7%
NPL3%
2011 2012 2013 2014 2015 2016 2017 2011 2012 2013 2014 2015 2016 2017
Corporate 4 5 10 24 15 207 331 0.2 0.3 0.6 1.0 0.5 6.3 9.7
Mid-corporate 60 127 184 263 230 415 470 3.8 7.4 9.0 11.5 10.6 17.1 19.3
International 23 25 28 38 26 78 68 2.1 1.9 1.7 1.8 1.1 2.9 2.4
SME 78 119 145 155 164 170 159 6.5 7.1 7.9 8.6 9.0 7.8 7.0
Agri 45 78 101 107 107 87 75 4.8 9.0 9.3 8.9 8.9 6.9 5.5
Retail 44 42 43 30 25 25 22 2.6 2.3 2.0 1.3 0.9 0.8 0.5
Total 253 397 512 616 567 982 1,123 3.3 4.4 4.8 5.0 4.3 6.5 6.9
Gross NPLs (Rs bn) Gross NPLs (%)
2012 2013 2014 2015 2016 2017 2012 2013 2014 2015 2016 2017
BOB 171 196 207 259 137 108 6.0 6.0 5.2 6.1 3.6 2.8
BoI 164 164 208 218 129 NA 6.5 5.6 5.5 5.3 3.4 NA
Canara 79 181 232 284 232 216 3.4 7.5 7.7 8.6 7.2 6.3
PNB 11 305 355 383 201 119 0.4 9.9 10.2 10.1 4.9 2.8
SBI 163 322 431 558 391 366 1.9 3.1 3.6 4.3 2.7 2.3
Union 91 116 154 181 176 162 4.1 4.2 5.3 5.2 3.1 1.9
Restructured loans (Rs bn) Restructured loans (% of loans)

State Bank of India Banks
KOTAK INSTITUTIONAL EQUITIES RESEARCH 11
Exhibit 9: Gross NPLs inched up in the quarter as slippages remained high Movement of NPLs, March fiscal year-ends, 4QFY15-4QFY17 (` bn)
Source: Company, Kotak Institutional Equities
Exhibit 10: Asset quality stable in the quarter Gross NPLs, net NPLs and provision coverage ratio, March fiscal year-ends, 2007-17 (%)
Source: Company, Kotak Institutional Equities
4QFY15 1QFY16 2QFY16 3QFY16 4QFY16 1QFY17 2QFY17 3QFY17 4QFY17
Opening 619.9 567.3 564.2 568.3 981.7 981.7 1,015.4 1,057.8 1,081.7
Addition 47.7 73.2 58.8 206.9 303.1 108.0 118.5 103.6 103.7
Cash recoveries 44.9 12.1 8.9 6.6 16.3 16.5 13.4 10.0 12.0
Upgradation 6.8 14.9 6.3 3.8 1.0 11.7 2.1 10.6 10.0
Write-off 48.7 49.2 39.4 37.0 32.1 46.1 60.6 59.1 39.9
Closing Gross NPL 567.3 564.2 568.3 981.7 981.7 1,015.4 1,057.8 1,081.7 1,123.4
Provision coverage (without w/off) 51.4 49.2 49.7 43.2 43.2 43.5 43.3 43.2 48.1
Provision coverage (reported) 69.1 69.5 70.5 65.2 60.7 61.6 62.1 62.9 66.0
Fresh impairment (%)
Slippages 1.5 2.3 1.8 9.1 8.3 3.0 3.3 2.9 2.6
Fresh restructuring 3.9 1.2 0.8 - - - - - -
Total 5.4 3.5 2.6 9.1 8.3 3.0 3.3 2.9 2.6
Outstanding (%)
Gross NPL 4.3 4.3 4.2 5.1 6.5 6.9 7.1 7.2 6.9
Restructured loans 4.3 4.4 4.0 2.7 2.7 2.6 2.6 2.4 2.3
Total 8.5 8.7 8.1 7.8 9.2 9.5 9.7 9.6 9.2
30
38
46
54
62
70
0.0
1.4
2.8
4.2
5.6
7.0
2007
2008
2009
2010
2011
2012
2013
2014
2015
2016
2017
Gross NPLs (LHS) Net NPLs (RHS) Provision coverage (RHS)
Banks State Bank of India
12 KOTAK INSTITUTIONAL EQUITIES RESEARCH
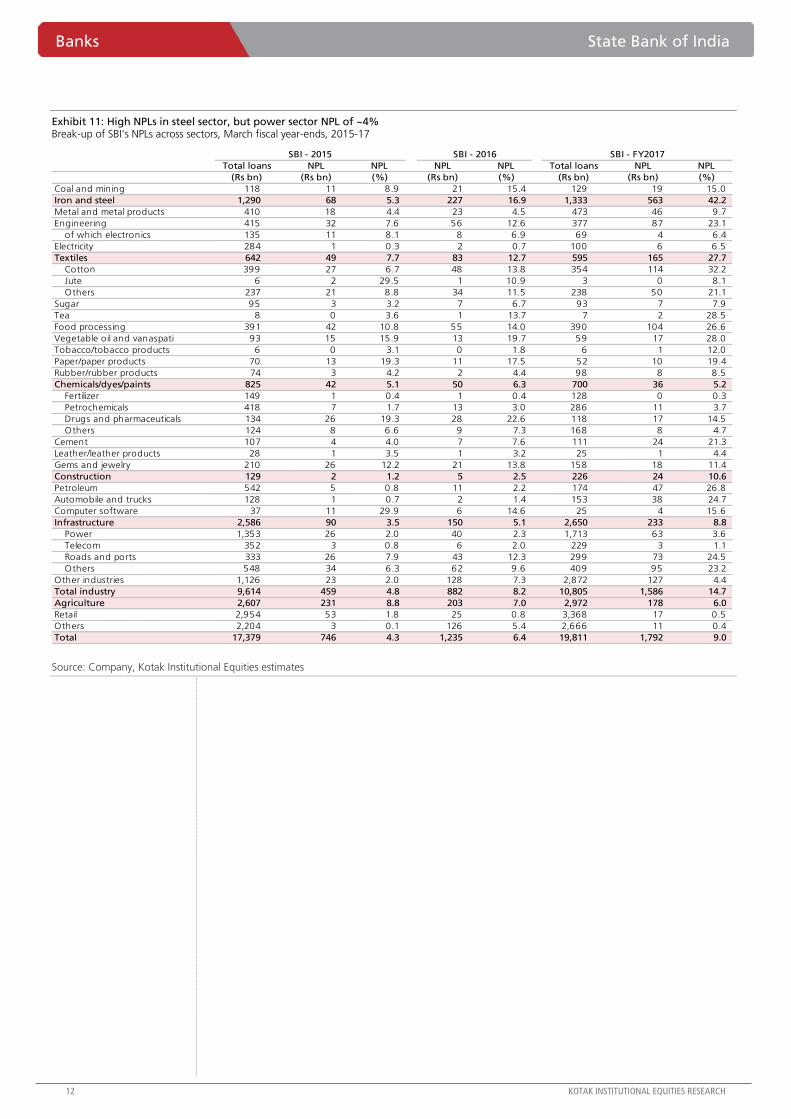
Exhibit 11: High NPLs in steel sector, but power sector NPL of ~4% Break-up of SBI's NPLs across sectors, March fiscal year-ends, 2015-17
Source: Company, Kotak Institutional Equities estimates
Total loans NPL NPL NPL NPL Total loans NPL NPL
(Rs bn) (Rs bn) (%) (Rs bn) (%) (Rs bn) (Rs bn) (%)
Coal and mining 118 11 8.9 21 15.4 129 19 15.0
Iron and steel 1,290 68 5.3 227 16.9 1,333 563 42.2
Metal and metal products 410 18 4.4 23 4.5 473 46 9.7
Engineering 415 32 7.6 56 12.6 377 87 23.1
of which electronics 135 11 8.1 8 6.9 69 4 6.4
Electricity 284 1 0.3 2 0.7 100 6 6.5
Textiles 642 49 7.7 83 12.7 595 165 27.7
Cotton 399 27 6.7 48 13.8 354 114 32.2
Jute 6 2 29.5 1 10.9 3 0 8.1
Others 237 21 8.8 34 11.5 238 50 21.1
Sugar 95 3 3.2 7 6.7 93 7 7.9
Tea 8 0 3.6 1 13.7 7 2 28.5
Food processing 391 42 10.8 55 14.0 390 104 26.6
Vegetable oil and vanaspati 93 15 15.9 13 19.7 59 17 28.0
Tobacco/tobacco products 6 0 3.1 0 1.8 6 1 12.0
Paper/paper products 70 13 19.3 11 17.5 52 10 19.4
Rubber/rubber products 74 3 4.2 2 4.4 98 8 8.5
Chemicals/dyes/paints 825 42 5.1 50 6.3 700 36 5.2
Fertilizer 149 1 0.4 1 0.4 128 0 0.3
Petrochemicals 418 7 1.7 13 3.0 286 11 3.7
Drugs and pharmaceuticals 134 26 19.3 28 22.6 118 17 14.5
Others 124 8 6.6 9 7.3 168 8 4.7
Cement 107 4 4.0 7 7.6 111 24 21.3
Leather/leather products 28 1 3.5 1 3.2 25 1 4.4
Gems and jewelry 210 26 12.2 21 13.8 158 18 11.4
Construction 129 2 1.2 5 2.5 226 24 10.6
Petroleum 542 5 0.8 11 2.2 174 47 26.8
Automobile and trucks 128 1 0.7 2 1.4 153 38 24.7
Computer software 37 11 29.9 6 14.6 25 4 15.6
Infrastructure 2,586 90 3.5 150 5.1 2,650 233 8.8
Power 1,353 26 2.0 40 2.3 1,713 63 3.6
Telecom 352 3 0.8 6 2.0 229 3 1.1
Roads and ports 333 26 7.9 43 12.3 299 73 24.5
Others 548 34 6.3 62 9.6 409 95 23.2
Other industries 1,126 23 2.0 128 7.3 2,872 127 4.4
Total industry 9,614 459 4.8 882 8.2 10,805 1,586 14.7
Agriculture 2,607 231 8.8 203 7.0 2,972 178 6.0
Retail 2,954 53 1.8 25 0.8 3,368 17 0.5
Others 2,204 3 0.1 126 5.4 2,666 11 0.4
Total 17,379 746 4.3 1,235 6.4 19,811 1,792 9.0
SBI - FY2017SBI - 2015 SBI - 2016

State Bank of India Banks
KOTAK INSTITUTIONAL EQUITIES RESEARCH 13
Loan growth of 8% yoy; adjusted loan growth of 14% yoy
Headline loan growth of 8% yoy was better than system loan growth of ~5% yoy. Loan
growth adjusting for food credit, FCNR redemptions and credit substitutes (CP, NCD) was
much higher at 14% yoy.
Retail segment performed better with 21% yoy loan growth. SME (3% yoy growth), mid-
corporate (flat yoy) and large corporate (4% yoy) witnessed slower loan growth. Retail
segment constitutes ~25% of the loan book.
The bank remains cautious in lending to SME and the mid corporate portfolio after
witnessing high levels of stress from these segments. Within retail growth in the housing
loans remains strong at 17% yoy. Auto loans grew by 21% yoy. Gross NPL ratio in retail
segment is just ~0.5%.
We are lot more concerned on growth as we are witnessing headline growth for the
sector slowing to 5% levels. We are less confident that SBI would be able to grow at a
significant premium despite their advantage on cost of funds as the bank has a strong
portfolio of companies who can tap alternate markets to raise funds and make early
repayment.
While SBI is also participating in the CP/NCD market, these loans will entail lower
margins. We are noting banks appear to be a lot more comfortable in reducing their
spreads to maintain growth momentum, which could hurt margins if growth takes
precedence.
We are building loan growth at 10-12% in the medium term as we don’t think the
growth will be sufficient to replace the repayment cycle of the loans taken in the previous
capex cycle.
Exhibit 12: Loan growth of 14% yoy, adjusting for credit substitute, food credit and FCNR loans Credit growth, March fiscal year-ends, 2016-17 (Rs bn)
Source: Company, Kotak Institutional Equities
2016 2017 YoY (%)
Domestic advances 12,427 13,411 8
Food credit 216 46 (79)
Domestic advances (ex food credit) 12,211 13,365 9
Commercial paper 131 587 348
Corporate bonds 412 596 45
Domestic including credit substitutes 12,754 14,548 14
Overseas advances 2,668 2,862 7
FCNR-B advances 185 66 (64)
Foreign offices ex FCNR-B 2,483 2,796 13
Overall adjusted credit growth 15,237 17,344 14
Corporate advances 5,726 5,849 2
Credit substitute as % of domestic corporate loans 9 20

Banks State Bank of India
14 KOTAK INSTITUTIONAL EQUITIES RESEARCH
Exhibit 13: Share of SME and mid-corporate loans has been coming off, increased for retail and large corporate loans Loan growth and loan break-up, March fiscal year-ends, 2011-17 (%)
Source: Company, Kotak Institutional Equities
NIM improved marginally qoq to 2.8%
Reported NIM improved ~5 bps qoq to 2.8%. Reported cost of deposits declined by ~10 bps
qoq to 5.8% while yield on advances also declined ~5 bps qoq to 9.4%. Margin pressure
due to fall in MCLR rates will be partly offset by (1) repricing of associates deposits which are
priced higher than parent, (2) bank has an excess SLR of ~5% which can be deployed in the
form of loans or credit substitutes, (3) parent’s treasury yields are better than associates.
CASA ratio declined marginally to 46%. SA growth was strong at 28% yoy. Bank indicated
that it has retained around 60-70% of the demonetization-related deposit flows. Bank has
benefitted from higher average balances in savings accounts post demonetization, greater
traction in corporate salary packages and new current accounts.
Exhibit 14: Credit / Deposit ratio improved during the quarter March fiscal year-ends, 4QFY14-4QFY17 (%)
Source: Company, Kotak Institutional Equities
Exhibit 15: Margins improve qoq March fiscal year-ends, 4QFY14-4QFY17 (%)
Source: Company, Kotak Institutional Equities
2011 2012 2013 2014 2015 2016 2017 2011 2012 2013 2014 2015 2016 2017
Corporate and others 3.2 7.3 12.2 38.0 16.2 17.1 3.6 19.3 17.5 16.3 19.5 21.1 21.9 21.0
International 12.7 24.1 24.6 26.8 9.4 13.8 7.3 14.5 15.2 15.7 17.2 17.6 17.7 17.6
Mid-corporate 19.4 10.0 18.2 11.5 (4.7) 11.4 0.2 20.8 19.4 19.0 18.3 16.3 16.1 14.9
SME 22.8 41.3 8.9 (2.4) 0.9 20.0 3.5 15.8 18.9 17.1 14.4 13.6 14.4 13.8
Retail 22.2 10.8 14.9 13.3 14.6 20.0 21.2 21.7 20.4 19.4 19.1 20.4 21.7 24.3
Agriculture 21.2 (9.0) 25.8 10.7 (0.4) 4.7 7.4 12.5 9.7 10.1 9.7 9.0 8.3 8.3
Total 18.0 18.1 20.7 15.4 7.3 13.0 7.8
Loan growth (YoY %) Loan break-up (%)
87
84
82 8282
79
8283
85
79
77
71
77
70
74
78
82
86
90
4Q
FY14
1Q
FY15
2Q
FY15
3Q
FY15
4Q
FY15
1Q
FY16
2Q
FY16
3Q
FY16
4Q
FY16
1Q
FY17
2Q
FY17
3Q
FY17
4Q
FY17
3.2 3.3 3.2
3.2
3.4
3.0 3.0
3.2 3.2
2.9 2.8
2.7
3.1
2.5
2.7
3.0
3.2
3.5
3.7
4Q
FY14
1Q
FY15
2Q
FY15
3Q
FY15
4Q
FY15
1Q
FY16
2Q
FY16
3Q
FY16
4Q
FY16
1Q
FY17
2Q
FY17
3Q
FY17
4Q
FY17

State Bank of India Banks
KOTAK INSTITUTIONAL EQUITIES RESEARCH 15
Exhibit 16: SBI has focused on growth while peers are consolidating balance sheets NII growth and loan growth, March fiscal year-ends, 4QFY15-4QFY17 (%)
Source: Company, Kotak Institutional Equities
Exhibit 17: MCLR rates have decline by 120 bps since April 2016
Source: Company, Kotak Institutional Equities
Exhibit 18: SBI has cut deposit rates in the last quarter Change in term deposit rates for deposits less than `10 mn (%)
Source: Company, Kotak Institutional Equities
4QFY16 1QFY17 2QFY17 3QFY17 4QFY17 4QFY16 1QFY17 2QFY17 3QFY17 4QFY17
BoB 14.8 (2.6) 5.6 15.9 7.6 (10.3) (11.2) (14.6) (8.9) (0.1)
BoI 12.0 (4.7) (9.9) 5.7 (4.1) (7.3) 0.5 (1.8) (2.7) 2.7
Canara (4.5) (8.3) (7.7) 8.4 14.1 (1.6) (0.9) 1.3 (0.1) 5.3
OBC 4.3 (9.3) (4.9) (17.4) (3.4) 3.8 2.6 (0.9) (2.6) 8.4
PNB (27.0) (9.8) (10.2) (9.4) 33.1 8.4 2.8 3.4 (1.8) 1.7
SBI 3.9 4.2 3.5 (3.5) 18.2 12.6 10.7 8.3 (1.1) 7.3
Union (1.7) (1.3) 8.4 7.0 14.5 5.7 5.1 9.6 5.5 8.6
Loan growth (%)NII growth (%)
Apr-16 May-16 Jun-16 Jul-16 Aug-16 Oct-16 Nov-16 Jan-17 Feb-17
Overnight 8.95 8.90 8.90 8.90 8.85 8.80 8.65 7.75 7.75
One month 9.05 9.00 9.00 9.00 8.95 8.90 8.75 7.85 7.85
Three month 9.10 9.05 9.05 9.05 9.00 8.95 8.80 7.90 7.90
Six month 9.15 9.10 9.10 9.10 9.05 9.00 8.85 7.95 7.95
One year 9.20 9.15 9.15 9.15 9.10 9.05 8.90 8.00 8.00
Two years 9.30 9.25 9.25 9.25 9.20 9.15 9.00 8.10 8.10
Three years 9.35 9.30 9.30 9.30 9.25 9.20 9.05 8.15 8.15
Jan-15 Oct-15 Nov-15 Oct-15 Mar-16 Oct-16 Nov-16 Dec-16 May-16
7-14 days 5.00 5.25 5.25 5.25 5.25 5.50 5.50 5.50 5.50
15-30days 5.00 5.25 5.25 5.25 5.25 5.50 5.50 5.50 5.50
31-45days 5.00 5.25 5.25 5.25 5.25 5.50 5.50 5.50 5.50
46 -90 days 7.00 6.50 6.50 6.50 6.50 6.50 6.50 6.50 6.50
91-120days 7.00 6.50 6.50 6.50 6.50 6.50 6.50 6.50 6.50
120-180 days 7.00 6.50 6.50 6.50 6.50 6.50 6.50 6.50 6.50
181-270 days 7.25-7.5 6.75-7.0 6.75-7.0 6.75-7.0 6.75-7.0 6.75-7.0 6.75-7.0 6.50 6.50
271 days-1year 7.50 7.00 7.00 7.00 7.00 7.00 7.00 6.50 6.50
1 year-2year 8.50 7.25-7.5 7.25-7.5 7.25-7.5 7.25-7.5 7.05-7.1 7.05-7.10 6.9-6.75 6.9-6.75
2 year-3year 8.50 7.50 7.50 7.50 7.50 7.00 7.00 6.75 6.25
3 years-5 years 8.50 7.00 7.00 7.00 7.00 6.50 6.50 6.50 6.25
5 years-8 years 8.25 7.00 7.00 7.00 7.00 6.50 6.50 6.50 6.25
8years-10
years
8.25 7.00 7.00 7.00 7.00 6.50 6.50 6.50 6.25

Banks State Bank of India
16 KOTAK INSTITUTIONAL EQUITIES RESEARCH
Exhibit 19: SBI has cut base rates by 75 bps in the current cycle Change in base rate and PLR (%)
Source: Company, Kotak Institutional Equities
Exhibit 20: Strong traction in savings account CASA ratio break-up across banks, March fiscal year ends, 2007-17 (%)
Source: Company, Kotak Institutional Equities
Costs growth at 5% yoy; merger to drive cost efficiencies
Overall operating expenses growth was 5% yoy, led by 10% yoy decline in staff cost and
16% yoy growth in non-staff expenses. Higher non-staff cost reflects spend towards IT,
network and technology-related infrastructure. Staff cost decline is a result of wage gap
between those retiring and the fresh recruits, a trend that is likely to continue.
Bank is benefitting from retirements at the higher salary levels and fresh recruitments at
lower salaries. We think this would be a long term gains that they are likely to see
considering the declining age of the bank’s employee base. Retirement related expenses
declined by 17% yoy at the standalone level in 4QFY17. Retirement related expenses in
FY2017 were stable yoy. Nearly 35% of parent’s staff is under defined contribution
schemes as compared to 40% for the associate banks.
Date PLR Base rate
Oct-10 12.50 7.60
Jan-11 12.75 8.00
Feb-11 13.00 8.25
Apr-11 13.25 8.50
May-11 14.00 9.25
Jul-11 14.25 9.50
Aug-11 14.75 10.00
Sep-12 14.50 9.75
Jan-13 14.45 9.70
Sep-13 14.55 9.80
Nov-13 14.75 10.00
Apr-15 - 9.85
Jun-15 - 9.70
Oct-15 - 9.30
Jan-17 - 9.25
18.8 18.3 14.9 11.2 11.5 9.4 9.2 8.0 7.9 7.8 6.2
29.7 28.7 26.7 31.9 34.6
34.5 34.5 33.7 32.6 33.6 34.6
-
12
24
36
48
60
2007
2008
2009
2010
2011
2012
2013
2014
2015
2016
2017
Current Savings

State Bank of India Banks
KOTAK INSTITUTIONAL EQUITIES RESEARCH 17
We believe that the cost growth is a sustainable advantage for the bank. The
management has indicated that it would like to keep growth in physical and human
infrastructure at minimum levels. Further, it would look to reduce other non-staff costs
though it may not be as material as what we have seen recently. We expect <10% yoy
cost growth over FY2017-19E.
Merger to drive synergies over time. Cost synergies are imminent post-merger over the
medium term as the merged entity rationalizes its branch and ATM network,
redundancies are eliminated, IT, loan processing centers, treasury functions are
integrated. Staff redundancies will be addressed by redeployment into revenue-
generating functions such as sales, business development and new initiatives such as
wealth management.
Exhibit 21: Cost-to-income increased during the quarter Operating costs and cost-income ratio, March fiscal year-end, 4QFY14-4QFY17
Source: Company, Kotak Institutional Equities
Exhibit 22: Decline in share of retirement related cost Retirement costs and staff costs to total income, March fiscal year-end, 2010-4QFY17
Source: Company, Kotak Institutional Equities
Retail fee income growth at 11% yoy; non-interest income declines 2% yoy
Non-interest income declined 2% yoy as the base quarter had the benefit of FX gains on
repatriation. Growth across other categories such as fee income (5% yoy), treasury gains
(25% yoy), recovery in written-off accounts (22% yoy), FX income (21% yoy), dividend
(flat yoy) was healthy.
While overall fee income growth was 5% yoy, retail fee income was 11% yoy, reflecting
the pressure on corporate fees. Loan processing fees, comprising of ~18% of fees,
declined 8% yoy. Transaction fees, comprising ~30% of fees grew just 2% yoy.
Cross-sell can become an important driver of fee income going forward. This segment
comprises only 5% of fee income currently, despite nearly 40% CAGR over FY2013-17.
Bank is focusing on leveraging on data analytics on customized sales across nearly 420
mn strong customer franchise. Growth of the recently launched wealth management unit
will drive fee income.
45
50 53 51
47
51
50
39
45
49 51 49
44
30
38
46
54
62
70
0
25
50
75
100
125
4Q
FY14
1Q
FY15
2Q
FY15
3Q
FY15
4Q
FY15
1Q
FY16
2Q
FY16
3Q
FY16
4Q
FY16
1Q
FY17
2Q
FY17
3Q
FY17
4Q
FY17
Operating costs (LHS)
Cost-income (RHS)(Rs bn) (%)
16 26 20 16 23 18 19 25 23 29 17 24 23 27 -
7
14
21
28
35
15
20
25
30
35
40
2010
2011
2012
2013
2014
2015
1Q
FY16
2Q
FY16
3Q
FY16
4Q
FY16
1Q
FY17
2Q
FY17
3Q
FY17
4Q
FY17
Retirement costs to staff costs (RHS)Staff costs to income (LHS)

Banks State Bank of India
18 KOTAK INSTITUTIONAL EQUITIES RESEARCH
Exhibit 23: ~40% CAGR in cross-sell fee income Break-up of cross-sell fee income, March fiscal year-ends, 2013-17 (Rs mn)
Source: Company, Kotak Institutional Equities estimates
Other key highlights for the quarter
Capital. CAR and tier-1 of the standalone was 13.1% and 9.8% respectively. Post-
merger, this has declined marginally to 12.9% and 9.4%.
SBI Cards. SBI Cards reported PAT growth of 37% yoy to `3.9 bn in FY2017. It has a
credit cards market share of 15.3% (up 50 bps yoy) with spends market share of 13.1%
(up 120 bps yoy). SBI is in process to increase its combined stake in the two card entities
(front-end and back-end) to 74% from 55%. Business had RoE of ~30%.
SBI Fund Management. FY2017 PAT grew 36% yoy to `2.2 bn. AUM grew 47% yoy to
`1.57 tn with market share of 8.6%, up 70 bps yoy. Monthly SIP book has grown by
64% yoy. Business had RoE of ~30%.
SBI Capital Markets. FY2017 PAT declined ~10% yoy to `2.5 bn, with RoE of 20%. It
was ranked first (by no. of issues) and second (by issue amount) for FY2017 for overall
equity deals.
SBI General Insurance. General insurance business reported net profit in FY2017 after
loss for two consecutive years. RoE of ~14% has scope to improve further. Gross written
premium for FY2018 is projected to grow at 35% yoy.
Exhibit 24: SBI has stakes in several large companies which can be monetized SBI’s key investments and financial metrics, March fiscal year-ends, 2016
Source: Company, Kotak Institutional Equities
`
2013 2014 2015 2016 2017 CAGR (%)
Life 1,440 1,595 2,446 3,372 4,646 34
MF 339 281 700 623 1,811 52
General 233 409 566 731 1,070 46
Other 74 63 171 165 239 34
Total 2,086 2,348 3,883 4,891 7,766 39
SBI's stake FY2016 PAT FY2016 NW FY2016 RoE
Strategic investment (%) (Rs mn) (Rs mn) (%)
IL&FS 6 2,740 56,057 5
NSE 5 4,393 52,110 8
BSE 5 1,061 22,320 5
CDSL 10 634 3,581 18
UTI 18 2,321 15,475 15
CCIL 21 3,172 19,801 16
SIDBI 13 12,172 111,845 11
Central Warehousing Corporation 22 1,978 18,218 11
NSDL 5 820 4,109 20
ARCIL 20 143 15,200 1
NPCI 11 1,176 5,578 21
State Bank of India Banks
KOTAK INSTITUTIONAL EQUITIES RESEARCH 19
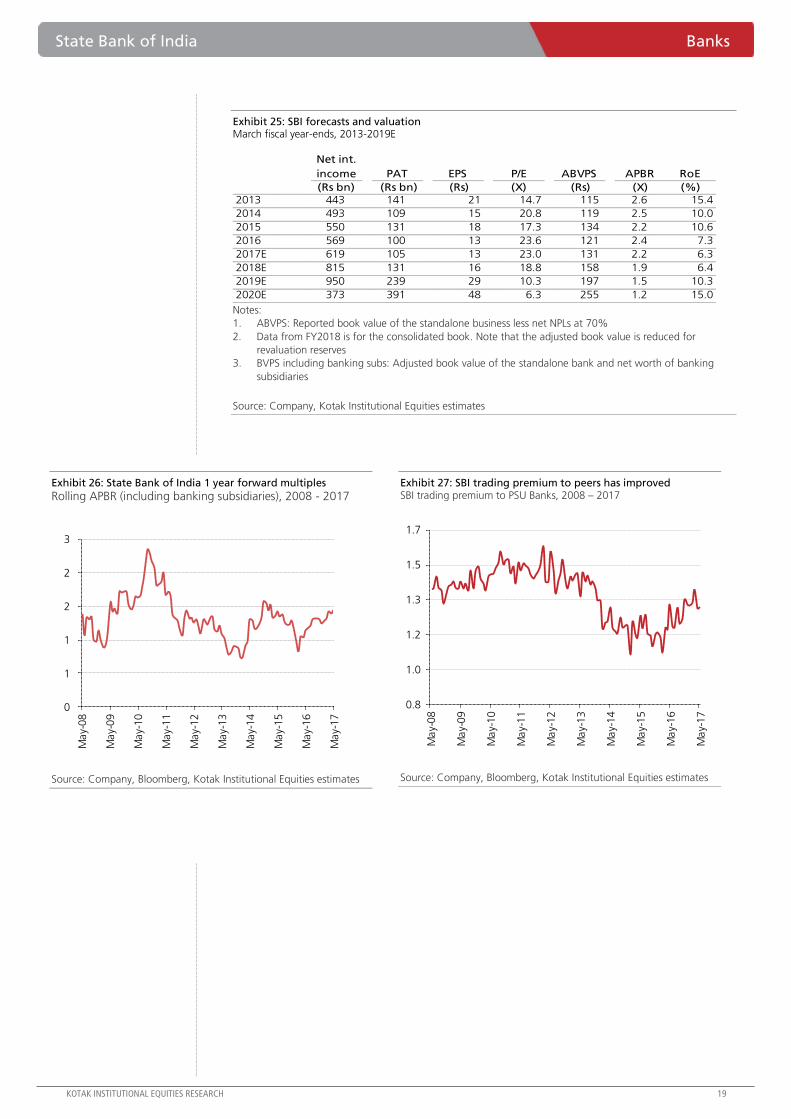
Exhibit 25: SBI forecasts and valuation March fiscal year-ends, 2013-2019E
Notes:
1. ABVPS: Reported book value of the standalone business less net NPLs at 70%
2. Data from FY2018 is for the consolidated book. Note that the adjusted book value is reduced for
revaluation reserves
3. BVPS including banking subs: Adjusted book value of the standalone bank and net worth of banking
subsidiaries
Source: Company, Kotak Institutional Equities estimates
Exhibit 26: State Bank of India 1 year forward multiples
Rolling APBR (including banking subsidiaries), 2008 - 2017
Source: Company, Bloomberg, Kotak Institutional Equities estimates
Exhibit 27: SBI trading premium to peers has improved SBI trading premium to PSU Banks, 2008 – 2017
Source: Company, Bloomberg, Kotak Institutional Equities estimates
Net int.
income PAT EPS P/E ABVPS APBR RoE
(Rs bn) (Rs bn) (Rs) (X) (Rs) (X) (%)2013 443 141 21 14.7 115 2.6 15.4
2014 493 109 15 20.8 119 2.5 10.0
2015 550 131 18 17.3 134 2.2 10.6
2016 569 100 13 23.6 121 2.4 7.3
2017E 619 105 13 23.0 131 2.2 6.3
2018E 815 131 16 18.8 158 1.9 6.4
2019E 950 239 29 10.3 197 1.5 10.3
2020E 373 391 48 6.3 255 1.2 15.0
0
1
1
2
2
3
May-
08
May-
09
May-
10
May-
11
May-
12
May-
13
May-
14
May-
15
May-
16
May-
17
0.8
1.0
1.2
1.3
1.5
1.7
May-
08
May-
09
May-
10
May-
11
May-
12
May-
13
May-
14
May-
15
May-
16
May-
17
Banks State Bank of India
20 KOTAK INSTITUTIONAL EQUITIES RESEARCH
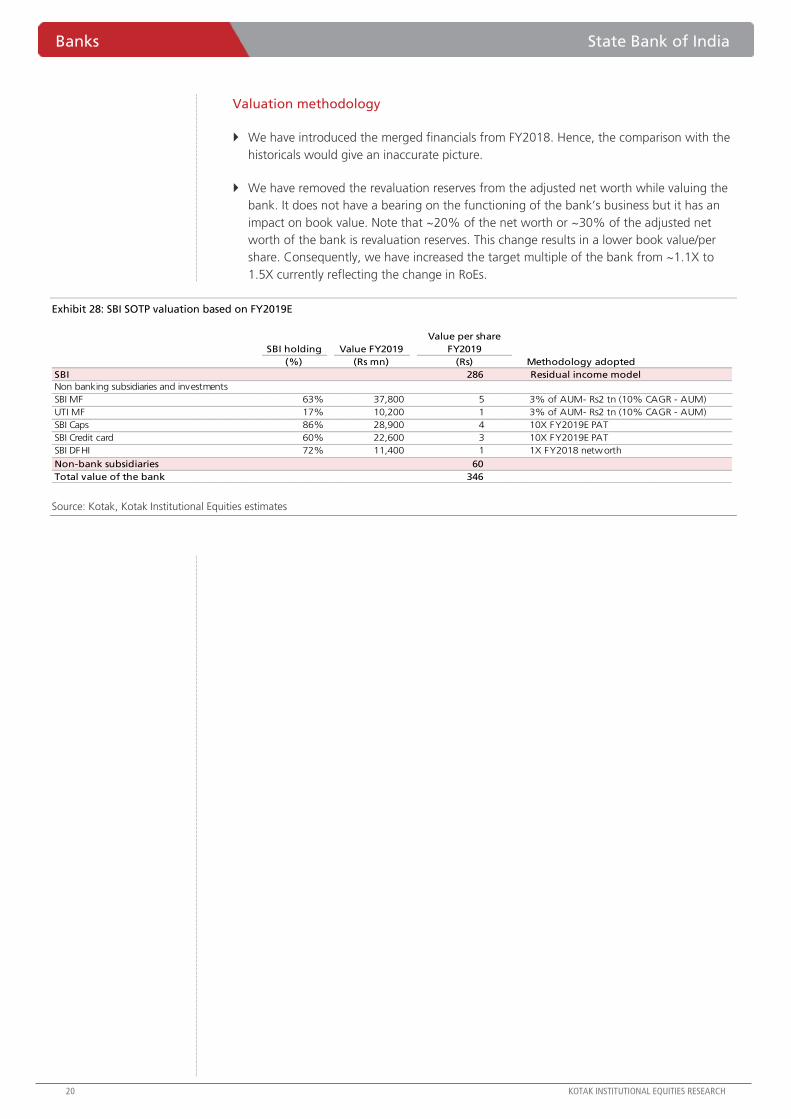
Valuation methodology
We have introduced the merged financials from FY2018. Hence, the comparison with the
historicals would give an inaccurate picture.
We have removed the revaluation reserves from the adjusted net worth while valuing the
bank. It does not have a bearing on the functioning of the bank’s business but it has an
impact on book value. Note that ~20% of the net worth or ~30% of the adjusted net
worth of the bank is revaluation reserves. This change results in a lower book value/per
share. Consequently, we have increased the target multiple of the bank from ~1.1X to
1.5X currently reflecting the change in RoEs.
Exhibit 28: SBI SOTP valuation based on FY2019E
Source: Kotak, Kotak Institutional Equities estimates
SBI holding Value FY2019
(%) (Rs mn) Methodology adopted
SBI 286 Residual income model
Non banking subsidiaries and investments
SBI MF 63% 37,800 5 3% of AUM- Rs2 tn (10% CAGR - AUM)
UTI MF 17% 10,200 1 3% of AUM- Rs2 tn (10% CAGR - AUM)
SBI Caps 86% 28,900 4 10X FY2019E PAT
SBI Credit card 60% 22,600 3 10X FY2019E PAT
SBI DFHI 72% 11,400 1 1X FY2018 networth
Non-bank subsidiaries 60
Total value of the bank 346
Value per share
FY2019
(Rs)

State Bank of India Banks
KOTAK INSTITUTIONAL EQUITIES RESEARCH 21
Exhibit 29: SBI – growth rates and key ratios March fiscal year-ends, 2015-20E (%)
Notes:
(a) Data from FY2018 is the consolidated performance of the bank
Source: Company, Kotak Institutional Equities estimates
2015 2016 2017E 2018E 2019E 2020E
Growth rates (%)Net loan 7.5 12.6 7.3 32.0 11.7 12.2
Total Asset 14.3 10.3 19.8 30.4 11.9 12.6
Deposits 13.1 9.8 18.1 38.0 11.7 12.2
Current 10.0 12.2 5.2 36.1 13.3 13.8
Sav ings 8.7 13.4 24.3 30.4 12.1 12.5
F ixed 16.2 7.4 16.2 43.1 11.4 11.8
Net interest income 11.6 3.4 8.8 31.8 16.5 11.9
Loan loss provisions 29.8 50.7 15.9 14.2 (6.9) (27.5)
Total other income 21.7 24.7 25.9 85.0 10.5 9.0
Net fee income 4.5 9.4 23.5 50.0 12.0 12.0
Net capital gains 58.7 42.9 108.0 23.3 7.5 -
Net exchange gains 2.1 9.1 26.7 100.0 12.0 12.0
Operating expenses 8.3 8.0 11.2 89.2 9.0 6.9
Employee expenses 4.6 6.7 5.5 39.1 5.9 2.8
Key ratios (%)Yield on average earning assets 8.3 8.2 7.7 8.1 8.0 7.9
Yield on average loans 9.0 8.4 7.9 8.8 8.6 8.6
Yield on average investments 8.3 9.1 8.0 7.5 7.3 7.1
Average cost of funds 5.7 5.7 5.2 5.6 5.5 5.5
Interest on deposits 6.0 6.0 5.6 5.9 5.8 5.8
Difference 2.6 2.5 2.4 2.6 2.4 2.4
Net interest income/earning assets 3.0 2.8 2.7 2.8 2.7 2.7 New provisions/average net loans 1.6 2.2 2.3 2.2 1.7 1.1
Interest income/total income 70.9 66.9 63.6 55.4 56.7 57.4
Fee income to total income 17.0 17.0 18.3 18.1 17.9 18.1
Operating expenses/total income 49.8 49.1 47.8 59.8 57.2 55.3
Tax rate 32.2 27.8 29.4 29.0 29.0 29.0
Div idend payout ratio 20.2 20.3 19.8 17.4 10.2 6.6
Share of deposits
Current 7.9 8.1 7.2 7.1 7.2 7.3
F ixed 58.7 57.4 56.5 58.6 58.4 58.2
Sav ings 33.4 34.5 36.4 34.4 34.5 34.6
Loans-to-deposit ratio 82.4 84.6 76.8 73.5 73.5 73.5
Equity/assets (EoY) 6.3 6.4 7.0 6.3 6.2 6.3
Asset quality trends (%)Gross NPL (%) 4.3 6.5 6.8 8.1 7.0 6.0
Net NPL (%) 2.1 3.8 3.7 4.7 3.9 3.1
Slippages (%) 2.4 4.9 3.0 2.1 1.8 1.8
Provision coverage (%, ex write-off) 51.4 43.2 48.1 45.2 48.0 51.8
Dupont analysis (%)Net interest income 2.9 2.6 2.5 2.6 2.5 2.5
Loan loss provisions 1.0 1.4 1.4 1.3 1.0 0.6
Net other income 1.2 1.3 1.4 2.1 1.9 1.9
Operating expenses 2.0 1.9 1.9 2.8 2.6 2.5
Invt. depreciation (0.0) 0.0 0.0 - - -
(1- tax rate) 67.8 72.2 70.6 71.0 71.0 71.0
RoA 0.7 0.5 0.4 0.4 0.6 0.9
Average assets/average equity 15.6 15.8 14.9 15.2 16.1 16.1
RoE 10.6 7.3 6.3 6.4 10.3 15.0

Banks State Bank of India
22 KOTAK INSTITUTIONAL EQUITIES RESEARCH
Exhibit 30: SBI – P&L and balance sheet March fiscal year-ends, 2015-20E (` mn)
Notes:
(a) Data from FY2018 is the consolidated performance of the bank
Source: Company, Kotak Institutional Equities estimates
2015 2016 2017E 2018E 2019E 2020E
Income statementTotal interest income 1,523,971 1,636,853 1,755,183 2,353,488 2,786,484 3,127,160
Loans 1,123,439 1,156,660 1,195,100 1,608,547 1,892,830 2,123,694
Investments 353,536 423,040 482,053 664,327 791,836 888,171
Total interest expense 973,818 1,068,035 1,136,580 1,538,352 1,836,493 2,064,330
Net interest income 550,153 568,818 618,603 815,136 949,990 1,062,831
Loan loss provisions 201,017 302,907 351,152 400,864 373,123 270,365
Net interest income (after prov.) 349,136 265,911 267,451 414,273 576,867 792,466
Other income 225,759 281,584 354,609 656,190 724,971 790,400
Net fee income 131,728 144,160 178,030 267,045 299,090 334,981
Net capital gains 36,180 51,688 107,490 132,490 142,490 142,490
Net exchange gains 19,360 21,123 26,760 53,520 59,942 67,135
Operating expenses 386,776 417,824 464,728 879,448 958,463 1,024,782
Employee expenses 235,371 251,138 264,893 368,574 390,415 401,489
Depreciation on investments (5,901) 1,496 2,080 - - -
Other Provisions 880 (9,565) 6,696 6,762 6,830 6,898
Pretax income 193,140 137,741 148,557 184,253 336,545 551,185
Tax provisions 62,124 38,234 43,711 53,433 97,598 159,844
Net Profit 131,016 99,507 104,846 130,819 238,947 391,342 % growth 20.3 (24.0) 5.4 24.8 82.7 63.8
PBT - Treasury + Provisions 352,955 380,890 400,994 459,389 574,009 685,958
% growth 18.3 7.9 5.3 14.6 25.0 19.5
Balance sheetCash and bank balance 1,547,558 1,674,677 1,719,720 2,133,025 2,351,761 2,606,996
Cash 149,432 150,809 135,728 162,874 195,449 234,538
Balance w ith RBI 1,009,406 1,145,484 1,199,361 1,585,520 1,771,681 1,987,826
Balance w ith banks 24,338 31,239 37,487 37,487 37,487 37,487
Net value of investments 4,817,587 4,770,973 7,659,900 10,164,821 11,666,891 13,515,150
Govt. and other securities 3,776,542 3,603,989 6,492,916 9,096,596 10,598,666 12,446,926
Shares 43,365 43,279 43,279 43,279 43,279 43,279
Debentures and bonds 305,278 411,268 411,268 411,268 411,268 411,268
Net loans and advances 13,000,264 14,637,004 15,710,780 20,731,368 23,165,502 25,991,693
F ixed assets 93,292 103,893 429,190 648,846 575,689 502,558
Other assets 1,022,097 1,404,084 1,540,080 1,617,084 1,730,280 1,851,399
Total assets 20,480,798 22,590,630 27,059,670 35,295,144 39,490,122 44,467,796
Deposits 15,767,932 17,307,224 20,447,510 28,219,479 31,532,815 35,379,818
Current 1,245,723 1,398,070 1,471,230 2,002,216 2,268,835 2,581,013
F ixed 9,248,881 9,931,693 11,543,420 16,523,610 18,400,632 20,574,750
Savings 5,273,328 5,977,461 7,432,860 9,693,653 10,863,348 12,224,056
Borrow ings and bills payable 2,253,350 2,426,290 3,361,325 3,280,126 3,715,309 4,213,629
Other liabilities 1,175,133 1,414,371 1,367,965 1,573,160 1,809,134 2,080,504
Total liabilities 19,196,416 21,147,886 25,176,800 33,072,765 37,057,259 41,673,952
Total shareholders' equity 1,284,382 1,442,744 1,882,861 2,222,379 2,432,863 2,793,844

For Private Circulation Only. FOR IMPORTANT INFORMATION ABOUT KOTAK SECURITIES’ RATING SYSTEM AND OTHER DISCLOSURES, REFER TO THE END OF THIS MATERIAL.
Kotak Institutional Equities Research [email protected] Mumbai: +91-22-4336-0000
Strong 4QFY17 results led by improvement in performance of SMP business
Motherson Sumi has reported consolidated EBITDA of `12.4 bn (24.6% yoy), which was 6%
above our estimates due to (1) stronger-than-expected revenue growth in standalone and
SMP businesses and (2) better-than-expected profitability in the SMP business. Net profit
adjusted for one-off expenses was `5.4 bn (+27.8% yoy), which was 15% above our
estimates; higher outperformance at the net profit level was due to higher other income,
lower interest expenses and lower tax rate.
The company reported standalone EBITDA of `3.6 bn (+17.4% yoy), which was in line with
our estimates as stronger-than-expected revenue growth was offset by lower-than-expected
EBITDA margin. Revenues grew by 19% yoy led by strong growth in passenger vehicle
industry volumes and increase in market share due to presence in Maruti’s high-growth
models such as Baleno and Brezza. EBITDA margin came in 20.6% (down 20 bps and 60 bps
qoq), which was 100 bps below our estimates due to lower gross margins.
Revenues for SMR business were EUR420 mn (+15% yoy), which was in line with our
estimate. EBITDA margin came in at 12.9% (down 20 bps yoy and up 110 bps qoq) as
compared to our estimate of 12.5%. Revenues for SMP business were EUR810 mn (+21%
yoy), which was ahead of our estimate of 15% yoy growth. EBITDA margin came in at 6.8%
(up 160 bps yoy and up 90 bps qoq) as compared to our estimate of 6%.
Increase our estimates as we build in PKC acquisition; maintain SELL with revised TP of `340
We have increased our FY2018-19E consolidated EPS estimates by 9-11% as we build in PKC
acquisition in our estimates. Our earnings estimates for standalone entity and SMRPBV business
remain largely unchanged. For PKC Group, we build in (1) 9% revenue CAGR over CY2016-19E
and (2) 90 bps expansion in EBITDA margin leading to 13%/40% EBITDA and EPS CAGR over
CY2016-19E. We have revised our SoTP-based target price to ₹340 (from ₹300 earlier) due to
(1) PKC acquisition and (2) rollover to March 2019E.
Motherson Sumi Systems (MSS) Automobiles
Strong performance of SMP business. Motherson reported strong 4QFY17 results
with 25% yoy growth in consolidated EBITDA, which was 6% above our estimates due
to stronger-than-expected revenue growth and profitability of SMP business. Standalone
business reported 17% yoy EBITDA growth (in line) led by order wins for Maruti’s
successful models. Going ahead, while we remain positive on the company’s growth
prospects, we believe valuations are expensive at 23X FY2019E EPS. We maintain our
SELL rating with revised target price of ₹340 (₹300 earlier) as we build in PKC
acquisition in our estimates and roll over to March 2019E.
SELL
MAY 22, 2017
RESULT
Coverage view: Cautious
Price (`): 424
Target price (`): 340
BSE-30: 30,465
Hitesh Goel [email protected]
Mumbai: +91-22-4336-0878
Nishit Jalan [email protected]
Mumbai: +91-22-4336-0877
Motherson Sumi Systems
Stock data Forecasts/Valuations 2017 2018E 2019E
52-week range (Rs) (high,low) EPS (Rs) 11.6 15.1 18.3
Market Cap. (Rs bn) EPS growth (%) 18.4 30.8 21.2
Shareholding pattern (%) P/E (X) 36.6 28.0 23.1
Promoters 63.1 Sales (Rs bn) 424.8 544.4 620.9
FIIs 19.7 Net profits (Rs bn) 16.2 21.2 25.7
MFs 6.5 EBITDA (Rs bn) 42.8 55.9 65.7
Price performance (%) 1M 3M 12M EV/EBITDA (X) 15.1 11.6 9.8
Absolute 12.8 21.1 56.2 ROE (%) 25.6 23.7 24.5
Rel. to BSE-30 8.6 13.2 30.2 Div. Yield (%) 0.5 1.1 1.3
Company data and valuation summary
429-255
594.5

Automobiles Motherson Sumi Systems
24 KOTAK INSTITUTIONAL EQUITIES RESEARCH
Consolidated EBITDA 6% ahead of estimates
Motherson Sumi has reported consolidated EBITDA of `12.4 bn (+24.6% yoy), which was
6% above our estimates due to (1) stronger-than-expected revenue growth and (2) better-
than-expected profitability in the SMP business. Consolidated revenues increased by 14.5%
yoy (KIE 10.7%), which was led by (1) 19% yoy revenue growth in the standalone business
and (2) 19% yoy revenue growth in SMRPBV business in euro terms. We note that euro has
depreciated by 4.3% on yoy basis in 4QFY17, thus reported SMRPBV revenues in rupee
terms increased by 14% yoy in 4QFY17. Net profit adjusted for one-off expenses (details
below) was `5.4 bn (+27.8% yoy), which was 15% above our estimates; higher
outperformance at net profit level was due to (1) higher other income (`948 mn versus
estimate of `430 mn), (2) lower interest expenses (`0.84 bn versus estimate of `1.1 bn) and
(3) lower tax rate (22.4% versus estimate of 33%). One-off expenses include costs incurred
in connection with the acquisition of PKC Group.
For FY2017, the company has reported (1) consolidated revenue growth of 14% led by
double-digit revenue growth in India and SMRPBV business, (2) EBITDA growth of 21% led
by 60 bps expansion in EBITDA margin driven by standalone and SMP business and (3)
adjusted net profit growth of 26%. The company has recommend (1) bonus shares in the
ratio of 1:2 (1 bonus share for every 2 shares held) and (2) dividend of `2 per share for
FY2017.
Standalone business: Strong quarter led by 17% yoy revenue growth
The company reported revenues of ₹17.4 bn (+18.9% yoy), which was 4% above our
estimates. Revenue growth was led by strong growth in passenger vehicle industry
volumes and increase in market share due to presence in Maruti’s high-growth models
such as Baleno and Brezza.
The company reported 4QFY17 EBITDA of `3.6 bn (+17.4% yoy), which was in line with
our estimates as stronger-than-expected revenue growth was offset by lower-than-
expected EBITDA margin. EBITDA margin came in 20.6% (down 20 bps and 60 bps qoq),
which was 100 bps below our estimates due to lower gross margins.
Net profit came in at `2.7 bn, which was 18% above our estimates due to lower-than-
expected interest expenses and tax rate. Interest expense was negative in the quarter
(despite gross debt of `13 bn) due to forex gain on loans led by rupee appreciation. Tax
rate for the quarter was 25.2% versus our estimate of 31.5%.
SMRPBV business: SMP’s revenue growth and EBITDA margin surprise positively
SMR business. Revenues increased by 14.8% yoy to EUR420 mn while EBITDA margin
came in at 12.9% (down 20 bps yoy and up 110 bps qoq). We were building in 15% yoy
revenue growth and 12.5% EBITDA margin in our estimates. For FY2017, revenues are
up 13% in euro terms and EBITDA margin was 10.8% (10.5% in FY2016).
SMP business. Revenues increased by 21.1% yoy to EUR810 mn while EBITDA margin
came in at 6.8% (up 160 bps yoy and up 90 bps qoq). We note that reported EBITDA
margin is after start-up expenses of EUR11 mn during the quarter (130 bps impact on
EBITDA margin). We were building in 15% yoy revenue growth and 6% EBITDA margin
in our estimates; thus the profitability was better than our estimates. For FY2017,
revenues are up 14% in euro terms and EBITDA margin was 6.4% (5.7% in FY2016).
Order book situation. The company has won new orders worth EUR4 bn in FY2017 and
current outstanding order book stands at EUR12.9 bn.
Net debt. Consolidated net debt `54.7 bn as of March 2017 (`43 bn as of March 2016).
Standalone net debt was `11 bn as of March 2017 versus `4.7 bn as of March 2016.
Increase in consolidated net debt (from `25.4 bn in 3QFY17) has increased due to PKC
Group acquisition.

Motherson Sumi Systems Automobiles
KOTAK INSTITUTIONAL EQUITIES RESEARCH 25
Increase FY2018-19E EPS estimates by 9-11% due to PKC acquisition
We have increased our FY2018-19E consolidated EPS estimates by 9-11% as we build in
PKC acquisition in our estimates. Our earnings estimates for standalone entity and SMRPBV
business remain largely unchanged. For PKC Group, we build in (1) 9% revenue CAGR over
CY2016-19E and (2) 90 bps expansion in EBITDA margin leading to 13%/40% EBITDA and
EPS CAGR over CY2016-19E.
For the SMRPBV business, we build in 15% revenue CAGR over FY2017-20E and expect
EBITDA margin to increase to 9.2% by FY2020E from ~8% in FY2017.
Exhibit 1: 4QFY17 standalone EBITDA was in line; PAT was aided by lower interest expense (includes forex gain) and tax rate MSSL standalone 4QFY17 results, March fiscal year-ends (` mn)
Source: Company, Kotak Institutional Equities estimates
(%chg.)
4QFY17 4QFY17E 4QFY16 3QFY17 4QFY17E 4QFY16 3QFY17 FY2017 FY2016 % chg. FY2018E
Net sales from operations 16,912 16,401 14,321 14,983 3.1 18.1 12.9 61,417 51,656
Other operating income 478 300 299 681 59.4 60.0 (29.7) 1,711 1,173
Net sales 17,390 16,701 14,620 15,664 4.1 18.9 11.0 63,129 52,829 19.5 72,651
Raw materials (9,391) (8,852) (7,744) (8,347) 6.1 21.3 12.5 (33,845) (28,535) (38,919)
Staff costs (2,476) (2,100) (2,051) (2,082) 17.9 20.7 18.9 (8,560) (7,133) (9,758)
Other expenses (2,056) (2,150) (1,752) (2,087) (4.4) 17.4 (1.5) (8,313) (6,955) (9,008)
Exchange fluctuations 107 — (29) 170 349 101
Total expenses (13,816) (13,102) (11,575) (12,345) 5.5 19.4 11.9 (50,369) (42,522) (57,685)
EBITDA 3,574 3,600 3,044 3,318 (0.7) 17.4 7.7 12,760 10,307 23.8 14,966
Depreciation (507) (510) (506) (500) (0.6) 0.3 1.4 (1,977) (2,009) (2,084)
EBIT 3,067 3,090 2,539 2,818 (0.7) 20.8 8.8 10,783 8,298 29.9 12,882
Other income 457 400 376 401 1,069 1,709 1,265
Interest expense 124 (100) (73) (100) (124) (474) (439)
Profit before tax 3,648 3,390 2,842 3,120 7.6 28.4 16.9 11,728 9,532 23.0 13,709
Tax expense (921) (1,068) (454) (990) (13.8) 103.0 (7.0) (3,455) (2,346) (4,113)
Profit after tax 2,727 2,322 2,388 2,130 17.5 14.2 28.1 8,273 7,186 15.1 9,596
Adj PAT 2,727 2,322 2,388 2,130 17.5 14.2 28.1 8,273 6,887 20.1 9,596
# of shares 1,404 1,404 1,323 1,404 1,404 1,323 1,404
EPS (Rs/share) 1.9 1.7 1.8 1.5 17.5 7.6 28.1 5.9 5.2 6.8
Tax rate (%) 25.2 31.5 16.0 31.7 29.5 24.6 30.0
As a % of revenues
Raw material 54.0 53.0 53.0 53.3 53.6 54.0 53.6
Staff costs 14.2 12.6 14.0 13.3 13.6 13.5 13.4
Other expenses 11.8 12.9 12.0 13.3 13.2 13.2 12.4
EBITDA margin (%) 20.6 21.6 20.8 21.2 20.2 19.5 20.6
EBITDA margin (ex forex) 19.9 21.6 21.0 20.1 19.7 19.3 20.6
EBIT Margin 17.6 18.5 17.4 18.0 17.1 15.7 17.7

Automobiles Motherson Sumi Systems
26 KOTAK INSTITUTIONAL EQUITIES RESEARCH
Exhibit 2: Standalone net sales growth was strong at 19% yoy in 4QFY17 Motherson Sumi's standalone net sales growth, March fiscal year-ends 2011-17 (%)
Source: Company, Kotak Institutional Equities
Exhibit 3: Standalone EBITDA margin (ex-forex gain) was largely flat on qoq basis Standalone quarterly ex-forex EBITDA margin trend, March fiscal year-ends, 2011-17 (%)
Source: Company, Kotak Institutional Equities
58
6770
55
34
17
9
41 41
2327
2 2
16
41
14 14 12
3 1
10
2
1318 17
2419
0
10
20
30
40
50
60
70
80
1Q
FY1
1
2Q
FY1
1
3Q
FY1
1
4Q
FY1
1
1Q
FY1
2
2Q
FY1
2
3Q
FY1
2
4Q
FY1
2
1Q
FY1
3
2Q
FY1
3
3Q
FY1
3
4Q
FY1
3
1Q
FY1
4
2Q
FY1
4
3Q
FY1
4
4Q
FY1
4
1Q
FY1
5
2Q
FY1
5
3Q
FY1
5
4Q
FY1
5
1Q
FY1
6
2Q
FY1
6
3Q
FY1
6
4Q
FY1
6
1Q
FY1
7
2Q
FY1
7
3Q
FY1
7
4Q
FY1
7
Yoy growth (%)
10
12
14
16
18
20
22
24
1Q
FY1
1
2Q
FY1
1
3Q
FY1
1
4Q
FY1
1
1Q
FY1
2
2Q
FY1
2
3Q
FY1
2
4Q
FY1
2
1Q
FY1
3
2Q
FY1
3
3Q
FY1
3
4Q
FY1
3
1Q
FY1
4
2Q
FY1
4
3Q
FY1
4
4Q
FY1
4
1Q
FY1
5
2Q
FY1
5
3Q
FY1
5
4Q
FY1
5
1Q
FY1
6
2Q
FY1
6
3Q
FY1
6
4Q
FY1
6
1Q
FY1
7
2Q
FY1
7
3Q
FY1
7
4Q
FY1
7
Ex forex EBITDA margin (%)

Motherson Sumi Systems Automobiles
KOTAK INSTITUTIONAL EQUITIES RESEARCH 27
Exhibit 4: Consolidated EBITDA was 6% above estimates due to stronger revenue growth and profitability in SMP business MSSL consolidated 4QFY17 results, March fiscal year-ends (` mn)
Source: Company, Kotak Institutional Equities estimates
Exhibit 5: Consolidated net debt increased on qoq basis due to PKC acquisition MSSL consolidated net debt position, March fiscal year-ends, 2012-17 (` bn)
Source: Company, Kotak Institutional Equities
(%chg.)
4QFY17 4QFY17E 4QFY16 3QFY17 4QFY17E 4QFY16 3QFY17 FY2017 FY2016 % chg. FY2018E
Net sales from operations 111,000 96,634 105,138 14.9 5.6 419,842 365,803
Other operating income 1,839 1,916 903 (4.0) 103.6 4,911 6,360
Net sales 112,839 109,042 98,549 106,041 3.5 14.5 6.4 424,752 372,163 14.1 544,380
Raw materials (67,041) (57,593) (65,427) 16.4 2.5 (257,507) (224,093) (326,698)
Staff costs (21,748) (19,544) (19,964) 11.3 8.9 (80,909) (71,573) (106,672)
Other expenses (11,507) (11,426) (9,903) 0.7 16.2 (43,671) (40,710) (55,123)
Exchange fluctuations (138) (32) 346 182 (306) —
Total expenses (100,434) (88,595) (94,948) 13.4 5.8 (381,905) (336,681) (488,493)
EBITDA 12,405 11,764 9,954 11,093 5.5 24.6 11.8 42,847 35,482 20.8 55,886
Depreciation (2,707) (2,800) (3,362) (2,733) (3.3) (19.5) (0.9) (10,590) (10,872) (15,058)
EBIT 9,698 8,964 6,593 8,360 8.2 47.1 16.0 32,257 24,610 31.1 40,828
Other income 948 430 55 433 120.3 1,629.0 118.6 1,463 392 2,216
Interest expense (838) (1,100) (696) (1,084) (23.8) 20.4 (22.7) (3,749) (3,450) (4,207)
Profit before tax 9,808 8,294 5,951 7,710 18.3 64.8 27.2 29,971 21,552 39.1 38,837
Exceptional item (974) — — — (974)
Tax expense (2,198) (2,737) (528) (2,845) (19.7) 316.8 (22.7) (9,103) (5,193) (12,290)
Share of profit from associates 424 600 448 609 1,831 1,377 2,014
Minority interest 2,311 1,450 1,623 1,314 6,181 4,814 7,333
Profit after tax 4,748 4,707 4,249 4,159 0.9 11.7 14.2 15,543 12,922 20.3 21,229
Adj PAT 5,430 4,707 4,249 4,159 15.4 27.8 30.6 16,225 12,922 25.6 21,229
# of shares 1,404 1,404 1,323 1,404 1,404 1,323 1,404
EPS (Rs/share) 3.9 3.4 3.2 3.0 11.6 9.8 15.1
Tax rate (%) 22.4 33.0 8.9 36.9 30.4 24.1 31.6
As a % of revenues
Raw material 59.4 58.4 61.7 60.6 60.2 60.0
Staff costs 19.3 19.8 18.8 19.0 19.2 19.6
Other expenses 10.2 11.6 9.3 10.3 10.9 10.1
EBITDA margin (%) 11.0 10.8 10.1 10.5 10.1 9.5 10.3
EBITDA margin (ex forex) 11.1 10.8 10.1 10.1 10.0 9.6 10.3
EBIT Margin 8.6 8.2 6.7 7.9 7.6 6.6 7.5
41.544.4
42.8 43.1 43.142.4
45.744.4
39.342
48.3 47.1
31.3
35.9
45.647.5
43.046.3
21.825.4
54.7
0
10
20
30
40
50
60
4Q
FY1
2
1Q
FY1
3
2Q
FY1
3
3Q
FY1
3
4Q
FY1
3
1Q
FY1
4
2Q
FY1
4
3Q
FY1
4
4Q
FY1
4
1Q
FY1
5
2Q
FY1
5
3Q
FY1
5
4Q
FY1
5
1Q
FY1
6
2Q
FY1
6
3Q
FY1
6
4Q
FY1
6
1Q
FY1
7
2Q
FY1
7
3Q
FY1
7
4Q
FY1
7
Net consolidated debt (Rs bn)
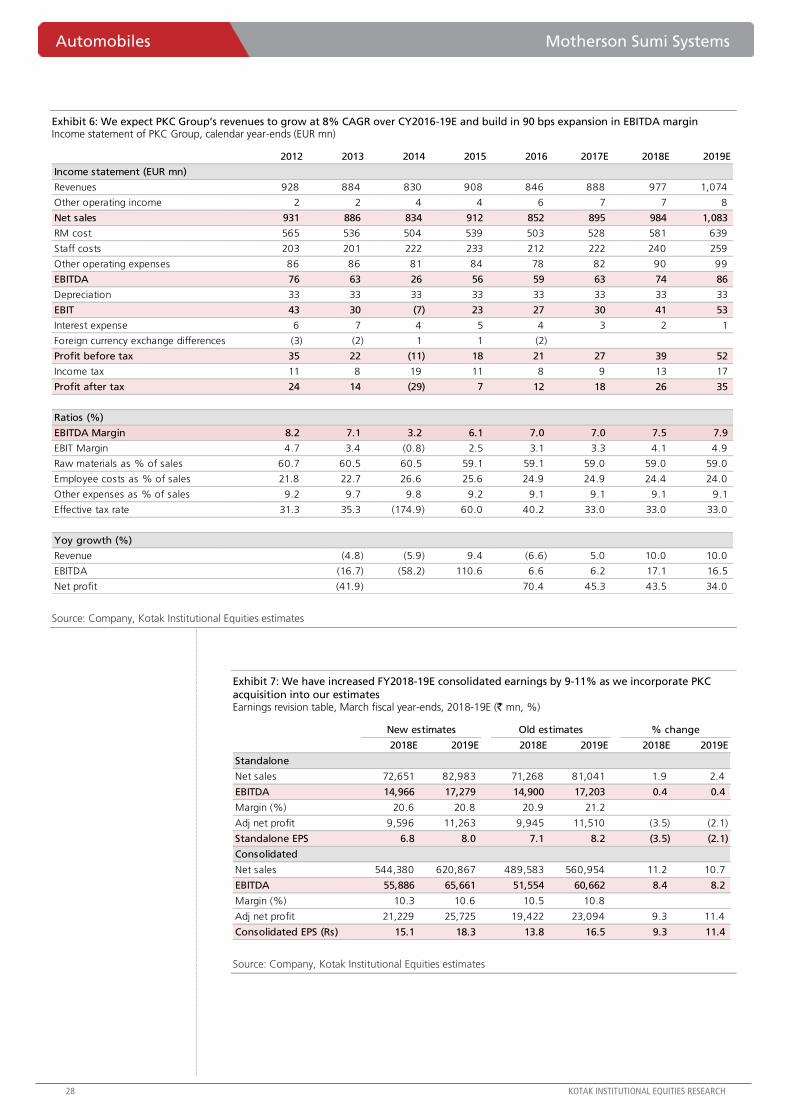
Automobiles Motherson Sumi Systems
28 KOTAK INSTITUTIONAL EQUITIES RESEARCH
Exhibit 6: We expect PKC Group’s revenues to grow at 8% CAGR over CY2016-19E and build in 90 bps expansion in EBITDA margin Income statement of PKC Group, calendar year-ends (EUR mn)
Source: Company, Kotak Institutional Equities estimates
Exhibit 7: We have increased FY2018-19E consolidated earnings by 9-11% as we incorporate PKC
acquisition into our estimates Earnings revision table, March fiscal year-ends, 2018-19E (` mn, %)
Source: Company, Kotak Institutional Equities estimates
2012 2013 2014 2015 2016 2017E 2018E 2019E
Income statement (EUR mn)
Revenues 928 884 830 908 846 888 977 1,074
Other operating income 2 2 4 4 6 7 7 8
Net sales 931 886 834 912 852 895 984 1,083
RM cost 565 536 504 539 503 528 581 639
Staff costs 203 201 222 233 212 222 240 259
Other operating expenses 86 86 81 84 78 82 90 99
EBITDA 76 63 26 56 59 63 74 86
Depreciation 33 33 33 33 33 33 33 33
EBIT 43 30 (7) 23 27 30 41 53
Interest expense 6 7 4 5 4 3 2 1
Foreign currency exchange differences (3) (2) 1 1 (2)
Profit before tax 35 22 (11) 18 21 27 39 52
Income tax 11 8 19 11 8 9 13 17
Profit after tax 24 14 (29) 7 12 18 26 35
Ratios (%)
EBITDA Margin 8.2 7.1 3.2 6.1 7.0 7.0 7.5 7.9
EBIT Margin 4.7 3.4 (0.8) 2.5 3.1 3.3 4.1 4.9
Raw materials as % of sales 60.7 60.5 60.5 59.1 59.1 59.0 59.0 59.0
Employee costs as % of sales 21.8 22.7 26.6 25.6 24.9 24.9 24.4 24.0
Other expenses as % of sales 9.2 9.7 9.8 9.2 9.1 9.1 9.1 9.1
Effective tax rate 31.3 35.3 (174.9) 60.0 40.2 33.0 33.0 33.0
Yoy growth (%)
Revenue (4.8) (5.9) 9.4 (6.6) 5.0 10.0 10.0
EBITDA (16.7) (58.2) 110.6 6.6 6.2 17.1 16.5
Net profit (41.9) 70.4 45.3 43.5 34.0
2018E 2019E 2018E 2019E 2018E 2019E
Standalone
Net sales 72,651 82,983 71,268 81,041 1.9 2.4
EBITDA 14,966 17,279 14,900 17,203 0.4 0.4
Margin (%) 20.6 20.8 20.9 21.2
Adj net profit 9,596 11,263 9,945 11,510 (3.5) (2.1)
Standalone EPS 6.8 8.0 7.1 8.2 (3.5) (2.1)
Consolidated
Net sales 544,380 620,867 489,583 560,954 11.2 10.7
EBITDA 55,886 65,661 51,554 60,662 8.4 8.2
Margin (%) 10.3 10.6 10.5 10.8
Adj net profit 21,229 25,725 19,422 23,094 9.3 11.4
Consolidated EPS (Rs) 15.1 18.3 13.8 16.5 9.3 11.4
% changeOld estimatesNew estimates

Motherson Sumi Systems Automobiles
KOTAK INSTITUTIONAL EQUITIES RESEARCH 29
Exhibit 8: We value MSSL at ₹340 on an SoTP basis Motherson Sumi sum-of-the-parts valuation methodology
Source: Company, Kotak Institutional Equities estimates
Exhibit 9: We expect standalone earnings to grow at 17% CAGR during FY2017-20E Motherson Sumi standalone profit model, balance sheet and cash model, March fiscal year-ends, 2010-20E (` mn)
Source: Company, Kotak Institutional Equities estimates
EPS Multiple Value
(Rs) (X) (Rs/share)
March 2019 standalone EPS 8.0 22.0 177
March 2019 EPS of other subs (concern share) 10.3 16.0 165
Equity value 341
Target price 340
2010 2011 2012 2013 2014 2015 2016 2017 2018E 2019E 2020E
Profit model (Rs mn)
Net sales 17,049 28,236 35,718 43,041 45,245 49,850 52,829 63,129 72,651 82,983 94,802
EBITDA 2,334 4,303 5,184 7,570 8,448 8,754 10,307 12,760 14,966 17,279 20,113
Other income 857 756 881 865 990 763 1,709 1,069 1,265 1,370 1,549
Interest 252 284 548 485 324 208 474 124 439 280 200
Depreciation 646 830 1,172 1,453 1,530 2,071 2,008 1,977 2,084 2,279 2,474
Profit before tax 2,293 3,946 4,345 6,497 7,584 7,238 9,533 11,728 13,709 16,090 18,988
Current tax 814 979 1,188 1,801 2,295 2,348 2,515 3,556 4,113 4,827 5,696
Deferred tax 153 92 (15) — (62) (259) (169) (101) — — —
Net profit 1,326 2,875 3,172 4,696 5,351 5,149 6,887 8,273 9,596 11,263 13,291
Earnings per share (Rs) 1.6 2.2 2.4 3.5 4.0 3.9 5.2 5.9 6.8 8.0 9.5
Balance sheet (Rs mn)
Equity 7,165 10,102 12,855 16,240 19,056 21,021 24,539 58,027 64,168 71,376 79,883
Deferred tax liability 135 225 214 177 115 — — — — — —
Total Borrowings 4,130 7,927 9,552 9,273 7,578 5,336 4,850 12,940 9,000 5,000 5,000
Current liabilities 5,274 6,684 7,649 8,714 9,895 11,032 9,551 11,813 13,423 15,056 16,867
Total liabilities 16,705 24,937 30,270 34,404 36,644 37,389 38,940 82,780 86,591 91,432 101,749
Net fixed assets 7,528 10,584 13,432 15,057 14,863 15,017 14,973 14,955 15,871 16,592 17,118
Investments 2,355 3,427 3,704 5,132 5,821 7,320 7,230 44,772 44,772 44,772 44,772
Cash 365 381 202 658 191 1,461 185 1,891 1,407 1,984 7,774
Other current assets 6,438 10,545 12,912 13,547 15,769 13,591 16,551 21,163 24,542 28,084 32,086
Miscellaneous expenditure 18 — 19 10 — — — — — — —
Total assets 16,705 24,937 30,270 34,404 36,644 37,389 38,940 82,780 86,591 91,432 101,749
Free cash flow (Rs mn)
Operating cash flow excl. working capital 2,498 3,824 5,364 6,488 7,044 7,093 7,566 9,474 11,084 12,632 14,597
Working capital changes (506) (2,498) (1,073) (488) (351) 1,115 (957) (2,210) (1,769) (1,909) (2,191)
Capital expenditure (2,048) (3,730) (3,673) (3,182) (1,526) (2,113) (1,731) (1,959) (3,000) (3,000) (3,000)
Free cash flow (56) (2,404) 618 2,818 5,167 6,095 4,878 5,306 6,314 7,722 9,406
Ratios
EBITDA margin (%) 13.7 15.2 14.5 17.6 18.7 17.6 19.5 20.2 20.6 20.8 21.2
PAT margin (%) 7.8 10.2 8.9 10.9 11.8 10.3 13.6 13.1 13.2 13.6 14.0
Net debt/equity (X) 0.5 0.7 0.7 0.5 0.4 0.2 0.2 0.2 0.1 0.0 (0.0)
Book value (Rs/share) 8.5 7.6 9.7 12.3 14.4 15.9 18.5 41.3 45.7 50.9 56.9
RoAE (%) 23.4 33.3 27.6 32.3 30.3 25.7 31.6 20.0 15.7 16.6 17.6
RoACE (%) 14.1 21.0 17.7 21.1 21.4 20.0 27.1 16.7 13.7 15.3 16.7

Automobiles Motherson Sumi Systems
30 KOTAK INSTITUTIONAL EQUITIES RESEARCH
Exhibit 10: We expect consolidated earnings to grow at 24% CAGR during FY2017-20E Motherson Sumi consolidated profit model, balance sheet and cash model, March fiscal year-ends, 2010-20E (` mn)
Source: Company, Kotak Institutional Equities estimates
2010 2011 2012 2013 2014 2015 2016 2017E 2018E 2019E 2020E
Profit model (Rs mn)
Net sales 67,022 81,756 147,141 256,170 307,210 350,319 372,163 424,752 544,380 620,867 707,601
EBITDA 3,271 6,932 8,301 17,778 26,873 32,027 35,482 42,847 55,886 65,661 77,202
Other income 3,331 2,341 2,070 170 176 177 392 1,463 2,216 2,594 3,333
Interest 573 497 1,649 2,495 2,944 3,178 3,450 3,749 4,207 3,667 3,487
Depreciation 2,601 2,465 3,796 7,145 8,172 9,206 10,872 10,590 15,058 16,686 18,314
Profit before tax 3,428 6,312 4,926 8,308 15,934 19,819 21,552 29,971 38,837 47,901 58,734
Current tax 1,237 1,859 2,060 3,805 5,169 5,218 5,193 9,103 12,290 15,135 18,535
Deferred tax (76) 29 93 31 (174) (846) (1,287) 476 — — —
Minority interest 91 (523) 631 (70) (3,316) (4,294) (4,814) (6,181) (7,333) (9,257) (11,587)
Adj Net profit 2,361 3,903 2,596 4,411 7,622 9,866 12,922 16,225 21,229 25,725 31,048
Earnings per share (Rs) 2.8 3.0 2.3 3.3 5.8 7.5 9.8 11.6 15.1 18.3 22.1
Balance sheet (Rs mn)
Equity 11,649 16,087 18,717 22,890 29,593 33,238 43,971 82,727 96,504 113,200 133,350
Deferred tax liability 40 10 1,506 1,441 1,680 1,457 2,394 4,260 4,260 4,260 4,260
Total Borrowings 8,180 12,635 46,023 48,556 47,758 51,979 60,690 103,491 83,491 79,491 75,491
Current liabilities 15,921 19,633 49,289 52,175 66,696 78,892 76,863 110,897 130,500 152,781 172,600
Minority interest 2,027 2,276 5,027 4,025 7,896 10,142 15,123 22,322 22,322 22,322 22,322
Total liabilities 37,817 50,641 120,562 129,088 153,623 175,708 199,040 323,697 337,077 372,053 408,023
Net fixed assets 16,356 22,258 51,380 56,629 65,660 70,847 83,091 121,898 128,840 134,153 137,839
Investments 471 453 938 716 749 649 5,317 4,737 4,737 4,737 4,737
Cash 3,431 3,565 4,557 5,944 9,061 18,919 17,717 48,866 30,165 31,290 39,220
Other current assets 17,541 24,365 63,687 65,798 78,153 85,293 89,987 128,820 153,959 182,497 206,851
Miscellaneous expenditure 18 — — — — — 2,928 19,376 19,376 19,376 19,376
Total assets 37,817 50,641 120,562 129,088 153,623 175,708 199,040 323,697 337,077 372,053 408,023
Free cash flow (Rs mn)
Operating cash flow excl. working capital 5,465 7,191 9,244 15,879 24,547 21,247 30,636 29,882 40,494 46,078 52,850
Working capital changes (661) (2,998) (3,357) (1,019) 2,403 12,650 (9,139) (3,378) (5,536) (6,257) (4,535)
Capital expenditure (4,129) (7,861) (10,758) (11,389) (14,120) (19,443) (22,452) (56,832) (22,000) (22,000) (22,000)
Free cash flow 674 (3,668) (4,871) 3,471 12,830 14,454 (955) (30,328) 12,958 17,822 26,315
Ratios
EBITDA margin (%) 4.9 8.5 5.6 6.9 8.7 9.1 9.5 10.1 10.3 10.6 10.9
PAT margin (%) 3.5 4.8 1.8 1.7 2.5 2.5 3.5 3.7 3.9 4.1 4.4
Net debt/equity (X) 0.4 0.6 2.2 1.9 1.3 1.0 1.0 0.7 0.6 0.4 0.3
Book value (Rs/share) 13.8 12.2 14.1 17.3 22.4 25.1 33.2 58.9 68.8 80.7 95.0
RoAE (%) 24.2 28.1 17.5 21.2 29.0 31.4 33.5 25.6 23.7 24.5 25.2
RoACE (%) 2.4 12.9 5.4 8.4 18.4 21.7 23.3 19.4 18.0 19.3 21.0

For Private Circulation Only. FOR IMPORTANT INFORMATION ABOUT KOTAK SECURITIES’ RATING SYSTEM AND OTHER DISCLOSURES, REFER TO THE END OF THIS MATERIAL.
Kotak Institutional Equities Research [email protected] Mumbai: +91-22-4336-0000
In line; high costs affect VSF business while chemicals improve sequentially
Grasim Industries reported consolidated revenues of `100 bn (+1% yoy, +18% qoq), EBITDA of
`18.7 bn (-1% yoy, +17% qoq) and net income of `7.8 bn (+11% yoy, +6% qoq)—EBITDA
was in line with our estimate (KIE: `18.6 bn) though higher interest and depreciation cost led to
7% miss at the net level (KIE: `7.8 bn). In standalone financials, the company reported revenues
of `28.8 bn (+15% yoy, +15% qoq), EBITDA of `5.3 bn (+22% yoy, +3% qoq) and net income
of `3.2 bn (+33% yoy, -5% qoq) against our estimate of EBITDA of `5 bn and net income of
`3.2 bn. In standalone operations, VSF segment EBITDA declined 14% qoq to `3.5 bn (+29%
yoy) while Chemicals EBITDA increased 13% qoq to `2.1 bn (-8% yoy).
VSF earnings affected by higher pulp and energy costs; debottlenecking to aid capacity
VSF EBITDA of `3.5 bn (+30% yoy, -14% qoq) was impacted due to higher pulp and energy
costs (EBITDA margin of 18% in the quarter versus 23% in 3QFY17). Operations at the captive
plant at Harihar were suspended from February 2017 due to water shortage. The company will
resume operations at the pulp plant with the onset of monsoons. Pulp prices have declined and
the company expects margins to be restored in ensuing quarters. VSF volumes increased by 2%
yoy to 133,000 tons (+9% qoq) and the plants are operating at full capacity. Grasim is looking
at capacity debottlenecking and has applied for environmental clearances which it expects to
receive by the end of the year.
Maintain ADD rating with revised target price of `1,240/share (`1225 earlier)
We maintain our ADD rating on Grasim with a revised target price of `1,240/share (from
`1225/share) based on March 2019E financials. We raise our earnings estimate by 2-4% to
`85.6 and `100.5 for FY2018E and FY2019E respectively. The scheme of merger of Aditya Birla
Nuvo with Grasim and listing of the financial services business has been approved by
shareholders and creditors and is in process of approval from the National Company Law
Tribunal and stock exchanges. It is expected to be completed by 2QFY18.
Grasim Industries (GRASIM) Cement
In line; high costs affect VSF, but chemicals improve. Grasim Industries’ EBITDA of
`18.7 bn (-1% yoy, +17% qoq) was in line with our estimate. VSF earnings for the
quarter were impacted by higher pulp and energy costs though the company expects
margins to improve in the ensuing quarters. Grasim is on track to increase capacity in
the chemicals segment by 25% by end-FY2018E and has also applied for approvals for
debottlenecking to raise capacity in the VSF business. We maintain ADD rating with
revised TP of `1,240 (`1,225 earlier).
ADD
MAY 22, 2017
RESULT
Coverage view: Cautious
Price (`): 1,120
Target price (`): 1,240
BSE-30: 30,465
Murtuza Arsiwalla [email protected]
Mumbai: +91-22-4336-0870
Abhishek Poddar [email protected]
Mumbai: +91-22-4336-0861
Grasim Industries
Stock data Forecasts/Valuations 2017 2018E 2019E
52-week range (Rs) (high,low) EPS (Rs) 67.8 85.6 100.5
Market Cap. (Rs bn) EPS growth (%) 23.5 26.2 17.3
Shareholding pattern (%) P/E (X) 16.5 13.1 11.1
Promoters 31.3 Sales (Rs bn) 360.7 394.1 435.5
FIIs 34.9 Net profits (Rs bn) 31.7 40.0 46.9
MFs 8.2 EBITDA (Rs bn) 73.9 85.5 98.8
Price performance (%) 1M 3M 12M EV/EBITDA (X) 6.8 5.5 4.2
Absolute 3.5 7.7 31.7 ROE (%) 10.8 12.0 12.6
Rel. to BSE-30 (0.3) 0.6 9.8 Div. Yield (%) 0.5 0.5 0.5
Company data and valuation summary
1,218-782
523.1

Cement Grasim Industries
32 KOTAK INSTITUTIONAL EQUITIES RESEARCH
Our SOTP-based TP of `1,240/share comprises (1) `738/share value for 60% ownership in
Ultratech valued at 30% holding company discount on our fair value of `2,950/share, (2)
VSF (`215/share) and chemicals (`155/share), valued at 7X EBITDA on March 2019E, (3)
`60/share for investments held in equity of group companies (at 30% discount to CMPs),
and (4) `70/share for net cash held by Grasim Industries (standalone).
Changes in our estimates
Exhibit 6 highlights key changes in our estimates. We raise our consolidated EBITDA estimate
for FY2018-19E by 0-1% largely led by increase in standalone EBITDA. Our FY2018-19E
earnings estimate increases by 2%. We estimate EPS of `85.6, `100.5 and `114.7 for
FY2018E, FY2019E and FY2020E, respectively
Chemicals – lower offtake in the quarter due to lower chlorine demand
Chemicals EBITDA of `2.1 bn (-8% yoy, +13% qoq) was impacted due to lower offtake
during the quarter—volumes declined 6% yoy to 194,000 tons (+1% qoq). Lower chlorine
demand restricted caustic soda production. The decline in EBITDA by 8% yoy reflects (1)
increase in power costs due to higher coal prices, (2) lower caustic volumes partially offset by
33% increase in chlorine value added products. The company is working on a plan to
increase production capacity to 1,048 kt from 840 kt in FY2018 and the plant is expected to
be commissioned by 4QFY18. The company also expects to double Phosphoric Acid capacity
to 54 kt in 2HFY18 from 25 kt.
Cement - weak volumes, lower realizations and rising costs drag earnings down
Ultratech’s 4QFY17 earnings were in line with our estimates—the company reported net
sales of `66 bn (+3% yoy, +19% qoq), EBITDA of `12.8 bn (-7% yoy, +22% qoq) and net
income (adjusted) of `7 bn (-10% yoy, +25% qoq) against our estimates of `66.3 bn, `12.7
bn and `7 bn respectively. Domestic cement volumes were flat yoy at 13.4 mn tons (+21%
qoq), although lower than 4% volume growth reported by ACC. UTCEM attributed lower
sales to weak demand especially in north markets given the negative sentiment in housing
market (demand was weak in the states of Uttar Pradesh and Punjab).
EBITDA/ton declined by 7% yoy to `957/ton (+1% qoq) due to an increase in overall costs
(+6% yoy) to `3,983/ton despite improved realizations (+3% yoy). Cost increases largely
pertain to higher fuel costs (+23% due to increase in pet-coke prices by 55%), freight costs
and other expenses. Weak EBITDA led to 10% yoy decline in net income at `7 bn despite
higher other income of `2.4 bn (led by a write back of `1.4 bn of provisions).
Exhibit 1: Grasim's consolidated EBITDA was in-line with estimate; FY2017 EBITDA increased 16% yoy Quarterly results for Grasim Industries (Consolidated), March fiscal year-ends (Rs mn)
Source: Company, Kotak Institutional Equities estimates
Change (%)
4QFY17 4QFY17E 4QFY16 3QFY17 4QFY17E 4QFY16 3QFY17 FY2017 FY2016 (% chg.) FY2018E
Net sales 99,954 96,901 98,964 84,954 3 1 18 360,684 362,177 (0) 394,075
Total expenditure (81,222) (78,291) (79,990) (68,897) (286,833) (299,478) (308,552)
EBITDA 18,732 18,609 18,974 16,057 1 (1) 17 73,851 62,700 18 85,522
EBITDA (%) 18.7 19.2 19.2 18.9 20.5 17.3 21.7
Other income 2,692 2,753 1,616 2,726 9,478 7,555 11,880
Interest (1,763) (1,573) (1,661) (1,557) (7,024) (7,513) (5,043)
Depreciation (4,721) (4,545) (5,325) (4,500) (18,076) (19,110) (17,548)
Pre-tax profits 14,941 15,245 13,605 12,726 (2) 10 17 58,229 43,632 74,811
Tax (4,291) (4,573) (3,762) (3,539) (17,067) (10,343) (21,991)
Minority interest (2,891) (2,806) (2,877) (2,358) (10,783) (9,105) (14,143)
Profit from associates (13) 474 273 453 1,294 1,455 1,307
Net income 7,745 8,339 7,239 7,282 (7) 7 6 31,673 25,639 24 39,984
Extraordinaries — — (279) — — — —
Reported net profits 7,745 8,339 6,961 7,282 (7) 11 6 31,673 25,639 24 39,984
EPS (Rs) 16.6 17.9 14.9 15.6 (7) 11 6 67.8 54.9 24 85.7

Grasim Industries Cement
KOTAK INSTITUTIONAL EQUITIES RESEARCH 33
Exhibit 2: Grasim's standalone earnings were in-line; VSF earnings declined sequentially due to higher costs Quarterly results for Grasim Industries (Standalone), March fiscal year-ends (Rs mn)
Source: Company, Kotak Institutional Equities estimates
Exhibit 3: VSF EBITDA increased 30% yoy aided by realizations; In chemicals lower chlorine demand restricted caustic soda volumes Division-wise breakup of Grasim's interim results (Consolidated), March fiscal year-ends (Rs mn)
Source: Company, Kotak Institutional Equities
Change (%)
4QFY17 4QFY17E 4QFY16 3QFY17 4QFY17E 4QFY16 3QFY17 FY2017 FY2016 (% chg.) FY2018E
Net sales 28,761 25,691 25,044 24,947 12 15 15 103,457 88,622 17 107,034
Total expenditure (23,507) (20,645) (20,746) (19,831) (81,909) (74,009) (84,799)
EBITDA 5,254 5,046 4,298 5,116 4 22 3 21,548 14,613 47 22,235
EBITDA (%) 18.3 19.6 17.2 20.5 20.8 16.5 20.8
Other income 304 874 635 865 4,739 3,992 5,102
Interest (83) (105) (268) (107) (576) (1,474) (351)
Depreciation (1,133) (1,117) (1,287) (1,106) (4,461) (4,471) (4,553)
Pre-tax profits 4,343 4,698 3,378 4,768 21,249 12,659 22,433
Tax (1,188) (1,456) (1,001) (1,455) (5,649) (2,835) (6,281)
Net income 3,155 3,242 2,378 3,314 (3) 33 (5) 15,600 9,825 59 16,152
Extraordinaries — — (292) — — (292) —
Reported net profits 3,155 3,242 2,086 3,314 15,600 9,533 16,152
EPS (Rs) 6.8 6.9 4.5 7.1 (3) 51 (5) 33.4 20.4 63.6 34.6
Change (%)
4QFY17 4QFY16 3QFY17 y-o-y q-o-q 4QFY17 4QFY16 3QFY17
Revenue
VSF and Pulp wood 19,450 21,506 17,620 (10) 10 19 22 21
Cement (including Star Cement) 65,953 64,359 55,401 2 19 66 65 65
Chemicals 10,680 9,561 9,210 12 16 11 10 11
Others 3,872 3,539 2,722 9 42 4 4 3
Total 99,954 98,964 84,954 1 18
Other income 2,692 1,616 2,726 67 (1)
EBITDA
VSF and Pulp wood 3,450 2,670 4,020 29 (14) 18 12 23
Cement (including Star Cement) 12,782 12,850 10,445 (1) 22 19 20 19
Chemicals 2,110 2,290 1,860 (8) 13 20 24 20
Others 3,083 2,780 2,458 11 25
Total 21,424 20,590 18,783 4 14 21 21 22
Interest (1763) (1661) (1557) 6 13
Depreciation (4721) (5325) (4500) (11) 5
PBT 14,941 13,605 12,726 10 17
Tax (4291) (3762) (3539)
Minority interest (2891) (2877) (2358)
Profit from associates (13) 273 453
PAT 7,745 7,239 7,282 7 6
Sales volumes (tons)
Viscose staple fibre 133,000 130,000 122,000 2 9
Cement (mn tons) 13.4 13.3 11.0 0 21
Chemicals 194,000 204,000 193,000 (5) 1
Per unit realization (Rs/ton)
Viscose staple fibre 146,241 133,038 144,426 10 1
Cement 4,940 4,832 5,032 2 (2)
Chemicals 55,052 46,899 47,720 17 15
EBITDA margin (%)
Proportion (%)

Cement Grasim Industries
34 KOTAK INSTITUTIONAL EQUITIES RESEARCH
Exhibit 4: Ultratech reported flat volumes and 7% yoy decline in EBITDA/ton Key performance metrics of UltraTech cement for 4QFY17
Source: Company, Kotak Institutional Equities estimates
Exhibit 5: Higher costs led to weak margins in VSF segment in 4QFY17 VSF business - realizations and margins
Source: Company, Kotak Institutional Equities
Exhibit 6: Grasim Industries, changes in estimates, March fiscal year ends, FY2018-19E
Source: Kotak Institutional Equities estimates
4QFY17 4QFY17E 4QFY16 3QFY17 4QFY17E 4QFY16 3QFY17
Revenues (Rs mn) 65,953 66,298 64,023 55,401 (1) 3 19
EBITDA (Rs mn) 12,782 12,733 13,770 10,445 0 (7) 22
PAT (Rs mn) 7,020 7,016 7,808 5,634 0 (10) 25
Volumes (mn tons) 13.4 13.5 13.3 11.0 (1) 0 21
Realizations (Rs/ton) 4,940 4,924 4,807 5,032 0 3 (2)
EBITDA/ton (Rs/ton) 957 946 1,034 949 1 (7) 1
Change (%)
0
10
20
30
60,000
80,000
100,000
120,000
140,000
160,000
2Q
FY
13
3Q
FY
13
4Q
FY
13
1Q
FY
14
2Q
FY
14
3Q
FY
14
4Q
FY
14
1Q
FY
15
2Q
FY
15
3Q
FY
15
4Q
FY
15
1Q
FY
16
2Q
FY
16
3Q
FY
16
4Q
FY
16
1Q
FY
17
2Q
FY
17
3Q
FY
17
4Q
FY
17
Average realization (Rs/ton) - LHS EBIT margin (%) - RHS
2018E 2019E 2018E 2019E 2018E 2019E
Consolidated
Revenues 394,075 435,542 390,586 430,279 1 1
EBITDA 85,522 98,766 85,171 98,003 0 1
PAT 39,984 46,915 39,313 46,141 2 2
EPS 85.6 100.5 84.2 98.8 2 2
Standalone
Revenues 107,034 114,013 105,383 110,501 2 3
EBITDA 22,235 24,479 21,778 23,572 2 4
PAT 16,152 17,953 15,835 17,228 2 4
EPS 34.6 38.5 33.9 36.9 2 4
Revised estimate Previous estimate Change (%)

Grasim Industries Cement
KOTAK INSTITUTIONAL EQUITIES RESEARCH 35
Exhibit 7: Grasim Industries, valuation details, March 2019E financials (Rs/share)
Source: Kotak Institutional Equities estimates
Exhibit 8: Grasim Industries, Profit model, balance sheet and cash flow model (consolidated), March fiscal year-ends, 2015-2020E (Rs mn)
Source: Company, Kotak Institutional Equities estimates
Value of standalone entity Methodology
VSF 100,784 7X March 2019E EBITDA
Chemicals 71,742 7X March 2019E EBITDA
Value of key investments 28,646 30% discount to current market price
Standalone net cash 32,789 March 2019E cash
Total 233,960
Value of standalone business (Rs/share) 501
Value of Cement business
KIE Target Price of UltraTech (Rs/share) 2,950
Value of 60% holding 344,336 Factoring holding company discount of 30%
Value of Cement business (Rs/share) 738
Market capitalization 578,295
Number of shares o/s (mn) 466.9
Implied share price (Rs) 1,240
Target price (Rs) 1,240
2015 2016 2017 2018E 2019E 2020E
Profit model (Rs mn)
Net sales 324,376 362,177 360,684 394,075 435,542 474,037
EBITDA 47,348 62,700 73,851 85,522 98,766 109,989
Other income 9,487 7,555 9,478 11,880 14,174 18,145
Interest (6,674) (7,513) (7,024) (5,043) (4,543) (4,543)
Depreciaiton (15,632) (19,110) (18,076) (17,548) (18,544) (19,567)
Profit before tax 34,528 43,632 58,229 74,811 89,853 104,024
Current tax (276) (5,107) (13,460) (17,097) (20,431) (23,594)
Deferred tax (9,884) (5,236) (3,607) (4,895) (6,274) (7,539)
Net profit before minority 24,369 33,289 41,162 52,820 63,149 72,892
Share of profit of associates 1,542 1,455 1,294 1,307 1,320 1,333
Minority Interest (8,379) (9,105) (10,783) (14,143) (17,554) (20,680)
Adjusted PAT 17,533 25,639 31,673 39,984 46,915 53,545
Earnings per share (Rs) 38.2 54.9 67.8 85.6 100.5 114.7
Balance sheet (Rs mn)
Equity 231,398 274,293 313,868 351,231 395,526 446,450
Borrowings 119,302 125,040 92,130 79,630 79,630 79,630
Minority Interest 76,818 87,288 97,019 111,162 128,715 149,396
Deferred tax liability 34,103 30,440 35,388 40,283 46,557 54,096
Current liabilities 78,728 78,894 89,271 90,876 101,478 111,353
Total liabilities 540,348 595,955 627,676 673,182 751,906 840,924
Fixed assets 312,997 330,436 330,893 341,876 348,332 353,765
Investments 16,500 40,064 50,694 52,001 53,321 54,654
Current investments 56,053 65,949 91,310 91,310 91,310 91,310
Cash 4,617 23,072 23,070 37,544 96,981 168,585
Other current assets 117,347 106,280 101,765 120,508 132,019 142,666
Goodwill 32,834 30,155 29,944 29,944 29,944 29,944
Total assets 540,348 595,955 627,676 673,182 751,906 840,924
Free cash flow (Rs mn)
Operating cash flow excl. working capital 42,153 52,303 61,910 75,262 87,966 99,998
Working capital changes (3,096) 21,217 16,579 (17,137) (909) (773)
Capital expenditure (32,794) (25,200) (17,597) (28,531) (25,000) (25,000)
Free cash flow 6,263 48,319 60,891 29,594 62,057 74,225
Ratios
Book value (Rs/share) 504 588 672 752 847 956
RoAE (%) 7.8 10.0 10.8 12.0 12.6 12.7
RoACE (%) 6.6 9.9 11.5 13.5 14.6 15.2
CRoCI (%) 7.7 10.5 11.5 12.6 13.6 14.4

For Private Circulation Only. FOR IMPORTANT INFORMATION ABOUT KOTAK SECURITIES’ RATING SYSTEM AND OTHER DISCLOSURES, REFER TO THE END OF THIS MATERIAL.
Kotak Institutional Equities Research [email protected] Mumbai: +91-22-4336-0000
Coal holds the mantle for consolidated earnings during the quarter
Tata Power reported adjusted consolidated profits of `3.8 bn substantially higher than profits of
`479 mn reported during the same period last year. The earnings performance was primarily
boosted by strong contribution from coal subsidiaries reflected in `3 bn contribution to
consolidated earnings from the share of associates, compared to a loss of `3 bn during the
same period last year. The performance also gains prominence on account of (1) continued
losses at Mundra UMPP—`1.4 bn during the quarter, (2) losses of `10 mn at Tata Power Delhi
Distribution, and (3) 18% yoy decline in earnings at Maithon as well. Reported losses of `2.6 bn
include the write-off of `6.5 bn pertaining to advances given towards investment in DoCoMo.
Standalone business performance impacted by higher interest cost
Tata Power reported weak earnings for the standalone business at `580 mn (-84% yoy) owing
to (1) provision of `300 mn during the quarter, (2) higher interest cost of `3.6 bn (+30% yoy)
related to the acquisition debt for Welspun assets, (3) absence of interest income from Mundra
UMPP as TPWR has stopped charging Mundra UMPP, and (4) tax reversal of `690 mn during
the same period last year. We highlight that TPWR has reported other operating income
clubbed with the revenue line, and that distorts the reported numbers in comparison to our
estimates as well as for the preceding quarters. Reported losses of `6 bn includes non-recurring
losses of `6.5 bn being write-off for payments made to DoCoMo as part of the put option for
sale of equity exercised by the latter.
Maintain REDUCE rating with target price of `80/share
We maintain our REDUCE rating and target price of `80/share on Tata Power. We note that
drag on earnings from Mundra UMPP will continue to weigh on the overall earnings of Tata
Power, though we would monitor potential company action towards (1) reducing generation
cost at Mundra UMPP through alternate fuel sourcing measures, and (2) reduction in overall
leverage in the company through monetization of non-core investments. In our view, the above
measures if pursued successfully could help in mitigating earnings as well as balance sheet
concerns of the company.
Tata Power (TPWR) Utilities
Down, but not out. Tata Power’s earnings in FY2017 were largely premised on
improving coal prices that aided better contribution from the ownership of mines in
Indonesia, even as this benefit was partly curtailed by incremental losses at Mundra
UMPP. An unfavorable ruling on fuel cost under-recovery at Mundra has not deterred
the management, which remains committed to finding alternate solutions to curtail fuel
cost under-recovery. TPWR is also looking to bring down balance sheet debt, possibly
through monetization of investments in group telecom businesses. Maintain REDUCE
rating with target price of `80/share.
REDUCE
MAY 22, 2017
RESULT
Coverage view: Attractive
Price (`): 84
Target price (`): 80
BSE-30: 30,465
Murtuza Arsiwalla [email protected]
Mumbai: +91-22-4336-0870
Samrat Verma [email protected]
Mumbai: +91-22-4336-0869
Tata Power
Stock data Forecasts/Valuations 2017 2018E 2019E
52-week range (Rs) (high,low) EPS (Rs) 6.4 4.9 7.0
Market Cap. (Rs bn) EPS growth (%) 15.7 (22.5) 42.1
Shareholding pattern (%) P/E (X) 13.2 17.1 12.0
Promoters 33.0 Sales (Rs bn) 272.9 291.9 312.5
FIIs 26.7 Net profits (Rs bn) 17.8 13.8 19.6
MFs 3.1 EBITDA (Rs bn) 52.4 57.0 52.4
Price performance (%) 1M 3M 12M EV/EBITDA (X) 13.6 10.4 10.7
Absolute (1.8) 0.1 23.0 ROE (%) 13.3 11.2 14.5
Rel. to BSE-30 (5.4) (6.5) 2.6 Div. Yield (%) 1.4 1.4 1.4
Company data and valuation summary
91-67
227.6

Tata Power Utilities
KOTAK INSTITUTIONAL EQUITIES RESEARCH 37
Mundra UMPP—higher fuel cost raises under-recovery to `0.86/kwh
Mundra UMPP saw a sharp 94% yoy decline in EBITDA at `240 mn in 4QFY17 on account
of 29% yoy increase in cost of generation despite maintaining higher availability compared
to the same period last year. Net losses of `1.4 bn would have been worse off but for the
sharp reduction (68% yoy) in interest cost for the quarter on account of waiver of interest by
Tata Power and derivative gains of `1 bn, besides forex gains of `1.3 bn. Under-recovery
increased to `0.86/kwh as tariff revision on account of higher coal prices for the escalable
component happens with a six month lag.
For full year 2017, Mundra UMPP had losses of `8.4 bn with under-recovery of `0.6/kwh,
though the increase in fuel cost was partly offset by 48% yoy reduction in interest cost on
account of mark-to-market gains. We highlight that even as TPWR seeks legal opinion on
the verdict of the Supreme Court, the company is looking at alternate fuel sourcing options
that may allow it to reduce cost of generation.
Maithon—higher overheads dent earnings for the quarter
Maithon saw an 18% yoy decline in net income at `610 mn despite (1) 8% yoy growth in
generation at 1,826 MU, and (2) higher plant availability at 94% owing to increase in repair
and maintenance expenses during the quarter. Performance for full-year FY2017 was more
representative with 37% yoy increase in net income at `2.5 bn benefitting from sale
arrangements for the full capacity of 1,050 MW that increased regulated equity to `14.4 bn
(from `14 bn in 2016). Maithon plant has stabilized and will likely continue to accrue stable
regulated returns at current levels from hereon.
Exhibit 1: Losses in CGPL were compensated by higher contribution from coal mines in Indonesia Interim results for Tata Power (consolidated) , March fiscal year-ends (Rs mn)
Source: Company, Kotak Institutional Equities estimates
4QFY17 4QFY16 3QFY17 yoy qoq FY2017 FY2016 (% chg.) FY2018E
Net sales 69,836 75,739 68,302 (8) 2 272,883 362,862 (25) 291,891
Employee cost (3,819) (3,160) (2,954) (12,959) (15,122) (13,607)
Cost of power purchased (17,696) (24,462) (16,967) (82,190) (92,567) (92,646)
Cost of fuel (25,154) (19,294) (22,841) (86,924) (82,688) (87,652)
Cost of raw material and components (5,554) (5,262) (3,601) (12,000) (15,000) (14,000)
Other expenditure (6,015) (7,084) (6,446) (26,437) (49,559) (26,986)
EBITDA 11,599 16,477 15,493 (30) (25) 52,372 78,167 (33) 57,000
Depreciation (5,698) (4,410) (5,318) (19,886) (23,764) (20,881)
EBIT 5,901 12,067 10,175 32,487 54,403 36,119
Other income 2,262 1,364 1,459 5,859 6,388 5,388
Net interest (8,973) (8,589) (7,010) (31,140) (34,765) (30,669)
PBT (811) 4,842 4,625 (117) (118) 7,206 26,025 (72) 10,837
Tax 1,496 (1,199) (706) 458 (8,693) (5,419)
Minority interest and share of associates 3,169 (3,164) 4,266 10,142 (1,940) 8,374
Net profit 3,854 479 8,184 705 (53) 17,806 15,392 16 13,793
Extraordinary (6,515) (262) (2,192) (10,989) (6,658) 0
Reported profit after statutory appropriation (2,661) 217 5,992 (1327) (144) 6,817 8,734 (22) 13,793
EPS (Rs/share) 1.4 0.2 2.9 6.4 5.5 4.9
EBITDA margin (%) 17 22 23 19 22 20
Effective tax rate (%) 185 25 15 (6) 33 50
(% Chg.)

Utilities Tata Power
38 KOTAK INSTITUTIONAL EQUITIES RESEARCH
Exhibit 2: Strong performance of the coal business and Maithon was off-set by weakness at CGPL Subsidiary-wise key financial and operational metrics (Rs mn)
Source: Company, Kotak Institutional Equities
4QFY17 4QFY16 3QFY17 (yoy) (qoq)
Tata Power (Standalone)
Net sales 19,505 20,186 13,284 (3) 47
EBITDA 6,766 5,644 7,002 20 (3)
PAT 580 3,713 3,063 (84) (81)
Regulated equity 37,780 36,320 36,930 4 2
Tata Power Delhi Distribution
Net sales 13,060 16,400 14,980 (20) (13)
EBITDA 840 2,950 3,000 (72) (72)
PAT (10) 1,050 1,130 (101) (101)
Regulated equity 11,630 12,110 12,690 (4) (8)
Coal
Sales (mn tons) 14 15 24 (4) (41)
Realization (US$/ton) 64 47 48 35 34
Cost of Production (US$/ton) 32 30 27 6 17
Coastal Gujarat Power Ltd (Mundra UMPP)
Net sales 17,950 16,030 14,970 12 20
EBITDA 260 3,870 330 (93) (21)
PAT (1,420) (1,960) (2,440) (28) (42)
Sales (MU) 7,383 6,394 6,304 15 17
Realization (Rs/kwh) 2.4 2.5 2.4 (3) 2
Cost of Production (Rs/kwh) 2.4 1.9 2.3 26 3
EBITDA incl. other income (Rs/kwh) 0.0 0.6 0.1 (94) (33)
Maithon Power Ltd
Net sales 6,130 5,890 6,240 4 (2)
EBITDA 1,950 2,240 2,180 (13) (11)
PAT 610 740 740 (18) (18)
Sales (MU) 1,826 1,698 1,870 8 (2)
Realization (Rs/kwh) 3.2 3.3 3.4 (3) (7)
Cost of Production (Rs/kwh) 2.1 2.0 2.2 7 (4)
EBITDA (Rs/kwh) 1.1 1.3 1.2 (19) (11)
(% Chg.)

Tata Power Utilities
KOTAK INSTITUTIONAL EQUITIES RESEARCH 39
Exhibit 3: Standalone revenues down due to low offtake, results cushioned by higher other income Interim results for Tata Power (standalone), March fiscal year-ends (Rs mn)
Source: Company, Kotak Institutional Equities
Exhibit 4: Tata Power sum-of-the-parts valuation
Source: Kotak Institutional Equities estimates
4QFY17 4QFY17E 4QFY16 3QFY17 4QFY17E 4QFY16 3QFY17 FY2017 FY2016 (% chg.)
Net sales 19,505 14,785 20,186 13,284 32 (3) 47 72,821 74,942 (3)
Cost of electrical energy purchased (1,264) (1,085) (1,480) (1,038) 17 (15) 22 (4,665) (7,930)
Cost of fuel (5,397) (6,404) (5,524) (6,186) (16) (2) (13) (23,428) (25,504)
Personnel costs, other expenses and provisions (7,630) (4,725) (7,538) (5,566) 61 1 37 (22,991) (23,776)
Total expenses (14,290) (12,214) (14,542) (12,790) 17 (2) 12 (51,084) (57,210)
EBITDA 5,215 2,572 5,644 494 103 (8) 956 21,736 17,732 23
Depreciation (1,600) (1,688) (1,539) (1,613) (6,342) (6,657)
EBIT 3,615 884 4,105 (1,119) 15,394 11,076
Other income 1,552 5,092 2,302 6,508 (70) (33) (76) 9,138 14,426
Net interest (3,624) (3,469) (2,786) (3,488) 4 30 4 (12,957) (11,560)
PBT 1,542 2,508 3,621 1,901 (39) (57) (19) 11,576 13,942 (17)
Tax (962) (698) 92 1,162 (2,909) (3,949)
Net profit 580 1,809 3,713 3,063 (68) (84) (81) 9,349 9,993 (6)
Extraordinary (6,515) — 0 (237) (6,515) (2,276)
Reported PAT after statutory appropriation (5,934) 1,809 3,713 2,826 (428) (260) (310) 2,835 7,717 (63)
EPS (Rs/share) 0.2 0.6 1.3 1.1 3.3 3.6
EBITDA margin (%) 27 17 28 4 30 24
Effective tax rate (%) 62 (3) (3) (61) 19 28
Key operating parameters
Units generated (MU) 2,691 3,230 2,716 3,043 (17) (1) (12) 12,445 12,433 0
Units sold (MU) 2,862 3,477 2,842 3,084 (18) 1 (7) 13,159 13,856 (5)
Per unit price realization (Rs) 5.7 8.3 6.0 5.3 (32) (5) 7 6.0 5.7 4
Fuel cost per unit sold (Rs) 1.9 2.3 1.9 2.3 (16) 0 (17) 2.1 2.3 (8)
(% Chg.)
Business Methodology Key assumptions/comments Value (Rs/share)
Mumbai (Generation, transmission &
distribution business)DCF-equity
Includes valuation of extant Mumbai business20
Delhi Distcom (NDPL) DCF-equity
NDPL earns 16% RoE provided it meets cetain A,T&C loss
reduction benchmarks. It is also incentivized by way of
higher returns in the event of bettering the benchmarks
12
Mundra UMPP DCF-equity Levelized tariff of Rs2.26/unit for 25 years (35)
Maithon DCF-equity
74% stake in 1,050 MW project; 300 MW to be sold to
DVC, 300 MW to NDPL, 300 MW to Punjab and 150 MW
to West Bengal (regulated returns); Coal linkage allocated10
Other generation assets (standalone) DCF-equity Jojobera + Belgaum + Haldia (629 MW) 6
IEL DCF-equity Jojobera Unit 5 + IEL Phase 6 - 240 MW 1
Powerlinks Transmission Ltd DCF-equityThe project earns a regulated RoE of 15.5% as per the
CERC tariff guideline for inter-state transmission project1
Coal DCFNet economic interest - based on dividend discount model
31
Investments Various 20% discount to CMP/ KIE target price 23
Investible surplus on books Market value Marketable securities & cash on books 11
Total 80

Utilities Tata Power
40 KOTAK INSTITUTIONAL EQUITIES RESEARCH
Exhibit 5: Change in estimates for Tata Power, March fiscal year-ends, 2018-19E (Rs mn)
Source: Company, Kotak Institutional Equities estimates
Exhibit 6: Tata Power: Profit model, balance sheet, cash model (consolidated), March fiscal year-ends, 2011-19E (Rs mn)
Source: Company, Kotak Institutional Equities estimates
Revenues EBITDA Net profit
Old New % Chg. Old New % Chg. Old New % Chg.
2018E 291,811 291,891 0.0 58,838 57,000 (3.1) 14,731 13,793 (6.4)
2019E 312,326 312,502 0.1 54,301 52,368 (3.6) 20,589 19,604 (4.8)
2011 2012 2013 2014 2015 2016 2017 2018E 2019E 2020E
Profit model (Rs mn)
Net sales 194,508 258,689 328,361 354,702 341,851 362,862 272,883 291,891 312,502 335,069
EBITDA 45,956 51,927 64,430 75,279 67,587 78,167 52,372 57,000 52,368 50,687
Other income 2,671 4,013 5,586 4,058 5,341 6,388 5,859 5,388 5,357 5,119
Interest (8,684) (15,271) (26,355) (34,399) (36,993) (34,765) (31,140) (30,669) (28,258) (26,994)
Depreciation (9,802) (13,346) (22,715) (27,296) (21,742) (23,764) (19,886) (20,881) (21,084) (21,302)
Pretax profits 30,141 27,323 20,945 17,642 14,193 26,025 7,206 10,837 8,383 7,510
Tax (9,756) (14,755) (9,201) (10,084) (10,339) (8,693) 458 (5,419) (4,192) (3,755)
Minority interest & profit from associates (1,223) (1,194) (1,842) (2,267) (2,410) (1,940) 10,142 8,374 15,412 18,753
Net profits 19,162 11,374 9,903 5,291 1,444 15,392 17,806 13,793 19,604 22,508
Extraordinary items 1,719 (22,251) (10,757) (7,891) 234 (6,658) (10,351) — — —
Earnings per share (Rs) 7.8 4.6 4.0 2.1 0.5 5.5 6.4 4.9 7.0 8.0
Balance sheet (Rs mn)
Total equity 137,442 124,001 118,852 118,662 137,072 142,996 117,795 127,657 143,330 161,907
Deferred taxation liability 4,753 6,387 10,005 11,229 13,955 14,758 (41,571) (41,571) (41,571) (41,571)
Total borrowings 247,624 353,598 393,823 416,725 387,049 387,519 429,228 321,185 306,240 285,004
Currrent liabilities 95,087 85,494 124,733 139,135 185,251 198,882 231,493 268,609 278,470 287,618
Capital contribution from Consumers 3,823 4,013 4,506 5,348 6,117 6,980 0 0 0 0
Minority interest 14,143 16,313 20,646 22,733 24,926 25,814 18,690 20,986 23,194 25,304
Total liabilities and equity 502,871 589,807 672,565 713,833 754,370 776,948 755,635 696,866 709,663 718,262
Cash 22,066 36,941 19,899 15,550 15,009 12,108 9,543 22,778 45,840 64,000
Current assets 88,862 108,682 184,357 200,268 222,084 223,891 140,209 153,175 156,718 160,596
Total fixed assets 356,124 402,878 437,109 467,823 483,896 507,462 486,313 481,337 466,318 451,532
Investments 28,410 34,229 31,201 30,193 33,381 33,488 119,570 39,575 40,787 42,134
Deferred expenditure 7,409 7,076 — — — — — — — —
Total assets 502,871 589,806 672,565 713,833 754,370 776,948 755,635 696,866 709,663 718,262
Key ratios
Net debt / equity (X) 1.5 2.3 2.7 2.9 2.3 2.3 3.1 2.0 1.6 1.2
ROE (%) 14.9 8.7 8.2 4.5 1.1 11.0 13.7 11.2 14.5 14.7
ROCE (%) 7.1 4.3 5.0 4.0 2.4 7.1 4.9 4.4 4.3 4.0
BVPS (Rs) 58 52 50 50 51 53 44 47 53 60

For Private Circulation Only. FOR IMPORTANT INFORMATION ABOUT KOTAK SECURITIES’ RATING SYSTEM AND OTHER DISCLOSURES, REFER TO THE END OF THIS MATERIAL.
Kotak Institutional Equities Research [email protected] Mumbai: +91-22-4336-0000
One-off masks 4Q performance
Sharp expansion in NIM; higher provisions offset. Muthoot reported PAT of ₹3.2 bn, up 21%
yoy and 18% above estimates. The company reported 1.2% qoq loan growth as compared
to 2% qoq decline in 3QFY17 when demonetization had badly hit its operating environment.
NII was up 32% yoy on the back of 12% loan growth but sharp NIM improvement (17% as
compared to 10-11% in past three quarter). The company made large extra provisions
smoothing the impact of large income recognition/NIM expansion during the quarter.
Income recognition provides a boost. Muthoot has followed a conservative policy to stop
income recognition on loans that may cross high LTV (typically due to fall in gold prices).
The company, however, had to change its conservative income recognition policy in 4QFY17
after an opinion expressed by Income Tax authorities. As such, in 4QFY17, Muthoot
recognized income that it had voluntarily not recognized in the past (pent-up, one-time
impact on NIM in 4Q). In order to maintain its prudential approach, it made large provisions
(3.6% of loans as compared to 0.1% in previous quarters). In the conference call,
management highlighted that extra provisions made during the quarter were almost
equivalent to the extra one-time income benefits, thus implying that qoq performance
excluding these one-offs was strong as well.
Business growth on track
We believe that impact of one-offs and episodes such as demonetization and income recognition
made in 4Q are behind us. Muthoot is now well-placed to deliver a moderate 14-15% medium-
term loan book CAGR; recent gold price rally (up 10% qoq in INR terms) provides a boost.
Declining borrowing cost is also providing tailwinds. Post our revisions in estimates to factor in
higher NIM (up 12%), we expect the company to deliver about 19% medium-term RoE and
14-15% EPS growth. At our target price of ₹440 (up from ₹380), the stock will trade at 2X
FY2019E book. Regulatory prescription of migration to the digital lending platform may pose
some challenges though the company has effectively demonstrated its ability to make the
transition to digital collections (10% of its borrowers transacted on the electronic platform).
Effective execution of non-gold business (5% of consolidated AUMs; management guidance of
10% in FY2018) remains crucial.
Muthoot Finance (MUTH) NBFCs
Gets back on track. Muthoot reported 1.2% qoq loan growth, shedding the impact of
demonetization, even as quarterly performance was masked by one-off in interest
recognition and provisions. We expect steady operating performance from here
although its business remains sensitive to gold price movements. Non-gold businesses
are gathering momentum posing upside/downside to our core business estimates.
Retain ADD; TP ₹440 (from ₹380).
ADD
MAY 22, 2017
RESULT
Coverage view: Neutral
Price (`): 379
Target price (`): 440
BSE-30: 30,465
QUICK NUMBERS
Loan book up 1.2%
qoq; 12% yoy
GNPLs down 2.1%
from 2.9% qoq
Borrowing cost
down 90 bps
Nischint Chawathe [email protected]
Mumbai: +91-22-4336-0887
M B Mahesh CFA [email protected]
Mumbai: +91-22-4336-0886
Abhijeet Sakhare [email protected]
Mumbai: +91-22-4336-0889
Muthoot Finance
Stock data Forecasts/Valuations 2017 2018E 2019E
52-week range (Rs) (high,low) EPS (Rs) 29.5 32.5 36.9
Market Cap. (Rs bn) EPS growth (%) 45.5 10.0 13.6
Shareholding pattern (%) P/E (X) 12.8 11.7 10.3
Promoters 74.6 NII (Rs bn) 33.6 34.9 39.1
FIIs 13.8 Net profits (Rs bn) 11.8 13.0 14.7
MFs 7.5 BVPS 163.1 188.0 216.3
Price performance (%) 1M 3M 12M P/B (X) 2.3 2.0 1.8
Absolute (6.8) 8.8 73.3 ROE (%) 19.4 18.5 18.3
Rel. to BSE-30 (10.3) 1.7 44.5 Div. Yield (%) 1.3 1.7 1.9
Company data and valuation summary
419-205
151.5

NBFCs Muthoot Finance
42 KOTAK INSTITUTIONAL EQUITIES RESEARCH
Exhibit 1: Muthoot Finance – quarterly financial statements March fiscal year-ends, 4QFY16- 4QFY17 (` mn)
Source: Company, Kotak Institutional Equities estimates
PAT up 21% yoy
Muthoot Finance reported PAT of ₹3.21 bn, up 21% yoy and 18% above estimates. The
company reported 32% NII growth on the back of 12% loan growth and sharp NIM
expansion. Opex/assets ratio increased to 4.9% from 4.4-4.8% over the past four quarters.
Provisions increased sharply (₹2.43 bn, of which ₹2.33 bn were one-off (as discussed
above). GNPLs ratio (120 dpd) declined to 2.1% from 2.9% yoy and qoq.
AUM growth of 12% yoy and up 1.2% qoq
Gold prices in India were up 10% qoq 4QFY17 versus 10% decline in 3QFY17. This,
supported by waning impact of demonetization, has led to loan growth resumption.
Historic trends suggest that gold loan growth is very volatile and has high linkages with gold
price movements. With no strong directional view on gold prices (ignoring recent gold price
rally), we model moderate growth of 14-15% in our forecasts. The company is increasingly
focusing on non-gold segments, which though provide diversification, pose a risk to nascent
and fast-growing portfolio.
(% chg.)
4QFY17 4QFY17E 4QFY16 3QFY17 4QFY17E 4QFY16 3QFY17 FY2017 FY2016 (% chg.) FY2018E
Income statement
Interest income 16,995 12,242 14,347 13,280 39 18 28 56,553 48,130 18 58,856
Interest expenses 5,460 4,888 5,639 5,970 12 (3) (9) 22,938 22,577 2 23,939
Net interest income 11,535 7,354 8,708 7,310 57 32 58 33,615 25,553 32 34,917
Provisions (including standard assets) 2,430 313 1,299 39 677 87 6,131 2,816 1,624 73 813
NII post provisions 9,105 7,041 7,409 7,271 29 23 25 30,799 23,929 29 34,104
Other income 137 325 166 184 (58) (17) (26) 914 620 47 914
Operating expenses 3,349 3,096 2,825 3,000 8 19 12 12,503 11,382 10 14,082
Admin expenses 1,213 1,110 1,027 1,100 9 18 10 4,763 4,405 8 4,837
Employee expenses 2,010 1,877 1,657 1,784 7 21 13 7,280 6,419 13 8,415
Depreciation 126 110 141 116 15 (11) 9 460 558 (18) 829
PBT 5,893 4,269 4,750 4,455 38 24 32 19,210 13,167 46 20,936
Tax 2,676 1,543 2,098 1,544 73 28 73 7,412 5,071 46 7,956
PAT 3,217 2,726 2,652 2,911 18 21 11 11,798 8,096 46 12,980
EPS (Rs) 8 7 7 7 18 21 11 30 20 46 32
Key highlights
Total AUMs (Rs mn) 272,785 268,797 243,555 269,625 12 1
Borrowings (Rs mn) 210,959 186,409 209,102 13 1
Yield of loans (KS - %) 25.1 23.3 19.5
Borrowings cost (KS - %) 10.4 11.6 11.3
Spread (KS - %) 14.7 11.7 8.3
NIM (KS - %) 17.0 14.1 10.7
Opex/ average assets (%) 4.9 4.6 4.4
RoA (%) 4.7 4.3 4.3
RoE (%) 19.8 19.2 18.4
Asset quality
Gross NPL (Rs mn) 5,621 7,025 7,863 (20) (29)
Net NPLs (Rs mn) 4,602 6,005 6,844 (23) (33)
Gross NPLs (%) 2.1 2.9 2.9
Net NPLs (%) 1.7 2.5 2.5
Operational highlights
Branches (#) 4,307 4,275 4,308 1 (0)
Gold (weight in tons) 149 142 147 5 1
Employees (#) 24,205 22,781 24,150 6 0
Loan per gram (Rs) 1,831 1,715 1,834 7 (0)
Average gold loan per branch (Rs mn) 63 57 62 11 1

Muthoot Finance NBFCs
KOTAK INSTITUTIONAL EQUITIES RESEARCH 43
Exhibit 2: AUM growth has been quite volatile over the past decade AUM and yoy growth, March fiscal year-ends, 2006-20120E (%)
Source: Company, Kotak Institutional Equities
Exhibit 3: Gold prices were up ~7% in 4QFY17 Domestic gold price (`/gm)
Source: Bloomberg, Kotak Institutional Equities
High growth in housing and microfinance
Muthoot is rapidly scaling up its non-gold loan business. This is done through three key
subsidiaries – Muthoot Homefin – an affordable housing finance business, Asia Asset –
multi-product in Sri Lanka, and Belstar Investment and Finance (microfinance); total
investment in all the three companies is ₹2 bn. The share of these loans is about 5% of
total, which, the management guided, will double next year. Muthoot has a multi-decade
experience of lending against gold but little track-record in other segments.
Muthoot Homefin is a subsidiary focused on affordable housing and loan book of ₹4.4
bn (₹441 mn in 1QFY17). It has a network of about eight branches and per loan ticket
size of ₹1.1 mn – lower than most housing finance companies.
Muthoot owns 64% in Belstar Investment finance – a microfinance business with loan
book of ₹5.66 bn (up 114% in last one year). The company is operates MFI business in
Tamil Nadu.
8 15 22 34
74
159
247 260
219 234 244
273
307
357
415
(20)
10
40
70
100
130
-
90
180
270
360
450
20
06
20
07
20
08
20
09
20
10
20
11
20
12
20
13
20
14
20
15
20
16
20
17
20
18
E
20
19
E
20
20
E
AUM (LHS) Yoy growth (%) (RHS)(Rs bn) (%)
-
500
1,000
1,500
2,000
2,500
3,000
3,500
May-
11
Aug-1
1
Nov-
11
Feb-1
2
May-
12
Aug-1
2
Nov-
12
Feb-1
3
May-
13
Aug-1
3
Nov-
13
Feb-1
4
May-
14
Aug-1
4
Nov-
14
Feb-1
5
May-
15
Aug-1
5
Nov-
15
Feb-1
6
May-
16
Aug-1
6
Nov-
16
Feb-1
7
May-
17

NBFCs Muthoot Finance
44 KOTAK INSTITUTIONAL EQUITIES RESEARCH
NIM improves sharply; expect moderation over time
Muthoot reported NIM of 17% in 4QFY17, 10.7% in 3QFY17 as compared to 14.1% in
4QFY16.
Most gold loans of Muthoot have tenure of 12 months. In most cases, loan has a bullet
repayment; assuming 120 dpd NPL norms, its accrued interest before a loan can be
classified as NPL can be up to a period of 16 months. In the past, Muthoot may stop
interest recognition if LTV (including accrued interest) crosses its comfort LTV levels. Post
discussion with income tax authorities, the company decided to recognize all income and
then make a relevant provision against the same. The one-time impact of the same was
reflected in 4QFY17 – calculated lending rate was up to 25% from 20-21% over the past
few quarters.
A key notable improvement is on the liability side. Reported cost of borrowing was down
90 bps to 9.7% largely due to re-pricing of bank loans, increase in share of NCDs (18%
from 14% in 3QFY17).
We expect Muthoot to pass on the benefit of lower interest rate to its borrowers. At the
same time, we continue to expect competition to continue. We are hence factoring
compression in interest spread to 9.2% in FY2020E from 10.4% in FY2017.
Exhibit 4: We forecast NIM compression over FY2018-20E after the expansion seen in FY2017 Yield on loans, cost of funds and NIMs, March fiscal year-ends, 2010-2020E (%)
Source: Company, Kotak Institutional Equities estimates
One-time provisions, gross NPL decline
Reported GNPL ratio declined ~80 bps qoq. Muthoot reported GNPLs of ₹5.6 bn (2.1%
of loans) in 4QFY17, up from ₹7.8 bn (2.9% of loans) in 3QFY17. This was largely
following large loan auctions, which are typically carried out in 4Q. Elevated gold prices
also worked in its favor.
The company continued its policy of 100 bps standard asset provisions. Additionally, the
company made one-time provisions of ₹2.33 bn out of total provisions of ₹2.43 bn
(3.6%of assets as compared to 0.1-0.2% in the past).
We expect provisions to be a bit higher due to its new policy to recognize higher income
and make extra provisions against the same. Eventual credit losses will, however, remain
unchanged.
19.9 19.7
22.3 21.1 20.4
18.8 20.1
21.9 20.3 19.8 19.3
8.4 8.8
13.4 13.2 11.9 10.7 11.8 11.5 10.7 10.4 10.1
11.2 10.9 10.8
10.0
9.5 9.5
10.7
13.0
12.0 11.8
11.5
7.0
8.4
9.8
11.2
12.6
14.0
0
5
10
15
20
25
20
10
20
11
20
12
20
13
20
14
20
15
20
16
20
17
20
18
E
20
19
E
20
20
E
Yield on loans (LHS-%) Cost of borrowings (LHS-%) NIM (RHS-%)

Muthoot Finance NBFCs
KOTAK INSTITUTIONAL EQUITIES RESEARCH 45
Expenses inch up
Operating costs increased 19% yoy, as staff costs increased 21% yoy (largely linked to
incentive payouts) while non-staff expenses were stable yoy.
Cost to assets ratio moved up to 4.9% from 4.4% in 3QFY17 and 4.6% in 4QFY17.
Muthoot has been showing good level of cost control in recent quarters with cost ratios (%
of AUM) having been around 4.4-4.9% range compared to 5.1-5.3% in FY2015. We expect
expenses to increase by 11-12% over FY2017-20E, translating into cost to asset ratio of
3.9% by FY2020E from 4.3% in FY2017.
Exhibit 5: Operating expenses to assets ratio expectedly peaked in FY2015 Operating expenses to average AUMs, March fiscal year-ends, 2010-20E
Source: Company, Kotak Institutional Equities
Exhibit 6: Muthoot Finance – old and new estimates March fiscal year-ends, 2018-19E (Rs mn)
Source: Kotak Institutional Equities estimates
3.0
3.4
3.8
4.2
4.6
5.0
-
0.5
1.0
1.6
2.1
2.6
20
10
20
11
20
12
20
13
20
14
20
15
20
16
20
17
20
18
E
20
19
E
20
20
E
Staff expenses (LHS) Non-staff expenses (LHS) Operating expenses (RHS)
2018E 2019E 2018E 2019E 2018E 2019E
Loans under management 307,076 357,217 317,532 366,107 (1) 0
NIM (%) 12.0 11.8 10.9 10.7
Interest income 58,856 65,765 58,482 64,604 3 4
Interest expenses 23,939 26,656 26,181 28,091 (4) (1)
Net Interest income 34,917 39,109 32,302 36,513 9 8
Provisions 813 1,034 848 1,053 (3) (1)
Operating expenses 14,082 15,722 13,668 15,314 3 3
Profit before tax 20,936 23,404 18,486 20,846 16 15
Tax 7,956 8,659 6,599 7,442 23 19
Profit after tax 12,980 14,744 11,886 13,404 12 12
EPS (Rs) 32 37 30 34 11 12
BVPS (Rs) 188 216 177 197 7 10
New vs old (%)Old estimatesNew estimates

NBFCs Muthoot Finance
46 KOTAK INSTITUTIONAL EQUITIES RESEARCH
Exhibit 7: Muthoot is trading at 2X one-year forward book One-year forward trading PER and PBR, 2014-2017 (X)
Source: Company, Bloomberg, Kotak Institutional Equities estimates
-
0.5
1.0
1.5
2.0
2.5
0.0
2.8
5.6
8.4
11.2
14.0
May-
14
Aug
-14
Nov-
14
Feb-1
5
May-
15
Aug
-15
Nov-
15
Feb-1
6
May-
16
Aug
-16
Nov-
16
Feb-1
7
May-
17
Rolling PER (X) (LHS) Rolling PBR (X) (RHS)

Muthoot Finance NBFCs
KOTAK INSTITUTIONAL EQUITIES RESEARCH 47
Exhibit 8: Muthoot Finance – key financial ratios and growth rates March fiscal year-ends, 2015-2020E (%)
Source: Company, Kotak Institutional Equities estimates
2015 2016 2017 2018E 2019E 2020E
Growth in key parameters (%)
Profit and loss statement - yoy (%)
Interest income (13) 13 18 4 12 13
Interest costs (20) 7 2 4 11 13
Net interest income (5) 19 32 4 12 13
Net total income (4) 18 32 4 12 13
Provisioning expenses (15) 337 73 (71) 27 13
Net income (post provisions) (4) 13 29 10 12 13
Operating expneses 6 (1) 10 13 12 11
Staff expenses 7 2 13 16 15 15
Other operating expenses (1) 0 8 2 7 6
Depreciation expenses 77 (34) (18) 80 7 6
PBT post extraordinaries (14) 28 46 9 12 15
Tax (14) 42 46 7 9 15
PAT (14) 21 46 10 14 15
Balance sheet - yoy (%)
Gold loans 7 4 12 13 16 16
Gold loans (incl sell down) 7 4 12 13 16 16
Fixed assets (19) (19) (5) 14 7 6
Other current assets (9) (22) 70 13 16 16
Total assets 5 1 17 13 16 16
Borrowings (2) (4) 13 12 17 17
Current liabilities 51 25 47 12 15 15
Total liabilities 2 (1) 18 12 16 16
Share capital 7 0 0 — — —
Reserves and surplus 20 11 17 16 16 16
Shareholders funds 19 11 16 15 15 15
Key ratios (%)
Interest yield (incl loans sold down) 18.8 20.1 21.9 20.3 19.8 19.3
Interest cost (incl loan sold down) 10.7 11.8 11.5 10.7 10.4 10.1
Spreads 8 8 10 10 9 9
NII/ loans under management 10 11 13 12 12 11
Operating costs/ net income (post provisions) 52.9 46.4 39.4 40.2 40.2 39.5
Cash/ total assets + loan sold down 6.5 2.5 4.8 — — —
Tax rate 34.8 38.5 38.6 38.0 37.0 37.0
Debt/ equity (X) 3.8 3.3 3.2 3.1 3.2 3.2
Du Pont analysis
(% of average assets including loans sold down)
Net interest income 8.2 9.5 11.4 10.4 10.1 9.9
Other income 0.2 0.2 0.3 0.3 0.3 0.3
Credit costs 0.1 0.6 1.0 0.2 0.3 0.3
Operating expenses 4.4 4.2 4.3 4.2 4.1 3.9
PBT post extraordinaries 3.9 4.9 6.5 6.2 6.1 6.0
1-tax rate 0.7 0.6 0.6 0.6 0.6 0.6
RoA 2.6 3.0 4.0 3.8 3.8 3.8
Average assets / average equity (X) 5.6 5.0 4.8 4.8 4.8 4.8
RoE 14.3 15.1 19.4 18.5 18.3 18.2

NBFCs Muthoot Finance
48 KOTAK INSTITUTIONAL EQUITIES RESEARCH
Exhibit 9: Muthoot Finance – income statement and balance sheet March fiscal year-ends, 2014-2020E (` mn)
Source: Company, Kotak Institutional Equities estimates
2015 2016 2017 2018E 2019E 2020E
Income statement (Rs mn)
Interest income 42,623 48,130 56,553 58,856 65,765 74,511
Interest costs 21,064 22,577 22,938 23,939 26,656 30,193
Net interest income 21,559 25,553 33,615 34,917 39,109 44,318
Other income 624 620 914 914 1,051 1,209
Net total income 22,183 26,173 34,529 35,831 40,160 45,527
Provisioning expenses 371 1,624 2,816 813 1,034 1,173
Net income (post provisions) 21,811 24,549 31,713 35,018 39,126 44,354
Operating expneses 11,533 11,382 12,503 14,082 15,722 17,513
Staff expenses 6,304 6,419 7,280 8,415 9,687 11,109
Other operating expenses 4,387 4,405 4,763 4,837 5,152 5,467
Depreciation expenses 841 558 460 829 883 937
PBT post extraordinaries 10,279 13,167 19,210 20,936 23,404 26,841
Tax 3,573 5,071 7,412 7,956 8,659 9,931
PAT 6,705 8,096 11,798 12,980 14,744 16,910
No of shares (mn) 397 399 400 400 400 400
EPS - adjusted for bonus (Rs) 17 20 30 32 37 42
BVPS - adjusted for bonus (Rs) 128 141 163 188 216 249
Balance sheet (Rs mn)
Assets
Gold loans 234,050 243,355 272,199 307,076 357,217 414,918
Investments 385 982 2,091 2,091 2,091 2,091
Fixed assets 2,642 2,138 2,022 2,304 2,454 2,604
Current assets 30,616 24,012 40,819 46,061 53,583 62,238
Cash and bank balances 17,366 6,791 15,343 — — —
Other cash balance 17,366 — — — — —
Other current assets 13,250 17,221 25,476 46,061 53,583 62,238
Total assets 267,693 270,487 317,131 357,532 415,345 481,851
Liabilities
Borrowings 194,640 186,409 210,959 236,496 276,125 321,755
Current liabilities 22,226 27,886 41,008 45,929 52,818 60,741
Total liabilities 216,866 214,295 251,967 282,425 328,943 382,496
Share capital 3,971 3,990 3,995 3,995 3,995 3,995
Reserves and surplus 46,855 52,202 61,169 71,112 82,407 95,360
Shareholders funds 50,826 56,192 65,164 75,107 86,402 99,355
Aggregate loan book (incl sell down)
Loans under management 234,050 243,789 272,785 307,076 357,217 414,918
Total assets under management 267,693 270,487 317,131 357,532 415,345 481,851

For Private Circulation Only. FOR IMPORTANT INFORMATION ABOUT KOTAK SECURITIES’ RATING SYSTEM AND OTHER DISCLOSURES, REFER TO THE END OF THIS MATERIAL.
Kotak Institutional Equities Research [email protected] Mumbai: +91-22-4336-0000
Strong operating performance; but high slippages remain a concern
KVB reported strong earnings growth of 58% yoy on the back of solid revenue growth of 27%
yoy and stable operating costs which resulted in operating profit growth of 55% yoy. The bank
reported 23% yoy NII growth but loan growth was weak at 4% yoy. NIM improved 35bps to
4%. The bank has changed its accounting for losses on account of sale of loans to ARCs. The
quarterly loss of `632 mn which was being charged to other operating expenses is now
included in provisions. Slippages were disappointingly high at 4% of loans though the
management indicated that this was driven by the corporate segment in accounts where a
resolution is already at the verge of clearance. Slippages were essentially driven by their
watchlist which has been gradually reducing. Gross NPLs increased 90bps qoq to 3.7% while
net NPLs increased 80 bps qoq to 2.5%. The strong coverage ratio of ~70% in the past
declined to 58% in the current quarter.
Low growth and higher slippages override the valuation argument
We believe that KVB has reasonably strong upsides to offer from current levels. The stock is
inexpensive at 1.3X book and 8X FY2018 EPS for RoEs in the range of 12-15% levels in the
short term. Two major challenges: (1) slippages have been persistently higher as compared to
other regional banks. The internal watchlist is being reduced but the pace is not comforting. (2)
Loan growth has been weak for the past four years. The management has been highlighting its
risk aversion and aggressive competition leading to subpar return in the large corporate
segment, but we find it difficult to understand the lower growth print in the SME
segment/retail. We are hopeful these issues will be addressed as the management continues to
highlight the difference between sanctions and utilization.
Maintain BUY: strong margins and last leg of NPL recognition drive our positive view
We maintain our BUY rating (TP at ₹130 from `110 earlier) on the bank as we believe that the
underlying valuations are undemanding at current levels. We should see growth returning to
~12-15% levels in FY2018-19E, which should result in RoEs moving closer to 13-15% levels. At
our TP, we value the bank at 1.4X book and 9X March 2019E EPS.
Karur Vysya Bank (KVB) Banks
A quarter where profits take precedence. KVB reported 58% yoy growth in
earnings on the back of strong growth in revenues. Gross NPLs increased 90bps qoq
due to corporate slippages, but some of it could be upgraded shortly. The drop in
coverage ratio is disappointing despite strong headline profits. We do believe that the
scope for rerating of the bank is high considering that we are closer to the end of peak
slippages of the bank. Maintain BUY with TP at `130 (from `110 earlier)
BUY
MAY 22, 2017
RESULT
Coverage view: Attractive
Price (`): 116
Target price (`): 130
BSE-30: 30,465
QUICK NUMBERS
58% yoy earnings
growth; 23% yoy
NII growth
Impaired loans
decline 40 bps qoq
to 5.6%
Retain BUY with TP
of `130 (from `110)
M B Mahesh CFA [email protected]
Mumbai: +91-22-4336-0886
Nischint Chawathe [email protected]
Mumbai: +91-22-4336-0887
Abhijeet Sakhare [email protected]
Mumbai: +91-22-4336-0889
Karur Vysya Bank
Stock data Forecasts/Valuations 2017 2018E 2019E
52-week range (Rs) (high,low) EPS (Rs) 10.0 11.5 14.9
Market Cap. (Rs bn) EPS growth (%) 7.5 14.8 29.9
Shareholding pattern (%) P/E (X) 11.5 10.0 7.7
Promoters 2.1 NII (Rs bn) 20.7 23.8 25.4
FIIs 22.8 Net profits (Rs bn) 6.1 7.0 9.1
MFs 13.3 BVPS 71.6 77.9 90.4
Price performance (%) 1M 3M 12M P/B (X) 1.6 1.5 1.3
Absolute (3.3) 24.5 23.5 ROE (%) 12.7 13.3 15.5
Rel. to BSE-30 (6.9) 16.4 2.9 Div. Yield (%) 2.2 2.5 3.2
Company data and valuation summary
123-80
69.8

Banks Karur Vysya Bank
50 KOTAK INSTITUTIONAL EQUITIES RESEARCH
Exhibit 1: Karur Vysya Bank – Quarterly details March fiscal year-ends, 4QFY16-4QFY17 (` mn)
Source: Company, Kotak Institutional Equities estimates
4QFY17 4QFY17E 4QFY16 3QFY17 4QFY17E 4QFY16 3QFY17 FY2017E FY2016E
(%
chg.) FY2018E
Interest Earned 14,332 14,179 13,702 14,112 1.1 4.6 1.6 56,224 54,594 3.0 58,182
Interest on loans 11,040 10,865 10,873 10,832 1.6 1.5 1.9 44,017 43,294 1.7 46,279
Interest on Investment 2,918 3,230 2,801 2,856 (9.7) 4.2 2.2 11,060 10,958 0.9 11,292
Interest on bal. w ith RBI & other inter bank funds343 39 9 340 787.4 3,755.1 1.0 1,146 182 NM 611
Interest expense 8,533 8,972 8,975 8,935 (4.9) (4.9) (4.5) 35,487 36,620 (3.1) 34,345
Net interest income 5,800 5,207 4,726 5,176 11.4 22.7 12.0 20,737 17,974 15.4 23,837
Other Income 2,320 1,961 1,661 1,701 18.3 39.6 36.4 7,862 7,068 11.2 7,998
Other Income exld treasury 1,540 1,641 1,551 1,381 (6.2) (0.7) 11.5 5,802 6,124 (5.3) 6,498
Treasury 780 320 110 320 143.8 609.1 143.8 2,060 944 118.2 1,500
Total Income 8,120 7,168 6,388 6,877 13.3 27.1 18.1 28,599 25,042 14.2 31,835
Operating Expenses 3,049 4,238 3,123 3,527 (28.1) (2.4) (13.6) 12,827 12,528 2.4 16,131
Employee expenses 1,380 1,655 1,393 1,756 (16.6) (0.9) (21.4) 6,080 5,474 11.1 6,868
Other operating expenses 1,669 2,583 1,730 1,771 (35.4) (3.5) (5.7) 6,748 7,054 (4.3) 9,264
Operating Profit Before Prov. & Cont. 5,071 2,930 3,265 3,350 73.1 55.3 51.4 15,772 12,514 26.0 15,704
Provisions & Contingencies 2,175 901 550 1,575 141.5 295.4 38.1 6,897 3,238 113.0 5,697
Loan loss provisions 2,040 1,015 853 1,523 101.0 139.2 33.9 6,747 3,186 111.8 5,647
Profit before tax 2,896 2,029 2,715 1,775 42.7 6.7 63.1 8,875 9,276 (4.3) 10,007
Provision for Taxes 720 668 1,335 618 7.8 (46.1) 16.6 2,775 3,440 3,002
Net Profit 2,176 1,361 1,380 1,158 59.8 57.7 87.9 6,100 5,836 4.5 7,005
Tax rate 24.9 32.9 49.2 34.8 31.3 37.1 30.0
PBT - treasury + investment dep. 2,306 1,697 2,405 1,458 35.9 (4.1) 58.2 6,915 8,325 (16.9) 8,507
Key balance sheet items (Rs bn)
Deposits 537 501 551 7.2 (2.5)
CASA (%) 27.7 23.3 30.8
Advances 414 395 385 5.0 7.7
Retail 63 59 61 7.1 4.1
Agriculture 70 70 64 (0.8) 8.3
Commercial/SME 145 128 130 13.6 11.3
Corporate 136 138 129 (1.1) 5.6
Gold loans 62 64 61 (3.1) 1.1
Yield ratios (%)
Yield on advances 11.2 11.3 11.3
Cost of deposits 6.2 6.9 6.3
NIM 4.0 3.6 3.7
ATset quality meATures
Gross NPL (Rs mn) 14,838 5,112 10,222 190.3 45.2
Gross NPL (%) 3.6 1.3 2.7
Net NPL (Rs mn) 10,335 2,162 6,375 378.1 62.1
Net NPL (%) 2.5 0.6 1.7
Provision coverage ratio (%) 30.4 57.7 37.6
Provision coverage ratio including tech. write-offs (%)57.8 82.5 67.1
Restructured (Rs mn) 8,418 13,550 12,790 (37.9) (34.2)
Restructured loans (%) 2.0 3.4 3.3
Capital adequacy details
CAR (%) 12.5 12.2 11.8
Tier I (%) 11.9 11.3 11.1
Tier II (%) 0.7 0.9 0.7
(% chg.)

Karur Vysya Bank Banks
KOTAK INSTITUTIONAL EQUITIES RESEARCH 51
Exhibit 2: NII growth outpacing loan growth NII and loan growth, March fiscal year-ends, 4QFY13-4QFY17 (%)
Source: Company, Kotak Institutional Equities
Exhibit 3: Cost-income ratio declined to ~40% Operating expenses growth and cost-income ratio, March fiscal year-ends, 4QFY13-4QFY17 (%)
Source: Company, Kotak Institutional Equities
Loan growth remains slow at 5% yoy and 8% qoq
Loan growth remains a challenge at just 5% yoy, even as qoq growth was better at 8%.
Loan growth has been sluggish for the past eight consecutive quarters at ~5-7% levels. This
will mark the fourth consecutive year of weak loan growth for the bank.
The bank reported relatively better performance in the retail (7% yoy and 4% qoq) and
commercial/SME (14% yoy growth and 11% qoq). The large corporate segment declined
1% yoy as bank infrastructure loans (~7% of loans) declined 12% yoy which is partly
explained by the discom bonds as power sector exposure declined 33% yoy.
We expect loan growth to improve to 12-15% yoy in FY2018-19E driven by growth in retail
and SME loans. Loan growth remains a challenge for the bank. Since FY2014, there always
seems to be newer headwinds in the business causing this slowdown. We had the gold loan
issue in FY2013-15 and given its size the decline was a cause of major concern.
Subsequently, the focus of the slowdown was led by the large corporate segment where the
bank turned cautious post the rise in NPLs. However, it does appear that the recent
slowdown is being led by the inability of the bank to defend its existing customers as
refinancing is being done aggressively by larger banks with stronger balance sheets.
Given the sluggish business environment and benign competition from public banks, we
would have expected KVB to move a lot more aggressively but the recent performance,
especially in the SME sector is a case of clear disappointment. We await more clarity from
the management as we do believe that these issues can be addressed as we are not too sure
if this is being led by high levels of caution post the rise in NPLs reported by the bank in
recent years.
-
8
16
24
32
40
4Q
FY13
1Q
FY14
2Q
FY14
3Q
FY14
4Q
FY14
1Q
FY15
2Q
FY15
3Q
FY15
1Q
FY16
1Q
FY16
2Q
FY16
4Q
FY16
1Q
FY17
2Q
FY17
3Q
FY17
4Q
FY17
Loan NII
43 42 40
28 25
11 7 7 2 18
8
38
24
37
19
(2)
30
38
46
54
62
70
(12)
-
12
24
36
48
4Q
FY13
1Q
FY14
2Q
FY14
3Q
FY14
4Q
FY14
1Q
FY15
2Q
FY15
3Q
FY15
1Q
FY16
1Q
FY16
2Q
FY16
4Q
FY16
1Q
FY17
2Q
FY17
3Q
FY17
4Q
FY17
Opex (LHS) Cost-income (RHS)

Banks Karur Vysya Bank
52 KOTAK INSTITUTIONAL EQUITIES RESEARCH
Exhibit 4: Loan growth slowed on the back of decline in growth in gold loans and large corporates Break-up of loan book, March fiscal year-ends, 2011-17 (%)
Source: Company, Kotak Institutional Equities estimates
Impaired loans decline ~40 bps qoq to 5.6%; slippages rise qoq
The bank reported decline in slippages qoq to 4.1% likely due to slippage from restructured
loans. Impaired loans declined 40 bps qoq to 5.6%, comprising of 3.6% GNPL (up 90 bps
qoq) and 2.0% standard restructured loans (down 130 bps qoq). We await further clarity on
the source of these slippages. Provision coverage ratio declined sharply during the quarter by
10 percentage points to 58% (including write-off).
The bank is amortizing loss on loans sold to ARC in the previous quarter. The balance
outstanding is about `1.85 bn. Unlike most of the other banks which are taking the impact
of the loss through provisions, KVB is routing this loss through operating expenses.
Cost-income unsustainably declines to 38%
Cost income ratio improved to ~38%, the lowest in many quarters. Reported operating
expense declined 2% yoy as staff cost declined 1% yoy as the bank has apparently reversed
the provision for pension in the light of rise in interest rates in 4QFY17. We see bank
slowing down on branch expansion (7% yoy) and employee additions (6% yoy decline).
We believe that the bank would continue to focus on improving productivity from existing
branches rather than increasing infrastructure presence, especially as demand conditions
appears fairly weak. We expect cost-income ratio to decline to ~50% by FY2019E.
Other highlights in the quarter
CASA growth was impressive at ~30% yoy but declined 12% qoq, with CASA ratio of
28% declining from 31% qoq.
Non-interest income increased 40% yoy due to treasury gains. Core fee income growth
was 19% yoy.
Tier-1 ratio improved ~80 bps qoq to 11.9% with CAR of 12.5%
2011 2012 2013 2014 2015 2016 2017
Agriculture 14.3 15.7 18.3 17.7 17.0 17.8 16.8
Retail 7.5 8.2 11.9 12.5 13.4 15.0 15.3
SME 13.4 34.0 32.3 32.5 32.4 32.3 35.0
Corporate and others 64.8 42.1 37.6 37.3 37.2 34.9 32.9
of which
Gold loans 16.2 21.5 26.3 23.4 19.6 16.1 14.9

Karur Vysya Bank Banks
KOTAK INSTITUTIONAL EQUITIES RESEARCH 53
Exhibit 5: KVB Change in estimates March fiscal year-ends, 2018-19E (` mn)
Source: Company, Kotak Institutional Equities estimates
Exhibit 6: KVB trading at 1.4X one-year forward adjusted book One-year forward PER and PBR, March fiscal year-ends, 2009-17
Source: Company, Bloomberg, Kotak Institutional Equities estimates
Exhibit 7: KVB trades at a discount to peers Trading premium to private banks, March fiscal year-ends, 2009-17
Source: Company, Bloomberg, Kotak Institutional Equities estimates
2018E 2019E 2018E 2019E 2018E 2019E
Net interest income 23,837 25,449 22,121 23,527 8 8
Loan growth 12.4 15.1 12.3 15.0
NIM 3.7 3.5 3.4 3.2
Loan loss provisions 5,647 4,944 4,237 3,615 33 37
Other income 7,998 8,897 8,111 9,029 (1) (1)
Fee income 5,365 6,009 5,301 5,937 1 1
Operating expenses 16,131 15,974 16,519 16,401 (2) (3)
Employee expenses 6,868 7,874 7,179 8,231 (4) (4)
PBT 10,007 13,379 9,426 12,490 6 7
Tax 3,002 4,281 2,828 3,872 6 11
Net profit 7,005 9,097 6,598 8,618 6 6
PBT before treasury
profits and investment 8,507 11,779 7,926 10,890 7 8
News estimates Old estimates Change (%)
0.0
0.4
0.8
1.2
1.6
2.0
0
3
6
9
12
15
May-
08
May-
09
May-
10
May-
11
May-
12
May-
13
May-
14
May-
15
May-
16
May-
17
Rolling PER (X) (LHS) Rolling PBR (X) (RHS)
0.0
0.2
0.4
0.6
0.8
1.0
May-
08
May-
09
May-
10
May-
11
May-
12
May-
13
May-
14
May-
15
May-
16
May-
17
Banks Karur Vysya Bank
54 KOTAK INSTITUTIONAL EQUITIES RESEARCH
Exhibit 8: KVB - Key ratios and growth rates March fiscal year-ends, 2014-19E (%)
Source: Company, Kotak Institutional Equities estimates
2015 2016 2017E 2018E 2019E 2020E
Growth rates (%)
Net loan 6.2 8.2 4.7 12.4 15.1 14.7
Total asset 2.9 8.5 7.2 12.4 12.4 12.0
Deposits 2.1 12.1 7.2 13.5 13.0 12.5
Current (1.5) 14.1 22.2 17.2 16.5 16.0
SAWings 16.7 21.1 30.3 15.3 14.8 14.3
F ixed 0.2 10.2 1.1 12.5 12.0 11.6
Net interest income 14.2 21.5 16.4 15.0 6.8 7.1
Loan loss provisions 134.1 (42.2) 111.8 (16.3) (12.4) (13.9)
Total other income 2.9 21.7 11.2 1.7 11.2 10.1
Net fee income 18.4 15.7 3.0 12.0 12.0 12.0
Net capital gains (31.5) 32.9 118.2 (27.2) 6.7 -
Net exchange gains 20.2 24.5 (30.0) 15.0 15.0 15.0
Operating expenses 9.2 13.5 2.4 25.8 (1.0) 12.7
Employee expenses 3.6 0.1 11.1 13.0 14.7 14.3
Key ratios (%)
Yield on AWerage earning assets 10.7 10.3 9.8 9.1 8.8 8.4
Yield on AWerage loans 12.0 11.5 11.0 10.7 10.2 9.8
Yield on AWerage investments 9.1 8.6 7.9 6.9 6.5 6.2
AWerage cost of funds 8.3 7.3 6.6 5.8 5.6 5.5
Interest on deposits 8.0 7.2 6.4 5.8 5.6 5.4
Spread 2.4 2.9 3.2 3.3 3.1 3.0
Net interest income/earning assets 2.9 3.4 3.6 3.7 3.5 3.4
Spreads on lending business 3.8 4.2 4.4 4.9 4.6 4.3
New provisions/AWerage net loans 1.6 0.8 1.7 1.3 1.0 0.8
Total provisions/gross loans 2.6 3.2 4.6 5.2 5.4 5.4
Interest income/total income 71.6 71.6 72.5 74.9 74.1 73.6
Other income / total income 28.4 28.4 27.5 25.1 25.9 26.4
Fee income to total income 19.4 18.5 16.7 16.9 17.5 18.2
Fee income to advances 1.1 1.2 1.2 1.2 1.2 1.2
Fees income to PBT 85.9 50.4 54.0 53.6 44.9 45.7
Net trading income to PBT 35.8 10.4 22.1 15.0 12.0 10.9
Exchange income to PBT 9.5 6.0 4.4 4.5 3.9 4.0
Operating expenses/total income 53.9 50.3 44.9 50.7 46.5 48.6
Operating expenses/assets 2.1 2.3 2.1 2.5 2.2 2.2
Tax rate 1.5 37.7 31.3 30.0 32.0 33.0
Div idend pBCout ratio 34.8 38.6 25.0 25.0 25.0 25.0
Share of deposits
Current 14.1 15.3 18.6 18.9 19.2 19.5
F ixed 78.0 76.7 72.3 71.7 71.1 70.5
SAWings 14.1 15.3 18.6 18.9 19.2 19.5
Loans-to-deposit ratio 80.8 78.0 76.2 75.5 76.9 78.3
Equity/assets (EoY) 8.0 7.9 8.1 8.0 7.9 7.9
Loan impairment ratios (%)
Gross NPL 1.8 1.3 3.5 3.8 3.1 2.5
Net NPL 0.8 0.6 2.5 2.6 1.9 1.2
Slippages 1.8 3.1 3.3 2.0 1.2 1.5
Provision coverage 58.5 57.7 30.4 34.3 40.3 54.6
Dupont analysis (%)
Net interest income 2.8 3.2 3.5 3.6 3.4 3.3
Loan loss provisions 1.1 0.6 1.1 0.9 0.7 0.5
Net other income 1.1 1.3 1.3 1.2 1.2 1.2
Operating expenses 2.2 2.3 2.2 2.5 2.2 2.2
(1- tax rate) 98.5 62.3 68.7 70.0 68.0 67.0
ROA 0.9 1.0 1.0 1.1 1.2 1.2
AWerage assets/AWerage equity 13.8 12.6 12.4 12.4 12.6 12.7
ROE 12.0 12.9 12.7 13.3 15.5 15.1

Karur Vysya Bank Banks
KOTAK INSTITUTIONAL EQUITIES RESEARCH 55
Exhibit 9: KVB - financial statements March fiscal year-ends, 2014-19E (` mn)
Source: Company, Kotak Institutional Equities estimates
2015 2016E 2017E 2018E 2019E 2020E
Income statement
Total interest income 53,959 54,434 56,224 58,182 63,031 68,243
Loans 42,113 43,294 44,017 46,279 50,342 55,409
Investments 11,582 10,958 11,060 11,292 12,087 12,168
Cash and deposits 264 182 1,146 611 601 666
Total interest expense 39,300 36,620 35,487 34,345 37,581 40,983
Deposits from customers 35,404 34,327 33,290 32,994 36,229 39,600
Net interest income 14,659 17,814 20,737 23,837 25,449 27,260
Loan loss provisions 5,513 3,186 6,747 5,647 4,944 4,259
Net interest income (after prov.) 9,146 14,628 13,990 18,190 20,505 23,000
Other income 5,808 7,068 7,862 7,998 8,897 9,796
Net fee income 3,973 4,595 4,790 5,365 6,009 6,730
Net capital gains 710 944 2,060 1,500 1,600 1,600
Net exchange gains 439 547 390 449 516 593
Operating expenses 11,034 12,528 12,827 16,131 15,974 18,008
Employee expenses 5,471 5,474 6,080 6,868 7,874 8,998
Depreciation on investments (948) (7) 100 - - -
Other provisions 240 59 50 50 50 50
Pretax income 4,628 9,116 8,875 10,007 13,379 14,738
Tax provisions 72 3,440 2,775 3,002 4,281 4,864
Net profit 4,556 5,676 6,100 7,005 9,097 9,875
% growth 6 25 7 15 30 9
PBT - Treasury + Provisions 8,723 11,410 13,712 14,204 16,773 17,448
% growth 19 31 20 4 18 4
Balance sheet
Cash and bank balance 27,491 27,916 43,451 38,011 42,139 46,635
Cash 6,272 5,238 5,500 5,775 6,063 6,367
Balance w ith RBI 20,658 20,053 35,326 29,611 33,450 37,643
Net value of investments 123,752 132,217 148,575 180,242 192,502 204,137
Govt. and other securities 115,114 121,640 138,572 170,756 183,481 195,535
Shares 1,071 906 906 906 906 906
Debentures and bonds 3,798 5,742 5,168 4,651 4,186 3,767
Net loans and advances 361,089 390,844 409,077 459,737 529,139 606,702
F ixed assets 4,112 4,201 4,186 3,861 3,671 3,418
Net Owned assets 4,112 4,201 3,990 3,861 3,671 3,418
Other assets 15,081 21,459 12,787 13,043 13,304 13,570
Total assets 531,525 576,637 618,076 694,894 780,755 874,463
Deposits 446,903 500,789 536,998 609,247 688,233 774,504
Borrow ings and bills pBCable 31,869 18,264 19,488 19,101 19,539 19,989
Other liabilities 10,293 11,855 11,233 11,233 11,233 11,233
Total liabilities 489,064 530,908 567,719 639,582 719,005 805,727
Paid-up capital 1,216 1,219 1,219 1,219 1,219 1,219
Reserves & surplus 41,244 44,511 49,138 54,094 60,531 67,517
Total shareholders' equity 42,460 45,730 50,357 55,313 61,750 68,736

For Private Circulation Only. FOR IMPORTANT INFORMATION ABOUT KOTAK SECURITIES’ RATING SYSTEM AND OTHER DISCLOSURES, REFER TO THE END OF THIS MATERIAL.
Kotak Institutional Equities Research [email protected] Mumbai: +91-22-4336-0000
4QFY17— print ad revenues decline, cost management better than expected
Print ad revenues declined 2.7% yoy (KIE 0%) to `3.1 bn due to continued weakness in print ad
environment following demonetization and marginal impact of RERA on real estate
advertisements. The management indicated that print ad growth recovered to high single digits
in April. Circulation revenues grew 7% (KIE 9%); growth has moderated to 8% in 2H from
13% in 1H. Radio and digital revenues grew 11% yoy (KIE 11%) and 19% yoy (KIE 30%).
Radio business EBITDA margin was down to 24% from 39% due to costs associated with the
launch of new stations. RM cost increase was contained at 1% yoy despite 7% yoy increase in
newsprint prices; DBCL tweaked pagination and newsprint mix. Other expenses declined 2.8%
yoy against our estimate of 3% growth. EBITDA at `1.12 bn (-2% yoy) missed our estimate by
7%. Net profit of `640 mn was flat yoy and 7% below our estimate. DB Corp has not declared
final dividend and it plans to return cash to shareholders through other means.
FY2017 review and FY2018 outlook
DB Corp reported 6.5%, 10.5%, 18% and 23% growth in print ad revenues, circulation
revenues, radio revenues and digital revenues in FY2017. EBITDA/PAT grew 20%/27% yoy led
by 240 bps margin expansion and partly aided by provision reversals (`200-250 mn). We note
muted print ad revenue CAGR of 2.3% over FY2014-17. The underlying demand for print
advertising remains weak— local advertising has not fully recovered after demonetization and
real estate category ad spends have been hit by RERA. Ad growth in FY2018 will be a function
of (1) the influence of GST on local unorganized segment and local advertising, and (2) pick up
in ad spends ahead of elections in DB Corp’s key markets (Gujarat 2HFY18, Rajasthan and MP
2HFY19). We note that GST of 5% on print advertising (versus nil earlier) would aid DB Corp’s
revenues without any increase in tax outgo given input tax credits. We expect modest
acceleration in print ad growth to high single digits in FY2018.
We trim earnings estimates by 3-5 %; maintain REDUCE
We trim FY2018/19E print ad growth forecast to 9%/10.6% from 10.4%/10.8%; it results in 3-
5% cut in EPS. We expect DB Corp to deliver 18% CAGR in earnings over FY2017-19E aided by
10% CAGR in revenues and 285 bps margin expansion aided by cost optimization. However, in
our view, re-rating calls for acceleration in print ad growth or significant increase in the share of
radio + digital in total ad revenues from 11% at present. Maintain our cautious stance.
DB Corp. (DBCL) Media
Weak print. DB Corp reported 2.7% yoy decline in print ad revenues (KIE 0%) due to
extended weakness in print ad spends post demonetization. Low base and state
elections would aid ad growth this fiscal whereas the impact of GST on local
unorganized businesses and local ad spends needs to be watched. We cut FY2018-19E
EPS by 3-5%. Rollover to Mar-19 with revised TP of `390 (`380 earlier) valuing DB Corp
at 14X FY2019 earnings. Retain REDUCE.
REDUCE
MAY 22, 2017
RESULT
Coverage view: Attractive
Price (`): 368
Target price (`): 390
BSE-30: 30,465
Jaykumar Doshi [email protected]
Mumbai: +91-22-4336-0863
DB Corp
Stock data Forecasts/Valuations 2017 2018E 2019E
52-week range (Rs) (high,low) EPS (Rs) 20.5 23.1 28.3
Market Cap. (Rs bn) EPS growth (%) 27.1 12.5 22.7
Shareholding pattern (%) P/E (X) 17.9 15.9 13.0
Promoters 69.9 Sales (Rs bn) 22.6 24.6 27.4
FIIs 18.6 Net profits (Rs bn) 3.8 4.2 5.2
MFs 6.2 EBITDA (Rs bn) 6.4 7.2 8.6
Price performance (%) 1M 3M 12M EV/EBITDA (X) 10.2 8.8 7.1
Absolute (3.1) (3.2) 16.2 ROE (%) 25.6 25.4 28.4
Rel. to BSE-30 (6.7) (9.5) (3.2) Div. Yield (%) 1.1 3.5 4.3
Company data and valuation summary
448-310
67.7

DB Corp. Media
KOTAK INSTITUTIONAL EQUITIES RESEARCH 57
Exhibit 1: Interim results of DB Corp (DBCL), March fiscal year-ends (Rs mn)
Source: Company, Kotak Institutional Equities estimates
Exhibit 2: Revised earnings estimates of DBCL, FY2018E-19E (Rs mn)
Source: Company, Kotak Institutional Equities estimates
chg (%)
4QFY17 4QFY17E 4QFY16 3QFY17 4QFY17E 4QFY16 3QFY17 FY2017 FY2016 chg (%)
Total revenues 5,171 5,368 5,143 6,270 (3.7) 0.6 (17.5) 22,535 20,519 9.8
Advertising revenues 3,097 3,184 3,184 4,006 (2.7) (2.7) (22.7) 14,140 13,282 6.5
Circulation revenues 1,217 1,238 1,136 1,243 (1.7) 7.1 (2.1) 4,815 4,356 10.5
Radio revenues 330 331 298 363 (0.2) 10.7 (9.1) 1,273 1,076 18.3
Digital revenues 142 155 119 162 (8.2) 19.3 (12.3) 567 460 23.3
Other operating revenues 385 461 406 496 (16.4) (5.1) (22.4) 1,740 1,345 29.4
Total expenditure (4,049) (4,168) (4,001) (4,284) (2.9) 1.2 (5.5) (16,104) (15,173) 6.1
Raw material costs (1,606) (1,625) (1,580) (1,769) (1.2) 1.6 (9.2) (6,609) (6,186) 6.8
Employee expenses (1,059) (1,077) (997) (1,084) (1.7) 6.2 (2.3) (4,285) (3,917) 9.4
Other expenses (1,384) (1,466) (1,424) (1,431) (5.6) (2.8) (3.3) (5,210) (5,070) 2.8
EBITDA 1,122 1,200 1,142 1,986 (6.5) (1.7) (43.5) 6,431 5,346 20.3
EBITDA margin (%) 21.7 22.4 22.2 31.7 28.5 26.1
Other income 51 80 122 38 (36.6) (58.4) 35.3 171 281 (39.2)
Interest expense (5) (10) (24) (30) (52.3) (80) (84.2) (74) (92) (19.1)
D&A expenses (218) (225) (222) (218) (3.1) (1.9) 0.2 (863) (878) (1.7)
PBT 950 1,045 1,017 1,776 (9.1) (6.6) (46.5) 5,665 4,657 21.7
Extraordinaries — — — — — —
Tax provision (309) (355) (375) (590) (13.2) (17.7) (47.7) (1,907) (1,690) 12.8
Minority interest — — — — — —
Reported PAT 642 690 642 1,186 (6.9) (0.1) (45.9) 3,758 2,966 26.7
Adjusted PAT 642 690 642 1,186 (6.9) (0.1) (45.9) 3,758 2,966 26.7
EPS (Rs/share) 3.5 3.8 3.5 6.5 20.5 16.1 26.8
Tax rate (%) 32.5 34.0 36.8 33.2 33.7 36.3
Revised Previous Change (%)
2018E 2019E 2018E 2019E 2018E 2019E
Print ad revenue 15,408 17,035 15,839 17,548 (2.7) (2.9)
Circulation revenue 5,247 5,720 5,537 6,202 (5.2) (7.8)
Other revenue 3,966 4,623 4,014 4,705 (1.2) (1.8)
Total revenues 24,621 27,377 25,391 28,455 (3.0) (3.8)
Production cost 9,539 10,153 9,645 10,305 (1.1) (1.5)
Employee cost 4,688 5,117 4,888 5,467 (4.1) (6.4)
SG&A expenses 3,154 3,511 3,251 3,657 (3.0) (4.0)
Total expenditure 17,381 18,781 17,784 19,429 (2.3) (3.3)
EBITDA 7,240 8,597 7,607 9,026 (4.8) (4.8)
PAT 4,244 5,207 4,469 5,356 (5.0) (2.8)
EPS (Rs) 23.1 28.3 24.3 29.2 (5.1) (2.9)
Key assumptions
Ad revenue growth (yoy %) 9.0 10.6 10.4 10.8
Circulation revenue growth (yoy %) 9.0 9.0 13.0 12.0
Newsprint price (yoy %) 3.0 3.0 3.0 2.5
EBITDA margin (%) 29.4 31.4 30.0 31.7
Media DB Corp.
58 KOTAK INSTITUTIONAL EQUITIES RESEARCH
Exhibit 3: DBCL's breakdown of financials, 1QFY15-4QFY17 (Rs mn)
Source: Company, Kotak Institutional Equities
Exhibit 4: Trends in advertising revenue growth of DBCL, (yoy %)
Source: Company, Kotak Institutional Equities
1QFY15 2QFY15 3QFY15 4QFY15 1QFY16 2QFY16 3QFY16 4QFY16 1QFY17 2QFY17 3QFY17 4QFY17 yoy (%) qoq (%)
DBCL standalone
Revenues 4,987 4,837 5,573 4,952 4,801 4,834 5,891 5,264 5,745 5,329 6,308 5,220 (0.8) (17.2)
EBITDA 1,442 1,271 1,876 1,296 1,317 1,208 1,913 1,275 1,863 1,556 2,024 1,173 (8.0) (42.0)
Margin (%) 28.9 26.3 33.7 26.2 27.4 25.0 32.5 24.2 32.4 29.2 32.1 22.5
MyFM radio
Revenues 208 228 257 268 215 240 323 298 281 299 363 330 10.7 (9.1)
EBITDA 73 86 115 120 61 80 144 115 98 152 148 80 (30.4) (45.9)
Margin (%) 35.1 37.7 44.7 44.8 28.4 33.4 44.6 38.6 34.9 50.8 40.8 24.2
Mature editions 183
Revenues 4,180 3,979 4,589 3,671 4,109 4,043 4,891 4,369 5,186 4,730 5,599 4,581 4.9 (18.2)
EBITDA 1,457 1,267 1,739 1,342 1,401 1,264 1,808 1,304 1,862 1,510 1,945 1,222 (6.3) (37.2)
Margin (%) 34.9 31.8 37.9 36.6 34.1 31.3 37.0 29.8 35.9 31.9 34.7 26.7
Emerging editions
Revenues 540 566 635 929 385 452 569 477 155 161 186 169 (64.6) (9.1)
Expenses 620 638 591 1,059 487 569 564 574 207 231 243 245 (57.3) 0.8
EBITDA (80) (72) 44 (130) (102) (117) 5 (97) (52) (70) (57) (76)
Margin (%) (14.8) (12.7) 6.9 (14.0) (26.5) (25.9) 0.9 (20.3) (33.5) (43.5) (30.6) (45.0)
Notes:
(a) DB Corp includes other/interest income in its calculation of mature, emerging editions and FM radio EBITDA.
(b) Costs associated w ith mobile apps downloading and e real estate business included in emerging edition from 4QFY15.
(c) Larger part of Jharkhand, after completion of 4 years have been transferred to mature editions w ith effect from 1QFY16.
20
16
7 5
(1)1
11 13
20
18 18
13
7 7 5
1
(7)
(1) (0)
20
7
2
(3)
(10)
-
10
20
30
1Q
FY12
2Q
FY12
3Q
FY12
4Q
FY12
1Q
FY13
2Q
FY13
3Q
FY13
4Q
FY13
1Q
FY14
2Q
FY14
3Q
FY14
4Q
FY14
1Q
FY15
2Q
FY15
3Q
FY15
4Q
FY15
1Q
FY16
2Q
FY16
3Q
FY16
4Q
FY16
1Q
FY17
2Q
FY17
3Q
FY17
4Q
FY17

DB Corp. Media
KOTAK INSTITUTIONAL EQUITIES RESEARCH 59
Exhibit 5: Trends in circulation revenue growth of DBCL (yoy %)
Source: Company, Kotak Institutional Equities
Exhibit 5: Trends in effective newsprint price for DBCL
Source: Company, Kotak Institutional Equities
6
13
17 16 15 16 16
18 17
14 14 15 15 15
17 17
15 16
18
15 15
12
9
7
-
5
10
15
20
1Q
FY12
2Q
FY12
3Q
FY12
4Q
FY12
1Q
FY13
2Q
FY13
3Q
FY13
4Q
FY13
1Q
FY14
2Q
FY14
3Q
FY14
4Q
FY14
1Q
FY15
2Q
FY15
3Q
FY15
4Q
FY15
1Q
FY16
2Q
FY16
3Q
FY16
4Q
FY16
1Q
FY17
2Q
FY17
3Q
FY17
4Q
FY17
32.3 33.1 33.5 32.8 33.2
34.9
37.2 37.9 37.2 36.2
35.3 34.4
33.6 33.3 33.3 33.6 34.0 34.8 35.4
6 6 5 3 3
5
11
16
12
4
(5)
(9) (10)(8)
(6)(2)
1 4
6
(15)
(10)
(5)
0
5
10
15
20
20
25
30
35
40
1Q
FY13
2Q
FY13
3Q
FY13
4Q
FY13
1Q
FY14
2Q
FY14
3Q
FY14
4Q
FY14
1Q
FY15
2Q
FY15
3Q
FY15
4Q
FY15
1Q
FY16
2Q
FY16
3Q
FY16
4Q
FY16
1Q
FY17
2Q
FY17
3Q
FY17
Newsprint price (Rs/Kg, LHS) Growth (yoy %, RHS)

Media DB Corp.
60 KOTAK INSTITUTIONAL EQUITIES RESEARCH
Exhibit 6: Trends in DBCL EBITDA margins (%)
Source: Company, Kotak Institutional Equities
Exhibit 7: Financial summary of DB Corp Limited, FY2012-20E (Rs mn)
Source: Company, Kotak Institutional Equities estimates
28.4
21.5
26.3
19.3
22.5 21.5
28.0
23.4
30.0
25.7
29.7
23.0
27.5
25.7
33.3
24.6 25.7
23.4
31.9
22.2
31.8
28.0
31.7
21.7
15
20
25
30
35
1Q
FY12
2Q
FY12
3Q
FY12
4Q
FY12
1Q
FY13
2Q
FY13
3Q
FY13
4Q
FY13
1Q
FY14
2Q
FY14
3Q
FY14
4Q
FY14
1Q
FY15
2Q
FY15
3Q
FY15
4Q
FY15
1Q
FY16
2Q
FY16
3Q
FY16
4Q
FY16
1Q
FY17
2Q
FY17
3Q
FY17
4Q
FY17
2012 2013 2014 2015 2016 2017 2018E 2019E 2020E
Profit model
Net sales 14,515 15,923 18,598 20,096 20,519 22,574 24,621 27,377 29,862
EBITDA 3,465 3,821 5,003 5,622 5,346 6,444 7,240 8,597 9,538
Other income 139 153 239 257 281 172 270 477 597
Interest (92) (80) (75) (76) (92) (74) (48) (48) (48)
Depreciation (506) (581) (642) (881) (878) (862) (982) (1,071) (1,230)
Pretax profits 3,006 3,313 4,524 4,923 4,657 5,680 6,480 7,955 8,857
Extraordinary items — — — — — — — — —
Current tax (932) (1,044) (1,406) (1,759) (1,690) (1,907) (2,236) (2,748) (3,095)
Deferred taxation (51) (88) (51) — — — — — —
Net income 2,023 2,181 3,066 3,163 2,966 3,773 4,244 5,207 5,761
Adjusted net income 2,021 2,181 3,066 3,163 2,966 3,773 4,244 5,207 5,761
Earnings per share (Rs) 11.0 11.9 16.7 17.2 16.1 20.5 23.1 28.3 31.3
Balance sheet
Total equity 9,271 10,292 11,467 12,882 13,466 15,989 17,459 19,253 20,748
Deferred taxation liability 746 834 885 832 842 781 781 781 781
Total borrow ings 2,100 1,593 1,506 983 1,135 561 600 600 600
Current liabilities 3,320 3,598 3,837 4,349 4,553 3,494 5,138 5,696 6,380
Total capital 15,452 16,327 17,695 19,046 19,996 20,825 23,979 26,330 28,510
Cash 1,896 1,279 1,135 1,780 898 1,733 3,980 6,016 7,880
Other current assets 5,069 5,780 7,248 8,377 9,040 9,001 10,132 10,829 11,650
Total fixed assets 7,933 8,383 8,526 8,203 9,370 9,294 9,069 8,688 8,182
Investments 460 807 724 686 688 797 797 797 797
Total assets 15,452 16,327 17,695 19,046 19,996 20,825 23,979 26,330 28,510
Free cash flow
Operating cash flow, excl. working capital 2,662 2,969 3,878 4,289 3,852 4,537 5,003 5,849 6,443
Working capital changes (421) (618) (1,387) (77) (459) (1,019) 513 (139) (137)
Capital expenditure (1,215) (605) (1,058) (715) (1,588) (617) (757) (690) (724)
Income from investments 116 95 79 100 281 172 270 477 597
Free cash flow 1,142 1,840 1,512 3,598 2,086 3,073 5,029 5,497 6,178
Ratios (%)
Net debt/equity 2 3 3 (6) 2 (7) (19) (27) (34)
ROAE (%) 21 21 26 24 21 24 24 27 28
ROACE (%) 20 19 24 23 20 24 26 32 36

For Private Circulation Only. FOR IMPORTANT INFORMATION ABOUT KOTAK SECURITIES’ RATING SYSTEM AND OTHER DISCLOSURES, REFER TO THE END OF THIS MATERIAL.
Kotak Institutional Equities Research [email protected] Mumbai: +91-22-4336-0000
4QFY17 results print – weaker-than-expected performance dragged by weak HI performance
JYL’s 4QFY17 performance was weaker than expected on all fronts – net revenues grew 4%
yoy to Rs4.46 bn (5% below estimates) and EBITDA was flat yoy at Rs603 mn (10% below our
estimates). Revenue growth was led by 5.1% yoy volume growth (9.7% yoy ex-HI). EBITDA
margin contracted 50 bps yoy dragged by 190 bps contraction in GM partly negated by tight
cost control (40 bps and 80 bps drop in staff costs and other expenses respectively) and 2%
jump in A&SP. We note GM contraction was primarily dragged by higher promotions (up 60%
yoy); adjusted for promotions (netted off from revenues under Ind-AS), GM was up 10 bps yoy.
We note reported PAT witnessed sharp jump to Rs1.09 bn (up from Rs123 mn in base quarter)
due to reversal of tax provisions on account of merger of JCPML; due to merger of JCPML,
deferred tax assets/MAT credit on brought forward losses has been recognized in FY2017 –
Rs920 mn (balance carried forward losses of Rs830 mn). Recurring PAT (adjusted for tax
reversal) grew 74% yoy to Rs169 mn due to lower ETR (high base in 4QFY16).
Modest growth ex-HI; HI posts 6.5% yoy decline in revenues for the quarter
Overall sales grew 3.7% yoy led by 5.1% yoy volume growth; however, barring HI (which
posted 6.5% yoy decline), sales grew 7.1% yoy and volumes grew 9.7% yoy. Most segments
witnessed modest growth led by personal wash (up 22.5% yoy led by Margo restage) and
fabric care (up 8.4% yoy led by Ujala Crisp & Shine – grew 37% yoy). Dishwash portfolio
posted modest 4.2% yoy growth in revenues for the quarter while HI sales declined, dragged
by 7.4% yoy decline in Maxo coils (we note Maxo LVs grew 11.5% yoy). Margin performance
(at EBIT level) was weak for dishwash and HI (margins down 340-390 bps yoy) while fabric care
(up 40 bps) and personal care (up 310 bps) posted margin expansion.
Henkel ‘call’ renders fundamentals irrelevant; retain Not Rated rating
JYL is a tricky stock for a fundamental analyst at this point. Henkel call option (to buy up to
26% stake in JYL) had vested on April 1, 2016 and the stock price continues to value the
potential upside from a likely open offer in case Henkel exercises this option (extended to
October 2017 from March 2017 earlier). We tried hard but failed to figure out any fundamental
basis of estimating this ‘value upside’. Retain our Not Rated coverage view on the stock.
Jyothy Laboratories (JYL) Consumer Products
Weaker-than-expected performance. JYL reported a weaker-than-expected quarter
with 5-10% miss in revenues and EBITDA; reported PAT growth was aided by reversal
of tax provision on account of JCPML merger. Input cost inflation showed up in
4QFY17; however, JYL has taken price hikes and remains confident of maintaining
margins. Lower tax guidance drives 7-8% upgrade in our EPS estimates in FY2018-19E.
The stock remains Not Rated for us (Henkel option extended to October 31, 2017).
NR
MAY 22, 2017
RESULT
Coverage view: Cautious
Price (`): 373
Target price (`): -
BSE-30: 30,465
Rohit Chordia [email protected]
Mumbai: +91-22-4336-0885
Anand Shah [email protected]
Mumbai: +91-22-4336-0882
J yothy Laboratories
Stock data Forecasts/Valuations 2017 2018E 2019E
52-week range (Rs) (high,low) EPS (Rs) 6.5 11.4 11.8
Market Cap. (Rs bn) EPS growth (%) 25.2 74.5 4.0
Shareholding pattern (%) P/E (X) 57.2 32.8 31.5
Promoters 66.9 Sales (Rs bn) 16.8 18.9 21.5
FIIs 13.3 Net profits (Rs bn) 1.2 2.1 2.2
MFs 6.2 EBITDA (Rs bn) 2.6 3.0 3.3
Price performance (%) 1M 3M 12M EV/EBITDA (X) 27.9 24.2 21.3
Absolute (3.9) 3.9 20.2 ROE (%) 12.2 18.3 18.0
Rel. to BSE-30 (7.5) (2.9) 0.2 Div. Yield (%) 1.6 1.6 1.9
Company data and valuation summary
427-270
67.8

Consumer Products Jyothy Laboratories
62 KOTAK INSTITUTIONAL EQUITIES RESEARCH
Exhibit 1: Interim consolidated results of JYL (as per Ind-AS), March fiscal year-end (Rs mn)
Source: Company, Kotak Institutional Equities
4QFY17 4QFY17E 4QFY16 3QFY17 KIE Est yoy qoq FY2017 FY2016 (% chg.)
Gross revenues 4,656 4,488 3,977 4 17 17,474 16,577 5 Excise (199) (206) (143) (3) 39 (662) (668) (1)
Excise (% of gross revenues) 4.3 4.6 3.6 -32 bps 66 bps 3.8 4.0 -24 bps
Net sales 4,457 4,690 4,282 3,834 (5) 4 16 16,812 15,909 6 Material cost (2,502) (2,550) (2,324) (2,089) (2) 8 20 (8,941) (8,360) 7
Gross profit 1,955 2,140 1,958 1,745 (9) (0) 12 7,871 7,549 4
Gross margin (%) 43.9 45.6 45.7 45.5 -176 bps -186 bps -165 bps 46.8 47.4 -64 bpsStaff cost (415) (460) (417) (431) (10) (0) (4) (1,729) (1,648) 5
Advertising & promotion (281) (305) (275) (269) (8) 2 4 (1,185) (1,180) 0
Other expenditure (656) (705) (665) (541) (7) (1) 21 (2,406) (2,357) 2
Total expenditure (3,854) (4,020) (3,681) (3,331) (4) 5 16 (14,261) (13,544) 5
EBITDA 603 670 601 503 (10) 0 20 2,550 2,365 8
OPM (%) 13.5 14.3 14.0 13.1 -75 bps -50 bps 40 bps 15.2 14.9 30 bpsOther income 21 30 34 26 (29) (38) (17) 107 143 (25)
Other operating income 5 5 2 5 - 150 (4) 18 18 -
Interest (99) (165) (153) (144) (40) (35) (32) (565) (618) (9)
Depreciation (83) (102) (100) (73) (18) (17) 13 (301) (314) (4)
Pretax profits 448 438 384 316 2 17 41 1,810 1,594 14 Tax (291) (128) (302) (108) 128 (4) 170 (665) (693) (4)
PAT 156 310 82 209 (50) 91 (25) 1,145 901 27 Minority interest 13 10 15 9 25 (16) 47 40 43 (7)
Recurring PAT 169 320 97 217 (47) 74 (22) 1,185 944 26 Extraordinaries 918 - 26 (2) 896 (163) (651)
Reported PAT 1,087 320 123 215 240 786 405 2,081 781 167
Income tax rate (%) 21.3 29.2 78.7 34.3 -787 bps -5734 bps -1297 bps 24.6 48.4 -2386 bps
EPS (Rs/share) 0.9 1.8 0.5 1.2 (47) 74 (22) 6.5 5.2 26
Cost as a % of salesMaterial cost 56.1 54.4 54.3 54.5 175 bps 185 bps 164 bps 53.2 52.6 63 bps
Staff cost 9.3 9.8 9.7 11.2 -51 bps -43 bps -194 bps 10.3 10.4 -8 bps
Advertising & promotion 6.3 6.5 6.4 7.0 -19 bps -12 bps -72 bps 7.1 7.4 -37 bps
Other expenditure 14.7 15.0 15.5 14.1 -33 bps -83 bps 59 bps 14.3 14.8 -51 bps
Segment results of Jyothy Laboratories
Gross revenuesDishwashing 1,209 1,161 1,254 4 (4) 5,103 4,767 7
Fabric care 1,820 1,678 1,729 8 5 7,379 6,830 8
Household insecticides 1,111 1,188 453 (6) 145 2,612 2,782 (6)
Personal care 332 271 340 22 (2) 1,596 1,477 8
Laundry serv ices 113 112 111 1 2 441 430 3
Others 72 77 95 (7) (24) 358 294 22
Less: Intersegmental (2) - (5) (15) (2)
Total gross revenues 4,656 4,488 3,977 4 17 17,474 16,577 5
EBITDishwashing 132 172 124 (23) 6 647 554 17
Fabric care 415 376 314 10 32 1,542 1,295 19
Household insecticides 20 62 5 (69) 333 41 102 (60)
Personal care 66 45 47 46 40 302 273 11
Laundry serv ices (41) (63) (23) (35) 75 (123) (148) (17)
Others 8 5 6 50 27 17 8 98
EBIT margin (%)Dishwashing 10.9 14.8 9.9 -392 bps 99 bps 12.7 11.6 105 bps
Fabric care 22.8 22.4 18.2 41 bps 463 bps 20.9 19.0 193 bps
Household insecticides 1.8 5.2 1.0 -348 bps 76 bps 1.6 3.6 -209 bps
Personal care 19.8 16.6 13.8 314 bps 594 bps 19.0 18.5 44 bps
Laundry serv ices (36.0) (56.0) (20.9) 2004 bps -1507 bps (27.8) (34.4) 660 bps
Others 11.3 7.0 6.7 427 bps 454 bps 4.6 2.9 177 bps
(% chg.)

Jyothy Laboratories Consumer Products
KOTAK INSTITUTIONAL EQUITIES RESEARCH 63
Exhibit 2: Adjusted EBITDA workings for JYL, March fiscal year-end (Rs mn)
Source: Company, Kotak Institutional Equities
Exhibit 3: JYL - key changes to earnings (consolidated, Ind-AS), March fiscal-year ends, 2018E-19E
Source: Company, Kotak Institutional Equities estimates
Earnings call takeaways
Comment on Henkel stake option. Management categorically highlighted that it
doesn’t want Henkel’s involvement in managing business operations and hence
negotiations are taking a bit of time (option for 26% stake has been extended to
October 31 versus March 31, 2017 earlier). JYL will remain on an independent growth
path and promoter stake will not go below 51%, irrespective of deal structure.
Management highlighted that JYL remains committed to its innovation pipeline and
will continue to invest behind its brands in FY2018 and hasn’t taken any course
correction post demonetization. It plans to maintain A&SP at 15% of sales (as under
IGAAP).
JYL has taken 7-8% price hike in Exo (through combination of price hikes and
grammage cut) and 8-10% hike in Ujala fabric whitener. It is awaiting clarity on GST
to decide on further pricing actions.
4QFY17 4QFY16 (% chg.) FY2017 FY2016 (% chg.)
Gross revenues 5,022 4,686 7 18,423 17,332 6 Excise (199) (206) (3) (662) (668) (1)
Excise (% of gross revenues) 4.0 4.4 -43 bps 3.6 3.9 -26 bps
Net sales 4,823 4,480 8 17,761 16,665 7 Material cost (2,389) (2,224) 7 (8,503) (7,985) 6
Gross profit 2,434 2,257 8 9,259 8,680 7
Gross margin (%) 50.5 50.4 10 bps 52.1 52.1 4 bpsStaff cost (415) (417) (0) (1,729) (1,648) 5
Advertising & promotion (760) (575) 32 (2,573) (2,310) 11
Other expenditure (656) (665) (1) (2,406) (2,357) 2
Total expenditure (4,220) (3,881) 9 (15,211) (14,300) 6
EBITDA 603 600 1 2,550 2,365 8
OPM (%) 12.5 13.4 -88 bps 14.4 14.2 16 bps
Cost as a % of salesMaterial cost 49.5 49.6 -11 bps 47.9 47.9 -5 bps
Staff cost 8.6 9.3 -71 bps 9.7 9.9 -16 bps
Advertising & promotion 15.8 12.8 292 bps 14.5 13.9 62 bps
Other expenditure 13.6 14.8 -126 bps 13.5 14.1 -60 bps
Note:
(1) Adjusted for A&SP regrouping (as per IGAAP); note in reported financials part of sales promotion is netted off
from sales and cost of goods traded as per Ind-AS.
2018E 2019E 2018E 2019E 2018E 2019E
Net revenues (Rs mn) 18,906 21,513
EBITDA (Rs mn) 2,930 3,312 3,028 3,438 (3.2) (3.7)
EBITDA margin (%) 15.5 15.4
Recurring PAT 2,068 2,151 1,914 1,982 8.0 8.5
EPS (Rs/share) 11.4 11.8 10.6 10.9 7.7 8.2
Effective tax rate (%) 10.0 20.0 24.5 32.7
Notes:
(1) We have moved to Ind-AS model; hence, revenues and EBITDA margin estimates are not strictly comparable.
Revised Earlier Change (%)

Consumer Products Jyothy Laboratories
64 KOTAK INSTITUTIONAL EQUITIES RESEARCH
Merger of JCPML with JYL. JCPML (formerly Henkel India Marketing) has been
merged with JYL effective April 1, 2015. Consequently, all assets and liabilities of
JCPML have been recorded at their fair value. Due to merger of JCPML, deferred tax
assets/MAT credit on brought forward losses has been recognized in FY2017 – Rs920
mn (balance carried forward losses of Rs830 mn). Consequently, management has
guided for 10-12% ETR in FY2018 (due to accumulated losses) and MAT rate in
FY2019.
Other takeaways. (1) JYL’s direct reach is little under 0.8 mn outlets and is looking to
grow it by 20% each year, (2) the company has successfully commenced commercial
production of Ujala fabric whitener, Margo and Maxo LVs in FY2017 at Guwahati
(north east) – these manufacturing units are entitled to avail 100% IT benefits under
Section 80 IE for next 9 years and (3) it has successfully commenced SAP S4 Hana from
April 1, 2017 for all group companies across all modules.
Key brand-wise takeaways
Ujala – Ujala franchise posted 9.8% yoy growth for the quarter led by strong 37% yoy
growth in Ujala Crisp & Shine; we note Ujala fabric whitener grew 3.7% yoy while Ujala
detergent growth slowed down to 8.7% yoy due to market share loss. Management
highlighted that Ujala Crisp & Shine posted 29% yoy growth for FY2017 – highest
ever growth in last 3 years and is on track to become a Rs1 bn + brand in FY2018
(already Rs600 mn size). It is currently present only in two states – Kerala and TN.
Henko – Henko posted 2.9% yoy decline in revenues – sharp deceleration from 20%
yoy growth in 3QFY17 (despite demonetization); for full year Henko posted 8.8% yoy
growth. Management highlighted – (1) its overall ambition for Henko remains to keep
it as a niche offering and not compete with larger players in premium detergents.
Dishwash – (1) Exo posted a modest 3.3% yoy growth for the quarter (6.8% in
F20Y17) and (2) Pril liquids posted 2.1% yoy growth during the quarter (up 6.5% in
FY2017). Overall dishwash portfolio posted 4% yoy growth for the quarter (up 7% in
FY2017). Management highlighted – (1) its recent innovation of Pril 500 tub is
growing at a very fast pace and now contributes to ~32% of total Pril bar portfolio
and (2) Exo scrubbers posted 5.2% yoy decline for the quarter; however, the brand is
sizeable now at Rs885 mn and is heading towards Rs1 bn+ size in FY2018.
Maxo – Maxo continued its weak run posting 6.5% yoy decline during the quarter
(down 6.1% in FY2017); growth during the quarter was dragged by sustained impact
on wholesale channel (especially in east markets) which impacted coil sales particularly
(Maxo coils down 7.4% yoy for the quarter, 6.8% for FY2017). Maxo LVs continue to
do well and posted 11.5% yoy growth for the quarter (2.3% yoy decline for the full
year). However, Maxo cards posted a sharp 47% yoy decline in revenues to Rs51 mn
(22% yoy decline for full year); management indicated that the HI cards market has
started to decline as category consumers are shifting back to coils.
Margo – Margo posted a solid rebound posting 19.3% yoy growth in revenues for the
quarter (up 4.1% yoy for FY2017) aided by brand restage (core relaunched in Margo,
2017).

Jyothy Laboratories Consumer Products
KOTAK INSTITUTIONAL EQUITIES RESEARCH 65
Exhibit 4: Brand-wise gross revenue break-up (Rs mn)
Source: Company, Kotak Institutional Equities
4QFY17 4QFY16 Chg. (%) FY2017 FY2016 Chg. (%)
Ujala 1,020 929 9.8 4,190 3,917 7.0
- Ujala Supreme 578 557 3.7 2,651 2,589 2.4
- Ujala Crisp & Shine 182 133 37.1 591 458 29.0
- Ujala Detergent 251 231 8.7 912 838 8.8
Exo 902 873 3.3 3,813 3,570 6.8
- Dishwash bar 675 643 5.1 2,834 2,646 7.1
- Scrubber 201 211 (5.2) 885 846 4.6
Maxo 1,111 1,188 (6.5) 2,612 2,782 (6.1)
- Maxo coil 689 744 (7.4) 1,641 1,761 (6.8)
- Maxo LV 358 321 11.5 844 864 (2.3)
- Maxo cards 51 96 (47.0) 100 127 (21.6)
Henko 440 453 (2.9) 1,813 1,666 8.8
Margo 289 242 19.4 1,365 1,311 4.1
Pril 300 293 2.4 1,289 1,217 5.9
- Liquid 220 216 2.1 951 893 6.5
- Bars 80 77 3.2 338 324 4.4
Power brands 4,062 3,978 2.1 15,082 14,463 4.3
Others 482 397 21.4 1,953 1,682 16.1
Total 4,544 4,375 3.9 17,035 16,145 5.5
Laundry serv ices 113 114 (0.9) 441 431 2.3
Total gross revenues (before excise) 4,656 4,488 3.7 17,474 16,577 5.4

Consumer Products Jyothy Laboratories
66 KOTAK INSTITUTIONAL EQUITIES RESEARCH
Exhibit 5: JYL: Consolidated profit model, balance sheet, cash flow (as per Ind-AS), March fiscal year-ends, 2014-20E (Rs mn)
Source: Company, Kotak Institutional Equities estimates
2014 2015 2016 2017 2018E 2019E 2020E
Profit model (Rs mn)
Net revenues 13,184 15,053 15,909 16,812 18,906 21,513 24,389
EBITDA 1,517 1,822 2,365 2,550 2,930 3,312 3,741
Other income 136 157 161 125 125 132 131
Interest expense (553) (138) (618) (565) (458) (446) (437)
Depreciation/Amortisation (243) (325) (314) (301) (345) (359) (373)
Pretax profits 858 1,516 1,594 1,810 2,253 2,639 3,063
Tax (6) (35) (693) (665) (225) (528) (704)
Minority Interest 2 1 43 40 40 40 40
Recurring Net Income 854 1,482 944 1,185 2,068 2,151 2,398
Extraordinary items (40) (271) (163) 896 - - -
Reported Net Income 814 1,211 781 2,081 2,068 2,151 2,398
Recurring EPS (Rs) 4.7 8.2 5.2 6.5 11.4 11.8 13.2
Adjusted EPS (Rs) 3.9 5.8 5.2 6.5 11.4 11.8 13.2
Balance sheet (Rs mn)
Total shareholder's equity 7,344 7,797 8,461 10,890 11,646 12,266 12,914
Total borrow ings 5,268 5,537 6,067 5,179 5,000 4,900 4,800
Deferred tax liability 11 5 253 69 69 69 69
Minority Interest 16 14 17 (67) (106) (146) (186)
Total liabilities and equity 12,639 13,354 14,798 16,072 16,608 17,089 17,598
Net fixed assets incl CWIP 10,983 10,902 10,757 11,058 11,008 10,929 10,866
Investments 610 1,935 835 285 285 285 285
Cash 698 767 612 1,034 1,213 1,248 1,247
Net current assets 348 (251) 2,594 3,695 4,103 4,627 5,199
Total assets 12,639 13,354 14,798 16,072 16,608 17,089 17,598
Free cash flow (Rs mn)
Operating cash flow (excl working capital) 1,355 1,431 1,884 2,800 2,725 2,806 3,061
Working capital (56) 232 32 (247) (408) (524) (572)
Capital expenditure (232) (164) (257) (611) (295) (279) (311)
Free cash flow 1,067 1,499 1,658 1,942 2,022 2,002 2,179
Key ratios (%)
Sales growth 19.4 14.2 5.7 5.7 12.5 13.8 13.4
EPS growth 21.4 73.5 (36.4) 25.2 74.5 4.0 11.5
Adj. EPS growth 0.8 47.0 (9.5) 25.2 74.5 4.0 11.5
Gross margin 47.3 48.4 47.4 46.8 47.0 46.8 46.6
EBITDA margin 11.5 12.1 14.9 15.2 15.5 15.4 15.3
RoE 12.4 19.5 11.6 12.3 18.5 18.2 19.3
RoCE 9.4 10.2 13.6 14.4 15.6 17.2 19.1
Ind-ASIGAAP

For Private Circulation Only. FOR IMPORTANT INFORMATION ABOUT KOTAK SECURITIES’ RATING SYSTEM AND OTHER DISCLOSURES, REFER TO THE END OF THIS MATERIAL.
Kotak Institutional Equities Research [email protected] Mumbai: +91-22-4336-0000
Results – strong all-round performance leads to FY2017 RoE of 20%
KEC reported a strong 4QFY17 EBITDA of Rs3 bn, up 29% yoy and 8% ahead of our estimates.
Most of the EBITDA growth was driven by a 150 bps yoy expansion in EBITDA margin to
10.4%, net of ~300 bps yoy increase in gross margin and 150 bps higher other expenses as
share of sales. Revenue growth was modest at 10%, driven by railways (grew 3X) and partly
impacted by currency impact of translating revenues of SAE Towers. Interest cost declined 10%
yoy, leading to a stronger 73% yoy growth in PBT. Lower tax rate (30%) further boosted PAT to
Rs1.45 bn, up 91% yoy and 38% ahead of our estimate. FY2017 has been a similarly strong
year, not growing in execution but still growing EBITDA/PBT by 18%/59%. Sharper-than-
expected decline in receivables and strong cash profit have reduced debt by more than Rs11 bn
over FY2017, improving pre-tax RoCE to 14.5% and RoE to 20%.
Guidance has credibility based on quantum and mix of order book and risks taken into account
Good order backlog lends credibility to the 15% revenue growth guidance for FY2018, which
bakes in a few months of disturbance from implementation of GST. Management envisages
double-digit growth in T&D and scale-up in railways (2X) and solar (3X). It defended the 9.5%
EBITDA margin guidance (versus 9.3% in FY2017) on the back of composition of the order
backlog and operating leverage. It expects to further reduce interest cost to 2.5-2.7% of sales
(from 2.9% in FY2017) based on reduction in receivable days (civil and solar has limited
requirements); does not bake in any improvement in cost of debt on the back of improved
credit ratings.
Good pipeline shared across segments
KEC shared good growth prospects in T&D domestic (states, PGCIL, TBCB), T&D overseas
(substation, SAARC) and railways. It also shared scope for growing its new civil business,
targeting ordering in the industrial and select (Rs1-3 bn) residential jobs. The management has
built capabilities in the civil space and has hired the business head for this business from L&T;
has already won Rs4.2 bn of orders in FY2018.
Cut in revenue more than compensated by higher margin and lower interest; ADD stays
We revise estimates for FY2018/19 to Rs14.9/19.2, an increase of 2-6%. We broadly maintain
our EBITDA estimates through lower estimates for debtor days and tax rate.
KEC International (KECI) Industrials
Blockbuster end to a great year. A very strong performance in 4QFY17 marked end
to a great year for KEC, lacking in execution but still growing EBITDA/PBT by 18%/59%.
Large decline in debt was attributable to both large cash profits and reduction in
debtors. Good FY2018 guidance given appears credible based on large order backlog
and builds in risk associated with GST disruption, current FX rate and no decline in G-
Sec rates; can drive further increase in RoE from current 20%. We increase multiple to
14X from 13X and estimates by 2-6%; revise March 2019E TP to Rs270 (from Rs235).
ADD
MAY 22, 2017
RESULT
Coverage view: Cautious
Price (`): 245
Target price (`): 270
BSE-30: 30,465
Aditya Mongia [email protected]
Mumbai: +91-22-4336-0884
Ajinkya Bhat [email protected]
Mumbai: +91-22-4336-0883
KEC International
Stock data Forecasts/Valuations 2017 2018E 2019E
52-week range (Rs) (high,low) EPS (Rs) 11.9 14.9 19.2
Market Cap. (Rs bn) EPS growth (%) 59.2 25.5 28.8
Shareholding pattern (%) P/E (X) 20.7 16.5 12.8
Promoters 50.9 Sales (Rs bn) 87.6 101.8 123.0
FIIs 6.8 Net profits (Rs bn) 3.0 3.8 4.9
MFs 22.6 EBITDA (Rs bn) 8.2 9.7 11.6
Price performance (%) 1M 3M 12M EV/EBITDA (X) 9.9 8.3 6.9
Absolute 13.2 47.8 87.0 ROE (%) 19.7 21.9 23.3
Rel. to BSE-30 9.0 38.2 55.9 Div. Yield (%) 0.7 0.8 1.1
Company data and valuation summary
254-110
63.0

Industrials KEC International
68 KOTAK INSTITUTIONAL EQUITIES RESEARCH
Exhibit 1: FY2017 was marked by flattish execution but spectacular order inflow that will provide tailwinds for FY2018 4QFY17 - key numbers for KEC (consolidated), March fiscal year-ends (Rs mn)
Source: Company, Kotak Institutional Equities estimates
Exhibit 2: Railways segment more than doubled the revenues in the year, countering the quantum of decline in T&D execution Segment-wise revenues for KEC (consolidated) in 4QFY17, March fiscal year-ends (Rs mn)
Source: Company, Kotak Institutional Equities
Exhibit 3: Reconciliation of 4QFY16 PAT from IGAAP to Ind-AS
Source: Company, Kotak Institutional Equities
4QFY17 4QFY17E 4QFY16 3QFY17 vs est. yoy qoq FY2017 FY2016 % change FY2018E FY2017 % change
Total operating income 28,843 29,871 26,198 19,646 (3.4) 10.1 46.8 87,551 87,096 0.5 101,784 87,551 16.3
Expenses (25,832) (27,085) (23,867) (17,828) (4.6) 8.2 44.9 (79,372) (80,173) (1.0) (92,083) (79,372) 16.0
Raw material cost (19,295) (18,009) (13,133) 7.1 46.9 (59,580) (61,611) (3.3) (74,302) (59,580) 24.7
Employee expenses (1,864) (1,654) (1,857) 12.6 0.4 (7,327) (6,392) 14.6 (4,549) (7,327) (37.9)
Other expenses (4,237) (3,471) (2,952) 22.1 43.5 (12,556) (11,982) 4.8 (13,232) (12,556) 5.4
EBITDA 3,011 2,787 2,332 1,818 8.1 29.2 65.6 8,179 6,923 18.1 9,700 8,179 18.6
Other income 114 35 11 70 934.5 63.0 289 103 181.4 306 289 5.8
Interest (637) (817) (705) (583) (22.1) (9.7) 9.1 (2,536) (2,794) (9.2) (2,694) (2,536) 6.2
Depreciation (408) (326) (436) (298) 25.2 (6.4) 36.7 (1,297) (1,318) (1.6) (1,495) (1,297) 15.3
PBT 2,081 1,679 1,202 1,006 23.9 73.1 106.8 4,635 2,914 59.0 5,817 4,635 25.5
Tax (625) (626) (438) (380) (0.1) 42.8 64.4 (1,587) (1,436) 10.5 (1,992) (1,587) 25.5
Net profit 1,455 1,053 764 626 38.2 90.5 132.5 3,048 1,479 106.1 3,825 3,048 25.5
Key ratios (%)
Raw material cost/ Sales 68.4 71.5 66.3 67.9 71.0 73.0 67.9
Employee expenses/ Sales 6.5 6.3 9.5 8.4 7.3 4.5 8.4
Other expenses/ Sales 14.7 13.2 15.0 14.3 13.8 13.0 14.3
EBITDA margin 10.4 9.3 8.9 9.3 9.3 7.9 9.5 9.3
PBT margin 7.2 5.6 4.6 5.1 5.3 3.3 5.7 5.3
Tax rate 30.1 37.3 36.4 37.8 34.2 49.3 34.2 34.2
PAT margin 5.0 3.5 2.9 3.2 3.5 1.7 3.8 3.5
EPS (Rs) 5.7 4.1 3.0 2.4 11.9 5.8 14.9 11.9
Order details
Order inflows 37,240 25,670 27,060 45.1 37.6 123,580 87,140 41.8 130,377 123,580 5.5
Order backlog 126,310 94,490 111,860 33.7 12.9 126,310 94,490 33.7 154,718 126,310 22.5
% change
4QFY17 4QFY17E 4QFY16 3QFY17 vs est. yoy qoq FY2017 FY2016 % change FY2018E FY2017 % change
T&D total 23,020 21,530 21,810 15,000 6.9 5.5 53.5 70,310 72,120 (2.5) 83,649 70,310 19.0
Cables 3,030 2,920 3,260 2,780 3.8 (7.1) 9.0 10,540 11,180 (5.7) 4,221 10,540 (59.9)
Railway 2,060 500 500 1,050 312.0 312.0 96.2 4,470 2,100 112.9 7,191 4,470 60.9
Solar 880 630 890 820 39.7 (1.1) 7.3 2,380 1,950 22.1 6,908 2,380 190.2
Total revenues 28,990 25,580 26,460 19,650 13.3 9.6 47.5 87,700 87,350 0.4 101,969 87,700 16.3
Revenue contribution (%)
Transmission & Distribition 79.4 84.2 82.4 76.3 80.2 82.6 82.0 80.2
Cables 10.5 11.4 12.3 14.1 12.0 12.8 4.1 12.0
Railway 7.1 2.0 1.9 5.3 5.1 2.4 7.1 5.1
Water 3.0 2.5 3.4 4.2 2.7 2.2 6.8 2.7
% change
Particulars 4QFY16 FY2016
Net Profit for the quarter under Previous Indian GAAP 799 1,915
Impact of measuring derivative financial instruments at fair value (1) (42)
Actuarial gain on employess defined benefits plans recognised 27 32
Expected credit loss (31) (31)
Effect on account of functional currency of subsidiaries (6) (267)
Effect on account of retrospective application of Ind AS 103 (15) (10)
Others (85) (9)
Impact of deferred tax 77 (110)
Net Profit for the quarter under Ind-AS 764 1,479

KEC International Industrials
KOTAK INSTITUTIONAL EQUITIES RESEARCH 69
4QFY17 earnings call takeaways
Guidance for FY2018. On the back of a strong starting backlog, the management has
guided for 15% topline growth in FY2018 with an EBITDA margin of 9.5%. The company
also has an L1 position in Rs33 bn worth of orders and can further improve order inflows.
While T&D forms the bulk of the company’s revenues and will grow in double digits in
FY2018, faster growth may be achieved in other segments on a low base. The company
thus expects: (1) Railways segment to grow by nearly 70% yoy to reach revenues of Rs7.5
bn, (2) Solar segment that achieved revenues of ~Rs1.7-1.8 bn in FY2017 is expected to
triple the revenues in FY2018 on the back of robust order inflows for large-capacity solar
plants won in FY2017 and (3) faster growth in cables segment as well. Margins will
improve marginally led by operating leverage benefits.
Domestic T&D orders will continue, both PGCIL and states. The management
mentioned that PGCIL has a budgeted spending of Rs245 bn in FY2018 and the entity is
optimistic of meeting that target. Further, states such as Karnataka, Uttar Pradesh, Tamil
Nadu, Odisha, West Bengal, Andhra Pradesh and Telangana are ordering projects as well.
The company is selectively participating in state contracts.
Overseas T&D orders have picked up as well. The company received significant order
inflows from international markets during FY2017 with a good pipeline seen from Asian
countries (Indonesia, Thailand, Bangladesh, Nepal and Bhutan). Expected inflows from
North America did not materialize for SAE during the year and is a cause for concern for
the management. However, the company expects better performance in the Brazilian
market in FY2018. The government and political scenario in Brazil is expected to be stable
in the coming year as the impeachment events of last year are over.
Further, KEC has not been a major player in the overseas substation orders so far.
However, the company currently has ~Rs8 bn worth of substation orders in the
international markets and expects to grow faster in this area.
GST disruption impact to be skirted by targeting international execution. The
company expects a material disruption in domestic activities in the initial period post
implementation of GST staring July 2017. The disruption will be especially felt by a
company like KEC that procures and supplies materials all over the country. The
management plans to tackle the initial hiccups by focusing on the execution of strong
international T&D backlog.
Deleveraging exercise to continue, especially on receivables. The management plans
to bring down account receivables from ~200 days of sales to ~180 days of sales despite
a strong 15% yoy revenue growth expected in FY2018. The cash flows will be used to
repay working capital debt. The management targets to bring down the interest cost
from 3% of sales to 2.5-2.7% by end-FY2018. The deleveraging exercise could also
improve return ratios further as interest cost reduces.
Aiming for quick ramp-up on new vertical of civil construction. The company has
forayed into the area of civil EPC contracts involving sub-segments such as buildings &
factories and residential realty. The management asserted that unlike the previous
attempts of water and solar verticals, the company has built the capability before bidding
for projects in this vertical. The management also cited hiring of experienced industry
persons in order to push into the new vertical.

Industrials KEC International
70 KOTAK INSTITUTIONAL EQUITIES RESEARCH
Other takeaways.
The company has turned around the cables segment with a positive PBT in FY2017.
The business being commoditized, the company will expand capacity only if ordering
for value-added products, such as EHV cables, picks up. The company has also won a
220 kV cable order from PGCIL and this order will make it qualified to bid for similar
such orders in the future providing a volume boost to the cables segment.
The company expects 5-6% of EBITDA margins in solar, but given zero debt and low
assets for the segment, this margin largely flows down to PBT level for the segment.
Exhibit 4: EBITDA margin expected to improve further as non-T&D margins converge to the benchmark T&D margins of 9-10% Trends in EBITDA margin over the past few quarters, March fiscal year-ends, 1QFY14-4QFY17 (%)
Source: Company, Kotak Institutional Equities
Exhibit 5: Yoy decline in interest cost as a percentage of sales due to lower debt and acceptances Interest cost as percentage of sales for KEC over the past few quarters, March fiscal year-ends (%)
Source: Company, Kotak Institutional Equities
15.0
19.0
23.0
27.0
31.0
35.0
1Q
FY14
2Q
FY14
3Q
FY14
4Q
FY14
1Q
FY15
2Q
FY15
3Q
FY15
4Q
FY15
1Q
FY16
1Q
FY16- In
d A
s
2Q
FY16- In
d A
s
3Q
FY16- In
d A
s
4Q
FY16 - Ind
As
1Q
FY17- In
d A
s
2Q
FY17- In
d A
s
3Q
FY17- In
d A
s
4Q
FY17- In
d A
s
Gross margin
4.0
5.0
6.0
7.0
8.0
9.0
10.0
11.0
1Q
FY14
2Q
FY14
3Q
FY14
4Q
FY14
1Q
FY15
2Q
FY15
3Q
FY15
4Q
FY15
1Q
FY16
1Q
FY16- In
d A
s
2Q
FY16- In
d A
s
3Q
FY16- In
d A
s
4Q
FY16 - Ind
As
1Q
FY17- In
d A
s
2Q
FY17- In
d A
s
3Q
FY17- In
d A
s
4Q
FY17- In
d A
s
EBITDA margin
3.43.6
3.3 3.1
3.84.2
3.9
2.8
3.8 3.73.3 3.3
2.7
4.0
2.8 3.0
2.2
0
1
2
3
4
5
1Q
FY14
2Q
FY14
3Q
FY14
4Q
FY14
1Q
FY15
2Q
FY15
3Q
FY15
4Q
FY15
1Q
FY16
1Q
FY16- In
d A
s
2Q
FY16- In
d A
s
3Q
FY16- In
d A
s
4Q
FY16 - Ind
As
1Q
FY17- In
d A
s
2Q
FY17- In
d A
s
3Q
FY17- In
d A
s
4Q
FY17- In
d A
s

KEC International Industrials
KOTAK INSTITUTIONAL EQUITIES RESEARCH 71
Exhibit 6: Strong order inflows in 4QFY17 and improved orders in the international T&D segment were the key highlights Trends in order inflows and backlog over the past few quarters, March fiscal year-ends (Rs bn)
Source: Company, Kotak Institutional Equities
Exhibit 7: Geographical and segmental breakup of backlog and inflow, March fiscal year-ends
Source: Company, Kotak Institutional Equities
05
1015202530354045
1Q
FY14
2Q
FY14
3Q
FY14
4Q
FY14
1Q
FY15
2Q
FY15
3Q
FY15
4Q
FY15
1Q
FY16
1Q
FY16- In
d A
s
2Q
FY16- In
d A
s
3Q
FY16- In
d A
s
4Q
FY16 - Ind
As
1Q
FY17- In
d A
s
2Q
FY17- In
d A
s
3Q
FY17- In
d A
s
4Q
FY17- In
d A
s
Order inflows
0
20
40
60
80
100
120
140
1Q
FY14
2Q
FY14
3Q
FY14
4Q
FY14
1Q
FY15
2Q
FY15
3Q
FY15
4Q
FY15
1Q
FY16
1Q
FY16- In
d A
s
2Q
FY16- In
d A
s
3Q
FY16- In
d A
s
4Q
FY16 - Ind
As
1Q
FY17- In
d A
s
2Q
FY17- In
d A
s
3Q
FY17- In
d A
s
4Q
FY17- In
d A
s
Order backlog
Transmission &
Distribution82%
Cables1%
Water5%
Railways12%
FY2017-end backlog (Rs126 bn)
India 48%
Overseas52%
FY2017-end backlog (Rs126 bn)
Transmission &
Distribution62%
Transmission - SAE
13%
Cables8%
Railways12%
Water5%
FY2017 order inflows (Rs124 bn)
India 46%
Overseas54%
FY2017 order inflows (Rs124 bn)

Industrials KEC International
72 KOTAK INSTITUTIONAL EQUITIES RESEARCH
Exhibit 8: Balance sheet details of KEC (consolidated), March fiscal year-ends, 2011-17 (Rs mn)
Source: Company, Kotak Institutional Equities
Exhibit 9: Consolidated estimates of KEC International, March fiscal year-ends, 2016-19E (Rs mn)
Source: Company, Kotak Institutional Equities estimates
Ind-AS Ind-AS
2011 2012 2013 2014 1HFY15 2015 1HFY16 2016 1HFY17 2017
Shareholders funds 9,466 11,080 11,472 11,916 12,269 13,298 14,136 15,119 15,496 15,864
Equity share capital 514 514 514 514 514 514 514 514 514 514
Reserves & surplus 8,952 10,566 10,958 11,402 11,755 12,784 13,622 14,605 14,981 15,349
Loan funds 14,322 12,390 16,690 21,270 24,333 20,451 22,346 23,246 27,908 19,981
Deferred tax liability 497 510 621 514 463 527 496 421 1,007 1,240
Total source of funds 24,285 23,980 28,783 33,700 37,065 34,277 36,978 38,786 44,411 37,085
Net fixed assets 8,409 9,221 10,114 9,922 9,756 8,811 8,752 8,598 8,774 9,216
Goodwill on consolidation 2,812 3,209 3,424 3,778 3,896 3,943 4,138 4,180 4,202 1,910
Investments — — — — — — — — 25 1,304
Cash balances 1,614 2,030 1,556 1,440 1,669 2,063 954 1,113 2,630 2,080
Current assets 34,259 41,050 47,253 58,757 62,757 62,455 63,764 67,244 70,978 72,638
Inventories 3,359 4,400 3,960 5,052 5,716 4,764 4,768 4,298 4,131 3,947
Sundry debtors 26,177 31,550 36,675 46,598 48,249 48,184 49,640 54,209 43,002 42,268
Loans and advances 4,723 5,100 6,618 7,106 8,792 9,507 9,355 8,737 23,845 26,424
Current liabilities and Provisions 22,809 31,530 33,564 40,197 41,014 42,995 40,630 42,348 42,197 50,063
Current liabilities 22,248 30,460 32,679 38,946 40,047 41,777 39,715 41,212 41,236 49,016
Provisions 561 1,070 885 1,251 967 1,219 915 1,136 961 1,047
Net current assets excl. cash 11,450 9,520 13,689 18,560 21,743 19,460 23,134 24,896 28,781 22,575
Total application of funds 24,285 23,980 28,783 33,700 37,065 34,277 36,978 38,786 44,411 37,085
Trailing 4 qtr revenues 44,742 58,147 69,795 79,018 82,709 84,678 84,732 85,163 85,236 87,551
WCap (days of sales)
Current assets 279 258 247 271 277 269 275 288 304 303
Inventories 27 28 21 23 25 21 21 18 18 16
Sundry debtors 214 198 192 215 213 208 214 232 184 176
Loans and advances 39 32 35 33 39 41 40 37 102 110
Current liabilities & Provisions 186 198 176 186 181 185 175 181 181 209
Net current assets excl. cash 93 60 72 86 96 84 100 107 123 94
2016 2017 2018E 2019E 2018E 2019E 2018E 2019E
Order inflows 87,140 123,580 130,377 150,258 136,559 158,020 (4.5) (4.9)
Yoy growth (%) 6.0 41.8 5.5 15.2 10.5 15.7
Order backlog 94,868 126,310 154,718 181,759 157,799 185,943 (2.0) (2.3)
Revenues 85,163 87,551 101,784 122,993 108,476 129,481 (6.2) (5.0)
Yoy growth (%) 0.6 2.8 16.3 20.8 23.9 19.4
EBITDA 6,793 8,179 9,700 11,631 9,926 11,910 (2.3) (2.3)
EBITDA margin (%) 8.0 9.3 9.5 9.5 9.2 9.2 37 bps 25 bps
Interest cost (2,774) (2,536) (2,694) (3,098) (2,796) (3,294) (3.7) (5.9)
Net PAT 1,915 3,048 3,825 4,926 3,762 4,644 1.7 6.1
EPS (Rs) 7.4 11.9 14.9 19.2 14.6 18.1 1.7 6.1
Yoy growth (%) 18.9 59.2 25.5 28.8 23.4 23.4
Revised estimates Previous estimates % change

KEC International Industrials
KOTAK INSTITUTIONAL EQUITIES RESEARCH 73
Exhibit 10: Key segmental financials of KEC (consolidated), March fiscal year-ends, 2011-20E (Rs mn)
Source: Company, Kotak Institutional Equities estimates
2011 2012 2013 2014 2015 2016 2017 2018E 2019E 2020E
Total
Order inflows 55,280 65,870 78,770 84,905 82,230 87,140 123,580 130,377 150,258 170,569
Yoy growth (%) 30.2 19.2 19.6 7.8 (3.2) 6.0 41.8 5.5 15.2 13.5
Revenues 44,740 58,150 69,790 79,010 84,680 85,420 87,710 101,969 123,217 140,315
Yoy growth (%) 14.5 30.0 20.0 13.2 7.2 0.9 2.7 16.3 20.8 13.9
Order backlog 78,000 85,720 94,700 102,000 95,080 94,868 126,310 154,718 181,759 212,013
Bill to book ratio (%) 54.1 52.4 55.8 57.6 59.2 61.6 56.0 53.2 53.6 52.5
EBITDA 4,626 4,654 3,814 4,933 5,118 6,793 8,179 9,700 11,631 13,128
EBITDA margin (%) 10.3 8.0 5.5 6.2 6.0 8.0 9.3 9.5 9.4 9.4
T&D total
Inflows 46,090 47,873 57,506 59,544 55,916 63,612 76,620 75,446 85,622 96,555
Inflows growth (%) - 3.9 20.1 3.5 (6.1) 13.8 20.4 (1.5) 13.5 12.8
Revenues 35,490 41,480 49,980 61,160 64,840 62,800 60,300 72,545 80,238 86,387
Backlog 63,640 70,033 77,559 80,784 71,310 70,868 90,943 93,844 99,228 109,397
Bill to book ratio (%) 46.6 47.4 50.6 57.0 59.6 60.9 55.2 56.4 58.7 58.6
EBITDA 3,899 3,510 2,706 4,657 5,385 5,649 6,111 7,319 8,105 8,731
EBITDA margin (%) 11.0 8.5 5.4 7.6 8.3 9.0 10.1 10.1 10.1 10.1
Cables
Inflows 5,440 5,927 5,104 8,567 11,512 9,585 9,886 10,875 11,963 13,159
Inflows growth (%) 277.8 9.0 (13.9) 67.8 30.0 (16.7) 3.1 10.0 10.0 10.0
Revenues 4,800 5,710 5,520 6,310 9,070 10,260 10,540 4,221 9,729 11,711
Backlog 1,240 1,457 1,042 2,448 5,705 4,725 1,263 7,917 10,151 11,598
Bill to book ratio (%) 79.5 79.7 84.1 65.7 65.0 67.1 72.1 63.0 70.0 70.0
EBITDA 120 114 (110) (316) (272) 205 527 211 486 586
EBITDA margin (%) 2.5 2.0 (2.0) (5.0) (3.0) 2.0 5.0 5.0 5.0 5.0
Railways
Inflows 3,440 1,179 3,627 2,375 2,467 2,614 14,830 19,278 25,062 30,074
Inflows growth (%) 173.0 (65.7) 207.7 (34.5) (25.0) 6.0 467.3 30.0 30.0 20.0
Revenues 910 1,640 2,700 1,690 1,330 2,100 4,470 7,191 11,933 16,623
Backlog 3,890 3,429 4,356 4,488 4,754 5,669 15,157 27,245 40,374 53,825
Bill to book ratio (%) 29.5 36.6 51.5 30.5 23.2 34.6 34.2 29.0 30.0 30.0
EBITDA 18 - - (51) (40) 126 313 503 955 1,330
EBITDA margin (%) 2.0 - - (3.0) (3.0) 6.0 7.0 7.0 8.0 8.0
Water/solar
Inflows 310 3,137 2,464 4,411 - 1,743 6,179 7,106 8,172 9,397
Inflows growth (%) 912.1 (21.5) 79.0 (20.0) 254.5 15.0 15.0 15.0
Revenues - 190 1,270 1,310 1,410 1,960 2,380 6,908 6,360 7,815
Backlog 310 3,257 4,451 5,712 3,803 2,268 6,316 6,513 8,326 9,908
Bill to book ratio (%) - 10.1 28.3 19.7 24.7 41.9 44.4 70.0 60.0 60.0
EBITDA - - - (39) (42) 59 143 449 477 586
EBITDA margin (%) - - - (3.0) (3.0) 3.0 6.0 6.5 7.5 7.5
SAE
Inflows - 7,753 10,069 10,009 12,335 9,585 16,065 17,672 19,439 21,383
Inflows growth (%) - - 29.9 - - (22.3) 67.6 10.0 10.0 10.0
Revenues 3,540 9,130 10,320 8,540 8,030 8,300 10,020 11,104 14,958 17,779
Backlog 8,920 7,543 7,292 8,568 9,508 11,339 12,631 19,199 23,680 27,284
Bill to book ratio (%) 71.3 82.1 69.5 54.5 58.0 51.7 51.7 51.7 51.7
EBITDA 496 1,096 1,290 837 80 415 902 999 1,346 1,600
EBITDA margin (%) 14.0 12.0 12.5 9.8 1.0 5.0 9.0 9.0 9.0 9.0

Industrials KEC International
74 KOTAK INSTITUTIONAL EQUITIES RESEARCH
Exhibit 11: Key financials for KEC (consolidated), March fiscal year-ends, 2011-20E (Rs mn)
Source: Company, Kotak Institutional Equities estimates
2011 2012 2013 2014 2015 2016 2017 2018E 2019E 2020E
Income statement
Total operating income 44,742 58,147 69,795 79,018 84,678 85,163 87,551 101,784 122,993 140,060
Total operating costs (40,116) (53,493) (65,981) (74,085) (79,560) (78,370) (79,372) (92,083) (111,362) (126,932)
Raw materials consumed (32,358) (43,173) (53,301) (59,594) (64,527) (62,198) (59,489) (74,302) (89,785) (102,244)
Employee expenses (2,832) (4,284) (4,829) (5,661) (5,865) (6,424) (7,327) (4,549) (5,588) (6,481)
Operating and other expenses (4,926) (6,037) (7,852) (8,831) (9,168) (9,749) (12,556) (13,232) (15,989) (18,208)
EBITDA 4,626 4,654 3,814 4,933 5,118 6,793 8,179 9,700 11,631 13,128
Other income 26 12 160 138 1,462 103 289 306 583 813
Interest expense (1,075) (1,448) (1,944) (2,633) (3,089) (2,774) (2,536) (2,694) (3,098) (3,498)
Depreciation (408) (479) (561) (705) (881) (876) (1,297) (1,495) (1,625) (1,755)
PBT 3,168 2,739 1,470 1,733 2,611 3,245 4,635 5,817 7,490 8,688
Taxes paid (1,111) (971) (818) (883) (1,001) (1,331) (1,587) (1,992) (2,564) (2,974)
Net PAT 2,057 1,768 652 850 1,610 1,915 3,048 3,825 4,926 5,714
Key ratios (%)
EBITDA margin 10.3 8.0 5.5 6.2 6.0 8.0 9.3 9.5 9.5 9.4
PAT margin 4.6 3.0 0.9 1.1 1.9 2.2 3.5 3.8 4.0 4.1
Effective tax rate 35.1 35.5 55.6 51.0 38.3 41.0 34.2 34.2 34.2 34.2
Earnings per share (Rs) 8.0 6.9 2.5 3.3 6.3 7.4 11.9 14.9 19.2 22.2
Balance sheet
Shareholders funds 9,466 11,078 11,472 11,916 13,298 15,119 15,864 19,085 23,233 28,045
Equity share capital 514 514 514 514 514 514 514 514 514 514
Reserves & surplus 8,952 10,564 10,958 11,402 12,784 14,605 15,349 18,571 22,719 27,530
Loan funds 14,322 12,392 16,690 21,273 21,894 25,144 19,981 23,481 26,481 27,981
Deferred tax liability 497 513 621 514 527 421 1,240 1,240 1,240 1,240
Total source of funds 24,285 23,983 28,783 33,702 35,719 40,684 37,085 43,806 50,954 57,266
Net fixed assets 8,409 9,348 10,114 9,922 8,811 8,598 9,216 9,221 9,096 8,841
Goodwill on consolidation 2,812 3,209 3,424 3,778 3,943 4,180 1,910 1,910 1,910 1,910
Cash balances 1,614 2,102 1,556 1,440 2,063 1,113 2,080 5,558 9,019 11,317
Net current assets excluding cash 11,450 9,324 13,689 18,562 20,902 26,794 22,575 25,662 29,325 33,394
Total application of funds 24,285 23,983 28,783 33,702 35,719 40,684 37,085 43,806 50,954 57,266
Cash flow statement
Operating profit before working capital changes 3,541 3,695 3,157 4,188 5,579 5,565 6,881 8,014 9,650 10,967
Change in working capital/other adjustments (3,149) 2,126 (4,365) (4,873) (2,340) (5,891) 4,219 (3,087) (3,663) (4,069)
Net cash flow from operating activites 392 5,821 (1,209) (686) 3,239 (327) 11,100 4,927 5,987 6,897
Cash (used)/realised in investing activities (4,429) (1,815) (1,542) (866) 65 (899) (950) (1,650) (1,650) (1,700)
Free cash flow (OCF + net capex) (4,067) 4,006 (2,751) (1,552) 3,305 (1,226) 11,454 3,427 4,487 5,397
Cash (used)/realised in financing activities 4,917 (3,858) 2,098 1,725 (2,695) 382 (10,002) 202 (876) (2,900)
Cash generated/utilised 916 164 (546) (116) 623 (951) 967 3,479 3,461 2,298
Net cash at end of year 1,614 1,777 1,556 1,440 2,063 1,113 2,080 5,558 9,019 11,317

For Private Circulation Only. FOR IMPORTANT INFORMATION ABOUT KOTAK SECURITIES’ RATING SYSTEM AND OTHER DISCLOSURES, REFER TO THE END OF THIS MATERIAL.
Kotak Institutional Equities Research [email protected] Mumbai: +91-22-4336-0000
Standalone: Gains from steady growth levered up by improving working capital
More than the expectedly strong 18% growth in EBITDA in 4QFY17, KPTL surprised positively
by maintaining debt levels yoy despite growing top-line 14% yoy. This was likely led by increase
in customer advances, more than negating the deterioration in debtor days. Related sharp
decline in interest cost coupled with a slightly lower tax rate led to a strong 36% growth in
PAT. Full-year financials were not very different with 14%/17%/40% growth in
revenues/EBITDA/PAT. We expect a stronger 17%/18%/23% growth in these metrics in
FY2018, broadly in line with guidance; backlog at ~2X trailing revenues provides comfort.
Subsidiaries: JMC benefitting from strong cash profits; Shubham worsens
JMC’s reported modest growth in execution, stabilizing margin and sharp decline in interest
cost in 4QFY17. It generated Rs1 bn of cash profits in FY2017, leading to a debt decline of
Rs0.7 bn in the year. Prospects for ordering appear strong as the company goes international
for both civil construction and infrastructure orders. JMC expects the same to drive strong
growth in orders to Rs45 bn in FY2018 (static at Rs30 bn for the past three years); guided for a
15-20% revenue growth with improving margin. Shubham Logistics ended the year on a weak
note. Full-year cash loss at Rs0.6 bn would have consumed most of the Rs0.75 bn infused
earlier by KPTL. KPTL expects the entity to reach EBITDA breakeven in FY2018.
Funding into assets to be a mix of equity and loss funding; cash cow in standalone comforts
KPTL highlighted funding of ~Rs1.7/3.7 bn from the standalone entity required over the next
one/three years, comprising (1) recently won T&D BOOT assets (Rs3 bn in all) and (2) Shubham
(potentially another Rs0.7 bn in FY2018). We ascribe a conservative 1X book value to such T&D
investments (despite historical 15-16% RoE profile) and almost nil value for the investments in
Shubham. Standalone balance sheet has absorbed a similar Rs4 bn increase in investments/L&A
over FY2013-17 while maintaining debt levels and growing business 1.5X.
Broadly maintain operational estimates; build in benefit of declining working capital
We maintain our estimates for EBITDA though build in further decline in working capital (less
support to subsidiaries) to 65 days of sales from 77 days at end-FY2017, on normalization of
retention money. This leads to ~6% higher EPS estimates for FY2018E-19E.
Kalpataru Power Transmission (KPP) Industrials
Resilient performance. Beyond a steady operational year in FY2017, what is
noteworthy is KPTL maintaining standalone debt at FY2013 levels despite large
investments and revenues becoming 1.5X. Similar scope of further investments
notwithstanding, we envisage a similar scale-up in business over FY2017-20E to help
achieve guidance for 20% pre-tax RoCE. Business concentration is the key risk, with
Africa accounting for 36% of standalone backlog. Build in positive surprise in working
capital and a further decline by 10 days of sales; revise TP to Rs400 (from Rs370).
BUY
MAY 22, 2017
RESULT
Coverage view: Cautious
Price (`): 352
Target price (`): 400
BSE-30: 30,465
Aditya Mongia [email protected]
Mumbai: +91-22-4336-0884
Ajinkya Bhat [email protected]
Mumbai: +91-22-4336-0883
Kalpataru Power Transmission
Stock data Forecasts/Valuations 2017 2018E 2019E
52-week range (Rs) (high,low) EPS (Rs) 14.2 16.8 25.1
Market Cap. (Rs bn) EPS growth (%) 85.5 18.5 49.2
Shareholding pattern (%) P/E (X) 24.8 20.9 14.0
Promoters 59.5 Sales (Rs bn) 75.1 88.5 103.9
FIIs 6.1 Net profits (Rs bn) 2.2 2.6 3.9
MFs 18.2 EBITDA (Rs bn) 8.7 10.7 12.6
Price performance (%) 1M 3M 12M EV/EBITDA (X) 8.9 7.6 6.2
Absolute 4.5 24.8 55.8 ROE (%) 9.2 10.3 13.9
Rel. to BSE-30 0.6 16.6 29.9 Div. Yield (%) 0.6 0.6 0.6
Company data and valuation summary
368-207
54.0

Industrials Kalpataru Power Transmission
76 KOTAK INSTITUTIONAL EQUITIES RESEARCH
Exhibit 1: KPTL (standalone) 4QFY17 – key numbers (Rs mn)
Source: Company, Kotak Institutional Equities estimates
Exhibit 2: Standalone balance sheet of KPTL, March fiscal year-ends, 2013-2017 (Rs mn)
Source: Company, Kotak Institutional Equities
4QFY17 4QFY17E 4QFY16 3QFY17 vs est. yoy qoq FY2017 FY2016 % change FY2018E FY2017 % change
Sales 15,225 15,734 13,572 11,576 (3.2) 12.2 31.5 50,107 44,088 13.7 58,617 50,107 17.0
Expenses (13,653) (14,136) (12,244) (10,385) (3.4) 11.5 31.5 (44,816) (39,557) 13.3 (52,303) (44,816) 16.7
Stock 89 - (439) (171) (120.3) (151.9) (11) (1,038) (98.9) - (11) (100.0)
Raw material & mfg exp. (10,764) - (9,304) (7,603) 15.7 41.6 (34,294) (29,137) 17.7 (40,130) (34,294) 17.0
Employee expenses (708) - (725) (740) (2.4) (4.3) (2,918) (2,928) (0.3) (3,414) (2,918) 17.0
Other operating expenses (2,270) - (1,776) (1,871) 27.8 21.3 (7,594) (6,455) 17.6 (8,759) (7,594) 15.4
EBITDA 1,573 1,598 1,327 1,191 (1.6) 18.5 32.1 5,291 4,531 16.8 6,314 5,291 19.3
Other income 102 132 128 115 (22.6) (20.1) (11.3) 493 537 (8.1) 561 493 13.6
Interest (198) (237) (230) (239) (16.4) (13.8) (17.1) (982) (1,274) (22.9) (1,044) (982) 6.4
Depreciation (193) (226) (208) (195) (14.5) (7.4) (1.3) (777) (837) (7.2) (889) (777) 14.4
PBT 1,284 1,268 1,017 871 1.3 26.3 47.3 4,026 2,957 36.1 4,941 4,026 22.7
Tax (388) (436) (361) (300) (11.1) 7.5 29.3 (1,335) (1,033) 29.3 (1,638) (1,335) 22.7
Net profit 896 831 656 571 7.8 36.5 56.8 2,691 1,924 39.8 3,302 2,691 22.7
Order details (Rs mn)
Order inflows 28,500 13,500 576 111.1 NM 62,000 74,500 (16.8) 73,489 62,000 19
Order backlog 90,000 83,000 83,000 8.4 8.4 90,000 83,000 8.4 104,872 90,000 17
Key ratios (%)
Raw material cost/sales 70.1 71.8 67.2 68.5 68.4 68.5 68.5
Employee expenses/sales 4.6 5.3 6.4 5.8 6.6 5.8 5.8
Other operating exp./sales 14.9 13.1 16.2 15.2 14.6 14.9 15.2
EBITDA margin 10.3 10.2 9.8 10.3 10.6 10.3 10.8 10.6
PBT margin 8.4 8.1 7.5 7.5 8.0 6.7 8.4 8.0
PAT margin 5.9 5.3 4.8 4.9 5.4 4.4 5.6 5.4
Tax rate 30.2 34.4 35.5 34.4 33.2 34.9 33.2 33.2
EPS (Rs) 5.8 5.4 4.3 3.7 17.5 12.5 21.5 17.5
% change
Ind-AS Ind-AS Ind-AS
Mar-13 Sep-13 Mar-14 Sep-14 Mar-15 Sep-15 Mar-16 Sep-16 Mar-17
Shareholder's funds 18,463 19,020 19,542 20,359 20,708 21,721 22,149 23,501 24,767
Share Capital 307 307 307 307 307 307 307 307 307
Reserves & Surplus 18,157 18,714 19,235 20,052 20,401 21,414 21,842 23,194 24,460
Loan funds 5,911 7,482 6,987 7,944 9,106 7,198 5,586 6,150 5,526
Deferred Tax Liability, Net 118 70 138 132 54 23 (259) (280) (410)
Total souce of funds 24,493 26,573 26,667 28,434 29,867 28,942 27,476 29,371 29,883
Net fixed assets and Capital WIP 5,387 5,710 5,918 5,779 5,590 5,274 5,426 5,251 5,239
Investments 3,351 3,351 3,836 3,836 3,939 3,945 5,178 5,986 7,160
Cash & Bank Balances 569 660 647 554 753 585 1,062 3,318 2,110
Current assets 32,280 33,695 35,559 37,658 37,661 39,208 40,525 43,326 46,081
Inventories 4,440 4,449 5,438 6,297 5,989 4,877 4,244 4,452 4,542
Sundry Debtors 13,432 14,816 15,417 16,834 17,836 19,979 23,046 25,023 28,480
Other Current Assets 4,691 5,783 5,878 5,496 5,033 6,012 8,419 9,259 8,205
Loans & Advances 9,718 8,647 8,826 9,032 8,803 8,340 4,816 4,592 4,854
Current liabilities and provisions 17,094 16,842 19,293 19,393 18,075 20,069 24,714 28,510 30,706
Current Liabilities 15,677 15,472 17,581 17,701 15,967 17,760 22,145 25,533 27,504
Provisions 1,417 1,371 1,712 1,693 2,108 2,309 2,569 2,977 3,203
Net current assets ex cash 15,186 16,852 16,266 18,265 19,586 19,139 15,811 14,816 15,375
Total application of funds 24,493 26,573 26,667 28,434 29,867 28,942 27,476 29,371 29,883
Days of sales
Current assets 353 326 320 312 311 312 331 345 336
Inventories 49 43 49 52 49 39 35 35 33
Sundry Debtors 147 143 139 139 147 159 188 199 207
Other Current Assets 51 56 53 46 42 48 69 74 60
Loans & Advances 106 84 79 75 73 66 39 37 35
Current liabilities and provisions 187 163 174 161 149 160 202 227 224
Current Liabilities 172 150 158 147 132 141 181 204 200
Provisions 16 13 15 14 17 18 21 24 23
Net current assets ex cash 166 163 146 151 162 152 129 118 112
Net current assets ex cash (excl. subs L&A) 115 120 107 115 122 114 90 80 77

Kalpataru Power Transmission Industrials
KOTAK INSTITUTIONAL EQUITIES RESEARCH 77
Exhibit 3: JMC 4QFY17 – key numbers, March fiscal year-ends (Rs mn)
Source: Company, Kotak Institutional Equities
Exhibit 4: Debt reduction through NWC improvements will see interest cost reach 1.75% of sales by end-FY2018 Balance sheet highlights of KPTL and JMC, March fiscal year-ends, 2014-4QFY17 (Rs mn)
Source: Company, Kotak Institutional Equities
4QFY17 4QFY16 3QFY17 yoy qoq FY2017 FY2016 % change FY2018E FY2017 % change
Sales 6,904 6,517 5,481 5.9 26.0 23,284 24,007 (3.0) 26,259 23,284 12.8
Expenses (6,319) (5,977) (5,001) 5.7 26.4 (21,173) (21,872) (3.2) (23,922) (21,173) 13.0
Stock - - 31 (145) 50 (145)
Raw material consumption (2,487) (2,558) (2,042) (2.8) 21.8 (8,444) (8,588) (8,444)
Construction expenses (2,707) (2,421) (1,987) 11.8 36.2 (8,777) (9,916) (8,777)
Employee expenses (628) (582) (578) 7.9 8.8 (2,358) (2,256) (2,358)
Other operating expenses (497) (416) (425) 19.4 16.9 (1,450) (1,162) (1,450)
EBITDA 585 540 481 8.4 21.8 2,111 2,135 (1.1) 2,337 2,111 10.7
Other income 25 39 85 (34.3) (70.3) 143 83 72.6 85 143 (40.9)
Interest (188) (267) (211) (29.5) (10.5) (843) (1,051) (19.8) (724) (843) (14.1)
Depreciation (152) (138) (145) 10.5 5.3 (574) (517) 11.0 (619) (574) 7.9
PBT 270 173 211 55.7 28.1 838 650 28.9 1,078 838 28.7
Tax (91) (57) (29) 59.5 217.4 (244) (217) 12.6 (358) (244) 46.6
Net profit 179 116 182 53.9 (1.9) 594 433 37.0 720 594 21.3
Key ratios (%)
Direct expenses/sales 75.2 76.4 72.9 74.6 76.9 74.6
Employee expenses/sales 9.1 8.9 10.5 10.1 9.4 10.1
Other operating expenses/sales 7.2 6.4 7.8 6.2 4.8 6.2
EBITDA margin 8.5 8.3 8.8 9.1 8.9 8.9 9.1
PBT margin 3.9 2.7 3.8 3.6 2.7 4.1 3.6
Tax rate 33.9 33.1 13.7 29.1 33.3 33.2 29.1
PAT margin 2.6 1.8 3.3 2.6 1.8 2.7 2.6
% change
Ind-AS Ind-AS Ind-AS Ind-AS Ind-AS Ind-AS Ind-AS Ind-AS
FY2014 FY2015 1QFY16 2QFY16 3QFY16 4QFY16 1QFY17 2QFY17 3QFY17 4QFY17 yoy qoq
KPTL
Loan funds 7,850 9,714 7,749 7,805 6,561 5,987 5,298 7,615 7,154 6,955 968 (199)
Long-term borrowings 677 2,943 2,867 2,941 2,801 2,716 3,023 2,404 2,334 3,212 496 878
Short-term borrowings 6,310 6,163 4,275 4,257 3,362 2,870 1,829 3,746 3,420 2,315 (555) (1,105)
Current maturities of LT debt 863 608 607 607 398 401 446 1,465 1,400 1,428 1,027 28
JMC
Loan funds 4,294 6,688 7,195 8,216 8,011 7,360 7,526 7,763 7,067 6,363 (997) (704)
Long-term borrowings 2,236 3,108 2,903 2,618 3,129 2,819 2,675 2,431 2,155 2,313 (506) 158
Short-term borrowings 1,345 2,684 3,251 4,593 3,717 3,362 3,713 4,176 3,734 3,391 29 (343)
Current maturities of LT debt 713 896 1,041 1,005 1,165 1,179 1,138 1,156 1,178 659 (520) (519)
Shubham Logistics
Loan funds 3,191 3,640 4,407 4,828 4,765 4,952 4,487 4,253 4,283 4,248 (704) (35)
Long-term borrowings 2,596 3,045 3,008 3,596 3,120 3,720 3,839 3,877 3,891 3,857 137 (34)
Short-term borrowings 412 412 822 667 1,061 667 79 121 103 65 (602) (38)
Current maturities of LT debt 183 183 577 565 584 565 569 255 289 326 (239) 37
Change

Industrials Kalpataru Power Transmission
78 KOTAK INSTITUTIONAL EQUITIES RESEARCH
Exhibit 5: We envisage pre-tax RoACE on reported/adjusted basis to become 21%/24% by end-
FY2020 Comparison of pre-tax RoACE for KPTL, both on a reported and adjusted basis, March fiscal year-ends, 2010-2020E (%)
Notes:
(a) We have adjusted ACE f investments and L&A support given to subsidiaries and also excluded any related
income booked.
Source: Company, Kotak Institutional Equities estimates
4QFY17 earnings call takeaways
Domestic growth was strong in FY2017, international will take over in FY2018.
The management is optimistic about prospects from international revenues growth in the
coming year. In FY2017, domestic revenue growth stood at 20% yoy while international
growth was lower at 5-10% yoy. However, the increased share of international orders in
the backlog (52% as of end-FY2017) will likely help international revenues grow faster
than domestic business in the coming year. The company has further announced order
inflows of Rs14.5 bn so far in FY2018 and holds L1 position on ~Rs20 bn worth of
contracts (70% international, 30% domestic). The company is witnessing increased
traction in Africa, CIS and South-East Asian countries. Middle East contracts will be
considered prudently if there is reasonable certainty on cash flows.
T&D business steady, focus on railways and substations. KPTL’s T&D business was up
12% yoy in FY2017 while other segments grew much faster as per the management. The
company received order inflows of ~Rs5.8 bn from railways in FY2017 and clocked
revenues of ~Rs3.3 bn. The management targets (and expects) revenues from railways to
double to ~Rs6.5 bn in FY2018. Further, the company has also garnered a substation
order book in excess of Rs7 bn. After venturing in the substations space four years ago,
the company has come a long way with experience in 220kV, 400 kV and GIS
substations. Several projects are tendered as a bundle of transmission line and substation
packages where the company can internally cover the whole project scope.
Working capital and interest cost improvements to continue. Receivables for the
company marginally increased to 207 days of sales as of end-FY2017 but the company
targets to bring it back to ~190 days by end FY2018. As working capital improvements
materialize, the company may further deleverage. The management cited that the
standalone debt has stayed in the range of Rs5-6 bn in FY2017 (same range as FY2016)
despite a double-digit revenue growth. The company targets to bring down interest cost
to 1.75% of revenues by end-FY2018 (vs 2% in FY2017).
1918
17
1415 14
19
2324 24 24
2221
17
14 14 1314
1719
2021
0
5
10
15
20
25
30
2010 2011 2012 2013 2014 2015 2016 2017 2018E 2019E 2020E
Unadjusted Adjusted for investments/L&A and income from subsidiaries

Kalpataru Power Transmission Industrials
KOTAK INSTITUTIONAL EQUITIES RESEARCH 79
JMC targets metro projects, OI of Rs40-45 bn in FY2018. The management confirmed
that JMC has submitted bids for two lines of Mumbai metro along with undisclosed
partners. JMC Projects targets order inflows of Rs40-45 bn in FY2018. Overall on the
infrastructure side of the business, the company is looking at metros, roads, flyovers and
water projects for more opportunities.
JMC roads still not cash breakeven. The company saw cash collections of Rs4.8mn/day
as its share for BOT road projects in FY2017, still below the breakeven of Rs5.5 mn/day at
EBITDA level and Rs7 mn/day at PBT level. The company got certain refunds from some
government departments in FY2017 that helped keep borrowings in check.
Update on Shree Shubham Logistics. The logistics business faced one of the worst
years in FY2017 with lowest utilization levels and reduced tariffs, partly led by certain
government actions. The company expects 30-40% revenue growth on this low base in
FY2018 and hopes to achieve positive EBITDA. Breakeven at the PBT level is, however, still
some time away as per the management.
Guidance for FY2018.
KPTL (standalone). The management expects order inflow of Rs75-80 bn in FY2018
and Rs80-90 bn in FY2019 (vs Rs62 bn in FY2017). The company expects to clock a
revenues growth of 15-20% with a steady 10.5-11% EBITDA margin.
JMC Projects. JMC Projects expects order inflow of Rs45-50 bn in FY2018 and
FY2019. JMC also expects to achieve revenue growth of 15-20% with 9%+ EBITDA
margin for the next two years.
Shree Shubham Logistics. As mentioned previously, the management expects 30-
40% yoy revenue growth in FY2018 on the low base of FY2017. EBITDA breakeven
will be achieved in FY2018 while PBT breakeven is still some time away. SSL has not
benefited from decline in interest rates as the banks are unwilling to reduce rates for
the company given its performance and credit ratings.
Further equity infusions to be limited. The company would need to make equity
contribution of Rs1-1.5 bn in T&D BOT projects (Rs3 bn in coming 3 years), infuse funds
of Rs300-400 mn for JMC BOT projects and Rs500-700 mn for Shree Shubham Logistics
in FY2018. However, beyond these, the management expects internal accruals to be
sufficient to fund incremental business.
Other takeaways.
While the company keeps exploring strategic partners and other monetization options
for BOT projects, it is not considering InvIT at the moment. The current focus of the
management is on improving operating metrics of the BOT projects.
Thane and Indore realty projects are progressing well for the company and it may look
to exit part of the project in Thane.
60% of order book of KPTL has price escalation clauses that may protect the company
from commodity price variations.

Industrials Kalpataru Power Transmission
80 KOTAK INSTITUTIONAL EQUITIES RESEARCH
Exhibit 6: Strong order inflow of Rs28.5 bn in 4QFY17 led to the backlog-growth towards the end of FY2017; share of international
orders has significantly picked up Geographical split of KPTL (standalone) backlog, March fiscal year-ends, 4QFY16-4QFY17 (%)
Source: Company, Kotak Institutional Equities
Exhibit 7: Revision in estimates of KPTL standalone, March fiscal year-ends, 2016-19E (Rs mn)
Source: Company, Kotak Institutional Equities estimates
Domestic48%
Africa36%
CIS3%
SAARC/MENA/others13%
Standalone 4QFY17-end backlog (Rs90 bn)
Domestic66%
Africa14%
CIS3%
Others2%
SAARC/MENA/others15%
Standalone 4QFY16-end backlog (Rs84 bn)
2016 2017 2018E 2019E 2018E 2019E 2018E 2019E
Income statement
New orders 73,817 57,457 73,489 85,236 77,618 89,261 (5.3) (4.5)
Yoy growth (%) 142.8 (22.2) 27.9 16.0 35.1 15.0
Gross revenue 44,714 50,107 58,617 68,266 59,083 69,707 (0.8) (2.1)
Yoy growth (%) (0.5) 12.1 17.0 16.5 17.9 18.0
EBITDA 4,669 5,291 6,260 7,313 6,301 7,440 (0.7) (1.7)
EBITDA margin (%) 10.4 10.6 10.7 10.7 10.7 10.7 1 bps 3 bps
Other income 508 493 561 703 528 485 6.2 45.1
PBDIT 5,177 5,785 6,821 8,016 6,829 7,925
Interest & finance charges (1,275) (982) (1,044) (1,135) (1,146) (1,301) (8.9) (12.8)
Depreciation (837) (777) (836) (909) (920) (998)
PBT 3,065 4,026 4,941 5,972 4,763 5,626 3.7 6.2
Tax (1,070) (1,335) (1,638) (1,983) (1,619) (1,868)
PAT 1,995 2,691 3,302 3,989 3,144 3,758 5.1 6.2
Standalone EPS (Rs) 13.0 17.5 21.5 26.0 20.5 24.5 5.1 6.2
New estimates Old estimates % revision

Kalpataru Power Transmission Industrials
KOTAK INSTITUTIONAL EQUITIES RESEARCH 81
Exhibit 8: Standalone income statement of KPTL, March fiscal year-ends, 2010-20E (Rs mn)
Source: Company, Kotak Institutional Equities estimates
2010 2011 2012 2013 2014 2015 2016 2017 2018E 2019E 2020E
FY2017-20
CAGR (%)
Income statement
Net revenue 26,316 28,741 30,327 33,354 40,553 44,223 44,714 50,107 58,617 68,266 78,980 16
Yoy growth (%) 39.8 9.2 5.5 10.0 21.6 9.1 1.1 12.1 17.0 16.5 15.7
Expenditure (23,246) (25,390) (27,035) (30,133) (36,690) (39,955) (40,045) (44,816) (52,357) (60,953) (70,456)
Material cost (11,448) (12,768) (14,886) (16,492) (19,095) (19,253) (16,842) (34,294) (40,130) (46,736) (54,071)
Manufacturing & operating exp. (8,387) (8,641) (7,347) (8,551) (10,414) (11,974) (12,775) - - - -
Employee expenses (1,560) (1,934) (1,702) (2,006) (2,602) (3,136) (2,932) (2,918) (3,414) (4,779) (5,529)
Admin and other expenses (1,747) (1,922) (2,956) (3,885) (5,011) (5,980) (6,458) (7,594) (8,813) (9,438) (10,856)
EBITDA 3,070 3,350 3,292 3,221 3,863 4,267 4,669 5,291 6,260 7,313 8,524 17
EBITDA margin (%) 11.7 11.7 10.9 9.7 9.5 9.6 10.4 10.6 10.7 10.7 10.8
Other income 346 511 512 477 484 522 508 493 561 703 816
Interest & finance charges (758) (836) (1,082) (1,220) (1,460) (1,409) (1,275) (982) (1,044) (1,135) (1,135)
Depreciation (382) (459) (481) (523) (696) (852) (837) (777) (836) (909) (982)
PBT 2,276 2,566 2,241 1,955 2,191 2,529 3,065 4,026 4,941 5,972 7,223
Tax (571) (660) (592) (579) (727) (873) (1,070) (1,335) (1,638) (1,983) (2,398)
PAT 1,705 1,906 1,649 1,377 1,464 1,656 1,995 2,691 3,302 3,989 4,825 21
EPS (Rs) 11.1 12.4 10.7 9.0 9.5 10.8 13.0 17.5 21.5 26.0 31.4
Balance sheet
Shareholder funds 9,881 15,911 17,429 18,463 19,542 20,708 22,585 24,767 27,711 31,341 35,807
Share capital 265 307 307 307 307 307 307 307 307 307 307
Reserves & surplus 9,616 15,604 17,122 18,156 19,235 20,401 22,279 24,460 27,404 31,034 35,500
Loan funds 6,043 4,531 4,721 5,911 7,850 9,714 5,987 5,526 7,000 7,000 7,000
Deferred tax liabilities 141 107 98 118 138 54 4 (410) (410) (410) (410)
Total sources of funds 16,065 20,548 22,248 24,492 27,529 30,475 28,576 29,883 34,300 37,930 42,396
Total net fixed assets 3,385 3,740 4,529 5,386 5,918 5,590 5,426 5,239 5,114 5,205 5,223
Investments 1,265 3,956 4,049 3,351 3,836 3,939 4,949 7,160 8,435 9,370 10,660
Cash and bank balance 369 1,443 1,034 569 647 753 1,066 2,110 4,118 7,726 10,375
Net current assets 11,046 11,410 12,636 15,186 17,129 20,193 17,136 15,375 16,573 15,569 16,079
Total application of funds 16,065 20,548 22,248 24,492 27,530 30,475 28,576 29,883 34,300 37,930 42,396
Industrials Kalpataru Power Transmission
82 KOTAK INSTITUTIONAL EQUITIES RESEARCH
Exhibit 9: JMC Projects’ standalone financials, March fiscal year-ends, 2010-20E (Rs mn)
Source: Company, Kotak Institutional Equities estimates
2010 2011 2012 2013 2014 2015 2016 2017 2018E 2019E 2020E
Income statement
Total revenue 13,092 13,738 20,764 25,419 26,588 23,999 24,837 23,284 26,976 32,479 37,858
Yoy growth (%) 0.0 4.9 51.1 22.4 4.6 (9.7) 3.5 (6.3) 15.9 20.4 16.6
Total expenditure (12,045) (12,614) (19,222) (24,234) (25,186) (22,365) (22,756) (21,173) (24,494) (29,491) (34,375)
Increase/(decrease) in WIP (61) 71 373 147 175 241 (594) (145)
Cost of materials (4,827) (4,354) (8,131) (8,506) (8,824) (8,593) (8,588) (8,444)
Construction and mining expenses (5,403) (6,317) (8,849) (13,127) (13,495) (10,776) (10,292) (8,777)
Employee expenses (971) (1,255) (1,421) (1,480) (1,689) (2,003) (2,244) (2,358)
Other operational expenses (783) (759) (1,193) (1,268) (1,353) (1,235) (1,038) (1,450)
EBITDA 1,047 1,124 1,542 1,185 1,402 1,634 2,081 2,111 2,482 2,988 3,483
EBITDA margin (%) 8.0 8.2 7.4 4.7 5.3 6.8 8.4 9.1 9.2 9.2 9.2
Other income 118 129 112 72 41 132 64 143 85 110 135
Interest and finance charges (285) (338) (539) (550) (551) (841) (1,019) (843) (724) (841) (958)
Depreciation (348) (395) (471) (549) (589) (489) (512) (574) (619) (661) (709)
PBT 532 520 644 159 302 436 614 838 1,224 1,597 1,951
Tax expenses (135) (103) (124) 24 (72) (138) (204) (244) (406) (530) (648)
PAT 397 418 519 183 230 299 410 594 818 1,067 1,304
Balance sheet
Shareholder funds 2,507 3,746 4,225 4,371 4,554 4,763 6,610 6,897 7,636 8,624 9,849
Share capital 218 261 261 261 261 261 336 336 336 336 336
Reserves & surplus 2,290 3,485 3,963 4,110 4,293 4,502 6,274 6,562 7,301 8,288 9,513
Loan funds 1,699 1,867 2,884 4,010 4,294 6,688 6,290 5,704 6,704 7,704 8,704
Deferred tax liability (net) 71 38 (78) (175) (166) (153) (304) (363) (363) (363) (363)
Total sources of funds 4,278 5,650 7,031 8,206 8,682 11,298 12,595 12,238 13,977 15,965 18,190
Total net fixed assets 2,174 2,312 2,742 2,596 2,841 3,183 3,510 3,706 3,520 3,464 3,421
Investments 69 869 1,178 1,707 1,878 1,891 1,892 1,797 1,797 1,797 1,797
Cash & bank balance 154 272 186 245 240 147 119 260 1,027 1,662 2,448
Net current asset (excl. cash) 1,872 2,196 2,924 3,658 3,722 6,077 7,075 6,475 7,633 9,042 10,524
Total application of funds 4,278 5,650 7,031 8,206 8,682 11,298 12,596 12,239 13,977 15,965 18,190

Kalpataru Power Transmission Industrials
KOTAK INSTITUTIONAL EQUITIES RESEARCH 83
Exhibit 10: Profit and loss, balance sheet and cash-flow statement of KPTL (consolidated), March fiscal year-ends, 2010-20E (Rs mn)
Source: Company, Kotak Institutional Equities estimates
Exhibit 11: We arrive at a March 2019E EPS-based SoTP of Rs400
Source: Company, Kotak Institutional Equities estimates
2010 2011 2012 2013 2014 2015 2016 2017 2018E 2019E 2020E
Income statement
Net reveneus 40,319 43,547 53,080 60,850 70,903 71,982 73,804 75,125 88,464 103,881 119,566
Expenditure (35,914) (38,716) (48,076) (56,106) (65,006) (64,939) (65,734) (66,451) (77,738) (91,329) (105,037)
EBITDA 4,404 4,830 5,004 4,745 5,897 7,043 8,070 8,674 10,726 12,551 14,529
Other income 247 418 333 357 233 250 188 240 152 454 759
Interest & finance charges (1,260) (1,469) (1,576) (1,938) (2,488) (3,370) (4,394) (3,845) (4,449) (4,680) (4,501)
Depreciation (745) (880) (986) (1,224) (1,490) (1,683) (2,018) (1,805) (2,313) (2,430) (2,440)
PBT 2,647 2,899 2,774 1,940 2,153 2,241 1,847 3,264 4,116 5,896 8,346
Tax (691) (773) (735) (595) (914) (1,086) (1,013) (1,375) (1,730) (2,119) (2,588)
PAT 1,777 2,001 1,887 1,295 1,222 1,204 1,175 1,864 2,321 3,637 5,486
Key ratios (%)
EBITDA margin 10.9 11.1 9.4 7.8 8.3 9.8 10.9 11.5 12.1 12.1 12.2
PAT margin 4.4 4.6 3.6 2.1 1.7 1.7 1.6 2.5 2.6 3.5 4.6
Effective tax rate 26.1 26.7 26.5 30.7 42.4 48.5 54.9 42.1 42.0 36.0 31.0
EPS (Rs) 11.6 13.0 12.3 8.4 8.0 7.8 7.7 12.1 15.1 23.7 35.8
Balance sheet
Shareholder funds 10,271 16,430 18,514 19,473 20,991 22,166 23,259 24,221 26,183 29,460 34,588
Share capital 265 307 307 307 307 307 307 307 307 307 307
Reserves & surplus 10,006 16,123 18,207 19,166 20,685 21,859 22,952 23,914 25,876 29,153 34,281
Minority interest 1,254 1,120 1,286 1,316 1,436 1,422 1,561 1,507 1,310 1,231 1,333
Loan funds 9,014 8,318 12,812 18,313 27,314 36,841 30,864 25,728 31,699 31,981 28,120
Deferred tax liabilities 196 139 30 (24) 96 90 (415) (42) (42) (42) (42)
Total sources of funds 20,735 26,007 32,642 39,078 49,837 60,519 55,270 51,413 59,150 62,631 63,998
Total net fixed assets 8,739 10,828 14,955 23,177 30,376 35,816 36,920 36,920 40,690 39,794 34,313
Investments 66 1,357 836 112 102 113 114 447 447 447 447
Goodwill on consolidation 83 202 202 202 202 201 202 202 202 202 202
Cash and bank balance 557 1,873 1,720 1,029 1,172 1,381 1,525 2,630 4,482 8,778 14,306
Net current assets 11,281 11,745 14,929 14,559 17,986 23,007 16,511 11,215 13,330 13,411 14,731
Miscellaneous expenditure 9 2 — — — — — — — — —
Total application of funds 20,735 26,007 32,642 39,078 49,837 60,519 55,270 51,413 59,150 62,631 63,998
Cash flow statement
Operating cash before working capital changes 3,961 4,475 4,602 4,506 5,216 6,207 7,245 7,539 9,148 10,886 12,700
Change in working capital/other adjustments 841 (464) (3,184) 370 (3,427) (5,021) 6,496 5,295 (2,115) (81) (1,320)
Net cash flow from operating activities 4,802 4,011 1,418 4,877 1,789 1,186 13,741 12,834 7,034 10,806 11,380
Cash (used)/realised in investing activities (3,004) (4,198) (4,584) (8,668) (8,499) (7,014) (3,122) 3,346 (11,568) (1,534) 3,040
Free cash flow 1,830 1,103 (3,686) (4,516) (6,720) (5,816) 10,620 16,514 (4,534) 9,271 14,420
Earnings
/book
Valn
multiple Value
KPTL
share
Value for
KPTL share
Per share
value
(Rs mn) (X) (Rs mn) (%) (Rs mn) (Rs) Valuation basis
Kalpataru valuation
Core construction business (Ex-other income from subs)3,517 13.0 45,723 100.0 45,723 298 13X Mar-19E EPS
Investments (Ex-JMC)
Jhajjar KT Transco 3,136 49.7 1,558 10 Mar-19E valuation
Satpura Transco 1,491 100.0 1,491 10 Mar-19E valuation
Shubham Logistics 741 1.0 741 80.0 593 4 Mar-19E book value
Energylink (Indore commercial-residential project) 1,860 0.8 1,488 100.0 1,488 10 0.8X investment
Amber Real Estate (Thane commercial project) 748 0.8 598 100.0 598 4 0.8X investment
Other investments (incl. recent BOOT wins) 3,523 0.8 2,818 100.0 2,818 18 0.8 X book
Internal loans to subsidiaries (Shubham and others) 631 1.0 631 100.0 631 4 1 X loan
Investments total 10,903 9,177 60
JMC valuation
Core construction business 1,067 8.0 8,532 67.2 5,734 37 8X Mar-19E earnings
Kurukshetra Expressway 1,958 33.6 658 4 Mar-19E valuation
Brij Bhoomi Expressway 78 67.2 52 0 Mar-19E valuation
Wainganga Expressway (2,233) 67.2 (1,500) (10) Mar-19E valuation
Vindhyachal Expressway 1,155 67.2 776 5 Mar-19E valuation
Internal loans to road SPVs 3,435 67.2 2,308 15 Mar-18E adjustment
JMC total 10,340 6,422 42 20% hold co. discount on SOTP
Total value 66,966 61,323 400

For Private Circulation Only. FOR IMPORTANT INFORMATION ABOUT KOTAK SECURITIES’ RATING SYSTEM AND OTHER DISCLOSURES, REFER TO THE END OF THIS MATERIAL.
Kotak Institutional Equities Research [email protected] Mumbai: +91-22-4336-0000
4QFY17 results were operationally weaker than estimates
Bajaj Auto reported 4QFY17 EBITDA of `9.1 bn (down 21% yoy), which was 4% below our
estimates due to sequential decline in gross margin (-100 bps qoq) and increase in other
expenses. Revenues declined by 8.7% yoy (3% above estimate) led by 9.7% yoy decline in
volumes while net realizations increased by 1.3% yoy due to 9% yoy increase in domestic
average selling prices. Export volumes declined by 3% yoy while export ASPs slipped by 9.6%
yoy as the company reduced prices in African market. Volume decline for the company in
4QFY17 was driven by (1) decline in export volumes (down 3% yoy) and (2) 30% yoy decline in
domestic three-wheeler volumes largely due to industry slowdown post demonetization.
Reported EBITDA margin came in at 18.5% (down 300 bps yoy and 210 bps qoq), which was
140 bps below our estimates. The company indicated that raw material costs impacted gross
margin this quarter and other expenses increased sequentially led by – (1) `160 mn
compensation to dealers to support incentives due to shift from BS-III to BS-IV technology and
(2) `730 mn CSR spend in 4QFY17 versus `200 mn spend in 9MFY17.
Maintains market share in motorcycles in India; export volumes to recover modestly in FY2018
Bajaj has improved its market share in domestic motorcycle market by 120 bps in FY2017 led by
new V motorcycles and market share gain in the economy segment. The company has managed
to increase its market share in the economy and executive segments. We expect the market
share to remain static at ~18% in the domestic motorcycle segment in FY2018. We expect
export volumes to recover in FY2018 for Bajaj Auto and forecast a modest 10% yoy growth in
the export two-wheeler segment and 5% yoy growth in three-wheeler exports (post a likely
sharp decline of 32% yoy in FY2017).
Downgrade the stock to REDUCE (from ADD earlier)
Our TP is based on 16X March 2019E core EPS (earlier 17X) + ₹160/share for the company’s
stake in KTM + ₹650/share value of cash and cash equivalents. We have rolled over to March
2019E from December 2018E for target price computation. We have cut our earnings estimates
by 12% led by 5% cut in volumes mainly in domestic two-wheeler and three-wheeler
segments. We also expect EBITDA margin to decline in FY2018 led by rise in commodity costs.
Bajaj Auto (BJAUT) Automobiles
Margins surprised negatively. Bajaj Auto reported EBITDA of `9.1 bn (-21% yoy) in
4QFY17, which was 4% below our estimates. Key negative surprise came from sequential
decline in gross margins due to increase in commodity costs and higher other expenses.
We expect the company to maintain its market share in the domestic motorcycle segment
but expect scooter to outpace motorcycle segment growth. We expect a modest recovery
in export volumes in FY2018. Downgrade to REDUCE (from ADD earlier) with a revised
target price of `2,800 (from `3,050 earlier) led by sharp cut in volumes.
REDUCE
MAY 22, 2017
RESULT, CHANGE IN RECO.
Coverage view: Cautious
Price (`): 2,970
Target price (`): 2,800
BSE-30: 30,465
Hitesh Goel [email protected]
Mumbai: +91-22-4336-0878
Nishit Jalan [email protected]
Mumbai: +91-22-4336-0877
Bajaj Auto
Stock data Forecasts/Valuations 2017 2018E 2019E
52-week range (Rs) (high,low) EPS (Rs) 132.3 136.7 160.3
Market Cap. (Rs bn) EPS growth (%) 4.8 3.4 17.2
Shareholding pattern (%) P/E (X) 22.5 21.7 18.6
Promoters 49.3 Sales (Rs bn) 217.7 235.1 268.8
FIIs 17.6 Net profits (Rs bn) 38.3 39.6 46.4
MFs 2.0 EBITDA (Rs bn) 44.2 46.4 54.5
Price performance (%) 1M 3M 12M EV/EBITDA (X) 16.7 15.3 12.6
Absolute 5.3 7.0 20.8 ROE (%) 26.1 21.9 22.8
Rel. to BSE-30 1.4 0.1 2.0 Div. Yield (%) 1.8 1.8 2.2
Company data and valuation summary
3,120-2,364
860.3
Bajaj Auto Automobiles
KOTAK INSTITUTIONAL EQUITIES RESEARCH 85
Conference call takeaways
The company mentioned that retail growth in domestic motorcycle industry is around 5-
7% yoy currently but it refrained from giving any annual growth guidance for the
industry. As per the management, profitability of domestic motorcycle industry will likely
decline in FY2018E (by around 100 bps) due to cost pressures and potential increase in
customer acquisition costs due to slower industry growth and increase in competitive
intensity.
In the domestic three-wheeler segment, demand environment still remains weak and has
not recovered post demonetization. Delhi and Maharashtra have issued 40,000 new
permits which if materializes could support overall volumes in FY2018E.
The company is cautiously optimistic on growth in export volumes in FY2018E. Demand is
still weaker in markets such as Nigeria and Sri Lanka while outlook is positive in markets
such as Nepal, Latin America, Philippines, Bangladesh, Indonesia, etc. Even Egypt market
is doing well currently but the overall macro-economic scenario still remains uncertain
which can impact volumes negatively in future. Monthly two-wheeler exports to Nigeria is
around 20,000 units currently from peak of 40,000-45,000 units/month
The company has started exports of Dominar 400cc while monthly domestic volumes are
currently in the range of 2,000-3,000 units. The company expects monthly volumes of
7,000 units for the model (including exports) from July 2017 onwards.
Commodity costs will likely increase further in 1QFY18 (by around 100 bps) which will
put further pressure on profitability. In January 2017, the company has taken price
increase of ₹500 in motorcycles and `1,000 in three-wheelers to offset the impact of
change in emission norms from BS-III to BS-IV. The company has not taken in price
increase in 1QFY18 so far.
Export revenues were `78.8 bn in FY2017; down 19% yoy. For 4QFY17, export revenues
were `17.8 bn. USD:INR realization on export revenues was 67 in FY2017 and will likely
remain flat on yoy basis in FY2018E due to hedges taken by the company.
Spare part revenues were ₹27.2 bn in FY2017 (versus ₹25.4 bn in FY2016). The company
mentioned that only 60% of end-market is being addressed by the company currently
while superior/fake products account for 40% of the overall market. The company
continues to expand its distribution reach which should drive 12-15% yoy growth in
spare revenues annually over the next two to three years.
The company will invest capex of around ₹2-3 bn in FY2018 and tax rate will be around
30% (28.3% in FY2017). Tax rate will go up in FY2018 as tax benefits at Pantnagar plant
has expired from April 2017.

Automobiles Bajaj Auto
86 KOTAK INSTITUTIONAL EQUITIES RESEARCH
Exhibit 1: Bajaj Auto’s 4QFY17 results were below our estimates due to increase in incentives to dealers and raw material cost pressure Interim result of Bajaj Auto, March fiscal year-ends (` mn)
Source: Company, Kotak Institutional Equities estimates
(% chg.)
4QFY17 4QFY17E 4QFY16 3QFY17 4QFY17E 4QFY16 3QFY17 FY2017 FY2016 Yoy (%) FY2018E
Volumes (units) 787,627 787,627 872,458 851,645 (9.7) (7.5) 3,665,950 3,893,465 (5.8) 3,899,295
Net realisations 61,010 59,075 60,234 58,423 3.3 1.3 4.4 58,304 56,903 59,302
Net sales 48,053 46,541 52,552 49,756 3.3 (8.6) (3.4) 213,738 221,549 231,237
Operating income 923 1,100 1,075 913 (16.1) (14.2) 1.1 3,932 4,348 3,901
Net sales (including op income) 48,976 47,641 53,627 50,669 2.8 (8.7) (3.3) 217,670 225,897 (3.6) 235,139
Inc/dec in stock 792 — (214) (680) 437 (635) 819
Raw materials (33,995) (31,919) (35,119) (33,160) 4.0 (6.0) (1.9) (146,678) (149,934) (160,358)
Staff costs (2,273) (2,450) (2,024) (2,427) (7.2) 12.3 (6.3) (9,971) (9,171) (10,768)
Other expenses (4,438) (3,800) (4,737) (3,962) 16.8 (6.3) 12.0 (17,234) (18,338) (18,481)
Total expenses (39,913) (38,169) (42,094) (40,230) 4.6 (5.2) (0.8) (173,446) (178,078) (188,788)
EBITDA 9,063 9,471 11,534 10,439 (4.3) (21.4) (13.2) 44,224 47,819 (7.5) 46,350
Other income 2,936 3,100 2,569 3,193 (5.3) 14.3 (8.0) 12,220 10,736 13,424
Interest expense (2) (7) (4) (3) (7.7) (14) (11) —
Depreciation expense (757) (775) (761) (772) (2.3) (0.5) (1.9) (3,073) (3,072) (3,238)
Profit before tax before exceptional 11,239 11,790 13,338 12,858 (4.7) (15.7) (12.6) 53,356 55,473 56,536
Extraordinary expense — — — — — — —
Profit before tax 11,239 11,790 13,338 12,858 (4.7) (15.7) (12.6) 53,356 55,473 (3.8) 56,536
Tax expense (3,218) (3,301) (3,844) (3,612) (2.5) (16.3) (10.9) (15,081) (16,177) (16,961)
Profit after tax 8,021 8,489 9,493 9,246 (5.5) (15.5) (13.2) 38,276 39,297 39,575
Adj PAT 8,021 8,489 9,493 9,246 (5.5) (15.5) (13.2) 38,276 39,297 (2.6) 39,575
Raw material cost as % of net sales 67.8 67.0 65.9 66.8 67.2 66.7 67.8
Staff cost as % of net sales 4.6 5.1 3.8 4.8 4.6 4.1 4.6
Other expenses as % of net sales 9.1 8.0 8.8 7.8 7.9 8.1 7.9
EBITDA margin (%) 18.5 19.9 21.5 20.6 20.3 21.2 19.7
No of shares 289 289 289 289 289 289 289
EPS 27.7 29.3 32.8 31.9 132.3 135.8 136.7
Tax rate (%) 28.6 28.0 28.8 28.1 28.3 29.2 30.0
Revenue breakdown (Rs mn)
Export revenues 17,790 20,210 19,350 (12.0) (8.1) 78,800 97,720 (19.4) 97,720
Export ASPs (Rs/unit) 54,912 60,768 57,144 (9.6) (3.9) 55,837 56,176 (0.6) 62,544
Domestic revenues 31,186 33,417 31,319 (6.7) (0.4) 138,870 128,177 8.3 137,419
Domestic ASPs (Rs/unit) 67,262 61,897 61,047 8.7 10.2 61,591 59,509 3.5 58,804
Volume breakdown (units)
Economy 148,966 148,966 183,819 204,421 (19.0) (27.1) 836,254 863,148 878,067
Executive 68,072 68,072 53,357 68,060 27.6 0.0 334,092 240,098 339,396
Premium 196,501 196,501 231,578 186,946 (15.1) 5.1 831,045 795,683 887,430
Domestic motorcycle 413,539 413,539 468,754 459,427 (11.8) (10.0) 2,001,391 1,898,929 5.4 2,104,892
Platina 77,810 77,810 52,158 126,768 49.2 (38.6) 383,542 275,276
CT 71,156 71,156 131,661 77,653 (46.0) (8.4) 452,712 587,872
Discover/V15 68,072 68,072 53,357 68,060 27.6 0.0 334,092 240,098
KTM 7,713 7,713 7,831 7,713 (1.5) — 33,730 30,356
Pulsar 138,514 138,514 139,761 138,514 (0.9) — 578,467 618,371
Ninja/Avenger/Others 50,274 50,274 83,986 40,719 (40.1) 23.5 218,848 146,956
Export motorcycle 287,478 287,478 283,623 289,534 1.4 (0.7) 1,218,541 1,459,181 (16.5) 1,340,395
Total motorcycle 701,017 701,017 752,377 748,961 (6.8) (6.4) 3,219,932 3,358,110 (4.1) 3,445,287
Domestic 3 wheelers 50,117 50,117 71,129 53,602 (29.5) (6.5) 253,306 254,995 231,987
Export 3 wh 36,493 36,493 48,952 49,082 (25.5) (25.6) 192,712 280,360 222,021
3 wheelers 86,610 86,610 120,081 102,684 (27.9) (15.7) 446,018 535,355 (16.7) 454,008
Total volumes 787,627 787,627 872,458 851,645 (9.7) (7.5) 3,665,950 3,893,465 (5.8) 3,899,295
Volume mix (%)
Economy 18.9 17.6 21.1 24.0 22.8 22.2 22.5
Executive 8.6 9.1 6.1 8.0 9.1 6.2 8.7
Premium 24.9 25.8 26.5 22.0 22.7 20.4 22.8
Domestic motorcycle 52.5 52.5 53.7 53.9 54.6 48.8 54.0
Platina 9.9 17.6 6.0 14.9 10.5 7.1
CT 9.0 — 15.1 9.1 12.3 15.1
Discover/V15 8.6 9.1 6.1 8.0 9.1 6.2
KTM 1.0 1.0 0.9 0.9 0.9 0.8
Pulsar 17.6 17.6 16.0 16.3 15.8 15.9
Ninja/Avenger/Others 6.4 7.2 9.6 4.8 6.0 3.8
Export motorcycle 36.5 36.5 32.5 34.0 33.2 37.5 34.4
Total motorcycle 89.0 89.0 86.2 87.9 87.8 86.2 88.4
Domestic 3 wheelers 6.4 6.4 8.2 6.3 6.9 6.5 5.9
Export 3 wh 4.6 4.6 5.6 5.8 5.3 7.2 5.7
3 wheelers 11.0 11.0 13.8 12.1 12.2 13.8 11.6
Total volumes 100.0 100.0 100.0 100.0 100.0 100.0 100.0
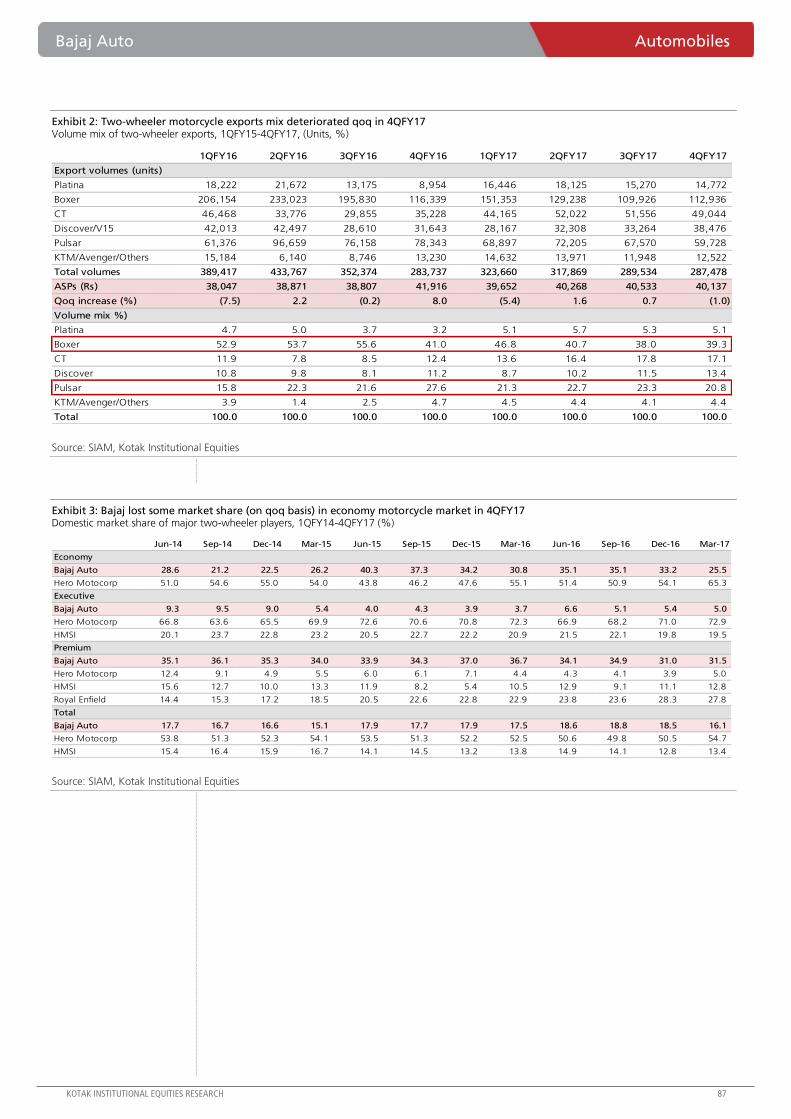
Bajaj Auto Automobiles
KOTAK INSTITUTIONAL EQUITIES RESEARCH 87
Exhibit 2: Two-wheeler motorcycle exports mix deteriorated qoq in 4QFY17 Volume mix of two-wheeler exports, 1QFY15-4QFY17, (Units, %)
Source: SIAM, Kotak Institutional Equities
Exhibit 3: Bajaj lost some market share (on qoq basis) in economy motorcycle market in 4QFY17 Domestic market share of major two-wheeler players, 1QFY14-4QFY17 (%)
Source: SIAM, Kotak Institutional Equities
1QFY16 2QFY16 3QFY16 4QFY16 1QFY17 2QFY17 3QFY17 4QFY17
Export volumes (units)
Platina 18,222 21,672 13,175 8,954 16,446 18,125 15,270 14,772
Boxer 206,154 233,023 195,830 116,339 151,353 129,238 109,926 112,936
CT 46,468 33,776 29,855 35,228 44,165 52,022 51,556 49,044
Discover/V15 42,013 42,497 28,610 31,643 28,167 32,308 33,264 38,476
Pulsar 61,376 96,659 76,158 78,343 68,897 72,205 67,570 59,728
KTM/Avenger/Others 15,184 6,140 8,746 13,230 14,632 13,971 11,948 12,522
Total volumes 389,417 433,767 352,374 283,737 323,660 317,869 289,534 287,478
ASPs (Rs) 38,047 38,871 38,807 41,916 39,652 40,268 40,533 40,137
Qoq increase (%) (7.5) 2.2 (0.2) 8.0 (5.4) 1.6 0.7 (1.0)
Volume mix %)
Platina 4.7 5.0 3.7 3.2 5.1 5.7 5.3 5.1
Boxer 52.9 53.7 55.6 41.0 46.8 40.7 38.0 39.3
CT 11.9 7.8 8.5 12.4 13.6 16.4 17.8 17.1
Discover 10.8 9.8 8.1 11.2 8.7 10.2 11.5 13.4
Pulsar 15.8 22.3 21.6 27.6 21.3 22.7 23.3 20.8
KTM/Avenger/Others 3.9 1.4 2.5 4.7 4.5 4.4 4.1 4.4
Total 100.0 100.0 100.0 100.0 100.0 100.0 100.0 100.0
Jun-14 Sep-14 Dec-14 Mar-15 Jun-15 Sep-15 Dec-15 Mar-16 Jun-16 Sep-16 Dec-16 Mar-17
Economy
Bajaj Auto 28.6 21.2 22.5 26.2 40.3 37.3 34.2 30.8 35.1 35.1 33.2 25.5
Hero Motocorp 51.0 54.6 55.0 54.0 43.8 46.2 47.6 55.1 51.4 50.9 54.1 65.3
Executive
Bajaj Auto 9.3 9.5 9.0 5.4 4.0 4.3 3.9 3.7 6.6 5.1 5.4 5.0
Hero Motocorp 66.8 63.6 65.5 69.9 72.6 70.6 70.8 72.3 66.9 68.2 71.0 72.9
HMSI 20.1 23.7 22.8 23.2 20.5 22.7 22.2 20.9 21.5 22.1 19.8 19.5
Premium
Bajaj Auto 35.1 36.1 35.3 34.0 33.9 34.3 37.0 36.7 34.1 34.9 31.0 31.5
Hero Motocorp 12.4 9.1 4.9 5.5 6.0 6.1 7.1 4.4 4.3 4.1 3.9 5.0
HMSI 15.6 12.7 10.0 13.3 11.9 8.2 5.4 10.5 12.9 9.1 11.1 12.8
Royal Enfield 14.4 15.3 17.2 18.5 20.5 22.6 22.8 22.9 23.8 23.6 28.3 27.8
Total
Bajaj Auto 17.7 16.7 16.6 15.1 17.9 17.7 17.9 17.5 18.6 18.8 18.5 16.1
Hero Motocorp 53.8 51.3 52.3 54.1 53.5 51.3 52.2 52.5 50.6 49.8 50.5 54.7
HMSI 15.4 16.4 15.9 16.7 14.1 14.5 13.2 13.8 14.9 14.1 12.8 13.4

Automobiles Bajaj Auto
88 KOTAK INSTITUTIONAL EQUITIES RESEARCH
Exhibit 4: Our FY2018-19E EPS estimates have been cut sharply Earnings estimates revision, March fiscal year-ends, 2018-19E (` mn, units)
Source: Company, Kotak Institutional Equities estimates
Exhibit 5: Bajaj Auto’s volumes are expected to grow at 8% CAGR over FY2017-20E Bajaj Auto volume projections, March fiscal year-ends, 2013-20E (units, %)
Source: Company, Kotak Institutional Equities estimates
2018E 2019E 2018E 2019E 2018E 2019E
Domestic two-wheelers 2,104,892 2,271,478 2,296,467 2,525,969 (8.3) (10.1)
Domestic three-wheelers 231,987 257,585 289,027 314,189 (19.7) (18.0)
Export two-wheelers 1,340,395 1,501,243 1,287,098 1,415,808 4.1 6.0
Export three-wheelers 222,021 244,119 223,860 257,229 (0.8) (5.1)
Total volumes (units) 3,899,295 4,274,424 4,096,452 4,513,195 (4.8) (5.3)
Average net realization 60,303 62,891 60,781 63,995 (0.8) (1.7)
Net sales (incl. operating income) 235,139 268,824 248,987 288,822 (5.6) (6.9)
EBITDA 46,350 54,548 52,584 61,203 (11.9) (10.9)
EBITDA margin (%) 19.7 20.3 21.1 21.2
Profit after tax 39,575 46,378 45,222 52,519 (12.5) (11.7)
EPS (Rs/share) 136.7 160.3 156.3 181.5 (12.5) (11.7)
New estimates Old estimates % change
2013 2014 2015 2016 2017 2018E 2019E 2020E
Sales volume (units)
Motorcycles 3,757,105 3,422,403 3,291,315 3,358,252 3,179,521 3,445,287 3,772,720 4,049,245
Domestic 2,463,874 2,099,230 1,770,009 1,898,957 1,960,980 2,104,892 2,271,478 2,397,878
Platina 484,600 465,111 486,568 275,276 383,542 402,719 422,855 431,312
CT100 — — 29,189 590,067 452,712 475,348 499,115 509,097
Discover 1,311,843 992,176 557,942 238,098 303,032 339,396 373,335 403,202
Pulsar/Avenger/KTM 667,431 641,943 696,310 795,516 821,694 887,430 976,172 1,054,266
Exports 1,293,231 1,323,173 1,521,306 1,459,295 1,218,541 1,340,395 1,501,243 1,651,367
Total two-wheelers 3,757,105 3,422,403 3,291,315 3,358,252 3,179,521 3,445,287 3,772,720 4,049,245
RE 60 — 334 2,000 2,100 2,205 2,315
Domestic three-wheelers 226,131 186,912 234,345 256,320 253,147 231,987 257,585 271,464
Passenger three-wheelers 223,287 186,856 234,345 254,995 239,985 215,987 237,585 249,464
Goods three-wheelers 2,844 56 — 1,325 13,162 16,000 20,000 22,000
Exports 253,926 260,762 285,541 280,000 191,236 219,921 241,914 266,105
Total three-wheelers 480,057 447,674 519,886 536,320 444,383 451,908 499,499 537,569
Total vehicles 4,237,162 3,870,077 3,811,201 3,894,906 3,625,904 3,899,295 4,274,424 4,589,129
Growth (yoy %)
Motorcycles (2.0) (8.9) (3.8) 2.0 (5.3) 8.4 9.5 7.3
Domestic (4.0) (14.8) (15.7) 7.3 3.3 7.3 7.9 5.6
Platina (9.5) (4.0) 4.6 (43.4) 39.3 5.0 5.0 2.0
CT100 (23.3) 5.0 5.0 2.0
Discover (0.3) (24.4) (43.8) (57.3) 27.3 12.0 10.0 8.0
Pulsar/Avenger/KTM (6.7) (3.8) 8.5 14.2 3.3 8.0 10.0 8.0
Exports 2.0 2.3 15.0 (4.1) (16.5) 10.0 12.0 10.0
Total two-wheelers (2.0) (8.9) (3.8) 2.0 (5.3) 8.4 9.5 7.3
RE 60
Domestic three-wheelers 11.4 (17.3) 25.4 9.4 (1.2) (8.4) 11.0 5.4
Passenger three-wheelers 14.4 (16.3) 25.4 8.8 (5.9) (10.0) 10.0 5.0
Goods three-wheelers (63.7) (98.0) — — — — — —
Exports (18.7) 2.7 9.5 (1.9) (31.7) 15.0 10.0 10.0
Total three-wheelers (6.8) (6.7) 16.1 3.2 (17.1) 1.7 10.5 7.6
Total vehicles (2.6) (8.7) (1.5) 2.2 (6.9) 7.5 9.6 7.4

Bajaj Auto Automobiles
KOTAK INSTITUTIONAL EQUITIES RESEARCH 89
Exhibit 6: We expect Bajaj Auto’s earnings to grow at 11% CAGR over FY2017-20E Bajaj Auto - financial summary, March fiscal year-ends, 2013-20E (` mn)
Source: Company, Kotak Institutional Equities estimates
2013 2014 2015 2016 2017 2018E 2019E 2020E
Profit model (Rs mn)
Net sales 204,684 205,147 216,120 226,876 217,667 235,139 268,824 296,426
EBITDA 41,064 44,710 41,166 47,796 44,224 46,350 54,548 60,506
Other income 3,244 3,412 5,824 9,133 12,220 13,424 15,034 17,064
Interest (5) (5) (65) (5) (14) — — —
Depreciation (1,640) (1,796) (2,674) (3,072) (3,073) (3,238) (3,327) (3,425)
Profit before tax 42,662 46,321 44,251 53,852 53,357 56,536 66,254 74,145
Extra-ordinary items — — (3,403) — — — — —
Taxes (12,227) (13,887) (12,711) (17,328) (15,081) (16,961) (19,876) (22,243)
Net profit 30,436 32,433 28,137 36,524 38,276 39,575 46,378 51,901
Adjusted net profit 30,436 32,433 31,540 36,524 38,276 39,575 46,378 51,901
Adjusted earnings per share (Rs) 105.2 112.1 109.0 126.2 132.3 136.7 160.3 179.3
Balance sheet (Rs mn)
Equity 79,020 96,080 106,922 122,917 170,341 190,920 215,037 242,026
Deferred tax liability 1,151 1,432 1,416 1,883 3,136 3,136 3,136 3,136
Total borrowings 2,105 1,466 1,699 1,625 1,625 1,625 1,625 1,625
Current liabilities 42,511 48,498 45,587 30,304 33,047 43,345 48,722 53,117
Total liabilities 124,786 147,476 155,623 156,728 208,149 239,026 268,520 299,904
Net fixed assets 20,277 20,386 20,190 19,633 19,075 18,337 18,010 17,585
Investments 64,305 85,496 91,533 95,127 135,088 149,099 175,099 207,099
Cash 5,589 4,955 5,862 8,595 2,798 16,763 15,867 11,428
Other current assets 33,913 35,524 36,507 32,227 50,427 54,065 58,783 63,030
Miscellaneous expenditure 703 1,115 1,532 1,146 762 762 762 762
Total assets 124,786 147,476 155,623 156,728 208,149 239,026 268,520 299,904
Free cash flow (Rs mn)
Operating cash flow excl. working capital 26,557 31,419 27,611 31,450 37,417 38,912 45,290 50,369
Working capital changes (5,213) 4,039 (6,138) 5,004 (15,457) 6,660 660 148
Capital expenditure (5,082) (2,201) (2,697) (2,651) (2,515) (2,500) (3,000) (3,000)
Free cash flow 16,262 33,257 18,777 33,803 19,445 43,071 42,950 47,517
Ratios
EBITDA margin (%) 20.1 21.8 19.0 21.1 20.3 19.7 20.3 20.4
PAT margin (%) 14.9 15.8 14.6 16.1 17.6 16.8 17.3 17.5
Book Value (Rs/share) 273.0 332.0 369.5 424.7 588.6 659.7 743.0 836.3
RoAE (%) 43.2 36.5 27.3 31.3 25.7 21.5 22.5 22.4

For Private Circulation Only. FOR IMPORTANT INFORMATION ABOUT KOTAK SECURITIES’ RATING SYSTEM AND OTHER DISCLOSURES, REFER TO THE END OF THIS MATERIAL.
Kotak Institutional Equities Research [email protected] Mumbai: +91-22-4336-0000
Exports—a discomforting tumbledown; heading towards a hat-trick of decline in FY2018
The slump in quarterly exports to levels last seen in FY2014 is discomforting, especially when
the slump is driven by LHP exports, the key growth driver as per management for overall
revenues. While noting the weakness in end markets (declining EM economies, liquidity issues),
we had envisaged single-digit market share of Cummins in the global market to have supported
market-agnostic growth. As LHP/MHP exports continue to decline for the second straight year,
HHP exports have started bottoming out. Cummins expects the recent uptick in commodity
prices as a precursor of improving HHP exports. This coupled with its expectation of LHP
demand recovering is driving its low-teen growth expectations for the export segment over the
medium term. Weak exit quarter financials and management guidance suggest scope of
another year of decline in FY2018E; we build a modest 2% growth for FY2018E and 14%
CAGR over FY2018E-20E.
Margin—tumbledown would be difficult to recover from
The slump of margin into sub-15% range in 4QFY17 was last seen in FY2015. Cummins
attributed the sharp decline in gross margin (35%, down 340 bps yoy) to an adverse product
mix and keen competition. It clarified nil impact of currency appreciation and increase in share
of traded goods on the margin profile; shared practice of outsourcing only if such exercise is
margin-neutral and return-accretive. While noting scope of some normalization, we note
multiple headwinds in margin breaching the 16% levels: (1) Share of traded goods would
further increase as per management and twin instance of margin should lower the same for
Cummins, (2) stiffening commodity prices (7% ahead of FY2017 prices) and (3) competition
making inroads in the domestic HHP segment.
Domestic—all well for now; industrial to continue outperforming other segments
Another strong quarter for domestic revenues (up 18% yoy) and second year of growth (up
13% yoy) was driven by industrial segment and has driven FY2017 power generation revenues
in range of FY2013 peak. Cummins expects industrial segment to continue outperforming
power generation segment. On the latter, it defended risks to business from surplus power
(prudent to have back-up power) and on decline in solar power/battery prices (ability to adapt).
For FY2018, Cummins has revised down its guidance for revenue growth to 5-10% (from 10%)
on decline in compressor business; we build a 12% CAGR over FY2017-20E.
Cummins India (KKC) Industrials
Attractiveness lessens. Recently volatility in financials of Cummins, higher dependence
on sourcing from external entities and keen competition/rising commodity prices
lessened attractiveness for a product portfolio with mixed growth prospects beyond the
industrial business. This coupled with a weak exit quarter and muted FY2018 guidance
increases risks to our 25X exit multiple and reduced estimates (lower by 8-10%). We
revise our March 2019E TP to ₹840 (from ₹915) and rating to SELL (from REDUCE).
SELL
MAY 22, 2017
RESULT, CHANGE IN RECO.
Coverage view: Cautious
Price (`): 973
Target price (`): 840
BSE-30: 30,465
Aditya Mongia [email protected]
Mumbai: +91-22-4336-0884
Ajinkya Bhat [email protected]
Mumbai: +91-22-4336-0883
Cummins India
Stock data Forecasts/Valuations 2017 2018E 2019E
52-week range (Rs) (high,low) EPS (Rs) 26.3 29.4 33.6
Market Cap. (Rs bn) EPS growth (%) 1.4 11.9 14.2
Shareholding pattern (%) P/E (X) 37.0 33.1 29.0
Promoters 51.0 Sales (Rs bn) 50.8 55.4 62.5
FIIs 15.1 Net profits (Rs bn) 7.3 8.1 9.3
MFs 24.5 EBITDA (Rs bn) 8.0 8.7 10.1
Price performance (%) 1M 3M 12M EV/EBITDA (X) 32.6 30.0 25.7
Absolute 2.5 9.5 13.3 ROE (%) 21.1 20.9 22.1
Rel. to BSE-30 (1.3) 2.3 (5.5) Div. Yield (%) 1.4 1.6 1.8
Company data and valuation summary
1,097-746
269.7
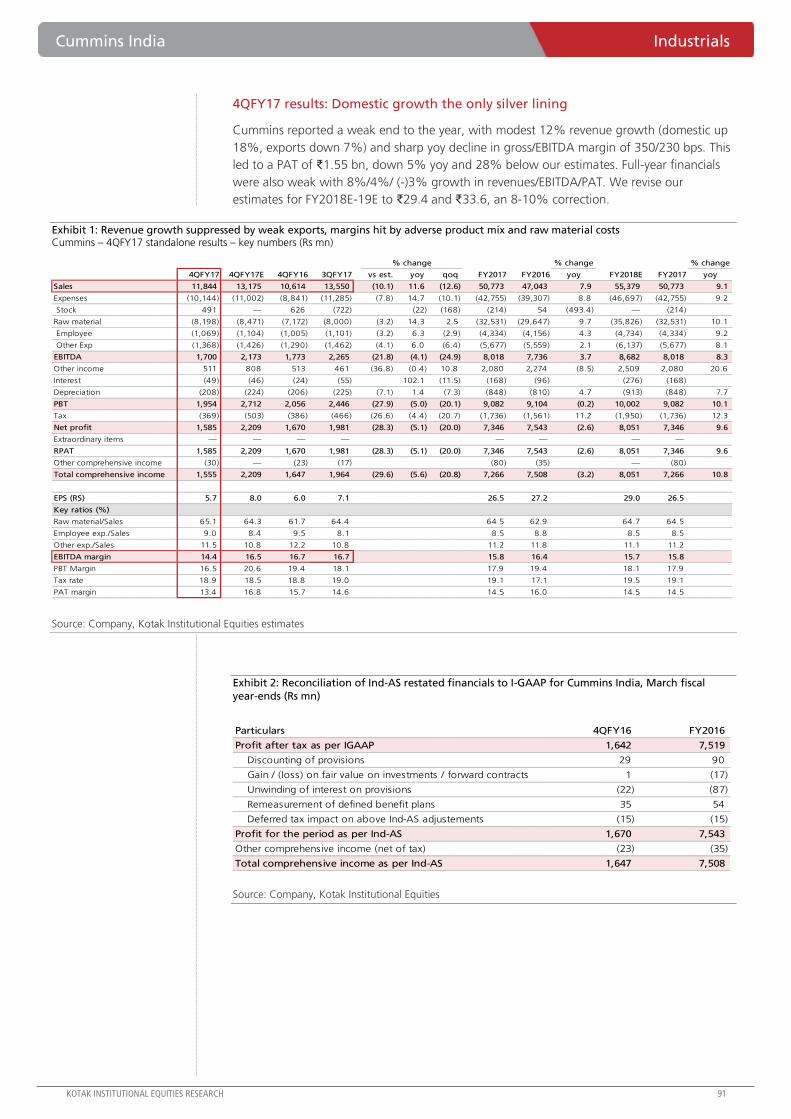
Cummins India Industrials
KOTAK INSTITUTIONAL EQUITIES RESEARCH 91
4QFY17 results: Domestic growth the only silver lining
Cummins reported a weak end to the year, with modest 12% revenue growth (domestic up
18%, exports down 7%) and sharp yoy decline in gross/EBITDA margin of 350/230 bps. This
led to a PAT of ₹1.55 bn, down 5% yoy and 28% below our estimates. Full-year financials
were also weak with 8%/4%/ (-)3% growth in revenues/EBITDA/PAT. We revise our
estimates for FY2018E-19E to ₹29.4 and ₹33.6, an 8-10% correction.
Exhibit 1: Revenue growth suppressed by weak exports, margins hit by adverse product mix and raw material costs Cummins – 4QFY17 standalone results – key numbers (Rs mn)
Source: Company, Kotak Institutional Equities estimates
Exhibit 2: Reconciliation of Ind-AS restated financials to I-GAAP for Cummins India, March fiscal
year-ends (Rs mn)
Source: Company, Kotak Institutional Equities
% change % change
4QFY17 4QFY17E 4QFY16 3QFY17 vs est. yoy qoq FY2017 FY2016 yoy FY2018E FY2017 yoy
Sales 11,844 13,175 10,614 13,550 (10.1) 11.6 (12.6) 50,773 47,043 7.9 55,379 50,773 9.1
Expenses (10,144) (11,002) (8,841) (11,285) (7.8) 14.7 (10.1) (42,755) (39,307) 8.8 (46,697) (42,755) 9.2
Stock 491 — 626 (722) (22) (168) (214) 54 (493.4) — (214)
Raw material (8,198) (8,471) (7,172) (8,000) (3.2) 14.3 2.5 (32,531) (29,647) 9.7 (35,826) (32,531) 10.1
Employee (1,069) (1,104) (1,005) (1,101) (3.2) 6.3 (2.9) (4,334) (4,156) 4.3 (4,734) (4,334) 9.2
Other Exp (1,368) (1,426) (1,290) (1,462) (4.1) 6.0 (6.4) (5,677) (5,559) 2.1 (6,137) (5,677) 8.1
EBITDA 1,700 2,173 1,773 2,265 (21.8) (4.1) (24.9) 8,018 7,736 3.7 8,682 8,018 8.3
Other income 511 808 513 461 (36.8) (0.4) 10.8 2,080 2,274 (8.5) 2,509 2,080 20.6
Interest (49) (46) (24) (55) 102.1 (11.5) (168) (96) (276) (168)
Depreciation (208) (224) (206) (225) (7.1) 1.4 (7.3) (848) (810) 4.7 (913) (848) 7.7
PBT 1,954 2,712 2,056 2,446 (27.9) (5.0) (20.1) 9,082 9,104 (0.2) 10,002 9,082 10.1
Tax (369) (503) (386) (466) (26.6) (4.4) (20.7) (1,736) (1,561) 11.2 (1,950) (1,736) 12.3
Net profit 1,585 2,209 1,670 1,981 (28.3) (5.1) (20.0) 7,346 7,543 (2.6) 8,051 7,346 9.6
Extraordinary items — — — — — — — —
RPAT 1,585 2,209 1,670 1,981 (28.3) (5.1) (20.0) 7,346 7,543 (2.6) 8,051 7,346 9.6
Other comprehensive income (30) — (23) (17) (80) (35) — (80)
Total comprehensive income 1,555 2,209 1,647 1,964 (29.6) (5.6) (20.8) 7,266 7,508 (3.2) 8,051 7,266 10.8
EPS (RS) 5.7 8.0 6.0 7.1 26.5 27.2 29.0 26.5
Key ratios (%)
Raw material/Sales 65.1 64.3 61.7 64.4 64.5 62.9 64.7 64.5
Employee exp./Sales 9.0 8.4 9.5 8.1 8.5 8.8 8.5 8.5
Other exp./Sales 11.5 10.8 12.2 10.8 11.2 11.8 11.1 11.2
EBITDA margin 14.4 16.5 16.7 16.7 15.8 16.4 15.7 15.8
PBT Margin 16.5 20.6 19.4 18.1 17.9 19.4 18.1 17.9
Tax rate 18.9 18.5 18.8 19.0 19.1 17.1 19.5 19.1
PAT margin 13.4 16.8 15.7 14.6 14.5 16.0 14.5 14.5
% change
Particulars 4QFY16 FY2016
Profit after tax as per IGAAP 1,642 7,519
Discounting of provisions 29 90
Gain / (loss) on fair value on investments / forward contracts 1 (17)
Unwinding of interest on provisions (22) (87)
Remeasurement of defined benefit plans 35 54
Deferred tax impact on above Ind-AS adjustements (15) (15)
Profit for the period as per Ind-AS 1,670 7,543
Other comprehensive income (net of tax) (23) (35)
Total comprehensive income as per Ind-AS 1,647 7,508

Industrials Cummins India
92 KOTAK INSTITUTIONAL EQUITIES RESEARCH
Exports down to FY2014 quarterly run-rate; domestic steady; commodity prices
hit margins
Revenues up 12% yoy in 4Q, faster than 9M. Cummins India reported 4QFY17
revenues of ₹12 bn, up 12% yoy. While the growth was faster than 9MFY17 growth of
7%, it was 10% below estimates in the quarter. The miss was primarily on the exports
front, which declined 7% yoy on low base to ₹3 bn. Domestic segment revenues grew
18% yoy, reaffirming the positive management commentary in previous quarters (off-grid
power for infra construction, mining), powergen (standby sales and service contracts) and
distribution segments. In FY2017, overall revenues at ₹51 bn grew a modest 8% yoy.
Commodity prices impacted margins. The company reported 4QFY17 EBITDA of ₹1.7
bn, down 4% yoy and EBITDA margin of 14.4%, down 230 bps yoy (200 bps below
estimates). The sharp margin decline was led by increased raw material costs to 65% of
sales, up 340 bps yoy. The management attributed the gross margin decline to adverse
product mix during the quarter. As we correlate it with the Pig Iron index, a key raw
material for Cummins, we find that the average quarterly Pig Iron index was up 18% yoy
in 4QFY17 impacting the margins. Such sharp increase would reflect in the RM cost index
over the next few quarters. The RM cost increase also negated the benefits in improved
employee and other expenses (both ~50-70 bps better yoy as percentage of sales). In
FY2017, the company reported EBITDA of ₹8 bn at 15.8% margin, down 60 bps yoy.
Below EBITDA items flat yoy, PAT down 5% yoy. Depreciation and other income
were flat yoy while other income was below estimates as we had estimated better rental
income from the India office complex. Interest expense was modestly higher yoy on
account of a short-term debt of ₹2.5 bn taken in 1HFY17. Reported PAT was thus down
5% yoy to ₹1.6 bn. The PAT was ~28% below estimates, a straight flow-down impact
from miss at the topline and miss on margin. On FY2017 basis, reported PAT stood at
₹7.3 bn, down 2.6% yoy.

Cummins India Industrials
KOTAK INSTITUTIONAL EQUITIES RESEARCH 93
Exhibit 3: While domestic growth (especially industrial applications) continued on the back of government spending in infrastructure,
sharp decline in exports impacted the overall revenue growth Trajectory of Cummins' segmental sales, March fiscal year-ends, 1QFY14-4QFY17
Source: Company, Kotak Institutional Equities
3.2
2.4
3.02.7
2.92.6
2.3
2.8
3.43.3
2.9 2.9
3.4 3.4 3.53.3
0.0
1.0
2.0
3.0
4.0
1Q
FY14
2Q
FY14
3Q
FY14
4Q
FY14
1Q
FY15
2Q
FY15
3Q
FY15
4Q
FY15
1Q
FY16
2Q
FY16
3Q
FY16
4Q
FY16
1Q
FY17
2Q
FY17
3Q
FY17
4Q
FY17
(Rs bn) Power generation
1.41.2
1.5
1.1 1.01.2
1.7
1.3 1.31.2
1.71.5
1.71.6
1.92.0
0.0
0.5
1.0
1.5
2.0
2.5
1Q
FY14
2Q
FY14
3Q
FY14
4Q
FY14
1Q
FY15
2Q
FY15
3Q
FY15
4Q
FY15
1Q
FY16
2Q
FY16
3Q
FY16
4Q
FY16
1Q
FY17
2Q
FY17
3Q
FY17
4Q
FY17
(Rs bn)Industrials
2.73.0 2.8
3.4
3.9
4.8
3.9
4.6
5.3
4.4
3.73.3
4.14.5 4.5
3.0
0.0
1.0
2.0
3.0
4.0
5.0
6.0
1Q
FY14
2Q
FY14
3Q
FY14
4Q
FY14
1Q
FY15
2Q
FY15
3Q
FY15
4Q
FY15
1Q
FY16
2Q
FY16
3Q
FY16
4Q
FY16
1Q
FY17
2Q
FY17
3Q
FY17
4Q
FY17
(Rs bn) Exports
2.6
2.3 2.4
2.02.2
2.4 2.42.1
2.5 2.42.6
2.42.6
2.8
3.3
2.9
0.0
0.5
1.0
1.5
2.0
2.5
3.0
3.5
1Q
FY14
2Q
FY14
3Q
FY14
4Q
FY14
1Q
FY15
2Q
FY15
3Q
FY15
4Q
FY15
1Q
FY16
2Q
FY16
3Q
FY16
4Q
FY16
1Q
FY17
2Q
FY17
3Q
FY17
4Q
FY17
Distribution(Rs bn)
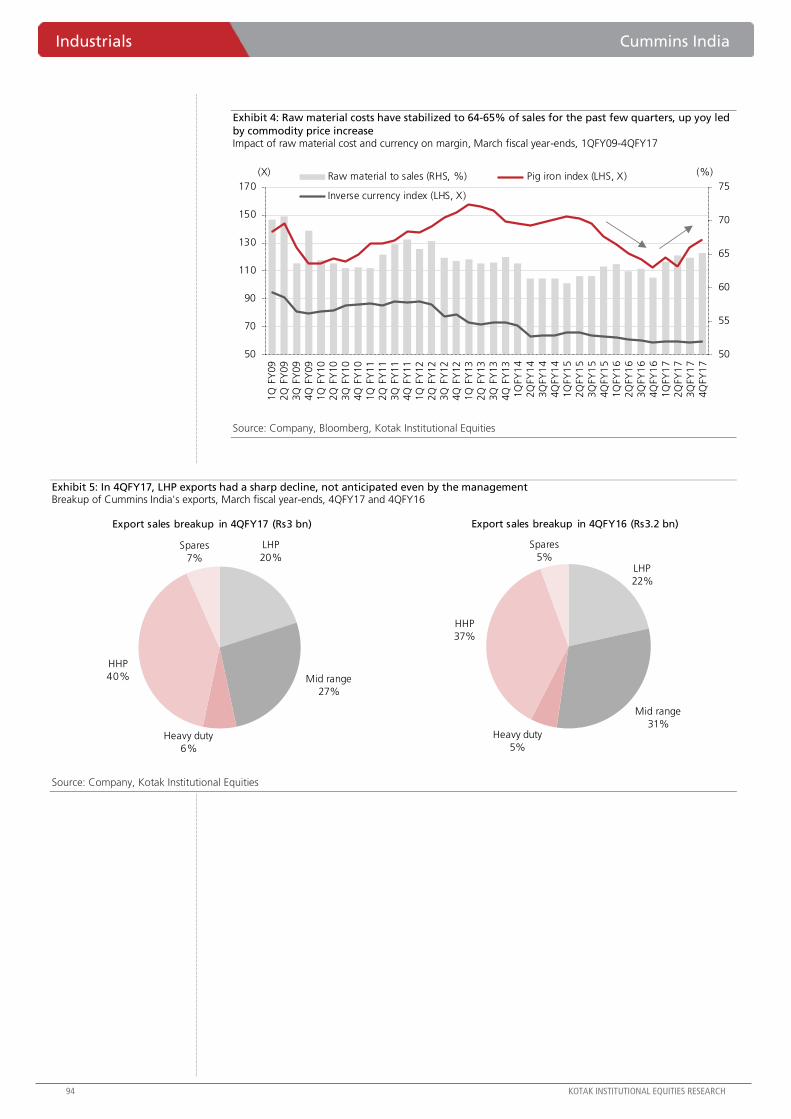
Industrials Cummins India
94 KOTAK INSTITUTIONAL EQUITIES RESEARCH
Exhibit 4: Raw material costs have stabilized to 64-65% of sales for the past few quarters, up yoy led
by commodity price increase Impact of raw material cost and currency on margin, March fiscal year-ends, 1QFY09-4QFY17
Source: Company, Bloomberg, Kotak Institutional Equities
Exhibit 5: In 4QFY17, LHP exports had a sharp decline, not anticipated even by the management Breakup of Cummins India's exports, March fiscal year-ends, 4QFY17 and 4QFY16
Source: Company, Kotak Institutional Equities
50
55
60
65
70
75
50
70
90
110
130
150
170
1Q
FY
09
2Q
FY
09
3Q
FY
09
4Q
FY
09
1Q
FY
10
2Q
FY
10
3Q
FY
10
4Q
FY
10
1Q
FY
11
2Q
FY
11
3Q
FY
11
4Q
FY
11
1Q
FY
12
2Q
FY
12
3Q
FY
12
4Q
FY
12
1Q
FY
13
2Q
FY
13
3Q
FY
13
4Q
FY
13
1Q
FY1
42Q
FY1
43Q
FY1
44Q
FY1
41Q
FY1
52Q
FY1
53Q
FY1
54Q
FY1
51Q
FY1
62Q
FY1
63Q
FY1
64Q
FY1
61Q
FY1
72Q
FY1
73Q
FY1
74Q
FY1
7
(%)(X) Raw material to sales (RHS, %) Pig iron index (LHS, X)
Inverse currency index (LHS, X)
LHP
20%
Mid range
27%
Heavy duty
6%
HHP
40%
Spares
7%
Export sales breakup in 4QFY17 (Rs3 bn)
LHP
22%
Mid range
31%Heavy duty
5%
HHP
37%
Spares
5%
Export sales breakup in 4QFY16 (Rs3.2 bn)

Cummins India Industrials
KOTAK INSTITUTIONAL EQUITIES RESEARCH 95
Exhibit 6: Working capital and cash (including financial assets) has improved yoy Balance sheet details of Cummins India, March fiscal year-ends, 2013-17 (Rs mn)
Source: Company, Kotak Institutional Equities
4QFY17 earnings call takeaways
Margin decline led by adverse mix, no impact from outsourcing. The management
allayed investor concerns regarding margin impact from higher share of traded goods in
the revenues. As a part of its strategic initiative, the company has shut down two
plants/engine lines at its Pirangut facility last year and had outsourced the manufacturing
to sister entities Tata-Cummins JV and Cummins Technologies India (CTIL) outside the CIL
legal entity. While this shift was reflected in the increase in ‘purchase of stock-in-trade’
costs in the quarter and the year, the management clarified that this did not have any
negative impact on the margins. The gross margin decline was largely led by adverse sales
mix. The management mentioned that they expect the outsourcing operation to be
margin-neutral and return-accretive due to economies of scale in the sister entities and
corresponding sourcing benefits to CIL.
Domestic growth continues well in industrial and powergen. The management
retained optimistic outlook on domestic growth in both industrial and powergen
segments. Growth in industrial applications would be led by continued government
spending in infrastructure requiring off-grid power (road construction, mining,
compressors for hydraulic drilling, etc.). Some tapering is seen in compressor applications
in recent months (cyclical downturn as per the management) but other sub-segments
continue to do well.
Ind-AS Ind-AS Ind-AS
2013 1HFY14 2014 1HFY15 2015 1HFY16 2016 2016 1HFY17 2017
Balance sheet
Shareholders' funds 23,867 26,977 25,652 28,154 28,865 32,959 31,713 34,813 35,558 37,422
Share Capital 554 554 554 554 554 554 554 554 554 554
Reserves & Surplus 23,313 26,423 25,097 27,599 28,311 32,404 31,159 34,259 35,003 36,867
Loan Funds 150 — — — — — — 2,500 2,508
Total souce of funds 24,018 26,977 25,652 28,154 28,865 32,959 31,713 34,813 38,058 39,930
Fixed assets and Capital WIP 6,144 6,830 10,149 13,037 14,046 17,371 18,476 18,086 18,417 16,954
Investments 6,276 5,500 4,954 1,768 4,650 1,614 3,354 3,336 6,247 3,507
Cash & Bank Balances 3,547 3,540 865 2,933 799 1,061 897 897 1,718 7,992
Current assets (ex cash) 20,730 21,142 21,760 23,411 23,723 24,954 23,040 21,985 22,663 21,956
Inventories 5,304 5,606 5,513 6,701 6,823 7,217 6,003 6,003 6,148 5,621
Sundry Debtors 8,550 6,884 7,820 9,173 9,355 9,426 9,506 9,506 9,222 9,557
Other Current Assets 90 142 22 4 73 143 559 2,527 2,615 4,890
Loans & Advances 6,786 8,510 8,405 7,533 7,472 8,169 6,973 3,949 4,679 1,889
Current liabilities and provisions (12,351) (9,728) (11,611) (12,348) (13,721) (11,355) (13,238) (10,095) (11,626) (10,455)
Current Liabilities (7,569) (7,512) (6,910) (10,209) (8,520) (9,292) (8,294) (8,260) (9,726) (8,479)
Provisions (4,782) (2,216) (4,701) (2,139) (5,202) (2,063) (4,944) (1,835) (1,900) (1,976)
Net current assets ex cash 8,379 11,414 10,149 11,063 10,001 13,599 9,802 11,890 11,037 11,501
Deferred Tax Asset, Net (328) (307) (465) (647) (631) (687) (817) 604 638 (24)
Total application of funds 24,018 26,977 25,652 28,154 28,865 32,959 31,713 34,813 38,058 39,930
Days of sales
Current assets (ex cash) 168 183 204 208 200 197 183 175 179 162
Inventories 43 48 52 60 58 57 48 48 49 41
Sundry Debtors 69 59 73 82 79 74 75 76 73 70
Other Current Assets 1 1 0 0 1 1 4 20 21 36
Loans & Advances 55 74 79 67 63 65 55 31 37 14
Current liabilities and provisions (100) (84) (109) (110) (116) (90) (105) (80) (92) (77)
Current Liabilities (61) (65) (65) (91) (72) (73) (66) (66) (77) (62)
Provisions (39) (19) (44) (19) (44) (16) (39) (15) (15) (15)
Net current assets ex cash 68 99 95 98 84 107 78 95 87 85

Industrials Cummins India
96 KOTAK INSTITUTIONAL EQUITIES RESEARCH
On the powergen side, the company is witnessing demand from hospitality (hotels for
HHP, small restaurants for LHP), realty (HHP, MHP and LHP) and services (esp. data centers
– HHP). The company highlighted a strong correlation between GDP growth and
powergen business. Despite surplus power availability in the country, it would be
imprudent for hospitals and commercial establishments to avoid installing a backup
generator. Thus the management remains optimistic on the domestic growth of this
segment as India’s GDP continues to grow.
Sharp decline in exports is a cause for worry. The management conceded that the
decline in exports in 4QFY17 is beyond their anticipated impact and remains a cause for
concern. Several key export markets such as Europe, Africa and Middle East are facing
declines in economic activity and cash flow issues leading to reduced investments in
powergen. While HHP exports have bottomed out and may have an upside hereon, LHP
exports may however see a further decline. Among the key markets for LHP exports,
Africa held the biggest share (29%) followed by Middle East and rest of Asia (15% each).
Guidance for FY2018. The management has guided for FY2018 growth guidance of
5-10% in domestic business and flat to 5% decline in exports. The outsourcing strategy
will continue as it stands. The management mentioned that margins are a function of
product mix, any price headwinds and benefits from the cost improvement programs
undertaken by the company.
Competitive intensity unaffected by new entrants in HHP. The management
mentioned that domestic competitive intensity in HHP segment remains fierce as before.
The company does not see any major impact from the entry of other competitors (KOEL’s
entry in HHP and local manufacturing by Perkins) on the competitive intensity. The
management assured that the company will strive to maintain its leadership position in
the Indian market backed by technology, local manufacturing, customer support and
distribution relationships.
Renewables seen as a technological opportunity. In recent quarters, solar power
tariffs have declined sharply in India and energy storage costs are also on a downward
trend. Analysts were apprehensive of its impact on powergen sales for Cummins
especially for applications like data centers that may be able to switch to storage batteries
backed by renewable generation. The management of Cummins however sees it as an
opportunity in the power solutions space and is open to explore new technologies as
market dynamics change.

Cummins India Industrials
KOTAK INSTITUTIONAL EQUITIES RESEARCH 97
Exhibit 7: Powergen revenues are expected to grow at 11% CAGR until FY2020 Breakup of powergen revenues of Cummins India, March fiscal year-ends, 2011-20E (Rs bn)
Source: Company, Kotak Institutional Equities estimates
Exhibit 8: Industrial revenues are expected to grow at 15% CAGR until FY2020 Breakup of Industrial revenues of Cummins India, March fiscal year-ends, 2011-20E (Rs bn)
Source: Company, Kotak Institutional Equities estimates
1312
16
1110
1213
15
17
18
0
4
8
12
16
20
2011 2012 2013 2014 2015 2016 2017 2018E 2019E 2020E
<160 kVa 160-380 kVA 450-625 kVa >=750 kVA
11% CAGR
5 5 5 5 5 6
7
8
9
11
0
2
4
6
8
10
12
2011 2012 2013 2014 2015 2016 2017 2018E 2019E 2020E
Compressor Construction Mining Locomotives Others
15% CAGR

Industrials Cummins India
98 KOTAK INSTITUTIONAL EQUITIES RESEARCH
Exhibit 9: Export revenues are expected to grow at 10% CAGR until FY2020 Breakup of export revenues of Cummins India, March fiscal year-ends, 2011-20E (Rs bn)
Source: Company, Kotak Institutional Equities estimates
Exhibit 10: The upward trend of oil prices in the last one year would help economic recovery in key
export markets of Cummins India (esp. Middle East, Nigeria) and subsequent demand revival Trend in price of Brent crude, December calendar year-ends, May-2011 – May-2017 (US$/bbl)
Source: Bloomberg, Kotak Institutional Equities
10 12
13 12
17 17 16 17
19
22
0
5
10
15
20
25
2011 2012 2013 2014 2015 2016 2017 2018E 2019E 2020E
LHP Mid-range Heavy Duty HHP Spares/others
10% CAGR
-
20
40
60
80
100
120
140
May-
11
Aug
-11
Nov-
11
Feb-1
2
May-
12
Aug
-12
Nov-
12
Feb-1
3
May-
13
Aug
-13
Nov-
13
Feb-1
4
May-
14
Aug
-14
Nov-
14
Feb-1
5
May-
15
Aug
-15
Nov-
15
Feb-1
6
May-
16
Aug
-16
Nov-
16
Feb-1
7
May-
17
Crude Brent (US$/bbl)

Cummins India Industrials
KOTAK INSTITUTIONAL EQUITIES RESEARCH 99
Exhibit 11: Technical fees and royalties paid to the parent increased in FY2014 and have remained at
~3% of sales since then Technical fees and royalties paid by Cummins India to the parent entity, March fiscal year-ends, 2006-16 (%)
Source: Company, Kotak Institutional Equities
Exhibit 12: Change in estimates led by continued weak exports as well as moderated domestic industrial sales Change in estimates for Cummins India, March fiscal year-ends, 2016-19E (Rs mn)
Source: Company, Kotak Institutional Equities estimates
1.4 1.4 1.5
1.3
1.0
1.6 1.6 1.8
3.0 3.1
2.6
-
0.5
1.0
1.5
2.0
2.5
3.0
3.5
2006 2007 2008 2009 2010 2011 2012 2013 2014 2015 2016
Technical fees and royalties as % of sales
2016 2017 2018E 2019E 2018E 2019E 2018E 2019E
Revenues 47,243 50,773 55,379 62,469 59,903 66,843 (7.6) (6.5)
Power generation 12,500 13,540 14,917 16,589 15,131 16,823 (1.4) (1.4)
Industrials 5,600 7,160 8,094 9,335 8,972 10,358 (9.8) (9.9)
Auto 700 870 957 1,053 847 932 13.0 13.0
Distribution 9,850 11,500 13,225 14,812 13,238 14,562 (0.1) 1.7
Exports 16,670 16,137 16,517 18,898 20,012 22,353 (17.5) (15.5)
EBITDA 7,604 8,018 8,682 10,057 10,222 11,548 (15.1) (12.9)
EBITDA margin (%) 16.1 15.8 15.7 16.1 17.1 17.3 -139 bps -118 bps
Other income 2,279 2,080 2,509 2,735 2,666 2,848 (5.9) (4.0)
Interest (9) (168) (276) (276) (330) (330) (16.4) (16.4)
Depreciation (810) (848) (913) (1,018) (1,098) (1,119) (16.8) (9.0)
PBT 9,064 9,082 10,002 11,498 11,460 12,948 (12.7) (11.2)
Tax rate (%) 17 19 20 20 20 20 0 bps 0 bps
PAT 7,519 7,346 8,051 9,199 9,225 10,358 (12.7) (11.2)
Adjusted PAT 7,179 7,280 8,145 9,302 9,018 10,142 (9.7) (8.3)
EPS (Rs) 25.9 26.3 29.4 33.6 32.5 36.6 (9.7) (8.3)
Growth (%)
Revenues 7.2 7.5 9.1 12.8
Power generation 18.5 8.3 10.2 11.2
Industrials 10.5 27.9 13.0 15.3
Auto (36.4) 24.3 10.0 10.0
Distribution 9.4 16.8 15.0 12.0
Exports (3.1) (3.2) 2.4 14.4
EBITDA 3.5 5.4 8.3 15.8
PAT (5.9) 1.4 11.9 14.2
New estimates New estimates % revision

Industrials Cummins India
100 KOTAK INSTITUTIONAL EQUITIES RESEARCH
Exhibit 13: Standalone balance sheet, profit model and cash flow statement of Cummins, March fiscal year-ends, 2012-20E (Rs mn)
Source: Company, Kotak Institutional Equities estimates
2012 2013 2014 2015 2016 2017 2018E 2019E 2020E
Profit model
Total operating income 41,172 46,012 39,767 44,058 47,243 50,773 55,379 62,469 70,377
Total operating costs (34,200) (37,545) (32,799) (36,708) (39,639) (42,755) (46,697) (52,412) (59,063)
EBITDA 6,972 8,467 6,967 7,351 7,604 8,018 8,682 10,057 11,314
Other operational income 651 922 776 847 1,212 1,192 1,277 1,370 1,471
Other income 1,233 1,949 1,777 2,040 2,279 2,080 2,509 2,735 2,991
PBDIT 8,206 10,416 8,744 9,390 9,883 10,098 11,191 12,792 14,304
Financial charges (54) (46) (42) (45) (9) (168) (276) (276) (276)
Depreciation (420) (473) (528) (797) (810) (848) (913) (1,018) (1,050)
Pre-tax profit 7,732 9,897 8,175 8,548 9,064 9,082 10,002 11,498 12,979
Taxation (2,282) (2,872) (2,175) (1,515) (1,546) (1,736) (1,950) (2,300) (2,596)
PAT 5,913 7,641 6,000 7,859 7,519 7,346 8,051 9,199 10,383
Adjusted PAT 6,251 7,964 5,999 7,631 7,179 7,280 8,145 9,302 10,497
Balance sheet
Shareholders funds 20,432 23,867 25,652 28,865 31,713 37,422 40,354 43,704 47,486
Loan funds — — — — — 2,508 2,508 2,508 2,508
Total source of funds 20,432 23,867 25,652 28,865 31,713 39,930 42,862 46,212 49,993
Net block 4,649 4,934 9,192 12,340 12,894 12,322 14,409 15,391 15,342
Net fixed assets 6,273 8,066 12,215 14,763 18,476 16,954 18,040 18,023 17,973
Investments and goodwill 5,975 6,276 4,954 4,650 3,354 3,507 3,507 3,507 3,507
Cash balances 2,235 3,547 865 799 897 7,992 8,785 10,546 12,585
Net current assets excluding cash 5,879 6,307 8,083 9,284 9,802 11,501 12,553 14,160 15,952
Total application of funds 20,432 23,867 25,652 28,865 31,713 39,930 42,862 46,212 49,993
Cash flow statement
Operating profit before working capital changes 7,404 8,826 7,525 8,006 8,455 9,767 10,741 12,257 13,666
Change in working capital (825) (883) (1,607) (1,142) (206) (1,699) (1,052) (1,607) (1,793)
Tax paid (2,155) (2,657) (2,308) (1,853) (1,694) (2,529) (1,950) (2,300) (2,596)
Cashflow from operating activites 4,425 5,286 3,611 5,012 6,556 5,539 7,739 8,350 9,278
Fixed assets (2,281) (2,148) (4,678) (3,304) (4,523) 675 (2,000) (1,000) (1,000)
Investments 1,547 302 1,489 1,296 1,296 (153) — — —
Cash (used) / realised in investing activities 77 (2,186) 552 (563) (1,780) 853 (1,550) (465) (362)
Borrowings — — — — — — — — —
Dividend paid (3,452) (3,544) (4,216) (4,216) (4,671) (4,671) (5,119) (5,849) (6,602)
Cash (used) /realised in financing activities (3,506) (3,590) (4,258) (4,261) (4,679) (3,124) (5,395) (6,124) (6,877)
Cash generated /utilised 996 (490) (95) 188 97 3,268 793 1,761 2,039
Cash at beginning of year 156 1,152 662 567 755 897 7,992 8,785 10,546
Cash at end of year (excl. other bank balances) 1,152 662 567 755 851 4,165 8,785 10,546 12,585
Key ratios (%)
EBITDA margin 16.9 18.4 17.5 16.7 16.1 15.8 15.7 16.1 16.1
PAT margin 13.2 15.3 15.1 16.0 15.9 14.5 14.5 14.7 14.8
RoE 28.3 31.7 24.2 25.8 24.8 21.3 20.7 21.9 22.8
RoCE 22.7 28.7 19.9 26.1 24.4 12.0 7.1 8.9 10.7
Debt / equity (X) 0.0 0.0 0.0 0.0 0.0 0.1 0.1 0.1 0.1
Adj. EPS (Rs) 22.6 28.7 21.6 27.5 25.9 26.3 29.4 33.6 37.9
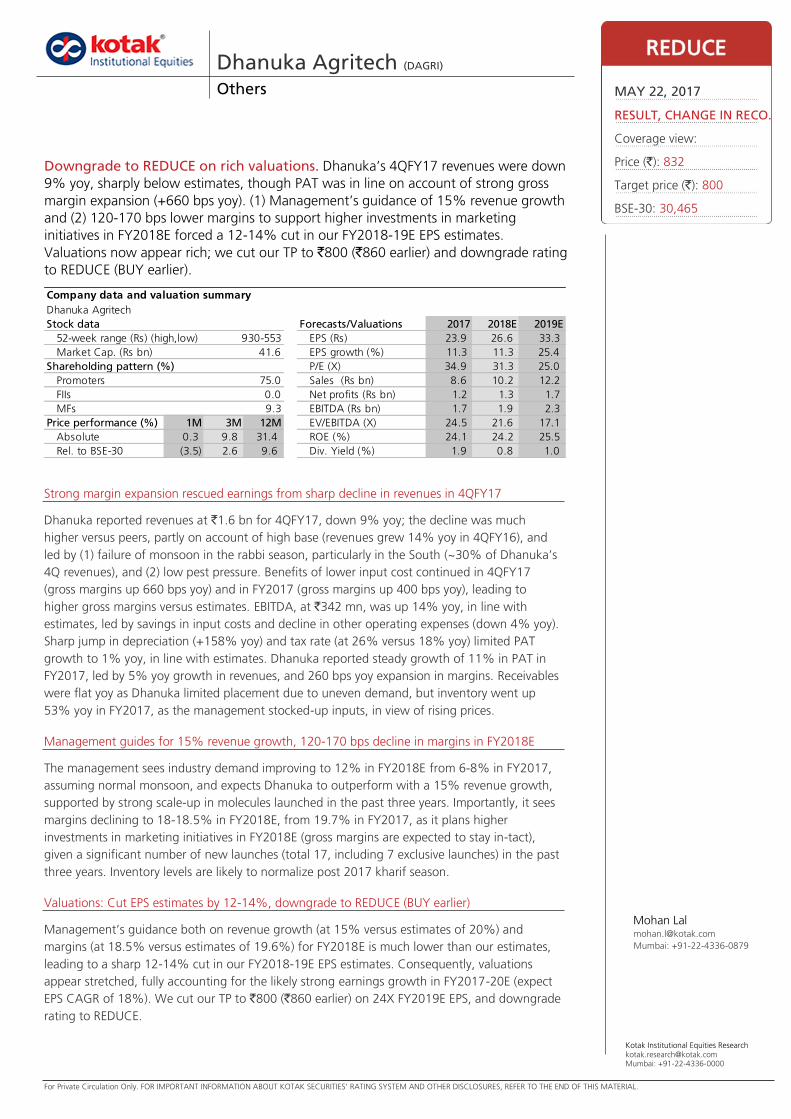
For Private Circulation Only. FOR IMPORTANT INFORMATION ABOUT KOTAK SECURITIES’ RATING SYSTEM AND OTHER DISCLOSURES, REFER TO THE END OF THIS MATERIAL.
Kotak Institutional Equities Research [email protected] Mumbai: +91-22-4336-0000
Strong margin expansion rescued earnings from sharp decline in revenues in 4QFY17
Dhanuka reported revenues at `1.6 bn for 4QFY17, down 9% yoy; the decline was much
higher versus peers, partly on account of high base (revenues grew 14% yoy in 4QFY16), and
led by (1) failure of monsoon in the rabbi season, particularly in the South (~30% of Dhanuka’s
4Q revenues), and (2) low pest pressure. Benefits of lower input cost continued in 4QFY17
(gross margins up 660 bps yoy) and in FY2017 (gross margins up 400 bps yoy), leading to
higher gross margins versus estimates. EBITDA, at `342 mn, was up 14% yoy, in line with
estimates, led by savings in input costs and decline in other operating expenses (down 4% yoy).
Sharp jump in depreciation (+158% yoy) and tax rate (at 26% versus 18% yoy) limited PAT
growth to 1% yoy, in line with estimates. Dhanuka reported steady growth of 11% in PAT in
FY2017, led by 5% yoy growth in revenues, and 260 bps yoy expansion in margins. Receivables
were flat yoy as Dhanuka limited placement due to uneven demand, but inventory went up
53% yoy in FY2017, as the management stocked-up inputs, in view of rising prices.
Management guides for 15% revenue growth, 120-170 bps decline in margins in FY2018E
The management sees industry demand improving to 12% in FY2018E from 6-8% in FY2017,
assuming normal monsoon, and expects Dhanuka to outperform with a 15% revenue growth,
supported by strong scale-up in molecules launched in the past three years. Importantly, it sees
margins declining to 18-18.5% in FY2018E, from 19.7% in FY2017, as it plans higher
investments in marketing initiatives in FY2018E (gross margins are expected to stay in-tact),
given a significant number of new launches (total 17, including 7 exclusive launches) in the past
three years. Inventory levels are likely to normalize post 2017 kharif season.
Valuations: Cut EPS estimates by 12-14%, downgrade to REDUCE (BUY earlier)
Management’s guidance both on revenue growth (at 15% versus estimates of 20%) and
margins (at 18.5% versus estimates of 19.6%) for FY2018E is much lower than our estimates,
leading to a sharp 12-14% cut in our FY2018-19E EPS estimates. Consequently, valuations
appear stretched, fully accounting for the likely strong earnings growth in FY2017-20E (expect
EPS CAGR of 18%). We cut our TP to `800 (`860 earlier) on 24X FY2019E EPS, and downgrade
rating to REDUCE.
Dhanuka Agritech (DAGRI) Others
Downgrade to REDUCE on rich valuations. Dhanuka’s 4QFY17 revenues were down
9% yoy, sharply below estimates, though PAT was in line on account of strong gross
margin expansion (+660 bps yoy). (1) Management’s guidance of 15% revenue growth
and (2) 120-170 bps lower margins to support higher investments in marketing
initiatives in FY2018E forced a 12-14% cut in our FY2018-19E EPS estimates.
Valuations now appear rich; we cut our TP to `800 (`860 earlier) and downgrade rating
to REDUCE (BUY earlier).
REDUCE
MAY 22, 2017
RESULT, CHANGE IN RECO.
Coverage view:
Price (`): 832
Target price (`): 800
BSE-30: 30,465
Mohan Lal [email protected]
Mumbai: +91-22-4336-0879
Dhanuka Agritech
Stock data Forecasts/Valuations 2017 2018E 2019E
52-week range (Rs) (high,low) EPS (Rs) 23.9 26.6 33.3
Market Cap. (Rs bn) EPS growth (%) 11.3 11.3 25.4
Shareholding pattern (%) P/E (X) 34.9 31.3 25.0
Promoters 75.0 Sales (Rs bn) 8.6 10.2 12.2
FIIs 0.0 Net profits (Rs bn) 1.2 1.3 1.7
MFs 9.3 EBITDA (Rs bn) 1.7 1.9 2.3
Price performance (%) 1M 3M 12M EV/EBITDA (X) 24.5 21.6 17.1
Absolute 0.3 9.8 31.4 ROE (%) 24.1 24.2 25.5
Rel. to BSE-30 (3.5) 2.6 9.6 Div. Yield (%) 1.9 0.8 1.0
Company data and valuation summary
930-553
41.6

Others Dhanuka Agritech
102 KOTAK INSTITUTIONAL EQUITIES RESEARCH
Exhibit 1: Weak rabbi season and high base impacted revenue growth in 4QFY17; margins were much ahead of estimates Interim results of Dhanuka, March fiscal year-ends (` mn)
Source: Company, Kotak Institutional Equities
Exhibit 2: Dhanuka’s FY2017 revenues growth was in-line with peers on domestic sales front Trend in revenues growth of major ag-chem companies, March fiscal year-ends (Rs mn)
Notes:
(a) Data pertains to the domestic ag-chem business.
(b) Data pertains to standalone business, which includes revenues from contract manufacturing operations.
Source: Companies, Kotak Institutional Equities
4QFY17 4QFY17E 3QFY17 4QFY16 Est Yoy Qoq 2017 2016 Change (%)
Sales 1,587 1,918 2,090 1,744 (17) (9) (24) 8,767 8,310 5
Raw material cost (791) (1,044) (1,173) (984) (24) (20) (33) (4,987) (5,057) (1)
Employee cost (248) (278) (244) (244) (11) 1 2 (977) (824) 19
Other expenses (206) (245) (286) (214) (16) (4) (28) (1,078) (1,008) 7
EBITDA 342 351 388 301 (2) 14 (12) 1,725 1,421 21
Other income/forex gain/(loss) 35 28 26 21 24 62 35 117 103 14
Depreciation and amortization (45) (38) (38) (17) 17 158 20 (148) (59) 151
Interest cost (3) (2) (2) (3) 24 11 25 (11) (11) (1)
Profit before tax 329 338 374 303 (3) 9 (12) 1,682 1,453 16
Extraordinaries — — — 46 — 46
Tax (net) (86) (95) (108) (64) (9) 36 (20) (488) (380) 28
Net income 242 243 266 285 (0) (15) (9) 1,194 1,119 7
Adjusted net income 242 243 266 239 (0) 1 (9) 1,194 1,073 11
Adjusted EPS (Rs) 4.8 4.9 5.3 4.8 (0) 1 (9) 23.9 21.5 11
Key ratios (as % of revenues)
Gross margins 50.2 45.6 43.9 43.6 43.1 39.1
Employee cost 15.6 14.5 11.7 14.0 11.1 9.9
Other expenses 13.0 12.8 13.7 12.3 12.3 12.1
EBITDA 21.6 18.3 18.6 17.3 19.7 17.1
Effective tax rate 26.3 28.0 28.8 21.1 29.0 26.2
% Change
4QFY17 4QFY16 Yoy (%) 2017 2016 Yoy (%)
Revenues
Dhanuka 1,587 1,744 (9) 8,767 8,310 5
PI Industries (a) 1,960 1,930 2 9,720 9,230 5
Rallis (b) 3,462 3,452 — 15,052 13,867 9
UPL (a) 4,870 4,610 6 33,340 29,920 11
Gross margins (%)
Dhanuka 50.2 43.6 661 43.1 39.1 397
PI Industries 48.0 44.0 397 46.7 42.7 404
Rallis (b) 40.6 38.0 268 39.2 39.7 (51)
UPL 47.7 47.9 (21) 50.9 50.7 27
EBITDA margins (%)
Dhanuka 21.6 17.3 428 19.7 17.1 258
PI Industries 24.5 17.9 656 23.1 19.5 356
Rallis (b) 14.6 14.4 23 15.6 14.9 74
UPL 20.9 19.7 122 19.3 18.2 107

Dhanuka Agritech Others
KOTAK INSTITUTIONAL EQUITIES RESEARCH 103
Exhibit 3: Inventory levels have gone up by 53% in FY2017 on advance purchases Balance sheet of Dhanuka, consolidated, March fiscal year-ends (Rs mn)
Source: Company, Kotak Institutional Equities
Other highlights
The management noted that 2017 has been a mixed year for farmers, with demand
sentiments in the South remaining weak on account of poor monsoon progress, while
cotton farmers in the North and horticulture farmers all over India didn’t see a good year.
Sentiments among sugarcane and cotton farmers in general however, improved
significantly as crop prices improved. The management believes that farmers are now
more inclined to adopt new farm-input technologies, which will give an edge to players
like Dhanuka, who have significantly upgraded their product offerings in the past three
years. Dhanuka has launched 17 new products in the past three years, seven out of which
are 9(3) registrations. It will be launching two under-patent fungicides from Japanese
partners in FY2018E.
Dhanuka registered a volume growth of 8% in FY2017, while realizations contracted by
2%. The management reckons the industry growth to be 6-8% in FY2017, with much
slower growth in the rabbi season. It noted that FY2017 was not a good year for Indian
agro-chemical firms, whereas MNCs (DuPont, Dow and Syngenta) did well. It expects
industry demand to improve to 12% in FY2018E, and expects Dhanuka to record 15%
revenue growth, led by 13% volume growth and 2% improvement in realizations.
The management sees gross margins staying flat in FY2018E, but EBITDA margins
contracting to 18-18.5%, from 19.7% in FY2017, on account of expected increase in
marketing expenses. It feels that it did not invest adequately on field development and
marketing initiatives in the past three years. With a significant number of new product
launches in the past three years, it intends to increase investments in marketing activities
significantly in FY2018E, to capitalize on likely improvement in industry demand.
2016 2017
Liabilities
Shareholder's funds 4,804 5,199
Deferred tax liability/others 324 385
Total debt 77 79
Liabilities 1,317 1,406
Provisions 44 63
Total liabilities 6,566 7,131
Assets
Fixed assets 1,334 1,383
Investments 432 468
Current assets
Cash 511 217
Trade receivables 1,858 1,843
Inventories 1,726 2,645
Loans and advances 676 556
Other current assets 30 20
Total assets 6,566 7,131
Total current assets (excl. cash) 4,289 5,063
Net working capital 2,928 3,595

Others Dhanuka Agritech
104 KOTAK INSTITUTIONAL EQUITIES RESEARCH
Input costs have increased sharply in recent months on account of (1) increase in crude oil
price and (2) shut down of capacities in China which have created supply shortage in
multiple generic products. Dhanuka has taken price hikes ranging from 10-40% in
generic molecules, to pass on the impact. The management noted that it stocked-up
most of its inputs required in 2017 kharif season, at lower rates, which will enable it to
earn higher margins in 1QFY18, as its peers have also taken price hikes to pass on the
recent increase in input costs, while Dhanuka is entering the season with low-cost
inventory.
The management sees revenues from its exclusive sugarcane herbicide – Sempra,
doubling in FY2018E as farm economics in sugarcane crop have improved strongly in
FY2017 on account of the sharp recent surge in price of sugar, which will spur
investment in premium products in coming years.
Tax rates under GST have remained unchanged for agro-chemicals (at 18%), however
Dhanuka enjoys 0% VAT in states of Punjab, Haryana and AP, where it will have to take
price hikes to pass on the higher tax incidence post GST rollout.
The Central Insecticide Board has recently issued guidelines to ban formulation imports
from China, for those molecules which are being manufactured in India. As per the
management, India imports 50% of its domestic pesticide requirement, predominantly
from China. The Central Board’s directive can significantly increase price of generic
molecules in India, if they are implemented. However, this will not impact Dhanuka’s
operations significantly, as it imports mainly from Japan given the high share of specialty
molecules in its revenues, all of which are manufactured in Japan.
Exhibit 4: Dhanuka’s exclusive products portfolio has been growing strongly in the past three years List of new products launched by Dhanuka in the past three years, March fiscal year-ends
Source: Company, Kotak Institutional Equities
Change in estimates
We have aligned our FY2018-19E earnings estimates with management guidance for
FY2018E, leading to a sharp 12-14% cut in our EPS estimates for FY2018-19E, as we were
building in higher revenue growth (20%) and margins (19.6%) versus management
guidance of 15% revenue growth and 18.5% margins in FY2018E.
We were expecting industry revenues to grow at 14% in FY2018E and Dhanuka to
outperform strongly as it has launched the highest number of products among peers in the
last three years, and the same were due for a sharp scale-up as demand environment for the
industry improves in FY2018E, backed by a normal monsoon. However, the management
sees both industry demand (12%) and Dhanuka’s revenues (15%) growing slower than our
estimates in FY2018E, leading to a cut in our FY2018-19E revenue estimates by 6%.
Further, we were building-in a 30 bps yoy contraction in margins in FY2018E, mainly on
account of reversal of some of the gains in gross margins in FY2017. However, the
management sees margins contracting by 120-170 bps in FY2018E, as it also plans to spend
more on marketing campaigns. This has led to a sharp cut of 12-14% in our FY2018-19E
EPS estimates.
2015 2016 2017
Sakura - 9(3) herbicide Cover - co-marketed insecticide Maxx-soy - 9(3) herbicide
Mortar - 9(3) insecticide Dhanwarsha - nutrient Conika - 9(3) fungicide
Sempra - 9(3) herbicide Dozo - 9(4) herbicide Fujiita - 9(3) fungicide
Pager - 9(4) insecticide Thiram - 9(4) fungicide Hi-Dice Super - co-marketed fungicide
Oxykill - 9(4) insecticide Goldy - 9(4) fungicide Bullon - 9(4) insecticide
Aashito - 9(4) insecticide
Delight - 9(4) fungicide

Dhanuka Agritech Others
KOTAK INSTITUTIONAL EQUITIES RESEARCH 105
Exhibit 5: Change in estimates of Dhanuka, March fiscal year-ends (Rs mn)
Source: Kotak Institutional Equities estimates
Exhibit 6: Summary financials: Dhanuka Agritech Profit and loss model, balance sheet and cash flow statement for Dhanuka, consolidated, March fiscal year-ends (Rs mn)
Source: Company, Kotak Institutional Equities estimates
2017 2018 2019 2017 2018 2019 2017 2018 2019
Revenue 8,767 10,192 12,228 8,987 10,889.4 12,998.9 (2) (6) (6)
EBITDA 1,725 1,886 2,348 1,788 2,134.3 2,612.8 (4) (12) (10)
Net income 1,194 1,329 1,667 1,304 1,540 1,889 (8) (14) (12)
Change (%)OldNew
2012 2013 2014 2015 2016 2017 2018E 2019E 2020E
Profit model (Rs mn)
Sales 5,292 5,823 7,384 7,851 8,310 8,767 10,192 12,228 14,286
EBITDA 794 819 1,206 1,317 1,421 1,725 1,886 2,348 2,743
Other income 6 69 48 61 57 117 158 194 246
Interest (55) (35) (42) (26) (11) (11) (9) (9) (9)
Depreciation (45) (45) (48) (59) (59) (148) (162) (185) (208)
Profit before tax 700 808 1,163 1,294 1,407 1,682 1,872 2,348 2,772
Tax expense (129) (163) (232) (233) (380) (488) (543) (681) (804)
Extraordinardy items — — — — 46 — — — —
PAT 571 644 931 1,061 1,073 1,194 1,329 1,667 1,968
EPS (adjusted) 11.4 12.9 18.6 21.2 20.5 23.9 26.6 33.3 39.3
Balance sheet (Rs mn)
Equity 2,146 2,628 3,325 4,123 4,804 5,021 5,950 7,115 8,491
Total borrowings 460 337 394 161 77 79 79 79 79
Deferred tax liability/minority interest 26 28 36 34 325 116 116 116 116
Current liabilities and provisions 1,325 1,212 1,413 1,622 1,361 1,738 2,046 2,454 2,867
Total liabilites 3,956 4,205 5,168 5,940 6,567 6,954 8,191 9,764 11,553
Net fixed assets 393 639 893 1,086 1,334 1,390 1,528 1,644 1,736
Investments 153 82 10 51 432 468 468 468 468
Cash 87 54 23 457 511 32 1,008 1,435 2,088
Other current assets and miscellaneous 3,323 3,430 4,242 4,345 4,289 5,063 5,186 6,218 7,261
Total assets 3,956 4,205 5,168 5,940 6,567 6,954 8,191 9,764 11,553
Free cash flow (Rs mn)
Operating cash flow 609 657 951 1,109 1,079 1,241 1,333 1,657 1,930
Working capital changes (76) (227) (659) (36) 307 (638) 185 (623) (630)
Capital expenditure (51) (279) (288) (253) (271) (200) (300) (300) (300)
Free cash flow 483 152 4 820 1,115 403 1,218 734 1,000
Ratios
EBITDA margin (%) 15.0 14.1 16.3 16.8 17.1 19.7 18.5 19.2 19.2
Net debt/equity (X) 0.17 0.11 0.11 (0.07) (0.09) 0.01 (0.16) (0.19) (0.24)
Book value (Rs/share) 42.9 52.5 66.5 82.4 96.1 100.4 119.0 142.2 169.7
ROAE (%) 29.4 24.7 30.0 27.1 22.1 22.6 22.2 23.4 23.0
ROACE (%) 24.4 20.8 24.8 26.6 20.9 21.0 23.0 25.2 26.2

For Private Circulation Only. FOR IMPORTANT INFORMATION ABOUT KOTAK SECURITIES’ RATING SYSTEM AND OTHER DISCLOSURES, REFER TO THE END OF THIS MATERIAL.
Kotak Institutional Equities Research [email protected] Mumbai: +91-22-4336-0000
Strong show from staffing segment; yoy associate count growth of 16%
TeamLease ended FY2017 with 126,463 associate employees implying a yoy growth of 16.2%,
higher than our estimates. NETAP apprentice count at 23,439 as of March 2016 was also ahead
of expectations. While 4QFY17 is a seasonally weak quarter and usually sees a sequential
decline in employee count, TeamLease managed to post a sequential increase led by strong
additions from fintech and telecom companies.
IT staffing – some deferment in 4QFY17
IT staffing segment missed estimates on account of weaker staffing in Jan-Feb 2017 due to
year-end reviews in IT companies and related deferment in new hiring. This was the key reason
for TeamLease missing our 4QFY17 EBITDA estimate by 4%. Management reiterated that
vendor consolidation in the IT staffing space should benefit TeamLease, and the revenue run-
rate in its three staffing companies has recovered March 2017 onwards.
Questions on cash utilization persist
TeamLease management mentioned that the board has decided to not pay any dividend this
year, in order to maintain financial flexibility for future acquisitions. Specifically, TeamLease is
scouting for staffing companies in specialized verticals such as hospitality; it is not looking for
more companies in the IT staffing space.
Stock pricing in fair amount of optimism; downgrade a notch to ADD
We increase our target price to Rs1,245 (from Rs1,200) to factor in the tax benefit from Section
80JJAA for the next two years. This section provides for a tax benefit on 30% of the salary of
additional employees employed during the year, provided the employee has worked for more
than 240 days (this translated to ~16,000 employees for TeamLease), for three years. We
believe GST implementation can boost growth prospects for TeamLease by helping it take away
some market-share from the large unorganized sector. Sharp stock price performance leads to a
downgrade in our rating to ADD.
TeamLease Services (TEAM) Others
4QFY17 – staffing segment remains buoyant. TeamLease reported stable 4Q
performance with 75% yoy increase in EBITDA. Core staffing segment employee count
increased 16% yoy and was better than estimates. We raise our March 2019E target
price to Rs1,245 (from Rs1,200) primarily as we factor in the Section 80JJAA tax benefit
for the next two years. GST implementation may lead to steady growth for the
company’s core staffing business. Sharp run-up in the stock price prompts a downgrade
in rating to ADD.
ADD
MAY 22, 2017
RESULT, CHANGE IN RECO.
Coverage view:
Price (`): 1,169
Target price (`): 1,245
BSE-30: 30,465
Garima Mishra [email protected]
Mumbai: +91-22-4336-0862
TeamLease Serives
Stock data Forecasts/Valuations 2017 2018E 2019E
52-week range (Rs) (high,low) EPS (Rs) 38.8 43.1 51.1
Market Cap. (Rs bn) EPS growth (%) 143.8 11.1 18.6
Shareholding pattern (%) P/E (X) 30.1 27.1 22.9
Promoters 45.6 Sales (Rs bn) 30.4 37.9 45.9
FIIs 16.5 Net profits (Rs bn) 0.7 0.7 0.9
MFs 14.3 EBITDA (Rs bn) 0.4 0.7 0.9
Price performance (%) 1M 3M 12M EV/EBITDA (X) 41.5 27.1 20.5
Absolute 11.8 33.9 27.3 ROE (%) 19.2 17.6 17.5
Rel. to BSE-30 7.7 25.1 6.2 Div. Yield (%) 0.0 0.0 0.0
Company data and valuation summary
1,265-823
20.0

TeamLease Services Others
KOTAK INSTITUTIONAL EQUITIES RESEARCH 107
Exhibit 1: 4QFY17 – Strong performance by the general staffing segment Consolidated quarterly financials of TeamLease, March fiscal year-ends (Rs mn)
Source: Company, Kotak Institutional Equities
xx
Yoy growth
4QFY17 4QFY17E 4QFY16 3QFY17 KIE yoy qoq FY2017 FY2016 (%)
Net revenue (staffing) 8,004 8,144 6,540 7,987 (1.7) 22.4 0.2 29,822 24,682 20.8
Other operating income 165 150 101 160 10.1 62.7 3.1 597 367 62.5
Revenue from operations 8,169 8,294 6,642 8,147 (1.5) 23.0 0.3 30,419 25,049 21.4
Employee benefits expense (7,846) (7,946) (6,452) (7,843) (1.2) 21.6 0.0 (29,377) (24,391) 20.4
Other expenses (175) (187) (106) (156) (6.2) 64.8 12.2 (599) (400) 49.5
Total Expenses (8,022) (8,133) (6,558) (7,999) (1.4) 22.3 0.3 (29,976) (24,791) 20.9
EBITDA 147 161 84 148 (8.8) 75.1 (0.7) 443 258 71.8
Finance Costs (3) (2) (1) (3) 36.4 113.5 (5.8) (11) (4) 179.8
Depreciation and amortization expense (13) (10) (10) (10) 25.8 22.3 21.2 (43) (30) 42.5
Other income 57 35 66 36 63.9 (13.6) 57.3 224 154 45.0
PBT 189 184 139 171 2.7 36.2 10.5 613 378 62.1
Tax expense 196 (63) (47) (56) (412.8) (514.1) (449.7) 50 (130) (138.7)
Net profit 384 121 91 115 216.7 320.5 234.2 663 248 167.5
Operational metrics
Number of associate employees 126,463 125,807 108,860 125,207 0.5 16.2 1.0 126,463 108,860 16.2
Mark-up per associate per month 702 691 687 691 1.6 2.2 1.6 702 687 2.2
Number of NETAP apprentices 23,439 22,427 11,574 19,427 4.5 102.5 20.7 23,439 11,574 102.5
Key ratios (%)
Employee cost as proportion of sales 96.1 95.8 97.1 96.3 96.6 97.4
Other cost as proportion of sales 2.1 2.3 1.6 1.9 2.0 1.6
EBITDA margin 1.8 1.9 1.3 1.8 1.5 1.0
Tax rate (104) 34 34 33 (8) 34
Segmental performance
Revenues
Staffing and allied services 7,806 7,914 6,540 7,800 (1.4) 19.4 0.1 29,453 24,758 19.0
IT staffing services 234 258 — 222 (9.2) nm 5.6 508 — nm
Other HR services 128 150 101 125 (14.5) 26.4 2.9 458 291 57.1
Total operating income 8,169 8,322 6,642 8,147 (1.8) 23.0 0.3 30,419 25,049 21.4
EBIT
Staffing and allied services 116 85 114 36.2 1.8 410 312 31.4
IT staffing services 34 — 35 nm (4.6) 76 — nm
Other HR services 24 24 3 (1.3) 621.4 31 30 4.1
Unallocated 19 31 22 (39.7) (13.9) 106 40 166.9
Total 192 140 174 36.9 10.2 624 382 63.3
Less: finance costs (3) (1) (3) 113.5 (5.8) (11) (4)
PBT 189 139 171 36.2 10.5 613 378 62.1
Change (%)

Others TeamLease Services
108 KOTAK INSTITUTIONAL EQUITIES RESEARCH
Exhibit 2: Hiring by fintech and telecom has ensured sequentially flat associate employee count Associate employee count for TeamLease, March fiscal year-ends, 1QFY16-4QFY17
Source: Company, Kotak Institutional Equities
Exhibit 3: Core employee productivity has steadily improved Associates and trainees handled per core staffing employee, March fiscal year-ends, 2011-4QFY17
Source: Company, Kotak Institutional Equities
70,000
80,000
90,000
100,000
110,000
120,000
130,000
1QFY16 2QFY16 3QFY16 4QFY16 1QFY17 2QFY17 3QFY17 4QFY17
(#) Associate employee count (#)
100
120
140
160
180
200
220
0
20,000
40,000
60,000
80,000
100,000
120,000
140,000
160,000
2011 2012 2013 2014 2015 2016 1QFY17 2QFY17 3QFY17 4QFY17
(#)(#) Associate+trainee count (#, LHS)
Associates+trainees handled per core staffing employee (#)

TeamLease Services Others
KOTAK INSTITUTIONAL EQUITIES RESEARCH 109
Earnings call takeaways
TeamLease has benefited from improved hiring in fintech and telecom sectors. Fintech
hiring was boosted by demonetization, while telecom hiring was boosted by R-Jio’s
launch of mobile services. TeamLease provided ~5,000 employees to R-Jio; it does not see
any major decline in these numbers in the near term.
GST implementation is the most significant near-term trigger, and should induce existing
customers to increase their dependence on organized staffing companies such as
TeamLease. Further, it should also lead to additional new clients coming to TeamLease for
their staffing needs. However, the company believes that benefits from GST in the form
of greater market-share would flow through only in the medium term. TeamLease has
upgraded its systems and will be fully GST compliant once it is fully rolled out.
Manufacturing is one of the largest sectors where informal staffing is rampant; GST can
change this as companies would be able to take tax credits on service charge paid on
staffing services availed.
TeamLease is looking out for staffing companies in specialized verticals such as
hospitality. It is choosing to stay away from outcome-driven services such as facility
management, which are working capital intensive.
Section 80JJAA benefit. Management mentioned that TeamLease took the benefit of this
section post its amendment to include companies in the service sector as well. The section
allows companies to take the benefit of a deduction on 30% of the total incremental
expense on new employees added during the year. This deduction can be availed by
eligible companies for three years. The deduction under this section is available subject to
the following conditions:
Net increase in employee count on a yoy basis, at year-end, provided that the added
employees have worked for more than 240 days
The net added employees should be paying PF and eligible for gratuity
The net added employees should be paid by check/bank transfer and should not earn
more than Rs25,000 per month
The net added employees should not be casual/temporary in nature
Per TeamLease, it meets the above criteria for ~16,000 employees, resulting in tax saving
of ~Rs210 mn for FY2017. We note that the actual refund of this would possibly come to
the company by FY2019 only.
Earnings changes
Our EPS estimates have gone up materially on incorporation of Section 80JJAA benefits
for FY2018 and FY2019. We note that the receipt of these benefits from the IT
authorities will not be immediate, and receivables will accordingly increase.

Others TeamLease Services
110 KOTAK INSTITUTIONAL EQUITIES RESEARCH
Exhibit 4: Summary of changes to assumptions for TeamLease, March fiscal year-ends
Source: Kotak Institutional Equities estimates
xx
2018E 2019E 2018E 2019E 2018E 2019E
Total
Sales (Rs mn) 37,915 45,879 38,340 46,499 (1.1) (1.3)
Sales growth (%) 24.6 21.0 26.0 21.3
EBITDA (Rs mn) 676 869 666 875 1.6 (0.7)
EBITDA margin (%) 1.8 1.9 1.7 1.9
EBIT (Rs mn) 634 822 618 822 2.6 (0.0)
PBT (Rs mn) 766 975 779 1,013 (1.6) (3.7)
Tax rate (%) 3.8 10.4 30.6 31.5
Net Profit (Rs mn) 737 874 541 694 36.3 26.0
EPS (Rs) 43.1 51.1 31.6 40.6 36.3 26.0
EPS growth (%) 11 19 (19) 28
Temporary staffing
Temporary staff count (#) 143,536 162,913 142,090 161,982 1.0 0.6
Salary per employee (Rs) 257,762 275,805 263,003 281,414 (2.0) (2.0)
Fee per employee per month (Rs) 734 767 757 795 (3.1) (3.5)
Revenue (Rs mn) 36,002 43,689 36,384 44,265 (1.0) (1.3)
EBITDA (Rs mn) 416 550 413 551 0.7 (0.2)
EBITDA margin (%) 1.2 1.3 1.1 1.2
IT Staffing
Revenue (Rs mn) 1,202 1,318 1,260 1,382 (4.6) (4.6)
EBITDA (Rs mn) 176 189 189 207 (6.7) (8.6)
EBITDA margin (%) 14.7 14.4 15.0 15.0
Apprentice staffing
Apprentice count (#) 32,815 41,018 31,500 39,375 4.2 4.2
Average monthly fee per apprentice (Rs) 450 450 450 450 0.0 0.0
Revenue (Rs mn) 152 199 146 191 4.2 4.2
EBITDA (Rs mn) 61 100 58 96 4.2 4.2
EBITDA margin (%) 40.0 50.0 40.0 50.0
Other HR services
Revenue (Rs mn) 559 673 550 661 1.7 1.8
EBITDA (Rs mn) 8 22 11 27 (27.5) (16.9)
EBITDA margin (%) 1.5 3.3 2.1 4.0
New estimates Old estimates % revision

TeamLease Services Others
KOTAK INSTITUTIONAL EQUITIES RESEARCH 111
Exhibit 5: DCF-based March 2019E target price of Rs1,245 DCF-based valuation of TeamLease, March fiscal year-ends (Rs mn)
Source: Company, Kotak Institutional Equities estimates
xx
2016 2017 2018E 2019E 2020E 2021E 2022E 2023E 2024E 2025E 2026E 2027E 2028E 2029E 2030E 2035E
Net sales 28,509 35,371 44,087 53,348 64,560 78,129 93,768 111,132 130,043 150,223 171,280 192,720 213,952 235,384 256,610 343,530
Yoy growth (%) 27 24 25 21 21 21 20 19 17 16 14 13 11 10 9 4
EBIT 228 400 634 822 1,043 1,317 1,619 1,963 2,349 2,773 3,224 3,675 4,080 4,489 4,894 6,552
EBIT margin (%) 0.8 1.1 1.4 1.5 1.6 1.7 1.7 1.8 1.8 1.8 1.9 1.9 1.9 1.9 1.9 1.9
EBIT*(1-tax rate) 156 433 610 737 709 889 1,084 1,305 1,550 1,816 2,111 2,407 2,672 2,940 3,205 4,291
Depreciation/Amortisation 30 43 42 47 53 60 67 76 86 97 108 120 130 147 166 273
(Inc.)/Dec. in working capital (374) (385) (569) (318) (157) (205) (363) (474) (516) (551) (575) (585) (579) (585) (579) (362)
Capital expenditure (70) (961) (160) (46) (52) (63) (73) (81) (89) (94) (99) (122) (142) (165) (184) (175)
Free cash flows (257) (870) (76) 420 553 681 716 826 1,032 1,268 1,546 1,821 2,081 2,337 2,608 4,027
Years discounted — — — — 1 2 3 4 5 6 7 8 9 10 11 16
Discount factor — — — 1.00 0.89 0.79 0.70 0.62 0.55 0.49 0.44 0.39 0.35 0.31 0.27 0.15
Discounted cash flow — — — 420 491 538 503 516 572 625 678 710 721 720 714 612
Associate employee count (#) 108,860 126,463 143,536 162,913 184,906 208,019 231,941 255,136 276,822 296,200 313,972 329,670 342,857 353,143 363,737 401,547
Risk-free rate 6.5
Risk premium 6.0
Beta (X) 1.0
Cost of equity (%) 12.5 1,245 11.5 12.0 12.5 13.0 13.5
WACC (%) 12.5 4.0 1,365 1,267 1,181 1,106 1,039
Terminal growth rate (%) 5.0 4.5 1,409 1,303 1,211 1,131 1,060
Sum of free cash flow 10,518 5.0 1,460 1,344 1,245 1,158 1,083
Terminal value 8,565 5.5 1,519 1,391 1,283 1,190 1,109
Enterprise value 19,083 6.0 1,588 1,446 1,327 1,226 1,138
Investments —
Net debt (2,195)
Equity value 21,278
No. of shares (mn) 17
Equity value per share (Rs) 1,245
WACC (%)
Terminal
growth
rate (%)

Others TeamLease Services
112 KOTAK INSTITUTIONAL EQUITIES RESEARCH
Exhibit 6: Snapshot of key segmental assumptions and financials, March fiscal year-ends, 2011-20E
Source: Company, Kotak Institutional Equities estimates
xx
2011 2012 2013 2014 2015 2016 2017 2018E 2019E 2020E
Total
Revenues 6,868 9,258 12,507 15,296 20,071 25,049 30,419 37,915 45,879 55,522
Revenue growth (%) 34.8 35.1 22.3 31.2 24.8 21.4 24.6 21.0 21.0
EBITDA (390) (207) (111) 120 241 258 443 676 869 1,096
EBITDA margin (%) (5.7) (2.2) (0.9) 0.8 1.2 1.0 1.5 1.8 1.9 2.0
Diluted EPS (Rs) (33) (11) (3) 12 20 16 39 43 51 49
EPS growth (%) NA NA NA NA 73 (21) 144 11 19 (3)
Temporary staffing
Number of associate employees 36,500 61,021 72,491 82,067 94,647 108,860 126,463 143,536 162,913 184,906
Growth in number of associate employees (%) (16) 67 19 13 15 15 16 14 14 14
Per employee monthly fee (Rs) 417 518 553 603 653 644 703 734 767 802
Growth in per employee fee (%) 24 7 9 8 (1) 9 5 5 5
Revenues 6,533 9,006 12,236 15,026 19,731 24,640 29,360 36,002 43,689 53,017
Revenue growth (%) 38 36 23 31 25 19 23 21 21
EBITDA 61 140 167 205 201 275 336 416 550 738
EBITDA margin (%) 0.9 1.6 1.4 1.4 1.0 1.1 1.1 1.2 1.3 1.4
IT Staffing business
No. of associates 1,289 1,354 1,422 1,493
Yoy increase (%) 5 5 5
Revenues 508 1,202 1,318 1,446
Revenue growth (%) 137 10 10
EBITDA 76 176 189 208
EBITDA margin (%) 15 15 14 14
Apprenticeship
Average employees billed in the year — — — — — 11,000 23,439 32,815 41,018 49,222
Per employee monthly fee (Rs) — — — — — 530 530 530 530 530
Revenues — — — — — 42 93 152 199 244
Revenue growth (%) — — — — — — 121 63 31 22
EBITDA — — — — — 4 19 61 100 122
EBITDA margin (%) 10 20 40 50 50
Permanent recruitment
Revenues 133 123 117 113 138 167 192 221 254 292
Revenue growth (%) (8) (5) (3) 22 21 15 15 15 15
EBITDA 2 (15) 0 (0) 33 (2) 4 3 5 6
EBITDA margin (%) 1 (12) 0 (0) 24 (1) 2 2 2 2
Training
Revenues 193 112 120 111 152 74 82 90 96 103
Revenue growth (%) (42) 7 (8) 38 (52) 11 10 7 7
EBITDA (261) (248) (125) (56) (8) (4) — — 1 2
EBITDA margin (%) (135) (222) (104) (51) (6) (6) — — 1 2
Others
Revenues 9 17 35 47 50 127 184 249 323 420
Revenue growth (%) 93 99 37 5 156 45 35 30 30
EBITDA (192) (84) (153) (28) 15 (16) 9 5 16 21
EBITDA margin (%) (2,132) (482) (442) (60) 31 (13) 5 2 5 5

TeamLease Services Others
KOTAK INSTITUTIONAL EQUITIES RESEARCH 113
Exhibit 7: Consolidated income statement, balance sheet and cash flow, March fiscal year-ends, 2011-20E (Rs mn)
Source: Company, Kotak Institutional Equities estimates
2011 2012 2013 2014 2015 2016 2017 2018E 2019E 2020E
Income statement
Total operating income 6,868 9,258 12,507 15,296 20,071 25,049 30,419 37,915 45,879 55,522
Associate employee expenses (6,351) (8,627) (11,755) (14,432) (18,990) (23,821) (28,728) (35,706) (43,255) (52,412)
Gross profit 518 632 752 865 1,081 1,228 1,691 2,209 2,624 3,109
EBITDA (390) (207) (111) 120 241 258 443 676 869 1,096
Depreciation (66) (38) (36) (19) (27) (30) (43) (42) (47) (53)
EBIT (456) (245) (147) 101 213 228 400 634 822 1,043
Other income 115 83 110 79 114 154 224 143 164 208
Financial charges (2) (3) (5) (2) (1) (4) (11) (11) (11) (11)
Pre-tax profit (343) (165) (43) 178 326 378 613 766 975 1,241
Taxation — — — — (18) (130) 50 (29) (101) (397)
Net income (recurring) (343) (165) (43) 178 308 248 663 737 874 843
Exceptional items (53) — — — — — — — — —
Net income (reported) (395) (165) (43) 178 308 248 663 737 874 843
Weighted average number of shares (mn) 12 15 15 15 15 16 17 17 17 17
EPS (Rs) (33.2) (10.8) (2.8) 11.6 20.1 15.9 38.8 43.1 51.1 49.3
Balance sheet
Equity share capital 4 5 5 5 5 171 171 171 171 171
Reserves & surplus 215 1,042 1,005 1,183 1,483 2,945 3,640 4,377 5,251 6,095
Shareholders funds 219 1,047 1,010 1,188 1,488 3,116 3,811 4,548 5,422 6,266
Loan funds 29 81 121 8 — 194 11 — — —
Total source of funds 247 1,127 1,131 1,197 1,488 3,309 3,822 4,548 5,422 6,266
Net fixed assets 211 195 107 107 95 111 1,029 1,147 1,146 1,145
Investments — 0 0 0 0 0 103 103 103 103
Cash balances 180 822 780 847 1,147 2,590 1,593 1,633 2,195 2,893
Current assets 574 952 1,355 1,478 1,827 3,039 4,048 5,381 6,511 7,651
Inventories 15 9 5 2 2 2 2 2 2 3
Sundry debtors 345 543 618 595 813 1,205 1,872 2,493 3,017 3,499
Other current assets 76 114 340 367 498 1,054 982 1,224 1,481 1,792
Loans and advances 139 286 392 515 514 778 1,192 1,662 2,011 2,358
Current liabilities and provisions 718 842 1,112 1,236 1,638 2,476 3,101 3,865 4,677 5,660
Total application of funds 247 1,127 1,131 1,197 1,488 3,309 3,822 4,549 5,428 6,283
Cash flow statement
Operating cash flow before WCchanges (275) (125) (1) 199 336 282 717 790 932 907
Change in working capital/ other adjustments 144 (255) (133) 1 53 (374) (385) (569) (318) (157)
Capital expenditure (408) (21) 51 (19) (15) (70) (961) (160) (46) (52)
Free cash flow (539) (400) (83) 181 375 (162) (628) 62 568 698

For Private Circulation Only. FOR IMPORTANT INFORMATION ABOUT KOTAK SECURITIES’ RATING SYSTEM AND OTHER DISCLOSURES, REFER TO THE END OF THIS MATERIAL.
Kotak Institutional Equities Research [email protected] Mumbai: +91-22-4336-0000
Jewelry business – solid revenue growth prognosis; margins not a focus area in near term
Management reiterated its aspiration of growing the jewelry business revenues 2.5X in five
years (20% CAGR; 80% growth to be achieved through SSSG and balance through store
expansion) aided by five key drivers – (1) higher share in the large wedding segment (Titan
has <2% share) through best-in-class inventory, differentiated designs and better stock
management through hub stores model, (2) higher presence in higher-value diamond
jewelry (targeting 50%+ growth in FY2018; Titan has recently launched Red Carpet collection),
(3) geographical market share expansion through local merchandise and local connect
(Titan has identified 20+ cities where Tanishq share is lower at 2-3%), (4) aggressive store
expansion; Titan plans to enter 19 new towns and open 27 stores in FY2018 and (5) GHS
expansion; targeting 21% revenues from GHS in FY2019 from 14% in FY2017.
Overall, Titan is looking at robust sales growth capitalizing on strong momentum of shift from
unorganized to organized (gaining share predominantly from local jewelers) through better
value proposition and aggressive marketing with a longer-term target of ~10% market share.
Margins isn’t a focus area in near term, albeit likely to expand over medium term.
Watches – year of innovation and calibrated expansion; eyewear – year of investments
Titan’s core focus in watches is to revive revenue growth through sustained focus on smart
watches (recently launched Sonata Act safety watch and Fastrack Reflex activity tracker),
creating excitement back through strong innovation funnel (across brands), stronger growth
from licensed brands (three new brands lined up for FY2018) and renovated and calibrated
channel expansion (new store designs for WOT and FTS; overall plan to open 50 new stores).
In eyewear, management highlighted that while FY2017 was a year of correction, FY2018 is
likely to be a year of investments in terms of store expansion (25 regular format stores, 12 low
cost format stores and 3 factory outlets in FY2018), creating an omni channel play with well-
supported digital strategy, investing in frame manufacturing facility (implementation in 2
phases) and expanding presence in sunglasses market (position Titan glares in premium
market). Profitability is likely to remain muted in eyewear in near term due to investments;
however, over a 3-year period, management expects margin to improve to ~10%+ (currently 3-
5%).
Titan Company (TTAN) Consumer Products
Investor forum takeaways: upbeat revenue growth prognosis. Titan reiterated its
aspiration of growing its core jewelry business revenues 2.5X in five years but was
relatively guarded on margins in near term. Wedding segment, higher-value diamond
jewelry and GHS expansion remain key focus areas to drive jewelry growth. Watches
growth is likely to be driven by strong innovation funnel and calibrated expansion while
eyewear profitability is likely to be muted due to investment phase. Rich valuations fully
price in improved momentum and optimistic outlook. REDUCE stays.
REDUCE
MAY 22, 2017
UPDATE
Coverage view: Cautious
Price (`): 471
Target price (`): 430
BSE-30: 30,465
Rohit Chordia [email protected]
Mumbai: +91-22-4336-0885
Anand Shah [email protected]
Mumbai: +91-22-4336-0882
Titan Industries
Stock data Forecasts/Valuations 2017 2018E 2019E
52-week range (Rs) (high,low) EPS (Rs) 8.9 12.4 14.4
Market Cap. (Rs bn) EPS growth (%) 14.2 38.4 16.3
Shareholding pattern (%) P/E (X) 52.8 38.1 32.8
Promoters 53.1 Sales (Rs bn) 129.8 158.6 181.6
FIIs 20.2 Net profits (Rs bn) 7.9 11.0 12.8
MFs 3.4 EBITDA (Rs bn) 11.6 15.8 18.6
Price performance (%) 1M 3M 12M EV/EBITDA (X) 35.0 25.4 21.4
Absolute (0.2) 9.2 29.5 ROE (%) 20.4 23.8 23.8
Rel. to BSE-30 (3.9) 2.0 7.9 Div. Yield (%) 0.6 0.8 1.0
Company data and valuation summary
506-296
418.3

Titan Company Consumer Products
KOTAK INSTITUTIONAL EQUITIES RESEARCH 115
Exhibit 1: Titan Industries – key assumptions driving our earnings model, March fiscal year-ends,
2014-20E (Rs mn)
Source: Company, Kotak Institutional Equities estimates
2014 2015 2016 2017 2018E 2019E 2020E
Jewelry business
Net revenues 86,274 94,206 87,080 103,487 126,753 145,867 166,875
Rev growth yoy (%) 7 9 (8) 19 22 15 14
EBITDA 8,728 9,694 8,235 10,389 13,309 15,462 17,856
EBITDA growth yoy (%) 4 11 (15) 26 28 16 15
EBITDA margin (%) 10.1 10.3 9.5 10.0 10.5 10.6 10.7
Total gold sold (tonnes) 20.9 22.6 23.3 23.6 28.3 31.6 35.2
Change yoy (%) 8 8 3 2 20 12 11
Average gold price (Rs/gm) 28,279 27,685 27,311 30,862 30,553 31,164 31,788
Change yoy (%) (6) (2) (1) 13 (1) 2 2
Studded share (%) 30.0 32.0 28.0 29.6 30.5 31.5 32.5
Total # of stores 198 209 227 240 255 275 295
Revenue/store (Rs '000) 457,688 462,928 399,449 443,201 512,135 550,440 585,525
EBITDA/store (Rs '000) 46,302 47,636 37,773 44,493 53,774 58,347 62,651
Watches business
Net revenues 17,889 19,188 19,504 20,355 22,441 24,624 26,889
Rev growth yoy (%) 7 7 2 4 10 10 9
EBITDA 2,075 2,293 1,900 1,493 2,805 3,324 3,697
EBITDA growth yoy (%) (4) 10 (17) (21) 88 19 11
EBITDA margin (%) 11.6 12.0 9.7 7.3 12.5 13.5 13.8
Watches sold (mn) 14.4 14.7 13.9 14.1 14.8 15.4 16.1
Change yoy (%) (6) 2 (6) 1 5 4 4
Others
Net revenues 5,111 2,421 2,484 3,806 4,932 6,133 7,301
Rev growth yoy (%) 24 (53) 3 53 30 24 19

Consumer Products Titan Company
116 KOTAK INSTITUTIONAL EQUITIES RESEARCH
Exhibit 2: Titan Industries: Consolidated profit model, balance sheet, cash model, March fiscal year-ends, 2014-20E (Rs mn)
Source: Company, Kotak Institutional Equities estimates
2014 2015 2016 2017 2018E 2019E 2020E
Profit model (Rs mn)
Net sales 109,274 119,134 112,779 129,789 158,632 181,579 206,515
EBITDA 10,443 11,484 9,314 11,555 15,844 18,638 21,499
Other income 1,202 708 650 705 1,257 1,412 1,608
Interest (871) (807) (423) (377) (405) (441) (487)
Depreciation (676) (896) (996) (1,105) (1,225) (1,357) (1,509)
Pretax profits 10,099 10,489 8,545 10,777 15,471 18,252 21,111
Tax (2,620) (2,326) (1,649) (3,099) (4,486) (5,476) (6,544)
PAT 7,479 8,163 6,896 7,679 10,984 12,776 14,566
Share of associate earnings 2 0 (2) (18) (18) (18) (18)
PAT after Associates 7,480 8,163 6,894 7,661 10,966 12,759 14,549
Extraordinary items (131) — — (688) — — —
Net profit (reported) 7,349 8,163 6,894 6,973 10,966 12,759 14,549
Earnings per share (Rs) 8.4 9.2 7.8 8.6 12.4 14.4 16.4
Balance sheet (Rs mn)
Total equity 25,227 30,839 34,900 42,587 49,596 57,540 66,205
Total borrow ings 8,068 998 1,131 610 360 110 —
Deferred tax liabilities (net) (88) (193) (235) (33) (33) (33) (33)
Total liabilities and equity 33,208 31,643 35,795 43,165 49,923 57,618 66,173
Net fixed assets (Incl CWIP) 6,334 7,441 8,770 9,964 10,802 11,714 12,683
Intangible assets 137 102 187 3,337 3,337 3,337 3,337
Investments 31 31 55 1,377 1,359 1,341 1,324
Cash 8,927 2,138 1,292 14,830 16,583 19,390 22,374
Net current assets (excl cash) 17,779 21,931 25,492 13,656 17,842 21,835 26,455
Total assets 33,208 31,643 35,795 43,165 49,923 57,618 66,173
Free cash flow (Rs mn)
Operating cash flow (excl working capital) 7,635 9,178 7,398 8,455 11,340 13,145 14,937
Working capital (13,182) (4,152) (1,596) 10,734 (4,186) (3,993) (4,620)
Capital expenditure (2,112) (2,070) (2,530) (1,935) (2,062) (2,270) (2,478)
Free cash flow (7,659) 2,956 3,273 17,255 5,091 6,882 7,839
Key assumptions, growth, %
Net revenue growth 7.9 9.0 (5.3) 15.1 22.2 14.5 13.7
EBITDA growth 3.1 10.0 (18.9) 24.1 37.1 17.6 15.3
EPS growth 3.1 9.1 (15.5) 11.1 43.2 16.3 14.0
EBITDA margin (%) 9.6 9.6 8.3 8.9 10.0 10.3 10.4
Tax rate (% of PBT) 25.9 22.2 19.3 28.8 29.0 30.0 31.0
Segment revenue assumptions, growth, %
Jewellery 7.4 9.2 (7.6) 18.8 22.5 15.1 14.4
Watches 6.6 7.3 1.6 4.4 10.3 9.7 9.2
Others 23.6 12.3 7.9 26.9 20.0 17.5 15.0
Ratios (%)
ROE (%) 33.3 29.1 21.0 19.8 23.8 23.8 23.5
ROCE (%) 35.9 31.7 23.8 25.6 30.6 31.4 31.7

For Private Circulation Only. FOR IMPORTANT INFORMATION ABOUT KOTAK SECURITIES’ RATING SYSTEM AND OTHER DISCLOSURES, REFER TO THE END OF THIS MATERIAL.
Kotak Institutional Equities Research [email protected] Mumbai: +91-22-4336-0000
TN digitization can increase subscription revenue by ₹2-6 bn from ₹2.5 bn over FY2017-20E
The grant of provisional DAS license to ARASU cable paves way for digitization in TN, improving
subscription revenue outlook for Sun. The quantum of upside will be determined by share shift
to DTH and improvement in monetization from ARASU. Sun’s subscription revenue from TN can
potentially increase by ₹2-6 bn from ₹2.5 bn over FY2017-20E (scenario analysis on Pages 3-5);
we model 31% CAGR to ₹5.75 bn (base case). We estimate Sun’s subscription revenue from
non-Tamil markets to grow at 14% CAGR, broadly in line with industry. Overall, we estimate
21% CAGR in domestic subscription revenues to ₹17 bn over FY2017-20E. There is upside risk
to our estimates in the event of (1) change in regime in TN and/or (2) strict implementation of
TRAI tariff order—Sun will be a beneficiary given breadth and depth of viewership (Exhibit 1).
Ad growth recovery around the corner
We expect Sun’s ad revenues to grow in line with the industry in FY2018E driven by (1) Gemini
TV’s bounce back to #1 position from #4 in Telugu GECs; weekday PT ratings have trebled over
the past year, (2) steady viewership of Sun TV, and (3) augmentation of ad sales force and
serious efforts to improve ad inventory monetization (details on Page 9), partly offset by (4) weak
viewership of Kannada and Malayalam GECs. Sun’s transition to commissioned model from slot
sale model has met with initial success—its big budget multi-lingual TV series ‘Nandini’ is
garnering good viewership. Encouraged by this success and cognizant of expected rise in
competition (launch of ‘Colors Tamil’ later this year), Sun has plans to launch 3-4 such multilingual
big-budget shows across all four southern markets. We welcome Sun’s decision to step up
investments to enrich content quality; it will help the network gain/defend viewership share.
Improved subscription revenue and earnings outlook and strong cash generation merit re-rating
Sun’s turnaround efforts will show up in financials starting FY2018. We incorporate digitization
in TN and increase our FY2018-19E earnings by 4-5%. We raise target multiple to 25X FY2019E
earnings (20X earlier) in view of (1) better subscription revenue outlook, (2) increased focus on
improving monetization and investing in content and digital. It gives us comfort on sustainable
growth even as Sun is yet to deliver on financials, and (3) optionality—further earnings kicker in
event of change in regime in TN, strict implementation of TRAI tariff order and/or moderation in
promoter remuneration to nominal levels. An appeal against CBI verdict is a key risk to our call.
Sun TV Network (SUNTV) Media
Multiple tailwinds. Sun is on a turnaround path and in a sweet spot given tailwinds
(digitization in Tamil Nadu, TRAI’s tariff order and IPL breakeven). Digitization in TN can
add ₹2-6 bn to subscription revenues in the next three years. We increase EPS by 4-5%
and TP to ₹950 (₹750 earlier) valuing Sun at 25X FY2019E EPS (20X earlier) in view of
(1) better subscription revenue outlook, (2) focused investments in content and sales for
sustainable growth and (3) optionality—further earnings upgrade in the event of
(a) strict enforcement of TRAI tariff order, (b) any change in the regime in TN, and/or
(c) moderation in promoter remuneration. ADD.
ADD
MAY 22, 2017
UPDATE
Coverage view: Attractive
Price (`): 871
Target price (`): 950
BSE-30: 30,435
Jaykumar Doshi [email protected]
Mumbai: +91-22-4336-0863
Sun TV Network
Stock data Forecasts/Valuations 2017 2018E 2019E
52-week range (Rs) (high,low) EPS (Rs) 26.5 30.9 38.0
Market Cap. (Rs bn) EPS growth (%) 15.2 16.6 23.2
Shareholding pattern (%) P/E (X) 32.9 28.2 22.9
Promoters 75.0 Sales (Rs bn) 28.1 32.4 37.9
FIIs 16.8 Net profits (Rs bn) 10.4 12.2 15.0
MFs 1.7 EBITDA (Rs bn) 15.2 17.8 21.9
Price performance (%) 1M 3M 12M EV/EBITDA (X) 21.8 18.4 14.7
Absolute 8.8 23.9 103.8 ROE (%) 28.3 30.0 32.8
Rel. to BSE-30 4.8 15.9 72.2 Div. Yield (%) 1.7 2.0 2.2
Company data and valuation summary
946-334
343.4

Media Sun TV Network
118 KOTAK INSTITUTIONAL EQUITIES RESEARCH
Assessing audience engagement (depth) and scale (breadth) of Sun’s GECs and
movie channels
The TRAI’s new tariff order seeks to provide consumers freedom to pick and choose
channels. It mandates broadcasters and distributors to publish a-la-carte prices of channels.
While we expect most consumers to continue to opt for bouquets offered by distributors,
the implementation of TRAI’s tariff order can lead to (1) data-driven content deals between
distributors and broadcasters, (2) price discovery of channels. Broadcasters would be
compelled to price its channel keeping in mind consumer appetite for its content, and (3)
driver channels in each genre may get slightly higher share in the subscription pie at the cost
of weaker channels.
We attempt to analyze strength of key channels in Tamil, Telugu and Kannada markets. A
simple way to analyze it is by comparing viewership data. However, it is not possible to
determine how many households would be willing to pay for the channel and the pricing
power of a channel relative to competition. We use two variables for this purpose—
Coverage and Average time spent helps us better understand breadth and depth of a
channel.
For the below analysis, we define
Coverage as the number of households (HHs) that viewed a particular channel for at
least one hour (aggregate) over two weeks. It indicates the breadth (scale) that a channel
can potentially achieve (we assume that a HH that watches a channel for at least one
hour over two weeks will likely opt for it if he/she has freedom to pick and choose. This
metric is an indicator of scale (subscriber base) that channel can potentially achieve.
Average time spent. It is average time spent per household per day on the channel
(total time spent on a channel divided by the number of HHs that viewed the channel for
at least a minute on that day; reach). It indicates the engagement of that channel in its
viewer base, essentially loyalty/depth/stickiness. In our view higher the depth, higher is
the pricing power of a channel.
Simply put, coverage gives an idea of number of households that would potentially
subscribe and average time spent indicates pricing power relative to other channels.
In Exhibit 1, Coverage is on Y axis and Average time spent is on X axis. We have used BARC
viewership data for first two weeks of Feb 2017 and all India households (HH) as universe.
Size of the bubble is based on headline viewership ratings of the channel in relevant market.
Conclusion—the data in Exhibit 1 suggests Sun channels fare well on both audience
engagement and scale in its markets. The a-la-carte price of its key channels is also
reasonable and can be justified based by engagement data. Thus, we believe that if TRAI’s
tariff order is implemented in true spirit, it can result in meaningful upside in cable
subscription revenues given Sun’s suboptimal subscription monetization. Further, we do not
see any risk to Sun’s DTH ARPU of ₹42/sub/month. We note that we have not built any
meaningful upside from implementation of TRAI’s tariff order as we have doubts if it will be
implemented in true spirit given several practical challenges.

Sun TV Network Media
KOTAK INSTITUTIONAL EQUITIES RESEARCH 119
Exhibit 1: Potential scale and relative pricing power that a regional genre channel can garner if viewers move to a-la-carte buying
Source: BARC, Kotak Institutional Equities
Evaluating subscription revenue opportunity
Tamil Nadu—digitization can increase Sun’s subscription revenues from the state by
₹2-6 bn (20-50% CAGR) under different scenarios
Ministry of Information & Broadcasting’s grant of provisional DAS license (digital cable) to
ARASU has paved way for digitization in TN and improved subscription revenue outlook for
Sun. The quantum of upside will be a function (1) shift of market share from cable to DTH,
(2) strategy of ARASU (ARPU from ARASU on revision of content contracts), (3) outcome of
implementation of TRAI tariff order, and (4) pace of digitization.
Given many moving parts and unknowns, accurately forecasting subscription revenue from
the state is a bit difficult. We make certain basic assumptions and carry out scenario analysis
considering three possibilities—
Our following assumptions are consistent across all the three scenarios
(1) Completion of digitization in Tamil Nadu by FY2018 end or 1HFY19. While
ARASU has received provisional license with a timeline of 3 months to carry out
digitization, we expect it to be extended to allow ARASU time required to procure
and seed set-top boxes. We note that ARASU has floated a tender for procurement
of set-top boxes. We do not expect any major road block.
(2) TRAI tariff order. We do not expect any material change in industry’s subscription
dynamics even after implementation of TRAI’s tariff order. We expect disparity
between cable and DTH to continue at least for some more time and convergence
will take place over the medium term.
With these two assumptions, we now assess subscription revenue potential under the
following three scenarios (Exhibit 1).
5
10
15
20
25
30
20 40 60 80 100 120
Co
vera
ge
(mn
HH
s)
Average time spent per HH per day (mins)
Sun TVRs19
ETV TeluguRs12
Star Suvarna
Rs12
Zee TeluguRs10
KTVRs15
Gemini TVRs15
Star V ijayRs14
MAA TVRs14
High engagement
High pricing powerLow engagement
Low pricing power
Su
bsc
rib
er
base
scale
Gemini moviesRs8
Colors Kannada
Rs15
Zee Kannada
Rs10
UdayaTVRs12
UdayamoviesRs11
Zee TamilRs6

Media Sun TV Network
120 KOTAK INSTITUTIONAL EQUITIES RESEARCH
Scenario 1 (Base case)—(1) ARASU partially subsidizes set-top box and increases
subscription price such that its discount to DTH reduces to 25% from 45% (i.e. cable
tariffs increase to ₹150-175 from ₹100-120). DTH’s market share increases to 35% from
20% led by improved competitiveness of its offerings, and (2) Sun’s monetization from
cable industry (mainly ARASU) improves significantly on low base but remains suboptimal
when compared with DTH or cable in other states.
Scenario 2 (Bear case)—(1) ARASU distributes set-top boxes for free (or at negligible
cost) and keeps monthly subscription price low (say at 35% discount to DTH versus 45%
at present; ₹125-150 from ₹100-120) making it difficult for DTH to gain market share,
and (2) modest increase in Sun’s collection from ARASU despite low base.
Scenario 3 (Bull case)—(1) ARASU offers modest subsidies on set-top box and increases
monthly subscription price such that its discount to DTH narrows to 15% from 45%
(₹175-200 from ₹100-120). DTH can gain significant market share in this scenario and (2)
ARASU pays Sun at par with other private cable MSOs. It results in significant increase in
Sun’s collection from ARASU.
Note: At present DTH base pack in South is priced at ₹200-235/sub/month. ARASU has
priced analog cable offerings at ₹70/sub/month but our checks suggest that LCOs collect
₹100-120 from subscribers, implying 45-50% discount to DTH making it difficult for DTH to
gain market share. Thus, DTH penetration in TN is about 20% as compared to about 33% at
all-India level. Increase in DTH penetration during digitization will be a function of ARASU’s
pricing for digital cable.

Sun TV Network Media
KOTAK INSTITUTIONAL EQUITIES RESEARCH 121
Exhibit 2: Digitization in TN could add Rs2-6 bn (bear/base/bull case) to Sun's subscription revenues over FY2017-20E Scenario analysis: Assessing subscription revenue potential for Sun TV, March fiscal year-ends, 2017-20E
Source: Company, Kotak Institutional Equities estimates
CAGR (%)
2017E 2020E 2017-20E Comments
Scenario 1 (Base case)
Cable subscribers (mn) 15.1 13.3
DTH subscribers (mn) 3.6 7.5
Total Pay-TV subscribers (mn) 18.7 20.8
DTH penetration in Pay-TV subs (%) 19.2 36.1
Cable ARPU (Rs/sub/month) 3.9 12.0 45.4
DTH ARPU (Rs/sub/month) 42.0 47.2 4.0
Cable subscription revenues (Rs mn) 700 1,909 39.2
DTH subscription revenues (Rs mn) 1,814 4,252 32.5
Total subscription revenue (Rs mn) 2,514 6,161 34.4
Incremental subs revenues (Rs mn) 3,646
Scenario 2 (Bear case)
Cable subscribers (mn) 15.1 15.2
DTH subscribers (mn) 3.6 5.6
Total Pay-TV subscribers (mn) 18.7 20.8
DTH penetration in Pay-TV subs (%) 19.2 27.0
Cable ARPU (Rs/sub/month) 3.9 8.0 27.2
DTH ARPU (Rs/sub/month) 42.0 47.2 4.0
Cable subscription revenues (Rs mn) 700 1,455 27.3
DTH subscription revenues (Rs mn) 1,814 3,175 20.3
Total subscription revenue (Rs mn) 2,514 4,630 22.3
Incremental subs revenues (Rs mn) 2,115
Scenario 3 (Bull case)
Cable subscribers (mn) 15.1 10.8
DTH subscribers (mn) 3.6 10.0
Total Pay-TV subscribers (mn) 18.7 20.8
DTH penetration in Pay-TV subs (%) 19.2 48.2
Cable ARPU (Rs/sub/month) 3.9 25.0 85.3
DTH ARPU (Rs/sub/month) 42.0 47.2 4.0
Cable subscription revenues (Rs mn) 700 3,227 65.6
DTH subscription revenues (Rs mn) 1,814 5,669 45.6
Total subscription revenue (Rs mn) 2,514 8,896 51.7
Incremental subs revenues (Rs mn) 6,381
Key assumptions: (1) ARASU partially subsidizes set-top box and
increases subscription price such that its discount to DTH reduces to
25% from 45% (i.e. cable tariffs increase to Rs150-175 from Rs100-
120). DTH’s market share doubles to 35% from 20% as its
competitiveness improves; DTH w ill continue to be 25% expensive
but there w ill be more takers given superior customer serv ice, (2)
Sun's blended ARPU from cable increases 200% over the next 3
years (Sun's subscription collection from ARASU increases to about
Rs1 bn from Rs300 mn). Our base case expects, the gap between
Sun's DTH and cable ARPU in TN to reduce significantly but it w ill
still be more than that in other markets.
Key assumptions: (1) ARASU distributes set-top box for free (or at
negligible cost) and increases subscription price maringally (say Rs125-
150 from Rs100-120) making it difficult for DTH to gain significant
market share, and (2) modest improvement in Sun's collection from
ARASU post digitization; Sun's blended ARPU from cable doubles
over the next 3 years on low base (Sun's subscription collection from
ARASU increases to Rs600 mn from Rs300 mn). Sub-optimal
monetization continues.
Key assumptions: (1) ARASU offers modest subsidies on STBs and
increases monthly subscription price to Rs175-200 from Rs100-120.
DTH gains significant market share as its competitiveness improves
materially (2) ARASU pays Sun at par w ith other private distributors
and the gap between DTH and Cable ARPU narrows.
This scenario implies: (1) cable monetization in the TN market aligns
w ith that in other markets, and (2) Subscription revenue : ad
revenue ratio of Sun in TN would match that of dominant players in
other regional markets

Media Sun TV Network
122 KOTAK INSTITUTIONAL EQUITIES RESEARCH
Strategy of ARASU and Sun Group holds the key
Sun’s subscription revenue would be a function of ARASU’s approach and Sun Group’s
strategy. In past, the Tamil Nadu state government has taken measures to keep media and
entertainment affordable to all. For instance, movie ticket prices in TN are capped at `120
for several years now. AIADMK government under its erstwhile Chief Minister revived
ARASU and fixed cable subscription price at `70/sub/month in 2011. Even though LCOs of
ARASU charge a bit more (say `100-120), analog cable tariff in TN is lower than that in
other states. We note that ARASU pays `300 mn annually to Sun at present. It implies about
`2-3.5/sub/month (reported subs of ARASU are 7.1 mn whereas actual subs could be
around 12-13 mn as per our industry interactions).
There is possibility that ARASU continues with low tariffs and provides set-top box for free
(or at negligible costs). The counter argument is that ARASU would be compelled to increase
subscription price as its content cost will align with other private producers post digitization
and upon implementation of TRAI’s new tariff order. It is difficult to predict if ARASU will be
able to full comply with TRAI’s tariff order as it would require ARASU to push meaningful
increase in cable tariffs to make up for higher content costs and taxes (such a step would be
deviation from its policy and there is risk of upsetting public sentiments; unlikely given
volatile political environment). In our view, it is unlikely that ARASU will increase cable tariffs
meaningfully. We also do not expect it to subsidize cable subscription (i.e. pay Sun at par
with other distributors but collect lower amount from its LCOs and subscribers). One-time
subsidy for set-top box is probable but recurring subsidy on subscription price looks unlikely.
We believe ARASU’s pricing and content payment would gradually align with market over
time.
Sun TV Network receives `42/sub/month from DTH subscribers, about `2-3.5/sub/month
from ARASU and `15-20/sub/month from a small set of private cable MSOs in Chennai. Shift
of market share from cable to DTH offers an immediate upside for Sun’s broadcasting
business. We expect Sun Group to devise Sun Direct (Group’s DTH entity) strategy keeping
this in mind. Given, full integration across value chain, Sun Group can afford to be more
aggressive in subsidizing set-top boxes to garner higher market share during digitization in
TN. We gather than Sun Direct is in the process of tying debt capital and ordering set-top
boxes to gear up for digitization. We note that upfront cost of DTH is about `1,500 for a
new connection. We would not be surprised if it is reduced to `750-1,000 by Sun Direct to
gain subscriber market share.

Sun TV Network Media
KOTAK INSTITUTIONAL EQUITIES RESEARCH 123
We model 21% CAGR in domestic subscription revenues over FY2017-20E
Our estimates factor in upside in digitization in Tamil Nadu broadly in line with base case
scenario detailed earlier. Our key assumptions are (1) 3.4% CAGR in pay-TV households, (2)
Shift in DTH: Cable market share to 35:65 from 20:80 on completion of digitization, (3) 4%
CAGR in DTH ARPU over the next 3 years, (4) 200% increase in cable ARPU to `12 from `4
led by digitization (our assumptions factor in ARPU of `22-25 from private cable MSOs in
Chennai + ARPU to `9-10 from ARASU in rest of Tamil Nadu). We have also factored in
disparity in paying potential for phase III and phase IV markets).
In our view, Sun’s subscription revenue from non-Tamil market is not materially different
from its viewership share and positioning. Given this, disproportionate increase in its
domestic subscription revenues from AP/Telangana, Karnataka and Kerala is unlikely.
Subscription revenue growth for Sun TV in these markets would be broadly in line with
industry.
Note that, we are not modeling increase in cable ARPU to DTH level post implementation of
TRAI’s tariff order. We expect divergence to continue for foreseeable future. We expect
21% CAGR in domestic subscription revenues.
Exhibit 2: We estimate 31% CAGR in subscription revenues from TN over FY2017-20E
Source: Company, Kotak Institutional Equities estimates
CAGR (%)
2017E 2018E 2019E 2020E 2017-20E
Tamil Nadu
TV Households (HHs) 20.8 21.4 22.1 22.7
Growth (%) 3.0 3.0 3.0
Pay-TV penetration (%) 90.0 90.3 90.7 91.0
Pay-TV subscribers (mn) 18.7 19.4 20.0 20.7
Growth (%) 3.4 3.4 3.4
DTH subscribers (mn) 3.6 5.6 6.5 7.0
Cable subscribers (mn) 15.1 13.8 13.5 13.7
- Digital cable subs (mn) 0.5 8.5 11.5 13.7
- Analog subs (largely ARASU) (mn) 14.6 5.3 2.0 0.0
DTH ARPU (Rs/sub/month) 42.0 43.7 45.4 47.2
Digital cable ARPU (Rs/sub/month) 20.0 9.0 11.0 12.5
Analog ARPU (Rs/sub/month) 3.3 3.3 3.0 3.0
DTH subscription revenues (Rs mn) 1,814 2,411 3,298 3,827 27.9
Digital cable subscription revnues (Rs mn) 120 486 1,320 1,889
Analog cable subscription revenues (Rs mn) 580 393 131 36
Total cable subscription revenues 700 879 1,451 1,925 39.6
Total subscription revenues 2,514 3,291 4,749 5,751 31.4

Media Sun TV Network
124 KOTAK INSTITUTIONAL EQUITIES RESEARCH
Exhibit 2 (continued): We estimate 14% CAGR in subscription revenues from non-TN (FY2017-20E)
Source: Company, Kotak Institutional Equities estimates
CAGR (%)
2017E 2018E 2019E 2020E 2017-20E
AP+Telangana
TV Households (mn) 20.8 21.5 22.3 23.1
Pay-TV penetration (%) 75.0 75.5 76.0 76.5
Pay-TV subscribers (mn) 15.6 16.3 16.9 17.6
DTH subscribers (mn) 4.1 4.7 5.4 6.0
Cable subscribers (mn) 11.5 11.5 11.5 11.7
- Phase I + II 1.7 1.7 1.7 1.7
- Phase III 2.8 2.8 2.8 2.8
- Phase IV 7.0 7.0 7.0 7.2
ARPU (Rs/sub/month)
DTH ARPU 42.0 43.7 45.4 47.2
Cable ARPU- blended 7.6 8.4 9.6 11.1
- Phase I + II 20.0 22.0 23.3 24.7
- Phase III 14.0 16.1 17.7 18.6
- Phase IV 2.0 2.0 3.0 5.0
Subscription revenues (Rs mn)
DTH subscription revenues 2,066 2,310 2,763 3,228 15.9
Cable subscription revenues
- Phase I + II 408 449 476 504
- Phase III 470 541 595 625
- Phase IV 168 168 253 426
Total cable subscription revenues (Rs mn) 1,046 1,158 1,324 1,555 14.0
Total subscription revenues (Rs mn) 3,113 3,468 4,087 4,783 15.2
Karnataka
TV Households (mn) 14.1 14.6 15.1 15.6
Pay-TV penetration (%) 75.0 75.5 76.0 76.5
Pay-TV subscribers (mn) 10.6 11.0 11.5 11.9
DTH subscribers (mn) 3.7 4.3 4.8 5.3
Cable subscribers (mn) 6.9 6.7 6.6 6.6
- Phase I + II 2.0 2.0 2.0 2.0
- Phase III 1.4 1.4 1.4 1.4
- Phase IV 3.5 3.3 3.2 3.2
ARPU (Rs/sub/month)
DTH ARPU 42.0 43.3 44.6 45.9
Cable ARPU- blended 7.4 8.5 10.1 11.3
- Phase I + II 15.0 16.5 17.8 18.7
- Phase III 10.0 11.5 13.2 13.0
- Phase IV 2.0 2.5 4.0 6.0
Subscription revenues (Rs mn)
DTH subscription revenues 1,865 2,065 2,423 2,780 14.1
Cable subscription revenues
- Phase I + II 360 396 428 449
- Phase III 168 193 222 218
- Phase IV 83 102 158 234
Total cable subscription revenues (Rs mn) 611 691 808 901 13.7
Total subscription revenues (Rs mn) 2,476 2,756 3,231 3,682 14.0
Kerala
TV Households (mn) 7.8 8.1 8.3 8.6
Pay-TV penetration (%) 90.0 90.5 91.0 91.5
Pay-TV subscribers (mn) 7.0 7.3 7.6 7.9
DTH subscribers (mn) 1.8 1.9 2.1 2.2
Cable subscribers (mn) 5.2 5.4 5.5 5.7
- Phase I + II 0.0 0.0 0.0 0.0
- Phase III 1.2 1.2 1.2 1.2
- Phase IV 4.0 4.2 4.3 4.5
ARPU (Rs/sub/month)
DTH ARPU 42.0 42.8 43.7 44.6
Cable ARPU- blended 4.6 5.6 6.7 7.8
- Phase I + II 0.0 0.0 0.0 0.0
- Phase III 10.0 11.5 13.2 15.0
- Phase IV 3.0 4.0 5.0 6.0
Subscription revenues (Rs mn)
DTH subscription revenues 907 958 1,045 1,130 7.5
Cable subscription revenues
- Phase I + II 0 0 0 0
- Phase III 144 166 190 216
- Phase IV 144 196 255 319
Total cable subscription revenues (Rs mn) 288 362 446 535 22.6
Total subscription revenues (Rs mn) 1,196 1,320 1,491 1,665 11.6

Sun TV Network Media
KOTAK INSTITUTIONAL EQUITIES RESEARCH 125
Turnaround efforts on track; good progress in Telugu market
Sun TV is on turnaround path under the leadership of its new President, R Mahesh and
backed by renewed focus of promoters following acquittal from Aircel-Maxis case.
Content strategy—move towards commissioned model is a step in the right
direction. Sun has taken several initiatives in the past 12-18 months to revive viewership
of non-Tamil GECs. It (1) augmented content teams and appointed new business heads,
and (2) revamped programming on non-Tamil GECs and has largely moved to
commissioned model from slot sale model. This shift reduces dependency on private
producers and allows Sun to have better control on content.
Outcome—Gemini TV’s has regained #1 position from #4 in Telugu market. Its headline
ratings have doubled and weekday primetime ratings have trebled. More importantly, the
entire improvement in ratings is led by sticky and profitable fiction + non-fiction content.
Sun recently launched a daily soap, ‘Nandini’, through commissioned model across all
four southern markets. The cost of production of this program is about 2-3X that of a
regular soap. The company is encouraged by viewership success of ‘Nandini ’ and it plans
to launch 3-4 such high quality fiction soaps /non-fiction shows across four markets. Sun
is cognizant of under-investment in content and intends to step up investments to enrich
content quality (look and feel). The company is also focused on revival of ratings of
Kannada and Malayalam GECs.
Sales transformation—focus on monetization. Sun has made several changes to its
sales organization to improve sales effectiveness. Key steps take so far (1) augmentation
of sales force and expansion of footprint over the past 12-18 months. Sun has added 60-
70 sales personnel over the past 12-18 months and about 40% of its sales workforce
comprise of new hires, (2) Sun has recently brought on board Paritosh Joshi, an industry
veteran having strong agency and advertiser relationships and experience of steering
sales/operations of a large organization. Paritosh works closely with Sun leadership as an
advisor (consultant) and is helping Sun improve ad sales monetization and move towards
analytics and data-driven selling.
The efforts to transform sales have not reflected on Sun’s ad sales performance as yet but
we do expect it to yield results in FY2018E. We note that Sun recently bargained hard with
HUL for better ad rates that led to a standoff with HUL for a few days. Such actions indicate
resolve to improve ad inventory monetization.
Digital opportunity—a lot of potential but strategic focus and investments are
needed. Sun does not have its own OTT platform despite having a collection of 9,000+
movies, probably the largest movie library. At present, the company provides its content
to several OTT platforms largely of fixed fee basis. The management is cognizant of its
under-investment in digital and it is working on its digital/OTT strategy.
Other tailwinds—IPL and radio
Sun is in a sweet spot on a few other counts as well: (1) IPL—Renewal of contract would
likely reduce license fee costs by about `500 mn starting FY2019. We expect IPL business to
break even and generate EBITDA of `348 mn in FY2019 as against loss of about `500
mn/year over FY2015-17, (2) Sun’s operates a good radio franchise. The outlook for this
business is steady and improving.
Media Sun TV Network
126 KOTAK INSTITUTIONAL EQUITIES RESEARCH
Valuations—improved earnings outlook, strong cash generation and optionality
merit premium multiple
We ascribe PE multiple of 25X FY2019E earnings as against 20X earlier as we capture (1)
improved subscription revenue outlook, (2) initial success of Sun in its transition to
commissioned model from slot sale model. We like the fact that Sun is reducing its
dependency on third party producers for content; the performance thus far is encouraging,
and (3) Sun has also started investing for sustainable growth and is well placed to step up
investments further in view of potential windfall in subscription revenue from TN. The
management plans to launch 3-4 big-budget shows, enriching content quality.
Additionally, we note that Sun’s promoters’ remuneration stood at `1.45 bn (10% of PBT;
maximum permissible limit). We expect 80% increase in PBT over FY2016-20E. There is a
possibility that promoter remuneration may not grow in tandem with PBT growth. Any
moderation in promoter remuneration to nominal levels will offer significant upside
(earnings kicker + re-rating).
We have not built in strict enforcement of TRAI’s tariff order; if implemented in true spirit
TRAI’s tariff order can aid Sun. Lastly, we note that any softening of ARASU’s aggressive
pricing or change in regime can result in materialization of significant upside to subscription
revenue as per our best case scenario.
Sun’s FCF as percentage of net profit was 110% over the past three year (cumulative). Its
cash generation is significantly better than peer Zee and in line with several high cash
generating FMCG companies. On a steady state basis, Sun’s FCF/PAT can continue to be
close to 100%. Sun has also maintained high dividend payout ratio of 50%+. Strong cash
generation and 50%+ dividend payout augur well for the stock. We note that Sun can trade
higher than our 25X target multiple if it is able to demonstrate ability to gain market share
in new markets or make a promising play in digital.
While we do not rule out risk to our estimates in event of any execution slippages, Sun’s
efforts and strategy gives us comfort that the organization is heading in the right direction.

Sun TV Network Media
KOTAK INSTITUTIONAL EQUITIES RESEARCH 127
Exhibit 3: BARC ratings market share, 09-Oct-15 to 14-Apr-17 (Week 41, 2015 to Week 15, 2017) (%)
Source: BARC, Kotak Institutional Equities estimates
Jan-16 Feb-16 Mar-16 Apr-16 May-16 Jun-16 Jul-16 Aug-16 Sep-16 Oct-16 Nov-16 Dec-16 Jan-17 Feb-17 Mar-17 Apr-17
Telugu- Ratings market share in top 5 channels (%)
Zee Telugu 22.6 23.5 24.8 25.0 26.0 23.9 22.8 21.5 22.1 21.3 19.7 21.3 22.4 21.5 21.7 20.9
Maa TV 22.4 22.1 22.3 22.0 21.7 21.8 20.0 20.1 19.5 19.7 21.2 21.0 20.8 21.9 20.4 19.3
Gemini TV 18.9 17.7 17.5 19.9 18.7 20.2 23.7 25.5 27.1 27.3 27.8 27.6 25.8 27.1 27.6 28.7
ETV Telugu 24.8 25.5 24.4 23.2 23.3 23.2 22.8 22.8 22.3 23.0 23.0 21.5 22.6 20.7 21.5 22.8
Gemini Movies 11.2 11.2 11.0 9.8 10.4 10.9 10.7 10.2 9.0 8.7 8.3 8.6 8.3 8.8 8.8 8.4
Total 100.0 100.0 100.0 100.0 100.0 100.0 100.0 100.0 100.0 100.0 100.0 100.0 100.0 100.0 100.0 100.0
Kannada- Ratings market share in top 5 channels (%)
Colors Kannada 33.0 28.6 29.5 29.1 27.5 30.3 30.2 30.2 31.8 29.8 30.5 29.3 31.4 28.2 27.5 27.6
Colors Super — — — — — — — 2.5 2.2 3.5 3.9 4.3 4.5 6.0 6.0 6.5
Zee Kannada 16.9 18.3 18.2 17.9 20.3 18.7 19.1 19.6 18.1 19.8 20.8 22.0 21.3 21.1 20.9 23.3
Udaya TV 16.1 16.3 14.8 16.4 15.6 17.4 16.7 15.5 15.7 11.7 10.6 9.9 10.7 11.5 10.9 10.5
Suvarna 16.4 20.3 20.6 19.0 17.1 15.0 16.2 17.2 17.0 19.5 19.8 19.4 18.1 18.1 18.8 16.8
Udaya Movies 17.6 16.5 16.9 17.6 19.5 18.6 17.8 15.0 15.3 15.8 14.3 15.0 13.9 15.1 16.0 15.3
Total 100.0 100.0 100.0 100.0 100.0 100.0 100.0 100.0 100.0 100.0 100.0 100.0 100.0 100.0 100.0 100.0
Tamil- Ratings market share in top 5 channels (%)
Sun TV 60.5 62.1 61.3 61.1 58.4 56.6 56.5 57.1 56.4 58.9 58.1 57.9 58.4 56.8 55.9 56.3
STAR V ijay 12.3 11.2 11.4 10.1 10.9 11.7 12.6 11.7 11.7 9.8 9.8 10.5 11.2 11.5 12.5 13.4
KTV 17.1 16.6 16.2 17.0 18.7 18.2 16.1 15.0 15.4 13.8 14.8 14.2 13.4 14.7 15.3 15.4
Polimer 5.5 5.0 4.9 4.7 5.2 4.9 4.4 4.6 4.4 4.3 4.0 4.2 4.4 4.4 4.4 4.3
Zee Tamizh 4.5 5.1 6.2 7.2 6.9 8.6 10.3 11.7 12.2 13.2 13.2 13.2 12.7 12.5 12.0 10.5
Total 100.0 100.0 100.0 100.0 100.0 100.0 100.0 100.0 100.0 100.0 100.0 100.0 100.0 100.0 100.0 100.0
Malayalam- Ratings market share in top 5 channels (%)
Asianet 55.2 53.8 53.3 51.2 50.6 54.6 49.9 48.8 45.2 46.0 49.1 49.8 52.7 50.5 47.8 51.1
Mazhavil Man. 15.1 14.8 15.9 17.5 17.4 16.0 15.8 14.3 15.8 14.5 13.5 12.1 12.9 14.5 15.0 16.5
Surya TV 9.1 9.2 9.6 11.3 11.3 10.9 14.9 15.7 16.7 14.7 12.4 12.8 12.9 13.2 12.7 12.1
Flowers TV 12.1 12.6 11.7 10.3 11.7 10.0 10.2 12.0 12.6 12.7 11.6 11.3 11.4 11.2 11.8 10.8
Asianet Movies 8.6 9.6 9.5 9.7 9.0 8.5 9.1 9.1 9.7 12.1 13.3 14.1 10.0 10.6 12.7 9.5
Total 100.0 100.0 100.0 100.0 100.0 100.0 100.0 100.0 100.0 100.0 100.0 100.0 100.0 100.0 100.0 100.0
Notes:
(1) Market share in top 5/6 channels.

Media Sun TV Network
128 KOTAK INSTITUTIONAL EQUITIES RESEARCH
Exhibit 4: BARC: Weekday prime time ratings market share, 09-Oct-15 to 14-Apr-17 (Week 41, 2015 to Week 15, 2017) (%) - Weekday
Prime time (7 pm to 11 pm)
Source: BARC, Kotak Institutional Equities estimates
Jan-16 Feb-16 Mar-16 Apr-16 May-16 Jun-16 Jul-16 Aug-16 Sep-16 Oct-16 Nov-16 Dec-16 Jan-17 Feb-17 Mar-17 Apr-17
Telugu- Ratings market share in top 5 channels (%)
Zee Telugu 27.6 28.2 31.1 33.0 33.4 32.5 30.1 26.6 26.6 26.2 23.2 23.5 25.6 25.6 24.9 25.0
Maa TV 23.4 23.4 22.6 21.5 20.4 19.0 17.8 18.9 19.5 18.5 22.0 23.9 24.4 25.8 23.6 21.6
Gemini TV 7.2 6.8 6.7 8.3 7.4 9.7 15.0 17.7 19.1 20.8 21.5 21.1 19.0 19.1 20.8 19.9
ETV Telugu 31.0 30.9 30.2 28.8 29.6 29.0 26.8 27.4 26.2 26.4 25.9 24.8 24.0 23.2 24.3 27.1
Gemini Movies 10.7 10.8 9.3 8.4 9.1 9.7 10.2 9.4 8.6 8.1 7.3 6.8 7.0 6.3 6.3 6.5
Total 100.0 100.0 100.0 100.0 100.0 100.0 100.0 100.0 100.0 100.0 100.0 100.0 100.0 100.0 100.0 100.0
Kannada- Ratings market share in top 5 channels (%)
Colors Kannada 42.4 35.2 32.3 32.9 31.6 35.0 36.0 36.9 39.0 40.0 40.1 38.6 44.2 39.3 36.4 37.9
Colors Super — — — — — — — 1.4 1.0 2.2 2.8 2.9 4.1 4.3 3.7 3.5
Zee Kannada 10.5 15.1 16.5 16.0 18.9 16.7 17.3 16.4 14.8 15.6 16.8 17.3 14.5 15.2 16.3 18.5
Udaya TV 11.8 10.8 13.2 14.6 13.9 16.8 13.6 12.7 12.9 3.5 3.4 3.7 3.3 4.9 5.4 5.9
Suvarna 22.5 27.8 26.7 26.2 22.8 18.0 20.1 22.8 23.4 27.8 26.5 26.9 23.7 25.1 27.6 23.3
Udaya Movies 12.9 11.1 11.2 10.2 12.9 13.5 13.0 9.7 9.0 10.8 10.4 10.6 10.3 11.1 10.6 10.9
Total 100.0 100.0 100.0 100.0 100.0 100.0 100.0 100.0 100.0 100.0 100.0 100.0 100.0 100.0 100.0 100.0
Tamil- Ratings market share in top 5 channels (%)
Sun TV 65.5 66.7 68.4 68.6 66.3 62.0 61.9 62.3 64.0 66.6 67.2 68.4 67.8 66.3 64.9 68.0
STAR V ijay 11.5 11.6 10.6 8.8 9.7 11.5 11.9 10.7 10.6 8.3 7.6 8.7 9.0 9.9 10.6 10.2
KTV 13.6 12.7 11.0 11.5 11.5 13.8 11.5 10.5 11.2 11.2 11.1 9.8 10.4 10.9 11.4 10.5
Polimer 6.6 5.7 5.5 5.1 5.5 4.9 5.0 5.1 4.0 3.3 3.2 3.2 3.9 4.1 4.0 3.5
Zee Tamizh 2.9 3.4 4.6 6.0 6.9 7.7 9.8 11.3 10.1 10.6 10.9 9.9 8.9 8.8 9.2 7.7
Total 100.0 100.0 100.0 100.0 100.0 100.0 100.0 100.0 100.0 100.0 100.0 100.0 100.0 100.0 100.0 100.0
Malayalam- Ratings market share in top 5 channels (%)
Asianet 67.0 63.1 63.9 66.4 63.3 63.1 58.6 57.0 53.1 52.9 58.5 61.3 64.1 61.8 58.6 63.9
Mazhavil Man. 13.1 14.6 16.0 14.8 16.1 15.1 14.1 13.7 16.0 14.6 11.5 10.9 10.6 13.1 15.1 13.5
Surya TV 2.5 2.3 2.0 3.2 3.8 5.1 11.9 11.8 11.3 10.1 8.4 7.3 8.5 7.9 7.9 6.5
Flowers TV 12.3 13.6 12.2 9.7 11.7 10.4 9.6 11.8 13.2 13.4 12.0 11.1 10.8 10.7 10.3 10.0
Asianet Movies 5.2 6.4 5.8 5.9 5.1 6.4 5.8 5.7 6.4 9.0 9.6 9.4 6.0 6.5 8.2 6.1
Total 100.0 100.0 100.0 100.0 100.0 100.0 100.0 100.0 100.0 100.0 100.0 100.0 100.0 100.0 100.0 100.0
Notes:
(1) Market share in top 5/6 channels. (2) Prime time ratings data (7 pm to 11 pm)

Sun TV Network Media
KOTAK INSTITUTIONAL EQUITIES RESEARCH 129
Exhibit 5: Revised earnings estimates for Sun TV Network, FY2017E-19E (Rs mn)
Source: Company, Kotak Institutional Equities
2017E 2018E 2019E 2017E 2018E 2019E 2017E 2018E 2019E
Advertising revenues (incl. slot sale) 13,087 14,953 16,825 13,087 14,960 16,954 0 (0) (1)
Domestic subscription revenues 9,569 11,820 14,587 9,569 11,170 13,291 0 6 10
- DTH subscription revenues 6,630 8,032 9,805 6,630 7,657 8,998 0 5 9
- Cable subscription revenues 2,939 3,788 4,782 2,939 3,513 4,294 0 8 11
Overseas subscription revenues 1,581 1,629 1,677 1,581 1,660 1,743 — (2) (4)
Radio revenues 1,994 2,353 2,776 1,994 2,353 2,776 — — -
Other operating revenues (incl IPL) 1,843 1,629 2,027 1,843 1,612 1,987 0 1 2
Total revenues 28,073 32,384 37,893 28,073 31,754 36,752 0 2 3
Direct expenses 2,620 3,065 3,453 2,620 2,964 3,351 0 3 3
Employee expenses 3,178 3,718 4,276 3,178 3,655 4,203 0 2 2
SG&A expenses 3,375 3,679 3,614 3,345 3,641 3,535 1 1 2
D&A expenses 4,577 5,106 5,685 4,577 5,106 5,593 0 0 2
Total expenditure 13,750 15,569 17,029 13,720 15,366 16,682 0 1 2
EBIT 14,323 16,815 20,863 14,353 16,388 20,071 (0) 3 4
EBIT margin (%) 51.0 51.9 55.1 51.1 51.6 54.6
PAT 10,444 12,174 14,994 10,373 11,737 14,306 1 4 5
EPS (Rs/share) 26.5 30.9 38.0 26.3 29.8 36.3 1 4 5
Key assumptions
Ad revenue growth (%) (0.4) 15.5 13.5 (0.4) 16.0 14.6
Domestic subs revenue growth (%) (0.1) 23.5 23.4 (0.1) 16.7 19.0
- DTH subscription revenue growth (%) 13.2 21.1 22.1 13.2 15.5 17.5
- Cable subscription revenue growth (%) 28.0 28.9 26.2 28.0 19.5 22.2
Overseas subscription revenue growth (%) 10.6 3.0 3.0 10.6 5.0 5.0
Radio revenue growth (%) 17.0 18.0 18.0 17.0 18.0 18.0
Movies amortization expense 3,725 4,117 4,625 3,725 4,117 4,532 - - 2
IPL profit / (loss) (318) (359) 348 (318) (359) 348 0 0 -
Direct costs growth (%) 19.1 17.0 12.6 19.1 13.1 13.0
Change (%)Revised Previous

Media Sun TV Network
130 KOTAK INSTITUTIONAL EQUITIES RESEARCH
Exhibit 6: Consolidated financial summary of Sun TV Network, FY2013-20E (Rs mn)
Source: Company, Kotak Institutional Equities estimates
2014 2015 2016 2017E 2018E 2019E 2020E
Profit model (Rs mn)
Net sales 22,236 23,954 25,698 28,073 32,384 37,893 43,067
EBIT 10,314 10,619 12,740 14,323 16,815 20,863 23,764
Other income 866 989 1,106 1,411 1,604 1,990 2,191
Interest (expense)/income (46) (23) (22) (5) (5) (5) (5)
Pretax profits 11,134 11,586 13,824 15,730 18,413 22,849 25,950
Tax-cash (3,730) (3,760) (4,755) (5,183) (6,117) (7,707) (8,843)
Tax-deferred 48 — — — — — —
Minority interest 28 (6) (68) (103) (123) (148) (177)
Net profits after minority interests 7,480 7,820 9,063 10,444 12,174 14,994 16,930
Earnings per share (Rs) 19.0 19.8 23.0 26.5 30.9 38.0 43.0
Balance sheet (Rs mn)
Total equity 30,954 33,481 35,263 38,591 42,698 48,677 55,169
Deferred Tax 260 226 176 176 176 176 176
Total borrow ings — — — — — — —
Currrent liabilities 3,082 2,262 2,765 2,933 3,286 3,677 4,137
Total capital 35,636 37,450 40,894 44,491 49,075 55,593 62,721
Cash 6,094 7,866 10,931 13,013 15,962 20,219 25,413
Current assets 11,075 12,716 14,950 13,709 15,636 18,100 20,414
Total fixed assets 7,976 7,330 4,544 7,492 7,002 6,342 5,570
Intangible assets 5,775 4,481 4,551 4,359 4,555 5,012 5,404
Total assets 35,636 37,450 40,894 44,491 49,075 55,592 62,721
Free cash flow (Rs mn)
Operating cash flow, excl. WC 12,358 13,034 13,300 13,717 15,804 18,842 21,315
Working capital (WC) (710) (1,519) (254) 1,408 (1,574) (2,073) (1,854)
Capital expenditure (4,305) (4,400) (3,735) (4,733) (4,813) (5,482) (6,014)
Other income 773 823 938 1,411 1,604 1,990 2,191
Free cash flow 8,116 7,938 10,249 11,804 11,021 13,277 15,638
Ratios (%)
Debt/equity — — — — — — —
Net debt/equity (20) (23) (31) (34) (37) (42) (46)
RoAE 25 24 26 28 30 33 32
RoACE 25 24 26 28 30 33 33

For Private Circulation Only. FOR IMPORTANT INFORMATION ABOUT KOTAK SECURITIES’ RATING SYSTEM AND OTHER DISCLOSURES, REFER TO THE END OF THIS MATERIAL.
Kotak Institutional Equities Research [email protected] Mumbai: +91-22-4336-0000
GST impact—modest upside of up 200 bps on margin versus expectations of at least 300 bps
GST rates for multiplexes are: (1) 28% on ticket sales (versus entertainment tax of about 30%).
In the near term, effective GST on ticket sales could be 2-3% lower (say 25%) as exemptions on
existing screens would continue, and (2) GST on F&B sales would vary from 12% to 40% across
products (40% on aerated beverages, which account for 25% of F&B sales). Blended GST rate
for PVR could be around 21% (versus 11% VAT at present). (3) GST would allow input tax
credits, likely reducing PVR’s tax outgo by about Rs1.1 bn in FY2019. Net impact—we believe
GST can aid PVR’s EBITDA margin by about 200 bps and result in 10% EBITDA upgrade if we
assume PVR to fully absorb higher taxes on F&B sales. The upside is lower than our earlier base
case expectation of 300-350 bps. We note that PVR plans to renegotiate its B2B contracts and
seek cost reduction wherever its vendors have gained from input tax credits.
Clarity is awaited on a few unknowns
While GST rates are out, the exhibition industry awaits clarity on the following—(1) e-tax
exemptions. About 16% of PVR’s screens are currently under e-tax exemption. The finance
minister’s comments suggest that exemptions would continue (wherever applicable) as per
grandfathering principle. Given this, we expect exemption to continue for existing screen as per
current schedule. However, it is not clear whether upcoming screens would be eligible for
exemptions; at present few states offer e-tax exemption for few years to new multiplexes,
(2) local body (municipalities) has power to tax multiplexes and it does not come under the
ambit of GST. Technically, local body can impose tax over and above GST particularly in states
such as Delhi and Mumbai where current e-tax of 40-45% is higher than GST rate; this is
industry’s key concern, and (3) regional movies are tax-free in several states and there is price
cap in a few states such as TN. It is not clear whether regional films will be tax-free and/or price
cap will be adjusted for GST rate.
We cut TP to Rs1,400 (from Rs1,450); retain REDUCE
We cut PVR’s target price to Rs1,400 on account of negative surprise (versus expectations) from
GST. We now expect 10-11% upside to our FY2018-20E EBITDA estimates from GST. We have
not built GST in our estimates yet but our TP captures ‘potential’ 200 bps margin expansion; it
implies 12.5X FY2019E ‘potential’ EV/EBITDA (10% higher than our estimates). We like PVR for
its premium location presence and branding and leadership in organic growth, monetization of
footfalls (F&B/ad revenues) and profitability. However, valuations are not appealing.
PVR (PVRL) Media
GST—modest benefit versus high expectations. PVR will incur (1) GST of 28% on
ticket sales (30% tax at present), and (2) blended GST of about 21% on F&B sales
(versus 11% VAT at present). Gains from input tax credits could be ~Rs1.1 bn in
FY2019. Net impact—up to 200 bps margin expansion (10% EBITDA upside) as against
our earlier expectation of at least 300 bps. The negative surprise is from higher taxes on
F&B sales; we cut TP to Rs,1400 (from Rs1,450) to factor the same. Retain REDUCE.
REDUCE
MAY 22, 2017
UPDATE
Coverage view: Attractive
Price (`): 1,514
Target price (`): 1,400
BSE-30: 30,465
Jaykumar Doshi [email protected]
Mumbai: +91-22-4336-0863
PVR
Stock data Forecasts/Valuations 2017 2018E 2019E
52-week range (Rs) (high,low) EPS (Rs) 22.4 33.9 43.2
Market Cap. (Rs bn) EPS growth (%) (17.0) 51.4 27.3
Shareholding pattern (%) P/E (X) 67.5 44.6 35.0
Promoters 25.2 Sales (Rs bn) 21.6 25.5 29.3
FIIs 31.0 Net profits (Rs bn) 1.0 1.6 2.0
MFs 12.6 EBITDA (Rs bn) 3.6 4.5 5.3
Price performance (%) 1M 3M 12M EV/EBITDA (X) 21.8 17.2 14.5
Absolute (2.9) 18.5 79.5 ROE (%) 11.4 15.4 17.0
Rel. to BSE-30 (6.5) 10.8 49.7 Div. Yield (%) 0.1 0.2 0.3
Company data and valuation summary
1,655-820
70.7

Media PVR
132 KOTAK INSTITUTIONAL EQUITIES RESEARCH
Exhibit 1: Impact of implementation of GST on PVR's financials
Source: Company, Kotak Institutional Equities
FY2019E FY2019E
EBITDA
gain/(loss) Comments
Impact of GST on ticket sales
Gross ticket sales (Rs mn) 19,171 19,171
Entertainment tax (Rs mn) 4,424 4,194
Entertainment tax (on net) (%) 30.0 28.0
Net ticket sales (Rs mn) 14,747 14,977 230
F ilm hire costs (Rs mn) 6,194 6,290 97
F ilm hire costs (%) 42.0 42.0
Gross profit on ticket sales (Rs mn) 8,553 8,687 134
Impact of GST on F&B revenues
Gross F&B Sales (Rs mn) 9,706 9,706
VAT (Rs mn) 962 1,685
VAT (on net) (%) 11.0 21.0
Net F&B sales (Rs mn) 8,744 8,022 (723)
F&B consumption (COGS) (Rs mn) 2,077 2,077
F&B consumption (COGS) (%) 23.8 25.9
Gross profit on F&B sales (Rs mn) 6,668 5,945 (723)
GST on input costs available for set off
Net serv ice tax payable on Rent (Rs mn) 600
Net serv ice tax payable on CAM and other
operataing expenses (Rs mn) 500
GST on input costs available for set off 1,100 1,100
Net Impact of GST on PVR's financials
Revenues (Rs mn) 29,307 28,814
EBITDA (Rs mn) 5,280 5,791 511
EBITDA margin (%) 18.0 20.1 208 bps
EBITDA upside (%) 10%
Net profit (Rs mn) 2,018 2,360 342
EPS (Rs/share) 43.2 50.6 7.3
EPS upside (%) 17%
Notes:
(a) Above working is based on FY2019E estimates
At present, PVR pays VAT of about 11% on F&B sales. Under GST,
tax rate would vary from 12-40% across F&B products. For instance,
GST on aerated beverages (25% of PVR's F&B sales) would be 40%.
PVR management expects blended GST on F&B sales to be about
21%.
PVR pays serv ice tax on rent and other operating costs such as
common area maintenance, house keeping and security serv ices but it
can not claim set off against VAT/e-tax. Under GST, it w ill be able to
claim set off for GST paid on input cost against GST on ticket sales
and F&B, resulting in tax sav ings. We assume tax sav ings of Rs1.1 bn.
Further, we note that PVR may also get some cost benefit on
renegotiation w ith vendors who would benefit from GST
(essentially , vendors who would gain from input tax credits may pass
of some benefit to PVR).
GST rate of 28/21% on ticket/F&B sales can lead to about 200 bps
expansion in EBITDA margin, about 10% upgrade in EBITDA estimate
and about 21%+ upgrade in earnings. Here, we have assumed that
PVR w ill absorb entire increase in tax on F&B sales. The company
normally takes price increase every year. It would be difficult to pass
on tax increase as well as price increase.
Without
GST
GST rate at 28%/21%
on ticket/F&B sales
GST rate is fixed at 28% and entertainment tax w ill be subsumed
under GST. At present PVR incurs e-tax of about 30% (blended
across states) on net ticket sales (9MFY17). We note that effective
GST on ticket sales in the near term could be 2-3% lower (say 25-
26%) as screens under exemptions would most likely continue to be
tax-free as per original exemption schedule.

PVR Media
KOTAK INSTITUTIONAL EQUITIES RESEARCH 133
Exhibit 2: Condensed consolidated financials for PVR, March fiscal year-ends, 2012-20E (Rs mn)
Source: Company, Kotak Institutional Equities estimates
2012 2013 2014 2015 2016 2017E 2018E 2019E 2020E
Profit model
Revenues 5,177 8,064 13,475 14,813 18,688 21,552 25,544 29,307 33,596
EBITDA 761 1,169 2,117 2,044 3,306 3,589 4,529 5,280 6,062
Other income 123 91 113 46 283 155 150 175 200
Depreciation (365) (560) (944) (1,168) (1,252) (1,378) (1,566) (1,772) (1,969)
Interest expense (185) (368) (795) (783) (839) (784) (700) (619) (500)
Pretax profits 310 319 523 118 1,432 1,557 2,413 3,064 3,793
Tax (57) 124 (19) (8) (232) (522) (808) (1,027) (1,271)
PAT before minority interest 253 443 504 110 1,200 1,035 1,605 2,038 2,523
Minority interest 1 2 57 11 (5) (15) (20) (20) (20)
PAT 254 445 561 121 1,194 1,020 1,585 2,018 2,503
Diluted EPS (Rs) 9.5 14.9 13.7 2.9 25.6 21.9 33.9 43.2 53.6
Balance sheet
Total equity 2,791 6,427 3,993 4,092 8,695 9,592 10,986 12,762 14,963
Deferred taxation liability 106 (10) 4 11 93 93 93 93 93
Total borrowings 2,035 6,566 6,134 7,470 6,623 7,623 7,123 6,623 6,123
Minority interest 139 854 771 383 401 416 436 456 476
Current liabilities 986 1,939 2,600 2,309 3,276 3,827 4,477 5,118 5,865
Total liabilities and equity 6,126 15,852 13,533 14,288 19,108 21,571 23,135 25,072 27,540
Cash and cash equivalents 211 732 495 261 2,674 62 104 672 1,700
Other current assets 2,038 3,229 3,763 4,605 5,763 6,290 7,172 8,018 8,967
Tangible fixed assets 2,621 5,710 6,990 7,523 8,824 9,471 10,291 10,843 11,366
Goodwill and Intangibles 374 4,712 1,466 1,273 1,262 5,162 4,982 4,952 4,922
CWIP 876 1,453 806 611 570 570 570 570 570
Total assets 6,126 15,852 13,533 14,288 19,108 21,571 23,135 25,072 27,540
Cash flow
Operating cash flow, excl. w-capital 679 1,429 2,003 2,170 3,169 3,042 3,721 4,253 4,791
Working capital changes (193) (239) 128 (617) 204 23 (233) (204) (201)
Capital expenditure (1,160) (7,704) (1,273) (2,064) (2,334) (5,925) (2,205) (2,295) (2,461)
Other income (90) 47 76 22 43 155 150 175 200
Interest expense (net) (207) (430) (812) (827) (797) (784) (700) (619) (500)
Free cash flow (971) (6,896) 123 (1,317) 284 (3,488) 732 1,310 1,829
Key ratios and assumptions
Footfalls (mn) 24.7 37.2 59.9 59.1 69.6 75.1 82.9 89.6 96.9
Average ticket price (ATP) (Rs) 156 163 168 177 188 197 208 218 228
Screens (#) 166 360 421 464 516 574 639 694 749
EBITDA margin (%) 14.7 14.5 15.7 13.8 17.7 16.7 17.7 18.0 18.0
Net debt 1,824 5,835 5,638 7,209 3,949 7,561 7,019 5,951 4,423
RoAE (%) 8.2 9.7 10.8 3.0 18.7 11.2 15.4 17.0 18.1
RoACE (%) 7.0 10.0 10.3 7.8 14.4 9.9 11.2 12.7 14.3
Notes:
(a) GST is not built in our estimates.

For Private Circulation Only. FOR IMPORTANT INFORMATION ABOUT KOTAK SECURITIES’ RATING SYSTEM AND OTHER DISCLOSURES, REFER TO THE END OF THIS MATERIAL.
Kotak Institutional Equities Research [email protected] Mumbai: +91-22-4336-0000
GST implementation to be largely neutral with 2-3% price increase in the small car segment
Exhibits 1-6 show our estimates of changes in overall tax structure across different automotive
segments after GST implementation. The government has notified GST rates for the automobile
sector with tax rates ranging between 12 and 43% including cess. For small cars, the effective
tax rate is between 29 and 31%, for two-wheelers and commercial vehicles 28%, for tractors
12% and for large sedans/SUVs 43%.
Prices of small petrol and diesel cars/SUVs and large sedans will increase by 1.5 to 2.8%
while the impact on two-wheelers, large SUVs, commercial vehicles and three-wheelers will
be neutral. Prices of tractors could come down by 1%. However, the mid-size car segment
will be impacted the most as prices are likely to increase by 6%. We have made calculations
based on the average VAT rate of 13.5% in the existing taxation structure and have not
considered other local taxes including octroi in our calculations.
Companies indicate that the impact on small car models will be limited and price increases
will be very small (1 to 2%). Maruti Suzuki Ertiga and Ciaz which come under mid-size car
segment will face the maximum impact. The company also sold diesel hybrids under these
brands where prices will have to be increased by 15% to offset the increase in tax rate; we
reckon diesel hybrid volumes accounted for 50% of the total. Ertiga and Ciaz form 8% of
total volumes of Maruti Suzuki. We expect demand for these models to get impacted,
leading to a shift towards compact SUVs and premium hatchbacks.
We see limited impact on overall demand in the automobile sector except mid-size car segment
The government has tried to keep GST rates largely neutral for the automobile sector with likely
price increase between 1.5 and 3%. Till now, Maruti Suzuki benefitted in the mid-size car/MPV
segment due to the duty differential versus the competition. This segment will be the most
impacted as GST rate for mid-size and large sedans/SUVs is unchanged that could lead to price
increases in the mid-size sedan segment impacting demand.
Automobiles India
GST rates to be neutral for the sector. We believe GST rates for the automobile
sector will lead to increase in prices of cars while remaining neutral for tractors, two-
wheelers and commercial vehicles. We expect passenger vehicle companies to pass on
the increase in prices to consumers as the impact is small. The maximum impacted
segment is the mid-size car segment (Vehicle length of more than four meters and
engine size below1,500cc). Maruti Suzuki’s Ertiga and Ciaz will be impacted the most.
The government has also increased tax on hybrid vehicles from 27 to 28% currently to
43% which will impact demand of Ciaz diesel, Ertiga diesel and Scorpio diesel hybrids.
CAUTIOUS
MAY 22, 2017
UPDATE
BSE-30: 30,435
Hitesh Goel [email protected]
Mumbai: +91-22-4336-0878
Nishit Jalan [email protected]
Mumbai: +91-22-4336-0877

Automobiles India
KOTAK INSTITUTIONAL EQUITIES RESEARCH 135
Exhibit 1: Price of small cars will increase by 1.5-2.6%; neutral for two-wheelers, maximum impacted will be mid-size cars Comparison of current tax structure and tax rate under GST for different auto segments (%)
Source: Government data, Kotak Institutional Equities estimates
Exhibit 2: Prices of small petrol cars/SUVs will increase by 1.5% under GST Comparison of current tax structure and GST rate for small petrol cars/SUVs
Source: Government data, Kotak Institutional Equities estimates
Small petrol
cars/Compact
SUVs
Small diesel
cars/Compact
SUVs Mid-sized cars Large cars Large SUVs Two-wheelers Three-wheelers Commercial vehicles Tractors
Excise duty (%) 12.5 12.5 24.0 30.0 27.0 12.5 12.5 12.5 8.8
VAT (%) 13.5 13.5 13.5 13.5 13.5 13.5 13.5 13.5 4.0
CST 2.0 2.0 2.0 2.0 2.0 2.0 2.0 2.0 2.0
Infrastructure cess 1.0 2.5 4.0 4.0 4.0 - - - -
Current blended tax rate on ex-showroom price (%) 24.3 24.3 32.3 34.1 35.9 24.3 24.3 24.3 11.9
GST rate assumption (%) 29.0 31.0 43.0 43.0 43.0 28.0 28.0 28.0 12.0
Potential price (reduction)/increase post GST 1.5 2.6 5.8 2.8 0.6 0.5 0.5 0.5 (0.9)
Notes:
(a) Small cars/mini SUVs includes vehicles <4 m in length and engine size less than 1,200 cc/1,500 cc for petrol/diesel vehicles
(b) Mid-sized cars/SUVs includes vehicles >4 m in length and engine size less than 1,500 cc
(c) Large SUVs/Cars includes vehicles w ith engine size greater than 1,500 cc
Current taxation structure Tax structure under GST
RM cost 100.0 RM cost 100.0
Excise (12.5%) 12.5 GST (28%) 28.0
NCCD 1.0 Cost to OEM 128.0
Infra cess 1.0 Value add 15.0
VAT (13.5%) 13.5 Factory gate cost 143.0
Cost to OEM 128.0 Dealer margin 4.3
Value add 15.0 Factory gate cost w ith dealer margin 147.3
Factory gate cost 143.0 GST (29%) 42.7
CST 2.9 GST refund (28.0)
Dealer margin 4.3 Cost of vehicle at factory after taxes 162.0
Factory gate cost w ith dealer margin 150.2 Logistic cost 3.2
Excise 17.9 Ex showroom price 165.3
VAT 20.3 GST 47.9
Excise refund (12.5) Registration, insurance and road tax 24.8
VAT refund (13.5) GST refund (42.7)
Cost of vehicle at factory after taxes 162.3 On road price 195.3
Logistic cost 3.2
Ex showroom price 165.5
VAT 22.3
Registration, insurance and road tax 24.8
VAT refund (20.3)
On road price 192.5
Overall taxes 47.9
Overall taxes 40.2 % of ex-showroom price 29.0
% of ex-showroom price 24.3 Overall (reduction)/increase in price (%) 1.5
Notes:
(a) Small cars/SUVs include vehicles <4 m in length and engine size <1,200 cc/1,500 cc for petrol/diesel vehicles

India Automobiles
136 KOTAK INSTITUTIONAL EQUITIES RESEARCH
Exhibit 3: Prices of small diesel cars/SUVs will increase by 2.6% under GST Comparison of current tax structure and GST rate for small diesel cars/SUVs
Source: Government data, Kotak Institutional Equities estimates
Current taxation structure Tax structure under GST
RM cost 100.0 RM cost 100.0
Excise (12.5%) 12.5 GST (28%) 28.0
NCCD 1.0 Cost to OEM 128.0
Infra cess 2.5 Value add 15.0
VAT (12.5%) 13.5 Factory gate cost 143.0
Cost to OEM 129.5 Dealer margin 4.3
Value add 15.0 Factory gate cost w ith dealer margin 147.3
Factory gate cost 144.5 GST (31%) 45.7
CST 2.9 GST refund (28.0)
Dealer margin 4.3 Cost of vehicle at factory after taxes 165.0
Factory gate cost w ith dealer margin 151.7 Logistic cost 3.3
Excise 18.1 Ex showroom price 168.3
VAT 20.5 GST 52.2
Excise refund (12.5) Registration, insurance and road tax 25.1
VAT refund (13.5) GST refund (45.7)
Cost of vehicle at factory after taxes 164.3 On road price 199.9
Logistic cost 3.3
Ex showroom price 167.6
VAT 22.6
Registration, insurance and road tax 25.1
VAT refund (20.5)
On road price 194.8
Overall taxes 52.2
Overall taxes 40.7 % of ex-showroom price 31.0
% of ex-showroom price 24.3 Overall (reduction)/increase in price (%) 2.6
Notes:
(a) Small cars/SUVs include vehicles <4 m in length and engine size <1,200 cc/1,500 cc for petrol/diesel vehicles

Automobiles India
KOTAK INSTITUTIONAL EQUITIES RESEARCH 137
Exhibit 4: Prices of mid-sized SUVs and cars will increase by 6% under GST Comparison of current tax structure and GST rate for mid-sized cars and SUVs
Source: Government data, Kotak Institutional Equities estimates
Current taxation structure Tax structure under GST
RM cost 100.0 RM cost 100.0
Excise (12.5%) 12.5 GST (28%) 28.0
NCCD 1.0 Cost to OEM 128.0
Infra cess 4.0 Value add 15.0
VAT (13.5%) 13.5 Factory gate cost 143.0
Cost to OEM 131.0 Dealer margin 4.4
Value add 15.0 Factory gate cost w ith dealer margin 147.4
Factory gate cost 146.0 GST (43%) 61.5
CST 2.9 GST refund (28.0)
Dealer margin 4.4 Cost of vehicle at factory after taxes 180.9
Factory gate cost w ith dealer margin 153.3 Logistic cost 3.7
Excise 35.0 Ex showroom price 184.5
VAT 20.7 GST 79.3
Excise refund (12.5) Registration, insurance and road tax -
VAT refund (13.5) GST refund (61.5)
Cost of vehicle at factory after taxes 183.0 On road price 202.4
Logistic cost 3.7
Ex showroom price 186.7
VAT 25.2
Registration, insurance and road tax
VAT refund (20.7)
On road price 191.2
Overall taxes 79.3
Overall taxes 60.2 % of ex-showroom price 43.0
% of ex-showroom price 32.3 Overall (reduction)/increase in price (%) 5.8
Notes:
(a) Mid-sized cars/SUVs includes vehicles >4 m in length and engine size less than 1,500 cc

India Automobiles
138 KOTAK INSTITUTIONAL EQUITIES RESEARCH
Exhibit 5: Prices of large SUVs will be neutral under GST Comparison of current tax structure and GST rate for large cars and SUVs
Source: Government data, Kotak Institutional Equities estimates
Exhibit 6: Tractor prices will come down by 1% with implementation of GST Comparison of current tax structure and GST rate for tractors
Source: Government data, Kotak Institutional Equities estimates
Current taxation structure Tax structure under GST
RM cost 100.0 RM cost 100.0
Excise (12.5%) 12.5 GST (28%) 28.0
NCCD 1.0 Cost to OEM 128.0
Infra cess (4%) 4.0 Value add 15.0
VAT (13.5%) 13.5 Factory gate cost 143.0
Cost to OEM 131.0 Dealer margin 4.4
Value add 15.0 Factory gate cost w ith dealer margin 147.4
Factory gate cost 146.0 GST (43%) 61.5
CST 2.9 GST refund (28.0)
Dealer margin 4.4 Cost of vehicle at factory after taxes 180.9
Factory gate cost w ith dealer margin 153.3 Logistic cost 3.8
Excise 43.8 Ex showroom price 184.7
VAT 20.7 GST 79.4
Excise refund (12.5) Registration, insurance and road tax 29.3
VAT refund (13.5) GST refund (61.5)
Cost of vehicle at factory after taxes 191.8 On road price 232.0
Logistic cost 3.8
Ex showroom price 195.6
VAT 26.4
Registration, insurance and road tax 29.3
VAT refund (20.7)
On road price 230.7
Overall taxes 79.4
Overall taxes 70.2 % of ex-showroom price 43.0
% of ex-showroom price 35.9 Overall (reduction)/increase in price (%) 0.6
Notes:
(a) Large SUVs/Cars includes vehicles w ith engine size greater than 1,500 cc
Current taxation structure Tax structure under GST
RM cost 100.0 RM cost 100.0
Excise (12.5%) 12.5 GST (12%) 12.0
VAT (4%) 4.0 Cost to OEM 112.0
Cost to OEM 116.5 Value add 30.0
Value add 30.0 Factory gate cost 142.0
Factory gate cost 146.5 Dealer margin 4.4
CST 1.5 Factory gate cost with dealer margin 146.4
Dealer margin 4.4 GST (12%) 17.6
Factory gate cost with dealer margin 152.4 GST refund (12.0)
Excise - Cost of vehicle at factory after taxes 152.0
VAT 6.1 Logistic cost 3.1
Excise refund - Ex showroom price 155.1
VAT refund (4.0) GST 18.6
Cost of vehicle at factory after taxes 154.5 Registration, insurance and road tax 23.6
Logistic cost 3.1 GST refund (17.6)
Ex showroom price 157.5 On road price 179.7
VAT 6.3
Registration, insurance and road tax 23.6
VAT refund (6.1)
On road price 181.4
Overall taxes 18.8 Overall taxes 18.6
% of ex-showroom price 11.9 % of ex-showroom price 12.0
Overall (reduction)/increase in price (%) (0.9)

For Private Circulation Only. FOR IMPORTANT INFORMATION ABOUT KOTAK SECURITIES’ RATING SYSTEM AND OTHER DISCLOSURES, REFER TO THE END OF THIS MATERIAL.
Kotak Institutional Equities Research [email protected] Mumbai: +91-22-4336-0000
Private sector strong—it’s not just the base effect
Private sector reported 86% growth in individual APE as the momentum in the business
continued and base (April 2016) was very low. Trend over the past 10 years suggests that
private sector volumes are typically down about 80% between March and April. In April 2017,
volumes were down 71% mom; thus, it’s not just a low base but that fact that the momentum
genuinely continued in April as well.
A strong month, triple-digit growth for few
The trend between players was divergent.
Some of the players delivered triple-digit growth—Bajaj Allianz (345%), ICICI Prudential Life
(145%) and India First (150%) despite high growth in the past. Value of policies seems to be
a big contributor to this—average ticket size in individual non-single business was up 62%
for ICICI Prudential Life, 82% for India First and 37% for Bajaj Allianz.
HDFC Life (6%; ticket size down 3%) and Met Life (12%) were, however, subdued. We read
this as low focus of these players on April targets and not necessarily any sign of weakness;
we expect growth to catch up and possibly gain market share by June.
Birla SL continued its ongoing momentum with 25% growth, a bit lower than about 35% in
FY2017. We expect growth rate for Birla SL to improve over the next few months as the
company recently tied up for an bancassurance agreement of HDFC Bank; the complete
details of the partnership are not available.
Reliance Life reported 46% growth as compared to 23% decline in FY2017; the company is
making a migration to traditional policies from ULIPs, which had led to a decline last year.
Average ticket size in individual non-single segment was up 33% despite a likely shift;
management highlighted they are working in increasing ticket size within the traditional
segment.
Growth for LIC was moderate at 17% on the back of 4% decline in average ticket size in
individual non-single business.
Steady inflows to equity mutual funds
Inflows to equity mutual funds remain strong at ₹94 bn, higher than past three months’ (₹49-
82 bn) indicating that underlying fund flow to capital market continues.
Insurance India
A solid beginning. It was a strong start to the year with 86% growth in individual APE
led by triple-digit growth for select large players. A low base and higher activity levels
over the past few months were key drivers even as capital market flows remain strong.
Evolving product portfolio strategy (players such as Bajaj Life focusing on ULIP in pursuit
of growth and some like Reliance on traditional products to improve margins) and
changing distribution dynamics (Birla SL tied up with HDFC Bank as a second partner
after HDFC Life) will determine medium-term business momentum.
MAY 22, 2017
UPDATE
BSE-30: 30,465
QUICK NUMBERS
86% growth in
individual APE for
private players
ICICI Life up 145%
HDFC Life up 6%
Max Life up 40%
Nischint Chawathe [email protected]
Mumbai: +91-22-4336-0887

India Insurance
140 KOTAK INSTITUTIONAL EQUITIES RESEARCH
Exhibit 1: Adjusted life insurance premium up 74% for private players March fiscal year-end, April 2017 (Rs mn)
Source: IRDA, Life council
Exhibit 2: Private sector volume in individual business were up 86% in April 2017 Yoy growth in adjusted individual business premium, March fiscal year-ends, 2014-April 2017 (%)
Source: IRDA, Life council
Individual
yoy
growth
(%) Group
yoy
growth
(%) Total
yoy
growth
(%)
Aegon Religare 38 10 — 38 10
Aviva 37 49 1 (78) 38 29
Bajaj Allianz 1,175 345 139 (8) 1,314 216
Bharti Axa 107 (35) 12 (4) 119 (33)
Birla Sunlife 332 25 62 2 394 21
Canara HSBC 250 61 1 (96) 251 48
DHFL Pramerica 150 114 56 124 206 117
Future Generali 79 9 10 (48) 89 (3)
HDFC Life 1,209 6 210 23 1,420 8
ICICI Prudential 4,918 145 32 (20) 4,950 141
IDBI Federal 282 93 4 (8) 286 90
India First 313 150 62 (23) 375 82
Exide Life 259 (8) 8 215 267 (6)
Kotak OM 455 8 83 19 538 9
Max Life 1,047 41 21 1 1,068 40
MetLife 501 12 10 153 511 14
Reliance Life 433 46 9 (75) 441 33
Sahara 2 94 — 2 94
Shriram Life 150 (16) 28 7 178 (13)
Star Union Daichi 80 19 4 60 84 20
Tata AIA 417 53 1 (82) 418 50
Private players 15,128 86 853 (20) 15,981 74
LIC 11,995 17 2,515 (41) 14,510 (0)
Total Premium 27,122 47 3,368 (37) 30,491 28
2014 2015 2016 2017 Apr-17
Bajaj Allianz (18.5) (22.6) (7.5) 40.9 344.9
Birla Sunlife (18.9) (11.8) (7.7) 35.3 24.7
HDFC Standard Life (24.2) 25.0 12.3 9.1 6.0
ICICI Prudential Life (1.7) 41.3 8.1 29.0 144.6
India First (37.2) 5.5 38.1 82.3 149.8
KMOM 1.2 32.8 52.2 28.1 7.8
Max Life 16.9 10.2 8.0 25.5 40.9
MetLife 2.8 23.4 28.5 10.8 12.4
Reliance Life 14.6 7.3 (25.6) (22.8) 45.8
Star Union Daichi 23.3 18.6 (9.0) 64.4 18.6
Private sector (3.6) 15.8 13.5 26.3 86.1
LIC (3.4) (26.3) 2.9 14.7 16.6
Total (3.4) (10.4) 8.1 20.7 47.3

Insurance India
KOTAK INSTITUTIONAL EQUITIES RESEARCH 141
Exhibit 3: Private sector players APE growth has been strong in FY2017 Adjusted premium equivalent of life insurance players, March fiscal year-ends, 2011-17 (Rs bn)
Source: IRDA, Life council
APE (Rs bn) YoY (%) Market share (%)
2011 2012 2013 2014 2015 2016 2017 2012 2013 2014 2015 2016 2017 2012 2013 2014 2015 2016 2017
Bajaj Allianz Life 20 14 14 11 9 9 12 (29) (2) (17) (18) (2) 34 3 3 2 2 2 2
Birla Sunlife 16 12 11 9 9 8 11 (24) (11) (17) (7) (3) 30 2 2 2 2 2 2
DHFL Pramerica 0.7 0.9 1.3 1.1 1.8 2.0 2.5 35 43 (17) 63 11 21 0 0 0 0 0 0
Exide 6.4 6.1 5.2 5.0 4.4 4.9 6.2 (5) (15) (3) (12) 10 27 1 1 1 1 1 1
HDFC Life 30 28 32 25 32 36 41 (7) 16 (22) 26 14 13 5 6 5 7 7 7
Max Life 17 15 15 18 20 21 27 (12) 0 17 10 8 26 3 3 3 4 4 4
Reliance Life 20 11 10 12 13 10 7 (44) (12) 19 8 (26) (24) 2 2 2 3 2 1
Private players 239 186 189 182 211 241 304 (22) 2 (3) 16 14 26 100 100 100 100 100 100
LIC 308 343 326 331 253 279 324 12 (5) 1 (23) 10 16 65 63 64 55 54 52
Total industry 547 529 515 513 464 520 628 (3) (3) (0) (9) 12 21 100 100 100 100 100 100

India Insurance
142 KOTAK INSTITUTIONAL EQUITIES RESEARCH
Exhibit 4: Most large players reported increase in ticket size Average policy size in individual non-single segment (Rs)
Source: IRDA, Life council
Exhibit 5: Private players lost market share in April 2017 Trend in adjusted individual business market share, March fiscal year-ends, 2014-April 2017 (%)
Source: IRDA, Life council
Apr-16 Mar-16 Apr-17
Aegon Religare 21,734 35,488 12,803 (41) (64)
Aviva 24,467 51,412 46,968 92 (9)
Bajaj Allianz 29,553 33,469 40,613 37 21
Bharti Axa 39,652 40,049 37,038 (7) (8)
Birla Sun Life 28,022 27,998 31,720 13 13
Canara HSBC Oriental 63,723 55,523 82,051 29 48
DHFL Pramerica 102,493 21,883 44,448 (57) 103
Future Generali 45,200 52,810 32,229 (29) (39)
HDFC Life 30,987 43,168 29,957 (3) (31)
ICICI Prudential 59,101 79,510 95,819 62 21
IDBI Federal 38,827 33,830 37,399 (4) 11
IndiaFirst 24,077 27,669 43,822 82 58
Exide Life 36,859 23,744 29,750 (19) 25
KMOM 56,732 45,541 55,837 (2) 23
Edelweiss Tokio 48,000 50,191 47,791 (0) (5)
Max Life 46,488 54,326 50,631 9 (7)
PNB Metlife 48,784 46,916 50,700 4 8
Reliance 22,911 26,713 30,575 33 14
Shriram 12,684 17,128 17,854 41 4
Star Union 31,675 45,995 34,255 8 (26)
Tata AIA 56,681 59,536 64,743 14 9
LIC 13,278 9,842 12,704 (4) 29
YoY (%) MoM (%)
2014 2015 2016 2017 Apr-17
Bajaj Allianz 2.2 1.9 1.6 4.3 1.9
Birla Sunlife 1.8 1.8 1.6 1.2 1.7
HDFC Standard Life 5.2 7.3 7.6 4.4 6.8
ICICI Prudential 7.2 11.3 11.3 18.1 12.0
Max Life 3.9 4.8 4.8 3.9 5.0
Met Life 1.3 1.8 2.1 1.8 1.9
Reliance Life 2.5 3.0 2.0 1.6 1.3
Private sector 37.9 48.9 51.4 55.7 53.6
LIC 62.1 51.1 48.6 44.1 46.1

Insurance India
KOTAK INSTITUTIONAL EQUITIES RESEARCH 143
Exhibit 6: Net inflows in equity mutual funds remained strong in April Movement of funds to equity schemes of mutual funds, March fiscal year-ends, 2013-April-17 (Rs bn)
Source: AMFI
Inflows
New
schemes
Existing
schemes Total Redemptions Net inflow AUMs
2009 23 272 295 284 11 958
2010 60 551 611 605 6 1,741
2011 33 598 631 765 (134) 1,698
2012 4 476 479 477 3 1,584
2013 7 400 407 537 (129) 1,498
2014 32 402 434 511 (76) 1,656
2015 155 1,282 1,437 730 707 3,451
2016 49 1,602 1,652 912 740 3,864
Apr-16 1 110 111 66 44 3,998
May-16 1 132 133 86 47 4,151
Jun-16 0 139 140 136 3 4,282
1QFY17 2 382 383 289 95 4,282
Jul-16 1 124 124 99 25 4,505
Aug-16 — 213 213 148 65 4,674
Sep-16 4 196 200 163 37 4,686
2QFY17 5 533 538 410 127 4,686
Oct-16 4 179 183 89 94 4,848
Nov-16 2 226 228 137 91 4,687
Dec-16 6 176 182 81 101 4,697
3QFY17 12 581 593 307 286 4,697
Jan-17 6 170 176 127 49 4,967
Feb-17 13 196 208 144 65 5,200
Mar-17 7 290 297 215 82 5,435
4QFY17 26 656 681 486 196 5,435
Apr-17 8 195 203 109 94 5,688

India Insurance
144 KOTAK INSTITUTIONAL EQUITIES RESEARCH
Exhibit 7: Share of ULIPs going up for most players Contribution of various products to APE, March fiscal year-ends, 2012-3QFY17 (% of total)
Source: Company, Kotak Institutional Equities
Exhibit 8: High share of bancassurance for select players Contribution of various products to APE, March fiscal year-ends, 2012-3QFY17 (% of total)
Source: Company, Kotak Institutional Equities
2012 2013 2014 2015 2016 1QFY17 2QFY17 3QFY17
Bajaj Life
Unit linked policies 12 12 10 24 29 27 33 42
Participating policies 60 49 51 21 19 13 13 10
Non participating policies 28 39 38 54 52 60 54 48
Birla SL
Unit linked policies 54 44 40 38 37 26 28 26
Participating policies 0 4 31 42 43 46 45 33
Non participating policies 46 52 29 20 20 28 27 41
ICICI Prudential Life
Unit linked policies 56 60 66 85 84 75 86 89
Participating policies 18 7 18 13 13 16 10 8
Non participating policies 26 33 15 2 3 9 5 4
HDFC Life
Unit linked policies 57 62 49 60 56 45 45 49
Participating policies 40 34 34 20 26 34 32 29
Non participating policies 3 5 17 21 18 21 23 22
Max Life
Unit linked policies 12 10 21 26 25 28 33 32
Participating policies 76 74 67 58 60 57 51 56
Non participating policies 12 16 12 15 15 15 16 12
Max+ HDFC
Unit linked policies 41 45 37 47 45 39 40 41
Participating policies 53 47 48 34 38 43 40 41
Non participating policies 6 8 15 19 17 19 20 17
2012 2013 2014 2015 2016 1QFY17 2QFY17 3QFY17
Bajaj Life
Agency 66 76 84 92 90 88 85 88
Bankassurance 10 7 8 1 2 2 4 2
Corporate agents 19 13 5 1 1 1 0 0
Others 5 4 3 7 7 9 11 10
Birla SL
Agency 70 66 — 67 81 78 75 75
Bankassurance 14 17 — 19 9 8 9 9
Corporate agents 15 17 — 2 5 6 7 6
Others — — — 12 5 8 9 10
HDFC Life
Agency 20 16 16 16 13 23 15 15
Bankassurance 64 72 70 67 68 54 59 58
Corporate agents 11 7 7 2 3 3 4 5
Others 4 5 7 14 16 20 21 22
ICICI Prudential Life
Agency 44 34 28 25 23 24 23 23
Bankassurance 38 45 54 58 57 55 57 57
Corporate agents 10 13 10 5 4 3 3 3
Others 7.5 7 8 13 16 18 16 16
Max Life
Agency 37 35 31 29 28 34 27 26
Bankassurance 40 48 51 57 59 51 59 60
Corporate agents 13 10 9 6 4 3 4 3
Others 9 7 8 8 9 13 11 10

Insurance India
KOTAK INSTITUTIONAL EQUITIES RESEARCH 145
Private sector up in group business; single business remains strong for LIC
LIC continues to have high share of single premium (80% in April 2017, up from 72% in
FY2017) in its overall business. This has been consistently growing over the years.
Private players have generally been selective in this segment; the share of single premium of
private players was 33% in April 2017. The ratio declined for most large players except ICICI
Prudential Life.
In the group business, the share of private players increased to 25% from 19% in the past
two financial years. Bajaj Allianz Life and HDFC Life gained market share.
Exhibit 9: Share of single premium in overall business was down in April 2017 Share of single premium to total premium, March fiscal year-ends, 2014-April 2017 (%)
Source: IRDA, Life council
Exhibit 10: Private player’s market share improved to 25% in April 2017 Market share in group business, March fiscal year-ends, 2014-April 2017 (%)
Source: Kotak Institutional Equities
Exhibit 11: Improving RoEV for ICICI Prudential Life EV movement, March fiscal year-ends, 2015-2019E (Rs bn)
Source: Company, Kotak Institutional Equities estimates
2014 2015 2016 2017 Apr-17
Bajaj Allianz 38 44 52 55 43
Birla Sunlife 3 2 2 55 3
HDFC Life 42 47 49 67 56
ICICI Prudential 13 14 27 17 22
Max Life 21 25 28 33 20
Reliance Life 5 5 7 13 5
Private sector 30 31 34 37 33
LIC 65 71 76 72 80
Total 56 58 63 59 67
2014 2015 2016 2017 Apr-17
Bajaj Allianz 2.4 2.8 2.5 2.3 4.1
Birla Sunlife 1.4 2.0 1.9 1.6 1.8
HDFC Life 2.5 3.8 3.5 4.6 6.2
ICICI Prudential 0.6 0.9 1.8 0.9 1.0
Max Life 0.3 0.4 0.3 0.4 0.6
Reliance Life 1.3 1.5 0.8 0.3 0.3
Private sector 17 21 19 19 25
LIC 83 79 81 81 75
2015 2016 2017 2018E 2019E 2020E
Opening Embedded value (EV) 117.8 137.0 138.8 161.2 175.9 198.6
Methodology changes 1.6
Economic assumption change (4.2)
NBV (before over-run) 6.4 4.1 6.7 8.9 11.5 13.7
Acquisition expense ovcerrun (3.7) 0.0
Expected return in force 11.7 12.6 12.2 15.3 16.7 18.9
Operating variance 2.1 4.5 4.1 3.5 2.5 2.5
Tax changes
Investment varina ce 15.1 (6.2) 5.8 5.0 5.0 5.0
Dividend payout (9.8) (14.4) (6.3) (18.0) (13.0) (17.0)
Closing EV 137 139 161 176 199 222
EVOP 18 23 23 28 31 35
RoEV (%) 16 1 16 9 13 12
Operating RoEV (%) 15 17 17 17 17 18

India Insurance
146 KOTAK INSTITUTIONAL EQUITIES RESEARCH
Exhibit 12: High RoEV for combined entity (HDFC Life + Max Life) RoEV movement, March fiscal year-ends, 2015-2019E (Rs bn)
Source: Company, Kotak Institutional Equities estimates
Max Life HDFC Life Max+HDFC Life
2015 2016 2017E 2018E 2019E 2015 2016 2017E 2018E 2019E 2015 2016 2017E 2018E 2019E
Opening Embedded value (EV) 44.4 52.3 56.2 63.7 72.3 69.9 88.9 102.3 124.2 146.8 114.3 141.2 158.5 187.9 219.1
Methodology changes 3.5 0.3 3.5 0.3
Assumption change 0.1 0.0 0.1
NBV (before over-run) 4.6 3.9 4.4 5.2 6.1 7.4 7.4 9.1 11.2 13.4 12.0 11.3 13.6 16.4 19.4
Acquisition expense overrun 0.0 (0.1) (0.1) 0.0 0.0 (1.5) 0.0 0.0 0.0 0.0 (1.5) (0.1) (0.1) 0.0 0.0
Expected return in force 4.0 5.1 5.6 6.4 7.2 6.1 8.1 9.0 10.9 12.9 10.1 13.2 14.6 17.3 20.1
Operating variance 1.2 (0.0) (0.3) 3.2 2.5 1.5 1.5 0.9 3.2 2.5 1.5 1.5
Tax changes
Investment/economic varinace 2.5 0.0 1.5 1.0 1.0 4.6 (3.1) 4.0 3.0 3.0 7.1 (3.1) 5.5 4.0 4.0
Other non-operating variance (0.6) (0.6)
Capital infusion/payouts (4.0) (4.4) (4.0) (4.0) (4.0) (1.7) (2.2) (3.0) (4.0) (4.0) (5.7) (6.6) (7.0) (8.0) (8.0)
Closing EV 52.8 56.2 63.7 72.3 82.5 88.1 102.3 124.2 146.8 173.6 140.9 158.5 187.9 219.1 256.2
EVOP 9.8 8.9 10.0 11.6 13.3 15.3 18.7 20.9 23.6 27.8 25.1 27.6 30.9 35.2 41.1
RoEV (%) 19 7 13 13 14 26 16 21 18 18 13 19 17 17
Operating RoEV (%) 22 17 18 18 18 22 21 20 19 19 20 19 19 19

In
dia
Da
ily S
um
ma
ry - M
ay 2
2, 2
01
7
147
K
OTA
K IN
STIT
UTIO
NA
L EQ
UIT
IES R
ESEA
RC
H
March 2017: Results calendar
Source: NSE, Kotak Institutional Equities
Mon Tue Wed Thu Fri Sat Sun
22-May 23-May 24-May 25-May 26-May 27-May 28-May
Bank of India Central Bank Adani Enterprises AIA Engineering CG Power & Industries Adani Power Ipca Labs.
Engineers India Jindal Steel Adani Ports Ashok Leyland Divi's Lab. Cadila Healthcare
GAIL (India) Jubilant Life Amara Raja Batteries Balkrishna Industries DLF Canara Bank
Godrej Indstries NCC Bharat Forge Bosch H P C L Indraprastha Gas
SRF Tata Motors Dish TV Britannia Inds. Indian Hotels Natl. Aluminium
Torrent Power GE T&D India Cipla ITC Reliance Communications
Voltas Healthcare Global Container Corporation Mahanagar Gas Speciality Restaurants
Jain Irrigation Guj.St.Petronet O N G C
Kaveri Seed Co. I O C L Power Fin.Corporation
Lupin MphasiS Rajesh Exports
Minda Corp NMDC SKF India
Timken India Page Industries Sun Pharma.Inds.
PC Jeweller Sun TV Network
Sunteck Realty
Tata Chemicals
Tech Mahindra
Torrent Pharma.
29-May 30-May 31-May 1-Jun 2-Jun 3-Jun 4-Jun
Aban Offshore Apollo Hospitals Castrol India
Aurobindo Pharma Ashoka Buildcon
B H E L Astral Poly
B P C L Berger Paints
City Union Bank Bharat Electron
Coal India Hindalco Indstries
Info Edg. (India) Jet Airways
Jagran Prakashan M & M
Jubilant Food. Max Financial
Larsen & Toubro Natco Pharma
NHPC Ltd Prestige Estates
NTPC PVR
Oil India Rural Elec.Corp.
Power Grid Corpn S A I L
Sadbhav Engineering The Ramco Cement
Suprajit Engineering Thermax
United Spirits
Vakrangee
WABCO India

K
OTA
K IN
STIT
UTIO
NA
L EQ
UIT
IES R
ESEA
RC
H
148
In
dia
Da
ily S
um
ma
ry - M
ay 2
2, 2
01
7
Ind
ia D
aily
Su
mm
ary
- Ma
y 2
2, 2
01
7
Kotak Institutional Equities: Valuation summary of KIE Universe stocks
Source: Company, Bloomberg, Kotak Institutional Equities estimates
Target O/S
Price (Rs) price Upside Mkt cap. shares EPS (Rs) EPS growth (%) PER (X) EV/EBITDA (X) ADVT-3mo
Company Rating 19-May-17 (Rs) (%) (Rs mn) (US$ mn) (mn) 2017 2018E 2019E 2017 2018E 2019E 2017 2018E 2019E 2017 2018E 2019E 2017 2018E 2019E 2017 2018E 2019E 2017 2018E 2019E (US$ mn)
Automobiles
Amara Raja Batteries SELL 896 765 (14.6) 153,005 2,367 171 29.4 34.7 39.4 2.6 18.1 13.5 30.5 25.8 22.7 17.5 15.0 13.4 6.2 5.2 4.4 0.7 0.8 0.9 21.9 21.9 21.1 6.6
Apollo Tyres BUY 235 290 23.6 119,443 1,848 509 21.6 19.3 26.4 4.1 (10.8) 37.0 10.9 12.2 8.9 6.1 5.9 4.6 1.6 1.5 1.3 1.3 1.3 1.3 15.8 12.8 15.5 15.1
Ashok Leyland ADD 85 90 5.7 242,326 3,749 2,846 4.5 5.2 5.9 29.3 14.3 14.6 18.9 16.5 14.4 10.5 9.4 8.3 3.8 3.3 2.9 1.6 1.8 2.1 21.7 21.6 21.6 14.2
Bajaj Auto REDUCE 2,973 2,800 (5.8) 860,187 13,308 289 132.3 136.7 160.3 4.8 3.4 17.2 22.5 21.7 18.5 16.7 15.3 12.6 5.1 4.5 4.0 1.8 1.8 2.2 26.1 21.9 22.8 13.0
Balkrishna Industries ADD 1,503 1,600 6.5 145,263 2,247 97 77.0 89.1 106.2 29.3 15.6 19.3 19.5 16.9 14.1 12.4 10.1 8.2 4.2 3.4 2.8 0.4 0.4 0.5 23.8 22.3 21.8 21.5
Bharat Forge SELL 1,056 935 (11.5) 245,819 3,803 233 28.2 36.8 45.8 1.1 30.7 24.4 37.5 28.7 23.1 19.1 15.4 12.8 6.0 5.2 4.5 0.6 0.8 1.0 17.2 19.6 20.9 13.3
Eicher Motors SELL 27,936 19,700 (29.5) 760,147 11,760 27 575.9 736.8 840.7 22.4 27.9 14.1 48.5 37.9 33.2 33.0 25.2 21.3 18.5 13.2 9.9 0.1 0.1 0.1 41.3 40.6 34.0 18.5
Exide Industries SELL 238 200 (16.0) 202,428 3,132 850 8.2 9.0 9.8 11.1 10.7 8.0 29.2 26.4 24.4 18.6 16.5 15.0 4.1 3.7 3.4 1.0 1.3 1.3 14.6 14.8 14.6 8.2
FAG Bearings ADD 4,506 5,100 13.2 74,877 1,158 17 117.0 149.1 184.7 (1.5) 27.4 23.9 38.5 30.2 24.4 23.1 18.3 14.7 5.2 4.6 4.1 0.3 0.7 1.2 14.2 16.0 17.7 0.3
Hero Motocorp REDUCE 3,572 3,200 (10.4) 713,247 11,035 200 169.1 186.1 203.1 6.9 10.0 9.1 21.1 19.2 17.6 14.1 12.3 11.1 7.1 6.2 5.4 2.4 2.6 2.8 35.7 34.2 32.7 21.8
Mahindra & Mahindra ADD 1,333 1,400 5.0 828,165 12,812 569 63.9 71.8 81.6 10.3 12.4 13.6 20.9 18.6 16.3 14.1 12.6 11.0 3.0 2.7 2.4 1.2 1.3 1.5 15.4 15.5 15.7 26.6
Maruti Suzuki ADD 6,791 6,600 (2.8) 2,051,290 31,735 302 238.9 274.6 332.0 34.6 14.9 20.9 28.4 24.7 20.5 17.5 14.5 11.8 5.7 4.9 4.2 1.1 1.0 1.2 21.9 21.2 22.1 52.6
Minda Corp. REDUCE 111 105 (5.3) 23,202 359 209 5.5 6.6 8.4 19.0 19.1 28.1 20.1 16.9 13.2 10.0 8.6 7.1 3.5 3.0 2.5 0.5 0.5 0.6 18.8 19.1 20.4 0.6
Motherson Sumi Systems SELL 424 340 (19.7) 594,479 9,197 1,404 11.6 15.1 18.3 18.4 30.8 21.2 36.6 28.0 23.1 15.1 11.6 9.8 7.2 6.2 5.3 0.5 1.1 1.3 25.6 23.7 24.5 10.9
SKF REDUCE 1,563 1,450 (7.2) 82,416 1,275 53 48.2 56.0 64.7 (0.1) 16.2 15.5 32.5 27.9 24.2 21.5 18.4 15.7 4.8 4.3 3.9 0.9 1.1 1.2 15.4 16.2 16.8 0.7
Suprajit Engineering REDUCE 256 210 (18.0) 33,629 520 131 6.7 9.7 11.8 21.9 46.0 20.7 38.4 26.3 21.8 18.9 14.2 12.1 6.5 5.4 4.5 0.5 0.6 0.7 18.2 22.5 22.6 0.3
Tata Motors BUY 443 540 21.8 1,415,774 21,903 3,396 16.2 36.5 49.9 (58.0) 124.6 36.7 27.3 12.2 8.9 6.1 4.5 3.7 1.7 1.5 1.3 — — — 6.6 13.3 15.7 45.5
Timken ADD 720 670 (6.9) 48,943 757 68 15.1 20.7 26.3 9.2 37.0 27.2 47.7 34.8 27.4 28.5 20.4 16.2 8.0 6.7 5.8 0.2 0.3 1.1 18.1 20.9 22.6 0.4
TVS Motor SELL 526 290 (44.8) 249,658 3,862 475 10.7 13.9 16.8 18.8 29.8 21.1 49.0 37.8 31.2 30.1 22.0 18.6 11.2 9.5 7.9 0.5 0.8 1.0 25.2 27.2 27.7 10.1
WABCO India ADD 5,875 6,100 3.8 111,428 1,724 19 122.2 148.4 180.2 13.3 21.4 21.4 48.1 39.6 32.6 30.0 24.6 20.0 8.8 7.3 6.1 0.2 0.2 0.2 20.0 20.2 20.4 0.9
Automobiles Cautious 9,049,271 140,000 (9.6) 32.5 22.9 27.0 20.4 16.6 12.5 9.9 8.2 4.0 3.5 3.0 0.9 1.0 1.1 14.8 17.0 18.0 282.0
Banks
Axis Bank REDUCE 502 525 4.6 1,202,358 18,602 2,395 15.4 23.6 35.3 (55.5) 53.6 49.6 32.7 21.3 14.2 — — — 2.4 2.3 2.0 1.0 0.7 1.1 6.8 9.7 13.2 76.8
Bank of Baroda ADD 189 210 11.3 434,910 6,728 2,310 6.0 17.2 23.2 125.6 187.4 35.0 31.5 11.0 8.1 — — — 1.8 1.5 1.3 0.6 1.8 2.5 3.8 10.4 12.9 31.7
Bank of India ADD 178 155 (13.1) 188,052 2,909 1,055 (3.9) 19.9 34.4 94.7 606.6 72.8 (45.3) 8.9 5.2 — — — 1.5 1.2 1.0 (0.4) 2.2 3.9 (1.5) 7.1 11.5 13.6
Canara Bank REDUCE 368 350 (4.8) 219,564 3,397 597 18.8 23.4 57.7 136.3 24.4 147.1 19.6 15.7 6.4 — — — 1.5 1.4 1.0 0.3 0.3 0.8 3.4 4.1 9.5 20.2
City Union Bank REDUCE 169 150 (11.4) 101,790 1,575 598 7.8 9.2 10.5 5.3 17.7 14.2 21.6 18.4 16.1 — — — 3.2 2.8 2.4 0.7 0.9 1.0 14.4 15.1 15.2 2.5
DCB Bank ADD 191 190 (0.8) 58,810 910 285 7.0 7.9 10.7 2.3 13.3 35.5 27.4 24.2 17.8 — — — 2.6 2.4 2.1 0.3 0.3 0.4 10.2 10.0 12.2 8.9
Equitas Holdings ADD 158 180 13.9 53,436 827 338 4.7 5.2 6.4 (23.8) 9.9 22.9 33.5 30.5 24.8 — — — 2.5 2.3 2.2 — — — 8.9 7.6 8.6 5.8
HDFC Bank REDUCE 1,561 1,450 (7.1) 4,004,464 61,953 2,563 56.8 67.7 77.2 16.7 19.2 14.1 27.5 23.1 20.2 — — — 4.5 3.9 3.4 0.7 0.8 1.0 17.9 18.0 17.9 41.6
ICICI Bank BUY 307 350 14.0 1,788,933 27,676 5,826 16.8 16.2 24.6 1.2 (3.9) 52.3 18.2 19.0 12.5 — — — 2.2 2.0 1.8 1.6 1.6 2.4 10.3 9.1 13.0 89.6
IDFC Bank ADD 61 70 15.4 206,171 3,190 3,399 3.0 3.0 3.7 149.7 (1.5) 26.0 20.2 20.5 16.3 — — — 1.4 1.3 1.3 1.2 1.0 1.2 7.2 6.7 7.9 11.4
IndusInd Bank ADD 1,389 1,500 8.0 831,177 12,859 598 47.9 57.2 66.9 24.8 19.2 17.0 29.0 24.3 20.8 — — — 4.2 3.7 3.2 0.4 0.5 0.6 15.5 15.8 16.1 28.7
J&K Bank BUY 85 100 17.7 44,287 685 522 (31.3) 9.7 13.8 (464.8) 131.0 41.8 (2.7) 8.7 6.2 — — — 1.1 1.0 0.8 — 2.3 3.3 (27.0) 8.6 11.3 1.4
Karur Vysya Bank BUY 116 130 12.6 69,798 1,080 609 10.0 11.5 14.9 7.5 14.8 29.9 11.5 10.0 7.7 — — — 1.6 1.5 1.3 2.2 2.5 3.2 12.7 13.3 15.5 2.6
Punjab National Bank REDUCE 155 165 6.3 330,261 5,109 2,128 6.2 16.4 22.2 130.8 163.5 35.4 24.9 9.5 7.0 — — — 1.9 1.4 1.1 0.8 2.1 2.9 3.5 8.6 10.7 28.9
RBL Bank SELL 555 350 (37.0) 208,756 3,230 375 11.9 15.5 20.7 32.0 30.5 33.4 46.7 35.8 26.8 — — — 4.9 4.5 4.1 0.3 0.5 0.6 12.2 12.7 15.2 18.9
State Bank of India BUY 308 350 13.6 2,497,836 38,644 7,974 13.1 16.1 29.5 2.6 22.7 82.7 23.4 19.1 10.5 — — — 2.3 1.9 1.6 0.8 0.9 1.0 6.3 6.4 10.3 73.7
Ujjivan Financial Services REDUCE 321 410 27.9 38,334 593 119 17.3 4.7 16.8 (1.2) (72.9) 258.3 18.5 68.3 19.1 — — — 2.2 2.2 2.0 0.4 0.1 0.5 14.0 3.1 10.6 8.4
Union Bank ADD 175 180 3.1 120,027 1,857 687 8.1 11.2 30.4 (58.9) 39.0 170.3 21.6 15.5 5.7 — — — 1.3 1.1 0.8 0.5 0.6 1.7 2.7 3.5 8.9 13.4
YES Bank SELL 1,430 1,400 (2.1) 653,541 10,111 456 73.0 74.2 78.9 20.8 1.8 6.3 19.6 19.3 18.1 — — — 3.1 2.7 2.4 0.7 0.9 0.9 18.6 14.5 13.7 58.8
Banks Attractive 13,246,228 204,931 63.2 35.1 44.5 26.0 19.2 13.3 1.9 1.7 1.5 0.8 1.0 1.3 7.3 8.9 11.6 556.6
NBFCs
Bajaj Finserv REDUCE 4,170 3,800 (8.9) 663,562 10,266 159 142.3 172.4 205.7 15.8 21.2 19.3 29.3 24.2 20.3 — — — 4.2 3.8 3.2 0.3 0.3 0.3 15.5 16.4 17.0 8.1
Bharat Financial Inclusion SELL 698 670 (4.1) 96,382 1,491 138 21.0 37.2 50.2 (11.6) 76.9 34.9 33.2 18.8 13.9 — — — 4.1 3.3 2.6 — — — 15.1 19.0 20.9 65.5
Cholamandalam ADD 1,040 1,200 15.4 162,531 2,515 156 46.0 55.9 67.0 26.9 21.6 19.8 22.6 18.6 15.5 — — — 4.1 3.5 3.0 0.5 0.7 0.8 18.0 18.7 19.0 6.3
HDFC ADD 1,521 1,675 10.2 2,416,038 37,378 1,589 49.6 56.4 64.4 4.8 13.9 14.2 30.7 26.9 23.6 — — — 5.7 5.1 4.1 1.2 1.3 1.5 20.4 20.0 19.5 66.4
ICICI Prudential Life ADD 410 410 (0.0) 588,637 9,107 1,432 11.7 11.6 12.7 1.9 (0.9) 9.2 34.9 35.3 32.3 — — — 9.8 8.8 7.9 — — — 29.7 26.3 25.9 6.6
IIFL Holdings REDUCE 466 450 (3.4) 148,110 2,291 318 21.6 25.6 29.6 33.6 18.6 15.5 21.6 18.2 15.7 — — — 3.4 3.0 2.6 1.0 1.1 1.3 22.6 21.0 21.5 2.4
L&T Finance Holdings ADD 127 145 14.4 230,930 3,573 1,895 5.5 6.5 8.9 13.0 18.4 36.7 23.1 19.5 14.2 — — — 3.0 2.7 2.4 0.6 1.5 1.7 13.7 14.6 17.8 8.3
LIC Housing Finance ADD 684 750 9.7 344,937 5,336 505 42.3 45.9 55.8 16.5 8.4 21.8 16.2 14.9 12.2 — — — 2.8 2.4 2.0 0.9 1.0 1.2 19.1 19.2 19.9 16.8
Mahindra & Mahindra Financial SELL 316 260 (17.6) 179,445 2,776 565 7.1 13.9 17.9 (40.5) 95.7 29.4 44.5 22.8 17.6 — — — 3.0 2.8 2.6 0.8 1.5 1.9 6.4 11.7 14.0 14.6
Max Financial Services ADD 641 675 5.3 171,400 2,652 267 7.0 7.1 7.2 62.8 1.5 1.5 91.3 89.9 88.6 — — — 0.4 0.4 0.5 10.9 10.5 10.0 14.4
Muthoot Finance ADD 379 440 16.0 151,461 2,343 400 29.5 32.5 36.9 45.5 10.0 13.6 12.8 11.7 10.3 — — — 2.3 2.0 1.8 1.3 1.7 1.9 19.4 18.5 18.3 4.6
PFC REDUCE 155 150 (2.9) 408,025 6,313 2,640 27.6 23.0 25.5 19.4 (16.6) 10.7 5.6 6.7 6.1 — — — 1.0 1.2 1.0 3.6 4.0 4.5 17.7 13.2 13.3 20.0
PNB Housing Finance SELL 1,269 1,100 (13.3) 211,382 3,270 166 31.5 42.3 52.3 22.2 34.0 23.7 40.2 30.0 24.2 — — — 3.8 3.5 3.2 0.5 0.7 0.9 13.6 12.1 13.8 6.2
Rural Electrification Corp. REDUCE 217 180 (17.0) 428,458 6,629 1,975 34.0 22.1 19.6 19.4 (35.0) (11.4) 6.4 9.8 11.1 — — — 1.5 1.5 1.4 3.4 2.2 1.9 22.3 13.1 10.6 27.2
Shriram City Union Finance SELL 2,144 1,850 (13.7) 141,391 2,187 66 84.2 121.5 144.6 5.1 44.2 19.0 25.4 17.7 14.8 — — — 2.9 2.6 2.3 0.5 0.7 0.8 11.6 14.9 15.6 1.5
Shriram Transport REDUCE 999 1,050 5.1 226,667 3,507 223 56.3 66.9 83.1 6.7 18.7 24.3 17.7 14.9 12.0 — — — 2.1 1.9 1.7 1.0 0.9 1.2 11.7 12.5 13.9 11.8
NBFCs Neutral 6,569,357 101,634 14.6 0.3 14.2 18.5 18.4 16.1 3.2 2.9 2.5 1.1 1.2 1.4 17.4 15.7 15.6 556.6
Dividend yield (%) RoE (%)Price/BV (X)

In
dia
Da
ily S
um
ma
ry - M
ay 2
2, 2
01
7
149
K
OTA
K IN
STIT
UTIO
NA
L EQ
UIT
IES R
ESEA
RC
H
Kotak Institutional Equities: Valuation summary of KIE Universe stocks
Source: Company, Bloomberg, Kotak Institutional Equities estimates
Target O/S
Price (Rs) price Upside Mkt cap. shares EPS (Rs) EPS growth (%) PER (X) EV/EBITDA (X) ADVT-3mo
Company Rating 19-May-17 (Rs) (%) (Rs mn) (US$ mn) (mn) 2017 2018E 2019E 2017 2018E 2019E 2017 2018E 2019E 2017 2018E 2019E 2017 2018E 2019E 2017 2018E 2019E 2017 2018E 2019E (US$ mn)
Cement
ACC SELL 1,675 1,375 (17.9) 314,619 4,867 188 34.3 48.1 72.8 (13.3) 40.2 51.3 48.8 34.8 23.0 24.8 19.9 13.7 3.6 3.4 3.1 1.0 1.0 1.0 7.5 10.1 14.1 9.9
Ambuja Cements REDUCE 251 230 (8.5) 498,893 7,718 1,985 5.8 7.7 11.3 4.2 33.7 45.7 43.3 32.4 22.2 15.8 12.5 8.8 2.6 2.5 2.3 1.4 1.4 1.4 7.6 7.8 10.8 12.0
Dalmia Bharat ADD 2,426 2,700 11.3 215,858 3,340 89 38.8 109.3 154.2 80.7 181.6 41.0 62.5 22.2 15.7 14.1 9.6 7.4 4.3 3.3 2.7 0.1 0.1 0.1 7.8 16.9 19.1 10.8
Grasim Industries ADD 1,120 1,240 10.7 523,096 8,093 467 67.8 85.6 100.5 23.5 26.2 17.3 16.5 13.1 11.1 6.8 5.5 4.2 1.7 1.5 1.3 0.5 0.5 0.5 10.8 12.0 12.6 28.9
India Cements SELL 207 120 (42.1) 63,678 985 307 6.2 8.8 11.2 35.1 42.5 27.1 NM 23.4 18.4 11.3 9.7 8.5 1.7 1.6 1.5 1.0 1.0 1.0 5.1 7.0 8.4 17.5
J K Cement REDUCE 1,111 1,100 (1.0) 77,670 1,202 70 34.6 67.9 96.1 304.7 96.5 41.5 32.1 16.4 11.6 15.4 10.5 8.3 4.4 3.6 2.8 0.7 0.7 0.7 14.3 24.2 27.2 0.8
JK Lakshmi Cement ADD 470 550 17.1 55,252 855 118 6.9 25.3 44.1 251.8 263.4 74.5 67.6 18.6 10.7 20.2 9.1 6.3 3.9 3.3 2.6 0.4 0.4 0.4 5.9 19.4 27.1 1.1
Orient Cement ADD 153 180 17.7 31,324 485 205 (1.6) 10.6 14.3 (151.6) 774.4 35.6 (97.6) 14.5 10.7 24.4 8.2 6.6 3.2 2.7 2.2 0.3 1.1 1.1 (3.2) 20.2 22.8 1.2
Shree Cement SELL 18,664 14,000 (25.0) 650,205 10,059 35 384.4 580.6 724.1 233.2 51.1 24.7 48.6 32.1 25.8 26.3 17.2 13.7 8.4 6.8 5.4 0.5 0.1 0.1 19.3 23.4 23.3 5.2
UltraTech Cement SELL 4,361 2,950 (32.3) 1,197,036 18,519 275 96.2 126.3 157.4 11.4 31.3 24.6 45.3 34.5 27.7 23.6 19.0 15.5 5.0 4.4 3.9 0.2 0.2 0.2 11.8 13.6 14.9 17.4
Cement Cautious 3,627,632 56,123 31.7 45.0 29.5 37.1 25.6 19.8 16.0 12.2 9.5 3.5 3.1 2.7 0.6 0.5 0.5 9.4 12.1 13.8 104.7
Consumer products
Asian Paints REDUCE 1,123 1,000 (11.0) 1,077,323 16,667 959 20.2 23.9 27.8 7.9 18.1 16.5 55.5 47.1 40.4 35.1 29.5 25.1 14.2 12.6 11.2 0.9 1.1 1.2 29.4 28.4 29.4 17.5
Bajaj Corp. ADD 364 430 18.0 53,749 832 148 15.8 16.8 19.3 (0.5) 6.2 15.0 23.1 21.7 18.9 19.3 18.1 15.1 10.9 10.5 10.0 3.2 3.6 4.0 47.8 49.2 54.3 0.6
Britannia Industries ADD 3,583 3,550 (0.9) 429,927 6,651 120 75.0 92.5 113.2 7.9 23.2 22.5 47.7 38.7 31.6 32.8 26.4 21.3 18.6 14.4 11.2 0.7 0.8 1.0 44.2 41.9 39.8 8.2
Coffee Day Enterprises ADD 262 255 (2.7) 54,014 836 206 2.3 6.6 9.8 151.1 188.9 47.9 114.2 39.6 26.7 14.8 12.5 11.0 2.5 2.3 2.1 — — — 2.2 6.0 8.3 0.7
Colgate-Palmolive (India) ADD 1,016 1,075 5.8 276,446 4,277 272 20.6 25.0 30.8 (3.5) 21.2 23.1 49.3 40.6 33.0 28.9 24.0 19.8 21.7 18.1 15.0 1.0 1.3 1.6 48.9 48.6 49.7 6.8
Dabur India REDUCE 275 290 5.4 484,859 7,501 1,762 7.2 7.8 9.0 3.6 9.1 14.6 38.4 35.2 30.7 31.9 29.5 25.7 10.0 8.7 7.6 0.8 1.1 1.4 28.0 26.5 26.5 8.5
GlaxoSmithKline Consumer ADD 5,290 5,900 11.5 222,491 3,442 42 156.1 170.4 190.1 0.9 9.2 11.6 33.9 31.0 27.8 23.0 21.0 18.3 7.1 6.5 5.9 1.3 1.5 1.7 23.6 21.9 22.2 1.2
Godrej Consumer Products SELL 1,803 1,600 (11.2) 613,984 9,499 341 38.3 46.0 52.5 11.3 20.2 14.1 47.1 39.2 34.3 33.3 27.8 24.2 11.6 9.9 8.4 0.8 0.8 0.8 25.1 27.3 26.4 7.4
Hindustan Unilever REDUCE 1,008 930 (7.7) 2,181,664 33,752 2,164 19.6 22.4 25.8 3.2 13.9 15.4 51.4 45.1 39.1 35.2 30.6 26.4 33.6 32.7 32.0 1.7 1.8 2.1 66.5 73.5 82.8 21.2
ITC ADD 286 280 (2.2) 3,476,581 53,786 12,140 8.4 9.5 10.7 8.5 13.1 12.6 34.2 30.2 26.8 22.7 20.0 17.6 9.8 9.2 8.8 1.9 2.2 2.7 27.0 29.7 32.6 49.5
Jubilant Foodworks SELL 1,018 850 (16.5) 67,144 1,039 66 13.1 20.8 30.5 (17.9) 59.4 46.3 78.0 48.9 33.4 25.1 18.0 13.6 8.4 7.5 6.6 0.2 0.5 0.9 11.3 16.3 21.1 8.8
Jyothy Laboratories NR 373 — — 67,759 1,048 182 6.5 11.4 11.8 25.2 74.5 4.0 57.2 32.8 31.5 27.9 24.2 21.3 6.2 5.8 5.5 1.6 1.6 1.9 12.2 18.3 18.0 1.1
Manpasand Beverages REDUCE 794 685 (13.7) 45,415 703 57 13.0 19.7 27.2 28.9 51.6 38.0 61.0 40.2 29.1 28.9 20.9 14.1 3.9 3.6 3.2 0.2 0.3 0.4 8.4 9.3 11.7 1.0
Marico REDUCE 309 285 (7.9) 399,143 6,175 1,291 6.2 7.1 8.1 10.8 14.2 15.0 50.0 43.8 38.1 34.0 30.9 26.7 17.2 15.1 13.2 1.1 1.2 1.4 36.1 36.7 37.0 6.3
Nestle India SELL 6,534 5,700 (12.8) 629,985 9,746 96 99.3 125.4 149.6 7.1 26.4 19.2 65.8 52.1 43.7 33.9 28.8 24.5 20.9 19.5 18.2 1.0 1.3 1.6 32.8 38.7 43.1 4.0
Page Industries REDUCE 14,621 13,000 (11.1) 163,083 2,523 11 249.6 309.5 380.7 19.7 24.0 23.0 58.6 47.2 38.4 37.0 30.2 24.6 24.9 19.0 14.3 0.6 0.7 0.7 48.0 45.5 42.4 2.3
PC Jeweller REDUCE 450 390 (13.4) 80,684 1,248 179 21.5 23.7 27.2 (3.6) 10.1 14.8 20.9 19.0 16.6 10.7 8.8 7.6 2.8 2.4 2.2 0.9 1.0 1.2 14.8 14.2 13.8 3.4
Pidilite Industries ADD 761 730 (4.1) 390,305 6,038 513 16.7 19.1 22.2 13.2 14.6 16.1 45.6 39.8 34.3 29.9 26.0 22.1 11.7 9.9 8.4 0.7 0.8 0.9 28.0 26.9 26.5 5.4
S H Kelkar and Company SELL 290 270 (6.8) 41,889 648 145 7.2 8.5 9.8 37.3 16.8 15.6 40.0 34.2 29.6 25.0 21.2 18.1 5.2 4.7 4.2 0.6 0.8 0.9 13.3 14.3 15.0 1.8
Tata Global Beverages ADD 150 150 0.3 94,354 1,460 631 6.9 7.9 9.0 39.1 13.5 14.9 21.6 19.0 16.6 11.2 10.1 8.8 1.6 1.5 1.4 1.5 1.7 2.0 7.4 8.0 8.8 5.0
Titan Company REDUCE 471 430 (8.7) 418,280 6,471 888 8.9 12.4 14.4 14.2 38.4 16.3 52.8 38.1 32.8 35.0 25.4 21.4 9.8 8.4 7.3 0.6 0.8 1.0 20.4 23.8 23.8 10.5
United Breweries SELL 775 650 (16.1) 204,901 3,170 264 8.7 11.9 16.1 (23.0) 37.3 34.7 89.1 64.9 48.2 32.5 27.0 22.5 8.8 7.9 7.0 0.1 0.2 0.3 10.3 12.8 15.3 3.4
United Spirits ADD 1,921 2,400 24.9 279,146 4,319 145 30.8 47.4 66.4 154.9 54.1 40.1 62.4 40.5 28.9 27.7 21.8 16.8 12.0 7.9 5.6 — — — 21.7 23.5 22.7 17.7
Varun Beverages BUY 497 550 10.6 90,753 1,404 182 8.6 12.0 15.6 66.3 39.9 29.5 57.8 41.3 31.9 14.2 12.7 11.0 4.6 4.3 3.8 — — — 11.8 11.0 12.6 1.1
Consumer products Cautious 11,843,878 183,235 9.2 17.6 16.1 43.8 37.3 32.1 27.8 23.9 20.5 11.6 10.4 9.4 1.3 1.5 1.8 26.5 28.0 29.3 193.6
Energy
BPCL SELL 702 675 (3.9) 1,015,861 15,716 1,446 51.9 50.7 55.4 1.0 (2.3) 9.3 13.5 13.9 12.7 10.0 8.7 7.9 3.4 3.0 2.6 4.2 2.2 2.4 26.5 23.0 21.8 25.9
Castrol India ADD 437 470 7.5 216,173 3,344 495 13.5 14.7 15.9 12.3 8.4 8.5 32.3 29.8 27.5 20.7 19.6 18.0 36.3 35.7 34.9 2.5 2.7 3.0 114.1 120.6 128.4 5.9
GAIL (India) ADD 401 425 6.0 678,297 10,494 1,691 22.9 26.3 28.7 70.2 15.1 9.0 17.5 15.2 14.0 10.7 9.5 8.8 2.0 1.9 1.7 2.0 2.1 2.2 12.1 12.8 12.9 29.9
GSPL ADD 174 175 0.6 98,064 1,517 563 8.7 11.0 12.0 9.7 27.3 8.8 20.1 15.8 14.5 10.2 8.1 7.3 2.3 2.1 1.9 1.1 1.6 2.1 11.8 13.7 13.6 2.5
HPCL REDUCE 521 550 5.5 529,630 8,194 1,017 52.1 43.9 45.8 37.2 (15.7) 4.2 10.0 11.9 11.4 7.7 8.6 8.4 2.6 2.3 2.0 5.5 2.6 2.7 27.6 20.7 19.0 26.5
Indraprastha Gas SELL 1,000 970 (3.0) 140,021 2,166 140 45.6 51.0 55.9 37.7 11.8 9.5 21.9 19.6 17.9 13.2 11.7 10.6 5.0 4.4 4.0 1.2 1.6 2.0 24.6 24.1 23.5 6.7
IOCL BUY 435 470 7.9 2,114,261 32,710 4,856 41.9 38.6 41.4 114.8 (7.9) 7.1 10.4 11.3 10.5 6.6 6.8 6.4 2.6 2.3 2.1 4.1 4.1 4.4 26.0 21.7 21.1 28.9
Mahanagar Gas SELL 982 775 (21.0) 96,960 1,500 99 39.9 42.5 44.9 27.8 6.5 5.6 24.6 23.1 21.9 14.6 13.6 12.8 5.7 5.2 4.7 2.0 2.1 2.3 24.5 23.6 22.7 2.4
ONGC ADD 180 210 16.6 2,310,624 35,747 12,833 16.5 19.3 21.7 22.2 17.2 12.0 10.9 9.3 8.3 4.9 4.1 3.7 1.2 1.1 1.0 3.1 3.7 4.2 11.1 12.2 12.7 21.9
Oil India SELL 316 320 1.2 253,559 3,923 802 27.6 31.1 33.8 (5.0) 12.5 8.8 11.5 10.2 9.4 6.5 5.5 5.0 1.1 1.0 1.0 3.5 4.0 4.3 9.7 10.3 10.6 2.7
Petronet LNG ADD 448 465 3.7 336,300 5,203 750 22.7 26.4 30.4 102.7 16.3 15.0 19.7 17.0 14.7 12.9 10.5 9.1 4.4 3.7 3.2 1.1 1.6 2.0 24.4 23.9 23.5 14.7
Reliance Industries ADD 1,319 1,420 7.7 3,902,477 60,375 2,959 101.1 87.1 99.2 18.7 (13.8) 13.9 13.1 15.1 13.3 13.2 10.4 7.9 1.5 1.4 1.3 0.8 1.0 1.2 11.2 8.8 9.3 528.4
Energy Attractive 12,227,514 189,171 32.8 (1.0) 11.1 12.7 12.8 11.5 8.6 7.5 6.4 1.7 1.6 1.5 2.5 2.4 2.7 13.5 12.3 12.6 711.7
Dividend yield (%) RoE (%)Price/BV (X)

K
OTA
K IN
STIT
UTIO
NA
L EQ
UIT
IES R
ESEA
RC
H
150
In
dia
Da
ily S
um
ma
ry - M
ay 2
2, 2
01
7
Ind
ia D
aily
Su
mm
ary
- Ma
y 2
2, 2
01
7
Kotak Institutional Equities: Valuation summary of KIE Universe stocks
Source: Company, Bloomberg, Kotak Institutional Equities estimates
Target O/S
Price (Rs) price Upside Mkt cap. shares EPS (Rs) EPS growth (%) PER (X) EV/EBITDA (X) ADVT-3mo
Company Rating 19-May-17 (Rs) (%) (Rs mn) (US$ mn) (mn) 2017 2018E 2019E 2017 2018E 2019E 2017 2018E 2019E 2017 2018E 2019E 2017 2018E 2019E 2017 2018E 2019E 2017 2018E 2019E (US$ mn)
Industrials
ABB SELL 1,527 1,170 (23.4) 323,552 5,006 212 17.8 25.2 36.9 25.5 42.1 46.5 86.0 60.5 41.3 42.5 31.0 23.7 9.9 8.9 7.7 0.3 0.5 0.6 12.0 15.4 20.0 3.3
BHEL SELL 164 110 (32.9) 401,529 6,212 2,448 3.5 3.6 7.4 193.6 3.2 104.0 47.0 45.5 22.3 29.6 22.4 9.0 1.2 1.2 1.1 0.5 0.6 1.1 2.6 2.6 5.1 16.1
Carborundum Universal REDUCE 298 265 (11.0) 56,145 869 189 9.3 12.5 15.4 21.7 34.8 23.4 32.1 23.8 19.3 16.9 13.2 10.8 4.1 3.7 3.3 0.6 1.3 1.6 13.6 16.2 17.8 1.0
CG Power and Industrial REDUCE 92 65 (29.1) 57,441 889 627 2.9 3.5 5.1 26.1 19.0 46.8 31.1 26.2 17.8 15.0 11.7 8.3 1.3 1.2 1.2 0.6 0.7 1.1 4.0 4.8 6.8 4.2
Crompton Greaves Consumer SELL 223 205 (8.1) 139,733 2,162 627 4.5 5.5 6.6 17.4 21.3 19.9 49.2 40.6 33.8 29.8 25.3 21.5 30.4 19.3 13.1 0.4 0.7 0.9 82.5 58.2 46.4 4.6
Cummins India SELL 973 840 (13.7) 269,702 4,173 277 26.3 29.4 33.6 1.4 11.9 14.2 37.0 33.1 29.0 32.6 30.0 25.7 7.2 6.7 6.2 1.4 1.6 1.8 21.1 20.9 22.1 5.4
Havells India SELL 486 420 (13.5) 303,492 4,695 624 9.5 11.3 13.5 22.8 18.9 19.3 50.9 42.9 35.9 34.7 26.4 22.0 9.7 8.7 7.8 0.7 0.9 1.3 19.9 21.3 22.9 10.3
Kalpataru Power Transmission BUY 352 400 13.6 54,056 836 153 14.2 16.8 25.1 85.5 18.5 49.2 24.8 20.9 14.0 8.9 7.6 6.2 2.2 2.1 1.8 0.6 0.6 0.6 9.2 10.3 13.9 0.7
KEC International ADD 245 270 10.1 63,025 975 257 11.9 14.9 19.2 59.2 25.5 28.8 20.7 16.5 12.8 9.9 8.3 6.9 4.0 3.3 2.7 0.7 0.8 1.1 19.7 21.9 23.3 2.9
L&T BUY 1,725 1,870 8.4 1,609,473 24,900 930 57.0 77.7 96.9 12.0 36.2 24.7 30.2 22.2 17.8 23.0 18.6 15.5 4.0 3.6 3.3 1.4 1.8 2.2 13.7 17.2 19.5 40.3
Siemens SELL 1,377 1,020 (25.9) 490,502 7,589 356 23.0 30.1 38.5 35.2 30.9 28.0 59.9 45.8 35.7 36.2 27.9 21.6 7.1 6.7 6.2 0.8 1.1 1.4 12.1 15.0 18.0 5.0
Thermax REDUCE 992 850 (14.3) 118,215 1,829 119 25.8 30.5 36.7 11.5 18.4 20.2 38.5 32.5 27.1 27.0 21.7 18.8 4.6 4.1 3.7 0.6 0.6 0.8 12.4 13.4 14.5 1.1
Voltas REDUCE 416 360 (13.4) 137,565 2,128 331 13.3 14.8 17.0 27.1 11.3 15.2 31.3 28.2 24.5 26.4 22.3 18.4 5.1 4.5 4.0 0.8 0.9 1.0 17.2 17.0 17.3 10.8
Industrials Cautious 4,024,431 62,262 43.3 27.8 30.5 38.0 29.8 22.8 24.7 19.8 15.7 3.8 3.5 3.2 1.0 1.2 1.6 9.9 11.9 14.2 105.6
Infrastructure
Adani Port and SEZ ADD 349 370 5.9 723,694 11,196 2,085 18.0 12.7 14.6 30.9 (29.5) 15.3 19.4 27.5 23.9 16.6 16.2 14.6 4.4 3.9 3.5 0.4 0.6 0.8 25.2 15.0 15.3 21.9
Ashoka Buildcon BUY 206 250 21.2 38,599 597 188 7.7 6.0 10.1 148.6 (23.0) 69.2 26.7 34.6 20.5 11.0 10.0 8.2 2.0 1.9 1.8 0.9 1.1 1.4 7.6 5.6 9.0 2.6
Container Corporation REDUCE 1,198 950 (20.7) 292,023 4,518 244 28.1 31.8 37.8 (13.1) 13.3 18.9 42.6 37.6 31.7 27.2 22.4 18.3 3.4 3.3 3.1 0.8 0.9 1.1 8.2 8.9 10.0 8.9
Gateway Distriparks BUY 246 275 11.9 26,720 413 109 6.8 8.8 12.7 (32.4) 28.9 44.2 36.0 28.0 19.4 28.5 25.3 20.3 2.6 2.5 2.3 2.8 1.1 1.5 6.6 9.1 12.3 0.8
Gujarat Pipavav Port BUY 154 170 10.6 74,281 1,149 483 5.3 6.0 7.8 53.3 13.3 30.9 29.2 25.7 19.7 17.0 13.8 11.6 3.8 3.8 3.7 2.6 3.0 3.9 13.2 14.7 18.9 1.3
IRB Infrastructure BUY 238 275 15.3 83,803 1,297 351 20.8 16.2 17.9 14.9 (21.8) 10.5 11.5 14.7 13.3 7.3 7.4 6.6 1.4 1.3 1.3 1.6 1.8 1.5 13.4 9.0 9.5 12.9
Sadbhav Engineering ADD 328 345 5.2 56,292 871 172 11.2 12.6 14.5 42.8 12.8 15.4 29.4 26.1 22.6 18.6 14.9 13.1 3.4 3.1 2.8 — — — 12.3 12.5 12.9 1.0
Infrastructure Attractive 1,295,412 20,041 22.6 (19.3) 18.2 22.2 27.5 23.3 14.7 13.9 12.1 3.4 3.1 2.9 0.8 0.9 1.1 15.4 11.4 12.5 49.4
Internet
Info Edge ADD 850 960 12.9 103,052 1,594 121 18.2 19.7 24.5 55.1 8.7 24.3 46.8 43.1 34.6 40.1 29.4 22.8 5.4 4.9 4.5 0.5 0.6 0.7 11.9 11.9 13.6 1.2
Just Dial REDUCE 509 400 (21.4) 35,406 548 69 18.6 16.5 19.5 (9.1) (11.0) 17.9 27.4 30.8 26.2 23.2 18.6 14.9 4.5 4.0 3.5 0.4 0.3 0.4 17.7 13.7 14.3 20.0
Internet Attractive 138,457 2,142 23.0 1.4 22.2 39.7 39.2 32.1 34.4 26.0 20.4 5.1 4.7 4.2 0.5 0.5 0.6 12.9 11.9 13.1 21.1
Media
DB Corp. REDUCE 369 390 5.7 67,853 1,050 184 20.5 23.1 28.3 27.1 12.5 22.7 18.0 16.0 13.0 10.2 8.8 7.2 4.2 3.9 3.5 1.1 3.5 4.3 25.6 25.4 28.4 7.0
DishTV BUY 99 105 6.1 105,474 1,632 1,066 1.5 2.4 3.6 (76.9) 62.8 48.8 NM 40.5 27.2 10.6 8.8 7.2 6.3 6.3 6.3 — — 1.0 9.6 15.6 23.2 9.3
Jagran Prakashan REDUCE 186 190 2.2 60,757 940 327 11.3 12.9 15.0 8.8 14.3 16.1 16.4 14.4 12.4 9.6 8.1 6.9 3.5 3.3 2.9 3.2 3.8 3.8 22.4 23.6 24.9 0.6
Ortel Communications BUY 102 185 81.3 3,099 48 30 (0.9) 1.9 7.6 (122.1) 316.0 308.8 (117.9) 54.6 13.4 9.0 7.0 5.3 2.3 2.2 1.9 — — — (1.9) 4.1 15.1 0.0
PVR REDUCE 1,514 1,400 (7.5) 70,741 1,094 47 22.4 33.9 43.2 (17.0) 51.4 27.3 67.5 44.6 35.0 21.8 17.2 14.5 7.4 6.4 5.5 0.1 0.2 0.3 11.4 15.4 17.0 5.0
Sun TV Network ADD 852 950 11.5 335,918 5,197 394 26.5 30.9 38.0 15.2 16.6 23.2 32.2 27.6 22.4 21.3 18.0 14.4 8.7 7.9 6.9 1.8 2.0 2.2 28.3 30.0 32.8 21.3
Zee Entertainment Enterprises BUY 512 570 11.3 491,750 7,608 960 16.2 15.8 19.0 72.9 (2.6) 20.4 31.5 32.4 26.9 23.5 20.1 16.8 7.4 6.2 5.2 0.5 0.7 0.8 24.2 20.9 21.1 14.4
Media Attractive 1,135,591 17,569 10.3 10.9 23.5 31.4 28.3 22.9 17.8 15.0 12.4 6.8 6.1 5.3 1.0 1.3 1.6 21.8 21.4 23.1 57.6
Metals & Mining
Coal India ADD 276 320 15.8 1,714,797 26,529 6,207 18.1 25.5 28.5 (20.0) 40.7 11.7 15.2 10.8 9.7 9.6 7.0 6.3 5.7 5.2 4.7 7.2 6.5 7.2 33.5 50.0 51.0 23.7
Hindalco Industries ADD 191 215 12.6 428,480 6,629 2,242 12.1 17.3 19.8 345.1 43.3 14.5 15.8 11.1 9.7 7.1 6.6 5.9 1.0 0.9 0.8 0.5 0.5 0.5 6.6 8.4 8.7 43.6
Hindustan Zinc REDUCE 246 265 7.7 1,039,640 16,084 4,225 19.7 22.2 23.9 1.5 12.8 7.6 12.5 11.1 10.3 9.0 6.8 5.5 3.4 2.8 2.3 11.9 2.0 2.0 24.4 27.4 24.4 15.6
Jindal Steel and Power BUY 112 160 42.7 102,620 1,588 915 (21.9) (6.6) 6.7 (20.3) 69.9 201.9 (5.1) (17.0) 16.7 12.9 8.8 6.7 0.3 0.3 0.3 — — — (7.5) (1.7) 1.7 33.9
JSW Steel ADD 194 225 16.3 467,732 7,236 2,417 14.6 19.3 21.6 1,484.3 32.7 11.6 13.3 10.0 9.0 7.3 6.6 6.3 2.0 1.7 1.5 1.2 1.2 1.2 16.3 18.4 17.6 19.7
National Aluminium Co. SELL 68 42 (37.9) 130,666 2,022 1,933 3.1 3.4 3.4 15.5 9.0 0.1 21.7 19.9 19.9 10.0 8.3 7.9 1.3 1.2 1.2 1.5 1.5 1.5 5.2 6.2 5.9 3.5
NMDC SELL 123 105 (14.7) 389,475 6,026 3,164 10.2 9.1 9.9 28.6 (11.1) 8.4 12.0 13.5 12.5 8.8 9.0 8.2 1.7 1.6 1.6 4.9 4.9 4.9 12.1 12.2 12.8 7.5
Tata Steel ADD 490 525 7.3 475,410 7,355 971 41.4 51.3 60.9 306.4 24.0 18.7 11.8 10 8.0 7.1 6.9 6.3 1.3 1.4 1.2 2.0 2.0 2.0 10.4 14.1 15.8 51.9
Vedanta ADD 230 300 30.2 856,256 13,247 3,717 19.7 29.9 36.8 157.9 51.8 23.2 11.7 7.7 6.3 7.2 5.5 4.6 1.5 1.3 1.2 3.8 3.9 4.8 14.4 18.3 20.2 51.4
Metals & Mining Attractive 5,605,075 86,716 50.6 35.5 16.3 14.4 10.6 9.1 8.1 6.7 5.9 1.9 1.8 1.6 5.7 3.6 4.0 13.4 16.7 17.6 250.8
Pharmaceutical
Apollo Hospitals REDUCE 1,261 1,300 3.1 175,437 2,714 139 20.6 30.9 38.7 (4.9) 49.6 25.4 61.1 40.9 32.6 25.4 20.6 17.8 4.8 4.4 4.0 0.4 0.6 0.8 8.1 11.3 13.0 13.2
Aurobindo Pharma ADD 595 770 29.3 348,776 5,396 584 41.8 46.3 51.5 23.3 10.6 11.2 14.2 12.9 11.6 10.3 8.9 7.8 3.7 2.9 2.4 0.3 0.4 0.5 29.6 25.5 22.8 22.7
Biocon SELL 980 605 (38.3) 195,960 3,032 200 30.6 24.5 27.8 53.1 (20.0) 13.8 32.0 40.1 35.2 20.7 17.9 14.4 4.1 3.8 3.5 1.1 0.9 1.0 13.3 9.8 10.3 14.9
Cipla BUY 565 650 15.1 454,530 7,032 805 19.1 27.3 35.6 13.7 43.2 30.3 29.6 20.7 15.9 17.5 12.6 9.9 3.4 3.0 2.7 0.7 1.0 1.3 12.2 15.6 17.9 12.0
Dr Lal Pathlabs REDUCE 910 920 1.1 75,611 1,170 83 19.1 21.4 24.6 20.2 12.0 15.0 47.6 42.5 37.0 30.5 25.9 22.3 11.5 9.4 7.8 0.3 0.4 0.4 27.4 24.4 23.1 3.0
Dr Reddy's Laboratories SELL 2,656 2,500 (5.9) 440,109 6,809 166 72.5 88.6 136.3 (47.9) 22.3 53.8 36.6 30.0 19.5 19.5 14.5 9.4 3.6 3.3 2.9 0.4 0.5 0.8 9.6 11.4 15.6 21.0
HCG BUY 255 270 5.9 21,853 338 85 2.3 2.5 4.5 1,502.4 7.8 79.9 109.2 101.3 56.3 24.8 19.5 15.0 3.9 3.8 3.5 — — — 3.6 3.8 6.5 1.2
Lupin ADD 1,318 1,350 2.4 595,393 9,211 450 61.9 66.1 75.0 22.7 6.8 13.5 21.3 19.9 17.6 13.5 12.1 10.3 4.4 3.7 3.2 0.7 0.8 0.9 22.8 20.3 19.5 21.7
Sun Pharmaceuticals REDUCE 653 660 1.0 1,567,058 24,244 2,406 31.1 30.1 34.9 40.8 (3.3) 15.8 21.0 21.7 18.7 12.4 12.0 9.9 4.1 3.5 3.0 1.0 0.9 1.1 21.5 17.4 17.3 32.6
Torrent Pharmaceuticals REDUCE 1,290 1,310 1.6 218,281 3,377 169 57.3 58.7 69.1 (44.0) 2.4 17.8 22.5 22.0 18.7 15.5 14.0 12.1 5.6 4.7 2.0 1.0 1.2 26.6 23.1 21.0 10.9
Pharmaceuticals Cautious 4,093,007 63,322 10.3 6.8 19.8 23.4 21.9 18.3 14.4 12.7 10.3 4.1 3.5 3.0 0.8 0.8 1.0 17.5 16.1 16.6 153.3
Dividend yield (%) RoE (%)Price/BV (X)

In
dia
Da
ily S
um
ma
ry - M
ay 2
2, 2
01
7
151
K
OTA
K IN
STIT
UTIO
NA
L EQ
UIT
IES R
ESEA
RC
H
Kotak Institutional Equities: Valuation summary of KIE Universe stocks
Source: Company, Bloomberg, Kotak Institutional Equities estimates
Target O/S
Price (Rs) price Upside Mkt cap. shares EPS (Rs) EPS growth (%) PER (X) EV/EBITDA (X) ADVT-3mo
Company Rating 19-May-17 (Rs) (%) (Rs mn) (US$ mn) (mn) 2017 2018E 2019E 2017 2018E 2019E 2017 2018E 2019E 2017 2018E 2019E 2017 2018E 2019E 2017 2018E 2019E 2017 2018E 2019E (US$ mn)
Real Estate
DLF ADD 208 160 (22.9) 370,359 5,730 1,784 3.7 1.6 1.9 18.7 (55.2) 14.2 56.8 126.7 111.0 18.6 19.6 19.2 1.3 1.3 1.3 1.0 1.0 1.0 2.2 1.0 1.1 30.8
Godrej Properties REDUCE 514 335 (34.8) 111,103 1,719 216 9.6 10.5 11.4 29.4 9.9 8.3 53.7 48.8 45.1 53.5 75.3 45.6 4.7 4.4 4.1 — 0.5 0.5 9.1 9.3 9.4 4.7
Oberoi Realty REDUCE 392 390 (0.5) 133,141 2,060 339 11.2 30.1 43.5 (11.1) 170.0 44.3 35.1 13.0 9.0 23.8 8.2 8.9 2.4 2.0 1.7 0.5 0.5 0.5 6.9 16.8 20.4 2.7
Prestige Estates Projects BUY 237 225 (4.9) 88,725 1,373 375 7.0 8.4 8.9 (24.8) 18.7 6.3 33.6 28.3 26.6 14.7 14.1 13.5 2.0 1.9 1.8 0.6 0.6 0.6 6.2 7.0 7.1 2.1
Sobha ADD 401 440 9.9 38,570 597 96 15.1 17.5 18.0 10.0 15.9 3.0 26.6 22.9 22.3 14.1 13.7 13.3 1.5 1.4 1.4 1.7 1.7 1.7 5.6 6.3 6.2 4.0
Sunteck Realty BUY 455 360 (20.8) 28,649 443 60 55.8 57.8 113.7 105.4 3.7 96.6 8.2 7.9 4.0 7.9 6.3 2.9 1.4 1.2 0.4 0.4 0.4 18.6 16.3 26.0 1.8
Real Estate Attractive 770,548 11,921 11.1 19.7 36.8 38.9 32.5 23.8 18.6 16.2 14.9 1.7 1.6 1.5 0.7 0.8 0.8 4.3 5.0 6.5 46.1
Technology
HCL Technologies REDUCE 845 840 (0.6) 1,205,377 18,648 1,430 59.2 60.9 65.4 50.2 3.0 7.4 14.3 13.9 12.9 10.5 9.6 8.6 3.5 3.1 2.8 2.9 0.9 3.9 27.2 23.6 22.9 24.0
Hexaware Technologies ADD 252 230 (8.9) 76,304 1,180 304 13.7 14.5 16.5 5.9 6.1 13.3 18.4 17.4 15.3 12.5 11.1 9.5 4.5 4.1 3.7 2.2 3.2 3.2 26.5 24.8 25.5 3.9
Infosys ADD 958 1,015 6.0 2,200,358 34,042 2,286 62.8 63.7 70.4 6.4 1.4 10.6 15.3 15.0 13.6 10.6 10.8 9.5 3.2 3.3 3.0 2.8 3.1 3.7 22.6 21.3 23.4 52.8
L&T Infotech BUY 774 800 3.3 132,094 2,044 174 55.8 59.7 65.2 13.3 7.0 9.2 13.9 13.0 11.9 9.7 8.5 7.3 4.3 3.7 3.2 1.2 3.1 3.6 37.6 30.5 28.7 1.0
Mindtree REDUCE 498 460 (7.5) 83,593 1,293 168 26.4 30.8 36.0 (26.3) 16.4 17.2 18.8 16.2 13.8 10.6 8.9 7.3 3.2 2.9 2.5 1.4 1.7 2.0 17.9 18.8 19.4 3.8
Mphasis SELL 583 450 (22.7) 122,568 1,896 210 39.5 40.8 41.1 14.8 3.3 0.6 14.7 14.3 14.2 9.5 9.9 9.5 1.8 1.9 1.8 3.4 3.4 3.4 12.9 12.6 13.1 1.1
TCS REDUCE 2,507 2,405 (4.1) 4,940,158 76,429 1,970 133.4 136.8 149.3 8.6 2.5 9.1 18.8 18.3 16.8 13.8 13.2 11.9 5.6 6.1 5.6 2.1 3.4 3.7 32.6 31.3 34.7 50.1
Tech Mahindra BUY 416 510 22.6 362,800 5,613 872 34.0 38.2 43.4 (4.8) 12.2 13.7 12.2 10.9 9.6 7.5 6.1 5.0 2.3 1.9 1.7 3.0 1.5 1.7 19.5 19.1 18.6 25.9
Wipro REDUCE 520 455 (12.5) 1,264,256 19,559 2,427 35.0 34.9 37.2 (3.0) (0.2) 6.6 14.9 14.9 14.0 8.9 8.8 7.9 2.4 2.2 2.0 0.4 1.0 2.3 17.2 15.4 15.2 15.3
Technology Cautious 10,387,507 160,704 9.3 (0.3) 8.8 16.4 16.5 15.1 11.4 11.0 9.8 3.8 3.9 3.5 2.2 2.6 3.4 23.1 23.6 23.3 178.0
Telecom
Bharti Airtel ADD 373 400 7.3 1,490,031 23,052 3,997 9.5 3.2 9.1 (3.0) (66.6) 188.9 39.4 118.0 40.8 7.2 8.1 6.8 2.2 2.2 2.2 0.3 0.1 0.5 5.6 1.9 5.3 30.6
Bharti Infratel REDUCE 379 335 (11.6) 700,909 10,844 1,850 14.9 16.1 17.7 18.3 8.1 10.0 25.5 23.6 21.5 11.9 10.8 10.0 4.5 4.4 4.4 4.3 3.3 3.6 16.2 19.0 20.5 52.2
Tata Communications ADD 675 730 8.1 192,389 2,976 285 10.5 16.6 22.9 540.1 57.9 38.1 64.3 40.7 29.5 11.1 10.0 8.7 12.1 9.4 7.2 1.0 1.0 1.0 51.0 26.0 27.6 7.6
Telecom Cautious 2,700,280 41,776 (31.7) (78.1) 257.5 42.0 191.4 53.5 8.0 9.0 7.6 2.5 2.5 2.5 1.3 0.9 1.2 5.9 1.3 4.7 134.9
Utilities
Adani Power SELL 32 24 (25.9) 124,965 1,933 3,334 (2.0) 4.2 4.2 (233.7) 315.3 (0.2) (16.5) 7.7 7.7 8.8 6.3 6.0 1.6 1.3 1.1 — — — (9.3) 18.9 15.9 9.5
CESC ADD 878 890 1.4 116,325 1,800 133 52.1 77.7 99.7 86.6 49.0 28.4 16.8 11.3 8.8 8.0 7.5 6.6 0.8 0.8 0.7 1.4 1.4 1.5 5.9 7.0 8.5 13.7
JSW Energy ADD 65 67 3.5 106,194 1,643 1,640 3.8 6.6 6.9 (50.0) 72.6 5.2 17.1 9.9 9.4 6.4 5.6 5.1 1.0 1.0 0.9 3.1 3.1 3.1 6.6 10.0 9.9 9.7
NHPC ADD 31 32 4.4 339,316 5,250 11,071 2.9 3.4 3.6 21.6 17.6 6.7 10.6 9.0 8.5 9.7 7.3 6.4 1.0 1.0 1.0 5.3 6.2 6.6 10.0 11.3 11.6 2.7
NTPC BUY 159 185 16.3 1,311,853 20,296 8,245 12.1 15.3 16.5 5.4 26.0 8.2 13.1 10.4 9.6 11.2 9.4 7.8 1.4 1.3 1.2 2.3 2.9 3.1 10.9 12.7 12.6 12.5
Power Grid BUY 206 230 11.8 1,076,400 16,653 5,232 14.3 15.7 17.7 25.9 9.2 13.2 14.3 13.1 11.6 9.9 8.6 7.5 2.2 2.0 1.7 1.4 1.5 1.7 16.5 15.9 15.9 17.5
Reliance Power SELL 46 34 (26.6) 129,877 2,009 2,805 4.2 4.4 4.6 (14.3) 5.9 4.5 11.1 10.5 10.0 9.3 8.4 8.2 0.6 0.6 0.5 — — — 5.5 5.6 5.6 7.3
Tata Power REDUCE 84 80 (4.9) 227,607 3,521 2,800 6.4 4.9 7.0 15.7 (22.5) 42.1 13.2 17.1 12.0 - - - - - - 1.4 1.4 1.4 13.3 11.2 14.5 7.0
Utilities Attractive 3,432,537 53,104 5.3 26.2 10.9 14.1 11.2 10.1 10.1 8.4 7.4 1.4 1.3 1.2 2.1 2.4 2.6 10.1 11.7 11.9 79.9
Others
Astral Poly Technik SELL 570 360 (36.8) 68,267 1,056 120 10.2 13.0 16.1 21.0 28.2 23.2 56.1 43.8 35.5 28.7 23.1 19.0 8.2 6.9 5.9 0.1 0.1 0.1 15.0 17.1 17.9 3.2
Avenue Supermarts SELL 723 580 (19.8) 451,151 6,980 563 8.5 13.0 16.4 49.1 52.4 26.8 85.0 55.8 44.0 45.1 33.3 26.0 10.6 9.7 7.9 — — — 17.9 19.0 19.9 —
Cera Sanitaryware REDUCE 2,968 2,140 (27.9) 38,598 597 13 74.2 89.0 104.4 15.6 20.0 17.3 40.0 33.3 28.4 23.8 19.8 16.9 7.6 6.2 5.1 0.3 0.3 0.3 20.7 20.5 19.8 0.4
Dhanuka Agritech REDUCE 832 800 (3.9) 41,619 644 50 23.9 26.6 33.3 11.3 11.3 25.4 34.9 31.3 25.0 24.5 21.6 17.1 8.3 7.0 5.8 1.9 0.8 1.0 24.1 24.2 25.5 0.5
Godrej Industries REDUCE 578 430 (25.6) 194,289 3,006 336 17.6 20.6 21.7 22.4 17.0 5.0 32.8 28.0 26.7 24.0 21.6 21.6 4.8 4.2 3.7 0.3 0.3 0.3 15.8 16.1 14.7 4.8
HSIL ADD 341 325 (4.8) 24,678 382 72 14.9 17.3 20.1 20.6 16.2 16.5 23.0 19.8 17.0 10.0 8.3 7.4 1.7 1.6 1.5 1.2 1.2 1.2 7.6 8.3 9.1 0.6
InterGlobe Aviation ADD 1,064 1,200 12.7 384,765 5,953 360 46.0 70.0 90.2 (18.9) 52.0 28.9 23.1 15.2 11.8 15.1 9.4 7.3 19.0 16.7 14.4 3.2 4.9 6.3 86.1 116.8 131.0 10.6
Kaveri Seed REDUCE 539 540 0.2 37,200 576 69 25.8 35.2 43.3 3.1 36.4 23.0 20.9 15.3 12.5 19.0 12.9 10.2 4.5 3.7 3.1 1.4 2.0 2.8 20.6 26.0 27.2 6.8
PI Industries ADD 809 910 12.5 111,335 1,722 136 33.5 32.4 37.8 44.9 (3.3) 16.7 24.1 25.0 21.4 20.1 18.2 14.9 7.1 5.7 4.6 0.5 0.5 0.6 33.4 25.2 23.8 2.1
Rallis India ADD 238 270 13.4 46,284 716 194 9.7 11.6 14.9 32.1 19.5 28.7 24.5 20.5 15.9 16.9 12.9 10.0 4.1 3.6 3.1 1.3 1.4 1.5 18.6 18.8 21.1 1.5
SRF BUY 1,739 1,910 9.9 99,834 1,545 57 84.2 95.7 113.1 14.4 13.6 18.2 20.6 18.2 15.4 12.2 10.6 9.2 3.2 2.8 2.4 0.6 0.7 0.8 16.8 16.6 17.0 5.2
Tata Chemicals ADD 616 630 2.2 157,045 2,430 255 31.6 45.7 49.5 3.1 44.7 8.3 19.5 13.5 12.5 9.7 7.7 6.8 2.3 1.8 1.6 1.6 1.6 1.6 12.3 14.9 13.6 5.5
TeamLease Services ADD 1,169 1,245 6.5 19,985 309 17 38.8 43.1 51.1 143.8 11.1 18.6 30.1 27.1 22.9 41.5 27.1 20.5 5.2 4.4 3.7 — — — 19.2 17.6 17.5 0.5
UPL ADD 791 860 8.7 402,036 6,220 507 35.7 43.0 53.6 12.2 20.5 24.7 22.2 18.4 14.8 13.2 11.1 9.3 4.9 4.0 3.3 0.7 0.9 1.1 23.8 23.9 24.6 20.5
Vardhman Textiles ADD 1,299 1,350 3.9 74,501 1,153 60 121.6 101.8 122.8 31.4 (16.3) 20.7 10.7 12.8 10.6 7.5 8.2 6.6 1.8 1.5 1.4 1.1 1.5 1.5 18.0 12.4 13.6 0.7
Whirlpool SELL 1,174 1,020 (13.1) 148,979 2,305 127 25.2 30.9 38.0 28.8 22.6 22.8 46.6 38.0 30.9 28.3 23.5 19.4 10.4 8.6 7.1 — 0.5 0.6 24.6 24.7 25.0 1.6
Others 2,237,289 34,613 13.2 26.8 21.7 28.0 22.1 18.2 16.9 13.6 11.4 5.8 4.8 4.1 1.0 1.3 1.7 20.5 21.8 22.7 63.4
KIE universe 92,447,292 1,430,242 20.3 13.4 20.3 21.3 18.8 15.6 11.9 10.3 8.9 2.8 2.6 2.3 1.6 1.6 1.9 13.1 13.6 14.8
KIE universe (ex-energy) 80,219,779 1,241,072 17.2 17.5 22.5 23.7 20.2 16.5 13.0 11.3 9.7 3.1 2.8 2.5 1.5 1.5 1.8 13.0 14.0 15.4
Notes:
(a) We have used adjusted book values for banking companies.
(b) 2017 means calendar year 2016, similarly for 2018 and 2019 for these particular companies.
(c) Exchange rate (Rs/US$)= 64.64
Dividend yield (%)Price/BV (X) RoE (%)
Ind
ia D
aily
Su
mm
ary
- Ma
y 2
2, 2
01
7
"Each of the analysts named below hereby certifies that, with respect to each subject company and its securities for which the analyst is responsible in this report, (1) all of the views expressed in this report accurately reflect his or her personal views about the subject companies and securities, and (2) no part of his or her compensation was, is, or will be, directly or indirectly, related to the specific recommendations or views expressed in this report: Sanjeev Prasad, Rohit Chordia, Hitesh Goel, Murtuza Arsiwalla, M.B. Mahesh, Nischint Chawathe, Aditya Mongia, Jaykumar Doshi, Anand Shah, Mohan Lal, Garima Mishra."
Ratings and other definitions/identifiers
Definitions of ratings
BUY. We expect this stock to deliver more than 15% returns over the next 12 months.
ADD. We expect this stock to deliver 5-15% returns over the next 12 months.
REDUCE. We expect this stock to deliver -5-+5% returns over the next 12 months.
SELL. We expect this stock to deliver <-5% returns over the next 12 months.
Our target prices are also on a 12-month horizon basis.
Other definitions
Coverage view. The coverage view represents each analyst’s overall fundamental outlook on the Sector. The coverage view will consist of one of the following
designations: Attractive, Neutral, Cautious.
Other ratings/identifiers
NR = Not Rated. The investment rating and target price, if any, have been suspended temporarily. Such suspension is in compliance with applicable regulation(s)
and/or Kotak Securities policies in circumstances when Kotak Securities or its affiliates is acting in an advisory capacity in a merger or strategic transaction
involving this company and in certain other circumstances.
CS = Coverage Suspended. Kotak Securities has suspended coverage of this company.
NC = Not Covered. Kotak Securities does not cover this company.
RS = Rating Suspended. Kotak Securities Research has suspended the investment rating and price target, if any, for this stock, because there is not a sufficient
fundamental basis for determining an investment rating or target. The previous investment rating and price target, if any, are no longer in effect for this stock
and should not be relied upon.
NA = Not Available or Not Applicable. The information is not available for display or is not applicable.
NM = Not Meaningful. The information is not meaningful and is therefore excluded.
Kotak Institutional Equities Research coverage universe
Distribution of ratings/investment banking relationships
Source: Kotak Institutional Equities As of March 31, 2017
Percentage of companies covered by Kotak Institutional
Equities, within the specified category.
* The above categories are defined as follows: Buy = We
expect this stock to deliver more than 15% returns over
the next 12 months; Add = We expect this stock to
deliver 5-15% returns over the next 12 months; Reduce
= We expect this stock to deliver -5-+5% returns over
the next 12 months; Sell = We expect this stock to deliver
less than -5% returns over the next 12 months. Our
target prices are also on a 12-month horizon basis.
These ratings are used illustratively to comply with
applicable regulations. As of 31/3/2017 Kotak Institutional
Equities Investment Research had investment ratings on
192 equity securities.
Percentage of companies within each category for
which Kotak Institutional Equities and or its affiliates has
provided investment banking services within the
previous 12 months.
21.4%
33.3%
28.1%
17.2%
1.6%3.6%
2.1% 1.6%
0%
10%
20%
30%
40%
50%
60%
70%
BUY ADD REDUCE SELL

Corporate Office Overseas Affiliates
Kotak Securities Ltd.
27 BKC, Plot No. C-27, “G Block”
Bandra Kurla Complex, Bandra (E)
Mumbai 400 051, India
Tel: +91-22-43360000
Kotak Mahindra (UK) Ltd
8th Floor, Portsoken House
155-157 Minories
London EC3N 1LS
Tel: +44-20-7977-6900
Kotak Mahindra Inc
369 Lexington Avenue
28th Floor, New York
NY 10017, USA
Tel:+1 212 600 8856
Copyright 2017 Kotak Institutional Equities (Kotak Securities Limited). All rights reserved.
1. Note that the research analysts contributing to this report may not be registered/qualified as research analysts with FINRA; and
2. Such research analysts may not be associated persons of Kotak Mahindra Inc and therefore, may not be subject to NASD Rule 2711 restrictions on communications with a subject company, public appearances and trading securities held by a research analyst account.
3. Any U.S. recipients of the research who wish to effect transactions in any security covered by the report should do so with or through Kotak Mahindra Inc and (ii) any transactions in the securities covered by the research by U.S. recipients must be effected only through Kotak Mahindra Inc at [email protected].
This report is distributed in Singapore by Kotak Mahindra (UK) Limited (Singapore Branch) to institutional investors, accredited investors or expert investors only as defined under the Securities and Futures Act. Recipients of this analysis / report are to contact Kotak Mahindra (UK) Limited (Singapore Branch) (16 Raffles Quay, #35-02/03, Hong Leong Building, Singapore 048581) in respect of any matters arising from, or in connection with, this analysis / report. Kotak Mahindra (UK) Limited (Singapore Branch) is regulated by the Monetary Authority of Singapore.
Kotak Securities Limited and its affiliates are a full-service, integrated investment banking, investment management, brokerage and financing group. We along with our affiliates are leading underwriter of securities and participants in virtually all securities trading markets in India. We and our affiliates have investment banking and other business relationships with a significant percentage of the companies covered by our Investment Research Department. Our research professionals provide important input into our investment banking and other business selection processes. Investors should assume that Kotak Securities Limited and/or its affiliates are seeking or will seek investment banking or other business from the company or companies that are the subject of this material and that the research professionals who were involved in preparing this material may participate in the solicitation of such business. Our research professionals are paid in part based on the profitability of Kotak Securities Limited, which include earnings from investment banking and other business. Kotak Securities Limited generally prohibits its analysts, persons reporting to analysts, and members of their households from maintaining a financial interest in the securities or derivatives of any companies that the analysts cover. Additionally, Kotak Securities Limited generally prohibits its analysts and persons reporting to analysts from serving as an officer, director, or advisory board member of any companies that the analysts cover. Our salespeople, traders, and other professionals may provide oral or written market commentary or trading strategies to our clients that reflect opinions that are contrary to the opinions expressed herein, and our proprietary trading and investing businesses may make investment decisions that are inconsistent with the recommendations expressed herein. In reviewing these materials, you should be aware that any or all of the foregoing, among other things, may give rise to real or potential conflicts of interest. Additionally, other important information regarding our relationships with the company or companies that are the subject of this material is provided herein.
This material should not be construed as an offer to sell or the solicitation of an offer to buy any security in any jurisdiction where such an offer or solicitation would be illegal. We are not soliciting any action based on this material. It is for the general information of clients of Kotak Securities Limited. It does not constitute a personal recommendation or take into account the particular investment objectives, financial situations, or needs of individual clients. Before acting on any advice or recommendation in this material, clients should consider whether it is suitable for their particular circumstances and, if necessary, seek professional advice. The price and value of the investments referred to in this material and the income from them may go down as well as up, and investors may realize losses on any investments. Past performance is not a guide for future performance, future returns are not guaranteed and a loss of original capital may occur. Kotak Securities Limited does not provide tax advise to its clients, and all investors are strongly advised to consult with their tax advisers regarding any potential investment.
Certain transactions -including those involving futures, options, and other derivatives as well as non-investment-grade securities - give rise to substantial risk and are not suitable for all investors. The material is based on information that we consider reliable, but we do not represent that it is accurate or complete, and it should not be relied on as such. Opinions expressed are our current opinions as of the date appearing on this material only. We endeavor to update on a reasonable basis the information discussed in this material, but regulatory, compliance, or other reasons may prevent us from doing so. We and our affiliates, officers, directors, and employees, including persons involved in the preparation or issuance of this material, may from time to time have "long" or "short" positions in, act as principal in, and buy or sell the securities or derivatives thereof of companies mentioned herein. Kotak Securities Limited and its non US affiliates may, to the extent permissible under applicable laws, have acted on or used this research to the extent that it relates to non US issuers, prior to or immediately following its publication. Foreign currency denominated securities are subject to fluctuations in exchange rates that could have an adverse effect on the value or price of or income derived from the investment. In addition, investors in securities such as ADRs, the value of which are influenced by foreign currencies affectively assume currency risk. In addition options involve risks and are not suitable for all investors. Please ensure that you have read and understood the current derivatives risk disclosure document before entering into any derivative transactions.
Kotak Securities Limited established in 1994, is a subsidiary of Kotak Mahindra Bank Limited. Kotak Securities is one of India's largest brokerage and distribution house.
Kotak Securities Limited is a corporate trading and clearing member of BSE Limited (BSE), National Stock Exchange of India Limited (NSE), MSEI and United Stock Exchange of India Limited (USEIL). Our businesses include stock broking, services rendered in connection with distribution of primary market issues and financial products like mutual funds and fixed deposits, depository services and Portfolio Management.
Kotak Securities Limited is also a depository participant with National Securities Depository Limited (NSDL) and Central Depository Services (India) Limited (CDSL). Kotak Securities Limited is also registered with Insurance Regulatory and Development Authority as Corporate Agent for Kotak Mahindra Old Mutual Life Insurance Limited and is also a Mutual Fund Advisor registered with Association of Mutual Funds in India (AMFI). Kotak Securities Limited is registered as a Research Analyst under SEBI (Research Analyst) Regulations, 2014.
We hereby declare that our activities were neither suspended nor we have defaulted with any stock exchange authority with whom we are registered in last five years. However SEBI, Exchanges and Depositories have conducted the routine inspection and based on their observations have issued advise letters or levied minor penalty on KSL for certain operational deviations. We have not been debarred from doing business by any Stock Exchange / SEBI or any other authorities; nor has our certificate of registration been cancelled by SEBI at any point of time.
We offer our research services to primarily institutional investors and their employees, directors, fund managers, advisors who are registered with us
Details of Associates are available on our website i.e. www.kotak.com
Research Analyst has served as an officer, director or employee of subject company(ies): No
We or our associates may have received compensation from the subject company(ies) in the past 12 months.
We or our associates have managed or co-managed public offering of securities for the subject company(ies) in the past 12 months. YES
We or our associates may have received compensation for investment banking or merchant banking or brokerage services from the subject company(ies) in the past 12 months. We or our associates may have received any compensation for products or services other than investment banking or merchant banking or brokerage services from the subject company(ies) in the past 12 months. We or our associates may have received compensation or other benefits from the subject company(ies) or third party in connection with the research report.
Our associates may have financial interest in the subject company(ies).
Research Analyst or his/her relative's financial interest in the subject company(ies): No
Kotak Securities Limited has financial interest in the subject company(ies) at the end of the month immediately preceding the date of publication of Research Report: YES
Our associates may have actual/beneficial ownership of 1% or more securities of the subject company(ies) at the end of the month immediately preceding the date of publication of Research Report.
Research Analyst or his/her relatives has actual/beneficial ownership of 1% or more securities of the subject company(ies) at the end of the month immediately preceding the date of publication of Research Report: No
Kotak Securities Limited has actual/beneficial ownership of 1% or more securities of the subject company(ies) at the end of the month immediately preceding the date of publication of Research Report: No
Subject company(ies) may have been client during twelve months preceding the date of distribution of the research report.
A graph of daily closing prices of securities is available at www.nseindia.com and http://economictimes.indiatimes.com/markets/stocks/stock-quotes. (Choose a company from the list on the browser and select the"three years" icon in the price chart).
Kotak Securities Limited. Registered Office: 27 BKC, C 27, G Block, Bandra Kurla Complex, Bandra (E), Mumbai 400051. CIN: U99999MH1994PLC134051, Telephone No.: +91-22 43360 000, Fax No.: +91-22- 6713 2430. Website: www.kotak.com. SEBI Registration No: NSE INB/INF/INE 230808130, BSE INB 010808153/INF 011133230, MSEI INE 260808130/INB 260808135/INF 260808135, Research Analyst INH000000586, AMFI ARN 0164 and PMS INP000000258. NSDL: IN-DP-NSDL-23-97. CDSL: IN-DP-CDSL-158-2001.
Compliance Officer Details: Mr. Manoj Agarwal. Call: +91-22-4285 6825, or Email: [email protected].
In case you require any clarification or have any concern, kindly write to us at below email ids:
Level 1: For Trading related queries, contact our customer service at '[email protected]' and for demat account related queries contact us at [email protected] or call us on: Online Customers - 30305757 (by using your city STD code as a prefix) or Toll free numbers 18002099191 / 1800222299, Offline Customers - 18002099292
Level 2: If you do not receive a satisfactory response at Level 1 within 3 working days, you may write to us at [email protected] or call us on +91-22-4285 8445 and if you feel you are still unheard, write to our customer service HOD at [email protected] or call us on +91-22-4285 8208.
Level 3: If you still have not received a satisfactory response at Level 2 within 3 working days, you may contact our Compliance Officer (Name: Manoj Agarwal) at [email protected] or call on +91-22-4285 6825.
Level 4: If you have not received a satisfactory response at Level 3 within 7 working days, you may also approach CEO (Mr. Kamlesh Rao) at [email protected] or call on +91-22-6652 9160.
First Cut notes published on this site are for information purposes only. They represent early notations and responses by analysts to recent events. Data in the notes may not have been verified by us and investors should not act upon any data or views in these notes. Most First Cut notes, but not necessarily all, will be followed by final research reports on the subject. There could be variance between the First cut note and the final research note on any subject, in which case the contents of the final research note would prevail. We accept no liability for the contents of the First Cut Notes.


![[Kotak] India Daily, October 24, 2016 - Kotak Securities](https://static.fdokumen.com/doc/165x107/633d69d4e674f41574068690/kotak-india-daily-october-24-2016-kotak-securities.jpg)
![[Kotak] India Daily, May 07, 2018 - Kotak Securities](https://static.fdokumen.com/doc/165x107/633c43a3f3eeefb08b0c1dc3/kotak-india-daily-may-07-2018-kotak-securities.jpg)


![[Kotak] India Daily, April 2, 2019 - Kotak Securities](https://static.fdokumen.com/doc/165x107/63265a4f5c2c3bbfa803a474/kotak-india-daily-april-2-2019-kotak-securities.jpg)


