![[Kotak] India Daily, April 2, 2019 - Kotak Securities](https://static.fdokumen.com/doc/165x107/63265a4f5c2c3bbfa803a474/kotak-india-daily-april-2-2019-kotak-securities.jpg)
India Daily, May 24, 2016 - Kotak Securities
55
For Private Circulation Only. FOR IMPORTANT INFORMATION ABOUT KOTAK SECURITIES’ RATING SYSTEM AND OTHER DISCLOSURES. REFER TO THE END OF THIS MATERIAL. Contents Daily Alerts Results Britannia Industries: Still a good bet Torrent Pharmaceuticals: Better late than never WABCO India: Continues to outpace industry growth DishTV: Steady subscriber growth story with comfort on margins City Union Bank: Stable performance Jyothy Laboratories: Operationally in-line quarter Company alerts Just Dial: Slow path to recovery Sector alerts Metals & Mining: Steel imports - a sharp fall in April 2016 KIE COMMUNICATION We are dropping coverage on Aban Offshore, given the lack of visibility on contracts, which makes it difficult to forecast earnings. We had suspended rating and target price in May 2012. INDIA DAILY May 24, 2016 India 23-May 1-day 1-mo 3-mo Sensex 25,230 (0.3) (2.4) 9.3 Nifty 7,731 (0.2) (2.1) 10.1 Global/Regional indices Dow Jones 17,493 (0.0) (2.8) 6.1 Nasdaq Composite 4,766 (0.1) (2.9) 4.9 FTSE 6,136 (0.3) (2.8) 4.6 Nikkei 16,562 (0.6) (5.8) 4.1 Hang Seng 19,809 (0.2) (7.7) 3.2 KOSPI 1,947 (0.4) (3.4) 1.8 Value traded – India Cash (NSE+BSE) 165 195 197 Derivatives (NSE) 4,015 2,963 4,578 Deri. open interest 2,552 2,403 2,557 Forex/money market Change, basis points 23-May 1-day 1-mo 3-mo Rs/US$ 67.5 2 77 (98) 10yr govt bond, % 7.8 1 (2) (37) Net investment (US$ mn) 20-May MTD CYTD FIIs (103) 168 1,967 MFs 156 507 906 Top movers Change, % Best performers 23-May 1-day 1-mo 3-mo HDIL IN Equity 94.0 0.1 13.0 55.7 UPLL IN Equity 570.7 (1.0) 9.1 50.7 MMFS IN Equity 294.4 (0.4) 6.8 44.6 DLFU IN Equity 121.3 (1.2) (1.1) 42.6 YES IN Equity 978.1 0.0 11.7 41.6 Worst performers LPC IN Equity 1465.1 (2.6) (6.0) (16.8) JPA IN Equity 6.1 (3.2) (25.8) (13.6) HCLT IN Equity 733.6 (0.4) (13.2) (9.6) ADSEZ IN Equity 181.1 1.8 (21.3) (9.5) UBBL IN Equity 715.5 (2.2) (5.2) (9.3)
-
Upload
khangminh22 -
Category
Documents
-
view
0 -
download
0
Transcript of India Daily, May 24, 2016 - Kotak Securities

For Private Circulation Only. FOR IMPORTANT INFORMATION ABOUT KOTAK SECURITIES’ RATING SYSTEM AND OTHER DISCLOSURES. REFER TO THE END OF THIS MATERIAL.
Contents
Daily Alerts
Results
Britannia Industries: Still a good bet
Torrent Pharmaceuticals: Better late than never
WABCO India: Continues to outpace industry growth
DishTV: Steady subscriber growth story with comfort on margins
City Union Bank: Stable performance
Jyothy Laboratories: Operationally in-line quarter
Company alerts
Just Dial: Slow path to recovery
Sector alerts
Metals & Mining: Steel imports - a sharp fall in April 2016
KIE COMMUNICATION
We are dropping coverage on Aban Offshore, given the lack of visibility on contracts,
which makes it difficult to forecast earnings. We had suspended rating and target price
in May 2012.
INDIA DAILY May 24, 2016 India 23-May 1-day 1-mo 3-mo
Sensex 25,230 (0.3) (2.4) 9.3
Nifty 7,731 (0.2) (2.1) 10.1
Global/Regional indices
Dow Jones 17,493 (0.0) (2.8) 6.1
Nasdaq Composite 4,766 (0.1) (2.9) 4.9
FTSE 6,136 (0.3) (2.8) 4.6
Nikkei 16,562 (0.6) (5.8) 4.1
Hang Seng 19,809 (0.2) (7.7) 3.2
KOSPI 1,947 (0.4) (3.4) 1.8
Value traded – India
Cash (NSE+BSE) 165 195 197
Derivatives (NSE) 4,015 2,963 4,578
Deri. open interest 2,552 2,403 2,557
Forex/money market
Change, basis points
23-May 1-day 1-mo 3-mo
Rs/US$ 67.5 2 77 (98)
10yr govt bond, % 7.8 1 (2) (37)
Net investment (US$ mn)
20-May MTD CYTD
FIIs (103) 168 1,967
MFs 156 507 906
Top movers
Change, %
Best performers 23-May 1-day 1-mo 3-mo
HDIL IN Equity 94.0 0.1 13.0 55.7
UPLL IN Equity 570.7 (1.0) 9.1 50.7
MMFS IN Equity 294.4 (0.4) 6.8 44.6
DLFU IN Equity 121.3 (1.2) (1.1) 42.6
YES IN Equity 978.1 0.0 11.7 41.6
Worst performers
LPC IN Equity 1465.1 (2.6) (6.0) (16.8)
JPA IN Equity 6.1 (3.2) (25.8) (13.6)
HCLT IN Equity 733.6 (0.4) (13.2) (9.6)
ADSEZ IN Equity 181.1 1.8 (21.3) (9.5)
UBBL IN Equity 715.5 (2.2) (5.2) (9.3)

For Private Circulation Only. FOR IMPORTANT INFORMATION ABOUT KOTAK SECURITIES’ RATING SYSTEM AND OTHER DISCLOSURES, REFER TO THE END OF THIS MATERIAL.
Weak end to an otherwise solid year; volume growth rates remain robust in double digits
After many quarters of outperformance and strong earnings delivery, Britannia (BRIT) reported a
miss in 4QFY16 driven by weaker-than-expected revenues, drop in other income and sharp
jump in ETR – consolidated net operating revenues grew 7% yoy to `22.1 bn (KIE: `23 bn),
EBITDA grew 15% yoy to `2.91 bn (KIE: `3.36 bn) and recurring PAT grew 14% yoy to `1.9 bn
(KIE: `2.3 bn) – its weakest quarterly performance over the past three years. Volume growth
during the quarter remained robust at 10% (despite material deceleration in category growth
rates) indicating further market share gains for BRIT.
Consolidated EBITDA margins for the quarter expanded 80 bps yoy (150 bps below our
estimates largely due to weaker leverage) to 13.3%; we note BRIT managed input cost inflation
well (GMs contracted 35 bps yoy, in line with our estimates) and cost-control efficiencies
continued to aid margins (A&SP went up 3% yoy, conversion charges were down 9% yoy and
other expenses increased 5% yoy in absolute terms). For FY2016, BRIT delivered consolidated
net revenues, EBITDA and recurring PAT growth of 10% (led by volume growth of 10-11%),
42% and 42% respectively; recurring EPS stood at `68. EBITDA margin expanded 320 bps yoy
to 14.3% aided by 210 bps expansion in GMs and cost-control efficiencies.
Cut EPS estimate by 9-11%; risk-reward favorable post correction – retain BUY
Even though BRIT’s performance was weak relative to high expectations that the company has
set (and surpassed for many quarters), absolute growth rates have remained robust and ahead-
of-market. We believe the company is well-poised to tackle both demand and margin
challenges. Risk-reward remains favorable post sharp correction in the stock on account of
weak 4QFY16 results; the stock is trading at 28X FY2018E revised EPS versus sector average
multiple (ex-ITC) of 32X. We note the company’s internals in terms of RoCE, FCF generation
and FCF conversion are healthier versus several peers trading at relatively expensive valuations.
Weak 4QFY16 drives 9-11% cut in our FY2017-18 EPS estimates led by 3-5% cut in revenues
and 80-90 bps cut in EBITDA margin (led by surge in input costs); retain BUY with a revised TP
of `3,100 (from `3,300) as we roll over to March 2018E (based on 32X target P/E multiple).
Britannia Industries (BRIT) Consumer Products
Still a good bet. Britannia’s (BRIT) 4QFY16 performance was clearly a miss on all
counts and drives 9-11% cut in our EPS estimates for FY2017-18. Near-term weak
demand conditions notwithstanding, we believe BRIT is well-poised to continue its
double-digit revenue growth momentum (though construct of volume-price will
change) led by distribution expansion, market share gains in the Hindi belt and strong
innovation funnel. Price hikes and cost-efficiency initiatives should help sustain margins
despite RM headwinds. Post correction, risk-reward has become favorable – retain BUY
with a revised TP of `3,100 (from `3,300) as we roll over to March 2018E.
BUY
MAY 24, 2016
RESULT
Coverage view: Cautious
Price (`): 2,683
Target price (`): 3,100
BSE-30: 25,230
Anand Shah
Rohit Chordia
Abhas Gupta
Britannia Industries
Stock data Forecasts/Valuations 2016 2017E 2018E
52-week range (Rs) (high,low) EPS (Rs) 68.0 79.6 97.6
Market Cap. (Rs bn) EPS growth (%) 50.4 17.0 22.7
Shareholding pattern (%) P/E (X) 39.4 33.7 27.5
Promoters 50.7 Sales (Rs bn) 86.8 98.2 113.5
FIIs 18.8 Net profits (Rs bn) 8.2 9.5 11.7
MFs 5.9 EBITDA (Rs bn) 12.3 14.2 17.2
Price performance (%) 1M 3M 12M EV/EBITDA (X) 25.9 22.2 18.0
Absolute (5.0) (4.3) 10.4 ROE (%) 54.1 46.2 42.8
Rel. to BSE-30 (2.7) (11.2) 22.3 Div. Yield (%) 0.7 0.9 1.1
Company data and valuation summary
3,434-2,421
321.8

Britannia Industries Consumer Products
KOTAK INSTITUTIONAL EQUITIES RESEARCH 3
Exhibit 1: Key changes to consolidated estimates, Britannia Industries, March fiscal year-ends,
2017-18E
Source: Company, Kotak Institutional Equities estimates
Exhibit 2: Interim consolidated results of Britannia Industries, March fiscal year-ends (Rs mn)
Source: Company, Kotak Institutional Equities
2017E 2018E 2017E 2018E 2017E 2018E
Net operating revenues (Rs mn) 98,212 113,516 101,246 118,867 (3.0) (4.5)
EBITDA (Rs mn) 14,188 17,200 15,430 19,053 (8.1) (9.7)
EBITDA margin (%) 14.4 15.2 15.2 16.0 -80 bps -88 bps
Net income (Rs mn) 9,551 11,716 10,496 13,083 (9.0) (10.4)
EPS (Rs/share) 79.6 97.6 87.5 109.1 (9.0) (10.5)
Other assumptions
Gross margin (%) 41.9 42.2 42.5 42.9 -65 bps -68 bps
Volume growth - Biscuits (%) 8.0 10.0 10.5 11.5 -250 bps -150 bps
Realisation growth - Biscuts (%) 4.0 5.0 3.5 5.0 50 bps -1 bps
Revised Earlier Change (%)
4QFY16 4QFY16E 4QFY15 3QFY16 KIE Est yoy qoq FY2016 FY2015 (% chg.) FY2017E
Net sales 21,898 22,635 20,318 22,236 (3) 8 (2) 86,071 77,751 11 97,351
Other operating income 216 378 318 166 (43) (32) 30 718 833 (14) 861
Net operating income 22,114 23,013 20,636 22,402 (4) 7 (1) 86,789 78,584 10 98,212
Material cost (12,810) (13,324) (11,883) (12,924) (4) 8 (1) (49,989) (46,918) 7 (57,060)
Gross profit 9,304 9,689 8,753 9,478 (4) 6 (2) 36,799 31,666 16 41,152
Gross margin (%) 42.1 42.1 42.4 42.3 -4 bps -35 bps -24 bps 42.4 40.3 210 bps 41.9
Employee cost (869) (875) (764) (860) (1) 14 1 (3,365) (2,823) 19 (3,846)
Advertising and promotion (2,087) (1,979) (2,029) (1,839) 5 3 13 (7,378) (6,517) 13 (8,134)
Conversion and other charges (1,073) (1,165) (1,179) (1,275) (8) (9) (16) (4,735) (4,881) (3) (5,016)
Other expenditure (2,363) (2,314) (2,253) (2,285) 2 5 3 (9,056) (8,824) 3 (9,968)
Total expenditure (19,202) (19,656) (18,107) (19,183) (2) 6 0 (74,523) (69,962) 7 (84,025)
EBITDA 2,912 3,357 2,530 3,219 (13) 15 (10) 12,265 8,622 42 14,188
OPM (%) 13.3 14.8 12.4 14.5 -154 bps 84 bps -118 bps 14.3 11.1 316 bps 14.6
Other income 243 309 283 275 (21) (14) (12) 1,000 880 14 1,184
Interest (15) (7) (8) (12) 118 83 25 (49) (39) 26 (42)
Depreciation (308) (295) (494) (281) 5 (38) 10 (1,134) (1,445) (22) (1,399)
Pretax profits 2,832 3,365 2,311 3,202 (16) 23 (12) 12,082 8,018 51 13,930
Tax (929) (1,061) (637) (1,024) (12) 46 (9) (3,920) (2,252) 74 (4,381)
PAT 1,903 2,303 1,674 2,178 (17) 14 (13) 8,163 5,766 42 9,549
Minority interest/share of associates (0) (1) (1) 1 2 2 2
Recurring PAT 1,902 2,303 1,673 2,179 (17) 14 (13) 8,164 5,768 42 9,551
Extraordinary items — — — (103) (103) 1,119 -
Net profit (reported) 1,902 2,303 1,673 2,076 (17) 14 (8) 8,061 6,887 17 9,551
Recurring EPS (Rs) 15.9 19.2 14.0 18.2 (17) 14 (13) 68.0 48.1 41 79.6
Income tax rate (%) 32.8 31.5 27.6 32.0 127 bps 524 bps 83 bps 32.4 28.1 435 bps 31.4
Costs as a percentage of sales
Material cost 57.9 57.9 57.6 57.7 3 bps 34 bps 23 bps 57.6 59.7 -211 bps 58.1
Employee cost 3.9 3.8 3.7 3.8 12 bps 22 bps 9 bps 3.9 3.6 28 bps 3.9
Advertising and promotion 9.4 8.6 9.8 8.2 83 bps -40 bps 122 bps 8.5 8.3 20 bps 8.3
Conversion and other charges 4.9 5.1 5.7 5.7 -22 bps -87 bps -85 bps 5.5 6.2 -76 bps 5.1
Other expenditure 10.7 10.1 10.9 10.2 63 bps -24 bps 48 bps 10.4 11.2 -80 bps 10.1
(% chg.)

Consumer Products Britannia Industries
4 KOTAK INSTITUTIONAL EQUITIES RESEARCH
Exhibit 3: Interim standalone results of Britannia Industries, March fiscal year-ends (Rs mn)
Source: Company, Kotak Institutional Equities
Key takeaways from management concall
Overall demand environment challenging. Overall demand environment remains
challenging across FMCG categories including biscuits. Management shared a chart in its
presentation, which indicates that biscuits category has witnessed material slowdown in
4QFY16 and month on month deceleration over July 2015 to March 2016 (refer to
Exhibit 4). Management also indicated – (1) premium products have exhibited a lot more
resilience and continue to grow in double digits while value segment of biscuit category
posted flattish-to-negative growth and (2) while BRIT will continue to chase
ahead-of-market growth rates, it will not chase growth at the cost of profitability as it
expects demand recovery to be gradual.
BRIT continues to outperform driven by strong growth rates in weaker states.
While rural growth has slowed down across categories, Britannia’s rural growth continues
to outpace urban growth due to distribution-led expansion in rural markets (especially
weaker states/Hindi belt). Management highlighted – (1) states like Gujarat, MP and
Rajasthan witnessed strong 15%+ growth yoy in FY2016 while UP registered 9% yoy
growth (parts of UP growing faster; BRIT is looking to break up UP in different parts to
improve its growth trajectory), (2) BRIT has gained market share across these 4 regions
and (3) overall BRIT has gained 150 bps value market share and has grown at almost 2X
category growth rates in volume terms in FY2016. Refer to Exhibit 5 for details.
4QFY16 4QFY16E 4QFY15 3QFY16 KIE Est yoy qoq FY2016 FY2015 (% chg.) FY2017E
Net sales 19,938 20,630 18,466 20,315 (3) 8 (2) 78,689 71,005 11 88,987
Other operating income 243 324 255 182 (25) (4) 34 790 755 5 886
Net operating income 20,181 20,953 18,720 20,497 (4) 8 (2) 79,479 71,760 11 89,873
Material cost (11,829) (12,244) (10,922) (11,908) (3) 8 (1) (46,223) (43,168) 7 (52,748)
Gross profit 8,352 8,710 7,798 8,589 (4) 7 (3) 33,256 28,592 16 37,125
Gross margin (%) 41.4 41.6 41.7 41.9 -19 bps -28 bps -52 bps 41.8 39.8 199 bps 41.3
Employee cost (530) (545) (470) (531) (3) 13 (0) (2,092) (1,785) 17 (2,411)
Advertising and promotion (1,710) (1,654) (1,695) (1,515) 3 1 13 (6,154) (5,507) 12 (6,779)
Conversion and other charges (1,409) (1,460) (1,470) (1,606) (3) (4) (12) (5,988) (6,018) (1) (6,501)
Other expenditure (2,025) (1,997) (1,951) (1,919) 1 4 6 (7,707) (7,585) 2 (8,445)
Total expenditure (17,503) (17,900) (16,508) (17,480) (2) 6 0 (68,165) (64,063) 6 (76,885)
EBITDA 2,678 3,054 2,212 3,018 (12) 21 (11) 11,315 7,697 47 12,988
OPM (%) 13.3 14.6 11.8 14.7 -131 bps 145 bps -146 bps 14.2 10.7 351 bps 14.5
Other income 243 318 290 260 (24) (16) (7) 986 876 13 1,167
Interest (3) (3) (3) (3) 19 19 (9) (13) (12) 3 (10)
Depreciation (241) (222) (421) (213) 9 (43) 13 (869) (1,173) (26) (1,108)
Pretax profits 2,677 3,148 2,079 3,062 (15) 29 (13) 11,419 7,388 55 13,038
Tax (835) (1,053) (628) (1,024) (21) 33 (18) (3,825) (2,243) 71 (4,368)
PAT 1,842 2,095 1,450 2,038 (12) 27 (10) 7,594 5,145 48 8,670
Extraordinary items — — (40) (103) (103) 1,079 -
Net profit (reported) 1,842 2,095 1,410 1,935 (12) 31 (5) 7,491 6,224 20 8,670
Recurring EPS (Rs) 15.4 17.5 12.1 17.0 (12) 27 (10) 63.3 42.9 48 72.3
Income tax rate (%) 31.2 33.4 30.2 33.4 -226 bps 97 bps -225 bps 33.5 30.4 313 bps 33.5
Costs as a percentage of sales
Material cost 58.6 58.5 58.3 58.1 11 bps 27 bps 51 bps 58.2 60.2 -200 bps 58.7
Employee cost 2.6 2.6 2.5 2.6 6 bps 11 bps 3 bps 2.6 2.5 14 bps 2.7
Advertising and promotion 8.5 7.8 9.1 7.4 64 bps -59 bps 108 bps 7.7 7.7 6 bps 7.5
Converstion and other charges 7.0 7.6 7.9 7.8 -62 bps -88 bps -86 bps 7.5 8.4 -86 bps 7.2
Other expenditure 10.0 9.8 10.4 9.4 18 bps -39 bps 67 bps 9.7 10.6 -88 bps 9.4
(% chg.)

Britannia Industries Consumer Products
KOTAK INSTITUTIONAL EQUITIES RESEARCH 5
Exhibit 4: Biscuits growth has slowed down mom and grew in low-single digits over last few months Biscuits category growth rates, yoy (%)
Source: Company, Nielsen, Kotak Institutional Equities
Exhibit 5: BRIT continues to gain market share driven by strong growth in weaker states (Hindi belt)
Source: Company, Nielsen, Kotak Institutional Equities
Innovation to remain a key growth driver. BRIT will continue to focus on innovation
agenda in both premium and value end – (1) it has recently launched new variants under
NutriChoice oats and premium variant in Good Day called Nuts Cookie, (2) Deuce remains
under test market phase (launched in Bangalore) and will be rolled out pan-India in
2HFY17, (3) it has relaunched multiple parts of its portfolio including breads, Tiger
Kreamz, Milk Bikis and 50-50 over the last 3-6 months and has received good response.

Consumer Products Britannia Industries
6 KOTAK INSTITUTIONAL EQUITIES RESEARCH
Continue to focus on expanding distribution reach. Management highlighted that
distribution gap between BRIT (at 4.6 mn outlets) and category universe (7.6 mn outlets)
offers significant headroom for growth; management highlighted three key distribution
expansion levers – (1) direct reach expansion; BRIT has doubled its direct reach from over
last three years to 1.3 mn outlets in FY2016 (has narrowed the gap with Parle to 1.2 mn
outlets), (2) rural reach expansion; BRIT continues to expand its rural reach via hub and
spoke model (not directly controlled via BRIT; it currently has 8,000 rural distributors and
(3) distribution expansion in Hindi belt; this remains a key focus area as BRIT’s gap in
Hindi belt versus competitors is much larger.
Dairy expansion plans under works. Management highlighted that dairy business
growth was weak in FY2016. However, it is working on a blueprint for expansion of dairy
business (likely to roll out in 3-4 months) with key focus on establishing a fully integrated
supply chain. In terms of product focus, BRIT will initially start with focus on existing
products like cheese (including variants), milk powder, condensed milk and whey powder
and will look to expand in other products like desserts and drinks at a later stage.
Other takeaways. (1) Capex – management has revised its capex guidance downwards
as it expects demand recovery to be gradual; it has now guided for `4 bn capex in
FY2017 and spent `2.1 bn in FY2016 (its earlier guidance was `9 bn+ capex for FY2016-
17), (2) input cost inflation – it expects 5% inflation in its input cost basket and the
company will look to negate this via price hikes (both absolute and removal of
promotional grammage) and (3) short-term loans and advances (consolidated) at
March 2016-end jumped to `6.1 bn (up from `4.65 bn); this largely included `3.25 inter-
corporate deposits in March 2015-end (bulk of this is to group entities) – management
indicated that ICDs to group entities inched up further by `0.5 bn.
Exhibit 6: BRIT delivered another strong quarter with 10% volume growth
Source: Company, Kotak Institutional Equities estimates
3.5
2.0
5.5
4.0 5.0
4.0 3.5
2.5
10.0
6.0
8.0 8.0
10.0
12.0 11.0
10.0
0
2
4
6
8
10
12
14
1Q
FY13
2Q
FY13
3Q
FY13
4Q
FY13
1Q
FY14
2Q
FY14
3Q
FY14
4Q
FY14
1Q
FY15
2Q
FY15
3Q
FY15
4Q
FY15
1Q
FY16
2Q
FY16
3Q
FY16
4Q
FY16

Britannia Industries Consumer Products
KOTAK INSTITUTIONAL EQUITIES RESEARCH 7
Exhibit 7: Price/mix-led growth turned negative partly impacted by excise hike
Source: Company, Kotak Institutional Equities estimates
7.3 6.7
11.3 9.5 9.9 9.7
7.6
6.5
5.3
7.0
5.6 6.0
3.0
(0.1) (0.2)
(2.0)
(4)
(2)
0
2
4
6
8
10
12
1Q
FY13
2Q
FY13
3Q
FY13
4Q
FY13
1Q
FY14
2Q
FY14
3Q
FY14
4Q
FY14
1Q
FY15
2Q
FY15
3Q
FY15
4Q
FY15
1Q
FY16
2Q
FY16
3Q
FY16
4Q
FY16

Consumer Products Britannia Industries
8 KOTAK INSTITUTIONAL EQUITIES RESEARCH
Exhibit 8: Key revenue growth assumptions, March fiscal year-ends, 2013-19E (Rs mn)
Source: Company, Kotak Institutional Equities estimates
2013 2014 2015 2016 2017E 2018E 2019E
Standalone Revenue breakup
Product-wise revenue (Rs mn)
Biscuits and high protein food 46,758 53,145 60,520 66,975 75,227 86,887 98,968
Bread 6,018 6,774 7,637 8,805 10,121 11,507 13,027
Cake and rusk 3,108 3,043 4,022 5,067 6,119 7,510 9,129
Others 613 517 515 545 578 613 650
Total gross revenue 56,497 63,479 72,693 81,393 92,045 106,516 121,774
Growth yoy (%)
Biscuits and high protein food 11.5 13.7 13.9 10.7 12.3 15.5 13.9
Bread 21.5 12.6 12.7 15.3 15.0 13.7 13.2
Cake and rusk 14.5 (2.1) 32.2 26.0 20.8 22.7 21.6
Others 31.4 (15.8) (0.4) 6.0 6.0 6.0 6.0
Total gross revenue 12.9 12.4 14.5 12.0 13.1 15.7 14.3
Product-wise volumes (MT)
Biscuits and high protein food 628,617 653,762 709,331 787,358 850,347 935,381 1,019,566
Bread 145,661 151,487 162,091 179,111 197,022 214,754 233,545
Cake and rusk 26,034 24,732 29,678 35,614 40,956 47,919 55,586
Total product volumes 800,311 829,981 901,101 1,002,083 1,088,325 1,198,054 1,308,696
Growth yoy (%)
Biscuits and high protein food 5.0 4.0 8.5 11.0 8.0 10.0 9.0
Bread 9.0 4.0 7.0 10.5 10.0 9.0 8.7
Cake and rusk 12.0 (5.0) 20.0 20.0 15.0 17.0 16.0
Total product volumes 5.9 3.7 8.6 11.2 8.6 10.1 9.2
Product-wise realisation (Rs/MT)
Biscuits and high protein food 74,382 81,291 85,319 85,063 88,466 92,889 97,069
Bread 41,312 44,719 47,115 49,160 51,372 53,581 55,778
Cake and rusk 119,376 123,031 135,506 142,282 149,396 156,716 164,238
Total realisation 69,827 75,860 80,100 80,679 84,044 88,396 92,553
Growth yoy (%)
Biscuits and high protein food 6.2 9.3 5.0 (0.3) 4.0 5.0 4.5
Bread 11.5 8.2 5.4 4.3 4.5 4.3 4.1
Cake and rusk 2.3 3.1 10.1 5.0 5.0 4.9 4.8
Total realisation 6.4 8.6 5.6 0.7 4.2 5.2 4.7
Subsidiary revenue breakup (Rs mn)
Britannia Dairy 3,095 3,043 3,334 3,456 3,902 4,419 4,946
Daily Bread 233 201 158 142 135 129 122
Strategic Food International 2,323 2,722 3,379 3,852 4,391 5,050 5,782
Al Sallan (65%) 1,254 1,356 1,637 1,866 2,127 2,446 2,807
Total subsidiary revenue 6,904 7,323 8,508 9,316 10,556 12,044 13,657
Less: Intersegmental (1,182) (1,346) (1,759) (1,931) (2,188) (2,497) (2,831)
Consolidated gross revenues (Rs mn) 62,218 69,455 79,442 88,778 100,412 116,063 132,600
Growth yoy (%)
Britannia Dairy 5.4 (1.7) 9.5 3.7 12.9 13.3 11.9
Daily Bread (3.3) (13.8) (21.2) (10.0) (5.0) (5.0) (5.0)
Strategic Food International 23.3 17.2 24.1 14.0 14.0 15.0 14.5
Al Sallan (65%) 16.8 8.2 20.7 14.0 14.0 15.0 14.8
Total subsidiary revenue 12.6 6.1 16.2 9.5 13.3 14.1 13.4
Consolidated revenues 12.7 11.6 14.4 11.8 13.1 15.6 14.2
Britannia Industries Consumer Products
KOTAK INSTITUTIONAL EQUITIES RESEARCH 9
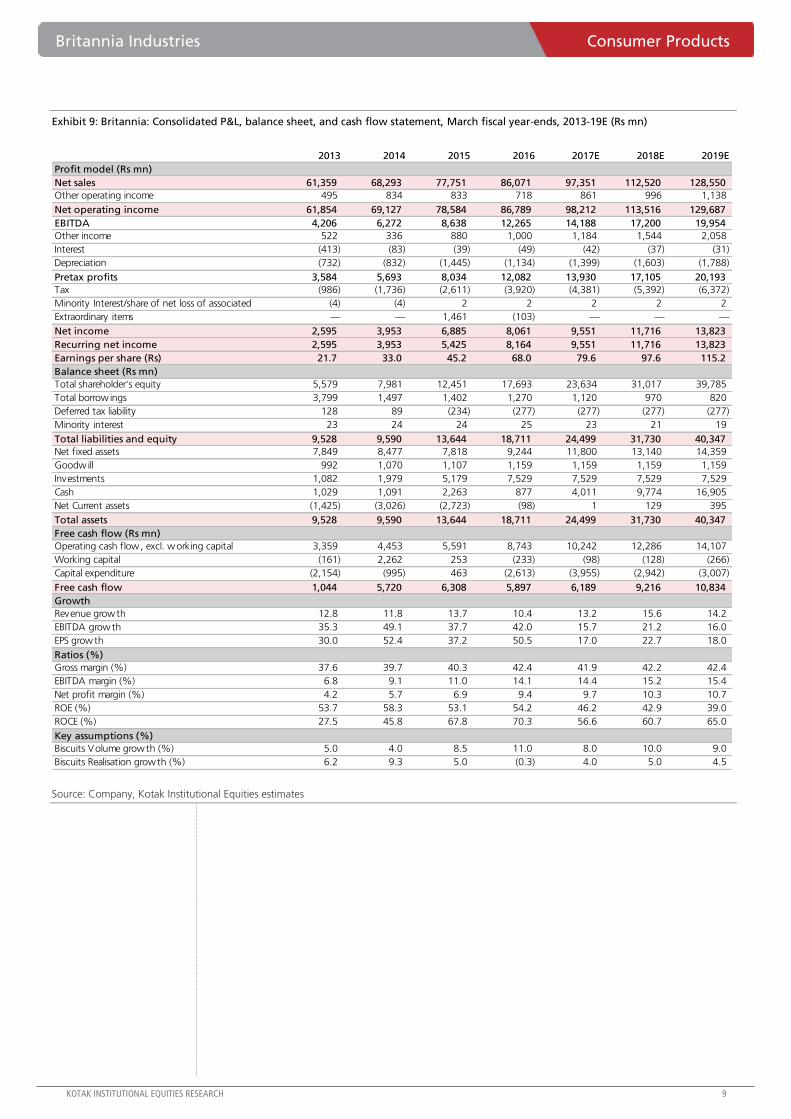
Exhibit 9: Britannia: Consolidated P&L, balance sheet, and cash flow statement, March fiscal year-ends, 2013-19E (Rs mn)
Source: Company, Kotak Institutional Equities estimates
2013 2014 2015 2016 2017E 2018E 2019E
Profit model (Rs mn)
Net sales 61,359 68,293 77,751 86,071 97,351 112,520 128,550
Other operating income 495 834 833 718 861 996 1,138
Net operating income 61,854 69,127 78,584 86,789 98,212 113,516 129,687
EBITDA 4,206 6,272 8,638 12,265 14,188 17,200 19,954
Other income 522 336 880 1,000 1,184 1,544 2,058
Interest (413) (83) (39) (49) (42) (37) (31)
Depreciation (732) (832) (1,445) (1,134) (1,399) (1,603) (1,788)
Pretax profits 3,584 5,693 8,034 12,082 13,930 17,105 20,193
Tax (986) (1,736) (2,611) (3,920) (4,381) (5,392) (6,372)
Minority Interest/share of net loss of associated (4) (4) 2 2 2 2 2
Extraordinary items — — 1,461 (103) — — —
Net income 2,595 3,953 6,885 8,061 9,551 11,716 13,823
Recurring net income 2,595 3,953 5,425 8,164 9,551 11,716 13,823
Earnings per share (Rs) 21.7 33.0 45.2 68.0 79.6 97.6 115.2
Balance sheet (Rs mn)
Total shareholder's equity 5,579 7,981 12,451 17,693 23,634 31,017 39,785
Total borrow ings 3,799 1,497 1,402 1,270 1,120 970 820
Deferred tax liability 128 89 (234) (277) (277) (277) (277)
Minority interest 23 24 24 25 23 21 19
Total liabilities and equity 9,528 9,590 13,644 18,711 24,499 31,730 40,347
Net fixed assets 7,849 8,477 7,818 9,244 11,800 13,140 14,359
Goodwill 992 1,070 1,107 1,159 1,159 1,159 1,159
Investments 1,082 1,979 5,179 7,529 7,529 7,529 7,529
Cash 1,029 1,091 2,263 877 4,011 9,774 16,905
Net Current assets (1,425) (3,026) (2,723) (98) 1 129 395
Total assets 9,528 9,590 13,644 18,711 24,499 31,730 40,347
Free cash flow (Rs mn)
Operating cash flow, excl. working capital 3,359 4,453 5,591 8,743 10,242 12,286 14,107
Working capital (161) 2,262 253 (233) (98) (128) (266)
Capital expenditure (2,154) (995) 463 (2,613) (3,955) (2,942) (3,007)
Free cash flow 1,044 5,720 6,308 5,897 6,189 9,216 10,834
Growth
Revenue growth 12.8 11.8 13.7 10.4 13.2 15.6 14.2
EBITDA growth 35.3 49.1 37.7 42.0 15.7 21.2 16.0
EPS growth 30.0 52.4 37.2 50.5 17.0 22.7 18.0
Ratios (%)
Gross margin (%) 37.6 39.7 40.3 42.4 41.9 42.2 42.4
EBITDA margin (%) 6.8 9.1 11.0 14.1 14.4 15.2 15.4
Net profit margin (%) 4.2 5.7 6.9 9.4 9.7 10.3 10.7
ROE (%) 53.7 58.3 53.1 54.2 46.2 42.9 39.0
ROCE (%) 27.5 45.8 67.8 70.3 56.6 60.7 65.0
Key assumptions (%)
Biscuits Volume growth (%) 5.0 4.0 8.5 11.0 8.0 10.0 9.0
Biscuits Realisation growth (%) 6.2 9.3 5.0 (0.3) 4.0 5.0 4.5

For Private Circulation Only. FOR IMPORTANT INFORMATION ABOUT KOTAK SECURITIES’ RATING SYSTEM AND OTHER DISCLOSURES, REFER TO THE END OF THIS MATERIAL.
Abilify drives EBITDA outperformance
TRP delivered a good quarter with revenues largely in line with our expectations, as the domestic
business division showed signs of revival after two quarters of subpar growth, delivering 13%
yoy growth. The management guided to ahead-of-the-market growth in FY2017 as price
increases in Chelcal/Chymoral are expected to help offset ~100 bps impact from expansion of
the NLEM basket. Brazil and RoW revenues too were weak, declining by ~16% and ~19%
respectively, impacted by cross-currency headwinds. The US business reported revenues of
US$76 mn, US$10 mn higher than our expectations, largely on account of Abilify. We expect
this to sharply decline in the coming quarters with incremental competition. EBITDA exceeded
our estimates by ~8%, largely due to the Abilify boost.
US scale-up benefits from Abilify—mending the fractured model
On our estimates, TRP booked ~US$25 mn Abilify sales in 4QFY16 and ~US$220 mn in FY2016.
Ex-Abilify, we believe TRP’s US base quarterly run-rate has moved up to ~US$50 mn in 4QFY16
(US$36 mn in 4QFY15). However, competitive dynamics for Abilify are sharply deteriorating,
and we expect FY2017 to be a weak year for launches as well. TRP filed less than five ANDAs in
FY2016, and now has only 20 ANDAs pending approval in the US. TRP guided to R&D costs
doubling to 8% of revenues in FY2018 as it intensifies efforts to build its US pipeline. Despite
the near-term pressure on earnings, we believe this is a step in the right direction. Among TRP’s
pending pipeline, only Renvela/Renagel are likely to be material contributors, though given the
FDA guidelines on characterization and lack of vertical integration, we believe TRP’s launch will
be in the second wave in 2HFY18. However, we believe the new wave of filings will not
materialize until FY2019, as we expect filing momentum to improve only from 2HFY17.
Expect pressures on profitability from FY2017; REDUCE
We expect Torrent’s FY2017/18 growth to come under pressure, with cross-currency headwinds
(Brazilian real) also adding to growth concerns. Torrent’s shares are currently trading at ~25X
and ~20X FY2017/18E EPS respectively. We cut our FY2017/18E EPS by ~12% and ~7%
respectively largely on account of higher R&D spend. We value TRP at 19X FY2018E EPS at a
discount to frontline peers. We retain REDUCE with a TP of ₹1,260 (from ₹1,320 earlier).
Torrent Pharmaceuticals (TRP) Pharmaceuticals
Better late than never. TRP had a good quarter with sales in line with our expectations,
although EBITDA beat our estimates by ~8%, helped by Abilify with other divisions
performing largely in line with expectations. Following years of neglect on organic R&D
efforts, TRP is now guiding to a doubling of R&D costs to ~₹5 bn (8% of sales) in
FY2017, which we see as a step in the right direction. However, we expect the current
R&D efforts to have a visible impact only from FY2019. We cut our FY2017/18E EPS by
~6% each. REDUCE with a revised TP of ₹1,260 (from ₹1,320).
REDUCE
MAY 24, 2016
RESULT
Coverage view: Cautious
Price (`): 1,330
Target price (`): 1,260
BSE-30: 25,230
Chirag Talati, CFA
Kumar Gaurav
Torrent Pharmaceuticals
Stock data Forecasts/Valuations 2016 2017E 2018E
52-week range (Rs) (high,low) EPS (Rs) 101.8 57.5 66.0
Market Cap. (Rs bn) EPS growth (%) 129.3 (43.5) 14.8
Shareholding pattern (%) P/E (X) 13.1 23.1 20.1
Promoters 71.3 Sales (Rs bn) 66.8 63.2 71.5
FIIs 12.2 Net profits (Rs bn) 17.2 9.7 11.2
MFs 5.7 EBITDA (Rs bn) 27.2 15.3 17.4
Price performance (%) 1M 3M 12M EV/EBITDA (X) 8.4 15.2 13.2
Absolute (9.0) 2.8 8.6 ROE (%) 58.6 25.9 24.5
Rel. to BSE-30 (6.8) (4.6) 20.3 Div. Yield (%) 3.0 1.0 1.1
Company data and valuation summary
1,698-1,155
225.0

Torrent Pharmaceuticals Pharmaceuticals
KOTAK INSTITUTIONAL EQUITIES RESEARCH 11
Exhibit 1: Torrent Pharma interim results March fiscal year-ends (Rs mn)
Source: Company, Kotak Institutional Equities estimates
Other key takeaways from the conference call
US FDA inspection at Indrad facility was conducted in May 2016, which was mainly
related to two filed products. 2-3 observations were noted, however, according to
management, observations were minor in nature. Indore dermatology facility was also
inspected in April 2016.
Torrent currently has 20 ANDA pending approval (including 6 tentative approval) in the
US. The company intends to file 15-20 additional ANDAs in FY2017 (including 4-5
products in dermatology segment). Torrent has guided for R&D spend to be ~8% of
FY2017 sales. Number of scientists has doubled starting 1QFY16 and the full impact of
increase in scientists is not captured in FY2016.
Nexium has witnessed a slow ramp-up for Torrent and the company is targeting for 5-7%
market share during FY2017. Management expects 2 additional players to enter Abilify
market in the coming quarter. 10 products are slated to be launched in US during
FY2017 of which Crestor will be the largest product by brand sales. Management expects
growth in US to be driven by commissioning of Dahej facility (1.8bn tablet capacity) while
freed up capacity at Indrad plant will be used for incremental supply to UK and Germany.
Number of medical representatives in India declined to 2,720 and has driven significant
improvement in field force productivity. Torrent sees 1-1.2% impact in sales due to NLEM
which the company intends to offset by new product launches. The company took a price
hike in Elder portfolio in 3QFY16 and expects improvement in domestic segment growth
rate to be driven by new product launches and full impact of price hike in Elder portfolio.
(% chg.) yoy
4QFY16 4QFY16E 4QFY15 3QFY16 4QFY16E 4QFY15 3QFY16 FY2016 FY2015 (% chg.) FY2017E
Sales 14,990 15,050 11,540 15,390 (0.4) 29.9 (2.6) 66,760 46,534 43.5 63,074
Raw material (4,110) (4,594) (3,610) (3,720) (10.5) 13.9 10.5 (15,770) (14,148) 11.5 (19,431)
Employee expenses (2,300) (2,242) (2,350) (2,060) 2.6 (2.1) 11.7 (8,560) (8,418) 1.7 (9,844)
R&D expenses (660) (602) (519) (600) 9.6 27.1 10.0 (2,460) (1,910) 28.8 (5,046)
Other expenses (3,080) (3,149) (3,441) (2,880) (2.2) (10.5) 6.9 (12,770) (11,856) 7.7 (14,302)
EBITDA 4,840 4,463 1,620 6,130 8.4 198.8 (21.0) 27,200 10,201 166.6 14,450
Other income 240 600 1,000 (1,420) 760 2,856 1,300
Interest (380) (420) (470) (420) (1,860) (1,752) (1,044)
Depreciation (650) (620) (600) (610) (2,460) (1,907) (3,056)
Pretax profits 4,050 4,023 1,550 3,680 0.7 161.3 10.1 23,640 9,398 151.5 11,650
Tax (480) (887) (250) (200) (6,420) (1,888) (2,563)
Minority interest - - - - - (0) -
Net income - reported 3,570 3,135 1,300 3,480 13.9 174.6 2.6 17,220 7,510 129.3 9,087
Net income - adjusted 3,570 3,135 1,300 3,480 13.9 174.6 2.6 17,220 7,510 129.3 9,087
Adjusted EPS (Rs) 21.1 18.6 7.7 20.6 13.9 174.6 2.6 101.8 44.4 129.3 53.7
Tax rate (%) 11.9 22.1 16.1 5.4 27.2 20.1 22.0
Segment wise sales
Domestic Formulation 4,470 4,421 3,960 4,460 1.1 12.9 0.2 18,250 16,090 13.4 20,905
US 5,140 4,424 2,250 5,580 16.2 128.4 (7.9) 26,720 8,320 221.2 26,720
Brazil 1,190 1,201 1,410 1,180 (0.9) (15.6) 0.8 5,060 6,060 (16.5) 5,060
Other branded 770 809 950 760 (4.8) (18.9) 1.3 3,020 3,430 (12.0) 3,020
Other generics 1,900 2,305 1,760 1,950 (17.6) 8.0 (2.6) 7,730 7,510 2.9 7,730
CRAMS 1,520 1,890 1,210 1,460 (19.6) 25.6 4.1 5,990 5,120 17.0 5,990
Total 14,990 15,050 11,540 15,390 (0.4) 29.9 (2.6) 66,760 46,534 43.5 63,074
% margin
Raw material (27.4) (30.5) (31.3) (24.2) (23.6) (30.4) (30.8)
Staff cost (15.3) (14.9) (20.4) (13.4) (12.8) (18.1) (15.6)
R&D expenses (4.4) (4.0) (4.5) (3.9) (3.7) (4.1) (8.0)
Other expenditure (20.5) (20.9) (29.8) (18.7) (19.1) (25.5) (22.7)
EBITDA 32.3 29.7 14.0 39.8 40.7 21.9 22.9

Pharmaceuticals Torrent Pharmaceuticals
12 KOTAK INSTITUTIONAL EQUITIES RESEARCH
Exhibit 2: Torrent Pharma - change in earnings estimates March fiscal year-ends (Rs mn)
Source: Company, Kotak Institutional Equities estimates
Exhibit 3: Abilify erosion set to hurt US business in FY2017/18 March fiscal year-ends, 2011-18E (US$ mn)
Source: Company, Kotak Institutional Equities estimates
2017E 2018E 2017E 2018E 2017E 2018E
Sales 61,176 68,205 63,188 71,543 3.3 4.9
Gross profits 43,724 48,375 44,228 50,110 1.2 3.6
EBITDA 16,340 17,835 15,282 17,394 (6.5) (2.5)
PBT 13,249 15,154 12,482 14,325 (5.8) (5.5)
Tax (2,915) (3,324) (2,746) (3,152) (5.8) (5.2)
PAT 10,334 11,820 9,736 11,174 (5.8) (5.5)
EPS 61.1 69.9 57.5 66.0 (5.8) (5.5)
Old Estimates New estimates Changes %
2011 2012 2013 2014 2015 2016E 2017E 2018E 2019E
Limited competition/P-IV's/FTF's 0 0 32 47 19 265 78 68 71
TRP base business 29 45 32 74 120 147 185 233 302
Total sales 29 45 64 121 139 412 263 301 373
growth % 19.0 53.7 42.2 89.2 14.5 196.9 (36.1) 14.2 24.2
Limited competition/P-IV's/FTF's as % of Sales 0.0 0.0 50.6 39.1 13.6 64.3 29.5 22.5 19.0

Torrent Pharmaceuticals Pharmaceuticals
KOTAK INSTITUTIONAL EQUITIES RESEARCH 13
Exhibit 4: Torrent Pharma - profit and loss, balance sheet, cash model March fiscal year-ends, 2011-19E (Rs mn)
Source: Company, Kotak Institutional Equities estimates
2011 2012 2013 2014 2015 2016E 2017E 2018E 2019E
Profit and loss statement
Net sales 22,330 27,975 31,696 41,847 46,534 66,760 63,074 72,111 83,531
COGS (7,916) (9,829) (10,505) (13,886) (14,148) (15,770) (19,431) (22,165) (25,764)
Staff cost (3,895) (5,337) (6,549) (7,834) (8,418) (8,560) (9,844) (11,075) (12,570)
SG&A (4,974) (5,257) (6,975) (8,071) (11,856) (12,770) (14,302) (15,864) (17,959)
R&D (1,388) (1,320) (1,111) (1,700) (1,910) (2,460) (5,046) (5,769) (7,100)
EBITDA 4,157 6,232 6,556 10,356 10,201 27,200 14,450 17,238 20,138
Pretax profits 3,427 4,602 5,817 8,438 9,398 23,640 11,650 14,156 17,381
Tax (739) (730) (1,476) (1,833) (1,888) (6,420) (2,563) (3,114) (3,824)
Adjusted net profit 2,702 3,879 4,350 6,637 7,510 17,220 9,087 11,042 13,557
Shares outstanding (mn) 169 169 169 169 169 169 169 169 169
Adjusted EPS (Rs) 16.0 22.9 25.7 39.2 44.4 101.8 53.7 65.3 80.1
Balance sheet
Current assets 15,944 19,872 25,598 34,046 40,587 46,610 48,682 50,894 56,324
Net block 8,155 8,918 10,825 13,808 15,999 21,262 25,043 28,583 31,923
Goodwill and intangibles — 239 226 286 17,804 15,968 14,132 12,296 10,460
Fixed assets 9,414 10,607 11,919 15,995 38,524 41,720 43,664 45,369 46,873
Total assets 25,358 30,479 37,517 50,041 79,111 88,330 92,346 96,263 103,197
Current liabilities 7,484 10,359 12,287 16,239 18,277 22,600 24,363 27,466 31,578
Debt 6,588 6,490 9,355 12,951 31,885 27,080 22,080 14,080 6,080
Other long-term liabilities 1,062 1,692 1,656 1,827 4,038 4,760 5,016 5,328 5,710
Total liabilities 15,134 18,541 23,298 31,017 54,201 54,440 51,459 46,874 43,368
Shareholders' equity 10,224 11,938 14,219 19,024 24,910 33,890 40,887 49,389 59,828
Total liabilities and equity 25,358 30,479 37,517 50,041 79,111 88,330 92,346 96,263 103,197
Cash flow
Profit before taxes 3,423 3,586 5,817 8,438 9,398 23,640 11,650 14,156 17,381
Depreciation and amortisation 626 817 827 870 1,907 2,460 3,056 3,296 3,496
Change in working capital 619 1,518 (4,218) (1,197) (4,094) 7,678 (8,345) (4,036) (4,494)
Other adjustements (718) (848) (891) (2,119) 890 (4,526) (2,307) (2,803) (3,442)
Total operational cash flow 3,950 5,073 1,536 5,993 8,102 29,253 4,055 10,613 12,942
Investment cash flow
Investment in fixed assets (2,650) (1,703) (2,929) (4,001) (2,426) (5,919) (5,000) (5,000) (5,000)
Acquisitions 19 11 85 19 (19,539) — — — —
Total investment cash flow (2,326) (1,459) (2,417) (3,653) (21,623) (5,919) (5,000) (5,000) (5,000)
Total financing cash flow (676) (1,920) 197 864 12,123 (15,574) (5,090) (8,540) (9,118)
Net cash flow 943 1,560 (733) 3,197 (1,393) 7,760 (6,035) (2,927) (1,176)
Free cash flow 1,319 3,382 (1,309) 2,011 (13,862) 23,334 (945) 5,613 7,942

For Private Circulation Only. FOR IMPORTANT INFORMATION ABOUT KOTAK SECURITIES’ RATING SYSTEM AND OTHER DISCLOSURES, REFER TO THE END OF THIS MATERIAL.
Strong revenue growth led by introduction of ABS; EBITDA margin impacted by one-offs
Wabco India reported revenues of ₹5.7 bn (+48% yoy) in 4QFY16 which was 8% ahead of our
estimates. The domestic OEM segment’s revenues increased by 76% yoy driven by the
introduction of ABS in trucks from October 2015 and strong volume growth in the MHCV
industry. Revenues related to ABS were around ₹800 mn during the quarter; excluding ABS, the
OEM segment’s revenues grew by 38% yoy in 4QFY16 (+25% yoy for FY2016) as compared to
25% yoy in MHCV production volumes in 4QFY16 (27% yoy in FY2016). Export revenues
increased by 30% yoy to ₹1.5 bn; the capacity utilization of the new export plant is 40-45%
which should improve next year. The company reported 8% yoy growth in aftermarket segment
revenues. EBITDA at ₹0.8 bn (+43% yoy) was 4% below our estimates due to lower-than-
expected gross margin. Gross margin deteriorated by 160bps qoq (KIE 20bps qoq decline); as
per the company, this was due to weaker product mix within the OEM segment and could vary
across quarters. Other expenses (+54% yoy) include non-recurring items of ₹140 mn (2.5%
margin impact) related to provision for bad debts and write-offs related to duty drawback.
Overall, the company reported EBITDA margin of 14.2% (KIE 16%). Reported PAT at ₹573 mn
(+88% yoy) was 5% ahead of our estimates due to higher other income and lower tax rate.
Growth outlook remains strong; expect Wabco to deliver 22% EPS CAGR over FY2016-19E
We expect Wabco to deliver 20% revenue CAGR over FY2016-19E led by (1) full year revenues
of ABS in FY2017, (2) continued strong growth in exports due to the parent’s target to increase
sourcing from low cost countries and (3) double-digit growth in domestic CV industry. We
expect EBITDA margin to improve to 17%/17.5% in FY2017E/18E led by (1) improvement in
gross margin due to the increase in localization of content in ABS to 90-95% by 3QFY17 from
60% currently and (2) normalization of one-off expenses which impacted 4QFY16.
Lower FY2017-18E EPS estimate by 1-4%; maintain BUY with revised target price of ₹6,500
We cut our FY2017-18E EPS estimates by 1-4% due to 40-90 bps cut in our EBITDA margin
assumptions. Consequently, we lower our DCF-based target price to ₹6,500 (from ₹6,600) but
maintain BUY rating. Slower-than-expected ramp-up in the adoption of AMT technology and
weakness in MHCV industry volumes are key risks to our investment thesis.
WABCO India (WIL) Automobiles
Continues to outpace industry growth. Wabco India reported strong 4QFY16 results
with 48% yoy revenue growth led by the introduction of ABS in trucks. EBITDA margin
in this quarter was impacted by weaker product mix and some non-recurring items. We
expect EBITDA margin to improve with increase in localization of ABS. Growth outlook
remains strong due to significant scope of increase in content per vehicle in trucks in
India; we expect the company to deliver 22% EPS CAGR over FY2016-19E. Maintain
BUY with a revised TP of ₹6,500 (from ₹6,600 earlier).
BUY
MAY 24, 2016
RESULT
Coverage view: Attractive
Price (`): 5,793
Target price (`): 6,500
BSE-30: 25,230
Hitesh Goel
Nishit Jalan
WABCO India
Stock data Forecasts/Valuations 2016 2017E 2018E
52-week range (Rs) (high,low) EPS (Rs) 107.9 145.7 170.1
Market Cap. (Rs bn) EPS growth (%) 69.6 35.1 16.7
Shareholding pattern (%) P/E (X) 53.7 39.8 34.1
Promoters 75.0 Sales (Rs bn) 18.4 24.0 27.4
FIIs 2.3 Net profits (Rs bn) 2.0 2.8 3.2
MFs 8.2 EBITDA (Rs bn) 2.9 4.1 4.8
Price performance (%) 1M 3M 12M EV/EBITDA (X) 36.0 25.6 21.4
Absolute (1.8) 4.6 3.4 ROE (%) 21.3 23.4 22.3
Rel. to BSE-30 0.6 (2.9) 14.6 Div. Yield (%) 0.1 0.2 0.2
Company data and valuation summary
7,450-5,166
109.9

WABCO India Automobiles
KOTAK INSTITUTIONAL EQUITIES RESEARCH 15
Exhibit 1: Wabco India reported strong 4QFY16 results; revenue increased by 48% yoy albeit gross margin declined by 160bps qoq Wabco India 4QFY16 result summary, March fiscal year-ends (₹ mn)
Source: Company, Kotak Institutional Equities estimates
4QFY16 4QFY16E 4QFY15 3QFY16 4QFY16E 4QFY15 3QFY16 FY2016 FY2015 Yoy chg.(%) FY2017E
Segment wise
OEM 3,180 2,826 1,805 2,355 12.5 76.2 35.0 9,244 6,056 13,720
Aftermarket 740 768 686 626 (3.7) 7.9 18.2 2,608 2,324 2,563
Exports 1,469 1,400 1,132 1,339 4.9 29.8 9.7 5,542 4,336 6,631
Other operating income 272 260 209 258 4.5 30.3 5.3 984 764 1,087
Net sales 5,665 5,254 3,832 4,578 7.8 47.8 23.7 18,382 13,480 36.4 24,001
Raw materials (3,480) (3,153) (2,280) (2,739) 10.4 52.6 27.0 (10,997) (7,929) (14,392)
Staff costs (467) (480) (394) (453) (2.7) 18.5 3.0 (1,738) (1,434) (2,085)
Other expenses (913) (780) (594) (609) 17.1 53.7 50.0 (2,718) (2,082) (3,438)
Total expenses (4,860) (4,413) (3,268) (3,801) 10.1 48.7 27.8 (15,453) (11,446) (19,915)
EBITDA 805 842 564 777 (4.3) 42.8 3.7 2,929 2,035 44.0 4,086
Depreciation (147) (145) (121) (142) 1.2 21.2 3.3 (562) (467) (607)
EBIT 659 697 443 635 (5.4) 48.7 3.8 2,367 1,568 50.9 3,479
Other income 102 60 59 61 70.2 73.0 68.5 346 203 360
Interest expense (2) — (2) — (2) (4) —
Profit before tax 759 757 500 695 0.4 51.9 9.2 2,712 1,767 53.5 3,839
Tax expense (186) (212) (196) (180) (12.0) (4.9) 3.6 (666) (559) (1,075)
Profit after tax 573 545 304 515 5.2 88.4 11.2 2,046 1,208 69.4 2,764
# of shares 19 19 19 19 19 19 19
EPS (Rs/ share) 30.2 28.7 16.0 27.2 107.9 63.7 145.7
Tax rate (%) 24.6 28.0 39.2 25.9 24.6 31.6 28.0
As % of net revenues
Raw material 61.4 60.0 59.5 59.8 59.8 58.8 60.0
Staff costs 8.2 9.1 10.3 9.9 9.5 10.6 8.7
Other expenses 16.1 14.8 15.5 13.3 14.8 15.4 14.3
EBITDA margin 14.2 16.0 14.7 17.0 15.9 15.1 17.0
EBIT margin 11.6 13.3 11.6 13.9 12.9 11.6 14.5
change (%)

Automobiles WABCO India
16 KOTAK INSTITUTIONAL EQUITIES RESEARCH
Exhibit 2: Our DCF-based target price for Wabco India is ₹6,500 Wabco India DCF valuation methodology, March fiscal year-ends, 2015-30E (₹ mn)
Source: Company, Kotak Institutional Equities estimates
Exhibit 3: We cut our FY2017-18E EPS estimates by 1-4% due to lower EBITDA margin assumptions Earnings revision table of Wabco India, March fiscal year-ends, 2016-18E (₹ mn)
Source: Company, Kotak Institutional Equities estimates
2015 2016E 2017E 2018E 2019E 2020E 2023E 2027E 2028E 2029E 2030E
Net revenue 13,480 18,383 24,001 27,370 31,138 40,450 69,346 120,713 138,833 158,175 179,863
EBIT 1,770 2,713 3,839 4,480 4,982 6,472 11,095 19,314 22,213 25,308 28,778
EBIT (1-tax) 1,209 2,047 2,764 3,226 3,587 4,660 7,989 13,906 15,994 18,222 20,720
Depreciation / Amortisation 467 562 607 697 737 872 1,445 2,629 2,993 3,409 3,810
(Inc)/Dec in working capital (277) 184 (936) (990) (619) (1,531) (2,104) (2,563) (2,979) (3,179) (2,087)
Capital expenditure (725) (881) (1,000) (1,000) (1,557) (1,820) (3,121) (4,225) (4,859) (5,536) (4,497)
Free cash flows 674 1,913 1,436 1,933 2,148 2,181 4,209 9,747 11,149 12,915 17,947
Discounted cash flow — — 1,933 1,926 1,754 2,442 3,659 3,754 3,900 4,861
WACC (%) 11.5 NPV calculation
Terminal growth rate 5.0 Sum of free cash flow 38,675
Capitalization rate (%) 6.5 Terminal value 78,517
Date 31-Mar-18 Enterprise value 117,191
Terminal value Calculation Net debt (6,359)
Cash flow in terminal year 17,947 Net present value-equity 123,551
Terminal value 289,908 Shares o/s (mn) 19
Discounted terminal value 78,517 NPV /share (Rs) 6,514
Key assumptions
Revenue build-up
Air assist and full air actuation system 5,835 7,717 9,260 10,372 11,616 13,010 17,952 26,284 28,912 31,225 33,098
yoy growth (%) 40.1 32.3 20.0 12.0 12.0 12.0 10.0 10.0 10.0 8.0 6.0
Spares 1,990 2,229 2,563 2,948 3,390 3,899 5,624 8,692 9,561 10,326 10,945
yoy growth (%) 10.6 12.0 15.0 15.0 15.0 15.0 12.0 10.0 10.0 8.0 6.0
Exports of automotive systems 4,317 5,526 6,631 7,625 8,769 10,084 14,032 20,545 22,599 24,181 25,390
yoy growth (%) 3.4 28.0 20.0 15.0 15.0 15.0 10.0 10.0 10.0 7.0 5.0
ABS (OEM) 574 1,800 4,200 4,620 5,082 5,590 7,441 10,894 11,983 12,942 13,718
yoy growth (%) 81.4 213.8 133.3 12.0 10.0 10.0 10.0 10.0 10.0 8.0 6.0
ABS (Replacement) 4,200 9,790 14,334 15,767 17,344 19,078
yoy growth (%) 92.6 10.0 10.0 10.0 10.0
Automated manual transmission (OEM) 127 160 436 775 1,313 5,923 15,660 19,294 23,536 29,662
yoy growth (%) — 26.0 173.1 77.6 69.3 32.8 24.7 23.2 22.0 26.0
Automated manual transmission (Replacement) — — — — 697 6,459 21,415 27,595 35,250 44,396
yoy growth (%) 54.7 29.9 28.9 27.7 25.9
Others 764 984 1,187 1,369 1,506 1,656 2,125 2,891 3,122 3,372 3,574
yoy growth (%) 17.8 28.8 20.6 15.3 10.0 10.0 8.0 8.0 8.0 8.0 6.0
Total 13,480 18,383 24,001 27,370 31,138 40,450 69,346 120,713 138,833 158,175 179,863
EBIT margin (%) 13.1 14.8 16.0 16.4 16.0 16.0 16.0 16.0 16.0 16.0 16.0
Tax rate (%) 31.7 24.5 28.0 28.0 28.0 28.0 28.0 28.0 28.0 28.0 28.0
Capex as % of revenues 5.4 4.8 4.2 5.0 5.0 4.5 4.5 3.5 3.5 3.5 2.5
Content per truck (US $) 446 525 645 660 675 693 778 855 875 900 924
YoY chg (%) 17.8 22.9 2.3 2.3 2.7 2.2 2.4 2.4 2.9 2.6
2017E 2018E 2017E 2018E 2017E 2018E
Net sales 24,001 27,370 24,223 27,451 (0.9) (0.3)
EBITDA 4,086 4,797 4,324 4,926 (5.5) (2.6)
Margin (%) 17.0 17.5 17.9 17.9
Net Profit 2,764 3,226 2,874 3,246 (3.8) (0.6)
EPS (Rs/share) 145.7 170.1 151.5 171.1 (3.8) (0.6)
New estimates Old estimates Yoy chg (%)
WABCO India Automobiles
KOTAK INSTITUTIONAL EQUITIES RESEARCH 17
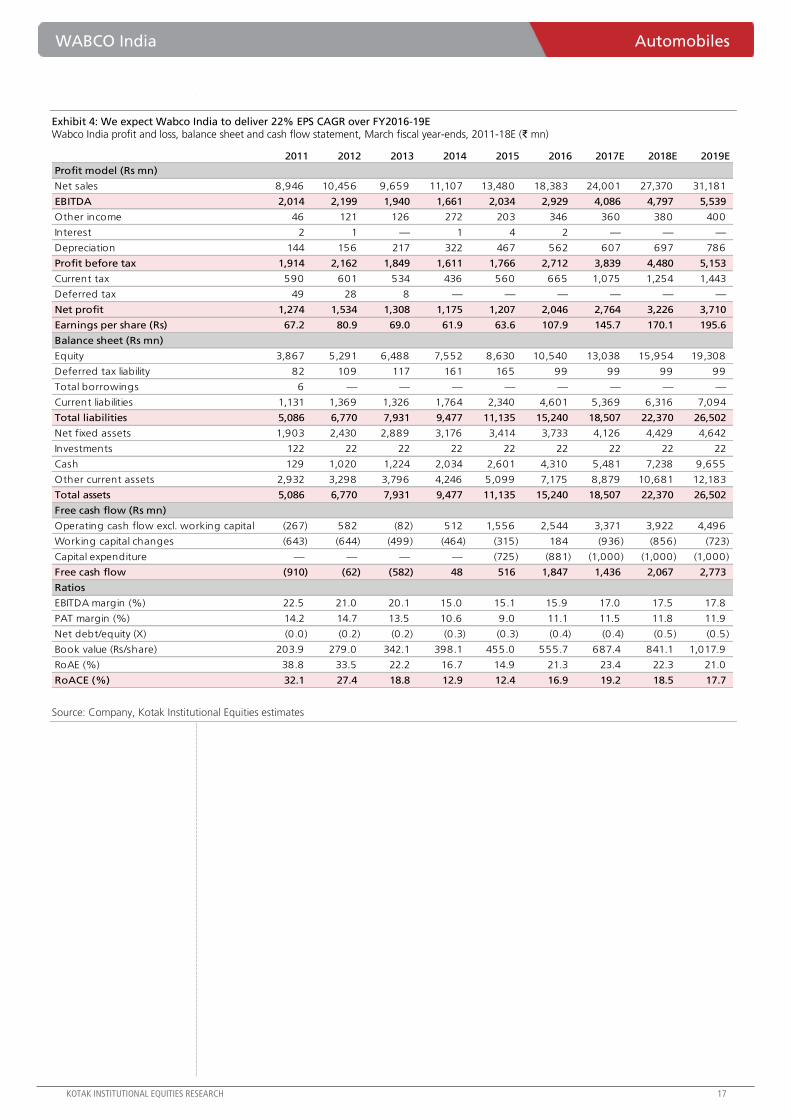
Exhibit 4: We expect Wabco India to deliver 22% EPS CAGR over FY2016-19E Wabco India profit and loss, balance sheet and cash flow statement, March fiscal year-ends, 2011-18E (₹ mn)
Source: Company, Kotak Institutional Equities estimates
2011 2012 2013 2014 2015 2016 2017E 2018E 2019E
Profit model (Rs mn)
Net sales 8,946 10,456 9,659 11,107 13,480 18,383 24,001 27,370 31,181
EBITDA 2,014 2,199 1,940 1,661 2,034 2,929 4,086 4,797 5,539
Other income 46 121 126 272 203 346 360 380 400
Interest 2 1 — 1 4 2 — — —
Depreciation 144 156 217 322 467 562 607 697 786
Profit before tax 1,914 2,162 1,849 1,611 1,766 2,712 3,839 4,480 5,153
Current tax 590 601 534 436 560 665 1,075 1,254 1,443
Deferred tax 49 28 8 — — — — — —
Net profit 1,274 1,534 1,308 1,175 1,207 2,046 2,764 3,226 3,710
Earnings per share (Rs) 67.2 80.9 69.0 61.9 63.6 107.9 145.7 170.1 195.6
Balance sheet (Rs mn)
Equity 3,867 5,291 6,488 7,552 8,630 10,540 13,038 15,954 19,308
Deferred tax liability 82 109 117 161 165 99 99 99 99
Total borrowings 6 — — — — — — — —
Current liabilities 1,131 1,369 1,326 1,764 2,340 4,601 5,369 6,316 7,094
Total liabilities 5,086 6,770 7,931 9,477 11,135 15,240 18,507 22,370 26,502
Net fixed assets 1,903 2,430 2,889 3,176 3,414 3,733 4,126 4,429 4,642
Investments 122 22 22 22 22 22 22 22 22
Cash 129 1,020 1,224 2,034 2,601 4,310 5,481 7,238 9,655
Other current assets 2,932 3,298 3,796 4,246 5,099 7,175 8,879 10,681 12,183
Total assets 5,086 6,770 7,931 9,477 11,135 15,240 18,507 22,370 26,502
Free cash flow (Rs mn)
Operating cash flow excl. working capital (267) 582 (82) 512 1,556 2,544 3,371 3,922 4,496
Working capital changes (643) (644) (499) (464) (315) 184 (936) (856) (723)
Capital expenditure — — — — (725) (881) (1,000) (1,000) (1,000)
Free cash flow (910) (62) (582) 48 516 1,847 1,436 2,067 2,773
Ratios
EBITDA margin (%) 22.5 21.0 20.1 15.0 15.1 15.9 17.0 17.5 17.8
PAT margin (%) 14.2 14.7 13.5 10.6 9.0 11.1 11.5 11.8 11.9
Net debt/equity (X) (0.0) (0.2) (0.2) (0.3) (0.3) (0.4) (0.4) (0.5) (0.5)
Book value (Rs/share) 203.9 279.0 342.1 398.1 455.0 555.7 687.4 841.1 1,017.9
RoAE (%) 38.8 33.5 22.2 16.7 14.9 21.3 23.4 22.3 21.0
RoACE (%) 32.1 27.4 18.8 12.9 12.4 16.9 19.2 18.5 17.7

For Private Circulation Only. FOR IMPORTANT INFORMATION ABOUT KOTAK SECURITIES’ RATING SYSTEM AND OTHER DISCLOSURES, REFER TO THE END OF THIS MATERIAL.
Kotak Institutional Equities Research [email protected] Mumbai: +91-22-4336-0000
4QFY16— Sub adds and ARPU tracking well, content costs disappoint
Dish TV’s EBITDA of `2.61 bn was 6% below our estimate. The negative surprise was due to
higher content costs (up 12% qoq). Content costs increased 7% yoy in FY2016, higher than
the run-rate of 5% yoy in 9MFY15, but within a guided range of 5-7%. Net sub adds at 508K
(KIE 475K) were up 60% qoq and 25% yoy driven by (1) robust demand in view of phase III
digitization activity in select markets and T20 cricket world cup, and (3) launch of low-ARPU
pack, Dish99 (tariff of `174/month versus `270/month for SD base pack). ARPU increased ~1%
qoq to `174 from `172; higher activation income in a quarter having strong sub adds boosts
ARPU while higher contribution of low-ARPU packs drags it down. Net profit of `4.8 bn
included deferred tax expense of `4.36 bn. Net debt increased by `800 mn to `6.4 bn.
Pros and cons of changing subscriber mix
Low-ARPU packs Dish99 (launched in Dec 2015) and Zing (launched in March 2014) with
monthly tariff of about `175-200 (versus `270 for SD base pack) contributed 30% and 20% to
sub adds in 4Q. These packs have better margins due to lower content costs as a proportion of
revenue. However, it drags ARPU growth. Additionally, although margin accretive, likely higher
subsidy on low-ARPU packs and lower absolute EBITDA/sub negatively impacted Free cash flow
conversion at the margin. Dish TV has upped the ante on marketing to push more HD sales
(20% of sub adds at present), a lever to drive ARPU growth. Dish TV’s guidance of 3% ARPU
growth in FY2017 despite likely annual price increase of about 7-8%+ factors in changing subs
mix. The flip side of this change in subs mix is that Dish’s subscriber base will be less vulnerable
to churn in the event of any disruptive cable + broadband offering by Reliance Jio.
Inexpensive valuations; steady 14-15% EBITDA growth ahead; Maintain BUY
Dish TV is trading at inexpensive valuation of 7.1X FY2018 EV/EBITDA. It is well-placed to deliver
about 12% CAGR in revenues (~9% from subs growth and 3% from ARPU) and about 15%
CAGR in EBITDA over the next 2-3 years. The ongoing consultative process to bring parity in
pricing between different distribution platforms augur well for DTH and will help DTH players
become more efficient from a content cost perspective. Upside from digitization, if
implemented, will pose upside risk to our estimates. We value Dish TV at 10X FY2018
EV/EBITDA and we partially factor in the risk of adverse verdict in the ongoing license fees case
(~`6 impact on fair value assuming 50% possibility of ~`11.5 bn liability materializing).
DishTV (DITV) Media
Steady subscriber growth story with comfort on margins. Dish TV reported strong
508K net sub adds and 1.2% qoq increase in ARPU but EBITDA at `2.6 bn (-2% qoq;
+18% yoy) missed our estimate by 6% due to high content costs. The management has
guided 1.5 mn net sub adds, 3% ARPU growth, 7-10% increase in content cost and
35% EBITDA margin for FY2017. Subscriber addition can exceed guidance on effective
implementation of digitization; margin guidance is comforting. We tweak estimates, roll
over to FY2018 and maintain TP of `115 valuing Dish TV at 10X EV/EBITDA.
BUY
MAY 24, 2016
RESULT
Coverage view: Neutral
Price (`): 88
Target price (`): 115
BSE-30: 25,230
Jaykumar Doshi
DishTV
Stock data Forecasts/Valuations 2016 2017E 2018E
52-week range (Rs) (high,low) EPS (Rs) 6.5 3.1 3.7
Market Cap. (Rs bn) EPS growth (%) ###### (52.8) 19.9
Shareholding pattern (%) P/E (X) 13.6 28.8 24.0
Promoters 64.4 Sales (Rs bn) 30.6 34.4 38.7
FIIs 8.7 Net profits (Rs bn) 6.9 3.3 3.9
MFs 5.8 EBITDA (Rs bn) 10.2 11.8 13.6
Price performance (%) 1M 3M 12M EV/EBITDA (X) 9.8 8.3 7.1
Absolute (0.6) 25.6 7.5 ROE (%) 41.5 19.6 23.5
Rel. to BSE-30 1.8 16.6 19.1 Div. Yield (%) 0.0 0.0 0.0
Company data and valuation summary
122-65
94.1

DishTV Media
KOTAK INSTITUTIONAL EQUITIES RESEARCH 19
A roundup of FY2016 and like-to-like comparison with FY2015
Dish TV’s subscription revenues grew 15.4% yoy led by 12% yoy growth in net subscribers
(up 1.55 mn to 14.5 mn) and about 3.5% growth in ARPU; adjusted for service tax increase
ARPU growth would be about 4.5-5% yoy (like-to-like). EBITDA increased 40% yoy to
`10.25 bn led by 620 bps expansion in EBITDA margin to 33.5%. We note that about 300
bps expansion in margin is attributable to lower license fees provisioning following the
transfer of non-core activities to Dish Infra subsidiary. In the absence of this restructuring,
License fees would have been higher by about `900 mn, EBITDA lower by the same amount,
EBITDA growth would have been 28% yoy and EBITDA margin 30.5%. Content costs
increased 7% yoy, significantly lower than revenue growth and content cost as a proportion
of revenues declined 180 bps to 28%. Net debt decreased `3.4 bn during the year to `6.4
bn
Guidance on content cost inflation and margins is comforting
Following renegotiation of its large content deals in 2014, Dish TV’s content cost as a
proportion of subscription revenues has reduced by about 400 bps to 30.3% over FY2014-
16. A resetting of content contracts at higher rate upon upcoming renewals with Star and
Zee in Sep 2016 was a key concern of several investors. We believe Dish TV’s prevailing
content costs as a percentage of revenues is a function of efficient negotiations; we were
not expecting any material headwind to margins. TRAI’s ongoing consultative process
following TDSAT judgment ordering non-discriminatory pricing between broadcasters and all
distributors (cable as well as DTH platforms) has strengthened DTH’s negotiating power, at
the margin. Dish TV management has guided for 7-10% increase on content costs in
FY2017, marginally below our below-consensus content cost inflation estimate. We are
building 10% and 12.5% increase in content costs for FY2017E and FY2018E. FY2017
EBITDA margin guidance is at 35%.
Brand-building efforts encouraging, robust HD sales imperative for ARPU
growth
HD accounts for 10% of net subscriber base and 20% of subscriber additions. Dish TV’s HD
subs and penetration is lower than some of its peers, partly due to the difference in
positioning of various players and slightly lower focus of Dish TV on HD. The management
has stepped up brand-building and it is visible in the increase in advertising across mediums
(advertising expense increased to `250 mn from `140 mn in the previous quarter). Brand-
building exercise is encouraging. Pick-up in HD sales from current levels is required for
steady growth in ARPU and to partly offset the drag of low-ARPU packs on overall ARPU.
We note that HD tarriff is about `190-250 higher than a SD pack while Dish99 and Zing are
about `70-100 below SD base pack.
Strict and timely implementation of digitization (low probability event) present
upside to subscriber growth expectations
Dish TV has guided for 1.5 mn net subscriber additions in FY2017E, below our and street’s
expectations of about 1.65-2 mn. Dish has not built any benefit from digitization given
uncertainty around implementation timelines in view of pending court cases. In the event of
acceleration in digitization activity, sub adds could be higher. As per the management,
about 6-7 mn subscribers in phase III markets are yet to be digitized while 14 mn STBs have
been seeded (total STB requirement for phase III was about 20 mn).
Media DishTV
20 KOTAK INSTITUTIONAL EQUITIES RESEARCH
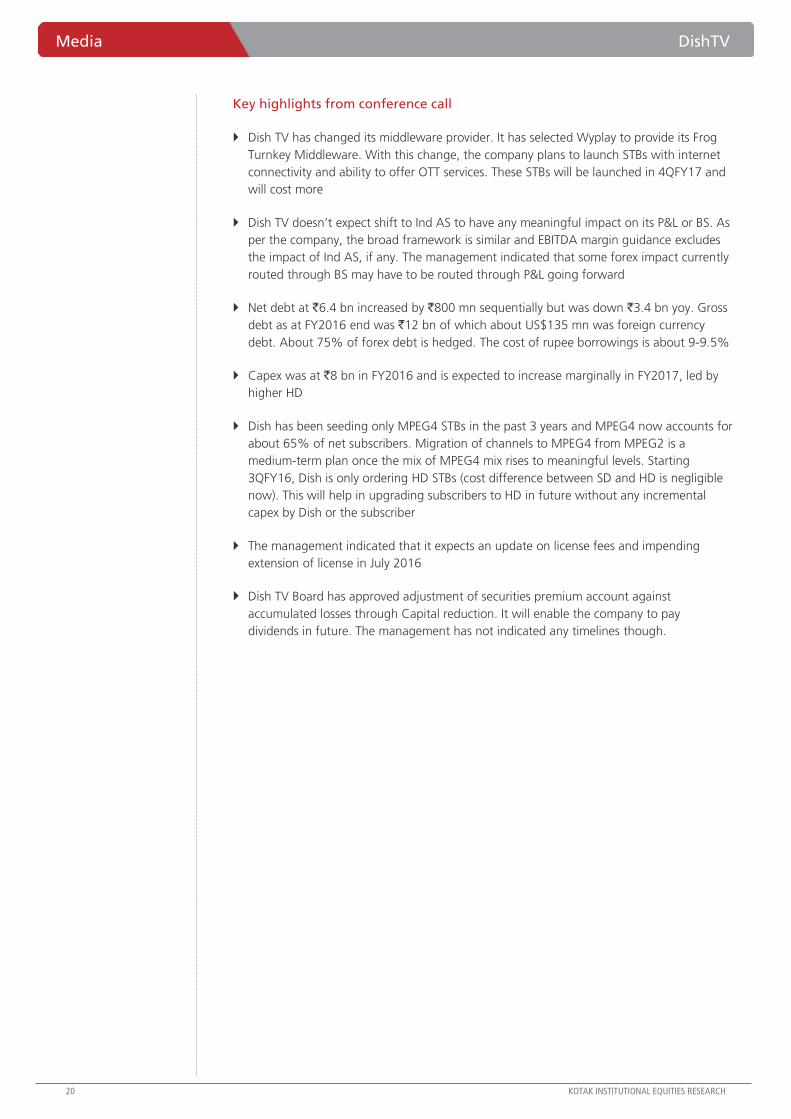
Key highlights from conference call
Dish TV has changed its middleware provider. It has selected Wyplay to provide its Frog
Turnkey Middleware. With this change, the company plans to launch STBs with internet
connectivity and ability to offer OTT services. These STBs will be launched in 4QFY17 and
will cost more
Dish TV doesn’t expect shift to Ind AS to have any meaningful impact on its P&L or BS. As
per the company, the broad framework is similar and EBITDA margin guidance excludes
the impact of Ind AS, if any. The management indicated that some forex impact currently
routed through BS may have to be routed through P&L going forward
Net debt at `6.4 bn increased by `800 mn sequentially but was down `3.4 bn yoy. Gross
debt as at FY2016 end was `12 bn of which about US$135 mn was foreign currency
debt. About 75% of forex debt is hedged. The cost of rupee borrowings is about 9-9.5%
Capex was at `8 bn in FY2016 and is expected to increase marginally in FY2017, led by
higher HD
Dish has been seeding only MPEG4 STBs in the past 3 years and MPEG4 now accounts for
about 65% of net subscribers. Migration of channels to MPEG4 from MPEG2 is a
medium-term plan once the mix of MPEG4 mix rises to meaningful levels. Starting
3QFY16, Dish is only ordering HD STBs (cost difference between SD and HD is negligible
now). This will help in upgrading subscribers to HD in future without any incremental
capex by Dish or the subscriber
The management indicated that it expects an update on license fees and impending
extension of license in July 2016
Dish TV Board has approved adjustment of securities premium account against
accumulated losses through Capital reduction. It will enable the company to pay
dividends in future. The management has not indicated any timelines though.

DishTV Media
KOTAK INSTITUTIONAL EQUITIES RESEARCH 21
Exhibit 1: Interim results of Dish TV India (DITV), March fiscal year-ends (Rs mn)
Source: Company, Kotak Institutional Equities
(b) chg (%) (b)
4QFY16 4QFY16E 4QFY15 3QFY16 4QFY16E 4QFY15 3QFY16 FY2016 FY2015 chg (%)
Total revenues 7,994 7,973 7,299 7,715 0 10 4 30,599 26,880 14
DTH serv ice revenues 7,480 7,438 6,751 7,211 1 11 4 28,675 25,302 13
Subscription revenues 7,410 7,328 6,581 7,111 1 13 4 28,275 24,502 15
Lease rental income 70 110 170 100 (36) (59) (30) 400 800 (50)
Bandwidth/Advertising revenues 420 435 430 410 (3) (2) 2 1,545 1,230 26
Other operating revenues 94 100 119 94 (6) (22) (0) 379 350 8
Total expenditure (5,385) (5,200) (5,090) (5,060) 4 6 6 (20,350) (19,548) 4
Direct operating costs (3,816) (3,750) (3,681) (3,695) 2 4 3 (14,780) (14,010) 5
--Content and other cost (2,315) (2,125) (2,076) (2,073) 9 12 12 (8,555) (8,008) 7
--License fees (551) (550) (543) (782) 0 1 (30) (2,175) (2,888) (25)
--Other direct cost (950) (1,075) (1,062) (840) (12) (11) 13 (4,051) (3,114) 30
Selling and distribution expenses (812) (750) (833) (679) 8 (3) 20 (2,835) (3,186) (11)
Employee expenses (298) (300) (248) (289) (1) 20 3 (1,229) (1,018) 21
Overhead expenses (459) (400) (328) (397) 15 40 16 (1,506) (1,334) 13
EBITDA 2,609 2,773 2,209 2,655 (6) 18 (2) 10,249 7,331 40
EBITDA Margin (%) 32.6 34.8 30.3 34.4 33.5 27.3
Other income 218 100 160 42 118 36 419 640 635 1
Interest expense (512) (500) (456) (549) 2 12 (7) (2,087) (1,754) 19
Depreciation (1,516) (1,550) (1,550) (1,463) (2) (2) 4 (5,907) (6,138) (4)
Pretax profits 799 823 363 686 (3) 120 17 2,895 74
Extraordinaries — — — — — —
Tax provision 4,029 — (14) — 4,029 (42)
Minority interest — — — — — —
Net income 4,828 823 350 686 486 1,282 604 6,924 31 NA
EPS 4.5 0.8 0.3 0.6 6.5 0.0
Operational metrics
Net subscriber additions ('000s) 508 475 404 317 6.9 25.7 60.3 1.55 1.53
Net paying subscribers (mn) 14.5 14.4 12.9 14.0 0.2 12.0 3.6 14.5 12.92
Subs ARPU (Rs/month/sub) 174 172 179 172 1.2 (2.8) 1.2 175 172
Annualized churn rate (%) 8.4 7.7 8.4 8.4 8 (0) (1)
Notes:
(a) Starting 1QFY16, Dish TV has started netting-off certain collection fees (commisions) paid to its trade partners from its revenues
and costs. This change is EBITDA neutral.
(b) 4QFY15 and FY2015 financials restated for like-to-like comparison.

Media DishTV
22 KOTAK INSTITUTIONAL EQUITIES RESEARCH
Exhibit 2: Revised estimates for DITV, FY2017E-18E (Rs mn)
Source: Company, Kotak Institutional Equities
Exhibit 3: Trends in Dish TV's net ARPU, 1QFY12-4QFY16 (Rs/sub/month)
Source: Company, Kotak Institutional Equities
Revised Previous Change (%)
2017E 2018E 2017E 2018E 2017E 2018E
Subscription revenues 32,183 36,339 32,454 37,061 (0.8) (1.9)
Other revenues 2,169 2,329 2,089 2,171 3.8 7.3
Total revenues 34,351 38,667 34,543 39,232 (0.6) (1.4)
Operating cost (16,151) (18,046) (16,282) (18,403) (0.8) (1.9)
Other expenses (6,360) (6,983) (6,380) (6,962) (0.3) 0.3
Total expenditure (22,511) (25,029) (22,662) (25,365) (0.7) (1.3)
EBITDA 11,841 13,638 11,881 13,867 (0.3) (1.7)
D&A expenses (6,124) (6,548) (6,380) (6,598) (4.0) (0.8)
EBIT 5,717 7,091 5,501 7,269 3.9 (2.5)
PAT 3,266 3,916 3,876 4,847 (15.7) (19.2)
EPS (Rs/share) 3.1 3.7 3.6 4.5 (15.7) (19.2)
EBITDA margin (%) 34.5 35.3 34.4 35.3
Key assumptions
Net subscribers yr-end (mn) 15.9 17.4 16.0 17.6
Net subscriber additions (mn) 1.48 1.47 1.63 1.55
ARPU (Rs/month/sub) 177 182 178 184
ARPU growth (yoy %) 2.5 2.9 3.0 3.4
Source: Company data, Kotak Institutional Equit ies
Notes.
(a) ARPU boosted by change in accouting policy start ing 1QFY15.
(b) ARPU suppressed by change in accouting policy start ing 1QFY16.
150 152 152 151
156
159 160 158
165 165 166
163
170 173
177 179
174 171 172
174
140
150
160
170
180
1Q
FY12
2Q
FY12
3Q
FY12
4Q
FY12
1Q
FY13
2Q
FY13
3Q
FY13
4Q
FY13
1Q
FY14
2Q
FY14
3Q
FY14
4Q
FY14
1Q
FY15
2Q
FY15
3Q
FY15
4Q
FY15
1Q
FY16
2Q
FY16
3Q
FY16
4Q
FY16

DishTV Media
KOTAK INSTITUTIONAL EQUITIES RESEARCH 23
Exhibit 4: Strong pick-up in net subscriber additions in 4Q
Source: Company, Kotak Institutional Equities
Exhibit 5: Churn rate remains stable at 8.4% (annualized)
Source: Company, Kotak Institutional Equities
0
150
300
450
600
3.0
6.0
9.0
12.0
15.0
1Q
FY12
2Q
FY12
3Q
FY12
4Q
FY12
1Q
FY13
2Q
FY13
3Q
FY13
4Q
FY13
1Q
FY14
2Q
FY14
3Q
FY14
4Q
FY14
1Q
FY15
2Q
FY15
3Q
FY15
4Q
FY15
1Q
FY16
2Q
FY16
3Q
FY16
4Q
FY16
Net subscribers (LHS, mn) Net subscriber additions (RHS, '000s)
5
8
11
14
17
20
-
100
200
300
400
500
1Q
FY12
2Q
FY12
3Q
FY12
4Q
FY12
1Q
FY13
2Q
FY13
3Q
FY13
4Q
FY13
1Q
FY14
2Q
FY14
3Q
FY14
4Q
FY14
1Q
FY15
2Q
FY15
3Q
FY15
4Q
FY15
1Q
FY16
2Q
FY16
3Q
FY16
4Q
FY16
Churn (LHS, '000s) Annualised churn (RHS, %)

Media DishTV
24 KOTAK INSTITUTIONAL EQUITIES RESEARCH
Exhibit 6: Content costs growth likely to be in high-single digits in FY2017E
Source: Company, Kotak Institutional Equities
Exhibit 7: Trends in EBITDA margins and content inflation
Source: Company, Kotak Institutional Equities
(5)
5
15
25
35
500
1,000
1,500
2,000
2,500
1Q
FY12
2Q
FY12
3Q
FY12
4Q
FY12
1Q
FY13
2Q
FY13
3Q
FY13
4Q
FY13
1Q
FY14
2Q
FY14
3Q
FY14
4Q
FY14
1Q
FY15
2Q
FY15
3Q
FY15
4Q
FY15
1Q
FY16
2Q
FY16
3Q
FY16
4Q
FY16
Content costs (LHS, Rs mn) Growth (RHS, yoy %)
18
21
24
27
30
33
36
(10)
-
10
20
30
40
50
1Q
FY12
2Q
FY12
3Q
FY12
4Q
FY12
1Q
FY13
2Q
FY13
3Q
FY13
4Q
FY13
1Q
FY14
2Q
FY14
3Q
FY14
4Q
FY14
1Q
FY15
2Q
FY15
3Q
FY15
4Q
FY15
1Q
FY16
2Q
FY16
3Q
FY16
4Q
FY16
Content inflation (LHS, yoy %) EBITDA margin (RHS, %)
DishTV Media
KOTAK INSTITUTIONAL EQUITIES RESEARCH 25
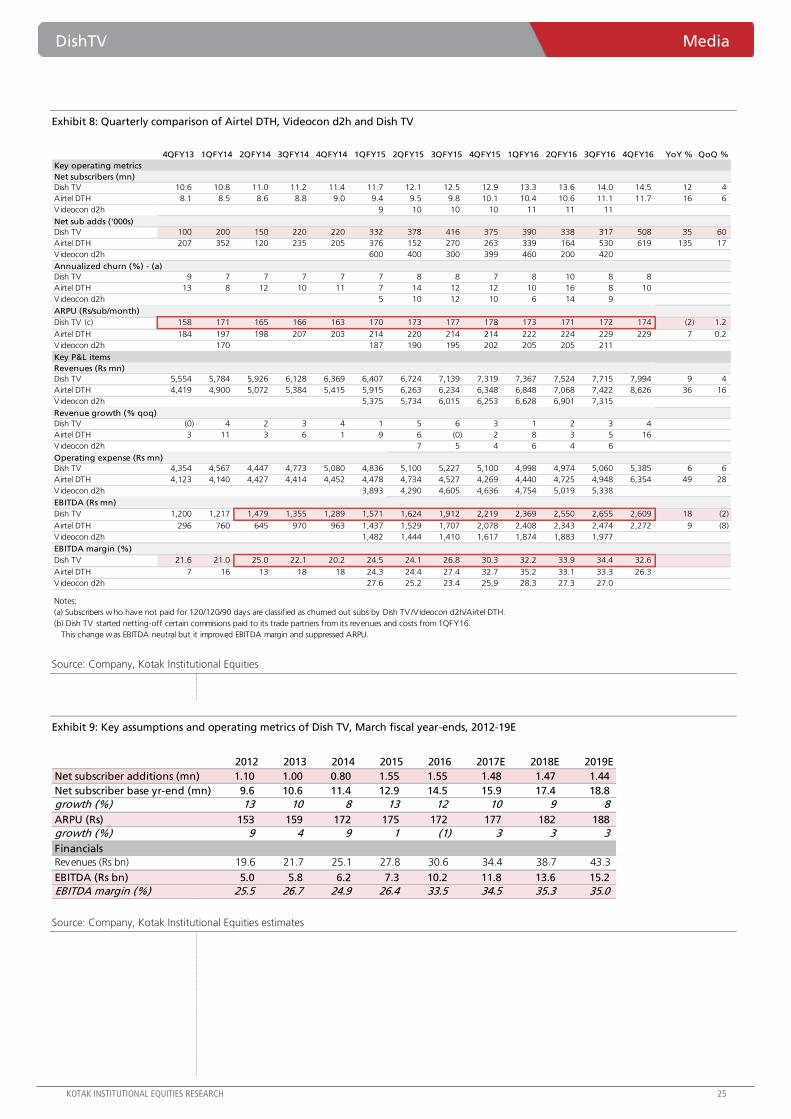
Exhibit 8: Quarterly comparison of Airtel DTH, Videocon d2h and Dish TV
Source: Company, Kotak Institutional Equities
Exhibit 9: Key assumptions and operating metrics of Dish TV, March fiscal year-ends, 2012-19E
Source: Company, Kotak Institutional Equities estimates
4QFY13 1QFY14 2QFY14 3QFY14 4QFY14 1QFY15 2QFY15 3QFY15 4QFY15 1QFY16 2QFY16 3QFY16 4QFY16 YoY % QoQ %
Key operating metrics
Net subscribers (mn)
Dish TV 10.6 10.8 11.0 11.2 11.4 11.7 12.1 12.5 12.9 13.3 13.6 14.0 14.5 12 4
Airtel DTH 8.1 8.5 8.6 8.8 9.0 9.4 9.5 9.8 10.1 10.4 10.6 11.1 11.7 16 6
Videocon d2h 9 10 10 10 11 11 11
Net sub adds ('000s)
Dish TV 100 200 150 220 220 332 378 416 375 390 338 317 508 35 60
Airtel DTH 207 352 120 235 205 376 152 270 263 339 164 530 619 135 17
Videocon d2h 600 400 300 399 460 200 420
Annualized churn (%) - (a)
Dish TV 9 7 7 7 7 7 8 8 7 8 10 8 8
Airtel DTH 13 8 12 10 11 7 14 12 12 10 16 8 10
Videocon d2h 5 10 12 10 6 14 9
ARPU (Rs/sub/month)
Dish TV (c) 158 171 165 166 163 170 173 177 178 173 171 172 174 (2) 1.2
Airtel DTH 184 197 198 207 203 214 220 214 214 222 224 229 229 7 0.2
Videocon d2h 170 187 190 195 202 205 205 211
Key P&L items
Revenues (Rs mn)
Dish TV 5,554 5,784 5,926 6,128 6,369 6,407 6,724 7,139 7,319 7,367 7,524 7,715 7,994 9 4
Airtel DTH 4,419 4,900 5,072 5,384 5,415 5,915 6,263 6,234 6,348 6,848 7,068 7,422 8,626 36 16
Videocon d2h 5,375 5,734 6,015 6,253 6,628 6,901 7,315
Revenue growth (% qoq)
Dish TV (0) 4 2 3 4 1 5 6 3 1 2 3 4
Airtel DTH 3 11 3 6 1 9 6 (0) 2 8 3 5 16
Videocon d2h 7 5 4 6 4 6
Operating expense (Rs mn)
Dish TV 4,354 4,567 4,447 4,773 5,080 4,836 5,100 5,227 5,100 4,998 4,974 5,060 5,385 6 6
Airtel DTH 4,123 4,140 4,427 4,414 4,452 4,478 4,734 4,527 4,269 4,440 4,725 4,948 6,354 49 28
Videocon d2h 3,893 4,290 4,605 4,636 4,754 5,019 5,338
EBITDA (Rs mn)
Dish TV 1,200 1,217 1,479 1,355 1,289 1,571 1,624 1,912 2,219 2,369 2,550 2,655 2,609 18 (2)
Airtel DTH 296 760 645 970 963 1,437 1,529 1,707 2,078 2,408 2,343 2,474 2,272 9 (8)
V ideocon d2h 1,482 1,444 1,410 1,617 1,874 1,883 1,977
EBITDA margin (%)
Dish TV 21.6 21.0 25.0 22.1 20.2 24.5 24.1 26.8 30.3 32.2 33.9 34.4 32.6
Airtel DTH 7 16 13 18 18 24.3 24.4 27.4 32.7 35.2 33.1 33.3 26.3
V ideocon d2h 27.6 25.2 23.4 25.9 28.3 27.3 27.0
Notes:
(a) Subscribers who have not paid for 120/120/90 days are classified as churned out subs by Dish TV/V ideocon d2h/Airtel DTH.
(b) Dish TV started netting-off certain commisions paid to its trade partners from its revenues and costs from 1QFY16.
This change was EBITDA neutral but it improved EBITDA margin and suppressed ARPU.
2012 2013 2014 2015 2016 2017E 2018E 2019E
Net subscriber additions (mn) 1.10 1.00 0.80 1.55 1.55 1.48 1.47 1.44
Net subscriber base yr-end (mn) 9.6 10.6 11.4 12.9 14.5 15.9 17.4 18.8
growth (%) 13 10 8 13 12 10 9 8
ARPU (Rs) 153 159 172 175 172 177 182 188
growth (%) 9 4 9 1 (1) 3 3 3
Financials
Revenues (Rs bn) 19.6 21.7 25.1 27.8 30.6 34.4 38.7 43.3
EBITDA (Rs bn) 5.0 5.8 6.2 7.3 10.2 11.8 13.6 15.2
EBITDA margin (%) 25.5 26.7 24.9 26.4 33.5 34.5 35.3 35.0
Media DishTV
26 KOTAK INSTITUTIONAL EQUITIES RESEARCH
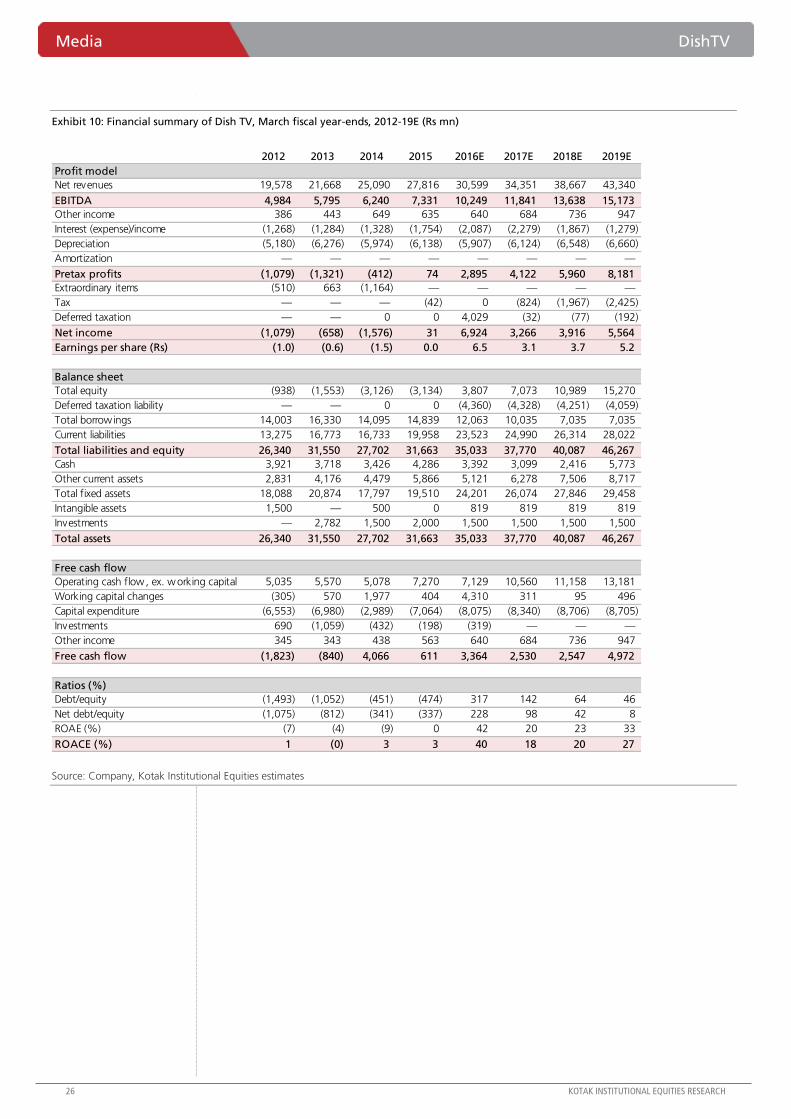
Exhibit 10: Financial summary of Dish TV, March fiscal year-ends, 2012-19E (Rs mn)
Source: Company, Kotak Institutional Equities estimates
2012 2013 2014 2015 2016E 2017E 2018E 2019E
Profit model
Net revenues 19,578 21,668 25,090 27,816 30,599 34,351 38,667 43,340
EBITDA 4,984 5,795 6,240 7,331 10,249 11,841 13,638 15,173
Other income 386 443 649 635 640 684 736 947
Interest (expense)/income (1,268) (1,284) (1,328) (1,754) (2,087) (2,279) (1,867) (1,279)
Depreciation (5,180) (6,276) (5,974) (6,138) (5,907) (6,124) (6,548) (6,660)
Amortization — — — — — — — —
Pretax profits (1,079) (1,321) (412) 74 2,895 4,122 5,960 8,181
Extraordinary items (510) 663 (1,164) — — — — —
Tax — — — (42) 0 (824) (1,967) (2,425)
Deferred taxation — — 0 0 4,029 (32) (77) (192)
Net income (1,079) (658) (1,576) 31 6,924 3,266 3,916 5,564
Earnings per share (Rs) (1.0) (0.6) (1.5) 0.0 6.5 3.1 3.7 5.2
Balance sheet
Total equity (938) (1,553) (3,126) (3,134) 3,807 7,073 10,989 15,270
Deferred taxation liability — — 0 0 (4,360) (4,328) (4,251) (4,059)
Total borrow ings 14,003 16,330 14,095 14,839 12,063 10,035 7,035 7,035
Current liabilities 13,275 16,773 16,733 19,958 23,523 24,990 26,314 28,022
Total liabilities and equity 26,340 31,550 27,702 31,663 35,033 37,770 40,087 46,267
Cash 3,921 3,718 3,426 4,286 3,392 3,099 2,416 5,773
Other current assets 2,831 4,176 4,479 5,866 5,121 6,278 7,506 8,717
Total fixed assets 18,088 20,874 17,797 19,510 24,201 26,074 27,846 29,458
Intangible assets 1,500 — 500 0 819 819 819 819
Investments — 2,782 1,500 2,000 1,500 1,500 1,500 1,500
Total assets 26,340 31,550 27,702 31,663 35,033 37,770 40,087 46,267
Free cash flow
Operating cash flow, ex. working capital 5,035 5,570 5,078 7,270 7,129 10,560 11,158 13,181
Working capital changes (305) 570 1,977 404 4,310 311 95 496
Capital expenditure (6,553) (6,980) (2,989) (7,064) (8,075) (8,340) (8,706) (8,705)
Investments 690 (1,059) (432) (198) (319) — — —
Other income 345 343 438 563 640 684 736 947
Free cash flow (1,823) (840) 4,066 611 3,364 2,530 2,547 4,972
Ratios (%)
Debt/equity (1,493) (1,052) (451) (474) 317 142 64 46
Net debt/equity (1,075) (812) (341) (337) 228 98 42 8
ROAE (%) (7) (4) (9) 0 42 20 23 33
ROACE (%) 1 (0) 3 3 40 18 20 27

For Private Circulation Only. FOR IMPORTANT INFORMATION ABOUT KOTAK SECURITIES’ RATING SYSTEM AND OTHER DISCLOSURES, REFER TO THE END OF THIS MATERIAL.
Steady performance driven by NIM expansion and loan growth
CUBK delivered in-line PBT growth of 16% yoy (13% yoy PAT growth on higher tax rate), as
17% yoy loan growth and NIM expansion (~50 bps yoy and ~15 bps qoq) drove 29% NII
growth. Other income growth was muted at 2% yoy as treasury income declined sharply by
17% yoy, while core fee growth was soft at 2% yoy. Operating expense growth was 23% yoy
(on a lower base), driven by non-staff costs. Credit costs increased 22% yoy, with the ratio
increasing by ~10 bps qoq to 1.2%. Ex-gold loan growth of 23% yoy was driven by segments
across the board, and SME/traders segment more specifically. CASA ratio improvement of ~150
bps to 20% and growth of ~20% yoy need more quarters of growth to establish as a trend.
Gross NPL unchanged qoq at 2.4%; slippages in steel along expected lines
CUBK reported stable qoq gross NPL ratio at 2.4%. Slippages increased 10 bps qoq to 1.2% as
one steel account, previously highlighted as weak, slipped from standard restructured loans
(~50% of slippage in the quarter). As such, total impaired loans declined ~60 bps qoq to 3.4%.
Consequently, SMA-2 outstanding declined ~100 bps qoq to 4.4% of loans. The bank did not
sell any loans to ARC in the year and the current SR book is about 1.7% of loans. The bank has
guided slippages of 1.75-2.0% for FY2017E. Recovery/upgrade was weak in the quarter due to
delay in sale/closure, with higher write-offs leading to stable GNPL ratio. We estimate gradual
decline in slippages from 2.3% in FY2016 to 1.9% by FY2019E, leading to decline in credit
costs from 1.2% to 0.7% during this period.
Maintain BUY with TP of `120
We maintain our BUY rating on the stock with TP at ₹120 (from ₹110). At our TP, we value the
bank at 1.9X book and 12X FY2018E EPS for RoEs in the range of ~15-16% and ~15% CAGR
in the medium term. While the bank has clearly outperformed other regional banks, current
valuation of ~1.6X FY2018E book is attractive to own this franchise that is predominantly based
in southern India and has seen relatively lower impairment trends than the sector. The bank is
well-capitalized with tier-1 ratio of 15%. The key risk for the bank would be to deliver earnings
growth given the expected decline in NIM and expense growth, without being too aggressive
on loan growth.
City Union Bank (CUBK) Banks/Financial Institutions
Stable performance. CUBK reported 13% yoy earnings growth, led by 20% yoy
revenue growth, but partly offset by high provisions (22% yoy) and operating expenses
(22% yoy on lower base). Fresh impairments were at 2.6% of loans, primarily led by
slippages in the steel sector, though overall stressed loans declined ~60 bps qoq to 3.4%
of loans. We maintain BUY given CUBK’s strong asset franchise, focus on profitability
over growth and stable return ratios. Maintain BUY with TP at ₹120 (from ₹110).
BUY
MAY 24, 2016
RESULT
Coverage view: Attractive
Price (`): 103
Target price (`): 120
BSE-30: 25,230
QUICK NUMBERS
Earnings growth of
13% yoy
Gross NPLs at 2.4%;
restructured loans
at 1.0% of loans
Maintain BUY; TP
₹120 (from ₹110)
M.B. Mahesh, CFA
Nischint Chawathe
Abhijeet Sakhare
City Union Bank
Stock data Forecasts/Valuations 2016 2017E 2018E
52-week range (Rs) (high,low) EPS (Rs) 7.4 8.4 9.9
Market Cap. (Rs bn) EPS growth (%) 12.3 13.0 17.5
Shareholding pattern (%) P/E (X) 13.9 12.3 10.4
Promoters 0.0 NII (Rs bn) 9.8 11.0 12.3
FIIs 37.5 Net profits (Rs bn) 4.4 5.0 5.9
MFs 6.2 BVPS 47.5 54.4 62.6
Price performance (%) 1M 3M 12M P/B (X) 2.2 1.9 1.6
Absolute 8.7 24.9 3.5 ROE (%) 15.5 15.4 16.0
Rel. to BSE-30 11.3 15.9 14.6 Div. Yield (%) 1.2 1.3 1.5
Company data and valuation summary
106-77
61.6
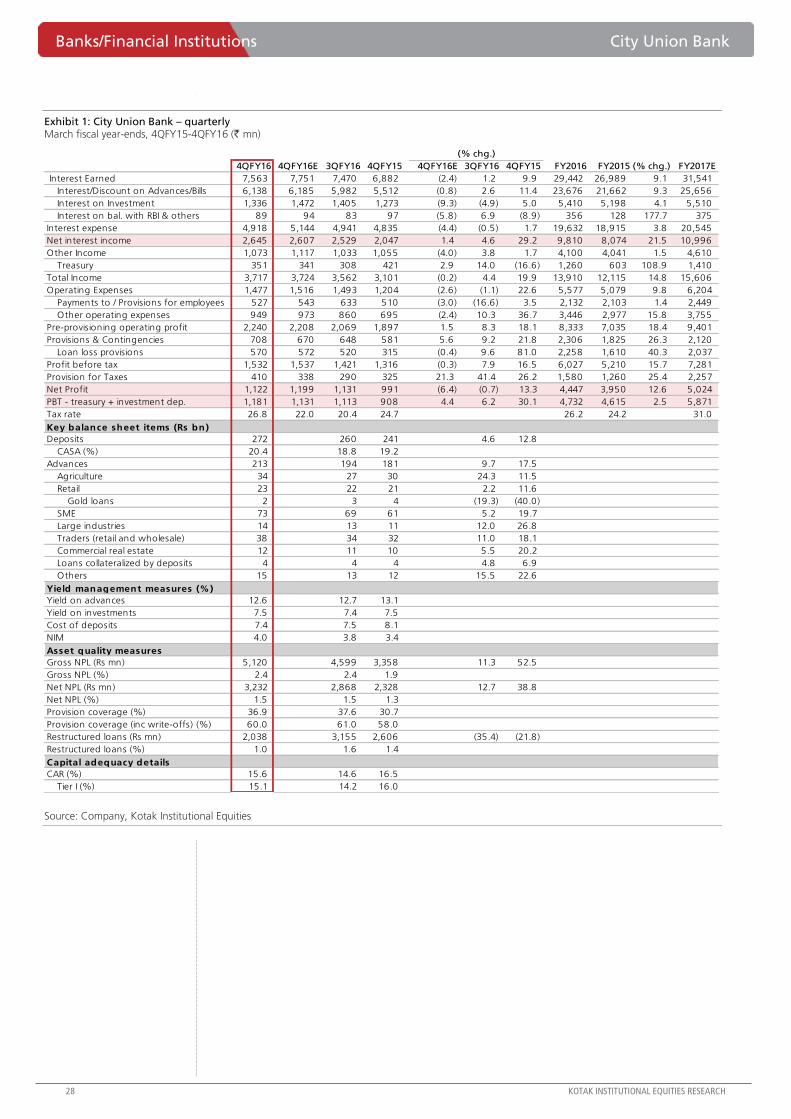
Banks/Financial Institutions City Union Bank
28 KOTAK INSTITUTIONAL EQUITIES RESEARCH
Exhibit 1: City Union Bank – quarterly March fiscal year-ends, 4QFY15-4QFY16 (` mn)
Source: Company, Kotak Institutional Equities
4QFY16 4QFY16E 3QFY16 4QFY15 4QFY16E 3QFY16 4QFY15 FY2016 FY2015 (% chg.) FY2017E
Interest Earned 7,563 7,751 7,470 6,882 (2.4) 1.2 9.9 29,442 26,989 9.1 31,541
Interest/Discount on Advances/Bills 6,138 6,185 5,982 5,512 (0.8) 2.6 11.4 23,676 21,662 9.3 25,656
Interest on Investment 1,336 1,472 1,405 1,273 (9.3) (4.9) 5.0 5,410 5,198 4.1 5,510
Interest on bal. with RBI & others 89 94 83 97 (5.8) 6.9 (8.9) 356 128 177.7 375
Interest expense 4,918 5,144 4,941 4,835 (4.4) (0.5) 1.7 19,632 18,915 3.8 20,545
Net interest income 2,645 2,607 2,529 2,047 1.4 4.6 29.2 9,810 8,074 21.5 10,996
Other Income 1,073 1,117 1,033 1,055 (4.0) 3.8 1.7 4,100 4,041 1.5 4,610
Treasury 351 341 308 421 2.9 14.0 (16.6) 1,260 603 108.9 1,410
Total Income 3,717 3,724 3,562 3,101 (0.2) 4.4 19.9 13,910 12,115 14.8 15,606
Operating Expenses 1,477 1,516 1,493 1,204 (2.6) (1.1) 22.6 5,577 5,079 9.8 6,204
Payments to / Provisions for employees 527 543 633 510 (3.0) (16.6) 3.5 2,132 2,103 1.4 2,449
Other operating expenses 949 973 860 695 (2.4) 10.3 36.7 3,446 2,977 15.8 3,755
Pre-provisioning operating profit 2,240 2,208 2,069 1,897 1.5 8.3 18.1 8,333 7,035 18.4 9,401
Provisions & Contingencies 708 670 648 581 5.6 9.2 21.8 2,306 1,825 26.3 2,120
Loan loss provisions 570 572 520 315 (0.4) 9.6 81.0 2,258 1,610 40.3 2,037
Profit before tax 1,532 1,537 1,421 1,316 (0.3) 7.9 16.5 6,027 5,210 15.7 7,281
Provision for Taxes 410 338 290 325 21.3 41.4 26.2 1,580 1,260 25.4 2,257
Net Profit 1,122 1,199 1,131 991 (6.4) (0.7) 13.3 4,447 3,950 12.6 5,024
PBT - treasury + investment dep. 1,181 1,131 1,113 908 4.4 6.2 30.1 4,732 4,615 2.5 5,871
Tax rate 26.8 22.0 20.4 24.7 26.2 24.2 31.0
Key balance sheet items (Rs bn)
Deposits 272 260 241 4.6 12.8
CASA (%) 20.4 18.8 19.2
Advances 213 194 181 9.7 17.5
Agriculture 34 27 30 24.3 11.5
Retail 23 22 21 2.2 11.6
Gold loans 2 3 4 (19.3) (40.0)
SME 73 69 61 5.2 19.7
Large industries 14 13 11 12.0 26.8
Traders (retail and wholesale) 38 34 32 11.0 18.1
Commercial real estate 12 11 10 5.5 20.2
Loans collateralized by deposits 4 4 4 4.8 6.9
Others 15 13 12 15.5 22.6
Yield management measures (%)
Yield on advances 12.6 12.7 13.1
Yield on investments 7.5 7.4 7.5
Cost of deposits 7.4 7.5 8.1
NIM 4.0 3.8 3.4
Asset quality measures
Gross NPL (Rs mn) 5,120 4,599 3,358 11.3 52.5
Gross NPL (%) 2.4 2.4 1.9
Net NPL (Rs mn) 3,232 2,868 2,328 12.7 38.8
Net NPL (%) 1.5 1.5 1.3
Provision coverage (%) 36.9 37.6 30.7
Provision coverage (inc write-offs) (%) 60.0 61.0 58.0
Restructured loans (Rs mn) 2,038 3,155 2,606 (35.4) (21.8)
Restructured loans (%) 1.0 1.6 1.4
Capital adequacy details
CAR (%) 15.6 14.6 16.5
Tier I (%) 15.1 14.2 16.0
(% chg.)
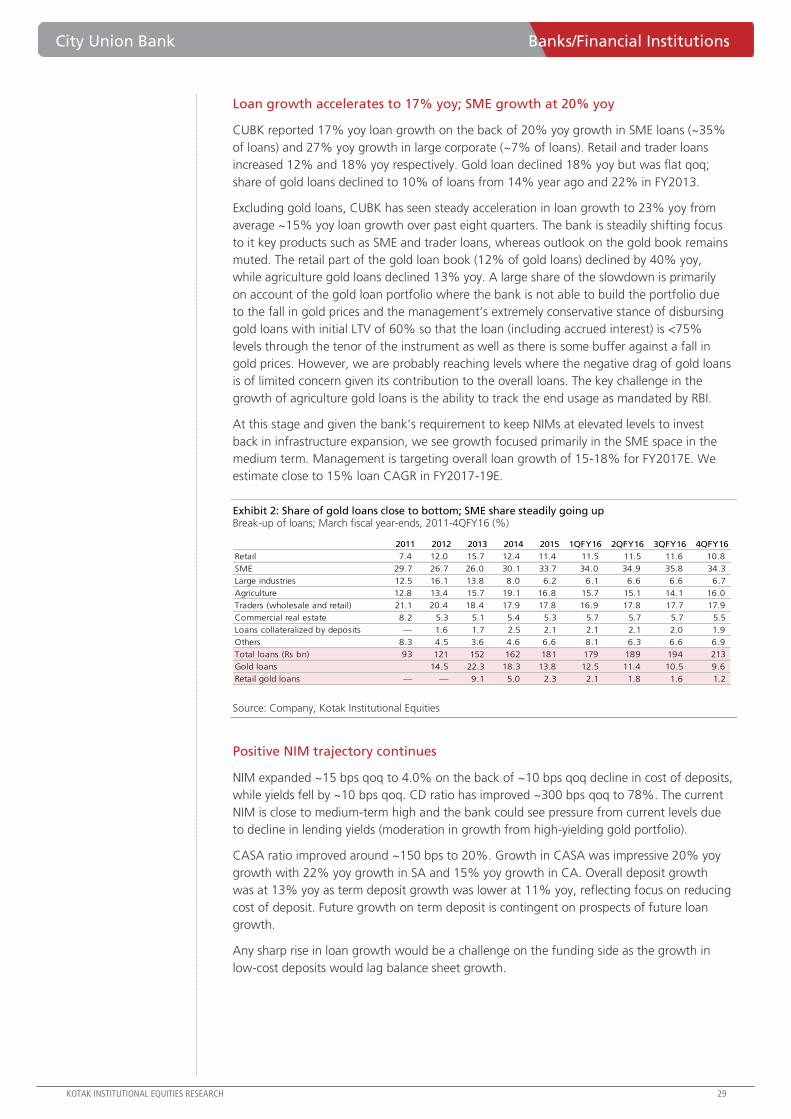
City Union Bank Banks/Financial Institutions
KOTAK INSTITUTIONAL EQUITIES RESEARCH 29
Loan growth accelerates to 17% yoy; SME growth at 20% yoy
CUBK reported 17% yoy loan growth on the back of 20% yoy growth in SME loans (~35%
of loans) and 27% yoy growth in large corporate (~7% of loans). Retail and trader loans
increased 12% and 18% yoy respectively. Gold loan declined 18% yoy but was flat qoq;
share of gold loans declined to 10% of loans from 14% year ago and 22% in FY2013.
Excluding gold loans, CUBK has seen steady acceleration in loan growth to 23% yoy from
average ~15% yoy loan growth over past eight quarters. The bank is steadily shifting focus
to it key products such as SME and trader loans, whereas outlook on the gold book remains
muted. The retail part of the gold loan book (12% of gold loans) declined by 40% yoy,
while agriculture gold loans declined 13% yoy. A large share of the slowdown is primarily
on account of the gold loan portfolio where the bank is not able to build the portfolio due
to the fall in gold prices and the management’s extremely conservative stance of disbursing
gold loans with initial LTV of 60% so that the loan (including accrued interest) is <75%
levels through the tenor of the instrument as well as there is some buffer against a fall in
gold prices. However, we are probably reaching levels where the negative drag of gold loans
is of limited concern given its contribution to the overall loans. The key challenge in the
growth of agriculture gold loans is the ability to track the end usage as mandated by RBI.
At this stage and given the bank’s requirement to keep NIMs at elevated levels to invest
back in infrastructure expansion, we see growth focused primarily in the SME space in the
medium term. Management is targeting overall loan growth of 15-18% for FY2017E. We
estimate close to 15% loan CAGR in FY2017-19E.
Exhibit 2: Share of gold loans close to bottom; SME share steadily going up Break-up of loans; March fiscal year-ends, 2011-4QFY16 (%)
Source: Company, Kotak Institutional Equities
Positive NIM trajectory continues
NIM expanded ~15 bps qoq to 4.0% on the back of ~10 bps qoq decline in cost of deposits,
while yields fell by ~10 bps qoq. CD ratio has improved ~300 bps qoq to 78%. The current
NIM is close to medium-term high and the bank could see pressure from current levels due
to decline in lending yields (moderation in growth from high-yielding gold portfolio).
CASA ratio improved around ~150 bps to 20%. Growth in CASA was impressive 20% yoy
growth with 22% yoy growth in SA and 15% yoy growth in CA. Overall deposit growth
was at 13% yoy as term deposit growth was lower at 11% yoy, reflecting focus on reducing
cost of deposit. Future growth on term deposit is contingent on prospects of future loan
growth.
Any sharp rise in loan growth would be a challenge on the funding side as the growth in
low-cost deposits would lag balance sheet growth.
2011 2012 2013 2014 2015 1QFY16 2QFY16 3QFY16 4QFY16
Retail 7.4 12.0 15.7 12.4 11.4 11.5 11.5 11.6 10.8
SME 29.7 26.7 26.0 30.1 33.7 34.0 34.9 35.8 34.3
Large industries 12.5 16.1 13.8 8.0 6.2 6.1 6.6 6.6 6.7
Agriculture 12.8 13.4 15.7 19.1 16.8 15.7 15.1 14.1 16.0
Traders (wholesale and retail) 21.1 20.4 18.4 17.9 17.8 16.9 17.8 17.7 17.9
Commercial real estate 8.2 5.3 5.1 5.4 5.3 5.7 5.7 5.7 5.5
Loans collateralized by deposits — 1.6 1.7 2.5 2.1 2.1 2.1 2.0 1.9
Others 8.3 4.5 3.6 4.6 6.6 8.1 6.3 6.6 6.9
Total loans (Rs bn) 93 121 152 162 181 179 189 194 213
Gold loans 14.5 22.3 18.3 13.8 12.5 11.4 10.5 9.6
Retail gold loans — — 9.1 5.0 2.3 2.1 1.8 1.6 1.2

Banks/Financial Institutions City Union Bank
30 KOTAK INSTITUTIONAL EQUITIES RESEARCH
Exhibit 3: CASA profile shows no improvement Break-up of deposits, March fiscal year-ends, 2009-4QFY16
Source: Company, Kotak Institutional Equities
Exhibit 4: Tamil Nadu contributes ~65-70% of branches, deposits and loans Break-up of business across states, March fiscal year-ends, 4QFY16 (%)
Source: Company, Kotak Institutional Equities
Impairment ratios similar to last quarter’s at 2.6%
Gross NPL was flat qoq at 2.4% despite 2.6% (annualized slippages) as the bank has written
off loans of 1% in the quarter. Recovery was much lower at 0.6% compared to 1.4% in
4QFY15 and 0.8% in the last quarter. Nearly half of slippages resulted from slippage of a
steel account from restructured loans. The bank has an outstanding exposure to steel of
4%.
Restructured loans declined 60 bps qoq to 1.0%. Although the overall impaired loans is not
alarmingly high, we need to keep watch on the health of the overall book, especially SME
where the bank has seen strong growth, and general tendency of SMEs to be affected in a
protracted economic slowdown. We are not too worried on the impairment cycle for the
bank as we are comfortable with their portfolio of assets as there is greater contribution
from working capital lending. The bank has guided to a 1.75-2.0% slippages in FY2017.
Other highlights
Tier-1 ratio stands at 15.1% with overall capital adequacy at 15.6% as per Basel-3. The
bank is well-capitalized in the short term and given the current growth and internal
accruals, we don’t see any immediate requirement for the bank to raise capital over the
next two years.
Cost-income ratio at 40% has declined qoq but closer to medium-term average for the
bank. FY2017 will see impact of wage revision, impact of which has been guided at 15%
of staff cost. The bank has indicated 300-400 bps rise in cost-income ratio, with FY2017E
operating expense growth expected at 10-12% yoy.
Non-interest income grew just 2% yoy. Core fee income growth was muted at 2% yoy
while treasury income declined 17% yoy.
2009 2010 2011 2012 2013 2014 2015 1QFY16 2QFY16 3QFY16 4QFY16
Current 8.5 10.7 8.4 7.4 6.6 6.5 6.9 6.9 7.3 6.4 7.1
Savings 10.4 11.2 11.2 10.8 10.2 11.2 12.3 12.0 12.2 12.4 13.3
CASA 18.9 21.9 19.6 18.2 16.8 17.8 19.2 18.9 19.5 18.8 20.4
Term deposits 81.1 78.1 80.4 81.8 83.2 82.2 80.8 81.1 80.5 81.2 79.6
Branches Deposits Loans
TN, 64 Seemandhra,
7
Telengana, 4
Karnataka, 5
Maharashtra,
3
Kerala, 3
Gujarat, 2
Others, 6
TN, 77
Seemandhra,
2
Telengana, 3
Karnataka, 5
Maharashtra, 4
Kerala, 2
Gujarat, 1
Others, 4
TN, 64
Seemandhra,
9
Telengana, 6
Karnataka, 5
Maharashtra, 4
Kerala, 2
Gujarat, 3
Others, 6

City Union Bank Banks/Financial Institutions
KOTAK INSTITUTIONAL EQUITIES RESEARCH 31
Exhibit 5: CUBK trading at 1.9X book one-year forward PBR and PER, March fiscal year-ends, May 2006-15 (X)
Source: Company, Bloomberg, Kotak Institutional Equities
Exhibit 6: CUBK has performed well compared to its peers Trading premium to peers, March fiscal year-ends, May 2006-16 (X)
Source: Company, Bloomberg, Kotak Institutional Equities
Exhibit 7: Change in estimates March fiscal year-ends, 2017-19E (` mn)
Source: Company, Kotak Institutional Equities estimates
0.0
0.5
1.0
1.5
2.0
2.5
0
3
6
9
12
15
May-
06
May-
07
May-
08
May-
09
May-
10
May-
11
May-
12
May-
13
May-
14
May-
15
May-
16
PER (X) (LHS) PBR (X) (RHS)
0.0
0.2
0.4
0.6
0.8
1.0
May-
06
May-
07
May-
08
May-
09
May-
10
May-
11
May-
12
May-
13
May-
14
May-
15
May-
16
2017E 2018E 2019E 2017E 2018E 2017E 2018E
Loans (Rs bn) 242 282 325 235 274 3.0 3.0
Loan growth (%) 15.0 16.3 15.6 15.0 16.3
Net interest income 10,996 12,340 13,826 10,479 11,804 4.9 4.5
NIM (%) 3.3 3.2 3.1 3.0 3.0
Other income 4,610 5,268 6,007 4,587 5,126 0.5 2.8
Net fee income 588 676 778 593 682 (0.8) (0.8)
Net capital gains 1,410 1,560 1,710 1,350 1,450 4.4 7.6
Operating expenses 6,204 7,003 7,870 6,290 7,006 (1.4) (0.1)
Employee expenses 2,449 2,833 3,268 2,414 2,707 1.5 4.7
Loan loss provisions 2,037 1,964 2,125 1,649 1,781 23.5 10.3
Other provisions 2,037 1,964 2,125 1,649 1,781
PBT 7,281 8,558 9,754 7,033 8,049 3.5 6.3
Tax 2,257 2,653 3,024 2,180 2,495 3.5 6.3
Net profit 5,024 5,905 6,731 4,853 5,554 3.5 6.3
% growth 13.0 17.5 14.0 7.3 14.4
PBT - Treasury + Provisions 7,991 9,045 10,252 7,426 8,474 7.6 6.7
Old estimates
Change in estimates
(%)New estimates

Banks/Financial Institutions City Union Bank
32 KOTAK INSTITUTIONAL EQUITIES RESEARCH
Exhibit 8: City Union Bank – growth rates and key ratios March fiscal year-ends, 2014-19E (%)
Source: Company, Kotak Institutional Equities estimates
2014 2015 2016 2017E 2018E 2019E
Growth rates (%)
Net loan 5.6 11.6 17.2 15.0 16.3 15.6
Total asset 8.8 11.5 12.1 15.0 14.3 13.7
Deposits 8.4 9.3 12.8 15.0 14.1 13.4
Current 8.0 15.7 15.1 19.3 21.9 20.6
Savings 19.6 19.7 22.0 19.3 18.3 17.4
Fixed 7.1 7.4 11.5 13.6 12.7 11.9
Net interest income 21.7 6.3 21.5 12.1 12.2 12.0
Loan loss provisions 39.5 (3.2) 40.3 (9.8) (3.6) 8.2
Total other income 10.1 34.2 1.5 12.4 14.3 14.0
Net fee income (3.1) 7.3 10.0 14.0 15.0 15.0
Net capital gains 33.9 164.2 108.9 11.9 10.6 9.6
Net exchange gains 77.7 110.9 15.0 17.0 18.0 18.0
Operating expenses 28.2 5.9 9.8 11.2 12.9 12.4
Employee expenses 23.0 13.3 1.4 14.9 15.7 15.4
Key ratios (%)
Yield on average earning assets 11.0 10.6 10.4 9.8 9.5 9.3
Yield on average loans 13.3 12.7 12.1 11.3 11.0 10.6
Yield on average investments 7.9 8.5 8.6 8.0 7.8 7.6
Average cost of funds 8.2 8.1 7.6 7.0 6.8 6.7
Interest on deposits 8.2 8.0 7.5 6.9 6.8 6.7
Spread 2.7 2.5 2.8 2.8 2.7 2.6
Net interest income/earning assets 3.3 3.2 3.5 3.4 3.3 3.2
Spreads on lending business 5.1 4.7 4.6 4.4 4.2 4.0
New provisions/average net loans 1.1 0.9 1.2 0.9 0.8 0.7
Total provisions/gross loans 3.2 3.8 4.2 4.5 4.5 4.5
Interest income/total income 71.6 66.6 70.5 70.5 70.1 69.7
Other income / total income 28.4 33.4 29.5 29.5 29.9 30.3
Fee income to total income 3.8 3.5 3.7 3.8 3.8 3.9
Fee income to advances 0.3 0.3 0.3 0.3 0.3 0.3
Fees income to PBT 9.7 8.3 8.6 8.1 7.9 8.0
Net trading income to PBT 5.3 11.4 21.5 19.4 18.2 17.5
Exchange income to PBT 7.9 13.2 13.1 12.7 12.8 13.2
Operating expenses/total income 45.2 41.9 40.1 39.8 39.8 39.7
Operating expenses/assets 2.0 1.9 1.9 1.8 1.8 1.8
Operating profit /AWF 1.7 1.8 1.7 1.8 1.9 1.9
Tax rate 16.1 24.2 26.2 31.0 31.0 31.0
Dividend payout ratio 15.6 16.6 16.1 16.1 16.1 16.1
Share of deposits
Current 11.2 12.3 13.3 13.8 14.3 14.8
Fixed 82.2 80.8 79.9 78.9 77.9 76.9
Savings 11.2 12.3 13.3 13.8 14.3 14.8
Loans-to-deposit ratio 73.1 74.6 77.5 77.5 79.0 80.5
Equity/assets (EoY) 8.1 9.7 9.8 9.6 9.6 9.6
Loan impairment ratios (%)
Gross NPL 1.8 1.8 2.3 2.2 2.0 1.8
Net NPL 1.2 1.3 1.5 1.3 1.1 0.9
Slippage 2.9 2.6 2.3 2.1 2.0 1.9
Provision coverage 32.5 30.5 36.8 43.7 49.4 54.9
Dupont analysis (%)
Net interest income 3.2 3.1 3.3 3.3 3.2 3.1
Loan loss provisions 0.7 0.6 0.8 0.6 0.5 0.5
Net other income 1.3 1.5 1.4 1.4 1.4 1.4
Operating expenses 2.0 2.0 1.9 1.9 1.8 1.8
(1- tax rate) 83.9 75.8 73.8 69.0 69.0 69.0
ROA 1.4 1.5 1.5 1.5 1.5 1.5
Average assets/average equity 13.1 11.2 10.3 10.3 10.4 10.4
ROE 18.9 16.7 15.5 15.4 16.0 16.0

City Union Bank Banks/Financial Institutions
KOTAK INSTITUTIONAL EQUITIES RESEARCH 33
Exhibit 9: City Union Bank – financial statements March fiscal year-ends, 2014-19E (` mn)
Source: Company, Kotak Institutional Equities estimates
2014 2015 2016 2017E 2018E 2019E
Income statement
Total interest income 25,459 26,989 29,442 31,541 35,419 39,571
Loans 20,921 21,662 23,676 25,656 28,799 32,301
Investments 4,380 5,198 5,410 5,510 6,208 6,830
Cash and deposits 158 128 356 375 412 439
Total interest expense 17,866 18,915 19,632 20,545 23,079 25,746
Deposits from customers 17,340 18,532 19,230 20,257 22,737 25,341
Net interest income 7,594 8,074 9,810 10,996 12,340 13,826
Loan loss provisions 1,663 1,610 2,258 2,037 1,964 2,125
Net interest income (after prov.) 5,931 6,464 7,552 8,958 10,376 11,701
Other income 3,012 4,041 4,100 4,610 5,268 6,007
Net fee income 401 430 516 588 676 778
Net capital gains 228 603 1,260 1,410 1,560 1,710
Net exchange gains 327 689 792 927 1,094 1,291
Operating expenses 4,796 5,079 5,577 6,204 7,003 7,870
Employee expenses 1,856 2,103 2,132 2,449 2,833 3,268
Depreciation on investments 11 8 (35) — — —
Other provisions — 207 83 83 83 83
Pretax income 4,136 5,210 6,027 7,281 8,558 9,754
Tax provisions 665 1,260 1,580 2,257 2,653 3,024
Net profit 3,471 3,950 4,447 5,024 5,905 6,731
% growth 8 14 13 13 18 14
PBT - Treasury + Provisions 5,581 6,432 7,073 7,991 9,045 10,252
% growth 10 15 10 13 13 13
Balance sheet
Cash and bank balance 21,796 25,368 26,001 29,524 31,491 33,619
Cash 1,282 2,811 2,811 2,811 2,811 2,811
Balance with RBI 9,119 9,524 12,102 13,917 15,884 18,013
Net value of investments 59,536 63,653 63,245 75,115 85,125 95,475
Govt. and other securities 53,190 54,875 54,505 66,409 76,449 86,826
Shares 306 234 234 234 234 234
Debentures and bonds 427 374 337 303 273 246
Net loans and advances 160,968 179,655 210,569 242,155 281,636 325,459
Fixed assets 1,830 2,104 2,176 2,091 2,055 1,979
Net Owned assets 1,830 2,104 2,087 2,091 2,055 1,979
Other assets 5,809 7,932 10,530 10,530 10,530 10,530
Total assets 249,938 278,711 312,520 359,415 410,837 467,061
Deposits 220,169 240,750 271,581 312,319 356,450 404,215
Borrowings and bills payable 4,870 3,437 3,225 3,869 4,643 5,571
Other liabilities 4,650 7,569 7,194 8,633 10,359 12,431
Total liabilities 229,689 251,756 282,000 324,820 371,452 422,217
Paid-up capital 543 597 598 598 598 598
Reserves & surplus 19,707 26,359 29,922 33,997 38,787 44,246
Total shareholders' equity 20,249 26,955 30,520 34,595 39,385 44,844

For Private Circulation Only. FOR IMPORTANT INFORMATION ABOUT KOTAK SECURITIES’ RATING SYSTEM AND OTHER DISCLOSURES, REFER TO THE END OF THIS MATERIAL.
4QFY16 results – revenues, EBITDA in line; PAT below estimates
JYL’s 4QFY16 earnings print was broadly in line with our expectations. Revenues came in at
`4.45 bn (+12% yoy; KIE: `4.4 bn) while EBITDA for the quarter (pre-ESOP charge) was `599
mn (+26% yoy; KIE: `590 mn). EBITDA margins expanded 149 bps yoy to 13.4%, led by 195
bps gross margin expansion and 65 bps lower A&SP as % of sales. Reported net profit of `356
mn (+32% yoy) missed our estimate by 25% on account of higher-than-expected depreciation
charge and effective tax rate. We note that growth in net profit was purely on account of the
swing in ESOP charges (from a charge of `109 mn in the base quarter to a reversal of `27 mn
in 4QFY16). Reversal was on account of the outgoing CEO S Raghunandan forfeiting his
unvested options on which the company had taken some P&L charge already.
S Raghunandan steps down as CEO
S Raghunandan, who was brought into JYL post the Henkel acquisition, has decided to
relinquish his position as the whole-time director and CEO of JYL. He will continue to be
involved with the company as a President but would not be involved in day-to-day operations.
The company has not named a replacement CEO but has elevated Rajnikant Sabnavis, currently
VP-sales and marketing, to the Chief Operating Officer (COO) position.
Operating highlights – strong, ahead-of-market growth in most power brands
JYL’s overall volume growth of 13.7% for the quarter was led by a stronger 15.3% yoy volume
growth in the power brands. All power brands performed well with the exception of Ujala
Supreme (which continues to face category growth challenges) and Margo (which got impacted
by delayed onset of summer). A detailed discussion on brand-wise performance follows later.
Henkel ‘call’ renders fundamentals irrelevant. Retain Not Rated rating
We have broadly retained our FY2017/18E forecasts. JYL is a tricky stock for a fundamental
analyst at this point. Henkel call option (to buy up to 26% stake in JYL) has vested on April 1,
2016 and the stock price continues to value the potential upside from a likely open offer in case
Henkel exercises this option. We tried hard but failed to figure out any fundamental basis of
estimating this ‘value upside’. Retain our Not Rated coverage view on the stock.
Jyothy Laboratories (JYL) Consumer Products
Operationally in-line quarter. JYL’s 4QFY16 earnings print was in line with our
expectations at the operating level even as higher-than-expected depreciation and ETR
drove a PAT miss. Topline growth of 12% yoy was ahead of market and led by strong
performance in the power brands with the exception of Margo. We retain our estimates
given the broadly in-line print. The stock remains ‘Not Rated’ for us as we refrain from
trying to ‘value’ the Henkel ‘call option’, given our accepted inability to do so.
NR
MAY 24, 2016
RESULT
Coverage view: Cautious
Price (`): 298
Target price (`): -
BSE-30: 25,230
Rohit Chordia
Anand Shah
Abhas Gupta
Jyothy Laboratories
Stock data Forecasts/Valuations 2016 2017E 2018E
52-week range (Rs) (high,low) EPS (Rs) 7.3 9.9 11.1
Market Cap. (Rs bn) EPS growth (%) 26.2 35.9 12.0
Shareholding pattern (%) P/E (X) 41.1 30.2 27.0
Promoters 66.7 Sales (Rs bn) 16.5 18.6 21.0
FIIs 4.7 Net profits (Rs bn) 1.8 2.2 2.0
MFs 5.9 EBITDA (Rs bn) 2.4 2.7 3.2
Price performance (%) 1M 3M 12M EV/EBITDA (X) 24.5 21.4 18.3
Absolute (1.7) 10.5 17.5 ROE (%) 21.6 27.1 24.0
Rel. to BSE-30 0.6 2.5 30.2 Div. Yield (%) 1.7 1.7 2.0
Company data and valuation summary
342-240
54.0
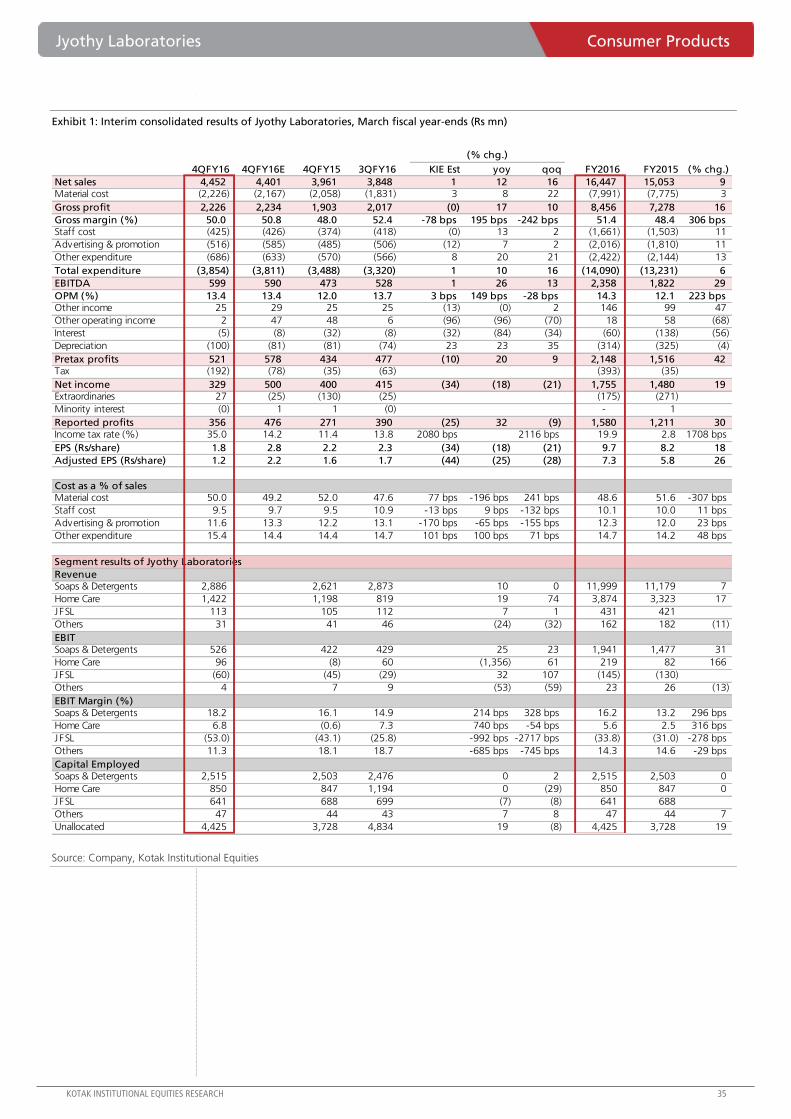
Jyothy Laboratories Consumer Products
KOTAK INSTITUTIONAL EQUITIES RESEARCH 35
Exhibit 1: Interim consolidated results of Jyothy Laboratories, March fiscal year-ends (Rs mn)
Source: Company, Kotak Institutional Equities
4QFY16 4QFY16E 4QFY15 3QFY16 KIE Est yoy qoq FY2016 FY2015 (% chg.)
Net sales 4,452 4,401 3,961 3,848 1 12 16 16,447 15,053 9 Material cost (2,226) (2,167) (2,058) (1,831) 3 8 22 (7,991) (7,775) 3
Gross profit 2,226 2,234 1,903 2,017 (0) 17 10 8,456 7,278 16
Gross margin (%) 50.0 50.8 48.0 52.4 -78 bps 195 bps -242 bps 51.4 48.4 306 bpsStaff cost (425) (426) (374) (418) (0) 13 2 (1,661) (1,503) 11
Advertising & promotion (516) (585) (485) (506) (12) 7 2 (2,016) (1,810) 11
Other expenditure (686) (633) (570) (566) 8 20 21 (2,422) (2,144) 13
Total expenditure (3,854) (3,811) (3,488) (3,320) 1 10 16 (14,090) (13,231) 6
EBITDA 599 590 473 528 1 26 13 2,358 1,822 29
OPM (%) 13.4 13.4 12.0 13.7 3 bps 149 bps -28 bps 14.3 12.1 223 bpsOther income 25 29 25 25 (13) (0) 2 146 99 47
Other operating income 2 47 48 6 (96) (96) (70) 18 58 (68)
Interest (5) (8) (32) (8) (32) (84) (34) (60) (138) (56)
Depreciation (100) (81) (81) (74) 23 23 35 (314) (325) (4)
Pretax profits 521 578 434 477 (10) 20 9 2,148 1,516 42 Tax (192) (78) (35) (63) (393) (35)
Net income 329 500 400 415 (34) (18) (21) 1,755 1,480 19 Extraordinaries 27 (25) (130) (25) (175) (271)
Minority interest (0) 1 1 (0) - 1
Reported profits 356 476 271 390 (25) 32 (9) 1,580 1,211 30 Income tax rate (%) 35.0 14.2 11.4 13.8 2080 bps 2116 bps 19.9 2.8 1708 bps
EPS (Rs/share) 1.8 2.8 2.2 2.3 (34) (18) (21) 9.7 8.2 18
Adjusted EPS (Rs/share) 1.2 2.2 1.6 1.7 (44) (25) (28) 7.3 5.8 26
Cost as a % of salesMaterial cost 50.0 49.2 52.0 47.6 77 bps -196 bps 241 bps 48.6 51.6 -307 bps
Staff cost 9.5 9.7 9.5 10.9 -13 bps 9 bps -132 bps 10.1 10.0 11 bps
Advertising & promotion 11.6 13.3 12.2 13.1 -170 bps -65 bps -155 bps 12.3 12.0 23 bps
Other expenditure 15.4 14.4 14.4 14.7 101 bps 100 bps 71 bps 14.7 14.2 48 bps
Segment results of Jyothy Laboratories
RevenueSoaps & Detergents 2,886 2,621 2,873 10 0 11,999 11,179 7
Home Care 1,422 1,198 819 19 74 3,874 3,323 17
J FSL 113 105 112 7 1 431 421
Others 31 41 46 (24) (32) 162 182 (11)
EBITSoaps & Detergents 526 422 429 25 23 1,941 1,477 31
Home Care 96 (8) 60 (1,356) 61 219 82 166
J FSL (60) (45) (29) 32 107 (145) (130)
Others 4 7 9 (53) (59) 23 26 (13)
EBIT Margin (%)Soaps & Detergents 18.2 16.1 14.9 214 bps 328 bps 16.2 13.2 296 bps
Home Care 6.8 (0.6) 7.3 740 bps -54 bps 5.6 2.5 316 bps
JFSL (53.0) (43.1) (25.8) -992 bps -2717 bps (33.8) (31.0) -278 bps
Others 11.3 18.1 18.7 -685 bps -745 bps 14.3 14.6 -29 bps
Capital EmployedSoaps & Detergents 2,515 2,503 2,476 0 2 2,515 2,503 0
Home Care 850 847 1,194 0 (29) 850 847 0
J FSL 641 688 699 (7) (8) 641 688
Others 47 44 43 7 8 47 44 7
Unallocated 4,425 3,728 4,834 19 (8) 4,425 3,728 19
(% chg.)

Consumer Products Jyothy Laboratories
36 KOTAK INSTITUTIONAL EQUITIES RESEARCH
Exhibit 2: Interim standalone results of Jyothy Laboratories, March fiscal year-ends (Rs mn)
Source: Company, Kotak Institutional Equities
4QFY16 4QFY15 3QFY16 yoy qoq FY2016 FY2015 (% chg.)
Net sales 4,265 3,785 3,658 13 17 15,735 14,283 10 Material cost (2,215) (2,039) (1,824) 9 21 (7,947) (7,606) 4
Gross profit 2,051 1,746 1,834 17 12 7,788 6,676 17
Gross margin (%) 48.1 46.1 50.1 194 bps -206 bps 49.5 46.7 275 bpsStaff cost (358) (312) (354) 14 1 (1,411) (1,271) 11
Advertising & promotion (476) (471) (475) 1 0 (1,899) (1,707) 11
Other expenditure (617) (494) (489) 25 26 (2,146) (1,851) 16
Total expenditure (3,665) (3,317) (3,142) 10 17 (13,402) (12,436) 8
EBITDA 600 468 516 28 16 2,333 1,847 26
OPM (%) 14.1 12.4 14.1 169 bps -6 bps 14.8 12.9 189 bpsOther income 125 147 126 (15) (1) 565 659 (14)
Other operating income 1 45 7 (97) (79) 19 58 (67)
Interest (2) (30) (6) (94) (71) (49) (120) (60)
Depreciation (175) (177) (169) (1) 3 (679) (704) (3)
Pretax profits 549 454 474 21 16 2,189 1,740 26 Tax (189) (41) (62) (391) (41)
Net income 360 413 412 (13) (12) 1,799 1,698 6 Extraordinaries 27 (130) (25) (175) (271)
Reported profits 387 283 387 37 0 1,624 1,428 14 Income tax rate (%) 34.4 9.1 13.2 17.8 2.4
EPS (Rs/share) 2.0 2.3 2.3 (13) (12) 9.9 9.4 6
Cost as a % of salesMaterial cost 51.9 53.9 49.9 -195 bps 205 bps 50.5 53.3 -276 bps
Staff cost 8.4 8.3 9.7 13 bps -131 bps 9.0 8.9 6 bps
Advertising & promotion 11.2 12.5 13.0 -129 bps -181 bps 12.1 12.0 11 bps
Other expenditure 14.5 13.1 13.4 140 bps 109 bps 13.6 13.0 67 bps
Segment results of Jyothy Laboratories
RevenueSoaps & Detergents 2,814 2,553 2,807 10 0 11,734 10,919 7
Home Care 1,418 1,196 810 19 75 3,862 3,235 19
Others 33 40 43 (19) (23) 157 180 (12)
EBITSoaps & Detergents 435 314 345 38 26 1,591 1,152 38
Home Care 97 (7) 53 (1,555) 85 209 96 118
Others (2) 1 1 (273) (267) (2) 1 (201)
EBIT Margin (%)Soaps & Detergents 15.4 12.3 12.3 313 bps 315 bps 13.6 10.6 300 bps
Home Care 6.8 (0.6) 6.5 740 bps 35 bps 5.4 3.0 244 bps
Others (6.1) 2.9 2.8 (1.0) 0.8
Capital EmployedSoaps & Detergents 4,285 4,580 4,333 (6) (1) 4,285 4,580 (6)
Home Care 850 855 1,194 (1) (29) 850 855 (1)
Others 194 215 197 (10) (1) 194 215 (10)
Unallocated 4,996 3,966 5,331 26 (6) 4,996 3,966 26
(% chg.)

Jyothy Laboratories Consumer Products
KOTAK INSTITUTIONAL EQUITIES RESEARCH 37
Exhibit 3: JYL - key changes to earnings model (consolidated), March fiscal-year ends, 2017-18E
Source: Company, Kotak Institutional Equities estimates
Key highlights from management concall
Consolidated revenue growth of 12% yoy was completely volume-led (up 13.7% yoy) as
price-led growth turned negative on account of deflation in detergents and dishwash
portfolio. Overall power brands portfolio grew 13.6% yoy led by 15.3% volume growth.
Key brand-wise takeaways.
Ujala – (1) Ujala fabric whitener posted 1% decline in revenues in 4QFY16 and 4%
growth for FY2016 (aided by 60 bps market share gain and price hikes); JYL is looking
to revive growth in Ujala whitener through its new communication positioning it as a
superior solution to address issue of yellowing of whites versus detergents, (2) Ujala
detergent posted 5% growth in FY2016 (stronger 16% growth in 4QFY16 aided by
relaunch); the brand only operates in Kerala and registered 160 bps market share gain
during the year to 17.7% (in Kerala) and (3) Ujala Crisp & Shine registered 11% yoy
growth in FY2016 and the brand has been extended to TN (initially present only in
Kerala).
Henko – Henko matics posted strong 44% growth in 4QFY16 and 31% growth in
FY2016 (volume growth rate higher at 36%) aided by robust category growth (22%
growth in matics category) and market share gains (up 80 bps to 5%). Unlike
commentary from previous quarters, management highlighted that it will continue to
focus on matics range and will only gradually focus on bucket wash portfolio.
Dishwash – JYL continues to outperform category growth rates – (1) Exo volumes
grew 19% yoy (value growth lower at 9.4% due to tactical promotions) for 4QFY16
and 18% for FY2016 (value growth at 10.7%) aided by brand relaunch and
distribution expansion (number of store that Exo reaches has increased by 43% over
the last two years) and (2) Pril posted 19% value growth (volume growth lower at
12%; value growth aided by higher saliency of bottle sales versus pouches) for
4QFY16 and 15.5% value growth for FY2016. JYL has recently launched Pril bar
monthly pack with premium pricing.
Maxo – JYL’s coils portfolio under Maxo continues to struggle (3% volume growth
and 0.7% decline in value terms in 4QFY16) due to weak market growth (marginal
decline in value terms for FY2016). However, liquids portfolio continued to post strong
growth (grew 30% yoy for the quarter and 42% for FY2016, in value terms).
Management highlighted that Maxo Magic card registered `103 mn revenues for
FY2016 (just 4 months of sales) and it has already garnered 4% market share on exit
basis up from 0.8% in December, 2015 quarter. It has already emerged as the No2
player in Kerala and Karnataka and the company is targeting to establish itself as the
No2 player nationally.
2017E 2018E 2017E 2018E 2017E 2018E
Net revenues (Rs mn) 18,550 21,017 18,505 20,972 0.2 0.2
EBITDA (Rs mn) 2,712 3,146 2,735 3,234 (0.9) (2.7)
EBIT (Rs mn) 2,394 2,822 2,427 2,912 (1.4) (3.1)
EBITDA margin (%) 14.6 15.0 14.8 15.4
Recurring PAT 2,226 2,000 2,262 2,041 (1.6) (2.0)
EPS (Rs/share) 12.3 11.1 12.5 11.3 (1.6) (2.0)
Adjusted EPS (Rs/share) 9.9 11.1 10.1 11.3 (2.0) (2.0)
Effective tax rate (%) 20.6 25.5 31.3 31.2
Revised Earlier Change (%)
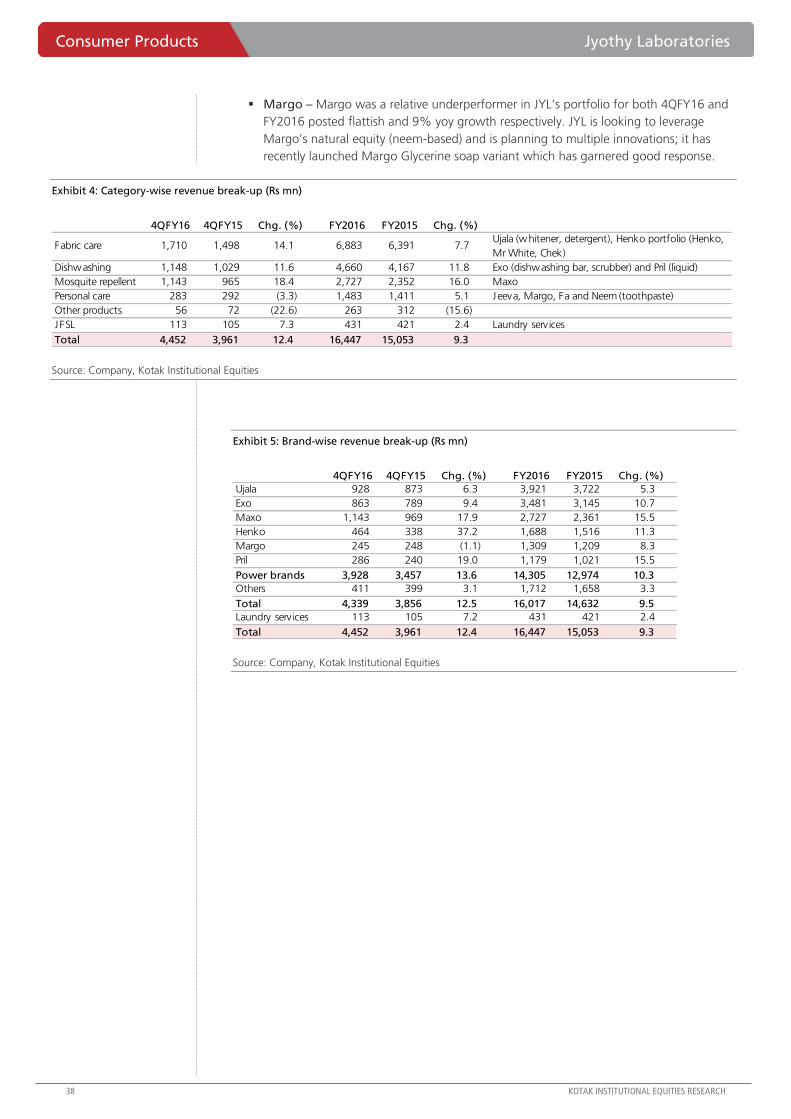
Consumer Products Jyothy Laboratories
38 KOTAK INSTITUTIONAL EQUITIES RESEARCH
Margo – Margo was a relative underperformer in JYL’s portfolio for both 4QFY16 and
FY2016 posted flattish and 9% yoy growth respectively. JYL is looking to leverage
Margo’s natural equity (neem-based) and is planning to multiple innovations; it has
recently launched Margo Glycerine soap variant which has garnered good response.
Exhibit 4: Category-wise revenue break-up (Rs mn)
Source: Company, Kotak Institutional Equities
Exhibit 5: Brand-wise revenue break-up (Rs mn)
Source: Company, Kotak Institutional Equities
4QFY16 4QFY15 Chg. (%) FY2016 FY2015 Chg. (%)
Fabric care 1,710 1,498 14.1 6,883 6,391 7.7Ujala (whitener, detergent), Henko portfolio (Henko,
Mr White, Chek)
Dishwashing 1,148 1,029 11.6 4,660 4,167 11.8 Exo (dishwashing bar, scrubber) and Pril (liquid)
Mosquite repellent 1,143 965 18.4 2,727 2,352 16.0 Maxo
Personal care 283 292 (3.3) 1,483 1,411 5.1 Jeeva, Margo, Fa and Neem (toothpaste)
Other products 56 72 (22.6) 263 312 (15.6)
JFSL 113 105 7.3 431 421 2.4 Laundry serv ices
Total 4,452 3,961 12.4 16,447 15,053 9.3
4QFY16 4QFY15 Chg. (%) FY2016 FY2015 Chg. (%)
Ujala 928 873 6.3 3,921 3,722 5.3
Exo 863 789 9.4 3,481 3,145 10.7
Maxo 1,143 969 17.9 2,727 2,361 15.5
Henko 464 338 37.2 1,688 1,516 11.3
Margo 245 248 (1.1) 1,309 1,209 8.3
Pril 286 240 19.0 1,179 1,021 15.5
Power brands 3,928 3,457 13.6 14,305 12,974 10.3
Others 411 399 3.1 1,712 1,658 3.3
Total 4,339 3,856 12.5 16,017 14,632 9.5
Laundry serv ices 113 105 7.2 431 421 2.4
Total 4,452 3,961 12.4 16,447 15,053 9.3

Jyothy Laboratories Consumer Products
KOTAK INSTITUTIONAL EQUITIES RESEARCH 39
Exhibit 6: Jyothy Labs: Consolidated profit model, balance sheet, cash flow, March fiscal year-ends, 2013-19E (Rs mn)
Source: Company, Kotak Institutional Equities estimates
2013 2014 2015 2016 2017E 2018E 2019E
Profit model (Rs mn)
Net revenues 11,042 13,184 15,053 16,447 18,550 21,017 23,646
EBITDA 1,281 1,517 1,822 2,358 2,712 3,146 3,593
Other income 68 136 157 164 119 92 93
Interest expense (682) (553) (138) (60) (126) (229) (210)
Depreciation/Amortisation (224) (243) (325) (314) (318) (324) (332)
Pretax profits 442 858 1,516 2,148 2,387 2,685 3,144
Tax 149 (6) (35) (393) (161) (685) (1,065)
Minority Interest 35 2 1 — — — —
Recurring Net Income 626 854 1,482 1,755 2,226 2,000 2,079
Extraordinary items (430) (40) (271) (175) (1,608) — —
Reported Net Income 196 814 1,211 1,580 618 2,000 2,079
Recurring EPS (Rs) 3.9 4.7 8.2 9.7 12.3 11.1 11.5
Adjusted EPS (Rs) 3.9 3.9 5.8 7.3 9.9 11.1 11.5
Balance sheet (Rs mn)
Total shareholder's equity 6,386 7,344 7,797 8,461 7,993 8,690 9,249
Total borrow ings 6,277 5,268 5,537 5,543 4,823 4,323 4,073
Deferred tax liability 9 11 5 253 253 253 253
Minority Interest 49 16 14 17 17 17 17
Total liabilities and equity 12,721 12,639 13,354 14,274 13,086 13,283 13,592
Net fixed assets incl CWIP 10,697 10,983 10,902 10,757 10,633 10,551 10,484
Investments 15 610 1,935 835 150 150 150
Cash 463 698 767 612 155 217 353
Net current assets 1,546 348 (251) 2,070 2,148 2,365 2,604
Total assets 12,721 12,639 13,354 14,274 13,086 13,283 13,592
Free cash flow (Rs mn)
Operating cash flow (excl working capital) 1,154 1,355 1,431 2,385 2,571 2,485 2,555
Working capital (877) (56) 232 (2,321) (77) (218) (238)
Capital expenditure (274) (232) (164) (150) (194) (241) (266)
Free cash flow 4 1,067 1,499 (85) 2,300 2,026 2,051
Key ratios (%)
Sales growth 21.0 19.4 14.2 9.3 12.8 13.3 12.5
EPS growth 40.5 21.4 73.5 18.4 26.9 (10.1) 3.9
Adj. EPS growth 40.5 0.8 47.0 26.2 35.9 12.0 3.9
Gross margin 47.1 47.3 48.4 51.4 50.7 50.4 50.4
EBITDA margin 11.6 11.5 12.1 14.3 14.6 15.0 15.2
RoE 9.9 12.4 19.5 21.5 27.0 23.9 23.1
RoCE 8.5 9.4 10.2 13.8 17.2 21.1 23.8

For Private Circulation Only. FOR IMPORTANT INFORMATION ABOUT KOTAK SECURITIES’ RATING SYSTEM AND OTHER DISCLOSURES, REFER TO THE END OF THIS MATERIAL.
Core business: further employee addition to boost campaign addition
Just Dial is looking to add ~2,000 employees in FY2017 in a bid to boost campaign addition.
Most of these employees would be added to the sales force, though the company has not yet
decided on a specialist sales force for Omni. The company envisages that the recent employee
addition (~1,000 employees in 4QFY16) would contribute to revenue growth 2QFY17 onwards.
Advertising to be scaled up in a bid to regain traffic
Just Dial’s unique visitors count moderated from a run-rate of 75-76 mn in 1Q-2QFY16 to 71.5
mn in 4QFY16, and was flat qoq. Just Dial intends to get more traffic by increasing its
advertising spend, and has guided for a spend of `1 bn over FY2017-18E. This spend is critical
to increase traffic on the platform and also drives adoption of Search Plus. The company will
take a final view on total spend after assessing the impact of spending in the first phase. We
now assume a lower and more phased spend of `0.8 bn over FY2017-18E.
Omni: merchant base of ~25,000 targeted by end-FY2017
Post the launch in Feb 2016, Omni garnered ~2,500 customers by Mar 2016 (1,800 of whom
paid the upfront fee of `20,000 as well), and Just Dial is targeting ~20,000-25,000 Omni
customers by year-end (some of whom could be core search customers as well, and may be
offered a bundled package). The company is confident of booking the entire set-up fee of
`20,000 upfront under IndAS, though final discussions with auditors are still underway.
Maintain REDUCE: business momentum may take time to pick up
We retain our cautious view on Just Dial as (1) key metrics such as campaign growth,
realizations and traffic are still to improve, and (2) FY2017 margins will be depressed due to
higher employee and advertising expenses. Our revenue estimates for FY2017 and FY2018
factor in 14-18% growth in the core business and contribution of `0.7 bn and `1.1 bn
respectively from the new businesses (primarily Omni). We adjust our FY2017 EPS estimates
upwards by 29% primarily on lower ad spend assumption, though FY2018 estimates remain
largely unchanged. Maintain REDUCE with a target price of `700 (based on 25X FY2018E EPS).
Just Dial (JUST) Internet
Slow path to recovery. Just Dial’s core business momentum remains weak, with slow
pace of campaign additions and traffic growth. In the results conference call,
management mentioned: (1) an additional ~2,000 employees would be added in
FY2017, and (2) Omni is targeting ~20,000-25,000 merchants by end-FY2016. We
believe business metrics may take longer to recover, and maintain REDUCE with a TP of
`700 (`710 earlier). FY2017 EPS estimates go up due to lower ad spend assumption.
REDUCE
MAY 24, 2016
UPDATE
Coverage view: Attractive
Price (`): 698
Target price (`): 700
BSE-30: 25,230
Kawaljeet Saluja
Garima Mishra
Just Dial
Stock data Forecasts/Valuations 2016 2017E 2018E
52-week range (Rs) (high,low) EPS (Rs) 20.6 19.7 28.0
Market Cap. (Rs bn) EPS growth (%) 4.6 (4.6) 42.2
Shareholding pattern (%) P/E (X) 33.8 35.5 25.0
Promoters 32.6 Sales (Rs bn) 6.9 8.5 10.4
FIIs 39.6 Net profits (Rs bn) 1.4 1.4 1.9
MFs 1.7 EBITDA (Rs bn) 1.7 1.7 2.4
Price performance (%) 1M 3M 12M EV/EBITDA (X) 23.9 23.2 15.3
Absolute (20.1) 26.7 (39.6) ROE (%) 21.3 18.7 22.1
Rel. to BSE-30 (18.2) 17.6 (33.1) Div. Yield (%) 0.0 0.3 0.4
Company data and valuation summary
1,290-376
48.5
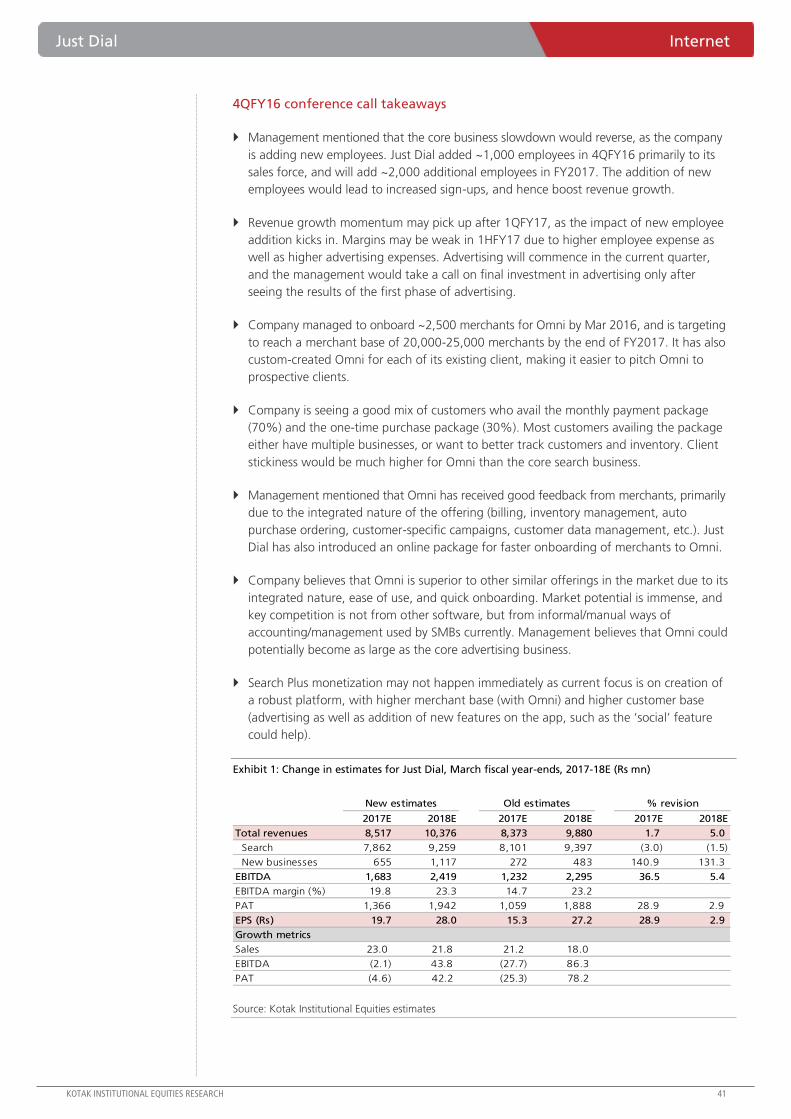
Just Dial Internet
KOTAK INSTITUTIONAL EQUITIES RESEARCH 41
4QFY16 conference call takeaways
Management mentioned that the core business slowdown would reverse, as the company
is adding new employees. Just Dial added ~1,000 employees in 4QFY16 primarily to its
sales force, and will add ~2,000 additional employees in FY2017. The addition of new
employees would lead to increased sign-ups, and hence boost revenue growth.
Revenue growth momentum may pick up after 1QFY17, as the impact of new employee
addition kicks in. Margins may be weak in 1HFY17 due to higher employee expense as
well as higher advertising expenses. Advertising will commence in the current quarter,
and the management would take a call on final investment in advertising only after
seeing the results of the first phase of advertising.
Company managed to onboard ~2,500 merchants for Omni by Mar 2016, and is targeting
to reach a merchant base of 20,000-25,000 merchants by the end of FY2017. It has also
custom-created Omni for each of its existing client, making it easier to pitch Omni to
prospective clients.
Company is seeing a good mix of customers who avail the monthly payment package
(70%) and the one-time purchase package (30%). Most customers availing the package
either have multiple businesses, or want to better track customers and inventory. Client
stickiness would be much higher for Omni than the core search business.
Management mentioned that Omni has received good feedback from merchants, primarily
due to the integrated nature of the offering (billing, inventory management, auto
purchase ordering, customer-specific campaigns, customer data management, etc.). Just
Dial has also introduced an online package for faster onboarding of merchants to Omni.
Company believes that Omni is superior to other similar offerings in the market due to its
integrated nature, ease of use, and quick onboarding. Market potential is immense, and
key competition is not from other software, but from informal/manual ways of
accounting/management used by SMBs currently. Management believes that Omni could
potentially become as large as the core advertising business.
Search Plus monetization may not happen immediately as current focus is on creation of
a robust platform, with higher merchant base (with Omni) and higher customer base
(advertising as well as addition of new features on the app, such as the ‘social’ feature
could help).
Exhibit 1: Change in estimates for Just Dial, March fiscal year-ends, 2017-18E (Rs mn)
Source: Kotak Institutional Equities estimates
xx
2017E 2018E 2017E 2018E 2017E 2018E
Total revenues 8,517 10,376 8,373 9,880 1.7 5.0
Search 7,862 9,259 8,101 9,397 (3.0) (1.5)
New businesses 655 1,117 272 483 140.9 131.3
EBITDA 1,683 2,419 1,232 2,295 36.5 5.4
EBITDA margin (%) 19.8 23.3 14.7 23.2
PAT 1,366 1,942 1,059 1,888 28.9 2.9
EPS (Rs) 19.7 28.0 15.3 27.2 28.9 2.9
Growth metrics
Sales 23.0 21.8 21.2 18.0
EBITDA (2.1) 43.8 (27.7) 86.3
PAT (4.6) 42.2 (25.3) 78.2
New estimates Old estimates % revision

Internet Just Dial
42 KOTAK INSTITUTIONAL EQUITIES RESEARCH
Exhibit 2: Details of the estimates for Just Dial, March fiscal year-ends, 2015-19E (Rs mn)
Source: Kotak Institutional Equities estimates
Exhibit 3: Financial snapshot of Just Dial, March fiscal year-ends, 2011-19E (Rs mn)
Source: Company, Kotak Institutional Equities estimates
2015 2016 2017E 2018E 2019E
Search
Search revenues 5,898 6,872 7,862 9,259 10,829
Yoy growth (%) 27.9 16.5 14.4 17.8 17.0
Omni
Number of customers at year-end (#) — 2,500 19,300 37,300 55,300
Omni revenues — 51 598 1,039 1,471
Search-Plus
Search-Plus revenues — — 57 78 103
Total revenues 5,898 6,922 8,517 10,376 12,404
Yoy growth (%) 27.9 17.4 23.0 21.8 19.5
Number of employees 9,533 11,142 13,142 14,886 16,960
Employee cost/ sales 52.4 54.5 55.7 55.9 56.5
Other expenses/sales 19.5 20.6 24.6 20.8 19.7
EBITDA margin (%) 28.1 24.8 19.8 23.3 23.8
PAT 1,389 1,432 1,366 1,942 2,382
EPS (Rs) 19.7 20.6 19.7 28.0 34.3
Yoy growth (%) 15.2 3.1 (4.6) 42.2 22.7
2011 2012 2013 2014 2015 2016 2017E 2018E 2019E
Profit model
Total operating income 1,839 2,621 3,628 4,613 5,898 6,922 8,517 10,376 12,404
Operating expenses (1,385) (1,948) (2,619) (3,191) (4,240) (5,203) (6,834) (7,957) (9,454)
Employee expenses (947) (1,308) (1,779) (2,286) (3,088) (3,774) (4,740) (5,802) (7,007)
Operating and other expenses (438) (640) (841) (905) (1,152) (1,429) (2,094) (2,154) (2,447)
EBITDA 454 672 1,008 1,422 1,658 1,719 1,683 2,419 2,950
Pre-tax profit 423 713 1,000 1,649 1,905 1,993 1,951 2,774 3,403
PAT 288 504 685 1,206 1,389 1,432 1,366 1,942 2,382
Weighted diluted number of shares (mn) 53 60 69 70 70 69 69 69 69
EPS (Rs) 5 8 10 17 20 21 20 28 34
Balance sheet
Equity share capital 519 519 695 702 705 695 695 695 695
Reserves & surplus 433 542 3,556 4,643 6,029 6,020 7,222 8,930 11,026
Shareholders funds 954 1,033 4,259 5,345 6,734 6,715 7,916 9,625 11,720
Loan funds 1 — — — — — — — —
Total source of funds 956 1,033 4,269 5,363 6,734 6,715 7,916 9,625 11,720
Net fixed assets 272 360 623 539 921 1,388 1,597 1,872 2,210
Investments 1,182 1,568 4,858 6,257 7,722 7,035 8,935 10,735 12,735
Cash balances 196 237 239 369 422 336 458 791 1,288
Net current assets excluding cash (707) (1,102) (1,452) (1,803) (2,355) (2,052) (3,080) (3,781) (4,520)
Total application of funds 956 1,034 4,269 5,363 6,734 6,715 7,916 9,625 11,720
Cash flow statement
Operating profit before working capital changes 357 595 846 1,379 1,630 1,743 1,754 2,393 2,913
Change in working capital/other adjustments 230 395 350 351 552 (303) 1,028 701 739
Cashflow from operating activites 586 990 1,196 1,730 2,182 1,440 2,782 3,093 3,652
Fixed assets (152) (179) (407) (89) (623) (778) (596) (726) (868)
Free cash flow 435 811 789 1,641 1,559 662 2,186 2,367 2,784
Issue of share capital 8 (425) 2,541 43 170 (1,451) — — —
Cash (used)/realised in financing activities 6 (427) 2,541 (121) 0 (1,451) (164) (234) (287)
Cash generated/utilised 457 427 3,292 1,529 1,517 (772) 2,021 2,133 2,497
Cash+investments at beginning of year 922 1,378 1,805 5,097 6,626 8,143 7,371 9,393 11,526
Cash+investments at end of year 1,378 1,805 5,097 6,626 8,143 7,371 9,393 11,526 14,023
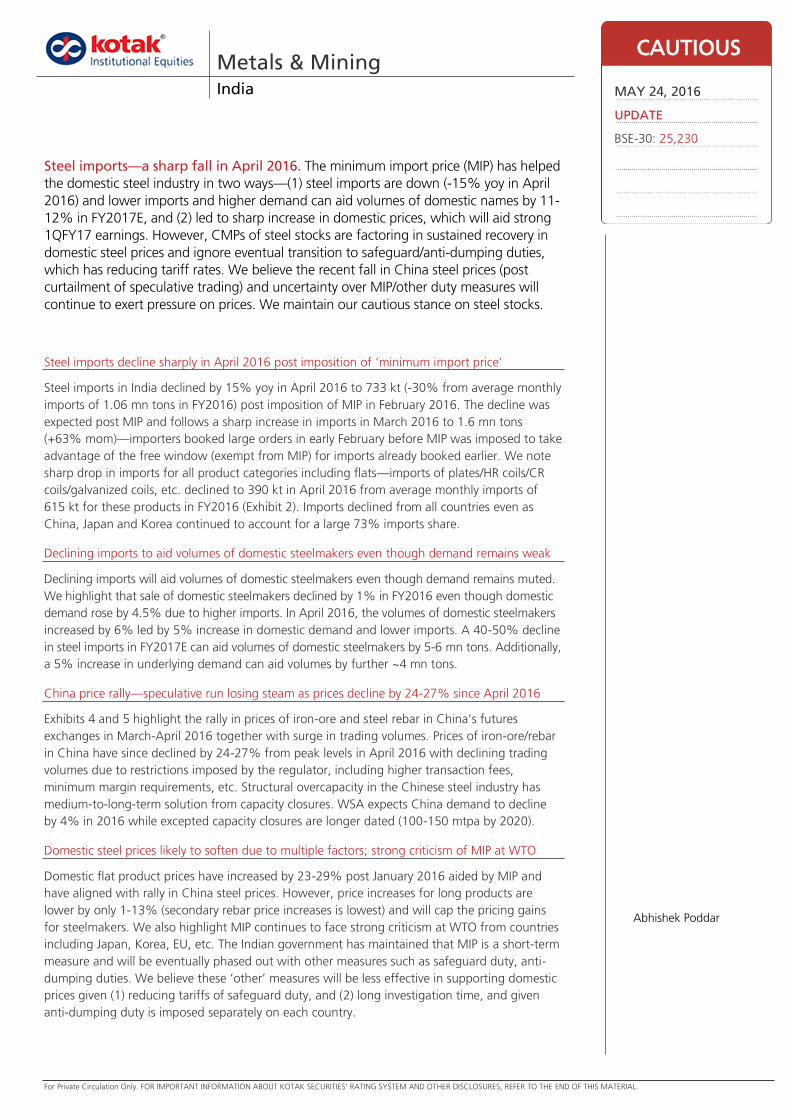
For Private Circulation Only. FOR IMPORTANT INFORMATION ABOUT KOTAK SECURITIES’ RATING SYSTEM AND OTHER DISCLOSURES, REFER TO THE END OF THIS MATERIAL.
Steel imports decline sharply in April 2016 post imposition of ‘minimum import price’
Steel imports in India declined by 15% yoy in April 2016 to 733 kt (-30% from average monthly
imports of 1.06 mn tons in FY2016) post imposition of MIP in February 2016. The decline was
expected post MIP and follows a sharp increase in imports in March 2016 to 1.6 mn tons
(+63% mom)—importers booked large orders in early February before MIP was imposed to take
advantage of the free window (exempt from MIP) for imports already booked earlier. We note
sharp drop in imports for all product categories including flats—imports of plates/HR coils/CR
coils/galvanized coils, etc. declined to 390 kt in April 2016 from average monthly imports of
615 kt for these products in FY2016 (Exhibit 2). Imports declined from all countries even as
China, Japan and Korea continued to account for a large 73% imports share.
Declining imports to aid volumes of domestic steelmakers even though demand remains weak
Declining imports will aid volumes of domestic steelmakers even though demand remains muted.
We highlight that sale of domestic steelmakers declined by 1% in FY2016 even though domestic
demand rose by 4.5% due to higher imports. In April 2016, the volumes of domestic steelmakers
increased by 6% led by 5% increase in domestic demand and lower imports. A 40-50% decline
in steel imports in FY2017E can aid volumes of domestic steelmakers by 5-6 mn tons. Additionally,
a 5% increase in underlying demand can aid volumes by further ~4 mn tons.
China price rally—speculative run losing steam as prices decline by 24-27% since April 2016
Exhibits 4 and 5 highlight the rally in prices of iron-ore and steel rebar in China’s futures
exchanges in March-April 2016 together with surge in trading volumes. Prices of iron-ore/rebar
in China have since declined by 24-27% from peak levels in April 2016 with declining trading
volumes due to restrictions imposed by the regulator, including higher transaction fees,
minimum margin requirements, etc. Structural overcapacity in the Chinese steel industry has
medium-to-long-term solution from capacity closures. WSA expects China demand to decline
by 4% in 2016 while excepted capacity closures are longer dated (100-150 mtpa by 2020).
Domestic steel prices likely to soften due to multiple factors; strong criticism of MIP at WTO
Domestic flat product prices have increased by 23-29% post January 2016 aided by MIP and
have aligned with rally in China steel prices. However, price increases for long products are
lower by only 1-13% (secondary rebar price increases is lowest) and will cap the pricing gains
for steelmakers. We also highlight MIP continues to face strong criticism at WTO from countries
including Japan, Korea, EU, etc. The Indian government has maintained that MIP is a short-term
measure and will be eventually phased out with other measures such as safeguard duty, anti-
dumping duties. We believe these ‘other’ measures will be less effective in supporting domestic
prices given (1) reducing tariffs of safeguard duty, and (2) long investigation time, and given
anti-dumping duty is imposed separately on each country.
Metals & Mining India
Steel imports—a sharp fall in April 2016. The minimum import price (MIP) has helped
the domestic steel industry in two ways—(1) steel imports are down (-15% yoy in April
2016) and lower imports and higher demand can aid volumes of domestic names by 11-
12% in FY2017E, and (2) led to sharp increase in domestic prices, which will aid strong
1QFY17 earnings. However, CMPs of steel stocks are factoring in sustained recovery in
domestic steel prices and ignore eventual transition to safeguard/anti-dumping duties,
which has reducing tariff rates. We believe the recent fall in China steel prices (post
curtailment of speculative trading) and uncertainty over MIP/other duty measures will
continue to exert pressure on prices. We maintain our cautious stance on steel stocks.
CAUTIOUS
MAY 24, 2016
UPDATE
BSE-30: 25,230
Abhishek Poddar

India Metals & Mining
44 KOTAK INSTITUTIONAL EQUITIES RESEARCH
We expect domestic steel prices to give away some recent gains with the fall in global prices
(Exhibits 6-9).
CMPs of steel stocks—factoring in sustained price increases, which is unlikely
CMPs of steel stocks are factoring in sustained recovery in domestic steel prices after the
recent price rally. In Exhibit 11, we back-calculate India EBITDA/ton for Tata Steel and JSW
Steel—the CMPs are factoring in recovery in EBITDA/ton by `3,700/ton to `4,600/ton from
FY2016E levels largely aided by higher prices.
However, we expect domestic prices to remain volatile due to (1) weak global demand and
prices, and (2) uncertainty towards MIP/safeguard duties. The government has stated that
MIP is a short-term measure and will be eventually replaced by safeguard duty/anti-dumping
duty. However, these duties have reducing tariff structure (in compliance with WTO) and
hence benefit will be lower in the later periods (Exhibit 9). Also, governments (both state
and central) are being approached by various consumer associations who are unhappy with
the price hikes. Steel players are being advised to be considerate in their pricing.
We maintain our cautious stance on steel stocks. Maintain REDUCE on Tata Steel and JSW
Steel.
Exhibit 1: Steel imports declined 15% yoy in April 2016 post MIP, China steel price rally Steel import details by countries, 2015-2017, March fiscal year-ends ('000 tons)
Source: JPC, Kotak Institutional Equities
Exhibit 2: Steel imports declined across product categories including flats and longs Steel import details by various products, 2015-2017, March fiscal year-ends ('000 tons)
Source: JPC, Kotak Institutional Equities
Apr-16 Apr-15 Mar-16 Apr-15 Mar-16 FY2016 FY2015 Change (%)
China 205 190 605 8 (66) 4,131 3,610 14
Japan 118 193 238 (39) (50) 2,195 1,602 37
Korea 209 194 323 7 (35) 3,084 1,927 60
Russia 53 46 54 16 (1) 367 229 61
Ukraine — 14 40 (100) (100) 239 349 (31)
Other countries 148 229 371 (35) (60) 2,674 2,300 16
Total 733 867 1,632 (15) (55) 12,692 10,017 27
Change (%)
Apr-16 Apr-15 Mar-16 Apr-15 Mar-16 FY2016 FY2015 Change (%)
Semis 76 104 127 (27) (40) 938 660 42
Bars & rods 43 58 4 NM NM 621 854 (27)
Other long products 10 4 2 NM NM 35 68 (49)
Plates 63 95 177 (34) (64) 1,060 732 45
HR sheets/coils/plates 212 231 418 (8) (49) 3,506 2,085 68
CR sheets/coils/plates 71 89 301 (21) (77) 2,235 1,714 30
Galvanised sheets/coils 44 37 70 18 (37) 586 444 32
Electrical sheets 33 27 30 22 12 318 418 (24)
Other flats 27 29 33 (6) (18) 356 439 (19)
Alloy steel 154 190 471 (19) (67) 3,036 2,603 17
Total 733 867 1,632 (15) (55) 12,692 10,016 27
Change (%)

Metals & Mining India
KOTAK INSTITUTIONAL EQUITIES RESEARCH 45
Exhibit 3: Domestic steel demand increased 5% yoy in April 2016; imports declined 16% yoy Domestic steel production, imports, exports and consumption, March fiscal year-ends (mn tons)
Source: JPC, Kotak Institutional Equities
Exhibit 4: Iron ore prices in China's futures exchange have declined 24% from April 2016 levels Dalian Commodity exchange, Iron ore futures contract (size 100 tons) - Sep 2016 (CNY/ton, mn)
Source: Bloomberg, Kotak Institutional Equities
Exhibit 5: Steel rebar prices in China's futures exchange have declined 27% from April 2016 levels SHFE, Steel rebar future contract (size 10 tons), (CNY/ton, mn)
Source: Bloomberg, Kotak Institutional Equities
Apr-16 Apr-15 Change (%) FY2016 FY2015 Change (%)
Finished steel production 7.7 7.3 6 90.4 92.2 (2)
Imports 0.7 0.8 (16) 11.7 9.3 26
Exports 0.3 0.4 (23) 4.1 5.6 (27)
Availability 8.0 7.6 5 98.0 95.9 2
Less: variation in stock 0.9 0.7 34 1.1 3.0 (64)
Apparent consumption 7.1 6.9 3 96.9 92.9 4
Less: double counting 1.4 1.5 (6) 16.5 15.9 4
Real finished steel consumption 5.8 5.5 5.0 80.5 77.0 4
200
250
300
350
400
450
500
0
1
2
3
4
5
6
7
Sep
-15
Oct
-15
Oct
-15
Nov-
15
Nov-
15
Dec-
15
Dec-
15
Dec-
15
Jan
-16
Jan
-16
Feb-1
6
Feb-1
6
Mar-
16
Mar-
16
Apr-
16
Apr-
16
May-
16
May-
16
Daily contract volumes (mn) (contract size 100 tons)
Open interest (mn)
Price (CNY/ton) (RHS)
1,200
1,500
1,800
2,100
2,400
2,700
3,000
0
5
10
15
20
25
Sep
-15
Oct
-15
Oct
-15
Oct
-15
Nov-
15
Nov-
15
Dec-
15
Dec-
15
Jan
-16
Jan
-16
Feb-1
6
Feb-1
6
Mar-
16
Mar-
16
Apr-
16
Apr-
16
Daily contract volumes (mn) (contract size 10 tons)
Open interest (mn)
Price (CNY/ton) (RHS)

India Metals & Mining
46 KOTAK INSTITUTIONAL EQUITIES RESEARCH
Exhibit 6: Domestic steel prices increased since February 2016 post MIP and were also aligned to rally
in China steel prices Comparison of domestic HRC steel prices and exports prices from China, Japan, 2014 - 2016 (Rs/ton, US$/ton)
Source: CRU, Kotak Institutional Equities
Exhibit 7: Post MIP, domestic steel prices increased sharply; we believe prices may soften if MIP is replaced with safeguard duty due to
reducing tariffs Comparison of HRC prices based on MIP, safeguard duty and only basic custom duty (US$/ton, Rs/ton)
Note: (a) We note that basic custom duty (BCD) from FTA countries is nil.
Source: Kotak Institutional Equities estimates
Exhibit 8: The safeguard, anti-dumping duties will not be as effective as MIP assuming lower China steel prices due to reducing tariffs Comparison of HRC prices based on MIP, safeguard duty and only basic custom duty (US$/ton, Rs/ton)
Note: (a) We note that Basic custom duty (BCD) from FTA countries is nil.
Source: Kotak Institutional Equities estimates
200
300
400
500
600
700
16,000
24,000
32,000
40,000
48,000
Jan
-14
Mar-
14
May-
14
Jul-1
4
Sep
-14
Nov-
14
Jan
-15
Mar-
15
May-
15
Jul-1
5
Sep
-15
Nov-
15
Jan
-16
Mar-
16
May-
16
HRC prices - Mumbai (Rs/ton)
HRC export prices - China (US$/ton) (RHS)
HRC export prices - Japan (US$/ton) (RHS)
MIP + BCD MIP + BCD Only Basic Custom Duty
China FTA Countries China FTA China FTA FTA FTA China
China Export HRC prices (US$/ton) 445 445 375 375 375 375 375 375
Add: Ocean freight (US$/ton) — — 15 15 15 15 15 15
Add; Import duty (%) 12.5 — 12.5 — 12.5 — — 12.5
Add: Safeguard duty (%) — — 20.0 20.0 10.0 10.0 — —
Add: Loading charges (US$/ton) 10 10 10 10 10 10 10 10
Import prices (US$/ton) 511 455 537 478 493 439 400 449
INR: USD 67.0 67.0 67.0 67.0 67.0 67.0 67.0 67.0
Import parity prices (Rs/ton) 34,212 30,485 35,946 32,026 33,006 29,413 26,800 30,066
Spot domestic prices (Rs/ton) 32,000 32,000 32,000 32,000 32,000 32,000 32,000 32,000
HR Coils
Safeguard duty (20%) Safeguard duty (10%)
MIP + BCD MIP + BCD Only Basic Custom Duty
China FTA Countries China FTA China FTA FTA FTA China
China Export HRC prices (US$/ton) 445 445 340 340 340 340 340 340
Add: Ocean freight (US$/ton) — — 15 15 15 15 15 15
Add; Import duty (%) 12.5 — 12.5 — 12.5 — — 12.5
Add: Safeguard duty (%) — — 20.0 20.0 10.0 10.0 — —
Add: Loading charges (US$/ton) 10 10 10 10 10 10 10 10
Import prices (US$/ton) 511 455 489 436 449 401 365 409
INR: USD 67.0 67.0 67.0 67.0 67.0 67.0 67.0 67.0
Import parity prices (Rs/ton) 34,212 30,485 32,780 29,212 30,104 26,834 24,455 27,428
Spot domestic prices (Rs/ton) 32,000 32,000 32,000 32,000 32,000 32,000 32,000 32,000
Safeguard duty (20%) Safeguard duty (10%)
HR Coils

Metals & Mining India
KOTAK INSTITUTIONAL EQUITIES RESEARCH 47
Exhibit 9: Safeguard duty on HRC is extended for 2 years with reducing tariffs Recommended safeguard duty rates for different dates (%)
Source: Director General of Safeguards, Kotak Institutional Equities
Exhibit 10: Prices of HRC increased by 29% since January while rebar prices increased by only 1-13% Comparison of domestic HRC steel prices with rebar prices, January 2014 - May 2016 (Rs/ton, US$/ton)
Source: CRU, Steelmint, Kotak Institutional Equities
Exhibit 11: CMPs of steel companies factor in sustained recovery in domestic steel prices Estimated India EBITDA/ton of Tata Steel, JSW Steel based on CMP, FY2017E financials (Rs bn, Rs/ton)
Notes: (a) Our estimate of Tata Steel's Europe EBITDA assumes improvement to US$430 mn in FY2017E as compared to estimated EBITDA loss of US$130 mn in FY2016E.
Source: Kotak Institutional Equities estimates
Safeguard duty
recommended
From — To (%)
September 14, 2015 — September 13, 2016 20
September 14, 2016 — March 13, 2017 18
March 14, 2017 — September 13, 2017 15
September 14, 2017 — March 13, 2018 10
Dates of applicable duty
16,000
24,000
32,000
40,000
48,000
Jan
-14
Mar-
14
May-
14
Jul-1
4
Sep
-14
Nov-
14
Jan
-15
Mar-
15
May-
15
Jul-1
5
Sep
-15
Nov-
15
Jan
-16
Mar-
16
May-
16
HRC prices - Mumbai (Rs/ton) Primary rebar prices - Mumbai (Rs/ton)
Secondary rebar prices - Mumbai (Rs/ton)
Tata Steel JSW Steel Tata Steel JSW Steel
CMP (Rs/share) 314 1,322 314 1,322
Market cap. (Rs bn) 305 320 305 320
FY2017E net debt - KIE estimates (Rs bn)* 760 439 760 439
Less: Others (investments, CWIP) (Rs bn) (79) - (79) -
Enterprise value (Rs bn) 987 759 987 759
EV/EBITDA multiple (X) 6.5 6.5 6.0 6.0
Computed FY2017E consolidated EBITDA (Rs bn) 152 118 164 126
Less: Others EBITDA - KIE estimates (Rs bn) 38 5 38 5
FY2017E Standalone India EBITDA (Rs bn) 113 113 126 122
KIE India volume estimate (mn tons) 10.7 14.5 10.7 14.5
Computed India EBITDA/ton (Rs) (A) 10,601 7,782 11,783 8,391
FY2016E EBITDA (Rs/ton) 7,194 4,718 7,194 4,718
Difference (A-B) (Rs/ton) 3,407 3,065 4,589 3,673
At 6.5X EBITDA multiple At 6X EBITDA multiple

India Metals & Mining
48 KOTAK INSTITUTIONAL EQUITIES RESEARCH
Exhibit 12: Metals comparative valuation
Source: Kotak Institutional Equities estimates
Market cap. CMP (Rs) Target EPS (Rs) P/E (X)
Company (US$ mn) 23-May price (Rs) Rating 2015 2016E 2017E 2018E 2015 2016E 2017E 2018E
NMDC 5,385 89 75 SELL 16.5 8.2 7.2 7.3 5.4 10.9 12.4 12.2
Hindustan Zinc 10,114 166 190 BUY 19.4 19.4 18.0 18.7 8.6 8.6 9.2 8.9
Jindal Steel and Power 813 59 - RS 6.9 (17.3) (16.9) (0.7) 8.5 NM NM NM
JSW Steel 4,677 1,322 1,045 REDUCE 75.6 (10.5) 131.8 154.3 17.5 NM 10.0 8.6
National Aluminium Co. 1,549 42 31 SELL 4.7 2.5 1.9 2.5 8.8 16.6 22.3 17.1
Vedanta 4,262 98 130 BUY 17.1 9.8 11.5 17.4 5.7 10.0 8.5 5.6
Tata Steel 4,646 314 250 REDUCE 0.0 (29.7) 22.2 37.1 NM NM 14.1 8.5
Hindalco Industries 2,662 87 70 REDUCE 4.1 0.7 2.9 7.5 21.0 NM 29.7 11.7
EV/EBITDA (X) Price/BV (X) RoE (%)
Company 2015 2016E 2017E 2018E 2015 2016E 2017E 2018E 2015 2016E 2017E 2018E
NMDC 2.3 6.6 8.0 7.5 1.1 1.1 1.2 1.2 21.0 10.2 9.2 9.6
Hindustan Zinc 5.0 5.0 5.3 4.4 1.6 1.9 1.6 1.4 20.2 20.2 19.0 17.3
Jindal Steel and Power 8.9 15.0 10.4 7.6 0.3 0.3 0.3 0.3 2.9 (7.9) (8.4) (0.3)
JSW Steel 7.2 11.5 5.9 5.4 1.4 1.5 1.3 1.2 8.4 (1.2) 14.3 14.6
National Aluminium Co. 2.9 5.3 7.2 5.0 0.8 0.8 0.8 0.8 10.6 5.5 3.7 4.8
Vedanta 5.1 5.1 4.6 3.6 0.5 0.7 0.5 0.5 8.0 5.9 8.1 10.1
Tata Steel 8.3 16.9 7.2 6.0 1.0 1.0 1.0 0.9 0.0 (9.5) 7.1 10.9
Hindalco Industries 8.3 9.7 7.8 6.6 0.5 0.5 0.5 0.5 2.2 0.4 1.6 3.9
Notes:
(1) EV/EBITDA for Vedanta is on attributable basis.

Ind
ia D
aily
Su
mm
ary
- Ma
y 2
4, 2
01
6
49
K
OTA
K IN
STIT
UTIO
NA
L EQ
UIT
IES R
ESEA
RC
H
March 2016: Results calendar
Source: NSE, Kotak Institutional Equities
Mon Tue Wed Thu Fri Sat Sun
23-May 24-May 25-May 26-May 27-May 28-May 29-May
Aban Offshore Amara Raja Batteries AIA Engineering BPCL Astral Poly Technik Coal India
BPCL Bajaj Finance Apollo Hospitals India Cements Bharat Electronics Divi's Laboratories
City Union Bank Bajaj Finserv Ashok Leyland Mphasis BHEL HDIL
DishTV Bank of India Bajaj Auto Natco Pharma Canara Bank Hindalco Industries
Engineers India Cipla Bajaj Holding & Investment ONGC Central Bank of India J K Cement
HSIL Colgate-Palmolive (India) Bosch Pow er Grid Crompton Greaves Jaiprakash Associates
Jyothy Laboratories Dhanuka Agritech Container Corporation Shree Cement DLF Jubilant Foodw orks
Tata Pow er J&K Bank Cummins India Tata Chemicals Dr Lal Pathlabs Kalpataru Pow er Transmission
Torrent Pharmaceuticals Jubilant Life Science Engineers India Union Bank HPCL National Aluminium Co.
NCC GAIL (India) United Spirits IOCL NHPC
Page Industries GlaxoSmithkline Pharmaceuticals Karur Vysya Bank Reliance Infrastructure
PFC Godrej Industries Minda Corp. Speciality Restaurants
PI Industries Info Edge Muthoot Finance
Tata Global Beverages L&T NMDC
Tech Mahindra PFC Oil India
Tata Steel PVR
Thermax Reliance Pow er
Rural Electrif ication Corp.
State Bank of India
Sun TV Netw ork
Tata Communications
30-May 31-May 1-Jun 2-Jun 3-Jun 4-Jun 5-Jun
Aurobindo Pharma
Bata India
Berger Paints
GMR Infrastructure
Ipca Laboratories
Jain Irrigation
Mahindra & Mahindra
Max Financial Services
NTPC
PC Jew eller
Prestige Estates Projects
Rajesh Exports
Reliance Communications
SAIL
Sun Pharmaceuticals
Suprajit Engineering
Suzlon Energy
Tata Motors

KO
TA
K IN
STIT
UTIO
NA
L EQ
UIT
IES R
ESEA
RC
H
50
In
dia
Da
ily S
um
ma
ry - M
ay 2
4, 2
01
6
Ind
ia D
aily
Su
mm
ary
- Ma
y 2
4, 2
01
6
Kotak Institutional Equities: Valuation summary of KIE Universe stocks
Source: Company, Bloomberg, Kotak Institutional Equities estimates
Target O/S
Price (Rs) price Upside Mkt cap. shares EPS (Rs) EPS growth (%) PER (X) EV/EBITDA (X) ADVT-3mo
Company Rating 23-May-16 (Rs) (%) (Rs mn) (US$ mn) (mn) 2016E 2017E 2018E 2016E 2017E 2018E 2016E 2017E 2018E 2016E 2017E 2018E 2016E 2017E 2018E 2016E 2017E 2018E 2016E 2017E 2018E (US$ mn)
Automobiles
Amara Raja Batteries SELL 922 735 (20.3) 157,455 2,335 171 30.4 34.3 39.0 26.1 12.9 13.5 30.3 26.8 23.6 18.1 15.6 13.8 7.5 6.2 5.2 0.7 0.7 0.8 27.4 25.3 23.8 3.5
Apollo Tyres BUY 152 230 51.8 77,117 1,143 509 19.9 21.4 23.2 (7.6) 7.2 8.3 7.6 7.1 6.5 4.2 4.8 4.5 1.3 1.1 1.0 1.3 1.3 1.4 18.4 16.8 15.7 6.2
Ashok Leyland ADD 100 115 15.0 284,588 4,219 2,846 3.7 5.7 7.1 308.6 53.9 24.7 27.0 17.5 14.0 14.4 10.5 8.8 4.9 4.2 3.5 1.1 1.7 2.1 19.3 25.7 27.1 17.1
Bajaj Auto ADD 2,422 2,600 7.4 700,789 10,390 289 128.2 141.8 159.9 17.6 10.6 12.7 18.9 17.1 15.1 14.4 13.5 12.2 5.5 4.7 4.0 2.1 2.3 2.6 31.8 29.8 28.8 10.2
Balkrishna Industries BUY 672 820 22.0 64,969 963 97 59.3 52.1 65.1 21.3 (12.2) 24.9 11.3 12.9 10.3 6.8 7.2 5.7 2.3 2.0 1.7 0.8 0.9 1.0 22.7 16.8 18.0 0.3
Bharat Forge BUY 713 870 22.1 165,866 2,459 237 27.4 30.6 41.0 (14.8) 11.9 34.0 26.0 23.3 17.4 12.6 12.4 9.7 4.7 4.1 3.5 1.6 1.0 1.4 18.5 18.9 21.9 9.6
Eicher Motors SELL 18,268 13,500 (26.1) 496,183 7,357 27 470.0 624.7 709.9 107.0 32.9 13.7 38.9 29.2 25.7 20.1 17.0 14.8 14.3 9.8 7.2 0.5 0.2 0.2 42.7 39.8 32.3 23.8
Exide Industries REDUCE 153 130 (15.1) 130,135 1,929 850 7.3 7.5 8.0 14.1 2.2 7.1 20.9 20.4 19.1 12.7 12.1 11.2 2.9 2.7 2.5 1.6 1.6 2.0 14.7 13.8 13.6 3.1
Hero Motocorp REDUCE 2,888 2,875 (0.4) 576,608 8,549 200 156.6 178.5 191.6 23.1 14.0 7.3 18.4 16.2 15.1 12.9 11.9 11.2 7.2 6.1 5.3 2.5 3.1 3.3 43.0 41.0 37.6 21.6
Mahindra CIE Automotive SELL 187 175 (6.3) 60,401 896 323 4.4 7.4 9.6 (41.1) 69.2 29.6 42.6 25.2 19.4 18.7 11.9 9.7 3.0 2.7 2.4 — — — 7.3 11.3 12.9 0.9
Mahindra & Mahindra ADD 1,285 1,305 1.6 798,073 11,833 569 58.4 65.1 75.1 7.7 11.4 15.4 22.0 19.7 17.1 15.7 14.4 12.4 3.3 2.9 2.6 1.1 1.3 1.5 15.8 15.8 16.3 20.6
Maruti Suzuki BUY 3,914 4,300 9.9 1,182,296 17,529 302 151.3 204.9 237.6 23.2 35.4 16.0 25.9 19.1 16.5 13.2 11.7 10.2 4.4 3.7 3.2 0.9 1.0 1.2 18.0 21.1 20.8 58.2
Minda Corp. REDUCE 113 115 2.0 23,589 350 209 4.8 6.2 7.8 14.3 30.1 25.8 23.6 18.1 14.4 11.8 9.1 7.5 4.2 3.5 2.9 0.5 0.5 0.6 19.5 21.0 21.8 0.1
Motherson Sumi Systems SELL 264 250 (5.3) 349,271 5,178 1,323 9.7 12.0 14.6 29.6 24.1 21.6 27.3 22.0 18.1 10.5 8.0 6.4 8.2 6.6 5.4 1.1 1.4 1.7 33.8 33.3 32.7 10.2
Suprajit Engineering BUY 162 175 7.9 21,297 316 120 6.3 7.9 9.3 49.9 25.0 18.4 25.8 20.6 17.4 16.7 12.1 10.6 6.5 5.2 4.3 0.7 0.9 1.1 27.9 28.0 26.9 0.2
Tata Motors BUY 382 500 31.0 1,234,343 18,301 3,395 29.8 41.8 53.1 (28.6) 40.1 27.1 12.8 9.1 7.2 4.5 4.0 3.5 1.8 1.5 1.2 — — — 15.7 17.8 18.9 50.8
TVS Motor SELL 295 235 (20.4) 140,198 2,079 475 7.7 12.7 15.3 27.3 65.7 20.1 38.5 23.2 19.3 19.6 13.8 11.6 8.9 7.0 5.6 0.8 1.1 1.3 25.1 33.7 32.3 10.0
WABCO India BUY 5,793 6,500 12.2 109,881 1,629 19 107.9 145.7 170.1 69.6 35.1 16.7 53.7 39.8 34.1 36.0 25.6 21.4 10.4 8.4 6.9 0.1 0.2 0.2 21.3 23.4 22.3 0.6
Automobiles Attractive 6,573,059 97,455 0.4 26.9 19.4 20.1 15.8 13.3 9.3 8.2 7.1 3.6 3.1 2.6 1.0 1.1 1.3 18.2 19.5 19.7 247.1
Banks/Financial Institutions
Axis Bank BUY 487 530 8.9 1,160,170 17,201 2,383 34.5 33.7 39.3 11.2 (2.3) 16.4 14.1 14.4 12.4 — — — 2.2 1.9 1.7 1.0 1.1 1.2 16.8 14.2 14.7 77.4
Bajaj Finserv ADD 1,820 2,150 18.1 289,619 4,294 159 111.1 133.9 156.3 4.5 20.5 16.7 16.4 13.6 11.6 — — — 2.2 1.8 1.9 0.7 0.7 0.7 14.5 14.6 16.0 2.2
Bank of Baroda REDUCE 132 140 6.2 303,688 4,503 2,310 (23.4) 7.2 18.1 (252.4) 131.0 149.2 (5.6) 18.2 7.3 — — — 0.8 0.7 0.7 - 1.1 2.7 (14.4) 4.6 10.7 24.9
Bank of India ADD 81 110 36.1 75,517 1,120 813 (43.4) 12.5 29.2 (269.0) 128.8 134.2 (1.9) 6.5 2.8 — — — 0.2 0.2 0.2 (10.5) 3.0 7.0 (12.6) 3.6 8.0 5.7
Canara Bank REDUCE 181 190 5.1 98,173 1,456 515 24.6 45.1 61.0 (56.8) 83.6 35.2 7.4 4.0 3.0 — — — 0.3 0.3 0.2 2.5 4.6 6.2 3.8 6.6 8.4 10.1
Cholamandalam ADD 877 880 0.4 136,877 2,029 156 36.2 44.1 53.5 20.0 21.8 21.3 24.2 19.9 16.4 — — — 3.7 3.2 2.8 0.5 0.6 0.8 17.9 17.4 18.2 1.0
City Union Bank BUY 103 120 16.4 61,644 914 598 7.4 8.4 9.9 12.3 13.0 17.5 13.9 12.3 10.4 — — — 2.0 1.8 1.6 1.2 1.3 1.5 15.5 15.4 16.0 0.9
DCB Bank ADD 88 100 13.1 25,168 373 284 6.8 6.2 7.7 0.9 (8.8) 24.1 12.9 14.2 11.4 — — — 1.4 1.3 1.2 — — — 11.9 9.7 10.8 1.8
Dewan Housing Finance BUY 186 245 31.4 54,406 807 291 27.6 33.5 36.7 (42.0) 21.4 9.5 6.8 5.6 5.1 — — — 1.1 1.0 0.8 4.3 1.9 2.1 16.3 17.6 17.3 4.6
Federal Bank BUY 50 70 41.3 85,129 1,262 1,720 2.8 5.2 6.7 (52.9) 87.8 29.6 17.9 9.5 7.4 — — — 1.1 1.0 0.9 1.4 2.7 3.4 6.0 10.6 12.7 5.2
HDFC BUY 1,160 1,335 15.1 1,833,010 27,177 1,580 47.3 53.2 59.4 17.2 12.4 11.7 24.5 21.8 19.5 — — — 5.4 4.8 4.3 1.5 1.6 1.8 22.3 22.2 21.6 64.4
HDFC Bank BUY 1,137 1,250 10.0 2,875,107 42,628 2,528 48.6 58.4 70.4 19.3 20.1 20.6 23.4 19.5 16.1 — — — 4.0 3.4 2.9 0.8 1.0 1.2 18.3 18.8 19.6 24.3
ICICI Bank BUY 221 320 44.7 1,285,813 19,064 5,816 16.7 18.6 24.3 (13.2) 11.2 30.8 13.2 11.9 9.1 — — — 1.4 1.3 1.2 2.3 2.5 3.3 11.4 11.6 14.0 77.9
IDFC BUY 47 60 27.9 74,849 1,110 1,594 (5.9) 4.5 6.2 (154.7) 176.1 39.2 (8.0) 10.5 7.6 — — — 0.7 0.7 0.6 (4.7) 0.6 0.7 (1.3) 10.1 13.6 3.1
IDFC Bank BUY 47 65 38.0 159,897 2,371 — 1.2 2.6 4.0 - 113.4 54.9 39.2 18.4 11.9 — — — 0.5 1.1 1.7 5.4 6.2 9.1 2.9
IIFL Holdings BUY 201 245 22.2 63,466 941 317 16.1 19.0 21.1 11.8 17.9 10.8 12.4 10.5 9.5 — — — 2.2 1.8 1.6 2.1 1.2 1.3 20.2 20.6 21.0 0.2
IndusInd Bank ADD 1,056 1,080 2.2 628,544 9,319 595 38.4 47.0 55.1 13.4 22.2 17.3 27.5 22.5 19.2 — — — 3.6 3.1 2.7 0.4 0.5 0.6 16.8 15.1 15.5 23.8
J&K Bank BUY 61 100 63.3 29,693 440 485 9.7 14.2 15.5 (7.3) 46.1 8.8 6.3 4.3 4.0 — — — 0.5 0.4 0.4 3.2 4.6 5.1 7.5 10.2 10.3 1.5
Karur Vysya Bank BUY 479 580 21.1 57,863 858 122 47.9 63.4 73.8 27.9 32.3 16.4 10.0 7.6 6.5 — — — 1.3 1.1 1.0 2.5 3.3 3.9 13.1 15.6 16.2 0.8
L&T Finance Holdings ADD 71 85 19.1 125,105 1,855 1,754 4.9 5.2 6.4 (1.7) 6.0 24.6 14.7 13.8 11.1 — — — 1.7 1.5 1.3 1.8 0.6 1.0 12.6 11.9 13.0 4.2
LIC Housing Finance ADD 435 550 26.4 219,629 3,256 505 36.3 42.3 47.2 20.8 16.5 11.6 12.0 10.3 9.2 — — — 2.4 2.1 1.7 1.3 1.5 1.6 19.6 19.4 20.4 16.2
Magma Fincorp ADD 87 105 20.1 20,700 307 235 9.0 11.1 13.2 2.5 23.7 18.5 9.7 7.9 6.6 — — — 1.0 0.9 0.8 0.9 1.9 2.3 10.6 11.8 12.3 0.2
Mahindra & Mahindra Financial ADD 294 305 3.6 167,444 2,483 565 11.9 14.4 18.1 (19.2) 20.5 26.1 24.7 20.5 16.3 — — — 2.7 2.5 2.3 1.1 1.3 1.6 11.4 12.7 14.6 8.1
Max Financial Services ADD 374 340 (9.1) 99,867 1,481 266 7.7 4.5 3.0 - (42.0) (33.3) 48.6 83.8 125.7 — — — 5.9 5.8 5.7 1.5 0.9 0.6 - 7.0 4.6 0.7
Muthoot Finance BUY 217 225 3.6 86,643 1,285 397 18.8 22.4 27.5 11.5 18.8 23.1 11.5 9.7 7.9 — — — 1.5 1.4 1.3 2.6 3.1 3.8 14.0 15.2 16.8 0.7
Oriental Bank of Commerce ADD 78 100 28.0 27,036 401 321 4.9 17.5 27.6 (70.7) 259.7 58.0 16.1 4.5 2.8 — — — 0.2 0.2 0.2 0.9 4.5 7.1 1.1 3.7 5.6 4.4
PFC REDUCE 168 180 7.3 221,437 3,283 1,319 48.2 40.8 41.7 6.6 (15.4) 2.4 3.5 4.1 4.0 — — — 0.6 0.5 0.5 5.8 4.9 5.0 18.3 13.7 12.7 5.0
Punjab National Bank REDUCE 72 80 10.7 141,870 2,103 1,964 (20.2) (0.9) 20.1 (222.6) 95.7 2,426.6 (3.6) (83.8) 3.6 — — — 0.4 0.4 0.3 - (0.2) 5.6 (10.9) (0.5) 10.6 12.2
Rural Electrification Corp. REDUCE 154 185 20.0 152,217 2,257 987 59.7 45.9 35.9 12.1 (23.1) (21.9) 2.6 3.4 4.3 — — — 0.5 0.5 0.4 8.3 6.4 5.0 21.7 14.5 10.4 7.6
Shriram City Union Finance ADD 1,525 1,650 8.2 100,546 1,491 66 80.1 97.5 124.0 (5.4) 21.7 27.2 19.0 15.6 12.3 — — — 2.2 2.0 1.7 0.6 0.7 0.9 12.1 13.2 14.9 0.3
Shriram Transport BUY 1,115 1,150 3.1 253,008 3,751 223 52.8 75.7 92.0 (4.8) 43.4 21.4 21.1 14.7 12.1 — — — 2.5 2.2 1.9 0.7 1.0 1.2 12.2 15.6 16.5 9.5
SKS Microfinance ADD 603 650 7.8 76,784 1,138 127 23.8 33.7 42.9 59.3 41.7 27.4 25.4 17.9 14.1 — — — 5.5 4.2 3.3 — — — 24.9 26.8 26.2 14.4
State Bank of India BUY 168 220 30.6 1,307,252 19,382 7,566 13.7 18.3 24.1 (22.1) 33.8 31.7 12.3 9.2 7.0 — — — 0.9 0.9 0.8 2.2 2.3 2.5 7.8 9.6 11.7 68.2
Union Bank ADD 105 130 23.4 72,422 1,074 687 19.7 29.4 38.4 (29.8) 49.6 30.6 5.4 3.6 2.7 — — — 0.3 0.3 0.3 1.9 2.8 3.6 6.8 9.0 10.7 9.4
YES Bank ADD 978 970 (0.8) 411,607 6,103 421 60.4 64.8 76.7 25.8 7.3 18.4 16.2 15.1 12.7 — — — 3.0 2.6 2.2 1.0 1.1 1.3 19.9 18.3 18.7 53.2
Banks/Financial Institutions Attractive 12,782,200 189,515 (24.7) 41.8 27.9 18.8 13.3 10.4 1.6 1.5 1.3 1.3 1.5 1.9 8.6 11.2 13.0 546.9
Dividend yield (%) RoE (%)Price/BV (X)

In
dia
Da
ily S
um
ma
ry - M
ay 2
4, 2
01
6
51
K
OTA
K IN
STIT
UTIO
NA
L EQ
UIT
IES R
ESEA
RC
H
Kotak Institutional Equities: Valuation summary of KIE Universe stocks
Source: Company, Bloomberg, Kotak Institutional Equities estimates
Target O/S
Price (Rs) price Upside Mkt cap. shares EPS (Rs) EPS growth (%) PER (X) EV/EBITDA (X) ADVT-3mo
Company Rating 23-May-16 (Rs) (%) (Rs mn) (US$ mn) (mn) 2016E 2017E 2018E 2016E 2017E 2018E 2016E 2017E 2018E 2016E 2017E 2018E 2016E 2017E 2018E 2016E 2017E 2018E 2016E 2017E 2018E (US$ mn)
Cement
ACC SELL 1,418 1,380 (2.7) 266,223 3,947 188 39.6 51.1 71.7 (13.3) 29.1 40.3 35.8 27.7 19.8 22.0 14.0 10.5 3.2 3.0 2.7 1.2 1.2 1.2 8.9 11.0 14.2 5.8
Ambuja Cements SELL 213 205 (3.6) 329,933 4,892 1,550 5.6 8.1 10.4 (34.6) 44.8 28.5 38.2 26.4 20.5 19.4 13.8 10.8 3.0 2.9 2.7 2.0 2.0 2.4 8.0 11.3 13.7 7.8
Dalmia Bharat BUY 860 1,015 18.0 76,367 1,132 89 21.5 71.0 100.5 1,802.5 230.6 41.5 40.0 12.1 8.6 9.2 6.6 5.2 2.0 1.7 1.4 0.2 0.2 0.2 5.5 15.2 18.2 0.4
Grasim Industries ADD 4,211 4,700 11.6 393,094 5,828 93 255.7 350.3 421.5 34.0 37.0 20.3 16.5 12.0 10.0 7.4 5.3 4.1 1.5 1.4 1.2 0.5 0.5 0.5 9.7 12.0 12.8 4.7
India Cements REDUCE 84 80 (4.8) 25,803 383 307 3.7 7.6 11.0 3,562.7 102.4 45.2 NM 11.1 7.7 7.9 6.2 5.3 0.7 0.7 0.6 2.5 2.5 2.5 3.3 6.3 8.6 4.7
J K Cement BUY 595 750 26.1 41,607 617 70 3.1 36.4 76.8 (82.7) 1,064.5 110.9 190.3 16.3 7.7 14.2 8.3 5.6 2.6 2.3 1.8 0.8 0.8 0.8 1.4 14.9 26.1 0.4
JK Lakshmi Cement BUY 348 410 17.7 40,984 608 118 2.0 20.1 35.3 (86.6) 917.4 75.9 176.4 17.3 9.9 22.5 9.6 6.0 3.0 2.6 2.1 0.6 0.6 0.6 1.7 16.3 23.8 0.4
Orient Cement BUY 152 170 11.8 31,140 462 205 3.0 8.3 16.2 (68.0) 172.9 95.6 50.0 18.3 9.4 24.8 9.8 6.4 3.1 2.7 2.2 0.7 1.2 1.2 6.2 15.7 25.8 0.2
Shree Cement SELL 13,096 9,750 (25.5) 456,213 6,764 35 175.3 334.0 479.2 32.3 90.5 43.5 74.7 39.2 27.3 25.3 16.2 11.7 7.9 6.7 5.4 0.2 0.2 0.2 11.0 18.4 21.9 2.4
UltraTech Cement SELL 3,130 2,825 (9.7) 858,979 12,736 274 79.2 129.9 164.5 7.9 64.0 26.6 39.5 24.1 19.0 20.0 13.8 10.9 4.1 3.6 3.0 0.3 0.3 0.3 11.0 15.9 17.3 16.3
Cement Cautious 2,520,343 37,368 4.1 63.1 32.8 35.0 21.5 16.2 14.8 10.2 7.8 3.0 2.7 2.4 0.7 0.7 0.7 8.7 12.6 14.6 43.2
Consumer products
Asian Paints REDUCE 947 865 (8.6) 907,977 13,462 959 18.5 21.6 25.4 25.0 16.3 17.8 51.0 43.9 37.3 31.7 27.3 23.3 16.2 13.7 11.6 0.8 1.0 1.2 34.4 33.8 33.7 14.9
Bajaj Corp. BUY 390 465 19.2 57,525 853 148 16.5 18.2 20.2 10.8 10.3 11.1 23.6 21.4 19.3 20.0 17.2 14.6 12.0 11.3 10.6 2.9 3.2 3.8 50.2 54.2 56.7 0.6
Britannia Industries BUY 2,683 3,100 15.6 321,835 4,772 120 68.0 79.6 97.6 50.4 17.0 22.7 39.4 33.7 27.5 25.9 22.2 18.0 18.2 13.6 10.4 0.7 0.9 1.1 54.1 46.2 42.8 8.3
Coffee Day Enterprises ADD 261 290 11.0 53,797 798 206 (0.4) 3.6 7.2 92.8 1,090.5 98.8 (714.5) 72.1 36.3 15.9 13.6 11.8 2.5 2.4 2.3 — — — (0.6) 3.4 6.4 0.6
Colgate-Palmolive (India) ADD 811 910 12.2 220,635 3,271 272 21.9 24.3 27.6 6.6 10.8 13.7 37.0 33.4 29.4 22.8 20.3 17.8 23.4 19.3 16.1 1.6 1.7 2.0 69.6 63.3 59.6 4.2
Dabur India ADD 286 300 5.0 502,411 7,449 1,759 7.1 8.2 9.4 19.1 15.4 14.3 40.1 34.7 30.4 33.0 28.2 24.2 12.1 10.1 8.4 0.8 1.0 1.1 33.3 31.6 30.1 5.6
GlaxoSmithKline Consumer ADD 5,812 6,400 10.1 244,406 3,624 42 154.6 173.8 198.6 11.4 12.4 14.3 37.6 33.4 29.3 26.2 23.0 19.6 10.0 8.8 7.8 1.2 1.4 1.6 28.5 28.0 28.3 2.0
Godrej Consumer Products REDUCE 1,361 1,340 (1.6) 463,620 6,874 341 33.5 39.7 45.9 27.3 18.7 15.6 40.7 34.3 29.6 29.6 25.1 21.1 9.1 7.5 6.2 0.4 0.4 0.5 24.2 24.0 22.9 6.0
Hindustan Unilever REDUCE 820 865 5.5 1,773,563 26,296 2,164 18.7 21.4 24.0 7.6 14.1 12.3 43.8 38.4 34.2 30.1 26.3 23.0 48.1 48.5 48.3 2.0 2.2 2.4 109.3 125.9 141.8 18.9
ITC BUY 347 385 11.0 2,791,174 41,383 8,069 12.2 13.7 15.7 2.2 12.0 14.9 28.4 25.4 22.1 18.7 16.6 14.3 8.5 7.7 7.0 2.4 2.3 2.7 28.5 29.0 31.9 47.2
Jubilant Foodworks REDUCE 1,112 1,000 (10.1) 73,164 1,085 66 15.8 24.1 33.6 (6.1) 51.8 39.6 70.2 46.2 33.1 25.9 18.8 14.3 10.2 8.7 7.3 0.3 0.4 0.6 15.3 20.4 24.1 8.7
Jyothy Laboratories NR 298 — — 54,037 801 181 7.3 9.9 11.1 26.2 35.9 12.0 41.1 30.2 27.0 24.5 21.4 18.3 6.4 6.8 6.2 1.7 1.7 2.0 21.6 27.1 24.0 0.4
Manpasand Beverages ADD 507 530 4.6 25,367 376 50 10.1 15.3 20.4 26.7 51.8 33.2 50.2 33.1 24.8 22.1 15.4 11.9 4.2 3.8 3.3 0.2 0.3 0.4 12.8 12.1 14.3 0.2
Marico REDUCE 248 240 (3.0) 319,382 4,735 1,290 5.5 6.7 7.8 23.4 21.6 16.0 45.0 37.0 31.9 29.7 24.7 21.2 15.2 12.8 10.8 1.4 1.2 1.4 36.2 37.6 36.7 5.9
Nestle India REDUCE 5,967 5,400 (9.5) 575,269 8,529 96 92.7 127.9 153.0 (24.1) 38.0 19.6 64.4 46.6 39.0 35.2 25.8 22.3 20.4 17.4 15.2 0.8 1.1 1.4 31.6 40.3 41.6 4.6
Page Industries SELL 12,920 10,000 (22.6) 144,108 2,137 11 214.2 269.3 325.5 21.9 25.7 20.9 60.3 48.0 39.7 37.6 30.4 25.1 27.9 20.8 15.7 0.7 0.7 0.8 53.0 49.7 45.0 2.6
PC Jeweller NR 344 — — 61,646 914 179 25.2 30.6 36.8 19.1 21.7 20.2 13.7 11.2 9.3 7.8 6.0 4.9 2.6 2.2 1.8 1.1 1.4 1.7 20.6 21.1 21.3 3.2
Pidilite Industries REDUCE 651 640 (1.7) 333,829 4,950 513 14.7 17.5 20.0 46.0 18.9 14.4 44.2 37.2 32.5 27.9 23.5 20.3 12.0 9.9 8.2 0.6 0.8 0.9 29.9 29.1 27.6 9.4
S H Kelkar and Company REDUCE 226 230 1.7 32,699 485 145 5.8 7.7 8.9 19.4 32.1 15.3 38.9 29.4 25.5 21.1 17.4 15.0 4.3 3.9 3.5 0.6 0.8 1.0 12.7 13.9 14.5 0.3
Speciality Restaurants REDUCE 88 105 18.7 4,153 62 47 1.2 2.3 3.5 (39.0) 83.8 55.3 72.0 39.2 25.2 12.9 9.1 6.8 1.3 1.3 1.2 1.1 1.1 1.1 1.9 3.3 5.0 0.0
Tata Global Beverages BUY 120 135 12.1 75,988 1,127 631 4.7 5.8 6.8 (13.8) 24.0 16.4 25.7 20.7 17.8 12.0 10.4 9.1 1.4 1.3 1.3 1.9 1.9 2.1 5.3 6.4 7.2 2.7
Titan Company REDUCE 363 320 (11.7) 321,911 4,773 888 8.0 10.1 11.4 (14.2) 26.5 13.3 45.5 36.0 31.7 33.8 24.3 21.1 9.2 8.0 6.9 0.6 0.9 1.0 21.5 23.8 23.3 8.8
United Breweries SELL 716 710 (0.8) 189,182 2,805 264 11.2 13.9 17.8 13.5 24.6 28.0 64.0 51.4 40.1 27.1 23.4 19.5 9.0 7.8 6.8 0.2 0.3 0.4 14.9 16.3 18.1 4.3
United Spirits ADD 2,467 2,900 17.6 358,458 5,315 145 22.8 36.7 56.2 304.5 60.9 53.4 NM 67.3 43.9 37.6 30.2 23.0 20.8 12.8 9.5 0.2 0.3 0.4 27.8 23.5 24.9 18.1
Consumer products Cautious 9,906,135 146,873 10.6 17.0 16.3 38.9 33.2 28.6 25.0 21.4 18.3 11.5 10.1 8.9 1.5 1.5 1.8 29.6 30.4 31.1 177.4
Energy
BPCL BUY 922 960 4.1 666,611 9,884 723 91.1 92.9 97.1 29.6 2.0 4.5 10.1 9.9 9.5 6.6 6.0 5.1 2.5 2.1 1.8 2.4 2.4 2.6 26.6 22.8 20.4 19.6
Cairn India RS 138 — — 258,825 3,837 1,875 11.4 7.0 11.8 (67.2) (39.2) 70.0 12.1 19.8 11.7 6.5 7.5 5.5 0.5 0.5 0.5 2.2 1.8 3.3 4.0 2.7 4.4 8.7
Castrol India ADD 370 420 13.4 183,136 2,715 495 12.0 14.0 14.9 25.4 16.0 6.7 30.8 26.5 24.9 19.7 17.5 16.3 31.8 29.9 28.7 2.4 3.0 3.2 111.0 116.1 117.8 10.3
GAIL (India) ADD 371 400 7.9 470,288 6,973 1,268 15.8 24.1 32.4 (39.5) 52.6 34.5 23.5 15.4 11.4 13.8 9.9 7.9 1.5 1.4 1.3 1.3 1.6 2.4 6.7 9.7 12.1 7.9
GSPL ADD 133 150 12.8 74,896 1,110 563 7.9 9.5 10.8 22.2 20.5 13.6 16.9 14.0 12.3 8.3 6.9 6.0 1.9 1.7 1.6 1.1 1.9 2.4 11.7 12.9 13.4 0.8
HPCL BUY 829 870 4.9 280,773 4,163 339 102.0 106.8 105.4 26.5 4.7 (1.3) 8.1 7.8 7.9 6.2 5.6 5.5 1.5 1.4 1.2 3.7 3.9 3.9 20.2 18.7 16.5 13.0
Indraprastha Gas ADD 568 600 5.7 79,506 1,179 140 33.2 37.1 40.4 6.0 11.8 8.9 17.1 15.3 14.1 9.7 8.7 7.8 3.3 2.9 2.6 1.1 1.3 1.6 20.6 20.1 19.3 4.6
IOCL BUY 404 480 18.7 981,864 14,558 2,428 52.9 56.3 58.2 207.5 6.3 3.3 7.6 7.2 7.0 5.3 4.2 3.9 1.3 1.1 1.0 4.4 4.5 4.4 17.7 16.8 15.6 7.0
ONGC SELL 208 175 (15.9) 1,780,825 26,403 8,556 18.9 14.5 20.2 (14.4) (23.5) 39.4 11.0 14.4 10.3 4.5 5.0 4.2 0.9 0.9 0.9 2.9 2.9 3.6 8.8 6.5 8.7 18.1
Oil India SELL 340 300 (11.6) 204,116 3,026 601 35.5 29.0 33.1 (15.1) (18.3) 14.4 9.6 11.7 10.2 5.2 6.6 5.8 0.9 0.9 0.8 4.1 3.5 3.8 9.7 7.6 8.3 2.2
Petronet LNG ADD 260 300 15.6 194,700 2,887 750 11.2 15.6 23.0 13.2 39.7 47.7 23.3 16.7 11.3 13.0 10.4 7.0 3.1 2.7 2.3 1.0 1.5 2.5 15.2 17.2 22.3 6.3
Reliance Industries ADD 930 1,130 21.5 2,737,358 40,585 3,240 84.6 88.4 99.4 20.5 4.4 12.5 11.0 10.5 9.4 8.9 8.4 6.8 1.3 1.1 1.0 1.2 1.3 1.5 12.0 11.4 11.6 61.7
Energy Attractive 7,924,376 117,491 9.7 (1.6) 16.4 10.5 10.7 9.2 6.7 6.4 5.5 1.2 1.1 1.0 2.3 2.4 2.8 11.2 10.3 11.0 166.2
Dividend yield (%) RoE (%)Price/BV (X)

K
OTA
K IN
STIT
UTIO
NA
L EQ
UIT
IES R
ESEA
RC
H
52
In
dia
Da
ily S
um
ma
ry - M
ay 2
4, 2
01
6
Ind
ia D
aily
Su
mm
ary
- Ma
y 2
4, 2
01
6
Kotak Institutional Equities: Valuation summary of KIE Universe stocks
Source: Company, Bloomberg, Kotak Institutional Equities estimates
Target O/S
Price (Rs) price Upside Mkt cap. shares EPS (Rs) EPS growth (%) PER (X) EV/EBITDA (X) ADVT-3mo
Company Rating 23-May-16 (Rs) (%) (Rs mn) (US$ mn) (mn) 2016E 2017E 2018E 2016E 2017E 2018E 2016E 2017E 2018E 2016E 2017E 2018E 2016E 2017E 2018E 2016E 2017E 2018E 2016E 2017E 2018E (US$ mn)
Industrials
ABB SELL 1,220 900 (26.2) 258,443 3,832 212 14.2 18.4 27.6 31.2 29.7 50.3 86.2 66.5 44.2 36.3 32.0 24.3 8.6 7.9 7.0 0.3 0.4 0.6 10.3 12.4 16.8 1.7
BHEL SELL 119 100 (15.8) 290,653 4,309 2,448 (3.7) 4.3 9.8 (163.0) 218.2 127.7 (32.5) 27.5 12.1 (9.7) 8.1 1.9 0.9 0.8 0.8 (0.7) 0.8 1.8 (2.6) 3.1 6.9 16.4
Carborundum Universal ADD 210 215 2.4 39,560 587 188 7.6 10.1 13.6 47.0 32.4 34.6 27.6 20.8 15.5 12.5 9.5 7.7 3.3 3.0 2.6 0.7 0.9 1.1 11.7 15.0 17.7 0.2
Crompton Greaves NR 62 — — 39,015 578 627 (3.2) (0.4) 3.1 (208.6) 87.3 854.1 (19.5) (153.1) 20.3 13.9 9.3 10.6 1.0 0.8 0.8 2.1 0.5 0.6 (5.2) (0.6) 4.0 15.8
Cummins India REDUCE 872 875 0.4 241,635 3,583 277 28.1 31.0 35.9 3.8 10.4 15.7 31.0 28.1 24.3 29.2 26.0 22.1 7.5 6.8 6.1 1.7 1.8 2.1 25.5 25.3 26.3 3.2
Havells India REDUCE 366 320 (12.6) 228,787 3,392 624 8.4 9.8 11.4 35.9 17.4 15.7 43.7 37.2 32.2 25.4 24.7 20.8 8.9 7.9 7.0 1.6 1.1 1.2 23.9 22.6 23.2 8.6
Kalpataru Power Transmission BUY 224 250 11.7 34,352 509 153 9.6 13.6 17.6 23.0 40.8 29.6 23.2 16.5 12.7 8.1 7.2 6.4 1.5 1.4 1.2 0.7 0.7 0.7 6.5 8.6 10.2 0.4
KEC International ADD 127 145 13.9 32,714 485 257 7.4 10.4 13.7 19.0 39.9 31.5 17.1 12.2 9.3 8.4 6.9 5.8 2.2 1.9 1.6 0.8 1.1 1.4 13.5 16.5 18.7 0.8
L&T ADD 1,241 1,300 4.7 1,156,593 17,148 930 41.3 53.3 65.7 17.7 29.1 23.2 30.0 23.3 18.9 18.7 15.8 13.4 3.0 2.8 2.5 1.2 1.1 1.2 10.4 12.4 13.9 36.5
Siemens SELL 1,128 830 (26.4) 401,650 5,955 356 19.6 25.7 32.3 74.2 31.0 25.7 57.5 43.9 34.9 33.3 27.4 21.7 6.0 5.7 5.3 3.5 1.1 1.4 11.8 13.3 15.8 4.9
Thermax REDUCE 705 720 2.1 84,035 1,246 119 26.4 23.8 27.8 21.4 (9.9) 17.1 26.7 29.7 25.3 16.3 18.2 15.5 3.6 3.3 3.0 1.0 0.9 0.9 13.9 11.5 12.4 0.8
Voltas ADD 329 330 0.4 108,795 1,613 331 10.4 11.6 15.2 2.0 11.5 30.6 31.5 28.3 21.7 25.0 23.2 16.9 4.5 4.1 3.6 0.8 0.9 1.2 15.3 15.2 17.6 9.0
Industrials Cautious 2,916,233 43,238 (18.8) 63.4 37.2 47.2 28.9 21.0 22.7 16.6 13.1 2.9 2.7 2.5 1.3 1.0 1.3 6.1 9.3 11.8 98.3
Infrastructure
Adani Port and SEZ ADD 181 255 40.8 375,049 5,561 2,085 13.8 14.6 13.0 23.8 6.5 (11.3) 13.2 12.4 13.9 12.4 10.5 9.5 2.9 2.4 2.1 0.8 0.8 1.2 23.9 20.9 15.9 17.8
Ashoka Buildcon BUY 136 220 61.3 25,527 378 188 3.1 7.4 7.1 (39.4) 138.0 (4.3) 43.8 18.4 19.2 8.4 8.3 7.2 1.4 1.3 1.2 1.1 1.2 1.7 3.6 7.2 6.6 1.7
Container Corporation ADD 1,372 1,400 2.1 267,417 3,965 195 44.5 51.3 58.8 (17.1) 15.1 14.6 30.8 26.8 23.3 20.7 17.5 14.9 3.2 3.0 2.7 0.8 0.9 1.1 10.9 11.6 12.3 5.4
Gujarat Pipavav Port ADD 161 180 11.8 77,858 1,154 483 3.6 5.3 7.1 (59.2) 46.2 32.4 44.2 30.2 22.8 20.0 15.8 12.4 4.1 3.8 3.4 1— 1— 1.9 9.5 12.9 15.7 1.0
IRB Infrastructure BUY 212 285 34.2 74,630 1,107 351 18.1 14.7 14.4 17.2 (18.6) (2.2) 11.7 14.4 14.7 7.8 7.3 7.2 1.5 1.3 1.2 1.8 1.8 1.8 13.9 9.7 8.3 4.6
Sadbhav Engineering ADD 275 300 9.2 47,112 699 172 8.0 8.7 12.6 13.4 8.4 44.2 34.2 31.5 21.9 18.2 16.6 13.1 3.2 2.9 2.6 — — — 9.8 9.7 12.7 0.6
Infrastructure Attractive 867,593 12,863 4.7 7.8 (1.3) 18.3 17.0 17.2 12.3 10.7 9.6 2.7 2.4 2.1 0.9 0.9 1.2 15.0 14.1 12.5 31.0
Internet
Info Edge BUY 747 955 27.9 90,270 1,338 121 11.6 16.7 23.0 (28.3) 44.8 37.2 64.6 44.6 32.5 56.0 33.1 22.8 5.2 4.8 4.4 0.5 0.8 1.1 8.2 11.2 14.2 0.9
Just Dial REDUCE 698 700 0.4 48,461 719 69 20.6 19.7 28.0 4.6 (4.6) 42.2 33.8 35.5 25.0 23.9 23.2 15.3 7.2 6.1 5.0 - 0.3 0.4 21.3 18.7 22.1 37.5
Internet Attractive 138,731 2,057 (15.0) 19.8 39.2 49.1 41.0 29.4 38.5 29.0 19.6 5.7 5.2 4.6 0.4 0.6 0.8 11.7 12.8 15.8 38.4
Media
DB Corp. ADD 330 345 4.5 60,636 899 184 16.1 20.4 24.5 (6.3) 26.4 20.1 20.4 16.2 13.5 11.3 8.9 7.4 4.5 4.1 3.7 3.3 3.3 4.2 22.5 26.5 28.8 0.1
DishTV BUY 88 115 30.3 94,060 1,395 1,066 2.7 3.6 4.5 9,116.5 33.9 25.0 NM 24.3 19.4 9.2 7.8 6.4 5.6 5.6 5.6 — — — 17.4 23.3 29.1 6.1
Jagran Prakashan ADD 171 180 5.2 55,918 829 327 10.0 12.0 14.0 24.8 20.3 16.5 17.1 14.2 12.2 9.7 7.9 6.7 4.1 3.7 3.3 2.9 3.5 4.1 26.1 27.1 28.3 0.3
PVR BUY 843 900 6.8 39,338 583 47 20.7 24.0 33.3 703.7 15.7 38.9 40.7 35.1 25.3 14.9 11.7 9.8 4.6 4.2 3.6 0.2 0.3 0.4 15.4 12.5 15.3 1.2
Sun TV Network ADD 366 390 6.6 144,215 2,138 394 23.1 26.1 29.7 16.2 13.2 13.8 15.9 14.0 12.3 10.0 8.6 7.3 4.0 3.6 3.3 3.6 4.2 4.7 26.0 27.0 28.1 6.0
Zee Entertainment Enterprises BUY 436 475 9.0 418,419 6,204 960 9.4 12.0 15.5 8.4 28.1 28.5 46.4 36.2 28.2 26.4 21.3 16.9 6.7 5.9 5.4 0.5 0.6 0.8 15.3 17.3 20.0 12.7
Media Neutral 812,587 12,048 28.3 22.4 21.8 28.8 23.5 19.3 14.8 12.3 10.2 5.4 4.9 4.5 1.4 1.5 1.9 18.7 20.7 23.1 26.3
Metals & Mining
Coal India ADD 281 320 14.1 1,771,740 26,269 6,316 24.2 26.1 30.9 11.5 7.8 18.0 11.6 10.7 9.1 6.4 6.5 5.3 4.6 4.1 3.6 9.8 5.6 6.6 37.6 40.7 42.4 24.2
Hindalco Industries REDUCE 87 70 (19.4) 179,447 2,661 2,065 0.5 2.9 7.5 (94.6) 443.4 154.7 161.1 29.7 11.6 9.7 7.8 6.6 0.5 0.5 0.4 1.2 1.2 1.2 0.3 1.6 3.9 19.4
Hindustan Zinc BUY 167 190 14.0 703,938 10,437 4,225 19.4 18.0 18.7 0.2 (7.2) 3.9 8.6 9.3 8.9 5.3 5.6 4.6 1.9 1.6 1.5 16.7 2.6 2.6 20.3 19.0 17.3 5.3
Jindal Steel and Power RS 59 — — 54,254 804 915 (18.2) (14.5) 1.4 (363.0) 20.1 109.4 (3.3) (4.1) 43.2 15.3 9.7 7.5 0.3 0.3 0.3 — — — (8.4) (7.4) 0.7 14.1
JSW Steel REDUCE 1,319 1,045 (20.7) 318,723 4,726 242 (10.5) 131.8 154.3 (113.9) 1,352.0 17.1 (125.2) 10.0 8.5 11.6 5.9 5.4 1.5 1.3 1.1 0.7 0.7 0.7 (1.1) 13.8 14.2 15.3
National Aluminium Co. SELL 42 31 (26.0) 107,986 1,601 2,577 2.5 1.9 2.5 (46.6) (25.7) 30.8 16.5 22.2 17.0 5.7 7.8 5.4 0.8 0.8 0.8 4.2 2.4 2.4 5.1 3.7 4.8 0.8
NMDC SELL 89 75 (15.4) 351,670 5,214 3,965 8.2 7.2 7.3 (50.4) (12.1) 1.9 10.8 12.3 12.1 6.3 7.7 7.2 1.1 1.1 1.2 10.7 7.9 7.9 10.2 9.2 9.6 4.3
Tata Steel REDUCE 314 250 (20.3) 304,525 4,515 971 (29.7) 22.2 37.1 (91,652.8) 174.9 67.0 (10.6) 14 8.4 16.7 7.1 5.9 1.0 1.0 0.9 2.6 0.6 0.6 (9.5) 7.1 10.9 41.4
Vedanta BUY 98 130 33.3 289,058 4,286 2,965 9.8 11.5 17.4 (42.5) 17.2 51.4 9.9 8.5 5.6 7.0 6.1 5.0 0.6 0.5 0.4 3.6 2.9 2.9 5.9 8.1 10.1 30.6
Metals & Mining Cautious 4,081,341 60,512 (34.7) 41.9 27.7 15.9 11.2 8.8 8.7 6.8 5.7 1.5 1.3 1.2 8.7 4.0 4.5 9.4 12.0 14.2 155.4
Pharmaceutical
Biocon SELL 641 460 (28.2) 128,170 1,900 200 21.8 24.1 26.2 11.4 10.5 8.8 29.4 26.6 24.4 16.2 13.4 10.7 2.9 2.7 2.5 1.2 1.3 1.4 11.2 10.6 10.6 7.3
Cipla BUY 497 700 40.7 399,603 5,925 805 22.2 25.6 37.8 51.4 15.4 47.7 22.4 19.4 13.2 15.2 12.4 8.7 3.2 2.9 2.4 0.9 1.1 1.6 15.3 15.6 20.1 17.7
Dr Lal Pathlabs SELL 963 860 (10.7) 79,682 1,181 68 17.6 17.3 19.8 (13.1) (2.0) 14.9 54.7 55.8 48.6 38.9 33.6 28.9 14.9 11.8 9.5 0.3 0.3 0.3 30.8 28.4 26.1 1.5
Dr Reddy's Laboratories NR 3,030 — — 516,700 7,661 171 139.3 119.5 144.2 2.7 (14.2) 20.7 21.8 25.4 21.0 12.8 13.5 11.0 4.0 4.0 3.4 0.7 0.6 0.7 19.9 15.8 17.5 19.0
Lupin REDUCE 1,465 1,600 9.2 660,293 9,790 450 50.5 60.0 73.3 (5.5) 19.0 22.1 29.0 24.4 20.0 18.8 14.3 11.9 6.0 5.0 4.1 0.5 0.6 0.8 22.8 22.2 22.4 54.8
Sun Pharmaceuticals SELL 785 760 (3.1) 1,888,172 27,995 2,406 22.1 31.7 35.3 11.1 43.5 11.1 35.5 24.7 22.2 20.7 16.0 12.6 6.0 4.9 4.1 0.7 1.0 1.1 18.3 21.9 20.2 42.2
Torrent Pharmaceuticals REDUCE 1,330 1,260 (5.2) 224,980 3,336 169 101.8 57.5 66.0 129.3 (43.5) 14.8 13.1 23.1 20.1 8.4 15.2 13.2 6.6 5.4 4.5 3— 1— 1— 58.6 25.9 24.5 3.6
Pharmaceuticals Cautious 3,897,600 57,788 17.7 14.3 19.1 27.8 24.3 20.4 17.0 14.9 11.8 5.1 4.4 3.7 0.8 0.9 1.0 18.5 18.2 18.3 146.0
Dividend yield (%) RoE (%)Price/BV (X)
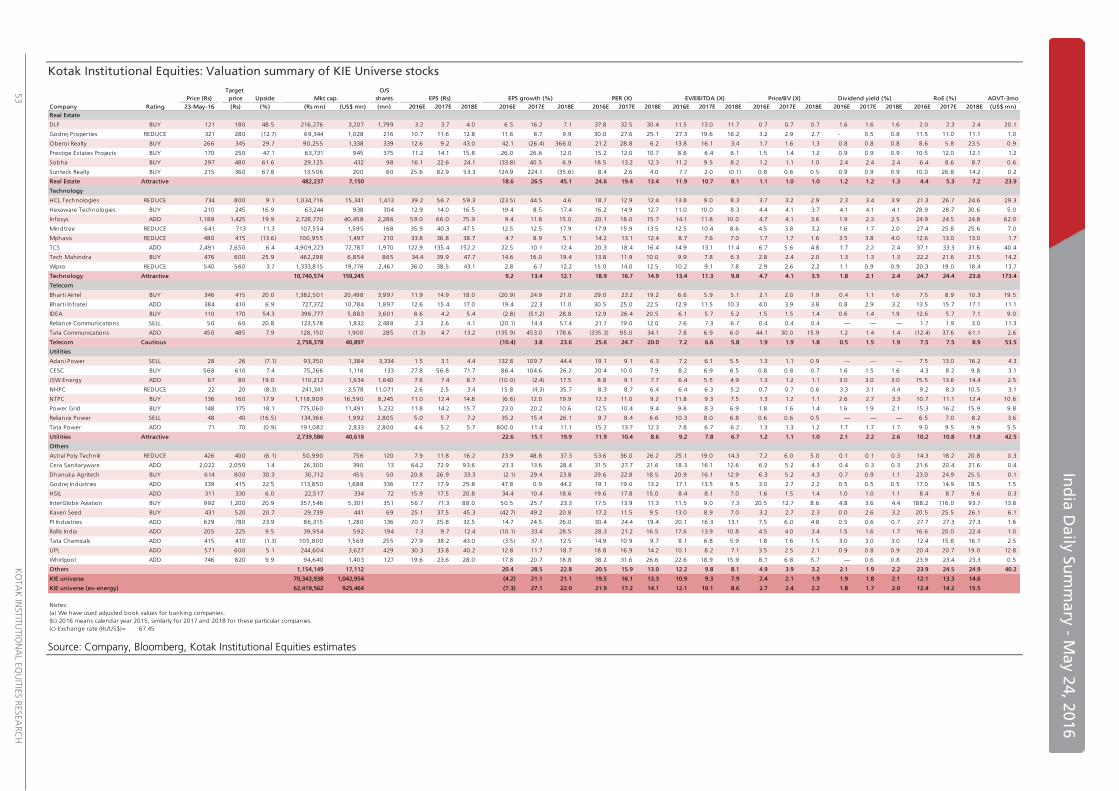
In
dia
Da
ily S
um
ma
ry - M
ay 2
4, 2
01
6
53
K
OTA
K IN
STIT
UTIO
NA
L EQ
UIT
IES R
ESEA
RC
H
Kotak Institutional Equities: Valuation summary of KIE Universe stocks
Source: Company, Bloomberg, Kotak Institutional Equities estimates
Target O/S
Price (Rs) price Upside Mkt cap. shares EPS (Rs) EPS growth (%) PER (X) EV/EBITDA (X) ADVT-3mo
Company Rating 23-May-16 (Rs) (%) (Rs mn) (US$ mn) (mn) 2016E 2017E 2018E 2016E 2017E 2018E 2016E 2017E 2018E 2016E 2017E 2018E 2016E 2017E 2018E 2016E 2017E 2018E 2016E 2017E 2018E (US$ mn)
Real Estate
DLF BUY 121 180 48.5 216,276 3,207 1,799 3.2 3.7 4.0 6.5 16.2 7.1 37.8 32.5 30.4 11.5 13.0 11.7 0.7 0.7 0.7 1.6 1.6 1.6 2.0 2.3 2.4 20.1
Godrej Properties REDUCE 321 280 (12.7) 69,344 1,028 216 10.7 11.6 12.8 11.6 8.7 9.9 30.0 27.6 25.1 27.3 19.6 16.2 3.2 2.9 2.7 - 0.5 0.8 11.5 11.0 11.1 1.0
Oberoi Realty BUY 266 345 29.7 90,255 1,338 339 12.6 9.2 43.0 42.1 (26.4) 366.0 21.2 28.8 6.2 13.8 16.1 3.4 1.7 1.6 1.3 0.8 0.8 0.8 8.6 5.8 23.5 0.9
Prestige Estates Projects BUY 170 250 47.1 63,731 945 375 11.2 14.1 15.8 26.0 26.6 12.0 15.2 12.0 10.7 8.6 6.4 6.1 1.5 1.4 1.2 0.9 0.9 0.9 10.5 12.0 12.1 1.2
Sobha BUY 297 480 61.6 29,125 432 98 16.1 22.6 24.1 (33.8) 40.5 6.9 18.5 13.2 12.3 11.2 9.5 8.2 1.2 1.1 1.0 2.4 2.4 2.4 6.4 8.6 8.7 0.6
Sunteck Realty BUY 215 360 67.8 13,506 200 60 25.6 82.9 53.3 124.9 224.1 (35.6) 8.4 2.6 4.0 7.7 2.0 (0.1) 0.8 0.6 0.5 0.9 0.9 0.9 10.0 26.8 14.2 0.2
Real Estate Attractive 482,237 7,150 18.6 26.5 45.1 24.6 19.4 13.4 11.9 10.7 8.1 1.1 1.0 1.0 1.2 1.2 1.3 4.4 5.3 7.2 23.9
Technology
HCL Technologies REDUCE 734 800 9.1 1,034,716 15,341 1,413 39.2 56.7 59.3 (23.5) 44.5 4.6 18.7 12.9 12.4 13.8 9.0 8.3 3.7 3.2 2.9 2.3 3.4 3.9 21.3 26.7 24.6 29.3
Hexaware Technologies BUY 210 245 16.9 63,244 938 304 12.9 14.0 16.5 19.4 8.5 17.4 16.2 14.9 12.7 11.0 10.0 8.3 4.4 4.1 3.7 4.1 4.1 4.1 28.9 28.7 30.6 5.0
Infosys ADD 1,188 1,425 19.9 2,728,770 40,458 2,286 59.0 66.0 75.9 9.4 11.8 15.0 20.1 18.0 15.7 14.1 11.8 10.0 4.7 4.1 3.6 1.9 2.3 2.5 24.9 24.5 24.8 62.0
Mindtree REDUCE 641 713 11.3 107,554 1,595 168 35.9 40.3 47.5 12.5 12.5 17.9 17.9 15.9 13.5 12.5 10.4 8.6 4.5 3.8 3.2 1.6 1.7 2.0 27.4 25.8 25.6 7.0
Mphasis REDUCE 480 415 (13.6) 100,955 1,497 210 33.8 36.8 38.7 4.7 8.9 5.1 14.2 13.1 12.4 8.7 7.6 7.0 1.7 1.7 1.6 3.5 3.8 4.0 12.6 13.0 13.0 1.7
TCS ADD 2,491 2,650 6.4 4,909,223 72,787 1,970 122.9 135.4 152.2 22.5 10.1 12.4 20.3 18.4 16.4 14.9 13.1 11.4 6.7 5.6 4.8 1.7 2.2 2.4 37.1 33.3 31.6 40.4
Tech Mahindra BUY 476 600 25.9 462,298 6,854 865 34.4 39.9 47.7 14.6 16.0 19.4 13.8 11.9 10.0 9.9 7.8 6.3 2.8 2.4 2.0 1.3 1.3 1.3 22.2 21.6 21.5 14.2
Wipro REDUCE 540 560 3.7 1,333,815 19,776 2,467 36.0 38.5 43.1 2.8 6.7 12.2 15.0 14.0 12.5 10.2 9.1 7.8 2.9 2.6 2.2 1.1 0.9 0.9 20.3 19.0 18.4 13.7
Technology Attractive 10,740,574 159,245 9.2 13.4 12.1 18.9 16.7 14.9 13.4 11.3 9.8 4.7 4.1 3.5 1.8 2.1 2.4 24.7 24.4 23.6 173.4
Telecom
Bharti Airtel BUY 346 415 20.0 1,382,501 20,498 3,997 11.9 14.9 18.0 (20.9) 24.9 21.0 29.0 23.2 19.2 6.6 5.9 5.1 2.1 2.0 1.9 0.4 1.1 1.6 7.5 8.9 10.3 19.5
Bharti Infratel ADD 384 410 6.9 727,372 10,784 1,897 12.6 15.4 17.0 19.4 22.3 11.0 30.5 25.0 22.5 12.9 11.5 10.3 4.0 3.9 3.8 0.8 2.9 3.2 13.5 15.7 17.1 11.1
IDEA BUY 110 170 54.3 396,777 5,883 3,601 8.6 4.2 5.4 (2.8) (51.2) 28.8 12.9 26.4 20.5 6.1 5.7 5.2 1.5 1.5 1.4 0.6 1.4 1.9 12.6 5.7 7.1 9.0
Reliance Communications SELL 50 60 20.8 123,578 1,832 2,488 2.3 2.6 4.1 (20.1) 14.4 57.4 21.7 19.0 12.0 7.6 7.3 6.7 0.4 0.4 0.4 — — — 1.7 1.9 3.0 11.3
Tata Communications ADD 450 485 7.9 128,150 1,900 285 (1.3) 4.7 13.2 (135.9) 453.0 178.6 (335.3) 95.0 34.1 7.8 6.9 6.0 44.1 30.0 15.9 1.2 1.4 1.4 (12.4) 37.6 61.1 2.6
Telecom Cautious 2,758,378 40,897 (10.4) 3.8 23.6 25.6 24.7 20.0 7.2 6.6 5.8 1.9 1.9 1.8 0.5 1.5 1.9 7.5 7.5 8.9 53.5
Utilities
Adani Power SELL 28 26 (7.1) 93,350 1,384 3,334 1.5 3.1 4.4 132.8 109.7 44.4 19.1 9.1 6.3 7.2 6.1 5.5 1.3 1.1 0.9 — — — 7.5 13.0 16.2 4.3
CESC BUY 568 610 7.4 75,266 1,116 133 27.8 56.8 71.7 86.4 104.6 26.2 20.4 10.0 7.9 8.2 6.9 6.5 0.8 0.8 0.7 1.6 1.5 1.6 4.3 8.2 9.8 3.1
JSW Energy ADD 67 80 19.0 110,212 1,634 1,640 7.6 7.4 8.7 (10.0) (2.4) 17.5 8.8 9.1 7.7 6.4 5.5 4.9 1.3 1.2 1.1 3.0 3.0 3.0 15.5 13.6 14.4 2.5
NHPC REDUCE 22 20 (8.3) 241,341 3,578 11,071 2.6 2.5 3.4 15.8 (4.3) 35.7 8.3 8.7 6.4 6.4 6.3 5.2 0.7 0.7 0.6 3.3 3.1 4.4 9.2 8.3 10.5 3.1
NTPC BUY 136 160 17.9 1,118,909 16,590 8,245 11.0 12.4 14.8 (6.6) 12.0 19.9 12.3 11.0 9.2 11.8 9.3 7.5 1.3 1.2 1.1 2.6 2.7 3.3 10.7 11.1 12.4 10.6
Power Grid BUY 148 175 18.1 775,060 11,491 5,232 11.8 14.2 15.7 23.0 20.2 10.6 12.5 10.4 9.4 9.8 8.3 6.9 1.8 1.6 1.4 1.6 1.9 2.1 15.3 16.2 15.9 9.8
Reliance Power SELL 48 40 (16.5) 134,366 1,992 2,805 5.0 5.7 7.2 35.2 15.4 26.1 9.7 8.4 6.6 10.3 8.0 6.8 0.6 0.6 0.5 — — — 6.5 7.0 8.2 3.6
Tata Power ADD 71 70 (0.9) 191,082 2,833 2,800 4.6 5.2 5.7 800.0 11.4 11.1 15.2 13.7 12.3 7.8 6.7 6.2 1.3 1.3 1.2 1.7 1.7 1.7 9.0 9.5 9.9 5.5
Utilities Attractive 2,739,586 40,618 22.6 15.1 19.9 11.9 10.4 8.6 9.2 7.8 6.7 1.2 1.1 1.0 2.1 2.2 2.6 10.2 10.8 11.8 42.5
Others
Astral Poly Technik REDUCE 426 400 (6.1) 50,990 756 120 7.9 11.8 16.2 23.9 48.8 37.3 53.6 36.0 26.2 25.1 19.0 14.3 7.2 6.0 5.0 0.1 0.1 0.3 14.3 18.2 20.8 0.3
Cera Sanitaryware ADD 2,022 2,050 1.4 26,300 390 13 64.2 72.9 93.6 23.3 13.6 28.4 31.5 27.7 21.6 18.3 16.1 12.6 6.2 5.2 4.3 0.4 0.3 0.3 21.6 20.4 21.6 0.4
Dhanuka Agritech BUY 614 800 30.3 30,712 455 50 20.8 26.9 33.3 (2.1) 29.4 23.8 29.6 22.8 18.5 20.9 16.1 12.9 6.3 5.2 4.3 0.7 0.9 1.1 23.0 24.9 25.5 0.1
Godrej Industries ADD 339 415 22.5 113,850 1,688 336 17.7 17.9 25.8 47.8 0.9 44.2 19.1 19.0 13.2 17.1 13.5 9.5 3.0 2.7 2.2 0.5 0.5 0.5 17.0 14.9 18.5 1.5
HSIL ADD 311 330 6.0 22,517 334 72 15.9 17.5 20.8 34.4 10.4 18.6 19.6 17.8 15.0 8.4 8.1 7.0 1.6 1.5 1.4 1.0 1.0 1.1 8.4 8.7 9.6 0.3
InterGlobe Aviation BUY 992 1,200 20.9 357,546 5,301 351 56.7 71.3 88.0 50.5 25.7 23.3 17.5 13.9 11.3 11.5 9.0 7.3 20.5 12.7 8.6 4.8 3.6 4.4 188.2 116.0 93.7 13.8
Kaveri Seed BUY 431 520 20.7 29,739 441 69 25.1 37.5 45.3 (42.7) 49.2 20.8 17.2 11.5 9.5 13.0 8.9 7.0 3.2 2.7 2.3 0.0 2.6 3.2 20.5 25.5 26.1 6.1
PI Industries ADD 629 780 23.9 86,315 1,280 136 20.7 25.8 32.5 14.7 24.5 26.0 30.4 24.4 19.4 20.1 16.3 13.1 7.5 6.0 4.8 0.5 0.6 0.7 27.7 27.3 27.3 1.6
Rallis India ADD 205 225 9.5 39,954 592 194 7.3 9.7 12.4 (10.1) 33.4 28.5 28.3 21.2 16.5 17.6 13.9 10.8 4.5 4.0 3.4 1.5 1.6 1.7 16.6 20.0 22.4 1.0
Tata Chemicals ADD 415 410 (1.3) 105,800 1,569 255 27.9 38.2 43.0 (3.5) 37.1 12.5 14.9 10.9 9.7 8.1 6.8 5.9 1.8 1.6 1.5 3.0 3.0 3.0 12.4 15.8 16.1 2.5
UPL ADD 571 600 5.1 244,604 3,627 429 30.3 33.8 40.2 12.8 11.7 18.7 18.8 16.9 14.2 10.1 8.2 7.1 3.5 2.5 2.1 0.9 0.8 0.9 20.4 20.7 19.0 12.8
Whirlpool ADD 746 820 9.9 94,640 1,403 127 19.6 23.6 28.0 17.8 20.7 18.8 38.2 31.6 26.6 22.6 18.9 15.9 8.1 6.8 5.7 — 0.6 0.8 23.9 23.4 23.3 0.5
Others 1,154,149 17,112 20.4 28.5 22.8 20.5 15.9 13.0 12.2 9.8 8.1 4.9 3.9 3.2 2.1 1.9 2.2 23.9 24.5 24.9 40.2
KIE universe 70,343,938 1,042,954 (4.2) 21.1 21.1 19.5 16.1 13.3 10.9 9.3 7.9 2.4 2.1 1.9 1.9 1.8 2.1 12.1 13.3 14.6
KIE universe (ex-energy) 62,419,562 925,464 (7.3) 27.1 22.0 21.9 17.2 14.1 12.1 10.1 8.6 2.7 2.4 2.2 1.8 1.7 2.0 12.4 14.2 15.5
Notes:
(a) We have used adjusted book values for banking companies.
(b) 2016 means calendar year 2015, similarly for 2017 and 2018 for these particular companies.
(c) Exchange rate (Rs/US$)= 67.45
Dividend yield (%)Price/BV (X) RoE (%)

Disclo
sure
s
Disclosures
Ratings and other definitions/identifiers
Definitions of ratings
BUY. We expect this stock to deliver more than 15% returns over the next 12 months.
ADD. We expect this stock to deliver 5-15% returns over the next 12 months.
REDUCE. We expect this stock to deliver -5-+5% returns over the next 12 months.
SELL. We expect this stock to deliver <-5% returns over the next 12 months.
Our target prices are also on a 12-month horizon basis.
Other definitions
Coverage view. The coverage view represents each analyst’s overall fundamental outlook on the Sector. The coverage view will consist of one of the following
designations: Attractive, Neutral, Cautious.
Other ratings/identifiers
NR = Not Rated. The investment rating and target price, if any, have been suspended temporarily. Such suspension is in compliance with applicable regulation(s)
and/or Kotak Securities policies in circumstances when Kotak Securities or its affiliates is acting in an advisory capacity in a merger or strategic transaction
involving this company and in certain other circumstances.
CS = Coverage Suspended. Kotak Securities has suspended coverage of this company.
NC = Not Covered. Kotak Securities does not cover this company.
RS = Rating Suspended. Kotak Securities Research has suspended the investment rating and price target, if any, for this stock, because there is not a sufficient
fundamental basis for determining an investment rating or target. The previous investment rating and price target, if any, are no longer in effect for this stock
and should not be relied upon.
NA = Not Available or Not Applicable. The information is not available for display or is not applicable.
NM = Not Meaningful. The information is not meaningful and is therefore excluded.
Kotak Institutional Equities Research coverage universe
Distribution of ratings/investment banking relationships
Source: Kotak Institutional Equities As of March 31, 2016
Percentage of companies covered by Kotak Institutional
Equities, within the specified category.
* The above categories are defined as follows: Buy = We
expect this stock to deliver more than 15% returns over
the next 12 months; Add = We expect this stock to
deliver 5-15% returns over the next 12 months; Reduce
= We expect this stock to deliver -5-+5% returns over
the next 12 months; Sell = We expect this stock to deliver
less than -5% returns over the next 12 months. Our
target prices are also on a 12-month horizon basis.
These ratings are used illustratively to comply with
applicable regulations. As of 31/03/2016 Kotak
Institutional Equities Investment Research had
investment ratings on 180 equity securities.
Percentage of companies within each category for
which Kotak Institutional Equities and or its affiliates has
provided investment banking services within the
previous 12 months.
34.4%
30.6%
19.4%
15.6%
3.3%5.0%
1.1% 0.6%
0%
10%
20%
30%
40%
50%
60%
70%
BUY ADD REDUCE SELL
Corporate Office Overseas Affiliates
Kotak Securities Ltd.
27 BKC, Plot No. C-27, “G Block”
Bandra Kurla Complex, Bandra (E)
Mumbai 400 051, India
Tel: +91-22-43360000
Kotak Mahindra (UK) Ltd
8th Floor, Portsoken House
155-157 Minories
London EC3N 1LS
Tel: +44-20-7977-6900
Kotak Mahindra Inc
369 Lexington Avenue
28th Floor, New York
NY 10017, USA
Tel:+1 212 600 8856
Copyright 2016 Kotak Institutional Equities (Kotak Securities Limited). All rights reserved.
1. Note that the research analysts contributing to this report may not be registered/qualified as research analysts with FINRA; and
2. Such research analysts may not be associated persons of Kotak Mahindra Inc and therefore, may not be subject to NASD Rule 2711 restrictions on communications with a subject company, public appearances and trading securities held by a research analyst account.
3. Any U.S. recipients of the research who wish to effect transactions in any security covered by the report should do so with or through Kotak Mahindra Inc and (ii) any transactions in the securities covered by the research by U.S. recipients must be effected only through Kotak Mahindra Inc at [email protected].
This report is distributed in Singapore by Kotak Mahindra (UK) Limited (Singapore Branch) to institutional investors, accredited investors or expert investors only as defined under the Securities and Futures Act. Recipients of this analysis / report are to contact Kotak Mahindra (UK) Limited (Singapore Branch) (16 Raffles Quay, #35-02/03, Hong Leong Building, Singapore 048581) in respect of any matters arising from, or in connection with, this analysis / report. Kotak Mahindra (UK) Limited (Singapore Branch) is regulated by the Monetary Authority of Singapore.
Kotak Securities Limited and its affiliates are a full-service, integrated investment banking, investment management, brokerage and financing group. We along with our affiliates are leading underwriter of securities and participants in virtually all securities trading markets in India. We and our affiliates have investment banking and other business relationships with a significant percentage of the companies covered by our Investment Research Department. Our research professionals provide important input into our investment banking and other business selection processes. Investors should assume that Kotak Securities Limited and/or its affiliates are seeking or will seek investment banking or other business from the company or companies that are the subject of this material and that the research professionals who were involved in preparing this material may participate in the solicitation of such business. Our research professionals are paid in part based on the profitability of Kotak Securities Limited, which include earnings from investment banking and other business. Kotak Securities Limited generally prohibits its analysts, persons reporting to analysts, and members of their households from maintaining a financial interest in the securities or derivatives of any companies that the analysts cover. Additionally, Kotak Securities Limited generally prohibits its analysts and persons reporting to analysts from serving as an officer, director, or advisory board member of any companies that the analysts cover. Our salespeople, traders, and other professionals may provide oral or written market commentary or trading strategies to our clients that reflect opinions that are contrary to the opinions expressed herein, and our proprietary trading and investing businesses may make investment decisions that are inconsistent with the recommendations expressed herein. In reviewing these materials, you should be aware that any or all of the foregoing, among other things, may give rise to real or potential conflicts of interest. Additionally, other important information regarding our relationships with the company or companies that are the subject of this material is provided herein.
This material should not be construed as an offer to sell or the solicitation of an offer to buy any security in any jurisdiction where such an offer or solicitation would be illegal. We are not soliciting any action based on this material. It is for the general information of clients of Kotak Securities Limited. It does not constitute a personal recommendation or take into account the particular investment objectives, financial situations, or needs of individual clients. Before acting on any advice or recommendation in this material, clients should consider whether it is suitable for their particular circumstances and, if necessary, seek professional advice. The price and value of the investments referred to in this material and the income from them may go down as well as up, and investors may realize losses on any investments. Past performance is not a guide for future performance, future returns are not guaranteed and a loss of original capital may occur. Kotak Securities Limited does not provide tax advise to its clients, and all investors are strongly advised to consult with their tax advisers regarding any potential investment.
Certain transactions -including those involving futures, options, and other derivatives as well as non-investment-grade securities - give rise to substantial risk and are not suitable for all investors. The material is based on information that we consider reliable, but we do not represent that it is accurate or complete, and it should not be relied on as such. Opinions expressed are our current opinions as of the date appearing on this material only. We endeavor to update on a reasonable basis the information discussed in this material, but regulatory, compliance, or other reasons may prevent us from doing so. We and our affiliates, officers, directors, and employees, including persons involved in the preparation or issuance of this material, may from time to time have “long” or “short” positions in, act as principal in, and buy or sell the securities or derivatives thereof of companies mentioned herein. Kotak Securities Limited and its non US affiliates may, to the extent permissible under applicable laws, have acted on or used this research to the extent that it relates to non US issuers, prior to or immediately following its publication. Foreign currency denominated securities are subject to fluctuations in exchange rates that could have an adverse effect on the value or price of or income derived from the investment. In addition, investors in securities such as ADRs, the value of which are influenced by foreign currencies affectively assume currency risk. In addition options involve risks and are not suitable for all investors. Please ensure that you have read and understood the current derivatives risk disclosure document before entering into any derivative transactions.
Kotak Securities Limited established in 1994, is a subsidiary of Kotak Mahindra Bank Limited. Kotak Securities is one of India’s largest brokerage and distribution house.
Kotak Securities Limited is a corporate trading and clearing member of BSE Limited (BSE), National Stock Exchange of India Limited (NSE), MSEI and United Stock Exchange of India Limited (USEIL). Our businesses include stock broking, services rendered in connection with distribution of primary market issues and financial products like mutual funds and fixed deposits, depository services and Portfolio Management.
Kotak Securities Limited is also a depository participant with National Securities Depository Limited (NSDL) and Central Depository Services (India) Limited (CDSL). Kotak Securities Limited is also registered with Insurance Regulatory and Development Authority as Corporate Agent for Kotak Mahindra Old Mutual Life Insurance Limited and is also a Mutual Fund Advisor registered with Association of Mutual Funds in India (AMFI). Kotak Securities Limited is registered as a Research Analyst under SEBI (Research Analyst) Regulations, 2014.
We hereby declare that our activities were neither suspended nor we have defaulted with any stock exchange authority with whom we are registered in last five years. However SEBI, Exchanges and Depositories have conducted the routine inspection and based on their observations have issued advise letters or levied minor penalty on KSL for certain operational deviations. We have not been debarred from doing business by any Stock Exchange / SEBI or any other authorities; nor has our certificate of registration been cancelled by SEBI at any point of time.
We offer our research services to primarily institutional investors and their employees, directors, fund managers, advisors who are registered with us
Details of Associates are available on our website i.e. www.kotak.com
Research Analyst has not served as an officer, director or employee of Subject Company. We or our associates have received compensation from the subject company in the past 12 months. We or our associates have managed or co-managed public offering of securities for the subject company in the past 12 months. We or our associates have received compensation for investment banking or merchant banking or brokerage services from the subject company in the past 12 months. We or our associates have received any compensation for products or services other than investment banking or merchant banking or brokerage services from the subject company in the past 12 months. We or our associates have received any compensation or other benefits from the subject company or third party in connection with the research report.
Research Analyst or his/her relative’s may have financial interest in the subject company. Kotak Securities Limited or its associates have financial interest in the subject company. Research Analyst or his/her relatives does not have actual/beneficial ownership of 1% or more securities of the subject company at the end of the month immediately preceding the date of publication of Research Report: Kotak Securities Limited does not have actual/beneficial ownership of 1% or more securities of the subject company at the end of the month immediately preceding the date of publication of Research Report. Associates of Kotak Securities Limited may have actual/beneficial ownership of 1% or more securities of the subject company at the end of the month immediately preceding the date of publication of Research Report. Subject Company has been client during twelve months preceding the date of distribution of the research report.
A graph of daily closing prices of securities is available at www.nseindia.com and http://economictimes.indiatimes.com/markets/stocks/stock-quotes. (Choose a company from the list on the browser and select the “three years” icon in the price chart).
Kotak Securities Limited. Registered Office: 27 BKC, C 27, G Block, Bandra Kurla Complex, Bandra (E), Mumbai 400051. CIN: U99999MH1994PLC134051, Telephone No.: +22 43360000, Fax No.: +22 67132430. Website: www.kotak.com. SEBI Registration No: NSE INB/INF/INE 230808130, BSE INB 010808153/INF 011133230, MSEI INE 260808130/INB 260808135/INF 260808135, Research Analyst INH000000586, AMFI ARN 0164 and PMS INP000000258. NSDL: IN-DP-NSDL-23-97. CDSL: IN-DP-CDSL-158-2001. Compliance Officer Details: Mr. Manoj Agarwal. Call: 022-4285 6825 or Email: [email protected]