india daily - Kotak Securities
152
For Private Circulation Only. FOR IMPORTANT INFORMATION ABOUT KOTAK SECURITIES’ RATING SYSTEM AND OTHER DISCLOSURES. REFER TO THE END OF THIS MATERIAL. Contents Special Reports Strategy Strategy: A good month for AlphaBet Strategy: Taking stock Theme Report Automobiles & Components: 2Ws - quest to conquer the world Daily Alerts Company alerts National Aluminium Co.: Cash burn to continue, growth projects to erode balance sheet Sector alerts Automobiles & Components: Honda launches H’Ness CB350 IT Services: Expect a robust quarter of growth Telecommunication Services: The VLR conundrum Economy alerts Economy: Borrowing target retained Economy: Trade-led BOP surplus INDIA DAILY October 1, 2020 India 30-Sep 1-day 1-mo 3-mo Sensex 38,068 0.2 (2.1) 7.5 Nifty 11,248 0.2 (1.9) 7.8 Global/Regional indices Dow Jones 27,782 1.2 (3.0) 8.0 Nasdaq Composite 11,168 0.7 (6.5) 10.0 FTSE 5,866 (0.5) 0.1 (4.7) Nikkei 23,185 (0.0) 0.2 4.8 Hang Seng 23,459 0.8 (6.9) (4.0) KOSPI 2,328 0.9 0.1 10.4 Value traded – India Cash (NSE+BSE) 518 585 625 Derivatives (NSE) 22,618 14,184 10,90 1 Deri. open interest 3,802 3,348 2,969 Forex/money market Change, basis points 30-Sep 1-day 1-mo 3-mo Rs/US$ 73.5 (26) 50 (192) 10yr govt bond, % 6.4 (2) (11) 12 Net investment (US$ mn) 29-Sep MTD CYTD FIIs (144) - 4,076 MFs (6) - 2,597 Top movers Change, % Best performers 30-Sep 1-day 1-mo 3-mo APHS IN Equity 2,148 3.0 28.6 62.8 AL IN Equity 74 (0.7) 8.1 54.4 TTMT/A IN Equity 63 4.6 23.9 53.4 HCLT IN Equity 812 (0.1) 17.7 47.1 JSTL IN Equity 278 (2.2) (3.2) 45.1 Worst performers YES IN Equity 13 (1.5) (10.2) (51.1) IHFL IN Equity 157 3.3 (23.6) (28.6) BHARTI IN Equity 421 (3.4) (22.9) (24.9) PNB IN Equity 29 (1.9) (17.7) (21.6) BOB IN Equity 41 (0.7) (13.7) (20.1) [email protected] Contact: +91 22 6218 6427
-
Upload
khangminh22 -
Category
Documents
-
view
1 -
download
0
Transcript of india daily - Kotak Securities

For Private Circulation Only. FOR IMPORTANT INFORMATION ABOUT KOTAK SECURITIES’ RATING SYSTEM AND OTHER DISCLOSURES. REFER TO THE END OF THIS MATERIAL.
Contents
Special Reports
Strategy
Strategy: A good month for AlphaBet
Strategy: Taking stock
Theme Report
Automobiles & Components: 2Ws - quest to conquer the world
Daily Alerts
Company alerts
National Aluminium Co.: Cash burn to continue, growth projects to erode balance sheet
Sector alerts
Automobiles & Components: Honda launches H’Ness CB350
IT Services: Expect a robust quarter of growth
Telecommunication Services: The VLR conundrum
Economy alerts
Economy: Borrowing target retained
Economy: Trade-led BOP surplus
INDIA DAILY October 1, 2020 India 30-Sep 1-day 1-mo 3-mo
Sensex 38,068 0.2 (2.1) 7.5
Nifty 11,248 0.2 (1.9) 7.8
Global/Regional indices
Dow Jones 27,782 1.2 (3.0) 8.0
Nasdaq Composite 11,168 0.7 (6.5) 10.0
FTSE 5,866 (0.5) 0.1 (4.7)
Nikkei 23,185 (0.0) 0.2 4.8
Hang Seng 23,459 0.8 (6.9) (4.0)
KOSPI 2,328 0.9 0.1 10.4
Value traded – India
Cash (NSE+BSE) 518 585 625
Derivatives (NSE) 22,618 14,184 10,90
1
Deri. open interest 3,802 3,348 2,969
Forex/money market
Change, basis points
30-Sep 1-day 1-mo 3-mo
Rs/US$ 73.5 (26) 50 (192)
10yr govt bond, % 6.4 (2) (11) 12
Net investment (US$ mn)
29-Sep MTD CYTD
FIIs (144) - 4,076
MFs (6) - 2,597
Top movers
Change, %
Best performers 30-Sep 1-day 1-mo 3-mo
APHS IN Equity 2,148 3.0 28.6 62.8
AL IN Equity 74 (0.7) 8.1 54.4
TTMT/A IN Equity 63 4.6 23.9 53.4
HCLT IN Equity 812 (0.1) 17.7 47.1
JSTL IN Equity 278 (2.2) (3.2) 45.1
Worst performers
YES IN Equity 13 (1.5) (10.2) (51.1)
IHFL IN Equity 157 3.3 (23.6) (28.6)
BHARTI IN Equity 421 (3.4) (22.9) (24.9)
PNB IN Equity 29 (1.9) (17.7) (21.6)
BOB IN Equity 41 (0.7) (13.7) (20.1)
[email protected]: +91 22 6218 6427

For Private Circulation Only. FOR IMPORTANT INFORMATION ABOUT KOTAK SECURITIES’ RATING SYSTEM AND OTHER DISCLOSURES, REFER TO THE END OF THIS MATERIAL.
Each single factor portfolio outperforms
After an August where none of the single factor portfolios beat the benchmark, September was
a kinder month for the AlphaBet suite. All four factors – momentum, fundamental, low-
volatility and sentiment – outperformed against the index. Momentum was the best performing
factor in September, which came as a relief after its horrid performance in CY2020 YTD.
Sentiment remains the best-performing factor YTD, delivering an outperformance of 47% over
the index.
All-Season benefits from pharma exposure
The outperformance of single factors also translated into the outperformance of the multi-
factor All-Season portfolio. It beat the benchmark by 8.6% in September, benefiting from
exposure to pharma (DRRD and CIPLA) and HCLT. On YTD basis, it is now up 15.9%, beating
the benchmark by 22.4%.
Higher volatility bad news for the anti-factor portfolio
Higher volatility was bad news for the anti-factor portfolio. The concentrated anti-factor
portfolio was down 5.3%, and the broad anti-factor portfolio was down 7.8%. The anti-factor
portfolio consists of stocks with the weakest fundamentals, poorest sentiment change, highest
volatility and the lowest momentum. Despite its underperformance in September, the anti-
factor portfolio is still up, and outperforming the benchmark, YTD.
October 2020 changes to the concentrated All-season portfolio
October 2020 concentrated All-Season portfolio consists of Hindustan Unilever (HUVR), Tata
Steel (TATA), Britannia Industries (BRIT), Dr Reddy’s Laboratories (DRRD) and Tata Consultancy
Services (TCS). TATA and TCS replace HCL Technologies (HCLT) and Cipla (CIPLA) in the
concentrated All-season portfolio. We show the factor scores of these stocks and their position
within the universe in Exhibits 4 – 7. The single factor portfolios are provided in Exhibits 8-17.
The anti-factor portfolio, which contains the stocks with the worst factor scores, has Tata
Motors (TTMT), Axis Bank (AXSB), ONGC (ONGC), IndusInd Bank (IIB) and Grasim Industries
(GRASIM). AlphaBet recommendations can differ from KIE analyst recommendations.
Strategy AlphaBet
A good month for AlphaBet. With the return of volatility, normal service resumed in
terms of factor performance. All the single factor portfolios in the AlphaBet suite
outperformed the index in September. The anti-factor portfolio, a collection of stocks
with the weakest fundamentals, lowest momentum, highest volatility and poorest
sentiment change, underperformed the benchmark by 4%. The multi-factor All-Season
portfolio beat the index by ~9%. We add TATA and TCS to the concentrated All-Season
portfolio, replacing CIPLA and HCLT.
INDIA
OCTOBER 01, 2020
UPDATE
BSE-30: 38,068
QUICK NUMBERS
Momentum the best
performing single-
factor in September
(4.4%)
Sentiment the best
performing factor
YTD (41%)
All-Season
outperformance
versus index (~9%
in September, 22%
YTD)
Anurag Singh
[email protected]: +91 22 6218 6427

Strategy India
KOTAK INSTITUTIONAL EQUITIES RESEARCH 3
PERFORMANCE UPDATE: A GOOD MONTH FOR ALPHABET
In our previous note dated September 1, we noted the outperformance of high-volatility
stocks in August, but cautioned against taking a position in these names. Our
recommendation was based on the expectation of return of volatility. These fears were
realized in September. After falling below 20 in August, India VIX remained elevated above
20 through most of September.
Realized volatility was also up in September, when compared to July and August. This was
not good news for the higher volatility names. A basket of the 10 highest volatility names in
Nifty Index, as of August 31, had an average return of -5.3% and a median return of -5.7%
over September. On the other hand, a similar basket of 10 lowest volatility names had an
average return of 1.7% and a median return of 0.9%. The index returned -1.2% during
September.
September was a good month for all single-factor portfolios. After enduring a rough
CY2020 till date, momentum was the best performing single factor. The concentrated
momentum portfolio, buffeted by its exposure to pharma sector and RIL, outperformed the
index by more than 5%.
The concentrated All-Season portfolio, which is a multi-factor portfolio of five stocks from
Nifty-50 Index with the best momentum, sentiment, volatility and fundamental
characteristics, beat the index by more than 8% in September. Exhibit 1 shows the
performance of the AlphaBet portfolios in the month of September.
The concentrated All-Season portfolio has now outperformed the benchmark by close to
22% from the start of 2020. While the benchmark’s total return in 2020 is close to -7%, the
concentrated All-Season portfolio has returned ~16%.
Exhibit 1: All single factor portfolios outperform against Nifty; concentrated All-Season portfolio beats the index by ~9% Performance of single factor and All-Season portfolios in September 2020
Source: Bloomberg, Kotak Institutional Equities
We also show the difference in the median of the returns of the best-performing 25 stocks
and the median of the returns of the worst-performing 25 stocks from the BSE-200 Index
each month. The higher the difference, the better the opportunities are for stock pickers.
The spread between the best performers and the worst performers had remained depressed
for close to 5 years before the Covid-19 pandemic. However, March to August had
performance spreads in the top quartile of historical performance spreads. The spread
reverted to a lower level in September (Exhibit 2).
September 2020 returns (%) YTD returns (%) Active September returns (%) Active YTD returns (%)
Nifty Index (1.2) (6.5) NA NA
Concentrated All-season 7.4 15.9 8.6 22.4
Broad All-Season 4.0 0.7 5.2 7.1
Concentrated fundamental (0.7) 3.2 0.5 9.7
Broad fundamental 1.7 4.1 2.9 10.6
Concentrated low volatility (0.1) (7.8) 1.1 (1.4)
Broad low volatility 2.0 1.6 3.2 8.0
Concentrated momentum 4.4 (24.6) 5.6 (18.2)
Broad momentum 3.1 (14.3) 4.3 (7.8)
Concentrated sentiment 2.1 41.0 3.3 47.4
Broad sentiment (1.3) (3.5) (0.1) 3.0
Concentrated anti-factor (5.3) 6.2 (4.1) 12.7
Broad anti-factor (7.8) 10.6 (6.6) 17.1

India Strategy
4 KOTAK INSTITUTIONAL EQUITIES RESEARCH
Exhibit 2: Past few months were good for active stock pickers with higher dispersion between the returns of best-performers and the
worst-performers Dispersion of returns (in %), measured as the difference of (a) median of returns of best-performing 25 stocks in BSE-200 Index and (b) median of returns of worst-performing 25 stocks in BSE-200 Index, over each month
Source: Bloomberg, Kotak Institutional Equities
0
10
20
30
40
50
60
70
80
90
Dec-
05
May-
06
Oct
-06
Mar-
07
Aug
-07
Jan
-08
Jun-0
8
Nov-
08
Apr-
09
Sep
-09
Feb-1
0
Jul-1
0
Dec-
10
May-
11
Oct
-11
Mar-
12
Aug
-12
Jan
-13
Jun-1
3
Nov-
13
Apr-
14
Sep
-14
Feb-1
5
Jul-1
5
Dec-
15
May-
16
Oct
-16
Mar-
17
Aug
-17
Jan
-18
Jun-1
8
Nov-
18
Apr-
19
Sep
-19
Feb-2
0
Jul-2
0
Dispersion of returns 3-month moving average

Strategy India
KOTAK INSTITUTIONAL EQUITIES RESEARCH 5
OCTOBER 2020 PORTFOLIOS
The stocks selected in the concentrated All-Season portfolio for the October 2020 portfolio
are Hindustan Unilever (HUVR), Tata Steel (TATA), Britannia Industries (BRIT), Dr Reddy’s
Laboratories (DRRD) and Tata Consultancy Services (TCS). TCS and TATA replace HCLT and
CIPLA.
Exhibit 3 shows the top half of the Nifty50 Index, as sorted by the combined multi-factor
score. The tickers in red (top five) are a part of the concentrated All-Season portfolio.
Exhibit 3: TCS and TATA replace HCLT and CIPLA in the September All-Season portfolio Top half of Nifty50 Index, as sorted by combined factor score; stock names in red are part of the October 2020 concentrated All-Season portfolio
Source: Bloomberg, Kotak Institutional Equities
Exhibit 4 shows the volatility metrics of the five stocks, alongside the bar chart of the same
for the benchmark. The chart demarcates the four quartiles (color coded) for the three
metrics included in our volatility factor – price volatility, downside deviation and max
drawdown. We also show the relative position of our All-Season portfolio picks and which
quartile they fall into. We truncate the metrics by clipping the edges at both ends. That is, to
reduce the effect of outliers, we cap the metrics at 90th and 10th percentile, respectively.
We also show similar metrics for momentum, fundamental and sentiment scores (see
Exhibits 5-7).
Stock name Sentiment Fundamental Momentum Low volatility Multi-factor
Dr Reddy's Laboratories Ltd 3.0 (0.2) 0.4 0.7 1.0
Tata Consultancy Services Ltd 1.4 0.6 (0.4) 1.0 0.7
Tata Steel Ltd 2.4 (0.1) 0.7 (0.7) 0.6
Hindustan Unilever Ltd (0.6) 1.1 (0.0) 1.7 0.5
Britannia Industries Ltd 0.2 0.3 0.3 1.0 0.5
Reliance Industries Ltd 1.0 (0.3) 0.9 0.3 0.5
Asian Paints Ltd 0.1 0.4 (0.0) 1.4 0.5
Bajaj Auto Ltd 0.6 0.4 (0.2) 0.7 0.4
Nestle India Ltd (0.8) 0.5 0.1 1.4 0.3
Power Grid Corp of India Ltd (0.4) 0.4 (0.1) 1.3 0.3
Cipla Ltd/India (0.4) (0.2) 1.2 0.6 0.3
Eicher Motors Ltd 1.0 0.2 0.4 (0.5) 0.3
HCL Technologies Ltd 0.1 0.4 (0.1) 0.6 0.2
HDFC Bank Ltd (0.4) 0.8 (0.3) 0.9 0.2
Infosys Ltd (0.4) 0.8 (0.2) 0.7 0.2
ITC Ltd (0.4) 1.0 (0.4) 0.6 0.2
Shree Cements Ltd 0.0 (0.2) 0.3 0.6 0.2
Wipro Ltd 0.4 0.2 (0.6) 0.7 0.2
Maruti Suzuki India Ltd 1.1 (0.1) 0.1 (0.4) 0.2
Tech Mahindra Ltd (0.1) 0.4 (0.3) 0.6 0.2
UltraTech Cement Ltd 0.4 (0.2) (0.3) 0.6 0.1
SBI Life Insurance (0.2) 0.5 (0.1) 0.2 0.1
Hero MotoCorp Ltd (0.1) 0.3 0.0 (0.0) 0.0
Bharti Airtel Ltd 0.2 (1.7) 1.4 0.2 0.0

India Strategy
6 KOTAK INSTITUTIONAL EQUITIES RESEARCH
Exhibit 4: All stocks in conc. All-Season portfolio, except Tata Steel, have good volatility
characteristics Concentrated All-Season portfolio, relative to benchmark, on volatility metrics
Source: Bloomberg, Kotak Institutional Equities
Exhibit 5: None of the stocks in the conc. All-Season portfolio have outstanding momentum score Concentrated All-Season portfolio, relative to benchmark, on momentum metrics
Source: Bloomberg, Kotak Institutional Equities

Strategy India
KOTAK INSTITUTIONAL EQUITIES RESEARCH 7
Exhibit 6: HUVR has good operating performance, high stability and not-very-expensive valuation Concentrated All-Season portfolio, relative to benchmark, on fundamental metrics
Source: Bloomberg, Kotak Institutional Equities
Exhibit 7: DRRD and TATA have excellent sentiment score, while HUVR’s sentiment score is below
average Concentrated All-Season portfolio, relative to benchmark, on sentiment metrics
Source: Bloomberg, Kotak Institutional Equities
We also show the portfolio for the broad and concentrated All-Season portfolio, along with
the different single factor portfolios in Exhibits 8-17.

India Strategy
8 KOTAK INSTITUTIONAL EQUITIES RESEARCH
Exhibit 8: TATA and TCS enter the concentrated All-Season portfolio The concentrated All-Season portfolio, as of September 30, 2020
Source: Bloomberg, Kotak Institutional Equities
Exhibit 9: Broader sector representation in the broad All-Season portfolio The broad All-Season portfolio, as of September 30, 2020
Source: Bloomberg, Kotak Institutional Equities
Exhibit 10: Reliance and Pharma make a large chunk of concentrated momentum portfolio The concentrated momentum portfolio, as of September 30, 2020
Source: Bloomberg, Kotak Institutional Equities
Stock name Portfolio Weight KIE analyst recommendation
Hindustan Unilever Ltd 30.0% ADD
Britannia Industries Ltd 21.7% ADD
Tata Consultancy Services Ltd 21.2% REDUCE
Dr Reddy's Laboratories Ltd 17.5% SELL
Tata Steel Ltd 9.6% BUY
Stock name Portfolio Weight KIE analyst recommendation
Hindustan Unilever Ltd 13.4% ADD
Asian Paints Ltd 9.6% REDUCE
Power Grid Corp of India Ltd 8.5% BUY
Cipla Ltd/India 7.7% BUY
Britannia Industries Ltd 6.9% ADD
Tata Consultancy Services Ltd 6.8% REDUCE
HDFC Bank Ltd 6.7% ADD
Bajaj Auto Ltd 6.5% BUY
ITC Ltd 6.5% BUY
HCL Technologies Ltd 5.8% ADD
Dr Reddy's Laboratories Ltd 5.6% SELL
Infosys Ltd 5.1% BUY
Reliance Industries Ltd 4.6% ADD
Eicher Motors Ltd 3.3% REDUCE
Tata Steel Ltd 3.1% BUY
Stock name Portfolio Weight KIE analyst recommendation
Cipla Ltd/India 28.7% BUY
Bharti Airtel Ltd 20.2% BUY
Divi's Laboratories 19.4% NA
Reliance Industries Ltd 17.0% ADD
Sun Pharmaceutical Industries Ltd 14.6% REDUCE

Strategy India
KOTAK INSTITUTIONAL EQUITIES RESEARCH 9
Exhibit 11: Broad momentum portfolio is relatively diversified across sectors The broad momentum portfolio, as of September 30, 2020
Source: Bloomberg, Kotak Institutional Equities
Exhibit 12: BRIT replaces INFO in the concentrated low-volatility portfolio The concentrated low volatility portfolio, as of September 30, 2020
Source: Bloomberg, Kotak Institutional Equities
Exhibit 13: The broad low-volatility portfolio has a defensive tilt The broad low volatility portfolio, as of September 30, 2020
Source: Bloomberg, Kotak Institutional Equities
Stock name Portfolio Weight KIE analyst recommendation
Hindustan Unilever Ltd 15.8% ADD
Nestle India Ltd 11.7% REDUCE
Cipla Ltd/India 9.0% BUY
Britannia Industries Ltd 8.1% ADD
HCL Technologies Ltd 6.8% ADD
Shree Cements Ltd 6.6% SELL
Dr Reddy's Laboratories Ltd 6.6% SELL
Bharti Airtel Ltd 6.4% BUY
Divi's Laboratories 6.1% NA
Reliance Industries Ltd 5.4% ADD
Sun Pharmaceutical Industries Ltd 4.6% REDUCE
Eicher Motors Ltd 3.9% REDUCE
Tata Steel Ltd 3.6% BUY
JSW Steel Ltd 3.5% ADD
Tata Motors Ltd 2.0% SELL
Stock name Portfolio Weight KIE analyst recommendation
Hindustan Unilever Ltd 27.7% ADD
Nestle India Ltd 20.5% REDUCE
Asian Paints Ltd 19.8% REDUCE
Power Grid Corp of India Ltd 17.6% BUY
Britannia Industries Ltd 14.3% ADD
Stock name Portfolio Weight KIE analyst recommendation
Hindustan Unilever Ltd 12.4% ADD
Nestle India Ltd 9.2% REDUCE
Asian Paints Ltd 8.9% REDUCE
Power Grid Corp of India Ltd 7.9% BUY
Britannia Industries Ltd 6.4% ADD
Tata Consultancy Services Ltd 6.3% REDUCE
Wipro Ltd 6.2% ADD
HDFC Bank Ltd 6.2% ADD
Bajaj Auto Ltd 6.0% BUY
NTPC Ltd 5.4% BUY
HCL Technologies Ltd 5.3% ADD
Shree Cements Ltd 5.2% SELL
Dr Reddy's Laboratories Ltd 5.2% SELL
Divi's Laboratories 4.8% NA
Infosys Ltd 4.7% BUY

India Strategy
10 KOTAK INSTITUTIONAL EQUITIES RESEARCH
Exhibit 14: Sentiment revision highest for TATA over the past one month The concentrated sentiment portfolio, as of September 30, 2020
Source: Bloomberg, Kotak Institutional Equities
Exhibit 15: IT and staples are the highest allocation in the broad sentiment portfolio The broad sentiment portfolio, as of September 30, 2020
Source: Bloomberg, Kotak Institutional Equities
Exhibit 16: HDFCB replaces TCS in the concentrated fundamental portfolio The concentrated sentiment portfolio, as of September 30, 2020
Source: Bloomberg, Kotak Institutional Equities
Stock name Portfolio Weight KIE analyst recommendation
Tata Consultancy Services Ltd 30.0% REDUCE
Dr Reddy's Laboratories Ltd 24.9% SELL
Maruti Suzuki India Ltd 16.5% SELL
Eicher Motors Ltd 14.9% REDUCE
Tata Steel Ltd 13.6% BUY
Stock name Portfolio Weight KIE analyst recommendation
Asian Paints Ltd 11.8% REDUCE
Britannia Industries Ltd 8.5% ADD
Tata Consultancy Services Ltd 8.3% REDUCE
Wipro Ltd 8.3% ADD
Bajaj Auto Ltd 8.0% BUY
UltraTech Cement Ltd 7.2% BUY
HCL Technologies Ltd 7.1% ADD
Dr Reddy's Laboratories Ltd 6.9% SELL
Divi's Laboratories 6.4% NA
Housing Development Finance Corp Ltd 5.8% NR
Reliance Industries Ltd 5.6% ADD
Maruti Suzuki India Ltd 4.6% SELL
Eicher Motors Ltd 4.1% REDUCE
Tata Steel Ltd 3.8% BUY
JSW Steel Ltd 3.7% ADD
Stock name Portfolio Weight KIE analyst recommendation
Hindustan Unilever Ltd 30.0% ADD
HDFC Bank Ltd 20.9% ADD
ITC Ltd 20.4% BUY
Infosys Ltd 15.9% BUY
Coal India Ltd 12.9% BUY

Strategy India
KOTAK INSTITUTIONAL EQUITIES RESEARCH 11
Exhibit 17: A bouquet of sectors in the broad fundamental portfolio The broad sentiment portfolio, as of September 30, 2020
Source: Bloomberg, Kotak Institutional Equities
Stock name Portfolio Weight KIE analyst recommendation
Hindustan Unilever Ltd 13.2% ADD
Asian Paints Ltd 9.5% REDUCE
Power Grid Corp of India Ltd 8.4% BUY
Britannia Industries Ltd 6.8% ADD
Tata Consultancy Services Ltd 6.7% REDUCE
HDFC Bank Ltd 6.6% ADD
Bajaj Auto Ltd 6.4% BUY
ITC Ltd 6.4% BUY
Hero MotoCorp Ltd 5.7% REDUCE
HCL Technologies Ltd 5.7% ADD
Tech Mahindra Ltd 5.7% BUY
Larsen & Toubro Ltd 5.4% BUY
Infosys Ltd 5.0% BUY
Reliance Industries Ltd 4.5% ADD
Coal India Ltd 4.0% BUY
For Private Circulation Only. FOR IMPORTANT INFORMATION ABOUT KOTAK SECURITIES’ RATING SYSTEM AND OTHER DISCLOSURES, REFER TO THE END OF THIS MATERIAL.
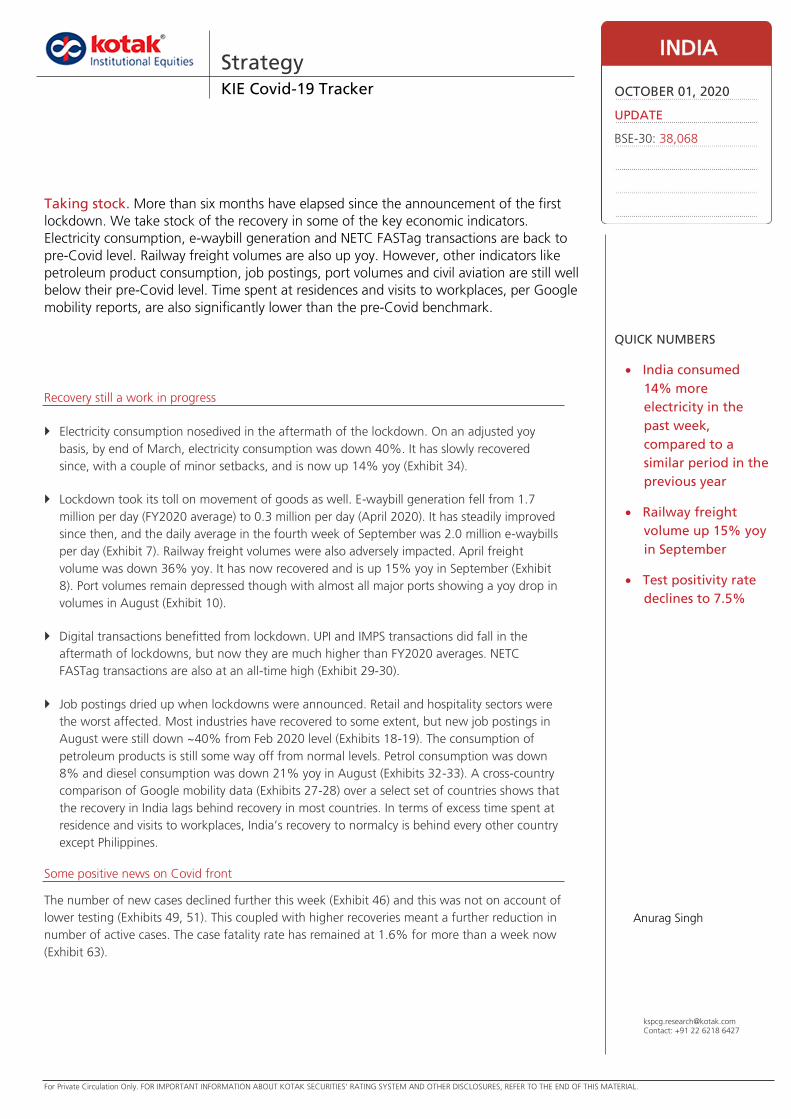
Recovery still a work in progress
Electricity consumption nosedived in the aftermath of the lockdown. On an adjusted yoy
basis, by end of March, electricity consumption was down 40%. It has slowly recovered
since, with a couple of minor setbacks, and is now up 14% yoy (Exhibit 34).
Lockdown took its toll on movement of goods as well. E-waybill generation fell from 1.7
million per day (FY2020 average) to 0.3 million per day (April 2020). It has steadily improved
since then, and the daily average in the fourth week of September was 2.0 million e-waybills
per day (Exhibit 7). Railway freight volumes were also adversely impacted. April freight
volume was down 36% yoy. It has now recovered and is up 15% yoy in September (Exhibit
8). Port volumes remain depressed though with almost all major ports showing a yoy drop in
volumes in August (Exhibit 10).
Digital transactions benefitted from lockdown. UPI and IMPS transactions did fall in the
aftermath of lockdowns, but now they are much higher than FY2020 averages. NETC
FASTag transactions are also at an all-time high (Exhibit 29-30).
Job postings dried up when lockdowns were announced. Retail and hospitality sectors were
the worst affected. Most industries have recovered to some extent, but new job postings in
August were still down ~40% from Feb 2020 level (Exhibits 18-19). The consumption of
petroleum products is still some way off from normal levels. Petrol consumption was down
8% and diesel consumption was down 21% yoy in August (Exhibits 32-33). A cross-country
comparison of Google mobility data (Exhibits 27-28) over a select set of countries shows that
the recovery in India lags behind recovery in most countries. In terms of excess time spent at
residence and visits to workplaces, India’s recovery to normalcy is behind every other country
except Philippines.
Some positive news on Covid front
The number of new cases declined further this week (Exhibit 46) and this was not on account of
lower testing (Exhibits 49, 51). This coupled with higher recoveries meant a further reduction in
number of active cases. The case fatality rate has remained at 1.6% for more than a week now
(Exhibit 63).
Strategy KIE Covid-19 Tracker
Taking stock. More than six months have elapsed since the announcement of the first
lockdown. We take stock of the recovery in some of the key economic indicators.
Electricity consumption, e-waybill generation and NETC FASTag transactions are back to
pre-Covid level. Railway freight volumes are also up yoy. However, other indicators like
petroleum product consumption, job postings, port volumes and civil aviation are still well
below their pre-Covid level. Time spent at residences and visits to workplaces, per Google
mobility reports, are also significantly lower than the pre-Covid benchmark.
INDIA
OCTOBER 01, 2020
UPDATE
BSE-30: 38,068
QUICK NUMBERS
India consumed
14% more
electricity in the
past week,
compared to a
similar period in the
previous year
Railway freight
volume up 15% yoy
in September
Test positivity rate
declines to 7.5%
Anurag Singh
[email protected]: +91 22 6218 6427

Strategy India
KOTAK INSTITUTIONAL EQUITIES RESEARCH 13
FURTHER PROGRESS IN RECOVERY
KIE’s Covid-19 Tracker examines the impact of Covid-19 on the economy through several sets of factors
contributing to economic activity. We find that (1) electricity consumption over the past seven days was 14%
higher when compared to a similar period over the previous year; (2) UPI and IMPS transaction values
continue to be strong in fourth week of September, (3) daily average import duty collection in September is
higher than that of August, and (4) railway freight volume was up both mom and yoy in September.
Steady improvement in most indicators
We track a set of indicators as a proxy for economic activity.
Road traffic. Road traffic remains lower than 2019 levels. This data is available for four
Indian cities – Mumbai, New Delhi, Bengaluru and Pune (Exhibits 2-5). While road traffic
is up from the extreme lows of April 2020, the week-on-week change in congestion level
was divergent across cities. The level of congestion remained flat to slightly positive,
compared to the previous week, in Mumbai, New Delhi and Pune while it increased in
Bengaluru (Exhibit 7). We also track the number of e-waybills generated. This is available
on a weekly basis and is a proxy for the movement of goods across the country. The daily
average of e-waybills generated over the fourth week of September was higher than the
daily average in August and of the first three weeks of September.
Civil aviation data. We track the number of domestic departures and the passengers
carried (Exhibit 6). The number of daily domestic departures has increased to over 1430
now. For comparison, the pre-Covid daily average was close to 4,000. The pace of
improvement has quickened over the past two weeks. The number of passengers on
these flights is now close to 135,000, as against pre-Covid figure of 400,000. Since the
re-start of domestic aviation, both the number of domestic departures and number of
passengers have tripled.
Electricity consumption. Covid-19 forced a prolonged lockdown and temporary
shutting down of factories. This, in turn, led to lower electricity consumption. We show
the daily electricity consumption of major states (Exhibits 34-45) in India and compare this
with consumption in the same week of CY2019. Electricity consumption in India, over the
seven day period ending September 29, was the 14% higher than the electricity
consumption in the similar period in 2019. For comparison, electricity consumption in
CY2020 for the week ending September 22 was 7% higher than that in CY2019. Seven
out of ten states we track saw higher electricity consumption in the past week compared
to a similar period the previous year. We do note however that the state-level electricity
consumption gaps are quite volatile and may change dramatically from one week to the
next.
Payment data. We use payment data released by RBI and National Payment Corporation
of India (NPCI). Specifically, we track UPI, IMPS and NETC FASTag transaction values. Daily
average UPI and IMPS transaction values have recorded an all-time high in September.
NETC transactions are at pre-Covid levels (Exhibits 29-30). We continue to see UPI and
IMPS payments peaking in the first week of month and then falling from there (Exhibit 31).
Also, we note that some of the UPI/IMPS transactions may be in lieu of cash payments (as
people avoid handling cash used by others) and may not reflect more total spending by
consumers. NETC FASTag transactions have continued to increase week-on-week.
Real estate and vehicle purchases. We track the number of property sales registered in
Maharashtra and the daily number of vehicles registered in Regional Transport Offices
under the Vahan4 umbrella (Exhibits 14-17). The daily average of property registrations in
Maharashtra in September is much higher than the daily average of March 2020. In terms
of vehicle registrations, number of cars and two-wheeler registrations increased mom in
August.

India Strategy
14 KOTAK INSTITUTIONAL EQUITIES RESEARCH
Railway/Ports data. We show daily average metric tons of freight carried by Indian
railways as a proxy of goods movement in India. We also show the year-on-year change
in the freight load for major commodities (Exhibits 8-9). Railway freight volume is up
sequentially in September. Also, on a yoy basis, the railway freight volume is higher in
September. We also show the volume of traffic at major ports and the change in volume
for major commodities (Exhibits 10-13). Container volume increased on a month-on-
month basis at JNPT; however it was well below the pre-Covid level. The volume at
Paradip port also declined. The ports on the western coast of India (Mumbai, Kandla and
JNPT) saw an increase in the yoy decline of port traffic. On the other hand, yoy decline in
volume moderated for the ports located on the eastern coast of India (Paradip, Kolkata
and Vishakhapattnam).
Employment and business sentiment. Covid-19 has led to hiring freezes as well as
involuntary attrition in certain industries. We show the change in the number of new job
postings since March 2020, and the change in new job postings in the most recent
month, on Naukri.com (Exhibits 18 and 19). The hospitality industry continues to remain
the worst affected industry as of August end. Pharma and healthcare industry has been
the least affected. Most industries saw an increase in the number of new job postings in
August, when compared to July. We also show estimated nation-wide unemployment
level based on CMIE survey (Exhibit 20). The unemployment level estimated by CMIE is
close to 8%. Finally, we show the number of new companies registered with the Ministry
of Corporate Affairs each month (Exhibit 21). The number of new companies registered
in August was similar to the number of companies registered in July.
Movement of people. We use Google mobility reports to track the change in the time
spent by people at their residences and number of visits to their workplaces compared
against the pre-Covid baseline (Exhibits 23-28). After falling for several weeks, the excess
time spent at residences increased this week across the country. Also, the recovery in
metro cities lagged the wider recovery for excess time spent at residential areas and
excess visits to workplaces. We also compare recovery in mobility in India to the same in a
select set of countries. India’s recovery towards normalcy is slower and behind many
other countries. Google has temporarily suspended updates to a few categories like
retail/recreation and grocery stores. Therefore, we have removed those exhibits from our
tracker. We will add them back once Google starts updating them once again.
Import duty collection. We also monitor external trade by comparing the import duty
collected in the current period against the import duty collected during the same period
in FY2020 (Exhibit 22). Daily average import duty collected was higher in September after
declining in August.
Petroleum product consumption. Petroleum consumption is another proxy of
economic activity. We track this using data released by Petroleum Planning and Analysis
Cell (PPAC). Monthly data (Exhibits 32-33) shows that consumption of motor spirit
(petroleum) in June was already back to March 2020 consumption level. Petrol
consumption increased marginally in August, compared to July. However, diesel
consumption declined again in August, and diesel consumption in August was lower than
the consumption in May.
Most of the indicators above show that economic activity is still below the pre-Covid period
(Exhibit 1). As evidence from other countries suggests, the road to recovery will not be a
straight line, especially as long as the daily case count continues to increase.

Strategy India
KOTAK INSTITUTIONAL EQUITIES RESEARCH 15
Exhibit 1: Most economic indicators improving Economic indicators tracked by KIE
Source: Kotak Institutional Equities
Exhibits 2 to 5 show vehicular congestion data for four major cities – Mumbai, New Delhi,
Bengaluru and Pune. Current congestion data is compared to day-of-week adjusted
historical average.
Exhibit 2: The congestion levels in Mumbai remained unchanged from previous week Daily traffic congestion data (Mumbai), relative to historical average (%) as estimated on Oct 1
Source: TomTom.com, Kotak Institutional Equities
Indicator Direction Comments
MovementLow, but
improving
Road traffic was flat on a week-on-week basis. Railway freight
data increased sequentially in September. Google mobility
report also flat week-on-week. Daily average e-waybills
continue to increase.
New vehicle
registration
Low, but
improving
Cars and two-wheeler registrations are now close to two-thirds
of pre-Covid level, but the registrations growth has flattened.
Agri-vehicles less affected.
Electricity
consumptionNormal
Electricity consumption gap negative, meaning India consumed
more electricity in past week, compared to a similar period in
2019.
Property sales Normal
Property sale registrations in Maharashtra were much higher in
September as compared to April 2020. They are also higher
than March 2020 daily average.
New job postingsLow, but
improving
Most industries saw an increase in the number of new job
postings in August, when compared to July. The Naukri
JobSpeak index increased by 11%.
Import duty
collection
Low, and
improvingDaily import duty collection increased in September
Petrochem
consumption
Low, and
stagnant
While petrol consumption increased marginally in August,
diesel consumption saw another mom decline in August.

India Strategy
16 KOTAK INSTITUTIONAL EQUITIES RESEARCH
Exhibit 3: Road congestion in New Delhi was flat week on week Daily traffic congestion data (New Delhi), relative to historical average (%) as estimated on Oct 1
Source: TomTom.com, Kotak Institutional Equities
Exhibit 4: Bengaluru traffic congestion nudged up over the past week Daily traffic congestion data (Bengaluru), relative to historical average (%) as estimated on Oct 1
Source: TomTom.com, Kotak Institutional Equities

Strategy India
KOTAK INSTITUTIONAL EQUITIES RESEARCH 17
Exhibit 5: Traffic congestion in Pune was flat, compared to previous week Daily traffic congestion data (Pune), relative to historical average (%) as estimated on Oct 1
Source: TomTom.com, Kotak Institutional Equities
Exhibit 6 shows the number of domestic flights and the passengers carried. This compares
with a daily average of ~3,000 domestic flights per day and ~400,000 daily domestic
passengers in pre-Covid period.
Exhibit 6: Number of departures averages around 1430 per day Daily domestic departures (#) and passengers carried (#)
Source: Ministry of Civil Aviation, Kotak Institutional Equities
Exhibit 7 shows the daily average e-waybills generated. E-waybills are needed to transport
goods of value over Rs 50,000. For the months prior to June 2020, we divide the number of
monthly e-waybills generated by 30 to estimate the average daily number of e-waybills
generated. From June 2020, we divide the weekly data by 7 to get the average daily e-
waybills generated for the week.
The number of average daily e-waybills generated fell slightly in March 2020, and sharply in
April 2020 demonstrating the effect of lockdown. With the relaxations in lockdown effective
from May 4, we see that the average daily e-waybills generated have been rising on a week-
on-week basis.
0
200
400
600
800
1,000
1,200
1,400
1,600
0
20,000
40,000
60,000
80,000
100,000
120,000
140,000
160,000
25
-May
29
-May
2-J
un
6-J
un
10
-Ju
n1
4-J
un
18
-Ju
n2
2-J
un
26
-Ju
n3
0-J
un
4-J
ul
8-J
ul
12
-Ju
l1
6-J
ul
20
-Ju
l2
4-J
ul
28
-Ju
l1
-Au
g5
-Au
g9
-Au
g1
3-A
ug
17
-Au
g2
1-A
ug
25
-Au
g2
9-A
ug
2-S
ep
6-S
ep
10
-Sep
14
-Sep
18
-Sep
22
-Sep
26
-Sep
Passengers Departures (rhs)

India Strategy
18 KOTAK INSTITUTIONAL EQUITIES RESEARCH
Exhibit 7: Number of daily e-waybills generated continues to increase Daily average e-waybills generated (mn)
Source: GST Network, Kotak Institutional Equities
Similarly, railway freight data (Exhibits 8 and 9) shows that there was a sharp decline in
railway freight movement in March and April.
Exhibit 8: Railway freight remains sequentially higher in September Daily average freight traffic (mn tons)
Source: Indian Railways, Kotak Institutional Equities
0.9
1.2
1.6 1.5
1.6 1.6
1.8
1.5 1.7 1.7 1.7
1.8 1.8 1.8
1.7 1.7 1.7 1.7 1.8 1.8
1.8 1.9 1.9
1.4
0.3
0.8
1.4 1.6 1.6
1.7 1.8 1.9
2.0
0.0
0.5
1.0
1.5
2.0
2.5
Ap
r-1
8
May-
18
Jun
-18
Jul-
18
Au
g-1
8
Sep
-18
Oct
-18
No
v-1
8
Dec-
18
Jan
-19
Feb
-19
Mar-
19
Ap
r-1
9
May-
19
Jun
-19
Jul-
19
Au
g-1
9
Sep
-19
Oct
-19
No
v-1
9
Dec-
19
Jan
-20
Feb
-20
Mar-
20
Ap
r-2
0
May-
20
Jun
-20
Jul-
20
Au
g-2
0
Sep
1 -
Sep
6
Sep
7 -
Sep
13
Sep
14
- Sep
20
Sep
21
- S
ep
26
3.7
3.3
2.2
2.7
3.1 3.1 3.0
3.4
0.0
0.5
1.0
1.5
2.0
2.5
3.0
3.5
4.0
4.5
Ap
r-1
8
May-
18
Jun
-18
Jul-
18
Au
g-1
8
Sep
-18
Oct
-18
No
v-1
8
Dec-
18
Jan
-19
Feb
-19
Mar-
19
Ap
r-1
9
May-
19
Jun
-19
Jul-
19
Au
g-1
9
Sep
-19
Oct
-19
No
v-1
9
Dec-
19
Jan
-20
Feb
-20
Mar-
20
Ap
r-2
0
May-
20
Jun
-20
Jul-
20
Au
g-2
0
Sep
-20

Strategy India
KOTAK INSTITUTIONAL EQUITIES RESEARCH 19
Exhibit 9: Freight volume up yoy for all categories in September Yoy change (%) for different freight categories
Source: Indian Railways, Kotak Institutional Equities
Apart from rail and road, we also show the impact of Covid-19 and lockdown on port
volumes. Exhibit 10 shows that all major ports saw a yoy drop in volume, when compared to
April and May 2019. The commodities which were most affected were coal and containers
(Exhibit 11). Jawaharlal Nehru Port Trust (JNPT) which handles a significant amount of India’s
container volumes saw a large decline in container volume in April and May (Exhibit 12).
Similarly, Paradip port trust, which handles a significant portion of India’s coal and iron ore
volumes, saw decline in April and May, with the largest drop in volume coming in coal
volumes (Exhibit 13).
Exhibit 10: Western coast ports saw an increase in yoy decline, while eastern coast ports saw a moderation in yoy decline in August Yoy change (%) in total volume handled
Source: Indian Ports Association, Kotak Institutional Equities
9% 19%
100%
13% 7% 2% 14% 15%
(150%)
(100%)
(50%)
0%
50%
100%
150%
Coal/coke Cement/clinker Food Fertilizer Container Petroleum/gases Others Total
Feb-20 Mar-20 Apr-20 May-20 Jun-20 Jul-20 Aug-20 Sep-20
(32%)
(13%) (13%)
(27%)
(33%)
(18%)(19%)
(1%)
(7%)
(15%)
(28%)
(22%)(23%)
(10%)(13%)
(9%)
(16%)
(8%)
(14%)
(9%)
12%
(17%) (17%)
(9%)
(40%)(35%)(30%)(25%)(20%)(15%)(10%)(5%)0%5%
10%15%
Ko
lkata
Para
dip
Vis
hakh
ap
att
nam
Mu
mb
ai
JNPT
Deen
dayal (K
an
dla
)
Apr & May yoy change June yoy change July yoy change August yoy change

India Strategy
20 KOTAK INSTITUTIONAL EQUITIES RESEARCH
Exhibit 11: Container volume data better in August, compared to previous months Yoy change (%) in selected commodities across major ports
Source: Indian Ports Association, Kotak Institutional Equities
Exhibit 12: Container traffic increased in August at JNPT; though still well below pre-Covid levels Monthly container traffic (‘000s TEUs) at JNPT
Source: Jawaharlal Nehru Port Trust (JNPT), Kotak Institutional Equities
(15%)
(36%)
14%
(14%)
34%
(36%)
(24%)
(36%)
(19%)(15%) (12%)
26%
(11%)
22%
(32%)(37%)
(24%)
10%
(26%)
5%
40% 34%
17%
(8%)
(44%)
(15%)(6%)
(22%)
(3%)
38%
16%
55%
1%
(30%)
(13%) (14%)
(60%)
(40%)
(20%)
0%
20%
40%
60%
PO
L
Oth
er
liquid
s
Iro
n o
re
Fert
ilizers
fin
ish
ed
Fert
lizers
raw
Co
al -
therm
al an
dst
eam
Co
al -
cokin
g a
nd
oth
ers
Co
nta
iners
(TEU
s)
Oth
ers
Apr & May yoy change June yoy change July yoy change August yoy change
448 449
410 431 434
400 403 384
418 426 417 410
284 275 289
344 353
0
50
100
150
200
250
300
350
400
450
500
Ap
r-1
9
May-
19
Jun
-19
Jul-
19
Au
g-1
9
Sep
-19
Oct
-19
No
v-1
9
Dec-
19
Jan
-20
Feb
-20
Mar-
20
Ap
r-2
0
May-
20
Jun
-20
Jul-
20
Au
g-2
0

Strategy India
KOTAK INSTITUTIONAL EQUITIES RESEARCH 21
Exhibit 13: August saw yet another decline in volumes at Paradip port; iron ore volume was higher
though Commodity traffic handled (‘000s MTs) at Paradip port
Source: Paradip Port Trust, Kotak Institutional Equities
We split the vehicle registration data into 4 categories – car registrations (Exhibit 14), two-
wheelers registration (Exhibit 15), goods vehicles registrations and agri-vehicles registration
(Exhibit 16). We see that agri-vehicle registrations were least impacted and have recovered
the quickest. Goods vehicle registrations remain extremely low.
Exhibit 14: Number of car registrations in the second half of August were strong; mom improvement
continues Daily average car registrations (as reported by Vahan)
Source: Ministry of Road Transport and Highways, Kotak Institutional Equities
3,206 3,531 3,091 3,304 3,418 3,023 3,042 2,981 2,360
3,176 2,047 2,122
2,795 2,579 2,173
1,062 1,054
966 638 1,176 1,550 1,410 1,321
1,466
1,483
979 1,316
1,711 1,357 1,671
3,642 3,451
2,720 2,690 2,411 2,344
3,579 3,670 3,566
3,686
3,707 1,996
2,665 2,597
2,234
0
1,000
2,000
3,000
4,000
5,000
6,000
7,000
8,000
9,000
Jun
-19
Jul-
19
Au
g-1
9
Sep
-19
Oct
-19
No
v-1
9
Dec-
19
Jan
-20
Feb
-20
Mar-
20
Ap
r-2
0
May-
20
Jun
-20
Jul-
20
Au
g-2
0
POL Iron Ore Coal
0
2,000
4,000
6,000
8,000
10,000
Cars
FY2020 April 2020 May 2020 June 2020 July 2020 August 2020

India Strategy
22 KOTAK INSTITUTIONAL EQUITIES RESEARCH
Exhibit 15: Two-wheeler registrations increases only slightly in August Daily two-wheeler registration (as reported by Vahan)
Source: Ministry of Road Transport and Highways, Kotak Institutional Equities
Exhibit 16: Goods vehicle registrations still much below FY2020 average; however mom recovery
continues Daily goods vehicles and agri-vehicles registration (as reported by Vahan)
Source: Ministry of Road Transport and Highways, Kotak Institutional Equities
The number of property sale registrations in Maharashtra (Exhibit 17) was extremely low in
April 2020 (this was also on account of registration offices being closed).
0
10,000
20,000
30,000
40,000
50,000
Two-wheelers
FY2020 April 2020 May 2020 June 2020 July 2020 August 2020
0
500
1,000
1,500
2,000
2,500
Goods vehicles Agri-vehicles
FY2020 April 2020 May 2020 June 2020 July 2020 August 2020

Strategy India
KOTAK INSTITUTIONAL EQUITIES RESEARCH 23
Exhibit 17: Daily average Maharashtra property registrations have increased sharply in September Average daily registration of property sales in Maharashtra (#)
Source: Department of Registration and Stamps (Maharashtra), Kotak Institutional Equities
Naukri JobSpeak Index measures the number of new job postings in each industry on a
monthly basis. We show the industries where the number of new job postings decreased
the least (Exhibit 18) and industries where the number of new job postings decreased the
most (Exhibit 19).
Center for monitoring Indian economy (CMIE) estimates unemployment rate in India
through surveys (Exhibit 20).
Exhibit 18: Hospitality and retail continues to be the worst affected sectors; however, a large mom increase in job postings in retail sector 6-month (from Feb-2020) and mom change in Naukri JobSpeak Index (%); August 2020 data
Source: Naukri.com, Kotak Institutional Equities
3,195
3,685
4,248
3,492
4,160
3,811 3,731
3,217
2,678 2,663
3,348
3,662 3,886
3,598
2,832
26
972
2,702 2,503
2,646
3,936
0
500
1,000
1,500
2,000
2,500
3,000
3,500
4,000
4,500
Jan
-19
Feb
-19
Mar-
19
Ap
r-1
9
May-
19
Jun
-19
Jul-
19
Au
g-1
9
Sep
-19
Oct
-19
No
v-1
9
Dec-
19
Jan
-20
Feb
-20
Mar-
20
Ap
r-2
0
May-
20
Jun
-20
Jul-
20
Au
g-2
0
Sep
-20
India Strategy
24 KOTAK INSTITUTIONAL EQUITIES RESEARCH
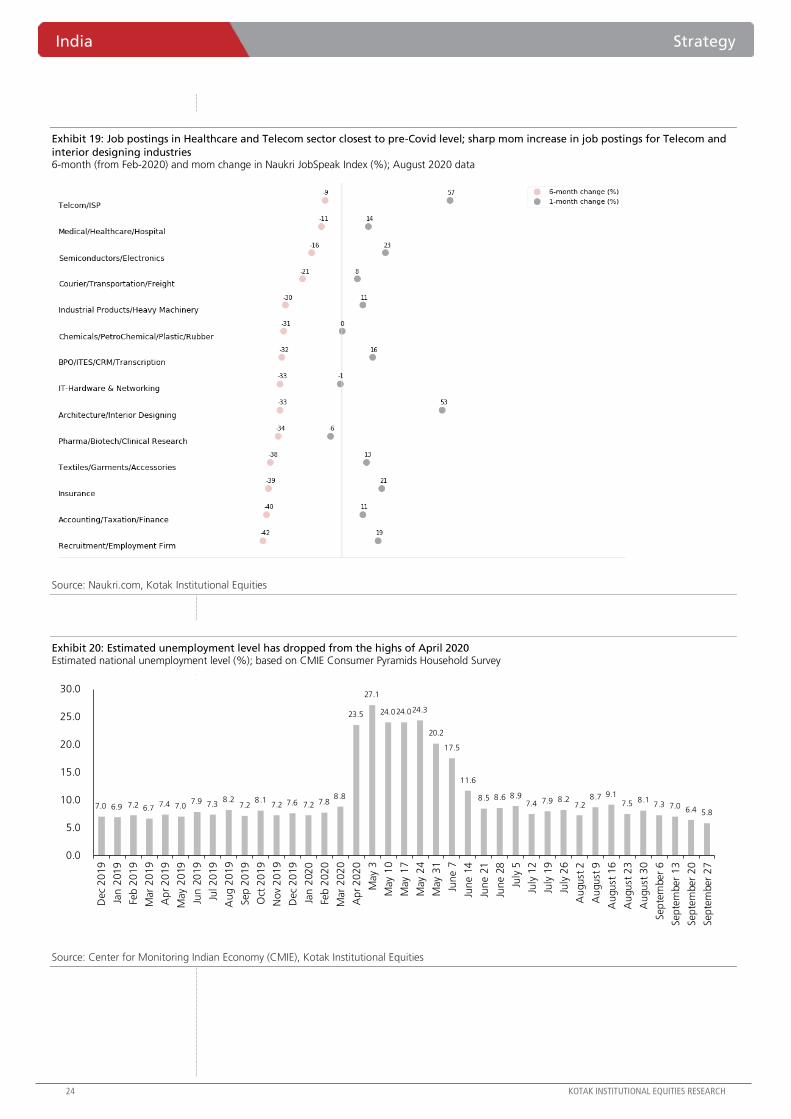
Exhibit 19: Job postings in Healthcare and Telecom sector closest to pre-Covid level; sharp mom increase in job postings for Telecom and
interior designing industries 6-month (from Feb-2020) and mom change in Naukri JobSpeak Index (%); August 2020 data
Source: Naukri.com, Kotak Institutional Equities
Exhibit 20: Estimated unemployment level has dropped from the highs of April 2020 Estimated national unemployment level (%); based on CMIE Consumer Pyramids Household Survey
Source: Center for Monitoring Indian Economy (CMIE), Kotak Institutional Equities
7.0 6.9 7.2 6.7 7.4 7.0
7.9 7.3 8.2
7.2 8.1
7.2 7.6 7.2 7.8 8.8
23.5
27.1
24.0 24.0 24.3
20.2
17.5
11.6
8.5 8.6 8.9 7.4 7.9 8 .2
7.2 8.7 9.1
7.5 8.1 7.3 7.0
6.4 5.8
0.0
5.0
10.0
15.0
20.0
25.0
30.0
Dec
20
19
Jan
201
9
Feb
20
19
Mar
20
19
Ap
r 2
01
9
May
20
19
Jun
20
19
Jul 2
01
9
Au
g 2
01
9
Sep
20
19
Oct
20
19
No
v 2
01
9
Dec
20
19
Jan
202
0
Feb
20
20
Mar
20
20
Ap
r 2
02
0
May
3
May
10
May
17
May
24
May
31
Jun
e 7
Jun
e 1
4
Jun
e 2
1
Jun
e 2
8
July
5
July
12
July
19
July
26
Au
gu
st 2
Au
gu
st 9
Au
gu
st 1
6
Au
gu
st 2
3
Au
gu
st 3
0
Sep
tem
ber
6
Sep
tem
ber
13
Sep
tem
ber
20
Sep
tem
ber
27

Strategy India
KOTAK INSTITUTIONAL EQUITIES RESEARCH 25
Exhibit 21: Company registrations remained high in August Number of private and public companies registered with Ministry of Corporate Affairs during a month
Source: Ministry of Corporate Affairs, Kotak Institutional Equities
We also show the daily import duty collected and compare it against the daily average of
import duty collected for same period in FY2020 (Exhibit 22). The import duty collection in
April 2020 was extremely low. Since then, import duty collections have improved but they
still remain some distance below the FY2020 average.
Exhibit 22: Import duty collection continues to be strong in September Daily import duty collection (Rs bn)
Source: Central Board of Indirect Taxes and Customs, Kotak Institutional Equities
We also use Google mobility reports to show that track time spent at residences (Exhibit 23)
and excess visits to workplaces (Exhibit 24). Google has temporarily suspended updates to
categories like ‘retail/recreational’ and ‘grocery/pharmaceutical’. Therefore, we have
removed those exhibits from our report.
Google mobility reports use the location data from Android phones. These reports note the
time spent in locations classified as ‘residence’, and visits to ‘workplace’ and then compare it
against the time spent/visits to these locations during pre-Covid baseline period.
0
2,000
4,000
6,000
8,000
10,000
12,000
14,000
16,000
18,000
Mar-
20
18
Ap
r-2
01
8
May-
201
8
Jun
e-2
01
8
July
-20
18
Au
g-2
01
8
Sep
t-20
18
Oct
-20
18
No
v-2
01
8
Dec-
20
18
Jan
-20
19
Feb
-20
19
Mar-
20
19
Ap
r-2
01
9
May-
201
9
Jun
e-2
01
9
July
-20
19
Au
g-2
01
9
Sep
t-20
19
Oct
-20
19
No
v-2
01
9
Dec-
20
19
Jan
-20
20
Feb
-20
20
Mar-
20
20
Ap
r-2
02
0
May-
202
0
Jun
e-2
02
0
July
-20
20
Au
g-2
02
0
8.1
5.7
7.5 7.3
9.3 8.8
10.1 10.9
0
2
4
6
8
10
12
FY2
02
1,
YTD
Ap
ril 2
02
0
May
20
20
Jun
e 2
02
0
July
20
20
Au
gu
st 2
02
0
Sep
tem
ber
20
20
FY2
02
0,
sam
e p
eri
od

India Strategy
26 KOTAK INSTITUTIONAL EQUITIES RESEARCH
Exhibit 23: An increase in excess time spent at residences over the past ten days, reversing the trend towards normalcy Change, from pre-Covid baseline, in time spent in residential areas (%); and its seven-day moving average for India and a select group of metros
Source: Google mobility report, Kotak Institutional Equities
Exhibit 24: There is a significant gap between the recovery in non-metro districts and metro cities in visits to workplaces Change, from pre-Covid baseline, in visit to workplaces (%); and its seven-day moving average for India and a select group of metros
Source: Google mobility report, Kotak Institutional Equities
We also show the change in time spent at residential and visits to workplaces for major
Indian states (Exhibits 27-28) and compare it to previous week. Finally, we compare the
recovery in these metrics in India, versus a select group of countries (Exhibits 29 - 30).
-5
0
5
10
15
20
25
30
35
40
15
-Feb
22
-Feb
29
-Feb
7-M
ar
14
-Mar
21
-Mar
28
-Mar
4-A
pr
11
-Ap
r
18
-Ap
r
25
-Ap
r
2-M
ay
9-M
ay
16
-May
23
-May
30
-May
6-J
un
13
-Ju
n
20
-Ju
n
27
-Ju
n
4-J
ul
11
-Ju
l
18
-Ju
l
25
-Ju
l
1-A
ug
8-A
ug
15
-Au
g
22
-Au
g
29
-Au
g
5-S
ep
12
-Sep
19
-Sep
India Metro India (7-day MA) Metros (7-day MA)
-100
-80
-60
-40
-20
0
20
15
-Feb
22
-Feb
29
-Feb
7-M
ar
14
-Mar
21
-Mar
28
-Mar
4-A
pr
11
-Ap
r
18
-Ap
r
25
-Ap
r
2-M
ay
9-M
ay
16
-May
23
-May
30
-May
6-J
un
13
-Ju
n
20
-Ju
n
27
-Ju
n
4-J
ul
11
-Ju
l
18
-Ju
l
25
-Ju
l
1-A
ug
8-A
ug
15
-Au
g
22
-Au
g
29
-Au
g
5-S
ep
12
-Sep
19
-Sep
India Metro India (7-day MA) Metros (7-day MA)

Strategy India
KOTAK INSTITUTIONAL EQUITIES RESEARCH 27
Exhibit 25: Many states saw the time spent at residences increase Change, from pre-Covid baseline, in time spent at residential areas (%), same figure for previous week; states with significant increase highlighted
Source: Google mobility report, Kotak Institutional Equities
Exhibit 26: Number of visits to workplaces did not change meaningfully for most states Change, from pre-Covid baseline, in number of visits to workplaces (%), same figure for previous week; states with significant decrease highlighted
Source: Google mobility report, Kotak Institutional Equities
Excess time spent at residence (current) Excess time spent at residence (1 week back)
India 14.9 13.0
Andhra Pradesh 15.9 14.7
Bihar 10.1 6.9
Delhi 12.4 12.4
Gujarat 13.1 11.4
Haryana 11.9 10.1
Jharkhand 13.6 11.4
Karnataka 15.1 14.0
Kerala 20.0 15.4
Madhya Pradesh 15.1 12.3
Maharashtra 19.9 18.1
Odisha 15.6 11.6
Punjab 11.4 8.9
Rajasthan 11.4 8.3
Tamil Nadu 14.9 12.9
Telangana 15.6 15.1
Uttar Pradesh 12.7 11.0
Uttarakhand 12.7 10.9
West Bengal 14.9 12.9
Excess visits to workplace (current) Excess visits to workplace (1 week back)
India (31.1) (32.0)
Andhra Pradesh (25.0) (27.9)
Bihar (18.9) (18.7)
Delhi (36.6) (38.1)
Gujarat (25.6) (27.0)
Haryana (28.9) (30.1)
Jharkhand (23.0) (25.1)
Karnataka (37.3) (39.4)
Kerala (28.6) (27.6)
Madhya Pradesh (25.4) (26.4)
Maharashtra (42.3) (43.1)
Odisha (30.1) (31.6)
Punjab (31.4) (30.3)
Rajasthan (24.4) (25.4)
Tamil Nadu (30.3) (32.0)
Telangana (37.4) (39.3)
Uttar Pradesh (25.0) (26.3)

India Strategy
28 KOTAK INSTITUTIONAL EQUITIES RESEARCH
Exhibit 27: Only Philippines, from a select group of countries, is above India in excess time spent in residential areas Change from pre-Covid baseline, in time spent in residential areas (%) for select group of countries; on first day of each month and the last available date
Source: Google mobility report, Kotak Institutional Equities
Exhibit 28: Similarly, only Philippines lags India in terms of number of excess visits to workplaces, Change from pre-Covid baseline, in visits to workplaces (%) for select group of countries; on first day of each month and the last available date
Source: Google mobility report, Kotak Institutional Equities

Strategy India
KOTAK INSTITUTIONAL EQUITIES RESEARCH 29
Payment statistics by National Payments Corporation of India (NPCI) shows that UPI and
IMPS payments have rebounded sharply after their precipitous drop in April 2020 (Exhibits
29-31).
Exhibit 29: UPI & IMPS transaction values in September are much higher than in previous months Daily average UPI and IMPS transaction values (in Rs bn)
Source: National Payments Corporation of India, Reserve Bank of India, Kotak Institutional Equities
Exhibit 30: NETC FASTag transactions have increased slowly over the past three months; September daily average slightly higher than
Feb-2020 daily average Daily average NETC FASTag transaction values (in Rs bn)
Source: National Payments Corporation of India, Kotak Institutional Equities
47 51 49 49 52 54
64 63 68
72 74 69
50
73
87 94 96
108
56 60 58
61 63 61
71 68 70 72 72
67
40
56
69 73
76 82
0
20
40
60
80
100
120
UPI IMPS
0.2 0.2 0.2 0.2 0.2 0.2
0.2 0.3
0.4
0.5
0.6
0.5
0.1
0.4
0.5 0.5
0.6
0.6
0.0
0.1
0.2
0.3
0.4
0.5
0.6
0.7

India Strategy
30 KOTAK INSTITUTIONAL EQUITIES RESEARCH
Exhibit 31: NETC FASTag transactions continue to increase week-on-week Daily average UPI and IMPS (in Rs bn) and NETC transaction values (in Rs crores)
Source: National Payments Corporation of India, Kotak Institutional Equities
We also show the consumption data for petro-products – motor spirits (petrol) and high
speed diesel (Exhibits 32 and 33).
Exhibit 32: Petrol consumption increased marginally in August; still lower than August 2019 Monthly petrol consumption (‘000s metric tons) and year-on-year change in consumption (%)
Source: Petroleum Planning and Analysis Cell, Kotak Institutional Equities
93
74
48
84
65
52
102
82
52
86
65
52
100
83
51
90
71
55
123
91
63
99
76
64
0
20
40
60
80
100
120
140
UPI IMPS NETC FASTag
June W1 June W2 June W3 June W4 July W1 July W2 July W3 July W4
Aug W1 Aug W2 Aug W3 Aug W4 Sep W1 Sep W2 Sep W3 Sep W4
2,459
2,737 2,639
2,523 2,575
2,372 2,539 2,535 2,473 2,456 2,511
2,156
973
1,769
2,281 2,263 2,381
-70
-60
-50
-40
-30
-20
-10
0
0
500
1,000
1,500
2,000
2,500
3,000
Ap
r-1
9
May-
19
Jun
-19
Jul-
19
Au
g-1
9
Sep
-19
Oct
-19
No
v-1
9
Dec-
19
Jan
-20
Feb
-20
Mar-
20
Ap
r-2
0
May-
20
Jun
-20
Jul-
20
Au
g-2
0
Petrol consumption yoy change (rhs)

Strategy India
KOTAK INSTITUTIONAL EQUITIES RESEARCH 31
Exhibit 33: Diesel consumption dropped again in August Monthly high speed diesel consumption (‘000s metric tons) and year-on-year change in consumption (%)
Source: Petroleum Planning and Analysis Cell, Kotak Institutional Equities
We also track electricity consumption (Exhibits 34 to 45) for a few major states –
Maharashtra, New Delhi, Andhra Pradesh, Karnataka, Gujarat, Tamil Nadu, Telangana,
Madhya Pradesh, Uttar Pradesh and Haryana. We show daily electricity consumption
compared to the same week in the calendar year prior (CY2019). The horizontal axis shows
the week of the year. Rather than comparing to recent 1-month or 3-month figures, we
compare against same week from the previous calendar year to isolate any effect of the
weather.
Exhibit 34: India consumed more electricity in the past week, compared to a similar period in the
previous year Reduction in electricity consumption (%) compared to same period last calendar year for India over past seven days
Source: Central Electricity Regulatory Commission, Kotak Institutional Equities
7,323 7,788
7,451
6,841
6,117 5,837
6,510
7,571 7,387 6,942 7,160
5,651
3,250
5,495
6,302
5,524
4,849
-60
-50
-40
-30
-20
-10
0
0
1,000
2,000
3,000
4,000
5,000
6,000
7,000
8,000
9,000
Ap
r-1
9
May-
19
Jun
-19
Jul-
19
Au
g-1
9
Sep
-19
Oct
-19
No
v-1
9
Dec-
19
Jan
-20
Feb
-20
Mar-
20
Ap
r-2
0
May-
20
Jun
-20
Jul-
20
Au
g-2
0
Diesel consumption yoy change (rhs)
(50.0%)
(40.0%)
(30.0%)
(20.0%)
(10.0%)
0.0%
10.0%
20.0%
7-M
ar
14
-Mar
21
-Mar
28
-Mar
4-A
pr
11
-Ap
r
18
-Ap
r
25
-Ap
r
2-M
ay
9-M
ay
16
-May
23
-May
30
-May
6-J
un
13
-Ju
n
20
-Ju
n
27
-Ju
n
4-J
ul
11
-Ju
l
18
-Ju
l
25
-Ju
l
1-A
ug
8-A
ug
15
-Au
g
22
-Au
g
29
-Au
g
5-S
ep
12
-Sep
19
-Sep
26
-Sep

India Strategy
32 KOTAK INSTITUTIONAL EQUITIES RESEARCH
Exhibit 35: Seven states consumed more electricity this week than a similar period last year Reduction in average electricity consumption (%) compared to same period last calendar year
Source: Central Electricity Regulatory Commission, Kotak Institutional Equities
Exhibit 36: Maharashtra consumed less electricity in the past week compared to similar period last
year Electricity consumption (mn kWh) in Maharashtra compared to same week last calendar year (Jan 24 – Sep 29)
Source: Central Electricity Regulatory Commission, Kotak Institutional Equities
(50.0)
(40.0)
(30.0)
(20.0)
(10.0)
0.0
10.0
20.0
Karn
ata
ka
Tela
ng
an
a
Mah
ara
shtr
a
An
dh
ra P
rad
esh
Tam
il N
adu
Guja
rat
Hary
an
a
Delh
i
Mad
hya
Pra
desh
Utt
ar
Pra
desh
Week ending Sep 29, 2020 Week ending Sep 22, 2020
405 380
0
100
200
300
400
500
600
Week 5 Week 9 Week 13 Week 17 Week 21 Week 25 Week 29 Week 33 Week 37
Maharashtra 2019 Maharashtra 2020

Strategy India
KOTAK INSTITUTIONAL EQUITIES RESEARCH 33
Exhibit 37: Delhi used more electricity over the previous week, compared to similar period last year Electricity consumption (mn kWh) in Delhi compared to same week last calendar year (Jan 24 – Sep 29)
Source: Central Electricity Regulatory Commission, Kotak Institutional Equities
Exhibit 38: Gap in consumption in Andhra Pradesh narrowed Electricity consumption (mn kWh) in Andhra Pradesh compared to the same week last calendar year (Jan 24 – Sep 29)
Source: Central Electricity Regulatory Commission, Kotak Institutional Equities
80
106
0
20
40
60
80
100
120
140
160
Week 5 Week 9 Week 13 Week 17 Week 21 Week 25 Week 29 Week 33 Week 37
Delhi 2019 Delhi 2020
168
147
0
50
100
150
200
250
Week 5 Week 9 Week 13 Week 17 Week 21 Week 25 Week 29 Week 33 Week 37
Andhra Pradesh 2019 Andhra Pradesh 2020

India Strategy
34 KOTAK INSTITUTIONAL EQUITIES RESEARCH
Exhibit 39: The electricity consumption gap decreased for Karnataka Electricity consumption (mn kWh) in Karnataka compared to same week last calendar year (Jan 24 – Sep 29)
Source: Central Electricity Regulatory Commission, Kotak Institutional Equities
Exhibit 40: Tamil Nadu’s electricity consumption gap was higher, compared to similar period last
calendar year Electricity consumption (mn kWh) in Tamil Nadu compared to same week last calendar year (Jan 24 – Sep 29)
Source: Central Electricity Regulatory Commission, Kotak Institutional Equities
157 149
0
50
100
150
200
250
300
Week 5 Week 9 Week 13 Week 17 Week 21 Week 25 Week 29 Week 33 Week 37
Karnataka 2019 Karnataka 2020
271
307
0
50
100
150
200
250
300
350
400
Week 5 Week 9 Week 13 Week 17 Week 21 Week 25 Week 29 Week 33 Week 37
Tamil Nadu 2019 Tamil Nadu 2020

Strategy India
KOTAK INSTITUTIONAL EQUITIES RESEARCH 35
Exhibit 41: Telangana electricity consumption continues to be lower than the consumption in
CY2020 Electricity consumption (mn kWh) in Telangana compared to same week last calendar year (Jan 24 – Sep 29)
Source: Central Electricity Regulatory Commission, Kotak Institutional Equities
Exhibit 42: Gujarat used more electricity over the past seven days, compared to similar period last
year Electricity consumption (mn kWh) in Gujarat compared to same week last calendar year (Jan 24 – Sep 29)
Source: Central Electricity Regulatory Commission, Kotak Institutional Equities
167
133
0
50
100
150
200
250
300
Week 5 Week 9 Week 13 Week 17 Week 21 Week 25 Week 29 Week 33 Week 37
Telangana 2019 Telangana 2020
275
326
0
50
100
150
200
250
300
350
400
450
Week 5 Week 9 Week 13 Week 17 Week 21 Week 25 Week 29 Week 33 Week 37
Gujarat 2019 Gujarat 2020

India Strategy
36 KOTAK INSTITUTIONAL EQUITIES RESEARCH
Exhibit 43: MP consumed more electricity in the past week, compared to similar period last year Electricity consumption (mn kWh) in Madhya Pradesh compared to same week last calendar year (Jan 24 – Sep 29)
Source: Central Electricity Regulatory Commission, Kotak Institutional Equities
Exhibit 44: Extremely volatile consumption gap continues in Uttar Pradesh Electricity consumption (mn kWh) in Uttar Pradesh compared to same week last calendar year (Jan 24 – Sep 29)
Source: Central Electricity Regulatory Commission, Kotak Institutional Equities
154
205
0
50
100
150
200
250
300
Week 5 Week 9 Week 13 Week 17 Week 21 Week 25 Week 29 Week 33 Week 37
MP 2019 MP 2020
281
398
0
100
200
300
400
500
600
Week 5 Week 9 Week 13 Week 17 Week 21 Week 25 Week 29 Week 33 Week 37
UP 2019 UP 2020

Strategy India
KOTAK INSTITUTIONAL EQUITIES RESEARCH 37
Exhibit 45: Haryana’s electricity consumption gap was negative Electricity consumption (mn kWh) in Haryana compared to same week last calendar year (Jan 24 – Sep 29)
Source: Central Electricity Regulatory Commission, Kotak Institutional Equities
145
190
0
50
100
150
200
250
300
Week 5 Week 9 Week 13 Week 17 Week 21 Week 25 Week 29 Week 33 Week 37
Haryana 2019 Haryana 2020

India Strategy
38 KOTAK INSTITUTIONAL EQUITIES RESEARCH
Covid-19 case updates
We continue to see an increase in the number of new confirmed cases. However, recoveries
also continue to rise (Exhibit 46).
Exhibit 46: The number of new cases was consistently lower over the past week Number of recovered cases, deaths, active cases (LHS) and new confirmed cases (RHS), as on Sep 30
Source: Johns Hopkins University, Kotak Institutional Equities
We also show the three-day moving average of new cases (Exhibit 47) and the seven day
moving average of change in active cases (Exhibit 48).
Exhibit 47: Three-day moving average of new cases fell to 80,000 Daily new confirmed cases and their three-day moving average, as on Sep 30
Source: Johns Hopkins University, Kotak Institutional Equities
0
12,000
24,000
36,000
48,000
60,000
72,000
84,000
96,000
108,000
0
600,000
1,200,000
1,800,000
2,400,000
3,000,000
3,600,000
4,200,000
4,800,000
5,400,000
6,000,000
6,600,000
Number of recovered cases Number of deaths
Number of active cases Number of new confirmed cases (RHS)
0
15,000
30,000
45,000
60,000
75,000
90,000
105,000
4-M
ar
11
-Mar
18
-Mar
25
-Mar
1-A
pr
8-A
pr
15
-Ap
r
22
-Ap
r
29
-Ap
r
6-M
ay
13
-May
20
-May
27
-May
3-J
un
10
-Ju
n
17
-Ju
n
24
-Ju
n
1-J
ul
8-J
ul
15
-Ju
l
22
-Ju
l
29
-Ju
l
5-A
ug
12
-Au
g
19
-Au
g
26
-Au
g
2-S
ep
9-S
ep
16
-Sep
23
-Sep
New confirmed cases 3-day moving average

Strategy India
KOTAK INSTITUTIONAL EQUITIES RESEARCH 39
Exhibit 48: Fewer new cases and more recoveries meant that number of active cases decreased in the past two weeks Daily change in active cases and their seven-day moving average, as on Sep 30
Source: Johns Hopkins University, Kotak Institutional Equities
Exhibit 49: After a week of low testing, the number of tests were almost back to normal this week Seven-day moving average of daily samples tested (#)
Source: Covid19India, Kotak Institutional Equities
The seven-day compounded growth rate of confirmed cases has been broadly falling since the
announcement of lockdown (Exhibit 50). However, at this juncture, we believe that absolute
numbers are a better metric to track than growth rates.
(40,000)
(30,000)
(20,000)
(10,000)
0
10,000
20,000
30,000
1-A
pr
8-A
pr
15
-Ap
r
22
-Ap
r
29
-Ap
r
6-M
ay
13
-May
20
-May
27
-May
3-J
un
10
-Ju
n
17
-Ju
n
24
-Ju
n
1-J
ul
8-J
ul
15
-Ju
l
22
-Ju
l
29
-Ju
l
5-A
ug
12
-Au
g
19
-Au
g
26
-Au
g
2-S
ep
9-S
ep
16
-Sep
23
-Sep
New active cases 7-day moving average
0
100,000
200,000
300,000
400,000
500,000
600,000
700,000
800,000
900,000
1,000,000
1,100,000
1,200,000

India Strategy
40 KOTAK INSTITUTIONAL EQUITIES RESEARCH
Exhibit 50: India's seven-day CDGR continues to decline Long-term compounded daily growth rate (CDGR) of cases, since the day number of cases crossed 30, and seven-day CDGR, as on Sep 30
Source: Johns Hopkins University, Kotak Institutional Equities
Several restrictions were relaxed in lockdown 4.0. From June 1 onwards, there have been a
further graded relaxations. We show that the positive sample rate trended downward in
lockdown 1.0, stabilized at around 4% in lockdown 2.0, increased slightly in lockdown 3.0
and sharply in lockdown 4.0 (Exhibit 51).
Exhibit 51: Lower number of cases, with testing almost back to usual numbers, implies a lower
positive rate Seven-day moving average of new cases divided by seven-day moving average of incremental samples tested; different phases of lockdown are shaded differently
Source: Covid19India, ICMR, Kotak Institutional Equities
Exhibit 52 shows the growth in the number of cases in India compared to the same in other
countries. We show the data from the day the end-of-day count of cases exceeded 30. The
vertical axis is log-scaled. The horizontal axis is the number of days since the end-of-day
count exceeded 30.
The slope of each country’s curve tells us how fast the number of cases is increasing in that
country.
0%
5%
10%
15%
20%
25%
4-M
ar
11
-Mar
18
-Mar
25
-Mar
1-A
pr
8-A
pr
15
-Ap
r
22
-Ap
r
29
-Ap
r
6-M
ay
13
-May
20
-May
27
-May
3-J
un
10
-Ju
n
17
-Ju
n
24
-Ju
n
1-J
ul
8-J
ul
15
-Ju
l
22
-Ju
l
29
-Ju
l
5-A
ug
12
-Au
g
19
-Au
g
26
-Au
g
2-S
ep
9-S
ep
16
-Sep
23
-Sep
Long-term CDGR Double every week Double every two weeks
Double every three weeks Seven-day CDGR
0%
2%
4%
6%
8%
10%
12%
14%
8-Apr 23-Apr 8-May 23-May 7-Jun 22-Jun 7-Jul 22-Jul 6-Aug 21-Aug 5-Sep 20-Sep

Strategy India
KOTAK INSTITUTIONAL EQUITIES RESEARCH 41
Exhibit 52: India’s curve remains steeper than other countries; France and Spain are witnessing a second wave Cumulative number of Covid-19 cases in India, compared to number of cases in other countries, as on Sep 30
Source: Johns Hopkins University, Kotak Institutional Equities
Exhibit 53: Spain and France have a higher CDGR than India Compounded daily growth rate (CDGR) of confirmed Covid-19 cases over past seven days, as measured on T + 210 where T is the day number of cases crossed 30 for each country
Source: Johns Hopkins University, Kotak Institutional Equities
State-wise trends
We also look at the state-wise data to check the distribution of Covid-19 cases in India
(Exhibit 54). Some of the states are more heavily affected compared to other states.
We also show the districts with the highest percentage increase in the number of new cases
(Exhibit 55) and the districts with the highest absolute increase in the number of new cases
(Exhibit 56). In both these cases, we only show districts where the seven-day moving average
of cases a week back was more than 50.
To understand which districts are succeeding in controlling the outbreak, we also show the
districts with the largest absolute week-on-week decrease in the number of new cases
(Exhibit 57).
Over a period of time, the distribution of new cases has changed from being limited to
largely urban districts to more cases in rural districts. In Exhibit 58, we show the new cases in
rural districts as a proportion of new cases.
30
300
3,000
30,000
300,000
3,000,000
T + 0 T + 15 T + 30 T + 45 T + 60 T + 75 T + 90 T + 105 T + 120 T + 135 T + 150 T + 165 T + 180 T + 195 T + 210 T + 225
India Italy US Spain UK Brazil South Korea Japan France
Country Seven-day compounded daily growth rate
Italy 0.5%
US 0.6%
South Korea 0.7%
Japan 0.7%
UK 1.3%
India 1.4%
Spain 1.7%
France 2.3%

India Strategy
42 KOTAK INSTITUTIONAL EQUITIES RESEARCH
We also show a time series of number of states where new confirmed cases, as of a given
day, are above the seven-day moving average of new confirmed cases in that state (Exhibit
59). This gives an idea of the number of states where the number of new confirmed cases
continues to rise. We do a similar analysis with number of districts in Exhibit 60.
The mortality rate of Covid-19 varies significantly in different states within India and in
countries across the world. Exhibits 61 and 62 compare the mortality rate for a few states in
India, versus a set of selected countries.
Exhibit 54: Wide disparity in the growth rate of cases across states; Kerala’s CDGR much higher than
country average Number of cases, deaths and seven-day compounded daily growth rate (CDGR) for a selected set of states, as on Sep 30
Source: Covid19India, Kotak Institutional Equities
Exhibit 55: Kerala has the maximum number of districts where new cases are increasing at a high
pace Districts with the largest percentage increase in the number of new cases, as on Sep 30
Source: Covid19India, Kotak Institutional Equities
State Number of confirmed cases Number of deaths Seven-day CDGR (%)Kerala 184,137 707 4.0 Madhya Pradesh 126,020 2,281 1.9 Rajasthan 133,115 1,474 1.6 Karnataka 592,911 8,437 1.5 Punjab 112,460 3,359 1.5 Haryana 126,974 1,356 1.4 Maharashtra 1,365,899 36,181 1.4 Assam 177,119 669 1.3 West Bengal 253,768 4,899 1.3 Delhi 276,325 5,320 1.3 Telengana 188,773 1,114 1.1 Uttar Pradesh 394,856 5,715 1.1 Gujarat 136,004 3,441 1.1 Andhra Pradesh 687,351 5,780 1.0 Tamil Nadu 591,943 9,456 1.0 Bihar 181,471 894 0.8
District State Current 7-day moving average 7-day moving average one week back
Malappuram KL 749 394
Ernakulam KL 703 378
Dakshin Bastar Dantewada CT 121 68
Kozhikode KL 782 448
Kollam KL 531 312
Thrissur KL 513 301
Mandya KA 200 119
Nuapada OR 120 72
Bengaluru Rural KA 213 130
Hassan KA 342 212
Palakkad KL 405 254
Korba CT 109 68
Kottayam KL 327 211
Alappuzha KL 453 292
Kannur KL 386 251

Strategy India
KOTAK INSTITUTIONAL EQUITIES RESEARCH 43
Exhibit 56: Bengaluru continues to see a substantial increase in the number of new cases Districts with the largest absolute increase in the number of new cases, as on Sep 30
Source: Covid19India, Kotak Institutional Equities
Exhibit 57: Pune, Nagpur and Thane among the districts with largest absolute decline in the number
of new cases Districts with the largest absolute decrease in the number of new cases, as on Sep 30
Source: Covid19India, Kotak Institutional Equities
District State Current 7-day moving average 7-day moving average one week back
Bengaluru Urban KA 3,958 3,431
Malappuram KL 749 394
Kozhikode KL 782 448
Ernakulam KL 703 378
Kollam KL 531 312
Thrissur KL 513 301
Chennai TN 1,202 1,006
Alappuzha KL 453 292
Palakkad KL 405 254
North 24 Parganas WB 658 509
Kolkata WB 650 509
Kannur KL 386 251
Hassan KA 342 212
Kottayam KL 327 211
Bengaluru Rural KA 213 130
District State Current 7-day moving average 7-day moving average one week back
Pune MH 3,156 3,762
Nagpur MH 1,301 1,859
Lucknow UP 552 1,001
Kolhapur MH 479 796
Jalgaon MH 427 733
East Godavari AP 1,024 1,283
Sangli MH 670 850
Dehradun UT 198 409
Raipur CT 565 794
Thane MH 1,594 1,854
Ludhiana PB 169 292
Ahmednagar MH 648 806
Kanpur Nagar UP 214 343
S.A.S. Nagar PB 142 276
Mysuru KA 477 515

India Strategy
44 KOTAK INSTITUTIONAL EQUITIES RESEARCH
Exhibit 58: New cases in rural districts as a proportion of total new cases has fallen noticeably since mid-August Proportion of new cases in rural districts, compared to total nationwide new cases (%)
Notes:
(a): Districts have been classified as rural/urban based on Census.
(b): Some states do not report district-level new cases on a daily basis but less frequently, leading to spikes in daily data
Source: Covid19India, Census 2011, Kotak Institutional Equities
Exhibit 59: Large decline in the number of states seeing an ever-increasing number of cases Number of states where new cases as of the given day are higher than the 7-day moving average of new cases in that state
Source: Covid19India, Kotak Institutional Equities
0%
10%
20%
30%
40%
50%
60%
70%
80%
1-May 15-May 29-May 12-Jun 26-Jun 10-Jul 24-Jul 7-Aug 21-Aug 4-Sep 18-Sep
New cases in rural districts as a proportion of total new cases Seven-day moving average
0
5
10
15
20
25
30
35
25
-Mar
8-A
pr
22
-Ap
r
6-M
ay
20
-May
3-J
un
17
-Ju
n
1-J
ul
15
-Ju
l
29
-Ju
l
12
-Au
g
26
-Au
g
9-S
ep
23
-Sep
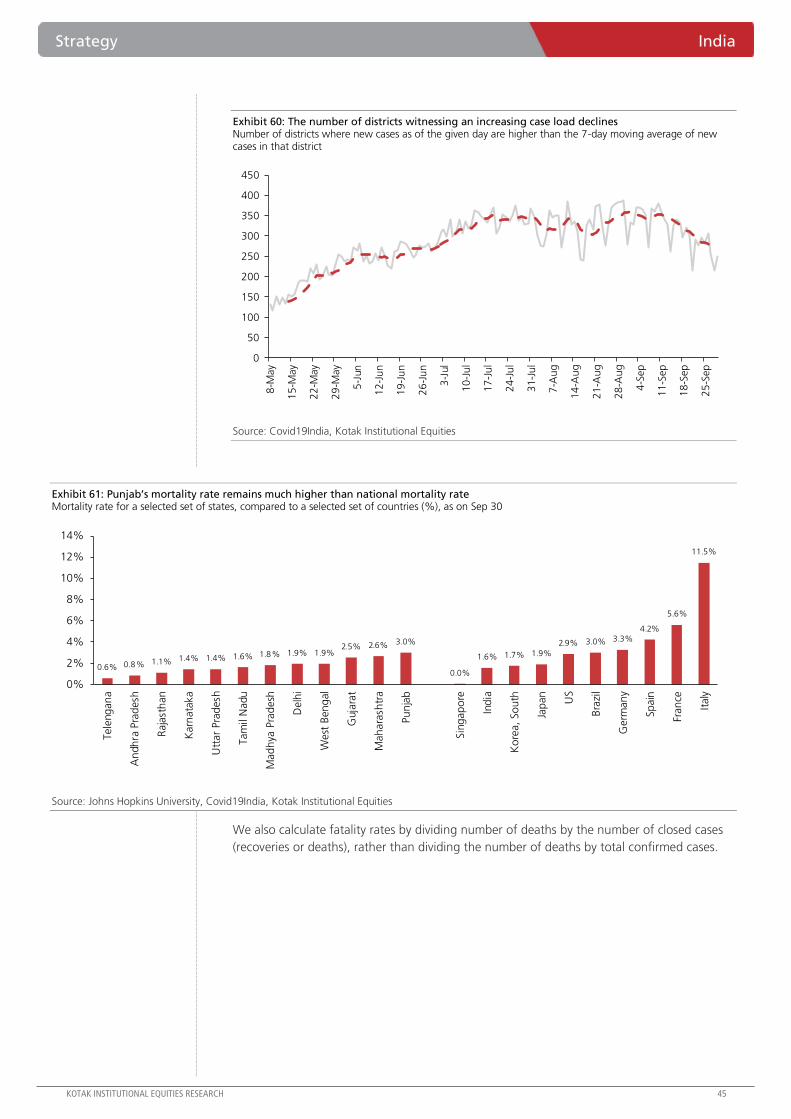
Strategy India
KOTAK INSTITUTIONAL EQUITIES RESEARCH 45
Exhibit 60: The number of districts witnessing an increasing case load declines Number of districts where new cases as of the given day are higher than the 7-day moving average of new cases in that district
Source: Covid19India, Kotak Institutional Equities
Exhibit 61: Punjab’s mortality rate remains much higher than national mortality rate Mortality rate for a selected set of states, compared to a selected set of countries (%), as on Sep 30
Source: Johns Hopkins University, Covid19India, Kotak Institutional Equities
We also calculate fatality rates by dividing number of deaths by the number of closed cases
(recoveries or deaths), rather than dividing the number of deaths by total confirmed cases.
0
50
100
150
200
250
300
350
400
450
8-M
ay
15
-May
22
-May
29
-May
5-J
un
12
-Ju
n
19
-Ju
n
26
-Ju
n
3-J
ul
10
-Ju
l
17
-Ju
l
24
-Ju
l
31
-Ju
l
7-A
ug
14
-Au
g
21
-Au
g
28
-Au
g
4-S
ep
11
-Sep
18
-Sep
25
-Sep
0.6% 0.8% 1.1% 1.4% 1.4% 1.6% 1.8% 1.9% 1.9% 2.5% 2.6% 3.0%
0.0%
1.6% 1.7% 1.9%
2.9% 3.0% 3.3% 4.2%
5.6%
11.5%
0%
2%
4%
6%
8%
10%
12%
14%
Tele
ng
an
a
An
dh
ra P
rad
esh
Raja
sth
an
Karn
ata
ka
Utt
ar
Pra
desh
Tam
il N
adu
Mad
hya
Pra
desh
Delh
i
West
Ben
gal
Guja
rat
Mah
ara
shtr
a
Pu
nja
b
Sin
gap
ore
Ind
ia
Ko
rea,
So
uth
Jap
an
US
Bra
zil
Germ
an
y
Sp
ain
Fran
ce
Italy

India Strategy
46 KOTAK INSTITUTIONAL EQUITIES RESEARCH
Exhibit 62: India’s mortality rate estimate increases to 1.9% if we take only closed cases (recoveries + deaths) in denominator Mortality rate for a selected set of states, compared to a selected set of countries (%), as on Sep 30
Source: Johns Hopkins University, Covid19India, Kotak Institutional Equities
Finally, we show that the case fatality rate (measured as number of deaths divided by total
number of confirmed cases) and the implied mortality rate (number of deaths divided by
number of closed cases) have been slowly nudging downwards, except for the one-time
addition of deaths in Maharashtra and Delhi (Exhibit 63).
Exhibit 63: Fatality rate continues to decline, and case fatality rate has settled at 1.6% Case fatality rate (%) and deaths as a percent of closed cases (%)
Source: Covid19India, Kotak Institutional Equities
0.7% 0.9% 1.3% 1.7% 1.7% 1.7% 2.1% 2.2% 2.2% 2.9% 3.3% 3.5%
0.0%
1.9% 1.9% 2.0% 3.3% 3.6%
6.8%
13.7%
17.3%
0%
2%
4%
6%
8%
10%
12%
14%
16%
18%
20%
Tele
ng
an
a
An
dh
ra P
rad
esh
Raja
sth
an
Utt
ar
Pra
desh
Tam
il N
adu
Karn
ata
ka
Delh
i
West
Ben
gal
Mad
hya
Pra
desh
Guja
rat
Mah
ara
shtr
a
Pu
nja
b
Sin
gap
ore
Ind
ia
Ko
rea,
So
uth
Jap
an
Bra
zil
Germ
an
y
US
Italy
Sp
ain
0
2
4
6
8
10
12
30
-Ap
r
7-M
ay
14
-May
21
-May
28
-May
4-J
un
11
-Ju
n
18
-Ju
n
25
-Ju
n
2-J
ul
9-J
ul
16
-Ju
l
23
-Ju
l
30
-Ju
l
6-A
ug
13
-Au
g
20
-Au
g
27
-Au
g
3-S
ep
10
-Sep
17
-Sep
24
-Sep
Case fatality rate (%) Deaths, as a proportion of closed cases (%)

Company Report
For Private Circulation Only. In the US, this document may only be distributed to QIBs (qualified institutional buyers) as defined under rule 144A of the Securities Act of 1933. This document is not for public distribution
and has been furnished to you solely for your information and may not be reproduced or redistributed to any other person. The manner of circulation and distribution of this document may be restricted by law or regulation in certain countries, including the United States. Persons into whose possession this document may come are required to inform themselves of, and to observe, such restrictions.
Automobiles & Components
Sector
2Ws – quest to conquer the world. Our detailed analysis of the global two-
wheeler industry indicates that Indian players are well-positioned to capture strong
growth opportunities in underpenetrated geographies such as Africa, LATAM and
South Asia and gain market shares. We believe Bajaj Auto will be the key beneficiary
of strong growth in exports while benefiting from the premiumization story and shift
to electric vehicles in India.
Export opportunity beckons Indian two-wheeler players
The global two-wheeler industry is likely to grow at 5% CAGR over the next 15 years led by
(1) 6% CAGR in India and (2) 9-14% CAGR in South Asian and LATAM regions. We expect
certain markets like Africa and South Asia to grow at a faster pace led by low penetration
levels (10-50% of Indian two-wheeler penetration levels) and rising income levels. Indian two-
wheeler players command a market share of 11% in the global two-wheeler industry
(excluding India and China). We expect the market share of Indian 2W OEMs to increase to
23% in CY2035E from 11% in CY2019.
Africa, LATAM and South Asian markets to be key focus areas for Indian players
Indian players are focusing on increasing their presence in Africa, LATAM and South Asia as
penetration levels there are 10-50% of the Indian market and rising per capita income levels,
proliferation of e-commerce and usage of motorcycles as taxis are increasing the usage of
two-wheelers in these markets. Indian players have also expanded their market share in these
geographies. We expect global two-wheeler market volumes (excluding India and China) to
grow at 7% CAGR over CY2019-35E led by (1) 14% CAGR in Africa led by rise in per capita
income, which will make two-wheelers affordable and increasing popularity of motorcycle
taxis as a way to earn livelihood, (2) 9% CAGR in South Asia led by strong growth in
Bangladesh and Nepal, and (3) 7% CAGR in LATAM led by strong growth in Mexico due to
proliferation of e-commerce. We have forecasted country-wise export growth trajectory to
arrive at our overall volume forecasts for Indian players.
Premiumization and shift to electric mobility to be key growth drivers in India
We reckon the premium motorcycle segment, scooters and electric 2Ws will be the fastest-
growing segments in the Indian two-wheeler industry. We expect the Indian domestic two-
wheeler industry to grow at 6.5% CAGR over FY2020-36E and saturate in FY2036E.
Bajaj Auto remains our top pick in the sector
We believe Bajaj Auto is well-positioned to grow in fast-growing segments in the Indian two-
wheeler industry (premium motorcycles, electric scooters and exports). The stock is not
adequately factoring in these opportunities, in our view. We believe the company can grow
its revenues at a strong double-digit rate over the next 15 years led by (1) market share gains
in Africa from Chinese competition, (2) improving its footprint in South East Asia and LATAM
by launching premium motorcycle offerings and entering newer geographies and (3)
consolidating its market share in South Asia (including Bangladesh and Sri Lanka). We have
raised our Fair Value to Rs3,900 (from Rs3,400) as we have increased the export volume
forecasts over the medium term.
CAUTIOUS
September 30, 2020
THEME
BSE-30: 38,068
Hitesh Goel
Rishi Vora
[email protected]: +91 22 6218 6427

KOTAK INSTITUTIONAL EQUITIES RESEARCH 3
Sector Automobiles & Components
EXPORT OPPORTUNITY BECKONS INDIAN TWO-WHEELER PLAYERS
The global two-wheeler industry has seen fluctuations over the past few years due to economic downturns,
political uncertainty, regulatory pressures resulting in higher upfront costs, US-China trade war and Covid-19.
However, we believe select geographies can grow at a rapid pace over the next decade led by rising per
capita income, rise in discretionary spending and urbanization, increasing commercial applications in the
form of taxis, e-commerce and food delivery, lack of proper public transport infrastructure in frontier markets
and increase in traffic congestion in cities. Indian two-wheeler OEMs are well-positioned to gain market share
in select geographies led by superior product offerings, wide-distribution network and weakening balance
sheet of Chinese players.
Expect global two-wheeler market to grow at 5% CAGR over CY2019-35E
As per our estimate, the two-wheeler market size stood at ~87.3 mn units (includes 26 mn
units of electric scooters sales from China) with India and China constituting 70% of the
total volumes as of CY2019. We expect global two-wheeler market volumes (excluding India
and China) to grow at 7% CAGR over CY2019-35E led by (1) 14% CAGR in African region
led by rise in per capita income, which will make two-wheelers affordable and increasing
popularity of motorcycle taxis as a way to earn livelihood, (2) 9% CAGR in South Asian
region led by strong growth in Bangladesh and Nepal, (3) 7% CAGR in LATAM region led by
strong growth in Mexico due to proliferation of e-commerce, and (4) 4% CAGR in South
East Asia region led by increase in two-wheeler penetration in Philippines and Myanmar
(refer to Exhibits 1-2).
Our analysis suggests that geographies with nominal GDP per capita between US$1,000 and
US$5,000 will continue to witness higher two-wheeler growth rates resulting in increase in
two-wheeler penetration. Empirical evidence suggests that consumers tend to migrate
towards cars as their preferred means of transport once nominal GDP per capita breaches
$5,000 level (refer to Exhibits 4-7). As a result, we believe two-wheeler growth potential
remains limited in (1) a few South East Asian countries like Vietnam, Indonesia and Thailand
as they have reached their saturation levels in terms of two-wheeler penetration and
consumers are migrating to entry-levels cars, which is reflected in PV industry
outperformance over two-wheeler industry over the past 10 years and (2) select LATAM
countries like Brazil, Argentina and Chile, which have nominal GDP per capita above
US$5,000 and people have directly switched to PVs before two-wheeler penetration reached
its peak level. This is evident given these geographies have higher car penetration than two-
wheeler penetration (refer to Exhibit 8). Having said that, growth potential in Africa, LATAM
and South Asian markets is quite significant and Indian players have been increasing market
shares in these countries.
Indian 2W OEMs well-positioned to gain market share in select markets
Over the past 10 years, global two-wheeler market volumes (excluding India and China)
have grown at a CAGR of 2%; however, two-wheeler exports from India have a grown at a
CAGR of 12% during the same period, implying market share gains for Indian two-wheeler
OEMs. In terms of market share in global markets (excluding India and China), Japanese 2W
OEMs have dominant market of ~75-76% followed by Chinese OEMs with market share of
~14% as of CY2019. Indian 2W OEMs have 11% market share globally. However, we
expect market share of Indian 2W OEMs to increase to 23% in CY2035E from 11% in
CY2019 led by (1) market share gains in African region due to superior product offering and
weakening competition from China, (2) market share gains in LATAM led by setting up
production facilities, increase in distribution network and aggressive product launches, and
(3) favorable geographical mix as Indian OEMs have higher market share in South Asian and
African regions, which we expect to grow faster than other geographies due to lower
penetration levels (refer to Exhibit 3). We expect Japan OEMs market share to decline to 54%
in CY2035E from 75% in CY2019 due to its higher share in saturated markets of South East
Asia and LATAM regions and minimal presence in African region (refer to Exhibit 2).

4 KOTAK INSTITUTIONAL EQUITIES RESEARCH
Automobiles & Components Sector
Bajaj Auto and Royal Enfield can be key beneficiaries of premiumization theme
We believe Bajaj Auto and Royal Enfield can be the key beneficiaries of shift towards
premium motorcycles as GDP per capita increases across the globe. We have identified key
geographies in (1) South East Asia – Thailand and Malaysia, (2) LATAM – Brazil, Argentina,
Chile, and (3) developed economies like the US, EU and Japan, where share of premium
motorcycles is likely to increase. We expect revenue growth in these geographies to
outperform volume growth as consumers shift towards premium motorcycles. For instance,
average realization growth (in local currency terms) in Brazil and South Africa has been
much higher than volume growth over the past 10 years (refer to Exhibit 10). We expect
Royal Enfield and Bajaj Auto to gain market share in these geographies with relevant
product offerings meeting customer requirements and setting up of distribution network.
Expect domestic two-wheeler industry to grow at 7% CAGR over FY2020-36E
We expect the domestic two-wheeler industry to grow at 7% CAGR over FY2020-36E as we
believe the Indian two-wheeler industry will reach its saturation level at 25% penetration on
per person basis. We expect the Indian two-wheeler industry to saturate at much lower level
than China and South-East Asian geographies like Indonesia, Thailand and Vietnam as
female participation in workforce in India is significantly lower as compared to China and
South East Asian regions. Also, we expect India’s nominal GDP per capita in dollar terms to
rise by 6% over the same period and reach US$5,939 by 2036E. We believe nominal GDP
per capita above US$5,000 will be the tipping point for the consumers to shift towards cars
as a favorable private mode of transportation. In terms of segments, we expect scooter
volumes to grow by 8% CAGR over FY2020-36E led by (1) rise in urbanization, (2) increase
in two-wheeler penetration within female population, and (3) increase in penetration in rural
areas. We expect motorcycle volumes to increase at 6% CAGR led by (1) 9% CAGR in the
premium motorcycle segment, (2) 7% CAGR in the economy motorcycle segment, and (3) 3%
CAGR in the executive motorcycle segment.

KOTAK INSTITUTIONAL EQUITIES RESEARCH 5
Sector Automobiles & Components
Exhibit 1: Global two-wheeler market is dominated by India and China with 70% share as of CY2019 Summary of global two-wheeler market region-wise, calendar year ends, 2008-19 (units, %)
Countries CY2019 CAGR - 10 yr CAGR - 5 yr
Penetration
per person
Penetration per
household
CY2019 Nominal GDP
per capita ($/ person) CAGR - 10 yr CAGR - 5 yr Gini Index Key players
India 18,600 7.9 3.0 13.0 57.2 2,338 6.7 6.0 37.8 Hero Motocorp, Bajaj Auto, TVS, HMSI
China 42,099 0.8 1.0 34.0 95.3 10,276 10.4 6.0 38.5 Lifan Motors, Loncin Motors, Chongqing Zongshen
South East Asian region
Indonesia 6,487 (1.4) 0.0 30.0 114.1 4,135 6.2 3.4 39.0 Honda
Thailand 1,719 (1.2) 1.2 31.1 87.2 7,808 6.4 5.6 36.4 Honda
Vietnam 3,255 0.7 5.6 37.7 131.9 2,715 8.4 6.0 35.7 Honda
Philippines 1,705 9.4 19.0 10.9 49.0 3,485 6.2 3.3 44.4 Honda, Yahama, Kawasaki, Bajaj Auto
Malaysia 547 2.4 4.3 17.7 67.3 11,137 4.6 0.2 41.0 Honda, Yahama, SYM
Myanmar 500 9.6 10.0 11.4 45.4 1,245 6.7 2.4 30.7 Honda
Total South East Asia 14,213 0.0 3.3 27.0
African region
Nigeria 1,236 2.5 (3.0) 2.9 12.6 2,230 1.7 (7.1) 43.0 Bajaj Auto, Chinese players, TVS Motors
East and Central Africa
Kenya 230 10.3 11.3 2.1 7.6 1,817 7.2 6.7 40.8 Bajaj Auto, Chinese players, TVS Motors
Congo 168 20.7 13.2 0.8 3.4 545 6.2 2.3 42.1 Bajaj Auto, Chinese players, TVS Motors
Ethiopia 46 20.1 20.8 0.2 1.0 858 8.5 8.6 35.0 Bajaj Auto, Chinese players, TVS Motors
Tanzania 156 6.9 (3.1) 1.7 7.9 1,089 4.9 1.7 40.5 Bajaj Auto, Chinese players, TVS Motors
Uganda 115 6.5 6.1 1.2 5.4 777 (0.2) (2.4) 42.8 Bajaj Auto, Chinese players, TVS Motors
West Africa
Ghana 116 4.8 (6.7) 2.6 8.7 2,202 7.4 2.2 43.5 Chinese players
Senegal 15 2.9 0.9 0.5 4.0 1,447 0.9 0.7 40.3 Chinese players
Ivory Coast 34 14.5 (1.5) 0.7 3.7 2,286 41.5 Chinese players
Burkina Faso 120 11.6 (1.1) 3.3 17.6 775 2.2 (0.5) 35.3 Chinese players
Mali 76 6.6 7.5 2.1 11.2 872 2.5 1.0 33.0 Chinese players
North and South Africa
Egypt 375 4.8 (8.9) 5.8 21.9 3,020 2.6 (2.2) 31.5 Bajaj Auto, Chinese players, TVS Motors
Algeria 108 17.1 6.1 1.8 10.2 3,949 0.2 (6.4) 27.6 Chinese players
Morocco 157 9.0 (5.8) 4.1 18.0 3,255 1.1 0.2 39.5 Chinese players
South Africa 98 7.1 2.7 1.9 5.6 6,001 0.2 (1.4) 63.0 BMW, Harley Davidson, Honda
Others 359 5.7 (1.6)
Total Africa 3,408 5.7 (1.6) 1.4 4.9
LATAM region
Brazil 1,085 (3.7) (5.4) 8.0 24.0 8,718 0.1 (6.4) 53.9 Honda, Yamaha, Kawasaki
Colombia 612 6.5 (2.6) 13.1 43.1 6,416 2.2 (4.5) 50.4 Bajaj Auto, Honda, Chinese players
Mexico 1,050 31.9 12.4 4.1 14.5 9,861 2.1 (2.0) 45.4 Italika
Argentina 325 (0.8) (3.0) 14.4 43.2 10,027 2.0 (4.1) 41.4 Benelli, Keeway, SYM, Honda, Chinese players
Peru 263 4.9 0.6 8.9 31.2 6,982 5.2 0.9 42.8 Honda, Italika, Chinese (Lifan Motors, Loncin Motors)
Paraguay 172 (0.7) 7.6 30.2 121.0 5,534 4.1 (2.4) 46.2 Kenton, Star, Taiga, Honda, Yamaha
Chile 49 8.2 (1.0) 2.6 8.1 14,880 3.9 0.3 44.4 Honda, Chinese players
Others 395 2.8 0.2
Latin America 3,951 2.8 0.2 7.0 20.9
South Asia region
Sri Lanka 301 2.8 (0.8) 15.3 53.6 3,940 6.3 0.2 39.8 Honda, Bajaj Auto, TVS, Yamaha, Suzuki
Pakistan 1,666 12.6 16.7 5.9 37.8 1,285 3.0 0.5 33.5 Honda, Yamaha, United Auto, Chinese ( (Lifan Motors, Loncin Motors,
Chongqing Zongshen)
Nepal 419 17.5 20.7 9.0 37.9 1,071 8.4 7.6 32.8 Honda, Bajaj Auto, TVS, Hero, Yamaha
Bangladesh 407 14.6 35.0 1.5 6.5 1,856 10.2 10.6 32.4 Honda, TVS, Bajaj Auto, Runner
South Asia 2,794 11.7 15.8 4.9 14.7
Developed markets 2,213 0.9 1.5
Total two-wheeler 87,277 2.3 1.9
Total two-wheeler excluding India & China 26,578 1.9 2.9
Notes:
(1) We have assumed 12 years of two-wheeler life to compute the penetration of two-wheelers except for Nigeria, East Africa, West Africa and Central Africa
(3) Developed markets includes sales volume from USA, EU region and Japan
(4) China sales includes the sales of electric scooters as well
Market size ('000 units) GDP per capitaPenetration (%)
(2) We have assumed 6 years of two-wheeler life to compute the penetration of two-wheelers for Nigeria, East Africa, West Africa and Central Africa as motorcycles are used as taxis, which have lower
replacement cycle
Source: UN Comtrade, Regional Automotive Associations, Kotak Institutional Equities estimates

6 KOTAK INSTITUTIONAL EQUITIES RESEARCH
Automobiles & Components Sector
Exhibit 2: We expect global two-wheeler market volumes (excluding India and China) to grow at 7% CAGR over CY2019-35E Summary of global two-wheeler market region-wise, calendar year ends, 2019-35E (units, %)
Countries CY2035E CY2019
Volume
CAGR (%) CY2035E CY2019 Indians
Japanese
and others Chinese Indians
Japanese
and others Chinese
India 47,722 18,600 6.1 25.0 13.0 64.4 35.6 — 65.7 34.3 —
China 52,863 42,099 1.4 35.0 34.0 — 6.0 94.0 — 6.0 94.0
South East Asian region
Indonesia 11,723 6,487 3.8 35.0 30.0 4.0 90.0 6.0 2.0 96.0 2.0
Thailand 2,621 1,719 2.7 35.0 31.1 10.0 90.0 — 2.0 98.0 —
Vietnam 4,238 3,255 1.7 40.0 37.7 — 96.0 4.0 — 97.0 3.0
Philippines 6,255 1,705 8.5 35.0 10.9 20.0 75.0 5.0 10.0 80.0 10.0
Malaysia 795 547 2.4 20.0 17.7 25.0 70.0 5.0 15.0 70.0 15.0
Myanmar 1,288 500 6.1 25.0 11.4 20.0 70.0 10.0 10.0 60.0 30.0
Total South East Asia 26,920 14,213 4.1 34.1 27.0 9.1 85.9 5.0 3.3 92.3 4.4
African region
Nigeria 9,718 1,236 13.8 15.0 2.9 55.0 5.0 40.0 55.0 5.0 40.0
East and Central Africa
Kenya 1,676 230 13.2 10.0 2.1 50.0 — 50.0 49.2 0.1 50.7
Congo 1,548 168 14.9 5.0 0.8 60.0 5.0 35.0 61.6 3.1 35.3
Ethiopia 1,354 46 23.6 3.0 0.2 80.0 5.0 15.0 83.9 7.3 8.8
Tanzania 966 156 12.1 5.0 1.7 35.0 5.0 60.0 32.4 0.7 67.0
Uganda 1,412 115 17.0 8.0 1.2 90.0 — 10.0 95.7 1.2 3.1
West Africa
Ghana 896 116 13.6 10.0 2.6 8.0 5.0 87.0 6.6 2.9 90.5
Senegal 270 15 19.7 5.0 0.5 5.0 5.0 90.0 5.0 3.2 91.8
Ivory Coast 442 34 17.4 5.0 0.7 5.0 — 95.0 3.2 0.9 95.8
Burkina Faso 666 120 11.3 10.0 3.3 5.0 — 95.0 5.4 0.0 94.5
Mali 487 76 12.3 8.0 2.1 1.0 5.0 94.0 0.1 1.6 98.2
North and South Africa
Egypt 3,011 375 13.9 15.0 5.8 30.0 20.0 50.0 28.0 16.1 55.9
Algeria 860 108 13.9 10.0 1.8 2.0 — 98.0 0.0 0.2 99.7
Morocco 554 157 8.2 10.0 4.1 2.0 20.0 78.0 0.1 16.8 83.1
South Africa 510 98 10.9 5.0 1.9 2.0 75.0 23.0 1.5 69.1 29.4
Others 2,256 359 12.2 15.0 5.0 80.0 10.0 5.0 85.0
Total Africa 26,628 3,408 13.7 5.9 1.4 42.2 7.4 50.4 36.8 7.4 55.8
LATAM region
Brazil 3,032 1,085 6.6 10.0 8.0 2.0 95.0 3.0 — 100.0 —
Colombia 2,086 612 8.0 25.0 13.1 45.0 25.0 30.0 33.5 18.0 48.5
Mexico 4,163 1,050 9.0 20.0 4.1 6.0 85.0 9.0 1.8 87.7 10.5
Argentina 964 325 7.0 15.0 14.4 10.0 80.0 10.0 6.5 75.0 18.5
Peru 421 263 3.0 10.0 8.9 15.0 65.0 20.0 9.0 61.0 30.0
Paraguay 303 172 3.6 35.0 30.2 — 90.0 10.0 — 90.0 10.0
Chile 145 49 7.0 5.0 2.6 20.0 60.0 20.0 11.0 56.5 32.5
Others 999 395 6.0 15.0 75.0 10.0 10.0 85.0 5.0
Latin America 12,112 3,951 7.3 13.7 7.0 13.1 75.1 11.8 7.9 76.9 15.2
South Asia region
Sri Lanka 693 301 5.3 25.0 15.3 70.0 25.0 5.0 70.0 25.0 5.0
Pakistan 5,893 1,666 8.2 15.0 5.9 — 80.0 20.0 — 78.0 22.0
Nepal 1,487 419 8.2 30.0 9.0 35.0 55.0 10.0 40.0 55.0 5.0
Bangladesh 3,169 407 13.7 10.0 1.5 65.0 30.0 5.0 65.0 20.0 15.0
South Asia 11,242 2,794 9.1 19.1 4.9 27.3 59.2 13.5 23.0 60.4 16.6
Developed markets 2,976 2,213 1.9 10.0 80.0 10.0 5.0 90 5.0
Total two-wheeler volumes 180,464 87,277 4.6 27.3 35.1 37.5 17.2 33.2 49.6
Total two-wheeler volumes excluding India & China 79,878 26,578 7.1 23.3 54.1 22.6 10.5 75.6 13.9
Notes:
(1) We have assumed 12 years of two-wheeler life to compute the penetration of two-wheelers except for Nigeria, East Africa, West Africa and Central Africa
(3) Developed markets includes sales volume from USA, EU region and Japan
(4) China sales includes the sales of electric scooters as well
(2) We have assumed 6 years of two-wheeler life to compute the penetration of two-wheelers for Nigeria, East Africa, West Africa and Central Africa as motorcycles are used as taxis, which have lower
replacement cycle
Market share (%), CY2035E Market share (%), CY2019Market size ('000 units) Penetration (%)
Source: UN Comtrade, Regional Automotive Associations, Kotak Institutional Equities estimates

KOTAK INSTITUTIONAL EQUITIES RESEARCH 7
Sector Automobiles & Components
Exhibit 3: We expect export volumes of Indian OEMs to grow at 13% CAGR over CY2019-35E Forecast of global two-wheeler market region-wise volumes and export potential for Indian OEMs, calendar year ends, 2019-35E (units, %)
2019 2020E 2021E 2022E 2023E 2024E 2025E 2035E
CY2019-35E
CAGR (%)
Total two-wheeler volumes excluding India and China (units)
South East Asia 14,212,722 11,370,178 13,644,213 14,292,698 14,981,947 15,715,258 16,496,247 26,919,982 4.1
South Asia 2,793,555 2,234,844 2,681,813 2,967,366 3,285,130 3,639,007 4,026,054 11,242,256 9.1
LATAM 3,950,625 3,220,695 3,864,834 4,196,811 4,550,191 4,935,097 5,354,440 12,112,086 7.3
Africa 3,408,106 2,810,285 3,372,342 3,918,467 4,555,551 5,299,166 6,135,980 26,628,149 13.7
Developed economies 2,213,144 1,991,830 2,191,013 2,300,563 2,346,574 2,393,506 2,441,376 2,976,024 1.9
Total volumes 26,578,152 21,627,832 25,754,215 27,675,906 29,719,393 31,982,034 34,454,097 79,878,495 7.1
India two-wheeler export volumes potential (units)
South East Asia 466,633 373,306 447,967 553,882 593,700 723,816 852,681 2,438,376 10.9
South Asia 642,863 514,291 617,149 683,782 768,554 864,892 969,350 3,065,364 10.3
LATAM 313,740 256,842 317,081 377,748 419,017 471,375 536,605 1,587,448 10.7
Africa 1,254,012 1,021,402 1,238,108 1,448,918 1,708,506 1,999,810 2,345,668 11,230,262 14.7
Developed economies 110,657 99,591 109,551 115,028 164,260 167,545 170,896 297,602 6.4
Total volumes 2,787,904 2,265,432 2,729,856 3,179,358 3,654,038 4,227,438 4,875,200 18,619,052 12.6
Indian OEMs market share
South East Asia 3.3 3.3 3.3 3.9 4.0 4.6 5.2 9.1
South Asia 23.0 23.0 23.0 23.0 23.4 23.8 24.1 27.3
LATAM 7.9 8.0 8.2 9.0 9.2 9.6 10.0 13.1
Africa 36.8 36.3 36.7 37.0 37.5 37.7 38.2 42.2
Developed economies 5.0 5.0 5.0 5.0 7.0 7.0 7.0 10.0
Total market share 10.5 10.5 10.6 11.5 12.3 13.2 14.1 23.3
Source: UN Comtrade, Regional Automotive Associations, Kotak Institutional Equities estimates
Exhibit 4: China two-wheeler industry grew by only 1% CAGR when nominal GDP per capita exceeded US$5,000 China annual domestic two-wheeler sales and nominal GDP per capita, calendar year-ends, 1994-2019 (US$ per person, %)
-
5,000,000
10,000,000
15,000,000
20,000,000
25,000,000
30,000,000
35,000,000
40,000,000
45,000,000
1,000
2,000
3,000
4,000
5,000
6,000
7,000
8,000
9,000
10,000
11,000
19
94
19
95
19
96
19
97
19
98
19
99
20
00
20
01
20
02
20
03
20
04
20
05
20
06
20
07
20
08
20
09
20
10
20
11
20
12
20
13
20
14
20
15
20
16
20
17
20
18
20
19
(Units)(US$) GDP per capita (Nominal basis, LHS) Domestic two-wheeler sales (RHS)
Source: CAAM, Kotak Institutional Equities estimates

8 KOTAK INSTITUTIONAL EQUITIES RESEARCH
Automobiles & Components Sector
Exhibit 5: China PV industry grew at 8% CAGR when nominal GDP per capita exceeded US$5,000 China annual domestic car sales and nominal GDP per capita, calendar year-ends, 1994-2019 (US$ per person, %)
-
5,000,000
10,000,000
15,000,000
20,000,000
25,000,000
30,000,000
1,000
2,000
3,000
4,000
5,000
6,000
7,000
8,000
9,000
10,000
11,000
19
94
19
95
19
96
19
97
19
98
19
99
20
00
20
01
20
02
20
03
20
04
20
05
20
06
20
07
20
08
20
09
20
10
20
11
20
12
20
13
20
14
20
15
20
16
20
17
20
18
20
19
(Units)(US$) GDP per capita (Nominal basis, LHS) Domestic car sales (RHS)
Source: CAAM, Kotak Institutional Equities
Exhibit 6: Indonesia two-wheeler industry has declined by 3% CAGR when nominal GDP per capita exceeded US$3,500 Indonesia annual domestic two-wheeler sales and nominal GDP per capita, calendar year-ends, 1994-2019 (US$ per person, %)
-
1,000,000
2,000,000
3,000,000
4,000,000
5,000,000
6,000,000
7,000,000
8,000,000
9,000,000
1,000
1,500
2,000
2,500
3,000
3,500
4,000
4,500
19
94
19
95
19
96
19
97
19
98
19
99
20
00
20
01
20
02
20
03
20
04
20
05
20
06
20
07
20
08
20
09
20
10
20
11
20
12
20
13
20
14
20
15
20
16
20
17
20
18
20
19
(Units)(US$) GDP per capita (Nominal basis, LHS) Domestic two-wheeler sales (RHS)
Source: AISI, Kotak Institutional Equities

KOTAK INSTITUTIONAL EQUITIES RESEARCH 9
Sector Automobiles & Components
Exhibit 7: Thailand’s two-wheeler industry declined by 1% CAGR when nominal GDP per capita exceeded US$5,000 Thailand annual domestic two-wheeler sales and nominal GDP per capita, calendar year-ends, 1994-2019 (US$ per person, %)
-
500,000
1,000,000
1,500,000
2,000,000
2,500,000
3,000,000
3,500,000
1,000
2,000
3,000
4,000
5,000
6,000
7,000
8,000
9,000
19
94
19
95
19
96
19
97
19
98
19
99
20
00
20
01
20
02
20
03
20
04
20
05
20
06
20
07
20
08
20
09
20
10
20
11
20
12
20
13
20
14
20
15
20
16
20
17
20
18
20
19
(Units)(US$) GDP per capita (Nominal basis, LHS) Domestic two-wheeler sales (RHS)
Source: FAMI, Kotak Institutional Equities
Exhibit 8: We expect PV sales to outperform in select South East Asian countries as two-wheeler market has reached its saturation point Summary of global two-wheeler and four-wheeler market region-wise, calendar year-ends, 2009-19 (%)
Car Sales Two-Wheeler Sales
CAGR - 5 yr CAGR - 10 yr CAGR - 5 yr CAGR - 10 yr
Countries
India 2.9 5.0 3.0 7.9 2.1 13.0
China 1.7 7.6 1.0 0.8 16.5 34.0
South East Asian region
Indonesia (1.5) 8.3 0.0 (1.4) 3.5 30.0
Thailand 2.6 7.4 1.2 (1.2) 8.2 31.1
Vietnam 23.9 14.0 5.6 0.7 1.4 37.7
Philippines 24.8 19.5 19.0 9.4 1.5 10.9
Malaysia (1.3) 1.2 4.3 2.4 23.7 17.7
Myanmar 48.3 16.9 10.0 9.6 2.3 11.4
LATAM region
Brazil (4.1) (1.5) (5.4) (3.7) 16.5 8.0
Colombia (3.6) 2.6 (2.6) 6.5 6.3 13.1
Mexico 0.4 5.7 12.4 31.9 8.5 4.1
Argentina (8.2) (2.8) (3.0) (0.8) 16.4 14.4
Peru (3.8) 9.0 0.6 4.9 4.2 8.9
Paraguay (0.9) 11.4 7.6 (0.7) 3.3 30.2
Chile 0.3 7.1 (1.0) 8.2 17.5 2.6
South Asia region
Sri Lanka (10.1) 10.4 (0.8) 2.8 0.6 15.3
Pakistan 5.5 5.5 16.7 12.6 1.1 5.9
Nepal 7.2 14.1 20.7 17.5 0.2 9.0
Bangladesh (36.6) (17.9) 35.0 14.6 0.1 1.5
Car penetration
(%)
Two-wheeler
penetration (%)
Source: UN Comtrade, Regional Automotive Associations, OICA, SIAM, Kotak Institutional Equities estimates

10 KOTAK INSTITUTIONAL EQUITIES RESEARCH
Automobiles & Components Sector
Exhibit 9: Ex-showroom prices (in US$ terms) in LATAM is higher due to higher nominal GDP per
capita Ex-showroom prices in global two-wheeler markets, calendar year-end, 2019 (US$)
Countries
Nominal GDP per capita
($/ person)
Average Selling
Price ($)
India 2,338 984
Japan 10,276 1,250
South East region
Indonesia 4,135 1,587
Thailand 7,808 1,539
Vietnam 2,715 1,409
Philippines 3,485 1,567
Malaysia 11,137 1,678
Myanmar 1,245 1,744
African region
Nigeria 2,230 503
East and Central Africa
Kenya 1,817 503
Congo 545 513
Ethiopia 858 538
Tanzania 1,089 489
Uganda 777 560
West Africa
Ghana 2,202 410
Senegal 1,447 400
Ivory Coast 2,286 428
Burkina Faso 775 380
Mali 872 400
North and South Africa
Egypt 3,020 554
Algeria 3,949 480
Morocco 3,255 500
South Africa 6,001 2,500
LATAM region
Brazil 8,718 1,951
Colombia 6,416 1,258
Mexico 9,861 905
Argentina 10,027 2,003
Peru 6,982 1,173
Paraguay 5,534 863
Chile 14,880 2,565
South Asia region
Sri Lanka 3,940 1,952
Pakistan 1,285 879
Nepal 1,071 1,916
Bangladesh 1,856 1,273
Source: Honda regional websites, Motorcycles data, Kotak Institutional Equities estimates

KOTAK INSTITUTIONAL EQUITIES RESEARCH 11
Sector Automobiles & Components
Exhibit 10: ASP in Brazil, Nigeria and South Africa have increased at a CAGR of 8-10% in local currency terms over the past 10 years Average selling price (ASP) summary of select two-wheeler markets, calendar year-ends, 2009-19 (US$, local currency)
Year
Average
Selling Price
(USD)
Average
Selling Price
(BRL)
Average
Selling Price
(USD)
Average
Selling Price
(LKR)
Average
Selling Price
(USD)
Average
Selling Price
(NGN)
Average
Selling Price
(USD)
Average
Selling Price
(KES)
Average
Selling Price
(USD)
Average
Selling Price
(EGP)
Average
Selling Price
(USD)
Average
Selling Price
(ZAR)
2009 3,195 6,308 661 73,711 389 57,397 480 36,365 498 2,765
2010 3,704 6,485 649 71,469 400 59,830 508 39,191 435 2,467 1,292 9,414
2011 4,085 6,823 721 77,389 427 67,080 526 45,729 441 2,622 1,178 8,165
2012 3,997 7,814 688 81,207 478 74,065 547 45,655 416 2,503 1,397 11,412
2013 3,773 8,189 676 84,900 474 74,832 545 46,204 420 2,891 1,417 13,875
2014 3,843 9,011 665 85,028 477 81,142 547 47,390 464 3,310 1,434 15,285
2015 3,047 10,335 683 88,849 454 89,827 511 49,571 433 3,295 1,352 17,679
2016 3,321 11,490 675 93,113 434 121,626 516 51,598 323 2,808 1,093 15,566
2017 3,783 12,130 688 100,377 426 138,601 503 51,049 333 5,854 1,186 15,406
2018 3,436 12,633 431 152,980 494 49,127 395 6,958 1,262 16,598
2019 3,412 13,484 433 154,707 497 49,911 473 7,842 1,296 18,342
CAGR (%) 0.7 7.9 0.5 3.9 1.1 10.4 0.4 3.2 (0.5) 11.0 0.0 7.7
South AfricaBrazil Sri Lanka Nigeria Kenya Egypt
Source: UN Comtrade, Regional Automotive Associations, Kotak Institutional Equities estimates
Exhibit 11: Bajaj Auto is the market leader in the export two-wheeler segment with ~52% market as of FY2020 Export two-wheeler market share of Indian OEMs, March fiscal year-ends, 2010-20 (%)
2010 2011 2012 2013 2014 2015 2016 2017 2018 2019 2020
Motorcycle exports market share (%)
Bajaj Auto 65.7 65.7 68.2 69.3 66.3 66.5 65.7 60.0 54.8 58.3 58.6
Hero MotoCorp 8.3 7.7 7.3 7.3 5.7 5.3 6.0 6.9 7.2 6.5 5.2
HMSI 6.2 6.1 5.0 5.6 5.6 4.9 4.4 6.0 6.4 5.2 4.3
TVS Motors 13.5 13.9 11.8 10.3 11.1 13.0 13.8 14.8 17.7 19.0 19.4
Royal Enfield 0.2 0.2 0.2 0.2 0.2 0.3 0.4 0.8 0.8 0.7 1.2
Others 6.1 6.5 7.5 7.3 11.0 9.9 9.7 11.5 13.2 10.1 11.3
Total market share 100.0 100.0 100.0 100.0 100.0 100.0 100.0 100.0 100.0 100.0 100.0
Scooter exports market share (%)
Hero MotoCorp 19.4 35.3 41.4 26.9 18.7 41.2 30.1 13.6 8.4 5.2 4.5
HMSI 37.8 26.4 20.4 47.2 55.3 40.1 40.1 55.4 60.3 57.7 51.8
TVS Motors 30.5 34.7 35.4 19.1 19.9 11.6 15.1 15.2 11.4 15.0 15.4
Others 12.3 3.6 2.8 6.8 6.2 7.1 14.7 15.8 20.0 22.1 28.4
Total market share 100.0 100.0 100.0 100.0 100.0 100.0 100.0 100.0 100.0 100.0 100.0
Moped exports market share (units)
TVS Motors 100.0 100.0 100.0 100.0 100.0 100.0 100.0 100.0 100.0 100.0 100.0
Total market share 100.0 100.0 100.0 100.0 100.0 100.0 100.0 100.0 100.0 100.0 100.0
Total two-wheeler exports market share (%)
Bajaj Auto 63.6 63.2 64.8 65.9 63.0 61.0 58.5 52.0 48.4 50.9 52.2
Hero MotoCorp 8.6 8.6 8.8 8.2 6.3 8.1 8.5 7.7 7.3 6.3 5.1
HMSI 7.0 6.8 5.7 7.5 7.9 7.7 8.1 12.1 12.4 11.6 9.3
TVS Motors 14.4 14.9 13.3 10.8 11.8 13.2 14.4 15.6 17.5 19.0 19.3
Royal Enfield 0.2 0.2 0.2 0.2 0.2 0.3 0.4 0.7 0.7 0.6 1.1
Others 6.2 6.3 7.3 7.3 10.8 9.7 10.2 11.9 13.8 11.5 13.0
Total market share 100.0 100.0 100.0 100.0 100.0 100.0 100.0 100.0 100.0 100.0 100.0
Source: SIAM, Kotak Institutional Equities
Bajaj Auto is our top pick; Royal Enfield can emerge as a winner in premium
segment in select export geographies
We expect the Indian two-wheeler industry to grow at 7% over FY202036E. We expect
India’s two-wheeler market to reach its penetration levels of 25% on per person basis by
FY2036E, where we expect the domestic two-wheeler market to reach its saturation point.
However, we are optimistic on growth in the export markets and have thus increased the
volume growth rate assumptions for the export two-wheeler companies over FY2020-36E
(12% CAGR over FY2020-36E versus previous estimate of 8-10%) resulting in increase in
Fair Values of Bajaj Auto and TVS Motor.

12 KOTAK INSTITUTIONAL EQUITIES RESEARCH
Automobiles & Components Sector
Bajaj Auto (BUY, FV: Rs3,900). We believe Bajaj Auto is the best bet in the 2W OEM
space given strong long-term growth potential in export geographies where the company
has already established itself as a formidable player. The company continues to improve
its positioning in the premium motorcycle segment with aggressive product launches. We
expect the company to reap benefits in the electric scooter segment over the medium
term. We have increased our Fair Value to Rs3,900 (from Rs3,400 earlier) based on DCF-
methodology led by higher growth rate assumptions for exports two-wheeler markets in
the medium term. We expect Bajaj Auto’s revenues to grow at 11% CAGR over FY2020-
36E led by (1) 12% CAGR in export 2W volumes, (2) 8% CAGR in domestic 2W volumes,
(3) 2-5% CAGR is 3W volumes and (4) 2-3% CAGR in domestic and export ASPs. As a
result, we expect EBIT to grow by 10% CAGR and FCF to grow by 9% CAGR over the
same period.
Hero MotoCorp (SELL, FV: Rs2,700). We believe Hero MotoCorp’s weaker positioning
in the high growth potential segments like scooter, premium motorcycle and exports
restricts valuation re-rating of the stock. We have maintained our Fair Value of Rs2,700
based on DCF methodology. We expect Hero MotoCorp’s revenues to grow at 9% CAGR
over FY2020-36E led by (1) 16% CAGR in export 2W volumes, (2) 5% CAGR in domestic
2W volumes and (3) 2-3% CAGR in domestic and export ASPs. As a result, we expect
EBIT to grow by 8% CAGR and FCF to grow by 5% CAGR over the same period. We
have downgraded the stock to SELL due to expensive valuations.
TVS Motor (SELL, FV: Rs285). We expect TVS Motor to gain market share in the
domestic and export 2W segments over FY2020-36E led by (1) new product launches, (2)
leveraging its tie-up with BMW Motorrad and acquisition of Norton Motorcycles to
enhances it premium product offerings both in domestic and export geographies and (3)
expansion of distribution network in global markets. Valuation remains expensive at CMP.
We have increased our Fair Value to Rs285 (from Rs260 earlier) based on DCF
methodology due to higher growth rate assumptions for exports two-wheeler markets in
the medium term. We expect TVS Motor’s revenues to grow at 9% CAGR over FY2020-
36E led by (1) 13% CAGR in export 2W volumes, (2) 7% CAGR in domestic 2W volumes,
(3) 1-4% CAGR is 3W volumes and (4) 2-3% CAGR in domestic and export ASPs. As a
result, we expect EBIT to grow by 10% CAGR and FCF to grow by 8% CAGR over the
same period.
Eicher Motors (SELL, FV: Rs1,920). We expect RE to be one of the key beneficiaries of
the premiumization theme in the domestic and export motorcycle segments. RE’s strategy
to aggressively expand into the hinterlands in the domestic markets and targeting mid-
sized motorcycle segment in LATAM and South East Asian regions will aid volume growth
in the medium term. However, at CMP, we believe all these opportunities are priced in.
We have kept our FV unchanged at Rs1,920 based on DCF methodology. We expect RE’s
revenues to grow at 13% CAGR over FY2020-36E led by (1) 20% CAGR in export 2W
volumes, (2) 9% CAGR in domestic 2W volumes and (3) 2-3% CAGR in domestic and
export ASPs. As a result, we expect FCF to grow by 15% CAGR over the same period. We
have downgraded the stock to SELL due to expensive valuations.
Exhibit 12: Bajaj Auto is our top pick in the two-wheeler OEM segment Rating and FV change of two-wheeler OEMs
Company Old New Old New Old New
Bajaj Auto BUY BUY 3,400 3,900 Multiple-based valuation DCF-based valuation
Hero MotoCorp REDUCE SELL 2,700 2,700 Multiple-based valuation DCF-based valuation
TVS Motors SELL SELL 260 285 Multiple-based valuation DCF-based valuation
Eicher Motors REDUCE SELL 1,920 1,920 Multiple-based valuation DCF-based valuation
Rating change FV change Valuation methodology change
Source: Company, Kotak Institutional Equities estimates

KOTAK INSTITUTIONAL EQUITIES RESEARCH 13
Sector Automobiles & Components
SOUTH EAST ASIA: GROWTH OPPORTUNITIES REMAIN LIMITED
South East Asian markets comprise the third largest two-wheeler market in terms of volumes, behind India
and China. However, we believe most of the South East Asian geographies have nearly reached saturation
point in terms of two-wheeler penetration. Consumers are migrating to cars from two-wheelers as per capita
income is higher than US$5,000, which is the tipping point for car sales to rise faster than two-wheelers. We
believe the Philippines and Myanmar will be key growth markets in the South East Asian region. However,
opportunity of market share gain for the Indian OEMs remains limited given monopoly of Japanese OEMs in
these geographies.
Expect two-wheeler market to grow at 4% CAGR over CY2019-35E
We expect South-East Asian two-wheeler market volumes to grow at 4% CAGR over
CY2019-35E led by (1) 9% volume CAGR in the Philippines led by rise of middle-income
class and efficient mode of alternative transportation than cars, due to increasing traffic
congestion in the major cities, (2) 6% volume CAGR in Myanmar led by rising rural incomes,
easy financing and further opening up of economy and (3) 2-4% CAGR in Indonesia,
Vietnam and Thailand as these markets have high two-wheeler penetration (refer to Exhibit
13). Japanese players dominate the two-wheeler market in South East Asia, hence it will be
difficult for Indian players to increase market share in more mature two-wheeler markets like
Indonesia and Vietnam.
Exhibit 13: We expect South East Asian region volumes to grow by 4% CAGR over CY2019-35E Volume growth forecast for South East Asian region, calendar year-ends, 2018-35E (units, %)
2018 2019 2020E 2021E 2022E 2023E 2024E 2025E 2035E
2019-35E
CAGR (%)
Indonesia
Volumes (units) 6,383,108 6,487,460 5,189,968 6,227,962 6,515,793 6,816,927 7,131,978 7,461,589 11,723,164 3.8
2W population (units) 79,494,026 81,293,223 80,267,361 80,643,361 79,789,905 78,594,291 78,661,812 78,379,522 111,065,122 2.0
2W penetration (%) 29.7 30.0 29.4 29.2 28.6 27.9 27.7 27.3 35.0
Nominal GDP per capita ($ per people) 3,893 4,135 4,259 4,387 4,518 4,654 4,793 4,937 6,635 3.0
Thailand
Volumes (units) 1,783,693 1,718,587 1,374,870 1,649,844 1,705,301 1,762,622 1,821,871 1,883,110 2,620,947 2.7
2W population (units) 21,533,787 21,680,374 21,352,243 21,445,775 21,233,643 20,988,881 20,680,689 20,559,302 26,393,309 1.2
2W penetration (%) 31.0 31.1 30.5 30.5 30.0 29.5 29.0 28.7 35.0
Nominal GDP per capita ($ per people) 7,295 7,808 8,199 8,609 9,039 9,491 9,965 10,464 17,044 5.0
Vietnam
Volumes (units) 3,386,098 3,254,964 2,603,971 3,124,765 3,193,512 3,263,771 3,335,576 3,408,961 4,237,732 1.7
2W population (units) 35,795,471 36,347,435 36,241,406 36,621,172 36,744,684 36,446,455 36,673,031 37,288,992 45,243,712 1.4
2W penetration (%) 37.5 37.7 37.2 37.2 37.0 36.3 36.2 36.4 40.0
Nominal GDP per capita ($ per people) 2,566 2,715 2,878 3,051 3,234 3,428 3,634 3,852 6,898 6.0
Philippines
Volumes (units) 1,590,333 1,704,898 1,363,918 1,636,702 1,822,311 2,028,968 2,259,061 2,515,248 6,255,465 8.5
2W population (units) 10,823,043 11,770,563 12,337,241 13,336,151 14,398,973 15,696,811 17,253,272 19,015,685 48,019,379 9.2
2W penetration (%) 10.1 10.9 11.2 12.0 12.7 13.7 14.8 16.1 35.0
Nominal GDP per capita ($ per people) 3,252 3,485 3,694 3,916 4,151 4,400 4,664 4,944 8,853 6.0
Malaysia
Volumes (units) 471,782 546,813 437,450 524,940 540,714 556,961 573,697 590,936 794,540 2.4
2W population (units) 5,786,479 5,771,369 5,590,703 5,682,963 5,755,502 5,817,877 5,853,821 5,898,038 8,144,155 2.2
2W penetration (%) 18.1 17.7 16.9 17.0 16.9 16.9 16.8 16.6 20.0
Nominal GDP per capita ($ per people) 11,373 11,137 11,582 12,046 12,528 13,029 13,550 14,092 20,859 4.0
Myanmar
Volumes (units) 525,000 500,000 400,000 480,000 515,067 552,697 593,075 636,403 1,288,132 6.1
2W population (units) 5,900,000 6,100,000 6,490,000 6,950,000 7,445,067 7,757,764 8,320,839 8,917,242 14,773,959 5.7
2W penetration (%) 11.2 11.4 12.0 12.8 13.6 14.1 15.0 16.0 25.0
Nominal GDP per capita ($ per people) 1,326 1,245 1,320 1,399 1,483 1,572 1,666 1,766 3,163 6.0
Total South East Asia 2W volumes 14,140,014 14,212,722 11,370,178 13,644,213 14,292,698 14,981,947 15,715,258 16,496,247 26,919,982 4.1
Source: FAMI, Statista, Kotak Institutional Equities estimates

14 KOTAK INSTITUTIONAL EQUITIES RESEARCH
Automobiles & Components Sector
Exhibit 14: Growth in South East Asian region will be led by Myanmar and Philippines where two-wheeler market is underpenetrated Two-wheeler penetration versus nominal GDP per capita for South East Asian countries, calendar year-end, 2019 (US$ per people, %)
China
Indonesia
Thailand
Philippines
Malaysia
MyanmarVietnam
-
2,000
4,000
6,000
8,000
10,000
12,000
14,000
0 5 10 15 20 25 30 35 40 45
No
min
al G
DP p
er
capita ($/
pers
on)
2W penetration per person (%)
South East Asian Region
Source: FAMI, Statista, Kotak Institutional Equities estimates
Vietnam, Thailand and Indonesia. We believe two-wheeler growth prospects remain
limited in these geographies as >90% of households already own two-wheelers. As a
result, two-wheeler volume growth CAGR over the past 10 years has remained subdued.
Rising per capita income has shifted the consumer preference to cars from two-wheelers.
For instance, PV volumes have grown at a CAGR of 7-14% over the last years versus
flattish CAGR in two-wheeler volumes in these geographies. However, the rapid rise of
ride-hailing and e-commerce services has unlocked a new market segment in the form of
commercial use of motorcycles.
a) Ride-hailing services. Ride hailing industry has quadrupled in value from US$3 bn in
CY2015 to US$13 bn in CY2019. As it stands, the sector is expected to exceed US$40
bn by CY2025E as a result of booming food delivery sector (refer to Exhibit 15). Four
years ago, ride-hailing industry primarily focused on providing alternative
transportation services. However, in 2019, ride-hailing companies in South East Asia
are not only providing transport services but also whole range of offerings including
food delivery and financial services.
b) E-commerce industry. The other major technology disruption driving commercial use
of motorcycles is the boom in e-commerce industry. As per report, South East Asian e-
commerce industry is expected to grow by 26% over CY2019-25E and will reach
US$153 bn by CY2025E (refer to Exhibit 16). E-commerce industry has given South
East Asians access to global market place and provided value, choice and convenience
unmatched by traditional brick and mortar stores. Thus, last mile delivery architecture
for these services will be dominated by two-wheelers, especially electric scooters.
Also, commercial use of motorcycles will lead to shortening of replacement cycle, which
will also drive the penetration in these geographies. Hence, we expect two-wheeler
penetration in Indonesia and Thailand to increase to 35% in CY2035E from 30-31% in
CY2019 implying volume CAGR of 3-4% over CY2019-35E. Also, we expect two-
wheeler penetration in Vietnam to increase to 40% in CY2035E from 38% in CY2019
implying volume CAGR of 2% over CY2019-35E.

KOTAK INSTITUTIONAL EQUITIES RESEARCH 15
Sector Automobiles & Components
Exhibit 15: Expect 21% CAGR over CY2019-25E Ride-hailing industry forecast, calendar year-ends, 2015-25E (US$ bn)
2.9
12.7
40
0
5
10
15
20
25
30
35
40
45
2015 2019 2025E
South East Asia ride hailing industry ($ bn)
34% CAGR over
CY2015-19
21% CAGR over
CY2019-25E
Source: Google, Temasek and Bain, Kotak Institutional Equities
Exhibit 16: Expect 26% CAGR over CY2019-25E E-commerce industry forecast, calendar year-ends, 2015-25E (US$ bn)
5.5
38.2
153
0
20
40
60
80
100
120
140
160
180
2015 2019 2025E
South East Asia e-commerce industry ($ bn)
47% CAGR over
CY2015-19
26% CAGR over
CY2019-25E
Source: Google, Temasek and Bain, Kotak Institutional Equities
Philippines. Compared to other South East Asian countries, the Philippines market has
not yet reached its peak penetration levels. The growing Filipino middle class sees
motorcycles as efficient and cost-effective for personal and business needs. Consumers
are able to buy motorcycles at reasonable prices facilitated by localization of inputs and
fiscal and non-fiscal incentives provided by the government to promote investments,
technology transfer and setting up of manufacturing capability. Around 2/3rd of the
consumers use motorcycles for personal use due to worsening traffic conditions in major
cities and they view motorcycles as the fastest and economical mode of transport. Lately,
boom in e-commerce industry has resulted in surge in sales and around ~20% of the
consumers use motorcycles for business use. Also, with the rise in cocooning trend
(millennials prefer ‘in-home’ staying lifestyle), we expect increasing demand for shopping
and grocery delivery, which will boost motorcycle demand as a delivery transport option.
Hence, we expect two-wheeler penetration in the Philippines to increase to 35% in
CY2035E from 11% in CY2019, which implies volume CAGR of 8-9% over CY2019-35E.
Malaysia. Malaysian geography is unique in the sense that PV penetration (~24%) is
above two-wheeler penetration (~18%) as of CY2019. Also, Malaysia has nominal GDP
per capita above US$10,000 and as a result, we do not expect Malaysian two-wheeler
market to reach penetration levels equivalent to other South East Asian countries as
customers are shifting to cars from two-wheelers. We expect a shift towards
premiumization in medium term as leisure biking is expected to pick up with rising per
capita GDP. Hence, we expect two-wheeler penetration in Malaysia to increase to 20% in
CY2035E from 18% in CY2019, which implies volume CAGR of 2-3% over CY2019-35E.
Myanmar. Myanmar has been rapidly promoting economic liberalization since the
transition to civilian rule in 2011. Specifically, it has relaxed import and export regulations,
established foreign investment law, which has led to surge in motorization in the country.
Myanmar motorcycle market is slowly shifting towards a service-oriented model with new
players focusing on product offerings and consumer preferences. Also, strong
government focus on encouraging automotive industry in the country will be an
important driving force. Currently, 84% of the total automotive sales come from the
motorcycle market. We believe rising rural incomes, ease of credit availability and
expansion in distribution network will be key growth drivers for the two-wheeler market.
However, stringent environmental regulations on pollution and carbon emissions will
necessitate heavy investments. Given lower nominal GDP per capita, we expect
Myanmar’s two-wheeler penetration to increase to 25% in CY2035E from 11% in
CY2019, which implies volume CAGR of 6% over CY2019-35E.

16 KOTAK INSTITUTIONAL EQUITIES RESEARCH
Automobiles & Components Sector
Entry barriers remain high due to dominance of Japanese 2W OEMs
Japanese dominate the South East Asian motorcycle market with overall market share
of >90%. Hence, we do not expect material improvement in market share of Indian 2W
OEMs. We expect market share of Indian 2W OEMs to increase from 3% in CY2019 to 9%
in CY2035E led by (1) market share gains in the Philippines and Myanmar and (2) increase in
premiumization trend in Thailand where Indian 2W OEMs can penetrate deeper (refer to
Exhibit 17).
Bajaj Auto has a strong presence in the Philippines where it is present with its partner
Kawasaki and we expect Bajaj Auto to gain market share led by superior product offerings
and wide distribution network. Lately, Bajaj Auto has been aggressively focusing on Thailand,
Vietnam, Myanmar and Indonesia in ASEAN region. The company will focus on premium
offerings by leveraging KTM, Husqvarna, Dominar and Pulsar brands. Bajaj Auto has already
appointed a new distributor in Thailand who will set up a local network.
Similarly, Royal Enfield is focused on expanding its presence in mid-sized motorcycle
segment (250-750 cc) and has set up dealerships across Thailand, Indonesia, Malaysia,
Cambodia and Vietnam. The company has also set up its first assembly plant outside India in
Thailand in order to gain further market share. Mix of sport motorcycle segment (>135 cc
segment) has increased to 18% in CY2019 to 3% in CY2000 (refer to Exhibit 18). Hence,
we are building in marginal market share gains for Indian two-wheeler OEMs in the
premium motorcycle segment. Also, we believe penetration of electric scooters will increase
significantly over the medium term. Given the limited adoption of electric vehicles globally, it
restricts our ability to forecast the market share trends.
Exhibit 17: We expect marginal gains for Indian 2W OEMs led by market share gains in Myanmar, Thailand and the Philippines Market share forecast for South East Asian region, calendar year-ends, 2019-35E (units, %)
South East
Asian region Indians
Japanese
and others Chinese Indians
Japanese
and others Chinese Total Indians
Japanese
and others Chinese Indians
Japanese
and others Chinese Total
Indonesia 4.0 90.0 6.0 469 10,551 703 11,723 2.0 96.0 2.0 130 6,228 130 6,487
Thailand 10.0 90.0 — 262 2,359 — 2,621 2.0 98.0 — 34 1,684 — 1,719
Vietnam — 96.0 4.0 — 4,068 170 4,238 — 97.0 3.0 — 3,157 98 3,255
Philippines 20.0 75.0 5.0 1,251 4,692 313 6,255 10.0 80.0 10.0 170 1,364 170 1,705
Malaysia 25.0 70.0 5.0 199 556 40 795 15.0 70.0 15.0 82 383 82 547
Myanmar 20.0 70.0 10.0 258 902 129 1,288 10.0 60.0 30.0 50 300 150 500
Total 9.1 85.9 5.0 2,438 23,127 1,354 26,920 3.3 92.3 4.4 467 13,116 630 14,213
Market share (%), CY2035E Market share (%), CY2019Absolute units ('000 units), CY2035E Absolute units ('000 units), CY2019
Source: AISI, Statista, Kotak Institutional Equities estimates
Exhibit 18: Sports segment mix has improved to 18% in CY2019 to 3% in CY2000 Motorcycle mix in Thailand based on production data, calendar year-ends, 2000-19 (%)
0
20
40
60
80
100
120
20
00
20
01
20
02
20
03
20
04
20
05
20
06
20
07
20
08
20
09
20
10
20
11
20
12
20
13
20
14
20
15
20
16
20
17
20
18
20
19
Commuter segment Sports segment
Source: FAMI, Statista, Kotak Institutional Equities estimates

KOTAK INSTITUTIONAL EQUITIES RESEARCH 17
Sector Automobiles & Components
SOUTH ASIA: LOW PENETRATION AND STRONG GDP GROWTH TO DRIVE 2-W SALES
Excluding India, the rest of South Asian nations – Bangladesh, Nepal, Pakistan and Sri Lanka – are majorly
two-wheeler importing nations with limited local assembling and manufacturing capabilities. Reduction in
registration fees, reduction in import duties on motorcycle components and policy-led incentives will help
boost demand and make the regional supply chain more robust and competitive. With population density
among the highest in the world in South Asia and cities continuing to develop chaotically and increasing
traffic congestion, we believe it will push people to switch to faster and cheaper alternatives to commute,
providing greater scope for two-wheeler penetration. We expect growing middle class, increased smartphone
penetration and rising popularity of e-commerce and ride-sharing apps to lead future demand in the entry
and executive segments. We expect Indian 2W OEMs to gain market share over CY2019-35E due to favorable
geographical mix; however, competitive intensity is increasing in these regions.
Expect two-wheeler market to grow at 9% CAGR over CY2019-35E
As per our estimate, two-wheeler market size for South Asia stood at ~2.8 mn units
(excluding India) with Pakistan alone constituting 60% of the total volumes as of CY2019.
We expect South Asia two-wheeler market volumes (excluding India) to grow 9% CAGR
over CY2019-35E led by (1) 14% CAGR in Bangladesh led by policy incentives on
automobile component imports, rise of local assemblers and growing income per capita,
which will make two-wheeler affordable, (2) 8% CAGR in Pakistan led by rising income
levels and low penetration levels, (3) 8% CAGR in Nepal led by improving road infrastructure,
rising disposable incomes due to higher remittances from abroad and increased women
participation in workforce and (4) 5% CAGR in Sri Lanka led by rising rural demand and
inefficient public transport system (refer to Exhibit 19).
Exhibit 19: We expect South Asian region volumes (excluding India) to grow at 9% CAGR over CY2019-35E Volume growth forecast for South Asian region, calendar year-ends, 2018-35E (units, %)
2018 2019 2020E 2021E 2022E 2023E 2024E 2025E 2035E
2019-35E
CAGR (%)
Sri Lanka
Volumes (units) 350,407 301,000 240,800 288,960 313,170 339,408 367,844 391,306 692,684 5.3
2W population (units) 3,118,375 3,265,350 3,393,839 3,455,255 3,540,881 3,628,251 3,809,624 3,950,665 6,250,940 4.1
2W penetration (%) 14.7 15.3 15.8 15.9 16.1 16.4 17.0 17.5 25.0
Nominal GDP per capita ($ per people) 4,165 3,940 4,137 4,344 4,561 4,789 5,028 5,280 8,600 5.0
Pakistan
Volumes (units) 1,878,757 1,666,457 1,333,166 1,599,799 1,755,964 1,927,373 2,115,514 2,322,021 5,893,428 8.2
2W population (units) 11,592,093 12,791,283 13,463,856 14,554,602 15,573,705 16,662,413 17,949,351 19,451,817 44,595,463 8.1
2W penetration (%) 5.5 5.9 6.1 6.5 6.8 7.1 7.5 8.0 15.0
Nominal GDP per capita ($ per people) 1,482 1,285 1,362 1,443 1,530 1,622 1,719 1,822 3,264 6.0
Nepal
Volumes (units) 403,077 419,200 335,360 402,432 441,805 485,030 532,484 584,580 1,486,695 8.2
2W population (units) 2,237,614 2,584,247 2,850,940 3,170,039 3,443,137 3,789,260 4,176,609 4,585,808 11,239,787 9.6
2W penetration (%) 8.0 9.0 9.8 10.7 11.4 12.4 13.4 14.5 30.0
Nominal GDP per capita ($ per people) 1,038 1,071 1,135 1,203 1,276 1,352 1,433 1,519 2,721 6.0
Bangladesh
Volumes (units) 395,603 406,897 325,518 390,621 456,427 533,319 623,165 728,146 3,169,449 13.7
2W population (units) 2,102,228 2,409,202 2,632,798 2,919,459 3,266,728 3,685,431 4,207,008 4,849,347 19,424,692 13.9
2W penetration (%) 1.3 1.5 1.6 1.8 1.9 2.2 2.4 2.8 10.0
Nominal GDP per capita ($ per people) 1,698 1,856 2,004 2,165 2,338 2,525 2,727 2,945 6,358 8.0
Total South Asia volumes 3,027,845 2,793,555 2,234,844 2,681,813 2,967,366 3,285,130 3,639,007 4,026,054 11,242,256 9.1
Source: Regional automotive associations, Statista, Kotak Institutional Equities estimates

18 KOTAK INSTITUTIONAL EQUITIES RESEARCH
Automobiles & Components Sector
Exhibit 20: Bangladesh has the lowest two-wheeler penetration in South Asian region as of CY2019 Two-wheeler penetration versus nominal GDP per capita for South Asian countries, calendar year-end, 2019 (US$ per people, %)
India
Sri Lanka
Pakistan Nepal
Bangladesh
-
500
1,000
1,500
2,000
2,500
3,000
3,500
4,000
4,500
5,000
0 2 4 6 8 10 12 14 16 18
No
min
al G
DP p
er
capita (
$/ pers
on)
2W penetration per person (%)
South Asian Region
Source: Regional automotive associations, Statista, Kotak Institutional Equities estimates
Bangladesh. Compared to other South Asian peers, Bangladesh appears to be a high
growth potential market with two-wheeler penetration per person <2% as of CY2019.
As income per capita led by the textile manufacturing boom has grown >2.5 times from
US$702 in CY2009 to US$1,856 in CY2019, two-wheeler volumes grew at 15% CAGR
over the past 10 years. Despite having lower GDP per capita, ex-showroom two-wheeler
prices are much higher than in India (despite cutting supplemental duties on imported
completely knocked units with four-stroke engine to 20% from 45% earlier). This is due
to higher taxes on the imported products (refer to Exhibit 21). The Government of
Bangladesh has formulated the Motorcycle Industry Development Policy 2018, which aims
to achieve the following goals – (1) to raise motorcycle production up to one million units
by CY2027E, (2) to raise local procurement ratio from the current 10% to 50% by
CY2027E and (3) to supply quality motorcycle to domestic and overseas markets at
competitive prices. We believe policy push towards local sourcing (currently around 70%
of the component parts used by local manufacturers are imported) and assembling led by
reduced supplementary duties on imported motorcycle components will help achieve
better economies of scale and lower ex-show room prices that will help drive higher
penetration in the affordable two-wheeler segment. In India, 50% of the two-wheelers
are financed, while in Bangladesh only <5% of the two-wheelers are financed. With the
government’s focus on increasing finance penetration in this segment, financing will also
be one of the key growth drivers for the two-wheeler industry as ease of availability of
credit also increases the purchasing power of the consumers. Hence, we expect two-
wheeler penetration to reach 10% in CY2035E, implying 14% CAGR over CY2019-35E.

KOTAK INSTITUTIONAL EQUITIES RESEARCH 19
Sector Automobiles & Components
Exhibit 21: Supplemental duties on imported products have resulted in higher prices of motorcycles Various taxes on imported products in Bangladesh, calendar year-end, 2020 (%)
Description
Custom
duty (%)
Supplemental
duty (%)
VAT
(%)
Advanced
Income Tax (%)
Other
taxes (%)
Total tax
(%)
Motorcycles(incl. mopeds) capacity not >50cc, in CBU with four-stroke engine 25.0 60.0 15.0 5.0 8.0 153.5
Motorcycles capacity not >50cc, in CBU with two stroke engine 25.0 250.0 15.0 5.0 8.0 448.6
Motorcycle capacity not >50 cc, in CKD with four stroke engine 25.0 20.0 15.0 5.0 8.0 91.4
Motorcycle capacity not>50cc, in CKD with two stroke engine 25.0 250.0 15.0 5.0 8.0 448.6
Motorcycle four-stroke engine in CKD cylinder capacity >50cc but <=250cc 25.0 20.0 15.0 5.0 8.0 91.4
Motorcycles with reciprocating piston engine of capacity 500-800cc 25.0 — 15.0 5.0 8.0 60.3
Motorcycles with reciprocating piston engine of capacity >800cc 25.0 — 15.0 5.0 8.0 60.3
Source: Bangladesh Customers, Kotak Institutional Equities
Nepal. Nepal’s female labor force participation at 80% is the highest among its South
Asian peers led by active involvement of women in agriculture and livestock sectors owing
to the high international migration of working age men. We believe the rise in
remittances from abroad which constitute >30% of the GDP has been a key factor in
driving higher disposable incomes and increased middle class spending. With more
women going to work, we expect the increasing need for personal mobility will drive
scooter sales growth. We believe poor public transportation and easy financing options
will drive two-wheeler sales growth. As a result, we expect two-wheeler penetration to
reach 30% in CY2035E from 9% in CY2019, which implies 8% CAGR over CY2019-35E.
Sri Lanka. The two-wheeler penetration is the highest in Sri Lanka in the South Asian
region (excluding India) at 15% as of CY2019 mainly on account of its higher GDP per
capita. With >50% households owning two-wheeler, sales growth in Sri Lanka over the
past 10 years has seen merely 3% CAGR against the average 12% CAGR in South Asia
(excluding India). We expect 5% CAGR in volume growth from CY2019-35E led by
demand for fuel economy and higher performance two-wheeler segments as road
infrastructure improves and incomes rise.
Japanese and Chinese gaining market share from dominant Indian 2W OEMs
Over the past 10 years, South Asia (excluding India) has been the fastest growing two-
wheeler market at a CAGR of 12%; however, Indian two-wheeler OEMs are dominant with
Japanese and Chinese players slowly establishing stronger foothold. In Nepal, Japanese 2W
OEMs have higher market of ~55% followed by Indian OEMs with market share of ~40% as
of CY2019. Indian 2W OEMs have no presence in Pakistan due to the historical unpleasant
relations between the two countries. In Sri Lanka, Indian 2W OEMs have 70% market share
followed by Japanese at 25% as of CY2019. In Bangladesh too, Japanese and local players
are giving stiff competition to dominant Indian 2W OEMs having market share of 65% as of
CY2019. However, going forward we expect the market share of Indian 2W OEMs to
remain flat in Sri Lanka and Bangladesh with a slight 5% decline in Nepal by CY2035E as we
expect a shift in consumer preference towards scooters where Japanese 2W OEMs have >90%
market share. However, we expect Indian 2W OEMs’ overall market share to increase due to
its favorable geographical mix (higher share in Bangladesh and Nepal) in South Asian region.

20 KOTAK INSTITUTIONAL EQUITIES RESEARCH
Automobiles & Components Sector
Exhibit 22: We expect marginal market share loss for Indian 2W OEMs led by increase in competitive intensity Market share forecast for South Asian region, calendar year-ends, 2019-35E (units, %)
South Asian
region Indians
Japanese
and others Chinese Indians
Japanese
and others Chinese Total Indians
Japanese
and others Chinese Indians
Japanese
and others Chinese Total
Sri Lanka 70.0 25.0 5.0 485 173 35 693 70.0 25.0 5.0 211 75 15 301
Pakistan — 80.0 20.0 — 4,715 1,179 5,893 — 78.0 22.0 — 1,300 367 1,666
Nepal 35.0 55.0 10.0 520 818 149 1,487 40.0 55.0 5.0 168 231 21 419
Bangladesh 65.0 30.0 5.0 2,060 951 158 3,169 65.0 20.0 15.0 264 81 61 407
Total 27.3 59.2 13.5 3,065 6,656 1,520 11,242 23.0 60.4 16.6 643 1,687 464 2,794
Market share (%), CY2035E Absolute units ('000 units), CY2035E Market share (%), CY2019 Absolute units ('000 units), CY2019
Source: Regional automotive associations, Statista, Kotak Institutional Equities estimates

KOTAK INSTITUTIONAL EQUITIES RESEARCH 21
Sector Automobiles & Components
LATIN AMERICA: RECOVERY LED BY GROWTH IN SELECT GEOGRAPHIES
The global commodity price shock in CY2014-15 that led most Latin American countries into a prolonged
economic recession deeply hit the two-wheeler industry in the region. Argentina and Brazil saw a steep
decline in two-wheeler sales from peak levels due to large currency devaluations and sharp fall in per capita
income. We expect Mexico and Columbia to lead volume growth recovery mainly on account of the lifestyle
changes that have driven two-wheeler demand as both remain immune to the regional decline.
Expect two-wheeler market to grow at 7% CAGR over CY2019-35E
We expect two-wheeler market volumes in Latin America to grow at 7% CAGR over
CY2019-35E led by (1) 8-9% volume CAGR in Columbia and Mexico led by lifestyle changes
driving growth for messenger services and food delivery apps, (2) 7% volume CAGR in Chile
as two-wheeler penetration is currently low, (3) 7% CAGR in Brazil and Argentina as we
expect a shift from budget to premium segment motorbikes with rise in per capita income
as well as due to lower base effect and (4) 3-4% CAGR in Peru and Paraguay as two-
wheeler penetration seems to have reached a saturation point and we expect car sales to
boom (refer to Exhibit 23).
Exhibit 23: We expect LATAM region volumes to grow by 7% CAGR over CY219-35E partly due to lower base of Brazil and Argentina Volume growth forecast for LATAM region, calendar year-ends, 2018-35E (units, %)
2018 2019 2020E 2021E 2022E 2023E 2024E 2025E 2035E
2019-35E
CAGR (%)
Brazil
Volumes (units) 957,617 1,084,639 867,711 1,041,253 1,123,852 1,213,002 1,309,224 1,413,079 3,031,736 6.6
2W population (units) 17,390,521 16,875,003 15,863,019 15,325,076 14,630,746 13,799,216 13,482,994 13,303,396 24,746,179 2.4
2W penetration (%) 8.3 8.0 7.4 7.1 6.7 6.3 6.1 5.9 10.0
GDP per capita ($ per people) 8,999 8,718 8,893 9,071 9,252 9,437 9,626 9,818 11,968 2.0
Colombia
Volumes (units) 576,360 612,086 489,669 587,603 643,257 704,183 770,879 843,892 2,085,909 8.0
2W population (units) 6,439,790 6,571,189 6,629,670 6,891,855 7,141,672 7,315,551 7,488,782 7,671,825 15,970,070 5.7
2W penetration (%) 13.0 13.1 13.0 13.3 13.6 13.7 13.8 13.9 25.0
GDP per capita ($ per people) 6,726 6,416 6,737 7,074 7,428 7,799 8,189 8,599 14,006 5.0
Mexico
Volumes (units) 900,000 1,050,000 840,000 1,008,000 1,115,464 1,234,384 1,365,983 1,511,612 4,162,837 9.0
2W population (units) 4,342,408 5,285,418 6,021,156 6,963,229 8,012,380 9,138,049 10,359,916 11,692,009 30,397,076 11.6
2W penetration (%) 3.4 4.1 4.7 5.3 6.1 6.9 7.7 8.6 20.0
GDP per capita ($ per people) 9,676 9,861 10,255 10,665 11,092 11,536 11,997 12,477 18,469 4.0
Argentina
Volumes (units) 580,914 325,312 276,515 331,818 358,092 386,446 417,046 450,068 964,322 7.0
2W population (units) 6,804,961 6,452,223 5,988,611 5,966,706 5,712,546 5,498,986 5,328,024 5,188,516 7,876,010 1.3
2W penetration (%) 15.3 14.4 13.2 13.1 12.4 11.8 11.3 10.9 15.0
GDP per capita ($ per people) 11,699 10,027 10,428 10,845 11,279 11,730 12,199 12,687 18,780 4.0
Peru
Volumes (units) 228,439 263,130 223,661 268,393 277,151 286,195 295,534 305,178 420,737 3.0
2W population (units) 2,854,662 2,898,752 2,911,283 3,015,878 3,044,065 3,047,227 3,059,728 3,060,403 4,257,504
2W penetration (%) 8.9 8.9 8.8 9.0 8.9 8.8 8.7 8.5 10.0
GDP per capita ($ per people) 6,940 6,982 7,331 7,698 8,083 8,487 8,911 9,357 15,242 5.0
Paraguay
Volumes (units) 145,406 171,580 145,843 175,012 181,993 189,252 196,801 204,651 302,611 3.6
2W population (units) 2,075,591 2,077,065 2,047,541 2,038,418 2,027,068 2,013,312 2,017,254 2,048,333 2,955,217 2.2
2W penetration (%) 29.8 30.2 29.4 28.9 28.4 27.8 27.5 27.6 35.0
GDP per capita ($ per people) 5,750 5,534 5,810 6,101 6,406 6,726 7,063 7,416 12,079 5.0
Chile
Volumes (units) 44,378 48,816 41,494 49,792 53,743 58,008 62,611 67,579 145,027 7.0
2W population (units) 478,874 494,933 502,657 530,237 556,977 578,247 592,218 604,512 1,183,627 5.6
2W penetration (%) 2.6 2.6 2.6 2.7 2.8 2.9 2.9 2.9 5.0
GDP per capita ($ per people) 15,911 14,880 15,326 15,786 16,259 16,747 17,250 17,767 23,877 3.0
Others
Volumes (units) 381,457 395,063 335,803 402,964 443,260 478,721 517,019 558,380 998,906 6.0
Total LATAM volumes 3,814,572 3,950,625 3,220,695 3,864,834 4,196,811 4,550,191 4,935,097 5,354,440 12,112,086 7.3
Source: Regional automotive associations, Statista, Kotak Institutional Equities estimates

22 KOTAK INSTITUTIONAL EQUITIES RESEARCH
Automobiles & Components Sector
Exhibit 24: Higher GDP per capita in LATAM countries will limit two-wheeler penetration in our view Two-wheeler penetration versus nominal GDP per capita for LATAM countries, calendar year-end, 2019 (US$ per people, %)
Brazil
Colombia
MexicoArgentina
Peru
Paraguay
Chile
-
2,000
4,000
6,000
8,000
10,000
12,000
14,000
16,000
0 5 10 15 20 25 30 35
No
min
al G
DP p
er
capita ($/
pers
on)
2W penetration per person (%)
Latin American Region
Source: Regional automotive associations, Statista, Kotak Institutional Equities estimates
Exhibit 25: LATAM region witnessed a slowdown in CY2014 and CY2019 due to decline in commodity prices GDP growth rate in LATAM region, calendar year-ends, 2010-19 (%)
2010 2011 2012 2013 2014 2015 2016 2017 2018 2019
GDP growth rate (%)
Brazil 7.5 4.0 1.9 3.0 0.5 (3.6) (3.3) 1.3 1.3 1.1
Argentina 10.1 6.0 (1.0) 2.4 (2.5) 2.7 (2.1) 2.7 (2.5) (2.2)
Colombia 4.5 7.0 3.9 5.1 4.5 3.0 2.1 1.4 2.5 3.3
Mexico 5.1 3.7 3.6 1.4 2.8 3.3 2.9 2.1 2.1 (0.2)
Peru 8.3 6.3 6.1 5.9 2.4 3.3 4.0 2.5 4.0 2.2
Paraguay 11.1 4.3 (0.5) 8.4 4.9 3.1 4.3 5.0 3.4 (0.0)
Chile 5.8 6.1 5.3 4.1 1.7 2.3 1.7 1.2 4.0 1.1
Nicaragua 4.4 6.3 6.5 4.9 4.8 4.8 4.6 4.6 (4.0) (3.9)
Guatemala 2.9 4.2 3.0 3.7 4.4 4.1 2.7 3.0 3.2 3.9
Honduras 3.7 3.8 4.1 2.8 3.1 3.8 3.9 4.8 3.7 2.7
Source: Macro trends, Kotak Institutional Equities
Mexico and Colombia. As per report, retail e-commerce sales in Latin America are
expected to grow at 16% CAGR over CY2018-23E. With Mexico and Colombia leading
the forefront of this growth resulting from changes in lifestyle factors driven by the rise of
messengers and food delivery services, ride sharing apps and online shopping websites,
we expect two-wheeler sales to gain momentum. Both, Mexico and Colombia despite
having high GDP per capita contradict the empirical evidence that above US$5,000 GDP
per capita level countries start moving away from two-wheelers towards passenger cars,
as two-wheeler sales has witnessed strong growth on account of reducing income
inequality in both these countries. In Mexico, the two-wheeler volumes grew at 32%
CAGR over CY2009-19, while the Gini Index fell from 50 in CY2008 to 45 in CY2018.
Also, in Colombia the two-wheeler market volumes have grown at 7% CAGR over the
past 10 years as the Gini Index registered a 9% fall over the same period. With income
inequality falling both the countries has seen a rapid emergence of strong middle class,
which has consequently resulted in a robust demand for two-wheelers. Hence, we expect
two-wheeler penetration in Mexico and Colombia to increase to 20% and 25%,
respectively by CY2035E, implying 8-9% volume CAGR over CY2019-35E.

KOTAK INSTITUTIONAL EQUITIES RESEARCH 23
Sector Automobiles & Components
Exhibit 26: Expect 16% CAGR in retail e-commerce industry over CY2018-23E in LATAM region Retail e-commerce growth projections for LATAM region, calendar year-ends, 2018-23E (US$ bn)
56
70
84
95
105
116
-
20
40
60
80
100
120
140
2018 2019 2020E 2021E 2022E 2023E
Retail e-commerce ($ bn)
Source: eMarketer, Kotak Institutional Equities
Brazil and Argentina. The nominal GDP of Brazil and Argentina have been negatively
impacted over CY2014-19 due to global commodity price crash in CY2014-15. The two-
wheeler market volumes in Brazil have fallen 47% as of CY2019 from all-time peak level
in CY2011. Argentina two-wheeler market too has witnessed high volatility over the past
10 years. With nominal per capita GDP in the range of US$8,000-US$10,000 as of
CY2019, we expect limited scope for market growth as two-wheeler volumes have
declined at 1-4% CAGR over the past 10 years owing to economic shocks in both these
countries. We believe consumers will shift from budget to premium segment motorcycles
as incomes rise due to growing popularity of leisure and adventure biking in the region.
Hence, we expect modest growth in two-wheeler penetration from 8% in CY2019 to 10%
in CY2035E for Brazil and from 14% in CY2019 to 15% in CY2035E for Argentina.
Chile. In Chile, there has been a rapid boom in the PV market as imported Chinese entry
level car prices have fallen to the level of affordable two-wheelers. However, both car
sales and two-wheeler sales have grown at 7-8% CAGR over CY2009-19. As two-
wheeler penetration is low at 3% as of CY2019, we expect volume growth momentum
to continue till consumers shift from two-wheelers to cars as income inequality falls. We
estimate two-wheeler volume growth at 7% CAGR over CY2019-35E.
Paraguay and Peru. In Paraguay, two-wheeler penetration seems to have reached a
saturation point at 30% as of CY2019. Car sales have increased at 11% CAGR over
CY2009-19, while two-wheeler sales have fallen over the same period. In Peru too
growing car sales at 9% CAGR have outperformed two-wheelers sales at 5% CAGR over
the past 10 years. We expect rapid premiumization and a shift towards four wheelers as
incomes rise. We expect two-wheeler penetration to reach 35% for Paraguay and 10%
for Peru by CY2035E, which implies 3-4% CAGR over CY2019-35E.

24 KOTAK INSTITUTIONAL EQUITIES RESEARCH
Automobiles & Components Sector
Limited market share gain potential for Indian 2W OEMs due to strong Japanese
foothold
Latin American two-wheeler market is dominated by the Japanese 2W OEMs with 77%
market share followed by the Chinese at 15%. However, we expect Indian 2W OEMs to
gain market share from 8% in CY2019 to 13% in CY2035E led by (1) market share increase
in Colombia and Chile and (2) rising premiumization trend in Brazil, Argentina and Peru
where Indian 2W OEMs can penetrate deeper (refer to Exhibit 27). Bajaj Auto is the market
leader in Colombia with 23% market share as of CY2019 followed by Honda and Yamaha.
Also, TVS Motor has recently appointed a new distributor Autotecnica Colombiana SAS in
Colombia, which will operate 50 dealerships exclusive to TVS Motor and will create a
dedicated space for TVS Motor in over 600 retail outlets.
We see further market share increase potential for Indian OEMs in Colombia led by superior
product offerings and wide distribution network. The motorcycle market in Chile is highly
fragmented with no clear market leader. We believe Indian 2W OEMs can gain 20% market
share by CY2035E from the local players. Mexico two-wheeler market is dominated by
single largest Mexican player, Italika having 70% market share. Also, motorcycles market in
Brazil is dominated by Japanese 2W OEMs with Honda as market leader having >80%
market share. We see limited market share gain potential for Indian 2W OEMs in these two
markets. Indian OEMs do not operate in the Paraguay market. Royal Enfield is a new entrant
in Brazil, Colombia and Argentina markets and is focused on expanding its presence in mid-
size motorcycles (250-700 cc). We expect market share gain for Bajaj Auto and Royal Enfield
in the higher cc motorcycle segment in Latin American region.
Exhibit 27: We expect marginal market share gain for Indian 2W OEMs led by increase in market share in the premium segment Market share forecast for LATAM region, calendar year-ends, 2019-35E (units, %)
LATAM region Indians
Japanese
and others Chinese Indians
Japanese
and others Chinese Total Indians
Japanese
and others Chinese Indians
Japanese
and others Chinese Total
Brazil 2.0 95.0 3.0 61 2,880 91 3,032 — 100.0 — — 1,085 — 1,085
Colombia 45.0 25.0 30.0 939 521 626 2,086 33.5 18.0 48.5 205 110 297 612
Mexico 6.0 85.0 9.0 250 3,538 375 4,163 1.8 87.7 10.5 19 920 110 1,050
Argentina 10.0 80.0 10.0 96 771 96 964 6.5 75.0 18.5 21 244 60 325
Peru 15.0 65.0 20.0 63 273 84 421 9.0 61.0 30.0 24 161 79 263
Paraguay — 90.0 10.0 — 272 30 303 — 90.0 10.0 — 154 17 172
Chile 20.0 60.0 20.0 29 87 29 145 11.0 56.5 32.5 5 28 16 49
Others 15.0 75.0 10.0 150 749 100 999 10.0 85.0 5.0 40 336 20 395
Latin America 13.1 75.1 11.8 1,587 9,094 1,431 12,112 7.9 76.9 15.2 314 3,038 599 3,951
Market share (%), CY2035E Absolute units ('000 units), CY2035E Market share (%), CY2019 Absolute units ('000 units), CY2019
Source: Regional automotive associations, Statista, Kotak Institutional Equities estimates

KOTAK INSTITUTIONAL EQUITIES RESEARCH 25
Sector Automobiles & Components
AFRICA: A HIGH GROWTH POTENTIAL MARKET
Africa, an emerging market, appears to be an exciting opportunity that can be a pillar of growth for the
global two-wheeler industry in the next decade. With a very low two-wheeler penetration compared to the
world average and a fast-growing population, we expect a rise in two-wheeler demand to be led by a shift in
consumer preference from motorcycle taxies to personal ownership for commute to work as per capita
incomes rise. It is one of the most important export markets for most two-wheeler OEMs. We expect fast
growth led by boom in large markets – Nigeria, Kenya, Egypt, Congo, Uganda and Ethiopia.
Expect two-wheeler market to grow at 14% CAGR over CY2019-35E
As per our estimate, two-wheeler market size for Africa stood at ~3.4 mn units with Nigeria
as the biggest market constituting 36% of the total volumes as of CY2019. The explosion of
motorcycles in Africa is projected to escalate to new levels as two-wheelers become the
main means of transport for the majority of the continent’s population. As a result, we
expect Africa two-wheeler market volumes to grow at 14% CAGR over CY2019-35E led by
(1) 14% CAGR in Nigeria led by formalization of motorcycle taxi business and a shift in two-
wheeler demand from commercial use to personal mobility over the medium term, (2) 15%
CAGR in East and Central Africa led by rise of motorcycle taxis and e-hailing ride sharing
services, (3) 14% CAGR in West Africa, (4) 12-14% CAGR in North Africa driven by rising
per capita income and development of better road infrastructure and (5) 11% CAGR in
South Africa led by volume expansion in premium two-wheeler segment (refer to Exhibit 28-
29). Certain African economies like Nigeria, Uganda, Kenya, Ethiopia, Tanzania where
motorcycles are used as taxis, the replacement demand is very strong (40-50% of annual
demand) as the motorcycles are used for commercial purposes so life of motorcycles are
reduced to half (5-6 years) versus usual life of motorcycles (12 years) if used in personal
transport.
Nigeria. Motorcycle taxies popularly known as ‘Okadas’ in Nigeria are an important
mode of commute and we believe account for >90% of the two-wheelers sold. However,
the Nigerian two-wheeler market has witnessed a 3% CAGR decline over CY2014-19 on
account of the economic downturn led by the global crash in the price of crude oil which
accounts for >90% of the country’s total export revenues. Also, the state has banned the
use of commercial motorcycles in Lagos, the largest city of Nigeria, owing to the
increasing disregard for traffic laws and rising safety concerns. However, we expect
commercial use of motorcycles to continue to rise led by (1) increase in urbanization in
the face of inadequate means of transportation, (2) high rate of unemployment prevalent
in the country (~29% unemployment rate), (3) lucrative nature of the Okada business as
most of the Okada operators derive reasonable profit from their operations (around
N2,000 to N3,000 on a daily basis after satisfying all their expenses and (4) formalization
of motorcycle taxi business with entry of ride-hailing companies such as Go-Jek, Max.ng,
Gokada, SafeBoda, ORide etc. As per Max.ng’s estimates, there are around 8 mn informal
Okada drivers. Ride hailing companies are heavily investing in ensuring safe rides for
passengers by providing training to all the drivers by opening training schools, equipping
drivers with safety gears, ensuring proper maintenance of motorcycles and proper
grievance redressal mechanism through a ratings and complaints system. Furthermore,
we also expect shift happening from commercial use to personal mobility driven by
increase in per capita income over the medium term. As a result, we expect two-wheeler
penetration to rise from 3% in CY2019 to 15% in CY2035E, which implies a 14% CAGR
over CY2019-35E. Replacement demand for motorcycles forms ~50% of annual volumes
in Nigerian market.

26 KOTAK INSTITUTIONAL EQUITIES RESEARCH
Automobiles & Components Sector
Exhibit 28: Growth in two-wheeler industry will be aided by formalization of motorcycle taxi industry in these regions Volume growth forecast for Nigeria, East Africa, West Africa and Central African regions, calendar year-ends, 2018-35E (units, %)
Countries 2018 2019 2020E 2021E 2022E 2023E 2024E 2025E 2035E
2019-35E
CAGR (%)
Nigeria
Volumes (units) 1,037,391 1,236,115 988,892 1,186,670 1,378,993 1,602,486 1,862,199 2,164,005 9,718,033 13.8
2W population (units) 5,837,527 5,777,244 5,328,355 5,542,684 6,456,727 7,430,547 8,255,355 9,183,245 41,384,737 13.1
2W penetration (%) 3.0 2.9 2.6 2.7 3.0 3.4 3.7 4.1 15.0
GDP per capita ($ per people) 2,033 2,230 2,364 2,505 2,656 2,815 2,984 3,163 5,665 6.0
Kenya
Volumes (units) 216,712 229,771 183,816 220,580 254,962 294,704 340,641 393,738 1,676,139 13.2
2W population (units) 990,866 1,080,309 1,129,788 1,184,918 1,277,749 1,400,546 1,524,474 1,688,441 7,217,558 12.6
2W penetration (%) 1.9 2.1 2.1 2.2 2.3 2.5 2.6 2.9 10.0
GDP per capita ($ per people) 1,708 1,817 1,926 2,041 2,164 2,293 2,431 2,577 4,615 6.0
Congo
Volumes (units) 152,379 168,122 134,498 161,398 189,687 222,936 262,012 307,937 1,548,372 14.9
2W population (units) 669,284 732,644 776,808 832,801 898,637 1,029,020 1,138,653 1,278,468 6,442,622 14.6
2W penetration (%) 0.8 0.8 0.9 0.9 1.0 1.1 1.2 1.3 5.0
GDP per capita ($ per people) 557 545 589 636 687 742 801 865 1,868 8.0
Ethiopia
Volumes (units) 40,873 45,813 38,941 46,729 59,431 75,587 96,134 122,267 1,353,991 23.6
2W population (units) 234,213 261,670 282,812 279,953 281,652 307,374 362,635 439,089 4,838,147 20.0
2W penetration (%) 0.2 0.2 0.2 0.2 0.2 0.3 0.3 0.3 3.0
GDP per capita ($ per people) 772 858 926 1,000 1,080 1,167 1,260 1,361 2,938 8.0
Tanzania
Volumes (units) 146,987 156,468 132,997 159,597 181,505 206,420 234,755 266,979 966,292 12.1
2W population (units) 957,560 958,567 908,612 895,128 909,395 983,973 1,071,741 1,182,252 4,305,543 9.8
2W penetration (%) 1.7 1.7 1.5 1.5 1.5 1.5 1.6 1.8 5.0
GDP per capita ($ per people) 1,030 1,089 1,155 1,224 1,297 1,375 1,458 1,545 2,767 6.0
Uganda
Volumes (units) 95,421 114,571 97,385 116,862 139,627 166,827 199,325 238,154 1,411,942 17.0
2W population (units) 495,240 535,314 547,581 587,918 650,219 730,693 834,598 958,181 5,683,271 15.9
2W penetration (%) 1.2 1.2 1.2 1.3 1.3 1.5 1.6 1.8 8.0
GDP per capita ($ per people) 2,054 2,157 2,287 2,424 2,569 2,724 2,887 3,060 5,480 6.0
Ghana
Volumes (units) 117,124 115,754 98,391 118,069 136,463 157,723 182,295 210,696 896,312 13.6
2W population (units) 820,772 802,573 737,284 709,252 700,379 743,523 808,695 903,637 3,860,131 10.3
2W penetration (%) 2.8 2.6 2.4 2.3 2.2 2.3 2.5 2.7 10.0
GDP per capita ($ per people) 2,202 2,202 2,334 2,474 2,623 2,780 2,947 3,124 5,594 6.0
Ivory Coast
Volumes (units) 26,157 33,942 28,851 34,621 41,528 49,813 59,751 71,671 441,925 17.4
2W population (units) 179,878 181,731 173,906 178,995 193,186 214,912 248,506 286,234 1,765,005 15.3
2W penetration (%) 0.7 0.7 0.7 0.7 0.7 0.8 0.9 1.0 5.0
GDP per capita ($ per people) 2,303 2,286 2,423 2,569 2,723 2,886 3,059 3,243 5,808 6.0
Burkina Faso
Volumes (units) 115,020 119,553 101,620 121,944 137,673 155,430 175,479 198,113 666,492 11.3
2W population (units) 644,238 663,494 638,664 653,892 694,623 751,239 811,698 890,258 3,016,516 9.9
2W penetration (%) 3.3 3.3 3.1 3.1 3.2 3.3 3.5 3.8 10.0
GDP per capita ($ per people) 820 775 837 904 976 1,054 1,139 1,230 2,655 8.0
Mali
Volumes (units) 73,109 76,004 64,604 77,525 88,403 100,807 114,953 131,083 487,321 12.3
2W population (units) 374,542 407,122 418,700 432,099 450,549 480,452 522,296 577,374 2,159,045
2W penetration (%) 2.0 2.1 2.1 2.1 2.2 2.3 2.4 2.6 8.0
GDP per capita ($ per people) 900 872 934 999 1,069 1,144 1,224 1,309 2,576 7.0
Source: UN Comtrade, Statista, Kotak Institutional Equities estimates

KOTAK INSTITUTIONAL EQUITIES RESEARCH 27
Sector Automobiles & Components
Exhibit 29: Growth in two-wheeler industry will be aided by rise in per capita income and increase in premiumization Volume growth forecast for North and South African regions, calendar year-ends, 2018-35E (units, %)
Countries 2018 2019 2020E 2021E 2022E 2023E 2024E 2025E 2035E
2019-35E
CAGR (%)
Egypt
Volumes (units) 438,000 375,021 318,768 382,521 443,261 513,646 595,207 689,718 3,011,009 13.9
2W population (units) 5,785,359 5,788,728 5,746,677 5,894,456 5,905,887 5,858,152 5,753,359 5,778,078 18,225,011 7.4
2W penetration (%) 5.9 5.8 5.7 5.7 5.7 5.6 5.4 5.4 15.0
GDP per capita ($ per people) 2,549 3,020 3,171 3,330 3,496 3,671 3,854 4,047 6,592 5.0
Algeria
Volumes (units) 106,543 107,609 91,468 109,761 127,145 147,282 170,608 197,629 859,712 13.9
2W population (units) 694,284 784,799 854,974 942,477 1,033,264 1,129,661 1,231,565 1,346,832 5,210,722 12.6
2W penetration (%) 1.6 1.8 2.0 2.1 2.3 2.5 2.7 2.9 10.0
GDP per capita ($ per people) 4,115 3,949 4,107 4,271 4,442 4,619 4,804 4,996 7,396 4.0
Morocco
Volumes (units) 154,106 156,830 133,305 159,966 174,816 191,043 208,777 228,158 554,310 8.2
2W population (units) 1,417,669 1,494,799 1,542,959 1,636,541 1,760,551 1,865,805 1,943,409 2,028,675 4,276,604
2W penetration (%) 3.9 4.1 4.2 4.4 4.7 4.9 5.1 5.2 10.0
GDP per capita ($ per people) 3,273 3,255 3,385 3,521 3,662 3,808 3,961 4,119 6,097 4.0
South Africa
Volumes (units) 98,533 98,094 78,475 94,170 106,251 119,881 135,259 152,611 510,227 10.9
2W population (units) 1,102,681 1,095,995 1,068,331 1,113,150 1,134,231 1,142,564 1,172,327 1,243,157 3,433,212 7.4
2W penetration (%) 1.9 1.9 1.8 1.9 1.9 1.9 1.9 2.0 5.0
GDP per capita ($ per people) 6,373 6,001 6,241 6,491 6,751 7,021 7,302 7,594 11,241 4.0
Others
Volumes (units) 314,716 359,185 305,307 366,369 439,643 527,571 633,086 728,048 2,255,837 12.2
Total African volumes 3,147,161 3,408,106 2,810,285 3,372,342 3,918,467 4,555,551 5,299,166 6,135,980 26,628,149 13.7
Source: UN Comtrade, Statista, Kotak Institutional Equities estimates
Exhibit 30: Africa has one of the lowest two-wheeler penetration globally Two-wheeler penetration versus nominal GDP per capita for African countries, calendar year-end, 2019 (US$ per people, %)
Nigeria
Kenya
Congo
Ethiopia
Tanzania
Uganda
Ghana
Senegal
Ivory Coast
Burkina FasoMali
EgyptAlgeria Morocco
South Africa
-
1,000
2,000
3,000
4,000
5,000
6,000
7,000
0 1 2 3 4 5 6 7
No
min
al G
DP
per c
apita
($/ p
ers
on)
2W penetration per person (%)
African Region
Source: UN Comtrade, Statista, Kotak Institutional Equities estimates
East and Central Africa (Kenya, Congo, Ethiopia, Tanzania, Uganda). Low public
spending on road transport infrastructure and reduced purchasing power due to long
depressed per capita GDP between US$500 and US$1,800 as of CY2019, has fueled the
rise of ‘Boda-boda’ motorcycle taxis and ‘Tuktuk’ rickshaws which now form the
backbone of public transport in the East and Central African region. We expect strong
growth in the commercial use two-wheeler segment led by the rise of venture capital
funded e-hailing rise sharing services to formalize the motorbike taxi business in the
region.
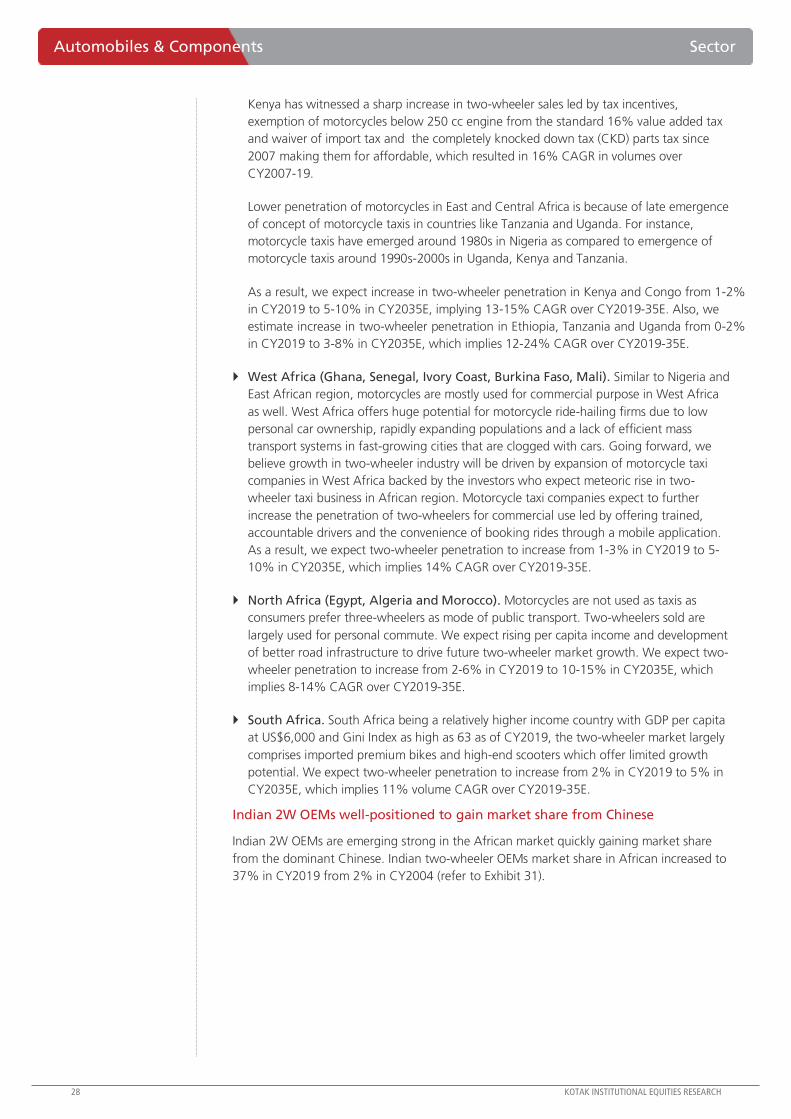
28 KOTAK INSTITUTIONAL EQUITIES RESEARCH
Automobiles & Components Sector
Kenya has witnessed a sharp increase in two-wheeler sales led by tax incentives,
exemption of motorcycles below 250 cc engine from the standard 16% value added tax
and waiver of import tax and the completely knocked down tax (CKD) parts tax since
2007 making them for affordable, which resulted in 16% CAGR in volumes over
CY2007-19.
Lower penetration of motorcycles in East and Central Africa is because of late emergence
of concept of motorcycle taxis in countries like Tanzania and Uganda. For instance,
motorcycle taxis have emerged around 1980s in Nigeria as compared to emergence of
motorcycle taxis around 1990s-2000s in Uganda, Kenya and Tanzania.
As a result, we expect increase in two-wheeler penetration in Kenya and Congo from 1-2%
in CY2019 to 5-10% in CY2035E, implying 13-15% CAGR over CY2019-35E. Also, we
estimate increase in two-wheeler penetration in Ethiopia, Tanzania and Uganda from 0-2%
in CY2019 to 3-8% in CY2035E, which implies 12-24% CAGR over CY2019-35E.
West Africa (Ghana, Senegal, Ivory Coast, Burkina Faso, Mali). Similar to Nigeria and
East African region, motorcycles are mostly used for commercial purpose in West Africa
as well. West Africa offers huge potential for motorcycle ride-hailing firms due to low
personal car ownership, rapidly expanding populations and a lack of efficient mass
transport systems in fast-growing cities that are clogged with cars. Going forward, we
believe growth in two-wheeler industry will be driven by expansion of motorcycle taxi
companies in West Africa backed by the investors who expect meteoric rise in two-
wheeler taxi business in African region. Motorcycle taxi companies expect to further
increase the penetration of two-wheelers for commercial use led by offering trained,
accountable drivers and the convenience of booking rides through a mobile application.
As a result, we expect two-wheeler penetration to increase from 1-3% in CY2019 to 5-
10% in CY2035E, which implies 14% CAGR over CY2019-35E.
North Africa (Egypt, Algeria and Morocco). Motorcycles are not used as taxis as
consumers prefer three-wheelers as mode of public transport. Two-wheelers sold are
largely used for personal commute. We expect rising per capita income and development
of better road infrastructure to drive future two-wheeler market growth. We expect two-
wheeler penetration to increase from 2-6% in CY2019 to 10-15% in CY2035E, which
implies 8-14% CAGR over CY2019-35E.
South Africa. South Africa being a relatively higher income country with GDP per capita
at US$6,000 and Gini Index as high as 63 as of CY2019, the two-wheeler market largely
comprises imported premium bikes and high-end scooters which offer limited growth
potential. We expect two-wheeler penetration to increase from 2% in CY2019 to 5% in
CY2035E, which implies 11% volume CAGR over CY2019-35E.
Indian 2W OEMs well-positioned to gain market share from Chinese
Indian 2W OEMs are emerging strong in the African market quickly gaining market share
from the dominant Chinese. Indian two-wheeler OEMs market share in African increased to
37% in CY2019 from 2% in CY2004 (refer to Exhibit 31).

KOTAK INSTITUTIONAL EQUITIES RESEARCH 29
Sector Automobiles & Components
Exhibit 31: Indian two-wheeler OEMs market share in Africa has increased from 37% in CY2019 to
2% in CY2004 Market share of Indian two-wheeler OEMs in Africa, calendar year-ends, 2004-19 (units, %)
2.33.6
5.4
10.8
13.3
21.620.3 20.7
27.426.1
24.6
32.631.1
33.6
37.5 36.8
0
5
10
15
20
25
30
35
40
2004 2005 2006 2007 2008 2009 2010 2011 2012 2013 2014 2015 2016 2017 2018 2019
Indian OEMs market share
Source: UN Comtrade, Statista, Kotak Institutional Equities estimates
Furthermore, we expect share of Indian 2W OEMs to increase from 37% in CY2019 to 42%
in CY2035E led by market share gain in Nigeria, Egypt, West, East and Central Africa on
account of
Weakening balance sheet of Chinese players. China’s conventional two-wheeler
industry has been on a downtrend since 2009 due to ban of motorcycles in urban centers,
focus on electrification of two-wheelers and the rural market downturn. The conventional
two-wheeler industry declined at a CAGR of 5-6% over CY2013-19 in China. Also, China
has more than 200 individual companies producing motorcycles nationally. China's
leading motorcycle manufacturers include Grand River (Haojue brand), Lifan, Loncin,
Zongshen, Jialing, Jianshe, Qianjiang, Haojin, Shineray, Bashan, Jonway and Cyclone. Due
to the abovementioned reasons, top conventional two-wheeler players in China like Lifan
Motors, Loncin Motors and Chongqing Zongshen saw steep decline in their return ratios.
RoAE and RoACE have declined significantly for the most of the OEMs over CY2012-19
period. Revenues grew at a CAGR of 1-8% over CY2012-19 (except for Lifan Motors).
Net profit for Loncin Motors and Chongqing Zongshen grew at a CAGR of only 3% over
CY2012-19; whereas, net profit of Lifan Motors declined significantly over the same
period. EBITDA margin for the companies was in the range of 9-11% in CY2019. Fixed
asset turnover ratio stood at 1.5-5X in CY2019 for the top three companies (refer to
Exhibit 32). Hence, Indian two-wheeler OEMs due to consolidated nature of the industry
enjoys superior profitability and return ratios as compared to Chinese conventional two-
wheeler OEMs.

30 KOTAK INSTITUTIONAL EQUITIES RESEARCH
Automobiles & Components Sector
Exhibit 32: Balance sheet of Chinese conventional two-wheeler companies are weaker than Indian players Financials of select two-wheeler companies of China, calendar year-ends, 2012-19 (RMB mn, %)
CAGR (%)
2012 2013 2014 2015 2016 2017 2018 2019 2012-19
Lifan Motors
Revenues (RMB mn) 8,529 9,926 11,250 12,333 10,894 12,427 11,070 7,483 (1.9)
EBITDA (RMB mn) 521 622 559 843 158 480 726 (4,289)
EBITDA margin (%) 6.1 6.3 5.0 6.8 1.5 3.9 6.6 (57.3)
PAT (RMB mn) 306 408 377 383 92 150 247 (4,692)
FCFF (RMB mn) (1,649) (1,399) (917) (2,487) (1,612) (1,249) 1,339 (1,024)
RoAE (%) 6.1 7.4 6.7 6.2 1.3 2.1 3.3 (90.4)
RoACE (%) 4.6 4.3 3.0 3.8 (0.3) 0.9 1.9 (25.0)
Net debt to equity (X) 0.8 1.0 1.8 1.8 2.3 2.1 1.9 3.8
Fixed asset turnover (X) 1.7 1.7 1.7 1.8 1.4 1.5 1.5 1.4
Loncin Motors
Revenues (RMB mn) 6,356 6,419 6,572 7,009 8,411 10,662 11,272 10,717 7.7
EBITDA (RMB mn) 593 654 681 715 1,190 1,485 1,432 1,012 7.9
EBITDA margin (%) 9.3 10.2 10.4 10.2 14.1 13.9 12.7 9.4
PAT (RMB mn) 486 584 637 822 949 1,061 999 603 3.1
FCFF (RMB mn) 283 258 386 725 827 551 664 519
RoAE (%) — 16.8 16.2 16.9 15.8 15.4 14.0 8.3
RoACE (%) — 26.2 20.5 15.5 17.7 20.0 16.5 9.6
Net debt to equity (X) (0.4) (0.3) (0.2) (0.1) (0.1) 0.0 0.1 0.1
Fixed asset turnover (X) 2.9 2.6 2.4 2.0 2.3 2.4 2.3 2.0
Zhejiang Qianjiang
Revenues (RMB mn) 3,550 3,167 2,309 2,090 2,175 2,626 2,988 3,872 1.2
EBITDA (RMB mn) 121 107 (92) (76) (134) 219 123 265 11.8
EBITDA margin (%) 3.4 3.4 (4.0) (3.7) (6.2) 8.3 4.1 6.8
PAT (RMB mn) 18 77 (149) (127) 263 79 37 172 37.9
FCFF (RMB mn) (64) (131) (113) 82 292 (16) (185) 300
RoAE (%) 1.0 3.3 (6.8) (6.1) 12.0 3.2 1.5 6.6
RoACE (%) 2.0 0.8 (7.8) (7.9) (11.3) 5.9 2.0 6.6
Net debt to equity (X) 0.0 0.2 0.1 0.0 (0.2) (0.1) (0.1) 0.1
Fixed asset turnover (X) 2.9 2.5 1.9 1.7 1.8 2.1 2.3 2.8
Chongqing Jianshe
Revenues (RMB mn) 1,799 1,865 1,743 1,326 867 1,001 965 NA
COGS (RMB mn) 1,595 1,622 1,550 1,252 713 838 824 774
Gross margin (%) 11.3 13.0 11.1 5.6 17.8 16.3 14.6 11.5
EBITDA (RMB mn) 3 53 (11) (98) 86 80 21 NA
EBITDA margin (%) 0.2 2.9 (0.6) (7.4) 9.9 8.0 2.2 NA
PAT (RMB mn) (143) 10 (134) 241 13 15 11 NA
FCFF (RMB mn) (86) 155 25 (50) 79 34 141 NA
RoAE (%) (66.0) 6.8 (157.3) 175.3 4.8 5.4 3.8 NA
RoACE (%) (4.5) (1.8) (6.2) (13.9) 5.2 5.5 (1.4) NA
Net debt to equity (X) 10.7 9.7 78.3 3.4 1.9 2.3 2.8 NA
Fixed asset turnover (X) 2.0 2.2 2.2 2.9 2.6 2.9 2.6 NA
Chongqing Zongshen
Revenues (RMB mn) 4,247 4,349 4,524 4,660 4,662 5,205 6,055 6,090 5.3
COGS (RMB mn) 3,551 3,611 3,606 3,696 3,698 4,192 4,827 4,827 5.3
Gross margin (%) 16.4 17.0 20.3 20.7 20.7 19.5 20.3 20.7
EBITDA (RMB mn) 440 449 583 576 456 543 654 662 6.0
EBITDA margin (%) 10.4 10.3 12.9 12.4 9.8 10.4 10.8 10.9
PAT (RMB mn) 343 318 425 443 356 337 416 416 2.8
FCFF (RMB mn) 234 (323) 117 693 51 (297) 354 707
RoAE (%) 13.7 10.1 12.2 11.4 8.8 8.2 9.5 9.0
RoACE (%) 16.3 12.5 13.1 10.8 8.1 9.9 11.6 10.7
Net debt to equity (X) (0.1) (0.0) 0.2 0.2 0.1 0.1 0.1 0.1
Fixed asset turnover (X) 4.3 4.4 3.9 3.6 3.4 5.0 5.0 5.0
Source: Bloomberg, Kotak Institutional Equities

KOTAK INSTITUTIONAL EQUITIES RESEARCH 31
Sector Automobiles & Components
Lower cost of ownership of Indian OEM manufactured two-wheelers. Cost of
running a Bajaj Boxer as compared to Daylong motorcycle (comparable Chinese brand
versus Bajaj in Africa) is lower by ~300,000 Nigerian Naira over the span of two years
(refer to Exhibit 33). Despite Bajaj’s bike retailing at 15-20% premium to Chinese bikes,
lower cost of ownership of Bajaj’s bike can be attributed to higher resale value, lower
maintenance cost, better fuel efficiency and longer life than Chinese bikes.
Exhibit 33: Cost of running Bajaj Boxer is significantly lower than even good quality Chinese bikes Comparison between running cost of Bajaj Boxer and Daylong, calendar year-end, 2020 (NGN, %)
Boxer 125 cc Daylong
Fuel efficiency (Kmpl) 55 44
Cost per trip per km 16 16
Passengers carried on bike (units) 2 2
KMs run annually (km) 30,000 25,000
Annual earnings of Okada operator (NGN) 960,000 800,000
Price of bike (NGN) 235,000 200,000
Fuel cost (NGN) 81,818 85,227
Repair expenses (NGN) 15,000 20,000
Savings of Okada operator (NGN) 628,182 494,773
Resale value after 2 years (NGN) 141,000 110,000
Savings after 2 years (NGN) 1,397,364 1,099,545
Source: Company, Kotak Institutional Equities estimates
Superior quality of bikes as compared to Chinese. Chinese bikes are less steady and
fuel efficient than Bajaj Auto’s bikes. Chinese manufacturers send kits to Africa and local
dealers assemble these bikes and sell to customers. Hence, there is no control on quality
of the bike. Bajaj has local assembly plants in Nigeria, Angola, Kenya, Egypt, Uganda and
Tanzania which helps them keep control on quality of the product. Bajaj Auto also trains
mechanics in Africa every year which has helped them improve their brand image in Africa.
Bajaj Auto is a market leader in Nigeria, Kenya, Congo, Ethiopia, Egypt and Uganda. TVS
Motor too is chipping away share from the Chinese in the East and Central African region.
However, Chinese are dominant in West Africa with >90% market share. South Africa being
a market for premium segment has no single dominant player. We expect market share gain
for Indian 2W OEMs in Africa led by superior product offerings and expanding presence in
under penetrated geographies.
Exhibit 34: We expect market share gain for Indian 2W OEMs due to weakening of Chinese competition Market share forecast for African region, calendar year-ends, 2019-35E (units, %)
African region Indians
Japanese
and others Chinese Indians
Japanese
and others Chinese Total Indians
Japanese
and others Chinese Indians
Japanese
and others Chinese Total
Nigeria 55.0 5.0 40.0 5,345 486 3,887 9,718 55.0 5.0 40.0 680 62 494 1,236
East and Central Africa
Kenya 50.0 — 50.0 838 — 838 1,676 49.2 0.1 50.7 113 0 116 230
Congo 60.0 5.0 35.0 929 77 542 1,548 61.6 3.1 35.3 104 5 59 168
Ethiopia 80.0 5.0 15.0 1,083 68 203 1,354 83.9 7.3 8.8 38 3 4 46
Tanzania 35.0 5.0 60.0 338 48 580 966 32.4 0.7 67.0 51 1 105 156
Uganda 90.0 — 10.0 1,271 — 141 1,412 95.7 1.2 3.1 110 1 4 115
West Africa
Ghana 8.0 5.0 87.0 72 45 780 896 6.6 2.9 90.5 8 3 105 116
Senegal 5.0 5.0 90.0 14 14 243 270 5.0 3.2 91.8 1 0 14 15
Ivory Coast 5.0 — 95.0 22 — 420 442 3.2 0.9 95.8 1 0 33 34
Burkina Faso 5.0 — 95.0 33 — 633 666 5.4 0.0 94.5 6 0 113 120
Mali 1.0 5.0 94.0 5 24 458 487 0.1 1.6 98.2 0 1 75 76
North and South Africa
Egypt 30.0 20.0 50.0 904 602 1,505 3,011 28.0 16.1 55.9 105 60 210 375
Algeria 2.0 — 98.0 17 — 843 860 0.0 0.2 99.7 0 0 107 108
Morocco 2.0 20.0 78.0 11 111 432 554 0.1 16.8 83.1 0 26 130 157
South Africa 2.0 75.0 23.0 10 383 117 510 1.5 69.1 29.4 1 68 29 98
Others 15.0 5.0 80.0 338 113 1,805 2,256 10.0 5.0 85.0 36 18 305 359
Total Africa 42.2 7.4 50.4 11,230 1,971 13,427 26,628 36.8 7.4 55.8 1,254 251 1,903 3,408
Market share (%), CY2035E Absolute units ('000 units), CY2035E Market share (%), CY2019 Absolute units ('000 units), CY2019
Source: UN Comtrade, Statista, Kotak Institutional Equities estimates

32 KOTAK INSTITUTIONAL EQUITIES RESEARCH
Automobiles & Components Sector
INDIA: TWO-WHEELER PENETRATION YET TO PEAK
We expect the domestic two-wheeler industry to grow at 7% CAGR over FY2020-36E driven by increase in
penetration in rural markets aided by rise in rural incomes, high proportion of youth population and
inadequate public transportation system in India. We expect Bajaj Auto to gain 300 bps market share over
FY2020-36E due to market share gains in the scooter segment and increase in share of the premium
motorcycle segment in the motorcycle industry. We also expect Bajaj Auto to dominate the exports two-
wheeler segment with ~45% market share.
Expect domestic two-wheeler market to grow at 7% CAGR over FY2020-36E
We expect domestic two-wheeler industry to grow at 7% CAGR over FY2020-36E led by
increase in rural incomes, high proportion of youth population and inadequate public
transportation system in India. Growth in domestic two-wheeler industry will be driven by (1)
8% volume CAGR in the scooter segment, (2) 6% CAGR in the motorcycle segment and (3)
2% CAGR decline in the moped segment. In the motorcycle segment, we believe growth
will led by (1) 10% CAGR in premium motorcycle segment, (2) 8% CAGR in economy
segment and (3) 5% CAGR in executive motorcycle segment. As a result, we expect two-
wheeler penetration levels to reach 25% by FY2036E from 13% in FY2020 (refer to Exhibit
35).
Exhibit 35: We expect India domestic two-wheeler volumes to grow at 6.5% CAGR over FY2020-36E Domestic two-wheeler industry forecast, March fiscal year-ends, 2019-36E (units, %)
2019 2020 2021E 2022E 2023E 2024E 2025E 2036E
2020-36E
CAGR (%)
India
Economy motorcycle (units) 3,888,815 3,287,507 2,794,381 3,213,538 3,534,892 4,039,958 4,257,489 8,432,493 6.1
Executive motorcycle (units) 6,488,080 5,267,072 4,570,658 5,579,393 6,158,814 6,343,090 6,542,715 8,976,525 3.4
Premium motorcycle (units) 3,219,615 2,653,825 2,255,751 2,752,017 3,109,779 3,083,479 3,391,425 9,792,572 8.5
Motorcycle volumes (units) 13,596,510 11,208,404 9,620,790 11,544,948 12,803,484 13,466,527 14,191,629 27,201,589 5.7
Scooter volumes (units) 6,701,469 5,566,039 4,564,152 5,476,982 6,298,530 6,953,601 7,669,766 20,043,276 8.3
Moped volumes (units) 880,243 636,940 445,858 535,030 561,781 631,550 676,126 477,221 (1.8)
Economy motorcycle mix as a % total motorcycles 28.6 29.3 29.0 27.8 27.6 30.0 30.0 31.0
Executive motorcycle mix as a % of total motorcycles 47.7 47.0 47.5 48.3 48.1 47.1 46.1 33.0
Premium motorcycle mix as a % of total motorcycles 23.7 23.7 23.4 23.8 24.3 22.9 23.9 36.0
Motorcycle mix (%) 64.2 64.4 65.8 65.8 65.1 64.0 63.0 57.0
Scooter mix (%) 31.6 32.0 31.2 31.2 32.0 33.0 34.0 42.0
Moped mix (%) 4.2 3.7 3.0 3.0 2.9 3.0 3.0 1.0
Volumes (units) 21,178,222 17,411,383 14,630,800 17,556,960 19,663,795 21,051,679 22,537,520 47,722,087 6.5
2W population (units) 169,218,576 179,397,750 186,608,228 194,796,930 202,670,850 210,337,268 219,077,041 404,541,773 5.2
2W penetration (%) 12.4 13.0 13.4 13.8 14.3 14.6 15.1 25.0
GDP per capita ($ per people) 2,165 2,338 2,478 2,627 2,785 2,952 3,129 5,939 6.0
Source: SIAM, Kotak Institutional Equities estimates
Key drivers for higher penetration of two-wheeler demand
As per our estimate, urban penetration has reached significantly high levels while rural
penetration levels are still on the lower side. Hence, we expect two-wheeler volumes to
be driven by double-digit growth in rural volumes (1.7X higher than urban volumes). Also,
rural India’s per capita income is significantly lower than urban India’s per capita income;
hence migration to cars from two-wheelers will not happen at robust pace.
Scooter mix has improved to 32% in FY2020 from 13% in FY2006 led by increase in
women participation in the labor force (refer Exhibit-35). However, penetration of two-
wheelers is still lower among the female population of India as compared to other South-
East Asian countries like Indonesia, Thailand, etc. Also, we expect urbanization to increase
from 38% in FY2020 to 48% in FY2036E, which would further drive scooter industry
volume growth. As a result, we expect scooter volumes to grow by 8% CAGR over
FY2020-36E driven by further increase in woman participation in the work force and dual
use (both female and male) of scooter in the family. As a result, we expect scooter mix to
reach 42% by FY2036E (refer to Exhibit 36)

KOTAK INSTITUTIONAL EQUITIES RESEARCH 33
Sector Automobiles & Components
Exhibit 36: We expect rural volumes to grow at 1.7X than urban volumes over FY2020-36E Urban-rural domestic two-wheeler volume CAGR, March fiscal year-ends, 2014-36E (units, %)
Year Urban Rural Urban Rural Urban Rural
2014 8.1 6.7 91 174 60.0 31.3
2015 8.8 7.2 95 175 64.0 34.0
2016 8.9 7.6 98 177 68.4 36.4
2017 9.6 8.0 102 179 72.1 38.7
2018 9.9 10.3 106 181 75.4 42.0
2019 10.2 11.0 110 182 78.7 45.5
2020 8.1 9.3 114 184 80.4 47.7
2021E 5.7 8.9 118 186 80.5 49.3
2022E 7.1 10.4 122 188 80.7 51.2
2023E 8.0 11.7 126 190 81.1 52.9
2024E 8.6 12.4 131 192 80.7 54.5
2025E 9.3 13.2 135 194 80.8 56.7
2036E 17.0 30.7 177 211 101.5 102.7
2020-36E CAGR (%) 4.7 7.8
Two-wheeler volumes (mn units) No. of households (mn) Household penetration (%)
Source: Companies, Kotak Institutional Equities estimates
Exhibit 37: Scooter mix has improved to 32% in FY2020 from 17% in FY2003 Domestic two-wheeler industry segmental mix, March fiscal year-ends, 2003-20 (%)
76 78 80 82 84 80 79 78 76 75 73 71 67 65 63 62 64 64
17 16 15 13 12 15 16 16 18 19 21 24 28 31 32 33 32 32
7 6 5 5 5 6 6 6 6 6 6 5 5 4 5 4 4 4
(10)
10
30
50
70
90
110
2003 2004 2005 2006 2007 2008 2009 2010 2011 2012 2013 2014 2015 2016 2017 2018 2019 2020
Motorcycles Scooters Mopeds
Source: SIAM, Kotak Institutional Equities estimates
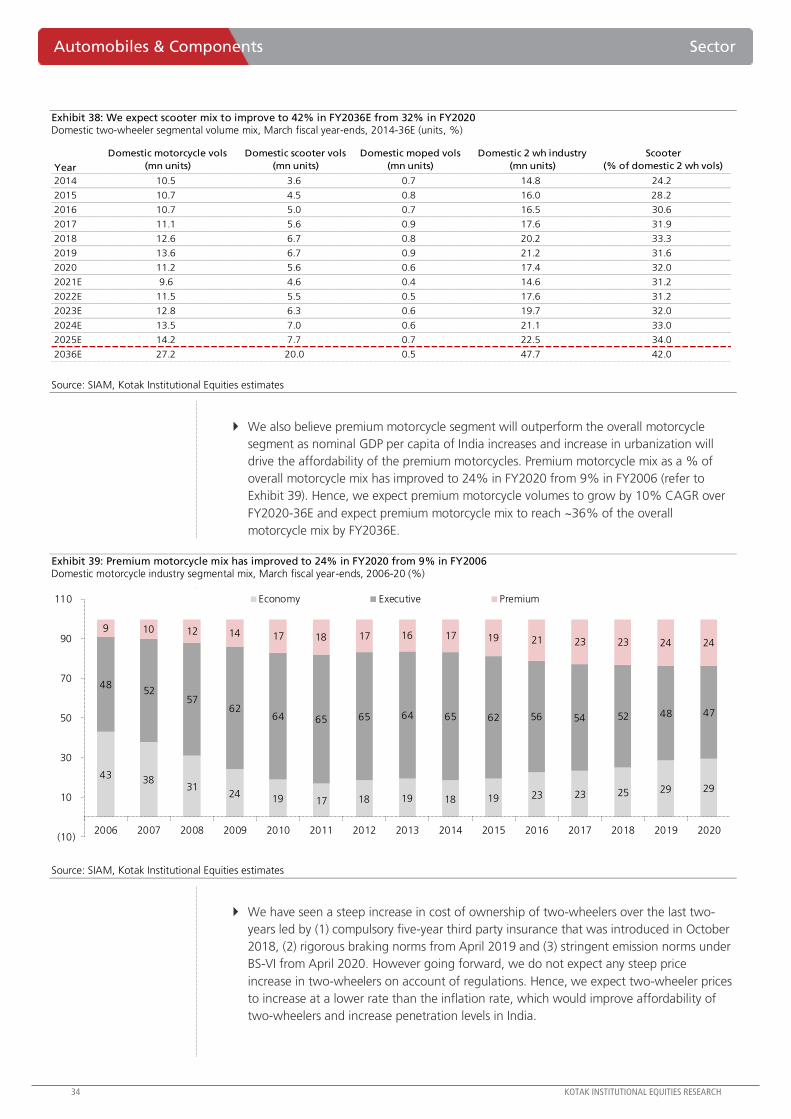
34 KOTAK INSTITUTIONAL EQUITIES RESEARCH
Automobiles & Components Sector
Exhibit 38: We expect scooter mix to improve to 42% in FY2036E from 32% in FY2020 Domestic two-wheeler segmental volume mix, March fiscal year-ends, 2014-36E (units, %)
Year
Domestic motorcycle vols
(mn units)
Domestic scooter vols
(mn units)
Domestic moped vols
(mn units)
Domestic 2 wh industry
(mn units)
Scooter
(% of domestic 2 wh vols)
2014 10.5 3.6 0.7 14.8 24.2
2015 10.7 4.5 0.8 16.0 28.2
2016 10.7 5.0 0.7 16.5 30.6
2017 11.1 5.6 0.9 17.6 31.9
2018 12.6 6.7 0.8 20.2 33.3
2019 13.6 6.7 0.9 21.2 31.6
2020 11.2 5.6 0.6 17.4 32.0
2021E 9.6 4.6 0.4 14.6 31.2
2022E 11.5 5.5 0.5 17.6 31.2
2023E 12.8 6.3 0.6 19.7 32.0
2024E 13.5 7.0 0.6 21.1 33.0
2025E 14.2 7.7 0.7 22.5 34.0
2036E 27.2 20.0 0.5 47.7 42.0
Source: SIAM, Kotak Institutional Equities estimates
We also believe premium motorcycle segment will outperform the overall motorcycle
segment as nominal GDP per capita of India increases and increase in urbanization will
drive the affordability of the premium motorcycles. Premium motorcycle mix as a % of
overall motorcycle mix has improved to 24% in FY2020 from 9% in FY2006 (refer to
Exhibit 39). Hence, we expect premium motorcycle volumes to grow by 10% CAGR over
FY2020-36E and expect premium motorcycle mix to reach ~36% of the overall
motorcycle mix by FY2036E.
Exhibit 39: Premium motorcycle mix has improved to 24% in FY2020 from 9% in FY2006 Domestic motorcycle industry segmental mix, March fiscal year-ends, 2006-20 (%)
43 38 31
24 19 17 18 19 18 19 23 23 25 29 29
48 52
57 62
64 65 65 64 65 62 56 54 52 48 47
9 10 12 14 17 18 17 16 17 19 21 23 23 24 24
(10)
10
30
50
70
90
110
2006 2007 2008 2009 2010 2011 2012 2013 2014 2015 2016 2017 2018 2019 2020
Economy Executive Premium
Source: SIAM, Kotak Institutional Equities estimates
We have seen a steep increase in cost of ownership of two-wheelers over the last two-
years led by (1) compulsory five-year third party insurance that was introduced in October
2018, (2) rigorous braking norms from April 2019 and (3) stringent emission norms under
BS-VI from April 2020. However going forward, we do not expect any steep price
increase in two-wheelers on account of regulations. Hence, we expect two-wheeler prices
to increase at a lower rate than the inflation rate, which would improve affordability of
two-wheelers and increase penetration levels in India.
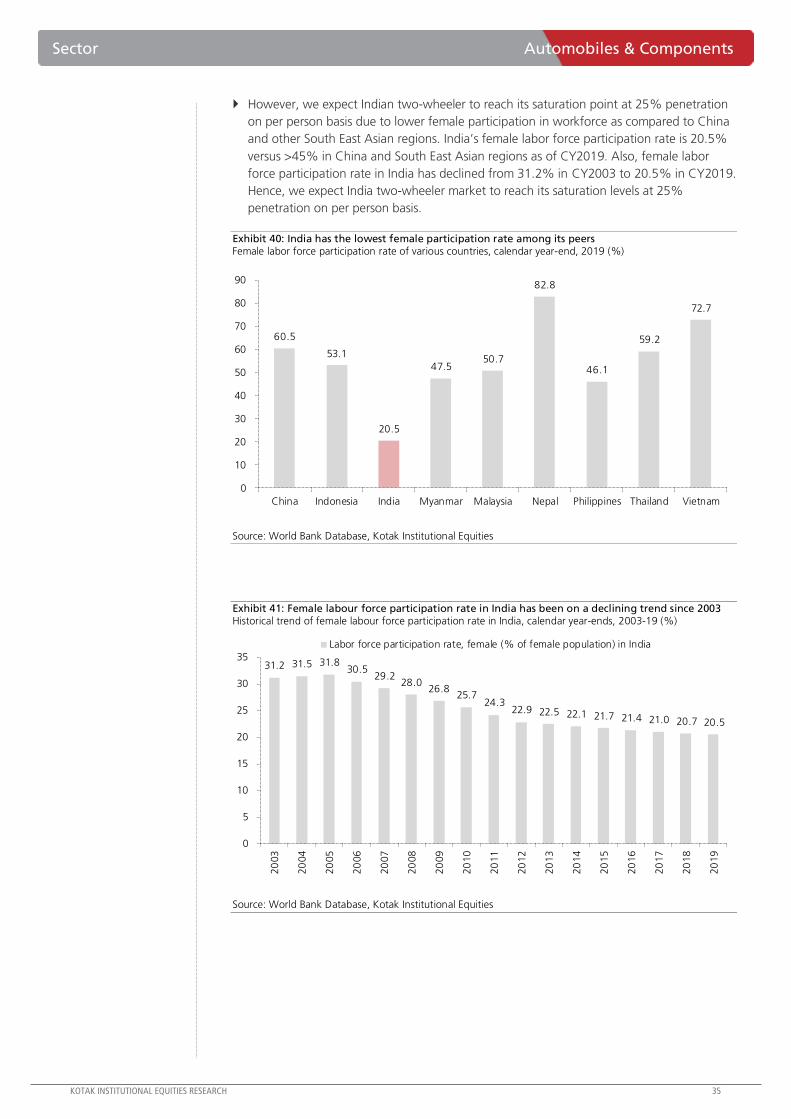
KOTAK INSTITUTIONAL EQUITIES RESEARCH 35
Sector Automobiles & Components
However, we expect Indian two-wheeler to reach its saturation point at 25% penetration
on per person basis due to lower female participation in workforce as compared to China
and other South East Asian regions. India’s female labor force participation rate is 20.5%
versus >45% in China and South East Asian regions as of CY2019. Also, female labor
force participation rate in India has declined from 31.2% in CY2003 to 20.5% in CY2019.
Hence, we expect India two-wheeler market to reach its saturation levels at 25%
penetration on per person basis.
Exhibit 40: India has the lowest female participation rate among its peers Female labor force participation rate of various countries, calendar year-end, 2019 (%)
60.5
53.1
20.5
47.550.7
82.8
46.1
59.2
72.7
0
10
20
30
40
50
60
70
80
90
China Indonesia India Myanmar Malaysia Nepal Philippines Thailand Vietnam
Source: World Bank Database, Kotak Institutional Equities
Exhibit 41: Female labour force participation rate in India has been on a declining trend since 2003 Historical trend of female labour force participation rate in India, calendar year-ends, 2003-19 (%)
31.2 31.5 31.830.5
29.228.0
26.825.7
24.322.9 22.5 22.1 21.7 21.4 21.0 20.7 20.5
0
5
10
15
20
25
30
35
20
03
20
04
20
05
20
06
20
07
20
08
20
09
20
10
20
11
20
12
20
13
20
14
20
15
20
16
20
17
20
18
20
19
Labor force participation rate, female (% of female population) in India
Source: World Bank Database, Kotak Institutional Equities

36 KOTAK INSTITUTIONAL EQUITIES RESEARCH
Automobiles & Components Sector
Electrification in scooter segment. Currently the shift towards electric scooters is not
significant because of limited production capacity of existing players like Hero Electric,
Ather Energy, and Okinawa, etc. while the bigger players like Bajaj Auto and TVS Motor
are not aggressively marketing the electric scooters due to lower profitability. Our current
cost of analysis for Bajaj e-Chetak versus Honda Activa FI implies breakeven of ~5 years at
the current landing cost of US$250 per kW-hr for batteries. Also, Bajaj e-scooter batteries
come with a warranty of 3 years/50,000 km, whichever comes first. Post 50,000 km of
running, there will be battery degradation due to which range of electric scooter will
come down and the customer will need to incur additional cost to buy a new battery.
However, we estimate battery prices will drop from US$250/kW-hr currently led by scale
benefits and higher specific and volumetric energy density as battery chemistry improves,
which will significantly reduce the price of e-scooter. Our analysis suggests that customers
can break even in two years (without government subsidies) if battery prices drop to
US$150/kW-hr, which will drive electric scooter penetration. In FY2030E, we expect
urban and rural mix in the scooter segment to be 50:50 and we estimate 75% of the
urban customers and 25% of the rural customers (due to charging infrastructure
constraints and poor quality of power supply in the rural areas) will shift towards electric
scooters. Hence we estimate that 50% of scooters will shift to electric by FY2030E. By
FY2036E, we expect 60% of the scooter segment to shift towards electric.
Exhibit 42: We expect electric scooters to form 60% of the total scooter volumes by FY2036E Annual volume forecasts for scooters, March fiscal year-ends, 2020-36E (mn units, %)
Scooter ICE Electric Electric fleet proportion in 2-Wh (%)
2020 5.6 5.5 0.1 1.4 `
2023E 6.3 5.5 0.8 12.6
2025E 7.7 6.1 1.5 20.0
2030E 12.1 6.0 6.0 50.0
2036E 20.0 8.0 12.0 60.0
CAGR (%) 8.3 2.4 36.8
Source: SIAM, Kotak Institutional Equities estimates
Exhibit 43: We expect electric scooters to form 47% of the total scooter population by FY2036E Annual population forecasts for scooter segment, March fiscal year-ends, 2020-36E (mn units, %)
Scooter ICE Electric Electric fleet proportion in 2-Wh (%)
2020 47.9 47.8 0.1 0.2
2023E 59.5 57.9 1.6 2.7
2025E 68.7 64.4 4.3 6.2
2030E 94.3 70.1 24.2 25.7
2036E 155.5 82.4 73.1 47.0
CAGR (%) 7.0 3.9 77.0
Source: SIAM, Kotak Institutional Equities estimates

KOTAK INSTITUTIONAL EQUITIES RESEARCH 37
Sector Automobiles & Components
Exhibit 44: At current battery cost of $250/kW-hr, breakeven for e-Chetak comes around ~4.7 years Comparison of the cost of ownership of an e-Chetak with Honda Activa FI
Bajaj e-Chetak
(Premium) Honda Activa FI
Battery prices (in $ per kW-hr)
On road price (Rs) 137,000 83,540
Incentives 22,000 —
Cost to consumer (Rs) 115,000 83,540
Battery size (Kwh) 3.0 —
Electricity cost (Rs/kwh) 5.0 —
Range at full charge (km) 70 —
Electricity cost (Rs/km) 0.2 —
Electricity cost (Rs) 10,714 —
Fuel cost (Rs) — 100,000
Maintenance cost (Rs) 2,500 7,500
Replacement value of battery 56,250 —
Total cost of ownership of vehicle over 50,000 kms (Rs) 184,464 191,040
Break-even (km)
Break-even (years)
Key assumptions: (1) We have assumed two-wheeler runs 10,000 kms per year
(2) We have assumed fuel cost of Rs80 per litre in our calculations
(3) We have taken replacement cost of battery at current market price of $250 per kW-hr
250
46,513
4.7
Source: Company, Kotak Institutional Equities estimates
Exhibit 45: We expect consumers to shift to electric scooter when battery prices reach US$150/kW-hr Comparison of the cost of ownership of an e-Chetak with Honda Activa FI
Bajaj e-Chetak
(Premium) Honda Activa FI
Battery prices (in $ per kW-hr)
On road price (Rs) 82,200 83,540
Incentives — —
Cost to consumer (Rs) 82,200 83,540
Battery size (Kwh) 3.0 —
Electricity cost (Rs/kwh) 5.0 —
Range at full charge (km) 70 —
Electricity cost (Rs/km) 0.2 —
Electricity cost (Rs) 10,714 —
Fuel cost (Rs) — 100,000
Maintenance cost (Rs) 2,500 7,500
Replacement value of battery 33,750 —
Total cost of ownership of vehicle over 50,000 kms (Rs) 129,164 191,040
Break-even (km)
Break-even (years)
Key assumptions: (1) We have assumed two-wheeler runs 10,000 kms per year
(2) We have assumed fuel cost of Rs80 per litre in our calculations
(3) We have taken replacement cost of battery at price of $150 per kW-hr
150
17,187
1.7
Source: Company, Kotak Institutional Equities estimates

38 KOTAK INSTITUTIONAL EQUITIES RESEARCH
Automobiles & Components Sector
Electrification in motorcycle segment. Currently the shift towards electric motorcycles
is limited due to higher TCO of electric motorcycles. We estimate that the shift in electric
motorcycles will start happening when the electric battery cost falls below US$125/kW-hr
levels. We believe the shift to electric will not happen in premium motorcycle segment
(due to inability of e-motorcycle to provide high power) and economy segment (due to
lower upfront cost of economy motorcycles). Hence, we expect executive segment to shift
towards electrification. In FY2030E, we expect 20% of the executive motorcycle segment
(7.8% of total motorcycle segment) to shift towards electric motorcycle segment mostly
driven by urban India. We believe electric shift will accelerate post FY2030E and we
expect 30% of the total motorcycle industry to shift towards electric by FY2036E. Our
current cost of analysis for Revolt RV400 versus Hero Splendor FI implies breakeven of ~9
years at the current landing cost of US$250 per kW-hr for batteries. However, we
estimate battery prices will drop from US$250/kW-hr currently led by scale benefits and
higher specific and volumetric energy density as battery chemistry improves, which will
significantly reduce the price of e-scooter. Our analysis suggests that customers can break
even in three years (without government subsidies) if battery prices drop to US$125/kW-
hr, which will drive electric motorcycle penetration.
Exhibit 46: We expect electric motorcycles to form ~30% of the total motorcycles volumes by FY2036E Annual volume forecasts for motorcycles, March fiscal year-ends, 2020-36E (mn units, %)
Total
Motorcycle
Executive
motorcycle ICE Electric
Electric fleet proportion
in total motorcycle (%)
Electric fleet proportion in
executive motorcycle (%)
2020 11.2 5.3 11.2 — — —
2023E 12.8 5.7 12.6 0.2 1.3 3.0
2025E 14.2 6.5 13.9 0.3 2.3 5.0
2030E 19.3 7.6 17.8 1.5 7.8 20.0
2036E 27.2 9.0 19.0 8.2 30.0 90.9
CAGR (%) 5.7 3.4 3.4
Source: SIAM, Kotak Institutional Equities estimates
Exhibit 47: We expect electric motorcycles to form 15% of the motorcycle population by FY2036E Annual population forecasts for motorcycle, March fiscal year-ends, 2020-36E (mn units, %)
Total motorcycle ICE Electric
Electric fleet
proportion in
motorcycle (%)
2020 122.8 122.8 — —
2023E 134.6 134.3 0.2 0.2
2025E 142.1 141.2 0.9 0.6
2030E 171.6 165.8 5.8 3.4
2036E 243.2 207.5 35.7 14.7
CAGR (%) 4.4 3.3
Source: SIAM, Kotak Institutional Equities estimates

KOTAK INSTITUTIONAL EQUITIES RESEARCH 39
Sector Automobiles & Components
Exhibit 48: At current battery cost of US$250/kW-hr, breakeven for Revolt RV400 comes around ~9
years Comparison of the cost of ownership of an Revolt RV400 with Hero Splendor
Revolt RV400 Hero Splendor
Battery prices (in $ per kW-hr)
On road price (Rs) 150,000 72,230
Incentives 22,000 —
Cost to consumer (Rs) 128,000 72,230
Battery size (Kwh) 3.2 —
Electricity cost (Rs/kwh) 5.0 —
Range at full charge (km) 100 —
Electricity cost (Rs/km) 0.2 —
Electricity cost (Rs) 8,100 —
Fuel cost (Rs) — 66,667
Maintenance cost (Rs) 2,500 7,500
Replacement value of battery 60,750 —
Total cost of ownership of vehicle over 50,000 kms (Rs) 199,350 146,397
Break-even (km)
Break-even (years)
Key assumptions: (1) We have assumed two-wheeler runs 10,000 kms per year
(2) We have assumed fuel cost of Rs80 per litre in our calculations
(3) We have taken replacement cost of battery at current market price of $250 per kW-hr
250
91,652
9.2
Source: Company, Kotak Institutional Equities estimates
Exhibit 49: We expect consumer to shift to electric motorcycles when battery prices reach
US$125/kW-hr Comparison of the cost of ownership of an Revolt RV400 with Hero Splendor
Revolt RV400 Hero Splendor
Battery prices (in $ per kW-hr)
On road price (Rs) 75,000 72,230
Incentives — —
Cost to consumer (Rs) 75,000 72,230
Battery size (Kwh) 3.2 —
Electricity cost (Rs/kwh) 5.0 —
Range at full charge (km) 100 —
Electricity cost (Rs/km) 0.2 —
Electricity cost (Rs) 8,100 —
Fuel cost (Rs) — 66,667
Maintenance cost (Rs) 2,500 7,500
Replacement value of battery 30,375 —
Total cost of ownership of vehicle over 50,000 kms (Rs) 115,975 146,397
Break-even (km)
Break-even (years)
Key assumptions: (1) We have assumed two-wheeler runs 10,000 kms per year
(2) We have assumed fuel cost of Rs80 per litre in our calculations
(3) We have taken replacement cost of battery at price of $125 per kW-hr
125
26,071
2.6
Source: Company, Kotak Institutional Equities estimates

40 KOTAK INSTITUTIONAL EQUITIES RESEARCH
Automobiles & Components Sector
Bajaj Auto will likely increase its market share in two-wheeler segment
Over the next decade, we do not anticipate any major shifts in market share in the two-
wheeler segment. We believe incumbents like Hero MotoCorp, Bajaj Auto, TVS Motors,
HMSI and Royal Enfield will continue to have >90% market share over FY2020-36E. In the
electric scooter segment, we expect incumbents to have >75% market share in the electric
by FY2030E led by new product launches, acquisition of electric two-wheeler start-ups and
wide distribution network. However, in the electric motorcycle segment, we expect
unorganized players to have dominant market share as we believe incumbents will not be
aggressive given unfavorable economics for electric motorcycle till FY2030E. However, if
battery prices drop below US$125/kW-hr, then incumbents will become more aggressive in
the electric motorcycle space, which we expect post FY2030E.
Hero MotoCorp. We expect Hero MotoCorp’s market share in the two-wheeler segment
to decline to 30% in FY2036E from 35.8% in FY2020 led by market share loss in the
motorcycle segment due to higher mix of executive segment (we expect executive
segment to underperform in the overall motorcycle segment). We expect Hero MotoCorp
to improve its market share in economy motorcycle segment from 62.4% in FY2020 to
65% in FY2036E and improve its market share in premium motorcycle segment from 1.5%
in FY2020 to 8% in FY2036E. Also, we expect Hero MotoCorp to gain ~300 bps market
share in the scooter segment over FY2020-36E. We estimate Hero MotoCorp to have 40%
market share in the electric motorcycle and 15% in the electric scooter segment by
FY2036E.
Bajaj Auto. We expect Bajaj Auto’s market share in the two-wheeler segment to increase
to 15% in FY2036E from 11.9% in FY2020 led by market share in the electric scooter
market and we are currently building 9% market share in the overall scooter segment by
FY2036E. We expect Bajaj Auto’s market share in the economy motorcycle segment to
come down to 30% in FY2036E from 32.2% in FY2020 and market share in the
premium motorcycle segment to come down to 28% in FY2036E from 37.3% in FY2020.
We are building in 15% market share for Bajaj Auto in the electric motorcycle segment by
FY2036E.
TVS Motor. We expect TVS’ market share in the two-wheeler segment to marginally
increase to 14.1% in FY2036E from 13.8% in FY2020 led by market share gain in the
motorcycle segment and scooter segment partly offset by higher mix of moped segment
(we expect moped segment to underperform in the overall two-wheeler segment). We
expect TVS Motor to have 25% market share in the electric scooter segment and 10% in
the electric motorcycle segment by FY2036E.
Royal Enfield. We expect Royal Enfield’s market share in the two-wheeler segment to
increase to 5.1% in FY2036E from 3.8% in FY2020 due to faster growth of premium
motorcycle segment. We expect market share of Royal Enfield in the premium motorcycle
segment to remain at similar ~25% levels over FY2020-36E despite increase in
competitive intensity from Honda and Bajaj Auto.
HMSI. We expect HMSI’s market share in the two-wheeler segment to increase to 28.8%
in FY2036E from 27% in FY2020 led by market share gain in the premium motorcycle
segment. We expect Honda to gain market share in the premium motorcycle segment
due to its strong premium motorcycle portfolio globally offset by market share loss in the
scooter segment as we expect domestic OEMs to have relatively higher market share in
the electric scooter segment as compared to ICE scooter segment.

KOTAK INSTITUTIONAL EQUITIES RESEARCH 41
Sector Automobiles & Components
Exhibit 50: We expect Hero’s market share to decline to 46% led by higher mix in executive segment OEM-wise market share forecast in the domestic motorcycle segment, March fiscal-year ends, 2019-36E (%)
2019 2020 2021E 2022E 2023E 2024E 2025E 2036E
Segmental market shares (%)
Economy
Hero 55.8 62.4 60.8 60.8 61.7 62.0 63.0 65.0
Bajaj 35.2 32.2 34.1 34.1 33.2 33.0 32.0 30.0
TVS 9.0 5.4 5.1 5.1 5.1 5.0 5.0 5.0
Total 100.0 100.0 100.0 100.0 100.0 100.0 100.0 100.0
Executive
Hero 72.1 71.0 70.3 70.6 71.8 70.0 70.0 68.0
Bajaj 2.1 0.6 0.6 0.5 0.5 1.0 1.0 1.0
Honda 21.8 24.0 22.1 20.3 20.2 20.2 22.0 25.0
TVS Motors 3.0 4.0 3.7 3.6 3.6 4.0 4.0 4.0
Others 1.0 0.5 3.2 4.9 3.9 4.8 3.0 2.0
Total 100.0 100.0 100.0 100.0 100.0 100.0 100.0 100.0
Premium
Hero 1.4 1.5 1.8 1.7 1.7 2.0 2.0 8.0
Bajaj 32.3 37.3 35.1 36.0 35.0 35.0 35.0 28.0
Honda 13.2 11.1 11.7 11.5 11.7 12.0 12.0 17.0
Yamaha 11.8 9.9 10.5 10.3 9.9 10.0 10.0 8.0
Royal Enfield 25.0 24.7 25.4 25.6 26.5 26.5 26.0 25.0
TVS Motors 14.6 13.8 12.2 13.0 12.7 13.0 13.0 13.0
Others 1.8 1.6 3.3 1.8 2.5 1.5 2.0 1.0
Total 100.0 100.0 100.0 100.0 100.0 100.0 100.0 100.0
Domestic motorcycle market share (%)
Hero 50.7 52.0 51.5 51.5 52.0 52.0 51.6 45.5
Bajaj 18.7 18.5 18.4 18.3 17.9 18.4 18.4 19.7
Honda 13.5 13.9 13.3 12.6 12.6 12.3 13.0 14.4
TVS 7.4 6.7 6.1 6.3 6.2 6.4 6.5 7.6
Royal Enfield 5.9 5.9 5.9 6.1 6.4 6.1 6.2 9.0
Others 3.7 3.0 4.8 5.3 4.9 4.9 4.3 3.9
Total 100.0 100.0 100.0 100.0 100.0 100.0 100.0 100.0
Source: SIAM, Kotak Institutional Equities estimates

42 KOTAK INSTITUTIONAL EQUITIES RESEARCH
Automobiles & Components Sector
Exhibit 51: We expect 300 bps market share for Bajaj Auto in the two-wheeler segment over FY2020-36E OEM-wise market share forecast in the domestic two-wheeler segment, March fiscal-year ends, 2019-36E (%)
2019 2020 2021E 2022E 2023E 2024E 2025E 2036E
Domestic volumes (mn units)
Scooters 6.7 5.6 4.6 5.5 6.3 7.0 7.7 20.0
Motorcycles 13.6 11.2 9.6 11.5 12.8 13.5 14.2 27.2
Mopeds 0.9 0.6 0.4 0.5 0.6 0.6 0.7 0.5
Total domestic volumes 21.2 17.4 14.6 17.6 19.7 21.1 22.5 47.7
Scooter segment market share (%)
Honda 54.9 56.6 55.2 55.2 53.7 50.6 53.5 49.0
Hero Motocorp 10.7 7.2 7.1 7.6 7.3 7.9 8.0 10.0
TVS Motors 18.5 18.3 16.7 18.1 17.3 19.0 18.0 21.0
Bajaj Auto — — — 0.9 1.6 2.1 2.6 9.0
Others 15.8 17.9 20.6 18.1 20.0 20.4 17.9 11.0
Total scooter market share 100.0 100.0 100.0 100.0 100.0 100.0 100.0 100.0
Motorcycle segment market share (%)
Hero Motocorp 50.7 52.0 51.5 51.5 52.0 52.0 51.6 45.5
Bajaj 18.7 18.5 18.4 18.3 17.9 18.4 18.4 19.7
Honda 13.5 13.9 12.7 11.9 11.9 12.3 13.0 14.4
TVS Motors 7.4 6.7 6.1 6.3 6.2 6.4 6.5 7.6
Royal Enfield 5.9 5.9 5.9 6.1 6.4 6.1 6.2 9.0
Others 3.7 3.0 5.4 6.0 5.6 4.9 4.3 3.9
Total motorcycle market share 100.0 100.0 100.0 100.0 100.0 100.0 100.0 100.0
Two-wheeler segment market share (%)
Hero Motocorp 35.9 35.8 36.1 36.2 36.2 35.9 35.2 30.1
Bajaj 12.0 11.9 12.1 12.0 11.7 12.5 12.5 15.0
Honda 26.1 27.0 25.5 25.0 24.9 24.6 26.4 28.8
TVS Motors 14.8 13.8 12.3 12.8 12.5 13.4 13.2 14.1
Royal Enfield 3.8 3.8 3.9 4.0 4.2 3.9 3.9 5.1
Others 7.4 7.7 10.1 9.9 10.6 9.9 8.8 6.8
Total motorcycle market share 100.0 100.0 100.0 100.0 100.0 100.0 100.0 100.0
Source: SIAM, Kotak Institutional Equities estimates

KOTAK INSTITUTIONAL EQUITIES RESEARCH 43
Sector Automobiles & Components
Exhibit 52: We expect Bajaj Auto to gain 15% market share in the electric scooter segment by FY2036E OEM-wise market share forecast in the domestic ICE and electric two-wheeler segment, March fiscal-year ends, 2020-36E (%)
2020 2021E 2022E 2023E 2024E 2025E 2036E
Domestic volumes (mn units)
Scooters 5.6 4.6 5.5 6.3 7.0 7.7 20.0
ICE scooters 5.5 4.3 5.0 5.5 5.8 6.1 8.0
Electric scooters 0.1 0.2 0.5 0.8 1.1 1.5 12.0
Motorcycles 11.2 9.6 11.5 12.8 13.5 14.2 27.2
ICE motorcycles 11.2 9.6 11.5 12.6 13.2 13.9 19.0
Electric motorcycles — — 0.1 0.2 0.3 0.3 8.2
Mopeds 0.6 0.4 0.5 0.6 0.6 0.7 0.5
Total domestic volumes 17.4 14.6 17.6 19.7 21.1 22.5 47.7
ICE scooter market share (%)
Honda 57.4 58.2 60.5 61.5 60.0 60.0 60.0
Hero Motocorp 7.3 7.4 8.4 8.4 9.0 9.0 9.0
TVS Motors 18.6 17.2 18.9 18.0 20.0 20.0 20.0
Bajaj Auto — — — — — — —
Others 16.7 17.2 12.2 12.1 11.0 11.0 11.0
Total scooter share 100.0 100.0 100.0 100.0 100.0 100.0 100.0
Electric scooter market share (%)
Honda — — — — 2.0 10.0 35.0
Hero Motocorp — — — — 2.0 4.0 15.0
TVS Motors — 8.5 10.3 12.6 14.0 14.0 25.0
Bajaj Auto — 8.5 10.3 12.6 13.0 13.0 15.0
Others 100.0 83.0 79.4 74.7 69.0 59.0 10.0
Total scooter share 100.0 100.0 100.0 100.0 100.0 100.0 100.0
Total scooter market share (%)
Honda 56.6 54.9 55.2 53.7 50.6 53.5 49.0
Hero Motocorp 7.2 7.0 7.6 7.3 7.9 8.0 10.0
TVS Motors 18.3 16.7 18.1 17.3 19.0 18.0 21.0
Bajaj Auto — 0.4 0.9 1.6 2.1 2.6 9.0
Others 17.9 20.9 19.0 21.6 20.4 17.9 11.0
Total scooter share (%) 100.0 100.0 100.9 101.6 100.0 100.0 100.0
ICE motorcycle market share (%)
Hero Motocorp 52.0 51.5 51.8 52.7 53.0 52.8 47.8
Bajaj 18.5 18.4 18.4 18.1 18.7 18.8 20.4
Honda 13.9 12.7 11.9 12.0 12.6 13.2 14.1
TVS Motors 6.7 6.1 6.3 6.3 6.5 6.5 6.5
Royal Enfield 5.9 5.9 6.1 6.5 6.2 6.4 10.7
Others 3.0 5.4 5.3 4.3 3.0 2.4 0.4
Total motorcycle share 100.0 100.0 100.0 100.0 100.0 100.0 100.0
Electric motorcycle market share (%)
Hero Motocorp — — — — 5.0 5.0 40.0
Bajaj — — — — 2.0 3.0 18.0
Honda — — — — — 5.0 15.0
TVS Motors — — — — 2.0 3.0 10.0
Royal Enfield — — — — — — 5.0
Others — — 100.0 100.0 91.0 84.0 12.0
Total motorcycle share — — 100.0 100.0 100.0 100.0 100.0
Total motorcycle market share (%)
Hero Motocorp 52.0 51.5 51.5 52.0 52.0 51.6 45.5
Bajaj 18.5 18.4 18.3 17.9 18.4 18.4 19.7
Honda 13.9 12.7 11.9 11.9 12.3 13.0 14.4
TVS Motors 6.7 6.1 6.3 6.2 6.4 6.5 7.6
Royal Enfield 5.9 5.9 6.1 6.4 6.1 6.2 9.0
Others 3.0 5.4 6.0 5.6 4.9 4.3 3.9
Total motorcycle share 100.0 100.0 100.0 100.0 100.0 100.0 100.0
Source: SIAM, Kotak Institutional Equities estimates

44 KOTAK INSTITUTIONAL EQUITIES RESEARCH
Automobiles & Components Sector
Bajaj Auto will retain dominant share of exports from India
We expect Bajaj Auto to dominate two-wheeler exports segment with ~45% market share
over FY2020-36E due to its strong distribution network in export geographies and good
brand recall. However, we expect Hero MotoCorp and Royal Enfield’s market share in the
export two-wheeler segment to improve mainly due to lower base. Overall, we expect Royal
Enfield’s export volumes to grow at 20% CAGR over FY2020-36E and Hero MotoCorp’s
export volumes to grow at 16% CAGR over the same period. We expect Bajaj Auto’s and
TVS Motor’s export volumes to grow at 12-13% CAGR over FY2020-36E. We expect HMSI’s
export volume CAGR to outperform Bajaj Auto and TVS Motors as we expect HMSI to gain
market share in South Asian geographies from Indian two-wheeler OEMs.
Exhibit 53: We expect Bajaj Auto to have ~45% market share in the export two-wheeler segment in FY2036E OEM-wise market share forecast in the export two-wheeler segment, March fiscal-year ends, 2019-36E (%)
2019 2020 2021E 2022E 2023E 2024E 2025E 2036E
Total two-wheeler exports market share (%)
Bajaj Auto 50.9 52.7 53.1 53.5 53.8 52.0 52.0 45.0
Hero MotoCorp 6.3 5.0 4.9 5.1 4.7 4.7 5.0 8.0
HMSI 11.6 9.2 9.0 9.0 10.0 10.0 10.0 15.0
TVS Motors 19.0 19.1 19.3 18.6 18.6 18.6 19.0 20.0
Royal Enfield 0.6 1.1 1.1 1.2 1.2 1.2 1.5 3.0
Others 11.5 12.9 12.6 12.6 12.6 13.5 12.5 9.0
Total market share 100.0 100.0 100.0 100.0 100.0 100.0 100.0 100.0
Source: SIAM, Kotak Institutional Equities estimates

For Private Circulation Only. FOR IMPORTANT INFORMATION ABOUT KOTAK SECURITIES’ RATING SYSTEM AND OTHER DISCLOSURES, REFER TO THE END OF THIS MATERIAL.
Kotak Institutional Equities Research [email protected] Mumbai: +91-22-4336-0000
Electric scooters to aid market share gains
We expect Bajaj Auto’s domestic 2W volumes to grow at 8% CAGR over FY2020-36E led by (1)
strong growth in the domestic scooter segment as the company has entered the electric
mobility space and (2) 6% CAGR in the domestic motorcycle segment. Despite building in
market share losses in the economy and premium motorcycle segment over FY2020-36E, we
expect Bajaj Auto’s market share in the domestic 2W segment to improve to 15% in FY2036E
from 11.9% in FY2020 led by market share gains in the domestic scooter segment. We expect
Bajaj Auto’s market share to improve to 19.7% in FY2036E from 18.5% in FY2020 in the
domestic motorcycle segment due to increase in share of premium motorcycle segment in
motorcycle industry, which will benefit Bajaj Auto as it is a leader in that segment. We expect
Bajaj Auto’s market share in electric scooter segment to increase to 15% by FY2036E (60% of
the total scooter segment) aided by being the first mover in the e-scooter segment and new
product launches. We expect domestic 3W volumes to grow at 2% CAGR over FY2020-36E.
Expect 12% CAGR in export volumes over FY2020-36E
We expect Bajaj Auto’s 2W export volumes to grow at 12% CAGR over FY2020-36E led by (1)
market share gains in African regions from Chinese competition, (2) improving its footprint in
the South East Asia and LATAM region by launching premium motorcycle offerings and
entering newer geographies and (3) consolidating its market share in South Asian markets like
Bangladesh and Sri Lanka. Given Bajaj Auto’s presence in the export market for over two
decades, we believe Bajaj Auto will continue to dominate the two-wheeler export segment
aided by (1) wide distribution reach across geographies and (2) strong brand connect in key
growth markets. Bajaj Auto is present in over 70+ geographies and the company holds the
number 1 or 2 position in 22 of these geographies. The company will be entering Brazil and EU
markets over the next few years and will be looking to gain market share in the premium
motorcycle segment by leveraging Pulsar, Dominar, KTM and Husqvarna brands. As a result, we
expect two-wheeler export volume share in overall volumes to improve to 57% in FY2036E
from 33.8% in FY2020. We are currently building in a decline in market share of two-wheeler
exports of Bajaj Auto from India (52% in FY2020 to 45% in FY2036E as Honda and Hero scale
up exports). We expect 3W’s export volumes to grow at 5% CAGR over FY2020-36E.
Bajaj Auto (BJAUT) Automobiles & Components
Best bet in the 2W segment. We believe Bajaj Auto is the best bet in the 2W OEM
space given strong long-term growth potential in export geographies where the
company has already established itself as a formidable player. The company continues
to improve its positioning in the premium motorcycle segment with aggressive product
launches. We expect the company to reap benefits in the electric scooter segment over
the medium term. Maintain BUY and revise FV to Rs3,900 (from Rs3,400 earlier).
BUY
SEPTEMBER 30, 2020
UPDATE
Sector view: Cautious
CMP (`): 2,881
Fair Value (`): 3,900
BSE-30: 38,068
Hitesh Goel [email protected]
Mumbai: +91-22-4336-0878
Rishi Vora [email protected]
Mumbai: +91-22-4336 0874
Bajaj Auto
Stock data Forecasts/valuations 2020 2021E 2022E
52-week range (Rs) (high,low) EPS (Rs) 176.2 154.1 187.9
Mcap (bn) (Rs/US$) EPS growth (%) 15.0 (12.6) 21.9
ADTV-3M (mn) (Rs/US$) P/E (X) 16.3 18.7 15.3
Shareholding pattern (%) P/B (X) 4.2 3.8 3.5
Promoters 53.7 EV/EBITDA (X) 13.0 13.5 10.5
FIIs 13.7 RoE (%) 24.5 21.4 23.9
MFs/BFIs Div. yield (%) 4.2 3.2 3.9
Price performance (%) 1M 3M 12M Sales (Rs bn) 299 267 334
Absolute (3) 2 (2) EBITDA (Rs bn) 51 48 60
Rel. to BSE-30 (1) (6) (1) Net profits (Rs bn) 51 45 54
3,315-1,789
834/11.4
3.3/6
2,771/38

46 KOTAK INSTITUTIONAL EQUITIES RESEARCH
Automobiles & Components Sector
Maintain BUY with revised FV of Rs3,900 (from Rs3,400 earlier)
We have revised Bajaj Auto’s FV to Rs3,900 (from Rs3,400 earlier). We have increased the
value of the standalone business, led by higher volume growth rate assumptions for the
two-wheeler export market (12% CAGR over FY2020-36E versus previous estimate of 8-
10% CAGR). We expect Bajaj Auto to be one of the key beneficiaries due to its higher two-
wheeler export mix given long-term growth potential in the African region. We value the
standalone business at Rs3,787 per share based on DCF methodology, which implies 18.6X
PE multiple based on September 2022E EPS. The company’s implied PE multiple is higher
than that of TVS Motor and HMCL due to higher market share in high growth segments like
exports and premium motorcycles and superior margins in export geographies.
Exhibit 54: We value Bajaj Auto’s standalone business at Rs3,787 per share as per DCF methodology DCF valuation of Bajaj Auto, March fiscal year-ends, 2019-36E (Rs mn)
CAGR
2019 2020 2021E 2022E 2023E 2024E 2025E 2036E 2020-36E
Domestic two-wheeler (mn units) 2.5 2.1 1.8 2.1 2.3 2.6 2.8 7.2 8.0
Domestic three-wheeler (mn units) 0.4 0.4 0.2 0.3 0.3 0.4 0.4 0.5 1.7
Domestic vols (mn units) 2.9 2.4 2.0 2.4 2.6 3.0 3.2 7.6 7.4
Export two-wheeler (mn units) 1.7 1.9 1.6 2.1 2.5 2.7 3.2 11.1 11.8
Export three-wheeler (mn units) 0.4 0.3 0.3 0.4 0.4 0.4 0.4 0.6 4.5
Export vols (mn unit) 2.1 2.2 1.9 2.4 2.9 3.2 3.6 11.7 11.1
Volumes (mn units) 5.0 4.6 3.9 4.8 5.5 6.1 6.8 19.4 9.4
Domestic 2W ASPs 46,170 53,671 56,430 57,278 57,561 58,713 59,887 74,462 2.1
Domestic 3W ASPs 92,475 97,099 94,186 94,186 94,186 96,070 97,991 121,840 1.4
Export 2W ASPs 43,207 45,368 49,905 51,402 52,944 54,532 56,168 77,750 3.4
Export 3W ASPs 117,925 123,749 136,124 140,208 144,414 147,303 150,249 186,815 2.6
Other operating revenue 30,856 29,964 24,421 28,270 32,660 34,293 36,008 61,586 4.6
Net revenue 303,576 299,187 266,720 334,015 384,731 432,559 481,808 1,633,414 11.2
EBIT 49,268 48,498 45,690 57,777 68,328 69,209 77,089 212,344 9.7
EBIT (1-tax) 28,988 33,696 33,994 42,986 50,836 51,492 57,354 157,984
Depreciation/amortisation 2,657 2,464 2,478 2,638 2,812 3,141 3,374 9,380
(Increase)/decrease in working capital (7,030) 3,763 (7,016) (4,022) (3,338) (3,316) (2,024) (6,189)
Capital expenditure (1,635) (2,828) (2,500) (3,000) (3,000) (3,826) (3,940) (12,048)
Free cash flows 22,980 37,095 26,956 38,602 47,309 47,491 54,765 149,127 9.1
Discounted cash flow 36,475 39,913 35,774 36,833 28,833
WACC used (%) 12.0
Terminal growth rate (%) 4.0
Capitalization rate (%) 8.0
Cash flow in terminal year 28,833
Terminal value 374,834
Sum of free cash flows till terminal year 525,209
EV 900,042
Net cash 195,843
Equity value 1,095,886
Equity value per share 3,787
Source: Company, Kotak Institutional Equities estimates
Exhibit 55: We value BJAUT’s at Rs3,900 per share SoTP valuation of Bajaj Auto, March fiscal year-ends, 2022E (Rs mn)
Value per share (Rs) Comments
Standalone business 3,787 DCF methodology
Stake in KTM 112
Total value per share 3,899
KIE fair value 3,900
Implied multiple of standalone business based on September 2022E EPS 18.6
Source: Company, Kotak Institutional Equities estimates

KOTAK INSTITUTIONAL EQUITIES RESEARCH 47
Sector Automobiles & Components
Exhibit 56: Bajaj Auto stock price has traded at 10-year average of 17.6X one-year forward PE PE valuation chart of Bajaj Auto, March fiscal year-ends, 2003-21 (X)
0
5
10
15
20
25
Jun-0
8
Oct
-08
Feb-0
9
Jun-0
9
Oct
-09
Feb-1
0
Jun-1
0
Oct
-10
Feb-1
1
Jun-1
1
Oct
-11
Feb-1
2
Jun-1
2
Oct
-12
Feb-1
3
Jun-1
3
Oct
-13
Feb-1
4
Jun-1
4
Oct
-14
Feb-1
5
Jun-1
5
Oct
-15
Feb-1
6
Jun-1
6
Oct
-16
Feb-1
7
Jun-1
7
Oct
-17
Feb-1
8
Jun-1
8
Oct
-18
Feb-1
9
Jun-1
9
Oct
-19
Feb-2
0
Jun-2
0
Forward PE 10 year average(X)
Source: Company, Kotak Institutional Equities estimates
Exhibit 57: We expect Bajaj Auto’s volumes to grow at 6% CAGR over FY2020-23E Volume assumptions of Bajaj Auto, March fiscal year-ends, 2013-23E (units, %)
2013 2014 2015 2016 2017 2018 2019 2020 2021E 2022E 2023E
Sales volume (units)
Motorcycles 3,757,105 3,422,403 3,291,315 3,358,252 3,179,521 3,369,334 4,236,873 3,947,568 3,419,335 4,171,535 4,758,489
Domestic 2,463,874 2,099,230 1,770,009 1,898,957 1,960,980 1,974,577 2,541,320 2,078,348 1,774,422 2,115,393 2,291,119
Platina 484,600 465,111 486,568 275,276 383,542 435,180 626,781 578,237 520,413 598,475 640,369
CT100 — — 29,189 590,067 452,712 466,897 742,199 480,204 432,184 497,011 531,802
Discover 1,311,843 992,176 557,942 238,098 303,032 244,315 133,786 29,495 29,495 29,495 29,495
Pulsar/Avenger/KTM 667,431 641,943 696,310 795,516 821,694 828,185 1,038,554 990,412 792,330 990,412 1,089,453
Export two-wheelers 1,293,231 1,323,173 1,521,306 1,459,295 1,218,541 1,394,757 1,695,553 1,869,220 1,644,914 2,056,142 2,467,370
Total two-wheelers 3,757,105 3,422,403 3,291,315 3,358,252 3,179,521 3,369,334 4,236,873 3,947,568 3,419,335 4,171,535 4,758,489
RE 60 — — — 334 2,000 — — — — — —
Domestic three-wheelers 226,131 186,912 234,345 256,320 253,147 369,637 399,453 365,759 223,394 303,951 346,244
Passenger three-wheelers 223,287 186,856 234,345 254,995 239,985 346,846 368,825 335,656 201,394 281,951 324,244
Goods three-wheelers 2,844 56 — 1,325 13,162 22,791 30,628 30,103 22,000 22,000 22,000
Export three-wheelers 253,926 260,762 285,541 280,000 191,236 267,820 383,177 301,885 286,791 358,488 394,337
Total three-wheelers 480,057 447,674 519,886 536,320 444,383 637,457 782,630 667,644 510,184 662,439 740,581
Total vehicles 4,237,162 3,870,077 3,811,201 3,894,906 3,625,904 4,006,791 5,019,503 4,615,212 3,929,519 4,833,975 5,499,070
Growth (yoy %)
Motorcycles (2.0) (8.9) (3.8) 2.0 (5.3) 6.0 25.7 (6.8) (13.4) 22.0 14.1
Domestic (4.0) (14.8) (15.7) 7.3 3.3 0.7 28.7 (18.2) (14.6) 19.2 8.3
Platina (9.5) (4.0) 4.6 (43.4) 39.3 13.5 44.0 (7.7) (10.0) 15.0 7.0
CT100 — — — — (23.3) 3.1 59.0 (35.3) (10.0) 15.0 7.0
Discover (0.3) (24.4) (43.8) (57.3) 27.3 (19.4) (45.2) (78.0) — — —
Pulsar/Avenger/KTM (6.7) (3.8) 8.5 14.2 3.3 0.8 25.4 (4.6) (20.0) 25.0 10.0
Export two-wheelers 2.0 2.3 15.0 (4.1) (16.5) 14.5 21.6 10.2 (12.0) 25.0 20.0
Total two-wheelers (2.0) (8.9) (3.8) 2.0 (5.3) 6.0 25.7 (6.8) (13.4) 22.0 14.1
Domestic three-wheelers 11.4 (17.3) 25.4 9.4 (1.2) 46.0 8.1 (8.4) (38.9) 36.1 13.9
Export three-wheelers (18.7) 2.7 9.5 (1.9) (31.7) 40.0 43.1 (21.2) (5.0) 25.0 10.0
Total three-wheelers (6.8) (6.7) 16.1 3.2 (17.1) 43.4 22.8 (14.7) (23.6) 29.8 11.8
Total vehicles (2.6) (8.7) (1.5) 2.2 (6.9) 10.5 25.3 (8.1) (14.9) 23.0 13.8
Source: Company, Kotak Institutional Equities estimates

48 KOTAK INSTITUTIONAL EQUITIES RESEARCH
Automobiles & Components Sector
Exhibit 58: We expect Bajaj Auto’s EPS to grow at 8% CAGR over FY2020-23E Financial summary of Bajaj Auto, March fiscal year-ends, 2013-23E (Rs mn, %)
2013 2014 2015 2016 2017 2018 2019 2020 2021E 2022E 2023E
Profit model (Rs mn)
Net sales 204,684 205,147 216,120 225,865 217,636 252,189 303,576 299,187 266,720 334,015 384,731
EBITDA 41,064 44,710 41,166 47,820 44,223 48,374 51,925 50,962 48,169 60,414 71,139
Other income 3,244 3,412 10,736 10,736 12,220 12,933 14,389 17,336 13,771 14,735 16,151
Interest (5) (5) (65) (11) (14) (13) (45) (32) — — —
Depreciation (1,640) (1,796) (2,674) (3,072) (3,073) (3,148) (2,657) (2,464) (2,478) (2,638) (2,812)
Profit before tax 42,662 46,321 49,162 55,474 53,355 58,146 63,612 65,802 59,461 72,512 84,478
Extra-ordinary items — — (3,403) — — (320) 3,420 — — — —
Taxes (12,227) (13,887) (12,711) (16,177) (15,080) (17,145) (20,280) (14,802) (14,865) (18,128) (21,120)
Net profit 30,436 32,433 33,049 39,298 38,276 40,681 46,752 51,000 44,596 54,384 63,359
Adjusted net profit 30,436 32,433 36,452 39,298 38,276 40,905 44,366 51,000 44,596 54,384 63,359
Adjusted earnings per share (Rs) 105.2 112.1 126.0 135.8 132.3 141.3 153.3 176.2 154.1 187.9 218.9
Balance sheet (Rs mn)
Equity 79,020 96,080 106,922 132,666 170,341 191,039 217,799 199,255 217,093 238,847 264,190
Deferred tax liability 1,151 1,432 1,416 2,028 3,136 3,234 5,427 3,464 3,464 3,464 3,464
Total borrowings 2,105 1,466 1,699 — — — — — — — —
Current liabilities 42,511 48,498 45,587 30,172 34,671 43,922 50,578 45,014 31,703 37,043 40,617
Total liabilities 124,786 147,476 155,623 164,865 208,149 238,195 273,804 247,733 252,260 279,353 308,270
Net fixed assets 20,277 20,386 20,190 21,383 20,440 19,349 18,120 17,592 17,614 17,976 18,165
Investments 64,305 85,496 104,149 102,606 147,315 175,883 191,594 181,960 191,855 207,548 230,143
Cash 5,589 4,955 5,862 8,595 2,937 7,780 9,228 3,083 3,989 5,665 4,886
Other current assets 33,913 35,524 23,891 31,388 37,012 35,184 54,863 45,099 38,803 48,165 55,077
Miscellaneous expenditure 703 1,115 1,532 893 447 — — — — — —
Total assets 124,786 147,476 155,623 164,865 208,149 238,195 273,804 247,733 252,260 279,353 308,270
Free cash flow (Rs mn)
Operating cash flow excl. working capital 26,557 31,419 27,611 30,816 30,859 32,157 31,925 34,855 40,167 48,892 56,672
Working capital changes (5,213) 4,039 (6,138) 5,753 2,533 10,451 (7,030) 3,763 (7,016) (4,022) (3,338)
Capital expenditure (5,082) (2,201) (2,697) (2,651) (1,994) (1,826) (1,635) (2,828) (2,500) (3,000) (3,000)
Free cash flow 16,262 33,257 18,777 33,917 31,398 40,782 23,260 35,790 30,652 41,870 50,334
Ratios
Gross margin (%) 29.6 32.4 31.3 33.3 32.8 31.0 28.2 29.8 30.7 30.8 31.3
EBITDA margin (%) 20.1 21.8 19.0 21.2 20.3 19.2 17.1 17.0 18.1 18.1 18.5
PAT margin (%) 14.9 15.8 16.9 17.4 17.6 16.2 14.6 17.0 16.7 16.3 16.5
Book Value (Rs/share) 273.0 332.0 369.5 458.4 588.6 660.1 752.6 688.5 750.1 825.3 912.9
RoAE (%) 43.2 36.5 32.1 32.3 24.8 22.1 22.4 23.9 21.1 23.5 24.8
Gross profit per vehicle (Rs/vehicle) 14,291 17,173 17,743 19,332 19,690 19,489 17,053 19,307 20,842 21,296 21,909
EBITDA per vehicle (Rs/vehicle) 9,691 11,553 10,801 12,278 12,196 12,073 10,345 11,042 12,258 12,498 12,937
Source: Company, Kotak Institutional Equities estimates

For Private Circulation Only. FOR IMPORTANT INFORMATION ABOUT KOTAK SECURITIES’ RATING SYSTEM AND OTHER DISCLOSURES, REFER TO THE END OF THIS MATERIAL.
Kotak Institutional Equities Research [email protected] Mumbai: +91-22-4336-0000
Expect market share loss in the domestic two-wheeler segment over FY2020-36E
We expect HMCL’s domestic 2W volumes to grow by 5% CAGR over FY2020-36E led by (1) 11%
CAGR in the domestic scooter segment and (2) 5% CAGR in the domestic motorcycle segment.
We expect HMCL’s market share in the domestic 2W segment to decline to 30.1% in FY2036E
from 35.8% in FY2020 led by market share loss in the domestic motorcycle segment. HMCL’s
market share will likely decline to 45.5% in FY2036E from 52% in FY2020 in the domestic
motorcycle segment due to a higher mix of executive motorcycles, which we expect will
underperform in the overall motorcycle segment. The company has ~71% market share in the
executive motorcycle segment led by strong brand positioning and pricing of Splendor and
Passion. However, with rising per capita income we expect consumers to shift to premium
motorcycles from executive motorcycles, this has been a global trend as well. We expect
HMCL’s market share to improve to 10% in FY2036E from 7.2% in FY2020 led by (1) new
product offerings and (2) 15% market share in electric scooter segment (60% of the total
scooter segment by FY2036E).
Expect 16% CAGR in export volumes over FY2020-36E
We expect HMCL’s export 2W volumes to grow by 16% CAGR over FY2020-36E on a lower
base led by (1) double-digit volume growth in Bangladesh (~40% of the overall export volumes
from Bangladesh) and (2) market share gains in the LATAM and African regions. Bangladesh’s
two-wheeler market has doubled over the past three years led by (1) an economic boom and (2)
higher remittances from expatriates. We expect the Bangladesh market to continue its strong
growth momentum led by tax incentives, favorable import policies, reduction of cost of
ownership and introduction of ride sharing services in major cities. We also expect to improve
its market share in the LATAM region (Peru, Ecuador, Colombia and Dominic Republic) and
African region (Nigeria, Kenya, Tanzania, Guinea and Uganda), where mass-market products
like Splendor and Passion have a high relevance. We expect export mix to improve to ~12.4%
of the total two-wheeler mix by FY2036E from ~3% in FY2020. We would like to highlight that
the company has been a laggard in the two-wheeler export segment and the company will
have to aggressively widen its distribution network and launch products to make up for the lost
ground. Currently, the company exports to 40 geographies. Also, the company has 150,000
unit assembly capacity in Bangladesh and 80,000 unit capacity in Colombia.
Hero Motocorp (HMCL) Automobiles & Components
Weaker franchise in export markets. HMCL has not been able to make its mark in
the export two-wheeler market despite being the largest domestic two-wheeler player
with ~36% market share. We believe Hero’s weaker positioning in the high growth
potential segments like scooters, premium motorcycles and exports restricts valuation
re-rating of the stock. Downgrade to SELL with unchanged FV of Rs2,700.
SELL
SEPTEMBER 30, 2020
CHANGE IN RECO.
Sector view: Cautious
CMP (`): 3,147
Fair Value (`): 2,700
BSE-30: 38,068
Hitesh Goel [email protected]
Mumbai: +91-22-4336-0878
Rishi Vora [email protected]
Mumbai: +91-22-4336 0874
Hero Motocorp
Stock data Forecasts/valuations 2020 2021E 2022E
52-week range (Rs) (high,low) EPS (Rs) 159.2 132.1 170.4
Mcap (bn) (Rs/US$) EPS growth (%) (6.1) (17.0) 29.0
ADTV-3M (mn) (Rs/US$) P/E (X) 19.8 23.8 18.5
Shareholding pattern (%) P/B (X) 4.4 4.2 3.8
Promoters 34.8 EV/EBITDA (X) 13.7 14.8 11.1
FIIs 32.7 RoE (%) 23.6 18.1 21.6
MFs/BFIs Div. yield (%) 3.1 2.7 3.2
Price performance (%) 1M 3M 12M Sales (Rs bn) 288 279 338
Absolute 5 24 16 EBITDA (Rs bn) 40 37 47
Rel. to BSE-30 6 13 18 Net profits (Rs bn) 32 26 34
3,222-1,475
629/8.6
8.1/11.5
4,560/62

50 KOTAK INSTITUTIONAL EQUITIES RESEARCH
Automobiles & Components Sector
Downgrade to SELL with unchanged FV of Rs2,700
We have kept HMCL’s fair value unchanged at Rs2,700. We expect the domestic two-
wheeler market to grow by 6.5% CAGR over FY2020-36E. We expect India’s two-wheeler
market to reach its penetration levels of 25% on per person basis by FY2036E, where we
expect domestic two-wheeler market to reach its saturation point. Downgrade to SELL (from
REDUCE earlier) on expensive valuations. We value the standalone business at Rs2,634 per
share based on DCF methodology, which implies 14.1X PE multiple based on September
2022E EPS. The company’s implied PE multiple is lower than TVS Motors and Bajaj Auto due
to lower market share in high growth segments like exports, scooters and premium
motorcycles. .
Exhibit 59: We value HMCL’s standalone business at Rs2,634 per share as per DCF methodology DCF valuation of Hero MotoCorp, March fiscal year-ends, 2019-36E (Rs mn)
CAGR (%)
2019 2020 2021E 2022E 2023E 2024E 2025E 2036E 2020-2036E
Domestic volumes (mn units) 7.6 6.2 5.3 6.4 7.1 7.6 7.9 14.4 5.4
Export volumes (mn unit) 0.2 0.2 0.2 0.2 0.2 0.2 0.3 2.0 16.2
Total volumes (mn units) 7.8 6.4 5.4 6.6 7.3 7.8 8.2 16.4 6.0
Domestic ASPs (Rs/vehicle) 38,792 43,460 44,313 45,201 46,105 47,027 58,473 2.6
Exports ASPs (Rs/vehicle) 41,724 46,772 47,707 48,662 50,121 51,625 71,461 3.4
Other operating revenue (Rs mn) 39,189 42,597 46,319 50,387 52,907 55,552 95,013 5.7
Net revenue 336,505 288,361 278,879 337,573 382,525 413,567 444,775 1,076,809 8.6
EBIT 43,281 31,400 28,407 37,898 45,767 49,628 53,373 107,681 8.0
EBIT (1-tax) 27,022 21,996 21,249 28,348 34,050 36,923 39,709 80,115
Depreciation/amortisation 6,020 8,180 8,121 8,821 9,241 8,642 9,847 15,323
(Increase)/decrease in working capital (19,189) 12,027 (7,022) 3,528 311 (2,266) (2,437) (5,900)
Capital expenditure (9,179) (13,586) (6,000) (7,000) (7,000) (6,208) (7,802) (26,152) 4.2
Free cash flows 4,674 28,617 16,348 33,697 36,602 37,090 39,318 63,385 5.1
Years discounted 0.5 1.5 2.5 3.5 14.5
Discount factor 0.9 0.8 0.8 0.7 0.2
Discounted cash flow 31,841 30,880 27,939 26,444 12,255
WACC used (%) 12.0
Terminal growth rate (%) 2.0
Capitalization rate (%) 10.0
Cash flow in terminal year 12,255
Terminal value 125,004
Sum of free cash flows till terminal year 312,001
EV 437,005
Net cash 88,979
Equity value 525,984
Equity value per share 2,634
Source: Company, Kotak Institutional Equities estimates
Exhibit 60: We value HMCL’s at Rs2,700 per share SoTP valuation of Hero MotoCorp, March fiscal year-ends, 2022E (Rs mn)
Value per share (Rs) Comments
Standalone business 2,634 Based on DCF valuation
Stake in Ather Energy and Hero FinCorp 68
Total value per share 2,702
KIE fair value 2,700
Implied multiple of standalone business based on September 2022E EPS 14.1
Source: Company, Kotak Institutional Equities estimates

KOTAK INSTITUTIONAL EQUITIES RESEARCH 51
Sector Automobiles & Components
Exhibit 61: HMCL stock price has traded at 10-year average of 17.5X one-year forward PE PE valuation chart of Hero MotoCorp, March fiscal year-ends, 2003-21 (X)
0
5
10
15
20
25
Jul-0
3
Dec-
03
May-
04
Oct
-04
Mar-
05
Aug
-05
Jan
-06
Jun-0
6
Nov-
06
Apr-
07
Sep
-07
Feb-0
8
Jul-0
8
Dec-
08
May-
09
Oct
-09
Mar-
10
Aug
-10
Jan
-11
Jun-1
1
Nov-
11
Apr-
12
Sep
-12
Feb-1
3
Jul-1
3
Dec-
13
May-
14
Oct
-14
Mar-
15
Aug
-15
Jan
-16
Jun-1
6
Nov-
16
Apr-
17
Sep
-17
Feb-1
8
Jul-1
8
Dec-
18
May-
19
Oct
-19
Mar-
20
Aug
-20
Forward PE 10 year average(X)
Source: Company, Kotak Institutional Equities estimates
Exhibit 62: We expect HMCL’s volumes to grow at 5% CAGR over FY2020-23E Volume assumptions of Hero MotoCorp, March fiscal year-ends, 2013-23E (units, %)
2013 2014 2015 2016 2017 2018 2019 2020 2021E 2022E 2023E
Motorcycles 5,499,245 5,538,291 5,799,695 5,735,854 5,834,260 6,677,207 7,080,787 5,990,349 5,089,791 6,121,482 6,851,719
Domestic 5,362,730 5,425,118 5,679,634 5,603,136 5,693,681 6,499,051 6,893,602 5,828,782 4,952,459 5,942,950 6,655,334
< 125 cc 5,165,222 5,278,537 5,553,921 5,497,840 5,595,382 6,427,773 6,849,749 5,788,661 4,920,362 5,904,434 6,612,966
> 125 cc 197,508 146,581 125,713 105,296 98,299 71,278 43,853 40,121 32,097 38,516 42,368
Exports 136,515 113,173 120,061 132,718 140,579 178,156 187,185 161,567 137,332 178,532 196,385
< 125 cc 122,015 99,946 95,364 101,039 119,532 139,786 153,714 125,178 106,401 138,322 152,154
> 125 cc 14,500 13,227 24,697 31,679 21,047 38,370 33,471 36,389 30,931 40,210 44,231
Scooters 574,336 707,604 832,008 896,298 829,786 909,986 739,958 419,370 335,496 436,145 479,759
Domestic 549,808 690,079 752,052 818,777 789,974 883,667 719,087 402,676 322,141 418,783 460,661
Exports 24,528 17,525 79,956 77,521 39,812 26,319 20,871 16,694 13,355 17,362 19,098
Total 2-wheelers 6,073,581 6,245,895 6,631,703 6,632,152 6,664,046 7,587,193 7,820,745 6,409,719 5,425,287 6,557,627 7,331,478
Growth (yoy %)
Motorcycles (4.9) 0.7 4.7 (1.1) 1.7 14.4 6.0 (15.4) (15.0) 20.3 11.9
Domestic (5.1) 1.2 4.7 (1.3) 1.6 14.1 6.1 (15.4) (15.0) 20.0 12.0
< 125 cc (2.9) 2.2 5.2 (1.0) 1.8 14.9 6.6 (13.0) (15.0) 20.0 12.0
> 125 cc (40.3) (25.8) (14.2) (16.2) (6.6) (27.5) (38.5) (10.0) (20.0) 20.0 10.0
Exports 6.2 (17.1) 6.1 10.5 5.9 26.7 5.1 (13.7) (15.0) 30.0 10.0
< 125 cc 6.7 (18.1) (4.6) 6.0 18.3 16.9 10.0 (20.0) (15.0) 30.0 10.0
> 125 cc 1.8 (8.8) 86.7 28.3 (33.6) 82.3 (12.8) (20.0) (15.0) 30.0 10.0
Scooters 26.1 23.2 17.6 7.7 (7.4) 9.7 (18.7) (43.3) (20.0) 30.0 10.0
Domestic 31.5 25.5 9.0 8.9 (3.5) 11.9 (18.6) (45.0) (20.0) 30.0 10.0
Exports (34.3) (28.6) 356.2 (3.0) (48.6) (33.9) (20.7) (40.0) (20.0) 30.0 10.0
Total 2-wheelers (2.6) 2.8 6.2 0.0 0.5 13.9 3.1 (18.0) (15.4) 20.9 11.8
Source: Company, Kotak Institutional Equities estimates

52 KOTAK INSTITUTIONAL EQUITIES RESEARCH
Automobiles & Components Sector
Exhibit 63: We expect HMCL’s EPS to grow at 9% CAGR over FY2020-23E Financial summary of Hero MotoCorp, March fiscal year-ends, 2013-23E (Rs mn, %)
2013 2014 2015 2016 2017 2018 2019 2020 2021E 2022E 2023E
Profit model (Rs mn)
Net sales 237,681 252,755 275,853 284,427 285,071 322,352 336,505 288,361 278,879 337,573 382,525
EBITDA 24,002 27,129 33,568 44,550 46,414 52,849 49,301 39,580 36,528 46,719 55,008
Other income 3,984 4,464 4,735 4,224 5,158 5,211 6,913 7,783 7,156 7,878 8,858
Interest (119) (118) (111) (49) (61) (63) (86) (220) (100) (40) —
Depreciation (2,575) (2,802) (3,354) (4,376) (4,927) (5,556) (6,020) (8,180) (8,121) (8,821) (9,241)
Profit before tax 25,292 28,673 34,839 44,349 46,585 52,442 50,107 38,963 35,463 45,737 54,625
Current tax (4,869) (9,966) (9,432) (9,609) (10,821) (14,470) (16,010) (10,841) (9,079) (11,709) (13,984)
Deferred tax 759 2,384 — (3,138) (1,993) (999) (248) 1,437 — — —
Net profit 21,182 21,091 23,856 31,602 33,771 36,974 33,849 36,333 26,385 34,028 40,641
Earnings per share (Rs) 106.1 105.6 119.5 154.5 169.1 185.1 169.5 159.2 132.1 170.4 203.5
Balance sheet (Rs mn)
Equity 50,062 55,999 65,413 88,344 101,113 117,689 128,571 141,364 150,599 164,210 180,466
Deferred tax liability 1,324 (1,060) (735) 2,225 4,143 5,117 5,365 3,928 3,928 3,928 3,928
Total Borrowings — — — — — — — — — — —
Current liabilities 42,008 44,730 39,490 34,936 41,686 44,583 42,476 42,201 38,081 44,373 49,081
Total liabilities 96,417 99,913 104,482 125,505 146,943 167,388 176,412 187,493 192,607 212,511 233,475
Net fixed assets 31,331 30,974 36,252 41,898 48,606 49,729 51,604 60,439 58,318 56,497 54,256
Investments 36,238 40,888 31,541 45,810 58,899 75,252 59,686 82,227 65,436 75,436 85,436
Cash 1,810 1,175 1,593 1,314 1,367 1,413 1,365 2,419 23,543 32,504 41,312
Other current assets 27,037 26,877 35,096 36,484 38,070 40,993 63,757 42,410 45,312 48,076 52,473
Total assets 96,417 99,913 104,482 125,505 146,943 167,388 176,412 187,493 192,607 212,511 233,475
Free cash flow (Rs mn)
Operating cash flow excl. working capital 26,777 29,089 25,859 34,719 36,287 38,208 28,979 42,074 27,450 35,011 41,024
Working capital changes (7,872) 545 (3,359) 3,772 3,993 1,601 (19,189) 12,027 (7,022) 3,528 311
Capital expenditure (6,004) (9,328) (11,530) (14,604) (11,491) (7,992) (9,179) (13,586) (6,000) (7,000) (7,000)
Free cash flow 12,900 20,307 10,970 23,888 28,790 31,816 611 40,515 14,428 31,539 34,334
Ratios
Gross profit per vehicle (Rs/unit) 10,489 11,280 11,809 13,771 14,210 13,708 13,212 14,258 15,047 15,118 15,451
EBITDA per vehicle (Rs/unit) 3,952 4,343 5,062 6,717 6,965 6,966 6,304 6,175 6,733 7,124 7,503
Gross margin (%) 26.8 27.9 28.4 32.1 33.2 32.3 30.7 31.7 29.3 29.4 29.6
EBITDA margin (%) 10.1 10.7 12.2 15.7 16.3 16.4 14.7 13.7 13.1 13.8 14.4
PAT margin (%) 8.9 8.3 8.6 11.1 11.8 11.5 10.1 12.6 9.5 10.1 10.6
Book Value (Rs/share) 257 275 324 454 527 615 671 727 774 842 923
RoAE (%) 44.0 39.7 39.9 40.7 34.5 32.4 26.4 26.0 17.6 21.1 23.1
RoACE (%) 235.8 120.3 79.9 63.1 65.9 64.2 54.1 49.2 37.0 33.6 47.9
Source: Company, Kotak Institutional Equities estimates

For Private Circulation Only. FOR IMPORTANT INFORMATION ABOUT KOTAK SECURITIES’ RATING SYSTEM AND OTHER DISCLOSURES, REFER TO THE END OF THIS MATERIAL.
Kotak Institutional Equities Research [email protected] Mumbai: +91-22-4336-0000
TVS Motor to marginally gain market share in domestic 2W segment over FY2020-36E
We expect TVS Motor’s domestic 2W volumes to grow by 7% CAGR over FY2020-36E led by (1)
9% CAGR in the domestic scooter segment, (2) 7% CAGR in the domestic motorcycle segment
and (3) 2% decline in CAGR in the domestic moped segment. We expect TVS Motor’s market
share in the domestic 2W segment to increase marginally to 14.1% in FY2036E from 13.8% in
FY2020 led by market share gain in the domestic motorcycle and scooter segments, offset by
underperformance of the domestic moped industry where the company has 100% market
share. We expect TVS’s market share to increase to 7.6% in FY2036E from 6.7% due to a
higher mix of the premium motorcycle segment. We estimate TVS’s market share to improve to
21% in FY2036E from 18.3% in FY2020 led by (1) new product offerings and (2) 25% market
share in electric scooter segment (60% of the total scooter segment by FY2036E). The company
has launched iQube electric scooter in January 2020 and we reckon the company will benefit
from being the first mover (among the incumbents) in this segment. The company recently
invested in the EV startup Ultraviolette; however, we do not expect consumers to shift to this
segment due to high upfront cost of the bike over the medium term.
Expect 13% CAGR in 2W export volumes over FY2020-36E
We expect TVS’s 2W export volumes to grow by 13% CAGR over FY2020-36E as it (1) further
consolidates its presence in 60+ geographies by expanding its distribution network and (2)
expands its product offerings. Over the past two years, the company has appointed several
distributors to expand its reach and improve its brand awareness in several regions. The
company had signed a deal with Honduras-based distributor Motomundo SA and recently
expanded operations in Colombia by partnering with Autoeco SAS. TVS Motor has also signed
up more distributors, including the Cadisa Group in Guatemala and El Salvador and a
distributor named Al Yousuf MC in the UAE. We expect the company to leverage its long-term
strategic partnership with BMW Motorrad and recent acquisition of Norton Motorcycles to
enhance its presence by expanding its premium product portfolio. As a result, we expect TVS
Motor to marginally improve its market share to 20% in FY2036E from 19% in FY2020 in the
2W export segment.. We expect TVS Motor’s export 2W mix to improve to 41% in FY2036E
from 21% in FY2020.
TVS Motor (TVSL) Automobiles & Components
Valuations remain expensive. We expect TVS Motor to gain market share in the
domestic and two-wheeler export segment over FY2020-36E led by (1) new product
launches, (2) leveraging its tie-up with BMW Motorrad and acquisition of Norton
Motorcycles to enhances it premium product offerings both in domestic and export
geographies and (3) expansion of distribution network in global markets. Despite
building in strong volume growth, we believe the company’s valuation is expensive at
CMP. Maintain SELL rating and revise FV to Rs285 (from Rs260 earlier).
SELL
SEPTEMBER 30, 2020
UPDATE
Sector view: Cautious
CMP (`): 468
Fair Value (`): 285
BSE-30: 38,068
Hitesh Goel [email protected]
Mumbai: +91-22-4336-0878
Rishi Vora [email protected]
Mumbai: +91-22-4336 0874
TVS Motor
Stock data Forecasts/valuations 2020 2021E 2022E
52-week range (Rs) (high,low) EPS (Rs) 13.0 7.4 14.7
Mcap (bn) (Rs/US$) EPS growth (%) (7.9) (43.1) 98.4
ADTV-3M (mn) (Rs/US$) P/E (X) 36.0 63.4 31.9
Shareholding pattern (%) P/B (X) 6.1 5.9 5.2
Promoters 57.4 EV/EBITDA (X) 17.7 22.8 15.4
FIIs 10.5 RoE (%) 17.7 9.5 17.3
MFs/BFIs Div. yield (%) 0.7 0.7 0.8
Price performance (%) 1M 3M 12M Sales (Rs bn) 164 140 173
Absolute 8 24 11 EBITDA (Rs bn) 13 10 15
Rel. to BSE-30 10 14 13 Net profits (Rs bn) 6 4 7
504-240
223/3.1
16.4/4.7
1,291/18

54 KOTAK INSTITUTIONAL EQUITIES RESEARCH
Automobiles & Components Sector
Maintain SELL, revise FV to Rs285 (from Rs260 earlier)
We have revised TVS Motor’s FV to Rs285 (from Rs260 earlier). We have increased the value
of the standalone business, led by higher volume growth rate assumptions for the export
two-wheeler market (13% CAGR over FY2020-36E versus previous estimate of 10%). We
value the standalone business at Rs257 per share based on DCF methodology, which implies
15.4X PE multiple based on September 2022E EPS. The company’s implied PE multiple is
lower than that of Bajaj Auto due to lower share of export business in overall revenues and
inferior margin profile in both domestic and export markets.
Exhibit 64: We value TVS’s standalone business at Rs257 per share as per DCF methodology DCF valuation of TVS Motor, March fiscal year-ends, 2019-36E (Rs mn)
CAGR (%)
2019 2020 2021E 2022E 2023E 2024E 2025E 2036E 2020-36E
Domestic two-wheeler volumes (units) 3,134,477 2,410,642 1,795,522 2,251,454 2,449,848 2,810,890 2,972,152 6,740,029 6.6
Export two-wheeler volumes (units) 622,019 678,839 597,378 716,854 853,232 981,216 1,152,628 4,945,869 13.2
Domestic three-wheeler volumes (units) 16,715 11,934 7,160 9,309 10,239 10,444 10,653 13,246 0.7
Export three-wheeler volumes (units) 139,491 161,887 137,604 154,116 172,610 179,515 186,695 287,409 3.7
Total three-wheeler volumes (units) 156,206 173,821 144,764 163,425 182,850 189,959 197,348 300,655 3.5
Overall volumes (units) 3,912,702 3,263,302 2,537,664 3,131,733 3,485,929 3,982,066 4,322,128 11,986,553 8.5
Domestic two-wheeler ASPs 38,238 41,735 44,574 45,270 45,758 46,673 47,607 59,193 2.2
Export two-wheeler ASPs 45,561 42,936 42,936 43,794 44,740 45,635 46,548 57,876 1.9
Domestic three-wheeler ASPs 90,000 93,600 96,600 96,600 96,600 99,498 102,483 141,860 2.6
Export three-wheeler ASPs 106,500 101,175 101,175 103,199 105,262 107,368 109,515 136,168 1.9
Other operating revenues 17,544 16,984 19,531 22,461 25,830 27,380 29,023 55,094 7.6
Net sales 182,099 164,233 139,828 172,582 195,263 223,664 245,707 781,318 10.2
EBIT 10,340 8,568 5,587 10,045 12,239 13,314 14,604 39,012 9.9
EBIT (1-tax) 7,238 5,998 4,157 7,473 9,106 9,905 10,866 29,025
Depreciation 3,993 4,890 4,900 5,237 5,687 5,698 6,281 19,587
Change in WC (1,257) 2,926 (2,430) 983 554 (2,698) 125 462
Capex (7,330) (7,209) (2,500) (5,000) (5,000) (6,710) (7,371) (25,784) 8.3
Free cash flow 2,644 6,605 4,126 8,693 10,347 6,195 9,900 23,290 8.2
Discounted free cash 8,201 8,688 4,630 6,585 4,302
After tax cost of debt (%) 8.2
Risk free rate (%) 7.0
Risk premium (%) 6.0
Beta 1.2
Cost of equity 14.2
Debt/Capital employed (%) 30.7
Equity/Capital employed (%) 69.3
FY2021E debt 16,802
FY2021E equity 37,936
FY2021E capital employed 54,739
WACC (%) 12.4
Terminal growth (%) 4.0
Terminal value 53,560
Discounted free cash flow 85,360
Enterprise value 138,920
Net debt 16,802
Equity value 122,118
Equity value per share of standalone (Rs) 257
Source: Company, Kotak Institutional Equities estimates
Exhibit 65: We value TVS Motor at Rs285 per share SoTP valuation of TVS Motor, March fiscal year-end, 2022E (Rs mn)
Value per share (Rs) Comments
Standalone EPS 257 DCF methodology
TVS Motor Services 27 Valued at 1X equity invested by TVS Motor (parent entity)
Total value per share 284
KIE fair value 285
Implied multiple of standalone business based on September 2022E EPS 15.4
Source: Company, Kotak Institutional Equities estimates

KOTAK INSTITUTIONAL EQUITIES RESEARCH 55
Sector Automobiles & Components
Exhibit 66: TVS Motor’s stock price has traded at 10-year average of 25.7X one-year forward PE PE valuation chart of TVS Motor, March fiscal year-ends, 2003-21 (X)
0
10
20
30
40
50
60
70
80
Jul-0
3
Dec-
03
May-
04
Oct
-04
Mar-
05
Aug
-05
Jan
-06
Jun-0
6
Nov-
06
Apr-
07
Sep
-07
Feb-0
8
Jul-0
8
Dec-
08
May-
09
Oct
-09
Mar-
10
Aug
-10
Jan
-11
Jun-1
1
Nov-
11
Apr-
12
Sep
-12
Feb-1
3
Jul-1
3
Dec-
13
May-
14
Oct
-14
Mar-
15
Aug
-15
Jan
-16
Jun-1
6
Nov-
16
Apr-
17
Sep
-17
Feb-1
8
Jul-1
8
Dec-
18
May-
19
Oct
-19
Mar-
20
Aug
-20
Forward PE 10 year average
Source: Company, Kotak Institutional Equities estimates

56 KOTAK INSTITUTIONAL EQUITIES RESEARCH
Automobiles & Components Sector
Exhibit 67: We expect TVS Motor’s volumes to grow at 2% CAGR over FY2020-23E Volume assumptions of TVS Motor, March fiscal year-ends, 2013-23E (units, %)
2013 2014 2015 2016 2017 2018 2019 2020 2021E 2022E 2023E
Volumes (units)
Domestic volumes
Motorcycles 558,468 572,732 667,624 712,002 776,934 916,811 1,012,868 755,275 585,843 723,458 795,804
Economy (Star City) 392,931 343,960 432,620 384,545 324,877 383,065 348,984 177,976 142,381 163,738 180,112
Executive (Victor & Phoenix) 43,475 88,357 37,660 65,828 155,703 133,067 194,870 209,768 167,814 201,377 221,515
Premium (Apache) 122,062 140,415 197,344 261,629 296,354 399,035 469,014 367,531 275,648 358,343 394,177
Scooters 424,183 456,975 684,569 773,597 826,291 1,099,135 1,241,366 1,018,427 763,820 992,966 1,092,263
Mopeds 788,761 722,920 755,503 723,767 890,367 859,820 880,243 636,940 445,858 535,030 561,781
Total domestic 2W 1,771,412 1,752,627 2,107,696 2,209,366 2,493,592 2,875,766 3,134,477 2,410,642 1,795,522 2,251,454 2,449,848
3 Wheelers 15,616 12,515 17,606 15,536 12,277 16,429 16,715 11,934 7,160 9,309 10,239
Total domestic 1,787,028 1,765,142 2,125,302 2,224,902 2,505,869 2,892,195 3,151,192 2,422,576 1,802,682 2,260,762 2,460,087
Export volumes
Motorcycles 191,338 220,747 292,935 304,805 299,388 438,765 545,596 608,188 535,205 642,247 770,696
Scooters 17,369 18,693 22,457 38,930 44,572 35,783 59,749 56,792 49,977 59,972 67,169
Mopeds 3,308 7,252 9,679 14,780 20,152 17,412 16,674 13,859 12,196 14,635 15,367
Total exports 2W 212,015 246,692 325,071 358,515 364,112 491,960 622,019 678,839 597,378 716,854 853,232
3 Wheelers 33,574 68,327 90,773 95,285 56,977 82,255 139,491 161,887 137,604 154,116 172,610
Total exports 245,589 315,019 415,844 453,800 421,089 574,215 761,510 840,726 734,982 870,970 1,025,842
Total volumes 2,032,617 2,080,161 2,541,146 2,678,702 2,926,958 3,466,410 3,912,702 3,263,302 2,537,664 3,131,733 3,485,929
YoY growth (%)
Domestic volumes
Motorcycles (10.2) 2.6 16.6 6.6 9.1 18.0 10.5 (25.4) (22.4) 23.5 10.0
Economy (Star City) (15.8) (12.5) 25.8 (11.1) (15.5) 17.9 (8.9) (49.0) (20.0) 15.0 10.0
Executive (Victor & Phoenix) 326.9 103.2 (57.4) 74.8 136.5 (14.5) 46.4 7.6 (20.0) 20.0 10.0
Premium (Apache) (15.7) 15.0 40.5 32.6 13.3 34.6 17.5 (21.6) (25.0) 30.0 10.0
Scooters (14.6) 7.7 49.8 13.0 6.8 33.0 12.9 (18.0) (25.0) 30.0 10.0
Mopeds 1.5 (8.3) 4.5 (4.2) 23.0 (3.4) 2.4 (27.6) (30.0) 20.0 5.0
Total domestic 2W (6.5) (1.1) 20.3 4.8 12.9 15.3 9.0 (23.1) (25.5) 25.4 8.8
3 Wheelers 10.2 (19.9) 40.7 (11.8) (21.0) 33.8 1.7 (28.6) (40.0) 30.0 10.0
Total domestic (6.4) (1.2) 20.4 4.7 12.6 15.4 9.0 (23.1) (25.6) 25.4 8.8
Export volumes
Motorcycles (12.9) 15.4 32.7 4.1 (1.8) 46.6 24.3 11.5 (12.0) 20.0 20.0
Scooters (46.1) 7.6 20.1 73.4 14.5 (19.7) 67.0 (4.9) (12.0) 20.0 12.0
Mopeds (63.6) 119.2 33.5 52.7 36.3 (13.6) (4.2) (16.9) (12.0) 20.0 5.0
Total exports 2W (18.7) 16.4 31.8 10.3 1.6 35.1 26.4 9.1 (12.0) 20.0 19.0
3 Wheelers 31.3 103.5 32.9 5.0 (40.2) 44.4 69.6 16.1 (15.0) 12.0 12.0
Total exports (14.3) 28.3 32.0 9.1 (7.2) 36.4 32.6 10.4 (12.6) 18.5 17.8
Total volumes (7.4) 2.3 22.2 5.4 9.3 18.4 12.9 (16.6) (22.2) 23.4 11.3
Source: Company, Kotak Institutional Equities estimates

KOTAK INSTITUTIONAL EQUITIES RESEARCH 57
Sector Automobiles & Components
Exhibit 68: We expect TVS Motor’s revenues to grow at 6% CAGR over FY2020-23E Revenue assumptions of TVS Motor, March fiscal year-ends, 2013-23E (Rs mn, %)
2013 2014 2015 2016 2017 2018 2019 2020 2021E 2022E 2023E
Revenues (Rs mn)
Domestic revenues
Motorcycles 20,410 21,564 24,676 28,018 32,215 40,147 47,225 38,649 32,073 40,693 45,420
Economy 11,871 10,307 11,329 11,387 9,584 11,639 10,816 5,737 5,016 5,769 6,346
Executive 1,826 3,534 1,506 2,765 6,540 5,756 8,599 9,811 8,353 10,123 11,247
Premium 6,713 7,723 11,841 13,866 16,092 22,751 27,810 23,101 18,704 24,801 27,827
Scooters 14,062 15,080 23,618 28,932 31,399 43,855 51,874 45,963 36,764 47,793 52,572
Mopeds 16,564 15,181 16,621 15,138 19,143 19,309 20,756 15,997 11,198 13,437 14,109
Total domestic 2W 51,036 51,826 64,915 72,088 82,757 103,311 119,855 100,608 80,034 101,923 112,100
3 Wheelers 1,379 1,198 1,581 1,395 1,105 1,479 1,504 1,117 692 899 989
Total domestic 52,415 53,024 66,496 73,484 83,862 104,790 121,360 101,725 80,725 102,822 113,089
Export revenues
Motorcycles 8,071 9,751 13,475 14,344 13,922 20,403 25,370 26,584 23,394 28,634 35,048
Scooters 680 761 915 1,617 1,872 1,503 2,494 2,205 1,940 2,375 2,713
Mopeds 85 193 253 410 574 496 475 357 315 385 412
Total exports 2W 8,836 10,706 14,643 16,371 16,368 22,402 28,340 29,146 25,649 31,394 38,174
3 Wheelers 3,022 6,491 8,179 8,844 6,272 8,637 14,856 16,379 13,922 15,905 18,169
Total exports 11,858 17,197 22,821 25,214 22,639 31,038 43,196 45,525 39,571 47,299 56,343
Total vehicle revenues 64,273 70,221 89,317 98,698 106,502 135,828 164,555 147,250 120,296 150,121 169,432
Accessories and spare parts 7,417 9,473 10,931 12,384 14,861 15,926 17,544 16,984 19,531 22,461 25,830
Total revenues 71,690 79,694 100,248 111,082 121,362 151,754 182,099 164,233 139,828 172,582 195,263
YoY growth (%) 0.6 11.2 25.8 10.8 9.3 25.0 20.0 (9.8) (14.9) 23.4 13.1
Revenue mix (%)
Motorcycles 28.5 27.1 24.6 25.2 26.5 26.5 25.9 23.5 22.9 23.6 23.3
Economy 16.6 12.9 11.3 10.3 7.9 7.7 5.9 3.5 3.6 3.3 3.2
Executive 2.5 4.4 1.5 2.5 5.4 3.8 4.7 6.0 6.0 5.9 5.8
Premium 9.4 9.7 11.8 12.5 13.3 15.0 15.3 14.1 13.4 14.4 14.3
Scooters 19.6 18.9 23.6 26.0 25.9 28.9 28.5 28.0 26.3 27.7 26.9
Mopeds 23.1 19.0 16.6 13.6 15.8 12.7 11.4 9.7 8.0 7.8 7.2
Total domestic 2W 71.2 65.0 64.8 64.9 68.2 68.1 65.8 61.3 57.2 59.1 57.4
3 Wheelers 1.9 1.5 1.6 1.3 0.9 1.0 0.8 0.7 0.5 0.5 0.5
Total domestic 73.1 66.5 66.3 66.2 69.1 69.1 66.6 61.9 57.7 59.6 57.9
Export revenues
Motorcycles 11.3 12.2 13.4 12.9 11.5 13.4 13.9 16.2 16.7 16.6 17.9
Scooters 0.9 1.0 0.9 1.5 1.5 1.0 1.4 1.3 1.4 1.4 1.4
Mopeds 0.1 0.2 0.3 0.4 0.5 0.3 0.3 0.2 0.2 0.2 0.2
Total exports 2W 12.3 13.4 14.6 14.7 13.5 14.8 15.6 17.7 18.3 18.2 19.5
3 Wheelers 4.2 8.1 8.2 8.0 5.2 5.7 8.2 10.0 10.0 9.2 9.3
Total exports 16.5 21.6 22.8 22.7 18.7 20.5 23.7 27.7 28.3 27.4 28.9
Total vehicle revenues 89.7 88.1 89.1 88.9 87.8 89.5 90.4 89.7 86.0 87.0 86.8
Accessories and spare parts 10.3 11.9 10.9 11.1 12.2 10.5 9.6 10.3 14.0 13.0 13.2
Total revenues 100.0 100.0 100.0 100.0 100.0 100.0 100.0 100.0 100.0 100.0 100.0
Source: Company, Kotak Institutional Equities estimates

58 KOTAK INSTITUTIONAL EQUITIES RESEARCH
Automobiles & Components Sector
Exhibit 69: We expect TVS Motor’s EPS to grow at 13% CAGR over FY2020-23E Financial summary of TVS Motor, March fiscal year-ends, 2013-23E (Rs mn, %)
2013 2014 2015 2016 2017 2018 2019 2020 2021E 2022E 2023E
Profit model (Rs mn)
Net sales 71,693 79,659 100,423 111,047 121,353 151,754 182,099 164,233 139,828 172,582 195,263
EBITDA 4,090 4,822 6,066 8,099 8,571 11,750 14,333 13,459 10,487 15,282 17,927
Other income 238 302 303 1,039 1,734 990 75 321 318 479 690
Interest (480) (254) (274) (487) (440) (566) (806) (1,022) (1,212) (1,210) (1,060)
Depreciation (1,304) (1,317) (1,533) (2,361) (2,878) (3,387) (3,993) (4,890) (4,900) (5,237) (5,687)
Exceptional income (908) (28) — — — — — (323) — — —
Profit before tax 1,636 3,525 4,562 6,289 6,987 8,786 9,610 7,544 4,694 9,313 11,869
Tax expense (476) (909) (1,083) (1,397) (1,406) (2,161) (2,908) (1,622) (1,183) (2,347) (2,991)
Reported PAT 1,160 2,616 3,478 4,893 5,581 6,626 6,701 5,922 3,511 6,966 8,878
Adjusted net profit 1,804 2,637 3,478 4,893 5,581 6,626 6,701 6,175 3,511 6,966 8,878
Earnings per share (Rs) 3.8 5.6 7.3 10.3 11.7 13.9 14.1 13.0 7.4 14.7 18.7
Balance sheet (Rs mn)
Equity 12,247 14,153 16,454 19,583 24,083 28,804 33,473 36,181 37,936 42,813 49,027
Deferred tax liability 931 1,247 1,528 1,437 1,257 1,482 2,126 1,581 1,581 1,581 1,581
Total Borrowings 6,345 5,276 9,705 9,244 11,072 11,892 14,000 20,219 20,173 20,173 15,173
Current liabilities 10,767 13,760 16,869 18,273 21,498 28,227 32,912 33,869 27,990 33,374 37,103
Other liabilities 1,066 1,211 1,488 985 1,137 1,158 1,183 1,763 1,763 1,763 1,763
Total liabilities 31,356 35,647 46,042 49,522 59,047 71,562 83,694 93,612 89,442 99,703 104,646
Net fixed assets 10,476 11,738 14,190 17,506 20,462 25,030 28,365 30,819 28,419 28,182 27,494
Investments 8,688 8,959 10,125 12,149 15,879 20,354 23,007 26,059 28,559 30,059 31,559
Cash 175 826 54 327 85 109 439 4,192 3,370 7,966 8,922
Other current assets 12,017 14,124 21,674 19,540 22,622 26,070 31,883 32,542 29,094 33,496 36,671
Total assets 31,356 35,647 46,042 49,522 59,047 71,562 83,694 93,612 89,442 99,703 104,646
Free cash flow (Rs mn)
Operating cash flow excl. working capital 3,685 3,625 4,699 6,658 7,754 9,306 12,235 11,011 9,304 12,935 14,936
Working capital changes 643 1,613 (3,851) 2,753 (514) 3,668 (1,257) 2,926 (2,430) 983 554
Capital expenditure (995) (2,580) (4,052) (4,872) (6,122) (7,698) (7,330) (7,209) (2,500) (5,000) (5,000)
Free cash flow 2,508 2,153 (4,671) 2,358 (1,257) 1,000 32 (245) 662 6,207 7,929
Ratios
Gross margin (%) 27.5 28.8 27.3 28.1 27.0 26.6 24.0 26.1 25.0 25.3 25.3
EBITDA margin (%) 5.7 6.1 6.0 7.3 7.1 7.7 7.9 8.2 7.5 8.9 9.2
PAT margin (%) 2.5 3.3 3.5 4.4 4.6 4.4 3.7 3.8 2.5 4.0 4.5
ASPs per vehicle (Rs/vehicle) 35,271 38,295 39,519 41,455 41,460 43,778 46,541 50,327 55,101 55,107 56,015
Gross profit per vehicle (Rs/vehicle) 9,687 11,024 10,803 11,668 11,213 11,662 11,163 13,138 13,775 13,942 14,172
EBITDA per vehicle (Rs/vehicle) 2,012 2,318 2,387 3,023 2,928 3,390 3,663 4,124 4,133 4,880 5,143
Net debt/equity (X) 0.5 0.3 0.6 0.5 0.5 0.4 0.4 0.4 0.4 0.3 0.1
Book Value (Rs/share) 25.8 29.8 34.6 41.2 50.7 60.6 70.5 76.2 79.8 90.1 103.2
RoAE (%) 15.1 20.0 22.7 27.2 25.6 25.1 21.5 17.7 9.5 17.3 19.3
RoACE (%) 10.3 14.1 15.5 16.4 14.3 16.7 16.5 13.6 7.8 13.7 16.6
Source: Company, Kotak Institutional Equities estimates

For Private Circulation Only. FOR IMPORTANT INFORMATION ABOUT KOTAK SECURITIES’ RATING SYSTEM AND OTHER DISCLOSURES, REFER TO THE END OF THIS MATERIAL.
Kotak Institutional Equities Research [email protected] Mumbai: +91-22-4336-0000
Expect Eicher Motors to remain dominant player in domestic premium motorcycle segment
We expect RE’s domestic 2W volumes to grow by 8.6% CAGR over FY2020-36E. Royal Enfield
is one of the leading players in the premium motorcycle segment with 25% market share led by
(1) 28% market share in rich states (nominal GDP per capita >US$2,500) and (2) 20-21%
market share in other states (nominal GDP per capita <US$2,500). With rising per capita GDP,
we expect the premium motorcycle mix to improve to 36% in FY2036E from 24% in FY2020
and see RE as one of the biggest beneficiaries of the premiumization trend. We believe that the
company’s aggressive plan to set up small studio stores will help increase its penetration in the
hinterlands over the medium term. Currently, the competition is limited to >350cc segment;
however, we expect competitive intensity to increase in this space with (1) aggressive product
launches by HMSI and (2) Bajaj Auto-Triumph JV entering 250-750cc space CY2022E onwards.
Despite increase in competitive intensity, we are currently building in flattish market share of
~25% for RE in the premium motorcycle segment over FY2020-36E due to an aggressive
product launch pipeline.
Expect 20% CAGR in export 2W volumes over FY2020-36E
We expect RE’s export 2W volumes to grow by 20% CAGR (partly due to lower base) over
FY2020-36E led by (1) targeting the mid-size motorcycle segment (250-750cc) in the developed
and developing (nominal GDP per capita above US$10,000) geographies and (2) gaining market
share in these geographies through global products and distribution expansion. We would like
to highlight that the mid-size motorcycle segment has outperformed the commuter motorcycle
segment in these geographies over CY2012-19, which bodes well for RE. The company has
achieved good response in Thailand, Brazil and North America for the RE brand with only a few
stores. The company is aggressively expanding its distribution network in South East Asian and
LATAM regions and currently has retail presence across 60 countries. Also, the company has set
up an assembly unit in Argentina, which will operate in partnership with Grupo Simpa (RÉ’s
local distributor in Argentina since 2018). This assembly unit will be a key hub to make further
inroads in the LATAM market. We expect premium motorcycles to continue to outperform the
overall two-wheeler market in LATAM and South East Asian regions; RE can leverage Himalayan
and Twins offerings in these markets. We expect the mix to improve to 18.9% in FY2036E from
5.6% in FY2020.
Eicher Motors (EIM) Automobiles & Components
Opportunities priced in. We expect Royal Enfield to be one of the key beneficiaries of
the premiumization theme in domestic and export motorcycle segments. RE’s strategy
of aggressively expanding into the hinterlands in the domestic markets and targeting
the mid-sized motorcycle segment in LATAM and South East Asian regions will aid
volume growth in the medium term. However, at CMP, we believe all these opportunities
are priced in. Downgrade the stock to SELL with Fair Value of Rs1,920 (unchanged).
SELL
SEPTEMBER 30, 2020
CHANGE IN RECO.
Sector view: Cautious
CMP (`): 2,203
Fair Value (`): 1,920
BSE-30: 38,068
Hitesh Goel [email protected]
Mumbai: +91-22-4336-0878
Rishi Vora [email protected]
Mumbai: +91-22-4336 0874
Eicher Motors
Stock data Forecasts/valuations 2020 2021E 2022E
52-week range (Rs) (high,low) EPS (Rs) 67.1 59.3 82.9
Mcap (bn) (Rs/US$) EPS growth (%) (17.7) (11.7) 39.8
ADTV-3M (mn) (Rs/US$) P/E (X) 32.8 37.2 26.6
Shareholding pattern (%) P/B (X) 7.2 6.2 5.2
Promoters 49.3 EV/EBITDA (X) 24.5 28.2 19.9
FIIs 27.0 RoE (%) 23.7 18.0 21.4
MFs/BFIs Div. yield (%) 0.6 0.6 0.6
Price performance (%) 1M 3M 12M Sales (Rs bn) 92 84 105
Absolute 5 20 24 EBITDA (Rs bn) 22 18 25
Rel. to BSE-30 7 10 26 Net profits (Rs bn) 18 16 23
2,387-1,245
602/8.2
9.4/2.3
5,198/71

60 KOTAK INSTITUTIONAL EQUITIES RESEARCH
Automobiles & Components Sector
Downgrade to SELL with unchanged FV of Rs1,920
We have kept Eicher Motors’ FV unchanged at Rs1,920. Given RE’s product offerings and
aggressive plans to expand its distribution network, we are building in strong growth in
domestic and export markets. However, expensive valuations drive our rating downgrade to
SELL. We value the standalone business at Rs1,850 per share based on the DCF
methodology, which implies 19.8X PE multiple based on September 2022E EPS. We value
the VECV business (proportionate stake) at Rs69 per share based on the DCF methodology.
We ascribe higher valuation multiple to RE as compared to other two-wheeler OEMs as we
expect (1) the premium motorcycle segment to outperform the overall motorcycle segment,
(2) superior profitability as compared to peers (we are building EBITDA margins to come off
over the medium term) and (3) higher growth potential in export markets given its
minuscule market share currently.
Exhibit 70: We value Eicher Motors’ consolidated business at Rs1,920 per share as per DCF methodology DCF valuation of Eicher Motors, March fiscal year-ends, 2019-36E (Rs mn)
CAGR (%)
2019 2020 2021E 2022E 2023E 2024E 2025E 2036E 2020-36E
Domestic volumes (units) 801,899 658,286 572,200 704,535 824,269 817,299 881,770 2,448,143 8.6
Export volumes (units) 20,825 39,296 35,366 45,976 55,172 63,447 90,997 741,880 20.2
Total volumes (units) 822,724 697,582 607,567 750,512 879,441 880,746 972,767 3,190,023 10.0
Domestic ASPs 109,954 113,590 114,897 116,159 118,482 120,852 150,264 2.0
Export ASPs 180,545 185,961 191,540 197,286 203,205 209,301 289,722 3.0
Other operating revenue 11,299 12,429 14,914 17,897 18,971 20,109 38,174 7.9
Net revenue 97,945 90,775 84,002 104,670 124,528 128,699 145,719 620,981 12.8
EBIT 26,454 18,259 14,698 20,856 27,100 25,740 27,687 99,357 11.2
EBIT (1-tax) 15,668 12,993 10,935 15,517 20,162 19,150 20,599 73,922 11.5
Depreciation/amortisation 2,989 3,779 4,344 5,004 5,719 6,149 6,550 19,972
(Increase)/decrease in working capital (4,524) (2,404) 392 44 (705) (891) (1,064) 2,060
Capital expenditure (7,842) (5,544) (5,500) (6,500) (6,500) (1,365) (5,957) (16,043) 6.9
Free cash flows 6,291 8,825 10,171 14,064 18,676 23,043 20,128 79,911 14.8
Discounted cash flow 13,289 15,756 17,358 13,538 15,451
WACC used (%) 12.0
Terminal growth rate (%) 4.0
Capitalization rate (%) 8.0
Cash flow in terminal year 15,451
Sum of free cash flow 221,797
Terminal value 200,858
Enterprise value- RE 422,655
Enterprise value- VECV 18,704
Enterprise value- Eicher Motors 441,359
Net cash 81,044
Net present value-equity 522,403
NPV /share(Rs) 1,919
Source: Company, Kotak Institutional Equities estimates

KOTAK INSTITUTIONAL EQUITIES RESEARCH 61
Sector Automobiles & Components
Exhibit 71: We value Eicher Motors at Rs1,920 per share SoTP valuation of Eicher Motors, March fiscal year-end, 2022E (Rs mn)
Valuation Comments
Standalone
Equity value per share 1,850 Based on DCF methodology
Implied multiple based on September 2022E EPS 19.8
Eicher stake in VECV
Equity value per share 126 Based on DCF methodology
Eicher stake in VECV (%) 54.4
Eicher equity value in VECV 69 Value of proportionate stake
Equity value 1,919
KIE fair value 1,920
Source: Company, Kotak Institutional Equities estimates
Exhibit 72: Eicher Motors stock price has traded at 10-year average of 26.7X one-year forward PE PE valuation chart of Eicher Motors, March fiscal year-ends, 2009-21 (X)
0
5
10
15
20
25
30
35
40
45
Dec-
09
Mar-
10
Jun-1
0
Sep
-10
Dec-
10
Mar-
11
Jun-1
1
Sep
-11
Dec-
11
Mar-
12
Jun-1
2
Sep
-12
Dec-
12
Mar-
13
Jun-1
3
Sep
-13
Dec-
13
Mar-
14
Jun-1
4
Sep
-14
Dec-
14
Mar-
15
Jun-1
5
Sep
-15
Dec-
15
Mar-
16
Jun-1
6
Sep
-16
Dec-
16
Mar-
17
Jun-1
7
Sep
-17
Dec-
17
Mar-
18
Jun-1
8
Sep
-18
Dec-
18
Mar-
19
Jun-1
9
Sep
-19
Dec-
19
Mar-
20
Jun-2
0
Forward PE 10 year average(X)
Source: Company, Kotak Institutional Equities estimates

62 KOTAK INSTITUTIONAL EQUITIES RESEARCH
Automobiles & Components Sector
Exhibit 73: We expect RE’s volumes to grow at 8% CAGR over FY2020-23E Volume assumptions of Eicher Motors, March fiscal year-ends, 2013-23E (units, %)
2013 2014 2016 2017 2018 2019 2020 2021E 2022E 2023E
Sales volumes (units)
Standalone
Two-wheelers 178,121 302,611 601,000 666,490 820,492 822,724 697,582 607,567 750,512 879,441
VECV
Domestic
5-7.5 ton 5,242 5,389 8,337 8,525 11,062 11,757 8,799 6,159 8,623 9,658
7.5-12 ton 20,768 17,490 26,981 22,395 27,005 31,535 21,041 14,729 20,620 23,095
>12 ton 2,907 3,056 5,683 6,216 7,315 7,695 4,146 2,902 4,063 4,551
Buses 8,333 8,123 13,038 12,270 10,494 10,734 9,060 6,342 7,610 8,371
Exports
Cargo 2,382 4,460 5,060 6,005 7,405 8,798 3,493 2,445 2,934 3,374
Buses 799 1,364 2,452 2,030 1,596 1,212 1,075 753 903 1,038
Volvo trucks
Volvo trucks domestic 701 891 1,499 1,164 1,055 1,266 1,107 664 863 1,122
Total 41,132 40,773 63,050 58,605 65,932 72,997 48,721 33,994 45,617 51,210
Yoy change (%)
Standalone
Two-wheelers 57.0 69.9 98.6 10.9 23.1 0.3 (15.2) (12.9) 23.5 17.2
VECV
Domestic
5-7.5 ton (2.4) 2.8 54.7 2.3 29.8 6.3 (25.2) (30.0) 40.0 12.0
7.5-12 ton (26.0) (15.8) 54.3 (17.0) 20.6 16.8 (33.3) (30.0) 40.0 12.0
>12 ton (23.8) 5.1 86.0 9.4 17.7 5.2 (46.1) (30.0) 40.0 12.0
Buses (2.2) (2.5) 60.5 (5.9) (14.5) 2.3 (15.6) (30.0) 20.0 10.0
Exports
Cargo 42.5 87.2 13.5 18.7 23.3 18.8 (60.3) (30.0) 20.0 15.0
Buses 17.7 70.7 79.8 (17.2) (21.4) (24.1) (11.3) (30.0) 20.0 15.0
Volvo trucks
Volvo trucks domestic 23.2 27.1 68.2 (22.3) (9.4) 20.0 (12.6) (40.0) 30.0 30.0
Total (15.5) (0.9) 54.6 (7.0) 12.5 10.7 (33.3) (30.2) 34.2 12.3
Source: Company, Kotak Institutional Equities estimates

KOTAK INSTITUTIONAL EQUITIES RESEARCH 63
Sector Automobiles & Components
Exhibit 74: We expect Eicher Motors’ revenues to grow at 10% CAGR over FY2020-23E Revenue and volume assumptions of Royal Enfield, March fiscal year-ends, 2017-23E (Rs mn, %)
2017 2018 2019 2020 2021E 2022E 2023E 2020-23E CAGR (%)
RE volumes modelwise (in units)
Bullet 350 143,833 156,709 166,243 176,348 149,896 179,875 201,460 4.5
Classic 350 416,693 555,513 523,068 399,728 359,755 449,694 539,633 10.5
Thunderbird 350 42,321 45,927 71,327 40,185 34,157 39,281 43,209 2.4
Bullet 500 9,210 6,644 2,737 786 — — — NA
Classic 500 24,333 27,509 19,282 4,925 — — — NA
Thunderbird 500 3,262 2,966 3,373 824 — — — NA
Himalayan 10,299 5,656 10,701 15,302 12,242 14,690 16,453 2.4
Continental GT 650/Interceptor 1,156 305 5,168 20,188 16,150 20,996 23,515 5.2
Exports 15,383 19,264 20,825 39,296 35,366 45,976 55,172 12.0
Total volumes 666,490 820,493 822,724 697,582 607,567 750,512 879,441 8.0
Two-wheeler revenues modelwise (in Rs mn)
Bullet 350 13,515 13,698 14,531 16,649 14,751 17,878 20,224 6.7
Classic 350 45,836 56,668 55,578 44,942 41,887 52,882 64,093 12.6
Thunderbird 350 4,952 4,999 7,763 4,655 4,093 4,754 5,282 4.3
Bullet 500 1,179 791 326 99 — — — NA
Classic 500 3,528 3,711 2,723 730 — — — NA
Thunderbird 500 476 403 457 118 — — — NA
Himalayan 1,359 695 1,314 1,986 1,638 1,985 2,245 4.2
Continental GT 650/Interceptor 176 43 789 3,203 2,627 3,450 3,902 6.8
Exports 1,770 2,135 3,440 7,095 6,577 8,806 10,885 15.3
Total two-wheeler revenues 72,793 83,142 86,921 79,476 71,573 89,755 106,631 10.3
Source: Company, Kotak Institutional Equities estimates

64 KOTAK INSTITUTIONAL EQUITIES RESEARCH
Automobiles & Components Sector
Exhibit 75: We expect Eicher Motors’ standalone EPS to grow at 14% CAGR over FY2020-23E Standalone financial summary of Eicher Motors, March fiscal year-ends, 2013-23E (Rs mn, %)
2013 2014 2016 2017 2018 2019 2020 2021E 2022E 2023E
Profit model (Rs mn)
Net sales 17,025 30,312 61,880 70,380 89,575 97,945 90,775 84,002 104,670 124,528
EBITDA 3,137 7,336 17,082 22,058 28,532 29,443 22,038 19,042 25,860 32,819
Other income 801 1,163 2,835 2,273 3,324 5,080 6,153 7,919 9,449 10,979
Interest (3) (17) (21) (28) (30) (30) (109) — — —
Depreciaton (304) (502) (1,366) (1,533) (2,223) (2,989) (3,779) (4,344) (5,004) (5,719)
Profit before tax 3,632 7,980 18,530 22,770 29,603 31,504 24,303 22,618 30,305 38,079
Current tax (782) (2,317) (5,247) (6,785) (9,354) (9,419) (5,488) (5,790) (7,758) (9,748)
Deferred tax (64) (74) (191) (384) — (1,366) 223 — — —
Net profit 2,786 5,589 13,092 15,601 17,129 20,543 19,038 16,827 22,547 28,331
Adjusted net profit 2,786 5,589 13,092 15,601 17,129 20,543 19,038 16,827 22,547 28,331
Adjusted Diluted EPS (Rs) 10.2 20.5 48.1 57.3 74.4 76.1 69.9 61.8 82.8 104.1
Balance sheet (Rs mn)
Equity 270 271 272 272 273 273 273 273 273 273
Reserves and Surplus 7,943 12,066 23,093 38,954 53,450 70,992 82,480 95,769 114,778 139,570
Deferred tax liability 126 201 408 792 1,430 2,765 2,520 2,520 2,520 2,520
Total borrowings 40 — 226 — — — — — — —
Current liabilities 6,452 9,752 12,241 15,201 22,795 20,745 20,516 20,292 22,388 24,278
Total liabilities 14,832 22,289 36,239 55,218 77,947 94,774 105,790 118,855 139,959 166,641
Net fixed assets 3,132 5,599 9,442 13,484 18,305 23,206 24,968 26,124 27,620 28,402
Investments 8,564 11,886 20,691 35,417 49,855 52,848 68,330 78,330 93,330 108,330
Cash 187 431 312 128 893 7,018 190 2,714 5,270 13,576
Other current assets 2,879 4,297 5,795 6,190 8,894 11,703 12,303 11,687 13,739 16,334
Miscellaneous expenditure 71 77 — — — — — — — —
Total assets 14,832 22,289 36,239 55,218 77,947 94,774 105,790 118,855 139,959 166,641
Free cash flow (Rs mn)
Operating cash flow excl. working capital 2,378 5,131 12,188 15,757 20,534 20,606 16,016 13,252 18,101 23,070
Working capital changes 1,311 1,729 2,554 1,862 4,620 (4,524) (2,404) 392 44 (705)
Capital expenditure (1,388) (3,699) (5,082) (5,448) (7,435) (7,842) (5,544) (5,500) (6,500) (6,500)
Free cash flow 2,298 3,144 9,639 12,143 17,706 8,226 8,060 8,143 11,645 15,865
Ratios
Gross margin (%) 37.7 40.4 44.3 47.3 48.6 48.3 45.1 43.4 43.9 44.7
EBITDA margin (%) 18.4 24.2 27.6 31.3 31.9 30.1 24.3 22.7 24.7 26.4
Net debt/equity (X) (1.1) (1.0) (0.9) (0.9) (0.9) (0.8) (0.8) (0.8) (0.9) (0.9)
RoAE (%) 37.9 53.5 72.1 48.9 42.6 32.1 23.9 18.3 20.9 21.8
Book value/share (X) 30 45 86 144 197 262 304 353 423 514
Gross profit per vehicle (Rs) 36,079 40,434 45,654 49,984 53,016 57,512 58,655 59,982 61,188 63,322
EBITDA per vehicle (Rs) 17,613 24,241 28,422 33,096 34,775 35,787 31,592 31,341 34,456 37,318
Source: Company, Kotak Institutional Equities estimates
Exhibit 76: We expect Eicher Motors’ consolidated EPS to grow at 17% CAGR over FY2020-23E Consolidated financial summary of Eicher Motors, March fiscal year-ends, 2013-23E (Rs mn, %)
2013 2014 2016 2017 2018 2019 2020 2021E 2022E 2023E
Profit model (Rs mn)
Net sales 68,098 87,383 61,735 70,334 89,650 97,971 91,536 84,002 104,670 124,528
EBITDA 7,132 11,148 16,896 21,740 28,076 29,031 21,804 18,492 25,310 32,269
Other income 953 1,074 1,781 2,273 2,801 4,434 5,433 7,919 9,449 10,979
Interest (79) (98) (21) (36) (53) (73) (189) (189) (189) (189)
Depreciaton (1,300) (2,198) (1,366) (1,538) (2,233) (3,003) (3,815) (4,344) (5,004) (5,719)
Profit before tax 6,706 9,926 17,290 22,439 28,591 30,389 23,232 21,879 29,567 37,341
Tax (1,452) (2,909) (5,389) (7,203) (9,359) (10,770) (5,275) (5,790) (7,758) (9,748)
Minority Interest (1,314) (864) — — — — — — — —
Share of profit/(loss) of joint ventures 1,479 1,435 2,566 2,584 317 43 745 1,479
Adjusted net profit 3,939 6,153 13,380 16,671 21,137 22,150 18,274 16,132 22,554 29,071
Adjusted Diluted EPS (Rs) 14.5 22.7 49.3 61.4 77.8 81.6 67.3 59.4 83.0 107.0
Source: Company, Kotak Institutional Equities estimates

For Private Circulation Only. FOR IMPORTANT INFORMATION ABOUT KOTAK SECURITIES’ RATING SYSTEM AND OTHER DISCLOSURES, REFER TO THE END OF THIS MATERIAL.
Negative FCF in FY2020, first time in the past decade; future capital allocation is worrisome
NACL generated Rs1 bn negative FCF in FY2020 led by higher working capital, escalating
capital expenditure and weak operating margins. Operating performance deteriorated with (1)
Aluminum division reporting an EBITDA loss of US$52/ton (+US$308/ton in FY2019) as costs
remain elevated amidst a 15% yoy correction in LME aluminum, (2) Alumina EBITDA declined
by 63% yoy to US$69/ton due to a 33% yoy correction in Alumina prices.
In the past decade (2011-20), 60% of the cash sourced from operations and cash balance was
returned to investors whereas only 38% was used for capex (refer Exhibit 10). However, over the
next three years, capex alone would use more than the operating cash flows and cash balance.
Growth projects are progressing at a snail’s pace and would erode balance sheet
The progress on various growth projects, detailed in AR 2020, has little to cheer. (1) The 1 mtpa
alumina refinery expansion project has yet to see any meaningful progress. The estimated cost
has been revised to Rs64 bn (as per the AGM speech) versus Rs55 bn estimated earlier. NACL’s
target to complete the project in FY2023E appears too ambitious. (2) NACL received the mining
lease for Utkal D coal mine however environment clearance (EC) and mine closure plan approval are
still awaited. Utkal E is yet to receive the mining lease, EC, and forest clearance (FC). We estimate
Utkal D coal mine to start from FY2023E and capex towards refinery to start from FY2022E.
Surplus alumina and aluminum market to keep prices range-bound
Alumina market remains well supplied, notwithstanding the recent supply disruption in Brazil.
Upcoming refinery projects are likely to keep market in surplus and prices subdued. Aluminum –
weak cost support and a surplus market caps upside in aluminum prices. We forecast LME
Aluminum at US$1650/1700/ton and Alumina at US$272/289/ton in FY2021/22E.
Valuations – Most expensive within metals, underperformance to continue; Maintain SELL
We have tweaked our EBITDA estimates by 1%/1%/4% for FY2021/22/23E. Our Fair Value
remains unchanged at Rs26/share at 5X EV/EBITDA. NACL, trading at 6.7X EV/EBITDA FY2022E,
is the most expensive metal stock within our coverage. It has underperformed its peers (Exhibit
24) and in absence of fundamental support, underperformance should continue. Maintain SELL.
National Aluminium Co. (NACL) Metals & Mining
Cash burn to continue, growth projects to erode balance sheet. NACL generated
a negative FCF of Rs1 bn in FY2020, for the first time in the past decade. A surplus
market should keep aluminum and alumina prices subdued and range bound. With a
high cost structure, NACL’s operating cash flows would just about fund its maintenance
capex. The high cost growth projects would erode existing cash balance and require
debt to complete. Valuations are most expensive within metals and past dividend yield
is no longer sustainable. Maintain SELL with a Fair Value of Rs26/share.
SELL
OCTOBER 01, 2020
UPDATE
Sector view: Attractive
CMP (`): 32
Fair Value (`): 26
BSE-30: 38,068
Sumangal Nevatia
Prayatn Mahajan
National Aluminium Co.
Stock data Forecasts/valuations 2021E 2022E 2023E
52-week range (Rs) (high,low) EPS (Rs) 0.9 1.5 2.6
Mcap (bn) (Rs/US$) EPS growth (%) 23.5 60.8 74.0
ADTV-3M (mn) (Rs/US$) P/E (X) 35.2 21.9 12.6
Shareholding pattern (%) P/B (X) 0.6 0.6 0.6
Promoters 51.5 EV/EBITDA (X) 5.9 6.2 5.4
FIIs 9.0 RoE (%) 1.7 2.7 4.6
MFs/BFIs Div. yield (%) 0.0 2.3 4.0
Price performance (%) 1M 3M 12M Sales (Rs bn) 83 91 97
Absolute (10) 1 (31) EBITDA (Rs bn) 6 8 12
Rel. to BSE-30 (9) (7) (29) Net profits (Rs bn) 2 3 5
49-24
61/0.9
7.7/9.1
543/7
[email protected]: +91 22 6218 6427

National Aluminium Co. Metals & Mining
KOTAK INSTITUTIONAL EQUITIES RESEARCH 49
Update on Key expansion projects and raw material security contracts
5th Stream of Alumina Refinery – Marginal progress in FY2020
The company expects to complete the project in FY2023. However, as per the progress, we
expect it could commission the earliest in FY2025E. The project as per the latest cost
estimate of Rs64 bn is twice the capital intensity of Hindalco’s 0.5 mtpa refinery expansion
at Utkal. We estimate that the project would be return dilutive with just a 4% RoCE.
NACL is in the process of setting up of the 5th stream in its existing alumina refinery
which shall add 1.0 mtpa to its existing installed capacity of 2.3 mtpa (total capacity 3.3
mtpa), at a projected expenditure of Rs55.4 bn. However, the budgeted cost was revised
to Rs64 as per the AGM speech on September 30, 2020.
It resolved the long pending protest and resistance of local villagers and project work
resumed since June 2019. The new boundary wall has been erected.
It has obtained major statutory clearances like Environmental Clearance from MoEF & CC
and Consent to Establish (CTE) from Odisha State Pollution Control Board.
Basic engineering for the project by M/s. RTAIL has been completed and detailed
engineering has progressed to the tune of 22% from 17% in FY2019.
Site activity comprising of survey and soil investigation work have been completed. Some
of the packages are already awarded and total cumulative order value for the project
stands at Rs8 bn.
Exhibit 1: Alumina refinery project would earn just 4% RoCE and is return dilutive ROCE of NACL’s alumina refinery expansion project (%)
Note: (a) Assumed 50% project cost as debt funded
Source: Company, Kotak Institutional Equities estimates
Amount
Particulars Units (Rs mn)
Realisation US$/ton 275
Cost US$/ton 200
EBITDA US$/ton 75
Capacity mtpa 1.0
Production mn tons 1.0
EBITDA US$ mn 71
Depreciation US$ mn 40
EBIT US$ mn 31
Tax 25%
Interest US$ mn 40
Capex US$ mn 800
(EBIT-I)(1-t)+I 33
RoCE 4%

Metals & Mining National Aluminium Co.
50 KOTAK INSTITUTIONAL EQUITIES RESEARCH
Bauxite - Well secured with mining leases valid till 2030
NACL is currently sourcing bauxite from Panchapatmali bauxite mines (Central & North
Block). The mining lease has validity till 2032. The Panchapatmali - South Block is planned to
serve the 5th
stream of alumina refinery till the dedicated Pottangai mines starts production.
1) South Block (Panchpatmali) - alternate sourcing of Bauxite for 5th Stream
Sourcing of bauxite for 5th
Stream Expansion of Alumina refinery has been envisaged
from Pottangi mines. However, availability of bauxite from Pottangi mines is expected
beyond the scheduled commissioning of 5th Stream expansion.
Hence, sourcing of bauxite from South Block of existing Panchpatmali mines has been
planned through setting up of a crushing & conveying system for which a capital
expenditure of Rs5 bn has been projected.
Tenders have been floated for all major packages and tendering activities are in advanced
stage.
2) Pottangi Bauxite Mine
Public Hearing conducted on 17th
December 2019 and the EIA/EMP report has been
submitted to MoEF & CC for obtaining Environmental Clearance.
Activities for obtaining Forest Clearance and Environment Clearance of the overland
conveyor corridor are under progress.
Activities for acquisition of land for the overland conveyor corridor are under progress.
Opening of Pottangi Bauxite Mine is scheduled by FY2022-23.
Exhibit 2: Bauxite production increased 1% yoy on 1% increase in alumina production Bauxite production, FY2011–20, (mn tons, %)
Source: Company, Kotak Institutional Equities estimates
-15%
-10%
-5%
0%
5%
10%
15%
20%
-
1.0
2.0
3.0
4.0
5.0
6.0
7.0
8.0
2011 2012 2013 2014 2015 2016 2017 2018 2019 2020
Bauxite produced (mn tons) (LHS) % growth (yoy) (RHS)
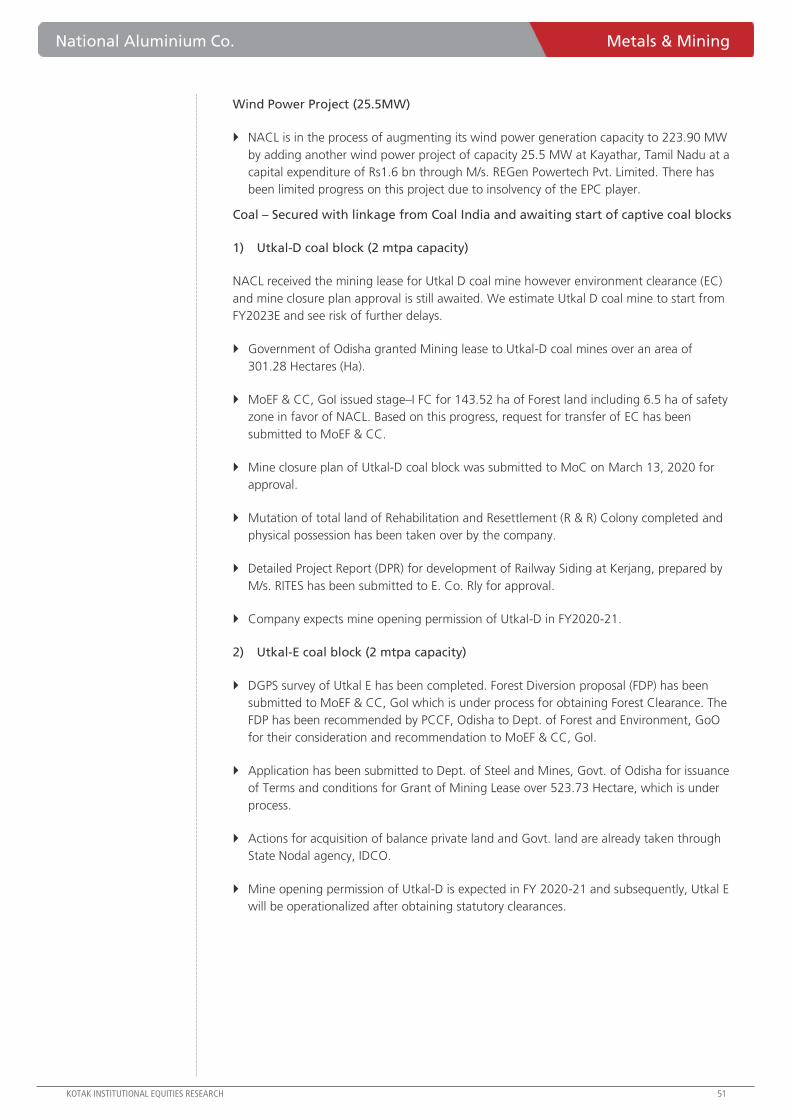
National Aluminium Co. Metals & Mining
KOTAK INSTITUTIONAL EQUITIES RESEARCH 51
Wind Power Project (25.5MW)
NACL is in the process of augmenting its wind power generation capacity to 223.90 MW
by adding another wind power project of capacity 25.5 MW at Kayathar, Tamil Nadu at a
capital expenditure of Rs1.6 bn through M/s. REGen Powertech Pvt. Limited. There has
been limited progress on this project due to insolvency of the EPC player.
Coal – Secured with linkage from Coal India and awaiting start of captive coal blocks
1) Utkal-D coal block (2 mtpa capacity)
NACL received the mining lease for Utkal D coal mine however environment clearance (EC)
and mine closure plan approval is still awaited. We estimate Utkal D coal mine to start from
FY2023E and see risk of further delays.
Government of Odisha granted Mining lease to Utkal-D coal mines over an area of
301.28 Hectares (Ha).
MoEF & CC, GoI issued stage–I FC for 143.52 ha of Forest land including 6.5 ha of safety
zone in favor of NACL. Based on this progress, request for transfer of EC has been
submitted to MoEF & CC.
Mine closure plan of Utkal-D coal block was submitted to MoC on March 13, 2020 for
approval.
Mutation of total land of Rehabilitation and Resettlement (R & R) Colony completed and
physical possession has been taken over by the company.
Detailed Project Report (DPR) for development of Railway Siding at Kerjang, prepared by
M/s. RITES has been submitted to E. Co. Rly for approval.
Company expects mine opening permission of Utkal-D in FY2020-21.
2) Utkal-E coal block (2 mtpa capacity)
DGPS survey of Utkal E has been completed. Forest Diversion proposal (FDP) has been
submitted to MoEF & CC, GoI which is under process for obtaining Forest Clearance. The
FDP has been recommended by PCCF, Odisha to Dept. of Forest and Environment, GoO
for their consideration and recommendation to MoEF & CC, GoI.
Application has been submitted to Dept. of Steel and Mines, Govt. of Odisha for issuance
of Terms and conditions for Grant of Mining Lease over 523.73 Hectare, which is under
process.
Actions for acquisition of balance private land and Govt. land are already taken through
State Nodal agency, IDCO.
Mine opening permission of Utkal-D is expected in FY 2020-21 and subsequently, Utkal E
will be operationalized after obtaining statutory clearances.

Metals & Mining National Aluminium Co.
52 KOTAK INSTITUTIONAL EQUITIES RESEARCH
3) Coal linkage
NACL has secured linkage coal of 1.29 mtpa (92% of total requirement) for alumina refinery
at Damanjodi and 5.6 mtpa (85% of total requirement) for captive power plant for
aluminum smelter at Angul.
G-8 grade Linkage coal (two lakh tons per annum) was booked through linkage auction
route in the Trench-II auction from M/s. NCL for Refinery Plant, which is valid for a period
of five years and can be further extended to another five years.
The Fuel Supply Agreements for Unit 1 to 8, CPP, Angul (47.16 LMT/Annum), Alumina
Plant, Damanjodi (5.47 lakh tons per annum), TG-I to III of SPP, Damanjodi (3.26 lakh
tons per annum) were renewed for another five years w.e.f. May 1, 2018 and are valid up
to April 30, 2023.
The existing Fuel Supply Agreement for TG-IV of Alumina Refinery (1.01 Lakh tpa) was
renewed for another 5 years w.e.f. 23rd December, 2016 and is valid up to 22nd
December, 2021. Out of which, 50% is indigenous coal (i.e. 50,500 tons) which is now
being supplied and 50% is imported coal which has not been opted.
MoU for Bridge linkage coal of 0.9 mtpa for CPP was signed on 10th November, 2016
and was valid up to 1st May, 2019. The same was applied for extension to Ministry of
Coal due to delay in commissioning of Utkal E and D Coal Blocks. The extension was
granted from 2nd May, 2019 to 31st March, 2021 and extension of MoU was signed on
4th May, 2019. This ensured additional coal security to CPP for 8.9 Lakhs tons till March,
2021.
NACL had participated in the Tranche- IV linkage auction for Alumina Refinery and has
booked 59,688 tons/annum linkage auction coal (G9 Grade) from M/s. NCL Block-B Spur-
II siding by rail mode and 106,900 tons/annum linkage auction coal from M/s. MCL
(Sardega siding, Spur 1 & 2, Spur 5 & 6). The FSA for linkage auction coal of M/s. NCL
was signed on 29th March, 2019 and is valid up to 28th March, 2024.
Exhibit 3: NACL is also evaluating other capex programs Future capex projects for NACL
Source: Company, Kotak Institutional Equities estimates
Joint Venture Project Project Cost Timeline Update
JV with Gujarat Alkalies
and Chemicals Ltd. (GACL)
2.7 LTPA Caustic Soda Plant and 130
MW Captive Power PlantRs 22 bn
Mechanical completion of the project is
scheduled to be February, 2021 and
Commissioning expected by May, 2021
Major packages of Caustic Soda Plant and Captive Power
Plant have been awarded. Financial closure of the
Joint Venture Company (JVC) completed. Up to
July, 2020, approximately 82% project has been
executed.
Angul Aluminium Park Pvt. Ltd.
in JV with lDCO
NALCO and IDCO are developing
Angul Aluminium Park for promotion
of aluminium downstream industries
in the state of Odisha.
Rs 1 bnExpected to be operationalized within
two years.
Land acquisition is completed. Internal infrastructure
development of the park is under progress.
NALCO and MIDHANI High End Aluminium Alloy Plant Rs 45 bn Expected commissioning by 2024-25The plant will be set up in Nellore district of Andhra
Pradesh.
JV “Khanij Bidesh India Limited
(KABIL)” has been formed
amongst NALCO, HCL and
MECL
Acquisition of Strategic minerals in
overseasRs 60 bn
Aluminium Downstream Projects —
In the first phase, Rolled Product Unit & Foil
Plant expected to be commissioned within
three years from the date of getting all the
statutory clearances after land acquisition
The DPR for setting up of Aluminium Downstream Projects
in Kamakhyanagar, Dhenkanal district in Odisha has been
prepared.
HLCA (High Level Clearance Authority) of Govt. of Odisha
had approved the proposal for establishing the proposed
downstream project and IPICOL has recommended
allotment of 152.26 acres of land (Plant area 126 acres &
26 acres for township).

National Aluminium Co. Metals & Mining
KOTAK INSTITUTIONAL EQUITIES RESEARCH 53
Exhibit 4: NACL to start capex towards 1 mtpa alumina refinery Capex break up for NACL (Rs mn), FY2021–23E
Source: Company, Kotak Institutional Equities estimates
Exhibit 5: High capex to result in negative FCF during FY2021-23E FCF, Capex (Rs mn), March Fiscal year-ends, 2016-23E
Source: Company, Kotak Institutional Equities estimates
Exhibit 6: Net Cash per share continues to decline with increase in Capex Cash per Share, Dividend Yield (Rs/share,%), FY2016-23E
Source: Company, Kotak Institutional Equities estimates
FY2021E FY2022E FY2023E
- 1 mtpa Alumina Refinery 1,000 13,000 13,000
- Utkal Coal Block 500 2,000 2,000
- JVs 1,000 1,000 1,000
- Maintenance 6,500 6,000 6,000
Total Capex 9,000 22,000 22,000
(25,000)
(20,000)
(15,000)
(10,000)
(5,000)
-
5,000
10,000
15,000
20,000
25,000
2016 2017 2018 2019 2020 2021E 2022E 2023E
Capital expenditure (Rs mn) Free cash flow (Rs mn)
0%
2%
4%
6%
8%
10%
12%
14%
16%
18%
20%
(5)
0
5
10
15
20
25
30
2016 2017 2018 2019 2020 2021E 2022E 2023E
Net cash per share (LHS) Dividend Yield (%) (RHS)

Metals & Mining National Aluminium Co.
54 KOTAK INSTITUTIONAL EQUITIES RESEARCH
Exhibit 7: Working capital increased sharply in FY2020 due to a decline in creditors NACL, working capital days, FY2016-20
Source: Kotak Institutional Equities estimates
Exhibit 8: NACL’s average cost per employee continues to increase Average cost per employee., number of employees, March Fiscal year ends, 2010-20 (Rs mn/employee)
Source: Kotak Institutional Equities estimates
Exhibit 9: Higher capex and working capital reduced the cash balance in FY2020 NACL, changes in net cash, (Rs mn, Rs/share)
Source: Kotak Institutional Equities estimates
Exhibit 10: Higher capex makes dividends unsustainable NACL, sources and uses of cash over FY2011-20 and FY2021-23E (Rs mn)
Source: Kotak Institutional Equities estimates
FY2016 FY2017 FY2018 FY2019 FY2020
Inventory Days 67 68 59 51 74
Recievable Days 12 9 11 8 5
Creditor Days 224 276 265 277 160
Net WC days (145) (198) (195) (217) (82)
2010 2011 2012 2013 2014 2015 2016 2017 2018 2019 2020
Total costs (Rs mn) 8,436 9,612 10,345 11,539 12,453 13,779 13,983 15,374 22,612 20,723 19,941
No of employees 7,467 7,714 7,964 7,555 7,425 7,320 7,100 6,950 6,776 6,496 6,203
Change in number of employees 6 247 250 (409) (130) (105) (220) (150) (174) (280) (293)
Average cost per employee (Rs mn) 1.1 1.3 1.3 1.5 1.7 1.9 1.9 2.2 2.9 3.2 3.2
% change 9 12 4 13 12 12 4 13 30 12 1
FY2020 Change in Net Cash Rs mn Rs/share
Opening Net Cash 35,104 19
OCF (ex of WC changes) 6,677 4
WC changes (7,917) (4)
Capex (8,336) (4)
Dividends (6,185) (3)
Others 889 0
Closing Net Cash 20,232 11
Cumulative Rs mn % mix Rs mn % mix
Source of Cash
Change in Cash Balance 21,158 13 26,499 47
Operating Cashflow 133,642 84 30,262 53
Other 3,936 2 — —
Total 158,736 100 56,761 100
Use of Cash
Capex (63,149) 40 (53,000) 93
Dividends (62,097) 39 (3,761) 7
Buyback (33,490) 21 — —
Total (158,736) 100 (56,761) 100
FY2011-20 FY2021E-23E

National Aluminium Co. Metals & Mining
KOTAK INSTITUTIONAL EQUITIES RESEARCH 55
Exhibit 11: We expect global aluminum markets to be in surplus in CY2020/21E Aluminum demand supply for China and World ex-China, December year ends, 2012-2020E ('000 tons)
Source: Kotak Institutional Equities estimates
Exhibit 12: Global aluminum inventories have increased sharply in YTD CY2020 due to demand
slowdown post COVID-19 Aluminum, Monthly inventory details, December year-ends, 2005-2020 (000 tons)
Source: Kotak Institutional Equities estimates
2012 2013 2014 2015 2016 2017 2018 2019 2020E 2021E
China capacity 26,140 29,470 34,287 37,690 40,960 39,000 41,000 42,500 44,000 45,000
World ex-China capacity 31,881 33,132 33,751 33,402 33,157 32,554 33,054 33,954 33,954 34,454
Global capacity ('000 tons) 58,021 62,602 68,038 71,092 73,840 71,554 74,054 76,454 77,954 79,454
World ex-China production (000' tons) 25,758 25,724 25,856 26,329 26,933 27,220 27,708 28,035 27,590 27,590
World ex-China consumption (000' tons) 25,868 25,876 26,807 27,158 28,007 28,832 29,377 28,343 24,245 27,640
World ex-China Surplus/(Deficit) (000' tons) (111) (152) (951) (829) (1,074) (1,611) (1,669) (308) 3,345 (49)
China production (000' tons) 22,205 24,884 28,315 30,752 32,069 36,262 36,221 35,100 36,156 36,656
China consumption (000' tons) 21,518 24,744 27,640 29,304 31,839 34,383 35,787 35,765 35,675 36,032
China Surplus/(Deficit) (000' tons) 687 141 675 1,447 230 1,879 434 (665) 481 624
Global production (000' tons) 47,962 50,608 54,170 57,081 59,002 63,482 63,929 63,135 63,747 64,247
Global consumption (000' tons) 47,386 50,620 54,446 56,462 59,846 63,214 65,164 64,109 59,921 63,672
Global Surplus/(Deficit) (000' tons) 577 (12) (276) 618 (844) 268 (1,235) (973) 3,826 575
Utilization rates (%)
Utilization—world ex-China (%) 81 78 77 79 81 84 84 83 81 80
Utilization—China (%) 85 84 83 82 78 93 88 83 82 81
0
2,500
5,000
7,500
10,000
12,500
15,000
Aug
-05
Aug
-06
Aug
-07
Aug
-08
Aug
-09
Aug
-10
Aug
-11
Aug
-12
Aug
-13
Aug
-14
Aug
-15
Aug
-16
Aug
-17
Aug
-18
Aug
-19
Aug
-20
China SHFE Global Other Reported Global LME Global Producer Global Unreported

Metals & Mining National Aluminium Co.
56 KOTAK INSTITUTIONAL EQUITIES RESEARCH
Exhibit 13: We expect global alumina markets to remain well supplied in CY2020 Alumina demand-supply for China and World ex-China, December year ends, 3QCY17-3QCY20 ('000 tons)
Source: Kotak Institutional Equities estimates
Exhibit 14: Alumina capacity additions to keep alumina prices under pressure Global alumina capacity additions, (mn tons)
Source: AVAC, Kotak Institutional Equities estimates
3QCY17 4QCY17 1QCY18 2QCY18 3QCY18 4QCY18 1QCY19 2QCY19 3QCY19 4QCY19 1QCY20 2QCY20 3QCY20
World ex-China production (000' tons) 13,179 13,433 13,234 13,255 13,366 14,420 13,225 13,595 14,236 14,492 14,415 14,342 14,027
World ex-China consumption (000' tons) 13,291 13,448 13,283 13,342 13,531 13,579 13,270 13,514 13,709 13,766 13,632 13,419 13,218
World ex-China Surplus/(Deficit) (000' tons) (112) (15) (49) (87) (165) 840 (45) 81 528 726 783 923 809
China production (000' tons) 17,232 16,467 17,266 17,929 18,122 18,213 17,330 17,393 16,761 16,611 16,897 16,306 17,050
China consumption (000' tons) 17,972 17,418 17,334 17,799 18,056 17,804 17,068 17,277 17,274 17,178 17,347 17,382 17,933
China Surplus/(Deficit) (000' tons) (740) (951) (69) 130 66 409 262 116 (514) (567) (450) (1,076) (882)
Global production (000' tons) 30,411 29,900 30,500 31,184 31,487 32,633 30,554 30,988 30,997 31,103 31,312 30,648 31,077
Global consumption (000' tons) 31,262 30,866 30,617 31,141 31,586 31,384 30,338 30,791 30,983 30,944 30,979 30,802 31,150
Global Surplus/(Deficit) (000' tons) (852) (966) (118) 43 (99) 1,249 217 197 14 159 333 (153) (73)
Growth rates (%) yoy
World ex-China production 5 1 3 1 4 9 0 (1) (2) (5) 2 (1) 0
World ex-China demand 7 2 1 (0) 1 2 (1) (1) (2) (1) 2 0 1
China production 11 1 2 3 5 11 0 (3) (8) (9) (2) (6) 2
China demand 12 3 (1) (2) 0 2 (2) (3) (4) (4) 2 1 4
Global production 5 1 3 1 4 9 0 (1) (2) (5) 2 (1) 0
Global demand 7 2 1 (0) 1 2 (1) (1) (2) (1) 2 0 1
Country Company Refinery Capacity(mpta) Type Status
Under Construction in China
China Guizhou 1.0 To be comissioned end 2020
China Guangxi 2.0 To be comissioned end 2020
Total 3.0
Under Construction Ex-of China
Indonesia Nanshan Bintan 1.0 Greenfield To be comissioned end 2020
Indonesia Hongqiao Ketapang PhaseII 1.0 Brownfield To be comissionedend 2020 / early 2021
Total 2.0
Under Consideration
India Hindalco Utkal 0.5 Brownfield Committed
Indonesia Inalum/Antam West Kalimantan 2.0 Greenfield Under Consideration
Indonesia Jinjiang West Kalimantan 1.0 Greenfield Under Consideration
Indonesia Nanshan/Press Metal Bintan 1.0 Brownfield Under Consideration
India Vedanta Lanjigarh 1.2 Brownfield Under Consideration
India Nalco Damanjodi 1.0 Brownfield Under Consideration
India Hindalco Rayagada 2.0 Greenfield Under Consideration
Guinea SMB/Winning Dapilon 1.0 Greenfield Under Consideration
Guinea Chalco Boffa 1.0 Greenfield Under Consideration
Greece Mytilineos Distomon 0.9 Brownfield Under Consideration
Laos Slaco Paksong 1.0 Greenfield Under Consideration
Jamaica JISCO Alpart 2.0 Brownfield/Greenfield Under Consideration
Total 14.6

National Aluminium Co. Metals & Mining
KOTAK INSTITUTIONAL EQUITIES RESEARCH 57
Exhibit 15: Alumina prices remains muted as market remains well supplied Metallurgical grade alumina, aluminum prices (US$/ton, FOB), October, FY2005 – 2020
Source: CRU, Kotak Institutional Equities estimates
Exhibit 16: Alumina prices are expected to remain around spot
prices Alumina price forecast, FY2017-23E (US$/ton)
Exhibit 17: Aluminum prices are expected to remain around spot
prices Aluminum price forecast, FY2017-23E (US$/ton)
Source: Kotak Institutional Equities estimates Source: Kotak Institutional Equities estimates
500
1,000
1,500
2,000
2,500
3,000
3,500
100
200
300
400
500
600
700
Oct
-05
Oct
-06
Oct
-07
Oct
-08
Oct
-09
Oct
-10
Oct
-11
Oct
-12
Oct
-13
Oct
-14
Oct
-15
Oct
-16
Oct
-17
Oct
-18
Oct
-19
Oct
-20
Australian alumina (LHS) LME aluminium (RHS)
-
50
100
150
200
250
300
350
400
450
500
2017 2018 2019 2020 2021E 2022E 2023E
Alumina Australia FoB (US$/ton)
Spot Alumina prices (US$/Ton)
-
500
1,000
1,500
2,000
2,500
2017 2018 2019 2020 2021E 2022E 2023E
LME aluminium price (US$/ton)
Spot Aluminum prices (US$/Ton)

Metals & Mining National Aluminium Co.
58 KOTAK INSTITUTIONAL EQUITIES RESEARCH
Exhibit 18: NACL, changes in estimates, March fiscal year-ends, 2021-23E (Rs mn)
Source: Kotak Institutional Equities estimates
Exhibit 19: NACL, Key assumptions sheet, March fiscal year-ends, 2017-23E
Source: Company, Kotak Institutional Equities estimates
Exhibit 20: NACL's FV changes by 10%/4% for every 1% change in
Aluminum/Alumina prices FV sensitivity of NACL for changes in alumina, aluminum prices (Rs)
Exhibit 21: NACL's EPS changes by 132%/10% for every 1% change
in Aluminum/Alumina prices EPS sensitivity of NACL for changes in alumina, aluminum prices (Rs)
Source: Kotak Institutional Equities estimates Source: Kotak Institutional Equities estimates
2021E 2022E 2023E 2021E 2022E 2023E 2021E 2022E 2023E
Net sales 82,570 91,142 96,926 84,296 91,764 95,082 (2) (1) 2
EBITDA 5,979 8,243 11,844 5,905 8,193 11,412 1 1 4
PAT 1,707 2,746 4,777 1,641 2,698 4,446 4 2 7
EPS (Rs) 0.9 1.5 2.6 0.9 1.4 2.4 4 2 7
Aluminium
LME price (US$/ton) 1,650 1,700 1,725 1,650 1,700 1,725 — — —
Volumes (mn tons) 0.4 0.4 0.4 0.4 0.4 0.4 — — —
EBITDA (US$/ton) 12 13 40 (47) (4) 42 (126) (387) (3)
Alumina
Alumina price (US$/ton) 272 289 311 284 289 311 (4) — —
Volumes (mn tons) 1.2 1.3 1.3 1.2 1.3 1.3 — — —
EBITDA (US$/ton) 61 80 104 80 84 101 (23) (5) 3
Capex 9,000 22,000 22,000 9,000 22,000 22,000 — — —
Net Debt (22,268) (6,488) 6,267 (22,096) (6,528) 6,321 1 (1) (1)
Re/US$ rate 74.2 75.0 77.0 76 76 76 (2) (1) 1
Revised estimates Old estimates Change (%)
2017 2018 2019 2020 2021E 2022E 2023E
Re/US$ rate 67.1 64.5 70.1 70.9 74.2 75.0 77.0
Aluminium
LME aluminium price (US$/ton) 1,689 2,042 2,050 1,760 1,650 1,700 1,725
Sales ('000 tons) 389 426 440 377 426 442 442
Realisation (US$/ton) 1,917 2,296 2,288 1,958 1,794 1,855 1,887
Costs (US$/ton) 1,861 2,077 1,980 2,010 1,782 1,843 1,847
EBITDA/ton (US$) 56 218 308 (52) 12 13 40
EBITDA (Rs mn) 1,451 6,004 9,501 (1,470) 383 422 1,376
Alumina
Alumina Australia FoB (US$/ton) 300 363 461 308 272 289 311
Production ('000 tons) 2,100 2,106 2,153 2,161 2,052 2,166 2,166
Sales ('000 tons) 1,295 1,337 1,318 1,304 1,227 1,309 1,309
EBITDA (US$/ton) 101 92 185 69 61 80 104
EBITDA (Rs mn) 8,782 7,971 17,109 6,362 5,596 7,821 10,468
Consolidated EBITDA (Rs mn) 10,233 13,975 26,610 4,892 5,979 8,243 11,844
Fair value (Rs/share)
26 1,500 1,600 1,700 1,800 1,900
269 0 10 20 30 40
279 3 13 23 33 43
289 6 16 26 36 46
299 9 19 29 39 50
309 12 22 32 43 53
LME aluminum prices (US$/ton)
Alumina
prices
(US$/ton)
1 1,500 1,600 1,700 1,800 1,900
269 (2.0) (0.6) 0.7 2.0 3.3
279 (1.6) (0.2) 1.1 2.4 3.7
289 (1.2) 0.2 1.5 2.8 4.1
299 (0.8) 0.6 1.9 3.2 4.5
309 (0.4) 1.0 2.3 3.6 4.9
LME aluminum prices (US$/ton)
Alumina
prices
(US$/ton)

National Aluminium Co. Metals & Mining
KOTAK INSTITUTIONAL EQUITIES RESEARCH 59
Exhibit 22: Our fair value remains at Rs26/share and is based on 5X March 2022E core earnings NACL, Valuation details, March 2022E (Rs mn)
Source: Kotak Institutional Equities estimates
Exhibit 23: NACL continues to underperform all metal companies under coverage Price performance of Indian metal companies under coverage
* Relative performance to Sensex
Source: Kotak Institutional Equities estimates
Exhibit 24: NACL continues to be the most expensive company under coverage on EV/EBITDA basis EV/EBITDA for coverage companies, March FY2022E (X)
Source: Kotak Institutional Equities estimates
(Rs mn) Rs/share
EBITDA 8,243 5.0 41,213 22
Net Debt (7,861) (4)
Equity value 49,073 26
Target price (Rs/share) 26
EVMultiple
(X) (Rs mn)
Stock price Market cap
Company (LC) (USD mn) 1m 3m 6m 1y YTD 1m 3m 6m 1y YTD
Metals and Mining
NMDC 82 3,416 (15.3) 1.4 2.8 (7.3) (36.2) (14.1) (7.0) (20.4) (5.8) (30.9)
Hindustan Zinc 210 12,032 (7.3) 7.1 35.1 (1.6) 0.1 (6.0) (1.7) 4.6 (0.1) 8.5
Jindal Steel and Power 187 2,585 (8.9) 15.7 127.3 80.4 11.4 (7.6) 6.1 76.0 83.3 20.7
JSW Steel 278 9,106 2.9 46.7 89.9 20.8 2.9 4.5 34.5 47.0 22.7 11.5
National Aluminium Co. 32 816 (10.0) 1.3 10.8 (30.6) (26.1) (8.7) (7.1) (14.2) (29.5) (19.9)
Vedanta 137 6,902 6.4 28.7 111.6 (11.2) (10.2) 8.0 18.0 63.8 (9.8) (2.7)
Tata Steel 360 5,552 (12.9) 10.1 33.4 (0.2) (23.8) (11.6) 1.0 3.3 1.4 (17.4)
Hindalco Industries 175 5,339 (5.4) 19.9 83.1 (8.4) (18.9) (4.0) 9.9 41.8 (7.0) (12.1)
Mean (6.3) 16.3 61.8 5.2 (12.6) (4.9) 6.7 25.2 6.9 (5.3)
Median (8.1) 12.9 59.1 (4.5) (14.6) (6.8) 3.6 23.2 (3.0) (7.4)
Absolute performance (%) Relative performance (%)
6.7
-
1.0
2.0
3.0
4.0
5.0
6.0
7.0
Vedanta Hindalco JSPL NMDC Tata Steel HindustanZinc
JSW Steel NALCO
EV/EBITDA (FY2022E)

Metals & Mining National Aluminium Co.
60 KOTAK INSTITUTIONAL EQUITIES RESEARCH
Exhibit 25: NACL, Profit model, balance sheet and cash flow model, March fiscal year-ends, 2016-2023E (Rs mn)
Source: Company, Kotak Institutional Equities estimates
2016 2017 2018 2019 2020 2021E 2022E 2023E
Profit model (Rs mn)
Net sales 68,170 75,430 95,095 114,993 84,718 82,570 91,142 96,926
EBITDA 9,595 10,233 13,975 26,610 4,892 5,979 8,243 11,844
Other income 6,051 4,083 2,997 3,259 2,726 2,015 1,510 986
Interest (33) (27) (20) (24) (57) (57) (57) (57)
Depreciaiton (4,261) (4,804) (4,804) (4,761) (5,298) (5,642) (6,004) (6,351)
Profit before tax 11,352 9,485 12,148 25,083 2,262 2,295 3,691 6,421
Current tax (3,669) (2,195) (7,932) (10,075) (880) (587) (945) (1,644)
Deferred tax (346) (767) 968 — — — — —
Net profit 7,871 6,122 13,424 17,324 1,382 1,707 2,746 4,777
Adjusted net profit 7,518 6,523 9,908 15,796 1,382 1,707 2,746 4,777
Earnings per share (Rs) 2.9 3.4 5.1 8.5 0.7 0.9 1.5 2.6
Balance sheet (Rs mn)
Equity 131,947 102,058 105,040 104,845 99,881 101,588 102,961 105,349
Deferred tax liability 11,641 12,456 11,515 11,307 10,606 10,606 10,606 10,606
Current liabilities 23,513 29,992 23,959 28,383 27,304 25,517 25,718 27,137
Other Current liabilities — — 5,166 6,267 7,582 7,582 7,582 7,582
Total liabilities 167,102 145,017 146,129 151,470 145,496 145,294 151,867 170,674
Net fixed assets 72,834 77,104 79,346 79,921 86,012 89,370 105,366 121,014
Investments 10,093 12,211 7,097 2,566 3,323 3,323 3,323 3,323
Cash 51,032 22,872 27,690 34,964 19,805 21,718 10,938 13,183
Other current assets 33,144 32,829 22,225 20,983 25,223 19,750 21,108 22,021
Other Non current assets — — 9,772 13,037 11,133 11,133 11,133 11,133
Total assets 167,102 145,017 146,129 151,470 145,496 145,294 151,867 170,674
Net Debt (61,124) (34,573) (33,169) (35,104) (20,232) (22,268) (6,488) 6,267
Free cash flow (Rs mn)
Operating cash flow excl. working capital 12,496 12,440 20,553 22,831 6,677 7,350 8,750 11,128
Working capital changes 1,021 4,929 (2,467) 3,935 (7,917) 3,686 (1,158) 506
Capital expenditure (Rs mn) (5,986) (7,781) (7,790) (7,409) (8,336) (9,000) (22,000) (22,000)
Free cash flow (Rs mn) 7,531 9,589 10,296 19,357 (9,575) 2,036 (14,408) (10,366)
Ratios
P/B 0.6 0.6 0.6 0.6 0.6 0.6 0.6 0.6
P/E 11.3 9.7 6.4 3.9 44.4 36.0 22.4 12.8
EV/EBITDA 2.5 2.8 2.2 1.0 8.4 6.5 6.7 5.7
FCF Yield 2.1 2.6 16.6 20.8 (6.4) (6.0) (24.0) (19.3)
Cash Per Share 19.8 11.8 14.3 18.7 10.6 11.6 5.9 7.1
Net debt/EBITDA 0.8 0.9 0.7 0.7 (2.0) 0.3 (1.7) (0.9)
Net debt/equity (X) (0.5) (0.3) (0.3) (0.3) (0.2) (0.2) (0.1) 0.1
Book Value 51 53 54 56 54 54 55 56
RoAE (%) 5.8 5.6 9.6 15.1 1.4 1.7 2.7 4.6
RoACE (%) 2.7 3.2 3.8 12.4 (0.2) 0.3 1.6 3.5

For Private Circulation Only. FOR IMPORTANT INFORMATION ABOUT KOTAK SECURITIES’ RATING SYSTEM AND OTHER DISCLOSURES, REFER TO THE END OF THIS MATERIAL.
Honda launches H’Ness CB350: competitively priced versus Classic 350
Honda has unveiled its first mid-range 350cc leisure riding bike H’Ness CB350 that has been
developed specifically for the Indian market. The bike will be formally launched within the next
fortnight with expected ex-showroom price of Rs190,000 (ex-showroom price of Classic 350 is
Rs186,319). The H'Ness CB350 will be available in two variants – Deluxe and Deluxe Pro. With
this launch, HMSI is targeting to enter a fast-growing mid-size motorcycle segment that has
been completely dominated by Royal Enfield to date.
The motorcycle is powered by a 350cc, air-cooled 4-stroke OHC single-cylinder engine equipped
with PGM-FI technology. It delivers a maximum torque of 30 Nm@3,000 rpm and peak power
output of 20.8 bhp@5,500 rpm. The motorcycle will be sold through Honda’s premium
BigWing range of dealerships and will be available in six different colors. The CB350 comes with
segment first Honda Selectable Torque Control (HSTC) that helps in maintaining rear wheel
traction by detecting difference between front and rear wheel speeds. Other key features
include Honda Smartphone Voice Control system (HSVCS), dual-channel ABS, all LED lighting,
engine start-stop switch, hazard switch and Bluetooth connectivity.
HSVCS allows superior connectivity of the rider's smartphone with the motorcycle via Bluetooth
and the rider can operate the system with controls on the left side of the handle bar to use
distinct features such as phone calls, navigation, music playback and incoming messages. To
facilitate complete concentration on riding, the information accessed will be communicated
from the helmet headset speaker. The Honda cruiser uses telescopic forks with dual shocks
while braking duties are tended to by 310 mm front and 240 mm rear disc brakes with dual-
channel ABS.
Competition heats up in the mid-size (250-500cc) motorcycle segment
Most of the specifications related to engine, build and safety of Honda H’Ness CB350 are in line
with Royal Enfield’s Classic 350 offerings; however, we believe H’Ness CB350 has an edge over
Classic 350 in terms of technological features such as Honda Selectable Torque Control, Honda
Smartphone Voice Control, Bluetooth connectivity, battery health monitor, etc. With the launch
of Honda H’Ness CB350, we believe the competitive intensity in the 300-500cc mid-size
motorcycle segment is increasing in the domestic market.
M&M has already entered this segment with Jawa brand and Bajaj-Triumph JV will be entering
this segment in CY2022. We believe Royal Enfield will have to step up its game in order to
protect its market share. Royal Enfield will also be launching Meteor 350 (successor of
Thunderbird) and the company will launch its mass customized offerings to all its consumers
soon, in order to keep brand excitement intact. Currently, we are not building in any market
share losses for Royal Enfield in this segment; however, we expect competitive intensity to inch
up in this segment over the medium term.
Automobiles & Components India
Honda launches H’Ness CB350. Honda has unveiled its first mid-range 350cc leisure
riding bike H’Ness CB350 that has been developed keeping the Indian consumer in
mind. H’Ness CB350 will be competing directly with Royal Enfield’s 350cc offerings and
Mahindra Jawa in the mid-size motorcycle (250-500 cc) segment. We expect
competitive intensity to inch up in this segment over the medium term, where Royal
Enfield has a clear monopoly to date.
CAUTIOUS
SEPTEMBER 30, 2020
UPDATE
BSE-30: 38,068
Hitesh Goel
Rishi Vora
[email protected]: +91 22 6218 6427

India Automobiles & Components
62 KOTAK INSTITUTIONAL EQUITIES RESEARCH
Exhibit 1: Honda has revealed H'Ness CB350 neo-retro roadster bike in India Honda H’Ness CB350
Source: Company, Kotak Institutional Equities

Automobiles & Components India
KOTAK INSTITUTIONAL EQUITIES RESEARCH 63
Exhibit 2: Engine performance and safety features of both the bikes are similar Comparison between Honda’s H’Ness CB350 and Royal Enfield’s Classic 350
Source: Company, Kotak Institutional Equities
Honda Royal Enfield
H'Ness CB 350 Classic 350
Ex-showroom price (Rs) 190,000 186,319
Performance
Engine type 4 Stroke, SI Engine, BS-VISingle cyclinder, 4 stroke,
twinspark, air-cooled
Displacement (cc) 348 346
Max Power (HP) 20.8 19.8
Max Torque (Nm) 30 28
Fuel Tank (litres) 15 13.5
Design & Build
Overall length (mm) 2,163 2,160
Overall width (mm) 800 790
Overall height (mm) 1,107 1,090
Wheelbase (mm) 1,441 1,390
Kerb weight (kgs) 181 194
Safety
Brakes front Disc280 mm disc with twin piston
caliper
Brakes rear Disc 240 mm disc, single piston caliper
Front suspension TelescopicTelescopic, 35 mm forks, 130
mm travel
Rear suspension Twin Hydraulic
Twin gas charged shock
absorbers with 5-step
adjustable
preload, 80 mm travel

For Private Circulation Only. FOR IMPORTANT INFORMATION ABOUT KOTAK SECURITIES’ RATING SYSTEM AND OTHER DISCLOSURES, REFER TO THE END OF THIS MATERIAL.
Expect robust growth, especially for companies that had supply-side impact on revenues
We expect sequential revenue growth of 1.8-3.7% in c/c and cross-currency tailwinds of 70-
170 bps. Revenue growth will be led by two factors—(1) reasonable demand trends across key
large verticals, viz. financial services, telecom and insurance, (2) supply-side factors that
impacted revenues in June 2020 quarter are down to trickle—companies with large exposure to
BPO and ERD were impacted in June 2020 quarter. Revenues on yoy comparison for Tier-1 IT
will range from decline of 4.1% to growth of 1.7%. HCLT will lead the way with strong c/c
revenue growth of 3.7% qoq, followed by TCS at 2.9%. We expect TechM to report
reasonable growth of 1.8%. Infosys will report strong growth of 2.6% for the quarter. Among
mid-tier companies, Mphasis and Mindtree will likely report strong growth of 2.8% and 2.9%
qoq led by ramp-up of large deals.
Stable EBIT margin on sequential basis, increase on yoy comparison
With no major cost increase, contained impact of pricing concessions and elimination of supply-
side impact, expect EBIT margin of IT companies to remain stable or increase. We forecast EBIT
margin increase across our coverage universe on yoy comparison due to twin advantages of—
(1) rupee depreciation and (2) lower costs, especially travel and G&A. In our view, TechM will
report the highest increase in EBIT margin on a sequential basis at 193 bps, followed by TCS at
161 bps.
Guidance—increase for Infosys, stability at HCLT
Noting solid demand trend, we believe that Infosys will up FY2021E revenue growth guidance
by a percentage to 1-3% from 0-2% earlier. HCLT had given 1.5-2.5% sequential growth
guidance for the three quarters of FY2021E. The company since announced an intra-quarter
update, taking the guidance up for September 2020 quarter to at least 3.5%, while keeping
the guidance for the remaining two quarters unchanged. We believe that Wipro will resume
quarterly guidance and indicate a range of 0-2% for December 2020 quarter.
Deals—strong pipeline with good conversion for smaller deals, greater scrutiny for larger deals
The deal pipeline is strong across all companies led by a mix of digital foundation, integrated
deals from smaller clients, experience transformation and core transformation deals. Deal
decisions are flowing through smoothly for short-duration small programs but face greater
scrutiny in select cases for larger deal awards. Vendor consolidation deals are still at early
stages. TCV numbers will be robust across large companies fuelled by mega and large deal
wins, awards of contracts that were initiated pre-Covid. For example, Infosys’ numbers will be
bolstered by Vanguard deal and TCS by Phoenix. HCLT’s mega-deal was reported in media,
while Wipro announced a couple of interesting wins. Mphasis among mid-tier companies will
likely report a strong number powered by the US$216 mn three-year deal signed in July 2020.
IT Services India
Expect a robust quarter of growth. We expect a robust September 2020 quarter for
IT services companies led by—(1) steady demand in large verticals and (2) negligible
supply-side impact, an aspect that impacted June 2020 quarter revenues and margins.
We expect yoy increase and stable margins on a sequential basis. The deal pipeline is
strong across companies although accompanied by greater scrutiny in select large deals.
In our view, IT services spending is set to accelerate, driving (1) elevated growth for
well-positioned service providers and (2) multiple expansions. Infosys, Tech Mahindra,
HCLT and LTI are our preferred picks.
ATTRACTIVE
SEPTEMBER 30, 2020
UPDATE
BSE-30: 38,068
Kawaljeet Saluja
Sathishkumar S
[email protected]: +91 22 6218 6427

IT Services India
KOTAK INSTITUTIONAL EQUITIES RESEARCH 65
IT companies are well-placed to benefit from potential acceleration in IT services
spending
In our view, Covid has acted as a catalyst for acceleration in IT spends. We believe that
global outsourcing spending will accelerate from 4-5% pre-Covid level numbers. We
attribute this change to three factors: (1) surge in cloud adoption. Adoption has accelerated
as clients are looking to reduce costs and capture the innovation of the cloud. Cloud also
provides the foundation for better access to data for new business outcomes and models,
(2) reshaping customer experiences. Online channel has become the only channel of
engagement for companies with customers in the current pandemic. Companies have been
investing in the experience layer for some time, although the current pandemic changes the
scope, scale and time-to-market for it and (3) core transformation. The true power of digital
can be leveraged only with an operationally resilient, lean, adaptive and cloud-enabled core.
Clients continue to run legacy systems that is an operational bottleneck that acts as a barrier
to launch innovation and transformation initiatives. Core transformation is a necessity for
organizations to truly harness capabilities of digital technologies.
We expect select companies to grow in double digits. We believe that Infosys is the best way
to play the transformation and acceleration theme. We like TCS but are constrained by
punchy valuations. TechM is an excellent play on margin normalization, 5G and
improvement in revenue growth. We like HCLT’s consistency in mega-deal wins leadership in
ERD, infrastructure services and improved competencies in applications. We believe that the
services portfolio can match peers on growth. LTI is a strong compounding play and
preferred mid-tier pick.
Furloughs in December 2020 quarter and pricing are the key variables
December quarter is typically marked by furloughs. Management commentary on furloughs
will be keenly tracked. Relative stability in pricing has surprised us positively. Clients in a few
verticals have pushed through for rebates and discounts although the impact at the
company level has not been meaningful. Management commentary on pricing at an overall
level will be keenly followed.
Comments on individual companies
TCS. We forecast robust c/c revenue growth rate of 2.9% led by—(1) resolution of
supply-side constraints that impacted 1QFY21 revenues, (2) ramp-up of large deals signed
earlier and (3) conversion of strong order wins into revenues. Recovery will likely be led by
financial services and communications. We expect robust sequential growth in India
business from a low base. On profitability, we forecast EBIT margin increase of 160 bps
qoq and 120 bps yoy. The sequential increase in margins will be led by—(1) better
absorption of fixed costs resulting from growth, (2) increase in utilization rates and (3)
negligible supply-side impact that weighed on margins in the previous quarter. Yoy
increase in EBIT margin is on account of rupee depreciation and lower travel costs. We
forecast sharp increase in net profit on a sequential basis due to—(1) solid revenue
growth, (2) EBIT margin expansion and (3) higher other income since 1QFY21 numbers
included Fx loss. We expect yoy increase in bookings led by Phoenix deal. However, we
expect sequential decline in bookings largely due to a high base. We expect investor
focus on—(1) demand trends across verticals, (2) impact of supply-side constraints, if any,
on revenues, (3) large deal pipeline and decision-making cycle, (4) company's view on
whether IT spending will accelerate in the medium term, (5) longer-term impact from
changes in delivery model, contractual structures, composition of IT spending to name a
few, (6) pricing pressure and cost take-outs and (7) progress on vendor consolidation
decisions.
Infosys. We expect c/c revenue growth of 2.6% sequentially and cross-currency tailwind
of 143 bps. Revenue growth will be led by—(1) ramp-up of large deals and (2) reasonable
pick-up in business across verticals except the directly impacted ones. Note that we do
not bake in revenues from the Vanguard deal. We forecast stable margins on a sequential

India IT Services
66 KOTAK INSTITUTIONAL EQUITIES RESEARCH
basis and increase in margins on yoy comparison. Impact of pricing will be offset to an
extent by operational improvement. We note that earnings growth is lower than EBIT
growth on yoy comparison due to decline in other income resulting from lower treasury
yields. We expect Infosys to raise FY2021E revenue growth guidance to 1-3% growth
from 0-2% earlier. The increase, in our view, will be led by better demand environment
and strong deal momentum. Courtesy Vanguard deal, we expect all-time high TCV of
large deals. We note that the previous high was US$2.85 bn announced in Sep 2019. We
expect investor focus on capital allocation noting that the company disappointed
investors by reducing payout to 55% of FCF in FY2020. Investors would hope for an
increase in payout in FY2021. We expect investor focus on—(1) demand trends across
verticals, (2) large deal pipeline and decision-making cycle, (3) company’s view on
whether IT spending will accelerate in the medium term, (4) M&A strategy, especially
noting the pick-up in transactions in the calendar year, (5) longer-term impact from
changes in delivery model, contractual structures, composition of IT spending to name a
few, (6) pricing pressure and cost take-outs and (7) progress on vendor consolidation
decisions.
Wipro. We expect sequential c/c revenue growth of 2% and cross-currency tailwind of
145 bps. Revenue growth will be led by addressing of supply-side constraints in cloud and
infrastructure services. Wipro has announced plenty of large deals in the past three
months, some of which have ramped up in the quarter and will lead to robust
performance. On profitability, we expect stable EBIT margin on a sequential basis and
increase on yoy comparison. Margins may even have scope for expansion noting lack of
headwinds and tailwinds from growth and elimination of supply-side constraints on
revenues. Mr Thierry Delaporte's strategy for Wipro, assessment of strengths and
weaknesses and turnaround strategy will be closely monitored. We also expect focus on
initiatives to augment the senior management bench. We expect Wipro to resume
quarterly guidance. We expect 0-2% revenue growth guidance for December 2020
quarter. Wipro's payout policy is close to 50% of net profit expected largely through
buyback of shares. We note that Wipro completed its last buyback in mid-September
2019. Regulations require a cooling off period of 12-months before the next buyback
announcement. Investors will likely look forward to a buyback announcement. We expect
investor focus on—(1) turnaround strategy under the new CEO, (2) order backlog,
especially in light of a few large deal announcements, (3) pricing pressure, if any, (4)
outlook for the energy segment in light of weak oil prices, (5) initiatives to participate in
core transformation programs and (6) path to achieving industry-matching performance.
HCLT. We expect 3.7% revenue growth on a sequential basis in c/c and model cross-
currency tailwind of 1.8%. Revenue growth will likely be broad-based across services
lines, geographies and most verticals. We note that HCLT provided an intra-quarter
update indicating strong execution and deal ramp-up will drive revenue growth of at least
3.5% qoq, higher than 1.5-2.5% growth rate guided in July 2020. We forecast qoq
growth rate of 5.2% in IT services, 6.8% in ERD and 5.6% in products business in
US$ terms. We forecast EBIT margin of 20.8%, up 30 bps qoq, led by better absorption
of costs due to growth and elimination of supply-side constraints on revenues. We expect
the company to retain 1.5-2.5% sequential revenue growth guidance for December 2020
and March 2021 quarters on organic basis. The company may add another 1% to March
2021 growth guidance after proposed acquisition of Australia-based DWS Ltd. HCLT
continues to be aggressive on acquisitions—the company has announced 29 transactions
since 2015. The latest one is acquisition of Australia-based IT services company, DWS for
AUD162 mn. Capital allocation will be an area of focus. HCLT has disappointed with non-
committed pay-out policy. Increase in pay-out ratio can aid valuations. We expect investor
focus on—(1) outlook on products business—the Street does not share management's
optimism on its resilience, (2) sustainability of demand after the positive intra-quarter
update, (3) large deal pipeline and secret sauce of success in mega-deal closures, (4)
sustainability of recovery in ERD services noting that 50% of revenues accrue from late

IT Services India
KOTAK INSTITUTIONAL EQUITIES RESEARCH 67
cycle asset intensive segments, (5) evolution of digital capabilities and success in
integrated deals and (6) will the company continue its aggressive acquisition strategy?
TechM. We forecast c/c revenue growth of 1.8% on qoq basis. We expect revenue
decline of 3.2% on yoy comparison and 7.5% on constant-currency organic basis.
Revenue growth will be led by—(1) sharp growth in the BPO business led by easing of
supply-side constraints, (2) stabilization in manufacturing and growth in financial services
and healthcare and (3) BPO-led growth in communications practice. We expect EBIT
margin increase of 200 bps led by—(1) cost-rationalization measures in underperforming
portfolio companies, (2) revenue growth, absorbing fixed costs, (3) increase in utilization
rates and (4) overall cost optimization. Despite a 21% qoq growth in EBIT, net profit
growth will be marginal due to lower other income. 1QFY21 had non-recurring other
income of Rs1.5 bn from three components—(1) interest on income tax refunds of
~Rs800 mn, (2) recognition from sale of stake in Terrapay and (3) Rs857 mn of forex
gain. We expect net-new TCV to range from US$400-500 mn. The normalization of deal
wins is largely on the back of decisions on mid-sized deals. Capital allocation policy will
be an area of focus. The company reduced pay-out in FY2020. Acquisitions will receive
high focus noting poor past track record. We expect investor focus on—(1) measures
taken by the company to improve operating margins and sustainable operating band, (2)
enabling factors required to bring consistency to performance, (3) will the company
continue to acquire given its poor track record, (4) BPO—the future of contact center
business, a dominant revenue stream within BPO and measures taken to increase non-
voice revenues, (5) measures required to grow in line with peers, (6) progress on 5G
opportunity and (7) hedge book, rates and gains/(losses) for FY2021.
Exhibit 1: Sequential currency movement in Sep 2020 quarter
Source: Bloomberg, Kotak Institutional Equities estimates
Exhibit 2: Yoy currency movement in Sep 2020 quarter
Source: Bloomberg, Kotak Institutional Equities estimates
Depreciation of currencies against the US Dollar
INR/USD USD/GBP USD/EUR USD/AUD JPY/USD
Jun-20 75.5 1.24 1.10 0.66 107.4
Sep-20 74.2 1.30 1.17 0.72 105.6
Appr/ (Depr) (%) 1.8 4.5 6.2 8.4 1.6
Appreciation of the Rupee against other currencies
INR/USD INR/GBP INR/EUR INR/AUD JPY/INR
Jun-20 75.5 93.6 83.1 49.8 1.4
Sep-20 74.2 96.1 86.7 53.1 1.4
Appr/ (Depr) (%) 1.8 (2.5) (4.2) (6.1) 0.2
Depreciation of currencies against the US Dollar
INR/USD USD/GBP USD/EUR USD/AUD JPY/USD
Sep-19 70.9 1.23 1.11 0.68 107.4
Sep-20 74.2 1.30 1.17 0.72 105.6
Appr/ (Depr) (%) (4.4) 5.3 5.3 5.2 1.7
Appreciation of the Rupee against other currencies
INR/USD INR/GBP INR/EUR INR/AUD JPY/INR
Sep-19 70.9 87.2 78.7 48.2 1.5
Sep-20 74.2 96.1 86.7 53.1 1.4
Appr/ (Depr) (%) (4.4) (9.3) (9.2) (9.2) (6.4)

India IT Services
68 KOTAK INSTITUTIONAL EQUITIES RESEARCH
Exhibit 3: Cross-currency movements provide 70-170 bps tailwind qoq and 50-170 bps tailwind yoy
for Sep 2020E
Source: Companies, Bloomberg, Kotak Institutional Equities estimates
Impact in bps on Impact in bps on
US US$ revenue US$ revenue
USD GBP EUR AUD Others growth (qoq ) growth (yoy )
TCS 54 13 11 168 132
Infosys 67 5 13 7 9 143 115
Wipro 63 10 8 5 14 145 99
HCL Tech 64 13 15 177 170
Tech M 52 11 9 5 23 137 99
L&T Infotech 71 91 54
Mindtree 79 77 51
Mphasis 77 71 45
Notes:
(a) As per disclosures for Infosys, TCS, Wipro and Tech M;
assumed to be in line with geographic mix for other companies.
8
Currency-wise revenue mix (a)
Europe Rest of the world
22
12 11
14 15
13 8

IT Services India
KOTAK INSTITUTIONAL EQUITIES RESEARCH 69
Exhibit 4: Results preview for the quarter-ending Sep 2020 (Rs mn)
Source: Companies, Kotak Institutional Equities estimates
Financials Sep-19 Jun-20 Sep-20 qoq (%) yoy (%) Comments/what to look for
TCS (October 7, 2020)
Revenues (US$ mn) 5,517 5,059 5,292 4.6 (4.1) We forecast robust c/c revenue growth rate of 2.9% led by -- (1) resolution of supply side constraints that impacted 1QFY21
revenues, (2) ramp up of large deals signed earlier and (3) conversion of strong order wins into revenues. We expect
recovery to be led by financial services and communications. We expect robust sequential growth in India business
Revenue growth (c/c qoq, %) 2.3 (6.9) 2.9 We forecast EBIT margin increase of 160 bps qoq and 120 bps yoy. Sequential increase will be led by-- (1) better absorption
of fixed costs resulting from growth, (2) increase in utilization rates and (3) negligible supply side impact that weighed on
margins in the previous quarter. YoY increase in EBIT margin is on account of Rupee depreciation and lower travel costs
Revenue growth (c/c yoy, %) 8.4 (6.3) (5.4) We forecast sharp increase in net profit on sequential basis due to -- (1) solid revenue growth, (2) EBIT margin expansion
and (3) higher other income since 1QFY21 numbers included Fx loss
Organic revenue growth (c/c qoq, %) 2.3 (6.9) 2.9 We expect yoy increase in bookings led by Phoenix deal. We expect sequential decline in bookings largely due to high base.
Organic revenue growth (c/c yoy, %) 8.4 (6.3) (5.4)
Revenues 389,770 383,220 392,678 2.5 0.7 We expect investor focus on -- (1) demand trends across verticals, (2) impact of supply side constraints, if any, on revenues,
(3) large deal pipeline and decision making cycle, (4) company's view on whether IT spending will accelerate in the medium
term, (5) longer term impact from changes in delivery model, contractual structures, composition of IT spending to name a
few, (6) pricing pressure and cost take outs and (7) progress on vendor consolidation decisions.
EBIT 93,610 90,480 99,049 9.5 5.8
Adjusted net profit 80,420 70,080 81,141 15.8 0.9
EBIT margin (%) 24.0 23.6 25.2 161 bps 121 bps
Wipro (October 13, 2020)
Total revenues 151,897 150,433 154,446 2.7 1.7 We expect sequential c/c revenue growth of 2% and cross-currency tailwind of 145 bps. Growth will be led by addressing
supply side constraints in cloud and infrastructure services. Wipro has announced plenty of large deals in the last three
months, some of which have ramped up in the quarter and will lead to robust performance
Global IT revenues (US$ mn) 2,049 1,922 1,988 3.5 (2.9) We expect stable EBIT margin on sequential basis and increase on yoy comparison. Margins even have scope for expansion
noting lack of headwinds and tailwinds from growth and elimination of supply side constraints on revenues
Global IT services revenue growth (c/c qoq, %) 1.1 (7.5) 2.0 Mr. Thierry Delaporte's strategy for Wipro, assessment of strengths and weaknesses and turnaround strategy will be closely
monitored. We also expect focus on initiatives to augment senior management bench
Global IT services revenue growth (c/c yoy, %) 3.8 (4.4) 0.7 We expect Wipro to resume quarterly guidance. We expect 0-2% revenue growth guidance for December 2020 quarter
Global IT services organic revenue growth (c/c
qoq, %)
(7.5) 1.7 Wipro's payout policy is close to 50% of net profit expected largely through buyback of shares. Wipro completed its last
buyback in mid-September 2019. Regulations require a cooling off period of 12-months before the next buyback
announcement. Investors will look forward to buyback announcement
Global IT services organic revenue growth (c/c (4.7) (0.2)
Global IT revenues 146,561 145,956 149,137 2.2 1.8
EBIT 26,735 26,938 28,633 6.3 7.1 We expect investor focus on-- (1) turnaround strategy under the new CEO, (2) order backlog especially in light of a few large
deal announcements, (3) pricing pressure, if any, (4) outlook for the energy segment in light of weak oil prices, (5) initiatives
to participate in core transformation programs, and (6) path to achieving industry matching performance
Adj. net profit 25,526 23,902 26,026 8.9 2.0
Total EBIT margin (%) 17.6 17.9 18.5 63 bps 94 bps
IT Services - EBIT margin (%) 18.1 19.0 19.2 21 bps 116 bps
Infosys (October 14, 2020)
Revenues (US$ mn) 3,210 3,121 3,246 4.0 1.1 We expect c/c revenue growth of 2.6% sequentially and cross-currency tailwind of 143 bps. Growth will be led by -- (1) ramp
up of large deals, and (2) reasonable pick in business across verticals except the directly impacted ones. We do not bake in
revenues from the Vanguard deal
Revenue growth (c/c qoq, %) 3.3 (0.8) 2.6 We forecast stable margins on sequential basis and increase on yoy comparison. Impact of pricing will be offset to an extent
by operational improvement.
Revenue growth (c/c yoy, %) 12.0 6.4 (0.0) Earnings growth is lower than EBIT growth on yoy comparison due to decline in other income resulting from lower treasury
yields
Organic revenue growth (c/c qoq, %) 2.7 (0.9) 2.6 We expect Infosys to raise FY2021E revenue growth guidance to 1-3% growth from 0-2% earlier. Increase in our view will be
led by better demand environment and strong deal momentum
Organic revenue growth (c/c yoy, %) 10.4 5.2 (0.5) Courtesy Vanguard deal, we expect all-time high TCV of large deals. The previous high was US$2.85 bn announced in Sep-
19
Revenues 226,290 236,650 240,879 1.8 6.4 We expect investor focus on capital allocation. The company disappointed investors by reducing payout to 55% of FCF in
FY2020. Investors would hope for an increase in FY2021.
EBIT 49,120 53,650 54,732 2.0 11.4 We expect investor focus on -- (1) demand trends across verticals, (2) large deal pipeline and decision making cycle, (3)
company's view on whether IT spending will accelerate in the medium term, (4) M&A strategy especially noting the pick up in
transactions in the calendar year, (5) longer term impact from changes in delivery model, contractual structures,
composition of IT spending to name a few, (6) pricing pressure and cost take outs and (7) progress on vendor consolidation
decisions.
Adjusted net profit 40,370 42,720 44,089 3.2 9.2
EBIT margin (%) 21.7 22.7 22.7 5 bps 102 bps
HCL Technologies (October 16, 2020)
Revenues (US$ mn) 2,486 2,356 2,485 5.5 (0.0) We expect 3.7% growth on sequential basis in c/c and model cross-currency tailwind of 1.8%. Growth will be broad-based
across services lines, geographies and most verticals. HCLT provided an intra-quarter update indicating strong execution and
momentum will drive revenue growth of at least 3.5% qoq, higher than 1.5-2.5% growth rate guided for in July 2020. We
forecast qoq growth rate of 5.2% in IT services, 6.8% in ERD and 5.6% in products business
Revenue growth (c/c qoq, %) 6.0 0.8 3.7 We forecast EBIT margin of 20.8%, up 30 bps qoq, led by better absorption of costs due to growth and elimination of
supply side constraints on revenues
Revenue growth (c/c yoy, %) 20.5 13.5 (1.7) We expect the company to retain 1.5-2.5% sequential revenue growth guidance for December 2020 and March 2021
quarter on organic basis. The company may add another 1% to March 2021 growth guidance after proposed acquisition of
Australia based, DWS Ltd
Organic revenue growth (c/c qoq, %) 1.5 0.8 3.7 Aggressive acquisitions continue-- the company has announced 29 transactions since 2015. The latest one is acquisition of
Australia based IT Services company, DWS for AUD162 mn
Organic revenue growth (c/c yoy, %) 12.7 5.9 (3.9) Capital allocation will be an area of focus. HCLT has disappointed with non-committed payout policy. Increase in payout ratio
can aid valuations.
Revenues 175,280 178,410 184,412 3.4 5.2

India IT Services
70 KOTAK INSTITUTIONAL EQUITIES RESEARCH
Exhibit 4: Results preview for the quarter-ending Sep 2020 (Rs mn) (contd)
Source: Companies, Kotak Institutional Equities estimates
Financials Sep-19 Jun-20 Sep-20 qoq (%) yoy (%) Comments/what to look for
Tech Mahindra (October 23, 2020)
Revenues (US$ mn) 1,287 1,207 1,246 3.2 (3.2) We forecast c/c revenue growth of 1.8% on qoq basis. We expect revenue decline of 3.2% on yoy comparison and 7.5% on
constant currency organic basis
Revenue growth (c/c qoq, %) 4.1 (3.3) 1.8 Revenue growth will be led by-- (1) sharp growth in BPO business led by easing of supply-side constraints, (2) stabilization in
manufacturing and growth in financial services and healthcare, (3) BPO-led growth in communications practice
Revenue growth (c/c yoy, %) 7.7 (1.2) (4.2) We expect EBIT margin increase of 200 bps led by -- (1) cost rationalization measures in underperforming portfolio
companies, (2) revenue growth, absorbing fixed costs, (3) increase in utilization rates and (4) overall cost optimization
Organic revenue growth (c/c qoq, %) 4.1 (4.0) 1.6 Despite a 21% qoq growth in EBIT, net profit growth will be marginal due to lower other income. 1QFY21 had non-recurring
other income of Rs1.5 bn from two compoents- (1) interest on income tax refunds, (2) recognition from sale of stake in
Terrapay leading ot gain of Rs750 mn and (3) Rs857 mn of forex gain
Organic revenue growth (c/c yoy, %) 7.2 (3.5) (7.5) We expect net-new TCV to range from US$400-500 mn. The normalization of deal wins is largely on the back of decisions
on mid-sized deals
Revenues 90,699 91,063 92,475 1.6 2.0 Capital allocation policy will be an area of focus. The company reduced payout in FY2020. Acquisition will receive high focus
noting poor past track record.
EBIT 11,594 9,173 11,101 21.0 (4.3) Expect investor focus on-- (1) measures taken by the company to improve operating margins and sustainable operating
band, (2) enabling factors required to bring consistency to performance, (3) will the company continue to acquire given its
poor track record, (4) BPO-- the future of contact center business, a dominant revenue stream within BPO and measures
taken to increase non-voice revenues, (5) measures required to grow in line with peers, (6) progress on 5G opportunity and
(7) hedge book, rates and gains/ (losses) for FY2021.
Adjusted net profit 11,239 9,723 9,592 (1.3) (14.7)
EBIT margin (%) 12.8 10.1 12.0 193 bps (78) bps
L&T Infotech (October 22, 2020)
Revenues (US$ mn) 364 390 400 2.5 10.0 LTI will outperform peers with strong 9.4% constant currency growth in revenues on yoy comparison. Growth will be modest
on sequential comparison on account of high base of the last quarter that benefited from large deal ramp ups. Growth on
sequential basis will be led by financial services and CPG vertical
Revenue growth (c/c qoq, %) 2.4 3.9 1.6 We expect 40 bps increase in EBIT margin led by growth, relative stability in pricing and increase in utilization rate. EBIT margin
increase on yoy comparison will be led by lower travel costs, higher offshore and Rupee depreciation
Revenue growth (c/c yoy, %) 11.9 15.9 9.4 We expect net profit margin of 14%, similar to previous quarter and same quarter last year. Fx gains for the quarter will be
modest at Rs160 mn
Organic revenue growth (c/c qoq, %) 2.4 3.8 1.6 Management indicated that large deal pipeline is strong. We expect company to report a large deal, consistent with the
trend of the past few quarters
Organic revenue growth (c/c yoy, %) 10.9 15.3 9.1 We expect investor focus on -- (1) decision making cycle for large deals, (2) outcome of ICE raids, (3) new customer
acquisition, something which has been impacted across the industry, (4) demand outlook in impacted manufacturing and
energy vertical and (5) areas of collaboration with Mindtree
Revenues 25,707 29,492 29,682 0.6 15.5
EBIT (excl. forex gains) 3,993 5,139 5,276 2.7 32.1
Adjusted net profit 3,601 4,164 4,165 0.0 15.7
EBIT margin (%) 15.5 17.4 17.8 35 bps 224 bps
Mindtree (October 15, 2020)
Revenues (US$ mn) 271.0 253.2 262.4 3.6 (3.2) We forecast c/c sequential revenue growth of 2.9% and cross-currency tailwind of 77 bps. Revenue growth will be led by
ramp up of Realogy deal, recovery in financial services and CPG verticals and continuing strong growth from the top client.
Travel and hospitality vertical will remain subdued
Revenue growth (c/c qoq, %) 3.2 1.2 2.9 We expect EBIT margin increase of 90 bps due to continued cost control and revenue flow-through of Realogy deal. Note
that part of transition costs of large deals was recognized in the previous quarter but the benefit of revenue will start
flowing through only in the current quarter
Revenue growth (c/c yoy, %) 11.0 6.3 (3.7) We expect subdued TCV due to delays in decision on large deals; note that TCV of deals announced in 1QFY21 stood at
US$290 mn
Organic revenue growth (c/c qoq, %) 3.2 1.2 2.9 We do not foresee any immediate risks to revenues from the top client since—(1) the sourcing strategy from the top client is
decentralized. As long as Mindtree manages efficient operations, growth could continue, (2) Mindtree is exposed to high
growth cloud platform of the client and (3) it gets revenues from multiple divisions across the organization
Organic revenue growth (c/c yoy, %) 11.0 6.3 (3.7) The company is making progress on focus shift to more managed services and mining of strategic accounts. Focus on
improving margins has yielded good results. Reduction in subcontractor usage, focus on reskilling as opposed to lateral
hiring for key skills, lower variable compensation, wage hike deferrals, cost rationalization in small accounts are levers that
Mindtree can flex to protect margin profile.
Revenues 19,143 19,088 19,470 2.0 1.7 We expect investors to focus on (1) outlook for TTH vertical and redeployment of bench, (2) deal TCV, (3) progress in mining
top accounts beyond the top client, (4) growth outlook for top client, (5) marquee external hires in recent months, (6)
growth in digital revenues and Interactive practice and (7) areas of collaboration with LTI
EBIT 1,775 2,881 3,117 8.2 75.6
Adjusted net profit 1,350 2,130 2,474 16.2 83.3
EBIT margin (%) 9.3 15.1 16.0 91 bps 674 bps
Mphasis (October 22, 2020)
Revenues (US$ mn) 305 305 316 3.5 3.7 We expect MPHL to report c/c revenue growth of 2.8% qoq. USD revenue growth will be higher due to cross-currency
tailwind of 71 bps.
Revenue growth (c/c qoq, %) 3.1 0.6 2.8 Revenue growth will be led by-- (1) ramp up of US$100 mn+ deal announced along with June 2020 quarter results, (2)
strong growth in Digital Risk courtesy pick in mortgage loan origination and refinance activity. We do not bake in revenue
from US$216 mn three-year deal announced in July 2020
Revenue growth (c/c yoy, %) 11.6 9.7 3.3 We expect DXC revenues to decline 7% qoq to US$57 mn. The future of DXC channel of revenues is uncertain
Organic revenue growth (c/c qoq, %) 3.1 0.6 2.8 We forecast stable EBIT margin on qoq and yoy comparison
Organic revenue growth (c/c yoy, %) 9.9 9.7 3.3 TCV of new deals will hit a record high on the back of strong deal activity in financial services and US$216 mn deal
announced in July 2020
Revenues 21,581 22,882 23,473 2.6 8.8 We expect investors to focus on— (1) future of DXC channel business in light of continuing ramp down, (2) secret sauce of
success in large consolidation and transformation deals, (3) scaling up accounts in Blackstone portfolio and new clients
channel, (4) top clients' growth outlook, discussions with clients on pricing and payment terms, and (6) levers available to
offset margin headwinds in light of potentially margin dilutive large deals
EBIT 3,470 3,583 3,699 3.2 6.6
Adjusted net profit 2,733 2,750 2,885 4.9 5.6
EBIT margin (%) 16.1 15.7 15.8 10 bps (32) bps
Notes:

IT Services India
KOTAK INSTITUTIONAL EQUITIES RESEARCH 71
Exhibit 5: Vertical-wise revenue mix (%), Jun-20 quarter
Source: Companies, Kotak Institutional Equities
Exhibit 5: Vertical-wise revenue mix (%), Jun-20 quarter (contd)
Source: Companies, Kotak Institutional Equities
Exhibit 6: Geo-wise revenue mix (%), Jun-20 quarter
Source: Companies, Kotak Institutional Equities
Exhibit 6: Geo-wise revenue mix (%), Jun-20 quarter (contd)
Source: Companies, Kotak Institutional Equities
Jun-20 quarter
Revenue % of revenues qoq yoy
TCS
BFSI 1,583 31.3 (2.1) (6.3)
Retail & CPG 708 14.0 (15.5) (13.9)
Communication & Media 359 7.1 (8.4) (5.1)
Manufacturing 491 9.7 (10.8) (8.7)
Life sciences & healthcare 486 9.6 1.4 12.1
Technology & Services 460 9.1 (2.8) (4.6)
Regional markets and others 971 19.2 (11.2) (14.9)
Total 5,059 100.0 (7.1) (7.8)
Infosys
Financial Services 983 31.5 (1.8) 1.7
Retail 446 14.3 (9.9) (8.3)
Communications 418 13.4 0.6 1.2
Energy, Utilities, Resources and Servcies399 12.8 (3.1) 2.8
Manufacturing 296 9.5 (8.2) (3.1)
Hi Tech 272 8.7 7.5 15.2
Life Sciences 209 6.7 2.2 13.9
Others 97 3.1 4.4 21.6
Total 3,121 100.0 (2.4) 2.0
Wipro
Communications 98 5.1 (14.7) (18.6)
Consumer 306 15.9 (12.3) (3.7)
Energy, Natural Resources & Utilities 254 13.2 (4.4) (3.0)
Finance Solutions 590 30.7 (6.6) (8.7)
Healthcare, Life Sciences & Services 259 13.5 (7.2) (2.9)
Manufacturing 156 8.1 (8.0) (3.5)
Technology 259 13.5 (2.0) (2.2)
Total 1,922 100.0 (7.3) (5.7)
Tech Mahindra
Telecom 483 40.0 (8.6) (7.8)
Manufacturing 203 16.8 (11.5) (16.2)
Tech, Media & Entertainment 109 9.0 13.4 14.7
BFSI 190 15.7 (4.3) 18.8
Retail, transport, logistics 88 7.3 (6.7) 14.0
Others 135 11.2 (9.2) (8.9)
Total 1,207 100.0 (6.7) (3.2)
Growth (%) Jun-20 quarter
Revenue % of revenues qoq yoy
HCLT
Financial services 528 22.4 (1.7) NA
Manufacturing (new classification) 426 18.1 (19.0) NA
Technology&Services 405 17.2 (1.7) NA
Retail & CPG 236 10.0 (9.2) NA
Telecom, media, publishing, entertainment 179 7.6 (15.2) NA
Life sciences 323 13.7 1.5 NA
Energy-utilities-public sector 259 11.0 (8.2) NA
Total 2,356 100.0 (7.4) 3.4
Mindtree
Hi-Tech & Media Services 129 51.0 7.6 24.1
BFSI 51 20.3 (9.4) (9.8)
Retail, CPG & Manufacturing 52 20.6 (7.8) (11.2)
Travel & Hospitality 20 8.1 (54.6) (53.8)
Total 253 100.0 (9.1) (4.2)
Mphasis
Banking and Capital market 149 48.8 2.1 12.3
Insurance 30 10.0 (16.7) (12.3)
IT, communication & Entertainment 43 14.1 (10.2) (12.2)
Logistics & transportation 43 14.0 (8.4) 11.9
Emerging industries 40 13.1 (5.7) (5.2)
Total 305 100.0 (4.5) 2.9
L&T Infotech
Banking and financial services 108 27.7 (4.4) 9.5
Insurance 67 17.2 (2.5) 4.0
Manufacturing 62 15.8 (16.4) 13.8
Energy & utilities 42 10.8 (9.8) 10.5
CPG retail and pharma 45 11.5 0.1 13.4
High-Tech, Media & Entertainment 45 11.6 0.4 1.6
Others 21 5.4 28.5 28.5
Total 390 100.0 (4.8) 9.5
Growth (%)
Jun-20 quarter
Revenues % of revenues qoq yoy
TCS
North America 2,600 51.4 (5.0) (6.3)
Latin America 86 1.7 (12.2) (12.9)
UK 774 15.3 (11.1) (10.7)
Continental Europe 789 15.6 (4.6) 0.6
India 218 4.3 (27.3) (33.9)
Asia Pacific 496 9.8 (2.1) (3.8)
MEA 96 1.9 (7.1) (16.6)
Total 5,059 100.0 (7.1) (7.8)
Infosys
North America 1,919 61.5 (2.5) 2.5
Europe 749 24.0 (4.0) 2.0
India 91 2.9 8.9 28.6
Rest of the world 362 11.6 (0.7) (5.4)
Total 3,121 100.0 (2.4) 2.0
Wipro
US 1,134 59.0 (7.4) (5.3)
Europe 455 23.7 (8.9) (9.1)
RoW 332 17.3 (4.7) (2.3)
Total 1,922 100.0 (7.3) (5.7)
Tech M
North America 595 49.3 (3.6) 0.3
Europe 312 25.8 (9.2) (9.5)
Rest of the world 301 24.9 (10.0) (2.8)
Total 1,207 100.0 (6.7) (3.2)
Growth (%) Jun-20 quarter
Revenues % of revenues qoq yoy
HCLT
US 1,500 63.7 (6.9) NA
Europe 667 28.3 (8.7) NA
ROW 188 8.0 (5.0) NA
Total 2,356 100.0 (7.4) 3.4
Mindtree
North America 200 79.0 (6.4) 2.8
Europe 33 13.1 (22.4) (29.7)
India 10 4.1 (3.3) (3.1)
Rest of the world 10 3.8 (14.5) (18.1)
Total 253 100.0 (9.1) (4.2)
Mphasis
Americas 235 76.8 (3.8) 0.3
EMEA 36 11.9 (7.6) 14.9
India 13 4.1 (21.4) (15.2)
ROW 22 7.1 6.5 33.3
Total 305 100.0 (4.5) 2.9
L&T Infotech
North America 276 70.8 (2.2) 12.8
Europe 56 14.4 (9.2) (1.5)
India 27 6.9 (15.8) (11.1)
RoW 31 7.9 (7.1) 25.3
Total 390 100.0 (4.8) 9.5
Growth (%)

India IT Services
72 KOTAK INSTITUTIONAL EQUITIES RESEARCH
Exhibit 7: Serviceline-wise revenue mix (%), Jun-20 quarter
Exhibit 7: Serviceline-wise revenue mix (%), Jun-20 quarter
(contd)
Source: Companies, Kotak Institutional Equities Source: Companies, Kotak Institutional Equities
Exhibit 8: Kotak Institutional Equities: valuation summary of key Indian technology companies
Source: Companies, Kotak Institutional Equities estimates
Revenues % of revenues qoq yoy
Infosys
Services 2,903 93.0 (3.1) 0.3
Products & platforms 218 7.0 9.0 32.2
Digital 1,389 44.5 3.7 34.3
Core 1,732 55.5 (6.7) (14.5)
Total 3,121 100 (2.4) 2.0
Wipro
Cloud and infrastructure services 498 25.9 (7.1) (5.0)
Data, Analytics and AI 138 7.2 (7.5) (8.5)
Digital operations and Platforms 284 14.8 (5.9) (5.0)
Industrial & Engineering services 148 7.7 (7.5) (4.3)
Modern application Services 853 44.4 (7.9) (6.2)
Total 1,922 100 (7.3) (5.7)
HCLT
IT and Business Services 1,654 70.2 (7.9) 4.0
Engineering and R&D Services 377 16.0 (9.1) 9.6
Products & Platforms 325 13.8 (2.4) 92.5
Total 2,356 100 (7.4) 3.4
Tech Mahindra
IT services 1,109 91.9 (6.2) (2.0)
BPO 98 8.1 (12.6) (14.5)
Total 1,207 100 (6.7) (3.2)
L&T Infotech
ADM and testing 139 35.6 (2.3) 2.3
Enterprise solutions 116 29.7 (13.0) 3.2
IMS 53 13.6 2.8 36.6
Analytics, AI and Cognitive 49 12.5 2.6 22.2
Enterprise integration and mobility 34 8.6 (5.9) 14.8
Total 390 100 (4.8) 9.5
Jun-20 quarter Growth (%)
Revenues % of revenues qoq yoy
Mindtree
Digital 94 37.0 (12.6) (6.7)
Interactive 53 20.9 (14.7) (16.1)
Data science and engineering 30 11.8 (13.4) 7.7
Cloud Services 11 4.3 2.1 23.9
Others 0 0.0 - (100.0)
Test Engineering 39 15.5 (22.3) (18.2)
Package Solutions 14 5.5 (16.0) (28.2)
Infrastructure management & Tech support 73 28.7 1.0 15.4
ADM 34 13.3 4.9 0.9
Total 253 100 (9.1) (4.2)
Mphasis
Application services 195 63.8 (5.0) 0.4
Business Process Services 64 21.1 11.6 44.6
Infrastructure Services 46 15.1 (18.9) (20.7)
Total 305 100 (4.5) 2.9
Jun-20 quarter Growth (%)
30-Sep-20
Company Price (Rs) Rating (Rs m) (US$ m) 2020E 2021E 2022E 2020E 2021E 2022E 2020E 2021E 2022E 2020E 2021E 2022E
HCL Technologies 812 ADD 2,202,411 29,871 44.6 48.4 52.9 18.2 16.8 15.4 11.0 9.9 8.8 22.2 20.3 19.2
Hexaware Technologies 466 REDUCE 139,996 1,899 23.3 24.6 26.4 20.0 19.0 17.7 13.3 11.8 10.6 23.5 21.6 20.5
Infosys 1,008 BUY 4,294,535 58,246 40.5 45.2 50.9 24.9 22.3 19.8 16.6 14.8 13.2 25.2 25.7 26.6
L&T Infotech 2,544 ADD 443,960 6,021 91.0 110.6 130.3 27.9 23.0 19.5 18.1 15.7 13.4 27.3 28.0 27.7
Mindtree 1,339 REDUCE 220,416 2,989 54.9 62.5 67.0 24.4 21.4 20.0 14.6 12.9 12.1 26.2 25.1 22.8
Mphasis 1,383 REDUCE 258,140 3,501 64.3 70.6 77.7 21.5 19.6 17.8 14.0 12.5 11.2 19.6 19.6 19.5
TCS 2,492 REDUCE 9,352,068 126,841 83.6 94.1 102.5 29.8 26.5 24.3 21.1 19.0 17.2 35.1 36.8 37.2
Tech Mahindra 792 BUY 689,675 9,354 40.8 51.3 61.0 19.4 15.4 13.0 10.9 8.5 7.0 15.7 17.9 19.0
Wipro 314 ADD 1,791,779 24,302 17.0 18.2 19.8 18.4 17.2 15.8 11.4 10.4 9.2 16.2 15.7 15.9
KIE universe 117,247,901 1,590,549 27.5 19.0 15.6 13.0 10.0 8.8 9.2 12.2 13.7
Target O/S shares EPS CAGR (%)
Company Price (Rs) (mn) 2020-22E 2020E 2021E 2022E 2020E 2021E 2022E 2020E 2021E 2022E 2020E 2021E 2022E
HCL Technologies 900 2,716 8.9 9.3 8.7 9.2 121,016 131,628 143,789 187,035 198,485 210,594 745,458 826,226 897,032
Hexaware Technologies 375 302 6.5 9.7 5.8 7.3 7,032 7,437 7,979 10,744 11,791 12,801 63,187 69,688 77,123
Infosys 1,115 4,259 12.1 4.0 11.7 12.5 172,516 192,658 216,681 244,693 269,885 300,263 975,488 1,080,192 1,196,647
L&T Infotech 2,800 176 19.7 5.1 21.5 17.8 16,021 19,469 22,936 23,430 26,422 30,340 121,361 140,685 160,766
Mindtree 980 165 10.5 43.3 13.8 7.3 9,039 10,284 11,034 14,089 15,418 15,907 79,298 85,403 92,110
Mphasis 1,100 187 10.0 1.1 9.9 10.1 11,984 13,167 14,500 17,365 19,023 20,584 95,806 104,690 113,950
TCS 2,320 3,752 10.7 (3.0) 12.5 8.9 313,845 353,057 384,591 420,706 464,452 508,751 1,571,899 1,739,218 1,924,121
Tech Mahindra 845 880 22.2 (11.0) 25.7 18.9 35,885 45,116 53,624 55,079 67,697 78,015 369,371 402,671 441,518
Wipro 285 5,703 7.9 2.4 7.1 8.6 97,096 104,034 112,999 128,720 135,622 146,366 602,301 634,625 674,068
KIE universe 8.7 44.5 21.8 4,264,956 6,161,740 7,505,779 8,047,038 10,222,253 11,608,840 53,276,298 63,866,410 70,041,165
Notes:
(a) Hexaware Technologies is December year-ending.
EPS growth (%) Net Profit (Rs mn) EBITDA (Rs mn) Sales (Rs mn)
Mkt cap. EPS (Rs) P/E (X) EV/EBITDA (X) RoE (%)

For Private Circulation Only. FOR IMPORTANT INFORMATION ABOUT KOTAK SECURITIES’ RATING SYSTEM AND OTHER DISCLOSURES, REFER TO THE END OF THIS MATERIAL.
VLR is a technical measure with limited, but not zero, utility
TRAI reports each operator’s peak VLR ratio every month in its monthly subscription report. VLR
ratio represents the monthly peak of the ratio of subscribers in an operator’s VLR to subscribers
in the operator’s HLR. Definitions of VLR and HLR from TRAI’s report (paraphrased) –
Home location register or HLR is a central database that contains details of each subscriber
that is authorized to use the operator’s network. The HLR stores details of every SIM card
issued by the service provider (SIMs-in-force; not churned out by the operator even if
inactive).
Visitor location register is a temporary database of subscribers in the active stage, i.e.
connected to the network at that point in time. Connected here means able to send/receive
calls/SMS and/or use data even if the subscriber may not be using the network at the time. A
subscriber would not be in the VLR if the SIM is either switched off or in a no-coverage zone.
The subscriber would still be in the HLR in such situations.
VLR ratio, hence, is a point-in-time measure and represents the ratio of SIMs connected to a
network at that point in time divided by number of SIM records in the HLR. It follows that the
gap between HLR and VLR subs at any point in time represents SIMs that are not connected to
the network they are authorized to use. TRAI reports peak VLRs (during a month) for operators.
We do note that that VLR ratio does not capture the total number of unique SIMs active on a
network at any point in time during a month. This number would generally be higher than VLR
subs even as we would argue that the gap between the two (active anytime during the month
and active during the peak VLR time) should not be high as wireless connections, especially
those on handsets, are generally always-on connections. Dongle connections, sometimes-on
SIMs, are a very small base. Lastly, operators do not disconnect or churn out SIMs immediately
after a prepaid voucher’s recharge validity expires. What this means is that generally, the
number of revenue-earning customers should be lower than VLR subs.
Conundrum #1 – why are the customer profiles of R-Jio and Bharti so different?
Here’s our first conundrum – R-Jio’s VLR ratio of 78% for the month of June 2020 stood a full
20%pts lower than Bharti’s 98%; more important, while R-Jio suggests that its revenue-earning
subs (RES) base is the same as HLR (or 28% higher than VLR base), Bharti’s investor disclosures
indicated that its RES is actually 10% lower than VLR and 12% lower than HLR. As we noted
earlier, VLR is a purely technical measure but is a fairly decent proxy of consumer activity on a
network. We are unable to comprehend why R-Jio’s subscriber base would exhibit much
different behavior than Bharti’s subscriber base. How does Bharti end up with a VLR base that is
10% higher than its paying consumer base while Jio has a VLR base that is 28% lower than its
paying consumer base?
Telecommunication Services India
The VLR conundrum. Bharti and Jio had equal number of ‘peak VLR’ subs in June
2020, 310 mn each, per TRAI’s latest subscription report. However, Bharti’s investor
disclosures suggest only 280 mn revenue-earning subs (10% lower than VLR) while Jio’s
disclosures suggest 397 mn (28% higher than VLR). Two things that intrigue us – (1)
the vast differential in the revenue-earnings subs base versus VLR base between the two
leading operators of the country, and (2) the massive absolute number (87 mn) of ‘not-
connected-to-the-network-at-peak-VLR-time’ SIMs that Jio’s 78.2% VLR ratio for the
month of June reflects.
ATTRACTIVE
OCTOBER 01, 2020
UPDATE
BSE-30: 38,068
Rohit Chordia
Aniket Sethi
[email protected]: +91 22 6218 6427

India Telecommunication Services
74 KOTAK INSTITUTIONAL EQUITIES RESEARCH
Conundrum #2 – the sheer magnitude of paying-but-not-connected-to-the-
network-at-peak-VLR-time subs on R-Jio’s network
The gap between Jio’s HLR (or paying, in Jio’s case; R-Jio maintains that 100% of its HLR
subs are revenue-earning subs) subs and its VLR subs stood at 87 mn in absolute terms in
the month of June 2020, having gone up by as much as 34 mn since June 2019. The sheer
magnitude of this absolute gap is startling. Who are these 87 mn subs who are recharging
their SIMs regularly, are not connected to Jio’s network at the time of peak-VLR but are
connected at some other times when an even larger number of peak-VLR-SIMs aren’t
connected.
Essentially, the 87 mn number actually represents the lowest number of not-connected-to-
the-network SIMs at any point during the month of June. At other times, this number would
have been even higher. What follows is that Jio has a very high number of only-
sometimes-on SIMs on its network. Dongle SIMs do have this sometimes-on characteristic
but handset SIMs generally do not. Most handset SIMs are always-on, in our view, especially
in case of R-Jio given that the R-Jio SIM only works in the primary slot of even dual-SIM
handsets. At least 87 mn SIMs not being connected to the network at any given point
during a month is a metric we are just unable to relate to.
Exhibit 1: We are unable to comprehend the massive difference in the HLR-VLR-RES gap between R-
Jio and Bharti
Source: Companies, TRAI
Jun-19 Sep-19 Dec-19 Mar-20 Jun-20
Reliance Jio
HLR subs reported to TRAI, EOP (mn) 331 355 370 388 397
VLR subs reported to TRAI, EOP (mn) 278 290 305 314 310
VLR ratio (%) 84.0 81.6 82.4 80.9 78.2
Gap between HLR and VLR subs (mn) 53 65 65 74 87
Rev earning subs reported to investors, EOP (mn) 331 355 370 388 397
Bharti Airtel
HLR subs reported to TRAI, EOP (mn) 320 326 327 328 317
VLR subs reported to TRAI, EOP (mn) 316 303 315 315 311
VLR ratio (%) 98.5 93.0 96.1 96.2 98.1
Gap between HLR and VLR subs (mn) 5 23 13 13 6
Rev earning subs reported to investors, EOP (mn) 277 279 283 284 280
Vodafone Idea
HLR subs reported to TRAI, EOP (mn) 383 372 333 319 305
VLR subs reported to TRAI, EOP (mn) 322 302 298 294 273
VLR ratio (%) 84.1 81.2 89.5 92.0 89.5
Gap between HLR and VLR subs (mn) 61 70 35 26 32
Rev earning subs reported to investors, EOP (mn) 320 311 304 291 280
BSNL/MTNL
HLR subs reported to TRAI, EOP (mn) 120 120 121 123 122
VLR subs reported to TRAI, EOP (mn) 68 66 66 67 64
VLR ratio (%) 56.4 54.6 53.9 54.0 52.4
Gap between HLR and VLR subs (mn) 52 55 56 57 58

For Private Circulation Only.
Government retains FY2021 gross dated market borrowing at Rs12 tn
The government, expectedly, has stuck to its borrowing plan for dated securities. After
borrowing Rs7.66 tn in 1HFY21, the government will borrow Rs4.34 tn in 2HFY21 taking the
total FY2021 dated market borrowing to Rs12 tn. Net issuance in 2HFY21 will be Rs3.4 tn, after
a heavy net issuance of Rs6.4 tn 1HFY21 (Exhibit 1). The amount will be borrowed in 16 weekly
auctions until the end of January, with the auction size between Rs270 bn and Rs280 bn. Given
that the central government has not been utilizing its WMA limit and has been maintaining a
comfortable cash balance, the WMA limit, expectedly, has been revised down to Rs1.25 tn from
Rs2 tn. Meanwhile, after having borrowed a net amount of Rs3.97 tn in 1HFY21 through T-
bills, the government plans to issue (-)Rs1.6 tn on a net basis in 3QFY21, taking the cumulative
net T-bill issuance to Rs2.3 tn up to 9MFY21 (Exhibit 2).
Supply concentrated in the belly of the curve
While the short end (2-year and 5-year) will have total issuance of 20.3%, bulk of the supply
will be concentrated in the belly of the curve (10-year and 14-year), which will account for
44.5% of the total supply (Exhibit 3). The extreme long-end of the curve (30-year and 40-year)
will account for 29.7% of the total issuance. Reliance on FRB would be 5.5% of the total
2HFY21 dated market borrowing, providing some relief to the belly and long-end of the curve.
SDL supply to remain heavy in 2HFY21
The state governments plan to borrow a gross amount of Rs2.0 tn in 3QFY21, 33% higher than
the actual amount of Rs1.5 tn in 3QFY20 (Rs1.9 bn in 2QFY21). This would amount to a net
SDL supply of Rs1.6 bn in 3QFY20. Owing to the shortfall in tax collections and the expenditure
requirements during the pandemic, we expect states’ consolidated GFD/GDP to be around
4.5%. We therefore expect overall FY2021 gross SDL supply to be around Rs8.7 tn (net supply
of Rs7.3 tn). States have so far borrowed Rs3.5 tn in 1HFY21. With states planning to borrow a
total of Rs2.0 tn in 3QFY21, we expect 4QFY21 SDL borrowing to be Rs3.1 tn (Exhibit 4).
Supply concerns continue to linger, more so for states
Even as the markets will breathe a sigh of relief after the government’s announcement, supply
concerns will continue to linger. We expect the benchmark 10-year G-Sec yield to trade in the
5.90-6.10% range for now, with breakout on the upside depending on (1) evolution of Covid
and the subsequent risks to growth and fiscals, and (2) persistence of high inflation.
Meanwhile, yields could trend towards 5.75-5.90% range depending on (1) faster-than-
expected moderation in inflation, (2) no additional market borrowing, and (3) OMO purchases.
We believe that while the center’s fiscal slippage concerns could partly be offset by extra T-bill
issuances or other financing sources, concerns remain about the states. We continue to monitor
the progress on the compensation cess tussle between the center and states to gauge the
magnitude of additional SDL supply. We expect the SDL spreads to widen further (over the G-
Sec) in the coming months owing to incremental supply.
Economy Public Finance
Borrowing target retained. The government will raise Rs4.34 tn in 2HFY21 until
January-end, taking the cumulative FY2021 borrowing to Rs12 tn. Supply concerns will
however continue to linger, and much will depend on the evolution of Covid and its
impact on fiscal slippages. While the center could diversify its borrowings, concerns
remain about the states, especially given the shortfall in compensation cess. We expect
the 10-year G-Sec to trade in the 5.90-6.10% range in the near term.
INDIA
SEPTEMBER 30, 2020
UPDATE
BSE-30: 38,068
QUICK NUMBERS
FY2021 dated gross
market borrowing
retained at Rs12 tn;
2HFY21 gross
market borrowing
at Rs4.34 tn
44.5% of the
2HFY21 supply
concentrated in the
belly of the curve
India 10-year
benchmark yield
likely in the range
of 5.90-6.10% in the
near term
Upasna Bhardwaj
Suvodeep Rakshit
Avijit Puri
[email protected]: +91 22 6218 6427

India Economy
76 KOTAK ECONOMIC RESEARCH
Exhibit 1: Net issuance of dated securities in 2HFY21 much lower than in 1HFY21 Gross and net market borrowings of dated securities (Rs bn)
4,420
2,680
7,660
4,340
3,410
1,330
6,354
3,374
0
1,000
2,000
3,000
4,000
5,000
6,000
7,000
8,000
9,000
1HFY20 2HFY20 1HFY21 2HFY21
Gross market borrowing (Rs bn) Net market borrowing (Rs bn)
Source: RBI, Kotak Economics Research
Exhibit 2: Net issuance through T-bills at (-)Rs1.6 tn in 3QFY21 Gross and net issuances of T-Bill across tenors, March fiscal year-ends (Rs bn)
3QFY20 3QFY21 3QFY20 3QFY21 3QFY20 3QFY21
91-day 1,230 1,170 320 (390) 910 1,560
182-day 520 390 (390) (1,370) 910 1,760
364-day 390 520 (130) 130 520 390
Total 2,140 2,080 (200) (1,630) 2,340 3,710
RedemptionGross issuance Net issuance
Source: RBI, Kotak Economics Research
Exhibit 3: Belly of the curve will account for 44.5% of the total supply in 2HFY21 Borrowing calendar for different tenors for 2HFY21 (Rs bn)
Borrowing 2 years 5 years 10 years 14 years 30 years 40 years FRB
October 1,100 60 160 250 240 150 180 60
November 810 60 80 240 120 70 180 60
December 1,080 60 160 240 240 140 180 60
January 1,350 60 240 240 360 210 180 60
Total 4,340 240 640 970 960 570 720 240
% of total 5.5 14.7 22.4 22.1 13.1 16.6 5.5
Source: RBI, Kotak Economics Research

Economy India
KOTAK ECONOMIC RESEARCH 77
Exhibit 4: State governments likely to borrow heavily in 2HFY21 Trend in gross and net borrowing of state governments (Rs bn)
1,6731,863
2,022
3,103
1,4271,599 1,584
2,703
0
500
1,000
1,500
2,000
2,500
3,000
3,500
1QFY21 2QFY21 3QFY21A 4QFY21E
Gross SDL borrowing (Rs bn) Net SDL borrowing (Rs bn)
Notes:
(a) 3QFY21A refers to the announced figure as mentioned in the release.
(b) 4QFY21E is as per our expectation of FY2021 state market borrowing.
Source: RBI, Kotak Economics Research estimates

For Private Circulation Only.
1QFY21 current account surplus at a record high
Current account in 1QFY21 registered a surplus of US$19.8 bn (3.9% of GDP) as against a
surplus of US$0.6 bn in 4QFY20 (0.1% of GDP) and a deficit of US$15 bn (2.1% of GDP) in the
same period last year (Exhibit 1). This was due to a sharp moderation in the trade deficit to
US$10 bn (US$35 bn in 4QFY20) on the back of lower import bill of US$62 bn (US$112 bn in
4QFY20), even though exports moderated to US$52 bn (US$77 bn in 4QFY20). Within imports,
oil imports fell to US$13 bn, and non-oil imports softened to US$49 bn due to weak domestic
demand conditions. Meanwhile, net invisible receipts held up to an extent, moderating to
US$30 bn (US$36 bn in 4QFY20), supported by software exports (US$21 bn) and transfers
(US$17 bn). Net income outgo was higher at (-)US$8 bn as against (-)US$5 bn in 4QFY20.
Sharp moderation in the capital account balance
The capital account balance moderated sharply to US$0.6 bn (US$17.4 bn in 4QFY20) led by
outflows from FDI, ECBs and other capital account items. Net FDI flows softened to (-)US$0.4
bn (US$12 bn in 4QFY20), largely due to a large repatriation of FDI. FDI flows will, however,
bounce back in the subsequent quarters given a few known large deals. Meanwhile, FPI flows
have stabilized after the global policy response to the pandemic, even though gains in equity
were mostly offset by losses in debt. With repayments exceeding disbursals, ECB flows recorded
a net inflow of (-)US$2 bn as against US$10 bn in 4QFY20. Net inflow on account of NRI
deposits remained stable at US$3 bn, while net inflows on account of external assistance
increased to US$4 bn. Overall, BOP surplus in 1QFY21 stood at US$19.8 bn (US$18.8 bn in
4QFY20).
Expect FY2021E BOP to remain hugely in surplus; USD-INR to trade in the 72-75 range
Given the relative weakness of domestic demand, we expect the slowdown in import growth to
be steeper than export growth. With oil prices likely to remain in check (expect FY2021 average
of US$40/bbl), we expect FY2021 current account to register a surplus of 1.1% of GDP.
Meanwhile, the capital account balance, even though it may moderate from last year’s levels, is
likely to be well supported by FDI flows. Factoring this, we expect FY2021E BOP surplus to be
comfortably in surplus at US$94.4 bn (Exhibit 2).
After a prolonged dollar weakness, the economic outperformance of the US along with
geopolitical uncertainties has provided a depreciation bias to the INR. Going ahead, the
following factors will continue to drive movements in INR, (1) pace of global economic recovery,
(2) direction of crude oil prices, (3) uncertainty ahead of the US Presidential elections and
tensions with China, and (4) evolution of the spread of Covid. While the abovementioned
factors could cause volatility, the overall global accommodative policy along with the sound
external vulnerability matrix of India should provide support to INR. We thus expect USD-INR in
the range of 72-75 through the rest of FY2021 (Exhibit 3).
Economy External Sector
Trade-led BOP surplus. Despite a sharp moderation in the capital account balance, a
surplus CAD kept BOP comfortably in surplus at US$19.8 bn in 1QFY21. With crude oil
prices in check, we expect current account to register a surplus of 1.1% of GDP in
FY2021E. Capital account may remain well supported by FDI flows, which will reflect in
the subsequent quarters’ data. We expect FY2021 BOP to stay hugely in surplus at
US$94.4 bn. We expect USD-INR within 72-75 range over the rest of FY2021.
INDIA
SEPTEMBER 30, 2020
UPDATE
BSE-30: 38,068
QUICK NUMBERS
1QFY21 current
account registers a
record surplus of
3.9% of GDP
(US$19.8 bn)
1QFY21 BOP surplus
at US$19.8 bn
FY2021E CAD/GDP
at 1.1%; BOP
surplus at US$94.4
bn
Expect USD-INR in
the range of 72-75
Upasna Bhardwaj
Suvodeep Rakshit
Avijit Puri
[email protected]: +91 22 6218 6427

Economy India
KOTAK ECONOMIC RESEARCH 79
Exhibit 1: Current account registers a record-high surplus of 3.9% of GDP in 1QFY21 India's quarterly balance of payments, March fiscal year-ends, 1QFY20-1QFY21 (US$ bn)
Source: Reserve Bank of India, Kotak Economics Research
1QFY20 2QFY20 3QFY20 4QFY20 1QFY21
Current account (15.0) (7.6) (2.6) 0.6 19.8
GDP 707 699 726 735 502
CAD/GDP (%) (2.1) (1.1) (0.4) 0.1 3.9
Trade balance (46.8) (39.6) (36.0) (35.0) (10.0)
Trade balance/GDP (%) (6.6) (5.7) (5.0) (4.8) (2.0)
- Exports 83 80 81 77 52
- oil exports 11 10 11 9 5
- non-oil exports 72 70 70 67 47
- Imports 129 120 117 112 62
- oil imports 35 30 32 34 13
- non-oil imports 94 90 86 78 49
- gold imports 11 4 7 5 0
Invisibles (net) 32 32 33 36 30
- Services 20 21 22 22 21
o/w Software 21 21 21 21 21
o/w Non-software (1) (0) 0 1 (0)
- Transfers 18 20 19 18 17
- Income (net) (6) (9) (7) (5) (8)
Capital account 29 14 24 17 1
% of GDP 4.0 1.9 3.3 2.4 0.1
Foreign investment 19 10 18 (2) 0
- FDI 14 7 10 12 (0)
- FPI 5 2 8 (14) 1
- Equities 3 (3) 6 (5) 4
- Debt 2 5 2 (9) (3)
- ADRs/GDRs 0 0 0 0 0
Banking capital 3 (2) (2) (5) 2
- NRI deposits 3 2 1 3 3
Short-term credit 2 (1) (1) (1) (0)
ECBs 6 3 3 10 (2)
External assistance 1 0 1 1 4
Other capital account items (3) 3 5 14 (4)
E&O 0 (1) 1 1 (0)
Overall balance 14.0 5.1 21.6 18.8 19.8
memo items:
Average exchange rate (US$/Rs) 69.5 70.4 71.2 72.5 75.9
Average Brent price (US$/bbl) 68.3 61.8 62.7 50.7 33.4

India Economy
80 KOTAK ECONOMIC RESEARCH
Exhibit 2: FY2021E BOP to stay hugely in surplus at US$94.4 bn India's balance of payments, March fiscal year-ends, 2016-21E (US$ bn)
Source: RBI, Kotak Economics Research estimates
2016 2017 2018 2019 2020 Oil@35/bbl Oil@40/bbl Oil@45/bbl
Current account (22.2) (14.4) (48.7) (57.3) (24.7) 24.9 28.4 21.8
GDP 2,104 2,290 2,653 2,715 2,868 2,467 2,467 2,467
CAD/GDP (%) (1.1) (0.6) (1.8) (2.1) (0.9) 1.0 1.1 0.9
Trade balance (130) (112) (160) (180) (158) (78) (85) (91)
Trade balance/GDP (%) (6.2) (4.9) (6.0) (6.6) (5.5) (3.2) (3.4) (3.7)
- Exports 266 280 309 337 320 282 284 286
- oil exports 31 32 37 47 41 32 34 37
- non-oil exports 236 249 272 291 279 250 250 250
- Imports 396 393 469 518 478 360 369 378
- oil imports 83 87 109 141 130 69 78 87
- non-oil imports 313 306 360 377 348 291 291 291
- gold imports 32 28 34 33 28 27 27 27
Invisibles (net) 108 98 111 123 133 103 113 113
- Services 70 68 78 82 85 80 80 80
- software 71 71 72 78 85 80 80 80
- non-software (1.8) (2.4) 5.4 4.3 0.3 0.0 0.0 0.0
- Transfers 63 56 62 70 75 55 65 65
- Income (net) (24) (26) (29) (29) (27) (32) (32) (32)
Capital account 41 36 91 54 83 66 66 66
Percentage of GDP 2.0 1.6 3.4 2.0 2.9 2.7 2.7 2.7
Foreign investment 32 43 52 30 44 60 60 60
- FDI 36 36 30 31 43 50 50 50
- FPI (4) 8 22 (1) 1 10 10 10
- Equities (4) 8 2 3 0 12 12 12
- Debt (0) (1) 21 (4) 1 (2) (2) (2)
Banking capital 11 (17) 16 7 (5) (5) (5) (5)
- NRI deposits 16 (12) 10 10 9 5 5 5
Short-term credit (2) 6 14 2 (1) 0 0 0
ECBs (5) (6) (0) 10 23 8 8 8
External assistance 2 2 3 3 4 2 2 2
Other capital account items 3 8 6 1 18 1 1 1
E&O (1) (0) 1 (0) 1 — — —
Overall balance 17.9 21.6 43.6 (3.3) 59.5 90.9 94.4 87.8
Memo items
RBI's FX intervention
Average USD/INR 65.4 67.2 64.5 69.9 70.9 74.2 74.2 74.2
Average Brent (US$/bbl) 47.5 49.0 57.6 70.0 60.9 35.0 40.0 45.0
2021E

Economy India
KOTAK ECONOMIC RESEARCH 81
Exhibit 3: INR likely to range between 72-75 through rest of FY2021 Trend and estimates of INR and major currencies against USD, March fiscal year-ends (X)
Source: Source: Bloomberg, Kotak Economics Research estimates
2018 2019 2020 2021E 1QFY20 2QFY20 3QFY20 4QFY20 1QFY21 2QFY21E 3QFY21E 4QFY21E
Average Rate
USD/INR 64.5 69.9 70.9 74.2 69.6 70.4 71.2 72.4 75.9 74.4 73.3 73.3
EUR/USD 1.17 1.16 1.11 1.16 1.12 1.11 1.11 1.10 1.10 1.17 1.18 1.20
GBP/USD 1.32 1.31 1.27 1.28 1.29 1.23 1.29 1.28 1.24 1.29 1.30 1.30
USD/JPY 110.8 110.8 108.7 106.8 110.0 107.3 108.7 109.0 107.5 106.0 106.0 107.5
Depreciation (-)/appreciation (+) against USD (%)
INR 4.0 (7.7) (1.4) (4.4) 1.2 (1.1) (1.2) (1.6) (4.6) 2.1 1.5 0.0
EUR 6.9 (0.9) (4.1) 4.6 (1.1) (1.0) (0.5) (0.4) (0.1) 6.3 0.9 1.7
GBP 1.0 (0.4) (3.2) 0.9 (1.3) (4.1) 4.4 (0.6) (3.0) 3.9 0.8 0.0
JPY (2.1) 0.0 1.9 1.9 0.2 2.5 (1.3) (0.2) 1.3 1.4 0.0 (1.4)

82 KOTAK ECONOMIC RESEARCH
KO
TA
K IN
STIT
UTIO
NA
L EQ
UIT
IES R
ESEA
RC
H
82
Ind
ia D
aily
Su
mm
ary
- Octo
be
r 1, 2
02
0
Kotak Institutional Equities: Valuation summary of KIE Universe stocks
Source: Company, Bloomberg, Kotak Institutional Equities estimates
Fair O/S ADVT
Price (Rs) Value Upside Mkt cap. shares EPS (Rs) EPS growth (%) P/E (X) EV/EBITDA (X) 3mo
Company Rating 30-Sep-20 (Rs) (%) (Rs bn) (US$ bn) (mn) 2021E 2022E 2023E 2021E 2022E 2023E 2021E 2022E 2023E 2021E 2022E 2023E 2021E 2022E 2023E 2021E 2022E 2023E 2021E 2022E 2023E (US$ mn)
Automobiles & Components
Amara Raja Batteries REDUCE 764 700 (8) 130 1.8 171 34 44 49 (10.9) 27.3 12.9 22 17.4 15.4 11.9 9.6 8.3 3.2 2.8 2.5 15.2 17.1 17.0 1.1 1.4 1.6 10.2
Apollo Tyres BUY 131 140 7 75 1.0 638 2.9 9.9 15.1 (64.7) 238.7 51.8 44.5 13.2 8.7 7.3 5.4 4.1 0.8 0.7 0.7 1.8 5.6 8.1 1.0 2.1 2.1 14.3
Ashok Leyland BUY 74 85 14 218 3.0 2,936 (0.4) 3.0 6.6 (134.0) 807.7 123.2 NM 25.1 11.2 33.1 11.6 6.4 3.0 2.8 2.4 NM 11.6 23 0.0 1.2 2.7 46
Bajaj Auto BUY 2,881 3,900 35 834 11 289 154 188 219 (12.6) 21.9 16.5 18.7 15.3 13.2 13.5 10.5 8.6 3.8 3.5 3.2 21 24 25 3.2 3.9 4.6 38
Balkrishna Industries SELL 1,477 1,150 (22) 286 3.9 193 48 58 71 (3.4) 21.7 21.0 30.8 25.3 20.9 17.5 14.4 11.9 5.2 4.6 4.1 17.6 19.3 21 1.5 1.6 1.8 15.1
Bharat Forge SELL 448 340 (24) 208 2.8 466 1 14 21 (87.3) 1,341.4 53.6 470.0 32.6 21.2 37.9 17.2 12.6 4.0 3.6 3.2 0.8 11.6 15.9 0.0 0.7 0.7 23
CEAT BUY 992 940 (5) 40 0.5 40 44 68 89 (30.5) 56.9 30.1 22.8 14.5 11.2 8.7 7.1 6.1 1.3 1.2 1.1 5.9 8.8 10.6 1.2 1.2 1.2 3.5
Eicher Motors SELL 2,203 1,920 (13) 602 8.2 272 59 83 107 (11.7) 39.8 28.9 37.2 26.6 20.6 28.2 19.9 14.9 6.2 5.2 4.3 18.0 21 23 0.6 0.6 0.6 71
Endurance Technologies REDUCE 1,152 875 (24) 162 2.2 141 29 46 57 (27.6) 59.6 22.1 40 24.8 20.3 16.3 11.6 9.6 4.8 4.2 3.6 12.2 16.8 17.5 0.4 0.7 0.8 1.5
Escorts BUY 1,318 1,300 (1) 117 2.4 101 55 74 88 1.4 34.2 17.8 23.8 17.7 15.1 14.0 10.1 8.2 2.7 2.4 2.1 11.2 13.4 13.9 0.6 0.8 1.0 42
Exide Industries REDUCE 165 155 (6) 140 1.9 850 7.8 9.1 9.9 (21.7) 16.5 9.0 21.1 18.1 16.6 11.3 9.9 9.1 2.1 2.0 1.8 10.2 11.2 11.4 2.1 2.1 2.1 9.2
Hero Motocorp SELL 3,147 2,700 (14) 629 8.5 200 132 170 203 (17.0) 29.0 19.4 23.8 18.5 15.5 14.8 11.1 9.1 4.2 3.8 3.5 18.1 22 24 2.7 3.2 3.9 62
Mahindra CIE Automotive SELL 135 95 (30) 51 0.7 378 1.6 7.5 11.3 (83.0) 366.5 49.9 83.8 18.0 12.0 13.2 7.3 5.3 1.1 1.0 0.9 1.3 5.9 8.2 — — — 0.6
Mahindra & Mahindra BUY 608 725 19 756 10.2 1,138 30 42 48 26.3 40.8 13.8 20.2 14.4 12.6 12.6 9.3 7.9 1.8 1.7 1.5 9.5 12.1 12.4 0.5 1.0 1.2 56
Maruti Suzuki SELL 6,743 4,500 (33) 2,037 27.6 302 140 225 284 (25.0) 60.2 26.6 48 30 24 28.5 17.1 12.8 4.0 3.6 3.2 8.5 12.6 14.4 0.7 0.8 1.1 117
Motherson Sumi Systems ADD 115 115 0 363 4.9 3,158 1.6 6.6 8.6 (55.6) 302.2 29.5 69.7 17.3 13.4 10.9 5.3 4.2 3.2 2.6 2.1 4.6 16.7 17.4 1.1 1.3 1.5 25
MRF SELL 59,572 58,500 (2) 253 3.4 4 2,159 2,896 3,578 (35.7) 34.2 23.5 28 20.6 16.6 10.1 8.0 6.5 1.9 1.8 1.6 7.2 9.0 10.1 0.1 0.1 0.2 13.9
Schaeffler India SELL 3,560 3,150 (12) 111 1.5 31 83 128 148 (29.7) 55.1 15.6 43 28 24 21.0 14.4 12.3 3.5 3.1 2.8 8.4 11.9 12.3 — — — 0.8
SKF REDUCE 1,462 1,550 6 72 1.0 49 43 58 72 (26.2) 33.6 25.3 34 25 20 24.6 17.7 13.8 4.9 4.2 3.6 14.5 16.7 17.9 7.4 0.7 0.8 1.3
Tata Motors SELL 133 90 (32) 480 6.0 3,829 (20.5) 4.2 12.6 1.0 120.3 202.2 NM 32.1 10.6 6.6 4.3 3.7 0.9 0.8 0.8 NM 2.7 7.7 — — — 127
Timken SELL 1,107 825 (25) 83 1.1 75 22 35 42 (34.2) 60.6 21.7 51 32 26 29.5 19.4 15.9 6.1 5.2 4.4 11.0 17.6 18.2 0.1 0.1 0.2 0.9
TVS Motor SELL 468 285 (39) 222 3.0 475 7.4 14.7 18.7 (43.1) 98.4 27.4 63 32 25 22.8 15.4 12.8 5.9 5.2 4.5 9.5 17.3 19.3 0.7 0.8 1.0 17.5
Varroc Engineering BUY 308 380 24 41 0.6 135 (14) 22 37 (7,416.5) 259.8 70.6 NM 14.1 8.3 10.3 5.5 3.9 1.5 1.3 1.2 NM 9.5 14.1 — — — 1.7
Automobiles & Components Cautious 7,910 107.6 (30.3) 155.0 33.2 55.6 21.8 16.4 13.3 8.8 7.1 2.8 2.5 2.3 5.0 11.6 13.8 1.1 1.3 1.6 697
Banks
AU Small Finance Bank SELL 654 590 (10) 201 2.7 304 19.3 23.0 31.2 (13.1) 19.4 35.7 34 28 21 — — — 4.3 3.8 3.2 12.6 13.2 15.5 — — — 7.4
Axis Bank BUY 425 600 41 1,299 17.6 2,822 35.1 41 49 509.3 17.8 17.5 12 10.3 8.7 — — — 1.3 1.2 1.1 11.1 11.9 12.7 1.2 1.5 1.7 179
Bandhan Bank REDUCE 273 330 21 440 6.0 1,610 20.7 20.7 24.7 14.3 (0.3) 19.7 13.2 13.2 11.0 — — — 2.5 2.1 1.7 19.8 16.5 16.7 — — — 99
Bank of Baroda ADD 41 65 58 190 2.6 4,627 7.3 17.3 19 516.4 137.1 9.3 6 2.4 2.2 — — — 0.3 0.3 0.3 5.0 11.1 11.0 3.5 8.4 9.2 22
Canara Bank REDUCE 89 90 1 129 1.8 1,454 (5.0) 7.5 21.7 76.9 249.7 188.9 NM 11.8 4.1 — — — 0.4 0.4 0.4 NM 2.1 5.8 — — — 16.9
City Union Bank ADD 140 140 0 103 1.4 737 5.6 10.2 11.6 (13.8) 82.6 13.6 25 13.7 12.1 — — — 2.1 1.8 1.6 7.5 12.7 13.0 0.7 1.3 1.5 5.3
DCB Bank BUY 78 150 91 24 0.3 310 9.3 10.3 15.1 (14.7) 10.4 46.8 8.4 7.6 5.2 — — — 0.8 0.7 0.6 8.7 8.9 11.9 1.2 1.3 1.9 3.5
Equitas Holdings BUY 50 100 99 17 0.2 342 5.4 9.0 16.5 (10.4) 66.5 83.8 9.3 5.6 3.0 — — — 0.6 0.6 0.5 6.4 9.8 15.9 — — — 8.9
Federal Bank BUY 49 80 65 97 1.3 1,993 6.1 6.9 10.4 (21.2) 12.7 50.8 8.0 7.1 4.7 — — — 0.7 0.6 0.6 8.1 8.6 12.0 2.8 3.2 4.8 28
HDFC Bank ADD 1,079 1,200 11 5,936 80.5 5,483 49 54 64 2.9 10.3 18.6 22 20 17 — — — 3.1 2.8 2.5 14.9 14.6 15.5 0.9 1.0 1.2 202
ICICI Bank BUY 355 470 32 2,446 33.2 6,474 23.0 27 30 88.0 16.6 10.9 15 13.2 11.9 — — — 1.9 1.7 1.6 12.2 12.9 13.0 1.3 1.5 1.7 195
IndusInd Bank ADD 527 600 14 399 5.4 756 26 64 78 (59.2) 147.6 21.6 20 8.2 6.7 — — — 1.1 1.0 0.9 5.3 11.8 13.0 0.7 1.8 2.2 161
Karur Vysya Bank BUY 33 65 99 26 0.4 799 4.2 6 9 41.4 55.6 40.8 8 5.0 3.6 — — — 0.5 0.4 0.4 4.9 7.4 9.8 3.3 5.2 7.3 1.6
Punjab National Bank REDUCE 29 33 16 269 3.6 9,411 1 5 7 5.7 885.4 34.5 54 5.5 4.1 — — — 0.5 0.5 0.4 0.7 6.0 7.4 — — — 14.9
RBL Bank BUY 170 270 59 86 1.2 509 10.3 20 24 3.4 97.2 18.8 17 8.4 7.1 — — — 0.9 0.8 0.7 4.8 9.0 9.9 0.8 1.6 1.9 68
State Bank of India BUY 185 340 83 1,655 22.4 8,925 24 29 40 49.2 17.9 38.4 8 6.5 4.7 — — — 0.9 0.8 0.7 8.9 9.6 11.9 0.1 0.1 0.1 174
Ujjivan Financial Services BUY 211 490 132 26 0.3 121 33.6 44 - 24.9 31.6 (100.0) 6 4.8 - — — — 1.0 0.9 — 17.0 19.3 NM 2.0 2.8 0.0 12.5
Ujjivan Small Finance Bank ADD 32 39 23 55 0.7 1,728 2 2 3 (4.7) (2.9) 85.6 18 18.5 10.0 — — — 1.9 1.7 1.5 9.8 8.9 14.8 1.1 1.1 2.0 0.0
Union Bank REDUCE 24 25 3 156 2.1 6,407 (1) 0 4 86.0 135.5 901.5 NM 57.6 5.8 — — — 0.4 0.4 0.4 NM 0.5 4.7 (0.7) 0.3 2.6 1.8
YES Bank SELL 13 10 (24) 329 4.5 25,055 (1) (0) 0 89.7 84.7 190.1 NM NM 71.2 — — — 1.3 1.3 1.2 NM NM 1.4 0.0 0.0 0.0 40
Banks Attractive 13,883 188.3 97.2 36.7 27.2 17 12.4 9.7 1.3 1.2 1.1 7.6 9.5 11.0 0.8 1.0 1.2 1,240
P/B (X) RoE (%) Dividend yield (%)

KOTAK ECONOMIC RESEARCH 83
In
dia
Da
ily S
um
ma
ry - O
ctob
er 1
, 202
0
83
K
OTA
K IN
STIT
UTIO
NA
L EQ
UIT
IES R
ESEA
RC
H
Kotak Institutional Equities: Valuation summary of KIE Universe stocks
Source: Company, Bloomberg, Kotak Institutional Equities estimates
Fair O/S ADVT
Price (Rs) Value Upside Mkt cap. shares EPS (Rs) EPS growth (%) P/E (X) EV/EBITDA (X) 3mo
Company Rating 30-Sep-20 (Rs) (%) (Rs bn) (US$ bn) (mn) 2021E 2022E 2023E 2021E 2022E 2023E 2021E 2022E 2023E 2021E 2022E 2023E 2021E 2022E 2023E 2021E 2022E 2023E 2021E 2022E 2023E (US$ mn)
Building Products
Astral Poly Technik SELL 1,225 765 (38) 185 2.5 151 18.3 25 31 11.3 37.9 24.6 67 49 39 36.7 27.6 22.0 10.6 8.9 7.6 17.0 20.0 21 0.2 0.3 0.5 2.8
Building Products Cautious 185 2.5 11.3 37.9 24.6 67 49 39 36.7 27.6 22.0 10.6 8.9 7.5 15.8 18.4 19.4 0.2 0.3 0.5 2.8
Capital goods
ABB SELL 860 840 (2) 182 2.5 212 9 21 26 (50.0) 140.4 22.5 98 41 33 63.1 26.2 21.1 5.1 4.7 4.4 5.3 12.1 13.7 0.7 0.8 1.0 2.5
Ashoka Buildcon BUY 64 130 102 18 0.2 281 9.3 11.4 12.4 (32.8) 23.3 8.3 7.0 5.6 5.2 4.7 3.8 3.0 0.6 0.6 0.5 9.6 10.9 10.8 2.3 2.8 3.1 2.0
Bharat Electronics BUY 96 110 15 233 3.2 2,437 6.2 6.8 6.8 (16.5) 8.6 0.5 15.3 14.1 14.0 9.2 8.2 7.5 2.1 2.0 1.8 14.5 14.5 13.5 2.4 2.7 2.7 24
BHEL SELL 29 28 (5) 102 1.4 3,482 (2.2) 2.4 2.7 48.4 208.5 14.1 NM 12.3 10.8 (19.0) 5.1 4.4 0.4 0.3 0.3 NM 2.8 3.2 (3.3) 3.3 3.3 30
Carborundum Universal ADD 269 285 6 51 0.7 189 12.1 15.2 17.4 (15.9) 26.0 14.1 22 17.7 15.5 12.4 9.8 8.4 2.5 2.3 2.1 11.8 13.7 14.3 1.2 1.6 1.8 1.5
Cochin Shipyard BUY 337 530 57 44 0.6 132 38 46 38 (21.6) 21.8 (16.8) 8.9 7.3 8.7 4.4 4.4 4.6 1.1 1.0 0.9 12.9 14.3 11.0 3.5 3.8 4.2 2.5
Cummins India BUY 445 500 12 123 1.7 277 18 26 29 (28.8) 41.2 14.2 24 17.3 15.2 28.1 17.5 15.3 2.9 2.7 2.6 11.9 16.1 17.6 2.2 3.2 3.6 8.9
Dilip Buildcon BUY 336 545 62 46 0.6 137 27 46 65 (12.3) 73.2 40.4 12.6 7.3 5.2 5.3 3.9 3.2 1.2 1.0 0.8 9.6 14.7 17.5 0.1 0.3 0.3 2.3
IRB Infrastructure BUY 113 150 33 40 0.5 351 15 12 9 (26.7) (22.8) (21.0) 7.5 9.7 12.3 6.4 5.8 5.0 0.6 0.5 0.5 7.7 5.7 4.3 3.4 2.1 2.4 5.4
Kalpataru Power Transmission BUY 245 470 92 38 0.5 153 25 39 44 (1.3) 57.4 11.8 9.8 6.2 5.5 4.3 3.7 3.2 1.0 0.9 0.8 10.9 15.4 15.1 1.3 1.9 2.2 1.8
KEC International BUY 345 360 4 89 1.2 257 24.5 30 34 11.6 24.3 12.6 14.0 11.3 10.0 8.1 6.7 5.9 2.6 2.2 1.8 21 21 20 0.8 1.0 1.1 2.0
L&T BUY 902 1,210 34 1,266 17.2 1,403 35 67 79 (44.9) 91.1 18.0 26 13.5 11.4 18.7 13.2 12.1 1.8 1.7 1.6 7.8 13.1 14.2 1.7 2.3 2.7 63
Sadbhav Engineering BUY 48 105 118 8 0.1 172 4.7 10.9 11.9 12.8 130.1 9.3 10.2 4.4 4.0 6.0 3.8 3.3 0.4 0.4 0.3 3.8 8.3 8.4 — — — 0.5
Siemens SELL 1,265 1,000 (21) 450 6.1 356 32 36 43 70.6 11.7 17.5 39 35 30 26.4 23.5 20.0 4.4 4.1 3.7 11.7 12.1 13.0 0.7 0.8 0.9 13.9
Thermax BUY 719 810 13 86 1.2 113 14 29 36 (24.9) 102.5 24.2 51 25 20 32.8 17.8 14.4 32.8 17.8 14.4 5.2 10.3 12.3 1.3 2.0 2.6 0.8
Capital goods Attractive 2,776 37.6 (27.4) 73.3 14.3 26 15.0 13.2 1.8 1.6 1.5 6.7 10.8 11.5 1.3 2.0 2.3 161
Commercial & Professional Services
SIS BUY 366 395 8 54 0.7 149 14 19 23 (10.2) 36.2 26.3 27 19.8 15.7 12.2 10.2 8.7 3.5 3.0 2.5 13.6 16.1 17.4 0.2 0.3 0.3 0.7
TeamLease Services ADD 2,195 2,000 (9) 38 0.5 17 49 67 93 140.9 36.5 38.1 45 33 24 31.5 24.5 18.8 5.7 4.9 4.0 13.7 16.1 18.7 — — — 1.3
Commercial & Professional Services Attractive 91 1.2 10.1 36.3 29.8 32 23 18.0 15.9 13.1 10.9 4.1 3.5 2.9 12.8 15.0 16.3 0.1 0.2 0.2 2
Commodity Chemicals
Asian Paints REDUCE 1,986 1,800 (9) 1,905 25.8 959 21.9 36.1 42.1 (19.4) 64.9 16.6 91 55 47 53.5 35.9 31.4 16.9 14.6 12.7 19.7 29 29 0.5 0.9 1.1 61
Berger Paints SELL 581 430 (26) 565 7.7 971 6.2 9.4 11.1 (8.5) 51.7 18.2 94 62 52 55.9 39.3 33.8 18.3 15.6 13.2 21 27 27 0.3 0.5 0.6 12.0
Kansai Nerolac ADD 496 485 (2) 267 3.6 539 8.1 12.6 14.7 (18.6) 55.3 17.4 61 40 34 38.5 26.0 22.5 6.6 6.1 5.6 11.2 16.0 17.6 0.6 0.9 1.0 1.9
Tata Chemicals ADD 300 330 10 76 1.0 255 23.1 35.2 39.3 (27.0) 52.2 11.9 13.0 8.5 7.6 4.9 3.8 3.3 0.6 0.6 0.5 4.5 6.6 7.1 2.7 4.1 4.6 12.5
Commodity Chemicals Neutral 2,814 38.2 (19.1) 59.6 16.2 75 47 41 39.9 27.9 24.5 8.9 8.1 7.3 11.8 17.0 17.9 0.5 0.9 1.1 88
Construction Materials
ACC BUY 1,393 1,550 11 262 3.5 188 61.4 79.5 83.6 (15.1) 29.5 5.2 23 17.5 16.7 10.1 7.8 6.9 2.2 2.0 1.9 9.8 12.0 11.9 2.2 2.9 3.0 21
Ambuja Cements BUY 217 235 8 431 5.8 1,986 9.5 12.4 14.6 (10.2) 31.0 17.6 23 17.4 14.8 8.0 5.8 4.5 1.7 1.5 1.4 7.6 9.2 10.0 0.7 0.7 0.7 12.2
Dalmia Bharat BUY 769 1,075 40 144 1.9 192 18.4 38.5 60.6 31.9 109.3 57.3 42 20.0 12.7 7.4 5.6 4.5 1.4 1.3 1.2 3.3 6.6 9.6 — — — 1.4
Grasim Industries ADD 744 700 (6) 490 6.6 657 42.5 71.6 99.6 (19.3) 68.5 39.1 17.5 10.4 7.5 8.6 5.8 4.3 0.8 0.8 0.7 4.8 7.6 9.8 0.1 0.3 0.6 30
J K Cement ADD 1,516 1,550 2 117 1.6 77 52.2 96.1 115.6 (18.7) 84.0 20.2 29 15.8 13.1 12.3 8.3 7.0 3.5 2.9 2.4 12.6 20 20 0.7 0.7 0.7 2.0
JK Lakshmi Cement BUY 258 340 32 30 0.4 118 16.0 27.4 35.2 (32.0) 71.4 28.6 16.1 9.4 7.3 5.8 4.6 3.8 1.6 1.4 1.2 10.6 16.2 17.9 0.9 1.6 2.1 1.2
Orient Cement ADD 61 75 23 13 0.2 205 3.7 6.3 9.0 (12.9) 72.1 41.4 16.6 9.6 6.8 6.1 5.0 4.0 1.1 1.0 0.9 6.6 10.8 14.0 3.3 3.3 3.3 0.3
Shree Cement SELL 20,257 16,000 (21) 731 9.9 36 382.0 651.5 720.3 (12.2) 70.5 10.6 53 31 28 21.4 14.9 13.1 5.3 4.6 4.0 10.3 15.8 15.3 0.5 0.5 0.5 18.1
UltraTech Cement BUY 4,050 4,600 14 1,169 15.9 289 133.7 219.9 284.3 0.6 64.4 29.3 30 18.4 14.2 13.8 9.4 7.5 2.7 2.4 2.1 9.4 13.9 15.6 0.4 0.5 0.6 29
Construction Materials Attractive 3,386 45.9 (10.1) 59.6 26.8 28 17.5 13.8 11.2 7.8 6.2 2.0 1.8 1.6 7.1 10.3 11.6 0.6 0.7 0.8 115
P/B (X) RoE (%) Dividend yield (%)

84 KOTAK ECONOMIC RESEARCH
K
OTA
K IN
STIT
UTIO
NA
L EQ
UIT
IES R
ESEA
RC
H
84
Ind
ia D
aily
Su
mm
ary
- Octo
be
r 1, 2
02
0
Kotak Institutional Equities: Valuation summary of KIE Universe stocks
Source: Company, Bloomberg, Kotak Institutional Equities estimates
Fair O/S ADVT
Price (Rs) Value Upside Mkt cap. shares EPS (Rs) EPS growth (%) P/E (X) EV/EBITDA (X) 3mo
Company Rating 30-Sep-20 (Rs) (%) (Rs bn) (US$ bn) (mn) 2021E 2022E 2023E 2021E 2022E 2023E 2021E 2022E 2023E 2021E 2022E 2023E 2021E 2022E 2023E 2021E 2022E 2023E 2021E 2022E 2023E (US$ mn)
Consumer Durables & Apparel
Crompton Greaves Consumer SELL 292 210 (28) 183 2.5 627 6.9 8.8 19.5 (12.8) 27.1 121.9 42 33 15.0 31 25 11 9.5 7.8 3.3 26 26 48 0.0 0.9 1.7 3.1
Havells India SELL 678 490 (28) 424 5.8 626 8.7 13.8 16.2 (26.1) 58.5 17.7 78 49 42 51 34 28 9.2 8.3 7.4 12.2 17.7 18.7 0.4 0.7 0.8 16.6
Page Industries REDUCE 21,336 18,250 (14) 238 3.2 11 240 407 474 (22.2) 70.0 16.3 89 52 45 55 35 30 25.8 20.8 17.3 31 44 42 0.6 1.1 1.3 13.6
Polycab ADD 820 875 7 122 1.7 149 40 53 58 (21.5) 30.7 10.5 20 15.5 14.0 14 10 9 2.8 2.4 2.1 14.7 16.8 16.2 0.7 0.9 1.0 3.7
TCNS Clothing Co. REDUCE 397 360 (9) 24 0.3 66 0 14 17 (99.8) 69,289.2 24.5 19,837 29 23 26 11 8.9 3.7 3.2 2.7 0.0 11.9 12.6 — — — 0.3
Vardhman Textiles ADD 802 720 (10) 46 0.6 57 25 90 104 (70.8) 260.6 16.1 32 8.9 7.7 12.1 5.7 4.9 0.7 0.7 0.7 2.3 8.0 8.7 1.6 2.5 3.1 0.3
Voltas SELL 680 530 (22) 225 3.1 331 12.9 19.7 22.8 (20.8) 52.8 16.1 53 35 30 48 28 24 4.9 4.5 4.0 9.6 13.5 14.2 0.5 0.7 0.9 19.6
Whirlpool SELL 2,185 1,700 (22) 277 3.8 127 30 49 61 (21.3) 67.1 24.4 74 44 36 50 31 24 9.9 8.9 8.1 14.1 21 24 0.4 0.9 1.4 2.0
Consumer Durables & Apparel Cautious 1,541 20.9 (28.7) 62.5 55 34 26 36 23 18 5.9 5.3 10.7 15.5 16.6 0.5 0.9 59
Consumer Staples
Bajaj Consumer Care ADD 183 200 9 27 0.4 148 12.8 13.1 14.1 2.1 2.7 7.7 14.3 13.9 12.9 10.9 10.5 9.3 3.6 3.3 3.0 27 24 24 3.3 4.4 4.9 3.4
Britannia Industries ADD 3,796 4,150 9 914 12.4 240 81 86 100 36.7 6.3 16.6 47 44 38 35 33 29 17.1 13.6 11.0 39 34 32 0.7 0.9 1.1 39
Colgate-Palmolive (India) ADD 1,434 1,550 8 390 5.3 272 31 36 42 8.1 18.0 14.9 47 40 35 29.9 25.7 22.6 24.3 23.1 21.9 52 60 65 2.0 2.4 2.8 15.2
Dabur India REDUCE 511 415 (19) 903 12.2 1,767 9.5 11.0 12.3 10.2 15.3 11.9 54 47 42 43 37 32 12.6 11.5 10.4 24 26 26 1.2 1.4 1.5 23
Godrej Consumer Products ADD 725 750 3 741 10.1 1,022 15.4 18.5 21.2 11.8 20.3 14.6 47 39 34 32 27 24 8.2 7.4 6.7 18.6 19.9 21 1.0 1.3 1.6 12.8
Hindustan Unilever ADD 2,068 2,500 21 4,859 65.9 2,343 35 45 53 12.3 28.1 17.1 59 46 39 42 33 28 11.2 10.7 10.2 32 24 27 1.5 2.0 2.3 72
ITC BUY 172 260 51 2,113 28.7 12,318 10.6 12.5 13.8 (7.9) 17.9 9.8 16.1 13.7 12.5 11.4 9.4 8.4 3.2 3.1 3.0 19.2 22 24 5.3 6.3 6.9 78
Jyothy Laboratories ADD 147 160 9 54 0.7 367 5.5 6.0 6.9 17.5 9.1 13.5 27 24 21 18.3 16.8 15.0 4.1 3.9 3.7 16.1 16.6 17.7 2.4 2.7 3.1 1.6
Marico ADD 363 390 7 469 6.4 1,290 8.7 9.7 10.5 7.7 11.2 8.5 42 37 34 29 26 24 14.4 13.4 13.1 36 37 39 1.9 2.1 2.5 14.1
Nestle India REDUCE 15,919 16,000 1 1,535 20.8 96 227 270 317 10.9 19.1 17.4 70 59 50 47 40 35 62.4 49.9 40.6 100 94 89 1.1 1.3 1.5 31
Tata Consumer Products ADD 500 470 (6) 460 6.2 922 9.8 11.9 13.5 22.3 22.4 12.9 51 42 37 27 25 22 3.2 3.0 2.9 6.4 7.4 8.0 0.7 0.9 1.0 34
United Breweries ADD 956 1,120 17 253 3.4 264 4.9 20.3 26.3 (70.0) 318.8 29.5 197 47 36 56 24 20 7.1 6.2 5.5 3.6 14.1 16.0 0.1 0.6 0.9 10.5
United Spirits ADD 516 620 20 375 5.1 727 8.6 14.0 16.9 (25.0) 62.8 20.6 60 37 30 32 23 19 8.2 6.7 5.8 14.6 20 20 — — 1.0 21
Varun Beverages BUY 698 825 18 202 2.7 289 6.5 25.5 32.5 (60.0) 291.5 27.7 107 27 21 21 12 11 5.7 4.8 4.0 5.4 18.9 20 0.2 0.3 0.4 2.5
Consumer Staples Attractive 13,294 180.3 3.0 23.2 13.9 40 33 29 28 23 20 8.0 7.5 7.0 19.8 23 24 1.9 2.3 2.7 359
Diversified Financials
Bajaj Finance REDUCE 3,279 2,800 (15) 1,976 26.8 600 74 131 173 (28) 77 32 44 25 19.0 — — — 5.4 4.6 3.8 13.0 19.8 22 0.2 0.4 0.5 365
Bajaj Finserv BUY 5,852 7,600 30 931 12.6 159 252 402 522 19 60 30 23 14.6 11.2 — — — 2.7 2.3 1.9 12.1 16.8 18.7 0.2 0.2 0.2 69
Cholamandalam BUY 249 300 20 204 2.8 820 13.9 20.2 24.6 8 45.0 22.0 17.9 12.3 10.1 — — — 2.5 2.1 1.7 13.1 16.7 17.5 0.6 0.9 1.1 28
IIFL Wealth ADD 973 1,200 23 85 1.2 88 33.4 48.7 65.1 41 45.8 33.6 29 20.0 15.0 — — — 2.8 2.7 2.5 9.7 13.7 17.5 2.2 3.3 3.3 0.6
L&T Finance Holdings ADD 62 90 45 125 1.7 2,005 5 9 14 (44.2) 85 57.1 13.1 7.1 4.5 — — — 0.8 0.7 0.6 6.3 10.9 15.3 2.3 2.6 2.6 15.1
LIC Housing Finance ADD 276 375 36 139 1.9 505 44.0 71.5 83.5 (8) 62.6 16.7 6.3 3.9 3.3 — — — 0.9 0.7 0.6 11.6 16.8 17.1 2.7 4.4 5.1 20
Muthoot Finance REDUCE 1,132 1,100 (3) 454 6.2 401 77 87 102 2.4 13 16.8 14.7 13.0 11.1 — — — 3.3 2.7 2.3 24 23 22 1.4 1.5 1.8 51
Shriram City Union Finance BUY 949 1,300 37 63 0.8 66 101 177 192 (33.3) 75 8.3 9.4 5.4 4.9 — — — 0.9 0.8 0.7 8.9 14.1 13.6 1.4 2.8 3.0 0.9
Shriram Transport BUY 619 1,050 70 157 2.1 253 73.2 107.4 142.5 (34) 46.6 32.8 8.5 5.8 4.3 — — — 0.8 0.7 0.6 9.5 12.2 14.5 1.8 2.6 3.5 44
Diversified Financials Attractive 7,464 101.2 (22.7) 39.9 24.9 24 16.9 13.5 2.7 2.4 2.2 11.4 14.2 16.0 0.9 1.1 1.4 749
P/B (X) RoE (%) Dividend yield (%)

KOTAK ECONOMIC RESEARCH 85
In
dia
Da
ily S
um
ma
ry - O
ctob
er 1
, 202
0
85
K
OTA
K IN
STIT
UTIO
NA
L EQ
UIT
IES R
ESEA
RC
H
Kotak Institutional Equities: Valuation summary of KIE Universe stocks
Source: Company, Bloomberg, Kotak Institutional Equities estimates
Fair O/S ADVT
Price (Rs) Value Upside shares 3mo
Company Rating 30-Sep-20 (Rs) (%) (Rs bn) (US$ bn) (mn) 2021E 2022E 2023E 2021E 2022E 2023E 2021E 2022E 2023E 2021E 2022E 2023E 2021E 2022E 2023E 2021E 2022E 2023E 2021E 2022E 2023E (US$ mn)
Electric Utilities
CESC BUY 614 820 34 81 1.1 133 108 124 135 10 14.8 8.3 5.7 4.9 4.6 4.6 4.0 3.5 0.6 0.5 0.5 11.0 11.4 11.3 2.1 2.1 2.4 3.5
JSW Energy BUY 56 65 15 93 1.3 1,640 4.8 5.3 5.6 (25) 12 4.7 11.8 10.6 10.1 5.7 4.9 4.5 0.7 0.7 0.7 6.5 6.8 6.6 0.0 — — 2.1
NHPC ADD 20 26 29 203 2.8 10,045 3.0 3.2 3.3 5.9 9 1.2 6.8 6.3 6.2 8.0 7.1 6.6 0.6 0.6 0.6 9.3 9.8 9.5 8.6 9.3 9.3 1.7
NTPC BUY 85 130 53 842 11.4 9,895 13.0 15.4 16.6 17.3 18.3 7.7 6.5 5.5 5.1 7.6 5.9 5.1 0.7 0.6 0.6 11.0 12.0 11.9 4.3 5.4 5.9 33
Power Grid BUY 162 220 35 850 11.5 5,232 22.0 25 28 6 16.1 8.9 7.4 6.4 5.8 6.3 5.6 5.1 1.2 1.1 1.0 17.2 18.3 18.1 6.5 7.6 8.3 23
Tata Power BUY 53 70 32 170 2.3 2,705 4.4 6.3 7.1 0 42 12.9 11.9 8.4 7.5 8.0 7.4 6.9 0.7 0.7 0.6 6.4 8.5 8.8 0.0 — — 25
Electric Utilities Attractive 2,239 30.4 9.1 17.1 7.8 7.3 6.2 5.8 0.8 0.8 0.7 11.4 12.3 12.3 5.0 5.8 6.3 88
Fertilizers & Agricultural Chemicals
Bayer Cropscience SELL 5,889 3,400 (42) 265 3.6 45 134.2 149.9 166.0 3.8 11.7 10.8 44 39 35 32 28 25 8.7 7.4 6.3 21 20 19.2 0.5 0.5 0.6 3.0
Dhanuka Agritech SELL 751 650 (13) 36 0.5 48 37.0 40.8 45.8 24.4 10.4 12.2 20.3 18.4 16.4 15.1 13.4 11.6 4.3 3.7 3.2 23 21 21 1.2 1.6 2.1 1.7
Godrej Agrovet SELL 509 420 (18) 98 1.3 192 14.9 17.5 20.4 29.1 17.2 17 34 29 25 17 15 13 4.0 3.6 3.2 12.3 13.0 13.6 1.0 1.2 1.4 1.6
PI Industries SELL 1,972 1,600 (19) 299 4.1 152 45.6 57.8 69.2 38.0 27 20 43 34 28 29 23 19 9.3 7.6 6.3 24 25 24 0.3 0.5 0.7 8.0
Rallis India SELL 285 265 (7) 55 0.8 195 11.3 14.8 18.0 25.0 30.9 21.4 25.2 19.3 15.9 16.9 13.2 10.7 3.5 3.1 2.7 14.7 17.0 17.9 1.0 1.1 1.2 4.7
UPL SELL 503 390 (22) 384 5.2 765 31.9 36.5 40.2 37.6 14.2 10.3 16 13.8 12.5 8.0 7.3 6.6 2.1 1.9 1.7 14.2 14.6 14.4 1.6 1.9 2.1 36
Fertilizers & Agricultural Chemicals Cautious 1,137 15.4 31.8 16.7 13.1 26 22 19.5 12.6 11.2 10.0 3.9 3.4 3.0 15.1 15.5 15.5 0.9 1.1 1.3 55
Gas Utilities
GAIL (India) BUY 87 140 61 391 5.3 4,510 7.6 11.0 12.4 (42.1) 44.8 12.3 11.4 7.9 7.0 8.3 5.8 4.9 0.9 0.8 0.8 7.7 10.6 11.2 4.6 5.8 6.9 18.6
GSPL SELL 209 200 (4) 118 1.6 564 13.2 11.8 8.0 (23.1) (10.6) (32.2) 15.8 17.7 26.1 6.4 6.8 8.9 1.6 1.5 1.4 10.6 8.7 5.6 1.0 1.1 1.0 3.0
Indraprastha Gas SELL 387 380 (2) 271 3.7 700 14.4 20.7 23.1 (13.9) 44.1 11.5 26.9 18.7 16.8 18.6 13.1 11.5 4.7 4.0 3.5 18.6 23 22 0.7 1.2 1.6 23
Mahanagar Gas ADD 830 1,115 34 82 1.1 99 53.8 81.3 86.6 (27.9) 51.1 6.5 15.4 10.2 9.6 10.0 6.4 5.7 2.5 2.2 2.0 17.0 23 22 2.4 4.1 4.9 13.9
Petronet LNG BUY 221 300 36 331 4.5 1,500 18.3 21.7 24.1 3.6 18.6 11.4 12.1 10.2 9.1 6.6 5.7 5.2 2.8 2.7 2.6 24 27 29 6.3 7.9 9.4 14.9
Gas Utilities Attractive 1,193 16.2 (26.2) 31.8 8.9 14.1 10.7 9.8 8.7 6.6 6.0 1.6 1.5 1.4 11.5 14.1 14.4 3.7 4.8 5.7 73
Health Care Services
Apollo Hospitals BUY 2,148 1,840 (14) 299 4.1 139 -18.1 32 60 (198) 277 86 NM 66.9 36.0 40.2 18.9 15.6 9.4 8.6 7.1 NM 13.4 21 (0.3) 0.6 1.1 30
Dr Lal Pathlabs SELL 1,880 1,300 (31) 157 2.1 83 26.7 37.2 42.9 (1.4) 39.2 15.5 70.4 50.6 43.8 44.0 30.9 27.5 13.2 11.2 9.5 20 24 23 0.4 0.6 0.7 4.0
HCG BUY 120 150 25 15 0.2 143 (8.7) (2.4) (1.7) 28 73 27 NM NM NM 12.4 6.8 5.9 1.8 1.8 1.9 NM NM NM — — — 0.2
Metropolis Healthcare SELL 1,782 1,300 (27) 91 1.2 51 30.0 39.7 44.6 (0.1) 32.5 12 59.5 44.9 40.0 35.9 28.0 24.5 14.5 12.0 10.0 26 29 27 0.5 0.7 0.8 3.3
Narayana Hrudayalaya BUY 358 345 (4) 73 1.0 204 -7.4 7.6 10.8 (227.9) 202 42 NM 47.2 33.2 66.4 15.8 13.0 7.4 6.4 5.4 NM 14.6 17.7 — — — 1.0
Health Care Services Attractive 701 9.5 (96) 3,576 42 1,694.4 46.1 32.4 26.0 15.3 13.1 6.7 6.1 5.2 0.4 13.2 16.2 0.0 0.5 0.7 40
Hotels & Restaurants
Jubilant Foodworks ADD 2,344 2,500 7 309 4.2 133 13 34 44 (45) 163.1 30 181.1 68.8 52.8 41.5 26.4 21.8 25.8 19.5 15.6 14.7 32 33 0.2 0.5 0.6 30
Lemon Tree Hotels BUY 28 35 26 22 0.3 790 -1.2 0.6 1.0 (932) 147 77 NM 47.9 27.0 35.1 11.8 8.2 3.0 3.0 2.8 NM 6.2 10.6 — 0.9 1.4 1.0
Hotels & Restaurants Attractive 331 4.5 (76) 579 35 449.6 66.2 49.0 40.6 23.3 18.5 17.1 14.1 11.8 3.8 21 24 0.2 0.5 0.7 31
Insurance
HDFC Life Insurance REDUCE 559 560 0 1,130 15.3 2,010 6.8 7.4 7.8 5.8 8.2 6.3 82 76 71 — — — 14.8 13.6 12.5 18.8 18.7 18.3 0.3 0.3 0.4 29
ICICI Lombard SELL 1,300 950 (27) 591 8.0 454 32.1 34.3 37.9 22 7 11 40 38 34 — — — 7.9 6.9 6.0 21 20 18.7 0.2 0.6 0.6 8.7
ICICI Prudential Life BUY 421 500 19 604 8.2 1,436 8.5 9.6 9.9 14 13.2 3.4 50 44 42 — — — 7.1 6.3 5.6 15.2 15.2 14.0 0.3 0.4 0.4 13.7
Max Financial Services NR 612 — — 165 2.2 343 9.5 26.7 16.0 (6) 180 (40) 64 23 38 — — — — — — 13.5 38 17.3 — 1.0 0.3 14.4
SBI Life Insurance BUY 811 1,050 29 811 11.0 1,001 15.5 16.6 17.7 8.9 7.4 6.5 52 49 46 — — — 8.7 7.6 6.7 18.0 16.7 15.5 — 0.3 0.3 18.4
Insurance Attractive 3,301 44.8 13.0 22.0 (0.6) 55.7 45.6 46 9.3 7.6 7.2 16.7 16.6 15.6 0.2 0.3 0.3 84
Mkt cap. EPS (Rs) EPS growth (%) P/E (X) EV/EBITDA (X) P/B (X) RoE (%) Dividend yield (%)

86 KOTAK ECONOMIC RESEARCH
K
OTA
K IN
STIT
UTIO
NA
L EQ
UIT
IES R
ESEA
RC
H
86
Ind
ia D
aily
Su
mm
ary
- Octo
be
r 1, 2
02
0
Kotak Institutional Equities: Valuation summary of KIE Universe stocks
Source: Company, Bloomberg, Kotak Institutional Equities estimates
Fair O/S ADVT
Price (Rs) Value Upside shares 3mo
Company Rating 30-Sep-20 (Rs) (%) (Rs bn) (US$ bn) (mn) 2021E 2022E 2023E 2021E 2022E 2023E 2021E 2022E 2023E 2021E 2022E 2023E 2021E 2022E 2023E 2021E 2022E 2023E 2021E 2022E 2023E (US$ mn)
Internet Software & Services
Info Edge SELL 3,635 2,800 (23) 467 6.3 128.3 26.7 43.1 52.8 (0.7) 61.3 22.4 136.0 84.3 68.9 126.3 77.4 61.3 10.2 9.4 8.5 9.8 11.6 12.9 0.2 0.3 0.4 20
Just Dial ADD 380 400 5 25 0.3 61.8 24.7 29.9 35.5 (41.1) 21.0 18.8 15.4 12.7 10.7 8.1 5.5 3.8 1.9 1.7 1.4 12.2 14.1 14.5 — — — 8.9
Internet Software & Services Cautious 492 6.7 (17.6) 48.9 21.5 99.3 66.7 54.9 91.4 60.7 49.4 8.5 7.7 6.9 8.6 11.6 12.6 0.2 0.3 0.3 29
IT Services
HCL Technologies ADD 812 900 11 2,202 29.9 2,716 44.6 48.4 52.9 9.3 8.7 9.2 18.2 16.8 15.4 11.0 9.9 8.8 3.7 3.2 2.7 22 20 19.2 1.3 1.7 1.7 83
Hexaware Technologies REDUCE 466 375 (20) 140 1.9 302 23.3 24.6 26.4 9.7 5.8 7.3 20.0 19.0 17.7 13.3 11.8 10.6 4.4 3.8 3.4 23 22 21 1.7 2.1 2.6 7.8
Infosys BUY 1,008 1,115 11 4,295 58.2 4,259 40.5 45.2 50.9 4.0 11.7 12.5 24.9 22.3 19.8 16.6 14.8 13.2 6.0 5.5 5.1 25 26 27 2.6 3.0 3.5 154
L&T Infotech ADD 2,544 2,800 10 444 6.0 176 91.0 110.6 130.3 5 21.5 17.8 27.9 23.0 19.5 18.1 15.7 13.4 7.1 5.9 5.0 27 28 28 1.2 1.4 1.5 8.1
Mindtree REDUCE 1,339 980 (27) 220 3.0 165 54.9 62.5 67.0 43 14 7 24.4 21.4 20.0 14.6 12.9 12.1 5.9 4.9 4.2 26 25 23 1.2 1.4 1.5 19.5
Mphasis REDUCE 1,383 1,100 (20) 258 3.5 187 64.3 70.6 77.7 1 9.9 10.1 21.5 19.6 17.8 14.0 12.5 11.2 4.0 3.7 3.3 19.6 19.6 19.5 2.5 2.5 2.5 8.3
TCS REDUCE 2,492 2,320 (7) 9,352 126.8 3,752 83.6 94.1 102.5 (3) 12.5 8.9 29.8 26.5 24.3 21.1 19.0 17.2 10.1 9.4 8.7 35 37 37 2.7 3.0 3.3 141
Tech Mahindra BUY 792 845 7 690 9.4 880 40.8 51.3 61.0 (11.0) 25.7 18.9 19.4 15.4 13.0 10.9 8.5 7.0 2.9 2.6 2.3 15.7 17.9 19.0 1.9 2.2 2.4 57
Wipro ADD 314 285 (9) 1,792 24.3 5,703 17.0 18.2 19.8 2.4 7.1 8.6 18.4 17.2 15.8 11.4 10.4 9.2 2.8 2.6 2.4 16.2 15.7 15.9 0.6 2.7 2.9 64
IT Services Attractive 19,393 263.0 0.9 11.8 10.4 24.7 22.1 20.0 16.4 14.7 13.2 5.8 5.3 4.8 24 24 24 2.2 2.7 3.0 543
Media
DB Corp. REDUCE 78 81 3 14 0.2 175 5.3 14.1 14.2 (66.5) 166.7 1.2 14.8 5.6 5.5 4.8 2.4 2.5 0.8 0.8 0.8 5.4 14.3 14.6 2.6 15.3 16.6 0.3
Jagran Prakashan REDUCE 37 37 (1) 10 0.1 281 3.9 7.3 8.4 (43.6) 87 NA 9.5 5.1 NA 2.0 1.2 NA 0.5 0.5 NA 5.7 10.3 11.5 5.4 13.4 13.4 0.3
PVR BUY 1,213 1,650 36 67 0.9 55 -70.7 55.6 71.5 (344) 179 29 NM 21.8 17.0 (39.6) 9.0 7.5 3.0 2.7 2.4 NM 13.1 14.9 (0.6) 0.5 0.6 40
Sun TV Network REDUCE 466 435 (7) 184 2.5 394 34.9 39.7 41.7 (2) 13.6 5.0 13.3 11.7 11.2 8.9 7.9 7.5 3.1 3.0 2.9 24 26 26 5.4 5.9 6.4 16.8
Zee Entertainment Enterprises ADD 209 250 20 201 2.7 960 11.5 17.3 19.1 2.9 50.8 10.4 18.2 12.1 10.9 11.0 7.4 6.2 2.0 1.8 1.6 11.4 15.7 15.5 1.7 1.9 2.2 102
Media Cautious 475 6.4 (25.8) 73.9 9.3 20.7 11.9 10.9 11.5 7.0 6.2 2.2 2.0 1.9 10.5 17.0 17.2 2.9 3.9 4.3 159
Metals & Mining
Hindalco Industries BUY 175 285 63 394 5.3 2,220 16.2 26.7 32.3 (8.9) 65.1 21 10.8 6.6 5.4 6.3 4.8 4.0 0.6 0.6 0.5 6.0 9.2 10.1 0.6 0.6 0.6 42
Hindustan Zinc BUY 210 290 38 887 12.0 4,225 15.3 20.1 21.3 (5.0) 31.5 5.9 13.7 10.4 9.9 7.6 5.8 5.4 2.7 2.7 2.7 17.5 25 27 7.3 9.6 10.1 5.7
Jindal Steel and Power BUY 187 280 50 191 2.6 1,020 12.8 20.4 21.7 267 60 6 14.7 9.1 8.6 5.5 4.7 4.4 0.6 0.5 0.5 4.0 6.0 6.0 — — — 40
JSW Steel ADD 278 300 8 671 9.1 2,402 12.6 24.7 31.4 25.0 96 26.9 22.0 11.2 8.9 9.0 6.3 5.3 1.7 1.5 1.3 8.0 14.2 15.7 0.8 0.8 0.8 34
National Aluminium Co. SELL 32 26 (19) 60 0.8 1,866 0.9 1.5 2.6 23 61 74.0 35.2 21.9 12.6 5.9 6.2 5.4 0.6 0.6 0.6 1.7 2.7 4.6 0.0 2.3 4.0 7.4
NMDC REDUCE 82 110 34 252 3.4 3,062 13.5 11.1 12.3 (7.4) (18.4) 12 6.1 7.4 6.7 4.0 4.9 4.5 0.9 0.8 0.8 14.5 11.1 11.7 8.2 6.7 7.5 11.7
Tata Steel BUY 360 550 53 409 5.6 1,146 (0.6) 69.1 84.3 (102) 11,982 22 NM 5.2 4.3 8.5 5.1 4.7 0.6 0.5 0.5 NM 11.0 12.2 2.9 3.6 3.9 82
Vedanta BUY 137 165 21 509 6.9 3,717 11.6 17.8 20.7 77 54 16.5 11.9 7.7 6.6 5.2 4.1 3.6 0.9 0.9 0.9 7.9 11.9 13.3 8.9 8.3 10.9 33
Metals & Mining Attractive 3,373 45.7 (2.3) 77.9 17.0 14.7 8.3 7.1 6.8 5.1 4.5 1.0 0.9 0.9 6.9 11.5 12.4 4.4 5.0 5.6 255
Mkt cap. EPS (Rs) EPS growth (%) P/E (X) EV/EBITDA (X) P/B (X) RoE (%) Dividend yield (%)

KOTAK ECONOMIC RESEARCH 87
In
dia
Da
ily S
um
ma
ry - O
ctob
er 1
, 202
0
87
K
OTA
K IN
STIT
UTIO
NA
L EQ
UIT
IES R
ESEA
RC
H
Kotak Institutional Equities: Valuation summary of KIE Universe stocks
Source: Company, Bloomberg, Kotak Institutional Equities estimates
Fair O/S ADVT
Price (Rs) Value Upside shares 3mo
Company Rating 30-Sep-20 (Rs) (%) (Rs bn) (US$ bn) (mn) 2021E 2022E 2023E 2021E 2022E 2023E 2021E 2022E 2023E 2021E 2022E 2023E 2021E 2022E 2023E 2021E 2022E 2023E 2021E 2022E 2023E (US$ mn)
Oil, Gas & Consumable Fuels
BPCL BUY 353 480 36 766 10.4 1,967 35 37 39 229.9 6.0 5.8 10.2 9.6 9.1 8.1 7.8 7.1 1.9 1.7 1.6 19.5 18.8 18.2 4.9 5.2 5.5 67.9
Coal India BUY 116 195 68 715 9.7 6,163 20 18 18 (28) (8.4) 2.5 5.9 6.5 6.3 5.4 5.6 5.0 2.2 2.3 2.4 37.8 35.4 37.6 17.2 17.2 17.2 20.6
HPCL BUY 181 260 44 275 3.7 1,524 34 29 32 371.9 (13.2) 10.1 5.4 6.2 5.6 6.8 7.1 6.4 0.9 0.8 0.8 17.0 13.7 14.0 9.3 8.1 8.9 23.2
IOCL BUY 74 110 49 696 9.4 9,181 9.6 12.9 13.9 343.8 34.3 7.4 7.7 5.7 5.3 5.5 4.8 4.5 0.7 0.6 0.6 9.2 11.6 11.7 5.9 7.9 8.4 27.9
Oil India SELL 89 70 (22) 97 1.3 1,084 3 6 10 (85) 103.6 56.9 29.7 14.6 9.3 8.4 7.2 5.8 0.4 0.4 0.4 1.3 2.7 4.1 1.0 2.7 4.3 1.3
ONGC SELL 69 60 (13) 871 11.8 12,580 4 7 12 (74) 101.4 76.2 19.7 9.8 5.6 4.6 3.5 2.6 0.4 0.4 0.3 1.9 3.8 6.4 2.8 4.2 7.0 20.9
Reliance Industries ADD 2,234 2,150 (4) 13,243 179.6 5,926 67 93 110 (0.1) 40.0 18.2 33.5 23.9 20.2 15.7 10.7 10.5 2.6 2.4 2.3 8.3 10.8 12.1 0.3 0.3 0.3 612.3
Oil, Gas & Consumable Fuels Attractive 16,663 226.0 2.9 34.1 19.2 21.6 16.1 13.5 10.5 7.9 7.5 1.7 1.6 1.5 8.1 9.6 11.1 1.7 1.9 2.1 774
Pharmaceuticals
Aurobindo Pharma REDUCE 797 790 (1) 467 6.3 586 55 59 62 12.9 8 4.7 14.6 13.5 12.9 8.8 7.8 7.0 2.4 2.1 1.8 16.3 15.3 14.2 0.9 1.1 1.3 50.2
Biocon SELL 448 225 (50) 537 7.3 1,202 8.2 10.1 11.6 32 23 15.8 55 45 38 24.6 20.0 17.6 6.6 5.9 5.3 12.1 13.3 13.8 0.6 0.8 0.9 35.1
Cipla BUY 775 840 8 625 8.5 806 28.2 33 45 47.3 16 38 27 23.5 17.0 15.2 13.1 9.6 3.5 3.1 2.7 12.7 13.3 16.0 0.7 0.8 1.1 87.4
Dr Reddy's Laboratories SELL 5,188 3,700 (29) 862 11.7 166 157 203 231 21 29 13.5 33 25.5 22.5 18.7 14.4 12.6 4.9 4.2 3.6 14.8 16.4 16.1 0.5 0.6 0.6 135.7
Laurus Labs REDUCE 287 870 203 154 2.1 107 54.6 55.3 66 128.6 1 19 5 5.2 4.4 16.6 15.6 12.8 1.3 1.0 0.8 24.8 20.1 19.2 — — — 31.8
Lupin ADD 1,007 1,000 (1) 457 6.2 450 28 44 52 30.3 54 20 36 23 19.3 15.6 10.9 9.0 3.3 3.0 2.6 9.3 12.8 13.5 0.4 0.6 0.8 55.8
Sun Pharmaceuticals REDUCE 500 510 2 1,201 16.3 2,406 19.7 23.1 28 17.6 17 22 25 22 17.8 13.8 11.7 9.7 2.6 2.3 2.1 10.2 11.3 11.8 0.2 0.9 1.1 73.8
Torrent Pharmaceuticals REDUCE 2,800 2,450 (12) 474 6.4 169 72 89 105 25.3 24 18 39 31 27 19.7 16.7 14.8 8.4 7.2 6.1 21.7 22.8 22.8 0.9 1.1 1.3 29.0
Pharmaceuticals Attractive 4,776 64.8 24.9 20 19 28 24 19.8 15.3 12.7 10.7 3.6 3.2 2.8 12.8 13.7 14.3 0.5 0.8 1.0 499
Real Estate
Brigade Enterprises BUY 162 235 45 33 0.4 204 6.8 15 17 6 114 15 23.8 11.1 9.6 10.2 5.3 4.7 1.4 1.3 1.2 6.0 12.0 12.6 1.5 1.5 1.5 0.8
DLF BUY 153 200 31 378 5.1 2,475 5.0 8.7 10.0 310 74 15 31 17.6 15.3 42.2 24.5 24.5 1.1 1.0 1.0 3.6 6.0 6.6 1.3 1.3 1.3 28.7
Embassy Office Parks REIT ADD 361 400 11 278 3.8 772 13.1 15.0 15.6 32 14 4 28 24 23 16.2 14.9 13.3 1.3 1.4 1.5 4.6 5.6 6.2 7.3 8.2 9.3 3.1
Godrej Properties SELL 860 690 (20) 217 2.9 252 11.9 15.4 31.6 10.5 29 105.9 73 56 27 81.3 140.6 46.4 4.2 3.9 3.4 6.0 7.3 13.5 — — — 8.1
Mindspace REIT ADD 305 330 8 181 2.5 593 14 16 18 (84.8) 9.5 13 21.1 19.3 17.0 17.3 14.0 12.6 1.1 1.1 1.1 9.1 5.7 6.5 2.7 6.7 7.1 —
Oberoi Realty ADD 394 450 14 143 1.9 364 22 28 34 14.1 28.8 21 18.2 14.1 11.7 14.3 12.0 8.8 1.5 1.4 1.3 8.8 10.3 11.3 0.5 0.5 0.5 2.4
Prestige Estates Projects ADD 252 275 9 101 1.4 401 6.6 10.2 18 (39.0) 54 81 38 25 13.6 8.1 6.9 5.7 1.8 1.7 1.5 4.9 7.2 11.9 0.6 0.6 0.6 2.7
Sobha BUY 223 400 80 21 0.3 95 32 40 59 9 24.7 45.9 6.9 5.5 3.8 4.2 3.9 3.4 0.8 0.7 0.6 12.1 13.6 17.4 3.1 3.1 3.1 1.3
Sunteck Realty BUY 274 300 9 40 0.5 140 8.8 18.1 20 23.5 105 9 31 15.2 13.9 23.8 13.2 12.3 1.3 1.2 1.1 4.2 8.1 8.1 0.4 0.4 0.4 2.6
Real Estate Attractive 1,392 18.9 97.9 39 24 28 20 16.0 16.8 13.4 11.4 1.4 1.3 1.3 5.0 6.7 8.1 2.4 3.1 3.3 50
Retailing
Aditya Birla Fashion and Retail BUY 134 150 12 110 1.5 773 (4.1) 2.7 4.4 (92.4) 165.6 62.8 NM 50 30 17.1 8.7 7.6 6.8 5.4 4.8 NM 12.4 17.2 — — — 3.9
Avenue Supermarts SELL 2,203 1,530 (31) 1,427 19.4 648 19.2 38 47 (8.7) 95.8 24.3 115 59 47 76 39 32 11.6 9.7 8.0 10.6 18.0 18.6 — — — 23.3
Titan Company BUY 1,201 1,270 6 1,067 14.5 888 9.0 20 26 (46.8) 127.6 29.8 134 59 45 71 37 29 14.8 12.6 10.5 11.5 23.1 25.3 0.2 0.5 0.7 51.9
Retailing Attractive 2,604 35.3 (35.0) 159.4 28.9 151 58 45 63 33 27 12.4 10.3 8.6 8.2 17.7 19.0 0.1 0.2 0.3 79
Speciality Chemicals
Castrol India BUY 109 165 51 108 1.5 989 5.1 8.9 9.7 (39.5) 75.0 9.1 21.6 12.3 11.3 13.9 8.2 7.5 7.9 7.7 7.6 36.5 63.0 67.5 4.6 7.8 8.7 2.0
Pidilite Industries REDUCE 1,434 1,400 (2) 729 9.9 508 18.3 28 34 (20.4) 54.9 18.3 78 50 43 54 36 30 14.6 12.5 10.7 19.7 26.7 27.0 0.5 0.7 0.8 18.7
S H Kelkar and Company BUY 84 105 26 12 0.2 141 5.3 6.5 7.3 14.4 23.4 11.8 15.8 12.8 11.4 8.3 6.6 6.1 1.3 1.2 1.2 8.8 10.1 10.8 1.2 2.1 3.0 1.5
SRF ADD 4,130 4,000 (3) 237 3.2 57 150 193 244 8.7 28.4 26.5 27.5 21.4 16.9 16.0 12.9 10.4 4.2 3.5 3.0 16.2 17.8 19.1 0.4 0.4 0.5 17.0
Speciality Chemicals Attractive 1,086 14.7 (17.1) 48.5 18.4 46 31 26.1 28.3 19.9 17.0 8.4 7.3 6.3 18.3 23.6 24.2 0.9 1.4 1.6 39
Mkt cap. EPS (Rs) EPS growth (%) P/E (X) EV/EBITDA (X) P/B (X) RoE (%) Dividend yield (%)

88 KOTAK ECONOMIC RESEARCH
K
OTA
K IN
STIT
UTIO
NA
L EQ
UIT
IES R
ESEA
RC
H
88
Ind
ia D
aily
Su
mm
ary
- Octo
be
r 1, 2
02
0
Kotak Institutional Equities: Valuation summary of KIE Universe stocks
Source: Company, Bloomberg, Kotak Institutional Equities estimates
Fair O/S ADVT
Price (Rs) Value Upside shares 3mo
Company Rating 30-Sep-20 (Rs) (%) (Rs bn) (US$ bn) (mn) 2021E 2022E 2023E 2021E 2022E 2023E 2021E 2022E 2023E 2021E 2022E 2023E 2021E 2022E 2023E 2021E 2022E 2023E 2021E 2022E 2023E (US$ mn)
Telecommunication Services
Bharti Airtel BUY 421 710 69 2,297 31.1 5,456 4.8 13.8 24.8 87.6 87.6 87.6 87.6 30.4 17.0 6.7 5.5 4.5 3.8 3.6 3.1 3.8 12.1 19.5 1.4 1.4 1.4 171.3
Bharti Infratel ADD 175 215 23 324 4.4 1,850 16.3 17.5 18.7 (1.1) 7.4 6.9 10.7 10.0 9.4 4.2 4.0 3.7 2.4 2.4 2.3 22.2 23.7 25.2 9.1 9.7 10.3 35.6
Vodafone Idea RS 10 — — 274 3.7 28,735 (7.3) (6.3) (4.0) NM NM NM NM NM NM 10.1 8.1 6.2 (1.2) (0.7) (0.5) 251.4 57.2 24.6 — — — 77
Tata Communications BUY 855 975 14 244 3.3 285 29.9 37.3 45.8 28.6 24.5 22.9 28.6 22.9 18.7 8.0 6.9 5.9 NM 61.3 16.0 NM NM 136.3 0.5 0.7 0.8 2.0
Telecommunication Services Attractive 3,139 42.6 59.4 56.4 208.6 NM NM 45.8 7.3 6.1 5.0 6.2 8.3 8.5 NM NM 18.5 2.0 2.1 2.2 286
Transportation
Adani Ports and SEZ BUY 341 400 17 693 9.4 2,032 18.7 21.9 23.8 (30.5) 16.9 8.9 18.2 15.6 14.3 13.0 11.1 9.6 2.4 2.1 1.9 14.0 14.5 14.0 1.0 0.9 1.0 20.7
Container Corp. SELL 365 370 1 222 3.0 609 7.6 13.3 17.1 (55.9) 74.9 28.3 48 27 21 21.9 14.3 11.6 2.2 2.1 2.0 4.6 7.8 9.7 1.1 2.0 2.5 15.4
Gateway Distriparks BUY 91 135 48 11 0.2 125 4.2 3.6 6.6 0.4 (15.1) 82.6 21.5 25.3 13.9 6.3 6.6 5.4 0.8 0.8 0.7 3.8 3.0 5.4 3.3 3.3 3.3 0.2
GMR Infrastructure BUY 23 26 13 139 1.9 6,036 (5.8) (2.8) (1.6) (95.8) 52.7 41.4 NM NM NM (136.5) 23.4 16.4 (2.5) (2.0) (2.2) 88.2 26.9 16.3 — — — 7.0
Gujarat Pipavav Port BUY 82 111 35 40 0.5 483 4.5 5.8 6.7 (24.9) 27.3 15.7 18.1 14.2 12.3 7.9 6.9 6.0 1.9 1.9 1.9 10.6 13.5 15.7 5.2 6.6 7.6 0.6
InterGlobe Aviation BUY 1,249 1,520 22 481 6.5 383 (202.0) 70.9 107.8 (3,015.5) 135.1 52.1 NM 18 11.6 NM 4.2 2.8 (65.5) 24.1 2.8 NM 433.4 102.0 — — — 45
Mahindra Logistics ADD 340 305 (10) 24 0.3 71 5.3 10.9 14.5 (40.8) 106.4 33.1 65 31 24 19.5 13.1 10.5 4.3 3.8 3.4 6.7 12.9 15.4 — — — 0.6
Transportation Attractive 1,610 21.8 (237.1) 200.3 39.6 NM 24 17.2 37.5 10.1 8.1 4.4 3.8 3.2 NM 15.8 18.5 0.7 0.9 1.0 89
KIE universe 117,248 1590.5 8.7 44.5 21.8 27 19.0 15.6 13.0 10.0 8.8 2.5 2.3 2.1 9.2 12.2 13.7 1.5 1.9 2.1
Notes:
(a) We have used adjusted book values for banking companies.
(b) 2021 means calendar year 2020, similarly for 2022 and 2023 for these particular companies.
(c) Exchange rate (Rs/US$)= 73.73
Mkt cap. EPS (Rs) EPS growth (%) P/E (X) EV/EBITDA (X) P/B (X) RoE (%) Dividend yield (%)

Disclo
sure
s
89 KOTAK INSTITUTIONAL EQUITIES RESEARCH
Disclosures
Ratings and other definitions/identifiers
Definitions of ratings
BUY. We expect this stock to deliver more than 15% returns over the next 12 months.
ADD. We expect this stock to deliver 5-15% returns over the next 12 months.
REDUCE. We expect this stock to deliver -5-+5% returns over the next 12 months.
SELL. We expect this stock to deliver <-5% returns over the next 12 months.
Our Fair Value estimates are also on a 12-month horizon basis.
Our Ratings System does not take into account short-term volatility in stock prices related to movements in the market. Hence, a particular Rating may not
strictly be in accordance with the Rating System at all times.
Other definitions
Coverage view. The coverage view represents each analyst’s overall fundamental outlook on the Sector. The coverage view will consist of one of the following
designations: Attractive, Neutral, Cautious.
Other ratings/identifiers
NR = Not Rated. The investment rating and fair value, if any, have been suspended temporarily. Such suspension is in compliance with applicable regulation(s)
and/or Kotak Securities policies in circumstances when Kotak Securities or its affiliates is acting in an advisory capacity in a merger or strategic transaction
involving this company and in certain other circumstances.
CS = Coverage Suspended. Kotak Securities has suspended coverage of this company.
NC = Not Covered. Kotak Securities does not cover this company.
RS = Rating Suspended. Kotak Securities Research has suspended the investment rating and fair value, if any, for this stock, because there is not a sufficient
fundamental basis for determining an investment rating or fair value. The previous investment rating and fair value, if any, are no longer in effect for this stock
and should not be relied upon.
NA = Not Available or Not Applicable. The information is not available for display or is not applicable.
NM = Not Meaningful. The information is not meaningful and is therefore excluded.
Kotak Institutional Equities Research coverage universe
Distribution of ratings/investment banking relationships
Source: Kotak Institutional Equities As of June 30, 2020
Percentage of companies covered by Kotak Institutional
Equities, within the specified category.
* The above categories are defined as follows: Buy = We
expect this stock to deliver more than 15% returns over the next
12 months; Add = We expect this stock to deliver 5-15% returns
over the next 12 months; Reduce = We expect this stock to
deliver -5-+5% returns over the next 12 months; Sell = We
expect this stock to deliver less than -5% returns over the next
12 months. Our target prices are also on a 12-month horizon
basis. These ratings are used illustratively to comply with
applicable regulations. As of 30/06/2020 Kotak Institutional
Equities Investment Research had investment ratings on 203
equity securities.
Percentage of companies within each category for which Kotak
Institutional Equities and or its affiliates has provided
investment banking services within the previous 12 months.45.3%
23.6%
11.8%
19.2%
4.4%
0.5% 0.5% 1.5%
0%
10%
20%
30%
40%
50%
60%
70%
BUY ADD REDUCE SELL

Corporate Office Overseas Affiliates
Kotak Securities Ltd.
27 BKC, Plot No. C-27, “G Block”
Bandra Kurla Complex, Bandra (E)
Mumbai 400 051, India
Tel: +91-22-43360000
Kotak Mahindra (UK) Ltd
8th Floor, Portsoken House
155-157 Minories
London EC3N 1LS
Tel: +44-20-7977-6900
Kotak Mahindra Inc
369 Lexington Avenue
28th Floor, New York
NY 10017, USA
Tel:+1 212 600 8856
Copyright 2020 Kotak Institutional Equities (Kotak Securities Limited). All rights reserved. 1. Note that the research analysts contributing to this report may not be registered/qualified as research analysts with FINRA; and
2. Such research analysts may not be associated persons of Kotak Mahindra Inc and therefore, may not be subject to NASD Rule 2711 restrictions on communications with a subject company, public appearances and trading securities held by a research analyst account.
3. Any U.S. recipients of the research who wish to effect transactions in any security covered by the report should do so with or through Kotak Mahindra Inc and (ii) any transactions in the securities covered by the research by U.S. recipients must be effected only through Kotak Mahindra Inc at [email protected].
This report is distributed in Singapore by Kotak Mahindra (UK) Limited (Singapore Branch) to institutional investors, accredited investors or expert investors only as defined under the Securities and Futures Act. Recipients of this analysis / report are to contact Kotak Mahindra (UK) Limited (Singapore Branch) (16 Raffles Quay, #35-02/03, Hong Leong Building, Singapore 048581) in respect of any matters arising from, or in connection with, this analysis / report. Kotak Mahindra (UK) Limited (Singapore Branch) is regulated by the Monetary Authority of Singapore. Kotak Securities Limited and its affiliates are a full-service, integrated investment banking, investment management, brokerage and financing group. We along with our affiliates are leading underwriter of securities and participants in virtually all securities trading markets in India. We and our affiliates have investment banking and other business relationships with a significant percentage of the companies covered by our Investment Research Department. Our research professionals provide important input into our investment banking and other business selection processes. Investors should assume that Kotak Securities Limited and/or its affiliates are seeking or will seek investment banking or other business from the company or companies that are the subject of this material and that the research professionals who were involved in preparing this material may participate in the solicitation of such business. Our research professionals are paid in part based on the profitability of Kotak Securities Limited, which include earnings from investment banking and other business. Kotak Securities Limited generally prohibits its analysts, persons reporting to analysts, and members of their households from maintaining a financial interest in the securities or derivatives of any companies that the analysts cover. Additionally, Kotak Securities Limited generally prohibits its analysts and persons reporting to analysts from serving as an officer, director, or advisory board member of any companies that the analysts cover. Our salespeople, traders, and other professionals may provide oral or written market commentary or trading strategies to our clients that reflect opinions that are contrary to the opinions expressed herein, and our proprietary trading and investing businesses may make investment decisions that are inconsistent with the recommendations expressed herein. In reviewing these materials, you should be aware that any or all of the foregoing, among other things, may give rise to real or potential conflicts of interest. Additionally, other important information regarding our relationships with the company or companies that are the subject of this material is provided herein. This material should not be construed as an offer to sell or the solicitation of an offer to buy any security in any jurisdiction where such an offer or solicitation would be illegal. We are not soliciting any action based on this material. It is for the general information of clients of Kotak Securities Limited. It does not constitute a personal recommendation or take into account the particular investment objectives, financial situations, or needs of individual clients. Before acting on any advice or recommendation in this material, clients should consider whether it is suitable for their particular circumstances and, if necessary, seek professional advice. The price and value of the investments referred to in this material and the income from them may go down as well as up, and investors may realize losses on any investments. Past performance is not a guide for future performance, future returns are not guaranteed and a loss of original capital may occur. Kotak Securities Limited does not provide tax advise to its clients, and all investors are strongly advised to consult with their tax advisers regarding any potential investment. Certain transactions -including those involving futures, options, and other derivatives as well as non-investment-grade securities - give rise to substantial risk and are not suitable for all investors. The material is based on information that we consider reliable, but we do not represent that it is accurate or complete, and it should not be relied on as such. Opinions expressed are our current opinions as of the date appearing on this material only. We endeavor to update on a reasonable basis the information discussed in this material, but regulatory, compliance, or other reasons may prevent us from doing so. We and our affiliates, officers, directors, and employees, including persons involved in the preparation or issuance of this material, may from time to time have "long" or "short" positions in, act as principal in, and buy or sell the securities or derivatives thereof of companies mentioned herein. Kotak Securities Limited and its non US affiliates may, to the extent permissible under applicable laws, have acted on or used this research to the extent that it relates to non US issuers, prior to or immediately following its publication. Foreign currency denominated securities are subject to fluctuations in exchange rates that could have an adverse effect on the value or price of or income derived from the investment. In addition, investors in securities such as ADRs, the value of which are influenced by foreign currencies affectively assume currency risk. In addition options involve risks and are not suitable for all investors. Please ensure that you have read and understood the current derivatives risk disclosure document before entering into any derivative transactions. Kotak Securities Limited established in 1994, is a subsidiary of Kotak Mahindra Bank Limited. Kotak Securities is one of India's largest brokerage and distribution house. Kotak Securities Limited is a corporate trading and clearing member of Bombay Stock Exchange Limited (BSE), National Stock Exchange of India Limited (NSE), Metropolitan Stock Exchange of India Limited (MSE), National Commodity and Derivatives Exchange (NCDEX) and Multi Commodity Exchange(MCX). Our businesses include stock broking, services rendered in connection with distribution of primary market issues and financial products like mutual funds and fixed deposits, depository services and Portfolio Management. Kotak Securities Limited is also a depository participant with National Securities Depository Limited (NSDL) and Central Depository Services (India) Limited (CDSL). Kotak Securities Limited is also registered with Insurance Regulatory and Development Authority as Corporate Agent for Kotak Mahindra Old Mutual Life Insurance Limited and is also a Mutual Fund Advisor registered with Association of Mutual Funds in India (AMFI). Kotak Securities Limited is registered as a Research Analyst under SEBI (Research Analyst) Regulations, 2014. We hereby declare that our activities were neither suspended nor we have defaulted with any stock exchange authority with whom we are registered in last five years. However SEBI, Exchanges and Depositories have conducted the routine inspection and based on their observations have issued advise letters or levied minor penalty on KSL for certain operational deviations. We have not been debarred from doing business by any Stock Exchange / SEBI or any other authorities; nor has our certificate of registration been cancelled by SEBI at any point of time. We offer our research services to primarily institutional investors and their employees, directors, fund managers, advisors who are registered with us Details of Associates are available on website i.e. www.kotak.com Research Analyst has served as an officer, director or employee of subject company(ies): No We or our associates may have received compensation from the subject company(ies) in the past 12 months. We or our associates have managed or co-managed public offering of securities for the subject company(ies) in the past 12 months. YES. Visit our website for more details We or our associates may have received compensation for investment banking or merchant banking or brokerage services from the subject company(ies) in the past 12 months. We or our associates may have received any compensation for products or services other than investment banking or merchant banking or brokerage services from the subject company(ies) in the past 12 months. We or our associates may have received compensation or other benefits from the subject company(ies) or third party in connection with the research report. Our associates may have financial interest in the subject company(ies). Research Analyst or his/her relative's financial interest in the subject company(ies): No Kotak Securities Limited has financial interest in the subject company(ies) at the end of the month immediately preceding the date of publication of Research Report: National Aluminium Co. - YES Nature of Financial interest: Holding equity shares or derivatives of the subject company. Our associates may have actual/beneficial ownership of 1% or more securities of the subject company(ies) at the end of the month immediately preceding the date of publication of Research Report. Research Analyst or his/her relatives has actual/beneficial ownership of 1% or more securities of the subject company(ies) at the end of the month immediately preceding the date of publication of Research Report: No Kotak Securities Limited has actual/beneficial ownership of 1% or more securities of the subject company(ies) at the end of the month immediately preceding the date of publication of Research Report: No Subject company(ies) may have been client during twelve months preceding the date of distribution of the research report. A graph of daily closing prices of securities is available at https://www.moneycontrol.com/india/stockpricequote/ and http://economictimes.indiatimes.com/markets/stocks/stock-quotes. (Choose a company from the list on the browser and select the"three years" icon in the price chart).
Kotak Securities Limited. Registered Office: 27 BKC, C 27, G Block, Bandra Kurla Complex, Bandra (E), Mumbai 400051. CIN: U99999MH1994PLC134051, Telephone No.: +22 43360000, Fax No.: +22 67132430. Website: www.kotak.com / www.kotaksecurities.com. Correspondence Address: Infinity IT Park, Bldg. No 21, Opp. Film City Road, A K Vaidya Marg, Malad (East), Mumbai 400097. Telephone No: 42856825. SEBI Registration No. INZ000200137(Member of NSE, BSE, MSE, MCX & NCDEX). Member Id: NSE-08081; BSE-673; MSE-1024; MCX-56285; NCDEX-1262. AMFI ARN 0164, PMS INP000000258 and Research Analyst INH000000586. NSDL/CDSL: IN-DP-NSDL-23-97. Compliance Officer Details: Mr. Manoj Agarwal. Call: 022 - 4285 8484, or Email: [email protected]. Investments in securities market are subject to market risks, read all the related documents carefully before investing. In case you require any clarification or have any concern, kindly write to us at below email ids: Level 1: For Trading related queries, contact our customer service at ‘[email protected]’ and for demat account related queries contact us at [email protected] or call us on: Toll free numbers 18002099191 / 1860 266 9191 Level 2: If you do not receive a satisfactory response at Level 1 within 3 working days, you may write to us at [email protected] or call us on 022-42858445 and if you feel you are still unheard, write to our customer service HOD at [email protected] or call us on 022-42858208. Level 3: If you still have not received a satisfactory response at Level 2 within 3 working days, you may contact our Compliance Officer (Name: Mr. Manoj Agarwal) at [email protected] or call on 91- (022) 4285 8484. Level 4 : If you have not received a satisfactory response at Level 3 within 7 working days, you may also approach Managing Director / CEO (Mr. Jaideep Hansraj) at [email protected] or call on 91-(022) 4285 8301. First Cut notes published on this site are for information purposes only. They represent early notations and responses by analysts to recent events. Data in the notes may not have been verified by us and investors should not act upon any data or views in these notes. Most First Cut notes, but not necessarily all, will be followed by final research reports on the subject. There could be variance between the First cut note and the final research note on any subject, in which case the contents of the final research note would prevail. We accept no liability for the contents of the First Cut Notes.


![[Kotak] India Daily, April 2, 2019 - Kotak Securities](https://static.fdokumen.com/doc/165x107/63265a4f5c2c3bbfa803a474/kotak-india-daily-april-2-2019-kotak-securities.jpg)


![[Kotak] India Daily, October 24, 2016 - Kotak Securities](https://static.fdokumen.com/doc/165x107/633d69d4e674f41574068690/kotak-india-daily-october-24-2016-kotak-securities.jpg)