
20July 2020_India_Daily - Kotak Securities
107
For Private Circulation Only. FOR IMPORTANT INFORMATION ABOUT KOTAK SECURITIES’ RATING SYSTEM AND OTHER DISCLOSURES. REFER TO THE END OF THIS MATERIAL. Contents Daily Alerts Results HDFC Bank: Revenue impact mostly at this point HCL Technologies: Impressive margin defense ICICI Lombard: Empty roads drive strong 1Q L&T Finance Holdings: So far, so good Results, Change in Reco Britannia Industries: Execution finesse Company alerts Bajaj Consumer Care: Sanitizer sales aid 1Q print; path forward remains uncertain Sector alerts Insurance: Improving across segments INDIA DAILY July 20, 2020 India 17-Jul 1-day 1-mo 3-mo Sensex 37,020 1.5 6.6 17.0 Nifty 10,902 1.5 6.4 17.7 Global/Regional indices Dow Jones 26,672 (0.2) 3.1 12.8 Nasdaq Composite 10,503 0.3 5.6 22.7 FTSE 6,290 0.6 (0.0) 8.2 Nikkei 22,704 0.0 1.0 15.4 Hang Seng 25,089 0.5 1.8 3.1 KOSPI 2,189 (0.5) 2.2 15.3 Value traded – India Cash (NSE+BSE) 620 638 602 Derivatives (NSE) 10,808 16,694 7,425 Deri. open interest 3,482 3,295 2,017 Forex/money market Change, basis points 17-Jul 1-day 1-mo 3-mo Rs/US$ 74.9 (2) (88) (172) 10yr govt bond, % 6.1 - (19) (60) Net investment (US$ mn) 16-Jul MTD CYTD FIIs (160) (385) (2,826) MFs (108) (378) 4,496 Top movers Change, % Best performers 17-Jul 1-day 1-mo 3-mo IHFL IN Equity 222 1.5 9.2 72.2 BHEL IN Equity 38 3.9 18.2 70.1 MM IN Equity 589 3.1 17.7 65.5 EDEL IN Equity 64 5.0 41.9 63.9 PIEL IN Equity 1,378 0.4 18.5 57.1 Worst performers YES IN Equity 20 3.1 (29.3) (32.8) DMART IN Equity 1,990 (0.9) (15.8) (11.8) NTPC IN Equity 88 1.8 (5.1) (10.7) COAL IN Equity 131 3.5 (4.8) (9.4) AXSB IN Equity 433 (0.2) 3.8 (5.0) [email protected] Contact: +91 22 6218 6427
-
Upload
khangminh22 -
Category
Documents
-
view
3 -
download
0
Transcript of 20July 2020_India_Daily - Kotak Securities
For Private Circulation Only. FOR IMPORTANT INFORMATION ABOUT KOTAK SECURITIES’ RATING SYSTEM AND OTHER DISCLOSURES. REFER TO THE END OF THIS MATERIAL.
Contents
Daily Alerts
Results
HDFC Bank: Revenue impact mostly at this point
HCL Technologies: Impressive margin defense
ICICI Lombard: Empty roads drive strong 1Q
L&T Finance Holdings: So far, so good
Results, Change in Reco
Britannia Industries: Execution finesse
Company alerts
Bajaj Consumer Care: Sanitizer sales aid 1Q print; path forward remains uncertain
Sector alerts
Insurance: Improving across segments
INDIA DAILY July 20, 2020 India 17-Jul 1-day 1-mo 3-mo
Sensex 37,020 1.5 6.6 17.0
Nifty 10,902 1.5 6.4 17.7
Global/Regional indices
Dow Jones 26,672 (0.2) 3.1 12.8
Nasdaq Composite 10,503 0.3 5.6 22.7
FTSE 6,290 0.6 (0.0) 8.2
Nikkei 22,704 0.0 1.0 15.4
Hang Seng 25,089 0.5 1.8 3.1
KOSPI 2,189 (0.5) 2.2 15.3
Value traded – India
Cash (NSE+BSE) 620 638 602
Derivatives (NSE) 10,808 16,694 7,425
Deri. open interest 3,482 3,295 2,017
Forex/money market
Change, basis points
17-Jul 1-day 1-mo 3-mo
Rs/US$ 74.9 (2) (88) (172)
10yr govt bond, % 6.1 - (19) (60)
Net investment (US$ mn)
16-Jul MTD CYTD
FIIs (160) (385) (2,826)
MFs (108) (378) 4,496
Top movers
Change, %
Best performers 17-Jul 1-day 1-mo 3-mo
IHFL IN Equity 222 1.5 9.2 72.2
BHEL IN Equity 38 3.9 18.2 70.1
MM IN Equity 589 3.1 17.7 65.5
EDEL IN Equity 64 5.0 41.9 63.9
PIEL IN Equity 1,378 0.4 18.5 57.1
Worst performers
YES IN Equity 20 3.1 (29.3) (32.8)
DMART IN Equity 1,990 (0.9) (15.8) (11.8)
NTPC IN Equity 88 1.8 (5.1) (10.7)
COAL IN Equity 131 3.5 (4.8) (9.4)
AXSB IN Equity 433 (0.2) 3.8 (5.0)
[email protected]: +91 22 6218 6427
For Private Circulation Only. FOR IMPORTANT INFORMATION ABOUT KOTAK SECURITIES’ RATING SYSTEM AND OTHER DISCLOSURES, REFER TO THE END OF THIS MATERIAL.
Weak revenue growth offset by cost controls; provisions remain high, as expected
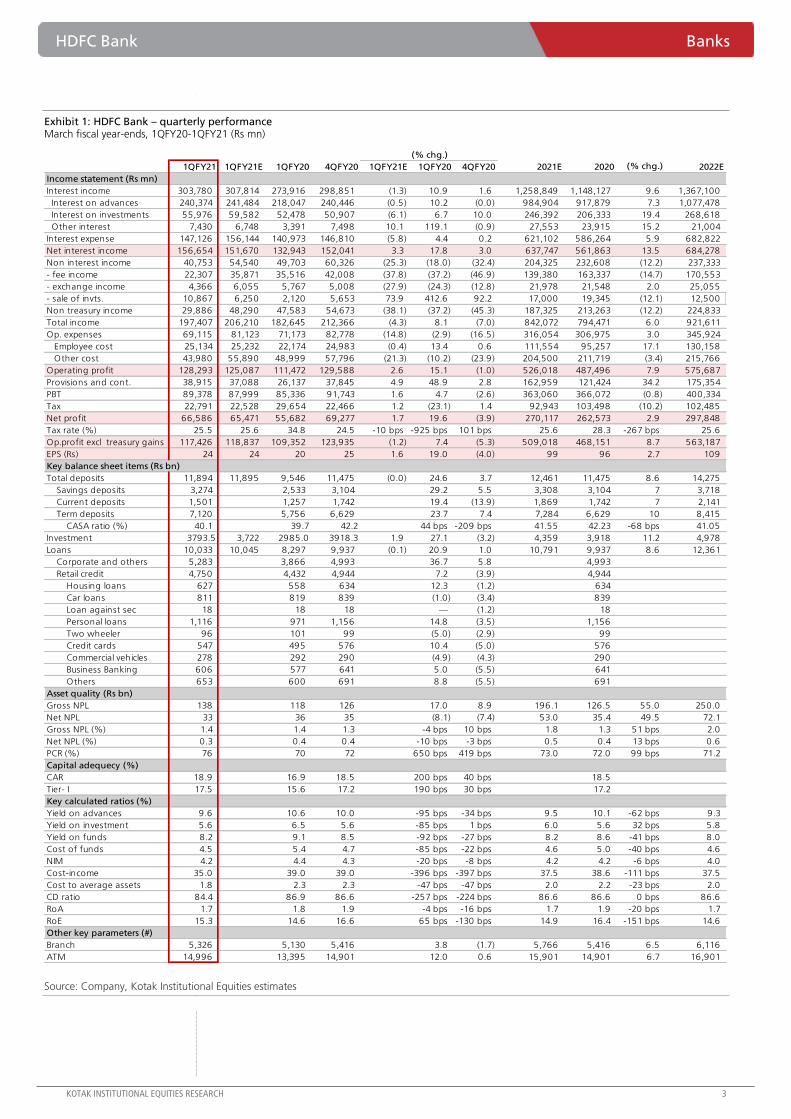
HDFC Bank reported 20% yoy earnings growth on the back of (1) 8% yoy revenue growth, (2)
3% yoy decline in operating expenses, (3) 50% yoy increase in provisions and (4) ~25% yoy
decline in tax. Revenue growth was led by 18% yoy NII growth but offset by 18% yoy decline
in non-interest income as fees declined ~37% yoy. Loans grew ~21% yoy while NIM was
unchanged at 4.3%. Credit cost was high at 1.5%, partly aided by an improvement in provision
coverage and building a contingent standard provision for Covid (~50 bps of loans). 9% of
loans are currently under moratorium but the management was not willing to give more
insights into the previous moratorium considering that they had declared their results early.
Leaning towards slower/weaker revenue growth, offset by better-than-expected credit costs
Even as we stick to our view that these are still early days, a few thoughts are emerging. We are
still of the view that the moratorium ratio provided is not giving a clear insight into building
credit cost estimate for any bank. The initial response, both from our discussion with investors
and prior history, was to build higher provision given its exposure in unsecured, SME and
commercial vehicle book. As we built and still have these high credit costs, 4QFY20 results for
the bank as well as channel checks in recent months saw a tilt in this commentary in two broad
themes: (1) An unchanged initial view, which has a high credit cost that is a function of the
loan mix or (2) a possibility of a slower revenue growth followed by slower-than-expected
impact on credit costs for HDFC Bank.
Even as earnings are broadly the same in each of these, the valuation impact is different. We
are leaning towards the latter but still yet to establish firm evidence. The bank’s earnings have
strong levers, which we see this quarter as a reflection of this thesis. The latter outcome is
positive as gears to accelerate growth are easier as compared to managing impairment issues.
Maintain ADD: valuation safety lower; comfort driven by its strong and dependable franchise
We maintain ADD rating with Fair Value unchanged at Rs1,200. At our FV, we value the bank
at 3X book and 21X June 2022E EPS for RoEs at 15% levels. We believe that the bank is well-
positioned to navigate through this crisis despite having a relatively larger-than-peers exposure
to some of the sectors that could be impacted by the current economic downturn.
HDFC Bank (HDFCB) Banks
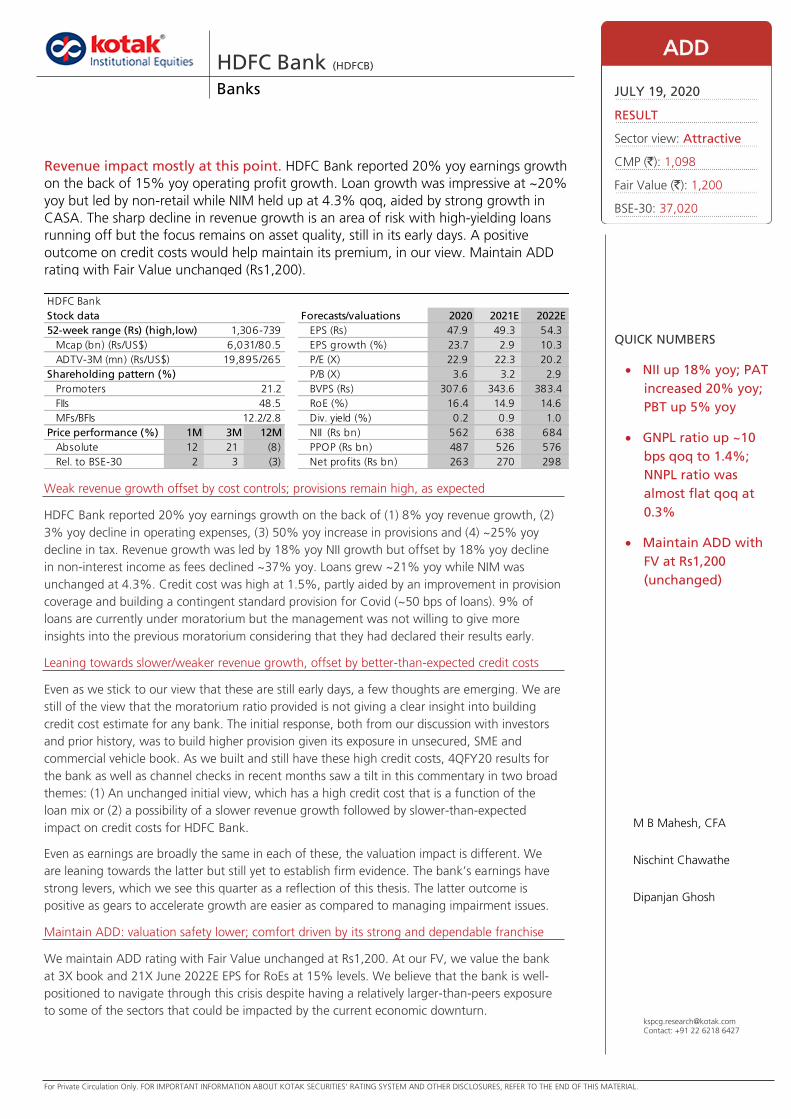
Revenue impact mostly at this point. HDFC Bank reported 20% yoy earnings growth
on the back of 15% yoy operating profit growth. Loan growth was impressive at ~20%
yoy but led by non-retail while NIM held up at 4.3% qoq, aided by strong growth in
CASA. The sharp decline in revenue growth is an area of risk with high-yielding loans
running off but the focus remains on asset quality, still in its early days. A positive
outcome on credit costs would help maintain its premium, in our view. Maintain ADD
rating with Fair Value unchanged (Rs1,200).
ADD
JULY 19, 2020
RESULT
Sector view: Attractive
CMP (`): 1,098
Fair Value (`): 1,200
BSE-30: 37,020
QUICK NUMBERS
NII up 18% yoy; PAT
increased 20% yoy;
PBT up 5% yoy
GNPL ratio up ~10
bps qoq to 1.4%;
NNPL ratio was
almost flat qoq at
0.3%
Maintain ADD with
FV at Rs1,200
(unchanged)
M B Mahesh, CFA
Nischint Chawathe
Dipanjan Ghosh
Stock data Forecasts/valuations 2020 2021E 2022E
52-week range (Rs) (high,low) EPS (Rs) 47.9 49.3 54.3
Mcap (bn) (Rs/US$) EPS growth (%) 23.7 2.9 10.3
ADTV-3M (mn) (Rs/US$) P/E (X) 22.9 22.3 20.2
Shareholding pattern (%) P/B (X) 3.6 3.2 2.9
Promoters 21.2 BVPS (Rs) 307.6 343.6 383.4
FIIs 48.5 RoE (%) 16.4 14.9 14.6
MFs/BFIs Div. yield (%) 0.2 0.9 1.0
Price performance (%) 1M 3M 12M NII (Rs bn) 562 638 684
Absolute 12 21 (8) PPOP (Rs bn) 487 526 576
Rel. to BSE-30 2 3 (3) Net profits (Rs bn) 263 270 298
12.2/2.8
HDFC Bank
6,031/80.5
19,895/265
1,306-739
[email protected]: +91 22 6218 6427
HDFC Bank Banks
KOTAK INSTITUTIONAL EQUITIES RESEARCH 3
Exhibit 1: HDFC Bank – quarterly performance March fiscal year-ends, 1QFY20-1QFY21 (Rs mn)
Source: Company, Kotak Institutional Equities estimates
1QFY21 1QFY21E 1QFY20 4QFY20 1QFY21E 1QFY20 4QFY20 2021E 2020 2022E
Income statement (Rs mn)
Interest income 303,780 307,814 273,916 298,851 (1.3) 10.9 1.6 1,258,849 1,148,127 9.6 1,367,100
Interest on advances 240,374 241,484 218,047 240,446 (0.5) 10.2 (0.0) 984,904 917,879 7.3 1,077,478
Interest on investments 55,976 59,582 52,478 50,907 (6.1) 6.7 10.0 246,392 206,333 19.4 268,618
Other interest 7,430 6,748 3,391 7,498 10.1 119.1 (0.9) 27,553 23,915 15.2 21,004
Interest expense 147,126 156,144 140,973 146,810 (5.8) 4.4 0.2 621,102 586,264 5.9 682,822
Net interest income 156,654 151,670 132,943 152,041 3.3 17.8 3.0 637,747 561,863 13.5 684,278
Non interest income 40,753 54,540 49,703 60,326 (25.3) (18.0) (32.4) 204,325 232,608 (12.2) 237,333
- fee income 22,307 35,871 35,516 42,008 (37.8) (37.2) (46.9) 139,380 163,337 (14.7) 170,553
- exchange income 4,366 6,055 5,767 5,008 (27.9) (24.3) (12.8) 21,978 21,548 2.0 25,055
- sale of invts. 10,867 6,250 2,120 5,653 73.9 412.6 92.2 17,000 19,345 (12.1) 12,500
Non treasury income 29,886 48,290 47,583 54,673 (38.1) (37.2) (45.3) 187,325 213,263 (12.2) 224,833
Total income 197,407 206,210 182,645 212,366 (4.3) 8.1 (7.0) 842,072 794,471 6.0 921,611
Op. expenses 69,115 81,123 71,173 82,778 (14.8) (2.9) (16.5) 316,054 306,975 3.0 345,924
Employee cost 25,134 25,232 22,174 24,983 (0.4) 13.4 0.6 111,554 95,257 17.1 130,158
Other cost 43,980 55,890 48,999 57,796 (21.3) (10.2) (23.9) 204,500 211,719 (3.4) 215,766
Operating profit 128,293 125,087 111,472 129,588 2.6 15.1 (1.0) 526,018 487,496 7.9 575,687
Provisions and cont. 38,915 37,088 26,137 37,845 4.9 48.9 2.8 162,959 121,424 34.2 175,354
PBT 89,378 87,999 85,336 91,743 1.6 4.7 (2.6) 363,060 366,072 (0.8) 400,334
Tax 22,791 22,528 29,654 22,466 1.2 (23.1) 1.4 92,943 103,498 (10.2) 102,485
Net profit 66,586 65,471 55,682 69,277 1.7 19.6 (3.9) 270,117 262,573 2.9 297,848
Tax rate (%) 25.5 25.6 34.8 24.5 -10 bps -925 bps 101 bps 25.6 28.3 -267 bps 25.6
Op.profit excl treasury gains 117,426 118,837 109,352 123,935 (1.2) 7.4 (5.3) 509,018 468,151 8.7 563,187
EPS (Rs) 24 24 20 25 1.6 19.0 (4.0) 99 96 2.7 109
Key balance sheet items (Rs bn)
Total deposits 11,894 11,895 9,546 11,475 (0.0) 24.6 3.7 12,461 11,475 8.6 14,275
Savings deposits 3,274 2,533 3,104 29.2 5.5 3,308 3,104 7 3,718
Current deposits 1,501 1,257 1,742 19.4 (13.9) 1,869 1,742 7 2,141
Term deposits 7,120 5,756 6,629 23.7 7.4 7,284 6,629 10 8,415
CASA ratio (%) 40.1 39.7 42.2 44 bps -209 bps 41.55 42.23 -68 bps 41.05
Investment 3793.5 3,722 2985.0 3918.3 1.9 27.1 (3.2) 4,359 3,918 11.2 4,978
Loans 10,033 10,045 8,297 9,937 (0.1) 20.9 1.0 10,791 9,937 8.6 12,361
Corporate and others 5,283 3,866 4,993 36.7 5.8 4,993
Retail credit 4,750 4,432 4,944 7.2 (3.9) 4,944
Housing loans 627 558 634 12.3 (1.2) 634
Car loans 811 819 839 (1.0) (3.4) 839
Loan against sec 18 18 18 — (1.2) 18
Personal loans 1,116 971 1,156 14.8 (3.5) 1,156
Two wheeler 96 101 99 (5.0) (2.9) 99
Credit cards 547 495 576 10.4 (5.0) 576
Commercial vehicles 278 292 290 (4.9) (4.3) 290
Business Banking 606 577 641 5.0 (5.5) 641
Others 653 600 691 8.8 (5.5) 691
Asset quality (Rs bn)
Gross NPL 138 118 126 17.0 8.9 196.1 126.5 55.0 250.0
Net NPL 33 36 35 (8.1) (7.4) 53.0 35.4 49.5 72.1
Gross NPL (%) 1.4 1.4 1.3 -4 bps 10 bps 1.8 1.3 51 bps 2.0
Net NPL (%) 0.3 0.4 0.4 -10 bps -3 bps 0.5 0.4 13 bps 0.6
PCR (%) 76 70 72 650 bps 419 bps 73.0 72.0 99 bps 71.2
Capital adequecy (%)
CAR 18.9 16.9 18.5 200 bps 40 bps 18.5
Tier- I 17.5 15.6 17.2 190 bps 30 bps 17.2
Key calculated ratios (%)
Yield on advances 9.6 10.6 10.0 -95 bps -34 bps 9.5 10.1 -62 bps 9.3
Yield on investment 5.6 6.5 5.6 -85 bps 1 bps 6.0 5.6 32 bps 5.8
Yield on funds 8.2 9.1 8.5 -92 bps -27 bps 8.2 8.6 -41 bps 8.0
Cost of funds 4.5 5.4 4.7 -85 bps -22 bps 4.6 5.0 -40 bps 4.6
NIM 4.2 4.4 4.3 -20 bps -8 bps 4.2 4.2 -6 bps 4.0
Cost-income 35.0 39.0 39.0 -396 bps -397 bps 37.5 38.6 -111 bps 37.5
Cost to average assets 1.8 2.3 2.3 -47 bps -47 bps 2.0 2.2 -23 bps 2.0
CD ratio 84.4 86.9 86.6 -257 bps -224 bps 86.6 86.6 0 bps 86.6
RoA 1.7 1.8 1.9 -4 bps -16 bps 1.7 1.9 -20 bps 1.7
RoE 15.3 14.6 16.6 65 bps -130 bps 14.9 16.4 -151 bps 14.6
Other key parameters (#)
Branch 5,326 5,130 5,416 3.8 (1.7) 5,766 5,416 6.5 6,116
ATM 14,996 13,395 14,901 12.0 0.6 15,901 14,901 6.7 16,901
(% chg.)
(% chg.)
Banks HDFC Bank
4 KOTAK INSTITUTIONAL EQUITIES RESEARCH
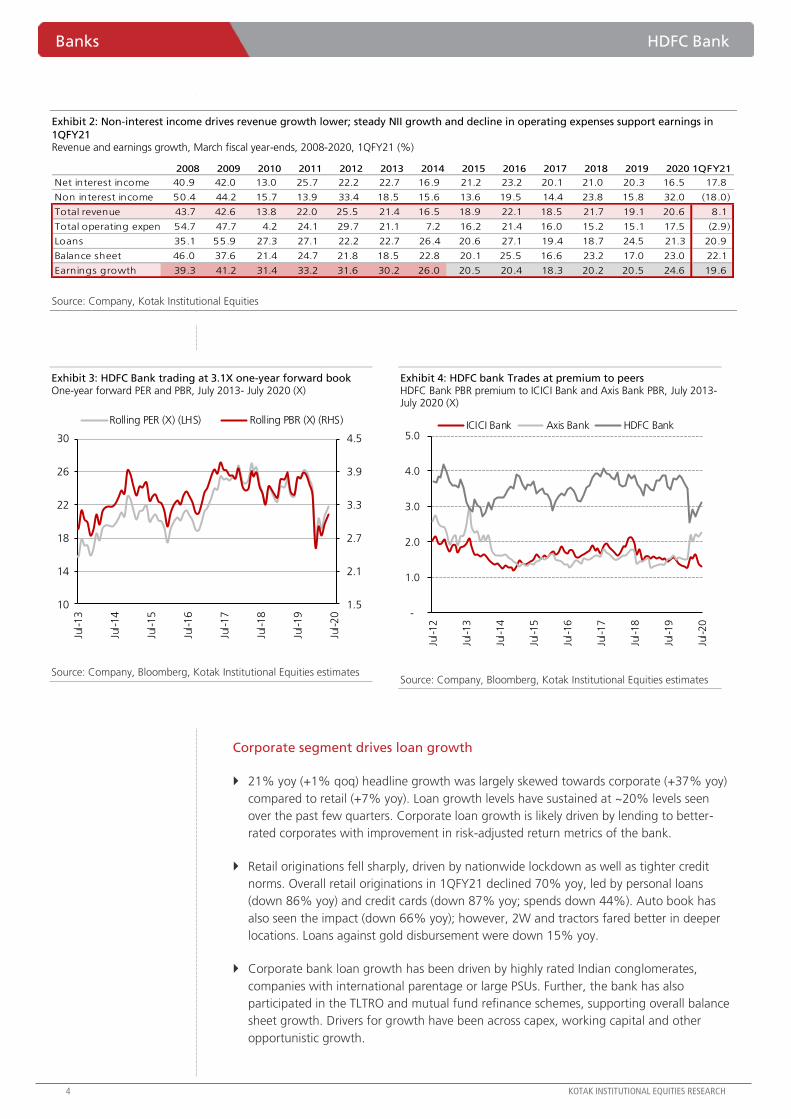
Exhibit 2: Non-interest income drives revenue growth lower; steady NII growth and decline in operating expenses support earnings in
1QFY21 Revenue and earnings growth, March fiscal year-ends, 2008-2020, 1QFY21 (%)
Source: Company, Kotak Institutional Equities
Exhibit 3: HDFC Bank trading at 3.1X one-year forward book One-year forward PER and PBR, July 2013- July 2020 (X)
Source: Company, Bloomberg, Kotak Institutional Equities estimates
Exhibit 4: HDFC bank Trades at premium to peers HDFC Bank PBR premium to ICICI Bank and Axis Bank PBR, July 2013- July 2020 (X)
Source: Company, Bloomberg, Kotak Institutional Equities estimates
Corporate segment drives loan growth
21% yoy (+1% qoq) headline growth was largely skewed towards corporate (+37% yoy)
compared to retail (+7% yoy). Loan growth levels have sustained at ~20% levels seen
over the past few quarters. Corporate loan growth is likely driven by lending to better-
rated corporates with improvement in risk-adjusted return metrics of the bank.
Retail originations fell sharply, driven by nationwide lockdown as well as tighter credit
norms. Overall retail originations in 1QFY21 declined 70% yoy, led by personal loans
(down 86% yoy) and credit cards (down 87% yoy; spends down 44%). Auto book has
also seen the impact (down 66% yoy); however, 2W and tractors fared better in deeper
locations. Loans against gold disbursement were down 15% yoy.
Corporate bank loan growth has been driven by highly rated Indian conglomerates,
companies with international parentage or large PSUs. Further, the bank has also
participated in the TLTRO and mutual fund refinance schemes, supporting overall balance
sheet growth. Drivers for growth have been across capex, working capital and other
opportunistic growth.
2008 2009 2010 2011 2012 2013 2014 2015 2016 2017 2018 2019 2020 1QFY21
Net interest income 40.9 42.0 13.0 25.7 22.2 22.7 16.9 21.2 23.2 20.1 21.0 20.3 16.5 17.8
Non interest income 50.4 44.2 15.7 13.9 33.4 18.5 15.6 13.6 19.5 14.4 23.8 15.8 32.0 (18.0)
Total revenue 43.7 42.6 13.8 22.0 25.5 21.4 16.5 18.9 22.1 18.5 21.7 19.1 20.6 8.1
Total operating expenses54.7 47.7 4.2 24.1 29.7 21.1 7.2 16.2 21.4 16.0 15.2 15.1 17.5 (2.9)
Loans 35.1 55.9 27.3 27.1 22.2 22.7 26.4 20.6 27.1 19.4 18.7 24.5 21.3 20.9
Balance sheet 46.0 37.6 21.4 24.7 21.8 18.5 22.8 20.1 25.5 16.6 23.2 17.0 23.0 22.1
Earnings growth 39.3 41.2 31.4 33.2 31.6 30.2 26.0 20.5 20.4 18.3 20.2 20.5 24.6 19.6
1.5
2.1
2.7
3.3
3.9
4.5
10
14
18
22
26
30
Jul-13
Jul-14
Jul-15
Jul-16
Jul-17
Jul-18
Jul-19
Jul-20
Rolling PER (X) (LHS) Rolling PBR (X) (RHS)
-
1.0
2.0
3.0
4.0
5.0Ju
l-12
Jul-13
Jul-14
Jul-15
Jul-16
Jul-17
Jul-18
Jul-19
Jul-20
ICICI Bank Axis Bank HDFC Bank
HDFC Bank Banks
KOTAK INSTITUTIONAL EQUITIES RESEARCH 5
SME book growth was slower in mid-teens with disbursement levels at one-third of
4QFY20 levels. Focus on this book remains on granularity, geographical spread and risk
mitigation including through self-funding ratio. As of mid-July, the bank has identified
eligible customers for credit guarantee scheme with disbursements of ~Rs200 bn.
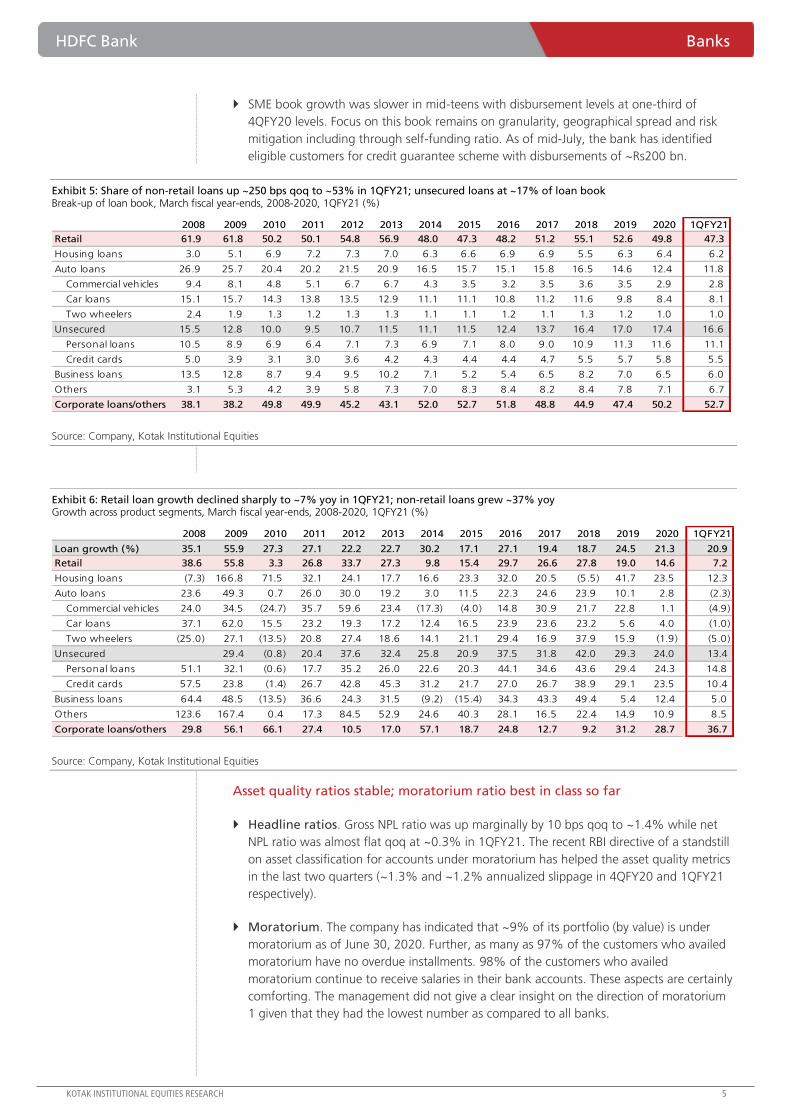
Exhibit 5: Share of non-retail loans up ~250 bps qoq to ~53% in 1QFY21; unsecured loans at ~17% of loan book Break-up of loan book, March fiscal year-ends, 2008-2020, 1QFY21 (%)
Source: Company, Kotak Institutional Equities
Exhibit 6: Retail loan growth declined sharply to ~7% yoy in 1QFY21; non-retail loans grew ~37% yoy Growth across product segments, March fiscal year-ends, 2008-2020, 1QFY21 (%)
Source: Company, Kotak Institutional Equities
Asset quality ratios stable; moratorium ratio best in class so far
Headline ratios. Gross NPL ratio was up marginally by 10 bps qoq to ~1.4% while net
NPL ratio was almost flat qoq at ~0.3% in 1QFY21. The recent RBI directive of a standstill
on asset classification for accounts under moratorium has helped the asset quality metrics
in the last two quarters (~1.3% and ~1.2% annualized slippage in 4QFY20 and 1QFY21
respectively).
Moratorium. The company has indicated that ~9% of its portfolio (by value) is under
moratorium as of June 30, 2020. Further, as many as 97% of the customers who availed
moratorium have no overdue installments. 98% of the customers who availed
moratorium continue to receive salaries in their bank accounts. These aspects are certainly
comforting. The management did not give a clear insight on the direction of moratorium
1 given that they had the lowest number as compared to all banks.
2008 2009 2010 2011 2012 2013 2014 2015 2016 2017 2018 2019 2020 1QFY21
Retail 61.9 61.8 50.2 50.1 54.8 56.9 48.0 47.3 48.2 51.2 55.1 52.6 49.8 47.3
Housing loans 3.0 5.1 6.9 7.2 7.3 7.0 6.3 6.6 6.9 6.9 5.5 6.3 6.4 6.2
Auto loans 26.9 25.7 20.4 20.2 21.5 20.9 16.5 15.7 15.1 15.8 16.5 14.6 12.4 11.8
Commercial vehicles 9.4 8.1 4.8 5.1 6.7 6.7 4.3 3.5 3.2 3.5 3.6 3.5 2.9 2.8
Car loans 15.1 15.7 14.3 13.8 13.5 12.9 11.1 11.1 10.8 11.2 11.6 9.8 8.4 8.1
Two wheelers 2.4 1.9 1.3 1.2 1.3 1.3 1.1 1.1 1.2 1.1 1.3 1.2 1.0 1.0
Unsecured 15.5 12.8 10.0 9.5 10.7 11.5 11.1 11.5 12.4 13.7 16.4 17.0 17.4 16.6
Personal loans 10.5 8.9 6.9 6.4 7.1 7.3 6.9 7.1 8.0 9.0 10.9 11.3 11.6 11.1
Credit cards 5.0 3.9 3.1 3.0 3.6 4.2 4.3 4.4 4.4 4.7 5.5 5.7 5.8 5.5
Business loans 13.5 12.8 8.7 9.4 9.5 10.2 7.1 5.2 5.4 6.5 8.2 7.0 6.5 6.0
Others 3.1 5.3 4.2 3.9 5.8 7.3 7.0 8.3 8.4 8.2 8.4 7.8 7.1 6.7
Corporate loans/others 38.1 38.2 49.8 49.9 45.2 43.1 52.0 52.7 51.8 48.8 44.9 47.4 50.2 52.7
2008 2009 2010 2011 2012 2013 2014 2015 2016 2017 2018 2019 2020 1QFY21
Loan growth (%) 35.1 55.9 27.3 27.1 22.2 22.7 30.2 17.1 27.1 19.4 18.7 24.5 21.3 20.9
Retail 38.6 55.8 3.3 26.8 33.7 27.3 9.8 15.4 29.7 26.6 27.8 19.0 14.6 7.2
Housing loans (7.3) 166.8 71.5 32.1 24.1 17.7 16.6 23.3 32.0 20.5 (5.5) 41.7 23.5 12.3
Auto loans 23.6 49.3 0.7 26.0 30.0 19.2 3.0 11.5 22.3 24.6 23.9 10.1 2.8 (2.3)
Commercial vehicles 24.0 34.5 (24.7) 35.7 59.6 23.4 (17.3) (4.0) 14.8 30.9 21.7 22.8 1.1 (4.9)
Car loans 37.1 62.0 15.5 23.2 19.3 17.2 12.4 16.5 23.9 23.6 23.2 5.6 4.0 (1.0)
Two wheelers (25.0) 27.1 (13.5) 20.8 27.4 18.6 14.1 21.1 29.4 16.9 37.9 15.9 (1.9) (5.0)
Unsecured 29.4 (0.8) 20.4 37.6 32.4 25.8 20.9 37.5 31.8 42.0 29.3 24.0 13.4
Personal loans 51.1 32.1 (0.6) 17.7 35.2 26.0 22.6 20.3 44.1 34.6 43.6 29.4 24.3 14.8
Credit cards 57.5 23.8 (1.4) 26.7 42.8 45.3 31.2 21.7 27.0 26.7 38.9 29.1 23.5 10.4
Business loans 64.4 48.5 (13.5) 36.6 24.3 31.5 (9.2) (15.4) 34.3 43.3 49.4 5.4 12.4 5.0
Others 123.6 167.4 0.4 17.3 84.5 52.9 24.6 40.3 28.1 16.5 22.4 14.9 10.9 8.5
Corporate loans/others 29.8 56.1 66.1 27.4 10.5 17.0 57.1 18.7 24.8 12.7 9.2 31.2 28.7 36.7

Banks HDFC Bank
6 KOTAK INSTITUTIONAL EQUITIES RESEARCH
Slippages. The portfolio saw ~1.2% slippage (annualized) in 1QFY21 amounting to
~Rs30 bn (KIE estimate). The bank used its internal analytical models to determine
slippages in an accelerated manner beyond the usual 90 DPD (days-past-due) approach.
This contributed 30 bps of addition to GNPA in 1QFY21. Management indicated that this
accelerated slippage can be attributed entirely to customers who did not avail
moratorium.
Recoveries. The lockdown also impacted collection activity and consequently recoveries
to the extent of ~Rs3 bn in 1QFY21. The bank has augmented its collections team by a
net of 20,000 employees – some of whom were reassigned from the sales and
underwriting teams.
Provisions. The bank reported that it holds Covid-related provisions in excess of what is
mandated by the RBI. The bank made contingent provisions of Rs10 bn during the
quarter. Total credit cost (annualized) for 1QFY21 was 1.54% of advances (1.51% in
4QFY20 and 1.25% in 1QFY20). Provision coverage ratio improved by ~420 bps qoq to
~76% in 1QFY21. The bank is comfortably placed with total provisions (including specific,
floating, contingent and general provisions) amounting to 149% of gross NPA as of June
2020. Management expressed comfort with the current level of provisioning.
Given that a large part of the bank’s portfolio is focused on the salaried segment, the impact
of the ongoing slowdown on the bank should be lower. The management indicated that the
bank had tightened credit standards before the pandemic hit and hence, it should be able to
navigate the crisis well. We have seen that HDFC Bank has demonstrated that it has one of
the best banking franchises among private banks and usually tends to use the regulatory
forbearances sparingly. It is this comfort which allows us to be a bit more comfortable to
build a positive view on the bank despite having a less favorable outlook to medium-term
business of the bank. Note that the portfolio is far more diversified by customer segment
and geography than it was a decade back.
We are building in gross NPLs to rise to ~2% and net NPLs at 0.6% of loans by FY2022E.
The gross NPL ratio has been rising in recent years largely led by increase in pressure from
agriculture and steadily rising NPLs in the retail loan portfolio. In recent months, we have
seen the pressure in the commercial vehicle space as well. We would have to additionally
watch the portfolio in the other segments of retail and business banking as well.
Exhibit 7: Absolute growth in GNPLs was lower than loan growth in the last two quarters March fiscal year-ends, 1QFY13-1QFY21 (#)
Source: Company, Kotak Institutional Equities
0
12
24
36
48
60
1Q
FY13
2Q
FY13
3Q
FY13
4Q
FY13
1Q
FY14
2Q
FY14
3Q
FY14
4Q
FY14
1Q
FY15
2Q
FY15
3Q
FY15
4Q
FY15
1Q
FY16
2Q
FY16
3Q
FY16
4Q
FY16
1Q
FY17
2Q
FY17
3Q
FY17
4Q
FY17
1Q
FY18
2Q
FY18
3Q
FY18
4Q
FY18
1Q
FY19
2Q
FY19
3Q
FY19
4Q
FY19
1Q
FY20
2Q
FY20
3Q
FY20
4Q
FY20
1Q
FY21
Loan growth (LHS) Gross NPL growth
HDFC Bank Banks
KOTAK INSTITUTIONAL EQUITIES RESEARCH 7
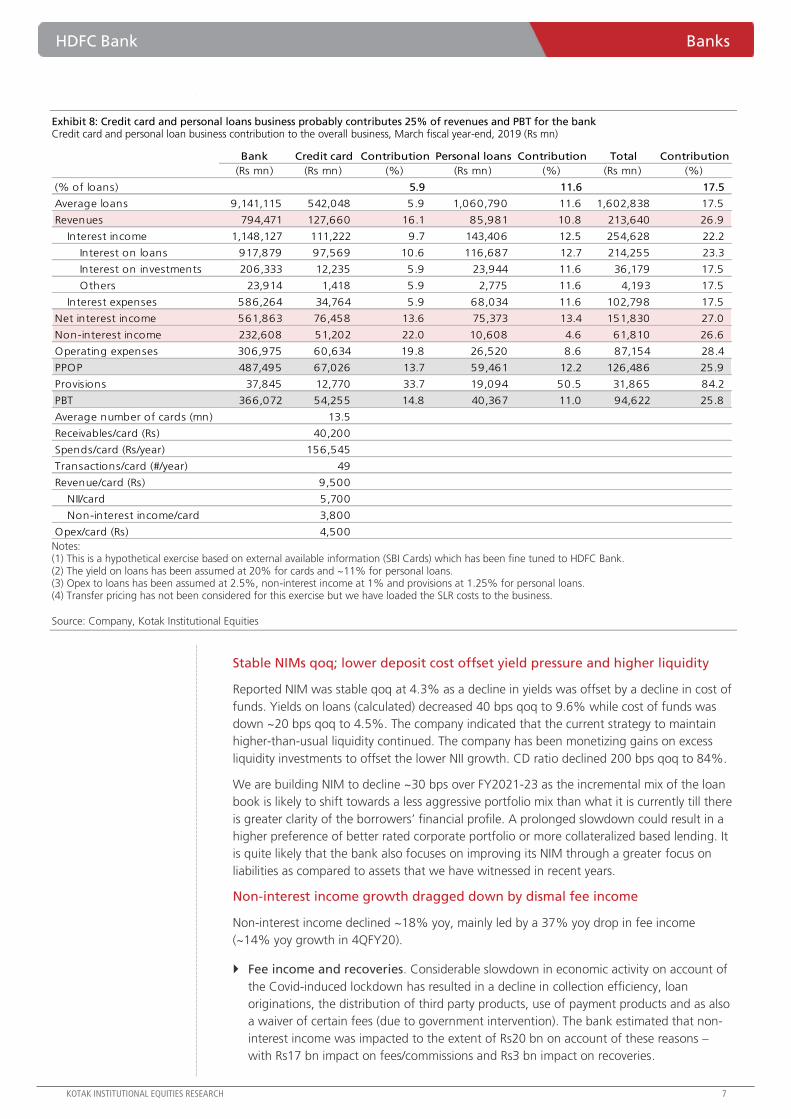
Exhibit 8: Credit card and personal loans business probably contributes 25% of revenues and PBT for the bank Credit card and personal loan business contribution to the overall business, March fiscal year-end, 2019 (Rs mn)
Notes: (1) This is a hypothetical exercise based on external available information (SBI Cards) which has been fine tuned to HDFC Bank. (2) The yield on loans has been assumed at 20% for cards and ~11% for personal loans. (3) Opex to loans has been assumed at 2.5%, non-interest income at 1% and provisions at 1.25% for personal loans. (4) Transfer pricing has not been considered for this exercise but we have loaded the SLR costs to the business.
Source: Company, Kotak Institutional Equities
Stable NIMs qoq; lower deposit cost offset yield pressure and higher liquidity
Reported NIM was stable qoq at 4.3% as a decline in yields was offset by a decline in cost of
funds. Yields on loans (calculated) decreased 40 bps qoq to 9.6% while cost of funds was
down ~20 bps qoq to 4.5%. The company indicated that the current strategy to maintain
higher-than-usual liquidity continued. The company has been monetizing gains on excess
liquidity investments to offset the lower NII growth. CD ratio declined 200 bps qoq to 84%.
We are building NIM to decline ~30 bps over FY2021-23 as the incremental mix of the loan
book is likely to shift towards a less aggressive portfolio mix than what it is currently till there
is greater clarity of the borrowers’ financial profile. A prolonged slowdown could result in a
higher preference of better rated corporate portfolio or more collateralized based lending. It
is quite likely that the bank also focuses on improving its NIM through a greater focus on
liabilities as compared to assets that we have witnessed in recent years.
Non-interest income growth dragged down by dismal fee income
Non-interest income declined ~18% yoy, mainly led by a 37% yoy drop in fee income
(~14% yoy growth in 4QFY20).
Fee income and recoveries. Considerable slowdown in economic activity on account of
the Covid-induced lockdown has resulted in a decline in collection efficiency, loan
originations, the distribution of third party products, use of payment products and as also
a waiver of certain fees (due to government intervention). The bank estimated that non-
interest income was impacted to the extent of Rs20 bn on account of these reasons –
with Rs17 bn impact on fees/commissions and Rs3 bn impact on recoveries.
Bank Credit card Contribution Personal loans Contribution Total Contribution
(Rs mn) (Rs mn) (%) (Rs mn) (%) (Rs mn) (%)
(% of loans) 5.9 11.6 17.5
Average loans 9,141,115 542,048 5.9 1,060,790 11.6 1,602,838 17.5
Revenues 794,471 127,660 16.1 85,981 10.8 213,640 26.9
Interest income 1,148,127 111,222 9.7 143,406 12.5 254,628 22.2
Interest on loans 917,879 97,569 10.6 116,687 12.7 214,255 23.3
Interest on investments 206,333 12,235 5.9 23,944 11.6 36,179 17.5
Others 23,914 1,418 5.9 2,775 11.6 4,193 17.5
Interest expenses 586,264 34,764 5.9 68,034 11.6 102,798 17.5
Net interest income 561,863 76,458 13.6 75,373 13.4 151,830 27.0
Non-interest income 232,608 51,202 22.0 10,608 4.6 61,810 26.6
Operating expenses 306,975 60,634 19.8 26,520 8.6 87,154 28.4
PPOP 487,495 67,026 13.7 59,461 12.2 126,486 25.9
Provisions 37,845 12,770 33.7 19,094 50.5 31,865 84.2
PBT 366,072 54,255 14.8 40,367 11.0 94,622 25.8
Average number of cards (mn) 13.5
Receivables/card (Rs) 40,200
Spends/card (Rs/year) 156,545
Transactions/card (#/year) 49
Revenue/card (Rs) 9,500
NII/card 5,700
Non-interest income/card 3,800
Opex/card (Rs) 4,500
Banks HDFC Bank
8 KOTAK INSTITUTIONAL EQUITIES RESEARCH
Treasury income. Treasury income growth was expectedly strong at >400% yoy and
~90% qoq, mainly driven by mark-to-market gains from lower interest rates.
Exchange income. The reduced FX demand in both retail and wholesale segments
resulted in a 24% yoy decline in exchange income.
We believe that fee income was vulnerable given the slowdown in retail business, since
~89% of the fee income comes from retail fees. However, we expect retail origination fees
to recover gradually as the retail business comes back up fully.
Cost ratios show improvement led by lower non-staff expenses
Cost-income ratio declined by ~400 bps qoq/yoy to ~35% in 1QFY21 against 38-39% in the
recent past. This was on the back of ~10% yoy decline in non-staff expenses and revenue
growth of ~8% yoy.
Non-employee expenses. These expenses were depressed due to lower spends, across
various sales channels, promotional activities and discretionary spends. However,
management expects these spends to resume as business normalizes. We believe some of
the reduction could be structural if it was driven by lease/contract renegotiations.
Employee expenses. These expenses increased 13% yoy on the back of ~11% yoy
increase in number of employees. The bank reported that two-thirds of its employees are
working from home and employee productivity has increased across the board. The bank
has also moved some staff from sales and underwriting teams to collections given the
heightened focus there. This demonstrates the agility of the bank and also enables it to
recover more quickly when the economic environment improves.
We believe that the target of ~35% was a challenging one to achieve for the bank.
Management commented that this performance is largely an aberration and the cost-income
ratio is likely to swing back to 38-39% levels in the short term. The management’s target is
to bring down the ratio to ~35% on a sustainable basis over the next 3-5 years.
Deposit momentum continues; CASA growth of 26%
Deposit growth in 1QFY21 was robust at 25% yoy led by similar growth in CASA and term
deposits. CASA growth at 26% is one of the highest in the last few years, helped by greater
savings level overall and lower credit demand. CASA ratio stood at 40% and has maintained
in this range in the last few quarters.
The bank is benefitting from multiple drivers of CASA, apart from its strong retail-driven
franchise. Bank indicated that corporate and SME CASA balances have also growth at strong
rates. Initiatives such as greater focus on self-funding have helped to improve deposit
balances. Bank has seen improved average balances in salary accounts reflecting negligible
impact of job losses in its portfolio.
Other key highlights
Capital. Tier-1 ratio stands comfortable at 17.5% (CET-1 ratio at 16.7%) with overall
CAR at 18.9% as per Basel-3 guidelines. RWA growth at ~4% yoy was higher than loan
growth at ~1% yoy. RWA/assets was flat qoq at 65%, down from 76% in 1QFY20.
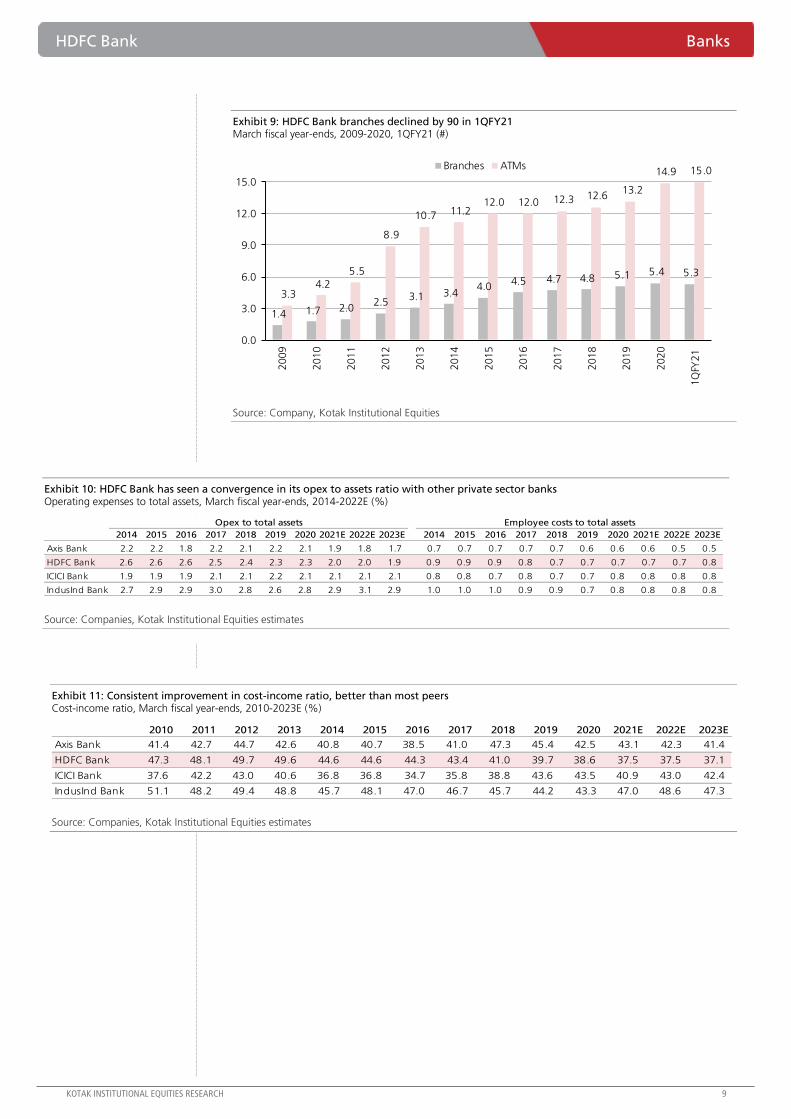
Branch network. HDFC Bank saw a net branch reduction of 90 during 1QFY21 taking
the total branch count to 5,326. ATMs increased at 12% yoy to ~15000. The bank has
been rapidly expanding footprint in semi-urban areas and rural areas, which now account
for 50% of the total banking outlets. In addition to this, the company has ~6,500
business correspondents most of which were added in the last 12 months (~1,000 in
1QFY21). The bank has about ~200 branches ready to be opened in near future; these
would have been opened during 1QFY21 were there no lockdown-related disruptions.
HDFC Bank Banks
KOTAK INSTITUTIONAL EQUITIES RESEARCH 9
Exhibit 9: HDFC Bank branches declined by 90 in 1QFY21 March fiscal year-ends, 2009-2020, 1QFY21 (#)
Source: Company, Kotak Institutional Equities
Exhibit 10: HDFC Bank has seen a convergence in its opex to assets ratio with other private sector banks Operating expenses to total assets, March fiscal year-ends, 2014-2022E (%)
Source: Companies, Kotak Institutional Equities estimates
Exhibit 11: Consistent improvement in cost-income ratio, better than most peers Cost-income ratio, March fiscal year-ends, 2010-2023E (%)
Source: Companies, Kotak Institutional Equities estimates
1.4 1.7 2.0 2.5
3.1 3.4 4.0
4.5 4.7 4.8 5.1 5.4 5.3
3.3 4.2
5.5
8.9
10.7 11.212.0 12.0 12.3 12.6
13.2
14.9 15.0
0.0
3.0
6.0
9.0
12.0
15.0
2009
2010
2011
2012
2013
2014
2015
2016
2017
2018
2019
2020
1Q
FY21
Branches ATMs
Opex to total assets Employee costs to total assets
2014 2015 2016 2017 2018 2019 2020 2021E 2022E 2023E 2014 2015 2016 2017 2018 2019 2020 2021E 2022E 2023E
Axis Bank 2.2 2.2 1.8 2.2 2.1 2.2 2.1 1.9 1.8 1.7 0.7 0.7 0.7 0.7 0.7 0.6 0.6 0.6 0.5 0.5
HDFC Bank 2.6 2.6 2.6 2.5 2.4 2.3 2.3 2.0 2.0 1.9 0.9 0.9 0.9 0.8 0.7 0.7 0.7 0.7 0.7 0.8
ICICI Bank 1.9 1.9 1.9 2.1 2.1 2.2 2.1 2.1 2.1 2.1 0.8 0.8 0.7 0.8 0.7 0.7 0.8 0.8 0.8 0.8
IndusInd Bank 2.7 2.9 2.9 3.0 2.8 2.6 2.8 2.9 3.1 2.9 1.0 1.0 1.0 0.9 0.9 0.7 0.8 0.8 0.8 0.8
2010 2011 2012 2013 2014 2015 2016 2017 2018 2019 2020 2021E 2022E 2023E
Axis Bank 41.4 42.7 44.7 42.6 40.8 40.7 38.5 41.0 47.3 45.4 42.5 43.1 42.3 41.4
HDFC Bank 47.3 48.1 49.7 49.6 44.6 44.6 44.3 43.4 41.0 39.7 38.6 37.5 37.5 37.1
ICICI Bank 37.6 42.2 43.0 40.6 36.8 36.8 34.7 35.8 38.8 43.6 43.5 40.9 43.0 42.4
IndusInd Bank 51.1 48.2 49.4 48.8 45.7 48.1 47.0 46.7 45.7 44.2 43.3 47.0 48.6 47.3
Banks HDFC Bank
10 KOTAK INSTITUTIONAL EQUITIES RESEARCH
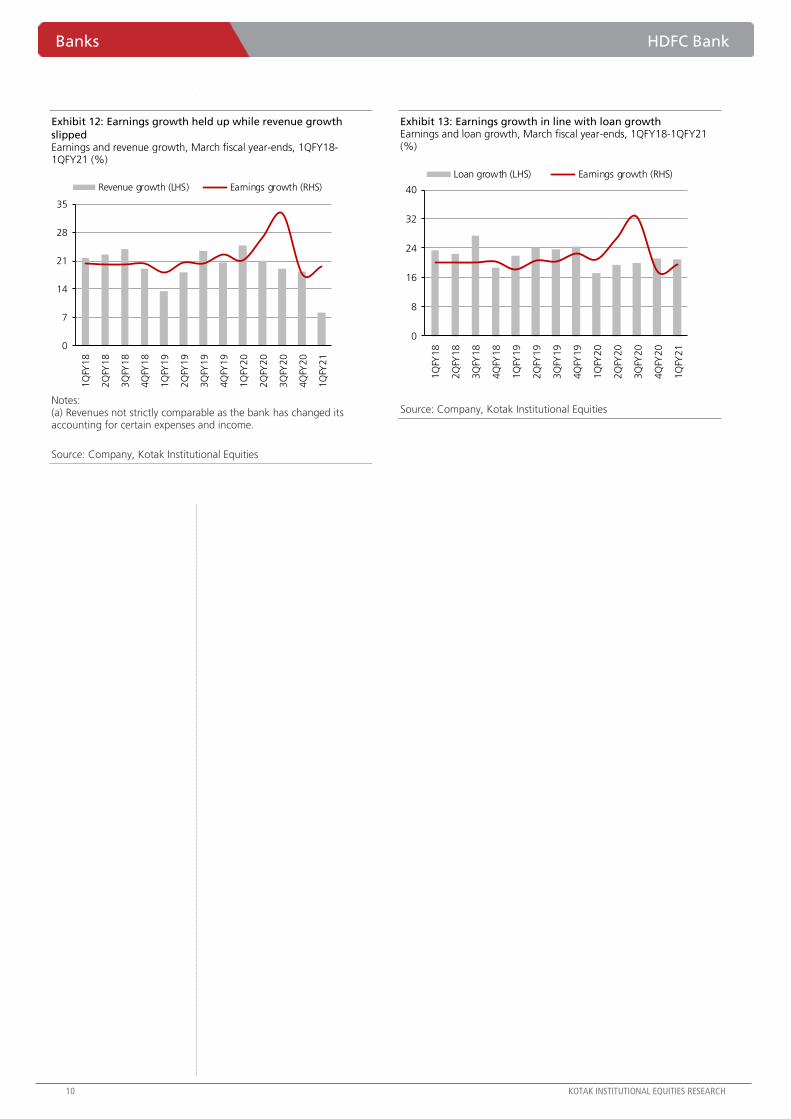
Exhibit 12: Earnings growth held up while revenue growth
slipped Earnings and revenue growth, March fiscal year-ends, 1QFY18-1QFY21 (%)
Notes: (a) Revenues not strictly comparable as the bank has changed itsaccounting for certain expenses and income.
Source: Company, Kotak Institutional Equities
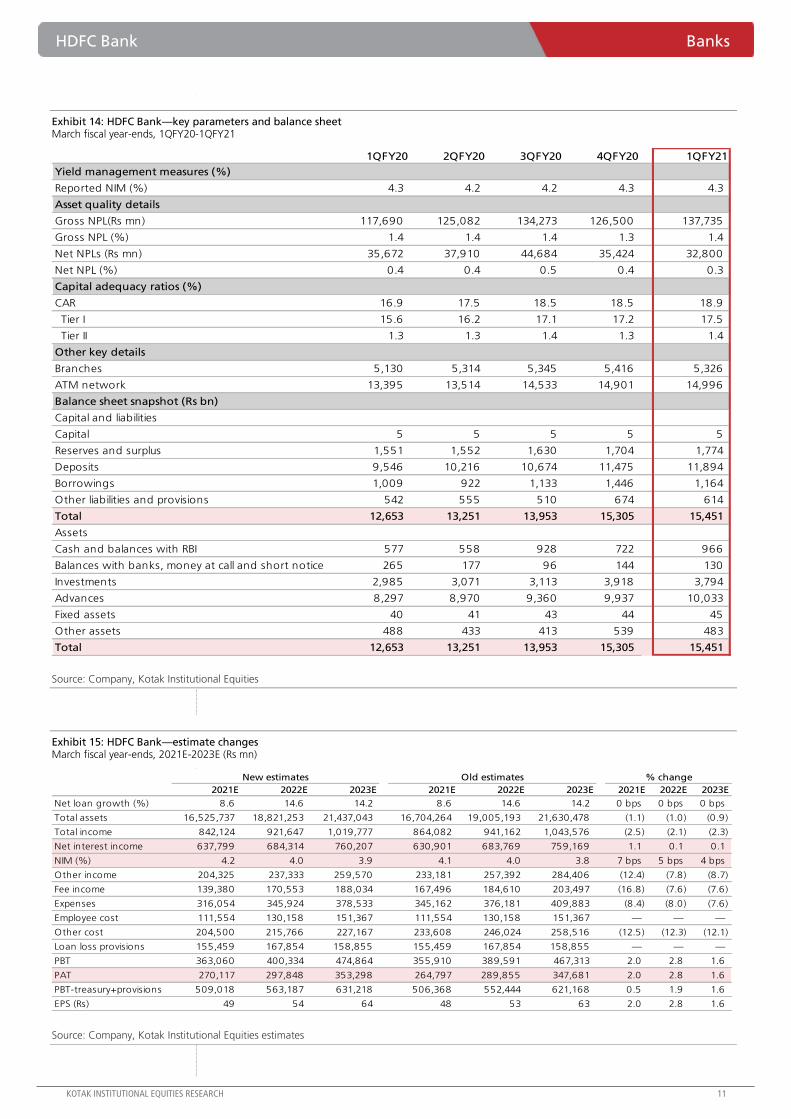
Exhibit 13: Earnings growth in line with loan growth Earnings and loan growth, March fiscal year-ends, 1QFY18-1QFY21 (%)
Source: Company, Kotak Institutional Equities
0
7
14
21
28
35
1Q
FY18
2Q
FY18
3Q
FY18
4Q
FY18
1Q
FY19
2Q
FY19
3Q
FY19
4Q
FY19
1Q
FY20
2Q
FY20
3Q
FY20
4Q
FY20
1Q
FY21
Revenue growth (LHS) Earnings growth (RHS)
0
8
16
24
32
40
1Q
FY18
2Q
FY18
3Q
FY18
4Q
FY18
1Q
FY19
2Q
FY19
3Q
FY19
4Q
FY19
1Q
FY20
2Q
FY20
3Q
FY20
4Q
FY20
1Q
FY21
Loan growth (LHS) Earnings growth (RHS)
HDFC Bank Banks
KOTAK INSTITUTIONAL EQUITIES RESEARCH 11
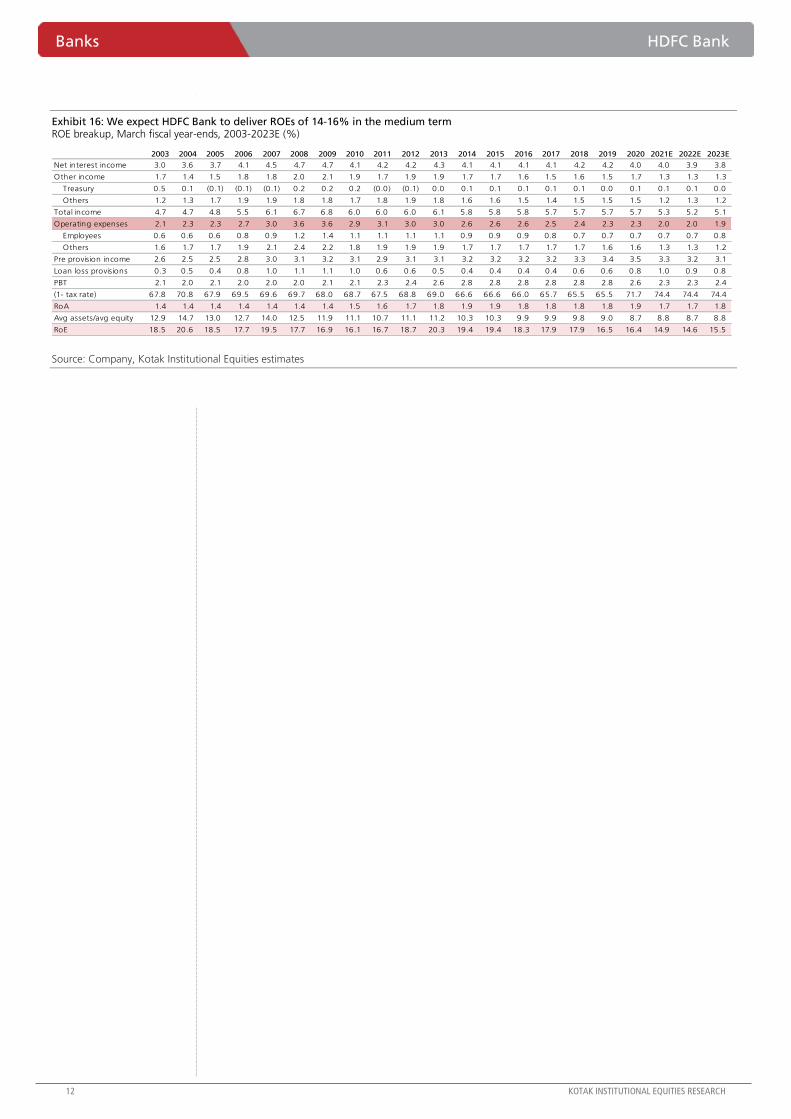
Exhibit 14: HDFC Bank—key parameters and balance sheet March fiscal year-ends, 1QFY20-1QFY21
Source: Company, Kotak Institutional Equities
Exhibit 15: HDFC Bank—estimate changes March fiscal year-ends, 2021E-2023E (Rs mn)
Source: Company, Kotak Institutional Equities estimates
1QFY20 2QFY20 3QFY20 4QFY20 1QFY21
Yield management measures (%)
Reported NIM (%) 4.3 4.2 4.2 4.3 4.3
Asset quality details
Gross NPL(Rs mn) 117,690 125,082 134,273 126,500 137,735
Gross NPL (%) 1.4 1.4 1.4 1.3 1.4
Net NPLs (Rs mn) 35,672 37,910 44,684 35,424 32,800
Net NPL (%) 0.4 0.4 0.5 0.4 0.3
Capital adequacy ratios (%)
CAR 16.9 17.5 18.5 18.5 18.9
Tier I 15.6 16.2 17.1 17.2 17.5
Tier II 1.3 1.3 1.4 1.3 1.4
Other key details
Branches 5,130 5,314 5,345 5,416 5,326
ATM network 13,395 13,514 14,533 14,901 14,996
Balance sheet snapshot (Rs bn)
Capital and liabilities
Capital 5 5 5 5 5
Reserves and surplus 1,551 1,552 1,630 1,704 1,774
Deposits 9,546 10,216 10,674 11,475 11,894
Borrowings 1,009 922 1,133 1,446 1,164
Other liabilities and provisions 542 555 510 674 614
Total 12,653 13,251 13,953 15,305 15,451
Assets
Cash and balances with RBI 577 558 928 722 966
Balances with banks, money at call and short notice 265 177 96 144 130
Investments 2,985 3,071 3,113 3,918 3,794
Advances 8,297 8,970 9,360 9,937 10,033
Fixed assets 40 41 43 44 45
Other assets 488 433 413 539 483
Total 12,653 13,251 13,953 15,305 15,451
New estimates Old estimates % change
2021E 2022E 2023E 2021E 2022E 2023E 2021E 2022E 2023E
Net loan growth (%) 8.6 14.6 14.2 8.6 14.6 14.2 0 bps 0 bps 0 bps
Total assets 16,525,737 18,821,253 21,437,043 16,704,264 19,005,193 21,630,478 (1.1) (1.0) (0.9)
Total income 842,124 921,647 1,019,777 864,082 941,162 1,043,576 (2.5) (2.1) (2.3)
Net interest income 637,799 684,314 760,207 630,901 683,769 759,169 1.1 0.1 0.1
NIM (%) 4.2 4.0 3.9 4.1 4.0 3.8 7 bps 5 bps 4 bps
Other income 204,325 237,333 259,570 233,181 257,392 284,406 (12.4) (7.8) (8.7)
Fee income 139,380 170,553 188,034 167,496 184,610 203,497 (16.8) (7.6) (7.6)
Expenses 316,054 345,924 378,533 345,162 376,181 409,883 (8.4) (8.0) (7.6)
Employee cost 111,554 130,158 151,367 111,554 130,158 151,367 — — —
Other cost 204,500 215,766 227,167 233,608 246,024 258,516 (12.5) (12.3) (12.1)
Loan loss provisions 155,459 167,854 158,855 155,459 167,854 158,855 — — —
PBT 363,060 400,334 474,864 355,910 389,591 467,313 2.0 2.8 1.6
PAT 270,117 297,848 353,298 264,797 289,855 347,681 2.0 2.8 1.6
PBT-treasury+provisions 509,018 563,187 631,218 506,368 552,444 621,168 0.5 1.9 1.6
EPS (Rs) 49 54 64 48 53 63 2.0 2.8 1.6
Banks HDFC Bank
12 KOTAK INSTITUTIONAL EQUITIES RESEARCH
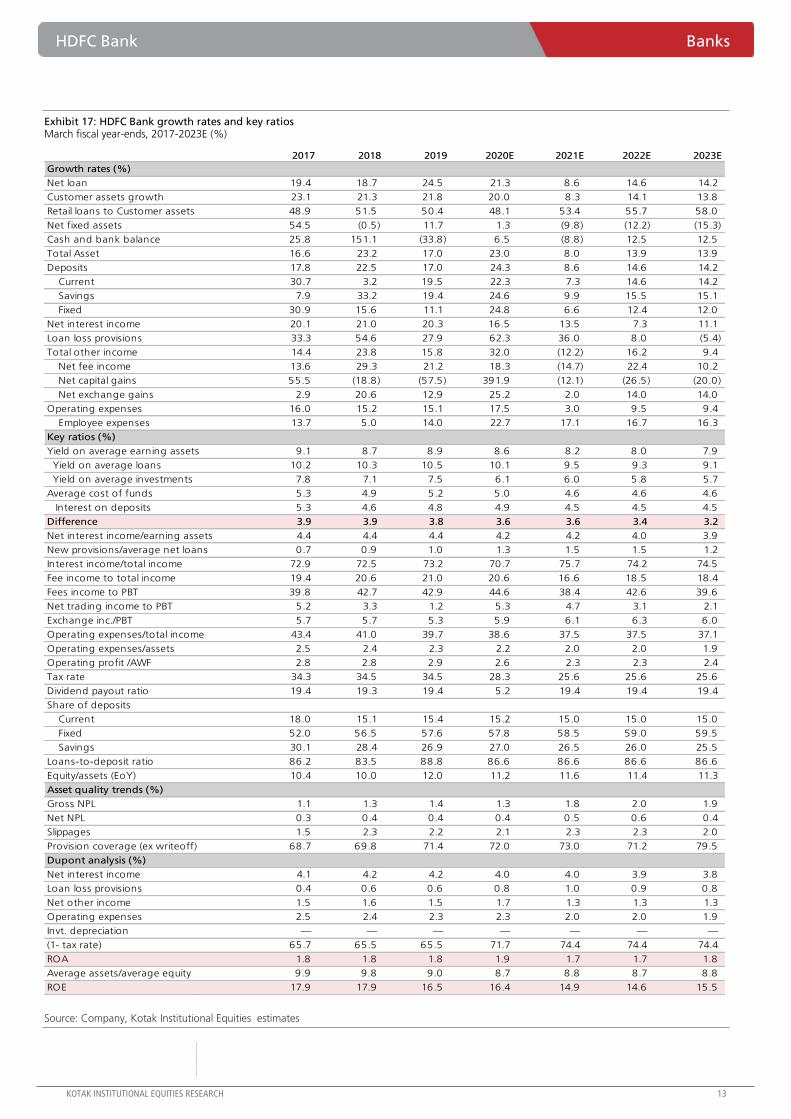
Exhibit 16: We expect HDFC Bank to deliver ROEs of 14-16% in the medium term ROE breakup, March fiscal year-ends, 2003-2023E (%)
Source: Company, Kotak Institutional Equities estimates
2003 2004 2005 2006 2007 2008 2009 2010 2011 2012 2013 2014 2015 2016 2017 2018 2019 2020 2021E 2022E 2023E
Net interest income 3.0 3.6 3.7 4.1 4.5 4.7 4.7 4.1 4.2 4.2 4.3 4.1 4.1 4.1 4.1 4.2 4.2 4.0 4.0 3.9 3.8
Other income 1.7 1.4 1.5 1.8 1.8 2.0 2.1 1.9 1.7 1.9 1.9 1.7 1.7 1.6 1.5 1.6 1.5 1.7 1.3 1.3 1.3
Treasury 0.5 0.1 (0.1) (0.1) (0.1) 0.2 0.2 0.2 (0.0) (0.1) 0.0 0.1 0.1 0.1 0.1 0.1 0.0 0.1 0.1 0.1 0.0
Others 1.2 1.3 1.7 1.9 1.9 1.8 1.8 1.7 1.8 1.9 1.8 1.6 1.6 1.5 1.4 1.5 1.5 1.5 1.2 1.3 1.2
Total income 4.7 4.7 4.8 5.5 6.1 6.7 6.8 6.0 6.0 6.0 6.1 5.8 5.8 5.8 5.7 5.7 5.7 5.7 5.3 5.2 5.1
Operating expenses 2.1 2.3 2.3 2.7 3.0 3.6 3.6 2.9 3.1 3.0 3.0 2.6 2.6 2.6 2.5 2.4 2.3 2.3 2.0 2.0 1.9
Employees 0.6 0.6 0.6 0.8 0.9 1.2 1.4 1.1 1.1 1.1 1.1 0.9 0.9 0.9 0.8 0.7 0.7 0.7 0.7 0.7 0.8
Others 1.6 1.7 1.7 1.9 2.1 2.4 2.2 1.8 1.9 1.9 1.9 1.7 1.7 1.7 1.7 1.7 1.6 1.6 1.3 1.3 1.2
Pre provision income 2.6 2.5 2.5 2.8 3.0 3.1 3.2 3.1 2.9 3.1 3.1 3.2 3.2 3.2 3.2 3.3 3.4 3.5 3.3 3.2 3.1
Loan loss provisions 0.3 0.5 0.4 0.8 1.0 1.1 1.1 1.0 0.6 0.6 0.5 0.4 0.4 0.4 0.4 0.6 0.6 0.8 1.0 0.9 0.8
PBT 2.1 2.0 2.1 2.0 2.0 2.0 2.1 2.1 2.3 2.4 2.6 2.8 2.8 2.8 2.8 2.8 2.8 2.6 2.3 2.3 2.4
(1- tax rate) 67.8 70.8 67.9 69.5 69.6 69.7 68.0 68.7 67.5 68.8 69.0 66.6 66.6 66.0 65.7 65.5 65.5 71.7 74.4 74.4 74.4
RoA 1.4 1.4 1.4 1.4 1.4 1.4 1.4 1.5 1.6 1.7 1.8 1.9 1.9 1.8 1.8 1.8 1.8 1.9 1.7 1.7 1.8
Avg assets/avg equity 12.9 14.7 13.0 12.7 14.0 12.5 11.9 11.1 10.7 11.1 11.2 10.3 10.3 9.9 9.9 9.8 9.0 8.7 8.8 8.7 8.8
RoE 18.5 20.6 18.5 17.7 19.5 17.7 16.9 16.1 16.7 18.7 20.3 19.4 19.4 18.3 17.9 17.9 16.5 16.4 14.9 14.6 15.5
HDFC Bank Banks
KOTAK INSTITUTIONAL EQUITIES RESEARCH 13
Exhibit 17: HDFC Bank growth rates and key ratios March fiscal year-ends, 2017-2023E (%)
Source: Company, Kotak Institutional Equities estimates
2017 2018 2019 2020E 2021E 2022E 2023E
Growth rates (%)
Net loan 19.4 18.7 24.5 21.3 8.6 14.6 14.2
Customer assets growth 23.1 21.3 21.8 20.0 8.3 14.1 13.8
Retail loans to Customer assets 48.9 51.5 50.4 48.1 53.4 55.7 58.0
Net fixed assets 54.5 (0.5) 11.7 1.3 (9.8) (12.2) (15.3)
Cash and bank balance 25.8 151.1 (33.8) 6.5 (8.8) 12.5 12.5
Total Asset 16.6 23.2 17.0 23.0 8.0 13.9 13.9
Deposits 17.8 22.5 17.0 24.3 8.6 14.6 14.2
Current 30.7 3.2 19.5 22.3 7.3 14.6 14.2
Savings 7.9 33.2 19.4 24.6 9.9 15.5 15.1
Fixed 30.9 15.6 11.1 24.8 6.6 12.4 12.0
Net interest income 20.1 21.0 20.3 16.5 13.5 7.3 11.1
Loan loss provisions 33.3 54.6 27.9 62.3 36.0 8.0 (5.4)
Total other income 14.4 23.8 15.8 32.0 (12.2) 16.2 9.4
Net fee income 13.6 29.3 21.2 18.3 (14.7) 22.4 10.2
Net capital gains 55.5 (18.8) (57.5) 391.9 (12.1) (26.5) (20.0)
Net exchange gains 2.9 20.6 12.9 25.2 2.0 14.0 14.0
Operating expenses 16.0 15.2 15.1 17.5 3.0 9.5 9.4
Employee expenses 13.7 5.0 14.0 22.7 17.1 16.7 16.3
Key ratios (%)
Yield on average earning assets 9.1 8.7 8.9 8.6 8.2 8.0 7.9
Yield on average loans 10.2 10.3 10.5 10.1 9.5 9.3 9.1
Yield on average investments 7.8 7.1 7.5 6.1 6.0 5.8 5.7
Average cost of funds 5.3 4.9 5.2 5.0 4.6 4.6 4.6
Interest on deposits 5.3 4.6 4.8 4.9 4.5 4.5 4.5
Difference 3.9 3.9 3.8 3.6 3.6 3.4 3.2
Net interest income/earning assets 4.4 4.4 4.4 4.2 4.2 4.0 3.9
New provisions/average net loans 0.7 0.9 1.0 1.3 1.5 1.5 1.2
Interest income/total income 72.9 72.5 73.2 70.7 75.7 74.2 74.5
Fee income to total income 19.4 20.6 21.0 20.6 16.6 18.5 18.4
Fees income to PBT 39.8 42.7 42.9 44.6 38.4 42.6 39.6
Net trading income to PBT 5.2 3.3 1.2 5.3 4.7 3.1 2.1
Exchange inc./PBT 5.7 5.7 5.3 5.9 6.1 6.3 6.0
Operating expenses/total income 43.4 41.0 39.7 38.6 37.5 37.5 37.1
Operating expenses/assets 2.5 2.4 2.3 2.2 2.0 2.0 1.9
Operating profit /AWF 2.8 2.8 2.9 2.6 2.3 2.3 2.4
Tax rate 34.3 34.5 34.5 28.3 25.6 25.6 25.6
Dividend payout ratio 19.4 19.3 19.4 5.2 19.4 19.4 19.4
Share of deposits
Current 18.0 15.1 15.4 15.2 15.0 15.0 15.0
Fixed 52.0 56.5 57.6 57.8 58.5 59.0 59.5
Savings 30.1 28.4 26.9 27.0 26.5 26.0 25.5
Loans-to-deposit ratio 86.2 83.5 88.8 86.6 86.6 86.6 86.6
Equity/assets (EoY) 10.4 10.0 12.0 11.2 11.6 11.4 11.3
Asset quality trends (%)
Gross NPL 1.1 1.3 1.4 1.3 1.8 2.0 1.9
Net NPL 0.3 0.4 0.4 0.4 0.5 0.6 0.4
Slippages 1.5 2.3 2.2 2.1 2.3 2.3 2.0
Provision coverage (ex writeoff) 68.7 69.8 71.4 72.0 73.0 71.2 79.5
Dupont analysis (%)
Net interest income 4.1 4.2 4.2 4.0 4.0 3.9 3.8
Loan loss provisions 0.4 0.6 0.6 0.8 1.0 0.9 0.8
Net other income 1.5 1.6 1.5 1.7 1.3 1.3 1.3
Operating expenses 2.5 2.4 2.3 2.3 2.0 2.0 1.9
Invt. depreciation — — — — — — —
(1- tax rate) 65.7 65.5 65.5 71.7 74.4 74.4 74.4
ROA 1.8 1.8 1.8 1.9 1.7 1.7 1.8
Average assets/average equity 9.9 9.8 9.0 8.7 8.8 8.7 8.8
ROE 17.9 17.9 16.5 16.4 14.9 14.6 15.5
Banks HDFC Bank
14 KOTAK INSTITUTIONAL EQUITIES RESEARCH
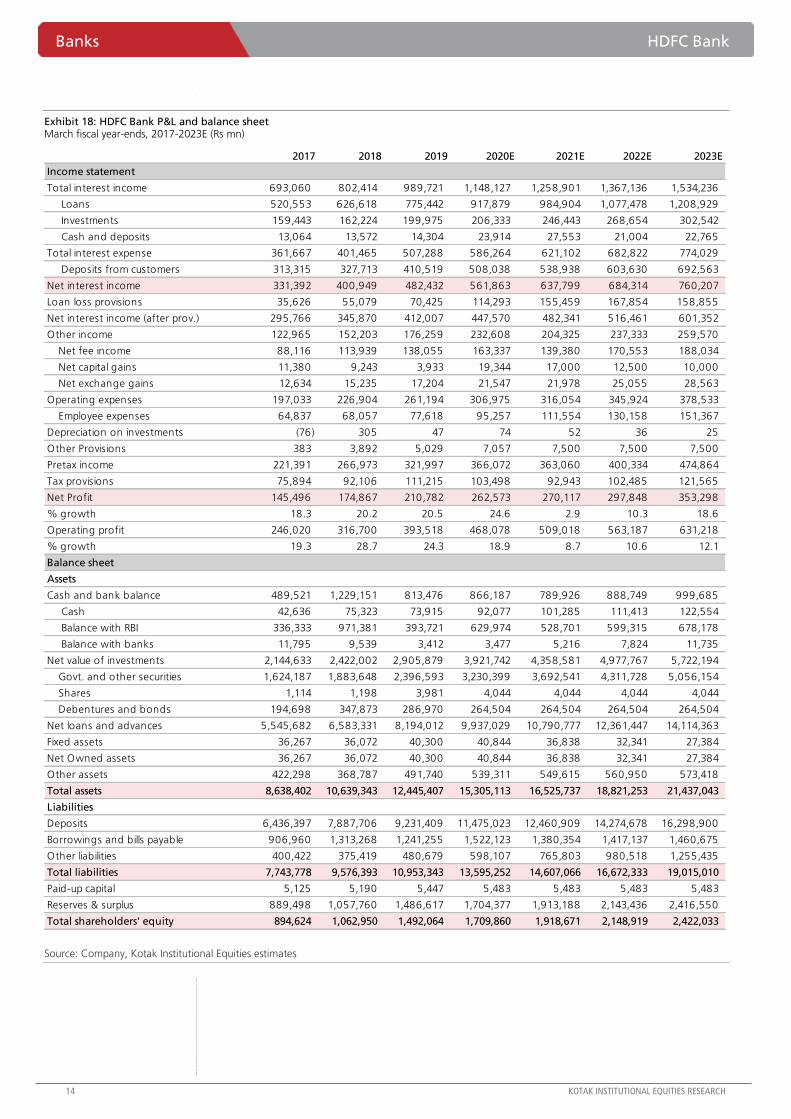
Exhibit 18: HDFC Bank P&L and balance sheet March fiscal year-ends, 2017-2023E (Rs mn)
Source: Company, Kotak Institutional Equities estimates
2017 2018 2019 2020E 2021E 2022E 2023E
Income statement
Total interest income 693,060 802,414 989,721 1,148,127 1,258,901 1,367,136 1,534,236
Loans 520,553 626,618 775,442 917,879 984,904 1,077,478 1,208,929
Investments 159,443 162,224 199,975 206,333 246,443 268,654 302,542
Cash and deposits 13,064 13,572 14,304 23,914 27,553 21,004 22,765
Total interest expense 361,667 401,465 507,288 586,264 621,102 682,822 774,029
Deposits from customers 313,315 327,713 410,519 508,038 538,938 603,630 692,563
Net interest income 331,392 400,949 482,432 561,863 637,799 684,314 760,207
Loan loss provisions 35,626 55,079 70,425 114,293 155,459 167,854 158,855
Net interest income (after prov.) 295,766 345,870 412,007 447,570 482,341 516,461 601,352
Other income 122,965 152,203 176,259 232,608 204,325 237,333 259,570
Net fee income 88,116 113,939 138,055 163,337 139,380 170,553 188,034
Net capital gains 11,380 9,243 3,933 19,344 17,000 12,500 10,000
Net exchange gains 12,634 15,235 17,204 21,547 21,978 25,055 28,563
Operating expenses 197,033 226,904 261,194 306,975 316,054 345,924 378,533
Employee expenses 64,837 68,057 77,618 95,257 111,554 130,158 151,367
Depreciation on investments (76) 305 47 74 52 36 25
Other Provisions 383 3,892 5,029 7,057 7,500 7,500 7,500
Pretax income 221,391 266,973 321,997 366,072 363,060 400,334 474,864
Tax provisions 75,894 92,106 111,215 103,498 92,943 102,485 121,565
Net Profit 145,496 174,867 210,782 262,573 270,117 297,848 353,298
% growth 18.3 20.2 20.5 24.6 2.9 10.3 18.6
Operating profit 246,020 316,700 393,518 468,078 509,018 563,187 631,218
% growth 19.3 28.7 24.3 18.9 8.7 10.6 12.1
Balance sheet
Assets
Cash and bank balance 489,521 1,229,151 813,476 866,187 789,926 888,749 999,685
Cash 42,636 75,323 73,915 92,077 101,285 111,413 122,554
Balance with RBI 336,333 971,381 393,721 629,974 528,701 599,315 678,178
Balance with banks 11,795 9,539 3,412 3,477 5,216 7,824 11,735
Net value of investments 2,144,633 2,422,002 2,905,879 3,921,742 4,358,581 4,977,767 5,722,194
Govt. and other securities 1,624,187 1,883,648 2,396,593 3,230,399 3,692,541 4,311,728 5,056,154
Shares 1,114 1,198 3,981 4,044 4,044 4,044 4,044
Debentures and bonds 194,698 347,873 286,970 264,504 264,504 264,504 264,504
Net loans and advances 5,545,682 6,583,331 8,194,012 9,937,029 10,790,777 12,361,447 14,114,363
Fixed assets 36,267 36,072 40,300 40,844 36,838 32,341 27,384
Net Owned assets 36,267 36,072 40,300 40,844 36,838 32,341 27,384
Other assets 422,298 368,787 491,740 539,311 549,615 560,950 573,418
Total assets 8,638,402 10,639,343 12,445,407 15,305,113 16,525,737 18,821,253 21,437,043
Liabilities
Deposits 6,436,397 7,887,706 9,231,409 11,475,023 12,460,909 14,274,678 16,298,900
Borrowings and bills payable 906,960 1,313,268 1,241,255 1,522,123 1,380,354 1,417,137 1,460,675
Other liabilities 400,422 375,419 480,679 598,107 765,803 980,518 1,255,435
Total liabilities 7,743,778 9,576,393 10,953,343 13,595,252 14,607,066 16,672,333 19,015,010
Paid-up capital 5,125 5,190 5,447 5,483 5,483 5,483 5,483
Reserves & surplus 889,498 1,057,760 1,486,617 1,704,377 1,913,188 2,143,436 2,416,550
Total shareholders' equity 894,624 1,062,950 1,492,064 1,709,860 1,918,671 2,148,919 2,422,033
For Private Circulation Only. FOR IMPORTANT INFORMATION ABOUT KOTAK SECURITIES’ RATING SYSTEM AND OTHER DISCLOSURES, REFER TO THE END OF THIS MATERIAL.
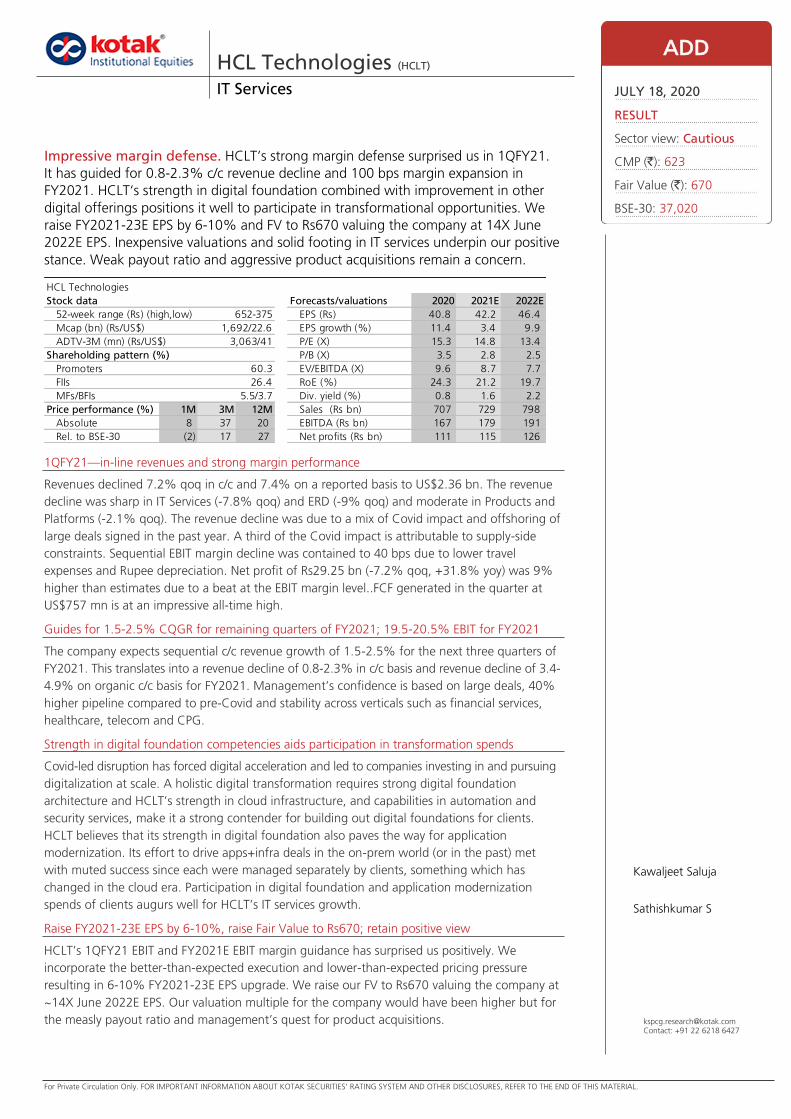
1QFY21—in-line revenues and strong margin performance
Revenues declined 7.2% qoq in c/c and 7.4% on a reported basis to US$2.36 bn. The revenue
decline was sharp in IT Services (-7.8% qoq) and ERD (-9% qoq) and moderate in Products and
Platforms (-2.1% qoq). The revenue decline was due to a mix of Covid impact and offshoring of
large deals signed in the past year. A third of the Covid impact is attributable to supply-side
constraints. Sequential EBIT margin decline was contained to 40 bps due to lower travel
expenses and Rupee depreciation. Net profit of Rs29.25 bn (-7.2% qoq, +31.8% yoy) was 9%
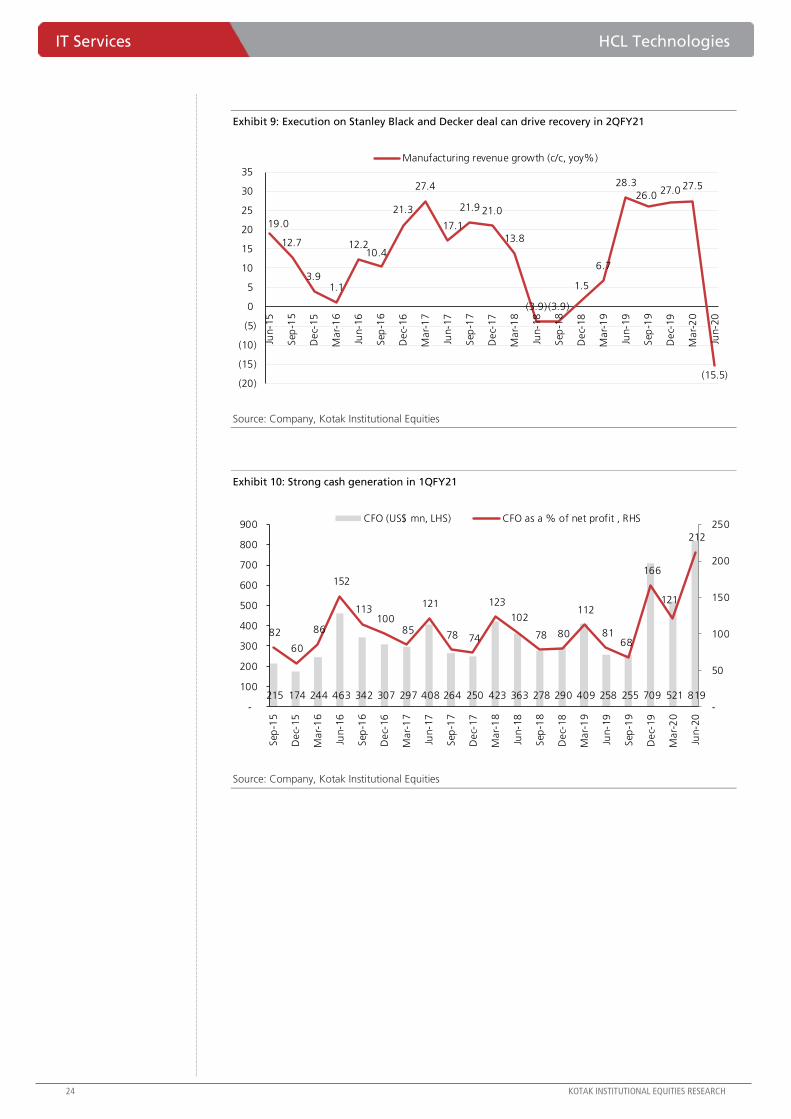
higher than estimates due to a beat at the EBIT margin level..FCF generated in the quarter at
US$757 mn is at an impressive all-time high.
Guides for 1.5-2.5% CQGR for remaining quarters of FY2021; 19.5-20.5% EBIT for FY2021
The company expects sequential c/c revenue growth of 1.5-2.5% for the next three quarters of
FY2021. This translates into a revenue decline of 0.8-2.3% in c/c basis and revenue decline of 3.4-
4.9% on organic c/c basis for FY2021. Management’s confidence is based on large deals, 40%
higher pipeline compared to pre-Covid and stability across verticals such as financial services,
healthcare, telecom and CPG.
Strength in digital foundation competencies aids participation in transformation spends
Covid-led disruption has forced digital acceleration and led to companies investing in and pursuing
digitalization at scale. A holistic digital transformation requires strong digital foundation
architecture and HCLT’s strength in cloud infrastructure, and capabilities in automation and
security services, make it a strong contender for building out digital foundations for clients.
HCLT believes that its strength in digital foundation also paves the way for application
modernization. Its effort to drive apps+infra deals in the on-prem world (or in the past) met
with muted success since each were managed separately by clients, something which has
changed in the cloud era. Participation in digital foundation and application modernization
spends of clients augurs well for HCLT’s IT services growth.
Raise FY2021-23E EPS by 6-10%, raise Fair Value to Rs670; retain positive view
HCLT’s 1QFY21 EBIT and FY2021E EBIT margin guidance has surprised us positively. We
incorporate the better-than-expected execution and lower-than-expected pricing pressure
resulting in 6-10% FY2021-23E EPS upgrade. We raise our FV to Rs670 valuing the company at
~14X June 2022E EPS. Our valuation multiple for the company would have been higher but for
the measly payout ratio and management’s quest for product acquisitions.
HCL Technologies (HCLT) IT Services
Impressive margin defense. HCLT’s strong margin defense surprised us in 1QFY21.
It has guided for 0.8-2.3% c/c revenue decline and 100 bps margin expansion in
FY2021. HCLT‘s strength in digital foundation combined with improvement in other
digital offerings positions it well to participate in transformational opportunities. We
raise FY2021-23E EPS by 6-10% and FV to Rs670 valuing the company at 14X June
2022E EPS. Inexpensive valuations and solid footing in IT services underpin our positive
stance. Weak payout ratio and aggressive product acquisitions remain a concern.
ADD
JULY 18, 2020
RESULT
Sector view: Cautious
CMP (`): 623
Fair Value (`): 670
BSE-30: 37,020
Kawaljeet Saluja
Sathishkumar S
HCL Technologies
Stock data Forecasts/valuations 2020 2021E 2022E
52-week range (Rs) (high,low) EPS (Rs) 40.8 42.2 46.4
Mcap (bn) (Rs/US$) EPS growth (%) 11.4 3.4 9.9
ADTV-3M (mn) (Rs/US$) P/E (X) 15.3 14.8 13.4
Shareholding pattern (%) P/B (X) 3.5 2.8 2.5
Promoters 60.3 EV/EBITDA (X) 9.6 8.7 7.7
FIIs 26.4 RoE (%) 24.3 21.2 19.7
MFs/BFIs Div. yield (%) 0.8 1.6 2.2
Price performance (%) 1M 3M 12M Sales (Rs bn) 707 729 798
Absolute 8 37 20 EBITDA (Rs bn) 167 179 191
Rel. to BSE-30 (2) 17 27 Net profits (Rs bn) 111 115 126
652-375
1,692/22.6
5.5/3.7
3,063/41
[email protected]: +91 22 6218 6427
IT Services HCL Technologies
16 KOTAK INSTITUTIONAL EQUITIES RESEARCH
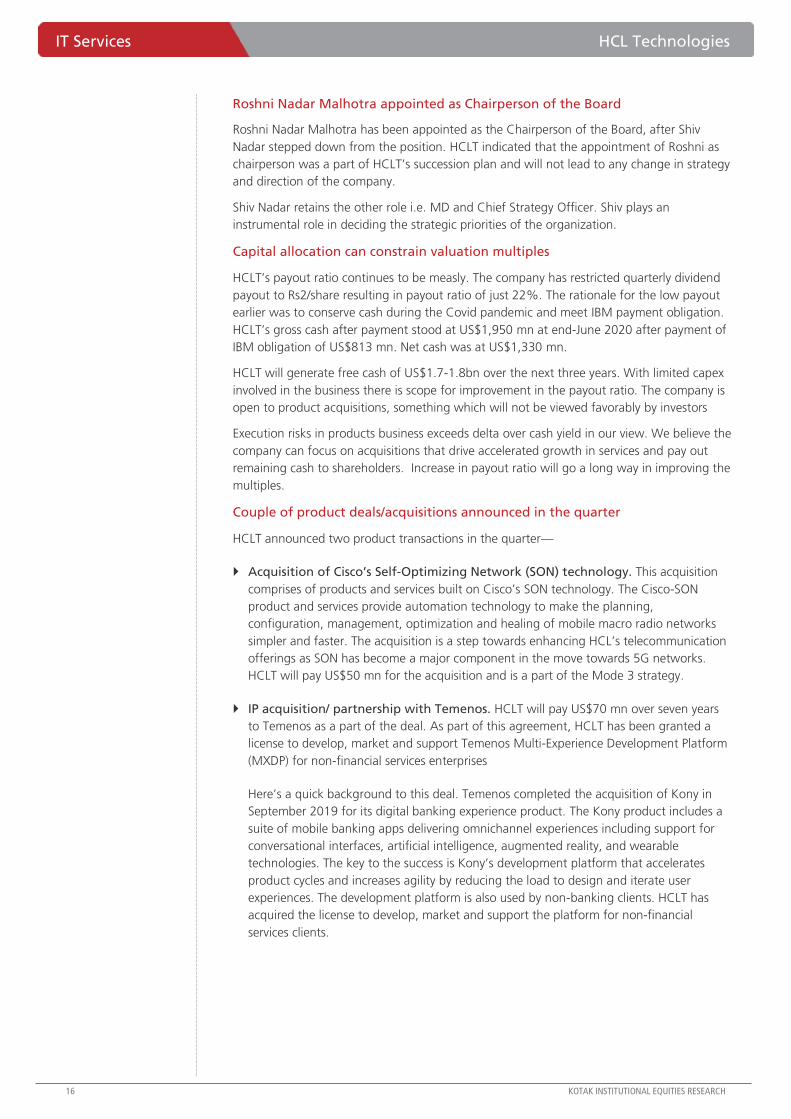
Roshni Nadar Malhotra appointed as Chairperson of the Board
Roshni Nadar Malhotra has been appointed as the Chairperson of the Board, after Shiv
Nadar stepped down from the position. HCLT indicated that the appointment of Roshni as
chairperson was a part of HCLT’s succession plan and will not lead to any change in strategy
and direction of the company.
Shiv Nadar retains the other role i.e. MD and Chief Strategy Officer. Shiv plays an
instrumental role in deciding the strategic priorities of the organization.
Capital allocation can constrain valuation multiples
HCLT’s payout ratio continues to be measly. The company has restricted quarterly dividend
payout to Rs2/share resulting in payout ratio of just 22%. The rationale for the low payout
earlier was to conserve cash during the Covid pandemic and meet IBM payment obligation.
HCLT’s gross cash after payment stood at US$1,950 mn at end-June 2020 after payment of
IBM obligation of US$813 mn. Net cash was at US$1,330 mn.
HCLT will generate free cash of US$1.7-1.8bn over the next three years. With limited capex
involved in the business there is scope for improvement in the payout ratio. The company is
open to product acquisitions, something which will not be viewed favorably by investors
Execution risks in products business exceeds delta over cash yield in our view. We believe the
company can focus on acquisitions that drive accelerated growth in services and pay out
remaining cash to shareholders. Increase in payout ratio will go a long way in improving the
multiples.
Couple of product deals/acquisitions announced in the quarter
HCLT announced two product transactions in the quarter—
Acquisition of Cisco’s Self-Optimizing Network (SON) technology. This acquisition
comprises of products and services built on Cisco’s SON technology. The Cisco-SON
product and services provide automation technology to make the planning,
configuration, management, optimization and healing of mobile macro radio networks
simpler and faster. The acquisition is a step towards enhancing HCL’s telecommunication
offerings as SON has become a major component in the move towards 5G networks.
HCLT will pay US$50 mn for the acquisition and is a part of the Mode 3 strategy.
IP acquisition/ partnership with Temenos. HCLT will pay US$70 mn over seven years
to Temenos as a part of the deal. As part of this agreement, HCLT has been granted a
license to develop, market and support Temenos Multi-Experience Development Platform
(MXDP) for non-financial services enterprises
Here’s a quick background to this deal. Temenos completed the acquisition of Kony in
September 2019 for its digital banking experience product. The Kony product includes a
suite of mobile banking apps delivering omnichannel experiences including support for
conversational interfaces, artificial intelligence, augmented reality, and wearable
technologies. The key to the success is Kony’s development platform that accelerates
product cycles and increases agility by reducing the load to design and iterate user
experiences. The development platform is also used by non-banking clients. HCLT has
acquired the license to develop, market and support the platform for non-financial
services clients.
HCL Technologies IT Services
KOTAK INSTITUTIONAL EQUITIES RESEARCH 17
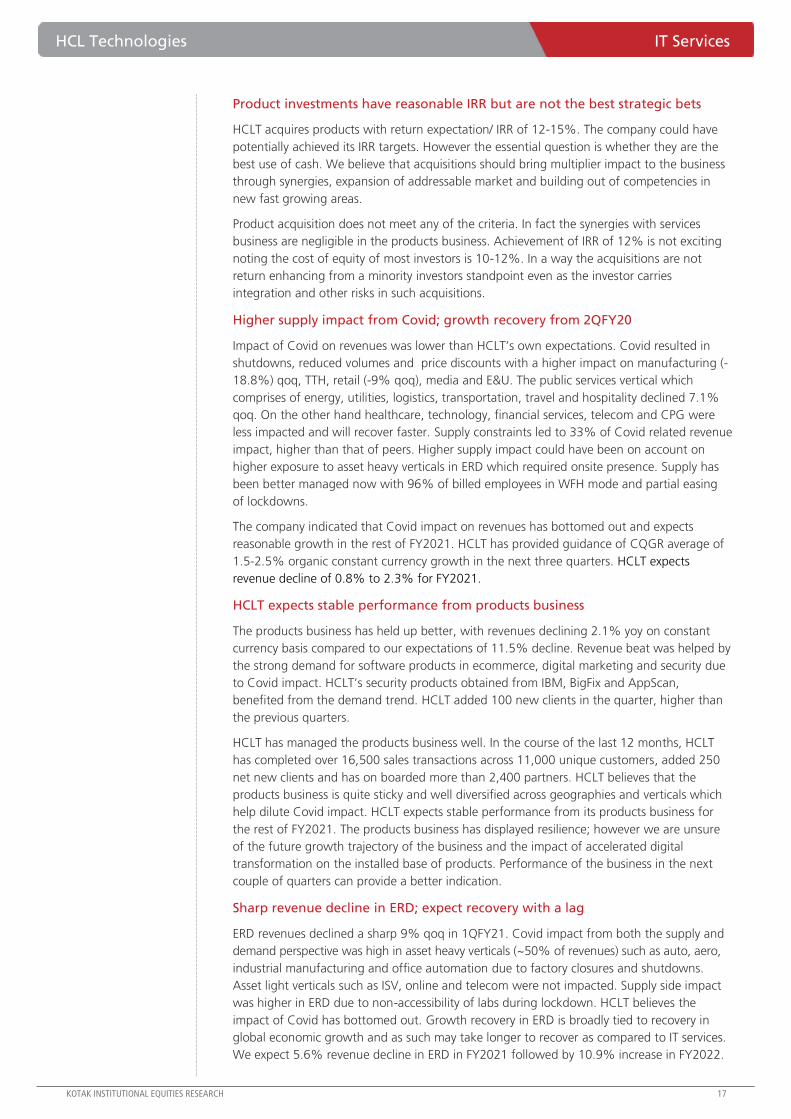
Product investments have reasonable IRR but are not the best strategic bets
HCLT acquires products with return expectation/ IRR of 12-15%. The company could have
potentially achieved its IRR targets. However the essential question is whether they are the
best use of cash. We believe that acquisitions should bring multiplier impact to the business
through synergies, expansion of addressable market and building out of competencies in
new fast growing areas.
Product acquisition does not meet any of the criteria. In fact the synergies with services
business are negligible in the products business. Achievement of IRR of 12% is not exciting
noting the cost of equity of most investors is 10-12%. In a way the acquisitions are not
return enhancing from a minority investors standpoint even as the investor carries
integration and other risks in such acquisitions.
Higher supply impact from Covid; growth recovery from 2QFY20
Impact of Covid on revenues was lower than HCLT’s own expectations. Covid resulted in
shutdowns, reduced volumes and price discounts with a higher impact on manufacturing (-
18.8%) qoq, TTH, retail (-9% qoq), media and E&U. The public services vertical which
comprises of energy, utilities, logistics, transportation, travel and hospitality declined 7.1%
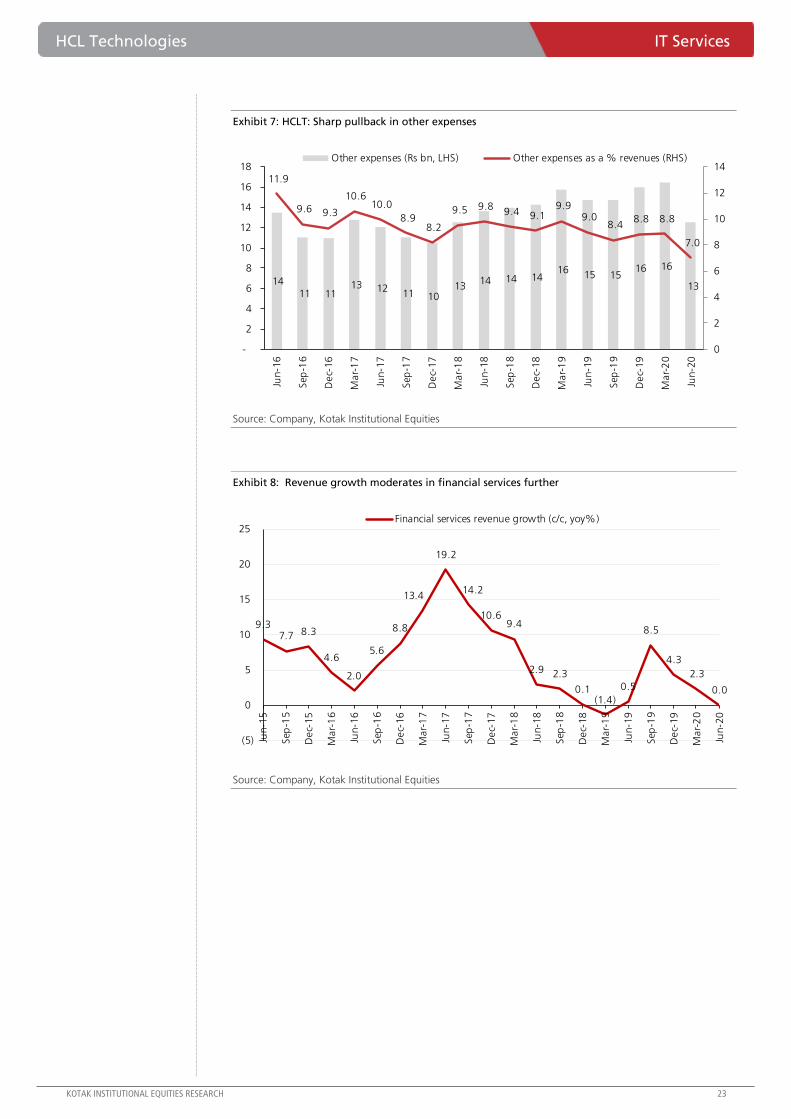
qoq. On the other hand healthcare, technology, financial services, telecom and CPG were
less impacted and will recover faster. Supply constraints led to 33% of Covid related revenue
impact, higher than that of peers. Higher supply impact could have been on account on
higher exposure to asset heavy verticals in ERD which required onsite presence. Supply has
been better managed now with 96% of billed employees in WFH mode and partial easing
of lockdowns.
The company indicated that Covid impact on revenues has bottomed out and expects
reasonable growth in the rest of FY2021. HCLT has provided guidance of CQGR average of
1.5-2.5% organic constant currency growth in the next three quarters. HCLT expects
revenue decline of 0.8% to 2.3% for FY2021.
HCLT expects stable performance from products business
The products business has held up better, with revenues declining 2.1% yoy on constant
currency basis compared to our expectations of 11.5% decline. Revenue beat was helped by
the strong demand for software products in ecommerce, digital marketing and security due
to Covid impact. HCLT’s security products obtained from IBM, BigFix and AppScan,
benefited from the demand trend. HCLT added 100 new clients in the quarter, higher than
the previous quarters.
HCLT has managed the products business well. In the course of the last 12 months, HCLT
has completed over 16,500 sales transactions across 11,000 unique customers, added 250
net new clients and has on boarded more than 2,400 partners. HCLT believes that the
products business is quite sticky and well diversified across geographies and verticals which
help dilute Covid impact. HCLT expects stable performance from its products business for
the rest of FY2021. The products business has displayed resilience; however we are unsure
of the future growth trajectory of the business and the impact of accelerated digital
transformation on the installed base of products. Performance of the business in the next
couple of quarters can provide a better indication.
Sharp revenue decline in ERD; expect recovery with a lag
ERD revenues declined a sharp 9% qoq in 1QFY21. Covid impact from both the supply and
demand perspective was high in asset heavy verticals (~50% of revenues) such as auto, aero,
industrial manufacturing and office automation due to factory closures and shutdowns.
Asset light verticals such as ISV, online and telecom were not impacted. Supply side impact
was higher in ERD due to non-accessibility of labs during lockdown. HCLT believes the
impact of Covid has bottomed out. Growth recovery in ERD is broadly tied to recovery in
global economic growth and as such may take longer to recover as compared to IT services.
We expect 5.6% revenue decline in ERD in FY2021 followed by 10.9% increase in FY2022.
IT Services HCL Technologies
18 KOTAK INSTITUTIONAL EQUITIES RESEARCH
Key highlights from earnings call
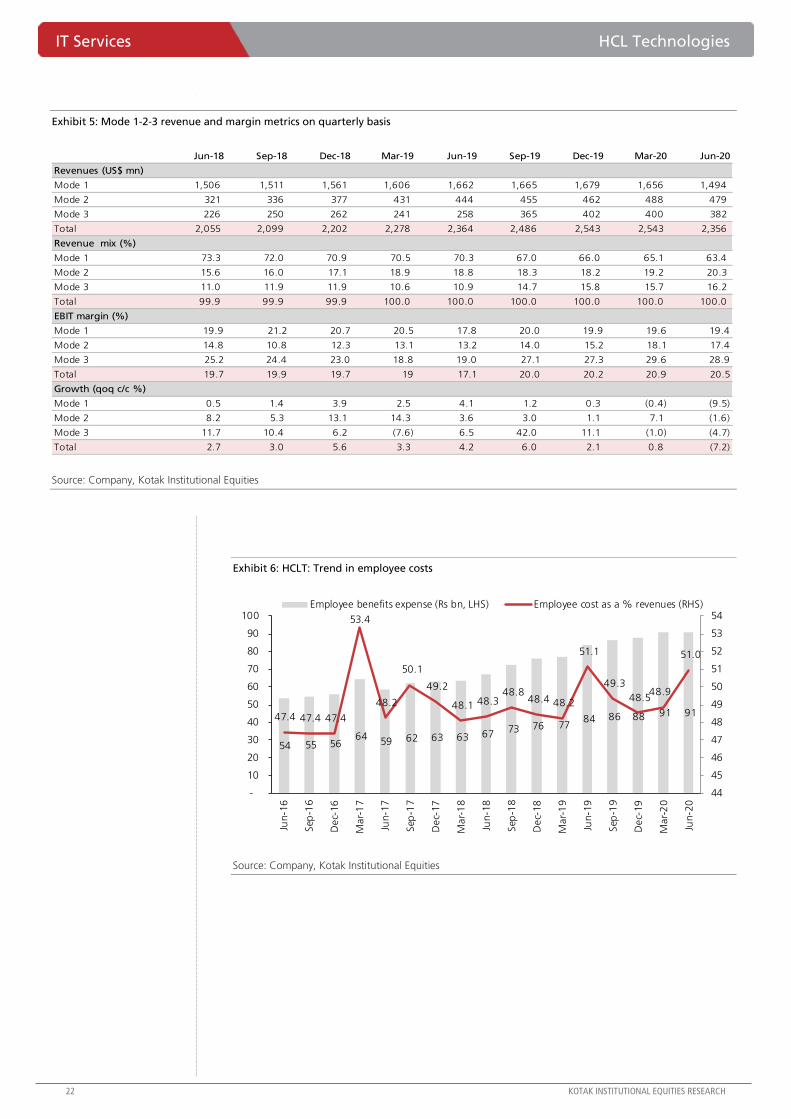
Margins. HCLT indicated that right shoring, automation, other cost management
initiatives and higher mode 3 mix contributed to a strong yoy EBIT margin performance.
HCLT indicated that it will not provide a wage hike to employees in FY2021.
WFH. 96% of billed employees are in WFH mode while 99.9% of support employees are
in WFH mode.
Revenue growth outlook. HCLT indicated that the revenue decline has bottomed out.
HCLT has provided guidance of CQGR average of 1.5-2.5% organic constant currency
growth in the next three quarters. HCLT expects revenue decline of 0.8% to 2.3% for
FY2021. HCLT indicated strong demand for digital foundation (IMS), IT ops, scale agile
ops model, digital workplace, cyber security. HCLT indicated healthy deal creation activity
among existing clients.
Deal wins. HCL signed 11 new transformational deals, led by telecommunication,
financial services, manufacturing, life sciences and healthcare. Net new bookings TCV is
higher than Jun-19 TCV. Renewals are also robust. HCLT has won a large consolidation
opportunity in Europe that it was pursuing over a year. Revenues from the deal will ramp
up gradually over the next few quarters
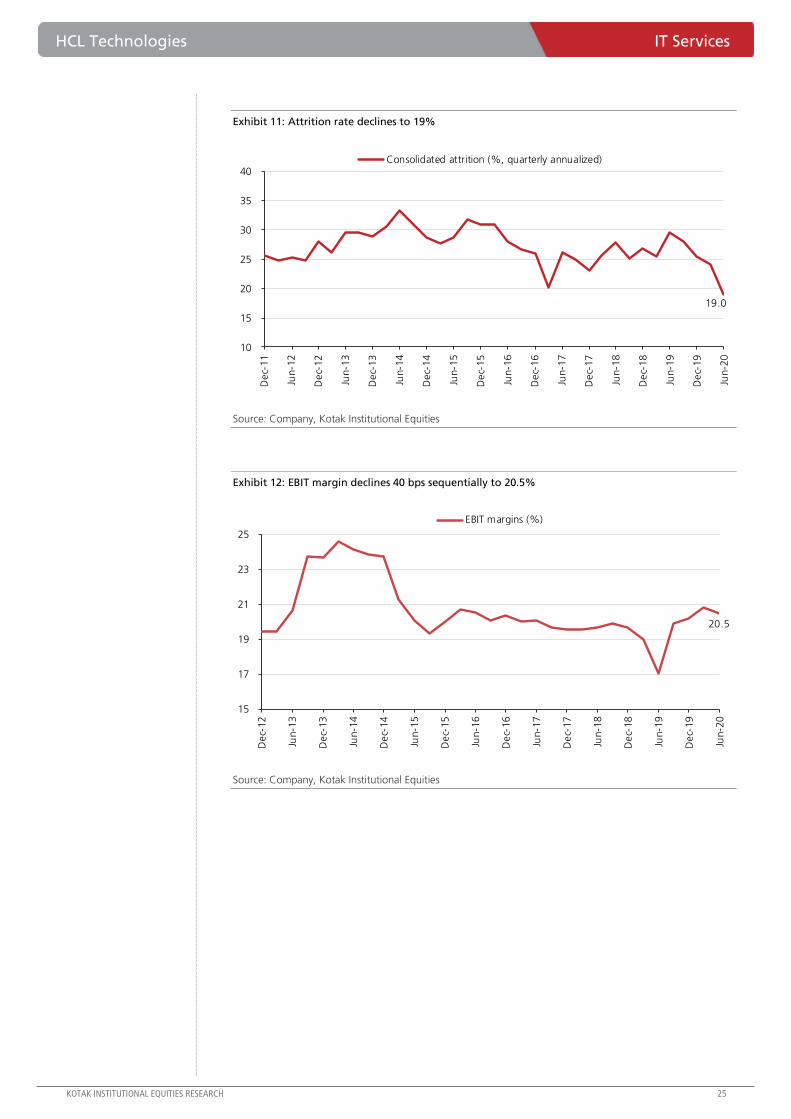
Margin walkthrough. EBIT margin was down 40 bps to 20.5%. Gross margin declined
by 70 bps and was supported by operational efficiencies. HCLT indicated a 76 bps
tailwind from Rupee depreciation and 40 bps benefit in SGA from control on travel and
discretionary spends. Margins faced a 67 bps headwind from higher depreciation and
amortization costs and 12 bps headwind from higher R&D expenses. Will continue to
increase S&M headcount especially in HCLT Software segment.
Cisco SON acquisition. HCLT indicated that the acquisition will likely be completed by
January 2021. The acquisition provides technology that helps HCLT a create niche
portfolio of telecom products relevant for 5G.
Temenos IP deal. HCLT entered into a seven-year IP deal with Temenos in 1QFY21. HCL
has been granted a license to develop, market and support Temenos’ Multi-Experience
Development Platform (MXDP) for non-financial services enterprises. HCLT indicated that
the company will integrate Temenos’ platform capabilities with other HCLT platform
products. License fee for the IP deal will be amortized over seven years. The deal is an
offshoot of Temenos’ acquisition of Kony’s digital banking and low code development
platform.
Symantec partnership. HCL Technologies has expanded its preferred services
partnership signed in 2018 with Broadcom to include the Symantec Enterprise Division
(SED) consulting services
Dividend. The Board declared a quarterly dividend of Rs2/share.
Other income. HCLT indicated that higher other income in the quarter was due to a one
time gain from the sale of a land parcel in India.
Cloud. HCLT indicated that hybrid cloud adoption is a good tailwind for IMS business.
Opportunities from cloud adoption are two-fold- (1) Clients on cloud adoption journey
also invest in digital foundation which includes security and a highly automated operating
model. This is a good services opportunity for HCLT and includes one-time system
integration as well as ongoing opportunities. (2) HCLT can also be considered for
application modernization during work on modernization of digital foundation.
HCL Technologies IT Services
KOTAK INSTITUTIONAL EQUITIES RESEARCH 19
Mode1-2-3 margin breakup. Mode 3- margins were lower in the quarter due to higher
amortization. Mode 2- margins declined after a sharp spike in the previous quarter. Mode
1 margins were relatively more stable and declined 20 bps to 19.4% from 19.6%.
Vendor consolidation. According to HCLT vendor consolidation opportunities are three-
fold- (1) Tail vendor consolidation which is a low hanging fruit and can bet at normal
pricing or rate cards, (2) In accounts where HCLT is not a large incumbent, it can be
invited by clients as a challenger due to capability differentiation. HCLT indicated that
much of this is not driven by pricing. (3) Clients unhappy with their existing service
provider can pass on the deal to HCLT ahead of schedule. In such a case HCLT may have
to contribute towards mitigating the client’s cost of exiting the previous provider. HCLT
said that the first two cases are more prevalent.
Infra + Apps opportunity. HCLT indicated that traditionally infra and apps were
managed separately. With hybrid cloud adoption infra apps can be integrated as one
cohort. Applications capability is available on public cloud of hyperscalers and have
become platform capabilities. This paves the way for an infrastructure vendor to
consolidate apps and vice versa. HCLT is strong in IMS and has won consolidation deals
with apps component. In a large deal in 1QFY21 HCLT consolidated two providers, one
providing workplace and data center services and the other providing applications. HCLT
has won similar deals in FY2020.
Tech spends. HCLT expects tech spends to meaningfully increase post Covid. Clients will
invest in developing a strong technology infrastructure. Clients have a much sharper
appreciation of the importance of a strong technology landscape for business survival and
HCLT believes the priority of technology spends has changed dramatically in the minds of
key decision makers. However timing and magnitude of the spending increase is uncertain.
Deal closures. HCLT indicated that 40% of deals closed in the last 15 days of the
quarter. Deal activity is higher in July compared to April. HCLT indicated that the deal
pipeline is 40% higher than the pipeline at the end of March.
IT Services HCL Technologies
20 KOTAK INSTITUTIONAL EQUITIES RESEARCH
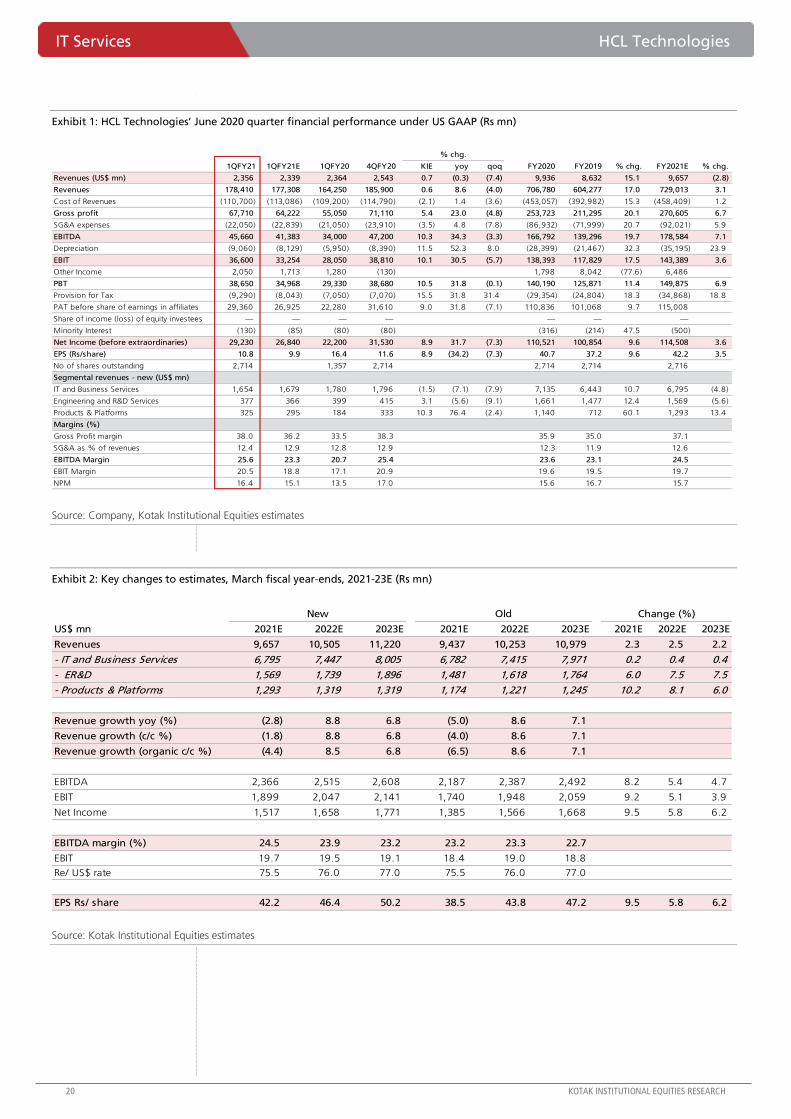
Exhibit 1: HCL Technologies’ June 2020 quarter financial performance under US GAAP (Rs mn)
Source: Company, Kotak Institutional Equities estimates
Exhibit 2: Key changes to estimates, March fiscal year-ends, 2021-23E (Rs mn)
Source: Kotak Institutional Equities estimates
1QFY21 1QFY21E 1QFY20 4QFY20 KIE yoy qoq FY2020 FY2019 % chg. FY2021E % chg.
Revenues (US$ mn) 2,356 2,339 2,364 2,543 0.7 (0.3) (7.4) 9,936 8,632 15.1 9,657 (2.8)
Revenues 178,410 177,308 164,250 185,900 0.6 8.6 (4.0) 706,780 604,277 17.0 729,013 3.1
Cost of Revenues (110,700) (113,086) (109,200) (114,790) (2.1) 1.4 (3.6) (453,057) (392,982) 15.3 (458,409) 1.2
Gross profit 67,710 64,222 55,050 71,110 5.4 23.0 (4.8) 253,723 211,295 20.1 270,605 6.7
SG&A expenses (22,050) (22,839) (21,050) (23,910) (3.5) 4.8 (7.8) (86,932) (71,999) 20.7 (92,021) 5.9
EBITDA 45,660 41,383 34,000 47,200 10.3 34.3 (3.3) 166,792 139,296 19.7 178,584 7.1
Depreciation (9,060) (8,129) (5,950) (8,390) 11.5 52.3 8.0 (28,399) (21,467) 32.3 (35,195) 23.9
EBIT 36,600 33,254 28,050 38,810 10.1 30.5 (5.7) 138,393 117,829 17.5 143,389 3.6
Other Income 2,050 1,713 1,280 (130) 1,798 8,042 (77.6) 6,486
PBT 38,650 34,968 29,330 38,680 10.5 31.8 (0.1) 140,190 125,871 11.4 149,875 6.9
Provision for Tax (9,290) (8,043) (7,050) (7,070) 15.5 31.8 31.4 (29,354) (24,804) 18.3 (34,868) 18.8
PAT before share of earnings in affiliates 29,360 26,925 22,280 31,610 9.0 31.8 (7.1) 110,836 101,068 9.7 115,008
Share of income (loss) of equity investees — — — — — — —
Minority Interest (130) (85) (80) (80) (316) (214) 47.5 (500)
Net Income (before extraordinaries) 29,230 26,840 22,200 31,530 8.9 31.7 (7.3) 110,521 100,854 9.6 114,508 3.6
EPS (Rs/share) 10.8 9.9 16.4 11.6 8.9 (34.2) (7.3) 40.7 37.2 9.6 42.2 3.5
No of shares outstanding 2,714 1,357 2,714 2,714 2,714 2,716
Segmental revenues - new (US$ mn)
IT and Business Services 1,654 1,679 1,780 1,796 (1.5) (7.1) (7.9) 7,135 6,443 10.7 6,795 (4.8)
Engineering and R&D Services 377 366 399 415 3.1 (5.6) (9.1) 1,661 1,477 12.4 1,569 (5.6)
Products & Platforms 325 295 184 333 10.3 76.4 (2.4) 1,140 712 60.1 1,293 13.4
Margins (%)
Gross Profit margin 38.0 36.2 33.5 38.3 35.9 35.0 37.1
SG&A as % of revenues 12.4 12.9 12.8 12.9 12.3 11.9 12.6
EBITDA Margin 25.6 23.3 20.7 25.4 23.6 23.1 24.5
EBIT Margin 20.5 18.8 17.1 20.9 19.6 19.5 19.7
NPM 16.4 15.1 13.5 17.0 15.6 16.7 15.7
% chg.
US$ mn 2021E 2022E 2023E 2021E 2022E 2023E 2021E 2022E 2023E
Revenues 9,657 10,505 11,220 9,437 10,253 10,979 2.3 2.5 2.2
- IT and Business Services 6,795 7,447 8,005 6,782 7,415 7,971 0.2 0.4 0.4
- ER&D 1,569 1,739 1,896 1,481 1,618 1,764 6.0 7.5 7.5
- Products & Platforms 1,293 1,319 1,319 1,174 1,221 1,245 10.2 8.1 6.0
Revenue growth yoy (%) (2.8) 8.8 6.8 (5.0) 8.6 7.1
Revenue growth (c/c %) (1.8) 8.8 6.8 (4.0) 8.6 7.1
Revenue growth (organic c/c %) (4.4) 8.5 6.8 (6.5) 8.6 7.1
EBITDA 2,366 2,515 2,608 2,187 2,387 2,492 8.2 5.4 4.7
EBIT 1,899 2,047 2,141 1,740 1,948 2,059 9.2 5.1 3.9
Net Income 1,517 1,658 1,771 1,385 1,566 1,668 9.5 5.8 6.2
EBITDA margin (%) 24.5 23.9 23.2 23.2 23.3 22.7
EBIT 19.7 19.5 19.1 18.4 19.0 18.8
Re/ US$ rate 75.5 76.0 77.0 75.5 76.0 77.0
EPS Rs/ share 42.2 46.4 50.2 38.5 43.8 47.2 9.5 5.8 6.2
New Change (%)Old
HCL Technologies IT Services
KOTAK INSTITUTIONAL EQUITIES RESEARCH 21
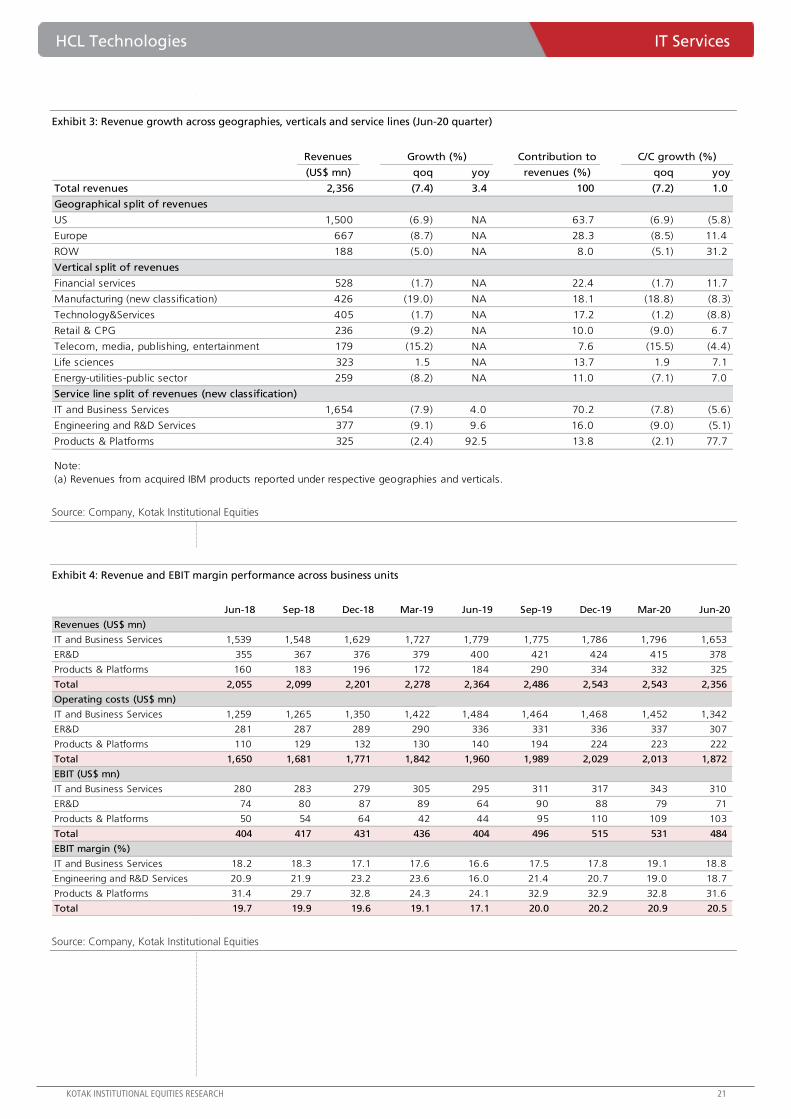
Exhibit 3: Revenue growth across geographies, verticals and service lines (Jun-20 quarter)
Source: Company, Kotak Institutional Equities
Exhibit 4: Revenue and EBIT margin performance across business units
Source: Company, Kotak Institutional Equities
Revenues Contribution to C/C growth (%)
(US$ mn) qoq yoy revenues (%) qoq yoy
Total revenues 2,356 (7.4) 3.4 100 (7.2) 1.0
Geographical split of revenues
US 1,500 (6.9) NA 63.7 (6.9) (5.8)
Europe 667 (8.7) NA 28.3 (8.5) 11.4
ROW 188 (5.0) NA 8.0 (5.1) 31.2
Vertical split of revenues
Financial services 528 (1.7) NA 22.4 (1.7) 11.7
Manufacturing (new classification) 426 (19.0) NA 18.1 (18.8) (8.3)
Technology&Services 405 (1.7) NA 17.2 (1.2) (8.8)
Retail & CPG 236 (9.2) NA 10.0 (9.0) 6.7
Telecom, media, publishing, entertainment 179 (15.2) NA 7.6 (15.5) (4.4)
Life sciences 323 1.5 NA 13.7 1.9 7.1
Energy-utilities-public sector 259 (8.2) NA 11.0 (7.1) 7.0
Service line split of revenues (new classification)
IT and Business Services 1,654 (7.9) 4.0 70.2 (7.8) (5.6)
Engineering and R&D Services 377 (9.1) 9.6 16.0 (9.0) (5.1)
Products & Platforms 325 (2.4) 92.5 13.8 (2.1) 77.7
Growth (%)
Note:
(a) Revenues from acquired IBM products reported under respective geographies and verticals.
Jun-18 Sep-18 Dec-18 Mar-19 Jun-19 Sep-19 Dec-19 Mar-20 Jun-20
Revenues (US$ mn)
IT and Business Services 1,539 1,548 1,629 1,727 1,779 1,775 1,786 1,796 1,653
ER&D 355 367 376 379 400 421 424 415 378
Products & Platforms 160 183 196 172 184 290 334 332 325
Total 2,055 2,099 2,201 2,278 2,364 2,486 2,543 2,543 2,356
Operating costs (US$ mn)
IT and Business Services 1,259 1,265 1,350 1,422 1,484 1,464 1,468 1,452 1,342
ER&D 281 287 289 290 336 331 336 337 307
Products & Platforms 110 129 132 130 140 194 224 223 222
Total 1,650 1,681 1,771 1,842 1,960 1,989 2,029 2,013 1,872
EBIT (US$ mn)
IT and Business Services 280 283 279 305 295 311 317 343 310
ER&D 74 80 87 89 64 90 88 79 71
Products & Platforms 50 54 64 42 44 95 110 109 103
Total 404 417 431 436 404 496 515 531 484
EBIT margin (%)
IT and Business Services 18.2 18.3 17.1 17.6 16.6 17.5 17.8 19.1 18.8
Engineering and R&D Services 20.9 21.9 23.2 23.6 16.0 21.4 20.7 19.0 18.7
Products & Platforms 31.4 29.7 32.8 24.3 24.1 32.9 32.9 32.8 31.6
Total 19.7 19.9 19.6 19.1 17.1 20.0 20.2 20.9 20.5
IT Services HCL Technologies
22 KOTAK INSTITUTIONAL EQUITIES RESEARCH
Exhibit 5: Mode 1-2-3 revenue and margin metrics on quarterly basis
Source: Company, Kotak Institutional Equities
Exhibit 6: HCLT: Trend in employee costs
Source: Company, Kotak Institutional Equities
Jun-18 Sep-18 Dec-18 Mar-19 Jun-19 Sep-19 Dec-19 Mar-20 Jun-20
Revenues (US$ mn)
Mode 1 1,506 1,511 1,561 1,606 1,662 1,665 1,679 1,656 1,494
Mode 2 321 336 377 431 444 455 462 488 479
Mode 3 226 250 262 241 258 365 402 400 382
Total 2,055 2,099 2,202 2,278 2,364 2,486 2,543 2,543 2,356
Revenue mix (%)
Mode 1 73.3 72.0 70.9 70.5 70.3 67.0 66.0 65.1 63.4
Mode 2 15.6 16.0 17.1 18.9 18.8 18.3 18.2 19.2 20.3
Mode 3 11.0 11.9 11.9 10.6 10.9 14.7 15.8 15.7 16.2
Total 99.9 99.9 99.9 100.0 100.0 100.0 100.0 100.0 100.0
EBIT margin (%)
Mode 1 19.9 21.2 20.7 20.5 17.8 20.0 19.9 19.6 19.4
Mode 2 14.8 10.8 12.3 13.1 13.2 14.0 15.2 18.1 17.4
Mode 3 25.2 24.4 23.0 18.8 19.0 27.1 27.3 29.6 28.9
Total 19.7 19.9 19.7 19 17.1 20.0 20.2 20.9 20.5
Growth (qoq c/c %)
Mode 1 0.5 1.4 3.9 2.5 4.1 1.2 0.3 (0.4) (9.5)
Mode 2 8.2 5.3 13.1 14.3 3.6 3.0 1.1 7.1 (1.6)
Mode 3 11.7 10.4 6.2 (7.6) 6.5 42.0 11.1 (1.0) (4.7)
Total 2.7 3.0 5.6 3.3 4.2 6.0 2.1 0.8 (7.2)
54 55 56 64
59 62 63 63 67 73 76 77 84 86 88 91 91 47.4 47.4 47.4
53.4
48.2
50.1
49.2
48.1 48.3 48.8
48.4 48.2
51.1
49.3
48.5 48.9
51.0
44
45
46
47
48
49
50
51
52
53
54
-
10
20
30
40
50
60
70
80
90
100
Jun-1
6
Sep
-16
Dec-
16
Mar-
17
Jun-1
7
Sep
-17
Dec-
17
Mar-
18
Jun-1
8
Sep
-18
Dec-
18
Mar-
19
Jun-1
9
Sep
-19
Dec-
19
Mar-
20
Jun-2
0
Employee benefits expense (Rs bn, LHS) Employee cost as a % revenues (RHS)
HCL Technologies IT Services
KOTAK INSTITUTIONAL EQUITIES RESEARCH 23
Exhibit 7: HCLT: Sharp pullback in other expenses
Source: Company, Kotak Institutional Equities
Exhibit 8: Revenue growth moderates in financial services further
Source: Company, Kotak Institutional Equities
14 11 11
13 12 11 10
13 14 14 14
16 15 15
16 16
13
11.9
9.6 9.3
10.6 10.0
8.9 8.2
9.5 9.89.4 9.1
9.9 9.0
8.4 8.8 8.8
7.0
0
2
4
6
8
10
12
14
-
2
4
6
8
10
12
14
16
18
Jun-1
6
Sep
-16
Dec-
16
Mar-
17
Jun-1
7
Sep
-17
Dec-
17
Mar-
18
Jun-1
8
Sep
-18
Dec-
18
Mar-
19
Jun-1
9
Sep
-19
Dec-
19
Mar-
20
Jun-2
0
Other expenses (Rs bn, LHS) Other expenses as a % revenues (RHS)
9.3 7.7 8.3
4.6
2.0
5.6
8.8
13.4
19.2
14.2
10.6 9.4
2.9 2.3
0.1 (1.4)
0.5
8.5
4.3
2.3
0.0
(5)
0
5
10
15
20
25
Jun-1
5
Sep
-15
Dec-
15
Mar-
16
Jun-1
6
Sep
-16
Dec-
16
Mar-
17
Jun-1
7
Sep
-17
Dec-
17
Mar-
18
Jun-1
8
Sep
-18
Dec-
18
Mar-
19
Jun-1
9
Sep
-19
Dec-
19
Mar-
20
Jun-2
0
Financial services revenue growth (c/c, yoy%)
IT Services HCL Technologies
24 KOTAK INSTITUTIONAL EQUITIES RESEARCH
Exhibit 9: Execution on Stanley Black and Decker deal can drive recovery in 2QFY21
Source: Company, Kotak Institutional Equities
Exhibit 10: Strong cash generation in 1QFY21
Source: Company, Kotak Institutional Equities
19.0
12.7
3.9 1.1
12.2 10.4
21.3
27.4
17.1
21.9 21.0
13.8
(3.9) (3.9)
1.5
6.7
28.3
26.0 27.0 27.5
(15.5)(20)
(15)
(10)
(5)
0
5
10
15
20
25
30
35
Jun-1
5
Sep
-15
Dec-
15
Mar-
16
Jun-1
6
Sep
-16
Dec-
16
Mar-
17
Jun-1
7
Sep
-17
Dec-
17
Mar-
18
Jun-1
8
Sep
-18
Dec-
18
Mar-
19
Jun-1
9
Sep
-19
Dec-
19
Mar-
20
Jun-2
0
Manufacturing revenue growth (c/c, yoy%)
215 174 244 463 342 307 297 408 264 250 423 363 278 290 409 258 255 709 521 819
82
60
86
152
113 100
85
121
78 74
123
102
78 80
112
81 68
166
121
212
-
50
100
150
200
250
-
100
200
300
400
500
600
700
800
900
Sep
-15
Dec-
15
Mar-
16
Jun-1
6
Sep
-16
Dec-
16
Mar-
17
Jun-1
7
Sep
-17
Dec-
17
Mar-
18
Jun-1
8
Sep
-18
Dec-
18
Mar-
19
Jun-1
9
Sep
-19
Dec-
19
Mar-
20
Jun-2
0
CFO (US$ mn, LHS) CFO as a % of net profit , RHS
HCL Technologies IT Services
KOTAK INSTITUTIONAL EQUITIES RESEARCH 25
Exhibit 11: Attrition rate declines to 19%
Source: Company, Kotak Institutional Equities
Exhibit 12: EBIT margin declines 40 bps sequentially to 20.5%
Source: Company, Kotak Institutional Equities
19.0
10
15
20
25
30
35
40
Dec-
11
Jun-1
2
Dec-
12
Jun-1
3
Dec-
13
Jun-1
4
Dec-
14
Jun-1
5
Dec-
15
Jun-1
6
Dec-
16
Jun-1
7
Dec-
17
Jun-1
8
Dec-
18
Jun-1
9
Dec-
19
Jun-2
0
Consolidated attrition (%, quarterly annualized)
20.5
15
17
19
21
23
25
Dec-
12
Jun-1
3
Dec-
13
Jun-1
4
Dec-
14
Jun-1
5
Dec-
15
Jun-1
6
Dec-
16
Jun-1
7
Dec-
17
Jun-1
8
Dec-
18
Jun-1
9
Dec-
19
Jun-2
0
EBIT margins (%)
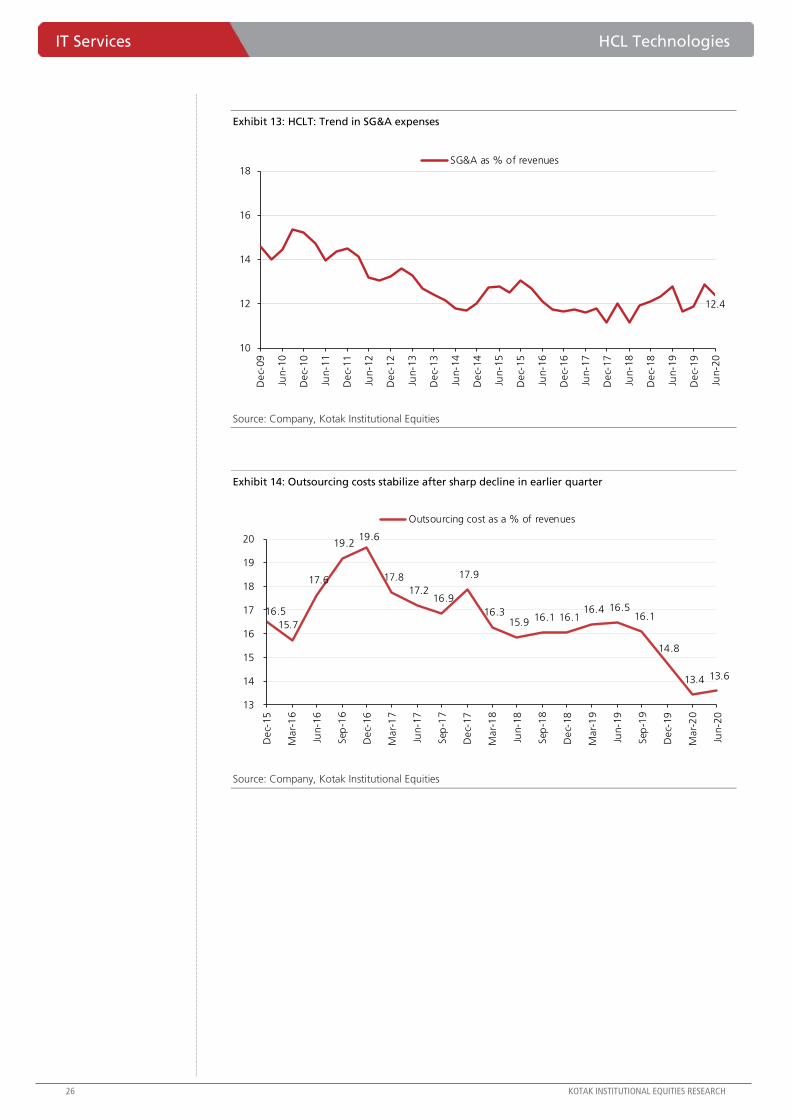
IT Services HCL Technologies
26 KOTAK INSTITUTIONAL EQUITIES RESEARCH
Exhibit 13: HCLT: Trend in SG&A expenses
Source: Company, Kotak Institutional Equities
Exhibit 14: Outsourcing costs stabilize after sharp decline in earlier quarter
Source: Company, Kotak Institutional Equities
12.4
10
12
14
16
18
Dec-
09
Jun-1
0
Dec-
10
Jun-1
1
Dec-
11
Jun-1
2
Dec-
12
Jun-1
3
Dec-
13
Jun-1
4
Dec-
14
Jun-1
5
Dec-
15
Jun-1
6
Dec-
16
Jun-1
7
Dec-
17
Jun-1
8
Dec-
18
Jun-1
9
Dec-
19
Jun-2
0
SG&A as % of revenues
16.5
15.7
17.6
19.2 19.6
17.8
17.2 16.9
17.9
16.3 15.9 16.1 16.1
16.4 16.5 16.1
14.8
13.4 13.6
13
14
15
16
17
18
19
20
Dec-
15
Mar-
16
Jun-1
6
Sep
-16
Dec-
16
Mar-
17
Jun-1
7
Sep
-17
Dec-
17
Mar-
18
Jun-1
8
Sep
-18
Dec-
18
Mar-
19
Jun-1
9
Sep
-19
Dec-
19
Mar-
20
Jun-2
0
Outsourcing cost as a % of revenues
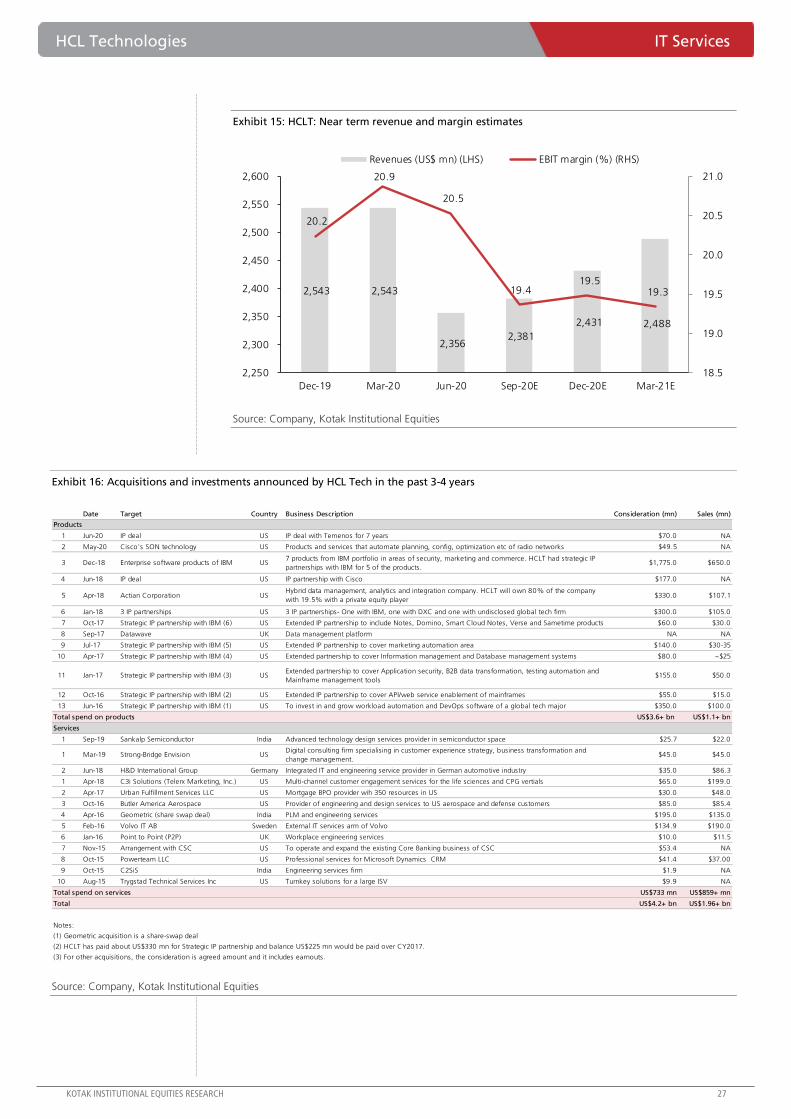
HCL Technologies IT Services
KOTAK INSTITUTIONAL EQUITIES RESEARCH 27
Exhibit 15: HCLT: Near term revenue and margin estimates
Source: Company, Kotak Institutional Equities
Exhibit 16: Acquisitions and investments announced by HCL Tech in the past 3-4 years
Source: Company, Kotak Institutional Equities
2,543 2,543
2,356 2,381
2,431 2,488
20.2
20.9
20.5
19.4 19.5
19.3
18.5
19.0
19.5
20.0
20.5
21.0
2,250
2,300
2,350
2,400
2,450
2,500
2,550
2,600
Dec-19 Mar-20 Jun-20 Sep-20E Dec-20E Mar-21E
Revenues (US$ mn) (LHS) EBIT margin (%) (RHS)
Date Target Country Business Description Consideration (mn) Sales (mn)
Products
1 Jun-20 IP deal US IP deal with Temenos for 7 years $70.0 NA
2 May-20 Cisco's SON technology US Products and services that automate planning, config, optimization etc of radio networks $49.5 NA
3 Dec-18 Enterprise software products of IBM US7 products from IBM portfolio in areas of security, marketing and commerce. HCLT had strategic IP
partnerships with IBM for 5 of the products.$1,775.0 $650.0
4 Jun-18 IP deal US IP partnership with Cisco $177.0 NA
5 Apr-18 Actian Corporation USHybrid data management, analytics and integration company. HCLT will own 80% of the company
with 19.5% with a private equity player$330.0 $107.1
6 Jan-18 3 IP partnerships US 3 IP partnerships- One with IBM, one with DXC and one with undisclosed global tech firm $300.0 $105.0
7 Oct-17 Strategic IP partnership with IBM (6) US Extended IP partnership to include Notes, Domino, Smart Cloud Notes, Verse and Sametime products $60.0 $30.0
8 Sep-17 Datawave UK Data management platform NA NA
9 Jul-17 Strategic IP partnership with IBM (5) US Extended IP partnership to cover marketing automation area $140.0 $30-35
10 Apr-17 Strategic IP partnership with IBM (4) US Extended partnership to cover Information management and Database management systems $80.0 ~$25
11 Jan-17 Strategic IP partnership with IBM (3) USExtended partnership to cover Application security, B2B data transformation, testing automation and
Mainframe management tools$155.0 $50.0
12 Oct-16 Strategic IP partnership with IBM (2) US Extended IP partnership to cover API/web service enablement of mainframes $55.0 $15.0
13 Jun-16 Strategic IP partnership with IBM (1) US To invest in and grow workload automation and DevOps software of a global tech major $350.0 $100.0
Total spend on products US$3.6+ bn US$1.1+ bn
Services
1 Sep-19 Sankalp Semiconductor India Advanced technology design services provider in semiconductor space $25.7 $22.0
1 Mar-19 Strong-Bridge Envision USDigital consulting firm specialising in customer experience strategy, business transformation and
change management.$45.0 $45.0
2 Jun-18 H&D International Group Germany Integrated IT and engineering service provider in German automotive industry $35.0 $86.3
1 Apr-18 C3i Solutions (Telerx Marketing, Inc.) US Multi-channel customer engagement services for the life sciences and CPG vertials $65.0 $199.0
2 Apr-17 Urban Fulfillment Services LLC US Mortgage BPO provider wih 350 resources in US $30.0 $48.0
3 Oct-16 Butler America Aerospace US Provider of engineering and design services to US aerospace and defense customers $85.0 $85.4
4 Apr-16 Geometric (share swap deal) India PLM and engineering services $195.0 $135.0
5 Feb-16 Volvo IT AB Sweden External IT services arm of Volvo $134.9 $190.0
6 Jan-16 Point to Point (P2P) UK Workplace engineering services $10.0 $11.5
7 Nov-15 Arrangement with CSC US To operate and expand the existing Core Banking business of CSC $53.4 NA
8 Oct-15 Powerteam LLC US Professional services for Microsoft Dynamics CRM $41.4 $37.00
9 Oct-15 C2SiS India Engineering services firm $1.9 NA
10 Aug-15 Trygstad Technical Services Inc US Turnkey solutions for a large ISV $9.9 NA
Total spend on services US$733 mn US$859+ mn
Total US$4.2+ bn US$1.96+ bn
Notes:
(1) Geometric acquisition is a share-swap deal
(2) HCLT has paid about US$330 mn for Strategic IP partnership and balance US$225 mn would be paid over CY2017.
(3) For other acquisitions, the consideration is agreed amount and it includes earnouts.
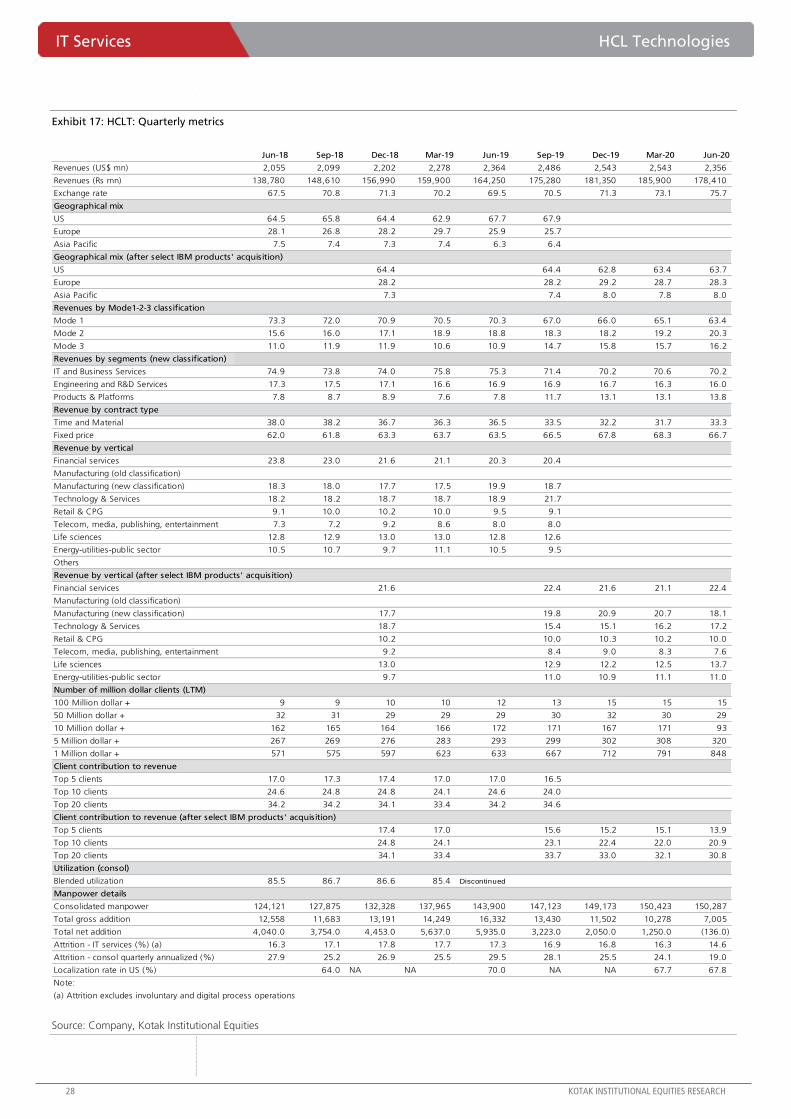
IT Services HCL Technologies
28 KOTAK INSTITUTIONAL EQUITIES RESEARCH
Exhibit 17: HCLT: Quarterly metrics
Source: Company, Kotak Institutional Equities
Jun-18 Sep-18 Dec-18 Mar-19 Jun-19 Sep-19 Dec-19 Mar-20 Jun-20
Revenues (US$ mn) 2,055 2,099 2,202 2,278 2,364 2,486 2,543 2,543 2,356
Revenues (Rs mn) 138,780 148,610 156,990 159,900 164,250 175,280 181,350 185,900 178,410
Exchange rate 67.5 70.8 71.3 70.2 69.5 70.5 71.3 73.1 75.7
Geographical mix
US 64.5 65.8 64.4 62.9 67.7 67.9
Europe 28.1 26.8 28.2 29.7 25.9 25.7
Asia Pacific 7.5 7.4 7.3 7.4 6.3 6.4
Geographical mix (after select IBM products' acquisition)
US 64.4 64.4 62.8 63.4 63.7
Europe 28.2 28.2 29.2 28.7 28.3
Asia Pacific 7.3 7.4 8.0 7.8 8.0
Revenues by Mode1-2-3 classification
Mode 1 73.3 72.0 70.9 70.5 70.3 67.0 66.0 65.1 63.4
Mode 2 15.6 16.0 17.1 18.9 18.8 18.3 18.2 19.2 20.3
Mode 3 11.0 11.9 11.9 10.6 10.9 14.7 15.8 15.7 16.2
Revenues by segments (new classification)
IT and Business Services 74.9 73.8 74.0 75.8 75.3 71.4 70.2 70.6 70.2
Engineering and R&D Services 17.3 17.5 17.1 16.6 16.9 16.9 16.7 16.3 16.0
Products & Platforms 7.8 8.7 8.9 7.6 7.8 11.7 13.1 13.1 13.8
Revenue by contract type
Time and Material 38.0 38.2 36.7 36.3 36.5 33.5 32.2 31.7 33.3
Fixed price 62.0 61.8 63.3 63.7 63.5 66.5 67.8 68.3 66.7
Revenue by vertical
Financial services 23.8 23.0 21.6 21.1 20.3 20.4
Manufacturing (old classification)
Manufacturing (new classification) 18.3 18.0 17.7 17.5 19.9 18.7
Technology & Services 18.2 18.2 18.7 18.7 18.9 21.7
Retail & CPG 9.1 10.0 10.2 10.0 9.5 9.1
Telecom, media, publishing, entertainment 7.3 7.2 9.2 8.6 8.0 8.0
Life sciences 12.8 12.9 13.0 13.0 12.8 12.6
Energy-utilities-public sector 10.5 10.7 9.7 11.1 10.5 9.5
Others
Revenue by vertical (after select IBM products' acquisition)
Financial services 21.6 22.4 21.6 21.1 22.4
Manufacturing (old classification)
Manufacturing (new classification) 17.7 19.8 20.9 20.7 18.1
Technology & Services 18.7 15.4 15.1 16.2 17.2
Retail & CPG 10.2 10.0 10.3 10.2 10.0
Telecom, media, publishing, entertainment 9.2 8.4 9.0 8.3 7.6
Life sciences 13.0 12.9 12.2 12.5 13.7
Energy-utilities-public sector 9.7 11.0 10.9 11.1 11.0
Number of million dollar clients (LTM)
100 Million dollar + 9 9 10 10 12 13 15 15 15
50 Million dollar + 32 31 29 29 29 30 32 30 29
10 Million dollar + 162 165 164 166 172 171 167 171 93
5 Million dollar + 267 269 276 283 293 299 302 308 320
1 Million dollar + 571 575 597 623 633 667 712 791 848
Client contribution to revenue
Top 5 clients 17.0 17.3 17.4 17.0 17.0 16.5
Top 10 clients 24.6 24.8 24.8 24.1 24.6 24.0
Top 20 clients 34.2 34.2 34.1 33.4 34.2 34.6
Client contribution to revenue (after select IBM products' acquisition)
Top 5 clients 17.4 17.0 15.6 15.2 15.1 13.9
Top 10 clients 24.8 24.1 23.1 22.4 22.0 20.9
Top 20 clients 34.1 33.4 33.7 33.0 32.1 30.8
Utilization (consol)
Blended utilization 85.5 86.7 86.6 85.4 Discontinued
Manpower details
Consolidated manpower 124,121 127,875 132,328 137,965 143,900 147,123 149,173 150,423 150,287
Total gross addition 12,558 11,683 13,191 14,249 16,332 13,430 11,502 10,278 7,005
Total net addition 4,040.0 3,754.0 4,453.0 5,637.0 5,935.0 3,223.0 2,050.0 1,250.0 (136.0)
Attrition - IT services (%) (a) 16.3 17.1 17.8 17.7 17.3 16.9 16.8 16.3 14.6
Attrition - consol quarterly annualized (%) 27.9 25.2 26.9 25.5 29.5 28.1 25.5 24.1 19.0
Localization rate in US (%) 64.0 NA NA 70.0 NA NA 67.7 67.8
Note:
(a) Attrition excludes involuntary and digital process operations
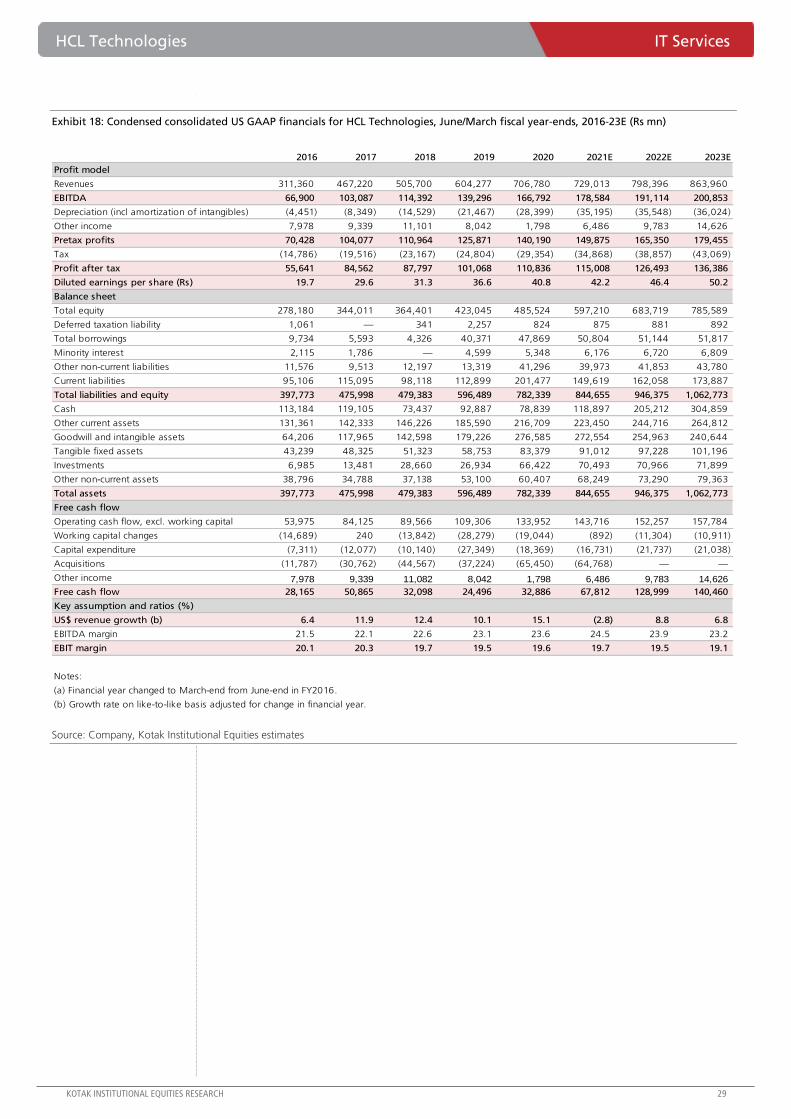
HCL Technologies IT Services
KOTAK INSTITUTIONAL EQUITIES RESEARCH 29
Exhibit 18: Condensed consolidated US GAAP financials for HCL Technologies, June/March fiscal year-ends, 2016-23E (Rs mn)
Source: Company, Kotak Institutional Equities estimates
2016 2017 2018 2019 2020 2021E 2022E 2023E
Profit model
Revenues 311,360 467,220 505,700 604,277 706,780 729,013 798,396 863,960
EBITDA 66,900 103,087 114,392 139,296 166,792 178,584 191,114 200,853
Depreciation (incl amortization of intangibles) (4,451) (8,349) (14,529) (21,467) (28,399) (35,195) (35,548) (36,024)
Other income 7,978 9,339 11,101 8,042 1,798 6,486 9,783 14,626
Pretax profits 70,428 104,077 110,964 125,871 140,190 149,875 165,350 179,455
Tax (14,786) (19,516) (23,167) (24,804) (29,354) (34,868) (38,857) (43,069)
Profit after tax 55,641 84,562 87,797 101,068 110,836 115,008 126,493 136,386
Diluted earnings per share (Rs) 19.7 29.6 31.3 36.6 40.8 42.2 46.4 50.2
Balance sheet
Total equity 278,180 344,011 364,401 423,045 485,524 597,210 683,719 785,589
Deferred taxation liability 1,061 — 341 2,257 824 875 881 892
Total borrowings 9,734 5,593 4,326 40,371 47,869 50,804 51,144 51,817
Minority interest 2,115 1,786 — 4,599 5,348 6,176 6,720 6,809
Other non-current liabilities 11,576 9,513 12,197 13,319 41,296 39,973 41,853 43,780
Current liabilities 95,106 115,095 98,118 112,899 201,477 149,619 162,058 173,887
Total liabilities and equity 397,773 475,998 479,383 596,489 782,339 844,655 946,375 1,062,773
Cash 113,184 119,105 73,437 92,887 78,839 118,897 205,212 304,859
Other current assets 131,361 142,333 146,226 185,590 216,709 223,450 244,716 264,812
Goodwill and intangible assets 64,206 117,965 142,598 179,226 276,585 272,554 254,963 240,644
Tangible fixed assets 43,239 48,325 51,323 58,753 83,379 91,012 97,228 101,196
Investments 6,985 13,481 28,660 26,934 66,422 70,493 70,966 71,899
Other non-current assets 38,796 34,788 37,138 53,100 60,407 68,249 73,290 79,363
Total assets 397,773 475,998 479,383 596,489 782,339 844,655 946,375 1,062,773
Free cash flow
Operating cash flow, excl. working capital 53,975 84,125 89,566 109,306 133,952 143,716 152,257 157,784
Working capital changes (14,689) 240 (13,842) (28,279) (19,044) (892) (11,304) (10,911)
Capital expenditure (7,311) (12,077) (10,140) (27,349) (18,369) (16,731) (21,737) (21,038)
Acquisitions (11,787) (30,762) (44,567) (37,224) (65,450) (64,768) — —
Other income 7,978 9,339 11,082 8,042 1,798 6,486 9,783 14,626
Free cash flow 28,165 50,865 32,098 24,496 32,886 67,812 128,999 140,460
Key assumption and ratios (%)
US$ revenue growth (b) 6.4 11.9 12.4 10.1 15.1 (2.8) 8.8 6.8
EBITDA margin 21.5 22.1 22.6 23.1 23.6 24.5 23.9 23.2
EBIT margin 20.1 20.3 19.7 19.5 19.6 19.7 19.5 19.1
Notes:
(a) Financial year changed to March-end from June-end in FY2016.
(b) Growth rate on like-to-like basis adjusted for change in financial year.
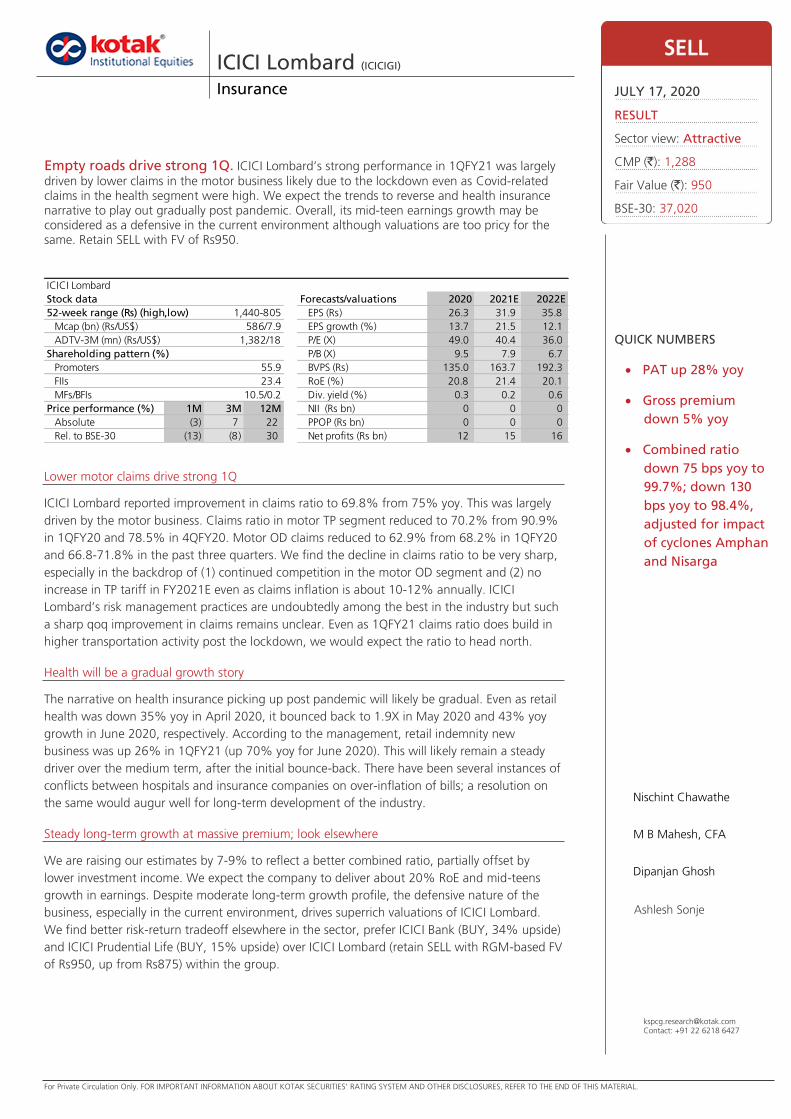
For Private Circulation Only. FOR IMPORTANT INFORMATION ABOUT KOTAK SECURITIES’ RATING SYSTEM AND OTHER DISCLOSURES, REFER TO THE END OF THIS MATERIAL.
Lower motor claims drive strong 1Q
ICICI Lombard reported improvement in claims ratio to 69.8% from 75% yoy. This was largely
driven by the motor business. Claims ratio in motor TP segment reduced to 70.2% from 90.9%
in 1QFY20 and 78.5% in 4QFY20. Motor OD claims reduced to 62.9% from 68.2% in 1QFY20
and 66.8-71.8% in the past three quarters. We find the decline in claims ratio to be very sharp,
especially in the backdrop of (1) continued competition in the motor OD segment and (2) no
increase in TP tariff in FY2021E even as claims inflation is about 10-12% annually. ICICI
Lombard’s risk management practices are undoubtedly among the best in the industry but such
a sharp qoq improvement in claims remains unclear. Even as 1QFY21 claims ratio does build in
higher transportation activity post the lockdown, we would expect the ratio to head north.
Health will be a gradual growth story
The narrative on health insurance picking up post pandemic will likely be gradual. Even as retail
health was down 35% yoy in April 2020, it bounced back to 1.9X in May 2020 and 43% yoy
growth in June 2020, respectively. According to the management, retail indemnity new
business was up 26% in 1QFY21 (up 70% yoy for June 2020). This will likely remain a steady
driver over the medium term, after the initial bounce-back. There have been several instances of
conflicts between hospitals and insurance companies on over-inflation of bills; a resolution on
the same would augur well for long-term development of the industry.
Steady long-term growth at massive premium; look elsewhere
We are raising our estimates by 7-9% to reflect a better combined ratio, partially offset by
lower investment income. We expect the company to deliver about 20% RoE and mid-teens
growth in earnings. Despite moderate long-term growth profile, the defensive nature of the
business, especially in the current environment, drives superrich valuations of ICICI Lombard.
We find better risk-return tradeoff elsewhere in the sector, prefer ICICI Bank (BUY, 34% upside)
and ICICI Prudential Life (BUY, 15% upside) over ICICI Lombard (retain SELL with RGM-based FV
of Rs950, up from Rs875) within the group.
ICICI Lombard (ICICIGI) Insurance
Empty roads drive strong 1Q. ICICI Lombard’s strong performance in 1QFY21 was largely driven by lower claims in the motor business likely due to the lockdown even as Covid-related claims in the health segment were high. We expect the trends to reverse and health insurance narrative to play out gradually post pandemic. Overall, its mid-teen earnings growth may be considered as a defensive in the current environment although valuations are too pricy for the same. Retain SELL with FV of Rs950.
SELL
JULY 17, 2020
RESULT
Sector view: Attractive
CMP (`): 1,288
Fair Value (`): 950
BSE-30: 37,020
QUICK NUMBERS
PAT up 28% yoy
Gross premium
down 5% yoy
Combined ratio
down 75 bps yoy to
99.7%; down 130
bps yoy to 98.4%,
adjusted for impact
of cyclones Amphan
and Nisarga
Nischint Chawathe
M B Mahesh, CFA
Dipanjan Ghosh
Ashlesh Sonje
Stock data Forecasts/valuations 2020 2021E 2022E
52-week range (Rs) (high,low) EPS (Rs) 26.3 31.9 35.8
Mcap (bn) (Rs/US$) EPS growth (%) 13.7 21.5 12.1
ADTV-3M (mn) (Rs/US$) P/E (X) 49.0 40.4 36.0
Shareholding pattern (%) P/B (X) 9.5 7.9 6.7
Promoters 55.9 BVPS (Rs) 135.0 163.7 192.3
FIIs 23.4 RoE (%) 20.8 21.4 20.1
MFs/BFIs Div. yield (%) 0.3 0.2 0.6
Price performance (%) 1M 3M 12M NII (Rs bn) 0 0 0
Absolute (3) 7 22 PPOP (Rs bn) 0 0 0
Rel. to BSE-30 (13) (8) 30 Net profits (Rs bn) 12 15 16
10.5/0.2
ICICI Lombard
586/7.9
1,382/18
1,440-805
[email protected]: +91 22 6218 6427
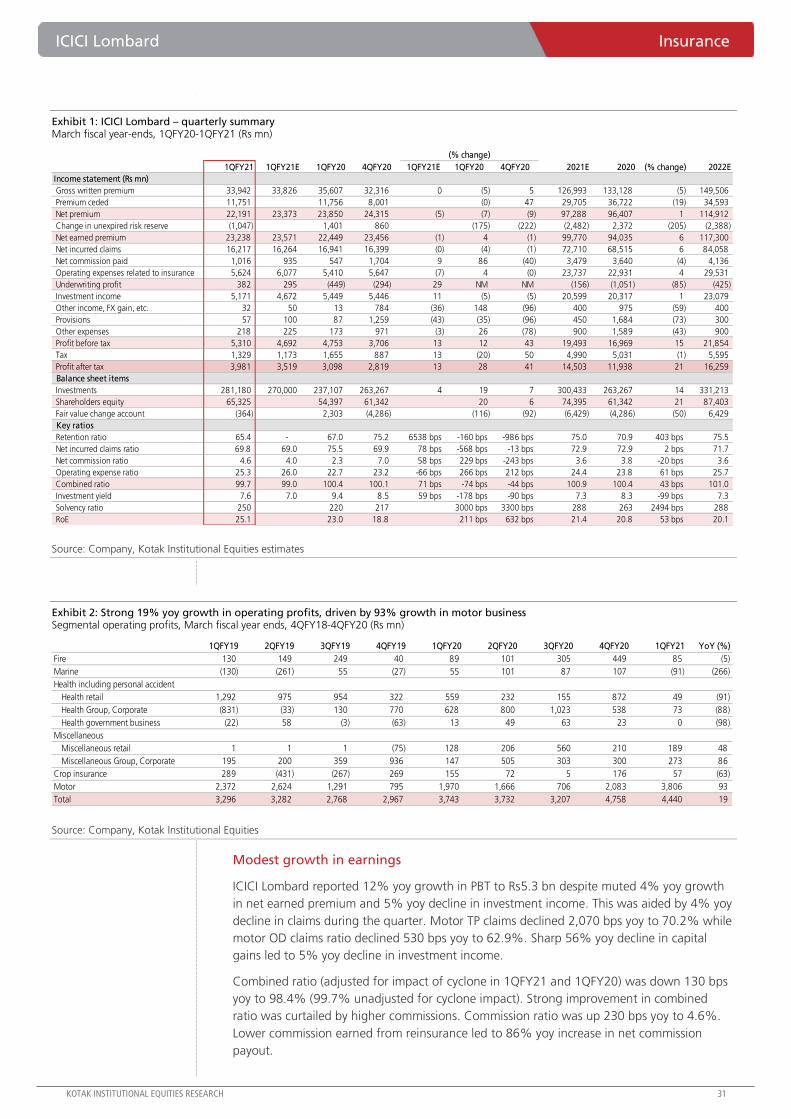
ICICI Lombard Insurance
KOTAK INSTITUTIONAL EQUITIES RESEARCH 31
Exhibit 1: ICICI Lombard – quarterly summary March fiscal year-ends, 1QFY20-1QFY21 (Rs mn)
Source: Company, Kotak Institutional Equities estimates
Exhibit 2: Strong 19% yoy growth in operating profits, driven by 93% growth in motor business Segmental operating profits, March fiscal year ends, 4QFY18-4QFY20 (Rs mn)
Source: Company, Kotak Institutional Equities
Modest growth in earnings
ICICI Lombard reported 12% yoy growth in PBT to Rs5.3 bn despite muted 4% yoy growth
in net earned premium and 5% yoy decline in investment income. This was aided by 4% yoy
decline in claims during the quarter. Motor TP claims declined 2,070 bps yoy to 70.2% while
motor OD claims ratio declined 530 bps yoy to 62.9%. Sharp 56% yoy decline in capital
gains led to 5% yoy decline in investment income.
Combined ratio (adjusted for impact of cyclone in 1QFY21 and 1QFY20) was down 130 bps
yoy to 98.4% (99.7% unadjusted for cyclone impact). Strong improvement in combined
ratio was curtailed by higher commissions. Commission ratio was up 230 bps yoy to 4.6%.
Lower commission earned from reinsurance led to 86% yoy increase in net commission
payout.
(% change)
1QFY21 1QFY21E 1QFY20 4QFY20 1QFY21E 1QFY20 4QFY20 2021E 2020 (% change) 2022E
Income statement (Rs mn)
Gross written premium 33,942 33,826 35,607 32,316 0 (5) 5 126,993 133,128 (5) 149,506
Premium ceded 11,751 11,756 8,001 (0) 47 29,705 36,722 (19) 34,593
Net premium 22,191 23,373 23,850 24,315 (5) (7) (9) 97,288 96,407 1 114,912
Change in unexpired risk reserve (1,047) 1,401 860 (175) (222) (2,482) 2,372 (205) (2,388)
Net earned premium 23,238 23,571 22,449 23,456 (1) 4 (1) 99,770 94,035 6 117,300
Net incurred claims 16,217 16,264 16,941 16,399 (0) (4) (1) 72,710 68,515 6 84,058
Net commission paid 1,016 935 547 1,704 9 86 (40) 3,479 3,640 (4) 4,136
Operating expenses related to insurance 5,624 6,077 5,410 5,647 (7) 4 (0) 23,737 22,931 4 29,531
Underwriting profit 382 295 (449) (294) 29 NM NM (156) (1,051) (85) (425)
Investment income 5,171 4,672 5,449 5,446 11 (5) (5) 20,599 20,317 1 23,079
Other income, FX gain, etc. 32 50 13 784 (36) 148 (96) 400 975 (59) 400
Provisions 57 100 87 1,259 (43) (35) (96) 450 1,684 (73) 300
Other expenses 218 225 173 971 (3) 26 (78) 900 1,589 (43) 900
Profit before tax 5,310 4,692 4,753 3,706 13 12 43 19,493 16,969 15 21,854
Tax 1,329 1,173 1,655 887 13 (20) 50 4,990 5,031 (1) 5,595
Profit after tax 3,981 3,519 3,098 2,819 13 28 41 14,503 11,938 21 16,259
Balance sheet items
Investments 281,180 270,000 237,107 263,267 4 19 7 300,433 263,267 14 331,213
Shareholders equity 65,325 54,397 61,342 20 6 74,395 61,342 21 87,403
Fair value change account (364) 2,303 (4,286) (116) (92) (6,429) (4,286) (50) 6,429
Key ratios
Retention ratio 65.4 - 67.0 75.2 6538 bps -160 bps -986 bps 75.0 70.9 403 bps 75.5
Net incurred claims ratio 69.8 69.0 75.5 69.9 78 bps -568 bps -13 bps 72.9 72.9 2 bps 71.7
Net commission ratio 4.6 4.0 2.3 7.0 58 bps 229 bps -243 bps 3.6 3.8 -20 bps 3.6
Operating expense ratio 25.3 26.0 22.7 23.2 -66 bps 266 bps 212 bps 24.4 23.8 61 bps 25.7
Combined ratio 99.7 99.0 100.4 100.1 71 bps -74 bps -44 bps 100.9 100.4 43 bps 101.0
Investment yield 7.6 7.0 9.4 8.5 59 bps -178 bps -90 bps 7.3 8.3 -99 bps 7.3
Solvency ratio 250 220 217 3000 bps 3300 bps 288 263 2494 bps 288
RoE 25.1 23.0 18.8 211 bps 632 bps 21.4 20.8 53 bps 20.1
1QFY19 2QFY19 3QFY19 4QFY19 1QFY20 2QFY20 3QFY20 4QFY20 1QFY21 YoY (%)
Fire 130 149 249 40 89 101 305 449 85 (5)
Marine (130) (261) 55 (27) 55 101 87 107 (91) (266)
Health including personal accident
Health retail 1,292 975 954 322 559 232 155 872 49 (91)
Health Group, Corporate (831) (33) 130 770 628 800 1,023 538 73 (88)
Health government business (22) 58 (3) (63) 13 49 63 23 0 (98)
Miscellaneous
Miscellaneous retail 1 1 1 (75) 128 206 560 210 189 48
Miscellaneous Group, Corporate 195 200 359 936 147 505 303 300 273 86
Crop insurance 289 (431) (267) 269 155 72 5 176 57 (63)
Motor 2,372 2,624 1,291 795 1,970 1,666 706 2,083 3,806 93
Total 3,296 3,282 2,768 2,967 3,743 3,732 3,207 4,758 4,440 19
Insurance ICICI Lombard
32 KOTAK INSTITUTIONAL EQUITIES RESEARCH
Stringent cost control, lower volumes in 1QFY21 and shift towards digital claims settlement
and sourcing led to muted 5% yoy increase in operating cost.
6% yoy decline in overall premium (excluding crop) in 1QFY21
ICICI Lombard reported 6% yoy (excluding crop) decline in gross premiums on the back of
sharp decline in motor premiums (~50% of overall premium in FY2020). Strong traction in
fire premium (higher retention post rise in reinsurance rates) and health segment provided
some comfort.
Sharp decline in motor premiums in 1QFY21
Motor premiums were down 22% yoy in 1QFY21 on the back of lower new auto sales and
marginal decline in renewals as retail customers focus on cash conservation. Overall motor
premiums declined sharply at 47% and 25% yoy in April 2020 and May 2020, respectively
but revived to 8% yoy growth in June 2020. Management guided that renewal premiums
were down ~15-16% during the initial phase of the lockdown but have broadly revived to
pre-Covid levels. Strong growth in motor premiums from June 2020 is directly related to
relaxation in lockdown restrictions resulting in higher share of vehicles plying on the road. It
is possible that select customer cohorts would have deferred motor renewals due to lower
traffic movements.
Motor TP was down 17% yoy due to moderation in industry volumes and the company’s
strategy to reduce focus on CVs (share of CVs down 250 bps yoy to 14.8% in 1QFY21).
Motor OD declined 27% yoy.
Strong growth in retail health indemnity in 1QFY21
ICICI Lombard reported 5% yoy decline in health premiums in 1QFY21 on the back of 4%
yoy decline in group health policies. Strong growth in retail health policies likely reflecting
increased risk aversion among consumers provided cushion. While retail health was down
35% yoy in April 2020, it bounced back to 1.9X in May 2020 and 43% yoy growth in June
2020, respectively. Within group health, the company is increasingly focusing on small and
mid-sized companies where pricing pressure in low; this segment is less profitable for the
company and hence not an area of focus.
The company has launched new health policies (Covid-19 defined benefit, Arogya
Sanjeevani and two other products under IRDAIs regulatory sandbox) to attract retail
customers. Management guided that retail health policies sold through individual channels
recorded strong growth while it was marginally down for policies sold through the banca
channel (including sale through strategic tie-ups).
Within retail health, the share of indemnity products has increased. According to
management, retail indemnity new business was up 26% in 1QFY21 (up 70% yoy for June
2020). For the retail health segment, growth is a function of penetration into newer
geographies and launch of new customer-centric products.
Fire premiums up 42% yoy in 1QFY21
GIC had increased property reinsurance rates in March 2019 (average rise of 2X) for eight
occupancies (comprising 35% of industry volumes) and subsequently for all 291 occupancies
from January 2020. Lower reinsurance and higher share of commercial business continued
to drive overall growth in premiums in the fire segment.
Health to support growth even as motor remains weak
FY2021E – a weak year for motor business. We expect gross written premium to
decline 5% yoy in FY2021E on the back of (1) sharp decline in motor business and (2)
gradual moderation in fire premiums (up 34% yoy in June 2020 compared to 43-52%
yoy over the past two months). Strong traction in health on the back of increased
demand from smaller companies and SMEs coupled with increased risk aversion among
individuals driving growth in retail health will cushion decline in premiums.
ICICI Lombard Insurance
KOTAK INSTITUTIONAL EQUITIES RESEARCH 33
Weak auto sales will pull down motor premiums. Our auto analyst expects 15% yoy
decline in 2Ws and higher decline in CVs in FY2021E and flat PVs (on a low base).
Additionally, renewal premiums over the year will likely be marginally lower.
IRDAI has directed stable motor TP rates for FY2021E till further notice and this can
affect growth in premiums to a marginal extent.
Competition and pricing pressure remains heightened in the motor OD segment,
which will put pressure on incremental business.
Post revised guideline by IRDAI, general insurers are restricted from selling long-term
motor OD policy (17% penetration in private cars and 17.5% penetration in 2Ws as of
FY2020) bundled with motor TP policies – this will reduce advance premium to some
extent, affect growth forecasts of later years.
ICICI Lombard has increased share of highly profitable PVs (up to 59.2% in 1QFY21
from 56.7% in FY2020 and 50% in FY2019) in overall motor TP mix and decreased
share of CVs (down 350 bps yoy to 14.8% in 1QFY21). The share of the latter is,
however, expected to increase owing to portfolio rebalancing.
Strong growth in health (including travel and personal accident) premiums in
FY2021E. We expect strong growth in health premiums in FY2021E on the back of
strong growth in retail business. Health benefit business will remain weak due to lower
disbursement by NBFCs and HFCs (down ~10-30% yoy in FY2021).
Growth in group health business will be driven by increase in penetration towards
smaller clients (SMEs, mid-tier companies, etc.). The company has witnessed increase
in pricing pressure in larger companies and select cohorts and has decided to expand
in a cautious manner. In case of rising pricing pressure in the smaller tier companies,
growth can moderate from peak levels.
Increase in retail health business will be a function of (1) rising risk aversion among
probable buyers post the pandemic, (2) increase in demand for pandemic-related
health insurance, (3) channel expansion strategies, (4) penetration into smaller towns
and tier-II and tier-III cities and (5) higher acquisition through digital channels. ICICI
Lombard has expanded its agency base to ~50,000 in 1QFY21 (addition of >2,200
agents in the quarter) from 37,500+ in FY2019. Additionally, management is focused
on providing value added services to customers to increase customer engagement and
retention. For example, it has launched ‘IL Take care’ where tele-consulting is provided
by doctors to health policyholders in the government business and the same has been
extended to the retail channel also.
The company has launched two products approved by IRDAI under the regulatory
sandbox. Continue product innovation will drive growth in the retail health business.
Going ahead, focus of most insurers will be to provide integrated solutions to its
customers (monitoring overall health, linking premiums to improvement in health
condition for renewals, co-pay based models, etc.)
Travel insurance will witness steep decline in FY2021E owing to restrictions on
travelling. Additionally, increasing risk aversion among travelers will likely lead to a
ripple effect and this segment will remain weak over the medium term. Overseas
medical premiums were down 90% yoy in 1QFY21.
Past experiences from previous epidemics like SARS and MERS suggest health
insurance business pick up pace post the epidemic. Given rising hospitalization
expense, growing awareness among consumers, low health insurance penetration and
ease of buying through digital channels, health insurance will likely maintain strong
growth at ~18% CAGR in FY2021-23E.
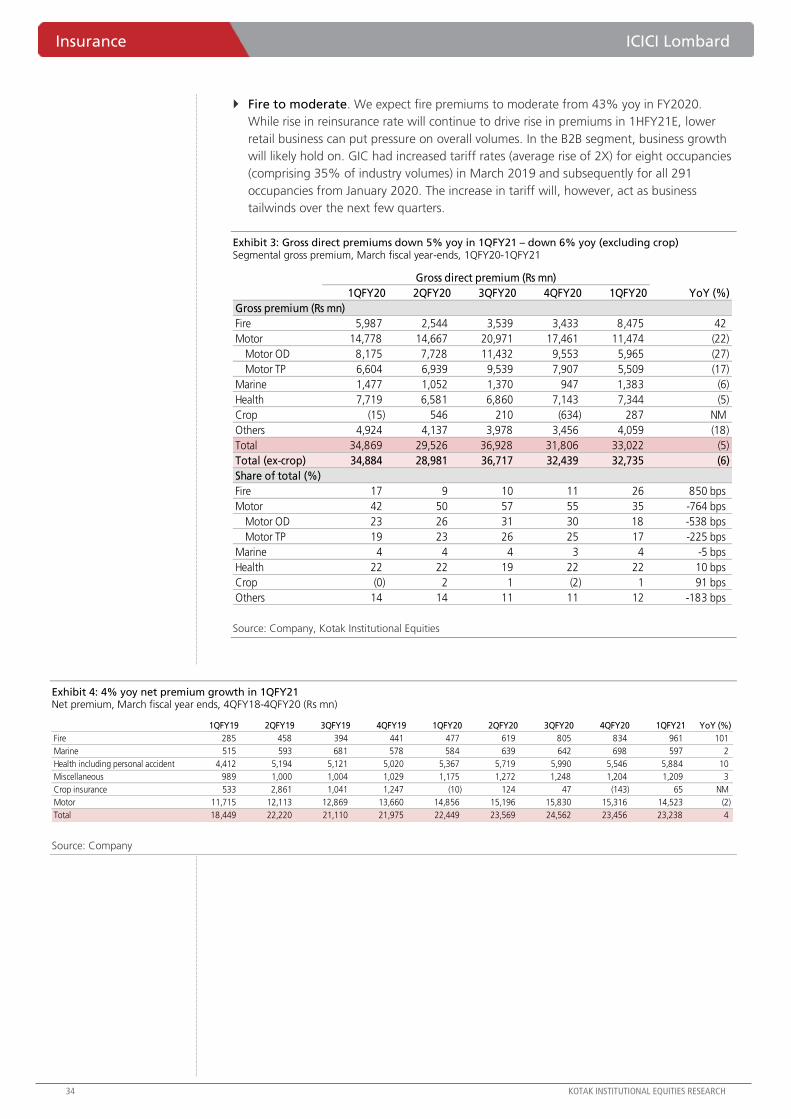
Insurance ICICI Lombard
34 KOTAK INSTITUTIONAL EQUITIES RESEARCH
Fire to moderate. We expect fire premiums to moderate from 43% yoy in FY2020.
While rise in reinsurance rate will continue to drive rise in premiums in 1HFY21E, lower
retail business can put pressure on overall volumes. In the B2B segment, business growth
will likely hold on. GIC had increased tariff rates (average rise of 2X) for eight occupancies
(comprising 35% of industry volumes) in March 2019 and subsequently for all 291
occupancies from January 2020. The increase in tariff will, however, act as business
tailwinds over the next few quarters.
Exhibit 3: Gross direct premiums down 5% yoy in 1QFY21 – down 6% yoy (excluding crop) Segmental gross premium, March fiscal year-ends, 1QFY20-1QFY21
Source: Company, Kotak Institutional Equities
Exhibit 4: 4% yoy net premium growth in 1QFY21 Net premium, March fiscal year ends, 4QFY18-4QFY20 (Rs mn)
Source: Company
Gross direct premium (Rs mn)
1QFY20 2QFY20 3QFY20 4QFY20 1QFY20 YoY (%)
Gross premium (Rs mn)
Fire 5,987 2,544 3,539 3,433 8,475 42
Motor 14,778 14,667 20,971 17,461 11,474 (22)
Motor OD 8,175 7,728 11,432 9,553 5,965 (27)
Motor TP 6,604 6,939 9,539 7,907 5,509 (17)
Marine 1,477 1,052 1,370 947 1,383 (6)
Health 7,719 6,581 6,860 7,143 7,344 (5)
Crop (15) 546 210 (634) 287 NM
Others 4,924 4,137 3,978 3,456 4,059 (18)
Total 34,869 29,526 36,928 31,806 33,022 (5)
Total (ex-crop) 34,884 28,981 36,717 32,439 32,735 (6)
Share of total (%)
Fire 17 9 10 11 26 850 bps
Motor 42 50 57 55 35 -764 bps
Motor OD 23 26 31 30 18 -538 bps
Motor TP 19 23 26 25 17 -225 bps
Marine 4 4 4 3 4 -5 bps
Health 22 22 19 22 22 10 bps
Crop (0) 2 1 (2) 1 91 bps
Others 14 14 11 11 12 -183 bps
1QFY19 2QFY19 3QFY19 4QFY19 1QFY20 2QFY20 3QFY20 4QFY20 1QFY21 YoY (%)
Fire 285 458 394 441 477 619 805 834 961 101
Marine 515 593 681 578 584 639 642 698 597 2
Health including personal accident 4,412 5,194 5,121 5,020 5,367 5,719 5,990 5,546 5,884 10
Miscellaneous 989 1,000 1,004 1,029 1,175 1,272 1,248 1,204 1,209 3
Crop insurance 533 2,861 1,041 1,247 (10) 124 47 (143) 65 NM
Motor 11,715 12,113 12,869 13,660 14,856 15,196 15,830 15,316 14,523 (2)
Total 18,449 22,220 21,110 21,975 22,449 23,569 24,562 23,456 23,238 4
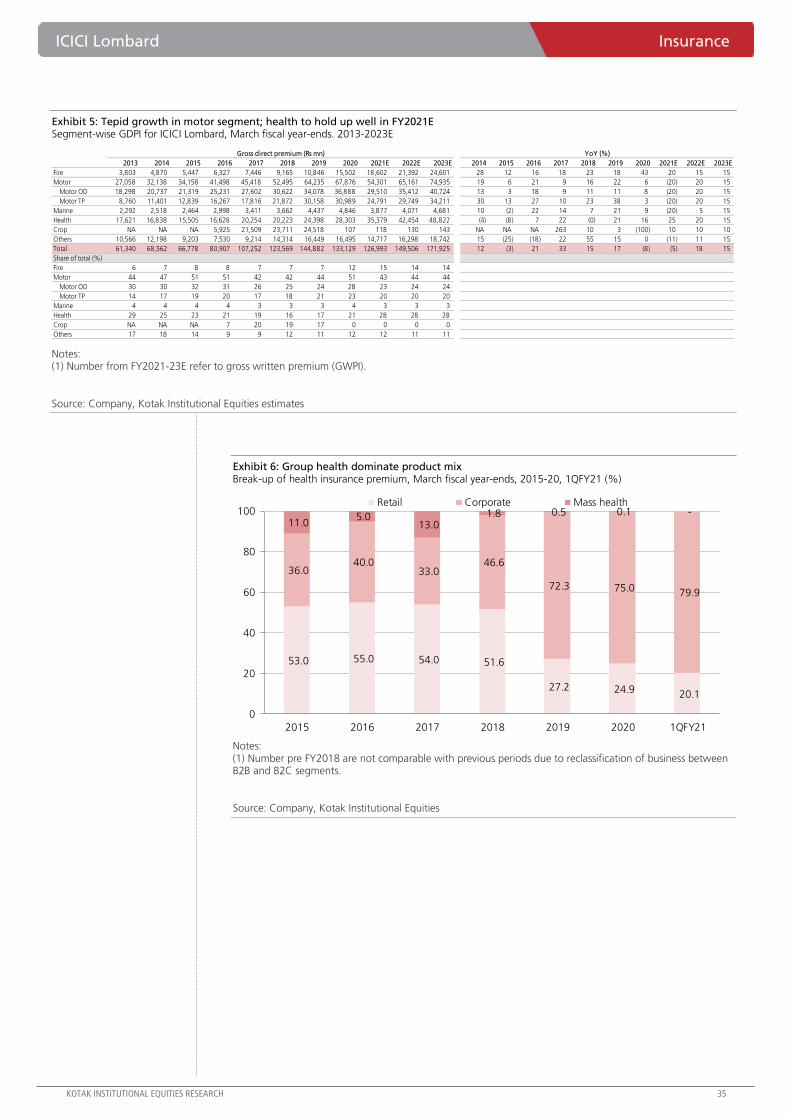
ICICI Lombard Insurance
KOTAK INSTITUTIONAL EQUITIES RESEARCH 35
Exhibit 5: Tepid growth in motor segment; health to hold up well in FY2021E Segment-wise GDPI for ICICI Lombard, March fiscal year-ends. 2013-2023E
Notes: (1) Number from FY2021-23E refer to gross written premium (GWPI).
Source: Company, Kotak Institutional Equities estimates
Exhibit 6: Group health dominate product mix Break-up of health insurance premium, March fiscal year-ends, 2015-20, 1QFY21 (%)
Notes: (1) Number pre FY2018 are not comparable with previous periods due to reclassification of business between B2B and B2C segments.
Source: Company, Kotak Institutional Equities
Gross direct premium (Rs mn) YoY (%) Quarterly
2013 2014 2015 2016 2017 2018 2019 2020 2021E 2022E 2023E 2014 2015 2016 2017 2018 2019 2020 2021E 2022E 2023E
Fire 3,803 4,870 5,447 6,327 7,446 9,165 10,846 15,502 18,602 21,392 24,601 28 12 16 18 23 18 43 20 15 15
Motor 27,058 32,138 34,158 41,498 45,418 52,495 64,235 67,876 54,301 65,161 74,935 19 6 21 9 16 22 6 (20) 20 15
Motor OD 18,298 20,737 21,319 25,231 27,602 30,622 34,078 36,888 29,510 35,412 40,724 13 3 18 9 11 11 8 (20) 20 15
Motor TP 8,760 11,401 12,839 16,267 17,816 21,872 30,158 30,989 24,791 29,749 34,211 30 13 27 10 23 38 3 (20) 20 15
Marine 2,292 2,518 2,464 2,998 3,411 3,662 4,437 4,846 3,877 4,071 4,681 10 (2) 22 14 7 21 9 (20) 5 15
Health 17,621 16,838 15,505 16,628 20,254 20,223 24,398 28,303 35,379 42,454 48,822 (4) (8) 7 22 (0) 21 16 25 20 15
Crop NA NA NA 5,925 21,509 23,711 24,518 107 118 130 143 NA NA NA 263 10 3 (100) 10 10 10
Others 10,566 12,198 9,203 7,530 9,214 14,314 16,449 16,495 14,717 16,298 18,742 15 (25) (18) 22 55 15 0 (11) 11 15
Total 61,340 68,562 66,778 80,907 107,252 123,569 144,882 133,129 126,993 149,506 171,925 12 (3) 21 33 15 17 (8) (5) 18 15
Share of total (%)
Fire 6 7 8 8 7 7 7 12 15 14 14
Motor 44 47 51 51 42 42 44 51 43 44 44
Motor OD 30 30 32 31 26 25 24 28 23 24 24
Motor TP 14 17 19 20 17 18 21 23 20 20 20
Marine 4 4 4 4 3 3 3 4 3 3 3
Health 29 25 23 21 19 16 17 21 28 28 28
Crop NA NA NA 7 20 19 17 0 0 0 0
Others 17 18 14 9 9 12 11 12 12 11 11
53.0 55.0 54.0 51.6
27.2 24.9 20.1
36.0 40.0
33.0 46.6
72.3 75.0 79.9
11.0 5.0
13.0 1.8 0.5 0.1 -
0
20
40
60
80
100
2015 2016 2017 2018 2019 2020 1QFY21
Retail Corporate Mass health

Insurance ICICI Lombard
36 KOTAK INSTITUTIONAL EQUITIES RESEARCH
Exhibit 7: Share of private cars have increased Break-up of motor GDPI, March fiscal year-ends, 2015-20, 1QFY21 (%)
Source: Company, Kotak Institutional Equities
Sharp decline in motor-related claims in 1QFY21
Overall claims ratio declined 570 bps yoy/10 bps qoq to 69.8% in 1QFY21 led by sharp
decline in motor-related claims. Claims, however, increased in marine (select one or two
accounts), health (led by Covid-related claims to the tune of ~Rs200 mn) and crop segment
(impact of Cyclone Amphan and Nisarga to the tune of Rs0.31 bn).
Overall traffic volumes were low during the quarter due to lockdown-related disruptions and
social-distancing measures. This led to 2,070 bps yoy and 530 bps yoy decline in motor TP
and motor OD claims ratio, respectively to 70.2% and 62.9% in June 2020. While the actual
claims realized by the company were significantly lower than normal levels, the company has
taken a conservative approach towards claims provisioning.
Crop claims increased 50 bps qoq/down 20 bps yoy to 111.2% on the back of Rs0.3 bn of
increased cyclone-related claims (impact of ~130 bps).
Health claims ratio increased 750 bps yoy to 75.5% owing to higher claims for Covid (~200
mn). Standard retail health claims, however, remain low as consumers are likely deferring
hospitalization treatment.
Marginal improvement in claims ratio over medium term; Covid claims will
remain monitorable
We expect overall claims ratio to be broadly stable at 72.9% in FY2021E and decrease by
80-100 bps over FY2021-23E to 71.9% by FY2023E.
Claims ratio to increase in motor TP. Amid absence of rate hike, we build in increase in
claims ratio in the motor TP segment. Motor OD claims will likely increase as
transportation activity picks up hereon; this segment anyway remains competitive.
Covid-related claims crucial. ICICI Lombard reported claims of 75.5% in the health
segment (68-71% in past four quarters) likely reflecting higher claims related to Covid.
While current experience has been good, exponential rise in cases in the country is likely
driving the company to make higher reserving at this stage.
The offtake and claims experience of the recently launched Covid policies is also not
known, driving the company to take a conservative stance.
48 47 50 51 50 57 59
29 31 32 31
27
29 26
23 22 18 18 23 15 15
0
20
40
60
80
100
2015 2016 2017 2018 2019 2020 1QFY21
Private car 2 wheeler Commercial vehicle
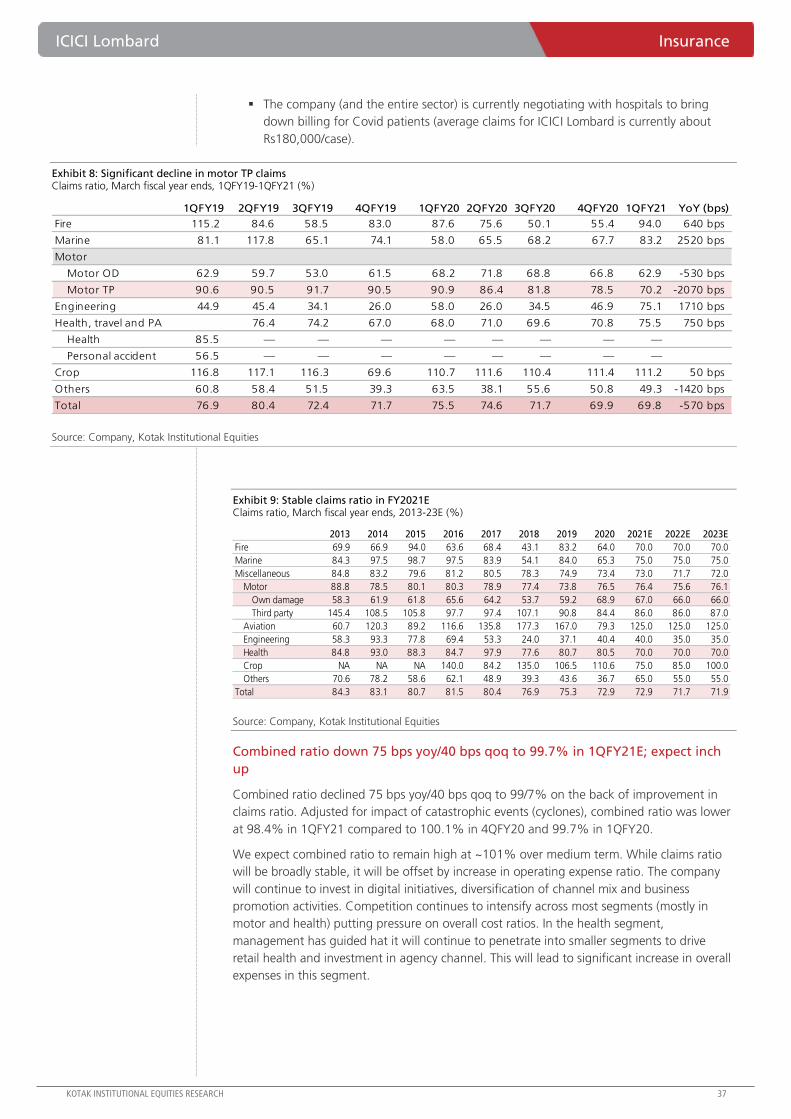
ICICI Lombard Insurance
KOTAK INSTITUTIONAL EQUITIES RESEARCH 37
The company (and the entire sector) is currently negotiating with hospitals to bring
down billing for Covid patients (average claims for ICICI Lombard is currently about
Rs180,000/case).
Exhibit 8: Significant decline in motor TP claims Claims ratio, March fiscal year ends, 1QFY19-1QFY21 (%)
Source: Company, Kotak Institutional Equities
Exhibit 9: Stable claims ratio in FY2021E Claims ratio, March fiscal year ends, 2013-23E (%)
Source: Company, Kotak Institutional Equities
Combined ratio down 75 bps yoy/40 bps qoq to 99.7% in 1QFY21E; expect inch
up
Combined ratio declined 75 bps yoy/40 bps qoq to 99/7% on the back of improvement in
claims ratio. Adjusted for impact of catastrophic events (cyclones), combined ratio was lower
at 98.4% in 1QFY21 compared to 100.1% in 4QFY20 and 99.7% in 1QFY20.
We expect combined ratio to remain high at ~101% over medium term. While claims ratio
will be broadly stable, it will be offset by increase in operating expense ratio. The company
will continue to invest in digital initiatives, diversification of channel mix and business
promotion activities. Competition continues to intensify across most segments (mostly in
motor and health) putting pressure on overall cost ratios. In the health segment,
management has guided hat it will continue to penetrate into smaller segments to drive
retail health and investment in agency channel. This will lead to significant increase in overall
expenses in this segment.
1QFY19 2QFY19 3QFY19 4QFY19 1QFY20 2QFY20 3QFY20 4QFY20 1QFY21 YoY (bps)
Fire 115.2 84.6 58.5 83.0 87.6 75.6 50.1 55.4 94.0 640 bps
Marine 81.1 117.8 65.1 74.1 58.0 65.5 68.2 67.7 83.2 2520 bps
Motor
Motor OD 62.9 59.7 53.0 61.5 68.2 71.8 68.8 66.8 62.9 -530 bps
Motor TP 90.6 90.5 91.7 90.5 90.9 86.4 81.8 78.5 70.2 -2070 bps
Engineering 44.9 45.4 34.1 26.0 58.0 26.0 34.5 46.9 75.1 1710 bps
Health, travel and PA 76.4 74.2 67.0 68.0 71.0 69.6 70.8 75.5 750 bps
Health 85.5 — — — — — — — —
Personal accident 56.5 — — — — — — — —
Crop 116.8 117.1 116.3 69.6 110.7 111.6 110.4 111.4 111.2 50 bps
Others 60.8 58.4 51.5 39.3 63.5 38.1 55.6 50.8 49.3 -1420 bps
Total 76.9 80.4 72.4 71.7 75.5 74.6 71.7 69.9 69.8 -570 bps
2013 2014 2015 2016 2017 2018 2019 2020 2021E 2022E 2023E
Fire 69.9 66.9 94.0 63.6 68.4 43.1 83.2 64.0 70.0 70.0 70.0
Marine 84.3 97.5 98.7 97.5 83.9 54.1 84.0 65.3 75.0 75.0 75.0
Miscellaneous 84.8 83.2 79.6 81.2 80.5 78.3 74.9 73.4 73.0 71.7 72.0
Motor 88.8 78.5 80.1 80.3 78.9 77.4 73.8 76.5 76.4 75.6 76.1
Own damage 58.3 61.9 61.8 65.6 64.2 53.7 59.2 68.9 67.0 66.0 66.0
Third party 145.4 108.5 105.8 97.7 97.4 107.1 90.8 84.4 86.0 86.0 87.0
Aviation 60.7 120.3 89.2 116.6 135.8 177.3 167.0 79.3 125.0 125.0 125.0
Engineering 58.3 93.3 77.8 69.4 53.3 24.0 37.1 40.4 40.0 35.0 35.0
Health 84.8 93.0 88.3 84.7 97.9 77.6 80.7 80.5 70.0 70.0 70.0
Crop NA NA NA 140.0 84.2 135.0 106.5 110.6 75.0 85.0 100.0
Others 70.6 78.2 58.6 62.1 48.9 39.3 43.6 36.7 65.0 55.0 55.0
Total 84.3 83.1 80.7 81.5 80.4 76.9 75.3 72.9 72.9 71.7 71.9
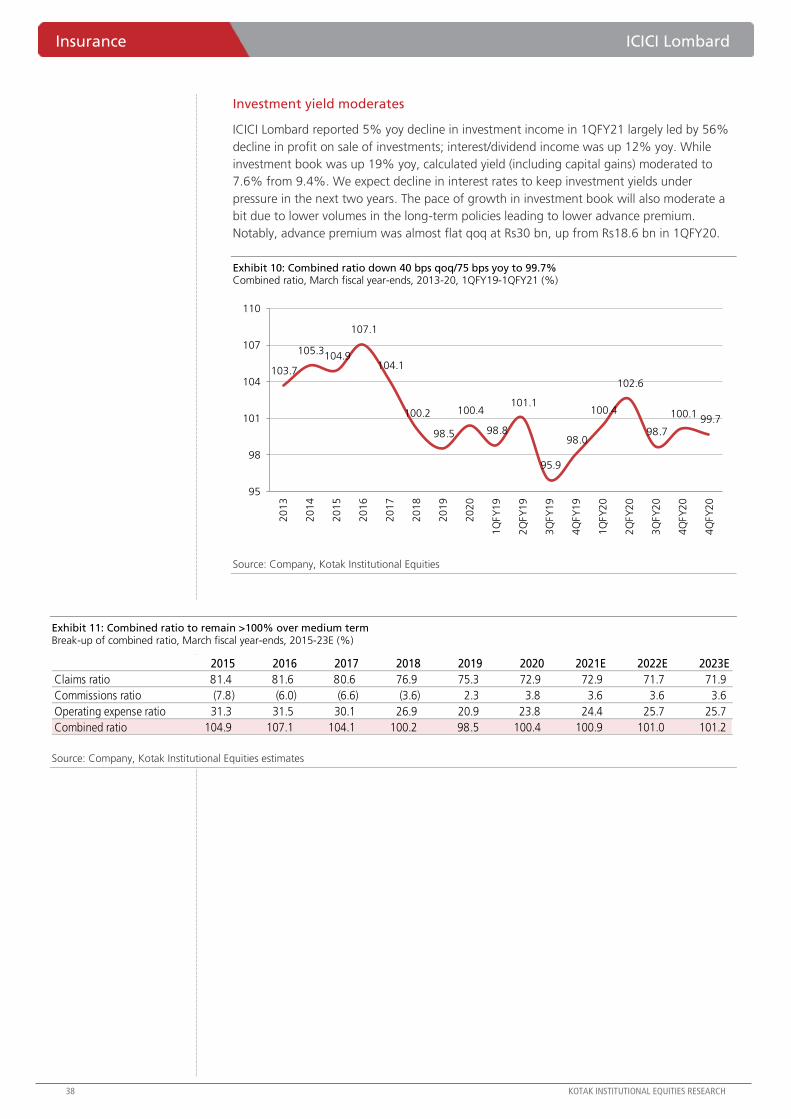
Insurance ICICI Lombard
38 KOTAK INSTITUTIONAL EQUITIES RESEARCH
Investment yield moderates
ICICI Lombard reported 5% yoy decline in investment income in 1QFY21 largely led by 56%
decline in profit on sale of investments; interest/dividend income was up 12% yoy. While
investment book was up 19% yoy, calculated yield (including capital gains) moderated to
7.6% from 9.4%. We expect decline in interest rates to keep investment yields under
pressure in the next two years. The pace of growth in investment book will also moderate a
bit due to lower volumes in the long-term policies leading to lower advance premium.
Notably, advance premium was almost flat qoq at Rs30 bn, up from Rs18.6 bn in 1QFY20.
Exhibit 10: Combined ratio down 40 bps qoq/75 bps yoy to 99.7% Combined ratio, March fiscal year-ends, 2013-20, 1QFY19-1QFY21 (%)
Source: Company, Kotak Institutional Equities
Exhibit 11: Combined ratio to remain >100% over medium term Break-up of combined ratio, March fiscal year-ends, 2015-23E (%)
Source: Company, Kotak Institutional Equities estimates
103.7
105.3 104.9
107.1
104.1
100.2
98.5
100.4
98.8
101.1
95.9
98.0
100.4
102.6
98.7
100.1 99.7
95
98
101
104
107
110
20
13
20
14
20
15
20
16
20
17
20
18
20
19
20
20
1Q
FY
19
2Q
FY
19
3Q
FY
19
4Q
FY
19
1Q
FY
20
2Q
FY
20
3Q
FY
20
4Q
FY
20
4Q
FY
20
2015 2016 2017 2018 2019 2020 2021E 2022E 2023E
Claims ratio 81.4 81.6 80.6 76.9 75.3 72.9 72.9 71.7 71.9
Commissions ratio (7.8) (6.0) (6.6) (3.6) 2.3 3.8 3.6 3.6 3.6
Operating expense ratio 31.3 31.5 30.1 26.9 20.9 23.8 24.4 25.7 25.7
Combined ratio 104.9 107.1 104.1 100.2 98.5 100.4 100.9 101.0 101.2
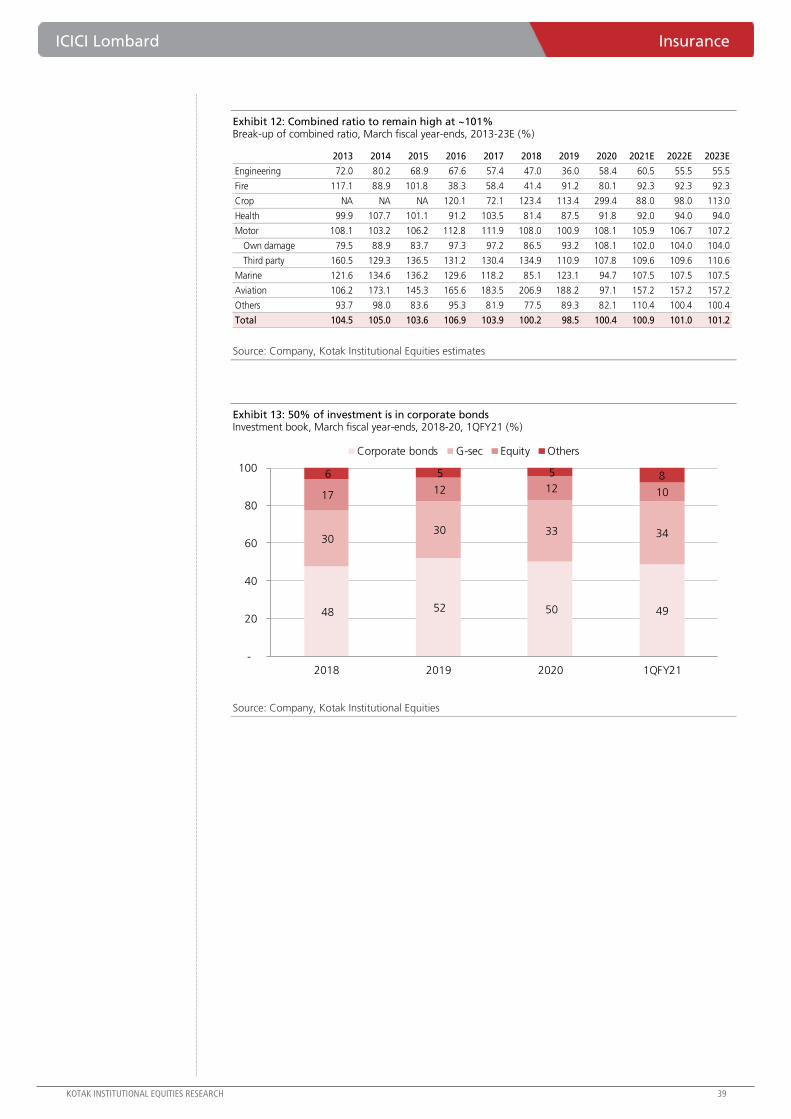
ICICI Lombard Insurance
KOTAK INSTITUTIONAL EQUITIES RESEARCH 39
Exhibit 12: Combined ratio to remain high at ~101% Break-up of combined ratio, March fiscal year-ends, 2013-23E (%)
Source: Company, Kotak Institutional Equities estimates
Exhibit 13: 50% of investment is in corporate bonds Investment book, March fiscal year-ends, 2018-20, 1QFY21 (%)
Source: Company, Kotak Institutional Equities
2013 2014 2015 2016 2017 2018 2019 2020 2021E 2022E 2023E
Engineering 72.0 80.2 68.9 67.6 57.4 47.0 36.0 58.4 60.5 55.5 55.5
Fire 117.1 88.9 101.8 38.3 58.4 41.4 91.2 80.1 92.3 92.3 92.3
Crop NA NA NA 120.1 72.1 123.4 113.4 299.4 88.0 98.0 113.0
Health 99.9 107.7 101.1 91.2 103.5 81.4 87.5 91.8 92.0 94.0 94.0
Motor 108.1 103.2 106.2 112.8 111.9 108.0 100.9 108.1 105.9 106.7 107.2
Own damage 79.5 88.9 83.7 97.3 97.2 86.5 93.2 108.1 102.0 104.0 104.0
Third party 160.5 129.3 136.5 131.2 130.4 134.9 110.9 107.8 109.6 109.6 110.6
Marine 121.6 134.6 136.2 129.6 118.2 85.1 123.1 94.7 107.5 107.5 107.5
Aviation 106.2 173.1 145.3 165.6 183.5 206.9 188.2 97.1 157.2 157.2 157.2
Others 93.7 98.0 83.6 95.3 81.9 77.5 89.3 82.1 110.4 100.4 100.4
Total 104.5 105.0 103.6 106.9 103.9 100.2 98.5 100.4 100.9 101.0 101.2
48 52 50 49
30 30 33 34
17 12 12 10
6 5 5 8
-
20
40
60
80
100
2018 2019 2020 1QFY21
Corporate bonds G-sec Equity Others
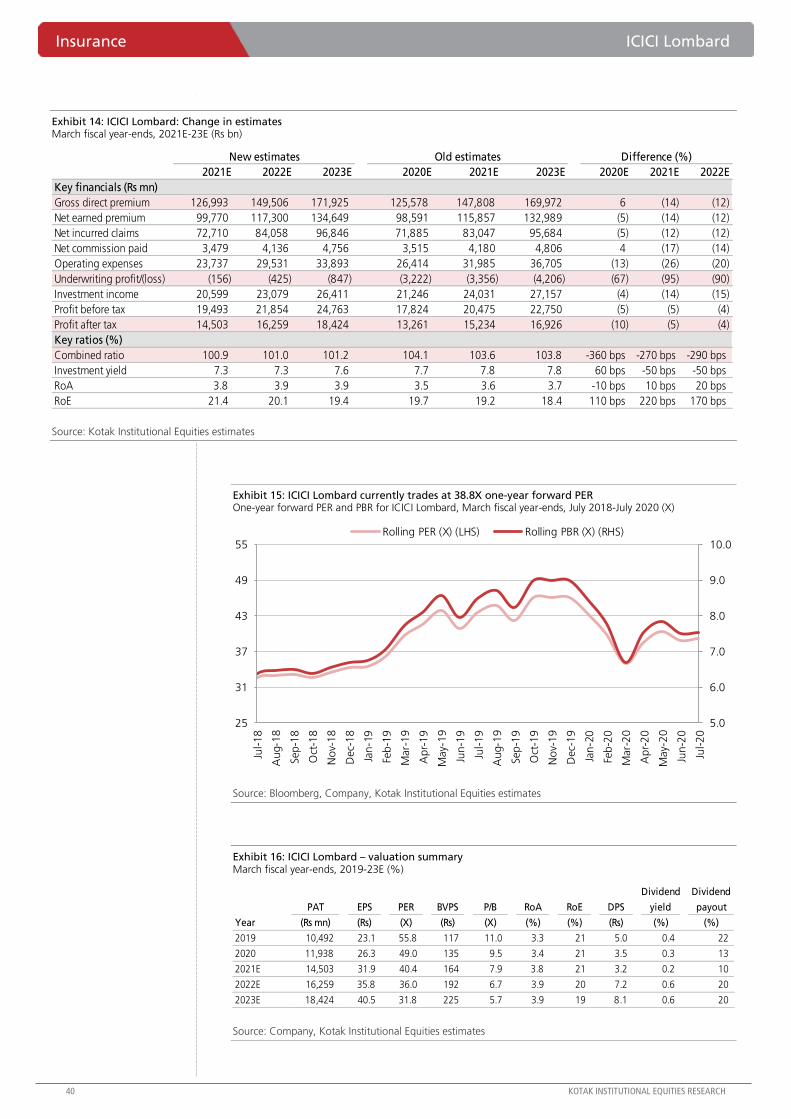
Insurance ICICI Lombard
40 KOTAK INSTITUTIONAL EQUITIES RESEARCH
Exhibit 14: ICICI Lombard: Change in estimates March fiscal year-ends, 2021E-23E (Rs bn)
Source: Kotak Institutional Equities estimates
Exhibit 15: ICICI Lombard currently trades at 38.8X one-year forward PER One-year forward PER and PBR for ICICI Lombard, March fiscal year-ends, July 2018-July 2020 (X)
Source: Bloomberg, Company, Kotak Institutional Equities estimates
Exhibit 16: ICICI Lombard – valuation summary March fiscal year-ends, 2019-23E (%)
Source: Company, Kotak Institutional Equities estimates
New estimates Old estimates Difference (%)
2021E 2022E 2023E 2020E 2021E 2023E 2020E 2021E 2022E
Key financials (Rs mn)
Gross direct premium 126,993 149,506 171,925 125,578 147,808 169,972 6 (14) (12)
Net earned premium 99,770 117,300 134,649 98,591 115,857 132,989 (5) (14) (12)
Net incurred claims 72,710 84,058 96,846 71,885 83,047 95,684 (5) (12) (12)
Net commission paid 3,479 4,136 4,756 3,515 4,180 4,806 4 (17) (14)
Operating expenses 23,737 29,531 33,893 26,414 31,985 36,705 (13) (26) (20)
Underwriting profit/(loss) (156) (425) (847) (3,222) (3,356) (4,206) (67) (95) (90)
Investment income 20,599 23,079 26,411 21,246 24,031 27,157 (4) (14) (15)
Profit before tax 19,493 21,854 24,763 17,824 20,475 22,750 (5) (5) (4)
Profit after tax 14,503 16,259 18,424 13,261 15,234 16,926 (10) (5) (4)
Key ratios (%)
Combined ratio 100.9 101.0 101.2 104.1 103.6 103.8 -360 bps -270 bps -290 bps
Investment yield 7.3 7.3 7.6 7.7 7.8 7.8 60 bps -50 bps -50 bps
RoA 3.8 3.9 3.9 3.5 3.6 3.7 -10 bps 10 bps 20 bps
RoE 21.4 20.1 19.4 19.7 19.2 18.4 110 bps 220 bps 170 bps
5.0
6.0
7.0
8.0
9.0
10.0
25
31
37
43
49
55
Jul-
18
Au
g-1
8
Sep
-18
Oct
-18
No
v-1
8
Dec-
18
Jan
-19
Feb
-19
Mar-
19
Ap
r-1
9
May-
19
Jun
-19
Jul-
19
Au
g-1
9
Sep
-19
Oct
-19
No
v-1
9
Dec-
19
Jan
-20
Feb
-20
Mar-
20
Ap
r-2
0
May-
20
Jun
-20
Jul-
20
Rolling PER (X) (LHS) Rolling PBR (X) (RHS)
Dividend Dividend
PAT EPS PER BVPS P/B RoA RoE DPS yield payout
Year (Rs mn) (Rs) (X) (Rs) (X) (%) (%) (Rs) (%) (%)
2019 10,492 23.1 55.8 117 11.0 3.3 21 5.0 0.4 22
2020 11,938 26.3 49.0 135 9.5 3.4 21 3.5 0.3 13
2021E 14,503 31.9 40.4 164 7.9 3.8 21 3.2 0.2 10
2022E 16,259 35.8 36.0 192 6.7 3.9 20 7.2 0.6 20
2023E 18,424 40.5 31.8 225 5.7 3.9 19 8.1 0.6 20
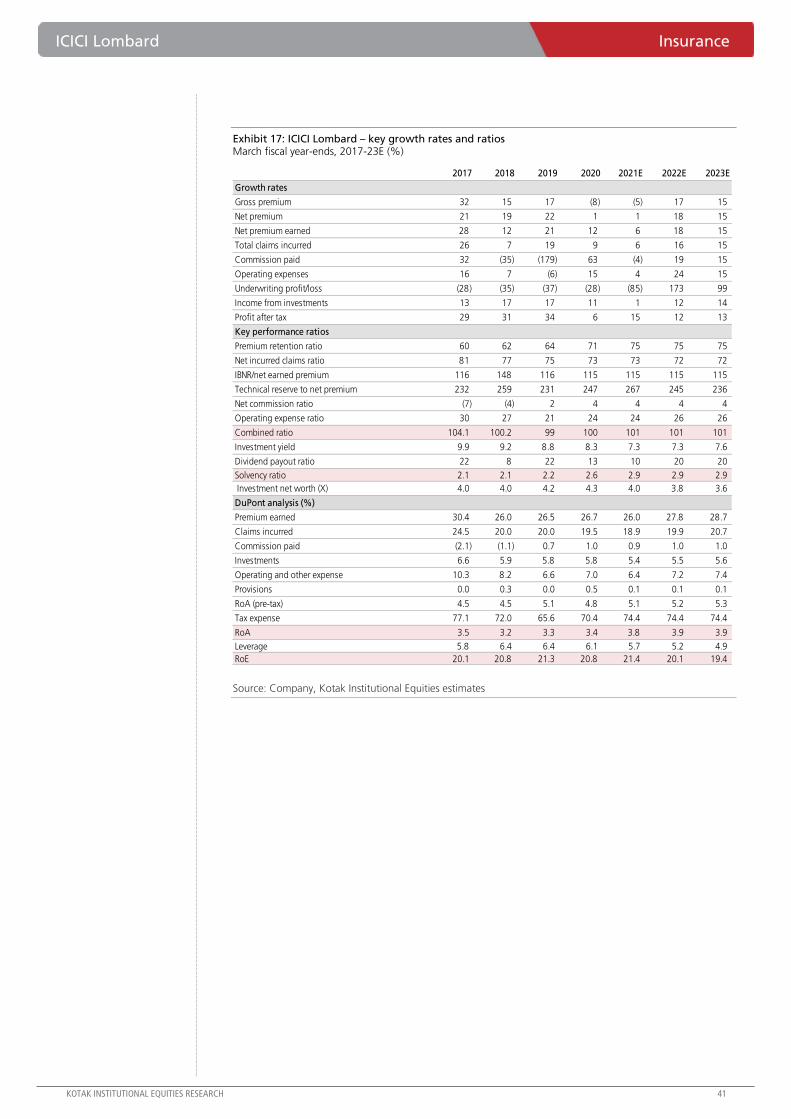
ICICI Lombard Insurance
KOTAK INSTITUTIONAL EQUITIES RESEARCH 41
Exhibit 17: ICICI Lombard – key growth rates and ratios March fiscal year-ends, 2017-23E (%)
Source: Company, Kotak Institutional Equities estimates
2017 2018 2019 2020 2021E 2022E 2023E
Growth rates
Gross premium 32 15 17 (8) (5) 17 15
Net premium 21 19 22 1 1 18 15
Net premium earned 28 12 21 12 6 18 15
Total claims incurred 26 7 19 9 6 16 15
Commission paid 32 (35) (179) 63 (4) 19 15
Operating expenses 16 7 (6) 15 4 24 15
Underwriting profit/loss (28) (35) (37) (28) (85) 173 99
Income from investments 13 17 17 11 1 12 14
Profit after tax 29 31 34 6 15 12 13
Key performance ratios
Premium retention ratio 60 62 64 71 75 75 75
Net incurred claims ratio 81 77 75 73 73 72 72
IBNR/net earned premium 116 148 116 115 115 115 115
Technical reserve to net premium 232 259 231 247 267 245 236
Net commission ratio (7) (4) 2 4 4 4 4
Operating expense ratio 30 27 21 24 24 26 26
Combined ratio 104.1 100.2 99 100 101 101 101
Investment yield 9.9 9.2 8.8 8.3 7.3 7.3 7.6
Dividend payout ratio 22 8 22 13 10 20 20
Solvency ratio 2.1 2.1 2.2 2.6 2.9 2.9 2.9
Investment net worth (X) 4.0 4.0 4.2 4.3 4.0 3.8 3.6
DuPont analysis (%)
Premium earned 30.4 26.0 26.5 26.7 26.0 27.8 28.7
Claims incurred 24.5 20.0 20.0 19.5 18.9 19.9 20.7
Commission paid (2.1) (1.1) 0.7 1.0 0.9 1.0 1.0
Investments 6.6 5.9 5.8 5.8 5.4 5.5 5.6
Operating and other expense 10.3 8.2 6.6 7.0 6.4 7.2 7.4
Provisions 0.0 0.3 0.0 0.5 0.1 0.1 0.1
RoA (pre-tax) 4.5 4.5 5.1 4.8 5.1 5.2 5.3
Tax expense 77.1 72.0 65.6 70.4 74.4 74.4 74.4
RoA 3.5 3.2 3.3 3.4 3.8 3.9 3.9
Leverage 5.8 6.4 6.4 6.1 5.7 5.2 4.9
RoE 20.1 20.8 21.3 20.8 21.4 20.1 19.4
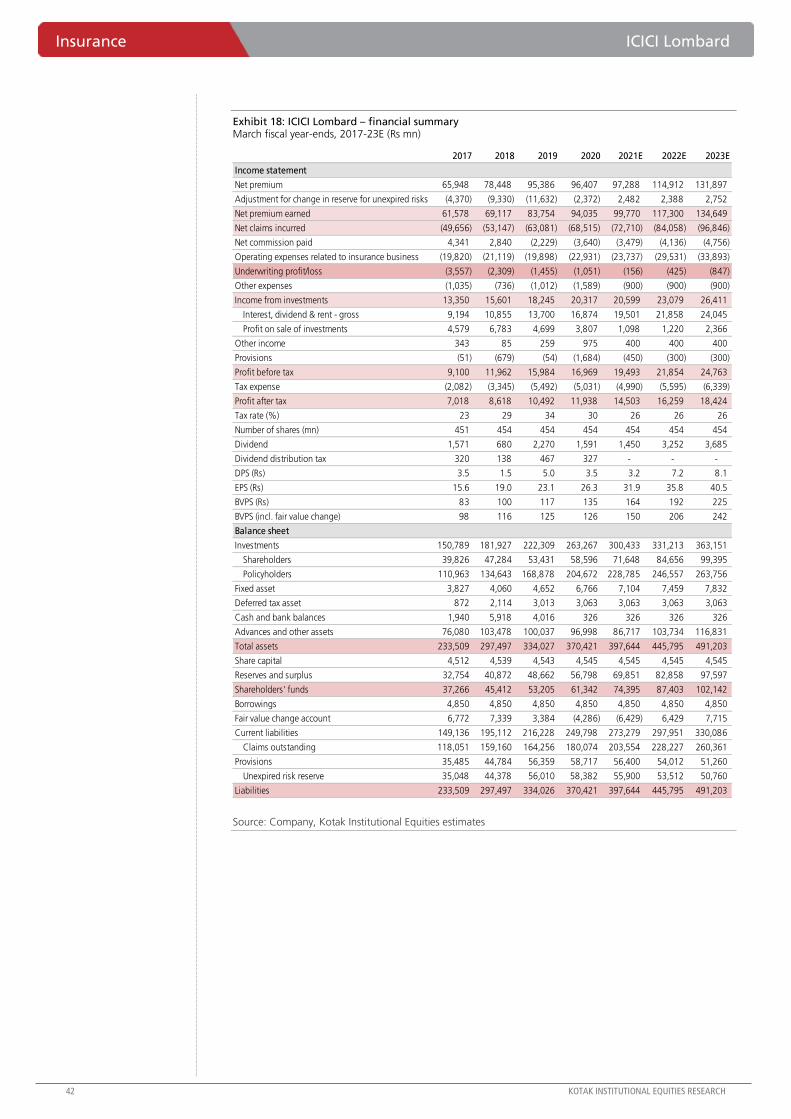
Insurance ICICI Lombard
42 KOTAK INSTITUTIONAL EQUITIES RESEARCH
Exhibit 18: ICICI Lombard – financial summary March fiscal year-ends, 2017-23E (Rs mn)
Source: Company, Kotak Institutional Equities estimates
2017 2018 2019 2020 2021E 2022E 2023E
Income statement
Net premium 65,948 78,448 95,386 96,407 97,288 114,912 131,897
Adjustment for change in reserve for unexpired risks (4,370) (9,330) (11,632) (2,372) 2,482 2,388 2,752
Net premium earned 61,578 69,117 83,754 94,035 99,770 117,300 134,649
Net claims incurred (49,656) (53,147) (63,081) (68,515) (72,710) (84,058) (96,846)
Net commission paid 4,341 2,840 (2,229) (3,640) (3,479) (4,136) (4,756)
Operating expenses related to insurance business (19,820) (21,119) (19,898) (22,931) (23,737) (29,531) (33,893)
Underwriting profit/loss (3,557) (2,309) (1,455) (1,051) (156) (425) (847)
Other expenses (1,035) (736) (1,012) (1,589) (900) (900) (900)
Income from investments 13,350 15,601 18,245 20,317 20,599 23,079 26,411
Interest, dividend & rent - gross 9,194 10,855 13,700 16,874 19,501 21,858 24,045
Profit on sale of investments 4,579 6,783 4,699 3,807 1,098 1,220 2,366
Other income 343 85 259 975 400 400 400
Provisions (51) (679) (54) (1,684) (450) (300) (300)
Profit before tax 9,100 11,962 15,984 16,969 19,493 21,854 24,763
Tax expense (2,082) (3,345) (5,492) (5,031) (4,990) (5,595) (6,339)
Profit after tax 7,018 8,618 10,492 11,938 14,503 16,259 18,424
Tax rate (%) 23 29 34 30 26 26 26
Number of shares (mn) 451 454 454 454 454 454 454
Dividend 1,571 680 2,270 1,591 1,450 3,252 3,685
Dividend distribution tax 320 138 467 327 - - -
DPS (Rs) 3.5 1.5 5.0 3.5 3.2 7.2 8.1
EPS (Rs) 15.6 19.0 23.1 26.3 31.9 35.8 40.5
BVPS (Rs) 83 100 117 135 164 192 225
BVPS (incl. fair value change) 98 116 125 126 150 206 242
Balance sheet
Investments 150,789 181,927 222,309 263,267 300,433 331,213 363,151
Shareholders 39,826 47,284 53,431 58,596 71,648 84,656 99,395
Policyholders 110,963 134,643 168,878 204,672 228,785 246,557 263,756
Fixed asset 3,827 4,060 4,652 6,766 7,104 7,459 7,832
Deferred tax asset 872 2,114 3,013 3,063 3,063 3,063 3,063
Cash and bank balances 1,940 5,918 4,016 326 326 326 326
Advances and other assets 76,080 103,478 100,037 96,998 86,717 103,734 116,831
Total assets 233,509 297,497 334,027 370,421 397,644 445,795 491,203
Share capital 4,512 4,539 4,543 4,545 4,545 4,545 4,545
Reserves and surplus 32,754 40,872 48,662 56,798 69,851 82,858 97,597
Shareholders' funds 37,266 45,412 53,205 61,342 74,395 87,403 102,142
Borrowings 4,850 4,850 4,850 4,850 4,850 4,850 4,850
Fair value change account 6,772 7,339 3,384 (4,286) (6,429) 6,429 7,715
Current liabilities 149,136 195,112 216,228 249,798 273,279 297,951 330,086
Claims outstanding 118,051 159,160 164,256 180,074 203,554 228,227 260,361
Provisions 35,485 44,784 56,359 58,717 56,400 54,012 51,260
Unexpired risk reserve 35,048 44,378 56,010 58,382 55,900 53,512 50,760
Liabilities 233,509 297,497 334,026 370,421 397,644 445,795 491,203
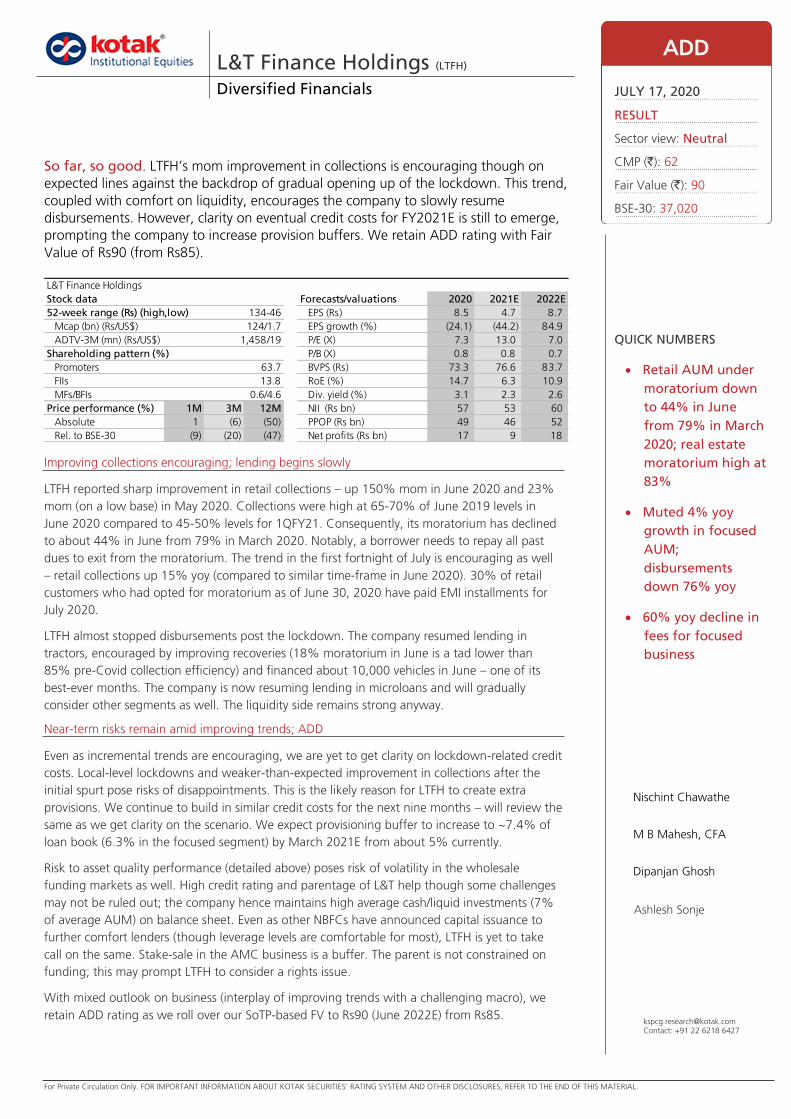
For Private Circulation Only. FOR IMPORTANT INFORMATION ABOUT KOTAK SECURITIES’ RATING SYSTEM AND OTHER DISCLOSURES, REFER TO THE END OF THIS MATERIAL.
Improving collections encouraging; lending begins slowly
LTFH reported sharp improvement in retail collections – up 150% mom in June 2020 and 23%
mom (on a low base) in May 2020. Collections were high at 65-70% of June 2019 levels in
June 2020 compared to 45-50% levels for 1QFY21. Consequently, its moratorium has declined
to about 44% in June from 79% in March 2020. Notably, a borrower needs to repay all past
dues to exit from the moratorium. The trend in the first fortnight of July is encouraging as well
– retail collections up 15% yoy (compared to similar time-frame in June 2020). 30% of retail
customers who had opted for moratorium as of June 30, 2020 have paid EMI installments for
July 2020.
LTFH almost stopped disbursements post the lockdown. The company resumed lending in
tractors, encouraged by improving recoveries (18% moratorium in June is a tad lower than
85% pre-Covid collection efficiency) and financed about 10,000 vehicles in June – one of its
best-ever months. The company is now resuming lending in microloans and will gradually
consider other segments as well. The liquidity side remains strong anyway.
Near-term risks remain amid improving trends; ADD
Even as incremental trends are encouraging, we are yet to get clarity on lockdown-related credit
costs. Local-level lockdowns and weaker-than-expected improvement in collections after the
initial spurt pose risks of disappointments. This is the likely reason for LTFH to create extra
provisions. We continue to build in similar credit costs for the next nine months – will review the
same as we get clarity on the scenario. We expect provisioning buffer to increase to ~7.4% of
loan book (6.3% in the focused segment) by March 2021E from about 5% currently.
Risk to asset quality performance (detailed above) poses risk of volatility in the wholesale
funding markets as well. High credit rating and parentage of L&T help though some challenges
may not be ruled out; the company hence maintains high average cash/liquid investments (7%
of average AUM) on balance sheet. Even as other NBFCs have announced capital issuance to
further comfort lenders (though leverage levels are comfortable for most), LTFH is yet to take
call on the same. Stake-sale in the AMC business is a buffer. The parent is not constrained on
funding; this may prompt LTFH to consider a rights issue.
With mixed outlook on business (interplay of improving trends with a challenging macro), we
retain ADD rating as we roll over our SoTP-based FV to Rs90 (June 2022E) from Rs85.
L&T Finance Holdings (LTFH) Diversified Financials
So far, so good. LTFH’s mom improvement in collections is encouraging though on
expected lines against the backdrop of gradual opening up of the lockdown. This trend,
coupled with comfort on liquidity, encourages the company to slowly resume
disbursements. However, clarity on eventual credit costs for FY2021E is still to emerge,
prompting the company to increase provision buffers. We retain ADD rating with Fair
Value of Rs90 (from Rs85).
ADD
JULY 17, 2020
RESULT
Sector view: Neutral
CMP (`): 62
Fair Value (`): 90
BSE-30: 37,020
QUICK NUMBERS
Retail AUM under
moratorium down
to 44% in June
from 79% in March
2020; real estate
moratorium high at
83%
Muted 4% yoy
growth in focused
AUM;
disbursements
down 76% yoy
60% yoy decline in
fees for focused
business
Nischint Chawathe
M B Mahesh, CFA
Dipanjan Ghosh
Ashlesh Sonje
Stock data Forecasts/valuations 2020 2021E 2022E
52-week range (Rs) (high,low) EPS (Rs) 8.5 4.7 8.7
Mcap (bn) (Rs/US$) EPS growth (%) (24.1) (44.2) 84.9
ADTV-3M (mn) (Rs/US$) P/E (X) 7.3 13.0 7.0
Shareholding pattern (%) P/B (X) 0.8 0.8 0.7
Promoters 63.7 BVPS (Rs) 73.3 76.6 83.7
FIIs 13.8 RoE (%) 14.7 6.3 10.9
MFs/BFIs Div. yield (%) 3.1 2.3 2.6
Price performance (%) 1M 3M 12M NII (Rs bn) 57 53 60
Absolute 1 (6) (50) PPOP (Rs bn) 49 46 52
Rel. to BSE-30 (9) (20) (47) Net profits (Rs bn) 17 9 18
0.6/4.6
L&T Finance Holdings
124/1.7
1,458/19
134-46
[email protected]: +91 22 6218 6427
Diversified Financials L&T Finance Holdings
44 KOTAK INSTITUTIONAL EQUITIES RESEARCH
Elevated provisions dent earnings
LTFH’s consolidated PAT declined 73% yoy owing to higher provision for Covid (including
macro-prudential provisions), weak NII (down 6% yoy for the focused lending business
segment) and fees (down 60% yoy for the focused lending business segment).
PAT from lending business (including defocused business) declined 73% yoy to Rs1.4 bn in
1QFY21. PBT before provisions of the focused businesses was down 22% yoy on the back
of 6% yoy decline in NII. Higher liquidity on balance sheet driving NIM compression and
slowdown in AUM growth (up 4% yoy from peak levels of >20% yoy till 2QFY20) were key
reasons. Fees declined 60% yoy for the focused business segment on the back of 76% yoy
decline in disbursements. Operating expenses was muted at 5% yoy owing to lower
variable-linked incentives during the quarter.
The de-focused business reported loss of Rs560 mn during the quarter due to Rs2.8 bn of
incremental provisions (~5% of AUM) incurred in 1QFY21. Out of this, Rs2.3 bn was
adjusted from gains from stake-sale in the wealth business. On a qoq basis, loss of the
defocused business increased to Rs2.2 bn (excluding gains from stake-sale) as compared to
Rs1.74 bn in 1QFY20 and Rs700 mn in 4QFY20.
Gross stage 3 ratio was down 12 bps qoq/50 bps yoy to 5.24% due to higher collections
from the rural segment, mostly led by higher recoveries in tractors. A significant proportion
of AUM (44% for retail and ~40% for wholesale and real estate finance) is under
moratorium and camouflages asset quality behavior due to relaxation in asset classification
(dpd freeze for account under moratorium).
PAT for the investment management business was Rs0.5 bn (decline in AAUM and marginal
qoq reduction in equity mix were likely drivers). AAUM was down 21% yoy/8% qoq to
Rs584 bn.
Collections have improved from trough levels though lower than comfort levels
Retail collections have picked up; yet to reach comforting levels. Overall
moratorium for retail segment (based on number of customers) declined to 44% in June
(~34% in terms of AUM) from 79% in March 2020. LTFH has offered moratorium to all
retail customers whose repayments have not standardized post May 31, 2020 (end of first
tranche of moratorium), under the second tranche and as such decline in share of
moratorium reflects pick-up in collections. Within the retail segment, tractor collections
have improved significantly owing to strong rural sentiment on the back of a robust rabi
harvest and expectation of a normal monsoon.
Overall collection efficiency has improved sequentially in June 2020 over April and May
2020. This was led by (1) higher engagement of field employees with customers
(mostly MFI) as lockdown-related restrictions were eased), and (2) ramp-up in
collection efforts with dedicated customer engagement sessions. Collections in June
2020 were ~65-70% of June 2019 levels compared to ~45-50% in 1QFY20.
The share of customers under moratorium declined to 18% in tractors in June 2020
from elevated levels of 75% in April 2020. In the 2W segment, share of customers
under moratorium peaked in May 2020 at 70% but moderated in June 2020 to 33%.
this likely reflected higher focus on cash conservation during the initial months of
lockdown. As of June 30, 2020, 48% of MFI customers are under moratorium.
Share of home loan and LAP customers declined to 33% in June 2020 from >50% in
April and May 2020 led by strengthening of on-field collection efforts.
Despite strong uptick in collections in the retail segment, the share of AUM under
moratorium remains high at 34%, indicating significant risk of deterioration in asset
quality over the next few quarters. Management has ramped up coverage on the book
(overall ECL coverage) to around 3.5% on the overall rural book though one expects
provisions to remain elevated over the next few quarters.
L&T Finance Holdings Diversified Financials
KOTAK INSTITUTIONAL EQUITIES RESEARCH 45
Early retail collection trends in July 2020 look promising. ~30% of retail customers
who had opted for moratorium as of June 30, 2020 have paid July EMI installment. Early
signs in 2QFY21 are encouraging with collections up to July 14, 2020 being 15% higher
than similar time-frame in June 2020. Average daily collections for the rural segment have
increased to ~0.27 mn in July 2020 compared to 0.12 mn in June 2020 and <0.02 mn in
April 2020 and May 2020.
Bounce rates in the tractor segment are <50% in July 2020 compared to 69% in April
2020 and ~40% under normal conditions. Bounce rates are different collection
efficiency (if recovery happens in the same month, the account is a successful
collection despite a bounce).
Bounce rates in the 2W segment have reduced to <50% in July 2020 from 60% in
April 2020 and 25-30% under normal conditions.
High share of real estate AUM under moratorium poses concerns. ~83% of real
estate AUM and ~25% of infrastructure AUM (including IDF) is also under moratorium as
of June 2020. ~80% of projects in real estate book are under construction and have
hence opted for moratorium though management guided that funds in DESRA are
sufficient to service debt obligations till March 2021 for most of these accounts. We
remain cautious of under-construction projects under moratorium as overall retail housing
sales remain muted and overall housing inventory in the systems has increased to ~4-5
years.
Despite weakness in overall residential real estate sales, overall collections in escrow
have improved to 33% of pre-Covid levels in June 2020, up from 14-15% in the prior
months. In 86% of under-construction projects, construction activities have resumed
from June 2020 onwards.
Toll-road collections in the infrastructure segment have increased to 80% in June 2020
from 60% in May 2020 and 30% in April 2020 (post resuming operations from April
22, 2020).
Provisions to remain elevated; coverage on loans increased ~100 bps qoq to
>5%
>Rs11 bn of provisions incurred in 1QFY21. LTFH incurred provisions of ~Rs9 bn
(excluding extra provisions made against one-off gains of Rs2.3 bn from sale of wealth
management business). These provisions were a combination of higher provisions on GS3
loans increasing coverage to 69% from 59% qoq, Covid-related provisions, macro-
prudential provisions and provisions to a specific large conglomerate account (Rs2.3 bn,
coverage ramped up to 100% in 1QFY21). Overall credit cost remained elevated at 4.2%
(including extra-provisions from stake-sale) compared to 2.8% in 4QFY20 and 1.3% in
1QFY20.
69% coverage on consolidated stage 3 loans for lending business. LTHF’s coverage
on stage 3 loans is high at ~69%. While coverage for rural and infrastructure business
(excluding IDF) is high at 93% and 63% respectively, it is relatively lower at 33% for the
housing finance segment owing to high security cover on such assets. Slowdown in
residential real estate sales and consequent price correction can dampen effective
realizations, however. The company has ramped up coverage on stage 3 loans in de-
focused business to ~70%.
Diversified Financials L&T Finance Holdings
46 KOTAK INSTITUTIONAL EQUITIES RESEARCH
>5% coverage on the overall book. LTFH’s coverage on the overall book (consolidated
lending business including de-focused segment) is ~5.1% as of 1QFY21 (up 100 bps
qoq). Coverage on stage 1 and 2 loans is low at ~1.7%, up 60 bps qoq. Excluding
standard ECL provisions, the company has 2.9% coverage (macro-prudential and other
Covid-related provisions) on rural stage 1 and 2 loans, 1.7% coverage on housing stage 1
and 2 loans and 0.1% coverage on infrastructure (excluding IDF) stage 1 and 2 loans.
While the coverage on the overall book has increased over the past two quarters, the
high share of unsecured loans (ex. MFI) and loans with high LGDs (ex. 2W) will likely drive
higher incremental provision across select asset classes.
Credit cost to remain elevated at 3.4% in FY2021E. We expect credit cost to remain
elevated over the next few quarters owing to (1) increase in delinquencies from accounts
under moratorium from 2QFY21 and 3QFY21 onwards and (2) increase in coverage on
non-delinquent stressed accounts in select customer cohorts (LAP, self-employed housing,
2W, real-estate finance, etc.) and (3) further increase in provisions on the de-focused
book. Overall credit costs will likely increase ~80 bps yoy to 3.4% in FY2021E and
marginally decline to 2.8% in FY2022E.
We expect credit cost in the rural business to increased ~100 bps qoq to 5.5% in
FY2021E driven by elevated provisions for MFI and 2Ws. While collections from
tractors have picked up meaningfully, it is yet to reflect in MFI and 2Ws. Given the
high LGDs in these segment (100% for the former and ~60-80% for the latter), the
company will likely frontload provisions in FY2021E.
We expect sharp 180 bps yoy increase in credit cost for the housing segment to 3.1%
in FY2021E. Higher slippages from LAP coupled with likely increase in delinquencies
from under-construction real estate account will drive provisions in these segment. As
a prudent practice, management will likely keep higher coverage on stage 2 assets.
Credit cost in the wholesale book (infrastructure and IDF) will likely increased 80 bps
yoy to 1.6%. Credit cost in the de-focused book will likely remain high at ~9%.
Business growth to remain weak
Disbursements down 76% yoy in 1QFY21. Overall disbursements declined 76% yoy in
1QFY21 on the back of sharp decline in disbursements across most segment barring
tractors. Business disruptions owing to lowdown, cautious stance in select segment and
tightened underwriting norms were key drivers. AUM was muted at 4% yoy; negligible
repayments and Rs650-670 mn of accrued interest provided cushion to moderation in
AUMs.
In the rural segment, AUM growth was muted at 6% yoy on the back of 78% yoy
decline in disbursements. Tractors disbursements were down 32% yoy and provided
some support. On the back of strong rural sentiment, tractors volumes were up ~23%
yoy in June 2020. LTFH financed >10,000 tractors in the period, similar to its highest
ever monthly disbursements.
In the housing segment, AUM growth was muted at 4% yoy led by 85% yoy decline
in disbursements; this was due to negligible repayments. Home loans disbursements
were down 90% yoy. LAP was negligible in 1QFY21. Real estate finance disbursement
to the tune of Rs2.5 bn (down 80% yoy) was only towards existing under construction
projects.
Disbursements declined 67% yoy (>90% of incremental disbursements in 1QFY21 was
towards renewables) in infrastructure (including IDF) segment. AUM growth was
muted at 2% yoy.
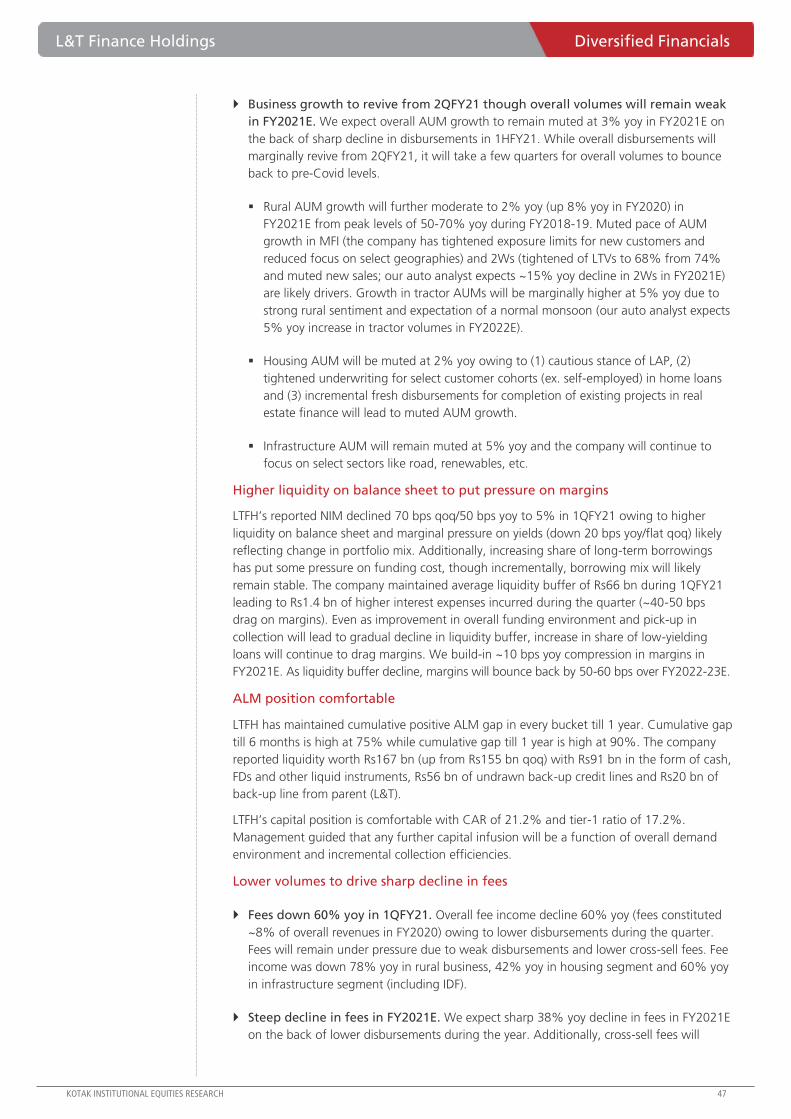
L&T Finance Holdings Diversified Financials
KOTAK INSTITUTIONAL EQUITIES RESEARCH 47
Business growth to revive from 2QFY21 though overall volumes will remain weak
in FY2021E. We expect overall AUM growth to remain muted at 3% yoy in FY2021E on
the back of sharp decline in disbursements in 1HFY21. While overall disbursements will
marginally revive from 2QFY21, it will take a few quarters for overall volumes to bounce
back to pre-Covid levels.
Rural AUM growth will further moderate to 2% yoy (up 8% yoy in FY2020) in
FY2021E from peak levels of 50-70% yoy during FY2018-19. Muted pace of AUM
growth in MFI (the company has tightened exposure limits for new customers and
reduced focus on select geographies) and 2Ws (tightened of LTVs to 68% from 74%
and muted new sales; our auto analyst expects ~15% yoy decline in 2Ws in FY2021E)
are likely drivers. Growth in tractor AUMs will be marginally higher at 5% yoy due to
strong rural sentiment and expectation of a normal monsoon (our auto analyst expects
5% yoy increase in tractor volumes in FY2022E).
Housing AUM will be muted at 2% yoy owing to (1) cautious stance of LAP, (2)
tightened underwriting for select customer cohorts (ex. self-employed) in home loans
and (3) incremental fresh disbursements for completion of existing projects in real
estate finance will lead to muted AUM growth.
Infrastructure AUM will remain muted at 5% yoy and the company will continue to
focus on select sectors like road, renewables, etc.
Higher liquidity on balance sheet to put pressure on margins
LTFH’s reported NIM declined 70 bps qoq/50 bps yoy to 5% in 1QFY21 owing to higher
liquidity on balance sheet and marginal pressure on yields (down 20 bps yoy/flat qoq) likely
reflecting change in portfolio mix. Additionally, increasing share of long-term borrowings
has put some pressure on funding cost, though incrementally, borrowing mix will likely
remain stable. The company maintained average liquidity buffer of Rs66 bn during 1QFY21
leading to Rs1.4 bn of higher interest expenses incurred during the quarter (~40-50 bps
drag on margins). Even as improvement in overall funding environment and pick-up in
collection will lead to gradual decline in liquidity buffer, increase in share of low-yielding
loans will continue to drag margins. We build-in ~10 bps yoy compression in margins in
FY2021E. As liquidity buffer decline, margins will bounce back by 50-60 bps over FY2022-23E.
ALM position comfortable
LTFH has maintained cumulative positive ALM gap in every bucket till 1 year. Cumulative gap
till 6 months is high at 75% while cumulative gap till 1 year is high at 90%. The company
reported liquidity worth Rs167 bn (up from Rs155 bn qoq) with Rs91 bn in the form of cash,
FDs and other liquid instruments, Rs56 bn of undrawn back-up credit lines and Rs20 bn of
back-up line from parent (L&T).
LTFH’s capital position is comfortable with CAR of 21.2% and tier-1 ratio of 17.2%.
Management guided that any further capital infusion will be a function of overall demand
environment and incremental collection efficiencies.
Lower volumes to drive sharp decline in fees
Fees down 60% yoy in 1QFY21. Overall fee income decline 60% yoy (fees constituted
~8% of overall revenues in FY2020) owing to lower disbursements during the quarter.
Fees will remain under pressure due to weak disbursements and lower cross-sell fees. Fee
income was down 78% yoy in rural business, 42% yoy in housing segment and 60% yoy
in infrastructure segment (including IDF).
Steep decline in fees in FY2021E. We expect sharp 38% yoy decline in fees in FY2021E
on the back of lower disbursements during the year. Additionally, cross-sell fees will
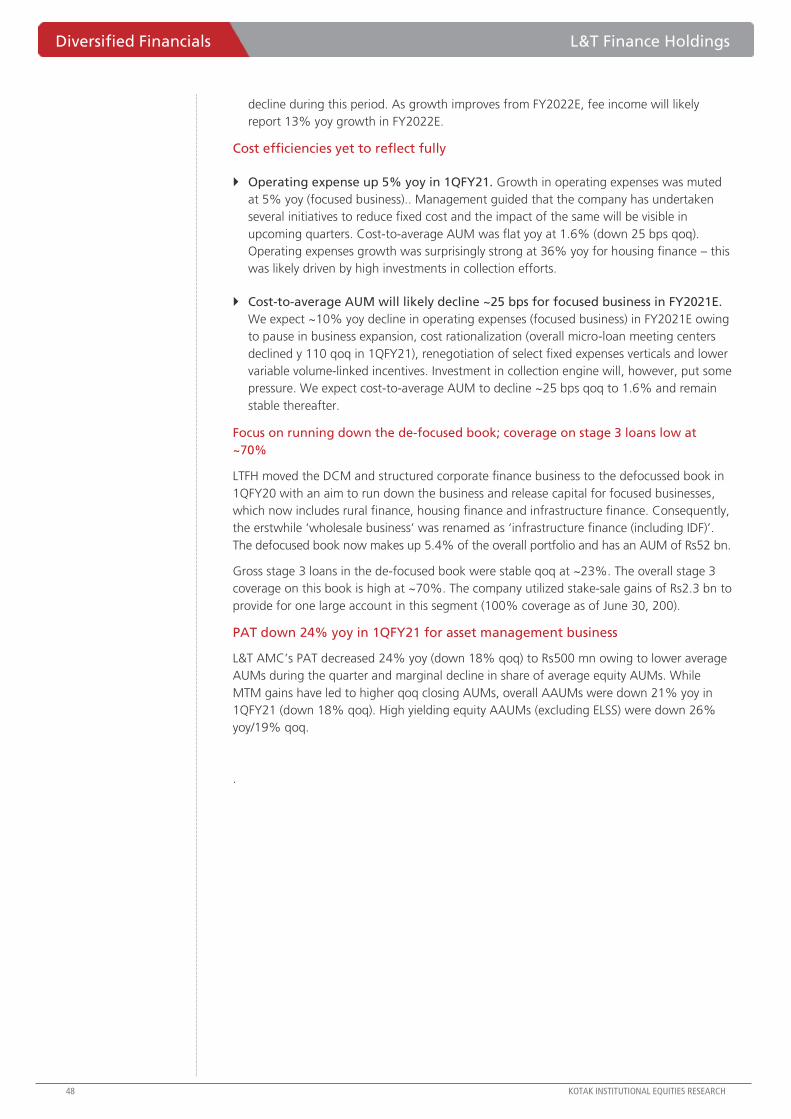
Diversified Financials L&T Finance Holdings
48 KOTAK INSTITUTIONAL EQUITIES RESEARCH
decline during this period. As growth improves from FY2022E, fee income will likely
report 13% yoy growth in FY2022E.
Cost efficiencies yet to reflect fully
Operating expense up 5% yoy in 1QFY21. Growth in operating expenses was muted
at 5% yoy (focused business).. Management guided that the company has undertaken
several initiatives to reduce fixed cost and the impact of the same will be visible in
upcoming quarters. Cost-to-average AUM was flat yoy at 1.6% (down 25 bps qoq).
Operating expenses growth was surprisingly strong at 36% yoy for housing finance – this
was likely driven by high investments in collection efforts.
Cost-to-average AUM will likely decline ~25 bps for focused business in FY2021E.
We expect ~10% yoy decline in operating expenses (focused business) in FY2021E owing
to pause in business expansion, cost rationalization (overall micro-loan meeting centers
declined y 110 qoq in 1QFY21), renegotiation of select fixed expenses verticals and lower
variable volume-linked incentives. Investment in collection engine will, however, put some
pressure. We expect cost-to-average AUM to decline ~25 bps qoq to 1.6% and remain
stable thereafter.
Focus on running down the de-focused book; coverage on stage 3 loans low at
~70%
LTFH moved the DCM and structured corporate finance business to the defocussed book in
1QFY20 with an aim to run down the business and release capital for focused businesses,
which now includes rural finance, housing finance and infrastructure finance. Consequently,
the erstwhile ‘wholesale business’ was renamed as ‘infrastructure finance (including IDF)’.
The defocused book now makes up 5.4% of the overall portfolio and has an AUM of Rs52 bn.
Gross stage 3 loans in the de-focused book were stable qoq at ~23%. The overall stage 3
coverage on this book is high at ~70%. The company utilized stake-sale gains of Rs2.3 bn to
provide for one large account in this segment (100% coverage as of June 30, 200).
PAT down 24% yoy in 1QFY21 for asset management business
L&T AMC’s PAT decreased 24% yoy (down 18% qoq) to Rs500 mn owing to lower average
AUMs during the quarter and marginal decline in share of average equity AUMs. While
MTM gains have led to higher qoq closing AUMs, overall AAUMs were down 21% yoy in
1QFY21 (down 18% qoq). High yielding equity AAUMs (excluding ELSS) were down 26%
yoy/19% qoq.
.

L&T Finance Holdings Diversified Financials
KOTAK INSTITUTIONAL EQUITIES RESEARCH 49
Exhibit 1: L&T Finance Holdings (lending business) – quarterly summary March fiscal year-ends, 1QFY20-1QFY21 (Rs mn)
Source: Company, Kotak Institutional Equities estimates
Ind-AS Ind-AS Ind-AS Ind-AS (% chg.) Ind-AS Ind-AS Ind-AS
1QFY21 1QFY21E 4QFY20 1QFY20 1QFY21E 4QFY20 1QFY20 2021E 2020 (% chg.) 2022E
Income statement (Rs mn)
Total income 32,090 32,836 33,250 33,190 (2) (3) (3) 132,339 134,080 (1.3) 144,489
Interest income 30,970 31,400 31,180 30,370 (1) (1) 2 125,976 123,780 1.8 137,291
Fee and other income 1,120 1,436 2,070 2,820 (22) (46) (60) 6,363 10,300 (38) 7,198
Interest expenses 18,400 17,943 16,909 16,960 3 9 8 71,773 68,319 5.1 75,578
NII 12,570 13,457 14,271 13,410 (7) (12) (6) 54,203 55,461 (2.3) 61,712
Credit losses/ provisions 7,510 5,347 6,610 2,850 40 14 164 30,068 18,060 66.5 26,895
NII post provision 6,180 9,547 9,731 13,380 (35) (36) (54) 30,498 47,701 (36.1) 42,016
Operating expenses 3,910 4,166 4,480 3,710 (6) (13) 5 14,791 16,390 (9.8) 15,990
PBT 2,270 5,381 5,251 9,670 (58) (57) (77) 15,707 31,311 (49.8) 26,026
Taxes 320 1,080 631 2,770 (70) (49) (88) 3,211 5,651 (43.2) 5,086
PAT (lending business from continuing operations) 1,950 4,301 4,620 6,900 (55) (58) (72) 12,496 25,660 (51.3) 20,940
PAT (de-focused and other businesses) (470) (800) (760) (1,410) NM NM NM (3,011) (3,930) NM (3,402)
Exceptional items (4,730)
PAT for overall business 1,480 3,501 3,860 5,490 (58) (62) (73) 9,485 17,002 (44.2) 17,538
Tax rate (%) 14.1 20.1 12.0 28.6 -597 bps 208 bps -1455 bps 20.4 18.0 240 bps 19.5
Core PBT (PBT+provisions) 9,780 10,727 11,861 12,520 (9) (18) (22) 45,775 49,371 (7.3) 52,921
Key balance sheet items (focused business) (Rs bn)
Gross loans 937 920 932 905 1.8 0.6 3.5 962 932 3.3 1,071
Rural 275 280 277 258 (1.9) (0.7) 6.3 282 277 1.9 321
Microfinance 125 125 125 0.3 0.1 126 125 1.0 139
2-W 64 66 59 (2.9) 9.0 62 66 (5.0) 74
Farm equipment 84 84 75 (0.4) 12.6 89 84 5.0 104
Consumer loans 2 2 - 0.6 5 2 200.0 5
Housing 270 265 266 260 1.6 1.4 3.5 271 266 2.1 301
Home loans and LAP 117 117 108 0.7 8.4 118 117 1.0 132
Real estate finance 152 149 152 1.9 0.1 154 149 3.0 169
Infrastructure finance (including IDF) 393 375 389 386 4.9 0.9 1.7 409 389 5.0 449
Net worth 152 154 128 (1.4) 19.0 165 154 6.7 182
Asset quality (Consolidated)
GNPL (Rs mn) 49,390 50,370 54,600 (1.9) (9.5) 50,370 (100.0)
GNPL (%) 5.2 5.4 5.7 -12 bps -48 bps 5.4 -536 bps
NNPL (Rs mn) 15,530 20,780 22,870 (25.3) (32.1) 20,780 (100.0)
NNPL (%) 1.7 2.3 2.5 -57 bps -77 bps 2.3 -228 bps
PCR (%) 69 59 58 1000 bps 1100 bps 59 -5900 bps
Key calculated ratios (focused business) (%)
Yield on AUM 13.3 13.3 13.6 -7 bps -29 bps 14.5 14.9 -41 bps 14.5
NIM (NII/AUM) 5.4 5.8 6.1 6.0 -43 bps -72 bps -60 bps 6.2 6.7 -44 bps 6.5
Cost to income 28.6 28.0 27.4 22.9 59 bps 115 bps 570 bps 24.4 24.9 -50 bps 23.2
Cost to average AUM 1.7 1.9 1.7 -24 bps 2 bps 1.7 2.0 -27 bps 1.7
Credit cost 3.2 2.8 1.3 39 bps 194 bps 3.5 2.2 128 bps 2.8
Disbursement mix (Rs bn)
Net disbursements 23 82 96 (71.8) (75.9) 372 (100.0)
Rural 9 44 42 (79.3) (78.4) 188 (100.0)
Microfinance 0 22 23 (99.7) (99.7) 99 (100.0)
2-W 3 12 11 (74.2) (71.6) 49 (100.0)
Farm equipment 6 9 9 (33.7) (32.5) 38 (100.0)
Consumer loans 0 1 - (94.6) 2
Housing 3 19 21 (83.4) (85.1) 81 (100.0)
Home loans and LAP 1 7 8 (90.4) (92.0) 32 (100.0)
Real estate finance 2 12 13 (79.3) (80.5) 49 (100.0)
Infrastructure finance (including IDF) 11 19 33 (42.4) (66.5) 103 (100.0)
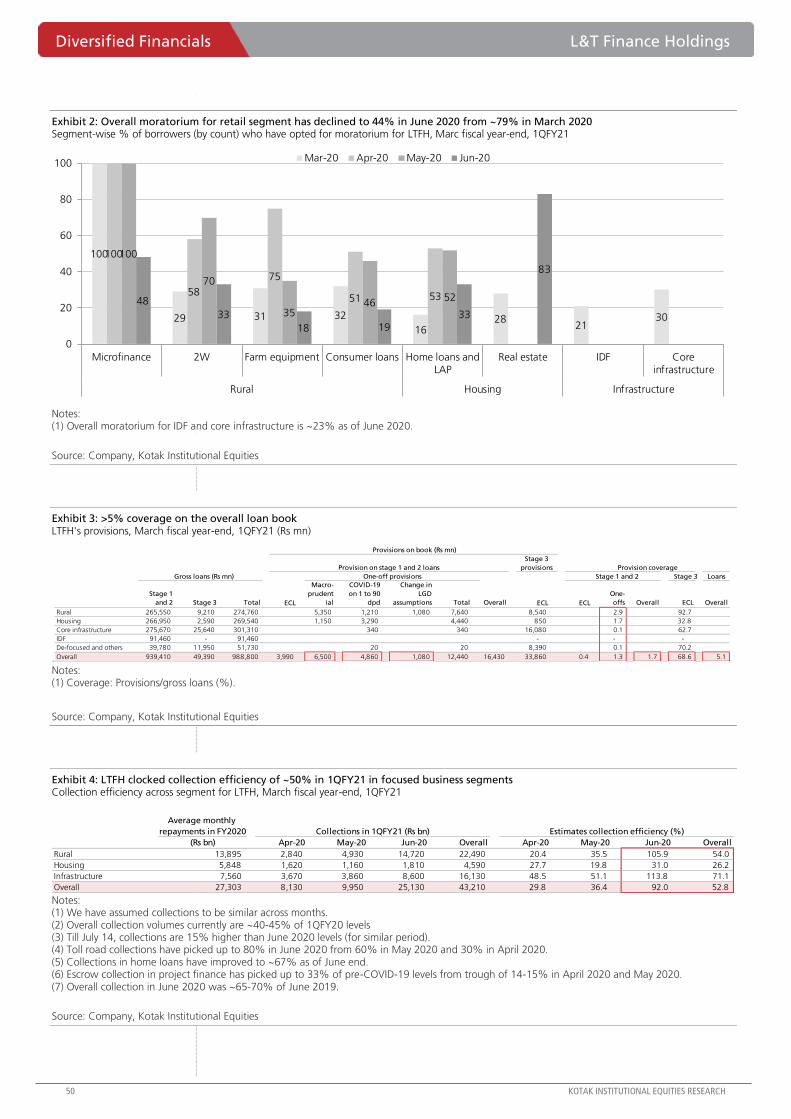
Diversified Financials L&T Finance Holdings
50 KOTAK INSTITUTIONAL EQUITIES RESEARCH
Exhibit 2: Overall moratorium for retail segment has declined to 44% in June 2020 from ~79% in March 2020 Segment-wise % of borrowers (by count) who have opted for moratorium for LTFH, Marc fiscal year-end, 1QFY21
Notes: (1) Overall moratorium for IDF and core infrastructure is ~23% as of June 2020.
Source: Company, Kotak Institutional Equities
Exhibit 3: >5% coverage on the overall loan book LTFH's provisions, March fiscal year-end, 1QFY21 (Rs mn)
.Notes: (1) Coverage: Provisions/gross loans (%).
Source: Company, Kotak Institutional Equities
Exhibit 4: LTFH clocked collection efficiency of ~50% in 1QFY21 in focused business segments Collection efficiency across segment for LTFH, March fiscal year-end, 1QFY21
Notes: (1) We have assumed collections to be similar across months.(2) Overall collection volumes currently are ~40-45% of 1QFY20 levels(3) Till July 14, collections are 15% higher than June 2020 levels (for similar period).(4) Toll road collections have picked up to 80% in June 2020 from 60% in May 2020 and 30% in April 2020.(5) Collections in home loans have improved to ~67% as of June end.(6) Escrow collection in project finance has picked up to 33% of pre-COVID-19 levels from trough of 14-15% in April 2020 and May 2020.(7) Overall collection in June 2020 was ~65-70% of June 2019.
Source: Company, Kotak Institutional Equities
100
29 31 32
1628
2130
100
58
75
51 53
100
70
3546
5248
33
18 1933
83
0
20
40
60
80
100
Microfinance 2W Farm equipment Consumer loans Home loans andLAP
Real estate IDF Coreinfrastructure
Rural Housing Infrastructure
Mar-20 Apr-20 May-20 Jun-20
Provisions on book (Rs mn)
Provision on stage 1 and 2 loans
Stage 3
provisions Provision coverage
Gross loans (Rs mn) One-off provisions Stage 1 and 2 Stage 3 Loans
Stage 1
and 2 Stage 3 Total ECL
Macro-
prudent
ial
COVID-19
on 1 to 90
dpd
Change in
LGD
assumptions Total Overall ECL ECL
One-
offs Overall ECL Overall
Rural 265,550 9,210 274,760 5,350 1,210 1,080 7,640 8,540 2.9 92.7
Housing 266,950 2,590 269,540 1,150 3,290 4,440 850 1.7 32.8
Core infrastructure 275,670 25,640 301,310 340 340 16,080 0.1 62.7
IDF 91,460 - 91,460 - - -
De-focused and others 39,780 11,950 51,730 20 20 8,390 0.1 70.2
Overall 939,410 49,390 988,800 3,990 6,500 4,860 1,080 12,440 16,430 33,860 0.4 1.3 1.7 68.6 5.1
Average monthly
repayments in FY2020 Collections in 1QFY21 (Rs bn) Estimates collection efficiency (%)
(Rs bn) Apr-20 May-20 Jun-20 Overall Apr-20 May-20 Jun-20 Overall
Rural 13,895 2,840 4,930 14,720 22,490 20.4 35.5 105.9 54.0
Housing 5,848 1,620 1,160 1,810 4,590 27.7 19.8 31.0 26.2
Infrastructure 7,560 3,670 3,860 8,600 16,130 48.5 51.1 113.8 71.1
Overall 27,303 8,130 9,950 25,130 43,210 29.8 36.4 92.0 52.8
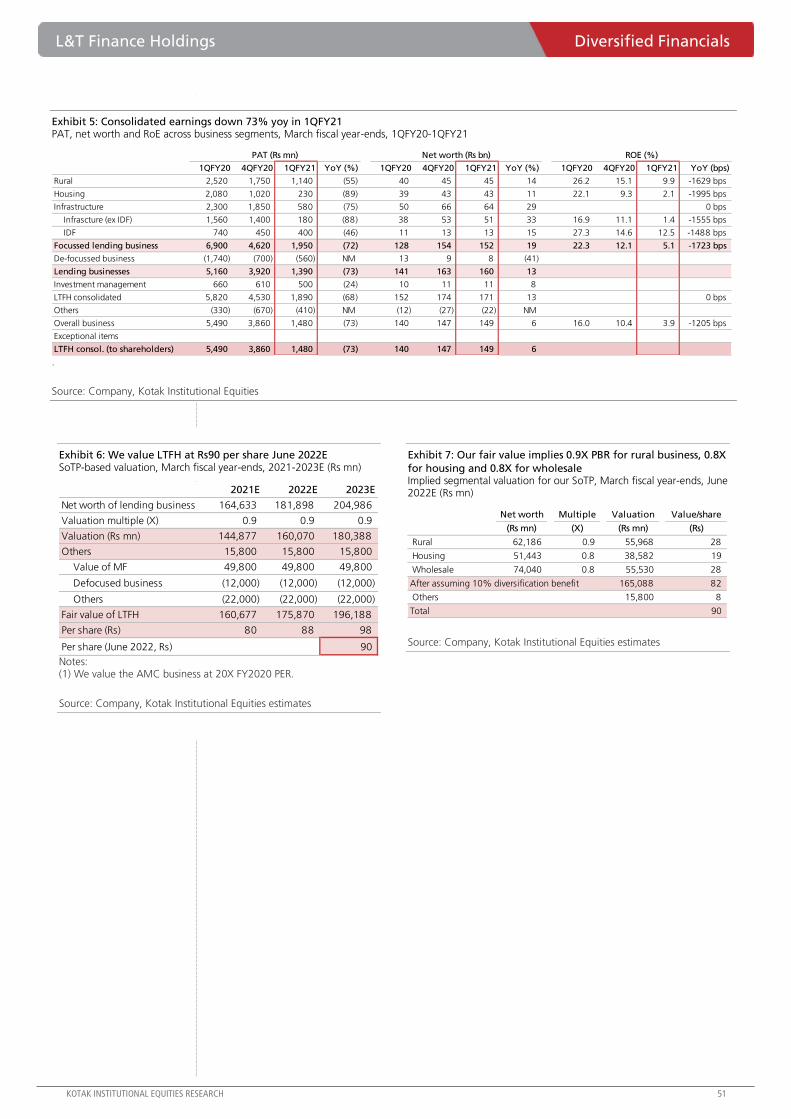
L&T Finance Holdings Diversified Financials
KOTAK INSTITUTIONAL EQUITIES RESEARCH 51
Exhibit 5: Consolidated earnings down 73% yoy in 1QFY21 PAT, net worth and RoE across business segments, March fiscal year-ends, 1QFY20-1QFY21
.
Source: Company, Kotak Institutional Equities
Exhibit 6: We value LTFH at Rs90 per share June 2022E SoTP-based valuation, March fiscal year-ends, 2021-2023E (Rs mn)
Notes: (1) We value the AMC business at 20X FY2020 PER.
Source: Company, Kotak Institutional Equities estimates
Exhibit 7: Our fair value implies 0.9X PBR for rural business, 0.8X
for housing and 0.8X for wholesale Implied segmental valuation for our SoTP, March fiscal year-ends, June 2022E (Rs mn)
Source: Company, Kotak Institutional Equities estimates
PAT (Rs mn) Net worth (Rs bn) ROE (%)
1QFY20 4QFY20 1QFY21 YoY (%) 1QFY20 4QFY20 1QFY21 YoY (%) 1QFY20 4QFY20 1QFY21 YoY (bps)
Rural 2,520 1,750 1,140 (55) 40 45 45 14 26.2 15.1 9.9 -1629 bps
Housing 2,080 1,020 230 (89) 39 43 43 11 22.1 9.3 2.1 -1995 bps
Infrastructure 2,300 1,850 580 (75) 50 66 64 29 0 bps
Infrascture (ex IDF) 1,560 1,400 180 (88) 38 53 51 33 16.9 11.1 1.4 -1555 bps
IDF 740 450 400 (46) 11 13 13 15 27.3 14.6 12.5 -1488 bps
Focussed lending business 6,900 4,620 1,950 (72) 128 154 152 19 22.3 12.1 5.1 -1723 bps
De-focussed business (1,740) (700) (560) NM 13 9 8 (41)
Lending businesses 5,160 3,920 1,390 (73) 141 163 160 13
Investment management 660 610 500 (24) 10 11 11 8
LTFH consolidated 5,820 4,530 1,890 (68) 152 174 171 13 0 bps
Others (330) (670) (410) NM (12) (27) (22) NM
Overall business 5,490 3,860 1,480 (73) 140 147 149 6 16.0 10.4 3.9 -1205 bps
Exceptional items
LTFH consol. (to shareholders) 5,490 3,860 1,480 (73) 140 147 149 6
2021E 2022E 2023E
Net worth of lending business 164,633 181,898 204,986
Valuation multiple (X) 0.9 0.9 0.9
Valuation (Rs mn) 144,877 160,070 180,388
Others 15,800 15,800 15,800
Value of MF 49,800 49,800 49,800
Defocused business (12,000) (12,000) (12,000)
Others (22,000) (22,000) (22,000)
Fair value of LTFH 160,677 175,870 196,188
Per share (Rs) 80 88 98
Per share (June 2022, Rs) 90
Net worth Multiple Valuation Value/share
(Rs mn) (X) (Rs mn) (Rs)
Rural 62,186 0.9 55,968 28
Housing 51,443 0.8 38,582 19
Wholesale 74,040 0.8 55,530 28
After assuming 10% diversification benefit 165,088 82
Others 15,800 8
Total 90
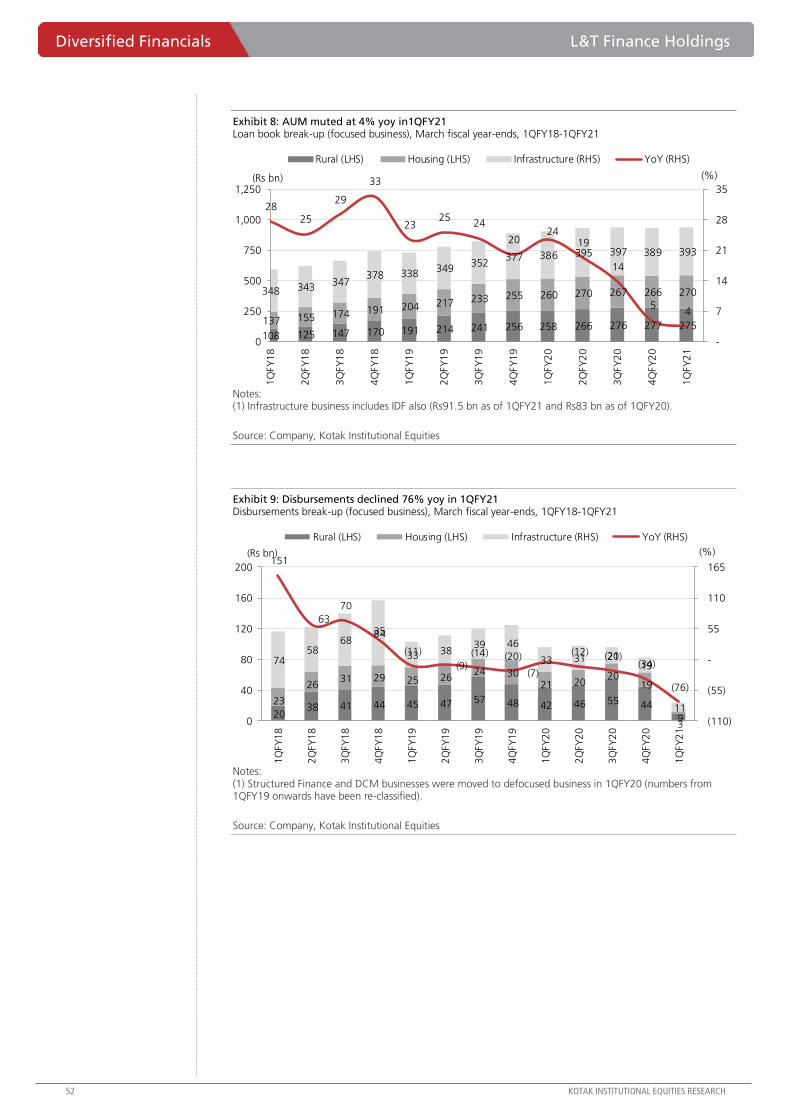
Diversified Financials L&T Finance Holdings
52 KOTAK INSTITUTIONAL EQUITIES RESEARCH
Exhibit 8: AUM muted at 4% yoy in1QFY21 Loan book break-up (focused business), March fiscal year-ends, 1QFY18-1QFY21
Notes: (1) Infrastructure business includes IDF also (Rs91.5 bn as of 1QFY21 and Rs83 bn as of 1QFY20).
Source: Company, Kotak Institutional Equities
Exhibit 9: Disbursements declined 76% yoy in 1QFY21 Disbursements break-up (focused business), March fiscal year-ends, 1QFY18-1QFY21
Notes: (1) Structured Finance and DCM businesses were moved to defocused business in 1QFY20 (numbers from 1QFY19 onwards have been re-classified).
Source: Company, Kotak Institutional Equities
108 125 147 170 191 214 241 256 258 266 276 277 275 137 155 174 191 204 217 233 255 260 270 267 266 270 348 343 347 378 338
349 352
377 386 395 397 389 393
28 25
29
33
23 25
24
20 24
19
14
5 4
-
7
14
21
28
35
0
250
500
750
1,000
1,250
1Q
FY
18
2Q
FY
18
3Q
FY
18
4Q
FY
18
1Q
FY
19
2Q
FY
19
3Q
FY
19
4Q
FY
19
1Q
FY
20
2Q
FY
20
3Q
FY
20
4Q
FY
20
1Q
FY
21
(%)(Rs bn)
Rural (LHS) Housing (LHS) Infrastructure (RHS) YoY (RHS)
20 38 41 44 45 47 57 48 42 46 55 44
9
23
26 31 29 25 26
24 30 21 20
20 19
3
74 58
68 84
33 38 39 46
33 31 21 19
11
151
63
70
35
(11)
(9)
(14) (20)
(7)
(12) (20)(34)
(76)
(110)
(55)
-
55
110
165
0
40
80
120
160
200
1Q
FY
18
2Q
FY
18
3Q
FY
18
4Q
FY
18
1Q
FY
19
2Q
FY
19
3Q
FY
19
4Q
FY
19
1Q
FY
20
2Q
FY
20
3Q
FY
20
4Q
FY
20
1Q
FY
21
(%)(Rs bn)
Rural (LHS) Housing (LHS) Infrastructure (RHS) YoY (RHS)
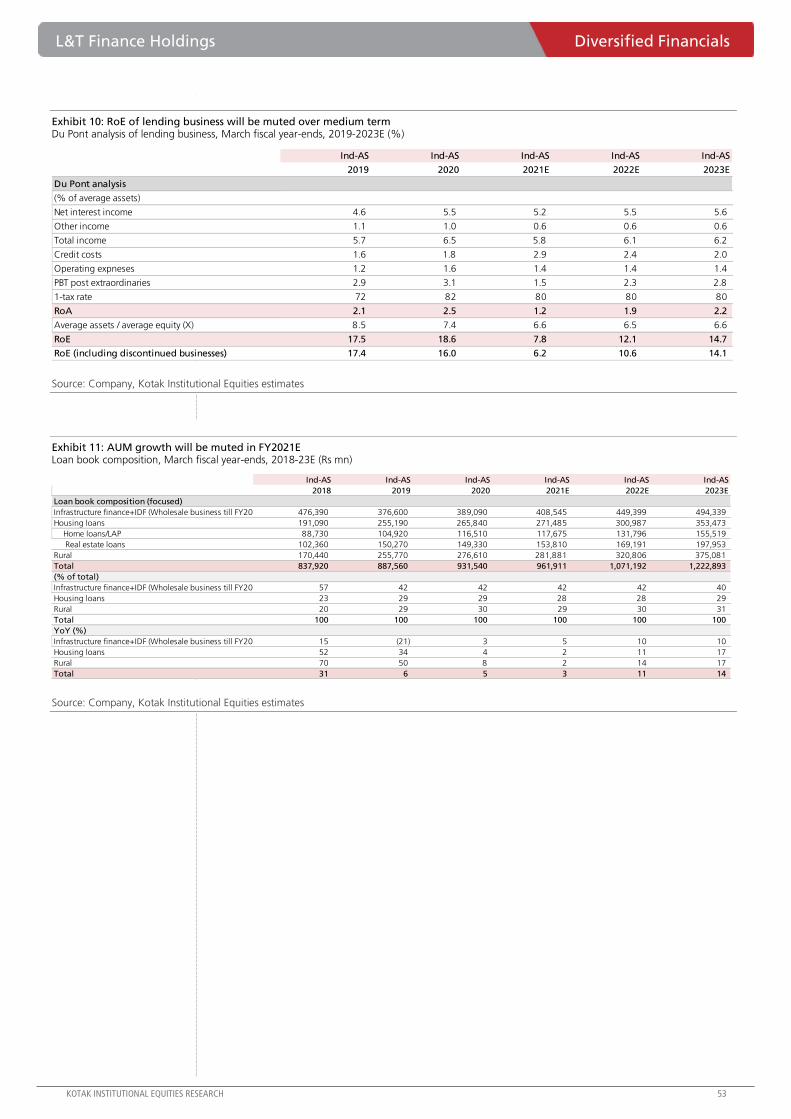
L&T Finance Holdings Diversified Financials
KOTAK INSTITUTIONAL EQUITIES RESEARCH 53
Exhibit 10: RoE of lending business will be muted over medium term Du Pont analysis of lending business, March fiscal year-ends, 2019-2023E (%)
Source: Company, Kotak Institutional Equities estimates
Exhibit 11: AUM growth will be muted in FY2021E Loan book composition, March fiscal year-ends, 2018-23E (Rs mn)
Source: Company, Kotak Institutional Equities estimates
Ind-AS Ind-AS Ind-AS Ind-AS Ind-AS
2019 2020 2021E 2022E 2023E
Du Pont analysis
(% of average assets)
Net interest income 4.6 5.5 5.2 5.5 5.6
Other income 1.1 1.0 0.6 0.6 0.6
Total income 5.7 6.5 5.8 6.1 6.2
Credit costs 1.6 1.8 2.9 2.4 2.0
Operating expneses 1.2 1.6 1.4 1.4 1.4
PBT post extraordinaries 2.9 3.1 1.5 2.3 2.8
1-tax rate 72 82 80 80 80
RoA 2.1 2.5 1.2 1.9 2.2
Average assets / average equity (X) 8.5 7.4 6.6 6.5 6.6
RoE 17.5 18.6 7.8 12.1 14.7
RoE (including discontinued businesses) 17.4 16.0 6.2 10.6 14.1
Ind-AS Ind-AS Ind-AS Ind-AS Ind-AS Ind-AS
2018 2019 2020 2021E 2022E 2023E
Loan book composition (focused)
Infrastructure finance+IDF (Wholesale business till FY2018) 476,390 376,600 389,090 408,545 449,399 494,339
Housing loans 191,090 255,190 265,840 271,485 300,987 353,473
Home loans/LAP 88,730 104,920 116,510 117,675 131,796 155,519
Real estate loans 102,360 150,270 149,330 153,810 169,191 197,953
Rural 170,440 255,770 276,610 281,881 320,806 375,081
Total 837,920 887,560 931,540 961,911 1,071,192 1,222,893
(% of total)
Infrastructure finance+IDF (Wholesale business till FY2018) 57 42 42 42 42 40
Housing loans 23 29 29 28 28 29
Rural 20 29 30 29 30 31
Total 100 100 100 100 100 100
YoY (%)
Infrastructure finance+IDF (Wholesale business till FY2018) 15 (21) 3 5 10 10
Housing loans 52 34 4 2 11 17
Rural 70 50 8 2 14 17
Total 31 6 5 3 11 14
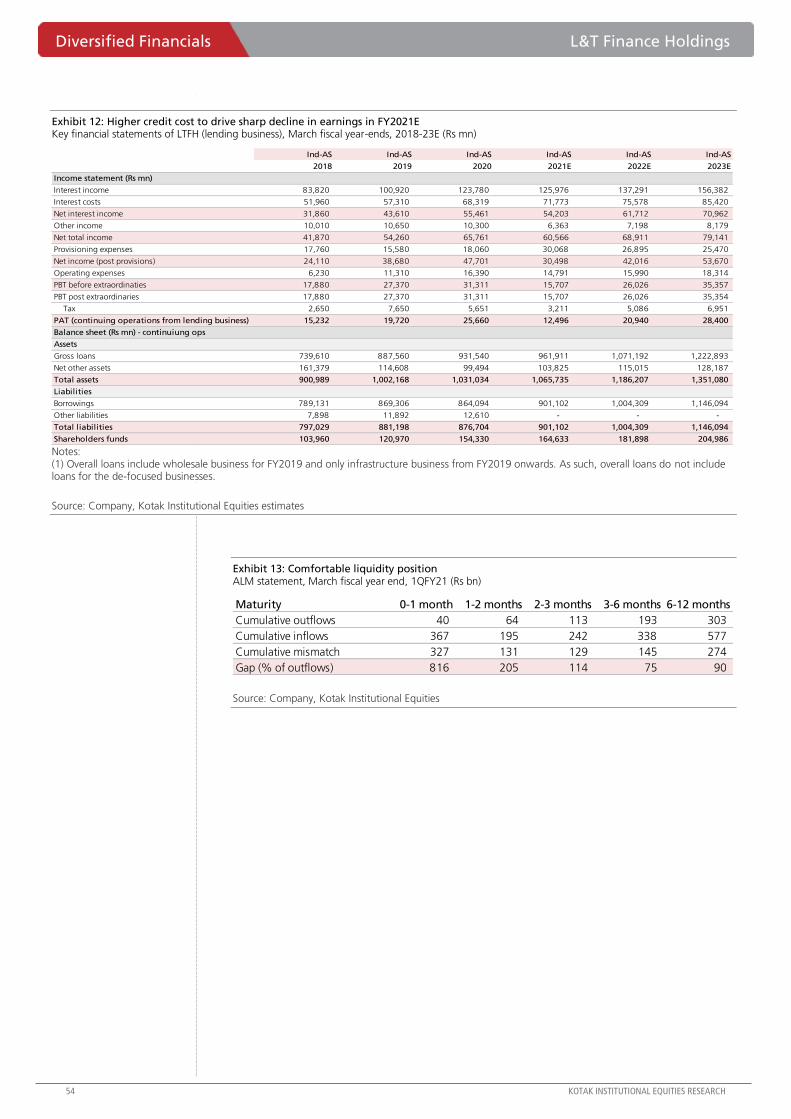
Diversified Financials L&T Finance Holdings
54 KOTAK INSTITUTIONAL EQUITIES RESEARCH
Exhibit 12: Higher credit cost to drive sharp decline in earnings in FY2021E Key financial statements of LTFH (lending business), March fiscal year-ends, 2018-23E (Rs mn)
Notes: (1) Overall loans include wholesale business for FY2019 and only infrastructure business from FY2019 onwards. As such, overall loans do not includeloans for the de-focused businesses.
Source: Company, Kotak Institutional Equities estimates
Exhibit 13: Comfortable liquidity position ALM statement, March fiscal year end, 1QFY21 (Rs bn)
Source: Company, Kotak Institutional Equities
Ind-AS Ind-AS Ind-AS Ind-AS Ind-AS Ind-AS
2018 2019 2020 2021E 2022E 2023E
Income statement (Rs mn)
Interest income 83,820 100,920 123,780 125,976 137,291 156,382
Interest costs 51,960 57,310 68,319 71,773 75,578 85,420
Net interest income 31,860 43,610 55,461 54,203 61,712 70,962
Other income 10,010 10,650 10,300 6,363 7,198 8,179
Net total income 41,870 54,260 65,761 60,566 68,911 79,141
Provisioning expenses 17,760 15,580 18,060 30,068 26,895 25,470
Net income (post provisions) 24,110 38,680 47,701 30,498 42,016 53,670
Operating expenses 6,230 11,310 16,390 14,791 15,990 18,314
PBT before extraordinaties 17,880 27,370 31,311 15,707 26,026 35,357
PBT post extraordinaries 17,880 27,370 31,311 15,707 26,026 35,354
Tax 2,650 7,650 5,651 3,211 5,086 6,951
PAT (continuing operations from lending business) 15,232 19,720 25,660 12,496 20,940 28,400
Balance sheet (Rs mn) - continuiung ops
Assets
Gross loans 739,610 887,560 931,540 961,911 1,071,192 1,222,893
Net other assets 161,379 114,608 99,494 103,825 115,015 128,187
Total assets 900,989 1,002,168 1,031,034 1,065,735 1,186,207 1,351,080
Liabilities
Borrowings 789,131 869,306 864,094 901,102 1,004,309 1,146,094
Other liabilities 7,898 11,892 12,610 - - -
Total liabilities 797,029 881,198 876,704 901,102 1,004,309 1,146,094
Shareholders funds 103,960 120,970 154,330 164,633 181,898 204,986
Maturity 0-1 month 1-2 months 2-3 months 3-6 months 6-12 months
Cumulative outflows 40 64 113 193 303
Cumulative inflows 367 195 242 338 577
Cumulative mismatch 327 131 129 145 274
Gap (% of outflows) 816 205 114 75 90
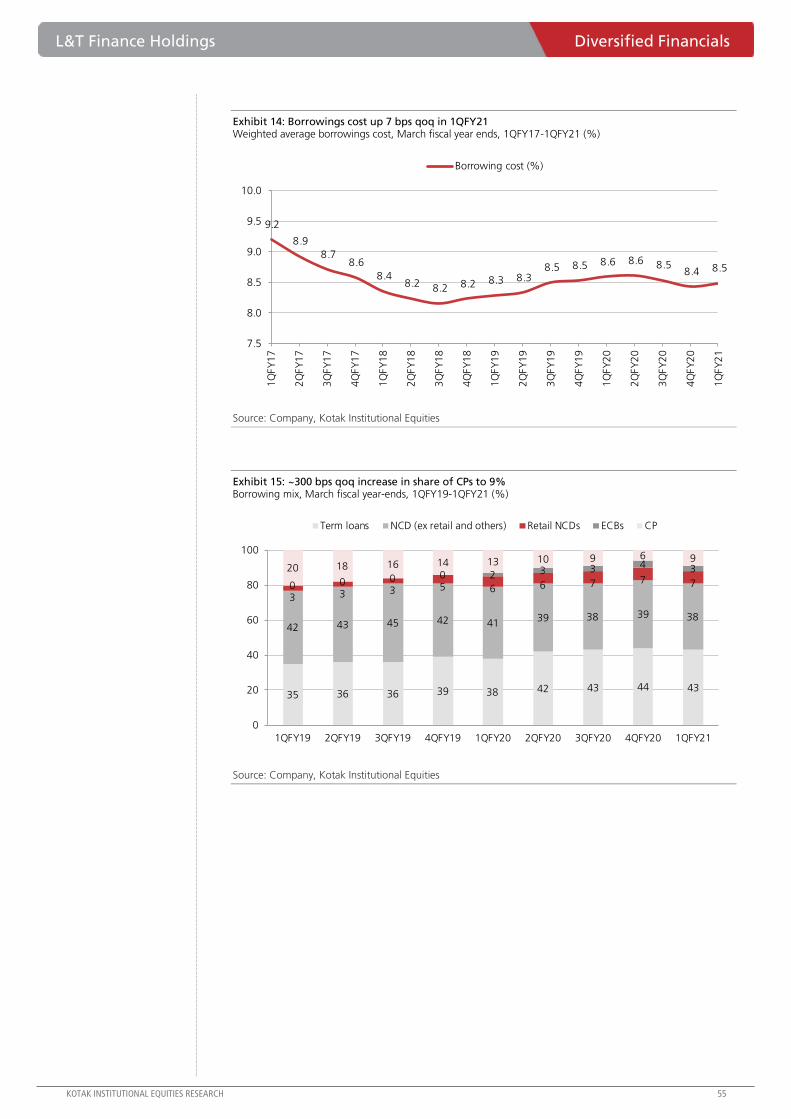
L&T Finance Holdings Diversified Financials
KOTAK INSTITUTIONAL EQUITIES RESEARCH 55
Exhibit 14: Borrowings cost up 7 bps qoq in 1QFY21 Weighted average borrowings cost, March fiscal year ends, 1QFY17-1QFY21 (%)
Source: Company, Kotak Institutional Equities
Exhibit 15: ~300 bps qoq increase in share of CPs to 9% Borrowing mix, March fiscal year-ends, 1QFY19-1QFY21 (%)
Source: Company, Kotak Institutional Equities
9.2
8.9
8.7 8.6
8.4 8.2 8.2 8.2 8.3 8.3
8.5 8.5 8.6 8.6 8.5 8.4 8.5
7.5
8.0
8.5
9.0
9.5
10.0
1Q
FY
17
2Q
FY
17
3Q
FY
17
4Q
FY
17
1Q
FY
18
2Q
FY
18
3Q
FY
18
4Q
FY
18
1Q
FY
19
2Q
FY
19
3Q
FY
19
4Q
FY
19
1Q
FY
20
2Q
FY
20
3Q
FY
20
4Q
FY
20
1Q
FY
21
Borrowing cost (%)
35 36 36 39 38 42 43 44 43
42 43 45 42 4139 38 39 38
3 3 3 5 6 6 7 7 70 0 0 0 2 3 3 4 320 18 16 14 13 10 9 6 9
0
20
40
60
80
100
1QFY19 2QFY19 3QFY19 4QFY19 1QFY20 2QFY20 3QFY20 4QFY20 1QFY21
Term loans NCD (ex retail and others) Retail NCDs ECBs CP

Diversified Financials L&T Finance Holdings
56 KOTAK INSTITUTIONAL EQUITIES RESEARCH
Exhibit 16: Elevated credit cost drag earnings of focused business Quarterly summary, March fiscal year-ends, 2019-20, 1QFY19-1QFY21 (Rs mn)
Source: Company, Kotak Institutional Equities
Exhibit 17: AUM growth muted at 6% yoy Loan book break-up (rural business), March fiscal year-ends, 1QFY18-1QFY21
Source: Company, Kotak Institutional Equities
Ind-AS Ind-AS Ind-AS Ind-AS Ind-AS Ind-AS Ind-AS Ind-AS Ind-AS Ind-AS
1QFY19 3QFY19 4QFY19 1QFY20 2QFY20 3QFY20 4QFY20 1QFY21 YoY (%) QoQ (%) 2019 2020 YoY (%)
Financials summary (Rs mn)
Net interest income 5,070 6,690 7,340 7,260 7,550 8,210 8,530 7,980 10 (6) 25,150 31,550 25
Fee and othe income 740 1,130 900 1,090 1,180 1,210 940 320 (71) (66) 3,750 4,420 18
Credit losses/provisions 1,860 2,480 2,520 2,230 2,510 2,760 4,350 3,800 70 (13) 9,020 11,850 31
Operating expenses 1,370 2,100 2,220 2,580 2,630 2,960 3,020 2,620 2 (13) 7,450 11,190 50
PBT 2,580 3,240 3,500 3,540 3,590 3,700 2,100 1,880 (47) (10) 12,430 12,930 4
PAT 1,930 2,330 2,500 2,520 3,090 2,900 1,750 1,140 (55) (35) 8,940 10,260 15
Gross loans 190,790 241,220 255,770 258,450 265,970 275,940 276,610 274,760 6 (1) 255,770 276,610 8
Networth 29,860 36,640 37,190 39,620 42,450 45,550 45,230 45,160 14 (0) 37,190 45,230 22
Reported ratios (%)
Yield 18.3 18.8 18.9 18.5 18.9 19.1 19.0 18.8 29 bps -14 bps 18.7 18.9 23 bps
Net Interest Margin 11.3 11.6 12.0 11.3 11.5 11.9 12.4 11.5 21 bps -82 bps 11.7 11.8 5 bps
Fee Income 1.6 2.0 1.5 1.7 1.8 1.8 1.4 0.5 -124 bps -90 bps 1.8 1.7 -10 bps
Operating Expenses 3.1 3.7 3.6 4.0 4.0 4.3 4.4 3.8 -24 bps -60 bps 3.5 4.2 70 bps
Credit Cost 4.1 4.3 4.1 3.5 3.8 4.0 6.3 6.3 280 bps -3 bps 4.2 4.4 22 bps
Return on Assets 4.3 3.9 4.0 3.9 4.6 4.1 2.5 1.5 -237 bps -94 bps 4.1 3.8 -34 bps
Return on Equity 28.0 27.5 27.1 26.2 30.3 26.5 15.1 9.9 -1629 bps -523 bps 27.9 24.2 -372 bps
Gross stage 3 (%) 4.9 3.8 3.5 3.4 3.6 3.6 3.8 3.4 1 bps -35 bps 3.5 3.8 32 bps
Net stage 3 (%) 1.7 1.3 1.3 1.3 1.5 1.3 0.9 0.3 -100 bps -63 bps 1.3 1.3 -8 bps
39 49 62 78 91 104 116 125 125 128 129 125 125
22 26
30 34
38 43
52 57 59 60 64 66 64
47 51
55
58 62
67
73 74
75
77 82 84 84
0 2 2
26
36
53
70 76
71
64
50
35
24
14 8 6 -
18
36
54
72
90
0
60
120
180
240
300
1Q
FY
18
2Q
FY
18
3Q
FY
18
4Q
FY
18
1Q
FY
19
2Q
FY
19
3Q
FY
19
4Q
FY
19
1Q
FY
20
2Q
FY
20
3Q
FY
20
4Q
FY
20
1Q
FY
21
(Rs bn)Microfinance (LHS) 2-W (LHS) Farm equipment (RHS)
Consumer loans YoY (RHS)
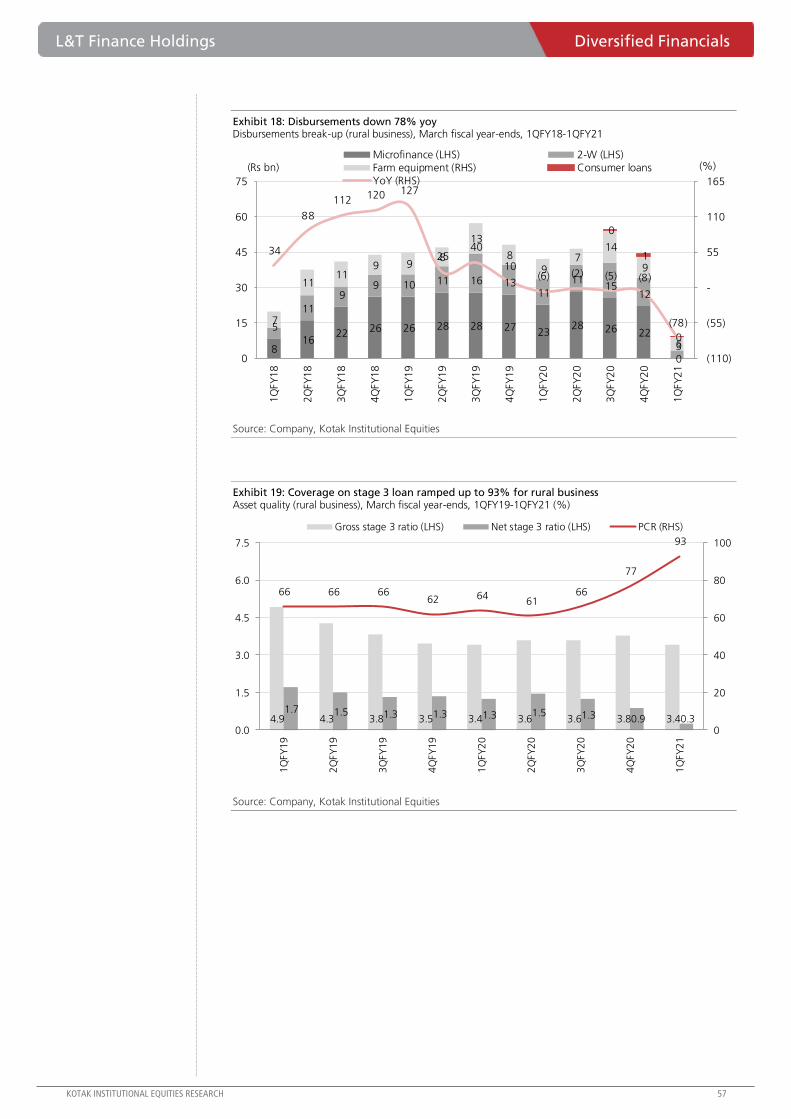
L&T Finance Holdings Diversified Financials
KOTAK INSTITUTIONAL EQUITIES RESEARCH 57
Exhibit 18: Disbursements down 78% yoy Disbursements break-up (rural business), March fiscal year-ends, 1QFY18-1QFY21
Source: Company, Kotak Institutional Equities
Exhibit 19: Coverage on stage 3 loan ramped up to 93% for rural business Asset quality (rural business), March fiscal year-ends, 1QFY19-1QFY21 (%)
Source: Company, Kotak Institutional Equities
8 16
22 26 26 28 28 27 23 28 26 22
0
5
11
9 9 10 11 16 13
11
1115
12
3
7
11 11
9 9 8
13
8
9 7
14
9
6
0
1
0
34
88
112 120 127
25 40
10 (6) (2) (5) (8)
(78)
(110)
(55)
-
55
110
165
0
15
30
45
60
75
1Q
FY
18
2Q
FY
18
3Q
FY
18
4Q
FY
18
1Q
FY
19
2Q
FY
19
3Q
FY
19
4Q
FY
19
1Q
FY
20
2Q
FY
20
3Q
FY
20
4Q
FY
20
1Q
FY
21
(%)(Rs bn)Microfinance (LHS) 2-W (LHS)
Farm equipment (RHS) Consumer loans
YoY (RHS)
4.9 4.3 3.8 3.5 3.4 3.6 3.6 3.8 3.4 1.7 1.5 1.3 1.3 1.3 1.5 1.3 0.9 0.3
66 66 66 62 64
61 66
77
93
0
20
40
60
80
100
0.0
1.5
3.0
4.5
6.0
7.5
1Q
FY
19
2Q
FY
19
3Q
FY
19
4Q
FY
19
1Q
FY
20
2Q
FY
20
3Q
FY
20
4Q
FY
20
1Q
FY
21
Gross stage 3 ratio (LHS) Net stage 3 ratio (LHS) PCR (RHS)

Diversified Financials L&T Finance Holdings
58 KOTAK INSTITUTIONAL EQUITIES RESEARCH
Exhibit 20: Steep decline in RoEs of the rural business LTFH’s rural business, key ratios, March fiscal year-ends, 2018-23E
Source: Company, Kotak Institutional Equities estimates
Ind-AS Ind-AS Ind-AS Ind-AS Ind-AS Ind-AS
2018 2019 2020E 2021E 2022E 2023E
Growth in key parameters (%)
Profit and loss statement - yoy (%)
Interest income 24 78 26 5 8 16
Interest costs 26 73 28 6 11 15
Net interest income 22 80 25 4 6 17
Other income 34 226 18 (45) 25 20
Net total income 23 92 24 (2) 8 17
Provisioning expenses 8 97 31 30 (8) (2)
Net income (post provisions) 31 89 21 (17) 19 28
Operating expenses (20) 160 50 (10) 10 15
PAT 84 68 15 (27) 29 39
Balance sheet - yoy (%)
Loans 70 50 8 2 14 17
Total assets 76 50 8 2 14 17
Borrowings 73 51 6 5 13 17
Total liabilities 74 51 6 5 13 16
Shareholders funds 90 47 22 14 16 18
Key ratios (%)
Interest yield 16.6 18.8 19.0 19.0 19.0 19.1
Interest cost 7.3 7.9 8.2 8.2 8.3 8.3
Spreads 9.4 10.9 10.8 10.8 10.7 10.8
NIMs 10.3 11.8 11.9 11.8 11.6 11.7
Cost-income ratio 19.0 25.8 31.1 28.5 29.2 28.7
Cost to assets (%) 2.0 3.3 3.9 3.4 3.4 3.4
Tax rate 30.5 28.1 20.6 24.0 24.0 24.0
Debt/ equity (X) 5.9 6.1 5.3 4.9 4.8 4.7
Credit costs(%) 3.4 4.2 4.5 5.5 4.7 4.0
Du Pont analysis
(% of average assets)
Net interest income 9.7 11.0 11.0 11.0 10.8 10.9
Other income 0.8 1.6 1.5 0.8 0.9 1.0
Total income 10.5 12.6 12.6 11.8 11.7 11.9
Credit costs 3.2 3.9 4.1 5.1 4.4 3.7
Operating expneses 2.0 3.3 3.9 3.4 3.4 3.4
PBT post extraordinaries 5.3 5.4 4.5 3.3 3.9 4.8
1-tax rate 69.5 71.9 79.4 76.0 76.0 76.0
RoA 3.7 3.9 3.6 2.5 3.0 3.6
Average assets / average equity (X) 7.4 7.3 6.9 6.2 5.8 5.8
RoE 27.6 28.6 24.9 15.6 17.5 20.8
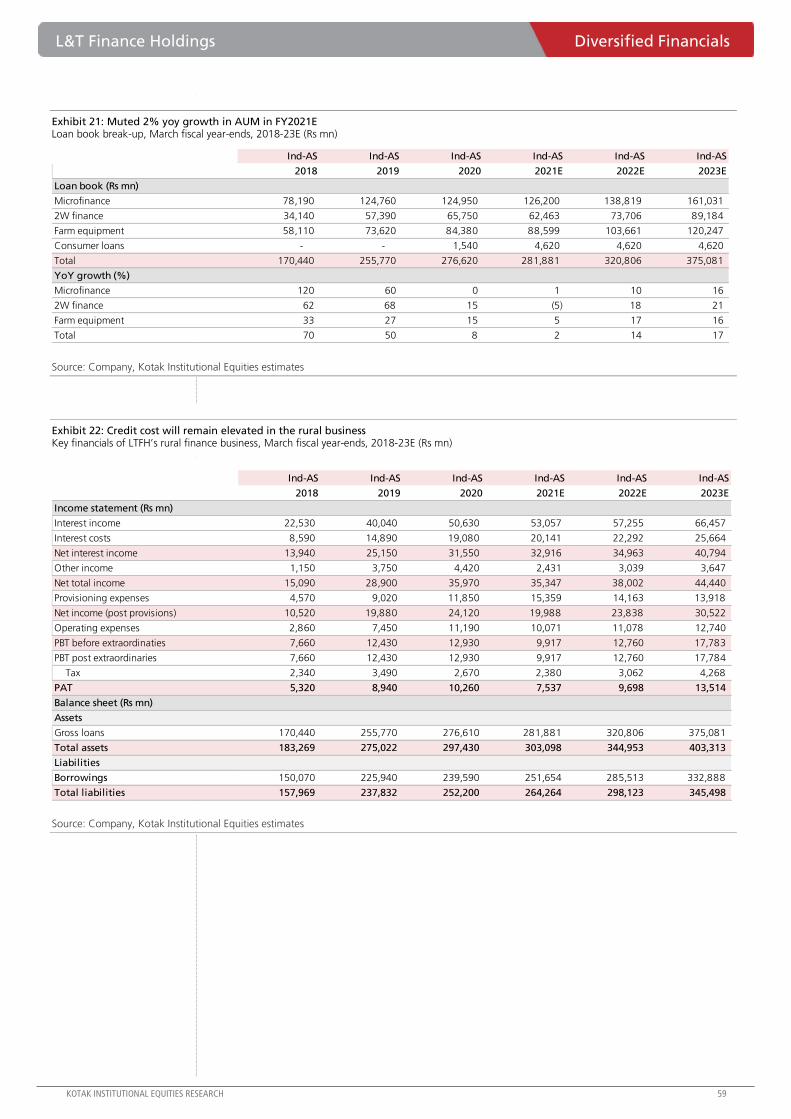
L&T Finance Holdings Diversified Financials
KOTAK INSTITUTIONAL EQUITIES RESEARCH 59
Exhibit 21: Muted 2% yoy growth in AUM in FY2021E Loan book break-up, March fiscal year-ends, 2018-23E (Rs mn)
Source: Company, Kotak Institutional Equities estimates
Exhibit 22: Credit cost will remain elevated in the rural business Key financials of LTFH’s rural finance business, March fiscal year-ends, 2018-23E (Rs mn)
Source: Company, Kotak Institutional Equities estimates
Ind-AS Ind-AS Ind-AS Ind-AS Ind-AS Ind-AS
2018 2019 2020 2021E 2022E 2023E
Loan book (Rs mn)
Microfinance 78,190 124,760 124,950 126,200 138,819 161,031
2W finance 34,140 57,390 65,750 62,463 73,706 89,184
Farm equipment 58,110 73,620 84,380 88,599 103,661 120,247
Consumer loans - - 1,540 4,620 4,620 4,620
Total 170,440 255,770 276,620 281,881 320,806 375,081
YoY growth (%)
Microfinance 120 60 0 1 10 16
2W finance 62 68 15 (5) 18 21
Farm equipment 33 27 15 5 17 16
Total 70 50 8 2 14 17
Ind-AS Ind-AS Ind-AS Ind-AS Ind-AS Ind-AS
2018 2019 2020 2021E 2022E 2023E
Income statement (Rs mn)
Interest income 22,530 40,040 50,630 53,057 57,255 66,457
Interest costs 8,590 14,890 19,080 20,141 22,292 25,664
Net interest income 13,940 25,150 31,550 32,916 34,963 40,794
Other income 1,150 3,750 4,420 2,431 3,039 3,647
Net total income 15,090 28,900 35,970 35,347 38,002 44,440
Provisioning expenses 4,570 9,020 11,850 15,359 14,163 13,918
Net income (post provisions) 10,520 19,880 24,120 19,988 23,838 30,522
Operating expenses 2,860 7,450 11,190 10,071 11,078 12,740
PBT before extraordinaties 7,660 12,430 12,930 9,917 12,760 17,783
PBT post extraordinaries 7,660 12,430 12,930 9,917 12,760 17,784
Tax 2,340 3,490 2,670 2,380 3,062 4,268
PAT 5,320 8,940 10,260 7,537 9,698 13,514
Balance sheet (Rs mn)
Assets
Gross loans 170,440 255,770 276,610 281,881 320,806 375,081
Total assets 183,269 275,022 297,430 303,098 344,953 403,313
Liabilities
Borrowings 150,070 225,940 239,590 251,654 285,513 332,888
Total liabilities 157,969 237,832 252,200 264,264 298,123 345,498
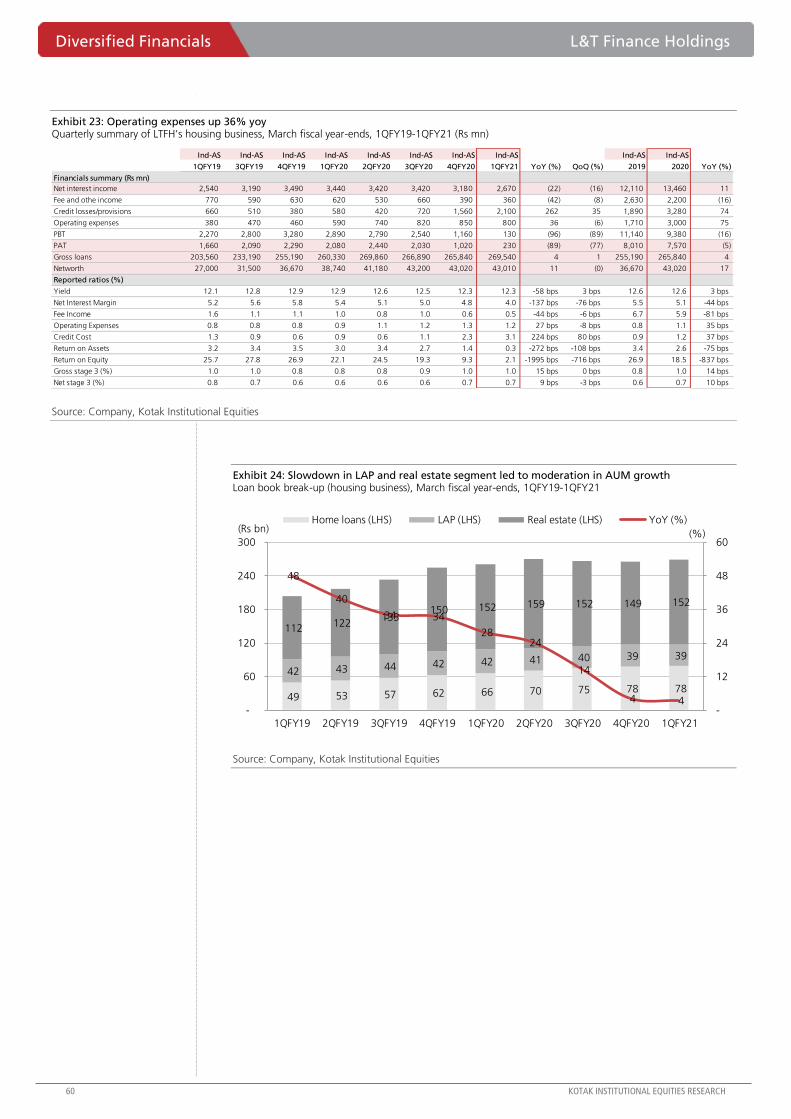
Diversified Financials L&T Finance Holdings
60 KOTAK INSTITUTIONAL EQUITIES RESEARCH
Exhibit 23: Operating expenses up 36% yoy Quarterly summary of LTFH’s housing business, March fiscal year-ends, 1QFY19-1QFY21 (Rs mn)
Source: Company, Kotak Institutional Equities
Exhibit 24: Slowdown in LAP and real estate segment led to moderation in AUM growth Loan book break-up (housing business), March fiscal year-ends, 1QFY19-1QFY21
Source: Company, Kotak Institutional Equities
Ind-AS Ind-AS Ind-AS Ind-AS Ind-AS Ind-AS Ind-AS Ind-AS Ind-AS Ind-AS
1QFY19 3QFY19 4QFY19 1QFY20 2QFY20 3QFY20 4QFY20 1QFY21 YoY (%) QoQ (%) 2019 2020 YoY (%)
Financials summary (Rs mn)
Net interest income 2,540 3,190 3,490 3,440 3,420 3,420 3,180 2,670 (22) (16) 12,110 13,460 11
Fee and othe income 770 590 630 620 530 660 390 360 (42) (8) 2,630 2,200 (16)
Credit losses/provisions 660 510 380 580 420 720 1,560 2,100 262 35 1,890 3,280 74
Operating expenses 380 470 460 590 740 820 850 800 36 (6) 1,710 3,000 75
PBT 2,270 2,800 3,280 2,890 2,790 2,540 1,160 130 (96) (89) 11,140 9,380 (16)
PAT 1,660 2,090 2,290 2,080 2,440 2,030 1,020 230 (89) (77) 8,010 7,570 (5)
Gross loans 203,560 233,190 255,190 260,330 269,860 266,890 265,840 269,540 4 1 255,190 265,840 4
Networth 27,000 31,500 36,670 38,740 41,180 43,200 43,020 43,010 11 (0) 36,670 43,020 17
Reported ratios (%)
Yield 12.1 12.8 12.9 12.9 12.6 12.5 12.3 12.3 -58 bps 3 bps 12.6 12.6 3 bps
Net Interest Margin 5.2 5.6 5.8 5.4 5.1 5.0 4.8 4.0 -137 bps -76 bps 5.5 5.1 -44 bps
Fee Income 1.6 1.1 1.1 1.0 0.8 1.0 0.6 0.5 -44 bps -6 bps 6.7 5.9 -81 bps
Operating Expenses 0.8 0.8 0.8 0.9 1.1 1.2 1.3 1.2 27 bps -8 bps 0.8 1.1 35 bps
Credit Cost 1.3 0.9 0.6 0.9 0.6 1.1 2.3 3.1 224 bps 80 bps 0.9 1.2 37 bps
Return on Assets 3.2 3.4 3.5 3.0 3.4 2.7 1.4 0.3 -272 bps -108 bps 3.4 2.6 -75 bps
Return on Equity 25.7 27.8 26.9 22.1 24.5 19.3 9.3 2.1 -1995 bps -716 bps 26.9 18.5 -837 bps
Gross stage 3 (%) 1.0 1.0 0.8 0.8 0.8 0.9 1.0 1.0 15 bps 0 bps 0.8 1.0 14 bps
Net stage 3 (%) 0.8 0.7 0.6 0.6 0.6 0.6 0.7 0.7 9 bps -3 bps 0.6 0.7 10 bps
49 53 57 62 66 70 75 78 78
42 43 44 42 42 41 40 39 39
112 122 133
150 152 159 152 149 152
48
40
34 34
28 24
14
4 4 -
12
24
36
48
60
-
60
120
180
240
300
1QFY19 2QFY19 3QFY19 4QFY19 1QFY20 2QFY20 3QFY20 4QFY20 1QFY21
(%)(Rs bn)Home loans (LHS) LAP (LHS) Real estate (LHS) YoY (%)
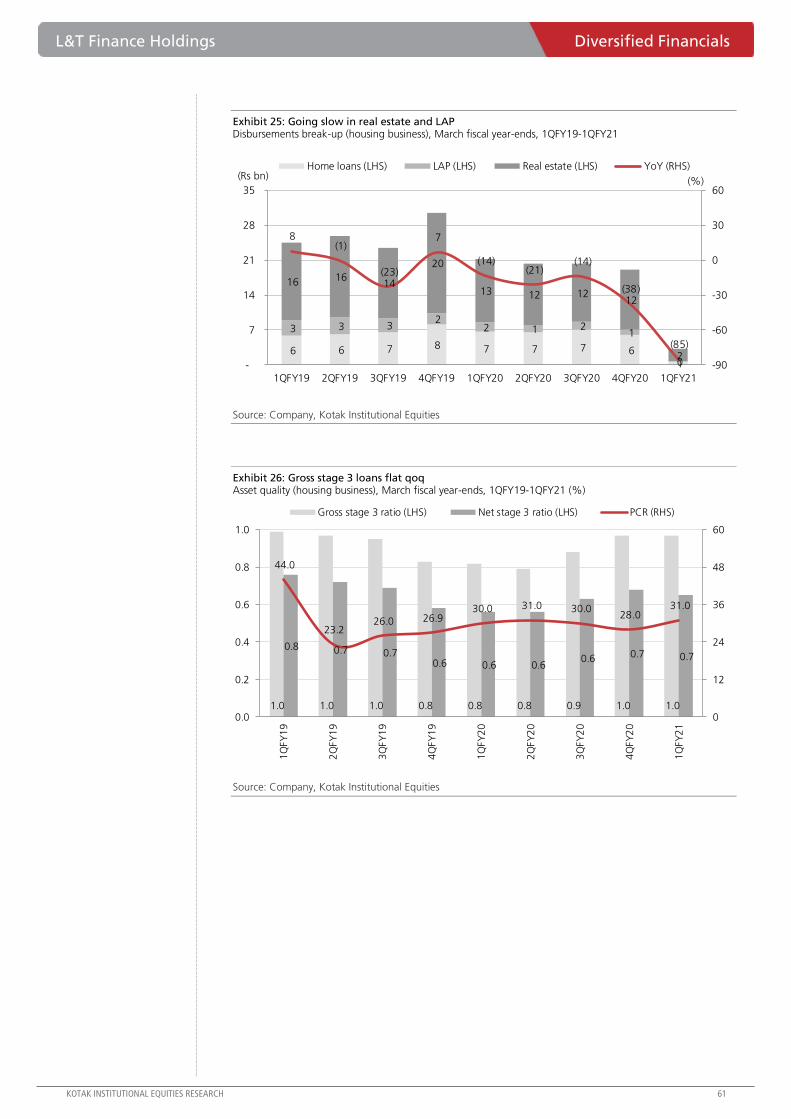
L&T Finance Holdings Diversified Financials
KOTAK INSTITUTIONAL EQUITIES RESEARCH 61
Exhibit 25: Going slow in real estate and LAP Disbursements break-up (housing business), March fiscal year-ends, 1QFY19-1QFY21
Source: Company, Kotak Institutional Equities
Exhibit 26: Gross stage 3 loans flat qoq Asset quality (housing business), March fiscal year-ends, 1QFY19-1QFY21 (%)
Source: Company, Kotak Institutional Equities
6 6 7 8 7 7 7 6
1
3 3 3 2
2 1 2 1
0
16 16 14
20
13 12 12 12
2
8 (1)
(23)
7
(14)(21)
(14)
(38)
(85)
-90
-60
-30
0
30
60
-
7
14
21
28
35
1QFY19 2QFY19 3QFY19 4QFY19 1QFY20 2QFY20 3QFY20 4QFY20 1QFY21
(%)(Rs bn)
Home loans (LHS) LAP (LHS) Real estate (LHS) YoY (RHS)
1.0 1.0 1.0 0.8 0.8 0.8 0.9 1.0 1.0
0.8 0.7 0.7 0.6 0.6 0.6
0.6 0.7 0.7
44.0
23.2 26.0 26.9
30.0 31.0 30.0 28.0
31.0
0
12
24
36
48
60
0.0
0.2
0.4
0.6
0.8
1.0
1Q
FY
19
2Q
FY
19
3Q
FY
19
4Q
FY
19
1Q
FY
20
2Q
FY
20
3Q
FY
20
4Q
FY
20
1Q
FY
21
Gross stage 3 ratio (LHS) Net stage 3 ratio (LHS) PCR (RHS)
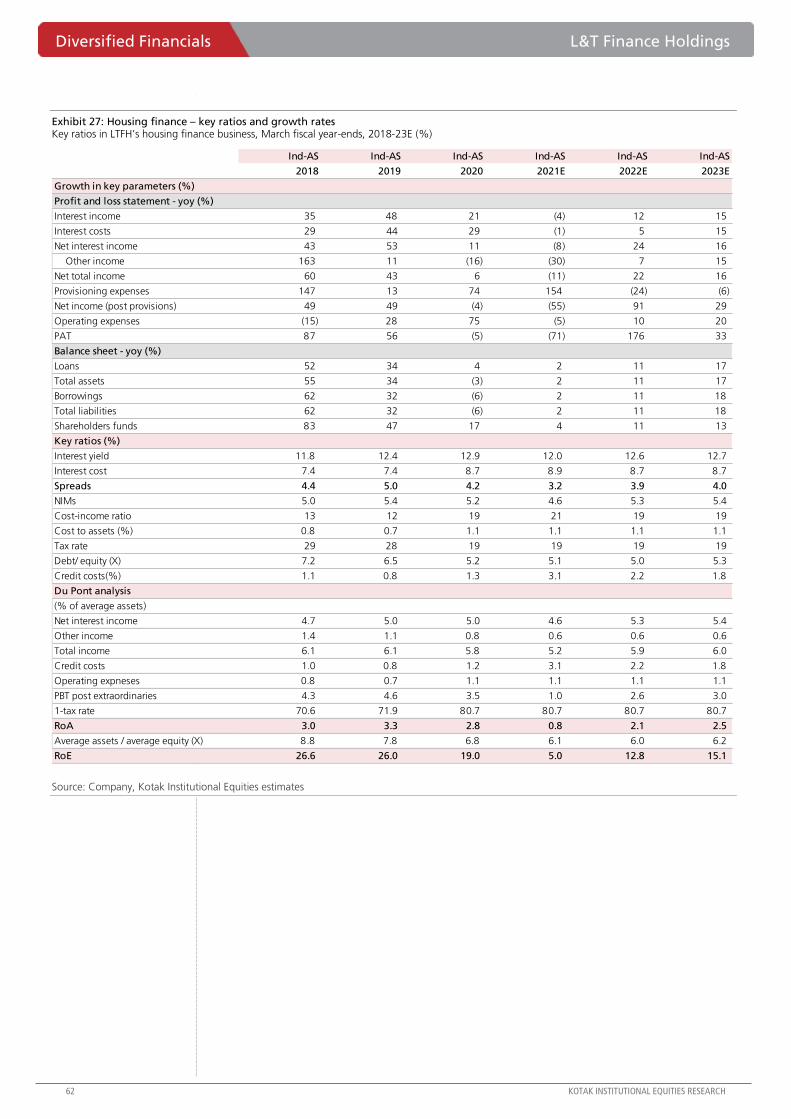
Diversified Financials L&T Finance Holdings
62 KOTAK INSTITUTIONAL EQUITIES RESEARCH
Exhibit 27: Housing finance – key ratios and growth rates Key ratios in LTFH’s housing finance business, March fiscal year-ends, 2018-23E (%)
Source: Company, Kotak Institutional Equities estimates
Ind-AS Ind-AS Ind-AS Ind-AS Ind-AS Ind-AS
2018 2019 2020 2021E 2022E 2023E
Growth in key parameters (%)
Profit and loss statement - yoy (%)
Interest income 35 48 21 (4) 12 15
Interest costs 29 44 29 (1) 5 15
Net interest income 43 53 11 (8) 24 16
Other income 163 11 (16) (30) 7 15
Net total income 60 43 6 (11) 22 16
Provisioning expenses 147 13 74 154 (24) (6)
Net income (post provisions) 49 49 (4) (55) 91 29
Operating expenses (15) 28 75 (5) 10 20
PAT 87 56 (5) (71) 176 33
Balance sheet - yoy (%)
Loans 52 34 4 2 11 17
Total assets 55 34 (3) 2 11 17
Borrowings 62 32 (6) 2 11 18
Total liabilities 62 32 (6) 2 11 18
Shareholders funds 83 47 17 4 11 13
Key ratios (%)
Interest yield 11.8 12.4 12.9 12.0 12.6 12.7
Interest cost 7.4 7.4 8.7 8.9 8.7 8.7
Spreads 4.4 5.0 4.2 3.2 3.9 4.0
NIMs 5.0 5.4 5.2 4.6 5.3 5.4
Cost-income ratio 13 12 19 21 19 19
Cost to assets (%) 0.8 0.7 1.1 1.1 1.1 1.1
Tax rate 29 28 19 19 19 19
Debt/ equity (X) 7.2 6.5 5.2 5.1 5.0 5.3
Credit costs(%) 1.1 0.8 1.3 3.1 2.2 1.8
Du Pont analysis
(% of average assets)
Net interest income 4.7 5.0 5.0 4.6 5.3 5.4
Other income 1.4 1.1 0.8 0.6 0.6 0.6
Total income 6.1 6.1 5.8 5.2 5.9 6.0
Credit costs 1.0 0.8 1.2 3.1 2.2 1.8
Operating expneses 0.8 0.7 1.1 1.1 1.1 1.1
PBT post extraordinaries 4.3 4.6 3.5 1.0 2.6 3.0
1-tax rate 70.6 71.9 80.7 80.7 80.7 80.7
RoA 3.0 3.3 2.8 0.8 2.1 2.5
Average assets / average equity (X) 8.8 7.8 6.8 6.1 6.0 6.2
RoE 26.6 26.0 19.0 5.0 12.8 15.1

L&T Finance Holdings Diversified Financials
KOTAK INSTITUTIONAL EQUITIES RESEARCH 63
Exhibit 28: Muted 2% yoy growth in AUM in FY2021E Loan book break-up of LTFH’s housing finance business, March fiscal year-ends, 2018-23E (Rs mn)
Source: Company, Kotak Institutional Equities estimates
Exhibit 29: Elevated credit cost to drive earnings decline in FY2021E Key financials of LTFH’s housing finance business, March fiscal year-ends, 2018-23E (Rs mn)
Source: Company, Kotak Institutional Equities estimates
Ind-AS Ind-AS Ind-AS Ind-AS Ind-AS Ind-AS
2018 2019 2020 2021E 2022E 2023E
Loan book (Rs mn)
Home loans / LAP 88,730 104,920 116,510 117,675 131,796 155,519
Real estate finance 102,370 150,270 149,330 153,810 169,191 197,953
Total 191,100 255,190 265,840 271,485 300,987 353,473
YoY growth (%)
Home loans / LAP 16 18 11 1 12 18
Real estate finance 109 47 (1) 3 10 17
Total 52 34 4 2 11 17
Ind-AS Ind-AS Ind-AS Ind-AS Ind-AS Ind-AS
2018 2019 2020 2021E 2022E 2023E
Income statement (Rs mn)
Interest income 18,670 27,620 33,500 32,240 36,066 41,558
Interest costs 10,750 15,510 20,040 19,890 20,786 23,851
Net interest income 7,920 12,110 13,460 12,350 15,280 17,707
Other income 2,370 2,630 2,200 1,540 1,648 1,895
Net total income 10,290 14,740 15,660 13,890 16,928 19,602
Provisioning expenses 1,680 1,890 3,280 8,329 6,297 5,890
Net income (post provisions) 8,610 12,850 12,380 5,561 10,630 13,712
Operating expenses 1,340 1,710 3,000 2,850 3,135 3,762
PBT before extraordinaties 7,270 11,140 9,380 2,711 7,495 9,950
PBT post extraordinaries 7,269 11,140 9,380 2,711 7,495 9,951
Tax 2,140 3,130 1,810 523 1,446 1,920
PAT 5,130 8,010 7,570 2,188 6,049 8,029
Balance sheet (Rs mn)
Assets
Loans 191,090 255,190 265,840 271,485 300,987 353,473
Total assets 205,473 274,398 265,840 271,485 300,987 353,473
Liabilities
Borrowings 180,523 237,728 222,820 226,661 251,175 297,135
Total liabilities 180,523 237,728 222,820 226,661 251,175 297,135
Shareholders funds 24,950 36,670 43,020 44,824 49,812 56,338
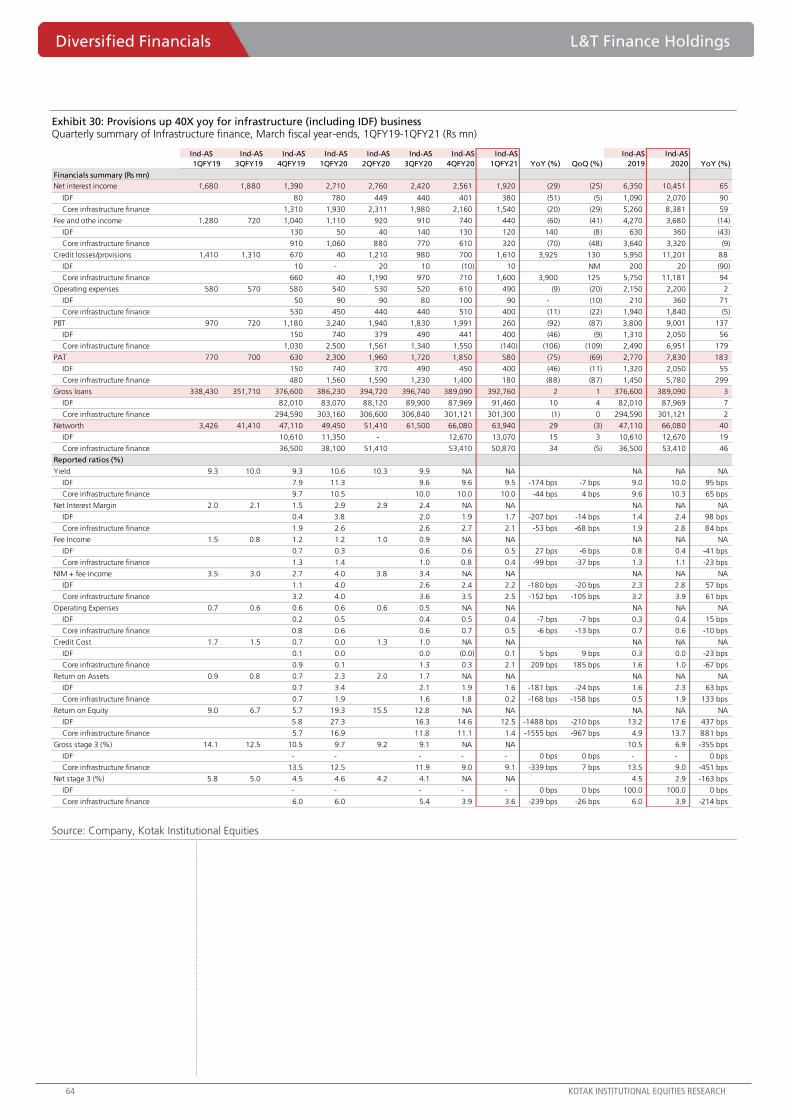
Diversified Financials L&T Finance Holdings
64 KOTAK INSTITUTIONAL EQUITIES RESEARCH
Exhibit 30: Provisions up 40X yoy for infrastructure (including IDF) business Quarterly summary of Infrastructure finance, March fiscal year-ends, 1QFY19-1QFY21 (Rs mn)
Source: Company, Kotak Institutional Equities
Ind-AS Ind-AS Ind-AS Ind-AS Ind-AS Ind-AS Ind-AS Ind-AS Ind-AS Ind-AS
1QFY19 3QFY19 4QFY19 1QFY20 2QFY20 3QFY20 4QFY20 1QFY21 YoY (%) QoQ (%) 2019 2020 YoY (%)
Financials summary (Rs mn)
Net interest income 1,680 1,880 1,390 2,710 2,760 2,420 2,561 1,920 (29) (25) 6,350 10,451 65
IDF 80 780 449 440 401 380 (51) (5) 1,090 2,070 90
Core infrastructure finance 1,310 1,930 2,311 1,980 2,160 1,540 (20) (29) 5,260 8,381 59
Fee and othe income 1,280 720 1,040 1,110 920 910 740 440 (60) (41) 4,270 3,680 (14)
IDF 130 50 40 140 130 120 140 (8) 630 360 (43)
Core infrastructure finance 910 1,060 880 770 610 320 (70) (48) 3,640 3,320 (9)
Credit losses/provisions 1,410 1,310 670 40 1,210 980 700 1,610 3,925 130 5,950 11,201 88
IDF 10 - 20 10 (10) 10 NM 200 20 (90)
Core infrastructure finance 660 40 1,190 970 710 1,600 3,900 125 5,750 11,181 94
Operating expenses 580 570 580 540 530 520 610 490 (9) (20) 2,150 2,200 2
IDF 50 90 90 80 100 90 - (10) 210 360 71
Core infrastructure finance 530 450 440 440 510 400 (11) (22) 1,940 1,840 (5)
PBT 970 720 1,180 3,240 1,940 1,830 1,991 260 (92) (87) 3,800 9,001 137
IDF 150 740 379 490 441 400 (46) (9) 1,310 2,050 56
Core infrastructure finance 1,030 2,500 1,561 1,340 1,550 (140) (106) (109) 2,490 6,951 179
PAT 770 700 630 2,300 1,960 1,720 1,850 580 (75) (69) 2,770 7,830 183
IDF 150 740 370 490 450 400 (46) (11) 1,320 2,050 55
Core infrastructure finance 480 1,560 1,590 1,230 1,400 180 (88) (87) 1,450 5,780 299
Gross loans 338,430 351,710 376,600 386,230 394,720 396,740 389,090 392,760 2 1 376,600 389,090 3
IDF 82,010 83,070 88,120 89,900 87,969 91,460 10 4 82,010 87,969 7
Core infrastructure finance 294,590 303,160 306,600 306,840 301,121 301,300 (1) 0 294,590 301,121 2
Networth 3,426 41,410 47,110 49,450 51,410 61,500 66,080 63,940 29 (3) 47,110 66,080 40
IDF 10,610 11,350 - 12,670 13,070 15 3 10,610 12,670 19
Core infrastructure finance 36,500 38,100 51,410 53,410 50,870 34 (5) 36,500 53,410 46
Reported ratios (%)
Yield 9.3 10.0 9.3 10.6 10.3 9.9 NA NA NA NA NA
IDF 7.9 11.3 9.6 9.6 9.5 -174 bps -7 bps 9.0 10.0 95 bps
Core infrastructure finance 9.7 10.5 10.0 10.0 10.0 -44 bps 4 bps 9.6 10.3 65 bps
Net Interest Margin 2.0 2.1 1.5 2.9 2.9 2.4 NA NA NA NA NA
IDF 0.4 3.8 2.0 1.9 1.7 -207 bps -14 bps 1.4 2.4 98 bps
Core infrastructure finance 1.9 2.6 2.6 2.7 2.1 -53 bps -68 bps 1.9 2.8 84 bps
Fee Income 1.5 0.8 1.2 1.2 1.0 0.9 NA NA NA NA NA
IDF 0.7 0.3 0.6 0.6 0.5 27 bps -6 bps 0.8 0.4 -41 bps
Core infrastructure finance 1.3 1.4 1.0 0.8 0.4 -99 bps -37 bps 1.3 1.1 -23 bps
NIM + fee income 3.5 3.0 2.7 4.0 3.8 3.4 NA NA NA NA NA
IDF 1.1 4.0 2.6 2.4 2.2 -180 bps -20 bps 2.3 2.8 57 bps
Core infrastructure finance 3.2 4.0 3.6 3.5 2.5 -152 bps -105 bps 3.2 3.9 61 bps
Operating Expenses 0.7 0.6 0.6 0.6 0.6 0.5 NA NA NA NA NA
IDF 0.2 0.5 0.4 0.5 0.4 -7 bps -7 bps 0.3 0.4 15 bps
Core infrastructure finance 0.8 0.6 0.6 0.7 0.5 -6 bps -13 bps 0.7 0.6 -10 bps
Credit Cost 1.7 1.5 0.7 0.0 1.3 1.0 NA NA NA NA NA
IDF 0.1 0.0 0.0 (0.0) 0.1 5 bps 9 bps 0.3 0.0 -23 bps
Core infrastructure finance 0.9 0.1 1.3 0.3 2.1 209 bps 185 bps 1.6 1.0 -67 bps
Return on Assets 0.9 0.8 0.7 2.3 2.0 1.7 NA NA NA NA NA
IDF 0.7 3.4 2.1 1.9 1.6 -181 bps -24 bps 1.6 2.3 63 bps
Core infrastructure finance 0.7 1.9 1.6 1.8 0.2 -168 bps -158 bps 0.5 1.9 133 bps
Return on Equity 9.0 6.7 5.7 19.3 15.5 12.8 NA NA NA NA NA
IDF 5.8 27.3 16.3 14.6 12.5 -1488 bps -210 bps 13.2 17.6 437 bps
Core infrastructure finance 5.7 16.9 11.8 11.1 1.4 -1555 bps -967 bps 4.9 13.7 881 bps
Gross stage 3 (%) 14.1 12.5 10.5 9.7 9.2 9.1 NA NA 10.5 6.9 -355 bps
IDF - - - - - 0 bps 0 bps - - 0 bps
Core infrastructure finance 13.5 12.5 11.9 9.0 9.1 -339 bps 7 bps 13.5 9.0 -451 bps
Net stage 3 (%) 5.8 5.0 4.5 4.6 4.2 4.1 NA NA 4.5 2.9 -163 bps
IDF - - - - - 0 bps 0 bps 100.0 100.0 0 bps
Core infrastructure finance 6.0 6.0 5.4 3.9 3.6 -239 bps -26 bps 6.0 3.9 -214 bps
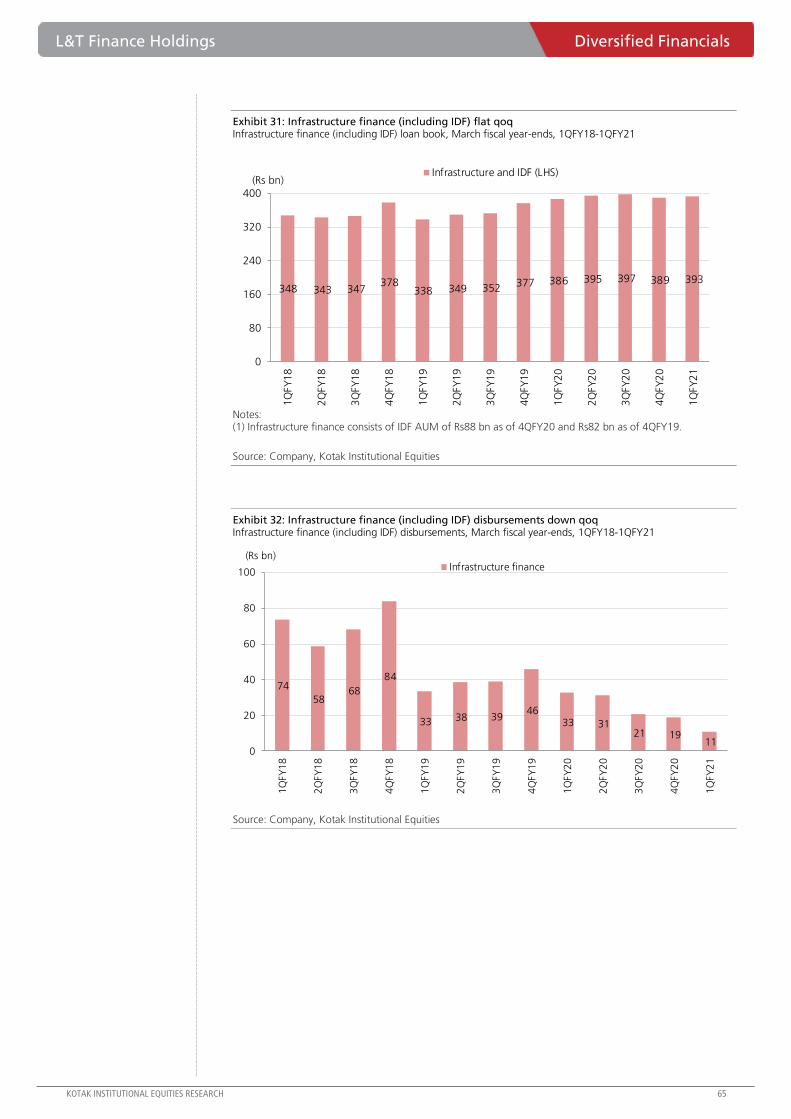
L&T Finance Holdings Diversified Financials
KOTAK INSTITUTIONAL EQUITIES RESEARCH 65
Exhibit 31: Infrastructure finance (including IDF) flat qoq Infrastructure finance (including IDF) loan book, March fiscal year-ends, 1QFY18-1QFY21
Notes: (1) Infrastructure finance consists of IDF AUM of Rs88 bn as of 4QFY20 and Rs82 bn as of 4QFY19.
Source: Company, Kotak Institutional Equities
Exhibit 32: Infrastructure finance (including IDF) disbursements down qoq Infrastructure finance (including IDF) disbursements, March fiscal year-ends, 1QFY18-1QFY21
Source: Company, Kotak Institutional Equities
348 343 347 378
338 349 352 377 386 395 397 389 393
0
80
160
240
320
400
1Q
FY
18
2Q
FY
18
3Q
FY
18
4Q
FY
18
1Q
FY
19
2Q
FY
19
3Q
FY
19
4Q
FY
19
1Q
FY
20
2Q
FY
20
3Q
FY
20
4Q
FY
20
1Q
FY
21
(Rs bn)Infrastructure and IDF (LHS)
74
58 68
84
33 38 39 46
33 31 21 19
11 0
20
40
60
80
100
1Q
FY
18
2Q
FY
18
3Q
FY
18
4Q
FY
18
1Q
FY
19
2Q
FY
19
3Q
FY
19
4Q
FY
19
1Q
FY
20
2Q
FY
20
3Q
FY
20
4Q
FY
20
1Q
FY
21
(Rs bn)Infrastructure finance
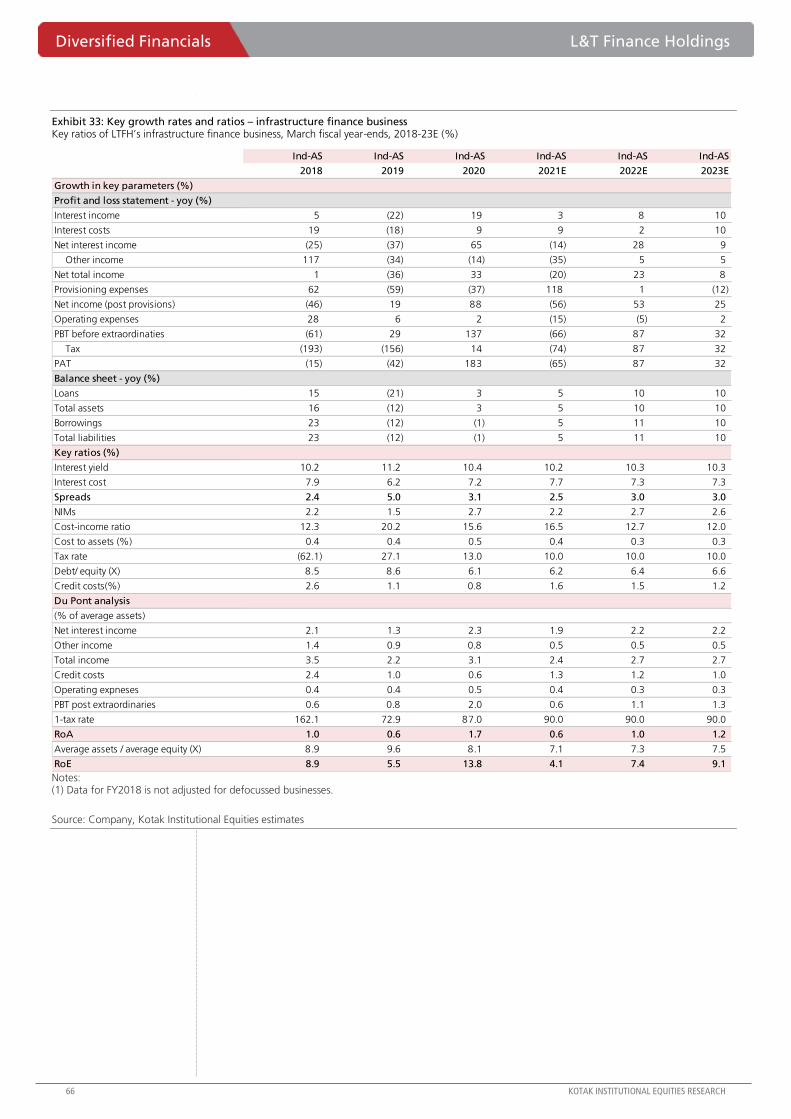
Diversified Financials L&T Finance Holdings
66 KOTAK INSTITUTIONAL EQUITIES RESEARCH
Exhibit 33: Key growth rates and ratios – infrastructure finance business Key ratios of LTFH’s infrastructure finance business, March fiscal year-ends, 2018-23E (%)
Notes: (1) Data for FY2018 is not adjusted for defocussed businesses.
Source: Company, Kotak Institutional Equities estimates
Ind-AS Ind-AS Ind-AS Ind-AS Ind-AS Ind-AS
2018 2019 2020 2021E 2022E 2023E
Growth in key parameters (%)
Profit and loss statement - yoy (%)
Interest income 5 (22) 19 3 8 10
Interest costs 19 (18) 9 9 2 10
Net interest income (25) (37) 65 (14) 28 9
Other income 117 (34) (14) (35) 5 5
Net total income 1 (36) 33 (20) 23 8
Provisioning expenses 62 (59) (37) 118 1 (12)
Net income (post provisions) (46) 19 88 (56) 53 25
Operating expenses 28 6 2 (15) (5) 2
PBT before extraordinaties (61) 29 137 (66) 87 32
Tax (193) (156) 14 (74) 87 32
PAT (15) (42) 183 (65) 87 32
Balance sheet - yoy (%)
Loans 15 (21) 3 5 10 10
Total assets 16 (12) 3 5 10 10
Borrowings 23 (12) (1) 5 11 10
Total liabilities 23 (12) (1) 5 11 10
Key ratios (%)
Interest yield 10.2 11.2 10.4 10.2 10.3 10.3
Interest cost 7.9 6.2 7.2 7.7 7.3 7.3
Spreads 2.4 5.0 3.1 2.5 3.0 3.0
NIMs 2.2 1.5 2.7 2.2 2.7 2.6
Cost-income ratio 12.3 20.2 15.6 16.5 12.7 12.0
Cost to assets (%) 0.4 0.4 0.5 0.4 0.3 0.3
Tax rate (62.1) 27.1 13.0 10.0 10.0 10.0
Debt/ equity (X) 8.5 8.6 6.1 6.2 6.4 6.6
Credit costs(%) 2.6 1.1 0.8 1.6 1.5 1.2
Du Pont analysis
(% of average assets)
Net interest income 2.1 1.3 2.3 1.9 2.2 2.2
Other income 1.4 0.9 0.8 0.5 0.5 0.5
Total income 3.5 2.2 3.1 2.4 2.7 2.7
Credit costs 2.4 1.0 0.6 1.3 1.2 1.0
Operating expneses 0.4 0.4 0.5 0.4 0.3 0.3
PBT post extraordinaries 0.6 0.8 2.0 0.6 1.1 1.3
1-tax rate 162.1 72.9 87.0 90.0 90.0 90.0
RoA 1.0 0.6 1.7 0.6 1.0 1.2
Average assets / average equity (X) 8.9 9.6 8.1 7.1 7.3 7.5
RoE 8.9 5.5 13.8 4.1 7.4 9.1
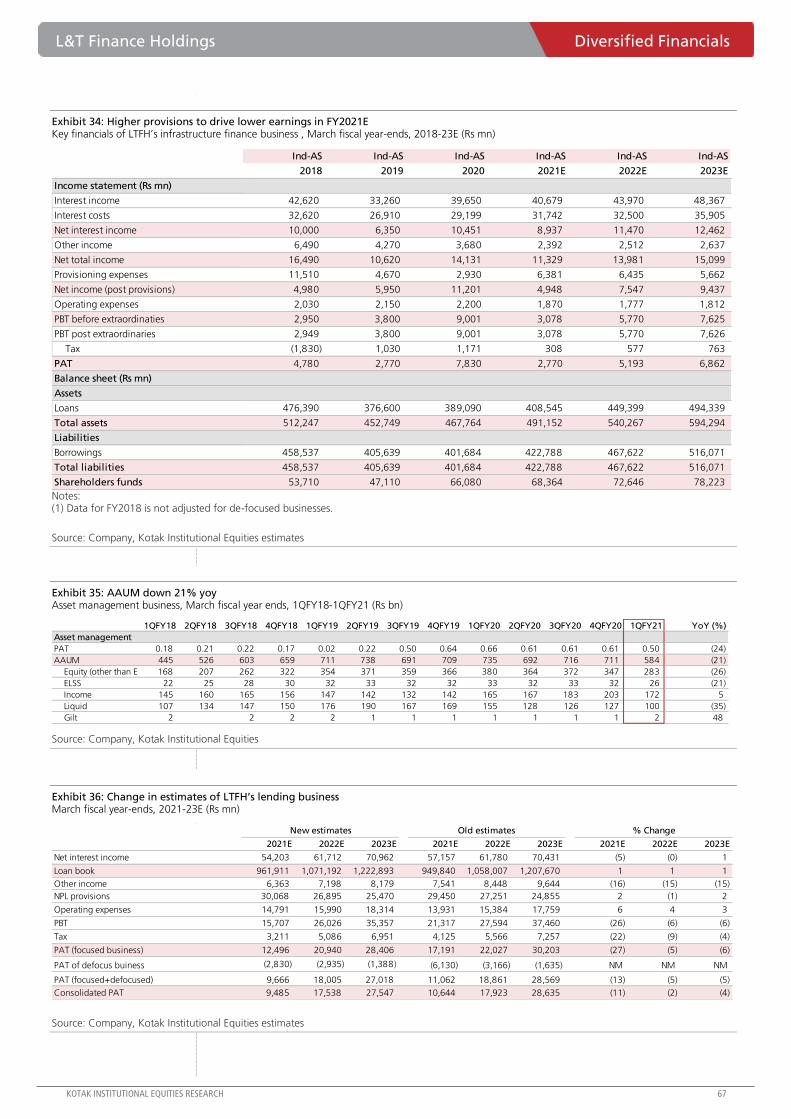
L&T Finance Holdings Diversified Financials
KOTAK INSTITUTIONAL EQUITIES RESEARCH 67
Exhibit 34: Higher provisions to drive lower earnings in FY2021E Key financials of LTFH’s infrastructure finance business , March fiscal year-ends, 2018-23E (Rs mn)
Notes: (1) Data for FY2018 is not adjusted for de-focused businesses.
Source: Company, Kotak Institutional Equities estimates
Exhibit 35: AAUM down 21% yoy Asset management business, March fiscal year ends, 1QFY18-1QFY21 (Rs bn)
Source: Company, Kotak Institutional Equities
Exhibit 36: Change in estimates of LTFH’s lending business March fiscal year-ends, 2021-23E (Rs mn)
Source: Company, Kotak Institutional Equities estimates
Ind-AS Ind-AS Ind-AS Ind-AS Ind-AS Ind-AS
2018 2019 2020 2021E 2022E 2023E
Income statement (Rs mn)
Interest income 42,620 33,260 39,650 40,679 43,970 48,367
Interest costs 32,620 26,910 29,199 31,742 32,500 35,905
Net interest income 10,000 6,350 10,451 8,937 11,470 12,462
Other income 6,490 4,270 3,680 2,392 2,512 2,637
Net total income 16,490 10,620 14,131 11,329 13,981 15,099
Provisioning expenses 11,510 4,670 2,930 6,381 6,435 5,662
Net income (post provisions) 4,980 5,950 11,201 4,948 7,547 9,437
Operating expenses 2,030 2,150 2,200 1,870 1,777 1,812
PBT before extraordinaties 2,950 3,800 9,001 3,078 5,770 7,625
PBT post extraordinaries 2,949 3,800 9,001 3,078 5,770 7,626
Tax (1,830) 1,030 1,171 308 577 763
PAT 4,780 2,770 7,830 2,770 5,193 6,862
Balance sheet (Rs mn)
Assets
Loans 476,390 376,600 389,090 408,545 449,399 494,339
Total assets 512,247 452,749 467,764 491,152 540,267 594,294
Liabilities
Borrowings 458,537 405,639 401,684 422,788 467,622 516,071
Total liabilities 458,537 405,639 401,684 422,788 467,622 516,071
Shareholders funds 53,710 47,110 66,080 68,364 72,646 78,223
1QFY18 2QFY18 3QFY18 4QFY18 1QFY19 2QFY19 3QFY19 4QFY19 1QFY20 2QFY20 3QFY20 4QFY20 1QFY21 YoY (%)
Asset management
PAT 0.18 0.21 0.22 0.17 0.02 0.22 0.50 0.64 0.66 0.61 0.61 0.61 0.50 (24)
AAUM 445 526 603 659 711 738 691 709 735 692 716 711 584 (21)
Equity (other than ELSS) 168 207 262 322 354 371 359 366 380 364 372 347 283 (26)
ELSS 22 25 28 30 32 33 32 32 33 32 33 32 26 (21)
Income 145 160 165 156 147 142 132 142 165 167 183 203 172 5
Liquid 107 134 147 150 176 190 167 169 155 128 126 127 100 (35)
Gilt 2 2 2 2 1 1 1 1 1 1 1 2 48
New estimates Old estimates % Change
2021E 2022E 2023E 2021E 2022E 2023E 2021E 2022E 2023E
Net interest income 54,203 61,712 70,962 57,157 61,780 70,431 (5) (0) 1
Loan book 961,911 1,071,192 1,222,893 949,840 1,058,007 1,207,670 1 1 1
Other income 6,363 7,198 8,179 7,541 8,448 9,644 (16) (15) (15)
NPL provisions 30,068 26,895 25,470 29,450 27,251 24,855 2 (1) 2
Operating expenses 14,791 15,990 18,314 13,931 15,384 17,759 6 4 3
PBT 15,707 26,026 35,357 21,317 27,594 37,460 (26) (6) (6)
Tax 3,211 5,086 6,951 4,125 5,566 7,257 (22) (9) (4)
PAT (focused business) 12,496 20,940 28,406 17,191 22,027 30,203 (27) (5) (6)
PAT of defocus buiness (2,830) (2,935) (1,388) (6,130) (3,166) (1,635) NM NM NM
PAT (focused+defocused) 9,666 18,005 27,018 11,062 18,861 28,569 (13) (5) (5)
Consolidated PAT 9,485 17,538 27,547 10,644 17,923 28,635 (11) (2) (4)
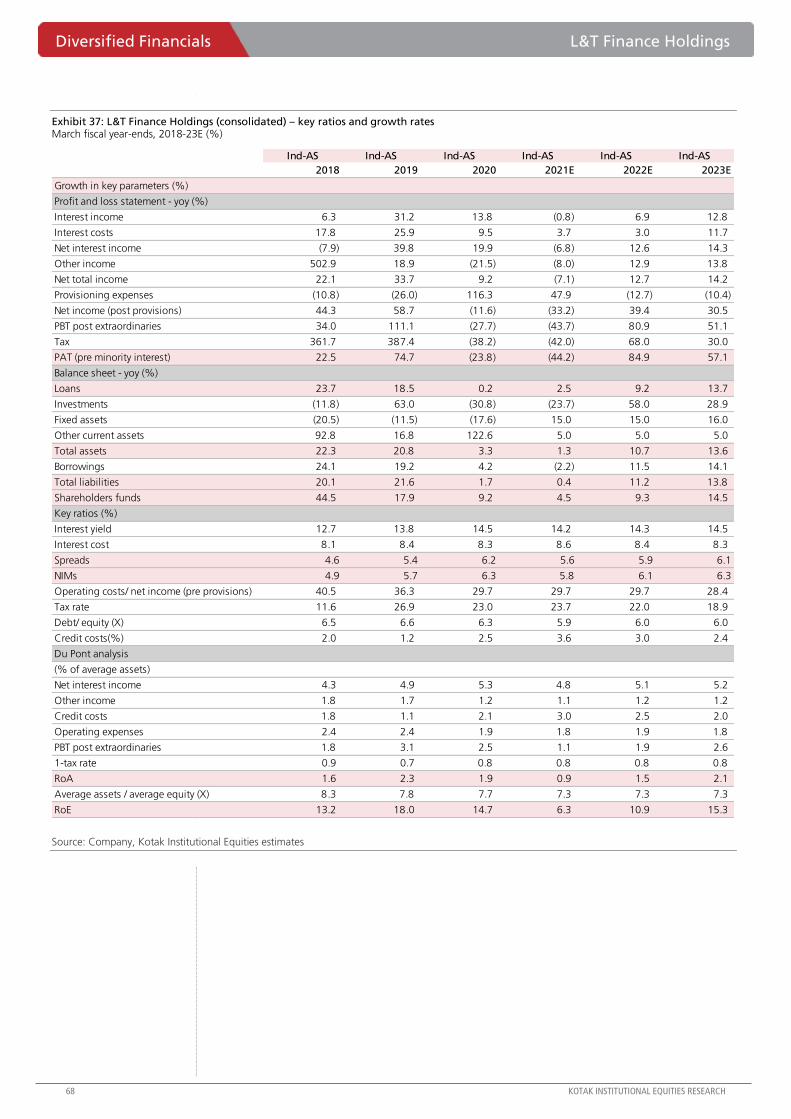
Diversified Financials L&T Finance Holdings
68 KOTAK INSTITUTIONAL EQUITIES RESEARCH
Exhibit 37: L&T Finance Holdings (consolidated) – key ratios and growth rates March fiscal year-ends, 2018-23E (%)
Source: Company, Kotak Institutional Equities estimates
Ind-AS Ind-AS Ind-AS Ind-AS Ind-AS Ind-AS
2018 2019 2020 2021E 2022E 2023E
Growth in key parameters (%)
Profit and loss statement - yoy (%)
Interest income 6.3 31.2 13.8 (0.8) 6.9 12.8
Interest costs 17.8 25.9 9.5 3.7 3.0 11.7
Net interest income (7.9) 39.8 19.9 (6.8) 12.6 14.3
Other income 502.9 18.9 (21.5) (8.0) 12.9 13.8
Net total income 22.1 33.7 9.2 (7.1) 12.7 14.2
Provisioning expenses (10.8) (26.0) 116.3 47.9 (12.7) (10.4)
Net income (post provisions) 44.3 58.7 (11.6) (33.2) 39.4 30.5
PBT post extraordinaries 34.0 111.1 (27.7) (43.7) 80.9 51.1
Tax 361.7 387.4 (38.2) (42.0) 68.0 30.0
PAT (pre minority interest) 22.5 74.7 (23.8) (44.2) 84.9 57.1
Balance sheet - yoy (%)
Loans 23.7 18.5 0.2 2.5 9.2 13.7
Investments (11.8) 63.0 (30.8) (23.7) 58.0 28.9
Fixed assets (20.5) (11.5) (17.6) 15.0 15.0 16.0
Other current assets 92.8 16.8 122.6 5.0 5.0 5.0
Total assets 22.3 20.8 3.3 1.3 10.7 13.6
Borrowings 24.1 19.2 4.2 (2.2) 11.5 14.1
Total liabilities 20.1 21.6 1.7 0.4 11.2 13.8
Shareholders funds 44.5 17.9 9.2 4.5 9.3 14.5
Key ratios (%)
Interest yield 12.7 13.8 14.5 14.2 14.3 14.5
Interest cost 8.1 8.4 8.3 8.6 8.4 8.3
Spreads 4.6 5.4 6.2 5.6 5.9 6.1
NIMs 4.9 5.7 6.3 5.8 6.1 6.3
Operating costs/ net income (pre provisions) 40.5 36.3 29.7 29.7 29.7 28.4
Tax rate 11.6 26.9 23.0 23.7 22.0 18.9
Debt/ equity (X) 6.5 6.6 6.3 5.9 6.0 6.0
Credit costs(%) 2.0 1.2 2.5 3.6 3.0 2.4
Du Pont analysis
(% of average assets)
Net interest income 4.3 4.9 5.3 4.8 5.1 5.2
Other income 1.8 1.7 1.2 1.1 1.2 1.2
Credit costs 1.8 1.1 2.1 3.0 2.5 2.0
Operating expenses 2.4 2.4 1.9 1.8 1.9 1.8
PBT post extraordinaries 1.8 3.1 2.5 1.1 1.9 2.6
1-tax rate 0.9 0.7 0.8 0.8 0.8 0.8
RoA 1.6 2.3 1.9 0.9 1.5 2.1
Average assets / average equity (X) 8.3 7.8 7.7 7.3 7.3 7.3
RoE 13.2 18.0 14.7 6.3 10.9 15.3
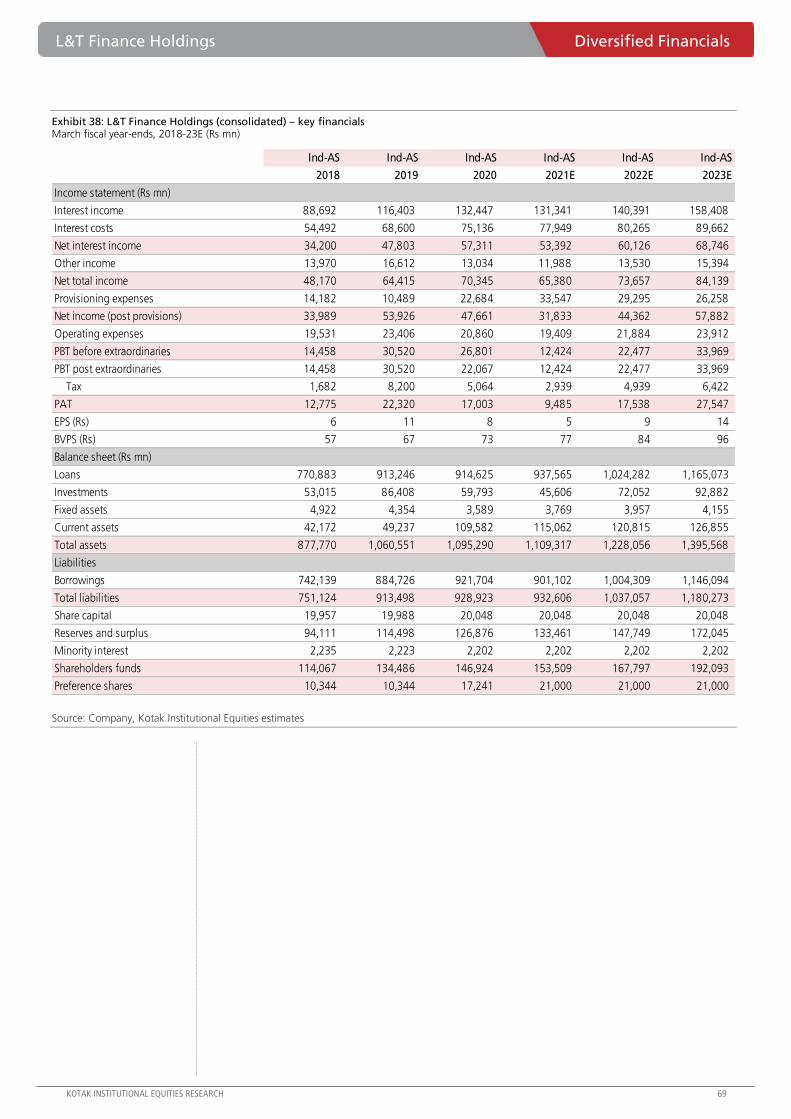
L&T Finance Holdings Diversified Financials
KOTAK INSTITUTIONAL EQUITIES RESEARCH 69
Exhibit 38: L&T Finance Holdings (consolidated) – key financials March fiscal year-ends, 2018-23E (Rs mn)
Source: Company, Kotak Institutional Equities estimates
Ind-AS Ind-AS Ind-AS Ind-AS Ind-AS Ind-AS
2018 2019 2020 2021E 2022E 2023E
Income statement (Rs mn)
Interest income 88,692 116,403 132,447 131,341 140,391 158,408
Interest costs 54,492 68,600 75,136 77,949 80,265 89,662
Net interest income 34,200 47,803 57,311 53,392 60,126 68,746
Other income 13,970 16,612 13,034 11,988 13,530 15,394
Net total income 48,170 64,415 70,345 65,380 73,657 84,139
Provisioning expenses 14,182 10,489 22,684 33,547 29,295 26,258
Net income (post provisions) 33,989 53,926 47,661 31,833 44,362 57,882
Operating expenses 19,531 23,406 20,860 19,409 21,884 23,912
PBT before extraordinaries 14,458 30,520 26,801 12,424 22,477 33,969
PBT post extraordinaries 14,458 30,520 22,067 12,424 22,477 33,969
Tax 1,682 8,200 5,064 2,939 4,939 6,422
PAT 12,775 22,320 17,003 9,485 17,538 27,547
EPS (Rs) 6 11 8 5 9 14
BVPS (Rs) 57 67 73 77 84 96
Balance sheet (Rs mn)
Loans 770,883 913,246 914,625 937,565 1,024,282 1,165,073
Investments 53,015 86,408 59,793 45,606 72,052 92,882
Fixed assets 4,922 4,354 3,589 3,769 3,957 4,155
Current assets 42,172 49,237 109,582 115,062 120,815 126,855
Total assets 877,770 1,060,551 1,095,290 1,109,317 1,228,056 1,395,568
Liabilities
Borrowings 742,139 884,726 921,704 901,102 1,004,309 1,146,094
Total liabilities 751,124 913,498 928,923 932,606 1,037,057 1,180,273
Share capital 19,957 19,988 20,048 20,048 20,048 20,048
Reserves and surplus 94,111 114,498 126,876 133,461 147,749 172,045
Minority interest 2,235 2,223 2,202 2,202 2,202 2,202
Shareholders funds 114,067 134,486 146,924 153,509 167,797 192,093
Preference shares 10,344 10,344 17,241 21,000 21,000 21,000
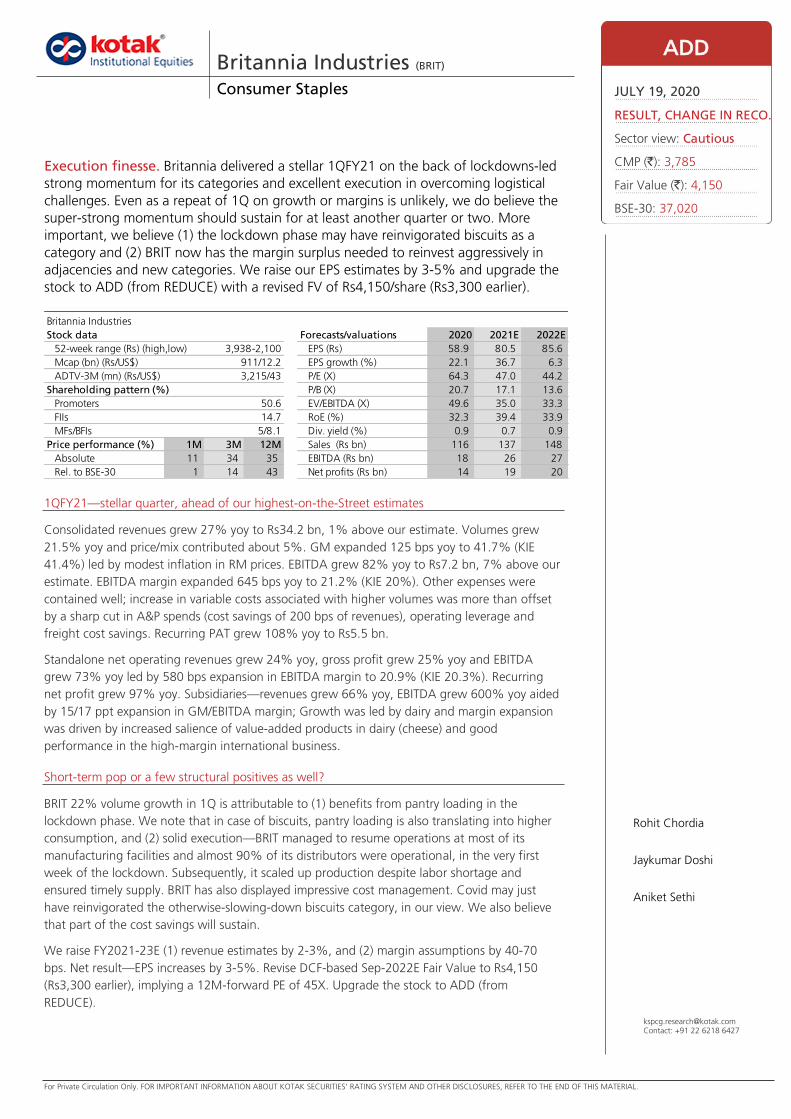
For Private Circulation Only. FOR IMPORTANT INFORMATION ABOUT KOTAK SECURITIES’ RATING SYSTEM AND OTHER DISCLOSURES, REFER TO THE END OF THIS MATERIAL.
1QFY21—stellar quarter, ahead of our highest-on-the-Street estimates
Consolidated revenues grew 27% yoy to Rs34.2 bn, 1% above our estimate. Volumes grew
21.5% yoy and price/mix contributed about 5%. GM expanded 125 bps yoy to 41.7% (KIE
41.4%) led by modest inflation in RM prices. EBITDA grew 82% yoy to Rs7.2 bn, 7% above our
estimate. EBITDA margin expanded 645 bps yoy to 21.2% (KIE 20%). Other expenses were
contained well; increase in variable costs associated with higher volumes was more than offset
by a sharp cut in A&P spends (cost savings of 200 bps of revenues), operating leverage and
freight cost savings. Recurring PAT grew 108% yoy to Rs5.5 bn.
Standalone net operating revenues grew 24% yoy, gross profit grew 25% yoy and EBITDA
grew 73% yoy led by 580 bps expansion in EBITDA margin to 20.9% (KIE 20.3%). Recurring
net profit grew 97% yoy. Subsidiaries—revenues grew 66% yoy, EBITDA grew 600% yoy aided
by 15/17 ppt expansion in GM/EBITDA margin; Growth was led by dairy and margin expansion
was driven by increased salience of value-added products in dairy (cheese) and good
performance in the high-margin international business.
Short-term pop or a few structural positives as well?
BRIT 22% volume growth in 1Q is attributable to (1) benefits from pantry loading in the
lockdown phase. We note that in case of biscuits, pantry loading is also translating into higher
consumption, and (2) solid execution—BRIT managed to resume operations at most of its
manufacturing facilities and almost 90% of its distributors were operational, in the very first
week of the lockdown. Subsequently, it scaled up production despite labor shortage and
ensured timely supply. BRIT has also displayed impressive cost management. Covid may just
have reinvigorated the otherwise-slowing-down biscuits category, in our view. We also believe
that part of the cost savings will sustain.
We raise FY2021-23E (1) revenue estimates by 2-3%, and (2) margin assumptions by 40-70
bps. Net result—EPS increases by 3-5%. Revise DCF-based Sep-2022E Fair Value to Rs4,150
(Rs3,300 earlier), implying a 12M-forward PE of 45X. Upgrade the stock to ADD (from
REDUCE).
Britannia Industries (BRIT) Consumer Staples
Execution finesse. Britannia delivered a stellar 1QFY21 on the back of lockdowns-led
strong momentum for its categories and excellent execution in overcoming logistical
challenges. Even as a repeat of 1Q on growth or margins is unlikely, we do believe the
super-strong momentum should sustain for at least another quarter or two. More
important, we believe (1) the lockdown phase may have reinvigorated biscuits as a
category and (2) BRIT now has the margin surplus needed to reinvest aggressively in
adjacencies and new categories. We raise our EPS estimates by 3-5% and upgrade the
stock to ADD (from REDUCE) with a revised FV of Rs4,150/share (Rs3,300 earlier).
ADD
JULY 19, 2020
RESULT, CHANGE IN RECO.
Sector view: Cautious
CMP (`): 3,785
Fair Value (`): 4,150
BSE-30: 37,020
Rohit Chordia
Jaykumar Doshi
Aniket Sethi
Britannia Industries
Stock data Forecasts/valuations 2020 2021E 2022E
52-week range (Rs) (high,low) EPS (Rs) 58.9 80.5 85.6
Mcap (bn) (Rs/US$) EPS growth (%) 22.1 36.7 6.3
ADTV-3M (mn) (Rs/US$) P/E (X) 64.3 47.0 44.2
Shareholding pattern (%) P/B (X) 20.7 17.1 13.6
Promoters 50.6 EV/EBITDA (X) 49.6 35.0 33.3
FIIs 14.7 RoE (%) 32.3 39.4 33.9
MFs/BFIs Div. yield (%) 0.9 0.7 0.9
Price performance (%) 1M 3M 12M Sales (Rs bn) 116 137 148
Absolute 11 34 35 EBITDA (Rs bn) 18 26 27
Rel. to BSE-30 1 14 43 Net profits (Rs bn) 14 19 20
3,938-2,100
911/12.2
5/8.1
3,215/43
[email protected]: +91 22 6218 6427
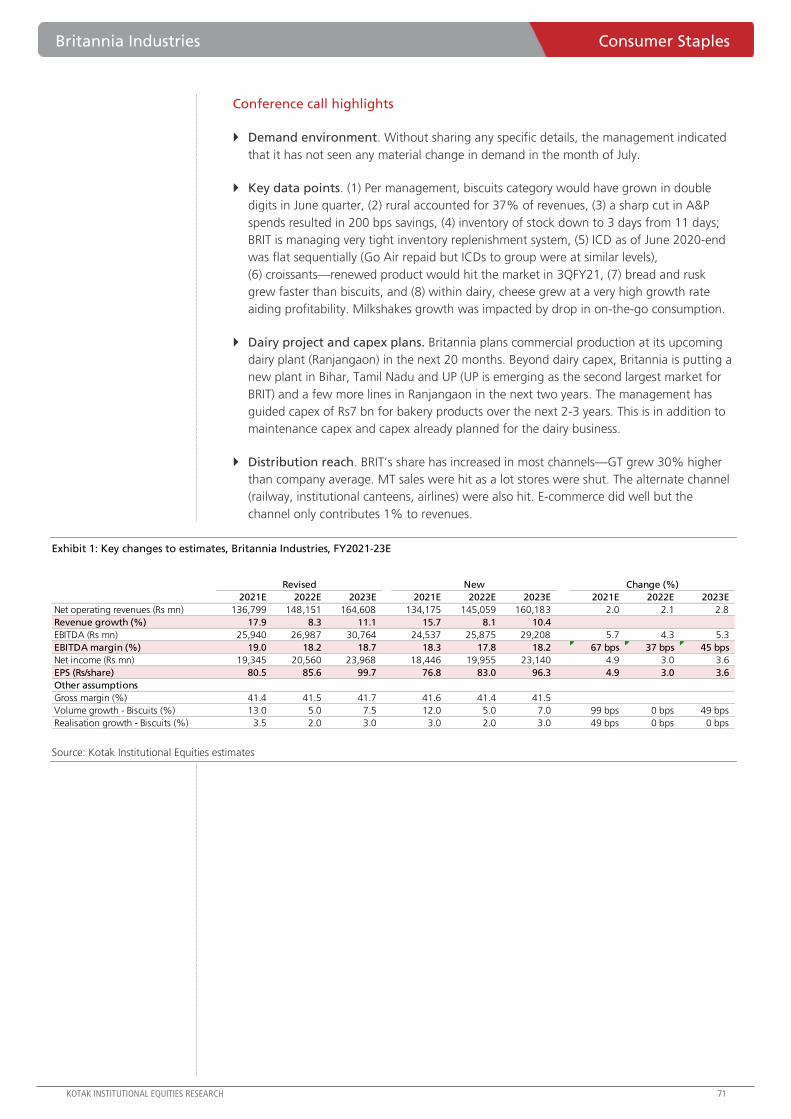
Britannia Industries Consumer Staples
KOTAK INSTITUTIONAL EQUITIES RESEARCH 71
Conference call highlights
Demand environment. Without sharing any specific details, the management indicated
that it has not seen any material change in demand in the month of July.
Key data points. (1) Per management, biscuits category would have grown in double
digits in June quarter, (2) rural accounted for 37% of revenues, (3) a sharp cut in A&P
spends resulted in 200 bps savings, (4) inventory of stock down to 3 days from 11 days;
BRIT is managing very tight inventory replenishment system, (5) ICD as of June 2020-end
was flat sequentially (Go Air repaid but ICDs to group were at similar levels),
(6) croissants—renewed product would hit the market in 3QFY21, (7) bread and rusk
grew faster than biscuits, and (8) within dairy, cheese grew at a very high growth rate
aiding profitability. Milkshakes growth was impacted by drop in on-the-go consumption.
Dairy project and capex plans. Britannia plans commercial production at its upcoming
dairy plant (Ranjangaon) in the next 20 months. Beyond dairy capex, Britannia is putting a
new plant in Bihar, Tamil Nadu and UP (UP is emerging as the second largest market for
BRIT) and a few more lines in Ranjangaon in the next two years. The management has
guided capex of Rs7 bn for bakery products over the next 2-3 years. This is in addition to
maintenance capex and capex already planned for the dairy business.
Distribution reach. BRIT’s share has increased in most channels—GT grew 30% higher
than company average. MT sales were hit as a lot stores were shut. The alternate channel
(railway, institutional canteens, airlines) were also hit. E-commerce did well but the
channel only contributes 1% to revenues.
Exhibit 1: Key changes to estimates, Britannia Industries, FY2021-23E
Source: Kotak Institutional Equities estimates
2021E 2022E 2023E 2021E 2022E 2023E 2021E 2022E 2023E
Net operating revenues (Rs mn) 136,799 148,151 164,608 134,175 145,059 160,183 2.0 2.1 2.8
Revenue growth (%) 17.9 8.3 11.1 15.7 8.1 10.4
EBITDA (Rs mn) 25,940 26,987 30,764 24,537 25,875 29,208 5.7 4.3 5.3
EBITDA margin (%) 19.0 18.2 18.7 18.3 17.8 18.2 67 bps 37 bps 45 bps
Net income (Rs mn) 19,345 20,560 23,968 18,446 19,955 23,140 4.9 3.0 3.6
EPS (Rs/share) 80.5 85.6 99.7 76.8 83.0 96.3 4.9 3.0 3.6
Other assumptions
Gross margin (%) 41.4 41.5 41.7 41.6 41.4 41.5
Volume growth - Biscuits (%) 13.0 5.0 7.5 12.0 5.0 7.0 99 bps 0 bps 49 bps
Realisation growth - Biscuits (%) 3.5 2.0 3.0 3.0 2.0 3.0 49 bps 0 bps 0 bps
Revised New Change (%)
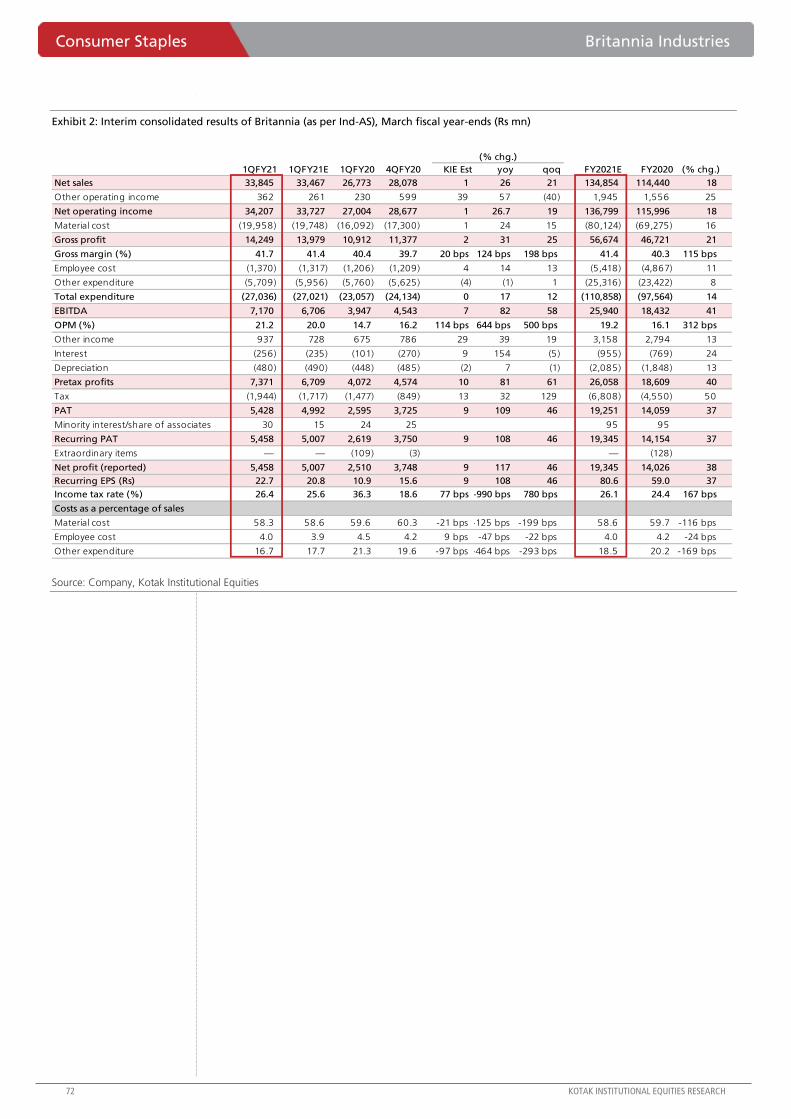
Consumer Staples Britannia Industries
72 KOTAK INSTITUTIONAL EQUITIES RESEARCH
Exhibit 2: Interim consolidated results of Britannia (as per Ind-AS), March fiscal year-ends (Rs mn)
Source: Company, Kotak Institutional Equities
1QFY21 1QFY21E 1QFY20 4QFY20 KIE Est yoy qoq FY2021E FY2020 (% chg.)
Net sales 33,845 33,467 26,773 28,078 1 26 21 134,854 114,440 18
Other operating income 362 261 230 599 39 57 (40) 1,945 1,556 25
Net operating income 34,207 33,727 27,004 28,677 1 26.7 19 136,799 115,996 18
Material cost (19,958) (19,748) (16,092) (17,300) 1 24 15 (80,124) (69,275) 16
Gross profit 14,249 13,979 10,912 11,377 2 31 25 56,674 46,721 21
Gross margin (%) 41.7 41.4 40.4 39.7 20 bps 124 bps 198 bps 41.4 40.3 115 bps
Employee cost (1,370) (1,317) (1,206) (1,209) 4 14 13 (5,418) (4,867) 11
Other expenditure (5,709) (5,956) (5,760) (5,625) (4) (1) 1 (25,316) (23,422) 8
Total expenditure (27,036) (27,021) (23,057) (24,134) 0 17 12 (110,858) (97,564) 14
EBITDA 7,170 6,706 3,947 4,543 7 82 58 25,940 18,432 41
OPM (%) 21.2 20.0 14.7 16.2 114 bps 644 bps 500 bps 19.2 16.1 312 bps
Other income 937 728 675 786 29 39 19 3,158 2,794 13
Interest (256) (235) (101) (270) 9 154 (5) (955) (769) 24
Depreciation (480) (490) (448) (485) (2) 7 (1) (2,085) (1,848) 13
Pretax profits 7,371 6,709 4,072 4,574 10 81 61 26,058 18,609 40
Tax (1,944) (1,717) (1,477) (849) 13 32 129 (6,808) (4,550) 50
PAT 5,428 4,992 2,595 3,725 9 109 46 19,251 14,059 37
Minority interest/share of associates 30 15 24 25 95 95
Recurring PAT 5,458 5,007 2,619 3,750 9 108 46 19,345 14,154 37
Extraordinary items — — (109) (3) — (128)
Net profit (reported) 5,458 5,007 2,510 3,748 9 117 46 19,345 14,026 38
Recurring EPS (Rs) 22.7 20.8 10.9 15.6 9 108 46 80.6 59.0 37
Income tax rate (%) 26.4 25.6 36.3 18.6 77 bps -990 bps 780 bps 26.1 24.4 167 bps
Costs as a percentage of sales
Material cost 58.3 58.6 59.6 60.3 -21 bps -125 bps -199 bps 58.6 59.7 -116 bps
Employee cost 4.0 3.9 4.5 4.2 9 bps -47 bps -22 bps 4.0 4.2 -24 bps
Other expenditure 16.7 17.7 21.3 19.6 -97 bps -464 bps -293 bps 18.5 20.2 -169 bps
(% chg.)
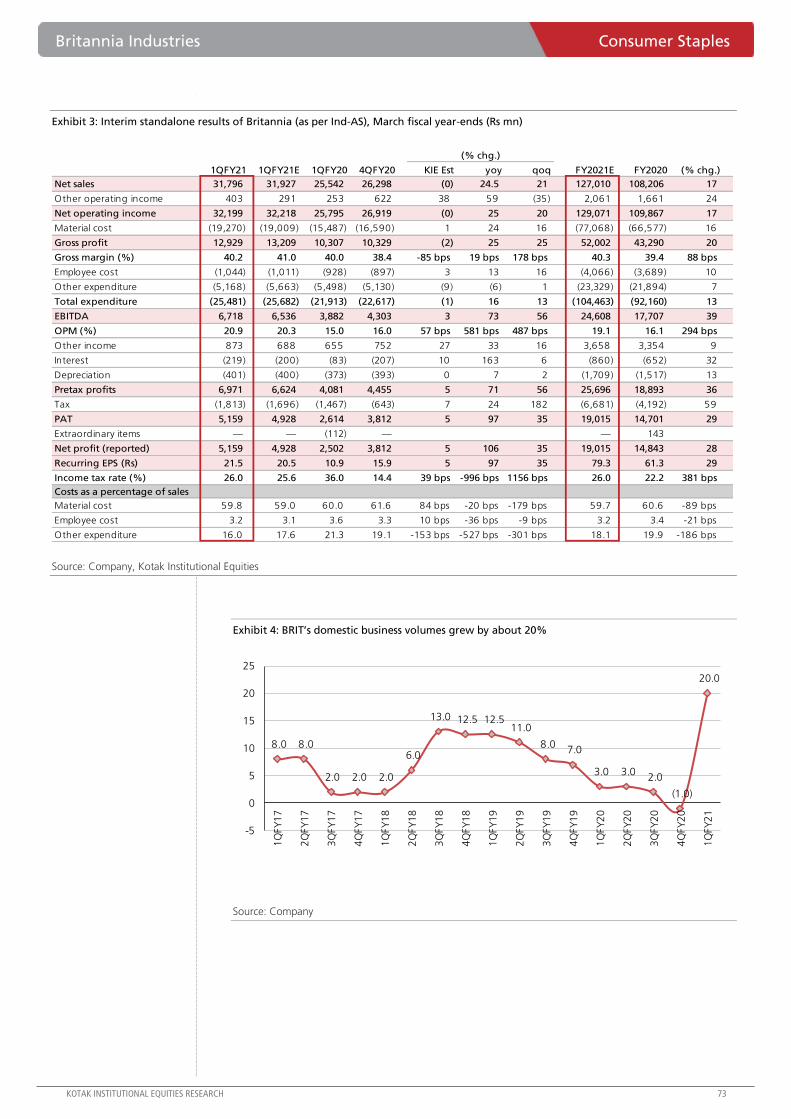
Britannia Industries Consumer Staples
KOTAK INSTITUTIONAL EQUITIES RESEARCH 73
Exhibit 3: Interim standalone results of Britannia (as per Ind-AS), March fiscal year-ends (Rs mn)
Source: Company, Kotak Institutional Equities
Exhibit 4: BRIT’s domestic business volumes grew by about 20%
Source: Company
1QFY21 1QFY21E 1QFY20 4QFY20 KIE Est yoy qoq FY2021E FY2020 (% chg.)
Net sales 31,796 31,927 25,542 26,298 (0) 24.5 21 127,010 108,206 17
Other operating income 403 291 253 622 38 59 (35) 2,061 1,661 24
Net operating income 32,199 32,218 25,795 26,919 (0) 25 20 129,071 109,867 17
Material cost (19,270) (19,009) (15,487) (16,590) 1 24 16 (77,068) (66,577) 16
Gross profit 12,929 13,209 10,307 10,329 (2) 25 25 52,002 43,290 20
Gross margin (%) 40.2 41.0 40.0 38.4 -85 bps 19 bps 178 bps 40.3 39.4 88 bps
Employee cost (1,044) (1,011) (928) (897) 3 13 16 (4,066) (3,689) 10
Other expenditure (5,168) (5,663) (5,498) (5,130) (9) (6) 1 (23,329) (21,894) 7
Total expenditure (25,481) (25,682) (21,913) (22,617) (1) 16 13 (104,463) (92,160) 13
EBITDA 6,718 6,536 3,882 4,303 3 73 56 24,608 17,707 39
OPM (%) 20.9 20.3 15.0 16.0 57 bps 581 bps 487 bps 19.1 16.1 294 bps
Other income 873 688 655 752 27 33 16 3,658 3,354 9
Interest (219) (200) (83) (207) 10 163 6 (860) (652) 32
Depreciation (401) (400) (373) (393) 0 7 2 (1,709) (1,517) 13
Pretax profits 6,971 6,624 4,081 4,455 5 71 56 25,696 18,893 36
Tax (1,813) (1,696) (1,467) (643) 7 24 182 (6,681) (4,192) 59
PAT 5,159 4,928 2,614 3,812 5 97 35 19,015 14,701 29
Extraordinary items — — (112) — — 143
Net profit (reported) 5,159 4,928 2,502 3,812 5 106 35 19,015 14,843 28
Recurring EPS (Rs) 21.5 20.5 10.9 15.9 5 97 35 79.3 61.3 29
Income tax rate (%) 26.0 25.6 36.0 14.4 39 bps -996 bps 1156 bps 26.0 22.2 381 bps
Costs as a percentage of sales
Material cost 59.8 59.0 60.0 61.6 84 bps -20 bps -179 bps 59.7 60.6 -89 bps
Employee cost 3.2 3.1 3.6 3.3 10 bps -36 bps -9 bps 3.2 3.4 -21 bps
Other expenditure 16.0 17.6 21.3 19.1 -153 bps -527 bps -301 bps 18.1 19.9 -186 bps
(% chg.)
8.0 8.0
2.0 2.0 2.0
6.0
13.0 12.5 12.5 11.0
8.0 7.0
3.0 3.0 2.0
(1.0)
20.0
-5
0
5
10
15
20
25
1Q
FY
17
2Q
FY
17
3Q
FY
17
4Q
FY
17
1Q
FY
18
2Q
FY
18
3Q
FY
18
4Q
FY
18
1Q
FY
19
2Q
FY
19
3Q
FY
19
4Q
FY
19
1Q
FY
20
2Q
FY
20
3Q
FY
20
4Q
FY
20
1Q
FY
21
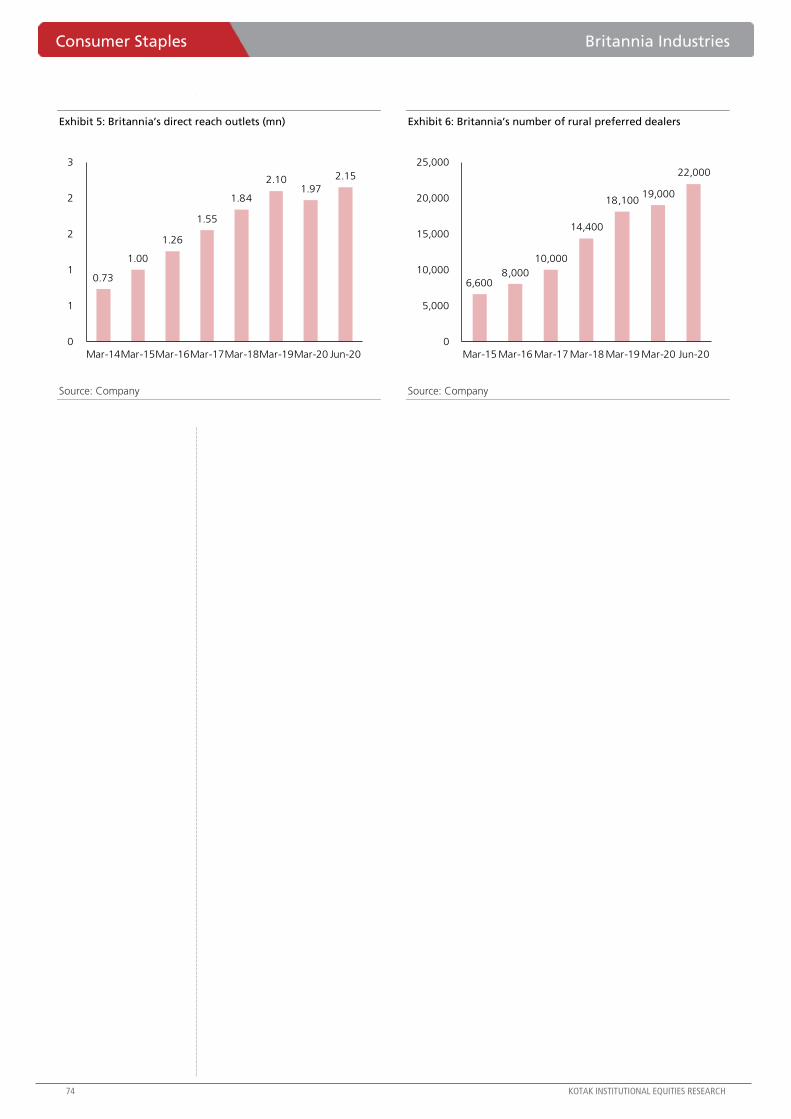
Consumer Staples Britannia Industries
74 KOTAK INSTITUTIONAL EQUITIES RESEARCH
Exhibit 5: Britannia’s direct reach outlets (mn)
Source: Company
Exhibit 6: Britannia’s number of rural preferred dealers
Source: Company
0.73
1.00
1.26
1.55
1.84
2.10 1.97
2.15
0
1
1
2
2
3
Mar-14Mar-15Mar-16Mar-17Mar-18Mar-19Mar-20 Jun-20
6,600 8,000
10,000
14,400
18,100 19,000
22,000
0
5,000
10,000
15,000
20,000
25,000
Mar-15 Mar-16 Mar-17 Mar-18 Mar-19 Mar-20 Jun-20
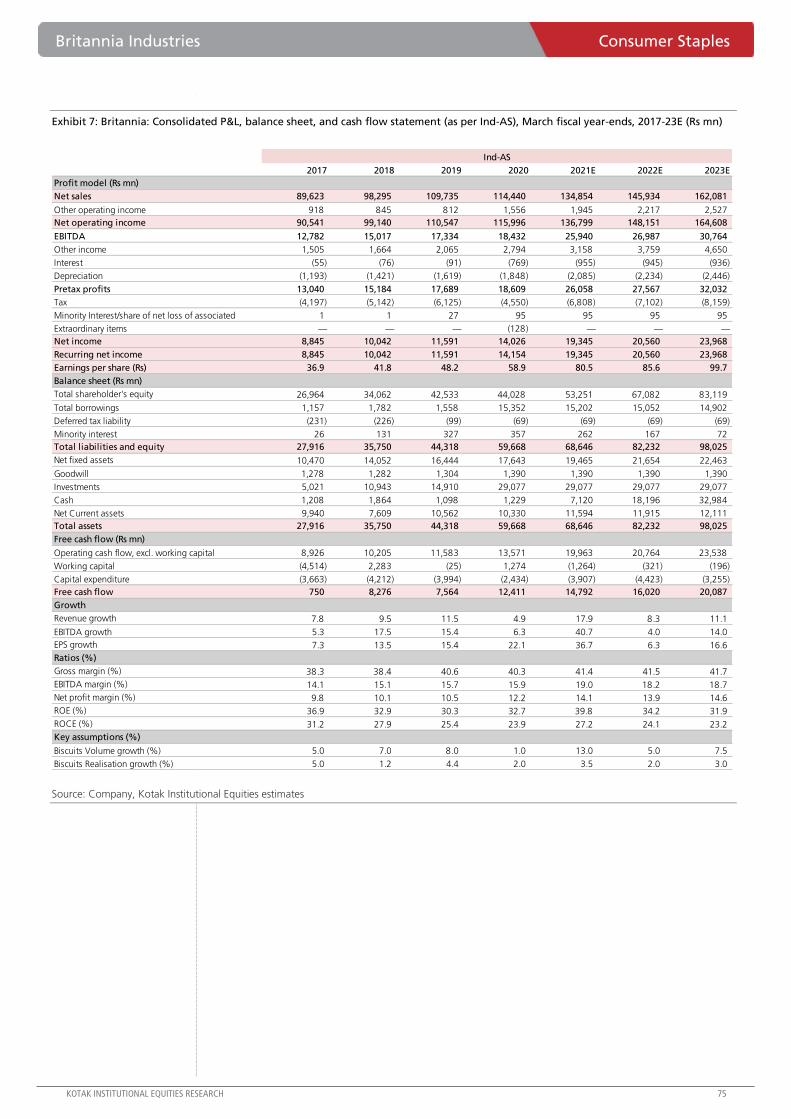
Britannia Industries Consumer Staples
KOTAK INSTITUTIONAL EQUITIES RESEARCH 75
Exhibit 7: Britannia: Consolidated P&L, balance sheet, and cash flow statement (as per Ind-AS), March fiscal year-ends, 2017-23E (Rs mn)
Source: Company, Kotak Institutional Equities estimates
2017 2018 2019 2020 2021E 2022E 2023E
Profit model (Rs mn)
Net sales 89,623 98,295 109,735 114,440 134,854 145,934 162,081
Other operating income 918 845 812 1,556 1,945 2,217 2,527
Net operating income 90,541 99,140 110,547 115,996 136,799 148,151 164,608
EBITDA 12,782 15,017 17,334 18,432 25,940 26,987 30,764
Other income 1,505 1,664 2,065 2,794 3,158 3,759 4,650
Interest (55) (76) (91) (769) (955) (945) (936)
Depreciation (1,193) (1,421) (1,619) (1,848) (2,085) (2,234) (2,446)
Pretax profits 13,040 15,184 17,689 18,609 26,058 27,567 32,032
Tax (4,197) (5,142) (6,125) (4,550) (6,808) (7,102) (8,159)
Minority Interest/share of net loss of associated 1 1 27 95 95 95 95
Extraordinary items — — — (128) — — —
Net income 8,845 10,042 11,591 14,026 19,345 20,560 23,968
Recurring net income 8,845 10,042 11,591 14,154 19,345 20,560 23,968
Earnings per share (Rs) 36.9 41.8 48.2 58.9 80.5 85.6 99.7
Balance sheet (Rs mn)
Total shareholder's equity 26,964 34,062 42,533 44,028 53,251 67,082 83,119
Total borrowings 1,157 1,782 1,558 15,352 15,202 15,052 14,902
Deferred tax liability (231) (226) (99) (69) (69) (69) (69)
Minority interest 26 131 327 357 262 167 72
Total liabilities and equity 27,916 35,750 44,318 59,668 68,646 82,232 98,025
Net fixed assets 10,470 14,052 16,444 17,643 19,465 21,654 22,463
Goodwill 1,278 1,282 1,304 1,390 1,390 1,390 1,390
Investments 5,021 10,943 14,910 29,077 29,077 29,077 29,077
Cash 1,208 1,864 1,098 1,229 7,120 18,196 32,984
Net Current assets 9,940 7,609 10,562 10,330 11,594 11,915 12,111
Total assets 27,916 35,750 44,318 59,668 68,646 82,232 98,025
Free cash flow (Rs mn)
Operating cash flow, excl. working capital 8,926 10,205 11,583 13,571 19,963 20,764 23,538
Working capital (4,514) 2,283 (25) 1,274 (1,264) (321) (196)
Capital expenditure (3,663) (4,212) (3,994) (2,434) (3,907) (4,423) (3,255)
Free cash flow 750 8,276 7,564 12,411 14,792 16,020 20,087
Growth
Revenue growth 7.8 9.5 11.5 4.9 17.9 8.3 11.1
EBITDA growth 5.3 17.5 15.4 6.3 40.7 4.0 14.0
EPS growth 7.3 13.5 15.4 22.1 36.7 6.3 16.6
Ratios (%)
Gross margin (%) 38.3 38.4 40.6 40.3 41.4 41.5 41.7
EBITDA margin (%) 14.1 15.1 15.7 15.9 19.0 18.2 18.7
Net profit margin (%) 9.8 10.1 10.5 12.2 14.1 13.9 14.6
ROE (%) 36.9 32.9 30.3 32.7 39.8 34.2 31.9
ROCE (%) 31.2 27.9 25.4 23.9 27.2 24.1 23.2
Key assumptions (%)
Biscuits Volume growth (%) 5.0 7.0 8.0 1.0 13.0 5.0 7.5
Biscuits Realisation growth (%) 5.0 1.2 4.4 2.0 3.5 2.0 3.0
Ind-AS
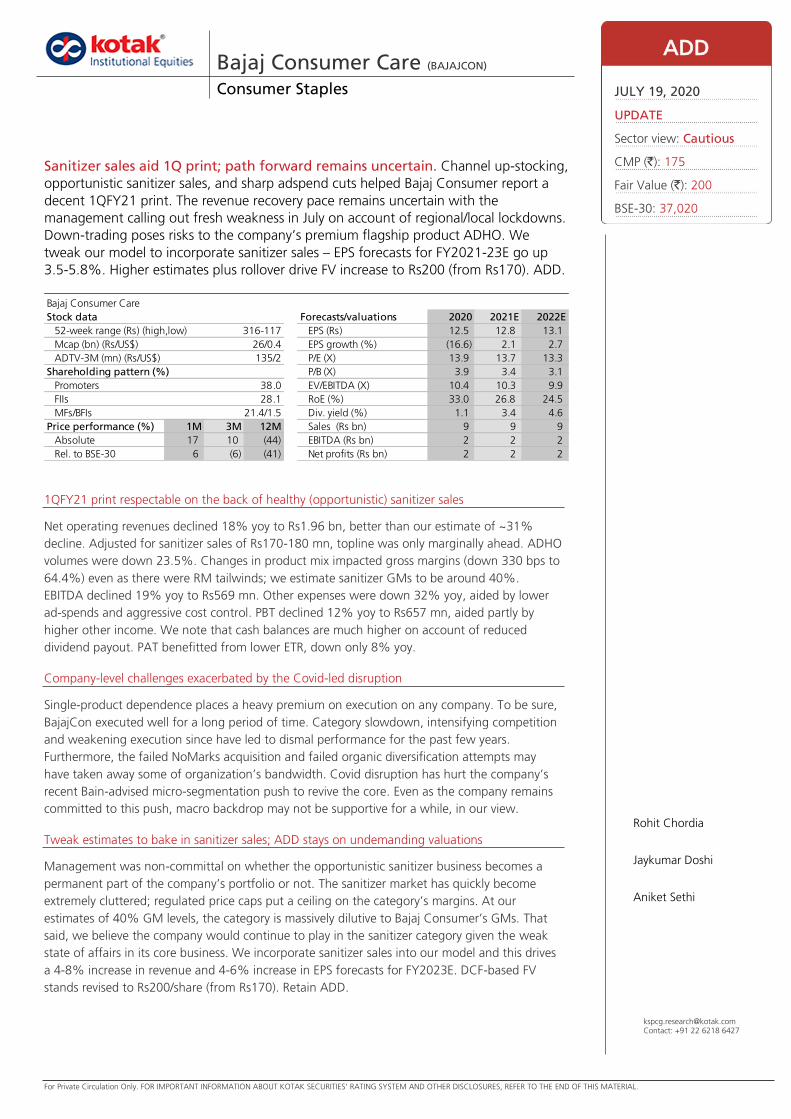
For Private Circulation Only. FOR IMPORTANT INFORMATION ABOUT KOTAK SECURITIES’ RATING SYSTEM AND OTHER DISCLOSURES, REFER TO THE END OF THIS MATERIAL.
1QFY21 print respectable on the back of healthy (opportunistic) sanitizer sales
Net operating revenues declined 18% yoy to Rs1.96 bn, better than our estimate of ~31%
decline. Adjusted for sanitizer sales of Rs170-180 mn, topline was only marginally ahead. ADHO
volumes were down 23.5%. Changes in product mix impacted gross margins (down 330 bps to
64.4%) even as there were RM tailwinds; we estimate sanitizer GMs to be around 40%.
EBITDA declined 19% yoy to Rs569 mn. Other expenses were down 32% yoy, aided by lower
ad-spends and aggressive cost control. PBT declined 12% yoy to Rs657 mn, aided partly by
higher other income. We note that cash balances are much higher on account of reduced
dividend payout. PAT benefitted from lower ETR, down only 8% yoy.
Company-level challenges exacerbated by the Covid-led disruption
Single-product dependence places a heavy premium on execution on any company. To be sure,
BajajCon executed well for a long period of time. Category slowdown, intensifying competition
and weakening execution since have led to dismal performance for the past few years.
Furthermore, the failed NoMarks acquisition and failed organic diversification attempts may
have taken away some of organization’s bandwidth. Covid disruption has hurt the company’s
recent Bain-advised micro-segmentation push to revive the core. Even as the company remains
committed to this push, macro backdrop may not be supportive for a while, in our view.
Tweak estimates to bake in sanitizer sales; ADD stays on undemanding valuations
Management was non-committal on whether the opportunistic sanitizer business becomes a
permanent part of the company’s portfolio or not. The sanitizer market has quickly become
extremely cluttered; regulated price caps put a ceiling on the category’s margins. At our
estimates of 40% GM levels, the category is massively dilutive to Bajaj Consumer’s GMs. That
said, we believe the company would continue to play in the sanitizer category given the weak
state of affairs in its core business. We incorporate sanitizer sales into our model and this drives
a 4-8% increase in revenue and 4-6% increase in EPS forecasts for FY2023E. DCF-based FV
stands revised to Rs200/share (from Rs170). Retain ADD.
Bajaj Consumer Care (BAJAJCON) Consumer Staples
Sanitizer sales aid 1Q print; path forward remains uncertain. Channel up-stocking,
opportunistic sanitizer sales, and sharp adspend cuts helped Bajaj Consumer report a
decent 1QFY21 print. The revenue recovery pace remains uncertain with the
management calling out fresh weakness in July on account of regional/local lockdowns.
Down-trading poses risks to the company’s premium flagship product ADHO. We
tweak our model to incorporate sanitizer sales – EPS forecasts for FY2021-23E go up
3.5-5.8%. Higher estimates plus rollover drive FV increase to Rs200 (from Rs170). ADD.
ADD
JULY 19, 2020
UPDATE
Sector view: Cautious
CMP (`): 175
Fair Value (`): 200
BSE-30: 37,020
Rohit Chordia
Jaykumar Doshi
Aniket Sethi
Bajaj Consumer Care
Stock data Forecasts/valuations 2020 2021E 2022E
52-week range (Rs) (high,low) EPS (Rs) 12.5 12.8 13.1
Mcap (bn) (Rs/US$) EPS growth (%) (16.6) 2.1 2.7
ADTV-3M (mn) (Rs/US$) P/E (X) 13.9 13.7 13.3
Shareholding pattern (%) P/B (X) 3.9 3.4 3.1
Promoters 38.0 EV/EBITDA (X) 10.4 10.3 9.9
FIIs 28.1 RoE (%) 33.0 26.8 24.5
MFs/BFIs Div. yield (%) 1.1 3.4 4.6
Price performance (%) 1M 3M 12M Sales (Rs bn) 9 9 9
Absolute 17 10 (44) EBITDA (Rs bn) 2 2 2
Rel. to BSE-30 6 (6) (41) Net profits (Rs bn) 2 2 2
316-117
26/0.4
21.4/1.5
135/2
[email protected]: +91 22 6218 6427

Bajaj Consumer Care Consumer Staples
KOTAK INSTITUTIONAL EQUITIES RESEARCH 77
Conference call highlights
Covid impact. With hair oil not being categorized as an essential category, Bajaj
Consumer was unable to resume operations till April 15. Their entire chain (factories,
depots) started operating from the first week of May and currently all factories and
depots are operating. On the category trends, management highlighted that the demand
for amla hair oils has increased, indicating consumer down-trading amid a subdued
environment. Demand for hair oils continues to be weak but the disruption in rural
markets is less than urban.
Capex plans. There are no major capex plans and they will take 2-3 years to move to
their new office at Worli.
Favorable RM environment. Currently, LLP prices are at Rs48/kg (1Q average of
Rs57/kg). The company may look to provide some benefits of favorable RM mix to
consumers though promotions. .
Bain update. BajajCon has completed the mirco-segmentation of the markets it is
focusing on. They are now looking to expand the geographic scope of this service soon.
Other key highlights. (1) The situation with the CSD channel is still not extremely
smooth given receivable issues and restrictions on purchases. (2) The company’s focus will
be on growing absolute EBITDA and not just the margin profile. (3) Higher packs are
seeing higher saliency as consumers prefer to avoid going out much. (4) Income tax rate
is likely to be close to ~17.5% (MAT rate). (5) As-spends are likely to be in the range of
17-18%. (6) There was some restocking benefit this quarter.
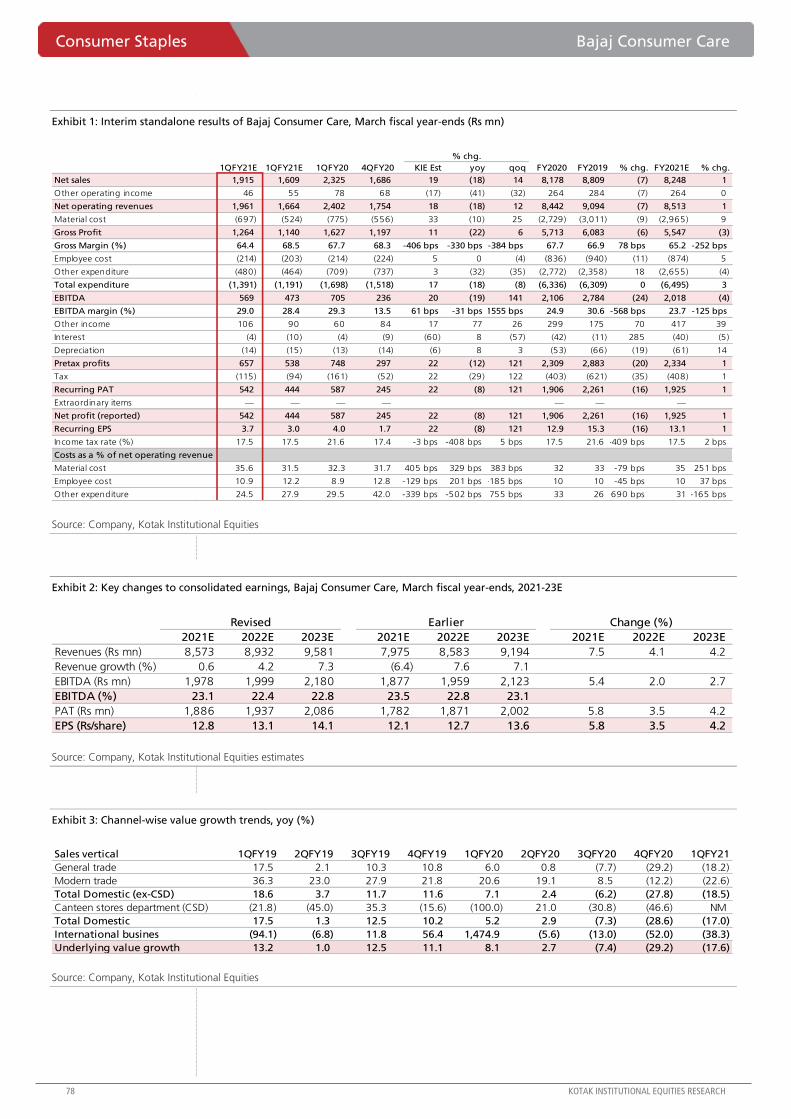
Consumer Staples Bajaj Consumer Care
78 KOTAK INSTITUTIONAL EQUITIES RESEARCH
Exhibit 1: Interim standalone results of Bajaj Consumer Care, March fiscal year-ends (Rs mn)
Source: Company, Kotak Institutional Equities
Exhibit 2: Key changes to consolidated earnings, Bajaj Consumer Care, March fiscal year-ends, 2021-23E
Source: Company, Kotak Institutional Equities estimates
Exhibit 3: Channel-wise value growth trends, yoy (%)
Source: Company, Kotak Institutional Equities
1QFY21E 1QFY21E 1QFY20 4QFY20 KIE Est yoy qoq FY2020 FY2019 % chg. FY2021E % chg.
Net sales 1,915 1,609 2,325 1,686 19 (18) 14 8,178 8,809 (7) 8,248 1
Other operating income 46 55 78 68 (17) (41) (32) 264 284 (7) 264 0
Net operating revenues 1,961 1,664 2,402 1,754 18 (18) 12 8,442 9,094 (7) 8,513 1
Material cost (697) (524) (775) (556) 33 (10) 25 (2,729) (3,011) (9) (2,965) 9
Gross Profit 1,264 1,140 1,627 1,197 11 (22) 6 5,713 6,083 (6) 5,547 (3)
Gross Margin (%) 64.4 68.5 67.7 68.3 -406 bps -330 bps -384 bps 67.7 66.9 78 bps 65.2 -252 bps
Employee cost (214) (203) (214) (224) 5 0 (4) (836) (940) (11) (874) 5
Other expenditure (480) (464) (709) (737) 3 (32) (35) (2,772) (2,358) 18 (2,655) (4)
Total expenditure (1,391) (1,191) (1,698) (1,518) 17 (18) (8) (6,336) (6,309) 0 (6,495) 3
EBITDA 569 473 705 236 20 (19) 141 2,106 2,784 (24) 2,018 (4)
EBITDA margin (%) 29.0 28.4 29.3 13.5 61 bps -31 bps 1555 bps 24.9 30.6 -568 bps 23.7 -125 bps
Other income 106 90 60 84 17 77 26 299 175 70 417 39
Interest (4) (10) (4) (9) (60) 8 (57) (42) (11) 285 (40) (5)
Depreciation (14) (15) (13) (14) (6) 8 3 (53) (66) (19) (61) 14
Pretax profits 657 538 748 297 22 (12) 121 2,309 2,883 (20) 2,334 1
Tax (115) (94) (161) (52) 22 (29) 122 (403) (621) (35) (408) 1
Recurring PAT 542 444 587 245 22 (8) 121 1,906 2,261 (16) 1,925 1
Extraordinary items — — — — — — —
Net profit (reported) 542 444 587 245 22 (8) 121 1,906 2,261 (16) 1,925 1
Recurring EPS 3.7 3.0 4.0 1.7 22 (8) 121 12.9 15.3 (16) 13.1 1
Income tax rate (%) 17.5 17.5 21.6 17.4 -3 bps -408 bps 5 bps 17.5 21.6 -409 bps 17.5 2 bps
Costs as a % of net operating revenue
Material cost 35.6 31.5 32.3 31.7 405 bps 329 bps 383 bps 32 33 -79 bps 35 251 bps
Employee cost 10.9 12.2 8.9 12.8 -129 bps 201 bps -185 bps 10 10 -45 bps 10 37 bps
Other expenditure 24.5 27.9 29.5 42.0 -339 bps -502 bps-1755 bps 33 26 690 bps 31 -165 bps
% chg.
2021E 2022E 2023E 2021E 2022E 2023E 2021E 2022E 2023E
Revenues (Rs mn) 8,573 8,932 9,581 7,975 8,583 9,194 7.5 4.1 4.2
Revenue growth (%) 0.6 4.2 7.3 (6.4) 7.6 7.1
EBITDA (Rs mn) 1,978 1,999 2,180 1,877 1,959 2,123 5.4 2.0 2.7
EBITDA (%) 23.1 22.4 22.8 23.5 22.8 23.1
PAT (Rs mn) 1,886 1,937 2,086 1,782 1,871 2,002 5.8 3.5 4.2
EPS (Rs/share) 12.8 13.1 14.1 12.1 12.7 13.6 5.8 3.5 4.2
Revised Earlier Change (%)
Sales vertical 1QFY19 2QFY19 3QFY19 4QFY19 1QFY20 2QFY20 3QFY20 4QFY20 1QFY21
General trade 17.5 2.1 10.3 10.8 6.0 0.8 (7.7) (29.2) (18.2)
Modern trade 36.3 23.0 27.9 21.8 20.6 19.1 8.5 (12.2) (22.6)
Total Domestic (ex-CSD) 18.6 3.7 11.7 11.6 7.1 2.4 (6.2) (27.8) (18.5)
Canteen stores department (CSD) (21.8) (45.0) 35.3 (15.6) (100.0) 21.0 (30.8) (46.6) NM
Total Domestic 17.5 1.3 12.5 10.2 5.2 2.9 (7.3) (28.6) (17.0)
International busines (94.1) (6.8) 11.8 56.4 1,474.9 (5.6) (13.0) (52.0) (38.3)
Underlying value growth 13.2 1.0 12.5 11.1 8.1 2.7 (7.4) (29.2) (17.6)
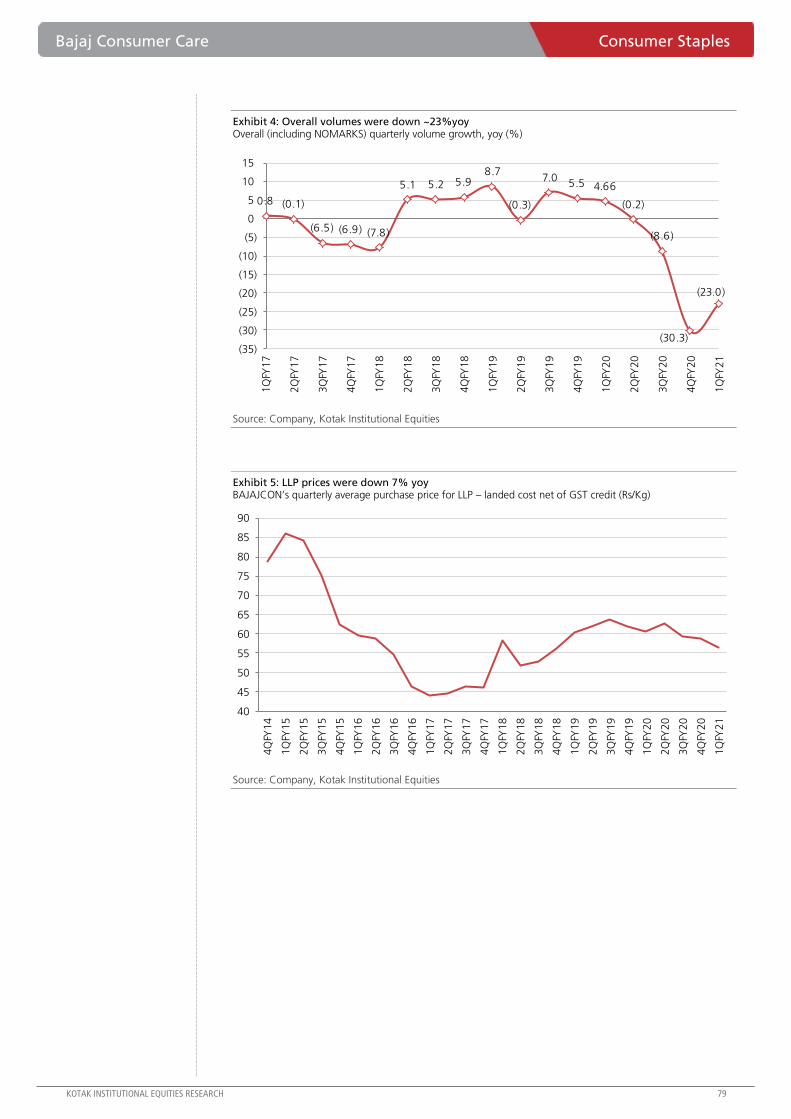
Bajaj Consumer Care Consumer Staples
KOTAK INSTITUTIONAL EQUITIES RESEARCH 79
Exhibit 4: Overall volumes were down ~23%yoy Overall (including NOMARKS) quarterly volume growth, yoy (%)
Source: Company, Kotak Institutional Equities
Exhibit 5: LLP prices were down 7% yoy BAJAJCON’s quarterly average purchase price for LLP – landed cost net of GST credit (Rs/Kg)
Source: Company, Kotak Institutional Equities
0.8 (0.1)
(6.5) (6.9) (7.8)
5.1 5.2 5.9 8.7
(0.3)
7.0 5.5 4.66
(0.2)
(8.6)
(30.3)
(23.0)
(35)
(30)
(25)
(20)
(15)
(10)
(5)
0
5
10
15
1Q
FY17
2Q
FY17
3Q
FY17
4Q
FY17
1Q
FY18
2Q
FY18
3Q
FY18
4Q
FY18
1Q
FY19
2Q
FY19
3Q
FY19
4Q
FY19
1Q
FY20
2Q
FY20
3Q
FY20
4Q
FY20
1Q
FY21
40
45
50
55
60
65
70
75
80
85
90
4Q
FY14
1Q
FY15
2Q
FY15
3Q
FY15
4Q
FY15
1Q
FY16
2Q
FY16
3Q
FY16
4Q
FY16
1Q
FY17
2Q
FY17
3Q
FY17
4Q
FY17
1Q
FY18
2Q
FY18
3Q
FY18
4Q
FY18
1Q
FY19
2Q
FY19
3Q
FY19
4Q
FY19
1Q
FY20
2Q
FY20
3Q
FY20
4Q
FY20
1Q
FY21
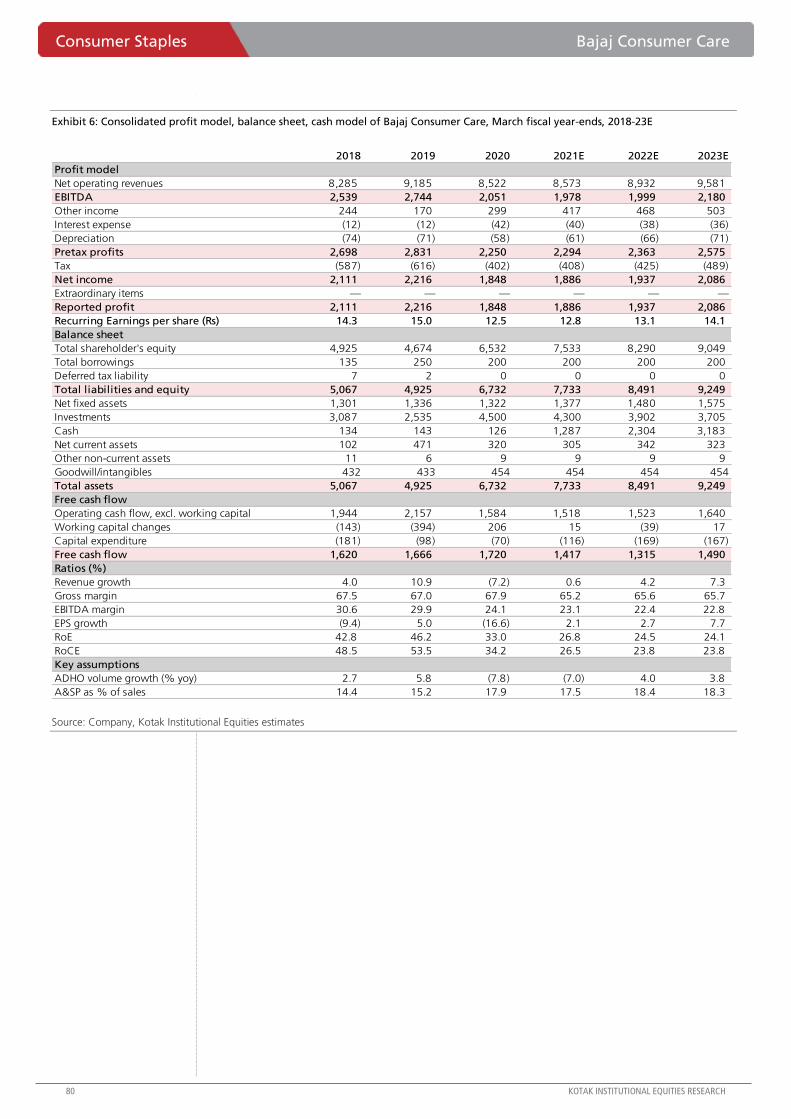
Consumer Staples Bajaj Consumer Care
80 KOTAK INSTITUTIONAL EQUITIES RESEARCH
Exhibit 6: Consolidated profit model, balance sheet, cash model of Bajaj Consumer Care, March fiscal year-ends, 2018-23E
Source: Company, Kotak Institutional Equities estimates
2018 2019 2020 2021E 2022E 2023E
Profit model
Net operating revenues 8,285 9,185 8,522 8,573 8,932 9,581
EBITDA 2,539 2,744 2,051 1,978 1,999 2,180
Other income 244 170 299 417 468 503
Interest expense (12) (12) (42) (40) (38) (36)
Depreciation (74) (71) (58) (61) (66) (71)
Pretax profits 2,698 2,831 2,250 2,294 2,363 2,575
Tax (587) (616) (402) (408) (425) (489)
Net income 2,111 2,216 1,848 1,886 1,937 2,086
Extraordinary items — — — — — —
Reported profit 2,111 2,216 1,848 1,886 1,937 2,086
Recurring Earnings per share (Rs) 14.3 15.0 12.5 12.8 13.1 14.1
Balance sheet
Total shareholder's equity 4,925 4,674 6,532 7,533 8,290 9,049
Total borrowings 135 250 200 200 200 200
Deferred tax liability 7 2 0 0 0 0
Total liabilities and equity 5,067 4,925 6,732 7,733 8,491 9,249
Net fixed assets 1,301 1,336 1,322 1,377 1,480 1,575
Investments 3,087 2,535 4,500 4,300 3,902 3,705
Cash 134 143 126 1,287 2,304 3,183
Net current assets 102 471 320 305 342 323
Other non-current assets 11 6 9 9 9 9
Goodwill/intangibles 432 433 454 454 454 454
Total assets 5,067 4,925 6,732 7,733 8,491 9,249
Free cash flow
Operating cash flow, excl. working capital 1,944 2,157 1,584 1,518 1,523 1,640
Working capital changes (143) (394) 206 15 (39) 17
Capital expenditure (181) (98) (70) (116) (169) (167)
Free cash flow 1,620 1,666 1,720 1,417 1,315 1,490
Ratios (%)
Revenue growth 4.0 10.9 (7.2) 0.6 4.2 7.3
Gross margin 67.5 67.0 67.9 65.2 65.6 65.7
EBITDA margin 30.6 29.9 24.1 23.1 22.4 22.8
EPS growth (9.4) 5.0 (16.6) 2.1 2.7 7.7
RoE 42.8 46.2 33.0 26.8 24.5 24.1
RoCE 48.5 53.5 34.2 26.5 23.8 23.8
Key assumptions
ADHO volume growth (% yoy) 2.7 5.8 (7.8) (7.0) 4.0 3.8
A&SP as % of sales 14.4 15.2 17.9 17.5 18.4 18.3
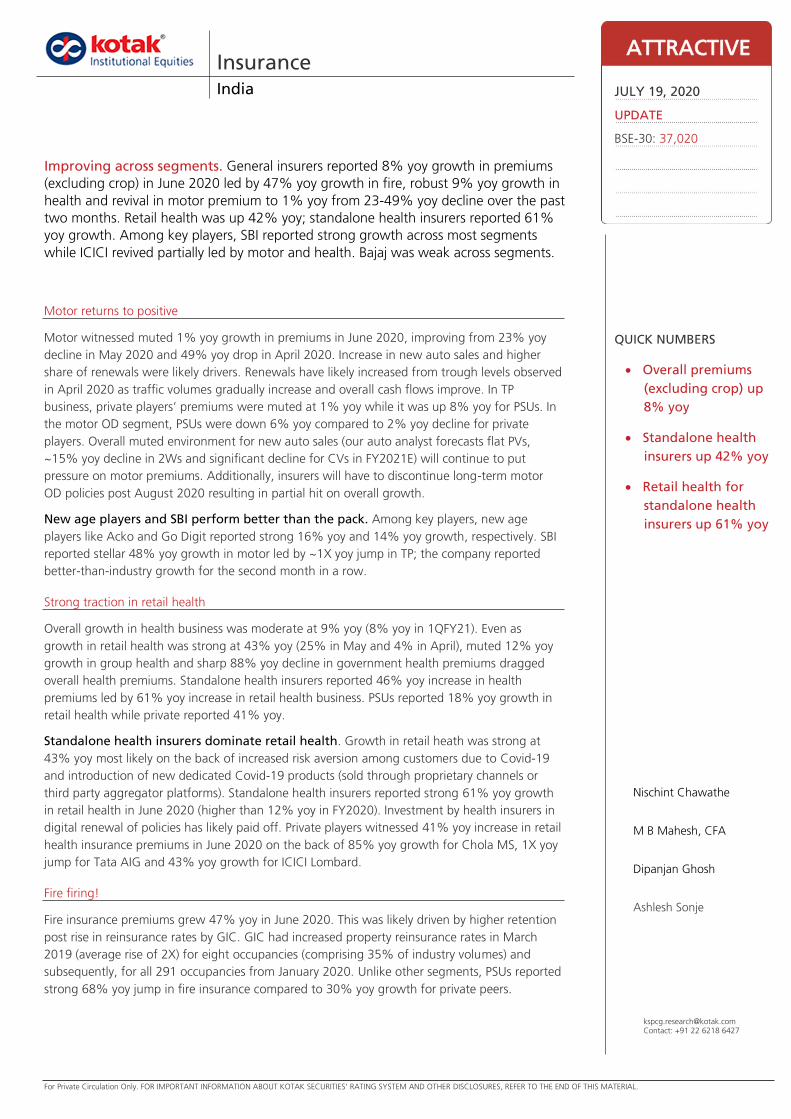
For Private Circulation Only. FOR IMPORTANT INFORMATION ABOUT KOTAK SECURITIES’ RATING SYSTEM AND OTHER DISCLOSURES, REFER TO THE END OF THIS MATERIAL.
Motor returns to positive
Motor witnessed muted 1% yoy growth in premiums in June 2020, improving from 23% yoy
decline in May 2020 and 49% yoy drop in April 2020. Increase in new auto sales and higher
share of renewals were likely drivers. Renewals have likely increased from trough levels observed
in April 2020 as traffic volumes gradually increase and overall cash flows improve. In TP
business, private players’ premiums were muted at 1% yoy while it was up 8% yoy for PSUs. In
the motor OD segment, PSUs were down 6% yoy compared to 2% yoy decline for private
players. Overall muted environment for new auto sales (our auto analyst forecasts flat PVs,
~15% yoy decline in 2Ws and significant decline for CVs in FY2021E) will continue to put
pressure on motor premiums. Additionally, insurers will have to discontinue long-term motor
OD policies post August 2020 resulting in partial hit on overall growth.
New age players and SBI perform better than the pack. Among key players, new age
players like Acko and Go Digit reported strong 16% yoy and 14% yoy growth, respectively. SBI
reported stellar 48% yoy growth in motor led by ~1X yoy jump in TP; the company reported
better-than-industry growth for the second month in a row.
Strong traction in retail health
Overall growth in health business was moderate at 9% yoy (8% yoy in 1QFY21). Even as
growth in retail health was strong at 43% yoy (25% in May and 4% in April), muted 12% yoy
growth in group health and sharp 88% yoy decline in government health premiums dragged
overall health premiums. Standalone health insurers reported 46% yoy increase in health
premiums led by 61% yoy increase in retail health business. PSUs reported 18% yoy growth in
retail health while private reported 41% yoy.
Standalone health insurers dominate retail health. Growth in retail heath was strong at
43% yoy most likely on the back of increased risk aversion among customers due to Covid-19
and introduction of new dedicated Covid-19 products (sold through proprietary channels or
third party aggregator platforms). Standalone health insurers reported strong 61% yoy growth
in retail health in June 2020 (higher than 12% yoy in FY2020). Investment by health insurers in
digital renewal of policies has likely paid off. Private players witnessed 41% yoy increase in retail
health insurance premiums in June 2020 on the back of 85% yoy growth for Chola MS, 1X yoy
jump for Tata AIG and 43% yoy growth for ICICI Lombard.
Fire firing!
Fire insurance premiums grew 47% yoy in June 2020. This was likely driven by higher retention
post rise in reinsurance rates by GIC. GIC had increased property reinsurance rates in March
2019 (average rise of 2X) for eight occupancies (comprising 35% of industry volumes) and
subsequently, for all 291 occupancies from January 2020. Unlike other segments, PSUs reported
strong 68% yoy jump in fire insurance compared to 30% yoy growth for private peers.
Insurance India
Improving across segments. General insurers reported 8% yoy growth in premiums
(excluding crop) in June 2020 led by 47% yoy growth in fire, robust 9% yoy growth in
health and revival in motor premium to 1% yoy from 23-49% yoy decline over the past
two months. Retail health was up 42% yoy; standalone health insurers reported 61%
yoy growth. Among key players, SBI reported strong growth across most segments
while ICICI revived partially led by motor and health. Bajaj was weak across segments.
ATTRACTIVE
JULY 19, 2020
UPDATE
BSE-30: 37,020
QUICK NUMBERS
Overall premiums
(excluding crop) up
8% yoy
Standalone health
insurers up 42% yoy
Retail health for
standalone health
insurers up 61% yoy
Nischint Chawathe
M B Mahesh, CFA
Dipanjan Ghosh
Ashlesh Sonje
[email protected]: +91 22 6218 6427
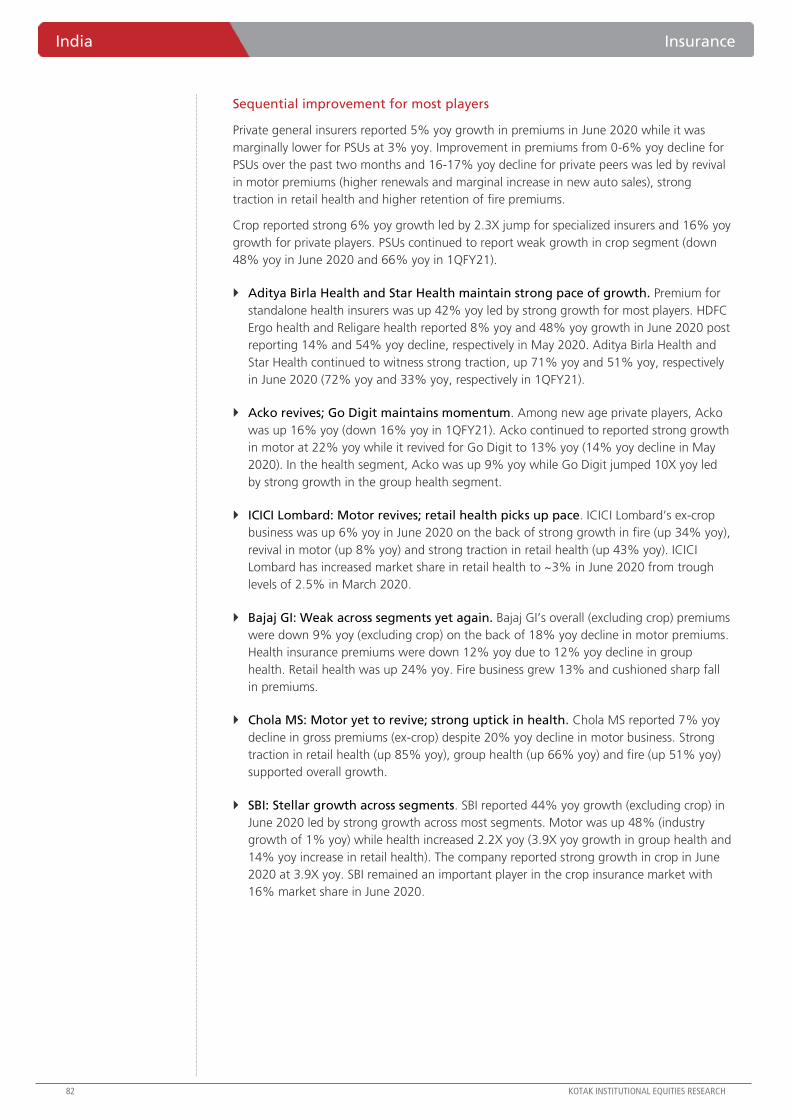
India Insurance
82 KOTAK INSTITUTIONAL EQUITIES RESEARCH
Sequential improvement for most players
Private general insurers reported 5% yoy growth in premiums in June 2020 while it was
marginally lower for PSUs at 3% yoy. Improvement in premiums from 0-6% yoy decline for
PSUs over the past two months and 16-17% yoy decline for private peers was led by revival
in motor premiums (higher renewals and marginal increase in new auto sales), strong
traction in retail health and higher retention of fire premiums.
Crop reported strong 6% yoy growth led by 2.3X jump for specialized insurers and 16% yoy
growth for private players. PSUs continued to report weak growth in crop segment (down
48% yoy in June 2020 and 66% yoy in 1QFY21).
Aditya Birla Health and Star Health maintain strong pace of growth. Premium for
standalone health insurers was up 42% yoy led by strong growth for most players. HDFC
Ergo health and Religare health reported 8% yoy and 48% yoy growth in June 2020 post
reporting 14% and 54% yoy decline, respectively in May 2020. Aditya Birla Health and
Star Health continued to witness strong traction, up 71% yoy and 51% yoy, respectively
in June 2020 (72% yoy and 33% yoy, respectively in 1QFY21).
Acko revives; Go Digit maintains momentum. Among new age private players, Acko
was up 16% yoy (down 16% yoy in 1QFY21). Acko continued to reported strong growth
in motor at 22% yoy while it revived for Go Digit to 13% yoy (14% yoy decline in May
2020). In the health segment, Acko was up 9% yoy while Go Digit jumped 10X yoy led
by strong growth in the group health segment.
ICICI Lombard: Motor revives; retail health picks up pace. ICICI Lombard’s ex-crop
business was up 6% yoy in June 2020 on the back of strong growth in fire (up 34% yoy),
revival in motor (up 8% yoy) and strong traction in retail health (up 43% yoy). ICICI
Lombard has increased market share in retail health to ~3% in June 2020 from trough
levels of 2.5% in March 2020.
Bajaj GI: Weak across segments yet again. Bajaj GI’s overall (excluding crop) premiums
were down 9% yoy (excluding crop) on the back of 18% yoy decline in motor premiums.
Health insurance premiums were down 12% yoy due to 12% yoy decline in group
health. Retail health was up 24% yoy. Fire business grew 13% and cushioned sharp fall
in premiums.
Chola MS: Motor yet to revive; strong uptick in health. Chola MS reported 7% yoy
decline in gross premiums (ex-crop) despite 20% yoy decline in motor business. Strong
traction in retail health (up 85% yoy), group health (up 66% yoy) and fire (up 51% yoy)
supported overall growth.
SBI: Stellar growth across segments. SBI reported 44% yoy growth (excluding crop) in
June 2020 led by strong growth across most segments. Motor was up 48% (industry
growth of 1% yoy) while health increased 2.2X yoy (3.9X yoy growth in group health and
14% yoy increase in retail health). The company reported strong growth in crop in June
2020 at 3.9X yoy. SBI remained an important player in the crop insurance market with
16% market share in June 2020.
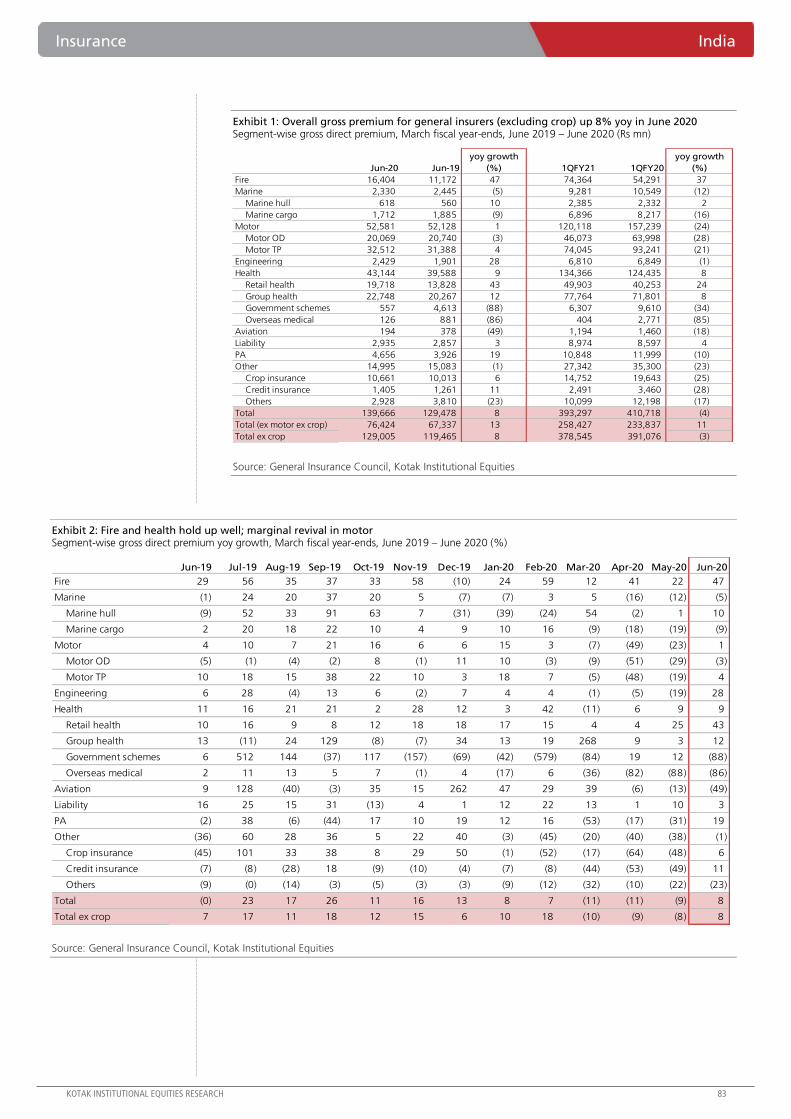
Insurance India
KOTAK INSTITUTIONAL EQUITIES RESEARCH 83
Exhibit 1: Overall gross premium for general insurers (excluding crop) up 8% yoy in June 2020 Segment-wise gross direct premium, March fiscal year-ends, June 2019 – June 2020 (Rs mn)
Source: General Insurance Council, Kotak Institutional Equities
Exhibit 2: Fire and health hold up well; marginal revival in motor Segment-wise gross direct premium yoy growth, March fiscal year-ends, June 2019 – June 2020 (%)
Source: General Insurance Council, Kotak Institutional Equities
Jun-20 Jun-19 1QFY21 1QFY20
Fire 16,404 11,172 47 74,364 54,291 37
Marine 2,330 2,445 (5) 9,281 10,549 (12)
Marine hull 618 560 10 2,385 2,332 2
Marine cargo 1,712 1,885 (9) 6,896 8,217 (16)
Motor 52,581 52,128 1 120,118 157,239 (24)
Motor OD 20,069 20,740 (3) 46,073 63,998 (28)
Motor TP 32,512 31,388 4 74,045 93,241 (21)
Engineering 2,429 1,901 28 6,810 6,849 (1)
Health 43,144 39,588 9 134,366 124,435 8
Retail health 19,718 13,828 43 49,903 40,253 24
Group health 22,748 20,267 12 77,764 71,801 8
Government schemes 557 4,613 (88) 6,307 9,610 (34)
Overseas medical 126 881 (86) 404 2,771 (85)
Aviation 194 378 (49) 1,194 1,460 (18)
Liability 2,935 2,857 3 8,974 8,597 4
PA 4,656 3,926 19 10,848 11,999 (10)
Other 14,995 15,083 (1) 27,342 35,300 (23)
Crop insurance 10,661 10,013 6 14,752 19,643 (25)
Credit insurance 1,405 1,261 11 2,491 3,460 (28)
Others 2,928 3,810 (23) 10,099 12,198 (17)
Total 139,666 129,478 8 393,297 410,718 (4)
Total (ex motor ex crop) 76,424 67,337 13 258,427 233,837 11
Total ex crop 129,005 119,465 8 378,545 391,076 (3)
yoy growth
(%)
yoy growth
(%)
Jun-19 Jul-19 Aug-19 Sep-19 Oct-19 Nov-19 Dec-19 Jan-20 Feb-20 Mar-20 Apr-20 May-20 Jun-20
Fire 29 56 35 37 33 58 (10) 24 59 12 41 22 47
Marine (1) 24 20 37 20 5 (7) (7) 3 5 (16) (12) (5)
Marine hull (9) 52 33 91 63 7 (31) (39) (24) 54 (2) 1 10
Marine cargo 2 20 18 22 10 4 9 10 16 (9) (18) (19) (9)
Motor 4 10 7 21 16 6 6 15 3 (7) (49) (23) 1
Motor OD (5) (1) (4) (2) 8 (1) 11 10 (3) (9) (51) (29) (3)
Motor TP 10 18 15 38 22 10 3 18 7 (5) (48) (19) 4
Engineering 6 28 (4) 13 6 (2) 7 4 4 (1) (5) (19) 28
Health 11 16 21 21 2 28 12 3 42 (11) 6 9 9
Retail health 10 16 9 8 12 18 18 17 15 4 4 25 43
Group health 13 (11) 24 129 (8) (7) 34 13 19 268 9 3 12
Government schemes 6 512 144 (37) 117 (157) (69) (42) (579) (84) 19 12 (88)
Overseas medical 2 11 13 5 7 (1) 4 (17) 6 (36) (82) (88) (86)
Aviation 9 128 (40) (3) 35 15 262 47 29 39 (6) (13) (49)
Liability 16 25 15 31 (13) 4 1 12 22 13 1 10 3
PA (2) 38 (6) (44) 17 10 19 12 16 (53) (17) (31) 19
Other (36) 60 28 36 5 22 40 (3) (45) (20) (40) (38) (1)
Crop insurance (45) 101 33 38 8 29 50 (1) (52) (17) (64) (48) 6
Credit insurance (7) (8) (28) 18 (9) (10) (4) (7) (8) (44) (53) (49) 11
Others (9) (0) (14) (3) (5) (3) (3) (9) (12) (32) (10) (22) (23)
Total (0) 23 17 26 11 16 13 8 7 (11) (11) (9) 8
Total ex crop 7 17 11 18 12 15 6 10 18 (10) (9) (8) 8
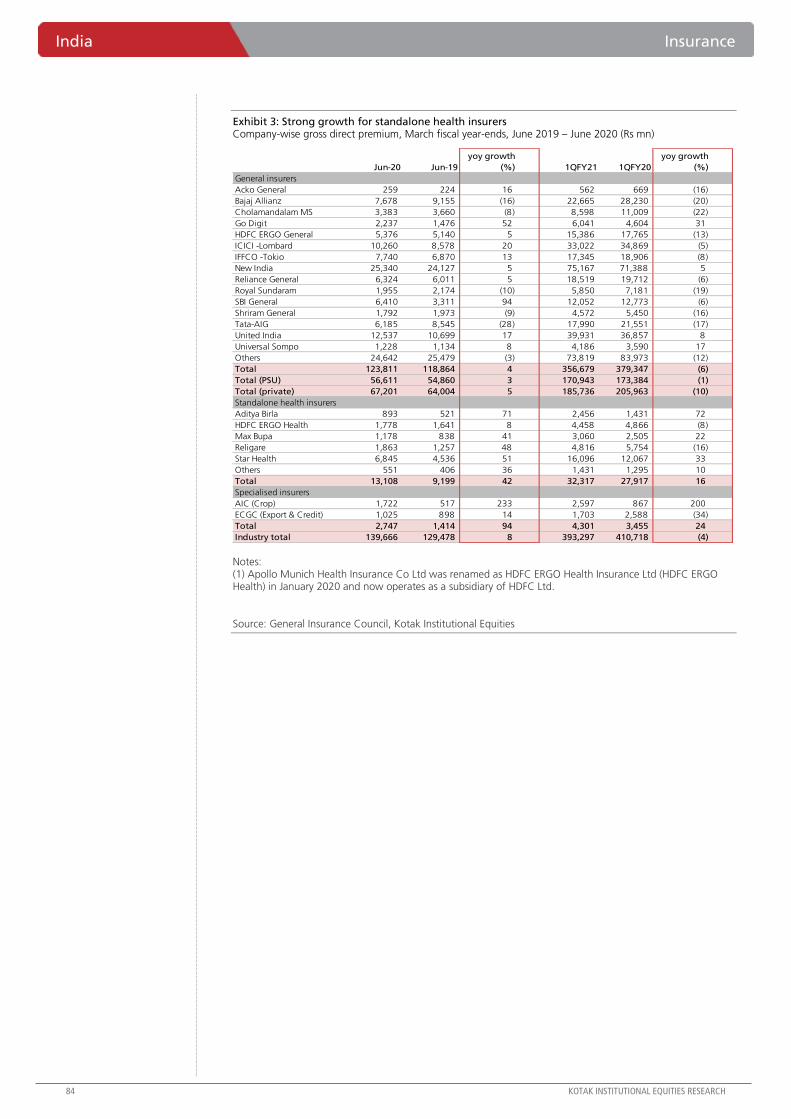
India Insurance
84 KOTAK INSTITUTIONAL EQUITIES RESEARCH
Exhibit 3: Strong growth for standalone health insurers Company-wise gross direct premium, March fiscal year-ends, June 2019 – June 2020 (Rs mn)
Notes: (1) Apollo Munich Health Insurance Co Ltd was renamed as HDFC ERGO Health Insurance Ltd (HDFC ERGO Health) in January 2020 and now operates as a subsidiary of HDFC Ltd.
Source: General Insurance Council, Kotak Institutional Equities
Jun-20 Jun-19
yoy growth
(%) 1QFY21 1QFY20
yoy growth
(%)
General insurers
Acko General 259 224 16 562 669 (16)
Bajaj Allianz 7,678 9,155 (16) 22,665 28,230 (20)
Cholamandalam MS 3,383 3,660 (8) 8,598 11,009 (22)
Go Digit 2,237 1,476 52 6,041 4,604 31
HDFC ERGO General 5,376 5,140 5 15,386 17,765 (13)
ICICI -Lombard 10,260 8,578 20 33,022 34,869 (5)
IFFCO -Tokio 7,740 6,870 13 17,345 18,906 (8)
New India 25,340 24,127 5 75,167 71,388 5
Reliance General 6,324 6,011 5 18,519 19,712 (6)
Royal Sundaram 1,955 2,174 (10) 5,850 7,181 (19)
SBI General 6,410 3,311 94 12,052 12,773 (6)
Shriram General 1,792 1,973 (9) 4,572 5,450 (16)
Tata-AIG 6,185 8,545 (28) 17,990 21,551 (17)
United India 12,537 10,699 17 39,931 36,857 8
Universal Sompo 1,228 1,134 8 4,186 3,590 17
Others 24,642 25,479 (3) 73,819 83,973 (12)
Total 123,811 118,864 4 356,679 379,347 (6)
Total (PSU) 56,611 54,860 3 170,943 173,384 (1)
Total (private) 67,201 64,004 5 185,736 205,963 (10)
Standalone health insurers
Aditya Birla 893 521 71 2,456 1,431 72
HDFC ERGO Health 1,778 1,641 8 4,458 4,866 (8)
Max Bupa 1,178 838 41 3,060 2,505 22
Religare 1,863 1,257 48 4,816 5,754 (16)
Star Health 6,845 4,536 51 16,096 12,067 33
Others 551 406 36 1,431 1,295 10
Total 13,108 9,199 42 32,317 27,917 16
Specialised insurers
AIC (Crop) 1,722 517 233 2,597 867 200
ECGC (Export & Credit) 1,025 898 14 1,703 2,588 (34)
Total 2,747 1,414 94 4,301 3,455 24
Industry total 139,666 129,478 8 393,297 410,718 (4)
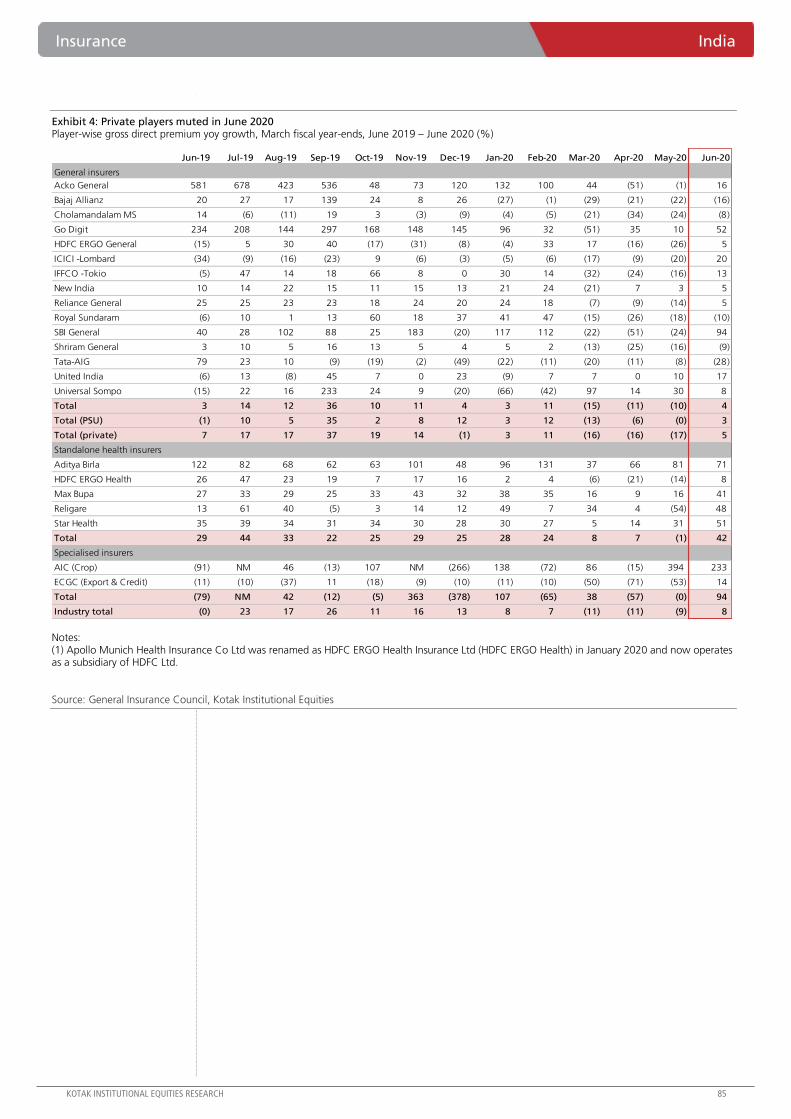
Insurance India
KOTAK INSTITUTIONAL EQUITIES RESEARCH 85
Exhibit 4: Private players muted in June 2020 Player-wise gross direct premium yoy growth, March fiscal year-ends, June 2019 – June 2020 (%)
Notes: (1) Apollo Munich Health Insurance Co Ltd was renamed as HDFC ERGO Health Insurance Ltd (HDFC ERGO Health) in January 2020 and now operates as a subsidiary of HDFC Ltd.
Source: General Insurance Council, Kotak Institutional Equities
Jun-19 Jul-19 Aug-19 Sep-19 Oct-19 Nov-19 Dec-19 Jan-20 Feb-20 Mar-20 Apr-20 May-20 Jun-20
General insurers
Acko General 581 678 423 536 48 73 120 132 100 44 (51) (1) 16
Bajaj Allianz 20 27 17 139 24 8 26 (27) (1) (29) (21) (22) (16)
Cholamandalam MS 14 (6) (11) 19 3 (3) (9) (4) (5) (21) (34) (24) (8)
Go Digit 234 208 144 297 168 148 145 96 32 (51) 35 10 52
HDFC ERGO General (15) 5 30 40 (17) (31) (8) (4) 33 17 (16) (26) 5
ICICI -Lombard (34) (9) (16) (23) 9 (6) (3) (5) (6) (17) (9) (20) 20
IFFCO -Tokio (5) 47 14 18 66 8 0 30 14 (32) (24) (16) 13
New India 10 14 22 15 11 15 13 21 24 (21) 7 3 5
Reliance General 25 25 23 23 18 24 20 24 18 (7) (9) (14) 5
Royal Sundaram (6) 10 1 13 60 18 37 41 47 (15) (26) (18) (10)
SBI General 40 28 102 88 25 183 (20) 117 112 (22) (51) (24) 94
Shriram General 3 10 5 16 13 5 4 5 2 (13) (25) (16) (9)
Tata-AIG 79 23 10 (9) (19) (2) (49) (22) (11) (20) (11) (8) (28)
United India (6) 13 (8) 45 7 0 23 (9) 7 7 0 10 17
Universal Sompo (15) 22 16 233 24 9 (20) (66) (42) 97 14 30 8
Total 3 14 12 36 10 11 4 3 11 (15) (11) (10) 4
Total (PSU) (1) 10 5 35 2 8 12 3 12 (13) (6) (0) 3
Total (private) 7 17 17 37 19 14 (1) 3 11 (16) (16) (17) 5
Standalone health insurers
Aditya Birla 122 82 68 62 63 101 48 96 131 37 66 81 71
HDFC ERGO Health 26 47 23 19 7 17 16 2 4 (6) (21) (14) 8
Max Bupa 27 33 29 25 33 43 32 38 35 16 9 16 41
Religare 13 61 40 (5) 3 14 12 49 7 34 4 (54) 48
Star Health 35 39 34 31 34 30 28 30 27 5 14 31 51
Total 29 44 33 22 25 29 25 28 24 8 7 (1) 42
Specialised insurers
AIC (Crop) (91) NM 46 (13) 107 NM (266) 138 (72) 86 (15) 394 233
ECGC (Export & Credit) (11) (10) (37) 11 (18) (9) (10) (11) (10) (50) (71) (53) 14
Total (79) NM 42 (12) (5) 363 (378) 107 (65) 38 (57) (0) 94
Industry total (0) 23 17 26 11 16 13 8 7 (11) (11) (9) 8
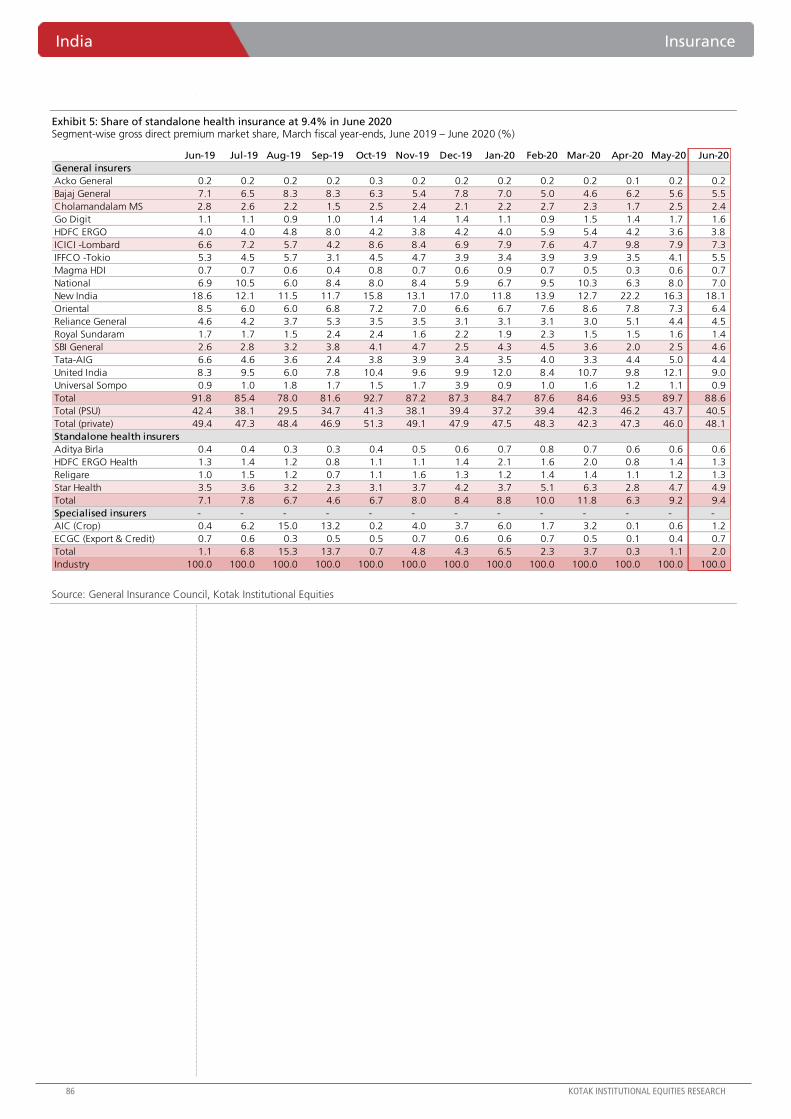
India Insurance
86 KOTAK INSTITUTIONAL EQUITIES RESEARCH
Exhibit 5: Share of standalone health insurance at 9.4% in June 2020 Segment-wise gross direct premium market share, March fiscal year-ends, June 2019 – June 2020 (%)
Source: General Insurance Council, Kotak Institutional Equities
Jun-19 Jul-19 Aug-19 Sep-19 Oct-19 Nov-19 Dec-19 Jan-20 Feb-20 Mar-20 Apr-20 May-20 Jun-20
General insurers
Acko General 0.2 0.2 0.2 0.2 0.3 0.2 0.2 0.2 0.2 0.2 0.1 0.2 0.2
Bajaj General 7.1 6.5 8.3 8.3 6.3 5.4 7.8 7.0 5.0 4.6 6.2 5.6 5.5
Cholamandalam MS 2.8 2.6 2.2 1.5 2.5 2.4 2.1 2.2 2.7 2.3 1.7 2.5 2.4
Go Digit 1.1 1.1 0.9 1.0 1.4 1.4 1.4 1.1 0.9 1.5 1.4 1.7 1.6
HDFC ERGO 4.0 4.0 4.8 8.0 4.2 3.8 4.2 4.0 5.9 5.4 4.2 3.6 3.8
ICICI -Lombard 6.6 7.2 5.7 4.2 8.6 8.4 6.9 7.9 7.6 4.7 9.8 7.9 7.3
IFFCO -Tokio 5.3 4.5 5.7 3.1 4.5 4.7 3.9 3.4 3.9 3.9 3.5 4.1 5.5
Magma HDI 0.7 0.7 0.6 0.4 0.8 0.7 0.6 0.9 0.7 0.5 0.3 0.6 0.7
National 6.9 10.5 6.0 8.4 8.0 8.4 5.9 6.7 9.5 10.3 6.3 8.0 7.0
New India 18.6 12.1 11.5 11.7 15.8 13.1 17.0 11.8 13.9 12.7 22.2 16.3 18.1
Oriental 8.5 6.0 6.0 6.8 7.2 7.0 6.6 6.7 7.6 8.6 7.8 7.3 6.4
Reliance General 4.6 4.2 3.7 5.3 3.5 3.5 3.1 3.1 3.1 3.0 5.1 4.4 4.5
Royal Sundaram 1.7 1.7 1.5 2.4 2.4 1.6 2.2 1.9 2.3 1.5 1.5 1.6 1.4
SBI General 2.6 2.8 3.2 3.8 4.1 4.7 2.5 4.3 4.5 3.6 2.0 2.5 4.6
Tata-AIG 6.6 4.6 3.6 2.4 3.8 3.9 3.4 3.5 4.0 3.3 4.4 5.0 4.4
United India 8.3 9.5 6.0 7.8 10.4 9.6 9.9 12.0 8.4 10.7 9.8 12.1 9.0
Universal Sompo 0.9 1.0 1.8 1.7 1.5 1.7 3.9 0.9 1.0 1.6 1.2 1.1 0.9
Total 91.8 85.4 78.0 81.6 92.7 87.2 87.3 84.7 87.6 84.6 93.5 89.7 88.6
Total (PSU) 42.4 38.1 29.5 34.7 41.3 38.1 39.4 37.2 39.4 42.3 46.2 43.7 40.5
Total (private) 49.4 47.3 48.4 46.9 51.3 49.1 47.9 47.5 48.3 42.3 47.3 46.0 48.1
Standalone health insurers
Aditya Birla 0.4 0.4 0.3 0.3 0.4 0.5 0.6 0.7 0.8 0.7 0.6 0.6 0.6
HDFC ERGO Health 1.3 1.4 1.2 0.8 1.1 1.1 1.4 2.1 1.6 2.0 0.8 1.4 1.3
Religare 1.0 1.5 1.2 0.7 1.1 1.6 1.3 1.2 1.4 1.4 1.1 1.2 1.3
Star Health 3.5 3.6 3.2 2.3 3.1 3.7 4.2 3.7 5.1 6.3 2.8 4.7 4.9
Total 7.1 7.8 6.7 4.6 6.7 8.0 8.4 8.8 10.0 11.8 6.3 9.2 9.4
Specialised insurers - - - - - - - - - - - - -
AIC (Crop) 0.4 6.2 15.0 13.2 0.2 4.0 3.7 6.0 1.7 3.2 0.1 0.6 1.2
ECGC (Export & Credit) 0.7 0.6 0.3 0.5 0.5 0.7 0.6 0.6 0.7 0.5 0.1 0.4 0.7
Total 1.1 6.8 15.3 13.7 0.7 4.8 4.3 6.5 2.3 3.7 0.3 1.1 2.0
Industry 100.0 100.0 100.0 100.0 100.0 100.0 100.0 100.0 100.0 100.0 100.0 100.0 100.0
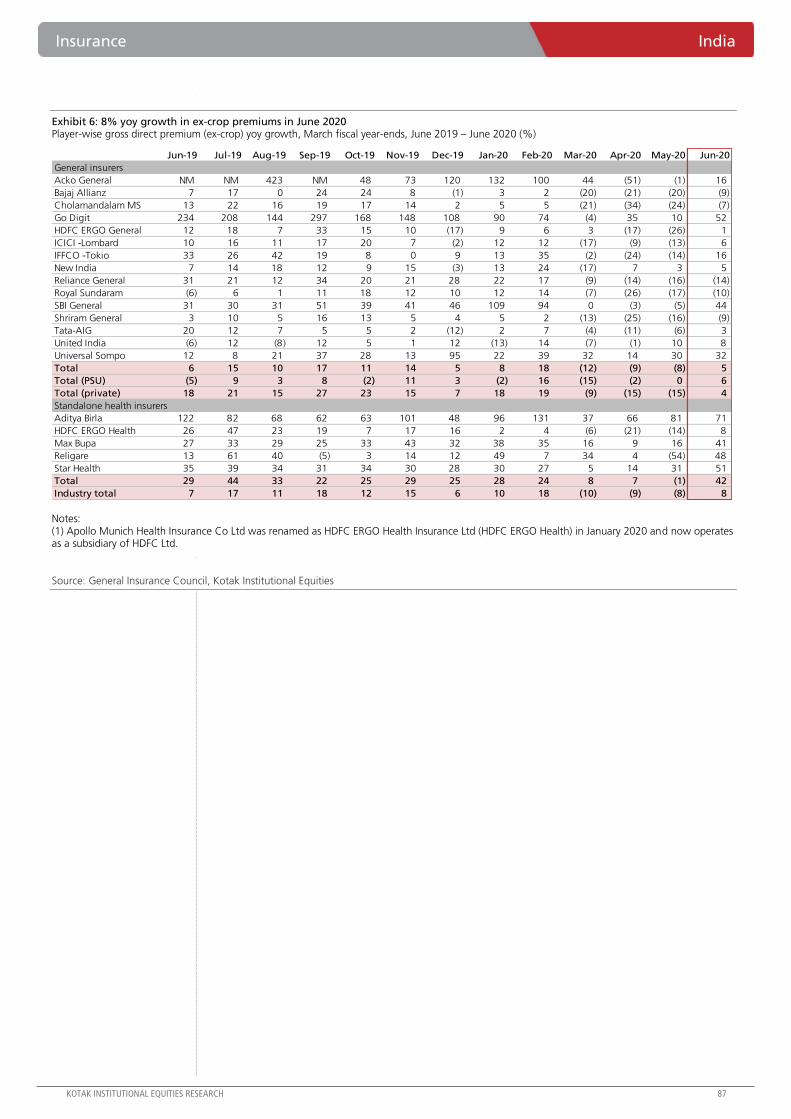
Insurance India
KOTAK INSTITUTIONAL EQUITIES RESEARCH 87
Exhibit 6: 8% yoy growth in ex-crop premiums in June 2020 Player-wise gross direct premium (ex-crop) yoy growth, March fiscal year-ends, June 2019 – June 2020 (%)
Notes: (1) Apollo Munich Health Insurance Co Ltd was renamed as HDFC ERGO Health Insurance Ltd (HDFC ERGO Health) in January 2020 and now operates as a subsidiary of HDFC Ltd.
Source: General Insurance Council, Kotak Institutional Equities
Jun-19 Jul-19 Aug-19 Sep-19 Oct-19 Nov-19 Dec-19 Jan-20 Feb-20 Mar-20 Apr-20 May-20 Jun-20
General insurers
Acko General NM NM 423 NM 48 73 120 132 100 44 (51) (1) 16
Bajaj Allianz 7 17 0 24 24 8 (1) 3 2 (20) (21) (20) (9)
Cholamandalam MS 13 22 16 19 17 14 2 5 5 (21) (34) (24) (7)
Go Digit 234 208 144 297 168 148 108 90 74 (4) 35 10 52
HDFC ERGO General 12 18 7 33 15 10 (17) 9 6 3 (17) (26) 1
ICICI -Lombard 10 16 11 17 20 7 (2) 12 12 (17) (9) (13) 6
IFFCO -Tokio 33 26 42 19 8 0 9 13 35 (2) (24) (14) 16
New India 7 14 18 12 9 15 (3) 13 24 (17) 7 3 5
Reliance General 31 21 12 34 20 21 28 22 17 (9) (14) (16) (14)
Royal Sundaram (6) 6 1 11 18 12 10 12 14 (7) (26) (17) (10)
SBI General 31 30 31 51 39 41 46 109 94 0 (3) (5) 44
Shriram General 3 10 5 16 13 5 4 5 2 (13) (25) (16) (9)
Tata-AIG 20 12 7 5 5 2 (12) 2 7 (4) (11) (6) 3
United India (6) 12 (8) 12 5 1 12 (13) 14 (7) (1) 10 8
Universal Sompo 12 8 21 37 28 13 95 22 39 32 14 30 32
Total 6 15 10 17 11 14 5 8 18 (12) (9) (8) 5
Total (PSU) (5) 9 3 8 (2) 11 3 (2) 16 (15) (2) 0 6
Total (private) 18 21 15 27 23 15 7 18 19 (9) (15) (15) 4
Standalone health insurers
Aditya Birla 122 82 68 62 63 101 48 96 131 37 66 81 71
HDFC ERGO Health 26 47 23 19 7 17 16 2 4 (6) (21) (14) 8
Max Bupa 27 33 29 25 33 43 32 38 35 16 9 16 41
Religare 13 61 40 (5) 3 14 12 49 7 34 4 (54) 48
Star Health 35 39 34 31 34 30 28 30 27 5 14 31 51
Total 29 44 33 22 25 29 25 28 24 8 7 (1) 42
Industry total 7 17 11 18 12 15 6 10 18 (10) (9) (8) 8
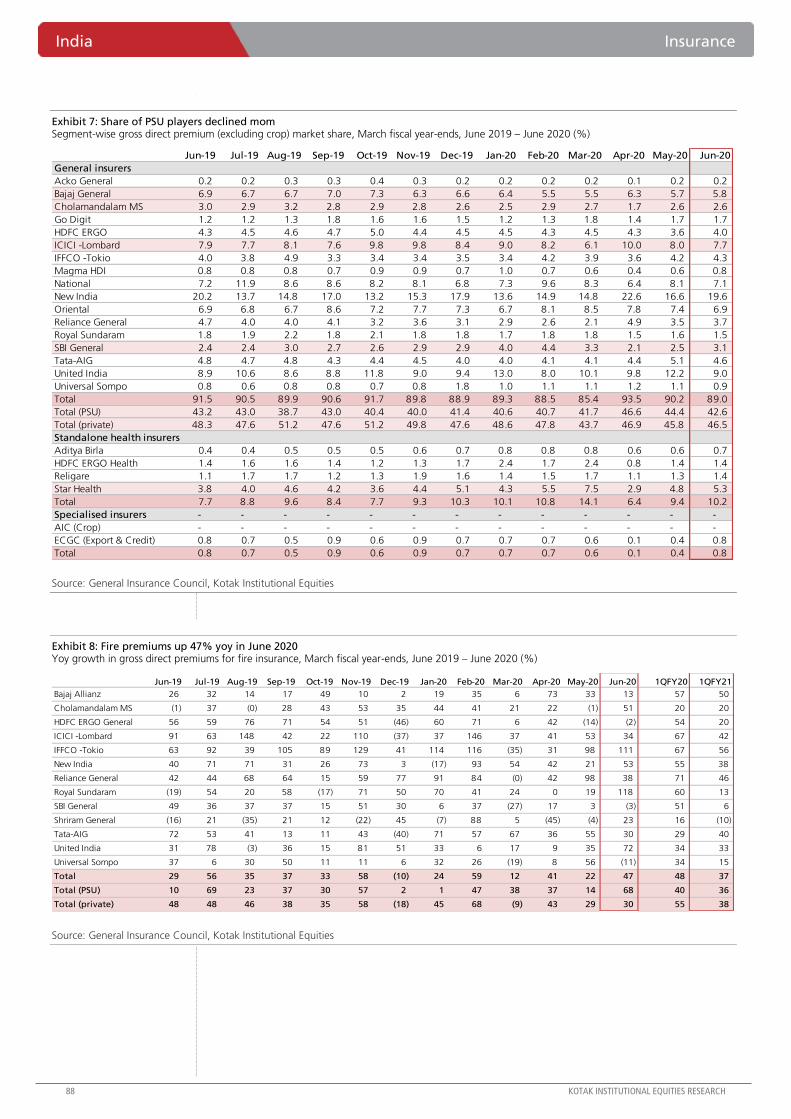
India Insurance
88 KOTAK INSTITUTIONAL EQUITIES RESEARCH
Exhibit 7: Share of PSU players declined mom Segment-wise gross direct premium (excluding crop) market share, March fiscal year-ends, June 2019 – June 2020 (%)
Source: General Insurance Council, Kotak Institutional Equities
Exhibit 8: Fire premiums up 47% yoy in June 2020 Yoy growth in gross direct premiums for fire insurance, March fiscal year-ends, June 2019 – June 2020 (%)
Source: General Insurance Council, Kotak Institutional Equities
Jun-19 Jul-19 Aug-19 Sep-19 Oct-19 Nov-19 Dec-19 Jan-20 Feb-20 Mar-20 Apr-20 May-20 Jun-20
General insurers
Acko General 0.2 0.2 0.3 0.3 0.4 0.3 0.2 0.2 0.2 0.2 0.1 0.2 0.2
Bajaj General 6.9 6.7 6.7 7.0 7.3 6.3 6.6 6.4 5.5 5.5 6.3 5.7 5.8
Cholamandalam MS 3.0 2.9 3.2 2.8 2.9 2.8 2.6 2.5 2.9 2.7 1.7 2.6 2.6
Go Digit 1.2 1.2 1.3 1.8 1.6 1.6 1.5 1.2 1.3 1.8 1.4 1.7 1.7
HDFC ERGO 4.3 4.5 4.6 4.7 5.0 4.4 4.5 4.5 4.3 4.5 4.3 3.6 4.0
ICICI -Lombard 7.9 7.7 8.1 7.6 9.8 9.8 8.4 9.0 8.2 6.1 10.0 8.0 7.7
IFFCO -Tokio 4.0 3.8 4.9 3.3 3.4 3.4 3.5 3.4 4.2 3.9 3.6 4.2 4.3
Magma HDI 0.8 0.8 0.8 0.7 0.9 0.9 0.7 1.0 0.7 0.6 0.4 0.6 0.8
National 7.2 11.9 8.6 8.6 8.2 8.1 6.8 7.3 9.6 8.3 6.4 8.1 7.1
New India 20.2 13.7 14.8 17.0 13.2 15.3 17.9 13.6 14.9 14.8 22.6 16.6 19.6
Oriental 6.9 6.8 6.7 8.6 7.2 7.7 7.3 6.7 8.1 8.5 7.8 7.4 6.9
Reliance General 4.7 4.0 4.0 4.1 3.2 3.6 3.1 2.9 2.6 2.1 4.9 3.5 3.7
Royal Sundaram 1.8 1.9 2.2 1.8 2.1 1.8 1.8 1.7 1.8 1.8 1.5 1.6 1.5
SBI General 2.4 2.4 3.0 2.7 2.6 2.9 2.9 4.0 4.4 3.3 2.1 2.5 3.1
Tata-AIG 4.8 4.7 4.8 4.3 4.4 4.5 4.0 4.0 4.1 4.1 4.4 5.1 4.6
United India 8.9 10.6 8.6 8.8 11.8 9.0 9.4 13.0 8.0 10.1 9.8 12.2 9.0
Universal Sompo 0.8 0.6 0.8 0.8 0.7 0.8 1.8 1.0 1.1 1.1 1.2 1.1 0.9
Total 91.5 90.5 89.9 90.6 91.7 89.8 88.9 89.3 88.5 85.4 93.5 90.2 89.0
Total (PSU) 43.2 43.0 38.7 43.0 40.4 40.0 41.4 40.6 40.7 41.7 46.6 44.4 42.6
Total (private) 48.3 47.6 51.2 47.6 51.2 49.8 47.6 48.6 47.8 43.7 46.9 45.8 46.5
Standalone health insurers
Aditya Birla 0.4 0.4 0.5 0.5 0.5 0.6 0.7 0.8 0.8 0.8 0.6 0.6 0.7
HDFC ERGO Health 1.4 1.6 1.6 1.4 1.2 1.3 1.7 2.4 1.7 2.4 0.8 1.4 1.4
Religare 1.1 1.7 1.7 1.2 1.3 1.9 1.6 1.4 1.5 1.7 1.1 1.3 1.4
Star Health 3.8 4.0 4.6 4.2 3.6 4.4 5.1 4.3 5.5 7.5 2.9 4.8 5.3
Total 7.7 8.8 9.6 8.4 7.7 9.3 10.3 10.1 10.8 14.1 6.4 9.4 10.2
Specialised insurers - - - - - - - - - - - - -
AIC (Crop) - - - - - - - - - - - - -
ECGC (Export & Credit) 0.8 0.7 0.5 0.9 0.6 0.9 0.7 0.7 0.7 0.6 0.1 0.4 0.8
Total 0.8 0.7 0.5 0.9 0.6 0.9 0.7 0.7 0.7 0.6 0.1 0.4 0.8
Jun-19 Jul-19 Aug-19 Sep-19 Oct-19 Nov-19 Dec-19 Jan-20 Feb-20 Mar-20 Apr-20 May-20 Jun-20 1QFY20 1QFY21
Bajaj Allianz 26 32 14 17 49 10 2 19 35 6 73 33 13 57 50
Cholamandalam MS (1) 37 (0) 28 43 53 35 44 41 21 22 (1) 51 20 20
HDFC ERGO General 56 59 76 71 54 51 (46) 60 71 6 42 (14) (2) 54 20
ICICI -Lombard 91 63 148 42 22 110 (37) 37 146 37 41 53 34 67 42
IFFCO -Tokio 63 92 39 105 89 129 41 114 116 (35) 31 98 111 67 56
New India 40 71 71 31 26 73 3 (17) 93 54 42 21 53 55 38
Reliance General 42 44 68 64 15 59 77 91 84 (0) 42 98 38 71 46
Royal Sundaram (19) 54 20 58 (17) 71 50 70 41 24 0 19 118 60 13
SBI General 49 36 37 37 15 51 30 6 37 (27) 17 3 (3) 51 6
Shriram General (16) 21 (35) 21 12 (22) 45 (7) 88 5 (45) (4) 23 16 (10)
Tata-AIG 72 53 41 13 11 43 (40) 71 57 67 36 55 30 29 40
United India 31 78 (3) 36 15 81 51 33 6 17 9 35 72 34 33
Universal Sompo 37 6 30 50 11 11 6 32 26 (19) 8 56 (11) 34 15
Total 29 56 35 37 33 58 (10) 24 59 12 41 22 47 48 37
Total (PSU) 10 69 23 37 30 57 2 1 47 38 37 14 68 40 36
Total (private) 48 48 46 38 35 58 (18) 45 68 (9) 43 29 30 55 38
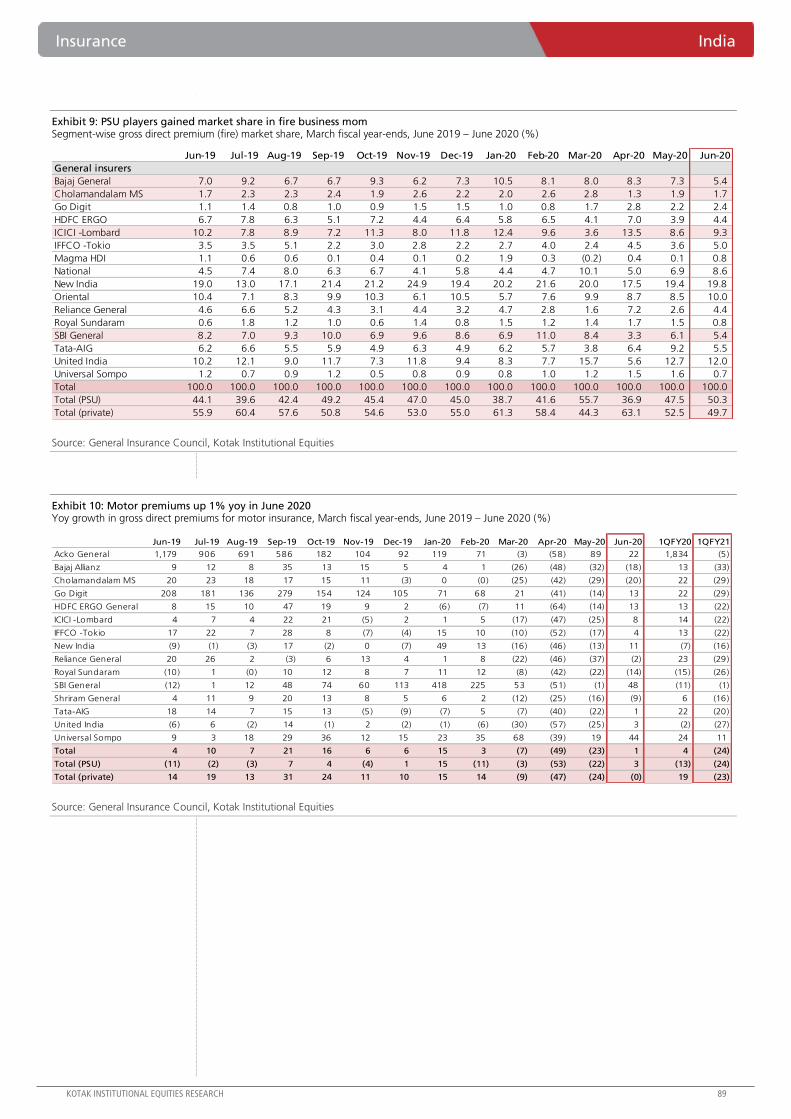
Insurance India
KOTAK INSTITUTIONAL EQUITIES RESEARCH 89
Exhibit 9: PSU players gained market share in fire business mom Segment-wise gross direct premium (fire) market share, March fiscal year-ends, June 2019 – June 2020 (%)
Source: General Insurance Council, Kotak Institutional Equities
Exhibit 10: Motor premiums up 1% yoy in June 2020 Yoy growth in gross direct premiums for motor insurance, March fiscal year-ends, June 2019 – June 2020 (%)
Source: General Insurance Council, Kotak Institutional Equities
Jun-19 Jul-19 Aug-19 Sep-19 Oct-19 Nov-19 Dec-19 Jan-20 Feb-20 Mar-20 Apr-20 May-20 Jun-20
General insurers
Bajaj General 7.0 9.2 6.7 6.7 9.3 6.2 7.3 10.5 8.1 8.0 8.3 7.3 5.4
Cholamandalam MS 1.7 2.3 2.3 2.4 1.9 2.6 2.2 2.0 2.6 2.8 1.3 1.9 1.7
Go Digit 1.1 1.4 0.8 1.0 0.9 1.5 1.5 1.0 0.8 1.7 2.8 2.2 2.4
HDFC ERGO 6.7 7.8 6.3 5.1 7.2 4.4 6.4 5.8 6.5 4.1 7.0 3.9 4.4
ICICI -Lombard 10.2 7.8 8.9 7.2 11.3 8.0 11.8 12.4 9.6 3.6 13.5 8.6 9.3
IFFCO -Tokio 3.5 3.5 5.1 2.2 3.0 2.8 2.2 2.7 4.0 2.4 4.5 3.6 5.0
Magma HDI 1.1 0.6 0.6 0.1 0.4 0.1 0.2 1.9 0.3 (0.2) 0.4 0.1 0.8
National 4.5 7.4 8.0 6.3 6.7 4.1 5.8 4.4 4.7 10.1 5.0 6.9 8.6
New India 19.0 13.0 17.1 21.4 21.2 24.9 19.4 20.2 21.6 20.0 17.5 19.4 19.8
Oriental 10.4 7.1 8.3 9.9 10.3 6.1 10.5 5.7 7.6 9.9 8.7 8.5 10.0
Reliance General 4.6 6.6 5.2 4.3 3.1 4.4 3.2 4.7 2.8 1.6 7.2 2.6 4.4
Royal Sundaram 0.6 1.8 1.2 1.0 0.6 1.4 0.8 1.5 1.2 1.4 1.7 1.5 0.8
SBI General 8.2 7.0 9.3 10.0 6.9 9.6 8.6 6.9 11.0 8.4 3.3 6.1 5.4
Tata-AIG 6.2 6.6 5.5 5.9 4.9 6.3 4.9 6.2 5.7 3.8 6.4 9.2 5.5
United India 10.2 12.1 9.0 11.7 7.3 11.8 9.4 8.3 7.7 15.7 5.6 12.7 12.0
Universal Sompo 1.2 0.7 0.9 1.2 0.5 0.8 0.9 0.8 1.0 1.2 1.5 1.6 0.7
Total 100.0 100.0 100.0 100.0 100.0 100.0 100.0 100.0 100.0 100.0 100.0 100.0 100.0
Total (PSU) 44.1 39.6 42.4 49.2 45.4 47.0 45.0 38.7 41.6 55.7 36.9 47.5 50.3
Total (private) 55.9 60.4 57.6 50.8 54.6 53.0 55.0 61.3 58.4 44.3 63.1 52.5 49.7
Jun-19 Jul-19 Aug-19 Sep-19 Oct-19 Nov-19 Dec-19 Jan-20 Feb-20 Mar-20 Apr-20 May-20 Jun-20 1QFY20 1QFY21
Acko General 1,179 906 691 586 182 104 92 119 71 (3) (58) 89 22 1,834 (5)
Bajaj Allianz 9 12 8 35 13 15 5 4 1 (26) (48) (32) (18) 13 (33)
Cholamandalam MS 20 23 18 17 15 11 (3) 0 (0) (25) (42) (29) (20) 22 (29)
Go Digit 208 181 136 279 154 124 105 71 68 21 (41) (14) 13 22 (29)
HDFC ERGO General 8 15 10 47 19 9 2 (6) (7) 11 (64) (14) 13 13 (22)
ICICI -Lombard 4 7 4 22 21 (5) 2 1 5 (17) (47) (25) 8 14 (22)
IFFCO -Tokio 17 22 7 28 8 (7) (4) 15 10 (10) (52) (17) 4 13 (22)
New India (9) (1) (3) 17 (2) 0 (7) 49 13 (16) (46) (13) 11 (7) (16)
Reliance General 20 26 2 (3) 6 13 4 1 8 (22) (46) (37) (2) 23 (29)
Royal Sundaram (10) 1 (0) 10 12 8 7 11 12 (8) (42) (22) (14) (15) (26)
SBI General (12) 1 12 48 74 60 113 418 225 53 (51) (1) 48 (11) (1)
Shriram General 4 11 9 20 13 8 5 6 2 (12) (25) (16) (9) 6 (16)
Tata-AIG 18 14 7 15 13 (5) (9) (7) 5 (7) (40) (22) 1 22 (20)
United India (6) 6 (2) 14 (1) 2 (2) (1) (6) (30) (57) (25) 3 (2) (27)
Universal Sompo 9 3 18 29 36 12 15 23 35 68 (39) 19 44 24 11
Total 4 10 7 21 16 6 6 15 3 (7) (49) (23) 1 4 (24)
Total (PSU) (11) (2) (3) 7 4 (4) 1 15 (11) (3) (53) (22) 3 (13) (24)
Total (private) 14 19 13 31 24 11 10 15 14 (9) (47) (24) (0) 19 (23)
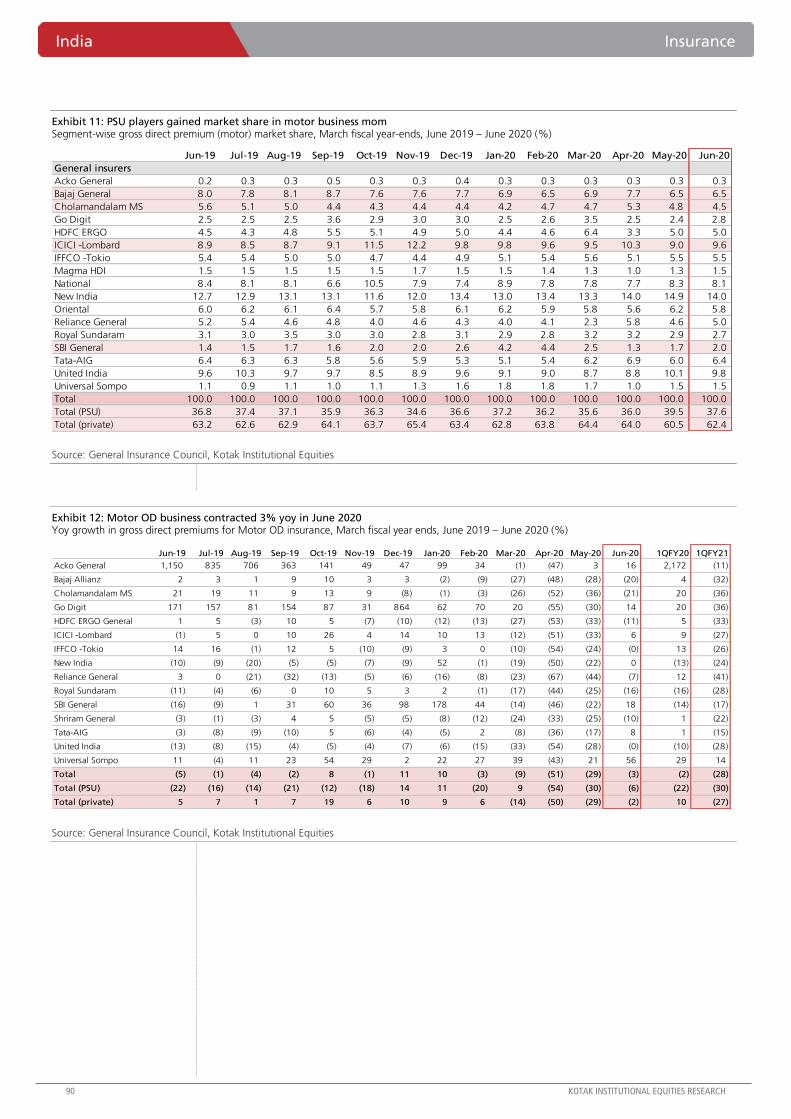
India Insurance
90 KOTAK INSTITUTIONAL EQUITIES RESEARCH
Exhibit 11: PSU players gained market share in motor business mom Segment-wise gross direct premium (motor) market share, March fiscal year-ends, June 2019 – June 2020 (%)
Source: General Insurance Council, Kotak Institutional Equities
Exhibit 12: Motor OD business contracted 3% yoy in June 2020 Yoy growth in gross direct premiums for Motor OD insurance, March fiscal year ends, June 2019 – June 2020 (%)
Source: General Insurance Council, Kotak Institutional Equities
Jun-19 Jul-19 Aug-19 Sep-19 Oct-19 Nov-19 Dec-19 Jan-20 Feb-20 Mar-20 Apr-20 May-20 Jun-20
General insurers
Acko General 0.2 0.3 0.3 0.5 0.3 0.3 0.4 0.3 0.3 0.3 0.3 0.3 0.3
Bajaj General 8.0 7.8 8.1 8.7 7.6 7.6 7.7 6.9 6.5 6.9 7.7 6.5 6.5
Cholamandalam MS 5.6 5.1 5.0 4.4 4.3 4.4 4.4 4.2 4.7 4.7 5.3 4.8 4.5
Go Digit 2.5 2.5 2.5 3.6 2.9 3.0 3.0 2.5 2.6 3.5 2.5 2.4 2.8
HDFC ERGO 4.5 4.3 4.8 5.5 5.1 4.9 5.0 4.4 4.6 6.4 3.3 5.0 5.0
ICICI -Lombard 8.9 8.5 8.7 9.1 11.5 12.2 9.8 9.8 9.6 9.5 10.3 9.0 9.6
IFFCO -Tokio 5.4 5.4 5.0 5.0 4.7 4.4 4.9 5.1 5.4 5.6 5.1 5.5 5.5
Magma HDI 1.5 1.5 1.5 1.5 1.5 1.7 1.5 1.5 1.4 1.3 1.0 1.3 1.5
National 8.4 8.1 8.1 6.6 10.5 7.9 7.4 8.9 7.8 7.8 7.7 8.3 8.1
New India 12.7 12.9 13.1 13.1 11.6 12.0 13.4 13.0 13.4 13.3 14.0 14.9 14.0
Oriental 6.0 6.2 6.1 6.4 5.7 5.8 6.1 6.2 5.9 5.8 5.6 6.2 5.8
Reliance General 5.2 5.4 4.6 4.8 4.0 4.6 4.3 4.0 4.1 2.3 5.8 4.6 5.0
Royal Sundaram 3.1 3.0 3.5 3.0 3.0 2.8 3.1 2.9 2.8 3.2 3.2 2.9 2.7
SBI General 1.4 1.5 1.7 1.6 2.0 2.0 2.6 4.2 4.4 2.5 1.3 1.7 2.0
Tata-AIG 6.4 6.3 6.3 5.8 5.6 5.9 5.3 5.1 5.4 6.2 6.9 6.0 6.4
United India 9.6 10.3 9.7 9.7 8.5 8.9 9.6 9.1 9.0 8.7 8.8 10.1 9.8
Universal Sompo 1.1 0.9 1.1 1.0 1.1 1.3 1.6 1.8 1.8 1.7 1.0 1.5 1.5
Total 100.0 100.0 100.0 100.0 100.0 100.0 100.0 100.0 100.0 100.0 100.0 100.0 100.0
Total (PSU) 36.8 37.4 37.1 35.9 36.3 34.6 36.6 37.2 36.2 35.6 36.0 39.5 37.6
Total (private) 63.2 62.6 62.9 64.1 63.7 65.4 63.4 62.8 63.8 64.4 64.0 60.5 62.4
Jun-19 Jul-19 Aug-19 Sep-19 Oct-19 Nov-19 Dec-19 Jan-20 Feb-20 Mar-20 Apr-20 May-20 Jun-20 1QFY20 1QFY21
Acko General 1,150 835 706 363 141 49 47 99 34 (1) (47) 3 16 2,172 (11)
Bajaj Allianz 2 3 1 9 10 3 3 (2) (9) (27) (48) (28) (20) 4 (32)
Cholamandalam MS 21 19 11 9 13 9 (8) (1) (3) (26) (52) (36) (21) 20 (36)
Go Digit 171 157 81 154 87 31 864 62 70 20 (55) (30) 14 20 (36)
HDFC ERGO General 1 5 (3) 10 5 (7) (10) (12) (13) (27) (53) (33) (11) 5 (33)
ICICI -Lombard (1) 5 0 10 26 4 14 10 13 (12) (51) (33) 6 9 (27)
IFFCO -Tokio 14 16 (1) 12 5 (10) (9) 3 0 (10) (54) (24) (0) 13 (26)
New India (10) (9) (20) (5) (5) (7) (9) 52 (1) (19) (50) (22) 0 (13) (24)
Reliance General 3 0 (21) (32) (13) (5) (6) (16) (8) (23) (67) (44) (7) 12 (41)
Royal Sundaram (11) (4) (6) 0 10 5 3 2 (1) (17) (44) (25) (16) (16) (28)
SBI General (16) (9) 1 31 60 36 98 178 44 (14) (46) (22) 18 (14) (17)
Shriram General (3) (1) (3) 4 5 (5) (5) (8) (12) (24) (33) (25) (10) 1 (22)
Tata-AIG (3) (8) (9) (10) 5 (6) (4) (5) 2 (8) (36) (17) 8 1 (15)
United India (13) (8) (15) (4) (5) (4) (7) (6) (15) (33) (54) (28) (0) (10) (28)
Universal Sompo 11 (4) 11 23 54 29 2 22 27 39 (43) 21 56 29 14
Total (5) (1) (4) (2) 8 (1) 11 10 (3) (9) (51) (29) (3) (2) (28)
Total (PSU) (22) (16) (14) (21) (12) (18) 14 11 (20) 9 (54) (30) (6) (22) (30)
Total (private) 5 7 1 7 19 6 10 9 6 (14) (50) (29) (2) 10 (27)
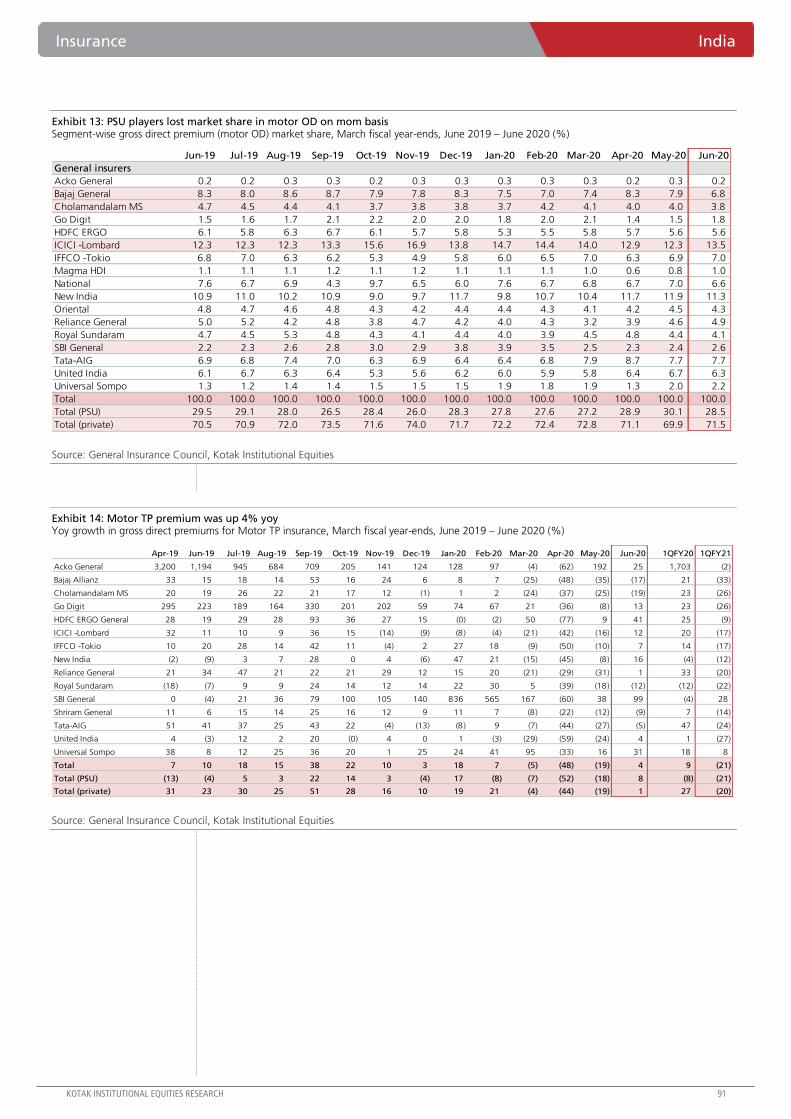
Insurance India
KOTAK INSTITUTIONAL EQUITIES RESEARCH 91
Exhibit 13: PSU players lost market share in motor OD on mom basis Segment-wise gross direct premium (motor OD) market share, March fiscal year-ends, June 2019 – June 2020 (%)
Source: General Insurance Council, Kotak Institutional Equities
Exhibit 14: Motor TP premium was up 4% yoy Yoy growth in gross direct premiums for Motor TP insurance, March fiscal year-ends, June 2019 – June 2020 (%)
Source: General Insurance Council, Kotak Institutional Equities
Jun-19 Jul-19 Aug-19 Sep-19 Oct-19 Nov-19 Dec-19 Jan-20 Feb-20 Mar-20 Apr-20 May-20 Jun-20
General insurers
Acko General 0.2 0.2 0.3 0.3 0.2 0.3 0.3 0.3 0.3 0.3 0.2 0.3 0.2
Bajaj General 8.3 8.0 8.6 8.7 7.9 7.8 8.3 7.5 7.0 7.4 8.3 7.9 6.8
Cholamandalam MS 4.7 4.5 4.4 4.1 3.7 3.8 3.8 3.7 4.2 4.1 4.0 4.0 3.8
Go Digit 1.5 1.6 1.7 2.1 2.2 2.0 2.0 1.8 2.0 2.1 1.4 1.5 1.8
HDFC ERGO 6.1 5.8 6.3 6.7 6.1 5.7 5.8 5.3 5.5 5.8 5.7 5.6 5.6
ICICI -Lombard 12.3 12.3 12.3 13.3 15.6 16.9 13.8 14.7 14.4 14.0 12.9 12.3 13.5
IFFCO -Tokio 6.8 7.0 6.3 6.2 5.3 4.9 5.8 6.0 6.5 7.0 6.3 6.9 7.0
Magma HDI 1.1 1.1 1.1 1.2 1.1 1.2 1.1 1.1 1.1 1.0 0.6 0.8 1.0
National 7.6 6.7 6.9 4.3 9.7 6.5 6.0 7.6 6.7 6.8 6.7 7.0 6.6
New India 10.9 11.0 10.2 10.9 9.0 9.7 11.7 9.8 10.7 10.4 11.7 11.9 11.3
Oriental 4.8 4.7 4.6 4.8 4.3 4.2 4.4 4.4 4.3 4.1 4.2 4.5 4.3
Reliance General 5.0 5.2 4.2 4.8 3.8 4.7 4.2 4.0 4.3 3.2 3.9 4.6 4.9
Royal Sundaram 4.7 4.5 5.3 4.8 4.3 4.1 4.4 4.0 3.9 4.5 4.8 4.4 4.1
SBI General 2.2 2.3 2.6 2.8 3.0 2.9 3.8 3.9 3.5 2.5 2.3 2.4 2.6
Tata-AIG 6.9 6.8 7.4 7.0 6.3 6.9 6.4 6.4 6.8 7.9 8.7 7.7 7.7
United India 6.1 6.7 6.3 6.4 5.3 5.6 6.2 6.0 5.9 5.8 6.4 6.7 6.3
Universal Sompo 1.3 1.2 1.4 1.4 1.5 1.5 1.5 1.9 1.8 1.9 1.3 2.0 2.2
Total 100.0 100.0 100.0 100.0 100.0 100.0 100.0 100.0 100.0 100.0 100.0 100.0 100.0
Total (PSU) 29.5 29.1 28.0 26.5 28.4 26.0 28.3 27.8 27.6 27.2 28.9 30.1 28.5
Total (private) 70.5 70.9 72.0 73.5 71.6 74.0 71.7 72.2 72.4 72.8 71.1 69.9 71.5
Apr-19 Jun-19 Jul-19 Aug-19 Sep-19 Oct-19 Nov-19 Dec-19 Jan-20 Feb-20 Mar-20 Apr-20 May-20 Jun-20 1QFY20 1QFY21
Acko General 3,200 1,194 945 684 709 205 141 124 128 97 (4) (62) 192 25 1,703 (2)
Bajaj Allianz 33 15 18 14 53 16 24 6 8 7 (25) (48) (35) (17) 21 (33)
Cholamandalam MS 20 19 26 22 21 17 12 (1) 1 2 (24) (37) (25) (19) 23 (26)
Go Digit 295 223 189 164 330 201 202 59 74 67 21 (36) (8) 13 23 (26)
HDFC ERGO General 28 19 29 28 93 36 27 15 (0) (2) 50 (77) 9 41 25 (9)
ICICI -Lombard 32 11 10 9 36 15 (14) (9) (8) (4) (21) (42) (16) 12 20 (17)
IFFCO -Tokio 10 20 28 14 42 11 (4) 2 27 18 (9) (50) (10) 7 14 (17)
New India (2) (9) 3 7 28 0 4 (6) 47 21 (15) (45) (8) 16 (4) (12)
Reliance General 21 34 47 21 22 21 29 12 15 20 (21) (29) (31) 1 33 (20)
Royal Sundaram (18) (7) 9 9 24 14 12 14 22 30 5 (39) (18) (12) (12) (22)
SBI General 0 (4) 21 36 79 100 105 140 836 565 167 (60) 38 99 (4) 28
Shriram General 11 6 15 14 25 16 12 9 11 7 (8) (22) (12) (9) 7 (14)
Tata-AIG 51 41 37 25 43 22 (4) (13) (8) 9 (7) (44) (27) (5) 47 (24)
United India 4 (3) 12 2 20 (0) 4 0 1 (3) (29) (59) (24) 4 1 (27)
Universal Sompo 38 8 12 25 36 20 1 25 24 41 95 (33) 16 31 18 8
Total 7 10 18 15 38 22 10 3 18 7 (5) (48) (19) 4 9 (21)
Total (PSU) (13) (4) 5 3 22 14 3 (4) 17 (8) (7) (52) (18) 8 (8) (21)
Total (private) 31 23 30 25 51 28 16 10 19 21 (4) (44) (19) 1 27 (20)
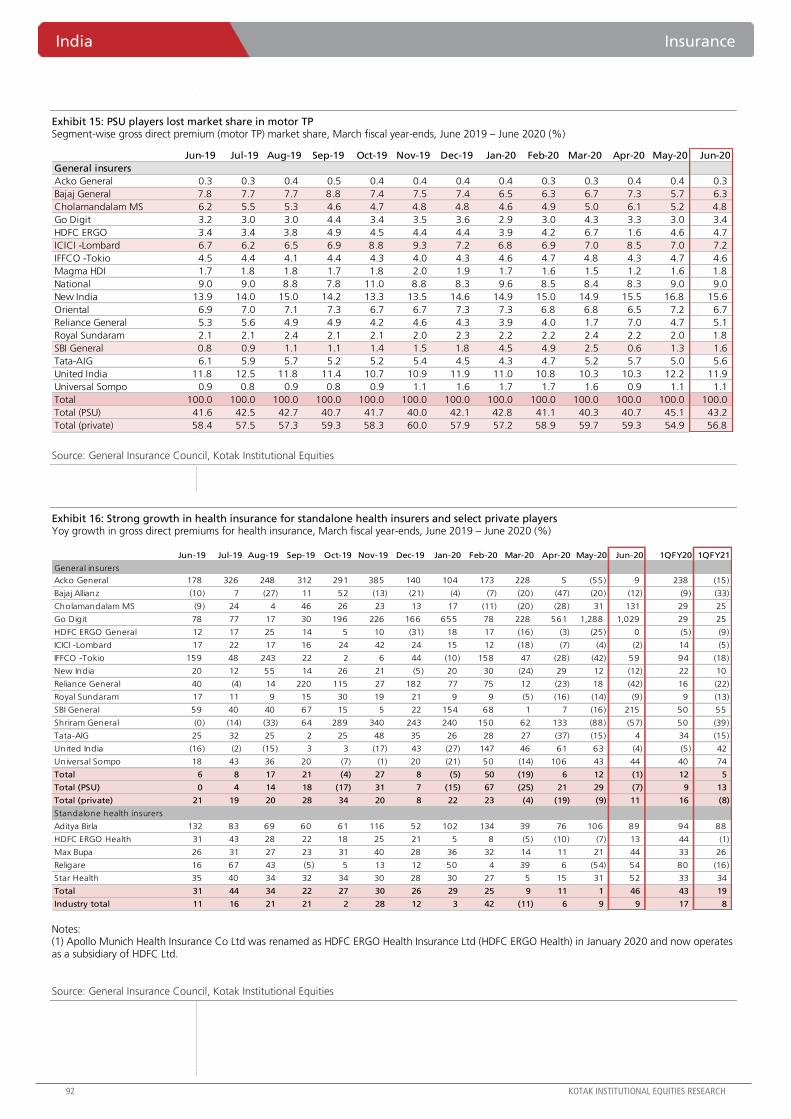
India Insurance
92 KOTAK INSTITUTIONAL EQUITIES RESEARCH
Exhibit 15: PSU players lost market share in motor TP Segment-wise gross direct premium (motor TP) market share, March fiscal year-ends, June 2019 – June 2020 (%)
Source: General Insurance Council, Kotak Institutional Equities
Exhibit 16: Strong growth in health insurance for standalone health insurers and select private players Yoy growth in gross direct premiums for health insurance, March fiscal year-ends, June 2019 – June 2020 (%)
Notes: (1) Apollo Munich Health Insurance Co Ltd was renamed as HDFC ERGO Health Insurance Ltd (HDFC ERGO Health) in January 2020 and now operates as a subsidiary of HDFC Ltd.
Source: General Insurance Council, Kotak Institutional Equities
Jun-19 Jul-19 Aug-19 Sep-19 Oct-19 Nov-19 Dec-19 Jan-20 Feb-20 Mar-20 Apr-20 May-20 Jun-20
General insurers
Acko General 0.3 0.3 0.4 0.5 0.4 0.4 0.4 0.4 0.3 0.3 0.4 0.4 0.3
Bajaj General 7.8 7.7 7.7 8.8 7.4 7.5 7.4 6.5 6.3 6.7 7.3 5.7 6.3
Cholamandalam MS 6.2 5.5 5.3 4.6 4.7 4.8 4.8 4.6 4.9 5.0 6.1 5.2 4.8
Go Digit 3.2 3.0 3.0 4.4 3.4 3.5 3.6 2.9 3.0 4.3 3.3 3.0 3.4
HDFC ERGO 3.4 3.4 3.8 4.9 4.5 4.4 4.4 3.9 4.2 6.7 1.6 4.6 4.7
ICICI -Lombard 6.7 6.2 6.5 6.9 8.8 9.3 7.2 6.8 6.9 7.0 8.5 7.0 7.2
IFFCO -Tokio 4.5 4.4 4.1 4.4 4.3 4.0 4.3 4.6 4.7 4.8 4.3 4.7 4.6
Magma HDI 1.7 1.8 1.8 1.7 1.8 2.0 1.9 1.7 1.6 1.5 1.2 1.6 1.8
National 9.0 9.0 8.8 7.8 11.0 8.8 8.3 9.6 8.5 8.4 8.3 9.0 9.0
New India 13.9 14.0 15.0 14.2 13.3 13.5 14.6 14.9 15.0 14.9 15.5 16.8 15.6
Oriental 6.9 7.0 7.1 7.3 6.7 6.7 7.3 7.3 6.8 6.8 6.5 7.2 6.7
Reliance General 5.3 5.6 4.9 4.9 4.2 4.6 4.3 3.9 4.0 1.7 7.0 4.7 5.1
Royal Sundaram 2.1 2.1 2.4 2.1 2.1 2.0 2.3 2.2 2.2 2.4 2.2 2.0 1.8
SBI General 0.8 0.9 1.1 1.1 1.4 1.5 1.8 4.5 4.9 2.5 0.6 1.3 1.6
Tata-AIG 6.1 5.9 5.7 5.2 5.2 5.4 4.5 4.3 4.7 5.2 5.7 5.0 5.6
United India 11.8 12.5 11.8 11.4 10.7 10.9 11.9 11.0 10.8 10.3 10.3 12.2 11.9
Universal Sompo 0.9 0.8 0.9 0.8 0.9 1.1 1.6 1.7 1.7 1.6 0.9 1.1 1.1
Total 100.0 100.0 100.0 100.0 100.0 100.0 100.0 100.0 100.0 100.0 100.0 100.0 100.0
Total (PSU) 41.6 42.5 42.7 40.7 41.7 40.0 42.1 42.8 41.1 40.3 40.7 45.1 43.2
Total (private) 58.4 57.5 57.3 59.3 58.3 60.0 57.9 57.2 58.9 59.7 59.3 54.9 56.8
Jun-19 Jul-19 Aug-19 Sep-19 Oct-19 Nov-19 Dec-19 Jan-20 Feb-20 Mar-20 Apr-20 May-20 Jun-20 1QFY20 1QFY21
General insurers
Acko General 178 326 248 312 291 385 140 104 173 228 5 (55) 9 238 (15)
Bajaj Allianz (10) 7 (27) 11 52 (13) (21) (4) (7) (20) (47) (20) (12) (9) (33)
Cholamandalam MS (9) 24 4 46 26 23 13 17 (11) (20) (28) 31 131 29 25
Go Digit 78 77 17 30 196 226 166 655 78 228 561 1,288 1,029 29 25
HDFC ERGO General 12 17 25 14 5 10 (31) 18 17 (16) (3) (25) 0 (5) (9)
ICICI -Lombard 17 22 17 16 24 42 24 15 12 (18) (7) (4) (2) 14 (5)
IFFCO -Tokio 159 48 243 22 2 6 44 (10) 158 47 (28) (42) 59 94 (18)
New India 20 12 55 14 26 21 (5) 20 30 (24) 29 12 (12) 22 10
Reliance General 40 (4) 14 220 115 27 182 77 75 12 (23) 18 (42) 16 (22)
Royal Sundaram 17 11 9 15 30 19 21 9 9 (5) (16) (14) (9) 9 (13)
SBI General 59 40 40 67 15 5 22 154 68 1 7 (16) 215 50 55
Shriram General (0) (14) (33) 64 289 340 243 240 150 62 133 (88) (57) 50 (39)
Tata-AIG 25 32 25 2 25 48 35 26 28 27 (37) (15) 4 34 (15)
United India (16) (2) (15) 3 3 (17) 43 (27) 147 46 61 63 (4) (5) 42
Universal Sompo 18 43 36 20 (7) (1) 20 (21) 50 (14) 106 43 44 40 74
Total 6 8 17 21 (4) 27 8 (5) 50 (19) 6 12 (1) 12 5
Total (PSU) 0 4 14 18 (17) 31 7 (15) 67 (25) 21 29 (7) 9 13
Total (private) 21 19 20 28 34 20 8 22 23 (4) (19) (9) 11 16 (8)
Standalone health insurers
Aditya Birla 132 83 69 60 61 116 52 102 134 39 76 106 89 94 88
HDFC ERGO Health 31 43 28 22 18 25 21 5 8 (5) (10) (7) 13 44 (1)
Max Bupa 26 31 27 23 31 40 28 36 32 14 11 21 44 33 26
Religare 16 67 43 (5) 5 13 12 50 4 39 6 (54) 54 80 (16)
Star Health 35 40 34 32 34 30 28 30 27 5 15 31 52 33 34
Total 31 44 34 22 27 30 26 29 25 9 11 1 46 43 19
Industry total 11 16 21 21 2 28 12 3 42 (11) 6 9 9 17 8
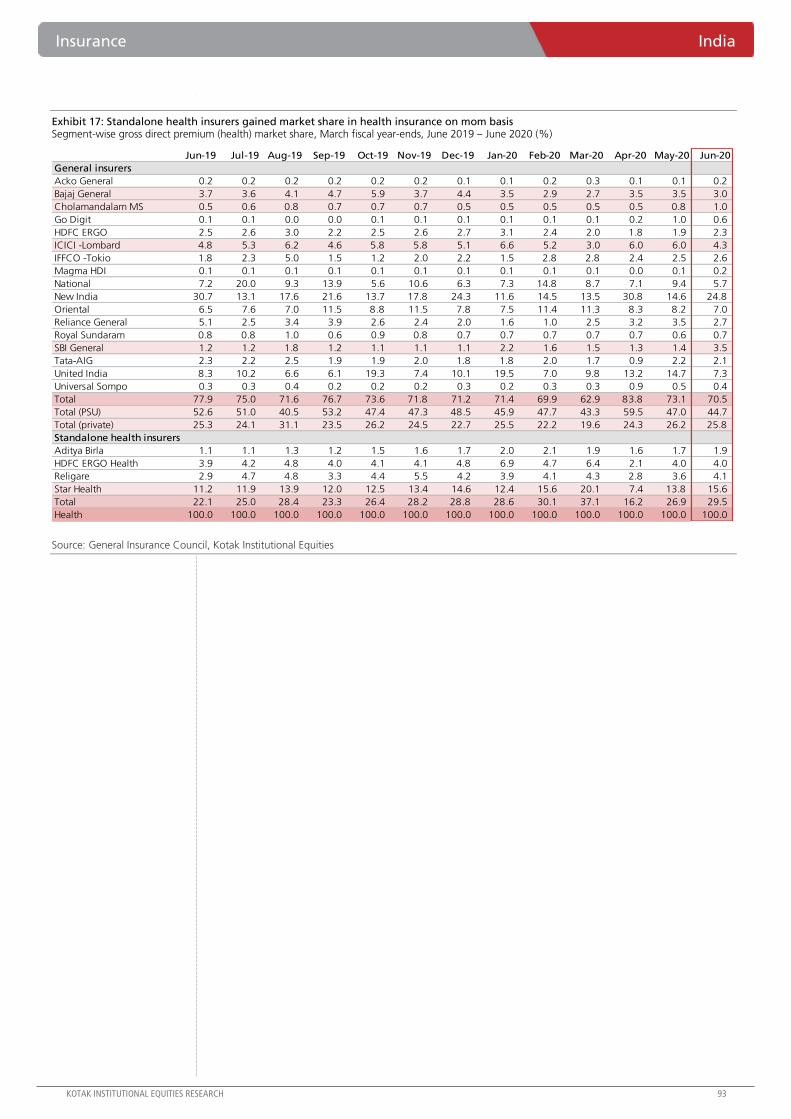
Insurance India
KOTAK INSTITUTIONAL EQUITIES RESEARCH 93
Exhibit 17: Standalone health insurers gained market share in health insurance on mom basis Segment-wise gross direct premium (health) market share, March fiscal year-ends, June 2019 – June 2020 (%)
Source: General Insurance Council, Kotak Institutional Equities
Jun-19 Jul-19 Aug-19 Sep-19 Oct-19 Nov-19 Dec-19 Jan-20 Feb-20 Mar-20 Apr-20 May-20 Jun-20
General insurers
Acko General 0.2 0.2 0.2 0.2 0.2 0.2 0.1 0.1 0.2 0.3 0.1 0.1 0.2
Bajaj General 3.7 3.6 4.1 4.7 5.9 3.7 4.4 3.5 2.9 2.7 3.5 3.5 3.0
Cholamandalam MS 0.5 0.6 0.8 0.7 0.7 0.7 0.5 0.5 0.5 0.5 0.5 0.8 1.0
Go Digit 0.1 0.1 0.0 0.0 0.1 0.1 0.1 0.1 0.1 0.1 0.2 1.0 0.6
HDFC ERGO 2.5 2.6 3.0 2.2 2.5 2.6 2.7 3.1 2.4 2.0 1.8 1.9 2.3
ICICI -Lombard 4.8 5.3 6.2 4.6 5.8 5.8 5.1 6.6 5.2 3.0 6.0 6.0 4.3
IFFCO -Tokio 1.8 2.3 5.0 1.5 1.2 2.0 2.2 1.5 2.8 2.8 2.4 2.5 2.6
Magma HDI 0.1 0.1 0.1 0.1 0.1 0.1 0.1 0.1 0.1 0.1 0.0 0.1 0.2
National 7.2 20.0 9.3 13.9 5.6 10.6 6.3 7.3 14.8 8.7 7.1 9.4 5.7
New India 30.7 13.1 17.6 21.6 13.7 17.8 24.3 11.6 14.5 13.5 30.8 14.6 24.8
Oriental 6.5 7.6 7.0 11.5 8.8 11.5 7.8 7.5 11.4 11.3 8.3 8.2 7.0
Reliance General 5.1 2.5 3.4 3.9 2.6 2.4 2.0 1.6 1.0 2.5 3.2 3.5 2.7
Royal Sundaram 0.8 0.8 1.0 0.6 0.9 0.8 0.7 0.7 0.7 0.7 0.7 0.6 0.7
SBI General 1.2 1.2 1.8 1.2 1.1 1.1 1.1 2.2 1.6 1.5 1.3 1.4 3.5
Tata-AIG 2.3 2.2 2.5 1.9 1.9 2.0 1.8 1.8 2.0 1.7 0.9 2.2 2.1
United India 8.3 10.2 6.6 6.1 19.3 7.4 10.1 19.5 7.0 9.8 13.2 14.7 7.3
Universal Sompo 0.3 0.3 0.4 0.2 0.2 0.2 0.3 0.2 0.3 0.3 0.9 0.5 0.4
Total 77.9 75.0 71.6 76.7 73.6 71.8 71.2 71.4 69.9 62.9 83.8 73.1 70.5
Total (PSU) 52.6 51.0 40.5 53.2 47.4 47.3 48.5 45.9 47.7 43.3 59.5 47.0 44.7
Total (private) 25.3 24.1 31.1 23.5 26.2 24.5 22.7 25.5 22.2 19.6 24.3 26.2 25.8
Standalone health insurers
Aditya Birla 1.1 1.1 1.3 1.2 1.5 1.6 1.7 2.0 2.1 1.9 1.6 1.7 1.9
HDFC ERGO Health 3.9 4.2 4.8 4.0 4.1 4.1 4.8 6.9 4.7 6.4 2.1 4.0 4.0
Religare 2.9 4.7 4.8 3.3 4.4 5.5 4.2 3.9 4.1 4.3 2.8 3.6 4.1
Star Health 11.2 11.9 13.9 12.0 12.5 13.4 14.6 12.4 15.6 20.1 7.4 13.8 15.6
Total 22.1 25.0 28.4 23.3 26.4 28.2 28.8 28.6 30.1 37.1 16.2 26.9 29.5
Health 100.0 100.0 100.0 100.0 100.0 100.0 100.0 100.0 100.0 100.0 100.0 100.0 100.0
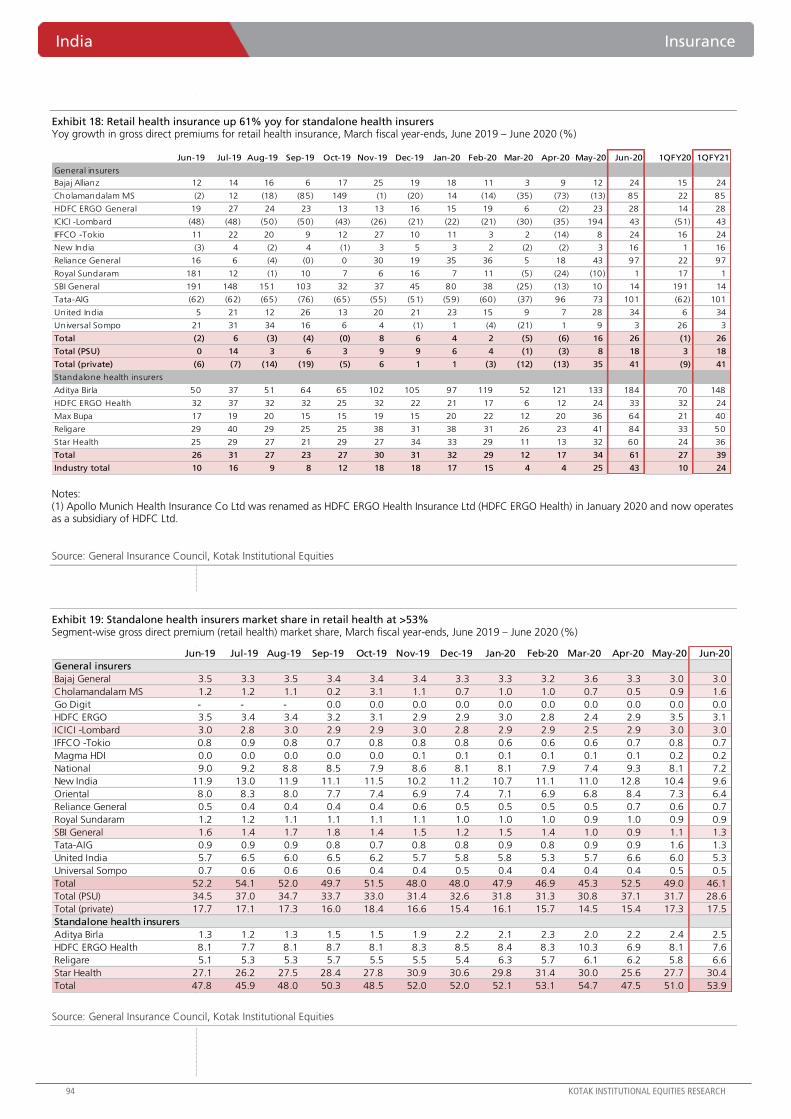
India Insurance
94 KOTAK INSTITUTIONAL EQUITIES RESEARCH
Exhibit 18: Retail health insurance up 61% yoy for standalone health insurers Yoy growth in gross direct premiums for retail health insurance, March fiscal year-ends, June 2019 – June 2020 (%)
Notes: (1) Apollo Munich Health Insurance Co Ltd was renamed as HDFC ERGO Health Insurance Ltd (HDFC ERGO Health) in January 2020 and now operates as a subsidiary of HDFC Ltd.
Source: General Insurance Council, Kotak Institutional Equities
Exhibit 19: Standalone health insurers market share in retail health at >53% Segment-wise gross direct premium (retail health) market share, March fiscal year-ends, June 2019 – June 2020 (%)
Source: General Insurance Council, Kotak Institutional Equities
Jun-19 Jul-19 Aug-19 Sep-19 Oct-19 Nov-19 Dec-19 Jan-20 Feb-20 Mar-20 Apr-20 May-20 Jun-20 1QFY20 1QFY21
General insurers
Bajaj Allianz 12 14 16 6 17 25 19 18 11 3 9 12 24 15 24
Cholamandalam MS (2) 12 (18) (85) 149 (1) (20) 14 (14) (35) (73) (13) 85 22 85
HDFC ERGO General 19 27 24 23 13 13 16 15 19 6 (2) 23 28 14 28
ICICI -Lombard (48) (48) (50) (50) (43) (26) (21) (22) (21) (30) (35) 194 43 (51) 43
IFFCO -Tokio 11 22 20 9 12 27 10 11 3 2 (14) 8 24 16 24
New India (3) 4 (2) 4 (1) 3 5 3 2 (2) (2) 3 16 1 16
Reliance General 16 6 (4) (0) 0 30 19 35 36 5 18 43 97 22 97
Royal Sundaram 181 12 (1) 10 7 6 16 7 11 (5) (24) (10) 1 17 1
SBI General 191 148 151 103 32 37 45 80 38 (25) (13) 10 14 191 14
Tata-AIG (62) (62) (65) (76) (65) (55) (51) (59) (60) (37) 96 73 101 (62) 101
United India 5 21 12 26 13 20 21 23 15 9 7 28 34 6 34
Universal Sompo 21 31 34 16 6 4 (1) 1 (4) (21) 1 9 3 26 3
Total (2) 6 (3) (4) (0) 8 6 4 2 (5) (6) 16 26 (1) 26
Total (PSU) 0 14 3 6 3 9 9 6 4 (1) (3) 8 18 3 18
Total (private) (6) (7) (14) (19) (5) 6 1 1 (3) (12) (13) 35 41 (9) 41
Standalone health insurers
Aditya Birla 50 37 51 64 65 102 105 97 119 52 121 133 184 70 148
HDFC ERGO Health 32 37 32 32 25 32 22 21 17 6 12 24 33 32 24
Max Bupa 17 19 20 15 15 19 15 20 22 12 20 36 64 21 40
Religare 29 40 29 25 25 38 31 38 31 26 23 41 84 33 50
Star Health 25 29 27 21 29 27 34 33 29 11 13 32 60 24 36
Total 26 31 27 23 27 30 31 32 29 12 17 34 61 27 39
Industry total 10 16 9 8 12 18 18 17 15 4 4 25 43 10 24
Jun-19 Jul-19 Aug-19 Sep-19 Oct-19 Nov-19 Dec-19 Jan-20 Feb-20 Mar-20 Apr-20 May-20 Jun-20
General insurers
Bajaj General 3.5 3.3 3.5 3.4 3.4 3.4 3.3 3.3 3.2 3.6 3.3 3.0 3.0
Cholamandalam MS 1.2 1.2 1.1 0.2 3.1 1.1 0.7 1.0 1.0 0.7 0.5 0.9 1.6
Go Digit - - - 0.0 0.0 0.0 0.0 0.0 0.0 0.0 0.0 0.0 0.0
HDFC ERGO 3.5 3.4 3.4 3.2 3.1 2.9 2.9 3.0 2.8 2.4 2.9 3.5 3.1
ICICI -Lombard 3.0 2.8 3.0 2.9 2.9 3.0 2.8 2.9 2.9 2.5 2.9 3.0 3.0
IFFCO -Tokio 0.8 0.9 0.8 0.7 0.8 0.8 0.8 0.6 0.6 0.6 0.7 0.8 0.7
Magma HDI 0.0 0.0 0.0 0.0 0.0 0.1 0.1 0.1 0.1 0.1 0.1 0.2 0.2
National 9.0 9.2 8.8 8.5 7.9 8.6 8.1 8.1 7.9 7.4 9.3 8.1 7.2
New India 11.9 13.0 11.9 11.1 11.5 10.2 11.2 10.7 11.1 11.0 12.8 10.4 9.6
Oriental 8.0 8.3 8.0 7.7 7.4 6.9 7.4 7.1 6.9 6.8 8.4 7.3 6.4
Reliance General 0.5 0.4 0.4 0.4 0.4 0.6 0.5 0.5 0.5 0.5 0.7 0.6 0.7
Royal Sundaram 1.2 1.2 1.1 1.1 1.1 1.1 1.0 1.0 1.0 0.9 1.0 0.9 0.9
SBI General 1.6 1.4 1.7 1.8 1.4 1.5 1.2 1.5 1.4 1.0 0.9 1.1 1.3
Tata-AIG 0.9 0.9 0.9 0.8 0.7 0.8 0.8 0.9 0.8 0.9 0.9 1.6 1.3
United India 5.7 6.5 6.0 6.5 6.2 5.7 5.8 5.8 5.3 5.7 6.6 6.0 5.3
Universal Sompo 0.7 0.6 0.6 0.6 0.4 0.4 0.5 0.4 0.4 0.4 0.4 0.5 0.5
Total 52.2 54.1 52.0 49.7 51.5 48.0 48.0 47.9 46.9 45.3 52.5 49.0 46.1
Total (PSU) 34.5 37.0 34.7 33.7 33.0 31.4 32.6 31.8 31.3 30.8 37.1 31.7 28.6
Total (private) 17.7 17.1 17.3 16.0 18.4 16.6 15.4 16.1 15.7 14.5 15.4 17.3 17.5
Standalone health insurers
Aditya Birla 1.3 1.2 1.3 1.5 1.5 1.9 2.2 2.1 2.3 2.0 2.2 2.4 2.5
HDFC ERGO Health 8.1 7.7 8.1 8.7 8.1 8.3 8.5 8.4 8.3 10.3 6.9 8.1 7.6
Religare 5.1 5.3 5.3 5.7 5.5 5.5 5.4 6.3 5.7 6.1 6.2 5.8 6.6
Star Health 27.1 26.2 27.5 28.4 27.8 30.9 30.6 29.8 31.4 30.0 25.6 27.7 30.4
Total 47.8 45.9 48.0 50.3 48.5 52.0 52.0 52.1 53.1 54.7 47.5 51.0 53.9
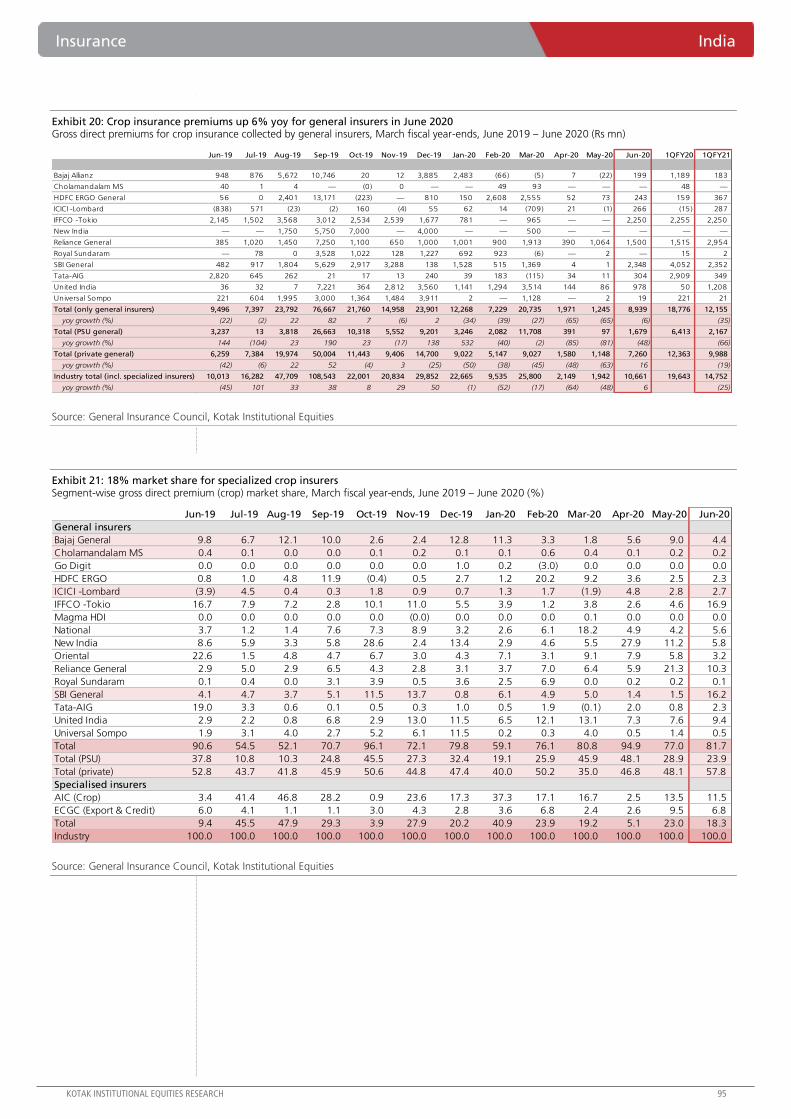
Insurance India
KOTAK INSTITUTIONAL EQUITIES RESEARCH 95
Exhibit 20: Crop insurance premiums up 6% yoy for general insurers in June 2020 Gross direct premiums for crop insurance collected by general insurers, March fiscal year-ends, June 2019 – June 2020 (Rs mn)
Source: General Insurance Council, Kotak Institutional Equities
Exhibit 21: 18% market share for specialized crop insurers Segment-wise gross direct premium (crop) market share, March fiscal year-ends, June 2019 – June 2020 (%)
Source: General Insurance Council, Kotak Institutional Equities
Jun-19 Jul-19 Aug-19 Sep-19 Oct-19 Nov-19 Dec-19 Jan-20 Feb-20 Mar-20 Apr-20 May-20 Jun-20 1QFY20 1QFY21
Bajaj Allianz 948 876 5,672 10,746 20 12 3,885 2,483 (66) (5) 7 (22) 199 1,189 183
Cholamandalam MS 40 1 4 — (0) 0 — — 49 93 — — — 48 —
HDFC ERGO General 56 0 2,401 13,171 (223) — 810 150 2,608 2,555 52 73 243 159 367
ICICI -Lombard (838) 571 (23) (2) 160 (4) 55 62 14 (709) 21 (1) 266 (15) 287
IFFCO -Tokio 2,145 1,502 3,568 3,012 2,534 2,539 1,677 781 — 965 — — 2,250 2,255 2,250
New India — — 1,750 5,750 7,000 — 4,000 — — 500 — — — — —
Reliance General 385 1,020 1,450 7,250 1,100 650 1,000 1,001 900 1,913 390 1,064 1,500 1,515 2,954
Royal Sundaram — 78 0 3,528 1,022 128 1,227 692 923 (6) — 2 — 15 2
SBI General 482 917 1,804 5,629 2,917 3,288 138 1,528 515 1,369 4 1 2,348 4,052 2,352
Tata-AIG 2,820 645 262 21 17 13 240 39 183 (115) 34 11 304 2,909 349
United India 36 32 7 7,221 364 2,812 3,560 1,141 1,294 3,514 144 86 978 50 1,208
Universal Sompo 221 604 1,995 3,000 1,364 1,484 3,911 2 — 1,128 — 2 19 221 21
Total (only general insurers) 9,496 7,397 23,792 76,667 21,760 14,958 23,901 12,268 7,229 20,735 1,971 1,245 8,939 18,776 12,155
yoy growth (%) (22) (2) 22 82 7 (6) 2 (34) (39) (27) (65) (65) (6) (35)
Total (PSU general) 3,237 13 3,818 26,663 10,318 5,552 9,201 3,246 2,082 11,708 391 97 1,679 6,413 2,167
yoy growth (%) 144 (104) 23 190 23 (17) 138 532 (40) (2) (85) (81) (48) (66)
Total (private general) 6,259 7,384 19,974 50,004 11,443 9,406 14,700 9,022 5,147 9,027 1,580 1,148 7,260 12,363 9,988
yoy growth (%) (42) (6) 22 52 (4) 3 (25) (50) (38) (45) (48) (63) 16 (19)
Industry total (incl. specialized insurers) 10,013 16,282 47,709 108,543 22,001 20,834 29,852 22,665 9,535 25,800 2,149 1,942 10,661 19,643 14,752
yoy growth (%) (45) 101 33 38 8 29 50 (1) (52) (17) (64) (48) 6 (25)
Jun-19 Jul-19 Aug-19 Sep-19 Oct-19 Nov-19 Dec-19 Jan-20 Feb-20 Mar-20 Apr-20 May-20 Jun-20
General insurers
Bajaj General 9.8 6.7 12.1 10.0 2.6 2.4 12.8 11.3 3.3 1.8 5.6 9.0 4.4
Cholamandalam MS 0.4 0.1 0.0 0.0 0.1 0.2 0.1 0.1 0.6 0.4 0.1 0.2 0.2
Go Digit 0.0 0.0 0.0 0.0 0.0 0.0 1.0 0.2 (3.0) 0.0 0.0 0.0 0.0
HDFC ERGO 0.8 1.0 4.8 11.9 (0.4) 0.5 2.7 1.2 20.2 9.2 3.6 2.5 2.3
ICICI -Lombard (3.9) 4.5 0.4 0.3 1.8 0.9 0.7 1.3 1.7 (1.9) 4.8 2.8 2.7
IFFCO -Tokio 16.7 7.9 7.2 2.8 10.1 11.0 5.5 3.9 1.2 3.8 2.6 4.6 16.9
Magma HDI 0.0 0.0 0.0 0.0 0.0 (0.0) 0.0 0.0 0.0 0.1 0.0 0.0 0.0
National 3.7 1.2 1.4 7.6 7.3 8.9 3.2 2.6 6.1 18.2 4.9 4.2 5.6
New India 8.6 5.9 3.3 5.8 28.6 2.4 13.4 2.9 4.6 5.5 27.9 11.2 5.8
Oriental 22.6 1.5 4.8 4.7 6.7 3.0 4.3 7.1 3.1 9.1 7.9 5.8 3.2
Reliance General 2.9 5.0 2.9 6.5 4.3 2.8 3.1 3.7 7.0 6.4 5.9 21.3 10.3
Royal Sundaram 0.1 0.4 0.0 3.1 3.9 0.5 3.6 2.5 6.9 0.0 0.2 0.2 0.1
SBI General 4.1 4.7 3.7 5.1 11.5 13.7 0.8 6.1 4.9 5.0 1.4 1.5 16.2
Tata-AIG 19.0 3.3 0.6 0.1 0.5 0.3 1.0 0.5 1.9 (0.1) 2.0 0.8 2.3
United India 2.9 2.2 0.8 6.8 2.9 13.0 11.5 6.5 12.1 13.1 7.3 7.6 9.4
Universal Sompo 1.9 3.1 4.0 2.7 5.2 6.1 11.5 0.2 0.3 4.0 0.5 1.4 0.5
Total 90.6 54.5 52.1 70.7 96.1 72.1 79.8 59.1 76.1 80.8 94.9 77.0 81.7
Total (PSU) 37.8 10.8 10.3 24.8 45.5 27.3 32.4 19.1 25.9 45.9 48.1 28.9 23.9
Total (private) 52.8 43.7 41.8 45.9 50.6 44.8 47.4 40.0 50.2 35.0 46.8 48.1 57.8
Specialised insurers
AIC (Crop) 3.4 41.4 46.8 28.2 0.9 23.6 17.3 37.3 17.1 16.7 2.5 13.5 11.5
ECGC (Export & Credit) 6.0 4.1 1.1 1.1 3.0 4.3 2.8 3.6 6.8 2.4 2.6 9.5 6.8
Total 9.4 45.5 47.9 29.3 3.9 27.9 20.2 40.9 23.9 19.2 5.1 23.0 18.3
Industry 100.0 100.0 100.0 100.0 100.0 100.0 100.0 100.0 100.0 100.0 100.0 100.0 100.0
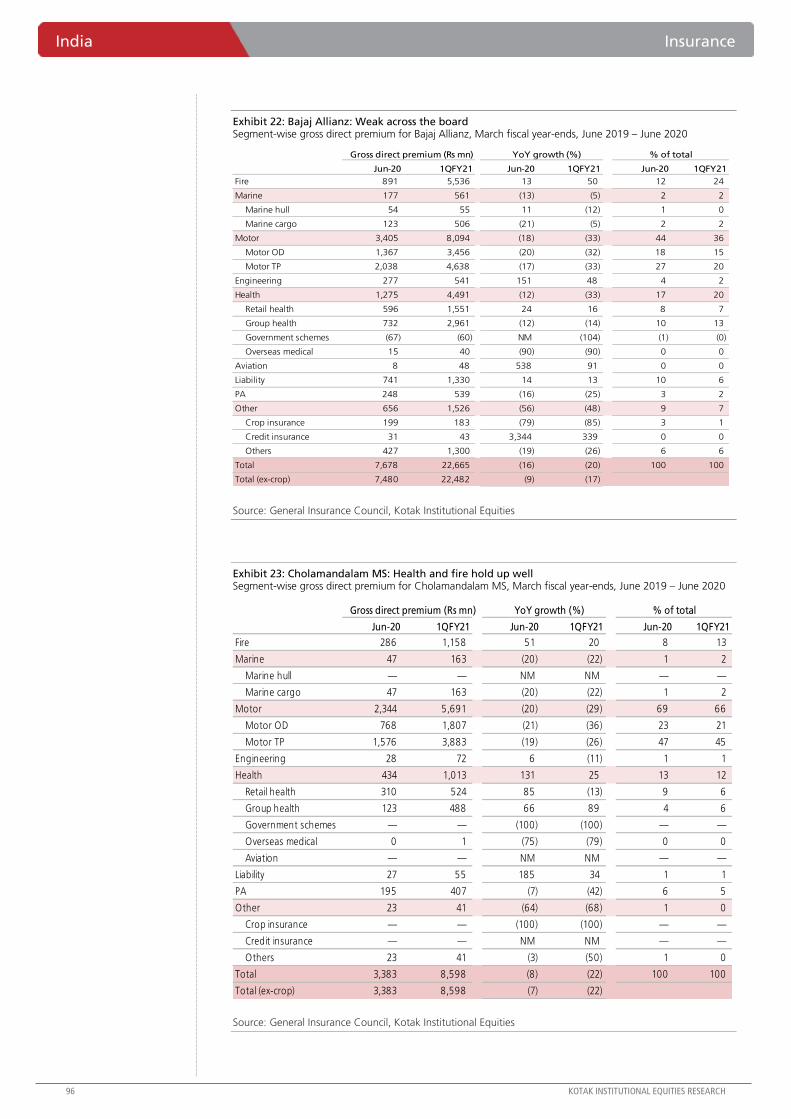
India Insurance
96 KOTAK INSTITUTIONAL EQUITIES RESEARCH
Exhibit 22: Bajaj Allianz: Weak across the board Segment-wise gross direct premium for Bajaj Allianz, March fiscal year-ends, June 2019 – June 2020
Source: General Insurance Council, Kotak Institutional Equities
Exhibit 23: Cholamandalam MS: Health and fire hold up well Segment-wise gross direct premium for Cholamandalam MS, March fiscal year-ends, June 2019 – June 2020
Source: General Insurance Council, Kotak Institutional Equities
Gross direct premium (Rs mn) YoY growth (%) % of total
Jun-20 1QFY21 Jun-20 1QFY21 Jun-20 1QFY21
Fire 891 5,536 13 50 12 24
Marine 177 561 (13) (5) 2 2
Marine hull 54 55 11 (12) 1 0
Marine cargo 123 506 (21) (5) 2 2
Motor 3,405 8,094 (18) (33) 44 36
Motor OD 1,367 3,456 (20) (32) 18 15
Motor TP 2,038 4,638 (17) (33) 27 20
Engineering 277 541 151 48 4 2
Health 1,275 4,491 (12) (33) 17 20
Retail health 596 1,551 24 16 8 7
Group health 732 2,961 (12) (14) 10 13
Government schemes (67) (60) NM (104) (1) (0)
Overseas medical 15 40 (90) (90) 0 0
Aviation 8 48 538 91 0 0
Liability 741 1,330 14 13 10 6
PA 248 539 (16) (25) 3 2
Other 656 1,526 (56) (48) 9 7
Crop insurance 199 183 (79) (85) 3 1
Credit insurance 31 43 3,344 339 0 0
Others 427 1,300 (19) (26) 6 6
Total 7,678 22,665 (16) (20) 100 100
Total (ex-crop) 7,480 22,482 (9) (17)
Gross direct premium (Rs mn) YoY growth (%) % of total
Jun-20 1QFY21 Jun-20 1QFY21 Jun-20 1QFY21
Fire 286 1,158 51 20 8 13
Marine 47 163 (20) (22) 1 2
Marine hull — — NM NM — —
Marine cargo 47 163 (20) (22) 1 2
Motor 2,344 5,691 (20) (29) 69 66
Motor OD 768 1,807 (21) (36) 23 21
Motor TP 1,576 3,883 (19) (26) 47 45
Engineering 28 72 6 (11) 1 1
Health 434 1,013 131 25 13 12
Retail health 310 524 85 (13) 9 6
Group health 123 488 66 89 4 6
Government schemes — — (100) (100) — —
Overseas medical 0 1 (75) (79) 0 0
Aviation — — NM NM — —
Liability 27 55 185 34 1 1
PA 195 407 (7) (42) 6 5
Other 23 41 (64) (68) 1 0
Crop insurance — — (100) (100) — —
Credit insurance — — NM NM — —
Others 23 41 (3) (50) 1 0
Total 3,383 8,598 (8) (22) 100 100
Total (ex-crop) 3,383 8,598 (7) (22)
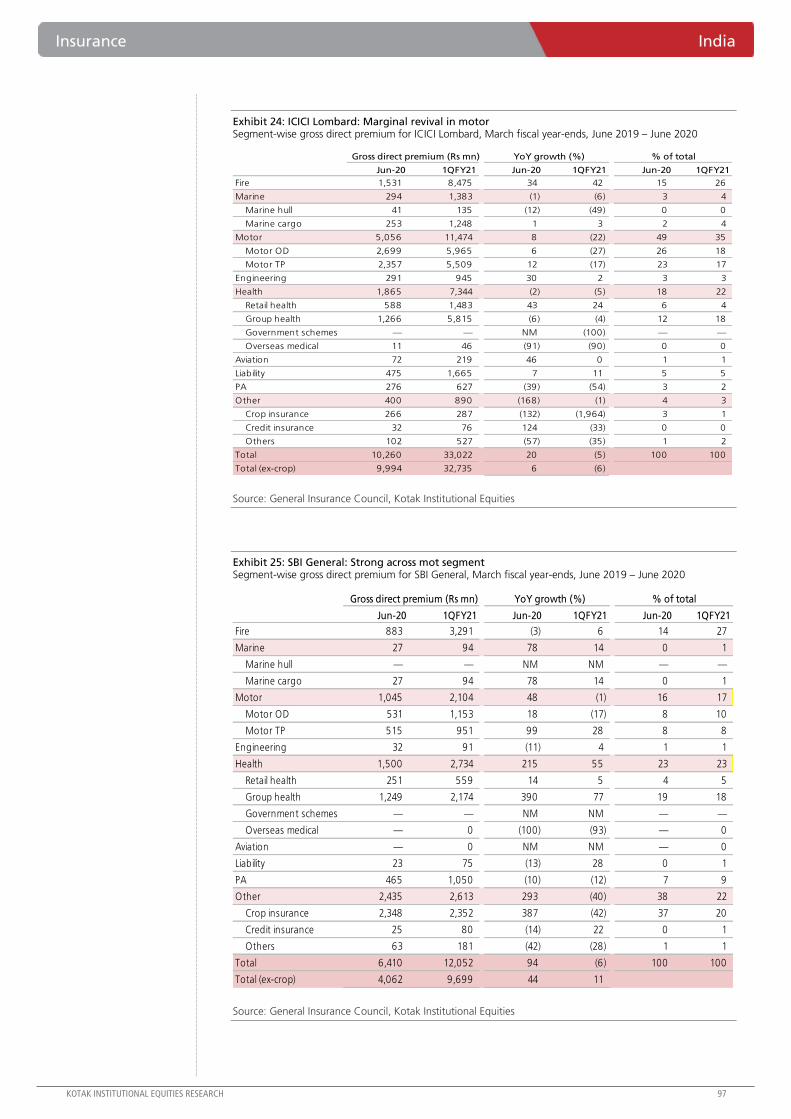
Insurance India
KOTAK INSTITUTIONAL EQUITIES RESEARCH 97
Exhibit 24: ICICI Lombard: Marginal revival in motor Segment-wise gross direct premium for ICICI Lombard, March fiscal year-ends, June 2019 – June 2020
Source: General Insurance Council, Kotak Institutional Equities
Exhibit 25: SBI General: Strong across mot segment Segment-wise gross direct premium for SBI General, March fiscal year-ends, June 2019 – June 2020
Source: General Insurance Council, Kotak Institutional Equities
Gross direct premium (Rs mn) YoY growth (%) % of total
Jun-20 1QFY21 Jun-20 1QFY21 Jun-20 1QFY21
Fire 1,531 8,475 34 42 15 26
Marine 294 1,383 (1) (6) 3 4
Marine hull 41 135 (12) (49) 0 0
Marine cargo 253 1,248 1 3 2 4
Motor 5,056 11,474 8 (22) 49 35
Motor OD 2,699 5,965 6 (27) 26 18
Motor TP 2,357 5,509 12 (17) 23 17
Engineering 291 945 30 2 3 3
Health 1,865 7,344 (2) (5) 18 22
Retail health 588 1,483 43 24 6 4
Group health 1,266 5,815 (6) (4) 12 18
Government schemes — — NM (100) — —
Overseas medical 11 46 (91) (90) 0 0
Aviation 72 219 46 0 1 1
Liability 475 1,665 7 11 5 5
PA 276 627 (39) (54) 3 2
Other 400 890 (168) (1) 4 3
Crop insurance 266 287 (132) (1,964) 3 1
Credit insurance 32 76 124 (33) 0 0
Others 102 527 (57) (35) 1 2
Total 10,260 33,022 20 (5) 100 100
Total (ex-crop) 9,994 32,735 6 (6)
Gross direct premium (Rs mn) YoY growth (%) % of total
Jun-20 1QFY21 Jun-20 1QFY21 Jun-20 1QFY21
Fire 883 3,291 (3) 6 14 27
Marine 27 94 78 14 0 1
Marine hull — — NM NM — —
Marine cargo 27 94 78 14 0 1
Motor 1,045 2,104 48 (1) 16 17
Motor OD 531 1,153 18 (17) 8 10
Motor TP 515 951 99 28 8 8
Engineering 32 91 (11) 4 1 1
Health 1,500 2,734 215 55 23 23
Retail health 251 559 14 5 4 5
Group health 1,249 2,174 390 77 19 18
Government schemes — — NM NM — —
Overseas medical — 0 (100) (93) — 0
Aviation — 0 NM NM — 0
Liability 23 75 (13) 28 0 1
PA 465 1,050 (10) (12) 7 9
Other 2,435 2,613 293 (40) 38 22
Crop insurance 2,348 2,352 387 (42) 37 20
Credit insurance 25 80 (14) 22 0 1
Others 63 181 (42) (28) 1 1
Total 6,410 12,052 94 (6) 100 100
Total (ex-crop) 4,062 9,699 44 11
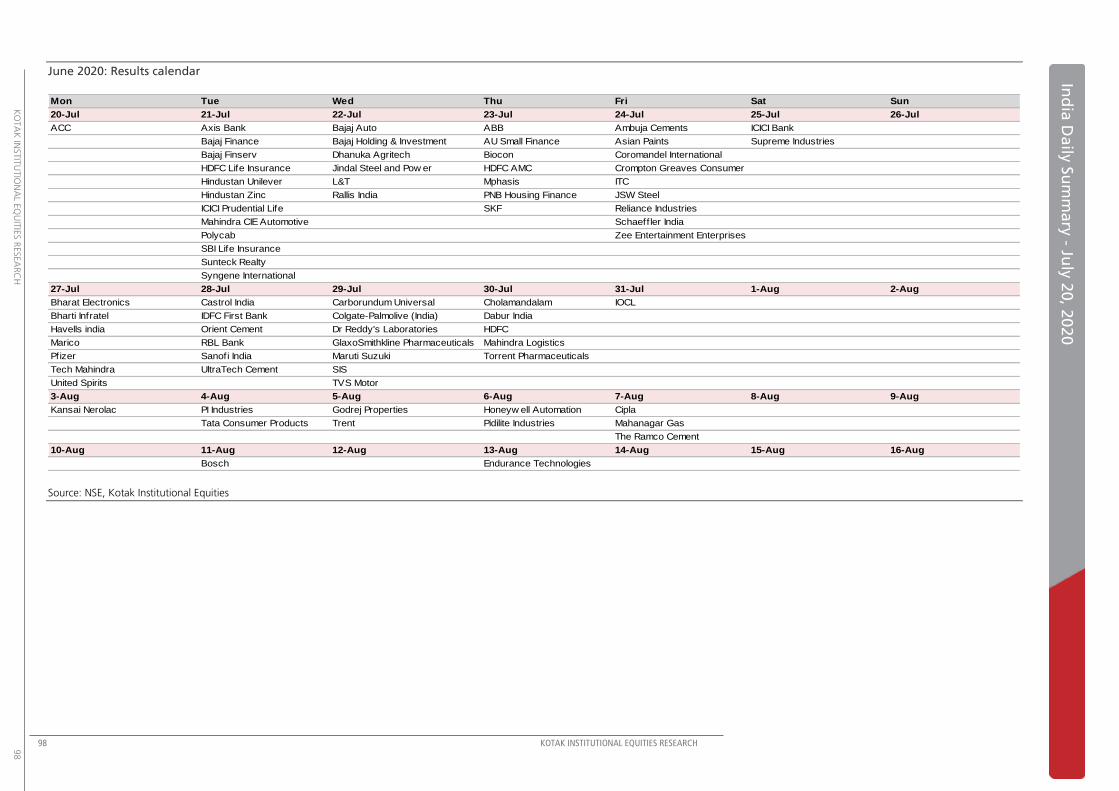
98 KOTAK INSTITUTIONAL EQUITIES RESEARCH
KO
TA
K IN
STIT
UTIO
NA
L EQ
UIT
IES R
ESEA
RC
H
98
Ind
ia D
aily
Su
mm
ary
- July
20, 2
02
0
June 2020: Results calendar
Source: NSE, Kotak Institutional Equities
Mon Tue Wed Thu Fri Sat Sun
20-Jul 21-Jul 22-Jul 23-Jul 24-Jul 25-Jul 26-Jul
ACC Axis Bank Bajaj Auto ABB Ambuja Cements ICICI Bank
Bajaj Finance Bajaj Holding & Investment AU Small Finance Asian Paints Supreme Industries
Bajaj Finserv Dhanuka Agritech Biocon Coromandel International
HDFC Life Insurance Jindal Steel and Pow er HDFC AMC Crompton Greaves Consumer
Hindustan Unilever L&T Mphasis ITC
Hindustan Zinc Rallis India PNB Housing Finance JSW Steel
ICICI Prudential Life SKF Reliance Industries
Mahindra CIE Automotive Schaeffler India
Polycab Zee Entertainment Enterprises
SBI Life Insurance
Sunteck Realty
Syngene International
27-Jul 28-Jul 29-Jul 30-Jul 31-Jul 1-Aug 2-Aug
Bharat Electronics Castrol India Carborundum Universal Cholamandalam IOCL
Bharti Infratel IDFC First Bank Colgate-Palmolive (India) Dabur India
Havells india Orient Cement Dr Reddy's Laboratories HDFC
Marico RBL Bank GlaxoSmithkline Pharmaceuticals Mahindra Logistics
Pfizer Sanofi India Maruti Suzuki Torrent Pharmaceuticals
Tech Mahindra UltraTech Cement SIS
United Spirits TVS Motor
3-Aug 4-Aug 5-Aug 6-Aug 7-Aug 8-Aug 9-Aug
Kansai Nerolac PI Industries Godrej Properties Honeyw ell Automation Cipla
Tata Consumer Products Trent Pidilite Industries Mahanagar Gas
The Ramco Cement
10-Aug 11-Aug 12-Aug 13-Aug 14-Aug 15-Aug 16-Aug
Bosch Endurance Technologies
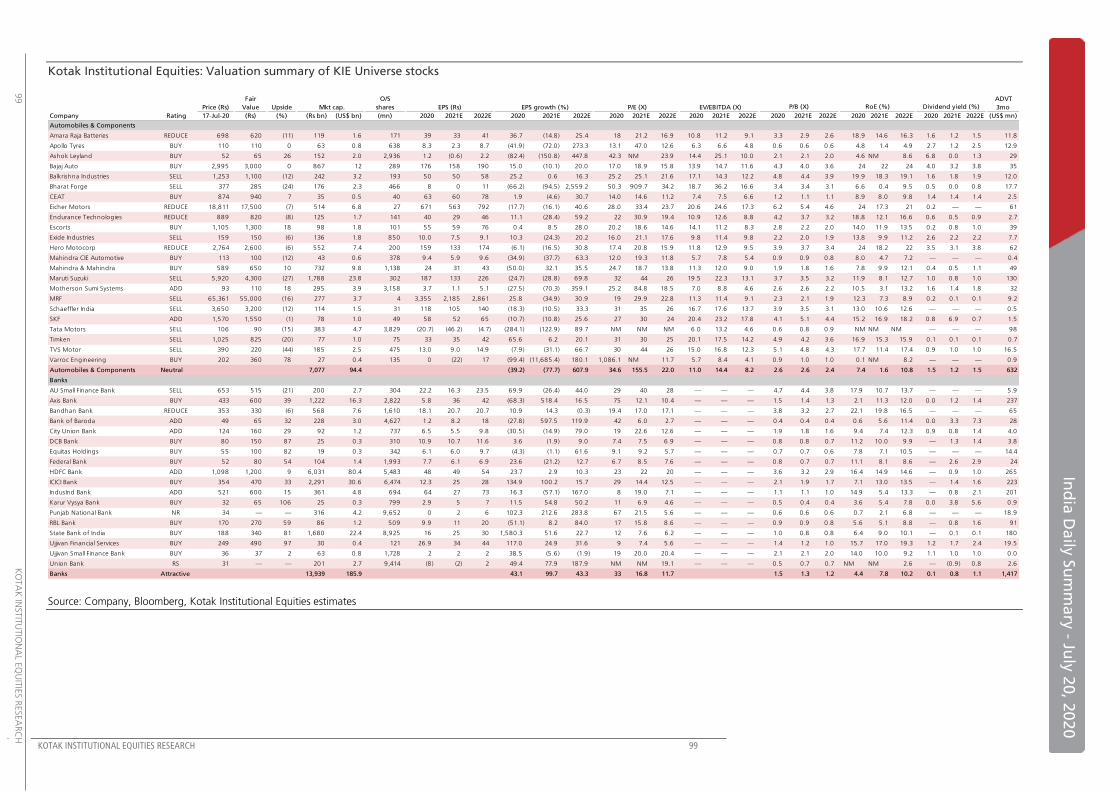
KOTAK INSTITUTIONAL EQUITIES RESEARCH 99
In
dia
Da
ily S
um
ma
ry - Ju
ly 2
0, 2
02
0
99
K
OTA
K IN
STIT
UTIO
NA
L EQ
UIT
IES R
ESEA
RC
H
Kotak Institutional Equities: Valuation summary of KIE Universe stocks
Source: Company, Bloomberg, Kotak Institutional Equities estimates
Fair O/S ADVT
Price (Rs) Value Upside Mkt cap. shares EPS (Rs) EPS growth (%) P/E (X) EV/EBITDA (X) 3mo
Company Rating 17-Jul-20 (Rs) (%) (Rs bn) (US$ bn) (mn) 2020 2021E 2022E 2020 2021E 2022E 2020 2021E 2022E 2020 2021E 2022E 2020 2021E 2022E 2020 2021E 2022E 2020 2021E 2022E (US$ mn)
Automobiles & Components
Amara Raja Batteries REDUCE 698 620 (11) 119 1.6 171 39 33 41 36.7 (14.8) 25.4 18 21.2 16.9 10.8 11.2 9.1 3.3 2.9 2.6 18.9 14.6 16.3 1.6 1.2 1.5 11.8
Apollo Tyres BUY 110 110 0 63 0.8 638 8.3 2.3 8.7 (41.9) (72.0) 273.3 13.1 47.0 12.6 6.3 6.6 4.8 0.6 0.6 0.6 4.8 1.4 4.9 2.7 1.2 2.5 12.9
Ashok Leyland BUY 52 65 26 152 2.0 2,936 1.2 (0.6) 2.2 (82.4) (150.8) 447.8 42.3 NM 23.9 14.4 25.1 10.0 2.1 2.1 2.0 4.6 NM 8.6 6.8 0.0 1.3 29
Bajaj Auto BUY 2,995 3,000 0 867 12 289 176 158 190 15.0 (10.1) 20.0 17.0 18.9 15.8 13.9 14.7 11.6 4.3 4.0 3.6 24 22 24 4.0 3.2 3.8 35
Balkrishna Industries SELL 1,253 1,100 (12) 242 3.2 193 50 50 58 25.2 0.6 16.3 25.2 25.1 21.6 17.1 14.3 12.2 4.8 4.4 3.9 19.9 18.3 19.1 1.6 1.8 1.9 12.0
Bharat Forge SELL 377 285 (24) 176 2.3 466 8 0 11 (66.2) (94.5) 2,559.2 50.3 909.7 34.2 18.7 36.2 16.6 3.4 3.4 3.1 6.6 0.4 9.5 0.5 0.0 0.8 17.7
CEAT BUY 874 940 7 35 0.5 40 63 60 78 1.9 (4.6) 30.7 14.0 14.6 11.2 7.4 7.5 6.6 1.2 1.1 1.1 8.9 8.0 9.8 1.4 1.4 1.4 2.5
Eicher Motors REDUCE 18,811 17,500 (7) 514 6.8 27 671 563 792 (17.7) (16.1) 40.6 28.0 33.4 23.7 20.6 24.6 17.3 6.2 5.4 4.6 24 17.3 21 0.2 — — 61
Endurance Technologies REDUCE 889 820 (8) 125 1.7 141 40 29 46 11.1 (28.4) 59.2 22 30.9 19.4 10.9 12.6 8.8 4.2 3.7 3.2 18.8 12.1 16.6 0.6 0.5 0.9 2.7
Escorts BUY 1,105 1,300 18 98 1.8 101 55 59 76 0.4 8.5 28.0 20.2 18.6 14.6 14.1 11.2 8.3 2.8 2.2 2.0 14.0 11.9 13.5 0.2 0.8 1.0 39
Exide Industries SELL 159 150 (6) 136 1.8 850 10.0 7.5 9.1 10.3 (24.3) 20.2 16.0 21.1 17.6 9.8 11.4 9.8 2.2 2.0 1.9 13.8 9.9 11.2 2.6 2.2 2.2 7.7
Hero Motocorp REDUCE 2,764 2,600 (6) 552 7.4 200 159 133 174 (6.1) (16.5) 30.8 17.4 20.8 15.9 11.8 12.9 9.5 3.9 3.7 3.4 24 18.2 22 3.5 3.1 3.8 62
Mahindra CIE Automotive BUY 113 100 (12) 43 0.6 378 9.4 5.9 9.6 (34.9) (37.7) 63.3 12.0 19.3 11.8 5.7 7.8 5.4 0.9 0.9 0.8 8.0 4.7 7.2 — — — 0.4
Mahindra & Mahindra BUY 589 650 10 732 9.8 1,138 24 31 43 (50.0) 32.1 35.5 24.7 18.7 13.8 11.3 12.0 9.0 1.9 1.8 1.6 7.8 9.9 12.1 0.4 0.5 1.1 49
Maruti Suzuki SELL 5,920 4,300 (27) 1,788 23.8 302 187 133 226 (24.7) (28.8) 69.8 32 44 26 19.5 22.3 13.1 3.7 3.5 3.2 11.9 8.1 12.7 1.0 0.8 1.0 130
Motherson Sumi Systems ADD 93 110 18 295 3.9 3,158 3.7 1.1 5.1 (27.5) (70.3) 359.1 25.2 84.8 18.5 7.0 8.8 4.6 2.6 2.6 2.2 10.5 3.1 13.2 1.6 1.4 1.8 32
MRF SELL 65,361 55,000 (16) 277 3.7 4 3,355 2,185 2,861 25.8 (34.9) 30.9 19 29.9 22.8 11.3 11.4 9.1 2.3 2.1 1.9 12.3 7.3 8.9 0.2 0.1 0.1 9.2
Schaeffler India SELL 3,650 3,200 (12) 114 1.5 31 118 105 140 (18.3) (10.5) 33.3 31 35 26 16.7 17.6 13.7 3.9 3.5 3.1 13.0 10.6 12.6 — — — 0.5
SKF ADD 1,570 1,550 (1) 78 1.0 49 58 52 65 (10.7) (10.8) 25.6 27 30 24 20.4 23.2 17.8 4.1 5.1 4.4 15.2 16.9 18.2 0.8 6.9 0.7 1.5
Tata Motors SELL 106 90 (15) 383 4.7 3,829 (20.7) (46.2) (4.7) (284.1) (122.9) 89.7 NM NM NM 6.0 13.2 4.6 0.6 0.8 0.9 NM NM NM — — — 98
Timken SELL 1,025 825 (20) 77 1.0 75 33 35 42 65.6 6.2 20.1 31 30 25 20.1 17.5 14.2 4.9 4.2 3.6 16.9 15.3 15.9 0.1 0.1 0.1 0.7
TVS Motor SELL 390 220 (44) 185 2.5 475 13.0 9.0 14.9 (7.9) (31.1) 66.7 30 44 26 15.0 16.8 12.3 5.1 4.8 4.3 17.7 11.4 17.4 0.9 1.0 1.0 16.5
Varroc Engineering BUY 202 360 78 27 0.4 135 0 (22) 17 (99.4) (11,685.4) 180.1 1,086.1 NM 11.7 5.7 8.4 4.1 0.9 1.0 1.0 0.1 NM 8.2 — — — 0.9
Automobiles & Components Neutral 7,077 94.4 (39.2) (77.7) 607.9 34.6 155.5 22.0 11.0 14.4 8.2 2.6 2.6 2.4 7.4 1.6 10.8 1.5 1.2 1.5 632
Banks
AU Small Finance Bank SELL 653 515 (21) 200 2.7 304 22.2 16.3 23.5 69.9 (26.4) 44.0 29 40 28 — — — 4.7 4.4 3.8 17.9 10.7 13.7 — — — 5.9
Axis Bank BUY 433 600 39 1,222 16.3 2,822 5.8 36 42 (68.3) 518.4 16.5 75 12.1 10.4 — — — 1.5 1.4 1.3 2.1 11.3 12.0 0.0 1.2 1.4 237
Bandhan Bank REDUCE 353 330 (6) 568 7.6 1,610 18.1 20.7 20.7 10.9 14.3 (0.3) 19.4 17.0 17.1 — — — 3.8 3.2 2.7 22.1 19.8 16.5 — — — 65
Bank of Baroda ADD 49 65 32 228 3.0 4,627 1.2 8.2 18 (27.8) 597.5 119.9 42 6.0 2.7 — — — 0.4 0.4 0.4 0.6 5.6 11.4 0.0 3.3 7.3 28
City Union Bank ADD 124 160 29 92 1.2 737 6.5 5.5 9.8 (30.5) (14.9) 79.0 19 22.6 12.6 — — — 1.9 1.8 1.6 9.4 7.4 12.3 0.9 0.8 1.4 4.0
DCB Bank BUY 80 150 87 25 0.3 310 10.9 10.7 11.6 3.6 (1.9) 9.0 7.4 7.5 6.9 — — — 0.8 0.8 0.7 11.2 10.0 9.9 — 1.3 1.4 3.8
Equitas Holdings BUY 55 100 82 19 0.3 342 6.1 6.0 9.7 (4.3) (1.1) 61.6 9.1 9.2 5.7 — — — 0.7 0.7 0.6 7.8 7.1 10.5 — — — 14.4
Federal Bank BUY 52 80 54 104 1.4 1,993 7.7 6.1 6.9 23.6 (21.2) 12.7 6.7 8.5 7.6 — — — 0.8 0.7 0.7 11.1 8.1 8.6 — 2.6 2.9 24
HDFC Bank ADD 1,098 1,200 9 6,031 80.4 5,483 48 49 54 23.7 2.9 10.3 23 22 20 — — — 3.6 3.2 2.9 16.4 14.9 14.6 — 0.9 1.0 265
ICICI Bank BUY 354 470 33 2,291 30.6 6,474 12.3 25 28 134.9 100.2 15.7 29 14.4 12.5 — — — 2.1 1.9 1.7 7.1 13.0 13.5 — 1.4 1.6 223
IndusInd Bank ADD 521 600 15 361 4.8 694 64 27 73 16.3 (57.1) 167.0 8 19.0 7.1 — — — 1.1 1.1 1.0 14.9 5.4 13.3 — 0.8 2.1 201
Karur Vysya Bank BUY 32 65 106 25 0.3 799 2.9 5 7 11.5 54.8 50.2 11 6.9 4.6 — — — 0.5 0.4 0.4 3.6 5.4 7.8 0.0 3.8 5.6 0.9
Punjab National Bank NR 34 — — 316 4.2 9,652 0 2 6 102.3 212.6 283.8 67 21.5 5.6 — — — 0.6 0.6 0.6 0.7 2.1 6.8 — — — 18.9
RBL Bank BUY 170 270 59 86 1.2 509 9.9 11 20 (51.1) 8.2 84.0 17 15.8 8.6 — — — 0.9 0.9 0.8 5.6 5.1 8.8 — 0.8 1.6 91
State Bank of India BUY 188 340 81 1,680 22.4 8,925 16 25 30 1,580.3 51.6 22.7 12 7.6 6.2 — — — 1.0 0.8 0.8 6.4 9.0 10.1 — 0.1 0.1 180
Ujjivan Financial Services BUY 249 490 97 30 0.4 121 26.9 34 44 117.0 24.9 31.6 9 7.4 5.6 — — — 1.4 1.2 1.0 15.7 17.0 19.3 1.2 1.7 2.4 19.5
Ujjivan Small Finance Bank BUY 36 37 2 63 0.8 1,728 2 2 2 38.5 (5.6) (1.9) 19 20.0 20.4 — — — 2.1 2.1 2.0 14.0 10.0 9.2 1.1 1.0 1.0 0.0
Union Bank RS 31 — — 201 2.7 9,414 (8) (2) 2 49.4 77.9 187.9 NM NM 19.1 — — — 0.5 0.7 0.7 NM NM 2.6 — (0.9) 0.8 2.6
Banks Attractive 13,939 185.9 43.1 99.7 43.3 33 16.8 11.7 1.5 1.3 1.2 4.4 7.8 10.2 0.1 0.8 1.1 1,417
P/B (X) RoE (%) Dividend yield (%)
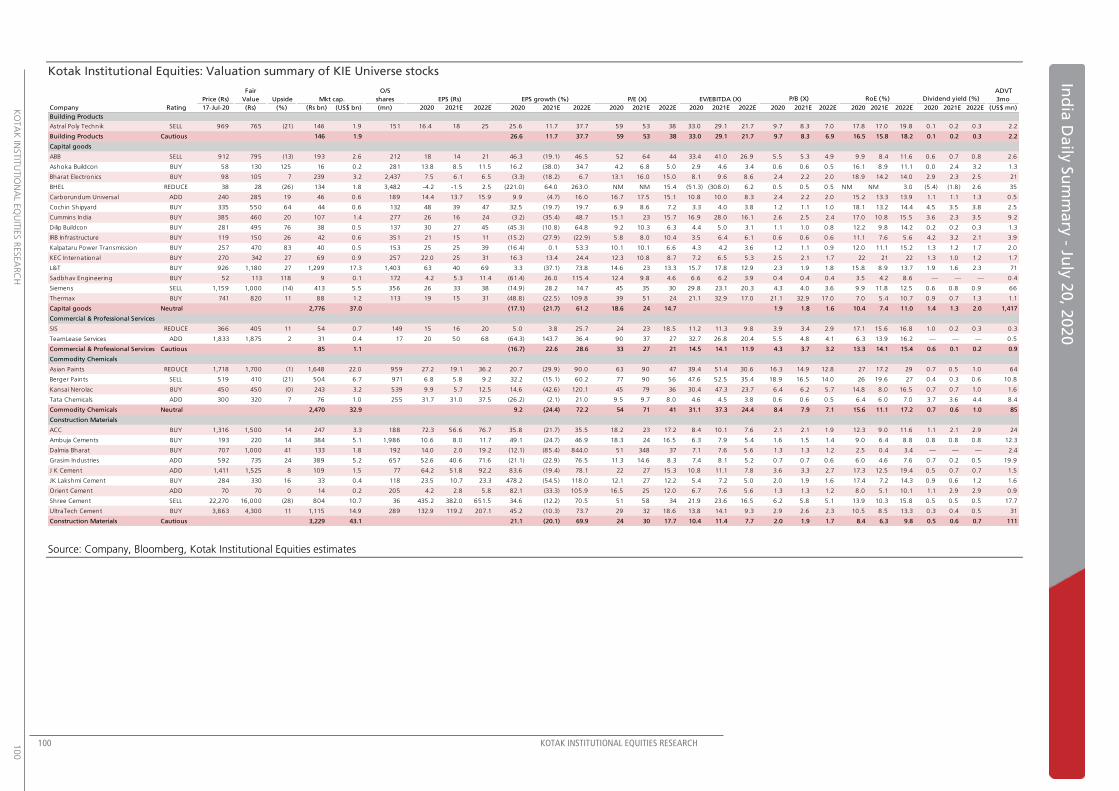
100 KOTAK INSTITUTIONAL EQUITIES RESEARCH
K
OTA
K IN
STIT
UTIO
NA
L EQ
UIT
IES R
ESEA
RC
H
100
Ind
ia D
aily
Su
mm
ary
- July
20, 2
02
0
Kotak Institutional Equities: Valuation summary of KIE Universe stocks
Source: Company, Bloomberg, Kotak Institutional Equities estimates
Fair O/S ADVT
Price (Rs) Value Upside Mkt cap. shares EPS (Rs) EPS growth (%) P/E (X) EV/EBITDA (X) 3mo
Company Rating 17-Jul-20 (Rs) (%) (Rs bn) (US$ bn) (mn) 2020 2021E 2022E 2020 2021E 2022E 2020 2021E 2022E 2020 2021E 2022E 2020 2021E 2022E 2020 2021E 2022E 2020 2021E 2022E (US$ mn)
Building Products
Astral Poly Technik SELL 969 765 (21) 146 1.9 151 16.4 18 25 25.6 11.7 37.7 59 53 38 33.0 29.1 21.7 9.7 8.3 7.0 17.8 17.0 19.8 0.1 0.2 0.3 2.2
Building Products Cautious 146 1.9 26.6 11.7 37.7 59 53 38 33.0 29.1 21.7 9.7 8.3 6.9 16.5 15.8 18.2 0.1 0.2 0.3 2.2
Capital goods
ABB SELL 912 795 (13) 193 2.6 212 18 14 21 46.3 (19.1) 46.5 52 64 44 33.4 41.0 26.9 5.5 5.3 4.9 9.9 8.4 11.6 0.6 0.7 0.8 2.6
Ashoka Buildcon BUY 58 130 125 16 0.2 281 13.8 8.5 11.5 16.2 (38.0) 34.7 4.2 6.8 5.0 2.9 4.6 3.4 0.6 0.6 0.5 16.1 8.9 11.1 0.0 2.4 3.2 1.3
Bharat Electronics BUY 98 105 7 239 3.2 2,437 7.5 6.1 6.5 (3.3) (18.2) 6.7 13.1 16.0 15.0 8.1 9.6 8.6 2.4 2.2 2.0 18.9 14.2 14.0 2.9 2.3 2.5 21
BHEL REDUCE 38 28 (26) 134 1.8 3,482 -4.2 -1.5 2.5 (221.0) 64.0 263.0 NM NM 15.4 (51.3) (308.0) 6.2 0.5 0.5 0.5 NM NM 3.0 (5.4) (1.8) 2.6 35
Carborundum Universal ADD 240 285 19 46 0.6 189 14.4 13.7 15.9 9.9 (4.7) 16.0 16.7 17.5 15.1 10.8 10.0 8.3 2.4 2.2 2.0 15.2 13.3 13.9 1.1 1.1 1.3 0.5
Cochin Shipyard BUY 335 550 64 44 0.6 132 48 39 47 32.5 (19.7) 19.7 6.9 8.6 7.2 3.3 4.0 3.8 1.2 1.1 1.0 18.1 13.2 14.4 4.5 3.5 3.8 2.5
Cummins India BUY 385 460 20 107 1.4 277 26 16 24 (3.2) (35.4) 48.7 15.1 23 15.7 16.9 28.0 16.1 2.6 2.5 2.4 17.0 10.8 15.5 3.6 2.3 3.5 9.2
Dilip Buildcon BUY 281 495 76 38 0.5 137 30 27 45 (45.3) (10.8) 64.8 9.2 10.3 6.3 4.4 5.0 3.1 1.1 1.0 0.8 12.2 9.8 14.2 0.2 0.2 0.3 1.3
IRB Infrastructure BUY 119 150 26 42 0.6 351 21 15 11 (15.2) (27.9) (22.9) 5.8 8.0 10.4 3.5 6.4 6.1 0.6 0.6 0.6 11.1 7.6 5.6 4.2 3.2 2.1 3.9
Kalpataru Power Transmission BUY 257 470 83 40 0.5 153 25 25 39 (16.4) 0.1 53.3 10.1 10.1 6.6 4.3 4.2 3.6 1.2 1.1 0.9 12.0 11.1 15.2 1.3 1.2 1.7 2.0
KEC International BUY 270 342 27 69 0.9 257 22.0 25 31 16.3 13.4 24.4 12.3 10.8 8.7 7.2 6.5 5.3 2.5 2.1 1.7 22 21 22 1.3 1.0 1.2 1.7
L&T BUY 926 1,180 27 1,299 17.3 1,403 63 40 69 3.3 (37.1) 73.8 14.6 23 13.3 15.7 17.8 12.9 2.3 1.9 1.8 15.8 8.9 13.7 1.9 1.6 2.3 71
Sadbhav Engineering BUY 52 113 118 9 0.1 172 4.2 5.3 11.4 (61.4) 26.0 115.4 12.4 9.8 4.6 6.6 6.2 3.9 0.4 0.4 0.4 3.5 4.2 8.6 — — — 0.4
Siemens SELL 1,159 1,000 (14) 413 5.5 356 26 33 38 (14.9) 28.2 14.7 45 35 30 29.8 23.1 20.3 4.3 4.0 3.6 9.9 11.8 12.5 0.6 0.8 0.9 66
Thermax BUY 741 820 11 88 1.2 113 19 15 31 (48.8) (22.5) 109.8 39 51 24 21.1 32.9 17.0 21.1 32.9 17.0 7.0 5.4 10.7 0.9 0.7 1.3 1.1
Capital goods Neutral 2,776 37.0 (17.1) (21.7) 61.2 18.6 24 14.7 1.9 1.8 1.6 10.4 7.4 11.0 1.4 1.3 2.0 1,417
Commercial & Professional Services
SIS REDUCE 366 405 11 54 0.7 149 15 16 20 5.0 3.8 25.7 24 23 18.5 11.2 11.3 9.8 3.9 3.4 2.9 17.1 15.6 16.8 1.0 0.2 0.3 0.3
TeamLease Services ADD 1,833 1,875 2 31 0.4 17 20 50 68 (64.3) 143.7 36.4 90 37 27 32.7 26.8 20.4 5.5 4.8 4.1 6.3 13.9 16.2 — — — 0.5
Commercial & Professional Services Cautious 85 1.1 (16.7) 22.6 28.6 33 27 21 14.5 14.1 11.9 4.3 3.7 3.2 13.3 14.1 15.4 0.6 0.1 0.2 0.9
Commodity Chemicals
Asian Paints REDUCE 1,718 1,700 (1) 1,648 22.0 959 27.2 19.1 36.2 20.7 (29.9) 90.0 63 90 47 39.4 51.4 30.6 16.3 14.9 12.8 27 17.2 29 0.7 0.5 1.0 64
Berger Paints SELL 519 410 (21) 504 6.7 971 6.8 5.8 9.2 32.2 (15.1) 60.2 77 90 56 47.6 52.5 35.4 18.9 16.5 14.0 26 19.6 27 0.4 0.3 0.6 10.8
Kansai Nerolac BUY 450 450 (0) 243 3.2 539 9.9 5.7 12.5 14.6 (42.6) 120.1 45 79 36 30.4 47.3 23.7 6.4 6.2 5.7 14.8 8.0 16.5 0.7 0.7 1.0 1.6
Tata Chemicals ADD 300 320 7 76 1.0 255 31.7 31.0 37.5 (26.2) (2.1) 21.0 9.5 9.7 8.0 4.6 4.5 3.8 0.6 0.6 0.5 6.4 6.0 7.0 3.7 3.6 4.4 8.4
Commodity Chemicals Neutral 2,470 32.9 9.2 (24.4) 72.2 54 71 41 31.1 37.3 24.4 8.4 7.9 7.1 15.6 11.1 17.2 0.7 0.6 1.0 85
Construction Materials
ACC BUY 1,316 1,500 14 247 3.3 188 72.3 56.6 76.7 35.8 (21.7) 35.5 18.2 23 17.2 8.4 10.1 7.6 2.1 2.1 1.9 12.3 9.0 11.6 1.1 2.1 2.9 24
Ambuja Cements BUY 193 220 14 384 5.1 1,986 10.6 8.0 11.7 49.1 (24.7) 46.9 18.3 24 16.5 6.3 7.9 5.4 1.6 1.5 1.4 9.0 6.4 8.8 0.8 0.8 0.8 12.3
Dalmia Bharat BUY 707 1,000 41 133 1.8 192 14.0 2.0 19.2 (12.1) (85.4) 844.0 51 348 37 7.1 7.6 5.6 1.3 1.3 1.2 2.5 0.4 3.4 — — — 2.4
Grasim Industries ADD 592 735 24 389 5.2 657 52.6 40.6 71.6 (21.1) (22.9) 76.5 11.3 14.6 8.3 7.4 8.1 5.2 0.7 0.7 0.6 6.0 4.6 7.6 0.7 0.2 0.5 19.9
J K Cement ADD 1,411 1,525 8 109 1.5 77 64.2 51.8 92.2 83.6 (19.4) 78.1 22 27 15.3 10.8 11.1 7.8 3.6 3.3 2.7 17.3 12.5 19.4 0.5 0.7 0.7 1.5
JK Lakshmi Cement BUY 284 330 16 33 0.4 118 23.5 10.7 23.3 478.2 (54.5) 118.0 12.1 27 12.2 5.4 7.2 5.0 2.0 1.9 1.6 17.4 7.2 14.3 0.9 0.6 1.2 1.6
Orient Cement ADD 70 70 0 14 0.2 205 4.2 2.8 5.8 82.1 (33.3) 105.9 16.5 25 12.0 6.7 7.6 5.6 1.3 1.3 1.2 8.0 5.1 10.1 1.1 2.9 2.9 0.9
Shree Cement SELL 22,270 16,000 (28) 804 10.7 36 435.2 382.0 651.5 34.6 (12.2) 70.5 51 58 34 21.9 23.6 16.5 6.2 5.8 5.1 13.9 10.3 15.8 0.5 0.5 0.5 17.7
UltraTech Cement BUY 3,863 4,300 11 1,115 14.9 289 132.9 119.2 207.1 45.2 (10.3) 73.7 29 32 18.6 13.8 14.1 9.3 2.9 2.6 2.3 10.5 8.5 13.3 0.3 0.4 0.5 31
Construction Materials Cautious 3,229 43.1 21.1 (20.1) 69.9 24 30 17.7 10.4 11.4 7.7 2.0 1.9 1.7 8.4 6.3 9.8 0.5 0.6 0.7 111
P/B (X) RoE (%) Dividend yield (%)
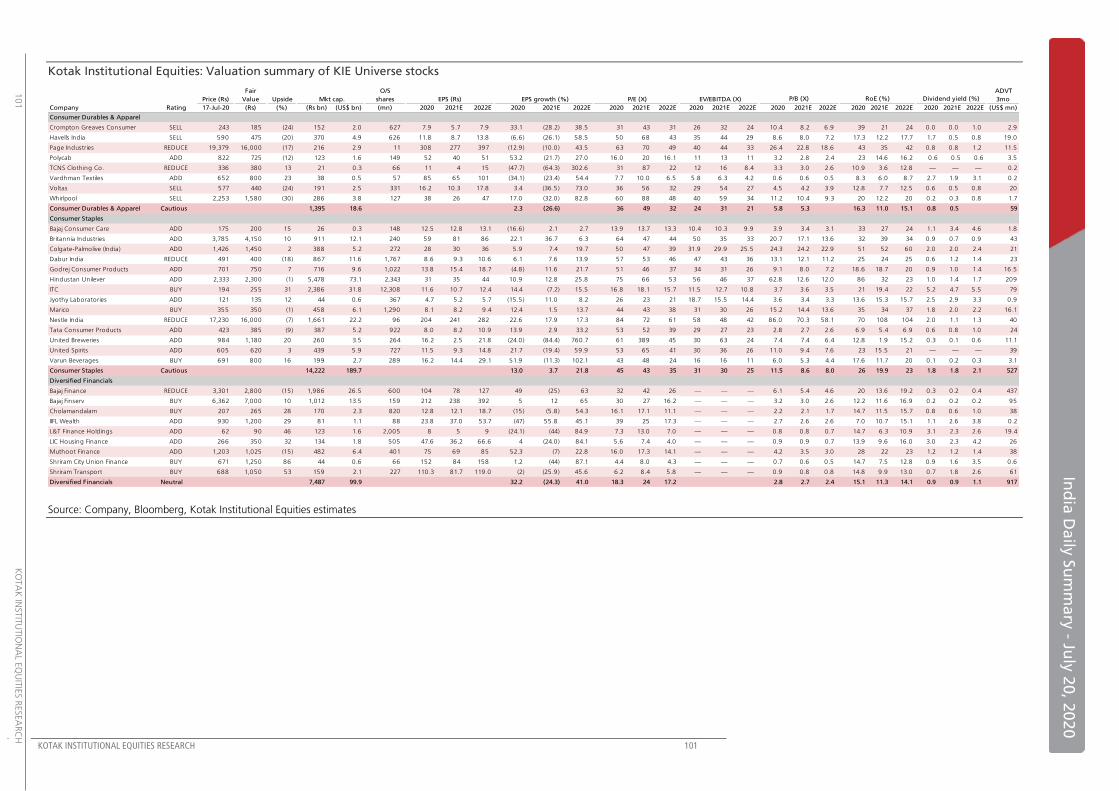
KOTAK INSTITUTIONAL EQUITIES RESEARCH 101
In
dia
Da
ily S
um
ma
ry - Ju
ly 2
0, 2
02
0
101
K
OTA
K IN
STIT
UTIO
NA
L EQ
UIT
IES R
ESEA
RC
H
Kotak Institutional Equities: Valuation summary of KIE Universe stocks
Source: Company, Bloomberg, Kotak Institutional Equities estimates
Fair O/S ADVT
Price (Rs) Value Upside Mkt cap. shares EPS (Rs) EPS growth (%) P/E (X) EV/EBITDA (X) 3mo
Company Rating 17-Jul-20 (Rs) (%) (Rs bn) (US$ bn) (mn) 2020 2021E 2022E 2020 2021E 2022E 2020 2021E 2022E 2020 2021E 2022E 2020 2021E 2022E 2020 2021E 2022E 2020 2021E 2022E (US$ mn)
Consumer Durables & Apparel
Crompton Greaves Consumer SELL 243 185 (24) 152 2.0 627 7.9 5.7 7.9 33.1 (28.2) 38.5 31 43 31 26 32 24 10.4 8.2 6.9 39 21 24 0.0 0.0 1.0 2.9
Havells India SELL 590 475 (20) 370 4.9 626 11.8 8.7 13.8 (6.6) (26.1) 58.5 50 68 43 35 44 29 8.6 8.0 7.2 17.3 12.2 17.7 1.7 0.5 0.8 19.0
Page Industries REDUCE 19,379 16,000 (17) 216 2.9 11 308 277 397 (12.9) (10.0) 43.5 63 70 49 40 44 33 26.4 22.8 18.6 43 35 42 0.8 0.8 1.2 11.5
Polycab ADD 822 725 (12) 123 1.6 149 52 40 51 53.2 (21.7) 27.0 16.0 20 16.1 11 13 11 3.2 2.8 2.4 23 14.6 16.2 0.6 0.5 0.6 3.5
TCNS Clothing Co. REDUCE 336 380 13 21 0.3 66 11 4 15 (47.7) (64.3) 302.6 31 87 22 12 16 8.4 3.3 3.0 2.6 10.9 3.6 12.8 — — — 0.2
Vardhman Textiles ADD 652 800 23 38 0.5 57 85 65 101 (34.1) (23.4) 54.4 7.7 10.0 6.5 5.8 6.3 4.2 0.6 0.6 0.5 8.3 6.0 8.7 2.7 1.9 3.1 0.2
Voltas SELL 577 440 (24) 191 2.5 331 16.2 10.3 17.8 3.4 (36.5) 73.0 36 56 32 29 54 27 4.5 4.2 3.9 12.8 7.7 12.5 0.6 0.5 0.8 20
Whirlpool SELL 2,253 1,580 (30) 286 3.8 127 38 26 47 17.0 (32.0) 82.8 60 88 48 40 59 34 11.2 10.4 9.3 20 12.2 20 0.2 0.3 0.8 1.7
Consumer Durables & Apparel Cautious 1,395 18.6 2.3 (26.6) 36 49 32 24 31 21 5.8 5.3 16.3 11.0 15.1 0.8 0.5 59
Consumer Staples
Bajaj Consumer Care ADD 175 200 15 26 0.3 148 12.5 12.8 13.1 (16.6) 2.1 2.7 13.9 13.7 13.3 10.4 10.3 9.9 3.9 3.4 3.1 33 27 24 1.1 3.4 4.6 1.8
Britannia Industries ADD 3,785 4,150 10 911 12.1 240 59 81 86 22.1 36.7 6.3 64 47 44 50 35 33 20.7 17.1 13.6 32 39 34 0.9 0.7 0.9 43
Colgate-Palmolive (India) ADD 1,426 1,450 2 388 5.2 272 28 30 36 5.9 7.4 19.7 50 47 39 31.9 29.9 25.5 24.3 24.2 22.9 51 52 60 2.0 2.0 2.4 21
Dabur India REDUCE 491 400 (18) 867 11.6 1,767 8.6 9.3 10.6 6.1 7.6 13.9 57 53 46 47 43 36 13.1 12.1 11.2 25 24 25 0.6 1.2 1.4 23
Godrej Consumer Products ADD 701 750 7 716 9.6 1,022 13.8 15.4 18.7 (4.8) 11.6 21.7 51 46 37 34 31 26 9.1 8.0 7.2 18.6 18.7 20 0.9 1.0 1.4 16.5
Hindustan Unilever ADD 2,333 2,300 (1) 5,478 73.1 2,343 31 35 44 10.9 12.8 25.8 75 66 53 56 46 37 62.8 12.6 12.0 86 32 23 1.0 1.4 1.7 209
ITC BUY 194 255 31 2,386 31.8 12,308 11.6 10.7 12.4 14.4 (7.2) 15.5 16.8 18.1 15.7 11.5 12.7 10.8 3.7 3.6 3.5 21 19.4 22 5.2 4.7 5.5 79
Jyothy Laboratories ADD 121 135 12 44 0.6 367 4.7 5.2 5.7 (15.5) 11.0 8.2 26 23 21 18.7 15.5 14.4 3.6 3.4 3.3 13.6 15.3 15.7 2.5 2.9 3.3 0.9
Marico BUY 355 350 (1) 458 6.1 1,290 8.1 8.2 9.4 12.4 1.5 13.7 44 43 38 31 30 26 15.2 14.4 13.6 35 34 37 1.8 2.0 2.2 16.1
Nestle India REDUCE 17,230 16,000 (7) 1,661 22.2 96 204 241 282 22.6 17.9 17.3 84 72 61 58 48 42 86.0 70.3 58.1 70 108 104 2.0 1.1 1.3 40
Tata Consumer Products ADD 423 385 (9) 387 5.2 922 8.0 8.2 10.9 13.9 2.9 33.2 53 52 39 29 27 23 2.8 2.7 2.6 6.9 5.4 6.9 0.6 0.8 1.0 24
United Breweries ADD 984 1,180 20 260 3.5 264 16.2 2.5 21.8 (24.0) (84.4) 760.7 61 389 45 30 63 24 7.4 7.4 6.4 12.8 1.9 15.2 0.3 0.1 0.6 11.1
United Spirits ADD 605 620 3 439 5.9 727 11.5 9.3 14.8 21.7 (19.4) 59.9 53 65 41 30 36 26 11.0 9.4 7.6 23 15.5 21 — — — 39
Varun Beverages BUY 691 800 16 199 2.7 289 16.2 14.4 29.1 51.9 (11.3) 102.1 43 48 24 16 16 11 6.0 5.3 4.4 17.6 11.7 20 0.1 0.2 0.3 3.1
Consumer Staples Cautious 14,222 189.7 13.0 3.7 21.8 45 43 35 31 30 25 11.5 8.6 8.0 26 19.9 23 1.8 1.8 2.1 527
Diversified Financials
Bajaj Finance REDUCE 3,301 2,800 (15) 1,986 26.5 600 104 78 127 49 (25) 63 32 42 26 — — — 6.1 5.4 4.6 20 13.6 19.2 0.3 0.2 0.4 437
Bajaj Finserv BUY 6,362 7,000 10 1,012 13.5 159 212 238 392 5 12 65 30 27 16.2 — — — 3.2 3.0 2.6 12.2 11.6 16.9 0.2 0.2 0.2 95
Cholamandalam BUY 207 265 28 170 2.3 820 12.8 12.1 18.7 (15) (5.8) 54.3 16.1 17.1 11.1 — — — 2.2 2.1 1.7 14.7 11.5 15.7 0.8 0.6 1.0 38
IIFL Wealth ADD 930 1,200 29 81 1.1 88 23.8 37.0 53.7 (47) 55.8 45.1 39 25 17.3 — — — 2.7 2.6 2.6 7.0 10.7 15.1 1.1 2.6 3.8 0.2
L&T Finance Holdings ADD 62 90 46 123 1.6 2,005 8 5 9 (24.1) (44) 84.9 7.3 13.0 7.0 — — — 0.8 0.8 0.7 14.7 6.3 10.9 3.1 2.3 2.6 19.4
LIC Housing Finance ADD 266 350 32 134 1.8 505 47.6 36.2 66.6 4 (24.0) 84.1 5.6 7.4 4.0 — — — 0.9 0.9 0.7 13.9 9.6 16.0 3.0 2.3 4.2 26
Muthoot Finance ADD 1,203 1,025 (15) 482 6.4 401 75 69 85 52.3 (7) 22.8 16.0 17.3 14.1 — — — 4.2 3.5 3.0 28 22 23 1.2 1.2 1.4 38
Shriram City Union Finance BUY 671 1,250 86 44 0.6 66 152 84 158 1.2 (44) 87.1 4.4 8.0 4.3 — — — 0.7 0.6 0.5 14.7 7.5 12.8 0.9 1.6 3.5 0.6
Shriram Transport BUY 688 1,050 53 159 2.1 227 110.3 81.7 119.0 (2) (25.9) 45.6 6.2 8.4 5.8 — — — 0.9 0.8 0.8 14.8 9.9 13.0 0.7 1.8 2.6 61
Diversified Financials Neutral 7,487 99.9 32.2 (24.3) 41.0 18.3 24 17.2 2.8 2.7 2.4 15.1 11.3 14.1 0.9 0.9 1.1 917
P/B (X) RoE (%) Dividend yield (%)

102 KOTAK INSTITUTIONAL EQUITIES RESEARCH
K
OTA
K IN
STIT
UTIO
NA
L EQ
UIT
IES R
ESEA
RC
H
102
Ind
ia D
aily
Su
mm
ary
- July
20, 2
02
0
Kotak Institutional Equities: Valuation summary of KIE Universe stocks
Source: Company, Bloomberg, Kotak Institutional Equities estimates
Fair O/S ADVT
Price (Rs) Value Upside shares 3mo
Company Rating 17-Jul-20 (Rs) (%) (Rs bn) (US$ bn) (mn) 2020 2021E 2022E 2020 2021E 2022E 2020 2021E 2022E 2020 2021E 2022E 2020 2021E 2022E 2020 2021E 2022E 2020 2021E 2022E (US$ mn)
Electric Utilities
CESC BUY 610 810 33 81 1.1 133 99 102 114 9 3.3 11.8 6.2 6.0 5.4 5.3 4.9 4.4 0.7 0.6 0.5 10.7 10.4 10.7 2.1 2.1 2.1 5.5
JSW Energy BUY 46 65 43 75 1.0 1,640 6.3 -2.2 -2.4 49 (136) (5.6) 7.2 NM NM 4.6 8.2 7.1 0.6 0.7 0.7 8.9 NM NM — — — 1.6
NHPC ADD 20 26 29 202 2.7 10,045 2.8 3.0 3.2 10.7 6 8.7 7.2 6.8 6.2 7.3 7.9 7.1 0.7 0.6 0.6 9.2 9.3 9.7 7.3 8.6 9.3 1.6
NTPC BUY 88 140 59 874 11.7 9,895 11.1 13.2 15.4 (0.9) 18.7 16.8 7.9 6.7 5.7 9.7 7.6 6.0 0.8 0.7 0.7 10.0 11.1 11.9 3.6 4.5 5.2 21
Power Grid BUY 163 220 35 854 11.4 5,232 20.7 22 25 9 6.3 16.1 7.9 7.4 6.4 6.6 6.3 5.6 1.3 1.2 1.1 17.5 17.0 18.1 6.1 6.5 7.6 28
Tata Power BUY 49 55 12 133 1.8 2,705 4.4 4.9 6.5 110 11 31.8 11.1 10.0 7.6 7.4 6.5 5.9 0.7 0.7 0.6 6.9 7.1 8.7 — — — 21
Electric Utilities Attractive 2,219 29.6 8.2 5.7 16.3 7.9 7.4 6.4 0.9 0.8 0.8 11.2 11.1 11.9 4.5 5.1 5.9 79
Fertilizers & Agricultural Chemicals
Bayer Cropscience SELL 5,566 3,400 (39) 250 3.3 45 129.3 134.2 149.9 64.7 3.8 11.7 43 41 37 33 30 26 9.7 8.2 7.0 24 21 20 0.4 0.5 0.5 2.4
Dhanuka Agritech SELL 814 535 (34) 39 0.5 48 29.7 34.9 38.2 25.7 17.4 9.5 27.4 23.3 21.3 21.9 18.3 16.5 5.5 5.2 5.0 21 23 24 3.0 3.5 3.8 1.2
Godrej Agrovet SELL 450 375 (17) 86 1.2 192 11.5 12.9 17.0 0.8 11.8 32 39 35 26 22 18 14 3.9 3.6 3.2 10.4 10.7 12.9 1.2 1.0 1.3 1.5
Rallis India ADD 286 230 (19) 56 0.7 195 9.0 10.6 14.2 7.4 17.1 33.7 31.6 26.9 20.2 21.6 18.5 14.1 3.9 3.6 3.1 13.1 13.9 16.5 0.9 1.0 1.1 3.3
UPL SELL 436 350 (20) 333 4.4 765 23.2 30.3 35.7 22.7 30.4 17.8 19 14.4 12.2 8.6 7.6 6.7 2.0 1.9 1.7 11.5 13.5 14.3 1.4 1.8 2.1 39
Fertilizers & Agricultural Chemicals Attractive 1,020 13.6 26.7 22.5 18.8 30 24 20.6 13.9 12.2 10.6 3.9 3.5 3.1 13.2 14.4 15.2 0.9 1.1 1.3 52
Gas Utilities
GAIL (India) BUY 101 150 49 455 6.1 4,510 13.2 9.5 11.6 (5.5) (28.2) 22.2 7.6 10.7 8.7 5.9 7.7 6.2 1.0 1.0 0.9 13.5 9.4 10.9 6.3 4.0 5.0 23
GSPL SELL 208 210 1 117 1.6 564 17.2 12.8 11.8 21.9 (25.7) (7.6) 12.1 16.3 17.6 5.5 6.6 6.8 1.7 1.6 1.5 15.5 10.2 8.7 1.0 0.9 1.1 2.3
Indraprastha Gas SELL 412 380 (8) 289 3.8 700 16.7 16.0 20.8 38.6 (4.1) 29.8 24.7 25.8 19.9 17.6 18.2 14.0 5.7 4.9 4.2 25 20 23 0.7 0.7 1.0 26
Mahanagar Gas ADD 994 1,175 18 98 1.3 99 74.6 61.9 82.8 32.8 (17.1) 33.9 13.3 16.1 12.0 9.1 10.5 7.6 3.3 3.0 2.7 28 19.6 24 3.5 3.0 4.5 14.0
Petronet LNG BUY 263 300 14 395 5.3 1,500 17.6 18.7 22.2 17.3 6.2 18.5 14.9 14.1 11.9 8.3 7.9 6.8 3.6 3.4 3.2 25 25 28 4.7 5.4 6.8 11.8
Gas Utilities Attractive 1,354 18.1 6.8 (16.9) 20.5 11.8 14.2 11.8 7.7 8.9 7.4 1.9 1.8 1.7 16.5 12.8 14.3 4.0 3.4 4.3 77
Health Care Services
Apollo Hospitals BUY 1,499 1,700 13 209 2.8 139 18.4 1 44 9 (97) 6,877 81.3 ##### 34.4 15.1 23.1 13.2 6.2 6.2 5.6 7.7 0.3 17.2 0.8 0.0 1.2 19.2
Dr Lal Pathlabs SELL 1,853 1,180 (36) 154 2.1 83 27.1 26.1 37.7 13.4 (3.5) 44.5 68.5 71.0 49.1 42.8 44.2 31.1 15.0 13.1 11.0 23 19.6 24 0.4 0.4 0.6 3.4
HCG BUY 124 140 13 11 0.1 143 (7.7) (6.4) (1.8) (128) 16 72 NM NM NM 9.7 8.3 5.5 2.2 1.9 1.9 NM NM NM — — — 0.7
Metropolis Healthcare SELL 1,509 1,240 (18) 76 1.0 51 29.2 28.9 40.0 22.0 (1.2) 39 51.7 52.3 37.7 31.9 31.0 22.9 14.5 12.4 10.2 31 26 30 0.5 0.6 0.8 4.0
Narayana Hrudayalaya BUY 279 360 29 57 0.8 204 5.8 -3.0 8.3 101.0 (152) 376 47.9 NM 33.7 14.7 30.6 12.1 5.0 5.3 4.6 10.7 NM 14.6 — — — 0.7
Health Care Services Attractive 571 7.6 6 (79) 707 58.5 272.5 33.8 15.7 20.9 12.6 5.8 5.5 4.9 10.0 2.0 14.5 0.5 0.2 0.7 29
Hotels & Restaurants
Jubilant Foodworks ADD 1,755 1,750 (0) 232 3.1 133 24 9 30 (2) (62.3) 240 74.5 197.5 58.0 25.6 33.4 20.2 20.5 20.2 15.5 26 10.3 30 0.3 0.2 0.6 30
Lemon Tree Hotels BUY 24 38 56 19 0.3 790 -0.1 -0.9 0.6 (118) (655) 161 NM NM 44.1 14.2 29.2 11.3 2.3 2.6 2.5 NM NM 5.7 — 0.0 0.9 1.5
Hotels & Restaurants Attractive 251 3.3 (18) (85) 868 82.9 543.1 56.1 23.2 32.8 18.3 12.8 13.2 11.0 15.5 2.4 19.6 0.3 0.2 0.6 32
Insurance
HDFC Life Insurance ADD 615 560 (9) 1,241 16.6 2,010 6.4 3.7 5.6 1.4 (42.4) 50.5 95.3 165.5 110 — — — 17.7 16.9 15.8 20 10.4 14.8 0.0 0.2 0.2 42
ICICI Lombard SELL 1,288 950 (26) 586 7.8 454 26.3 31.9 35.8 14 21 12 49.0 40.4 36 — — — 9.5 7.9 6.7 21 21 20 0.3 0.2 0.6 18.4
ICICI Prudential Life BUY 440 500 14 632 8.4 1,436 7.4 6.3 7.6 (6) (14.7) 20.7 59.3 69.5 58 — — — 8.4 7.7 6.9 14.8 11.5 12.6 0.2 0.2 0.3 18.3
Max Financial Services ADD 575 575 0 155 2.1 343 10.1 10.3 28.1 452 2 173 56.8 55.7 20 — — — — — — 12.7 14.5 40 — 0.2 1.1 12.5
SBI Life Insurance BUY 875 1,050 20 875 11.7 1,001 14.2 14.9 15.6 7.2 4.9 4.5 61.5 58.7 56 — — — 11.0 9.5 8.3 18.4 17.3 15.8 — 0.3 0.3 17.4
Insurance Attractive 3,489 46.5 8.4 (5.6) 30.8 66.5 70.4 54 11.3 10.0 8.3 17.0 14.2 15.4 0.0 0.2 0.2 108
Mkt cap. EPS (Rs) EPS growth (%) P/E (X) EV/EBITDA (X) P/B (X) RoE (%) Dividend yield (%)
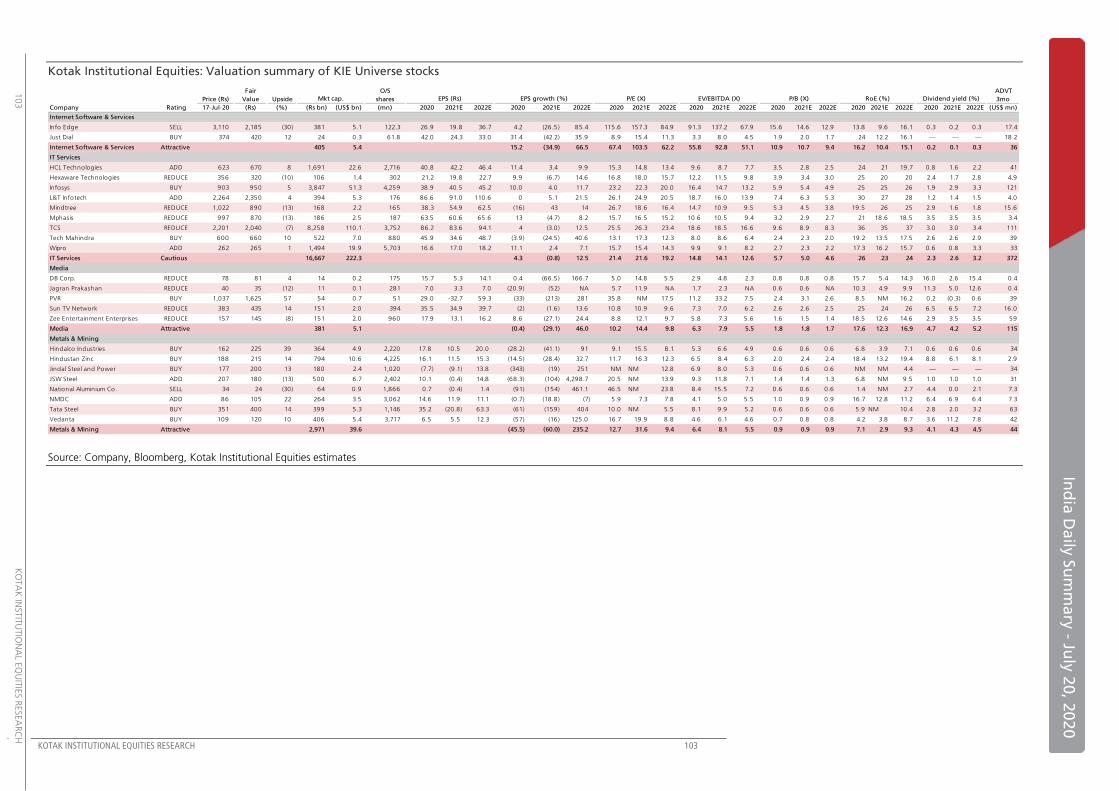
KOTAK INSTITUTIONAL EQUITIES RESEARCH 103
In
dia
Da
ily S
um
ma
ry - Ju
ly 2
0, 2
02
0
103
K
OTA
K IN
STIT
UTIO
NA
L EQ
UIT
IES R
ESEA
RC
H
Kotak Institutional Equities: Valuation summary of KIE Universe stocks
Source: Company, Bloomberg, Kotak Institutional Equities estimates
Fair O/S ADVT
Price (Rs) Value Upside shares 3mo
Company Rating 17-Jul-20 (Rs) (%) (Rs bn) (US$ bn) (mn) 2020 2021E 2022E 2020 2021E 2022E 2020 2021E 2022E 2020 2021E 2022E 2020 2021E 2022E 2020 2021E 2022E 2020 2021E 2022E (US$ mn)
Internet Software & Services
Info Edge SELL 3,110 2,185 (30) 381 5.1 122.3 26.9 19.8 36.7 4.2 (26.5) 85.4 115.6 157.3 84.9 91.3 137.2 67.9 15.6 14.6 12.9 13.8 9.6 16.1 0.3 0.2 0.3 17.4
Just Dial BUY 374 420 12 24 0.3 61.8 42.0 24.3 33.0 31.4 (42.2) 35.9 8.9 15.4 11.3 3.3 8.0 4.5 1.9 2.0 1.7 24 12.2 16.1 — — — 18.2
Internet Software & Services Attractive 405 5.4 15.2 (34.9) 66.5 67.4 103.5 62.2 55.8 92.8 51.1 10.9 10.7 9.4 16.2 10.4 15.1 0.2 0.1 0.3 36
IT Services
HCL Technologies ADD 623 670 8 1,691 22.6 2,716 40.8 42.2 46.4 11.4 3.4 9.9 15.3 14.8 13.4 9.6 8.7 7.7 3.5 2.8 2.5 24 21 19.7 0.8 1.6 2.2 41
Hexaware Technologies REDUCE 356 320 (10) 106 1.4 302 21.2 19.8 22.7 9.9 (6.7) 14.6 16.8 18.0 15.7 12.2 11.5 9.8 3.9 3.4 3.0 25 20 20 2.4 1.7 2.8 4.9
Infosys BUY 903 950 5 3,847 51.3 4,259 38.9 40.5 45.2 10.0 4.0 11.7 23.2 22.3 20.0 16.4 14.7 13.2 5.9 5.4 4.9 25 25 26 1.9 2.9 3.3 121
L&T Infotech ADD 2,264 2,350 4 394 5.3 176 86.6 91.0 110.6 0 5.1 21.5 26.1 24.9 20.5 18.7 16.0 13.9 7.4 6.3 5.3 30 27 28 1.2 1.4 1.5 4.0
Mindtree REDUCE 1,022 890 (13) 168 2.2 165 38.3 54.9 62.5 (16) 43 14 26.7 18.6 16.4 14.7 10.9 9.5 5.3 4.5 3.8 19.5 26 25 2.9 1.6 1.8 15.6
Mphasis REDUCE 997 870 (13) 186 2.5 187 63.5 60.6 65.6 13 (4.7) 8.2 15.7 16.5 15.2 10.6 10.5 9.4 3.2 2.9 2.7 21 18.6 18.5 3.5 3.5 3.5 3.4
TCS REDUCE 2,201 2,040 (7) 8,258 110.1 3,752 86.2 83.6 94.1 4 (3.0) 12.5 25.5 26.3 23.4 18.6 18.5 16.6 9.6 8.9 8.3 36 35 37 3.0 3.0 3.4 111
Tech Mahindra BUY 600 660 10 522 7.0 880 45.9 34.6 48.7 (3.9) (24.5) 40.6 13.1 17.3 12.3 8.0 8.6 6.4 2.4 2.3 2.0 19.2 13.5 17.5 2.6 2.6 2.9 39
Wipro ADD 262 265 1 1,494 19.9 5,703 16.6 17.0 18.2 11.1 2.4 7.1 15.7 15.4 14.3 9.9 9.1 8.2 2.7 2.3 2.2 17.3 16.2 15.7 0.6 0.8 3.3 33
IT Services Cautious 16,667 222.3 4.3 (0.8) 12.5 21.4 21.6 19.2 14.8 14.1 12.6 5.7 5.0 4.6 26 23 24 2.3 2.6 3.2 372
Media
DB Corp. REDUCE 78 81 4 14 0.2 175 15.7 5.3 14.1 0.4 (66.5) 166.7 5.0 14.8 5.5 2.9 4.8 2.3 0.8 0.8 0.8 15.7 5.4 14.3 16.0 2.6 15.4 0.4
Jagran Prakashan REDUCE 40 35 (12) 11 0.1 281 7.0 3.3 7.0 (20.9) (52) NA 5.7 11.9 NA 1.7 2.3 NA 0.6 0.6 NA 10.3 4.9 9.9 11.3 5.0 12.6 0.4
PVR BUY 1,037 1,625 57 54 0.7 51 29.0 -32.7 59.3 (33) (213) 281 35.8 NM 17.5 11.2 33.2 7.5 2.4 3.1 2.6 8.5 NM 16.2 0.2 (0.3) 0.6 39
Sun TV Network REDUCE 383 435 14 151 2.0 394 35.5 34.9 39.7 (2) (1.6) 13.6 10.8 10.9 9.6 7.3 7.0 6.2 2.6 2.6 2.5 25 24 26 6.5 6.5 7.2 16.0
Zee Entertainment Enterprises REDUCE 157 145 (8) 151 2.0 960 17.9 13.1 16.2 8.6 (27.1) 24.4 8.8 12.1 9.7 5.8 7.3 5.6 1.6 1.5 1.4 18.5 12.6 14.6 2.9 3.5 3.5 59
Media Attractive 381 5.1 (0.4) (29.1) 46.0 10.2 14.4 9.8 6.3 7.9 5.5 1.8 1.8 1.7 17.6 12.3 16.9 4.7 4.2 5.2 115
Metals & Mining
Hindalco Industries BUY 162 225 39 364 4.9 2,220 17.8 10.5 20.0 (28.2) (41.1) 91 9.1 15.5 8.1 5.3 6.6 4.9 0.6 0.6 0.6 6.8 3.9 7.1 0.6 0.6 0.6 34
Hindustan Zinc BUY 188 215 14 794 10.6 4,225 16.1 11.5 15.3 (14.5) (28.4) 32.7 11.7 16.3 12.3 6.5 8.4 6.3 2.0 2.4 2.4 18.4 13.2 19.4 8.8 6.1 8.1 2.9
Jindal Steel and Power BUY 177 200 13 180 2.4 1,020 (7.7) (9.1) 13.8 (343) (19) 251 NM NM 12.8 6.9 8.0 5.3 0.6 0.6 0.6 NM NM 4.4 — — — 34
JSW Steel ADD 207 180 (13) 500 6.7 2,402 10.1 (0.4) 14.8 (68.3) (104) 4,298.7 20.5 NM 13.9 9.3 11.8 7.1 1.4 1.4 1.3 6.8 NM 9.5 1.0 1.0 1.0 31
National Aluminium Co. SELL 34 24 (30) 64 0.9 1,866 0.7 (0.4) 1.4 (91) (154) 461.1 46.5 NM 23.8 8.4 15.5 7.2 0.6 0.6 0.6 1.4 NM 2.7 4.4 0.0 2.1 7.3
NMDC ADD 86 105 22 264 3.5 3,062 14.6 11.9 11.1 (0.7) (18.8) (7) 5.9 7.3 7.8 4.1 5.0 5.5 1.0 0.9 0.9 16.7 12.8 11.2 6.4 6.9 6.4 7.3
Tata Steel BUY 351 400 14 399 5.3 1,146 35.2 (20.8) 63.3 (61) (159) 404 10.0 NM 5.5 8.1 9.9 5.2 0.6 0.6 0.6 5.9 NM 10.4 2.8 2.0 3.2 63
Vedanta BUY 109 120 10 406 5.4 3,717 6.5 5.5 12.3 (57) (16) 125.0 16.7 19.9 8.8 4.6 6.1 4.6 0.7 0.8 0.8 4.2 3.8 8.7 3.6 11.2 7.8 42
Metals & Mining Attractive 2,971 39.6 (45.5) (60.0) 235.2 12.7 31.6 9.4 6.4 8.1 5.5 0.9 0.9 0.9 7.1 2.9 9.3 4.1 4.3 4.5 44
Mkt cap. EPS (Rs) EPS growth (%) P/E (X) EV/EBITDA (X) P/B (X) RoE (%) Dividend yield (%)
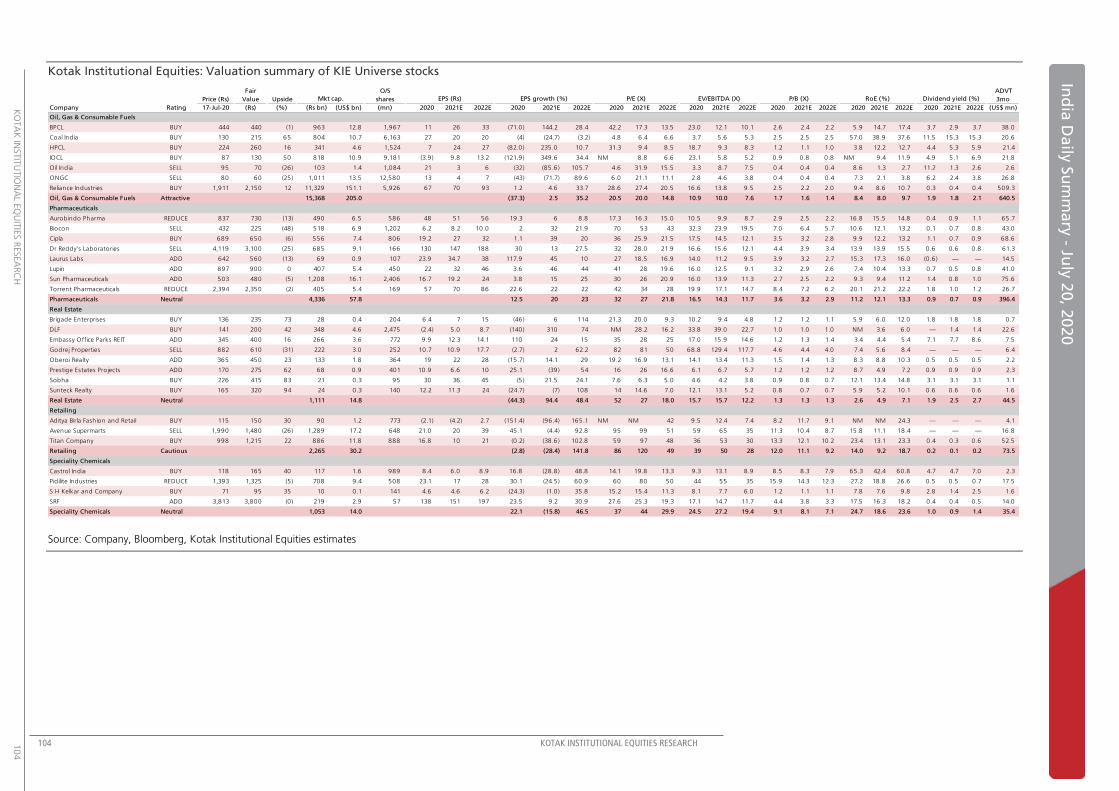
104 KOTAK INSTITUTIONAL EQUITIES RESEARCH
K
OTA
K IN
STIT
UTIO
NA
L EQ
UIT
IES R
ESEA
RC
H
104
Ind
ia D
aily
Su
mm
ary
- July
20, 2
02
0
Kotak Institutional Equities: Valuation summary of KIE Universe stocks
Source: Company, Bloomberg, Kotak Institutional Equities estimates
Fair O/S ADVT
Price (Rs) Value Upside shares 3mo
Company Rating 17-Jul-20 (Rs) (%) (Rs bn) (US$ bn) (mn) 2020 2021E 2022E 2020 2021E 2022E 2020 2021E 2022E 2020 2021E 2022E 2020 2021E 2022E 2020 2021E 2022E 2020 2021E 2022E (US$ mn)
Oil, Gas & Consumable Fuels
BPCL BUY 444 440 (1) 963 12.8 1,967 11 26 33 (71.0) 144.2 28.4 42.2 17.3 13.5 23.0 12.1 10.1 2.6 2.4 2.2 5.9 14.7 17.4 3.7 2.9 3.7 38.0
Coal India BUY 130 215 65 804 10.7 6,163 27 20 20 (4) (24.7) (3.2) 4.8 6.4 6.6 3.7 5.6 5.3 2.5 2.5 2.5 57.0 38.9 37.6 11.5 15.3 15.3 20.6
HPCL BUY 224 260 16 341 4.6 1,524 7 24 27 (82.0) 235.0 10.7 31.3 9.4 8.5 18.7 9.3 8.3 1.2 1.1 1.0 3.8 12.2 12.7 4.4 5.3 5.9 21.4
IOCL BUY 87 130 50 818 10.9 9,181 (3.9) 9.8 13.2 (121.9) 349.6 34.4 NM 8.8 6.6 23.1 5.8 5.2 0.9 0.8 0.8 NM 9.4 11.9 4.9 5.1 6.9 21.8
Oil India SELL 95 70 (26) 103 1.4 1,084 21 3 6 (32) (85.6) 105.7 4.6 31.9 15.5 3.3 8.7 7.5 0.4 0.4 0.4 8.6 1.3 2.7 11.2 1.3 2.6 2.6
ONGC SELL 80 60 (25) 1,011 13.5 12,580 13 4 7 (43) (71.7) 89.6 6.0 21.1 11.1 2.8 4.6 3.8 0.4 0.4 0.4 7.3 2.1 3.8 6.2 2.4 3.8 26.8
Reliance Industries BUY 1,911 2,150 12 11,329 151.1 5,926 67 70 93 1.2 4.6 33.7 28.6 27.4 20.5 16.6 13.8 9.5 2.5 2.2 2.0 9.4 8.6 10.7 0.3 0.4 0.4 509.3
Oil, Gas & Consumable Fuels Attractive 15,368 205.0 (37.3) 2.5 35.2 20.5 20.0 14.8 10.9 10.0 7.6 1.7 1.6 1.4 8.4 8.0 9.7 1.9 1.8 2.1 640.5
Pharmaceuticals
Aurobindo Pharma REDUCE 837 730 (13) 490 6.5 586 48 51 56 19.3 6 8.8 17.3 16.3 15.0 10.5 9.9 8.7 2.9 2.5 2.2 16.8 15.5 14.8 0.4 0.9 1.1 65.7
Biocon SELL 432 225 (48) 518 6.9 1,202 6.2 8.2 10.0 2 32 21.9 70 53 43 32.3 23.9 19.5 7.0 6.4 5.7 10.6 12.1 13.2 0.1 0.7 0.8 43.0
Cipla BUY 689 650 (6) 556 7.4 806 19.2 27 32 1.1 39 20 36 25.9 21.5 17.5 14.5 12.1 3.5 3.2 2.8 9.9 12.2 13.2 1.1 0.7 0.9 68.6
Dr Reddy's Laboratories SELL 4,119 3,100 (25) 685 9.1 166 130 147 188 30 13 27.5 32 28.0 21.9 16.6 15.6 12.1 4.4 3.9 3.4 13.9 13.9 15.5 0.6 0.6 0.8 61.3
Laurus Labs ADD 642 560 (13) 69 0.9 107 23.9 34.7 38 117.9 45 10 27 18.5 16.9 14.0 11.2 9.5 3.9 3.2 2.7 15.3 17.3 16.0 (0.6) — — 14.5
Lupin ADD 897 900 0 407 5.4 450 22 32 46 3.6 46 44 41 28 19.6 16.0 12.5 9.1 3.2 2.9 2.6 7.4 10.4 13.3 0.7 0.5 0.8 41.0
Sun Pharmaceuticals ADD 503 480 (5) 1,208 16.1 2,406 16.7 19.2 24 3.8 15 25 30 26 20.9 16.0 13.9 11.3 2.7 2.5 2.2 9.3 9.4 11.2 1.4 0.8 1.0 75.6
Torrent Pharmaceuticals REDUCE 2,394 2,350 (2) 405 5.4 169 57 70 86 22.6 22 22 42 34 28 19.9 17.1 14.7 8.4 7.2 6.2 20.1 21.2 22.2 1.8 1.0 1.2 26.7
Pharmaceuticals Neutral 4,336 57.8 12.5 20 23 32 27 21.8 16.5 14.3 11.7 3.6 3.2 2.9 11.2 12.1 13.3 0.9 0.7 0.9 396.4
Real Estate
Brigade Enterprises BUY 136 235 73 28 0.4 204 6.4 7 15 (46) 6 114 21.3 20.0 9.3 10.2 9.4 4.8 1.2 1.2 1.1 5.9 6.0 12.0 1.8 1.8 1.8 0.7
DLF BUY 141 200 42 348 4.6 2,475 (2.4) 5.0 8.7 (140) 310 74 NM 28.2 16.2 33.8 39.0 22.7 1.0 1.0 1.0 NM 3.6 6.0 — 1.4 1.4 22.6
Embassy Office Parks REIT ADD 345 400 16 266 3.6 772 9.9 12.3 14.1 110 24 15 35 28 25 17.0 15.9 14.6 1.2 1.3 1.4 3.4 4.4 5.4 7.1 7.7 8.6 7.5
Godrej Properties SELL 882 610 (31) 222 3.0 252 10.7 10.9 17.7 (2.7) 2 62.2 82 81 50 68.8 129.4 117.7 4.6 4.4 4.0 7.4 5.6 8.4 — — — 6.4
Oberoi Realty ADD 365 450 23 133 1.8 364 19 22 28 (15.7) 14.1 29 19.2 16.9 13.1 14.1 13.4 11.3 1.5 1.4 1.3 8.3 8.8 10.3 0.5 0.5 0.5 2.2
Prestige Estates Projects ADD 170 275 62 68 0.9 401 10.9 6.6 10 25.1 (39) 54 16 26 16.6 6.1 6.7 5.7 1.2 1.2 1.2 8.7 4.9 7.2 0.9 0.9 0.9 2.3
Sobha BUY 226 415 83 21 0.3 95 30 36 45 (5) 21.5 24.1 7.6 6.3 5.0 4.6 4.2 3.8 0.9 0.8 0.7 12.1 13.4 14.8 3.1 3.1 3.1 1.1
Sunteck Realty BUY 165 320 94 24 0.3 140 12.2 11.3 24 (24.7) (7) 108 14 14.6 7.0 12.1 13.1 5.2 0.8 0.7 0.7 5.9 5.2 10.1 0.6 0.6 0.6 1.6
Real Estate Neutral 1,111 14.8 (44.3) 94.4 48.4 52 27 18.0 15.7 15.7 12.2 1.3 1.3 1.3 2.6 4.9 7.1 1.9 2.5 2.7 44.5
Retailing
Aditya Birla Fashion and Retail BUY 115 150 30 90 1.2 773 (2.1) (4.2) 2.7 (151.4) (96.4) 165.1 NM NM 42 9.5 12.4 7.4 8.2 11.7 9.1 NM NM 24.3 — — — 4.1
Avenue Supermarts SELL 1,990 1,480 (26) 1,289 17.2 648 21.0 20 39 45.1 (4.4) 92.8 95 99 51 59 65 35 11.3 10.4 8.7 15.8 11.1 18.4 — — — 16.8
Titan Company BUY 998 1,215 22 886 11.8 888 16.8 10 21 (0.2) (38.6) 102.8 59 97 48 36 53 30 13.3 12.1 10.2 23.4 13.1 23.3 0.4 0.3 0.6 52.5
Retailing Cautious 2,265 30.2 (2.8) (28.4) 141.8 86 120 49 39 50 28 12.0 11.1 9.2 14.0 9.2 18.7 0.2 0.1 0.2 73.5
Speciality Chemicals
Castrol India BUY 118 165 40 117 1.6 989 8.4 6.0 8.9 16.8 (28.8) 48.8 14.1 19.8 13.3 9.3 13.1 8.9 8.5 8.3 7.9 65.3 42.4 60.8 4.7 4.7 7.0 2.3
Pidilite Industries REDUCE 1,393 1,325 (5) 708 9.4 508 23.1 17 28 30.1 (24.5) 60.9 60 80 50 44 55 35 15.9 14.3 12.3 27.2 18.8 26.6 0.5 0.5 0.7 17.5
S H Kelkar and Company BUY 71 95 35 10 0.1 141 4.6 4.6 6.2 (24.3) (1.0) 35.8 15.2 15.4 11.3 8.1 7.7 6.0 1.2 1.1 1.1 7.8 7.6 9.8 2.8 1.4 2.5 1.6
SRF ADD 3,813 3,800 (0) 219 2.9 57 138 151 197 23.5 9.2 30.9 27.6 25.3 19.3 17.1 14.7 11.7 4.4 3.8 3.3 17.5 16.3 18.2 0.4 0.4 0.5 14.0
Speciality Chemicals Neutral 1,053 14.0 22.1 (15.8) 46.5 37 44 29.9 24.5 27.2 19.4 9.1 8.1 7.1 24.7 18.6 23.6 1.0 0.9 1.4 35.4
Mkt cap. EPS (Rs) EPS growth (%) P/E (X) EV/EBITDA (X) P/B (X) RoE (%) Dividend yield (%)

KOTAK INSTITUTIONAL EQUITIES RESEARCH 105
In
dia
Da
ily S
um
ma
ry - Ju
ly 2
0, 2
02
0
105
K
OTA
K IN
STIT
UTIO
NA
L EQ
UIT
IES R
ESEA
RC
H
Kotak Institutional Equities: Valuation summary of KIE Universe stocks
Source: Company, Bloomberg, Kotak Institutional Equities estimates
Fair O/S ADVT
Price (Rs) Value Upside shares 3mo
Company Rating 17-Jul-20 (Rs) (%) (Rs bn) (US$ bn) (mn) 2020 2021E 2022E 2020 2021E 2022E 2020 2021E 2022E 2020 2021E 2022E 2020 2021E 2022E 2020 2021E 2022E 2020 2021E 2022E (US$ mn)
Telecommunication Services
Bharti Airtel BUY 567 690 22 3,092 41.2 5,456 (6.7) 5.7 14.5 NM NM NM NM 100.1 39.2 10.8 8.5 6.9 4.0 4.0 3.8 NM 4.0 10.0 0.4 1.1 1.1 182.5
Bharti Infratel BUY 198 185 (7) 366 4.9 1,850 16.5 16.5 17.7 25.7 0.2 6.9 12.0 12.0 11.2 5.0 4.8 4.5 2.7 2.7 2.7 21.7 22.5 23.9 5.4 8.1 8.6 30.8
Vodafone Idea RS 9 — — 256 3.4 28,735 (25.7) (3.6) (5.9) NM NM NM NM NM NM 8.1 6.9 5.6 4.3 -5.8 (1.2) NM NM 132 — — — 82
Tata Communications BUY 669 705 5 191 2.5 285 16.0 14.9 21.4 41.8 (6.6) 43.7 41.8 44.8 31.2 8.7 7.7 6.7 NM NM (39.2) NM NM NM 0.6 0.6 0.9 1.1
Telecommunication Services Cautious 3,905 52.1 NM 56.0 66.6 NM NM NM 9.4 7.7 6.3 4.1 4.6 5.4 NM NM NM 0.8 1.6 1.7 296.3
Transportation
Adani Ports and SEZ BUY 313 390 25 636 8.5 2,032 26.9 18.7 21.9 34.7 (30.5) 16.9 11.6 16.7 14.3 11.3 12.2 10.4 2.5 2.2 2.0 21.8 14.0 14.5 4.1 1.1 1.0 18.1
Container Corp. SELL 449 390 (13) 273 3.6 609 17.3 8.0 13.0 5.7 (53.6) 62.2 26 56 35 15.0 26.6 18.3 2.7 2.7 2.6 10.3 4.8 7.6 0.7 1.0 1.6 11.0
Gateway Distriparks BUY 89 135 51 10 0.1 109 4.2 (0.4) 5.1 (37.5) (108.6) 1,491.1 21.1 NM 17.6 7.0 8.6 6.3 0.7 0.7 0.7 3.5 NM 4.1 3.4 3.4 3.4 0.2
GMR Infrastructure BUY 20 26 30 120 1.6 7,147 (3.1) (1.8) (0.8) (25.4) 40.9 55.9 NM NM NM 15.8 18.4 16.6 (4.5) (7.1) (5.5) 106.6 55.8 25.2 — — — 3.0
Gujarat Pipavav Port BUY 81 106 31 39 0.5 483 6.0 4.5 5.8 42.2 (25.1) 28.0 13.4 17.9 14.0 7.3 7.8 6.8 1.9 1.9 1.9 14.2 10.5 13.5 6.9 5.2 6.7 0.8
InterGlobe Aviation SELL 991 925 (7) 381 5.1 383 (6.5) (189.9) 66.4 (258.9) (2,828.8) 135.0 NM NM 14.9 4.5 (9.0) 2.2 6.5 (142.0) 2.2 NM NM 253.3 — — — 42
Mahindra Logistics ADD 317 275 (13) 23 0.3 71 8.9 5.9 10.3 (29.0) (34.2) 75.8 36 54 31 14.7 16.8 11.9 4.2 3.9 3.6 12.2 7.5 12.2 — — — 0.4
Transportation Attractive 1,483 19.8 17.6 (183.9) 288.8 31 NM 19.5 10.5 21.7 8.7 3.5 3.6 3.2 11.2 NM 16.3 2.1 0.8 0.9 76
KIE universe 111,678 1489.5 (14.1) 2.1 51.2 28 27.8 18.4 12.5 12.7 9.6 2.6 2.4 2.2 9.2 8.7 12.0 1.5 1.6 1.9
Notes:
(a) We have used adjusted book values for banking companies.
(b) 2020 means calendar year 2019, similarly for 2021 and 2022 for these particular companies.
(c) Exchange rate (Rs/US$)= 74.98
Mkt cap. EPS (Rs) EPS growth (%) P/E (X) EV/EBITDA (X) P/B (X) RoE (%) Dividend yield (%)

Ind
ia D
aily
Su
mm
ary
- July
20, 2
02
0
"Each of the analysts named below hereby certifies that, with respect to each subject company and its securities for which the analyst is responsible in this report, (1) all of the views expressed in this report accurately reflect his or her personal views about the subject companies and securities, and (2) no part of his or her compensation was, is, or will be, directly or indirectly, related to the specific recommendations or views expressed in this report: Kawaljeet Saluja, Sathishkumar S., Rohit Chordia, Jaykumar Doshi, Aniket Sethi, M.B. Mahesh, Nischint Chawathe, Abhijeet Sakhare, Dipanjan Ghosh, Ashlesh Sonje."
Ratings and other definitions/identifiers
Definitions of ratings
BUY. We expect this stock to deliver more than 15% returns over the next 12 months.
ADD. We expect this stock to deliver 5-15% returns over the next 12 months.
REDUCE. We expect this stock to deliver -5-+5% returns over the next 12 months.
SELL. We expect this stock to deliver <-5% returns over the next 12 months.
Our Fair Value estimates are also on a 12-month horizon basis.
Our Ratings System does not take into account short-term volatility in stock prices related to movements in the market. Hence, a particular Rating may not
strictly be in accordance with the Rating System at all times.
Other definitions
Coverage view. The coverage view represents each analyst’s overall fundamental outlook on the Sector. The coverage view will consist of one of the following
designations: Attractive, Neutral, Cautious.
Other ratings/identifiers
NR = Not Rated. The investment rating and fair value, if any, have been suspended temporarily. Such suspension is in compliance with applicable regulation(s)
and/or Kotak Securities policies in circumstances when Kotak Securities or its affiliates is acting in an advisory capacity in a merger or strategic transaction
involving this company and in certain other circumstances.
CS = Coverage Suspended. Kotak Securities has suspended coverage of this company.
NC = Not Covered. Kotak Securities does not cover this company.
RS = Rating Suspended. Kotak Securities Research has suspended the investment rating and fair value, if any, for this stock, because there is not a sufficient
fundamental basis for determining an investment rating or fair value. The previous investment rating and fair value, if any, are no longer in effect for this stock
and should not be relied upon.
NA = Not Available or Not Applicable. The information is not available for display or is not applicable.
NM = Not Meaningful. The information is not meaningful and is therefore excluded.
Kotak Institutional Equities Research coverage universe
Distribution of ratings/investment banking relationships
Source: Kotak Institutional Equities As of June 30, 2020
Percentage of companies covered by Kotak Institutional
Equities, within the specified category.
* The above categories are defined as follows: Buy = We
expect this stock to deliver more than 15% returns over the next
12 months; Add = We expect this stock to deliver 5-15% returns
over the next 12 months; Reduce = We expect this stock to
deliver -5-+5% returns over the next 12 months; Sell = We
expect this stock to deliver less than -5% returns over the next
12 months. Our target prices are also on a 12-month horizon
basis. These ratings are used illustratively to comply with
applicable regulations. As of 30/06/2020 Kotak Institutional
Equities Investment Research had investment ratings on 203
equity securities.
Percentage of companies within each category for which Kotak
Institutional Equities and or its affiliates has provided
investment banking services within the previous 12 months.45.3%
23.6%
11.8%
19.2%
4.4%
0.5% 0.5% 1.5%
0%
10%
20%
30%
40%
50%
60%
70%
BUY ADD REDUCE SELL
Corporate Office Overseas Affiliates
Kotak Securities Ltd.
27 BKC, Plot No. C-27, “G Block”
Bandra Kurla Complex, Bandra (E)
Mumbai 400 051, India
Tel: +91-22-43360000
Kotak Mahindra (UK) Ltd
8th Floor, Portsoken House
155-157 Minories
London EC3N 1LS
Tel: +44-20-7977-6900
Kotak Mahindra Inc
369 Lexington Avenue
28th Floor, New York
NY 10017, USA
Tel:+1 212 600 8856
Copyright 2020 Kotak Institutional Equities (Kotak Securities Limited). All rights reserved. 1. Note that the research analysts contributing to this report may not be registered/qualified as research analysts with FINRA; and
2. Such research analysts may not be associated persons of Kotak Mahindra Inc and therefore, may not be subject to NASD Rule 2711 restrictions on communications with a subject company, public appearances and trading securities held by a research analyst account.
3. Any U.S. recipients of the research who wish to effect transactions in any security covered by the report should do so with or through Kotak Mahindra Inc and (ii) any transactions in the securities covered by the research by U.S. recipients must be effected only through Kotak Mahindra Inc at [email protected].
This report is distributed in Singapore by Kotak Mahindra (UK) Limited (Singapore Branch) to institutional investors, accredited investors or expert investors only as defined under the Securities and Futures Act. Recipients of this analysis / report are to contact Kotak Mahindra (UK) Limited (Singapore Branch) (16 Raffles Quay, #35-02/03, Hong Leong Building, Singapore 048581) in respect of any matters arising from, or in connection with, this analysis / report. Kotak Mahindra (UK) Limited (Singapore Branch) is regulated by the Monetary Authority of Singapore. Kotak Securities Limited and its affiliates are a full-service, integrated investment banking, investment management, brokerage and financing group. We along with our affiliates are leading underwriter of securities and participants in virtually all securities trading markets in India. We and our affiliates have investment banking and other business relationships with a significant percentage of the companies covered by our Investment Research Department. Our research professionals provide important input into our investment banking and other business selection processes. Investors should assume that Kotak Securities Limited and/or its affiliates are seeking or will seek investment banking or other business from the company or companies that are the subject of this material and that the research professionals who were involved in preparing this material may participate in the solicitation of such business. Our research professionals are paid in part based on the profitability of Kotak Securities Limited, which include earnings from investment banking and other business. Kotak Securities Limited generally prohibits its analysts, persons reporting to analysts, and members of their households from maintaining a financial interest in the securities or derivatives of any companies that the analysts cover. Additionally, Kotak Securities Limited generally prohibits its analysts and persons reporting to analysts from serving as an officer, director, or advisory board member of any companies that the analysts cover. Our salespeople, traders, and other professionals may provide oral or written market commentary or trading strategies to our clients that reflect opinions that are contrary to the opinions expressed herein, and our proprietary trading and investing businesses may make investment decisions that are inconsistent with the recommendations expressed herein. In reviewing these materials, you should be aware that any or all of the foregoing, among other things, may give rise to real or potential conflicts of interest. Additionally, other important information regarding our relationships with the company or companies that are the subject of this material is provided herein. This material should not be construed as an offer to sell or the solicitation of an offer to buy any security in any jurisdiction where such an offer or solicitation would be illegal. We are not soliciting any action based on this material. It is for the general information of clients of Kotak Securities Limited. It does not constitute a personal recommendation or take into account the particular investment objectives, financial situations, or needs of individual clients. Before acting on any advice or recommendation in this material, clients should consider whether it is suitable for their particular circumstances and, if necessary, seek professional advice. The price and value of the investments referred to in this material and the income from them may go down as well as up, and investors may realize losses on any investments. Past performance is not a guide for future performance, future returns are not guaranteed and a loss of original capital may occur. Kotak Securities Limited does not provide tax advise to its clients, and all investors are strongly advised to consult with their tax advisers regarding any potential investment. Certain transactions -including those involving futures, options, and other derivatives as well as non-investment-grade securities - give rise to substantial risk and are not suitable for all investors. The material is based on information that we consider reliable, but we do not represent that it is accurate or complete, and it should not be relied on as such. Opinions expressed are our current opinions as of the date appearing on this material only. We endeavor to update on a reasonable basis the information discussed in this material, but regulatory, compliance, or other reasons may prevent us from doing so. We and our affiliates, officers, directors, and employees, including persons involved in the preparation or issuance of this material, may from time to time have "long" or "short" positions in, act as principal in, and buy or sell the securities or derivatives thereof of companies mentioned herein. Kotak Securities Limited and its non US affiliates may, to the extent permissible under applicable laws, have acted on or used this research to the extent that it relates to non US issuers, prior to or immediately following its publication. Foreign currency denominated securities are subject to fluctuations in exchange rates that could have an adverse effect on the value or price of or income derived from the investment. In addition, investors in securities such as ADRs, the value of which are influenced by foreign currencies affectively assume currency risk. In addition options involve risks and are not suitable for all investors. Please ensure that you have read and understood the current derivatives risk disclosure document before entering into any derivative transactions. Kotak Securities Limited established in 1994, is a subsidiary of Kotak Mahindra Bank Limited. Kotak Securities is one of India's largest brokerage and distribution house. Kotak Securities Limited is a corporate trading and clearing member of Bombay Stock Exchange Limited (BSE), National Stock Exchange of India Limited (NSE), Metropolitan Stock Exchange of India Limited (MSE), National Commodity and Derivatives Exchange (NCDEX) and Multi Commodity Exchange(MCX). Our businesses include stock broking, services rendered in connection with distribution of primary market issues and financial products like mutual funds and fixed deposits, depository services and Portfolio Management. Kotak Securities Limited is also a depository participant with National Securities Depository Limited (NSDL) and Central Depository Services (India) Limited (CDSL). Kotak Securities Limited is also registered with Insurance Regulatory and Development Authority as Corporate Agent for Kotak Mahindra Old Mutual Life Insurance Limited and is also a Mutual Fund Advisor registered with Association of Mutual Funds in India (AMFI). Kotak Securities Limited is registered as a Research Analyst under SEBI (Research Analyst) Regulations, 2014. We hereby declare that our activities were neither suspended nor we have defaulted with any stock exchange authority with whom we are registered in last five years. However SEBI, Exchanges and Depositories have conducted the routine inspection and based on their observations have issued advise letters or levied minor penalty on KSL for certain operational deviations. We have not been debarred from doing business by any Stock Exchange / SEBI or any other authorities; nor has our certificate of registration been cancelled by SEBI at any point of time. We offer our research services to primarily institutional investors and their employees, directors, fund managers, advisors who are registered with us Details of Associates are available on website i.e. www.kotak.com Research Analyst has served as an officer, director or employee of subject company(ies): No We or our associates may have received compensation from the subject company(ies) in the past 12 months. We or our associates have managed or co-managed public offering of securities for the subject company(ies) in the past 12 months. YES. Visit our website for more details We or our associates may have received compensation for investment banking or merchant banking or brokerage services from the subject company(ies) in the past 12 months. We or our associates may have received any compensation for products or services other than investment banking or merchant banking or brokerage services from the subject company(ies) in the past 12 months. We or our associates may have received compensation or other benefits from the subject company(ies) or third party in connection with the research report. Our associates may have financial interest in the subject company(ies). Research Analyst or his/her relative's financial interest in the subject company(ies): No Kotak Securities Limited has financial interest in the subject company(ies) at the end of the month immediately preceding the date of publication of Research Report: Britannia Industries, L&T Finance Holdings, HCL Technologies, HDFC Bank - YES Nature of Financial interest: Holding equity shares or derivatives of the subject company. Our associates may have actual/beneficial ownership of 1% or more securities of the subject company(ies) at the end of the month immediately preceding the date of publication of Research Report. Research Analyst or his/her relatives has actual/beneficial ownership of 1% or more securities of the subject company(ies) at the end of the month immediately preceding the date of publication of Research Report: No Kotak Securities Limited has actual/beneficial ownership of 1% or more securities of the subject company(ies) at the end of the month immediately preceding the date of publication of Research Report: No Subject company(ies) may have been client during twelve months preceding the date of distribution of the research report. A graph of daily closing prices of securities is available at https://www.moneycontrol.com/india/stockpricequote/ and http://economictimes.indiatimes.com/markets/stocks/stock-quotes. (Choose a company from the list on the browser and select the"three years" icon in the price chart).
Kotak Securities Limited. Registered Office: 27 BKC, C 27, G Block, Bandra Kurla Complex, Bandra (E), Mumbai 400051. CIN: U99999MH1994PLC134051, Telephone No.: +22 43360000, Fax No.: +22 67132430. Website: www.kotak.com / www.kotaksecurities.com. Correspondence Address: Infinity IT Park, Bldg. No 21, Opp. Film City Road, A K Vaidya Marg, Malad (East), Mumbai 400097. Telephone No: 42856825. SEBI Registration No. INZ000200137(Member of NSE, BSE, MSE, MCX & NCDEX). Member Id: NSE-08081; BSE-673; MSE-1024; MCX-56285; NCDEX-1262. AMFI ARN 0164, PMS INP000000258 and Research Analyst INH000000586. NSDL/CDSL: IN-DP-NSDL-23-97. Compliance Officer Details: Mr. Manoj Agarwal. Call: 022 - 4285 8484, or Email: [email protected]. Investments in securities market are subject to market risks, read all the related documents carefully before investing. In case you require any clarification or have any concern, kindly write to us at below email ids: Level 1: For Trading related queries, contact our customer service at ‘[email protected]’ and for demat account related queries contact us at [email protected] or call us on: Toll free numbers 18002099191 / 1860 266 9191 Level 2: If you do not receive a satisfactory response at Level 1 within 3 working days, you may write to us at [email protected] or call us on 022-42858445 and if you feel you are still unheard, write to our customer service HOD at [email protected] or call us on 022-42858208. Level 3: If you still have not received a satisfactory response at Level 2 within 3 working days, you may contact our Compliance Officer (Name: Mr. Manoj Agarwal) at [email protected] or call on 91- (022) 4285 8484. Level 4 : If you have not received a satisfactory response at Level 3 within 7 working days, you may also approach Managing Director / CEO (Mr. Jaideep Hansraj) at [email protected] or call on 91-(022) 4285 8301. First Cut notes published on this site are for information purposes only. They represent early notations and responses by analysts to recent events. Data in the notes may not have been verified by us and investors should not act upon any data or views in these notes. Most First Cut notes, but not necessarily all, will be followed by final research reports on the subject. There could be variance between the First cut note and the final research note on any subject, in which case the contents of the final research note would prevail. We accept no liability for the contents of the First Cut Notes.


![[Kotak] India Daily, April 2, 2019 - Kotak Securities](https://static.fdokumen.com/doc/165x107/63265a4f5c2c3bbfa803a474/kotak-india-daily-april-2-2019-kotak-securities.jpg)


![[Kotak] India Daily, October 26, 2016 - Kotak Securities](https://static.fdokumen.com/doc/165x107/631c83236c6907d3680156e0/kotak-india-daily-october-26-2016-kotak-securities.jpg)