![[Kotak] India Daily, April 2, 2019 - Kotak Securities](https://static.fdokumen.com/doc/165x107/63265a4f5c2c3bbfa803a474/kotak-india-daily-april-2-2019-kotak-securities.jpg)
India Daily, April 11, 2013 - Kotak Securities
43
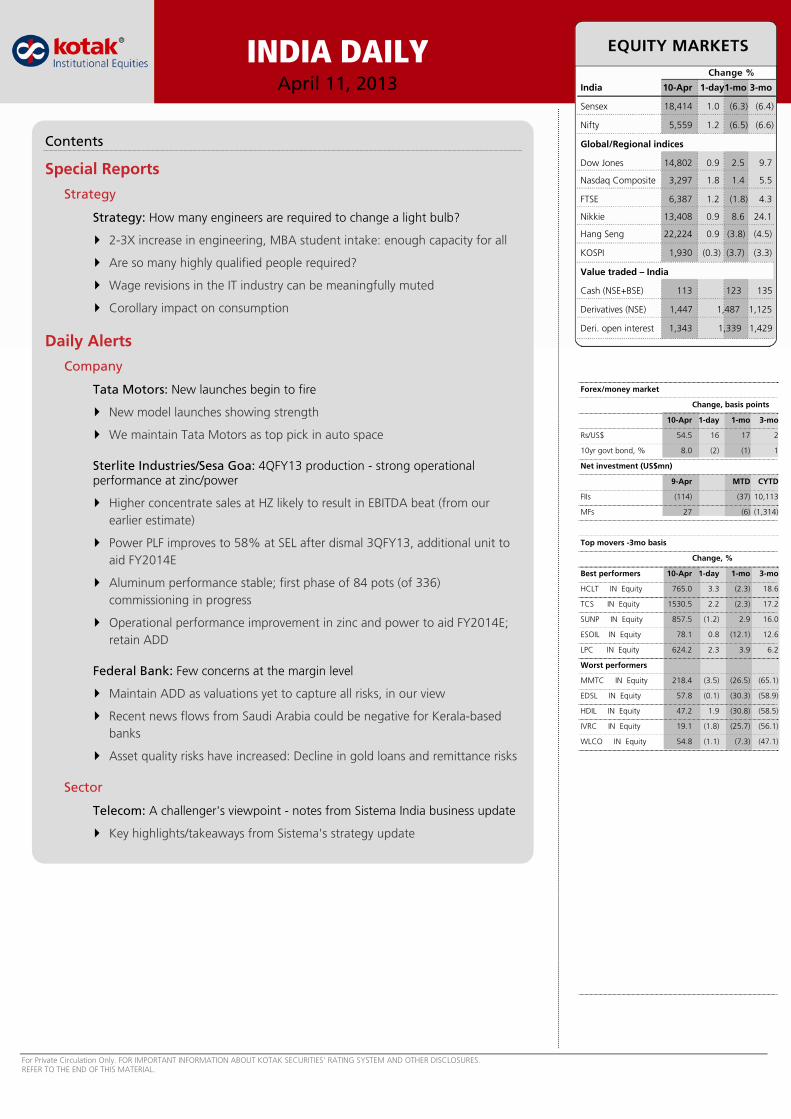
For Private Circulation Only. FOR IMPORTANT INFORMATION ABOUT KOTAK SECURITIES’ RATING SYSTEM AND OTHER DISCLOSURES. REFER TO THE END OF THIS MATERIAL. INDIA DAILY April 11, 2013 India 10-Apr 1-day1-mo 3-mo Sensex 18,414 1.0 (6.3) (6.4) Nifty 5,559 1.2 (6.5) (6.6) Global/Regional indices Dow Jones 14,802 0.9 2.5 9.7 Nasdaq Composite 3,297 1.8 1.4 5.5 FTSE 6,387 1.2 (1.8) 4.3 Nikkie 13,408 0.9 8.6 24.1 Hang Seng 22,224 0.9 (3.8) (4.5) KOSPI 1,930 (0.3) (3.7) (3.3) Value traded – India Cash (NSE+BSE) 113 123 135 Derivatives (NSE) 1,447 1,487 1,125 Deri. open interest 1,343 1,339 1,429 Forex/money market Change, basis points 10-Apr 1-day 1-mo 3-mo Rs/US$ 54.5 16 17 2 10yr govt bond, % 8.0 (2) (1) 1 Net investment (US$mn) 9-Apr MTD CYTD FIIs (114) (37) 10,113 MFs 27 (6) (1,314) Top movers -3mo basis Change, % Best performers 10-Apr 1-day 1-mo 3-mo HCLT IN Equity 765.0 3.3 (2.3) 18.6 TCS IN Equity 1530.5 2.2 (2.3) 17.2 SUNP IN Equity 857.5 (1.2) 2.9 16.0 ESOIL IN Equity 78.1 0.8 (12.1) 12.6 LPC IN Equity 624.2 2.3 3.9 6.2 Worst performers MMTC IN Equity 218.4 (3.5) (26.5) (65.1) EDSL IN Equity 57.8 (0.1) (30.3) (58.9) HDIL IN Equity 47.2 1.9 (30.8) (58.5) IVRC IN Equity 19.1 (1.8) (25.7) (56.1) WLCO IN Equity 54.8 (1.1) (7.3) (47.1) Contents Special Reports Strategy Strategy: How many engineers are required to change a light bulb? 2-3X increase in engineering, MBA student intake: enough capacity for all Are so many highly qualified people required? Wage revisions in the IT industry can be meaningfully muted Corollary impact on consumption Daily Alerts Company Tata Motors: New launches begin to fire New model launches showing strength We maintain Tata Motors as top pick in auto space Sterlite Industries/Sesa Goa: 4QFY13 production - strong operational performance at zinc/power Higher concentrate sales at HZ likely to result in EBITDA beat (from our earlier estimate) Power PLF improves to 58% at SEL after dismal 3QFY13, additional unit to aid FY2014E Aluminum performance stable; first phase of 84 pots (of 336) commissioning in progress Operational performance improvement in zinc and power to aid FY2014E; retain ADD Federal Bank: Few concerns at the margin level Maintain ADD as valuations yet to capture all risks, in our view Recent news flows from Saudi Arabia could be negative for Kerala-based banks Asset quality risks have increased: Decline in gold loans and remittance risks Sector Telecom: A challenger's viewpoint - notes from Sistema India business update Key highlights/takeaways from Sistema's strategy update
-
Upload
khangminh22 -
Category
Documents
-
view
0 -
download
0
Transcript of India Daily, April 11, 2013 - Kotak Securities
For Private Circulation Only. FOR IMPORTANT INFORMATION ABOUT KOTAK SECURITIES’ RATING SYSTEM AND OTHER DISCLOSURES. REFER TO THE END OF THIS MATERIAL.
INDIA DAILYApril 11, 2013 India 10-Apr 1-day1-mo 3-mo
Sensex 18,414 1.0 (6.3) (6.4)
Nifty 5,559 1.2 (6.5) (6.6)
Global/Regional indices
Dow Jones 14,802 0.9 2.5 9.7
Nasdaq Composite 3,297 1.8 1.4 5.5
FTSE 6,387 1.2 (1.8) 4.3
Nikkie 13,408 0.9 8.6 24.1
Hang Seng 22,224 0.9 (3.8) (4.5)
KOSPI 1,930 (0.3) (3.7) (3.3)
Value traded – India
Cash (NSE+BSE) 113 123 135
Derivatives (NSE) 1,447 1,487 1,125
Deri. open interest 1,343 1,339 1,429
Forex/money market
Change, basis points
10-Apr 1-day 1-mo 3-mo
Rs/US$ 54.5 16 17 2
10yr govt bond, % 8.0 (2) (1) 1
Net investment (US$mn)
9-Apr MTD CYTD
FIIs (114) (37) 10,113
MFs 27 (6) (1,314)
Top movers -3mo basis
Change, %
Best performers 10-Apr 1-day 1-mo 3-mo
HCLT IN Equity 765.0 3.3 (2.3) 18.6
TCS IN Equity 1530.5 2.2 (2.3) 17.2
SUNP IN Equity 857.5 (1.2) 2.9 16.0
ESOIL IN Equity 78.1 0.8 (12.1) 12.6
LPC IN Equity 624.2 2.3 3.9 6.2
Worst performers
MMTC IN Equity 218.4 (3.5) (26.5) (65.1)
EDSL IN Equity 57.8 (0.1) (30.3) (58.9)
HDIL IN Equity 47.2 1.9 (30.8) (58.5)
IVRC IN Equity 19.1 (1.8) (25.7) (56.1)
WLCO IN Equity 54.8 (1.1) (7.3) (47.1)
Contents
Special Reports
Strategy
Strategy: How many engineers are required to change a light bulb?
2-3X increase in engineering, MBA student intake: enough capacity for all
Are so many highly qualified people required?
Wage revisions in the IT industry can be meaningfully muted
Corollary impact on consumption
Daily Alerts
Company
Tata Motors: New launches begin to fire
New model launches showing strength
We maintain Tata Motors as top pick in auto space
Sterlite Industries/Sesa Goa: 4QFY13 production - strong operational performance at zinc/power
Higher concentrate sales at HZ likely to result in EBITDA beat (from our earlier estimate)
Power PLF improves to 58% at SEL after dismal 3QFY13, additional unit to aid FY2014E
Aluminum performance stable; first phase of 84 pots (of 336) commissioning in progress
Operational performance improvement in zinc and power to aid FY2014E; retain ADD
Federal Bank: Few concerns at the margin level
Maintain ADD as valuations yet to capture all risks, in our view
Recent news flows from Saudi Arabia could be negative for Kerala-based banks
Asset quality risks have increased: Decline in gold loans and remittance risks
Sector
Telecom: A challenger's viewpoint - notes from Sistema India business update
Key highlights/takeaways from Sistema's strategy update
For private Circulation Only. FOR IMPORTANT INFORMATION ABOUT KOTAK SECURITIES’ RATING SYSTEM AND OTHER DISCLOSURES, REFER TO THE END OF THIS MATERIAL.
2-3X increase in engineering, MBA student intake: enough capacity for all
The intake of engineering students has gone up to 1.5 mn in FY2012 (from 0.7 mn in FY2008); MBA cohort increased to 0.4 mn (0.1 mn). The demand-supply scenario in higher education industry has shown significant capacity addition over the past few years (up to 2.4 mn from 1.1 mn in FY2008); this has (1) reduced the importance of ‘capitation fees’ and (2) led to underutilization of investments in college infrastructure.
Are so many highly qualified people required?
In the initial GameChanger report, ‘365 mn: Can India live up to its demographic dividend?’, we had pointed out that there will be a glut of ‘graduates and above’ in India. Updating the calculations, we find that, given the structure of India’s economy, India requires around 1 mn graduates a year, compared to the 2.4 mn being trained every year (quality/employability is an area of concern). We note that the Government wants to increase the gross enrollment ratio of college-going students to 30%: lack of employment opportunities may mean money wasted on education. We note that skill-development opportunities still abound in India: it is just that they are at a level below.
Wage revisions in the IT industry can be meaningfully muted
We expect moderation in engineers’ wage revisions to mid-to-high-single digits from low-to-mid-teens historically. We expect this change to be driven by (1) change in business mix of IT companies as they now require employees of different (analytics, BPO, etc.) or lower (infrastructure management) skills: we expect modest growth in fresh intake of engineering talent by Indian IT and (2) 2X increase in supply of engineers in the past four years. Surplus of engineers could pressure compensation across the entire value chain.
Corollary impact on consumption
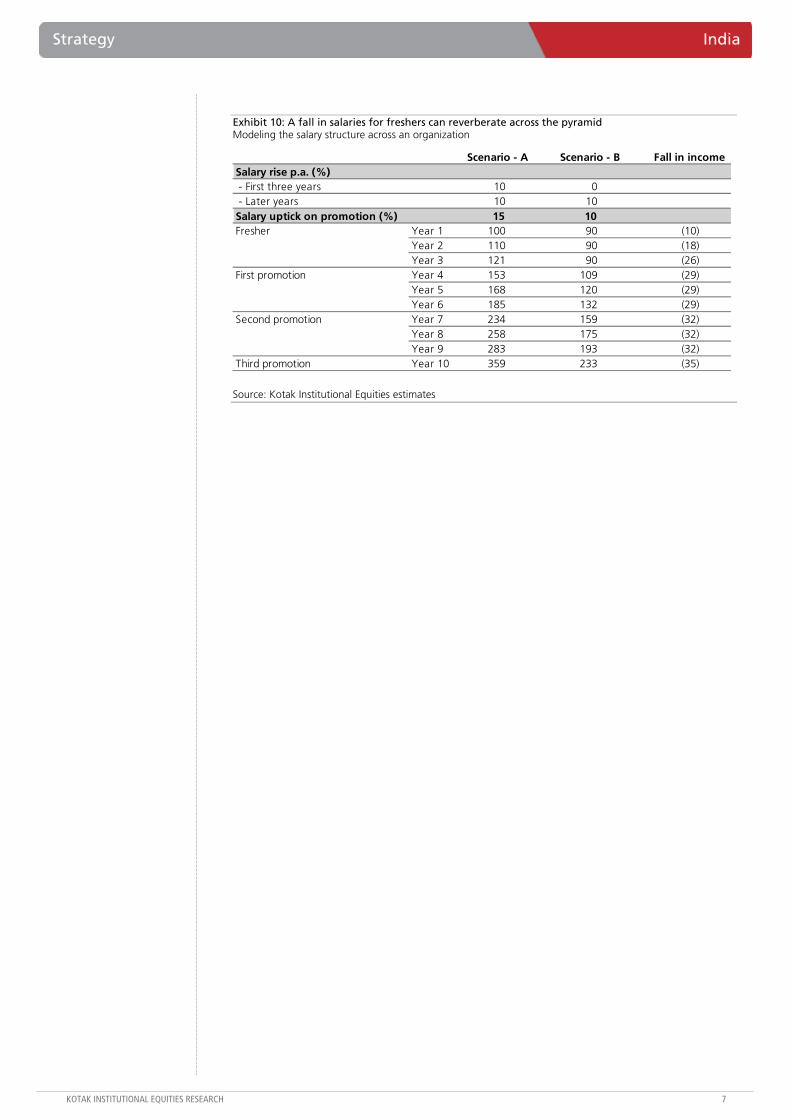
Last year GameChanger, in its report ‘RUPEES: India consumption model’, projected the consumption market in India over the next few years. A bulk of the growth in consumption was to come from increasing affluence as households move up the consuming class. However, a slowdown in pay growth can impact meaningfully the number of households that move up the pyramid and also the consumption wallet that they can spend. We also note that education loans have spiraled 10X over the past seven years; EMIs on those loans can now form a meaningful component of a fresher’s salary. We would turn cautious on the consumption thesis unless we see gainful employment opportunities being created.
Strategy.dot
Strategy
How many engineers are required to change a light bulb? A very large graduating class of engineers and MBAs worries us about their job prospects; India now trains more engineers annually (1.5 mn) than China (1.1 mn) and the US (0.1 mn) combined! This may lead to meaningful underemployment and/or stagnating wages, stoking frustration among the overqualified. We explore the impact of a glut of trained professionals on the banking sector (education loans) and on consumption.
INDIA
APRIL 11, 2013
NEW RELEASE
BSE-30: 18,414
QUICK FACTS
• Demand-supply scenarios for graduates and post-graduates turning in favor of employers
• Even IIM-A graduates are taking a beating on salaries
• Trade unions in Indian IT?
Strategy India
KOTAK INSTITUTIONAL EQUITIES RESEARCH 3
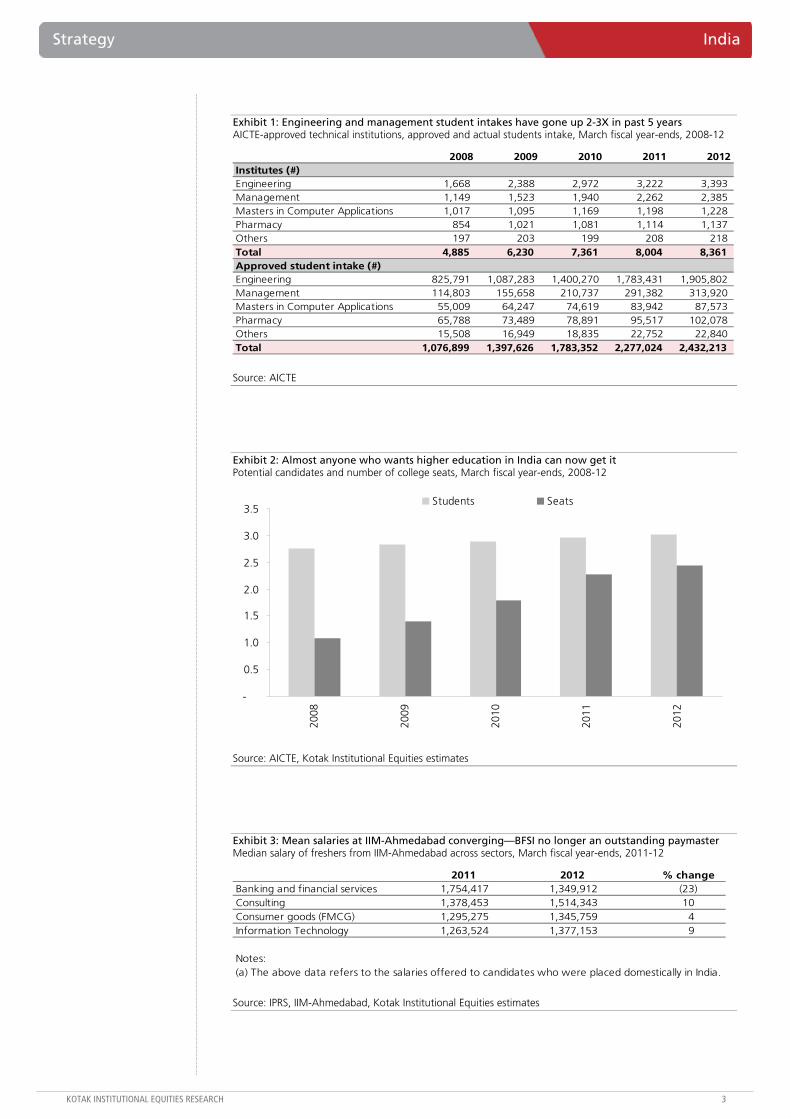
Exhibit 1: Engineering and management student intakes have gone up 2-3X in past 5 years AICTE-approved technical institutions, approved and actual students intake, March fiscal year-ends, 2008-12
2008 2009 2010 2011 2012Institutes (#)Engineering 1,668 2,388 2,972 3,222 3,393 Management 1,149 1,523 1,940 2,262 2,385 Masters in Computer Applications 1,017 1,095 1,169 1,198 1,228 Pharmacy 854 1,021 1,081 1,114 1,137 Others 197 203 199 208 218 Total 4,885 6,230 7,361 8,004 8,361 Approved student intake (#)Engineering 825,791 1,087,283 1,400,270 1,783,431 1,905,802 Management 114,803 155,658 210,737 291,382 313,920 Masters in Computer Applications 55,009 64,247 74,619 83,942 87,573 Pharmacy 65,788 73,489 78,891 95,517 102,078 Others 15,508 16,949 18,835 22,752 22,840 Total 1,076,899 1,397,626 1,783,352 2,277,024 2,432,213
Source: AICTE
Exhibit 2: Almost anyone who wants higher education in India can now get it Potential candidates and number of college seats, March fiscal year-ends, 2008-12
-
0.5
1.0
1.5
2.0
2.5
3.0
3.5
2008
2009
2010
2011
2012
Students Seats
Source: AICTE, Kotak Institutional Equities estimates
Exhibit 3: Mean salaries at IIM-Ahmedabad converging—BFSI no longer an outstanding paymaster Median salary of freshers from IIM-Ahmedabad across sectors, March fiscal year-ends, 2011-12
2011 2012 % changeBanking and financial services 1,754,417 1,349,912 (23) Consulting 1,378,453 1,514,343 10 Consumer goods (FMCG) 1,295,275 1,345,759 4 Information Technology 1,263,524 1,377,153 9
Notes:(a) The above data refers to the salaries offered to candidates who were placed domestically in India.
Source: IPRS, IIM-Ahmedabad, Kotak Institutional Equities estimates
India Strategy
4 KOTAK INSTITUTIONAL EQUITIES RESEARCH
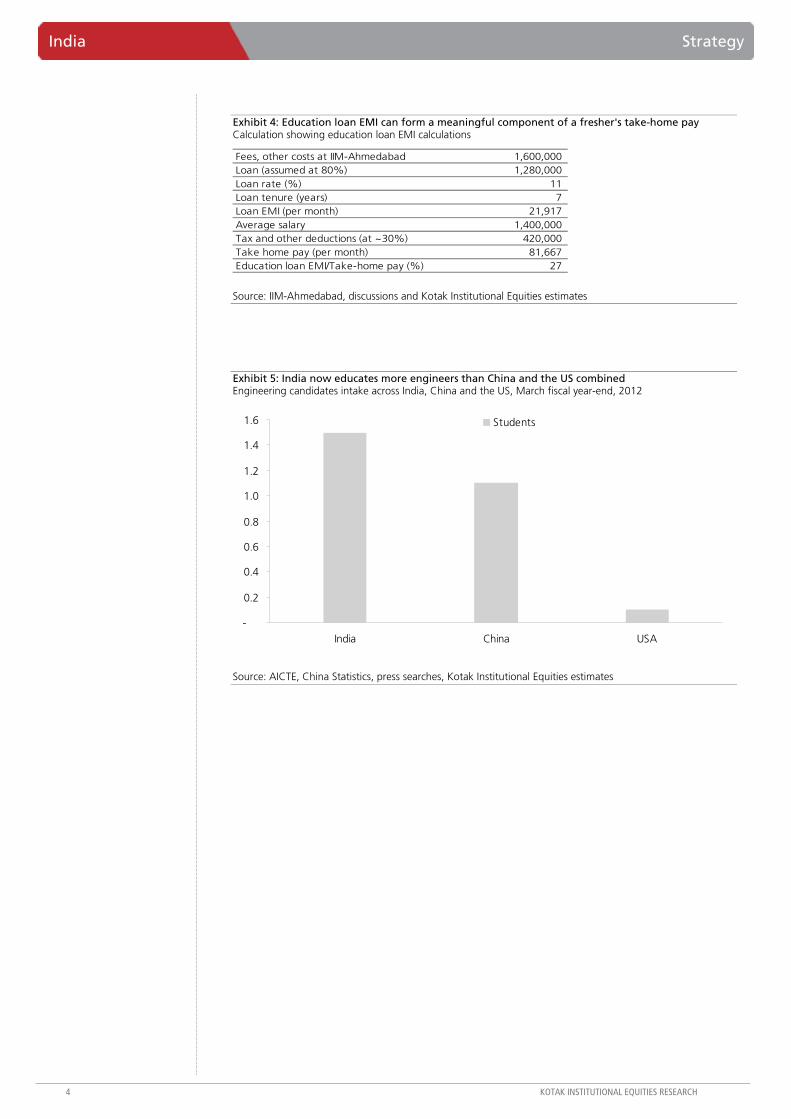
Exhibit 4: Education loan EMI can form a meaningful component of a fresher's take-home pay Calculation showing education loan EMI calculations
Fees, other costs at IIM-Ahmedabad 1,600,000 Loan (assumed at 80%) 1,280,000 Loan rate (%) 11 Loan tenure (years) 7 Loan EMI (per month) 21,917 Average salary 1,400,000 Tax and other deductions (at ~30%) 420,000 Take home pay (per month) 81,667 Education loan EMI/Take-home pay (%) 27
Source: IIM-Ahmedabad, discussions and Kotak Institutional Equities estimates
Exhibit 5: India now educates more engineers than China and the US combined Engineering candidates intake across India, China and the US, March fiscal year-end, 2012
Students
-
0.2
0.4
0.6
0.8
1.0
1.2
1.4
1.6
India China USA
Students
Source: AICTE, China Statistics, press searches, Kotak Institutional Equities estimates
Strategy India
KOTAK INSTITUTIONAL EQUITIES RESEARCH 5
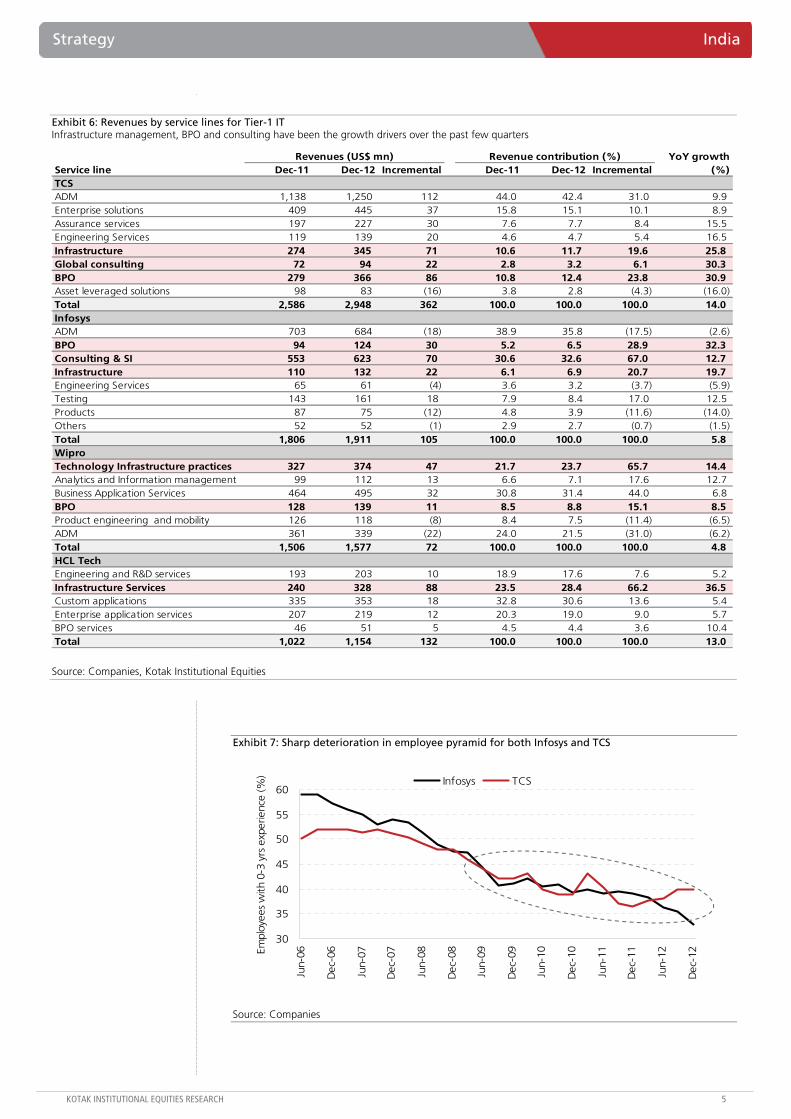
Exhibit 6: Revenues by service lines for Tier-1 IT Infrastructure management, BPO and consulting have been the growth drivers over the past few quarters
YoY growthService line Dec-11 Dec-12 Incremental Dec-11 Dec-12 Incremental (%)TCSADM 1,138 1,250 112 44.0 42.4 31.0 9.9 Enterprise solutions 409 445 37 15.8 15.1 10.1 8.9 Assurance services 197 227 30 7.6 7.7 8.4 15.5 Engineering Services 119 139 20 4.6 4.7 5.4 16.5 Infrastructure 274 345 71 10.6 11.7 19.6 25.8 Global consulting 72 94 22 2.8 3.2 6.1 30.3 BPO 279 366 86 10.8 12.4 23.8 30.9 Asset leveraged solutions 98 83 (16) 3.8 2.8 (4.3) (16.0) Total 2,586 2,948 362 100.0 100.0 100.0 14.0 InfosysADM 703 684 (18) 38.9 35.8 (17.5) (2.6) BPO 94 124 30 5.2 6.5 28.9 32.3 Consulting & SI 553 623 70 30.6 32.6 67.0 12.7 Infrastructure 110 132 22 6.1 6.9 20.7 19.7 Engineering Services 65 61 (4) 3.6 3.2 (3.7) (5.9) Testing 143 161 18 7.9 8.4 17.0 12.5 Products 87 75 (12) 4.8 3.9 (11.6) (14.0) Others 52 52 (1) 2.9 2.7 (0.7) (1.5) Total 1,806 1,911 105 100.0 100.0 100.0 5.8 WiproTechnology Infrastructure practices 327 374 47 21.7 23.7 65.7 14.4 Analytics and Information management 99 112 13 6.6 7.1 17.6 12.7 Business Application Services 464 495 32 30.8 31.4 44.0 6.8 BPO 128 139 11 8.5 8.8 15.1 8.5 Product engineering and mobility 126 118 (8) 8.4 7.5 (11.4) (6.5) ADM 361 339 (22) 24.0 21.5 (31.0) (6.2) Total 1,506 1,577 72 100.0 100.0 100.0 4.8 HCL TechEngineering and R&D services 193 203 10 18.9 17.6 7.6 5.2 Infrastructure Services 240 328 88 23.5 28.4 66.2 36.5 Custom applications 335 353 18 32.8 30.6 13.6 5.4 Enterprise application services 207 219 12 20.3 19.0 9.0 5.7 BPO services 46 51 5 4.5 4.4 3.6 10.4 Total 1,022 1,154 132 100.0 100.0 100.0 13.0
Revenues (US$ mn) Revenue contribution (%)
Source: Companies, Kotak Institutional Equities
Exhibit 7: Sharp deterioration in employee pyramid for both Infosys and TCS
30
35
40
45
50
55
60
Jun-
06
Dec
-06
Jun-
07
Dec
-07
Jun-
08
Dec
-08
Jun-
09
Dec
-09
Jun-
10
Dec
-10
Jun-
11
Dec
-11
Jun-
12
Dec
-12Em
ploy
ees
with
0-3
yrs
exp
erie
nce
(%) Infosys TCS
Source: Companies
India Strategy
6 KOTAK INSTITUTIONAL EQUITIES RESEARCH
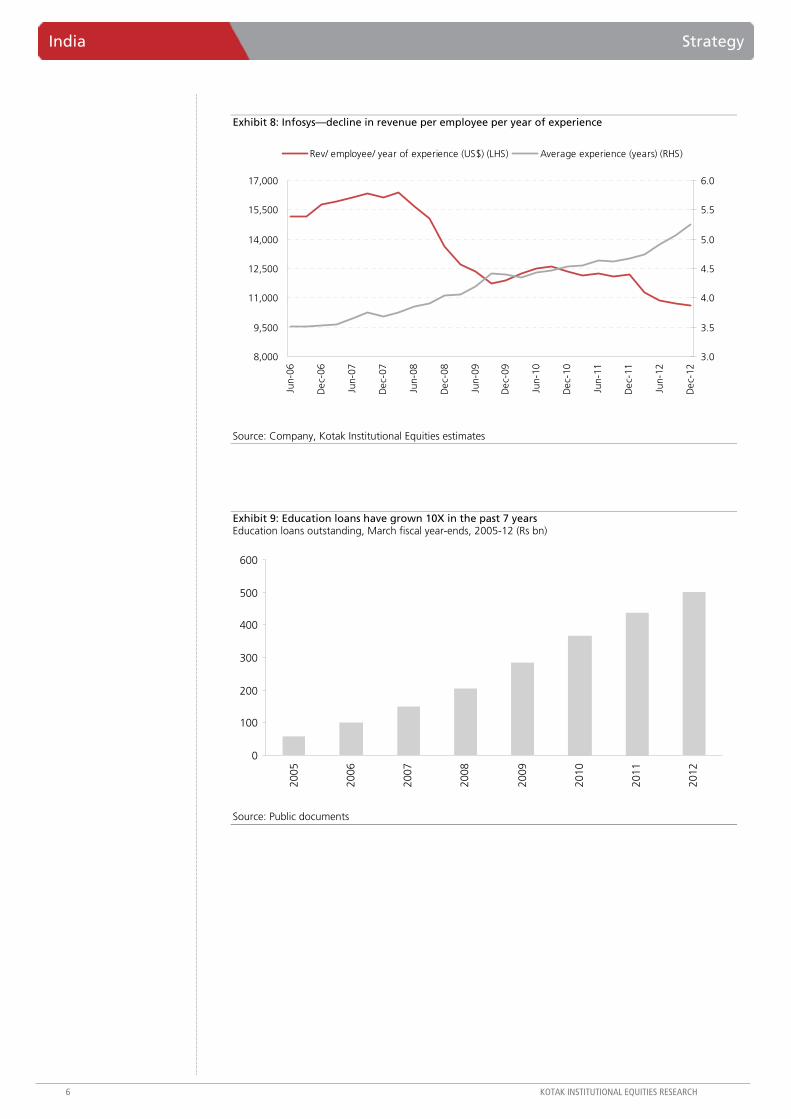
Exhibit 8: Infosys—decline in revenue per employee per year of experience
8,000
9,500
11,000
12,500
14,000
15,500
17,000
Jun-
06
Dec
-06
Jun-
07
Dec
-07
Jun-
08
Dec
-08
Jun-
09
Dec
-09
Jun-
10
Dec
-10
Jun-
11
Dec
-11
Jun-
12
Dec
-12
3.0
3.5
4.0
4.5
5.0
5.5
6.0
Rev/ employee/ year of experience (US$) (LHS) Average experience (years) (RHS)
Source: Company, Kotak Institutional Equities estimates
Exhibit 9: Education loans have grown 10X in the past 7 years Education loans outstanding, March fiscal year-ends, 2005-12 (Rs bn)
0
100
200
300
400
500
600
2005
2006
2007
2008
2009
2010
2011
2012
Source: Public documents
Strategy India
KOTAK INSTITUTIONAL EQUITIES RESEARCH 7
Exhibit 10: A fall in salaries for freshers can reverberate across the pyramid Modeling the salary structure across an organization
Scenario - A Scenario - B Fall in incomeSalary rise p.a. (%) - First three years 10 0 - Later years 10 10Salary uptick on promotion (%) 15 10Fresher Year 1 100 90 (10)
Year 2 110 90 (18)Year 3 121 90 (26)
First promotion Year 4 153 109 (29)Year 5 168 120 (29)Year 6 185 132 (29)
Second promotion Year 7 234 159 (32)Year 8 258 175 (32)Year 9 283 193 (32)
Third promotion Year 10 359 233 (35)
Source: Kotak Institutional Equities estimates
For private Circulation Only. FOR IMPORTANT INFORMATION ABOUT KOTAK SECURITIES’ RATING SYSTEM AND OTHER DISCLOSURES, REFER TO THE END OF THIS MATERIAL.
New model launches showing strength
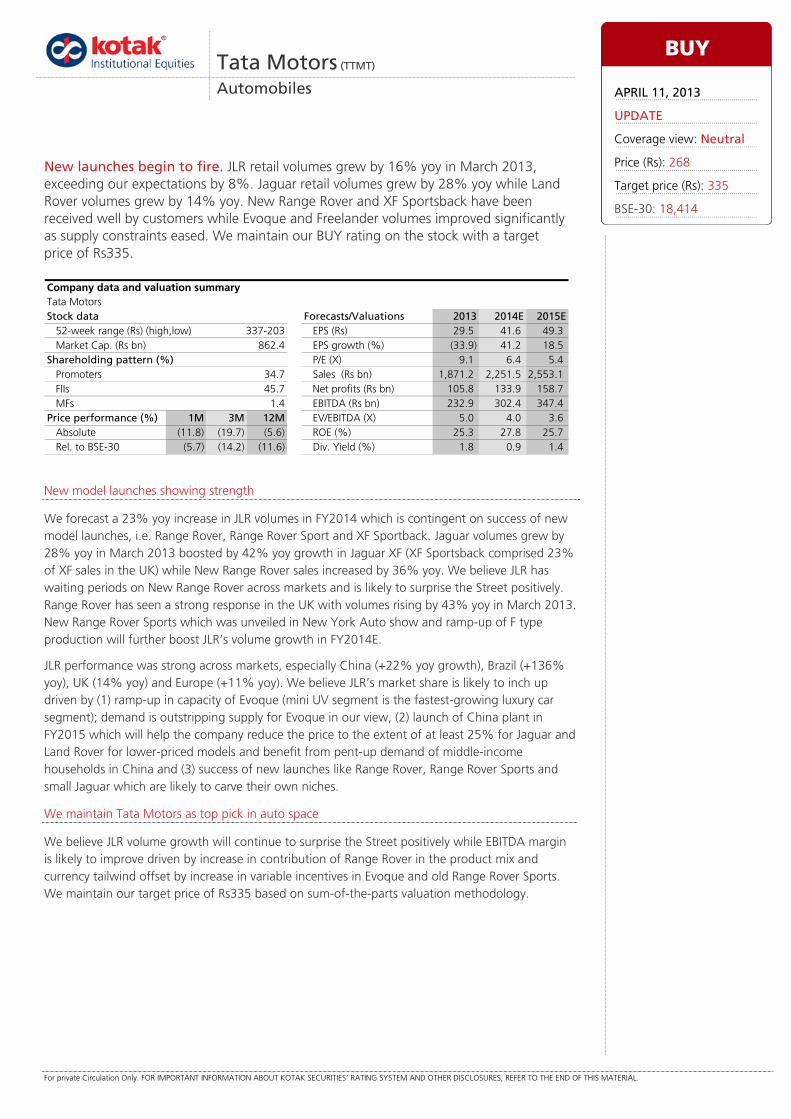
We forecast a 23% yoy increase in JLR volumes in FY2014 which is contingent on success of new model launches, i.e. Range Rover, Range Rover Sport and XF Sportback. Jaguar volumes grew by 28% yoy in March 2013 boosted by 42% yoy growth in Jaguar XF (XF Sportsback comprised 23% of XF sales in the UK) while New Range Rover sales increased by 36% yoy. We believe JLR has waiting periods on New Range Rover across markets and is likely to surprise the Street positively. Range Rover has seen a strong response in the UK with volumes rising by 43% yoy in March 2013. New Range Rover Sports which was unveiled in New York Auto show and ramp-up of F type production will further boost JLR’s volume growth in FY2014E.
JLR performance was strong across markets, especially China (+22% yoy growth), Brazil (+136% yoy), UK (14% yoy) and Europe (+11% yoy). We believe JLR’s market share is likely to inch up driven by (1) ramp-up in capacity of Evoque (mini UV segment is the fastest-growing luxury car segment); demand is outstripping supply for Evoque in our view, (2) launch of China plant in FY2015 which will help the company reduce the price to the extent of at least 25% for Jaguar and Land Rover for lower-priced models and benefit from pent-up demand of middle-income households in China and (3) success of new launches like Range Rover, Range Rover Sports and small Jaguar which are likely to carve their own niches.
We maintain Tata Motors as top pick in auto space
We believe JLR volume growth will continue to surprise the Street positively while EBITDA margin is likely to improve driven by increase in contribution of Range Rover in the product mix and currency tailwind offset by increase in variable incentives in Evoque and old Range Rover Sports. We maintain our target price of Rs335 based on sum-of-the-parts valuation methodology.
Tata Motors (TTMT)
Automobiles
New launches begin to fire. JLR retail volumes grew by 16% yoy in March 2013, exceeding our expectations by 8%. Jaguar retail volumes grew by 28% yoy while Land Rover volumes grew by 14% yoy. New Range Rover and XF Sportsback have been received well by customers while Evoque and Freelander volumes improved significantly as supply constraints eased. We maintain our BUY rating on the stock with a target price of Rs335.
Tata MotorsStock data Forecasts/Valuations 2013 2014E 2015E
52-week range (Rs) (high,low) EPS (Rs) 29.5 41.6 49.3Market Cap. (Rs bn) 862.4 EPS growth (%) (33.9) 41.2 18.5
Shareholding pattern (%) P/E (X) 9.1 6.4 5.4Promoters 34.7 Sales (Rs bn) 1,871.2 2,251.5 2,553.1FIIs 45.7 Net profits (Rs bn) 105.8 133.9 158.7MFs 1.4 EBITDA (Rs bn) 232.9 302.4 347.4
Price performance (%) 1M 3M 12M EV/EBITDA (X) 5.0 4.0 3.6Absolute (11.8) (19.7) (5.6) ROE (%) 25.3 27.8 25.7Rel. to BSE-30 (5.7) (14.2) (11.6) Div. Yield (%) 1.8 0.9 1.4
Company data and valuation summary
337-203
BUY
APRIL 11, 2013
UPDATE
Coverage view: Neutral
Price (Rs): 268
Target price (Rs): 335
BSE-30: 18,414
Tata Motors Automobiles
KOTAK INSTITUTIONAL EQUITIES RESEARCH 9
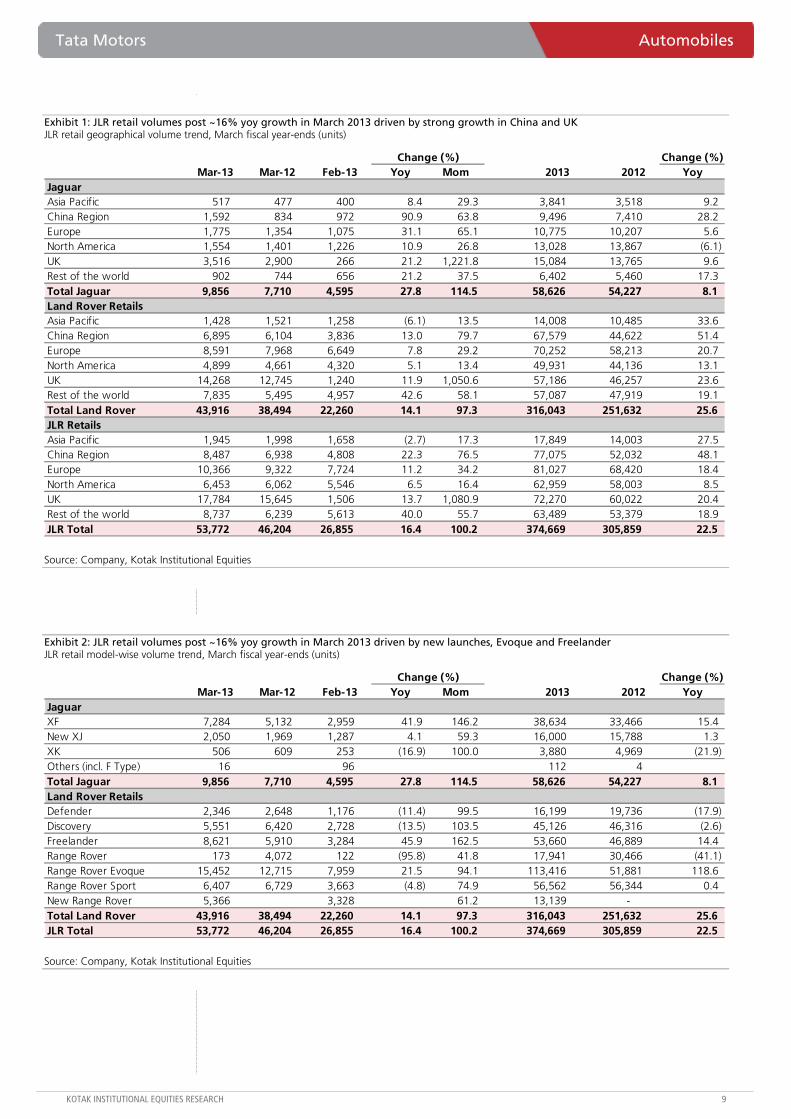
Exhibit 1: JLR retail volumes post ~16% yoy growth in March 2013 driven by strong growth in China and UK JLR retail geographical volume trend, March fiscal year-ends (units)
Change (%) Change (%)Mar-13 Mar-12 Feb-13 Yoy Mom 2013 2012 Yoy
JaguarAsia Pacific 517 477 400 8.4 29.3 3,841 3,518 9.2 China Region 1,592 834 972 90.9 63.8 9,496 7,410 28.2 Europe 1,775 1,354 1,075 31.1 65.1 10,775 10,207 5.6 North America 1,554 1,401 1,226 10.9 26.8 13,028 13,867 (6.1) UK 3,516 2,900 266 21.2 1,221.8 15,084 13,765 9.6 Rest of the world 902 744 656 21.2 37.5 6,402 5,460 17.3 Total Jaguar 9,856 7,710 4,595 27.8 114.5 58,626 54,227 8.1 Land Rover RetailsAsia Pacific 1,428 1,521 1,258 (6.1) 13.5 14,008 10,485 33.6 China Region 6,895 6,104 3,836 13.0 79.7 67,579 44,622 51.4 Europe 8,591 7,968 6,649 7.8 29.2 70,252 58,213 20.7 North America 4,899 4,661 4,320 5.1 13.4 49,931 44,136 13.1 UK 14,268 12,745 1,240 11.9 1,050.6 57,186 46,257 23.6 Rest of the world 7,835 5,495 4,957 42.6 58.1 57,087 47,919 19.1 Total Land Rover 43,916 38,494 22,260 14.1 97.3 316,043 251,632 25.6 JLR RetailsAsia Pacific 1,945 1,998 1,658 (2.7) 17.3 17,849 14,003 27.5 China Region 8,487 6,938 4,808 22.3 76.5 77,075 52,032 48.1 Europe 10,366 9,322 7,724 11.2 34.2 81,027 68,420 18.4 North America 6,453 6,062 5,546 6.5 16.4 62,959 58,003 8.5 UK 17,784 15,645 1,506 13.7 1,080.9 72,270 60,022 20.4 Rest of the world 8,737 6,239 5,613 40.0 55.7 63,489 53,379 18.9 JLR Total 53,772 46,204 26,855 16.4 100.2 374,669 305,859 22.5
Source: Company, Kotak Institutional Equities
Exhibit 2: JLR retail volumes post ~16% yoy growth in March 2013 driven by new launches, Evoque and Freelander JLR retail model-wise volume trend, March fiscal year-ends (units)
Change (%) Change (%)Mar-13 Mar-12 Feb-13 Yoy Mom 2013 2012 Yoy
JaguarXF 7,284 5,132 2,959 41.9 146.2 38,634 33,466 15.4 New XJ 2,050 1,969 1,287 4.1 59.3 16,000 15,788 1.3 XK 506 609 253 (16.9) 100.0 3,880 4,969 (21.9) Others (incl. F Type) 16 96 112 4 Total Jaguar 9,856 7,710 4,595 27.8 114.5 58,626 54,227 8.1 Land Rover RetailsDefender 2,346 2,648 1,176 (11.4) 99.5 16,199 19,736 (17.9) Discovery 5,551 6,420 2,728 (13.5) 103.5 45,126 46,316 (2.6) Freelander 8,621 5,910 3,284 45.9 162.5 53,660 46,889 14.4 Range Rover 173 4,072 122 (95.8) 41.8 17,941 30,466 (41.1) Range Rover Evoque 15,452 12,715 7,959 21.5 94.1 113,416 51,881 118.6 Range Rover Sport 6,407 6,729 3,663 (4.8) 74.9 56,562 56,344 0.4 New Range Rover 5,366 3,328 61.2 13,139 - Total Land Rover 43,916 38,494 22,260 14.1 97.3 316,043 251,632 25.6 JLR Total 53,772 46,204 26,855 16.4 100.2 374,669 305,859 22.5
Source: Company, Kotak Institutional Equities
Automobiles Tata Motors
10 KOTAK INSTITUTIONAL EQUITIES RESEARCH
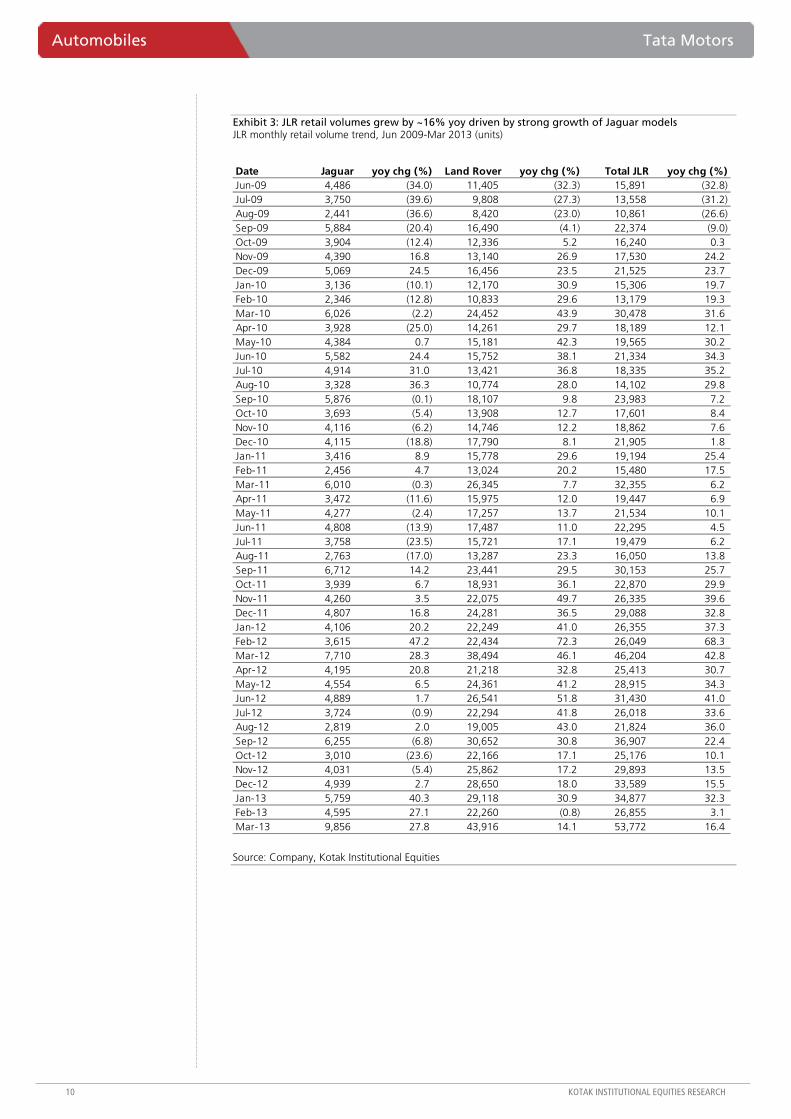
Exhibit 3: JLR retail volumes grew by ~16% yoy driven by strong growth of Jaguar models JLR monthly retail volume trend, Jun 2009-Mar 2013 (units)
Date Jaguar yoy chg (%) Land Rover yoy chg (%) Total JLR yoy chg (%)Jun-09 4,486 (34.0) 11,405 (32.3) 15,891 (32.8) Jul-09 3,750 (39.6) 9,808 (27.3) 13,558 (31.2) Aug-09 2,441 (36.6) 8,420 (23.0) 10,861 (26.6) Sep-09 5,884 (20.4) 16,490 (4.1) 22,374 (9.0) Oct-09 3,904 (12.4) 12,336 5.2 16,240 0.3 Nov-09 4,390 16.8 13,140 26.9 17,530 24.2 Dec-09 5,069 24.5 16,456 23.5 21,525 23.7 Jan-10 3,136 (10.1) 12,170 30.9 15,306 19.7 Feb-10 2,346 (12.8) 10,833 29.6 13,179 19.3 Mar-10 6,026 (2.2) 24,452 43.9 30,478 31.6 Apr-10 3,928 (25.0) 14,261 29.7 18,189 12.1 May-10 4,384 0.7 15,181 42.3 19,565 30.2 Jun-10 5,582 24.4 15,752 38.1 21,334 34.3 Jul-10 4,914 31.0 13,421 36.8 18,335 35.2 Aug-10 3,328 36.3 10,774 28.0 14,102 29.8 Sep-10 5,876 (0.1) 18,107 9.8 23,983 7.2 Oct-10 3,693 (5.4) 13,908 12.7 17,601 8.4 Nov-10 4,116 (6.2) 14,746 12.2 18,862 7.6 Dec-10 4,115 (18.8) 17,790 8.1 21,905 1.8 Jan-11 3,416 8.9 15,778 29.6 19,194 25.4 Feb-11 2,456 4.7 13,024 20.2 15,480 17.5 Mar-11 6,010 (0.3) 26,345 7.7 32,355 6.2 Apr-11 3,472 (11.6) 15,975 12.0 19,447 6.9 May-11 4,277 (2.4) 17,257 13.7 21,534 10.1 Jun-11 4,808 (13.9) 17,487 11.0 22,295 4.5 Jul-11 3,758 (23.5) 15,721 17.1 19,479 6.2 Aug-11 2,763 (17.0) 13,287 23.3 16,050 13.8 Sep-11 6,712 14.2 23,441 29.5 30,153 25.7 Oct-11 3,939 6.7 18,931 36.1 22,870 29.9 Nov-11 4,260 3.5 22,075 49.7 26,335 39.6 Dec-11 4,807 16.8 24,281 36.5 29,088 32.8 Jan-12 4,106 20.2 22,249 41.0 26,355 37.3 Feb-12 3,615 47.2 22,434 72.3 26,049 68.3 Mar-12 7,710 28.3 38,494 46.1 46,204 42.8 Apr-12 4,195 20.8 21,218 32.8 25,413 30.7 May-12 4,554 6.5 24,361 41.2 28,915 34.3 Jun-12 4,889 1.7 26,541 51.8 31,430 41.0 Jul-12 3,724 (0.9) 22,294 41.8 26,018 33.6 Aug-12 2,819 2.0 19,005 43.0 21,824 36.0 Sep-12 6,255 (6.8) 30,652 30.8 36,907 22.4 Oct-12 3,010 (23.6) 22,166 17.1 25,176 10.1 Nov-12 4,031 (5.4) 25,862 17.2 29,893 13.5 Dec-12 4,939 2.7 28,650 18.0 33,589 15.5 Jan-13 5,759 40.3 29,118 30.9 34,877 32.3 Feb-13 4,595 27.1 22,260 (0.8) 26,855 3.1 Mar-13 9,856 27.8 43,916 14.1 53,772 16.4
Source: Company, Kotak Institutional Equities
Tata Motors Automobiles
KOTAK INSTITUTIONAL EQUITIES RESEARCH 11
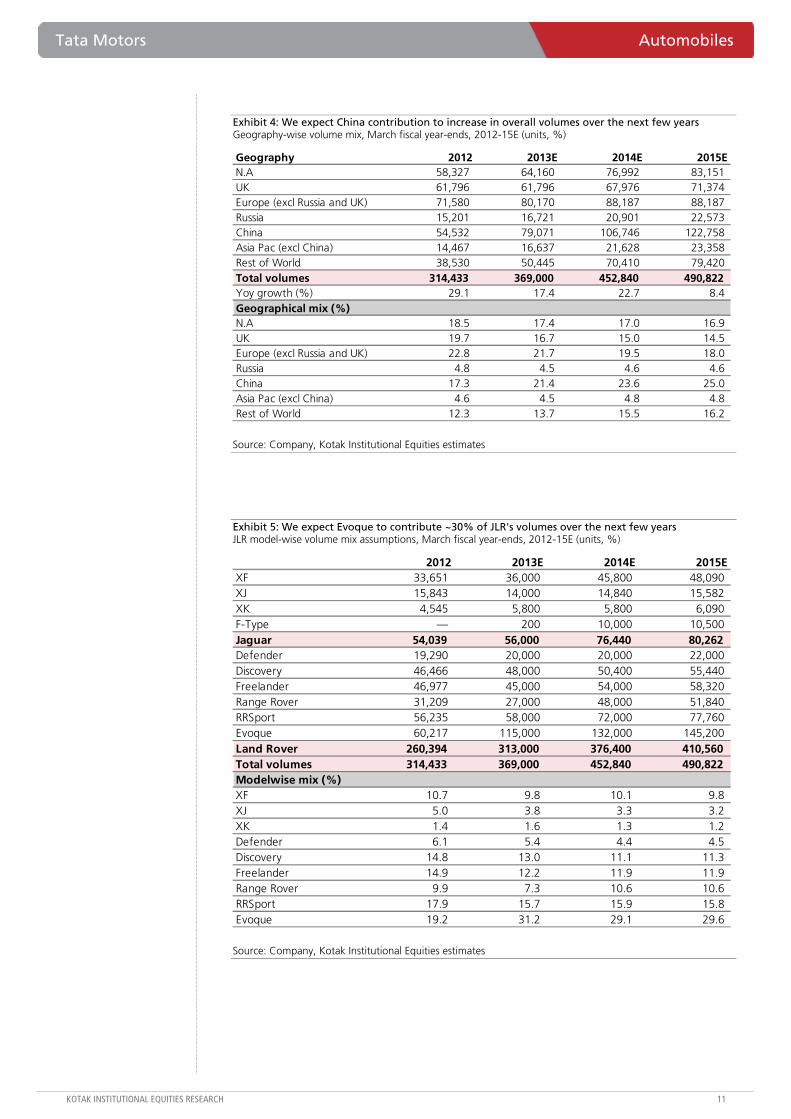
Exhibit 4: We expect China contribution to increase in overall volumes over the next few years Geography-wise volume mix, March fiscal year-ends, 2012-15E (units, %)
Geography 2012 2013E 2014E 2015EN.A 58,327 64,160 76,992 83,151 UK 61,796 61,796 67,976 71,374 Europe (excl Russia and UK) 71,580 80,170 88,187 88,187 Russia 15,201 16,721 20,901 22,573 China 54,532 79,071 106,746 122,758 Asia Pac (excl China) 14,467 16,637 21,628 23,358 Rest of World 38,530 50,445 70,410 79,420 Total volumes 314,433 369,000 452,840 490,822 Yoy growth (%) 29.1 17.4 22.7 8.4 Geographical mix (%)N.A 18.5 17.4 17.0 16.9 UK 19.7 16.7 15.0 14.5 Europe (excl Russia and UK) 22.8 21.7 19.5 18.0 Russia 4.8 4.5 4.6 4.6 China 17.3 21.4 23.6 25.0 Asia Pac (excl China) 4.6 4.5 4.8 4.8 Rest of World 12.3 13.7 15.5 16.2
Source: Company, Kotak Institutional Equities estimates
Exhibit 5: We expect Evoque to contribute ~30% of JLR's volumes over the next few years JLR model-wise volume mix assumptions, March fiscal year-ends, 2012-15E (units, %)
2012 2013E 2014E 2015EXF 33,651 36,000 45,800 48,090 XJ 15,843 14,000 14,840 15,582 XK 4,545 5,800 5,800 6,090 F-Type — 200 10,000 10,500 Jaguar 54,039 56,000 76,440 80,262 Defender 19,290 20,000 20,000 22,000 Discovery 46,466 48,000 50,400 55,440 Freelander 46,977 45,000 54,000 58,320 Range Rover 31,209 27,000 48,000 51,840 RRSport 56,235 58,000 72,000 77,760 Evoque 60,217 115,000 132,000 145,200 Land Rover 260,394 313,000 376,400 410,560 Total volumes 314,433 369,000 452,840 490,822 Modelwise mix (%)XF 10.7 9.8 10.1 9.8 XJ 5.0 3.8 3.3 3.2 XK 1.4 1.6 1.3 1.2 Defender 6.1 5.4 4.4 4.5 Discovery 14.8 13.0 11.1 11.3 Freelander 14.9 12.2 11.9 11.9 Range Rover 9.9 7.3 10.6 10.6 RRSport 17.9 15.7 15.9 15.8 Evoque 19.2 31.2 29.1 29.6
Source: Company, Kotak Institutional Equities estimates
Automobiles Tata Motors
12 KOTAK INSTITUTIONAL EQUITIES RESEARCH
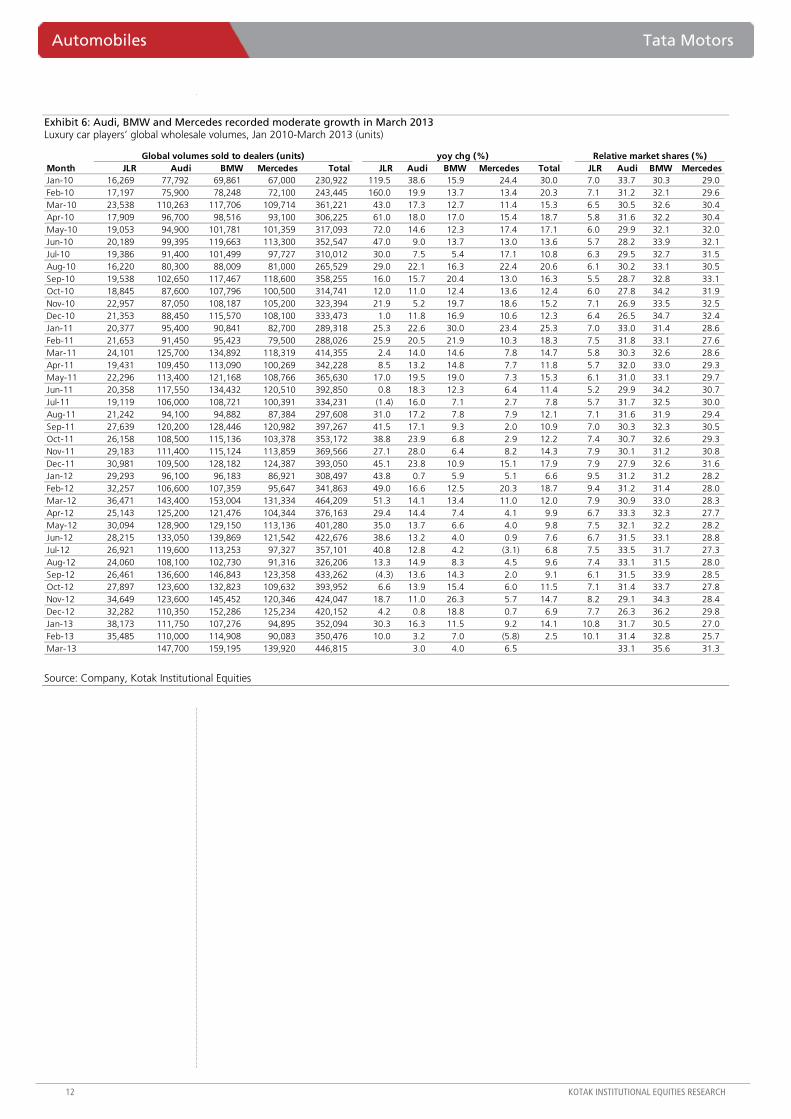
Exhibit 6: Audi, BMW and Mercedes recorded moderate growth in March 2013 Luxury car players’ global wholesale volumes, Jan 2010-March 2013 (units)
Month JLR Audi BMW Mercedes Total JLR Audi BMW Mercedes Total JLR Audi BMW MercedesJan-10 16,269 77,792 69,861 67,000 230,922 119.5 38.6 15.9 24.4 30.0 7.0 33.7 30.3 29.0 Feb-10 17,197 75,900 78,248 72,100 243,445 160.0 19.9 13.7 13.4 20.3 7.1 31.2 32.1 29.6 Mar-10 23,538 110,263 117,706 109,714 361,221 43.0 17.3 12.7 11.4 15.3 6.5 30.5 32.6 30.4 Apr-10 17,909 96,700 98,516 93,100 306,225 61.0 18.0 17.0 15.4 18.7 5.8 31.6 32.2 30.4 May-10 19,053 94,900 101,781 101,359 317,093 72.0 14.6 12.3 17.4 17.1 6.0 29.9 32.1 32.0 Jun-10 20,189 99,395 119,663 113,300 352,547 47.0 9.0 13.7 13.0 13.6 5.7 28.2 33.9 32.1 Jul-10 19,386 91,400 101,499 97,727 310,012 30.0 7.5 5.4 17.1 10.8 6.3 29.5 32.7 31.5 Aug-10 16,220 80,300 88,009 81,000 265,529 29.0 22.1 16.3 22.4 20.6 6.1 30.2 33.1 30.5 Sep-10 19,538 102,650 117,467 118,600 358,255 16.0 15.7 20.4 13.0 16.3 5.5 28.7 32.8 33.1 Oct-10 18,845 87,600 107,796 100,500 314,741 12.0 11.0 12.4 13.6 12.4 6.0 27.8 34.2 31.9 Nov-10 22,957 87,050 108,187 105,200 323,394 21.9 5.2 19.7 18.6 15.2 7.1 26.9 33.5 32.5 Dec-10 21,353 88,450 115,570 108,100 333,473 1.0 11.8 16.9 10.6 12.3 6.4 26.5 34.7 32.4 Jan-11 20,377 95,400 90,841 82,700 289,318 25.3 22.6 30.0 23.4 25.3 7.0 33.0 31.4 28.6 Feb-11 21,653 91,450 95,423 79,500 288,026 25.9 20.5 21.9 10.3 18.3 7.5 31.8 33.1 27.6 Mar-11 24,101 125,700 134,892 118,319 414,355 2.4 14.0 14.6 7.8 14.7 5.8 30.3 32.6 28.6 Apr-11 19,431 109,450 113,090 100,269 342,228 8.5 13.2 14.8 7.7 11.8 5.7 32.0 33.0 29.3 May-11 22,296 113,400 121,168 108,766 365,630 17.0 19.5 19.0 7.3 15.3 6.1 31.0 33.1 29.7 Jun-11 20,358 117,550 134,432 120,510 392,850 0.8 18.3 12.3 6.4 11.4 5.2 29.9 34.2 30.7 Jul-11 19,119 106,000 108,721 100,391 334,231 (1.4) 16.0 7.1 2.7 7.8 5.7 31.7 32.5 30.0 Aug-11 21,242 94,100 94,882 87,384 297,608 31.0 17.2 7.8 7.9 12.1 7.1 31.6 31.9 29.4 Sep-11 27,639 120,200 128,446 120,982 397,267 41.5 17.1 9.3 2.0 10.9 7.0 30.3 32.3 30.5 Oct-11 26,158 108,500 115,136 103,378 353,172 38.8 23.9 6.8 2.9 12.2 7.4 30.7 32.6 29.3 Nov-11 29,183 111,400 115,124 113,859 369,566 27.1 28.0 6.4 8.2 14.3 7.9 30.1 31.2 30.8 Dec-11 30,981 109,500 128,182 124,387 393,050 45.1 23.8 10.9 15.1 17.9 7.9 27.9 32.6 31.6 Jan-12 29,293 96,100 96,183 86,921 308,497 43.8 0.7 5.9 5.1 6.6 9.5 31.2 31.2 28.2 Feb-12 32,257 106,600 107,359 95,647 341,863 49.0 16.6 12.5 20.3 18.7 9.4 31.2 31.4 28.0 Mar-12 36,471 143,400 153,004 131,334 464,209 51.3 14.1 13.4 11.0 12.0 7.9 30.9 33.0 28.3 Apr-12 25,143 125,200 121,476 104,344 376,163 29.4 14.4 7.4 4.1 9.9 6.7 33.3 32.3 27.7 May-12 30,094 128,900 129,150 113,136 401,280 35.0 13.7 6.6 4.0 9.8 7.5 32.1 32.2 28.2 Jun-12 28,215 133,050 139,869 121,542 422,676 38.6 13.2 4.0 0.9 7.6 6.7 31.5 33.1 28.8 Jul-12 26,921 119,600 113,253 97,327 357,101 40.8 12.8 4.2 (3.1) 6.8 7.5 33.5 31.7 27.3 Aug-12 24,060 108,100 102,730 91,316 326,206 13.3 14.9 8.3 4.5 9.6 7.4 33.1 31.5 28.0 Sep-12 26,461 136,600 146,843 123,358 433,262 (4.3) 13.6 14.3 2.0 9.1 6.1 31.5 33.9 28.5 Oct-12 27,897 123,600 132,823 109,632 393,952 6.6 13.9 15.4 6.0 11.5 7.1 31.4 33.7 27.8 Nov-12 34,649 123,600 145,452 120,346 424,047 18.7 11.0 26.3 5.7 14.7 8.2 29.1 34.3 28.4 Dec-12 32,282 110,350 152,286 125,234 420,152 4.2 0.8 18.8 0.7 6.9 7.7 26.3 36.2 29.8 Jan-13 38,173 111,750 107,276 94,895 352,094 30.3 16.3 11.5 9.2 14.1 10.8 31.7 30.5 27.0 Feb-13 35,485 110,000 114,908 90,083 350,476 10.0 3.2 7.0 (5.8) 2.5 10.1 31.4 32.8 25.7 Mar-13 147,700 159,195 139,920 446,815 3.0 4.0 6.5 33.1 35.6 31.3
Global volumes sold to dealers (units) Relative market shares (%)yoy chg (%)
Source: Company, Kotak Institutional Equities
Tata Motors Automobiles
KOTAK INSTITUTIONAL EQUITIES RESEARCH 13
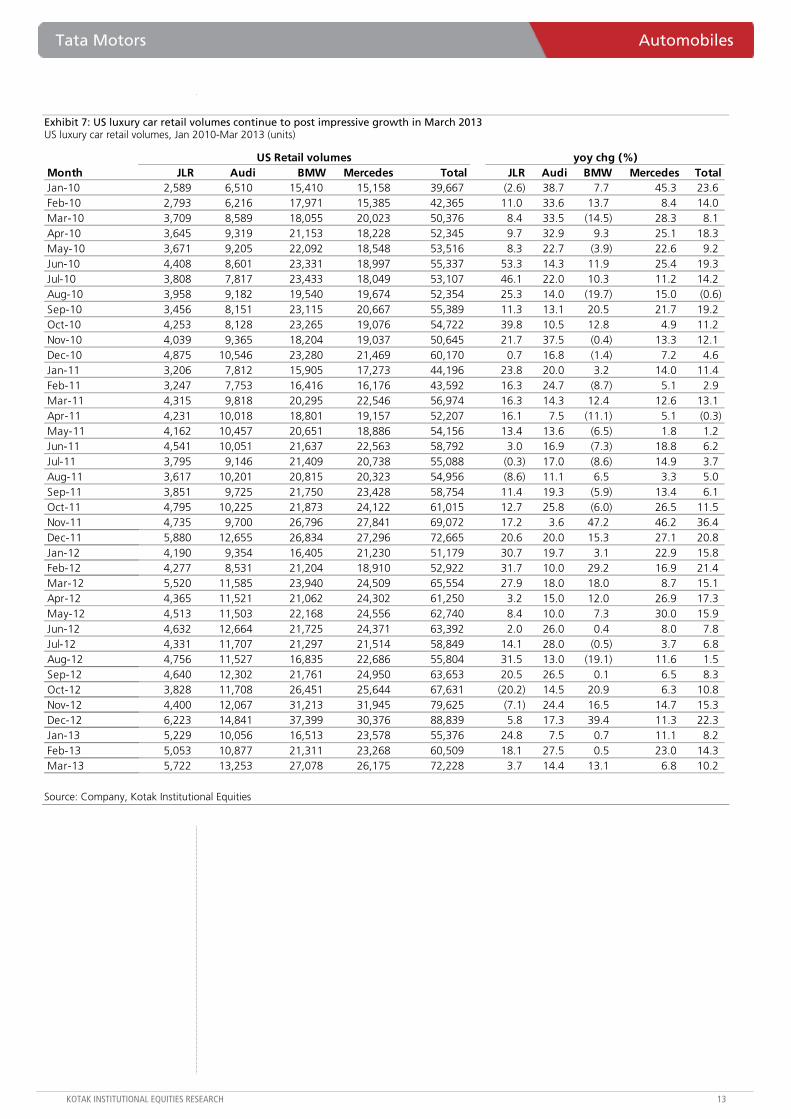
Exhibit 7: US luxury car retail volumes continue to post impressive growth in March 2013 US luxury car retail volumes, Jan 2010-Mar 2013 (units)
Month JLR Audi BMW Mercedes Total JLR Audi BMW Mercedes TotalJan-10 2,589 6,510 15,410 15,158 39,667 (2.6) 38.7 7.7 45.3 23.6 Feb-10 2,793 6,216 17,971 15,385 42,365 11.0 33.6 13.7 8.4 14.0 Mar-10 3,709 8,589 18,055 20,023 50,376 8.4 33.5 (14.5) 28.3 8.1 Apr-10 3,645 9,319 21,153 18,228 52,345 9.7 32.9 9.3 25.1 18.3 May-10 3,671 9,205 22,092 18,548 53,516 8.3 22.7 (3.9) 22.6 9.2 Jun-10 4,408 8,601 23,331 18,997 55,337 53.3 14.3 11.9 25.4 19.3 Jul-10 3,808 7,817 23,433 18,049 53,107 46.1 22.0 10.3 11.2 14.2 Aug-10 3,958 9,182 19,540 19,674 52,354 25.3 14.0 (19.7) 15.0 (0.6) Sep-10 3,456 8,151 23,115 20,667 55,389 11.3 13.1 20.5 21.7 19.2 Oct-10 4,253 8,128 23,265 19,076 54,722 39.8 10.5 12.8 4.9 11.2 Nov-10 4,039 9,365 18,204 19,037 50,645 21.7 37.5 (0.4) 13.3 12.1 Dec-10 4,875 10,546 23,280 21,469 60,170 0.7 16.8 (1.4) 7.2 4.6 Jan-11 3,206 7,812 15,905 17,273 44,196 23.8 20.0 3.2 14.0 11.4 Feb-11 3,247 7,753 16,416 16,176 43,592 16.3 24.7 (8.7) 5.1 2.9 Mar-11 4,315 9,818 20,295 22,546 56,974 16.3 14.3 12.4 12.6 13.1 Apr-11 4,231 10,018 18,801 19,157 52,207 16.1 7.5 (11.1) 5.1 (0.3) May-11 4,162 10,457 20,651 18,886 54,156 13.4 13.6 (6.5) 1.8 1.2 Jun-11 4,541 10,051 21,637 22,563 58,792 3.0 16.9 (7.3) 18.8 6.2 Jul-11 3,795 9,146 21,409 20,738 55,088 (0.3) 17.0 (8.6) 14.9 3.7 Aug-11 3,617 10,201 20,815 20,323 54,956 (8.6) 11.1 6.5 3.3 5.0 Sep-11 3,851 9,725 21,750 23,428 58,754 11.4 19.3 (5.9) 13.4 6.1 Oct-11 4,795 10,225 21,873 24,122 61,015 12.7 25.8 (6.0) 26.5 11.5 Nov-11 4,735 9,700 26,796 27,841 69,072 17.2 3.6 47.2 46.2 36.4 Dec-11 5,880 12,655 26,834 27,296 72,665 20.6 20.0 15.3 27.1 20.8 Jan-12 4,190 9,354 16,405 21,230 51,179 30.7 19.7 3.1 22.9 15.8 Feb-12 4,277 8,531 21,204 18,910 52,922 31.7 10.0 29.2 16.9 21.4 Mar-12 5,520 11,585 23,940 24,509 65,554 27.9 18.0 18.0 8.7 15.1 Apr-12 4,365 11,521 21,062 24,302 61,250 3.2 15.0 12.0 26.9 17.3 May-12 4,513 11,503 22,168 24,556 62,740 8.4 10.0 7.3 30.0 15.9 Jun-12 4,632 12,664 21,725 24,371 63,392 2.0 26.0 0.4 8.0 7.8 Jul-12 4,331 11,707 21,297 21,514 58,849 14.1 28.0 (0.5) 3.7 6.8 Aug-12 4,756 11,527 16,835 22,686 55,804 31.5 13.0 (19.1) 11.6 1.5 Sep-12 4,640 12,302 21,761 24,950 63,653 20.5 26.5 0.1 6.5 8.3 Oct-12 3,828 11,708 26,451 25,644 67,631 (20.2) 14.5 20.9 6.3 10.8 Nov-12 4,400 12,067 31,213 31,945 79,625 (7.1) 24.4 16.5 14.7 15.3 Dec-12 6,223 14,841 37,399 30,376 88,839 5.8 17.3 39.4 11.3 22.3 Jan-13 5,229 10,056 16,513 23,578 55,376 24.8 7.5 0.7 11.1 8.2 Feb-13 5,053 10,877 21,311 23,268 60,509 18.1 27.5 0.5 23.0 14.3 Mar-13 5,722 13,253 27,078 26,175 72,228 3.7 14.4 13.1 6.8 10.2
yoy chg (%)US Retail volumes
Source: Company, Kotak Institutional Equities

Automobiles Tata Motors
14 KOTAK INSTITUTIONAL EQUITIES RESEARCH
Exhibit 8: European luxury car retail volume growth moderated in February 2013 European luxury car retail volumes, Jan 2010-Mar 2013 (units)
Month JLR Audi BMW Mercedes Total JLR Audi BMW Mercedes TotalJan-10 7,985 46,337 37,875 35,959 128,156 17.7 (0.5) (0.0) (12.6) (3.2) Feb-10 4,773 40,885 36,399 35,913 117,970 21.4 (6.5) 6.2 1.2 0.5 Mar-10 19,238 72,787 67,720 62,011 221,756 41.9 15.4 14.1 3.9 13.3 Apr-10 7,293 56,787 52,072 49,363 165,515 2.4 (1.1) 15.7 2.7 5.0 May-10 8,555 55,327 52,891 52,428 169,201 37.0 2.2 (0.8) (2.0) 1.2 Jun-10 8,770 59,063 65,824 60,710 194,367 14.7 (6.7) 9.9 (6.6) (0.8) Jul-10 7,498 50,441 50,427 49,847 158,213 19.7 (11.6) 1.0 (3.2) (4.0) Aug-10 3,069 36,848 30,670 30,404 100,991 (7.2) 0.1 (8.5) (1.0) (3.2) Sep-10 12,026 53,925 58,514 62,228 186,693 (13.7) 9.7 1.7 6.7 4.3 Oct-10 5,966 52,161 52,088 50,855 161,070 (21.0) 1.9 6.5 (2.5) 0.8 Nov-10 7,867 53,238 54,300 53,343 168,748 2.8 3.7 20.0 6.5 9.3 Dec-10 6,468 46,646 52,140 43,085 148,339 (14.7) 15.2 7.6 4.2 7.6 Jan-11 6,911 46,380 45,612 39,200 138,103 (13.5) 0.1 20.4 9.0 7.8 Feb-11 4,516 47,034 37,108 37,108 125,766 (5.4) 15.0 1.9 3.3 6.6 Mar-11 16,784 77,987 70,036 61,617 226,424 (12.8) 7.1 3.4 (0.6) 2.1 Apr-11 5,963 58,828 53,827 48,787 167,405 (18.2) 3.6 3.4 (1.2) 1.1 May-11 7,165 64,050 61,351 55,327 187,893 (16.2) 15.8 16.0 5.5 11.0 Jun-11 7,455 64,325 64,521 59,648 195,949 (15.0) 8.9 (2.0) (1.7) 0.8 Jul-11 6,235 53,906 48,891 52,206 161,238 (16.8) 6.9 (3.0) 4.7 1.9 Aug-11 2,725 43,466 40,337 35,625 122,153 (11.2) 18.0 31.5 17.2 21.0 Sep-11 14,463 64,334 59,526 58,877 197,200 20.3 19.3 1.7 (5.4) 5.6 Oct-11 8,095 53,409 51,533 45,217 158,254 35.7 2.4 (1.1) (11.1) (1.7) Nov-11 8,779 57,621 52,579 49,486 168,465 11.6 8.2 (3.2) (7.2) (0.2) Dec-11 8,604 48,093 51,241 47,433 155,371 33.0 3.1 (1.7) 10.1 4.7 Jan-12 9,838 51,455 43,601 43,506 148,400 42.4 10.9 (4.4) 11.0 7.5 Feb-12 7,105 45,187 39,905 39,620 131,817 57.3 (3.9) 7.5 6.8 4.8 Mar-12 21,321 83,452 73,899 65,814 244,486 27.0 7.0 5.5 6.8 8.0 Apr-12 7,893 61,401 55,624 49,750 174,668 32.4 4.4 3.3 2.0 4.3 May-12 9,782 66,513 59,136 53,124 188,555 36.5 3.8 (3.6) (4.0) 0.4 Jun-12 10,869 69,858 64,553 57,730 203,010 45.8 8.6 0.0 (3.2) 3.6 Jul-12 8,515 59,174 43,406 44,092 155,187 36.6 9.8 (11.2) (15.5) (3.8) Aug-12 4,052 46,929 35,877 35,816 122,674 48.7 8.0 (11.1) 0.5 0.4 Sep-12 16,367 65,186 65,585 55,269 202,407 13.2 1.3 10.2 (6.1) 2.6 Oct-12 9,046 59,120 51,046 46,891 166,103 11.7 10.7 (0.9) 3.7 5.0 Nov-12 10,236 56,300 54,698 50,235 171,469 16.6 (2.3) 4.0 1.5 1.8 Dec-12 8,912 37,247 50,810 42,893 139,862 3.6 (22.6) (0.8) (9.6) (10.0) Jan-13 11,888 50,128 47,813 45,543 155,372 20.8 (2.6) 9.7 4.7 4.7 Feb-13 7,516 43,294 39,522 38,844 129,176 5.8 (4.2) (1.0) (2.0) (2.0)
EU Retail volumes yoy chg (%)
Source: Company, Kotak Institutional Equities

Tata Motors Automobiles
KOTAK INSTITUTIONAL EQUITIES RESEARCH 15
Exhibit 9: China luxury car volumes reported modest growth in March 2013 China luxury car retail volumes, Jan 2010-Mar 2013 (units)
Month JLR Audi BMW Mercedes Total JLR Audi BMW Mercedes TotalJan-10 2,215 16,798 11,915 8,400 39,328 278.6 114.9 122.3 145.7 128.9 Feb-10 1,267 15,108 9,599 7,300 33,274 87.4 61.7 96.7 143.3 85.9 Mar-10 2,304 19,543 12,757 8,500 43,104 164.5 64.2 101.2 57.4 75.8 Apr-10 2,289 19,606 12,440 11,300 45,635 126.6 62.0 114.9 101.8 86.3 May-10 2,275 17,396 13,998 11,463 45,132 103.3 39.9 107.3 121.0 77.0 Jun-10 2,153 21,436 14,905 13,700 52,194 84.0 61.6 75.2 177.2 87.2 Jul-10 1,699 20,537 13,852 14,616 50,704 52.1 53.3 82.0 204.7 88.3 Aug-10 1,990 22,358 16,980 13,400 54,728 74.0 67.5 83.1 111.3 81.8 Sep-10 2,112 22,125 15,379 13,551 53,167 90.6 45.0 89.1 98.0 69.6 Oct-10 2,038 17,153 13,738 13,500 46,429 78.5 18.2 44.0 104.8 46.1 Nov-10 2,010 17,692 17,302 14,500 51,504 31.1 7.2 110.4 68.0 47.6 Dec-10 3,762 22,996 16,132 18,200 61,090 100.6 21.3 59.5 93.5 51.4 Jan-11 3,519 22,190 20,304 15,500 61,513 58.9 32.1 70.4 84.5 56.4 Feb-11 2,087 18,700 16,511 12,200 49,498 64.7 23.8 72.0 67.1 48.8 Mar-11 2,959 23,232 21,687 15,242 63,120 28.4 18.9 70.0 79.3 46.4 Apr-11 3,044 23,666 20,800 16,528 64,038 33.0 20.7 67.2 46.3 40.3 May-11 3,746 25,155 21,150 16,401 66,452 64.7 44.6 51.1 43.1 47.2 Jun-11 3,406 27,658 21,162 16,303 68,529 58.2 29.0 42.0 19.0 31.3 Jul-11 3,248 27,767 18,858 14,248 64,121 91.2 35.2 36.1 (2.5) 26.5 Aug-11 3,685 28,068 18,462 13,812 64,027 85.2 25.5 8.7 3.1 17.0 Sep-11 4,107 29,500 18,588 15,272 67,467 94.5 33.3 20.9 12.7 26.9 Oct-11 2,820 27,729 18,346 16,539 65,434 38.4 61.7 33.5 22.5 40.9 Nov-11 4,810 29,861 19,155 18,067 71,893 139.3 68.8 10.7 24.6 39.6 Dec-11 5,167 29,510 17,563 23,227 75,467 37.3 28.3 8.9 27.6 23.5 Jan-12 4,849 27,206 26,505 14,463 73,023 37.8 22.6 30.5 (6.7) 18.7 Feb-12 6,212 31,352 22,916 19,205 79,685 197.7 67.7 38.8 57.4 61.0 Mar-12 6,938 31,505 30,593 17,660 86,696 134.5 35.6 41.1 15.9 37.4 Apr-12 5,538 34,221 27,197 14,677 81,633 81.9 44.6 30.8 (11.2) 27.5 May-12 6,419 36,278 27,815 16,529 87,041 71.4 44.2 31.5 0.8 31.0 Jun-12 6,508 33,309 23,930 17,250 80,997 91.1 20.4 13.1 5.8 18.2 Jul-12 5,374 32,877 23,092 14,128 75,471 65.5 18.4 22.5 (0.8) 17.7 Aug-12 5,654 34,800 25,377 14,205 80,036 53.4 24.0 37.5 2.8 25.0 Sep-12 6,124 35,512 29,631 16,806 88,073 49.1 20.4 59.4 10.0 30.5 Oct-12 4,651 35,899 27,828 15,895 84,273 64.9 29.5 51.7 (3.9) 28.8 Nov-12 6,879 37,600 31,090 16,876 92,445 43.0 25.9 62.3 (6.6) 28.6 Dec-12 8,201 35,279 30,470 18,910 92,860 58.7 19.5 73.5 (18.6) 23.0 Jan-13 8,432 37,678 30,397 16,695 93,202 73.9 38.5 14.7 15.4 27.6 Feb-13 4,808 30,268 23,449 10,134 68,659 (22.6) (3.5) 2.3 (47.2) (13.8) Mar-13 8,487 34,864 32,224 18,611 94,186 22.3 10.7 5.3 5.4 8.6
China retail volumes yoy chg (%)
Source: Company, Kotak Institutional Equities
Exhibit 10: We value Tata Motors at Rs335/share on SOTP basis Tata Motors sum-of-the-parts valuation table, March fiscal year-ends (Rs mn)
EBITDA Multiple ValueValue per
share(Rs mn) (X) (Rs mn) (Rs) Comments
Tata Motors standalone EV 30,051 7.5 225,382 71 based on 7.5X June-14 estimate
JLR standalone EV 221,278 4 907,238 286 based on 4X June-14 estimate, deducting 650 mn pounds of R&D expense from reported EBITDA
Less: Net debt - consol 144,870 46 ex vehicle financing debtTotal standalone + JLR 987,750 311 Value of subsidiaries 22 SOTP-based value 334 Target price 335
Notes:(1) We have valued the subsidiaries after considering 20% holding company discount.
Source: Kotak Institutional Equities estimates
Automobiles Tata Motors
16 KOTAK INSTITUTIONAL EQUITIES RESEARCH
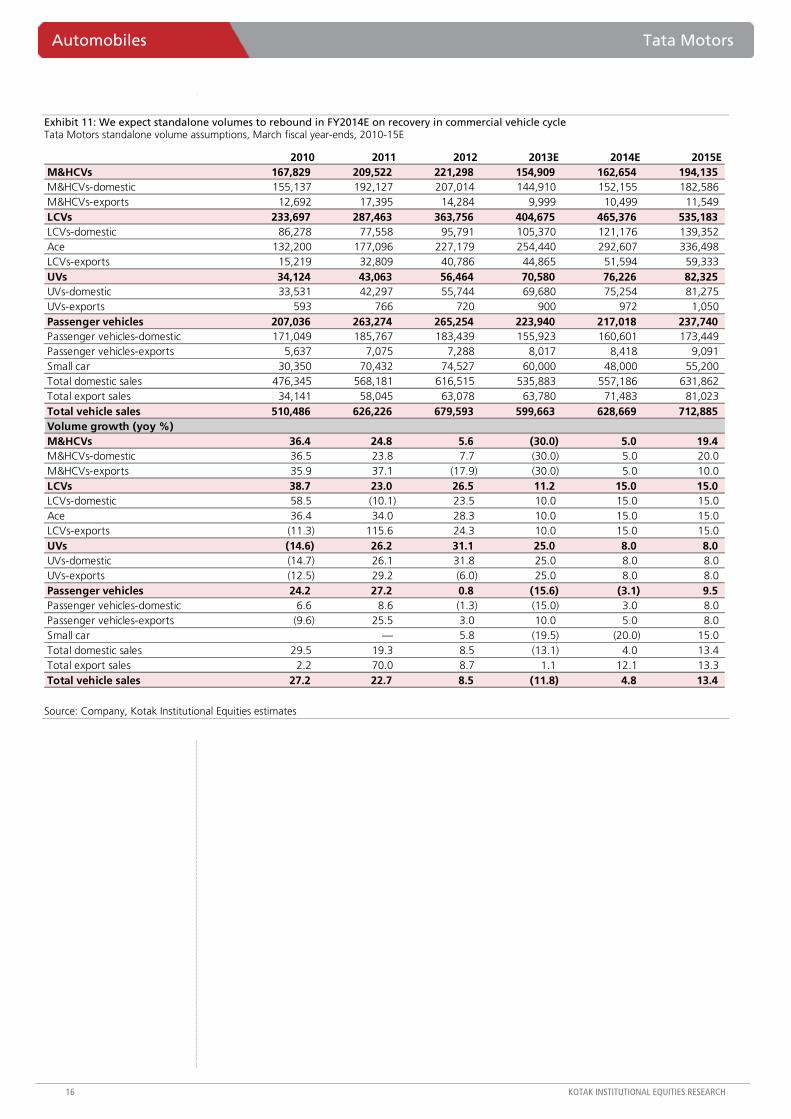
Exhibit 11: We expect standalone volumes to rebound in FY2014E on recovery in commercial vehicle cycle Tata Motors standalone volume assumptions, March fiscal year-ends, 2010-15E
2010 2011 2012 2013E 2014E 2015EM&HCVs 167,829 209,522 221,298 154,909 162,654 194,135 M&HCVs-domestic 155,137 192,127 207,014 144,910 152,155 182,586 M&HCVs-exports 12,692 17,395 14,284 9,999 10,499 11,549 LCVs 233,697 287,463 363,756 404,675 465,376 535,183 LCVs-domestic 86,278 77,558 95,791 105,370 121,176 139,352 Ace 132,200 177,096 227,179 254,440 292,607 336,498 LCVs-exports 15,219 32,809 40,786 44,865 51,594 59,333 UVs 34,124 43,063 56,464 70,580 76,226 82,325 UVs-domestic 33,531 42,297 55,744 69,680 75,254 81,275 UVs-exports 593 766 720 900 972 1,050 Passenger vehicles 207,036 263,274 265,254 223,940 217,018 237,740 Passenger vehicles-domestic 171,049 185,767 183,439 155,923 160,601 173,449 Passenger vehicles-exports 5,637 7,075 7,288 8,017 8,418 9,091 Small car 30,350 70,432 74,527 60,000 48,000 55,200 Total domestic sales 476,345 568,181 616,515 535,883 557,186 631,862 Total export sales 34,141 58,045 63,078 63,780 71,483 81,023 Total vehicle sales 510,486 626,226 679,593 599,663 628,669 712,885 Volume growth (yoy %)M&HCVs 36.4 24.8 5.6 (30.0) 5.0 19.4 M&HCVs-domestic 36.5 23.8 7.7 (30.0) 5.0 20.0 M&HCVs-exports 35.9 37.1 (17.9) (30.0) 5.0 10.0 LCVs 38.7 23.0 26.5 11.2 15.0 15.0 LCVs-domestic 58.5 (10.1) 23.5 10.0 15.0 15.0 Ace 36.4 34.0 28.3 10.0 15.0 15.0 LCVs-exports (11.3) 115.6 24.3 10.0 15.0 15.0 UVs (14.6) 26.2 31.1 25.0 8.0 8.0 UVs-domestic (14.7) 26.1 31.8 25.0 8.0 8.0 UVs-exports (12.5) 29.2 (6.0) 25.0 8.0 8.0 Passenger vehicles 24.2 27.2 0.8 (15.6) (3.1) 9.5 Passenger vehicles-domestic 6.6 8.6 (1.3) (15.0) 3.0 8.0 Passenger vehicles-exports (9.6) 25.5 3.0 10.0 5.0 8.0 Small car — 5.8 (19.5) (20.0) 15.0 Total domestic sales 29.5 19.3 8.5 (13.1) 4.0 13.4 Total export sales 2.2 70.0 8.7 1.1 12.1 13.3 Total vehicle sales 27.2 22.7 8.5 (11.8) 4.8 13.4
Source: Company, Kotak Institutional Equities estimates
Tata Motors Automobiles
KOTAK INSTITUTIONAL EQUITIES RESEARCH 17
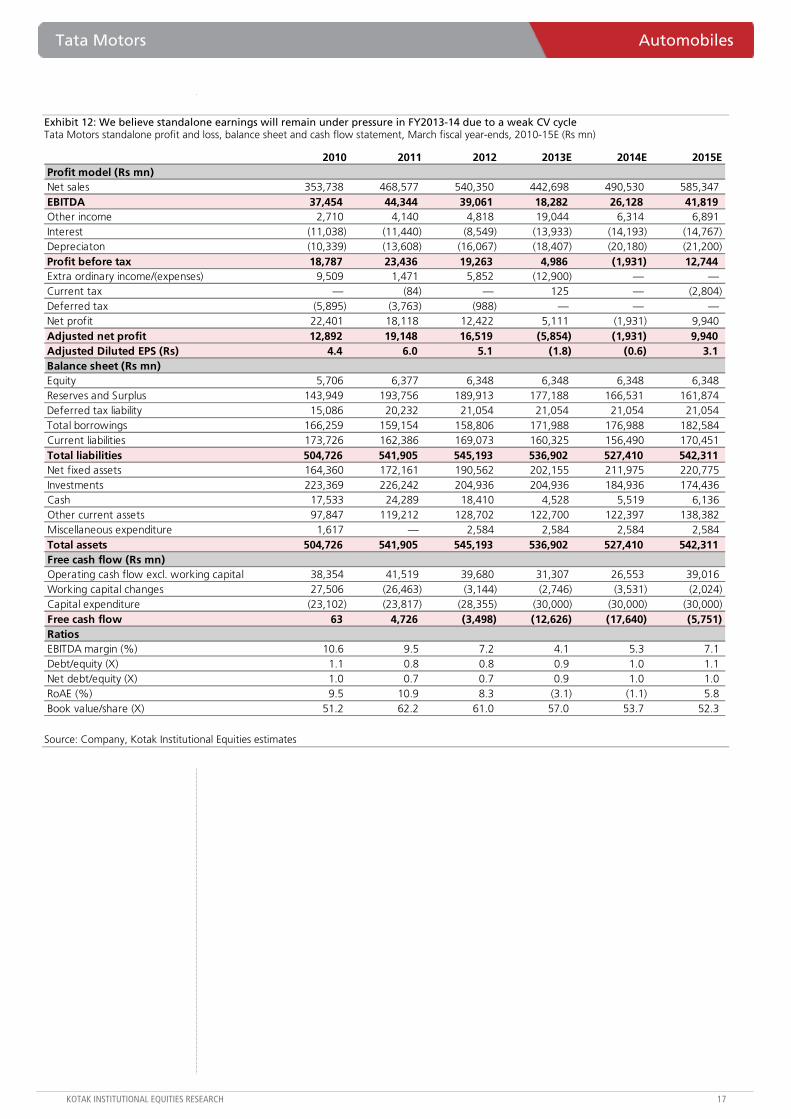
Exhibit 12: We believe standalone earnings will remain under pressure in FY2013-14 due to a weak CV cycle Tata Motors standalone profit and loss, balance sheet and cash flow statement, March fiscal year-ends, 2010-15E (Rs mn)
2010 2011 2012 2013E 2014E 2015EProfit model (Rs mn)Net sales 353,738 468,577 540,350 442,698 490,530 585,347 EBITDA 37,454 44,344 39,061 18,282 26,128 41,819 Other income 2,710 4,140 4,818 19,044 6,314 6,891 Interest (11,038) (11,440) (8,549) (13,933) (14,193) (14,767) Depreciaton (10,339) (13,608) (16,067) (18,407) (20,180) (21,200) Profit before tax 18,787 23,436 19,263 4,986 (1,931) 12,744 Extra ordinary income/(expenses) 9,509 1,471 5,852 (12,900) — —Current tax — (84) — 125 — (2,804) Deferred tax (5,895) (3,763) (988) — — —Net profit 22,401 18,118 12,422 5,111 (1,931) 9,940 Adjusted net profit 12,892 19,148 16,519 (5,854) (1,931) 9,940 Adjusted Diluted EPS (Rs) 4.4 6.0 5.1 (1.8) (0.6) 3.1 Balance sheet (Rs mn)Equity 5,706 6,377 6,348 6,348 6,348 6,348 Reserves and Surplus 143,949 193,756 189,913 177,188 166,531 161,874 Deferred tax liability 15,086 20,232 21,054 21,054 21,054 21,054 Total borrowings 166,259 159,154 158,806 171,988 176,988 182,584 Current liabilities 173,726 162,386 169,073 160,325 156,490 170,451 Total liabilities 504,726 541,905 545,193 536,902 527,410 542,311 Net fixed assets 164,360 172,161 190,562 202,155 211,975 220,775 Investments 223,369 226,242 204,936 204,936 184,936 174,436 Cash 17,533 24,289 18,410 4,528 5,519 6,136 Other current assets 97,847 119,212 128,702 122,700 122,397 138,382 Miscellaneous expenditure 1,617 — 2,584 2,584 2,584 2,584 Total assets 504,726 541,905 545,193 536,902 527,410 542,311 Free cash flow (Rs mn)Operating cash flow excl. working capital 38,354 41,519 39,680 31,307 26,553 39,016 Working capital changes 27,506 (26,463) (3,144) (2,746) (3,531) (2,024) Capital expenditure (23,102) (23,817) (28,355) (30,000) (30,000) (30,000) Free cash flow 63 4,726 (3,498) (12,626) (17,640) (5,751) RatiosEBITDA margin (%) 10.6 9.5 7.2 4.1 5.3 7.1 Debt/equity (X) 1.1 0.8 0.8 0.9 1.0 1.1 Net debt/equity (X) 1.0 0.7 0.7 0.9 1.0 1.0 RoAE (%) 9.5 10.9 8.3 (3.1) (1.1) 5.8 Book value/share (X) 51.2 62.2 61.0 57.0 53.7 52.3
Source: Company, Kotak Institutional Equities estimates
Automobiles Tata Motors
18 KOTAK INSTITUTIONAL EQUITIES RESEARCH
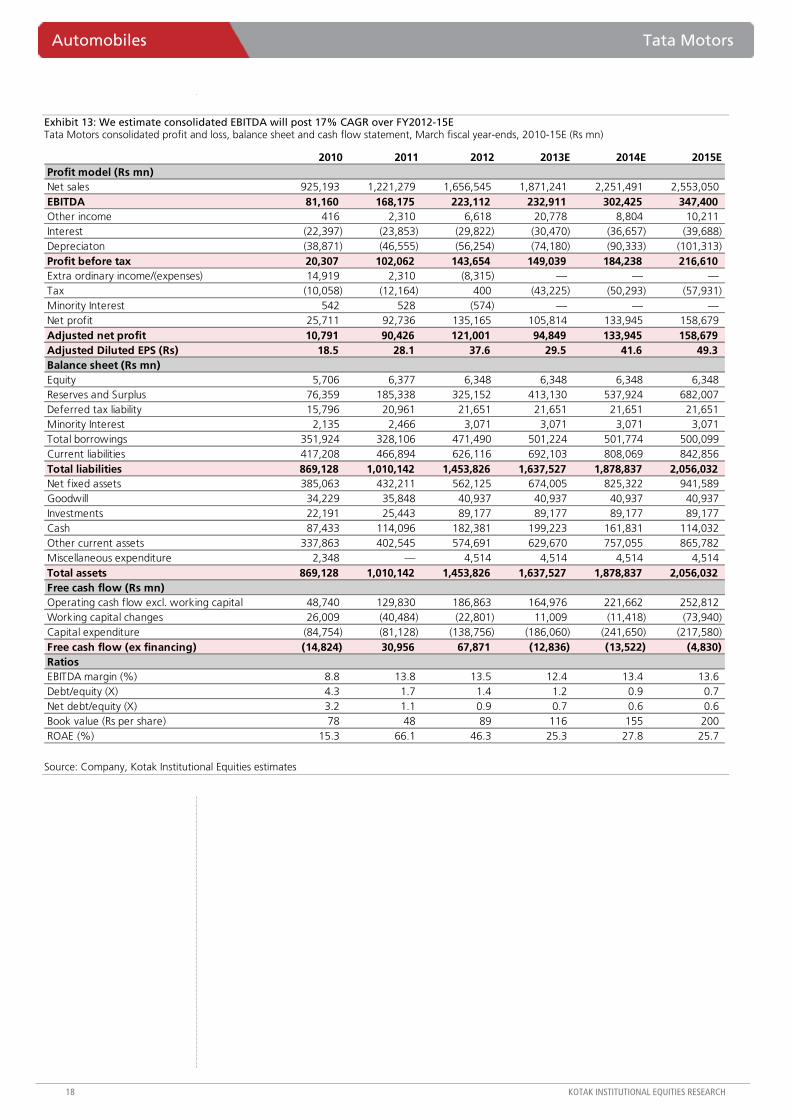
Exhibit 13: We estimate consolidated EBITDA will post 17% CAGR over FY2012-15E Tata Motors consolidated profit and loss, balance sheet and cash flow statement, March fiscal year-ends, 2010-15E (Rs mn)
2010 2011 2012 2013E 2014E 2015EProfit model (Rs mn)Net sales 925,193 1,221,279 1,656,545 1,871,241 2,251,491 2,553,050 EBITDA 81,160 168,175 223,112 232,911 302,425 347,400 Other income 416 2,310 6,618 20,778 8,804 10,211 Interest (22,397) (23,853) (29,822) (30,470) (36,657) (39,688) Depreciaton (38,871) (46,555) (56,254) (74,180) (90,333) (101,313) Profit before tax 20,307 102,062 143,654 149,039 184,238 216,610 Extra ordinary income/(expenses) 14,919 2,310 (8,315) — — —Tax (10,058) (12,164) 400 (43,225) (50,293) (57,931) Minority Interest 542 528 (574) — — —Net profit 25,711 92,736 135,165 105,814 133,945 158,679 Adjusted net profit 10,791 90,426 121,001 94,849 133,945 158,679 Adjusted Diluted EPS (Rs) 18.5 28.1 37.6 29.5 41.6 49.3 Balance sheet (Rs mn)Equity 5,706 6,377 6,348 6,348 6,348 6,348 Reserves and Surplus 76,359 185,338 325,152 413,130 537,924 682,007 Deferred tax liability 15,796 20,961 21,651 21,651 21,651 21,651 Minority Interest 2,135 2,466 3,071 3,071 3,071 3,071 Total borrowings 351,924 328,106 471,490 501,224 501,774 500,099 Current liabilities 417,208 466,894 626,116 692,103 808,069 842,856 Total liabilities 869,128 1,010,142 1,453,826 1,637,527 1,878,837 2,056,032 Net fixed assets 385,063 432,211 562,125 674,005 825,322 941,589 Goodwill 34,229 35,848 40,937 40,937 40,937 40,937 Investments 22,191 25,443 89,177 89,177 89,177 89,177 Cash 87,433 114,096 182,381 199,223 161,831 114,032 Other current assets 337,863 402,545 574,691 629,670 757,055 865,782 Miscellaneous expenditure 2,348 — 4,514 4,514 4,514 4,514 Total assets 869,128 1,010,142 1,453,826 1,637,527 1,878,837 2,056,032 Free cash flow (Rs mn)Operating cash flow excl. working capital 48,740 129,830 186,863 164,976 221,662 252,812 Working capital changes 26,009 (40,484) (22,801) 11,009 (11,418) (73,940) Capital expenditure (84,754) (81,128) (138,756) (186,060) (241,650) (217,580) Free cash flow (ex financing) (14,824) 30,956 67,871 (12,836) (13,522) (4,830) RatiosEBITDA margin (%) 8.8 13.8 13.5 12.4 13.4 13.6 Debt/equity (X) 4.3 1.7 1.4 1.2 0.9 0.7 Net debt/equity (X) 3.2 1.1 0.9 0.7 0.6 0.6 Book value (Rs per share) 78 48 89 116 155 200 ROAE (%) 15.3 66.1 46.3 25.3 27.8 25.7
Source: Company, Kotak Institutional Equities estimates
For private Circulation Only. FOR IMPORTANT INFORMATION ABOUT KOTAK SECURITIES’ RATING SYSTEM AND OTHER DISCLOSURES, REFER TO THE END OF THIS MATERIAL.
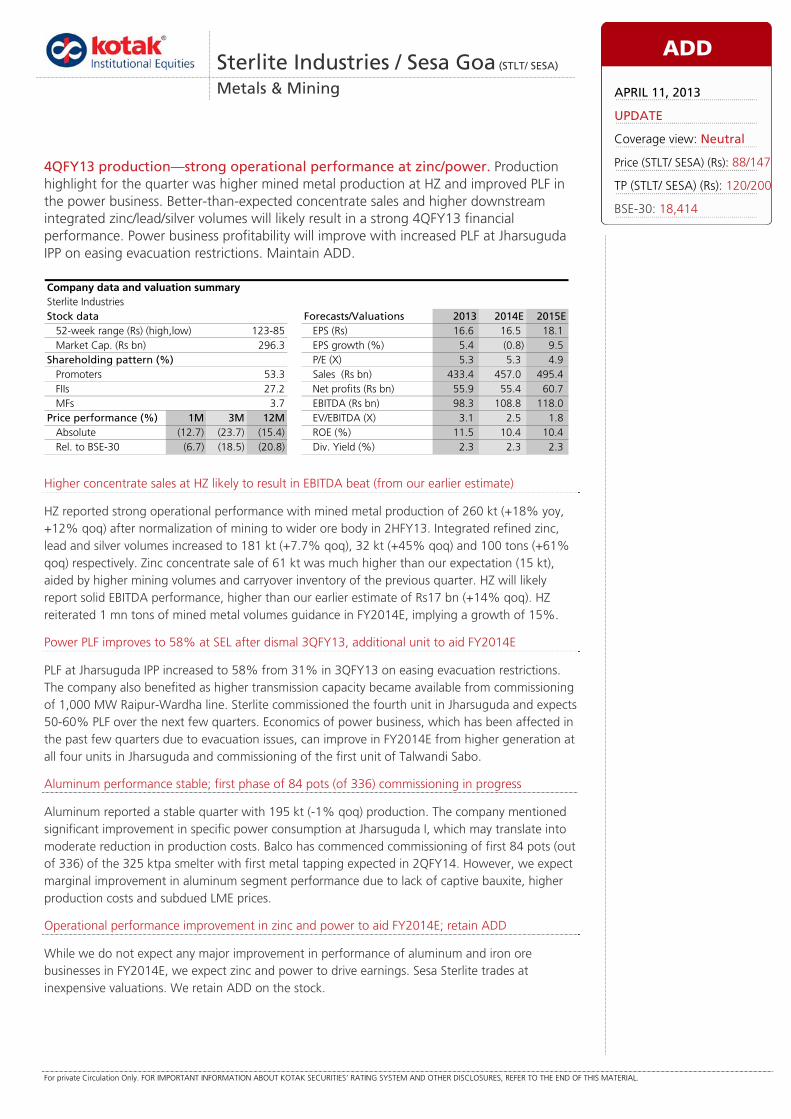
Higher concentrate sales at HZ likely to result in EBITDA beat (from our earlier estimate)
HZ reported strong operational performance with mined metal production of 260 kt (+18% yoy, +12% qoq) after normalization of mining to wider ore body in 2HFY13. Integrated refined zinc, lead and silver volumes increased to 181 kt (+7.7% qoq), 32 kt (+45% qoq) and 100 tons (+61% qoq) respectively. Zinc concentrate sale of 61 kt was much higher than our expectation (15 kt), aided by higher mining volumes and carryover inventory of the previous quarter. HZ will likely report solid EBITDA performance, higher than our earlier estimate of Rs17 bn (+14% qoq). HZ reiterated 1 mn tons of mined metal volumes guidance in FY2014E, implying a growth of 15%.
Power PLF improves to 58% at SEL after dismal 3QFY13, additional unit to aid FY2014E
PLF at Jharsuguda IPP increased to 58% from 31% in 3QFY13 on easing evacuation restrictions. The company also benefited as higher transmission capacity became available from commissioning of 1,000 MW Raipur-Wardha line. Sterlite commissioned the fourth unit in Jharsuguda and expects 50-60% PLF over the next few quarters. Economics of power business, which has been affected in the past few quarters due to evacuation issues, can improve in FY2014E from higher generation at all four units in Jharsuguda and commissioning of the first unit of Talwandi Sabo.
Aluminum performance stable; first phase of 84 pots (of 336) commissioning in progress
Aluminum reported a stable quarter with 195 kt (-1% qoq) production. The company mentioned significant improvement in specific power consumption at Jharsuguda I, which may translate into moderate reduction in production costs. Balco has commenced commissioning of first 84 pots (out of 336) of the 325 ktpa smelter with first metal tapping expected in 2QFY14. However, we expect marginal improvement in aluminum segment performance due to lack of captive bauxite, higher production costs and subdued LME prices.
Operational performance improvement in zinc and power to aid FY2014E; retain ADD
While we do not expect any major improvement in performance of aluminum and iron ore businesses in FY2014E, we expect zinc and power to drive earnings. Sesa Sterlite trades at inexpensive valuations. We retain ADD on the stock.
Sterlite Industries / Sesa Goa (STLT/ SESA)
Metals & Mining
4QFY13 production—strong operational performance at zinc/power. Production highlight for the quarter was higher mined metal production at HZ and improved PLF in the power business. Better-than-expected concentrate sales and higher downstream integrated zinc/lead/silver volumes will likely result in a strong 4QFY13 financial performance. Power business profitability will improve with increased PLF at Jharsuguda IPP on easing evacuation restrictions. Maintain ADD.
Sterlite IndustriesStock data Forecasts/Valuations 2013 2014E 2015E
52-week range (Rs) (high,low) EPS (Rs) 16.6 16.5 18.1Market Cap. (Rs bn) 296.3 EPS growth (%) 5.4 (0.8) 9.5
Shareholding pattern (%) P/E (X) 5.3 5.3 4.9Promoters 53.3 Sales (Rs bn) 433.4 457.0 495.4FIIs 27.2 Net profits (Rs bn) 55.9 55.4 60.7MFs 3.7 EBITDA (Rs bn) 98.3 108.8 118.0
Price performance (%) 1M 3M 12M EV/EBITDA (X) 3.1 2.5 1.8Absolute (12.7) (23.7) (15.4) ROE (%) 11.5 10.4 10.4Rel. to BSE-30 (6.7) (18.5) (20.8) Div. Yield (%) 2.3 2.3 2.3
Company data and valuation summary
123-85
ADD
APRIL 11, 2013
UPDATE
Coverage view: Neutral
Price (STLT/ SESA) (Rs): 88/147
TP (STLT/ SESA) (Rs): 120/200
BSE-30: 18,414
Metals & Mining Sterlite Industries
20 KOTAK INSTITUTIONAL EQUITIES RESEARCH
Copper smelter remains suspended—we do not expect a long-term impact
Sterlite’s Tuticorin custom copper smelter remains non-operational after the closure order from the Tamil Nadu Pollution Control Board on complaints of high emission of sulphur dioxide gas after restart following the maintenance shutdown taken by the company. The gas emission reported is normally captured by a hood system for conversion to sulphuric acid. A higher emission at any point could be due to operational issues at the acid plant/smelter during a restart phase. The matter is pending before the National Green Tribunal.
Tuticorin smelter contributes an EBITDA of Rs8.4 bn (FY2014E) and Rs10/share to our fair value estimate of Rs120/share for Sterlite. We believe sulphur dioxide emissions for copper smelters worldwide have been a manageable affair in an environmental sustainable manner with an unlikely precedent of permanent closures—we do not expect a long-term impact.
During the quarter, Sterlite reported cathode production of 86,000 tons (+7.5% yoy). Note that the plant was ordered to close on March 29, 2013.
Cairn India—production marginally lower than expectations
Cairn India reported gross oil production from the Rajasthan block of 168.6 kb/d in 4QFY13 (~1% decline qoq), marginally lower than our expectations of 170.1 kb/d. We note that the management has moderated its production guidance from Rajasthan block to 200-215 kb/d by end-FY2014 versus their earlier guidance of 210-240 kb/d by end-CY2013 noting lower-than-expected production from Bhagyam field. The company has commenced oil production from Aishwarya field in late March 2013 and aims to reach FDP approved production rate of 10 kb/d. We model gross production from the Rajasthan block at 9.2 mn tons (184 kb/d) for FY2014E and 10 mn tons (200 kb/d) for FY2015E. Production from Ravva and Cambay fields also declined sharply by ~19-22% yoy in 4QFY13.
Other updates from 4QFY13 production release
Production at Zinc International was 102 kt (-4% yoy, -2% qoq). Full-year (FY2013) production of 426 kt (-4.1% yoy) was marginally ahead of the management’s guidance of 420 kt. We expect further production decline (392 kt) in FY2014 due to fall in ore volumes and grades.
Iron ore operations remain suspended due to continuing mining ban in Karnataka and Goa. The company sold a meager 0.01 mn tons in Karnataka e-auctions. Hearing at the Supreme Court regarding opening of Category A and B mines in Karnataka is over and the order is expected to be announced soon. Note that Sesa’s R&R plans for 2.29 mn tons has been approved by CEC.
However, hearing on Goa mining suspension is yet to begin at the Supreme Court.
Sterlite Industries Metals & Mining
KOTAK INSTITUTIONAL EQUITIES RESEARCH 21
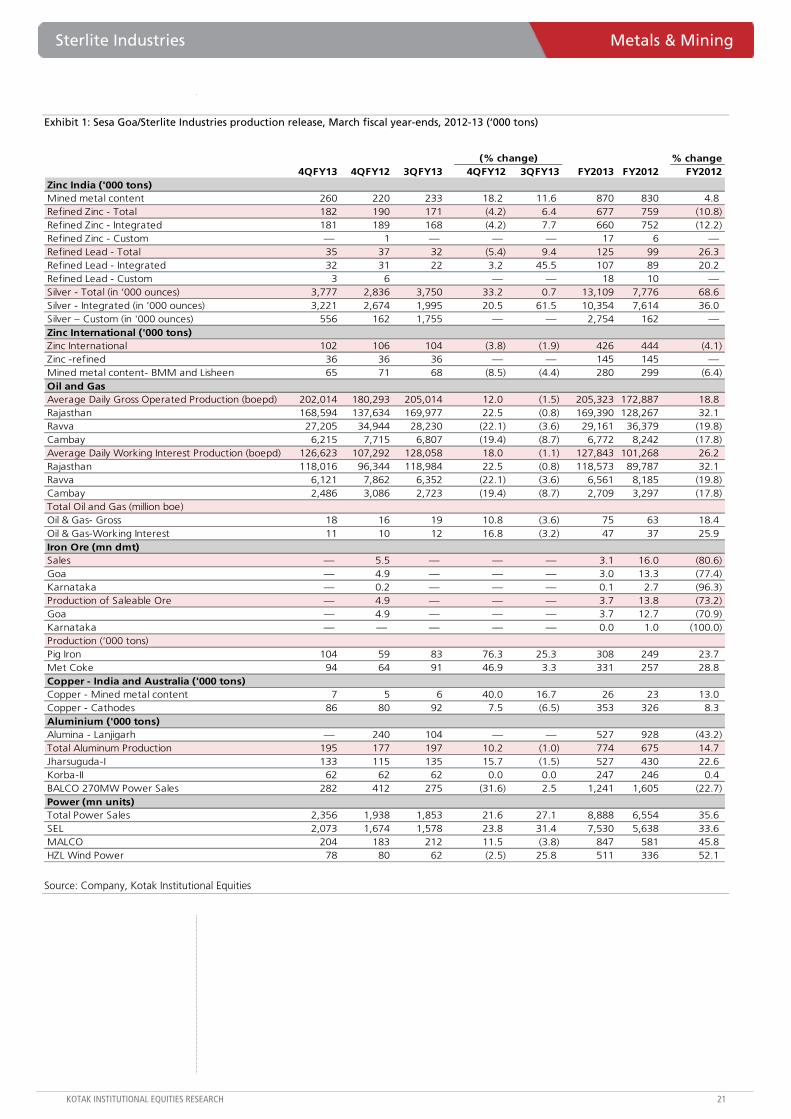
Exhibit 1: Sesa Goa/Sterlite Industries production release, March fiscal year-ends, 2012-13 (‘000 tons)
% change4QFY13 4QFY12 3QFY13 4QFY12 3QFY13 FY2013 FY2012 FY2012
Zinc India ('000 tons)Mined metal content 260 220 233 18.2 11.6 870 830 4.8Refined Zinc - Total 182 190 171 (4.2) 6.4 677 759 (10.8)Refined Zinc - Integrated 181 189 168 (4.2) 7.7 660 752 (12.2)Refined Zinc - Custom — 1 — — — 17 6 —Refined Lead - Total 35 37 32 (5.4) 9.4 125 99 26.3Refined Lead - Integrated 32 31 22 3.2 45.5 107 89 20.2Refined Lead - Custom 3 6 — — 18 10 —Silver - Total (in ‘000 ounces) 3,777 2,836 3,750 33.2 0.7 13,109 7,776 68.6Silver - Integrated (in '000 ounces) 3,221 2,674 1,995 20.5 61.5 10,354 7,614 36.0Silver – Custom (in '000 ounces) 556 162 1,755 — — 2,754 162 —Zinc International ('000 tons)Zinc International 102 106 104 (3.8) (1.9) 426 444 (4.1)Zinc -refined 36 36 36 — — 145 145 —Mined metal content- BMM and Lisheen 65 71 68 (8.5) (4.4) 280 299 (6.4)Oil and GasAverage Daily Gross Operated Production (boepd) 202,014 180,293 205,014 12.0 (1.5) 205,323 172,887 18.8Rajasthan 168,594 137,634 169,977 22.5 (0.8) 169,390 128,267 32.1Ravva 27,205 34,944 28,230 (22.1) (3.6) 29,161 36,379 (19.8)Cambay 6,215 7,715 6,807 (19.4) (8.7) 6,772 8,242 (17.8)Average Daily Working Interest Production (boepd) 126,623 107,292 128,058 18.0 (1.1) 127,843 101,268 26.2Rajasthan 118,016 96,344 118,984 22.5 (0.8) 118,573 89,787 32.1Ravva 6,121 7,862 6,352 (22.1) (3.6) 6,561 8,185 (19.8)Cambay 2,486 3,086 2,723 (19.4) (8.7) 2,709 3,297 (17.8)Total Oil and Gas (million boe)Oil & Gas- Gross 18 16 19 10.8 (3.6) 75 63 18.4Oil & Gas-Working Interest 11 10 12 16.8 (3.2) 47 37 25.9Iron Ore (mn dmt)Sales — 5.5 — — — 3.1 16.0 (80.6)Goa — 4.9 — — — 3.0 13.3 (77.4)Karnataka — 0.2 — — — 0.1 2.7 (96.3)Production of Saleable Ore — 4.9 — — — 3.7 13.8 (73.2)Goa — 4.9 — — — 3.7 12.7 (70.9)Karnataka — — — — — 0.0 1.0 (100.0)Production (‘000 tons)Pig Iron 104 59 83 76.3 25.3 308 249 23.7Met Coke 94 64 91 46.9 3.3 331 257 28.8Copper - India and Australia ('000 tons)Copper - Mined metal content 7 5 6 40.0 16.7 26 23 13.0Copper - Cathodes 86 80 92 7.5 (6.5) 353 326 8.3Aluminium ('000 tons)Alumina - Lanjigarh — 240 104 — — 527 928 (43.2)Total Aluminum Production 195 177 197 10.2 (1.0) 774 675 14.7Jharsuguda-I 133 115 135 15.7 (1.5) 527 430 22.6Korba-II 62 62 62 0.0 0.0 247 246 0.4BALCO 270MW Power Sales 282 412 275 (31.6) 2.5 1,241 1,605 (22.7)Power (mn units)Total Power Sales 2,356 1,938 1,853 21.6 27.1 8,888 6,554 35.6SEL 2,073 1,674 1,578 23.8 31.4 7,530 5,638 33.6MALCO 204 183 212 11.5 (3.8) 847 581 45.8HZL Wind Power 78 80 62 (2.5) 25.8 511 336 52.1
(% change)
Source: Company, Kotak Institutional Equities
Metals & Mining Sterlite Industries
22 KOTAK INSTITUTIONAL EQUITIES RESEARCH
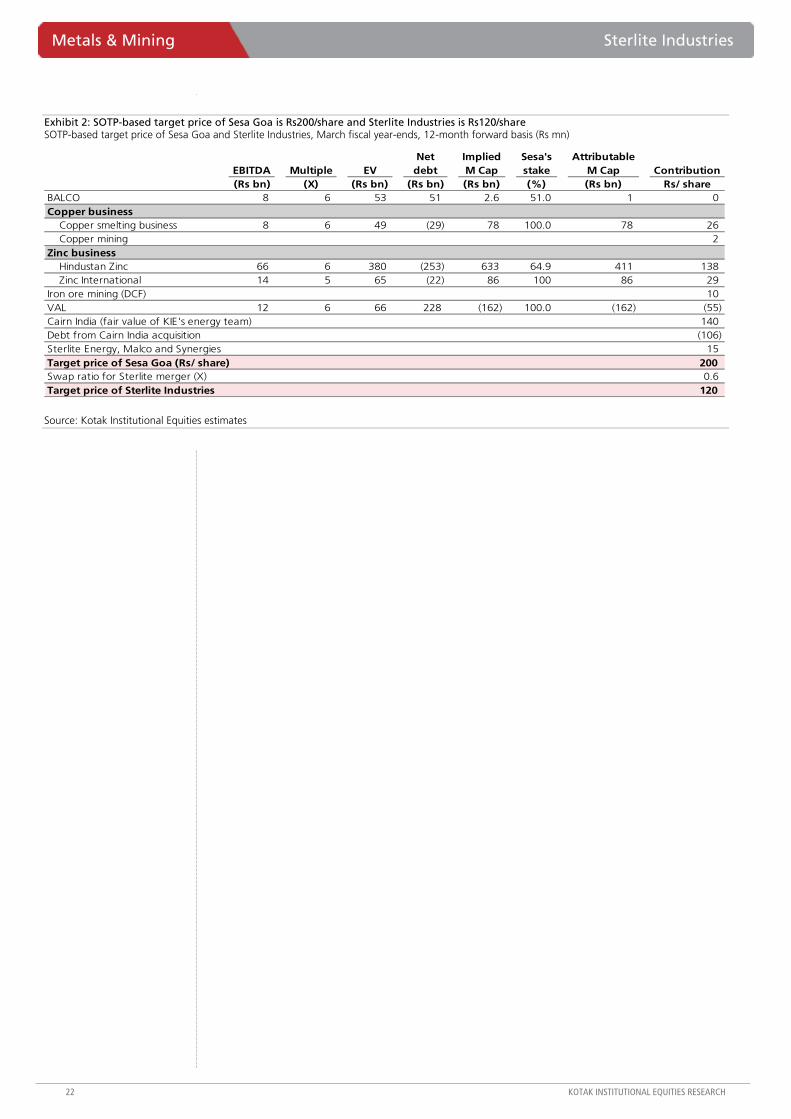
Exhibit 2: SOTP-based target price of Sesa Goa is Rs200/share and Sterlite Industries is Rs120/share SOTP-based target price of Sesa Goa and Sterlite Industries, March fiscal year-ends, 12-month forward basis (Rs mn)
EBITDA Multiple EVNet debt
Implied M Cap
Sesa's stake
Attributable M Cap Contribution
(Rs bn) (X) (Rs bn) (Rs bn) (Rs bn) (%) (Rs bn) Rs/ shareBALCO 8 6 53 51 2.6 51.0 1 0 Copper business
Copper smelting business 8 6 49 (29) 78 100.0 78 26 Copper mining 2
Zinc businessHindustan Zinc 66 6 380 (253) 633 64.9 411 138 Zinc International 14 5 65 (22) 86 100 86 29
Iron ore mining (DCF) 10 VAL 12 6 66 228 (162) 100.0 (162) (55) Cairn India (fair value of KIE's energy team) 140 Debt from Cairn India acquisition (106) Sterlite Energy, Malco and Synergies 15 Target price of Sesa Goa (Rs/ share) 200 Swap ratio for Sterlite merger (X) 0.6 Target price of Sterlite Industries 120
Source: Kotak Institutional Equities estimates
Sterlite Industries Metals & Mining
KOTAK INSTITUTIONAL EQUITIES RESEARCH 23
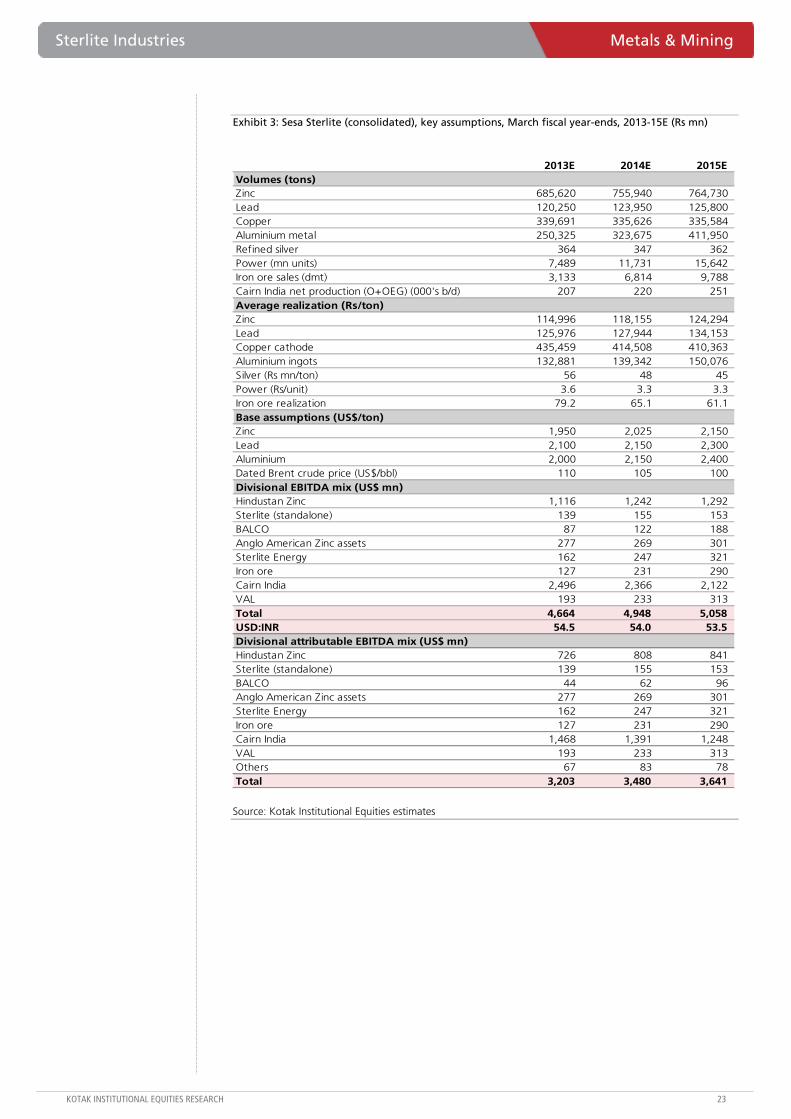
Exhibit 3: Sesa Sterlite (consolidated), key assumptions, March fiscal year-ends, 2013-15E (Rs mn)
2013E 2014E 2015EVolumes (tons)Zinc 685,620 755,940 764,730 Lead 120,250 123,950 125,800 Copper 339,691 335,626 335,584 Aluminium metal 250,325 323,675 411,950 Refined silver 364 347 362 Power (mn units) 7,489 11,731 15,642 Iron ore sales (dmt) 3,133 6,814 9,788 Cairn India net production (O+OEG) (000's b/d) 207 220 251 Average realization (Rs/ton)Zinc 114,996 118,155 124,294 Lead 125,976 127,944 134,153 Copper cathode 435,459 414,508 410,363 Aluminium ingots 132,881 139,342 150,076 Silver (Rs mn/ton) 56 48 45 Power (Rs/unit) 3.6 3.3 3.3 Iron ore realization 79.2 65.1 61.1 Base assumptions (US$/ton)Zinc 1,950 2,025 2,150 Lead 2,100 2,150 2,300 Aluminium 2,000 2,150 2,400 Dated Brent crude price (US$/bbl) 110 105 100 Divisional EBITDA mix (US$ mn)Hindustan Zinc 1,116 1,242 1,292 Sterlite (standalone) 139 155 153 BALCO 87 122 188 Anglo American Zinc assets 277 269 301 Sterlite Energy 162 247 321 Iron ore 127 231 290 Cairn India 2,496 2,366 2,122 VAL 193 233 313 Total 4,664 4,948 5,058 USD:INR 54.5 54.0 53.5 Divisional attributable EBITDA mix (US$ mn)Hindustan Zinc 726 808 841 Sterlite (standalone) 139 155 153 BALCO 44 62 96 Anglo American Zinc assets 277 269 301 Sterlite Energy 162 247 321 Iron ore 127 231 290 Cairn India 1,468 1,391 1,248 VAL 193 233 313 Others 67 83 78 Total 3,203 3,480 3,641
Source: Kotak Institutional Equities estimates
Metals & Mining Sterlite Industries
24 KOTAK INSTITUTIONAL EQUITIES RESEARCH
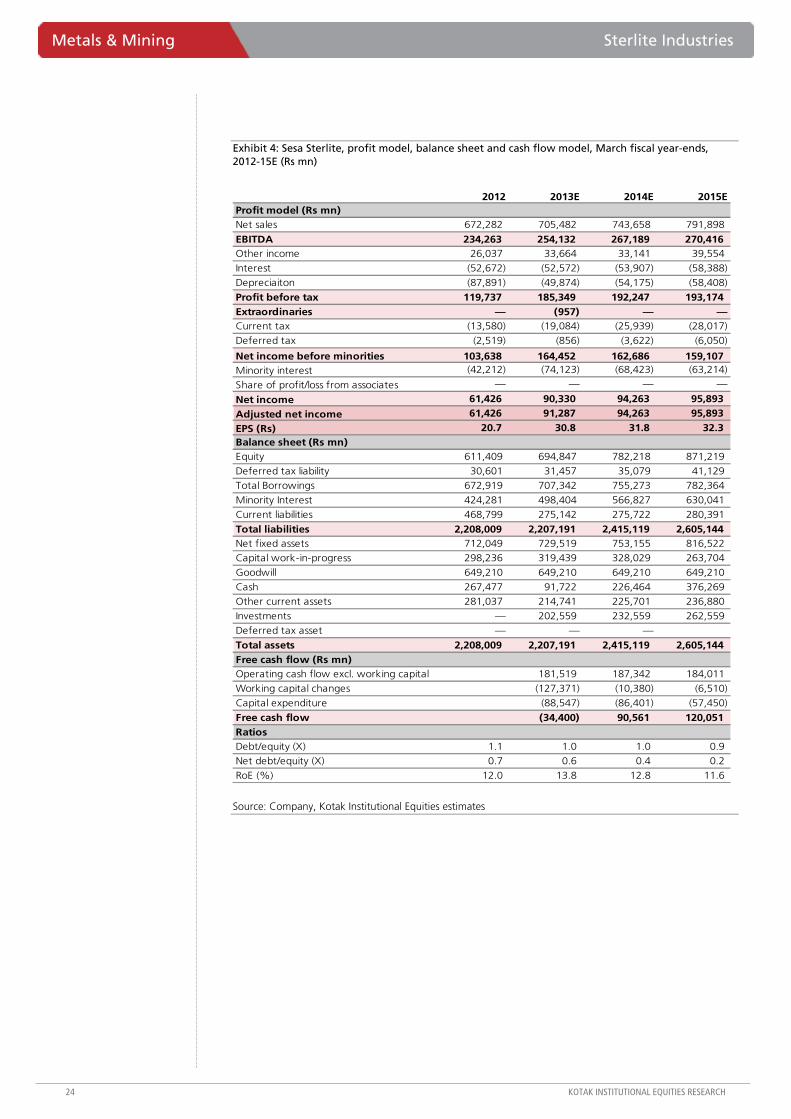
Exhibit 4: Sesa Sterlite, profit model, balance sheet and cash flow model, March fiscal year-ends, 2012-15E (Rs mn)
2012 2013E 2014E 2015EProfit model (Rs mn)Net sales 672,282 705,482 743,658 791,898
EBITDA 234,263 254,132 267,189 270,416 Other income 26,037 33,664 33,141 39,554
Interest (52,672) (52,572) (53,907) (58,388)
Depreciaiton (87,891) (49,874) (54,175) (58,408)
Profit before tax 119,737 185,349 192,247 193,174 Extraordinaries — (957) — —Current tax (13,580) (19,084) (25,939) (28,017)
Deferred tax (2,519) (856) (3,622) (6,050)
Net income before minorities 103,638 164,452 162,686 159,107 Minority interest (42,212) (74,123) (68,423) (63,214)
Share of profit/loss from associates — — — —
Net income 61,426 90,330 94,263 95,893
Adjusted net income 61,426 91,287 94,263 95,893
EPS (Rs) 20.7 30.8 31.8 32.3 Balance sheet (Rs mn)Equity 611,409 694,847 782,218 871,219
Deferred tax liability 30,601 31,457 35,079 41,129 Total Borrowings 672,919 707,342 755,273 782,364
Minority Interest 424,281 498,404 566,827 630,041
Current liabilities 468,799 275,142 275,722 280,391
Total liabilities 2,208,009 2,207,191 2,415,119 2,605,144 Net fixed assets 712,049 729,519 753,155 816,522 Capital work-in-progress 298,236 319,439 328,029 263,704
Goodwill 649,210 649,210 649,210 649,210
Cash 267,477 91,722 226,464 376,269 Other current assets 281,037 214,741 225,701 236,880
Investments — 202,559 232,559 262,559
Deferred tax asset — — —
Total assets 2,208,009 2,207,191 2,415,119 2,605,144 Free cash flow (Rs mn)Operating cash flow excl. working capital 181,519 187,342 184,011
Working capital changes (127,371) (10,380) (6,510)
Capital expenditure (88,547) (86,401) (57,450)
Free cash flow (34,400) 90,561 120,051 RatiosDebt/equity (X) 1.1 1.0 1.0 0.9 Net debt/equity (X) 0.7 0.6 0.4 0.2
RoE (%) 12.0 13.8 12.8 11.6
Source: Company, Kotak Institutional Equities estimates
For private Circulation Only. FOR IMPORTANT INFORMATION ABOUT KOTAK SECURITIES’ RATING SYSTEM AND OTHER DISCLOSURES, REFER TO THE END OF THIS MATERIAL.
Maintain ADD as valuations yet to capture all risks, in our view
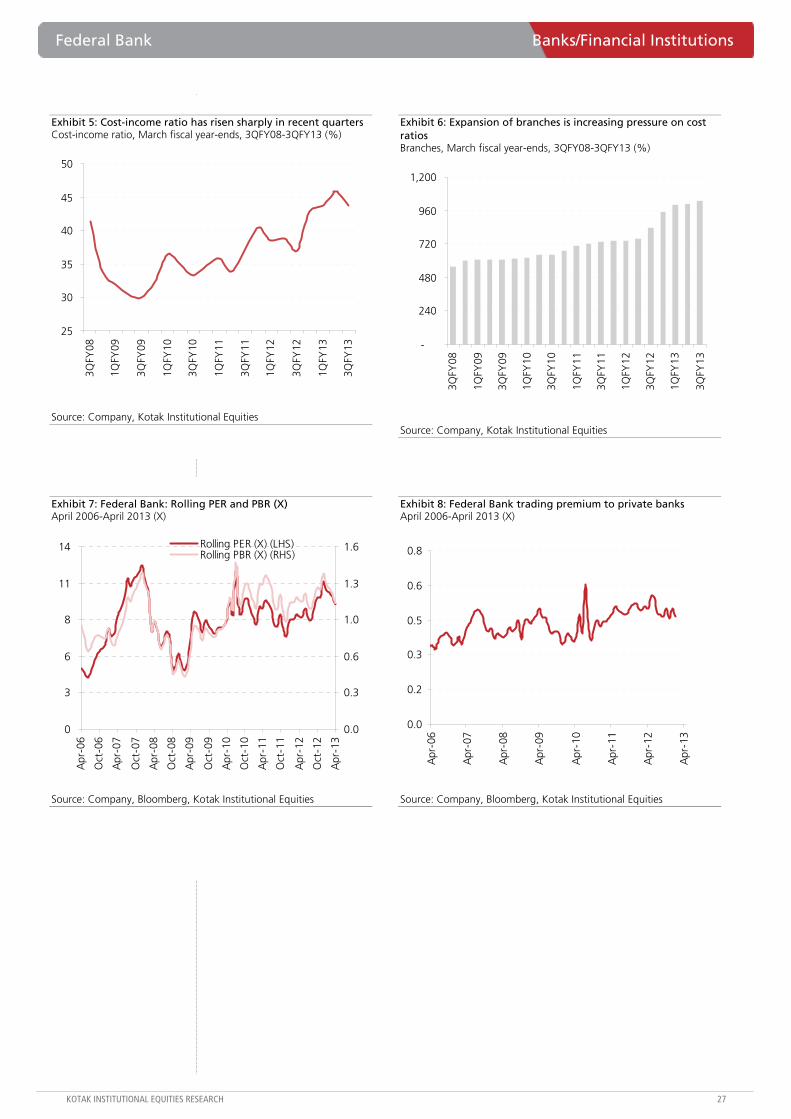
We maintain our ADD rating but revise our TP to `530 (from `540 earlier), valuing the bank at 1.3X book and 11X EPS (12-month forward) for RoEs in the range of 12-14% and earnings growth at 10% CAGR in the medium term. At this point, we note a few concerns that have emerged primarily on remittances from select countries and decline in gold prices and their implications on the bank’s deposits profile, loan impairment ratio and/or growth prospects. The bank’s specific concerns are rising, specifically on the rising cost-income structure (Exhibit 5) post the strong expansion in infrastructure but negligible improvement in key metrics.
Recent news flows from Saudi Arabia could be negative for Kerala-based banks
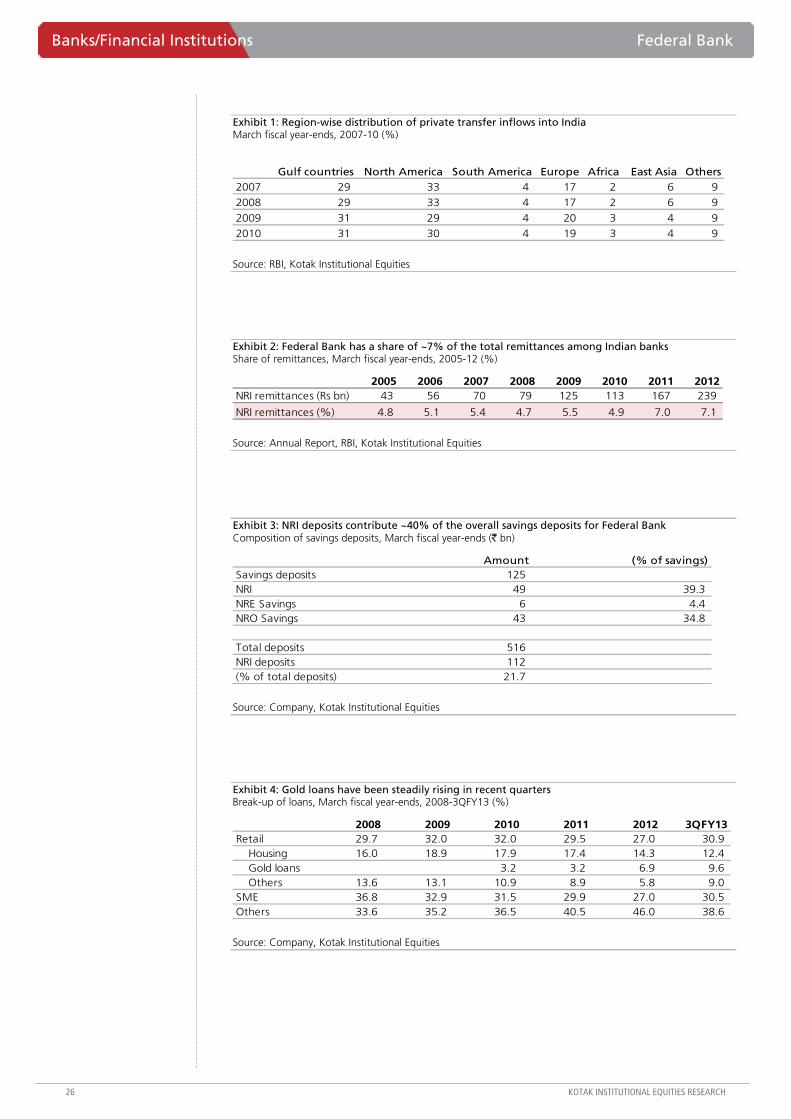
Saudi Arabia recently imposed employment restrictions (10% of employees from local population and registration of migrant employees), which have increased the risk of business for most Kerala-based banks (Federal Bank, South Indian Bank and State Bank of Travancore). These regions are a strong source of deposits (Exhibit 1) and domestic retail loans. Federal Bank has a strong market share of ~7% of the total remittance business and NRI deposits contribute ~20% of the overall deposits, but ~40% of the overall savings deposits, for the bank. While this is currently a region-specific issue, a contagion to other Gulf countries would be a key risk.
Asset quality risks have increased: Decline in gold loans and remittance risks
We believe that there is an increased risk on delinquencies on the back of softening prices of gold and/or possible lower remittances. (1) Gold loans LTV is possibly comfortable at ~75% (adjusted for a lower value of market price of gold), duration is ~8 months to 1 year (bullet repayment) and interest rates are not prohibitive to incentivize a customer default. A sharp decline could increase risk. Banks are actively looking at building this portfolio, as it acts as a safer alternative to highly delinquent agriculture loans. (2) Sharp decline in remittances adds another dimension to loan impairment. The economic slowdown, post FY2007, increased delinquencies for some of these banks given the nature of economic activity in Kerala, as loans are backed by remittances rather than income from local operations. While the share of NRI loans is fairly low (<5% of the loans), the risk of slippages has increased post this development.
Federal Bank (FB)
Banks/Financial Institutions
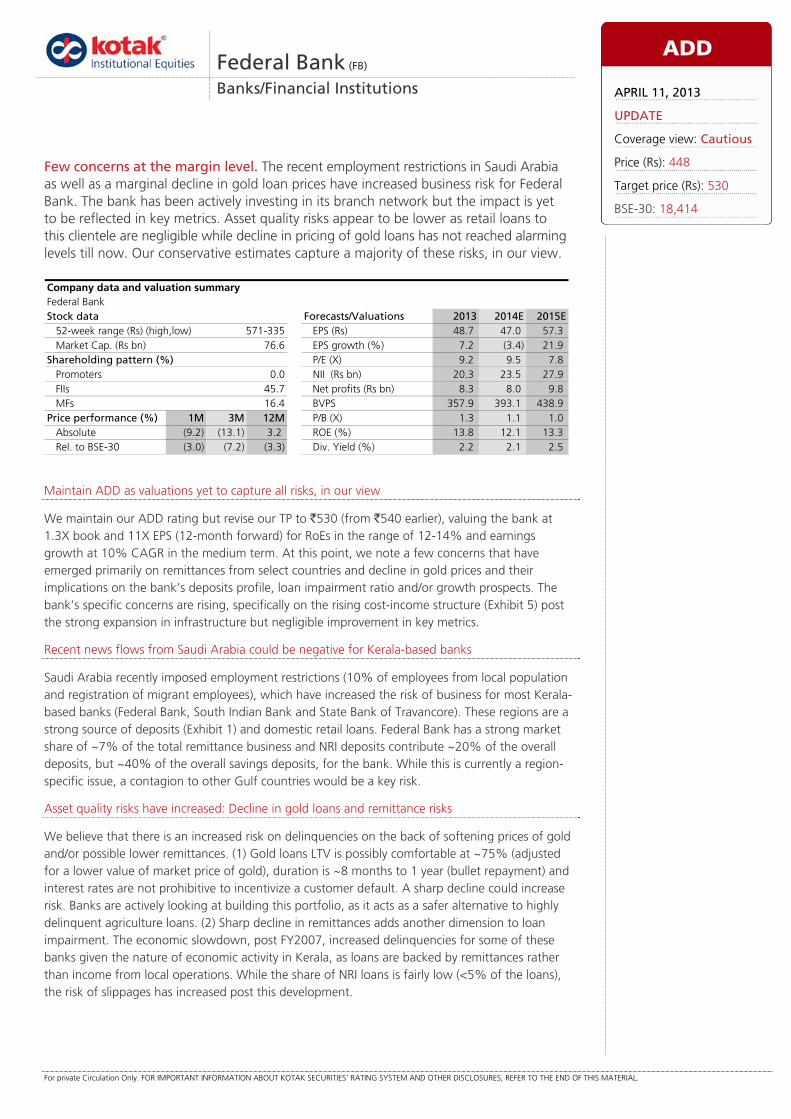
Few concerns at the margin level. The recent employment restrictions in Saudi Arabia as well as a marginal decline in gold loan prices have increased business risk for Federal Bank. The bank has been actively investing in its branch network but the impact is yet to be reflected in key metrics. Asset quality risks appear to be lower as retail loans to this clientele are negligible while decline in pricing of gold loans has not reached alarming levels till now. Our conservative estimates capture a majority of these risks, in our view.
Federal BankStock data Forecasts/Valuations 2013 2014E 2015E
52-week range (Rs) (high,low) EPS (Rs) 48.7 47.0 57.3Market Cap. (Rs bn) 76.6 EPS growth (%) 7.2 (3.4) 21.9
Shareholding pattern (%) P/E (X) 9.2 9.5 7.8Promoters 0.0 NII (Rs bn) 20.3 23.5 27.9FIIs 45.7 Net profits (Rs bn) 8.3 8.0 9.8MFs 16.4 BVPS 357.9 393.1 438.9
Price performance (%) 1M 3M 12M P/B (X) 1.3 1.1 1.0Absolute (9.2) (13.1) 3.2 ROE (%) 13.8 12.1 13.3Rel. to BSE-30 (3.0) (7.2) (3.3) Div. Yield (%) 2.2 2.1 2.5
Company data and valuation summary
571-335
ADD
APRIL 11, 2013
UPDATE
Coverage view: Cautious
Price (Rs): 448
Target price (Rs): 530
BSE-30: 18,414
Banks/Financial Institutions Federal Bank
26 KOTAK INSTITUTIONAL EQUITIES RESEARCH
Exhibit 1: Region-wise distribution of private transfer inflows into India March fiscal year-ends, 2007-10 (%)
Gulf countries North America South America Europe Africa East Asia Others2007 29 33 4 17 2 6 9
2008 29 33 4 17 2 6 9
2009 31 29 4 20 3 4 9
2010 31 30 4 19 3 4 9
Source: RBI, Kotak Institutional Equities
Exhibit 2: Federal Bank has a share of ~7% of the total remittances among Indian banks Share of remittances, March fiscal year-ends, 2005-12 (%)
2005 2006 2007 2008 2009 2010 2011 2012NRI remittances (Rs bn) 43 56 70 79 125 113 167 239
NRI remittances (%) 4.8 5.1 5.4 4.7 5.5 4.9 7.0 7.1
Source: Annual Report, RBI, Kotak Institutional Equities
Exhibit 3: NRI deposits contribute ~40% of the overall savings deposits for Federal Bank Composition of savings deposits, March fiscal year-ends (` bn)
Amount (% of savings)Savings deposits 125 NRI 49 39.3 NRE Savings 6 4.4 NRO Savings 43 34.8
Total deposits 516 NRI deposits 112 (% of total deposits) 21.7
Source: Company, Kotak Institutional Equities
Exhibit 4: Gold loans have been steadily rising in recent quarters Break-up of loans, March fiscal year-ends, 2008-3QFY13 (%)
2008 2009 2010 2011 2012 3QFY13Retail 29.7 32.0 32.0 29.5 27.0 30.9
Housing 16.0 18.9 17.9 17.4 14.3 12.4 Gold loans 3.2 3.2 6.9 9.6 Others 13.6 13.1 10.9 8.9 5.8 9.0
SME 36.8 32.9 31.5 29.9 27.0 30.5 Others 33.6 35.2 36.5 40.5 46.0 38.6
Source: Company, Kotak Institutional Equities
Federal Bank Banks/Financial Institutions
KOTAK INSTITUTIONAL EQUITIES RESEARCH 27
Exhibit 5: Cost-income ratio has risen sharply in recent quarters Cost-income ratio, March fiscal year-ends, 3QFY08-3QFY13 (%)
25
30
35
40
45
50
3QFY
08
1QFY
09
3QFY
09
1QFY
10
3QFY
10
1QFY
11
3QFY
11
1QFY
12
3QFY
12
1QFY
13
3QFY
13
Source: Company, Kotak Institutional Equities
Exhibit 6: Expansion of branches is increasing pressure on cost ratios Branches, March fiscal year-ends, 3QFY08-3QFY13 (%)
-
240
480
720
960
1,200
3QFY
08
1QFY
09
3QFY
09
1QFY
10
3QFY
10
1QFY
11
3QFY
11
1QFY
12
3QFY
12
1QFY
13
3QFY
13
Source: Company, Kotak Institutional Equities
Exhibit 7: Federal Bank: Rolling PER and PBR (X) April 2006-April 2013 (X)
0
3
6
8
11
14
Apr
-06
Oct
-06
Apr
-07
Oct
-07
Apr
-08
Oct
-08
Apr
-09
Oct
-09
Apr
-10
Oct
-10
Apr
-11
Oct
-11
Apr
-12
Oct
-12
Apr
-13
0.0
0.3
0.6
1.0
1.3
1.6Rolling PER (X) (LHS)Rolling PBR (X) (RHS)
Source: Company, Bloomberg, Kotak Institutional Equities
Exhibit 8: Federal Bank trading premium to private banks April 2006-April 2013 (X)
0.0
0.2
0.3
0.5
0.6
0.8
Apr
-06
Apr
-07
Apr
-08
Apr
-09
Apr
-10
Apr
-11
Apr
-12
Apr
-13
Source: Company, Bloomberg, Kotak Institutional Equities
Banks/Financial Institutions Federal Bank
28 KOTAK INSTITUTIONAL EQUITIES RESEARCH
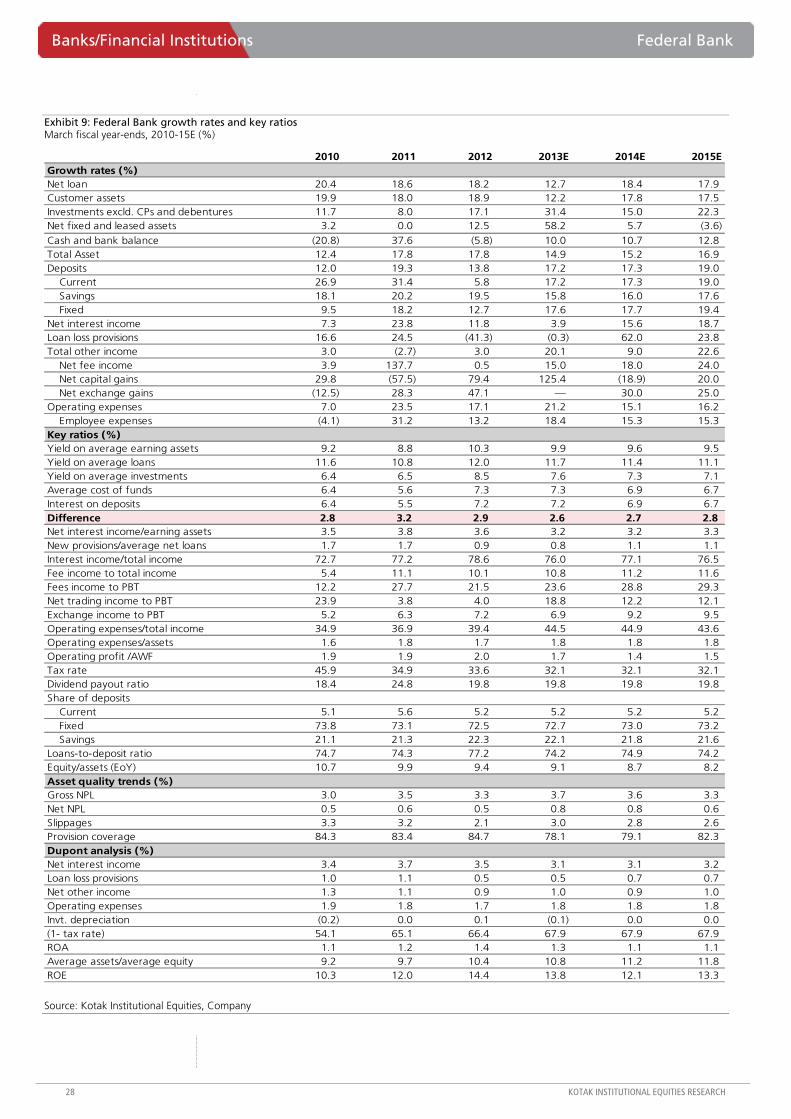
Exhibit 9: Federal Bank growth rates and key ratios March fiscal year-ends, 2010-15E (%)
2010 2011 2012 2013E 2014E 2015EGrowth rates (%)Net loan 20.4 18.6 18.2 12.7 18.4 17.9 Customer assets 19.9 18.0 18.9 12.2 17.8 17.5 Investments excld. CPs and debentures 11.7 8.0 17.1 31.4 15.0 22.3 Net fixed and leased assets 3.2 0.0 12.5 58.2 5.7 (3.6)
Cash and bank balance (20.8) 37.6 (5.8) 10.0 10.7 12.8 Total Asset 12.4 17.8 17.8 14.9 15.2 16.9 Deposits 12.0 19.3 13.8 17.2 17.3 19.0
Current 26.9 31.4 5.8 17.2 17.3 19.0 Savings 18.1 20.2 19.5 15.8 16.0 17.6 Fixed 9.5 18.2 12.7 17.6 17.7 19.4
Net interest income 7.3 23.8 11.8 3.9 15.6 18.7 Loan loss provisions 16.6 24.5 (41.3) (0.3) 62.0 23.8 Total other income 3.0 (2.7) 3.0 20.1 9.0 22.6
Net fee income 3.9 137.7 0.5 15.0 18.0 24.0 Net capital gains 29.8 (57.5) 79.4 125.4 (18.9) 20.0 Net exchange gains (12.5) 28.3 47.1 — 30.0 25.0
Operating expenses 7.0 23.5 17.1 21.2 15.1 16.2 Employee expenses (4.1) 31.2 13.2 18.4 15.3 15.3
Key ratios (%)Yield on average earning assets 9.2 8.8 10.3 9.9 9.6 9.5 Yield on average loans 11.6 10.8 12.0 11.7 11.4 11.1 Yield on average investments 6.4 6.5 8.5 7.6 7.3 7.1 Average cost of funds 6.4 5.6 7.3 7.3 6.9 6.7 Interest on deposits 6.4 5.5 7.2 7.2 6.9 6.7 Difference 2.8 3.2 2.9 2.6 2.7 2.8 Net interest income/earning assets 3.5 3.8 3.6 3.2 3.2 3.3 New provisions/average net loans 1.7 1.7 0.9 0.8 1.1 1.1 Interest income/total income 72.7 77.2 78.6 76.0 77.1 76.5 Fee income to total income 5.4 11.1 10.1 10.8 11.2 11.6 Fees income to PBT 12.2 27.7 21.5 23.6 28.8 29.3 Net trading income to PBT 23.9 3.8 4.0 18.8 12.2 12.1 Exchange income to PBT 5.2 6.3 7.2 6.9 9.2 9.5 Operating expenses/total income 34.9 36.9 39.4 44.5 44.9 43.6 Operating expenses/assets 1.6 1.8 1.7 1.8 1.8 1.8 Operating profit /AWF 1.9 1.9 2.0 1.7 1.4 1.5 Tax rate 45.9 34.9 33.6 32.1 32.1 32.1 Dividend payout ratio 18.4 24.8 19.8 19.8 19.8 19.8 Share of deposits
Current 5.1 5.6 5.2 5.2 5.2 5.2 Fixed 73.8 73.1 72.5 72.7 73.0 73.2 Savings 21.1 21.3 22.3 22.1 21.8 21.6
Loans-to-deposit ratio 74.7 74.3 77.2 74.2 74.9 74.2 Equity/assets (EoY) 10.7 9.9 9.4 9.1 8.7 8.2 Asset quality trends (%)Gross NPL 3.0 3.5 3.3 3.7 3.6 3.3 Net NPL 0.5 0.6 0.5 0.8 0.8 0.6 Slippages 3.3 3.2 2.1 3.0 2.8 2.6 Provision coverage 84.3 83.4 84.7 78.1 79.1 82.3 Dupont analysis (%)Net interest income 3.4 3.7 3.5 3.1 3.1 3.2 Loan loss provisions 1.0 1.1 0.5 0.5 0.7 0.7 Net other income 1.3 1.1 0.9 1.0 0.9 1.0 Operating expenses 1.9 1.8 1.7 1.8 1.8 1.8 Invt. depreciation (0.2) 0.0 0.1 (0.1) 0.0 0.0 (1- tax rate) 54.1 65.1 66.4 67.9 67.9 67.9 ROA 1.1 1.2 1.4 1.3 1.1 1.1 Average assets/average equity 9.2 9.7 10.4 10.8 11.2 11.8 ROE 10.3 12.0 14.4 13.8 12.1 13.3
Source: Kotak Institutional Equities, Company
Federal Bank Banks/Financial Institutions
KOTAK INSTITUTIONAL EQUITIES RESEARCH 29
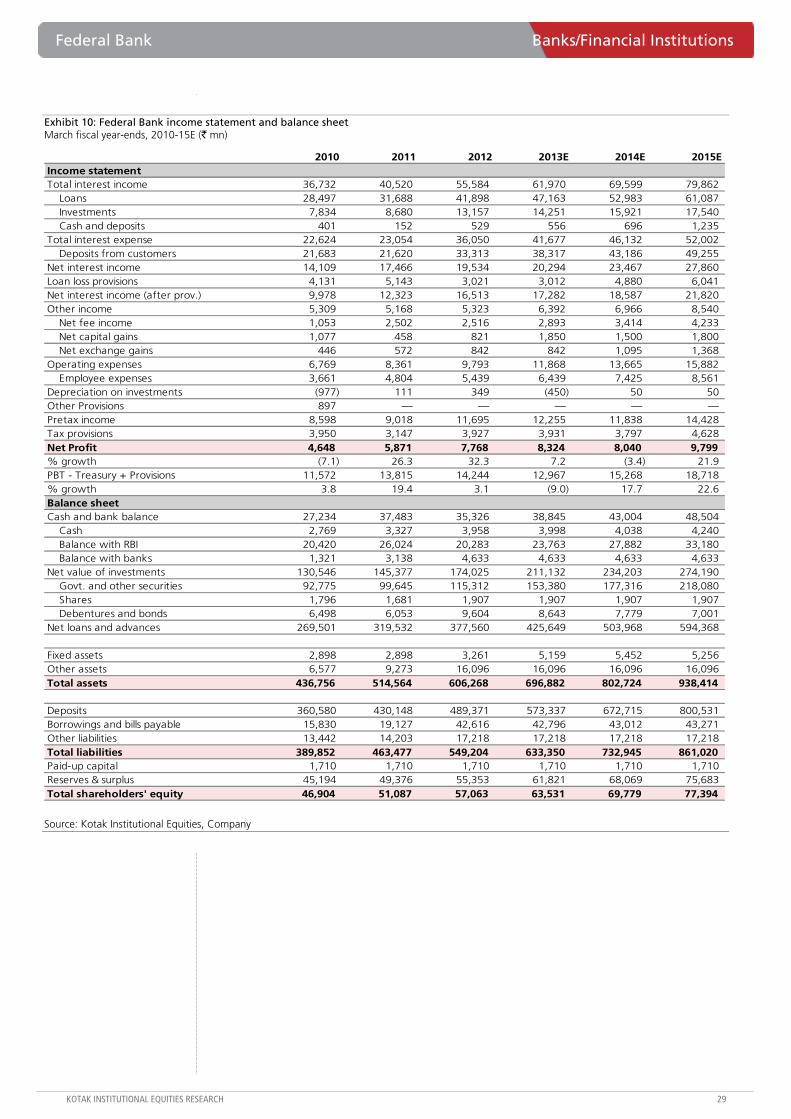
Exhibit 10: Federal Bank income statement and balance sheet March fiscal year-ends, 2010-15E (` mn)
2010 2011 2012 2013E 2014E 2015EIncome statementTotal interest income 36,732 40,520 55,584 61,970 69,599 79,862
Loans 28,497 31,688 41,898 47,163 52,983 61,087 Investments 7,834 8,680 13,157 14,251 15,921 17,540 Cash and deposits 401 152 529 556 696 1,235
Total interest expense 22,624 23,054 36,050 41,677 46,132 52,002 Deposits from customers 21,683 21,620 33,313 38,317 43,186 49,255
Net interest income 14,109 17,466 19,534 20,294 23,467 27,860 Loan loss provisions 4,131 5,143 3,021 3,012 4,880 6,041 Net interest income (after prov.) 9,978 12,323 16,513 17,282 18,587 21,820 Other income 5,309 5,168 5,323 6,392 6,966 8,540
Net fee income 1,053 2,502 2,516 2,893 3,414 4,233 Net capital gains 1,077 458 821 1,850 1,500 1,800 Net exchange gains 446 572 842 842 1,095 1,368
Operating expenses 6,769 8,361 9,793 11,868 13,665 15,882 Employee expenses 3,661 4,804 5,439 6,439 7,425 8,561
Depreciation on investments (977) 111 349 (450) 50 50 Other Provisions 897 — — — — —Pretax income 8,598 9,018 11,695 12,255 11,838 14,428 Tax provisions 3,950 3,147 3,927 3,931 3,797 4,628 Net Profit 4,648 5,871 7,768 8,324 8,040 9,799 % growth (7.1) 26.3 32.3 7.2 (3.4) 21.9 PBT - Treasury + Provisions 11,572 13,815 14,244 12,967 15,268 18,718 % growth 3.8 19.4 3.1 (9.0) 17.7 22.6 Balance sheet Cash and bank balance 27,234 37,483 35,326 38,845 43,004 48,504
Cash 2,769 3,327 3,958 3,998 4,038 4,240 Balance with RBI 20,420 26,024 20,283 23,763 27,882 33,180 Balance with banks 1,321 3,138 4,633 4,633 4,633 4,633
Net value of investments 130,546 145,377 174,025 211,132 234,203 274,190 Govt. and other securities 92,775 99,645 115,312 153,380 177,316 218,080 Shares 1,796 1,681 1,907 1,907 1,907 1,907 Debentures and bonds 6,498 6,053 9,604 8,643 7,779 7,001
Net loans and advances 269,501 319,532 377,560 425,649 503,968 594,368
Fixed assets 2,898 2,898 3,261 5,159 5,452 5,256 Other assets 6,577 9,273 16,096 16,096 16,096 16,096 Total assets 436,756 514,564 606,268 696,882 802,724 938,414
Deposits 360,580 430,148 489,371 573,337 672,715 800,531 Borrowings and bills payable 15,830 19,127 42,616 42,796 43,012 43,271 Other liabilities 13,442 14,203 17,218 17,218 17,218 17,218 Total liabilities 389,852 463,477 549,204 633,350 732,945 861,020 Paid-up capital 1,710 1,710 1,710 1,710 1,710 1,710 Reserves & surplus 45,194 49,376 55,353 61,821 68,069 75,683 Total shareholders' equity 46,904 51,087 57,063 63,531 69,779 77,394
Source: Kotak Institutional Equities, Company
For private Circulation Only. FOR IMPORTANT INFORMATION ABOUT KOTAK SECURITIES’ RATING SYSTEM AND OTHER DISCLOSURES, REFER TO THE END OF THIS MATERIAL.
Key highlights/takeaways from Sistema’s strategy update
Reduced footprint. Shyam-Sistema will adopt a data-focused strategy in the 9 circles where it will continue operations. The 13 discontinued circles contributed 25% of Sistema’s revenues and accounted for 40% of the EBITDA losses. Reduced footprint of challengers will help the incumbents gain market share.
Subscriber acquisition costs. Management indicated that the subscriber acquisition market was still very competitive with most circles having 7-8 active players. However, Sistema will focus on retaining its subscriber base before looking to acquire customers. The company feels data customers are less inclined to switch operators and are experience-focused.
Pricing. Sistema believes the competitive intensity on discounting voice tariffs has become milder compared to previous years. However, it does not see scope for material increases in RPM just yet.
Data centric strategy. Sistema sees great opportunity for data services in India with data contributing just 6-7% of industry revenues (Sistema gets 27% of its revenues from data), and is betting on a sharp increase in smartphone penetration. With higher spectrum holding (3.75 Mhz versus 2.5 Mhz earlier) in the 9 circles, it will look to roll out services in Tier-2 and 3 cities across its circles. However, incremental capex will be minimal as it utilizes equipment from the 13 discontinued circles to expand coverage in its existing circles. Sistema believes voice service on CDMA is not a great value proposition with low ARPU and high costs of subsidizing handsets.
Low capex intensity. Sistema’s capex for 2013 and 2014 will be around US$20 mn. Decisions regarding additional capex for newer technologies like LTE will be taken after achieving EBITDA breakeven, which the management hopes to do by 2015; ambitious in our view. It currently has broken even in just one circle. Low capex intensity is reflective of the balance sheet challenges faced by Sistema and other challengers. Under-investing in network will further dent the challengers’ ability to attract subscribers to their network. Protecting/growing revenue base while keeping a tight leash on costs (capex/opex) is a tightrope walk for challengers, in our view.
LTE rollout a part of medium-term strategy. Its technology neutral spectrum in 8 out of 9 circles (excluding Rajasthan) will help in upgradation of its network to support LTE services for an incremental capex of ~US$200 mn.
Consolidation. Sistema expects the industry will consolidate further with increased M&A activity in the medium term. It expects to be an acquisition target once it achieves EBITDA and cash-flow breakeven.
Telecom India
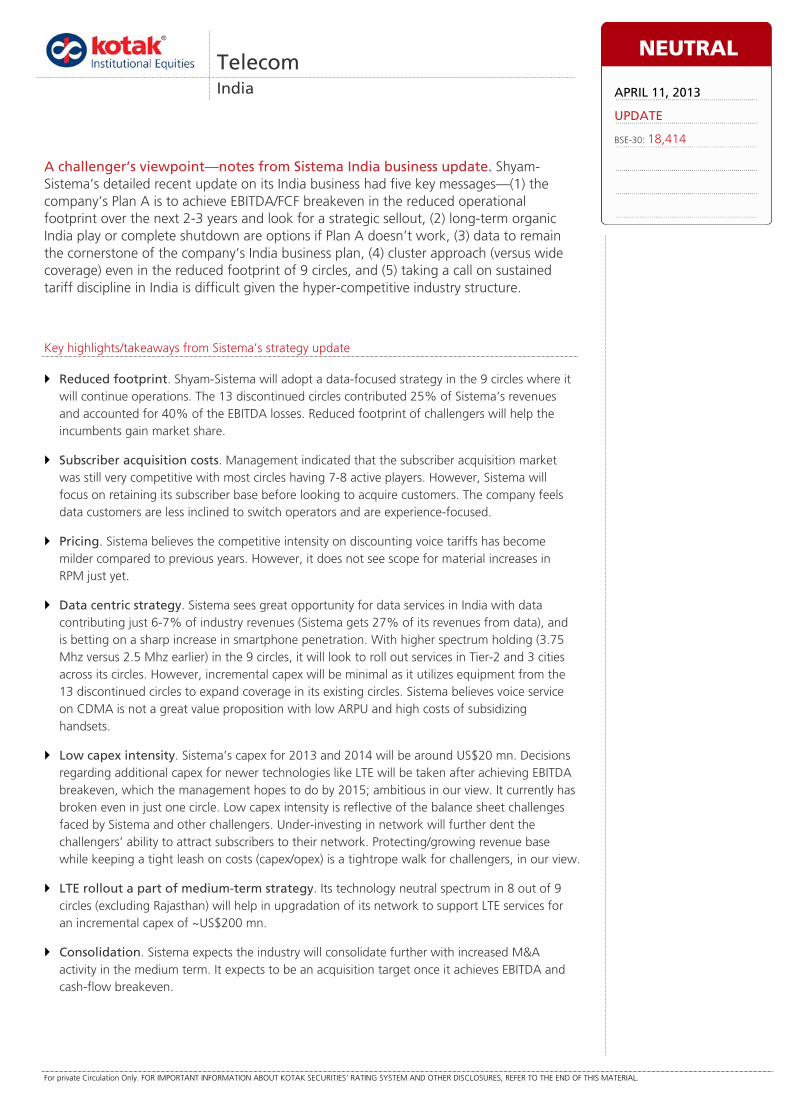
A challenger’s viewpoint—notes from Sistema India business update. Shyam-Sistema’s detailed recent update on its India business had five key messages—(1) the company’s Plan A is to achieve EBITDA/FCF breakeven in the reduced operational footprint over the next 2-3 years and look for a strategic sellout, (2) long-term organic India play or complete shutdown are options if Plan A doesn’t work, (3) data to remain the cornerstone of the company’s India business plan, (4) cluster approach (versus wide coverage) even in the reduced footprint of 9 circles, and (5) taking a call on sustained tariff discipline in India is difficult given the hyper-competitive industry structure.
NEUTRAL
APRIL 11, 2013
UPDATE
BSE-30: 18,414
Telecom India
KOTAK INSTITUTIONAL EQUITIES RESEARCH 31
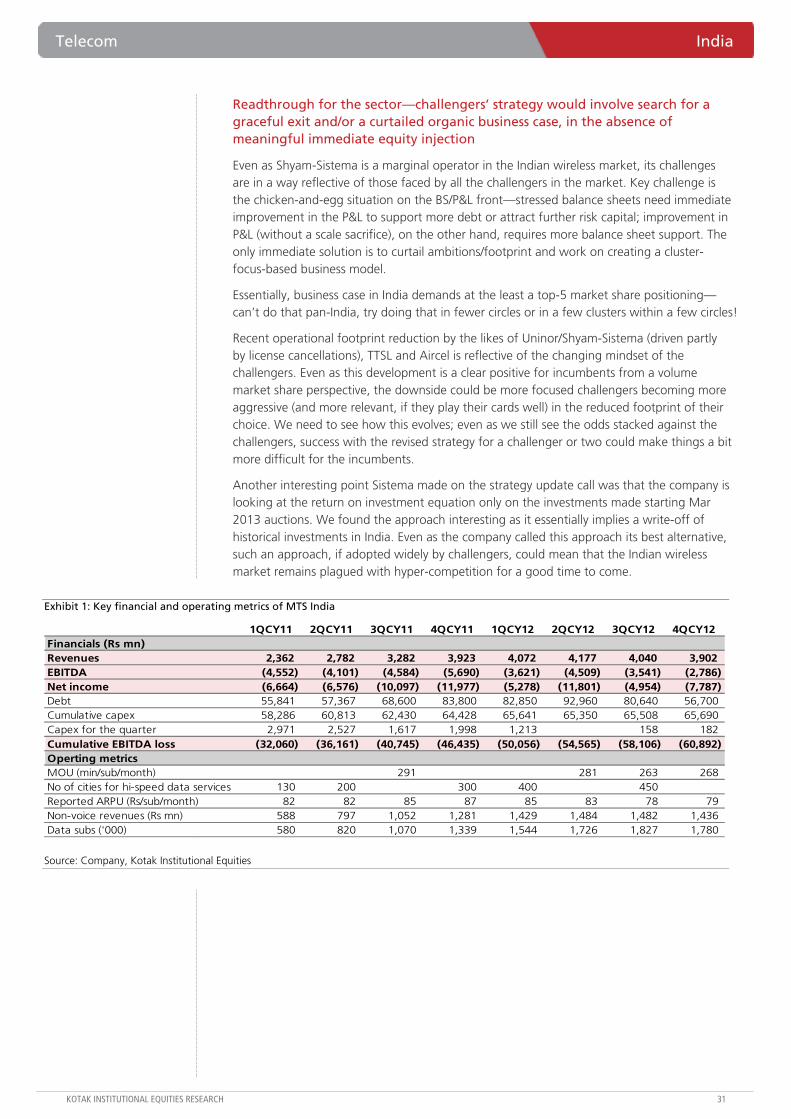
Readthrough for the sector—challengers’ strategy would involve search for a graceful exit and/or a curtailed organic business case, in the absence of meaningful immediate equity injection
Even as Shyam-Sistema is a marginal operator in the Indian wireless market, its challenges are in a way reflective of those faced by all the challengers in the market. Key challenge is the chicken-and-egg situation on the BS/P&L front—stressed balance sheets need immediate improvement in the P&L to support more debt or attract further risk capital; improvement in P&L (without a scale sacrifice), on the other hand, requires more balance sheet support. The only immediate solution is to curtail ambitions/footprint and work on creating a cluster-focus-based business model.
Essentially, business case in India demands at the least a top-5 market share positioning—can’t do that pan-India, try doing that in fewer circles or in a few clusters within a few circles!
Recent operational footprint reduction by the likes of Uninor/Shyam-Sistema (driven partly by license cancellations), TTSL and Aircel is reflective of the changing mindset of the challengers. Even as this development is a clear positive for incumbents from a volume market share perspective, the downside could be more focused challengers becoming more aggressive (and more relevant, if they play their cards well) in the reduced footprint of their choice. We need to see how this evolves; even as we still see the odds stacked against the challengers, success with the revised strategy for a challenger or two could make things a bit more difficult for the incumbents.
Another interesting point Sistema made on the strategy update call was that the company is looking at the return on investment equation only on the investments made starting Mar 2013 auctions. We found the approach interesting as it essentially implies a write-off of historical investments in India. Even as the company called this approach its best alternative, such an approach, if adopted widely by challengers, could mean that the Indian wireless market remains plagued with hyper-competition for a good time to come.
Exhibit 1: Key financial and operating metrics of MTS India
1QCY11 2QCY11 3QCY11 4QCY11 1QCY12 2QCY12 3QCY12 4QCY12Financials (Rs mn)Revenues 2,362 2,782 3,282 3,923 4,072 4,177 4,040 3,902 EBITDA (4,552) (4,101) (4,584) (5,690) (3,621) (4,509) (3,541) (2,786) Net income (6,664) (6,576) (10,097) (11,977) (5,278) (11,801) (4,954) (7,787) Debt 55,841 57,367 68,600 83,800 82,850 92,960 80,640 56,700 Cumulative capex 58,286 60,813 62,430 64,428 65,641 65,350 65,508 65,690 Capex for the quarter 2,971 2,527 1,617 1,998 1,213 158 182 Cumulative EBITDA loss (32,060) (36,161) (40,745) (46,435) (50,056) (54,565) (58,106) (60,892) Operting metricsMOU (min/sub/month) 291 281 263 268 No of cities for hi-speed data services 130 200 300 400 450 Reported ARPU (Rs/sub/month) 82 82 85 87 85 83 78 79 Non-voice revenues (Rs mn) 588 797 1,052 1,281 1,429 1,484 1,482 1,436 Data subs ('000) 580 820 1,070 1,339 1,544 1,726 1,827 1,780
Source: Company, Kotak Institutional Equities
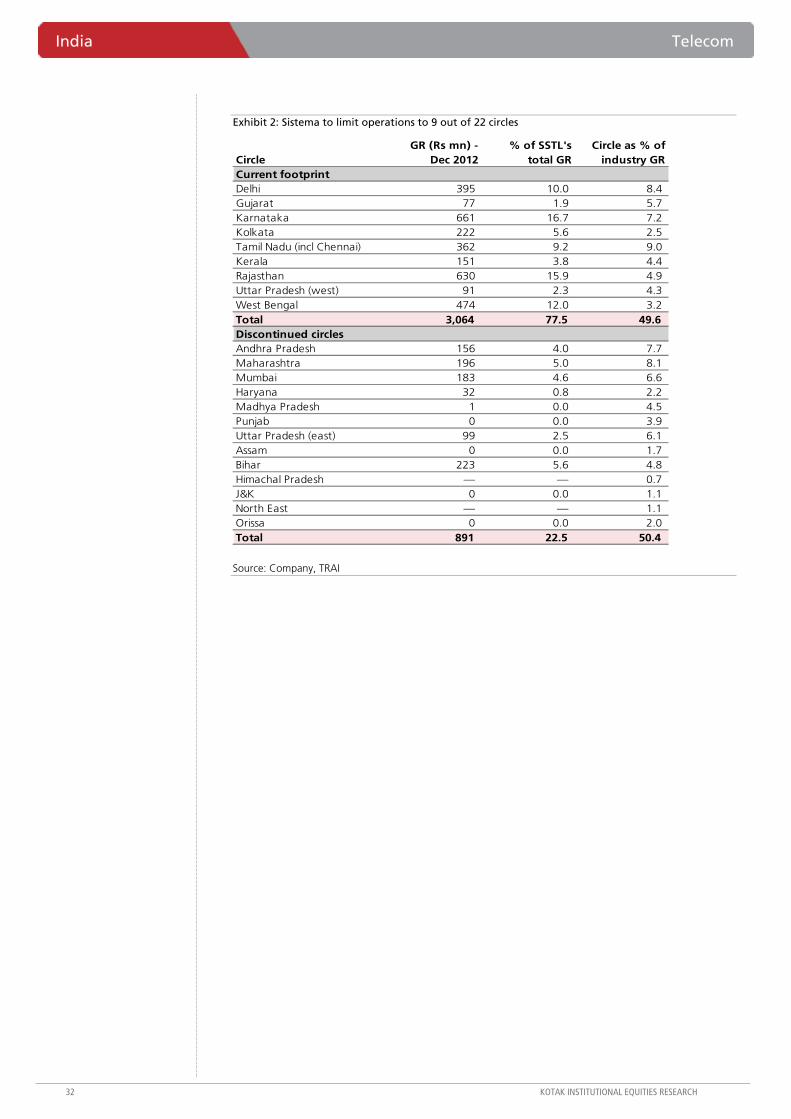
India Telecom
32 KOTAK INSTITUTIONAL EQUITIES RESEARCH
Exhibit 2: Sistema to limit operations to 9 out of 22 circles
CircleGR (Rs mn) -
Dec 2012% of SSTL's
total GRCircle as % of
industry GRCurrent footprintDelhi 395 10.0 8.4 Gujarat 77 1.9 5.7 Karnataka 661 16.7 7.2 Kolkata 222 5.6 2.5 Tamil Nadu (incl Chennai) 362 9.2 9.0 Kerala 151 3.8 4.4 Rajasthan 630 15.9 4.9 Uttar Pradesh (west) 91 2.3 4.3 West Bengal 474 12.0 3.2 Total 3,064 77.5 49.6 Discontinued circlesAndhra Pradesh 156 4.0 7.7 Maharashtra 196 5.0 8.1 Mumbai 183 4.6 6.6 Haryana 32 0.8 2.2 Madhya Pradesh 1 0.0 4.5 Punjab 0 0.0 3.9 Uttar Pradesh (east) 99 2.5 6.1 Assam 0 0.0 1.7 Bihar 223 5.6 4.8 Himachal Pradesh — — 0.7 J&K 0 0.0 1.1 North East — — 1.1 Orissa 0 0.0 2.0 Total 891 22.5 50.4
Source: Company, TRAI
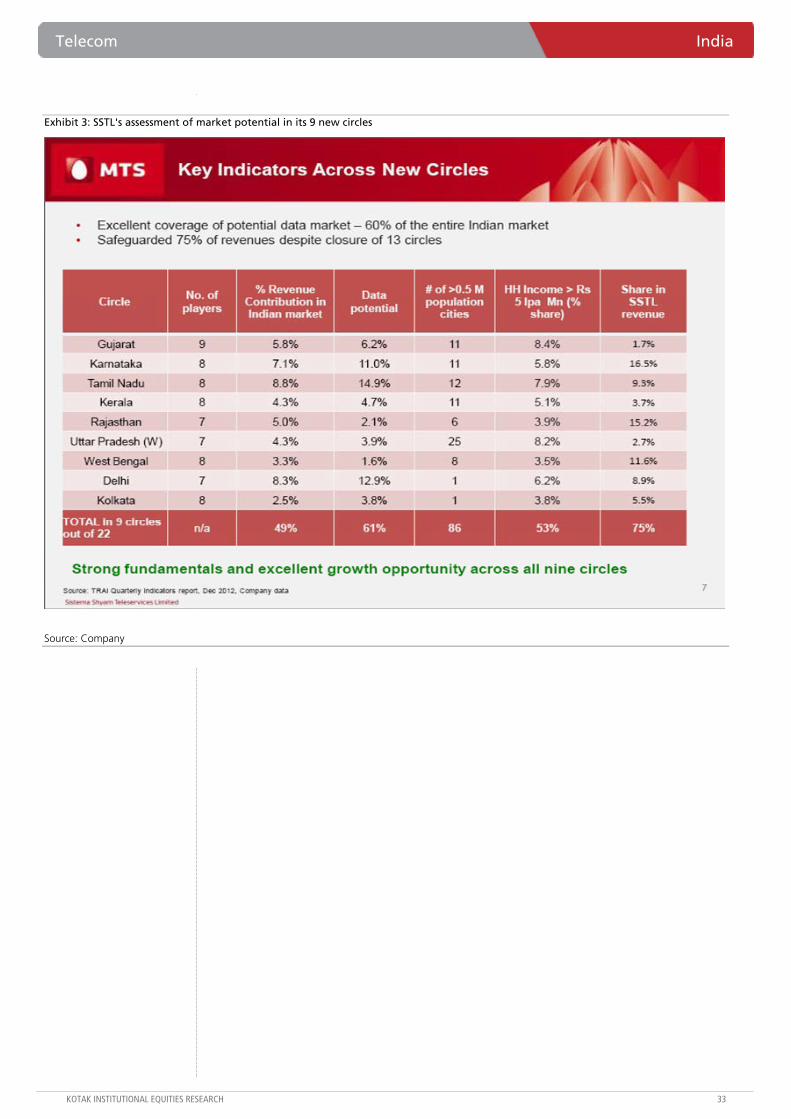
Telecom India
KOTAK INSTITUTIONAL EQUITIES RESEARCH 33
Exhibit 3: SSTL's assessment of market potential in its 9 new circles
Source: Company
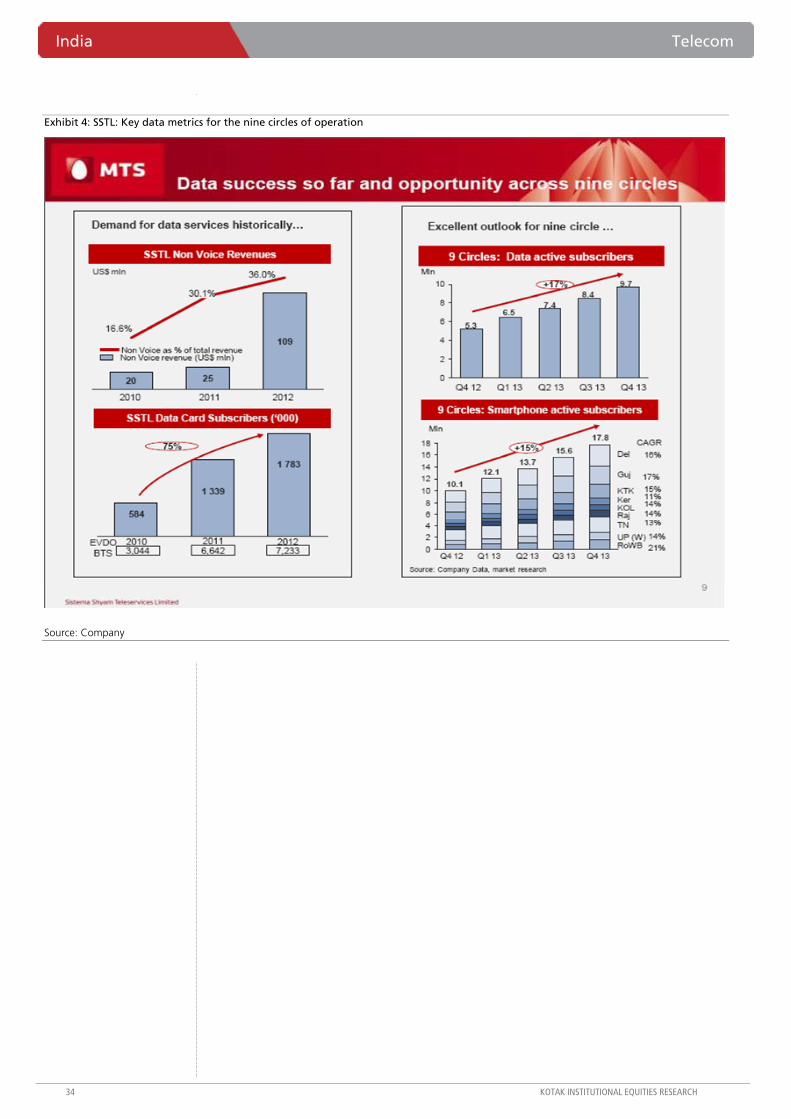
India Telecom
34 KOTAK INSTITUTIONAL EQUITIES RESEARCH
Exhibit 4: SSTL: Key data metrics for the nine circles of operation
Source: Company
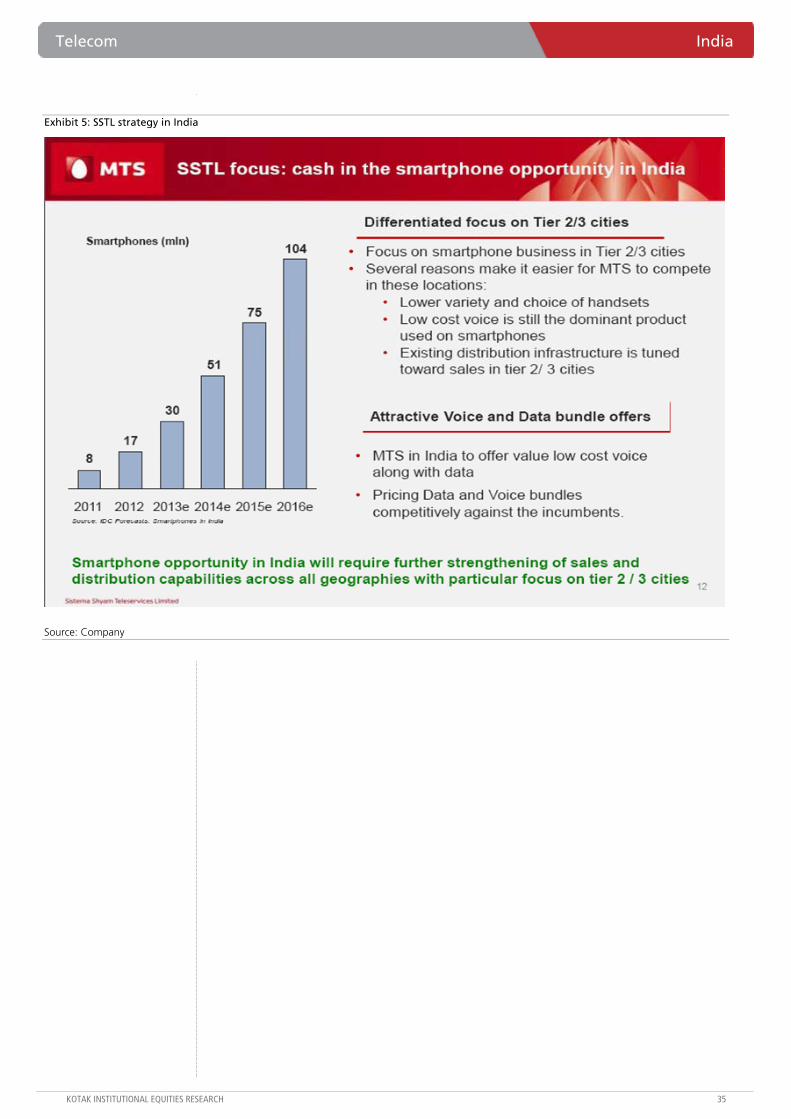
Telecom India
KOTAK INSTITUTIONAL EQUITIES RESEARCH 35
Exhibit 5: SSTL strategy in India
Source: Company
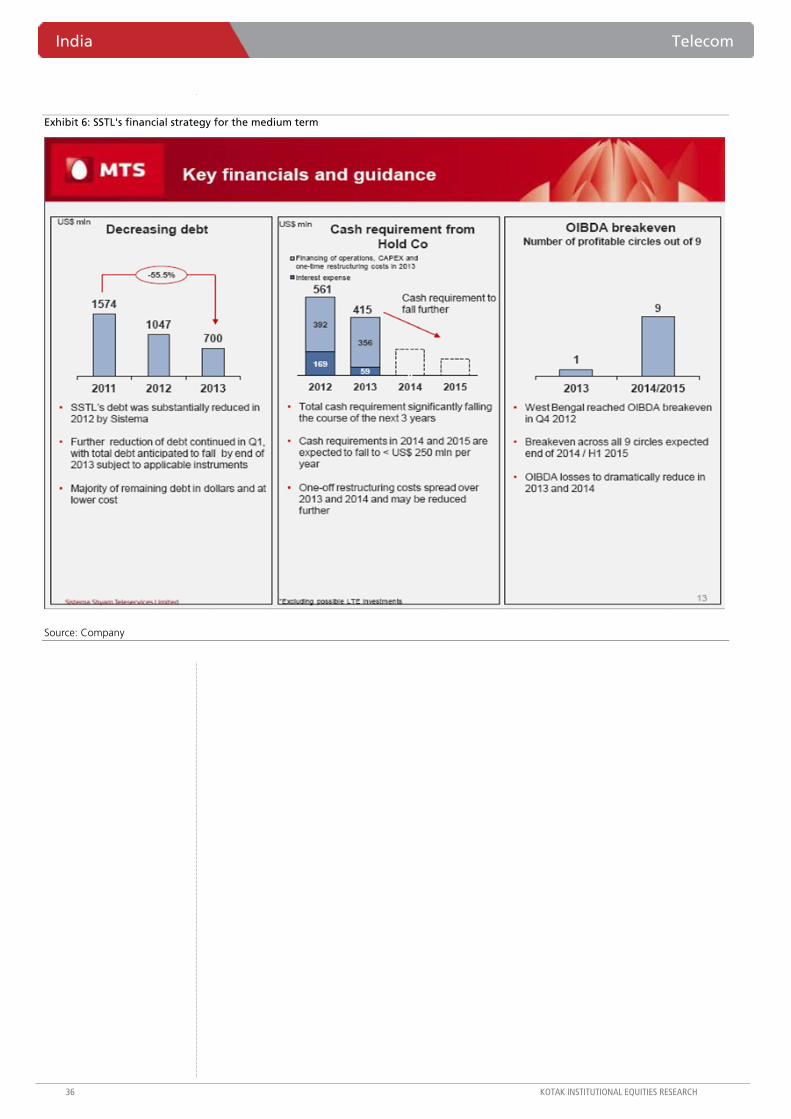
India Telecom
36 KOTAK INSTITUTIONAL EQUITIES RESEARCH
Exhibit 6: SSTL's financial strategy for the medium term
Source: Company

In
dia D
aily Sum
mary - A
pril 11, 2013
37
KOTAK IN
STITUTIO
NAL EQ
UITIES RESEARCH
March 2013: Results calendar
Mon Tue Wed Thu Fri Sat8-Apr 9-Apr 10-Apr 11-Apr 12-Apr 13-Apr
Development Credit BankInfosys
15-Apr 16-Apr 17-Apr 18-Apr 19-Apr 20-AprCMC Reliance Industries HCL Technologies IndusInd Bank Wipro
Puravankara Projects MRFTCSYes Bank
22-Apr 23-Apr 24-Apr 25-Apr 26-Apr 27-AprCairn India Coromandel International Axis Bank Bata India ICICI BankMindtree HDFC Bank Biocon Maruti SuzukiPersistent Systems MMFSL Gillette India Cholamandalam Investment
L&T Finance Holdings29-Apr 30-Apr 1-May 2-May 3-May 4-MayExide Industries Dabur India IDFC Titan Inds Kansai NerolacHexaw are Technologies Godrej ConsumersING Vysya Bank IL&FS Invest Mgrs6-May 7-May 8-May 9-May 10-May 11-May
HDFCRanbaxy Lab
Source: BSE, NSE, Kotak Institutional Equities
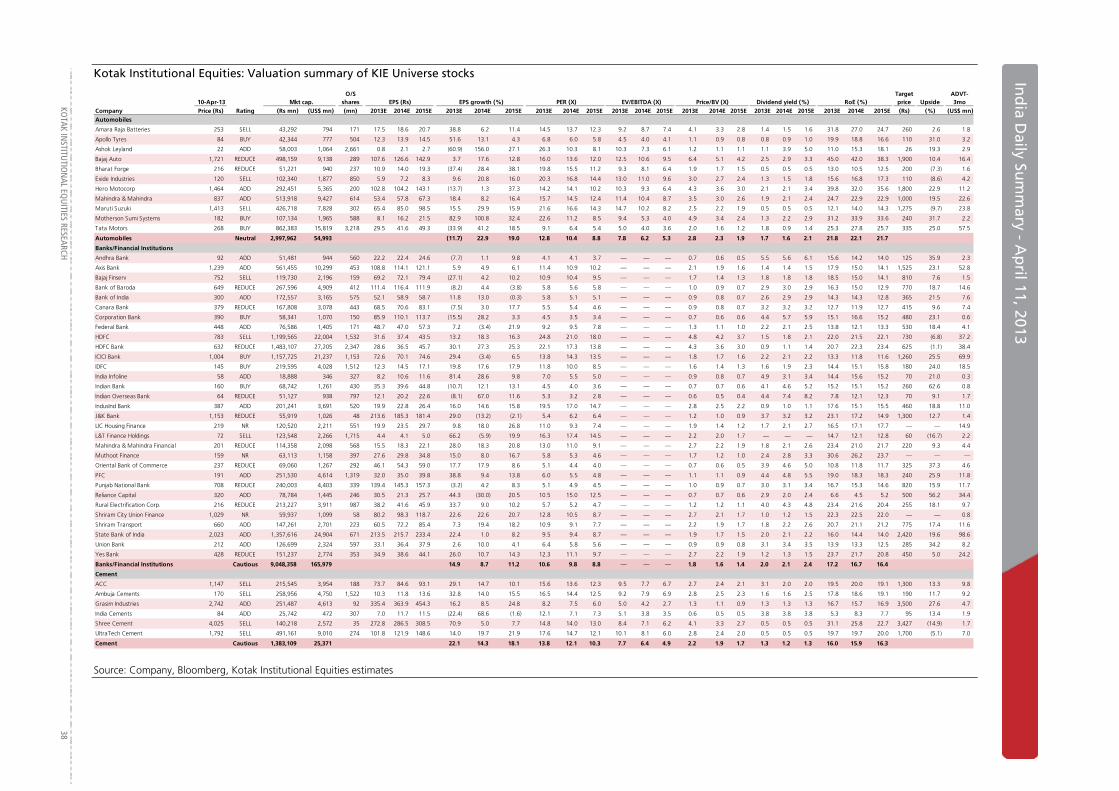
KO
TAK INSTITUTIO
NAL EQ
UITIES RESEARCH 38
In
dia D
aily Sum
mary - A
pril 1
Ind
ia Daily Su
mm
ary - Ap
ril 11, 2013
Kotak Institutional Equities: Valuation summary of KIE Universe stocks
10-Apr-13 Mkt cap.O/S
shares EPS (Rs) EPS growth (%) PER (X) EV/EBITDA (X) RoE (%)Target price Upside
ADVT-3mo
Company Price (Rs) Rating (Rs mn) (US$ mn) (mn) 2013E 2014E 2015E 2013E 2014E 2015E 2013E 2014E 2015E 2013E 2014E 2015E 2013E 2014E 2015E 2013E 2014E 2015E 2013E 2014E 2015E (Rs) (%) (US$ mn)Automobiles
Amara Raja Batteries 253 SELL 43,292 794 171 17.5 18.6 20.7 38.8 6.2 11.4 14.5 13.7 12.3 9.2 8.7 7.4 4.1 3.3 2.8 1.4 1.5 1.6 31.8 27.0 24.7 260 2.6 1.8
Apollo Tyres 84 BUY 42,344 777 504 12.3 13.9 14.5 51.6 13.1 4.3 6.8 6.0 5.8 4.5 4.0 4.1 1.1 0.9 0.8 0.8 0.9 1.0 19.9 18.8 16.6 110 31.0 3.2
Ashok Leyland 22 ADD 58,003 1,064 2,661 0.8 2.1 2.7 (60.9) 156.0 27.1 26.3 10.3 8.1 10.3 7.3 6.1 1.2 1.1 1.1 1.1 3.9 5.0 11.0 15.3 18.1 26 19.3 2.9
Bajaj Auto 1,721 REDUCE 498,159 9,138 289 107.6 126.6 142.9 3.7 17.6 12.8 16.0 13.6 12.0 12.5 10.6 9.5 6.4 5.1 4.2 2.5 2.9 3.3 45.0 42.0 38.3 1,900 10.4 16.4
Bharat Forge 216 REDUCE 51,221 940 237 10.9 14.0 19.3 (37.4) 28.4 38.1 19.8 15.5 11.2 9.3 8.1 6.4 1.9 1.7 1.5 0.5 0.5 0.5 13.0 10.5 12.5 200 (7.3) 1.6
Exide Industries 120 SELL 102,340 1,877 850 5.9 7.2 8.3 9.6 20.8 16.0 20.3 16.8 14.4 13.0 11.0 9.6 3.0 2.7 2.4 1.3 1.5 1.8 15.6 16.8 17.3 110 (8.6) 4.2
Hero Motocorp 1,464 ADD 292,451 5,365 200 102.8 104.2 143.1 (13.7) 1.3 37.3 14.2 14.1 10.2 10.3 9.3 6.4 4.3 3.6 3.0 2.1 2.1 3.4 39.8 32.0 35.6 1,800 22.9 11.2
Mahindra & Mahindra 837 ADD 513,918 9,427 614 53.4 57.8 67.3 18.4 8.2 16.4 15.7 14.5 12.4 11.4 10.4 8.7 3.5 3.0 2.6 1.9 2.1 2.4 24.7 22.9 22.9 1,000 19.5 22.6
Maruti Suzuki 1,413 SELL 426,718 7,828 302 65.4 85.0 98.5 15.5 29.9 15.9 21.6 16.6 14.3 14.7 10.2 8.2 2.5 2.2 1.9 0.5 0.5 0.5 12.1 14.0 14.3 1,275 (9.7) 23.8
Motherson Sumi Systems 182 BUY 107,134 1,965 588 8.1 16.2 21.5 82.9 100.8 32.4 22.6 11.2 8.5 9.4 5.3 4.0 4.9 3.4 2.4 1.3 2.2 2.9 31.2 33.9 33.6 240 31.7 2.2
Tata Motors 268 BUY 862,383 15,819 3,218 29.5 41.6 49.3 (33.9) 41.2 18.5 9.1 6.4 5.4 5.0 4.0 3.6 2.0 1.6 1.2 1.8 0.9 1.4 25.3 27.8 25.7 335 25.0 57.5
Automobiles Neutral 2,997,962 54,993 (11.7) 22.9 19.0 12.8 10.4 8.8 7.8 6.2 5.3 2.8 2.3 1.9 1.7 1.6 2.1 21.8 22.1 21.7
Banks/Financial Institutions
Andhra Bank 92 ADD 51,481 944 560 22.2 22.4 24.6 (7.7) 1.1 9.8 4.1 4.1 3.7 — — — 0.7 0.6 0.5 5.5 5.6 6.1 15.6 14.2 14.0 125 35.9 2.3
Axis Bank 1,239 ADD 561,455 10,299 453 108.8 114.1 121.1 5.9 4.9 6.1 11.4 10.9 10.2 — — — 2.1 1.9 1.6 1.4 1.4 1.5 17.9 15.0 14.1 1,525 23.1 52.8
Bajaj Finserv 752 SELL 119,730 2,196 159 69.2 72.1 79.4 (27.1) 4.2 10.2 10.9 10.4 9.5 — — — 1.7 1.4 1.3 1.8 1.8 1.8 18.5 15.0 14.1 810 7.6 1.5
Bank of Baroda 649 REDUCE 267,596 4,909 412 111.4 116.4 111.9 (8.2) 4.4 (3.8) 5.8 5.6 5.8 — — — 1.0 0.9 0.7 2.9 3.0 2.9 16.3 15.0 12.9 770 18.7 14.6
Bank of India 300 ADD 172,557 3,165 575 52.1 58.9 58.7 11.8 13.0 (0.3) 5.8 5.1 5.1 — — — 0.9 0.8 0.7 2.6 2.9 2.9 14.3 14.3 12.8 365 21.5 7.6
Canara Bank 379 REDUCE 167,808 3,078 443 68.5 70.6 83.1 (7.5) 3.0 17.7 5.5 5.4 4.6 — — — 0.9 0.8 0.7 3.2 3.2 3.2 12.7 11.9 12.7 415 9.6 7.4
Corporation Bank 390 BUY 58,341 1,070 150 85.9 110.1 113.7 (15.5) 28.2 3.3 4.5 3.5 3.4 — — — 0.7 0.6 0.6 4.4 5.7 5.9 15.1 16.6 15.2 480 23.1 0.6
Federal Bank 448 ADD 76,586 1,405 171 48.7 47.0 57.3 7.2 (3.4) 21.9 9.2 9.5 7.8 — — — 1.3 1.1 1.0 2.2 2.1 2.5 13.8 12.1 13.3 530 18.4 4.1
HDFC 783 SELL 1,199,565 22,004 1,532 31.6 37.4 43.5 13.2 18.3 16.3 24.8 21.0 18.0 — — — 4.8 4.2 3.7 1.5 1.8 2.1 22.0 21.5 22.1 730 (6.8) 37.2
HDFC Bank 632 REDUCE 1,483,107 27,205 2,347 28.6 36.5 45.7 30.1 27.3 25.3 22.1 17.3 13.8 — — — 4.3 3.6 3.0 0.9 1.1 1.4 20.7 22.3 23.4 625 (1.1) 38.4
ICICI Bank 1,004 BUY 1,157,725 21,237 1,153 72.6 70.1 74.6 29.4 (3.4) 6.5 13.8 14.3 13.5 — — — 1.8 1.7 1.6 2.2 2.1 2.2 13.3 11.8 11.6 1,260 25.5 69.9
IDFC 145 BUY 219,595 4,028 1,512 12.3 14.5 17.1 19.8 17.6 17.9 11.8 10.0 8.5 — — — 1.6 1.4 1.3 1.6 1.9 2.3 14.4 15.1 15.8 180 24.0 18.5
India Infoline 58 ADD 18,888 346 327 8.2 10.6 11.6 81.4 28.6 9.8 7.0 5.5 5.0 — — — 0.9 0.8 0.7 4.9 3.1 3.4 14.4 15.6 15.2 70 21.0 0.3
Indian Bank 160 BUY 68,742 1,261 430 35.3 39.6 44.8 (10.7) 12.1 13.1 4.5 4.0 3.6 — — — 0.7 0.7 0.6 4.1 4.6 5.2 15.2 15.1 15.2 260 62.6 0.8
Indian Overseas Bank 64 REDUCE 51,127 938 797 12.1 20.2 22.6 (8.1) 67.0 11.6 5.3 3.2 2.8 — — — 0.6 0.5 0.4 4.4 7.4 8.2 7.8 12.1 12.3 70 9.1 1.7
IndusInd Bank 387 ADD 201,241 3,691 520 19.9 22.8 26.4 16.0 14.6 15.8 19.5 17.0 14.7 — — — 2.8 2.5 2.2 0.9 1.0 1.1 17.6 15.1 15.5 460 18.8 11.0
J&K Bank 1,153 REDUCE 55,919 1,026 48 213.6 185.3 181.4 29.0 (13.2) (2.1) 5.4 6.2 6.4 — — — 1.2 1.0 0.9 3.7 3.2 3.2 23.1 17.2 14.9 1,300 12.7 1.4
LIC Housing Finance 219 NR 120,520 2,211 551 19.9 23.5 29.7 9.8 18.0 26.8 11.0 9.3 7.4 — — — 1.9 1.4 1.2 1.7 2.1 2.7 16.5 17.1 17.7 — — 14.9
L&T Finance Holdings 72 SELL 123,548 2,266 1,715 4.4 4.1 5.0 66.2 (5.9) 19.9 16.3 17.4 14.5 — — — 2.2 2.0 1.7 — — — 14.7 12.1 12.8 60 (16.7) 2.2
Mahindra & Mahindra Financial 201 REDUCE 114,358 2,098 568 15.5 18.3 22.1 28.0 18.3 20.8 13.0 11.0 9.1 — — — 2.7 2.2 1.9 1.8 2.1 2.6 23.4 21.0 21.7 220 9.3 4.4
Muthoot Finance 159 NR 63,113 1,158 397 27.6 29.8 34.8 15.0 8.0 16.7 5.8 5.3 4.6 — — — 1.7 1.2 1.0 2.4 2.8 3.3 30.6 26.2 23.7 — — —
Oriental Bank of Commerce 237 REDUCE 69,060 1,267 292 46.1 54.3 59.0 17.7 17.9 8.6 5.1 4.4 4.0 — — — 0.7 0.6 0.5 3.9 4.6 5.0 10.8 11.8 11.7 325 37.3 4.6
PFC 191 ADD 251,530 4,614 1,319 32.0 35.0 39.8 38.8 9.4 13.8 6.0 5.5 4.8 — — — 1.1 1.1 0.9 4.4 4.8 5.5 19.0 18.3 18.3 240 25.9 11.8
Punjab National Bank 708 REDUCE 240,003 4,403 339 139.4 145.3 157.3 (3.2) 4.2 8.3 5.1 4.9 4.5 — — — 1.0 0.9 0.7 3.0 3.1 3.4 16.7 15.3 14.6 820 15.9 11.7
Reliance Capital 320 ADD 78,784 1,445 246 30.5 21.3 25.7 44.3 (30.0) 20.5 10.5 15.0 12.5 — — — 0.7 0.7 0.6 2.9 2.0 2.4 6.6 4.5 5.2 500 56.2 34.4
Rural Electrification Corp. 216 REDUCE 213,227 3,911 987 38.2 41.6 45.9 33.7 9.0 10.2 5.7 5.2 4.7 — — — 1.2 1.2 1.1 4.0 4.3 4.8 23.4 21.6 20.4 255 18.1 9.7
Shriram City Union Finance 1,029 NR 59,937 1,099 58 80.2 98.3 118.7 22.6 22.6 20.7 12.8 10.5 8.7 — — — 2.7 2.1 1.7 1.0 1.2 1.5 22.3 22.5 22.0 — — 0.8
Shriram Transport 660 ADD 147,261 2,701 223 60.5 72.2 85.4 7.3 19.4 18.2 10.9 9.1 7.7 — — — 2.2 1.9 1.7 1.8 2.2 2.6 20.7 21.1 21.2 775 17.4 11.6
State Bank of India 2,023 ADD 1,357,616 24,904 671 213.5 215.7 233.4 22.4 1.0 8.2 9.5 9.4 8.7 — — — 1.9 1.7 1.5 2.0 2.1 2.2 16.0 14.4 14.0 2,420 19.6 98.6
Union Bank 212 ADD 126,699 2,324 597 33.1 36.4 37.9 2.6 10.0 4.1 6.4 5.8 5.6 — — — 0.9 0.9 0.8 3.1 3.4 3.5 13.9 13.3 12.5 285 34.2 8.2
Yes Bank 428 REDUCE 151,237 2,774 353 34.9 38.6 44.1 26.0 10.7 14.3 12.3 11.1 9.7 — — — 2.7 2.2 1.9 1.2 1.3 1.5 23.7 21.7 20.8 450 5.0 24.2
Banks/Financial Institutions Cautious 9,048,358 165,979 14.9 8.7 11.2 10.6 9.8 8.8 — — — 1.8 1.6 1.4 2.0 2.1 2.4 17.2 16.7 16.4
Cement
ACC 1,147 SELL 215,545 3,954 188 73.7 84.6 93.1 29.1 14.7 10.1 15.6 13.6 12.3 9.5 7.7 6.7 2.7 2.4 2.1 3.1 2.0 2.0 19.5 20.0 19.1 1,300 13.3 9.8
Ambuja Cements 170 SELL 258,956 4,750 1,522 10.3 11.8 13.6 32.8 14.0 15.5 16.5 14.4 12.5 9.2 7.9 6.9 2.8 2.5 2.3 1.6 1.6 2.5 17.8 18.6 19.1 190 11.7 9.2
Grasim Industries 2,742 ADD 251,487 4,613 92 335.4 363.9 454.3 16.2 8.5 24.8 8.2 7.5 6.0 5.0 4.2 2.7 1.3 1.1 0.9 1.3 1.3 1.3 16.7 15.7 16.9 3,500 27.6 4.7
India Cements 84 ADD 25,742 472 307 7.0 11.7 11.5 (22.4) 68.6 (1.6) 12.1 7.1 7.3 5.1 3.8 3.5 0.6 0.5 0.5 3.8 3.8 3.8 5.3 8.3 7.7 95 13.4 1.9
Shree Cement 4,025 SELL 140,218 2,572 35 272.8 286.5 308.5 70.9 5.0 7.7 14.8 14.0 13.0 8.4 7.1 6.2 4.1 3.3 2.7 0.5 0.5 0.5 31.1 25.8 22.7 3,427 (14.9) 1.7
UltraTech Cement 1,792 SELL 491,161 9,010 274 101.8 121.9 148.6 14.0 19.7 21.9 17.6 14.7 12.1 10.1 8.1 6.0 2.8 2.4 2.0 0.5 0.5 0.5 19.7 19.7 20.0 1,700 (5.1) 7.0
Cement Cautious 1,383,109 25,371 22.1 14.3 18.1 13.8 12.1 10.3 7.7 6.4 4.9 2.2 1.9 1.7 1.3 1.2 1.3 16.0 15.9 16.3
Price/BV (X) Dividend yield (%)
Source: Company, Bloomberg, Kotak Institutional Equities estimates
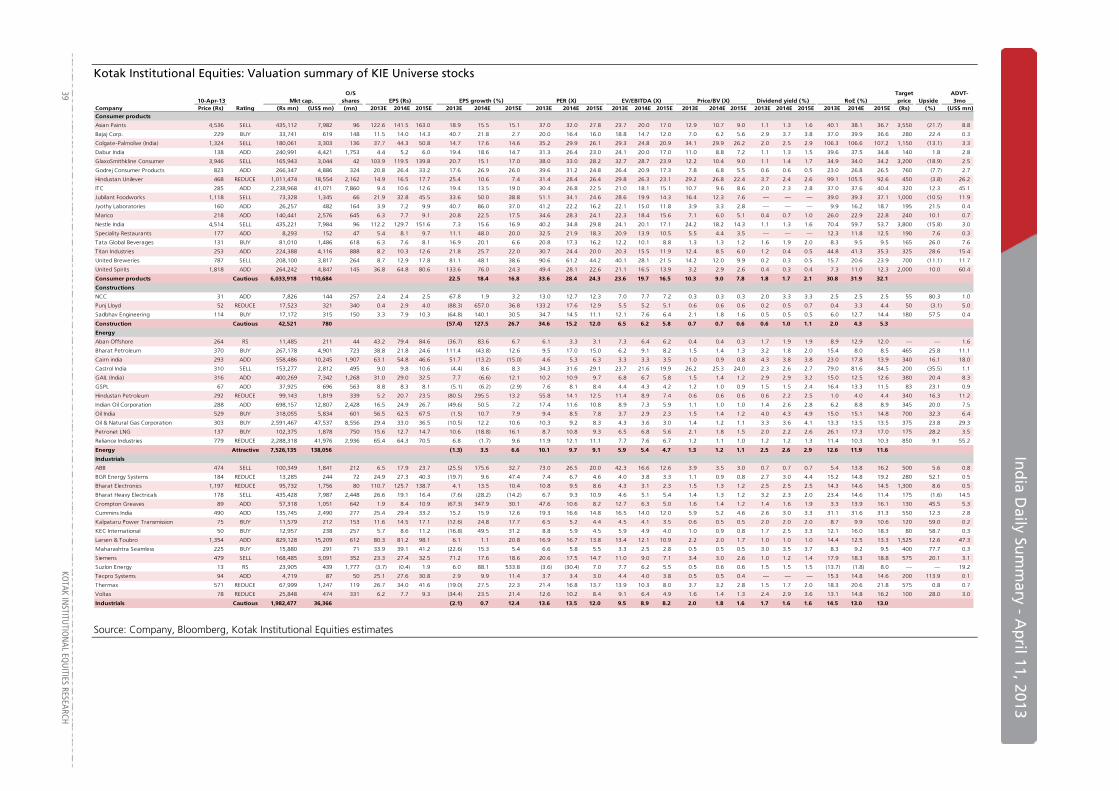
In
dia D
aily Sum
mary - A
pril 11, 2013
39
KOTAK IN
STITUTIO
NAL EQ
UITIES RESEARCH
Kotak Institutional Equities: Valuation summary of KIE Universe stocks
10-Apr-13 Mkt cap.O/S
shares EPS (Rs) EPS growth (%) PER (X) EV/EBITDA (X) Price/BV (X) RoE (%)Target price Upside
ADVT-3mo
Company Price (Rs) Rating (Rs mn) (US$ mn) (mn) 2013E 2014E 2015E 2013E 2014E 2015E 2013E 2014E 2015E 2013E 2014E 2015E 2013E 2014E 2015E 2013E 2014E 2015E 2013E 2014E 2015E (Rs) (%) (US$ mn)Consumer products
Asian Paints 4,536 SELL 435,112 7,982 96 122.6 141.5 163.0 18.9 15.5 15.1 37.0 32.0 27.8 23.7 20.0 17.0 12.9 10.7 9.0 1.1 1.3 1.6 40.1 38.1 36.7 3,550 (21.7) 8.8
Bajaj Corp. 229 BUY 33,741 619 148 11.5 14.0 14.3 40.7 21.8 2.7 20.0 16.4 16.0 18.8 14.7 12.0 7.0 6.2 5.6 2.9 3.7 3.8 37.0 39.9 36.6 280 22.4 0.3
Colgate-Palmolive (India) 1,324 SELL 180,061 3,303 136 37.7 44.3 50.8 14.7 17.6 14.6 35.2 29.9 26.1 29.3 24.8 20.9 34.1 29.9 26.2 2.0 2.5 2.9 106.3 106.6 107.2 1,150 (13.1) 3.3
Dabur India 138 ADD 240,991 4,421 1,753 4.4 5.2 6.0 19.4 18.6 14.7 31.3 26.4 23.0 24.1 20.0 17.0 11.0 8.8 7.2 1.1 1.3 1.5 39.6 37.5 34.8 140 1.8 2.8
GlaxoSmithkline Consumer 3,946 SELL 165,943 3,044 42 103.9 119.5 139.8 20.7 15.1 17.0 38.0 33.0 28.2 32.7 28.7 23.9 12.2 10.4 9.0 1.1 1.4 1.7 34.9 34.0 34.2 3,200 (18.9) 2.5
Godrej Consumer Products 823 ADD 266,347 4,886 324 20.8 26.4 33.2 17.6 26.9 26.0 39.6 31.2 24.8 26.4 20.9 17.3 7.8 6.8 5.5 0.6 0.6 0.5 23.0 26.8 26.5 760 (7.7) 2.7
Hindustan Unilever 468 REDUCE 1,011,474 18,554 2,162 14.9 16.5 17.7 25.4 10.6 7.4 31.4 28.4 26.4 29.8 26.3 23.1 29.2 26.8 22.4 3.7 2.4 2.6 99.1 105.5 92.6 450 (3.8) 26.2
ITC 285 ADD 2,238,968 41,071 7,860 9.4 10.6 12.6 19.4 13.5 19.0 30.4 26.8 22.5 21.0 18.1 15.1 10.7 9.6 8.6 2.0 2.3 2.8 37.0 37.6 40.4 320 12.3 45.1
Jubilant Foodworks 1,118 SELL 73,328 1,345 66 21.9 32.8 45.5 33.6 50.0 38.8 51.1 34.1 24.6 28.6 19.9 14.3 16.4 12.3 7.6 — — — 39.0 39.3 37.1 1,000 (10.5) 11.9
Jyothy Laboratories 160 ADD 26,257 482 164 3.9 7.2 9.9 40.7 86.0 37.0 41.2 22.2 16.2 22.1 15.0 11.8 3.9 3.3 2.8 — — — 9.9 16.2 18.7 195 21.5 0.4
Marico 218 ADD 140,441 2,576 645 6.3 7.7 9.1 20.8 22.5 17.5 34.6 28.3 24.1 22.3 18.4 15.6 7.1 6.0 5.1 0.4 0.7 1.0 26.0 22.9 22.8 240 10.1 0.7
Nestle India 4,514 SELL 435,221 7,984 96 112.2 129.7 151.6 7.3 15.6 16.9 40.2 34.8 29.8 24.1 20.1 17.1 24.2 18.2 14.3 1.1 1.3 1.6 70.4 59.7 53.7 3,800 (15.8) 3.0
Speciality Restaurants 177 ADD 8,293 152 47 5.4 8.1 9.7 11.1 48.0 20.0 32.5 21.9 18.3 20.9 13.9 10.5 5.5 4.4 3.5 — — — 12.3 11.8 12.5 190 7.6 0.3
Tata Global Beverages 131 BUY 81,010 1,486 618 6.3 7.6 8.1 16.9 20.1 6.6 20.8 17.3 16.2 12.2 10.1 8.8 1.3 1.3 1.2 1.6 1.9 2.0 8.3 9.5 9.5 165 26.0 7.6
Titan Industries 253 ADD 224,388 4,116 888 8.2 10.3 12.6 21.8 25.7 22.0 30.7 24.4 20.0 20.3 15.5 11.9 12.4 8.5 6.0 1.2 0.4 0.5 44.8 41.3 35.3 325 28.6 15.4
United Breweries 787 SELL 208,100 3,817 264 8.7 12.9 17.8 81.1 48.1 38.6 90.6 61.2 44.2 40.1 28.1 21.5 14.2 12.0 9.9 0.2 0.3 0.5 15.7 20.6 23.9 700 (11.1) 11.7
United Spirits 1,818 ADD 264,242 4,847 145 36.8 64.8 80.6 133.6 76.0 24.3 49.4 28.1 22.6 21.1 16.5 13.9 3.2 2.9 2.6 0.4 0.3 0.4 7.3 11.0 12.3 2,000 10.0 60.4
Consumer products Cautious 6,033,918 110,684 22.5 18.4 16.8 33.6 28.4 24.3 23.6 19.7 16.5 10.3 9.0 7.8 1.8 1.7 2.1 30.8 31.9 32.1
Constructions
NCC 31 ADD 7,826 144 257 2.4 2.4 2.5 67.8 1.9 3.2 13.0 12.7 12.3 7.0 7.7 7.2 0.3 0.3 0.3 2.0 3.3 3.3 2.5 2.5 2.5 55 80.3 1.0
Punj Lloyd 52 REDUCE 17,523 321 340 0.4 2.9 4.0 (88.3) 657.0 36.8 133.2 17.6 12.9 5.5 5.2 5.1 0.6 0.6 0.6 0.2 0.5 0.7 0.4 3.3 4.4 50 (3.1) 5.0
Sadbhav Engineering 114 BUY 17,172 315 150 3.3 7.9 10.3 (64.8) 140.1 30.5 34.7 14.5 11.1 12.1 7.6 6.4 2.1 1.8 1.6 0.5 0.5 0.5 6.0 12.7 14.4 180 57.5 0.4
Construction Cautious 42,521 780 (57.4) 127.5 26.7 34.6 15.2 12.0 6.5 6.2 5.8 0.7 0.7 0.6 0.6 1.0 1.1 2.0 4.3 5.3
Energy
Aban Offshore 264 RS 11,485 211 44 43.2 79.4 84.6 (36.7) 83.6 6.7 6.1 3.3 3.1 7.3 6.4 6.2 0.4 0.4 0.3 1.7 1.9 1.9 8.9 12.9 12.0 — — 1.6
Bharat Petroleum 370 BUY 267,178 4,901 723 38.8 21.8 24.6 111.4 (43.8) 12.6 9.5 17.0 15.0 6.2 9.1 8.2 1.5 1.4 1.3 3.2 1.8 2.0 15.4 8.0 8.5 465 25.8 11.1
Cairn india 293 ADD 558,486 10,245 1,907 63.1 54.8 46.6 51.7 (13.2) (15.0) 4.6 5.3 6.3 3.3 3.3 3.5 1.0 0.9 0.8 4.3 3.8 3.8 23.0 17.8 13.9 340 16.1 18.0
Castrol India 310 SELL 153,277 2,812 495 9.0 9.8 10.6 (4.4) 8.6 8.3 34.3 31.6 29.1 23.7 21.6 19.9 26.2 25.3 24.0 2.3 2.6 2.7 79.0 81.6 84.5 200 (35.5) 1.1
GAIL (India) 316 ADD 400,269 7,342 1,268 31.0 29.0 32.5 7.7 (6.6) 12.1 10.2 10.9 9.7 6.8 6.7 5.8 1.5 1.4 1.2 2.9 2.9 3.2 15.0 12.5 12.6 380 20.4 8.3
GSPL 67 ADD 37,925 696 563 8.8 8.3 8.1 (5.1) (6.2) (2.9) 7.6 8.1 8.4 4.4 4.3 4.2 1.2 1.0 0.9 1.5 1.5 2.4 16.4 13.3 11.5 83 23.1 0.9
Hindustan Petroleum 292 REDUCE 99,143 1,819 339 5.2 20.7 23.5 (80.5) 295.5 13.2 55.8 14.1 12.5 11.4 8.9 7.4 0.6 0.6 0.6 0.6 2.2 2.5 1.0 4.0 4.4 340 16.3 11.2
Indian Oil Corporation 288 ADD 698,157 12,807 2,428 16.5 24.9 26.7 (49.6) 50.5 7.2 17.4 11.6 10.8 8.9 7.3 5.9 1.1 1.0 1.0 1.4 2.6 2.8 6.2 8.8 8.9 345 20.0 7.5
Oil India 529 BUY 318,055 5,834 601 56.5 62.5 67.5 (1.5) 10.7 7.9 9.4 8.5 7.8 3.7 2.9 2.3 1.5 1.4 1.2 4.0 4.3 4.9 15.0 15.1 14.8 700 32.3 6.4
Oil & Natural Gas Corporation 303 BUY 2,591,467 47,537 8,556 29.4 33.0 36.5 (10.5) 12.2 10.6 10.3 9.2 8.3 4.3 3.6 3.0 1.4 1.2 1.1 3.3 3.6 4.1 13.3 13.5 13.5 375 23.8 29.3
Petronet LNG 137 BUY 102,375 1,878 750 15.6 12.7 14.7 10.6 (18.8) 16.1 8.7 10.8 9.3 6.5 6.8 5.6 2.1 1.8 1.5 2.0 2.2 2.6 26.1 17.3 17.0 175 28.2 3.5
Reliance Industries 779 REDUCE 2,288,318 41,976 2,936 65.4 64.3 70.5 6.8 (1.7) 9.6 11.9 12.1 11.1 7.7 7.6 6.7 1.2 1.1 1.0 1.2 1.2 1.3 11.4 10.3 10.3 850 9.1 55.2
Energy Attractive 7,526,135 138,056 (1.3) 3.5 6.6 10.1 9.7 9.1 5.9 5.4 4.7 1.3 1.2 1.1 2.5 2.6 2.9 12.6 11.9 11.6
Industrials
ABB 474 SELL 100,349 1,841 212 6.5 17.9 23.7 (25.5) 175.6 32.7 73.0 26.5 20.0 42.3 16.6 12.6 3.9 3.5 3.0 0.7 0.7 0.7 5.4 13.8 16.2 500 5.6 0.8
BGR Energy Systems 184 REDUCE 13,285 244 72 24.9 27.3 40.3 (19.7) 9.6 47.4 7.4 6.7 4.6 4.0 3.8 3.3 1.1 0.9 0.8 2.7 3.0 4.4 15.2 14.8 19.2 280 52.1 0.5
Bharat Electronics 1,197 REDUCE 95,732 1,756 80 110.7 125.7 138.7 4.1 13.5 10.4 10.8 9.5 8.6 4.3 3.1 2.3 1.5 1.3 1.2 2.5 2.5 2.5 14.3 14.6 14.5 1,300 8.6 0.5
Bharat Heavy Electricals 178 SELL 435,428 7,987 2,448 26.6 19.1 16.4 (7.6) (28.2) (14.2) 6.7 9.3 10.9 4.6 5.1 5.4 1.4 1.3 1.2 3.2 2.3 2.0 23.4 14.6 11.4 175 (1.6) 14.5
Crompton Greaves 89 ADD 57,318 1,051 642 1.9 8.4 10.9 (67.3) 347.9 30.1 47.6 10.6 8.2 12.7 6.3 5.0 1.6 1.4 1.2 1.4 1.6 1.9 3.3 13.9 16.1 130 45.5 5.3
Cummins India 490 ADD 135,745 2,490 277 25.4 29.4 33.2 15.2 15.9 12.6 19.3 16.6 14.8 16.5 14.0 12.0 5.9 5.2 4.6 2.6 3.0 3.3 31.1 31.6 31.3 550 12.3 2.8
Kalpataru Power Transmission 75 BUY 11,579 212 153 11.6 14.5 17.1 (12.6) 24.8 17.7 6.5 5.2 4.4 4.5 4.1 3.5 0.6 0.5 0.5 2.0 2.0 2.0 8.7 9.9 10.6 120 59.0 0.2
KEC International 50 BUY 12,957 238 257 5.7 8.6 11.2 (16.8) 49.5 31.2 8.8 5.9 4.5 5.9 4.9 4.0 1.0 0.9 0.8 1.7 2.5 3.3 12.1 16.0 18.3 80 58.7 0.3
Larsen & Toubro 1,354 ADD 829,128 15,209 612 80.3 81.2 98.1 6.1 1.1 20.8 16.9 16.7 13.8 13.4 12.1 10.9 2.2 2.0 1.7 1.0 1.0 1.0 14.4 12.5 13.3 1,525 12.6 47.3
Maharashtra Seamless 225 BUY 15,880 291 71 33.9 39.1 41.2 (22.6) 15.3 5.4 6.6 5.8 5.5 3.3 2.5 2.8 0.5 0.5 0.5 3.0 3.5 3.7 8.3 9.2 9.5 400 77.7 0.3
Siemens 479 SELL 168,485 3,091 352 23.3 27.4 32.5 71.2 17.6 18.6 20.6 17.5 14.7 11.0 9.0 7.1 3.4 3.0 2.6 1.0 1.2 1.4 17.9 18.3 18.8 575 20.1 3.1
Suzlon Energy 13 RS 23,905 439 1,777 (3.7) (0.4) 1.9 6.0 88.1 533.8 (3.6) (30.4) 7.0 7.7 6.2 5.5 0.5 0.6 0.6 1.5 1.5 1.5 (13.7) (1.8) 8.0 — — 19.2
Tecpro Systems 94 ADD 4,719 87 50 25.1 27.6 30.8 2.9 9.9 11.4 3.7 3.4 3.0 4.4 4.0 3.8 0.5 0.5 0.4 — — — 15.3 14.8 14.6 200 113.9 0.1
Thermax 571 REDUCE 67,999 1,247 119 26.7 34.0 41.6 (19.0) 27.5 22.3 21.4 16.8 13.7 13.9 10.3 8.0 3.7 3.2 2.8 1.5 1.7 2.0 18.3 20.6 21.8 575 0.8 0.7
Voltas 78 REDUCE 25,848 474 331 6.2 7.7 9.3 (34.4) 23.5 21.4 12.6 10.2 8.4 9.1 6.4 4.9 1.6 1.4 1.3 2.4 2.9 3.6 13.1 14.8 16.2 100 28.0 3.0
Industrials Cautious 1,982,477 36,366 (2.1) 0.7 12.4 13.6 13.5 12.0 9.5 8.9 8.2 2.0 1.8 1.6 1.7 1.6 1.6 14.5 13.0 13.0
Dividend yield (%)
Source: Company, Bloomberg, Kotak Institutional Equities estimates
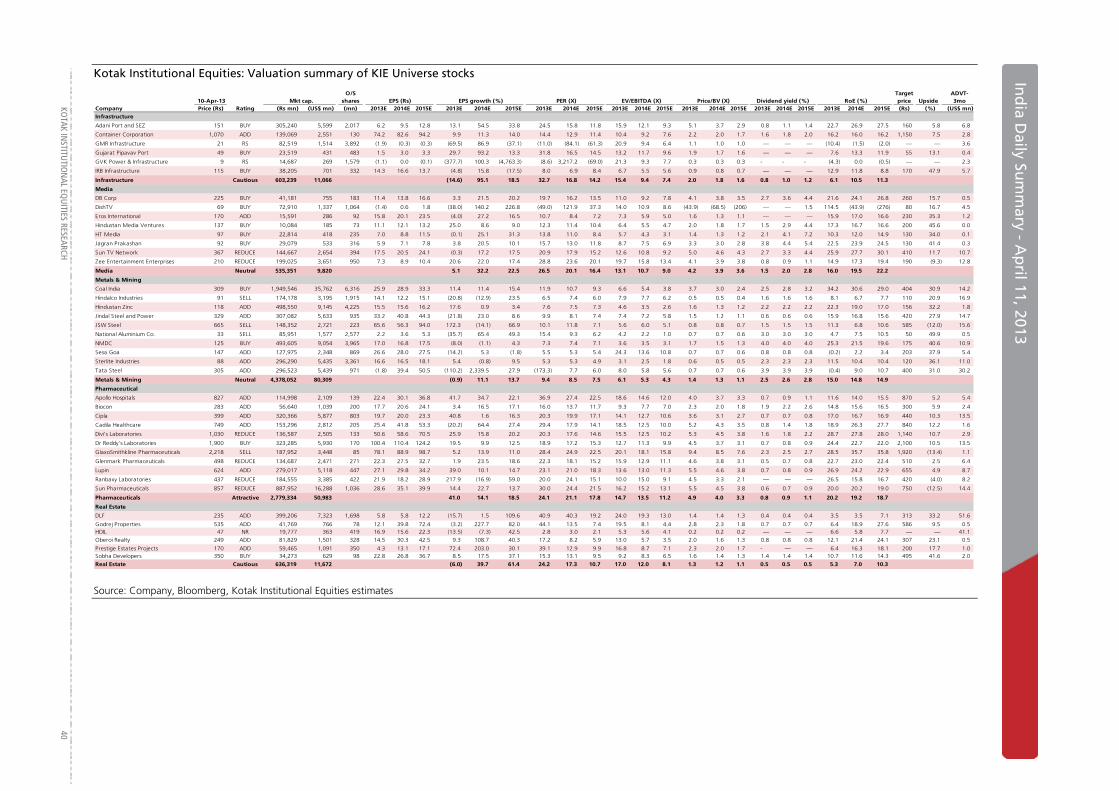
KO
TAK INSTITUTIO
NAL EQ
UITIES RESEARCH 40
In
dia D
aily Sum
mary - A
pril 1
Ind
ia Daily Su
mm
ary - Ap
ril 11, 2013
Kotak Institutional Equities: Valuation summary of KIE Universe stocks
10-Apr-13 Mkt cap.O/S
shares EPS (Rs) EPS growth (%) PER (X) EV/EBITDA (X) Price/BV (X) RoE (%)Target price Upside
ADVT-3mo
Company Price (Rs) Rating (Rs mn) (US$ mn) (mn) 2013E 2014E 2015E 2013E 2014E 2015E 2013E 2014E 2015E 2013E 2014E 2015E 2013E 2014E 2015E 2013E 2014E 2015E 2013E 2014E 2015E (Rs) (%) (US$ mn)Infrastructure
Adani Port and SEZ 151 BUY 305,240 5,599 2,017 6.2 9.5 12.8 13.1 54.5 33.8 24.5 15.8 11.8 15.9 12.1 9.3 5.1 3.7 2.9 0.8 1.1 1.4 22.7 26.9 27.5 160 5.8 6.8
Container Corporation 1,070 ADD 139,069 2,551 130 74.2 82.6 94.2 9.9 11.3 14.0 14.4 12.9 11.4 10.4 9.2 7.6 2.2 2.0 1.7 1.6 1.8 2.0 16.2 16.0 16.2 1,150 7.5 2.8
GMR Infrastructure 21 RS 82,519 1,514 3,892 (1.9) (0.3) (0.3) (69.5) 86.9 (37.1) (11.0) (84.1) (61.3) 20.9 9.4 6.4 1.1 1.0 1.0 — — — (10.4) (1.5) (2.0) — — 3.6
Gujarat Pipavav Port 49 BUY 23,519 431 483 1.5 3.0 3.3 29.7 93.2 13.3 31.8 16.5 14.5 13.2 11.7 9.6 1.9 1.7 1.6 — — — 7.6 13.3 11.9 55 13.1 0.4
GVK Power & Infrastructure 9 RS 14,687 269 1,579 (1.1) 0.0 (0.1) (377.7) 100.3 (4,763.3) (8.6) 3,217.2 (69.0) 21.3 9.3 7.7 0.3 0.3 0.3 - - - (4.3) 0.0 (0.5) — — 2.3
IRB Infrastructure 115 BUY 38,205 701 332 14.3 16.6 13.7 (4.8) 15.8 (17.5) 8.0 6.9 8.4 6.7 5.5 5.6 0.9 0.8 0.7 — — — 12.9 11.8 8.8 170 47.9 5.7
Infrastructure Cautious 603,239 11,066 (14.6) 95.1 18.5 32.7 16.8 14.2 15.4 9.4 7.4 2.0 1.8 1.6 0.8 1.0 1.2 6.1 10.5 11.3
Media
DB Corp 225 BUY 41,181 755 183 11.4 13.8 16.6 3.3 21.5 20.2 19.7 16.2 13.5 11.0 9.2 7.8 4.1 3.8 3.5 2.7 3.6 4.4 21.6 24.1 26.8 260 15.7 0.5
DishTV 69 BUY 72,910 1,337 1,064 (1.4) 0.6 1.8 (38.0) 140.2 226.8 (49.0) 121.9 37.3 14.0 10.9 8.6 (43.9) (68.5) (206) — — 1.5 114.5 (43.9) (276) 80 16.7 4.5
Eros International 170 ADD 15,591 286 92 15.8 20.1 23.5 (4.0) 27.2 16.5 10.7 8.4 7.2 7.3 5.9 5.0 1.6 1.3 1.1 — — — 15.9 17.0 16.6 230 35.3 1.2
Hindustan Media Ventures 137 BUY 10,084 185 73 11.1 12.1 13.2 25.0 8.6 9.0 12.3 11.4 10.4 6.4 5.5 4.7 2.0 1.8 1.7 1.5 2.9 4.4 17.3 16.7 16.6 200 45.6 0.0
HT Media 97 BUY 22,814 418 235 7.0 8.8 11.5 (0.1) 25.1 31.3 13.8 11.0 8.4 5.7 4.3 3.1 1.4 1.3 1.2 2.1 4.1 7.2 10.3 12.0 14.9 130 34.0 0.1
Jagran Prakashan 92 BUY 29,079 533 316 5.9 7.1 7.8 3.8 20.5 10.1 15.7 13.0 11.8 8.7 7.5 6.9 3.3 3.0 2.8 3.8 4.4 5.4 22.5 23.9 24.5 130 41.4 0.3
Sun TV Network 367 REDUCE 144,667 2,654 394 17.5 20.5 24.1 (0.3) 17.2 17.5 20.9 17.9 15.2 12.6 10.8 9.2 5.0 4.6 4.3 2.7 3.3 4.4 25.9 27.7 30.1 410 11.7 10.7
Zee Entertainment Enterprises 210 REDUCE 199,025 3,651 950 7.3 8.9 10.4 20.6 22.0 17.4 28.8 23.6 20.1 19.7 15.8 13.4 4.1 3.9 3.8 0.8 0.9 1.1 14.9 17.3 19.4 190 (9.3) 12.8
Media Neutral 535,351 9,820 5.1 32.2 22.5 26.5 20.1 16.4 13.1 10.7 9.0 4.2 3.9 3.6 1.5 2.0 2.8 16.0 19.5 22.2
Metals & Mining
Coal India 309 BUY 1,949,546 35,762 6,316 25.9 28.9 33.3 11.4 11.4 15.4 11.9 10.7 9.3 6.6 5.4 3.8 3.7 3.0 2.4 2.5 2.8 3.2 34.2 30.6 29.0 404 30.9 14.2
Hindalco Industries 91 SELL 174,178 3,195 1,915 14.1 12.2 15.1 (20.8) (12.9) 23.5 6.5 7.4 6.0 7.9 7.7 6.2 0.5 0.5 0.4 1.6 1.6 1.6 8.1 6.7 7.7 110 20.9 16.9
Hindustan Zinc 118 ADD 498,550 9,145 4,225 15.5 15.6 16.2 17.6 0.9 3.4 7.6 7.5 7.3 4.6 3.5 2.6 1.6 1.3 1.2 2.2 2.2 2.2 22.3 19.0 17.0 156 32.2 1.8
Jindal Steel and Power 329 ADD 307,082 5,633 935 33.2 40.8 44.3 (21.8) 23.0 8.6 9.9 8.1 7.4 7.4 7.2 5.8 1.5 1.2 1.1 0.6 0.6 0.6 15.9 16.8 15.6 420 27.9 14.7
JSW Steel 665 SELL 148,352 2,721 223 65.6 56.3 94.0 172.3 (14.1) 66.9 10.1 11.8 7.1 5.6 6.0 5.1 0.8 0.8 0.7 1.5 1.5 1.5 11.3 6.8 10.6 585 (12.0) 15.6
National Aluminium Co. 33 SELL 85,951 1,577 2,577 2.2 3.6 5.3 (35.7) 65.4 49.3 15.4 9.3 6.2 4.2 2.2 1.0 0.7 0.7 0.6 3.0 3.0 3.0 4.7 7.5 10.5 50 49.9 0.5
NMDC 125 BUY 493,605 9,054 3,965 17.0 16.8 17.5 (8.0) (1.1) 4.3 7.3 7.4 7.1 3.6 3.5 3.1 1.7 1.5 1.3 4.0 4.0 4.0 25.3 21.5 19.6 175 40.6 10.9
Sesa Goa 147 ADD 127,975 2,348 869 26.6 28.0 27.5 (14.2) 5.3 (1.8) 5.5 5.3 5.4 24.3 13.6 10.8 0.7 0.7 0.6 0.8 0.8 0.8 (0.2) 2.2 3.4 203 37.9 5.4
Sterlite Industries 88 ADD 296,290 5,435 3,361 16.6 16.5 18.1 5.4 (0.8) 9.5 5.3 5.3 4.9 3.1 2.5 1.8 0.6 0.5 0.5 2.3 2.3 2.3 11.5 10.4 10.4 120 36.1 11.0
Tata Steel 305 ADD 296,523 5,439 971 (1.8) 39.4 50.5 (110.2) 2,339.5 27.9 (173.3) 7.7 6.0 8.0 5.8 5.6 0.7 0.7 0.6 3.9 3.9 3.9 (0.4) 9.0 10.7 400 31.0 30.2
Metals & Mining Neutral 4,378,052 80,309 (0.9) 11.1 13.7 9.4 8.5 7.5 6.1 5.3 4.3 1.4 1.3 1.1 2.5 2.6 2.8 15.0 14.8 14.9
Pharmaceutical
Apollo Hospitals 827 ADD 114,998 2,109 139 22.4 30.1 36.8 41.7 34.7 22.1 36.9 27.4 22.5 18.6 14.6 12.0 4.0 3.7 3.3 0.7 0.9 1.1 11.6 14.0 15.5 870 5.2 5.4
Biocon 283 ADD 56,640 1,039 200 17.7 20.6 24.1 3.4 16.5 17.1 16.0 13.7 11.7 9.3 7.7 7.0 2.3 2.0 1.8 1.9 2.2 2.6 14.8 15.6 16.5 300 5.9 2.4
Cipla 399 ADD 320,366 5,877 803 19.7 20.0 23.3 40.8 1.6 16.3 20.3 19.9 17.1 14.1 12.7 10.6 3.6 3.1 2.7 0.7 0.7 0.8 17.0 16.7 16.9 440 10.3 13.5
Cadila Healthcare 749 ADD 153,296 2,812 205 25.4 41.8 53.3 (20.2) 64.4 27.4 29.4 17.9 14.1 18.5 12.5 10.0 5.2 4.3 3.5 0.8 1.4 1.8 18.9 26.3 27.7 840 12.2 1.6
Divi's Laboratories 1,030 REDUCE 136,587 2,505 133 50.6 58.6 70.5 25.9 15.8 20.2 20.3 17.6 14.6 15.5 12.5 10.2 5.3 4.5 3.8 1.6 1.8 2.2 28.7 27.8 28.0 1,140 10.7 2.9
Dr Reddy's Laboratories 1,900 BUY 323,285 5,930 170 100.4 110.4 124.2 19.5 9.9 12.5 18.9 17.2 15.3 12.7 11.3 9.9 4.5 3.7 3.1 0.7 0.8 0.9 24.4 22.7 22.0 2,100 10.5 13.5
GlaxoSmithkline Pharmaceuticals 2,218 SELL 187,952 3,448 85 78.1 88.9 98.7 5.2 13.9 11.0 28.4 24.9 22.5 20.1 18.1 15.8 9.4 8.5 7.6 2.3 2.5 2.7 28.5 35.7 35.8 1,920 (13.4) 1.1
Glenmark Pharmaceuticals 498 REDUCE 134,687 2,471 271 22.3 27.5 32.7 1.9 23.5 18.6 22.3 18.1 15.2 15.9 12.9 11.1 4.6 3.8 3.1 0.5 0.7 0.8 22.7 23.0 22.4 510 2.5 6.4
Lupin 624 ADD 279,017 5,118 447 27.1 29.8 34.2 39.0 10.1 14.7 23.1 21.0 18.3 13.6 13.0 11.3 5.5 4.6 3.8 0.7 0.8 0.9 26.9 24.2 22.9 655 4.9 8.7
Ranbaxy Laboratories 437 REDUCE 184,555 3,385 422 21.9 18.2 28.9 217.9 (16.9) 59.0 20.0 24.1 15.1 10.0 15.0 9.1 4.5 3.3 2.1 — — — 26.5 15.8 16.7 420 (4.0) 8.2
Sun Pharmaceuticals 857 REDUCE 887,952 16,288 1,036 28.6 35.1 39.9 14.4 22.7 13.7 30.0 24.4 21.5 16.2 15.2 13.1 5.5 4.5 3.8 0.6 0.7 0.9 20.0 20.2 19.0 750 (12.5) 14.4
Pharmaceuticals Attractive 2,779,334 50,983 41.0 14.1 18.5 24.1 21.1 17.8 14.7 13.5 11.2 4.9 4.0 3.3 0.8 0.9 1.1 20.2 19.2 18.7
Real Estate
DLF 235 ADD 399,206 7,323 1,698 5.8 5.8 12.2 (15.7) 1.5 109.6 40.9 40.3 19.2 24.0 19.3 13.0 1.4 1.4 1.3 0.4 0.4 0.4 3.5 3.5 7.1 313 33.2 51.6
Godrej Properties 535 ADD 41,769 766 78 12.1 39.8 72.4 (3.2) 227.7 82.0 44.1 13.5 7.4 19.5 8.1 4.4 2.8 2.3 1.8 0.7 0.7 0.7 6.4 18.9 27.6 586 9.5 0.5 HDIL 47 NR 19,777 363 419 16.9 15.6 22.3 (13.5) (7.3) 42.5 2.8 3.0 2.1 5.3 5.6 4.1 0.2 0.2 0.2 — — — 6.6 5.8 7.7 — — 41.1
Oberoi Realty 249 ADD 81,829 1,501 328 14.5 30.3 42.5 9.3 108.7 40.3 17.2 8.2 5.9 13.0 5.7 3.5 2.0 1.6 1.3 0.8 0.8 0.8 12.1 21.4 24.1 307 23.1 0.5
Prestige Estates Projects 170 ADD 59,465 1,091 350 4.3 13.1 17.1 72.4 203.0 30.1 39.1 12.9 9.9 16.8 8.7 7.1 2.3 2.0 1.7 - — — 6.4 16.3 18.1 200 17.7 1.0 Sobha Developers 350 BUY 34,273 629 98 22.8 26.8 36.7 8.5 17.5 37.1 15.3 13.1 9.5 9.2 8.3 6.5 1.6 1.4 1.3 1.4 1.4 1.4 10.7 11.6 14.3 495 41.6 2.0
Real Estate Cautious 636,319 11,672 (6.0) 39.7 61.4 24.2 17.3 10.7 17.0 12.0 8.1 1.3 1.2 1.1 0.5 0.5 0.5 5.3 7.0 10.3
Dividend yield (%)
Source: Company, Bloomberg, Kotak Institutional Equities estimates
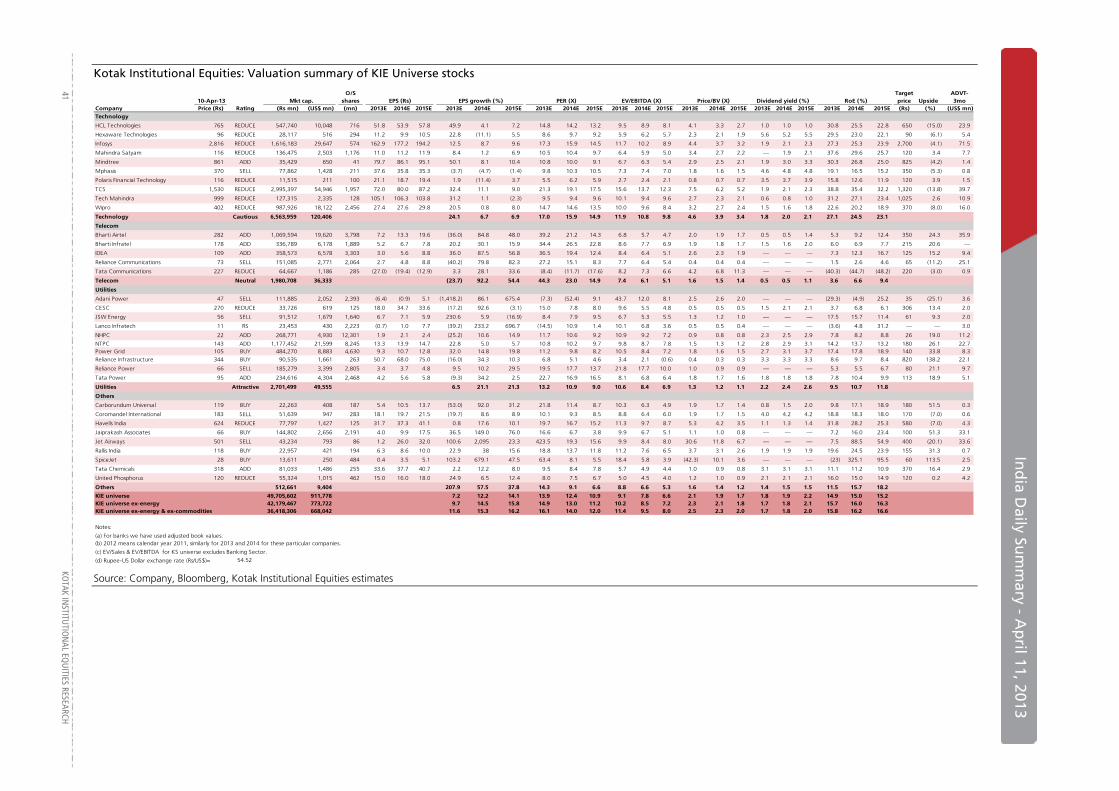
In
dia D
aily Sum
mary - A
pril 11, 2013
41
KOTAK IN
STITUTIO
NAL EQ
UITIES RESEARCH
Kotak Institutional Equities: Valuation summary of KIE Universe stocks
10-Apr-13 Mkt cap.O/S
shares EPS (Rs) EPS growth (%) PER (X) EV/EBITDA (X) Price/BV (X) RoE (%)Target price Upside
ADVT-3mo
Company Price (Rs) Rating (Rs mn) (US$ mn) (mn) 2013E 2014E 2015E 2013E 2014E 2015E 2013E 2014E 2015E 2013E 2014E 2015E 2013E 2014E 2015E 2013E 2014E 2015E 2013E 2014E 2015E (Rs) (%) (US$ mn)Technology
HCL Technologies 765 REDUCE 547,740 10,048 716 51.8 53.9 57.8 49.9 4.1 7.2 14.8 14.2 13.2 9.5 8.9 8.1 4.1 3.3 2.7 1.0 1.0 1.0 30.8 25.5 22.8 650 (15.0) 23.9
Hexaware Technologies 96 REDUCE 28,117 516 294 11.2 9.9 10.5 22.8 (11.1) 5.5 8.6 9.7 9.2 5.9 6.2 5.7 2.3 2.1 1.9 5.6 5.2 5.5 29.5 23.0 22.1 90 (6.1) 5.4
Infosys 2,816 REDUCE 1,616,183 29,647 574 162.9 177.2 194.2 12.5 8.7 9.6 17.3 15.9 14.5 11.7 10.2 8.9 4.4 3.7 3.2 1.9 2.1 2.3 27.3 25.3 23.9 2,700 (4.1) 71.5
Mahindra Satyam 116 REDUCE 136,475 2,503 1,176 11.0 11.2 11.9 8.4 1.2 6.9 10.5 10.4 9.7 6.4 5.9 5.0 3.4 2.7 2.2 — 1.9 2.1 37.6 29.6 25.7 120 3.4 7.7
Mindtree 861 ADD 35,429 650 41 79.7 86.1 95.1 50.1 8.1 10.4 10.8 10.0 9.1 6.7 6.3 5.4 2.9 2.5 2.1 1.9 3.0 3.3 30.3 26.8 25.0 825 (4.2) 1.4
Mphasis 370 SELL 77,862 1,428 211 37.6 35.8 35.3 (3.7) (4.7) (1.4) 9.8 10.3 10.5 7.3 7.4 7.0 1.8 1.6 1.5 4.6 4.8 4.8 19.1 16.5 15.2 350 (5.3) 0.8
Polaris Financial Technology 116 REDUCE 11,515 211 100 21.1 18.7 19.4 1.9 (11.4) 3.7 5.5 6.2 5.9 2.7 2.4 2.1 0.8 0.7 0.7 3.5 3.7 3.9 15.8 12.6 11.9 120 3.9 1.5
TCS 1,530 REDUCE 2,995,397 54,946 1,957 72.0 80.0 87.2 32.4 11.1 9.0 21.3 19.1 17.5 15.6 13.7 12.3 7.5 6.2 5.2 1.9 2.1 2.3 38.8 35.4 32.2 1,320 (13.8) 39.7
Tech Mahindra 999 REDUCE 127,315 2,335 128 105.1 106.3 103.8 31.2 1.1 (2.3) 9.5 9.4 9.6 10.1 9.4 9.6 2.7 2.3 2.1 0.6 0.8 1.0 31.2 27.1 23.4 1,025 2.6 10.9
Wipro 402 REDUCE 987,926 18,122 2,456 27.4 27.6 29.8 20.5 0.8 8.0 14.7 14.6 13.5 10.0 9.6 8.4 3.2 2.7 2.4 1.5 1.6 1.8 22.6 20.2 18.9 370 (8.0) 16.0
Technology Cautious 6,563,959 120,406 24.1 6.7 6.9 17.0 15.9 14.9 11.9 10.8 9.8 4.6 3.9 3.4 1.8 2.0 2.1 27.1 24.5 23.1
Telecom
Bharti Airtel 282 ADD 1,069,594 19,620 3,798 7.2 13.3 19.6 (36.0) 84.8 48.0 39.2 21.2 14.3 6.8 5.7 4.7 2.0 1.9 1.7 0.5 0.5 1.4 5.3 9.2 12.4 350 24.3 35.9
Bharti Infratel 178 ADD 336,789 6,178 1,889 5.2 6.7 7.8 20.2 30.1 15.9 34.4 26.5 22.8 8.6 7.7 6.9 1.9 1.8 1.7 1.5 1.6 2.0 6.0 6.9 7.7 215 20.6 —
IDEA 109 ADD 358,573 6,578 3,303 3.0 5.6 8.8 36.0 87.5 56.8 36.5 19.4 12.4 8.4 6.4 5.1 2.6 2.3 1.9 — — — 7.3 12.3 16.7 125 15.2 9.4
Reliance Communications 73 SELL 151,085 2,771 2,064 2.7 4.8 8.8 (40.2) 79.8 82.3 27.2 15.1 8.3 7.7 6.4 5.4 0.4 0.4 0.4 — — — 1.5 2.6 4.6 65 (11.2) 25.1
Tata Communications 227 REDUCE 64,667 1,186 285 (27.0) (19.4) (12.9) 3.3 28.1 33.6 (8.4) (11.7) (17.6) 8.2 7.3 6.6 4.2 6.8 11.3 — — — (40.3) (44.7) (48.2) 220 (3.0) 0.9
Telecom Neutral 1,980,708 36,333 (23.7) 92.2 54.4 44.3 23.0 14.9 7.4 6.1 5.1 1.6 1.5 1.4 0.5 0.5 1.1 3.6 6.6 9.4
Utilities
Adani Power 47 SELL 111,885 2,052 2,393 (6.4) (0.9) 5.1 (1,418.2) 86.1 675.4 (7.3) (52.4) 9.1 43.7 12.0 8.1 2.5 2.6 2.0 — — — (29.3) (4.9) 25.2 35 (25.1) 3.6
CESC 270 REDUCE 33,726 619 125 18.0 34.7 33.6 (17.2) 92.6 (3.1) 15.0 7.8 8.0 9.6 5.5 4.8 0.5 0.5 0.5 1.5 2.1 2.1 3.7 6.8 6.1 306 13.4 2.0
JSW Energy 56 SELL 91,512 1,679 1,640 6.7 7.1 5.9 230.6 5.9 (16.9) 8.4 7.9 9.5 6.7 5.3 5.5 1.3 1.2 1.0 — — — 17.5 15.7 11.4 61 9.3 2.0
Lanco Infratech 11 RS 23,453 430 2,223 (0.7) 1.0 7.7 (39.2) 233.2 696.7 (14.5) 10.9 1.4 10.1 6.8 3.6 0.5 0.5 0.4 — — — (3.6) 4.8 31.2 — — 3.0
NHPC 22 ADD 268,771 4,930 12,301 1.9 2.1 2.4 (25.2) 10.6 14.9 11.7 10.6 9.2 10.9 9.2 7.2 0.9 0.8 0.8 2.3 2.5 2.9 7.8 8.2 8.8 26 19.0 11.2
NTPC 143 ADD 1,177,452 21,599 8,245 13.3 13.9 14.7 22.8 5.0 5.7 10.8 10.2 9.7 9.8 8.7 7.8 1.5 1.3 1.2 2.8 2.9 3.1 14.2 13.7 13.2 180 26.1 22.7 Power Grid 105 BUY 484,270 8,883 4,630 9.3 10.7 12.8 32.0 14.8 19.8 11.2 9.8 8.2 10.5 8.4 7.2 1.8 1.6 1.5 2.7 3.1 3.7 17.4 17.8 18.9 140 33.8 8.3 Reliance Infrastructure 344 BUY 90,535 1,661 263 50.7 68.0 75.0 (16.0) 34.3 10.3 6.8 5.1 4.6 3.4 2.1 (0.6) 0.4 0.3 0.3 3.3 3.3 3.3 8.6 9.7 8.4 820 138.2 22.1
Reliance Power 66 SELL 185,279 3,399 2,805 3.4 3.7 4.8 9.5 10.2 29.5 19.5 17.7 13.7 21.8 17.7 10.0 1.0 0.9 0.9 — — — 5.3 5.5 6.7 80 21.1 9.7
Tata Power 95 ADD 234,616 4,304 2,468 4.2 5.6 5.8 (9.3) 34.2 2.5 22.7 16.9 16.5 8.1 6.8 6.4 1.8 1.7 1.6 1.8 1.8 1.8 7.8 10.4 9.9 113 18.9 5.1
Utilities Attractive 2,701,499 49,555 6.5 21.1 21.3 13.2 10.9 9.0 10.6 8.4 6.9 1.3 1.2 1.1 2.2 2.4 2.6 9.5 10.7 11.8
Others
Carborundum Universal 119 BUY 22,263 408 187 5.4 10.5 13.7 (53.0) 92.0 31.2 21.8 11.4 8.7 10.3 6.3 4.9 1.9 1.7 1.4 0.8 1.5 2.0 9.8 17.1 18.9 180 51.5 0.3
Coromandel International 183 SELL 51,639 947 283 18.1 19.7 21.5 (19.7) 8.6 8.9 10.1 9.3 8.5 8.8 6.4 6.0 1.9 1.7 1.5 4.0 4.2 4.2 18.8 18.3 18.0 170 (7.0) 0.6
Havells India 624 REDUCE 77,797 1,427 125 31.7 37.3 41.1 0.8 17.6 10.1 19.7 16.7 15.2 11.3 9.7 8.7 5.3 4.2 3.5 1.1 1.3 1.4 31.8 28.2 25.3 580 (7.0) 4.3
Jaiprakash Associates 66 BUY 144,802 2,656 2,191 4.0 9.9 17.5 36.5 149.0 76.0 16.6 6.7 3.8 9.9 6.7 5.1 1.1 1.0 0.8 — — — 7.2 16.0 23.4 100 51.3 33.1
Jet Airways 501 SELL 43,234 793 86 1.2 26.0 32.0 100.6 2,095 23.3 423.5 19.3 15.6 9.9 8.4 8.0 30.6 11.8 6.7 — — — 7.5 88.5 54.9 400 (20.1) 33.6
Rallis India 118 BUY 22,957 421 194 6.3 8.6 10.0 22.9 38 15.6 18.8 13.7 11.8 11.2 7.6 6.5 3.7 3.1 2.6 1.9 1.9 1.9 19.6 24.5 23.9 155 31.3 0.7
SpiceJet 28 BUY 13,611 250 484 0.4 3.5 5.1 103.2 679.1 47.5 63.4 8.1 5.5 18.4 5.8 3.9 (42.3) 10.1 3.6 — — — (23) 325.1 95.5 60 113.5 2.5
Tata Chemicals 318 ADD 81,033 1,486 255 33.6 37.7 40.7 2.2 12.2 8.0 9.5 8.4 7.8 5.7 4.9 4.4 1.0 0.9 0.8 3.1 3.1 3.1 11.1 11.2 10.9 370 16.4 2.9
United Phosphorus 120 REDUCE 55,324 1,015 462 15.0 16.0 18.0 24.9 6.5 12.4 8.0 7.5 6.7 5.0 4.5 4.0 1.2 1.0 0.9 2.1 2.1 2.1 16.0 15.0 14.9 120 0.2 4.2
Others 512,661 9,404 207.9 57.5 37.8 14.3 9.1 6.6 8.8 6.6 5.3 1.6 1.4 1.2 1.4 1.5 1.5 11.5 15.7 18.2
KIE universe 49,705,602 911,778 7.2 12.2 14.1 13.9 12.4 10.9 9.1 7.8 6.6 2.1 1.9 1.7 1.8 1.9 2.2 14.9 15.0 15.2 KIE universe ex-energy 42,179,467 773,722 9.7 14.5 15.8 14.9 13.0 11.2 10.2 8.5 7.2 2.3 2.1 1.8 1.7 1.8 2.1 15.7 16.0 16.3 KIE universe ex-energy & ex-commodities 36,418,306 668,042 11.6 15.3 16.2 16.1 14.0 12.0 11.4 9.5 8.0 2.5 2.3 2.0 1.7 1.8 2.0 15.8 16.2 16.6
Notes:
(a) For banks we have used adjusted book values.(b) 2012 means calendar year 2011, similarly for 2013 and 2014 for these particular companies.
(c) EV/Sales & EV/EBITDA for KS universe excludes Banking Sector.
(d) Rupee-US Dollar exchange rate (Rs/US$)= 54.52
Dividend yield (%)
Source: Company, Bloomberg, Kotak Institutional Equities estimates
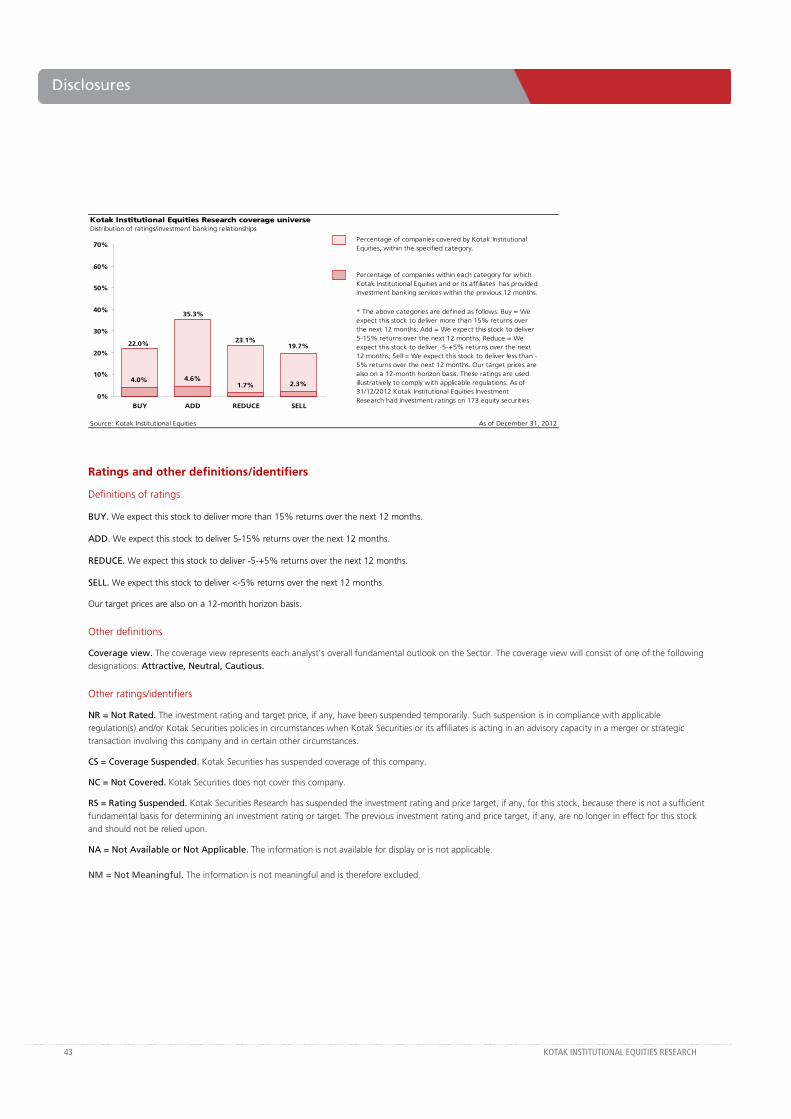
43 KOTAK INSTITUTIONAL EQUITIES RESEARCH
Disclosures
Kotak Institutional Equities Research coverage universeDistribution of ratings/investment banking relationships
Source: Kotak Institutional Equities As of December 31, 2012
Percentage of companies covered by Kotak Institutional Equities, within the specified category.
Percentage of companies within each category for which Kotak Institutional Equities and or its affiliates has provided investment banking services within the previous 12 months.
* The above categories are defined as follows: Buy = We expect this stock to deliver more than 15% returns over the next 12 months; Add = We expect this stock to deliver 5-15% returns over the next 12 months; Reduce = We expect this stock to deliver -5-+5% returns over the next 12 months; Sell = We expect this stock to deliver less than -5% returns over the next 12 months. Our target prices are also on a 12-month horizon basis. These ratings are used illustratively to comply with applicable regulations. As of 31/12/2012 Kotak Institutional Equities Investment Research had investment ratings on 173 equity securities.
19.7%22.0%
35.3%
23.1%
4.0% 4.6%1.7% 2.3%
0%
10%
20%
30%
40%
50%
60%
70%
BUY ADD REDUCE SELL
Ratings and other definitions/identifiers
Definitions of ratings
BUY. We expect this stock to deliver more than 15% returns over the next 12 months.
ADD. We expect this stock to deliver 5-15% returns over the next 12 months.
REDUCE. We expect this stock to deliver -5-+5% returns over the next 12 months.
SELL. We expect this stock to deliver <-5% returns over the next 12 months.
Our target prices are also on a 12-month horizon basis.
Other definitions
Coverage view. The coverage view represents each analyst’s overall fundamental outlook on the Sector. The coverage view will consist of one of the following designations: Attractive, Neutral, Cautious.
Other ratings/identifiers
NR = Not Rated. The investment rating and target price, if any, have been suspended temporarily. Such suspension is in compliance with applicable regulation(s) and/or Kotak Securities policies in circumstances when Kotak Securities or its affiliates is acting in an advisory capacity in a merger or strategic transaction involving this company and in certain other circumstances.
CS = Coverage Suspended. Kotak Securities has suspended coverage of this company.
NC = Not Covered. Kotak Securities does not cover this company.
RS = Rating Suspended. Kotak Securities Research has suspended the investment rating and price target, if any, for this stock, because there is not a sufficient fundamental basis for determining an investment rating or target. The previous investment rating and price target, if any, are no longer in effect for this stock and should not be relied upon.
NA = Not Available or Not Applicable. The information is not available for display or is not applicable.
NM = Not Meaningful. The information is not meaningful and is therefore excluded.
Corporate Office Overseas Offices
Kotak Securities Ltd.
Bakhtawar, 1st Floor
229, Nariman Point
Mumbai 400 021, India
Tel: +91-22-6634-1100
Kotak Mahindra (UK) Ltd
8th Floor, Portsoken House
155-157 Minories
London EC3N 1LS
Tel: +44-20-7977-6900
Kotak Mahindra Inc
50 Main Street, Ste. 890
Westchester Financial Centre
White Plains, New York 10606
Tel:+1-914-997-6120
Copyright 2013 Kotak Institutional Equities (Kotak Securities Limited). All rights reserved.
1. Note that the research analysts contributing to this report may not be registered/qualified as research analysts with FINRA; and
2. Such research analysts may not be associated persons of Kotak Mahindra Inc and therefore, may not be subject to NASD Rule 2711 restrictions on communications with a subject company, public appearances and trading securities held by a research analyst account.
Kotak Securities Limited and its affiliates are a full-service, integrated investment banking, investment management, brokerage and financing group. We along with our affiliates are leading underwriter of securities and participants in virtually all securities trading markets in India. We and our affiliates have investment banking and other business relationships with a significant percentage of the companies covered by our Investment Research Department. Our research professionals provide important input into our investment banking and other business selection processes. Investors should assume that Kotak Securities Limited and/or its affiliates are seeking or will seek investment banking or other business from the company or companies that are the subject of this material and that the research professionals who were involved in preparing this material may participate in the solicitation of such business. Our research professionals are paid in part based on the profitability of Kotak Securities Limited, which include earnings from investment banking and other business. Kotak Securities Limited generally prohibits its analysts, persons reporting to analysts, and members of their households from maintaining a financial interest in the securities or derivatives of any companies that the analysts cover. Additionally, Kotak Securities Limited generally prohibits its analysts and persons reporting to analysts from serving as an officer, director, or advisory board member of any companies that the analysts cover. Our salespeople, traders, and other professionals may provide oral or written market commentary or trading strategies to our clients that reflect opinions that are contrary to the opinions expressed herein, and our proprietary trading and investing businesses may make investment decisions that are inconsistent with the recommendations expressed herein. In reviewing these materials, you should be aware that any or all of the foregoing, among other things, may give rise to real or potential conflicts of interest. Additionally, other important information regarding our relationships with the company or companies that are the subject of this material is provided herein.
This material should not be construed as an offer to sell or the solicitation of an offer to buy any security in any jurisdiction where such an offer or solicitation would be illegal. We are not soliciting any action based on this material. It is for the general information of clients of Kotak Securities Limited. It does not constitute a personal recommendation or take into account the particular investment objectives, financial situations, or needs of individual clients. Before acting on any advice or recommendation in this material, clients should consider whether it is suitable for their particular circumstances and, if necessary, seek professional advice. The price and value of the investments referred to in this material and the income from them may go down as well as up, and investors may realize losses on any investments. Past performance is not a guide for future performance, future returns are not guaranteed and a loss of original capital may occur. Kotak Securities Limited does not provide tax advise to its clients, and all investors are strongly advised to consult with their tax advisers regarding any potential investment.
Certain transactions -including those involving futures, options, and other derivatives as well as non-investment-grade securities - give rise to substantial risk and are not suitable for all investors. The material is based on information that we consider reliable, but we do not represent that it is accurate or complete, and it should not be relied on as such. Opinions expressed are our current opinions as of the date appearing on this material only. We endeavor to update on a reasonable basis the information discussed in this material, but regulatory, compliance, or other reasons may prevent us from doing so. We and our affiliates, officers, directors, and employees, including persons involved in the preparation or issuance of this material, may from time to time have “long” or “short” positions in, act as principal in, and buy or sell the securities or derivatives thereof of companies mentioned herein. For the purpose of calculating whether Kotak Securities Limited and its affiliates holds beneficially owns or controls, including the right to vote for directors, 1% of more of the equity shares of the subject issuer of a research report, the holdings does not include accounts managed by Kotak Mahindra Mutual Fund. Kotak Securities Limited and its non US affiliates may, to the extent permissible under applicable laws, have acted on or used this research to the extent that it relates to non US issuers, prior to or immediately following its publication. Foreign currency denominated securities are subject to fluctuations in exchange rates that could have an adverse effect on the value or price of or income derived from the investment. In addition, investors in securities such as ADRs, the value of which are influenced by foreign currencies affectively assume currency risk. In addition options involve risks and are not suitable for all investors. Please ensure that you have read and understood the current derivatives risk disclosure document before entering into any derivative transactions.
This report has not been prepared by Kotak Mahindra Inc. (KMInc). However KMInc has reviewed the report and, in so far as it includes current or historical information, it is believed to be reliable, although its accuracy and completeness cannot be guaranteed. Any reference to Kotak Securities Limited shall also be deemed to mean and include Kotak Mahindra Inc.


![[Kotak] India Daily, October 26, 2016 - Kotak Securities](https://static.fdokumen.com/doc/165x107/631c83236c6907d3680156e0/kotak-india-daily-october-26-2016-kotak-securities.jpg)