Kansai Nerolac - Mar 2014.pmd - Kotak Securities
21
One-year performance (Rel to Sensex) Source: ACE Equity Kansai Nerolac Paints Ltd (KNPL) PRICE: RS.1063 RECOMMENDATION: BUY TARGET PRICE: RS.1270 FY16E P/E: 18.5X Stock details BSE code : 500165 NSE code : KANSAINER Market cap (Rs bn) : 57.4 Free float (%) : 30.73 52 wk Hi/Lo (Rs) : 1320/976 Avg daily volume : 11800 Shares (o/s) (mn) : 53.9 Summary table (Rs mn) FY14E FY15E FY16E Sales 32,686 36,786 41,317 Growth (%) 14.0 12.5 12.3 EBITDA 3,897 4,345 5,208 EBITDA margin (%) 11.9 11.8 12.6 PBT 3,404 3,809 4,633 Net profit 2,281 2,552 3,104 EPS (Rs) 42.3 47.4 57.6 Growth (%) 22.9 11.9 21.6 CEPS (Rs) 61.2 67.8 80.5 BV (Rs/share) 287.3 330.8 386.2 Dividend / share (Rs) 10.0 10.0 10.0 ROE (%) 14.7 14.3 14.9 ROCE (%) 10.9 10.7 11.5 Net cash (debt) 1,724 3,287 5,663 NW Capital (Days) 43.2 42.2 43.4 EV/EBITDA (x) 14.1 12.7 10.7 P/E (x) 25.1 22.4 18.5 P/Cash Earnings 17.4 15.7 13.4 P/BV (x) 3.7 3.2 2.8 Source: Company, Kotak Securities - Private Client Research INITIATING COVERAGE MARCH 26, 2014 PRIVATE CLIENT RESEARCH Shareholding pattern Source: ACE Equity Amit Agarwal [email protected] +91 22 6621 6222 KNPL is the market leader in Industrial paint segment (~ 44% market share) & third in decorative paint segment (~15% market share). With favourable demographic factors, rising income, improving automotive de- mand (over FY14 to FY16E) and aggressive push in the decorative seg- ment, we believe the company is well placed structurally for healthy long term growth. Slowing economy, stiff competition and rise in input cost moderated the growth and return ratios for the company over the past 2 years. However, we estimate profitability of KNPL to grow at a CAGR of 18% over FY14 to FY16E at Rs 2.55 bn in FY15E (EPS of Rs 47.4) and at Rs 3.10 bn in FY16E (EPS of Rs 57.6). At CMP of Rs 1063 the stock trades at 18.5 times FY16E. We initiate coverage on Kansai Nerolac Paints (KNPL) with a BUY rating and TP of Rs 1270. Key investment argument Industry leader in the industrial segment with 42% market share - bull- ish over long term. Industrial segment contributes ~45% to KNPL's revenues with automotive segment contributing 75% of the industrial segment rev- enues. KNPL's dominance in automotive paints segment is supplemented by its parent Kansai's association with global OEMs that have a strong presence in India. High level of investments in technology/R&D and relationships with OEMs act as key entry barrier for this segment. KNPL has been able to gradu- ally improve its market share in this segment. Due to weak macro-economic situation, demand for new vehicles has been subdued (negative growth YTD). However, we estimate 12.4% overall revenue CAGR over FY14 to FY16E for KNPL on the basis of our estimate of ~10% CAGR for passenger vehicles vol- umes during the period. We expect KNPL to be the largest beneficiary of re- vival in automotive segment. Aggressively looking to increase market share in decorative paints. KNPL has ~15% market share in decorative paints which it intends to improve through 1) Aggressive marketing 2) Improving geographical reach through ad- dition of dealers, 3) New product launches which are eco-friendly, lead free, low VOC etc. and 4) Trying to connect directly with the customers through initiatives like tinting machines. Based on our interaction with management, we understand that the growth in the decorative segment was healthy in 9MFY14 for KNPL, which helped overall revenue growth despite weak indus- trial segment. Margins on decorative paints are also better as compared to industrial paints. We expect revenue contribution of decorative segment to im- prove gradually for KNPL over FY13 to FY16E from 55% to 60%. Near term capacity requirements in place - no major near term capex. With the commencement of phase 2 operations in Hosur, Tamil Nadu, the total installed capacity for KNPL currently stands at ~3 lakh tonnes (up from 220K tonnes in FY11) with utilization rate of ~70%. We believe the current capacity should be sufficient for medium term growth of the company. We estimate the company to spend a total of ~Rs 1.5 bn towards maintenance capex over FY14E to FY16E. Improvement in capex cycle in India imminent. Investment climate cur- rently is weak as many projects are stalled because of 1) Weak Macro environ- ment, 2) constrained funding environment, 3) environmental concerns, 4) prob- lem of fuel supply and 5) poor private participation. Our base case is that the capex cycle is likely to stabilize around the current levels and improve from Kotak Securities Limited has two independent equity research groups: Institutional Equities and Private Client Group. This report has been pre- pared by the Private Client Group. The views and opinions expressed in this document may or may not match or may be contrary with the views, estimates, rating, target price of the Institutional Equities Research Group of Kotak Securities Limited. Promoter 69% Domestic Institutions 5% FIIs 11% Corporate bodies 6% Public 9%
-
Upload
khangminh22 -
Category
Documents
-
view
0 -
download
0
Transcript of Kansai Nerolac - Mar 2014.pmd - Kotak Securities

One-year performance (Rel to Sensex)
Source: ACE Equity
Kansai Nerolac Paints Ltd (KNPL)
PRICE: RS.1063 RECOMMENDATION: BUYTARGET PRICE: RS.1270 FY16E P/E: 18.5X
Stock details
BSE code : 500165
NSE code : KANSAINER
Market cap (Rs bn) : 57.4
Free float (%) : 30.73
52 wk Hi/Lo (Rs) : 1320/976
Avg daily volume : 11800
Shares (o/s) (mn) : 53.9
Summary table(Rs mn) FY14E FY15E FY16E
Sales 32,686 36,786 41,317Growth (%) 14.0 12.5 12.3EBITDA 3,897 4,345 5,208EBITDA margin (%) 11.9 11.8 12.6PBT 3,404 3,809 4,633Net profit 2,281 2,552 3,104EPS (Rs) 42.3 47.4 57.6Growth (%) 22.9 11.9 21.6CEPS (Rs) 61.2 67.8 80.5BV (Rs/share) 287.3 330.8 386.2Dividend / share (Rs) 10.0 10.0 10.0ROE (%) 14.7 14.3 14.9ROCE (%) 10.9 10.7 11.5Net cash (debt) 1,724 3,287 5,663NW Capital (Days) 43.2 42.2 43.4EV/EBITDA (x) 14.1 12.7 10.7P/E (x) 25.1 22.4 18.5P/Cash Earnings 17.4 15.7 13.4P/BV (x) 3.7 3.2 2.8
Source: Company,
Kotak Securities - Private Client Research
INITIATING COVERAGEMARCH 26, 2014
PRIVATE CLIENT RESEARCH
Shareholding pattern
Source: ACE Equity
Amit [email protected]+91 22 6621 6222
KNPL is the market leader in Industrial paint segment (~ 44% marketshare) & third in decorative paint segment (~15% market share). Withfavourable demographic factors, rising income, improving automotive de-mand (over FY14 to FY16E) and aggressive push in the decorative seg-ment, we believe the company is well placed structurally for healthy longterm growth. Slowing economy, stiff competition and rise in input costmoderated the growth and return ratios for the company over the past 2years. However, we estimate profitability of KNPL to grow at a CAGR of18% over FY14 to FY16E at Rs 2.55 bn in FY15E (EPS of Rs 47.4) and at Rs3.10 bn in FY16E (EPS of Rs 57.6). At CMP of Rs 1063 the stock trades at18.5 times FY16E. We initiate coverage on Kansai Nerolac Paints (KNPL)with a BUY rating and TP of Rs 1270.
Key investment argument Industry leader in the industrial segment with 42% market share - bull-
ish over long term. Industrial segment contributes ~45% to KNPL's revenueswith automotive segment contributing 75% of the industrial segment rev-enues. KNPL's dominance in automotive paints segment is supplemented by itsparent Kansai's association with global OEMs that have a strong presence inIndia. High level of investments in technology/R&D and relationships withOEMs act as key entry barrier for this segment. KNPL has been able to gradu-ally improve its market share in this segment. Due to weak macro-economicsituation, demand for new vehicles has been subdued (negative growth YTD).However, we estimate 12.4% overall revenue CAGR over FY14 to FY16E forKNPL on the basis of our estimate of ~10% CAGR for passenger vehicles vol-umes during the period. We expect KNPL to be the largest beneficiary of re-vival in automotive segment.
Aggressively looking to increase market share in decorative paints.KNPL has ~15% market share in decorative paints which it intends to improvethrough 1) Aggressive marketing 2) Improving geographical reach through ad-dition of dealers, 3) New product launches which are eco-friendly, lead free,low VOC etc. and 4) Trying to connect directly with the customers throughinitiatives like tinting machines. Based on our interaction with management,we understand that the growth in the decorative segment was healthy in9MFY14 for KNPL, which helped overall revenue growth despite weak indus-trial segment. Margins on decorative paints are also better as compared toindustrial paints. We expect revenue contribution of decorative segment to im-prove gradually for KNPL over FY13 to FY16E from 55% to 60%.
Near term capacity requirements in place - no major near term capex.With the commencement of phase 2 operations in Hosur, Tamil Nadu, the totalinstalled capacity for KNPL currently stands at ~3 lakh tonnes (up from 220Ktonnes in FY11) with utilization rate of ~70%. We believe the current capacityshould be sufficient for medium term growth of the company. We estimate thecompany to spend a total of ~Rs 1.5 bn towards maintenance capex overFY14E to FY16E.
Improvement in capex cycle in India imminent. Investment climate cur-rently is weak as many projects are stalled because of 1) Weak Macro environ-ment, 2) constrained funding environment, 3) environmental concerns, 4) prob-lem of fuel supply and 5) poor private participation. Our base case is that thecapex cycle is likely to stabilize around the current levels and improve from
Kotak Securities Limited has two independent equity research groups: Institutional Equities and Private Client Group. This report has been pre-pared by the Private Client Group. The views and opinions expressed in this document may or may not match or may be contrary with the views,estimates, rating, target price of the Institutional Equities Research Group of Kotak Securities Limited.
Promoter69%
Domestic Institutions
5%
FIIs11%
Corporate bodies6%
Public9%

Kotak Securities - Private Client Research Please see the disclaimer on the last page For Private Circulation 2
INITIATING COVERAGE March 26, 2014
here (unlikely to turn worse) on the back of 1) Favourable political/regulatoryenvironment; 2) Low capex to current sales ratio for the corporate sector (onlyroom for improvement); 3) Falling inflation (benign interest rates) and 4) Revivalin the economy.
Ebidta Margin to improve over FY14 to FY16E. We estimate margins of thecompany to improve over FY14 to FY16E by 70 bps on the back of 1) Recoveryin automotive demand over FY14 to FY16E and 2) Aggressive push in the deco-rative segment with strong focus on emulsion category, a high-margin productwithin decorative paints. Also the company has been increasing prices of itsproducts in line with other industry players, especially in the decorative paintsegment to pass on the raw material cost inflation. However, due to higher ad-vertisement and sales promotion expenses, the EBITDA margin expansion willbe restricted to 70bps from 11.9% in FY14 to 12.6% in FY16.
Focus on marketing and improved products. Despite slowdown, KNPL isfocused on improving its brand image and increase its geographical reachthrough increasing its dealer base, effective regular advertisement, investmentin R&D and introduction of many niche products. We expect these initiatives toyield results for the company in the long run.
Valuation and outlook
There has been a re-rating of the paint sector in the last 5 years with all the paintcompanies trading above their historical average one year forward valuations. Thecompanies also trade at ~30 percent premium to global paint companies, which isjustified by the long term prospects of Indian Paint companies. Revival in passengercar sales and focus on decorative segment should aid the profits of KNPL which isestimated to grow at a CAGR of 18% over FY14 to FY16E at Rs 2.55 bn in FY15E(EPS of Rs 47.4 ) and at Rs 3.10 bn in FY16E (EPS of Rs 57.6). The stock of KNPL atCMP of Rs 1025 is trading at 17.8 times FY16E. We prefer to use a P/E approach tovalue the stock (like any other consumer company) and give a value of 22 timesone year forward FY16E P/E which is the average for KNPL for the last 5 years. Weinitiate coverage on KNPL with a BUY rating and a TP of Rs 1270 implying anupside of 19.5%.
Risk and concerns
Prolong slowdown in automotive segment
Prolong slowdown in the economy leading to weak capex cycle impacting in-dustrial demand
Sharp increase in raw material prices coupled with inability to take price hikes
Increasing competition
Kotak Securities - Private Client Research Please see the disclaimer on the last page For Private Circulation 3
INITIATING COVERAGE March 26, 2014
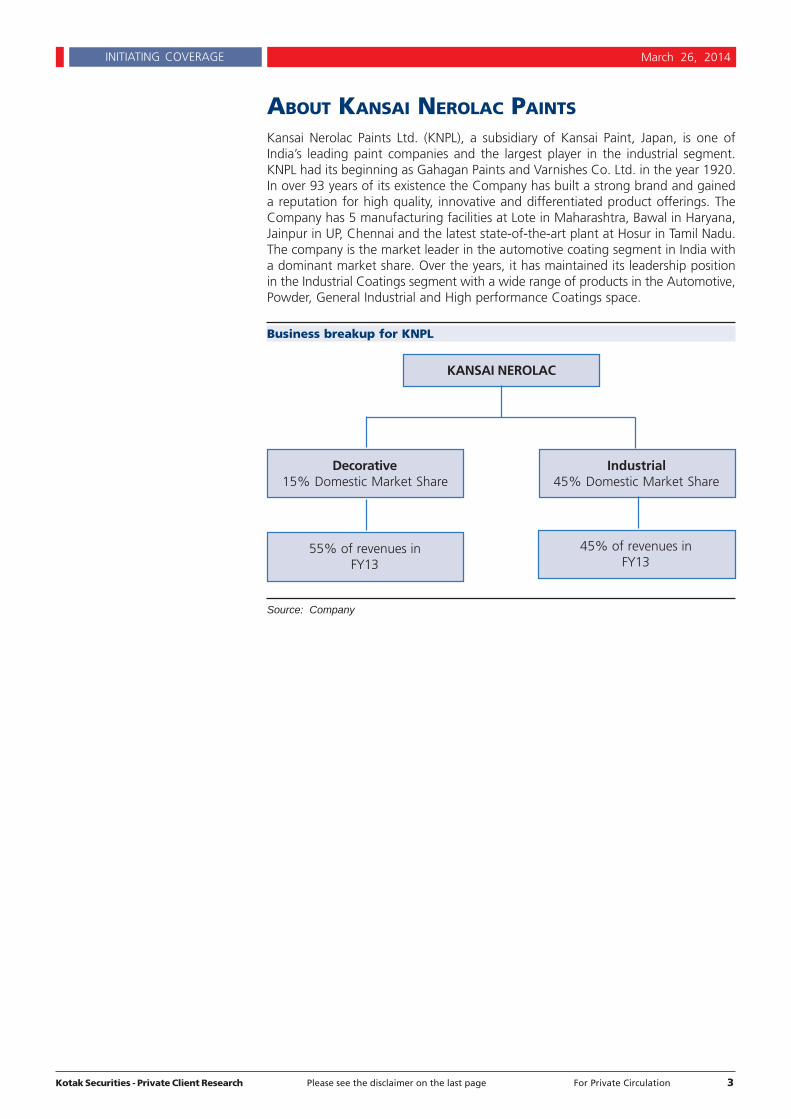
ABOUT KANSAI NEROLAC PAINTS
Kansai Nerolac Paints Ltd. (KNPL), a subsidiary of Kansai Paint, Japan, is one ofIndia’s leading paint companies and the largest player in the industrial segment.KNPL had its beginning as Gahagan Paints and Varnishes Co. Ltd. in the year 1920.In over 93 years of its existence the Company has built a strong brand and gaineda reputation for high quality, innovative and differentiated product offerings. TheCompany has 5 manufacturing facilities at Lote in Maharashtra, Bawal in Haryana,Jainpur in UP, Chennai and the latest state-of-the-art plant at Hosur in Tamil Nadu.The company is the market leader in the automotive coating segment in India witha dominant market share. Over the years, it has maintained its leadership positionin the Industrial Coatings segment with a wide range of products in the Automotive,Powder, General Industrial and High performance Coatings space.
Business breakup for KNPL
Source: Company
KANSAI NEROLAC
Decorative15% Domestic Market Share
Industrial45% Domestic Market Share
55% of revenues inFY13
45% of revenues inFY13
Kotak Securities - Private Client Research Please see the disclaimer on the last page For Private Circulation 4
INITIATING COVERAGE March 26, 2014
INDIAN PAINT INDUSTRY
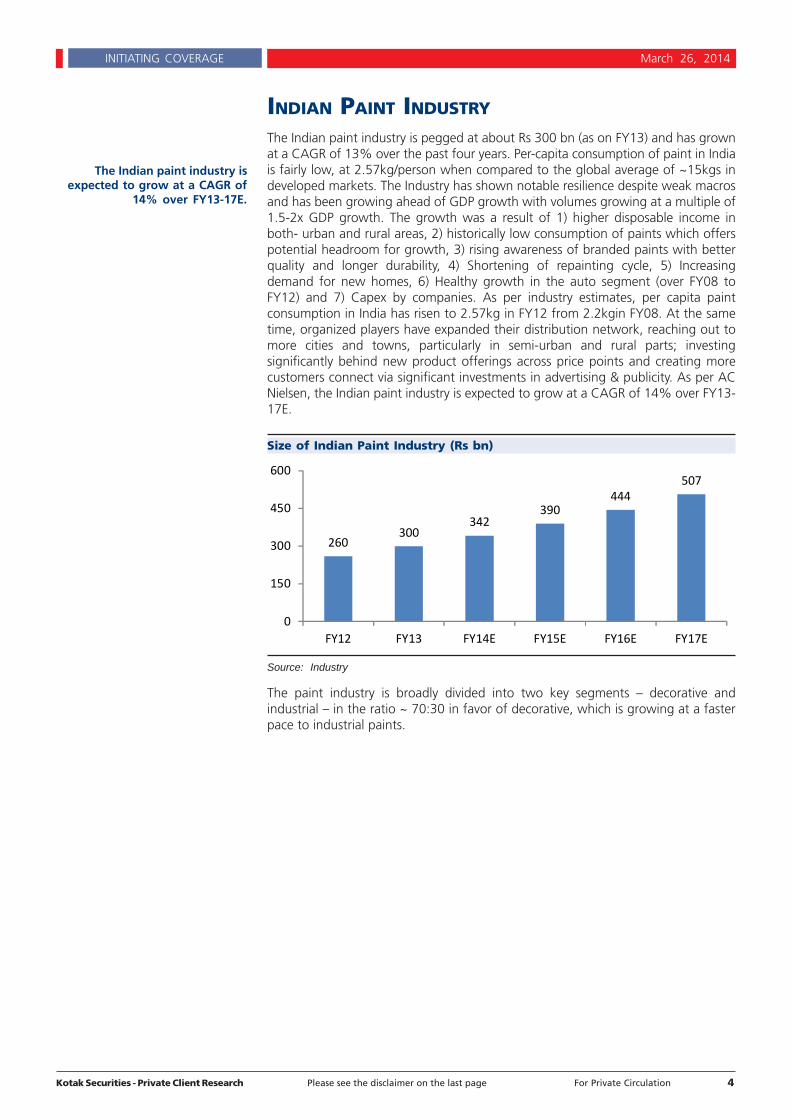
The Indian paint industry is pegged at about Rs 300 bn (as on FY13) and has grownat a CAGR of 13% over the past four years. Per-capita consumption of paint in Indiais fairly low, at 2.57kg/person when compared to the global average of ~15kgs indeveloped markets. The Industry has shown notable resilience despite weak macrosand has been growing ahead of GDP growth with volumes growing at a multiple of1.5-2x GDP growth. The growth was a result of 1) higher disposable income inboth- urban and rural areas, 2) historically low consumption of paints which offerspotential headroom for growth, 3) rising awareness of branded paints with betterquality and longer durability, 4) Shortening of repainting cycle, 5) Increasingdemand for new homes, 6) Healthy growth in the auto segment (over FY08 toFY12) and 7) Capex by companies. As per industry estimates, per capita paintconsumption in India has risen to 2.57kg in FY12 from 2.2kgin FY08. At the sametime, organized players have expanded their distribution network, reaching out tomore cities and towns, particularly in semi-urban and rural parts; investingsignificantly behind new product offerings across price points and creating morecustomers connect via significant investments in advertising & publicity. As per ACNielsen, the Indian paint industry is expected to grow at a CAGR of 14% over FY13-17E.
Size of Indian Paint Industry (Rs bn)
Source: Industry
The paint industry is broadly divided into two key segments – decorative andindustrial – in the ratio ~ 70:30 in favor of decorative, which is growing at a fasterpace to industrial paints.
260300
342390
444507
0
150
300
450
600
FY12 FY13 FY14E FY15E FY16E FY17E
The Indian paint industry isexpected to grow at a CAGR of
14% over FY13-17E.

Kotak Securities - Private Client Research Please see the disclaimer on the last page For Private Circulation 5
INITIATING COVERAGE March 26, 2014
Indian Paint Industry
Source: Industry
Paint Industry Value Chain
Source: Industry
Raw materialsuppliersfor paintindustry
Contractmanufacturing
units
Brand ownersof
paints
Decorativepaints
Industrialpaints
Institutionalcustomers(Builders)
Individualcustomers
Dealers(Decorative
paints)
Dealers (Industrialpaints)
DirectCustomers
InstitutionalCustomers/ painting/ Engg. contractors
INDIAN PAINT INDUSTRY
Decorative Segment70%
Industrial Segment30%
Automotive Sector(about 2/3rd
share)
Consumer DurablesMarine PaintsOther OEM’s
Premium Range(High end Acralic
Emulsions)
Medium Range(Enamel Paints)
Distemper Range(Low end paints)
Metros and Largecities
Small Cities Sub-urban andRural areas

Kotak Securities - Private Client Research Please see the disclaimer on the last page For Private Circulation 6
INITIATING COVERAGE March 26, 2014
DECORATIVE PAINT INDUSTRY
Decorative paints account for over 70% of the overall paint market in India andinclude wall finishes for interior and exterior use, enamels, wood finishes andancillary products such as primers, putties, etc. Over the past five years, the share ofdecorative paints has risen from 67% to over 70% now. Organized playersdominate with ~80% share of the decorative market, while 20% share isaccounted for by unorganized/local players. The lower-end distemper segment isfairly fragmented, with many unorganized players operating in this segment.
Indian Decorative paint market
The decorative segment is the faster growing paints category, having registered aCAGR of 15% over FY08-13. The growth is a result of 1) Healthy growth in Tier 2and 3 cities,2 ) Healthy growth in emulsions sub-segment (+25% CAGR over thepast five years) with customers upgrading to high end products. As emulsion is ahigh end product with superior margins, this trend bodes well for paint companies.Wood coatings too have been growing high teens. The distempers and enamelssegments are growing at a relatively lower pace. Demand for decorative paints isalso influenced by seasonality factor:1) Festive season (October to December) and2) Wedding season (October to June).
Size of Indian Decorative Paint Industry (Rs bn)
Source: Industry
Growth of various sub- segments of Decorative paint industry
Source: Industry
In the last few years, decorative paints have experienced a shift away from solvent-based products, in favour of water-based. The share of water-based products hasrisen over the years and these now account for a ~50% share vs. the solvent-basedshare at 50%. In water-based solvents, water is used as a medium for dilution –these are more durable, offer better finish and are higher margin products.
177225
261303
351407
0
150
300
450
600
FY12 FY13 FY14E FY15E FY16E FY17E
25
18
12 11 10
0
5
10
15
20
25
30
Emulsion Wood coatings Distempers Enamels Thinner
(CAGR over FY08 to FY13)

Kotak Securities - Private Client Research Please see the disclaimer on the last page For Private Circulation 7
INITIATING COVERAGE March 26, 2014
Key sub-segments under decorative include: Enamels, Emulsion (interior andexterior), Primer, Distemper, wood coatings, thinner and putty. From FY08-13, theshare of emulsions in terms of value (within decorative paints) has risen from 25%to 40%, while for enamels it moderated from 33% to 25%. The share ofdistempers has marginally declined.
Current break-up of decorative paint industry
Source: Industry
Demand drivers for decorative paints
Increasing urbanization - Healthier trends for urbanization and acceleratedimprovement in literacy rates (growing consumer awareness) bode well for con-sumption trends in India.
Growing income levels - With rising income levels, complemented by increas-ing consumer awareness levels, the propensity to spend on home decor is in-creasing and that is fuelling more frequent demand for decorative paints.
Shorter repainting cycle - The above has also led to gradual reduction in therepainting cycle duration from 8-10 years about a decade ago to 5-6 years now.
New home demand - Easy availability of home loans at affordable rates is alsoaiding faster growth for residential home demand. There is a social changetending towards nuclear families, which is also creating demand for new homes.
Demand for premium paints – Across segments there has been a gradualshift by customers towards better quality and durable paints. This is evident ingrowth rates across various sub segments of decorative paints – the Emulsionscategory is growing at nearly double the pace of distempers.
Enhanced distribution network and product offerings by organized play-ers - There have been significant investments being made by organised playersto enhance their distribution reach by constantly adding new dealers and tintingmachines
Emulsion40%
Wood coatings5%
Distempers11%
Enamels25%
Thinner12%
Others7%

Kotak Securities - Private Client Research Please see the disclaimer on the last page For Private Circulation 8
INITIATING COVERAGE March 26, 2014
INDUSTRIAL PAINT INDUSTRY
The industrial paint segment accounts for ~30% of the Indian paint industry in valueterms and is primarily solvent based with few water applications. Industrial paint ismainly a B2B market with paint companies working closely with their customers todevelop formulation to match their requirements. The segment can be further sub-divided into key sub-categories of automotive paints, protective coatings, GI paints(general industrial), powder coating, coil coating and others. The sales contributionof the dealer channel is low in industrial as compared to decorative.
Size of Indian Industrial Paint Industry
Source: Industry
Growth of various sub- segments of Industrial paint industry (CAGR overFY08 to FY13)
Source: Industry
Current share of key sub-segments for industrial paints
Segment Share % Key Players
Performance Coatings & General Industrial 33 Berger, AKzoNobel, KNPL
Auto OEM 23 KNPL, Asian Paints, BASF
Auto Refinish 15 Akzonobel, BASF
Powder coating 12 KNPL, Asian Paints
Others 17 All
Source; Industry
7890
99109
120132
0
30
60
90
120
150
FY12 FY13 FY14E FY15E FY16E FY17E
10
1412 12
9
0
4
8
12
16
PerformanceCoatings &GeneralIndustrial
Auto OEM Auto Refinish Powder coating Others

Kotak Securities - Private Client Research Please see the disclaimer on the last page For Private Circulation 9
INITIATING COVERAGE March 26, 2014
The industrial paints segment is dominated by organized players, as it requiresspecialized technology, higher capital investments and good relationships withinstitutional/industrial buyers. Kansai Nerolac dominates the industrial paintscategory in India with an estimated ~42% market share. The company has ~60%market share in the automotive industry and 30-35% market share in the powdercoatings industry.
Most domestic companies have tie-ups with international paints majors to leveragetheir technology assets. Kansai Nerolac benefits from its parent Kansai’s relationshipwith global auto OEMs.
Automotive segment – Weak near-term outlook but structuralgrowth drivers in place
Domestic auto sales grew at a CAGR 14.5% over FY08 to FY13 at 17.8 lakh unitsas per SIAM. However the industry has been in the midst of a protracted slowdowngiven the challenging macro environment and high interest rates and fuel prices.Passenger car sales have declined for 11 months in a row for FY14, with mostOEMs announcing temporary plant shutdowns and laying off contract workers tobetter align production with the subdued demand environment. The depreciatingrupee further is adding pressure on input prices and fuel prices. Given the abovefactors, the near-term outlook for the automotive segment remains challenging,
However, the reduction in excise duty in the interim budget in FY15 should providesome support, in our view.
Passenger vehicle sales trend (Domestic + export)
Source: SIAM
Two wheeler sales trend (Domestic + export)
Source: SIAM
Automotive sector to reportvolume CAGR of ~10% over FY14
to FY16E

Kotak Securities - Private Client Research Please see the disclaimer on the last page For Private Circulation 10
INITIATING COVERAGE March 26, 2014
We estimate the automotive sector to report volume CAGR of ~10%over FY14 to FY16E
Auto OEM and refinish form the largest component of the industrial paints in India.KNPLs association with global OEMs that have a strong presence in India hashelped KNPL engage with companies like Maruti Suzuki, Toyota, Honda, GM, TataMotors and Mahindra for supply of automotive paints. KNPL’s volume CAGR was~1x passenger car’s industry volume CAGR over FY09 to FY13 and currently thecompany is the market leader in the segment.
Due to weak macro-economic situation, demand for new vehicles has beensubdued (negative growth YTD). However, we estimate ~10% CAGR for passengervehicles volume over FY14 to FY16E with KNPL to be the largest beneficiary ofrevival in automotive segment. Revival in auto demand should help KNPL increaseits revenues and improve its profitability.
Capex cycle is currently weak - should only improve from here
The capex cycle in India, which was on a strong upswing 2004 onwards, peakedjust around the global financial crisis and it has decelerated sharply since then. Thedeceleration was exceptionally sharp over FY11 to FY14.
Investment currently is weak as many projects are stalled because of 1) WeakMacro environment, 2) constrained funding environment, 3) environmentalconcerns, 4) problem of fuel supply and 5) poor private participation. Although thepolicy environment has seen some improvement, on the ground investmentsentiment is yet to pick up, particularly for private developers who are significantlyleveraged.
Our base case is that the capex cycle is likely to stabilize around the current levelsand only improve from here (unlikely to turn worse) on the back of 1) Favourablepolitical/regulatory environment; 2) Low current sales to capex ratio for thecorporate sector (only room for improvement); 3) Falling inflation (benign interestrate environment) and 4) Revival in the economy.
Average quarterly new project start (Rs bn)
Source: CMIE
0
20
40
60
80
100
120
We estimate capex cycle to onlyimprove from here

Kotak Securities - Private Client Research Please see the disclaimer on the last page For Private Circulation 11
INITIATING COVERAGE March 26, 2014
Brief Comparison between Decorative and Industrial Paint Industry in India
Parameter Decorative Paints Industrial Paints
Size (FY13 Rs bn) 300 90
Customer Base Mostly Retail (B2C) Mostly Corporates (B2B)
Dealer Involvement High Low
Pricing Power High Low
Operating Margins ~20% ~11%
Growth drivers Urbanisation, Improving capex,increasing income demand for auto
Estimated CAGR over FY13 to FY17E 16% 11%
Key Paint types Emulsion, Enamels General Industrial,
Market leader Asian Paints Auto OEM KNPL
Source: Kotak Securities - Private Client Research
Kotak Securities - Private Client Research Please see the disclaimer on the last page For Private Circulation 12
INITIATING COVERAGE March 26, 2014
INVESTMENT ARGUMENTS
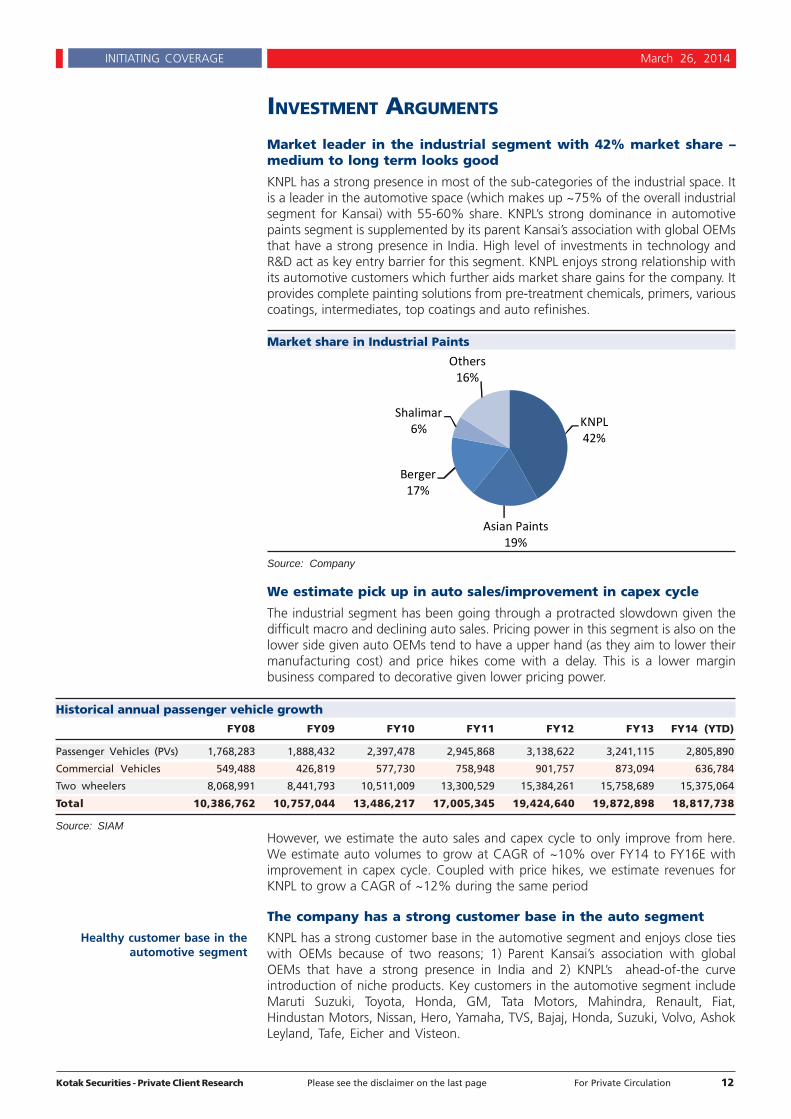
Market leader in the industrial segment with 42% market share –medium to long term looks good
KNPL has a strong presence in most of the sub-categories of the industrial space. Itis a leader in the automotive space (which makes up ~75% of the overall industrialsegment for Kansai) with 55-60% share. KNPL’s strong dominance in automotivepaints segment is supplemented by its parent Kansai’s association with global OEMsthat have a strong presence in India. High level of investments in technology andR&D act as key entry barrier for this segment. KNPL enjoys strong relationship withits automotive customers which further aids market share gains for the company. Itprovides complete painting solutions from pre-treatment chemicals, primers, variouscoatings, intermediates, top coatings and auto refinishes.
Market share in Industrial Paints
Source: Company
We estimate pick up in auto sales/improvement in capex cycle
The industrial segment has been going through a protracted slowdown given thedifficult macro and declining auto sales. Pricing power in this segment is also on thelower side given auto OEMs tend to have a upper hand (as they aim to lower theirmanufacturing cost) and price hikes come with a delay. This is a lower marginbusiness compared to decorative given lower pricing power.
Historical annual passenger vehicle growth
FY08 FY09 FY10 FY11 FY12 FY13 FY14 (YTD)
Passenger Vehicles (PVs) 1,768,283 1,888,432 2,397,478 2,945,868 3,138,622 3,241,115 2,805,890
Commercial Vehicles 549,488 426,819 577,730 758,948 901,757 873,094 636,784
Two wheelers 8,068,991 8,441,793 10,511,009 13,300,529 15,384,261 15,758,689 15,375,064
Total 10,386,762 10,757,044 13,486,217 17,005,345 19,424,640 19,872,898 18,817,738
Source: SIAMHowever, we estimate the auto sales and capex cycle to only improve from here.We estimate auto volumes to grow at CAGR of ~10% over FY14 to FY16E withimprovement in capex cycle. Coupled with price hikes, we estimate revenues forKNPL to grow a CAGR of ~12% during the same period
The company has a strong customer base in the auto segment
KNPL has a strong customer base in the automotive segment and enjoys close tieswith OEMs because of two reasons; 1) Parent Kansai’s association with globalOEMs that have a strong presence in India and 2) KNPL’s ahead-of-the curveintroduction of niche products. Key customers in the automotive segment includeMaruti Suzuki, Toyota, Honda, GM, Tata Motors, Mahindra, Renault, Fiat,Hindustan Motors, Nissan, Hero, Yamaha, TVS, Bajaj, Honda, Suzuki, Volvo, AshokLeyland, Tafe, Eicher and Visteon.
KNPL42%
Asian Paints19%
Berger17%
Shalimar6%
Others16%
Healthy customer base in theautomotive segment

Kotak Securities - Private Client Research Please see the disclaimer on the last page For Private Circulation 13
INITIATING COVERAGE March 26, 2014
Increasing focus on Decorative segment – to help improve sales andmargins
KNPL is the third largest player in the decorative space after Asian Paints andBerger Paints and has a ~15% market share in this space. Its market share over thelast five years has largely remained stable. Decorative paints accounts for ~55%revenue share for the company. The company has been making sustained efforts toincrease its share of revenues from the decorative segment with focus on emulsionand premium products. For instance, KNPL has pioneered the launch of eco-friendlyZero VOC (volatile organic compound), Low VOC, low odour and lead free range ofproducts in the decorative segment.
Market share in decorative paints
Source: Company
Product Portfolio of KNPL
Category Product
Premium Eco Clean, Impressions, Excel Total
Economy Emulsions, Excel, Beauty
Mass Little Master, Suraksha, Beauty
Source: Company
Mix improvement key for margin enhancement
Within decorative segment KNPL gets 35% of its revenue from Emulsion andanother 30% from Enamels with presence in distempers, primers, putties, thinneretc.as well. The portfolio is skewed largely towards mid end products with premiumcontributing ~20% of total sales for the company. Over the years, the company haswitnessed premiumisation and mix improvement in favor of emulsions which tendsto be higher margin.
Decorative segment revenue mix for KNPL
Source:Company
Asian Paints55%
Berger18%
KNPL15%
Akzo Nobel10%
Others2%
Emulsion33%
Enamels29%
Distemper14%
Others24%
KNPL is focusing on high growthdecorative paint segment

Kotak Securities - Private Client Research Please see the disclaimer on the last page For Private Circulation 14
INITIATING COVERAGE March 26, 2014
KNPL has made significant investments in branding and marketing –to help boost sales
KNPL has been getting aggressive to gain share in the decorative paint segment.They have substantially increased their marketing spends in this category as it seekshigher growth and attractive margins. At the same time, the company remainsinnovative with new product launches which are eco-friendly; lead free, low VOCetc.
Due to the low involvement of consumers in the paint buying process, KNPL set upExperience centers in FY08 to enhance customer awareness by allowing them towitness the different color schemes, combinations and designer finishes and makeinformed decisions. The first experience center was setup at KNPL’s head office andthen extended to southern markets of Chennai and Hyderabad. KNPL also hasinitiatives whereby it reaches out and collaborates with “influencers” such asinterior decorators and architects.
Marketing spend by KNPL
Year Promotional expenditure (Rs mn) Sales (Rs Mn) % of sales
FY10 743 17,063 4.4
FY11 918 21,413 4.3
FY12 1001 26,006 3.8
FY13 1033 28,670 3.6
Source; Company
Increasing geographical reach
KNPL has pan India presence with ~15,000 dealers across the country. KNPL derivesmajority share of its decorative revenues from North (~40% share) with the leastcoming from East at 15% share. The company is focusing on gaining more share inEastern and Southern markets. It is also targeting Tier 2/3 cities, which arewitnessing faster growth for branded paints.
Geographical break up of sales for KNPL
Source: Company
Enhancing dealer base – to boost sales
A loyal, strong and vast dealer network is a key determinant of success in thedecorative paints industry. KNPL has been increasing its distribution reach andimproving its supply chain by adding depots, dealers and tinting machines. KNPLadded 25-30 depots over the last two years and currently has 94 depots. Its dealernetwork has also increased from ~11,500 two years ago to ~15,000 at present ofwhich 7,500 have tinting machines. It aims to add over 1,000 dealers and tintingmachines every year.
North 40%
West22%
East15%
South23%
KNPL has been marketingaggressively to improve its
reach.
Dealer base expected toincrease from current ~15000
dealers

Kotak Securities - Private Client Research Please see the disclaimer on the last page For Private Circulation 15
INITIATING COVERAGE March 26, 2014
Technological collaborations and IT initiatives of KNPL
Specialized technology, good relationship with auto OEMs and higher capitalinvestment are some of the key entry barriers in the industrial space and hence thissegment is largely dominated by organized players. Organized segment accountsfor ~80% of the industrial paints segment. Most of the domestic companies have atie-up with international paint majors.
KNPL has three technical collaborations with Japanese companies that benefit it interms of superior technology, quality and access to modern processes. It also has aproduct portfolio spanning the entire coating space. It has been a pioneer in varioussegments such as home painting services, lead free paints and has ~200 peopleworking for its R&D facilities.
Technological collaboration of KNPL
Partner From For
Kanai Paints Japan Technology for manufacture of architectural coatings and support on process design and quality
improvement.
Oshima Kogyo Japan Technical assistance agreement for manufacturing heat resistance coatings
Cashew Japan Technical assistance agreement for manufacturing coating products MICRON and their thinners
Source: Company
KNPL has made investments in various IT initiatives of the years to improveoperational performance. These include customer relationship management (CRM),business communication manager (BCM) and business intelligence and businessobjects (BI-BO). The company also has a supply chain initiative called APO(Advanced planner and optimizer) and introduced new functionalities under thisinitiative with the aim of optimizing cost and planning time
Acquisition of Nepal Shalimar Paints Pvt Ltd
The company acquired 68% stake in Nepal Shalimar Paints Pvt Ltd for Rs78.6mn inFY13 and renamed it Kansai Paints Nepal Pvt Ltd (KPNPL). The company also gavea loan Rs 63.8 mn to fund its working capital requirements. KNPL commands amarket share of 8% in Nepal. It is likely to manufacture and market the Nerolacrange of products that are currently exported to Nepal. As per the management,KPNPL will add Rs250mn to the topline and Rs20mn to the bottom line goingforward.
Kotak Securities - Private Client Research Please see the disclaimer on the last page For Private Circulation 16
INITIATING COVERAGE March 26, 2014
FINANCIAL ANALYSIS
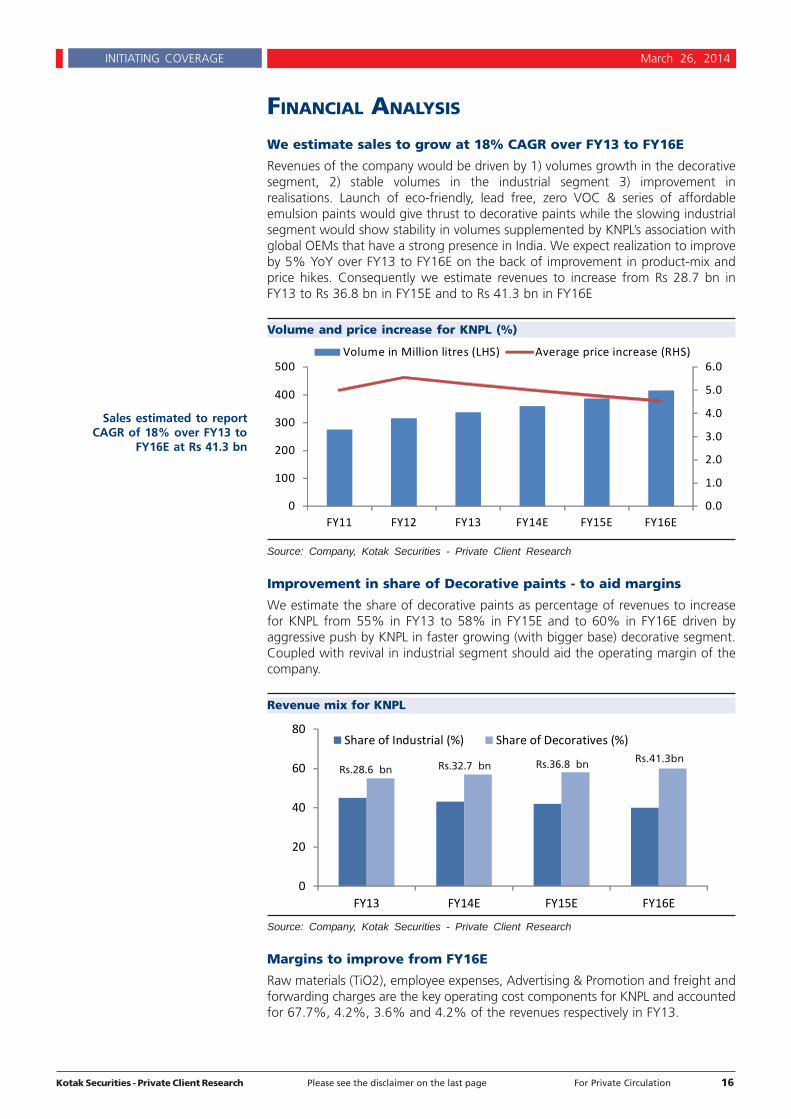
We estimate sales to grow at 18% CAGR over FY13 to FY16E
Revenues of the company would be driven by 1) volumes growth in the decorativesegment, 2) stable volumes in the industrial segment 3) improvement inrealisations. Launch of eco-friendly, lead free, zero VOC & series of affordableemulsion paints would give thrust to decorative paints while the slowing industrialsegment would show stability in volumes supplemented by KNPL’s association withglobal OEMs that have a strong presence in India. We expect realization to improveby 5% YoY over FY13 to FY16E on the back of improvement in product-mix andprice hikes. Consequently we estimate revenues to increase from Rs 28.7 bn inFY13 to Rs 36.8 bn in FY15E and to Rs 41.3 bn in FY16E
Volume and price increase for KNPL (%)
Source: Company, Kotak Securities - Private Client Research
Improvement in share of Decorative paints - to aid margins
We estimate the share of decorative paints as percentage of revenues to increasefor KNPL from 55% in FY13 to 58% in FY15E and to 60% in FY16E driven byaggressive push by KNPL in faster growing (with bigger base) decorative segment.Coupled with revival in industrial segment should aid the operating margin of thecompany.
Revenue mix for KNPL
Source: Company, Kotak Securities - Private Client Research
Margins to improve from FY16E
Raw materials (TiO2), employee expenses, Advertising & Promotion and freight andforwarding charges are the key operating cost components for KNPL and accountedfor 67.7%, 4.2%, 3.6% and 4.2% of the revenues respectively in FY13.
0.0
1.0
2.0
3.0
4.0
5.0
6.0
0
100
200
300
400
500
FY11 FY12 FY13 FY14E FY15E FY16E
Volume in Million litres (LHS) Average price increase (RHS)
0
20
40
60
80
FY13 FY14E FY15E FY16E
Share of Industrial (%) Share of Decoratives (%)
Rs.28.6 bn Rs.32.7 bn Rs.36.8 bn Rs.41.3bn
Sales estimated to reportCAGR of 18% over FY13 to
FY16E at Rs 41.3 bn

Kotak Securities - Private Client Research Please see the disclaimer on the last page For Private Circulation 17
INITIATING COVERAGE March 26, 2014
Key operating cost for KNPL
% of revenue FY11 FY12 FY13
Raw Material 65.5 66.9 67.7
Employee 4.3 4.1 4.2
Advertisement 3.8 3.8 3.6
Freight 4.3 4.2 4.2
Source: Company
Raw Material accounts for more than 65% for KNPL
Key raw materials for KNPL are titanium dioxide, pigments, resins, and solvents.30% of the raw material is imported and rest is locally sourced. Being crudederivatives have exposure to import pricing parity. This implies that forex exposure isfairly high for earnings for paint companies. The input cost environment has beenrelatively benign for paint companies in the last few quarters with stable prices forTiO2. Companies are able to pass any input inflation easily to customers in thedecorative segment, but with difficulty in the industrial segment. Managementindicated that passing on is easy even in Industrial segment in a good market,Sharp depreciation in rupee has also added to the input cost of paint companiesthough the trend is reversing since the last 6 months.
We expect operating margins to remain under pressure for KNPL in near term. Butwith improving capex cycle, increasing auto volumes and increasing share ofdecorative paints we estimate margins to improve for KNPL over FY14 to FY16E.We build in 70bps improvement in margin over FY14 to FY16E which should alsoaid the return ratios of the company.
Brent crude ($/barrel)
Source: Bloomberg
Titanium dioxide (TiO2) in $/tonne
Source: Bloomberg
2000
2250
2500
2750
3000
Nov‐12 Jan‐13 Mar‐13 May‐13 Jul‐13 Sep‐13 Nov‐13 Jan‐14
Input cost environment iscurrently benign

Kotak Securities - Private Client Research Please see the disclaimer on the last page For Private Circulation 18
INITIATING COVERAGE March 26, 2014
Operating margins for KNPL (%)
Source: Company, Kotak Securities - Private Client Research
Debt and free cash flow analysis
Capex in the last few years has influenced FCF for the company. For FY14/FY15management expects maintenance capex of Rs 1.5 billion. As on September 2013,KNPL had cash and cash equivalents of ~ Rs 8 bn with operating cash flowgeneration of around Rs 3 bn per annum, which is self-sufficient in our view to fundany incremental capex requirements from internal accruals.
Debt and free cash flow analysis
Rs Mn FY12 FY13 FY14E FY15E FY16E
Gross Debt 690 748 673 606 545
Networth 10,594 13,454 15,483 17,828 20,815
Cash 602 784 2,398 3,893 6,209
Operating cash flow 1,672 2,233 3,252 2,929 3,742
Free cash flow -965 -1,654 2,538 2,189 3,002
Capex 2,637 3,887 714 740 740
Source: Kotak Securities - Private Client Research
Return ratios would continue to be healthy
ROE for KNPL has moderated significantly from ~23% in FY11 to -14% in FY13which we believe should improve over FY14 to FY16E to 14.9%. The improvementwould be led by margin improvement.
DuPont Analysis
Parameter Ratio FY12 FY13 FY14E FY15E FY16E
EBIT margin EBIT/ Revenue 0.12 0.11 0.10 0.10 0.11
Asset Turn over Revenue /Capital employed 2.30 2.02 2.02 2.00 1.93
Financial Leverage Capital Employed/ Equity 1.07 1.06 1.04 1.03 1.03
Interest Burden PBT/EBIT 1.00 1.00 1.00 1.00 1.00
Tax burden PAT/PBT 0.71 0.59 0.67 0.67 0.67
ROE (%) PAT/Equity 20.4 13.8 14.7 14.3 14.9
EBIT Margin EBIT/ Revenue 0.12 0.11 0.10 0.10 0.11
Capital Turnover Revenue/ Capital Employed 1.07 1.06 1.04 1.03 1.03
ROCE (%) EBIT/Capital Employed 12.5 11.6 10.9 10.7 11.5
Source: Kotak Securities - Private Client Research
13.6
13.0
12.0 11.9 11.8
12.6
11.5
12.0
12.5
13.0
13.5
14.0
FY11 FY12 FY13 FY14E FY15E FY16E
Cash situation is also healthy
Kotak Securities - Private Client Research Please see the disclaimer on the last page For Private Circulation 19
INITIATING COVERAGE March 26, 2014
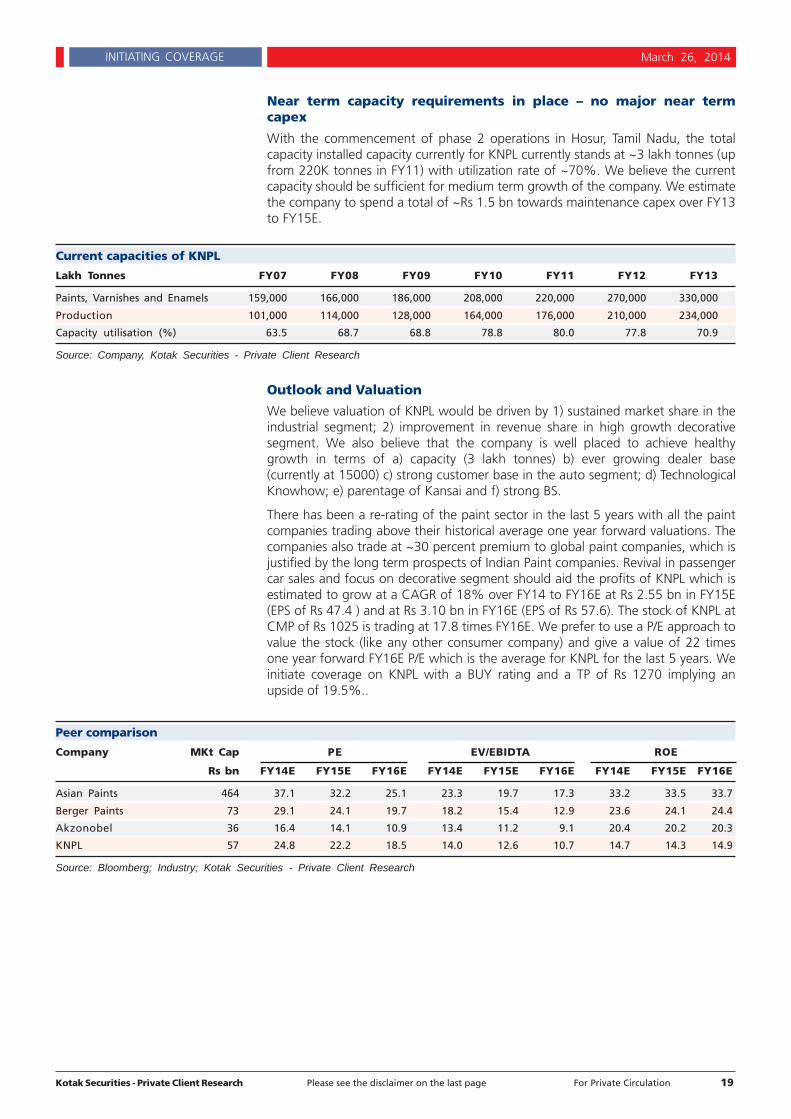
Near term capacity requirements in place – no major near termcapex
With the commencement of phase 2 operations in Hosur, Tamil Nadu, the totalcapacity installed capacity currently for KNPL currently stands at ~3 lakh tonnes (upfrom 220K tonnes in FY11) with utilization rate of ~70%. We believe the currentcapacity should be sufficient for medium term growth of the company. We estimatethe company to spend a total of ~Rs 1.5 bn towards maintenance capex over FY13to FY15E.
Current capacities of KNPL
Lakh Tonnes FY07 FY08 FY09 FY10 FY11 FY12 FY13
Paints, Varnishes and Enamels 159,000 166,000 186,000 208,000 220,000 270,000 330,000
Production 101,000 114,000 128,000 164,000 176,000 210,000 234,000
Capacity utilisation (%) 63.5 68.7 68.8 78.8 80.0 77.8 70.9
Source: Company, Kotak Securities - Private Client Research
Outlook and Valuation
We believe valuation of KNPL would be driven by 1) sustained market share in theindustrial segment; 2) improvement in revenue share in high growth decorativesegment. We also believe that the company is well placed to achieve healthygrowth in terms of a) capacity (3 lakh tonnes) b) ever growing dealer base(currently at 15000) c) strong customer base in the auto segment; d) TechnologicalKnowhow; e) parentage of Kansai and f) strong BS.
There has been a re-rating of the paint sector in the last 5 years with all the paintcompanies trading above their historical average one year forward valuations. Thecompanies also trade at ~30 percent premium to global paint companies, which isjustified by the long term prospects of Indian Paint companies. Revival in passengercar sales and focus on decorative segment should aid the profits of KNPL which isestimated to grow at a CAGR of 18% over FY14 to FY16E at Rs 2.55 bn in FY15E(EPS of Rs 47.4 ) and at Rs 3.10 bn in FY16E (EPS of Rs 57.6). The stock of KNPL atCMP of Rs 1025 is trading at 17.8 times FY16E. We prefer to use a P/E approach tovalue the stock (like any other consumer company) and give a value of 22 timesone year forward FY16E P/E which is the average for KNPL for the last 5 years. Weinitiate coverage on KNPL with a BUY rating and a TP of Rs 1270 implying anupside of 19.5%..
Peer comparison
Company MKt Cap PE EV/EBIDTA ROE
Rs bn FY14E FY15E FY16E FY14E FY15E FY16E FY14E FY15E FY16E
Asian Paints 464 37.1 32.2 25.1 23.3 19.7 17.3 33.2 33.5 33.7
Berger Paints 73 29.1 24.1 19.7 18.2 15.4 12.9 23.6 24.1 24.4
Akzonobel 36 16.4 14.1 10.9 13.4 11.2 9.1 20.4 20.2 20.3
KNPL 57 24.8 22.2 18.5 14.0 12.6 10.7 14.7 14.3 14.9
Source: Bloomberg; Industry; Kotak Securities - Private Client Research
Kotak Securities - Private Client Research Please see the disclaimer on the last page For Private Circulation 20
INITIATING COVERAGE March 26, 2014
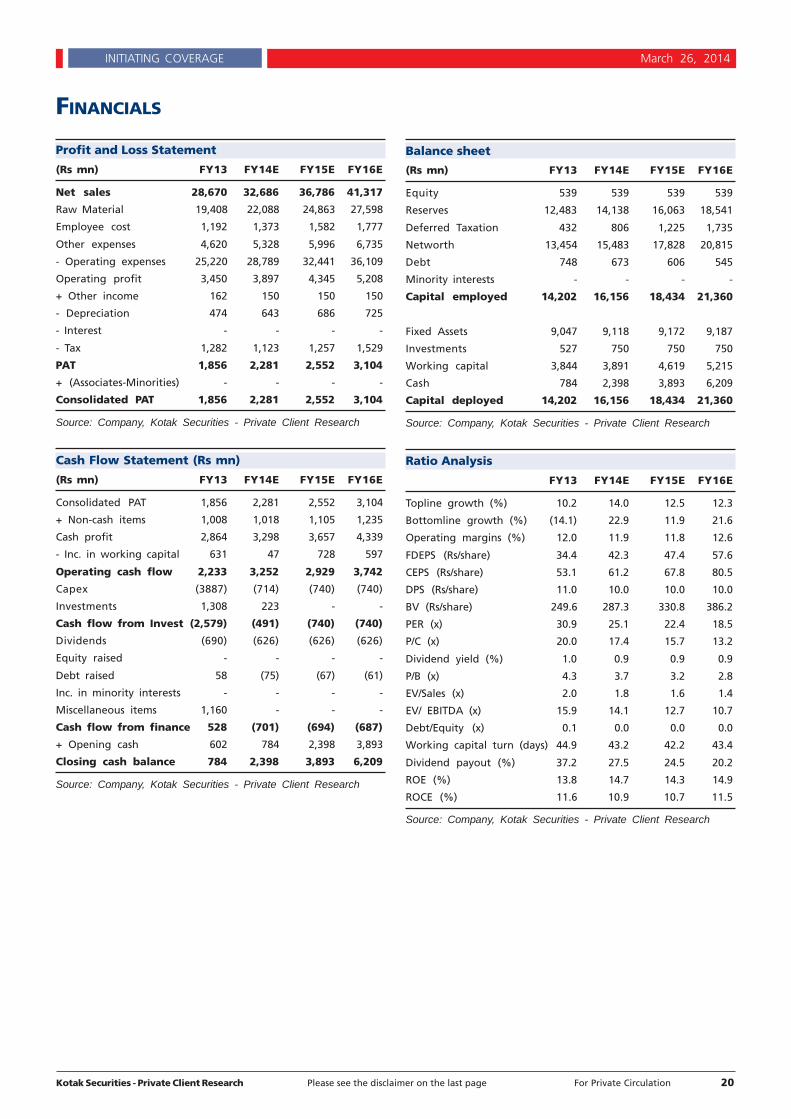
FINANCIALS
Profit and Loss Statement
(Rs mn) FY13 FY14E FY15E FY16E
Net sales 28,670 32,686 36,786 41,317
Raw Material 19,408 22,088 24,863 27,598
Employee cost 1,192 1,373 1,582 1,777
Other expenses 4,620 5,328 5,996 6,735
- Operating expenses 25,220 28,789 32,441 36,109
Operating profit 3,450 3,897 4,345 5,208
+ Other income 162 150 150 150
- Depreciation 474 643 686 725
- Interest - - - -
- Tax 1,282 1,123 1,257 1,529
PAT 1,856 2,281 2,552 3,104
+ (Associates-Minorities) - - - -
Consolidated PAT 1,856 2,281 2,552 3,104
Source: Company, Kotak Securities - Private Client Research
Cash Flow Statement (Rs mn)
(Rs mn) FY13 FY14E FY15E FY16E
Consolidated PAT 1,856 2,281 2,552 3,104
+ Non-cash items 1,008 1,018 1,105 1,235
Cash profit 2,864 3,298 3,657 4,339
- Inc. in working capital 631 47 728 597
Operating cash flow 2,233 3,252 2,929 3,742
Capex (3887) (714) (740) (740)
Investments 1,308 223 - -
Cash flow from Invest (2,579) (491) (740) (740)
Dividends (690) (626) (626) (626)
Equity raised - - - -
Debt raised 58 (75) (67) (61)
Inc. in minority interests - - - -
Miscellaneous items 1,160 - - -
Cash flow from finance 528 (701) (694) (687)
+ Opening cash 602 784 2,398 3,893
Closing cash balance 784 2,398 3,893 6,209
Source: Company, Kotak Securities - Private Client Research
Balance sheet
(Rs mn) FY13 FY14E FY15E FY16E
Equity 539 539 539 539
Reserves 12,483 14,138 16,063 18,541
Deferred Taxation 432 806 1,225 1,735
Networth 13,454 15,483 17,828 20,815
Debt 748 673 606 545
Minority interests - - - -
Capital employed 14,202 16,156 18,434 21,360
Fixed Assets 9,047 9,118 9,172 9,187
Investments 527 750 750 750
Working capital 3,844 3,891 4,619 5,215
Cash 784 2,398 3,893 6,209
Capital deployed 14,202 16,156 18,434 21,360
Source: Company, Kotak Securities - Private Client Research
Ratio Analysis
FY13 FY14E FY15E FY16E
Topline growth (%) 10.2 14.0 12.5 12.3
Bottomline growth (%) (14.1) 22.9 11.9 21.6
Operating margins (%) 12.0 11.9 11.8 12.6
FDEPS (Rs/share) 34.4 42.3 47.4 57.6
CEPS (Rs/share) 53.1 61.2 67.8 80.5
DPS (Rs/share) 11.0 10.0 10.0 10.0
BV (Rs/share) 249.6 287.3 330.8 386.2
PER (x) 30.9 25.1 22.4 18.5
P/C (x) 20.0 17.4 15.7 13.2
Dividend yield (%) 1.0 0.9 0.9 0.9
P/B (x) 4.3 3.7 3.2 2.8
EV/Sales (x) 2.0 1.8 1.6 1.4
EV/ EBITDA (x) 15.9 14.1 12.7 10.7
Debt/Equity (x) 0.1 0.0 0.0 0.0
Working capital turn (days) 44.9 43.2 42.2 43.4
Dividend payout (%) 37.2 27.5 24.5 20.2
ROE (%) 13.8 14.7 14.3 14.9
ROCE (%) 11.6 10.9 10.7 11.5
Source: Company, Kotak Securities - Private Client Research
Kotak Securities - Private Client Research Please see the disclaimer on the last page For Private Circulation 21
INITIATING COVERAGE March 26, 2014
DisclaimerThis document is not for public distribution and has been furnished to you solely for your information and must not be reproduced or redistributed to any otherperson. Persons into whose possession this document may come are required to observe these restrictions.
This material is for the personal information of the authorized recipient, and we are not soliciting any action based upon it. This report is not to be construedas an offer to sell or the solicitation of an offer to buy any security in any jurisdiction where such an offer or solicitation would be illegal. It is for the generalinformation of clients of Kotak Securities Ltd. It does not constitute a personal recommendation or take into account the particular investment objectives,financial situations, or needs of individual clients.
We have reviewed the report, and in so far as it includes current or historical information, it is believed to be reliable though its accuracy or completenesscannot be guaranteed. Neither Kotak Securities Limited, nor any person connected with it, accepts any liability arising from the use of this document. Therecipients of this material should rely on their own investigations and take their own professional advice. Price and value of the investments referred to inthis material may go up or down. Past performance is not a guide for future performance. Certain transactions -including those involving futures, options andother derivatives as well as non-investment grade securities - involve substantial risk and are not suitable for all investors. Reports based on technical analysiscenters on studying charts of a stock's price movement and trading volume, as opposed to focusing on a company's fundamentals and as such, may not matchwith a report on a company's fundamentals.
Opinions expressed are our current opinions as of the date appearing on this material only. While we endeavor to update on a reasonable basis the informationdiscussed in this material, there may be regulatory, compliance, or other reasons that prevent us from doing so. Prospective investors and others are cautionedthat any forward-looking statements are not predictions and may be subject to change without notice. Our proprietary trading and investment businesses maymake investment decisions that are inconsistent with the recommendations expressed herein.
Kotak Securities Limited has two independent equity research groups: Institutional Equities and Private Client Group. This report has been prepared by thePrivate Client Group . The views and opinions expressed in this document may or may not match or may be contrary with the views, estimates, rating, targetprice of the Institutional Equities Research Group of Kotak Securities Limited.
We and our affiliates, officers, directors, and employees worldwide may: (a) from time to time, have long or short positions in, and buy or sell the securitiesthereof, of company (ies) mentioned herein or (b) be engaged in any other transaction involving such securities and earn brokerage or other compensation oract as a market maker in the financial instruments of the company (ies) discussed herein or act as advisor or lender / borrower to such company (ies) or haveother potential conflict of interest with respect to any recommendation and related information and opinions. Kotak Securities Limited (KSL) may have pro-prietary long/short position in the above mentioned scrip(s) and therefore should be considered as interested. Proprietary holding for Kansai Nerolac PaintsLtd is NIL as on 24/03/2014. Analyst holding: Nil. The views provided herein are general in nature and does not consider risk appetite or investment ob-jective of particular investor; readers are requested to take independent professional advice before investing. This should not be construed as invitation orsolicitation to do business with KSL. Kotak Securities Limited is also a Portfolio Manager. Portfolio Management Team (PMS) takes its investment decisionsindependent of the PCG research and accordingly PMS may have positions contrary to the PCG research recommendation.
The analyst for this report certifies that all of the views expressed in this report accurately reflect his or her personal views about the subject company orcompanies and its or their securities, and no part of his or her compensation was, is or will be, directly or indirectly related to specific recommendations orviews expressed in this report.
No part of this material may be duplicated in any form and/or redistributed without Kotak Securities' prior written consent.
Analyst holding in stock: Nil
Kotak Securities Limited. 27 BKC, C 27, G Block, Bandra Kurla Complex, Bandra (E) Mumbai 400 05. CIN: U99999MH1994PLC134051, Tel No.: +22 43360000,Fax No.: +22 67132430.Website: www.kotak.com. Correspondence address: Infinity IT Park, Bldg. No 21, Opp Film City Road, A K Vaidya Marg, Malad(East), Mumbai 400097.Tel No :66056825.SEBI Reg No's: NSE INB/INF/INE 230808130, BSE INB 010808153/INF 011133230/INE 011207251, OTC INB 200808136,MCXSX INE 260808130/INB 260808135/INF 260808135, AMFI ARN 0164.NSDL: IN-DP-NSDL-23-97. CDSL: IN-DPCDSL-158-2001. SEBI PMS Reg No.: INP000000258.Investment in securities market is subject to market risk, please read the combined risk disclosure document prior to investing. Our research should notbe considered as an advertisement or advice, professional or otherwise. The investor is requested to take into consideration all the risk factors includingtheir financial condition, suitability to risk return profile and the like and take professional advice before investing. Compliance Officer - Mr. SandeepChordia. Tel. No: 022 6605 6825, Email id: [email protected] case you require any clarification or have any concern, kindly write to us at below email ids: "For Trading Account related queries:[email protected]; "For Demat Account related queries: [email protected]. Alternatively, you may feel free to contact our customer servicedesk at our toll free numbers 18002099191 or 1800222299. You may also call at 30305757 by using your city STD code as a prefix. In case you wish toescalate your concern / query, please write to us at [email protected] and if you feel you are still unheard, write to our customer service HOD [email protected].
Technical Research Team
Shrikant [email protected]+91 22 6621 6360
Amol [email protected]+91 20 6620 3350
Premshankar [email protected]+91 22 6621 6261
Derivatives Research TeamSahaj [email protected]+91 22 6621 6343
Rahul [email protected]+91 22 6621 6198
Malay [email protected]+91 22 6621 6350
Prashanth [email protected]+91 22 6621 6110
Fundamental Research TeamDipen [email protected]+91 22 6621 6301
Sanjeev ZarbadeCapital Goods, [email protected]+91 22 6621 6305
Teena VirmaniConstruction, Cement, Mid [email protected]+91 22 6621 6302
Saurabh AgrawalMetals, [email protected]+91 22 6621 6309
Saday SinhaBanking, NBFC, [email protected]+91 22 6621 6312
Arun AgarwalAuto & Auto [email protected]+91 22 6621 6143
Ruchir KhareCapital Goods, [email protected]+91 22 6621 6448
Ritwik RaiFMCG, [email protected]+91 22 6621 6310
Sumit PokharnaOil and [email protected]+91 22 6621 6313
Amit AgarwalLogistics, [email protected]+91 22 6621 6222
Jayesh [email protected]+91 22 6652 9172
K. [email protected]+91 22 6621 6311


![[Kotak] India Daily, April 2, 2019 - Kotak Securities](https://static.fdokumen.com/doc/165x107/63265a4f5c2c3bbfa803a474/kotak-india-daily-april-2-2019-kotak-securities.jpg)


![[Kotak] India Daily, July 25, 2017 - Kotak Securities](https://static.fdokumen.com/doc/165x107/63161b1a15106505030be7d5/kotak-india-daily-july-25-2017-kotak-securities.jpg)


![[Kotak] India Daily, May 07, 2018 - Kotak Securities](https://static.fdokumen.com/doc/165x107/633c43a3f3eeefb08b0c1dc3/kotak-india-daily-may-07-2018-kotak-securities.jpg)