India Daily, April 25, 2012 - Kotak Securities
59
For Private Circulation Only. FOR IMPORTANT INFORMATION ABOUT KOTAK SECURITIES’ RATING SYSTEM AND OTHER DISCLOSURES. REFER TO THE END OF THIS MATERIAL. INDIA DAILY April 25, 2012 India 24-Apr 1-day1-mo 3-mo Sensex 17,207 0.6 (0.9) 0.8 Nifty 5,223 0.4 (1.1) 1.2 Global/Regional indices Dow Jones 13,002 0.6 (0.6) 1.9 Nasdaq Composite 2,962 (0.3) (3.5) 5.1 FTSE 5,709 0.8 (2.5) (0.2) Nikkie 9,535 0.7 (4.8) 7.3 Hang Seng 20,702 0.1 0.2 2.9 KOSPI 1,969 0.3 (2.9) 0.8 Value traded – India Cash (NSE+BSE) 141 138 163 Derivatives (NSE) 1,501 1,698 2,053 Deri. open interest 1,283 1,476 1,435 Forex/money market Change, basis points 24-Apr 1-day 1-mo 3-mo Rs/US$ 52.5 (16) 148 229 10yr govt bond, % 8.6 4 16 30 Net investment (US$mn) 23-Apr MTD CYTD FIIs (65) 109 8,975 MFs (19) (79) (282) Top movers -3mo basis Change, % Best performers 24-Apr 1-day 1-mo 3-mo TTMT IN Equity 311.9 0.7 14.4 35.0 TGBL IN Equity 118.5 0.9 5.1 24.4 APNT IN Equity 3462.0 (0.3) 11.3 21.5 HCLT IN Equity 510.2 3.0 5.2 21.2 ITC IN Equity 245.1 0.1 10.2 18.9 Worst performers ADE IN Equity 278.9 0.2 (3.4) (30.3) ESOIL IN Equity 51.4 (0.5) (5.9) (17.6) SUEL IN Equity 22.7 0.2 (18.9) (16.7) RCOM IN Equity 80.4 (1.4) (10.1) (16.4) UNTP IN Equity 120.0 (6.1) (9.7) (16.3) Contents Daily Alerts Results Sesa Goa: Quarterly numbers muted, but in line Coromandel International: Higher sales into channel inventories mean weak 1HFY13 Rallis India: Disappointing results Polaris Financial Technology: No saving grace Results, Change in Reco Petronet LNG: Weak results Change in Reco Larsen & Toubro: Risk-reward in fair balance after sharp correction; upgrade to ADD Company Reliance Industries: Lessons from disappointments Sector Infrastructure: West coast container capacity delay to benefit Mundra/Pipavav; upgrade ADSEZ News Round-up COAL IN. Power producers (including NTPC) have refused to sign the new Fuel Supply Agreement with Coal India, saying that the proposed contract is biased and absolves the state-owned companies of all obligations. (ECNT) COAL IN. Coal India said it has fixed a production target of 468.74 MT for the current FY. (BSTD) RPWR IN. The Asian Development Bank (ADB) agreed to lend a further USD 103mn to a solar power project owned by Reliance Power in Rajasthan. (THBL) PLNG IN. Petronet LNG may get strategic partner to buy Asian Development Bank's (ADB) stake in the company. The bank is planning to sell its 5.2% stake in Petronet LNG. (THBL) STLT IN / SESA IN. The Competition Commission of India has approved the merger of Sterlite Industries & Sesa Goa that was announced by parent company Vedanta Resources on February 25th. (BSTD) BHFC IN. Alstom-Bharat Forge said it has bagged a USD 302mn order for supplying power equipment to state-run NTPC's power plants. (BSTD) UNBK IN / CRPBK IN. Union Bank of India and Corporation Bank has slashed their benchmark lending rate by 15bps. (ECNT) AXSB IN. Axis Bank’s proposed acquisition of Enam Securities’ businesses has received final approval from the RBI. The bank now aims to integrate these operations by the end of 3rd quarter of this FY. (BSTD) Source: ECNT= Economic Times, BSTD = Business Standard, FNLE = Financial Express, THBL = Business Line.
-
Upload
khangminh22 -
Category
Documents
-
view
0 -
download
0
Transcript of India Daily, April 25, 2012 - Kotak Securities

For Private Circulation Only. FOR IMPORTANT INFORMATION ABOUT KOTAK SECURITIES’ RATING SYSTEM AND OTHER DISCLOSURES. REFER TO THE END OF THIS MATERIAL.
INDIA DAILYApril 25, 2012 India 24-Apr 1-day1-mo 3-mo
Sensex 17,207 0.6 (0.9) 0.8
Nifty 5,223 0.4 (1.1) 1.2
Global/Regional indices
Dow Jones 13,002 0.6 (0.6) 1.9
Nasdaq Composite 2,962 (0.3) (3.5) 5.1
FTSE 5,709 0.8 (2.5) (0.2)
Nikkie 9,535 0.7 (4.8) 7.3
Hang Seng 20,702 0.1 0.2 2.9
KOSPI 1,969 0.3 (2.9) 0.8
Value traded – India
Cash (NSE+BSE) 141 138 163
Derivatives (NSE) 1,501 1,698 2,053
Deri. open interest 1,283 1,476 1,435
Forex/money market
Change, basis points
24-Apr 1-day 1-mo 3-mo
Rs/US$ 52.5 (16) 148 229
10yr govt bond, % 8.6 4 16 30
Net investment (US$mn)
23-Apr MTD CYTD
FIIs (65) 109 8,975
MFs (19) (79) (282)
Top movers -3mo basis
Change, %
Best performers 24-Apr 1-day 1-mo 3-mo
TTMT IN Equity 311.9 0.7 14.4 35.0
TGBL IN Equity 118.5 0.9 5.1 24.4
APNT IN Equity 3462.0 (0.3) 11.3 21.5
HCLT IN Equity 510.2 3.0 5.2 21.2
ITC IN Equity 245.1 0.1 10.2 18.9
Worst performers
ADE IN Equity 278.9 0.2 (3.4) (30.3)
ESOIL IN Equity 51.4 (0.5) (5.9) (17.6)
SUEL IN Equity 22.7 0.2 (18.9) (16.7)
RCOM IN Equity 80.4 (1.4) (10.1) (16.4)
UNTP IN Equity 120.0 (6.1) (9.7) (16.3)
Contents
Daily Alerts
Results
Sesa Goa: Quarterly numbers muted, but in line
Coromandel International: Higher sales into channel inventories mean weak 1HFY13
Rallis India: Disappointing results
Polaris Financial Technology: No saving grace
Results, Change in Reco
Petronet LNG: Weak results
Change in Reco
Larsen & Toubro: Risk-reward in fair balance after sharp correction; upgrade to ADD
Company
Reliance Industries: Lessons from disappointments
Sector
Infrastructure: West coast container capacity delay to benefit Mundra/Pipavav; upgrade ADSEZ
News Round-up
COAL IN. Power producers (including NTPC) have refused to sign the new Fuel Supply Agreement with Coal India, saying that the proposed contract is biased and absolves the state-owned companies of all obligations. (ECNT)
COAL IN. Coal India said it has fixed a production target of 468.74 MT for the current FY. (BSTD)
RPWR IN. The Asian Development Bank (ADB) agreed to lend a further USD 103mn to a solar power project owned by Reliance Power in Rajasthan. (THBL)
PLNG IN. Petronet LNG may get strategic partner to buy Asian Development Bank's (ADB) stake in the company. The bank is planning to sell its 5.2% stake in Petronet LNG. (THBL)
STLT IN / SESA IN. The Competition Commission of India has approved the merger of Sterlite Industries & Sesa Goa that was announced by parent company Vedanta Resources on February 25th. (BSTD)
BHFC IN. Alstom-Bharat Forge said it has bagged a USD 302mn order for supplying power equipment to state-run NTPC's power plants. (BSTD)
UNBK IN / CRPBK IN. Union Bank of India and Corporation Bank has slashed their benchmark lending rate by 15bps. (ECNT)
AXSB IN. Axis Bank’s proposed acquisition of Enam Securities’ businesses has received final approval from the RBI. The bank now aims to integrate these operations by the end of 3rd quarter of this FY. (BSTD)
Source: ECNT= Economic Times, BSTD = Business Standard, FNLE = Financial Express, THBL = Business Line.
For private Circulation Only. FOR IMPORTANT INFORMATION ABOUT KOTAK SECURITIES’ RATING SYSTEM AND OTHER DISCLOSURES, REFER TO THE END OF THIS MATERIAL.
Quarterly performance muted, but in line
Sesa reported EBITDA of Rs9.97 bn, down 52.9% yoy. EBITDA performance was impacted by (1) an increase in exports tax to 30% and (2) lower volumes due to logistics constraints in Goa and continuation of the mining ban in Karnataka. Adjusting for a forex loss of Rs1.5 bn, reported in other expenses, EBITDA was 5.1% ahead of our estimate. Iron ore realization of US$100/tonne increased 7.3% qoq and declined 11.7 % yoy. Net income of Rs11.6 bn was in line with our estimates and includes Rs4.66 bn from consolidation of share of earnings in Cairn India.
Iron ore shipments in 4QFY12, of 5.2 mn tones, declined 22.8 % yoy. In FY2012 iron ore shipments declined 7.2% to 16 mn tonnes—a reflection of logistics constraints in Goa, a mining ban in Karnataka and termination of a mining lease agreement with a third party in Orissa due to unfavorable contractual terms.
Volumes may decline in FY2013E
Sesa’s Karnataka iron ore mine has been classified in Category B in the CEC report that was submitted to the Supreme Court. Category B comprises mining leases with moderate violations. CEC recommended restart of mining only after a comprehensive set of measures is implemented. The Supreme Court of India has refrained from giving specific direction on the restart of mining by Category B mines. Restart of mining in Karnataka, as a result, remains uncertain for Sesa. Mines in Goa have been impacted by logistics constraints and trucking restrictions. Therefore, we cut FY2013E and FY2014E volumes by 23% and 16% to 14.2 mn and 17.2 mn tonnes respectively.
Consolidated operations matter for valuation; iron ore is one of the many segments
After group restructuring, all assets owned by Vedanta Resources, except Konkola Copper Mines, will be consolidated into a single entity, Sesa Sterlite. Valuations, as a result, will be influenced by performance of assets/companies operating in verticals such as energy, zinc, aluminium, power and other businesses. We value the Sesa Sterlite business at Rs220, based on SOTP valuation for different business segments. We retain our ADD rating on the stock due to inexpensive valuations. Our fair value is based on conservative assumptions.
Sesa Goa (SESA)
Metals & Mining
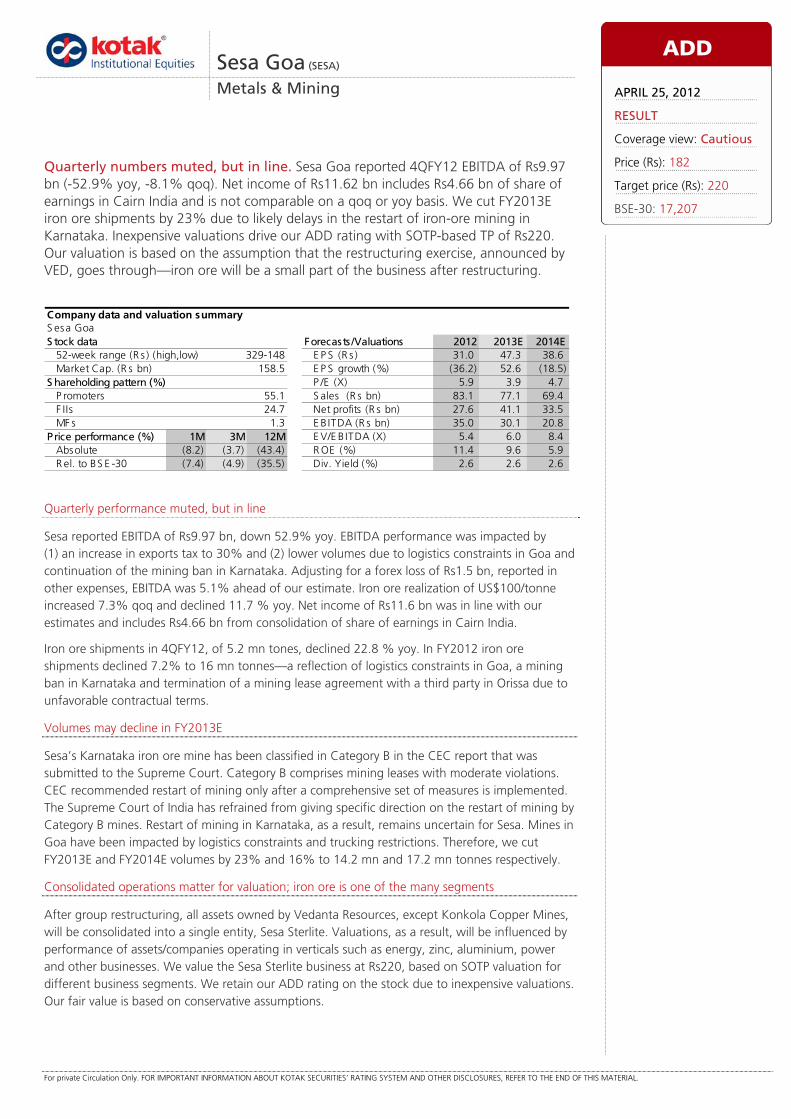
Quarterly numbers muted, but in line. Sesa Goa reported 4QFY12 EBITDA of Rs9.97 bn (-52.9% yoy, -8.1% qoq). Net income of Rs11.62 bn includes Rs4.66 bn of share of earnings in Cairn India and is not comparable on a qoq or yoy basis. We cut FY2013E iron ore shipments by 23% due to likely delays in the restart of iron-ore mining in Karnataka. Inexpensive valuations drive our ADD rating with SOTP-based TP of Rs220. Our valuation is based on the assumption that the restructuring exercise, announced by VED, goes through—iron ore will be a small part of the business after restructuring.
S esa GoaS tock data Forecasts /Valuations 2012 2013E 2014E
52-week range (R s ) (high,low) E P S (R s ) 31.0 47.3 38.6Market Cap. (R s bn) 158.5 E P S growth (%) (36.2) 52.6 (18.5)
S hareholding pattern (%) P /E (X) 5.9 3.9 4.7P romoters 55.1 S ales (R s bn) 83.1 77.1 69.4F IIs 24.7 Net profits (R s bn) 27.6 41.1 33.5MF s 1.3 E B ITDA (R s bn) 35.0 30.1 20.8
Price performance (%) 1M 3M 12M E V/E B ITDA (X) 5.4 6.0 8.4Absolute (8.2) (3.7) (43.4) R OE (%) 11.4 9.6 5.9R el. to BS E -30 (7.4) (4.9) (35.5) Div. Yield (%) 2.6 2.6 2.6
Company data and valuation summary
329-148
ADD
APRIL 25, 2012
RESULT
Coverage view: Cautious
Price (Rs): 182
Target price (Rs): 220
BSE-30: 17,207

Sesa Goa Metals & Mining
KOTAK INSTITUTIONAL EQUITIES RESEARCH 3
Announcement of addition to reserves and resources, a positive
Sesa announced net accretion of 68 mn tonnes to reserves and resources, taking the total number to 374 mn tonnes. A press release indicates that R&R has been reviewed and certified as per JORC standards. Cut off Fe grade used to assess R&R is consistent with earlier years. R&R of 306 mn tonnes as at FY 2011 was divided into A Narrain mine in Karnataka with R&R of 51.4 mn tonnes and various mines in Goa accounting for the balance R&R. Average Fe grade of R&R in FY2011 was ~52%.
Accretion to reserves is a positive, though the challenge is to get approval to restart mining in Karnataka and investment in logistics, and EC clearance to step-up exports from Goa.
We value iron ore business at Rs30/share post restructure; Rs90 pre-restructure
We expect iron ore prices to remain in a narrow band in 2012 before declining in 2013 and beyond. Slowdown in China would have hurt but for continued iron ore supply issues in India. Production step-up from major and junior miners in Australia and likely easing of logistics constraints in Brazil will lead to steady easing of iron ore prices. Our estimates for the iron ore business are based on benchmark iron price assumptions of US$120 and US$100/tonne for FY2013E and FY2014E, respectively.
We value the iron ore business at Rs87/share based on near-term iron ore price, as indicated above, and long-term iron ore price assumption of US$85/tonne. We assume mining operations in Karnataka will restart in FY2014 and assume R&R accretion of 10 mn tonnes in DCF-based fair value for the business.
Other details
Sesa has declared final dividend of Rs2/share, taking the total dividend payout to Rs4/share in FY2012.
4QFY12 results included one-off charge of Rs661 mn for the Cairn India acquisition.
Sesa has reclassified reporting of forex losses between the other expenses line (above EBITDA) and finance cost. Forex gain was Rs800 mn in 4QFY12. Sesa partly adjusted forex loss of 9MFY12 in the other expenses line in 4QFY12.
Sesa reported cash and cash equivalents of Rs5.9 bn and debt of Rs37.3 bn at the end of March 2012.
Metals & Mining Sesa Goa
4 KOTAK INSTITUTIONAL EQUITIES RESEARCH
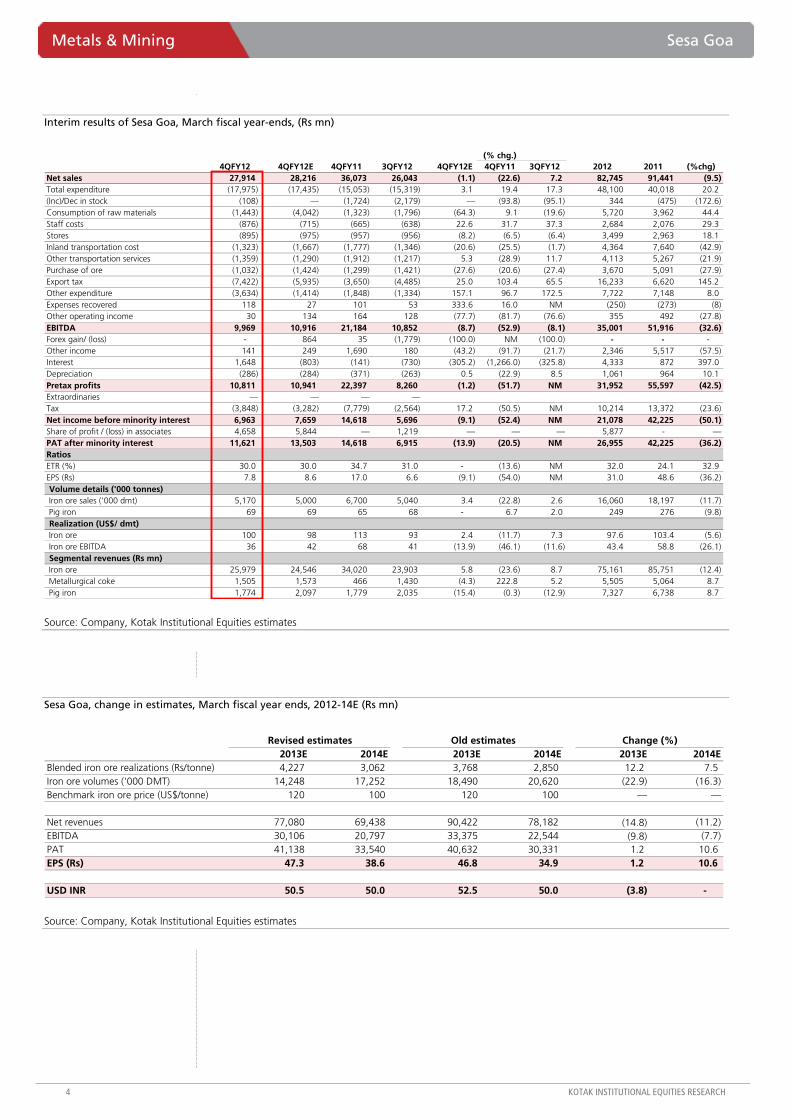
Interim results of Sesa Goa, March fiscal year-ends, (Rs mn)
(% chg.)4QFY12 4QFY12E 4QFY11 3QFY12 4QFY12E 4QFY11 3QFY12 2012 2011 (%chg)
Net sales 27,914 28,216 36,073 26,043 (1.1) (22.6) 7.2 82,745 91,441 (9.5) Total expenditure (17,975) (17,435) (15,053) (15,319) 3.1 19.4 17.3 48,100 40,018 20.2 (Inc)/Dec in stock (108) — (1,724) (2,179) — (93.8) (95.1) 344 (475) (172.6) Consumption of raw materials (1,443) (4,042) (1,323) (1,796) (64.3) 9.1 (19.6) 5,720 3,962 44.4 Staff costs (876) (715) (665) (638) 22.6 31.7 37.3 2,684 2,076 29.3 Stores (895) (975) (957) (956) (8.2) (6.5) (6.4) 3,499 2,963 18.1 Inland transportation cost (1,323) (1,667) (1,777) (1,346) (20.6) (25.5) (1.7) 4,364 7,640 (42.9) Other transportation services (1,359) (1,290) (1,912) (1,217) 5.3 (28.9) 11.7 4,113 5,267 (21.9) Purchase of ore (1,032) (1,424) (1,299) (1,421) (27.6) (20.6) (27.4) 3,670 5,091 (27.9) Export tax (7,422) (5,935) (3,650) (4,485) 25.0 103.4 65.5 16,233 6,620 145.2 Other expenditure (3,634) (1,414) (1,848) (1,334) 157.1 96.7 172.5 7,722 7,148 8.0 Expenses recovered 118 27 101 53 333.6 16.0 NM (250) (273) (8) Other operating income 30 134 164 128 (77.7) (81.7) (76.6) 355 492 (27.8) EBITDA 9,969 10,916 21,184 10,852 (8.7) (52.9) (8.1) 35,001 51,916 (32.6) Forex gain/ (loss) - 864 35 (1,779) (100.0) NM (100.0) - - - Other income 141 249 1,690 180 (43.2) (91.7) (21.7) 2,346 5,517 (57.5) Interest 1,648 (803) (141) (730) (305.2) (1,266.0) (325.8) 4,333 872 397.0 Depreciation (286) (284) (371) (263) 0.5 (22.9) 8.5 1,061 964 10.1 Pretax profits 10,811 10,941 22,397 8,260 (1.2) (51.7) NM 31,952 55,597 (42.5) Extraordinaries — — — —Tax (3,848) (3,282) (7,779) (2,564) 17.2 (50.5) NM 10,214 13,372 (23.6) Net income before minority interest 6,963 7,659 14,618 5,696 (9.1) (52.4) NM 21,078 42,225 (50.1) Share of profit / (loss) in associates 4,658 5,844 — 1,219 — — — 5,877 - —PAT after minority interest 11,621 13,503 14,618 6,915 (13.9) (20.5) NM 26,955 42,225 (36.2) RatiosETR (%) 30.0 30.0 34.7 31.0 - (13.6) NM 32.0 24.1 32.9 EPS (Rs) 7.8 8.6 17.0 6.6 (9.1) (54.0) NM 31.0 48.6 (36.2) Volume details ('000 tonnes)Iron ore sales ('000 dmt) 5,170 5,000 6,700 5,040 3.4 (22.8) 2.6 16,060 18,197 (11.7) Pig iron 69 69 65 68 - 6.7 2.0 249 276 (9.8) Realization (US$/ dmt)Iron ore 100 98 113 93 2.4 (11.7) 7.3 97.6 103.4 (5.6) Iron ore EBITDA 36 42 68 41 (13.9) (46.1) (11.6) 43.4 58.8 (26.1) Segmental revenues (Rs mn)Iron ore 25,979 24,546 34,020 23,903 5.8 (23.6) 8.7 75,161 85,751 (12.4) Metallurgical coke 1,505 1,573 466 1,430 (4.3) 222.8 5.2 5,505 5,064 8.7 Pig iron 1,774 2,097 1,779 2,035 (15.4) (0.3) (12.9) 7,327 6,738 8.7
Source: Company, Kotak Institutional Equities estimates
Sesa Goa, change in estimates, March fiscal year ends, 2012-14E (Rs mn)
Revised estimates Old estimates Change (%)2013E 2014E 2013E 2014E 2013E 2014E
Blended iron ore realizations (Rs/tonne) 4,227 3,062 3,768 2,850 12.2 7.5 Iron ore volumes ('000 DMT) 14,248 17,252 18,490 20,620 (22.9) (16.3) Benchmark iron ore price (US$/tonne) 120 100 120 100 — —
Net revenues 77,080 69,438 90,422 78,182 (14.8) (11.2) EBITDA 30,106 20,797 33,375 22,544 (9.8) (7.7) PAT 41,138 33,540 40,632 30,331 1.2 10.6 EPS (Rs) 47.3 38.6 46.8 34.9 1.2 10.6
USD INR 50.5 50.0 52.5 50.0 (3.8) -
Source: Company, Kotak Institutional Equities estimates

Sesa Goa Metals & Mining
KOTAK INSTITUTIONAL EQUITIES RESEARCH 5
SOTP-based target price of Sesa Sterlite
EBITDA Multiple EV Net debtImplied M Cap
Sterlite's stake
Attributable M Cap Contribution
(Rs bn) (X) (Rs bn) (Rs bn) (Rs bn) (%) (Rs bn) Rs/ share
BALCO 7 6.3 46 44.8 0.9 51.0 0 0 VAL 15 6.5 97 220.9 (123.5) 100.0 (124) (42) Copper business
Copper smelting business 10 6.0 63 (8) 70.9 100.0 71 24 Copper mining 2
Zinc businessHindustan Zinc 67 5.5 370 (220) 590 64.9 383 129 Zinc International 15 3.5 54 21 75 100.0 75 25
Sesa Goa (iron ore mining) 30 Cairn India (fair value assumed at the current market price) 133 Debt transferred for Cairn India acquisition (97) Synergies and other businesses 16 Target price (Rs/ share) 221
Source: Kotak Institutional Equities estimates
Sesa Goa, key assumptions, March fiscal year-ends, 2010-14E, (Rs mn)
2010 2011 2012E 2013E 2014E
Tonnages ('000 dmt)
Iron ore production 11,543 10,952 9,021 9,472 11,840
Iron ore purchases 5,185 4,029 1,595 1,595 1,595
Iron ore sales 15,177 14,368 12,820 11,067 13,435
Metallurgical coke sales 263 266 251 392 420
Pig Iron sales 270 266 251 375 500
Tonnages ('000 dmt) (consolidated)
Iron ore production 12,633 13,162 10,789 11,240 13,961
Iron ore purchases 7,445 5,794 3,008 3,008 3,290
Iron ore sales 19,434 18,256 16,000 14,248 17,252
Metallurgical coke sales 263 266 251 392 420
Pig Iron sales 270 266 251 375 500
Realizations
Average ore realization (US$/tonne) 53 93 91 84 61
Metallurgical coke prices (Rs/tonne) 13,545 17,731 22,782 21,329 19,714
Source: Company, Kotak Institutional Equities estimates

Metals & Mining Sesa Goa
6 KOTAK INSTITUTIONAL EQUITIES RESEARCH
Sesa Sterlite, key assumptions, March fiscal year ends, 2010-14E (Rs mn)
2010 2011 2012E 2013E 2014EVolumes (tonnes)Aluminium metal 267,802 247,412 267,453 268,770 268,770 Copper 333,244 303,327 335,619 335,605 335,584 Iron ore ('000 dmt) 19,434 18,256 16,000 14,248 17,252 Lead 64,391 57,229 83,250 125,800 125,800 Power (mn units) — — 5,990 12,495 14,664 Refined silver 139 147 200 351 396 Zinc 577,685 712,603 769,125 804,285 835,050 Zinc International 427 442 452 453 Average realization (Rs/tonne)Aluminium ingots 96,607 118,384 122,071 135,730 137,500 Copper cathode 303,652 398,148 433,996 419,556 383,804 Iron ore (Rs/tonne) 2,909 4,665 4,453 4,227 3,062 Lead 105,922 114,877 112,210 114,235 124,571 Power (Rs/unit) 3.5 3.5 3.5 Silver (Rs mn/tonne) 25 37 46 44 45 Zinc 99,421 106,469 104,178 108,439 119,864 LME assumptions (US$/tonne)Zinc 1,936 2,186 2,050 2,025 2,300 Lead 1,990 2,244 2,150 2,100 2,350 Copper 6,500 8,138 8,300 7,450 7,150 Aluminium 1,900 2,257 2,225 2,350 2,450
Source: Company, Kotak Institutional Equities estimates

Sesa Goa Metals & Mining
KOTAK INSTITUTIONAL EQUITIES RESEARCH 7
Earnings and valuation impact from Vedanta group restructuring (Rs mn)
Sterlite Sesa Goa Sesa-Sterlite2012E 2013E 2014E 2012E 2013E 2014E 2012E 2013E 2014E
EBITDA (attributable)Hindustan Zinc 39,391 43,649 53,083 39,391 43,649 53,083 Sterlite Industries- ex Hindustan Zinc 28,712 33,726 39,663 28,712 33,726 39,663 Sterlite Industries (consolidated) 68,103 77,375 92,745 68,103 77,375 92,745 Sesa Goa 35,001 30,106 20,797 35,001 30,106 20,797 Cairn India 59,216 81,460 69,783 VAL 4,425 14,971 15,272 Consolidated attributable EBITDA 68,103 77,375 92,745 35,001 30,106 20,797 166,744 203,912 198,598
Net debt (attributable)Hindustan Zinc (116,494) (142,842) (180,385) (116,494) (142,842) (180,385) Sterlite + subs- ex-HZ 44,308 36,364 2,125 44,308 36,364 2,125 Sterlite (72,186) (106,477) (178,259) (72,186) (106,477) (178,259) Cairn India (39,869) (59,105) (89,890) Sesa 31,325 21,897 15,202 31,325 21,897 15,202 VAL (excluding loans by Sterlite) 200,860 220,860 240,860 Cairn India acquisition debt pushdown 287,965 287,965 287,965 Attributable debt (72,186) (106,477) (178,259) 31,325 21,897 15,202 408,094 365,139 275,877
Shares outstanding (mn) 3,361 3,361 3,361 869 869 869 2,965 2,965 2,965 Stock price 107 107 107 186 186 186 181 181 181 Market capitalization 357,968 357,968 357,968 161,827 161,827 161,827 536,614 536,614 536,614 Value of Cairn India's stake (without holdco discount) 137,016 137,016 137,016 Enterprise value 285,781 251,491 179,708 56,135 46,708 40,013 944,708 901,754 812,491 EV/EBITDA (X) 4.2 3.3 1.9 1.6 1.6 1.9 5.7 4.4 4.1
Earnings impact (Rs mn)Hindustan Zinc 35,864 38,352 45,780 35,864 38,352 45,780 Sterlite-ex HZ 16,461 13,315 18,148 16,461 13,315 18,148 Sterlite - consolidated (excluding VAL) 52,325 51,668 63,928 52,325 51,668 63,928 Sesa Goa 14,088 12,944 8,392 21,078 17,891 11,868 Cairn India 51,002 65,162 54,882 VAL (assuming no capitalization of interest) (6,942) (2,002) (1,914) (23,533) (10,437) (10,429) Cairn India debt (14,974) (14,974) (14,974) Total 45,383 49,665 62,015 14,088 12,944 8,392 85,898 109,309 105,275
EPS 13.5 14.8 18.5 16.2 14.9 9.7 29.0 36.9 35.5 P/E (X) 7.9 7.2 5.8 11.5 12.5 19.3 6.2 4.9 5.1
Source: Kotak Institutional Equities estimates

Metals & Mining Sesa Goa
8 KOTAK INSTITUTIONAL EQUITIES RESEARCH
Sesa Goa (consolidated), profit model, balance sheet and cash-flow model, March fiscal year-ends, 2009-2014E (Rs mn)
2010 2011 2012E 2013E 2014EProfit model (Rs mn)Net sales 58,583 92,051 83,101 77,080 69,438 EBITDA 31,448 51,543 35,001 30,106 20,797 Other income 4,260 5,399 2,346 698 1,222 Interes t (517) (381) (4,333) (3,239) (3,239) Depreciaiton (745) (964) (1,061) (1,080) (1,212) Profit before tax 34,446 55,597 31,952 26,484 17,568 Taxes (8,056) (13,372) (10,214) (8,593) (5,700) Net profit 26,390 42,225 21,078 17,891 11,868 Income from associates — — 5,877 23,247 21,672 PAT 26,291 42,225 26,955 41,138 33,540 Earnings per share (Rs) 29.4 48.6 31.0 47.3 38.6
Balance sheet (Rs mn)E quity 79,177 128,104 151,182 188,271 217,761 Deferred tax liability 750 682 1,046 1,046 1,046 Total Borrowings 19,606 9,995 37,342 37,342 37,342 Minority interes t 433 — — — —Current liabilities 12,400 17,256 14,442 10,815 9,977 Total liabilities 112,366 156,037 204,011 237,473 266,125 Net fixed assets 22,557 31,443 41,443 44,388 47,385 Inves tments 45,649 87,998 136,626 159,874 181,546 Cash 23,918 8,970 6,017 15,445 22,140 Other current as sets 20,242 27,626 19,925 17,767 15,054 Miscellaneous expenditure (0) — — — —Total assets 112,366 156,037 204,011 237,473 266,125 Free cash flow (Rs mn)Operating cash flow excl. working capital 23,922 38,372 19,793 18,274 11,858 Working capital changes 1,791 (3,037) 4,886 (1,469) 1,875 Capital expenditure (1,316) (8,330) (8,050) (4,025) (4,210) Free cash flow 24,397 27,005 16,629 12,780 9,524 RatiosDebt/equity (%) 0.2 0.1 0.2 0.2 0.2 Net debt/equity (%) (0.8) (0.8) 0.1 0.1 0.0 R oAE (%) 36.1 36.8 11.4 9.6 5.9 RoACE (%) 31.6 32.6 11.6 8.8 5.9
Source: Company, Kotak Institutional Equities estimates

For private Circulation Only. FOR IMPORTANT INFORMATION ABOUT KOTAK SECURITIES’ RATING SYSTEM AND OTHER DISCLOSURES, REFER TO THE END OF THIS MATERIAL.
EBITDA margins weak – inventories pushed into sales channel
Coromandel reported net sales at Rs27.4 bn (+7.3% qoq, +132% yoy), significantly higher than our estimates. Reported EBITDA at Rs1.4 bn was in line with our estimates. The company reported 4QFY12 EBITDA margins at 5.2%, lower versus 9.2% in 3QFY12, even as sales moved higher qoq from Rs25.5 bn in 3QFY12. 4Q is a seasonally weaker quarter and higher sales qoq mean that the company has pushed inventories into the sales channel (dealer level) ahead of lower subsidy rates in FY2013. The fact that EBITDA margins have moved lower qoq means that the company has given discounts/other incentives in order to push sales.
As per the company, dip in EBITDA margins in 4QFY12 is a one-off and the margins should normalize going forward.
Working capital has increased
Working capital levels have increased substantially versus FY2011. Working capital stood at Rs24 bn in March 2012 versus Rs13 bn in March 2011 even as it declined from Rs27 bn in September 2011. Net current assets increased from Rs43 bn in 2QFY12 to Rs50 bn in 4QFY12 led by higher inventories (Rs19.2 bn in 4QFY12 versus Rs15 bn in 2QFY12) and higher debtors (Rs9.6 bn in 4QFY12 versus Rs4 bn in 2QFY12) even as advances declined from Rs23.6 bn in 2QFY12 to Rs21 bn in 4QFY12.
Excess inventories of ~3 mn tons in the sales channel – 1HFY13 sales could be subdued
As per the company, there are excess inventories of ~3 mn tons of complex fertilizers in the sales channel which could depress sales in 1HFY13. In case imports reduce going forward, recovery in domestic sales could be faster.
We retain our estimates and SELL rating
We retain our estimates and SELL rating on the company with an unchanged target price of Rs260/share.
Coromandel International (CRIN)
Others
Higher sales into channel inventories mean weak 1HFY13. Coromandel’s 4QFY12 results were in line with estimates. EBITDA margins declined to 5.2% (versus 9.2% in 3QFY12) even as sales increased to Rs27.4 bn (versus Rs25.5 bn in 3QFY12) with the company pushing inventory in the sales channel ahead of a cut in subsidy rates in FY2013. Hence, net current assets increased from Rs43 bn in 2QFY12 to Rs50 bn in 4QFY12 even as working capital reduced from Rs27 bn in 2QFY12 to Rs24 bn in 4QFY12.
Coromandel InternationalStock data Forecasts/Valuations 2012 2013E 2014E
52-week range (Rs) (high,low) EPS (Rs) 22.5 22.7 24.6Market Cap. (Rs bn) 79.8 EPS growth (%) (8.5) 0.9 8.5
Shareholding pattern (%) P/E (X) 12.6 12.5 11.5Promoters 64.0 Sales (Rs bn) 97.9 95.4 104.4FIIs 7.7 Net profits (Rs bn) 6.4 6.4 7.0MFs 5.3 EBITDA (Rs bn) 9.4 10.3 10.8
Price performance (%) 1M 3M 12M EV/EBITDA (X) 10.3 8.9 8.2Absolute (2.3) 3.5 (11.1) ROE (%) 27.5 23.3 21.9Rel. to BSE-30 (1.4) 2.3 1.3 Div. Yield (%) 2.6 2.7 2.9
Company data and valuation summary
376-251
SELL
APRIL 24, 2012
RESULT
Coverage view:
Price (Rs): 283
Target price (Rs): 260
BSE-30: 17,207
Others Coromandel International
10 KOTAK INSTITUTIONAL EQUITIES RESEARCH
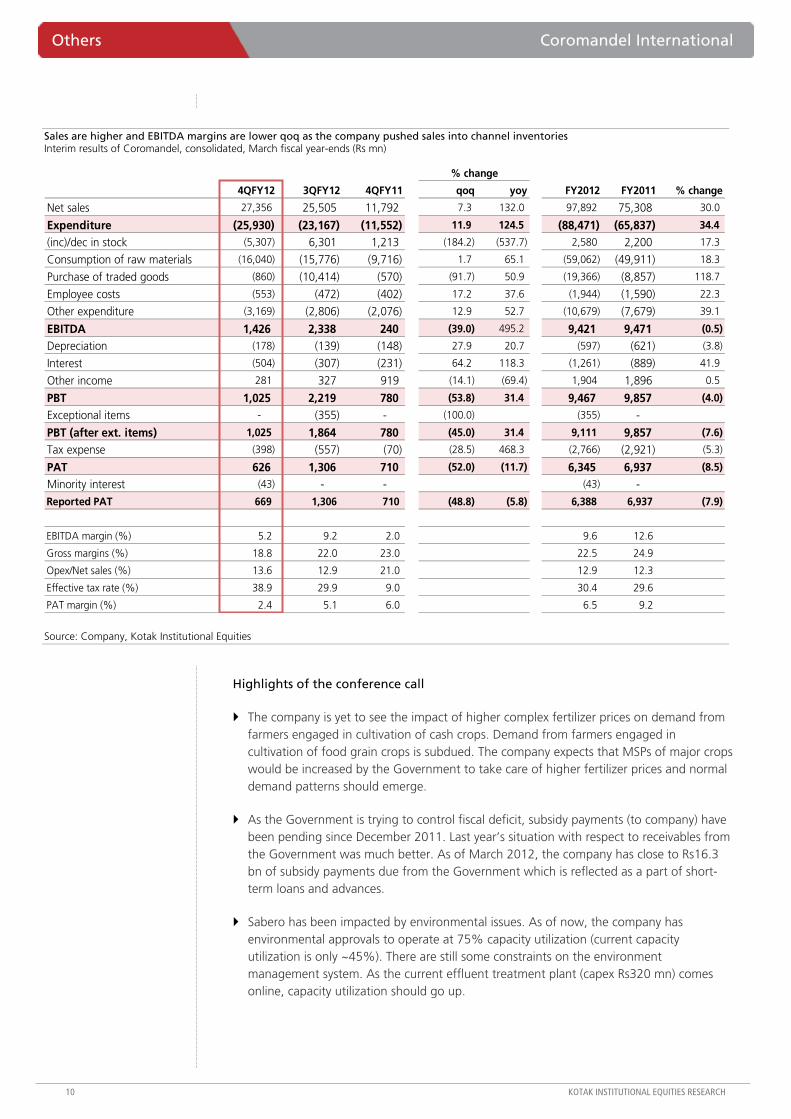
Sales are higher and EBITDA margins are lower qoq as the company pushed sales into channel inventories Interim results of Coromandel, consolidated, March fiscal year-ends (Rs mn)
4QFY12 3QFY12 4QFY11 qoq yoy FY2012 FY2011 % change
Net sales 27,356 25,505 11,792 7.3 132.0 97,892 75,308 30.0
Expenditure (25,930) (23,167) (11,552) 11.9 124.5 (88,471) (65,837) 34.4
(inc)/dec in stock (5,307) 6,301 1,213 (184.2) (537.7) 2,580 2,200 17.3
Consumption of raw materials (16,040) (15,776) (9,716) 1.7 65.1 (59,062) (49,911) 18.3
Purchase of traded goods (860) (10,414) (570) (91.7) 50.9 (19,366) (8,857) 118.7
Employee costs (553) (472) (402) 17.2 37.6 (1,944) (1,590) 22.3
Other expenditure (3,169) (2,806) (2,076) 12.9 52.7 (10,679) (7,679) 39.1
EBITDA 1,426 2,338 240 (39.0) 495.2 9,421 9,471 (0.5)
Depreciation (178) (139) (148) 27.9 20.7 (597) (621) (3.8)
Interest (504) (307) (231) 64.2 118.3 (1,261) (889) 41.9
Other income 281 327 919 (14.1) (69.4) 1,904 1,896 0.5
PBT 1,025 2,219 780 (53.8) 31.4 9,467 9,857 (4.0)
Exceptional items - (355) - (100.0) (355) -
PBT (after ext. items) 1,025 1,864 780 (45.0) 31.4 9,111 9,857 (7.6)
Tax expense (398) (557) (70) (28.5) 468.3 (2,766) (2,921) (5.3)
PAT 626 1,306 710 (52.0) (11.7) 6,345 6,937 (8.5)
Minority interest (43) - - (43) - Reported PAT 669 1,306 710 (48.8) (5.8) 6,388 6,937 (7.9)
EBITDA margin (%) 5.2 9.2 2.0 9.6 12.6
Gross margins (%) 18.8 22.0 23.0 22.5 24.9
Opex/Net sales (%) 13.6 12.9 21.0 12.9 12.3
Effective tax rate (%) 38.9 29.9 9.0 30.4 29.6
PAT margin (%) 2.4 5.1 6.0 6.5 9.2
% change
Source: Company, Kotak Institutional Equities
Highlights of the conference call
The company is yet to see the impact of higher complex fertilizer prices on demand from farmers engaged in cultivation of cash crops. Demand from farmers engaged in cultivation of food grain crops is subdued. The company expects that MSPs of major crops would be increased by the Government to take care of higher fertilizer prices and normal demand patterns should emerge.
As the Government is trying to control fiscal deficit, subsidy payments (to company) have been pending since December 2011. Last year’s situation with respect to receivables from the Government was much better. As of March 2012, the company has close to Rs16.3 bn of subsidy payments due from the Government which is reflected as a part of short-term loans and advances.
Sabero has been impacted by environmental issues. As of now, the company has environmental approvals to operate at 75% capacity utilization (current capacity utilization is only ~45%). There are still some constraints on the environment management system. As the current effluent treatment plant (capex Rs320 mn) comes online, capacity utilization should go up.

Coromandel International Others
KOTAK INSTITUTIONAL EQUITIES RESEARCH 11
Inventory of Rs19 bn includes Rs9.2 bn of finished good inventories most of which are in the sales channel and hence subsidy rates of FY2012 would be applicable. Hence, the company won’t be affected by the lower subsidy rates fixed by the Government in FY2013E.
Current assets increased, led by higher debtors and inventories Balance sheet of Coromandel, consolidated, March fiscal year-ends (Rs mn)
4QFY12 2QFY12 4QFY11
Liabilities
Share capital 283 282 282
Reserves and surplus 23,721 23,926 19,286
Shareholder's funds 24,003 24,209 19,567
Minority interest 158
Deferred tax liability 675 715 815
Total debt 28,760 23,193 15,478
Liabilities 24,553 14,682 18,110
Provisions 1,502 1,250 1,321
Total liabilities 79,651 64,048 55,292
Assets
Fixed assets 14,756 12,449 11,041
Goodwill on consolidation 3,470 - -
Investments 1,495 2,857 1,706
Current assets
Cash 9,847 5,634 9,605
Trade receivables 9,579 3,971 2,024
Inventories 19,218 15,477 15,139
Loand and advances 21,160 23,661 11,396
Other current assets 126 - 4,381
Total current assets 59,930 48,742 42,544
Total assets 79,651 64,048 55,292
Current assets 50,083 43,109 32,939
Working capital 24,027 27,176 13,507
Source: Company, Kotak Institutional Equities

Others Coromandel International
12 KOTAK INSTITUTIONAL EQUITIES RESEARCH
Financial summary: Coromandel International Profit model, balance sheet and cash flow statement of Coromandel International, March fiscal year-ends (Rs mn)
2007 2008 2009 2010 2011 2012 2013E 2014EProfit model (Rs mn)Income 20,665 37,573 93,750 63,947 75,279 97,892 95,352 104,392EBITDA 1,994 4,128 6,521 7,100 9,450 9,420 10,302 10,804Other income 160 432 2,066 1,362 1,896 1,904 1,478 1,369Interest (320) (699) (876) (782) (868) (1,261) (1,564) (1,065)Depreciation (399) (522) (562) (594) (621) (597) (736) (826)Profit before tax 1,435 3,339 7,149 7,086 9,857 9,467 9,480 10,283Tax expense (457) (1,238) (3,140) (2,409) (2,921) (2,766) (3,076) (3,336)Exceptional items 189 — 1,586 — — (355) — —Reported PAT 1,167 2,101 5,595 4,677 6,937 6,345 6,404 6,946Minority interest (43) (43) (43)Reported PAT 1,167 2,101 5,595 4,677 6,937 6,388 6,447 6,989Adjusted PAT 916 1,829 3,256 3,778 5,603 5,353 5,406 6,021EPS 4.1 7.4 19.8 16.6 24.6 22.6 22.8 24.8Balance sheet (Rs mn)Equity 5,511 7,955 12,120 15,015 19,567 24,004 27,856 32,124Total borrowings 5,493 10,431 17,708 20,470 16,638 28,760 19,377 13,377Deferred tax liability/minority interest 713 825 795 855 815 833 833 833Current liabilities and provisions 5,985 8,359 17,626 10,031 18,391 26,055 18,250 19,935Total liabilites 17,702 27,570 48,248 46,370 55,411 79,651 66,316 66,269Net fixed assets 3,873 7,402 7,966 9,576 11,430 14,756 14,520 15,953Investments and goodwill 2,115 718 2,208 1,693 1,705 4,965 4,965 4,965Cash 1,695 1,072 4,253 9,605 9,605 9,847 6,467 2,999Other current assets 10,019 18,377 33,821 25,497 32,671 50,083 40,364 42,353Total assets 17,702 27,570 48,248 46,370 55,411 79,651 66,316 66,269RatiosEBITDA margin (%) 9.6 11.0 7.0 11.1 12.6 9.6 10.8 10.3Net debt/equity (X) 0.69 1.18 1.11 0.72 0.36 0.79 0.46 0.32Book value (Rs/share) 19.5 28.2 42.9 53.2 69.3 85.1 98.7 113.8ROAE (%) 27.9 24.4 26.3 26.3 30.9 23.7 20.2 19.5ROACE (%) 10.2 14.7 13.4 12.8 16.9 13.8 12.7 14.3
Source: Company, Kotak Institutional Equities

For private Circulation Only. FOR IMPORTANT INFORMATION ABOUT KOTAK SECURITIES’ RATING SYSTEM AND OTHER DISCLOSURES, REFER TO THE END OF THIS MATERIAL.
EBITDA margins lowest in past three years – gross margins intact
Rallis reported 4QFY12 standalone (SA) sales at Rs1.99 bn (-36% qoq, -12% yoy) which were lower than our estimates. Reported 4QFY12 (SA) EBITDA at Rs132 mn (-77% qoq, -55% yoy) was lower than our estimates led by lower margins at 6.6% (lowest in the past three years). Pricing was intact in the market as is evident from 4QFY12 (SA) gross margins at 39% (-80 bps yoy, -163 bps qoq) which were stable. EBITDA margins were hit as sales declined (-12% yoy) even as expenses (excluding raw materials) were up 5% yoy. Reported PAT (SA) at Rs118 mn was boosted by write-back of cessation costs (Thane plant) of Rs71 mn and other income of Rs71 mn.
Net working capital declines led by lower debtors
Net working capital of the company (consolidated) declined from Rs1.39 bn in September 2011 to Rs1.07 bn in March 2012 led by lower debtors (declined from Rs1.99 bn in September 2011 to Rs1.04 bn in March 2012). In our view, the company’s decision not to push sales in an environment of depressed demand is judicious and the balance sheet is much more efficient, as a result.
Reasons for poor performance
The management attributed the poor performance to the following: (1) Poor farm economics which led to lower usage of pesticides and also usage of lower value products, (2) erratic rains in Andhra, Maharashtra, Karnataka and West Bengal (45% of the pesticide industry in India) also led to lower usage, (3) paddy, pulses and oil seed acreages fell yoy, and (4) the company has moved out of red triangle (environmentally hazardous) products which used to contribute 6-7% of sales.
As per the management, increase in MSPs by the Government should improve farm economics and hence, improve demand conditions for agri-inputs going forward.
Metahelix reports encouraging numbers for the year
Metahelix reported sales and net profit of Rs814 mn and Rs5.5 mn in FY2012 versus sales and net loss of Rs424 mn and Rs149 mn in FY2011. The company is creating a hybrid seed for the BT cotton market (biggest seed market by value in India), which should take another 2-3 years.
Rallis India (RALI)
Others
Disappointing results. Rallis’ 4QFY12 results were below estimates led by 12% decline in standalone sales which clearly indicates subdued demand on account of pressure on farm profitability. Pricing was maintained in the market which is evident in stable gross margins. EBITDA margins at 6.6% (lowest in the past three years) took a hit as expenses (excluding raw materials) increased 5% yoy. We have cut our PAT estimates by 6% and 7% for FY2013E and FY2014E respectively. Retain BUY with a revised target price of Rs145 (Rs160 earlier) at 16.5X September 2013 EPS.
Rallis IndiaStock data Forecasts/Valuations 2012 2013E 2014E
52-week range (Rs) (high,low) EPS (Rs) 5.1 8.2 9.4Market Cap. (Rs bn) 23.8 EPS growth (%) (21.6) 60.9 14.7
Shareholding pattern (%) P/E (X) 24.0 14.9 13.0Promoters 51.0 Sales (Rs bn) 12.7 14.6 16.0FIIs 8.7 Net profits (Rs bn) 1.0 1.6 1.8MFs 14.5 EBITDA (Rs bn) 2.1 2.6 2.9
Price performance (%) 1M 3M 12M EV/EBITDA (X) 11.7 9.2 7.9Absolute 0.9 (0.4) (14.6) ROE (%) 21.6 25.1 23.4Rel. to BSE-30 1.8 (1.6) (2.8) Div. Yield (%) 1.6 1.6 1.6
Company data and valuation summary
187-113
BUY
APRIL 24, 2012
RESULT
Coverage view:
Price (Rs): 122
Target price (Rs): 145
BSE-30: 17,207

Others Rallis India
14 KOTAK INSTITUTIONAL EQUITIES RESEARCH
Sales declined yoy which led to decline in EBITDA margins even as gross margins are intact Interim results of Rallis, consolidated, March fiscal year-ends (Rs mn)
4QFY12 3QFY12 4QFY11 qoq yoy FY2012 FY2011 % change
Sales 2,160 3,261 2,457 (34) (12) 12,749 10,863 17
Raw material cost (1,253) (1,888) (1,415) (34) (11) (7,428) (6,336) 17
Employee cost (207) (236) (176) (12) 18 (902) (729) 24
Other expenses (577) (575) (563) 0 2 (2,292) (1,883) 22
EBITDA 124 563 302 (78) (59) 2,126 1,915 11
Other income/forex gain/(loss) 70 (83) 67 (185) 5 (28) 138 (120)
Depreciation and amortization (87) (72) (52) 20 69 (287) (171) 68
Interest cost (28) (41) (24) (33) 17 (146) (37) 291
Extraordinaries 71 (242) - (129) (172) -
Profit before tax 150 124 294 21 (49) 1,494 1,845 (19)
Tax (net) (57) (57) (102) 0 (44) (487) (581) (16)
Net income 93 67 192 38 (52) 1,007 1,264 (20)
Minority interest (6) (10) 4 (35) (259) 15 4 287
Adjusted net income 99 77 188 29 (47) 992 1,260 (21)
Margins (%)
Gross margins 42 42 42 42 42
EBITDA 5.7 17.3 12.3 16.7 17.6
% change
Source: Company, Kotak Institutional Equities
Decline in sales led to EBITDA margins at 6.6%, lowest in the past three years Interim results of Rallis, standalone, March fiscal year-ends (Rs mn)
1QFY11 2QFY11 3QFY11 4QFY11 1QFY12 2QFY12 3QFY12 4QFY12 qoq yoy
Net sales from operations 1,960 3,631 2,681 2,195 2,327 4,270 3,028 1,895 (37) (14)
Other operating income 72 49 32 72 55 95 70 100 42 38
Total income 2,033 3,680 2,712 2,267 2,382 4,365 3,098 1,994 (36) (12)
Raw material cost (1,219) (2,110) (1,593) (1,361) (1,434) (2,607) (1,835) (1,214) (34) (11)
Employee cost (184) (184) (185) (143) (202) (194) (208) (177) (15) 23
Other expenditure (399) (504) (420) (473) (433) (484) (484) (472) (2) (0)
EBITDA 231 883 515 290 312 1,081 570 132 (77) (55)
Depreciation (36) (40) (44) (52) (51) (70) (69) (82) 19 56
Other income/forex gain/(loss) 12 11 19 65 2 (68) (62) 71 (214) 9
Interest (net) 9 1 (11) (17) (20) (29) (29) (16) (44) (6)
Exceptional items - - - - - - (242) 71 (129)
PBT 216 855 480 285 243 914 168 175 4 (39)
Tax (68) (268) (143) (95) (78) (295) (57) (57) 0 (40)
PAT 148 587 337 190 166 619 111 118 6 (38)
Gross margin (%) 40.0 42.7 41.3 40.0 39.8 40.3 40.8 39.1
EBITDA margin (%) 11.4 24.0 19.0 12.8 13.1 24.8 18.4 6.6
% change
Source: Company, Kotak Institutional Equities

Rallis India Others
KOTAK INSTITUTIONAL EQUITIES RESEARCH 15
Net working capital declined, led by lower debtors Interim balance sheet of Rallis, consolidated, March fiscal year-ends (Rs mn)
4QFY12 2QFY12 4QFY11
Liabilities
Share capital 195 195 195
Reserves and surplus 5,336 5,435 4,855
Shareholder's funds 5,530 5,630 5,049
Minority interest 15 33 22
Deferred tax liability 131 125 32
Total debt 1,506 1,652 1,148
Liabilities 3,423 3,898 3,330
Provisions 622 651 586
Total liabilities 11,226 11,988 10,167
Assets
Fixed assets 4,236 4,108 3,834
Goodwill on consolidation 1,533 1,481 1,236
Investments 227 246 256
Current assets
Cash 112 216 146
Trade receivables 1,035 1,988 1,064
Inventories 2,717 2,729 2,289
Loand and advances 1,358 1,207 1,329
Other current assets 8 12 13
Total current assets 5,230 6,153 4,841
Total assets 11,226 11,988 10,167
Current assets 5,118 5,936 4,695
Net working capital 1,073 1,388 779
Source: Company, Kotak Institutional Equities
Change in estimates
We have reduced our PAT estimates for FY2013E and FY2014E by 6% and 7% respectively. We maintain our BU Y rating with a reduced target price of Rs145 (Rs160 earlier) at 16.5X September 2013 EPS.
Change in estimates for Rallis, consolidated, March fiscal year-ends
New Old % change New Old % changeRevenue (Rs mn) 14,618 15,285 (4.4) 16,025 17,392 (7.9) EBITDA (Rs mn) 2,645 2,770 (4.5) 2,914 3,171 (8.1) Net income (Rs mn) 1,596 1,689 (5.5) 1,830 1,975 (7.3)
FY2013E FY2014E
Source: Company, Kotak Institutional Equities

Others Rallis India
16 KOTAK INSTITUTIONAL EQUITIES RESEARCH
Financial summary: Rallis Profit model, balance sheet and cash flow statement, consolidated, March fiscal year-ends (Rs mn)
2008 2009 2010 2011 2012 2013E 2014EProfit model (Rs mn)Sales 6,957 8,562 9,005 10,934 12,749 14,618 16,025EBITDA 802 1,303 1,667 1,991 2,126 2,645 2,914Other income 906 33 70 69 (28) 116 172Interest (43) (34) (27) (40) (146) (65) (23)Depreciation (201) (229) (183) (175) (287) (309) (324)Extraordinardy items — — — — (172) 0 0Profit before tax 1,464 1,072 1,527 1,845 1,494 2,387 2,739Tax expense (211) (352) (512) (580) (487) (774) (889)Minority interest — — — — 15 16 20Extraordinardy items — — — — — — — PAT 1,253 720 1,015 1,264 992 1,596 1,830EPS 6.4 3.7 5.2 6.5 5.1 8.2 9.4Balance sheet (Rs mn)Equity 2,198 2,617 4,245 5,049 5,530 6,696 8,113Preference capital 880 880 — — — — — Total borrowings 466 825 81 1,172 1,506 862 — Deferred tax liability/minority interest (132) (102) (53) 54 145 129 109Current liabilities and provisions 2,011 2,608 3,041 3,891 4,045 5,068 5,515Total liabilites 5,423 6,828 7,314 10,167 11,226 12,755 13,737Net fixed assets 1,479 1,877 2,648 4,009 4,236 4,676 4,661Goodwill — — — 1,236 1,533 1,533 1,533Investments 555 1,362 1,402 256 227 227 227Cash 84 82 119 146 112 18 529Other current assets and miscellaneous 3,305 3,509 3,145 4,520 5,118 6,301 6,786Total assets 5,423 6,828 7,314 10,167 11,226 12,755 13,737RatiosEBITDA margin (%) 11.5 15.2 18.5 18.2 16.7 18.1 18.2Net debt/equity (X) 0.17 0.28 (0.01) 0.20 0.25 0.13 (0.07)Book value (Rs/share) 11.3 13.5 21.8 26.0 28.4 34.4 41.7ROAE (%) 36.4 29.0 28.2 26.2 21.6 25.1 23.4ROACE (%) 8.9 18.9 23.2 23.6 18.4 21.2 22.0
Source: Company, Kotak Institutional Equities
For private Circulation Only. FOR IMPORTANT INFORMATION ABOUT KOTAK SECURITIES’ RATING SYSTEM AND OTHER DISCLOSURES, REFER TO THE END OF THIS MATERIAL.
4QFY12 results – disappointing across the board
Polaris’ revenues declined 8% qoq to US$103.5 mn, 10.2% lower than our estimate. The company attributed the decline to one-off license revenues of US$7 mn from a large APAC client in the previous quarter. EBITDA margin declined 590 bps to 12.5%, largely a flow-through impact of lower license revenues. Reported net income of Rs611 mn was 6.4% lower than our estimate despite Rs194 mn other income, largely booked from sale of real estate. Results once again highlight the known negatives, i.e. high dependence on products for profitability and poor pricing in the services business.
Margins at risk in FY2013E
The company does not have much headroom to protect profitability in FY2013E. High utilization rates and underinvestment in sales and marketing do not leave many operational levers to protect profitability. We forecast margin decline of 110 bps in FY2013E and 10 bps in FY2014E.
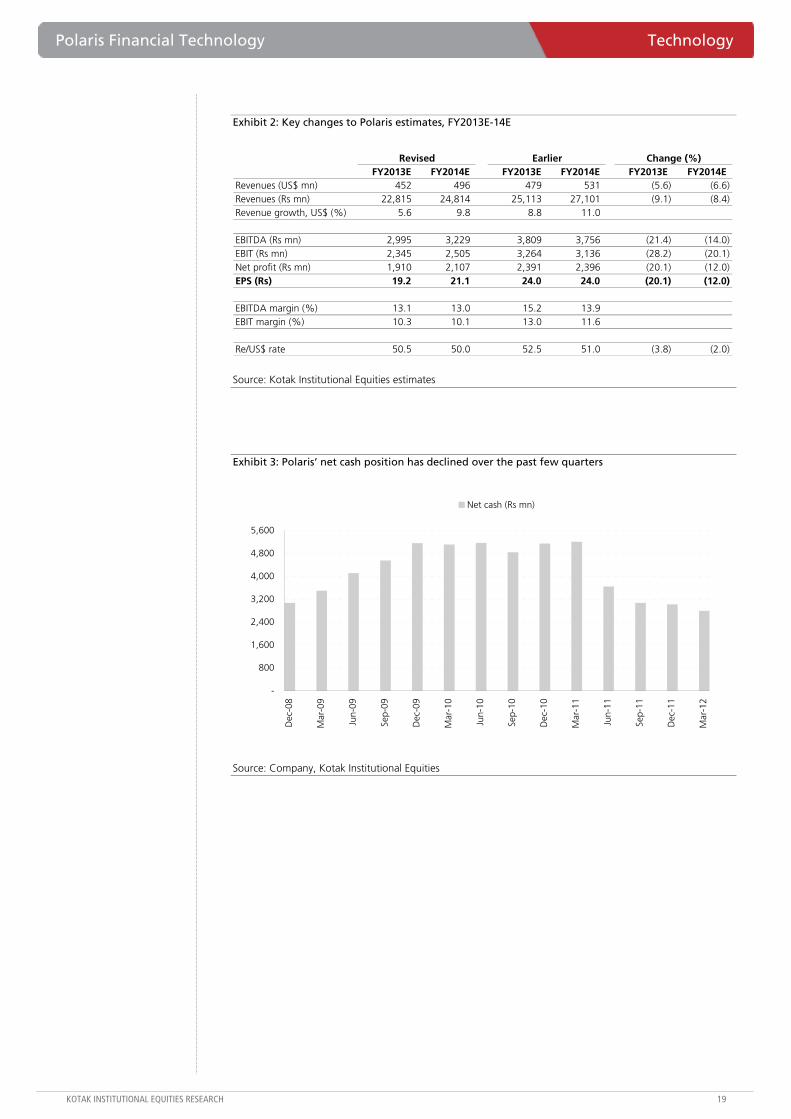
Cash burn in FY2012 surprising
Polaris generated operating cash flow of Rs83 mn, an OCF/ EBITDA conversion of 3% and insignificant compared to Rs2.2 bn net income reported in FY2012. Debtor days increased to 63 from 45 in FY2012, while loans and advances increased by 6 days which could have been due to increase in unbilled revenues. The company has borrowed Rs1.18 bn in FY2012.
Cut revenue and EPS estimates; retain REDUCE
Dependence on the volatile products business for revenue growth and margin improvement and the current macro situation affecting spends in the BFSI vertical will pose serious challenges to Polaris’ performance. We cut our FY2013E/2014E US$ revenue estimates by 5.6-6.6% and forecast modest revenue of 5.6% in FY2013E and 9.8% in FY2014E. We cut our EPS estimates for FY2013E-14E to Rs19.2 and Rs21.1 (from Rs24 for both FY2013E and FY2014E). We value the stock at ex-growth multiples, and reduce target price to Rs135/share (Rs145/share earlier). Rupee depreciation will remain an upside risk. We retain our REDUCE rating on the stock.
Polaris Financial Technology (POL)
Technology
No saving grace. Polaris reported a weak quarter with significant decline in revenue and profitability. US$ revenue declined 8% qoq to US$103.5 mn, which the company attributed to high base from one-off license booking in 3QFY12. EBITDA margin declined 590 bps qoq to 12.5%. The company reported cash burn of Rs286 mn in 4QFY12 and Rs1,238 mn in FY2012. Slowing financial services vertical, nascent stage of volatile products business and high client concentration are potential pitfalls. Cut estimates by 12.0-20.1% for FY2013/14E and target price by 7% to Rs135. Retain REDUCE.
Polaris Financial TechnologyStock data Forecasts/Valuations 2012 2013E 2014E
52-week range (Rs) (high,low) EPS (Rs) 20.8 19.2 21.1Market Cap. (Rs bn) 14.1 EPS growth (%) 7.4 (7.7) 10.3
Shareholding pattern (%) P/E (X) 6.8 7.4 6.7Promoters 29.2 Sales (Rs bn) 20.5 22.8 24.8FIIs 22.0 Net profits (Rs bn) 2.1 1.9 2.1MFs 11.4 EBITDA (Rs bn) 2.9 3.0 3.2
Price performance (%) 1M 3M 12M EV/EBITDA (X) 3.9 3.5 2.9Absolute (16.9) 3.9 (29.6) ROE (%) 18.1 14.4 14.3Rel. to BSE-30 (16.2) 2.7 (19.9) Div. Yield (%) 2.8 2.9 3.0
Company data and valuation summary
212-112
REDUCE
APRIL 24, 2012
RESULT
Coverage view: Attractive
Price (Rs): 142
Target price (Rs): 135
BSE-30: 17,207

Technology Polaris Financial Technology
18 KOTAK INSTITUTIONAL EQUITIES RESEARCH
Other results and earnings call highlights
The management guided to FY2013E revenues of Rs24.0-24.6 bn, at an average Re/US$ rate of 50. This translates into US$480-492 mn of revenues, a growth of 12-15%. The guidance is aggressive in our view.
The consolidated headcount was 12,886 with 4QFY12 net addition of 382.
The outstanding hedge book stood at $218 mn spread over FY2013-15E, at an average Re/US$ rate of 50.26.
Polaris announced 11 wins in Intellect. Intellect contributed US$108 mn out of FY2012 revenue of US$428 mn.
DSO days increased sharply to 63 days from 56 days at the end of 3QFY12.
Attrition was down to 15.6% from 18% at the end of the previous quarter.
Exhibit 1: Polaris Software Interim Results - 4QFY12 (Rs mn)
qoq yoy4QFY11 3QFY12 4QFY12 % chg. % chg. KIE
Revenues (US$ mn) 96.7 112.5 103.5 (8.0) 7.1 115.3 (10.2) Total Revenues 4,375 5,725 5,203 (9.1) 18.9 5,752 (9.6) Cost of Revenues (3,022) (3,766) (3,567) (5.3) 18.0 (3,918) (9.0) Gross Profit 1,354 1,959 1,636 (16.5) 20.9 1,834 (10.8) SG&A Expenses (827) (904) (985) 9.0 19.2 (965) 2.1 EBITDA 527 1,055 651 (38.3) 23.5 870 (25.2) Other income 133 (124) 194 (256.7) 46.2 25 690.1 Interest expense (4) (8) (10) (8) EBDT 656 923 835 (9.6) 27.3 886 (5.8) Depreciation (87) (131) (134) 2.8 54.6 (135) (0.6) Minority interest 1 1 - Pretax profits 569 793 701 (11.6) 23.2 751 (6.6) Provision for Tax (90) (183) (165) (9.6) 84.4 (198) (16.6) Net Profit 480 611 536 (12.2) 11.8 553 (3.1) Extraordinaries 96 1 75 100 Net Profit reported 576 612 611 (0.0) 6.2 653 (6.4)
EPS - recurring (Rs) 4.8 6.1 5.4 (12.2) 11.8 5.5 Margins (%)Gross margin 30.9 34.2 31.4 31.9 SG&A expenses 18.9 15.8 18.9 16.8 EBITDA margin 12.0 18.4 12.5 15.1 EBIT margin 10.1 16.2 9.9 12.8 Net profit margin 13.2 10.7 11.8 11.4 Tax rate 18.7 23.0 23.5 26.4
% Deviation
Source: Company, Kotak Institutional Equities estimates
Polaris Financial Technology Technology
KOTAK INSTITUTIONAL EQUITIES RESEARCH 19
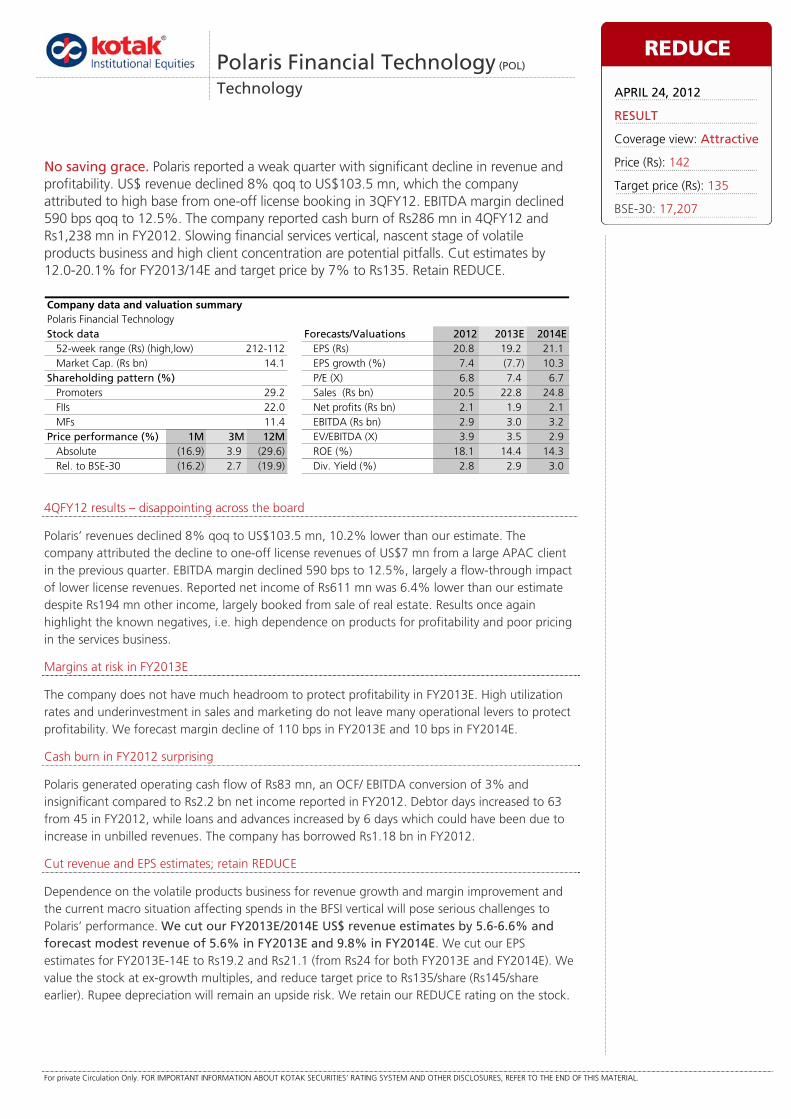
Exhibit 2: Key changes to Polaris estimates, FY2013E-14E
FY2013E FY2014E FY2013E FY2014E FY2013E FY2014ERevenues (US$ mn) 452 496 479 531 (5.6) (6.6) Revenues (Rs mn) 22,815 24,814 25,113 27,101 (9.1) (8.4) Revenue growth, US$ (%) 5.6 9.8 8.8 11.0
EBITDA (Rs mn) 2,995 3,229 3,809 3,756 (21.4) (14.0) EBIT (Rs mn) 2,345 2,505 3,264 3,136 (28.2) (20.1) Net profit (Rs mn) 1,910 2,107 2,391 2,396 (20.1) (12.0) EPS (Rs) 19.2 21.1 24.0 24.0 (20.1) (12.0)
EBITDA margin (%) 13.1 13.0 15.2 13.9 EBIT margin (%) 10.3 10.1 13.0 11.6
Re/US$ rate 50.5 50.0 52.5 51.0 (3.8) (2.0)
Revised Earlier Change (%)
Source: Kotak Institutional Equities estimates
Exhibit 3: Polaris’ net cash position has declined over the past few quarters
-
800
1,600
2,400
3,200
4,000
4,800
5,600
Dec
-08
Mar
-09
Jun-
09
Sep-
09
Dec
-09
Mar
-10
Jun-
10
Sep-
10
Dec
-10
Mar
-11
Jun-
11
Sep-
11
Dec
-11
Mar
-12
Net cash (Rs mn)
Source: Company, Kotak Institutional Equities

Technology Polaris Financial Technology
20 KOTAK INSTITUTIONAL EQUITIES RESEARCH
Exhibit 4: Condensed consolidated financials for Polaris, March fiscal year-ends, 2010-14E (Rs mn)
FY2010 FY2011 FY2012 FY2013E FY2014EProfit & Loss ModelRevenues 13,538 15,863 20,527 22,815 24,814 EBITDA 2,220 2,139 2,906 2,995 3,229 Depreciation (350) (337) (472) (650) (724) EBIT 1,870 1,802 2,434 2,345 2,505 Other Income (73) 494 369 272 399 PBT 1,788 2,285 2,775 2,576 2,863 Tax (255) (359) (706) (666) (756) Net Profit 1,533 1,926 2,069 1,910 2,107 Balance Sheet (Rs mn)Total Equity 8,725 10,325 12,525 13,956 15,562 Borrowings 25 83 1,260 1,260 1,260 Total capital 8,749 10,408 13,785 15,217 16,822 Net fixed Assets 2,271 2,937 3,987 4,442 4,543 Investments 3,897 3,843 1,803 1,803 1,803 Goodwill 506 644 1,994 1,994 1,994 Working Capital 2,041 2,891 5,961 6,937 8,442 - Cash 1,237 1,423 2,224 3,096 4,333 - Current Assets 3,830 5,274 8,209 8,812 9,482 - Current Liabilities 3,026 3,805 4,473 4,971 5,373 Total assets 8,749 10,408 13,785 15,217 16,822 Free Cash Flow (Rs mn)Cash generated from operations 2,163 2,085 2,634 1,934 2,906 Working Capital Changes 871 (914) (1,854) (309) (268) Capital expenditure (429) (941) (1,476) (901) (825) Tax (290) (359) (706) (666) (756) Free Cash Flow 2,315 (129) (1,402) 59 1,057
Source: Company, Kotak Institutional Equities estimates

For private Circulation Only. FOR IMPORTANT INFORMATION ABOUT KOTAK SECURITIES’ RATING SYSTEM AND OTHER DISCLOSURES, REFER TO THE END OF THIS MATERIAL.
Results marred by decline in volumes and lower tariffs
PLNG reported net income of `2.45 bn (-17% qoq and +18.8% yoy), 19% below our expected `3 bn. PLNG’s EBITDA declined 15.9% qoq to `4.2 bn, led by (1) a decline in re-gasification volumes to 135 tn BTU (-6.9% qoq and +7.4% yoy) and (2) lower implied re-gasification tariffs of `36.6/mn BTU (-6.1% qoq and +11.7% yoy). We note that the company reported a foreign exchange fluctuation gain of `575.3 mn, which it passed on to consumers and has been adjusted while computing blended re-gasification tariffs.
Potential regulation of marketing margins on spot LNG volumes to impact earnings
We see downside risks to PLNG’s earnings from potential regulation of marketing margins on imported natural gas. We highlight that PLNG’s profitability has improved significantly in FY2012, led by high marketing margins on spot LNG cargoes. We compute implied marketing margins of `32.3/mn BTU on spot volumes for FY2012 (see Exhibit 1), which seems very high compared to actual re-gasification tariffs of `33.8/mn BTU during the same period.
Revise rating to REDUCE with a target price of `140
We revise our rating on PLNG stock to REDUCE from SELL previously with an unchanged 12-month DCF-based target price of `140. We have assumed full capacity utilization at PLNG’s Dahej and Kochi terminals in the long term. We model higher re-gasification tariffs for Kochi terminal at `42.5/mn BTU versus current tariff of `35.02/mn BTU for Dahej terminal. We expect PLNG’s re-gasification tariff to increase by 5% yoy in FY2013-14 and remain flat thereafter. We note that higher re-gasification tariffs may be sustained in the near term in the absence of regulations.
Revise earnings to reflect higher re-gasification tariffs for Kochi
We revise our EPS estimates for FY2013-15 to `14.3, `13.3 and `17.6 from `13.6, `11.8 and `16.5 respectively, to reflect (1) higher re-gasification tariffs for the Kochi terminal, (2) revised Rupee exchange rate assumptions, (3) higher LNG price assumptions, reflecting higher crude prices and (4) other minor changes.
Petronet LNG (PLNG)
Energy
Weak results. PLNG reported 4QFY12 net income at 2̀.45 bn (-17% qoq), sharply lower than our estimate of `3 bn, led by (1) lower-than-expected re-gasification volumes of 135 tn BTU (-6.9% qoq) and (2) lower implied re-gasification tariffs of `36.6/mn BTU (-6.1% qoq). We revise our rating on PLNG to REDUCE from SELL previously. Our 12-month target price remains unchanged at `140. Downside risks exist from (1) potential regulatory interventions in LNG business and (2) lower-than-expected volumes.
Petronet LNGStock data Forecasts/Valuations 2012 2013E 2014E
52-week range (Rs) (high,low) EPS (Rs) 14.1 14.3 13.3Market Cap. (Rs bn) 110.1 EPS growth (%) 74.0 1.5 (7.2)
Shareholding pattern (%) P/E (X) 10.4 10.3 11.0Promoters 50.0 Sales (Rs bn) 226.6 318.2 429.6FIIs 14.5 Net profits (Rs bn) 10.6 10.7 10.0MFs 7.9 EBITDA (Rs bn) 18.3 18.9 21.7
Price performance (%) 1M 3M 12M EV/EBITDA (X) 7.1 7.6 6.7Absolute (10.4) (8.2) 7.6 ROE (%) 29.7 23.8 18.0Rel. to BSE-30 (9.5) (9.3) 22.6 Div. Yield (%) 1.7 1.7 1.7
Company data and valuation summary
186-125
REDUCE
APRIL 24, 2012
RESULT, CHANGE IN RECO.
Coverage view: Neutral
Price (Rs): 147
Target price (Rs): 140
BSE-30: 17,207
QUICK NUMBERS
• 135 tn BTU of re-gasification volumes
• `36.6/mn BTU implied tariff
• `32/mn BTU of implied marketing margins on spot volumes for FY2012
Energy Petronet LNG
22 KOTAK INSTITUTIONAL EQUITIES RESEARCH
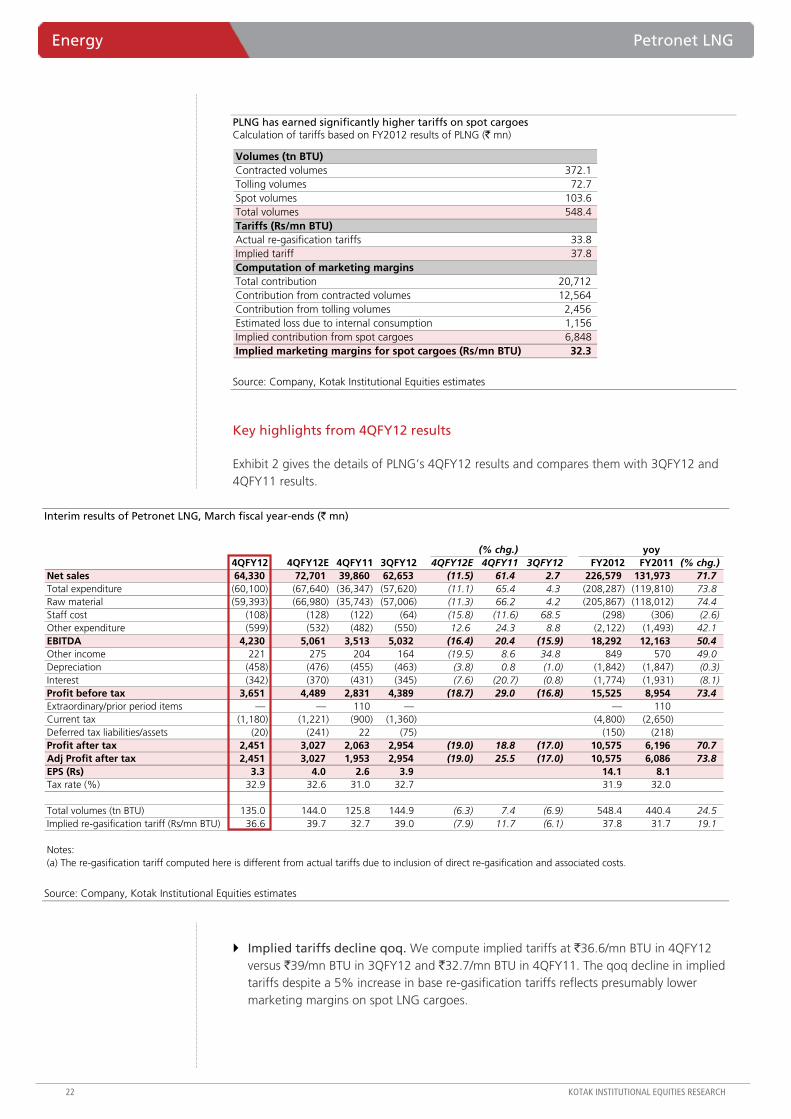
PLNG has earned significantly higher tariffs on spot cargoes Calculation of tariffs based on FY2012 results of PLNG (` mn)
Volumes (tn BTU)Contracted volumes 372.1 Tolling volumes 72.7 Spot volumes 103.6 Total volumes 548.4 Tariffs (Rs/mn BTU)Actual re-gasification tariffs 33.8 Implied tariff 37.8 Computation of marketing marginsTotal contribution 20,712 Contribution from contracted volumes 12,564 Contribution from tolling volumes 2,456 Estimated loss due to internal consumption 1,156 Implied contribution from spot cargoes 6,848 Implied marketing margins for spot cargoes (Rs/mn BTU) 32.3
Source: Company, Kotak Institutional Equities estimates
Key highlights from 4QFY12 results
Exhibit 2 gives the details of PLNG’s 4QFY12 results and compares them with 3QFY12 and 4QFY11 results.
Interim results of Petronet LNG, March fiscal year-ends (` mn)
(% chg.) yoy4QFY12 4QFY12E 4QFY11 3QFY12 4QFY12E 4QFY11 3QFY12 FY2012 FY2011 (% chg.)
Net sales 64,330 72,701 39,860 62,653 (11.5) 61.4 2.7 226,579 131,973 71.7Total expenditure (60,100) (67,640) (36,347) (57,620) (11.1) 65.4 4.3 (208,287) (119,810) 73.8Raw material (59,393) (66,980) (35,743) (57,006) (11.3) 66.2 4.2 (205,867) (118,012) 74.4Staff cost (108) (128) (122) (64) (15.8) (11.6) 68.5 (298) (306) (2.6)Other expenditure (599) (532) (482) (550) 12.6 24.3 8.8 (2,122) (1,493) 42.1EBITDA 4,230 5,061 3,513 5,032 (16.4) 20.4 (15.9) 18,292 12,163 50.4Other income 221 275 204 164 (19.5) 8.6 34.8 849 570 49.0Depreciation (458) (476) (455) (463) (3.8) 0.8 (1.0) (1,842) (1,847) (0.3)Interest (342) (370) (431) (345) (7.6) (20.7) (0.8) (1,774) (1,931) (8.1)Profit before tax 3,651 4,489 2,831 4,389 (18.7) 29.0 (16.8) 15,525 8,954 73.4Extraordinary/prior period items — — 110 — — 110Current tax (1,180) (1,221) (900) (1,360) (4,800) (2,650)Deferred tax liabilities/assets (20) (241) 22 (75) (150) (218)Profit after tax 2,451 3,027 2,063 2,954 (19.0) 18.8 (17.0) 10,575 6,196 70.7Adj Profit after tax 2,451 3,027 1,953 2,954 (19.0) 25.5 (17.0) 10,575 6,086 73.8EPS (Rs) 3.3 4.0 2.6 3.9 14.1 8.1 Tax rate (%) 32.9 32.6 31.0 32.7 31.9 32.0
Total volumes (tn BTU) 135.0 144.0 125.8 144.9 (6.3) 7.4 (6.9) 548.4 440.4 24.5Implied re-gasification tariff (Rs/mn BTU) 36.6 39.7 32.7 39.0 (7.9) 11.7 (6.1) 37.8 31.7 19.1
Notes:(a) The re-gasification tariff computed here is different from actual tariffs due to inclusion of direct re-gasification and associated costs.
Source: Company, Kotak Institutional Equities estimates
Implied tariffs decline qoq. We compute implied tariffs at `36.6/mn BTU in 4QFY12 versus `39/mn BTU in 3QFY12 and `32.7/mn BTU in 4QFY11. The qoq decline in implied tariffs despite a 5% increase in base re-gasification tariffs reflects presumably lower marketing margins on spot LNG cargoes.

Petronet LNG Energy
KOTAK INSTITUTIONAL EQUITIES RESEARCH 23
LNG volumes decline qoq. PLNG reported 6.9% qoq decline in re-gasification volumes to 135 tn BTU versus 144.9 tn BTU in 3QFY12, led by (1) lower contracted volumes of 93.5 tn BTU in 4QFY12 (-4.9 tn BTU qoq) and (2) lower tolling volumes of 15 tn BTU (-6.8 tn BTU qoq). Spot LNG volumes increased modestly to 26.5 tn BTU from 24.7 tn BTU in 3QFY12.
Increase in other expenditure. PLNG’s other expenditure increased to `599 mn in 4QFY12 from `550 mn in 3QFY12 and `482 mn in 4QFY11.
Increase in other income. Other income increased to `221 mn for 4QFY12 from `164 mn in 3QFY12 and `204 mn in 4QFY11.
Key assumptions behind our earnings model
We discuss the key assumptions underlying our earnings model below (see Exhibit 3).
We model Petronet's volumes to ramp-up to 17 mtpa by FY2015E Key volume/price assumptions for Petronet LNG, March fiscal year-ends, 2007-15E
2008 2009 2010 2011 2012E 2013E 2014E 2015E Volume assumptions (mn tons)Contract LNG volumes 4.8 4.8 7.1 7.5 7.3 8.4 10.5 13.8 Spot LNG volumes 1.5 1.5 0.4 0.6 2.0 1.7 1.5 1.5 Tolling volumes — — 0.3 0.6 1.4 1.6 1.6 1.6 Total volumes 6.3 6.3 7.9 8.7 10.8 11.6 13.5 16.8 Price assumptions (US$/mn BTU)LNG purchase price (FOB) 3.7 4.2 4.6 5.6 8.1 10.2 11.9 12.9 Landed cost (incl. import tariff) 4.2 4.7 5.2 6.3 9.0 11.1 13.0 14.0 Re-gasification charges for Dahej 0.69 0.64 0.65 0.71 0.70 0.68 0.73 0.77 Re-gasification charges for Dahej (Rs/mn BTU) 27.8 29.2 30.6 32.2 33.8 35.5 37.2 38.6 Re-gasification charges for Kochi 0.82 0.84 0.89 Re-gasification charges for Kochi (Rs/mn BTU) 42.5 43.0 44.6 Escalation in re-gasification charges (%) 5.0 5.0 5.0 5.0 5.0 5.0 5.0 3.7 Sales price (US$/mn BTU) 4.9 5.4 5.8 7.0 9.7 11.8 13.7 14.8 Other assumptionsRupee/US dollar exchange rate 40.1 45.8 47.4 45.6 47.9 52.0 51.0 50.0
Source: Company, Kotak Institutional Equities estimates
Volumes. We model contract LNG volumes of 8.4 mn tons, 10.5 mn tons and 13.8 mn tons in FY2013E, FY2014E and FY2015E respectively. We model spot LNG imports (including tolling) of 3.2 mn tons in FY2013E, 3 mn tons in FY2014E and 3 mn tons in FY2015E versus 3.5 mn tons in FY2012.
Re-gasification tariffs. We model PLNG’s re-gasification tariffs to increase by 5% in each year over FY2013-14 and remain flat thereafter until FY2022, the terminal year of our DCF model (see Exhibit 4). We have assumed higher re-gasification tariff of `42.5/mn BTU for Kochi terminal versus current tariff of `35.02/mn BTU for Dahej terminal.
Exchange rate. We assume an exchange rate for FY2013E, FY2014E and FY2015E of `52/US$, `51/US$ and `50/US$ respectively, versus `52.5/US$, `51/US$ and `50/US$ previously.

Energy Petronet LNG
24 KOTAK INSTITUTIONAL EQUITIES RESEARCH
Our DCF-based fair value for PLNG is `140 Calculation of equity value of PLNG using discounted cash flow analysis (` mn)
2013E 2014E 2015E 2016E 2017E 2018E 2019E 2020E 2021E 2022E 2023E 2024E EBITDA 18,881 21,738 26,603 29,768 33,757 35,862 36,021 35,860 35,689 35,506 35,506 35,506Adjusted tax expense (3,826) (3,839) (5,834) (6,203) (7,649) (8,901) (9,658) (10,425) (11,146) (11,825)Change in working capital (4,959) (1,895) (2,569) (1,334) (1,737) (656) (8) (506) (591) (696)Operating cash flow 10,096 16,004 18,199 22,231 24,370 26,305 26,355 24,929 23,951 22,985Capital expenditure (20,896) (11,450) (12,000) (6,500) (1,000) (1,000) (1,000) (1,000) (1,000) (5,335)Free cash flow (10,800) 4,554 6,199 15,731 23,370 25,305 25,355 23,929 22,951 17,650 17,650 17,650Discounted cash flow-now (9,675) 3,626 4,388 9,894 13,065 12,575 11,200 9,393 8,008 5,474Discounted cash flow-1 year forward 4,080 4,936 11,134 14,698 14,147 12,600 10,570 9,009 6,158 5,474Discounted cash flow-2 year forward 5,553 12,526 16,541 15,915 14,175 11,892 10,138 6,928 6,158 5,474
Now + 1-year + 2-yearsDiscount rate (%) 12.5% 12.5% 12.5%Total PV of free cash flow 67,948 92,807 105,301Terminal value assumptionGrowth in perpetuity 0.0% 0.0% 0.0%FCF in 2022E 17,650 17,650 17,650Exit FCF multiple (X) 8.0 8.0 8.0 141 -1.0% -0.5% 0.0% 1.0% 1.5%Exit EV/EBITDA multiple (X) 4.0 4.0 4.0 11.5% 152 155 158 165 170Terminal value 141,202 141,202 141,202 12.0% 143 146 149 155 159PV of terminal value 43,792 43,792 43,792 12.5% 136 138 141 146 150Total company value 111,741 136,600 149,093 13.0% 129 131 133 138 141
13.5% 122 124 126 131 133Net debt 19,096 34,330 34,499Equity value 92,644 102,270 114,594 Shares outstanding (mn) 750 750 750 Equity value of regasification business (Rs) 124 136 153 Equity value of 26% stake in Dahej Port (Rs) 4 4 4 Fair value of PLNG (Rs) 128 141 157
Fiscal Year end (March 31, XXXX) March-13 March-14 March-15 March-16 March-17 March-18 March-19 March-20 March-21 March-22 March-23 March-24Today 24-Apr-12 24-Apr-12 24-Apr-12 24-Apr-12 24-Apr-12 24-Apr-12 24-Apr-12 24-Apr-12 24-Apr-12 24-Apr-12 24-Apr-12 24-Apr-12Days left 341 706 1,071 1,437 1,802 2,167 2,532 2,898 3,263 3,628 3,993 4,359 Years left 0.93 1.93 2.93 3.94 4.94 5.94 6.94 7.94 8.94 9.94 10.94 11.94 Discount factor at WACC 0.90 0.80 0.71 0.63 0.56 0.50 0.44 0.39 0.35 0.31 0.28 0.24
Sensitivity of 12-month fair value to WACC and perpetual growthPerpetual growth (%)
WA
CC
(%
)
Source: Kotak Institutional Equities estimates

Petronet LNG Energy
KOTAK INSTITUTIONAL EQUITIES RESEARCH 25
Petronet LNG: Profit model, balance sheet, cash model March fiscal year-ends, 2008-15E (` mn)
2008 2009 2010 2011 2012 2013E 2014E 2015EProfit model (Rs mn)Net sales 65,553 84,287 106,491 131,973 226,579 318,196 429,591 580,775EBITDA 8,661 9,013 8,465 12,163 18,292 18,881 21,738 26,603Other income 536 765 978 563 849 723 419 462Interest (1,024) (1,012) (1,839) (1,931) (1,774) (1,090) (2,853) (2,710)Depreciation (1,022) (1,025) (1,609) (1,847) (1,842) (2,622) (4,551) (4,854)Extraordinary items — — — 117 — — — —Pretax profits 7,152 7,740 5,995 9,064 15,525 15,892 14,753 19,500Tax (2,185) (2,526) (1,410) (2,650) (4,800) (3,581) (3,217) (5,122)Deferred taxation (220) (30) (540) (218) (150) (1,576) (1,570) (1,204)Net profits 4,747 5,184 4,045 6,196 10,575 10,736 9,967 13,173Earnings per share (Rs) 6.3 6.9 5.4 8.1 14.1 14.3 13.3 17.6
Balance sheet (Rs mn)Total equity 16,185 19,834 22,349 26,802 35,198 43,755 51,542 60,357Deferred taxation liability 2,692 2,722 3,262 3,480 3,630 5,206 6,776 7,980Total borrowings 15,776 22,817 24,998 32,161 30,340 39,342 40,342 41,342Currrent liabilities 8,588 8,922 9,006 12,134 22,943 24,564 32,112 42,285Total liabilities and equity 43,242 54,295 59,614 74,577 92,110 112,866 130,771 151,964Cash 3,586 6,578 3,405 1,540 9,845 3,613 4,444 4,783Current assets 7,890 11,519 8,811 12,334 22,758 29,338 38,780 51,523Total fixed assets 26,293 33,156 42,012 49,053 58,109 78,516 86,148 94,259Investments 5,473 3,043 5,386 11,649 1,399 1,399 1,399 1,399Total assets 43,242 54,295 59,614 74,577 92,110 112,866 130,771 151,964
Free cash flow (Rs mn)Operating cash flow, excl. working capital 6,982 5,378 5,513 8,348 10,445 12,078 14,935 17,805Working capital 1,589 (3,384) 3,026 (1,079) 386 (4,959) (1,895) (2,569)Capital expenditure (263) (27) (15,757) (8,889) (9,625) (20,896) (11,450) (12,000)Investments (2,780) 2,462 (2,339) (6,263) 10,250 — — —Free cash flow 5,528 4,429 (9,556) (7,882) 11,457 (13,778) 1,591 3,236Other income (414) 695 452 386 849 723 419 462
Ratios (%)Debt/equity 84 101 98 106 78 80 69 60 Net debt/equity 65 72 84 101 53 73 62 53 RoAE 27.8 25.0 16.8 22.2 30.6 24.5 18.6 20.8RoACE 30.7 33.2 20.1 25.5 41.1 21.7 14.9 18.0 Adjusted CROCI 32.0 28.5 17.7 25.1 34.7 15.7 16.3 18.8
Key assumptions (US$/mn BTU)Contract LNG volumes (mn tons) 4.8 4.8 7.1 7.5 7.3 8.4 10.5 13.8Total LNG volumes (mn tons) 6.3 6.3 7.9 8.7 10.8 11.6 13.5 16.8LNG purchase price (FOB) 3.7 4.2 4.6 5.6 8.1 10.2 11.9 12.9Base re-gasification charges 0.69 0.64 0.65 0.71 0.70 0.68 0.73 0.77Sales price 4.9 5.4 5.8 7.0 9.7 11.8 13.7 14.8Rupee/US dollar exchange rate 40.1 45.8 47.4 45.6 47.9 52.0 51.0 50.0
Source: Company, Kotak Institutional Equities estimates

For private Circulation Only. FOR IMPORTANT INFORMATION ABOUT KOTAK SECURITIES’ RATING SYSTEM AND OTHER DISCLOSURES, REFER TO THE END OF THIS MATERIAL.
Inflows: Rs709 bn in FY2013E; Rs700 bn+ inflow possible on segmental/geographical diversity
Annual inflow traction of Rs700 bn+ may be possible on (1) diverse presence across segments, (2) strong activity in certain sectors (T&D, roads, urban infrastructure) and (3) widening international opportunities. We build Rs709 bn inflows in FY2013 (a 4% decline over Rs735 bn in FY12E) led by (1) Rs331 bn from infrastructure (buildings, roads, railways and water), (2) Rs144 bn from power (mostly T&D; negligible inflows from generation), (3) Rs161 bn from process and O&G and (4) Rs74 bn from other segments. Strong backlog of Rs1.45 tn provides confidence to our EPC execution of Rs529 bn in FY2013E (14% yoy growth) and Rs587 bn in FY2014E (up 11% yoy).
Margin: Some decline already panned out, build further dip in FY2013E; level not exorbitant vs peers
L&T’s margins are likely to contract about 100 bps in FY2012. We build a further 50-75 bps margin contraction over FY2012-14E. Thus downside risk on margins is potentially low even with order inflow focused on roads, T&D and buildings. Even in absolute terms, L&T’s EBITDA margin do not seem high versus peers (KEC, Kalpataru) even as percentage overheads seem lower.
Subsidiaries: Rs400 value is 1.3X P/B; fear of losses exaggerated as Rs13 incremental EPS possible
L&T’s subsidiaries could contribute a net incremental EPS of about Rs13 to consolidated EPS for FY2013 and FY2014. Fear of losses from forgings, shipbuilding and power subsidiaries is likely exaggerated and near-term focused, as these can be large opportunities over the medium-term. We value subsidiaries at Rs400/share and this valuation is essentially about 1.3X P/B on FY2013E.
Significant correction, strong RoCEs, limited downside to estimates; upgrade to ADD
We upgrade L&T to ADD (from REDUCE) with TP of Rs1,350 (Rs1,380 earlier) as (1) significant time and price correction offers better risk-reward, (2) limited incremental downside to inflow, revenue and margin estimates, (3) strong core business RoCE of 20-22% despite building lower margins and higher working capital, (4) reasonable core business valuations (of 12.4X FY2013E and 11.5X FY2014E P/E); after adj. for subsidiaries at 1.3X FY2013E P/B and are below 10-year lows as well, (5) much more diversified and strong positioning versus its infrastructure/capital goods peers.
Larsen & Toubro (LT)
Industrials
Risk-reward in fair balance after sharp correction; upgrade to ADD. We upgrade L&T to ADD (from REDUCE) on limited downside to estimates and valuations (2.1X P/B, 12.4X adj. P/E on FY2013E) well below the 10-year average. Downside to estimates limited on (1) revenues, on large backlog, (2) margins, absolute margins not high versus peers and build 200 bps decline from peak, (3) inflows, very diverse segmental/ geographical presence (Rs700 bn in FY13E), (4) strong standalone adj. RoCEs of 20-22% support valuations and (5) subsidiary valuation (Rs400) reasonable based on P/B (1.3X FY2013E).
Larsen & ToubroStock data Forecasts/Valuations 2012 2013E 2014E
52-week range (Rs) (high,low) EPS (Rs) 78.1 82.4 91.5Market Cap. (Rs bn) 741.9 EPS growth (%) 15.4 5.4 11.0
Shareholding pattern (%) P/E (X) 15.6 14.8 13.3Promoters 0.0 Sales (Rs bn) 641.1 734.6 821.0FIIs 17.0 Net profits (Rs bn) 47.6 50.2 55.7MFs 5.5 EBITDA (Rs bn) 100.2 113.9 127.2
Price performance (%) 1M 3M 12M EV/EBITDA (X) 11.0 10.1 9.3Absolute (6.3) (9.9) (28.6) ROE (%) 16.5 14.8 14.3Rel. to BSE-30 (5.5) (11.0) (18.7) Div. Yield (%) 1.1 1.1 1.1
Company data and valuation summary
1,868-969
ADD
APRIL 24, 2012
CHANGE IN RECO.
Coverage view: Cautious
Price (Rs): 1,219
Target price (Rs): 1,350
BSE-30: 17,207

Larsen & Toubro Industrials
KOTAK INSTITUTIONAL EQUITIES RESEARCH 27
Rs700 bn+ a year inflow traction possible on segmental/geographical diversity
We build an order inflow decline of 4% in FY2013E to Rs700-710 bn (post expected inflow decline of about 8% in FY2012 to Rs735 bn). Our FY2013 inflow estimate is based on:
Rs331 bn of inflows from the infrastructure segment. This is likely to be led by commercial buildings and road projects. We believe roads segment could potentially contribute about Rs95 bn of inflows in FY2013 based on 800-900 km worth of road projects from in-house development project wins, other developer orders and other agencies such as states (apart from NHAI). Additionally industrial and commercial buildings segment may contribute about Rs120 bn of orders (based on historical track record). Other potential contributors to this segment include railways (about Rs50 bn led by opportunities from DFCC, orders from ongoing Hyderabad metro, other urban infra projects) and water (Rs50 bn based on track record and typically originating from city level municipal corporations).
Rs143 bn from the power segment. This is mainly from the T&D segment with no significant contribution from the generation segment. T&D may contribute Rs125 bn worth of orders in FY2012 and we expect that T&D can contribute Rs115 bn worth of orders in FY2013. Note that more than half of FY2012E T&D inflows were from international markets and about 40-45% was domestic. We do not expect meaningful contribution from the generation segment.
Rs161 bn from process and oil & gas segments. This includes platforms, pipelines, mineral and metals, refineries and petrochemicals. International markets could potentially contribute Rs70-80 bn of inflows (about Rs50 bn in FY2012E) on back of increasing focus as well as near-shore presence with fabrication facilities (yard in Oman) and the remaining Rs80-90 bn from the domestic market (brown-field investments and pending order decisions in projects underway).
Rs67 bn from others segments. This includes mainly product orders from segments such as machinery and industrial products and electrical and electronics products.

Industrials Larsen & Toubro
28 KOTAK INSTITUTIONAL EQUITIES RESEARCH
Rough break-up of sector-wise order inflows of L&T
Segment 2008 2009 2010 2011 9M Rep. + 4Q Ann. KIE Est. 2013EProcess + Oil & Gas 168 (137) 144 (140) 230 (168) 183 (139) 141 (87) 161 161
Refineries 38 37 21 12 —Petrochemicals 3 8 30 — 10 25 Minerals & metals 54 80 43 99 38 80
Steel sector 50 59 10 93 21 Bulk material handling — — — 4 —Platforms 42 — 74 18 31 45 Pipelines — 15 — 6 8 15
Power 59 (35) 129 (80) 230 (217) 255 (200) 140 (111) 160 144 BOP 5 20 45 46 2 10 EPC — — 103 93 18 25 Equipment — 16 24 28 — —
Electrification/ T&D 30 45 45 32 91 125 115 Domestic 8 26 17 14 34 International 23 19 28 18 57
Infrastructure 130 (100) 201 (185) 188 (112) 303 (220) 291 (256) 349 331 Roads and bridges 3 43 — 33 82 125 95
Ports and airports 55 — — 22 8 10 15 Railways 3 28 8 70 21 25 50
Industrial & commercial bldg 33 92 92 72 118 145 120
Residential 17 14 32 53 61 Water 6 23 13 23 27 45 50
Others 63 (7) 41 (5) 49 (10) 56 (5) 46 (2) 67 74 Total 420 (280) 516 (410) 696 (507) 798 (565) 618 736 709
Note: Figures in brackets represent quantum of orders announced (versus the reported number)
FY2012E
25
Source: Company, Kotak Institutional Equities estimates
We believe annual order inflow traction of Rs700 bn+ may be possible for L&T based on (1) a meaningful presence across a diverse set of sectors, (2) potential strong activity in sectors such as roads, T&D and urban infrastructure segment (witnessed in strong ordering activity of PGCIL, NHAI etc.), and (3) improved traction in overseas geographies across segments providing relatively large opportunities.
L&T announced inflows of about Rs124 bn in 4QFY12, led by infrastructure (roads, buildings), power (T&D) and process (metals) segments. Adding this to the Rs494 bn of inflows reported in 9MFY12, it implies full-year inflows of about Rs618 bn for L&T. This is versus our estimate of Rs735 bn and management guidance of 0-5% growth (Rs800 bn).
However L&T had announced only about 75% of its total recorded inflows in 9MFY12 and hence actual inflows in 4QFY12E are likely to be higher and may thus reach our estimate of Rs735 bn for the full year. Note that L&T has emerged as the lowest bidder for two NHAI projects (bids opened on March 30, 2012) in Maharashtra, with a cumulative project cost of about Rs45 bn (Amravati-Jalgaon and Jalgaon-Gujarat/Maharashtra border projects).
Loss of large opportunities
L&T missed some potentially large opportunities in FY2012: (1) it did not win orders from the NTPC bulk tenders and (2) it did not qualify to bid for a US$4 bn contract for the construction of the new Abu Dhabi Airport.
Larsen & Toubro Industrials
KOTAK INSTITUTIONAL EQUITIES RESEARCH 29
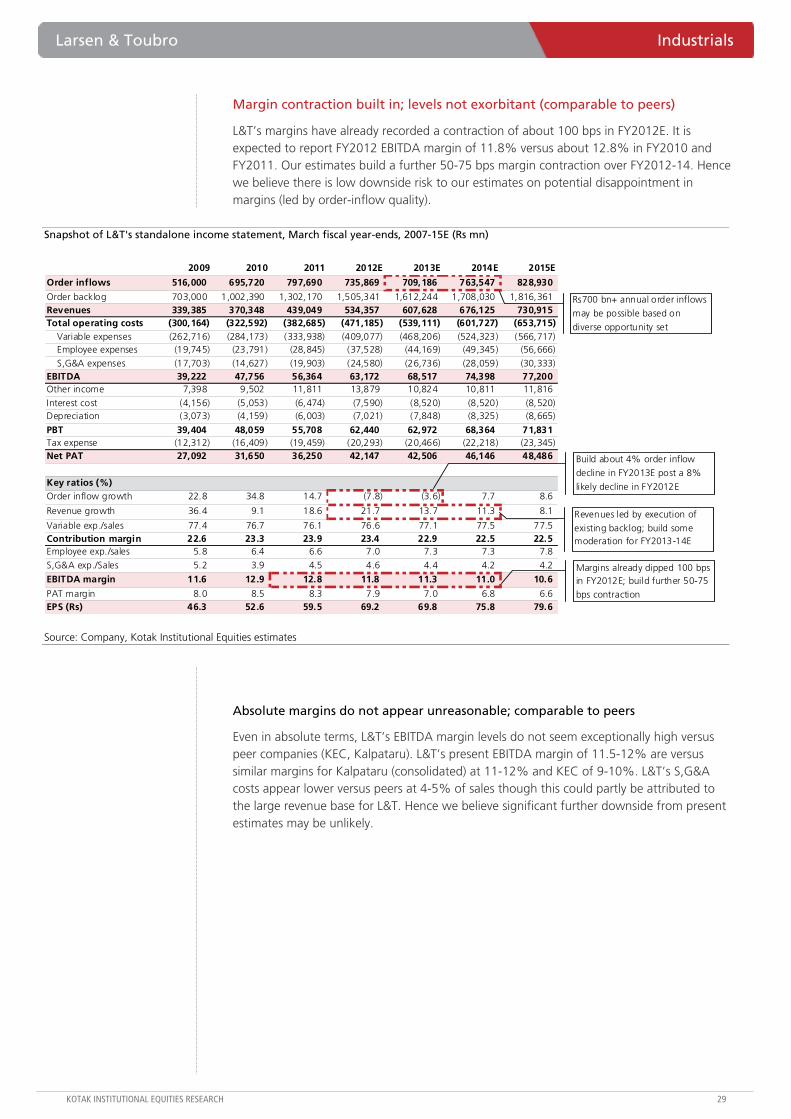
Margin contraction built in; levels not exorbitant (comparable to peers)
L&T’s margins have already recorded a contraction of about 100 bps in FY2012E. It is expected to report FY2012 EBITDA margin of 11.8% versus about 12.8% in FY2010 and FY2011. Our estimates build a further 50-75 bps margin contraction over FY2012-14. Hence we believe there is low downside risk to our estimates on potential disappointment in margins (led by order-inflow quality).
Snapshot of L&T's standalone income statement, March fiscal year-ends, 2007-15E (Rs mn)
2009 2010 2011 2012E 2013E 2014E 2015E
Order inflows 516,000 695,720 797,690 735,869 709,186 763,547 828,930
Order backlog 703,000 1,002,390 1,302,170 1,505,341 1,612,244 1,708,030 1,816,361 Revenues 339,385 370,348 439,049 534,357 607,628 676,125 730,915 Total operating costs (300,164) (322,592) (382,685) (471,185) (539,111) (601,727) (653,715)
Variable expenses (262,716) (284,173) (333,938) (409,077) (468,206) (524,323) (566,717) Employee expenses (19,745) (23,791) (28,845) (37,528) (44,169) (49,345) (56,666)
S,G&A expenses (17,703) (14,627) (19,903) (24,580) (26,736) (28,059) (30,333) EBITDA 39,222 47,756 56,364 63,172 68,517 74,398 77,200 Other income 7,398 9,502 11,811 13,879 10,824 10,811 11,816
Interest cost (4,156) (5,053) (6,474) (7,590) (8,520) (8,520) (8,520) Depreciation (3,073) (4,159) (6,003) (7,021) (7,848) (8,325) (8,665)
PBT 39,404 48,059 55,708 62,440 62,972 68,364 71,831 Tax expense (12,312) (16,409) (19,459) (20,293) (20,466) (22,218) (23,345) Net PAT 27,092 31,650 36,250 42,147 42,506 46,146 48,486
Key ratios (%)Order inflow growth 22.8 34.8 14.7 (7.8) (3.6) 7.7 8.6
Revenue growth 36.4 9.1 18.6 21.7 13.7 11.3 8.1
Variable exp./sales 77.4 76.7 76.1 76.6 77.1 77.5 77.5 Contribution margin 22.6 23.3 23.9 23.4 22.9 22.5 22.5 Employee exp./sales 5.8 6.4 6.6 7.0 7.3 7.3 7.8
S,G&A exp./Sales 5.2 3.9 4.5 4.6 4.4 4.2 4.2
EBITDA margin 11.6 12.9 12.8 11.8 11.3 11.0 10.6
PAT margin 8.0 8.5 8.3 7.9 7.0 6.8 6.6 EPS (Rs) 46.3 52.6 59.5 69.2 69.8 75.8 79.6
Build about 4% order inflow
decline in FY2013E post a 8%
likely decline in FY2012E
Revenues led by execution of
existing backlog; build some moderation for FY2013-14E
Margins already dipped 100 bps in FY2012E; build further 50-75 bps contraction
Rs700 bn+ annual order inflows
may be possible based on
diverse opportunity set
Source: Company, Kotak Institutional Equities estimates
Absolute margins do not appear unreasonable; comparable to peers
Even in absolute terms, L&T’s EBITDA margin levels do not seem exceptionally high versus peer companies (KEC, Kalpataru). L&T’s present EBITDA margin of 11.5-12% are versus similar margins for Kalpataru (consolidated) at 11-12% and KEC of 9-10%. L&T’s S,G&A costs appear lower versus peers at 4-5% of sales though this could partly be attributed to the large revenue base for L&T. Hence we believe significant further downside from present estimates may be unlikely.

Industrials Larsen & Toubro
30 KOTAK INSTITUTIONAL EQUITIES RESEARCH
EBITDA margin of L&T (standalone) versus peer companies, March fiscal year-ends, 2009-13E (Rs mn)
2009 2010 2011 9MFY12 2012E 2013EL&T (standalone)Revenues 339,385 370,348 439,049 347,264 534,357 607,628 Total operating costs (300,164) (322,592) (382,685) (310,828) (471,185) (539,111) EBITDA 39,222 47,756 56,364 36,436 63,172 68,517
Key ratios (%)Variable exp./sales 77.4 76.7 76.1 76.9 76.6 77.1 Contribution margin 22.6 23.3 23.9 23.1 23.4 22.9 Employee exp./sales 5.8 6.4 6.6 7.9 7.0 7.3 S,G&A, other exp./Sales 5.2 3.9 4.5 4.6 4.6 4.4
EBITDA margin 11.6 12.9 12.8 10.5 11.8 11.3
Kalapataru Power (consolidated)Revenues 18,824 26,316 28,741 19,588
Total operating costs (16,603) (22,989) (25,098) (17,404) EBITDA 2,221 3,327 3,643 2,184 Key ratios (%)Variable exp./sales 76.7 75.8 74.9 72.7 Contribution margin 23.3 24.2 25.1 27.3 Employee exp./sales 5.8 5.9 6.7 6.4 S,G&A, other exp./Sales 5.7 5.7 5.7 9.8
EBITDA margin 11.8 12.6 12.7 11.2
KEC InternationalRevenues 34,288 39,072 44,742 37,458 54,074 58,445 Total operating costs (31,278) (35,014) (40,116) (34,469) (49,466) (53,145) EBITDA 3,010 4,059 4,626 2,989 4,609 5,300
Key ratios (%)Variable exp./sales 74.4 76.0 72.3 72.3 72.3 72.0
Contribution margin 25.6 24.0 27.7 27.7 27.8 28.0 Employee exp./sales 4.1 4.3 6.3 8.4 8.2 7.9 S,G&A, other exp./Sales 12.7 9.3 11.0 11.3 11.0 11.0
EBITDA margin 8.8 10.4 10.3 8.0 8.5 9.1
Source: Company, Kotak Institutional Equities estimates
Margin contraction mainly due to lower inflow quality
The recent margin contraction and further 50-75 bps built into our estimates are based on (1) quality concerns of recent order inflows concentrated in buildings, T&D and roads sectors, (2) increased competition across most sectors and (3) potential negative operating leverage on rising employee and SG&A costs (as in 9MFY12) in inflationary environment with moderation in execution growth (potential for increase in direct manufacturing expenses which has not panned out so far).
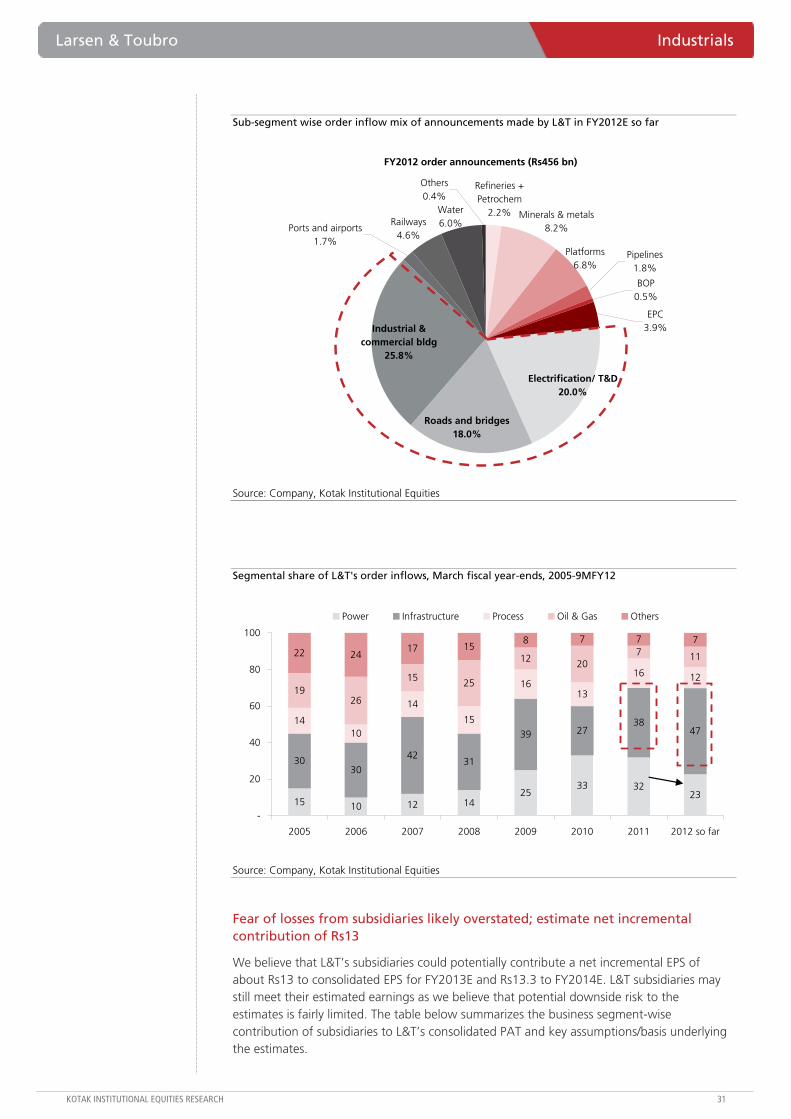
Larsen & Toubro Industrials
KOTAK INSTITUTIONAL EQUITIES RESEARCH 31
Sub-segment wise order inflow mix of announcements made by L&T in FY2012E so far
FY2012 order announcements (Rs456 bn)
Refineries + Petrochem
2.2%
Industrial & commercial bldg
25.8%
Electrification/ T&D20.0%
Others0.4%
Pipelines1.8%
Water6.0%Ports and airports
1.7%
Railways4.6%
Roads and bridges18.0%
EPC3.9%
BOP0.5%
Platforms 6.8%
Minerals & metals8.2%
Source: Company, Kotak Institutional Equities
Segmental share of L&T's order inflows, March fiscal year-ends, 2005-9MFY12
15 10 12 1425
33 3223
3030
4231
39 2738
4714
10
14
15
1613
16 1219
26
15 25
12 207 1122 24
17 158 7 7 7
-
20
40
60
80
100
2005 2006 2007 2008 2009 2010 2011 2012 so far
Power Infrastructure Process Oil & Gas Others
Source: Company, Kotak Institutional Equities
Fear of losses from subsidiaries likely overstated; estimate net incremental contribution of Rs13
We believe that L&T’s subsidiaries could potentially contribute a net incremental EPS of about Rs13 to consolidated EPS for FY2013E and Rs13.3 to FY2014E. L&T subsidiaries may still meet their estimated earnings as we believe that potential downside risk to the estimates is fairly limited. The table below summarizes the business segment-wise contribution of subsidiaries to L&T’s consolidated PAT and key assumptions/basis underlying the estimates.
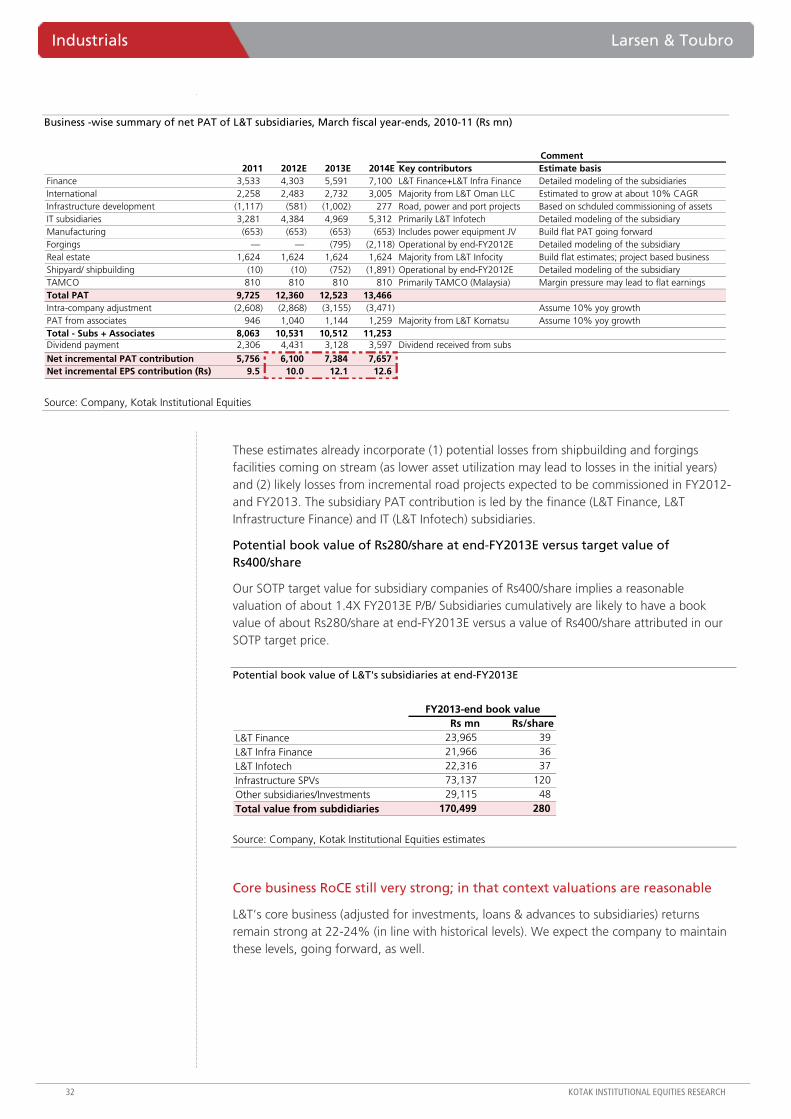
Industrials Larsen & Toubro
32 KOTAK INSTITUTIONAL EQUITIES RESEARCH
Business -wise summary of net PAT of L&T subsidiaries, March fiscal year-ends, 2010-11 (Rs mn)
2011 2012E 2013E 2014E Key contributors Estimate basisFinance 3,533 4,303 5,591 7,100 L&T Finance+L&T Infra Finance Detailed modeling of the subsidiariesInternational 2,258 2,483 2,732 3,005 Majority from L&T Oman LLC Estimated to grow at about 10% CAGRInfrastructure development (1,117) (581) (1,002) 277 Road, power and port projects Based on schduled commissioning of assetsIT subsidiaries 3,281 4,384 4,969 5,312 Primarily L&T Infotech Detailed modeling of the subsidiaryManufacturing (653) (653) (653) (653) Includes power equipment JV Build flat PAT going forwardForgings — — (795) (2,118) Operational by end-FY2012E Detailed modeling of the subsidiaryReal estate 1,624 1,624 1,624 1,624 Majority from L&T Infocity Build flat estimates; project based businessShipyard/ shipbuilding (10) (10) (752) (1,891) Operational by end-FY2012E Detailed modeling of the subsidiaryTAMCO 810 810 810 810 Primarily TAMCO (Malaysia) Margin pressure may lead to flat earningsTotal PAT 9,725 12,360 12,523 13,466 Intra-company adjustment (2,608) (2,868) (3,155) (3,471) Assume 10% yoy growthPAT from associates 946 1,040 1,144 1,259 Majority from L&T Komatsu Assume 10% yoy growthTotal - Subs + Associates 8,063 10,531 10,512 11,253 Dividend payment 2,306 4,431 3,128 3,597 Dividend received from subs
Net incremental PAT contribution 5,756 6,100 7,384 7,657 Net incremental EPS contribution (Rs) 9.5 10.0 12.1 12.6
Comment
Source: Company, Kotak Institutional Equities
These estimates already incorporate (1) potential losses from shipbuilding and forgings facilities coming on stream (as lower asset utilization may lead to losses in the initial years) and (2) likely losses from incremental road projects expected to be commissioned in FY2012-and FY2013. The subsidiary PAT contribution is led by the finance (L&T Finance, L&T Infrastructure Finance) and IT (L&T Infotech) subsidiaries.
Potential book value of Rs280/share at end-FY2013E versus target value of Rs400/share
Our SOTP target value for subsidiary companies of Rs400/share implies a reasonable valuation of about 1.4X FY2013E P/B/ Subsidiaries cumulatively are likely to have a book value of about Rs280/share at end-FY2013E versus a value of Rs400/share attributed in our SOTP target price.
Potential book value of L&T's subsidiaries at end-FY2013E
Rs mn Rs/shareL&T Finance 23,965 39 L&T Infra Finance 21,966 36 L&T Infotech 22,316 37 Infrastructure SPVs 73,137 120 Other subsidiaries/Investments 29,115 48 Total value from subdidiaries 170,499 280
FY2013-end book value
Source: Company, Kotak Institutional Equities estimates
Core business RoCE still very strong; in that context valuations are reasonable
L&T’s core business (adjusted for investments, loans & advances to subsidiaries) returns remain strong at 22-24% (in line with historical levels). We expect the company to maintain these levels, going forward, as well.
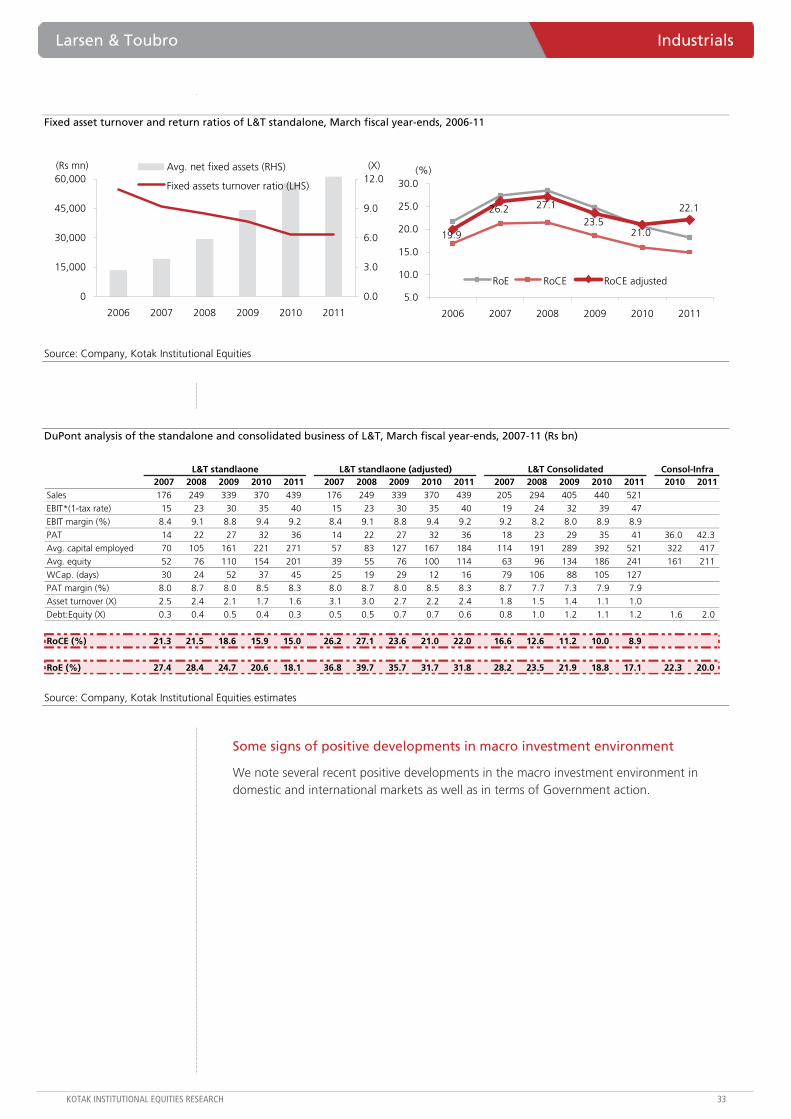
Larsen & Toubro Industrials
KOTAK INSTITUTIONAL EQUITIES RESEARCH 33
Fixed asset turnover and return ratios of L&T standalone, March fiscal year-ends, 2006-11
0
15,000
30,000
45,000
60,000
2006 2007 2008 2009 2010 2011
(Rs mn)
0.0
3.0
6.0
9.0
12.0(X)Avg. net fixed assets (RHS)
Fixed assets turnover ratio (LHS)
22.1
19.9
26.2 27.1
23.521.0
5.0
10.0
15.0
20.0
25.0
30.0
2006 2007 2008 2009 2010 2011
(%)
RoE RoCE RoCE adjusted
Source: Company, Kotak Institutional Equities
DuPont analysis of the standalone and consolidated business of L&T, March fiscal year-ends, 2007-11 (Rs bn)
2007 2008 2009 2010 2011 2007 2008 2009 2010 2011 2007 2008 2009 2010 2011 2010 2011Sales 176 249 339 370 439 176 249 339 370 439 205 294 405 440 521 EBIT*(1-tax rate) 15 23 30 35 40 15 23 30 35 40 19 24 32 39 47 EBIT margin (%) 8.4 9.1 8.8 9.4 9.2 8.4 9.1 8.8 9.4 9.2 9.2 8.2 8.0 8.9 8.9
PAT 14 22 27 32 36 14 22 27 32 36 18 23 29 35 41 36.0 42.3 Avg. capital employed 70 105 161 221 271 57 83 127 167 184 114 191 289 392 521 322 417 Avg. equity 52 76 110 154 201 39 55 76 100 114 63 96 134 186 241 161 211
WCap. (days) 30 24 52 37 45 25 19 29 12 16 79 106 88 105 127 PAT margin (%) 8.0 8.7 8.0 8.5 8.3 8.0 8.7 8.0 8.5 8.3 8.7 7.7 7.3 7.9 7.9 Asset turnover (X) 2.5 2.4 2.1 1.7 1.6 3.1 3.0 2.7 2.2 2.4 1.8 1.5 1.4 1.1 1.0 Debt:Equity (X) 0.3 0.4 0.5 0.4 0.3 0.5 0.5 0.7 0.7 0.6 0.8 1.0 1.2 1.1 1.2 1.6 2.0
RoCE (%) 21.3 21.5 18.6 15.9 15.0 26.2 27.1 23.6 21.0 22.0 16.6 12.6 11.2 10.0 8.9
RoE (%) 27.4 28.4 24.7 20.6 18.1 36.8 39.7 35.7 31.7 31.8 28.2 23.5 21.9 18.8 17.1 22.3 20.0
L&T standlaone L&T standlaone (adjusted) L&T Consolidated Consol-Infra
Source: Company, Kotak Institutional Equities estimates
Some signs of positive developments in macro investment environment
We note several recent positive developments in the macro investment environment in domestic and international markets as well as in terms of Government action.

Industrials Larsen & Toubro
34 KOTAK INSTITUTIONAL EQUITIES RESEARCH
List of recent positive developments in domestic & global macro environment and Government action
Variable DevelopmentMacroInflation Sub 7% reading of WPI inflation over Jan-Mar-12 (9.11% in Nov-11) Credit RBI reducing repo rate by 50 bps in Apr-12Interest rate 10 year yield have fallen by 25 bps post the rate cut to about 8.1%Cement Three quarters of moderate growth in cement (5-10%) after flattish 1QFY12PowerCIL FSA guranteeing 80% of coal supply for projects to be commisioned till Mar-15, although with low penaltyUtility tariff hike TN (37%), AP (25%) and Odisha (25%) discoms taking steep tariff hikes; Rajasthan, Gujarat took hikes in Sep-11Clearances Provision of parallel processing of environmental and forest clearance for coal based projectsRoads - NHAIAwards FY2012 ordering at 7,900 kms surpasses target, aims for 8,800 kms in FY2013E (including 1,500 kms state awards)Land acquisition Land acquisition activity has stepped up 3X over the last 4 yearsEquity sale of stressed projects NHAI not averse to add provisions for clean equity stake sale in case of financially stressed projectsT&D - PGCILAwards Awarded projects worth Rs211 bn in FY2012 (strong 73% yoy growth excluding HVDC order)
Source: News flows, Kotak Institutional Equities
Reverse DCF implies 6.4% revenue CAGR and marginal inflow growth over 10 years
The reverse DCF exercise below attempts to figure out the assumptions underlying the current stock price of L&T at Rs1,222/share.
Methodology
The model takes the current share price as an input and calculates the revenue growth requirement from the price. Assumptions related to margins, capex, working capital etc. are built in the model as per our present understanding. Cells in dark red background with white font text are the results while cells in yellow background are the assumptions. From the revenue growth requirement for a particular price, the model also attempts to calculate the annual order inflow requirements for L&T.
Key takeaways:
Stock at Rs1,222 is pricing in revenue growth of 6.4% CAGR between FY2014-22E (an EPS growth of 5.3% p.a. during this period) and 5% thereafter perpetually
Stock price also implies relatively slow order inflow growth over the next 10 years (average order inflow CAGR of about 2.9% over FY2014-22E)
Key assumptions include:
SOTP valuation of subsidiaries at Rs375/share. Against this, attributed value the book value of all the subsidiaries combined together at end of FY2013E is expected to be about Rs280/share.
EBIT margin declines to 9.5% (potentially equivalent to an EBITDA margin of slightly below 11%) from current FY2012E level of about 11.25%.
Sustained working capital level of about 75 days of sales.

Larsen & Toubro Industrials
KOTAK INSTITUTIONAL EQUITIES RESEARCH 35
Reverse DCF valuation of L&T's standalone business, March fiscal year-ends, 2011-31E (Rs bn)
2011 2012 2013 2014 2015 2016 2017 2018 2019 2020 2021 2022 2027 2030 2031E&CBacklog 1,302 1,504 1,605 1,565 1,885 1,769 2,101 1,996 2,341 2,249 2,607 2,530 3,411 3,777 4,129 Inflows 798 736 709 606 912 510 994 596 1,085 691 1,185 797 1,422 1,302 1,694 Total gross revenues 439 534 608 646 688 732 778 828 881 937 997 1,060 1,353 1,566 1,645 EBIT 52 59 64 61 65 69 74 79 84 89 95 101 129 149 156 EBIT*(1-tax rate) 34 40 43 41 44 47 50 53 56 60 63 67 86 100 105 Depreciation / Amortisation 6 7 8 8 9 10 10 11 11 12 12 13 16 19 19 (Incr)/Decr in Working Capital (17) (55) (15) 10 (7) (7) (7) (8) (8) (9) (9) (10) (11) (13) (13) Capital Expenditure (15) (15) (14) (7) (7) (8) (8) (9) (9) (10) (10) (11) (11) (13) (14) Free Cash Flows 8 (23) 22 53 39 41 44 47 50 53 56 60 80 93 97 Years discounted - - 1 2 3 4 5 6 7 8 9 10 15 18 19 Discounted cash flow 8 (23) 20 44 29 27 26 24 23 22 21 20 15 12 11
Revenue growth (FY2014-22) 6.4 NPV calculationRevenue growth (FY2023-31) 5.0 Sum of free cash flow 391
Average inflows growth (FY2014-22) 2.9 Terminal value 154
Enterprise value 545 WACC used (%) 12.5 Add Investments 43 Terminal gorwth rate (%) 5.0 Net debt 79 Capitalisation rate (%) 7.5 Net present value-equity 508 Terminal value Calc Shares o/s (mn) 609 Cash flow in terminal year 97 NPV /share(Rs) 835 Terminal value 1,362 Subsidiary value 375Discounted value 19 Total value 1,210
Key assumptionsBill to book (%) 27.3 27.9 28.4 30.0 30.0 30.0 30.0 30.0 30.0 30.0 30.0 30.0 30.0 30.0 30.0 EBIT margin (%) 11.8 11.1 10.6 9.5 9.5 9.5 9.5 9.5 9.5 9.5 9.5 9.5 9.5 9.5 9.5 Capex as % of change in revenues 22.0 15.7 19.1 17.5 17.5 17.5 17.5 17.5 17.5 17.5 17.5 17.5 17.5 17.5 17.5 Depreciation as % of Net fixed assets 6.9 6.9 6.7 6.5 6.5 6.5 6.5 6.5 6.5 6.5 6.5 6.5 6.5 6.5 6.5 Net WCap excl. cash (days of sales) 52 86 86 75 75 75 75 75 75 75 75 75 75 75 75
Source: Company, Kotak Institutional Equities estimates
Upgrade to ADD as recent correction offers better risk-reward balance
We upgrade our rating on L&T to ADD from REDUCE as
Recent stock price correction offers better risk-reward balance; stock has witnessed significant time and price correction (corrected by 27% in the last 12-month period and has underperformed the Sensex by 16%; stock was trading at about Rs2,000 at end-CY2010 versus present levels of Rs1,200-1,250)
Strong core business generates strong returns of 22-24% RoCE
Low risk to earnings disappointments as inflow and revenue estimate may pan out and large part of margin decline already built into the numbers
Strong presence across a diverse set of segments provides comfort
L&T’s subsidiaries could potentially contribute a net incremental EPS of about Rs13 to the consolidated EPS for FY2013E and Rs13.3 to FY2014E consolidated EPS. Our target price includes Rs400/share from subsidiary companies versus a potential book value of Rs275-300/share at end-FY2013E.
Valuations appear reasonable at about 12.4X FY2013E (11.6X FY2014E) earnings for the core standalone business (adjusted for dividend income from subsidiaries); earnings growth is likely to be lower over next two years but that is likely to be already priced in – reflected in lower valuations (trading at about 17% P/E discount to historical average levels). Valuations appear reasonable even on historical basis - trading at about 12.8X FY2012E earnings.

Industrials Larsen & Toubro
36 KOTAK INSTITUTIONAL EQUITIES RESEARCH
Key valuation charts of L&T, April 2002 - April 2012
PE Chart of SENSEX and L&T on 12-month forward EPS, Apr 2002-12 PE premium of L&T over SENSEX on 12-month forward EPS, Feb 2002-12
Source: Bloomberg, Kotak Institutional Equities. Source: Bloomberg, Kotak Institutional Equities.
EV/EBITDA Chart of L&T on 12-month forward EPS, Feb 2002-12 P/B Chart of L&T based on 12-month forward EPS, Feb 2002-12
Source: Bloomberg, Kotak Institutional Equities. Source: Bloomberg, Kotak Institutional Equities.
0
10
20
30
40
50
Apr
-02
Apr
-03
Apr
-04
Apr
-05
Apr
-06
Apr
-07
Apr
-08
Apr
-09
Apr
-10
Apr
-11
Apr
-12
-
5.0
10.0
15.0
20.0
25.0L&T P/E (LHS) Avg. 5-yr P/E (LHS)Avg. 10-yr P/E (LHS) SENSEX (RHS)
0
7
14
21
28
35
Apr
-02
Apr
-03
Apr
-04
Apr
-05
Apr
-06
Apr
-07
Apr
-08
Apr
-09
Apr
-10
Apr
-11
Apr
-12
EV/EBITDA Avg. 5-yr EV/EBITDA
Avg. 10-yr EV/EBITDA
0
2
4
6
8
10
Apr
-02
Apr
-03
Apr
-04
Apr
-05
Apr
-06
Apr
-07
Apr
-08
Apr
-09
Apr
-10
Apr
-11
Apr
-12
P/B Avg. 5-yr P/B Avg. 10-yr P/B
(30)
0
30
60
90
120
Apr
-02
Apr
-03
Apr
-04
Apr
-05
Apr
-06
Apr
-07
Apr
-08
Apr
-09
Apr
-10
Apr
-11
Apr
-12
Premium over Sensex Avg. 5-yr premium
Avg. 10-yr premium
Source: Company, Bloomberg, Kotak Institutional Equities estimates
We note that L&T is presently under-owned by institutional investors particularly among FIIs and Indian MFs, and hence may incrementally be less susceptible to sharp corrections.
FIIs and MF are underweight on L&T Over/under ownership of L&T of various investors versus BSE 200 benchmark as of Dec-2011
BenchmarkFIIs MFs Insurance LIC BSE 200
Larsen and Toubro 1.2 2.3 3.6 5.0 2.7Overweight/(Underweight) (1.5) (0.5) 0.9 2.3 NA
% of portfolio
Source: BSE, Kotak Institutional Equities
Marginally revise estimates and target price to Rs1,350
We revise our consolidated estimates to Rs82.4 and Rs91.5 (from Rs85 and Rs96.4) and standalone estimates to Rs69.8 and Rs75.8 (from Rs72.4 and Rs80.5) for FY2013E and FY2014E respectively based on slightly lower order inflows in FY2013E and FY2014E.

Larsen & Toubro Industrials
KOTAK INSTITUTIONAL EQUITIES RESEARCH 37
We correspondingly revise our SOTP-based target price to Rs1,350 (from Rs1,380 earlier). Our target price comprises (1) Rs930/share from the standalone EPC business (on 14X FY2013E EPS), (2) Rs176/share from the service subsidiaries (Finance, Infra Finance and Infotech), (3) Rs40/share from the manufacturing subsidiaries and associate companies, (4) Rs150/share from 1.25X FY2013E book value of infrastructure SPVs and (5) Rs36/share from other subsidiaries and investments of the company.
We arrive at a SOTP-based target price of Rs1,350/share for L&T. FY2013E-based Sum of The Parts (SOTP) valuation of Larsen & Toubro
Earnings/Book FY13E multiple Value Stake L&T's stake value Per share
(Rs mn) (X) (Rs bn) (%) (Rs bn) (Rs)Core company valuation 40,327 14.0 565 P/E 100 565 927 Key subsidiaries-services 176
L&T Finance 28,666 1.3 35.8 P/B 84 30 49 L&T Infra. Finance 26,276 1.3 32.8 P/B 84 27 45 L&T Infotech 4,969 10.0 49.7 P/E 100 50 82
Key subsidiaries - mfg 40 Associate companies* 2,009 10.0 20 P/E 50 10 16 Power equipment JV NA 28 DCF 51 14 24
Infrastructure SPVs 74,897 1.3 94 P/B 97.7 91 150 Other subsidiaries 29,115 0.8 22 P/B 100.0 22 36 Total subsidiaries 245 402 Grand total 809 1,329
Valuation basis
Likely total equity investment in infrastructure subsidiaries by end-FY2012E
Investment and loand & advances to subsidiaries not seperately valued in the SOTP at end-FY2011
Source: Company, Kotak Institutional Equities estimates

Industrials Larsen & Toubro
38 KOTAK INSTITUTIONAL EQUITIES RESEARCH
Details of L&T investment in infrastructure subsidiaries, March fiscal year-ends, 2010-13E (Rs mn)
Projects IDPL Standalone Other IDPL Standalone Others 2012E 2013ERoadsCompletedL&T Panipat Elevated Corridor 4,220 843 843 — —Narmada Infra Construction Enterprise 1,420 121 127 226 121 127 226 L&T Krishnagiri Thopur Toll Road 5,250 788 788 — —L&T Western Andhra Tollways 3,730 565 565 L&T Transportation Infra Ltd 1,040 531 109 531 109 L&T Interstate Road Corridor Ltd 5,550 572 572 L&T Vadodara Bharuch Tollway Ltd 14,610 2,175 435 Under implementationAhmedabad-Maliya Tollway 14,970 630 970 — 1,572 1,949 L&T Halol-Shamlaji Tollway Pvt Ltd 13,050 653 1,305 — 1,762 848 Rajkot Vadinar Tollway Pvt Ltd 10,960 550 550 350 1,315 1,073 Chennai-Tada Tollway Ltd 8,480 420 — 420 1,145 979 Pimplegaon-Nasik (60 km) 6,000 220 406 220 406 400 307 Krishnagiri-Walajahpet 13,700 900 1,644 1,566 Samakhiali-Gandhidham (56 km) 13,000 0 805 1,365 1,730 Devihalli-Hassan (73 km) 4,940 21 311 593 557 Beawar-Pali-Pindwara 17,100 513 1,539 PortsDhamra port (50:50 JV) 24,600 2,465 — 3,240 250 200 Katupalli port 28,370 1 6,231 2,280 MetroHyderabad Metro project 150,000 — — 3,406 34 4,063 8,125 L&T Urban Infra (portfolio investment) 750 1,070 Sub-total 14,767 1,040 8,749 16,900 18,873 L&T Power Development LtdRajpura 700X 3 MW project 100,000 1,810 — 7,390 9,600 4,000 5,000 Other projects 20,000 5,000
Grand total 8,809 2,288 1,052 14,767 1,040 18,349 20,900 28,873
Additional equityProject cost
Equity invested2010 2011
Source: Company, Kotak Institutional Equities estimates
Details of equity investments and advances towards subsidiaries of L&T included in the SOTP, March fiscal year-ends, 2010-11 (Rs mn)
Equity L&A Equity L&A Total Equity L&ASubsidiary companiesL&T Aviation Services Pvt. Ltd 240 240 240 —L&T General Insurance Co. 290 2,000 2,000 1,710 —L&T Realty 472 4,620 472 472 — (4,620)
L&T Seawoods 0.1 8,583 0.1 8,811 8,811 — 228
L&T Sapura Shipping Pvt Ltd 951 951 951 —L&T Special Steels & Heavy Forgings 1,110 2,220 2,220 1,110 —L&T Uttaranchal Hydropower 500 500 — 500 L&T International FZE 11,474 11,474 11,474 — —
Total investments 18,002 13,393 19,732 9,382 29,115 1,730 (4,010)
yoy change2010 2011
Source: Company, Kotak Institutional Equities

Larsen & Toubro Industrials
KOTAK INSTITUTIONAL EQUITIES RESEARCH 39
Standalone balance sheet and income statement of L&T, March fiscal year-ends, 2007-14E (Rs mn)
2007 2008 2009 2010 2011 2012E 2013E 2014EIncome statementNet operating revenues 176,142 248,779 339,385 370,348 439,049 534,357 607,628 676,125Cost of goods sold (158,247) (220,515) (300,164) (322,592) (382,685) (471,185) (539,111) (601,727)S, G & A (10,280) (13,856) (17,703) (14,627) (19,903) (24,580) (26,736) (28,059)Salaries & wages (12,592) (15,354) (19,745) (23,791) (28,845) (37,528) (44,169) (49,345)EBIDTA 17,895 28,264 39,222 47,756 56,364 63,172 68,517 74,398EBIDTA margin (%) 10.2 11.4 11.56 12.9 12.8 11.8 11.3 11.0Other income 4,927 6,520 7,398 9,502 11,811 13,879 10,824 10,811Interest (930) (1,227) (4,156) (5,053) (6,474) (7,590) (8,520) (8,520)Depreciation (1,715) (2,022) (3,073) (4,159) (6,003) (7,021) (7,848) (8,325)PBT 20,191 31,534 39,404 48,059 55,708 62,440 62,972 68,364Tax (6,019) (9,821) (12,312) (16,409) (19,459) (20,293) (20,466) (22,218)PAT 14,172 21,714 27,092 31,650 36,250 42,147 42,506 46,146Extraordinaries — (8) 7,725 12,105 3,329 — — —Reported PAT 14,172 21,706 34,817 43,755 39,579 42,147 42,506 46,146EPS (Rs) 25.0 37.1 46.3 52.6 59.5 69.2 69.8 75.8Balance sheetShareholders funds 57,405 95,292 124,351 182,884 218,241 250,416 282,949 319,122 Equity capital 567 585 1,171 1,204 1,218 1,218 1,218 1,218 Reserves & surplus 56,839 94,707 123,180 181,679 217,024 249,198 281,731 317,905 Total debt 20,778 35,840 65,560 68,008 71,611 91,611 91,611 91,611 Total sources of funds 78,462 131,391 190,157 251,125 290,074 342,248 374,782 410,955 Total fixed assets 21,440 35,534 50,538 62,231 72,370 80,348 86,500 90,175 Intangible assets 807 920 1,408 1,427 2,212 2,212 2,212 2,212 Investments 31,044 69,223 82,637 137,053 146,848 140,733 142,590 163,298 Net working capital (excl. cash) 14,530 16,652 48,303 36,869 53,975 109,438 124,926 130,194 Cash and bank balances 10,944 9,645 7,753 14,319 17,304 12,151 21,189 27,711 Total application of funds 78,462 131,391 190,157 251,125 290,074 342,248 374,782 410,955 Cash flow statementCash flow from operations 21,510 21,893 (1,600) 47,522 26,996 (6,295) 34,867 49,203 Cash flow from investing activities (19,343) (53,941) (30,695) (69,191) (25,681) (8,885) (15,857) (32,709) Free cash flows 2,167 (32,047) (32,295) (21,668) 1,315 (15,180) 19,010 16,495 Cash flow from financing activities 3,367 31,243 23,963 17,225 (618) 10,027 (9,973) (9,973) Cash generated /utilised 5,534 (812) (608) 7,662 4,026 (5,152) 9,037 6,522 Net cash at start of year 5,832 10,944 9,645 7,753 14,319 17,304 12,151 21,189 Net cash at end of year 10,944 9,645 7,753 14,319 17,304 12,151 21,189 27,711
Source: Company, Kotak Institutional Equities estimates

For private Circulation Only. FOR IMPORTANT INFORMATION ABOUT KOTAK SECURITIES’ RATING SYSTEM AND OTHER DISCLOSURES, REFER TO THE END OF THIS MATERIAL.
Surrender of blocks with discoveries negative for long-term gas supply in India
RIL’s decision to surrender 10 blocks including four with discoveries of oil and gas (see Exhibit 1) is disappointing for long-term supply of gas and oil in India. In particular, Hardy Oil was especially upbeat about the prospects of the KG D-9 block; RIL and Hardy continue to hold the KG D-3 block, another block in the same area with discoveries. Although we had recently excluded contribution from KG D-3 and KG D-9 blocks from our long-term supply of gas in India, the surrender of KG D-9 block is still disappointing. Most of our estimated growth in natural gas supply in India in FY2012-17E now comes from imported LNG (see Exhibit 2).
No impact on our SOTP valuation of RIL
We had excluded KG D-9 and KG D-3 blocks from our SOTP valuation of RIL (see Exhibit 3) in December 2011. As such, there is no impact on our SOTP valuation of RIL. However, recent developments may rule out meaningful upside to the valuation of RIL’s E&P segment (`132/share). We note that RIL has 16 NELP blocks out of 39 won by it in various rounds of NELP bidding (see Exhibit 4 for a list of blocks awarded and relinquished in various rounds of NELP bidding).
Still plenty of issues with KG D-6 block
We would watch for developments in the crucial KG D-6 block before reassessing our valuation of RIL’s E&P segment. The approval process for further development in other areas of the KG D-6 block remains quite tortuous. The Government had approved the FDP of four satellite fields in January 2011 but has reportedly rejected an integrated pre-development study for 16 discoveries. Instead, it has asked RIL to restrict the study to five commercial discoveries only.
Experience of KG D-9 block may provide sobering lessons for companies and investors
The disappointing experience of KG D-9 block shows the high risks in the E&P business and provides valuable lessons for companies and investors. GCA had estimated 4.1-23 tcf of gross risked prospective resources in KG D-9 block in May 2009 in 16 leads and prospects. We do not want to sound alarmist but investors assessing the reserves prospects of other companies may want to note that prospective resources may not translate into recoverable reserves.
Reliance Industries (RIL)
Energy
Lessons from disappointments. RIL’s decision to relinquish 10 blocks including four with oil or gas discoveries highlights the perils of investment in the E&P business. RIL has relinquished 23 of 39 NELP blocks it had won in various NELP rounds of bidding. The KG D-6 block is seeing tortuously slow progress in terms of Government approvals for further development. Finally, the surrender of the once-prospective KG D-9 block may provide invaluable lessons for investors wanting to preempt conclusive reserves.
Reliance IndustriesStock data Forecasts/Valuations 2012 2013E 2014E
52-week range (Rs) (high,low) EPS (Rs) 61.3 56.3 58.7Market Cap. (Rs bn) 2,191.3 EPS growth (%) (1.1) (8.1) 4.3
Shareholding pattern (%) P/E (X) 12.0 13.1 12.5Promoters 41.0 Sales (Rs bn) 3,299.0 3,779.6 3,620.6FIIs 20.5 Net profits (Rs bn) 200.4 184.2 192.2MFs 3.0 EBITDA (Rs bn) 339.8 297.2 305.6
Price performance (%) 1M 3M 12M EV/EBITDA (X) 7.0 7.2 6.3Absolute (1.2) (6.2) (29.4) ROE (%) 11.7 9.9 9.5Rel. to BSE-30 (0.3) (7.4) (19.5) Div. Yield (%) 1.1 1.0 1.1
Company data and valuation summary
1,021-687
REDUCE
APRIL 24, 2012
UPDATE
Coverage view: Neutral
Price (Rs): 735
Target price (Rs): 770
BSE-30: 17,207
QUICK NUMBERS
• RIL has relinquished 23 out of 39 NELP blocks
• We value RIL’s E&P business at `132/share

Reliance Industries Energy
KOTAK INSTITUTIONAL EQUITIES RESEARCH 41
RIL has relinquished several blocks with good prospects/discoveries RIL's relinquished blocks in FY2012
Area RIL's stakeBlock NELP round (sq. km) (%) CommentsAS-ONN-2000/1 NELP II 6,215 60CY-PR-DWN-2001/4 NELP III 10,590 70GK-OSJ-3 Pre-NELP 5,725 60KG-DWN-2001/1 NELP III 11,605 60 Prospective resource potential of 4.7 tcf and 180 mn bblsKG-DWN-98/1 NELP I 6,700 70 Oil discovery in September 2007 (D-36)KG-OSN-2001/1 NELP III 1,100 100 Gas discoveries (D-28, D-37 & D-38)KG-OSN-2001/2 NELP III 200 100 Gas discoveries (D-24 & D-25)MN-DWN-98/2 NELP I 7,195 70NEC-DWN-2002/1 NELP IV 25,565 60PR-DWN-2001/1 NELP III 8,255 70
Source: Company, Kotak Institutional Equities
We expect gas volumes to increase led by higher LNG imports Supply of natural gas in India, March fiscal year-ends, 2008-17E (mcm/d)
2008 2009 2010 2011 2012E 2013E 2014E 2015E 2016E 2017EMumbai High 45 46 48 48 48 48 48 48 48 48 Gujarat 8 7 7 6 6 6 6 6 6 6 North-East 9 9 9 9 10 10 11 11 11 11 Rajasthan 1 1 1 1 1 1 1 1 1 1 TN/AP 7 8 7 7 7 7 7 7 7 7 Eastern offshoreKG-D6 (RIL-Niko) — — 39 56 42 30 25 25 33 40 NEC-25 (RIL-Niko) — — — — — — — — — 6 Deen Dayal (GSPC) — — — — — — 3 5 6 6 ONGC — — — — 0 1 2 2 2 2 PY-3 0 0 0 0 0 0 0 0 0 0 Ravva 2 2 1 2 2 2 1 1 1 1 Western offshoreLakshmi 1 1 1 1 1 0 0 — — —Panna-Mukta 6 5 5 4 5 5 4 5 4 4 Tapti 9 12 8 7 7 6 6 6 6 5 ONGC marginal fields — — — — 1 3 4 6 6 6 LNG and CBMPetronet LNG - Dahej 24 24 30 33 41 41 40 48 53 62 Petronet LNG - Kochi — — — — — 3 11 16 18 18 RGPPL - Dabhol — — — — — 4 6 8 11 18 Shell Total LNG - Hazira 8 6 5 4 10 11 14 15 18 18 CBM gas — — — — 0 2 3 4 5 5 Total gas supply 120 119 163 178 181 180 192 213 235 264
Source: MOPNG, Kotak Institutional Equities estimates
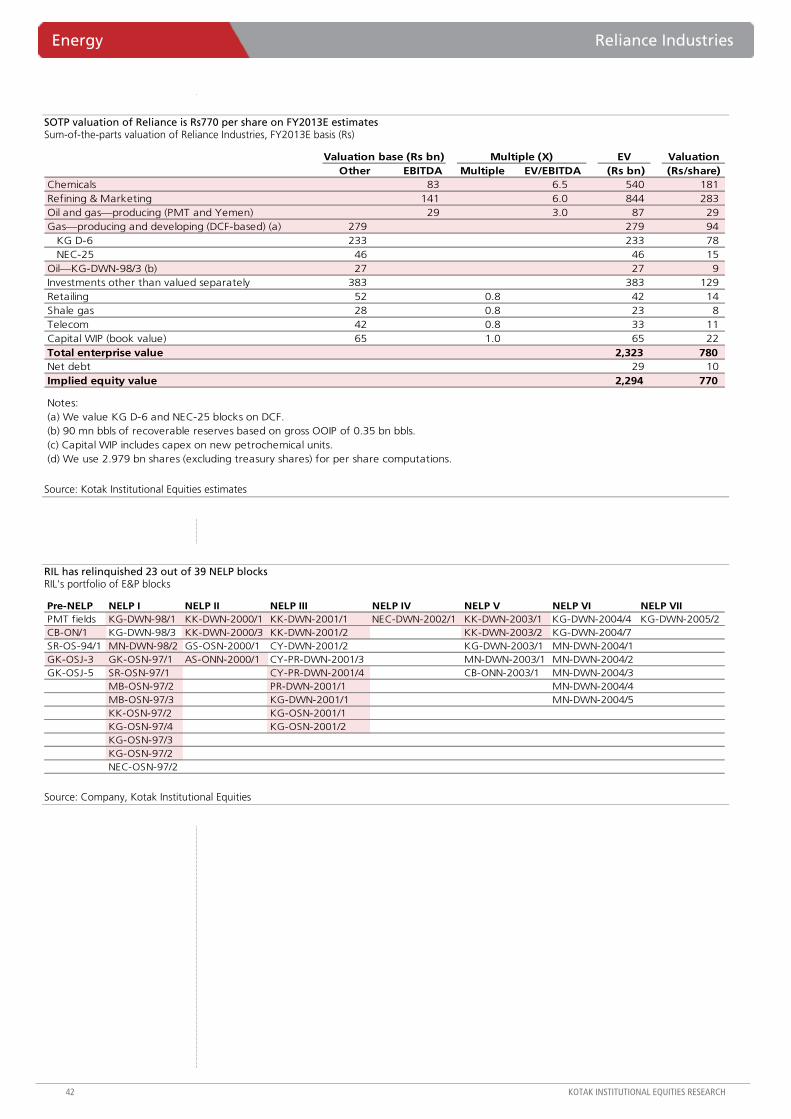
Energy Reliance Industries
42 KOTAK INSTITUTIONAL EQUITIES RESEARCH
SOTP valuation of Reliance is Rs770 per share on FY2013E estimates Sum-of-the-parts valuation of Reliance Industries, FY2013E basis (Rs)
Valuation base (Rs bn) Multiple (X) EV ValuationOther EBITDA Multiple EV/EBITDA (Rs bn) (Rs/share)
Chemicals 83 6.5 540 181Refining & Marketing 141 6.0 844 283Oil and gas—producing (PMT and Yemen) 29 3.0 87 29Gas—producing and developing (DCF-based) (a) 279 279 94 KG D-6 233 233 78 NEC-25 46 46 15Oil—KG-DWN-98/3 (b) 27 27 9Investments other than valued separately 383 383 129Retailing 52 0.8 42 14Shale gas 28 0.8 23 8Telecom 42 0.8 33 11Capital WIP (book value) 65 1.0 65 22Total enterprise value 2,323 780Net debt 29 10Implied equity value 2,294 770
Notes:(a) We value KG D-6 and NEC-25 blocks on DCF.(b) 90 mn bbls of recoverable reserves based on gross OOIP of 0.35 bn bbls.(c) Capital WIP includes capex on new petrochemical units.(d) We use 2.979 bn shares (excluding treasury shares) for per share computations.
Source: Kotak Institutional Equities estimates
RIL has relinquished 23 out of 39 NELP blocks RIL's portfolio of E&P blocks
Pre-NELP NELP I NELP II NELP III NELP IV NELP V NELP VI NELP VIIPMT fields KG-DWN-98/1 KK-DWN-2000/1 KK-DWN-2001/1 NEC-DWN-2002/1 KK-DWN-2003/1 KG-DWN-2004/4 KG-DWN-2005/2CB-ON/1 KG-DWN-98/3 KK-DWN-2000/3 KK-DWN-2001/2 KK-DWN-2003/2 KG-DWN-2004/7SR-OS-94/1 MN-DWN-98/2 GS-OSN-2000/1 CY-DWN-2001/2 KG-DWN-2003/1 MN-DWN-2004/1GK-OSJ-3 GK-OSN-97/1 AS-ONN-2000/1 CY-PR-DWN-2001/3 MN-DWN-2003/1 MN-DWN-2004/2GK-OSJ-5 SR-OSN-97/1 CY-PR-DWN-2001/4 CB-ONN-2003/1 MN-DWN-2004/3
MB-OSN-97/2 PR-DWN-2001/1 MN-DWN-2004/4MB-OSN-97/3 KG-DWN-2001/1 MN-DWN-2004/5KK-OSN-97/2 KG-OSN-2001/1KG-OSN-97/4 KG-OSN-2001/2KG-OSN-97/3KG-OSN-97/2NEC-OSN-97/2
Source: Company, Kotak Institutional Equities

Reliance Industries Energy
KOTAK INSTITUTIONAL EQUITIES RESEARCH 43
RIL: Profit model, balance sheet, cash model, March fiscal year-ends, 2008-15E (Rs mn)
2008 2009 2010 2011 2012 2013E 2014E 2015EProfit model (Rs mn)Net sales 1,334,430 1,418,475 1,924,610 2,481,700 3,299,040 3,779,584 3,620,643 3,614,613EBITDA 233,056 233,139 305,807 381,257 336,190 293,625 301,992 342,526Other income 8,953 20,599 24,605 30,517 61,920 69,673 61,116 61,795Interest (10,774) (17,452) (19,972) (23,276) (26,670) (27,363) (12,616) (3,937)Depreciation & depletion (48,471) (51,953) (104,965) (136,076) (113,940) (96,649) (98,015) (98,873)Pretax profits 182,764 184,332 205,474 252,422 257,500 239,286 252,477 301,511Extraordinary items 47,335 — — — — — — —Tax (26,520) (12,634) (31,118) (43,204) (51,500) (48,290) (53,709) (69,267)Deferred taxation (8,999) (18,605) (12,000) (6,355) (5,600) (6,771) (6,608) (4,376)Net profits 194,580 153,093 162,357 202,863 200,400 184,226 192,160 227,868Adjusted net profits 152,605 153,093 162,357 202,863 200,400 184,226 192,160 227,868Earnings per share (Rs) 52.5 50.6 49.6 62.0 61.3 56.3 58.7 69.7
Balance sheet (Rs mn)Total equity 847,853 1,263,730 1,371,706 1,515,403 1,660,200 1,816,728 1,979,458 2,174,435Deferred taxation liability 78,725 97,263 109,263 115,618 121,218 127,989 134,597 138,974Minority interest 33,622 — — — — — — —Total borrowings 493,072 739,045 624,947 673,967 682,590 450,426 116,928 106,100Currrent liabilities 251,427 357,019 404,148 542,206 486,630 527,575 504,139 498,042Total liabilities and equity 1,704,700 2,457,057 2,510,064 2,847,194 2,950,638 2,922,718 2,735,123 2,917,550Cash 42,823 221,765 134,627 271,349 395,129 421,850 275,205 493,831Current assets 402,720 325,357 489,165 644,070 800,570 778,846 754,742 751,340Total fixed assets 1,081,638 1,693,869 1,653,987 1,555,260 1,214,859 1,181,942 1,165,096 1,132,299Investments 177,519 216,065 232,286 376,515 540,080 540,080 540,080 540,080Deferred expenditure — — — — — — — —Total assets 1,704,700 2,457,057 2,510,064 2,847,194 2,950,638 2,922,718 2,735,123 2,917,550
Free cash flow (Rs mn)Operating cash flow, excl. working capital 180,718 174,508 222,605 304,310 253,720 215,111 232,829 266,996Working capital (31,071) (37,983) (53,015) 695 (122,036) 62,669 667 (2,695)Capital expenditure (239,691) (247,128) (219,427) (123,661) (59,146) (66,889) (78,540) (63,750)Investments (78,953) (10,392) 14,206 (195,439) (163,565) — — —Other income 6,132 16,195 22,043 23,316 61,920 69,673 61,116 61,795Free cash flow (162,865) (104,800) (13,587) 9,220 (29,107) 280,564 216,072 262,345
Ratios (%)Debt/equity 53.2 54.3 42.2 41.3 38.3 23.2 5.5 4.6 Net debt/equity 48.6 38.0 33.1 24.7 16.1 1.5 (7.5) (16.8) RoAE 18.9 13.6 11.8 13.1 11.6 9.7 9.3 10.1 RoACE 12.7 10.0 8.6 10.1 9.2 8.3 8.6 9.8 Adjusted ROACE 21.7 17.3 12.3 12.5 11.9 11.7 12.5 15.1
Source: Kotak Institutional Equities estimates

For private Circulation Only. FOR IMPORTANT INFORMATION ABOUT KOTAK SECURITIES’ RATING SYSTEM AND OTHER DISCLOSURES, REFER TO THE END OF THIS MATERIAL.
West coast container capacity additions (JNPT, Mumbai port) plagued by delays
JNPT’s fourth terminal: consortium members part ways. PSA International (Singapore) and ABG Ports (Mumbai), partners in a consortium, which emerged as the highest bidder for JNPT’s fourth terminal, have parted ways. PSA International will develop the project on its own. The project (awarded in September 2011 for a revenue share of over 50%) has already seen delays in signing the concession agreement (initially scheduled for January 2012).
Gammon’s Mumbai container terminal delayed significantly. We also note that Gammon’s container terminal at Mumbai port (1 mn TEUs capacity) has been delayed significantly. The Rs10 bn project was awarded to Gammon in FY2007 and was due for commissioning in December 2010. The company says commissioning will be delayed to December 2012 (invested capital of Rs2.4 bn till end-FY2011; total project cost, Rs10 bn).
Mundra/Pipavav key beneficiaries; Mundra may become India’s primary calling port (versus JNPT)
We expect strong growth in container volumes at Mundra and Pipavav ports, boosted by spill-over volumes from JNPT (operating at over 100% capacity). We believe incremental growth in container volumes may spill over to these ports as JNPT’s capacity is constrained. India’s west coast could see incremental volumes of about 600,000 TEUs a year, which would need to be absorbed mainly by Mundra and Pipavav. Mundra is also adding another container terminal (1.5 mn TEUs) which would enhance its container capacity, matching JNPT’s ~4 mn TEU capacity. Pipavav has limited spare capacity of 0.4-0.5 mn TEUs. We note that typically container volumes concentrate on key ports only and thus it is a virtuous positive cycle business with increased scale of operations.
Key updates: ADSEZ completes Abbot Point refinance; Maersks’ US-based service to call at Pipavav
ADSEZ completes Abbot Point refinance. ADSEZ recently completed refinancing of its US$2 bn acquisition debt for Abbot Point terminal. The company has refinanced the acquisition loan through debt, without equity investment, which is a positive development. We remain positive on the acquisition and believe it is unlikely to be a value-losing deal.
Maersk’s US service to call at Pipavav; will help to reduce volume lost to Mundra. Shipping company Maersk recently announced that from April 4, 2012, its US-based MECL1 service would call at Pipavav instead of Mundra. This will help to reduce Pipavav’s loss of volume to Mundra on the shift of the ME1 service to Mundra (also from April 4, 2012).
Upgrade ADSEZ to BUY (TP: Rs160); retain ADD on GPPL (TP: Rs65)
ADSEZ (BUY, TP: Rs160). We upgrade ADSEZ to BUY as a recent correction offers reasonable valuations (11X FY2013E, 8.6X FY2014E EV/EBITDA) for (1) a relatively acyclical business, (2) strong cash flows (EBITDA of Rs16.8 bn in FY2012E and Rs21.7 bn in FY2013E) and (3) competitive advantage from large operational assets.
GPPL (ADD, TP: Rs65). We are positive about the business on an attractive asset profile and cash-flow generation, though relatively expensive valuations (12.2X Mar-13E EV/EBITDA) and impending need for capacity addition limits potential upside.
Infrastructure India
West coast container capacity delay to benefit Mundra/Pipavav; upgrade ADSEZ. Container capacity additions on the west coast may be further delayed as (1) concession partners for JNPT’s fourth terminal part ways and (2) significant delays have been seen in Gammon’s Mumbai terminal. Mundra and Pipavav are likely to be key beneficiaries from these delays with available spare capacity to absorb volumes. We upgrade ADSEZ to BUY as a recent correction offers reasonable valuations (11X FY2013E and 8.6X FY2014E EV/EBITDA) for a strong cash flow generating asset. t.
CAUTIOUS
APRIL 24, 2012
UPDATE
BSE-30: 17,097

Infrastructure India
KOTAK INSTITUTIONAL EQUITIES RESEARCH 45
JNPT’s fourth terminal may be further delayed as consortium partners split up
A consortium, comprising PSA International (Singapore-based) and ABG Ports (Mumbai-based), which had emerged as the highest bidder for the JNPT fourth terminal project, has split. The minority partner, ABG Ports (24% stake, PSA International held 76%) decided to drop the project and the consortium partners informed JNPT that PSA International would develop the project on its own.
The project was awarded to the consortium in September 2011 for a revenue share of 50.82% to JNPT (the highest revenue share quoted by a private firm for a port project). The signing of the concession agreement, which was to have taken place in January 2012, was delayed and subsequently cancelled when PSA refused to pay the stamp duty (of about Rs500 mn) to register the agreement. This matter has been referred for adjudication, but news reports indicate that the project may still go ahead without disqualification as the bid was evaluated based mainly on PSA’s financial strength.
The Rs67 bn port project was designed to eventually add 4.8 mn TEUs of container capacity to JNPT port, more than doubling the port’s current capacity of about 4 mn TEUs.
The JNPT fourth terminal project has been significantly delayed since it was conceived almost eight years ago. In 2006, JNPT had called for expressions of interest from parties for development of the fourth terminal and the project the received the go-ahead from the board in 2008. After this, bids were invited, but the first round of bidding was called off by the shipping ministry as the project did not attract adequate participation. The second round of bidding was delayed by a case filed by AP Moller-Maersk Group (APM), challenging its disqualification from bidding for the project.
Mundra and Pipavav ports may benefit from further delays in the JNPT project
The handling capacity of the existing three container terminals at JNPT is almost fully used (operating at close to/over 100% capacity). JNPT’s container terminals are working well above their planned capacity despite bad approach roads, congestion at terminals and reduction in the available draft due to siltation. This provides a significant opportunity for non-major ports along India’s west coast, such as Pipavav. We believe incremental growth in container volumes may spill over to other ports as JNPT’s capacity remains constrained.
Container volumes at Indian ports amounted to about 9.2 mn TEUs in FY2011 with 6-6.5 mn TEUs being handled on the west coast. Assuming India’s container volumes post 10% CAGR (versus a historical 15-year average of about 14%) over FY2011-14, volumes will be 12.5-13 mn TEUs by FY2014E, against 9.2 mn TEUs in FY2011. This would imply additional volumes of 600,000-650,000 TEUs a year landing on the west coast. Most of this volume would have to be absorbed by Mundra and/or Pipavav since there is limited spare capacity at other west-coast ports.
Mundra, Pipavav likely to be key beneficiaries of a capacity-constrained west coast Additional container volumes likely in India, March fiscal year-ends, 2011-14E
mn TEUsTotal container traffic in FY2011 9.3
West coast ports 6.5 East and South ports 2.8
Expected traffic in FY2014E 12.3 West coast ports 8.6
East and South ports 3.7 Expected increase in container volumes over FY2011-14E 3.1
West coast ports 2.1 East and South ports 0.9
Source: Indian Ports Association, Crisil Research, Kotak Institutional Equities estimates

India Infrastructure
46 KOTAK INSTITUTIONAL EQUITIES RESEARCH
JNPT has been losing market share to minor ports over the past few years
JNPT’s market share in overall container volumes decreased to 46% in FY2011 from 57% in FY2007. Pipavav’s market share of container cargo increased to about 5.4% in FY2011 (from 2.4% in FY2007) and Mundra’s market share increased to 13.3% in FY2011 (from about 9% in FY2007).
Shift in container cargo market share towards minor ports like Pipavav and Mundra is visible Container volumes handled and market share of ports, March fiscal year-ends, 2003-11
2004 2005 2006 2007 2008 2009 2010 2011JNPT 2,269 2,371 2,667 3,298 4,059 3,953 4,061 4,271 Chennai 539 617 735 886 1,020 1,143 1,225 1,523
Mundra 48.0 212 299 521 638 806 924 1,228 Pipavav 69 62 83 135 192 196 321 497 Tuticorin 254 307 321 377 450 439 440 467 Kolkata 123 159 203 239 297 302 377 378 Cochin 170 185 203 227 254 260 290 312 Haldia 137 128 110 110 128 127 124 149 Kandla 170 181 148 178 161 138 146 160 Visakhapatnam 20 45 47 56 71 90 98 144 Mumbai 197 219 159 138 117 92 58 73 New Mangalore 7 9 10 17 21 29 31 40 All ports 3,980 4,522 5,011 5,751 7,511 8,154 8,792 9,263
2004 2005 2006 2007 2008 2009 2010 2011JNPT 57.0 52.4 53.2 57.3 54.0 48.5 46.2 46.1 Chennai 13.5 13.6 14.7 15.4 13.6 14.0 13.9 16.4
Mundra 1.2 4.7 6.0 9.1 8.5 9.9 10.5 13.3 Pipavav 1.7 1.4 1.7 2.4 2.6 2.4 3.7 5.4 Tuticorin 6.4 6.8 6.4 6.6 6.0 5.4 5.0 5.0 Kolkata 3.1 3.5 4.1 4.2 4.0 3.7 4.3 4.1 Cochin 4.3 4.1 4.1 3.9 3.4 3.2 3.3 3.4 Haldia 3.4 2.8 2.2 1.9 1.7 1.6 1.4 1.6 Kandla 4.3 4.0 3.0 3.1 2.1 1.7 1.7 1.7 Visakhapatnam 0.5 1.0 0.9 1.0 0.9 1.1 1.1 1.6 Mumbai 4.9 4.8 3.2 2.4 1.6 1.1 0.7 0.8 New Mangalore 0.2 0.2 0.2 0.3 0.3 0.4 0.4 0.4 All ports 100.0 100.0 100.0 100.0 100.0 100.0 100.0 100.0
Volumes ('000 TEUs)
Market share (%)
Sharp pick up in Mundra & Pipavav's market share in container volumes
Congestion at JNPT likely to have led to loss of market share to 46-47% from 57% in FY2004
Source: Indian Ports Association, Crisil Research, Kotak Institutional Equities
JNPT, which handles almost half of India’s container volumes, is operating at over 100% of its container capacity. Given the potential strong growth in container volumes and capacity constraints at JNPT, we expect this share to fall further in future. We believe Mundra and Pipavav ports will benefit from the strong container volume growth and spill-over traffic from JNPT.
Gammon’s Mumbai port, the other incremental container capacity, also delayed
Gammon Infrastructure is developing a container terminal at Mumbai port, which will potentially have capacity of about 1 mn TEUs. However we note that this project has been significantly delayed. The Rs10 bn project was awarded to Gammon Infrastructure in FY2007 and was scheduled for commissioning in December 2010. However, due to factors such as a slowdown in dredging (by Mumbai Port Trust) the commissioning date was pushed to September 2012. The company now says commissioning will be delayed further to December 2012. Of the project cost of Rs10 bn, the company invested about Rs2.4 bn until the end of March 2011.

Infrastructure India
KOTAK INSTITUTIONAL EQUITIES RESEARCH 47
Mundra to match JNPT’s capacity with addition of 1.5 mn TEU terminal
ADSEZ is developing an additional container terminal at Mundra port, which would add another 1.5 mn TEUs of container capacity. The container terminal with two berths is expected to be commissioned by FY2014 and the first berth is expected to be commissioned by July 2012. This would be in addition to the current 2.5 mn TEUs of container capacity at Mundra port (current volume is about 1.5 mn TEUs). Against this, spare capacity at Pipavav is limited with current capacity (quay side) of about 1 mn TEUs and volumes of about 600,000 TEUs (though the port has sufficient waterfront to further increase capacity).
The new terminal will increase Mundra’s capacity to 4 mn TEUs, which would almost match capacity at JNPT port. Large available capacity at Mundra could potentially even make it the primary port of calling for container lines, replacing JNPT port. We note that typically container volumes concentrate only on certain key ports and thus it is a virtuous positive cycle business with increased scale of operations. The list of top global container terminals (by volume handled) has remained broadly the same since 2004-05.
List of top container ports (by volume handled) of the world, December calendar year-ends, 2004-10 ('000 TEUs)
Rank Port Country 2004 2005 2006 2007 2008 2009 20101 Shanghai China 14,557 18,084 21,710 26,150 27,980 25,002 29,069 2 Singapore Singapore 21,329 23,192 24,792 27,932 29,918 25,866 28,431 3 Hong Kong Hong Kong 21,984 22,427 23,539 23,881 24,248 20,983 23,699 4 Shenzhen China 13,615 16,197 18,469 21,099 21,414 18,250 22,510 5 Busan South Korea 11,430 11,843 12,039 13,270 13,425 11,954 14,194 6 Ningbo China 4,006 5,208 7,068 9,349 11,226 10,502 13,144 7 Guangzhou China 3,308 4,685 6,600 9,200 11,001 11,190 12,550 8 Qingdao China 5,140 6,307 7,702 9,462 10,320 10,260 12,012 9 Dubai United Arab Emirates 6,429 7,619 8,923 10,653 11,827 11,124 11,600 10 Rotterdam Netherlands 8,281 9,287 9,655 10,791 10,784 9,743 11,140 11 Tianjin China 3,814 4,801 5,950 7,103 8,500 8,700 10,080 12 Kaohsiung Taiwan 9,714 9,471 9,775 10,257 9,677 8,581 9,180 13 Port Klang Malaysia 5,244 5,544 6,326 7,120 7,970 7,309 8,870 14 Antwerp Belgium 6,064 6,482 7,019 8,176 8,663 7,309 8,470 15 Hamburg Germany 7,003 8,088 8,862 9,890 9,737 7,007 7,910 16 Tanjung Pelepas Malaysia 4,020 4,177 4,770 5,500 5,600 6,000 6,540 17 Los Angeles United States 7,321 7,485 8,470 8,355 7,850 6,748 6,500 18 Long Beach United States 5,780 6,710 7,289 7,316 6,350 5,067 6,260 19 Xiamen China 2,872 3,342 4,019 4,627 5,035 4,680 5,820 20 New York/New Jersey United States 4,478 4,785 5,093 5,299 5,265 4,561 5,290 21 Dalian China 2,211 2,665 3,212 4,574 4,503 4,552 5,260 22 Laem Chabang Thailand 3,529 3,834 4,123 4,642 5,134 4,538 5,190 23 Bremen/Bremerhaven Germany 3,469 3,736 4,450 4,912 5,529 4,578 4,890 24 Jakarta Indonesia 3,170 3,282 3,280 3,900 3,984 3,800 4,720 25 Tokyo Japan 3,358 3,593 3,969 3,818 4,271 3,810 4,280 26 Jawaharlal Nehru (Mumbai) India 2,361 2,667 3,298 4,060 3,953 4,061 4,280
Source: World Shipping Council, American Association of Port Authorities
ADSEZ expanding asset profile with several new ports under development
Besides port activities at Mundra, ADSEZ has 74% stake in Adani Petronet (Dahej) Pvt. Ltd, a JV between Adani Group and Petronet LNG, formed to develop and operate the Dahej port. ADSEZ is also developing a coal handling terminal at Mormugao port (with a capacity of 8 mn tons) and a bulk + container terminal at Hazira port. The company recently (1) won a concession to develop a 6.4 mn ton coal handling terminal at Visakhapatnam and (2) received a letter of intent to build a 20 mn ton dry bulk terminal at Kandla port.

India Infrastructure
48 KOTAK INSTITUTIONAL EQUITIES RESEARCH
Details of ADSEZ’s other port assets (apart from Mundra port)
Dahej Port (operational) Mormugao Coal Terminal74% stake in Dahej port project; investment of Rs2.5 bn 12 mn ton coal terminal at a capex of Rs4 bnJV along with Petronet LNG Ltd (PLL) Concession period of 30 yearsSolid cargo port terminal Revenue share of 20% with port trustHandling capacity: 16 mtpa Estimated to commence operations in FY2013E-14E
Hazira Port Visakhapatnam Port20 mn ton bulk terminal and about 1 mn TEU container terminal 6.4 mn ton coal terminalTotal capex of Rs25 bn (Rs13 bn already incurred) Estimated capex of Rs3.4 bnExpected to be fully operational by FY2014E Expected completion in FY2015E
To pay revenue share of 40% to Vizag port trust
Kandla Port (LoI received; concession to be signed) Abbot Point coal terminal20 mn ton dry bulk terminal 50 mn ton coal terminal (option to increase to 80 mn tons)Estimated capex of about Rs11-12 bn Take-or-pay contract signed for almost entire volumeExpected commissioning by FY2016E 99-year lease contractTo pay a revenue share of 25% to Kandla Port trust Recently completed refinancing of the US$2 bn acquisition loan
Source: Company, Kotak Institutional Equities
Chennai mega container terminal: a potentially large opportunity in the offing
Adani Ports has placed its bid to develop a mega container terminal at Chennai port. The company faces only one competitor, Essar Ports, (eight companies were in the RFP stage but only two eventually placed bids as per news reports). Note that this is the second time that Adani Ports’ is bidding for the project. In the first round the company was the sole bidder and bid for revenue share of 5%. The bid was rejected by the port authorities on the grounds that the bid was too low.
The project involves the development of a container terminal with potential capacity of 4 mn TEUs and total project cost of about Rs37 bn. Chennai Port Trust will bear the cost of dredging, floating crafts and navigational aids, estimated at about Rs5.6 bn, and the remaining Rs31 bn would be borne by the winning bidder.
Security clearance not an issue – lots of assets already under development
Because of issues related to ED (Enforcement Directorate), company is not getting security clearances for incremental domestic ports opportunities at twelve major ports (can continue to develop minor ports), but we believe that company has a large portfolio of assets (Mundra container terminal - III, Mundra bulk berths and Additional coal berths, Hazira, Dahej, Vizag, Murmgoa, Kandla and bidding for Chennnai) already at hand and some consolidation in this regards would be + ve.
ADSEZ completes refinancing US$2bn acquisition debt for Abbott Point terminal
ADSEZ recently completed refinancing its US$2 bn acquisition debt for Abbot Point coal terminal. The company raised US$1.25 bn (AUD1.1 bn) at Abbott Point Terminal in non-recourse funding from a group of Australian and Asian lenders. The loan was raised at AUD Libor + 275 bps to be repaid over five years. Besides, the company raised US$800 mn at MPPL, the acquiring SPV at USD Libor + 280 bps, repayable after seven years. Key lenders include: Commonwealth Bank of Australia (CBA) - AU$300 mn, National Australia Bank (NAB) - AU$250 mn, Westpac Banking Corp - AU$250 mn, Bank of Tokyo-Mitsubishi UFJ (BTMU) - AU$150 mn, Mizuho Corporate Bank - AU$100 mn, Standard Chartered Bank AU$100 mn and OCBC Bank - AU$75 mn.

Infrastructure India
KOTAK INSTITUTIONAL EQUITIES RESEARCH 49
ADSEZ raised AUD1.8 bn debt at the end of June 2011 to complete the acquisition, with Standard Chartered and State Bank of India funding the remittance to the Australian Government. This was a short-term debt raised by the company and is likely to come up for refinancing shortly. The company refinanced the entire acquisition loan through debt without any equity investment, which is a key positive development.
We believe the acquisition is unlikely to be a value-losing deal on evidence of (1) a recent rail link increasing visibility of additional business, (2) long-term established take-or-pay contracts and (3) incremental mining plans in Bowen Basin. We note potential upsides to our valuation such as (1) option to expand capacity by 30 MMT, (2) potential for further margin expansion, (3) lower tax rate, depending on corporate structuring possibilities, and (4) lower-than-expected interest costs.
ADSEZ: Upgrade to BUY with unchanged estimates and target price of Rs160
We upgrade our rating on ADSEZ to a BUY as a recent correction offers reasonable valuations for a strong cash-flow generating business. We are positive about the business based on (1) a relatively acyclical business as most port volumes are linked to energy imports (coal for upcoming power plants), (2) strong cash-flow generation assets (EBITDA of Rs16.8 bn in FY2012E) and (3) resilient competitive advantage from large operational assets.
The current market price of Rs127 implies a valuation of about 11X FY2013E and 8.6X FY2014E EV/EBITDA for the core port asset (Mundra port, adjusted for value from other assets). The share trades at about 13.2X FY2013E (9.8X FY2014E) P/E and 3.2X FY2013E (2.5X FY2014E) P/B (for likely 27-28% RoE). Note that Mundra port trades only at a marginal premium over average valuations of utility companies (trading at about 10X FY2013E EV/EBITDA, trades broadly at par on FY2014E basis; valuations based on KIE estimates). We believe the asset deserves a higher premium versus utility companies, due to (1) better asset profile which provides higher revenue and cash flow visibility and (2) relatively monopolistic business with several difficulties in setting up competing assets.

India Infrastructure
50 KOTAK INSTITUTIONAL EQUITIES RESEARCH
Key numbers and valuation metrics of GPPL versus Mundra port, December calendar year-ends, 2011-14E
FY2011 FY2012E FY2013E FY2014E CY2010 CY2011E CY2012E CY2013ECapacityBulk (mn tons) 75 75 75 75 3.7 4.1 4.5 6.0 Containers ('000 TEUs) 2,500 2,500 2,500 2,500 1,161 1,161 1,300 1,301 Crude (mn tons) 20 30 40 40 — — — —Total (mn tons) 125 135 145 145 17.6 18.0 20.1 21.6 VolumesBulk (mn tons) 31 42 47 56 3.6 4.3 4.8 5.0 Containers ('000 TEUs) 1,228 1,509 1,812 2,089 466 610 732 860 Crude (mn tons) 7 9 18 19 — — — —Total (mn tons) 54 70 88 102 10 12 14 16 Key ratios (%)Revenue growth 35.4 32.1 27.0 21.1 28.6 39.8 21.1 18.8 PAT growth 40.7 11.9 41.4 34.9 (53.0) (204.7) 85.7 16.8 EBIDTA margin 69.5 67.5 68.6 69.1 41.3 46.2 48.4 51.3 RoE 25.3 23.3 26.7 28.7 (10.5) 7.5 12.6 12.9 RoCE 13.1 12.9 15.2 19.1 2.1 7.6 10.3 10.5
Key valuation ratios (X)P/E 20.9 18.7 13.2 9.8 (43.6) 41.7 22.4 19.2 P/B 4.8 4.0 3.2 2.5 3.2 3.0 2.7 2.3 EV/Sales 12.3 10.1 7.6 5.9 10.5 7.4 6.1 5.4
EV/EBITDA 17.7 15.0 11.0 8.6 25.5 16.0 12.7 10.5
Gujarat Pipavav Port LtdMundra Port
Source: Company, Kotak Institutional Equities estimates
Our SOTP-based target price of Rs160 comprises (1) Rs136/share from the Mundra port business (Mar-13E-based DCF valuation), (2) Rs6/share from the SEZ business, (3) Rs5/share from Dahej port value, (4) Rs5/share from Mormugao and Hazira ports, (5) Rs6/share from Abbot Point Coal Terminal, and (6) Rs3/share from book value of investments in Adani Logistics.
We arrive at an SOTP-based target price of Rs160 for ADSEZ FY2013E-based Sum-Of-Total-Parts valuation of Adani Port and SEZ
Valuation MPSEZ stake Value of MPSEZ stake Per share P/B implied EV/EBITDA implied(Rs mn) (%) (Rs mn) (Rs) Method of valuation (X) (X)
Mundra port 274,467 100.0 274,467 136 Mar13E-based DCF 4.2 14.2 SEZ 11,281 100.0 11,281 6 Mar13E-based DCFDahej port 13,417 74.0 9,928 5 Mar13E-based DCF 3.9 Mormugao port 2,882 100.0 2,882 1 Mar13E-based DCF 2.1 Hazira port 9,136 100.0 9,136 5 Mar13E-based DCF 1.9 Abbot Point Port 12,618 100.0 12,618 6 Mar13E-based DCF 1.6 Adani Logistics 3,119 100.0 6,237 3 2.0X book value 2.0 Total 162
Source: Company, Kotak Institutional Equities estimates
We retain our consolidated earnings estimates of Rs5.6 and Rs7.3 for FY2012 and FY2013, respectively. We expect Mundra to post strong volume growth of over 20% CAGR over FY2012-14, driven by coal (increased imports, upcoming power plants), crude (increased volumes for Bhatinda refinery) and container (limited capacity on the west coast) cargo.

Infrastructure India
KOTAK INSTITUTIONAL EQUITIES RESEARCH 51
Consolidated financials of Adani Port & SEZ Ltd, March fiscal year-ends, 2007-15E (Rs mn)
2008 2009 2010 2011 2012E 2013E 2014E 2015EIncome statementNet sales 8,170 11,949 14,955 20,001 36,377 46,760 57,152 71,508 Total operating costs (2,813) (4,393) (5,293) (7,007) (13,046) (15,848) (18,734) (22,048) EBITDA 5,357 7,557 9,663 12,994 23,332 30,912 38,418 49,460 EBITDA margin (%) 65.6 63.2 64.6 65.0 64.1 66.1 67.2 69.2 Other income 279 446 321 309 528 737 1,092 2,279 Depreciation (1,023) (1,468) (1,868) (2,388) (6,417) (7,276) (7,828) (7,791) Financial charges (1,079) (1,459) (559) (880) (5,115) (8,910) (8,662) (8,854) Pre-tax profit 3,535 5,075 7,556 10,036 12,327 15,463 23,019 35,094 Taxation (1,534) (533) (601) (874) (1,116) (745) (465) (1,328) Adjusted PAT 2,001 4,542 6,955 9,162 11,211 14,718 22,555 33,766 EPS (Rs) 5.2 10.7 16.7 4.6 5.6 7.3 11.2 16.7
Balance sheetShareholders funds 26,216 29,306 34,637 41,899 50,347 61,941 80,738 108,909
Share capital 4,051 4,045 4,035 4,035 4,035 4,035 4,035 4,035 Reserves and surplus 22,164 25,261 30,602 37,864 46,312 57,906 76,703 104,874
Loan funds 20,680 28,957 37,062 35,925 145,748 142,248 129,005 129,004 Amt received/ receivable under LT lease 6,568 6,505 6,291 6,121 5,638 5,345 5,052 4,901 Deferred tax liability (net) 1,771 2,296 2,817 3,468 4,528 5,126 5,340 5,433 Total sources of funds 55,252 67,156 81,629 88,400 207,146 215,608 221,219 249,663 Total fixed assets 36,673 51,792 67,682 84,683 186,513 196,873 195,556 189,874 Investments 8,886 2,072 2,249 1,070 4,508 4,508 4,508 4,508 Cash and bank balance 9,029 12,951 9,997 2,515 7,156 9,762 15,842 51,732 Net current assests excl cash 663 321 1,701 132 8,969 4,465 5,314 3,548 Total application of funds 55,252 67,156 81,629 88,400 207,146 215,608 221,219 249,663
Cash flowsCash flow from operations 7,243 8,336 8,524 14,649 14,966 36,006 38,410 52,269 Cash flow from investing activities (21,920) (10,094) (18,463) (18,688) (113,129) (17,441) (5,515) (1,595) Free cash flows (14,678) (1,758) (9,939) (4,039) (98,162) 18,565 32,896 50,674 Cash flow from financing activities 22,806 5,519 5,927 (4,106) 101,463 (15,827) (25,956) (14,602) Cash generated /utilised 8,418 3,922 (4,539) (8,725) 2,433 2,012 6,326 35,694 Net cash at start of year 611 9,029 12,951 9,997 2,515 7,156 9,762 15,842 Net cash at end of year 9,029 12,951 8,413 1,272 4,948 9,168 16,088 51,535
Source: Company, Kotak Institutional Equities estimates
Maersk’s US service to call at Pipavav; will help to reduce volume lost to Mundra
Maersk recently announced that from April 4, 2012, its MECL1 service line (North America- Middle East and Indian Subcontinent) would call at Pipavav port instead of Mundra port. This would help to reduce the Pipavav’s loss of volumes to Mundra after a shift of the Europe-Middle East 1 (ME1) service to Mundra port from Pipavav (also from April 4, 2012).
GPPL: Retain ADD with a target price of Rs65
We are positive about the business and management of GPPL based on (1) its attractive asset profile with good cash-flow generation characteristics, (2) pick-up in business operations with the addition of several new shipping lines, (3) improved balance-sheet quality with lower debt levels after its IPO and (4) long-term potential to add capacity at Pipavav port, led by availability of a large waterfront.
Our positive stance is limited despite the strong operations as (1) valuations are not cheap (12.2X Mar-13E EV/EBITDA), (2) concerns over macro issues such as broad economic slowdown and issues in coal imports partially remain and (3) potential for disappointment on relatively strong estimates if volume growth/margin expansion does not pan out.

India Infrastructure
52 KOTAK INSTITUTIONAL EQUITIES RESEARCH
Our SOTP-based target price of Rs65 comprises (1) Rs55/share for the core port business (FCFE valuation), (2) Rs2.6/share for its JV with Pipavav Rail Corporation (1.5X book value) and (3) Rs7/share from 50% of the calculated depreciated replacement value receivable at the end of the concession period. Our target price implies EV/EBITDA valuation of about 13X Mar-13E EV/EBITDA for the port.
SOTP-based target price of Rs65 Sum-Of-Total-Parts valuation of GPPL
Value Stake GPPL stake value Per share (Rs bn) (%) (Rs bn) (Rs) Method of valuation
Pipavav port 23,372 100 23,372 55.2 1-year forward FCFE valuationPipavav Rail Corporation Ltd (PRCL) 2,940 38 1,117 2.6 1.5X book valueDRV/ extension of concession agreement 3,001 100 3,001 7.1 50% of calculated DRV/ agreement extn
Total value for GPPL 29,313 27,490 65
Source: Company, Kotak Institutional Equities estimates
We retain our estimates of Rs 2.5 and Rs2.9 for CY2012 and CY2013 respectively.
Profit, balance sheet and cash model of GPPL, December calendar year ends, 2009-15E (Rs mn)
2009 2010 2011 2012E 2013E 2014E 2015EProfit modelNet sales 2,207 2,839 3,968 4,805 5,710 7,074 8,438 Total operating costs (1,831) (1,665) (2,135) (2,477) (2,778) (3,272) (3,856) EBITDA 376 1,174 1,833 2,328 2,932 3,802 4,582 EBITDA margin (%) 17.0 41.3 46.2 48.4 51.3 53.7 54.3 Other income 133 81 149 86 50 62 108 Financial charges (1,157) (1,271) (852) (739) (729) (883) (971) Depreciation (458) (493) (558) (611) (701) (836) (946) Pre-tax profit (1,105) (509) 573 1,064 1,552 2,145 2,773 Taxation (1) — — — (309) (427) (553) Adjusted PAT (1,106) (547) 573 1,064 1,243 1,717 2,220 EPS (Rs) (3.5) (1.3) 1.35 2.5 2.9 4.1 5.2 Balance sheetShareholders' funds 3,111 7,359 7,930 8,993 10,236 11,953 14,174 Equity share capital 3,149 4,236 4,236 4,236 4,236 4,236 4,236 Reserves and surplus (38) 3,123 3,694 4,758 6,000 7,718 9,938 Loan funds 10,891 7,973 6,759 6,669 7,209 9,609 8,889 Total sources of funds 14,002 15,332 14,688 15,662 17,445 21,562 23,062 Total fixed assets 12,986 12,907 12,819 14,043 16,551 19,431 20,765 Investments 830 830 830 830 830 830 830 Cash and bank balances 798 1,949 1,272 1,025 312 1,345 1,529 Net current assets excl. cash (612) (354) (232) (236) (249) (44) (62) Total application of funds 14,002 15,332 14,688 15,662 17,445 21,562 23,062
Cash flow statementCash flow from operations (284) 915 2,049 2,663 3,333 3,938 4,124 Cash flow from investing activities (3,226) (322) (469) (1,836) (3,210) (3,716) (2,279) Free cash flows (3,510) 594 1,580 826 124 223 1,845 Cash flow from financing activities 2,774 905 (1,916) (742) (139) 1,579 (1,583) Cash generated /utilised (902) 825 (256) (234) (713) 1,034 184 Net cash at start of year 1,700 798 1,623 1,367 1,133 419 1,453 Net cash at end of year 798 1,623 1,367 1,133 419 1,453 1,637
Source: Company, Kotak Institutional Equities estimates
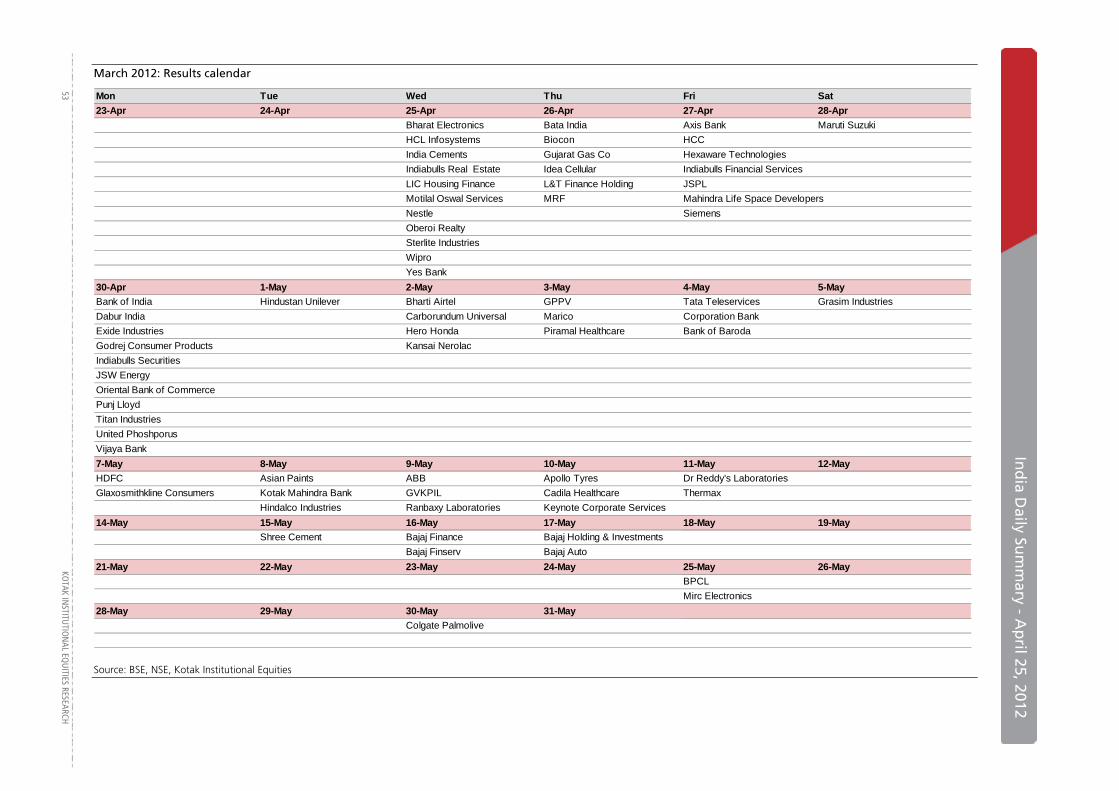
In
dia D
aily Sum
mary - A
pril 25, 2012
53
KOTAK IN
STITUTIO
NAL EQ
UITIES RESEARCH
March 2012: Results calendar
Mon Tue Wed Thu Fri Sat23-Apr 24-Apr 25-Apr 26-Apr 27-Apr 28-AprContainer Corporation Bajaj Corp Bharat Electronics Bata India Axis Bank Maruti SuzukiCoromandel International ING Vysya Bank HCL Infosystems Biocon HCCMMFSL Petronet LNG India Cements Gujarat Gas Co Hexaware TechnologiesRaills India Polaris Financial Technology Indiabulls Real Estate Idea Cellular Indiabulls Financial ServicesTCS Sesa Goa LIC Housing Finance L&T Finance Holding JSPLUltratech Cement Motilal Oswal Services MRF Mahindra Life Space Developers
Nestle SiemensOberoi RealtySterlite IndustriesWiproYes Bank
30-Apr 1-May 2-May 3-May 4-May 5-MayBank of India Hindustan Unilever Bharti Airtel GPPV Tata Teleservices Grasim IndustriesDabur India Carborundum Universal Marico Corporation BankExide Industries Hero Honda Piramal Healthcare Bank of BarodaGodrej Consumer Products Kansai NerolacIndiabulls SecuritiesJSW EnergyOriental Bank of CommercePunj LloydTitan IndustriesUnited PhoshporusVijaya Bank7-May 8-May 9-May 10-May 11-May 12-MayHDFC Asian Paints ABB Apollo Tyres Dr Reddy's LaboratoriesGlaxosmithkline Consumers Kotak Mahindra Bank GVKPIL Cadila Healthcare Thermax
Hindalco Industries Ranbaxy Laboratories Keynote Corporate Services14-May 15-May 16-May 17-May 18-May 19-May
Shree Cement Bajaj Finance Bajaj Holding & InvestmentsBajaj Finserv Bajaj Auto
21-May 22-May 23-May 24-May 25-May 26-MayBPCLMirc Electronics
28-May 29-May 30-May 31-MayColgate Palmolive
Source: BSE, NSE, Kotak Institutional Equities
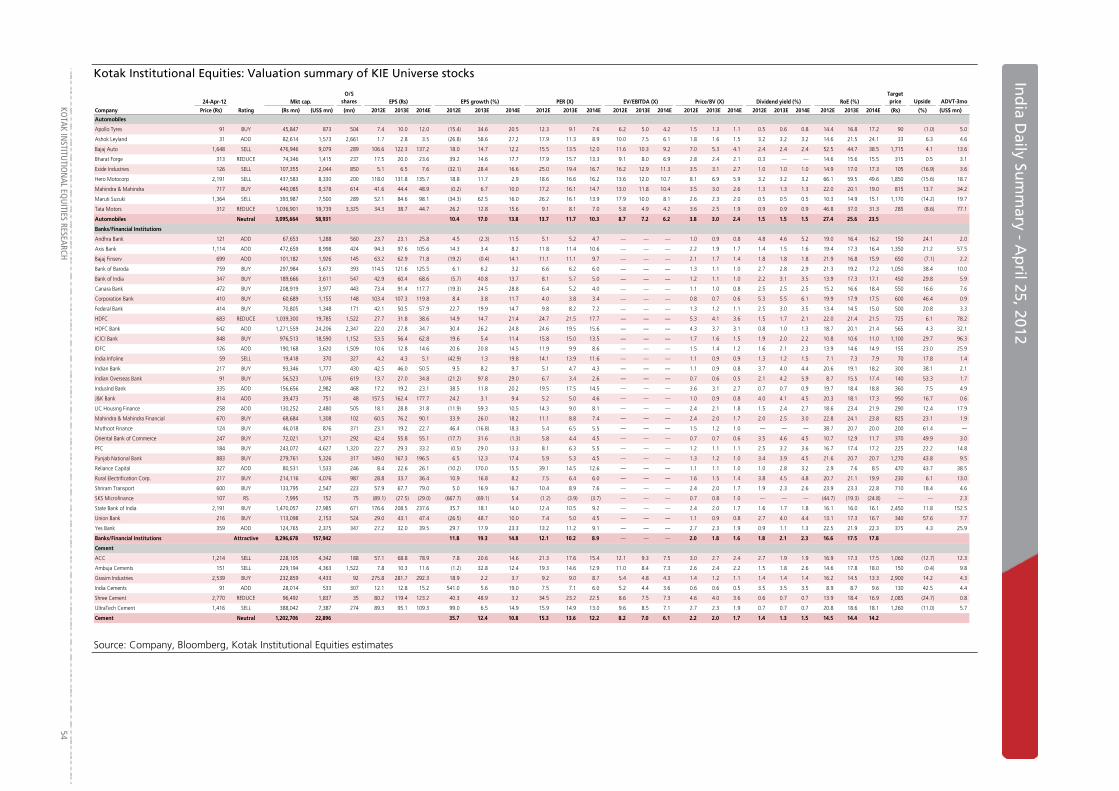
KO
TAK INSTITUTIO
NAL EQ
UITIES RESEARCH 54
In
dia D
aily Sum
mary - A
pril 2
Ind
ia Daily Su
mm
ary - Ap
ril 25, 2012
Kotak Institutional Equities: Valuation summary of KIE Universe stocks
24-Apr-12 Mkt cap.O/S
shares EPS (Rs) EPS growth (%) PER (X) EV/EBITDA (X) RoE (%)Target price Upside ADVT-3mo
Company Price (Rs) Rating (Rs mn) (US$ mn) (mn) 2012E 2013E 2014E 2012E 2013E 2014E 2012E 2013E 2014E 2012E 2013E 2014E 2012E 2013E 2014E 2012E 2013E 2014E 2012E 2013E 2014E (Rs) (%) (US$ mn)
Automobiles
Apollo Tyres 91 BUY 45,847 873 504 7.4 10.0 12.0 (15.4) 34.6 20.5 12.3 9.1 7.6 6.2 5.0 4.2 1.5 1.3 1.1 0.5 0.6 0.8 14.4 16.8 17.2 90 (1.0) 5.0
Ashok Leyland 31 ADD 82,614 1,573 2,661 1.7 2.8 3.5 (26.8) 58.6 27.2 17.9 11.3 8.9 10.0 7.5 6.1 1.8 1.6 1.5 3.2 3.2 3.2 14.6 21.5 24.1 33 6.3 4.6
Bajaj Auto 1,648 SELL 476,946 9,079 289 106.6 122.3 137.2 18.0 14.7 12.2 15.5 13.5 12.0 11.6 10.3 9.2 7.0 5.3 4.1 2.4 2.4 2.4 52.5 44.7 38.5 1,715 4.1 13.6
Bharat Forge 313 REDUCE 74,346 1,415 237 17.5 20.0 23.6 39.2 14.6 17.7 17.9 15.7 13.3 9.1 8.0 6.9 2.8 2.4 2.1 0.3 — — 14.6 15.6 15.5 315 0.5 3.1
Exide Industries 126 SELL 107,355 2,044 850 5.1 6.5 7.6 (32.1) 28.4 16.6 25.0 19.4 16.7 16.2 12.9 11.3 3.5 3.1 2.7 1.0 1.0 1.0 14.9 17.0 17.3 105 (16.9) 3.6
Hero Motocorp 2,191 SELL 437,583 8,330 200 118.0 131.8 135.7 18.8 11.7 2.9 18.6 16.6 16.2 13.6 12.0 10.7 8.1 6.9 5.9 3.2 3.2 3.2 66.1 59.5 49.6 1,850 (15.6) 18.7
Mahindra & Mahindra 717 BUY 440,085 8,378 614 41.6 44.4 48.9 (0.2) 6.7 10.0 17.2 16.1 14.7 13.0 11.8 10.4 3.5 3.0 2.6 1.3 1.3 1.3 22.0 20.1 19.0 815 13.7 34.2
Maruti Suzuki 1,364 SELL 393,987 7,500 289 52.1 84.6 98.1 (34.3) 62.5 16.0 26.2 16.1 13.9 17.9 10.0 8.1 2.6 2.3 2.0 0.5 0.5 0.5 10.3 14.9 15.1 1,170 (14.2) 19.7
Tata Motors 312 REDUCE 1,036,901 19,739 3,325 34.3 38.7 44.7 26.2 12.8 15.6 9.1 8.1 7.0 5.8 4.9 4.2 3.6 2.5 1.9 0.9 0.9 0.9 46.8 37.0 31.3 285 (8.6) 77.1
Automobiles Neutral 3,095,664 58,931 10.4 17.0 13.8 13.7 11.7 10.3 8.7 7.2 6.2 3.8 3.0 2.4 1.5 1.5 1.5 27.4 25.6 23.5
Banks/Financial Institutions
Andhra Bank 121 ADD 67,653 1,288 560 23.7 23.1 25.8 4.5 (2.3) 11.5 5.1 5.2 4.7 — — — 1.0 0.9 0.8 4.8 4.6 5.2 19.0 16.4 16.2 150 24.1 2.0
Axis Bank 1,114 ADD 472,659 8,998 424 94.3 97.6 105.6 14.3 3.4 8.2 11.8 11.4 10.6 — — — 2.2 1.9 1.7 1.4 1.5 1.6 19.4 17.3 16.4 1,350 21.2 57.5
Bajaj Finserv 699 ADD 101,182 1,926 145 63.2 62.9 71.8 (19.2) (0.4) 14.1 11.1 11.1 9.7 — — — 2.1 1.7 1.4 1.8 1.8 1.8 21.9 16.8 15.9 650 (7.1) 2.2
Bank of Baroda 759 BUY 297,984 5,673 393 114.5 121.6 125.5 6.1 6.2 3.2 6.6 6.2 6.0 — — — 1.3 1.1 1.0 2.7 2.8 2.9 21.3 19.2 17.2 1,050 38.4 10.0
Bank of India 347 BUY 189,666 3,611 547 42.9 60.4 68.6 (5.7) 40.8 13.7 8.1 5.7 5.0 — — — 1.2 1.1 1.0 2.2 3.1 3.5 13.9 17.3 17.1 450 29.8 5.9
Canara Bank 472 BUY 208,919 3,977 443 73.4 91.4 117.7 (19.3) 24.5 28.8 6.4 5.2 4.0 — — — 1.1 1.0 0.8 2.5 2.5 2.5 15.2 16.6 18.4 550 16.6 7.6
Corporation Bank 410 BUY 60,689 1,155 148 103.4 107.3 119.8 8.4 3.8 11.7 4.0 3.8 3.4 — — — 0.8 0.7 0.6 5.3 5.5 6.1 19.9 17.9 17.5 600 46.4 0.9
Federal Bank 414 BUY 70,805 1,348 171 42.1 50.5 57.9 22.7 19.9 14.7 9.8 8.2 7.2 — — — 1.3 1.2 1.1 2.5 3.0 3.5 13.4 14.5 15.0 500 20.8 3.3
HDFC 683 REDUCE 1,039,300 19,785 1,522 27.7 31.8 38.6 14.9 14.7 21.4 24.7 21.5 17.7 — — — 5.3 4.1 3.6 1.5 1.7 2.1 22.0 21.4 21.5 725 6.1 78.2
HDFC Bank 542 ADD 1,271,559 24,206 2,347 22.0 27.8 34.7 30.4 26.2 24.8 24.6 19.5 15.6 — — — 4.3 3.7 3.1 0.8 1.0 1.3 18.7 20.1 21.4 565 4.3 32.1
ICICI Bank 848 BUY 976,513 18,590 1,152 53.5 56.4 62.8 19.6 5.4 11.4 15.8 15.0 13.5 — — — 1.7 1.6 1.5 1.9 2.0 2.2 10.8 10.6 11.0 1,100 29.7 96.3
IDFC 126 ADD 190,168 3,620 1,509 10.6 12.8 14.6 20.6 20.8 14.5 11.9 9.9 8.6 — — — 1.5 1.4 1.2 1.6 2.1 2.3 13.9 14.6 14.9 155 23.0 25.9
India Infoline 59 SELL 19,418 370 327 4.2 4.3 5.1 (42.9) 1.3 19.8 14.1 13.9 11.6 — — — 1.1 0.9 0.9 1.3 1.2 1.5 7.1 7.3 7.9 70 17.8 1.4
Indian Bank 217 BUY 93,346 1,777 430 42.5 46.0 50.5 9.5 8.2 9.7 5.1 4.7 4.3 — — — 1.1 0.9 0.8 3.7 4.0 4.4 20.6 19.1 18.2 300 38.1 2.1
Indian Overseas Bank 91 BUY 56,523 1,076 619 13.7 27.0 34.8 (21.2) 97.8 29.0 6.7 3.4 2.6 — — — 0.7 0.6 0.5 2.1 4.2 5.9 8.7 15.5 17.4 140 53.3 1.7
IndusInd Bank 335 ADD 156,656 2,982 468 17.2 19.2 23.1 38.5 11.8 20.2 19.5 17.5 14.5 — — — 3.6 3.1 2.7 0.7 0.7 0.9 19.7 18.4 18.8 360 7.5 4.9
J&K Bank 814 ADD 39,473 751 48 157.5 162.4 177.7 24.2 3.1 9.4 5.2 5.0 4.6 — — — 1.0 0.9 0.8 4.0 4.1 4.5 20.3 18.1 17.3 950 16.7 0.6
LIC Housing Finance 258 ADD 130,252 2,480 505 18.1 28.8 31.8 (11.9) 59.3 10.5 14.3 9.0 8.1 — — — 2.4 2.1 1.8 1.5 2.4 2.7 18.6 23.4 21.9 290 12.4 17.9
Mahindra & Mahindra Financial 670 BUY 68,684 1,308 102 60.5 76.2 90.1 33.9 26.0 18.2 11.1 8.8 7.4 — — — 2.4 2.0 1.7 2.0 2.5 3.0 22.8 24.1 23.8 825 23.1 1.9
Muthoot Finance 124 BUY 46,018 876 371 23.1 19.2 22.7 46.4 (16.8) 18.3 5.4 6.5 5.5 — — — 1.5 1.2 1.0 — — — 38.7 20.7 20.0 200 61.4 —
Oriental Bank of Commerce 247 BUY 72,021 1,371 292 42.4 55.8 55.1 (17.7) 31.6 (1.3) 5.8 4.4 4.5 — — — 0.7 0.7 0.6 3.5 4.6 4.5 10.7 12.9 11.7 370 49.9 3.0
PFC 184 BUY 243,072 4,627 1,320 22.7 29.3 33.2 (0.5) 29.0 13.3 8.1 6.3 5.5 — — — 1.2 1.1 1.1 2.5 3.2 3.6 16.7 17.4 17.2 225 22.2 14.8
Punjab National Bank 883 BUY 279,761 5,326 317 149.0 167.3 196.5 6.5 12.3 17.4 5.9 5.3 4.5 — — — 1.3 1.2 1.0 3.4 3.9 4.5 21.6 20.7 20.7 1,270 43.8 9.5
Reliance Capital 327 ADD 80,531 1,533 246 8.4 22.6 26.1 (10.2) 170.0 15.5 39.1 14.5 12.6 — — — 1.1 1.1 1.0 1.0 2.8 3.2 2.9 7.6 8.5 470 43.7 38.5
Rural Electrification Corp. 217 BUY 214,116 4,076 987 28.8 33.7 36.4 10.9 16.8 8.2 7.5 6.4 6.0 — — — 1.6 1.5 1.4 3.8 4.5 4.8 20.7 21.1 19.9 230 6.1 13.0
Shriram Transport 600 BUY 133,795 2,547 223 57.9 67.7 79.0 5.0 16.9 16.7 10.4 8.9 7.6 — — — 2.4 2.0 1.7 1.9 2.3 2.6 23.9 23.3 22.8 710 18.4 4.6
SKS Microfinance 107 RS 7,995 152 75 (89.1) (27.5) (29.0) (667.7) (69.1) 5.4 (1.2) (3.9) (3.7) — — — 0.7 0.8 1.0 — — — (44.7) (19.3) (24.8) — — 2.3
State Bank of India 2,191 BUY 1,470,057 27,985 671 176.6 208.5 237.6 35.7 18.1 14.0 12.4 10.5 9.2 — — — 2.4 2.0 1.7 1.6 1.7 1.8 16.1 16.0 16.1 2,450 11.8 152.5
Union Bank 216 BUY 113,098 2,153 524 29.0 43.1 47.4 (26.5) 48.7 10.0 7.4 5.0 4.5 — — — 1.1 0.9 0.8 2.7 4.0 4.4 13.1 17.3 16.7 340 57.6 7.7
Yes Bank 359 ADD 124,765 2,375 347 27.2 32.0 39.5 29.7 17.9 23.3 13.2 11.2 9.1 — — — 2.7 2.3 1.9 0.9 1.1 1.3 22.5 21.9 22.3 375 4.3 25.9
Banks/Financial Institutions Attractive 8,296,678 157,942 11.8 19.3 14.8 12.1 10.2 8.9 — — — 2.0 1.8 1.6 1.8 2.1 2.3 16.6 17.5 17.8
Cement
ACC 1,214 SELL 228,105 4,342 188 57.1 68.8 78.9 7.8 20.6 14.6 21.3 17.6 15.4 12.1 9.3 7.5 3.0 2.7 2.4 2.7 1.9 1.9 16.9 17.3 17.5 1,060 (12.7) 12.3
Ambuja Cements 151 SELL 229,194 4,363 1,522 7.8 10.3 11.6 (1.2) 32.8 12.4 19.3 14.6 12.9 11.0 8.4 7.3 2.6 2.4 2.2 1.5 1.8 2.6 14.6 17.8 18.0 150 (0.4) 9.8
Grasim Industries 2,539 BUY 232,859 4,433 92 275.8 281.7 292.3 18.9 2.2 3.7 9.2 9.0 8.7 5.4 4.8 4.3 1.4 1.2 1.1 1.4 1.4 1.4 16.2 14.5 13.3 2,900 14.2 4.3
India Cements 91 ADD 28,014 533 307 12.1 12.8 15.2 541.0 5.6 19.0 7.5 7.1 6.0 5.2 4.4 3.6 0.6 0.6 0.5 3.5 3.5 3.5 8.9 8.7 9.6 130 42.5 4.4
Shree Cement 2,770 REDUCE 96,492 1,837 35 80.2 119.4 123.2 40.3 48.9 3.2 34.5 23.2 22.5 8.6 7.5 7.3 4.6 4.0 3.6 0.6 0.7 0.7 13.9 18.4 16.9 2,085 (24.7) 0.8
UltraTech Cement 1,416 SELL 388,042 7,387 274 89.3 95.1 109.3 99.0 6.5 14.9 15.9 14.9 13.0 9.6 8.5 7.1 2.7 2.3 1.9 0.7 0.7 0.7 20.8 18.6 18.1 1,260 (11.0) 5.7
Cement Neutral 1,202,706 22,896 35.7 12.4 10.8 15.3 13.6 12.2 8.2 7.0 6.1 2.2 2.0 1.7 1.4 1.3 1.5 14.5 14.4 14.2
Price/BV (X) Dividend yield (%)
Source: Company, Bloomberg, Kotak Institutional Equities estimates

In
dia D
aily Sum
mary - A
pril 25, 2012
55
KOTAK IN
STITUTIO
NAL EQ
UITIES RESEARCH
Kotak Institutional Equities: Valuation summary of KIE Universe stocks
24-Apr-12 Mkt cap.O/S
shares EPS (Rs) EPS growth (%) PER (X) EV/EBITDA (X) Price/BV (X) RoE (%)Target price Upside ADVT-3mo
Company Price (Rs) Rating (Rs mn) (US$ mn) (mn) 2012E 2013E 2014E 2012E 2013E 2014E 2012E 2013E 2014E 2012E 2013E 2014E 2012E 2013E 2014E 2012E 2013E 2014E 2012E 2013E 2014E (Rs) (%) (US$ mn)
Consumer products
Asian Paints 3,462 SELL 332,074 6,322 96 94.4 106.9 132.3 16.8 13.3 23.8 36.7 32.4 26.2 25.0 20.2 16.5 12.4 10.2 8.1 0.8 1.0 1.0 39.9 35.6 34.9 2,500 (27.8) 6.3
Colgate-Palmolive (India) 1,164 SELL 158,228 3,012 136 32.5 39.1 44.1 9.9 20.3 12.6 35.8 29.7 26.4 30.8 24.9 21.8 41.9 33.4 29.0 2.4 2.4 2.8 116.1 124.9 117.3 900 (22.6) 1.8
Dabur India 111 ADD 193,791 3,689 1,740 3.7 4.4 5.1 12.1 19.2 17.0 30.4 25.5 21.8 23.2 19.8 17.0 11.5 9.1 7.3 1.2 1.4 1.6 43.2 40.2 37.5 115 3.3 3.3
GlaxoSmithkline Consumer (a) 2,839 ADD 119,391 2,273 42 84.5 105.4 122.6 18.5 24.8 16.4 33.6 26.9 23.1 25.6 20.9 17.9 10.8 9.0 7.5 1.2 1.5 1.8 33.8 35.2 34.3 3,000 5.7 1.2
Godrej Consumer Products 514 ADD 166,342 3,167 324 16.8 21.8 25.6 13.1 29.8 17.3 30.5 23.5 20.1 23.0 17.2 14.4 7.2 5.9 5.0 0.6 0.6 0.8 27.6 28.9 30.9 500 (2.7) 2.3
Hindustan Unilever 421 REDUCE 908,043 17,286 2,159 11.8 14.2 16.3 19.7 19.7 15.3 35.6 29.7 25.8 29.4 23.4 19.8 29.7 25.4 21.8 2.3 2.8 3.3 89.8 92.4 92.0 420 (0.1) 19.2
ITC 245 ADD 1,882,149 35,830 7,681 8.0 9.0 10.5 24.1 13.8 15.6 30.8 27.1 23.4 21.2 18.4 15.7 9.7 8.4 6.8 1.5 1.8 1.3 35.3 34.5 33.2 250 2.0 37.5
Jubilant Foodworks 1,137 SELL 74,584 1,420 66 16.3 24.0 33.1 45.4 47.3 38.2 69.8 47.4 34.3 38.7 26.7 19.6 25.0 16.4 11.1 — — — 43.6 41.7 38.5 800 (29.6) 21.1
Jyothy Laboratories 173 ADD 13,391 255 78 8.4 10.8 12.6 (18.8) 28.0 17.0 20.5 16.1 13.7 31.5 23.5 17.5 1.9 1.8 1.7 2.7 3.4 3.4 9.7 11.7 12.8 190 10.1 0.5
Nestle India (a) 4,884 SELL 470,865 8,964 96 104.6 125.1 146.3 20.5 19.6 16.9 46.7 39.0 33.4 30.8 25.0 20.8 37.0 22.0 16.9 1.0 1.2 1.4 94.7 70.7 57.3 3,600 (26.3) 3.0
Tata Global Beverages 119 BUY 73,280 1,395 618 5.3 6.6 7.5 35.1 23.0 14.1 22.2 18.0 15.8 12.1 9.8 8.5 1.4 1.3 1.2 1.5 1.8 2.1 8.2 9.5 10.2 110 (7.2) 9.1
Titan Industries 237 ADD 210,317 4,004 888 6.5 7.9 9.8 32.5 20.7 24.4 36.4 30.1 24.2 25.7 20.8 16.0 15.3 11.9 8.2 0.9 1.3 0.4 48.0 44.4 40.1 260 9.8 16.7
United Spirits 677 BUY 85,052 1,619 126 36.6 42.7 45.9 3.5 16.9 7.5 18.5 15.8 14.7 11.5 10.6 9.5 1.8 1.7 1.5 0.4 0.5 0.6 10.5 11.1 10.8 900 32.9 26.9
Consumer products Attractive 4,798,310 91,344 19.9 18.0 16.8 33.3 28.2 24.2 23.3 19.5 16.5 10.5 9.0 7.4 1.5 1.7 1.6 31.7 31.8 30.8
Constructions
IVRCL 61 REDUCE 16,261 310 267 2.9 3.9 7.1 (50.5) 33.6 81.2 20.8 15.6 8.6 8.8 7.6 6.3 0.8 0.8 0.7 0.7 0.7 0.7 3.9 5.0 8.5 67 10.0 20.7
Nagarjuna Construction Co. 53 ADD 13,573 258 257 1.8 3.7 5.5 (71.1) 100.8 49.6 28.7 14.3 9.5 9.3 7.9 7.1 0.6 0.6 0.5 3.8 3.8 3.8 2.0 4.0 5.8 65 22.9 2.4
Punj Lloyd 52 REDUCE 17,709 337 340 5.1 6.6 9.3 (442.7) 28.9 42.2 10.2 8.0 5.6 9.1 6.4 5.4 0.6 0.5 0.5 0.9 1.1 1.6 5.7 6.9 9.1 60 15.1 5.1
Sadbhav Engineering 141 BUY 21,192 403 150 10.0 10.0 11.5 28.5 0.5 14.2 14.2 14.1 12.3 8.7 8.4 7.2 2.7 2.3 2.0 0.4 0.4 1.1 19.2 16.3 16.1 180 27.3 0.5
Construction Attractive 68,736 1,309 15.6 27.8 43.2 15.3 12.0 8.4 9.0 7.2 6.1 0.8 0.8 0.7 1.3 1.3 1.7 5.4 6.5 8.6
Energy
Aban Offshore 420 BUY 18,262 348 44 71.5 92.4 96.0 (46.7) 29.1 3.9 5.9 4.5 4.4 7.5 6.7 6.5 1.1 0.9 0.8 1.0 1.1 1.2 20.8 21.4 18.1 615 46.6 12.8
Bharat Petroleum 688 RS 248,595 4,732 362 42.3 53.5 58.8 8.8 26.3 10.0 16.2 12.9 11.7 8.7 8.2 7.4 1.6 1.4 1.3 2.0 2.5 2.8 9.3 11.0 11.2 — — 7.2
Cairn india 342 REDUCE 651,568 12,404 1,907 41.6 60.9 56.8 25.0 46.4 (6.8) 8.2 5.6 6.0 6.1 3.8 3.6 1.4 1.2 1.1 — 3.5 4.4 17.9 22.7 18.9 355 3.9 19.6
Castrol India (a) 506 SELL 125,087 2,381 247 18.9 20.7 21.7 (4.4) 9.4 4.8 26.7 24.4 23.3 18.2 16.7 15.9 22.8 20.9 19.5 3.0 3.2 3.4 87.9 89.4 86.6 400 (20.9) 1.0
GAIL (India) 347 ADD 440,353 8,383 1,268 32.4 30.0 30.1 15.1 (7.6) 0.5 10.7 11.6 11.5 7.6 8.1 7.1 1.8 1.6 1.4 2.4 2.3 2.3 17.5 14.1 12.6 445 28.2 10.0
GSPL 68 ADD 38,284 729 563 9.2 8.5 9.0 3.2 (7.4) 6.0 7.4 8.0 7.5 4.8 4.8 4.4 1.4 1.2 1.1 2.0 3.1 5.3 20.5 16.1 15.2 87 27.8 3.4
Hindustan Petroleum 299 RS 101,517 1,933 339 11.0 28.8 31.1 (73.2) 162.9 8.0 27.3 10.4 9.6 2.8 3.3 3.0 0.6 0.6 0.6 1.1 3.0 3.2 2.2 5.7 5.8 — — 5.7
Indian Oil Corporation 264 RS 640,493 12,193 2,428 30.1 29.8 33.9 (7.2) (0.9) 13.7 8.8 8.8 7.8 7.0 6.4 5.5 1.1 1.0 0.9 0.7 3.4 3.9 12.2 11.1 11.7 — — 2.9
Oil India 463 BUY 278,411 5,300 601 66.9 73.7 79.0 39.5 10.2 7.2 6.9 6.3 5.9 2.5 2.0 1.6 1.4 1.2 1.1 4.4 4.9 5.3 19.7 18.9 17.8 680 46.8 2.7
Oil & Natural Gas Corporation 268 BUY 2,295,873 43,706 8,556 33.7 35.2 36.8 36.5 4.5 4.6 8.0 7.6 7.3 3.4 2.9 2.5 1.4 1.2 1.1 4.5 4.5 4.7 17.3 16.1 15.1 325 21.1 22.6
Petronet LNG 147 REDUCE 110,100 2,096 750 14.1 14.3 13.3 74.0 1.5 (7.2) 10.4 10.3 11.0 7.1 7.6 6.7 2.8 2.2 1.9 1.7 1.7 1.7 29.7 23.8 18.0 140 (4.6) 7.2
Reliance Industries 735 REDUCE 2,191,333 41,716 2,981 61.3 56.3 58.7 (1.1) (8.1) 4.3 12.0 13.1 12.5 7.1 7.2 6.4 1.2 1.1 1.0 1.2 1.1 1.2 11.7 9.9 9.5 770 4.7 76.4
Energy Neutral 7,139,875 135,920 14.1 5.7 3.7 9.3 8.8 8.5 5.3 4.7 4.2 1.3 1.2 1.1 2.4 3.0 3.2 14.3 13.6 12.9
Industrials
ABB 805 SELL 170,608 3,248 212 11.7 22.7 24.9 291.5 94.5 9.7 68.9 35.4 32.3 45.7 23.0 20.7 6.6 5.7 5.0 0.4 0.4 0.4 9.9 17.3 16.4 515 (36.0) 1.8
BGR Energy Systems 354 REDUCE 25,557 487 72 29.4 27.2 33.4 (34.4) (7.4) 22.7 12.1 13.0 10.6 6.2 5.4 5.2 2.3 2.0 1.8 1.7 1.5 1.9 20.5 16.5 17.8 260 (26.6) 11.7
Bharat Electronics 1,470 REDUCE 117,564 2,238 80 89.3 120.4 131.6 (16.8) 34.9 9.3 16.5 12.2 11.2 10.1 5.0 3.7 2.1 1.8 1.6 1.7 1.7 1.7 13.2 16.0 15.5 1,550 5.5 2.1
Bharat Heavy Electricals 237 SELL 580,204 11,045 2,448 28.1 26.2 22.9 14.6 (6.8) (12.6) 8.4 9.0 10.3 5.9 5.9 6.4 2.3 1.9 1.7 2.5 2.4 2.1 30.3 23.2 17.4 230 (3.0) 41.2
Crompton Greaves 131 ADD 83,812 1,596 642 6.4 10.3 12.3 (55.2) 60.0 19.8 20.4 12.7 10.6 9.9 6.9 5.7 2.3 2.0 1.8 1.1 1.2 1.4 12.0 17.0 17.7 170 30.1 8.6
Cummins India 484 REDUCE 134,040 2,552 277 21.6 25.9 29.8 (2.9) 19.8 15.3 22.4 18.7 16.2 20.2 16.0 13.3 6.5 5.7 5.0 2.2 2.6 3.0 29.7 31.2 31.5 475 (1.8) 2.8
KEC International 64 BUY 16,351 311 257 6.7 8.1 10.0 (16.5) 21.6 22.8 9.5 7.8 6.4 6.7 5.8 4.7 1.4 1.3 1.1 2.1 1.9 2.4 16.2 17.2 18.2 65 2.2 0.5
Larsen & Toubro 1,219 ADD 741,914 14,124 609 78.1 82.4 91.5 15.4 5.4 11.0 15.6 14.8 13.3 11.0 10.1 9.3 2.4 2.0 1.8 1.1 1.1 1.1 16.5 14.8 14.3 1,350 10.8 68.2
Maharashtra Seamless 377 BUY 26,607 507 71 42.1 46.8 50.9 (12.6) 11.0 8.8 9.0 8.1 7.4 5.0 4.2 3.5 1.0 0.9 0.8 2.2 2.5 2.7 11.1 11.5 11.6 460 21.9 0.2
Siemens 796 SELL 270,892 5,157 340 22.3 27.9 31.4 (12.7) 25.5 12.4 35.8 28.5 25.3 22.7 18.1 15.8 6.1 5.2 4.5 0.6 0.7 0.8 18.2 19.7 19.1 550 (30.9) 3.0
Suzlon Energy 23 REDUCE 39,624 754 1,746 (0.9) 3.8 4.2 (85.7) (539.2) 12.4 (26.4) 6.0 5.3 7.6 5.1 4.6 0.6 0.6 0.5 0.9 0.9 0.9 (2.2) 9.7 10.0 32 41.0 18.8
Tecpro Systems 195 ADD 9,865 188 50 28.2 24.4 27.6 4.3 (13.5) 13.4 6.9 8.0 7.1 5.5 5.4 4.7 1.3 1.1 1.0 — — — 19.7 15.0 15.2 220 12.6 0.4
Thermax 439 REDUCE 52,337 996 119 32.6 29.8 33.8 3.0 (8.7) 13.6 13.5 14.8 13.0 8.9 9.5 7.9 3.3 2.9 2.5 2.1 1.8 2.0 26.8 20.8 20.4 450 2.4 1.3
Voltas 116 ADD 38,217 728 331 7.5 8.4 9.0 (23.0) 11.9 6.9 15.3 13.7 12.8 10.4 8.9 7.5 2.5 2.3 2.0 2.0 2.2 2.4 17.2 17.4 16.7 125 8.2 10.3
Industrials Cautious 2,307,592 43,929 11.2 10.7 3.0 14.7 13.3 12.9 9.9 8.7 8.3 2.6 2.2 1.9 1.5 1.5 1.5 17.3 16.6 15.0
Infrastructure
Adani Port and SEZ 129 ADD 259,545 4,941 2,017 5.6 7.3 11.2 22.1 31.3 53.2 23.2 17.6 11.5 17.3 12.9 9.9 5.1 4.1 3.2 0.8 1.1 1.5 23.8 25.8 31.2 160 24.4 4.2
Container Corporation 885 ADD 115,013 2,189 130 71.0 77.5 86.3 5.0 9.2 11.4 12.5 11.4 10.3 7.8 6.6 5.3 2.0 1.8 1.6 1.9 2.0 2.3 17.4 16.7 16.5 1,100 24.3 1.6
GMR Infrastructure 28 RS 109,766 2,090 3,892 (0.8) (0.2) 0.8 131.2 (77.8) (564.2) (36.2) (163.0) 35.1 13.4 11.1 7.1 1.0 0.9 0.9 — — — (4.0) (0.9) 4.2 — — 5.7
Gujarat Pipavav Port 60 ADD 25,435 484 424 1.4 2.5 2.9 (212.6) 85.7 16.8 44.4 23.9 20.5 16.4 13.0 10.7 3.2 2.8 2.5 — — — 10.4 13.0 13.7 65 8.2 0.4
GVK Power & Infrastructure 17 RS 26,294 501 1,579 1.0 0.3 2.6 1.6 (73.4) 861.1 16.7 62.8 6.5 16.5 19.5 7.5 0.8 0.8 0.7 1.8 2.1 4.8 4.6 1.2 11.1 — — 8.5
IRB Infrastructure 181 ADD 60,258 1,147 332 11.9 15.2 13.3 (12.9) 27.9 (12.3) 15.3 12.0 13.6 8.9 7.5 6.8 1.7 1.4 1.3 — — — 13.1 13.0 9.8 190 4.8 9.2
Infrastructure Cautious 596,310 11,352 5.7 30.4 52.1 25.4 19.5 12.8 13.4 10.9 7.9 2.0 1.8 1.6 0.8 1.0 1.3 7.9 9.3 12.4
Dividend yield (%)
Source: Company, Bloomberg, Kotak Institutional Equities estimates

KO
TAK INSTITUTIO
NAL EQ
UITIES RESEARCH 56
In
dia D
aily Sum
mary - A
pril 2
Ind
ia Daily Su
mm
ary - Ap
ril 25, 2012
Kotak Institutional Equities: Valuation summary of KIE Universe stocks
24-Apr-12 Mkt cap.O/S
shares EPS (Rs) EPS growth (%) PER (X) EV/EBITDA (X) Price/BV (X) RoE (%)Target price Upside ADVT-3mo
Company Price (Rs) Rating (Rs mn) (US$ mn) (mn) 2012E 2013E 2014E 2012E 2013E 2014E 2012E 2013E 2014E 2012E 2013E 2014E 2012E 2013E 2014E 2012E 2013E 2014E 2012E 2013E 2014E (Rs) (%) (US$ mn)
Media
DB Corp 205 BUY 37,572 715 183 11.2 13.5 16.6 (20.7) 20.6 23.3 18.3 15.2 12.3 10.7 8.9 7.2 4.0 3.5 3.2 1.9 2.9 4.9 23.0 24.5 27.4 300 46.3 0.1
DishTV 59 BUY 62,930 1,198 1,063 (0.7) 0.5 1.7 (62.6) (176.1) 240.3 (88.7) 116.6 34.2 13.7 10.5 7.9 (767.7) 137.4 27.4 — — — (260.1) 287.2 133.5 80 35.1 7.7
Eros International 192 BUY 18,612 354 97 15.3 18.5 22.1 30.2 20.4 19.8 12.5 10.4 8.7 8.9 6.8 5.6 2.3 1.8 1.5 — — — 19.9 19.5 19.0 260 35.4 1.6
Hindustan Media Ventures 141 BUY 10,381 198 73 9.0 10.6 12.7 23.3 17.8 19.5 15.7 13.3 11.2 9.0 6.9 5.4 2.4 2.1 1.8 0.7 1.4 2.8 16.1 16.5 17.5 190 34.3 0.1
HT Media 128 ADD 30,023 572 235 7.5 9.3 13.0 (2.4) 23.9 39.7 17.0 13.7 9.8 8.3 6.1 4.1 1.9 1.8 1.6 1.6 3.1 4.7 11.9 13.6 17.5 160 25.3 0.1
Jagran Prakashan 100 BUY 31,546 601 316 6.5 7.8 9.3 (5.3) 21.6 18.3 15.5 12.7 10.7 8.4 7.2 6.1 4.1 3.6 3.2 3.5 4.0 5.0 27.6 30.0 31.5 150 50.4 0.5
Sun TV Network 284 ADD 112,017 2,132 394 18.5 21.4 25.2 (5.4) 15.9 17.8 15.4 13.3 11.3 9.0 7.9 6.7 4.2 3.9 3.7 3.9 4.9 6.0 30.2 32.2 35.1 390 37.2 5.5
Zee Entertainment Enterprises 125 BUY 122,198 2,326 978 6.1 7.4 9.2 3.9 22.6 24.2 20.6 16.8 13.5 13.8 11.0 8.6 2.8 2.7 2.6 1.0 1.2 1.5 14.0 16.5 19.7 160 28.1 3.7
Media Attractive 425,280 8,096 3.9 26.6 26.8 20.7 16.4 12.9 10.7 8.7 7.0 3.7 3.4 3.1 1.9 2.5 3.2 17.7 20.6 23.8
Metals & Mining
Coal India 356 ADD 2,249,257 42,819 6,316 23.4 26.9 32.2 35.1 14.9 19.9 15.2 13.3 11.1 9.5 8.2 6.4 5.1 4.1 3.3 2.0 2.3 2.7 37.3 34.1 33.0 380 6.7 26.1
Hindalco Industries 121 REDUCE 231,033 4,398 1,915 17.2 16.0 16.6 34.3 (6.6) 3.5 7.0 7.5 7.3 6.3 6.1 5.5 0.7 0.7 0.6 1.2 1.2 1.2 10.8 9.2 8.8 135 11.9 33.9
Hindustan Zinc 126 ADD 530,660 10,102 4,225 13.2 14.0 16.7 13.2 6.1 19.4 9.5 9.0 7.5 5.8 4.6 3.1 2.0 1.7 1.4 1.9 1.9 1.9 22.6 20.2 20.4 145 15.4 2.6
Jindal Steel and Power 480 REDUCE 448,137 8,531 934 40.9 46.1 57.8 1.7 12.7 25.4 11.7 10.4 8.3 8.8 8.2 6.0 2.5 2.0 1.7 0.4 0.4 0.4 24.1 21.8 22.1 530 10.5 23.8
JSW Steel 694 SELL 156,923 2,987 226 32.3 77.7 94.8 (58.9) 140.5 22.0 21.5 8.9 7.3 5.5 6.0 5.6 0.9 0.9 0.8 1.4 1.4 1.4 14.1 9.9 11.1 680 (2.1) 40.2
National Aluminium Co. 60 SELL 154,892 2,949 2,577 3.2 3.7 4.3 (23.9) 15.8 18.2 19.0 16.4 13.9 9.2 7.3 5.5 1.3 1.3 1.2 2.5 2.5 2.5 7.2 8.0 9.0 53 (11.8) 1.1
Sesa Goa 182 ADD 158,481 3,017 869 31.0 47.3 38.6 (36.2) 52.6 (18.5) 5.9 3.9 4.7 5.4 6.0 8.4 1.0 0.8 0.7 2.6 2.6 2.6 11.4 9.6 5.9 220 20.6 20.3
Sterlite Industries 106 ADD 355,447 6,767 3,361 13.5 15.2 18.3 (11.0) 12.4 20.8 7.8 7.0 5.8 3.7 3.0 2.1 0.8 0.7 0.6 1.9 1.9 1.9 10.5 10.8 11.8 132 24.8 26.3
Tata Steel 470 ADD 456,806 8,696 971 27.8 58.4 80.4 (63.1) 110.4 37.6 16.9 8.0 5.8 7.9 6.0 5.0 1.1 1.0 0.9 2.5 2.5 2.5 7.1 13.4 16.3 525 11.6 58.3
Metals & Mining Cautious 4,741,635 90,265 (1.8) 17.6 18.2 11.7 9.9 8.4 7.2 6.2 5.0 1.9 1.7 1.4 1.8 2.0 2.2 16.3 16.7 17.1
Pharmaceutical
Apollo Hospitals 603 ADD 83,803 1,595 139 17.4 20.8 27.3 31.4 19.6 31.4 34.7 29.0 22.1 15.4 13.3 10.5 3.3 2.9 2.7 — — — 10.3 10.5 12.4 680 12.7 2.1
Biocon 233 ADD 46,620 887 200 16.4 19.5 20.5 (10.6) 18.9 5.2 14.2 11.9 11.3 7.7 6.3 5.5 2.1 1.9 1.7 — — — 15.3 16.4 15.6 260 11.5 4.3
Cipla 314 REDUCE 251,997 4,797 803 14.1 17.7 20.0 14.2 25.8 12.8 22.3 17.7 15.7 17.5 13.4 11.8 3.4 2.9 2.6 1.0 1.1 1.3 15.6 17.4 17.2 315 0.4 10.3
Cadila Healthcare 730 SELL 149,425 2,845 205 31.1 37.1 44.9 (10.5) 19.4 21.1 23.5 19.7 16.2 18.3 13.8 11.5 5.6 4.6 3.8 0.9 1.0 1.2 26.4 25.8 25.7 670 (8.2) 1.7
Dishman Pharma & chemicals 47 REDUCE 3,786 72 81 5.1 8.3 10.2 (48.6) 64.7 22.6 9.2 5.6 4.6 7.1 5.3 4.6 0.4 0.4 0.4 — — — 4.6 7.2 8.4 50 7.4 0.4
Divi's Laboratories 824 BUY 109,319 2,081 133 37.4 46.4 55.8 15.6 24.1 20.1 22.0 17.7 14.8 17.2 12.6 10.4 5.2 4.4 3.7 — — — 25.4 26.8 27.2 935 13.5 3.1
Dr Reddy's Laboratories 1,763 REDUCE 299,725 5,706 170 90.7 106.9 110.4 39.7 17.8 3.3 19.4 16.5 16.0 12.7 10.5 9.9 5.1 4.0 3.3 0.7 0.8 0.8 29.3 27.1 22.6 1,740 (1.3) 11.8
GlaxoSmithkline Pharmaceuticals (a) 2,212 SELL 187,333 3,566 85 74.3 82.8 94.6 8.8 11.5 14.2 29.8 26.7 23.4 21.6 18.0 15.4 9.7 9.0 8.1 2.0 2.6 2.6 32.4 35.0 36.6 1,930 (12.7) 1.3
Glenmark Pharmaceuticals 324 REDUCE 87,534 1,666 270 19.9 22.4 25.9 17.6 12.2 15.7 16.2 14.5 12.5 19.7 11.7 10.0 3.4 2.8 2.3 — — — 23.6 21.5 20.5 315 (2.7) 3.3
Jubilant Life Sciences 185 REDUCE 29,399 560 159 16.9 29.5 35.7 17.3 74.1 21.3 10.9 6.3 5.2 8.0 6.3 5.4 1.2 1.0 0.9 1.1 1.6 2.2 16.3 18.0 18.6 180 (2.5) 0.3
Lupin 539 ADD 241,755 4,602 448 23.0 27.5 32.5 19.4 19.5 18.5 23.5 19.6 16.6 18.6 14.5 11.9 5.8 4.6 3.8 0.6 0.8 1.0 27.8 26.6 25.5 550 2.0 7.1
Ranbaxy Laboratories 525 SELL 221,240 4,212 422 19.9 30.4 23.3 (50.9) 52.3 (23.1) 26.3 17.3 22.5 16.6 12.3 15.3 5.4 4.1 3.5 — — — 17.4 27.4 16.9 380 (27.6) 7.1
Sun Pharmaceuticals 595 ADD 616,648 11,739 1,036 23.4 25.6 28.6 33.2 9.8 11.4 25.5 23.2 20.8 18.6 15.4 13.3 4.9 4.1 3.4 0.7 0.8 1.0 23.1 21.2 20.0 600 0.8 10.8
Pharmaceuticals Attractive 2,328,584 44,329 9.3 20.4 7.4 22.3 18.5 17.3 15.4 12.0 11.8 3.4 2.9 3.2 0.7 0.9 0.9 15.4 15.8 18.5
Property
DLF 186 ADD 319,425 6,081 1,715 9.7 12.7 16.9 6.5 31.5 33.1 19.3 14.7 11.0 13.4 10.8 8.3 1.2 1.1 1.0 1.3 1.6 1.9 6.1 7.6 9.5 260 39.6 38.9
Housing Development & Infrastructure 82 BUY 36,251 690 441 19.4 29.8 30.9 (2.1) 53.6 3.6 4.2 2.8 2.7 5.9 4.4 4.0 0.3 0.3 0.3 1.2 1.8 2.4 8.4 11.6 10.8 130 58.2 48.4
Indiabulls Real Estate 61 RS 24,476 466 402 8.5 15.4 17.6 114.1 81.5 14.1 7.2 3.9 3.5 9.2 4.0 3.2 0.2 0.2 0.2 0.8 1.2 — 2.9 5.0 5.4 — — 9.3
Mahindra Life Space Developer 325 BUY 13,245 252 41 26.7 32.2 32.1 6.9 20.8 (0.3) 12.2 10.1 10.1 8.2 6.4 6.6 1.2 1.1 1.0 1.4 1.5 1.7 10.2 11.2 10.3 405 24.8 0.4
Oberoi Realty 266 BUY 87,710 1,670 330 14.9 26.4 42.6 (5.0) 77.3 61.3 17.8 10.1 6.2 13.0 6.2 3.8 2.3 1.9 1.5 0.6 0.9 1.1 13.9 21.1 27.2 300 12.8 0.6
Phoenix Mills 212 BUY 30,736 585 145 7.4 10.7 11.5 17.2 44.1 7.9 28.6 19.9 18.4 20.7 15.5 14.8 1.8 1.7 1.6 0.9 0.9 0.9 6.6 8.9 9.0 300 41.4 0.3
Puravankara Projects 68 REDUCE 14,449 275 213 7.4 9.5 16.3 33.2 29.4 71.0 9.2 7.1 4.2 12.5 10.4 4.3 0.9 0.8 0.7 2.2 3.0 3.7 9.9 11.8 17.9 80 18.2 0.1
Sobha Developers 324 BUY 31,729 604 98 15.6 25.7 32.8 (17.2) 65.3 27.6 20.8 12.6 9.9 15.0 9.5 7.7 1.6 1.4 1.3 1.1 1.2 1.4 7.9 12.0 13.8 430 32.9 1.5
Unitech 28 RS 74,172 1,412 2,616 1.5 2.0 2.4 (35.3) 34.7 20.8 18.9 14.0 11.6 16.2 11.2 8.7 0.6 0.5 0.5 0.7 1.1 1.1 3.3 4.0 4.2 — — 14.9
Property Cautious 673,846 12,828 12.4 45.0 27.5 14.0 9.6 7.6 11.8 8.4 6.4 0.9 0.8 0.7 1.1 1.4 1.6 6.4 8.5 9.7
Dividend yield (%)
Source: Company, Bloomberg, Kotak Institutional Equities estimates
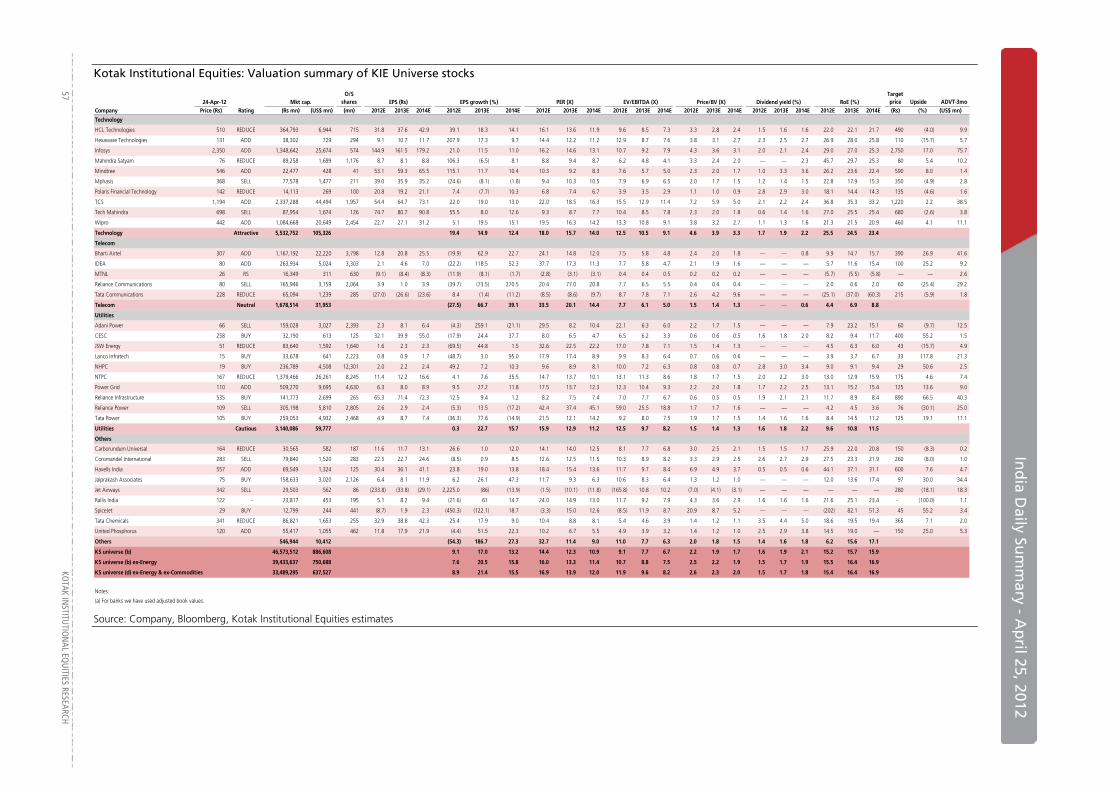
In
dia D
aily Sum
mary - A
pril 25, 2012
57
KOTAK IN
STITUTIO
NAL EQ
UITIES RESEARCH
Kotak Institutional Equities: Valuation summary of KIE Universe stocks
24-Apr-12 Mkt cap.O/S
shares EPS (Rs) EPS growth (%) PER (X) EV/EBITDA (X) Price/BV (X) RoE (%)Target price Upside ADVT-3mo
Company Price (Rs) Rating (Rs mn) (US$ mn) (mn) 2012E 2013E 2014E 2012E 2013E 2014E 2012E 2013E 2014E 2012E 2013E 2014E 2012E 2013E 2014E 2012E 2013E 2014E 2012E 2013E 2014E (Rs) (%) (US$ mn)
Technology
HCL Technologies 510 REDUCE 364,793 6,944 715 31.8 37.6 42.9 39.1 18.3 14.1 16.1 13.6 11.9 9.6 8.5 7.3 3.3 2.8 2.4 1.5 1.6 1.6 22.0 22.1 21.7 490 (4.0) 9.9
Hexaware Technologies 131 ADD 38,302 729 294 9.1 10.7 11.7 207.9 17.3 9.7 14.4 12.2 11.2 12.9 8.7 7.6 3.8 3.1 2.7 2.3 2.5 2.7 26.9 28.0 25.8 110 (15.7) 5.7
Infosys 2,350 ADD 1,348,642 25,674 574 144.9 161.5 179.2 21.0 11.5 11.0 16.2 14.6 13.1 10.7 9.2 7.9 4.3 3.6 3.1 2.0 2.1 2.4 29.0 27.0 25.3 2,750 17.0 75.7
Mahindra Satyam 76 REDUCE 89,258 1,699 1,176 8.7 8.1 8.8 106.3 (6.5) 8.1 8.8 9.4 8.7 6.2 4.8 4.1 3.3 2.4 2.0 — — 2.3 45.7 29.7 25.3 80 5.4 10.2
Mindtree 546 ADD 22,477 428 41 53.1 59.3 65.5 115.1 11.7 10.4 10.3 9.2 8.3 7.6 5.7 5.0 2.3 2.0 1.7 1.0 3.3 3.6 26.2 23.6 22.4 590 8.0 1.4
Mphasis 368 SELL 77,578 1,477 211 39.0 35.9 35.2 (24.6) (8.1) (1.8) 9.4 10.3 10.5 7.9 6.9 6.5 2.0 1.7 1.5 1.2 1.4 1.5 22.8 17.9 15.3 350 (4.9) 2.8
Polaris Financial Technology 142 REDUCE 14,113 269 100 20.8 19.2 21.1 7.4 (7.7) 10.3 6.8 7.4 6.7 3.9 3.5 2.9 1.1 1.0 0.9 2.8 2.9 3.0 18.1 14.4 14.3 135 (4.6) 1.6
TCS 1,194 ADD 2,337,288 44,494 1,957 54.4 64.7 73.1 22.0 19.0 13.0 22.0 18.5 16.3 15.5 12.9 11.4 7.2 5.9 5.0 2.1 2.2 2.4 36.8 35.3 33.2 1,220 2.2 38.5
Tech Mahindra 698 SELL 87,954 1,674 126 74.7 80.7 90.8 55.5 8.0 12.6 9.3 8.7 7.7 10.4 8.5 7.8 2.3 2.0 1.8 0.6 1.4 1.6 27.0 25.5 25.4 680 (2.6) 3.8
Wipro 442 ADD 1,084,668 20,649 2,454 22.7 27.1 31.2 5.1 19.5 15.1 19.5 16.3 14.2 13.3 10.8 9.1 3.8 3.2 2.7 1.1 1.3 1.6 21.3 21.5 20.9 460 4.1 11.1
Technology Attractive 5,532,752 105,326 19.4 14.9 12.4 18.0 15.7 14.0 12.5 10.5 9.1 4.6 3.9 3.3 1.7 1.9 2.2 25.5 24.5 23.4
Telecom
Bharti Airtel 307 ADD 1,167,192 22,220 3,798 12.8 20.8 25.5 (19.9) 62.9 22.7 24.1 14.8 12.0 7.5 5.8 4.8 2.4 2.0 1.8 — — 0.8 9.9 14.7 15.7 390 26.9 41.6
IDEA 80 ADD 263,934 5,024 3,303 2.1 4.6 7.0 (22.2) 118.5 52.3 37.7 17.3 11.3 7.7 5.8 4.7 2.1 1.9 1.6 — — — 5.7 11.6 15.4 100 25.2 9.2
MTNL 26 RS 16,349 311 630 (9.1) (8.4) (8.3) (11.9) (8.1) (1.7) (2.8) (3.1) (3.1) 0.4 0.4 0.5 0.2 0.2 0.2 — — — (5.7) (5.5) (5.8) — — 2.6
Reliance Communications 80 SELL 165,946 3,159 2,064 3.9 1.0 3.9 (39.7) (73.5) 270.5 20.4 77.0 20.8 7.7 6.5 5.5 0.4 0.4 0.4 — — — 2.0 0.6 2.0 60 (25.4) 29.2
Tata Communications 228 REDUCE 65,094 1,239 285 (27.0) (26.6) (23.6) 8.4 (1.4) (11.2) (8.5) (8.6) (9.7) 8.7 7.8 7.1 2.6 4.2 9.6 — — — (25.1) (37.0) (60.3) 215 (5.9) 1.8
Telecom Neutral 1,678,514 31,953 (27.5) 66.7 39.1 33.5 20.1 14.4 7.7 6.1 5.0 1.5 1.4 1.3 — — 0.6 4.4 6.9 8.8
Utilities
Adani Power 66 SELL 159,028 3,027 2,393 2.3 8.1 6.4 (4.3) 259.1 (21.1) 29.5 8.2 10.4 22.1 6.3 6.0 2.2 1.7 1.5 — — — 7.9 23.2 15.1 60 (9.7) 12.5
CESC 258 BUY 32,190 613 125 32.1 39.9 55.0 (17.9) 24.4 37.7 8.0 6.5 4.7 6.5 6.2 3.3 0.6 0.6 0.5 1.6 1.8 2.0 8.2 9.4 11.7 400 55.2 1.5
JSW Energy 51 REDUCE 83,640 1,592 1,640 1.6 2.3 2.3 (69.5) 44.8 1.5 32.6 22.5 22.2 17.0 7.8 7.1 1.5 1.4 1.3 — — — 4.5 6.3 6.0 43 (15.7) 4.9
Lanco Infratech 15 BUY 33,678 641 2,223 0.8 0.9 1.7 (48.7) 3.0 95.0 17.9 17.4 8.9 9.9 8.3 6.4 0.7 0.6 0.6 — — — 3.9 3.7 6.7 33 117.8 21.3
NHPC 19 BUY 236,789 4,508 12,301 2.0 2.2 2.4 49.2 7.2 10.3 9.6 8.9 8.1 10.0 7.2 6.3 0.8 0.8 0.7 2.8 3.0 3.4 9.0 9.1 9.4 29 50.6 2.5
NTPC 167 REDUCE 1,379,466 26,261 8,245 11.4 12.2 16.6 4.1 7.6 35.5 14.7 13.7 10.1 13.1 11.3 8.6 1.8 1.7 1.5 2.0 2.2 3.0 13.0 12.9 15.9 175 4.6 7.4
Power Grid 110 ADD 509,270 9,695 4,630 6.3 8.0 8.9 9.5 27.2 11.8 17.5 13.7 12.3 12.3 10.4 9.3 2.2 2.0 1.8 1.7 2.2 2.5 13.1 15.2 15.4 125 13.6 9.0
Reliance Infrastructure 535 BUY 141,773 2,699 265 65.3 71.4 72.3 12.5 9.4 1.2 8.2 7.5 7.4 7.0 7.7 6.7 0.6 0.5 0.5 1.9 2.1 2.1 11.7 8.9 8.4 890 66.5 40.3
Reliance Power 109 SELL 305,198 5,810 2,805 2.6 2.9 2.4 (5.3) 13.5 (17.2) 42.4 37.4 45.1 59.0 25.5 18.8 1.7 1.7 1.6 — — — 4.2 4.5 3.6 76 (30.1) 25.0
Tata Power 105 BUY 259,053 4,932 2,468 4.9 8.7 7.4 (36.3) 77.6 (14.9) 21.5 12.1 14.2 9.2 8.0 7.5 1.9 1.7 1.5 1.4 1.6 1.6 8.4 14.5 11.2 125 19.1 11.1
Utilities Cautious 3,140,086 59,777 0.3 22.7 15.7 15.9 12.9 11.2 12.5 9.7 8.2 1.5 1.4 1.3 1.6 1.8 2.2 9.6 10.8 11.5
Others
Carborundum Universal 164 REDUCE 30,565 582 187 11.6 11.7 13.1 26.6 1.0 12.0 14.1 14.0 12.5 8.1 7.7 6.8 3.0 2.5 2.1 1.5 1.5 1.7 25.9 22.0 20.8 150 (8.3) 0.2
Coromandel International 283 SELL 79,840 1,520 283 22.5 22.7 24.6 (8.5) 0.9 8.5 12.6 12.5 11.5 10.3 8.9 8.2 3.3 2.9 2.5 2.6 2.7 2.9 27.5 23.3 21.9 260 (8.0) 1.0
Havells India 557 ADD 69,549 1,324 125 30.4 36.1 41.1 23.8 19.0 13.8 18.4 15.4 13.6 11.7 9.7 8.4 6.9 4.9 3.7 0.5 0.5 0.6 44.1 37.1 31.1 600 7.6 4.7
Jaiprakash Associates 75 BUY 158,633 3,020 2,126 6.4 8.1 11.9 6.2 26.1 47.3 11.7 9.3 6.3 10.6 8.3 6.4 1.3 1.2 1.0 — — — 12.0 13.6 17.4 97 30.0 34.4
Jet Airways 342 SELL 29,503 562 86 (233.8) (33.8) (29.1) 2,225.0 (86) (13.9) (1.5) (10.1) (11.8) (165.8) 10.8 10.2 (7.0) (4.1) (3.1) — — — — — — 280 (18.1) 18.3
Rallis India 122 - 23,817 453 195 5.1 8.2 9.4 (21.6) 61 14.7 24.0 14.9 13.0 11.7 9.2 7.9 4.3 3.6 2.9 1.6 1.6 1.6 21.6 25.1 23.4 - (100.0) 1.1
SpiceJet 29 BUY 12,799 244 441 (8.7) 1.9 2.3 (450.3) (122.1) 18.7 (3.3) 15.0 12.6 (8.5) 11.9 8.7 20.9 8.7 5.2 — — — (202) 82.1 51.3 45 55.2 3.4
Tata Chemicals 341 REDUCE 86,821 1,653 255 32.9 38.8 42.3 25.4 17.9 9.0 10.4 8.8 8.1 5.4 4.6 3.9 1.4 1.2 1.1 3.5 4.4 5.0 18.6 19.5 19.4 365 7.1 2.0
United Phosphorus 120 ADD 55,417 1,055 462 11.8 17.9 21.9 (4.4) 51.5 22.3 10.2 6.7 5.5 4.9 3.9 3.2 1.4 1.2 1.0 2.5 2.9 3.8 14.5 19.0 — 150 25.0 5.3
Others 546,944 10,412 (54.3) 186.7 27.3 32.7 11.4 9.0 11.0 7.7 6.3 2.0 1.8 1.5 1.4 1.6 1.8 6.2 15.6 17.1
KS universe (b) 46,573,512 886,608 9.1 17.0 13.2 14.4 12.3 10.9 9.1 7.7 6.7 2.2 1.9 1.7 1.6 1.9 2.1 15.2 15.7 15.9
KS universe (b) ex-Energy 39,433,637 750,688 7.6 20.5 15.8 16.0 13.3 11.4 10.7 8.8 7.5 2.5 2.2 1.9 1.5 1.7 1.9 15.5 16.4 16.9
KS universe (d) ex-Energy & ex-Commodities 33,489,295 637,527 8.9 21.4 15.5 16.9 13.9 12.0 11.9 9.6 8.2 2.6 2.3 2.0 1.5 1.7 1.8 15.4 16.4 16.9
Notes:
(a) For banks we have used adjusted book values.
Dividend yield (%)
Source: Company, Bloomberg, Kotak Institutional Equities estimates

59 KOTAK INSTITUTIONAL EQUITIES RESEARCH
Disclosures
Kotak Institutional Equities Research coverage universeDistribution of ratings/investment banking relationships
Source: Kotak Institutional Equities As of March 31, 2012
Percentage of companies covered by Kotak Institutional Equities, within the specified category.
Percentage of companies within each category for which Kotak Institutional Equities and or its affiliates has provided investment banking services within the previous 12 months.
* The above categories are defined as follows: Buy = We expect this stock to deliver more than 15% returns over the next 12 months; Add = We expect this stock to deliver 5-15% returns over the next 12 months; Reduce = We expect this stock to deliver -5-+5% returns over the next 12 months; Sell = We expect this stock to deliver less than -5% returns over the next 12 months. Our target prices are also on a 12-month horizon basis. These ratings are used illustratively to comply with applicable regulations. As of 31/03/2012 Kotak Institutional Equities Investment Research had investment ratings on 166 equity securities.
18.7%
30.7% 31.9%
18.7%
1.8%0.0% 1.2% 0.6%
0%
10%
20%
30%
40%
50%
60%
70%
BUY ADD REDUCE SELL
Ratings and other definitions/identifiers
Definitions of ratings
Definitions of ratings
BUY. We expect this stock to deliver more than 15% returns over the next 12 months.
ADD. We expect this stock to deliver 5-15% returns over the next 12 months.
REDUCE. We expect this stock to deliver -5-+5% returns over the next 12 months.
SELL. We expect this stock to deliver <-5% returns over the next 12 months.
Our target prices are also on a 12-month horizon basis.
Other definitions
Coverage view. The coverage view represents each analyst’s overall fundamental outlook on the Sector. The coverage view will consist of one of the following designations: Attractive, Neutral, Cautious.
Other ratings/identifiers
NR = Not Rated. The investment rating and target price, if any, have been suspended temporarily. Such suspension is in compliance with applicable regulation(s) and/or Kotak Securities policies in circumstances when Kotak Securities or its affiliates is acting in an advisory capacity in a merger or strategic transaction involving this company and in certain other circumstances.
CS = Coverage Suspended. Kotak Securities has suspended coverage of this company.
NC = Not Covered. Kotak Securities does not cover this company.
RS = Rating Suspended. Kotak Securities Research has suspended the investment rating and price target, if any, for this stock, because there is not a sufficient fundamental basis for determining an investment rating or target. The previous investment rating and price target, if any, are no longer in effect for this stock and should not be relied upon.
NA = Not Available or Not Applicable. The information is not available for display or is not applicable.
NM = Not Meaningful. The information is not meaningful and is therefore excluded.

Corporate Office Overseas Offices
Kotak Securities Ltd.
Bakhtawar, 1st Floor
229, Nariman Point
Mumbai 400 021, India
Tel: +91-22-6634-1100
Kotak Mahindra (UK) Ltd
8th Floor, Portsoken House
155-157 Minories
London EC3N 1LS
Tel: +44-20-7977-6900
Kotak Mahindra Inc
50 Main Street, Ste. 890
Westchester Financial Centre
White Plains, New York 10606
Tel:+1-914-997-6120
Copyright 2012 Kotak Institutional Equities (Kotak Securities Limited). All rights reserved.
1. Note that the research analysts contributing to this report may not be registered/qualified as research analysts with FINRA; and
2. Such research analysts may not be associated persons of Kotak Mahindra Inc and therefore, may not be subject to NASD Rule 2711 restrictions on communications with a subject company, public appearances and trading securities held by a research analyst account.
Kotak Securities Limited and its affiliates are a full-service, integrated investment banking, investment management, brokerage and financing group. We along with our affiliates are leading underwriter of securities and participants in virtually all securities trading markets in India. We and our affiliates have investment banking and other business relationships with a significant percentage of the companies covered by our Investment Research Department. Our research professionals provide important input into our investment banking and other business selection processes. Investors should assume that Kotak Securities Limited and/or its affiliates are seeking or will seek investment banking or other business from the company or companies that are the subject of this material and that the research professionals who were involved in preparing this material may participate in the solicitation of such business. Our research professionals are paid in part based on the profitability of Kotak Securities Limited, which include earnings from investment banking and other business. Kotak Securities Limited generally prohibits its analysts, persons reporting to analysts, and members of their households from maintaining a financial interest in the securities or derivatives of any companies that the analysts cover. Additionally, Kotak Securities Limited generally prohibits its analysts and persons reporting to analysts from serving as an officer, director, or advisory board member of any companies that the analysts cover. Our salespeople, traders, and other professionals may provide oral or written market commentary or trading strategies to our clients that reflect opinions that are contrary to the opinions expressed herein, and our proprietary trading and investing businesses may make investment decisions that are inconsistent with the recommendations expressed herein. In reviewing these materials, you should be aware that any or all of the foregoing, among other things, may give rise to real or potential conflicts of interest. Additionally, other important information regarding our relationships with the company or companies that are the subject of this material is provided herein.
This material should not be construed as an offer to sell or the solicitation of an offer to buy any security in any jurisdiction where such an offer or solicitation would be illegal. We are not soliciting any action based on this material. It is for the general information of clients of Kotak Securities Limited. It does not constitute a personal recommendation or take into account the particular investment objectives, financial situations, or needs of individual clients. Before acting on any advice or recommendation in this material, clients should consider whether it is suitable for their particular circumstances and, if necessary, seek professional advice. The price and value of the investments referred to in this material and the income from them may go down as well as up, and investors may realize losses on any investments. Past performance is not a guide for future performance, future returns are not guaranteed and a loss of original capital may occur. Kotak Securities Limited does not provide tax advise to its clients, and all investors are strongly advised to consult with their tax advisers regarding any potential investment.
Certain transactions -including those involving futures, options, and other derivatives as well as non-investment-grade securities - give rise to substantial risk and are not suitable for all investors. The material is based on information that we consider reliable, but we do not represent that it is accurate or complete, and it should not be relied on as such. Opinions expressed are our current opinions as of the date appearing on this material only. We endeavor to update on a reasonable basis the information discussed in this material, but regulatory, compliance, or other reasons may prevent us from doing so. We and our affiliates, officers, directors, and employees, including persons involved in the preparation or issuance of this material, may from time to time have “long” or “short” positions in, act as principal in, and buy or sell the securities or derivatives thereof of companies mentioned herein. For the purpose of calculating whether Kotak Securities Limited and its affiliates holds beneficially owns or controls, including the right to vote for directors, 1% of more of the equity shares of the subject issuer of a research report, the holdings does not include accounts managed by Kotak Mahindra Mutual Fund. Kotak Securities Limited and its non US affiliates may, to the extent permissible under applicable laws, have acted on or used this research to the extent that it relates to non US issuers, prior to or immediately following its publication. Foreign currency denominated securities are subject to fluctuations in exchange rates that could have an adverse effect on the value or price of or income derived from the investment. In addition, investors in securities such as ADRs, the value of which are influenced by foreign currencies affectively assume currency risk. In addition options involve risks and are not suitable for all investors. Please ensure that you have read and understood the current derivatives risk disclosure document before entering into any derivative transactions.
This report has not been prepared by Kotak Mahindra Inc. (KMInc). However KMInc has reviewed the report and, in so far as it includes current or historical information, it is believed to be reliable, although its accuracy and completeness cannot be guaranteed. Any reference to Kotak Securities Limited shall also be deemed to mean and include Kotak Mahindra Inc.


![[Kotak] India Daily, July 25, 2017 - Kotak Securities](https://static.fdokumen.com/doc/165x107/63161b1a15106505030be7d5/kotak-india-daily-july-25-2017-kotak-securities.jpg)


![[Kotak] India Daily, May 07, 2018 - Kotak Securities](https://static.fdokumen.com/doc/165x107/633c43a3f3eeefb08b0c1dc3/kotak-india-daily-may-07-2018-kotak-securities.jpg)


![[Kotak] India Daily, October 26, 2016 - Kotak Securities](https://static.fdokumen.com/doc/165x107/631c83236c6907d3680156e0/kotak-india-daily-october-26-2016-kotak-securities.jpg)